the link between local environment and obesity: a multilevel analysis in the lisbon metropolitan...
TRANSCRIPT
lable at ScienceDirect
Social Science & Medicine 68 (2009) 601–609
Contents lists avai
Social Science & Medicine
journal homepage: www.elsevier .com/locate/socscimed
The link between local environment and obesity: A multilevel analysis in theLisbon Metropolitan Area, Portugal
Paula Santana*, Rita Santos, Helena NogueiraCentre for Geographic Studies, Institute for Geographical Studies University of Coimbra, 3004-530 Coimbra, Portugal
a r t i c l e i n f o
Article history:Available online 8 January 2009
Keywords:Healthy urban planningPhysical activityDietLisbon Metropolitan AreaPortugalBody mass index (BMI)
* Corresponding author. Tel.: þ351914812550.E-mail address: [email protected] (P. S
0277-9536/$ – see front matter � 2008 Elsevier Ltd.doi:10.1016/j.socscimed.2008.11.033
a b s t r a c t
Although individual factors have been shown to predict weight gain, contextual determinants have alsoattracted attention, with some authors stressing the role played by deprivation, urban sprawl, socialcapital and safety. Recent evidence has implicated environmental factors that facilitate the consumptionof excess calories and/or make it more difficult to expend them in routine physical activity. The inter-relationships found in some places between physical and social environments (key mediators) and bodymass index (BMI), as well as the potential that exists for the development of healthier places, mean thatmore research is required into the contextual determinants of health.In Portugal, particularly in the Lisbon Metropolitan Area (LMA), the effects of physical and social envi-ronments on physical activity and BMI have not previously been explored in any detail. This study aims tohighlight the associations between residential (physical and social) environment and the risk of weightgain and obesity, over and above individual attributes, assessing which indicators are the best predictorsof excess weight in the LMA.The study involved data from 7669 individuals aged 18 and over from 143 neighbourhoods. Self-reportedbody height and weight were used to define overweight body mass index (BMI� 25). BMI and individual(socio-demographic and behavioural) characteristics were linked to contextual data and analysed ina multilevel framework.Our findings show that different environmental factors are significantly associated with excess weightand obesity, either directly or indirectly (e.g. health-related behaviours such as eating patterns andphysical activity, which are key mediators), after adjustment for individual characteristics. The resultssuggest that a deeper understanding of these mechanisms is critical if we want to tackle the obesityepidemic, and that policies aimed at weight control and obesity reduction must address people andplaces in order to bear fruit.
� 2008 Elsevier Ltd. All rights reserved.
Introduction
Obesity has reached epidemic proportions in almost all devel-oped countries (Backett-Milburn, Wills, Gregory, & Lawton, 2006)and in many urban areas in developing countries. Recent estimatessuggest that one billion adults in the world are overweight (Kjell-strom, 2007).
Portugal has a significant obesity problem, which is rapidlyworsening. In 1996, 10.3% of males and 11.4% of females had a BMIof over 30 kg/m2 (OECD, 2006); by 2006, this had increased to 16%for males and 16.9% for females (ACS, 2008), representing anadditional 55.3% and 43.9% for males and females respectively overa period of ten years. Thus, by 2006, 1 in 2 adults were overweight
antana).
All rights reserved.
or obese (ACS, 2008). Targets have been set by the National HealthPlan (ACS, 2008) to reduce obesity and excess weight in the pop-ulation by the year 2010. Obesity is a national public healthproblem: it has damaging effects on the social, economic and healthstatus of individuals, exacerbating their risks of disease andpremature death and increasing health care costs.
Several authors have claimed that excess body weight resultsfrom multifactorial causes, including polygenic, metabolic,psychosocial and environmental influences, and behaviouralaspects (Borders, Rohrer, & Cardarelli, 2006; Ellaway, Anderson, &Macintyre, 1997; Poortinga, 2006a; Poston & Foreyt, 1999). Genesplay a role, but the gene pool in industrialised countries has notchanged significantly in the few decades in which obesity hasrocketed. Therefore, environmental (obesogenic) factors must alsocontribute significantly to weight gain. Some authors (Cohen, Finch,Bower, & Sastry, 2006; Ellaway et al., 1997; Kim, Subramanian,Gortmaker, & Kawachi, 2006; Poortinga, 2006a; Poston & Foreyt,
P. Santana et al. / Social Science & Medicine 68 (2009) 601–609602
1999; Stafford et al., 2007; Van Lenthe & Mackenbach, 2002) haveindicated the potential obesogenicity of certain environmentalfactors (i.e. the extent to which they could promote caloric intakeand/or discourage the expenditure of energy in routine physicalactivity).
However, the precise cause of the epidemic remains unknown,and no possible solutions are yet in sight. It is important, therefore,to identify exactly what is a ‘‘toxic environment’’ (Poston & Foreyt,1999) in order to focus upon changing it. Swinburn, Egger, & Raza(1999: 564) argue that ‘‘there is an urgent need for a conceptual andpractical framework to dissect the rather nebulous concept of theenvironment into concrete elements which are amenable tomeasurement and interventions’’.
Increasing obesity amongst the Portuguese population is asso-ciated with trends in: excessive energy intake (3747 calories onaverage per person, in 2003, representing an increase of 32.6% inthe last thirty years, that is 1.6% per year) (OECD, 2006); and lowrates of leisure-time physical activity (overall age-adjusted preva-lence for a sedentary lifestyle was 62.8% for males and 75.4% forfemales in 1999) (Demarest et al., 2007). By 2004, 73% of Portu-guese people reported that they seldom or never did physicalexercise for recreation or as a leisure-time activity, and 54%reported identical levels of inactivity at work (Eurobaromater,2004). These behavioural risks for obesity, in isolation or togetherwith genetic susceptibilities or vulnerabilities, may vary fromindividual to individual (in association with socioeconomic status)and according to place of residence (opportunities for healthybehaviours: physical recreation and eating) (Ellaway et al., 1997;Stafford et al., 2007).
The purpose of this paper is to examine the contribution of thelocal environment and personal attributes to the risk of weight gainin LMA neighbourhoods and evaluate their importance for theunderstanding and treatment of obesity. This information will berelevant for the design and planning of health promotion inter-ventions, in so far as it will facilitate the identification of areasrequiring analysis, major issues and priorities for tackling theobesity epidemic in the Lisbon Metropolitan Area (LMA).
To achieve this, the authors intend to: (1) develop indicators tomeasure social environment and availability of local resources; (2)link individuals to their neighbourhoods through the character-ization of each individual personally and according to the specificfeatures of their place of residence; (3) establish associationsbetween sustainable communities, their citizens’ body mass index(BMI) and risk factors for obesity (i.e. behaviours such as physicalactivity and healthy eating habits).
The next section describes the conceptual framework forobesity, including data and methods used, followed by the mainachieved results. Finally, in the last part, possible explanations aresuggested, some conclusions are drawn and key proposals aremade for changes that could lead to alternative health outcomes.
A conceptual framework for obesity, and hypotheses
How might area characteristics be associated with the risk ofincreased BMI? Does place act or interact with individual charac-teristics? How does this happen?
A web of interlinking determinants
In 1997, Macintyre (Macintyre, 1997) presented three types ofexplanations for geographical variations in health: compositional,contextual and collective. Macintyre, Ellaway, and Cummins (2002:125) subsequently suggested that the distinction ‘‘betweencomposition and context may be more apparent than real .’’. Aconceptual framework linking residential context to obesity,
including a plausible causal pathway, was suggested by Staffordet al. (2007) (discussed below). Social and physical environmentsthat define the residential context (physical, social, economic, andpolitical) are shaped by multiple factors and multiple players(national and local government, private sector, civil society) atmultiple levels (global and local) (Vlahov, Galea, Gibbe, & Freu-denberg, 2005).
Excess weight and residential area deprivationA large body of literature has established links between the
neighbourhood environment and BMI, directly or indirectly(pathways). A greater prevalence of obesity in more deprivedneighbourhoods was reported by a number of studies (Ellawayet al., 1997; Van Lenthe & Mackenbach, 2002).
The association between neighbourhood deprivation and excessweight may be modified by individual socio-demographic factorsdue to the different amounts of time spent in the neighbourhoodsby different groups and the nature of their presence. For lowersocioeconomic groups, females (housewives) and the elderly(retired), the environment may have a larger impact on daily lifethan for subjects in higher socioeconomic groups, males andyounger people (Van Lenthe & Mackenbach, 2002).
It has been argued that local social organization, which may beinversely related to area deprivation (Wilkinson, 2005), playsa major role in promoting healthy behaviours. Cohen et al. (2006)suggested that collective efficacy, defined as social cohesion amongneighbours, stimulates various positive health behaviours,including physical activity, and exerts some measure of socialcontrol over deviant behaviours, such as smoking and alcoholabuse. Individuals living in neighbourhoods that are socially andphysically disadvantaged are at increased risk of engaging inunhealthy behaviours, such as physical inactivity, often asa response to a stressful and hazardous environment (McNeill,Kreuter, & Subramanian, 2006; Stafford et al., 2007). Poortinga(2006a) indicated positive associations between obesity and the‘‘presence of social nuisances’’, and between social support, socialcapital and higher levels of physical activity. Sampson, Raudenbush,and Earls (1997) reports a positive association between deprivationand violence which make areas unsafe, while Van Lenthe, Brug, andMackenbach (2005) stressed the role of neighbourhood attrac-tiveness and safety in encouraging physical activity.
Area deprivation is associated with the decline in healthy lifestyles (Santana, 2002), promoting excess weight and obesity, phys-ical inactivity (Kim et al., 2006; Poortinga, 2006a), availability of fast-food outlets (Cummins et al., 2005) and fast-food consumption(Macdonald, Cummins, & Macintyre, 2007). The poorest settings areexperienced as having an adverse ‘‘obesogenic’’ impact (Schoeppe &Braubach, 2007). The emergence of the ‘‘obesogenic’’ environmenthas been both rapid and multifactorial, involving changes in eatinghabits (including the availability, portion size and low cost of fast-food) together with decreasing energy expenditure (active lifestyledecrease). Healthy behaviour, such as planned physical activity (e.g.walking, running or sports) and healthy eating (fruit and vegetableintake) are related to residential environment, categorized into fourtypes: physical (availability), economic (costs), political (rules) andsociocultural (the attitudes and beliefs held by the community orsociety) (Swinburn et al., 1999).
Neighbourhood walkability and behaviour weight gain relatedOn the other side of the energy equation is energy expenditure.
The literature suggests that local urban planning and designinfluence weight in a number of ways. Residential density andmixed land use, combined with street connectivity, provideopportunities for physical activity (Calthorpe & Fulton 2001; Doyle,Kelly-Schawartz, Scholossberg & Stockard, 2006; Frank et al., 2006;
P. Santana et al. / Social Science & Medicine 68 (2009) 601–609 603
Jochelson, 2004), while neighbourhood attractiveness and safety(i.e. low crime and accident rates) encourage outdoor activities(Calthorpe & Fulton 2001; Doyle et al., 2006; Jochelson, 2004;Stafford et al., 2007). Ellaway et al. (1997) and Stafford et al. (2007)suggested that the provision of and access to local public facilitiesand spaces for recreation and play are directly correlated withindividual level planned physical activity.
Factors related with urban sprawl (for example, areas with lowpopulation density and low street connectivity), land use (living inhomogeneous land use areas), location of facilities (sports andleisure centres, public services, shops, parks and green spaceslocated far from area of residence) (Frank et al., 2006) andcommunity perceptions (unsafe and unpleasant environments)could create ‘‘unwalkable’’ communities. Cerin, Leslie, du Toit,Owen, & Frank (2007: 723) presented the results of the PLACE(Physical Activity in Localities and Community Environments)study in Adelaide, Australia. The authors concluded that this study‘‘strengthens the evidence base for a causal effect of the builtenvironment on physical activity’’. Access to destinations (work-place proximity) from home has been shown to be positivelycorrelated with walking for transports, especially among women.
The environmental characteristics have been related to theprevalence of excess weight and obesity (Doyle et al., 2006), evenafter controlling the individual variables usually implicated inweight gain (Kim et al., 2006; Poortinga, 2006a).
Data and methods
The LMA comprises 19 municipalities, 216 neighbourhoods andover 2.5 million inhabitants. The mean population of neighbour-hoods was 12,420 inhabitants, ranging from 341 to 81.845 inhabi-tants (INE, 2001). Population density ranges from 9.3 to34.474 inhabitants/km2 at the neighbourhood level. The samplinguniverse consisted of the residents of the LMA. A sample of 7.669individuals, living in 143 neighbourhoods, was collected by trainedinterviewers (National Health Survey – NHS – 1998–99). Individualcharacteristics were linked to residential environment data at theneighbourhood level, since all data was geocodified.
Outcome measureThis study has four binary outcome measures, based on self-
reported weight, height, leisure activities, and fruit and vegetableintake. Excess body weight was assessed through body mass index(BMI), defined as a ratio between self-reported weight (kilograms)and squared height (metres). The BMI variable was categorised intotwo groups: normal (18� BMI< 25) and overweight (BMI� 25).
The planned physical activity variable was divided into twocategories (vigorous and moderate activity), both based on self-reported leisure-time activities. Vigorous physical activity wasconsidered to be competitive sports, jogging or other recreationalsports, while moderate activity included walking, cycling and otherlight activities.
A healthy diet was defined in accordance with self-reported fruitand vegetable intake on the day before the interview.
Predictor variablesIndividual and contextual variables tested in the models vary
according to previous work (Santana, Nogueira, & Santos, 2007) andtheoretical support.
At the individual level, some key characteristics related to weightgain were collected from the NHS. These were: demographic factors(age, gender); marital status (single, married, divorced/separated);economic activity (employed, unemployed, student, retired andhousewife); educational level (less than 4 years, between 5 and 12years and more than 12 years); occupational class (manual,
non-manual workers); income (household income divided bynumber of relatives living in the household) and health-relatedbehaviours (moderate or vigorous physical activity, smoking andhealthy diet) (see Table 1). All individual variables were included asdummy variables, except age, which was included as continuous,centred and squared, in order to model the curvilinear relationshipbetween age and BMI. In fact, it was expected that BMI wouldincrease with age through mid-adulthood and then decline in oldage (Robert & Reither, 2004).
At the neighbourhood level, we addressed the challenge ofaccurately assessing a range of specific features from the localenvironment that may influence each of the four health outcomesconsidered. Observations were originally made and data collectedat two different levels, municipality and neighbourhood. However,in the present study, all the contextual variables were converted toneighbourhood. We theorized a range of environmental domainsrelated with weight gain, some of which were operationalizedusing statistical procedures. Three composite ecological indices(local resources, social capital and public health services avail-ability) were created through Principal Components Analysis (PCA)(Cummins et al., 2005; Nogueira, Santana, & Santos, 2006). In thesecases, a large number of variables were assigned to the environ-mental domains (32). Then, PCA was performed to explore andreduce these data. In order to maximize component feasibility, allwere extracted using orthogonal rotation, and rejected whenconsidered irrelevant using Kaiser’s criterion. Throughout theextraction process, we systematically modified the number ofentered variables, discarding those with a low loading intocomponents. This procedure allows the generation of a singlestrong component in each of the conceptualized environmentaldomains (Cummins et al., 2005). To assess the internal consistencyof the generated indices, a reliability analysis was performed. Thehigh values of the Cronbach’s Alpha scores (ranging from 0.51 to0.90) show that created indices are reliable scales, confirming theirconsistency and capacity of measuring the latent environmentaldomains. The other composite ecological measure was a depriva-tion score, operationalized following the methodology of Carstairsand Morris (1991) (standardization and sum of three census vari-ables). All the other indicators were single measures, i.e. proxies ofhousing inadequacy, urban sprawl, mixed land use and availabilityof sport features (see Table 2). Some of these single measures werestandardized since this transformation produces more interpret-able (centred in mean and standard variation of 1) and better fittedresults from the regression model (Long, 1997). Moreover, contex-tual variables were previously correlated, providing feedback aboutthe more accurate mix of variables to use in each health outcomemodel. Interactions between variables were calculated and testedin all models (see Appendix A and B, Supplementary material).
Multilevel logistical model
Behavioural and social data commonly have a nested structure.This means that individuals within a neighbourhood are more alikethan individuals living in different neighbourhoods. Goldstein(1995) claims that even in extreme cases when groupings areestablished randomly (as when subjects are allocated to differentexperimental groups), once grouping is established, they will tendto become differentiated. This implies that both the group and itsmembers can influence and be influenced by the group composi-tion. Ignoring this hierarchical structure in regression models leadsto an underestimation of standard errors, and a subsequent over-statement of statistical significance.
Multilevel models avoid this bias, allowing the assessment ofhealth variations across neighbourhoods (random intercept), aftercontrolling for individual level variables (Sundquist & Yang, 2007).
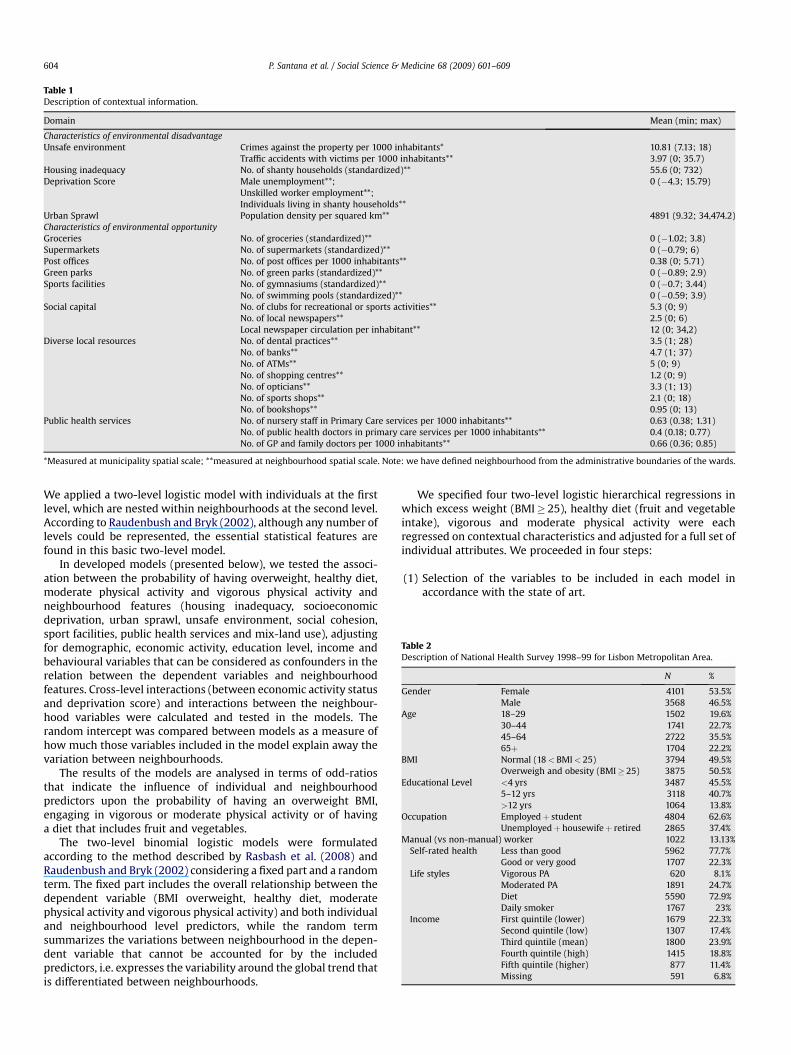
Table 1Description of contextual information.
Domain Mean (min; max)
Characteristics of environmental disadvantageUnsafe environment Crimes against the property per 1000 inhabitants* 10.81 (7.13; 18)
Traffic accidents with victims per 1000 inhabitants** 3.97 (0; 35.7)Housing inadequacy No. of shanty households (standardized)** 55.6 (0; 732)Deprivation Score Male unemployment**; 0 (�4.3; 15.79)
Unskilled worker employment**;Individuals living in shanty households**
Urban Sprawl Population density per squared km** 4891 (9.32; 34,474.2)Characteristics of environmental opportunityGroceries No. of groceries (standardized)** 0 (�1.02; 3.8)Supermarkets No. of supermarkets (standardized)** 0 (�0.79; 6)Post offices No. of post offices per 1000 inhabitants** 0.38 (0; 5.71)Green parks No. of green parks (standardized)** 0 (�0.89; 2.9)Sports facilities No. of gymnasiums (standardized)** 0 (�0.7; 3.44)
No. of swimming pools (standardized)** 0 (�0.59; 3.9)Social capital No. of clubs for recreational or sports activities** 5.3 (0; 9)
No. of local newspapers** 2.5 (0; 6)Local newspaper circulation per inhabitant** 12 (0; 34,2)
Diverse local resources No. of dental practices** 3.5 (1; 28)No. of banks** 4.7 (1; 37)No. of ATMs** 5 (0; 9)No. of shopping centres** 1.2 (0; 9)No. of opticians** 3.3 (1; 13)No. of sports shops** 2.1 (0; 18)No. of bookshops** 0.95 (0; 13)
Public health services No. of nursery staff in Primary Care services per 1000 inhabitants** 0.63 (0.38; 1.31)No. of public health doctors in primary care services per 1000 inhabitants** 0.4 (0.18; 0.77)No. of GP and family doctors per 1000 inhabitants** 0.66 (0.36; 0.85)
*Measured at municipality spatial scale; **measured at neighbourhood spatial scale. Note: we have defined neighbourhood from the administrative boundaries of the wards.
Table 2Description of National Health Survey 1998–99 for Lisbon Metropolitan Area.
N %
Gender Female 4101 53.5%Male 3568 46.5%
Age 18–29 1502 19.6%30–44 1741 22.7%45–64 2722 35.5%65þ 1704 22.2%
BMI Normal (18< BMI< 25) 3794 49.5%Overweigh and obesity (BMI� 25) 3875 50.5%
Educational Level <4 yrs 3487 45.5%5–12 yrs 3118 40.7%>12 yrs 1064 13.8%
Occupation Employedþ student 4804 62.6%Unemployedþ housewifeþ retired 2865 37.4%
Manual (vs non-manual) worker 1022 13.13%Self-rated health Less than good 5962 77.7%
Good or very good 1707 22.3%Life styles Vigorous PA 620 8.1%
Moderated PA 1891 24.7%Diet 5590 72.9%Daily smoker 1767 23%
Income First quintile (lower) 1679 22.3%Second quintile (low) 1307 17.4%Third quintile (mean) 1800 23.9%Fourth quintile (high) 1415 18.8%Fifth quintile (higher) 877 11.4%Missing 591 6.8%
P. Santana et al. / Social Science & Medicine 68 (2009) 601–609604
We applied a two-level logistic model with individuals at the firstlevel, which are nested within neighbourhoods at the second level.According to Raudenbush and Bryk (2002), although any number oflevels could be represented, the essential statistical features arefound in this basic two-level model.
In developed models (presented below), we tested the associ-ation between the probability of having overweight, healthy diet,moderate physical activity and vigorous physical activity andneighbourhood features (housing inadequacy, socioeconomicdeprivation, urban sprawl, unsafe environment, social cohesion,sport facilities, public health services and mix-land use), adjustingfor demographic, economic activity, education level, income andbehavioural variables that can be considered as confounders in therelation between the dependent variables and neighbourhoodfeatures. Cross-level interactions (between economic activity statusand deprivation score) and interactions between the neighbour-hood variables were calculated and tested in the models. Therandom intercept was compared between models as a measure ofhow much those variables included in the model explain away thevariation between neighbourhoods.
The results of the models are analysed in terms of odd-ratiosthat indicate the influence of individual and neighbourhoodpredictors upon the probability of having an overweight BMI,engaging in vigorous or moderate physical activity or of havinga diet that includes fruit and vegetables.
The two-level binomial logistic models were formulatedaccording to the method described by Rasbash et al. (2008) andRaudenbush and Bryk (2002) considering a fixed part and a randomterm. The fixed part includes the overall relationship between thedependent variable (BMI overweight, healthy diet, moderatephysical activity and vigorous physical activity) and both individualand neighbourhood level predictors, while the random termsummarizes the variations between neighbourhood in the depen-dent variable that cannot be accounted for by the includedpredictors, i.e. expresses the variability around the global trend thatis differentiated between neighbourhoods.
We specified four two-level logistic hierarchical regressions inwhich excess weight (BMI� 25), healthy diet (fruit and vegetableintake), vigorous and moderate physical activity were eachregressed on contextual characteristics and adjusted for a full set ofindividual attributes. We proceeded in four steps:
(1) Selection of the variables to be included in each model inaccordance with the state of art.
P. Santana et al. / Social Science & Medicine 68 (2009) 601–609 605
(2) Creation of a first set of models that included only the variablesthat were intrinsic to the individuals involved (demographic,economic and life style variables), which allowed us to definea baseline model.
(3) Creation of a second set of models, developed upon the base-line model estimated in the first step by adding a randomintercept coefficient, specifying b0jx0ij þ m0jx00 and then addingthe contextual variables mentioned above one at a time.
(4) Finally, development of the full model, which includes only thesignificant individual and neighbourhood variables thatshowed significance and the random intercept.
All the models were estimated using MLwiN software (Version2.02) (Rasbash et al., 2008), based upon predictive/penalized quasi-likelihood approximation of a second-order Taylor linearizationprocedure (Goldstein & Rasbash, 1996). We estimated the oddsratio (OR) and 95% confidence intervals (CI) for each individual andneighbourhood predictor. Moreover, to obtain the Deviance Infor-mation Criterion (DIC) we used MCMC estimation procedure ofMLwiN. DIC was used in each of the four models as a tool withwhich to compare the diverse estimated models until the finalmodel (Spiegelhater, Best, Carlin, & van der Linde, 2002), for each ofthe four outcomes.
Results
Multilevel models
We present in Table 3 the models that showed the better fitaccording to DIC, for the four models developed. The values ofvariance between neighbourhoods and DIC for the null models arepresented to highlight the reduction of variance between neigh-bourhoods after taking into account the included variables andof DIC.
Age, gender, occupation, education and income, marital status,lifestyles and overall health /initial health status (self-rated) wereincluded, although there were some differences in the variablesreported (see Table 3).
Healthy Diet
Women, married couples, the employed, non-smokers, thebetter educated and those on a higher income all showedincreased odds of fruit and vegetable intake. A similar associationwas found for manual workers but without statistical significance.Age shows that older individuals (over 48) are more likely to eathealthily. When adjustments were made for these individualattributes, empirical evidence was found for an environmentaleffect on diet, as there were significant variations in diet betweenneighbourhoods. Fruit and vegetables intake was negativelyassociated with the number of crimes against property, showinga direct association between neighbourhood disorder and healthydiet. Moreover, relevant associations were found betweencontextual measures, although without statistical significance. Lessdeprived neighbourhoods have more supermarkets (see correla-tions, Appendix B, Supplementary material), and the inhabitants ofthose areas have a greater fruit and vegetable intake, results thatcorroborate previous studies in this field (cf. Stafford et al., 2007).However, this relation changes with different types of food retailprovision. A negative association was found between healthy dietand the presence of groceries shops, which are more prevalent inmore deprived neighbourhoods. These findings suggest that thetype and quality of food retail outlets, and their accessibility, arecontextual determinants of diet, shaping dietary patterns, whichhave a well-known relationship with obesity.
Physical activity
Two physical activity models were developed, distinguishingbetween vigorous and moderate physical activity.
Moderate exercise – walkingIt was found that women, the less well educated and people
with a poor (self-rated) health status and lower income are lesslikely to engage in moderate physical activity. Age shows thatolder individuals (i.e. over 48) are less likely to engage inmoderate exercise. After adjusting for individual characteristics,important neighbourhood effects upon levels of moderate phys-ical activity were found. Strong positive associations were foundbetween moderate physical activity and population density, socialcohesion, availability of public health services and availability ofhigh street facilities (the higher the density, social cohesion andavailability, the higher the level of physical activity), whilea negative significant association between violence and moderatePA was found (the more crimes against property, the lower thelevels of physical activity). Moderate physical activity was nega-tively associated with traffic accidents involving victims, andpositively with the number of swimming pools, green parks andspaces, and post offices (not significant). Moreover, cross-levelinteractions suggest that individuals that are outside the labourmarket, living in more deprived areas, are less likely to engage inmoderate physical activity. Testing for interactions betweencontextual variables, we found a significant positive relationbetween individuals living in the higher population density tercileand more deprived areas, and levels of moderate physical activity.
Vigorous exerciseWomen, those with lower levels of education, low (self-rated)
health status and smokers are less likely to engage in vigoroussports activities, while lower income show a similar impact onvigorous physical activity, though without statistical significance.Age shows that older individuals (i.e. over 48) are less likely toengage in vigorous exercise.
Strong evidence was found for neighbourhood effect on vigorousphysical activity, after controlling for individual characteristics.Vigorous physical activity was negatively associated with trafficaccidents involving victims, lack of gymnasiums and swimming pools,and weaker social cohesion. Furthermore, living in areas character-ized by higher population density, higher levels of violence (crimesagainst property), lack of green parks decreases the likelihood ofengaging in sports activities, although without statistical significance.
Testing for interactions, we found a significant positive relationbetween individuals living simultaneously in the higher populationdensity tercile and more deprived areas and levels of vigorousphysical activity. We also found a significant negative relationbetween individuals outside the labour market living in deprivedareas and levels of vigorous physical activity.
BMIMen, people with lower education levels and those with
a poorer health status were more likely to be overweight. Ageshows the expected relationship; older individuals are more likelyto be overweight. However, this effect is not linear (Robert &Reither, 2004). In fact, a squared age term, included in the modelassesses the curvilinear relationship between age and BMI. Asexpected, poor quality diet, characterized by a low fruit and vege-tables intake, is associated with a high BMI, though withoutstatistical significance. Adjusting for individual attributes, urbansprawl (lower population density), inadequate housing (shanties)and unsafe environment (violence measured through crimesagainst property and traffic accidents involving victims) show
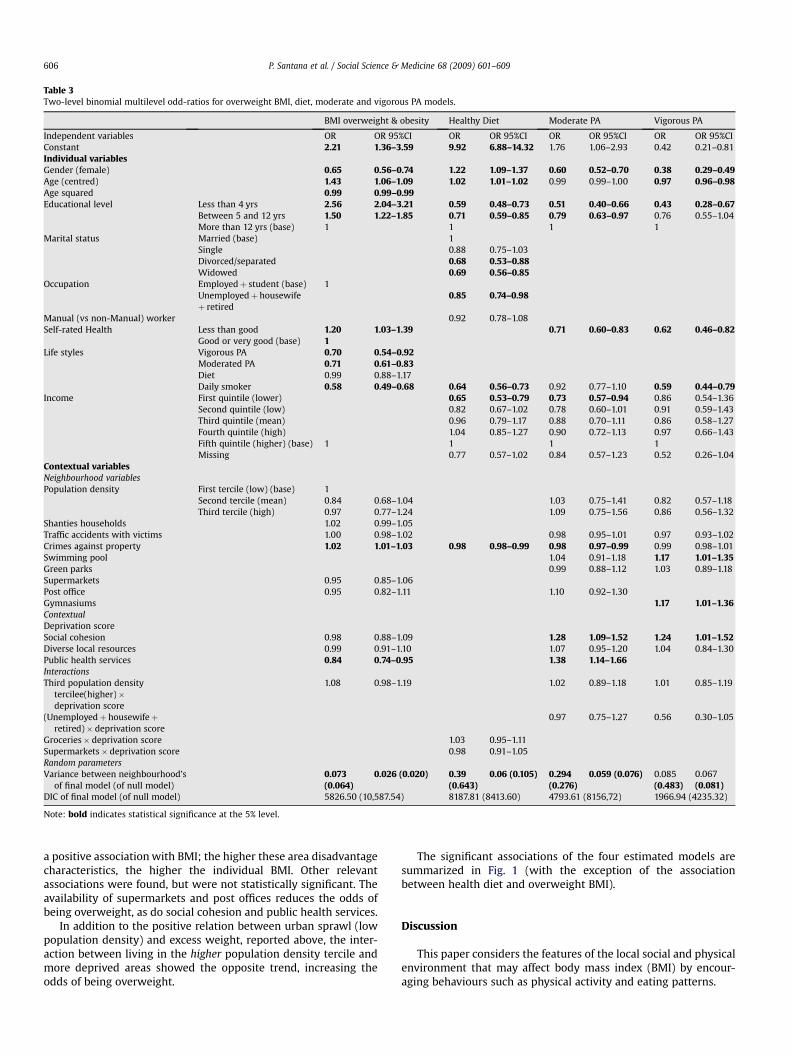
Table 3Two-level binomial multilevel odd-ratios for overweight BMI, diet, moderate and vigorous PA models.
BMI overweight & obesity Healthy Diet Moderate PA Vigorous PA
Independent variables OR OR 95%CI OR OR 95%CI OR OR 95%CI OR OR 95%CIConstant 2.21 1.36–3.59 9.92 6.88–14.32 1.76 1.06–2.93 0.42 0.21–0.81Individual variablesGender (female) 0.65 0.56–0.74 1.22 1.09–1.37 0.60 0.52–0.70 0.38 0.29–0.49Age (centred) 1.43 1.06–1.09 1.02 1.01–1.02 0.99 0.99–1.00 0.97 0.96–0.98Age squared 0.99 0.99–0.99Educational level Less than 4 yrs 2.56 2.04–3.21 0.59 0.48–0.73 0.51 0.40–0.66 0.43 0.28–0.67
Between 5 and 12 yrs 1.50 1.22–1.85 0.71 0.59–0.85 0.79 0.63–0.97 0.76 0.55–1.04More than 12 yrs (base) 1 1 1 1
Marital status Married (base) 1Single 0.88 0.75–1.03Divorced/separated 0.68 0.53–0.88Widowed 0.69 0.56–0.85
Occupation Employedþ student (base) 1Unemployedþ housewifeþ retired
0.85 0.74–0.98
Manual (vs non-Manual) worker 0.92 0.78–1.08Self-rated Health Less than good 1.20 1.03–1.39 0.71 0.60–0.83 0.62 0.46–0.82
Good or very good (base) 1Life styles Vigorous PA 0.70 0.54–0.92
Moderated PA 0.71 0.61–0.83Diet 0.99 0.88–1.17Daily smoker 0.58 0.49–0.68 0.64 0.56–0.73 0.92 0.77–1.10 0.59 0.44–0.79
Income First quintile (lower) 0.65 0.53–0.79 0.73 0.57–0.94 0.86 0.54–1.36Second quintile (low) 0.82 0.67–1.02 0.78 0.60–1.01 0.91 0.59–1.43Third quintile (mean) 0.96 0.79–1.17 0.88 0.70–1.11 0.86 0.58–1.27Fourth quintile (high) 1.04 0.85–1.27 0.90 0.72–1.13 0.97 0.66–1.43Fifth quintile (higher) (base) 1 1 1 1Missing 0.77 0.57–1.02 0.84 0.57–1.23 0.52 0.26–1.04
Contextual variablesNeighbourhood variablesPopulation density First tercile (low) (base) 1
Second tercile (mean) 0.84 0.68–1.04 1.03 0.75–1.41 0.82 0.57–1.18Third tercile (high) 0.97 0.77–1.24 1.09 0.75–1.56 0.86 0.56–1.32
Shanties households 1.02 0.99–1.05Traffic accidents with victims 1.00 0.98–1.02 0.98 0.95–1.01 0.97 0.93–1.02Crimes against property 1.02 1.01–1.03 0.98 0.98–0.99 0.98 0.97–0.99 0.99 0.98–1.01Swimming pool 1.04 0.91–1.18 1.17 1.01–1.35Green parks 0.99 0.88–1.12 1.03 0.89–1.18Supermarkets 0.95 0.85–1.06Post office 0.95 0.82–1.11 1.10 0.92–1.30Gymnasiums 1.17 1.01–1.36ContextualDeprivation scoreSocial cohesion 0.98 0.88–1.09 1.28 1.09–1.52 1.24 1.01–1.52Diverse local resources 0.99 0.91–1.10 1.07 0.95–1.20 1.04 0.84–1.30Public health services 0.84 0.74–0.95 1.38 1.14–1.66InteractionsThird population density
tercilee(higher)�deprivation score
1.08 0.98–1.19 1.02 0.89–1.18 1.01 0.85–1.19
(Unemployedþ housewifeþretired)� deprivation score
0.97 0.75–1.27 0.56 0.30–1.05
Groceries� deprivation score 1.03 0.95–1.11Supermarkets� deprivation score 0.98 0.91–1.05Random parametersVariance between neighbourhood’s
of final model (of null model)0.073(0.064)
0.026 (0.020) 0.39(0.643)
0.06 (0.105) 0.294(0.276)
0.059 (0.076) 0.085(0.483)
0.067(0.081)
DIC of final model (of null model) 5826.50 (10,587.54) 8187.81 (8413.60) 4793.61 (8156,72) 1966.94 (4235.32)
Note: bold indicates statistical significance at the 5% level.
P. Santana et al. / Social Science & Medicine 68 (2009) 601–609606
a positive association with BMI; the higher these area disadvantagecharacteristics, the higher the individual BMI. Other relevantassociations were found, but were not statistically significant. Theavailability of supermarkets and post offices reduces the odds ofbeing overweight, as do social cohesion and public health services.
In addition to the positive relation between urban sprawl (lowpopulation density) and excess weight, reported above, the inter-action between living in the higher population density tercile andmore deprived areas showed the opposite trend, increasing theodds of being overweight.
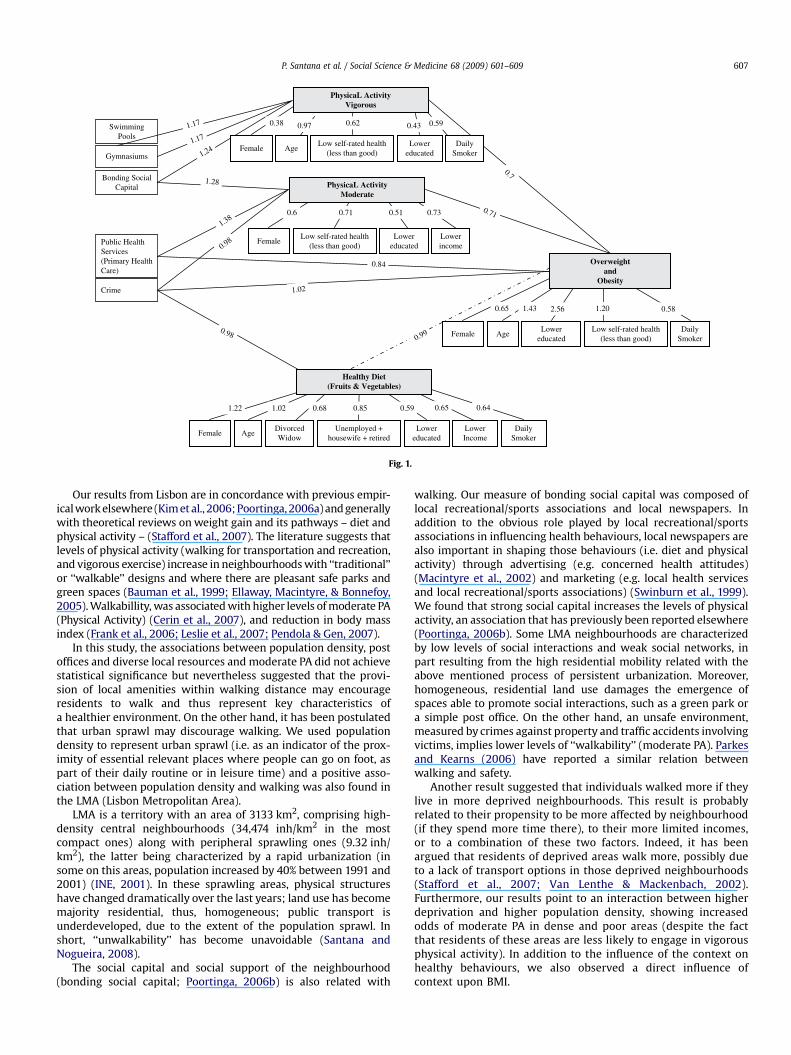
The significant associations of the four estimated models aresummarized in Fig. 1 (with the exception of the associationbetween health diet and overweight BMI).
Discussion
This paper considers the features of the local social and physicalenvironment that may affect body mass index (BMI) by encour-aging behaviours such as physical activity and eating patterns.
AgeLower
educated
PhysicaL ActivityVigorous
0.38 0.97 0.43
FemaleLow self-rated health
(less than good)Lower
educatedLowerincome
Healthy Diet(Fruits & Vegetables)
Female AgeDivorcedWidow
Lowereducated
1.22 0.68
PhysicaL ActivityModerate
Low self-rated health(less than good)
LowerIncome
DailySmoker
1.02
0.62
Overweightand
Obesity
AgeDaily
SmokerLower
educatedLow self-rated health
(less than good)Female
SwimmingPools
Gymnasiums
Bonding SocialCapital
Public HealthServices(Primary HealthCare)
Crime
1.28
1.38
1,24
1.17
1.17
0.59
DailySmoker
Female
0.7
0.71
0.99
1.02
0.84
0.98
0.98
0.6 0.71 0.51 0.73
Unemployed +housewife + retired
0.85 0.59 0.65 0.64
2.561.430.65 1.20 0.58
Fig. 1.
P. Santana et al. / Social Science & Medicine 68 (2009) 601–609 607
Our results from Lisbon are in concordance with previous empir-ical work elsewhere (Kim et al., 2006; Poortinga, 2006a) and generallywith theoretical reviews on weight gain and its pathways – diet andphysical activity – (Stafford et al., 2007). The literature suggests thatlevels of physical activity (walking for transportation and recreation,and vigorous exercise) increase in neighbourhoods with ‘‘traditional’’or ‘‘walkable’’ designs and where there are pleasant safe parks andgreen spaces (Bauman et al., 1999; Ellaway, Macintyre, & Bonnefoy,2005). Walkabillity, was associated with higher levels of moderate PA(Physical Activity) (Cerin et al., 2007), and reduction in body massindex (Frank et al., 2006; Leslie et al., 2007; Pendola & Gen, 2007).
In this study, the associations between population density, postoffices and diverse local resources and moderate PA did not achievestatistical significance but nevertheless suggested that the provi-sion of local amenities within walking distance may encourageresidents to walk and thus represent key characteristics ofa healthier environment. On the other hand, it has been postulatedthat urban sprawl may discourage walking. We used populationdensity to represent urban sprawl (i.e. as an indicator of the prox-imity of essential relevant places where people can go on foot, aspart of their daily routine or in leisure time) and a positive asso-ciation between population density and walking was also found inthe LMA (Lisbon Metropolitan Area).
LMA is a territory with an area of 3133 km2, comprising high-density central neighbourhoods (34,474 inh/km2 in the mostcompact ones) along with peripheral sprawling ones (9.32 inh/km2), the latter being characterized by a rapid urbanization (insome on this areas, population increased by 40% between 1991 and2001) (INE, 2001). In these sprawling areas, physical structureshave changed dramatically over the last years; land use has becomemajority residential, thus, homogeneous; public transport isunderdeveloped, due to the extent of the population sprawl. Inshort, ‘‘unwalkability’’ has become unavoidable (Santana andNogueira, 2008).
The social capital and social support of the neighbourhood(bonding social capital; Poortinga, 2006b) is also related with
walking. Our measure of bonding social capital was composed oflocal recreational/sports associations and local newspapers. Inaddition to the obvious role played by local recreational/sportsassociations in influencing health behaviours, local newspapers arealso important in shaping those behaviours (i.e. diet and physicalactivity) through advertising (e.g. concerned health attitudes)(Macintyre et al., 2002) and marketing (e.g. local health servicesand local recreational/sports associations) (Swinburn et al., 1999).We found that strong social capital increases the levels of physicalactivity, an association that has previously been reported elsewhere(Poortinga, 2006b). Some LMA neighbourhoods are characterizedby low levels of social interactions and weak social networks, inpart resulting from the high residential mobility related with theabove mentioned process of persistent urbanization. Moreover,homogeneous, residential land use damages the emergence ofspaces able to promote social interactions, such as a green park ora simple post office. On the other hand, an unsafe environment,measured by crimes against property and traffic accidents involvingvictims, implies lower levels of ‘‘walkability’’ (moderate PA). Parkesand Kearns (2006) have reported a similar relation betweenwalking and safety.
Another result suggested that individuals walked more if theylive in more deprived neighbourhoods. This result is probablyrelated to their propensity to be more affected by neighbourhood(if they spend more time there), to their more limited incomes,or to a combination of these two factors. Indeed, it has beenargued that residents of deprived areas walk more, possibly dueto a lack of transport options in those deprived neighbourhoods(Stafford et al., 2007; Van Lenthe & Mackenbach, 2002).Furthermore, our results point to an interaction between higherdeprivation and higher population density, showing increasedodds of moderate PA in dense and poor areas (despite the factthat residents of these areas are less likely to engage in vigorousphysical activity). In addition to the influence of the context onhealthy behaviours, we also observed a direct influence ofcontext upon BMI.
P. Santana et al. / Social Science & Medicine 68 (2009) 601–609608
Policy implications
The results of this study may contribute to the prioritization ofinterventions designed to reduce obesity amongst the populationof the Lisbon Metropolitan Area, where a quarter of the Portuguesepopulation live. Targets have been set by the National Health Plan(NHP) (ACS, 2008) to reduce the obesity in the population by theyear 2010 (e.g. by 8% for men and 10% for women in the 55–64 ageband).
In 2007, this problem has been identified in Portugal, and as anintersectorial solution is required (the problem cannot be solved bythe health sector alone), a national anti-obesity platform has beencreated as a strategic measure. This measure has been politicallytaken up at national level and focuses upon intersectorial synergies.The Platform involves representatives from the Departments ofHealth, Education, Economics and Agriculture, the National Asso-ciation of Portuguese Municipalities and various other civil asso-ciations. We believe that our study provides crucial information forunderstanding the pathways to obesity and the local factors asso-ciated with excess BMI. The challenge is to inform the policymakers of the best options to create supportive environments formaking individual healthy choices/behaviours.
The results suggest that area vulnerability, characterized byurban sprawl, long distances to facilities, unsafe and unpleasantenvironments, poor housing conditions, and sociomaterial depri-vation, could create communities with unhealthy behaviours; asthey are ‘‘unwalkable’’, they discourage planned physical activity,leading to unhealthy diets and higher obesity rates. Environmentalconstraints which reduce ‘‘walkability’’ and increase unhealthybehaviours are powerful mechanisms linking environment toobesity.
This study shows that it is crucial to promote walkable andsafe environments, which may be possible by improving localhealth policies through healthy urban planning. This willencourage the population to walk and use bicycles, not only asa leisure occupation but also as a means of transport, therebypromoting physical activity levels and social interactions andcontributing to the creation of a sense of place and community,with positive consequences not only on BMI but also on generalhealth status. This should be complemented by improvededucation campaigns in schools and primary health care centres,and via the mass media (i.e. free local newspapers, televisionadvertising and news), which directly or indirectly influencesociety’s beliefs and attitudes.
Results show that a deeper understanding of these mechanismsis critical if we are to find effective solutions for the obesityepidemic. Besides, it clearly shows that policies aimed at weightcontrol and obesity reduction must address both people and placesin order to bear fruit. When new residential areas are planned andbuilt in growing urban areas (such as the LMA), consideration needsto be given to all of these issues in order to achieve truly health-promoting living conditions (i.e. housing quality; mixed land use;access to destinations – health services, shops, recreational facili-ties and parks; public transport system; safety from violence, trafficaccidents and environmental hazards). For example, the existenceof safe urban green spaces in the vicinity of residential neigh-bourhoods encourages physical exercise, walking and recreationalactivities, thereby helping also to raise the quality of life for allresidents, irrespective of their socioeconomic situation. By identi-fying the most relevant issues for the use of green spaces, directintervention can take place designed to increase their usage bypeople. One can expect in the future more attention to the way inwhich urban environment change impacts on physical activity,including walking, and their consequences on populations’ healthand well-being.
Limitations
Different institutions and organisations collect data in differentways. This has implications for the analysis of such data throughissues of comparability, generation and interpretation and scale.
Information at the individual level, collated from the NHS, is oflimited use for the design of the Survey: i) behaviours and evenheight and weight are self-reported, which can introduce some bias(although there is no strong evidence of systematic bias); ii) thequestion concerning fresh vegetables and fruit consumption is ‘‘didyou consume fresh fruits or/and vegetables yesterday?’’ with noinformation about the size of the portion; iii) from the NHS, it wasnot possible to assess the respondents’ perception of safety. In factthis strongly limits the study, making it impossible for us to achievea broader and more accurate understanding of the influence ofneighbourhood environment over walkability. As we have no ‘‘fearof crime’’ score, the neighbourbood safety level has been measuredusing the crime against property figures, since this is sociologicallylinked to fear perception.
Another weakness is related to time of environmental exposure.As Cummins, Curtis, Diez-Roux, and Macintyre (2007) argue,information is required concerning the time of exposure todifferent contexts in space and time, if the aim is to further ourknowledge of environmental effects on health. Moreover, we areunable to measure residents’ perceptions and reports, usuallyrelated with health and health-related behaviours (Van Lentheet al., 2005; Wilson et al., 2004). Therefore, an effort must be madeto generate and collect data concerning individual perceptions ofneighbourhood, which can be achieved by integrating qualitativeresearch into our quantitative approach.
Also the analysis here has used a simple binary measure ofobesity and further work using continuous BMI scores wouldprovide greater detail of the ‘size of effect’ on BMI variation due toenvironmental factors.
Acknowledgements
The authors would like to thank Sally Macintyre, Anne Ellawayand Min Hua Jen for their useful insights and advice, Claudia Costafor helping to collate and manage geographical data, Karen Bennettfor the language review, and two anonymous referees for their veryhelpful comments. This research was supported by grant POCTI/GEO/45730/2002 from the Portuguese Foundation for Science andTechnology (FCT) ‘‘Healthy Urban Planning’’.
References
ACS. (2008). Plano Nacional de Saude: Indicadores e Metas do PNS. Ministerio daSaude – Alto Comissariado da Saude. consulted January 3, 2008, http://www.acs.min-saude.pt/pns/.
Backett-Milburn, K., Wills, W., Gregory, S., & Lawton, J. (2006). Making sense ofeating, weight and risk in the early teenage years: views and concerns ofparents in poorer socio-economic circumstances. Social Science & Medicine, 63,624–635.
Bauman, A., Smith, B., Stoker, L., Bellew, B., & Booth, M. (1999). Geographicalinfluences upon physical activity participation: evidence of a ‘coastal effect’.Australian and New Zealand Journal of Public Health, 23(3), 322–324.
Borders, T. F., Rohrer, J. E., & Cardarelli, K. M. (2006). Gender-specific disparities inobesity. Journal of Community Health, 31(1), 57–68.
Calthorpe, P., & Fulton, W. (2001). The regional city. Planning for the end of sprawl.Washington: Island Press.
Carstairs, V., & Morris, R. (1991). Deprivation and health in Scotland. Aberdeen:Aberdeen University Press.
Cerin, E., Leslie, E., du Toit, L., Owen, N., & Frank, L. D. (2007). Destinations thatmatter: associations with walking for transport. Health & Place, 13(3), 713–724.
Cohen, D., Finch, B., Bower, A., & Sastry, N. (2006). Collective efficacy and obesity:the potential influence of social factors on health. Social Science & Medicine, 62,769–778.
Cummins, S., Macintyre, S., Davidson, S., & Ellaway, A. (2005). Measuring neigh-bourhood social and material context: generation and interpretation of
P. Santana et al. / Social Science & Medicine 68 (2009) 601–609 609
ecological data from routine and non-routine sources. Health & Place, 11(3),249–260.
Cummins, S., Curtis, S., Diez-Roux, A. V., & Macintyre, S. (2007). Understanding andrepresenting, ‘place’ in health research: a relational approach. Social Science &Medicine Special Issue, 65, 1825–1838.
Demarest, S., Roskam, A., Cox, B., Regidor, E., Van Oyen, H., Mackenbach, J., et al.(2007). Socio economic inequalities in leisure time physical activity. Tacklinghealth inequalities in Europe: An integrated approach. EUROTHINE Final Report.
Doyle, S., Kelly-Schawartz, A., Scholossberg, M., & Stockard, J. (2006). Activecommunity environments and health: the relationship of walkable and safecommunities to individual health. Journal of the American Planning Association, I,19–31.
Ellaway, A., Anderson, A., & Macintyre, S. (1997). Does area of residence affect bodysize and shape? International Journal of Obesity, 21, 304–308.
Ellaway, A., Macintyre, S., & Bonnefoy, X. (2005). Graffiti, greenery, and obesity inadults: secondary analysis of European cross sectional survey. BMJ, 331, 611–612.
Eurobaromater. (2004). European commission, the citizens of the European unionand sport. Eurobarometer Special Surveys213, Consulted January 3, 2008, from.
Frank, L. D., Sallis, J. F., Conway, T. L., Chapman, J. E., Saelens, B. E., & Bachman, W.(2006). Many pathways from land use of health: associations between neigh-borhood walkability and active transportation, body mass index, and air quality.Journal of the American Planning Association, I, 75–87.
Goldstein, H. (1995). Multilevel statistical models (2nd ed.). New York: John Wiley.Goldstein, H., & Rasbash, J. (1996). Improved approximations for multilevel models
with binary responses. Journal of Royal Statistical Society, Series A, 159, 505–513.INE. (2001). Censos 2001: Recenseamento Nacional da Populaçao. Lisboa: INE. www.
ine.pt.Jochelson, K. (2004). The Public Health Impact of Cities & Urban Planning. Report.
London Development Agency: King’s Fund.Kim, D., Subramanian, S., Gortmaker, S., & Kawachi, I. (2006). US state-and county-
level social capital in relation to obesity and physical inactivity: a multilevel,multivariable analysis. Social Science & Medicine, 63, 1045–1059.
Kjellstrom, T. (2007). Our cities, our health, our future: Acting on social determinantsfor health equity in urban settings. Kobe, Japan: WHO Centre for HealthDevelopment.
Leslie, E., Coffee, N., Frank, L., Owen, N., Bauman, A., & Hugo, G. (2007). Walkabilityof local communities: using geographical information systems to objectivelyassess relevant environmental attributes. Health & Place, 13, 111–122.
Long, J. S. (1997). Regression models for categorical and limited dependent variables(1st ed.). USA: SAGE Publications.
Macdonald, L., Cummins, S., & Macintyre, S. (2007). Neighbourhood fast foodenvironment and area deprivation–substitution or concentration? Appetite,49(1), 251–254.
Macintyre, S. (1997). The black report and beyond what are issues? Social Science &Medicine, 44(6), 723–745.
Macintyre, S., Ellaway, A., & Cummins, S. (2002). Place effects on health: how can weconceptualise, operationalise and measure them? Social Science & Medicine, 55,125–139.
McNeill, L., Kreuter, M., & Subramanian, S. (2006). Social environment and physicalactivity: a review of concepts and evidence. Social Science & Medicine, 63,1011–1022.
Nogueira, H., Santana, P., & Santos, R. (2006). Linking perceptions of health toneighbourhood environment in the Lisbon Metropolitan Area, Portugal. Thesustainable city IV – Urban regeneration and sustainability. Witpress. pp. 723–731.
OECD. (2006). Health data 2006. Paris: OECD.
Parkes, A., & Kearns, A. (2006). The multi-dimensional neighbourhood and health:a cross-sectional analysis of the Scottish Housing Survey, 2001. Health & Place,12(1), 1–18.
Pendola, R., & Gen, S. (2007). BMI, auto use, and the urban environment in SanFrancisco. Health & Place, 13(2), 551–556.
Poortinga, W. (2006a). Perceptions of the environment, physical activity, andobesity. Social Science & Medicine, 63, 2835–2846.
Poortinga, W. (2006b). Social relations or social capital? Individual and communityhealth effects of bonding social capital. Social Science & Medicine, 63, 255–270.
Poston, W. S., & Foreyt, J. P. (1999). Obesity is an environmental issue. Atheroscle-rosis, 146(2), 201–209.
Rasbash, J., Steele, F., Browne, W., & Prosser, B. (2008). A user’s guide to MLwiN.London: Center for Multilevel Modelling, Institute of Education, University ofLondon.
Raudenbush, S. W., & Bryk, A. S. (2002). Hierarchical linear models, applications anddata analysis methods. Londres: SAGE Publications.
Robert, S., & Reither, E. (2004). A multilevel analysis of race, community disad-vantage, and body mass index among adults in the US. Social Science & Medi-cine, 59, 2421–2434.
Sampson, R. J., Raudenbush, S. W., & Earls, F. (1997). Neighbourhood and violentcrime: a multilevel study of collective efficacy. Science, 277(5328), 918–924.
Santana, P. (2002). Poverty, social exclusion and health in Portugal. Social Science &Medicine, 55, 33–45.
Santana, P. & Nogueira, H. (2008). Environment and health: place, sense of placeand weight gain in urban areas. In John Eyles & Williams (ed.), Place, sense ofplace and quality of life, pp. 153–165.
Santana, P., Nogueira, H. & Santos, R. (2007). Comunidades sustentaveis: impacte docontexto social e material no aumento de peso e obesidade. Revista Brasileira deCiencias Ambientais, Dezembro 11, 2007, pp. 23–29.
Schoeppe, S., & Braubach, M. (2007). Tackling obesity by creating healthy residentialenvironments. WHO Europe. Copenhagen Ø: Denmark.
Spiegelhater, Best, Carlin, & van der Linde. (2002). Bayesian measures of modelcomplexity and fit. Journal of Royal Statistical Society, Series B, 64, 583–639.
Stafford, M., Cummins, S., Ellaway, A., Sacker, A., Wiggins, R. D., & Macintyre, S.(2007). Pathways to obesity: identifying local, modifiable determinants ofphysical activity and diet. Social Science & Medicine, 65, 1882–1897.
Sundquist, K., & Yang, M. (2007). Linking social capital and self-rated health:a multi-level analysis of 11,175 men and women in Sweden. Health and Place, 13,324–334.
Swinburn, M. D. B., Egger, P. D. G., & Raza, M. A. F. (1999). Dissecting obesogenicenvironments: the development and application of framework for identifyingand prioritizing environmental interventions for obesity. Preventive Medicine,29, 563–570.
Van Lenthe, F. J., Brug, J., & Mackenbach, J. P. (2005). Neighbourhood inequalities inphysical inactivity: the role of neighbourhood attractiveness, proximity to localfacilities and safety in the Netherlands. Social Science & Medicine, 60, 763–775.
Van Lenthe, F. J., & Mackenbach, J. P. (2002). Neighbourhood deprivation andoverweight: the GLOBE study. International Journal of Obesity, 26, 234–240.
Vlahov, D., Galea, S., Gibbe, E., & Freudenberg, N. (2005). Perspectives on urbanconditions and population health. Cadernos de Saude Publica, 21(3), 949–957.
Wilson, K., Elliot, S., Law, M., Eyles, J., Jerret, M., & Keller-Olaman, S. (2004). Linkingperceptions of neighbourhood to health in Hamilton, Canada. Journal ofEpidemiology & Community Health, 58(3), 192–198.
Wilkinson, R. G. (2005). The impact of inequality. New York: New Press.