the latin american debt crisis and lessons for europe
TRANSCRIPT
sbd.anadolu.edu.tr 159
Abstract In the1970s, Latin American countries with the help of global conditions, financed generous social expendi-tures by foreign credit. At the beginning of the1980s, interest rates skyrocketed in developed countries as a consequence of stringent monetary policies. Servicing enormous debt became problematic for Latin Ameri-can countries. Multinational banks had considerable claims so international coordination was provided. La-tin America spent years in negotiations resulting in “a lost decade” for the region. Today debt is the most chal-lenging issue for Europe. Greece, Portugal and Ireland are facing problems while servicing their debts. The probability of those countries’ default and spread to the giant European economies undermines the credibility of all European countries. Indeed, this has become a threat for the viability of the EMU. In this study with respect to the Latin American experience, the European debt crisis is evaluated. Policy choices for the future of the EMU will also be assessed as a conclusion.
Keywords: Latin American Debt Crisis, European Debt Crisis, Economic and Monetary Union (EMU)
Öz1970’lerde tüm dünyada ortaya çıkan kredi genişleme-sinden Latin Amerika ülkeleri de nasibini almış, artan sosyal harcamalarını yabancı kredilerle finanse etmiş-lerdir. 1980’lerle birlikte uygulanan sıkı para politikala-rı sonucu gelişmiş ülkelerde faiz oranları önemli ölçüde artmıştır. Sonuçta; Latin Amerika ülkeleri için borcun servisini gerçekleştirmek sıkıntılı olmaya başlamıştır. Çokuluslu bankalar, önemli alacaklara sahip oldukla
rından uluslararası koordinasyon kolayca sağlanmıştır. Ancak Latin Amerika bu müzakerelere yıllar harcamış ve bu yıllar bölgede “kayıp on yıl” olarak adlandırıl-maya başlanmıştır. Bu gün ise borç başka bir kıtada önemli bir sorun haline gelmiştir. Bazı Avrupa ülkeleri borç servislerini gerçekleştirme de sıkıntılar yaşamak-tadır. Bu ülkelerin iflası ve büyük ülkelere sıçrama ihti-mali tümbirlik ülkelerinin kredibilitesini sarsmaktadır. Bu durum Ekonomik ve Parasal Birlik(EPB)’in devamı için de tehdit oluşturmaktadır. Bu çalışmada öncelikle Latin Amerika’nın yaşadığı borç tecrübesi ele alınacak, buradan alınan dersle Avrupa borç krizi incelenecektir. Sonuç olarak ise parasal birliğin geleceği için olası poli-tika seçenekleri değerlendirilecektir.
Anahtar Kelimeler: Latin Amerika Borç Krizi, Avrupa Borç Krizi, Ekonomik ve Parasal Birlik(EPB)
IntroductionIn the1980s, Latin American countries, like most deve-loping countries, faced highly controversial debt prob-lems. Major economies of the region defaulted, almost all of them had negotiated their debts, and rescue plans were announced sequentially. This is why the 1980s are expressed as a “lost decade” in the region.
The debt problems of the major economies were ext-remely severe in Latin America. Creditor banks, es-pecially the central banks of the U.S, had enormous claims on those economies. This was a great threat for the viability of the international financial system. It was borne in mind that in the 1930s, the govern-
The Latin American Debt Crisis and Lessons For Europe
Latin Amerika Borç Krizi ve Avrupa İçin Çıkarılacak Dersler
Prof. Dr. Emin Ertürk - Res. Assist. Derya Yılmaz
Prof. Dr. Emin Ertürk, Uludağ University Faculty of Economics and Administrative Sciences, eerturk@uludag. edu.trRes. Assist. Derya Yılmaz, Uludağ University Faculty of Economics and Administrative Sciences, [email protected]
Anadolu UniversityJournal of Social Sciences
Anadolu ÜniversitesiSosyal Bilimler Dergisi
160
The Latin American Debt Crisis and Lessons For Europe
ments of the creditor banks made serious efforts to overcome the debt crisis1. The threat was great so an international and coordinated response was immedi-ately activated. Because of political and economic ties with the region, the U.S was highly involved in the solution and proposed rescue operations. Thanks to the great and coordinated effort of the international authorities a 1930s-style bond defaults and financial crisis at an international level was avoided. However, the market access of these economies could not be ac-hieved until the second half of the 90s.
Today we are again encountering debt problems but in a different continent: Europe. Some European co-untries are having difficulties servicing their debt and need help to make payments. Two giant economies, Italy and Spain also have unsustainable debt levels. Coordinated rescue operations have been provided to Greece, Portugal and Ireland. The threat has a poli-tical dimension this time. Concern is not only related with the financial system, but also with the viability of the EU.
It is important to note that we know that these two debt crisis are very different in many aspects. We are trying to learn some lessons from the early experien-ces of the debt crisis. Management of the debt crisis of Latin America could shed light on the management of the debt crisis of the EU. The mistakes made in the Latin American case should be avoided but the immediate and coordinated response should also be repeated in Europe. It is important to note that Euro-pe has more to loose.
There is a vast literature deals with both Latin Ame-rican and European debt crises. But there is no study that compare the two crisis analytically with their similarities and differences. With this aim this study investigate the Latin American debt crisis from its origins and management. Then the European case is examined. After explaining the European debt crisis, the differences and similarities with the Latin Ameri-can debt crisis are analysed. In the last section, conc-lusions are drawn.
1 In the 1930s, developing countries were exposed to bond defa-ults. This damaged their market access for decades. For details see Eichengreen and Portes(1985)
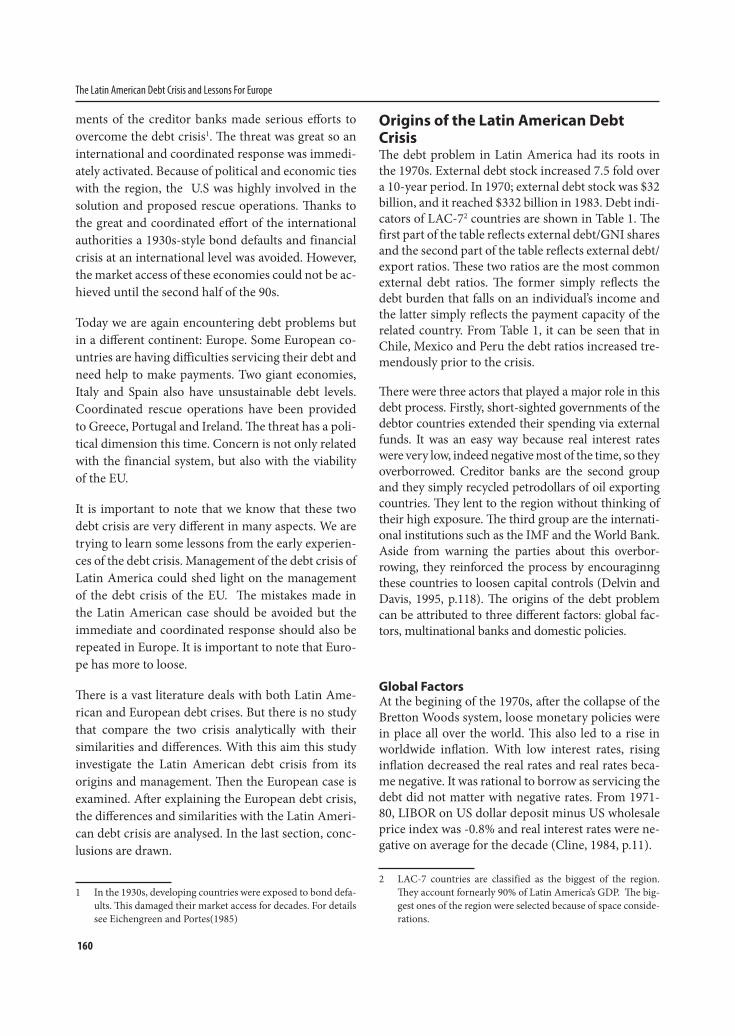
Origins of the Latin American Debt Crisis The debt problem in Latin America had its roots in the 1970s. External debt stock increased 7.5 fold over a 10-year period. In 1970; external debt stock was $32 billion, and it reached $332 billion in 1983. Debt indi-cators of LAC-72 countries are shown in Table 1. The first part of the table reflects external debt/GNI shares and the second part of the table reflects external debt/export ratios. These two ratios are the most common external debt ratios. The former simply reflects the debt burden that falls on an individual’s income and the latter simply reflects the payment capacity of the related country. From Table 1, it can be seen that in Chile, Mexico and Peru the debt ratios increased tre-mendously prior to the crisis.
There were three actors that played a major role in this debt process. Firstly, short-sighted governments of the debtor countries extended their spending via external funds. It was an easy way because real interest rates were very low, indeed negative most of the time, so they overborrowed. Creditor banks are the second group and they simply recycled petrodollars of oil exporting countries. They lent to the region without thinking of their high exposure. The third group are the internati-onal institutions such as the IMF and the World Bank. Aside from warning the parties about this overbor-rowing, they reinforced the process by encouraginng these countries to loosen capital controls (Delvin and Davis, 1995, p.118). The origins of the debt problem can be attributed to three different factors: global fac-tors, multinational banks and domestic policies.
Global Factors At the begining of the 1970s, after the collapse of the Bretton Woods system, loose monetary policies were in place all over the world. This also led to a rise in worldwide inflation. With low interest rates, rising inflation decreased the real rates and real rates beca-me negative. It was rational to borrow as servicing the debt did not matter with negative rates. From 1971-80, LIBOR on US dollar deposit minus US wholesale price index was -0.8% and real interest rates were ne-gative on average for the decade (Cline, 1984, p.11).
2 LAC-7 countries are classified as the biggest of the region. They account fornearly 90% of Latin America’s GDP. The big-gest ones of the region were selected because of space conside-rations.
161sbd.anadolu.edu.tr
Cilt/Vol.: 14 - Sayı/No: 1 (159-174) Anadolu Üniversitesi Sosyal Bilimler Dergisi
From the supply side, credit was also abundant. Two OPEC crises caused oil price hikes and surpluses in oil exporting countries. These petrodollars fueled the credit boom. With an abundant credit supply and negative real interest rates, having a deficit and financing it with an external fund was not a matter of concern. Governments extended their spending and borrowed heavily in international markets.
Multinational BanksAfter the 1930s bond defaults, multinational banks stopped lending to the developing world. Between 1950-70, the dominant form of capital flow was an official flow. This trend was reversed in the 1970s. Pri-vate capital flow, basically commercial bank lending, surpassed the official flow (Sachs, 1987).
After the OPEC crisis, the surpluses of the oil expor-ting countries should have gone to oil importing co-untries for the sake of consumption smoothing. Tra-ditionally this process should be maintained through the governments of advanced countries or internati-onal institutions. However, advanced countries did not take on this responsibility and left it to the com-mercial banks. Commercial banks, as profit seekers, act aggressively and increased their exposure to those countries (Dooley, 1994, p.10). This increased expo-
sure, posed risks to the international financial system. If these countries can not fullfill their obligations, the collapse of the financial system of advanced countries is inevitable. In order to avoid such a systemic crisis, those banks would have to be bailed out. The inevita-bilty of a bailout caused moral hazard problems, risks were underestimated and banks increased their len-ding more than they should have.
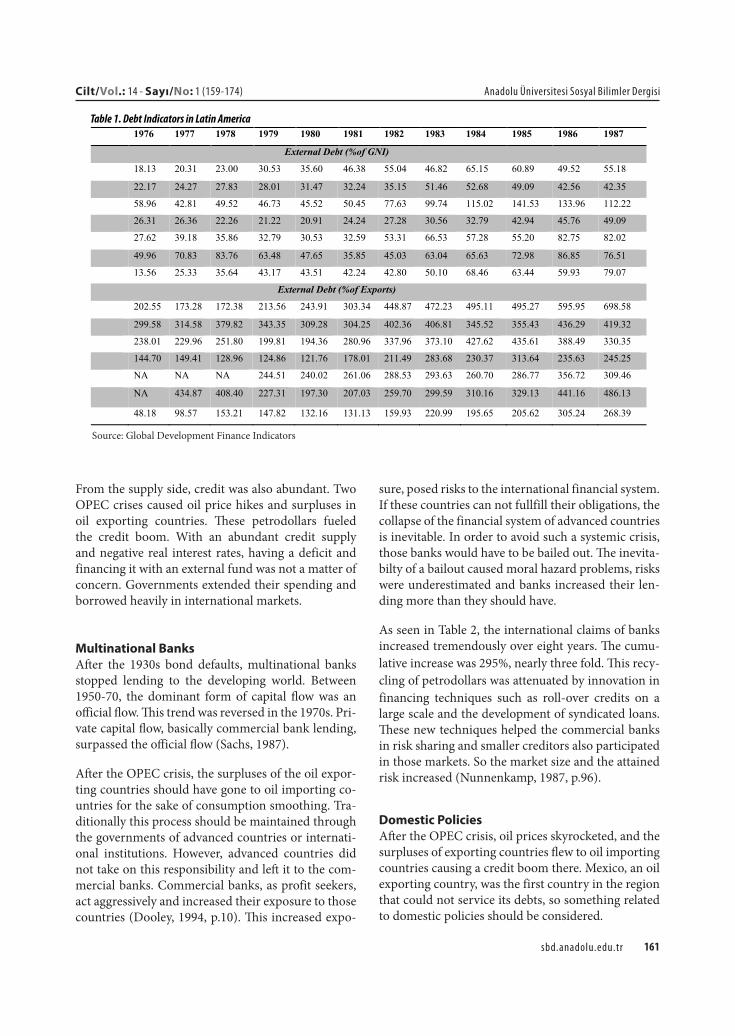
As seen in Table 2, the international claims of banks increased tremendously over eight years. The cumu-lative increase was 295%, nearly three fold. This recy-cling of petrodollars was attenuated by innovation in financing techniques such as roll-over credits on a large scale and the development of syndicated loans. These new techniques helped the commercial banks in risk sharing and smaller creditors also participated in those markets. So the market size and the attained risk increased (Nunnenkamp, 1987, p.96).
Domestic Policies After the OPEC crisis, oil prices skyrocketed, and the surpluses of exporting countries flew to oil importing countries causing a credit boom there. Mexico, an oil exporting country, was the first country in the region that could not service its debts, so something related to domestic policies should be considered.
1976 1977 1978 1979 1980 1981 1982 1983 1984 1985 1986 1987
External Debt (%of GNI)
Argentina 18.13 20.31 23.00 30.53 35.60 46.38 55.04 46.82 65.15 60.89 49.52 55.18
Brazil 22.17 24.27 27.83 28.01 31.47 32.24 35.15 51.46 52.68 49.09 42.56 42.35
Chile 58.96 42.81 49.52 46.73 45.52 50.45 77.63 99.74 115.02 141.53 133.96 112.22
Colombia 26.31 26.36 22.26 21.22 20.91 24.24 27.28 30.56 32.79 42.94 45.76 49.09
Mexico 27.62 39.18 35.86 32.79 30.53 32.59 53.31 66.53 57.28 55.20 82.75 82.02
Peru 49.96 70.83 83.76 63.48 47.65 35.85 45.03 63.04 65.63 72.98 86.85 76.51
Venezuela 13.56 25.33 35.64 43.17 43.51 42.24 42.80 50.10 68.46 63.44 59.93 79.07
External Debt (%of Exports)
Argentina 202.55 173.28 172.38 213.56 243.91 303.34 448.87 472.23 495.11 495.27 595.95 698.58
Brazil 299.58 314.58 379.82 343.35 309.28 304.25 402.36 406.81 345.52 355.43 436.29 419.32
Chile 238.01 229.96 251.80 199.81 194.36 280.96 337.96 373.10 427.62 435.61 388.49 330.35
Colombia 144.70 149.41 128.96 124.86 121.76 178.01 211.49 283.68 230.37 313.64 235.63 245.25
Mexico NA NA NA 244.51 240.02 261.06 288.53 293.63 260.70 286.77 356.72 309.46
Peru NA 434.87 408.40 227.31 197.30 207.03 259.70 299.59 310.16 329.13 441.16 486.13
Venezuela 48.18 98.57 153.21 147.82 132.16 131.13 159.93 220.99 195.65 205.62 305.24 268.39
Table 1. Debt Indicators in Latin America
Source: Global Development Finance Indicators
162
The Latin American Debt Crisis and Lessons For Europe
According to Enders(1994), if Latin America had not overborrowed so heavily in the 1970s and defaulted partly because of negative developments in the world economy, it may have taken a longer time but it would eventually have collapsed. Foreign money was mas-king the vulnerabilty of the growth model. Govern-ments were bad at raising revenue, relying on foreign borrowing. Resources were abundant but they were misused (p.724).
In Latin America, the dominant strategy was import substitution. Pegged exchange rates were in effect all over the region. Countries such as Argentina, Chile, Mexico, Uruguay and Venezuela were using pegged
rates. Real Exchange rates were also overvalued in those countries. This led to a current account deficit. Monetary policy control diminished as a consequen-ce of pegged rates and there was only fiscal policy re-maining to promote growth (Sachs, 1987, p.12). Bud-get deficits occured as a result of expansionary fiscal policies and they were financed by borrowing.
From Table 3 this can easily be seen. All countries ex-cept Colombia had overvalued exchange rates. This led to a current account deficit problem. Argentina and Mexico also had high government budget deficits that expanded their debt burden.
Table 2. International Claims of BIS Reporting Banks on Latin America (In billion $)* Gross** Net**
1975 43.5 27.2
1976 57.4 35.1
1977 64.7 40.2
1978 79.1 46.6
1979 102.5 64.8
1980 129.2 93.2
1981 158.3 118.6
1982 169.2 132.3
1983 172.1 132.8
*Non-oil producing countries
** Gross: Total assets of BIS reporting banks in domestic and forign currency, net: gross
minus total liabilities of banks
Source: Nunnenkamp(1987)
Real Exchange Rate (1970-
73=100)
Goverment Budget Deficit
in Domestic Absoption
(%)
Current Account
Deficit/GDP (%)
1974-78 1979-82 1974-78 1979-82 1976-82
Argentina 109.1 89.2 -5.87 -3.09 -1.32
Brazil 112.0 122.4 0.14 0.03 -4.58
Chile 218.0 218.8 -0.97 5.04 -6.66
Colombia 90.8 79.6 0.18 -0.25 -1.18
Mexico 103.1 101.8 -3.81 -3.19 -4.81
Venezuela 111.5 100.0 -2.60 -1.16 -0.60
Table 3. Some Measures for Selected Latin American Countries
Source: Nunennkamp (1987), World Development Indicators, and Own Calculations
In Mexico, the government allowed the peso to be overvalued and budget deficits to become unprece-dently high in the wake of elections. Brazil also pro-
moted growth by accumulating external debt. When the international economic environment weakened and this led to a decrease in export revenues with an
163sbd.anadolu.edu.tr
Cilt/Vol.: 14 - Sayı/No: 1 (159-174) Anadolu Üniversitesi Sosyal Bilimler Dergisi
overvalued exchange rate, Brazil suffered very badly. In Argentina ineffective stabilization policies, an as-sets freeze after the Falklands War and the overvalued peso caused capital flows. In Venezuela and Mexico especially, but almost all of them were faced with lar-ge capital outflows. The main flaw in Latin America was a high effort of authorities to maintain the over-valued exchange rate with a poor interest rate policy to attract capital (Cline, 1984, p.15).
At the beginning of the 1980s, these countries began to struggle with inflation. Monetization of the budget deficits as a result of the credit squeeze led to high inflation rates.3 In those countries central bank in-dependence did not occur until the begining of the 1990s (Guiterrez, 2003).4
Debt Crisis and ManagementAfter the second oil price shock, contractionary mo-netary policies became dominant all over the world. The US Federal Reserve adopted a highly contracti-onary monetary policy in order to control inflation in the US (Agarwal and Sengupta, 1999:3129).Servi-cing the debt became problematic for these countries. Banks had protected themselves from two kinds of risks. They avoided exchange rate risk by lending in dollars and interest rate risk by tying interest rate to London Interbank Offer Rate (LIBOR). But they had to face with default risk arising from mounting inte-rest rates (Eichengreen and Kenen,1994).
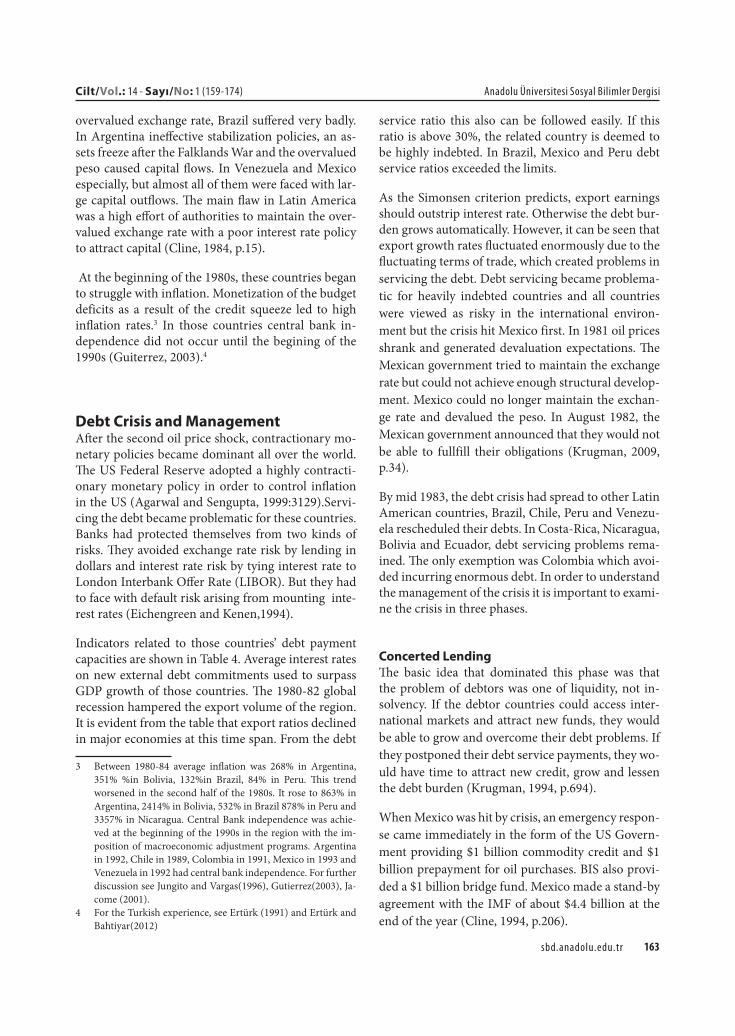
Indicators related to those countries’ debt payment capacities are shown in Table 4. Average interest rates on new external debt commitments used to surpass GDP growth of those countries. The 1980-82 global recession hampered the export volume of the region. It is evident from the table that export ratios declined in major economies at this time span. From the debt
3 Between 1980-84 average inflation was 268% in Argentina, 351% %in Bolivia, 132%in Brazil, 84% in Peru. This trend worsened in the second half of the 1980s. It rose to 863% in Argentina, 2414% in Bolivia, 532% in Brazil 878% in Peru and 3357% in Nicaragua. Central Bank independence was achie-ved at the beginning of the 1990s in the region with the im-position of macroeconomic adjustment programs. Argentina in 1992, Chile in 1989, Colombia in 1991, Mexico in 1993 and Venezuela in 1992 had central bank independence. For further discussion see Jungito and Vargas(1996), Gutierrez(2003), Ja-come (2001).
4 For the Turkish experience, see Ertürk (1991) and Ertürk and Bahtiyar(2012)
service ratio this also can be followed easily. If this ratio is above 30%, the related country is deemed to be highly indebted. In Brazil, Mexico and Peru debt service ratios exceeded the limits.
As the Simonsen criterion predicts, export earnings should outstrip interest rate. Otherwise the debt bur-den grows automatically. However, it can be seen that export growth rates fluctuated enormously due to the fluctuating terms of trade, which created problems in servicing the debt. Debt servicing became problema-tic for heavily indebted countries and all countries were viewed as risky in the international environ-ment but the crisis hit Mexico first. In 1981 oil prices shrank and generated devaluation expectations. The Mexican government tried to maintain the exchange rate but could not achieve enough structural develop-ment. Mexico could no longer maintain the exchan-ge rate and devalued the peso. In August 1982, the Mexican government announced that they would not be able to fullfill their obligations (Krugman, 2009, p.34).
By mid 1983, the debt crisis had spread to other Latin American countries, Brazil, Chile, Peru and Venezu-ela rescheduled their debts. In Costa-Rica, Nicaragua, Bolivia and Ecuador, debt servicing problems rema-ined. The only exemption was Colombia which avoi-ded incurring enormous debt. In order to understand the management of the crisis it is important to exami-ne the crisis in three phases.
Concerted LendingThe basic idea that dominated this phase was that the problem of debtors was one of liquidity, not in-solvency. If the debtor countries could access inter-national markets and attract new funds, they would be able to grow and overcome their debt problems. If they postponed their debt service payments, they wo-uld have time to attract new credit, grow and lessen the debt burden (Krugman, 1994, p.694).
When Mexico was hit by crisis, an emergency respon-se came immediately in the form of the US Govern-ment providing $1 billion commodity credit and $1 billion prepayment for oil purchases. BIS also provi-ded a $1 billion bridge fund. Mexico made a stand-by agreement with the IMF of about $4.4 billion at the end of the year (Cline, 1994, p.206).
164
The Latin American Debt Crisis and Lessons For Europe
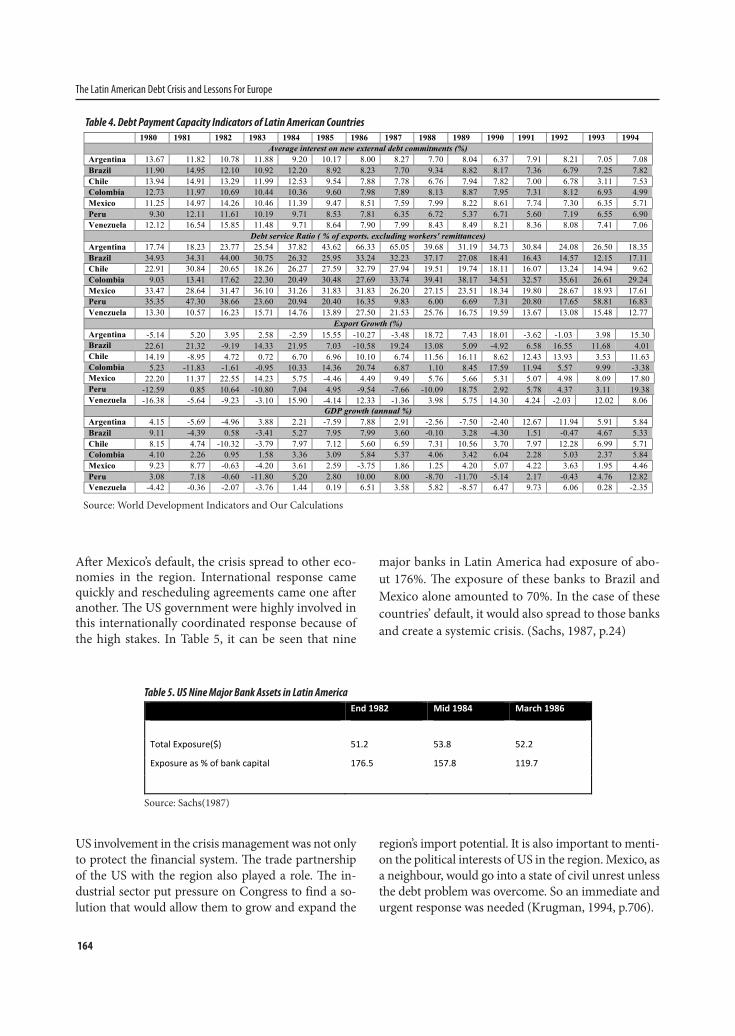
After Mexico’s default, the crisis spread to other eco-nomies in the region. International response came quickly and rescheduling agreements came one after another. The US government were highly involved in this internationally coordinated response because of the high stakes. In Table 5, it can be seen that nine
major banks in Latin America had exposure of abo-ut 176%. The exposure of these banks to Brazil and Mexico alone amounted to 70%. In the case of these countries’ default, it would also spread to those banks and create a systemic crisis. (Sachs, 1987, p.24)
Table 4. Debt Payment Capacity Indicators of Latin American Countries
Source: World Development Indicators and Our Calculations
1980 1981 1982 1983 1984 1985 1986 1987 1988 1989 1990 1991 1992 1993 1994
Average interest on new external debt commitments (%)
Argentina 13.67 11.82 10.78 11.88 9.20 10.17 8.00 8.27 7.70 8.04 6.37 7.91 8.21 7.05 7.08
Brazil 11.90 14.95 12.10 10.92 12.20 8.92 8.23 7.70 9.34 8.82 8.17 7.36 6.79 7.25 7.82
Chile 13.94 14.91 13.29 11.99 12.53 9.54 7.88 7.78 6.76 7.94 7.82 7.00 6.78 3.11 7.53
Colombia 12.73 11.97 10.69 10.44 10.36 9.60 7.98 7.89 8.13 8.87 7.95 7.31 8.12 6.93 4.99
Mexico 11.25 14.97 14.26 10.46 11.39 9.47 8.51 7.59 7.99 8.22 8.61 7.74 7.30 6.35 5.71
Peru 9.30 12.11 11.61 10.19 9.71 8.53 7.81 6.35 6.72 5.37 6.71 5.60 7.19 6.55 6.90
Venezuela 12.12 16.54 15.85 11.48 9.71 8.64 7.90 7.99 8.43 8.49 8.21 8.36 8.08 7.41 7.06
Debt service Ratio ( % of exports. excluding workers' remittances)
Argentina 17.74 18.23 23.77 25.54 37.82 43.62 66.33 65.05 39.68 31.19 34.73 30.84 24.08 26.50 18.35
Brazil 34.93 34.31 44.00 30.75 26.32 25.95 33.24 32.23 37.17 27.08 18.41 16.43 14.57 12.15 17.11
Chile 22.91 30.84 20.65 18.26 26.27 27.59 32.79 27.94 19.51 19.74 18.11 16.07 13.24 14.94 9.62
Colombia 9.03 13.41 17.62 22.30 20.49 30.48 27.69 33.74 39.41 38.17 34.51 32.57 35.61 26.61 29.24
Mexico 33.47 28.64 31.47 36.10 31.26 31.83 31.83 26.20 27.15 23.51 18.34 19.80 28.67 18.93 17.61
Peru 35.35 47.30 38.66 23.60 20.94 20.40 16.35 9.83 6.00 6.69 7.31 20.80 17.65 58.81 16.83
Venezuela 13.30 10.57 16.23 15.71 14.76 13.89 27.50 21.53 25.76 16.75 19.59 13.67 13.08 15.48 12.77
Export Growth (%)
Argentina -5.14 5.20 3.95 2.58 -2.59 15.55 -10.27 -3.48 18.72 7.43 18.01 -3.62 -1.03 3.98 15.30
Brazil 22.61 21.32 -9.19 14.33 21.95 7.03 -10.58 19.24 13.08 5.09 -4.92 6.58 16.55 11.68 4.01
Chile 14.19 -8.95 4.72 0.72 6.70 6.96 10.10 6.74 11.56 16.11 8.62 12.43 13.93 3.53 11.63
Colombia 5.23 -11.83 -1.61 -0.95 10.33 14.36 20.74 6.87 1.10 8.45 17.59 11.94 5.57 9.99 -3.38
Mexico 22.20 11.37 22.55 14.23 5.75 -4.46 4.49 9.49 5.76 5.66 5.31 5.07 4.98 8.09 17.80
Peru -12.59 0.85 10.64 -10.80 7.04 4.95 -9.54 -7.66 -10.09 18.75 2.92 5.78 4.37 3.11 19.38
Venezuela -16.38 -5.64 -9.23 -3.10 15.90 -4.14 12.33 -1.36 3.98 5.75 14.30 4.24 -2.03 12.02 8.06
GDP growth (annual %)
Argentina 4.15 -5.69 -4.96 3.88 2.21 -7.59 7.88 2.91 -2.56 -7.50 -2.40 12.67 11.94 5.91 5.84
Brazil 9.11 -4.39 0.58 -3.41 5.27 7.95 7.99 3.60 -0.10 3.28 -4.30 1.51 -0.47 4.67 5.33
Chile 8.15 4.74 -10.32 -3.79 7.97 7.12 5.60 6.59 7.31 10.56 3.70 7.97 12.28 6.99 5.71
Colombia 4.10 2.26 0.95 1.58 3.36 3.09 5.84 5.37 4.06 3.42 6.04 2.28 5.03 2.37 5.84
Mexico 9.23 8.77 -0.63 -4.20 3.61 2.59 -3.75 1.86 1.25 4.20 5.07 4.22 3.63 1.95 4.46
Peru 3.08 7.18 -0.60 -11.80 5.20 2.80 10.00 8.00 -8.70 -11.70 -5.14 2.17 -0.43 4.76 12.82
Venezuela -4.42 -0.36 -2.07 -3.76 1.44 0.19 6.51 3.58 5.82 -8.57 6.47 9.73 6.06 0.28 -2.35
End1982 Mid1984 March1986
TotalExposure($) 51.2 53.8 52.2
Exposureas%ofbankcapital 176.5 157.8 119.7
Table 5. US Nine Major Bank Assets in Latin America
Source: Sachs(1987)
US involvement in the crisis management was not only to protect the financial system. The trade partnership of the US with the region also played a role. The in-dustrial sector put pressure on Congress to find a so-lution that would allow them to grow and expand the
region’s import potential. It is also important to menti-on the political interests of US in the region. Mexico, as a neighbour, would go into a state of civil unrest unless the debt problem was overcome. So an immediate and urgent response was needed (Krugman, 1994, p.706).
165sbd.anadolu.edu.tr
Cilt/Vol.: 14 - Sayı/No: 1 (159-174) Anadolu Üniversitesi Sosyal Bilimler Dergisi
In this concerted strategy, the loans that were pro-vided to the countries, were “involuntary”. The IMF forced the banks to expand their credit and propo-sed this as condition for IMF credit. If these countri-es could not access IMF credit, they could not make payments. So commercial banks participated in this concerted strategy involuntarily5.
After Mexico, Brazil and Argentina, rescheduling programs were put into place in Chile, Costa Rica, Ecuador, Panama, Peru and Uruguay. These prog-rams aimed to reschedule the debt coming due over 18 months to 2 years with harder terms: 2% over the US prime rate and with a maturity of 8 years. After these programs, in 1984 the strategy was seen to be successful as growth accelerated and current accounts shifted from deficits to surpluses. However, involun-tarily lending was finished. In mid 1985, the Mexican authorities were talking about a need for additional lending. After the eathquake hit Mexico city, the plausibility of the austerity programs were undermi-ned. In Argentina and Brazil, military regimes were replaced by civil governments, and they opposed to the debt strategy (Cline, 1994, p.207). The need for a more comprehensive debt strategy was apparent.
Baker PlanThe Treasury Secretary of the US proposed a debt strategy in October 1985 at the IMF-World Bank Meetings in Seoul. The new strategy was based on long-term structural change rather than short-term financing. As it was about long-term credit, the invol-vement of World Bank was enhanced. However, the core of the strategy remained. The problem was still perceived as one of liquidity.
The plan set a target of $20 billion credit over three years for 15 countries.6 This credit was to be provided in three years time. Baker countries should streng-then their structural changes. Import liberalization, the liberalization in the treatment of foreign invest-ment and privatization of public firms were the prio-rities of the plan (Cline, 1994, p.209).
5 Federal Reserve Chairman Volcker personally intervened and put presure on the banks himself. The basic hindsight of this involvement was related to a sense of history and to avoid re-peating the 1930s .(Krugman, 1994, p.711)
6 These countries were Argentina, Bolivia, Brazil, Chile, Colom-bia Costa Rica, Cote d’Ivorie, Ecuador, Jamaica, Mexico, Mo-rocco, Nigeria, Peru, Phillipines, Uruguay, Venezuela, Yugos-lavia. Jamaica and Costa Rica were added after 15 countries.
The wrong assumption of the public was that the Ba-ker plan failed because of the banks refusing to provide credit. The banks provided $13 billion credits, which was nearly two thirds of the plan. The failure was rela-ted to the macroeconomic policies pursued in the regi-on. They were inadequate in calming the markets. Two developments were responsible for this failure. Firstly, the drop in oil prices hampered the debt service capa-city of highly indebted oil exporting countries such as Mexico and Venezuela. Secondly, and related with the former, Citibank raised its reserves and was followed by the other commercial banks (Rhodes, 1994, p.728). It was a signal that these countries were seen to be in-capable of servicing their debts.
Brazil’s 1987 moratorium set the stage for the Brady deal. Something had to be changed in these strategies. The menu approach of these programs should have been maintained because the needs of the countries differed in many ways. Some had only liquidity prob-lems and needed new money but others needed debt relief beause of an intolerable debt burden. Commer-cial banks also had different preferences beause of their accounting conventions or principles.
Brady PlanIn the 1989 riots in Caracas, associated with the aus-terity plans, 300 people died. It was seen as evidence that the debt strategy had to be changed and moved in the direction of debt forgiveness. In March 1989, the new treasury secretary Brady announced a new plan. Debt strategy would be a partial debt relief and this debt reduction would be a voluntary debt reduc-tion.7 The new ingredient was new provision of public sector funding for use in collateralization of conver-sion bonds. It was suggested that the plan would be able to reduce $340 billion debt of 39 countries by $70 billion. The plan offered a menu approach. Both debt reduction and new money were in place. The plan was also market-oriented because the debt reductions had a close relationship with pre-agreement of the se-condary market prices and risk reduction was based on the collateral (Cline, 1994, p.220).
It basically changed the strategy of growing out the debt problem to the debt reduction and relief for deb-
7 Secretary Brady emphasized the voluntary basis of the plan by declaring voluntary reduction 7 times in his speech (Krugman 1994, p.701). But this voluntary approach is only voluntary in the choice of new money or reduction, and the instruments used. Banks also had to participate in the lending process.
166
The Latin American Debt Crisis and Lessons For Europe
tor countries. To compensate banks for debt reduc-tion, banks were given guarantees for principal and some for interest (Krugman, 1994, p.702).
The deals under the plan reduced the net present va-lue of the debt service obligations by about $50 billi-on, or one-third. Among the Latin American count-ries on the Baker list, only three did not receive Brady deals: Chile, Colombia and Jamaica, as they had not requested it (Cline, 1994, p.232)
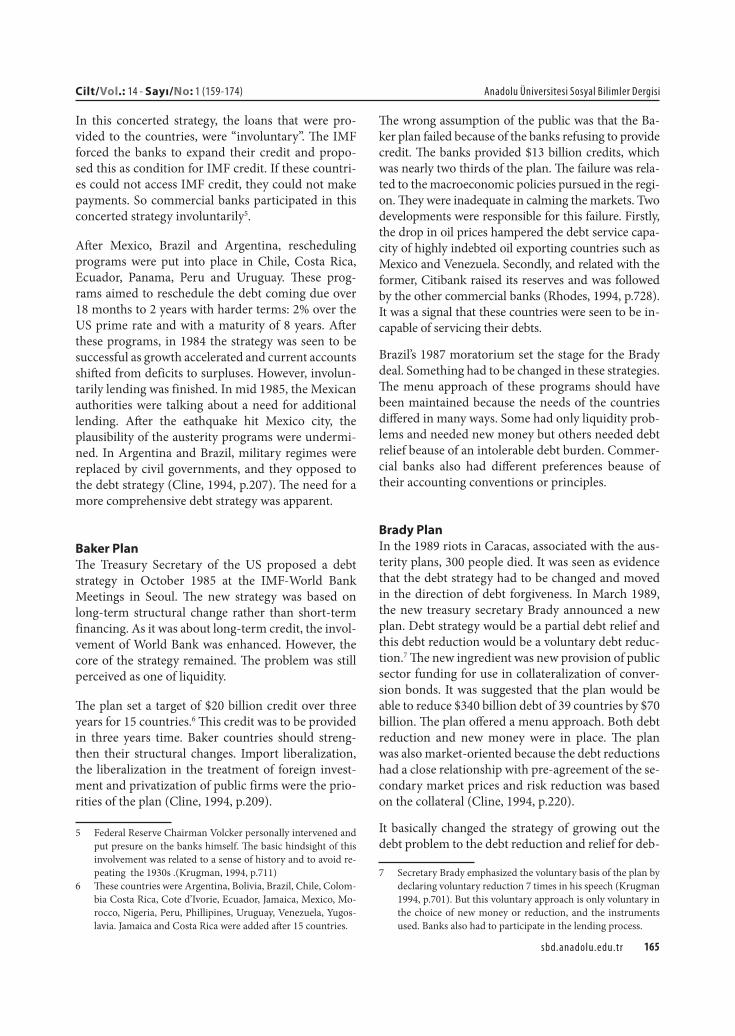
It is evident from Table 6 that this strategy emphasized foregiveness. In Bolivia and Costa Rica, relatively small and poor countries, foregiveness accounted for ne-arly 80% and 60% of the eligible debt. However debt-reduction programs brought an end to the lending re-lationship of commercial banks with the countries. For these countries to be able to grow, some new money was needed to pursue structural policies. From the tab-le it can be seen that the new money option was only achieved in Mexico, Brazil, Venezuela and Uruguay.
Table 6. Brady Plan Agreements of Selected Latin American Countries
Source: Cline (1994)
Eligible debt
(Billions of $)
Forgiveness New Money
Billions of $ %
Mexico 47.17 14.15 30 1.03
Brazil 50.0 14.0 28 0.50
Argentina 29.34 8.43 28.7 …
Venezuela 19.01 3.76 19.8 1.17
Uruguay 1.60 0.50 31.3 0.09
Bolivia 0.18 0.14 79.0 …
Costa Rica 1.61 0.98 60.9 …
Ecuador 7.60 3.42 45.0 ….
For the commercial banks, Brady deals offered a complex set of instruments. These were buyback, part exchange, discount exchange, temporary interest re-duction exchange, debt conversion and new money options. The most popular ones were discount and part exchanges. Creditors exchanged their existing loans for lower principal bonds (discount exchange) or the same principal with fixed exchange rates (part exchange). Both of these instruments decreased the exposure of the banks (Clark, 1993, p.42).
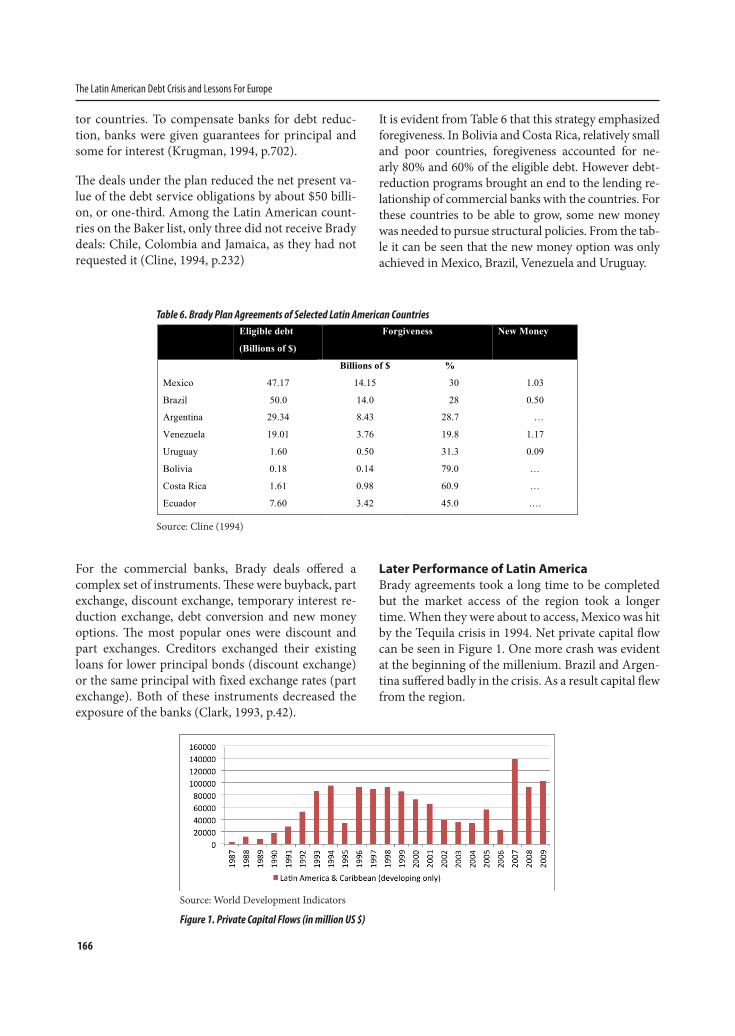
Later Performance of Latin AmericaBrady agreements took a long time to be completed but the market access of the region took a longer time. When they were about to access, Mexico was hit by the Tequila crisis in 1994. Net private capital flow can be seen in Figure 1. One more crash was evident at the beginning of the millenium. Brazil and Argen-tina suffered badly in the crisis. As a result capital flew from the region.
Source: World Development Indicators
Figure 1. Private Capital Flows (in million US $)
167sbd.anadolu.edu.tr
Cilt/Vol.: 14 - Sayı/No: 1 (159-174) Anadolu Üniversitesi Sosyal Bilimler Dergisi
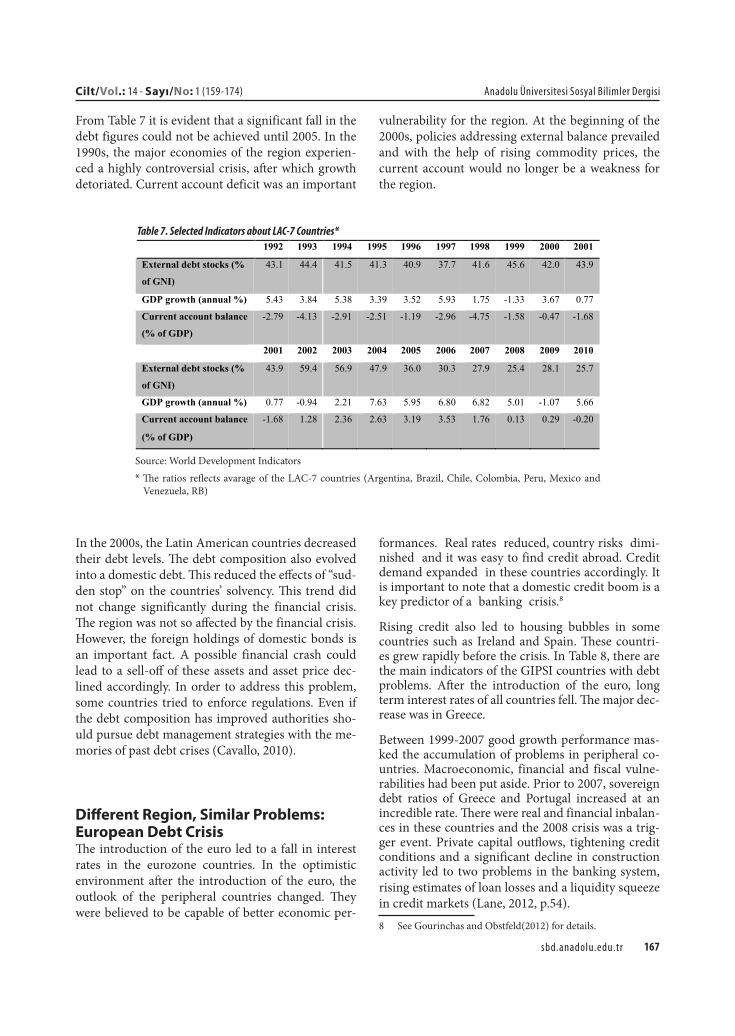
From Table 7 it is evident that a significant fall in the debt figures could not be achieved until 2005. In the 1990s, the major economies of the region experien-ced a highly controversial crisis, after which growth detoriated. Current account deficit was an important
vulnerability for the region. At the beginning of the 2000s, policies addressing external balance prevailed and with the help of rising commodity prices, the current account would no longer be a weakness for the region.
1992 1993 1994 1995 1996 1997 1998 1999 2000 2001
External debt stocks (%
of GNI)
43.1 44.4 41.5 41.3 40.9 37.7 41.6 45.6 42.0 43.9
GDP growth (annual %) 5.43 3.84 5.38 3.39 3.52 5.93 1.75 -1.33 3.67 0.77
Current account balance
(% of GDP)
-2.79 -4.13 -2.91 -2.51 -1.19 -2.96 -4.75 -1.58 -0.47 -1.68
2001 2002 2003 2004 2005 2006 2007 2008 2009 2010
External debt stocks (%
of GNI)
43.9 59.4 56.9 47.9 36.0 30.3 27.9 25.4 28.1 25.7
GDP growth (annual %) 0.77 -0.94 2.21 7.63 5.95 6.80 6.82 5.01 -1.07 5.66
Current account balance
(% of GDP)
-1.68 1.28 2.36 2.63 3.19 3.53 1.76 0.13 0.29 -0.20
Table 7. Selected Indicators about LAC-7 Countries*
Source: World Development Indicators * The ratios reflects avarage of the LAC-7 countries (Argentina, Brazil, Chile, Colombia, Peru, Mexico and
Venezuela, RB)
In the 2000s, the Latin American countries decreased their debt levels. The debt composition also evolved into a domestic debt. This reduced the effects of “sud-den stop” on the countries’ solvency. This trend did not change significantly during the financial crisis. The region was not so affected by the financial crisis. However, the foreign holdings of domestic bonds is an important fact. A possible financial crash could lead to a sell-off of these assets and asset price dec-lined accordingly. In order to address this problem, some countries tried to enforce regulations. Even if the debt composition has improved authorities sho-uld pursue debt management strategies with the me-mories of past debt crises (Cavallo, 2010).
Different Region, Similar Problems: European Debt CrisisThe introduction of the euro led to a fall in interest rates in the eurozone countries. In the optimistic environment after the introduction of the euro, the outlook of the peripheral countries changed. They were believed to be capable of better economic per-
formances. 1Real rates 2reduced, country risks3 dimi-nished 4and it was easy to find credit abroad. Credit demand expanded5 in these countries accordingly. It is important to note that a domestic credit boom is a key predictor of a 6banking 7crisis.8
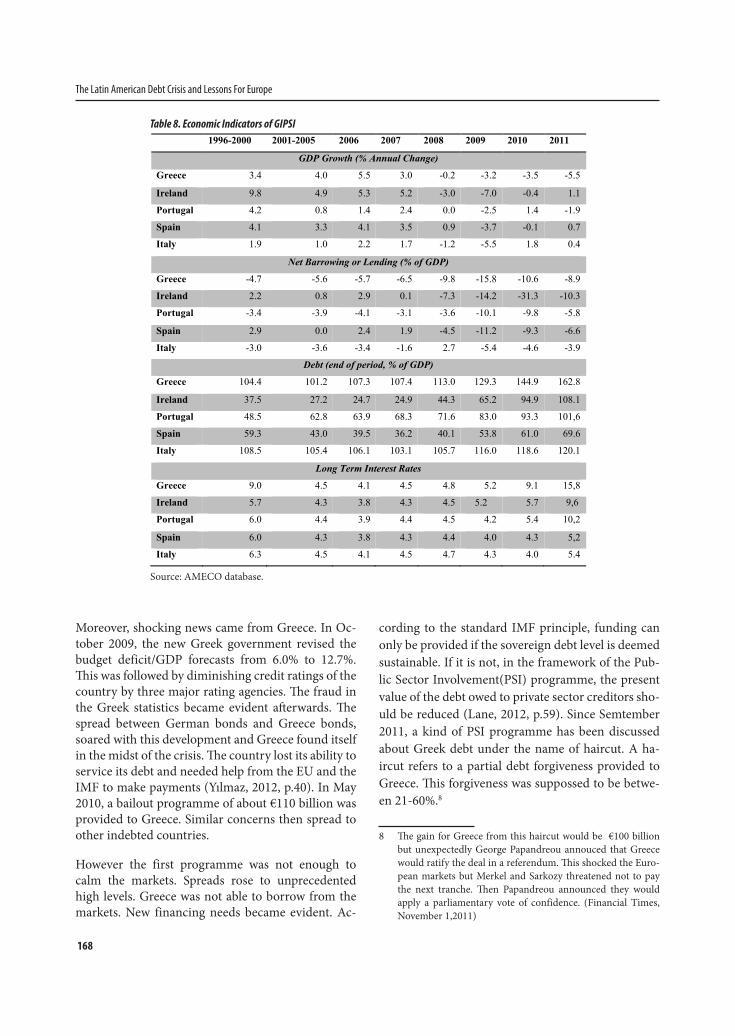
Rising credit also led to housing bubbles in some countries such as Ireland and Spain. These countri-es grew rapidly before the crisis. In Table 8, there are the main indicators of the GIPSI countries with debt problems. After the introduction of the euro, long term interest rates of all countries fell. The major dec-rease was in Greece.
Between 1999-2007 good growth performance mas-ked the accumulation of problems in peripheral co-untries. Macroeconomic, financial and fiscal vulne-rabilities had been put aside. Prior to 2007, sovereign debt ratios of Greece and Portugal increased at an incredible rate. There were real and financial inbalan-ces in these countries and the 2008 crisis was a trig-ger event. Private capital outflows, tightening credit conditions and a significant decline in construction activity led to two problems in the banking system, rising estimates of loan losses and a liquidity squeeze in credit markets (Lane, 2012, p.54). 8 See Gourinchas and Obstfeld(2012) for details.
168
The Latin American Debt Crisis and Lessons For Europe
Moreover, shocking news came from Greece. In Oc-tober 2009, the new Greek government revised the budget deficit/GDP forecasts from 6.0% to 12.7%. This was followed by diminishing credit ratings of the country by three major rating agencies. The fraud in the Greek statistics became evident afterwards. The spread between German bonds and Greece bonds, soared with this development and Greece found itself in the midst of the crisis. The country lost its ability to service its debt and needed help from the EU and the IMF to make payments (Yılmaz, 2012, p.40). In May 2010, a bailout programme of about €110 billion was provided to Greece. Similar concerns then spread to other indebted countries.
However the first programme was not enough to calm the markets. Spreads rose to unprecedented high levels. Greece was not able to borrow from the markets. New financing needs became evident. Ac-
cording to the standard IMF principle, funding can only be provided if the sovereign debt level is deemed sustainable. If it is not, in the framework of the Pub-lic Sector Involvement(PSI) programme, the present value of the debt owed to private sector creditors sho-uld be reduced (Lane, 2012, p.59). Since Semtember 2011, a kind of PSI programme has been discussed about Greek debt under the name of haircut. A ha-ircut refers to a partial debt forgiveness provided to Greece. This forgiveness was suppossed to be betwe-en 21-60%.8
8 The gain for Greece from this haircut would be €100 billion but unexpectedly George Papandreou annouced that Greece would ratify the deal in a referendum. This shocked the Euro-pean markets but Merkel and Sarkozy threatened not to pay the next tranche. Then Papandreou announced they would apply a parliamentary vote of confidence. (Financial Times, November 1,2011)
1996-2000 2001-2005 2006 2007 2008 2009 2010 2011
GDP Growth (% Annual Change)
Greece 3.4 4.0 5.5 3.0 -0.2 -3.2 -3.5 -5.5
Ireland 9.8 4.9 5.3 5.2 -3.0 -7.0 -0.4 1.1
Portugal 4.2 0.8 1.4 2.4 0.0 -2.5 1.4 -1.9
Spain 4.1 3.3 4.1 3.5 0.9 -3.7 -0.1 0.7
Italy 1.9 1.0 2.2 1.7 -1.2 -5.5 1.8 0.4
Net Barrowing or Lending (% of GDP)
Greece -4.7 -5.6 -5.7 -6.5 -9.8 -15.8 -10.6 -8.9
Ireland 2.2 0.8 2.9 0.1 -7.3 -14.2 -31.3 -10.3
Portugal -3.4 -3.9 -4.1 -3.1 -3.6 -10.1 -9.8 -5.8
Spain 2.9 0.0 2.4 1.9 -4.5 -11.2 -9.3 -6.6
Italy -3.0 -3.6 -3.4 -1.6 2.7 -5.4 -4.6 -3.9
Debt (end of period, % of GDP)
Greece 104.4 101.2 107.3 107.4 113.0 129.3 144.9 162.8
Ireland 37.5 27.2 24.7 24.9 44.3 65.2 94.9 108.1
Portugal 48.5 62.8 63.9 68.3 71.6 83.0 93.3 101,6
Spain 59.3 43.0 39.5 36.2 40.1 53.8 61.0 69.6
Italy 108.5 105.4 106.1 103.1 105.7 116.0 118.6 120.1
Long Term Interest Rates
Greece 9.0 4.5 4.1 4.5 4.8 5.2 9.1 15,8
Ireland 5.7 4.3 3.8 4.3 4.5 5.2 5.7 9,6
Portugal 6.0 4.4 3.9 4.4 4.5 4.2 5.4 10,2
Spain 6.0 4.3 3.8 4.3 4.4 4.0 4.3 5,2
Italy 6.3 4.5 4.1 4.5 4.7 4.3 4.0 5.4
Table 8. Economic Indicators of GIPSI
Source: AMECO database.
169sbd.anadolu.edu.tr
Cilt/Vol.: 14 - Sayı/No: 1 (159-174) Anadolu Üniversitesi Sosyal Bilimler Dergisi
In March 2012, Eurozone Finance Ministers reached an agreement to provide a €130 billion rescue fund to Greece including a haircut. This haircut would redu-ce the nominal value of the debt by 53.5%, which is also equal to the 70% loss on the net present value of the debt and 47% of Greece’s GDP. This programme also aimed to reduce the debt/GDP ratio to 120.5% by 2020 (EC, 2012, p.6).
Sovereign debt crisis then spread to other indebted countries. However, in the case of Ireland, the debt was not the fault of the government, but primarily belonged to the banks. When the crisis hit, the banks lost €100 billion related to defaulted loans. After that, the government provided deposit insurance sche-mes. This made the budget balance negative (Smaghi, 2011, p.4). This can be seen in Table 8. After the 2008 crisis, borrowing needs arose and became deeper in Ireland. In Portugal, as in Greece, after democratiza-tion and encouraging over-expenditure, public debt level rose. Bailing out Greece raised similar concerns about these two indebted economies. Bailout packa-ges were designed for Ireland (November 2010) and Portugal (May 2011) respectively.
Spain has a low debt level in comparison with other counterparts in the Eurozone. The real problem in Spain is related to the banks. Spanish banks require additional capital to offset their losses following the burst of the housing bubble. In June 2012, a €100 billi-on bailout package to recapitalize the banking system was granted for Spain. The exact amount would be determined after the audits reflecting the needs of banks (Economist, 2012). Italy has a comparable low level of budget deficit but the public debt level is simi-lar to that of Greece. For Italy the problem is a growth problem associated with a loss in competitiveness. This led investors to see Italian bonds as risky and there was an increase in spreads accordingly.
In order to preserve financial stability in the Eurozo-ne, the European Council(EC) agreed in December 2010 on the need to establish a permanent stability mechanism, under the name of the European Stabi-lity Mechanism(ESM), which replaced the Europe-an Financial Stability Facility(EFSF) and European Financial Stability Mechanism(EFSM). It was estab-lished in September 2012 with a maximum lending capacity of €500 billion and provides Eurozone co-untries with financial assistance when needed.
At the end of 2011, the debt burden ratio, the share of debt per capita in income per capita, was 0.88 in the eurozone. This ratio is 1.65 for Greece, 1.09 for Ireland, 1.21 for Italy and 1.06 for Portugal. This high debt burden also increased the risk of default and the interest on sovereign bonds correspondingly. Long term interest rates reached 36% in Greece, 11.4% in Portugal, 8.43% in Ireland, 7.16% in Italy and 6.97% in Spain.9
Similarities and Differences of Debt Crises
Similarities The debt experience of Europe resembles the Latin American experience. Firstly, the debt problem occu-red because of the fiscal indiscipline of governments and their foreign funded growth models. In Table 3 it can be seen that the budget deficit ratios were high in Argentina and Mexico. Particularly in those countri-es and most of the countries in general, civil govern-ments replaced the military juntas and expanded the-ir spending accordingly. The major engine of growth in those countries was foreign credit. Brazil, Mexico and Argentina followed an import substitution stra-tegy and they subsidised their industries with foreign credit (Cline,1984:15). In the European case, govern-ments have inherited the credibility of the euro and borrowed heavily in the international markets. This can be seen from the debt ratios in Table 8. Between 2001-07, the average gross national saving rate was only 10.8 % of GDP in Greece, but it grew rapidly by nearly 5 % in this time span. On the other hand, as a benchmark, in Germany the average gross saving rate was 23% but only grew by 1.4 %. This compari-son shows the major flaw in the growth model of the country.10
Secondly, the debt is denominated in a currency that they could not control. This is expressed as an “ori-ginal sin” problem11 in literature. Latin America had debt mainly in dollars and European countries have a euro debt. In both cases the control of the currency
9 With respect to €410 billion exposure in Italy, interest rates in France were 3.69% in April 2011. In fact this turmoil raised German bond rates to 3.34 % at the same time.
10 Data are drawn from AMECO database. 11 See Eichengreen et.al.(2003) for original sin problem.
170
The Latin American Debt Crisis and Lessons For Europe
is not in the hands of the debtor.12 This means they could not lead to inflation or devaluation to erode the real value of the debt (Smaghi, 2011:4).
Another way is internal devaluation. GIPSI countri-es have had to implement austerity measures such as cutting wages and public expenditures. If wages are cut to below the level of productivity, there will be an increase in competitiveness. However, the problem related to this approach is that fiscal restraint impo-sed by a troika, will worsen the recession and the go-vernment of eurozone countries may find themselves in the same position as a Latin American country that issued debt in a foreign currency (Armigeon and Bac-caro, 2011,p.6).
Thirdly, another important similarity between these two debt crises is the flaw in the related co-untries’ public sectors. According to public sector performance(PSP) indicators13 that were prepared by Afonso et.al(2006), the lowest scores were attained by Greece, Portugal, Italy and Spain in Europe.14 Me-xico, Brazil and Chile have much lower scores than their European counterparts.15 When we focus on administrative sub indicator, Mexico and Brazil has the second and the third lowest scores in the samp-le (Handler et.al, 2005, p.18). Corruption has always been an important ingredient of these economies. The average corruption perception index(CPI)16 bet-ween 1980-2005 is 3.9 for Brazil and 3.2 for Mexico. Between 1980-85 this ratio was 1.9 for Mexico. When we turn to Europe, corruption is also a significant factor in Greece and Italy. CPI scores are 3.8 and 4.3 respectively. In the countries which have problems in
12 In Europe, the euro is the currency of most nations but with strong adherence to price stabilty, no one can expect the ECB to create inflation to erode the burden of debt.
13 This indicator is composed of sub indicators: Administrative(including corruption, red-tape, quality of ju-diciary, black economy), education, health, distribution(Gini coefficient), Stability (inflation and stability of GDP growth) and economic performance (unemployment and GDP real growth).
14 It is not related with the government size. When we look at the share of public employment in total employment (for a proxy for government size),in Greece this ratio was 7.9 % in Portugal 12.1 %, in Spain 12.3%, in Italy 14.3 % and OECD avarage is 15 %.
15 In Greece PSP value is 1.09 but in Brazil this value is 0.75, in Mexico 0.84 in Chile 0.94.
16 CPI values range from 0 (highest corruption) to 10 (lowest corruption). Somalia is the most corrupt country with a score of 1.1 and Denmark, New Zealand and Singapore are the least corrupt countries with a score of 9.3 according to 2009 figures.
their public sector governance, economic performan-ce is not satisfactory and applying structural reforms become problematic.
Fourthly, moral hazard problems were apparent in both crises. Prior to the debt crisis, in Latin America particularly, multinational banks increased their ex-posure by underestimating the risks attained. Major banks of the US had enourmous claims on region economies. So; banks were sure that the US would participate and would not let the banks go bankrupt in the case of those countries’ default. It was also an-ticipated by borrowing countries, causing them to act imprudently and overborrow.
In Europe, being a Eurozone member calmed each party in the credit process. There was a strong belief that core countries would not abandon the periphe-ral countries for the viability of the Euro despite rules forbidding such action. In order to avoid moral ha-zard problems in the Eurozone, the Maastricht treaty forbids governments, European Institutions and ECB “to be liable for or assume the commitments of cent-ral governments, regional or other public authorities” (art.125). The May 2010 bailout of Greece was a bre-ach of that rule. This was confirmed by the bailing out of Portugal and Ireland. The creation of the EFSF, and a successor ESM, institutionalized the elimina-tion of the rule (Wyplosz, 2012, p.8). There is always a risk in bailing out an indebted country because it can spur that economy or others to live beyond their means. This risk has been realized by authorities and penalty rates have been applied to funds provided by the ESM.
Fifthly, macroeconomic adjustment needs were also in place in Latin America. Privatization imposed by creditor countries caused job losses, which led to riots in countries such as Venezuela and Mexico. Similarly in Europe, austerity measures have caused civil unrest in countries where youth unemployment figures are high, such as Greece and Spain.
Differences Substantial differences are apparent between the two cases. Firstly, the debt problem in the Eurozone is a sovereign debt problem but in Latin America, it was an external debt problem. However, in Latin America an important portion of the external debt was a pub-lic and publicly guaranteed debt. In fact this ratio rose with the crisis. In 1985, the public and publicly gua-
171sbd.anadolu.edu.tr
Cilt/Vol.: 14 - Sayı/No: 1 (159-174) Anadolu Üniversitesi Sosyal Bilimler Dergisi
ranteed external debt share of the total external debt was 67% on average in LAC-7 countries. By 1990, this ratio had increased to 71%.
It is important to note that external holdings of the soverign debt is also an important fact for Europe. Prior to the crisis, the soverign debt held by foregi-ners increased tremendously. At the end of 2008, ex-ternal holdings of soverign debt was 70% in Greece, 72% in Ireland and 86% in Portugal. After the Greek crisis, foreign banks decreased their exposure accor-dingly (Buiter,et.al, 2011, p.24).
Secondly, this time the debtor countries are advanced countries. Italy and Spain are major world economies so their debt tolerance is higher. In 1982, the year of the Mexico crisis, the debt ratio was approximately 53%. On the other hand, in troubled European count-ries this ratio is about 100%.
Thirdly, the narrative of the debt problem of Latin America is simply the debt problem of Third World countries affecting advanced ones. However, in the Eurozone, the debt problem of some countries affects the other members of the group. The debt problem can be solved within the group but this requires grea-ter integration in the eurozone, which may lead to an intergovernmentalist opposition.
Fourthly, in Latin America because of high claims, the US government played a leading role with the IMF as a technocratic institution, whereas in Europe, theEuropean Council(EC) has tried to manage the crisis. As the EC is made up of politicians, decisions could be conditioned to electoral concerns. It is im-portant to note that taking decisions with countries that have different interests, is a more difficult pro-cess than bilateral negotiations (Ardagna and Caselli 2012, p.1).
Concluding Remarks The debt crisis in European countries is reminiscent of the debt problems of Latin America in 1980s, when the economies detoriated to such an extent that more than a decade was lost. Civil unrest and even riots erupted in some countries as a consequence of mac-roeconomic adjustment programs imposed by credi-tor governments. Thus anger against advanced count-
ries rose accordingly. Economies could not access the markets and attract funds to promote growth, which then hampered their growth potential.
After creditor governments changed their minds and strategies through debt relief, confidence in their solvency began to emerge, although they were faced with a crisis again during the 1990s and at the begin-ning of the 2000s.
This time the debt problems are in the advanced world. Although these two crisis have very different aspects, they also have also considerable similarities. A fundamental cause of the crisis, as seems likely in all crises of capitalist systems, was about the moral hazard issues. Flaws in the design of the systems were appreciated by the participants and could not be avo-ided until the crisis hit. The institutional framework, which addressed these flaws could not be maintained in the environment of the crisis. Thus the damage of the crisis on troubled economies deepened.
With the memories of the Latin American debt cri-sis, the effects of the European debt crisis seem to be lasting longer than expected. Austerity measures im-posed by the countries can be a tool to restore confi-dence lost during the crisis. But is it enough for mar-kets? These tools are not growth-friendly so they may not be enough for market participants. Their market access may take longer than expected. However, this time political costs outweigh economic ones. If these countries suffer for a long time, the exit option will become more viable. In the worst case scenario, this exit option would end the European Union.
To avoid this scenario, a response that emphasizes debt relief should be on the agenda. This option will lessen the debt burden. Mutualizing some portion of the debt union-wide or conversion to eurobonds may be put on the menu, which would calm the pub-lic in debtor countries and help reform packages to be pursued with lower tensions. This would also give a chance to authorities of debted countries to imp-lement more growth-friendly structural policies, es-pecially that adressed the competetiveness problems.
It is also now apparent that monetary union needs banking union. Thus, European-wide banking super-vision is an important step towards banking union. Nationwide supervision of banks operating across borders, especially union-wide, poses significant
172
The Latin American Debt Crisis and Lessons For Europe
contagion problems. Union-wide supervision and deposit insurance schemes could releive the problems of the banks that is exposed to sovereign risk. It will be an important step in breaking the vicious circle between sovereign and banks and mitigate the effects of sovereign risk on banks.
References(2012, June 16). The Spanish Bailout: Going to Extra
Time. The Economist, p. 12-13.
Afonso, A., Schuknecht, L., Tanzi, V. (2006). Public Sector Efficiency: Evidence from new EU member States and Emerging Markets (ECB Working Paper Series No. 581). Retrieved 2012, January 06.
Agarwal , M.., & Sengupta, D. (1999). Strucural Ad-justment in Latin America. Econonomic and Politi-cal Weekly, 34(44), 3129-3136.
Ardagna , S., & Caselli, F. (2011). The Political Economy of Greek Debt Crisis: A Tale of Two Debt Crisis (CEP Special Paper No. 25). Retrieved 2012, January 06.
Armigeon, K., & Baccaro, L. (2011, July 05). The Sor-rows and Young Euro: Policy Responses to the So-vereign Debt Crisis. Retrieved 2012, January 06, from http://www.unige.ch/ses/socio/rechetpub/dejeuner/dejeuner2011-2012/thesorrowsofyoun-geuro.pdf
Buiter , W., Rahbari, E., Michels, J., Gini, G. (2011). Debt of Nations (Citigroup Global Economics View No. 01). Retrieved 2011, February 12, from http://www.nber.org/~wbuiter
Cavallo, E. A. (2010). Debt Management in Latin Ame-rica, How Safe is New Debt Composition? (Inter-American Development Bank Working Paper No. IDB-PB-109). Retrieved 2012, January 06.
Clark, J. (1993). Debt Reduction and Market Reentry Under the Brady Plan. FED Quarterly Review, 18(4), 38-62.
Cline, W. (1984). International Debt: Systematic Risk and Policy Response. Washington, D.C, Amerika Birleşik Devletleri: Institute for International Eco-nomics.
Cline, W. (1994). International Debt Reexamined. Was-hington, D.C, Amerika Birleşik Devletleri: Institute for International Economics.
Cline,W.(2011), Alternative Strategies for Resolving the European Debt Crisis, Speech at Resolving Debt Crisis Conference, Bruegel, France, September 13-14, 2011.
Cline, W. (2011). Sustainability of Greek Public Debt (Institute for International Economics Policy Brief, No. PB11-15). Retrieved 2012, February 06.
Delvin, R., & Davis, R. F. (1995). The Great Latin American Debt Crisis: A Decade of Asymmetric Adjustment. Revista de Economica Politica, 13(3), 117-142.
Dooley, M. (1994). A Retrospective on the Debt Crisis (NBER Working Paper No. 4963). Retrieved 2012, November 07.
EC.(2011). The Economic Adjustment Programme for Greece, Fourth Review, Spring 2011, Occasional Papers, No:82.
Eichengreen, B., & Lindert, P. (1992). The International Debt Crisis in Historical Perspective,. London, Bir-leşik Krallık: MIT Press.
Eichengreen, B., & Kenen, P. (1992). Managing the World Economy under the Bretton Woods System. London, UK., Longman Group, in Kenen, P. (Eds.) Managing The World Economy Fifty Years After Bretton Wood, (p.3-57).
Eichengreen, B., & Portes, R. (2012). Debt and Defa-ult in the 1930s: Causes and Consequences (NBER Working Paper No. 1772). Retrieved 2012, October 07.
Eichengreen, B., Hausmann, R., Panizza, U. (2003). Currency Mismatches, Debt Intolerance and Origi-nal Sin: Why They are not The Same and Why It Matters? (NBER Working Paper No. 10036). Retri-eved 2012, November 07.
Enders, T. (1994). American Economic Policy in 1980s. Chicago, Amerika Birleşik Devletleri: NBER Bo-oks, University of Chicago Press.In Feldstein , M. (Eds.), LDC Debt Policy (p. 722-725).
173sbd.anadolu.edu.tr
Cilt/Vol.: 14 - Sayı/No: 1 (159-174) Anadolu Üniversitesi Sosyal Bilimler Dergisi
Ertürk, E. (1991). Para İkamesi, Kavram, Teori, Olu-şum Süreci ve Sonuçları [Currency Substitution, Concept,Theory, Process and Consequences]. Bursa, Türkiye: Uludağ Üniversitesi Yayınları.
Ertürk, E., Bahtiyar,G., Tayyar,A. (2012). Bütçe Açıkları ve Enflasyonun Ekonomi Politiği, YEBKO Internati-onal Conference, October, 6-7, Kuşadası.
Gourinchas , P., & Obstfeld, M. (2012). Stories of the Twenieth Ceuntry for the Twentyfirst. American Economic Journal: Macroeconomics, 4(1), 226-265.
Gutierrez, E. (2003). Inflation Performance and Consti-tutional Central Bank Independence: Evidence from Latin America and the Caribbean (IMF Working Paper No. WP/03/53). Retrieved 2012, November 07.
Handler, H., Koebel, B., Reiss, B., Schratzenstaller, M. (2012). The Size and Performance of Public Sector Activities in Europe (WIFO Working Papers No. 246). Retrieved 2012, March 05.
Jungito, R. and Vargas, H. (1996), “Central Bank In-dependence and Foreign Exchange Policies in La-tin America”, IMF-Banco de Republica Seminar on Central Bank Independence. http://www.banrep.org/publicaciones/pub_borra.htm.
Krugman, P. (1994). American Economic Policy in the 1980s . Chicago, Amerika Birleşik Devletleri: NBER Books, University of Chicago Press.In Feld-stein, M. (Eds.), US Policy on Developing Country Debt (p. 691-722).
Krugman, P. (2009). The Return of Depression Econo-mics and The Crisis of 2008. NewYork, Amerika Birleşik Devletleri: W.W. Norton&Company.
Lane, P. (2012). The European Sovereign Debt Crisis. Journal of Economic Perspectives, 26(3), 49-68.
Manasse, P., & Roubini, N. (2005). Rules of Thumb for Sovereign Debt Crises (IMF Working Paper No. WP/05/42). Retrieved 2012, January 04.
Manasse, P., & Schimmelpfenning, A. (2003). Predic-ting Sovereign Debt Crisis (IMF Working Paper No. WP/03/221). Retrieved 2012, January 04.
Montefusco, A. (2011). International Debt in Individu-al Countries. NewYork, Amerika Birleşik Devletle-ri: Nova Science Publishers Inc..
Nunnenkamp, P. (1987). International Debt Crisis. NewYork, Amerika Birleşik Devletleri: Prentice Hall..
Ortiz, G., (2011), “What Can The Developed World Le-arn From The Latin American Debt and Mexican Peso Crisis?” Speech at the New Horizons for the Global Economic Landscape, NABE Annual Mee-ting, September 12,2011.
Rachman, G. (2011, November 01). Europe’s Fear of the Greek Referandum. Financial Times, p. 12-12.
Rhodes, M. (1994). American Economic Policy in the 1980s. Chicago, Amerika Birleşik Devletleri: NBER Books, University of Chicago Press.In Feldstein, M. (Eds.), LDC Debt Policy (p. 725-733).
Sachs , J. (1987). Conditionality, Debt Releif and the De-veloping Country Debt Crisis (NBER Working Pa-per No. 2644). Retrieved 2011, February 14.
Smaghi, B.L. (2011), “Eurozone, European Crisis and Policy Responses” speech at Goldman Sachs Global Macro Conference, Hong Kong 2011.
Stein, E. (1999). Fiscal Decentralization and Govern-ment Size in Latin America. Journal of Applied Eco-nomics, 2(2), 357-391.
Wyplosz, C.(2012). The International Monetary System after the Euro Area Sovereign Debt Crisis, paper to be presented at the conference on “Energy, International Monetary System and Sustainable Development” in Seoul on September 21,2012. Ret-reived 2012, October 23, from http://m.kdi.re.kr/data/download/attach/9680_1-3.pdf
Yılmaz, D. (2012). Yunanistan Krizi ve Euro’dan Çıkış Tratışmaları [Greek Crisis and Leaving The Euro Arguement]. Finans Politik ve Ekonomik Yorumlar, 49(564), 37-46.