the invisible eye? electronic performance monitoring ... - core
TRANSCRIPT
Singapore Management University Singapore Management University
Institutional Knowledge at Singapore Management University Institutional Knowledge at Singapore Management University
Research Collection Lee Kong Chian School Of Business Lee Kong Chian School of Business
9-2014
The Invisible Eye? Electronic Performance Monitoring and The Invisible Eye? Electronic Performance Monitoring and
Employee Job Performance Employee Job Performance
Devasheesh P BHAVE Singapore Management University, [email protected]
Follow this and additional works at: https://ink.library.smu.edu.sg/lkcsb_research
Part of the Human Resources Management Commons, Industrial and Organizational Psychology
Commons, and the Organizational Behavior and Theory Commons
Citation Citation BHAVE, Devasheesh P. The Invisible Eye? Electronic Performance Monitoring and Employee Job Performance. (2014). Personnel Psychology. 67, (3), 605-635. Research Collection Lee Kong Chian School Of Business. Available at:Available at: https://ink.library.smu.edu.sg/lkcsb_research/3642
This Journal Article is brought to you for free and open access by the Lee Kong Chian School of Business at Institutional Knowledge at Singapore Management University. It has been accepted for inclusion in Research Collection Lee Kong Chian School Of Business by an authorized administrator of Institutional Knowledge at Singapore Management University. For more information, please email [email protected].
CORE Metadata, citation and similar papers at core.ac.uk
Provided by Institutional Knowledge at Singapore Management University
1
The Invisible Eye? Electronic Performance Monitoring and
Employee Job Performance
Devasheesh P. Bhave1
Published in Personnel Psychology, Volume 67, Issue 3, Autumn 2014 , Pages 605–635
http://doi.org/10.1111/peps.12046
Abstract
To enhance employee performance, many organizations are increasingly using electronic performance
monitoring (EPM). The relationship between the frequency of EPM use and employee performance is
examined in 2 field studies. In Study 1, which uses a unique longitudinal data set, results reveal that
shorter time lags between 2 consecutive employee performance assessments are related to better task
performance as indicated by call quality metrics. A second field study using matched supervisor–
employee and EPM system data is conducted in 2 call centers to extend these results and to focus more
directly on the supervisors’ use of EPM and its relationship with additional performance criteria:
counterproductive work behaviors (CWBs) and organizational citizenship behaviors (OCBs). Results
indicate that more frequent supervisory use of EPM is associated with better task performance and OCB.
However, supervisory use of EPM was not significantly related to CWB.
Electronic performance monitoring (EPM) systems—electronic technologies used to observe, record, and
analyze information on employee performance (Stanton, 2000; US Congress, OTA, 1987)—have changed
how supervisors monitor their subordinates (Ilgen & Pulakos, 1999). In contrast to traditional methods of
monitoring, such as direct observation or meetings, which are undertaken at discrete time intervals and
without the use of technology, EPM systems assess quantifiable aspects of employee performance
continually (Hesketh & Neal, 1999; Stanton, 2000).In addition EPM systems also enable capturing
qualitative observational data on specific service behaviors that supervisors and other organizational units
such as quality teams subsequently assess (George, 1996; Lund, 1992; Stanton, 2000). These
sophisticated systems can therefore provide supervisors the tools they need to assess employee
performance more comprehensively (Ilgen & Pulakos, 1999) and to better align employee and
organizational interests (Fayol, 1916; Simon, 1946). Given the increasing prevalence of EPM (American
Management Association, 2005; National Workrights Institute, 2004), it is important to understand
whether the frequency of supervisory use of EPM—critical in traditional monitoring (Komaki, 1986)—
enhances performance and achieves the desired interest-alignment objective of EPM. Theoretical and
1 The HR Division of the Academy of Management, the SHRM Foundation, and the Bell Research Center for
Business Process Innovations provided valuable financial support for this study. This article is based on a portion of
Devasheesh Bhave's doctoral dissertation at the University of Minnesota. Some of the analyses were presented at the
2010 Society for Industrial and Organizational Psychology Conference in Atlanta, GA.
For their guidance, I particularly thank Theresa Glomb, Joyce Bono, John Budd, Susan Meyer-Goldstein, and Jason
Shaw. I am grateful to Miriam Nelson and Clifford Jay for providing data access to the organizations that
participated in this study, and to Jacquelyn Thompson for editing assistance. Reeshad Dalal, Gary Johns, Amit
Kramer, and Alex Lefter very kindly commented on previous drafts of this article. Finally, I am thankful to Chad
Van Iddekinge and two anonymous reviewers for their constructive feedback and suggestions throughout the review
process.
2
practical imperatives call for examining whether EPM functions as an “invisible eye” that aligns
intraorganizational interests and enhances employee performance.
However, empirical evidence informing this question is limited, particularly from field studies. Most
research on the EPM–performance relationship consists of laboratory experiments that find, generally,
that EPM facilitates performance for simple tasks (e.g., Davidson & Henderson, 2000; Kolb &
Aiello, 1997). Of note, studies report experimental findings for the EPM–performance relationship only
for in-role task performance, but little research considers the other performance dimensions such as
organizational citizenship behaviors (OCBs) and counterproductive work behaviors (CWBs).
Furthermore, the relatively few field studies of EPM largely focus on employees’ perceptions of the
importance the organization places on different performance dimensions (e.g., production quantity vs.
work quality) but not on the actual performance on these dimensions (e.g., Grant, Higgins, &
Irving, 1988; Irving, Higgins, & Safayeni, 1986). Moreover, EPM research reports mixed evidence about
the efficacy of EPM systems with productivity benefits contrasted with concerns related to privacy,
fairness, and employee stress (see Bates & Holton, 1995; Chalykoff & Kochan, 1989; Lund, 1992).
Finally, although by design EPM has two key constituents, supervisors using EPM systems and
employees who are electronically monitored through these systems, EPM field studies primarily focus on
the latter. Although important, that emphasis largely neglects the supervisor's crucial role (for
experimental exceptions, see Alge, Ballinger, & Green, 2004; Zweig & Scott, 2007). This omission is
important because, as Komaki (1986) observed, the frequency of supervisory monitoring—traditional
observational monitoring—is a key differentiator between effective and noneffective supervisors and one
that is likely to prevail in EPM settings as well (Alge et al., 2004; Stanton, 2000).
In light of these conflicting and incomplete findings, rigorously assessing the importance of EPM in field
settings is crucial. My primary objective in this study is thus to determine how frequently supervisors use
EPM systems and how the frequency relates to employee performance. I draw on agency theory
(Fama, 1980; Jensen & Meckling, 1976), which suggests that greater information allows supervisors to
better monitor subordinates and to align subordinates’ and supervisors’ interests (and therefore align with
organizational interests). To obtain deeper understanding of the relationship between EPM use and
employee performance, specifically task performance, I undertook Study 1 using a unique longitudinal
data set of objective call quality assessments in a call center firm. To complement Study 1's objective
EPM data, in Study 2 I drew data from multiple sources: supervisors, employees, and EPM system data
provided by quality units from two different call center organizations. The multisource data allowed me to
focus more directly on supervisors’ reports of EPM use while simultaneously incorporating a more
comprehensive view of employee performance in the areas of task, OCB, and CWB. Collectively, this
research addresses calls to better evaluate EPM contextual influences by drawing data from field settings,
and by incorporating objective and subjective data to thoroughly assess EPM use and its relationship with
multiple performance dimensions (see Johns, 2006). Thus, this research contributes to our knowledge of
the essential role of technology for employee performance in technology-mediated contexts (see
Hesketh & Neal, 1999).
Development of Hypotheses
Most research on the EPM–performance relationship has focused on task performance and has primarily
used experimental methods. For instance, social facilitation theory (Zajonc, 1965) suggests that when
other people are physically present, individuals perform complex tasks more poorly but perform simple
tasks better. Drawing on that theory, Aiello and Svec (1993) investigated whether such social facilitation
effects operate when EPM provides an “electronic presence.” They reported that participants in both
electronic and supervisory monitoring conditions performed a complex task more poorly than did
participants who were not monitored or were monitored in a group. On the other hand, Griffith (1993)
reported better performance on a simple experimental task for electronically monitored study participants
3
compared with nonmonitored participants, although the differences were not statistically significant.
Other studies using both complex and simple tasks have observed social facilitation effects; electronically
monitored participants demonstrated higher performance on simple tasks but not on complex tasks
(Davidson & Henderson, 2000; Kolb & Aiello, 1997). Overall, the experimental results suggest that EPM
facilitates performance for simple tasks but hinders performance for complex tasks.
Field studies in the EPM literature have mainly focused on employee views of the importance of different
performance attributes. For example, Grant et al. (1988) surveyed monitored and nonmonitored
employees in the same firm and asked them which performance attribute they believed was most critical
in their performance evaluations. Although 80% of monitored employees considered production quantity
the main attribute affecting their performance ratings, most nonmonitored employees (85%) considered
work quality the most important attribute. Irving and colleagues reported similar results: Employees in
two organizations with EPM systems stated that managers placed a higher emphasis on quantitative
aspects of work and a lower emphasis on quality of work, compared to employees in three organizations
without EPM systems (Irving et al., 1986). Although these findings suggest that EPM can influence
employees’ attention to specific performance domains, they provide little information whether this results
in changes in employee performance (Bates & Holton, 1995).
Overall, experimental studies have focused primarily on comparing electronic versus traditional forms of
monitoring, whereas field studies have focused on soliciting employees’ preferences for different aspects
of task performance. In addition, both experimental and field studies in EPM have primarily focused on
the employees’ perspective, leaving an important question unaddressed: How does the frequency of
supervisory use of EPM—critical in traditional observational monitoring (Komaki, 1986)—relate to
employee performance? A related question is to understand the effects of supervisory use of EPM across
the performance domain given that job performance is multidimensional (Campbell, 1999; Dalal, 2005;
Rotundo & Sackett, 2002). To examine these questions, I draw on the theoretical perspectives of agency
theory and social facilitation theory (see Alge et al., 2004; Stanton, 2000).
Supervisory Use of EPM and Task Performance
Agency theory (Fama, 1980; Jensen & Meckling, 1976) focuses on how work is delegated from a
principal (here, the supervisor) to an agent (here, the subordinate) who does the work. Eisenhardt (1989)
illustrated how agency theory metaphorically views the relationship between supervisor and subordinate
as a contract for ascertaining the most efficient agreement between the two parties. Sometimes, however,
moral hazard renders contracts inefficient (Milgrom & Roberts, 1992), which is more likely to occur
when asymmetric information exists between the principal and the agent (Eisenhardt, 1989). For example,
supervisors may lack accurate performance information about their subordinates and consequently are
limited in eliciting performance improvements.
However, if supervisors cannot directly observe subordinates’ performance, organizations can invest in
information systems such as EPM (when the systems are less costly than other alternatives) to glean
performance information (Eisenhardt, 1989). For instance, call center supervisors can use the EPM
system to determine how well customer service representatives (CSRs) are performing on key metrics,
such as their average time for handling calls, and use this information to suggest performance
improvements. Agency theory predicts that this greater information facilitates better monitoring, which
serves to align supervisors’ and subordinates’ interests. Experimental results are supportive: Particularly
for simple tasks, electronically monitored participants demonstrate higher performance (Davidson &
Henderson, 2000; Kolb & Aiello, 1997) indicating that greater performance information gathered through
EPM mitigates agency problems caused by asymmetric information between supervisors and
subordinates. Therefore, based on agency theory, I expect that greater use of EPM will be associated with
favorable task performance effects.
4
Based on Komaki's (1986) work in traditional observational monitoring, using EPM systems to gather
employee performance information can be conceptualized either as (a) objective measures of EPM
frequency based on the actual time between EPM assessments or (b) subjective supervisor reports on how
frequently they electronically monitor focal subordinates. Although these alternative conceptualizations
are consistent with the agency theory reasoning that greater EPM facilitates employees’ task performance,
nuances occur in their rationale for favorable performance effects. In addition, the specific
operationalization of EPM frequency differs based on the conceptualization, which prompts a more
refined examination of the frequency of EPM–task performance relationship.
Objective Measures of EPM Frequency
The first conceptualization of the frequency of EPM use is based on the time between EPM assessments.
According to social facilitation theory (Zajonc, 1965), EPM may enhance task performance because it
serves as an “electronic presence” (Aiello & Svec, 1993) driving employees to perform better because
they are aware of being evaluated (i.e., evaluation apprehension; Cottrell, 1972). Furthermore, in the
presence of others, employees want to impress observers favorably and present a particular image of
themselves (i.e., self-presentation; Baumeister, 1982; Goffman, 1959). Evaluation apprehension and self-
presentation undergird social facilitation effects by increasing employees’ arousal levels and desire to
achieve task performance expectations. In other words, more frequent EPM would signal that the
organization focuses strongly on evaluation, which would increase employees’ evaluation apprehension
and, in turn, enhance their task performance (see Brewer & Ridgway, 1998). Thus, according to this
social facilitation explanation, longer time lags between EPM assessments will decrease employees’ drive
to meet task performance expectations. In sum, social facilitation theory and agency theory suggest that
longer time lags between EPM assessments will adversely affect task performance.
Hypothesis 1: Time between two consecutive EPM assessments is negatively related to task
performance.
Subjective Supervisory Reports of EPM Use
Another way to conceptualize EPM is based on supervisors’ subjective assessment of how frequently they
electronically monitor their subordinates. Research on traditional observational monitoring shows that
more frequent monitoring is essential to motivate subordinates to achieve work-related goals
(Komaki, 1986). The frequency of supervisory monitoring signals the importance of the work to
subordinates and directs their attention to its completion (Larson & Callahan, 1990). That is, by cueing
subordinates on valued aspects of performance, more frequent supervisory monitoring aims to enhance
performance. As discussed previously, this reasoning is congruent with the propositions of agency theory:
More frequent supervisory use of EPM will help mitigate agency problems related to asymmetric
information between supervisors and subordinates (Eisenhardt, 1989). Accordingly, I expect that greater
supervisory use of EPM (based on supervisors’ judgments of how much they electronically monitor their
subordinates) will facilitate task performance.
Hypothesis 2: Supervisory use of EPM is positively related to subordinates’ task performance.
Supervisory Use of EPM and CWBs
CWB “refers to any intentional behavior on the part of an organization member viewed by the
organization as contrary to its legitimate interests” (Sackett, 2002, p. 5) and is another vital dimension of
performance (Campbell, 1999; Dalal, 2005; Rotundo & Sackett, 2002). It is noteworthy that the definition
of CWB explicitly recognizes the role of incongruent interests between the organization and its members
in classifying behaviors as counterproductive—incongruent interests that agency theory suggests might be
alleviated by monitoring. CWBs can include a wide range of behaviors such as theft, tardiness, violence,
accidents, sabotage, absenteeism, sexual harassment, and drug and alcohol abuse (Ones, 2002). For
5
parsimony and to focus explicitly on the performance domain, this study will focus on the
counterproductive behaviors that Robinson and Bennett (1995) classified as production deviance (e.g.,
intentionally working slowly, taking excessive breaks).
From an agency theory perspective, employee-shirking behaviors are an example of CWBs in which
employees avoid working as hard as expected (Eisenhardt, 1989; Milgrom & Roberts, 1992). Agency
theory contends that shirking may occur because agents (employees) know more about their work efforts
than do principals (supervisors). The resulting information asymmetry may prompt employees to act
opportunistically by shirking (Eisenhardt, 1989). Specific monitoring mechanisms, such as EPM, help
counteract information asymmetry by curtailing opportunistic subordinate behavior and obtaining more
accurate performance information (Eisenhardt, 1989; Fama, 1980). Substantial research has illustrated
that monitoring may combat shirking behavior. For instance, Eisenhardt (1985) found that greater
monitoring mechanisms (e.g., budgeting systems) yielded more accurate performance information about
salespersons in specialty stores.
Incorporating these agency theory arguments, Alge et al. (2004) reported that when team leaders’
dependence on their subordinates was higher, which could create information asymmetry and opportunist
subordinate behavior, they engaged in more intense monitoring. To supplement these experimental
results, Alge et al. (2004) conducted a qualitative study of 22 managers. Results of this qualitative study
indicated that EPM was used to elicit accurate information on subordinate CWBs, specifically those
related to production deviance. One manager reported monitoring employees when it seemed that certain
workers were starting to slack on the job. Another manager said that “lack of productivity” would prompt
monitoring to “find out what the employee was really doing” (p. 400). Similarly, in a call center setting, a
supervisor can use EPM data to determine whether a CSR is taking too many breaks and then use the
information to combat shirking. These illustrations are consistent with agency theory arguments that
supervisory use of EPM can help mitigate subordinate production deviance when supervisors cannot
directly observe subordinate behavior. To this end, monitoring mechanisms would alleviate agency
problems manifested in CWBs. Accordingly, I expect that supervisory use of EPM will help mitigate
CWBs.
Hypothesis 3: Supervisory use of EPM is negatively related to subordinates’ CWBs.
Supervisory Use of EPM and OCBs
OCBs, another facet of job performance, are defined as “contributions to the maintenance and
enhancement of the social and psychological context that supports task performance” (Organ, 1997,
p. 91). Broadly, OCBs are employee behaviors that go beyond the call of duty (Bolino & Turnley, 2003)
and reflect a latent construct representing “behavioral manifestations of positive cooperativeness at work”
(LePine, Erez, & Johnson, 2002, p. 61). Because predictability and personalization represent a core
dichotomy in customer service interactions (Surprenant & Solomon, 1987; Wallace, Eagleson, &
Waldresee, 2000), examining citizenship behaviors is especially intriguing. For example, call center
customer-service interactions are designed to be predictable so that all customers receive standardized
service levels (Batt & Moynihan, 2002). Monitoring processes inform employees, implicitly and
explicitly, that the organization desires certain work behaviors, particularly those that focus on task
performance (Larson & Callahan, 1990). Monitoring thus emphasizes in-role behaviors the organization
expects. Although traditional job responsibilities do not include OCBs, they contribute positively to the
organization's social and psychological context (see LePine et al., 2002). By focusing employees on task
performance, EPM may hinder OCBs.
From an agency theory perspective, monitoring may restrict certain employee behaviors. Supervisors and
subordinates have differing interests that can cause problems in rewarding task performance while
sustaining OCBs (Deckop, Mangel, & Cirka, 1999). The supervisors’ interest would require the employee
to maximize in-role or task performance, at the cost of likely decreasing OCBs (Deckop et al., 1999).
That is, when organizations explicitly specify behaviors to be rewarded, employees will be less likely to
6
exhibit unrewarded behaviors such as OCBs (Morrison, 1996). In accordance, research has reported
negative and direct effects between supervisory monitoring methods such as observations and formal
meetings with specific dimensions of OCBs (Niehoff & Moorman, 1993). A related finding shows that
employees are more creative under less supervisory monitoring (Zhou, 2003). Along the same lines,
because EPM systems comprehensively monitor task performance to ensure predictability in service
interactions, generally helpful behaviors in the workplace are likely to suffer. Consequently, supervisory
use of EPM would cue employees to the importance of task performance factors and adversely affect their
performance of OCBs.
On the other hand, alternative theoretical perspectives and empirical findings suggest that supervisory use
of EPM may positively affect subordinates’ OCBs. First, the EPM literature shows some contradictory
findings when considering performance dimensions other than task performance. EPM systems highlight
performance expectations, but in emphasizing task performance they may also stress the importance of
other performance facets. For instance, Grant and Higgins (1989) reported that if employees believe that
managers ascribe greater importance to the number of calls handled over the customer service, the
employees nevertheless also increase their focus on customer service. As a result, Grant and Higgins
(1989) contended that managerial attention to one facet of employee performance stimulates employees to
value all performance facets. Furthermore, some experimental work suggests that EPM causes no
compromises between service quality and quantity (e.g., Nebeker & Tatum, 1993).
A related but separate view suggests that employees may use impression management tactics to influence
supervisory evaluations (Bolino, 1999). Furthermore, the odds of impression management may be higher
under electronic monitoring; employees may be motivated to perform more citizenship acts because they
believe supervisors will observe them. This reasoning is also consistent with emerging research on OCB
role definitions, which suggests that employees may perceive that the organization essentially requires
and rewards OCBs (e.g., Kamdar, McAllister, & Turban, 2006; Morrison, 1994; Tepper, Lockhart, &
Hoobler, 2001).
Overall, two contradictory sets of arguments govern the supervisory use of EPM–OCB relationship.
Based on agency theory and empirical findings from traditional monitoring, supervisory use of EPM may
inhibit OCBs. Based on the broader job performance literature and some evidence from EPM research,
however, supervisory use of EPM may enhance OCBs. Given the polarity inherent in these arguments,
rather than offering a formal hypothesis, I examine the relationship between supervisory use of EPM and
OCB as a research question:
Research Question: Is there a relationship between supervisory use of EPM and subordinates’
OCBs?
Overview of the Present Research
I tested the EPM–performance hypotheses by conducting two field studies in call centers. Call centers use
EPM to continually collect a stream of performance information that permits supervisors to track
employee performance in “real time” and includes a wide variety of work activities that can be potentially
monitored (e.g., work pace, breaks, and accuracy; Aiello & Kolb, 1995; Holman, Chissick, &
Totterdell, 2002). Although EPM systems can continually monitor employees and provide information on
objective metrics, supervisors still must assess specific behaviors—an aspect labeled service
observation—either by listening in during a customer transaction or by accessing digital records of the
call later (George, 1996; Lund, 1992; Stanton, 2000). In general, of the total calls the CSR handles in a
call center, only a few are assessed on service behaviors; the call center industry estimates that 75% of
call centers monitor approximately four to five calls per employee per month (Incoming Calls
Management Institute [ICMI], 2005).
Because service observation requires supervisors to devote more time and be more involved, many call
center organizations also establish quality assessment units to track, observe, and evaluate CSR
7
performance (ICMI, 2005). Some call centers use quality departments to assess performance internally;
others use external consulting firms, primarily because consulting firms specialize in service observation
and provide benchmarking metrics across call center organizations. Third-party monitoring is consistent
with the principles of quality assessment (Crosby, 1980; Juran, 1974) because external assessors are less
likely to be biased by internal organizational (client) dynamics. As discussed below, the two studies in the
present research incorporate these different organizational structures that call center firms adopt for
electronically monitoring their employees.
Study 1 differs from Study 2 in its emphasis on external rather than internal assessments of EPM. This
facilitates directly measuring the time between performance assessments and provides a more objective
measure of frequency of EPM use. Therefore Study 1 primarily examines the relationship between degree
of use of EPM, in terms of objective assessment of the time between EPM assessments and task
performance. Study 2 uses surveys that directly assess supervisory use of EPM and its relationship across
the three employee performance dimensions of task, CWB, and OCB. Thus, it is necessary to take a
complementary view of both studies: Study 1 provides a more objective understanding of frequency of
EPM by measuring the time between two consecutive assessments and tests Hypothesis 1; Study 2
provides an understanding of the frequency of supervisory use of EPM based on an individual
supervisor's perspective and facilitates a test of the other hypotheses.
Study 1
Method
Participants, procedures, and setting
As mentioned above, Study 1 focuses on external rather than internal assessments of EPM. I obtained data
on EPM assessments for “Finco,” the call center of a financial services firm, from “Consultco,” a third-
party consulting firm (organization names are changed for confidentiality). Both firms are U.S. based.
Finco's customers call primarily to resolve issues related to financial trade requests and account statuses.
A group of assessors at Consultco rated a random selection of CSRs’ performance in handling these client
calls. Only one assessor, however, rated each of these randomly selected calls. CSRs at Finco were aware
that their performance would be assessed and were provided their performance evaluation soon after the
assessment took place.
Consultco assessors were specifically trained in service observations and were also skilled in identifying
differences among superior, acceptable, and poor service based on a template of behaviors developed in
collaboration with Finco. Consultco made ratings on specific customer service behaviors as well an
overall employee performance score (discussed below) accessible to Finco supervisors and CSRs weekly.
Over a 3-month period, assessment data for 4,207 calls were available for 248 of Finco's CSRs.
Measures
Employee performance
In consultation with Finco's subject matter experts, Consultco organizational consultants, who have PhD
degrees in industrial-organizational psychology, developed a set of measures to assess performance based
on 20 items measuring different aspects of service observation: service orientation (e.g., opening call
appropriately), issue identification (e.g., obtaining the right information), issue resolution (e.g., providing
thorough information), communication (e.g., projecting enthusiastic tone), and call management (e.g.,
using time efficiently). Based on these items, Consultco assessors provided a summary score (on a scale
of 0–100) for each assessment.
Time between EPM assessments
The EPM system digitally recorded the specific times that Consultco assessors evaluated a focal
employee's performance. These digital records of the time between EPM assessments provided the
difference between two consecutive assessments, measured in days. On average, 4.35 days passed
8
between any two consecutive EPM assessments. As a reference point, the time between EPM assessments
was positively skewed; it was less than 10 days in most cases, which is consistent with industry standards
(ICMI, 2005).
Control variables
Although calls were similarly complex, customer attitudes are likely to vary. For example, one customer
checking an account balance may display a hostile attitude; another may be neutral. To control for
potential effects of such variations on CSR performance and consequent assessor evaluations, the analysis
controlled for both customer attitude at the initiation of the call and customer attitude at the end of the
call. Trained Consultco assessors also coded customer attitudes—measured on a four-point scale
(0 = negative to 3 = delighted). Furthermore, each CSR's prior performance (t – 1) was also controlled;
the inclusion of a lagged measure of performance in model estimation helps to account for time-based
dependencies arising from performance monitoring (see Ployhart & Hakel, 1998).
Analysis Strategy
In these data, CSRs' performance was measured over time, with CSRs nested within supervisors, which
necessitated the use of multilevel modeling procedures (Raudenbush & Bryk, 2002). In accordance, the
intraclass correlation (ICC) values of .14 and .12 indicated that 14% of the variance in employee
performance was at the CSR level and 12% of the variance was at the supervisor level, respectively (see
Hox, 2010; Kim, 2009). To account for these interdependencies, multilevel models were estimated in
STATA 10.0 to check whether employee performance deteriorated as time between EPM assessments
increased.
Results
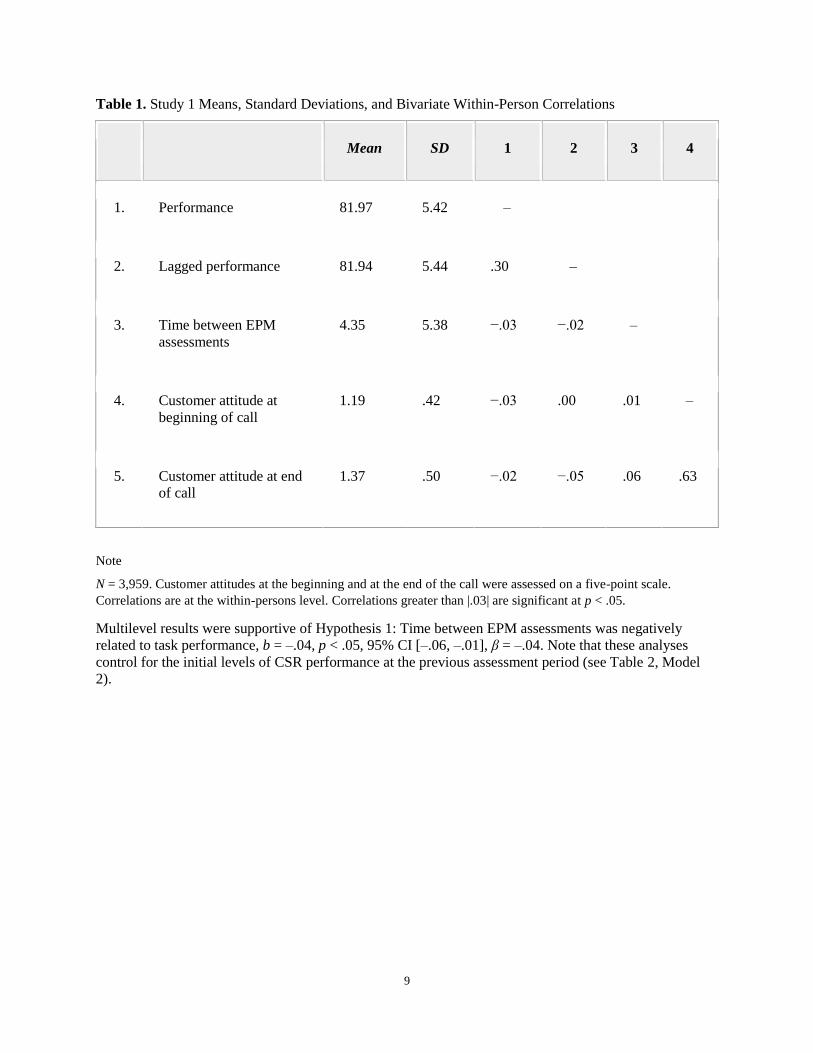
Table 1 shows the descriptive statistics and within-person correlations. The time between two EPM
assessments was expected to be negatively related to performance. Although negative, the bivariate
correlation was not statistically significant (r = –.03, p > .05); note, however, that the bivariate correlation
does not consider temporal effects and omitted variables.
9
Table 1. Study 1 Means, Standard Deviations, and Bivariate Within-Person Correlations
Mean SD 1 2 3 4
1. Performance 81.97 5.42 –
2. Lagged performance 81.94 5.44 .30 –
3. Time between EPM
assessments
4.35 5.38 −.03 −.02 –
4. Customer attitude at
beginning of call
1.19 .42 −.03 .00 .01 –
5. Customer attitude at end
of call
1.37 .50 −.02 −.05 .06 .63
Note
N = 3,959. Customer attitudes at the beginning and at the end of the call were assessed on a five-point scale.
Correlations are at the within-persons level. Correlations greater than |.03| are significant at p < .05.
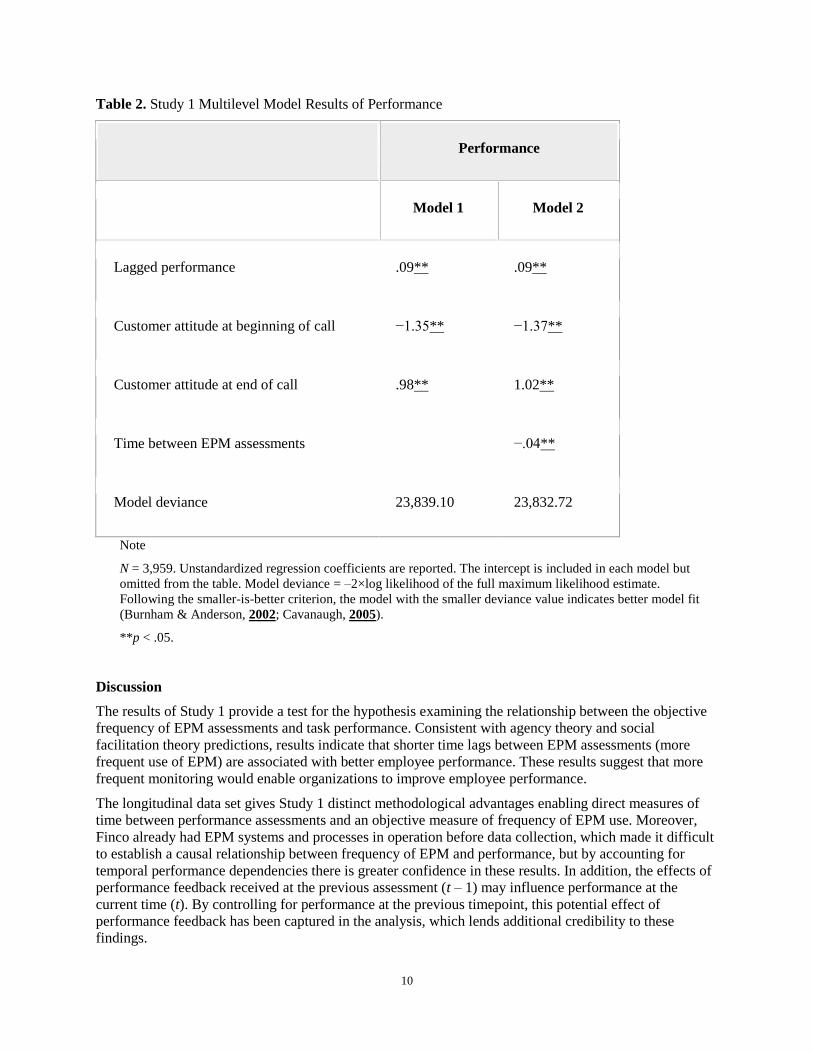
Multilevel results were supportive of Hypothesis 1: Time between EPM assessments was negatively
related to task performance, b = –.04, p < .05, 95% CI [–.06, –.01], β = –.04. Note that these analyses
control for the initial levels of CSR performance at the previous assessment period (see Table 2, Model
2).
10
Table 2. Study 1 Multilevel Model Results of Performance
Performance
Model 1 Model 2
Lagged performance .09** .09**
Customer attitude at beginning of call −1.35** −1.37**
Customer attitude at end of call .98** 1.02**
Time between EPM assessments −.04**
Model deviance 23,839.10 23,832.72
Note
N = 3,959. Unstandardized regression coefficients are reported. The intercept is included in each model but
omitted from the table. Model deviance = –2×log likelihood of the full maximum likelihood estimate.
Following the smaller-is-better criterion, the model with the smaller deviance value indicates better model fit
(Burnham & Anderson, 2002; Cavanaugh, 2005).
**p < .05.
Discussion
The results of Study 1 provide a test for the hypothesis examining the relationship between the objective
frequency of EPM assessments and task performance. Consistent with agency theory and social
facilitation theory predictions, results indicate that shorter time lags between EPM assessments (more
frequent use of EPM) are associated with better employee performance. These results suggest that more
frequent monitoring would enable organizations to improve employee performance.
The longitudinal data set gives Study 1 distinct methodological advantages enabling direct measures of
time between performance assessments and an objective measure of frequency of EPM use. Moreover,
Finco already had EPM systems and processes in operation before data collection, which made it difficult
to establish a causal relationship between frequency of EPM and performance, but by accounting for
temporal performance dependencies there is greater confidence in these results. In addition, the effects of
performance feedback received at the previous assessment (t – 1) may influence performance at the
current time (t). By controlling for performance at the previous timepoint, this potential effect of
performance feedback has been captured in the analysis, which lends additional credibility to these
findings.
11
Furthermore, in contrast to Finco supervisors, Consultco assessors do not directly interact with Finco's
CSRs. Consequently, they are less likely to be biased in their evaluations than are supervisors who know
CSRs personally. As numerous studies have previously noted, bias in performance evaluations is an
important issue (Feldman, 1981; Landy & Farr, 1980), so third-party assessments offer advantages by
avoiding potential distortions in the evaluation process. To that end, estimates of the relationship of time
between EPM assessments and CSR performance will be robust, relatively unbiased, and immune to
many common method concerns (Podsakoff, MacKenzie, Lee, & Podsakoff, 2003). Finally, data in Study
1 were not collected through a survey and were therefore relatively uncontaminated by issues such as
social desirability and mood states of survey respondents (Podsakoff et al., 2003).
One concern in Study 1 is that, in large samples, even relatively small effects may be significant (see
Combs, 2010). Results of Study 1 indicate that, all else being equal, an increase in each additional day
between any two consecutive monitoring assessments is associated with a .04 point decrease in
performance. Based on Ellis's (2010) advice, I interpret this effect size on the basis of the study's context
and sample characteristics. Compare two EPM systems: one in which assessment is done on a daily basis,
and a second in which assessment is done on a monthly basis. In the latter EPM system, the estimated
drop in performance compared to the former system will be 1.2 points. This result is put in perspective by
considering the standard deviation of performance. The observed standard deviation is low (SD = 5.42),
which is consistent with previous research suggesting that performance ratings in a “strong” situation (one
in which desirable behavior is clearly defined and highly consequential) generally exhibit range
restriction (Meyer, Dalal, & Hermida, 2010). Given the low observed standard deviation, an estimated
drop in performance of 1.2 points represents 22% of the standard deviation. In short, when the
distribution of performance ratings is compressed, relatively small changes in performance scores capture
meaningful differences in actual performance.
Finally, a noteworthy feature of Study 1 is that it does not directly assess supervisory use of EPM; rather,
external assessors used EPM to assess employees. Thus, although the study provides insight into the
frequency of EPM use and its relationship with employee performance, it cannot identify the specific
effects associated with supervisory use of EPM. Study 1 also provides no information on the association
of EPM with other performance dimensions such as OCB and CWB. Study 2 aims to address those
limitations and to more comprehensively test the hypotheses.
Study 2
Method
Participants, procedures, and setting
Data were collected from call center units of two large organizations in a midwestern U.S. city. These call
centers, which are specific divisions within larger organizations, provide billing, promotions, and related
services to their customers. Both call centers handle in-bound transactions wherein customers initiate the
calls. Multiple site visits at both organizations helped generate, clarify, and change items to terminology
appropriate to the organization. As outlined below, I used three data sources: supervisors, CSRs, and
EPM data provided by quality teams. The organizations provided an employee roster that enabled
matching CSR data to supervisor and EPM data.
Across these two organizations, I sent web-based surveys to 284 CSRs and received 204 completed
surveys for a response rate of about 72%. Both organizations showed similar response rates. CSRs
provided information on demographic attributes of age, gender, tenure, education, and employment status.
Most respondents were female (72%), worked full time (84%), and averaged 37.6 years old (SD = 13.7).
The average organizational tenure was 5.2 years (SD = 5.8). All CSRs had at least a high school degree,
and 27% were college graduates.
All supervisors (n = 24) completed both an individual web-based survey and paper survey for each of
their subordinates, for a response rate of 100%. Most of the supervisors were female (66.7%) and
12
averaged 38.6 years old (SD = 9.7). All supervisors worked full time and possessed a high school degree
or higher (33% were college graduates). The average organizational tenure was 9.2 years (SD = 8.2). On
average, supervisors managed 12.9 CSRs (SD = 2.4) and monitored 3.7 (SD = 1.6) calls per CSR per
month.
In terms of monitoring procedures, both organizations followed similar processes of using electronic
monitoring systems to continually collect information on performance metrics, such as average call
handle time, total number of calls handled, and time on breaks. Both supervisors and CSRs had access to
these performance metrics. Furthermore, supervisors monitored CSR calls through side-by-side sessions
(supervisors sat next to the CSRs and listened while they spoke with customers), real-time remote
listening (supervisors listened to CSR calls from their workstations), or digital voice recordings of prior
CSR call transactions.
Both organizations also had separate quality departments that independently electronically monitored and
evaluated CSRs; like the supervisors, quality departments could access the calls in real time or through
recordings. These departments evaluated at least four calls per agent per month on customer service
behaviors—a number consistent with industry standards (ICMI, 2005). Quality departments provided a
summary call quality metric based on the ratings of service behaviors and the performance metrics (e.g.,
average call handle time). Quality departments consisted of multiple raters, although each call was rated
by only one rater. To ensure consistency of evaluation across work units, quality departments had
periodic calibration sessions. In addition to their monitoring assessments, supervisors used ratings from
the quality departments to provide feedback to their subordinate CSRs on multiple dimensions of call
quality. Supervisors generally valued quality department evaluations in addition to their own evaluations
because quality department ratings provided independent and relatively objective assessments.
Measures
Using a paper-based survey, supervisors evaluated each CSR on the three performance dimensions and
provided information on their use of monitoring for each CSR, as well as the complexity of their calls.
Supervisory use of EPM
Discussions with organizational representatives complemented Wilk and Moynihan's (2005) approach,
which inquires about supervisory levels of monitoring in call centers, and helped identify the specific
forms of electronic monitoring that supervisors could use. This is consistent with EPM research that lists
a set of monitoring techniques to assess EPM use (Stanton, 2000). Thus, supervisors reported on EPM use
of (a) call monitoring systems that allow supervisors to view, for example, call handle times and call
loads; (b) voice recording systems that enable call playback; (c) quality assurance metrics to evaluate
calls; and (d) other electronic systems that generate performance data; for the last item, examples of
specific systems in the organization, such as schedule adherence and attendance monitoring, were
provided. All supervisors had access to these EPM techniques and could choose the frequency for using
them. These items were assessed on a five-point (1 = never to 5 = always) Likert-type scale. Coefficient
alpha for this scale was .87.
Call complexity
Because experimental EPM research (Davidson & Henderson, 2000; Griffith, 1993) and agency theory
(Eisenhardt, 1989) have highlighted the relevance of task complexity in estimating the EPM–performance
relationship, I controlled for the complexity of the calls handled by the CSR in the analysis. Based on
Dean and Snell (1991), supervisors assessed the complexity of calls a focal CSR handled by answering:
“How complicated are the calls handled by this representative?” This item was assessed on a seven-point
scale (1 = among the most simple to 7 = among the most complex).
13
Task performance
Task performance was assessed using four items from the “Job – doing things specifically related to one's
job description” dimension of the role-based performance measure (Welbourne, Johnson, & Erez, 1998,
p. 554). The items were assessed on a five-point scale (1 = needs much improvement to 5 = excellent). An
example is “Quantity of work output,” and the coefficient alpha for this scale was .91.
Organizational citizenship behaviors
The Welbourne et al. (1998) measure was used to assess OCBs. Four items were assessed on a five-point
scale (1 = needs much improvement to 5 = excellent). The items used were from the “Organization –
going beyond the call of duty in one's concern for the firm” dimension (Welbourne et al., 1998, p. 554),
which “parallels those behaviors associated with OCBs” (Welbourne et al., 1998, p. 543). An example:
“Doing things that help others when it's not a part of his/her job.” The coefficient alpha for this scale was
.95.
Counterproductive work behaviors
Five items that reflected loss in work productivity were selected from Bennett and Robinson's (2000)
organizational deviance scale. The items were assessed on a five-point scale (1 = never to 5 = always). An
example item is: “Takes an additional or longer break than is acceptable at your workplace.” To
appropriately suit the call center context, the wording of one item about fantasizing and daydreaming at
work was revised to “Spends time surfing the Internet or on private phone calls.” The coefficient alpha for
this scale was .86.
A confirmatory factor analysis (CFA) to determine whether the three performance dimensions were
empirically distinct indicated that a three-factor solution exhibited superior fit: χ2(62) = 160.63,
comparative fit index (CFI) = .95, root mean square of approximation (RMSEA) = .08, standardized mean
square residual (SRMR) = .05, compared with a single-factor solution χ2(65) = 918.99, CFI = .53,
RMSEA = .22, SRMR = .16. Overall, the three-factor model provided a significantly better fit than the
one-factor model (Δχ2[3] = 256.46, p < .001).
Call quality
To evaluate call quality, both organizations had multiple dimensions (restricted by confidentiality
agreements). In general, these dimensions covered various aspects of the call such as greeting, probing,
closing, providing value, helping the customer, and documenting the transaction. Thus, elements of task
performance were incorporated into the call quality score, which provides an alternative assessment of
task performance by a different data source: quality teams.
Call quality data were provided for a 4-month period, and an average of these evaluations for each CSR
was computed. Technical issues (e.g., if the quality department monitored fewer than four calls) and
administrative issues (e.g., employee absence) caused data to be missing for each month so that complete
call quality data for all 4 months were not available. To counteract the randomly missing data (7.47%), a
multiple imputation procedure across the 4-month time period was performed to retain the maximum
number of call quality assessments (see Carlin, Galati, & Royston, 2008). This procedure follows
Newman's (2009, p. 11) advice that emphasizes using “all of the available data” and recommends
multiple imputation procedures because they are unbiased and have greater power.
Analysis Strategy
In these field data neither supervisory use of EPM nor CSR performance are randomly assigned to
experimental conditions. Thus, in estimating the relationship between supervisory use of EPM and
performance, the potential exists for endogeneity, which may lie in the simultaneity of the monitoring–
performance relationship. For instance, it may be unclear whether CSR performance is better because the
14
supervisor frequently uses electronic monitoring or whether the supervisor uses more electronic
monitoring because of low CSR performance. When estimating a potentially simultaneous relationship,
the ordinary least squares (OLS) regression results may be biased and inconsistent because the OLS
assumption that the error term be independent of the predictor variable may be violated
(Wooldridge, 2002); in this situation, the internal validity of the study could be compromised (see
Antonakis, Bendahan, Jacquart, & Lalive, 2010). The Durbin–Wu–Hausman test empirically assesses
whether the predictor variable and the error term are correlated; if they are it implies that OLS-based
estimates may be inconsistent and that two-stage least squares (2SLS) estimates, which are consistent,
should be used instead. Accordingly, the Durbin–Wu–Hausman test provided empirical evidence of the
endogeneity of supervisory use of EPM (χ2 = 15.17, p < .01) and recommended the use of 2SLS methods
for estimation (see Gujarati, 2003; Wooldridge, 2002). 2SLS procedures—a general solution to mitigate
endogeneity—are widely used in the field of economics, have also been employed in organizational
research (e.g., Glomb & Liao, 2003; Schmitt & Bedeian, 1982), and are recommended to increase internal
validity (Antonakis et al., 2010). In 2SLS regressions, potentially endogenous variables are “replaced”
with instrumental variables to mitigate endogeneity concerns (Wooldridge, 2002).
Instrumental variables
Four instrumental variables—assessed in a separate supervisor web survey—were created for supervisory
use of EPM: the supervisor's tenure, dispositional propensity to trust, perceived usefulness of EPM, and
perceived ease of use of EPM. The supervisor's tenure is indicative of their greater experience and
familiarity with EPM systems and their use. Propensity to trust reflects a general willingness to trust
others (Mayer, Davis, & Schoorman, 1995). Supervisors’ propensity to trust would thus reflect their trust
of employees prior to receiving any information on employees’ ability or performance. Supervisors
responded to Mayer and Davis's (1999) nine-item scale assessing propensity to trust (1 = disagree
strongly; 5 = agree strongly). The coefficient alpha was .65. This alpha value, though somewhat low, was
similar to Mayer and Davis's originally reported .66 value. Supervisors also reported their perceptions of
ease of use and usefulness of EPM, which strongly determine behavioral intentions to use a technology
(Davis, 1989; Davis, Bagozzi, & Warshaw, 1989). Supervisors responded to Venkatesh's (2000) four-item
measures for both perceived usefulness (e.g., “Using the system improves my performance in the job”)
and perceived ease of use (e.g., “I find the system easy to use”; 1 = strongly disagree; 7 = strongly agree).
In consideration of one organization's request to use specific items for this scale, only three items could
be used for each dimension. The coefficient alpha values were similar between the four-item and three-
item versions of the scale. To ensure consistency across organizations, these three-item versions of the
scale are used in the analysis. The coefficient alpha for perceived usefulness was .83 and for perceived
ease of use was .77. The correlations of supervisory use of EPM with the instrumental variables were as
follows: propensity to trust (r = .25), perceived usefulness (r = .25), perceived ease of use (r = .44), and
supervisor's tenure (r = .27). These correlations were statistically significant (p < .01), and the average
correlation of these four instrumental variables and supervisory use of EPM was .30.
Testing the validity of instruments
Valid instrumental variables must be (a) correlated with the endogenous variable that they are replacing
and (b) uncorrelated with the error term in the equation (i.e., orthogonality condition).
The first condition can be tested using the fit of the first stage regression, which is the regression of the
endogenous variable (supervisory use of EPM) on the set of instrumental variables (Baum, 2006;
Wooldridge, 2002). The recommended statistic here is to examine the F-test of the joint significance of
the instruments in the first-stage regression (Bound, Jaeger, & Baker, 1995) with the following rule:
An F-test statistic below 10 potentially indicates that the first condition is not satisfied and that the
15
instruments have weak explanatory power (Staiger & Stock, 1997). Results supported adherence to the
first condition of relevance of these instruments to explain the endogenous variable of supervisory use of
EPM (F [6, 181] = 21.06, p < .01; R2 = .41).
To test the second condition, the Sargan test for overidentification of instruments, where the null
hypothesis suggests that the instrumental variables in the model are uncorrelated with the error term
(Baum, 2006; Wooldridge, 2002), was performed for the outcome variable of task performance. By
failing to reject the null hypothesis, results supported adherence to the second condition of orthogonality
of the error term (χ2 = 7.18, p > .05) and provided additional evidence of the exogeneity of the
instruments. Overall, these tests satisfied the two conditions of validity for instrumental variables (see
Baum, 2006; Wooldridge, 2002, for additional methodological details).
In testing the hypotheses, the nested structure of the data must also be accounted for: CSRs are nested
within supervisors. Such nested models were estimated using the “cluster” function in STATA 10.0,
which estimates a variance–covariance matrix with interdependent error terms across groups (supervisors)
and independent error terms within groups (supervisors; Rogers, 1993; Wooldridge, 2002). That is, these
models were estimated based on 2SLS procedures while simultaneously accounting for nested effects (for
a similar application of the cluster procedure using 2SLS, see Glomb & Liao, 2003).
Results
Descriptive results
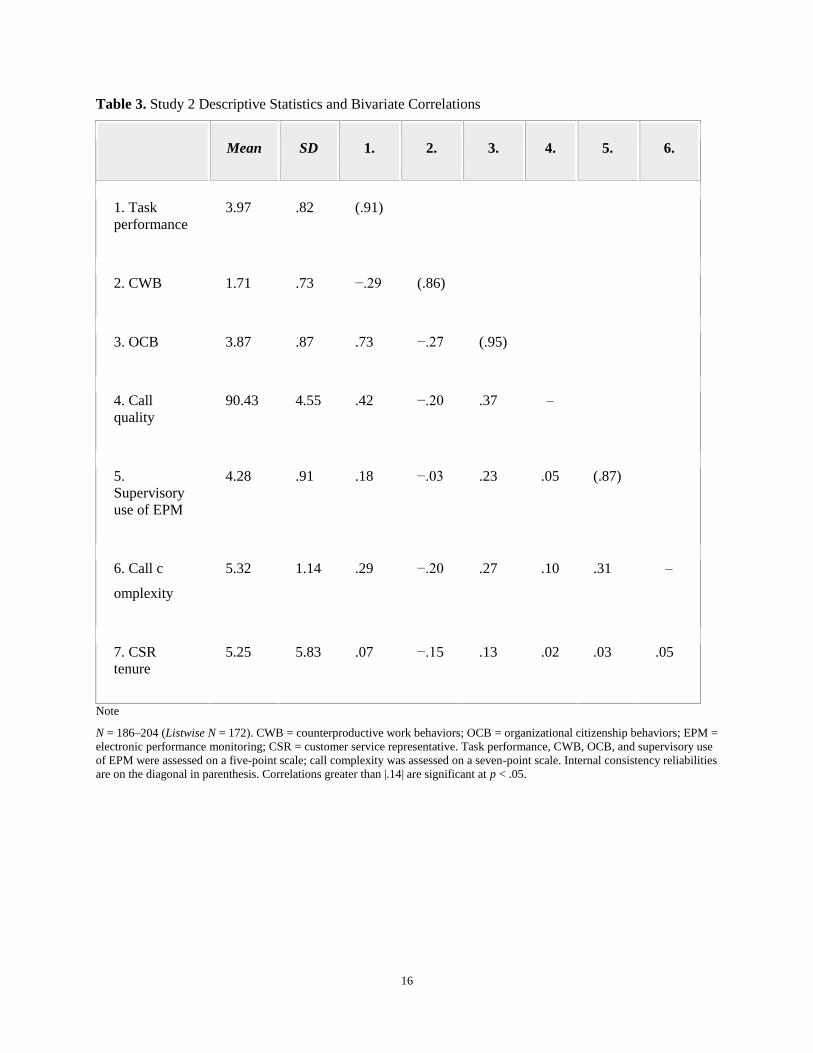
As seen in Table 3, supervisory use of EPM was positively related to task performance (r = .18, p < .05)
and OCB (r = .23, p < .05), but was unrelated to call quality (r = .05, p > .05) and CWB (r = –.03, p >
.05). The correlations between the performance dimensions were as expected: task, OCB, and call quality
were positively related to each other, and all were negatively related to CWB.
16
Table 3. Study 2 Descriptive Statistics and Bivariate Correlations
Mean SD 1. 2. 3. 4. 5. 6.
1. Task
performance
3.97 .82 (.91)
2. CWB 1.71 .73 −.29 (.86)
3. OCB 3.87 .87 .73 −.27 (.95)
4. Call
quality
90.43 4.55 .42 −.20 .37 –
5.
Supervisory
use of EPM
4.28 .91 .18 −.03 .23 .05 (.87)
6. Call c
omplexity
5.32 1.14 .29 −.20 .27 .10 .31 –
7. CSR
tenure
5.25 5.83 .07 −.15 .13 .02 .03 .05
Note
N = 186–204 (Listwise N = 172). CWB = counterproductive work behaviors; OCB = organizational citizenship behaviors; EPM =
electronic performance monitoring; CSR = customer service representative. Task performance, CWB, OCB, and supervisory use
of EPM were assessed on a five-point scale; call complexity was assessed on a seven-point scale. Internal consistency reliabilities
are on the diagonal in parenthesis. Correlations greater than |.14| are significant at p < .05.
17
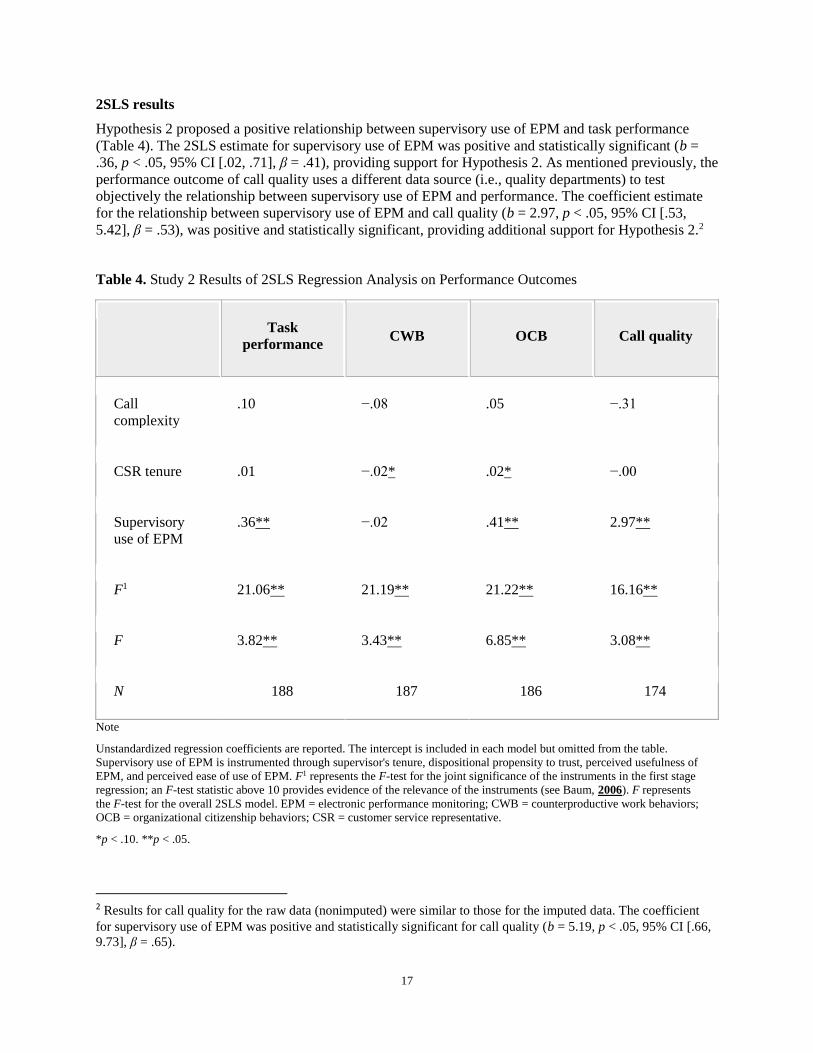
2SLS results
Hypothesis 2 proposed a positive relationship between supervisory use of EPM and task performance
(Table 4). The 2SLS estimate for supervisory use of EPM was positive and statistically significant (b =
.36, p < .05, 95% CI [.02, .71], β = .41), providing support for Hypothesis 2. As mentioned previously, the
performance outcome of call quality uses a different data source (i.e., quality departments) to test
objectively the relationship between supervisory use of EPM and performance. The coefficient estimate
for the relationship between supervisory use of EPM and call quality (b = 2.97, p < .05, 95% CI [.53,
5.42], β = .53), was positive and statistically significant, providing additional support for Hypothesis 2.2
Table 4. Study 2 Results of 2SLS Regression Analysis on Performance Outcomes
Task
performance CWB OCB Call quality
Call
complexity
.10 −.08 .05 −.31
CSR tenure .01 −.02* .02* −.00
Supervisory
use of EPM
.36** −.02 .41** 2.97**
F1 21.06** 21.19** 21.22** 16.16**
F 3.82** 3.43** 6.85** 3.08**
N 188 187 186 174
Note
Unstandardized regression coefficients are reported. The intercept is included in each model but omitted from the table.
Supervisory use of EPM is instrumented through supervisor's tenure, dispositional propensity to trust, perceived usefulness of
EPM, and perceived ease of use of EPM. F1 represents the F-test for the joint significance of the instruments in the first stage
regression; an F-test statistic above 10 provides evidence of the relevance of the instruments (see Baum, 2006). F represents
the F-test for the overall 2SLS model. EPM = electronic performance monitoring; CWB = counterproductive work behaviors;
OCB = organizational citizenship behaviors; CSR = customer service representative.
*p < .10. **p < .05.
2 Results for call quality for the raw data (nonimputed) were similar to those for the imputed data. The coefficient
for supervisory use of EPM was positive and statistically significant for call quality (b = 5.19, p < .05, 95% CI [.66,
9.73], β = .65).
18
Hypothesis 3 proposed a negative relationship between supervisory use of EPM and CWB. The
coefficient estimate for supervisory use of EPM was negative but not statistically significant, b = –
.02, p > .05, β = –.02, thus failing to support Hypothesis 3. Research Question 1 sought to understand the
relationship between supervisory use of EPM and OCB. The coefficient of supervisory use of EPM was
positive and statistically significant (b = .41, p < .05, 95% CI [.08, .74], β = .44), indicating that
supervisory use of EPM was associated with higher OCB.
Discussion
In this study, I examine how supervisors’ use of information from EPM systems relates to subordinates’
performance. Consistent with agency theory predictions, positive associations surface for supervisory use
of EPM with task performance for different operationalizations of task performance: through supervisory
evaluations of a CSR's performance, as well as through call quality evaluations based on EPM system
data by a separate quality team. All else being equal, for each additional unit increase in supervisory use
of EPM, task performance increases by .36 (on a five-point scale), and call quality increases by 2.97
points (on a 100-point scale).
Monitoring is considered a key mechanism to alleviate agency problems that are represented in CWBs.
Although I anticipated a negative relationship between supervisory use of EPM and CWBs, the results
failed to support such an association. Based on agency theory, I expected monitoring to be negatively
related to OCBs. But the wider OCB literature and some prior empirical findings of EPM research
suggested that supervisory use of EPM may be positively related to OCBs. Results indicated a positive
relationship between supervisory use of EPM and OCBs, which align with this latter view. Although this
result is desirable from an organizational perspective, I address the finding in the general discussion.
Study 2 has some limitations. First, it was not possible to independently evaluate the validity of the call-
quality metrics, and so it was necessary to defer to organizational assessments of their suitability. Also
unavailable was direct access to performance metrics, such as the average call time or number of calls
handled by CSRs. But both supervisors and quality assessment teams had access to these metrics, which
the quality assessment teams explicitly incorporated into their evaluations of call quality.
Second, from a methodological standpoint, rather than the cross-sectional design employed here, a
randomized field experiment design would mitigate the endogeneity problem discussed earlier
(Antonakis, et al., 2010). Furthermore, because this study assesses supervisor perceptions of how
extensively they monitor subordinates, this indicator of the frequency of monitoring is not objective. In
addition, no objective measure identifies the time between monitoring assessments or indicates how this
issue may relate to performance. Research indicates that effective supervisors monitor their subordinates’
performance more frequently than do noneffective supervisors (Komaki, 1986), and so precise
measurement of time lags between monitoring assessments would strengthen these findings. Because
Study 1 addresses these methodological limitations by objectively measuring time lags between
monitoring assessments, it provides complementary evidence to Study 2 results.
General Discussion
Drawing on Adam Smith's metaphor, wherein the pursuit of individual self-interest stimulates the greater
good through the social mechanism of an “invisible hand” (Smith, 1776/2003), in these studies I examine
whether EPM functions as an “invisible eye” in aligning intraorganizational interests and facilitating
employee performance. Consistent with predictions based on agency theory and social facilitation theory,
EPM use and task performance show positive associations, as revealed in Study 1. Results indicate that as
EPM is performed less frequently (i.e., more time lapses between EPM assessments), employees perform
more poorly. This finding lends credence to Cottrell's (1972) social comparison explanation that
19
evaluation apprehension may heighten employees’ drive levels. Put simply, call center representatives,
concerned about their performance assessments, are driven to work harder. This result dovetails Komaki's
(1986) work in traditional monitoring demonstrating that frequent monitoring is effective supervisory
behavior. This reasoning is also consistent with feedback research that emphasizes the criticality of timely
feedback for employee performance (Ilgen, Fisher, & Taylor, 1979). If more time passes between EPM
assessments, employees will fail to receive prompt feedback that they may need to improve performance
(Ilgen et al., 1979; Komaki, 1986).
Study 2 explicitly focuses on supervisory EPM use and reveals a positive relationship for different
operationalizations of task performance (through supervisory evaluations of a CSR's performance and call
quality evaluations based on EPM system data by a separate quality team). Overall, these results support
prior experimental work (e.g., Davidson & Henderson, 2000; Kolb & Aiello, 1997) and are in accordance
with agency theory: The better the ability to monitor employees, the better their task performance.
Monitoring is considered a key mechanism to alleviate agency problems represented by CWBs, and thus I
anticipated a negative relationship between EPM and CWBs. My study results, however, fail to support
such an association. Empirical and contextual considerations potentially explain this result. Similar to
other work on CWBs (e.g., Gruys & Sackett, 2003), the base-rate of CWBs was low (M = 1.71 on a five-
point scale) and so was the related variance (SD = .73). This modest variation could be an underlying
reason for the lack of statistical significance. Also possible is that the lower base rate of CWBs is neither
a rating error nor a statistical artifact but merely indicates lower manifestations of CWBs in this work
environment. An examination of specific CWBs reveals that the most frequently observed
counterproductive behavior is “spending time on the Internet or on private phone calls” (only 9.1%).
Other CWBs observed are even lower, from 3.3% to 6.6%. These results suggest that electronic
monitoring, coupled with the structured nature of work in a call center environment, would make it more
difficult for employees to engage in CWBs. Of course, the prospect remains that observability of
CWBs—“the Achilles’ heel of counterproductivity research” (Sackett, 2002, p. 7)—is limited; perhaps
this electronically monitored setting fails to detect unique and unmeasured CWBs (see also, Hulin, 1991).
Two divergent perspectives suggested alternate directions for the supervisory use of EPM–OCB
relationship. Based on agency theory, I expected supervisory use of EPM to be negatively related to
OCBs. Considering that CSRs must perform specific in-role behaviors, agency theory suggests that they
would attend more acutely to the highlighted in-role behaviors and reduce their proclivity to perform
OCBs. Research findings from the OCB and EPM literatures, however, suggested that supervisory use of
EPM would be positively related to OCBs. Contrary to agency theory predictions, the results indicate a
positive relationship between supervisory use of EPM and OCBs. Thus, because EPM systems highlight
performance expectations, when emphasizing task performance they may also stress the importance of
other performance facets, which is consistent with related EPM research findings (e.g., Davidson &
Henderson, 2000; Grant & Higgins, 1989). Similar to results from traditional observational monitoring,
therefore, supervisory use of EPM to monitor task performance may signal to employees the importance
of performing OCBs (Larson & Callahan, 1990; Salancik & Pfeffer, 1978). This positive relationship
between supervisory use of EPM and OCBs is also consistent with self-presentation theory that EPM's
“electronic presence” would drive impression management behaviors (Baumeister, 1982). Simply by
instituting EPM systems, organizations communicate the desired work behaviors to employees and induce
processes of social comparisons that underlie social facilitation effects.
Another possible reason for the positive relationship between supervisory use of EPM and OCBs is that
the rater, in this case the supervisor, may influence results. Supervisors are likely to commit halo errors
when evaluating their subordinates’ OCBs, in considering a “unitary” view of performance. That is,
supervisors may assume a singular performance dimension to classify subordinates as either “good” or
“bad” performers across other job dimensions (Campbell, 1990). This view, reflected in the high bivariate
correlation between task performance and OCB (r = .73), is consistent with Hoffman and colleagues’
meta-analytic reports that OCB, though a separate dimension, is strongly related to task performance
20
(Hoffman, Blair, Meriac, & Woehr, 2007).3 Such an explanation is also consistent with the reasoning that
task performance and OCBs are intertwined; OCBs contribute to a positive organizational context for
facilitating task performance (Motowidlo, 2000; Organ, 1997; Rotundo & Sackett, 2002).
Implications for Future Research
The findings of this study offer theoretical refinements for EPM research from an agency theory
perspective. Results suggest differences in how supervisors use information from EPM systems to ensure
that CSR performance accords with the supervisor's desires. Because EPM systems grant all supervisors
the same potential levels for information generation, this implies that supervisors vary in their information
processing needs and/or in their judgment and decision making. Incorporating judgment and decision-
making aspects in an agency theory framework would be in accordance with research advances of
modifying rational choice theory by integrating behavioral assumptions (see Mellers, Schwartz, &
Cooke, 1998, for a review). In terms of future research, this indicates that supervisors’ judgment and
decision-making attributes potentially influence the monitoring–performance relationship. A related need
is to understand the roles of supervisory motivations (autonomy supportive or controlling; Deci,
Connell, & Ryan, 1989) and personality traits such as the Dark Triad (machiavellianism, narcissism, and
psychopathy; O'Boyle, Forsyth, Banks, & McDaniel, 2012) that may influence supervisors’ use of EPM.
From an organizational design perspective, it will be opportune to more closely examine the different
roles between supervisors and quality teams to understand how monitoring responsibilities should be
distributed and how to best observe different aspects of employee performance (task, OCB, and CWB).
Doing so may be particularly pertinent when investigating different dimensions of OCB (e.g., altruism,
courtesy, conscientiousness, sportsmanship, and civic virtue; Podsakoff, MacKenzie, Moorman, &
Fetter, 1990) and CWB (e.g., interpersonal deviance and organization deviance; Bennett &
Robinson, 2000). At the same time, we must pay greater attention to levels of EPM use. Although the
results of this study indicate a positive association between supervisory use of EPM and employee
performance dimensions, excessively high levels of EPM use may be detrimental to employee
performance on account of fairness and autonomy concerns (see Alder & Ambrose, 2005; Stanton &
Barnes-Farrell, 1996). Examining potential nonlinear relations between EPM use and employee
performance is therefore important (see Larson & Callahan, 1990).
Another area for future research is to elucidate the dimensions and nature of providing EPM feedback,
including feedback control, feedback constructiveness, and feedback medium (see Alder &
Ambrose, 2005). Although frequent feedback is considered useful, the construct of frequency must be
more thoroughly understood in light of some other related questions, such as whether frequent feedback is
useful for performance improvement or whether a cognitive burden exists for both employees and
supervisors based on the frequency of the feedback (whether daily, weekly, or monthly). An event-
contingent experience sampling study would provide an avenue for examining the dynamic between a
supervisor's EPM assessment and an employee's response. Specifically, assessing employee attitudinal
and performance reactions based on a supervisor's specific monitoring assessment in “real time” may
inform issues related to cognitive loads and their effects.
3 Note that measures of task performance and OCB were drawn from an established scale (i.e., Welbourne,
et al., 1998). In addition, confirmatory factor analysis—based on only these two performance dimensions—provided
evidence that the two dimensions were empirically distinct. A two-factor solution was a superior fit, χ2(19) = 61.70,
CFI = .96, RMSEA = .09, SRMR = .05, compared with a single-factor solution χ2(20) = 229.29, CFI = .82,
RMSEA = .20, SRMR = .09.
21
Implications for Practice
The findings of this study offer practical suggestions for organizations seeking to balance the efficiencies
of information collection through EPM systems and the sharing of information about employee
performance. The variation in supervisory use of EPM information suggests that organizational efforts in
generating data through EPM are not matched by resources for using and processing data, especially
across different user groups within organizations. Supervisors are likely to face information overload
from the data generated, thereby creating an additional cognitive burden when they use EPM systems.
Additional organizational efforts should be directed at interpretation of performance data (see also,
Kulik & Ambrose, 1993).
To avoid information overload, organizational initiatives could focus on developing a key set of metrics
combining different dimensions drawn from EPM data to create performance dashboards, or scorecards,
for ease of data interpretation. Supervisory training in ensuring consistent data interpretation is also
important from the perspective of ensuring equitable outcomes for CSRs. For this purpose, supervisory
training could also encompass areas such as improving decision-making and coaching skills (see Liu &
Batt, 2010). Finally, given the performance-driven culture in call center environments and economic
pressures to reduce costs without compromising service quality, specific feedback will also be helpful for
goal-setting (Locke & Latham, 1984) and achieving organizational performance objectives. Thus, another
area for supervisory training would be interpreting and communicating feedback on employee
performance.
In conclusion, findings from two field studies provide evidence that EPM functions as an “invisible eye”
in aligning intraorganizational interests and facilitating performance. Results indicate that the use of EPM
systems is associated with performance benefits for organizations, specifically for increasing employees’
task performance and OCBs.
References
Aiello JR, Kolb KJ. (1995). Electronic performance monitoring and social context: Impact on
productivity and stress. Journal of Applied Psychology, 80, 339–353.
Aiello JR, Svec CM. (1993). Computer monitoring of work performance: Extending the social facilitation
framework to electronic presence. Journal of Applied Social Psychology, 23, 537–548.
Alder GS, Ambrose ML. (2005). An examination of the effect of computerized performance monitoring
feedback on monitoring fairness, performance, and satisfaction. Organizational Behavior and Human
Decision Processes, 97, 161–177.
Alge B, Ballinger GA, Green SG. (2004). Remote control: Predictors of electronic monitoring intensity
and secrecy. Personnel Psychology, 57, 377–410.
American Management Association. (2005). 2005 Electronic monitoring and surveillance survey.
Retrieved from http://www.amanet.org/research/index.htm.
Antonakis J, Bendahan S, Jacquart P, Lalive R. (2010). On making causal claims: A review and
recommendations. The Leadership Quarterly, 21, 1086–1120.
Bates RA, Holton EF. (1995). Computerized performance monitoring: A review of research issues.
Human Resource Management Review, 5, 267–288.
Batt R, Moynihan L. (2002). The viability of call center production models. Human Resource
Management Journal, 12, 150–154.
Baum CF. (2006). An introduction to modern econometrics using Stata. College Station, TX: Stata Press.
22
Baumeister RF. (1982). A self presentational view of social phenomena. Psychological Bulletin, 91, 3–26.
Bennett RJ, Robinson SL. (2000). Development of a measure of workplace deviance. Journal of Applied
Psychology, 85, 349–360.
Bolino MC. (1999). Citizenship and impression management: Good soldiers or good actors? Academy of
Management Review, 24, 82–98.
Bolino MC, Turnley WH. (2003). Going the extra mile: Cultivating and managing employee citizenship
behavior. Academy of Management Executive, 17, 60–70.
Bound J, Jaeger DA, Baker R. (1995). Problems with instrumental variables estimation when the
correlation between the instruments and the endogeneous explanatory variable is weak. Journal of the
American Statistical Association, 90, 443–450.
Brewer N, Ridgway T. (1998). Effects of supervisory monitoring on productivity and quality of
performance. Journal of Experimental Psychology: Applied, 4, 211–227.
Burnham K, Anderson D. (2002). Model selection and multi-model inference. New York, NY: Springer-
Verlag.
Campbell JP. (1990). Modeling the performance prediction problem in industrial and organizational
psychology. In Dunnette MD, Hough LM (Eds.), Handbook of industrial and organizational psychology
(Vol. 1, 2nd ed., pp. 687–732). Palo Alto, CA: Consulting Psychologists Press.
Campbell JP. (1999). The definition and measurement of performance in the New Age. In Ilgen DR,
Pulakos ED (Eds.), The changing nature of performance: Implications for staffing, motivation, and
development (pp. 399–429). San Francisco, CA: Jossey-Bass.
Carlin JB, Galati JC, Royston P. (2008). A new framework for managing and analyzing multiply imputed
data in Stata. Stata Journal, 8, 49–67.
Cavanaugh J. (2005). The application of model selection criteria. Iowa City, IA: Department of
Biostatistics, College of Public Health, University of Iowa.
Chalykoff J, Kochan TA. (1989). Computer-aided monitoring: Its influence on employee job satisfaction
and turnover. Personnel Psychology, 42, 807–834.
Combs JG. (2010). Big samples and small effects: Let's not trade relevance and rigor for power (From the
Editors). Academy of Management Journal, 53, 9–13.
Cottrell NB. (1972). Social facilitation. In McClintock CG (Ed.), Experimental social psychology (pp.
185–236). New York, NY: Holt.
Crosby P. (1980). Quality is free: The art of making quality certain. New York, NY: Mentor.
Dalal RS. (2005). A meta-analysis of the relationship between organizational citizenship behavior and
counterproductive work behavior. Journal of Applied Psychology, 90, 1241–1255.
Davidson R, Henderson R. (2000). Electronic performance monitoring: A laboratory investigation of the
influence of monitoring and difficulty on task performance, mood state, and self-reported stress levels.
Journal of Applied Social Psychology, 30, 906–920.
Davis FD. (1989). Perceived usefulness, perceived ease of use, and user acceptance of information
technology. MIS Quarterly, 13, 319–340.
23
Davis FD, Bagozzi RP, Warshaw PR. (1989). User acceptance of computer technology: A comparison of
two theoretical models. Management Science, 35, 982–1003.
Dean JW, Snell SA. (1991). Integrated manufacturing and job design: Moderating effects of
organizational inertia. Academy of Management Journal, 34, 776–804.
Deci EL, Connell JP, Ryan RM. (1989). Self-determination in a work organization. Journal of Applied
Psychology, 74, 580–590.
Deckop JR, Mangel R, Cirka CC. (1999). Getting more than you pay for: Organizational citizenship
behavior and pay-for-performance plans. Academy of Management Journal, 42, 420–428.
Eisenhardt KM. (1985). Control: Organizational and economic approaches. Management Science, 31,
134–149.
Eisenhardt KM. (1989). Agency theory: An assessment and review. Academy of Management Review,
14, 57–74.
Ellis PD. (2010). The essential guide to effect sizes. New York, NY: Cambridge University Press.
Fama E. (1980). Agency problems and the theory of the firm. Journal of Political Economy, 88, 288–307.
Fayol H. (1916). General principles of management. In Shafritz JM, Ott JS (Eds.), Classics of
organization theory (4th ed., pp. 52–65). Orlando, FL: Harcourt Brace.
Feldman JM. (1981). Beyond attribution theory: Cognitive processes in performance appraisal. Journal of
Applied Psychology, 66, 127–148.
George JF. (1996). Computer-based monitoring: Common perceptions and empirical results. MIS
Quarterly, 20, 459–480.
Glomb TM, Liao H. (2003). Interpersonal aggression in work groups: Social influence, reciprocal, and
individual effects. Academy of Management Journal, 46, 486–496.
Goffman E. (1959). The presentation of self in everyday life. New York, NY: Doubleday-Anchor.
Grant RA, Higgins CA. (1989). Monitoring service workers: The effect on employees, productivity, and
service. National Productivity Review, 8, 101–112.
Grant RA, Higgins CA, Irving RH. (1988). Computerized performance monitors: Are they costing you
customers? Sloan Management Review, 29, 39–45.
Griffith TL. (1993). Monitoring and performance: A comparison of computer and supervisor monitoring.
Journal of Applied Social Psychology, 23, 549–572.
Gruys ML, Sackett PL. (2003). Investigating the dimensionality of counterproductive work behavior.
International Journal of Selection and Assessment, 11, 30–42.
Gujarati DN. (2003). Basic econometrics. Madison, WI: McGraw-Hill.
Hesketh B, Neal A. (1999). Technology and performance. In Ilgen DR, Pulakos ED (Eds.), The changing
nature of performance: Implications for staffing, motivation, and development (pp. 21–55). San
Francisco, CA: Jossey-Bass.
Hoffman BJ, Blair CA, Meriac JP, Woehr DJ. (2007). Expanding the criterion domain? A quantitative
review of the OCB literature. Journal of Applied Psychology, 92, 555–566.
24
Holman D, Chissick C, Totterdell P. (2002). The effects of performance monitoring on emotional labor
and well-being in call centers. Motivation and Emotion, 26, 57–81.
Hox JJ. (2010). Multilevel analysis (2nd ed.). New York, NY: Routledge.
Hulin CL. (1991). Withdrawal, persistence, and commitment in organizations. In Dunnette MD, Hough
LM (Eds.), Handbook of industrial and organizational psychology (Vol. 2, 2nd ed., pp. 445–505). Palo
Alto, CA: Consulting Psychologists Press.
ICMI. (2005). ICMI call center monitoring Study III final report. Annapolis, MD: Call Center Press.
Ilgen DR, Fisher CD, Taylor MS. (1979). Consequences of individual feedback on behavior in
organization. Journal of Applied Psychology, 64, 349–371.
Ilgen DR, Pulakos ED. (1999). Introduction: Employee performance in today's organization. In Ilgen DR,
Pulakos ED (Eds.), The changing nature of performance: Implications for staffing, motivation, and
development (pp. 1–18). San Francisco, CA: Jossey-Bass.
Irving RH, Higgins CA, Safayeni FR. (1986). Computerized performance monitoring systems: Use and
abuse. Communications of the ACM, 29, 801–994.
Jensen MC, Meckling WH. (1976). Theory of the firm: Managerial behavior, agency costs, and
ownership structure. Journal of Financial Economics, 3, 305–360.
Johns G. (2006). The essential impact of context on organizational behavior. Academy of Management
Review, 31, 386–408.
Juran JM. (1974). The quality control handbook (3rd ed.). New York, NY: McGraw-Hill.
Kamdar D, McAllister DJ, Turban DB. (2006). All in a day's work: How follower individual differences
and justice perceptions predict OCB role definitions and behavior. Journal of Applied Psychology, 91,
841–855.
Kim J. (2009). Multilevel analysis: An overview and some contemporary issues. In Millsap RE, Maydeu-
Olivares A. (Eds.), The Sage handbook of quantitative methods in psychology (pp. 337–361). Thousand
Oaks, CA: Sage.
Kolb KJ, Aiello JR. (1997). Computer-based performance monitoring and productivity in a multiple task
environment. Journal of Business and Psychology, 12, 189–204.
Komaki JL. (1986). Toward effective supervision: An operant analysis and comparison of managers at
work. Journal of Applied Psychology, 71, 270–279.
Kulik CT, Ambrose ML. (1993). Category-based and feature-based processes in performance appraisal:
Integrating visual and computerized sources of performance data. Journal of Applied Psychology, 78,
821–830.
Landy FJ, Farr J. (1980). Performance rating. Psychological Bulletin, 87, 72–107.
Larson JR, Callahan C. (1990). Performance monitoring: How it affects productivity. Journal of Applied
Psychology, 75, 530–548.
LePine JA, Erez A, Johnson DE. (2002). The nature and dimensionality of organizational citizenship
behavior: A critical review and meta-analysis. Journal of Applied Psychology, 87, 52–65.
Liu X, Batt R. (2010). How supervisors influence performance: A multilevel study of coaching and group
management in technology-mediated services. Personnel Psychology, 63, 265–298.
25
Locke EA, Latham GP. (1984). Goal setting: A motivational technique that works! New York, NY:
Prentice Hall.
Lund J. (1992). Electronic performance monitoring: A review of research issues. Applied Ergonomics,
23, 54–58.
Mayer RC, Davis JH. (1999). The effect of the performance appraisal system on trust for management: A
field quasi-experiment. Journal of Applied Psychology, 84, 123–136.
Mayer RC, Davis JH, Schoorman D. (1995). An integrative model of organizational trust. Academy of
Management Review, 20, 709–734.
Mellers BA, Schwartz A, Cooke ADJ. (1998). Judgment and decision making. Annual Review of
Psychology, 49, 447–477.
Meyer RD, Dalal RS, Hermida R. (2010). A review and synthesis of situational strength in the
organizational sciences. Journal of Management, 36, 121–140.
Milgrom P, Roberts J. (1992). Economics, organization and management. Upper Saddle River, NJ:
Prentice-Hall.
Morrison EW. (1994). Role definitions and organizational citizenship behavior: The importance of the
employee's perspective. Academy of Management Journal, 37, 1543–1567.
Morrison EW. (1996). Organizational citizenship behavior as a critical link between HRM practices and
service quality. Human Resource Management, 35, 493–512.
Motowidlo SJ. (2000). Some basic issues related to contextual performance and organizational citizenship
behavior in human resource management. Human Resource Management Review, 10, 115–126.
National Workrights Institute. (2004). Privacy under siege: Electronic monitoring in the workplace.
Report retrieved from http://www.workrights.org/issue_electronic/NWI_EM_Report.pdf.
Nebeker DM, Tatum BC. (1993). The effects of computer monitoring, standards, and rewards on work
performance, job satisfaction and stress. Journal of Applied Social Psychology, 23, 508–536.
Newman DA. (2009). Missing data techniques and low response rates: The role of systematic
nonresponse parameters. In Lance CE, Vandenberg RJ (Eds.), Statistical and methodological myths and
urban legends (pp. 7–36). New York, NY: Routledge.
Niehoff BP, Moorman RH. (1993). Justice as a mediator of the relationship between methods of
monitoring and organizational citizenship behavior. Academy of Management Journal, 36, 527–556.
O'Boyle EH, Jr., Forsyth DR, Banks GC, McDaniel MA. (2012). A meta-analysis of the Dark Triad and
work behavior: A social exchange perspective. Journal of Applied Psychology, 97, 557–579.
Ones DS. (2002). Introduction to the special issue on counterproductive behaviors at work. International
Journal of Selection and Assessment, 10, 1–4.
Organ DW. (1997). Organizational citizenship behavior: It's construct clean-up time. Human
Performance, 10, 85–97.
Ployhart RE, Hakel MD. (1998). The substantive nature of performance variability: Predicting
interindividual differences in intraindividual performance. Personnel Psychology, 51, 859–901.
26
Podsakoff PM, MacKenzie SB, Lee J, Podsakoff NP. (2003). Common method biases in behavioral
research: A critical review of the literature and recommended remedies. Journal of Applied Psychology,
88, 879–903.
Podsakoff PM, MacKenzie SB, Moorman RH, Fetter R. (1990). Transformational leader behaviors and
their effects on followers’ trust in leader, satisfaction, and organizational citizenship behaviors.
Leadership Quarterly, 1, 107–142.
Raudenbush SW, Bryk AS. (2002). Hierarchical linear models (2nd ed.) Thousand Oaks, CA: Sage.
Robinson SL, Bennett RJ. (1995). A typology of deviant workplace behaviors: A multidimensional
scaling study. Academy of Management Journal, 38, 555–572.
Rogers WH. (1993). Regression standard errors in clustered samples. Stata Technical Bulletin, 1, 19–23.
Rotundo M, Sackett PR. (2002). The relative importance of task, citizenship, and counterproductive
performance to global ratings of job performance: A policy-capturing approach. Journal of Applied
Psychology, 87, 66–80.
Sackett PL. (2002). The structure of counterproductive work behaviors: Dimensionality and relationships
with facets of job performance. International Journal of Selection and Assessment, 10, 5–11.
Salancik GR, Pfeffer J. (1978). A social information processing approach to job attitudes and task design.
Administrative Science Quarterly, 23, 224–253.
Schmitt N, Bedeian AG. (1982). A comparison of LISREL and two-stage least squares analysis of a
hypothesized life job satisfaction reciprocal relationship. Journal of Applied Psychology, 67, 806–817.
Simon HA. (1946). The proverbs of administration. In Shafritz JM, Ott JS (Eds.), Classics of organization
theory (4th ed., pp. 112–126). Orlando, FL: Harcourt Brace.
Smith A. (1776/2003). An inquiry into the nature and causes of the wealth of nations. New York, NY:
Bantam.
Staiger D, Stock JH. (1997). Instrumental variables regression with weak instruments. Econometrica, 65,
557–586.
Stanton JM. (2000). Reactions to employee performance monitoring: Framework, review, and research
directions. Human Performance, 13, 85–113.
Stanton JM, Barnes-Farrell JL. (1996). Effects of electronic performance monitoring on personal control,
task satisfaction, and task performance. Journal of Applied Psychology, 81, 738–745.
Surprenant CF, Solomon MR. (1987). Predictability and personalization in the service encounter. Journal
of Marketing, 51, 86–96.
Tepper BJ, Lockhart D, Hoobler J. (2001). Justice, citizenship, and role definition effects. Journal of
Applied Psychology, 86, 789–796.
US Congress, Office of Technology Assessment. (1987). The electronic supervisor: New technology new
tensions (OTA-CIT-333). Washington, DC: US Government Printing Office.
Venkatesh V. (2000). Determinants of perceived ease of use: Integrating control, intrinsic motivation, and
emotion into the technology acceptance model. Information Systems Research, 11, 342–365.
Wallace CM, Eagleson G, Waldresee R. (2000). The sacrificial HR strategy in call centers. International
Journal of Service Industry Management, 11, 174–184.
27
Welbourne TM, Johnson DE, Erez A. (1998). The role-based performance scale: Validity analysis of a
theory-based measure. Academy of Management Journal, 41, 540–555.
Wilk SL, Moynihan LM. (2005). Display rule “regulators”: The relationship between supervisor and
worker emotional exhaustion. Journal of Applied Psychology, 90, 917–927.
Wooldridge JM. (2002). Econometric analysis of cross section and panel data. Cambridge, MA: The MIT
Press.
Zajonc RB. (1965). Social facilitation. Science, 149, 269–274.
Zhou J. (2003). When the presence of creative coworkers is related to creativity: Role of supervisor close
monitoring, developmental feedback, and creative personality. Journal of Applied Psychology, 88, 413–
422.
Zweig D, Scott K. (2007). When unfairness matters most: Supervisory violations of electronic monitoring
practices. Human Resource Management Journal, 17, 227–247.