the inverting pyramid:pension systems facing demographic challenges in europe and central asia
TRANSCRIPT


THE INVERTING PYRAMID


THE INVERTING PYRAMID Pension Systems Facing Demographic Challenges
in Europe and Central Asia
Anita M. Schwarz
Omar S. Arias
Asta Zviniene
Heinz P. Rudolph
Sebastian Eckardt
Johannes Koettl
Herwig Immervoll
Miglena Abels

© 2014 International Bank for Reconstruction and Development / The World Bank1818 H Street NW, Washington DC 20433Telephone: 202-473-1000; Internet: www.worldbank.org
Some rights reserved
1 2 3 4 17 16 15 14
This work is a product of the staff of The World Bank with external contributions. Note that The World Bank does not necessarily own each component of the content included in the work. The World Bank therefore does not warrant that the use of the content contained in the work will not infringe on the rights of third parties. The risk of claims resulting from such infringement rests solely with you.
The findings, interpretations, and conclusions expressed in this work do not necessarily reflect the views of The World Bank, its Board of Executive Directors, or the governments they represent. The World Bank does not guarantee the accuracy of the data included in this work. The boundaries, colors, denom-inations, and other information shown on any map in this work do not imply any judgment on the part of The World Bank concerning the legal status of any territory or the endorsement or acceptance of such boundaries.
Nothing herein shall constitute or be considered to be a limitation upon or waiver of the privileges and immunities of The World Bank, all of which are specifically reserved.
Rights and Permissions
This work is available under the Creative Commons Attribution 3.0 Unported license (CC BY 3.0) http://creativecommons.org/licenses/by/3.0. Under the Creative Commons Attribution license, you are free to copy, distribute, transmit, and adapt this work, including for commercial purposes, under the following conditions:
Attribution—Please cite the work as follows: Schwarz, Anita M., Omar S. Arias. 2014. The Inverting Pyramid: Pension Systems Facing Demographic Challenges in Europe and Central Asia. DOI: 10.1596/978-0-8213-9908-8. Washington, DC: World Bank. License: Creative Commons Attribution CC BY 3.0
Translations—If you create a translation of this work, please add the following disclaimer along with the attribution: This translation was not created by The World Bank and should not be considered an official World Bank translation. The World Bank shall not be liable for any content or error in this translation.
All queries on rights and licenses should be addressed to the Office of the Publisher, The World Bank, 1818 H Street NW, Washington, DC 20433, USA; fax: 202-522-2625; e-mail: [email protected].
ISBN (paper): 978-0-8213-9908-8
ISBN (electronic): 978-0-8213-9909-5
DOI: 10.1596/978-0-8213-9908-8
Cover design: Naylor Design, Inc.:
Library of Congress Cataloging-in-Publication Data has been requested.

Contents
Foreword xviiAcknowledgments xxi
Executive Summary 1
1. The Inverting Pyramid 5
Five Country Clusters 8Organization of the Report 11
2. The Evolution of Public Pension Programs 13
Introduction 13Beginnings of Pension Systems in Western Europe 15From Limited “Insurance” to Generous
“Savings” Schemes 17Outcomes of Pension Program Introduction in
Western Europe 27Choices Made by Other Countries of the Region 31The Inverting Pyramid: Structural Break in
the PAYG Financing Model 41Policy Conclusions 53Notes 56References 57 v

vi Contents
3. Have the Pension Reforms to Date Been Enough? 61
Introduction 61The Need for Parametric Reforms 63Parametric Reform Options 66Effects of the Reforms on Fiscal Sustainability and
Policy Space for More Reforms 79Impact of Benefit Adequacy on Social
Sustainability of Pension Reforms 92Influence of Economic and Political Cycles on
Pension Reforms 104Policy Conclusions 108Annex 3A The Polish Experience with
Curbing Early Retirement 109Notes 112References 112
4. The Role of Savings in the Provision of Retirement Income 115
Introduction 115Modalities of Retirement Savings 118The Experience with Funded Pension Schemes 133Lessons from Experiences with Funded
Pension Schemes 140Notes 152References 154
5. Financing Pensions in Europe and Central Asia 157
Introduction 157The Current Financing of Pension Systems in
Europe and Central Asia 158Finding Alternative Sources of Pension Financing 170Policy Options 183Notes 185References 187
6. Working More, Longer, and More Productively 191
Introduction 191Labor Force Challenges: Low Participation,
High Unemployment, and Informality 193Myths and Misperceptions about Older Workers 206Policy Measures to Remove Impediments and
Encourage Employment of Older Workers 211How Much Can Reforms Help? 226

Contents vii
Conclusions 236Annex 6A Myths, Misperceptions, and Facts
about Older Workers 238Annex 6B Modeling Direct and Feedback
Effects of Reforms on Pension and Labor Market Outcomes 245
Notes 246References 248
7. Lessons from Two Decades of Pension Reform and Policy Solutions for the Future 253
Introduction 253What Have We Learned from Reforms of
the First Pillar? 253What Have We Learned from Experience
with Second-Pillar Systems? 258Demographic Challenges Facing Countries
of the Region 261Expanding the Labor Force 263Rethinking the Pension System and
Prioritizing Spending 268References 276
Boxes
2.1 World Bank Definitions of PensionPillars and Characteristics of Different Pension Systems 35
3.1 Parameters of a Traditional Pension System 665.1 The Inverting Pyramid and Economic Growth 1695.2 Tax Shifting in European Countries 1766.1 Adapting the Workplace for an Aging
Workforce: BMW’s “2017 Assembly Line” 221
Figures
1.1 Population and Pension System Dynamics inEurope and Central Asia 7
1.2 Pension Benefit Generosity and Working-Age Population Growth in Europe and Central Asia 9
2.1 Increase in the Proportion of the Labor Force with Pension Scheme Coverage in Selected European Economies with Contributory Pension Schemes, 1900–1975 19

viii Contents
2.2 Population Growth in the Twentieth Century in Selected European Economies 20
2.3 Labor Force Growth in the Twentieth Century in Selected European Economies 21
2.4 Growth of Active Contributors in Selected European Economies with Contributory Pension Schemes, 1900–2005 22
2.5 Comparison of Growth in Pensions, Wages, and Prices in Selected EuropeanEconomies, 1965–1979 23
2.6 Growth in Average Pension Comparedto Average Wage in the Netherlandsand Hungary, 1950–1990 24
2.7 Change in Effective Retirement Ages in Selected European Economies, 1970–2010 26
2.8 Changes in Retirement Age and Impact onDuration of Retirement in Belgium, Spain, and Sweden, 1970–2009 27
2.9 Pension Spending as a Percentage of GDP in Selected European Economies, 1954–2004 28
2.10 Gap between Elderly Poverty and Poverty in the General Population, Selected European Economies, 1987 and 2004 29
2.11 Link between Pre-Retirement Earnings and Benefit Entitlements as Reflected in PensionSystem Design in Selected European Countries 30
2.12 Link between Pre-Retirement Earnings and Benefit Entitlements as Reflected in Pension System Design in CentralEurope and the Balkans 40
2.13 Link between Pre-Retirement Earnings and Benefit Entitlements as Reflected in PensionSystem Design in the Former Soviet Union Countries and Turkey 40
2.14 Extension of Coverage and Its Impact on Pension Systems in Europe and Central Asia, 1900s through 2050 42
2.15 Increasing Pension Contribution Rates in Response to Expanding Expenditures in Selected European Economies, 1940–2012 43
2.16 Working-Age Population from 1950 to 2050 Relative to 2013, Selected European and Central Asian Economies 45

Contents ix
2.17 Change in Working-Age Population inSelected European and Central Asian Economies, 1970–2010 and 2010–2050 48
2.18 Number of Children under Age 5 Compared to 1990, Europe and Central Asia 49
2.19 Births in Poland in 1990–2011 and Projected Future Births through 2026 50
2.20 Decomposition of Average Annual Change in Working-Age Population in Selected European and Central Asian Economies, 2000–2010 51
2.21 Percentage of Elderly in the Population in Selected European and Central Asian Economies, 2010 and 2050 52
2.22 Old-Age Dependency Ratios in SelectedEuropean and Central Asian Economies,1970, 2010, and 2050 54
2.23 Projected Pension Deficits in an AverageCentral European Economy, 2007–2077 54
3.1 Implicit Pension Liabilities and Explicit Debt as a Percentage of GDP in SelectedEuropean Economies, 2006 and 2011 64
3.2 Parametric Pension Reforms in Europe and Central Asia, 1995–2010 65
3.3 Average Legislated Retirement Ages for Men and Women in Europe andCentral Asia, 2013 68
3.4 Proportion of Pension Spending on Old Age, Disability, and Survivors in Selected Europeanand Central Asian Economies, 2010 71
3.5 Eligibility Restrictions for SurvivorBenefits in Pension Systems of Europeand Central Asia, 2012–2013 72
3.6 Average Pension Contribution Rates inEurope and Central Asia, 2013 76
3.7 Change in Effective Retirement AgeCompared to Change in Life Expectancy,Selected European Economies, 2001–2009 80
3.8 Duration of Retirement in Selected European and Central Asian Economies, 2009 81
3.9 Percentage of Old-Age Pension Beneficiariesbelow Age 65 in Selected European and Central Asian Economies 82

x Contents
3.10 Pension Spending per Elderly Person Compared to GDP per Capita, Selected European and Central Asian Economies, 2009 83
3.11 Pension Spending per Beneficiary Comparedto GDP per Capita, Selected European andCentral Asian Economies, 2009 84
3.12 Growth in Pension Spending per Elderly Person Compared to Growth in GDP per Capita, Selected European and Central AsianEconomies, 2001–2009 85
3.13 Change in Pension Spending in 2009Relative to Spending Levels in 2001, SelectedEuropean and Central Asian Economies 86
3.14 Growth in Number of Disability Beneficiaries in Bulgaria, 2000–2011 88
3.15 Decline in Number of Disability Beneficiaries in Poland, 2000–2010 89
3.16 Current and Projected Pension Spending as a Percentage of GDP in Selected European and Central Asian Economies, 2010 and 2060 90
3.17 Decline in Projected Pension Benefit as a Percentage of Average Wage in Polandand Serbia, 2007–2072 91
3.18 Living Arrangements of Elderly in SelectedEuropean and Central Asian Economies, by Gender and Rural/Urban Residence 93
3.19 Percentage of Households, with and without Pensioners, in Poverty in Selected European and Central Asian Economies, 2009 95
3.20 Rate of Severe Material Deprivation amongDifferent Age Cohorts in European Union Member States, 2011 96
3.21 Reduction in Poverty across All Householdswith and without Pensioners, SelectedEuropean and Central Asian Economies,2001–2010 97
3.22 Comparison of per Capita Consumptionby Households with and withoutPensioners, Selected European and Central Asian Economies 98
3.23 Average Pension Benefit Relative to Average Wage, Selected European and Central AsianEconomies, 2009 99

Contents xi
3.24 Hypothetical Wage Replacement Rates for Individuals Earning the Average Wage and Beginning Work in 2010 in the PensionSystems of Selected European and CentralAsian Economies 100
3.25 Hypothetical Wage Replacement Rates for Individuals Earning Half the Average Wageand Beginning Work in 2010 in the Pension Systems of Selected European and CentralAsian Economies 101
3.26 Percentage of Elderly Receiving Social Insurance Benefits in Selected European and Central Asian Economies,2010 and 2050 103
3A.1 Early Retirement Rate andEmployment Rate of Older Workers in Poland, 1997–2012 111
3A.2 New Old-Age Pensioners and AverageActual Retirement Age for Men andWomen in Poland, 1999–2011 111
4.1 Gross National Savings Rates as a Percentageof GDP in Selected European Economies, 2000–2012 117
4.2 Public Pension Reserve Funds in Selected European Economies: Asset Allocation as a Percentage of Total Assets, 2011 120
4.3 Private Pension Assets as a Percentage of GDP in Selected European and Central Asian Economies, 2011 122
4.4 Voluntary Pension Savings as a Percentage of GDP in Selected European and CentralAsian Economies, 2012 123
4.5 Voluntary and Mandatory Pension Savings as a Percentage of GDP in Selected European and Central Asian Economies, 2012 124
4.6 Voluntary and Mandatory Pension Savingsin Hungary, 2002–2012 125
4.7 Coverage of Funded Pension Schemes in Selected Economies, 2010 126
4.8 Annual Real Returns of Mandatory FundedPension Schemes in Selected European andCentral Asian Economies, 2002–2012 136

xii Contents
4.9 Government Securities and Bank Deposits in Second-Pillar Portfolios of Pension Funds,Selected European and Central Asian Economies, 2012 138
4.10 Asset Allocation of Mandatory Funded Pension Systems in Selected European and Central Asian Economies, 2012 138
4.11 Fees Charged by Pension Fund Management Companies in Mandatory Funded Systems,Selected European and Central Asian Countries, 2006 and 2011 139
4.12 Fiscal Balance of Hungary, 2001–2010 1424.13 Fiscal Balance of Poland, 2001–2010 1425.1 Statutory Social Security Contribution Rates
in Selected European and Central Asian Economies, 2011 159
5.2 Distributional Features of Social Security Contribution Systems in Selected EuropeanEconomies, 2011 161
5.3 Effective Social Security Contribution Rates in Germany, the Czech Republic, and Bulgaria, 2010 162
5.4 Social Security Contribution Revenue as a Percentage of GDP in Selected European Economies, 1970–2010 163
5.5 Revenue Yield of Social SecurityContributions as a Percentage of GDP, Selected European and Central Asian Economies, 2011 163
5.6 Social Security Contribution Rates andRevenue Yield, Selected European andCentral Asian Economies, 2011 164
5.7 Relationship Between Informality andRevenue Productivity of Social SecuritySystems, Selected European and Central Asian Countries, 2011 165
5.8 Social Protection Spending in Relation to Social Security Contribution Revenue, Selected European and Central Asian Economies, 2011 166
5.9 Contribution of Labor Taxes to Gross Labor Costs in Selected European and CentralAsian Economies, 2011 167

Contents xiii
5.10 Labor Tax Wedge in Relation to SocialProtection Spending, Europe and Central Asia, 2011 167
5.11 Labor Tax Wedge in Relation to Old-AgeDependency Ratio, Europe and Central Asia, 2011 168
5.12 Growth of the Working-Age Population,2010–2050, in Selected European and Central Asian Economies 170
5.13 Tax Burden as a Percentage of GDP in Selected European and Central Asian Countries, 2011 171
5.14 Composition of Government Revenue inSelected European and Central Asian Economies, 2011 172
5.15 VAT Payments as a Percentage of Disposable Household Income in Five EuropeanCountries, 2013 178
5.16 Simulation of Long-Term Fiscal Impact ofIncreases in Social Security Contributions (SSC) and VAT Tax, Poland and theSlovak Republic, 2010 and 2050 179
5.17 Property Tax Yield as a Percentage of GDP in Selected European and Central Asian Economies, 2010 180
5.18 Components of Public Spending as aPercentage of GDP in Selected European and Central Asian Countries, 2011 182
6.1 Employment Rates by Gender and AgeGroup, Selected European and CentralAsian Economies with OECD Comparators, 2011 195
6.2 Employment Status over the Life Cycle inCountries of Europe and Central Asia, by Gender, circa 2009 196
6.3 Potential Labor Force Gain in the Population Aged 45–64, by Age Group, in Selected European and Central Asian Economies 198
6.4 Projected Change in the Labor Force in Europe and Central Asia, by Age Group andPeriod, 2010s through 2050s 199

xiv Contents
6.5 Projected Change in the Labor Force in Europe and Central Asia, by CountryCluster, Age Group, and Decade, 2010s through 2050s 201
6.6 Projected Change in the Labor Force in Europe and Central Asia under DifferentScenarios, by Age Group, 2010–2050 202
6.7 Projected Change in the Labor Force in Europe and Central Asia under DifferentScenarios, by Country Cluster and Age Group, 2010–2050 204
6.8 Why Older Workers Stop Working: Perceptions in the European Union, 2011 207
6.9 Opportunity Costs of Formal Work asMeasured by the Formalization Tax Rate inBulgaria, Romania, Australia, and theUnited States, 2008 214
6.10 Work Disincentives (Formalization TaxRate and Marginal Effective Tax Rate) for Low-Wage Earners across Age Groups,Selected European Economies, 2008 215
6.11 Change in Pension Deficit as a Result ofPolicy-Induced Reductions in Informal Employment in the Slovak Republic, 2011–2061 232
6B.1 Modeling Labor Market Feedbacks in Pension Reforms 246
7.1 Projected Labor Force in 2050 Compared to Actual Labor Force in 2010, SelectedEuropean and Central Asian Economies 262
7.2 Projected Labor Force in 2050 with Higher Participation at Older Ages Compared to Actual Labor Force in 2010, SelectedEuropean and Central Asian Economies 264
7.3 Effective Retirement Ages with LifeExpectancy of 15 Years in 2050 Compared to Effective Retirement Age in 2010, SelectedEuropean and Central Asian Economies 265
7.4 Percentage of People Aged 65–74 Reporting Difficulty with One of the Activities of DailyLiving in Denmark, Finland, and Sweden, 1980s and 2000s 266

Contents xv
7.5 Percentage of People over Age 65 in the Labor Force in Various World Regions, 2010 267
7.6 Example of the Cost of Financing Pension Priorities in 2050 with an Effective Retirement Age of 65, Selected Europeanand Central Asian Economies 269
7.7 Cost of Pension Priorities in 2050 with Retirement Ages Where Life ExpectancyEquals 15 Years, Selected European and Central Asian Economies 274
Tables
2.1 Pension System Designs and Componentsin Selected European and Central AsianEconomies 33
4.1 Pension Reserve Funds in SelectedEuropean Economies, 2011 119
4.2 Real Annual Rates of Return for Public Pension Funds in Selected EuropeanEconomies, 2008–2010 121
4.3 Structure of Pension Systems, Selected European and Central Asian Economies, 2008 135
4.4 Annual Real Returns of Mandatory Funded Pension Schemes, Selected European Economies, 2002–2012 137
4.5 Outcome of the Financial Crisis on Funded Defined Contributions to Pension Schemes, Selected European Economies,2008–2013 141
4.6 Real GDP Growth in Selected European andCentral Asian Economies, 2007–2012 145
5.1 VAT Systems and Performance across European and Central Asian Economies 175
5.2 Asset Accumulation in Four Oil-ExportingCountries 181
6.1 Policy Simulations of Pension, Labor,and Tax Reforms: Nine Scenarios 230


Foreword
The pension and old age security systems that originated in Europe in
the nineteenth and twentieth centuries have been effective in
sharply reducing poverty rates among the elderly throughout
Europe. However, in many countries of the Europe and Central Asia
(ECA) region, these systems now comprise the single largest expen-
diture item in the government budget. As these countries faced fiscal
consolidation in the aftermath of the transition, many of them
already substantially reformed their pension systems. Current demo-
graphic trends in the region, however, suggest that further reforms
will be needed.
This book presents the historical evolution of pension systems in
Europe, showing how policy makers were able to use the expanding
population pyramid, with large younger cohorts and small older
cohorts to expand the coverage and increase the generosity of pen-
sion systems. Levels of benefits were increased and the duration of
retirement increased over time, making pension systems more
expensive, with each generation receiving more generous benefits
than the generation before. This book focuses on the impact of the
break in this demographic evolution, whereby the prognosis for the
future population structure is likely to resemble a column or even an
inverting pyramid, with smaller cohorts of working age population xvii

xviii Foreword
expected to support larger cohorts of elderly retirees. This change in
the demographic structure calls into question the traditional financ-
ing mechanisms for old-age support, which relied on the labor taxes
on the working age population to finance benefits for the elderly.
The good news is that, despite the demographic challenges, ECA
countries do not have to roll back the progress they have made in
reducing poverty among the elderly. If the generosity of the pension
systems pension promise were rolled back only to where it was in the
1970s, when most of Europe had already achieved substantial pov-
erty reduction among the elderly, the pension systems would be fis-
cally sustainable. Going back to the promise of the 1970s would
involve adjusting the retirement age in line with rising longevity to
ensure that average life expectancy after retirement is 15 years,
thereby encouraging the elderly to spend their increased healthy
years in the labor force rather than in retirement. As the working age
population begins to shrink, keeping older workers in the labor force
will become important, not just for financing the pension system, but
also for maintaining overall economic growth.
Changes in pension policy will need to be accompanied by poli-
cies to increase labor market flexibility so as to encourage older
workers to remain in the work force. Such policies include incen-
tives for employers to provide lifelong learning and training spe-
cifically geared to older workers, and make workforce adaptations
which allow older workers to retain a high level of productivity. In
some countries, benefits will need to be streamlined to provide
workers with basic benefits that ensure that they do not fall into
poverty, but may not be sufficient to fully maintain the living
standard they enjoyed while working. Tax and social protection
systems need to encourage workers to save for a more generous
level of retirement benefits than can be provided by the public
system, if they desire more benefits in retirement. To that end,
governments can encourage the financial sector to provide rele-
vant savings instruments, while ensuring adequate transparency
and regulation so that individuals have the opportunity to under-
take additional savings without exposing themselves to unknown
risks. Governments may also need to re-examine the efficiency of
their revenue administration systems to help finance not just pen-
sions, but all other societal needs. This book goes into each of
these accompanying policies, but concludes that none of these by
itself can address the impact of the demographic challenges that
are underway. A combination of policies will be required to effec-
tively face the challenges.

Foreword xixd
The book concludes that the inverting population pyramid clearly
presents challenges to the provision of old age security, but consistent
policy choices to return the pension system to parameters similar to
those in the 1970s can result in sustainable systems of old age secu-
rity. But this means that governments need to communicate to the
population at large that the growth in generosity experienced in the
past 100 years will not be able to continue and will in fact need to be
rolled back somewhat. The Inverting Pyramid provides a wealth of sta-d
tistics and analysis that will enable a better understanding of the
changes that are needed and illustrates the possible trade-offs when
policy makers or voters consider who they want to protect through
their countries’ pension systems, how much, and when.
Laura Tuck
Vice President
Europe and Central Asia Region
The World Bank


Acknowledgments
This study was prepared by a multisectoral team co-led by Anita M.
Schwarz and Omar S. Arias and including Miglena Abels, Sebastian
Eckardt, Herwig Immervoll, Johannes Koettl, Heinz P. Rudolph, and
Asta Zviniene. The team is grateful for the guidance, support, and
technical inputs of Indermit Gill, Kathy Lindert, Andrew Mason,
and Ana Revenga. The work was carried out under the overall super-
vision of Philippe Le Houérou as Vice President of the Europe and
Central Asia Region of the World Bank. The team is also grateful for
the financing and support they received from the Social Protection
and Labor Practice at the World Bank.
Chapter authors are as follows. Chapter 1: Anita Schwarz, with
substantive contributions from Omar Arias, Asta Zviniene, Heinz
Rudolph, Sebastian Eckardt, and Miglena Abels; chapter 2: Asta
Zviniene and Anita Schwarz, with contributions from Miglena Abels
and Heinz Rudolph; chapter 3: Anita Schwarz and Asta Zviniene,
with contributions from Miglena Abels; chapter 4: Heinz Rudolph;
chapter 5: Sebastian Eckardt; chapter 6: Omar Arias, Johannes
Koettl, and Herwig Immervoll; chapter 7: Anita Schwarz, with con-
tributions from Asta Zviniene and Miglena Abels.
Thomas Davoine, Christian Keuschnigg, and Philip Schuster of the
Institute for Advanced Studies in Vienna prepared background xxi

xxii Acknowledgments
analysis on overlapping generations modeling under the supervision
of Omar Arias and Herwig Immervoll. Andrew Reilly and the pen-
sions team at the Organisation for Economic Co-operation and
Development applied the OECD’s Pensions at a Glance methodology
to the pension systems of transition countries of Europe and Central
Asia. The author team is also grateful to Otar Dzidzikashvili, Melis U.
Guven, Emily Sinnott, Oleksiy A. Sluchynskyy, Manami Suga, and
Victor Sulla for their substantive contributions to the development of
the report.
Cathy Sunshine edited the full final report, and Jennica Larrison
edited preliminary drafts. Marta Helena Reis de Assis, Anahit
Poghosyan, and Solange Van Veldhuizen provided invaluable logisti-
cal and administrative support.
The team is grateful for the insightful advice and recommenda-
tions received from members of the Advisory Board for the report:
Anna d’Addio (OECD), Axel Börsch-Supan (Germany), Agnieszka
Chłon-Dominczak (Poland), Mikhail Dmitriev (Russian Federation),
Per Eckefeldt (European Commission, DG ECFIN), Elsa Fornero
(Italy), Peter Holtzer (Hungary), Gordana Matkovic (Serbia), Insan
Tunali (Turkey), and Fritz von Nordheim (European Commission,
DG Employment). Peer reviewers were Gordon Betcherman, Robert
Palacios, Roberto Rocha, and Carlos Silva-Jáuregui. The authors also
acknowledge useful comments from Mamta Murthi, Martin Raiser,
and Michal Rutkowski of the World Bank, as well as from many
other colleagues at the concept review and subsequent stages.
Finally, the team received valuable comments and suggestions
from government officials who participated in country consultations
in Croatia and Georgia; participants in the Pensions Practice Seminar
series at the World Bank; staff at the International Monetary Fund;
and members of the Europe and Central Asia Regional Leadership
Team of the World Bank.
The findings, interpretations, and conclusions expressed in this
document are those of the authors and do not necessarily reflect the
views of the Executive Directors of the World Bank, the governments
they represent, or the counterparts consulted or engaged during the
study process.

Executive Summary
1
One of the greatest social achievements in Europe has been the rapid
reduction of old-age poverty. This took place in the context of both an
expanding pension system and an expanding population. Beginning
with the first pension systems in the late nineteenth century, an ever-
growing number of workers made contributions to finance the old-age
benefits of a relatively small number of pensioners. Both the popula-
tion and the pension system resembled a pyramid in shape, with a
large, youthful population at the base and a small number of elderly at
the peak. This arrangement made it possible to provide relatively gen-
erous benefits to qualifying elderly. Now, more than a hundred years
later, both pension system dynamics and overall demographics have
changed, and Europe’s pension systems face an uncertain future.
To begin with, pension systems are now mostly “mature,” with lit-
tle room to expand the number of contributors by drawing in larger
cohorts of new workers. Initially covering only a subset of formal
sector workers, pension systems gradually widened to embrace all
formal sector workers, as well as the self-employed, farmers, and
women. Few workers now remain outside the pension system in the
largest European countries.
Second, while population—and more importantly, working-age
population—expanded throughout the twentieth century, both

2 The Inverting Pyramid
overall population and working-age population are expected to
decline in Europe in the twenty-first century. At the same time, in
almost all countries in the region, people are living longer. These
changes have been magnified in the transition countries of Europe
and Central Asia, where labor force participation rates have dropped,
and sharp declines in fertility, along with increasing emigration, have
resulted in a rapidly declining labor force. In some countries with
especially low fertility and high outmigration, the population pyra-
mid has started to resemble an inverted pyramid, with younger
cohorts smaller than the cohorts preceding them for the first time.
These changes call into question the continuing feasibility of financ-
ing old-age support for a growing elderly population from taxes on
the wages of a shrinking number of wage earners.
Technical experts throughout Europe are well aware of the chal-
lenges ahead and have been busy devising mechanisms that will
automatically adjust benefits and retirement ages to the coming real-
ity. The transition countries, in particular, faced huge fiscal challenges
in the 1990s as they moved from centrally planned to market-based
economies. These countries undertook innovative pension reforms,
experimenting with variations on the traditional financing systems
while also allowing individuals to set aside part of their own wages as
future retirement savings for themselves. These reforms, had they
been allowed to unfold as originally envisaged, would have helped
pension systems face the upcoming demographic challenges.
The reforms were undertaken as countries attempted to recover
from the massive dislocations caused by the transformation of their
economies. During the transition, people expected to tighten their
belts, and they did. However, when the economies started to recover
and grow again, the expectations of the past returned. For a century,
every generation of elderly had received more generous benefits
than the previous generation of elderly, and once the transition
economies stabilized, people expected this pattern of increases to
resume. The population at large seemed unaware that the increased
benefits of the past had been made possible by a growing popula-
tion of workers, not by the generosity of benevolent politicians or by
a fair return on contributions. Nor was there widespread under-
standing of the sober implications of changing demography: not
only was increasing generosity no longer affordable, but a portion of
past increases might need to be given back. When people saw bene-
fit reductions going hand in hand with a growing economy, they
demanded rollbacks in the reductions. Politicians often complied,
throwing out the elegant designs that technical policymakers had
devised.

Executive Summary 3
This book was written not for the pension technician but to pro-
vide the average reader a convincing explanation of why the increas-
ing generosity of the past is no longer possible. No one expects
generosity to increase during a downturn, such as the one Europe
has experienced in recent years, but the past pattern of increases will
not be able to rebound even when Europe recovers. The structural
demographic shift, in which working-age populations are stagnant or
declining, makes future increases in generosity unaffordable.
But the message of the report is not all somber: countries have a
number of options. The concept of retirement age is key.
The history of pension systems shows an evolution of pension eli-
gibility, from the first German system, in which pensioners were
older than 70 and had limited work capacity, to today’s systems,
which allow people in good health to retire after only 30 years of
work, at ages as young as 55. As health and life expectancy have
improved, retirement ages have actually fallen. As a result, pension-
ers may end up collecting benefits for as long as they paid into the
system or even longer. At the same time, as noted, benefit levels have
risen. The earliest pensions were meant to supplement the lower
earnings that an individual with limited work capacity might earn,
but they rapidly expanded into something more, providing healthy
individuals an income almost commensurate to what they would
have received had they continued working.
As recently as the 1970s, when the grandparents of the baby boom
generation retired, retirement typically lasted about 15 years.
Benefits were modest and kept the elderly out of poverty, but they
did not provide elderly cohorts with higher incomes than working-
age cohorts. If countries could now raise retirement ages until life
expectancy at retirement is 15 years, as it was in the 1970s, most
could afford today’s benefit structure even with the future challeng-
ing demographics. Alternatively, countries could choose to reduce
benefits to a more basic level, comparable to what was provided in
the 1970s, but retain the right to retire at age 65. Or they could do
both, that is, raise the retirement age while reducing benefits, which
would mean less drastic changes on both counts. Encouraging immi-
gration could keep the labor force growing and mitigate some of the
changes needed, but immigrants will also get old and require pen-
sions. Immigration reforms can provide time to allow the economy to
adjust to a more basic level of old-age support, but they do not pre-
vent the need for adjustment unless a country envisages steadily
increasing the number of immigrants forever.
If the future problem is coming from the declining number of
wage earners relative to pensioners, might it be possible to

4 The Inverting Pyramid
supplement the financing of old age from wage taxes with other
sources of government revenue? While a few countries might be able
to find additional sources of revenue, in most European countries
revenue collection is already quite high, and the decline in the num-
ber of wage earners is likely to negatively affect other revenue
sources as well. One option might be to move away from labor taxes
and toward a broader-based consumption tax. But this would imply
restructuring the pension system away from a contribution-based
benefit system to a general-revenue financed system, which would
tend to provide more basic benefits to the elderly.
If workers are to spend more of their healthy lives working, rather
than retiring at some age that in the past was considered appropriate
for retirement, the labor market will need to accommodate older
workers. Attitudes will need to adapt, with both employers and
employees recognizing that older workers are not taking jobs from
younger workers but instead offer complementary skills. Simple and
relatively cheap physical modifications to the workplace can also
help make older workers more productive. And while older workers
might not appear to learn as quickly as younger workers, training
specifically aimed at their learning styles has been found to be quite
effective. A legal framework that provides more flexibility, allowing
older individuals to draw part of their pensions while working part-
time, can also encourage people to stay in the workforce.
As pension systems downsize, the role of personal savings for
retirement becomes even more important. Savings allow workers
more flexibility in choosing when they retire; they also allow work-
ers to spread their consumption across their lifetime as they wish,
choosing whether to consume more when young or when older.
Savings systems that encourage personal savings will be an integral
part of any pension system in the future.
The bottom line is that while the demographics look grim, it is
possible to retain benefits similar to those provided today if people
are willing to work as long as they stay healthy and rely on a pension
for only the last 15 years of life. Alternatively, a more basic benefit
might be provided earlier. Countries need to think about and choose
which path they wish to follow. But making these choices is not a
simple election-year decision. It must be a long-term strategy,
grounded in broad societal consensus, to be followed for decades into
the future. The authors hope that this volume will contribute to a
public dialogue that enables each society to safeguard its future pros-
perity by deciding how much old-age security it will provide, and
when, and to whom.

The Inverting Pyramid
CHAPTER 1
5
One of the spectacular achievements of European social policy in
the twentieth century has been a significant reduction in old-age
poverty. This has been achieved largely through the introduction
and development of pension systems, most often based on social
insurance policies, with social assistance programs often used to
protect those few elderly who do not have access to the pension
programs. Over time, however, these pension systems have become
one of the largest expenditure items in government budgets. And
these expenditures are set to rise even further as people live longer,
healthier lives.
The primary financing source for these pension systems has been
labor taxes, often labeled contributions, which are levied on the
wages of the employed working-age population. Projections suggest
that the working-age population will shrink in Europe over the next
few decades, calling into question the financing for the increasing
pension expenditures. Even general budget revenues will be
pressured as the labor force shrinks and the growth rate of govern-
ment commitments keeps pace or increases.
While the primary source of the pressure on pension systems is
the aging of the population and declining fertility rates, additional
pressure comes from the previous expansion of coverage within the

6 The Inverting Pyramid
pension system and the lack of opportunities for further coverage
expansion. In the historical evolution of a typical country, the age
structure starts out looking something like a pyramid, with few
elderly at the peak and large numbers of children at the base
(figure 1.1a). Within this population pyramid, as explained in
chapter 2, the pension system produces its own pyramid. Initially,
few elderly collect pensions, while only a part of the working-age
population contributes. As more and more working-age people join
the pension system over time, each generation of pensioners is fol-
lowed by a generation with higher coverage in the pension system.
As long as the pension system keeps expanding, the number of
pensioners remains lower than the number of contributors and the
pension pyramid remains a pyramid, even if the age structure of the
population changes.
In Europe, the age structure has indeed changed: it has moved
toward a column rather than a pyramid, primarily due to lower
fertility rates. In some countries with especially low fertility rates and
high outmigration, it has even started to resemble an inverted
pyramid, in which younger cohorts are smaller than the cohorts
preceding them for the first time. The age structure of the pension
system, instead of remaining a pyramid, has also moved toward a
column, albeit for slightly different reasons. As long as the percentage
of the working-age population covered by the pension system kept
growing, the system maintained its pyramid shape. But once
the majority of the working-age population became contributors, the
pension system became bound by the population age structure
(figure 1.1b).
The transition countries, those moving from centrally planned to
market economies, have had a slightly different experience. Coverage
of the working-age population in the pension system was complete
at a much earlier date. For example, while many nontransition
countries still had limited women’s labor force participation in the
1960s, most of the transition countries already had close to
100 percent of women in the labor market. While fiscal pressures on
pension systems have been slowly building everywhere, they were
felt most strongly in the early 1990s in the transition countries of
Central Europe, the Balkans, and the former Soviet Union (FSU),
where sharp losses in formal employment occurred during the transi-
tion. So these countries are experiencing an inverted pyramid in
their pension systems, with large numbers of elderly being supported
by a relatively small working-age population (figure 1.1c).
Buckling under this pressure, most of the transition countries
significantly reformed their pension systems in the 1990s and

The Inverting Pyramid 7d
b. Pension system dynamic as coverage expands among younger cohorts
Number of people
a. Population dynamic as life expectancy grows, fertility rates decline, and net emigration continues
Number of people
Age
Age
Age
c. Pension system dynamic as formal sector employment declines
Number of people
FIGURE 1.1Population and Pension System Dynamics in Europe and Central Asia
early 2000s. They introduced a multitude of parametric and struc-
tural reforms, often with World Bank support. The urgency of the
reforms subsided in the mid-2000s as the region enjoyed high
growth in gross domestic product (GDP). Some countries relaxed
their pension reform efforts and even reversed prior reforms,

8 The Inverting Pyramid
offering more generous benefit indexation, legislating new pen-
sion supplements, and straying from the plans to build pension
system assets and reduce liabilities. As fiscal pressures returned
with the financial crisis of 2008, however, many countries had to
make painful cuts in other programs in order to continue paying
the elevated pension benefits promised during the boom years.
This report evaluates the pension reform experience of the last
20 years in Central Europe and Central Asia. It asks whether the
assumptions made at the start of the reform period were valid,
whether the reform paths initially chosen by the countries were
preferable and remain so today, whether the speed of reform imple-
mentation was sufficient, and whether these reforms have so far
delivered on their expectations.
Reversals and revisions of the pension reforms raise questions
about whether the reforms have been sufficiently discussed outside
the relatively narrow circles of pension experts. The report is
intended to initiate pension reform debate more broadly among
policy makers, the media, and social organizations. There is an effort
to broaden the debate to include the linkages of pension systems to
economic growth, fiscal policies, and the functioning of labor and
capital markets. The political economy questions of how pension
expectations are built and how pension reforms are agreed upon are
also considered. The breadth of the discussion inevitably means sacri-
ficing some depth, which the report attempts to partially remedy by
referencing numerous publications by experts in the areas of
pensions, macroeconomics, fiscal policy, labor markets, financial
markets, and political science.
While the report has been written primarily for the benefit of policy
makers in the developing countries of Europe and Central Asia, it also
provides comparative information where possible on all the European
Union (EU) member countries and on Switzerland, Iceland, and
Norway, as well as other non-EU countries of Europe. Due to con-
straints of data availability, not all analysis is carried out for all coun-
tries, but efforts were made to include as many countries as possible.
Five Country Clusters
The report groups the countries in clusters based on the analysis
presented in figure 1.2. The grouping takes into account three main
characteristics that determine pension system sustainability. The
horizontal axis of the figure indexes pension benefit generosity, mea-
sured as a ratio of average pension to GDP per capita. The vertical

The Inverting Pyramid 9d
12
14
16
18
20
22
24
20 30 40 50 60 70 80
Life
exp
ecta
ncy
at re
tirem
ent,
year
s
Ratio of average pension to GDP per capita
Young Countries
High-Income
Generous Spenders
High-Income Moderate Spenders
High-Spending
Transition
Countries
Lower-Spending
Transition
Countries
FIGURE 1.2Pension Benefit Generosity and Working-Age Population Growth in Europe and Central Asia
axis shows the average expected number of years in retirement.
Therefore, the countries with high values on both axes currently
tend to spend a large proportion of their GDP on pension programs.
The size of the bubbles in figure 1.2 shows the expected growth of
the working-age populations in these countries over the next four
decades. Countries marked by large bubbles expect their working-
age population to grow; assuming a contribution-based, pay-as-you-
go financing model, this allows them to afford higher benefit levels
and longer retirement spans over this period. On the other hand,
countries represented by smaller bubbles expect the working-age
population to contract, and they will have to make painful choices if
they hope to sustain their pay-as-you-go pension systems.
Five distinct clusters of countries are shown in figure 1.2 and will
be discussed separately throughout the report:
• High-Income Generous Spenders consist of Belgium, Cyprus, France,
Greece, Italy, Luxembourg, Malta, Slovenia, Spain, and Switzer-
land. They are distinguished from the rest of the countries by long
retirement spans of 20 to 23 years. These countries also tend to pay
generous benefits of around 50 percent of GDP per capita or higher.
The demographic prospects of these countries are quite challeng-
ing, which puts the sustainability of their generous pension systems
at risk.

10 The Inverting Pyramid
• High-Income Moderate Spenders include Austria, Denmark, Finland,
Germany, Iceland, Ireland, the Netherlands, Norway, Portugal,
Sweden, and the United Kingdom. Retirement spans in these
countries range from 18 to 20 years. While benefit levels among
this group of countries vary substantially, the average is around
50 percent of GDP per capita. Except for Portugal, which faces very
challenging future demographics, the countries in this cluster are
projected on average to maintain the current size of their working-
age populations, often with the help of significant immigration.
• Lower-Spending Transition Countries include Albania, Armenia,
Belarus, Bulgaria, Croatia, the Czech Republic, Estonia, Georgia,
Hungary, Latvia, Lithuania, Moldova, Poland, Romania, the
Russian Federation, and the Slovak Republic. In this report, “tran-
sition countries” are those that have recently moved from centrally
planned economies to market-based economies. Fiscal strains asso-
ciated with this transition have induced a diverse set of pension
reforms in these countries, resulting in retirement spans of 14 to 19
years and benefit levels averaging around 35 percent of GDP per
capita. Unfortunately, these countries also face extremely chal-
lenging demographic realities, raising issues of sustainability even
at lower benefit levels.
• High-Spending Transition Countries include Bosnia and Herzegovina,
the former Yugoslav Republic of Macedonia, Montenegro, Serbia,
and Ukraine. This cluster of countries faces demographic realities
just as challenging as those of the Lower-Spending Transition
Countries, if not more so, but they have not yet reduced their ben-
efits to more sustainable levels. Life expectancy at retirement is also
relatively low among countries in this cluster, from 14 to 17 years.
(The country of Bosnia-Herzegovina comprises two entities, the
Federation of Bosnia-Herzegovina and Republika Srpska. They have
separate pension systems, and both provided data for the study;
therefore, they are sometimes treated separately in this report.)
• Young Countries consist of Azerbaijan, Kazakhstan, Kosovo, the
Kyrgyz Republic, Tajikistan, Turkey, Turkmenistan, and Uzbekistan.
They are shown in figure 1.2 as large blue bubbles, and their place-
ment appears somewhat random. This is because the generosity of
pension spending in these countries, where the elderly population
is still small, has a much smaller impact on overall government
expenditure than in the other country clusters. Therefore, pension
spending generosity is influenced much more by cultural and
historic factors than by fiscal considerations.

The Inverting Pyramid 11d
While the analysis is largely based on the country clusters, the report
also refers to the geographic-political subregions of Western Europe;
Central Europe (including the Baltics); the former Soviet Union (FSU)
countries (excluding the Baltics); and the Balkans. Countries in these
subregions often share similar historic and economic contexts and
exhibit some similarities in their policy choices. Dividing countries
into these subregions was found more illuminating when discussing
the historic development of pension systems, while the cluster
approach is used in discussing pension system outcomes and future
prospects. Finally, the report frequently refers to “transition coun-
tries,” meaning the Central European, FSU, and Balkan countries, all
of which have moved from primarily centrally planned to market-
based economies in the last two decades.
Organization of the Report
Chapter 2 looks at the birth and development of pension systems and
the accompanying societal expectations. This discussion is set primar-
ily in Western Europe, the birthplace of the social insurance model.
The story is also relevant to the broader set of European and Central
Asian countries, as the goals for their pension systems are often mod-
eled on the poverty reduction and income replacement targets
already achieved by the pension systems of Western Europe.
Chapter 3 discusses the pension reforms implemented over the
last two decades and their impact on ensuring financial sustainability
and poverty reduction. Chapter 4 suggests ways to increase private
and public savings to supplement retirement income when the cur-
rent pension financing model comes under strain in the next few
decades. Chapter 5 looks for the fiscal room to supplement labor tax
financing with other revenues, while chapter 6 considers the possi-
bilities for stemming the decline in the labor force. The final chapter
sums up lessons from two decades of pension reform and presents
options for countries facing demographic and fiscal pressures going
forward.


The Evolution of Public Pension Programs
CHAPTER 2
13
Introduction
Over the past century, public pension programs in Europe have
successfully reduced poverty among the elderly and provided a
mechanism for replacing wage income during old age, when the
elderly no longer work. The initial goals for these programs were
much more modest, however. They set out to deliver some supple-
mental income to low- and middle-income industrial workers who
were not able to work full-time due to their advanced age. Over time
the programs were expanded to include most elderly, other kinds of
benefits were added, pension levels rose significantly, and the average
period of benefit receipt grew much longer.
The societal expectations of what public pension programs should
deliver grew accordingly, and the modest beginnings were quickly
forgotten. Public pension programs today are often perceived to be
static institutions that have always delivered and will always deliver
standards of living to the older population similar to those enjoyed by
the employed, especially in countries with earnings-related benefit
design. New societal norms about the “right” time to retire have also
become strongly entrenched. Furthermore, a strong public percep-
tion exists that the current level of benefits and long retirement spans

14 The Inverting Pyramid
are fully paid for by contributions and taxes collected during the
active period of workers’ lives.
After the collapse of the centrally planned economic systems, the
transition countries of Central Europe, the former Soviet Union
(FSU), and the Balkans started rebuilding their pension systems,
hoping to meet the same social goals achieved by the pension pro-
grams of the developed countries of Europe. The transition countries
also tried to improve on the Western European model by introducing
new combinations of pension system components. These innovations
were expected to help insulate the pension structures from political
interference, add to their financial robustness, improve incentives for
labor market participation, and increase economic growth.
However, under the prevalent pay-as-you-go (PAYG) financing
model, the generosity of a pension program can only depend on the
contribution revenues per pensioner. After growing rapidly for a cen-
tury, these revenues per pensioner are stabilizing and even starting to
decline as the number of contributors begins to fall and the number
of elderly increases, both in Western Europe and in the broader
region. As illustrated in chapter 1, both the population pyramid and
the pension pyramid are starting to invert. This is the most important
structural change in the financing mechanism of the PAYG pension
programs to date, and it cannot be overemphasized. Consequently,
public pension programs have to change and adapt to this new real-
ity, just as they adapted to the more favorable environment of the
past. The short public memory of the history of pension programs
and the perceived stability that has become associated with them are
obstructing necessary reforms.
So far, pension programs in Western Europe have easily delivered
increasingly generous benefits to increasingly large numbers of peo-
ple. A continuously growing contributor base from the expanding
pyramid along with rising contribution and tax rates have guaran-
teed a strong source of financing. In fact, at just over 100 years of age,
many of the European pension systems are still not fully mature,
meaning that the oldest residents, especially women, do not yet nec-
essarily have a right to their own pensions or at least do not yet have
full contribution histories resulting in full pension benefits. This
reduces pension expenses compared to what might be expected
given current demographics if the pension system were fully mature,
and temporarily allows for increased benefit generosity.
However, the current generosity of benefit packages cannot be sus-
tained in the future. This chapter reviews the history of the pension
systems in Western Europe to aid in understanding the evolution of
pension programs and reform agendas in Europe and Central Asia.

The Evolution of Public Pension Programs 15
While the reforms demanded by the demographic changes and matu-
ration of the pension systems are far from trivial, history shows that a
“new” interpretation of retirement, required by the new circum-
stances, was in fact the accepted social norm just a few decades earlier.
Beginnings of Pension Systems in Western Europe
Prior to the late nineteenth century, extended families and small
local communities provided old-age support. People working in
small-scale agriculture could continue to provide some work effort
until very late in life while also receiving support from family mem-
bers as their ability to work declined. Since people typically did not
move far from their birthplace, most elderly were lifelong members
of close-knit communities. In the event that an old person had no
surviving family members, churches and neighbors often provided
basic support.
As industrialization proceeded, people were drawn from their
local communities into the newly developing cities, where they lived
and worked among people with whom they had few family or social
ties. Urban industrial jobs did not provide the flexibility of a reduced
work pace for older individuals that agricultural communities
had offered. Moreover, with continuously changing technology, the
human capital of older workers was quickly depleted. Small occupa-
tional savings societies developed to address some of these needs,
but participation was voluntary, and many people remained unpro-
tected from important risks. People increasingly felt the need for a
safety net to protect themselves against the risk of sickness, loss of
the household breadwinner, and old age (CES n.d.).
The earliest pension schemes were designed to address the risk of
old-age poverty for industrial workers with low-to-middle incomes.
Otto von Bismarck, the chancellor of Germany, was the first to set up
a contributory pension scheme in 1889. The scheme included only
workers with incomes below a modest threshold, who were per-
ceived to need a safety net. Higher-income workers were assumed to
have other resources with which to self-insure against the risk of
poverty in old age. Benefits were paid when a person reached the age
of 70, but only if he retained no more than one-third of normal
working capacity. Benefits were only provided if the individual had
made contributions during his working life, and on average they
amounted to only 18 percent of the average wage (Verbon 1988, 17).
This model of income provision to the elderly spread widely. As in
Germany, the programs focused on protecting a limited part of the

16 The Inverting Pyramid
labor force, typically the lower-income segment that was considered
more vulnerable. Benefits were modest and were provided only at
very advanced ages, and only when working capacity was reduced.
Benefits were treated as a supplement to other forms of old-age
income and were not intended to be the sole income source (Cutler
and Johnson 2004).1
In the contributory pension programs that copied the blueprint of
Bismarck, the pension amount depended on contributions paid by
workers and employers. At the beginning, no workers were eligible
for benefits, since no worker had a contribution history. Because of
this initial program immaturity, reserves accumulated very fast. A
new system in its first few years takes in contributions but pays out
few pensions, as few retirees are eligible for benefits. In addition, the
few retirees who become eligible receive very low pensions, since
their contributions were paid for only a few years. Pension expendi-
tures gradually rise as more individuals satisfy eligibility conditions
for retirement and as benefit levels increase in recognition of longer
contribution histories. Full career pensions are awarded only once
those who have contributed throughout their working careers begin
to retire. This can take 40 to 50 years from the time the system is set
up; during this time, full cohorts of the labor force are paying contri-
butions, but full pensions are not being paid. When the first cohort of
individuals who contributed throughout their entire working career
begins to retire, the retiree pool will include some of these people,
but also many others who had retired earlier with lower pensions.
Only when all living retirees have made a full career’s worth of con-
tributions is the system considered fully mature. This takes 60 to
70 years from the time the system starts.
Bismarck’s model in its pure form could not ensure full poverty
protection, and it was later complemented by features that provided
minimum income to elderly workers who had contributed for only a
short time or whose contributions were based on very low incomes.
These took the form of either a minimum pension guarantee that
required some minimum years of contributions, or a minimum
income support benefit for the elderly that did not require contribu-
tions but involved an income test to establish need.
In many cases, the model was also complemented by redistributive
features such as maximum limits on pensions, formulas that com-
pressed past earnings, slower benefit accrual rates for workers with
long careers, and so on. These features were intended to reduce pen-
sion program costs and to favor low- and middle-income workers,
who might not have had complete work histories. However, they also
tended to complicate benefit formulas and were often counteracted

The Evolution of Public Pension Programs 17
by other design elements that unintentionally redistributed income
from poorer workers to higher-income ones.
A simple alternative to the earnings-related pension model was
suggested by William Beveridge in the United Kingdom in 1942 and
has been adopted by that country along with Denmark, Iceland,
Ireland, the Netherlands, and Norway. This model implies provision
of the same public pension benefit to all elderly, usually funded
from general taxes. Technically, in the United Kingdom and Ireland,
contributions are still required and flat-rate pensions are prorated
for shorter contribution histories. But these countries also have a
noncontributory income-tested benefit for the elderly of a similar
amount, which for practical purposes translates into a universal
benefit. Since these are all de facto noncontributory schemes, they
can be considered mature from the outset, since those above retire-
ment age are immediately eligible for benefits when the scheme
begins, regardless of their lack of contribution history. This model
does not offer enough protection against significant decline in income
for middle- and high-income workers, which has stimulated large
private pension asset buildup in five of the six countries. Norway, the
only country without significant private pension assets, chose
another approach and by 2011 had built up public pension assets of
around 122 percent of gross domestic product (GDP) instead, largely
from its oil revenues. Among countries that did not follow the flat-
benefit approach in their public pension systems, only Finland and
Switzerland have built up private pension assets of significant size.
From Limited “Insurance” to Generous “Savings” Schemes
All the European contributory pension systems started with an
accumulation of reserves, as described above, but for various rea-
sons these disappeared over time. In the case of Germany, by 1910
reserves were eight times greater than annual benefit payments;
two world wars and a major economic contraction in between
were the major contributors to the depletion of those reserves in
Germany, as in most countries of Europe. As life expectancy
increased, benefits were paid for longer periods, also slowing
reserve accumulation. However, the biggest reason for the disap-
pearance of the reserves was their very existence, which tempted
governments always short of revenues to use the pension reserves
to finance other spending.
The existence of reserves also stimulated increased generosity of
the pension systems. New beneficiaries were added as the schemes

18 The Inverting Pyramid
expanded from old-age coverage to include widows and orphans,
younger disabled people, and sometimes children of the disabled.
Workers who were in midcareer at the time the systems started
were often provided full pensions with less than a full career of con-
tributions. Retirement ages began to fall, and the requirement of
incapacity for work, which had characterized the earliest programs,
disappeared in countries like France, Germany, and Sweden.
Programs were also made more generous so that the elderly could
live entirely on the benefits provided rather than use them to supple-
ment other income (Diamond 1997).
Even with all the new spending, the revenue surpluses continued
as coverage of the labor force expanded. While pension systems ini-
tially were limited only to certain groups of workers, systems quickly
grew to include most of the employed population. First, the composi-
tion of the labor force changed, with more and more workers joining
occupations that provided old-age coverage. In addition, the number
of covered occupations continued to grow. While the pace of expan-
sion varied across countries, as did the order in which different sec-
tors were covered, the systems grew from covering only industrial
workers to include salaried employees, employees in commerce, civil
servants, employees in agriculture, the self-employed, farmers, and
domestic servants. With each new wave of entrants into the system,
the program once again became immature, as new contributions
were added but few benefits were paid to the newly covered group.
These new contributors expanded the pension pyramid within the
demographic pyramid.
Figure 2.1 shows that the coverage rate of the labor force grew as
these systems continued to expand throughout Europe. For example,
the system in Belgium covered as few as 20 percent of the labor force
when it began, but by 1960, about 85 percent of the labor force was
covered. A similar pattern holds for each of the countries for which
historical data are available.2
In addition, the labor force itself grew as the population increased
and women entered paid employment in greater numbers. As
figure 2.2 shows, the population in each of the European countries
grew by at least 50 percent, and in some cases by more than 400 per-
cent, in the course of the twentieth century.3 Much of this growth
occurred in the working-age population, expanding the population
pyramid. The entry of women swelled the labor force still further,
expanding the pension pyramid even more.
Figure 2.3 demonstrates the tremendous growth in the labor force
despite the impact of the two world wars. For contributory pension
schemes, the expansion of coverage combined with growth of the

The Evolution of Public Pension Programs 19
labor force resulted in even stronger growth of contributor numbers,
as shown in figure 2.4. For example, in Belgium, active contributors
doubled while the labor force only grew by 25 percent. Growth in
the labor force also indirectly benefited noncontributory programs,
as it helped swell general budget revenues, which in turn made
financing of all public programs much easier.
The increased demands on pension reserves of contributory pro-
grams induced the shift toward the PAYG financing model by the
mid-twentieth century. Contribution revenue differs from other
forms of government revenue in that each contribution comes with a
liability: that is, the government takes in contributions from workers
today in exchange for retirement benefits that government will pro-
vide in the future. If the programs were actuarially fair and reserves
were invested safely, then the large gap between the contributions of
large contributor cohorts and benefits paid to the small beneficiary
cohorts while a pension program was immature would lead to
FIGURE 2.1Increase in the Proportion of the Labor Force with Pension SchemeCoverage in Selected European Economies with Contributory PensionSchemes, 1900–1975
Source: Flora et al. 1983, 466–550.
Note: Coverage rates over 100 percent may reflect the fact that some people were contributing at ages older than 65,
while the standard definition of the labor force counts only those between 15 and 64 years of age.
0
20
40
60
80
100
120
140
1900
1905
1910
1915
1920
1925
1930
1935
1940
1945
1950
1955
1960
1965
1970
1975
% o
f lab
or fo
rce
cove
red
Austria France Italy
Belgium Germany Netherlands
Denmark Ireland Linear (average)

20 The Inverting Pyramid
the accumulation of large reserves. These reserves would then be
available later to pay benefits to the elderly cohorts that had contrib-
uted to the buildup of reserves when they were young. But the
combination of governments’ inability to maintain these reserves
during the war and interwar years, fiscal demands outside the pen-
sion system, and the continued increase in benefit generosity led
almost all governments to abandon the system of maintaining
reserves to fully cover future liabilities. Current contribution revenue
was spent immediately, with future pensions to be paid out of future
contributions. Even the few countries that chose to maintain a
reserve accumulated far greater liabilities than the reserve could
cover. Initially, given the pension program immaturity, the new
financing model easily allowed countries to meet ongoing pension
payment needs. However, the contributory pension programs later
became precariously dependent on continuing growth in the number
of contributors.
The switch to the PAYG financing model increasingly blurred the
line between contributory and noncontributory pension schemes.
Initially, reserves and surpluses generated within contributory
schemes were sometimes used to finance other government pro-
grams. A few decades later, many of the “contributory” schemes now
finance their deficits from the general budget. Even in countries
where the contributory pension scheme budget and the government
FIGURE 2.2Population Growth in the Twentieth Century in Selected European Economies
Source: Madison 2010a, 2010b.
0
0.5
1.0
1.5
2.0
2.5
3.0
3.5
4.0
4.5
High-Income
Generous Spenders
High-Income
Moderate Spenders
Lower-Spending
Transition Countries
Ratio
of p
opul
atio
n in
200
0 to
popu
latio
n in
190
0
Irel
and
Aus
tria
Uni
ted
Kin
gdom
Ger
man
y
Sw
eden
Port
ugal
Finl
and
Nor
way
Den
mar
k
Net
herl
ands
Fran
ce
Bel
gium Ital
y
Gre
ece
Spa
in
Sw
itze
rlan
d
Hun
gary
Pola
nd
Bul
gari
a
Rom
ania
Alb
ania

The Evolution of Public Pension Programs 21
budget are clearly separated, the government still implicitly stands
behind most of the unfunded promises made by the public pension
scheme. Therefore, the distinction between public pension schemes
with earnings-related benefits and those with flat benefits often
tends to be more striking than the difference between schemes
financed in different ways, whether through contributions or gen-
eral revenue.
Another fundamental shift occurred in the perceived role of pen-
sion benefits, which went from providing a limited “insurance” func-
tion to acting as a “savings” scheme. The initial dual eligibility criteria
of minimum retirement age and incapacity to work meant that the
pension program insured against the relatively unlikely contingency
of an individual being able to survive to a very old age, but with sig-
nificantly diminished work capacity. The benefit was low and was
only meant to supplement other income, often from part-time or
lesser-paid labor. The removal of the second eligibility condition—
incapacity to work—and an increase in benefit levels introduced a
completely new concept: individuals should not work after reachingt
a certain age, healthy or not, because through their lifetime
FIGURE 2.3Labor Force Growth in the Twentieth Century in Selected EuropeanEconomies
Sources: Flora, Kraus, and Pfenning 1987, 451–606. Data for 1980 and later from ILO LABORSTA (database).
Note: Gaps between data points are filled with straight lines.
25
75
125
175
225
1901
1906
1911
1916
1921
1926
1931
1936
1941
1946
1951
1956
1961
1966
1971
1976
1981
1986
1991
1996
2001
2006
2011
Labo
r for
ce c
ompa
red
to19
50,
%
Norway
Sweden
Romania
Denmark
Netherlands
Spain
Finland
Austria
France
Poland
Switzerland
Belgium
Bulgaria
Italy
Hungary
Portugal
UK

22 The Inverting Pyramid
contributions they have “earned” the right to a work-free period of
retirement. Thus, pension programs that had initially functioned
purely on the insurance principle were transformed into public “sav-
ings” schemes, especially in countries with an earnings-related pen-
sion benefit design, where people assume they have publicly
managed savings accounts that entitle them to pension benefits. In
reality, little money was actually accumulated and these contribu-
tions were spent as soon as they were received. In contrast, countries
with flat-benefit pension programs tended to create additional pri-
vate pension savings schemes to meet the need for income smooth-
ing during old age.
Moreover, the expectations were formed that living standards of
pensioners should rise in line with the living standards of the employed.
These expectations were fueled by the postwar boom in contribution
revenue that led to the automatic indexation of pension benefits. The
interwar and postwar inflationary experiences coupled with rapid
wage growth after the war led to political pressure on politicians to
increase pensions to keep up with living standards. The prevailing
FIGURE 2.4Growth of Active Contributors in Selected European Economies withContributory Pension Schemes, 1900–2005
Source: Flora et al. 1983, 466–550.
Note: Gaps between data points are filled with straight lines.
0
0.5
1.0
1.5
2.0
2.5
3.0
3.5
1900
1905
1910
1915
1920
1925
1930
1940
1945
1950
1955
1960
1965
1970
1975
1980
1985
1990
1995
2000
2005
Num
ber o
f act
ive
cont
ribu
tors
rela
tive
to 1
950
1935
Switzerland
Belgium
Netherlands
Denmark
Finland
Italy
France
Austria
Germany
Ireland
Sweden
United Kingdom

The Evolution of Public Pension Programs 23
view was that since individual contributions grew with wage growth,
providing pension increases linked to wage increases would be finan-
cially feasible. Some countries tied pension increases explicitly to
growth in wages; others were more cautious, tying the benefit
increases to growth in prices; still others used some combination of
these approaches. However, in almost all cases, the actual pension
increases were even greater than what the respective indexes would
have indicated.
Figure 2.5 shows that pension increases exceeded wage growth in
the Netherlands and Switzerland; increases were roughly equal to
wage growth in France, Germany, the United Kingdom, and Sweden;
and pension increases were below wage growth, though above infla-
tion, in Austria (see also International Labour Office 1977; Galasso
and Profeta 2004).
Examples of increasing generosity can be seen in the Netherlands
and Hungary, where pensions more than doubled as a percentage of
average wage in a relatively short period of time (figure 2.6). While
some of the overall increase for Hungary can be attributed to system
maturation, with new retirees having longer periods of contribution
and thus higher benefits, the more discrete jumps are attributable to
policy changes. Also, as individuals with less regular contribution
history were brought into the pension system, many became eligible
for the minimum pension guarantee, which raised their benefit level
above what they would have contributed or earned.
FIGURE 2.5Comparison of Growth in Pensions, Wages, and Prices in SelectedEuropean Economies, 1965–1979
Source: U.S. Senate 1981.
0
100
200
300
400
500
Gro
wth
bet
wee
n 19
65 a
nd 1
979,
%
Austri
a
Franc
e
German
y
Nethe
rland
s
Switzer
land
United
Kingdo
mSwed
en
Pensions Wages Inflation

24 The Inverting Pyramid
FIGURE 2.6Growth in Average Pension Compared to Average Wage in theNetherlands and Hungary, 1950–1990
a. The Netherlands
0
10
20
30
40
50
60
70
1957
1961
1966
1971
1976
1981
Ratio
of a
vera
ge p
ensi
on to
aver
age
wag
e, %
Source: Verbon 1988, 24.
b. Hungary
0
10
20
30
40
50
60
1950
1955
1960
1965
1970
1975
1980
1985
1990
Ratio
of a
vera
ge p
ensi
on to
aver
age
wag
e, %
Source: IWE 1995, 179.

The Evolution of Public Pension Programs 25
However, the most important increase in benefit generosity came
through the reduction in retirement ages, similarly prevalent among
contributory and noncontributory pension programs. Lower retire-
ment ages have a double impact on a contributory pension program:
they reduce the number of contributors and increase the number of
beneficiaries. Nonetheless, despite the fiscal implications and despite
increasing life expectancy, retirement ages were lowered for several
reasons. First, with the abundance of revenue, politicians could easily
grant early retirement to some occupations as a political bonus in
exchange for votes. Second, decisions were guided by the mistaken
view that youth would find jobs more easily if older workers retired
early to make room for them. And finally, given seniority-based
remuneration schemes that automatically pay higher wages to work-
ers who have been at a given job longer, older workers, who often
experience some decline in productivity as they age, were becoming
too expensive in light of their decreased productivity.
Even in countries where the statutory retirement ages were not
lowered, early retirement options and flexible retirement resulted in
a decline in the effective retirement age (figure 2.7). As individuals
became wealthier, their taste for leisure increased, encouraging them
to choose leisure over additional work. Moreover, as benefit levels
increased, people could afford to retire earlier and still enjoy a com-
fortable lifestyle. And with technological changes, skills of some older
workers became obsolete, making continued employment difficult.
For example, in Austria and Germany, the percentage of new retirees
below the statutory retirement age increased from approximately
5 percent in 1960 to more than 50 percent by 1976. Similarly, in
Sweden, early retirement rose from 9 percent of the total in 1967 to
21 percent by 1974. As retirement ages fell, labor force participation
(LFP) rates of workers above the retirement age, those aged 65 and
older, also fell from 16 percent in 1955 to 8 percent by 1980 in
Europe as a whole.
The duration of retirement increased dramatically because effec-
tive retirement ages declined while life expectancies increased rap-
idly. Figure 2.8 shows the changes in the duration of retirement for
Belgium, Spain, and Sweden. Between 1970 and 1990, the average
retirement period increased in all three countries.4 Duration of retire-
ment continued to increase between 1990 and 2009 as well, outpac-
ing the rise in the retirement age in Sweden and Belgium. It is also
important to note that the probability of contributors reaching retire-
ment age and claiming the benefit also rose due to decreased mortal-
ity at younger ages, further increasing the overall benefit costs
generated by later-born cohorts (Chomik and Whitehouse 2010).

26 The Inverting Pyramid
FIGURE 2.7Change in Effective Retirement Ages in Selected European Economies,1970–2010
56
58
60
62
64
66
68
70
1970
1975
1980
1985
1990
1995
2000
2005
2010
a. Male average effective retirement age
Age
at r
etir
emen
t
GermanyFrance
NetherlandsDenmark
AustriaSpain
ItalySweden
BelgiumUnited Kingdom
Source: OECD 2013.
54
56
58
60
62
64
66
68
70
72
74
1970
1975
1980
1985
1990
1995
2000
2005
2010
b. Female average effective retirement age
Age
at r
etir
emen
t
France Austria
Netherlands Belgium
Denmark Germany
Sweden Italy
Spain United Kingdom

The Evolution of Public Pension Programs 27
Increase in benefit generosity, the aging of societies, and pension
program maturation led to an enormous increase in public pension
spending relative to GDP from the 1950s to the end of the twentieth
century (figure 2.9). The countries with contributory, earnings-
related pension schemes tended to exhibit higher spending growth
(figure 2.9a), while the flat-benefit schemes showed slower increases
(figure 2.9b).
Outcomes of Pension Program Introduction in Western Europe
Pension programs made an enormous contribution to reducing
poverty rates among the elderly in the developed countries of Europe
(figure 2.10). All components of the pension system added to this
result, but flat-benefit contributory and noncontributory programs,
as well as minimum pension guarantees and minimum income sup-
port for the elderly, were the most important contributors. By now,
all pension systems of Western Europe have introduced at least one
of these redistributive features. The only exception is Italy, which
supports poor elderly through the general social assistance program.
In 1987, the average relative poverty gap between the elderly and
the rest of the population was close to zero for the group of countries
FIGURE 2.8Changes in Retirement Age and Impact on Duration of Retirement in Belgium, Spain, andSweden, 1970–2009
Source: OECD.
0
5
10
15
20
25
Belgium Spain Sweden
Expe
cted
yea
rs in
retir
emen
tAverage effective retirement age shown on bars
1970 1990 2009
63
5759
71
64
63
67
6365

28 The Inverting Pyramid
FIGURE 2.9Pension Spending as a Percentage of GDP in Selected EuropeanEconomies, 1954–2004
Germany
Austria
Sweden
Italy
France
Finland
Switzerland
Belgium Greece
Turkey
0
2
4
6
8
10
12
14
16
18
% o
f GD
P
1954
1964
1974
1984
1994
2004
a. Contributory pension schemes
Source: Flora et al. 1983, 457.
0
1954
1964
1974
1984
1994
2004
2
4
6
8
10
12
14
16
18
% o
f GD
P
Denmark
IrelandNetherlands Norway
United Kingdom
b. Flat-benefit pension schemes

The Evolution of Public Pension Programs 29
shown in figure 2.10. By 2004 it even tended to be negative in nine of
the 12 countries, although not significantly. This suggests that the pen-
sion systems first adopted in Europe in the late nineteenth century
fully accomplished the goal of reducing poverty among the elderly. In
the beginning, the elderly possessed limited work capacity and little or
no safety net, but the pension systems are now providing them with
sufficient resources so that their poverty rates are comparable to or
even lower than those of the other age cohorts (see also European
Commission 2012).
Pension programs also provide a vehicle for significant income
replacement for middle- and high-income populations in many coun-
tries (figure 2.11). The data shown are based on modeling results from
the Organisation for Economic Co-operation and Development
(OECD) series Pensions at a Glance. Pre-retirement earnings of individu-
als relative to average wage are shown on the horizontal axis. Expected
benefit entitlements as a percentage of economy-wide average wage
FIGURE 2.10Gap between Elderly Poverty and Poverty in the General Population, Selected EuropeanEconomies, 1987 and 2004
Source: LIS 2013.
Note: Data are for 1987 and 2004 or closest available years.
–5
–4
–3
–2
–1
0
1
2
3
4
5
Diff
eren
ce b
etw
een
rela
tive
pove
rty
rate
s of
eld
erly
and
gen
eral
pop
ulat
ion,
%
Spain
United
King
dom
Irelan
d
Finlan
d
Franc
e
Sweden
German
y
Denmar
k
Austri
aIta
ly
Nethe
rland
s
Norway
Gap in 1987 Gap in 2004

30 The Inverting Pyramid
are shown on the vertical axis for workers who begin work at age 20 in
year 2010 and work continuously at their pre-retirement relative wage
until they reach the retirement age in their country. The steeper the
line for a country, the more emphasis it places on income replacement;
the flatter the line, the greater the focus on redistribution. Countries
for which the line starts higher provide higher benefits for the lowest-
income contributors. Since the OECD methodology models future
entitlements for those starting work only recently, the results include
all the legislation enacted to date.5
Different countries chose to provide income replacement to
greater or lesser degrees. Some countries, such as the ones in figure
2.11a, provide substantial income replacement for earners with mod-
erately high incomes. Greece, for example, provides benefits almost
equal to twice the average wage to those who earned twice the aver-
age wage. Other countries, such as the ones in figure 2.11b, provide
limited income replacement for high earners. France, which pays
74 percent of average wage to those who earn twice the average
wage, is the most generous of this group; some others, like Ireland,
pay as little as 29 percent of average wage to similarly high earners
(OECD 2011; see also Conde-Ruiz and Profeta 2007).
FIGURE 2.11Link between Pre-Retirement Earnings and Benefit Entitlements as Reflected in Pension SystemDesign in Selected European Countries
Source: Based on data from the OECD Pension Modeling Team, using methodology from the OECD series Pensions at a Glance.
0
0.5
1.0
1.5
2.0
0.5 0.8 1.0 1.5 2.0
Pens
ion
bene
fit a
s %
of a
vera
ge w
age
Individual wage as % of average wage
a. Countries that provide substantialincome replacement
FinlandSpainIceland
ItalyNetherlands
Greece PortugalSweden
AustriaDenmark Slovenia
Pens
ion
bene
fit a
s %
of a
vera
ge w
age
Individual wage as % ofaverage wage
Germany
Switzerland
Belgium
France
United KingdomNorway
Ireland
0
0.5
1.0
1.5
2.0
0.5 0.8 1.0 1.5 2.0
b. Countries that provide lessincome replacement

The Evolution of Public Pension Programs 31
However, introduction of the PAYG financing mechanism and the
accompanying increased benefit generosity also introduced undesir-
able intergenerational transfers. Cohorts of the elderly that made
small contributions were able to enjoy increased benefits over long
retirement periods, benefiting greatly from the system. These
arrangements could be upheld temporarily because of the rapid
increase in the numbers of contributors, rising contribution rates, and
small numbers of pensioners due to program immaturity as the pen-
sion pyramid expanded. But the longer these unsustainable arrange-
ments continue and the more implicit pension liabilities are built up,
the higher will be the financial and social costs of unwinding these
arrangements. And the higher the costs, the more abrupt the transi-
tion to a fiscally sustainable system will have to be, as the pension
pyramid reaches the boundaries of the demographic pyramid or starts
to invert. Unfortunately, these benefits in Western Europe have been
perceived as realistic, desirable, and sustainable by other countries of
the region with weaker demographic and economic fundamentals,
leading them to aspire to the same results.
Choices Made by Other Countries of the Region
The collapse of the centrally planned economic systems in Central
Europe, the former Soviet Union, and the Balkans in the early 1990s
was devastating for government finances. Enormous cuts had to be
made in all government programs, including pensions. Pensions
were drastically reduced, paid late, and sometimes even paid in kind,
although the most extreme measures were avoided in the countries
of Central Europe. Pensioner numbers swelled as old-age pension
programs were used to absorb huge numbers of older unemployed
workers, adding to fiscal strains. In this environment, protection
against extreme poverty of the elderly was the main goal, and most
pensioners ended up with similarly low incomes, regardless of their
contribution history. Yet again, Central European countries suffered
a bit less, and some income differentiation in pension levels was
preserved in these countries.
Earnings-related benefit design seemed to be the best fit for the
Central European and Baltic countries that were rebuilding their
pension systems in the late 1990s as their economies started to grow
again. At the time, with their liquid savings largely destroyed, most
elderly depended largely on public pension benefits that were rela-
tively flat, reflecting both the fiscal constraints and the low differenti-
ation in their past wage levels. This focused the minds of the

32 The Inverting Pyramid
reformers on reinstituting the income replacement function of the
pension systems to mirror the new differentiated wage structure. In
addition, it was hoped that a contributions-linked pension benefit
design would induce badly needed formalization of the labor market.
On the other hand, the region did not have the experience of wide
income inequality in recent memory, so the objectives of income
redistribution and protection of the most vulnerable were not at the
forefront of the agenda (Hirose 2011).
Privately owned individual pension accounts were seen as a
desirable option, as people in the region yearned to harness
market- based solutions and had developed a deep distrust of
governments. The fact that this arrangement would entail high
transition costs, when pension contribution revenues redirected to
individual accounts had to be replaced by alternative financing
sources, was understood but not considered insurmountable. The
promise of high growth rates, as the region joined developed
Western European countries in the European Union, was expected
to bring quick prosperity that would help to pay the costs.
Privatization revenue was another financing source commonly
assumed to be sufficient in paying much of the transition costs.
Finally, borrowing would provide short-term financing before
parametric reforms of the current PAYG pension scheme started to
yield significant savings. Since there were limited other financial
assets for pension funds to invest in, pension funds could easily
lend to governments the funds they needed to borrow to finance
the transition costs (Holzmann 2009).
It was realized that existing PAYG pension schemes were too big to
be replaced altogether and might even be a desirable component of
the pension system for diversification purposes. To make these
schemes sustainable and attractive to populations, innovations like
notional pension accounts and point systems were introduced.
Minimum pension provisions remained in most PAYG systems, but
they were assumed to be small additions to the main design rather
than key components of the system to be relied upon by a large pro-
portion of the population. Similarly, minimum income provisions for
the elderly without pension coverage were not considered to be
important elements, as at the time of the reform an overwhelming
majority of the population had long contribution histories (also see
Chlon-Dominczak and Strzelecki 2013).
Pension system designs chosen by the countries in this subregion
reflect the plethora of different decisions made, as shown in clusters
3, 4, and 5 of table 2.1. Box 2.1 provides some details on the main
features of each pension system.6

The Evolution of Public Pension Programs 33
TABLE 2.1Pension System Designs and Components in Selected European and Central Asian Economies
Cluster Country Universal PAYG Mandatory savings
(1) High-Income Generous Spenders
Belgium — DB —
Cyprus — DB —
France — DB/points —
Greece — DB —
Italy — NDC —
Luxembourg — DB —
Malta — DB —
Slovenia — DB —
Spain — DB —
Switzerland — DB X
(2) High-Income Moderate Spenders
Austria — DB —
Denmark X — X
Finland — DB X
Germany — Points —
Iceland — DB X
Ireland X — X
Netherlands X — X
Norway — NDC —
Portugal — DB —
Sweden — NDC X
United Kingdom X DB X
(3) Lower-Spending Transition Countries
Albania — DB —
Armenia — DB —
Belarus — DB —
Bulgaria — DB X
Croatia — Points X
Czech Republic X DB —
Estonia X Points X
Georgia X — —
Hungary — DB —
Latvia — NDC X
Lithuania — DB X
Moldova — DB —
Poland — NDC X
continued

34 The Inverting Pyramid
TABLE 2.1Continued
Cluster Country Universal PAYG Mandatory savings
(4) High-Spending Transition Countries
Romania — Points X
Russian Federation — NDC X
Slovak Republic — Points X
Bosnia and Herzegovina (bothentities) — Points —
Macedonia, FYR — DB X
Montenegro — Points —
Serbia — Points —
Ukraine — DB —
(5) Young Countries
Azerbaijan — DB/NDC —
Kazakhstan X — X
Kosovo X — —
Kyrgyz Republic — NDC X
Tajikistan — DB —
Turkey — DB —
Turkmenistan — NDC —
Uzbekistan — DB —
Note: DB = defined benefit; NDC = notional defined contribution; PAYG = pay-as-you-go; — = does not exist.
Country choices often reflected historical and geographic group-
ings as well as aspirations. The pension systems of Central Europe
and the Baltics tended to have more elaborate multipillar designs
than the Western European countries presented in clusters 1 and 2 of
table 2.1.
The countries of the former Soviet Union, excluding the Baltics,
have been less ambitious in redesigning their pension systems. The
collapse of economies in this cluster of countries was deeper and
more prolonged. The fall in formal employment and government
revenue base was more pronounced, and poverty among the general
population, as well as the elderly, became more entrenched. High
inflation also eroded the value of the benefits, bringing them down
to a more basic level. The region was also less optimistic about the

The Evolution of Public Pension Programs 35
BOX 2.1
World Bank Definitions of Pension Pillars and Characteristics of Different Pension Systems
Zero Pillar
The zero pillar refers to pension benefits provided without a contribution requirement. These are
financed from general revenues. One form of a zero pillar is the universal pension noted below;
other forms are based on need and can be part of, or separate from, the social assistance
system.
Universal Pension
• All residents or citizens above a certain age are provided with a universal pension.
• After retirement, benefits are typically increased over time through some type of
indexation.
First Pillar
The first pillar refers to pensions where eligibility depends on the person having made contribu-
tions during his or her working life. These pensions are largely financed on a pay-as-you-go
(PAYG) basis, with contributions from current workers and their employers being used to finance
benefits for current pensioners. These systems can accumulate some reserves when they are
immature; conversely, contribution revenues can be supplemented with general revenues when
a system runs deficits. These systems are primarily run as conventional defined benefit (DB) sys-
tems, but they can also include basic pensions, point systems, and notional defined contribution
(NDC) systems.
Conventional Defined Benefit System
• Pension benefits are calculated as some percentage of a person’s past salary (accrual rate)
per year of contribution or service.
• The salary base from which the pension is calculated can be the last salary, an average of
some years of past salaries, or the average of a person’s lifetime salary.
• The salaries used to calculate the salary base are typically revalued or valorized by a param-d
eter such as the cumulative growth of average wage between when the salary was earned
and the date of retirement.
• Pension increases after retirement are indexed to an observable parameter, typically infla-
tion, but sometimes the rate of average wage growth.
continued

36 The Inverting Pyramid
Basic Pension
• All those who have fulfilled a minimum years-of-service requirement receive a flat benefit,
unrelated to their own wages or the value of their contributions.
• Benefit may vary depending on years of service.
• After retirement, benefits are typically indexed to some parameter.
Point System
• The individual is awarded personal points for each year he or she contributes. The number ofs
points awarded each year is based on the relationship between the wage on which contri-
butions are made and the average wage and the length of time during the year that the
person actually makes contributions.
• At retirement, all the points the person has earned are added up and multiplied by the value
of the general point, which is typically some percentage of the average wage of the year intt
which the individual retires.
• This value of the general point, set when the system begins, is typically indexed to average
wage growth, making the value of the general point as a percentage of average wage iden-
tical to the accrual rate in the traditional DB system. Indexing the general point to parame-
ters other than wage growth is equivalent to setting cohort-specific accrual rates in the
traditional system.
• After retirement, the pension follows some indexation rule.
Notional Account System
• Each individual’s contributions are recorded as if they were going into a saving account.
• Notional interest rate is granted on each individual’s account balance, with the notional interest
rate tied to measurable indicators, such as average wage growth, growth in the wage bill,
or gross domestic product growth.
• At retirement, the account balance is divided by life expectancy at the age of retirement, in
the simplest case, or by a factor that takes into account some interest rate and life
expectancy.
• As life expectancy grows, the benefit available at a particular retirement age tends to fall as
the account balance is divided by a longer life expectancy, thus providing some degree of
fiscal balancing.
• After retirement, the pension follows some indexation rule.
BOX 2.1 continued
continued

The Evolution of Public Pension Programs 37
Second Pillar
The second pillar refers to mandated defined contribution systems where individuals put
their contributions into savings accounts with financial institutions, typically specialized
pension funds. These funds invest the money, with retirement benefits paid out of the proceeds
of that investment.
Fully Funded Defined Contribution System
• Contributions are collected, transferred to a pension fund, and invested. There are typically
multiple pension funds or asset managers, and the individual chooses one of them to man-
age his or her retirement savings.
• Some administrative fees are deducted before the remaining funds are invested.
• The person earns an interest rate based on what the invested savings earn.
• At retirement, the individual typically purchases an annuity from an annuity provider who
guarantees the retiree a pension benefit throughout his or her lifetime for a fee. The benefit
may be indexed or not.
• In some cases, payouts can also be taken as scheduled withdrawals, where the account bal-
ance is divided by life expectancy, with the remainder continuing to generate interest. This
process is repeated the following year, with the resulting pension rising or falling depend-
ing on realized returns.
Third Pillar
The third pillar is almost identical to the second pillar, but savings are made on a voluntary rather
than mandatory basis. The third pillar can be organized as individual savings accounts or, alterna-
tively, as occupational pension schemes, where members of one occupation hold savings
accounts with a particular financial institution and contributions are made as part of the benefits
package.
Multipillar System
A multipillar pension system contains more than one of the pillars outlined above.
BOX 2.1 continued
future and less motivated to embark on structural reform than
Central Europe, where reform fever was augmented by the promise
of European Union accession. Therefore, some FSU countries chose
to reform their pension systems with much more modest goals in
mind, while others opted only to patch up their existing pension

38 The Inverting Pyramid
systems rather than redesign them. The reformers generally targeted
much lower pension levels and continued to be torn between the
need for poverty prevention and the desire for income replacement,
finding that it was hard to accommodate both within the limited fis-
cal envelope. The countries that opted for maintaining their one-pil-
lar PAYG model generally struggled to prevent their pension costs
from rising unsustainably.
The war-ravaged economies of the Balkan region had a delayed
start on the pension reform agenda. They have closely followed the
Central European countries in making reforms, with similar aspira-
tions for their redesigned pension systems. However, the conditions
for achieving these objectives are more difficult, as labor markets
tend to be less buoyant, financial markets are less developed, and
pension systems are more burdened with large disability and veteran
pension costs. Poverty in this region is also much more prevalent,
which tends to sway the pension system objectives toward poverty
protection, although there are some high spenders in this group that
have focused on income replacement.
Finally, the Young Countries of the region, including Turkey, have
generally been preoccupied with other government programs, as
their elderly populations are still quite small. In the pension policy
area they have tended to fine-tune their existing simple pension sys-
tem structures. The two exceptions are the Kyrgyz Republic, which
has tried to implement an elaborate pension design and pays rela-
tively high pensions, and Kazakhstan, which has introduced a rela-
tively radical reform, having abolished its PAYG system altogether.
The rest of the Young Countries of the FSU generally only provide
poverty-level benefits to their elderly through PAYG financed pro-
grams, as shown in cluster 5 of table 2.1.
Pension system designs chosen in the last two decades in this
broad region rested on some important assumptions:
• LFP and formalization in the post-transition economies would
return close to the levels observed before the transition.
• Earnings-related benefit design could provide sufficient incentives
to workers to participate in the pension system and to voluntarily
delay retirement.
• Pension structures, once chosen, would be insulated from political
interference.
• Development of the financial markets, financial literacy, efficient
portfolios, and growth-producing investments would naturally fol-
low from the introduction of funded individual pension accounts.

The Evolution of Public Pension Programs 39
• The sharp fall in fertility rates, observed early in the transition,
would fully reverse. The strong emigration experienced when the
economies first opened would not continue.
In all of these reforms across countries, a convergence on a single
pension paradigm did not emerge. The lack of convergence can be
traced back to the dual purpose of pension systems, which exist both
to prevent poverty in old age and to replace the income individuals
earned during their working years. The first objective often requires
redistribution from middle and high earners toward low earners,
while the second suggests that high earners should keep the benefits
of their higher contributions in the form of higher pensions for
themselves. These two objectives have conflicting impacts on policy,
especially when fiscal space is limited. Different countries place vary-
ing weights on the two objectives: countries focused on poverty alle-
viation are more likely to choose basic pensions and universal
pensions, while countries favoring income replacement are more
likely to choose options like notional accounts, point systems, and
funded defined contribution systems. In the second case, there is a
danger that if many people do not contribute for long, earn very low
returns on contributions, or contribute on the basis of low wages,
most of the elderly will eventually qualify only for the same mini-
mum pension, which results in a burden of accounting and adminis-
tration without much of the intended contribution- benefit link (see
Conde-Ruiz and Profeta 2007).
Countries of Central Europe and the Balkans largely focus on mod-
erate replacement of incomes, as shown by the simulated results of
different options in figure 2.12. The exception is the Czech Republic,
where there is greater redistribution and only limited income replace-
ment (figure 2.12a). In the Balkans (figure 2.12b), the very high ben-
efits accruing to low earners in Albania are notable, as is the long-run
elimination of virtually all income replacement in Serbia.
By contrast, FSU countries with older populations tend to have
more limited income replacement. For example, a person who earns
half the average wage will get a pension benefit equal to 34 percent
of average wage in the case of Ukraine, while a person who earns
twice average wage will get a pension equal to 80 percent of average
wage. Only the Russian Federation and Armenia achieve moderate-
income replacement (figure 2.13a). However, these countries also
tend to have more generous benefits for the elderly from lower-
income groups. The younger countries of the FSU, as well as Turkey,
tend to aim for both high-income replacement and relatively high
benefits for low earners (figure 2.13b).

40 The Inverting Pyramid
Source: Based on data from the OECD Pension Modeling Team, using methodology from the OECD series Pensions at a Glance.
Note: The Federation of Bosnia-Herzegovina (BiH Federation) and Republika Srpska, which together make up the country of Bosnia and Herzegovina, have separate
pension systems and are treated as separate data points in the figure.
FIGURE 2.12Link between Pre-Retirement Earnings and Benefit Entitlements as Reflected in Pension SystemDesign in Central Europe and the Balkans
00.2
0.4
0.6
0.8
1.0
1.2
1.4
1.6
1.8
2.0
0.50 0.75 1.00 1.50 2.00
Ratio
of p
ensi
on b
enefi
t to
aver
age
wag
e
Ratio of individual's income toaverage wage
a. Central Europe
Estonia Croatia
Slovak RepublicHungary
Czech Republic Poland
00.20.40.60.81.01.21.41.61.82.0
0.50 0.75 1.00 1.50 2.00
Ratio
of p
ensi
on b
enefi
t to
aver
age
wag
e
Ratio of individual's wage to average wage
b. Balkans
Macedonia, FYR
Republika SrpskaKosovo
SerbiaAlbania
BiH Federation Montenegro
FIGURE 2.13Link between Pre-Retirement Earnings and Benefit Entitlements asReflected in Pension System Design in the Former Soviet UnionCountries and Turkey
0
0.2
0.4
0.6
0.8
1.0
1.2
1.6
1.8
2.0
1.4
0.50 0.75 1.00 1.50 2.00
Ratio of individual’s wage to average wage
a. Old FSU countries
Ratio
of p
ensi
on b
enef
it to
ave
rage
wag
e
Russian FederationArmenia
BelarusGeorgia
Moldova Ukraine
continued

The Evolution of Public Pension Programs 41
This analysis ignores the fact that in some countries many people
contribute only sporadically: they are not able to reach the full
careers assumed in figures 2.12 and 2.13 because of high unemploy-
ment, a large informal economy, long employment gaps among
women raising children, lax early retirement rules, and other rea-
sons. In those cases, especially when the minimum pension guaran-
tee is relatively high and the accrual rate in the benefit formula is
relatively low, the actual differences in pension levels across income
groups are likely to be much smaller than those suggested in the
figures.
The Inverting Pyramid: Structural Break in the PAYG Financing Model
The early twentieth century saw a successive expansion of groups
covered by the pension system in Western Europe, but this trend has
waned. From the beginning, with each new group of entrants, the
system became immature again. By the mid-1950s there were few, if
any, occupational groups left out of the system. However, the system
Source: Based on data from the OECD Pension Modeling Team using methodology from the OECD series Pensions at a Glance.
0
0.2
0.4
0.6
0.8
1.0
1.2
1.4
1.6
1.8
2.0
0.50 0.75 1.00 1.50 2.00
b. Young FSU countries and Turkey TTRa
tio o
f pen
sion
ben
efit t
o av
erag
e w
ages
Ratio of individual’s wages to average wage
Tajikistan
Azerbaijan
Turkey
Kazakhstan
Turkmenistan
Kyrgyz Republic
FIGURE 2.13Continued

42 The Inverting Pyramid
found new sources of expansion, first women joining the labor force
in greater numbers and then the large baby-boomer cohort.
The top portion of the pyramid depicted in figure 2.14 summarizes
the development of the pension system through the mid-1970s. By
that time, women’s LFP had nearly reached its current levels among
young cohorts, and demographic projections were beginning to show
the impact of lower fertility on the future working-age population.
The first alarms sounded in the more fiscally conservative countries
as they started to doubt the ability of the pension scheme to sustain
its previous growth in the number of contributors.
Compared to Western Europe, the growth in contributor numbers
slowed earlier in transition countries as women’s LFP rates equaled
men’s much earlier. Furthermore, the transition to a market economy
in the early 1990s resulted in a sharp drop in LFP rates, particularly in
the formal sector. The accompanying acute and sustained drop in fer-
tility rates in these countries coupled with ongoing emigration has
advanced by several decades the impact of the system maturation and
demographic change (see also Galasso, Gatti, and Profeta 2009).
Governments initially reacted to the slower growth in contributor
numbers, current and projected, by raising contribution rates in an
FIGURE 2.14Extension of Coverage and Its Impact on Pension Systems in Europe and Central Asia, 1900sthrough 2050
Established around 1900s
Since 1930s
Since 1950s
Since 1970s
Since 1990s in Europe
and Central Asia
Since 2010s
Industrial workers Maturity expected in 1960
Extended to 1990
Extended to 2010
Extended to 2020
Extended to 2030
No extension,
added stress 1990–2030
No extension,
added stress 2010–2050
Since 1960s (earlier in Europe
and Central Asia)
Commerce, civil servants,salaried employees added
Farmers, domestic workers,self-employed added
Increased female LFP rate
Baby boomers added
Drop in total and formal LFP rate
Post-1990s babies enterlabor market

The Evolution of Public Pension Programs 43
attempt to maintain the earlier pace of revenue increases. Figure 2.15
shows how countries attempted to raise revenue by raising contribu-
tion rates. The figure also demonstrates that these rates, after rising
quite dramatically in some cases, have stabilized since the mid-1990s.
Countries soon learned that higher contribution rates did not
FIGURE 2.15Increasing Pension Contribution Rates in Response to ExpandingExpenditures in Selected European Economies, 1940–2012
0
5
10
15
20
25
30
35
40
45
1940
1945
1950
1955
1960
1965
1970
1975
1980
1985
1990
1995
2000
2005
2010
Cont
ribu
tion
rate
, % o
f wag
e
a. High-Income Moderate Spenders
Austria Sweden
FinlandIreland
PortugalNetherlands
IcelandNorway
United Kingdom Germany
0
5
10
15
20
25
30
35
1940
1945
1950
1955
1960
1965
1970
1975
1980
1985
1990
1995
2000
2005
2010
Cont
ribu
tion
rate
, % o
f wag
e
High-Income Generous Spenders
SwitzerlandItaly
Slovenia Belgium
GreeceFrance
SpainCyprus
continued

44 The Inverting Pyramid
necessarily generate higher revenue, as they resulted in a less globally
competitive labor market and led to a rapid expansion of the informal
sector. While the Northern European countries generally did not suf-
fer from growth in the informal sector, the potential loss of competi-
tiveness in an increasingly global economy halted further increases in
the contribution rate.
Having approached the limits of raising additional revenue
through coverage expansion and higher contribution rates, coun-
tries now face the challenge of an expected decline in the working-
age population. As shown in figure 2.16, the working-age
population, defined as people 15 to 64 years of age, peaked at around
2010 for most countries in Western Europe (figure 2.16a and b).
Central European countries peaked a couple of decades earlier
(figure 2.16c).
The cumulative effect of this trend was an important structural
change: the rapid growth in working-age population abruptly changed
into prolonged decline. Between 1970 and 2010, very few countries
had faced a decline in the working-age population. Only three coun-
tries in Central Europe—Bulgaria, Latvia, and Hungary—experienced
such a decline in this period. But between 2010 and 2050, almost all of
the countries not labeled as “young” will face a shrinking working-age
population (figure 2.17). The only exceptions are Sweden, the United
0
10
20
30
40
50
60
1940
1945
1950
1955
1960
1965
1970
1975
1980
1985
1990
1995
2000
2005
2010
Cont
ribu
tion
rate
, % o
f wag
e
c. Lower-Spending Transition Countries
Czech Republic Romania
HungaryLithuania
PolandSerbia
Slovak Republic Bulgaria
EstoniaLatvia
Croatia Albania
Source: U.S. Social Security Administration, various years.
FIGURE 2.15Continued

The Evolution of Public Pension Programs 45
FIGURE 2.16Working-Age Population from 1950 to 2050 Relative to 2013, Selected European and Central Asian Economies
a. High-Income Generous Spenders
0
0.2
0.4
0.6
0.8
1.0
1.2
1950
1955
1960
1965
1970
1975
1980
1985
1990
1995
2000
2005
2010
2015
2020
2025
2030
2035
2040
2045
2050
Ratio
of w
orki
ng-a
ge
popu
latio
n to
that
in 2
013
Cyprus
LuxembourgBelgium
France
Slovenia
Italy Malta
Greece
Spain
Switzerland
b. High-Income Moderate Spenders
0
0.2
0.4
0.6
0.8
1.0
1.2
1950
1955
1960
1965
1970
1975
1980
1985
1990
1995
2000
2005
2010
2015
2020
2025
2030
2035
2040
2045
2050
Ratio
of w
orki
ng-a
ge p
opul
atio
n to
that
in 2
013
Iceland
Ireland
Denmark
Portugal
Sweden Finland
Netherlands
Norway
Germany
Austria
United Kingdom
continued

46 The Inverting Pyramid
0
0.2
0.4
0.6
0.8
1
1.2
1.4
1950
1955
1960
1965
1970
1975
1980
1985
1990
1995
2000
2005
2010
2015
2020
2025
2030
2035
2040
2045
2050
Ratio
of w
orki
ng a
ge p
opul
atio
n to
that
in 2
013
Russian Federation
Slovak Republic
Poland
Armenia
Lithuania
Moldova
Romania
Albania
Czech Republic
Belarus
Hungary
Georgia
Bulgaria
Latvia
Estonia
Croatia
c. Lower-Spending Transition Countries
FIGURE 2.16Continued
continued

The Evolution of Public Pension Programs 47
Source: United Nations population projections (UN 2011).
Note: Working-age population refers to people 15–64 years of age.
0
0.2
0.4
0.6
0.8
1.0
1.2
1.4
1.6
1.8
1950
1955
1960
1965
1970
1975
1980
1985
1990
1995
2000
2005
2010
2015
2020
2025
2035
2040
2045
2050
2030
Ratio
of w
orki
ng-a
gepo
pula
tion
toth
at in
201
3
e. Young Countries
TajikistanKazakhstan
TurkmenistanAzerbaijan
Kyrgyz Republic Uzbekistan
Turkey
0
0.2
0.4
0.6
0.8
1.0
1.2
1950
1955
1960
1965
1970
1975
1980
1985
1990
1995
2000
2005
2010
2015
2020
2025
2030
2035
2040
2045
2050
Ratio
of w
orki
ng-a
ge p
opul
atio
n to
that
in 2
013
d. High-Spending Transition Countries
Bosnia and HerzegovinaUkraine
MontenegroSerbia
Macedonia, FYR
FIGURE 2.16Continued

48 The Inverting Pyramid
Kingdom, Norway, Ireland, and Iceland, from the High-Income
Moderate Spenders group, and France and Cyprus, from the High-
Income Generous Spenders group. In some cases, such as Bulgaria, the
expected decline in the working-age population is sizable. Even among
the Young Countries, while the percentage of elderly is expected to
triple, the working-age population is not expected to even double.
The projected decline in the working-age population is partly due
to a sharp and sustained decline in fertility that occurred in the tran-
sition countries over the last 20 years. Figure 2.18 shows the decrease
in the number of children under the age of 5 between 1990 and 2010
in these countries. While the high-income countries experienced
minor fluctuations, the other three clusters experienced sharp and
fairly sustained fertility reductions.
While many countries are hoping for increased fertility rates,
policies intended to encourage this change are rarely successful.
Furthermore, changes in fertility have a demographic momentum of
their own. Lower numbers of children in one cohort lead to a small
FIGURE 2.17Change in Working-Age Population in Selected European and Central Asian Economies,1970–2010 and 2010–2050
Source: United Nations population projections (UN 2011).
–100
–50
0
50
100
150
200
250
Slo
veni
aIt
alyy
Mal
taS
wit
zerl
and
Gre
ece
Sppa
inB
elggi
umFr
ance
Cyyp
rpus
Luxe
mbo
urgg
Port
uggal
Ger
man
yyA
ustr
iaN
ethe
rlan
dsFi
nlan
dD
enm
ark
Sw
eden
Uni
ted
Kin
ggdo
mN
orw
ayyIr
elan
dIc
elan
dB
ulgga
ria
Geo
rgiga
Mol
dova
Bel
arus
Rom
ania
Latv
iaR
ussi
an F
eder
atio
nPo
land
Lith
uani
aC
roat
iaS
lova
k R
epub
licp
Hun
gar
gyy
Esto
nia
Cze
ch R
epub
lp
icA
lban
iaA
rmen
iaB
osni
a an
d H
erze
govi
ng
aU
krai
neM
aced
onia
, FY
RS
erbi
aM
onte
negr
og
Aze
rbai
jan
jTu
rkeyy
Kaz
akhs
tan
Uzb
ekis
tan
Turk
men
ista
nK
yrgy
z R
epub
licy
gyp
Tajijk
ista
n
Chan
ge in
wor
king
-age
pop
ulat
ion,
%
High-Income Generous
Spenders
High-Income Moderate
Spenders
Lower-Spending Transition Countries High-
Spending
Transition
Countries
Young
Countries
1970–2010 2010–2050

The Evolution of Public Pension Programs 49
childbearing cohort, which results in lower numbers of children in
subsequent cohorts. Figure 2.19 illustrates this fertility trajectory in
Poland. It shows that the number of babies born would continue to
decline in the future even if fertility rates stay constant at 2011 levels
(and to keep the number of children the same as in 2011, the number
of children per family would have to increase by 40 percent by 2025).
This decline is attributable solely to the reduction in the cohorts of
potential parents, which was predetermined by fertility declines 20
years ago.
The other major element leading to the decline in the working-
age population is emigration. Figure 2.20 shows the impact of emi-
gration on the working-age population in the 2000s in most
countries in the region. The blue diamonds indicate average annual
growth rate in the working-age population (aged 15–64) over the
last decade. In countries where the blue diamonds are below
the zero line, the working-age population is already falling. Note
the prevalence of the emigration component in the total growth
rate in the countries that recorded the largest declines in working-
age population, namely Romania, Lithuania, Latvia, and Bulgaria.
FIGURE 2.18Number of Children under Age 5 Compared to 1990, Europe and CentralAsia
Source: United Nations population projections (UN 2011).
50
60
70
80
90
100
110
1990
1995
2000
2005
2010
Popu
latio
n un
der a
ge5
as %
of
1990
leve
l
High-Income Generous
Spenders
High-Spending Transition
Countries
High-Income Moderate
Spenders
Lower-Spending Transition
Countries
Young Countries

50 The Inverting Pyramid
FIGURE 2.19Births in Poland in 1990–2011 and Projected Future Births through 2026
Source: Eurostat Statistics Database.
200,000
250,000
300,000
350,000
400,000
450,000
500,000
550,000
600,000
1990
1992
1994
1996
1998
2000
2002
2004
2006
2008
2010
2012
2014
2016
2018
2020
2022
2024
2026
Num
ber o
f bir
ths
Babies born Assuming 2011 fertility rate
In the high-income countries, the countries with the largest immi-
gration experienced growth in their working-age population.
Those with lower or no net immigration experienced little growth
in the working-age population.
For example, between 2000 and 2010 in Greece, the working-age
population expanded on average by 1.5 percent per year due to new
entrants in the labor force turning 15, but this was negated by the
1.6 percent of the labor force that reached the age of 65 and left.
Immigrants aged 15–64 added 0.4 percent to the labor force per year,
but 0.2 percent of the working-age population died, resulting in a
0.1 percent net increase in the working-age population.
The working-age population projections shown might be consid-
ered optimistic, as they do not take into account the impact of the
recent financial crisis. Ireland’s growth in this projection is largely
due to assuming the large inflow of immigrants in the past 20 years
continues. However, since the financial crisis, Ireland has experi-
enced a significant outflow of population, and the degree to which
this outflow will reverse in the future is unclear. Because the United
Nations population projections forecast immigration based on his-
torical flows, they also do not take into account the increasing

The Evolution of Public Pension Programs 51
emigration outflows that Central European, Balkan, FSU, and Young
Countries might experience as the higher-income countries start to
experience labor shortages and pull in workers from countries that
pay lower wages. They also do not take into account the possibility
that substantial immigration from outside the region might replace
some of this lost labor force, although such immigration would
require social and political consensus on the desirability of welcom-
ing and integrating people with different social and ethnic back-
grounds (see Bongaarts 2004).
Similarly, projections assume that fertility rates will follow a
pre-crisis path. The hardest-hit countries have already experienced
a significant decline in fertility during the crisis. This not only will
FIGURE 2.20Decomposition of Average Annual Change in Working-Age Population in Selected Europeanand Central Asian Economies, 2000–2010
Sources: Eurostat Statistics Database; United Nations population projections (UN 2011).
–4
–3
–2
–1
0
1
2
3
4
5
Gre
ece
Slo
veni
a
Ital
y
Fran
ce
Bel
gium
Sw
itze
rlan
d
Spa
in
Cyp
rus
Ger
man
y
Port
ugal
Den
mar
k
Net
herl
ands
Finl
and
Sw
eden
Aus
tria
Uni
ted
Kin
gdom
Nor
way
Icel
and
Irel
and
Latv
ia
Bul
gari
a
Lith
uani
a
Rom
ania
Hun
gary
Cze
ch R
epub
lic
Esto
nia
Pola
nd
Cro
atia
Mol
dova
Geo
rgia
Bel
arus
Arm
enia
Alb
ania
Ser
bia
Mon
tene
gro
Ukr
aine
Aze
rbai
jan
Turk
ey
Chan
ge in
wor
king
-age
pop
ulat
ion,
%
Net immigration, 15–64
Died, 15–64
Turning 65, % 15–64
Turning 15, % 15–64
Total growth in 15–64 populationM
aced
onia
, FY
R
Rus
sian
Fed
erat
ion
Slo
vak
Rep
ublic
High-Income
Generous Spenders
High-Income
Moderate Spenders
Lower-Spending
Transition Countries
High-
Spending
Transition
Countries
Young
Countries

52 The Inverting Pyramid
affect the labor market entrants in 2030, but also will lead to a reduc-
tion in the size of the childbearing cohort; this in turn will reduce the
number of labor market entrants in 2050, compared to what has
been projected.
Finally, while life expectancies have been increasing until now,
continued increases can be expected to burden the pension system
much more significantly in the future, as they will apply to much
larger cohorts of elderly with wide pension coverage. Figure 2.21
shows the percentage of the population over the age of 65 in 2010
and 2050. In all country clusters except the Young Countries, the
percentage of the population over 65 is expected to almost double in
the next 40 years.
High-Income Generous Spenders will see a doubling of their
populations over 65. France and Belgium will experience slightly
lower increases, but almost a quarter of their populations will be
elderly by 2050. Among the High-Income Moderate Spenders, the
United Kingdom, Sweden, Denmark, and Finland elderly populations
FIGURE 2.21Percentage of Elderly in the Population in Selected European and Central Asian Economies,2010 and 2050
Source: United Nations population projections (UN 2011).
2010 2050
0
5
10
15
20
25
30
35
40
Luxe
mbo
urg
Fran
ceB
elgi
umC
ypru
sM
alta
Slo
veni
aG
reec
eS
wit
zerl
and
Ital
yy
Spa
in
Icel
and
Irel
and
Uni
ted
Kin
gdom
Nor
way
Den
mar
kS
wed
enFi
nlan
dN
ethe
rlan
dsA
ustr
iaG
erm
any
Port
ugal
Arm
enia
Rus
sian
Fed
erat
ion
Rep
ublic
of
Mol
dova
Bel
arus
Lith
uani
aE s
toni
aA
lban
iaH
unga
ryLa
tvia
Geo
rgia
Slo
vak
Rep
ublic
Pola
ndC
zech
Rep
ublic
Cro
atia
Rom
ania
Bul
gari
aM
onte
negr
oU
krai
neS
erbi
aM
aced
onia
, FY
RB
osni
a an
d H
erze
govi
naTa
jikis
tan
Kyr
gyz
Rep
ublic
Turk
men
ista
nK
azak
hsta
nU
zbek
ista
nA
zerb
aija
nTu
rkey
High-Income
Generous Spenders
High-Income
Moderate Spenders
Lower-Spending
Transition Countries
High-
Spending
Transition
Countries
Shar
e of
eld
erly
in th
e po
pula
tion,
%
Young
Countries

The Evolution of Public Pension Programs 53
will expand a bit less than in the other countries, but on average in
2050 more than one person in four will be over age 65 in these coun-
tries. Countries like Austria and Germany will exceed this average,
with closer to one of every three people being elderly; the proportion
in Portugal will be even higher.
In the transition countries, both low-spending and high-spending,
the percentage of elderly in the population will double. On average,
these countries are projected to have one elderly for every 3.5 peo-
ple, but Bosnia and Herzegovina expects to have one elderly for
every three people. Even countries currently considered younger in
this region, like Albania, should expect to have elderly account for
one of every four people. The surprising result comes in the Young
Countries. While these countries often do not worry about aging,
they will see a tripling of the percentage of elderly in their popula-
tions in the 40-year period and will have one elderly for every seven
people. Turkey will be a bit older, with one of every five people being
elderly. For these younger countries as a whole, this is a significant
change from the present demographics, where on average only one
in 20 people is elderly.
Slower working-age population growth translates into fewer con-
tributors, and this, combined with growing numbers of elderly, leads
to large deficits in the pension system. Another way of thinking
about this is to consider how many elderly each working-age person
needs to support, often called the old-age dependency ratio. Figure
2.22 shows the striking growth in the old-age dependency ratio from
1970 to 2010 and from 2010 to 2050. By 2050, on average, each
working-age person will have to support more than three times as
many elderly as in 1970, and the rate of change in 2010–50 will be
greater than it was in 1970–2010. Projections for a stylized Central
European country show that the resulting deficits might be as high as
7 percent of GDP by 2050 if contribution rates, benefit levels, and
effective retirement ages remain unchanged (figure 2.23).
Policy Conclusions
Pension systems in Western Europe have successfully achieved social
goals of reducing poverty among the elderly and providing a mecha-
nism to replace wage income in old age. The systems became a cor-
nerstone of society and expanded coverage toward all elderly. With
the concept of the pension system firmly in place, pensions came to
be understood as an earned right, and pensioners’ incomes were
expected to rise with the living standards of workers.

54 The Inverting Pyramid
FIGURE 2.22Old-Age Dependency Ratios in Selected European and Central Asian Economies, 1970, 2010, and2050
Source: United Nations population projections (UN 2011).
0
10
20
30
40
50
60
70
Luxe
mbo
urg
Cyp
rus
Fran
ceB
elgi
umM
alta
Slo
veni
aG
reec
eS
wit
zerl
and
Ital
yS
pain
Icel
and
Uni
ted
Kin
gdom
Nor
way
Irel
and
Den
mar
kS
wed
enFi
nlan
dN
ethe
rlan
dsA
ustr
iaG
erm
any
Port
ugal
Arm
enia
Mol
dova
Rus
sian
Fed
erat
ion
Alb
ania
Bel
arus
Lith
uani
aEs
toni
aH
unga
ryLa
tvia
Geo
rgia
Slo
vak
Rep
ublic
Pola
ndC
roat
iaR
oman
iaC
zech
Rep
ublic
Bul
gari
aM
onte
negr
oU
krai
neS
erbi
aM
aced
onia
, FY
RB
osni
a an
d H
erze
govi
naTa
jikis
tan
Kyr
gyz
Rep
ublic
Turk
men
ista
nK
azak
hsta
nU
zbek
ista
nA
zerb
aija
nTu
rkey
Old
age
dep
ende
ncy
ratio
in p
erce
nt
High-Income
Generous Spenders
High-Income
Moderate Spenders
Lower-Spending
Transition Countries
High-
Spending
Transition
Countries
Young Countries
1970 2010 2050
FIGURE 2.23Projected Pension Deficits in an Average Central European Economy, 2007–2077
Source: Projections generated using World Bank’s Pension Reform Options Software Toolkit (PROST).
–7
2007 2017 2027 2037 2047 2057 2077
–6
–5
–4
–3
–2
–1
0
% o
f GDP

The Evolution of Public Pension Programs 55
However, introduction of the PAYG financing mechanism, and the
increased benefit generosity associated with it, has resulted in high
and growing pension costs and undesirable intergenerational trans-
fers, especially in earnings-related benefit schemes. Cohorts of the
elderly that made small contributions but were able to enjoy
increased benefits over long retirement periods benefited greatly
from the system. However, these arrangements could only be upheld
because of the rapid increase in the numbers of contributors, increas-
ingly higher contribution rates, and small numbers of pensioners due
to program immaturity—the expansion of the pension pyramid
within the expanding demographic pyramid.
Other countries of Europe and Central Asia aspire to reach the
same social goals already achieved in Western Europe, despite the
associated high costs. They have introduced a plethora of pension
system designs, hoping to further improve on the model of income
provision to the elderly developed in Western Europe.
Pension system designs chosen in the last two decades in this
broad region rested on some important assumptions. First of all, it
was widely assumed that LFP and formalization in the post-transi-
tion economies could be expected to return close to the levels
observed before the transition. It was believed that earnings-related
benefit design could provide sufficient incentives to workers to par-
ticipate in the pension system and to voluntarily delay retirement.
Moreover, it was expected that the pension structures, once chosen,
would be insulated from political interference. Development of the
financial markets, financial literacy, efficient portfolios, and growth-
producing investments would naturally follow the introduction of
funded individual pension accounts. Finally, the sharp fall in fertil-
ity rates, observed early in the transition, was expected to fully
reverse, and a protracted period of strong emigration was not
expected.
Some of the assumptions made at the time of the reform were
quite optimistic and were bound to disappoint, but the unpredicted
turn for the worse in demographic developments had the largest
impact on the pension systems in the transition countries. Sharp and
prolonged decline in fertility coupled with large emigration waves in
some countries has added to the already challenging problems of
population aging and program maturation, leading to the inverting
of the demographic pyramid.
The importance of the structural break in the PAYG financing
model of pension programs prevalent throughout the region cannot
be emphasized enough. By an unfortunate coincidence, many pen-
sion systems in the region are reaching full maturity just as the size of

56 The Inverting Pyramid
younger cohorts is starting to decline. Many pension systems will
have to adjust to the structural shift from an environment of contin-
ued contributor growth to an environment of prolonged contraction
in contributor numbers. The longer these changes are postponed, the
more implicit pension liabilities are built up, the higher will be the
financial and social costs to current and future cohorts of workers of
unwinding these arrangements, and the more abrupt this transition
will have to be.
The next chapters review implementation challenges faced by the
countries of the region when introducing their chosen pension system
designs. For successful implementation, the parameters of different
pension system components had to be set in a fiscally and socially sus-
tainable manner, transition from the old to the new system had to be
handled smoothly and without disruptive fiscal implications, new
institutions had to be set up, and the population had to be persuaded
to accept the reforms and participate in the new pension system struc-
tures. Accompanying reforms of capital and labor markets were also
necessary. Finally, the system had to be made robust to economic
shocks, which was soon to be tested by an economic boom in the mid-
dle of the 2000s and the subsequent financial crisis. Negative demo-
graphic developments made some of these tasks even harder to
accomplish.
Notes
1. Much of the historical description comes from Verbon (1988) for Germany and the Netherlands. While each country has its individual story of how social security developed, similar patterns can be seen in the other European countries. See, for example, Boldrin, Jimenez-Martin, and Peracchi (1997) for a discussion of Spanish social security; Hohman (1940) and Palme and Svensson (1999) on Swedish social security; Queisser (1996) on German social security; Tomka (2002) for a discussion of social security in Hungary; and Cutler and Johnson (2004), Gruber and Wise (1999), and U.S. Social Security Administration (n.d.) for international comparisons.
2. These same patterns of limited initial systems with gradually expand-ing coverage can be seen throughout the Central European, Balkan, and FSU countries. The increases in coverage were especially great in the former Soviet Union, as the entire working-age population, men and women, joined the contributing labor force. Data constraints pre-clude providing time series for these countries, but historical sources suggest that the progression was similar to what can be seen in Western Europe.
3. Population comparisons are only valid for a limited number of coun-tries, given the changes in boundaries over the twentieth century.

The Evolution of Public Pension Programs 57
4. Looking forward, the duration of retirement for those who in 1970reached age 63 in Belgium, 71 in Spain, and 67 in Sweden is evengreater, so the figure underestimates the impact of retirement age declineon retirement duration for retirees with the same characteristics.
5. OECD assumptions for the modeling include real earnings growth of 2 percent per year in all countries, inflation of 2.5 percent per year in allcountries, and real return on funded, defined contribution rates of3.5 percent per year. A more detailed description of the methodologyused may be found in OECD (2011).
6. Details on pension system design can be found in the EuropeanCommission’s Mutual Information System on Social Protection(MISSOC 2012); in studies by Holzmann and Guven (2009), Holzmannand Hinz (2005), Pallares-Miralles, Romero, and Whitehouse (2012),and Börsch-Supan (2012); as well as in the OECD Pensions at a Glanceseries (various years) and the U.S. Social Security Administration’s Social Security Programs throughout the World (various years).d
References
Boldrin, Michele, Sergi Jimenez-Martin, and Franco Peracchi. 1997. “SocialSecurity and Retirement in Spain.” NBER Working Paper 6136, NationalBureau of Economic Research, Cambridge, MA.
Bongaarts, John. 2004. “Population Ageing and the Rising Cost of PublicPensions.” Population and Development Review 30 (1): 1–23.
Börsch-Supan, Axel H. 2012. “Entitlement Reforms in Europe: Policy Mixesin the Current Pension Reform Process.” NBER Working Paper 18009,National Bureau of Economic Research, Cambridge, MA.
CES (Committee on Economic Security). n.d. “Old Age Security Abroad.”Available on the U.S. Social Security Administration website, http://www.ssa.gov/history/reports/ces/cesbookc9.html.
Chlon-Dominczak, Agnieszka and Pawel Strzelecki. 2013. “The MinimumPension as an Instrument of Poverty Protection in the Defined ContributionPension System—An Example of Poland.” Journal of Pension Economics and Finance 12 (3): 326–50.
Chomik, Rafal, and Edward R. Whitehouse. 2010. “Trends in PensionEligibility Ages and Life Expectancy, 1950–2050.” OECD Social,Employment, and Migration Working Paper 105, Organisation for Economic Co-operation and Development, Paris.
Conde-Ruiz, J. Ignacio, and Paola Profeta. 2007. “The Redistributive Designof Social Security Systems.” Economic Journal 117 (520): 686–712.l
Cutler, David M., and Richard Johnson. 2004. “The Birth and Growth of theSocial Insurance State: Explaining Old Age and Medical Insurance across Countries.” Public Choice 120 (1–2): 87–121.
Diamond, Peter A. 1997. “Insulation of Pensions from Political Risk.” In TheEconomics of Pensions: Principals, Policies, and International Experience, editedby Salvador Valdés-Prieto, 33–58. New York: Cambridge University Press.

58 The Inverting Pyramid
European Commission. 2012. Pension Adequacy in the European Union 2010–2050. Brussels: European Commission, Directorate-General forEmployment, Social Affairs and Inclusion, Social Protection Committee.
Eurostat Statistics Database. European Commission, Brussels. http://epp.eurostat.ec.europa.eu/portal/page/portal/statistics/search_database.
Flora, Peter, Jens Alber, Richard Eichenberg, Jürgen Kohl, Franz Kraus, andWinfried Pfenning. 1983. State, Economy, and Society in Western Europe 1815–1975: A Data Handbook in Two Volumes. Vol. 1 of The Growth of Mass Democraciesand Welfare States. Frankfurt, Germany: Campus Verlag; London, U.K.:Macmillan; Chicago, IL: St. James Press.
Flora, Peter, Franz Kraus, and Winfried Pfenning. 1987. State, Economy, and Society in Western Europe 1815–1975: A Data Handbook in Two Volumes. Vol. 2of The Growth of Industrial Societies and Capitalist Economies. Frankfurt,Germany: Campus Verlag; London, U.K.: Macmillan; Chicago, IL: St.James Press.
Galasso, Vincenzo, Roberta Gatti, and Paola Profeta. 2009. “Investing for the Old Age: Pensions, Children and Savings.” International Tax and Public Finance 16 (4): 538–59.
Galasso, Vincenzo, and Paola Profeta. 2004. “Lessons for an Ageing Society: The Political Sustainability of Social Security Systems.” Economic Policy 19y(38): 63–115.
Gruber, Jonathan, and David A. Wise, eds. 1999. Social Security and Retirement around the World. Chicago, IL: University of Chicago Press.
Hirose, Kenichi, ed. 2011. Pension Reform in Central and Eastern Europe: In Timesof Crisis, Austerity and Beyond. Budapest: International Labour Organization.
Hohman, Helen Fisher. 1940. “Social Democracy in Sweden.” Social SecurityBulletin 3 (2).
Holzmann, Robert. 2009. Aging Population, Pension Funds, and Financial Markets: Regional Perspectives and Global Challenges for Central, Eastern, and Southern Europe. Washington, DC: World Bank.
Holzmann, Robert, and Ufuk Guven. 2009. Adequacy of Retirement Income after Pension Reforms in Central, Eastern, and Southern Europe: Eight Country Studies.Washington, DC: World Bank.
Holzmann, Robert, and Richard P. Hinz. 2005. Old-Age Income Support in the21st Century: An International Perspective on Pension Systems and Reform.Washington, DC: World Bank.
ILO (International Labour Organization), Department of Statistics. LABORSTA (database). http://laborsta.ilo.org/.
International Labour Office. 1977. Pensions and Inflation. Geneva, Switzerland:International Labour Office.
IWE (Institute for World Economics of the Hungarian Academy of Sciences). 1995. Human Resources and Social Stability during Transition in Hungary. SanFrancisco, CA: International Center for Economic Growth.
LIS (Cross-National Data Center in Luxembourg). 2013. “Inequality and Poverty Key Figures,” (accessed March 15, 2013), http://www.lisdatacen-ter .org/data-access/key-figures/inequality-and-poverty/.
The Evolution of Public Pension Programs 59
Madison, Angus. 2010a. “Revision of Population Estimates: Explanatory Background Note on Historical Statistics (2010).” University of Groningen,Sweden. http://www.ggdc.net/maddison/Maddison.htm.
———. 2010b. “Statistics on World Population, GDP and per Capita GDP,1–2008 AD.” University of Groningen, Sweden. http://www.ggdc.net/ maddison/Maddison.htm.
MISSOC (European Commission, Mutual Information System on Social Protection). 2012. Comparative Tables on Social Protection. http://ec.europa.eu/social/main.jsp?catId=815&langId=en.
OECD (Organisation for Economic Co-operation and Development). 2002.OECD Economic Outlook, no. 72 (December). Paris: OECD.
———. 2011. Pensions at a Glance 2011: Retirement-Income Systems in OECD and G20 Countries. Paris: OECD.
———. 2013. “Ageing and Employment Policies: Statistics on Average Effective Age of Retirement.” http://www.oecd.org/insurance/public - pensions/ageingandemploymentpolicies-statisticsonaverageeffectiveageofretirement.htm.
Pallares-Miralles, Montserrat, Carolina Romero, and Edward Whitehouse.2012. “International Patterns of Pension Provision II: A WorldwideOverview of Facts and Figures.” Social Protection Discussion Paper 70319,World Bank, Washington, DC.
Palme, Marten, and Ingemar Svensson. 1999. “Social Security, OccupationalPensions, and Retirement in Sweden.” In edited by Jonathan Gruber andDavid A. Wise, 355–402.
Queisser, Monika. 1996. “Pensions in Germany.” Policy Research Working Paper 1664, World Bank, Washington, DC.
Tomka, Bela. 2002. Social Security in Hungary in a Long-Run and Comparative Perspective: Expenditures, Social Rights, and Organization, 1918–1990. Berlin:Osteuropa-Inst.
UN (United Nations). 2011. World Population Prospects: The 2010 Revision. NewYork: United Nations, Department of Economic and Social Affairs,Population Division. CD-ROM.
U.S. Senate. 1981. “Social Security in Europe: The Impact of an AgingPopulation.” Information paper prepared for use by the Special Committeeon Aging, U.S. Senate, Washington, DC.
U.S. Social Security Administration. n.d. “Social Security History.” http://www.ssa.gov/history/pre1935table2.html.
———. Various years. Social Security Programs throughout the World. http://www.ssa.gov/policy/docs/progdesc/ssptw/.
Verbon, Harrie. 1988. “The History of Transfer Payments for the Old.” Chapter2 in The Evolution of Public Pension Schemes. Berlin: Springer-Verlag.


Have the Pension Reforms to Date Been Enough?
CHAPTER 3
61
Introduction
While the choice of pension system design reflects some clear societal
preferences, it does not necessarily ensure fiscal and social
sustainability, as is sometimes believed. Instead, the design addresses
philosophical beliefs about the main goals of the pension system and
the need for income redistribution. It reflects the definition of fairness
as understood by the society and the level of trust in the government,
markets, the political process, and an individual’s ability to choose.
The design also attempts to ensure against demographic, political,
and market risks most feared by the society and offers a tool for some
risk diversification.
Ensuring the sustainability of a given design entails restructuring
unsustainable liabilities, choosing the right program parameters, and
implementing competent regulation and administration. All this
must be done while avoiding impediments to economic growth and
to the efficient functioning of capital and labor markets. At the same
time, social sustainability of the chosen design requires a tireless
educational campaign, open discussion of inherent trade-offs in pen-
sion policy, honest intergenerational dialogue, and public acceptance
of necessary sacrifices. The planning of these reforms in the context

62 The Inverting Pyramid
of transition is further complicated by the volatility of the economies,
with underlying conditions—economic growth, growth in the formal
labor force, trends in remuneration, willingness of workers to con-
tribute to the pension system, and willingness of bond markets to
help finance transition costs—particularly difficult to predict.
The goal of ensuring long-term fiscal sustainability, always elusive,
was far out of reach at the time of pension system reform in Europe
and Central Asia. Accrued implicit pension liabilities were large, and
demographic projections seemed discouraging, even before they
turned for the worse in some transition countries. The introduction of
a private pension system component required finding a new source of
financing, as some of the pension contributions were now redirected
to individual savings accounts in many countries of the region.
Attempts to increase long-term fiscal sustainability included immedi-
ate restructuring of some of the accrued pension liabilities, gradual
reduction of future pension promises, and changes in contribution rates.
The political uproar surrounding pension reforms often limits the
ability of policy makers to try for a politically sustainable solution
immediately. Instead it typically leads to a series of smaller reforms,
all moving in the same direction. Complications arise when there is a
change of government and the forward momentum for further
reforms either stalls or reverses. So the reformers opted to go as far as
they could toward fiscal sustainability, assuming that once the public
had accepted the initial changes, further reforms could be enacted.
But these reformist governments often were voted out at the next
election, replaced by populist governments that backtracked on
reforms. After reformers were voted back in, they had to restart the
reforms, but from a point that was further back than where they had
left off, making it difficult to make progress. This cycle of reformist/
populist governments continues to this day.
A further challenge to sustainability was lack of understanding or
acceptance of system trade-offs. The public seemed favorable toward
the goals and main design features of the new pension systems, which
focused on an income replacement function. However, time and
again, political pressure to increase the minimum pension amount
revealed that the public was not ready to make trade-offs between
income replacement and minimum income provision, but instead
demanded both kinds of protection. Cooperation from workers and
employers was also needed in raising contribution revenue and
increasing retirement ages, but public pension programs could not
afford to offer big financial incentives to motivate such behavior.
Finally, expectations for pension levels were high, in part because of
what was being delivered by pension systems in Western Europe,

Have the Pension Reforms to Date Been Enough? 63?
but also because of a narrow gap between wage levels and the high
cost of minimal living standards. Negative demographic developments
were also eroding trust of the younger generation in the new pension
system. Consequently, public enthusiasm for participation in public
pension programs was not high, and contributor coverage did not
expand as much as initially expected. In some countries participation
in the pension system was simply unaffordable for low-paid workers.
This chapter describes the parametric changes to date and
evaluates the gains in fiscal and social sustainability of public pen-
sion programs in Europe and Central Asia. It starts by discussing the
scale of the restructuring challenge and then describes the paramet-
ric reforms of public pension programs, including attempts to imple-
ment these reforms through self-adjusting mechanisms. The chapter
assesses reform achievements to date, measuring gains in fiscal and
social sustainability of pension systems by the shortening of the
average benefit receipt period, lower benefit generosity, reduction
in current and projected pension spending, coverage rates, benefit
adequacy, and observed frequency in the changes of system design.
The discussion then touches upon the cycle of reform, observing
that initial reforms born from worries about fiscal sustainability
were partially reversed in some countries during subsequent boom
years and as a consequence of the financial crisis. The chapter con-
cludes with policy implications moving forward.
The Need for Parametric Reforms
For most European governments, the estimates of future pension obli-
gations exceed explicit government liabilities. Müller, Raffelhüschen,
and Weddige (2009) provide some estimates of the implicit pension
liabilities of a selected group of European countries. As shown in fig-
ure 3.1, the amount of implicit pension liabilities is significantly higher
than explicit liabilities, except in the United Kingdom. While these fig-
ures are highly sensitive to the discount rate (and to other assump-
tions as well), other reports (e.g., Mink 2005) also suggest that implicit
pension debt levels are very high in most countries of the region.
High implicit liabilities become unaffordable when contributor
numbers start to shrink. The average implicit pension liabilities shown
in figure 3.1 are on the order of 200 percent of gross domestic product
(GDP). Given that these liabilities have risen from zero in about
100 years, this amounts to an average increase in liabilities of
about 2 percent of GDP per year, which is the outcome of making
increasingly generous promises to an increasingly large number of

64 The Inverting Pyramid
contributors, often in return for increasingly large contributions. This
pattern could continue as long as even more contributors were joining
pension programs each year, allowing governments to “refinance” the
liabilities coming due by “borrowing” from numerous new contribu-
tors. However, when the number of new “lenders” starts to shrink,
implicit liabilities due can no longer be fully refinanced: they have to
be paid from other sources or made explicit by borrowing in capital
markets. At the time of structural pension reforms, governments real-
ized that however difficult the payment of pensions was currently,
future pension deficits would be even higher. Thus, the need to lower
implicit pension liabilities as soon as possible was well understood.
Restructuring already accrued liabilities, which normally affect
current pensioners and older workers, can reduce implicit liabilities.
This can involve a retroactive reduction in the accrual rate,
redefinition of insured income, a rapid increase in retirement age
without actuarially fair compensation, elimination of early retire-
ment options, levying of a new tax on pension benefits, and less gen-
erous benefit indexation. All of these have been tried by different
countries under various circumstances, and in some cases they have
been challenged in court. However, more often than not, significant
restructuring of accrued liabilities did not happen in this group of
countries, and the pension rights of older populations were largely
grandfathered, exacerbating issues of intergenerational inequity.
Most governments, instead, have opted for the slower accrual of
new liabilities introduced through gradual parametric reforms or
through a reduced degree of income insurance going forward. As a
result, lower contributions are combined with lower benefits; this was
FIGURE 3.1Implicit Pension Liabilities and Explicit Debt as a Percentage of GDPin Selected European Economies, 2006 and 2011
Source: Müller, Raffelhüschen, and Weddige 2009.
% o
f GD
P
0
50
100
150
200
250
300
350
400
450
500
Czech
Rep
ublic
Austri
a
Bulgar
ia
German
ySpa
in
Finlan
d
Franc
e
Greec
e
Hunga
ryIta
ly
Lithu
ania
Latvi
a
Nethe
rland
s
Polan
d
Portu
gal
Sweden
Slovak
Rep
ublic
United
King
dom
Implicit pension liabilities as of 2006Explicit debt as of 2011
72
3601515
202
41
200
81
330
69
204
49
301
86
365
165
231
81
257
120
323
39
181
38
125
65
236
56
361
108
298
38
284
43
21182
91

Have the Pension Reforms to Date Been Enough? 65?
often done when introducing a system of private individual pension
savings accounts. Unfortunately, grandfathering older generations
often meant that pension rights of younger generations were reduced
much more, jeopardizing future benefit adequacy and incentives of
younger workers to contribute. Other governments have felt unable to
sufficiently reduce future pension promises or have done so extremely
slowly, leaving the fiscal sustainability problem largely unresolved.
Countries of the region have undertaken a variety of parametric
reforms in recent years. These include tightening of the eligibility con-
ditions to obtain a pension and changes to the benefit calculation that
effectively reduce the benefits paid. Also included are changes to the
contribution rates, as countries with lower-than-average contribution
rates have raised them, while countries with higher contribution rates
have tended to lower them. Transition countries typically have been
the strongest reformers for a number of reasons: (a) they were struc-
turally redesigning their systems, which was an opportune time to
also reform main program parameters; (b) they were fiscally more
constrained and had to undertake aggressive reform; and (c) the tran-
sition from a centrally planned economy to a market economy pro-
vided an opportunity to make changes in a variety of areas, including
pension provision. Figure 3.2 summarizes the parametric reforms that
have taken place since 1995 by cluster. Box 3.1 explains these para-
metric reforms in detail (see also Hirose 2011).
FIGURE 3.2Parametric Pension Reforms in Europe and Central Asia, 1995–2010
Sources: U.S. Social Security Administration, various years; country-provided data.
0
20
40
60
80
100
High-Income
Generous
Spenders
High-Income
Moderate
Spenders
Lower-Spending
Transition
Countries
High-Spending
Transition
Countries
Young
Countries
% o
f cou
ntri
es in
eac
h gr
oup
unde
rtak
ing
refo
rms
Increase in retirement age
Years of service reforms
Increase in contribution rate
Decrease in contribution rate
Indexation reforms
Extension of averaging period
Changes to benefit rate

66 The Inverting Pyramid
BOX 3.1
Parameters of a Traditional Pension System
Eligibility Conditions
Retirement age: Normal age at which people can retire.
Years of service: Minimum years of service required to qualify for a pension (for some occupa-
tions, the years of service awarded exceed the years actually worked).
Benefit Parameters
Accrual rate: Percentage of wage base earned per year of service.
Wage base: Wage on which pension benefits are calculated, typically average wage earned
during a specified period of time.
Averaging period for wage base: Number of years included in the average wage on which the
pension benefits are calculated. This can range from last salary to full-career average.
Valorization of past wages: Parameter used to revalue past wages when averaging to account
for the fact that wages were earned at different points in time when the cost of living and
economy-wide average wages differed from what exists at the time of retirement. This is typically
the economy-wide average wage growth between the time the wages were earned and the time
of retirement.
Indexation: Parameter that determines how pensions are increased after retirement. It is typi-:
cally linked to inflation or wage growth or some combination of the two.
Contribution Rates
Workers, their employers, and sometimes the government make contributions as a percentage
of the net or gross wage. These contributions are typically subject to a ceiling and sometimes
subject to a minimum as well.
Parametric Reform Options
In undertaking parametric reform, countries primarily made four
types of changes: (a) changes in benefit eligibility conditions;
(b) changes in benefits provided; (c) changes in contribution rates;
and (d) the introduction of self-adjusting mechanisms. Most of the
changes were designed to make the systems less costly, but also more
fair (see also Whitehouse et al. 2009).

Have the Pension Reforms to Date Been Enough? 67?
Changes in Benefit Eligibility Requirements
Changes in benefit eligibility requirements attracted a lot of attention
within the reform agenda. The strongest reforms of this type were
changes in retirement ages. These have a double positive impact on
pension systems: they both increase revenue, by increasing the num-
ber of contributors, and reduce expenditure, by reducing the number
of beneficiaries as workers continue to work longer. Interestingly,
legislated retirement age increase was almost never reversed once
enacted, with the single exception of the Kyrgyz Republic. Most
High-Income Moderate Spender countries already had retirement
ages for full pension of at least 65 for both men and women by 1995,
with Germany and the United Kingdom catching up by 2010.
Denmark, Iceland, Ireland, and the United Kingdom have subse-
quently raised retirement ages above 65. The only exception is
Austria, where the retirement age for women remains 60, to be
increased to 65 only by 2033. All High-Income Generous Spender
countries except Slovenia and France have increased the retirement
age for men to 65, but women continue to retire younger with full
pensions in Greece and Italy.
Retirement ages rose in the majority of the Lower-Spending
Transition Countries, but this cluster is sharply divided between those
countries that were part of the Soviet Union and those that were not.
Retirement ages for all of the countries were typically 60 for men and
55 for women in 1995. Most of the non–Soviet Union countries now
have retirement ages above 62 for men and at least 60 for women,
and all, except for the Slovak Republic, have already legislated an
increase in retirement age to at least 65 for men (Poland has recently
legislated an increase to 67). Only Albania, Bulgaria, and Romania
have not yet legislated the equalization of retirement ages between
men and women. In many of the former Soviet Union (FSU) coun-
tries, retirement ages are significantly lower, with Belarus, Moldova,
and the Russian Federation at retirement ages of 62 or below for men
and below 60 for women. In addition, Georgia, which has raised the
retirement age for men to 65, continues to maintain a lower retire-
ment age for women.
The High-Spending Transition Countries also increased retirement
ages. They had normal retirement ages of 60 for men and 55 for
women in 1995. The average retirement age is now legislated to be
65 for men and 63 for women, with Montenegro having legislated
retirement ages of 67 for both men and women. Even the Young
Countries have been actively raising retirement ages, with increases
in five of eight countries. These countries also had retirement ages of

68 The Inverting Pyramid
60 for men and 55 for women, with the exception of Turkey, which
did not have a minimum retirement age. The average legislated
retirement age for this group of countries is now 62.6 for men and
58.4 for women. In this group of countries, only Turkey has legis-
lated equalization of retirement ages for men and women, although
the equalization will not be implemented for several decades.
Figure 3.3 shows the average legislated retirement age for each of the
country clusters.
Encouraging women to retire earlier than men means that women
contribute for fewer years. This adds to the interruption of contribu-
tion periods that many women experience during their childbearing
years. Fewer years of contribution result in lower benefits for women
received for a long retirement period, since women tend to live lon-
ger than men and retire earlier. Internationally, much of the poverty
among the elderly is concentrated in women who had no or limited
years of contribution. The international trend is toward equalization
of retirement ages between men and women, partly to reduce this
disparity.
Because of early retirement provisions, average effective retirement
ages are often substantially lower than the legislated ages shown in
figure 3.3. As discussed in chapter 2, early retirement substantially
FIGURE 3.3Average Legislated Retirement Ages for Men and Women in Europe and Central Asia, 2013
Sources: MISSOC Comparative Tables on Social Protection; OECD; country-provided data.
54
56
58
60
62
64
66
68
High-Income
Generous
Spenders
High-Income
Moderate
Spenders
Lower-Spending
Transition
Countries
High-Spending
Transition
Countries
Young
Countries
Legi
slat
ed re
tirem
ent a
ge, y
ears
Men Women

Have the Pension Reforms to Date Been Enough? 69?
increases the average duration of retirement and thus the value and
cost of retirement benefits. Still, most countries allow it in some cir-
cumstances. Early retirement, usually with full pension, might be
offered to certain special occupations like military personnel, police-
men, and miners. The list can also include a host of other categories
like opera singers in Austria, ballerinas in Serbia, and bullfighters in
Spain. While employers in these professions are often required to
make higher contributions to help finance full benefits for their work-
ers, these are not sufficient to cover the costs of the early retirement;
this leaves early retirement programs to be subsidized by workers in
other industries, introducing some interoccupational inequities.
Alternatively, some countries allow all individuals the option to retire
early, but with some type of reduction in pension. Meanwhile, a few
countries allow anyone to retire earlier than the normal retirement
age with a full pension, but they put limits on the number of years a
person can retire early or on the earliest eligible age for retirement to
avoid allowing people to make choices that will leave them in poverty
in advanced old age (Zaidi and Whitehouse 2009; Chomik and
Whitehouse 2010).
Country policies regarding early retirement vary considerably, but
the overall trend is toward reduction of this practice. Some countries,
like Ireland, do not allow early retirement except for special
occupations, while others, like Greece, allow retirement up to
10 years before the normal retirement age. Benefit reductions for
early retirement also differ across countries, with countries like Spain
reducing benefits as much as 7 percent per year for early retirement,
and others, like Belgium and Luxembourg, not reducing early retire-
ment pensions at all. Reforming countries have been moving toward
reducing the number of occupations eligible for early retirement and
restricting the type of work within the occupation that is eligible for
early retirement, such as by providing these benefits only to
underground miners and not to other workers connected with the
mining industry. Poland, for example, successfully limited the
number of people eligible for early retirement from 1.53 million to
860,000 in a 2009 reform (see annex 3A). Countries have also been
raising the benefit reductions for early retirement to discourage the
practice (OECD 2011).
Another common benefit eligibility condition that is often revised
pertains to the minimum number of contribution years. As pension
system designs have changed, the number of working years required
to collect a pension has risen in some countries and fallen in others. To
improve fiscal sustainability, countries have been increasing the mini-
mum number of working years required. However, policy makers also

70 The Inverting Pyramid
worry that tighter eligibility conditions will leave some people, who
have sporadic contribution histories, without a pension and will dis-
courage others, who do not foresee having long careers, from contrib-
uting altogether. This has often led to retirement options: full pension
with increasingly high number of contribution years required, or par-
tial pension with fewer required years, lower benefits, and possibly a
higher minimum retirement age. Given these complicated changes
that tighten eligibility for one group while relaxing it for another,
quantifying overall impact on sustainability and coverage is difficult.
The region has been struggling in setting eligibility conditions for
disability benefits. The number of disability beneficiaries depends
heavily on the definition of disability as well as on the disability certifi-
cation process, policies on requalification, and rehabilitation efforts, all
of which introduce an element of subjectivity. The minimum eligibility
age for old-age pension also affects disability benefits, as the probabil-
ity of becoming disabled before reaching a now-higher retirement age
increases. The high retirement age of 67 in Iceland and Norway could
be a significant contributor to the high proportion of disability spend-
ing in those countries, as shown in figure 3.4, although in Iceland rela-
tively low old-age benefit spending is probably a more important
factor. Broadening the definition of disability to include mental illness
and substance abuse also tends to increase the number of beneficiaries
substantially. Finally, wars also leave their mark on disability pro-
grams, as shown by the example of Croatia in figure 3.4.
During downturns, disability applications and the number of
newly certified beneficiaries tend to rise, as the unemployed turn to
disability benefits to replace wage income. Suggesting some degree of
flexibility in how criteria are applied. Some of the increases could
derive from downturn-related mental stress, but in many countries
the increases are too large to be explained in this manner. In many
transition countries, the disruptions caused by the move from
centrally planned to market economies led to large jumps in the
number of disability beneficiaries. Even though rules and certifica-
tion procedures have been tightened subsequently, people who qual-
ified under earlier, more lenient rules are still on the disability rolls,
and countries have found removing them to be difficult and in some
cases unconstitutional. As a result, many of the transition countries
are spending a sizable but declining budget on disability benefits, as
newly eligible cohorts of disabled are typically smaller than previous
ones. Disability spending has again started to increase due to the
financial crisis that began in 2008 and continues in some countries.
This could be another contributor to high disability spending in
Iceland in 2010.

FIGURE 3.4Proportion of Pension Spending on Old Age, Disability, and Survivors in Selected European andCentral Asian Economies, 2010
Source: Eurostat Statistics Database.
Note: Data are for 2010 or latest year available. The Federation of Bosnia-Herzegovina (BiH Federation) and Republika Srpska, which together make up the country of
Bosnia and Herzegovina, have separate pension systems and are treated as separate data points in the figure.
Hig
h-In
com
e
Gen
erou
s
Spe
nder
s
Hig
h-In
com
e
Mod
erat
e
Spe
nder
s
Low
er- S
pend
ing
Tran
siti
on
Cou
ntri
es
Hi g
h-S
pend
ing
Tran
siti
on
Cou
ntri
es
You
n g
Cou
ntri
es
0 10 20 30 40 50 60 70 80 90 100
% of pension spending in each program
Spain
France
Italy
Malta
Old age Survivor Disability Other
Belgium
Greece
Cyprus
Slovenia
Luxembourg
Switzerland
Denmark
Germany
Ireland
Netherlands
Austria
Finland
Sweden
United Kingdom
Iceland
Norway
Portugal
Bulgaria
Czech Republic
Estonia
Latvia
Lithuania
Hungary
Poland
Romania
Slovak Republic
Croatia
Albania
Armenia
Russian Federation
Belarus
Georgia
Moldova
Montenegro
Macedonia, FYR
BiH Federation
Serbia
Ukraine
Tajikistan
Azerbaijan
Kyrgyz Republic
Turkey
Kazakhstan
71

72 The Inverting Pyramid
Transition countries have adopted more survivor benefit eligibility
tests than countries in Western Europe, as shown in figure 3.5. These
tests include age restrictions, remarriage restrictions, and restrictions
based on employment status, where surviving spouses who can work
are not eligible for benefits. The exceptions to the pattern are means
testing and marriage vesting, which are more prevalent in Western
Europe.
However, eligibility tests are not the only determinants of survivor
pension program costs. Survivor benefit spending tends to be higher
in countries with low women’s labor force participation in the past or
with large wage differentials between genders. Most countries pro-
vide individuals with only one pension benefit, either their own pen-
sion or the survivor pension from their deceased spouse, and most
women survivors tend to choose the survivor pension over their own
FIGURE 3.5Eligibility Restrictions for Survivor Benefits in Pension Systems ofEurope and Central Asia, 2012–2013
Sources: MISSOC Comparative Tables on Social Protection; U.S. Social Security Administration 2012.
0
10
20
30
40
50
60
70
80
High-
Income
Moderate
Spenders
High-
Income
Generous
Spenders
Lower-
Spending
Transition
Countries
High-
Spending
Transition
Countries
Young
Countries
% o
f cou
ntri
es w
ith re
stri
ctio
ns
Contribution vesting Marriage vesting
Age restriction on widow(er) Flat pension
Means test Missing countries, % of cluster

Have the Pension Reforms to Date Been Enough? 73?
pension in those countries. For example, Sweden has high female
labor participation rates and generous maternity benefits, which
include pension credits for the years spent raising children.
Consequently, Sweden spends very little on survivor benefits
compared to, for example, Italy or Spain, where labor force participa-
tion by women is not nearly as high. Transition countries currently
also benefit from higher female labor force participation rates in the
past, which tend to reduce the reliance on survivor benefits. These
countries may find that survivor payments increase in the future,
following the drop in women’s participation in the formal sector
labor force after transition.
While all of these eligibility conditions pertaining to old age, dis-
ability, and survivors determine the numbers of people who collect
benefits, the number of beneficiaries is only one component of pen-
sion spending. The other component is the level of benefits and the
growth of those benefits.
Changes in Benefit Levels
Countries have also tried to enact changes in benefit parameters that
would reduce pension levels in relation to wages, thereby reducing
pension spending. On the benefit rates themselves, it is difficult to
identify a trend, given the substantive changes in the way pensions
are provided in these countries. However, two components of the
benefit levels can be readily quantified: the number of years in
the averaging period and the indexation of benefits post-retirement.
The averaging period, as mentioned earlier, is the number of years
included in the average wage on which the pension benefits are cal-
culated. The indexation of benefits determines how benefits are
increased during the retirement years from the initial benefit pro-
vided on the day of retirement.
The trend is clearly toward lengthening the averaging period for
wages that constitute the base on which pensions are paid.
Lengthening the averaging period has at least five positive outcomes:
(a) it better links the contributions paid by the individual with the
benefits received, making the benefit levels fairer within a cohort;
(b) it limits the fraud associated with extremely high wage increases
being granted in the last year before retirement to benefit an individ-
ual’s retirement, but with large costs to the system; (c) it limits the
fraud involved in underreporting earnings and contributions in the
years prior to those included in the averaging period; (d) it avoids
rewarding high earners who often see large wage increases toward
the end of their career compared to lower earners who receive much

74 The Inverting Pyramid
lower wage increases throughout their career; and (e) it lowers ben-
efit levels, since including low wages earned in the early part of one’s
career (and on which commensurately lower contributions have
been paid) brings down the average wage used to calculate the bene-
fit level.
Of the High-Income Generous Spender countries, only France,
Greece, and Slovenia use averaging periods shorter than full career.
France has raised the averaging period from best 10 to best 25 years
of earnings, and Slovenia from last 10 years of earnings to any con-
secutive 24 years of earnings. The gradual increase in the averaging
period in Slovenia will be complete by 2018; in 2013 it stands at
any consecutive 19 years of earnings. Greece maintains a 5-year
average. Among the High-Income Moderate Spender countries,
only Norway and Austria use a wage base other than full career for
earnings-related benefits: Norway uses 20 years, while Austria is
increasing the averaging period from best 20 years of earnings to
best 40 years. Most transition countries have legislated a move to
full-career average wages, with some still in flux due to the unavail-
ability of old wage records. The Czech Republic uses a 30-year
career average, while Lithuania uses a 25-year average. Most of the
Young Countries use full-career averages, with the exception of
Uzbekistan.
Rules governing benefit indexation are one of the greatest influ-
ences on fiscal sustainability of pension programs in the short to
medium term, since benefit indexation is the only parameter that
affects spending on the already retired. The other parameters all
affect the rights of not-yet-retired workers, so the impact tends to be
delayed. When pension spending is deemed already unsustainably
high, policy makers need to address not only future generations but
the current elderly as well. In their reassessment of the financial sus-
tainability of pension programs in the 1970s and 1980s, most
countries in Western Europe began moving to inflation indexation of
benefits, in contrast to the earlier trend, when immaturity of pension
programs stimulated a move toward benefit indexation that followed
wage growth. The prevailing view in Western Europe in recent
decades has been that the elderly can afford to be protected only
against inflation risk, to ensure that their absolute, rather than rela-
tive, living standards do not fall.
Most of the transition countries have legislated at least partial
moves toward inflation indexation, with Albania, Bulgaria, Hungary,
Kosovo, Latvia, and Serbia having legislated 100 percent inflation
indexation, along with the Young Countries of Azerbaijan, the

Have the Pension Reforms to Date Been Enough? 75?
Kyrgyz Republic, and Uzbekistan. However, inflation indexation has
been difficult to achieve for a couple of reasons. First, successful
reformers experienced rapid wage growth prior to the financial crisis
as their economies made up for the declines of the 1990s. Pensioners
whose benefits increased only with inflation fell significantly behind
other cohorts, leading to political dissatisfaction. Second, the earlier
retirement ages prevalent in many of these countries resulted in long
periods of retirement. The discrepancy between the wage growth
experienced by the working-age population and the inflation
increases received by the elderly became more noticeable over the
long retirement periods. In Russia, for example, where the pre-crisis
wage growth was 20 percent each year after inflation, inflation
indexation of the basic benefit helped drive the overall pension levels
to 26 percent of average wage by 2008. In response to this
experience, Hungary and Serbia have legislated inflation indexation
with the caveat that if real GDP growth rises above a certain level,
some of that growth will be shared with pensioners.
The combination of eligibility conditions and benefit levels deter-
mines pension spending. Countries have also implemented changes
on the revenue side, such as changes in contribution rates.
Changes in Contribution Rates
In terms of contributions, countries appear to be converging toward
an average contribution rate of about 24 percent. Countries that had
higher contribution rates are reducing them, while countries that
had lower rates are increasing them. Figure 3.6 shows the average
contribution rates by cluster, omitting countries where the main
public system is not based on contributions. In High-Income
Generous Spender countries, where rates are highest, France and
Italy increased rates, while Slovenia, Greece, and Cyprus reduced
them. Among the High-Income Moderate Spender countries, where
contribution rates are near average, a number of countries raised
rates. Initially, many of the transition countries responded to the
drop in contribution revenue due to labor restructuring by raising
contribution rates. After experiencing a significant rise in informal
labor markets, defined as employment where workers do not make
contributions, many have tried to induce workers to participate by
reducing contribution rates.
A fourth type of parametric change, which tries to link benefits
with contribution revenue, is the introduction of self-adjusting
mechanisms in the pay-as-you-go design.

76 The Inverting Pyramid
Introduction of Self-Adjusting Pay-as-You-Go Designs
Recent innovations in the pay-as-you-go program design have been
developed to create a self-adjusting pension program, influencing
both benefit eligibility conditions and benefit levels.1 Pension policy
has long-term effects, but politicians usually have short-term hori-
zons. They tend to raise benefits when revenues grow, yet refrain
from taking action when benefits and generosity need to be cut in
response to life expectancy changes or demographic and economic
developments outside the pension system. Therefore, policy makers
have long searched for a means to automatically trigger adjustments
that politicians are reluctant to make. For example, when life expec-
tancy increases, the system could automatically reduce benefits or
raise retirement ages without politicians having to make the difficult
choices.
The simplest of the self-adjusting mechanisms are the pension
indexation rules. These tie future pension increases to average wage
growth, as in Ireland; to inflation, as in Serbia; to some combination
of the two, as in Switzerland; to GDP growth, as in Turkey; or even to
the growth in contribution revenue per pensioner, as in Russia.
However, these rules were often ignored even when legislated, and
FIGURE 3.6Average Pension Contribution Rates in Europe and Central Asia, 2013
Source: World Bank HDNSP Pensions Database.
Note: Applies to first and second pillars.
0
5
10
15
20
25
High-Income
Moderate
Spenders
Young
CountriesHigh-Income
Generous
Spenders
Lower-Spending
Transition
Countries
High-Spending
Transition
Countries
Ave
rage
pen
sion
cont
ribu
tion
rate
, %

Have the Pension Reforms to Date Been Enough? 77?
politicians could always change the effective level of pensions by
other means, like instituting an end-of-year bonus payment or
adding pension supplements to different categories of pensioners.
As chapter 2 showed, although legislated increases were limited to
inflation, pension increases in many countries of Western Europe
historically exceeded wage growth.
The valorization rules governing revaluation of past wages used in
benefit calculation have also been linked to economic and even
demographic parameters (the revaluation rate could be thought of as
interest paid on past contributions). Conventional defined benefit
formulas commonly use wage growth as a revaluation rate, as do
point systems. Tying the revaluation rate to wage bill growth, as has
been done in Latvia and Poland, and contribution revenue per
pensioner, as in Russia, introduces a demographic component to the
calculation in addition to a purely economic component. A complica-
tion of this approach, as commonly applied in these countries, is that
economic and demographic parameters are calculated annually and
locked into the eventual benefit calculation formula sometimes
observed decades before benefits are actually paid. In the interim, the
economic and demographic situation may change significantly and
may require different adjustments than those that were locked in
based on observed variables in the past.
More recently, changes in life expectancy have started to be
automatically incorporated in setting benefit eligibility conditions or
calculating benefit levels. In Denmark and Italy, the minimum retire-
ment age is adjusted to reflect the increase in life expectancy, an
approach also currently proposed in Germany. In Italy, Latvia,
Poland, and Sweden, this is accomplished through the notional
accounts scheme by adjusting benefit levels to life expectancy.
Notional accounts combine this approach with automatic revaluing
of past contributions, as discussed above, giving individuals the
option of choosing either a lower benefit level or a higher retirement
age. While it was hoped that this would result in a significant increase
in the effective retirement age, most workers tended to retire at the
first available opportunity, opting for the lower pension amount.
The approach, however, may have helped explain inherent trade-offs
between benefit levels and retirement ages to the public and may
have softened the opposition to subsequent statutory retirement age
increases in Italy, Latvia, and Poland (Holzmann and Palmer 2006).
However, some dangers are involved in overreliance on automatic
stabilizers. First, automatic adjustments can be introduced into an
overly generous program. For example, linking retirement ages to
changes in life expectancy makes great sense. However, if policy

78 The Inverting Pyramid
makers create the link at a time when the expected duration of
retirement is 25 years, the link is not going to make the pension
system sustainable in the long run, and policy makers will have lost
the tool of a discretionary future increase in the retirement age that
might help make the system more sustainable. Even if the initial
parameters seem balanced, unpredictable events inevitably happen
at some point, as policy makers cannot accurately predict all future
events when drafting the initial legislation. Once the system is out of
balance, pension programs with high degrees of interconnections
between parameters become impossible to fix within the existing
framework in a reasonable time horizon. Governments then make
ad hoc changes that undermine the legitimacy and underlying ratio-
nale of the self-adjusting mechanisms. Examples of these issues can
be found in the recent experiences of Latvia, Russia, and Serbia,
among many others.
The more stable and predictable the economy, the greater the like-
lihood that automatic stabilizers will perform successfully. However,
the volatility and unpredictability in the transition countries has led
to some concerns. For example, an unforeseen permanent drop in
the number of contributors, which might be due to an emigration
wave, could increase today’s pension scheme deficit. In a traditional
system this could be addressed by raising the contribution rate.
However, in the notional accounts system, an increase in the
contribution rate automatically raises future pension benefits,
making the deficit smaller in the short run but increasing long-run
pension liabilities. Alternatively, the number of contributors might
rise in a period of economic boom, especially if the retirement age is
increased at the same time, which further fuels the growth in
contributor numbers, the wage bill, and the notional interest rate.
This in turn raises future benefits. However, at the same time, the
long-term trend for contributor numbers might be declining, and the
boom-time adjustment of benefits upward is counterproductive with
respect to long-term fiscal sustainability.
The volatility experienced by transition economies through
automatic stabilizers is transferred to benefit levels and might lead to
wildly different outcomes for adjacent cohorts. When individuals
with similar work histories born days apart receive vastly different
pensions, the fairness of the system is questioned and there is politi-
cal pressure on governments to remove the differences. This invari-
ably means increasing the lower benefit to the level of the higher one
in an ad hoc manner, undermining long-run fiscal sustainability.
Given all the reforms of the last 15 years, it is useful to see what
impact, if any, these reforms have already had on controlling pension

Have the Pension Reforms to Date Been Enough? 79?
spending and changing retirement outcomes for individuals. While
many of the reforms are being implemented only gradually, some
impact should already be visible. Measuring the pace of reforms also
matters: the countries that are able to achieve some results in increas-
ing fiscal sustainability and adjusting social expectations in the first
years and decades of the reform process are able to spread the needed
adjustments among more age cohorts and can avoid treating differ-
ent cohorts unequally. The next sections analyze the impact reforms
have had on pension spending and retirement behavior.
Effects of the Reforms on Fiscal Sustainability and Policy Space for More Reforms
As discussed in the previous sections, countries have been choosing
different pension system designs and undertaking all kinds of para-
metric reforms. They have tightened benefit eligibility conditions,
changed benefit parameters, raised and then lowered contribution
rates, and introduced incentives to contribute and retire later, all in an
attempt to address the projected pension deficits, increase coverage,
and provide adequate pension levels in the future. Countries have
made different choices, with some being more aggressive on retire-
ment age changes while others have relied more heavily on reducing
benefits.
Ultimately, all these reform efforts can be measured with a few
important statistics. Gains in fiscal program sustainability can be
measured by the shortening of the average benefit receipt period,
lowered benefit generosity, and past and projected changes in total
pension spending. Social sustainability of reform is measured in
current and projected benefit adequacy and observed frequency in
the changes to system design. Gains in pension system coverage are
important for both goals, as higher coverage signals public confidence
in the pension system and also helps make the system fiscally sus-
tainable in the short and medium run.
Effective retirement ages, the ages at which people actually retire,
rose as a consequence of the reforms, but the average duration of
retirement remained constant over the 2001–09 period in the three
clusters included in figure 3.7. Increases in retirement age are shown
by the blue bars, which are positive for most countries where data
were available. However, the duration of retirement, essentially life
expectancy at the effective retirement age, shown by the red bars, did
not fall in tandem with the rise in retirement age. In a static environ-
ment, if effective retirement ages rise, the duration of retirement falls

80 The Inverting Pyramid
a bit less because those who die at ages between the old and the new
retirement age are no longer included in the new average. In addi-
tion, during the period that retirement ages were rising, life expec-
tancies continued to rise as well, resulting in an even smaller fall in
the duration of retirement. Note the substantial increases in effective
retirement age in countries like Slovenia, Belgium, Sweden, the
Netherlands, Iceland, Poland, Bulgaria, and Romania. However, in
each case, the duration of retirement fell much less than the retire-
ment age increase, indicating that life expectancy probably increased
substantially during the period, counteracting the impact of the
retirement age increase.
Effective retirement ages remain quite low in most countries and
could be increased further, as signaled by the relatively high duration
of retirement (figure 3.8). Figure 2.8 in chapter 2 shows that the
duration of retirement stood on average at about 15 years in Western
European countries in 1970, which implies life expectancies for
women higher than 15 years and life expectancies for men lower
than 15 years. The duration of retirement today is considerably
higher in most countries. In all countries except Kazakhstan,
Lithuania, Latvia, Albania, and Russia, duration of retirement for
men is above 15 years. Lithuania is the only country where duration
of retirement for women is below 20 years.
FIGURE 3.7Change in Effective Retirement Age Compared to Change in Life Expectancy, Selected EuropeanEconomies, 2001–2009
Source: Eurostat Statistics Database.
–4
–2
0
2
4
6
Sw
itze
rlan
d
Ital
y
Gre
ece
Cyp
rus
Fran
ce
Spa
in
Mal
ta
Slo
veni
a
Bel
gium
Nor
way
Den
mar
k
Finl
and
Uni
ted
Kin
gdom
Irel
and
Port
ugal
Ger
man
y
Aus
tria
Sw
eden
Net
herl
ands
Icel
and
Cro
atia
Latv
ia
Esto
nia
Hun
gary
Slo
vak
Rep
ublic
Cze
ch R
epub
lic
Lith
uani
a
Pola
nd
Bul
gari
a
Rom
ania
High-Income Generous
Spenders
High-Income Moderate
Spenders
Lower-Spending Transition
Countries
Year
s
Change in effective retirement age Change in life expectancy at effective retirement age

Have the Pension Reforms to Date Been Enough? 81?
FIGURE 3.8Duration of Retirement in Selected European and Central Asian Economies, 2009
a. Male life expectancy at exit age
10
15
20
25
Bel
gium
Gre
ece
Spa
i n
Ital
y
Fran
ce
Luxe
mbo
urg
Mal
ta
Irel
and
Sw
eden
Den
mar
k
Net
herl
ands
Port
ugal
Uni
ted
Kin
gdom
Aus
tria
Ger
man
y
Finl
and
Nor
way
Lith
uani
a
Latv
ia
Alb
ania
Rus
sian
Fed
erat
ion
Bel
arus
Arm
enia
Bul
gari
a
Hun
gary
Rom
ania
Cze
ch R
epub
lic
Slo
vak
Rep
ublic
Pola
nd
Cro
atia
Ser
bia
BiH
Fed
erat
ion
Kaz
akhs
tan
Kyr
gyz
Rep
ublic
Aze
rbai
jan
Turk
ey
Year
s
High-Income
Generous Spenders
High-Income Moderate
Spenders
Lower-Spending
Transition CountriesHigh-
Spending
Transition
Countries
Young
Countries
Source: Eurostat Statistics Database.
Note: The Federation of Bosnia-Herzegovina (BiH Federation) and Republika Srpska, which together make up the country of Bosnia and Herzegovina, have separate
pension systems and are treated as separate data points in the figure.
b. Female life expectancy at exit age
10
15
20
25
30
Gre
ece
Mal
ta
Bel
gium
Spa
in
Ital
y
Fran
ce
Luxe
mbo
urg
Irel
and
Port
ugal
Sw
eden
Net
herl
ands
Den
mar
k
Nor
way
Ger
man
y
Uni
ted
Kin
gdom
Finl
and
Aus
tria
Lith
uani
a
Latv
ia
Bul
gari
a
Arm
enia
Rom
ania
Hun
gary
Cze
ch R
epub
lic
Cro
atia
Slo
vak
Rep
ublic
Rus
sian
Fed
erat
ion
Bel
arus
Alb
ania
Pola
nd
Ser
bia
BiH
Fed
erat
ion
Kaz
akhs
tan
Kyr
gyz
Rep
ublic
Aze
rbai
jan
Turk
ey
Year
s
High-Income
Generous Spenders
High-Income Moderate
Spenders
Lower-Spending
Transition CountriesHigh-
Spending
Transition
Countries
Young
Countries

82 The Inverting Pyramid
Another way to assess the remaining policy space for increasing
effective retirement ages is to look at the percentage of old-age
beneficiaries who are younger than 65, which not so long ago was an
internationally accepted standard for a reasonable retirement age.
Figure 3.9 provides these data for countries where detailed data are
available, showing that a sizable proportion of old-age beneficiaries
are still younger than 65. The percentages are higher for women than
for men because in these countries women’s retirement ages are typi-
cally lower. Only in Lithuania, Latvia, Bulgaria, Albania, Georgia,
Armenia, and Serbia do retirees under the age of 65 constitute less
than 40 percent of the overall retiree population. In Kazakhstan and
Azerbaijan the percentage of beneficiaries under age 65 is above
50 percent, and in Turkey it reaches nearly 70 percent.
Many reforms also sought to reduce the relative value of the pen-
sion benefit package, which is still high in some countries if measured
FIGURE 3.9Percentage of Old-Age Pension Beneficiaries below Age 65 in Selected European andCentral Asian Economies
Source: Country-provided data, latest available year.
0
10
20
30
40
50
60
70
80
Lower-Spending
Transition Countries
High-Spending
Transition
Countries
Young
Countries
% o
f old
-age
pen
sion
ben
efic
iari
es b
elow
age
65
Male Female Total
Lith
uani
a
Latv
ia
Pola
nd
Bul
gari
a
Cro
atia
Slo
vak
Rep
ublic
Rom
ania
Arm
enia
Geo
rgia
Alb
ania
Bel
arus
Rus
sian
Fed
erat
ion
Rep
ublik
a S
rpsk
a
Ser
bia
BiH
Fed
erat
ion
Kyr
gyz
Rep
ublic
Kaz
akhs
tan
Aze
rbai
jan
Turk
ey

Have the Pension Reforms to Date Been Enough? 83?
by pension spending per elderly. Pension spending per elderly person
(aged 65 or older) as a percentage of GDP per capita provides one
measure of the relative benefit level, or benefit generosity.
As discussed in the previous sections, many countries also increase
generosity of the overall benefit package by allowing people to retire
early or obtain disability benefits fairly easily. If a country allows
many early retirements, its pension spending per elderly person will
be high. Similarly, pension spending per elderly will also be high if
spending is just on the elderly and the benefit levels are high.
Figure 3.10 shows that in many countries, pension spending per
elderly person is still high relative to GDP per capita. In the
Netherlands, Austria, France, Poland, Serbia, and Tajikistan, pension
spending per elderly person exceeds 80 percent of GDP per capita.
In Montenegro, Ukraine, Turkey, and the Kyrgyz Republic, it exceeds
100 percent of GDP per capita.
Pension spending per pensioner is lower and again reflects the
presence of many relatively young beneficiaries. This measure, com-
pared to GDP per person in the country, isolates the generosity of the
benefit level from the generosity of the overall benefit package
FIGURE 3.10Pension Spending per Elderly Person Compared to GDP per Capita, Selected European andCentral Asian Economies, 2009
Sources: Eurostat Statistics Database; country-provided data.
0
20
40
60
80
100
120
140
Nor
way
Irel
and
Ger
man
yIc
elan
dS
wed
enD
enm
ark
Finl
and
Uni
ted
Kin
gdom
Port
ugal
Net
herl
ands
Aus
tria
Spa
inC
ypru
sS
love
nia
Mal
taB
elgi
umG
reec
e
Sw
itze
rlan
dIt
aly
Fran
ceG
eorg
iaLa
tvia
Bul
gari
aEs
toni
aA
lban
iaLi
thua
nia
Cro
atia
Bel
arus
Cze
ch R
epub
licR
oman
ia
Rus
sian
Fed
erat
ion
Mol
dova
Hun
gary
Arm
enia
Slo
vak
Rep
ublic
Pola
ndB
osni
a an
d H
erze
govi
naM
aced
onia
, FY
RS
erbi
aM
onte
negr
oU
krai
neK
azak
hsta
nK
osov
oA
zerb
aija
nTa
jikis
tan
Turk
eyK
yrgy
z R
epub
lic
High-Income Moderate
Spenders
High-Income Generous
Spenders
Lower-Spending Transition
Countries
High-Spending
Transition
Countries
Young Countries
Pens
ion
spen
ding
per
eld
erly
as
% o
f GD
P pe
r cap
ita

84 The Inverting Pyramid
(figure 3.11). The average pension spending per beneficiary for the
countries shown is 46 percent of GDP per capita. In Cyprus, the
Netherlands, the former Yugoslav Republic of Macedonia, Ukraine,
both Bosnian entities, Serbia, Montenegro, and the Kyrgyz Republic,
the corresponding figure is at least 60 percent. Austria, France,
Poland, Ukraine, Tajikistan, and Turkey are high on the graph in
figure 3.10 but not on this one, suggesting that each of these coun-
tries has many younger beneficiaries, but the benefits themselves are
not necessarily very high. Cyprus, FYR Macedonia, and both Bosnian
entities appear high in figure 3.11 but not in the preceding one, sug-
gesting that these countries have relatively high benefit levels rather
than an excessive number of young beneficiaries.
Pension spending per elderly person did not fall relative to GDP
per capita on average over the period between 2001 and 2009, as
shown in figure 3.12. The reforms, by increasing retirement ages,
tightening disability rules, increasing the averaging period, strength-
ening links between contributions and benefits, and reducing the
generosity of indexation post-retirement, were expected to cause
significant decreases in this statistic.
FIGURE 3.11Pension Spending per Beneficiary Compared to GDP per Capita, Selected European and CentralAsian Economies, 2009
Sources: Eurostat Statistics Database; country-provided data.
Note: The Federation of Bosnia-Herzegovina (BiH Federation) and Republika Srpska, which together make up the country of Bosnia and Herzegovina, have separate
pension systems and are treated as separate data points in the figure.
0
10
20
30
40
50
60
70
80
90
Luxe
mbo
urg
Pens
ion
spen
ding
per
ben
efici
ary
as%
of G
DP
per c
apita
Slo
veni
aFr
ance
Mal
taS
pain
Gre
ece
Ital
yC
ypru
sN
orw
ayIr
elan
dIc
elan
dG
erm
any
Finl
and
Sw
eden
Den
mar
kPo
rtug
alA
ustr
iaU
nite
d K
ingd
omN
ethe
rlan
dsG
eorg
iaB
ulga
ria
Alb
ania
Bel
arus
Esto
nia
Latv
iaC
zech
Rep
ublic
Lith
uani
aR
ussi
an F
eder
atio
nS
lova
k R
epub
licR
oman
iaC
roat
iaH
unga
ryM
oldo
vaPo
land
Arm
enia
Kaz
akhs
tan
Mac
edon
ia, F
YR
Ukr
aine
BiH
Fed
erat
ion
Ser
bia
Rep
ublik
a S
rpsk
aM
onte
negr
oK
osov
oA
zerb
aija
nTa
jikis
tan
Turk
eyK
yrgy
z R
epub
lic
High-Income Generous
Spenders
High-Income Moderate
Spenders
Lower-Spending Transition
Countries
High-Spending
Transition Countries
Young
Countries

Have the Pension Reforms to Date Been Enough? 85?
The majority of High-Income Generous Spenders experienced
no change in spending, but relative pension spending declined in
Slovenia, Switzerland, and Italy and increased significantly in
crisis-affected Cyprus. Among High-Income Moderate Spenders,
pension spending fell, for the most part, relative to GDP per capita,
but there were steep increases in Iceland, Portugal, and Ireland,
where the financial crisis sharply reduced GDP but not pension
spending. Among Lower-Spending Transition Countries, spending
declined in eight of 14 countries, with significant reductions in
Latvia, Croatia, and Poland. The sizable decline in Latvia is espe-
cially surprising, given the large post-crisis decline in GDP, and
reflects the strong pre-crisis GDP growth and restrained pension
spending. However, Estonia, Romania, Hungary, Russia, Armenia,
and Moldova instead experienced sizeable increases. In the High-
Spending Transition Countries, while relative pension spending
FIGURE 3.12Growth in Pension Spending per Elderly Person Compared to Growth in GDP per Capita,Selected European and Central Asian Economies, 2001–2009
Sources: Eurostat Statistics Database; country-provided data.
–60
–40
–20
0
20
40
60
80
100
Slo
veni
aS
wit
zerl
and
Ital
yS
pain
Gre
ece
Bel
gium
Fran
ceC
ypru
sG
erm
any
Aus
tria
Net
herl
ands
Finl
and
Uni
ted
Kin
gdom
Den
mar
kN
orw
ayS
wed
enIc
elan
dPo
rtug
alIr
elan
dLa
tvia
Cro
atia
Pola
ndB
ulga
ria
Lith
uani
aS
lova
k R
epub
licB
elar
usC
zech
Rep
ublic
Esto
nia
Rom
ania
Hun
gary
Rus
sian
Fed
erat
ion
Arm
enia
Mol
dova
Mon
tene
gro
Mac
edon
ia, F
YR
Alb
ania
Ser
bia
Kaz
akhs
tan
Turk
eyK
yrgy
z R
epub
licA
zerb
aija
nTa
jikis
tan
High-Income Generous
Spenders
High-Income Moderate
Spenders
Lower-Spending Transition
Countries
High-
Spending
Transition
Countries
Young
Countries
Gro
wth
in p
ensi
on s
pend
ing
per e
lder
ly a
s %
of g
row
th in
GD
P pe
r cap
ita

86 The Inverting Pyramid
declined in most countries, Serbia shows a hefty increase in spend-
ing. In the Young Countries, with the exception of Kazakhstan,
there were sizable increases rather than decreases. While the objec-
tive of many of these reforms was to restrain the growth in spend-
ing, this objective was only achieved in some of the High-Income
Moderate Spenders, some of the Lower-Spending Transition
Countries, and a few of the High-Spending Transition Countries.
In general, countries moved their spending levels toward a norm.
Countries with high benefit levels in 2001 decreased their pension
spending, while countries with low benefit levels tended to increase
spending between 2001 and 2009, as shown in figure 3.13. For
example, Iceland and Ireland, which had below-average pension
spending, moved to increase it, and high spenders like Latvia and
Poland moved to decrease their pension spending. However, there
are many outliers. Serbia and Turkey, which were both already
relatively high spenders, increased spending dramatically. Ukraine,
which was one of the highest spenders initially, did not reduce spend-
ing. On the other hand, Kazakhstan, which was one of the lower
spenders, reduced spending even further.
Most reforms fully compensated longer careers with higher pension
benefits, a policy that has limited the long-term effect on overall
FIGURE 3.13Change in Pension Spending in 2009 Relative to Spending Levels in 2001, Selected Europeanand Central Asian Economies
Sources: Eurostat Statistics Database; World Bank World Development Indicators (database); country provided-data.
Note: R2 = 0.4237. Elderly is defined as aged 65 and above.
AUT
DNKFIN
DEU
ISL
IRL
NLD
NORSWE
CHEGBR
BELCYP
FRAGRC Italy
PRT
SVN
ESPBGR CZE
EST
HUN
LVA
LTU
POL
ROM
SVKALB
MKD
MNE
SRB
ARM
BLR
RUS
UKR
AZE
KAZ
TJK
TUR
Pension spending per elderly person as % of GDP per capita, 2001
Fitted values Pension spending in 2009 relative to 2001
0
0
1
0.5
–0.5
Pens
ion
spen
ding
in 2
009
rela
tive
to 2
001
0.4 0.6 0.8 1.0 1.2

Have the Pension Reforms to Date Been Enough? 87?
pension spending. This partially explains the absence of a downward
trend in the average generosity of the benefit package and the
apparent convergence of pension spending between countries. Policy
makers recognized that the impending demographic crisis would
require much higher retirement ages and less benefit generosity.
However, the mismatch between the short-term horizons of politi-
cians and the long-term nature of the changing demographics reduced
the willingness of politicians to endure the political pain of simultane-
ously enacting cuts and establishing harsher benefit eligibility condi-
tions. Therefore, many countries took a politically easier route by
increasing retirement ages under the existing linear accrual rate sched-
ule, fully compensating longer careers with higher pension benefits.
The cuts in benefit generosity that were enacted, often under the
automatic adjustment rules, were often offset by subsequent ad hoc
pension increases. Trying to avoid explicit public and legislative debate
about the needed benefit cuts, policy makers opted to legislate rules
that would take the discretion out of pension policy and automatically
reduce benefits in a gradual manner, but they chose not to clearly
explain the implications of the rules they were passing to the public.2
As a result, when the automatic measures began to cut expenditures
as expected, the population at large objected, and politicians reverted
to ad hoc measures. This effect can be seen throughout the region, in
countries like Hungary, Latvia, Russia, Serbia, and Ukraine. For exam-
ple, as noted previously, the indexation reforms did not fully hold, and
pensions were frequently increased by more than what was prescribed
by the automatic adjustment rules. In addition, countries added sup-
plements, bonuses, and end-of-year bonus pensions in response to
political pressures, all of which counteracted the move toward
inflation indexation and the objective of reduced pension spending.
Some countries were fairly successful in enacting disability reform,
while others were not.3 Since older workers are more likely than
younger workers to develop disabilities, as the work force ages, the
number of disabled is expected to increase. Moreover, rising retire-
ment ages in the old-age programs tended to increase the number of
applications for disability pensions, as people eager to retire, but pro-
hibited under the new legislation from doing so through the old-age
programs, tried to become eligible through disability programs. The
financial crisis also put pressure on disability programs, as individuals
who faced unemployment tried to become eligible. As a result, while
there were some attempts at disability reform, the overall impact was
not always strong enough to counteract the pressure to expand the
number of beneficiaries (also see Lafortune, Balestat, and the
Disability Study Expert Group Members 2007).

88 The Inverting Pyramid
Bulgaria is an example of a country where the increase in disability
beneficiaries coincided with a gradual introduction of tighter eligibil-
ity conditions in the old-age program (figure 3.14). As a result, dis-
ability spending as a percentage of GDP more than doubled between
2001 and 2011. While disability inflow rates have stabilized since
2006, they have not decreased back to their original levels despite
attempts at reform (NSSI 2013).
The Netherlands and Poland were successful at reducing the
number of disability beneficiaries from extremely high levels
(figure 3.15). Elements of their reforms included (a) redefinition of
eligibility with stricter examination criteria, (b) reexamination and
recertification of those who might recover from disability, (c) empha-
sis on rehabilitation and retraining, and (d) reemployment of the
partially disabled. The Netherlands uses experience ratings for
employers with riskier employees; these employers are charged
higher premiums to encourage better workplace safety. Dutch
employers are also responsible for reintegration of the disabled
(OECD 2007; De Jong 2008; van Sonsbeek and Gradus 2012).
FIGURE 3.14Growth in Number of Disability Beneficiaries in Bulgaria, 2000–2011
Source: NSSI 2013.
Num
ber o
f ben
efici
arie
s re
lativ
e to
200
0, %
0
50
100
150
200
250
2000 2001 2002 2003 2004 2005 2006 2007 2008 2009 2010 2011
Total pension beneficiaries
Old-age beneficiaries
Disability beneficiaries
Population 60+

Have the Pension Reforms to Date Been Enough? 89?
While the transition countries clearly undertook what were
perceived as substantial and painful reforms, these actions have not
yet resulted in meaningful adjustments to the generosity of benefit
packages or the duration of benefit receipt in preparation for the
upcoming demographic crisis. Retirement age changes to date have
in most cases only kept pace with life expectancy changes, leaving
the duration of retirement unchanged. Furthermore, as enacted,
increases in retirement ages normally imply higher benefits, limiting
the fiscal impact of these reforms. Benefit reductions often are
reversed as soon as the impact of the changes begins to be felt by the
population, and benefit levels remain high by historic standards in
many of the countries. Some of the reforms are still unfolding and
their full impact will be felt in future years, as countries frequently
grandfathered the currently retired or soon to be retired cohorts,
leaving their more generous benefits in place. However, this only
means that future generations will have to endure greater reforms
(see also European Commission 2012a, 2012b).
For most countries, already legislated future adjustments are not
expected to bring the average pension system to fiscal sustainability
either. A comparison of pension spending as a share of GDP in 2010
with projected pension spending in 2060 provides a sobering outlook
(figure 3.16). Very few countries can expect to see declines in pen-
sion spending over this period, despite the reforms legislated to date.
Those projected to experience a decline include Italy, Denmark,
Croatia, Latvia, Armenia, Poland, Estonia, Russia, Serbia, Bosnia and
FIGURE 3.15Decline in Number of Disability Beneficiaries in Poland, 2000–2010
Source: ZUS 2012.
0
500
1,000
1,500
2,000
2,500
3,000
2000 2001 2002 2003 2004 2005 2006 2007 2008 2009 2010
Num
ber o
f ben
efici
arie
s,th
ousa
nds

90 The Inverting Pyramid
Herzegovina (BiH Federation), and Kazakhstan. Given that pensions
are financed by taxes on wages and that the number of wage earners
is projected to stop growing or even shrink, most governments will
have to find alternative sources of revenue, find ways to increase the
labor force, or undertake further pension reforms.
For some countries with a projected decline in pension spending,
the credibility of this decline is questionable. When one compares the
current and projected pension levels relative to average wage, as
shown in figure 3.17 for Poland and Serbia, pensions fall dramatically
in the future. In Poland, pension benefits are expected to fall from
51 percent of average wage today to 26 percent in the future, without
FIGURE 3.16Current and Projected Pension Spending as a Percentage of GDP in Selected European andCentral Asian Economies, 2010 and 2060
Sources: European Commission 2012c for European Union countries; for others, projections generated with World Bank’s Pension Reform Options Software Toolkit
(PROST).
Note: The Federation of Bosnia and Herzegovina (BiH Federation) and Republika Srpska, which together make up the country of Bosnia and Herzegovina,
have separate pension systems and are treated as separate data points in the figure.
0
2
4
6
8
10
12
14
16
18
20
Ital
yyFr
ance
Gre
ece
Spa
ip
nM
alta
Bel
ggium
Slo
veni
aC
ypru
syp
Luxe
mbo
urgg
Den
mar
kPo
rtug
algS
wed
enU
nite
dK
ingd
og
mA
ustr
iaG
erm
anyy
Finl
and
Net
herl
ands
Irel
and
Nor
wayy
Cro
atia
Latv
iaA
rmen
iaPo
land
Esto
nia
Rus
sian
Fed
erat
ion
Alb
ania
Bul
ggari
aC
zech
Rep
ublic
pH
unga
rg
yyLi
thua
nia
Rom
ania
Slo
vak
Re p
ublic
p Ser
bia
BiH
Fed
erat
ion
Bel
arus
Rep
upbl
ika
Srp
spka
Kaz
akhs
tan
Aze
rbai
jjan
Kyr
gyz
Rep
ubli
ygy
pc
Turk
eyy
Pens
ion
spen
ding
as
% o
f GD
P
2010 2060
High-Income Moderate
Spenders
Lower-Spending
Transition Countries
High-Income Generous
Spenders
High
Spending
Transition
Countries
Young
countries

Have the Pension Reforms to Date Been Enough? 91?
taking into account the new changes announced in August 2013. In
Serbia, the projected decline is even greater, from 52 percent today to
as little as 7 percent. It is not clear whether such huge declines are
politically sustainable. In general, if politicians revert to ad hoc benefit
increases, as they have done in the past, the projected decline in pen-
sion spending may be a mirage. It is also not clear whether such low
benefit levels will provide enough incentives for the working-age
population to continue contributing. If the working-age population
further withdraws from contributing to the scheme, fiscal sustainabil-
ity issues could arise even if pension levels are in fact very low.
FIGURE 3.17Decline in Projected Pension Benefit as a Percentage of AverageWage in Poland and Serbia, 2007–2072
0
10
20
30
40
50
70
60
2011
2015
2019
2023
2027
2031
2035
2039
2043
2047
2051
2055
2059
2063
2067
2071
2075
Pens
ion
bene
fits
as %
of a
vera
gew
age
a. Poland
Source: PROST projections using country-provided data.
0
10
20
30
40
50
60
70
2007
2011
2015
2019
2023
2027
2031
2035
2039
2043
2047
2051
2055
2059
2063
2067
2071
2075
Pens
ion
bene
fits
as %
of a
vera
gew
age
b. Serbia

92 The Inverting Pyramid
It is also unclear whether projected low benefit levels in countries
like Poland and Serbia can be considered adequate even under the
most stringent definitions. After all, the stated goal of the Polish and
Serbian pension systems, presented here as examples, is not only to
protect against poverty, but also to provide a reasonable level of income
replacement. Therefore, the improvements in fiscal sustainability, com-
ing at the expense of adequacy, might not be socially sustainable.
Moreover, if benefits provided by the pension system are inadequate,
the rationale for having a pension system at all can be questioned.
This leads to the overall question of whether pension benefits are
adequate even today. Do pensions provide enough income to keep
the elderly out of poverty?
Impact of Benefit Adequacy on Social Sustainability of Pension Reforms
Living alone is typically costlier than living in larger households, so
understanding pensioner living arrangements is important when
discussing the importance of pension income. In the transition coun-
tries, only a little over half the elderly, defined as individuals aged 65
or older, live with nonelderly people (figure 3.18). This makes
pension income even more important for the elderly in this region
than in many other parts of the world.
The percentage of elderly living with nonelderly varies, from a low
of 40 percent in Central Europe to a high of 69 percent in the Young
Countries. The percentage of elderly living with nonelderly is higher
among the very old, defined as individuals aged 80 or older, with
almost two-thirds of the very old living in larger households. Among
the very old, the greatest increase in living with nonelderly comes in
Central Europe, where the percentage jumps to 56 percent. In 11 of
the 22 countries shown in the figure, elderly men are more likely
than elderly women to live in larger households, while in the other
countries the ratios are about the same. In the Young Countries and
the Balkans, almost 15 percent of elderly live alone and almost
22 percent of the very old live alone. In the FSU countries and in
Central Europe, the percentages are much higher, with almost
30 percent of the elderly living alone and as many as a third of the
very old living alone. As expected, elderly women are more likely to
live alone than elderly men, given that they tend to outlive their
spouses. More than 45 percent of elderly women live alone in the
urban areas of the Kyrgyz Republic, Moldova, and Poland, while
56 percent of rural elderly women live alone in Belarus.

Have the Pension Reforms to Date Been Enough? 93?
FIGURE 3.18Living Arrangements of Elderly in Selected European and Central Asian Economies, by Genderand Rural/Urban Residence
0
20
40
60
80
100
a. Young Countries
Rur
al m
ale
Rur
al m
ale
Rur
al f
emal
e
Urb
an m
a le
Urb
an f
emal
e
All
elde
rly
All
80+
elde
rly
All
80+
elde
rly
All
80+
elde
rly
Rur
al f
emal
e
Rur
al f
emal
e
Rur
al m
ale
Rur
al m
ale
Urb
an m
ale
Urb
an m
ale
Urb
an f
emal
e
Urb
an f
emal
e
All
elde
rly
All
elde
rly
All
80+
elde
rly
Rur
al f
emal
e
Urb
an m
ale
Urb
an f
emal
e
All
elde
rly
Rur
al m
ale
Rur
al f
emal
e
Urb
an m
a le
Urb
an f
emal
e
All
elde
rly
Azerbaijan Kazakhstan Kyrgyz Republic TajikistanTT Turkey
% o
f eld
erly
Albania Bosnia and Herzegovina Kosovo Serbia Montenegro
0
20
40
60
80
100
% o
f eld
erly
b. Balkans (non–European Union)
With other people With spouse Alone
Rur
al
ma
le
Rur
al
fem
ale
Urb
an
ma
le
Urb
an
fem
ale
All
elde
rly
All
80+
elde
rly
Urb
an
fem
ale
All
elde
rly
All
80+
elde
rly
Rur
al
ma
le
Rur
al
fem
ale
Urb
an
ma
le
Urb
an
fem
ale
All
elde
rly
All
80+
elde
rly
Rur
al
ma
le
Rur
al
fem
ale
Urb
an
ma
le
Urb
an
fem
ale
All
eld
erly
All
80+
elde
rly
Rur
al
ma
le
Rur
al
fem
ale
Urb
an
ma
le
Urb
an
fem
ale
All
eld
erly
All
80+
elde
rly
Rur
al
ma
le
Rur
al
fem
ale
Urb
an
ma
le
continued

94 The Inverting Pyramid
Source: Household survey data, latest available year.
Armenia Belarus Moldova Ukraine Georgia
0
20
40
60
80
100
With other people With spouse Alone
% o
f eld
erly
d.Countries of the former Soviet Union
Rur
al m
ale
Rur
al f
emal
e
Urb
an m
ale
Urb
an f
emal
e
All
elde
rly
All
80+
elde
rly
Rur
al m
ale
Rur
al f
emal
e
Urb
an m
ale
Urb
an f
emal
e
All
elde
rly
All
80+
elde
rly
Rur
al m
ale
Rur
al f
emal
e
Urb
an m
ale
Urb
an f
emal
e
All
elde
rly
All
80+
elde
rly
Rur
al m
ale
Rur
al f
emal
e
Urb
an m
ale
Urb
an f
emal
e
All
elde
rly
All
80+
elde
rly
Rur
al m
ale
Rur
al f
emal
e
Urb
an m
ale
Urb
an f
emal
e
All
elde
rly
All
80+
elde
rly
Rur
al
fem
ale
Rur
al
ma
le
Urb
an
fem
ale
Urb
an
ma
le
All
80+
elde
rly
All
eld
erly
Rur
al
fem
ale
Rur
al
ma
le
Urb
an
fem
ale
Urb
an
ma
le
Urb
an
ma
le
Urb
an
ma
le
Urb
an
ma
le
Urb
an
ma
le
Rur
al m
ale
Urb
an
ma
le
All
80+
eld
erly
All
eld
erly
All
elde
rly
All
eld
erly
All
elde
rly
All
elde
rly
All
eld
erly
Rur
al
fem
ale
Rur
al
ma
le
Rur
al
ma
le
Rur
al
ma
le
Rur
al
ma
le
Urb
an
fem
ale
All
80+
elde
rly
Rur
al
fem
ale
Urb
an
fem
ale
All
80+
eld
erly
Rur
al
fem
ale
Urb
an
fem
ale
All
80+
elde
rly
Rur
al
fem
ale
Urb
an
fem
ale
All
80+
eld
erly
Rur
al f
ema
le
Urb
an
fem
ale
All
80+
eld
erly
Bulgaria Croatia Hungary Lithuania Poland Romania Slovak Republic
0
20
40
60
80
100
y y yy
% o
f eld
erly
c. Central Europe
FIGURE 3.18Continued

Have the Pension Reforms to Date Been Enough? 95?
On average, pensioners are not poorer than the working-age popu-
lation in transition countries. Figure 3.19 compares poverty rates of
pensioner and nonpensioner households using the World Bank stan-
dard poverty rates: households living on less than $5.00 per day for
Central Europe and the Balkans and less than $2.50 per day for the
FSU countries and Young Countries. Among the 19 countries for
which data were available, in only six—Bulgaria, Croatia, Lithuania,
Bosnia and Herzegovina, Kosovo, and Moldova—are households with
pensioners perceptibly more likely to be poor than households without
pensioners, based on a measure of income. And in Hungary, Poland,
Romania, Armenia, the Kyrgyz Republic, and Georgia, they are less
likely to be poor than households without pensioners. While we would
expect similarity across pensioner and nonpensioner households in
countries where most pensioners live with others, in Georgia and
Armenia it appears that pensioners are bringing enough regular
income into the household to pull the entire household out of poverty.
Similar results are apparent from Eurostat data for the European
Union member states, as shown in figure 3.20. Among the high-
income countries, only in Slovenia is the rate of severe material
deprivation higher among the elderly than among the working-age
FIGURE 3.19Percentage of Households, with and without Pensioners, in Poverty in Selected European andCentral Asian Economies, 2009
Source: Household survey data.
0
10
20
30
40
50
60
70
80
Alb
ania
Bul
gari
a
Cro
atia
Hun
gary
Lith
uani
a
Pola
nd
Rom
ania
Ser
bia
Bos
nia
and
Her
zego
vina
Kos
ovo
Aze
rbai
jan
Arm
enia
Kyr
gyz
Rep
ublic
Mol
dova
Geo
rgia
Kaz
akhs
tan
Bel
arus
Ukr
aine
Turk
ey
$5.00 a day $2.50 a day
% o
f hou
seho
lds
Households with no pensioners Households with pensioners 65+ Households with pensioners 80+

96 The Inverting Pyramid
population.4 Among the Lower-Spending Transition Countries, from
suffer pensioners greater material deprivation in Bulgaria, Croatia,
Lithuania, Romania, and Poland (Eurostat poverty measures,
which refer to relative poverty, differ from the absolute poverty mea-
sures shown in figure 3.19). Both sets of evidence suggest that in most
countries, the elderly are not poorer than the working-age population.
Poverty declined by a similar degree for both pensioner and non-
pensioner households between 2001 and 2010 in countries where
data are available, with the exception of Croatia, where poverty
increased for pensioner households, and Bosnia and Herzegovina
and Georgia, where poverty increased among households with very
old pensioners (figure 3.21). In Romania, Serbia, Armenia, and the
Kyrgyz Republic, the poverty status of pensioners improved more
than that of nonpensioner households. In Hungary, Lithuania,
Poland, Kosovo, Bosnia and Herzegovina, Moldova, and Turkey, pen-
sioner households were less poor in 2010 than in 2001 but showed
less improvement than nonpensioner households.
Consumption by households with and without pensioners is also
similar (figure 3.22). Consumption in some sense can be a better
measure of a pensioner’s well-being than income, since many
FIGURE 3.20Rate of Severe Material Deprivation among Different Age Cohorts in European Union MemberStates, 2011
Source: Eurostat Statistics Database.
0
10
20
30
40
50
60
Ital
y
Luxe
mbo
urg
Sw
itze
rlan
d
Spa
in
Bel
gium
Fran
ce
Mal
ta
Slo
veni
a
Cyp
rus
Gre
ece
Sw
eden
Icel
and
Nor
way
Net
herl
ands
Den
mar
k
Aus
tria
Uni
ted
Kin
gdom
Finl
and
Ger
man
y
Port
ugal
Cze
ch R
epub
li c
Esto
nia
Slo
vak
Rep
ublic
Pola
nd
Cro
atia
Hun
gary
Lith
uani
a
Rom
ania
Latv
ia
Bul
gari
a
High-Income Generous
Spenders
High-Income Moderate
Spenders
Lower-Spending Transition
Countries
% o
f age
coh
ort
Aged 16–64 Aged 65+ Aged 75+

Have the Pension Reforms to Date Been Enough? 97?
countries provide pensioners with various discounts on fuel, electric-
ity, transportation, bread, entertainment, medicines, and other
goods. These in-kind payments and discounts help increase the pen-
sioner’s consumption but might not be reflected in income.
Furthermore, a pensioner’s income is often taxed less than wage
income, increasing the difference in disposable income and con-
sumption even further. In most countries, households with pension-
ers have per capita consumption above 100 percent of the per capita
consumption of nonpensioner households. Consumption by house-
holds with pensioners is below consumption by households without
pensioners in Lithuania, Croatia, Moldova, Bosnia and Herzegovina,
and Azerbaijan. These are some of the same countries for which
pensioner households had higher income poverty rates than
nonpensioner households. In all other countries, households with
FIGURE 3.21Reduction in Poverty across All Households with and without Pensioners, Selected Europeanand Central Asian Economies, 2001–2010
Source: Household survey data.
–100
–80
–60
–40
–20
0
20
40
60
80
100
120
Alb
ania
Bul
gari
a
Cro
atia
Hun
gary
Lith
uani
a
Pola
nd
Rom
ania
Ser
bia
Bos
nia
and
Her
zego
vina
Kos
ovo
Aze
rbai
jan
Arm
enia
Kyr
gyz
Rep
ublic
Mol
dova
Geo
rgia
Kaz
akhs
tan
Bel
arus
Ukr
aine
Turk
ey
$5.00 a day $2.50 a day
Chan
ge b
etw
een
2001
and
201
0, %
Households with no pensioners
Households with pensioners 65+
Households with pensioners 80+

98 The Inverting Pyramid
pensioners have higher consumption per capita than households
without pensioners.
A more direct way to evaluate the adequacy of pensions in their
ability to replace income is to compute gross replacement rates,
defined as the average pension benefit divided by average wage. This
is essentially a measure of what proportion of wage income is
replaced by pension benefits on average. The data in figure 3.23 show
a wide variance in replacement rates across countries. Some coun-
tries provide pensions that replace a fairly substantial portion of
today’s average wage, which is typically higher than the average
wage earned by the person during his or her working career and
higher than the wages on which the person made contributions.
FIGURE 3.22Comparison of per Capita Consumption by Households with and without Pensioners,Selected European and Central Asian Economies
Source: Household survey data, latest available year.
0
20
40
60
80
100
120
140
Lith
uani
a
Cro
atia
Mol
dova
Bul
gari
a
Bel
arus
Alb
ania
Arm
enia
Geo
rgia
Hun
gary
Slo
vak
Rep
ublic
Pola
nd
Rom
ania
Bos
nia
and
Her
zego
vina
Ukr
aine
Mon
tene
gro
Ser
bia
Aze
rbai
jan
Kaz
akhs
tan
Kos
ovo
Kyr
gyz
Rep
ublic
Tajik
ista
n
Cons
umpt
ion
by h
ouse
hold
s w
ith p
ensi
oner
sre
lativ
e to
thos
e w
ithou
t, %
Lower-Spending Transition Countries Young CountriesHigh-Spending
Transition Countries
Households with pensioners 65+ Households with pensioners 80+

Have the Pension Reforms to Date Been Enough? 99?
Other countries, like Georgia, are providing pensions that cover a rel-
atively small proportion of today’s average wage. Given that most
countries tax wages more than they tax pensions, and require social
security contributions5 on wages but not on pensions, replacement
rates as a proportion of net wages are often much higher, sometimes
exceeding 100 percent.
All of this evidence suggests that pensioners in most transition
countries are doing as well as nonpensioners, if not better. This is not
to claim that all individual pensioners are doing well, as there are
unquestionably some who suffer from material deprivation in all of
these countries. However, where benefit increases are being consid-
ered, a selective targeted approach seems to be more appropriate
than a blanket increase in pensions for all. In some countries, bene-
fits might also be adjusted downward without making pensioners
worse off than the working-age population and children.
While the discussion above provides a snapshot of where pension-
ers are today, considering future pension levels is even more impor-
tant, especially given various reforms that are still unfolding in the
region. The APEX methodology used by the Organisation for Economic
FIGURE 3.23Average Pension Benefit Relative to Average Wage, Selected European and Central Asian Economies, 2009
Source: Country-provided data.
Note: The Federation of Bosnia-Herzegovina (BiH Federation) and Republika Srpska, which together make up the country of Bosnia and Herzegovina, have separate
pension systems and are treated as separate data points in the figure.
0
10
20
30
40
50
60
70
80
90
Cyp
rus
Fran
ce
Gre
ece
Mal
ta
Spa
in
Luxe
mbo
urg
Ital
y
Sw
eden
Irel
and
Ger
man
y
Aus
tria
Nor
way
Finl
and
Port
ugal
Geo
rgia
Arm
enia
Mol
dova
Cro
atia
Alb
ania
Lith
uani
a
Rus
sian
Fed
erat
ion
Hun
gary
Bul
gari
a
Slo
vak
Rep
ublic
Esto
nia
Latv
ia
Pola
nd
Bel
arus
Rom
ania
Cze
ch R
epub
lic
Mon
tene
gro
Ser
bia
BiH
Fed
erat
ion
Mac
edon
ia, F
YR
Rep
ublik
a S
rpsk
a
Kaz
akhs
tan
Aze
rbai
jan
Tajik
ista
n
Kyr
gyz
Rep
ublic
Turk
ey
High-Income
Generous Spenders
High-Income
Moderate SpendersLower-Spending
Transition Countries
High-Spending
Transition
Countries
Young
Countries
Ave
rage
pen
sion
ben
efit a
s %
of a
vera
ge w
age

100 The Inverting Pyramid
Co-operation and Development can provide some insight into the gen-
erosity of pension system designs, taking into account all of the reforms
that have been legislated and are being implemented gradually. While
the projected replacement rates are not applicable to any one person or
even to groups of people in a specific country, they show the results for
a hypothetical individual who starts work at age 20 in the year 2010,
earning the average wage of that country. That person is further
assumed to work continuously until retirement age, always earning
the average wage of the current year, and all such workers in all
countries are assumed to experience the same macroeconomic envi-
ronment. The hypothetical benefit rates calculated under this method-
ology can then be compared across countries, since they were
computed in the same way, to derive some measure of the relative
generosity of the system design toward a full-career individual.
Figure 3.24 shows the benefit that an average earner would
receive relative to the prevailing average wage. Pension systems
across countries will provide very different outcomes for pensioners,
under common assumptions. Typically, pension schemes are
expected to provide benefits equal to 40 to 50 percent of wages for
full-career earners. The benefits currently provided are considerably
FIGURE 3.24Hypothetical Wage Replacement Rates for Individuals Earning the Average Wage andBeginning Work in 2010 in the Pension Systems of Selected European and Central AsianEconomies
Source: Based on data from the OECD Pension Modeling Team, using methodology from the OECD series Pensions at a Glance.
Note: The Federation of Bosnia-Herzegovina (BiH Federation) and Republika Srpska, which together make up the country of Bosnia and Herzegovina, have separate
pension systems and are treated as separate data points in the figure.
0
20
40
60
80
100
120
Ital
yS
pain
Bel
gium
Fran
ceS
wit
zerl
and
Slo
veni
aLu
xem
bour
gG
reec
eIr
elan
dU
nite
d K
ingd
omG
erm
any
Nor
way
Sw
eden
Port
ugal
Finl
and
Aus
tri a
Den
mar
kN
ethe
rlan
d sIc
elan
dG
eorg
iaB
elar
usC
roat
iaE s
toni
aC
zech
Rep
ublic
Mol
dova
Slo
vak
Rep
ublic
Pola
ndR
ussi
an F
eder
atio
nA
rmen
iaH
unga
ryA
lban
iaS
erbi
aM
onte
negr
og
Ukr
aine
Re p
ublik
a S
rpsk
pp
aM
aced
onia
, FY
RB
iH F
eder
atio
nTa
jikis
taj
nA
zerb
aija
nj
Turk
men
ista
nK
osov
oT u
rkeyy
Kyr
gyz
Rep
ublic
ygy
pK
azak
hsta
n
High-Income
Generous
Spenders
High-Income
Moderate
Spenders
Lower-Spending
Transition
Countries
High-Spending
Transition
Countries
Young Countries
Pens
ion
bene
fit a
s %
of
aver
age
wag
e

Have the Pension Reforms to Date Been Enough? 101?
higher than that for a significantly shorter average career except in
the FSU countries, where they fall within that range. The High-
Income Generous Spender countries have hypothetical future bene-
fits averaging 70 percent, while the High-Income Moderate Spender
countries have hypothetical future benefits averaging 60 percent.
However, within these two groups, Spain, Slovenia, Luxembourg,
Greece, Austria, Denmark, the Netherlands, and Iceland are well
above those averages. The Lower-Spending and High-Spending
Transition Countries, which have been active reformers, have lower
average replacement rates, at 58 percent and 43 percent respectively,
although the average for the High-Spending Transition Countries is
brought down by future lower—but unlikely—benefits in both
Serbia and Montenegro. The Young Countries average a very high 72
percent, but this is largely due to the extremely high benefits in
Kazakhstan, which skew the average upward.
Replacement rates for individuals earning half the average wage
illustrate how well protected a low-income person might be under
FIGURE 3.25Hypothetical Wage Replacement Rates for Individuals Earning Half the Average Wage andBeginning Work in 2010 in the Pension Systems of Selected European and Central AsianEconomies
Source: Based on data from the OECD Pension Modeling Team, using methodology from the OECD series Pensions at a Glance.
Note: The Federation of Bosnia-Herzegovina (BiH Federation) and Republika Srpska, which together make up the country of Bosnia and Herzegovina, have separate
pension systems and are treated as separate data points in the figure.
0
20
40
60
80
100
120
140
160
Ital
y
Spa
in
Fran
ceB
elgi
u m
Sw
itze
rlan
d
Slo
veni
aG
reec
eLu
xem
bour
gG
erm
any
Uni
ted
Kin
gdom
Irel
and
Port
ugal
Nor
way
Finl
and
Sw
eden
Aus
tria
Net
herl
ands
Den
mar
kIc
elan
dC
roat
iaS
lova
k R
epub
lic
Pola
ndB
elar
usEs
toni
aR
ussi
an F
eder
atio
nH
unga
ryC
zech
Rep
ublic
Geo
rgi a
Mol
dova
Arm
enia
Alb
ania
Mon
tene
gro
Rep
ublik
a S
rpsk
aS
erbi
a
Mac
edon
ia, F
YR
BiH
Fed
erat
ion
Ukr
aine
Tajik
ista
nTu
rkey
Aze
rbai
jan
Kos
ovo
Kyr
gyz
Rep
ublic
Turk
men
ista
nK
azak
hsta
n
High-Income
Generous Spenders
High-Income
Moderate Spenders
Lower-Spending
Transition Countries
High-Spending
Transition
Countries
Young Countries
Pens
ion
bene
fit a
s %
of h
alf o
f ave
rage
wag
e

102 The Inverting Pyramid
these various pension systems (figure 3.25). The ordering of coun-
tries in this case changes only slightly. Average replacement for indi-
viduals earning half the average wage comes in at 76 percent for
High-Income Generous Spenders, 77 percent for High-Income
Moderate Spenders, 77 percent for Lower-Spending Transition
Countries, 52 percent for High-Spending Transition Countries, and
92 percent for the Young Countries. These values suggest that all of
the regions tend to protect lower-income elderly with work histories,
providing higher replacement rates for them than for the average
earner. It is also worth noting that in Denmark, Iceland, Moldova,
Armenia, Albania, the Kyrgyz Republic, Turkmenistan, and
Kazakhstan, a person earning half the average wage and continu-
ously contributing throughout his career would have higher income
once he retires compared to the income he earns while working.
While this might appear to be an indicator of excessive old-age insur-
ance, in reality many lower-income contributors do not have full
careers and will likely retire with lower pensions than those sug-
gested by the figure.
While these replacement rates seem reasonable and sometimes
even high, they should be regarded as the maximum that individu-
als can expect to receive. Most people do not begin work at age 20
and work continuously until reaching retirement age. They also do
not begin work at the average wage, but typically begin at some
lower wage and receive wage increases as their experience increases.
Therefore, someone who retires at the average wage might receive
the replacement rates shown, but as a percentage of a lower career-
long average wage and not the pre-retirement wage, which tends to
be higher. Also, the replacement rates shown here reflect what pen-
sioners will receive in their first year of retirement. With the trend
toward inflation indexation, the average pension that an individual
receives during his retirement period could be considerably lower.
However, this analysis suggests that some countries with higher
replacement rates might have room to adjust benefits further as the
demographic crisis nears, while others will have to make adjust-
ments elsewhere.
The increase in informal employment in the transition countries
in the last 20 years means that in the future many people will not
have accumulated a sufficient formal sector contribution history to
qualify for a pension. In contrast, today most elderly have substantial
past work histories and are collecting benefits on that basis.
Figure 3.26 shows the percentage of elderly who are currently col-
lecting regular pension benefits and the percentage of elderly who
can expect to collect benefits in the future. Projections here are based

Have the Pension Reforms to Date Been Enough? 103?
on the percentage of the population currently in prime working
years, defined as those aged 35–39, who contribute to the social
security system today.
Of the 24 countries where detailed age-specific data were avail-
able, only in Croatia, both entities of Bosnia and Herzegovina, and
Serbia is the percentage of elderly currently collecting benefits less
than 80 percent. One explanation for the lower coverage rates in the
former Yugoslavia is the relatively common occurrence of single-
earner families, even in the pre-1990 period. As a result, older
women who never worked in the formal sector and whose spouses
are still alive are not yet collecting pensions. In the future, based on
current labor force participation and contribution records, only about
60 percent of the elderly in the Central Europe subregion will be eli-
gible for pensions; elsewhere in transition countries, the number falls
to 50 percent or less. The three countries with universal pensions,
Georgia, Kazakhstan, Kosovo, and will continue to pay benefits to
100 percent of the elderly population.
FIGURE 3.26Percentage of Elderly Receiving Social Insurance Benefits in Selected European and CentralAsian Economies, 2010 and 2050
Source: Country-provided data.
Note: The Federation of Bosnia-Herzegovina (BiH Federation) and Republika Srpska, which together make up the country of Bosnia and Herzegovina, have separate
pension systems and are treated as separate data points in the figure.
0
10
20
30
40
50
60
70
80
90
100A
rmen
ia
Alb
ani a
Rom
ania
Rus
sian
Fed
erat
ion
Hun
gary
Bul
gari
a
Bel
arus
L atv
ia
Cro
atia
Lith
uani
a
Cze
ch R
epub
lic
Esto
nia
Pola
nd
Slo
vak
Rep
ublic
Geo
rgi a
Rep
ublik
a S
rpsk
a
BiH
Fed
erat
ion
Ser
bia
Aze
rbai
jan
Kyr
gyz
Rep
ublic
Turk
ey
Kaz
akhs
tan
Tajik
ista
n
Kos
ovo
Lower-Spending Transition Countries High-
Spending
Transition
Countries
Young Countries
% o
f pop
ulat
ion
age
65+
rece
ivin
g be
nefit
s
2010 2050

104 The Inverting Pyramid
Governments need to start thinking about how they will address
the needs of the 40–50 percent of elderly who will have no pension
rights in the future. The solution for each country will depend on its
own circumstances, but the issue of future elderly without pension
rights cannot be ignored. First, whether or not governments have
explicit programs to provide some support to the elderly who were
not in formal sector jobs, it is politically and socially difficult to
have no provision in place for such a large group of elderly. Second,
from an equity perspective, it becomes hard to deny rights to individ-
uals who contribute to general state revenues through value-added
taxes, but not through payroll contributions, if general revenue ends
up subsidizing the pension system. However, what is offered to non-
contributors needs to be designed carefully. Some of the contributors
today are already only contributing for enough years and on the basis
of the lowest wage required to become eligible for a minimum pen-
sion. Benefits provided to those who do not contribute reduce the
incentive to contribute and might result in a reduction in the number
of contributors. Offering a universal pension to all removes this dis-
tortion, but this is a more expensive approach than providing it only
to those who do not have alternative means. Alternatively, benefits
could be offered to noncontributors at higher ages, which might pro-
vide incentives to individuals to contribute so that they might retire
earlier.
The sections above discuss policy makers’ intentions in undertak-
ing reform. The outcome of the reforms also rests heavily on general
economic developments in the countries and in the region as a
whole.
Influence of Economic and Political Cycles on Pension Reforms
Transition countries started their pension reform process vigorously.
Countries in Central Europe chose their bold new pension designs in
the late 1990s and early 2000s. The countries of the FSU that chose
to radically change their pension system designs did so around the
same time, while Balkan countries reformed a bit later, in the mid-
2000s. At the time of setting their new pension system designs in
place, some countries, like Hungary, also restructured their existing
pension liabilities. In the Hungarian case, for workers choosing to
switch to the new pension design, liabilities accrued to date were
reduced by 25 percent. The majority of the reformers set retirement
ages on a gradually increasing path, often narrowing the gap between

Have the Pension Reforms to Date Been Enough? 105?
male and female eligibility requirements. Formulas governing the
conventional pay-as-you-go scheme component were often revised,
lengthening past wage-averaging periods, tightening the link
between benefits and contributions, and linking benefit indexation
to inflation or some mixture of inflation and wage growth. Given
assumptions at the time about high long-term GDP growth and cov-
erage expansion, these systems were generally expected to return to
fiscal sustainability in the medium term, or at least to significantly
narrow pension deficits in that time frame.
During the economic boom years of the mid-2000s, the pace of
reforms slowed. Echo boomers—the children of baby boomers—
were joining the labor market in great numbers. This was coupled
with increased formalization of the labor market fueled by the high
rate of economic growth. The numbers of contributors grew. Wages
also rose rapidly, and a greater proportion of wages was declared. The
economic boom was felt most strongly in countries of Central Europe
that were also boosted by early entry to the EU or the promise of
imminent entry. Fueled by credit expansion, countries like Russia
also grew rapidly, benefiting from buoyant commodity markets. All
these developments led to contribution revenue growth that
exceeded even the most optimistic projections in these countries. As
in so many instances described in chapter 2, the rise in the pay-as-
you-go and general budget revenues led to increased generosity of
benefits. Retirement ages continued to increase, but tight benefit
indexation rules were undermined and different benefit supplements
were added.
Some original public pension scheme parameters proved socially
and politically unsustainable in the high-growth environment,
especially those governing benefit indexation. Real wage growth
reached double digits in some countries, and pensioners were feeling
left behind. Some revision of benefit indexation rules was therefore
in order. However, instead of carefully discussing the options and
ensuring long-term sustainability of proposed changes, for example
by trading elimination of early retirement for a higher indexation
rate, politicians and pension scheme administrators tended to raise
pensions as much as current revenue would allow. Luckily, some of
the new revenue was redirected to individual savings accounts in
countries that had instituted them, which may have prevented pen-
sions from being raised to even more unsustainable levels.
Countries also strayed from their chosen reform path in other
ways. The high-growth environment offered a perfect opportunity to
pay down some of the transition costs with swelling pension scheme
and general budget revenues and increasingly high-priced public

106 The Inverting Pyramid
asset sales. Many countries were instead tempted by low borrowing
costs and built up public debt rapidly. Accruing a small reserve fund
against economic shocks was part of almost every original pension
reform plan, but this rarely occurred on a significant scale during the
boom years. Policy makers started to forget that the observed increase
in contributor numbers could only be a temporary phenomenon, as
demographic projections were increasingly pessimistic due to the
steadily low fertility rate and strong emigration outflows.
The pace of rapid change that these economies faced as they
transitioned from centrally planned economies to market economies
was also politically unsettling, particularly in new democracies with
relatively new political parties. It was not uncommon to find people
voting for a government that promised to restore the old system or
status quo following a period of vigorous reforms. As a result, the
series of public pension reforms and enabling reforms in labor
markets and financial markets envisaged by the original reformers,
and expected to eventually lead to financial sustainability, never hap-
pened. In some cases, the reforms not only did not move forward but
actually moved in the opposite direction.
The financial crisis caught public pension schemes unprepared.
Like the economic boom, the crisis was felt most strongly in Central
European economies, which among the transition countries had
developed deeper financial markets and stronger trade links with
Western Europe. Contributor numbers dropped and revenue quickly
declined, but pension spending stayed at the same level, as it was
impossible to change the number of pensioners who had already
been granted pensions and difficult to reduce their benefits. In fact,
the inflow of new pensioners increased, as many older workers chose
an early retirement option or, with rising unemployment, attempted
to qualify for a disability pension. Many countries stopped indexing
benefits and some even attempted to cut pension payments.
End-of-year bonus payments for pensioners in countries like Bulgaria
and Hungary were no longer paid. Pensions of working pensioners
were curtailed. All these measures tended to be of an ad hoc nature,
presented unpredicted negative surprises for pensioners, eroded pub-
lic trust in the system, and led to reduced incentives to contribute.
However, even these relatively drastic measures were not able to
bring pension spending to the level of sharply reduced revenues.
General state budgets were also stretched to the limit and could not
offer much help.
Unable to ensure financial sustainability of the pension system,
policy makers were forced to revise the design. In response to fiscal
pressures, some countries decided to temporarily or permanently

Have the Pension Reforms to Date Been Enough? 107?
reduce contribution flows to the individual pension savings accounts
(discussed in more detail in chapter 4). With their hands tied by
constitutional and political constraints, politicians turned to the
resources accumulating in the second-pillar pension funds to bail out
the first-pillar (or public) pension system. While in some cases
suboptimal pension design did require revisions—as in Kazakhstan,
where a flat pension component was introduced to protect the poor-
est population—more frequently these forced changes were not part
of a productive pension policy and masked the lack of real reform. A
reasonable fiscal policy cushion should have been created soon after
the chosen pension system design was in place and maintained so
that the system could withstand economic downturns. Similarly,
open public dialogue about long-term trends in the pension system
could have helped to ensure broad public support for the chosen
design and fiscally sustainable scheme parameters, discouraging dras-
tic policy changes.
While immediate responses to the onset of the financial crisis
tended toward ad hoc reform measures, the subsequent reaction to
the economic downturn was slightly more strategic. As the financial
crisis started to enlarge into an economic crisis in Western and
Central Europe, the FSU countries, Balkan countries, and Turkey
started to find themselves under fiscal stress from spillover effects.
This forced policy makers to return to a reform agenda, and many
countries legislated further rises in retirement ages and reaffirmed
their commitment to more stringent benefit indexation rules.
Others, including several Balkan countries, found that advancing
the reform agenda further became difficult, especially given
extremely high unemployment rates. In some cases, as in Greece
and Italy, the reforms had to be extremely painful, marked by sub-
stantial cuts in pensions and sharp overnight increases in retirement
ages, pushing the limits of social acceptance. It remains to be seen
whether these reforms, forced on the population by the financial
crisis without much public debate, can hold once economic growth
returns.
As of 2013, five of the 14 countries that originally instituted
private pension savings accounts have reduced contribution flows
into these accounts, but of these five, only Estonia has reaffirmed
its commitment to fully return to the previous pension system design.
The remaining four feel they are still unable to recommit to the
transition costs required. The private pension savings accounts
were meant to reduce the public pension expenditures when the
countries start to age. These countries now need alternative strategies
to reduce future pension liabilities and ensure that social goals of

108 The Inverting Pyramid
their pension systems can still be met in the long term. More details
on these reversals can be found in the next chapter.
Policy Conclusions
The countries of Europe and Central Asia have undertaken an active
reform agenda, but with limited impact, particularly in light of
the demographics they are facing. Retirement ages have risen, but
these adjustments have been more or less matched by increases in
life expectancy. Pension spending has not fallen for the region over-
all, nor have benefits become less generous. The reforms also have
not been very equitable: the majority of countries did not restructure
pension liabilities accrued to date, but instead grandfathered old
pension promises for most current pensioners and older workers,
while young cohorts in some countries face harsh benefit declines.
The self-adjusting mechanisms, adopted by many countries in order
to slowly decrease benefit package generosity, have been under-
mined in many cases by ad hoc pension increases whenever pensions
seem to fall below expectations of the public, however unrealistic
these expectations may be.
During the years of the economic boom, countries relaxed their
reform efforts. They did not take advantage of the high-growth envi-
ronment to pay transition costs and strengthen government and
pension program balance sheets, which was especially needed in the
countries that had elected to introduce private pension savings
accounts. Rather, policy makers started to act as if the choice of pen-
sion system design could solve long-term fiscal sustainability prob-
lems by itself, without the hard work of continued parametric
reforms.
When the financial crisis hit, they were forced to make revisions
to their chosen pension system designs. As a consequence of the
crisis, contributor numbers dropped, contribution revenue declined
sharply, and new pensioner inflows increased. Despite some hurried
actions to curb spending, large pension program deficits could not be
closed, and a few of the countries that had adopted individual
pension saving accounts decided to redirect some or all of the contri-
bution flows from them to the cash-strapped pay-as-you-go schemes,
on a temporary or permanent basis. These countries have improved
their short-run fiscal circumstances but have worsened their long-
term pension liabilities, putting them farther from achieving fiscal
sustainability of their pension systems together with adequacy of
benefits. They will now need to make deeper reforms in their public

Have the Pension Reforms to Date Been Enough? 109?
pension systems than they would otherwise have had to make. Policy
makers in these countries must now think of alternative strategies for
reducing future pension liabilities and ensuring that the social goals
of their pension systems can be met in the long term—and they will
need to build the political consensus to do so.
Looking forward, the reforms legislated to date do not appear to
have been sufficient to curb the projected growth of pension spending.
This suggests that more reforms may be necessary unless new financ-
ing sources are found or the number of contributors increases sub-
stantially. Historically, reforms that did not provide adequate benefits,
as defined by social consensus of the time, were not politically sustain-
able, as they were subject to ad hoc revisions. Social sustainability of
the needed reforms will continue to require tireless educational cam-
paigns, open discussion of inherent trade-offs in pension policy, and
public acceptance of the sacrifices required. It remains to be seen
whether social expectations of what is considered adequate pension
provision can shift before the demographic crisis takes hold with full
force and drives a much more dramatic revaluation of expectations.
While pensioners as a whole do not appear to be poorer than
other cohorts today, countries have set up very different benefit
levels for the years ahead. While some countries may have space for
further benefit adjustment, others have only limited room to maneu-
ver without sacrificing benefit adequacy, even under the most strin-
gent definitions. In these cases, availability of retirement savings to
supplement low publicly provided benefits will be particularly
important. Finally, transition countries need to address the issue of
old-age support for those who are not part of the formal labor mar-
ket and who will begin to retire in substantial numbers in the next
20 years.
Annex 3A The Polish Experience with Curbing Early Retirement
When Poland began its economic transition, the country inherited a
typical pension system with widespread early retirement privileges.
The list of occupations eligible for early retirement covered more than
300 jobs and 1,000 types of workplaces. Separate laws gave early
retirement rights to miners, railway workers, teachers, members of
army, police, border guards, professional firefighters, prison guards,
judges, and prosecutors. Women with long careers could retire at age
55 if they had worked for 30 years or more. The average actual retire-
ment age at the beginning of the 1990s was around 56 for women and

110 The Inverting Pyramid
58–59 for men, even though the legislated retirement ages were 60 for
women and 65 for men. Early retirement was also possible through
pre-retirement benefits and allowances granted to workers who lost
their jobs due to restructuring or bankruptcy of their employer.
Given the long list of occupations with early pension rights, a
new approach was proposed in 1999. Under the reform, which cov-
ered people born after 1948, early retirement was to be significantly
limited by introducing new “bridging pensions.” Instead of revising
the existing list of occupations eligible for early retirement, the
reform defined two broad categories of work that confer the right to
bridging pensions. These are (a) work in special conditions, and
(b) work of a special nature. The first refers to work conditions that
cannot be changed and that may harm the health of workers who
work in such conditions until retirement age (for example, work
underwater or underground). The second refers to jobs where the
worker (for example, a pilot) is directly responsible for the safety
and lives of other people. The definitions and lists were developed
with the participation of occupational health specialists. Anyone
who had worked in the occupations listed before 1999 is eligible to
retire up to 5 years early with a bridging pension. Once the person
reaches legal retirement age, the bridging pension is discontinued
and a regular old-age pension begins. The reform did not change the
legal retirement age, which remained at 60 years for women and
65 years for men.
Initially the plan was to introduce bridging pensions in 2007.
However, because of political disagreements, parliamentary elections
held in 2005 and 2007, and protests by miners in 2005 (which also
resulted in miners regaining the previous defined-benefit early retire-
ment scheme), the bridging pensions law was finally adopted only in
2008 and came into force in 2009.
The reform was launched at a time of economic slowdown in
Poland. Despite the unfavorable labor market situation, the number
of people receiving early retirement payments dropped from 1.53 mil-
lion in 2008 to 860,000 in 2012. At the same time, the employment
rate of people aged 55–64 increased from 31.6 percent to 38.7 percent
(figure 3A.1). The average age at retirement also increased, particu-
larly for women (by 3.7 years between 2008 and 2012), and the num-
ber of newly granted old-age pensions decreased. Unfortunately, the
number of retiring men increased after the Constitutional Court ruled
that men born between 1944 and 1948 could retire at age 60 if they
had worked for more than 35 years (figure 3A.2a). This reduced the
overall positive impact of the reform. The reform is expected to have
more impact on men’s pensions from 2013 onward.

Have the Pension Reforms to Date Been Enough? 111?
FIGURE 3A.1Early Retirement Rate and Employment Rate of Older Workers in Poland, 1997–2012
Sources: ZUS (Social Insurance Institution); Eurostat Statistics Database (employment rate).
0
200
400
600
800
1,000
1,200
1,400
1,600
1,800
0
5
10
15
20
25
30
35
40
45
% o
f pop
ulat
ion
aged
55–
64
Num
ber o
f wor
kers
, tho
usan
ds
1997 1998 1999 2000 2001 2002 2003 2004 2005 2006 2007 2008 2009 2010 2011 2012
Pre-retirement benefits
Pre-retirement allowances
Employment rate for population aged 55–64
Old-age pensions below retirement age Bridging pensions
FIGURE 3A.2New Old-Age Pensioners and Average Actual Retirement Age for Men and Women in Poland,1999–2011
Sources: ZUS (Social Insurance Institution), with data disaggregation by the Institute for Structural Research in Warsaw.
a. Men
53
54
55
56
57
58
59
60
61
62
0
50
100
150
200
1999
2001
2003
2005
2007
2009
2011
New
old
-age
pen
sion
ers,
thou
sand
s
Ave
rage
age
at r
etir
emen
t
Average age in years
Men under age 50
Men aged 50–54
Men aged 55–59
Men aged 60–64
Men aged 65+
b. Women
53
54
55
56
57
58
59
60
61
62
0
50
100
150
200
1999
2001
2003
2005
2007
2009
2011
New
old
-age
pen
sion
ers,
thou
sand
s
Ave
rage
age
at r
etir
emen
t
Average age in years
Women aged 60+
Women aged 50–54
Women under age 50
Women aged 55–59

112 The Inverting Pyramid
Curbing early retirement eventually led to changes in the official
retirement age. In 2012 the government enacted a further increase in
the legal retirement age by 3 months each calendar year, aimed at
equalizing the legal retirement age at 67 for both men and women.
This means that men will retire at age 67 from 2020 and women
from 2040.
Notes
1. The discussion of self-adjusting mechanisms draws heavily on Zviniene (forthcoming).
2. Political scientists Guardiancich and Weaver (2012) refer to these as stealth reforms.
3. This section draws heavily from Abels (forthcoming). 4. “Severe material deprivation” is defined by Eurostat as the inability to
afford at least four of the following items: (a) pay rent, mortgage, or utility bills; (b) keep the home adequately warm; (c) face unexpected expenses; (d) eat meat or proteins regularly; (e) go on holiday; (f) a television set; (g) a washing machine; (h) a car; (i) a telephone. While this definition is significantly different from the absolute poverty mea-sures used by the World Bank, the point that pensioners are not usually more poor than nonpensioners remains valid.
5. “Social security contributions” refers to the broad set of payroll taxes that finance pensions, unemployment insurance, health insurance, sickness and maternity benefits, as well as worker injury benefits. The exact mix of benefits varies from country to country. Pension contribu-tions, a subset of social security contributions, affect pension system revenues and the rights that individuals hold in the pension system. But in the discussion here, when comparing income when one receives a pension to income when one receives a wage, the correct approach is to compare pension income on which no contributions are paid to wage income from which all relevant contributions have been subtracted.
References
Abels, Miglena. Forthcoming. “Experience with Disability Program Reforms in Central and Eastern Europe.” World Bank, Washington, DC.
Chomik, Rafal, and Edward R. Whitehouse. 2010. “Trends in Pension Eligibility Ages and Life Expectancy, 1950–2050.” OECD Social, Employment, and Migration Working Paper 105, Organisation for Economic Co-operation and Development, Paris.
De Jong, Philip R. 2008. “Recent Changes in Dutch Disability Policy.” APE (Public Economics), The Hague, the Netherlands.

Have the Pension Reforms to Date Been Enough? 113?
European Commission. 2012a. The 2012 Ageing Report: Economic and Budgetary Projections for the 27 EU Member States (2010–2060). Brussels: European Commission, Directorate-General for Economic and Financial Affairs.
———. 2012b. “An Agenda for Adequate, Safe and Sustainable Pensions.”White Paper, European Commission, Brussels.
———. 2012c. Pension Adequacy in the European Union 2010–2050. Brussels:European Commission, Directorate-General for Employment, SocialAffairs and Inclusion, Social Protection Committee.
Eurostat Statistics Database. European Commission, Brussels. http://epp .eurostat.ec.europa.eu/portal/page/portal/statistics/search_database.
Guardiancich, Igor, and R. Kent Weaver. 2012. “The Political Economy ofPension Reform.” Presentation at “Reforming Pension Systems in Europe and Central Asia: A Joint European Commission–World Bank Conference,” Brussels, June 25–26.
Hirose, Kenichi, ed. 2011. Pension Reform in Central and Eastern Europe: In Times of Crisis, Austerity and Beyond. Budapest: International Labour Organization.
Holzmann, Robert, and Edward Palmer, eds. 2006. Pension Reform: Issues and Prospects for Non-Financial Defined Contribution (NDC) Schemes. Washington, DC: World Bank.
Lafortune, Gaétan, Gaëlle Balestat, and the Disability Study Expert GroupMembers. 2007. “Trends in Severe Disability among Elderly People: Assessing the Evidence in 12 OECD Countries and the Future Implications.” OECD Health Working Paper 26, Organisation for Economic Co-operation and Development, Paris.
Mink, Reimund. 2005. “General Government Pension Obligations in Europe.” IFC Bulletin 28 (1): 199–209. http://www.bis.org/ifc/publ/ifcb28y.pdf.
MISSOC (European Commission, Mutual Information System on SocialProtection). Comparative Tables on Social Protection. http://ec.europa.eu / social/main.jsp?catId=815&langId=en.
Müller, Christoph, Bernd Raffelhüschen, and Olaf Weddige. 2009. PensionObligations of Government Employer Pension Schemes and Social Security Pension Schemes Established in EU Countries. Freiburg, Germany: Research Center for Generational Contracts, Freiburg University.
NSSI (National Social Security Institute of Bulgaria). 2013. Statistical Yearbook on Pensions 2012. Sofia: NSSI.
OECD (Organisation for Economic Co-operation and Development). 2007. “Sickness and Disability Schemes in the Netherlands.” Background Paper for OECD Disability Review, OECD, Paris.
———. 2011. Pensions at a Glance 2011: Retirement-Income Systems in OECD and G20 Countries. Paris: OECD.
U.S. Social Security Administration. Various years. Social Security Programs throughout the World. http://www.ssa.gov/policy/docs/progdesc/ssptw/.
Van Sonsbeek, Jan-Maarten, and Raymund Gradus. 2012. “Estimating the Effects of Recent Disability Reforms in the Netherlands.” Oxford Economic Papers. doi:10.1093/oep/gps043.

114 The Inverting Pyramid
Whitehouse, Edward R., Anna D’Addio, Rafal Chomik, and Andrew Reilly. 2009. “Two Decades of Pension Reform: What Has Been Achieved and What Remains to be Done?” Geneva Papers on Risk & Insurance—Issues & Practice 34: 515–35.
World Bank. HDNSP Pensions Database. Human Development Network Social Protection, World Bank, Washington, DC.
———. World Development Indicators (database). http://data.worldbank .org/data-catalog/world-development-indicators.
Zaidi, Asghar, and Edward R. Whitehouse. 2009. “Should Pension Systems Recognise ‘Hazardous and Arduous Work’?” OECD Social, Employment, and Migration Working Paper 91, Organisation for Economic Co-operation and Development, Paris.
ZUS (Social Insurance Institution). 2012. Social Insurance in Poland. Warsaw: ZUS.
Zviniene, Asta. Forthcoming. “In Search of the Ideal Self-Adjusting PAYG System.” World Bank, Washington, DC.

The Role of Savings in the Provision of Retirement Income
CHAPTER 4
115
Introduction
Because of the inverting pyramid, as explained in chapter 3, most
European countries will need to adjust pension benefits in order
for the schemes to remain fiscally sustainable. In the context of
uncertainty about the expected value of public pensions, retirement
savings can play an important role in ensuring that individuals do
not suffer severe contractions in their consumption pattern after
retirement. This chapter analyzes the different mechanisms for
incentivizing savings, including public reserve funds as well as vol-
untary and mandatory savings for retirement.
Consumption smoothing and poverty reduction are the main
objectives of any pension system, but the role of savings is stronger in
the first. While consumption smoothing can be accomplished
through contributory systems, it might be more efficient to finance
poverty reduction through government general revenues.
Retirement savings are an efficient way to support and preserve pur-
chasing power after retirement. Consumption smoothing implies not
only intragenerational smoothing (contributors are able to preserve
consumption levels after retirement), but also intergenerational

116 The Inverting Pyramid
smoothing (retirees of different generations but similar characteris-
tics should receive similar interest rates on their contributions).
Considering the need to diversify the sources of retirement
income, it is essential to ensure that savings are properly invested. In
the context of multipillar pension schemes, with an important part of
the expected retirement income to come from the pay-as-you-go
(PAYG) system, it is essential to ensure that the assets of the funded
component have low correlation with the repayment capacity of the
government.1 Investments in the domestic and international corpo-
rate sector are necessary to reduce the pension risk and support
consumption smoothing in the population.
Savings not only provide a diversified source of income for indi-
viduals; they also have a positive effect on the growth rate of the
economy. As savings have a dynamic effect on increasing growth of
gross domestic product (GDP), the impact of savings should be
analyzed from an intertemporal perspective. Both the capacity to
deliver future income and the effect on economic growth need to be
taken into consideration at the time of evaluating the importance of
funded pension schemes for the countries.
The effects of pension reforms on savings and investment are not
evident because of the involvement of multiple agents. The seminal
work of Feldstein and Horioka (1980) helped build consensus on the
positive correlation between national savings and the rate of domes-
tic investment. Subsequent studies, including those by Calderón and
Schmidt-Hebbel (2003) and Corbo and Schmidt-Hebbel (2003),
confirm these findings for a broader number of countries. The effect
of the introduction of mandatory funded schemes on national sav-
ings needs to be analyzed separately. It depends on four factors2:
• The change in the government’s overall saving or surplus stemming from
the transitional pension deficit caused by the reform and the fiscal response
to that deficit, as reflected in the nonpension deficit. The government
financing of the transitional deficit is one of the most delicate
points in the implementation of pension reform, as governments
have the capacity to offset the increases in households’ savings
with greater public sector deficits. As stated by Corsetti and
Schmidt-Hebbel (1997), careful consideration should be given to
the distortionary nature of the taxes that may need to be raised to
finance the transitional deficit (in the case of a tax-financed
reform) or to pay the government debt interests (in the case of a
debt-financed reform).
• The response of private saving to the change in total government saving.
This discussion is intrinsically related to the existence of Ricardian

The Role of Savings in the Provision of Retirement Income 117
equivalence, which supports the view that the private sector
responds to a change in public saving by adjusting its saving level
by the same amount, but with the opposite sign. Under reasonable
assumptions, including credit constraints, finite planning horizons,
and different discount rates, the private sector does not fully offset
the changes in public savings.
• The new mandatory pension saving by households in the pension funds.
This is the gross effect of the increases in contribution rates.
• The response by households in terms of voluntary saving. Households
may adjust their voluntary savings in response to the increases in
mandatory pension saving.
While all four factors are important in explaining the overall
behavior of savings, it is unlikely that countries will increase their
savings ratios if governments follow debt-financing strategies. The
evidence in the region suggests that gross national savings have
remained relatively stable since the introduction of mandatory
funded schemes (figure 4.1). The fact that these reforms have not
had a significant impact on national savings rates in countries that
reformed their pension systems is a reflection of the partial or total
FIGURE 4.1Gross National Savings Rates as a Percentage of GDP in Selected European Economies,2000–2012
Source: IMF World Economic Outlook Database.
5
2000 2001 2002 2003 2004 2005 2006 2007 2008 2009 2010 2011 2012
10
15
20
25
% o
f GD
P
30
35
40
Bulgaria
Hungary
Latvia
Lithuania
Macedonia, FYR
Poland
Romania
Russian Federation
Slovak Republic
Kazakhstan
Croatia
Estonia

118 The Inverting Pyramid
debt financing of the transitional deficit in the years that followed
the reform.
Pension reforms are unlikely to have an impact on capital market
development unless governments implement proactive public poli-
cies to develop the capital market. While the introduction of funded
schemes creates an investable pool of assets, capital markets are
unlikely to develop unless other enabling conditions are in place or
developed simultaneously. More sophisticated capital markets can
also help increase total factor productivity, which affects the potential
GDP growth of the countries.3 Even in countries as dynamic as
Poland in listing small and medium-sized enterprises in the stock
market, the volumes are unlikely to cope with the growth in assets of
the pension funds. In this regard, participation of the pension funds
in the privatization of assets owned by the state provides the basis for
the supply of equity instruments. In the fixed income market, the
creation of a government yield curve through issuance of govern-
ment bonds provides the basis for pricing private sector instruments.
The development of the capital market remains a challenge in smaller
economies.
Modalities of Retirement Savings
While retirement savings may come from public or private sources,
the motivation of public and private savings tends to be different.
Public savings are typically designed to build reserves to sustain social
security systems, but private savings are created as an additional
source of retirement income for pensioners.
The strategy for managing pension fund assets needs to be related
to the structure of liabilities of the fund. While the investment strat-
egy of the reserve funds is conditioned on the expected availability of
government resources for paying pensions, the investment strategy
of private pension funds should be linked to the expected retirement
age of the contributors. These different objectives should create dif-
ferent approaches to managing investment risk. In addition, the
investment strategy of private savings should be conditioned on the
expectation of retirement income derived from social security.4
Public Pension Reserve Funds
Public pension reserve funds are common in countries that want to
support the sustainability of their social security systems. While in
most cases these funds are created to help finance public pension

The Role of Savings in the Provision of Retirement Income 119
schemes, they can also be used for making pension payments.
In addition, the funding of public pension reserve funds may come
from contributions, privatizations, or external sources of funds, such
as oil revenues in the case of Norway.
Pension reserve funds are relatively small compared to the implicit
pension debt of European countries. As shown in table 4.1, nine
countries in Europe have public reserve funds and manage assets for
amounts that are relatively low, especially when compared to the
implicit pension debt obligations of these countries (figure 2.1).5 For
example, while France has implicit pension liabilities that amount to
approximately 365 percent of GDP, the amount of assets accumu-
lated in the pension reserve fund accounts for only 1.6 percent of
GDP. The relatively small size of these funds compared to the
government’s implicit commitments creates doubts about their future
effectiveness in paying the social security debt in these countries.
Without a sizable and permanent source of funding, pension reserve
funds will be insufficient to cope with the pension liabilities.
Asset allocation of public reserve funds varies by country. While
the public reserve funds of Ireland, Sweden, and Norway have an
asset allocation of more than 50 percent to equities, funds in Spain
and Belgium are 100 percent invested in bonds (figure 4.2). Policy
makers in the first group of countries have targeted a long-term
TABLE 4.1Pension Reserve Funds in Selected European Economies, 2011
Economy Fund or institution
Assets
US$, billions % of GDP
Sweden National Pension Funds (AP1–AP4 and AP6) 124.7 25.3
Spain Social Security Reserve Fund 85.3 6.2
Francea AGIRC-ARRCO 71.7 2.7
France Pension Reserve Fund (FRR) 40.7 1.6
Ireland National Pensions Reserve Fund 17.4 8.4
Belgium Zilverfonds 23.8 5.0
Norway Government Pension Fund Norway 23.0 5.1
Portugal Social Security Financial Stabilization Fund 11.5 5.2
Poland Demographic Reserve Fund 3.7 0.8
Sovereign wealth funds with a pension focusbss
Norway Government Pension Fund Global 553.8 121.7
Russian Federation National Wealth Fund 87.2 5.1
Source: Country-provided data.
a. Figure is for year 2010.
b. Mandates of these funds go beyond the financing of pension expenditures.

120 The Inverting Pyramid
strategy by diversifying assets based internationally. The funds in
Portugal, France, and Poland have equity allocations of less than
20 percent of the total portfolio. As expected, performance of pen-
sion return guarantees in the past 3 years has been relatively low, but
it is not different than performance of private pension schemes
(table 4.2).
Public pension reserve funds in Europe have proven not to be
immune to the financial crisis. The funds of France, Ireland, and
Spain diverted their investment strategies to stabilize the domestic
markets. In 2010, the French Pension Reserve Fund reduced foreign
equity participation from 81 percent to 45 percent of the overall
equity exposure, and foreign bond exposure from 68 percent to
19 percent of the overall bond exposure. In Ireland, the National
Pensions Reserve Fund was required to participate in the rescue of
the failed Irish banks, and a quarter of the fund assets were invested
in Irish banks. Consequently, Irish public pension reserves
dropped from $32.3 billion to $17.4 billion between 2010 and 2011.
Currently, the majority of the Irish pension reserve fund assets
are direct investments in equities of the Irish banking system.
FIGURE 4.2Public Pension Reserve Funds in Selected European Economies: AssetAllocation as a Percentage of Total Assets, 2011
Sources: Country-provided data; World Bank Private Pensions (internal database).
0
10
20
30
40
50
60
70
80
90
100
% o
f tot
al p
ortfo
lio
Ireland Sweden Norway
(Global)
Norway
(Norway)
FrancePortugal Poland Spain Belgium
DebtEquityOther Cash and bank deposits

The Role of Savings in the Provision of Retirement Income 121
In addition, the Irish pension reserve fund was authorized to invest
in Irish government securities.6 In Spain, the Social Security Reserve
Fund has been used to stabilize the funding of the government. The
fund increased the share of Spanish government bond securities from
55 percent to 87 percent and then to 100 percent of the fund in 2009,
2010, and 2011.
Building sizable pension reserve funds from labor income contri-
butions might be difficult. In the face of conflicts of interests faced by
governments as managers, and with limited fiscal capacity for getting
enough funds to make a difference, pension reserve funds are vehi-
cles with limited impact. Unless countries receive windfall revenues
from the discovery of a commodity, or receive endowments of
resources that are unrelated to the current value of the country’s
assets, the growth potential of these funds is limited.
Private Savings for Retirement
Private pension funds have become important institutional investors
in Europe and Central Asia (figure 4.3).
From a macroeconomic perspective, the behavior of savings is
difficult to explain. Since income and consumption theories are
the foundation of modern macroeconomics, savings theories tend
to be weaker, as they are derived from a residual between income
TABLE 4.2Real Annual Rates of Return for Public Pension Funds in SelectedEuropean Economies, 2008–2010
Economy Annual return
Norway 2.0
Spain 2.5
Belgium 2.1
Poland −0.5
Sweden—AP4 0.9
Sweden—AP1 −0.2
Portugal −0.3
Sweden—AP2 −0.7
Sweden—AP3 −0.8
Sweden—AP6 −0.8
France—Pension Reserve Fund (FRR) −4.9
Ireland −6.3
Source: Source: OECD Global Pension Statistics Database.OECD Global Pension Statistics Database.

122 The Inverting Pyramid
and consumption. The permanent income hypothesis, which is
one of the most useful theories for explaining consumption, argues
that individuals consume a constant fraction of their expected
long-term average income. According to this theory, for example,
individuals would save any transitory increases in current income.
Macroeconomic theory predicts negative savings for young work-
ers. The consequences of this permanent income hypothesis have
direct policy implications for the role of savings during the life cycle.
In the case of individuals with minimum human capital, the pattern
of wages along the life cycle typically takes the shape of an inverted
“U” that reaches its peak when workers are in their forties. Assuming
that income for the average person follows that pattern, young work-
ers have incentives to consume more than their current income.
NetherlandsIceland
SwitzerlandUnited Kingdom
FinlandDenmark
IrelandPolandCroatia
KazakhstanSweden
Slovak RepublicSpain
PortugalEstoniaNorway
LatviaCzech Republic
BulgariaGermany
AustriaItaly
Russian Federation
BelgiumSloveniaLithuaniaHungary
Macedonia, FYRLuxembourg
RomaniaKyrgyz Republic
FranceUkraineGreece
% of GDP
0 20 40 60 80 100 120 140
FIGURE 4.3Private Pension Assets as a Percentage of GDP in Selected Europeanand Central Asian Economies, 2011
Sources: OECD Global Pension Statistics Database; World Bank Private Pensions (internal database).

The Role of Savings in the Provision of Retirement Income 123
From the savings perspective, there is a risk that individuals may start
saving too late in their working lives in order to ensure consumption
smoothing.
Working-age people are likely to save less money than they will
need during retirement. With perfect foresight, individuals would
save enough to maintain their consumption over time, even after
retirement. However, in the presence of imperfect information,
uncertainty about life expectancy, and shortsighted contributors,
individuals may postpone excessively their retirement savings deci-
sions. For example, people with high discount rates will have incen-
tives to maintain high consumption patterns for longer periods than
those that would allow them to maintain consumption after retire-
ment. The same situation occurs when people assume a shorter life
expectancy than what is predicted on the relevant mortality tables,
or when they have unreasonable expectations of income growth in
the future. Since all of these variables are not deterministic, the
probability is high that people will save less than the amounts
required to sustain consumption after retirement.
In the presence of market imperfections in all the countries in
the region, the low volume of accumulation in voluntary schemes is
not surprising. As shown in figure 4.4, voluntary pension savings
have been very low in countries that have offered such instruments,
with assets under management of less than 1 percent of GDP.
FIGURE 4.4Voluntary Pension Savings as a Percentage of GDP in Selected European and Central Asian Economies, 2012
Source: World Bank Private Pensions (internal database).
Note: The year in parentheses is the year of creation of the mandatory funded scheme. Data for Ukraine and Slovenia refer to year 2011.
0
Polan
d (19
98)
Kazak
hsta
n (19
98)
Latvi
a (20
01)
Esto
nia (2
002)
Bulgar
ia (20
02)
Croat
ia (20
02)
Russia
n Fed
erat
ion (2
002)
Lithu
ania
(2004
)
Slovak
Rep
ublic
(200
5)
Mac
edon
ia, FY
R (200
6)
Roman
ia (20
08)
Kyrgyz
Rep
ublic
(200
9)
Hunga
ry (19
98–20
11)
Ukraine
Sloven
ia
Czech
Rep
ublic
1
2
3% o
f GD
P
4
5
6
7
8

124 The Inverting Pyramid
The evidence suggests some level of substitution between manda-
tory and voluntary pension savings. Countries with larger accumu-
lated assets in mandatory savings, like Poland and Croatia, tend to
have a lower volume of voluntary savings than countries that have
only voluntary savings, like Slovenia and the Czech Republic (figure
4.5).7 Understanding why voluntary savings in less developed coun-
tries and those without mandatory funded schemes, such as Ukraine,
are negligible would require a more elaborated theory and
understanding of the corporate structure in these countries. For
example, the corporate structure of Slovenia and the Czech Republic
supports larger voluntary savings. The Russian Federation is an out-
lier, with total voluntary savings of approximately 1.2 percent of GDP.
These savings are explained by plans offered by large corporations to
their employees, and cover a small part of the working population.
Voluntary savings in Hungary do not appear to substitute for sav-
ings from the mandatory scheme. The higher level of voluntary pen-
sion savings in Hungary compared to the rest of the region is not a
consequence of the nationalization of the mandatory funded
scheme,8 but of a pattern of relatively high voluntary savings
throughout the decade. As shown in figure 4.6, voluntary savings in
Hungary have been high since 2002. So far, the data for 2012 do not
show any clear short-term substitution of savings after the national-
ization of the mandatory funded scheme.
FIGURE 4.5Voluntary and Mandatory Pension Savings as a Percentage of GDP in Selected European and Central Asian Economies, 2012
Source: World Bank Private Pensions (internal database).
Note: The year in parentheses is the year of creation of the mandatory funded scheme. Data for Ukraine and Slovenia refer to year 2011.
0
Polan
d (19
98)
Kazak
hsta
n (19
98)
Latvi
a (20
01)
Esto
nia (2
002)
Bulgar
ia (20
02)
Croat
ia (20
02)
Russia
n Fed
erat
ion (2
002)
Lithu
ania
(2004
)
Slovak
Rep
ublic
(200
5)
Mac
edon
ia, FY
R (200
6)
Roman
ia (20
08)
Kyrgyz
Rep
ublic
(200
9)
Hunga
ry (19
98–20
11)
Ukraine
Sloven
ia
Czech
Rep
ublic
2
4
6% o
f GD
P
8
10
12
14
18
16
Voluntary Mandatory

The Role of Savings in the Provision of Retirement Income 125
Corporate structure and tax incentives are important drivers of
voluntary pension systems. As a part of the compensation package,
some state-owned companies (for example in Russia) offer pension
benefits to their employees that are more generous than those
offered by private sector companies. These agreements are typically
supported by unions and respond to the corporate culture of the
country. Also, in countries with a high proportion of workers in the
formal sector and strong enforcement by the tax collection author-
ity, voluntary pension plans have greater opportunity to grow.
The voluntary pension systems in the Netherlands and the
United States provide good examples of the importance of the corpo-
rate structure and the presence of a strong tax collection authority in
a highly formal labor market, respectively. As shown in figure 4.7,
almost 90 percent of the labor force in the Netherlands is covered
under these voluntary schemes, and this is considered part of the
social contract between employers and employees. Given the support
of the unions and corporations, voluntary pension schemes based on
corporate plans typically have more consistency than those based
purely on tax incentives. These schemes can hardly be replicated in
countries with different corporate cultures.
In the case of the United States, the 401(k) plans are based on tax
incentives and matching contributions from employers. For an
economy with low levels of unionization, 401(k) plans offer a tax
relief opportunity to employers and employees that makes these
plans attractive. The success of the 401(k) plans in attracting
contributors is based on the premise of a tax authority with
FIGURE 4.6Voluntary and Mandatory Pension Savings in Hungary, 2002–2012
Source: Central Bank of Hungary.
0
500
1,000
1,500
2,000
2,500
3,000
3,500
2002 2003 2004 2005 2006 2007 2008 2009 2010 2011 2012
Hun
gari
an fo
rint
s, b
illio
ns
Voluntary Mandatory

126 The Inverting Pyramid
enforcement capacity, the tax benefits for employers in matching
employees’ contributions, a well-defined default option for new
entrants (automatic enrollment), and a labor market with high par-
ticipation in the formal sector. A similar type of system has insignifi-
cant effects in Ukraine, as the economy has a high proportion of
workers in the informal sector and the government faces sizable
challenges in the area of tax collection.
With progressive income tax structures, voluntary pension
schemes tend to favor higher-income individuals. Tax-induced
voluntary savings are mainly used by people who face higher income
tax rates. This segment of the population has a higher level of substi-
tution between pure voluntary savings and tax-induced retirement
savings. In addition, individual savings plans are typically expensive
to manage, as they require expensive platforms for distribution of
products and sales. In countries with mandatory funded schemes,
such as Estonia and Poland, only a small percentage of individuals
participate in individual voluntary pension schemes (figure 4.7).9
One important caveat is that the tax incentives and initial conditions
are not necessarily comparable across countries. While tax incentives
in the Czech Republic are relatively generous, they are minimal in
Poland. As explained below, default options can also play a role in
motivating people to participate in the system.
FIGURE 4.7Coverage of Funded Pension Schemes in Selected Economies, 2010
Sources: OECD 2012; Price and Rudolph 2013.
20
40
% o
f wor
king
-age
pop
ulat
ion
60
80
100
Canada Ireland Netherlands United
Kingdom
United
States
Estonia Poland
Mandatory Occupational Personal

The Role of Savings in the Provision of Retirement Income 127
Even in the best of cases, coverage of voluntary systems will be
low. As shown in figure 4.7, with the exception of the Netherlands,
the coverage level of voluntary pension schemes in developed econo-
mies such as Canada, the United Kingdom, and the United States is
lower than 40 percent of the labor force. These levels of coverage will
be insufficient to ensure consumption smoothing for the middle class
in these countries. The expectations for coverage of voluntary pen-
sion systems are likely to be even lower in developing economies.
Public policy plays an important role in ensuring that voluntary
pension portfolios are invested in line with an expected replacement
rate. Most of the countries have liberal policies in terms of the
portfolio allocation of voluntary savings, accepting the rationale that
“It’s my money and I can do whatever I want.” While this argument
is valid to an extent, these savings are incentivized with public money
through tax breaks, and therefore the eligibility criteria for voluntary
pension plans could be narrowed to plans that are effectively designed
to complement the expected replacement rate. Without trying to be
prescriptive, one can argue that public policy should play a more
important role in guiding portfolio decisions in voluntary schemes.
This becomes especially important in countries that will not be able
to offer adequate replacement rates with public pension systems and
defined contribution systems.
While the literature suggests that financial literacy may help
increase savings (not necessarily retirement savings), financial
literacy has a more limited effect on individuals’ choices of portfolio
allocation. In countries with relatively well developed capital
markets, pension fund managers might offer many combinations of
portfolios, and individuals decide how to invest their money. In the
absence of proper financial education, contributors do not necessarily
choose pension portfolios that are aligned to their long-term objec-
tives. The low level of financial literacy is an important impediment
to building portfolios that are consistent with an expected replace-
ment rate in the future.
The likelihood that improvements in financial literacy will result
in proper asset allocation in the near future is minimal. It will take at
least two or three decades before such programs have an effect on
decisions of savers, especially with respect to the importance of
retirement savings and the effect of asset allocation decisions on
future retirement income. Assuming that people start saving for
retirement early in their life, it is unlikely that individuals with aver-
age skills will provide an elaborated response to the question of what
portfolio, at each point in a person’s life, is most likely to optimize the
expected value of his or her pension at the expected retirement age.

128 The Inverting Pyramid
This calculation typically requires a college degree in finance or eco-
nomics or solid training in the financial markets.
The limitations of voluntary systems for achieving coverage and for
committing individuals to contribute regularly provide an advantage
to mandatory or quasi-mandatory systems. Consumption smoothing
can only be achieved with a significant participation of workers,
which voluntary schemes in most of the countries unfortunately can-
not provide. Madrian (2013) suggests that matching contributions
increase savings plan participation and contributions, but the impact
is less significant than that of nonfinancial approaches, including
automatic enrollment, simplification, planning aids, reminders, and
other commitment devices. Mandatory or quasi-mandatory funded
schemes for all segments of the population can be more effective in
achieving coverage and contribution rates conducive to adequate
replacement rates.
Mandatory funded schemes increase the probability of achieving a
certain replacement rate for a broader group of future retirees. The
main advantages of mandatory funded schemes are the possibility of
reaching similar coverage of the social security system and ensuring a
consistent contribution rate over an individual’s working life.
Quasi-mandatory schemes offer an attractive way to address the
weaknesses of voluntary schemes, namely coverage and contribution
rate. While mandatory funded schemes are still a legitimate option,
quasi-mandatory schemes can achieve similar outcomes by persuad-
ing workers to contribute, using both financial and nonfinancial
incentives. Foremost among these is automatic enrollment, or auto-
enrollment: workers are notified at the time of eligibility that they
will be enrolled in the plan at a specified savings rate and asset alloca-
tion unless they actively elect not to participate or change the default
selections.10 Quasi-mandatory schemes are based on behavioral
incentives that respond to the limited rationality of individuals. In a
world with perfect rationality, individuals would make their choices
without respect to the way options are presented. However, evidence
suggests that given limited rationality, outcomes may vary when
options are presented differently.11 For example, the participation in
voluntary savings when the default option is not to save (opt-in
schemes) is much lower than when the default option is to save
(opt-out schemes).
The extent to which quasi-mandatory systems are at all voluntary
is an open question. Auto-enrollment schemes are based on the
concept of “libertarian paternalism,” which is elegantly presented by
Thaler and Sunstein (2008). These authors argue that policy deci-
sions need to take into account the limited rationality of individuals,

The Role of Savings in the Provision of Retirement Income 129
and consequently default options can play an important role by
providing a noncoercive “nudge” toward the desired behavior. Proper
default options and proper communication strategies are essential for
the success of these plans. However, if the communication strategy
strongly promotes the benefits of the default option, it is not evident
that the decisions made by individuals will be well informed and
voluntary.
Madrian (2013) suggests that opt-out automatic enrollment is the
most effective method for increasing participation in defined contri-
bution schemes. The evidence on employer-sponsored savings plans
in the United States shows that participation rates are substantially
higher when enrollment is the default option.12 In addition, the
impact of automatic enrollment is greatest for young and low-income
groups. The evidence on individual pension plans in the Slovak
Republic supports these findings, and in the past 7 years the Slovak
government has changed the default option four times as a means of
incentivizing or disincentivizing participation in funded schemes.13
The main difference between the outcomes of the mandatory
funded scheme and the opt-out auto-enrollment system has to do
with the effect on retirement savings of the most vulnerable sectors
of the population: younger and low-income workers. While the
expected participation rate with auto-enrollment is much higher
than participation in a purely voluntary (opt-in) scheme, it might still
be lower than the coverage that results from a mandatory system. As
it gives a way out to individuals with financial constraints and a
preference for present consumption, auto-enrollment may still
induce young and low-income workers to step out of the system.
However, proper implementation might mitigate the incentives for
opting out. Benartzi and Thaler (2013) suggest including four fea-
tures in any comprehensive plan to facilitate adequate saving for
retirement: availability, automatic enrollment, automatic invest-
ment, and automatic escalation.14
Given the fiscal cost of funded schemes, government budget
considerations are biased criteria for selecting voluntary, auto-
enrollment, or mandatory funded schemes. Since they are unable to
cover a sizable part of the population, tax-incentivized, individual vol-
untary opt-in systems create lower fiscal costs than the other two
options, but they tend to skew the allocation of fiscal resources toward
segments of the population with higher income. Individual voluntary
pension schemes actually tend to be more expensive for contributors
than mandatory funded schemes because of market imperfections and
high distribution costs. Although fees charged by mandatory schemes
are high in some countries, fees charged by individual voluntary

130 The Inverting Pyramid
schemes tend to be even higher, creating an additional disincentive for
participating in individual voluntary pension schemes.
Countries with advanced central collection and record-keeping
platforms may consider extending these platforms to voluntary
pension schemes. Taking advantage of their developed information
technology systems, centralized account management system, and
extensive distribution channels, social security agencies may consider
making their low-cost infrastructure available to low-cost asset
managers that can offer voluntary retirement savings. While these
asset managers would need to be properly supervised, social security
agencies may impose tight requirements in terms of fees. For exam-
ple, besides the proper regulation from the relevant authority, the
social security agency might be willing to collect and manage the
accounts of a set of voluntary pension funds managed by indepen-
dent fund managers. This could encourage the development of a
low-cost asset management industry that could foster the develop-
ment of the voluntary pension fund system.
Some innovative formulas for incentivizing retirement savings can
be considered. In the Estonian case, people born before 1983 had the
option of contributing to the mandatory funded scheme, but such an
option implied an additional contribution by workers. This was called
the 2+2+2, which meant a contribution rate of 2 percent of the wage
from the employer, 2 percent from the employee, and 2 percent from
the state. This simple construction makes it possible to achieve a
more reasonable replacement rate (due to the higher contribution
rate) at a more moderate fiscal cost during the transition.
Incentivizing savings should be attractive to many of the coun-
tries in the region that have decreased the relative size of the man-
datory funded pillar and have had difficulty returning these
schemes to pre-2010 levels because of expected fiscal constraints.
As discussed above, the use of default option is essential to ensure
success of the program: participation by individuals is expected to
be completely different if they are given the option of making or
not making an additional contribution. In addition, the more
transparency the government provides on the expected replace-
ment rates for individuals, the more likely it is that people will
participate in the program. For example, according to the World
Bank (2012), Poland’s workers will see their replacement rates
reduced by 20 percentage points in the next three to four decades.
Consequently, the more the current generations internalize their
relative decrease in retirement income compared to the current
generation of retirees, the more the current contributors will be
willing to participate in voluntary schemes.

The Role of Savings in the Provision of Retirement Income 131
Nondiscrimination tests can be powerful in ensuring participation
of high- and low-income workers in voluntary pension programs.
Personal voluntary programs are typically perceived as a tax incen-
tive used only by high-income people, and consequently some
governments are reluctant to expand these programs. Downsizing
the tax benefits of personal voluntary plans and expanding the bene-
fits of collective plans—subject to a nondiscrimination test—increases
the likelihood of broad participation by lower-income workers in
these retirement plans.
Nondiscrimination tests ensure that the contributions of non-
highly compensated workers in a company amount to at least a
minimum proportion of the contributions of the highly compen-
sated workers. The test works from the perspective of incentives:
highly compensated employees have an interest in obtaining tax
benefits for their savings, but the regulation may require the plan to
pass a nondiscrimination test as a condition for providing such ben-
efits. Motivated by their own interests, highly compensated workers
would work with company management and with nonhighly
compensated workers and labor organizations (including unions) to
ensure that a critical mass of nonhighly compensated workers par-
ticipate in these retirement savings plans. Strategies for promoting
voluntary contributions at the level of the company may include
educational campaigns and matching fund contributions by the
employers. It is essential for the success of these plans that highly
compensated contributors do not receive the same tax benefits
through voluntary contributions to personal plans. In the case of the
United States, the collective plans (which include a nondiscrimina-
tion test) have an annual contribution limit of $17,500, while
Individual Retirement Accounts (which resemble voluntary per-
sonal pension plans) have a limit of only $5,500.
Other Forms of Retirement Savings
For many people, the equity in their houses is considered a form of
retirement savings. Homeowners can continue living in their houses
after retirement, and this alternative to making rental payments is
considered a form of income. However, the notion that housing
prices are always stable or rising needs to be dismissed. Housing,
like any other asset, is subject to changes in value: housing prices
are affected by idiosyncratic factors (neighborhood, city, schools,
etc.) and macroeconomic factors, including interest rates. While
housing should be considered as an additional source of retirement
savings, people need to complement these savings with other

132 The Inverting Pyramid
financial assets that can provide a more stable source of future
retirement income.
In reverse mortgages, homeowners receive payments from an
agency for the rest of their lives and transfer the property to the
agency when they die. While this is a promising idea, allowing
elderly people to maximize the equity in their houses, the transac-
tion costs are relatively high, which makes this market difficult to
develop in emerging economies. First of all, the housing market is
not well standardized, and therefore there are large margins for set-
ting the price of a house. Second, given an average retiree life expec-
tancy of 20 years or more, the value of the house can change
dramatically during that period of time. Third, once the price of the
house has been set, the incentives for home maintenance decrease.
Fourth, reverse mortgages are unlikely to be profitable in social hous-
ing or for the homes of middle- to lower-income retirees. This tends
to bias reverse mortgage programs toward high-end earners, who
arguably need them less than other retirees.
The Payout Phase of Funded Pension Schemes
A liberal approach with no restrictions on payout options is not
consistent with a mandatory pension pillar that is predicated on the
inability of workers to make adequate provision for their retirement
needs. Some restrictions on lump-sum withdrawals are therefore
advisable.15
Pensioners face several risks that often pull in opposite directions.
For example, purchasing life annuities protects against longevity risk
but eliminates the possibility of bequests. Meanwhile, investing in
long-term assets addresses the investment risk but exposes hold-
ers to liquidity risks. Policy makers should target an adequate
level of annuitization but should be wary of causing excessive
annuitization.
A pragmatic approach is to adopt an integrated threshold
replacement rate from the compulsory public and private pillars and
mandate some form of annuitization in the funded pillar up to the
level that reaches the integrated threshold rate. An integrated thresh-
old of between 50 percent and 70 percent of the average real earn-
ings (i.e., adjusted for inflation) over the last 10 years of employment
is eminently sensible. Under this approach, unrestricted lump-sum
withdrawals are not permitted, but once the threshold replacement
rate is attained, any excess balances can be withdrawn.
All retirement products have their advantages, but they also suf-
fer from shortcomings. Fixed nominal annuities do not protect

The Role of Savings in the Provision of Retirement Income 133
against inflation. Fixed real annuities require access to long-duration
inflation-indexed securities issued by both the public and private sec-
tors; otherwise, they are overly expensive. Variable annuities are
exposed to investment risk and require a very high level of transpar-
ency and integrity on the part of providers. Deferred annuities are
difficult to price. Phased withdrawals and term annuities do not pro-
tect against longevity risk. Self-annuitization requires considerable
financial expertise and is very difficult to manage in advanced old age.
Mandating a single retirement product for all retirees is not the
answer, either. A single product avoids market fragmentation and
self-selection and has the advantage of simplicity. However, it is not
optimal because it disregards the significant shortcomings of all types
of retirement products and forces all retiring workers to use the same
product despite potentially large differences in risk preferences,
longevity, and economic circumstances.
The optimal solution is often a constrained choice from a specified
menu of retirement products, given varying circumstances within a
country. Taking into account the merits and drawbacks of different
types of retirement products and the varying preferences and circum-
stances of retiring workers, policy makers should allow constrained
choice from a specified menu of retirement products to be offered.
This would vary across countries, but in principle it should favor a
combination of payout options, covering different products at a par-
ticular point in time as well as different payout options over time.
The introduction of government guarantee schemes covering all
types of retirement products merits serious consideration. The
government guarantees should cover benefit payments and could
emulate the practice evolving in deposit insurance schemes, includ-
ing upper limits on the amounts insured and a reasonable amount of
coinsurance by pensioners in order to minimize the possible loss of
market discipline at the point of purchase. The potential cost of gov-
ernment guarantees should be estimated, and such estimates should
be used to determine risk-based premiums for annuity providers.
The Experience with Funded Pension Schemes
With different idiosyncratic features, pension reform in the region
has generally followed a multipillar approach.16 This includes a
strong earnings-related PAYG component (public pension systems);
mandatory or quasi-mandatory funded schemes (mandatory funded
systems) of different sizes; and tax-induced voluntary pension
schemes. Between 1998 and 2011, 12 countries in Europe and

134 The Inverting Pyramid
Central Asia introduced multipillar pension reforms.17 The Czech
Republic introduced a mandatory funded scheme in 2013, and
Armenia is planning to implement a mandatory funded scheme in
2014. Table 4.3 summarizes some key elements of the reformed
pension systems in the region before the financial crisis.
During the pre-crisis period, many European and Central Asian
countries increased the generosity of their PAYG benefits without
proposing sustainable sources of financing. Many countries saw
strong economic performance and temporary surpluses in the social
security systems and used them to increase the generosity of pension
benefits above the initial reform package. Most of these reforms were
not complemented by austere fiscal reforms conducive to increases in
savings and investments.
Performance of pension systems was mixed, but most of the coun-
tries managed to offer positive real returns. As shown in figure 4.8, in
the pre-crisis period returns in Latvia and Russia were negative in
real terms and below those in other countries. Returns were positive
in the rest of the countries, including Poland, with an average return
before the crisis of more than 10 percent in real terms. The 2008
financial crisis imposed major temporary losses on most of the pen-
sion funds, but most recovered part of the loss the following year
(table 4.4). By measuring performance as the value added of pension
funds over basic benchmarks (Sharpe ratios), Walker and Iglesias
(2010) and Rudolph and Rocha (2007) provide evidence that pen-
sion funds in Estonia, Hungary, and Poland exceeded some basic
benchmarks in terms of efficiency.
Moving forward, pension funds in the region face important
challenges in the area of asset allocation. As shown in figure 4.9,
government securities and bank deposits are still a sizable part of the
portfolios of the pension funds. On average, they represent approxi-
mately two-thirds of the pension portfolios in a selected group of
countries in the region that conducted pension reform (figure 4.10).
Most countries need to move toward better diversification of assets in
order to effectively diversify the future pension risk of individuals.
In countries with multiple types of systems, pension risk is diversi-
fied when asset portfolios of pension funds are invested in instru-
ments with low correlation to the source of repayment for the public
pension system. Diversification of pension portfolios into equities,
corporate bonds, mortgage bonds, and international securities is
essential to ensure that the repayment capacity of the state does not
affect pensions of unfunded and funded systems. International diver-
sification allows diversification of the sovereign risk, which allows
contributors to hedge against country-specific idiosyncratic risks.

The Role of Savings in the Provision of Retirement Income 135
TABLE 4.3Structure of Pension Systems, Selected European and Central Asian Economies, 2008
Country
Publicscheme
type Public pension (PAYG) reform
Mandatorypillar
contributionsEnactment
date Who participates
Bulgaria Defined
benefit
Retirement age: 60/55 → 63/60 2%↗5% 2002 Mandatory for
workers <42Benefits: 55% highest 3 years → full
career 1%
Croatia Points Retirement age: 65/60 5% 2002 Mandatory for
workers <40,
voluntary for
40–50
Benefits: 0.825% full career
Estonia Defined
benefit
Retirement age: 60/55 → 63/63 6% 2002 Mandatory only for
new entrantsBenefits: 55% best 5 years +1% → flat
component + earnings-related points
Hungary Defined
benefit
Retirement age: 60/55 → 62/62 6%↗8% 1998 Mandatory only for
new entrantsBenefits: 33% for first 10 years + 2.5% →
1.65% full career
Kazakhstan Defined
benefit
Retirement age: 63/58 10% 1998 Mandatory for all
Benefits: 60% of monthly average of best
consecutive 3 years
Kosovo Universal
flat for all
>65
Retirement age: 65/65 10% 2002 Mandatory for all
working habitual
residents <55Benefits: defined annually by value of
minimum consumption basket
Latvia Notional
accounts
Retirement age: 60/55 → 62/62 2%↗8% 2001 Mandatory for
new and young
workers <30,
voluntary for
30–50
Benefits: 55% highest 5 years +1% → full
career based on notional accumulation
Lithuania Defined
benefit
Retirement age: 60/55 → 62.5/60 2.5%↗5.5% 2004 Voluntary for current
and new workersBenefits: 55% highest 5 years plus
1% → earnings-related and
unrelated components
Macedonia,
FYR
Defined
benefit
Retirement age: 64/62 7.42% 2006 Mandatory for new
entrantsBenefits: defined by minimum wage ratio
and total years of participation
Poland Notional
accounts
Retirement age: 65/60 (many exemptions)
→ 65/60 (fewer exemptions)
7.3% 1999 Mandatory for
new and young
workers <30,
voluntary for
30–50Benefits: flat +1.3% → full career notional
accumulation
continued

136 The Inverting Pyramid
TABLE 4.3Continued
Country
Publicscheme
type Public pension (PAYG) reform
Mandatorypillar
contributionsEnactment
date Who participates
RomaniaDefined
benefit
Retirement age: 62/57 → 65/60
2%↗3% 2008
Mandatory for <35,
voluntary for
36–45Benefits: 75% first 30–20 years + 1% →
full career points based
Russian
Federation
Notional
accounts
Retirement age: 60/55
3%↗6% 2002
Mandatory only for
those born after
1966Benefits: defined by individual lifetime
accumulations
Slovak Republic Points
Retirement age: 60/53–57 → 62/62
9% 2005
Mandatory only for
those born after
1983Benefits: 2% first 25 years,
1% thereafter → 1.19% full career
Sources: Based on data provided by pension fund supervision agencies of the respective countries. See also Kasek, Laursen, and Skrok 2008; Schwarz 2011; OECD
2012.
Note: By 2008, with the exception of the former Yugoslav Republic of Macedonia, all countries had voluntary pension schemes.
FIGURE 4.8Annual Real Returns of Mandatory Funded Pension Schemes inSelected European and Central Asian Economies, 2002–2012
Source: World Bank Private Pensions (internal database).
Note: Returns for the Russian Federation refer to performance of the “enhanced” portfolio of Vnesheconombank (VEB),
which in 2012 represented over 70 percent of mandatory pillar assets.
2002 2003 2004 2005 2006 2007 2008 2009 2010 2011 2012
0
5
10
15
20
–5
–10
–15
–20
–25
–30
–35
Real
retu
rns,
%
Estonia
Latvia
Romania
Croatia
Lithuania
Poland
Hungary
Macedonia, FYR
Slovak Republic
Bulgaria
Russian Federation
Kazakhstan

The Role of Savings in the Provision of Retirement Income 137
International portfolio diversification becomes necessary in most
countries that reform their pension systems, as pension funds tend to
outgrow the size of the domestic capital market. By keeping the pen-
sion funds captive inside the country, regulation might increase the
risk for pension funds, as the domestic asset prices could be artifi-
cially inflated. While Poland’s pension funds have all equities
TABLE 4.4Annual Real Returns of Mandatory Funded Pension Schemes,Selected European Economies, 2002–2012
Annual real rate of return
CountrySince inception or
2002–2007Since inception or
2002–2012
Bulgaria 4.0 0.5
Croatia 5.0 3.2
Estonia 3.1 0.1
Hungary 4.2 n.a.
Latvia −2.0 −1.3
Lithuania 3.2 0.8
Macedonia, FYR 2.6 2.4
Poland 10.8 6.4
Romania n.a. 5.1
Russian Federation −3.1 −2.7
Slovak Republic 0.8 −1.2
Average annual rate of return
CountrySince inception or
2002–2007Since inception or
2002–2012
Bulgaria 4.0 0.5
Croatia 5.0 3.2
Estonia 3.1 0.1
Hungary 4.2 n.a.
Latvia −2.0 −1.3
Lithuania 3.2 0.8
Macedonia, FYR 2.6 2.4
Poland 10.8 6.4
Romania n.a. 5.1
Russian Federation −3.1 −2.7
Slovak Republic 0.8 −1.2
Source: World Bank Private Pensions (internal database).
Note: Figures exclude fees charged by pension fund management companies. Returns for Russia refer to performance of
the “enhanced” portfolio of Vnesheconombank (VEB). n.a. = not applicable.

138 The Inverting Pyramid
invested in the domestic market, pension funds in Lithuania and
Estonia have the large majority of equities invested abroad.
Individuals are more likely to optimize the expected value of the
replacement rate when portfolios are invested in life-cycle strategies.
Life-cycle strategies require a higher proportion of equity when
contributors are young and a larger proportion of long-term
FIGURE 4.9Government Securities and Bank Deposits in Second-Pillar Portfolios of Pension Funds,Selected European and Central Asian Economies, 2012
Source: World Bank Private Pensions (internal database).
% o
f tot
al p
ortfo
lio
Bulgar
ia
Mac
edon
ia, FY
R
Roman
ia
Polan
d
Hunga
ry
Croat
ia
Slovak
Rep
ublic
Russia
n Fed
erat
ion
Kazak
hsta
n
Goverment bonds and depositsOthers
0
10
20
30
40
50
60
70
80
90
100
Source: World Bank Private Pensions (internal database).
FIGURE 4.10Asset Allocation of Mandatory Funded Pension Systems in Selected European and CentralAsian Economies, 2012
% o
f tot
al p
ortfo
lio
Bulgar
ia
Mac
edon
ia, FY
RLa
tvia
Roman
ia
Esto
nia
Lithu
ania
Polan
d
Hunga
ry
Croat
ia
Slovak
Rep
ublic
Russia
n Fed
erat
ion
Kazak
hsta
n
10
20
30
40
50
60
70
80
90
100
0
BondsEquityBank depositOther

The Role of Savings in the Provision of Retirement Income 139
inflation-linked bonds when contributors are closer to retirement
age. The movement from one asset allocation to another should be
automatic along the lifecycle of contributors. While most countries
in the region offer at least three portfolios, the mechanisms for allo-
cating individuals among them are relatively underdeveloped, and
most countries do not allow automatic movements from riskier to
conservative portfolios.
While high fees have captured most of the headlines regarding
mandatory funded systems in Europe, these fees have been decreas-
ing in the past few years. As shown in figure 4.11, fees as a percentage
of the assets under management have dropped in most countries
(with the exception of Latvia). An increase in asset volume explains
the fee reduction. In the remarkable case of Poland, fees have
dropped by half in 5 years, and pension fund management compa-
nies continue performing active asset management of the pension
portfolios. In the Slovak Republic, the reduction in fees has come at
a high cost to contributors. Pension fund management companies
in that country were forced to reduce their fees to 0.5 percent of
the assets under management (equivalent to one-fifth of the lev-
els in 2006) and to provide short-term guarantees on the value of
the contributions. Under these circumstances, Slovak pension fund
FIGURE 4.11Fees Charged by Pension Fund Management Companies in MandatoryFunded Systems, Selected European and Central Asian Countries, 2006and 2011
Source: World Bank Private Pensions (internal database).
Note: Data on the Russian Federation refer to the management fee structure of Vnesheconombank (VEB), the largest
second-pillar asset manager in Russia (more than 70 percent of total assets in 2011). Russian nongovernment pension
funds charged much higher fees, close to 1 percent of total assets in 2011.
0
1
23
4
5
6
78
9
10
Fee
as %
of t
otal
ass
ets
unde
rm
anag
emen
t
Bulgar
ia
Mac
edon
ia, FY
RLa
tvia
Roman
ia
Esto
nia
Lithu
ania
Polan
d
Croat
ia
Slovak
Rep
ublic
Russia
n Fed
erat
ion
Kazak
hsta
n
2006 2011

140 The Inverting Pyramid
management companies lost interest in managing pension portfolios
adequately and moved portfolios into short-term government
securities and bank deposits.
Despite the relative success of some countries in reducing the fees
charged by pension fund management companies, the efforts should
continue to ensure reasonable rates of return on the pension funds.
As interest rates are expected to be low in the medium term, and
returns consequently will become more modest, it is essential that
the funded schemes in place be able to operate at low cost. As dis-
cussed below, further reduction in fees may require changing the
industrial organization of the pension fund management industry.
Lessons from Experiences with Funded Pension Schemes
Mandatory funded pension components have been reduced in some
countries. Despite the initial intentions to build long-lasting pension
reforms, in the aftermath of the financial crisis some European and
Central Asian countries have taken measures to temporarily or
permanently reduce the relative size of the mandatory funded com-
ponent. Table 4.5 illustrates the main adjustments in the relative role
of funded schemes in the region, which vary from full nationaliza-
tion of the mandatory funded schemes, as in Hungary, to transitory
reduction in contributions of the mandatory funded scheme as an
instrument for accessing the euro area, as in Estonia.
This section explains the main drivers of recent downsizes and
reversals in the region. Three elements explain the government
reactions in adjusting the initial pension reforms: (a) incomplete
reforms, (b) tension between short-term and long-term priorities,
and (c) institutional design.
Incomplete Reforms
Shortly after introducing the reforms, some of the countries followed
economic policies that were inconsistent with the basic ideas that fos-
tered the reforms. Countries like Hungry and Poland followed expan-
sive fiscal policies over the decade, with sizable fiscal deficits and
increases in private retirement savings. The subsequent effects on
economic growth and capital market development did not materialize
at the expected levels. As shown in figures 4.12 and 4.13, fiscal defi-
cits in Hungary and Poland were above the 3 percent limit of the
European Union’s Stability and Growth Pact for almost the whole
decade. The lack of fiscal discipline was an important impediment to

The Role of Savings in the Provision of Retirement Income 141
the sustainability of the funded systems on various fronts. In the case
of Hungary, the fiscal deficits would have been above 3 percent even
if the contributions to the mandatory funded scheme had been
considered part of the social security revenues.18
Large fiscal deficits during the pre-crisis period resulted in
unsustainable government debt stocks. These triggered concern
when the crisis hit the region. At the time of the reversal, Polish and
Hungarian government debt was close to 55 and 80 percent of GDP
respectively. By netting the debt held by pension funds, the national-
ization of the mandatory funded systems in Hungary implied a
reduction in the debt stock by approximately $8 billion.19
TABLE 4.5Outcome of the Financial Crisis on Funded Defined Contributions to Pension Schemes,Selected European Economies, 2008–2013
ReversalHungary
Permanent
8% 2nd-pillar contribution rate reduced to 0% in January 2011 and transferred
to the 1st pillar/state PAYG system. Reversal is permanent.
Part reversal, part reduction
Poland
Permanent
7.3% contribution rate cut to 2.3% in May 2011. While rate was expected
to gradually increase to 3.5% by 2017, in August 2013 the government
announced several measures that will significantly reduce the role of the
mandatory funded system.
Russian Federation
Permanent
State Duma backed the plan to reduce rates from 6% to 2% in November 2012.
Change is permanent and will go into force in January 2014.
Reductions in contributions
Slovak Republic
Permanent
9% contribution was reduced to 4% in 2013. The funded scheme moved from
an opt-out to an opt-in system.
Estonia
Temporary
6% (4% + 2%) rate cut to 0% between June 2009 and January 2011.
Contributions shifted from 2nd to 1st pillar. Gradual increase from 2011.
Rate set at 3% in January 2011 and 6% in January 2012. Rate may rise to
8% in 2014–17 to offset missed contributions.
Latvia
Temporary
8% contribution rate reduced to 2% in May 2009. Rates increased to 4% from
2013.
Lithuania
Temporary
5.5% contribution rate reduced to 2% in July 2009. Rates were further lowered
in January 2012 to 1.5%. Increase to 2% is planned from January 2014.
Romania
Temporary
Reduction in planned growth path of contribution rate from 2% to 6%. Rate
froze in 2010 at 2% but started to increase again in 2011 at annual rate
of 0.5%.
No changes in 2nd pillar
arrangements announced
as of June 2012
Croatia No changes; 2nd pillar contribution rate remains at 5%.
Bulgaria No changes; 2nd pillar contribution rate remains at 5%.
Macedonia, FYR No changes; 2nd pillar contribution rate remains at 7.42%.
KosovoNo changes; 2nd pillar contribution rate remains at 10% (additional voluntary
contributions can add up to 20%).
Planned implementation of
2nd pillar continuing Czech Republic
2nd pillar reform went into force on January 1, 2013. Contribution rate is set
at 5%.
Sources: Sources: National regulatory authorities; Schwarz 2011; OECD 2012.National regulatory authorities; Schwarz 2011; OECD 2012.

142 The Inverting Pyramid
Pension reforms in some countries were not backed by the whole
political spectrum, and the first attempts to scale down the funded
schemes took place shortly after approval of the reforms. In Hungary
and the Slovak Republic, attempts to unwind the reforms started
once the political parties (or coalitions) that opposed the pension
reforms took office. The Slovak case illustrates these attempts. The
Slovak mandatory funded system was created in 2005 as an opt-out
system in which the default option for contributors was to split
contributions between the public pension system and the manda-
tory funded system. In 2008, legislation promoted by the new
FIGURE 4.12Fiscal Balance of Hungary, 2001–2010
Sources: Central Bank of Hungary; IMF World Economic Outlook Database.
Note: The red line reflects the 3 percent fiscal deficit limit of the Stability and Growth Pact.
–10
–8
–6
–4
–2
0
2001 2002 2003 2004 2005 2006 2007 2008 2009 2010
% o
f GD
P
Non-pension-attributed Second-pillar-attributed
FIGURE 4.13Fiscal Balance of Poland, 2001–2010
Sources: Polish Financial Supervision Authority (KNF); IMF World Economic Outlook Database.
Note: The red line reflects the 3 percent fiscal deficit limit of the Stability and Growth Pact.
% o
f GD
P
0
–2
–4
–6
–8
–10
2001 2002 2003 2004 2005 2006 2007 2008 2009 2010
Non-pension-attributed Second-pillar-attributed

The Role of Savings in the Provision of Retirement Income 143
government was approved to turn it into an opt-in system. In this
system, by default, workers contribute only to the public pension sys-
tem, and therefore contributors need to make an explicit decision to
enter the funded scheme. In 2012 the new government reinstituted
the original opt-out scheme, but within a few months it was reversed
again when yet another government took power. While at the
beginning, the pension fund management industry fought back by
increasing efforts to bring new contributors into the funded scheme,
subsequent lowering of caps on management fees and increases in
the level of guarantees provided by pension fund management com-
panies eroded the industry’s willingness to attract contributors.20
In addition, pension reforms in most countries were not followed
by forceful policies to foster the development of domestic capital
markets. The lack of development of the corporate bond market,
mortgage bond markets, and infrastructure bond markets is not
because pension funds lack interest in developing these markets, but
in some cases is due to the lack of institutional development on the
supply side that might facilitate the issuance of these instruments.
For example, the development of the infrastructure bond market
requires institutional capacity at the level of the government to bring
the ideas of marketable infrastructure projects to concessionary com-
panies, which may later issue infrastructure bonds to refinance these
projects in the long term.
The development of a private long-term fixed-income market
requires the development of a long-term government bond
market. Issuers of private sector bonds require liquid benchmarks
of long-term bonds for pricing long-term securities. As discussed
below, investment regulations of pension funds would need to be
revised to foster interest in this segment of the market. All of these
elements require deliberated coordination with the private
sector and within the government, which is unlikely to happen
spontaneously.21
It takes more than a stock exchange and pension reform to
develop the local equity market. Despite the fact that all countries in
the region have stock exchanges, most of these markets are highly
illiquid. Exchanges provide the infrastructure for issuing and trading
instruments, and pension funds and other institutional investors pro-
vide potential demand for these securities. However, corporations
consider a number of other elements when deciding whether to list
their companies, including alternative sources of financing, growth
prospects of the business, tax benefits, rule of law, and a set of rules
and regulations that may protect the interests of the shareholders.
Some countries face challenges in this area. For example, in the case

144 The Inverting Pyramid
of Russia, many companies prefer to be listed abroad rather than in
the domestic market.
The strong presence of bank financing of businesses in the region
before the crisis was a limiting factor for capital market develop-
ment. At that time, a favorable economic cycle and banks’ reliance
on foreign funding for financing domestic projects did not create the
conditions for domestic capital market development. Besides the
problems of restrictive investment regulations for pension funds
that inhibited investments in riskier assets, the weaknesses in
banking regulation that allowed financing of local projects in foreign
currency was an important impediment to the development of the
capital market.
However, the availability of banking sector funding in the region is
changing rapidly, and consequently institutional investors should
start playing a more active role in the financing of economic growth.
Since 2010, banks in Central and Eastern European countries have
increasingly deleveraged their portfolios and moved into strategies of
lending driven by deposit growth. Considering a narrower deposit
base solely from domestic economies compared to the availability of
funds before the crisis, the deleveraging of banks in the region will
have consequences for the availability of funds for local companies
and individuals. In this context, if incentives are properly placed,
domestic pension funds and other institutional investors may start
playing a larger role in the financing of economic growth in the
region. Finally, the presence of local pension funds might be a stable
source of domestic funding, for example, through bond issuance for
subsidiaries of international banks that are increasingly required to
have financial autonomy.22
Tension between Short-Term and Long-Term Priorities
Pension reforms involving the diversion of part of the social security
contribution to a funded scheme require long and, most of the time,
painful fiscal transitions. In most cases, these transitions have been
partially or totally debt-financed, which has created constant
budgetary tension in governments, especially in the years since the
crisis. The introduction of funded schemes solves a long-term fiscal
problem, but it also creates discomfort during the transition, often
requiring additional fiscal efforts for at least a couple of decades. In
the absence of a clear political consensus on the role that funded
pension schemes play in the long term, and in the presence of large
public pension deficits, it will be difficult to sustain funded schemes
in the region.

The Role of Savings in the Provision of Retirement Income 145
This tension becomes more evident in periods of recession, as the
fiscal deficit increases and financing deficits become more
expensive. Shifting part of the contributions from the funded pillar
into the PAYG component is an evident but short-term alternative.
Unfortunately, reversing these pension reforms addresses the short-
term problem at the cost of significantly worsening the long-term
fiscal situation, reducing the future pensions of individuals, or a
combination of both.
During the financial crisis, all the Baltic countries and Romania
switched a portion of contributions from the mandatory funded
scheme to the public pension system as a means of increasing
revenues for paying other fiscal obligations.23 As shown in table 4.6,
the crisis in the region was severe, and in the case of the Baltic
countries—with negative GDP growth of around 15 percent in
2009—there was some justification for temporary measures affecting
the pension systems, including the funded component. Crises of this
order of magnitude shift the balance toward resuming economic
growth, and therefore temporary measures might be expected.
Stabilizing the economies in order to resume economic growth in the
medium term may require drastic measures to restore the credibility
of the market. In fact, these countries did stabilize their economies,
TABLE 4.6Real GDP Growth in Selected European and Central AsianEconomies, 2007–2012
Country 2007 2008 2009 2010 2011 2012
Bulgaria 6.45 6.19 −5.48 0.39 1.67 0.78
Croatia 5.06 2.08 −6.95 −1.41 −0.01 −1.98
Estonia 7.49 −3.67 −14.26 2.26 7.64 2.45
Hungary 0.10 0.90 −6.80 1.27 1.70 −1.66
Kazakhstan 8.90 3.20 1.18 7.25 7.50 5.04
Kosovo 6.26 6.91 2.90 3.90 4.96 2.15
Latvia 9.60 −3.28 −17.73 −0.34 5.47 5.58
Lithuania 9.80 2.91 −14.84 1.44 5.87 3.62
Macedonia, FYR 6.15 5.00 −0.92 2.90 3.11 −0.27
Poland 6.79 5.13 1.63 3.87 4.32 2.05
Romania 6.32 7.35 −6.58 −1.65 2.45 0.33
Russian Federation 8.54 5.25 −7.80 4.30 4.30 3.40
Slovak Republic 10.49 5.75 −4.93 4.18 3.35 2.03
Source: IMF World Economic Outlook Database.

146 The Inverting Pyramid
and economic growth resumed in the subsequent years. However, it
is not clear whether the downsizing of mandatory funded systems
will be transitory or permanent, as Latvia and Lithuania still have
contribution rates to the mandatory funded system well below the
pre-crisis rates.
The asymmetry in the treatment of explicit and implicit debt is
at the heart of the incentives for reversing pension reforms. In
funded schemes, to the extent that part of the transitional deficit is
financed with debt, governments make explicit commitments to
bondholders. In PAYG systems, by contrast, governments simply
commit to pay future pensions to current contributors. While rene-
gotiation of the terms of sovereign bonds is rare in countries that
are not facing an imminent crisis, renegotiation of commitments of
future pensions (in terms of, for example, retirement age or index-
ation rules) is common.
Explicit debt is subject to intensive market screening. Investors are
willing to buy these bonds on the condition that they receive a mar-
ket interest rate, which is a function of the expected probability of
default. Independent agents, including financial institutions, banks,
rating agencies, and general investors, buy these bonds and value
these instruments on a regular basis. The interest rate fluctuates over
time, depending on the market perception about default probability.
Implicit pension debt follows a different dynamic than explicit
debt. Instead of being taken by bondholders, implicit pension debt
is taken by the government (on behalf of future pensioners). It is
therefore unsurprising that independent of its probability of default,
the government is willing to take this debt at face value.
Governments face an important conflict of interest, as they are both
the issuers of and the representative of the holders of “implicit con-
tracts” at the same time. In the absence of transparency about the
volume of the implicit pension liabilities, and given the incestuous
relationship between the issuer and the holder of the contractual
obligations, governments may have incentives to oversize the
amount of implicit liabilities (which have a more obscure method of
accounting) at the cost of more modest and transparent figures of
explicit debt.
To the extent that the cost of taking implicit debt for governments
is flat and governments are not accountable for taking excessive
implicit contracts, governments have incentives to limit the size of
funded schemes. The sizable gap between the average duration of
pension contracts and the duration of government mandates together
with the lack of transparency on implicit pension obligations creates
incentives to transfer these liabilities to future generations.24

The Role of Savings in the Provision of Retirement Income 147
In democratic countries, the horizon for government mandates is
much shorter than the duration of pension obligations that the
government is taking on behalf of workers. While governments’
horizons are typically shorter than 6 years, as representatives of pen-
sion contract holders (implicit bondholders) they might be willing to
take these long-term contracts related to the retirement age of the
working population with low accountability.
The conflict of interest derived from the distortion created by the
asymmetric treatment of implicit and explicit debt leaves mandatory
funded pension systems in a vulnerable position for reversals. In the
presence of fiscal needs, governments might prefer to take a
long-term (undisclosed) liability and finance the deficit by downsizing
the funded defined contribution, rather than by issuing explicit debt
for financing the transitional deficit (or increasing taxes).
Rating agencies and investors, in general, may have only an indi-
rect interest in the implicit pension liabilities. It is important to
understand that the rating agencies’ business is to evaluate the
default probability of each specific debt instrument, and they receive
compensation for this service. To the extent that the implicit commit-
ments of governments have a potential effect on the probability of
default on explicit debt, rating agencies and investors may have an
interest in implicit pension liabilities; otherwise it is an additional
parameter in the determination of the credit risk of the country.25
Italy’s 2011 pension reform was able to calm the market regarding
the probability of default on explicit debt. The government’s obliga-
tions were of such magnitude that a credible government commit-
ment to reduce the implicit liabilities (by increasing the retirement
age and reducing pension benefits) significantly reduced the default
probability of the government and therefore its cost of debt
financing.
In addition, as it does not consider implicit pension debt, the
Maastricht treaty does not contribute to stable funded schemes. As
transition countries see the possibility of accessing the euro area as a
way of weathering the pressures on their currencies and stabilizing
their economies, the incentives for maintaining the mandatory
funded systems are less clear. As it only considers explicit debt and
fiscal deficit, the Maastricht treaty unfairly penalizes countries with
large funded schemes and creates incentives for downsizing them. By
temporarily downsizing contributions to the mandatory funded
system, Estonia was successful in complying with the parameters for
accessing the euro area in 2011. Assuming that future pensioners in
Estonia will not be affected by the temporary reduction in the
mandatory funded system, if implicit and explicit liabilities had

148 The Inverting Pyramid
been treated symmetrically, such a change would not have been
necessary.
A series of recent agreements and guidelines by the European
Commission have had an impact on this dilemma but have not
resolved it. Changes known as the “Six Pack” and the guidelines of
the Economic and Financial Committee (EFC) of the European
Union produced in September 2012 may have an effect on the future
stability of funded pension schemes.26 The EFC report discusses
multipillar pension reforms and explains that the formula for setting
the medium-term budgetary objective (MTO) for each member state
explicitly includes a fraction of the adjustment needed to cover the
present value of the future increase in age-related government
expenditure. The report further states that multipillar reforms that
include the transfer of contribution revenue previously recorded as
government revenue to pension funds classified outside the general
government sector are reasons for temporary deviations from the
MTO. They thus allow these countries to have a safety margin with
respect to the 3 percent GDP deficit reference value. For euro area
member states, the safety margin is taken to be a deficit not exceed-
ing 1 percent of GDP. However, the EFC report stipulates that tempo-
rary deviations from the normal adjustment path toward the MTO
should be no more than 4 years.
The key issue for funded pension systems is whether the changes
to the fiscal rules outlined above will still have the effect of getting
countries to abandon, reverse, or reduce their mandatory funded
schemes in favor of increasing liabilities in unfunded or only partly
funded social security reserves. First, while the costs of aging are
reflected in the MTO, it is not clear that the new guidelines make
governments indifferent with respect to raising implicit or explicit
debt.27 The incentives of the MTO might be insufficient to persuade
countries to prefer funded schemes over unfunded ones, so countries
may still prefer to hide debt in the form of implicit pension liabilities.
Second, the 4-year transition period for taking account of multipillar
reforms in the EFC report contrasts with three to four decades for the
transitional deficit of a funded system. Third, the maximum 1 percent
deviation from the path also imposes a cap on the contribution rate
that can be managed by mandatory funded schemes, which is
unlikely to be higher than 3 percent of wages. Fourth, the timing of
the EFC guidelines is a factor, as they were issued when most Central
and Eastern European countries had already taken bold policy deci-
sions about their funded pension schemes.
While the direction of the EFC guidelines is welcome, the mea-
sures are likely to be insufficient to ensure stability of mandatory

The Role of Savings in the Provision of Retirement Income 149
funded schemes in countries with multipillar pension systems. Given
that governments are making potentially damaging long-term
decisions, it is clearly an area that needs further consideration.
Institutional Design
While fees in some Central European countries have reached more
reasonable levels, there is a widespread perception that mandatory
funded systems are expensive and manage poorly diversified pools of
assets. The relatively high costs of the system are explained by the
emphasis on individual selection, by provision of costly and mis-
placed guarantees by pension fund management companies, and by
an industrial organization of the pension fund management industry
that facilitates oligopoly behavior.
Pension reforms in the region placed great emphasis on individual
choice in the selection of pension fund management companies.28
This policy preference was not aligned with the low level of financial
literacy of the average contributor or the track record of the manage-
ment companies, nor were there standardized parameters that could
help people make an objective selection. The launching of funded
pension schemes was accompanied by multimillion-dollar marketing
campaigns run by pension fund management companies and
supported by massive sales forces that played a deceptive role in allo-
cating contributors among pension fund management companies.
While the costs of these campaigns were undisclosed, prices for
recruiting contributors ranged between 10 and 150 euros per
contributor at the beginning and end of the recruiting period respec-
tively. A cost-benefit analysis may suggest that temporary allocation
of contributors among a small group of eligible pension fund man-
agement companies would have brought the same outcome—
supply-driven selection—at a much lower cost.
While the authorities knew about these expensive campaigns,
their actions were focused on preventing use of malpractice to attract
clients, such as offers of gifts or other incentives by the pension fund
management companies. Since these marketing campaigns were
financed by the private sector, the government perceived the cam-
paigns as beyond their interest; moreover, the regulations imposed
caps that would avoid excessive fees. In practice, individual selection
resulted in the supply-driven selection of pension fund managers and
big expenditures by management companies.
In the years that followed the reform, pension fund management
companies tried to recover some of the initial expenses through fees.
In most countries in the region, they still charge the maximum

150 The Inverting Pyramid
fees authorized. A few years after the reform, the authorities realized
that the caps on fees were not low enough and decided to change
regulations to lower them. While pension fund management compa-
nies in countries like Poland had enough time to recover their initial
expenses, others, for example in the Slovak Republic, did not. In the
latter case, the industry reacted by cutting costs to the minimum
while continuing to charge the maximum fee allowed in the regula-
tion, which has resulted in poor asset allocation.
In the presence of an uninformed demand, the model of open
competition for allocating new contributors is suboptimal. The prin-
ciple of voluntariness in the selection of a pension fund management
company can also be achieved by making an initial random alloca-
tion of contributors among a predefined number of companies, and
then—after 2 years or so, when pension funds may show some
differentiation—allowing contributors to switch between companies.
However, this model would require a strict licensing process and a
predictable fee scenario. In addition, while improvements in financial
literacy may help increase the elasticity of the demand for manage-
ment of pension funds, this is a slow process, and it may take decades
before the average contributor can make an informed selection of a
pension fund manager.
Guarantees of relative performance create distortions in portfolio
allocation and increase the cost of funded schemes. Pension fund
management companies are required to guarantee that returns are
aligned with the average return of the industry. As shown by
Castañeda and Rudolph (2010), these relative guarantees create
incentives to move to suboptimal asset allocations, with an excessive
focus on short-term returns. Consequently, the competition derived
from such a scheme is not welfare-improving in terms of the
expected replacement rates at retirement age. The minimum return
guarantee is an ineffective instrument for ensuring that contributors
receive adequate pensions at retirement age. In addition, these
guarantees are expensive to manage and consequently serve to
increase the fees charged to contributors.
Proper strategic asset allocation is the best guarantee of good
pensions in the future. Investment regulations driven by minimum
return guarantees are not only an important source of distortion for
asset allocation and management costs, but also provide short-term
protection that contributors do not need. These misplaced guarantees
support a vicious cycle of undiversified portfolios, low performance,
high fees, and discomfort among participants. This combination may
endanger the stability of the funded scheme, as in the case of the
Slovak Republic. The short-term guarantee only prevents volatility.

The Role of Savings in the Provision of Retirement Income 151
Volatility might even be good for young contributors as they may
benefit more than older individuals from investing in risky portfolios.
The design of a defined contribution pension system that is
welfare-improving for society also requires changes in the industrial
organization of the companies. Pension fund management companies
in the region are typically hybrids between account management
(record keeping) and portfolio management (asset management).
Account management is a business with scale economies and there-
fore there is not much room for competition. The lowest administra-
tion costs for portfolio management are achieved at a level that opens
room for multiple asset managers.
The combination of these two businesses in one entity, namely the
pension fund management company, creates incentives to acquire
market share. In a market with little growth in the labor force,
pension fund management companies have incentives to steal con-
tributors from competitors. As it is largely supply driven, this form of
competition is wasteful and can hardly be considered welfare-
improving. In order to avoid a war of attrition, pension fund man-
agement companies typically reach some sort of agreement that
allows them to keep their relative market shares and maintain high
fees. These arrangements can include cartels. The need for a sizable
sales force and physical presence (office space for attending clients)
serves to deter potential new entrants and facilitate the creation of
oligopoly structures.
Full separation between the asset management and account man-
agement businesses, with centralized account management and com-
petition in portfolio management, is a way of introducing efficiency
to both functions. As the businesses become clearer and more
straightforward, it becomes easier to impose tariffs on the account
management and portfolio management separately. The introduction
of blind accounts, as in Sweden, where the asset managers do not
know the identities of the contributors, reduces the incentives for
direct sales and keeps costs low, helping to focus the portfolio man-
agement business on its core objective. Most importantly, blind
accounts are efficient in lowering the barriers to potential entry of
new competitors, which in turn helps reduce fees.
Finally, as shown by Rudolph et al. (2010), portfolio benchmarks
that follow life-cycle strategies are the most effective way to ensure
that investments of pension funds are consistent with the optimiza-
tion of the expected future pensions of individuals. Benchmarking
portfolios of pension funds against a set of explicit market indexes is a
necessary step. Since market interactions by themselves are not con-
ducive to portfolios that optimize the future pensions of individuals,

152 The Inverting Pyramid
it is essential to rely on exogenous portfolio benchmarks that pension
funds can use to guide their investments. To avoid manipulation of
the assets, portfolio benchmarks should be based on market indexes
and designed to optimize the expected value of the pensions at
retirement age. This implies the use of life-cycle strategies with
higher components of equity for young contributors, and more long-
term fixed income for older contributors.29 As funded schemes are
expected to provide a sizable part of future pensions, these portfolio
benchmarks would need to be validated in society.
In order to build confidence in the system, risk-averse policy mak-
ers may want to introduce some sort of guarantees of the value of the
contributions at retirement age. Viceira and Rudolph (2012) provide
some estimates of the cost of these guarantees in relation to the real
or nominal value of contributions, but it is important to note that the
cost of guarantees is a function of the underlying pension portfolios.
In their analysis, life-cycle strategies minimize the cost of the guaran-
tee and optimize the expected replacement rate for individuals. In
order to make them effective, the guarantees need to be priced at
market value, and the guarantor who writes the guarantees needs to
be independent from the pension fund management companies.
With the weakening of public pension schemes as a consequence
of the inverting pyramid, savings for retirement will be essential to
ensure consumption smoothing. However, the introduction of pen-
sion reform in the region, which includes the creation of funded
schemes, needs to be accompanied by sound macroeconomic and
financial sector policies.
Notes
1. The payoff of the portfolio of the funded component is higher when the government capacity to pay pensions, for example, as a consequence of the inverting pyramid, is lower.
2. To the best of the authors’ knowledge, there are no studies that quantify the impact of these reforms on savings, investments, and economic growth in the region. However, Corbo and Schmidt-Hebbel (2003) estimated the contribution of pension reform for the case of Chile in the period 1981–2003. Chile’s pension reform has features similar to the reforms in Europe and Central Asia. The study suggests that the combi-nation of these factors increased the rate of national savings, domestic investment, and economic growth by 2.3 percent, 2.1 percent, and 1.2 percent of GDP, respectively.
3. Total factor productivity measures a combination of changes in efficiency in the use of factor inputs in the production function of the economy and technological changes.

The Role of Savings in the Provision of Retirement Income 153
4. Pension funds based on revenues from commodity endowments are an exception.
5. Exceptions are Norway and to some extent Sweden. However, Norway’s Government Pension Fund Global has objectives that go beyond financ-ing pension expenditures.
6. It is interesting to note that prior to the crisis, Ireland’s National Pensions Reserve Fund was used as an example of governance, but the magni-tude of the crisis was such that the fund was sacrificed to stabilize the country’s failed banking system.
7. The Czech Republic implemented a mandatory funded scheme in 2013. 8. For more discussion on nationalization, see Price and Rudolph (2013). 9. Some countries, such as Chile, have been able to increase coverage of
the voluntary scheme, but these plans do not require maintaining sav-ings until retirement.
10. Examples of auto-enrollment plans include the National Employment Savings Trust in the United Kingdom and KiwiSaver in New Zealand. See IOPS (2013) for more details on these programs.
11. For a discussion about the impact of bounded rationality on retirement savings behavior, see Benartzi and Thaler (2007).
12. Madrian and Shea (2001) document a 50 percent increase in savings plan participation by newly hired employees at a large employer after a switch from an opt-in to an opt-out automatic enrollment regime.
13. Different parties and coalitions in the Slovak Republic take different approaches toward the role of mandatory funded systems in the overall pension system.
14. While automatic enrollment is efficient in getting people started, employees can be stuck with insufficient saving rates. Auto-enrollment requires employees to be automatically signed up at a certain saving rate; as these rates need to be low enough not to deter people from par-ticipating in the program, they can sometimes be insufficient to gener-ate enough savings for retirement. Benartzi and Thaler (2013) propose the use of automatic escalation, meaning that individuals are invited to commit at sign-up to increase their saving rate later, but those increases will be linked to salary increases.
15. This section is based on Vittas, Rudolph, and Pollner (2010). 16. In Central Asia, Kazakhstan in 1998 followed the Chilean model of a
single mandatory funded system. 17. Bulgaria, Croatia, Estonia, Hungary, Kosovo, Latvia, Lithuania, the for-
mer Yugoslav Republic of Macedonia, Poland, Romania, the Russian Federation, and the Slovak Republic.
18. The red bars in figures 4.12 and 4.13 reflect the value of the contribu-tions to mandatory funded schemes that theoretically are diverted from the social security agency.
19. It is not simple to separate the impact of the pension fund nationalization from other elements that affected the cost of funding the Hungarian government. While nationalization had an effect in reducing the government debt stocks, it did not help reduce the cost of funding the government. While in the period right after the nationalization, the spread of government debt increased by 125 basis points, additional reductions followed, which might be a consequence of multiple regional

154 The Inverting Pyramid
and idiosyncratic factors. Further research might be needed to clarify this point.
20. It is interesting to note that in all countries where pension funds were nationalized, including Argentina, Bolivia, and Hungary, the pension fund management industry has not played a role in defending the sys-tem. Typically, it is not in the interest of these institutions to confront governments, as they have to protect their brands and the possibility of attracting other potential business in the country. Pension fund man-agement companies have typically reacted to threats of policy reversal by lowering operational costs and minimizing losses.
21. One reason for the success of the Chilean pension reform in fostering the development of the domestic capital market has been the active role of the government and regulatory agencies in supporting the institu-tional development needed to facilitate the supply of innovative instru-ments to the market.
22. This point is strongly made by Impavido, Rudolph, and Ruggerone (2013).
23. In the case of Romania, it was a slowdown in the programmed path of increases of the contributions to the mandatory funded system.
24. For a working population with an average age of 40 years and a retire-ment age of 65, the average duration of the implicit commitment might be greater than 20 years, while the government mandate is typically below 6 years.
25. It would be interesting to analyze whether rating agencies would be willing to rate the probability of default on implicit debt of different governments.
26. On the Six Pack, see European Commission (2011). For the EFC guide-lines, see European Commission (2012), available on the “Relevant Legal Texts and Guidelines” page of the European Commission Economic and Financial Affairs website, http://ec.europa.eu/economy _ finance/economic_governance/sgp/legal_texts/.
27. The August 2013 announcements by the Polish government regarding the future of the mandatory funded system provide evidence of the preference for implicit debt.
28. The institutional design adopted in these countries for mandatory funded schemes followed Chile’s 1981 pension reform.
29. Individuals should be allowed to select the portfolios that are aligned with their preferences, but experience suggests that only a small proportion of contributors will make explicit selections.
References
Benartzi, Shlomo, and Richard Thaler. 2007. “Heuristics and Biases in Retirement Savings Behavior.” Journal of Economic Perspectives 21 (3): 81–104.
. 2013. “Behavioral Economics and the Retirement Savings Crisis.” Science 339 (6124): 1152–53.

The Role of Savings in the Provision of Retirement Income 155
Calderón, César, and Klaus Schmidt-Hebbel. 2003. “Learning the Hard Way:Ten Lessons for Latin America.” Central Bank of Chile, Santiago.
Castañeda, Pablo, and Heinz P. Rudolph. 2010. “Portfolio Choice, MinimumReturn Guarantees, and Competition.” In Evaluating the Financial Performance of Pension Funds, edited by Richard Hinz, Heinz P. Rudolph,Pablo Antolín, and Juan Yermo, 97–118. Washington, DC: World Bank.
Corbo, Vittorio, and Klaus Schmidt-Hebbel. 2003. “Macroeconomic Effects ofPension Reform in Chile.” In Pension Reforms: Results and Challenges, edited by Federación Internacional de Administradoras de Fondos de Pensiones. Santiago: CIEDESS.
Corsetti, Giancarlo, and Klaus Schmidt-Hebbel. 1997. “Pension Reform and Growth.” In The Economics of Pensions: Principles, Policies and International Experience, edited by Salvador Valdés-Prieto, 127–59. New York: Cambridge University Press.
European Commission. 2011. “EU Economic Governance ‘Six-Pack’ Enters into Force.” Memo/11/898 (December 12). Brussels.
———. 2012. Specifications on the Implementation of the Stability and Growth Pact and Guidelines on the Format and Content of Stability and Convergence Programmes. Brussels: European Commission.
Feldstein, Martin, and Charles Horioka. 1980. “Tax Policy and International Capital Flows.” Economic Journal 90 (358): 314–29.l
IMF (International Monetary Fund). World Economic Outlook Database. http://www.imf.org/external/pubs/ft/weo/2013/01/weodata/index.aspx.
Impavido, Gregorio, Heinz P. Rudolph, and Luigi Ruggerone. 2013. “Bank Funding in Central, Eastern and South Eastern Europe Post Lehman: A ‘New Normal?’” IMF Working Paper WP/13/148, International Monetary Fund, Washington, DC.
IOPS (International Organization of Pensions Supervisors). 2013. “Supervising Auto-Enrollment.” Paper presented by IOPS Technical Committee at IOPS Conference, Paris, June 5, 2013.
Kasek, Leszek, Thomas Laursen, and Emilia Skrok. 2008. “Sustainability of Pension Systems in the New EU Member States and Croatia: Coping with Aging Challenges and Fiscal Pressures.” World Bank Working Paper 129, World Bank, Washington, DC.
Madrian, Brigitte C. 2013. “Matching Contributions and Savings Outcomes: A Behavioral Economics Perspective.” In Matching Contributions for Pensions: A Review of International Experience, edited by Richard Hinz, Robert Holzmann, David Tuesta, and Noriyuki Takayama, 289–309. Washington, DC: World Bank.
Madrian, Brigitte C., and Dennis Shea. 2001. “The Power of Suggestion: Inertia in 401(k) Participation and Savings Behavior.” Quarterly Journal of Economics 116 (4): 1149–87.
OECD (Organisation for Economic Co-operation and Development). Global Pension Statistics Database. http://www.oecd.org/finance/private - pensions/globalpensionstatistics.htm.
———. 2012. OECD Pensions Outlook 2012. Paris: OECD.

156 The Inverting Pyramid
Price, William, and Heinz P. Rudolph. 2013. “Reversal and Reduction, Resolution and Reform: Lessons from the Financial Crisis in Europe and Central Asia to Improve Outcomes from Mandatory Private Pensions.” Working Paper 77779, World Bank, Washington, DC.
Rudolph, Heinz P., Richard Hinz, Pablo Antolín, and Juan Yermo. 2010. “Evaluating the Financial Performance of Pension Funds.” In Evaluating the Financial Performance of Pension Funds, edited by Richard Hinz, Heinz P. Rudolph, Pablo Antolín, and Juan Yermo, 1–23. Washington, DC: World Bank.
Rudolph, Heinz P., and Roberto Rocha. 2007. “Competition and Performance in the Polish Second Pillar.” World Bank Working Paper 107, World Bank, Washington, DC.
Schwarz, Anita. 2011. “New Realities of Pension Policy in Central Europe.” Human Development Group, Europe and Central Asia Region, World Bank, Washington, DC. http://www.ebrd.com/english/downloads /research/news/Schwarz_paper.pdf.
Thaler, Richard H., and Cass R. Sunstein. 2008. Nudge: Improving Decisions about Health, Wealth, and Happiness. New Haven, CT: Yale University Press.
Viceira, Luis, and Heinz P. Rudolph. 2012. The Use of Guarantees on Contributions in Pension Funds. World Bank, Washington, DC.
Vittas, Dimitri, Heinz P. Rudolph, and John Pollner. 2010. “Designing the Payout Phase of Funded Pension Pillars in Central and Eastern European Countries.” Policy Research Working Paper 5276, World Bank, Washington, DC.
Walker, Eduardo, and Augusto Iglesias. 2010. “Financial Performance of Pension Funds: An Exploratory Study.” In Evaluating the Financial Performance of Pension Funds, edited by Richard Hinz, Heinz P. Rudolph, Pablo Antolín, and Juan Yermo, 39–95. Washington, DC: World Bank.
World Bank. 2012. Program Document on a Proposed Loan in the Amount of EURO 750 Million to the Republic of Poland. Report 68697-PL. Washington, DC:World Bank.
. Private Pensions (internal database). Capital Markets Practice, Financial and Private Sector Development, World Bank, Washington, DC.

Financing Pensions in Europe and Central Asia
CHAPTER 5
157
Introduction
Pension benefits are already the largest public spending item in most
European countries. As shown in chapter 2, pension spending has
increased steadily in recent decades, as both the number of pension-
ers and the generosity of pension benefits have expanded. Today,
approximately 130 million people (about 17 percent of the popula-
tion) receive pension benefits in European and Central Asian
countries. Governments tend to spend about a quarter of their reve-
nue on pensions, equal to about 9 percent of gross domestic product
(GDP). However, the latter proportion varies widely across coun-
tries, from 3.5 percent of GDP in Kazakhstan to over 15 percent
in Austria and Ukraine, reflecting differences in demographics,
pension c overage, and generosity.
With aging populations, pension spending will continue to grow.
Increasing life expectancy and the approaching retirement of the
baby boomers will continue to strain pension finances. Over the next
four decades another 75 million people will reach pension age, exert-
ing additional fiscal pressure on pension spending. The European
Union (EU) expects average pension spending by its member states
to rise to about 12.8 percent of GDP by 2050. Similar—or even

158 The Inverting Pyramid
larger—increases can be expected in other countries in the region,
especially in many countries of the former Soviet Union (FSU) that
face similar or, in some cases, more pronounced demographic
transitions.
The growing financial burden of pension benefits and how it is
financed matters not only for fiscal sustainability but also for
employment, competitiveness, and income distribution. While much
attention has focused on measures to contain spending pressures
related to aging, the revenue side is equally important.
The current model of financing social security outlays, notably
pensions, primarily through labor taxes has important implications.
First, in terms of fiscal sustainability, the growth in pension spending
is only a concern to the extent that pension obligations grow faster
than the contribution base. Since labor taxes are the predominant
source of financing for most pension systems in the region, aging not
only will increase pension spending but simultaneously will exert
pressure on revenues, with fewer taxpayers paying social security
contributions (SSCs). Second, the large tax burden, especially on
labor, can have detrimental impacts on (formal) employment and
competitiveness in an increasingly global economy (see chapter 6).
This will constrain the choices available to countries seeking to
increase revenue from payroll contributions to improve the fiscal
balance of social protection and pension systems. Third, these labor
market constraints, together with growing fiscal pressures in social
security systems, imply that noncontributory revenue sources,
including general government revenue, are likely to become more
important in financing social protection and pensions.
The Current Financing of Pension Systems in Europe and Central Asia
Countries in the region have adopted different social security financing
models, but most are based on labor taxes. At present, the vast major-
ity of pension systems in Europe and Central Asia rely heavily on labor
taxes paid by active workers to finance pensions and other social ben-
efits. These are usually collected in the form of payroll contributions on
gross wages (or self-employment income), with contributions shared
between employees and employers. Unlike other labor taxes, the pay-
ment of SSCs is principally—albeit in some cases weakly—linked to
specific benefit entitlements, of which pensions are typically the most
significant financially. If taxpayers perceive this link to be actuarially
fair and credible, they may see SSCs as a form of deferred consumption

Financing Pensions in Europe and Central Asia 159
or forced savings, which would mitigate distortionary effects on
employment compared to other forms of direct taxation. There is little
evidence, however, that behavioral responses to SSCs differ from
responses to other direct taxes. Moreover, aging will further weaken
the contribution-benefit link, forcing public schemes to reduce benefits
to maintain financial sustainability.
While contribution-based financing is the most prevalent model,
there are alternative approaches in a few countries. For example,
Denmark, Georgia, and Ireland have largely or fully eliminated pay-
roll contributions. They finance public pay-as-you-go (PAYG) systems
with flat, social pension benefits through general government reve-
nue while relying on funded, private pensions for additional
retirement income support.1
SSC systems vary widely across countries in terms of contribution
rates and tax bases (figure 5.1). The average statutory payroll contri-
bution rate, comprising both employer and employee contributions,
in countries of Europe and Central Asia is around 32 percent,
FIGURE 5.1Statutory Social Security Contribution Rates in Selected European and Central AsianEconomies, 2011
Sources: U.S. Social Security Administration 2012; OECD 2013; country-provided data.
Note: Since not all countries specify separate rates for individual benefits, e.g., pension, unemployment, etc., the reported rates are the aggregate rates for social
contributions. For countries that apply differentiated rates, the reported rate is the highest marginal contribution rate.
0
10
20
30
40
50
60
Gree
ceBe
lgiu
mSl
oven
iaIta
lyFr
ance
Irela
ndDe
nmar
kN
orw
ayUn
ited
King
dom
Swed
enFi
nlan
dGe
rman
yPo
rtuga
lN
ethe
rland
sAu
stria
Geor
gia
Arm
enia
Alba
nia
Mol
dova
Russ
ian
Fede
ratio
nBu
lgar
iaLa
tvia
Bela
rus
Croa
tiaEs
toni
aLi
thua
nia
Pola
ndHu
ngar
yCz
ech
Repu
blic
Slov
ak R
epub
licRo
man
iaSe
rbia
Ukra
ine
Azer
baija
nKy
rgyz
Repu
blic
Kaza
khst
anTu
rkey
High-IncomeGenerousSpenders
High-IncomeModerate Spenders
Lower-SpendingTransition Countries
High-SpendingTransitionCountries
YoungCountries
Soci
al s
ecur
ity c
ontr
ibut
ion
rate
, %
of w
a ge
EmployeeEmployer Group average

160 The Inverting Pyramid
significantly higher than the 24 percent average for non-European
countries of the Organisation for Economic Co-operation and
Development (OECD). While this makes the region as a whole a
high-tax area, there is wide variation, from a low of 3 percent in
Armenia to a high of 55 percent in Romania. Several countries apply
differential (either regressive or progressive) rate schedules to
employee SSCs. For example, France applies four different rates; the
Slovak Republic has three different rates; while Germany, the Czech
Republic, and Poland each have two different rates. Most countries
also apply maximum income thresholds beyond which income is
exempted from employee SSCs. As a result, the incidence of SSCs is
regressive in most countries but progressive in some, and in still
others it combines regressive and progressive features.
SSC systems vary in terms of covered earnings and incidence.2
There is a substantial degree of complexity in the design of contribu-
tion systems and specifically in the taxable earning base. Many coun-
tries apply minimum and/or maximum income thresholds,
differential rates, and exemptions, all of which affect not only the
size of the tax base but also the distributional impact of payroll taxes.
In a majority of countries, employee SSCs are capped at a certain
income level, making employee SSCs regressive.3 However, these
thresholds are set at vastly different levels in the overall income
distribution.
Figure 5.2a, shows the upper threshold at which SSCs are
capped in relation to the average gross earnings across a number of
countries. While the upper threshold is set at 70 percent of average
gross earnings in the Netherlands, it is set at more than 600 percent
in the Czech Republic. This results in marked differences in the dis-
tributional impact. In many of the High-Income Moderate Spender
countries, SSCs tend to be strongly regressive. As shown in figure
5.2b, the average effective SSC rates in the Netherlands, Sweden,
Germany, and Denmark drop sharply for higher gross earnings. For
example, the effective average contribution rate for a single tax-
payer with gross earnings of 167 percent of average gross earnings
in the Netherlands is 9.3 percent, compared to 15.4 and 21.1 per-
cent for taxpayers with average gross earnings and 67 percent of
average gross earnings, respectively. In contrast, comparatively
high upper thresholds result in essentially flat SSC rates in most
transition countries (see figure 5.3 for a comparison of the effective
contribution rates at different levels of income in Germany, the
Bulgaria, and Czech Republic).
In contrast, only a few countries apply minimum income thresh-
olds below which SSCs are not payable, implying some progressivity

Financing Pensions in Europe and Central Asia 161
in employee SSC. This is the case with all forms of employee SSCs in
Austria, Belgium, Germany, Ireland, Norway, Sweden, and the
United Kingdom, as well as with pension contributions in Hungary.
While some of these countries generally exempt income below the
minimum threshold (which in some countries is linked to minimum
wages), exemptions in others only benefit taxpayers with total gross
earnings below the threshold. Taxpayers who earn more usually are
subject to contributions on their first unit of earnings. This is the case,
for example, with pension contributions in Norway and Sweden.
Very few countries, most notably Belgium and Italy, apply progres-
sive rate schedules similar to progressive personal income taxes (PITs)
for employee contributions, making contributions in these countries
generally progressive.
FIGURE 5.2Distributional Features of Social Security Contribution Systems inSelected European Economies, 2011
0 2 4 6 8
NetherlandsSweden
United KingdomAustria
GermanyPoland
Slovak RepublicTurkey
HungaryFrance
Czech Republic
a. Ratio of upper SSC threshold toaverage gross earnings
Source: OECD 2013.
Note: Panel b shows the difference in the average SCC employee contribution rate for a single person at 167 percent of
average wage and a single person at 67 percent of average wage.
–60
–50
–40
–30
–20
–10
0
10
Finlan
dIta
ly
Belgium
Czech R
epub
lic
Eston
ia
Hunga
ryIre
land
NorwayPo
land
Portu
gal
Sloven
iaTu
rkey
Switzerla
nd
Slovak
Repub
lic
United
Kingdo
mFra
nceSpain
Austria
Denmark
German
y
Sweden
Netherl
ands
Regr
essi
vity
in a
vera
ge S
CC ra
teof
sin
gle
taxp
ayer
, %
b. Regressivity in average SSC rate of single taxpayer

162 The Inverting Pyramid
The fiscal importance of SSC revenue has grown steadily over the
past four decades. While comprehensive historical data are not avail-
able for all countries, data from Western European countries and
Turkey show that SSC revenue on average more than doubled as a
share of GDP between 1970 and 2011 (figure 5.4). For example,
while SSC revenue in Germany in 1970 accounted for only
8.5 percent of GDP (and 26 percent of government revenue), it grew
rapidly until the late 1990s, more than doubling to over 15 percent of
GDP (and 39 percent of consolidated general government revenue)
in 2000. It has since remained at this level. A similar trend can be
observed in France, where SSC revenue grew from around
12 percent of GDP (34 percent of consolidated general government
revenue) in 1970 to about 17 percent in 2010. These sharp increases
resulted from expansion of the contribution base (more people enter-
ing the labor force and higher social insurance coverage) together
with rate increases in several countries, as described in chapter 2.
Today, SSCs yield, on average, about 10 percent of GDP in reve-
nue, accounting for about a quarter of government revenue
(figure 5.5). Alongside differences in rates, tax bases, and tax compli-
ance, the yield from payroll contributions varies across countries,
ranging from 1.9 percent of GDP in Denmark to 18.7 percent of GDP
FIGURE 5.3Effective Social Security Contribution Rates in Germany,the Czech Republic, and Bulgaria, 2010
Source: OECD 2013.
0
5
10
15
20
25
1 200
Effe
ctiv
e em
ploy
ee S
SC a
s %
of
gros
s in
com
e
Single Person Taxpayer Gross Income/Average Gross Income, %
Germany Czech Republic Bulgaria

Financing Pensions in Europe and Central Asia 163
FIGURE 5.4Social Security Contribution Revenue as a Percentage of GDP inSelected European Economies, 1970–2010
Source: OECD revenue statistics.
5
10
15
20
25
1970
1975
1980
1985
1990
1995
2000
2005
2010
SSC
Reve
nue,
%of
GDP
France
Ireland
NetherlandsBelgiumItaly
Germany
NorwayPortugalSwitzerlandFinlandTurkey
Austria
Denmark
GreeceUnited KingdomSweden
Spain
FIGURE 5.5Revenue Yield of Social Security Contributions as a Percentage of GDP, Selected European andCentral Asian Economies, 2011
Sources: World Bank data; Eurostat Statistics Database.
0
2
4
6
8
10
12
14
16
18
20
Gre
ece
Ital
y
Slo
veni
a
Bel
gium
Fran
ce
Den
mar
k
Irel
and
Uni
ted
Kin
gdom
Sw
eden
Port
ugal
Finl
and
Net
herl
ands
Aus
tria
Nor
way
Ger
man
y
Geo
rgia
Arm
enia
Alb
ania
Rus
sian
Fed
erat
ion
Bul
gari
a
Latv
ia
Lith
uani
a
Rom
ania
Mol
dova
Pola
nd
Cro
atia
Bel
arus
Hun
gary
Slo
vak
Rep
ublic
Esto
nia
Cze
ch R
epub
lic
Ser
bia
Ukr
aine
Kaz
akhs
tan
Aze
rbai
jan
Kyr
gyz
Rep
ublic
Turk
ey
High-Income
Generous
Spenders
High-Income
Moderate Spenders
Lower-Spending
Transition Countries
High-
Spending
Transition
Countries
Young
Countries
% o
f GD
P

164 The Inverting Pyramid
in France. In terms of share in total revenue, payroll contributions
account for about 25 percent across countries on average, again with
much variation, from just above 4 percent in Denmark to almost
40 percent in the Czech Republic and the Slovak Republic.
However, the productivity of contribution systems varies across
countries. As can be seen in figure 5.6, the relationship between
contribution rates and revenue yield tends to be U-shaped. The figure
suggests that revenue yield declines for contribution rates above a
certain level. Romania, for example, has the highest statutory contri-
bution rate, but its revenue yield is close to the average across coun-
tries. Higher contribution rates may induce labor supply responses,
including higher degrees of informality, which may harm revenue
yield rather than increase it.4 The figure also shows that revenue pro-
ductivity tends to be lower in transition economies, most of which
are below the trend line, than in old EU member states, most of
which are above the trend line.
These differences in SSC revenue productivity are related to differ-
ences in the level of informal economic activity across countries, mak-
ing social security financing especially challenging in environments
with low tax compliance. Among other factors, revenue productivity
is affected by tax compliance.5 Transition economies tend to face par-
ticularly low tax compliance, as the informal sector accounts for
a large share of economic activity. According to estimates from
Schneider, Buehn, and Montenegro (2010), the average shadow
economy size in Europe and Central Asia (excluding Western Europe)
was 36.5 percent of official GDP in 2005, compared to 13.5 percent in
FIGURE 5.6Social Security Contribution Rates and Revenue Yield, Selected European and Central AsianEconomies, 2011
Sources: World Bank data; Eurostat Statistics Database.
Note: R2 = 0.5266.
Albania
Austria
Azerbaijan
Belgium
Bulgaria
BelarusCroatia
Czech Republic
EstoniE t aFinland
FranceGermany
A t
GreeceHungary
ItalyItalyi
Kyrgyz Republicblic
Latvia LithuaniaMoldova
Netherlands
PolandPortugal
Romania
Russian Federation
SlovakRepublic
Slovenia
Sweden Turkey
Ukraine
0
2
4
6
8
10
12
14
16
18
20
20 25 30 35 40 45 50 55 60
Reve
nue
yiel
d, %
of G
DP
Statutory contribution rate
ri
a

Financing Pensions in Europe and Central Asia 165
high-income OECD countries. These large informal sectors erode the
tax base, especially for labor taxes. Figure 5.7 shows that revenue pro-
ductivity is in fact inversely correlated with the estimated size of the
informal economy across countries. As also discussed in chapter 6,
finding the right balance between incentives for participation in the
formal labor market and financing of social security obligations is an
especially difficult task in environments with low tax compliance.6
While payroll contributions are the primary source of financing for
social protection spending in the region, revenue coverage is insuffi-
cient in most countries, requiring general government revenue to par-
tially fund social benefits. On average, noncontributory financing of
social benefits accounts for about 30 percent of total social protection
spending, equal to about 3 percent of GDP. As shown in figure 5.8,
there are widespread variations from country to country, reflecting
differences in the scope and coverage of social benefits and differences
in the mix between contributory and noncontributory social benefits
in different countries. The share of social protection spending financed
by noncontributory revenue, such as general taxation, is particularly
large in countries such as Denmark, Ireland, and Georgia, which by
design rely on general taxation to finance their social protection sys-
tems. But most countries with payroll tax financing also face large
(and growing) financing gaps, originating from fiscal imbalances in the
public pension PAYG system.
At the same time, SSCs drive high labor taxes in the region,
accounting for about 65 percent of nonwage labor costs on average.
Taken together, labor taxes, including PITs and SSCs, account on
FIGURE 5.7Relationship Between Informality and Revenue Productivity of Social Security Systems,Selected European and Central Asian Countries, 2011
Sources: World Bank data; Eurostat Statistics Database.
Note: R² = 0.4571.
Albania
Austria
Azerbaijan
Belgium
BulgariaBu
Belarus
Croatia
CzechRepublic
Estonia
FinlandFinFranceGermany
A
publicpu
Greece
HungaryItaly
Kyrgyz RepubliKyrgy c
LatviaLithuania
Moldova
Netherlands
PolandlandPortugalPortugalC hC hhh
Romania
Russian Federation
Slovak Republic
Slovenia
Sweden
TurkeuTurkeyy
Ukraine
0
10
20
30
40
50
60
70
0 0.05 0.10 0.15 0.20 0.25 0.30 0.35 0.40 0.45 0.50
SSC revenue productivity
Size
of i
nfor
mal
eco
nom
y, %
of G
DP

166 The Inverting Pyramid
average for about 40 percent of total gross labor costs, compared to
34 percent on average in OECD countries. If a worker receives the
equivalent of 100 euros in net earnings, the employer incurs a labor
cost of 167 euros on average. There is, however, significant variation
among countries (figure 5.9), with the tax wedge being highest in
Belgium (55.8 percent) and lowest in Georgia (19.4 percent).7 SSCs
are the largest part of the tax wedge except in Ireland, Denmark, and
Georgia, where PIT by design accounts for the main portion of the
tax wedge. The tax wedge tends to increase with the aging of the
population, which results in larger social security financing needs
supported by fewer contributors (figures 5.10 and 5.11).
Given the already large tax burden on labor, addressing pension
financing needs by increasing revenue from SSCs is constrained by
the potential negative impacts of high labor taxes on employment
and competitiveness. By increasing the cost of labor, labor taxation
may have an impact on labor demand. However, the relationship is
complex and depends on, among other things, the rigidity of wages—
that is, whether increased nonwage labor costs can be passed through
to employees. This varies across countries and within countries across
FIGURE 5.8Social Protection Spending in Relation to Social Security Contribution Revenue, SelectedEuropean and Central Asian Economies, 2011
Sources: World Bank data; Eurostat Statistics Database.
0
5
10
15
20
25
30
35
Gre
ece
Ital
y
Slo
veni
a
Bel
gium
Fran
ce
Den
mar
k
Irel
and
Uni
ted
Kin
gdom
Sw
eden
Port
ugal
Finl
and
Net
herl
ands
Aus
tria
Nor
way
Ger
man
y
Geo
rgia
Arm
enia
Alb
ania
Rus
sian
Fed
erat
ion
Bul
gari
a
Latv
ia
Lith
uani
a
Rom
ania
Mol
dova
Pola
nd
Cro
atia
Bel
arus
Hun
gary
Slo
vak
Rep
ublic
Esto
nia
Cze
ch R
epub
lic
Ser
bia
Ukr
aine
Kaz
akhs
tan
Aze
rbai
jan
Kyr
gyz
Rep
ublic
Turk
ey
High-Income
Generous
Spenders
High-Income
Moderate Spenders
Lower-Spending
Transition Countries
High-
Spending
Transition
Countries
Young
Countries
% o
f GD
P
SSC revenue Social protection spending

Financing Pensions in Europe and Central Asia 167
FIGURE 5.9Contribution of Labor Taxes to Gross Labor Costs in Selected European and Central AsianEconomies, 2011
Sources: U.S. Social Security Administration 2012; OECD 2013.
10
0
20
30
40
50
60
Spai
nSl
oven
iaIta
lyFr
ance
Belg
ium
Irela
ndUn
ited
King
dom
Icel
and
Nor
way
Net
herla
nds
Denm
ark
Portu
gal
Finl
and
Swed
enAu
stria
Germ
any
Geor
gia
Alba
nia
Russ
ian
Fede
ratio
nPo
land
Bulg
aria
Bela
rus
Slov
ak R
epub
licEs
toni
aLi
thua
nia
Czec
h Re
publ
icHu
ngar
yLa
tvia
Rom
ania
Ukra
ine
Serb
iaKy
rgyz
Repu
blic
Kaza
khst
anTu
rkey
OECD
- Av
erag
e
High-IncomeGenerousSpenders
High-Income Moderate Spenders Lower-SpendingTransition Countries
High-SpendingTransitionCountries
YoungCountries
% o
f gro
ss la
bor c
osts
Personal income taxSCC by employeesSCC by employers
FIGURE 5.10Labor Tax Wedge in Relation to Social Protection Spending, Europeand Central Asia, 2011
Sources: U.S. Social Security Administration 2012; OECD 2013.
Note: R² = 0.2115.
Albania
Austria
Belarus
BelgiumelgiuBulgariaria
Czech RepublicCz c
DenmarkrkEstoniatonia
Finland
France
Georgia
Germany
Hungary
Ireland
Italy
Kazakhstanzakhstan
Kyrgyz Republic
Latvia
Lithuania
NetherlandsPoland
PortugalPo
Romania
Russian Federationgg
SerbiaiaSSlovak RepublicSlovak Repu
SloveniaSloveniaSweden
Turkey
United Kingdom
Ukraine
10
15
20
25
30
35
40
45
50
55
60
0 5 10 15 20 25 30 35
Labo
r tax
wed
ge a
s of
% g
ross
labo
rco
sts
Social protection spending as % GDP

168 The Inverting Pyramid
different groups of employees.8 Higher labor costs may erode
international competitiveness and discourage investment and job
creation. Finally, a larger tax wedge may also encourage economic
activity to shift to the informal sector, with respective fiscal implica-
tions, as discussed earlier in this chapter.
Moreover, going forward, a shrinking labor force will put further
pressure on revenue from payroll taxes. Together with rising expen-
ditures on pensions, the reliance on payroll contributions of active
workers is central to the demographic impact on the financial
sustainability of social security systems in general and pension
systems in particular (see box 5.1 for a review of the potential eco-
nomic impact of changing demographics). Since labor taxes are the
main financing source of social security and pension systems in
Europe, demographic change will simultaneously affect pension
spending and contribution revenue. The key problem is that over the
next several decades, the number of retirees is expected to grow
rapidly, while the number of workers who will make the payroll con-
tributions will decline (or grow at a much slower pace).
As can be seen in figure 5.12, a majority of countries will experi-
ence substantial declines in their labor force through 2050. On aver-
age, the labor force will contract by about 20 percent of today’s labor
force, with the decline expected to be most severe in the eastern part
of the continent: among Central European EU members, some FSU
FIGURE 5.11Labor Tax Wedge in Relation to Old-Age Dependency Ratio, Europeand Central Asia, 2011
Source: World Bank staff estimates using World Bank, OECD, and UN data.
Note: R² = 0.2916.
Albania
Austria
Belarus
Belgium
Bulgaria
Czech RepublicC Repepub
Denmark
Estonis aFinlandand
France
Georgia
GermanyHungary
Ireland
Italy
Kazakhstan
Latvia
LithuanianniauanuanNetherlandslanN
NorwayPoland
Portugal
Romania
Russian Federation
SerbiaSlovak Republic
Sloveniaa
SpainpainDD
EstoEsTurkey
United Kingdom
0
10
20
30
40
50
60
5 10 15 20 25 30 35
Labo
r tax
wed
ge a
s %
of g
ross
labo
r cos
ts
Old age dependency ratio, %
Kyrgyz Republirgyz Republicc
UkraineUkrUkraineUkrUkraine
Swedenl
Swe

Financing Pensions in Europe and Central Asia 169
BOX 5.1
The Inverting Pyramid and Economic Growth
At the microeconomic level, there are strong life-cycle effects on the decisions to work, save,
and invest. Since individuals attempt to maximize their lifetime utility, they tend to work and save
more at younger ages in order to enjoy a higher level of leisure time and consumption at older
ages. In a simple growth-accounting framework, the changing age structure of the population—
that is, the inverting pyramid—is expected to have a direct effect on aggregate labor supply and
on savings behavior, which, together with prevailing production technologies, will determine the
long-term growth potential of any economy (Bloom, Canning, and Fink 2011). However, the
potential drag on economic growth created by an aging population could be at least partially
offset by higher productivity, increases in labor quality, or increased labor force participation.
Moreover, the specific sources of the shift in age structure do matter, as aging is the result of
simultaneous declines in fertility rates and increases in life expectancy. While increases in lon-
gevity can be seen as growth enhancing (Romer 1990), fertility decreases are generally expected
to lower growth potential. In reality, the overall impact of aging may therefore depend on the rel-
ative change between fertility and mortality, whether it is associated with increasing or decreas-
ing long-run economic growth (Jones 1995).
Savings and Capital Accumulation
The standard consumption-smoothing motive predicts that at the individual level the highest
savings rate will take place in the midlife period in anticipation of the need to provide for con-
sumption expenditures during retirement, when incomes are expected to decline (see, for
example, Jappelli and Modigliani 2005). Higher savings may in turn imply deepened capital mar-
kets, productivity-enhancing investments, and hence high per capita incomes (Börsch-Supan
and Winter 2001). Rising longevity may induce individuals to increase their savings rates further
during their economically active years (Bloom, Canning, and Sevilla 2003; Mason 2005). How-
ever, a shift in the age structure that results in a larger share of older (retired) individuals would
be expected to lead to a decrease in aggregate savings, thus reducing the speed of capital accu-
mulation (see, for example, Lindh and Malmberg 1999).
Labor Supply
Aging presents a shock to aggregate labor supply. Some empirical estimates have quantified the
impact of declining workforces in OECD countries, showing reductions in annual growth rates of
0.2 to 0.5 percentage points in France and Germany and 0.8 percentage points in Japan (Martins
et al. 2005). The extent to which demographic change will affect labor supply will depend on
labor participation rates, which vary substantially across countries (Burniaux, Duval, and
Jaumotte 2004).
continued

170 The Inverting Pyramid
countries (except in Central Asia), and the countries of the Balkans.
In all of these, population aging is compounded by outmigration.
Finding Alternative Sources of Pension Financing
The demographic and labor market realities described above are test-
ing the labor tax–based model of social security financing. As noted
Productivity
Changes in age structure may also affect productivity. On the one hand, increases in the life
expectancy of individuals may render investments in human capital more profitable (Hazan and
Zoabi 2006; Cervellati and Sunde 2009). Lower fertility may reinforce incentives for human capi-
tal investments among women (Becker, Murphy, and Tamura 1994). At the same time, shifts in
the age structure mean that the labor market becomes more reliant on mature and older work-
ers to meet new and emerging skill needs, while these workers may face weak incentives for
further human capital investments (Hazan and Zoabi 2006).
BOX 5.1 continued
Sources: United Nations population projections (UN 2011); World Bank World Development Indicators (database).
FIGURE 5.12Growth of the Working-Age Population, 2010–2050, in Selected European and Central AsianEconomies
–60
–40
–20
0
20
40
60
80
High-IncomeGenerousSpenders
High-IncomeModerate Spenders
Lower-SpendingTransition Countries
High-SpendingTransitionCountries
YoungCountries
Chan
ge in
wor
king
-age
pop
ulat
ion,
%
Slov
enia
Italyy
Switz
erla
nd
Gree
ce
Belg
ium
Fran
cePo
rtuga
lGe
rman
yN
ethe
rland
sFi
nlan
dDe
nmar
kSw
eden
Cypr
usUn
ited
King
dom
Nor
way
Irela
ndIc
elan
dBu
lgar
iaGe
orgi
aM
oldo
vaBe
laru
sRo
man
iaLa
tvia
Russ
ian
Fede
ratio
nPo
land
Lith
uani
aCr
oatia
Slov
ak R
e pub
licp
Hung
ary
E sto
nia
Alba
nia
Czec
h Re
publ
icp
Arm
enia
Bosn
ia a
ndHe
rzeg
ovin
aUk
rain
eM
aced
onia
,FYR
Mon
tene
gro
Turk
ey
Serb
ia
Azer
baija
n
Kaza
khst
anUz
beki
stan
Kyrg
yzRe
publ
icTu
rkm
enis
tan
Tajik
ista
n
Aust
ria
Spai
n

Financing Pensions in Europe and Central Asia 171
in chapter 3, in the long run, countries with aging populations will
need to mobilize between 4 percent and 6 percent of annual GDP to
cover the additional financing needs of their pension systems. While
taming the growth in pension spending is key to restoring sustainable
finances, in most countries revenue measures will have to play a
role in preserving long-term fiscal health (as no government will
leave its retirees destitute). But raising additional financing from the
existing labor taxes will be harmful to labor markets, job creation,
and growth. These longer-term pressures have been reinforced by
the more acute concerns about simultaneous deterioration of fiscal
accounts and soaring unemployment in the aftermath of the global
financial crisis. In these circumstances, governments are seeking
wider tax reform options that can contribute to fiscal consolidation in
the short term while addressing long-term fiscal pressures related to
prospective demographic change, minimizing distortionary effects on
decisions to work, save, and invest.9
Europe will have to cope with aging-related fiscal pressures in the
pension system on top of an already sizable public sector footprint.
The average tax burden in European and Central Asian countries is
around 38 percent of GDP (2011), but this average masks wide differ-
ences across the region (figure 5.13). While the Young Countries tend
FIGURE 5.13Tax Burden as a Percentage of GDP in Selected European and Central Asian Countries, 2011
Sources: World Bank staff estimates using OECD government revenue statistics; World Bank World Development Indicators (database).
Note: R2 = 0.4955.
ALB
ARMAZE
BLR
BIH
BGRBGR
HRVHRHHHRHRHRHHHH CZE
EST
GEOGE
HUN
KAZ
KGZ
LVA
LTUMKD
MDA
MNE
POLROMROM
RUSRUSRUURUSUSUU
SRB
SVK
SVN
TJK
TUR
UKR
DNK
IRL
GBR
SWE
FIN
NLDAUTUT
NOR
DEUPRTPRT
GRC
ITA
BELFRA
0
10
20
30
40
50
60
20,000 40,000 60,000 80,000 100,000 120,000
Cons
olid
ated
gov
ernm
ent r
even
ue a
s %
of G
DP
GDP per capita, current US$

172 The Inverting Pyramid
to have smaller governments and may have room for additional reve-
nue mobilization, the tax burden is especially large in European coun-
tries, many of which face the most severe demographic pressures. The
space for expanding the size of government in these countries is
severely limited, as additional tax increases would be harmful to long-
term growth prospects. Already, today, social protection spending is a
main driver of public spending in Europe, accounting for 42 percent
of general government expenditures on average. In addition to
increased pension spending, aging is also expected to increase the
need for spending on health and long-term care. The room for addi-
tional growth in revenues and rationalization of expenditures is there-
fore small, putting an additional constraint on pension reforms.
Current tax structures in Europe and Central Asia rely mainly on
consumption and income taxes and on social security contributions
(figure 5.14). Direct taxes account for 58 percent of tax revenue on
average, equal to 18 percent of GDP, split about equally between
FIGURE 5.14Composition of Government Revenue in Selected European and Central Asian Economies, 2011
Sources: World Bank staff estimates using OECD; World Bank data.
0
5
10
15
20
25
30
35
40
45
Slo
veni
a
Arm
enia
Alb
ani a
Rus
sian
Fed
erat
ion
Geo
rgia
Lith
uani
a
Rom
ania
Esto
nia
Latv
ia
Slo
vak
Rep
ublic
Bul
gari
a
Mol
dova
Pola
nd
Cro
atia
Cze
ch R
epub
lic
Bel
arus
Hun
gary
Mac
edon
ia, F
YR
Ukr
aine
Mon
tene
gro
Bos
nia
and
Her
zego
vina
Ser
bia
Aze
rbai
jan
Tajik
ista
n
Kos
ovo
Kyr
gyz
Rep
ublic
Kaz
ahks
tan
Turk
ey
High-
Income
Generous
Spender
Lower-Spending
Transition Countries
High-Spending
Transition
Countries
Young Countries
% o
f GD
P
Social security contributions Other taxes Taxes on goods and services Income taxes

Financing Pensions in Europe and Central Asia 173
income taxes (both corporate and personal) and SSCs. Indirect taxes,
including most importantly the value-added tax (VAT), account for
about 37 percent of tax revenue (12 percent of GDP). Other taxes,
including property taxes, contribute about 5 percent of tax revenue
(1.5 percent of GDP). There are notable differences across different
groups of countries, in terms of both composition of revenue and
underlying tax systems. Income taxes tend to be more important in
Northern Europe, where they account for 40 percent of tax revenue
(15 percent of GDP). In contrast, income taxes account for a smaller
share of tax revenue in central Europe and the FSU, largely due to
the prevalence of low flat tax initiatives; the average PIT rate for
Central European and FSU countries is 16.7 percent, less than half
that of other European subregions.
The following sections explore options for increasing fiscal space,
including raising consumption and property taxes, using fiscal
savings from natural resource revenue, and rationalizing other
expenditures.
Raising Consumption Taxes
Raising consumption taxes, and especially VAT, is often considered a
primary option for mobilizing additional fiscal revenue. Compared to
income taxes, consumption taxes are generally seen as less distor-
tionary and more efficient sources of tax revenue (see, for example,
Myles 2009). Shifting the financial burden of growing pension
spending to consumption taxes offers several potential advantages:
• Improving competitiveness. Income taxes, including SSCs, are origin-
based, meaning that they are levied on domestic production while
imports are not included in the tax base. In contrast, consumption
taxes are destination-based, meaning that domestic consumption
of both nontraded and imported goods is included in the tax base,
while exports are zero-rated (and as such are excluded from the tax
base). As a result, a tax shift from labor taxes to VAT implies a
change in relative prices, lowering the cost of exports while increas-
ing the cost of imports. It has been argued that tax shifts can, there-
fore, contribute to fiscal devaluation and help adjustments in the
context of external imbalances through containment of imports and
boosting of exports (de Mooij and Keen 2012 show this theoreti-
cally and empirically). There is also some empirical evidence that a
tax mix that relies more heavily on consumption taxes, rather than
income taxes, is associated with higher rates of economic growth—
at least in OECD countries (Kneller, Bleaney, and Gemmell 1999).

174 The Inverting Pyramid
• Broadening the tax base. Consumption provides a broader base than
labor income. Consumption is financed not only by income from
labor, but also by other sources of income, including pensions and
other government transfers, corporate profits, and savings.
A broader base allows for similar revenue generation at a lower
rate, and since distortionary effects tend to increase disproportion-
ally with increases in the tax rate, this can mitigate the distortion-
ary effect of the tax system.
• Mitigating the revenue impact of demographic change and enhancing
intergenerational equity. Since the two tax bases, consumption and
labor income, may grow at different rates, tax shifts may have
important long-term revenue implications. While aging will have
a substantial impact on the composition of domestic consump-
tion, for example by increasing consumption of health services,
demographic change will affect the overall level of consumption
less than it will affect labor income. Raising additional revenue
from consumption taxes means that taxpayers receiving a major
share of their income from sources other than labor and those
financing consumption out of savings will carry a larger burden:
they will pay higher consumption taxes without receiving the
benefit of reduced labor income taxes. This group of taxpayers
includes pensioners, among others, and increased consumption
taxation may therefore help offset the intergenerational inequi-
ties associated with the intergenerational redistribution of PAYG
systems.
Current VAT systems vary widely in terms of rates and revenue
yield. Table 5.1 summarizes the main features of VAT systems across
European countries. While the standard VAT rates vary from a low
of 12 percent in Kazakhstan to a high of 27 percent in Hungary, the
vast majority of countries have standard VAT rates between
19 percent and 23 percent. In addition, many countries apply
reduced rates and/or VAT exemptions to certain categories of goods
and services, such as medicines, basic foodstuffs, hotel services, and
others.
Since the global financial crisis, many countries have increased VAT
rates as part of their fiscal consolidation programs, raising their stan-
dard statutory VAT rates and to a lesser extent their reduced VAT rates.
VAT increases were implemented in 13 of the 27 EU member states,
with the average standard VAT rate increasing from 19.4 percent in
2007 to 21.0 percent in 2011.10 A few countries have undertaken VAT
increases in conjunction with SSC reductions (box 5.2).

Financing Pensions in Europe and Central Asia 175
TABLE 5.1VAT Systems and Performance across European and Central Asian Economies
VATstandard rate (%)
VATreduced rate (%)
VATrevenueas % of
GDP
VAT revenue as % of final consumption
C-efficiency (%)
Additional revenue fromimproving C-efficiency by
10 percentage points(% of GDP)
Albania 20.0 10.0 9.3 9.5 47.6 1.9
Austria 20.0 10.0/12.0 7.8 10.7 53.5 1.5
Belarus 20.0 0/0.5/10.0 10.0 14.9 74.6 1.3
Belgium 21.0 0/6.0/12.0 7.0 9.1 43.4 1.6
Bulgaria 20.0 9.0 9.2 12.1 60.7 1.5
Czech Republic 20.0 14.0 7.3 10.2 50.9 1.4
Denmark 25.0 0 9.9 12.9 51.5 1.9
Estonia 20.0 9.0 8.5 12.4 62.1 1.4
Finland 23.0 0/9.0/13.0 8.9 11.2 48.6 1.8
France 19.6 2.1/5.5/7.0 7.0 8.5 43.4 1.6
Georgia 18.0 n.a. 10.6 11.6 64.2 1.7
Germany 19.0 7.0 7.3 9.6 50.4 1.5
Hungary 27.0 5.0/18.0 7.9 10.7 39.8 2.0
Italy 21.0 4.0/10.0 6.2 7.7 36.4 1.7
Kazakhstan 12.0 0 3.1 5.8 47.9 0.6
Latvia 21.0 12.0 6.1 7.8 37.3 1.7
Lithuania 21.0 9.0/5.0 6.6 8.0 38.0 1.7
Netherlands 19.0 6.0 7.2 9.9 52.3 1.4
Poland 23.0 5.0/8.0 7.6 9.6 41.8 1.8
Portugal 23.0 6.0/13.0 7.8 9.0 39.3 2.0
Romania 24.0 9.0/5.0 7.5 9.9 41.2 1.8
Russian Federation 18.0 10.0 5.5 8.0 44.5 1.2
Slovak Republic 20.0 10.0 6.8 9.0 44.8 1.5
Slovenia 20.0 8.5 8.2 10.5 52.5 1.6
Sweden 25.0 0/6.0/12.0 9.5 13.0 51.9 1.8
Turkey 18.0 1.0/8.0 6.1 7.1 39.7 1.5
Ukraine 20.0 0 9.5 11.3 56.4 1.7
United Kingdom 20.0 0/5.0 7.3 8.5 42.3 1.7
Sources: World Bank staff estimates using World Bank and OECD data; IMF 2012.
Note: n.a. = not applicable.

176 The Inverting Pyramid
However, like any tax increases, VAT rate increases trigger
behavioral responses by taxpayers, up to and including evasion. Rate
increases beyond a certain level may therefore harm rather than
increase revenue yield. Some estimates have placed the revenue-
maximizing VAT rate at below 25 percent (Agha and Haughton 1996;
Matthews 2003). Room for future rate increases may therefore be
limited.
BOX 5.2
Tax Shifting in European Countries
Denmark
Many observers consider Denmark as the prime example of noncontributory financing of social
security. In 1987 Denmark introduced wide-ranging tax reform to improve the viability of the
social security system while strengthening competitiveness. Average marginal effective tax
rates on labor income for fully employed individuals declined from about 58 percent in 1986 to
54 percent in 2002. Initially, the employer payroll tax for unemployment and disability insurance
was phased out and replaced by a VAT-like tax on consumption. That tax was later merged into the
general VAT by increasing the VAT rate from 21 percent to 25 percent. In parallel, excise duties on
energy products (petroleum products, electricity, gas, coal) were raised gradually. To mitigate the
regressive nature of VAT and excise financing of social security benefits, the tax system has a
progressive personal income tax with one of the highest marginal tax rates in the world.
Georgia
Georgia eliminated payroll contributions entirely in 2008 as part of a comprehensive tax reform,
shifting social insurance benefits, including a flat pension benefit, to general government
revenue.
Germany
Germany introduced a 3 percentage point increase in the standard VAT rate (from 16 percent to
19 percent) and a simultaneous reduction of 1.8 percentage points in employer social secu-
rity contributions (SSCs) in 2007. It simultaneously reduced the unemployment insurance
contribution by 2.3 percentage points and increased the pension contribution by 0.5 percentage
points.
Hungary
In 2009 Hungary implemented a simultaneous 5 percent reduction in employer SSCs and a
5 percent increase in VAT.

Financing Pensions in Europe and Central Asia 177
As a result, further VAT revenue reforms will increasingly have to
rely on base broadening and on improvements in compliance. As
can be seen from table 5.1, C-efficiency, which measures the reve-
nue yield at any given statutory rate, is on average 49 percent across
countries in the region (varying from 36 percent in Italy to
75 percent in Belarus). For a fully compliant country with a single
VAT rate, C-efficiency would be 100 percent. The gap reflects differ-
ences in policy (e.g., reduced rates and exemptions) and compli-
ance. Reining in reduced rates and exemptions and curbing evasion
through enhanced tax administration can increase C-efficiency. The
potential revenue gains that could be realized by improving
C-efficiency are quite substantial, as can be seen in the last column
of table 5.1. On average, a 10 percentage point increase in
C-efficiency would yield around 1.6 percent of GDP across the
countries covered here.
However, tax shifts to consumption taxes may have important
distributional impacts. Consumption taxes are, in principle, distribu-
tionally neutral when assessed against lifetime income (provided
constant tax rates and no inheritances, so that all lifetime income is
eventually spent on consumption). However, governments may be
more concerned about the immediate redistributional impact on
current household income and consumption. Consumption taxes
tend to be regressive when assessed relative to current household
incomes (figure 5.15). This is because lower-income households
tend to spend a higher share of their income on current consump-
tion, while the saving rate tends to increase with higher incomes.
In particular, eliminating reduced VAT rates to improve C-efficiency
is likely to have significant distributional impacts because the
consumption of poorer households tends to include a larger share
of goods that are VAT-exempted or taxed at reduced rates. If
VAT increases are combined with reduction in SSCs, then the net
distributional impact of the reform also depends on the initial inci-
dence of SSC (which varies substantially across countries, as
described earlier in this chapter). In addition, rather than assess-
ing VAT increases in isolation, the focus should be on the overall
equity in fiscal policy. There may be more efficient ways than
reduced VAT rates to achieve desirable redistribution, for example,
through progressive income taxation or targeted social assistance
spending.
To assess the fiscal impact of tax policy options, an overlapping
generations model is used for two countries, Poland and the Slovak
Republic (Keuschnigg, Davoine, and Schuster 2013).11 The model
and policy simulations are discussed in more detail in chapter 6.
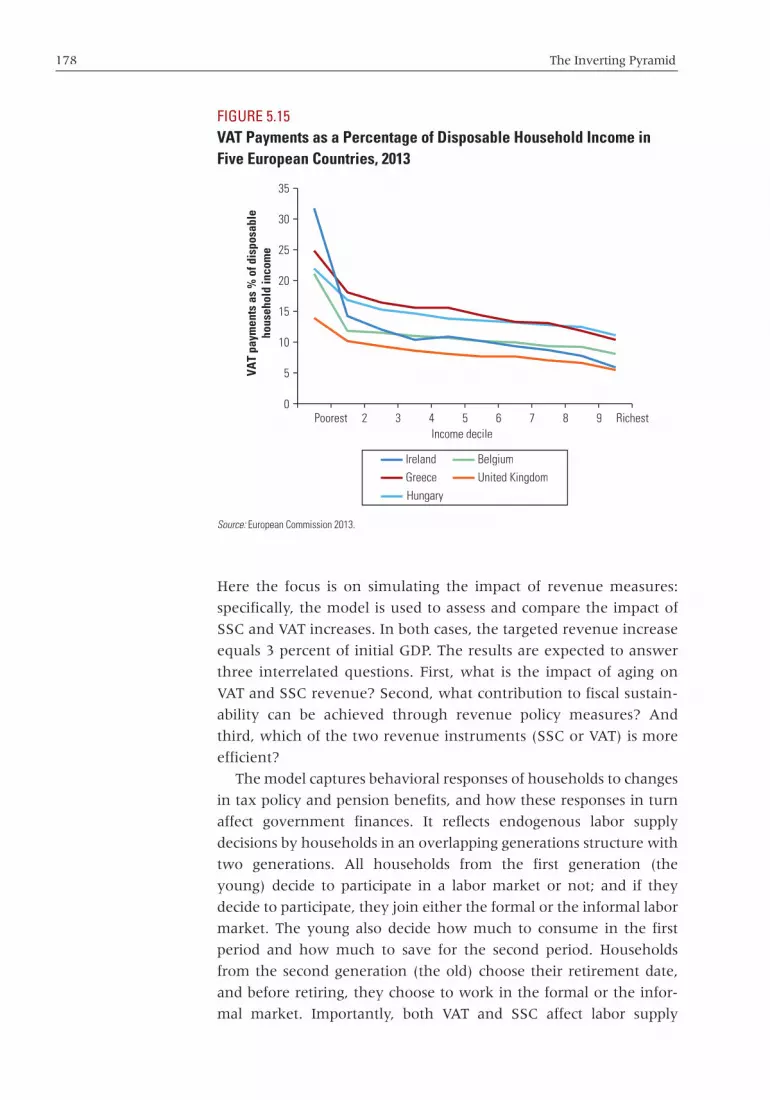
178 The Inverting Pyramid
Here the focus is on simulating the impact of revenue measures:
specifically, the model is used to assess and compare the impact of
SSC and VAT increases. In both cases, the targeted revenue increase
equals 3 percent of initial GDP. The results are expected to answer
three interrelated questions. First, what is the impact of aging on
VAT and SSC revenue? Second, what contribution to fiscal sustain-
ability can be achieved through revenue policy measures? And
third, which of the two revenue instruments (SSC or VAT) is more
efficient?
The model captures behavioral responses of households to changes
in tax policy and pension benefits, and how these responses in turn
affect government finances. It reflects endogenous labor supply
decisions by households in an overlapping generations structure with
two generations. All households from the first generation (the
young) decide to participate in a labor market or not; and if they
decide to participate, they join either the formal or the informal labor
market. The young also decide how much to consume in the first
period and how much to save for the second period. Households
from the second generation (the old) choose their retirement date,
and before retiring, they choose to work in the formal or the infor-
mal market. Importantly, both VAT and SSC affect labor supply
FIGURE 5.15VAT Payments as a Percentage of Disposable Household Income in Five European Countries, 2013
Source: European Commission 2013.
0
5
10
15
20
25
30
35
VAT
paym
ents
as
% o
f dis
posa
ble
hous
ehol
d in
com
e
Income decile
Poorest Richest2 3 4 5 6 7 8 9
Belgium
United Kingdom
Hungary
Greece
Ireland

Financing Pensions in Europe and Central Asia 179
decisions and tax compliance. The results of this exercise suggest the
following (see figure 5.16):
• Aging affects consumption tax revenue and labor tax revenue dif-
ferently. The simulation results for Poland (figure 5.16a) and the
Slovak Republic (figure 5.16b) show that aging populations affect
both revenue from consumption taxes and SSC. However, SSC will
decline more sharply as a result of a declining contributor base.
• Revenue mobilization can help improve the fiscal position, but its
contribution will be relatively small compared to reforms of ben-
efit entitlements. The model results suggest that tax increases
deliver some fiscal benefits, but in a limited fashion (around
1.0 percent of GDP in Poland and 1.4 percent of GDP in the
Slovak Republic), and with much less impact than pension ben-
efit reductions.
• Because they lead to increased rates of informality, Social Security
Contribution (SSC) rate increases are a relatively inefficient means
of raising additional revenue. Lower compliance in turn affects
revenue yield. Due to these behavioral responses, the increase in
SCC revenue is lower than 1 percent of GDP in both countries
(0.77 percent in Poland and 0.43 percent in the Slovak Republic).
• VAT increases also increase informality, but the revenue is higher
than with SSC rate increases, mainly due to the broader tax base.
Behavioral responses to VAT increases include both lower labor
supply and lower compliance, which reduce the overall revenue
impact. However, because consumption is a larger tax base, the
FIGURE 5.16Simulation of Long-Term Fiscal Impact of Increases in Social Security Contributions (SSC) andVAT Tax, Poland and the Slovak Republic, 2010 and 2050
Source: Keuschnigg, Davoine, and Schuster 2013.
0
5
10
15
20
25
2010 2050Impact ofaging, no
policy change
2050SSC
increase
2050VAT
increase
% o
f GD
P
a. Simulation results for Poland
2010 2050Impact ofaging, no
policy change
2050SSC
increase
2050VAT
increase
0
5
10
15
20
25
% o
f GD
P
b. Simulation results for the Slovak Republic
SSC VAT

180 The Inverting Pyramid
revenue impact is greater (1.44 percent in Poland and 1.85 percent
in the Slovak Republic).
Raising Property Taxes
Recurrent property taxes are another potential source that could be
tapped for additional fiscal revenue. Both the OECD and the EU have
recommended tax reforms that raise the share of recurrent property
taxes in the tax mix. Figure 5.17 shows that revenues from prop-
erty taxes vary substantially across countries, but overall, revenue
yield tends to be relatively low in most European countries.12 While
there are considerable differences in the tax treatment of properties,
this is the result of both low tax rates and tax assessment based on
undervalued properties in several countries.
While property taxes affect investment decisions, taxing immobile
wealth, such as buildings and land, is generally considered less distor-
tionary and harmful to growth than taxing income.13 Property taxes
also tend to be progressive (with the notable exception of the United
Kingdom), although undervaluation of the tax base may undermine
FIGURE 5.17Property Tax Yield as a Percentage of GDP in Selected European and Central Asian Economies,2010
Sources: World Bank data; OECD government revenue statistics.
0
0.5
1.0
1.5
2.0
2.5
3.0
3.5
Slov
enia
Italy
Spai
n
Belg
ium
Fran
ce
Aust
ria
Nor
way
Germ
any
Finl
and
Swed
en
Denm
ark
Unite
dKi
ngdo
m
Alba
nia
Czec
h Re
publ
ic
Croa
tia
Esto
nia
Hung
ary
Mol
dova
Slov
ak R
epub
lic
Geor
gia
Bela
rus
Russ
ian
Fede
ratio
n
Mon
tene
gro
Ukra
ine
Turk
ey
Koso
vo
Tajik
ista
n
Kaza
hkst
an
Kyrg
yzRe
publ
ic
High-IncomeGenerous Spenders
High-IncomeModerate Spenders
Lower-SpendingTransition Countries
High-SpendingTransitionCountries
YoungCountries
% o
f GD
P

Financing Pensions in Europe and Central Asia 181
progressivity. Finally, as in the case of consumption tax financing, a
shift from labor to property tax financing may also have impacts on
intergenerational equity, especially as retired property owners may
enjoy the income effect of fully owned housing that is taxed at rela-
tively low rates.
Tapping Natural Resource Revenues
Fiscal savings from natural resource revenue may provide additional
financing for pension obligations in resource-rich economies.
Azerbaijan, Kazakhstan, Norway, and the Russian Federation possess
significant proven oil reserves and have established sovereign wealth
funds. They have done so not only to stabilize fiscal accounts in view
of volatile revenue inflows, but also to accumulate long-term savings,
typically invested in offshore financial assets.
These funds operate with different rules, and the asset values vary
substantially. In principle, the financial returns on the fund assets as
well as withdrawals of the principal could be used to finance future
pension liabilities. In fact, both Norway and Russia have linked their
savings funds explicitly to pension obligations. As can be seen from
table 5.2, the level of proven reserves, the maturity of the extraction
cycle, and the accumulated financial assets vary across countries. But
if managed responsibly, fiscal savings generated from natural
resources could provide additional future fiscal revenue, at least in
some countries.
Reducing Other Expenditures
Finally, governments should consider rationalizing nonpension
expenditures to cope with increased pension spending. If pension
reform measures are insufficient to ensure actuarial sustainability of
TABLE 5.2Asset Accumulation in Four Oil-Exporting Countries
Country
Provenreserves
(billions of barrels)
Oil production(thousands of
barrels/day), 2011Reserves-to-
production ratio
Asset value of oil fund (US$,
billions, 2011)
Asset value of oilfund (% of
GDP)
Norway 6.9 2,039.3 9.2 235 48
Azerbaijan 7.0 1,033.0 18.6 30 52
Kazakhstan 39.8 1,681.6 64.9 62 30
Russian Federation 74.2 10,032.1 20.3 87 4
Sources: World Bank staff estimates using World Bank data; data provided by the finance ministries of Norway, Azerbaijan, Kazakhstan, and Russian Federation; BP 2013.

182 The Inverting Pyramid
the pension system, governments need to seek measures to reduce
spending on a wider front, especially given the already high level of
taxation. Assessing the room and specific options for expenditure
rationalization is a highly country-specific endeavor. It is inherently
linked not only to specific policy objectives but also to the design and
efficiency of the current public spending program in a particular
country.
While an in-depth analysis of these issues is beyond the scope of
this chapter, some very general trends can be observed (figure 5.18).
Given the significance of social welfare spending, reforms of social
welfare systems are central to fiscal reforms. Aside from curtailing
pension spending, which is addressed in chapter 3, countries will also
have to deal with the challenging task of containing health care costs,
which are expected to rise as a result of aging and the increasing
availability of expensive care. For other social assistance transfers
there may be options for improved targeting and means testing,
although these need to be assessed in light of equity and efficiency
FIGURE 5.18Components of Public Spending as a Percentage of GDP in Selected European and CentralAsian Countries, 2011
Source: World Bank ECA Fiscal Database.
0
10
20
30
40
50
60
Slo
veni
a
Arm
enia
Alb
ania
Geo
rgia
Lith
uani
a
Rus
sia
Slo
vak
Rep
ublic
Esto
nia
Rom
ania
Bul
gari
a
Latv
ia
Cro
atia
Mol
dova
Pola
nd
Cze
ch R
epub
lic
Bel
arus
Hun
gary
Mac
edon
ia, F
YR
Mon
tene
gro
Ser
bia
Ukr
aine
Bos
nia
and
Her
zego
vina
Kaz
ahks
tan
Kos
ovo
Tajik
ista
n
Kyr
gyz
Rep
ublic
Turk
ey
% o
f GD
P
High-Income
Generous
Spender
Lower-Spending
Transition Countries
High-
Spending
Transition
Countries
Young
Countries
Defense
Economic affairs
Health
Fuel and energy
Social protection
Education
Other

Financing Pensions in Europe and Central Asia 183
concerns, which again will be country-specific. Outside the welfare
system, there may be room to improve efficiency and cut spending in
a number of areas, including energy subsidies, which remain signifi-
cant in a number of countries. These subsidies are costly, they tend to
be regressive, and they may encourage inefficiency in energy
consumption.
Policy Options
Maintaining sustainable public finances while securing adequate old-
age income support will require a combination of policy measures.
Aging will place significant constraints on fiscal policies for years to
come. Reforms of public pension schemes, including increases in the
statutory and effective retirement age and reduced generosity of
pension benefits, remain essential. However, governments may also
have to consider a broader range of fiscal reforms that could
contribute to closing the long-term financing gap. Generally, the
room to redress pension-financing imbalances within the general
government budget is relatively limited, given the already large size
of the tax burden in most countries in the region. Simulations sug-
gest that revenue measures taken individually will be insufficient to
achieve sustainability, but they may constitute important elements in
a comprehensive policy response necessary to tackle aging-related
fiscal challenges.
While circumstances and available options vary across countries,
this chapter has looked at the broad contours of available fiscal policy
choices:
• Maintaining fiscal discipline. The daunting fiscal implications of aging
reinforce the need for prudent fiscal management with a medium-
to long-term perspective. Since today’s policy choices and even
relatively modest changes to the primary balance may have large
dynamic effects in the long term, countries need to anchor fiscal
policy in measures of long-term sustainability. Adopting such mea-
sures in a formalized fiscal framework, such as, for example, the
sustainability gap measure in the Netherlands, could help improve
the time consistency of fiscal policy.
• Reforming SSC systems to broaden the tax base and improve work incen-
tives. High SSC rates limit the room for revenue-enhancing
increases in these rates in most countries, but there may be scope
in several countries for revenue-neutral or even revenue-
enhancing reductions in marginal rates and improvements in

184 The Inverting Pyramid
progressivity in social contribution systems. Low compliance
appears to undermine collection efficiency, particularly in transi-
tion economies. Countries like Romania and Ukraine seem to be
trapped in high rate–low collection equilibria and may therefore
have considerable room for additional taxpayers and more trans-
actions coming into the system.
There are different options for strengthening compliance,
including improved tax administration as well as changes in policy
that could improve incentives for tax compliance. The latter could
include reductions in marginal rates, especially for low-income
wage earners with relatively high labor supply sensitivity. In addi-
tion, changes to the earning base could improve revenue yield and
increase progressivity, for example by raising the contribution limit
of covered earnings. This broadening of the tax base is different
from an across-the-board increase in the payroll tax rate, because
it restricts the tax increase to those with the highest earnings. How-
ever, such policy changes need to take into account the implied
increases in benefits that are linked to covered earnings in most
countries and may therefore offset revenue increases, at least
partially.
• Shifting social security financing to consumption taxes and property taxes.
Broad-based consumption taxes are generally viewed as more
efficient and less distortionary than labor taxes. Shifting the tax
burden from labor taxes to consumption taxes may therefore help
meet long-term financing needs and enhance efficiency while
reducing adverse effects of labor taxes on employment and growth.
The VAT already constitutes a significant revenue source in most
countries. Most tax policy changes in recent years have involved
increases in the standard statutory VAT rate and to a lesser extent
in reduced VAT rates. Since rate increases beyond a certain level
may depress rather than increase revenue yield, room for future
rate increases may be limited.
Further increases in revenue through VAT reforms will increas-
ingly have to rely on base broadening and on improvements in
compliance. VAT C-efficiency, which measures the revenue yield at
any given statutory rate, is on average 49 percent across countries
in the region, suggesting that significant potential revenue gains
could be achieved by reining in reduced rates and exemptions and
curbing evasion through enhanced tax administration. Such policy
measures could achieve, on average, around 1.6 percent of GDP in
additional revenue. Since shifts to consumption taxes may increase
regressivity of the tax system, such reforms will need to be assessed

Financing Pensions in Europe and Central Asia 185
carefully from an equity perspective. In addition, property taxes
may offer another potential revenue source that is seen as relatively
harmless to growth and tends to be progressive.
• Rationalizing expenditures. If pension reform measures are insuf-
ficient to ensure fiscal sustainability of the pension system,
governments will need to seek measures to reduce spending on
a wider front, especially in light of the already high levels of
taxation. Given the significance of social welfare spending,
reforms of social welfare systems are central to fiscal reforms.
Along with curtailing pension spending, as discussed in chapter
3, countries will also have to deal with the challenging task of
containing health care costs, which are expected to rise as a
result of aging and the availability of increasingly expensive
care. Outside the social welfare system, there may be room to
improve efficiency and cut spending in a range of areas, includ-
ing energy subsidies, which remain significant in a number of
countries. Fiscal rules constraining expenditure growth may also
be useful in ensuring creation and preservation of fiscal space on
the spending side.
Shifts of pension financing to general government revenue need
to be embedded in wider reforms of the pension system. Since shift-
ing the financing burden to general government revenue eliminates
the link between individual contributions and benefits, changes on
the revenue side will most likely need to be accompanied by changes
to the determination of pension benefits. Public schemes that are
largely financed from general taxation will most likely concentrate
public retirement provision on basic income support rather than
paying earning-related pension benefits while relying on private sav-
ings for additional income support (as discussed in chapter 4). This is
the case both in Denmark and Georgia. Of course, some countries
will need to change the philosophy underlying their pension systems
if they are to move in this direction, but the alternative of increasing
cross-subsidization from the general budget of rising deficits in con-
tributory public pension schemes is likely to involve greater inequi-
ties and fiscal costs.
Notes
1. In Denmark, social contributions of both employers and employeesare lump-sum charges, covering mostly unemployment insurance,while pensions are financed from the general budget. The social secu-rity rate for Danish employees is a monthly lump-sum contribution

186 The Inverting Pyramid
(DKr 90 in 2012), while employers contribute to a number of funds(approximately DKr 8,000–10,000 per employee per year). The reported SSC rate for Denmark is the effective rate for the average wage earner.
2. The incidence of SSC payments, however, should not be assessed in isolation. Rather, the overall distributional impact of any social security and/or pension system will depend on the impact of tax and spending instruments combined.
3. These thresholds are typically set below the income level at which the top statutory personal income tax (PIT) rate begins to apply, implying that SSC rates do not increase the marginal personal tax rate (encom-passing PIT and employee SSC) beyond the top statutory PIT rate. In addition, several countries, including France, Germany, Poland, and the United Kingdom, apply regressive rate schedules in which contribution rates decline for higher-income brackets.
4. There is extensive research on the so-called Laffer curve, which under-pins the U-shaped relationship between tax rates and revenue yield. Much of this literature is concerned with the behavioral response to tax rates and its impact on the tax base. In addition, more recent literature has stressed the effect of tax rates on compliance behavior. Of particular relevance in this context is the work of Sanyal, Gang, and Goswami (2000), who show how a Laffer curve may arise under informality, and Papp and Takáts (2008), who focus on the relationship of tax rates, compliance, and revenue yield.
5. Differences in productivity across countries are also related to policies such as coverage (for example, the treatment of self-employed people) and to the underlying tax base upon which contributions are levied.
6. Informality also decreases pension obligations under PAYG systems, because informal activity does not accrue pension rights. However, fiscal pressure will remain, as governments will find themselves compelled to provide at least minimum old-age income support to the uninsured.
7. The tax wedge is the difference between gross labor costs and net take-home pay of the employee, expressed as a share of gross labor costs.
8. This has been confirmed by several empirical studies, most recently by Packard, Koettl, and Montenegro (2012) and Andrews, Caldera Sánchez, and Johansson (2011).
9. An analysis of the key fiscal policy challenges and possible reform options faced by countries in Europe and Central Asia after the recent financial crisis is provided by Islam and Smits (2013).
10. At the onset of the crisis, in late 2008 and early 2009, some countries postponed plans to increase VAT rates (the Netherlands, 19 to 20 percent) or reduced the standard VAT rate (Ireland, 21.5 to 21.0 percent in 2010; Portugal, 21 to 20 percent; the United Kingdom, 17.5 to 15.0 percent) to boost domestic demand during the initial down-turn. Later on, in 2009 and 2010, many countries began to raise their VAT rates. They included Ireland (21.0 to 21.5 percent); from mid-2009, Hungary (20 to 25 percent), Estonia (18 to 20 percent), the Czech Republic (19 to 20 percent), and Latvia (21 to 23 percent); from mid-2010, Lithuania (21 to 23 percent), Spain (16 to 18 percent), Portugal (back to 21 percent), Greece (21 to 23 percent), Finland (22 to

Financing Pensions in Europe and Central Asia 187
23 percent), and Romania (19 to 24 percent); and in early 2011, the United Kingdom (17.5 to 20.0 percent).
11. Both countries face similar challenges of aging, but they vary in terms of their pension finance outcomes. Poland currently spends more on pensions but is expected to experience a decrease in pension expendi-tures, according to projections from the European Commission (2012)—from 11.8 percent of GDP in 2010 to 9.6 percent in 2060. In contrast, the European Commission estimates an increase in pension expendi-ture for the Slovak Republic, from 8 percent of GDP in 2010 to 13.2 percent in 2060. This is mainly because the Polish PAYG system relies on defined contribution notional accounts and hence adjusts ben-efits to changes in life expectancy, even after retirement, while benefits in the Slovak PAYG pillar are calculated according to points earned dur-ing time before retirement.
12. In fact, net property taxation is negative in several countries because of tax-deductible mortgage interest payments.
13. Conceptually, property taxation can be treated either as wealth taxation or as a consumption tax on the imputed rent in owner-occupied housing.
References
Agha, Ali, and Jonathan Haughton. 1996. “Designing VAT Systems: Some Efficiency Considerations.” Review of Economics and Statistics 78 (2): 303–8.
Andrews, Dan, Aida Caldera Sánchez, and Åsa Johansson. 2011. “Towards a Better Understanding of the Informal Economy.” OECD Economics Department Working Paper 873, Organisation for Economic Co-operation and Development, Paris.
Becker, Gary S., Kevin M. Murphy, and Robert Tamura. 1994. “Human Capital, Fertility, and Economic Growth.” In Human Capital: A Theoretical and Empirical Analysis, with Special Reference to Education, edited by Gary S. Becker, chapter 12. Chicago, IL: University of Chicago Press.
Bloom, David E., David Canning, and Günther Fink. 2011. “Implications of Population Aging for Economic Growth.” PGDA Working Paper 64, Program on the Global Demography of Aging, Harvard University, Cambridge, MA.
Bloom, David E., David Canning, and Jaypee Sevilla. 2003. The Demographic Dividend: A New Perspective on the Economic Consequences of Population Change.Santa Monica, CA: RAND.
Börsch-Supan, Axel H., and Joachim K. Winter. 2001. “Population Aging, Savings Behavior and Capital Markets.” NBER Working Paper 8561, National Bureau of Economic Research, Cambridge, MA.
BP. 2013. Energy Outlook 2030. http://www.bp.com/en/global/corporate / about-bp/statistical-review-of-world-energy-2013/energy-outlook -2030.html.
Burniaux, Jean-Marc, Romain Duval, and Florence Jaumotte. 2004. “Coping with Ageing: A Dynamic Approach to Quantify the Impact of Alternative

188 The Inverting Pyramid
Policy Options on Future Labour Supply in OECD Countries.” OECD Economics Department Working Paper 371, Organisation for Economic Co-operation and Development, Paris.
Cervellati, Matteo, and Uwe Sunde. 2009. “Life Expectancy and Economic Growth: The Role of the Demographic Transition.” IZA Discussion Paper 4160, Institute for the Study of Labor (IZA), Bonn, Germany.
de Mooij, Ruud, and Michael Keen. 2012. “‘Fiscal Devaluation’ and Fiscal Consolidation: The VAT in Troubled Times.” IMF Working Paper 12/85, International Monetary Fund, Washington, DC.
European Commission. 2012. The 2012 Ageing Report: Economic and Budgetary Projections for the 27 EU Member States (2010–2060). Brussels: European Commission, Directorate-General for Economic and Financial Affairs.
———. 2013. Employment and Social Developments in Europe 2012. Brussels:European Commission.
Eurostat Statistics Database. European Commission, Brussels. http://epp .eurostat.ec.europa.eu/portal/page/portal/statistics/search_database.
Hazan, Moshe, and Hosny Zoabi. 2006. “Does Longevity Cause Growth? A Theoretical Critique.” Journal of Economic Growth 2 (4): 363–76.
IMF (International Monetary Fund). 2012. World Economic Outlook 2012. Washington, DC: IMF.
Islam, Roumeen, and Karlis Smits. 2013. “Fiscal Recovery in ECA? Managing in a Risky World.” World Bank, Washington, DC.
Jappelli, Tullio, and Franco Modigliani. 2005. “The Age-Saving Profile and the Life-Cycle Hypothesis.” In The Collected Papers of Franco Modigliani, vol. 6, 141–72. Cambridge, MA: MIT Press.
Jones, Charles I. 1995. “R&D-Based Models of Economic Growth.” Journal of Population Economics 103 (4): 759–83.
Keuschnigg, Christian, Thomas Davoine, and Philip Schuster. 2013. “Aging and Pension Reform: A General Equilibrium Approach.” Background paper for this report, World Bank, Washington, DC.
Kneller, Richard, Michael F. Bleaney, and Norman Gemmell. 1999. “Fiscal Policy and Growth: Evidence from OECD Countries.” Journal of Public Economics 74: 171–90.
Lindh, Thomas, and Bo Malmberg. 1999. “Age Structure Effects and Growth in the OECD, 1950–90.” Journal of Population Economics 12 (3): 431–49.
Martins, Joaquim Oliveira, Frédéric Gonand, Pablo Antolin, Christine de la Maisonneuve, and Kwang-Yeol Yoo. 2005. “The Impact of Aging onDemand, Factor Markets and Growth.” OECD Economics Department Working Paper 420, Organisation for Economic Co-operation and Development, Paris.
Mason, Andrew. 2005. “Demographic Transition and Demographic Dividends in Developed and Developing Countries.” Paper presented at the United Nations Expert Group Meeting on Social and Economic Implications ofChanging Population Age Structures, Mexico City, August 31–September 2.

Financing Pensions in Europe and Central Asia 189
Matthews, Kent. 2003. “VAT Evasion and VAT Avoidance: Is There a EuropeanLaffer Curve for VAT?” International Review of Applied Economics 17 (1):105–14.
Myles, Gareth D. 2009. “Economic Growth and the Role of Taxation: Aggregate Data.” OECD Economics Department Working Paper 714, Organisation for Economic Co-operation and Development, Paris.
OECD (Organisation for Economic Co-operation and Development). 2013.Taxing Wages 2013. Paris: OECD.
Packard, Truman, Johannes Koettl, and Claudio E. Montenegro. 2012. In from the Shadow: Integrating Europe’s Informal Labor. Washington, DC: World Bank.
Papp, Tamás K., and Elod Takáts. 2008. “Tax Rate Cuts and Tax Compliance: The Laffer Curve Revisited.” IMF Working Paper 08/7, International Monetary Fund, Washington, DC.
Romer, Paul M. 1990. “Endogenous Technological Change.” Journal of Political Economy 98 (5): 71–102.y
Sanyal, Amal, Ira N. Gang, and Omkar Goswami. 2000. “Corruption, TaxEvasion and the Laffer Curve.” Public Choice 105 (1–2): 61–78.
Schneider, Friedrich, Andreas Buehn, and Claudio E. Montenegro. 2010.“New Estimates for the Shadow Economies All Over the World.” Background Paper for In from the Shadow: Integrating Europe’s Informal Labor(Washington, DC: World Bank, 2012).
UN (United Nations). 2011. World Population Prospects: The 2010 Revision. NewYork: United Nations, Department of Economic and Social Affairs, Population Division. CD-ROM.
U.S. Social Security Administration. 2012. Social Security Programs throughout the World. http://www.ssa.gov/policy/docs/progdesc/ssptw/.
World Bank. ECA Fiscal Database (internal database). World Bank, Washington, DC.
World Bank. World Development Indicators (database). http://data.worldbank.org/data-catalog/world-development-indicators.


Working More, Longer, and More Productively
CHAPTER 6
191
Introduction
As argued in chapters 2 and 5, a key factor straining pension systems is
a shrinking labor force, a result of the inverting of the working-age
population pyramid. This process uncovers the unsustainability of past
generous expansions of old-age benefit provisions: more and more
pensions are paid, for longer periods of time, and have to be financed
from the contributions of fewer and fewer workers, who spend less of
their longer adult lives in employment. This chapter focuses on ways
to mitigate the effects of a declining labor force on pension systems in
the aging countries of the Europe and Central Asia region.
There is considerable scope for increasing employment levels, and
achieving this could significantly ease pressures on pension financing
and reduce poverty risks for both current and future cohorts of older
people. However, improving labor market performance is far from a
simple task, especially in the current economic climate. The financial
crisis and its aftermath in Europe have led to large employment losses
and a significant rise in unemployment. New European Union (EU)
member states and other countries closest to the euro area have
experienced the largest job losses, while the Russian Federation,
Turkey, and some of the former Soviet Union (FSU) countries

192 The Inverting Pyramid
bounced back more quickly. However, the region as a whole had
weak employment performance prior to the financial crisis as a result
of structural factors. In many countries, low labor force participation
(LFP) and a decline in the share of people working in formal sector
jobs, where they pay social security contributions, are of particular
concern for achieving the sustainability and adequacy of pension
systems.
Creating more and better jobs calls for a multisectoral policy agenda
that goes beyond the scope of this chapter. Above all, there is a need
for policies that facilitate a sustained economic and labor market
recovery that lays the groundwork for sustained creation of jobs
individuals, and that help individuals prepare for these new jobs.
These issues are analyzed in great detail in a new World Bank report
that discusses solutions to the overall employment problem in the
region, including youth joblessness (Arias and Sánchez-Páramo 2013).
This chapter focuses more specifically on the obstacles to achieving
longer and more productive working lives and the policies that can
help confront the barriers faced by older workers in the region.
The remainder of the chapter is organized in four parts. A first sec-
tion examines the employment challenges resulting from low LFP,
high unemployment, and informality, factors prevalent in many
countries in the region. Using projections of demographic trends, it
then analyzes how population aging will affect the size and composi-
tion of the labor force in coming decades. The results show that
inducing more women to join the labor force and encouraging older
workers to remain in the labor force are key for safeguarding old-age
income provisions. It is also clear, though, that there is only so much
that can be achieved by increasing the participation of the domestic
working-age population. Beyond these limits, only immigration of
younger workers can help stem the demographic decline.
The second section discusses the barriers to achieving greater work
attachment and higher productivity (and hence fiscal contributions)
of older workers. This requires us, first of all, to confront several
widespread myths and misperceptions about employment at older
ages: that older workers prefer retirement to working, that older
workers are less productive and difficult to employ, and that keeping
older workers in the active labor force prevents the young from find-
ing jobs. The chapter argues that once past these misperceptions, pol-
icy makers can focus on devising strategies that confront the real
barriers faced by older workers.
The third section sets forth policy options, highlighting four key
sets of measures that can make a notable difference in helping to
achieve longer and more productive working lives. First, governments

Working More, Longer, and More Productively 193y
should review taxes and social benefits, notably those that give people
strong incentives to remain out of the labor force. The objective is to
encourage a more gradual transition from work into retirement—for
example, by allowing older people to work part-time while collecting
a partial pension. Second, governments should reform labor regula-
tions that impede flexible work, and they should tackle wage-setting
mechanisms that are based on seniority rather than rewarding pro-
ductivity. Third, employers should be encouraged and enabled to
make proactive adjustments to the workplace that prepare their oper-
ations for an aging workforce, raise the productivity and comfort level
of older workers, and tap the benefits of age-diverse working teams.
Fourth, employers, governments, and workers need to invest in
appropriate training strategies that enable mature workers to learn
new skills cost-effectively.
The final section explores the consequences of successful reforms
more directly. It presents new results from a comprehensive model-
ing exercise that accounts for links between real-world pension
parameters and benefits, tax burdens, and formal and informal
employment choices. The analysis suggests that more active, produc-
tive, and longer working lives are no panacea, but they can contrib-
ute substantially to mitigating any short-term adverse impacts of
unavoidable reforms in the pension system.
In particular, expanding the base of contributors can only ease or
delay reforms of pension systems. Greater formalization of the work-
force or an influx of immigrants, for instance, only provides a tempo-
rary mitigation of the strain on pension systems. Since these “new”
workers become entitled to future pensions, pension systems will
become even more unsustainable over time as long as they do not bal-
ance contributions and pension promises in a realistic and sustainable
way. Each additional worker, each additional year and hour of work,
and each additional contribution made to the pension system widens
the pension gap if the relationship between contributions and benefit
accrual is fundamentally flawed. Having more people work and work
longer will help ease the transition to a more sustainable pension
system by spreading out the costs of reforms to more people over a
longer period of time, but it is no substitute for pension reform itself.
Labor Force Challenges: Low Participation, High Unemployment, and Informality
Between 2000 and 2007, transition countries in the Europe and
Central Asia region experienced rapid income growth, increased

194 The Inverting Pyramid
productivity, and reduced poverty. As discussed by Arias and
Sánchez-Páramo (2013), many countries successfully integrated into
the global economy, restructured enterprises, improved conditions
for doing business, and modernized labor markets and social benefits
systems. But these actions did not always translate into higher aggre-
gate employment, as economic restructuring in some countries
meant that jobs were both created and destroyed. Economic and
labor market performance was heterogeneous. Some countries expe-
rienced strong economic and productivity growth with higher
employment levels, while others did not.
Following the 2008 financial crisis, job destruction accelerated in
many countries and the unemployment situation worsened sharply,
particularly among youth and older workers. Since then, the strength
and speed of the economic and labor market recovery has varied sig-
nificantly across countries. For instance, countries like Poland and
Turkey have weathered the employment impacts of the crisis better,
while labor markets in the western Balkans and the Baltic countries
remain very weak, with employment rates still below their pre-crisis
peak.
Overall employment rates in the region are much lower than in
Western Europe and in the non-European countries of the
Organisation for Economic Co-operation and Development (OECD),
particularly among women and older workers. The economic transi-
tion of the early 1990s made it difficult for older workers to stay
employed. Moreover, those who continued working through the
transition often dropped out of the labor force relatively early in their
lives. Once older workers leave the labor market, it becomes increas-
ingly difficult to bring them back.
Figure 6.1 compares recent employment rates across the country
clusters used in this report. In 2010, over one-third of men and over
half of women in the age group 55–64 were not employed. Relative
to the High-Income Moderate Spender countries, employment rates
among older women are around 15 to 25 percentage points lower in
the Lower-Spending and High-Spending Transition Countries, while
the gap is 5 to 10 percentage points for women aged 25–54. These
employment gaps are even larger in the Young Countries. The
employment rates among older men in Lower-Spending and High-
Spending Transition Countries and Young Countries are nearly 10 to
15 percentage points lower than among their peers in the High-
Income Moderate Spenders, while the gap is 5 to 10 points among
men aged 25–54. The gaps in male employment rates are somewhat
lower in the Young Countries and more pronounced for women in
the Balkans and Turkey, following a similar age pattern.

Working More, Longer, and More Productively 195y
FIGURE 6.1Employment Rates by Gender and Age Group, Selected European and Central Asian Economieswith OECD Comparators, 2011
Source: World Bank and Eurostat estimates from labor force and households surveys, latest years available.
Empl
oyed
as
% o
f wor
king
-age
mal
e po
pula
tion
1.0
0.9
0.8
0.7
0.6
0.5
0.4
0.3
0.2
0.1
0
Spa
inG
reec
eIt
aly
Slo
veni
aB
elgi
umC
ypru
sFr
ance
Mal
taLu
xem
bour
gS
wit
zerl
and
Irel
and
Port
ugal
Finl
and
Den
mar
kU
nite
d K
ingd
omIc
elan
dN
orw
ayG
erm
any
Sw
eden
Net
herl
ands
Aus
tria
Mol
dova
Arm
enia
Geo
rgia
Cro
atia
Bul
gari
aLa
tvia
Lith
uani
aR
ussi
an F
eder
atio
nH
unga
ryA
lban
iaR
oman
iaEs
toni
aS
lova
k R
epub
licPo
land
Cze
ch R
epub
licM
aced
onia
, FY
RU
krai
neTa
jikis
tan
Turk
eyK
yrgy
z R
epub
licU
nite
d S
tate
sTu
rkey
Can
ada
Chi
leM
exic
oA
rgen
tina
High-Income
Generous Spenders
High-Income
Moderate Spenders
Lower-Spending
Transition Countries
High-
Spending
Transition
Countries
OECD
a. Male employment rates
Young
Countries
OECD
Empl
oyed
as
% o
f wor
king
-age
fem
ale
popu
latio
n
90
80
70
60
50
40
30
20
10
0
High-Income
Generous Spenders
High-Income
Moderate Spenders
Lower-Spending
Transition Countries
High-
Spending
Transition
Countries
Young
Countries
b. Female employment rates
Mal
taG
reec
eIt
aly
Spa
inLu
xem
bour
gB
elgi
umFr
ance
Cyp
rus
Sw
itze
rlan
dS
love
nia
Irel
and
Port
ugal
Uni
ted
Kin
gdom
Ger
man
yD
enm
ark
Net
herl
ands
Finl
and
Icel
and
Aus
tria
Nor
way
Sw
eden
Mol
dova
Alb
ania
Arm
eni a
Geo
rgia
Cro
atia
Hun
gary
Rom
ania
Slo
vak
Rep
ublic
Pola
ndB
ulga
ria
Rus
sian
Fed
erat
ion
Cze
ch R
epub
licEs
toni
aLa
tvia
Lith
uani
aM
aced
onia
, FY
RU
krai
neTu
rkey
Tajik
ista
nK
yrgy
z R
epub
licTu
rkey
Mex
ico
Chi
leA
rgen
tina
Uni
ted
Sta
tes
Can
ada
Aged 25–54 Aged 55–64

196 The Inverting Pyramid
Looking closely, the employment problem in Europe and Central
Asia reflects low LFP and high levels of unemployment and informal-
ity. As shown in figure 6.2, this also has distinct age and gender
dimensions. About one in four individuals do not actively seek jobs
and stay outside the labor force. Nearly one in 10 of those in the labor
force are unemployed. And roughly one in three of those who are
employed have an informal job, whether as self-employed or as
employees not making contributions to social security. Older workers,
and older women in particular, exhibit low labor market attachment.
0
10
20
30
40
50
% o
f wor
king
-age
mal
es
a. Male employment status
60
70
80
90
15–19 20–24 25–29 30–34 35–39 40–44 45–49 50–54 55–59 60–64
b. Female employment status
% o
f wor
king
-age
fem
ales
Age cohort
Age cohort
15–19 20–24 25–29 30–34 35–39 40–44 45–49 50–54 55–59 60–640
20
40
60
80
100
Informal employment
NEET
Formal employment
UnemployedInactive
Employed
NEET Informal employment Formal employment
Inactive UnemployedEmployed
FIGURE 6.2Employment Status over the Life Cycle in Countries of Europe and Central Asia, by Gender,circa 2009
Source: World Bank estimates based on labor force and household surveys, latest years available.
Note: Based on simple average for available countries: Albania, Armenia, Bulgaria, the Czech Republic, Estonia, Georgia, Hungary, the Kyrgyz Republic, Latvia,
Lithuania, the former Yugoslav Republic of Macedonia, Moldova, Poland, Romania, the Russian Federation, the Slovak Republic, Slovenia, Turkey, and Ukraine. For
formal/informal breakdown, the sample does not include Armenia, Georgia, Lithuania, Moldova, Romania, and Russia. Note that all rates are presented as a percent-
age of working-age population. Some rates, like the informality rate, when expressed as a percentage of total employment would display quite different profiles over
age groups. NEET = not in education, employment, or training.

Working More, Longer, and More Productively 197y
The problem of joblessness is particularly acute among youth
(aged 15–24), having reached dramatic levels in Armenia, Greece, the
former Yugoslav Republic of Macedonia, and Spain (20 to 33 percent).
Informal employment is actually more prevalent than formal work
among youth and older workers. The compound effect of the result-
ing “unused work capacity” and smaller base of contributors is an
enormous strain on contributory pension systems in the region.
Ensuring the adequacy and sustainability of old-age pensions in
the region hinges especially on the ability to increase the labor mar-
ket attachment of women and of workers beyond age 55. For youth,
there is a trade-off between getting them quickly into the workforce
and allowing them time to develop the skills needed to support lon-
ger careers in an increasingly demanding and changing labor market.
The rapid aging of the population implies that keeping older workers
longer in work is a key strategy to stem the impact of a shrinking
labor force.
In this respect, the gaps in LFP in Europe and Central Asia are
unique in the world. LFP rates are lower (average 57 percent in 2011)
than in most non-European OECD countries, particularly among
women. The gap in LFP among women, measured in relation to
OECD levels, ranges from nearly 10 percentage points in Central and
Southern Europe to about 20 percentage points in the Balkans and
the Young Countries. For men, the participation gaps range from only
3 or 4 percentage points in Southern Europe and the Young Countries
to 8 percentage points in Central Europe to nearly 10 percentage
points in Russia and other countries of the FSU. The gaps in LFP are
widest among older workers. The average participation rate among
older workers, 58 percent, is far below the average for the OECD (73
percent) and other middle-income regions (between 60 and 65 per-
cent in Latin America and Asia).1
Countries could increase their labor force significantly if older
workers reached their participation potential. Older populations
across the region are increasingly healthy, making it feasible to
achieve longer working lives. Figure 6.3 shows the potential to
increase the labor force in four older age groups, taking the participa-
tion rate of prime-age adults (aged 40–44) in each country as the
benchmark. By this yardstick, the majority of Lower-Spending and
High-Spending Transition Countries could increase their workforce
of individuals aged 45–64 by at least 15 percent; Hungary and Poland
could increase it by up to one-third. The High-Income Moderate
Spenders could achieve participation gains of 15 to 20 percent. Given
the gender gap in participation profiles, the lion’s share of these gains
would come from drawing more women into the labor force.

198 The Inverting Pyramid
The next section examines the demographic arithmetic and vari-
ous scenarios for stemming the projected shrinking of the working-
age population. It quantifies the scope to do this through higher LFP
(mainly of women and older people) and longer working lives, along
with possible labor relocation to leverage youth bulges in the Young
Countries.
The Scope for Curbing the Inverting Population Pyramid
Since pension systems in the region are mostly pay-as-you-go sys-
tems, financed through labor taxation, the sustainability of these
systems depends crucially on the size of the labor force. Hence, it is
important to assess the impact of the region’s demographic trends in
this regard. As discussed in chapter 2, old-age dependency ratios2
are already high in the region and are projected to increase dramati-
cally over the next 50 years. Today, in most countries of the region,
0
5
10
15
20
25
30
35
Incr
ease
in la
bor f
orce
, %
Sw
eden
Irel
and
Uni
ted
Kin
gdom
Ger
man
y
Finl
and
Den
mar
k
Port
ugal
Net
herl
and s
Aus
tria
Spa
in
Gre
ece
Fran
ce
Ital
y
Bel
gium
Slo
veni
a
Geo
rgia
Esto
nia
Latv
ia
Lith
uani
a
Mol
dova
Bul
gari
a
Rus
sian
Fed
erat
ion
Cze
ch R
epub
lic
Slo
vak
Rep
ublic
Rom
ania
Ser
bia
Cro
atia
Hun
gary
Pola
nd
Ukr
aine
Kaz
akhs
tan
Kyr
gyz
Rep
ublic
Aze
rbai
jan
Turk
ey
High-Income
Moderate
Spenders
High-Income
Generous
Spenders
Lower-Spending
Transition
Countries
High-
Spending
Transition
Country
Young
Countries
Aged 60–64 Aged 50–54Aged 55–59 Aged 45–49
FIGURE 6.3Potential Labor Force Gain in the Population Aged 45–64, by Age Group, in Selected Europeanand Central Asian Economies
Source: World Bank estimates based on World Development Indicators and labor force and households surveys, latest years available.
Note: Potential gain is calculated as the projected increase in the size of the workforce aged 45–64 if the population aged 45–64 had the same participation rate as
the 40–44 age group in each country. Data are for 2008 for all countries except Georgia, Moldova, and Ukraine (2005) and the Kyrgyz Republic (2006).

Working More, Longer, and More Productively 199y
there are about 20 to 30 people aged 65 or older for every 100 people
aged 15–64. This ratio is expected to increase to up to 70 per 100 over
the next decades (for example, in Albania and in Bosnia and
Herzegovina). These demographic dynamics are leading to an invert-
ing population pyramid: the size of the labor force will shrink drasti-
cally while the number of pensioners will increase significantly.
In order to better understand the interaction between the demo-
graphic transition and the evolution of the size of the labor force, a
detailed analysis of LFP rates across age, gender, and countries com-
bined with demographic trends was carried out. This analysis used
data from the United Nations Population Division on projected future
demographic developments in combination with data from the
International Labour Organization on current and future LFP rates
by gender and age group; this allowed a detailed assessment of the
impact of the demographic transition on the size and the structure of
the labor force.3 In addition, assuming alternative developments for
LFP profiles offers insights on how increasing the participation rates
of the population—in particular of young workers, older workers,
and women—could potentially stem the decline of the labor force.
With no changes in LFP profiles, Europe and Central Asia—
including EU and European Free Trade Association countries—will
lose 54 million workers between 2010 and 2060. Figure 6.4 depicts
projected changes in the size of the labor force over the next
five decades by age group. During the current decade, the 2010s,
Num
ber o
f wor
kers
, mill
ions
–5
20
15
10
5
0
–10
–15
–20
–252010s 2020s 2030s 2040s 2050s
Aged 15–39 Aged 65+Aged 40–64
FIGURE 6.4Projected Change in the Labor Force in Europe and Central Asia,by Age Group and Period, 2010s through 2050s
Source: Based on methodology in Koettl 2008.
Note: Includes all countries of Europe and Central Asia, including all EU and EFTA countries.

200 The Inverting Pyramid
no major changes will be felt yet. Although the younger labor force
will start to decline, losing 9 million workers aged 15–39, the prime-
age labor force aged 40–64 will still grow significantly. By far the big-
gest change will happen during the 2020s, with a projected decline of
22 million young workers. Although the prime-age labor force will
still increase slightly, the 2020s will be the first real decade of aging,
with dramatically fewer young workers entering the labor market.
The result will be massive declines in the prime-age labor force during
the 2030s and the 2040s. The 2040s will see the largest overall decline
in the labor force, with a loss of 18 million workers in that decade
alone. The 2050s will see a slight slowdown in the overall decline, but
the “demographic echo” of ever-smaller age cohorts will speed up the
decline of the young labor force and lead to further declines of the
overall labor force beyond 2060.
Looking at the country clusters shows that these overall regional
trends vary significantly across countries and subregions (figure 6.5).
The High-Income Generous Spenders in aggregate are still experienc-
ing a significant increase in their prime-age labor force, which is pro-
jected to gain 5.5 million workers during the 2010s. During the 2020s
these countries will experience a strong decrease in the labor force,
but the drop will be less steep than in the High-Income Moderate
Spenders, which face a considerably starker demographic decline. In
the latter group of countries the decline will be “front-loaded,” with
an earlier onset and the biggest drop (a loss of 5.1 million overall)
coming during the 2020s. Declines for this group continue in the
2030s through the 2050s but become gradually less severe. This gives
hope that once countries face their most severe labor force declines
during the 2030s, they will be able and willing to carry out reforms to
address the unsustainability of their pension systems, as many of the
High-Income Moderate Spenders have already done over the last
decade.
Worryingly, though, such contrasting demographic pictures can-
not be observed in the High-Spending Transition Countries and the
Lower-Spending Transition Countries. Both clusters are already
experiencing declines in the labor force during the 2010s, driven by
significant decreases in younger workers. This trend will continue
during the 2020s, translating into substantial decreases in the labor
force aged 40–64 during the 2030s and 2040s. Despite the bleak
demographic outlook, some countries seem to have opted for consid-
erably more generous pension systems than others.
As for the Young Countries, they will continue to enjoy labor force
increases well into the 2050s. Only then will the demographic transi-
tion start to be felt, with vast decreases in the younger labor force

Working More, Longer, and More Productively 201y
Num
ber o
f wor
kers
, mill
ions
Num
ber o
f wor
kers
, mill
ions
2010s 2020s 2030s 2040s 2050s
0
–2
–4
–6
2
4
6
–2
–3
–4
–1
0
1
2010s 2020s 2030s 2040s 2050s
a. High-Income Generous Spenders b. High-Income Moderate Spenders
d. Lower-Spending Transition CountriesTTc. High-Spending Transition CountriesTT
2010s 2020s 2030s 2040s 2050s
Num
ber o
f wor
kers
, mill
ions
–2
–3
–1
0
1
2010s 2020s 2030s 2040s 2050s
Num
ber o
f wor
kers
, mill
ions
–10
–15
–5
0
5
e. Young CountriesYY
2010s 2020s 2030s 2040s 2050s
Num
ber o
f wor
kers
, mill
ions
–2
–3
–1
0
6
5
4
3
2
1
Aged 15–39 Aged 65+Aged 40–64
FIGURE 6.5Projected Change in the Labor Force in Europe and Central Asia, by Country Cluster, Age Group,and Decade, 2010s through 2050s
Source: Based on methodology in Koettl 2008.

202 The Inverting Pyramid
that will eventually put these countries in the same situation as their
older European peers today.
Can the inverting of the working-age population pyramid be
halted through increases in LFP? Figure 6.6 shows the projected
impact of four alternative scenarios (in addition to the baseline sce-
nario just discussed). They are based on simulations of the effects of
achieving different goals for LFP rates across age, gender, and coun-
tries. The scenarios do not focus on one particular policy goal, but
rather on a combination. Increases in LFP of women, youth, and,
most importantly, older workers are part of each scenario, but the
emphasis is different in each. The main overall finding from these
simulations is that significant increases in participation rates in many
countries, especially among women, youth, and older workers, could
indeed stem some of the decline in the labor force. It is informative to
examine the results in detail.
Scenario 1, constant participation rates, serves as a baseline and
corresponds to the projections presented above. Scenario 2, conver-
gence to benchmark countries, simulates an overall increase in par-
ticipation rates to levels similar to those observed today in countries
with the highest participation rates among the 50+ population:
Iceland, Norway, Sweden, and Switzerland. This scenario implies
increases in LFP across the board, but especially among women and
–60
–40
–20
0
20
40
Num
ber o
f wor
kers
, mill
ions
60
80
Constant
participation
rates
Convergence
to benchmark
countries
Female to
male
convergence
Increase in
work life by
10 years
Combined
maximum
scenario
Aged 15–39 Aged 40–64 Aged 65+
FIGURE 6.6Projected Change in the Labor Force in Europe and Central Asia under Different Scenarios, byAge Group, 2010–2050
Source: Based on methodology in Koettl 2008.

Working More, Longer, and More Productively 203y
older workers, who exhibit the largest participation gaps. Scenario 3,
female to male convergence, simulates a convergence of the female
participation profile to the male profile in each country. This also
implies a considerable increase in female LFP at older ages. Scenario
4, increase in work life by 10 years, simulates an increase of a decade
in the average length of the working life, country by country and
gender by gender.
Scenario 5—the maximum scenario—combines all three alterna-
tives to give a sense of the maximum potential for stemming the
decline in the labor force by increasing LFP. In such a scenario, par-
ticipation in all countries would increase to the average of the pro-
files seen today among the male population in Iceland, Norway,
Sweden, and Switzerland, with an additional increase of 10 years in
work life. This implies LFP rates above 80 percent even among people
aged 70–74. It should be kept in mind that achieving the policy goals
in all of these scenarios would require major pension reforms (such
as, for example, higher statutory retirement ages) in tandem with
many other labor market, tax, and skills policy reforms to enable
such increases in participation and extension of working lives.
The biggest impact would come from a convergence to the LFP
rates observed in benchmark countries (Iceland, Norway, Sweden,
and Switzerland). Not only could the decline by 54 million workers
be stemmed, but such a development would actually yield an
increase of nearly 27 million workers in the overall labor force—an
80 million net increase compared to the base scenario. The decline
in the younger labor force, though, could not be avoided; the poten-
tial to activate more workers is mostly among prime-age women
and older workers. An increase in work life of 10 years could also
stem the labor force decline by bringing in more than 40 million
workers aged 65 and older. Combining the various scenarios of
increasing overall LFP, in particular among women, and lengthening
work life would substantially increase the labor force in Europe and
Central Asia by more than 100 million workers. Yet even in this
unrealistically optimistic scenario, the decline in the younger labor
force—and subsequent decline in the overall labor force—could not
be prevented.
When considering these various scenarios, looking only at aggre-
gate numbers obscures important differences between countries
( figure 6.7). The country cluster disaggregation reveals that most of
the increases in the younger labor force would be achieved in the
Young Countries. For the region as a whole to benefit from these
increases would require an integrated labor market and efficient allo-
cation of labor throughout the whole region. In other words,

204 The Inverting PyramidN
umbe
r of w
orke
rs, m
illio
ns
Cons
tant
part
icip
atio
n ra
tes
Conv
erge
nce
to
benc
hmar
k co
untr
ies
Fem
ale
to m
ale
conv
erge
nce
Incr
ease
in w
ork
life
by 1
0 ye
ars
Com
bine
d
max
imum
sce
nario
5
0
–5
–10
10
15
20a. High-Income Generous Spenders
Num
ber o
f wor
kers
, mill
ions
Cons
tant
part
icip
atio
n ra
tes
Conv
erge
nce
to
benc
hmar
k co
untr
ies
Fem
ale
to m
ale
conv
erge
nce
Incr
ease
in w
ork
life
by 1
0 ye
ars
Com
bine
d
max
imum
sce
nario
5
0
–5
–15
–10
10
15
20b. High-Income Moderate Spenders
Num
ber o
f wor
kers
, mill
ions
Cons
tant
part
icip
atio
n ra
tes
Conv
erge
nce
to
benc
hmar
k co
untr
ies
Fem
ale
to m
ale
conv
erge
nce
Incr
ease
in w
ork
life
by 1
0 ye
ars
Com
bine
d
max
imum
sce
nario
0
–2
–4
–8
–6
2
4
6c. High-Spending Transition CountriesTT
Num
ber o
f wor
kers
, mill
ions
Cons
tant
part
icip
atio
n ra
tes
Conv
erge
nce
to
benc
hmar
k co
untr
ies
Fem
ale
to m
ale
conv
erge
nce
Incr
ease
in w
ork
life
by 1
0 ye
ars
Com
bine
d
max
imum
sce
nario
0
–10
–20
–30
10
20
30d. Lower-Spending Transition CountriesTT
Num
ber o
f wor
kers
, mill
ions
Cons
tant
part
icip
atio
n ra
tes
Conv
erge
nce
to
benc
hmar
k co
untr
ies
Fem
ale
to m
ale
conv
erge
nce
Incr
ease
in w
ork
life
by 1
0 ye
ars
Com
bine
d
max
imum
sce
nario
20
15
10
5
0
–5
25
30
35e. Young CountriesYY
Aged 15–39 Aged 65+Aged 40–64
FIGURE 6.7Projected Change in the Labor Force in Europe and Central Asia under Different Scenarios, byCountry Cluster and Age Group, 2010–2050
Source: Based on methodology in Koettl 2008.

Working More, Longer, and More Productively 205y
intraregional migration would have to increase considerably, namely
from the younger to the aging countries.
For example, in the High-Income Moderate Spenders, where par-
ticipation rates are already high, there is little potential to increase
them further, except among those aged 65 and older. Among the
High-Income Generous Spenders, on the other hand, there is consid-
erable potential to increase overall participation rates, which could
possibly even stem the decline among the young and prime-age
labor force. In the transition countries, both low and high spenders,
however, the decline among young and prime-age workers is
unlikely to be contained: the only potential here is to significantly
increase participation among older workers. Finally, in the Young
Countries, there is enormous potential to increase the LFP of young
and prime-age workers, especially among women. For Europe and
Central Asia as a whole to benefit from these favorable conditions in
the Young Countries of the region—and especially in Turkey, the
largest young country—the region will have to integrate its labor
market much more.
Immigration, therefore, offers a natural way to counter the decline
of the labor force. Bringing in more workers from other countries to
cover the gap left by a shrinking workforce can complement other
reforms and increase overall LFP. It spreads out the costs of reforms
over more people and in this way can help decrease the political
costs of reforms. Of course, increased migration itself might pose
new political challenges beyond those of pension reform, especially
in a subdued economy and a sluggish labor market. The key is to
strengthen the link between immigration policies and labor market
needs to ensure that those workers entering the country’s labor mar-
ket from outside have the skills that are in demand. Most countries in
the region have just begun to design immigration policies, and as
immigration starts to increase, it will be important to ensure that the
right talents and skills are attracted (Gill and Raiser 2012).
In sum, there seems to be considerable potential to stem—or at
least slow down—some of the inverting of the working-age popula-
tion pyramid and the ensuing decline in the labor force over the next
50 years. This would require first and foremost, of course, that these
workers be able to find jobs. As argued by Arias and Sánchez-Páramo
(2013), to get more people back to work, countries need to regain the
momentum that existed before the crisis to carry out economic and
institutional reforms. This would mean, first of all, pushing reforms
to establish the fundamentals to create jobs for all workers by laying
an enabling environment for existing firms to grow, become more
productive, or exit the market, and by tapping entrepreneurship

206 The Inverting Pyramid
potential so that new firms emerge and succeed or fail fast and cheap.
It would also require implementing policies to support workers so
they are prepared to take on the new jobs being created: workers
need the right skills, appropriate incentives, access to work, and read-
iness to move to places with the highest job-creation potential.
Policies and reforms to remove impediments that keep older
workers from staying longer in the workforce are crucial to efforts
to stem labor force decline. Many of these impediments come from
pension systems themselves, which discourage people from length-
ening their work lives and participating in the labor force at older
ages. There are many other areas, though, outside of the pension
s ystem—like tax and benefit systems, labor regulations and institu-
tions, training, and workplace adjustments—that also need
reforms to enable and encourage people to work longer and more
productively.
A growing number of older workers are in good health, have valu-
able skills and experience, and are willing to stay longer in the labor
market. However, to realize this potential, it is necessary to confront
a number of barriers faced by older workers, including ill-adapted
workplaces, stereotypes about older workers, and attitudes and social
norms about work at older ages.
Myths and Misperceptions about Older Workers
As a first step, societies and employers must confront some of the most
common myths and misperceptions about older workers, namely that
they prefer retirement over work, that they are less productive and not
employable, and that they take away jobs from the young.
Figure 6.8 summarizes results from a Eurobarometer survey con-
ducted in 2011 on active aging in the then EU-27 member states and
five non-EU countries: Croatia (at that time was not yet an EU mem-
ber), FYR Macedonia, Iceland, Norway, and Turkey (Eurobarometer
2012).4 Respondents were asked to rate the importance of commonly
accepted reasons why the population 55 and over may stop working.
The presentation of results compares the responses in the EU-15 (the
15 EU members in Western Europe) and the EU-11 (new member
states including Croatia), highlighting, when relevant, differences for
Turkey and FYR Macedonia and across demographic groups, drawing
on Eurobarometer (2012).
A lack of gradual retirement options, exclusion from training, and
negative perceptions about older workers on the part of employers
are thought to be the main reasons that older people stop working.

Working More, Longer, and More Productively 207
These three obstacles were seen as fairly or very important by seven
in 10 respondents across most of the EU member countries in 2011.
Only 4 to 6 percent viewed these reasons as unimportant across the
EU. Respondents in the EU-11 rated these obstacles more highly
important than those in the EU-15 countries. About six in 10 respon-
dents also highlighted a lack of skills for the modern workplace, dis-
incentives in the pension and tax systems, and workplaces that are ill
adapted to the needs of older workers. Family-related reasons, such
as obligations to care for grandchildren or the desire to retire at the
same time as a partner, were less likely to be viewed as important,
although women were more likely to feel that family care obligations
were an important obstacle (56 percent vs. 52 percent of men). On
most other obstacles, men and women held similar views, while,
interestingly, the age of the respondents was not linked to significant
differences in responses.
These results reveal three salient myths or misperceptions about
older workers, outlined briefly below. They also highlight real barri-
ers facing older workers, which need to be confronted to pave the
way for longer working lives (see annex 6A for a more detailed
discussion).
0 10 20 30 40 50 60 70 80 90 100
Family care obligation
Retire with partner
Lack of modern skills
Places are not adapted
Pensions/tax systems
Attitudes of employers
No gradual retirement
Excluded from training
Retire with partner
Family care obligation
Pensions/tax systems
Lack of modern skills
Places are not adapted
No gradual retirement
Excluded from training
Attitudes of employers
EU15
EU11
% of respondents
Very important Not very importantFairly important Not important at all
FIGURE 6.8Why Older Workers Stop Working: Perceptions in the European Union, 2011
Source: Eurobarometer 2012.
208 The Inverting Pyramid
Myth number 1: Workers, particularly at older ages, prefer to retire:
rather than continue working.
Fact: Most workers prefer to have the option of combining work:
and retirement, although in some countries attitudes and social
norms do not favor longer working lives.
According to the Eurobarometer (2012) results, just over half of
EU-27 respondents (54 percent) and EU-11 respondents (52 percent)
do not want to continue working once they are entitled to a pension.
A third want to continue working, and the rest are unsure. The pro-
portion of individuals who would like to continue working once they
reach pensionable age is actually higher (41 percent) among older
workers.
A closer examination of work and retirement preferences reveals
that about two-thirds of respondents in most countries, especially at
older ages, would prefer to have or allow others the flexibility to
combine partial retirement with longer working lives. Also, most citi-
zens (61 percent) think people should be able to work past the offi-
cial retirement age if they so desire. Similarly, a slight majority
(53 percent) disagree with the entire notion of a compulsory retire-
ment age. There is significant variation in revealed preferences and
attitudes toward retirement across countries, and in some countries
attitudes and social norms do not favor longer working lives (see
annex 6A).
Importantly, empirical evidence suggests that responding to pref-
erences for a more flexible approach to retirement would improve
the quality of life in old age (see annex 6A for more details). Thus,
reforms that foster LFP at older ages not only help ensure the sus-
tainability of pension systems but may also lead to positive health
benefits for older individuals.
Myth number 2: Older workers are less productive than younger:
workers and are difficult to employ.
Fact: Most older workers can remain very productive over longer:
careers, yet many do face barriers in the workplace and when look-
ing for work.
In reality, individuals and employers have mixed views about
older workers. In the Eurobarometer (2012) survey, shown in
figure 6.8, six in 10 respondents in the EU-15 and nearly eight in 10
in the EU-11 perceive the lack of skills for the modern workplace to
be a strong obstacle that inhibits people 55 years and older from
working. However, when asked to compare the workplace qualities
of older and younger workers, the vast majority of respondents
actually believe that older ones have more advantages. For one
thing, 38 percent see older workers as more productive than younger

Working More, Longer, and More Productively 209y
workers, while 41 percent see them as equally productive. Not sur-
prisingly, virtually all respondents perceive older workers to be more
experienced, and an overwhelming majority (80 percent or more)
see them as either equal or superior to younger employees in terms
of reliability, independent decision making, problem solving, han-
dling stress, and working with other people.
Seven of 10 survey respondents believe that employers’ negative
perceptions of older employees constitute an important barrier that
keeps people 55 years and over from working, a view more com-
monly held in the EU-11 countries. Surveys of employers reveal that
while they recognize strengths in older workers, many harbor nega-
tive views as well. In its report on aging and employment policies
covering 21 countries, the OECD (2006) cites evidence that employ-
ers often have mixed views of older workers, including negative per-
ceptions about their flexibility and ability to adapt to changes in
technology and business.
Are these ambivalent perceptions and attitudes supported by
facts? Overall, the scientific evidence does not support the inevitabil-
ity of a significant fall in productivity with aging, at least not before
very old age and not for tasks that do not require physical strength.
Numerous studies in occupational medicine, developmental psychol-
ogy, and gerontology find that physical capacities (like muscle
strength and eyesight) and some mental capacities (like memory and
cognitive ability) can start weakening as early as age 25. However, as
discussed further in annex 6A, such early onset of decline is far from
universal. Depending on the task or job, mild deficits often can be
offset by the older worker’s accumulated knowledge and experience
in performing tasks.
The micro-empirical literature on whether older workers are less
productive is mixed. While some studies claim to find a fall in pro-
ductivity at older ages, those with stronger designs find either no fall,
a slight fall, or an increased variance in labor productivity at older
ages. In studies where aging dampens productivity, the decline is
to a level that is still above productivity in midlife and younger ages.
A recent study using the Survey of Health, Ageing and Retirement in
Europe, a household panel of nationally representative population
samples for several European countries, finds that retirement per se
accelerates cognitive decline. This effect is heightened by low educa-
tion, with less educated individuals experiencing more significant
age-related decline in cognitive abilities (Mazzonna and Peracchi
2012).
Myth number 3: Older workers keep younger ones from finding
jobs.

210 The Inverting Pyramid
Fact: The “lump of labor” is nothing but a fallacy.:
The long-standing public perception of an alleged trade-off
between employment of younger and older workers is known as the
lump-of-labor fallacy.5 In a Eurobarometer (2009) survey on inter-
generational solidarity covering the 27 EU countries, 56 percent of
respondents said they thought that if older people worked longer
there would be fewer jobs for young people.6 Respondents over age
55 (57 percent) were more likely to agree with this idea than respon-
dents aged 15–24 (51 percent).
Although the lump-of-labor notion permeates the policy debate
about encouraging older workers to work longer, it has been refuted
by both simple observations and serious analysis of the data. Time
and again, the evidence has shown that if anything, the opposite is
true. Comparison of employment rates of older individuals (aged
55–64) and of young people (aged 20–24) across countries in the
Europe and Central Asia region actually yields a positive statistically
significant relationship; the same result holds for the changes in the
employment rates of both groups over the 2000s (Arias and Sánchez-
Páramo 2013). Gruber and Wise (2010) provide the most thorough
analysis debunking claims of a trade-off between older workers and
youth employment. Analyzing long time-series data from the 1960s
to the 2000s in 12 OECD countries (including nine in Western
Europe),7 they found in each country a strong positive correlation
between employment of older (55–64) and younger (20–24) work-
ers, and even those in prime age. Moreover, results from within-
country “natural experiment” comparisons in Denmark, France, and
Germany—exploiting reforms that induced older workers to leave
the labor force but were unrelated to the employment of youth—
yield no evidence that reducing the employment of older persons
provides more job opportunities for younger persons or that increas-
ing the LFP of older persons keeps youth out of work.
The lump of labor across ages is indeed a fallacy. If anything, the
weight of the evidence suggests that increasing the employment of
older workers provides more job opportunities for youth and reduces
their unemployment rate. As more workers of any age are employed,
the growing segments of the economy tend to create more job oppor-
tunities for all workers, including youth. It should be noted, how-
ever, that in economies with sclerotic labor markets, such as those
heavily dominated by public sector employment, there could indeed
be trade-offs between the employment of different groups. In such
situations, early retirement is, nevertheless, not the way to promote
higher youth employment. Instead, reforms are needed to tackle the
root causes of labor market sluggishness.

Working More, Longer, and More Productively 211y
Summing up, the three myths about older workers—their alleged
resistance to longer working lives, their low productivity, and their
displacement of youth—lack a solid empirical basis. Once policy
makers in the region move past these misperceptions, they can then
confront real barriers that hinder the labor participation of older
workers. As discussed below, disincentives rooted in the design of the
tax and social benefits system, including pensions, and labor market
regulations too often limit hiring or flexible work schedules, do not
make work pay, and discourage participation in the social security
system.
Policy Measures to Remove Impediments and Encourage Employment of Older Workers
Improving the overall rates of formal employment requires strength-
ening incentives for individuals of all ages to (a) move out of inactiv-
ity or unemployment to take on a formal job; (b) opt for and remain
in formal rather than informal employment (for those already in the
labor force); and (c) stay longer in employment (in the case of older
workers).
In the first two cases, disincentives can arise when the design of
taxes and social benefits does not make work pay for both the
employee and the employer. These include employment-related ben-
efits such as unemployment and family allowances, as well as bene-
fits from social assistance programs. Disincentives can also arise from
the way pension systems are designed, especially in case of retire-
ment provisions or benefit formulas that induce early exit from the
labor force. Recent findings in behavioral economics also show that
contextual factors, including norms and institutions, and individual
cognitive and noncognitive traits affect the responses to incentives
and attitudes about participation in pension schemes. Finally, labor
market regulations and institutions, like employment protection leg-
islation (EPL), provisions governing part-time work, or seniority
wages, may create disincentives for firms to hire formal workers,
even though such measures are intended to provide protection or
prevent discrimination of older workers.
This section discusses policies to increase participation in the labor
market, both overall and of older workers in particular, through two
broad sets of measures: first, reforms to improve incentives to partici-
pate in the (formal) labor markets through better design of taxes,
benefits, and labor regulations; and second, measures to improve the
productivity of older workers through workplace adjustments and

212 The Inverting Pyramid
skills development so that employers are encouraged to hire them
and keep them employed longer. Older workers can enjoy longer
productive working lives if the design of taxes, benefits, and labor
regulations do not discourage work, businesses make smart accom-
modations in the workplace, and training strategies are age-informed
so that older workers can enhance their valuable experience with
new skills.
Tax and Benefit Reforms to Make Formal Work Pay at All Ages
Designing taxes and benefits is a balancing act between achieving
redistribution and ensuring adequate incomes for jobless people, on
the one hand, and maintaining strong incentives for formal sector
employment, on the other. The main conclusion from recent studies
is that work disincentives arising from the design of tax and social
benefits in the region are especially severe for low-wage and second-
ary earners (Koettl and Weber 2012; Arias and Sánchez-Páramo
2013). These groups consist of exactly those workers whose partici-
pation in the formal labor market overall is lagging: young, low-
skilled, female, and older workers, who are often looking for
part-time opportunities to work while studying or to supplement
income from a spouse or a pension.
This section looks more closely at work incentives, especially for
older workers, stemming from labor taxation and social benefits
design, including pensions. Disincentives for formal work currently
appear substantial in many countries in the region, especially for low-
productivity workers. Applying a micro-econometric analysis, Koettl
and Weber (2012) show that there is a negative correlation between
the incidence of formal employment and tacit work disincentives
at the individual level. Crucially, this correlation is twice as strong
when the sample is restricted to low-wage earners, suggesting a more
decisive impact of work disincentives in the low-wage segment.
For workers in the new EU member states with very high effective
taxes on formal work, the benefits of formal jobs, such as employ-
ment-related benefits and protection, would have to be large enough
to offset their opportunity costs, mainly higher taxes and social secu-
rity contributions and the withdrawal of some social assistance bene-
fits. Formal jobs, especially low-paying, part-time jobs, may not be an
economically viable option for low-productivity job seekers and their
employers in these countries. The tax and benefit structures of some
non-EU countries, in particular in the Balkans or Turkey, have simi-
lar features that can make low-paying, part-time formal work

Working More, Longer, and More Productively 213
unappealing. Yet it might be exactly these so-called “mini” and
“midi” jobs—casual part-time jobs at low-to-medium wage levels,
often in the service or retail sector, with uncertain work hours—that
could be filled by older workers who either already draw a pension or
would like to work while drawing a partial pension. Data from the
European Union Statistics on Income and Living Conditions confirm
that informal employment in the new member states is indeed
most prevalent in the low-wage sector, especially for those jobs
that earn less than 50 percent of average wage (Packard, Koettl, and
Montenegro 2012).
At the individual level, work disincentives vary significantly by
income level and family type. Figure 6.9 depicts potential work disin-
centives for formal work for an archetypical single person with no
children in Bulgaria and Romania in comparison to Australia and the
United States in 2008. Work disincentives are quantified by the
so-called formalization tax rate (FTR), which measures how much
informal income would be “taxed away” through taxes, social contri-
butions, and reduced social benefits if the same job were done for-
mally.8 In Bulgaria and Romania (figure 6.9a), the opportunity costs
of formal work as measured by the FTR can be as high as 70 percent.
That is, at low wage levels, informal workers would lose up to 70 per-
cent of their informal income (wages and benefits) from formaliza-
tion. The corresponding benefits that come with formalization would
have to be unreasonably high to make up for the costs. Other coun-
tries, like Australia and the United States, design their tax and benefit
systems differently—providing, for instance, an earned income tax
benefit. In these two countries the opportunity costs of formal work
are much lower (up to about 40 percent) for low-wage earners.
Building on these results, figure 6.10 shows disincentives for low-
wage earners across age groups in various European countries. These
are average work disincentives, as measured by the FTR and the mar-
ginal effective tax rate, faced by people in five different age groups in
10 countries. By and large, work disincentives in most countries are
highest for the oldest workers (aged 55–64) and display a U-shaped
curve with age. Thus, these potential disincentives might be a fac-
tor behind the higher rates of informal employment among older
workers.
How can policy makers ease some of these disincentives to formal
work? The key is to target low-wage earners, many of whom work
today in informal jobs or casual part-time jobs in order to supplement
household income from pensions or earned by the main breadwin-
ner of the family. These types of jobs frequently do not pay off when
done in the formal sector.

214 The Inverting Pyramid
Packard, Koettl, and Montenegro (2012) and Arias and Sánchez-
Páramo (2013) suggest two main avenues for changing work disin-
centives: (a) improve the design of social benefits like social
assistance, unemployment compensation, and family and housing
benefits in such a way as to reward or at least not penalize formal
work; and (b) reduce labor taxation, with a focus on low-wage
earners. The former entails reforms that make formal work pay and
a. Bulgaria and Romania
Form
aliz
atio
n ta
x ra
te, %
0
10
20
30
40
50
60
70
80
1 10 19 28 37 46 55 64 73 82 91 100 109 118 127 136 145 154 163 172 181 190 199
Minimum wage, Bulgaria
Minimum wage, Romania
FTR, Bulgaria
FTR, Romania
Form
aliz
atio
n ta
x ra
te, %
b. Australia and the United States
1 10 19 28 37 46 55 64 73 82 91 100 109 118 127 136 145 154 163 172 181 190 199
0
10
20
30
40
50
60
70
80
% of average wage
% of average wage
Minimum wage, Australia
Minimum wage, United States
FTR, Australia
FTR, United States
FIGURE 6.9Opportunity Costs of Formal Work as Measured by the Formalization Tax Rate in Bulgaria,Romania, Australia, and the United States, 2008
Source: Koettl and Weber 2012.
Note: The formalization tax rate (FTR) measures the percentage of informal income that would be “taxed away” through taxes, social contributions, and reduced
social benefits if the same job were done formally. The figure shows the FTR for an archetypical single person with no children.

Working More, Longer, and More Productively 215y
20
25
30
35
40
45
50
55
60
15–24 25–34 35–44 45–54 55–64
Form
aliz
atio
n ta
x ra
te,%
Age group
a. Formalization tax rate
Czech Republic
Belgium
Slovenia
Latvia
Estonia
Spain
Poland
Bulgaria
Netherlands
Portugal
Luxembourg
Greece
Slovak Republic
b. Marginal effective tax rate
15–24 25–34 35–44 45–54 55–64
Age group
10
20
30
40
50
60
70
Mar
gina
l effe
ctiv
e ta
x ra
te,%
Belgium
Slovenia
Netherlands
Luxembourg
Portugal
Poland
Spain
Latvia
Czech Republic
Slovak Republic
Estonia
Greece
Bulgaria
FIGURE 6.10Work Disincentives (Formalization Tax Rate and Marginal Effective Tax Rate) for Low-Wage Earners across Age Groups, Selected EuropeanEconomies, 2008
Sources: World Bank staff calculations based on EU-SILC 2008; and OECD Tax-Benefit Model 2008.
Note: Calculations for a sample restricted to low-wage earners earning 50 percent of the average wage or less.

216 The Inverting Pyramid
allow for a phased withdrawal of benefits. That is, as work income
increases, social benefits are not withdrawn abruptly but instead
are reduced gradually in order not to penalize formal work. Those
taking up a new formal job can be allowed to keep some of their ben-
efit entitlements for a certain period. The reduction of labor taxes
entails shifting taxation away from labor to other types of income,
consumption, or property and assets. Targeting labor tax reductions
to low-wage earners has proven more effective than making across-
the-board tax reductions in the past.9 This could be done through tax
credits or so-called in-work benefits that grant benefit entitlements
or tax breaks conditional on having a job, like the U.S. Earned
Income Tax Credit (Immervoll and Pearson 2009). Chapter 5 dis-
cussed the scope for these and other fiscally neutral reforms, taking
into account their consequences for both equity and efficiency.
While incentives are important, recent research in behavioral
economics warns that they do not necessarily translate immedi-
ately to changes in behavior. Work decisions also depend on psycho-
logical and social features of the workplace environment, including
employee morale, job security, and the perceived fairness of one’s
pay. As noted by Perry et al. (2007) and Packard, Koettl, and
Montenegro (2012), survey evidence reveals that mistrust and dis-
satisfaction with public institutions may cultivate a social norm of
noncompliance with taxes and divert participation in institutions like
pension schemes. It is well known that attitudes toward risk on the
part of young workers, who have to pay contributions now, influ-
ence how they value the resulting future entitlements and whether
they see these entitlements as certain or uncertain.10 In this context,
as noted in chapter 4, the use of default rules can have substantial
effects on participation in voluntary retirement savings plans.11 Thus,
policies to encourage participation in formal employment should
factor in ways to cultivate social norms and attitudes that favor
participation in pension schemes.
Finally, looking at why older workers may not stay longer in the
workforce, we turn to disincentives stemming from the pension sys-
tem itself. Clearly, the level of pension benefits and the ensuing social
security contributions alter incentives for formal employment and
affect labor and economy-wide productivity.12 The disincentive
effects on the labor supply of older people are well documented for
many industrialized countries. For instance, in their comprehensive
study that included nine Western European economies, Gruber and
Wise (1999, 2004) found that pension benefit rules—and the result-
ing “implicit tax on continued work”—are a crucial determinant of
the timing of retirement across several countries. They estimate that

Working More, Longer, and More Productively 217y
a reform that increases the pension age by 3 years would likely reduce
the proportion of inactive men aged 56–65 by up to 36 percent.
Likewise, high contributions, and a perceived uncertainty of even-
tual retirement benefits, can erode people’s incentives to work or,
more precisely, to contribute to the pension system.
Data availability has precluded the study of labor supply and
retirement effects of pension systems in emerging economies, includ-
ing in the transition economies of Europe and Central Asia.13 An
exception is a recent study by Danzer (2010), who uses a natural
experiment from Ukraine to estimate the causal effect of a threefold
increase in the legal minimum pension on labor supply and retire-
ment behavior at older ages. Applying difference-in-difference and
regression discontinuity methods to two independent, nationally
representative data sets, he finds that higher pension incomes have
strong disincentive effects on the labor supply decisions of older indi-
viduals. The income effect from the new pension policy leads to a
37–47 percent increase in retirement at the statutory retirement age
for men, and to a 30–39 percent increase for women. Those women
who remain in the workforce reduce their yearly working hours by
15 percent, while men have no significant response. The estimated
effects are much stronger for less educated workers. Danzer (2010)
concludes that although the substantial pension increase had positive
impacts in terms of averting old-age poverty, it provided strong disin-
centives to work and put a heavy fiscal burden on Ukraine.
Issues related to disincentives stemming from the pension system
and the trade-offs with adequacy are addressed in more in depth in
chapter 7.
Labor Regulations and Institutions that Enable Longer Working Lives
Labor regulations can also create disincentives for formal work. In
some countries, incumbents might be favored at the expense of new
entrants, including older workers out of work. A study by the OECD
(2011) shows that in 2004, there was indeed a negative correlation
across countries between the employment and hiring rates of men
aged 50–64 on the one hand and the strictness of EPL on the other.
There is, however, inconclusive evidence on the causal mechanisms
behind this correlation.
Deelen and Bourmpoula (2009), constructing an EPL index spe-
cifically for older workers and applying panel regression to 28 OECD
countries, confirm this finding more rigorously. In particular,
they find that strict EPL is negatively related to participation and

218 The Inverting Pyramid
employment rates and to the inflow into unemployment of older
workers. At the same time, it is positively related to long-term unem-
ployment. These effects seem more pronounced with older women.
However, Langot and Moreno-Galbis (2008) find that EPL negatively
affects employment rates of younger workers across OECD countries,
but for older workers the effect seems to be the inverse. Thus, as in
the literature on the role of labor regulations in hindering overall
employment, the emerging evidence on the effect of EPL on employ-
ment of older workers is mixed.14 What is important is for countries
to set labor regulations in a range where impacts on employment or
productivity are modest and distributional impacts minimized, so
that labor markets remain contestable.
Meanwhile, Neumark and Song (2012) find for the United States
that stronger state-level age discrimination protections actually
increase employment and hiring of older workers. Since their
result is for workers who are caught by recent increases in the retire-
ment age, their evidence points to important policy complementari-
ties between pension age reforms and employment protection
policies to lessen barriers to the employment of older workers.15 They
also point out that the deterrent effect of stringent employment
protection—the implicit increase in hiring costs due to higher firing
costs—could be less severe for older workers, especially those close to
retirement age, because of a foreseeable exit of the hired workers
into retirement.
One aspect of regulations and labor institutions that does seem
crucial is provisions for flexible work arrangements to enhance
opportunities for gradual retirement of older workers and LFP of
women of all ages. Today’s workplace and labor regulations have
been mainly designed for prime-age male workers who can work
full-time, have limited family and household responsibilities, have
completed their formal education, and have significant work experi-
ence. As a result, these regulations do not necessarily fit the needs of
older workers transitioning into retirement, of women who take
time off for maternity leave and child care, or of men and women
who would like to balance family and work throughout their careers.
Part-time work could benefit employers by giving them more flex-
ibility to adjust work hours in the economic cycle. Yet part-time
employment in the Europe and Central Asia region is less common
than in Western Europe, covering less than 10 percent of the
employed. Constraints to flexible work schedules are sometimes
embedded in labor legislation, but they can also arise from norms
and attitudes in the workplace. In most countries, it is a statutory
right of employees to increase (or decrease) their working hours,

Working More, Longer, and More Productively 219y
but in some places it is more difficult. For example, in Montenegro,
part-time work cannot be less than one-fourth of a full-time engage-
ment, or 10 hours per week. In a survey of employers in 21 EU coun-
tries, on average only 27 percent of managers reported that part-time
employees could easily get a full-time job: 43 percent said that this
could happen only exceptionally and the rest said there was “no
chance” of this happening (Eurofound 2011). Constraints also arise
from the interaction with the tax and benefit systems. For instance,
in Serbia, minimum social contributions of those earning less than
35 percent of the average wage are not adjusted for hours worked,
amounting to a double penalty for anyone working less than full-
time (Koettl 2013).
Seniority wages, arising from collective bargaining or perfor-
mance-pay rules based on experience, could be another potential dis-
incentive for employing older workers. If wages of older workers are
based on seniority—that is, years with the company—independent of
actual productivity levels, they can drive up labor costs of older work-
ers beyond what employers are willing to pay for such workers.
There seems to be strong negative correlation across countries
between hiring rates and wage levels of older workers (OECD 2011).
However, as de Hek and van Vuuren (2011) conclude in their review
of the literature, seniority wages need not imply that older workers
are overpaid. From a company perspective, it can very well pay off to
“backload” wage increases to later years to tie valuable employees—
in whom the employer might have invested substantial training
resources—to the company. However, if regulations undermine
employers’ ability to decrease wages for those employees whose pro-
ductivity has fallen over the years, then separation or early retire-
ment might be the only option. As with all other age groups, the key
is to allow employers sufficient flexibility to adjust wages to produc-
tivity levels. For older workers, this might be even more important,
as research has shown that the variance in productivity levels across
individuals increases significantly with age (see annex 6A).
Keeping Older Workers Productive through Workplace Interventions and Skills Development
An important question is how older workers fare in terms of employ-
ment prospects and productivity levels in a changing and globalizing
economy. As noted, one of the concerns about older workers is that
employers are less willing to hire them or keep them in employment
because they are less able to adapt to new technologies. If this is true,
overall productivity in an aging economy may suffer. Are older

220 The Inverting Pyramid
workers indeed less able to adapt to new technologies, and if so, what
can firms and countries do to adjust when faced with an aging
workforce?
Langot and Moreno-Galbis (2008) show that in the United States,
employment rates of workers below age 55 are inversely related to
total factor productivity growth. They speculate that as technology
advances, firms tend to rely on younger workers to adopt newer
technologies, while older workers are made redundant. Specifically,
they argue that for young workers, the time during which a firm can
recoup costs of updating production technology is longer than for
older workers.
Therefore, the optimal strategy for a firm introducing a new tech-
nology may be to keep younger workers in the affected jobs while
removing older workers. This process would result in young workers
being positioned at the technological frontier, while older workers
stay in jobs that are becoming technologically obsolete. Empirical
findings of Abowd et al. (2007), Ahituv and Zeira (2011), and
Borghans and Weel (2002) confirm that this is indeed happening.
However, firms may opt to retain older workers whose productivity
can remain high, and it may even pay off for firms to invest in skills
training of older workers rather than destroying the jobs they occupy.
Moreover, at the enterprise level there is evidence of a complemen-
tarity between older and younger workers that positively affects firm
productivity. Enterprises can reap the potential benefits of an aging
workforce through the use of age-diverse working teams. This high-
lights the importance of individual productivity levels and invest-
ments in skills development for the retention of older workers.
Experience in a number of companies has shown that making
changes to business practices to adapt to an aging workforce is a
smart business strategy (Hodin and Hoffmann 2011). A prominent
example is the German automaker BMW, which found ways to keep
older workers productive by making physical accommodations in the
workplace (box 6.1)
The drugstore chain CVS in the United States has also taken inno-
vative steps to maximize the productivity of older workers (Hodin
and Hoffmann 2011). In retail, as opposed to manufacturing, cus-
tomer service is at the core of productivity. CVS’s innovation was to
introduce new initiatives and programs to attract and retain older
workers, put them in positions to mentor younger employees and
help older customers, create flexible work programs to accommodate
their lifestyles and needs, and reward them for their life experiences.
CVS has more than doubled the number of employees over age 50 in
recent years.

Working More, Longer, and More Productively 221y
BOX 6.1
Adapting the Workplace for an Aging Workforce: BMW’s “2017 Assembly Line”
German luxury automaker BMW has gone beyond talk to test ways to accommodate an aging
workforce. BMW’s highly specialized and well-trained workforce is aging quickly. Traditional
approaches to dealing with an aging workforce, like dismissals or early retirement, are not an
option for BMW, which prizes itself on being a dependable employer and committed to its loyal
workers. In addition, because BMW is one of the largest employers in Bavaria, large-scale
dismissals of older workers would be perceived as discriminatory and would have political reper-
cussions. Instead, through an experiment at its Dingolfing plant, BMW tried to address the
coming challenges of aging proactively.
The average age of workers at the plant was expected to increase from 39 in 2007 to 47 in
2017. Because of more frequent and longer sick leaves and decreased physical ability of older
workers, management feared that the plant’s productivity levels would decrease and its com-
petitiveness erode. The experiment consisted of staffing a particular assembly line—one making
rear-axle gearboxes for medium-sized cars—with a team of workers who fit the expected
average worker profile of 2017. The line was relatively small, only 42 workers, but very labor
intensive. Almost 40 percent of workers on the so-called “2017 line” were 50 or older, while only
20 percent were that age on a typical 2007 line.
In the course of one year, through a series of 70 interventions, the productivity level of the 2017
line increased by 7 percent, bringing it up to par with the plant’s average. Quality defects quickly
decreased to expected levels and, later on, decreased even further. Absenteeism due to sick leave
and rehabilitation dropped from an above-average 7 percent to 2 percent, well below average.
Key to the success of the intervention was the process that was applied. Plant management
initiated the project, creating the environment in which solutions could be developed, but it was
the workers themselves who found those solutions. Management turned to the Workers’ Coun-
cil at the plant for initial consultations. The council referred management to a study on the issue
previously conducted at the same plant that provided a basic framework for proposed changes
along five dimensions: health management, skills development, workplace adjustments, work-
time adjustments, and change management. The study also showed that although productivity
of workers on average seems to decrease with age, the variance in productivity levels also
increases significantly. The challenge was to find out why some workers seem to be able to
keep their productivity levels high while others do not.
After considerable initial resistance—the project line was referred to as the “pensioners’ line”
among staff—management was able to win over enough young and old workers to staff the
project line by creating ownership and applying a hands-on approach. In various workshops, staff
came up with a list of 70 specific interventions, most of them physical changes at the workplace
continued

222 The Inverting Pyramid
The BMW and CVS examples give hope that through targeted
interventions, productivity levels of an aging workforce can be sus-
tained. The question is whether the success of these experiments is
driven by specific interventions that could be replicated elsewhere or
whether it also reflects idiosyncrasies—related, for example, to moti-
vation of workers, enthusiasm of project participants, or successful
industrial relations—in these particular firms. More importantly,
among the many interventions implemented at BMW and CVS,
which ones really delivered results, and which ones are irrelevant?
Recent research, also from Germany, shows that in aggregate, spe-
cific measures for older employees do indeed have an impact on their
productivity. Importantly, though, this research suggests that not all
such measures have the same impact, or any impact for that matter.
Using a large matched employer-employee survey, Göbel and Zwick
(2009) compare plant-level productivity profiles of workers in spe-
cific age groups in firms that use such measures and in those that do
not. They categorize these measures in five groups: (a) workplace
adjustments; (b) reassignment to age-specific tasks; (c) mixed-age
working teams; (d) reduced work time; and (e) training. Within the
representative sample of German companies, about 50 percent used
at least one of these measures for older workers in 2002. Interestingly,
there does not seem to be much correlation between the different
measures, suggesting that firms do not apply the whole range of
instruments.
that reduced wear and tear on workers’ bodies. These ranged from installing wooden flooring to
reduce strain on joints to using chairs, orthopedic footwear, adjustable work tables, angled moni-
tors, magnifying lenses, large-handled gripping tools, stackable containers, and manual hoisting
cranes. These workplace adjustments were complemented by job rotations that ensured that
the physically most demanding tasks were limited to three hours per shift. Workers engaged in
stretching and strength exercises with a physiotherapist at the beginning of shifts and during
breaks.
All of these interventions came at the negligible cost of 40,000 euros, half of which went
toward salaries of staff attending workshops, while the other half paid for equipment and salaries
of an ergonomist and a physiotherapist. For BMW, the experiment was a big success, as it
showed that productivity challenges coming from its aging workforce could be addressed
successfully. Follow-up projects were successfully implemented in many other plants through-
out the automaker’s global production chain.
Source: Based on Loch et al. 2010.
BOX 6.1 continued

Working More, Longer, and More Productively 223y
The findings of Göbel and Zwick (2009) suggest that there is
indeed a drop in productivity—albeit relatively small—for workers
aged 50 and older. Overall, the productivity profile across ages seems
surprisingly flat. Moreover, firms that use at least one age-specific
measure register significantly higher levels of productivity among
their older workers than firms that do not adopt such measures. The
first three categories of measures significantly increase the productiv-
ity of older workers. There are some spillover effects from these
investments to prime-age workers: in companies with workplace
adjustments for older workers, the relative productivity not only of
older workers but also of workers aged 40–45 is significantly higher
than in companies that do not invest in such adjustments. This pro-
ductivity spillover seems lower for workers aged 55–59 than for those
aged 40–45. Reassignment to age-specific jobs has a statistically sig-
nificant impact on this oldest group of workers, but not for younger
groups. The adoption of mixed-age work groups, finally, has a signifi-
cant positive effect not only on the oldest group of workers, but also
on the relative productivity of younger workers aged 20–30. This
points to important complementarities in term of knowledge and
experience between older and younger workers.
Among the five categories of measures discussed, reduced work
time and additional training do not seem to have a significant effect
on the productivity levels of older workers. The findings on work
time could be explained by the fact that in Germany, the majority of
workers do not choose “bridging pensions”—that is, reduced work
hours while drawing a partial pension—but opt for “block pensions,”
meaning early retirement after working full-time. As discussed
below, the findings on training raise questions about how to upgrade
the skills of older workers. For example, is classroom training really
the right measure for older learners, or do “aging brains” require a
different form of learning?
Many older workers in the Europe and Central Asia region, edu-
cated prior to the transition, are likely to suffer from skills obsoles-
cence. However, there are promising avenues to address weaknesses
in current training and adult education systems in order to develop
relevant skills of adults in a constantly changing labor market.
Over the last two decades, the rapid pace of change in technolo-
gies and business organization has in turn changed the key labor
competencies needed in a dynamic labor market. Many jobs have
become less routine and more interactive, particularly in the service
sector, with implications for skills requirements. A seminal study by
Autor, Levy, and Murnane (2003), looking at the United States, doc-
umented the rise of jobs that require nonroutine cognitive,

224 The Inverting Pyramid
analytical, and interpersonal skills, which they call “new economy
skills.” There was a concomitant decline in jobs requiring mostly rou-
tine cognitive skills as well as routine and nonroutine physical skills,
many of which can be easily automated or offshored. These trends
have also been observed in many Western European economies and
some emerging economies (Handel 2012).
Arias and Sánchez-Páramo (2013) offer evidence that the eco-
nomic transition in Europe and Central Asia may have rendered
obsolete the skills of many older workers. Looking at the most
modern economies in the region, those with a relatively skilled
labor force, the study finds that—consistent with changes observed
in OECD economies—the demand for “new economy” skills
increased while the demand for skills associated with manual tasks
remained sluggish or declined. These changes were more pro-
nounced in new member states that became more integrated with
external markets after EU accession. Importantly, the demand for
new skills is stronger or in some cases only evident among younger
cohorts, while job intensity in manual skills falls or is flat for older
cohorts.
Thus, older workers have not benefitted as much from the expan-
sion of jobs that require higher-order skills, and they are losing out as
jobs requiring traditional skills disappear. Countries lagging in policy
reforms have not yet experienced significant changes in the skills
intensity of jobs, but as they embark on the pending reforms agenda
they may experience similar age-differentiated changes in skills
demand that could leave some older workers shortchanged. These
trends will affect the labor market prospects not only of today’s older
workers but also of people currently in their thirties and forties,
whose work lives extend over the next couple of decades.
These trends in skills demand and the rapidly advancing demo-
graphic outlook in many countries in the region further underscore
the need to develop effective adult education and training systems.
Currently, the participation rates in continuous education in the
region are much lower than in the EU-15. Only about 10 to
20 percent of employees participate in continuous vocational train-
ing activities in Estonia, Hungary, and Poland, whereas the lowest
share for the EU-15 is 26 percent in Italy. Similar proportions can be
observed if the share of the working-age population participating in
any educational activity is considered. Hungary has the lowest rates
of participation, with only 4.4 percent of the population aged 55–64
continuing to learn, while in the EU-15 this share varies from
22 percent in the United Kingdom to 35 percent in Italy. But more
importantly, the relatively few rigorous evaluations of these programs

Working More, Longer, and More Productively 225y
in the region show a mixed record. Most programs have modest or
no impact on earnings and productivity.16
Moving forward, there is a need to fundamentally rethink educa-
tion, training, and lifelong learning systems. There are three key
directions: (a) stronger policy coordination between government,
training providers, and the enterprise sector, with a sound regulatory
regime for the development of private provision; (b) appropriate
incentives for firms to engage in more training of adults and older
workers; and (c) a concerted effort by employers, governments, and
workers to invest more effectively in training at older ages.
Emerging findings in various disciplines and recent evaluations of
training programs suggest that these cannot be age-blind. New find-
ings in neurology, psychology, and education challenge many long-
held views about adult learning and the effectiveness of adult
training (Johnson and Taylor 2006; Maestas and Zissimopoulos
2010). As scientists look more deeply into how brains age, they have
found that different abilities tend to follow relatively independent
paths over the life cycle. Some abilities, like performance and speed
when solving new tasks, are reduced at older ages, while other abili-
ties, like verbal capacities and fluency, remain at a high functional
level until late in life. As people pass middle age, the brain gets better
at recognizing the central idea—the big picture. In many cases the
older brain can rely on cumulated knowledge and experience and
use shortcuts to find solutions despite diminished cognitive speed.
Prior experience and knowledge plays a much greater role in how
older workers learn new skills compared to younger individuals.
New insights from this research and promising interventions sug-
gest that with appropriate training strategies, mature brains can learn
new skills. Recent evaluations of a range of public and private work-
force training strategies in the United States, largely focused on the
needs of adults, have shown them to produce returns as high as
10–26 percent when program impacts are followed over longer peri-
ods than in previous evaluations of training programs (Besharov and
Cottingham 2011). Key features of promising strategies to train older
workers include establishing clear links to employers beforehand—to
ensure relevance, but also to overcome any reluctance to hire older
workers—and competence-based training organized as a series of
shorter modules and fully built on recognition of prior learning. As
noted before, older workers can use their know-how and maturity
derived from experience to bring new skills and contribute effectively
to age-diverse teams.
It would be important for governments, employers, and training
providers to engage in serious impact evaluation of new training

226 The Inverting Pyramid
initiatives. These should include cost-benefit analysis and also plan
for learning about the duration of program impacts. Most evalua-
tions of active labor market programs in Europe provide only a year
or two of follow-up. The available evidence on longer-term impacts
for the United States suggests that in some cases impacts remain
remarkably steady for years after an intervention, while in other
cases they fade out over time; in still other cases, impacts appear
only belatedly.17
In sum, there are indeed many reform options that can help
increase LFP and encourage older individuals to work longer in order
to stem some of the decline of the labor force. These involve policy
interventions and reforms to improve incentives for formal work by
reforming taxation, social benefit design, and labor regulations, and
increasing productivity of older workers through workplace inter-
ventions and training so employers are more willing to hire and keep
them in jobs. With these, some of the previously discussed scenarios
for increasing LFP seem to offer viable aspirations for many countries
in the region seeking to mitigate the negative impact of an aging
workforce. The policy reforms are all about bringing more people
into the labor force, having them work longer, having them work
formally, having them contribute more, and even having more peo-
ple coming into the country from outside. All of these reforms share
one overriding goal: to increase revenues flowing into the pension
system. In that sense, they will help ease the pain of the transition to
a more sustainable pension system.
Such policies, however, have limits. More contributions—coming
from more formal workers and more productive workers, whether
native or migrant—will help in the short run. But each additional
contribution to the pension system will undermine the long-term
sustainability of the system unless reforms are made to address the
fundamental flaws in the relationship between contributions and
benefit accrual in current pension systems.
How Much Can Reforms Help?
Policies to improve employment opportunities for older workers,
strengthen work incentives, and develop skills are needed for longer,
more productive working lives that can provide income security dur-
ing old age. But what contribution can they make to fiscally and
socially sustainable pension systems, and how much of the pension
financing gap can they actually close in the absence of further
reforms of pension schemes? The short answer is that more active,

Working More, Longer, and More Productively 227y
productive, and longer working lives are no panacea but are a quint-
essential part of the solution to the problem of pension adequacy and
sustainability in the region.
The policy debate often proceeds under an implicit assumption
that increased participation in the formal labor market and greater
productivity could address much of the pension dilemma. Although
the role of a strong labor market is undisputed, the extent to which it
could relieve fiscal pressure in the context of existing pension sys-
tems is, in fact, far from clear. Indeed, there is a risk that, without a
good understanding of the links between labor markets and pension
systems, an overreliance on unspecified improvements in labor mar-
ket performance would distract from necessary, but politically diffi-
cult, pension reforms.
The interplay between tax, labor, and pension reforms is often not
sufficiently recognized in the policy debate. For instance, projections
of pension financing needs are based on assumptions about demo-
graphic trends and LFP and the resulting dependency ratios. These
policy projections should account for the likely feedback effects on
employment levels (lower LFP and/or higher informality) of the
higher labor taxes and/or reduced entitlements that are needed to
finance pension gaps. Tax burdens, benefit levels, and benefit dura-
tions also have implications for people’s choices about skills invest-
ments and for firms’ hiring and investment decisions. All these
factors affect the growth potential of the economy, household
incomes, and the government’s budget position. Given the scale of
the demographic challenge and the extent of required policy adjust-
ments, such links and feedback effects between pensions, labor, and
fiscal policies should be factored into the understanding of the chal-
lenges and options for reforming pensions in the region.
This section analyzes these links and their importance for putting
pension systems in the region on a sustainable path. It is based on a
background paper for this report by Keuschnigg, Davoine, and
Schuster (2013) who develop a policy-relevant modeling approach
that is firmly grounded in demographic trends and economic funda-
mentals (see annex 6B for a methodological description). The model
simulations assess the fiscal, employment, and welfare implications
of a range of specific policy reforms that governments may consider.
They account for labor participation, informality, retirement, educa-
tion, and other decisions that households may take in response to
changing policies or economic conditions.
As with any modeling or policy simulation, the results can hinge
heavily on assumptions about household behavior and on relevant
policy and structural parameters characterizing the economy, the

228 The Inverting Pyramid
labor market, and the design of a pension system. To make the models
as realistic as possible, they were specifically fitted (“calibrated”) to
the situation of specific countries using national economic and house-
hold data, as well as detailed policy parameters. Simulation results are
presented for two countries: Poland and the Slovak Republic. While
the situation and result would likely differ for other countries, these
two countries are believed to illustrate the types of policy challenges
faced by other countries in Eastern Europe. A comprehensive set of
sensitivity analyses indicates that results are, indeed, qualitatively and
quantitatively robust to variations in some of the key parameters and
assumptions (see Keuschnigg, Davoine, and Schuster 2013).
The results confirm that population aging poses a serious chal-
lenge to the fiscal sustainability of pension systems. This challenge
grows over time, with social security deficits increasing by more than
5 percent of gross domestic product (GDP) in the long term. This
section focuses on a subset of the results to highlight the most impor-
tant consequences of a “passive” or “active” policy reform strategy.
A “passive strategy” is one without any policy change, where popula-
tion aging and the shrinking of the working-age population has an
impact on the pension balance and on all other outcomes of interest
(again accounting for responses in terms of labor supply, skills, pro-
duction, and so on). An “active strategy” entails different parametric
pension reforms, such as changing the retirement age or the pension
benefit formula, reforming taxation and social benefits to improve
the government budget, or strengthening work incentives to increase
LFP, formal employment, human capital, and labor productivity.
It is important to stress that the results of the modeling exercise
provide illustrations of important policy mechanisms rather than fore-
casts of what will happen. For instance, in view of the scale of the
resulting pension financing deficits, a key government decision
would be how these budget shortfalls are to be financed. Rather than
reducing government consumption, which is the default assumption
underlying the results presented here, governments may choose any
combination of measures to reduce pensions or other social transfers
or increase revenues or debt. This decision will have different impli-
cations for the impacts on household incomes, labor markets, old-age
income protection, fiscal outcomes, and other economic outcomes.
Table 6.1 presents the long-run impacts of alternative reform sce-
narios on pension (fiscal) deficits, household welfare (per capita con-
sumption, pension benefits), and labor market outcomes, in that
order, for the Slovak Republic.18 Results for Poland are qualitatively
similar, with some exceptions that are noted below. As a result of the
demographic challenges, the old-age dependency ratio is projected to

Working More, Longer, and More Productively 229y
increase enormously, from 19.0 to 45.7 in the Slovak Republic and
from 22.7 to 46.0 in Poland. The size of the working-age population
would fall by over 25 percent.
Before delving into specific results, we highlight five main findings.
• Tackling informality is not a solution to pension deficits in the long
run. Although in the short run a reduction in informality would
help cut pension deficits, those gains are wiped out later on, as the
(new) formal workers retire and start collecting pension benefits.
• Increases in the retirement age would be essential to restore the
financial sustainability of pension systems while maintaining ade-
quate old-age income protection.
• Among the reforms considered, reductions in pension benefits
would have the biggest impact on reducing aging-related pension
deficits; such reductions are more effective than increases in con-
tribution rates in achieving a better balance between fiscal and
pension adequacy goals.
• Higher productivity growth leads to a very modest improvement in
pension deficits as pension benefits are normally partly indexed to
wages and thus increase with productivity.
• Feedback effects from the labor market are very significant for
assessing the likely impact of reforms on pension financing and the
economy more broadly.
Consistent with the analysis in chapter 2, pension deficit in the
Slovak Republic, which starts from a balanced position, is predicted
to climb to 5.4 percent of GDP by 2100 in the absence of any reforms.
Although workers in the model can choose to retire somewhat later
to finance consumption in old age, this effect is small, and the imbal-
ance between the number of contributors to the pension system and
the number of beneficiaries creates the sizable deficit. Without any
other government action, the overall government per capita con-
sumption is calculated to fall by more than 50 percent as a result of
the negative impacts of the shrinking and aging of the population on
employment and economic growth. This is a stark indication of the
severe fiscal adjustment that would be required to avoid significant
cuts in spending on essential public goods (e.g., infrastructure) and
social services (e.g., education, health) in fast-aging economies. It
underscores the urgent need for reforms that partly offset the
impacts on the economy of the decline and aging of the labor force.
A first notable finding is that over the long run, formalization in
itself does not reduce the social security deficit, although it delivers
some short-term gains. Figure 6.11 illustrates this result over the
entire period of the policy simulations (again for the Slovak Republic).

230 The Inverting Pyramid
TABL
E 6.
1Po
licy
Sim
ulat
ions
of P
ensi
on, L
abor
, and
Tax
Ref
orm
s: N
ine
Scen
ario
s
(1)
(2)
(3)
(4)
(5)
(6)
(7)
(8)
(9)
Base
line
2010
Agin
g
Cons
tant
hum
anca
pita
lCo
nsta
nt
info
rmal
ityRe
tirem
ent
+ 2
year
s
Soci
alse
curit
y co
ntrib
utio
n in
crea
se
Pens
ion
flat
bene
fitde
crea
se
Pens
ion
earn
ings
-re
late
d de
crea
se
Soci
alas
sist
ance
de
crea
sePr
oduc
tivity
grow
th
Abso
lute
num
bers
Popu
latio
n (a
ge 1
5+, n
orm
alize
d, 2
010
= 10
0)10
081
8181
8181
8181
8181
Depe
nden
cy ra
tio1 9
.245
.745
.745
.745
.745
.745
.745
.745
.745
.7
Pens
ione
rs (%
of p
opul
atio
n)24
. 940
.340
.2
40.3
37.7
40
.540
.0
40.5
40.3
40
.3
Unem
ploy
men
t rat
e (%
)14
.714
.4
14.0
14
.614
.2
15.0
14.4
15
.0
14.9
14.7
Effe
ctive
em
ploy
men
t(ye
arly
hour
s pe
r cap
ita)
793
667
685
640
699
614
681
617
706
629
Low
-skil
led
(% o
f wor
king-
age
popu
latio
n)9.
19.
7 9.
1 9.
79.
79.
89.
99.
89.
69.
7
Med
ium
-skil
led
(% o
f wor
king-
age
popu
latio
n)75
.277
.2
75.2
76.3
77.1
77
.677
.177
.677
.177
.5
High
-skil
led
(% o
f wor
king-
age
popu
latio
n)15
.813
.1
15.8
14
.013
.2
12.6
13
.1
12.7
13.4
12
.8
Info
rmal
ity ra
te (%
of p
artic
ipan
ts)
12.7
9.3
7.6
12.7
9.7
14.6
8.1
14.2
4.
314
.4
Incr
ease
from
bas
is (%
)
Labo
r cos
ts (l
ow-s
kille
d)—
−3.5
−0.3
−4.8
−5.4
−2.7
−4.0
−2.4
−13.
7−1
0.1
Labo
r cos
ts (m
ediu
m-s
kille
d )—
−3.0
0−3
.8−2
.8−2
.4−3
.2−2
.4−3
.0−9
.2
Labo
r cos
ts (h
igh-
skill
ed)
—13
.81.
416
.715
.1
15.3
14.7
15.1
14.7
6.7
Pens
ion
paym
entp
er b
enef
iciar
y—
− 1.4
1.8
−5.8
3.1
−11.
8−3
7.9
−46.
73.
51.
5

Working More, Longer, and More Productively 231y
TABL
E 6.
1Continued
(1)
(2)
(3)
(4)
(5)
(6)
(7)
(8)
(9)
Base
line
2010
Agin
g
Cons
tant
hum
anca
pita
lCo
nsta
nt
info
rmal
ityRe
tirem
ent
+ 2
year
s
Soci
alse
curit
y co
ntrib
utio
n in
crea
se
Pens
ion
flat
bene
fitde
crea
se
Pens
ion
earn
ings
-re
late
d de
crea
se
Soci
alas
sist
ance
de
crea
sePr
oduc
tivity
grow
th
GDP
per c
apita
—−1
4.5
−11.
3−1
8.1
−10.
5−2
1.1
−13.
1−2
0.7
−10.
38.
7
Cons
umpt
ion
per c
apita
(for
mal
and
in
form
algo
ods)
—0
1.6
0.2
2.5
−4.3
−4.6
−5.8
−0.1
8.4
Gove
rnm
ent c
onsu
mpt
ion
per c
apita
—−5
6.1
−52.
9−5
9.0
−45.
7−4
7.1
−18.
7−2
7.0
−52.
5−7
.0
Asse
ts p
er ca
pita
—33
.935
.4
35.2
34.0
32.7
39
.6
40.6
31.9
10
.8
% o
f bas
is GD
P
Pens
ion
expe
nditu
r e7.
109.
199.
468.
778.
998.
255.
744.
989.
647.
52
Pens
ion
expe
nditu
re(co
nsta
ntpo
pula
tion)
7.10
11.3
411
.67
10.8
311
.10
10.1
97.
086.
1511
.91
9.28
Socia
l sec
urity
def
icit
0.08
5.08
5.08
5.01
4.45
3.29
1.45
1.46
5.11
4.40
Socia
l sec
urity
def
icit (
cons
tant
po
pula
tion)
0.08
6.27
6.27
6.19
5.50
4.
061.
791.
806.
315.
44
Pens
ion
socia
l sec
urity
def
icit
0.04
4.40
4.51
4.18
3.95
3.02
0.84
0.51
4.
603.
29
Pens
ion
socia
l sec
urity
def
icit
(cons
tant
popu
latio
n)0.
045.
435.
575.
164.
883.
721.
040.
635.
674.
06
Sour
ce: K
eusc
hnig
g, D
avoi
ne, a
nd S
chus
ter 2
013.
Note
: The
resu
lts
of th
ese
sim
ulat
ions
are
bas
ed o
n pa
ram
eter
s of
the
pens
ion
syst
em o
f the
Slo
vak
Rep
ublic
but
are
mea
nt to
be
illus
trat
ive
for o
ther
Eas
tern
Eur
opea
n an
d C
entr
al E
urop
ean
coun
trie
s. T
he n
ine
scen
ario
s ar
e as
follo
ws:
(1) a
ging
: pur
e po
pula
tion
agi
ng u
ntil
2100
, no
refo
rms;
(2) c
onst
ant
hum
an c
apit
al: a
ging
, no
refo
rms,
con
stan
t hu
man
cap
ital
dec
isio
ns; (
3) c
onst
ant
info
rmal
ity:
agi
ng, n
o re
form
s, c
onst
ant
info
rmal
ity
deci
sion
s; (4
) ret
irem
ent
+2 y
ears
:
a gin
g, in
crea
se in
ret
irem
ent
age
of 2
yea
rs; (
5) s
ocia
l sec
urit
y co
ntri
buti
on in
crea
se: i
ncre
ase
in s
ocia
l sec
urit
y co
ntri
buti
on r
ates
by
3 pe
rcen
t of
GD
P; (6
) pen
sion
fla
t be
nefi
t de
crea
se: d
ecre
ase
in f
lat
port
ion
of p
ensi
on b
enef
its
by 3
perc
ent
of G
DP;
(7) p
ensi
on e
arni
ngs-
rela
ted
decr
ease
: dec
reas
e in
ear
ning
s-re
late
d po
rtio
n of
pen
sion
ben
efit
s by
3 p
erce
nt o
f G
DP;
(8) s
ocia
l ass
ista
nce
decr
ease
: dec
reas
e in
wel
fare
ben
efit
s by
0.5
per
cent
of
GD
P; (9
) pro
duct
ivit
y
grow
t h: i
ncre
ase
in e
xoge
nous
pro
duct
ivit
y gr
owth
rate
by
20 p
erce
nt. —
= n
ot a
vaila
ble.

232 The Inverting Pyramid
It plots the difference in the pension deficit between two scenarios,
both combining aging and no reforms but with distinct labor supply
responses (scenarios 1 and 3 in table 6.1). In scenario 1 (“aging”),
people are able to make choices about formal and informal work;
informality falls over the long haul, since workers invest more in
skills as they live longer and are more likely to land formal jobs.
In scenario 3 (“constant informality”), people are not allowed to
choose the type of work, so the occupational structure of formal/
informal work by age groups remains the same as in the baseline.
As people respond to incentives and enter the formal sector, the pen-
sion deficit falls in the short run (20 years or so) by up to 0.5 percent
of GDP. But this gain is wiped out in the longer term (about four
decades later), when these new formal workers start to retire and
collect pension benefits according to the current benefits schedule.
Indeed, simulations under constant informality show that the pen-
sion deficit would reach 4.18 percent of GDP, which is lower than ther
4.40 percent obtained when allowing individuals to make informality
decisions.
This runs against the conventional wisdom that sees informal
workers as a main drag on pension financing. Although they do not
–0.6
–0.5
–0.4
–0.3
–0.2
–0.1
0
Chan
ge in
pen
sion
defi
cit a
s %
of G
DP
2011 2021 2031 2041 2051 2061
FIGURE 6.11Change in Pension Deficit as a Result of Policy-Induced Reductions inInformal Employment in the Slovak Republic, 2011–2061
Source: Keuschnigg, Davoine, and Schuster 2013.
Note: This is the projected time evolution of the difference in the pension deficit between two scenarios of aging and no
reforms (scenarios 1 and 3 in table 6.1).

Working More, Longer, and More Productively 233y
contribute to financing, informal workers only receive non-earnings-
related benefits, which are far lower than average earnings-related
benefits. This is a result of the strong earnings-related link present in
the pension system of the Slovak Republic, as well as in other
countries. The immediate benefit of lower informality is higher social
security contributions, but this eventually leads to higher expendi-
tures in the form of larger pension payments. For public finances in
the long run, the crucial factor is the sustainability of current schemes
in terms of their ability to finance longer retirement periods at
current benefit levels.
A related finding is that population aging alone, without any
reforms, would reduce the rate of informality by as much as
30 percent in the Slovak Republic (from 12.7 percent to 9.3 per-
cent). Two effects explain this. First, as workers live longer it
becomes more beneficial for them to train and increase productivity
over the life cycle in the formal sector (as, essentially, they get to
enjoy the payoff from these investments for longer). Productivity
increases as a result, and so do wages in the formal sector and social
contributions and (later) pension benefits. Second, as people live
longer, post-retirement income and thus access to formal pension
benefits become more important. As a result, participation in the
formal sector becomes overall more attractive.19 These mechanisms
illustrate the importance of accounting for labor and skill decisions
of individuals over the life cycle when analyzing the outlook of pen-
sion finance.
Policy reforms of taxes, social assistance, and increases in the
retirement age would help offset the demographic-driven social
security financing gap, but by themselves they would be quite
insufficient to eliminate it. As expected, postponement of the
retirement age by 2 or 4 years, from 58 to 60 or 62 (scenario 4 in
table 6.1), would lead to an improvement in the financing of
pensions. However, the magnitude of the impact is modest
(0.6 percent of GDP in the 2-year case, 1.4 percent in the 4-year
case) and is insufficient to address the impending deficit. The
impact of postponing the retirement age, which ceteris paribus low-
ers pension outlays, is dampened by the adjustments in the labor
market: more workers stay in the formal labor force, pressing
down formal sector wages and thus decreasing social security con-
tributions revenue. Nevertheless, as this diminishes the aging-
driven reductions in yearly hours per capita and per capita growth,
the increases in the pension deficit can be contained by about
30 percent in the Slovak Republic and 50 percent in Poland.
Hence, an increase in the effective retirement age by 4 years,

234 The Inverting Pyramid
which amounts to approximately 40 percent of the projected
increase in life expectancy during the period of the analysis, is
insufficient but can significantly contain the rise in the pension
and general social security deficit for given tax and contribution
rates.
Reforms to delay retirement have other beneficial effects. They
contain the fall in per capita output and government consumption
while increasing household consumption, thus reducing the chance
of old-age poverty. In summary, further increases in the retirement
age would be essential to restore the financial sustainability of pen-
sion systems while maintaining adequate old-age income protection
and the overall fiscal capacity to provide public services to the
population.
Increases in pension (social security) contributions could con-
tain the pension deficit by more, but they would also lead to lower
growth and employment. Raising contributions by an (ex-ante)
equivalent of 3 percent of GDP (scenario 5) could reduce the
aging-driven deficit by 1.8 percent of GDP, but it has negative
impacts on growth, overall labor effort, and formal employment.
This leads to a pension financing surplus in the first years after the
reform but is not sufficient to contain the deficit in the long run.
As a result, this reform ends up collecting far lower revenues than
intended. Because of the induced reduction in employment, work-
ing hours, and formality, average pensions per beneficiary also
drop, and overall household consumption per capita (a proxy of
welfare) falls modestly. Therefore, an increase in contributions
entails important fiscal, efficiency, and welfare trade-offs, which
would need to be resolved on the basis of the main policy goals of
the reforms.
Reducing the flat (universal) component or the earnings-related
component of pension benefits (scenarios 6 and 7) can cut signifi-
cantly the shortfall in pension financing without large negative
impacts on growth, welfare, and formal employment. Cutting either
of these benefit components by 3 percent of GDP reduces the pen-
sion deficit by 3.6 percent of GDP (pure-aging scenario) and thus to
a more manageable level. In the case of the earnings-related com-
ponent, the ensuing reductions in growth, hours of work, and for-
mal employment are comparable to those obtained from increases
in contribution rates, but household welfare (per capita consump-
tion) declines by more (-5.8 percent compared to -4.4 percent).
Reducing the flat component actually improves working hours and
formality somewhat. Most of the gains from decreasing pension

Working More, Longer, and More Productively 235y
benefits come from the targeted aggregate expenditures reduction,
and as a result, they also mitigate much more than the aging-
induced decline in government consumption per capita. Reductions
in pension benefits are a more effective policy tool to tackle the
pension deficits due to aging than increases in contribution rates, as
they achieve a better balance between fiscal and welfare policy
goals of the reforms.
Unexpectedly, lowering social assistance benefits by 0.5 percent of
GDP (scenario 8) has little impact on the pension deficit, despite posi-
tive impacts on employment and the economy. In fact, the deficit
increases slightly despite a drop in informality (as work incentives
improve) and a subsequent short-term increase in contributions rev-
enue. This again reflects the negative long-term impact on pension
expenditures as more households have access to earnings-related
pension benefits.
Could higher productivity be the answer? Contrary to common
expectations, higher productivity growth leads to a very modest
(0.6 percent) improvement in the pension deficit (0.7 percent of
initial GDP). To assess this scenario, the analysis simulates the
impacts of a sizable (20 percent) exogenous increase in productiv-
ity growth (scenario 9). This can also be seen as equivalent to an
increase in the economy’s long-term potential growth rate. The
result is by the type of pension indexation and by the assumption
that productivity in the informal and formal sectors grows at the
same rate and translates directly into higher wages in both sec-
tors.20 Pension benefits are partially indexed to wages and thus to
productivity growth. Therefore, part of the increase in productiv-
ity translates into higher pension entitlements, and another part
translates into sizable increases in consumption of both house-
holds (through higher wages) and government (through higher
taxes).21
Summing up, the policy simulations illustrate the impact of popu-
lation aging on the financing of pensions, with deficits growing by
more than 5 percentage points of GDP in constant population terms
until 2100. They show that informality alone is neither a cause of
nor a solution to pension deficits over the long term. Of the various
reforms considered, a reduction in pension benefits is the most effec-
tive means to curtail pension deficits due to aging; however, it leads
to lower household consumption and thus increases the risk of old-
age poverty. An increase in social security contributions can also
help finance the pension system in the long run, but it leads to about
half of the reduction in the deficit achieved by cuts in the

236 The Inverting Pyramid
earnings-related part of pension benefits. Increasing the retirement
age is a quintessential policy to balance the objectives of financial
sustainability, reduction in informality, prevention of old-age pov-
erty, and economic efficiency.
These results are intended only to illustrate the interaction
between reforms and labor market feedback over the long term.
Keuschnigg, Davoine, and Schuster (2013) also examined scenarios
that combine different policy reforms. Solutions for individual
countries will depend on their specific circumstances and the
demographic challenges they face. In every setting, it is crucial
to define the appropriate balance between the multiple goals of
reforms according to societal preferences and political economy
considerations. Chapter 7 will discuss some specific policy options
for pension reform, depending on countries’ prototypical circum-
stances and pension systems.
Conclusions
This chapter has considered two ways to mitigate the effects on pen-
sion systems of the inverting population age pyramid and the ensu-
ing decline in the labor force. The first is by increasing LFP in order to
stem the shrinkage of the labor force—by having more people in
work, having more people work longer, and having more people
contributing to pension systems, as well as by expanding the con-
tributory base through immigration. The second option is to enable
people to work more productively so they stay in the labor force and
so that each worker produces more, earns more, and contributes
more to the pension system. More active, productive, and longer
working lives are no panacea, but they can contribute substantially
to mitigating the impacts of indispensable reforms in the pension
system.
While there is some scope in some countries to increase women’s
participation in employment, in most countries a majority of men
and women are already actively involved in job markets throughoutd
their prime working years. For younger workers, there is a trade-off
between getting them quickly into the workforce and strengthening
their educational base to support longer careers. The main scope for
adding to the base of contributors is therefore among older workers,
aged 55 and above. Successful reforms in this respect will slow the
decline in the labor force. But in the absence of very substantial
immigration of young workers, the labor force is going to age
significantly.

Working More, Longer, and More Productively 237y
With an older workforce, removing policy barriers to remaining
active in the labor market will be crucial. This requires confronting a
number of damaging stereotypes that are based on myth rather than
reality. There is the myth that older workers prefer retirement to
working, when in fact a majority prefer to have the option of com-
bining work and retirement. Another myth holds that older workers
are less productive and difficult to employ, when in reality older
workers can remain very productive over longer careers and can add
to the productivity of others by being part of age-diverse teams.
Finally, there is the prevalent myth that keeping older workers in the
workforce prevents the young from finding jobs, when evidence
shows time and again that strong LFP of old and young go hand in
hand and reinforce each other. In a fluid labor market, greater
employment levels among any age group strengthen demand and
economic growth, meaning that more jobs are created for both older
and younger generations.
A firm commitment to employment-friendly reforms will be cru-
cial for tackling policy-related barriers that have inhibited formal
employment in general and among older individuals in particular.
This includes boosting work incentives and support for those wishing
to take up or continue employment, reviewing overly restrictive or
rigid labor market regulations, ensuring that wages reflect productiv-
ity rather than unwarranted seniority rules, as well as workplace
interventions and skill development strategies that account for the
strengths and needs of different age groups. Focus group interviews
with older workers in Croatia, Poland, and Russia have shown the
willingness of workers to work longer, at least part-time; but there is
also considerable doubt that such opportunities are there. Workers
become discouraged because employers are sometimes unwilling to
hire older workers, citing concerns about their physical stamina, their
ability to learn new skills, and their commitment to continued
employment. The legal framework may not support part-time work,
while the design of the tax and social benefits system, including
pensions, often does not make (formal) work worthwhile and dis-
courages longer working lives.
With regard to productivity, countries face two challenges. First,
maintaining or increasing productivity in aging economies will entail
substantial investments in the lifelong development of skills—
technical, cognitive, and social-emotional. The skills mismatches and
gaps that are evident in Europe’s labor markets today must be over-
come. Second, countries will need to find ways to tame the possible
decline in productivity of some older workers. Recent evidence sug-
gests that workplace adjustments, reassignments to age-specific tasks,

238 The Inverting Pyramid
and mixed-age teams are the most promising ways to do so.
Opportunities for meaningful adult training or lifelong learning are
very limited for older workers in most countries in the region.
Moreover, such training, where it is available, has had disappointing
results, suggesting that new methods of learning adapted for aging
brains must be found.
The chapter highlights the importance of factoring in the labor mar-
ket feedback effects of different types of reforms to address the pension
financing dilemmas while maintaining adequate old-age protection.
From the perspective of the individual, reforms that seek to improve
the sustainability of pension systems can worsen the ratio of benefits
received to contributions paid. As a result, workers who are either
expecting or experiencing large-scale reforms will increasingly see
contributions as taxes and not as savings with a reasonable future
return. To the extent that these taxes discourage employment, it can
become significantly more challenging to counter the demographically
driven deterioration of the dependency ratio. The induced employ-
ment response may instead exacerbate demographic trends if the sys-
tem is not carefully designed to preserve labor market incentives.
Most importantly, having more workers work longer and more
productively is no substitute for reforming pension systems. Every
additional worker, every additional hour and year worked, and
every additional euro earned and contributed to the pension sys-
tem will bring a short-term gain. But in the long run, it will not
solve the financing dilemma of pension systems and in fact may
make it worse, because the relationship between contributions
and benefit accrual is fundamentally flawed. In other words, all
these mitigating measures can ease the pain and spread out the
costs of the necessary reforms over more people and generations;
but as long as the pension system itself is not reformed, bringing
more workers, more productive workers, and more contributions
into the pension system will eventually drag it into deeper
trouble.
Annex 6A Myths, Misperceptions, and Facts about Older Workers
Myth number 1: Workers, particularly at older ages, prefer to retire
rather than continue working.
Fact: Most workers prefer to have the option of combining work:
and retirement, although in some countries attitudes and social
norms do not favor longer working lives.

Working More, Longer, and More Productively 239y
As already noted, the myth that workers in the region prefer to
retire rather than continue working is unfounded. According to the
results of a Eurobarometer (2012) survey on active aging in the
EU-27 member states and five non-EU countries, most workers pre-
fer to have the option of combining work and retirement. Around
two-thirds of citizens across EU-27 and other participating countries
find combining part-time work with a partial pension more appeal-
ing than full retirement. There is, however, significant variation
across countries. Respondents in EU-15 member states were more
likely than those in the EU-11 (69 percent vs. 52 percent) to find this
option attractive. For instance, in Denmark, Estonia, Iceland, Latvia,
and the United Kingdom, over half of respondents would like to con-
tinue working during retirement, while the opposite is true in most
of Southern Europe, FYR Macedonia, and Turkey.
Furthermore, most citizens (61 percent) think people should be
able to work past the official retirement age if they so desire.
Similarly, a slight majority (53 percent) disagree with the entire
notion of a compulsory retirement age. A higher proportion of
respondents in EU-15 member states than in the EU-11 believe that
older people should be able to continue working (64 percent vs. 49
percent). Well over half of respondents consider that the lack of
opportunities to reduce work gradually is an important reason for
stopping work at older ages; the highest proportions agreeing with
this idea are found in Greece (82 percent), Hungary (81 percent),
Belgium (79 percent), and Denmark (78 percent), while the lowest
proportions are in Malta (61 percent), Lithuania (62 percent), and
Estonia (63 percent). Moreover, when those currently employed
are asked how long they expect to continue working, the majority
of EU-27 respondents (59 percent) think they will carry on until
they are in their sixties. Those aged 55 years and over expect to
work until age 66, while those aged 15–24 only expect to work until
56.7 years.
Empirical evidence suggests that responding to these preferences
for a more flexible approach to retirement would improve the quality
of life in old age. Studies using longitudinal data for individuals aged
50+ living in the United States and cross-country European data
found a similar significant negative effect of retirement on cognitive
functioning (see, for instance, Bonsang, Adam, and Perelman 2012;
Adam et al. 2007). Involuntary retirement has also been found to
have adverse effects on the subjective well-being of pensioners, as
they would prefer to work in order to consume more but are pre-
vented from doing so (Bonsang and Klein 2012). Thus, reforms that
foster LFP at older ages not only help ensure the sustainability of

240 The Inverting Pyramid
pension systems but may also lead to positive health benefits for
older individuals.
In sum, the notion that older workers in the region are unwilling
to have longer working lives is flawed. As noted in chapter 2, the
expectation of retiring at age 65 came in with the social security sys-
tem and employer-based pensions, but full retirement is not a uni-
versal goal for most workers. The majority of the population in
pre-retirement age, and even those over 65, do not have health
impediments that prevent them from working. Thanks to medical
advances, the older population can enjoy good health, and in fact the
elderly enjoy better-than-ever health status in Northern European
and other OECD countries. Given the flexibility to choose, many
would continue working longer in some fashion, perhaps changing
the way they work but not stopping altogether. By doing so, they can
also improve their health and well-being.
However, in several countries of Southern and Central Europe,
attitudes and social norms do not seem to favor longer working lives.
These norms are, of course, not immutable and may be related to
policies and regulations affecting the suitability of employment at
older ages, as well to unfounded perceptions about older workers’
productivity, employability, and competition with younger workers.
Myth number 2: Older workers are less productive and are difficult:
to employ.
Fact: Most older workers can remain very productive over longer:
careers, yet many do face barriers in the workplace and when look-
ing for work.
In reality, individuals and employers have mixed views about older
workers. A vast majority of the respondents in the Eurobarometer
(2012) survey perceive lack of skills for the modern workplace to be
a strong obstacle that inhibits people 55 years and older from work-
ing. Many believe that older workers are less likely to be open to new
ideas (57 percent) and up to date with new technology (41 percent)
compared with younger workers. Perceptions tend to be polarized as
far as how older workers compare to younger workers on flexibility
and creativity—roughly one in three see each group as having an
advantage.
However, when asked to compare the workplace qualities of older
and younger workers, the vast majority of respondents actually
believe that older ones have more advantages. For one thing,
38 percent see older workers as more productive than younger work-
ers, while 41 percent see them as equally productive. Not surpris-
ingly, virtually all respondents perceive older workers to be more
experienced, and an overwhelming majority (80 percent or more)

Working More, Longer, and More Productively 241y
see them as either equal or superior to younger employees in terms
of reliability, independent decision making, problem solving, han-
dling stress, and working with other people.
Surveys of employers reveal that while they recognize strengths in
older workers, many harbor negative views as well. In its report on
aging and employment policies covering 21 countries, the OECD
(2006) cites evidence that employers often have mixed views of older
workers, including negative perceptions about their flexibility and
ability to adapt to changes in technology and business. A 2008–09
survey of employers in France on management of employees over
age 50 found that while employers’ views about older workers have
improved (compared to a 2001 survey), 30 to 40 percent of employ-
ers considered them less able to adapt to change and to new technol-
ogies, and over 20 percent saw them as more expensive, less healthy,
and less mobile than younger workers. The interviews with focus
groups of employers conducted in Croatia, Poland, and Russia for this
report also reveal similar negative attitudes toward older workers in
these countries: employers worry about their physical stamina, their
ability to learn new things, and their commitment to continued
employment. On the positive side, in all of these surveys a majority
of employers considered older workers’ greater work experience to
be an asset, and they gave older employees an edge in qualities such
as being reliable and having strong interpersonal skills.
A vast majority of the Eurobarometer survey respondents believe
that negative perceptions of older employees among employers con-
stitute an important barrier that keeps people 55 years and over from
working. This belief that employer perceptions play an important
role is stronger in the EU-11 than in the EU-15 countries (76 percent
vs. 67 percent). Unfavorable employer perceptions are most widely
seen (over 80 percent) as an important obstacle in Greece, Hungary,
and Slovenia. Even at the other end of the scale, around 60 percent
of respondents in Denmark, Iceland, and Sweden consider unfavor-
able employer perceptions to be important.
Are these ambivalent perceptions and attitudes supported by
facts? Overall, the scientific evidence does not support the inevitabil-
ity of a sharp fall in productivity with aging for all individuals.
Numerous studies in occupational medicine, developmental psychol-
ogy, and gerontology find that physical capacities (like muscle
strength and eyesight) and mental capacities (like memory and cog-
nitive ability) can start weakening as early as age 25.22 However, such
early onset is far from universal, and individual factors—chiefly exer-
cise, training, and above all experience—can offset any age-specific
declines in abilities until late in the working life. While some

242 The Inverting Pyramid
productivity-related capacities do diminish with age, the knowledge
and capacity to understand and react to new situations can allow
older workers to be equally, if not more, capable of taking on a vari-
ety of tasks where performance does not depend exclusively on
physical prowess.
The micro-empirical literature on whether older workers are less
productive is mixed. Studies with stronger designs either find no evi-
dence that aging dampens labor productivity or find, at most, a slight
fall to a level that is still above productivity in midlife and younger
ages. There is also an increase in the variation in productivity levels
at older ages.23 For instance, recent studies using well-suited matched
employer-worker panel data for Germany, the Netherlands, and
Portugal fail to find a negative age-productivity effect.
A study by Börsch-Supan and Weiss (2011) of a Mercedes-Benz
manufacturing plant in southern Germany is illustrative. The authors
examine the relationship between the workers’ age and their pro-
ductivity in work teams using a unique panel data set that combines
errors in the production process (a proxy for productivity) with
detailed characteristics of workers in the plant, including the age
composition of teams. Errors are rare, but when they are severe they
can be quite costly for output, and there is little time to fix them. This
leads to tense situations. While this work environment requires more
physical strength, dexterity, and agility than many service sector jobs,
experience and capacity to improvise and manage emotionally
intense situations in a team are also vital. The authors, in fact, find
that average productivity actually increases monotonically from ages
25 to 65. While older workers are slightly more likely to make errors,
they make almost no severe errors. These results suggest that older
workers compensate for any loss of physical abilities with an
enhanced ability to grasp and focus on the vital aspects of tasks and
difficult situations—an ability that comes with experience.
Although they are not corroborated by evidence, negative percep-
tions about the productivity or qualities of older workers can make it
harder for them to find work. There is strong experimental evidence
for discrimination in hiring against older workers, at least for entry-
level jobs (Riach and Rich 2006, 2007a, 2007b). For instance, labor
market experiments in France, Spain, and the United Kingdom sent
out thousands of resumes for fictitious candidates to employers, with
characteristics and qualifications the same except for age or work
experience. A comparison of response rates found that older appli-
cants were significantly less likely to be called for an interview.
In the EU survey on “intergenerational solidarity” (Eurobarometer
2009), age discrimination in the workplace or in the search for

Working More, Longer, and More Productively 243y
employment is the most frequent form of age discrimination reported
by respondents. Around one in five had either personally experi-
enced such discrimination (6 percent) or witnessed it (15 percent) in
the two years preceding the survey. Interestingly, those aged 55 and
over are somewhat less likely (16 percent) than young or middle-
aged people (25 percent) to say they have personally experienced or
witnessed work-related age discrimination. There is no gender differ-
ence. Overall, citizens in the EU-12 are more likely to report experi-
encing or witnessing work-related age discrimination than those in
EU-15—respondents in Hungary, the Czech Republic, the Slovak
Republic, and Turkey being the most likely (33 percent).24
Myth number 3: Older workers keep younger ones from finding:
jobs.
Fact: The “lump of labor” is nothing but a fallacy.:
The long-standing public perception of a trade-off between
employment of younger and older workers is commonly known as
the lump-of-labor fallacy. In a Eurobarometer (2009) survey on inter-
generational solidarity, covering the 27 EU countries, 56 percent of
respondents said they thought that if older people worked longer
there would be fewer jobs for young people. Respondents over age 55
were more likely to agree with this idea (57 percent) than respon-
dents aged 15–24 (51 percent). There is also important variation
across countries. Over two-thirds of respondents in Greece, Italy,
Lithuania, Portugal, Romania, the Slovak Republic, and Slovenia
believed in the lump of labor across ages, while only one in four
respondents in Denmark and fewer than half of those in the
Netherlands, Ireland, and the United Kingdom subscribed to this idea.
Although the lump-of-labor notion has been contradicted by both
empirical observations and serious analysis of the data, it still perme-
ates the policy debate about encouraging older workers to work lon-
ger. In fact, several pension reforms over the last three decades have
been predicated explicitly on the argument that having fewer older
workers in the labor market opens up more job opportunities for
youth. However, time and again, the evidence has shown that if any-
thing, the opposite is true. A comparison of employment rates of
older individuals (aged 55–64) and unemployment of young people
(aged 20–24) across countries actually yields a negative statistically
significant relationship.
Gruber and Wise (2010) provide the most thorough analysis
debunking claims of a trade-off between older workers and youth
employment. Analyzing long time-series data from the 1960s to the
2000s in 12 OECD countries (including nine in Western Europe),
they found in each country a strong positive correlation between

244 The Inverting Pyramid
employment of older (55–64) and younger (20–24) workers and
even those in prime age. From panel cross-country regressions they
found that a 1 percent increase in the employment of older persons is
associated with a 0.91 percent decrease in the unemployment rate of
youth. Moreover, results from within-country “natural experiment”
comparisons in Denmark, France, and Germany—exploiting reforms
that induced older workers to leave the labor force but were unre-
lated to the employment of youth—yield no evidence that reducing
the employment of older persons provides more job opportunities for
younger persons or that increasing the LFP of older persons keeps
youth out of work.
The lump of labor across ages is indeed a fallacy. If anything, the
weight of the evidence suggests that increasing the employment of
older workers provides more job opportunities for youth and reduces
their unemployment rate. As more workers of any age are employed,
the growing segments of the economy tend to create more job oppor-
tunities for all workers, including youth. However, this positive
dynamic may be hampered in economies with a sclerotic labor mar-
ket, for instance, those with a dominant role for public sector
employment that leads people to queue for government jobs.
Moreover, at the enterprise level there is some evidence of a com-
plementarity between older and younger workers that positively
affects firm productivity. Workers often work in teams and thereby
affect one another’s productivity. In the above-mentioned study by
Börsch-Supan and Weiss (2011) in Germany, productivity of workers
is measured jointly in a work team so that the results take into
account the individual worker’s contribution to his co-workers’ pro-
ductivity. Holding average age in a team constant, more experienced
work teams (i.e., those with members of longer job tenure) are more
productive. Hence, the productivity-enhancing effect of having more
experienced workers translates into more productive teams. Another
recent study by Göbel and Zwick (2009), using 1997–2005 matched
employer-employee data for a representative sample of German
enterprises, shows that establishments that use age-mixed working
teams are characterized by higher productivity of both old and young
employees.
These findings suggest that enterprises can adapt and reap the
potential benefits of an aging workforce through the use of age-
diverse working teams. Older and younger workers bring different
strengths in their skills sets and experience. Older workers can use
the tacit know-how and maturity derived from experience to effec-
tively mentor younger workers, help teams focus on the vital aspects
of a task, share tasks according to their strengths, and contribute to

Working More, Longer, and More Productively 245y
a better work climate. These aspects can be more important than the
potential communication problems that may arise from different atti-
tudes and aspirations across generations. In the 2009 Eurobarometer
survey, roughly seven in 10 EU-27 citizens disagreed that companies
that mostly employ young people perform better than those that
employ an age-diverse workforce.
Summing up, the three myths about older workers—their alleged
resistance to longer working lives, their low productivity, and their
displacement of youth—lack a solid empirical basis. Once policy
makers in the region move past these misperceptions, they can then
confront real barriers that hinder the labor participation of older
workers, as discussed in this chapter.
Annex 6B Modeling Direct and Feedback Effects of Reforms on Pension and Labor Market Outcomes
The analysis relies on a stylized overlapping-generations model,
developed by Keuschnigg, Davoine, and Schuster (2013) for this
report, that is able to capture the most salient features of pension
reforms.25 The approach has an explicit life-cycle structure to capture
the dynamics of population aging and differentiate the labor market
experiences (and retirement patterns) of different age groups and
cohorts. It allows endogenous decision margins along several dimen-
sions, including hours, participation, retirement, informality, educa-
tion, and search effort while unemployed, thus capturing feedback
effects on the labor market of pension, tax, and labor reforms. The
explicit modeling of the informality/formality decision is an impor-
tant innovation, given the role of the informal sector in transition
economies. This extension allows us to assess the impact of reforms
on pension expenditures and government revenue in a more realistic
way. Figure 6A.1 shows a schematic representation of the individual
and household decisions that the model accounts for.
The model also contains a stylized enterprise sector that makes
production and investment decisions, and a government that sets tax
and benefits parameters. The model is calibrated for Poland and the
Slovak Republic using detailed information on three sectors:
• Government: redistribution and social protection policies, includ-
ing benefit replacement rates of unemployment benefits and
pensions, pension indexation, and tax rates.
• Households: labor supply responsiveness to financial (tax/benefit)
incentives (“elasticities”), information on population size and

246 The Inverting Pyramid
structure, incomes, labor market patterns, and savings rates by age
group.
• Production: real interest rate, productivity and productivity growth,
and substitution elasticity between capital and labor.
As some parameters are difficult to obtain, an effort was made to
derive plausible values when data were unavailable for either of the
two countries. Sensitivity analysis is conducted to assess the robust-
ness of results to key parameters and assumptions.
While extremely useful for studying the impacts of reforms, the
model has some important limitations. First, it does not model wel-
fare (income) distribution explicitly, thus making it less suitable for
poverty and income inequality analysis. Second, it assumes constant
per capita (and per-age-group) health expenditures. And finally, sim-
ulations relied on a technical choice for balancing (“closing”) the
government budget through reductions in public consumption. This
isolates the effect of aging and reforms, but again should be taken as
an indication of the actual fiscal cost of aging in terms of reduced
capacity to provide public goods and services.
Notes
1. Based on 2010 data from the International Labour Organization’s ILOSTAT database. “OECD” refers to non-EU OECD countries; “Latin America and Asia” refers to non-OECD countries in these regions only.
Participate?Work
formally?
How hard
to search?
Howmany hoursto supply?
Matchingtechnology
decideswhether a
job is found:
Ge hour-dependentafter-tax wage income
ManyNot manyNo
NoNo
Get unemployment benefits
Get welfare plus informal incomeGet welfare
Yes
Yes Very hardYes
Not very hard
FIGURE 6B.1Modeling Labor Market Feedbacks in Pension Reforms
Source: Keuschnigg, Davoine, and Schuster 2013.

Working More, Longer, and More Productively 247
2. The old-age dependency ratio is the number of those 65 or older per 100 people of working age: (65+)/(15–64) × 100.
3. See Koettl (2008) for a detailed description of the methodology. 4. The survey covers 31,280 respondents aged 15 and above who were
interviewed between September and November 2011. 5. Similar arguments have been made about the implications of women
and immigrants joining the workforce, purportedly at the expense of male and native-born workers, respectively.
6. The Flash Eurobarometer survey on intergenerational solidarity covered more than 27,000 randomly selected citizens aged 15 and over in the 27 EU member states.
7. The countries are Belgium, Canada, Denmark, France, Germany, Italy, Japan, the Netherlands, Spain, Sweden, the United Kingdom, and the United States.
8. See Koettl and Weber (2012) for an exact definition and discussion of the FTR.
9. See, for example, Betcherman, Daysal, and Pagés (2008). 10. A recent study found that lower cognitive ability is associated with
greater risk aversion and more pronounced impatience—factors known to affect old-age savings decisions (Dohmen et al. 2010).
11. For instance, Turner and Verma (2007) found that of those who were eligible to participate in 401(k) plans in the United States but did not, 40 percent explained that they could not afford to. Yet, when a sample of individuals was subject to automatic enrollment with a later option to opt out, they substantially increased their participation. Many allegedly income-constrained workers did not opt out, thus suggesting that for many, the contributions were, in fact, manageable.
12. Indeed, prominent authors warn that tax distortions that result from the financing needs of pay-as-you-go pensions are going to be the main chan-nel through which aging will affect economic output. See Weil (2006).
13. Although a number of emerging middle-income economies have suc-cessfully carried out several reforms, including introduction of noncon-tributory pensions with broad coverage (Willmore 2007; Barr and Diamond 2009), empirical research has been constrained by lack of long time-series or natural experiments data that may allow isolation of causal effects. Examples of studies for middle-income countries are those documenting the effects of disincentives in South Africa (Bertrand, Mullainathan, and Miller 2003; Duflo 2003; Ardington, Case, and Hose-good 2009). In addition, a study by de Carvalho Filho (2008) shows that changes in pension eligibility rules and a doubling of minimum benefits for rural workers in Brazil reduced male labor supply by roughly 38 per-centage points.
14. Betcherman (2012) provides a recent comprehensive review of the literature.
15. The EU enacted specific legislation requiring member states to prohibit age discrimination in employment. All member countries have now made it unlawful to discriminate in the labor market on grounds of age (among other factors).
16. See the recent review by Smith (2011). Jespersen, Munch, and Skipper (2008) provide a notable Danish example, while Raaum, Torp, and

248 The Inverting Pyramid
Zhang (2002) do the same for Norway. Osikominu (2013) shows a more common situation, with only a very rudimentary comparison of costsand impacts.
17. See the evaluation of German training programs by Lechner, Miquel,and Wunsch (2007).
18. These results refer to the final “steady state,” which in the modelapproximately corresponds to the year 2100. For much more detail on the modeling and results from a larger set of policy simulations consid-ered, see Keuschnigg, Davoine, and Schuster (2013).
19. A counterfactual experiment in which pension indexation for retir-ees is doubled, on top of higher productivity, leads to a dampening of the increase in informality but a still modest improvement in the deficit.
20. Since informal earnings are untaxed, they grow faster than formal net earnings, making informal work more attractive (since pensions, part of the benefits of formality, grow less). The resulting increase in informal-ity translates into higher consumption and also lowers contributions revenue.
21. See Skirbekk (2004) for a survey of the literature in various disciplines. 22. de Hek and van Vuuren (2011) provide a survey of the empirical
literature. 23. Prejudice against older workers has led to the enactment of anti-
discrimination legislation in many countries. The EU has enacted specific legislation requiring member states to prohibit age discrimina-tion in employment. All member countries have now legislated to make it unlawful to discriminate in the labor market on grounds of age (or other factors).
24. The model is based on adaptations of the model developed by Fisher and Keuschnigg (2010) and Jaag, Keuschnigg, and Keuschnigg (2010).
References
Abowd, John M., John C. Haltiwanger, Julia Lane, Kevin L. McKinney, and L. Kristin Sandusky. 2007. “Technology and the Demand for Skill: AnAnalysis of Within and Between Firm Differences.” IZA Discussion Paper 2707, Institute for the Study of Labor (IZA), Bonn, Germany.
Adam, Stéphane, Éric Bonsang, Sophie Germain, and Sergio Perelman. 2007. “Retraite, activités non professionnelles et vieillissement cognitif. Une exploration à partir des données de Share.” Economie et Statistique 303:83–96.
Ahituv, Avner, and Joseph Zeira. 2011. “Technical Progress and Early Retirement.” Economic Journal (Royal Economic Society) 121 (551):l171–93.
Ardington, Cally, Anne Case, and Victoria Hosegood. 2009. “Labor Supply Responses to Large Social Transfers: Longitudinal Evidence from South Africa.” American Economic Journal: Applied Economics 1 (1): 22–48.

Working More, Longer, and More Productively 249y
Arias, Omar S., and Carolina Sánchez-Páramo. 2013. Back to Work: Growingwith Jobs in Europe and Central Asia. Washington, DC: World Bank.
Autor, David, Frank Levy, and Richard J. Murnane. 2003. “The Skill Contentof Recent Technological Change: An Empirical Exploration.” QuarterlyJournal of Economics 118 (4): 1279–1334.
Barr, Nicholas, and Peter Diamond. 2009. “Reforming Pensions: Principles, Analytical Errors and Policy Directions.” International Social Security Review62 (2): 5–29.
Bertrand, Marianne, Sendhil Mullainathan, and Douglas Miller. 2003. “PublicPolicy and Extended Families: Evidence from Pensions in South Africa.”World Bank Economic Review 17 (1): 27–50.w
Besharov, Douglas J., and Phoebe H. Cottingham, eds. 2011. The WorkforceInvestment Act: Implementation Experiences and Evaluation Findings. Kalamazoo, MI: W. E. Upjohn Institute for Employment Research.
Betcherman, Gordon. 2012. “Labor Market Institutions: A Review of theLiterature.” Background Paper for World Development Report 2013, WorldBank, Washington, DC.
Betcherman, Gordon, N. Meltem Daysal, and Carmen Pagés. 2008. “DoEmployment Subsidies Work? Evidence from Regionally TargetedSubsidies in Turkey.” IZA Discussion Paper 3508, Institute for the Study ofLabor (IZA), Bonn, Germany.
Bonsang, Eric, Stéphane Adam, and Sergio Perelman. 2012. “Does RetirementAffect Cognitive Functioning?” Journal of Health Economics 31 (3): 490–501.
Bonsang, Eric, and Tobias J. Klein. 2012. “Retirement and Subjective Well-Being.” Journal of Economic Behavior and Organization 83 (3): 311–29.
Borghans, Lex, and Bas ter Weel. 2002. “Do Older Workers Have MoreTrouble Using a Computer than Younger Workers?” Research Memorandum 003, Research Centre for Education and the Labour Market (ROA), Maastricht University, the Netherlands.
Börsch-Supan, Axel H., and Matthias Weiss. 2011. “Productivity and Age:Evidence from Work Teams at the Assembly Line.” MEA Discussion Paper 07148, Munich Center for the Economics of Aging (MEA), Max Planck Institute for Social Law and Social Policy, Munich.
Danzer, Alexander M. 2010. “Retirement Responses to a Generous PensionReform: Evidence from a Natural Experiment in Eastern Europe.” IZADiscussion Paper 4726, Institute for the Study of Labor (IZA), Bonn, Germany.
de Carvalho Filho, Irineu Evangelista. 2008. “Old-Age Benefits and RetirementDecisions of Rural Elderly in Brazil.” Journal of Development Economics 86(1): 129–46.
Deelen, Anja P., and Evangelia Bourmpoula. 2009. “Employment ProtectionLegislation: A Cross-Country Analysis Focusing on the Elderly.” Paper pre-sented at the European Association of Labour Economists (EALE) AnnualConference, Tallinn, Estonia, February 27.
de Hek, Paul, and Daniel van Vuuren. 2011. “Are Older Workers Overpaid?A Literature Review.” International Tax and Public Finance 18 (4): 436–60.

250 The Inverting Pyramid
Dohmen, Thomas, Armin Falk, David Huffman, and Uwe Sunde. 2010. “Are Risk Aversion and Impatience Related to Cognitive Ability?” American Economic Review 100 (3): 1238–60.w
Duflo, Esther. 2003. “Grandmothers and Granddaughters: Old-Age Pensions and Intrahousehold Allocation in South Africa.” World Bank Economic Review 17 (1): 1–25.w
Eurobarometer. 2009. Intergenerational Solidarity: Analytical Report. FlashEurobarometer 269. Brussels: European Commission.
. 2012. Active Ageing: Report. Special Eurobarometer 378. Brussels: European Commission.
Eurofound (European Foundation for the Improvement of Living and Working Conditions). 2011. Part-Time Work in Europe: European Company Survey 2009. Dublin: Eurofound. http://www.eurofound.europa.eu/ pubdocs/2010/86/en/3/EF1086EN.pdf.
Eurostat Statistics Database. European Commission, Brussels. http://epp.eurostat.ec.europa.eu/portal/page/portal/statistics/search_database.
Fisher, Walter H., and Christian Keuschnigg. 2010. “Pension Reform and Labor Market Incentives.” Journal of Population Economics 23 (2): 769–803.
Gill, Indermit, and Martin Raiser. 2012. Golden Growth: Restoring the Lustre of the European Economic Model. Washington, DC: World Bank.
Göbel, Christian, and Thomas Zwick. 2009. “Age and Productivity: Evidence from Linked Employer Employee Data.” ZEW Discussion Paper 09-020, Centre for European Economic Research (ZEW), Mannheim, Germany.
Gruber, Jonathan, and David A. Wise, eds. 1999. Social Security and Retirement around the World. Chicago, IL: University of Chicago Press.
. 2004. Social Security Programs and Retirement around the World: Micro-Estimation. Chicago, IL: University of Chicago Press.
. 2010. Social Security Programs and Retirement around the World: TheRelationship to Youth Employment. Chicago, IL: University of Chicago Press.
Handel, J. Michael. 2012. “Trends in Job Skill Demands in OECD Countries.” OECD Social, Employment, and Migration Working Paper 143, Organisation for Economic Co-operation and Development, Paris.
Hodin, Michael W., and Mark Hoffmann. 2011. “Snowbirds and Water Coolers: How Aging Populations Can Drive Economic Growth.” SAISReview of International Affairs 31 (2): 5–14.
Immervoll, Herwig, and Mark Pearson. 2009. “A Good Time for Making Work Pay? Taking Stock of In-Work Benefits and Related Measures across the OECD.” OECD Social, Employment, and Migration Working Paper 81, Organisation for Economic Co-operation and Development, Paris.
Jaag, Christian, Christian Keuschnigg, and Mirela Keuschnigg. 2010. “Pension Reform, Retirement, and Life-Cycle Unemployment.” International Tax and Public Finance 17 (5): 556–85.
Jespersen, Svend T., Jakob R. Munch, and Lars Skipper. 2008. “Costs and Benefits of Danish Active Labour Market Programmes.” Labour Economics15 (5): 859–84.

Working More, Longer, and More Productively 251
Johnson, Sandra, and Kathleen Taylor, eds. 2006. The Neuroscience of Adult Learning. New Directions for Adult and Continuing Education, no. 110. San Francisco, CA: Jossey-Bass.
Keuschnigg, Christian, Thomas Davoine, and Philip Schuster. 2013. “Aging and Pension Reform: A General Equilibrium Approach.” Background Paper, World Bank, Washington, DC.
Koettl, Johannes. 2008. “Prospects for Management of Migration between Europe and the Middle East and North Africa: Demographic Trends, Labor Force Projections, and Implications for Policies of Immigration, Labor Markets, and Social Protection.” Background Paper, World Bank, Washington, DC.
———. 2013. “Does Formal Work Pay in Serbia? The Role of Labor Taxes and Social Benefit Design in Providing Disincentives for Formal Work.” In Poverty and Exclusion in the Western Balkans: New Directions in Measurement and Policy, edited by Caterina Ruggeri Laderchi and Sara Savastano, 133–54. New York: Springer.
Koettl, Johannes, and Michael Weber. 2012. “Does Formal Work Pay? The Role of Labor Taxation and Social Benefit Design in the New EU Member States.” In Informal Employment in Emerging and Transition Economies, edited by Hartmut Lehmann and Konstantinos Tatsiramos, 167–204. Research in Labor Economics 34. Bingley, U.K.: Emerald.
Langot, François, and Eva Moreno-Galbis. 2008. “Does the Growth Process Discriminate against Older Workers?” IZA Discussion Paper 3841, Institute for the Study of Labor (IZA), Bonn, Germany.
Lechner, Michael, Ruth Miquel, Conny Wunsch. 2007. “The Curse and Blessing of Training the Unemployed in a Changing Economy: The Case of East Germany after Unification.” German Economic Review 8 (4): 468–509.
Loch, Christoph H., Fabian J. Sting, Nikolaus Bauer, and Helmut Mauermann. 2010. “The Globe: How BMW Is Defusing the Demographic Time Bomb.” Harvard Business Review, March.
Maestas, Nicole, and Julie Zissimopoulos. 2010. “How Longer Work Lives Ease the Crunch of Population Aging.” Journal of Economic Perspectives 24 (1): 139–60.
Mazzonna, Fabrizio, and Franco Peracchi. 2012. “Ageing, Cognitive Abilities and Retirement.” European Economic Review 56 (4): 691–710.w
Neumark, David, and Joanne Song. 2012. “Barriers to Later Retirement: Increases in the Full Retirement Age, Age Discrimination, and the Physical Challenges of Work.” Working Paper 2012-265, Michigan Retirement Research Center, University of Michigan, Ann Arbor, MI.
OECD (Organisation for Economic Co-operation and Development). 2006. Live Longer, Work Longer. Paris: OECD.
———. 2011. Pensions at a Glance 2011: Retirement-Income Systems in OECD and G20 Countries. Paris: OECD.
Osikominu, Aderonke. 2013. “Quick Job Entry or Long-Term Human Capital Development? The Dynamic Effects of Alternative Training Schemes.” Review of Economic Studies 80 (1): 313–42.

252 The Inverting Pyramid
Packard, Truman, Johannes Koettl, and Claudio E. Montenegro. 2012. In fromthe Shadow: Integrating Europe’s Informal Labor. Washington, DC: WorldBank.
Perry, Guillermo E., William F. Maloney, Omar S. Arias, Pablo Fajnzylber, Andrew D. Mason, and Jaime Saavedra-Chanduvi. 2007. Informality: Exit and Exclusion. Washington, DC: World Bank.
Raaum, Oddbjørn, Hege Torp, and Tao Zhang. 2002. “Do Individual Programme Effects Exceed the Costs? Norwegian Evidence on Long Run Effects of Labour Market Training.” Memorandum 15/2002, Department of Economics, University of Oslo.
Riach, Peter A., and Judith Rich. 2006. “An Experimental Investigation of Age Discrimination in the French Labour Market.” IZA Discussion Paper 2522, Institute for the Study of Labor (IZA), Bonn, Germany.
———. 2007a. “An Experimental Investigation of Age Discrimination in the Spanish Labour Market.” IZA Discussion Paper 2654, Institute for the Study of Labor (IZA), Bonn, Germany.
———. 2007b. “An Experimental Investigation of Age Discrimination in the English Labor Market.” IZA Discussion Paper 3029, Institute for the Study of Labor (IZA), Bonn, Germany.
Skirbekk, Vegard. 2004. “Age and Individual Productivity: A Literature Survey.” In Vienna Yearbook of Population Research 2004, edited by G. Gustav Feichtinger, 133–53. Vienna: Verlag der Österreichischen Akademie der Wissenschaften.
Smith, Jeffrey. 2011. “Improving Impact Evaluation in Europe.” In The Workforce Investment Act: Implementation Experiences and Evaluation Findings, edited by Douglas Besharov and Phoebe Cottingham, 473–94. Kalamazoo, MI: W. E. Upjohn Institute for Employment Research.
Turner, John A., and Satyendra Verma. 2007. “Why Some Workers Don’t Take 401(k) Plan Offers: Inertia versus Economics.” CeRP Working Paper 56, Center for Research on Pensions and Welfare Policies, Turin, Italy.
Weil, David N. 2006. “Population Aging.” NBER Working Paper 12147, National Bureau of Economic Research, Cambridge, MA.
Willmore, Larry. 2007. “Universal Pensions for Developing Countries.” World Development 35 (1): 24–51.t
World Bank. World Development Indicators (database). http://data . worldbank.org/data-catalog/world-development-indicators.

Lessons from Two Decades of Pension Reform and Policy
Solutions for the Future
CHAPTER 7
253
Introduction
Tackling the demographics of the inverting pyramid is a formidable
task. Policy options exist, but few of them will be easy. Each country
will have to make its own decision on which measures to adopt.
Given the hard choices and differing country circumstances, each
country will have to consider which options are easier for it to imple-
ment and which are impossibly difficult. Employing a mix of options
may allow countries to make small changes rather than putting the
full burden of adjustment on a single sweeping measure.
What Have We Learned from Reforms of the First Pillar?
Before looking at the policy options, it is worth reviewing some of
the lessons from the two decades of pension reform already experi-
enced by these countries. These lessons are concentrated in four
main areas: (a) the limited impact of incentives on behavior, (b) the
need to communicate what people should expect, (c) the need for
policy consistency with regard to both the overall reform strategy

254 The Inverting Pyramid
and the measures required to make the strategy successful, and
(d) the importance of a holistic approach to pension reform.
Limited Impact of Incentives
Contrary to expectations, neither improved incentives nor strength-
ened enforcement has led to full coverage of the labor force at
pre-transition levels. The initial reforms had assumed a strong role
for incentives and their impact on individual behavior. With contrib-
utor coverage falling during the transition from the whole labor force
to only about half of the labor force on average, the original thinking
had been that strong enforcement coupled with benefit formulas that
tightly link future benefits to contributions would induce individuals
back into formal labor markets. The evidence suggests that there has
been some recovery in contributor coverage from the sharp initial
drops in the early years of transition, but only to levels typical of
other middle-income countries worldwide.
The lack of complete coverage has both short- and long-run
implications. In the short run, countries should not expect to see
rapid revenue growth from further increases in contributors. In the
long run, there will be a smaller number of qualifying pensioners,
which improves pension system finances, but there will also need to
be some minimal old-age assistance provided to the noncovered
elderly.
Similarly, reducing contribution rates has not provided sufficient
incentive for formalization and has resulted in worsening pension
system finances. Since some of the growth in informality stemmed
from the very high contribution rates, it was hoped that reducing the
rates would provide incentives for workers and employers to rejoin
the formal labor market, which would improve pension system
finances. While reducing contribution rates did improve the func-
tioning of the labor markets and improve labor competitiveness, the
increases in formalization were not sufficient to offset the decline in
revenue from existing contributors. As a result, pension system
finances have gotten worse, not better.
Incentives for postponing retirement have also been unable to
induce individuals to work longer. The initial thinking was that if the
pension system provided people sufficient incentives to keep work-
ing, they would choose to retire later, sparing governments from
taking the painful political step of raising the retirement age. But the
evidence suggests that people do not postpone retirement even with
fairly high incentives. For example, in 2007, the notional interest
rate in Latvia briefly reached 20 percent, suggesting that postponing

Lessons from Two Decades of Pension Reform and Policy Solutions for the Future 255
retirement by an additional year would result in a 20 percent higher
benefit throughout retirement. Nevertheless, people continued to
retire at the earliest possible age. And going forward, with the limited
financing available, countries will not be able to afford to provide
incentives high enough to entice people to postpone retirement.
These observations suggest that individual attitudes toward
retirement are less influential than societal norms of the “right time
to retire,” and more efforts should be put into raising societal accep-
tance of longer working lives.
Incentives proved similarly ineffective in stemming the demo-
graphic decline. Generous family policies like two- or three-year
maternity leaves, maternity cash benefits, and earlier retirement ages
for women with many children did not result in substantially
increased contributor cohorts in most countries. Rather, these poli-
cies increased social insurance expenditures and made it more diffi-
cult for young women to get jobs. The long maternity leaves also
made it difficult for women to retain relevant skills, impeding their
return to the workplace, and hindered the development of quality
child care. The prolonged decline in fertility coupled with continued
outmigration resulted in a very different demographic reality than
what was assumed at the time of the initial pension reforms. This
made some of the reforms that looked sustainable in the early transi-
tion appear increasingly unsustainable later.
The Need for Communication
A second area where the policy reforms made thus far have
provided lessons is the need to communicate with the public and
explain to people what they should expect. The initial intention was
to enact reasonably strong reforms that would be automatically
implemented based on developments in observable parameters,
such as life expectancy and inflation. While linking parameters of
the pension system to these external parameters should lead to a
welcome consistency in pension policy, policy makers also adopted
the automatic stabilization approach to avoid difficult political
battles over where the retirement age and benefit levels should be
in the long run. Meaningful public debate, aimed at convincing the
population of the need for a rise in the retirement age and cuts in
benefits, did not take place. As a result, when people saw reductions
in benefits they started complaining and demanding that elements
of the reforms be reversed. The subsequent changes undermined
both the objectives and the underlying structure of the reforms,
which did not have scope for unplanned ad hoc changes.

256 The Inverting Pyramid
The application of starkly different retirement rules and benefits
to adjacent cohorts also led to a feeling that the reforms were not
fair. The logic behind the differences was clear: cohorts close to
retirement had little time to adjust to new rules and benefit struc-
tures and thus needed to be protected, while those further away
from retirement had time to adjust to the new rules and could face
the full impact of the reforms. As a result, in many cases, the
reforms applied to all those below a certain age at the time of the
reform and not to those above that age. The problem was that indi-
viduals born on December 31 were often treated very differently
from similar individuals born the next day, that is, on January 1 of
the following calendar year. This differential treatment led to dissat-
isfaction with the reforms and to demands for reversals, again lead-
ing to ad hoc solutions. More gradual implementation of reforms,
perhaps starting with small changes for even the oldest cohorts,
with explanations to the public of why different cohorts were being
treated differently, might help maintain the momentum of the
reform path.
Part of the problem with tailoring benefits to cohorts was that the
benefits of the oldest cohorts were kept largely fixed, even when
unsustainable. Early in the reform process some countries missed the
chance to restructure their unsustainable pension liabilities. Rather
than explain to the public that older cohorts were being given more
generous treatment because they had limited ability to adjust to the
new rules, policy makers perpetuated the myth that older workers
had “earned” these higher benefits. This sacrificed the opportunity to
restructure some of the implicit pension liabilities by curbing early
retirement, disallowing multiple benefits, and putting in place benefit
ceilings. The one component of the reforms that did affect these older
workers, indexation of benefits, was often not implemented as
legislated.
While pensioners and workers were generally amenable to austerity
when economic conditions were unfavorable, as soon as economic
conditions improved, they began to demand rollbacks of the pension
reforms. The public, in general, needs to understand that long-run
demographics, and not just short-run economic conditions, require
major changes to the pension system. There are limits to what the pub-
lic system can provide, and there needs to be a broad public debate
about what it will provide and the extent to which individuals will
have to supplement that public provision. This should include discus-
sions of public priorities for resource allocation—between categories
of pensioners within the pension system (old age vs. disabled vs.
survivors); between categories of elderly (those who did not contribute

Lessons from Two Decades of Pension Reform and Policy Solutions for the Future 257
vs. those who contributed during full careers vs. those who contrib-
uted for the minimum number of years); between generations (cur-
rent pensioners vs. future pensioners); and between pension spending
and other spending. People need to realize that the burden of provid-
ing for old age in the future will have to be shared between the state
and its citizens, and that this will require people to take a much more
active approach toward retirement planning.
The Need for Policy Consistency
A third important lesson is the need for consistency in pension policy
and in the follow-up measures required to make that policy
successful. The region has benefited from a vibrant growth of democ-
racy, with complete changes in government occurring in many of the
countries as frequently as every four to five years. While democracy
is a good thing, the installation of a new government has frequently
been accompanied by repudiation of the policies enacted by the
previous government. This constant shifting of policy has been unfa-
vorable in a variety of contexts, but it has been particularly harmful
in regard to pension policy.
Pensions represent a long-term contract between workers and the
government. While it is acceptable that some parameters might need
to change over the length of the contract in response to economic
and demographic developments, huge and frequent policy shifts lead
to worker perceptions that the government is not really providing
any old-age security. This in turn undermines workers’ willingness to
contribute their limited earnings to such a system. Consistency is
important not just in pension policy itself, but in other policies
needed to make the pension system work. For example, the fiscal
framework must remain consistent with the pension policy chosen.
If there are transition costs to be financed, the fiscal policy needs to
remain conservative enough to generate the resources to finance
those costs. If retirement ages are rising, labor market policies need to
support longer working careers.
Importance of a Holistic Intersectoral Approach
A final lesson is that pensions are part of a larger, holistic policy
framework. Pension policy affects so much of the population and
is so large fiscally that it touches a broad range of seemingly
unrelated sectors. As a result, it requires a broad societal consen-
sus on the way forward, with appropriate adjustments in multiple
sectors.

258 The Inverting Pyramid
Too often, pension policy is drafted by one ministry, with little
input from other ministries. However, the success of that policy
depends on factors that might not be under the control of the lead
ministry. For example, later retirement ages might require increases
in lifelong learning, which could fall under the purview of the educa-
tion ministry. Issuing and regulating financial securities are functions
that come under yet other ministries. Making the fiscal space for
pensions clearly involves the finance ministry, tax authorities, and
other ministries, all of which might have to adjust their budget
envelopes. Even within the labor ministry, one reason that incentives
have not worked as well as hoped in the pension area is that there
are other rigidities in the labor market, unrelated to pensions, that
prevent the labor market from being flexible. There needs to be a
societal consensus on how old-age support will be provided and a
coherent effort to make it happen once the decisions are made.
What Have We Learned from Experience with Second-Pillar Systems?
The more than 15-year experience with funded second-pillar sys-
tems has also provided lessons. The most important of these is the
need for fiscal resources to pay for the transition costs, and to make
space for the private, funded system, if the overall rate of pension
contributions is not increased. As noted in chapter 4, many coun-
tries in Europe and Central Asia chose to borrow funds to pay for
transition costs rather than paying for them by raising taxes or
reducing other expenditures. The privatization revenues that were
supposed to help offset the transition costs sometimes did not mate-
rialize, were insufficient to cover the costs, or were spent on other
priorities. Interest on the borrowed funds accumulated quickly,
which exacerbated fiscal pressures and led to unsustainable levels of
debt. These fiscal pressures were the primary driving force that led
some of the governments to reverse the second-pillar systems. This
reversal temporarily relieves the fiscal pressure but leads to much
larger fiscal liabilities in the longer run. Going forward, countries
need to carefully plan financing to cover the fiscal costs of transition
and to maintain a consistent policy framework so that future gov-
ernments do not divert the resources meant to cover transition costs
to other priorities.
The heavy reliance by government on borrowing to finance
annual expenditures also adversely affects the pension funds’
ability to diversify into other assets and the development of

Lessons from Two Decades of Pension Reform and Policy Solutions for the Future 259
financial markets. Pension funds are often criticized for their
heavy investment in government securities. The argument has
been that since pension funds often invest in government securi-
ties, a funded system is really no different from a public system
that depends on the government’s ability to pay pensioners. But
governments need to recognize that some of this investing in gov-
ernment debt comes from their own overreliance on borrowing.
The more governments borrow, the higher the interest rates they
pay for that debt, and if these government assets are considered
safe or riskless, it is harder for pension funds to find other instru-
ments with a similar risk-return profile. Governments also need to
proactively assist in the development of financial markets. But
when they rely on these pension funds for their own financing,
development of the financial markets can threaten this financing,
giving them less interest in further developing capital markets.
The institutional structure of the pension funds, adopted from
Latin America, has turned out to be costly and is not necessarily
producing the best results for workers. The original pension fund
design consisted of multiple private pension fund administrators who
provided both record keeping and portfolio management, each man-
aging a single portfolio. Workers were expected to decide whether
they wanted to join a private pension fund, and then expected to
choose their pension fund administrator. A number of issues,
including economies of scale in pension fund administration, the
need for differing portfolios at different stages of the working life, and
individuals’ lack of sufficient knowledge or willingness to make
choices, emerged to suggest that this might not be the optimal insti-
tutional design for a funded pension system.
Relatively small changes could lead to much better outcomes.
Separating pension fund administration from portfolio management
may result in lower-cost pension administration. In the pension fund
administration industry, there are high costs of setting up the
business, but relatively low costs of adding new participants. Pension
fund administrators were generating high administrative costs by
spending on advertising and salespeople to convince workers to join
their pension funds. A single pension fund administrator could
perform the record-keeping functions required at lower cost than
multiple administrators.
Competition in portfolio management can help generate good
returns for workers and provide individuals the flexibility to change
portfolios over their life cycle. People at different stages of the life
cycle have different investment needs. The appropriate pension port-
folio for a young worker 30 years away from retirement looks very

260 The Inverting Pyramid
different from the portfolio of a person about to retire. The original
design expected different pension fund administrators to offer
different portfolios, but that did not happen. Instead, people of all
ages were given the same portfolio. Active competition in portfolio
management will help ensure the best risk-return mix for individuals
and give them the flexibility to change their portfolios as they age.
In view of most people’s reluctance to make complex choices,
policy makers need to provide well-designed default options while
still allowing individuals to make active choices if they wish to do so.
The original design depended heavily on consumers making a series
of decisions: whether to join a private pension fund, which of the
many pension funds they should join, and if the fund offered multi-
ple portfolios, which one they wanted. When they reached retire-
ment, they were supposed to decide how they wanted their pension
to be provided and who should provide the annuity. The competition
arising from these individual choices, like competition in the market
for toothpaste, was expected to generate the best returns for partici-
pants. In reality, most people were unwilling or unable to make these
decisions. They let the system choose for them, or they made an
initial choice and then left that arrangement in place through inertia
despite evidence that there were better options available. The lesson
from behavioral economics and from experience with private pen-
sion funds is that the default options need to be designed carefully to
generate the best outcomes for most people. And the default options
need to automatically apply to all individuals unless they choose to
do something different.
Evidence from labor markets also suggests that it should be possi-
ble to keep workers working longer. Three findings stand out. First,
not all workers want to retire as soon as they are eligible for a
pension. Many would be willing to continue working, but they might
prefer to work flexible hours or work part-time while drawing a par-
tial pension. Second, older workers can remain productive through-
out long working lives and are not necessarily less productive than
younger workers. While certain physical abilities do decline, other
capacities are enhanced by experience. Workplace adaptations to
accommodate older workers and training geared toward older brains
can raise productivity. However, employer prejudice against older
workers is real, and rigidities in the labor market that require
employers to pay older workers based on seniority and not
productivity may also serve to reduce their employment opportuni-
ties. Third, continuing to employ older workers does not reduce
employment opportunities for the young. Workers of different gen-
erations are not substitutes for each other, and there is evidence that

Lessons from Two Decades of Pension Reform and Policy Solutions for the Future 261
increasing the employment of older workers does not increase youth
unemployment; if anything, it may decrease it. When mixed-age
teams work together, older workers are able to mentor younger
workers, increasing the productivity of the whole work team.
Evidence from fiscal analysis suggests that raising revenue through
consumption taxes might be more productive than raising revenue
through alternative means. Some studies suggest, as noted in
chapter 5, that consumption taxes have a positive impact on compet-
itiveness and on growth. They are typically more broadly based than
labor taxes, and the broader tax base means they generate similar
revenues with lower tax rates and less distortion. Finally, given the
intergenerational inequities in current pension systems, with the
burden of benefit and retirement age adjustment falling largely on
younger cohorts, consumption taxes allow for better intergenera-
tional burden sharing as they affect all cohorts, while labor taxes
again affect only younger cohorts.
Demographic Challenges Facing Countries of the Region
The policy choices available to each country depends on what its
population pyramid looks like. In countries where the working-age
population is still expanding, the population pyramid is in fact a
pyramid, as shown in figure 1.1a (chapter 1). Even though coverage
in the pension system might have expanded so much that the pen-
sion pyramid becomes almost identical to the population pyramid,
this group of countries is continuing to bring in new contributors,
who help pay liabilities of the elderly. In these countries the projected
labor force in 2050 is expected to be larger than the labor force in
2010; thus their bars extend above the population stabilization line in
figure 7.1. This group includes a few high-income countries, which
continue to attract immigrants, along with the Young Countries,
where fertility is still high. For these countries, the demographic
challenge consists largely of increases in longevity—the easiest of the
challenges to address. Linking retirement age to increases in longev-
ity or reducing benefits through a formula like notional accounts
might work in these cases as long as both economic growth and labor
force growth are relatively steady.
The danger for these countries is that the factors that keep their
population structure in a pyramid shape, high immigration and high
fertility rates, could wane in the future. This could cause their popu-
lation structure to change into a column or even an inverted
pyramid. In the case of some of the Young Countries, while their

262 The Inverting Pyramid
population is projected to grow, the projections are based on
historical migration patterns. As some of their neighboring countries
begin to experience labor force shortages, Young Countries’ emigra-
tion rates might begin to exceed historical patterns, and these coun-
tries might stop experiencing labor force growth, despite higher
fertility rates. For the countries where the working-age population is
expanding due to immigration it is also vital to ensure that the new
residents can quickly accumulate human capital and reach the pro-
ductivity levels of the domestically born population.
Countries whose labor force is no longer expanding have a colum-
nar population structure. These countries can continue to expand the
number of pension system contributors for a time by bringing in
female workers, rural workers, and the self-employed. But once all
workers in the country are in the system and have been in the s ystem
for 50 to 60 years, the country has no capacity to increase contribu-
tors further to help pay liabilities of the current elderly. The generos-
ity of the pension system, which was built on the premise of a
continuously expanding contributor base, will no longer be afford-
able, and these countries may need to return to the less generous
pension system of the past. Alternatively, if they raise the retirement
age sufficiently to return to the average retirement duration of only
FIGURE 7.1Projected Labor Force in 2050 Compared to Actual Labor Force in 2010, Selected European andCentral Asian Economies
Source: United Nations population projections (UN 2011).
Note: The Federation of Bosnia-Herzegovina (BiH Federation) and Republika Srpska, which together make up the country of Bosnia and Herzegovina, have separate
pension systems and are treated as separate data points in the figure.
Ital
yS
love
nia
Mal
taS
wit
zerl
and
Gre
ece
Spa
inB
elgi
umFr
anc e
Cyp
rus
Luxe
mbo
urg
Port
ugal
Ger
man
yA
ustr
iaN
ethe
rlan
dsFi
nlan
dD
enm
ark
Sw
eden
Uni
ted
Kin
gdom
Nor
way
Irel
and
Icel
and
Bul
gari
aG
eorg
iaM
oldo
vaB
elar
usR
oman
iaLa
tvia
Rus
sian
Fed
erat
ion
Pola
ndLi
thua
nia
Cro
atia
Slo
vak
Re p
ublic
Hun
gary
Esto
nia
Cze
ch R
epub
licA
lban
iaA
rmen
iaU
krai
neB
iH F
eder
atio
nM
aced
onia
, FY
RS
erbi
aR
epub
lika
Srp
ska
Mon
tene
gro
Aze
rbai
jan
Turk
eyK
osov
oK
azak
hsta
nU
zbek
ista
nTu
rkm
enis
tan
Kyr
gyz
Rep
ublic
Tajik
ista
n0
20
40
60
80
100
120
140
160
180
200
High-Income
Generous Spenders
High-Income
Moderate Spenders
Lower-Spending
Transition Countries
High-Spending
Transition
Countries
Young
Countries
Labo
r for
ce in
205
0 as
% o
f lab
orfo
rce
in 2
010
y
p g yp
gy y
gg
pg
y
p
pp
jy
ygy
p j

Lessons from Two Decades of Pension Reform and Policy Solutions for the Future 263
15 years, which was the norm in the 1970s, they could both generate
substantial numbers of older contributors and reduce the number of
beneficiaries. This would allow them to maintain both the poverty
prevention and income replacement functions of the pension system
at levels similar to the benefits received today. Countries can then
link the retirement age that results in a life expectancy of 15 years
with further growth in life expectancy.
Countries where the working-age population is actually shrinking
are experiencing the inverting pyramid. This group—the countries
with bars below the line in figure 7.1—is large, and it includes some
high-income, some middle-income, and some lower-income coun-
tries. The transition countries, in addition to the inverting population
structure, also have been subject to premature pension system
inverting as both unemployment and the rise of informal labor
markets has reduced the formal labor force. They face the toughest
choices. In addition to setting the duration of retirement at 15 years,
as was common in the European pension systems of the 1970s, they
may have to reexamine what kind of benefits they can afford to pro-
vide for old-age support. The difficulty for many of these countries is
that they have already reduced the generosity of their benefits, and
the gap between poverty-prevention benefits and average benefits is
already quite narrow. Note that the red bubble countries in figure 1.2
(chapter 1) are relatively close to the origin and have already reduced
benefit generosity. Here economic growth is especially needed, as it
would allow a widening of the gap between poverty-prevention ben-
efits and average benefits.
Expanding the Labor Force
Increasing the size of the labor force expands the policy choices avail-
able to all the countries. However, measures to increase fertility,
while popular with governments, typically have limited impact on
the size of the labor force, at least for several decades. The viable
options therefore include (a) increasing labor force participation
(LFP), especially at higher ages; (b) raising retirement ages until life
expectancy at retirement is around 15 years; and (c) encouraging
immigration.
Figure 7.2 shows the labor force as in figure 7.1, but in this figure
the red bars show the labor force in 2050 if the LFP rates currently
seen in the cohort aged 40–44 are extended until age 64. The blue
bars above the red ones show the additional labor force gained if the
LFP rates of the age 40–44 cohort are extended not just until age 64,

264 The Inverting Pyramid
but until the age when life expectancy becomes 15 years in 2050.
Back in the 1970s, before the last wave of expansions in retirement
duration, retirement ages were commonly set at a level that, on aver-
age, provided pension income for the last 15 years of life. Therefore,
the last 15 years of life seems like a reasonable yardstick to define
“too old to work” for these higher-income societies. But extending
the LFP of the age 40–44 cohort until age 64 brings only two coun-
tries, Belgium and Denmark, into the group without the inverting
pyramid. By extending LFP further to the ages where only 15 years
of life expectancy remain, almost all of the high-income countries,
and a very few of the older transition countries, reach the point
where the pyramid is no longer inverting. Increased immigration
could push each of these labor force bars still higher.
The retirement ages at which life expectancy would be 15 years
in 2050 are shown in figure 7.3. For high-income countries, the
FIGURE 7.2Projected Labor Force in 2050 with Higher Participation at Older Ages Compared to ActualLabor Force in 2010, Selected European and Central Asian Economies
Source: United Nations population projections (UN 2011).
Note: The Federation of Bosnia-Herzegovina (BiH Federation) and Republika Srpska, which together make up the country of Bosnia and Herzegovina, have separate
pension systems and are treated as separate data points in the figure.
Ital
yS
love
nia
Sw
itze
rlan
dM
alta
Gre
ece
Spa
inB
elgi
umC
ypru
sFr
ance
Luxe
mbo
urg
Port
ugal
Ger
man
yA
ustr
iaN
ethe
rlan
dsFi
nlan
dD
enm
ark
Sw
eden
Uni
ted
Kin
gdom
Nor
way
Icel
and
Irel
and
Bul
gari
aG
eorg
iaM
oldo
vaB
elar
usLa
tvia
Rom
ania
Lith
uani
aR
ussi
an F
eder
atio
nPo
land
Cro
atia
Esto
nia
Slo
vak
Rep
ublic
Hun
gary
Alb
ania
Arm
eni a
Cze
ch R
epub
licU
krai
neM
onte
negr
oB
iH F
eder
atio
nM
aced
onia
, FY
RS
erbi
aR
epub
lika
Srp
ska
Kos
ovo
Aze
rbai
jan
Kaz
akhs
tan
Turk
eyK
yrgy
z R
epub
licTa
jikis
tan
0
50
100
150
200
250
Labo
r for
ce in
205
0 as
% o
f lab
or fo
rce
in 2
010
High-Income
Generous Spenders
High-Income
Moderate Spenders
Lower-Spending Transition Countries High-spending
Transition
Countries
Young Countries
y
g
g
g
If prime-age LFP rate is extended to age where life expectancy is 15 years
If prime-age LFP rate is extended to age 64
If prime-age LFP remains as is

Lessons from Two Decades of Pension Reform and Policy Solutions for the Future 265
retirement ages would have to be nearly 74 in 2050, while for transi-
tion and Young Countries, they would be close to 70. It would require
an increase in the effective retirement age of about three months per
calendar year, on average, between now and 2050 to achieve these
retirement ages. It must be stressed that these increases are for the
average effective, not statutory, retirement ages. If some people, such
as miners or military service members, are allowed to retire early,
everyone else will have to retire even later. Also, these increases in
retirement ages will most likely have to be mandatory. Evidence has
shown that raising benefits for workers who prolong their careers
voluntarily does not persuade most people to do so, even when the
incentives offered are very generous (as in Brazil and Latvia).
Can people work to such advanced ages? The evidence suggests
that increasing life expectancy is associated with healthy aging.
Health practitioners have compiled a list of “activities of daily living”
and have studied the percentage of people in particular age groups
who have difficulty completing at least one of these activities. The
evidence from three European countries where some time series
FIGURE 7.3Effective Retirement Ages with Life Expectancy of 15 Years in 2050 Compared to EffectiveRetirement Age in 2010, Selected European and Central Asian Economies
Source: Eurostat Statistics Database; country-provided data.
Note: The Federation of Bosnia-Herzegovina (BiH Federation) and Republika Srpska, which together make up the country of Bosnia and Herzegovina, have separate
pension systems and are treated as separate data points in the figure.
High-Income
Generous Spenders
High-Income
Moderate Spenders
Lower-Spending
Transition Countries
High-
Spending
Transition
Countries
Young
Countries
20
30
40
50
60
70
80
Fran
ce
Ital
y
Mal
ta
Bel
gium
Gre
ece
Spa
in
Nor
way
Finl
and
Aus
tria
Ger
man
y
Net
herl
ands
Den
mar
k
Port
ugal
Uni
ted
Kin
gdom
Irel
and
Sw
eden
Rus
sian
Fed
erat
ion
Bel
arus
Cro
atia
Hun
gary
Rom
ania
Pola
nd
Mol
dova
Slo
vak
Rep
ublic
Bul
gari
a
Cze
ch R
epub
lic
Latv
ia
Arm
enia
Alb
ania
Lith
uani
a
BiH
Fed
erat
ion
Ser
bia
Turk
ey
Aze
rbai
jan
Kyr
gyz
Rep
ublic
Kaz
akhs
tan
Age
y y
gy
Age at which life expectancy = 15 in 2050 Effective retirement age in 2010

266 The Inverting Pyramid
is available suggests that the percentage of people in the 65–74 age
group who report difficulties with at least one daily function has
decreased over time, as shown in figure 7.4. The increase in life
expectancy seems to translate largely into an increase in healthy
years. Of course, not everyone will be healthy enough to work until
these higher retirement ages, and those who cannot should of course
be protected through the pension system.
LFP rates among those older than 65 are much higher in other
parts of the world than in Europe, as shown in figure 7.5. This sug-
gests that some of the low LFP rates in Europe and Central Asia arise
not from the lack of ability to work, but from societal choices about
when to provide a pension and when it is acceptable to stop working.
LFP rates among those over age 65 are almost inversely related to life
expectancy at that age. The highest LFP among older workers occurs
in Sub-Saharan Africa, where life expectancy at age 65 was 12 years
on average in 2010, while the lowest occurs in high-income countries
of the Organisation for Economic Co-operation and Development
(OECD), where life expectancy at 65 was 19 years. Life expectancy at
age 65, well above the current effective retirement ages, averaged
14 years in the Europe and Central Asia region, the same as in East
Asia and the Pacific, but with much lower LFP. Clearly, some of this is
FIGURE 7.4Percentage of People Aged 65–74 Reporting Difficulty with One of the Activities of Daily Livingin Denmark, Finland, and Sweden, 1980s and 2000s
Source: Lafortune, Balestat, and the Disability Study Expert Group Members 2007.
0
5
10
15
20
25
30
35
% re
port
ing
diffi
culty
with
an
activ
ity o
f dai
ly li
ving
Denmark Finland Sweden
1987
2000
1980
20001980
2000
1980s 2000s

Lessons from Two Decades of Pension Reform and Policy Solutions for the Future 267
a societal choice, but it is a choice that may not be affordable in the
near future.
Immigration and productivity growth, if it does not translate
into higher wages, can also help countries with the financing of
old-age security. Countries where the labor force is projected to
decline between 2010 and 2050, even with all of these changes,
could consider filling the gap with immigrants. Even for the
countries that can reach above 100 percent by raising retirement
ages significantly, measures that increase immigration above what
is already built into the United Nations population projections will
allow a country to permit some earlier retirement. However, it
should be noted that increasing immigration merely makes the
system immature again and expands the pyramid. At some point,
these immigrants will get old and will require pension benefits. But
the immediate increase in revenues will help buy the system some
time to accommodate more gradual adjustments. Productivity
growth that does not translate into higher wages could also posi-
tively affect the pension system. Productivity growth that causes
wages to rise, as is often the case, would not help in the medium
term, since it would tend to raise benefit levels for those who expe-
rienced the higher wages.
FIGURE 7.5Percentage of People over Age 65 in the Labor Force in Various WorldRegions, 2010
Source: Pallares-Miralles, Romero, and Whitehouse 2012.
0
5
10
15
20
25
30
35
40
45
50
% o
f peo
ple
over
age
65
in la
bor f
orce
East
Asia an
d Pac
i�c
Euro
pe an
d Cen
tral A
sia
High-in
come O
ECD
Latin
Amer
ica an
d Car
ibbea
n
Midd
le Ea
st an
d Nor
th A
frica
South
Asia
Sub-S
ahar
an A
frica

268 The Inverting Pyramid
Rethinking the Pension System and Prioritizing Spending
Faced with these challenging demographics, countries may be forced
to rethink whether their pension system design will continue to
provide the old-age security they want. Those countries where
contributor growth is slowing and where the labor force falls below
the 2010 level, even with increasing retirement ages, may need to
reconsider what benefits they provide and to whom. Other countries
might need to rethink their pension model, irrespective of their labor
force growth, as the percentage of elderly who are not eligible for
benefits begins to rise.
Countries typically enact modest reforms of their existing systems,
but given the scope of the projected demographic change, it might be
more useful to start by deciding where the country wants to be in
2050 and then deciding how to get there. Countries can first list the
groups of people they want to protect through the pension system
and try to quantify how many people are projected to be in each
group by a long-run date like 2050. They can then define what bene-
fits they want to pay each of these groups. Multiplying benefits by
numbers of people will provide some measure of costs. The next step
is to decide what budget envelope will be available to finance old-age
and related security. To complete the calculations, countries will need
to compare their estimated costs against their budget envelope to
determine whether the proposed old-age security system is afford-
able. An example of such an exercise is shown in figure 7.6 and
described below.
The first priority could be to make sure that all elderly receive at
least a poverty-level benefit. We assume for this exercise that the
average effective retirement age can be raised to 65 by 2050 from its
current age, which is estimated to be 62 for high-income countries
and 60 for transition countries, with the prime-age LFP rate extended
through age 64. The absolute minimum that a country has to provide
must be sufficient to keep all elderly, defined as those 65 and older,
regardless of contribution history, out of poverty. The benefit level
assumed in figure 7.6 is 20 percent of gross domestic product (GDP)
per capita. The current poverty line is approximately at 20 percent of
GDP per capita in lower-income countries, and a little lower in
middle- and higher-income countries. Choosing 20 percent of GDP
per capita instead of the absolute poverty line recognizes that poverty
has both a relative and an absolute dimension. Countries are free to
choose a different benefit level for this baseline benefit, but it should
aim to cover the poverty line.

Lessons from Two Decades of Pension Reform and Policy Solutions for the Future 269
The bottom segment of each bar in figure 7.6 shows the cost of
providing this baseline benefit to all elderly as a percentage of GDP.
This bottom segment includes the cost of providing this baseline
benefit for those who have paid contributions and for those who
have not. Currently, in most transition countries, almost all elderly
are covered under the contributory system; the few who are not cov-
ered sometimes receive social pensions administered by the pension
system, sometimes receive social assistance, and sometimes receive
nothing. In the future, as noted in chapter 3, there will be many
more elderly without contributory pensions, and decisions will need
to be made as to whether their benefits will be administered by the
pension system or the social assistance system; in either case, this will
be a cost for the government.
A second priority is to provide resources for those who are not
healthy enough to work until retirement age. The second segment
from the bottom in each bar represents the cost of disability
FIGURE 7.6Example of the Cost of Financing Pension Priorities in 2050 with an Effective Retirement Ageof 65, Selected European and Central Asian Economies
Sources: Eurostat Statistics Database; United Nations population projections (UN 2011); country-provided data.
Note: The Federation of Bosnia-Herzegovina (BiH Federation) and Republika Srpska, which together make up the country of Bosnia and Herzegovina, have separate
pension systems and are treated as separate data points in the figure.
5
10
15
20
25
Fran
ceS
love
nia
Gre
ece
Bel
gium
Cyp
rus
Ital
yS
pain
Mal
taPo
rtug
alIr
elan
dN
orw
ayU
nite
d K
ingd
omD
enm
ark
Sw
eden
Finl
and
Icel
and
Ger
man
yN
ethe
rlan
dsA
ustr
iaA
lban
iaG
eorg
iaR
ussi
an F
eder
atio
nM
oldo
vaA
rmen
iaB
elar
usLi
thua
nia
Bul
gari
aH
unga
ryEs
toni
aC
zech
Rep
ublic
Latv
iaS
lova
k R
epub
licR
oman
iaPo
land
Cro
atia
BiH
Fed
erat
ion
Re p
ublik
a S
rpsk
aS
erbi
aK
azak
hsta
nA
zerb
aija
nK
yrgy
z R
epub
licK
osov
oTu
rkey
High-Income
Generous Spenders
High-Income
Moderate Spenders
Lower-Spending
Transition Countries
High-
Spending
Transition
Countries
Young
Countries
% o
f GD
P
g ypy
p g
yg
y
g
g gy
p p
pp
jy
gyp
y
Survivor spending
Top-up for covered population
Disability spending
Basic pension for all

270 The Inverting Pyramid
payments. Some people will not be healthy enough to work until
retirement age and will need government support. As we do not
know how population health will evolve, we simply assume that the
numbers of people receiving benefits and the benefit relative to
average wage will remain roughly the same as they are today. This
could be an underestimate, since older people are more likely to
become disabled, and the numbers of people qualifying for disability
benefits may increase as populations age. Similarly, increasing the
effective retirement age means that some people who collect old-age
pensions at the younger retirement ages of today may find them-
selves unable to work to higher ages and thus will need disability
benefits. Nonetheless, improving health would tend to reduce the
number of disabled. The second segment of the bar is based on the
assumption that these three effects cancel each other out and disabil-
ity spending relative to GDP remains about where it is today.
A third priority is to provide additional benefits for those who
have contributed. In each bar the third segment from the bottom
represents the cost of additional or top-up old-age benefits for these
individuals. These are calculated by holding constant the current old-
age benefit as a percentage of average wage, regardless of what the
pension law would project, and subtracting the base-level benefit to
these individuals, which was already included in the bottom seg-
ment. Benefits are provided only to those 65 or older and only to
those in this age group who contributed.
Figure 7.6 shows this contributory benefit as a top-up to the base-
level benefit for accounting purposes, but it may be administered dif-
ferently. Many countries may prefer to combine this third segment
together with the portion of the first segment that goes to contributors
as the contributory pension, administered by the pension system. The
remainder of the first segment might be called a social pension and
might be administered by a different social agency. The advantage of
combining the contributor and noncontributor base-level benefits, as
figure 7.6 does, relates to the financing. As chapter 5 showed, taxes on
a declining contributor base may not be sufficient to finance old-age
security for contributors in the future and may need to be augmented
by general revenue. Rather than financing the social pension through
general revenue and then having to finance the deficit of the contribu-
tory system through general revenue, it might be cleaner to provide a
base-level pension for everyone out of general revenue and then
finance a smaller, additional benefit for contributors out of the smaller
contribution revenue, with that top-up system being financially self-
sustainable. However, these are implementation issues that countries
can decide once the basic affordability decisions have been made.

Lessons from Two Decades of Pension Reform and Policy Solutions for the Future 271
A final priority is to provide benefits to surviving family members
upon the death of the breadwinner. The top segment of each bar
represents the cost of family and survivor pensions. As with disability
pensions, the benefits as a percentage of average wage and the num-
bers of people receiving benefits are assumed to be roughly the same
as they are today. Survivor benefits include benefits for widows and
widowers and for orphans. Population aging suggests that the
number of widows and widowers receiving benefits might increase,
but the number of orphans might fall.
However, two factors suggest that overall survivor spending might
decrease. First, higher LFP by women might lead to more women
collecting their own pensions rather than survivor benefits, reducing
the number of beneficiaries, given that the vast majority of spousal
benefits go to women. Second, the level of additional benefit per
survivor would be lower than today. At present, contributory old-age
pensions average around 50 percent of GDP per capita. Survivor pen-
sions are typically 60–70 percent of average old-age pensions, which
would amount to 30–35 percent of GDP per capita. Since 20 percent
of GDP per capita is already included in the bottom segment of the
bar for all individuals over the age of 65, only the difference would
need to be provided as survivor pensions.
If effective retirement ages rise to 65 and benefit generosity
remains where it is today, pension spending will rise dramatically in
many countries. In comparing projected 2050 spending in figure 7.6
to what countries are spending today, it becomes clear that spending
in the future will be much higher; this is cause for concern, given
that countries are already having trouble financing their pension
systems. The High-Income Generous Spenders are today spending
about 11 percent of GDP on pensions, while the High-Income
Moderate Spenders are spending about 10 percent of GDP. Transition
countries are spending on average 9 percent of GDP, while Young
Countries spend only 5 percent of GDP. In 2050, by contrast, main-
taining benefit levels similar to those shown in figure 7.6 will cost
High-Income Generous Spenders on average 15 percent and High-
Income Moderate Spenders on average 14 percent of GDP. Lower-
Spending Transition Countries will average 10 percent of GDP, while
the High-Spending Transition Countries will average 16 percent.
Even the Young Countries will experience a modest increase from
5 percent of GDP to 6 percent.
What to do? Countries have a number of options. They can look
for alternative fiscal resources to make the future spending require-
ments affordable; this may mean cutting other expenditure to make
more fiscal room for pension spending and looking for other revenue

272 The Inverting Pyramid
sources, as suggested in chapter 5. They can revisit their pension
spending priorities to see whether there is anything that can be
reduced or eliminated. They can also look at increasing the labor
force, either by raising retirement ages or by encouraging
immigration. It should be noted that raising retirement ages affects
both the expenditure and revenue sides of the pension balance,
while immigration affects only the revenue side, and also increases
long-term liabilities.
With respect to pension spending priorities, countries can evaluate
all four components to look for potential cost savings. On the base-
level benefit, there are a number of options. First, countries could
means-test this benefit for noncontributors. The only major group
likely to be excluded by a means test is nonworking spouses in
middle- and higher-income households or spouses working in infor-
mal labor markets in middle- and higher-income households. In
countries where coverage is moderate or high, suggesting there are
few spouses in these categories, little is likely to be gained from means
testing, particularly since administering a means test costs money.
The level of the benefit for noncontributors could be lower than
20 percent of GDP per capita, but again this will have a small
impact on countries that have moderate to high coverage and few
noncontributors. Typically, countries with low coverage are also
lower-income, and this 20 percent of GDP per capita might be very
close to the poverty line, which would make it difficult to cut. The
age at which the benefit is available could also be raised for
noncontributors.
An alternative approach would be to provide the base-level bene-
fit at age 65 but raise the age for the contributory benefit. This would
provide some income to contributors at 65 but would encourage
them to continue in part-time work until they reach the age when
they can receive their full benefit. For low-income individuals
involved in physically demanding labor, who typically start work
early in their lives, the base-level benefit might represent the major-
ity of their benefit anyway and would allow them to retire after
45 years of contribution. For higher-income individuals who start
work later and typically have less physically demanding jobs, receiv-
ing only the base-level benefit at 65 might encourage them to con-
tinue working.
Other countries might find that they can introduce better controls
on disability spending. Countries spend widely varying amounts on
disability, with differences in benefit levels and in definitions and
practices. Definitions have been moving away from the inability to
do the previous job or the percentage of the body that is impaired
Lessons from Two Decades of Pension Reform and Policy Solutions for the Future 273
and now emphasize incapacity to perform any type of work. On the
other hand, many countries have begun to include illnesses that rely
on subjective assessments, such as mental illnesses and addictions,
which are more prone to fraud. Countries can compare their
spending to that of other countries in the region to determine
whether they could realistically expect reforms in disability to save
expenditure.
Still other countries might find that their contributor benefits can
be reduced. On the top-up benefit to contributors, the question
largely relates to the size of the benefit, since early retirement is
assumed to have been largely eliminated. The inverting pyramid
countries that provide sizable benefits above the base level might find
that these benefits have to be reduced. Higher earnings-related bene-
fits might be possible only through increased private savings, which
can supplement the base-level benefit and the smaller earnings-
related benefit.
It may also be possible to find some cost savings in survivor bene-
fits. Some countries provide benefits to widows and widowers, well
below the retirement age. While orphaned children do need to
receive benefits and those benefits could enable a spouse to stay at
home and care for the children, in general spouses below the retire-
ment age should be encouraged to work.
A measure that might complement, or even substitute for, benefit
reductions is an increase in the retirement age. Such a decision does
not mean giving up all the gains in old-age security made during the
twentieth century, but only returning countries to the benefit dura-
tion they offered in the 1970s, before the last expansion of social
security took place. As noted in chapter 2, people used to expect ben-
efits only for the last 15 years of life. Raising the retirement age is
extremely powerful since it has a three-pronged impact: (a) it reduces
total pension spending by limiting the number of beneficiaries; (b) it
increases pension contribution revenue by increasing the number of
people working who can pay contributions; and (c) by increasing the
labor force, it also has a growth impact on GDP, which results in more
noncontribution fiscal resources that can be used to support old-age
security. If raising the retirement age is coupled with other policies,
the duration of retirement can continue to be somewhat longer than
15 years.
If retirement ages are raised to the point where life expectancy
equals 15 years, most countries will be able to spend about the
same as they currently spend or less, as a percentage of GDP, and
offer similar benefits to those offered today. In figure 7.7, High-
Income Generous Spenders and High-Income Moderate Spenders

274 The Inverting Pyramid
can provide benefits as generous as those that are provided today—
that is, maintaining the same level of average benefit to average
wage—while spending only 9 percent of GDP. This is significantly
below the spending levels for these countries shown in figure 7.6.
The Lower-Spending Transition Countries can provide the same
generosity with only 7 percent of GDP. Young Countries will find
that they need to spend only 4 percent of GDP on average in 2050.
Only the High-Spending Transition Countries will still need to
spend 13 percent of GDP, which is likely to still be unaffordable.
These countries will have to make spending decisions in addition to
increasing the retirement age.
Once a country has decided on a combination of benefit changes,
retirement age increases, and changes to immigration policy, it must
turn its attention to implementation and accompanying policy
changes. The first issue is how to finance the chosen benefit mix. In
countries where the contributory benefits are very close to the base-
level benefit—whether because contributory benefits are low today
FIGURE 7.7Cost of Pension Priorities in 2050 with Retirement Ages Where Life Expectancy Equals 15 Years,Selected European and Central Asian Economies
Sources: Eurostat Statistics Database; United Nations population projections (UN 2011); country-provided data.
Note: The Federation of Bosnia-Herzegovina (BiH Federation) and Republika Srpska, which together make up the country of Bosnia and Herzegovina, have separate
pension systems and are treated as separate data points in the figure.
5
10
15
% o
f GD
P
High-Income
Generous Spenders
High-Income
Moderate Spenders
Lower-Spending
Transition Countries
High-
Spending
Transition
Countries
Young
Countries
Fran
ceS
love
nia
Gre
ece
Bel
gium
Cyp
rus
Ital
yS
pain
Mal
taPo
rtug
alIr
elan
dN
orw
ayU
nite
d K
ingd
omD
enm
ark
Sw
eden
Finl
and
Icel
and
Ger
man
yN
ethe
rlan
dsA
ustr
iaA
lban
iaG
eorg
iaR
ussi
an F
eder
atio
nM
oldo
vaA
rmen
iaB
elar
usLi
thua
nia
Bul
gari
aH
unga
ryEs
toni
aC
zech
Rep
ublic
Latv
iaS
lova
k R
epub
licR
oman
iaPo
land
Cro
atia
BiH
Fed
erat
ion
Rep
ublik
a S
rpsk
aS
erbi
aK
azak
hsta
nA
zerb
aija
nK
yrgy
z R
epub
licK
osov
oTu
rkey
H Ei
Ri
Sbi
K
S
Basic pension for allDisability spendingTop-up for covered populationTTSurvivor spending

Lessons from Two Decades of Pension Reform and Policy Solutions for the Future 275
or because choices were made to reduce contributory benefits in
order to make the system fiscally sustainable—the country may be
well advised to consider moving away from a contributory tax basis
and toward general revenue. In countries where the contributory
benefit is significantly higher than the base-level benefit, the country
may consider financing the base-level benefit through general reve-
nue while maintaining self-contained, contribution-based financing
for the earnings-related contributory benefit. Providing earnings-
related contributory benefits, with higher benefits for higher earners,
from general revenue can be regressive, as is currently the case when
pension deficits, which arise from higher benefits for higher earners,
are financed from general revenues.
Adequacy of benefits will most likely require generation of private
savings. While retirement savings are always desirable, they become
especially important if average contributory benefits become close to
the flat base-level benefit. In this case, there is very little room for
differentiated benefits for higher earners. Wage earners will always
want and expect to have their retirement income somehow relate to
what they earned during their working years. If the public benefit
that middle- and higher-income people receive becomes very low
relative to their past earnings, there will be public pressure to raise
the benefit level for everyone, which may be unaffordable. A better
solution may be to help these individuals generate enough private
savings to complement the lower public benefit and create a link to
their previous earnings from private savings. The policies recom-
mended in chapter 4, including automatic enrollment, well-designed
default options, life-cycle portfolios, and a better institutional struc-
ture for pension funds, can help generate these retirement savings.
Retirement age changes will require complementary labor market
policies. Even raising effective retirement ages to age 65, as was
assumed in figure 7.6, will require active policies on the labor market
side. Moving to the retirement ages of figure 7.7 will require even
more proactive approaches. Early retirement practices need to be
reevaluated and policies that couple part-time retirement with part-
time work need to be instituted. Labor policies that allow discrimina-
tion against older workers, including pay structures that strictly relate
pay to seniority, need to be discouraged. Older workers also need to
have access to retraining opportunities designed to maximize their
learning abilities and to workplace adaptations that can increase their
productivity, as noted in chapter 6.
The bottom line is that countries will be able to provide old-age
security despite the challenging demographics, but they will need
to rethink the level of benefits they can provide and to whom.

276 The Inverting Pyramid
They may also need to return to a duration of retirement closer to
what they had in the 1970s, before increasing generosity lengthened
the time most people spend in retirement.
References
Eurostat Statistics Database. European Commission, Brussels. http://epp .eurostat.ec.europa.eu/portal/page/portal/statistics/search_database.
Lafortune, Gaétan, Gaëlle Balestat, and the Disability Study Expert Group Members. 2007. “Trends in Severe Disability among Elderly People: Assessing the Evidence in 12 OECD Countries and the Future Implications.” OECD Health Working Paper 26, Organisation for Economic Co-operation and Development, Paris.
Pallares-Miralles, Montserrat, Carolina Romero, and Edward Whitehouse. 2012. “International Patterns of Pension Provision II: A Worldwide Overview of Facts and Figures.” Social Protection Discussion Paper 70319, World Bank, Washington, DC.
UN (United Nations). 2011. World Population Prospects: The 2010 Revision. New York: United Nations, Department of Economic and Social Affairs, Population Division. CD-ROM.


ECO-AUDIT
Environmental Benefits Statement
The World Bank is committed to preservingendangered forests and natural resources. The Inverting Pyramid was printed on recy-dcled paper with 30 percent postconsumer fiberin accordance with the recommended stand-ards for paper usage set by the Green Press Initiative, a nonprofit program supportingpublishers in using fiber that is not sourcedfrom endangered forests. For more informa-tion, visit www.greenpressinitiative.org.
Saved:• 15 trees• 7 million British
thermal units oftotal energy
• 1,232 pounds ofnet greenhousegases
• 6,689 gallons ofwaste water
• 448 pounds ofsolid waste

