the influence of interface polarization on the determination of lithium transference numbers of salt...
TRANSCRIPT
Tt
Ma
b
c
a
ARR2AA
KLPEDP
1
taitgiotier
ttbti
0h
Electrochimica Acta 114 (2013) 21– 29
Contents lists available at ScienceDirect
Electrochimica Acta
jo u r n al hom ep age: www.elsev ier .com/ locate /e lec tac ta
he influence of interface polarization on the determination of lithiumransference numbers of salt in polyethylene oxide electrolytes
.M. Hillera, M. Joostc, H.J. Goresb, S. Passerinib, H.-D. Wiemhöfera,∗
University of Münster, Institute of Inorganic and Analytical Chemistry, Corrensstrasse 28/30, 48149 Münster, GermanyUniversity of Münster, Department of Physical Chemistry, Corrensstrasse 28/30, 48149 Münster, GermanyUniversity of Münster, Battery Research Laboratory MEET, Corrensstrasse 46, 48149 Münster, Germany
r t i c l e i n f o
rticle history:eceived 19 August 2013eceived in revised form3 September 2013ccepted 24 September 2013vailable online 12 October 2013
a b s t r a c t
Lithium transference numbers, salt diffusion coefficients and effective lithium conductivities are inves-tigated with the steady state polarization method for poly(ethylene oxide) (PEO) based polymerelectrolytes containing lithium bis(oxalato)borate (LiBOB) or lithium bis(trifluoromethanesulfonyl)imide(LiTFSI). We compare the commonly used evaluation technique with our approach. Here, the focus is laidon the potential relaxation of the polarized sample which delivers information about the salt diffusionand the potential distribution in symmetric Li/electrolyte/Li cell. The new approach circumvents the
eywords:ithium transference numbersEOffective lithium conductivityiffusion coefficientoly(ethylene oxide)
well-known initial current issue and thus increases the reliability of the experiment. The temperaturedependence of the lithium transference numbers and the importance of data acquisition time are alsodiscussed. The highest lithium transference numbers are 0.19 for P(EO)60·LiTFSI at 90 ◦C.
© 2013 Elsevier Ltd. All rights reserved.
. Introduction
Since the pioneering work of Fenton et al. on salt-in-P(EO) solu-ions [1] and the subsequent findings of Armand et al. who proposednd tested them as solid polymer electrolytes (SPE) for lithiumon batteries (LIB) [2], polymer electrolytes represent a challengingopic in the search for alternative battery electrolytes. The interestrows in parallel to the increasing focus on higher safety and stabil-ty and high energy density batteries, although the DC conductivityf pure salt-in-polymer electrolytes is distinctly lower as comparedo liquid organic solvents used in most current lithium cells. Recentnvestigations show that polymer based hybrid, gel and multilayerlectrolytes open up a great potential for future improvementsegarding conductivity as well as safety and stability.
For further development, the main issues to concentrate onhe enhancement of the partial conductivity of lithium ions, i.e.heir transference number. Further, the control of the interfacesetween electrolyte and the active electrode particles, especially
he achievement of stable reaction layers at the negative electrodess necessary. For future types of lithium batteries, electrolytes∗ Corresponding author. Tel.: +49 251 83 33115.E-mail address: [email protected] (H.-D. Wiemhöfer).
013-4686/$ – see front matter © 2013 Elsevier Ltd. All rights reserved.ttp://dx.doi.org/10.1016/j.electacta.2013.09.138
are desirable which form long-term stable interfaces to metalliclithium electrodes.
It is evident, that detailed information on the relative contri-bution of cations and anions to the total charge transport in apractical lithium-polymer battery will be useful in order to assessthe effects of chemical and structural modifications of the polymerand lithium salts or the influence of additives. Hence, it is especiallyhelpful to measure the transference number of lithium ions besidesthe total conductivity. For polymer based electrolytes, this cov-ers consideration of incomplete salt dissociation, formation of saltconcentration gradients and the role of the electrolyte/electrodeinterface and possible reaction layers, for instance, the well-knownsolid electrolyte interface (SEI) formation at anodes with a partic-ular interest for lithium metal anodes.
Accordingly, this work is not only focusing on the efficiency oflithium ion transport in polymer based electrolytes, but also to theanalysis of the influence of reaction layers (= SEI) between lithiummetal and polymer electrolyte in terms of their time and frequencydependent contributions to the typical polarization experiment. Inthis context, the reaction layers (= SEI) at the electrode interfacesare treated as additional thin electrolyte films with different partial
ionic conductivities in series to the bulk electrolyte. The SEI forma-tion of polymer electrolytes at lithium metal anodes (and also otheranode materials) has been investigated much less than SEI forma-tion at graphite anodes with liquid organic solvents up to now. In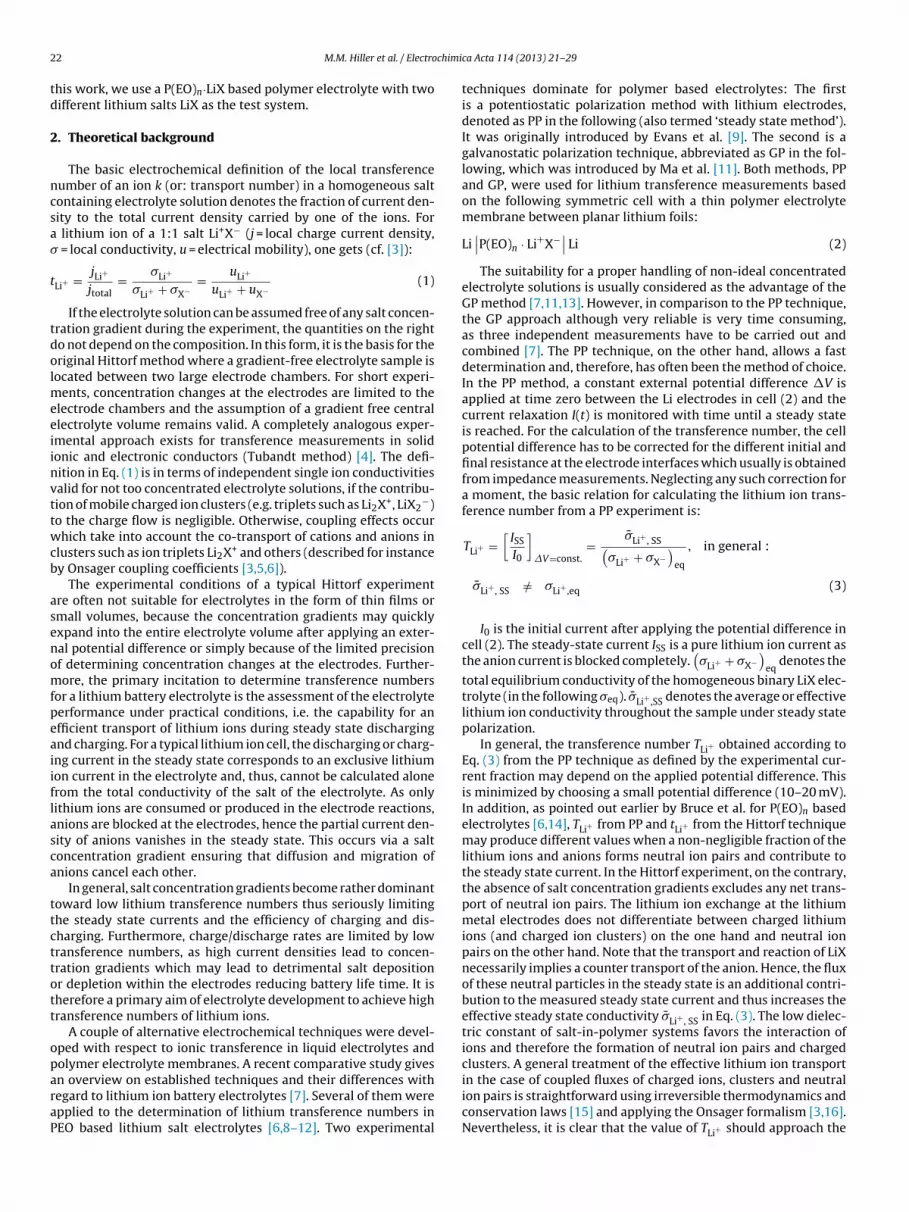
2 chimi
td
2
ncsa�
t
tdolmeeiinvttwcb
asenomfpeaiiflasca
ttcttott
oparaP
2 M.M. Hiller et al. / Electro
his work, we use a P(EO)n·LiX based polymer electrolyte with twoifferent lithium salts LiX as the test system.
. Theoretical background
The basic electrochemical definition of the local transferenceumber of an ion k (or: transport number) in a homogeneous saltontaining electrolyte solution denotes the fraction of current den-ity to the total current density carried by one of the ions. For
lithium ion of a 1:1 salt Li+X− (j = local charge current density, = local conductivity, u = electrical mobility), one gets (cf. [3]):
Li+ = jLi+
jtotal= �Li+
�Li+ + �X−= uLi+
uLi+ + uX−(1)
If the electrolyte solution can be assumed free of any salt concen-ration gradient during the experiment, the quantities on the righto not depend on the composition. In this form, it is the basis for theriginal Hittorf method where a gradient-free electrolyte sample isocated between two large electrode chambers. For short experi-
ents, concentration changes at the electrodes are limited to thelectrode chambers and the assumption of a gradient free centrallectrolyte volume remains valid. A completely analogous exper-mental approach exists for transference measurements in solidonic and electronic conductors (Tubandt method) [4]. The defi-ition in Eq. (1) is in terms of independent single ion conductivitiesalid for not too concentrated electrolyte solutions, if the contribu-ion of mobile charged ion clusters (e.g. triplets such as Li2X+, LiX2
−)o the charge flow is negligible. Otherwise, coupling effects occurhich take into account the co-transport of cations and anions in
lusters such as ion triplets Li2X+ and others (described for instancey Onsager coupling coefficients [3,5,6]).
The experimental conditions of a typical Hittorf experimentre often not suitable for electrolytes in the form of thin films ormall volumes, because the concentration gradients may quicklyxpand into the entire electrolyte volume after applying an exter-al potential difference or simply because of the limited precisionf determining concentration changes at the electrodes. Further-ore, the primary incitation to determine transference numbers
or a lithium battery electrolyte is the assessment of the electrolyteerformance under practical conditions, i.e. the capability for anfficient transport of lithium ions during steady state dischargingnd charging. For a typical lithium ion cell, the discharging or charg-ng current in the steady state corresponds to an exclusive lithiumon current in the electrolyte and, thus, cannot be calculated alonerom the total conductivity of the salt of the electrolyte. As onlyithium ions are consumed or produced in the electrode reactions,nions are blocked at the electrodes, hence the partial current den-ity of anions vanishes in the steady state. This occurs via a saltoncentration gradient ensuring that diffusion and migration ofnions cancel each other.
In general, salt concentration gradients become rather dominantoward low lithium transference numbers thus seriously limitinghe steady state currents and the efficiency of charging and dis-harging. Furthermore, charge/discharge rates are limited by lowransference numbers, as high current densities lead to concen-ration gradients which may lead to detrimental salt depositionr depletion within the electrodes reducing battery life time. It isherefore a primary aim of electrolyte development to achieve highransference numbers of lithium ions.
A couple of alternative electrochemical techniques were devel-ped with respect to ionic transference in liquid electrolytes andolymer electrolyte membranes. A recent comparative study gives
n overview on established techniques and their differences withegard to lithium ion battery electrolytes [7]. Several of them werepplied to the determination of lithium transference numbers inEO based lithium salt electrolytes [6,8–12]. Two experimentalca Acta 114 (2013) 21– 29
techniques dominate for polymer based electrolytes: The firstis a potentiostatic polarization method with lithium electrodes,denoted as PP in the following (also termed ‘steady state method’).It was originally introduced by Evans et al. [9]. The second is agalvanostatic polarization technique, abbreviated as GP in the fol-lowing, which was introduced by Ma et al. [11]. Both methods, PPand GP, were used for lithium transference measurements basedon the following symmetric cell with a thin polymer electrolytemembrane between planar lithium foils:
Li∣∣P(EO)n · Li+X−∣∣ Li (2)
The suitability for a proper handling of non-ideal concentratedelectrolyte solutions is usually considered as the advantage of theGP method [7,11,13]. However, in comparison to the PP technique,the GP approach although very reliable is very time consuming,as three independent measurements have to be carried out andcombined [7]. The PP technique, on the other hand, allows a fastdetermination and, therefore, has often been the method of choice.In the PP method, a constant external potential difference �V isapplied at time zero between the Li electrodes in cell (2) and thecurrent relaxation I(t) is monitored with time until a steady stateis reached. For the calculation of the transference number, the cellpotential difference has to be corrected for the different initial andfinal resistance at the electrode interfaces which usually is obtainedfrom impedance measurements. Neglecting any such correction fora moment, the basic relation for calculating the lithium ion trans-ference number from a PP experiment is:
TLi+ =[
ISS
I0
]�V=const.
= �̄Li+ , SS(�Li+ + �X−
)eq
, in general :
�̄Li+ , SS /= �Li+ ,eq (3)
I0 is the initial current after applying the potential difference incell (2). The steady-state current ISS is a pure lithium ion current asthe anion current is blocked completely.
(�Li+ + �X−
)eq
denotes the
total equilibrium conductivity of the homogeneous binary LiX elec-trolyte (in the following �eq). �̄Li+ ,SS denotes the average or effectivelithium ion conductivity throughout the sample under steady statepolarization.
In general, the transference number TLi+ obtained according toEq. (3) from the PP technique as defined by the experimental cur-rent fraction may depend on the applied potential difference. Thisis minimized by choosing a small potential difference (10–20 mV).In addition, as pointed out earlier by Bruce et al. for P(EO)n basedelectrolytes [6,14], TLi+ from PP and tLi+ from the Hittorf techniquemay produce different values when a non-negligible fraction of thelithium ions and anions forms neutral ion pairs and contribute tothe steady state current. In the Hittorf experiment, on the contrary,the absence of salt concentration gradients excludes any net trans-port of neutral ion pairs. The lithium ion exchange at the lithiummetal electrodes does not differentiate between charged lithiumions (and charged ion clusters) on the one hand and neutral ionpairs on the other hand. Note that the transport and reaction of LiXnecessarily implies a counter transport of the anion. Hence, the fluxof these neutral particles in the steady state is an additional contri-bution to the measured steady state current and thus increases theeffective steady state conductivity �̄Li+ , SS in Eq. (3). The low dielec-tric constant of salt-in-polymer systems favors the interaction ofions and therefore the formation of neutral ion pairs and chargedclusters. A general treatment of the effective lithium ion transport
in the case of coupled fluxes of charged ions, clusters and neutralion pairs is straightforward using irreversible thermodynamics andconservation laws [15] and applying the Onsager formalism [3,16].Nevertheless, it is clear that the value of TLi+ should approach the
chimica Acta 114 (2013) 21– 29 23
Hac
tiIdalbmantGbehpotstameiew
twilaaiwrp
3
3
sLt1MPfds2Mmifi
3
p
M.M. Hiller et al. / Electro
ittorf value of Eq. (1) as the applied external potential differencend the concentration gradients approach zero provided that wean neglect the contribution of neutral ion pairs.
Experimental evidence for ion pairing and contribution to ionransport in concentration gradients was reported and discussedn a number of investigations on polymer electrolytes [17–19].t is also clear that the lithium ion transference numbers shouldepend on the choice and concentration of the lithium salt as wells on the temperature. For instance, Appetecchi et al. analyzedithium transference for ratios n in P(EO)n·LiBOB (LiBOB = lithiumis(oxalato)borate) ranging between 20 and 100 using a slightlyodified version of the PP technique of Evans et al. [20]. They
pplied potential differences of 30 mV and reported transferenceumbers ranging between 0.25 and 0.3 at ambient tempera-ure. Another investigation by Edman et al. [13] based on theP method was carried out on P(EO)n·LiTFSI (LiTFSI = lithiumis(trifluoromethanesulfonyl)imide and yielded lithium transfer-nce numbers from 0.17 (for n = 30) to 0.60 (for n = 5). On the otherand, another study using the PP method gave 0.12–0.13 for a sam-le P(EO)30·LiTFSI [21]. For the system P(EO)8·LiClO4, Bruce et al.btained lithium transference numbers around 0.05 using the Hit-orf method in contrast to 0.20 as measured with the PP method anduggests as probable explanation the additional ion pair contribu-ion to the steady state current in the PP technique [6]. Hence, therere clear deviations among the different techniques. A part of theseay be due to different assumptions and restrictions in the various
xperiments [7], a great deal, however, results from experimentalnfluences such as reaction layers at interfaces between polymerlectrolyte and lithium metal contacts (SEI). Accordingly, the latterill be one of the key issues as described in the following.
We have chosen the steady state potentiostatic polarizationechnique (PP) for analyzing the lithium ion transference [9]. Itill be combined with an extended analysis of the initial and final
mpedance in the PP technique. We also make use of the short andong time relaxation of the concentration gradients directly after
steady-state PP experiment. Particular attention is paid to thenalysis of the initial fast, short-time current decay, as former stud-es pointed to a predominant error influence from that [20]. There
ere also doubts whether the evaluation of the ohmic interfaceesistance of the SEI is reliable enough for correction of the appliedotential difference.
. Experimental
.1. Synthesis of P(EO)-membranes
The polymer electrolyte films were easily prepared by aolvent-free technique already described in the literature [22].ithium bis(trifluoromethanesulfonyl)imide, LiTFSI (99.9 wt%, bat-ery grade, purchased from 3 M) was vacuum dried (10−7 mbar) at10 ◦C for 48 h prior to use. The P(EO) (Dow Chemical, WSR 301,W = 4.000.000) was vacuum dried at 50 ◦C for 48 h prior to use.
(EO) and LiTFSI (EO/Li mole ratio = 60, denoted by the short-handormula P(EO)60·LiTFSI) were mixed in a flask under dry room con-itions (average dew point: −50 ◦C) with a spatula and vacuumealed in a pouch bag followed by annealing at 100 ◦C for at least4 h. The resulting bulk mixture was sandwiched between twoylar® foils and hot-pressed at 100 ◦C and 10–100 bar for severalinutes to obtain ∼100 �m films. Based on the very low humid-
ty level in the starting materials and considering that all furtherabrication steps were performed in a dry room, the water contam-nation of the SPE films is assumed to be as low as a few ppm.
.2. Thermal analysis
The differential scanning calorimetry (DSC) measurements wereerformed using a DSC 204 F1 Phoenix (Netzsch) calorimeter.
Fig. 1. DSC heating curves of P(EO)60·LiTFSI and P(EO)60·LiBOB.
The DSC samples were filled into aluminum pans under argonatmosphere with controlled moisture (<0.6 ppm) and oxygen(<0.1 ppm) levels. The polymer electrolytes were cooled to 123 Kwith 20 K/min, held for 15 min and then heated up with 10 K/minto 450 K. Fig. 1 shows the typical heating scans for samples with dif-ferent salts. In both cases, i.e. for P(EO)32·LiBOB and P(EO)60·LiTFSI,the third heating curve is shown in the temperature range between200 K and 420 K. The presented Tg-values were specified as theonset of the heat capacity increase.
At low temperatures, i.e. at 230 K with the salt LiTFSI and at 250 Kwith LiBOB, one observes a second order phase transition in Fig. 1.This marks the glass transition temperatures (Tg) of the amorphousphase of the P(EO) solvent. The crystalline domains of P(EO) meltat Tm = 338 K (LiTFSI) and Tm = 340 K (LiBOB). All electrochemicalmeasurements performed at 60 ◦C or higher therefore correspondto the completely amorphous samples.
3.3. Cell set-up
Lithium transference number measurements were carried outin symmetric Swagelok®-cells assembled under argon atmosphereunder controlled moisture (<0.3 ppm) and oxygen (<1.0 ppm) lev-els. The investigated membranes were cut into circular discs(Ø = 12.5 mm) with a mean thickness of 100–200 �m. Two lithiumfoils (Rockwood Lithium GmbH, 99.99%) were used as reversibleelectrodes (Ø = 12 mm) for lithium ion exchange on both sides ofthe polymer membrane. A two electrode Swagelok-cell was used(area A = 1.13 cm2). After preparation of a cell set-up, the impedanceof the polymer/lithium boundary was monitored in order to followthe formation of a stable SEI. Usually, the cell impedance convergedafter a few days to a constant value [9].
All transference number measurements were performed inthe temperature range 50–90 ◦C. According to the original paper[9], at each measurement temperature, the lithium transferencecells were thermally equilibrated for at least 8 h (AC-200, ThermoScientific). Temperature fluctuations did not exceed ±0.02 K.The complete transference experiments including the interme-diate impedance measurements were performed and controlledusing a computer controlled potentiostat (Autolab PGSTAT302N,Metrohm, Nova software V 1.6). The temperature control was real-ized with an external program.
3.4. Evaluation of transference experiments
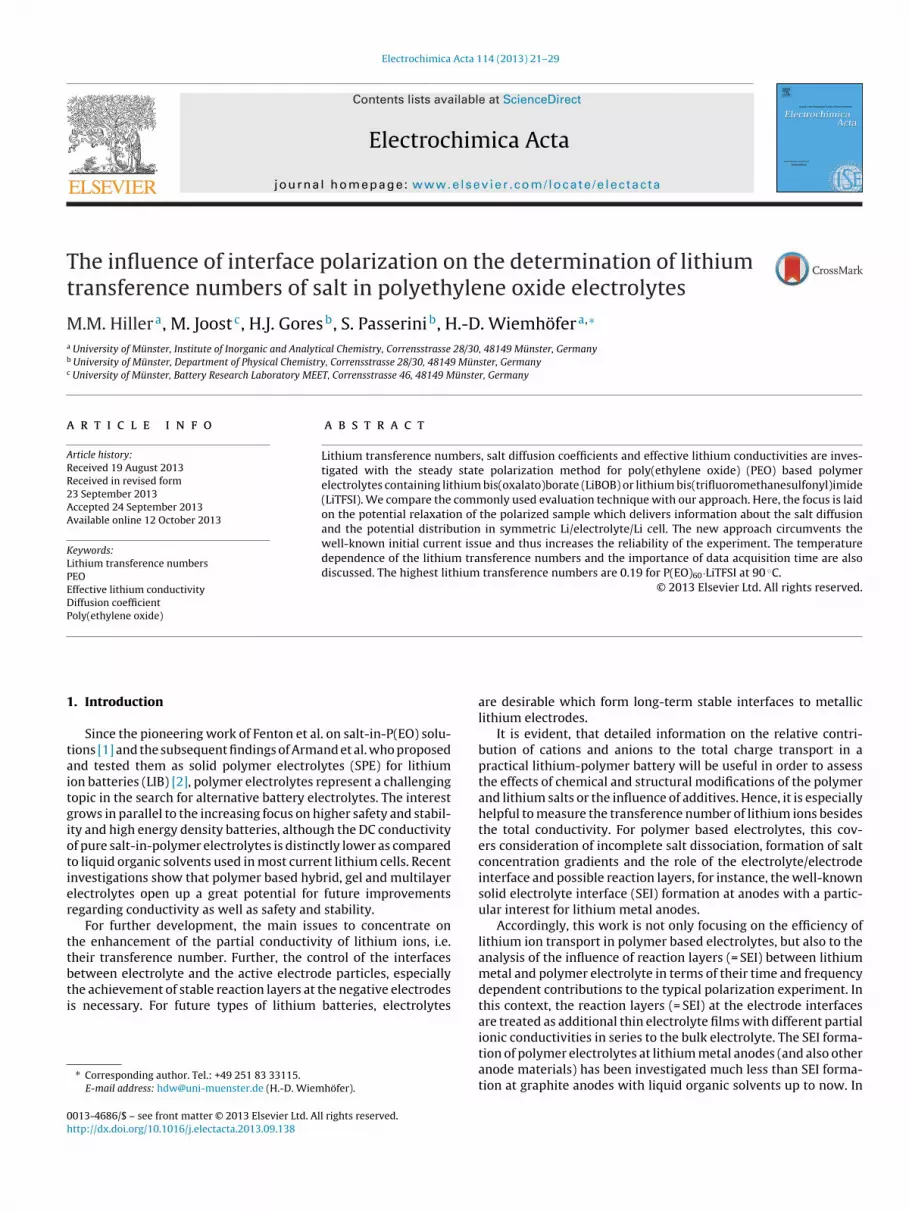
Fig. 2 illustrates the typical steps in a transference number mea-surement. Our approach is a slightly modified version of the method
24 M.M. Hiller et al. / Electrochimica Acta 114 (2013) 21– 29
Fig. 2. Measurement procedure for lithium transference experiments at a cer-ti
itatlsdrtpitStp
tsuamliDtrOificfbtm
i0abr(
etde
the initial salt concentration c0. We replace the salt concentrations′′ ′
ain temperature illustrated with typical experimental data (EIS = electrochemicalmpedance spectroscopy).
ntroduced by Evans et al. [9]. A typical experiment consisted ofwo AC impedance measurements combined with an intermedi-te DC polarization in the symmetric cell (2). After ascertaininghe formation of a stable SEI in a fresh cell between polymer andithium electrodes by impedance, the typical transference mea-urement started by polarizing the cell with constant potentialifference �V for a sufficient time. The steady state was usuallyeached after 1–10 h, depending on thickness and conductivity ofhe samples. Then, the impedance was measured again before theotential difference was switched off. To avoid any influence of the
mpedance measurement on the following open circuit relaxation,he applied potential difference was maintained for another 500 s.ubsequently, the open circuit potential decay �E(t) was moni-ored with time (the observation time was usually similar to therevious the polarization time).
The impedance was measured in the frequency range of 1 MHzo 1 Hz with an AC amplitude of 10 mV (rms). Impedance mea-urements with a frequency lower than 1 Hz are not advisable asndesired polarization of the electrolyte at low frequencies occursnd affects the results (the electrolyte should be unpolarized beforeeasurement). The impedance contribution due to the SEI of at the
ithium foils, i.e. Li | SEI, was determined immediately before polar-zation and at the end of the DC polarization but still under appliedC bias to obtain the resistances in a defined state. When measuring
he final impedance of the sample during the beginning open circuitelaxation, an ill-defined transient state would have been chosen.n the other hand, when an impedance measurement is carried out
n the presence of an applied DC bias, a close look on the Lissajousgures is advisable to exclude any interference and non-linearityoming from the DC bias. A plot of AC current vs. AC potential dif-erence should show a perfect symmetric shape to the origin foroth: open circuit and biased conditions. As Fig. 3 proves, this ishe case and, thus, the DC bias had no influence on the impedance
easurement.The analysis of the frequency dependent initial and final
mpedances in a medium frequency range yielded R0,SEI (indices: = initial state before polarization step at t = 0, SEI = reaction layer)nd RSS,SEI (SS = steady-state polarized sample) which were usedelow to eliminate the interface influence. In addition, after cur-ent interruption, the relaxation of the open circuit cell potential�E) was monitored as a function of time.
For the DC polarization, the applied constant potential differ-nce �V was set to 10 mV. From the time dependent current I(t),
he initial current (I0) and the final steady-state current (ISS) wereetermined. In order to calculate TLi+, the overpotential at thelectrode interfaces (SEI) has to be subtracted from the appliedFig. 3. Lissajous curve: the AC current as function of AC potential difference at6.7 kHz with and without applied DC bias is symmetric to the center and, thus,shows no non-linear contribution.
potential difference. Using R0,SEI for the initial and RS,SEI for the finalinterface resistance, the following equation results [9]:
TLi+ =(
�Li+)
eff(�Li+ + �X−
)eq
= ISS (�V − I0R0,SEI)I0 (�V − ISSRSS,SEI)
(4)
We introduce the electrolyte resistance Rel for the equilibriumelectrolyte according to:
Rel = d(�Li+ + �X−
)eq
A= �V − I0R0,SEI
I0(5)
d and A denote electrolyte thickness and electrode contact area.With the definition (5), Eq. (4) can be rewritten to give [5,16]:
TLi+ = RelISS
�V − ISSRSS,SEI(6)
Using Rel from an impedance measurement according to Eq. (6),omits the determination of the initial current I0 (for the use in Eq.(4)) which is obtainable with rather limited accuracy only.
Our additional interest is directed to the influence of the polar-ized SEI at the interface Li-metal | polymer electrolyte during the PPexperiments. In the following, we discuss the contributions to theopen circuit cell potential difference after switching-off the exter-nal potential difference. It is denoted as �E(t) and reflects the timedependent decay of the concentration gradient which was built upin the cell before. For a polarized cell (2), �E(t) is given by the well-known formula of a concentration cell with transference accordingto [11,23]:
�E(t) = −2RT
FtX− ln
[f ′′± c′′±f ′± c′±
](7)
Here, tX− is an average transference number over the samplethickness, i.e. over the current salt concentration gradient. c
′′± and c
′±
(with c′′±≥c
′±) denote the time dependent molar salt concentrations
in front of the right and left lithium electrode of cell (2), respec-tively. f
′′± and f
′± denote the corresponding mean activity coefficients
of the ions. As mentioned before, the applied potential difference�V is small, which allows some simplifications of Eq. (7). First, thechange of the ionic activity coefficient can be considered negli-gible. The salt concentration changes will be small compared to
at the two boundaries by c± = c0 + �c(t)/2 and c± = c0 − �c(t)/2,where |�c(t)| << c0 for all t. Approximating the natural log-arithm under these conditions according to ln(1 ± x) ≈ ± x finally

chimi
g
�
rta
�
�tsTa
�
i
�
ietsbcnmcgtie�wfmse�
�
idb�z
T
M.M. Hiller et al. / Electro
ives:
E(t) ∼= −2 RT
F· tX−
�c(t)c0
if �E(t) <RT
F,
|�c(t)| << c0 (8)
Eq. (8) can be written in a convenient form by introducing theatio of the concentration change at a general time t to that atime zero and the initial value �E(0) of the cell potential differenceccording to:
E(t) ∼= −(
2 tX− RT
F
�c1
c0
)· �c(t)
�c1= �E(0) · �c(t)
�c1(9)
Extrapolation of �E(t) to t = 0 should give an accurate value forE(0). As shown in the appendix, the solution of the diffusion equa-
ion for the conditions during the concentration relaxation afterwitching off from the steady state can be simplified in two cases.his allows to evaluate �E(0) in two ways. For long times, thepproximation Eq. (B.3) yields:
E(t) ∼= �E(0) · �c(t)�c1
= �E(0) · 8�2
exp
[−�2Dt
d2
]for large t
(10)
For very short times, the second approximation from Eq. (B.4)n the appendix yields:
E(t) ∼= �E(0) · �c(t)�c1
= �E(0) ·(
1 − 2
√4Dt
�d2
)
for small values of t (11)
Both approximations deliver a straightforward way of obtain-ng the initial cell potential difference just after switching off thexternal polarization �V. Now the question arises how much of theotal open circuit potential �E(t) is due to the SEI films. As they aretable and permeable to lithium ions, we infer that SEI films cane seen as polymeric electrolyte layers as well. However, their saltoncentration, their total ionic conductivity, and their transferenceumbers may have different values as compared to the bulk poly-er electrolyte. The same can be expected for the salt interdiffusion
oefficient which determines the relaxation of salt concentrationradients within the SEI films. The observed additional ohmic resis-ance which builds up with time at the Li | polymer electrolytenterfaces is a safe indication for these assumptions. Hence, wexpect that the relaxation curve of the total cell potential differenceE(t) should contain information on the concentration relaxationithin the SEI for short times. It may, however, be necessary to care
or a superposition of this and the double layer relaxation whichay happen in the same time domain. First, we define an expres-
ion where �E(t) is expressed by the contributions of the bulklectrolyte domain by �ϕel(t) and the polymer/lithium interface byϕSEI(t) (the latter containing charge transfer and SEI-resistance):
E(t) = �ϕel(t) + �ϕSEI(t) (12)
If one can separate the bulk contribution ��el(t) from thenterface contributions in Eq. (12), for instance, by making use ofifferent time domains and relaxation time constants, there wille another way to calculate the transference number TLi+ . Usingϕel(0) as the bulk potential difference extrapolated to the time
ero after switching off �V, one may write instead of Eq. (4):
Li+ = RelyISS
�ϕely (o)with �ϕely (0) = �V − ISSRSS,bd (13)
ca Acta 114 (2013) 21– 29 25
The determination of the initial potential difference �ϕel(0) inthe electrolyte can be performed by monitoring the long time relax-ation of �E(t) and comparing the experimental curve with theexpected relaxation function as derived from the solution of thediffusion problem for �c(t). Extrapolation of this to the time t = 0when the external potential difference was switched off gives thepotential difference applied to the electrolyte �ϕel(0).
3.5. Experimental precision
The current and potential accuracy of the used potentiostat is±0.2%, the fit-error for the determination of �ϕel is ±0.001 mV(= ± 0.02%) for the short-time decay according to Eq. (11). Thusfor this determination, an overall error of ∼1% is estimated for Eq.(13). Hence, the TLi+ values display three significant digits with anestimated error of ca. ±0.001. If instead the original technique isused and evaluated with Eq. (4), the estimated error is ∼2% (sumof potentiostat accuracy for each variable in the equation). In thiswork, a batch of three samples is analyzed in parallel to minimizesample related errors.
4. Results
4.1. Impedance measurement
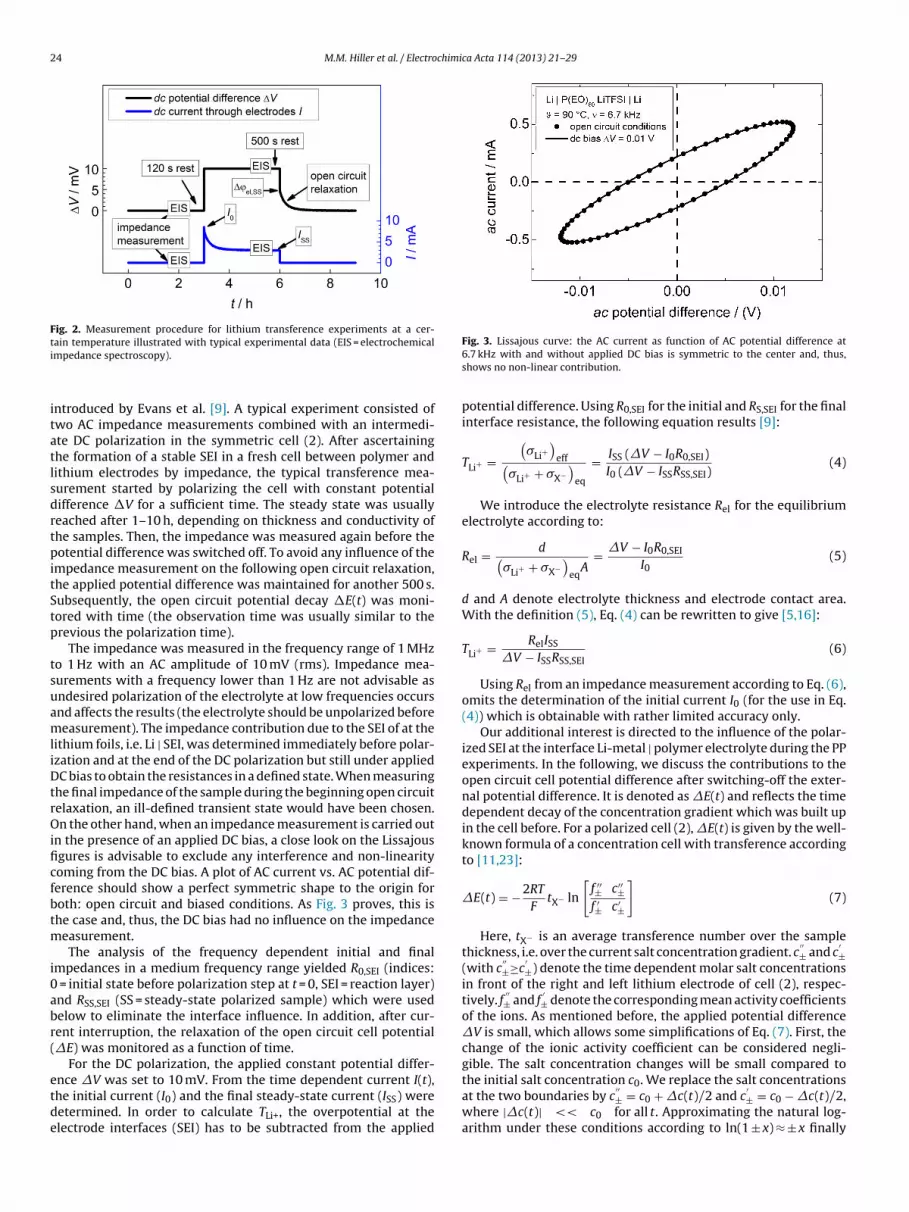
Fig. 4 shows the Nyquist plot of the impedance of a typicalsample, here P(EO)60·LiTFSI, measured at 90 ◦C in the symmetriccell (2), i.e. Li | Polymer | Li. The diagram compares two sets ofdata, those before applying a DC potential difference and thoseunder steady-state conditions in order to give an impression onthe changes during a PP experiment. The polymer electrolyte resis-tance is given by the high frequency intersection with the real axisin Fig. 4 on the left. The central feature between 0.2 MHz and 54 Hzis a slightly deformed semicircle with a characteristic frequencyof 6.7 kHz. Normally, a Randles circuit is chosen for an electrodewith charge transfer. However, the fitting is only possible with twodepressed semi-circles with slightly different capacities (∼1 �F).The additional presence of a reaction layer (SEI) will superim-pose an additional contribution, which cannot be separated fromthe charge transfer. Hence, the deformed semi-circle should beattributed to the electrode interface. The data is thus fitted with aelectrolyte resistance Rel in series with two R-CPE-elements whichhas been also used by other authors for the same type of measure-ments [7]. The frequency dependence of the imaginary impedancecomponent is shown on the right of Fig. 4 for three different tem-peratures. The maximum there corresponds to the maximum of thesemi-circle in the Nyquist plot of Fig. 4. The shift of the maximumtoward higher frequency with temperature indicates the decreaseof the SEI resistance RSEI. The frequency at which the minimum ofthe phase angle occurs marks the end of the relaxation of the SEIand charge transfer resistance. Thus for further analysis, this valueis considered as a reasonable short time limit for the evaluation of�E(t) and the corresponding bulk electrolyte properties.
4.2. Polarization step and current–time curve
Fig. 5 shows the current response vs. time during a potentiostaticpolarization step. Within a few seconds after starting the potentio-static polarization (�E = 10 mV), the current drops from the initialvalue I0 = 0.37 mA to the steady state current of ISS = 0.16 mA. Asmentioned above, the current response for small times is thus asum of the double layer charging and the lithium plating/stripping
process which are inseparable. This leads to an overestimation of I0.At longer times, one can expect the relaxation due to building up ofthe salt concentration gradient in the SEI and the bulk polymer elec-trolyte. The current becomes almost constant after about 20 min at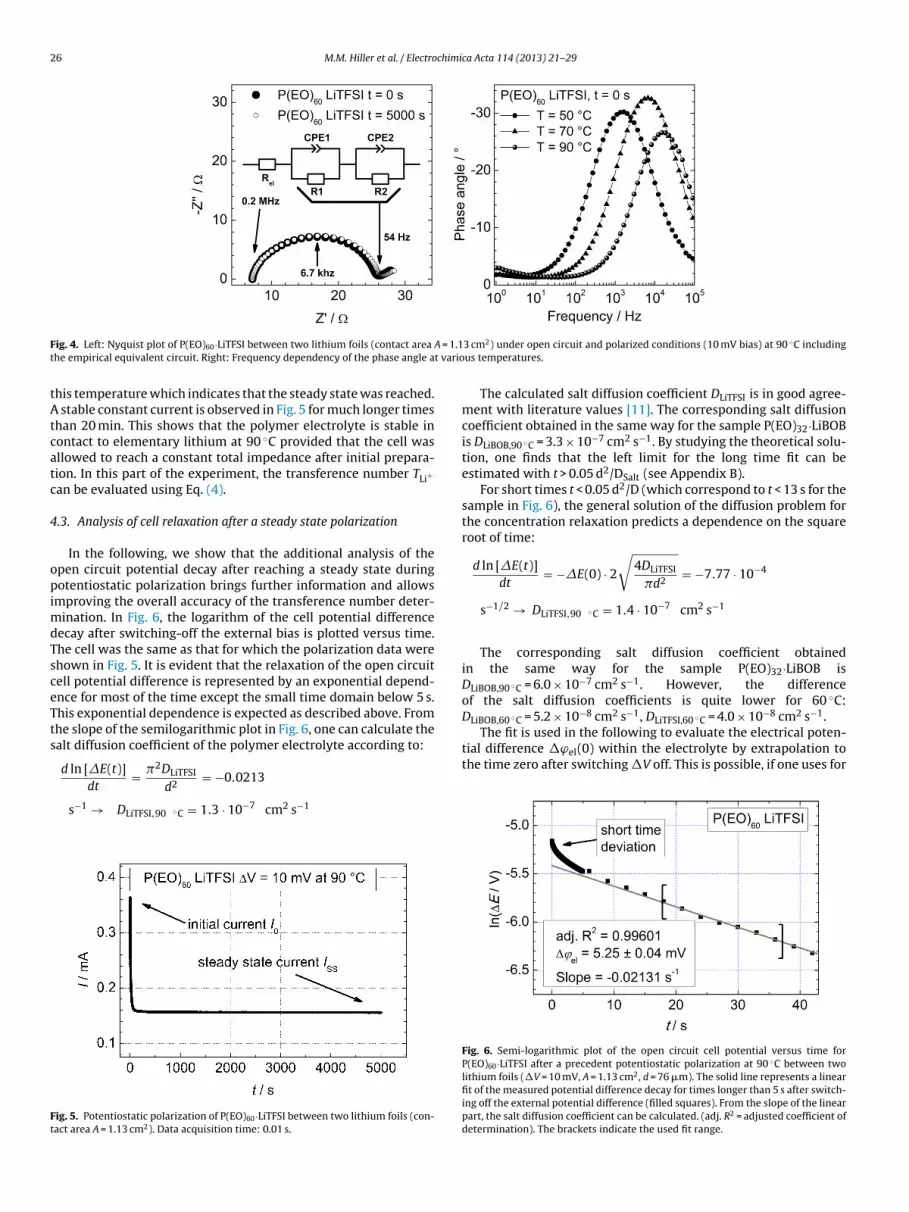
26 M.M. Hiller et al. / Electrochimica Acta 114 (2013) 21– 29
F A = 1.1t t vario
tAtcatc
4
opimdTsceTts
Ft
DLiBOB,60 ◦C = 5.2 × 10 cm s , DLiTFSI,60 ◦C = 4.0 × 10 cm s .The fit is used in the following to evaluate the electrical poten-
tial difference �ϕel(0) within the electrolyte by extrapolation tothe time zero after switching �V off. This is possible, if one uses for
ig. 4. Left: Nyquist plot of P(EO)60·LiTFSI between two lithium foils (contact area
he empirical equivalent circuit. Right: Frequency dependency of the phase angle a
his temperature which indicates that the steady state was reached. stable constant current is observed in Fig. 5 for much longer times
han 20 min. This shows that the polymer electrolyte is stable inontact to elementary lithium at 90 ◦C provided that the cell wasllowed to reach a constant total impedance after initial prepara-ion. In this part of the experiment, the transference number TLi+an be evaluated using Eq. (4).
.3. Analysis of cell relaxation after a steady state polarization
In the following, we show that the additional analysis of thepen circuit potential decay after reaching a steady state duringotentiostatic polarization brings further information and allows
mproving the overall accuracy of the transference number deter-ination. In Fig. 6, the logarithm of the cell potential difference
ecay after switching-off the external bias is plotted versus time.he cell was the same as that for which the polarization data werehown in Fig. 5. It is evident that the relaxation of the open circuitell potential difference is represented by an exponential depend-nce for most of the time except the small time domain below 5 s.his exponential dependence is expected as described above. Fromhe slope of the semilogarithmic plot in Fig. 6, one can calculate thealt diffusion coefficient of the polymer electrolyte according to:
d ln [�E(t)] �2DLiTFSI
dt=
d2= −0.0213
s−1 → DLiTFSI,90 ◦C = 1.3 · 10−7 cm2 s−1
ig. 5. Potentiostatic polarization of P(EO)60·LiTFSI between two lithium foils (con-act area A = 1.13 cm2). Data acquisition time: 0.01 s.
3 cm2) under open circuit and polarized conditions (10 mV bias) at 90 ◦C includingus temperatures.
The calculated salt diffusion coefficient DLiTFSI is in good agree-ment with literature values [11]. The corresponding salt diffusioncoefficient obtained in the same way for the sample P(EO)32·LiBOBis DLiBOB,90 ◦C = 3.3 × 10⁻⁷ cm2 s−1. By studying the theoretical solu-tion, one finds that the left limit for the long time fit can beestimated with t > 0.05 d2/DSalt (see Appendix B).
For short times t < 0.05 d2/D (which correspond to t < 13 s for thesample in Fig. 6), the general solution of the diffusion problem forthe concentration relaxation predicts a dependence on the squareroot of time:
d ln [�E(t)]dt
= −�E(0) · 2
√4DLiTFSI
�d2= −7.77 · 10−4
s−1/2 → DLiTFSI,90 ◦C = 1.4 · 10−7 cm2 s−1
The corresponding salt diffusion coefficient obtainedin the same way for the sample P(EO)32·LiBOB isDLiBOB,90 ◦C = 6.0 × 10⁻⁷ cm2 s−1. However, the differenceof the salt diffusion coefficients is quite lower for 60 ◦C:
−8 2 −1 −8 2 −1
Fig. 6. Semi-logarithmic plot of the open circuit cell potential versus time forP(EO)60·LiTFSI after a precedent potentiostatic polarization at 90 ◦C between twolithium foils (�V = 10 mV, A = 1.13 cm2, d = 76 �m). The solid line represents a linearfit of the measured potential difference decay for times longer than 5 s after switch-ing off the external potential difference (filled squares). From the slope of the linearpart, the salt diffusion coefficient can be calculated. (adj. R2 = adjusted coefficient ofdetermination). The brackets indicate the used fit range.

M.M. Hiller et al. / Electrochimica Acta 114 (2013) 21– 29 27
Fig. 7. Analysis of the short-time potential difference decay: Logarithm of cellpotential versus square root of time for P(EO)60·LiTFSI polarized at 90 ◦C betweentor
tfttfievet
4
�sepca(ttbd
itwrb�
Fig. 8. Comparison of the lithium transference numbers of P(EO)60·LiTFSI at vari-ous temperatures calculated with Eq. (4) and Eq. (13). Error bars: median absolutedeviation.
Fig. 9. Comparison of the lithium transference numbers of P(EO)32·LiBOB at vari-
TR
wo lithium foils (A = 1.13 cm2, d = 76 �m). The gray solid line represents a linear fitf the measured values for very short times t < 5 s. The brackets indicate the used fitange.
he fit experimental values above 0.018 s at 90 ◦C where the inter-ace relaxation is already finished (�ϕSEI = 0, fit range indicated byhe brackets). The relaxation is slower at lower temperature andhus 0.1 s are used at 50 ◦C (from EIS-measurement). Hence, weocus on the time domain between 0.02 s and 5 s where the exper-mental curve in Fig. 6 deviates from the linear fit. Fig. 7 shows anvaluation of this range in terms of a semilogarithmic plot of �E(t)s. the square root of time which results in a linear dependence asxpected. A slight deviation starts to appear for the points below1/2 = 0.2 s1/2, i.e. t < 0.04 s (impedance relaxation) [11,24].
.4. Results for the transference number of lithium ions
With the given potential difference across the electrolyteϕel(0), the transport properties can be calculated. A compari-
on of TLi+ calculated with Eq. (4) and (13) for the solid polymerlectrolyte P(EO)60 ·LiTFSI is presented in Fig. 8. For the low tem-erature range of 50–70 ◦C the TLi+ values are slightly higher whenalculated with Eq. (13) instead of Eq. (4), since the interface relax-tion is affecting Eq. (4). The values range from 0.13 to 0.18 (Eq.13)) and increase with temperature. This behavior was also inves-igated by Wiencierz et al. [17] in P(EO)20-1000·NaI electrolytes inhe temperature range from 75 ◦C to 190 ◦C and could be explainedy the different temperature dependence of the anion and cationiffusion coefficients.
Fig. 9 presents the results for the lithium transference numbersn the system P(EO)32·LiBOB. It is evident that TLi+ shows a weakemperature dependence. At 90 ◦C, TLi+ reaches the highest value
ith 0.15. The absence of a distinct temperature dependence andoughly the same transference numbers of LiBOB in P(EO) have alsoeen reported by other authors [20]. Again, the determination ofϕel(0) and thus T+ with Eq. (13) leads to higher values in the
able 1esults of lithium transference number measurements at 50, 70 and 90 ◦C for P(EO)60·LiT
T [◦C] I0 [�A] IS [�A] R0,SEI [�] RSS,SEI [�] R0,el [�] RSS,el [�] �ϕel,short [m
50 15.7 6.5 544 546 109 110 5.67
27.5 10.7 294 291 71.7 71.6 6.14
16.5 5.49 452 451 143 144 6.63
70 112 57.8 75.6 75.7 13.9 13.8 4.99
141 68.0 57.9 58.4 12.5 12.4 5.27
157 65.5 47.5 46.6 15.0 15.0 5.99
90 300 137 25.3 25.8 7.48 7.41 5.69
372 156 18.5 19.1 7.16 7.15 5.89
275 119 25.2 25.8 8.33 8.26 5.72
ous temperatures calculated with Eq. (4) and Eq. (13). Error bars: median absolutedeviation.
low temperature region, because the influence of the interface isavoided.
5. Discussion
Table 1 compiles the measured interface resistances used to cor-rect the experimental current fractions and all other parametersneeded to calculate TLi+ . At lower temperatures, the lithium trans-ference numbers calculated with Eq. (4) are lower compared to Eq.(13). Here, the influence of the interface capacity charging on the I0-
values is evident (cf. Fig. 4, time domain). At higher temperatures,where the interface relaxation is faster, the lithium transferencenumbers are equal for both equations.FSI (three samples, �V = 10 mV).
V] DLiTFSI,short [cm2 s−1] DLiTFSI,long [cm2 s−1] TLi+ (Eq. (4)) TLi+ (Eq. (13))
2.56 × 10⁻⁸ 1.43 × 10⁻⁸ 0.111 0.1272.60 × 10−8 1.71 × 10⁻⁸ 0.110 0.1253.37 × 10−8 1.67 × 10⁻⁸ 0.110 0.1195.94 × 10−8 4.60 × 10⁻⁸ 0.157 0.1607.43 × 10−8 5.65 × 10⁻⁸ 0.154 0.1617.74 × 10−8 6.11 × 10⁻⁸ 0.150 0.1641.11 × 10−7 6.11 × 10⁻⁸ 0.180 0.1781.40 × 10−7 1.13 × 10⁻⁸ 0.183 0.1891.66 × 10−7 1.25 × 10⁻⁸ 0.192 0.172
28 M.M. Hiller et al. / Electrochimi
FcL
dttod9irfLslo�
6
paLt�dswfbApabpetlqLtati
�
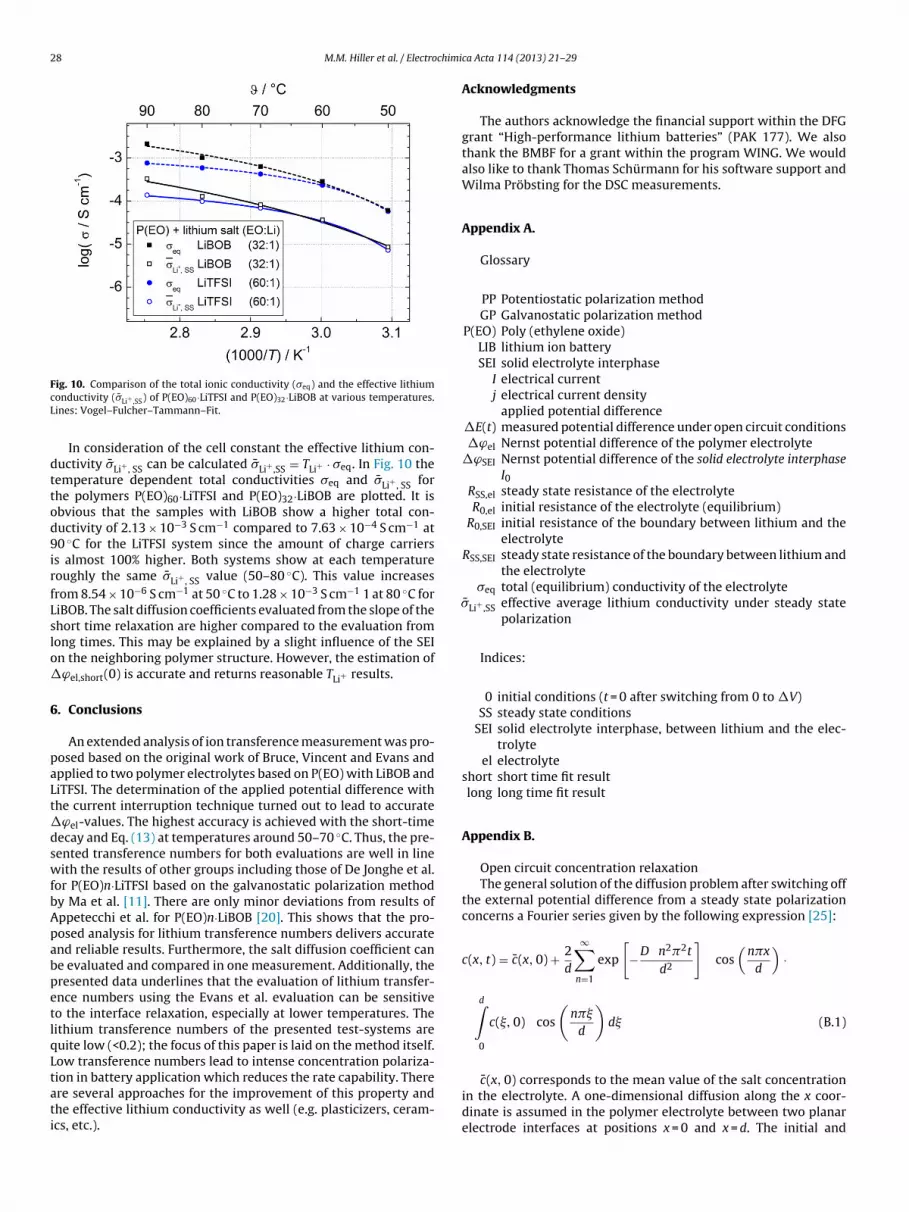
ig. 10. Comparison of the total ionic conductivity (�eq) and the effective lithiumonductivity ( �̄Li+ ,SS) of P(EO)60·LiTFSI and P(EO)32·LiBOB at various temperatures.ines: Vogel–Fulcher–Tammann–Fit.
In consideration of the cell constant the effective lithium con-uctivity �̄Li+ , SS can be calculated �̄Li+ ,SS = TLi+ · �eq. In Fig. 10 theemperature dependent total conductivities �eq and �̄Li+ , SS forhe polymers P(EO)60·LiTFSI and P(EO)32·LiBOB are plotted. It isbvious that the samples with LiBOB show a higher total con-uctivity of 2.13 × 10⁻³ S cm−1 compared to 7.63 × 10⁻⁴ S cm−1 at0 ◦C for the LiTFSI system since the amount of charge carriers
s almost 100% higher. Both systems show at each temperatureoughly the same �̄Li+ , SS value (50–80 ◦C). This value increasesrom 8.54 × 10⁻⁶ S cm−1 at 50 ◦C to 1.28 × 10⁻³ S cm−1 1 at 80 ◦C foriBOB. The salt diffusion coefficients evaluated from the slope of thehort time relaxation are higher compared to the evaluation fromong times. This may be explained by a slight influence of the SEIn the neighboring polymer structure. However, the estimation ofϕel,short(0) is accurate and returns reasonable TLi+ results.
. Conclusions
An extended analysis of ion transference measurement was pro-osed based on the original work of Bruce, Vincent and Evans andpplied to two polymer electrolytes based on P(EO) with LiBOB andiTFSI. The determination of the applied potential difference withhe current interruption technique turned out to lead to accurate
ϕel-values. The highest accuracy is achieved with the short-timeecay and Eq. (13) at temperatures around 50–70 ◦C. Thus, the pre-ented transference numbers for both evaluations are well in lineith the results of other groups including those of De Jonghe et al.
or P(EO)n·LiTFSI based on the galvanostatic polarization methody Ma et al. [11]. There are only minor deviations from results ofppetecchi et al. for P(EO)n·LiBOB [20]. This shows that the pro-osed analysis for lithium transference numbers delivers accuratend reliable results. Furthermore, the salt diffusion coefficient cane evaluated and compared in one measurement. Additionally, theresented data underlines that the evaluation of lithium transfer-nce numbers using the Evans et al. evaluation can be sensitiveo the interface relaxation, especially at lower temperatures. Theithium transference numbers of the presented test-systems areuite low (<0.2); the focus of this paper is laid on the method itself.ow transference numbers lead to intense concentration polariza-
ion in battery application which reduces the rate capability. Therere several approaches for the improvement of this property andhe effective lithium conductivity as well (e.g. plasticizers, ceram-cs, etc.).ca Acta 114 (2013) 21– 29
Acknowledgments
The authors acknowledge the financial support within the DFGgrant “High-performance lithium batteries” (PAK 177). We alsothank the BMBF for a grant within the program WING. We wouldalso like to thank Thomas Schürmann for his software support andWilma Pröbsting for the DSC measurements.
Appendix A.
Glossary
PP Potentiostatic polarization methodGP Galvanostatic polarization method
P(EO) Poly (ethylene oxide)LIB lithium ion batterySEI solid electrolyte interphase
I electrical currentj electrical current density
applied potential difference�E(t) measured potential difference under open circuit conditions�ϕel Nernst potential difference of the polymer electrolyte
�ϕSEI Nernst potential difference of the solid electrolyte interphaseI0
RSS,el steady state resistance of the electrolyteR0,el initial resistance of the electrolyte (equilibrium)
R0,SEI initial resistance of the boundary between lithium and theelectrolyte
RSS,SEI steady state resistance of the boundary between lithium andthe electrolyte
�eq total (equilibrium) conductivity of the electrolyte¯ Li+ ,SS effective average lithium conductivity under steady state
polarization
Indices:
0 initial conditions (t = 0 after switching from 0 to �V)SS steady state conditions
SEI solid electrolyte interphase, between lithium and the elec-trolyte
el electrolyteshort short time fit resultlong long time fit result
Appendix B.
Open circuit concentration relaxationThe general solution of the diffusion problem after switching off
the external potential difference from a steady state polarizationconcerns a Fourier series given by the following expression [25]:
c(x, t) = c̄(x, 0) + 2d
∞∑n=1
exp
[−D n2�2t
d2
]cos(
n�x
d
)·
d∫0
c(�, 0) cos
(n��
d
)d� (B.1)
c̄(x, 0) corresponds to the mean value of the salt concentrationin the electrolyte. A one-dimensional diffusion along the x coor-dinate is assumed in the polymer electrolyte between two planarelectrode interfaces at positions x = 0 and x = d. The initial and
chimi
ba
itccticb
edttli(m
�
tfl
�
re
R
[
[
[
[
[
[
[
[
[
[
[
[
[
[bers of lithium chloride solutions, J. Am. Chem. Soc. 42 (1920) 1117.
M.M. Hiller et al. / Electro
oundary conditions for the relaxation from a steady state aressumed as:
c(x, 0) = c0 + �c1 · x − (d/2)d
at t = 0(∂c
∂x
)= 0 at x = 0 and x = d
(B.2)
Hence, a constant concentration gradient is taken asnitial condition with the two initial boundary concen-rations: c(0,0) = c0–(�c1/2) and c(d,0) = c0 + (�c1/2) with0 = [c(d,0) + c(0,0)]/2. Note that c0 is also the equilibrium saltoncentration of the unpolarized electrolyte. The total concen-ration difference in the electrolyte between the two electrodenterfaces corresponds to �c1. As discussed under theoreticalonsiderations, the steady state potential difference is assumed toe small. In accordance with this, we assume �c1 < <c0.
Two limiting cases for long and short times yield a simplifiedxpression for the concentration relaxation. As the concentrationifference in the electrolyte between the boundaries is needed inhe expression of the open circuit potential difference, we expresshe solution in the form of the difference �c(t) = c(d,t) − c(0,t). Forong times, i.e. t » (d2/D), the exponential function in Eq. (B.1) dom-nates yielding the following long-time approximation from Eq.B.1) by neglecting all higher order terms with n > 1 in the sum-
ation:
c(t) = c(d, t) − c(0, t) ∼= �c1 · 8�2
exp
[−�2D t
d2
]for large t
(B.3)
Note: This assumption is valid for times t > 0.05·d2/D where theerms with n > 1 in Eq. (B.1) become negligible. On the other hand,or very small values of the time, the following relation is an excel-ent approximation for Eq. (B.1):
c(t) = c(d, t) − c(0, t) ∼= �c1 ·(
1 − 2
√4Dt
� d2
)
for small values of t (B.4)
Eqs. (B.3) and (B.4) were used to evaluate the experimentalesults for the relaxation of the concentration difference in thelectrolyte as specified in the discussion.
eferences
[1] D.E. Fenton, J.M. Parker, P.V. Wright, Complexes of alkali metal ions withpoly(ethylene oxide), Polymer 14 (1973) 589.
[
[
ca Acta 114 (2013) 21– 29 29
[2] M. Armand, J.M. Chabagno, M. Duclot, Polymer solid electrolytes, in: SecondInternational Meeting on Solid Electrolytes, St. Andrews, Scotland, 1978.
[3] J.O.M. Bockris, A.K.N. Reddy, Modern Electrochemistry 1 – Ionics, 2nd ed.,Plenum Press, New York and London, 1998, pp. 489.
[4] C. Tubandt, H. Reinhold, Z. Anorg, Ueber Gemischte elektrische Leitung in ein-heitlichen festen Verbindungen, Allg. Chem. 160 (1927) 222–236.
[5] P.G. Bruce, M.T. Hardgrave, C.A. Vincent, Steady state current flow in solidbinary electrolyte cells: part 2. The effect of ion association, J. Electroanal. Chem.271 (1989) 27–34.
[6] P.G. Bruce, M.T. Hardgrave, C.A. Vincent, The determination of transferencenumbers in solid polymer electrolytes using the Hittorf method, Solid StateIon. 2 (1992) 1087–1094, 53–56 Part.
[7] S. Zugmann, M. Fleischmann, M. Amereller, R.M. Gschwind, H.D. Wiemhöfer,H.J. Gores, Measurement of transference numbers for lithium ion electrolytesvia four different methods, a comparative study, Electrochim. Acta 56 (2011)3926–3933.
[8] P. Ravn Sørensen, T. Jacobsen, Conductivity, charge transfer and transportnumber—an ac-investigation of the polymer electrolyte LiSCN-poly(ethylene-oxide), Electrochim. Acta 27 (1982) 1671–1675.
[9] J. Evans, C.A. Vincent, P.G. Bruce, Electrochemical measurement of transferencenumbers in polymer electrolytes, Polymer 28 (1987) 2324–2328.
10] K.M. Abraham, Z. Jiang, B. Carroll, Highly conductive PEO-like polymer elec-trolytes, Chem. Mater. 9 (1997) 1978–1988.
11] Y. Ma, M. Doyle, T.F. Fuller, M.M. Doeff, L.C. De Jonghe, J. Newman, The measure-ment of a complete set of transport properties for a concentrated solid polymerelectrolyte solution, J. Electrochem. Soc. 142 (1995) 1859–1868.
12] M. Spiro, Transference numbers, in: A. Weissberger, B. Rossiter (Eds.), Tech-niques of Chemistry, 1, Wiley, New York, 1970.
13] L. Edman, M.M. Doeff, A. Ferry, J. Kerr, L.C. De Jonghe, Transport properties ofthe solid polymer electrolyte system P(EO)nLiTFSI, J. Phys. Chem. B 104 (2000)3476–3480.
14] P.G. Bruce, M.T. Hardgrave, C.A. Vincent, DC polarization of polymer elec-trolytes, Electrochim. Acta 37 (1992) 1517–1520.
15] J. Maier, Mass transport in the presence of internal defect reactions – concept ofconservative ensembles: II, evaluation of electrochemical transport measure-ments, J. Am. Ceram. Soc. 76 (1993) 1218–1222.
16] P.G. Bruce, C.A. Vincent, Steady state current flow in solid binary electrolytecells, J. Electroanal. Chem. 225 (1987) 1–17.
17] M. Wiencierz, N.A. Stolwijk, Systematics of ionic transport and pair forma-tion in amorphous PEO-NaI polymer electrolytes, Solid State Ion. 212 (2012)88–99.
18] G.G. Cameron, M.D. Ingram, J.L. Harvie, Ion transport in polymer electrolytes,Faraday Discuss. 88 (1989) 55–63.
19] M. Burjanadze, Y. Karatas, N. Kaskhedikar, L.M. Kogel, S. Kloss, A.-C. Gentschev,M.M. Hiller, R.A. Müller, R. Stolina, P. Vettikuzha, H.-D.Z. Wiemhöfer, Salt-in-polymer electrolytes for lithium ion batteries based on organo-functionalizedpolyphosphazenes and polysiloxanes, Phys. Chem. 224 (2010) 1439–1473.
20] G.B. Appetecchi, D. Zane, B. Scrosati, PEO-based electrolyte membranes basedon LiBC4O8 salt, J. Electrochem. Soc. 151 (2004) A1369–A1374.
21] F. Lemaître-Auger, J. Prud’homme, Ion–ion, short-range interactionsin PEO-LiX rubbery electrolytes containing LiSCN, LiN(CF3SO2)2 orLi[CF3SO2N(CH2)3OCH3] as deduced from studies performed on PEO-LiX-KXternary systems, Electrochim. Acta 46 (2001) 1359–1367.
22] J.-H. Shin, W.A. Henderson, S. Passerini, Ionic liquids to the rescue? Overcom-ing the ionic conductivity limitations of polymer electrolytes, Electrochem.Commun. 5 (2003) 1016–1020.
23] D.A. MacInnes, J. Beattie, The free energy of dilution and the transference num-
24] A. Ferry, M.M. Doeff, L.C. DeJonghe, Transport property measurements of poly-mer electrolytes, Electrochim. Acta 43 (1998) 1387–1393.
25] J. Crank, Mathematics of Diffusion, 2nd ed., Oxford University Press, Bristol,1975, pp. 63.