the influence of gender and age on choosing computing courses at south african universities
TRANSCRIPT
1
The Influence of Gender and Age on Choosing Computing Courses at South African Universities
Trish Alexander University of Pretoria
Lynnwood Rd
PRETORIA
012 420-3367
Marthie Schoeman, Estelle De Kock
University of South Africa Pretoria, South Africa
Bennett Alexander, Roxi Piderit
Cape Peninsula University of Technology
Cape Town, South Africa
University of Fort Hare Alice, South Africa
ABSTRACT Reportedly more than 50% of the people working in the ICT sector have made a career change from another field or have joined it after qualifying in another discipline. The number of women choosing to join the ICT work force at a later stage in their careers is markedly higher than the number who make
this decision early. This paper reports on an extensive survey among students at four very different South African universities regarding the factors they consider important in deciding on an ideal career. Since, in the case of older students a decision to start studying computing may point to a decision to change career, the responses given by males and females and between different age groups have been compared. The aim is to identify whether reasons for career
choices differ between the four groups. The research has found that self-efficacy and career progress have different importance for the different age groups. In addition, quality of life issues, financial resources and flexibility related to career are valued differently by males and females. However, there is only one factor that can be identified as viewed differently by both the different genders and one of the different age groups. This is computer self-efficacy where older women reduce the
significant gap in this regard as they get older.
Categories and Subject Descriptors K.7 The Computing Profession
General Terms Human Factors
Keywords Career choice, Computing disciplines, Gender, Age, Women
in IT
1. INTRODUCTION The world-wide drop, since the start of this century, in numbers of students graduating with qualifications in computing disciplines is a matter of concern for those involved in tertiary education as well as those with broader
interests regarding the national economy1. This decrease has
1 ICT and computing are used as synonyms and we define this
as any subject where design or use of computer hardware or software or systems is central in the field of study.
occurred even though there continues to be a demand for
highly skilled and qualified workers to meet the technology requirements of organizations [23; 33]. Fortunately, there is an indication that the numbers have started to stabilize since about 2007 [8; 14; 26; 38; 46] but, as some of this evidence is anecdotal and there is a delay between obtaining data and publishing recent graduation figures, it still needs to be confirmed whether this is a worldwide trend.
Within the more general topic of decreasing numbers of students taking tertiary-level computing courses, there is a well-recognised problem of the disproportionately low percentage of women enrolling for computing courses at tertiary level and employed in the sector.
Two 2011 sources that confirm improving enrolment
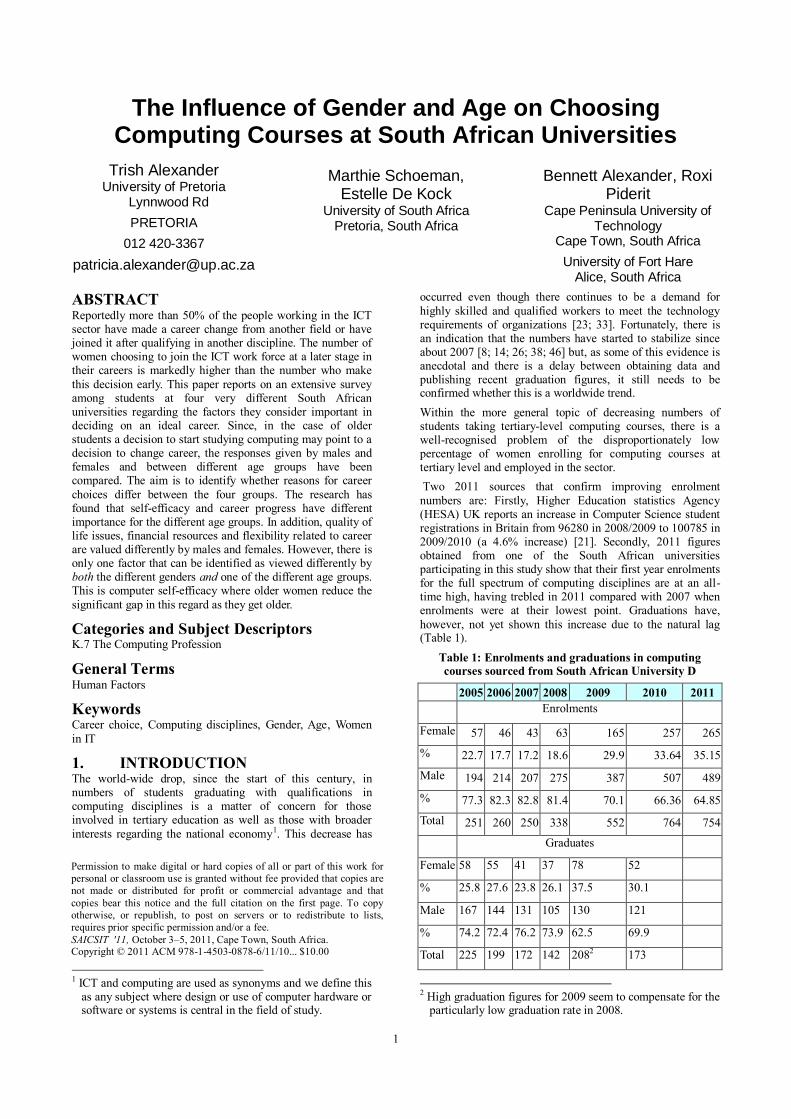
numbers are: Firstly, Higher Education statistics Agency (HESA) UK reports an increase in Computer Science student registrations in Britain from 96280 in 2008/2009 to 100785 in 2009/2010 (a 4.6% increase) [21]. Secondly, 2011 figures obtained from one of the South African universities participating in this study show that their first year enrolments for the full spectrum of computing disciplines are at an all-time high, having trebled in 2011 compared with 2007 when enrolments were at their lowest point. Graduations have,
however, not yet shown this increase due to the natural lag (Table 1).
Table 1: Enrolments and graduations in computing courses sourced from South African University D
2005 2006 2007 2008 2009 2010 2011
Enrolments
Female 57 46 43 63 165 257 265
% 22.7 17.7 17.2 18.6 29.9 33.64 35.15
Male 194 214 207 275 387 507 489
% 77.3 82.3 82.8 81.4 70.1 66.36 64.85
Total 251 260 250 338 552 764 754
Graduates
Female 58 55 41 37 78 52
% 25.8 27.6 23.8 26.1 37.5 30.1
Male 167 144 131 105 130 121
% 74.2 72.4 76.2 73.9 62.5 69.9
Total 225 199 172 142 2082 173
2 High graduation figures for 2009 seem to compensate for the
particularly low graduation rate in 2008.
Permission to make digital or hard copies of all or part of this work for
personal or classroom use is granted without fee provided that copies are
not made or distributed for profit or commercial advantage and that
copies bear this notice and the full citation on the first page. To copy
otherwise, or republish, to post on servers or to redistribute to lists,
requires prior specific permission and/or a fee.
SAICSIT '11, October 3–5, 2011, Cape Town, South Africa. Copyright © 2011 ACM 978-1-4503-0878-6/11/10... $10.00
2
Various research projects have been initiated in South Africa to consider issues related to skills demands, training and vocational behaviour of students in computing and attitudes of IT professional regarding their careers [5; 6; 10; 12; 13; 30; 31; 35; 36]. This paper reports on one aspect of a larger
project on understanding the vocational behaviour of computing students where four South African universities collaborate. The project is now in its third year, and involves surveys of large numbers of first year students taking introductory courses in computing regarding their vocational choices and career expectations. Since the 2011 data is not all available this paper uses the 2010 data.
This paper looks at two specific aspects, namely gender and age. The very serious under-representation of women in the ICT sector is widely reported, and even though the enrolment and graduation statistics given in Table 1 show an
improvement in the percentages for women students at one South African university the participation in the discipline by women remains worrying.
The paper will look at reported research on this and then use the data from the surveys to try to understand gender related vocational choices in the South African context. Age and how it influences decisions regarding career change in the ICT sector, and the associated matter of obtaining suitable computing qualifications as an older student, has not been found to be discussed much in the reported research. However, the e-Skills UK web site points to an alarming fact,
namely, that whereas in 2001 33% of those employed in the ICT sector in the UK were under 30 years old, in 2011 this figure stands at 19% [16]. The 2008 report [17] gave this as 21% in 2007 showing a clear downward trend.
We acknowledge, as a limitation, that this paper looks at this issue of age from only one perspective, that of older students registering for courses in computing topics and that we are not necessarily presenting evidence that older students are changing career focus. A number of these older students may already be working in the ICT sector and are simply trying to improve their qualifications and hence their career prospects.
2. LITERATURE REVIEW
2.1 Gender related to ICT sector
employment The percentage of women employed in the ICT sector varies from country to country, at different times and by the level of skill. In Europe, women make up about 43% of the work force but only 18% of computing professionals are women in 2007
[17]. The figure for Germany is similar (about 20%) and the situation is even worse in the Netherlands where a ratio of seven to one is given [41]. Figures for the participation by women in the UK ICT workforce are given as 21% in 1999, 22% in 2001, 12.5% in 2003 and 18% in 2007 [17; 34]. E-Skills UK currently on their web site say that women make up only 17% of the UK IT workforce while they make up 45% of the overall UK work force [16]. Figures given in 2001 for
Australia are 23.6% [cited in 41]. By contrast, a figure of 55% of women in the IT workforce is given for Singapore [17].
In Europe, only 20% of the less highly skilled computer
associate professionals are women [17] and in New Zealand 2001 figures indicate a 11% employment figure for women in systems technician occupations and 16% who are application engineers [cited in 41].
Panko [33] gives a figure of 25% for computer-related positions occupied by women in the USA. Trauth et al. [41] cited The Information Technology Association of America‟s
(ITAA) Blue Ribbon Diversity Panel as finding that in 2004 women represented 32.4% of the U.S. IT workforce. Comparing these two percentages reveals a serious decrease in participation. Similarly, in Canada a decline is reported over the period 1993 to 2003 with a decrease from 28% in
2001 to 25% in 2003 [cited in 41]. Ireland showed a decrease of women in the IT workforce from 31% in 1998 to 27.5% in 2004 [cited in 41].
Related topics are retention and choices and options that women face when returning to the ICT workforce after a career break. The same percentage of men and women (found to be 84% for both in a large survey) who study computing-related topics choose to make this the focus of their careers at least initially [44]. However, in this same survey, a far larger percentage of women (34%) were shown to have left the IT profession sometime after embarking on it than men did
(14%) [44]. Trauth et al. [43] refers to the Harvard Business Review report which noted that “women hit a „breaking point‟ in their mid- to late 30s which has resulted in 52% of highly qualified women in the [Science, Engineering and Technology] sectors quitting their jobs” [cited in 43].
A substantial amount of research into gender issues related to IT career choice and professional progress has studied the importance of support and barriers including role models [2], the common perceptions and stereotypes associated with computing [2], sources of advice before selecting courses [2], and the reality of working conditions and parenting responsibilities [34; 35; 36; 44]
2.2 Gender and ICT students The shortage of women in the ICT workforce is related to the noticeable shortage of female students enrolling for computing related degree programmes at universities. For example, Agosto et al, [2] gave a figure of 9.7% in their sample and Narasimham [32] claims that interest in Computer Science among women has fallen by 80% between 1998 and
2004. Overall, in the USA only 33.2% of Bachelor‟s degrees in MIS are conferred on women despite the fact that MIS is believed to have a more equal gender distribution than other computing majors [U.S. Department of Education, 2006 cited by 9]). The four IS programs that responded to a query by Panko had all seen a sharp drop in female students – where 2000/2001 percentages of women in their programmes varied between 33% and 53%, in 2007/2008 these same programmes showed percentages between 9% and 28% [33]. Whereas, in the UK in general females make up 46% of all
applications and 55% acceptances in to Higher Education programmes, in the computing discipline this is only 15% for both measures and women make up 20% of those qualifying [18]. Furthermore the figures reported in 2008 dropped by 29% since 2004 compared with an 11% drop for men [18].
This means that there is a shortage of suitably qualified women entering the workforce and also that there is a shortage of established women following computing careers who can act as role models which in turn may affect the number of girls choosing a computing career.
2.3 Self-efficacy and gender Self-efficacy was defined by Bandura as, “people‟s judgments of their capabilities to organize and execute courses of action required to attain designated types of performances” [ cited by 27: 83]. Since self-efficacy is specific to a particular skill or topic, computer self-efficacy indicates the individual‟s assessment of his or her own ability to succeed in computing-related activities. Bandura et al. [7] argue that the career
3
choices and expectations of adolescents relate strongly to career self-efficacy.
Self-efficacy has been identified in numerous studies as being the predominant factor in career choice and in performance, both during the education phase and subsequently in a career [3; 4; 25; 28; 29; 39]. It is important to note that, although self-efficacy is built on past performance to some extent,
students often either over-estimate their own capabilities [19; 22; 27; 29; 39] or, particularly in the case of women, under-estimate them [9; 45].
Johnson et al. [25] indicate a link between IT self-efficacy (defined as a person‟s beliefs in his capacity to pursue a successful career in IT) and the intention to follow a career in IT. IT self-efficacy should be distinguished from computer self-efficacy (confidence using IT). The distinction becomes meaningful in the South African context where it has been seen that students who have had limited exposure to computers nevertheless have an interest in computer-related
careers [11; 24; 37]. Contrasting research indicates that ultimately high computer self-efficacy results in higher IT self-efficacy [25]. Other research findings suggest that computer self-efficacy does not match actual computer skills, with most students being over optimistic about their own abilities [19; 22]. The tendency of women in general to under estimate computer self-efficacy is particularly noticeable [9; 15; 20]. However, even women who are taking computing majors at university have much lower computer self-efficacy
than their male classmates [9]. Hence, past results are not the only, or even necessarily the most important, predictor of self-efficacy. One would expect similar tendencies related to IT self-efficacy.
2.4 Individual differences Trauth and her co-authors make the very valid point that women are not totally determined by their gender and that there are many individual differences that play important roles
in choice of career, persistence and success [41; 42; 43]. Independent research in the ICT sector confirms this, namely that there are important differences between individual women (intra-gender differences) [1; 35; 36; 40]. Identifying these differences is usually done by conversing at some length with individuals in order to understand their world views and how these views and associated attitudes have been shaped by other people and experiences as well as personal attributes.
The relationships between computing career “success” and the set of individual differences, which may include world view, attitude, experience and personal attributes, are the main foci of this type of qualitative research.
The quantitative research being reported on in this paper clearly does not contribute to the individual difference discourse directly, but the importance of that research into computing careers and gender needs to be acknowledged.
2.5 Older entrants into the ICT sector The so called pipeline model has often been used to discuss
scarce skills. It assumes that the shortage will be solved if sufficient numbers of women are skilled in a particular vocational field, as they will be optimally employed and will choose to remain in that sector [44]. Wardell et al. [44] point out that this is a limited view as organisational and social factors come into play and have a large influence on women deciding to leave the IT professions.
While the pipeline model can be seen to have certain „leaks‟ (that is, people leaving the profession) caused to some extent by the inflexible and long working hours frequently required in IT, it also has more than one entry point and this does not
generally seem to be recognised. In order to look at the human resources issue more completely you need to look not only at the further education and career choices made while the potential entrant is at school or university, but also to recognise that an extraordinarily high number of people enter
the ICT sector from other occupations and with formal qualifications that are not computing related. eSkills UK report that 55% of new management and senior professionals come into the ICT sector in the UK from other occupations [17: 55]; that the average age of these entrants (at all levels) is 35 and that 35% are female compared with the very low percentage of 18% female for entrants from all sources [17: 54]. Wardell et al. note this in passing as well (in the research in the United States) but gives no statistics in this regard [44].
In contrast, in the UK in 2004/2005, only 52% of those who had studied IT had entered the IT & Telecoms workforce
within 6 months of graduating [17: 71]. This seems at odds with Wardell et al‟s [44] findings that 16% of computing graduates never worked in the ICT sector, but the Wardell report covered people who had graduated in the period 1988 to 2001 and also did not specify how long it took them to obtain their first job in the ICT sector.
3. RESEARCH GOAL
3.1 Research context This research is part of a large project that has as its overall goal to understand factors relating to the choice of tertiary
qualifications by students at South African universities. More particularly, it is intended to find out what the dominant underlying factors that influence potential students in their decision whether or not to choose a computing major, are. The larger research project studies responses from a variety of students, some of whom intend majoring in a computing-related subject (we refer to these as computing majors or CM students) and others who intend to major in subjects that are not computing-related (referred to here as NCM students).
This paper looks at issues regarding choice of majors as affected by gender and age for the CM group. The students
are divided into three age categories, namely up to and including 22, 23 to 26, 27 and older. These categories are assumed largely to differentiate between students who have not yet embarked on a career, those who have probably been employed although not necessarily in the ICT sector and who left school at least five years previously, those who have been out of school for more than five years and who are likely to have had quite substantial work experience, again not necessarily in the ICT sector.
3.2 Hypotheses H1: There are no significant differences regarding career choice between CM women in the three age categories.
H2: There are no significant differences regarding career choice between CM men in the three age categories.
H3: There are no significant differences regarding career choice between young CM men and young CM women.
H4: There are no significant differences regarding career choice between the middle age group of CM men and the corresponding CM women.
H5: There are no significant differences regarding career choice between the older group of CM men and older CM women.
H6: The significant differences between different age groups of CM women relate to the same career choice factors as in the case of CM men.
4
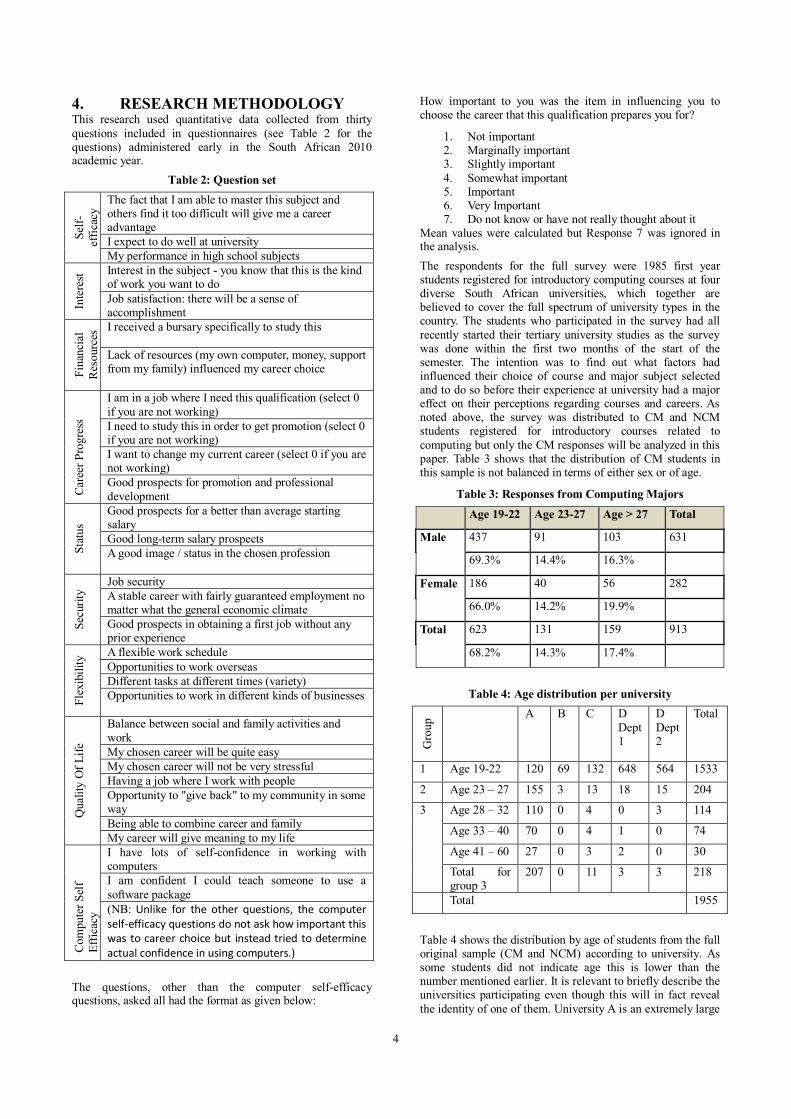
4. RESEARCH METHODOLOGY This research used quantitative data collected from thirty
questions included in questionnaires (see Table 2 for the questions) administered early in the South African 2010 academic year.
Table 2: Question set
Sel
f-
effi
cacy
The fact that I am able to master this subject and others find it too difficult will give me a career advantage
I expect to do well at university
My performance in high school subjects
Inte
rest
Interest in the subject - you know that this is the kind of work you want to do
Job satisfaction: there will be a sense of accomplishment
Fin
anci
al
Res
ourc
es I received a bursary specifically to study this
Lack of resources (my own computer, money, support from my family) influenced my career choice
Car
eer
Pro
gre
ss
I am in a job where I need this qualification (select 0
if you are not working)
I need to study this in order to get promotion (select 0 if you are not working)
I want to change my current career (select 0 if you are not working)
Good prospects for promotion and professional
development
Sta
tus
Good prospects for a better than average starting salary
Good long-term salary prospects
A good image / status in the chosen profession
Sec
uri
ty Job security
A stable career with fairly guaranteed employment no matter what the general economic climate
Good prospects in obtaining a first job without any prior experience
Fle
xib
ilit
y A flexible work schedule
Opportunities to work overseas
Different tasks at different times (variety)
Opportunities to work in different kinds of businesses
Qual
ity O
f L
ife
Balance between social and family activities and
work
My chosen career will be quite easy
My chosen career will not be very stressful
Having a job where I work with people
Opportunity to "give back" to my community in some way
Being able to combine career and family
My career will give meaning to my life
Com
pute
r S
elf
Eff
icac
y
I have lots of self-confidence in working with computers
I am confident I could teach someone to use a
software package
(NB: Unlike for the other questions, the computer self-efficacy questions do not ask how important this was to career choice but instead tried to determine actual confidence in using computers.)
The questions, other than the computer self-efficacy questions, asked all had the format as given below:
How important to you was the item in influencing you to choose the career that this qualification prepares you for?
1. Not important 2. Marginally important 3. Slightly important
4. Somewhat important 5. Important 6. Very Important 7. Do not know or have not really thought about it
Mean values were calculated but Response 7 was ignored in the analysis.
The respondents for the full survey were 1985 first year students registered for introductory computing courses at four diverse South African universities, which together are believed to cover the full spectrum of university types in the country. The students who participated in the survey had all
recently started their tertiary university studies as the survey was done within the first two months of the start of the semester. The intention was to find out what factors had influenced their choice of course and major subject selected and to do so before their experience at university had a major effect on their perceptions regarding courses and careers. As noted above, the survey was distributed to CM and NCM students registered for introductory courses related to
computing but only the CM responses will be analyzed in this paper. Table 3 shows that the distribution of CM students in this sample is not balanced in terms of either sex or of age.
Table 3: Responses from Computing Majors
Age 19-22 Age 23-27 Age > 27 Total
Male 437 91 103 631
69.3% 14.4% 16.3%
Female 186 40 56 282
66.0% 14.2% 19.9%
Total 623 131 159 913
68.2% 14.3% 17.4%
Table 4: Age distribution per university
Gro
up A B C D
Dept 1
D
Dept 2
Total
1 Age 19-22 120 69 132 648 564 1533
2 Age 23 – 27 155 3 13 18 15 204
3 Age 28 – 32 110 0 4 0 3 114
Age 33 – 40 70 0 4 1 0 74
Age 41 – 60 27 0 3 2 0 30
Total for group 3
207 0 11 3 3 218
Total 1955
Table 4 shows the distribution by age of students from the full original sample (CM and NCM) according to university. As some students did not indicate age this is lower than the number mentioned earlier. It is relevant to briefly describe the universities participating even though this will in fact reveal
the identity of one of them. University A is an extremely large
5
university that offers courses by means of distance teaching only. This university has students from all segments of the population, including some from outside South Africa. A high percentage of their students work full time and their average age is high in comparison with the average ages of the other
universities (see Table 4). This university offers a range of programmes (degrees, diploma and certificate courses).
University B is a University of Technology in a major city which offers degree and diploma courses. The students at this university are heterogeneous in terms of demographic description. University C has had students almost exclusively from disadvantaged backgrounds throughout its 100 years of existence and is in a smaller centre in a low-income area. University D in contrast is considered a prestigious research university, in a major city and which has historically had advantaged students. Only in the last twenty years has this
university had a more inclusive registration policy. In Table 4, two sets of values are given for university D as the survey was carried out in two separate departments in that university.
The uneven distribution of responses across the universities is acknowledged as a weakness in this research and means that the research can only be considered to be exploratory. This lack of balance is accentuated when we acknowledge that older students are much more common at University A than at the residential universities. Furthermore, the lecturers undertaking the survey had different policies regarding incentives. For example, university D, department 1 gave a
very small assignment mark for completing the survey, whereas university A was totally against the ideas of incentives and made completion of the questionnaire entirely voluntary. A decision was made to use all the responses received and not to try to structure the sample in order to reflect the proportions of students served by the different types of universities. In addition it was decided that, by including all the universities rather than only residential
universities or only the distance university a more complete picture of South African students could be obtained and that the mode of teaching was less important in this particular survey regarding career choice.
Table 5: Reliability Statistics (Cronbach's Alpha)
Name of Group
α N of Items
Name of Group
α N of Items
Self-efficacy .591 3 Flexibility .622 4
Interest .439 2 Security .634 3
Financial Resources
.602 2 Status .692 3
Career Progress
.697 4 Quality Of Life
.775 7
The questions were grouped in order to analyse them (See Table 2). Only Career Progress, Status and Quality of Life had Cronbach Alpha scores close to or higher than 0.7 (See Table 5). However, using non-parametric correlation (Kendall‟s tau-B) the groups with smaller numbers of questions were found to be significantly cross correlated in all cases with p < 0.000.
A mean value was calculated for each respondent from the responses to questions in each group and these are used for the analyses discussed below. However, individual questions were also analysed within gender for differences between the age groups. These individual results will be referred to but are not discussed in full.
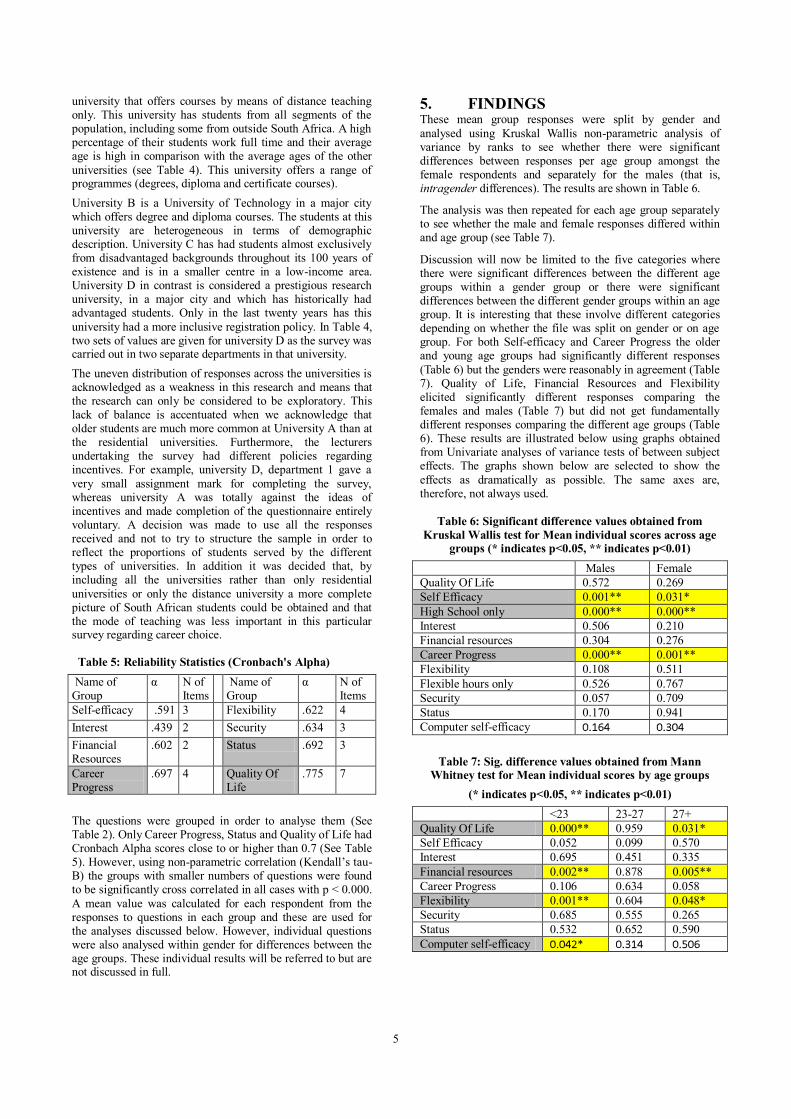
5. FINDINGS These mean group responses were split by gender and
analysed using Kruskal Wallis non-parametric analysis of variance by ranks to see whether there were significant differences between responses per age group amongst the female respondents and separately for the males (that is, intragender differences). The results are shown in Table 6.
The analysis was then repeated for each age group separately to see whether the male and female responses differed within and age group (see Table 7).
Discussion will now be limited to the five categories where there were significant differences between the different age groups within a gender group or there were significant differences between the different gender groups within an age group. It is interesting that these involve different categories depending on whether the file was split on gender or on age group. For both Self-efficacy and Career Progress the older and young age groups had significantly different responses
(Table 6) but the genders were reasonably in agreement (Table 7). Quality of Life, Financial Resources and Flexibility elicited significantly different responses comparing the females and males (Table 7) but did not get fundamentally different responses comparing the different age groups (Table 6). These results are illustrated below using graphs obtained from Univariate analyses of variance tests of between subject effects. The graphs shown below are selected to show the
effects as dramatically as possible. The same axes are, therefore, not always used.
Table 6: Significant difference values obtained from
Kruskal Wallis test for Mean individual scores across age groups (* indicates p<0.05, ** indicates p<0.01)
Males Female
Quality Of Life 0.572 0.269
Self Efficacy 0.001** 0.031*
High School only 0.000** 0.000**
Interest 0.506 0.210
Financial resources 0.304 0.276
Career Progress 0.000** 0.001**
Flexibility 0.108 0.511
Flexible hours only 0.526 0.767
Security 0.057 0.709
Status 0.170 0.941
Computer self-efficacy
Table 7: Sig. difference values obtained from Mann Whitney test for Mean individual scores by age groups
(* indicates p<0.05, ** indicates p<0.01)
<23 23-27 27+
Quality Of Life 0.000** 0.959 0.031*
Self Efficacy 0.052 0.099 0.570
Interest 0.695 0.451 0.335
Financial resources 0.002** 0.878 0.005**
Career Progress 0.106 0.634 0.058
Flexibility 0.001** 0.604 0.048*
Security 0.685 0.555 0.265
Status 0.532 0.652 0.590
Computer self-efficacy
6
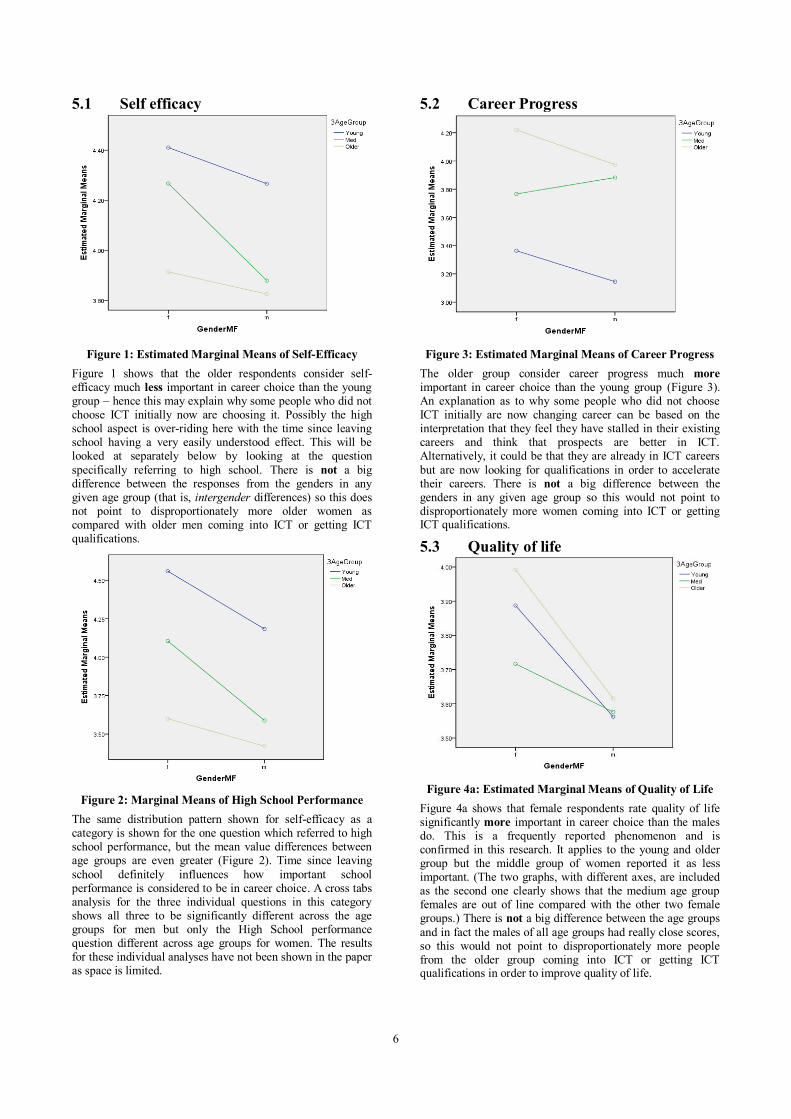
5.1 Self efficacy
Figure 1: Estimated Marginal Means of Self-Efficacy
Figure 1 shows that the older respondents consider self-efficacy much less important in career choice than the young group – hence this may explain why some people who did not choose ICT initially now are choosing it. Possibly the high school aspect is over-riding here with the time since leaving school having a very easily understood effect. This will be looked at separately below by looking at the question
specifically referring to high school. There is not a big difference between the responses from the genders in any given age group (that is, intergender differences) so this does not point to disproportionately more older women as compared with older men coming into ICT or getting ICT qualifications.
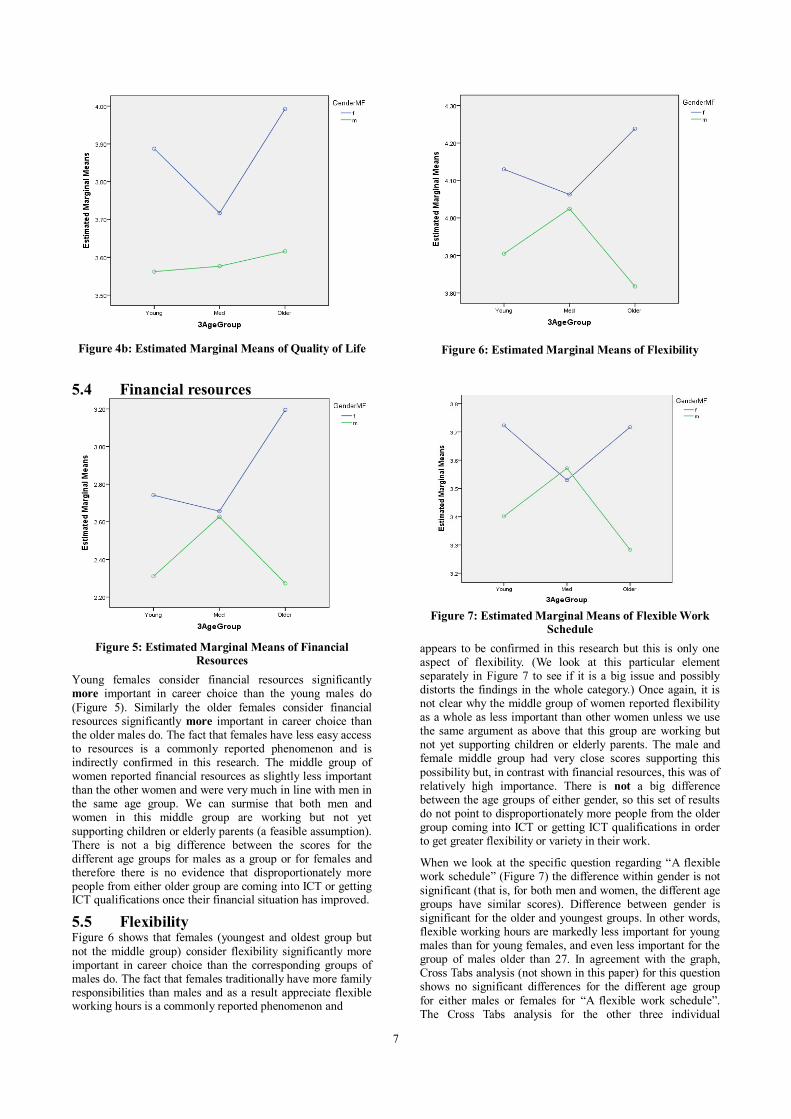
Figure 2: Marginal Means of High School Performance
The same distribution pattern shown for self-efficacy as a category is shown for the one question which referred to high school performance, but the mean value differences between age groups are even greater (Figure 2). Time since leaving
school definitely influences how important school performance is considered to be in career choice. A cross tabs analysis for the three individual questions in this category shows all three to be significantly different across the age groups for men but only the High School performance question different across age groups for women. The results for these individual analyses have not been shown in the paper as space is limited.
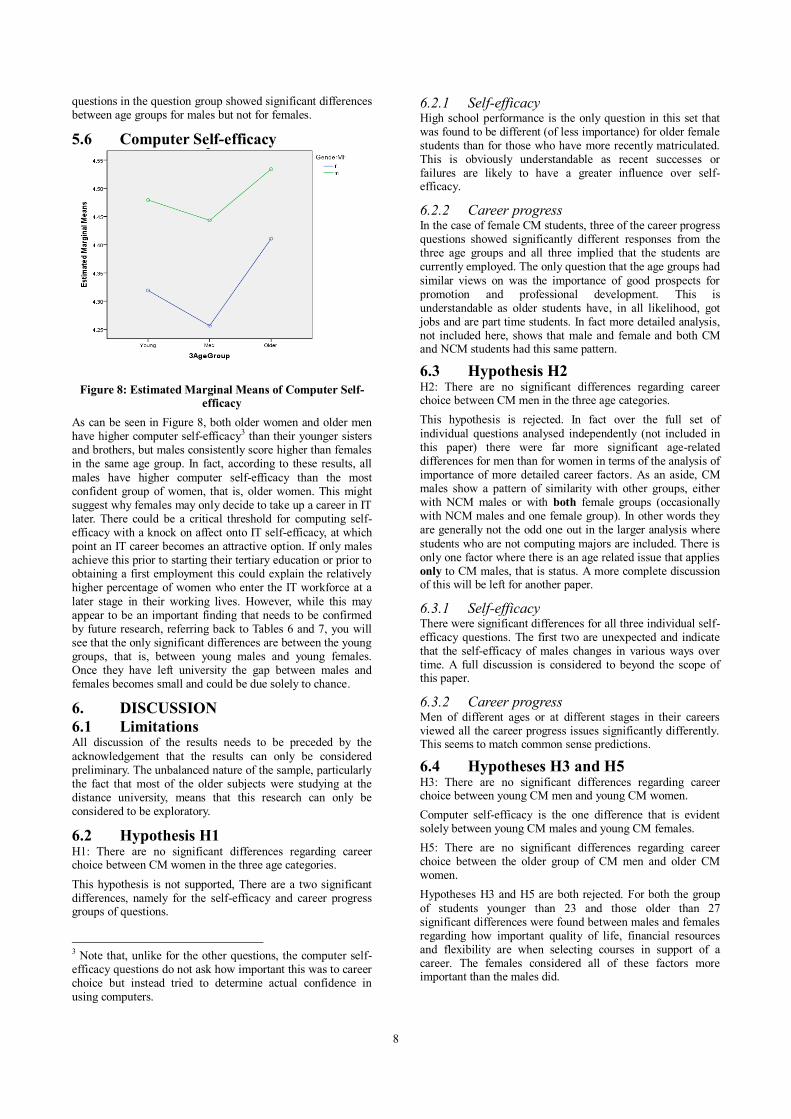
5.2 Career Progress
Figure 3: Estimated Marginal Means of Career Progress
The older group consider career progress much more important in career choice than the young group (Figure 3). An explanation as to why some people who did not choose ICT initially are now changing career can be based on the interpretation that they feel they have stalled in their existing careers and think that prospects are better in ICT. Alternatively, it could be that they are already in ICT careers
but are now looking for qualifications in order to accelerate their careers. There is not a big difference between the genders in any given age group so this would not point to disproportionately more women coming into ICT or getting ICT qualifications.
5.3 Quality of life
Figure 4a: Estimated Marginal Means of Quality of Life
Figure 4a shows that female respondents rate quality of life significantly more important in career choice than the males do. This is a frequently reported phenomenon and is confirmed in this research. It applies to the young and older group but the middle group of women reported it as less important. (The two graphs, with different axes, are included as the second one clearly shows that the medium age group females are out of line compared with the other two female groups.) There is not a big difference between the age groups
and in fact the males of all age groups had really close scores, so this would not point to disproportionately more people from the older group coming into ICT or getting ICT qualifications in order to improve quality of life.
7
Figure 4b: Estimated Marginal Means of Quality of Life
5.4 Financial resources
Figure 5: Estimated Marginal Means of Financial Resources
Young females consider financial resources significantly more important in career choice than the young males do
(Figure 5). Similarly the older females consider financial resources significantly more important in career choice than the older males do. The fact that females have less easy access to resources is a commonly reported phenomenon and is indirectly confirmed in this research. The middle group of women reported financial resources as slightly less important than the other women and were very much in line with men in the same age group. We can surmise that both men and women in this middle group are working but not yet
supporting children or elderly parents (a feasible assumption). There is not a big difference between the scores for the different age groups for males as a group or for females and therefore there is no evidence that disproportionately more people from either older group are coming into ICT or getting ICT qualifications once their financial situation has improved.
5.5 Flexibility Figure 6 shows that females (youngest and oldest group but
not the middle group) consider flexibility significantly more important in career choice than the corresponding groups of males do. The fact that females traditionally have more family responsibilities than males and as a result appreciate flexible working hours is a commonly reported phenomenon and
Figure 6: Estimated Marginal Means of Flexibility
Figure 7: Estimated Marginal Means of Flexible Work Schedule
appears to be confirmed in this research but this is only one aspect of flexibility. (We look at this particular element separately in Figure 7 to see if it is a big issue and possibly distorts the findings in the whole category.) Once again, it is not clear why the middle group of women reported flexibility as a whole as less important than other women unless we use the same argument as above that this group are working but not yet supporting children or elderly parents. The male and female middle group had very close scores supporting this
possibility but, in contrast with financial resources, this was of relatively high importance. There is not a big difference between the age groups of either gender, so this set of results do not point to disproportionately more people from the older group coming into ICT or getting ICT qualifications in order to get greater flexibility or variety in their work.
When we look at the specific question regarding “A flexible work schedule” (Figure 7) the difference within gender is not
significant (that is, for both men and women, the different age groups have similar scores). Difference between gender is significant for the older and youngest groups. In other words, flexible working hours are markedly less important for young males than for young females, and even less important for the group of males older than 27. In agreement with the graph, Cross Tabs analysis (not shown in this paper) for this question shows no significant differences for the different age group
for either males or females for “A flexible work schedule”. The Cross Tabs analysis for the other three individual
8
questions in the question group showed significant differences between age groups for males but not for females.
5.6 Computer Self-efficacy
Figure 8: Estimated Marginal Means of Computer Self-efficacy
As can be seen in Figure 8, both older women and older men have higher computer self-efficacy3 than their younger sisters and brothers, but males consistently score higher than females in the same age group. In fact, according to these results, all
males have higher computer self-efficacy than the most confident group of women, that is, older women. This might suggest why females may only decide to take up a career in IT later. There could be a critical threshold for computing self-efficacy with a knock on affect onto IT self-efficacy, at which point an IT career becomes an attractive option. If only males achieve this prior to starting their tertiary education or prior to obtaining a first employment this could explain the relatively higher percentage of women who enter the IT workforce at a
later stage in their working lives. However, while this may appear to be an important finding that needs to be confirmed by future research, referring back to Tables 6 and 7, you will see that the only significant differences are between the young groups, that is, between young males and young females. Once they have left university the gap between males and females becomes small and could be due solely to chance.
6. DISCUSSION
6.1 Limitations All discussion of the results needs to be preceded by the
acknowledgement that the results can only be considered preliminary. The unbalanced nature of the sample, particularly the fact that most of the older subjects were studying at the distance university, means that this research can only be considered to be exploratory.
6.2 Hypothesis H1 H1: There are no significant differences regarding career choice between CM women in the three age categories.
This hypothesis is not supported, There are a two significant differences, namely for the self-efficacy and career progress groups of questions.
3 Note that, unlike for the other questions, the computer self-efficacy questions do not ask how important this was to career choice but instead tried to determine actual confidence in using computers.
6.2.1 Self-efficacy High school performance is the only question in this set that was found to be different (of less importance) for older female students than for those who have more recently matriculated. This is obviously understandable as recent successes or failures are likely to have a greater influence over self-efficacy.
6.2.2 Career progress In the case of female CM students, three of the career progress questions showed significantly different responses from the three age groups and all three implied that the students are currently employed. The only question that the age groups had
similar views on was the importance of good prospects for promotion and professional development. This is understandable as older students have, in all likelihood, got jobs and are part time students. In fact more detailed analysis, not included here, shows that male and female and both CM and NCM students had this same pattern.
6.3 Hypothesis H2 H2: There are no significant differences regarding career choice between CM men in the three age categories.
This hypothesis is rejected. In fact over the full set of
individual questions analysed independently (not included in this paper) there were far more significant age-related differences for men than for women in terms of the analysis of importance of more detailed career factors. As an aside, CM males show a pattern of similarity with other groups, either with NCM males or with both female groups (occasionally with NCM males and one female group). In other words they are generally not the odd one out in the larger analysis where
students who are not computing majors are included. There is only one factor where there is an age related issue that applies only to CM males, that is status. A more complete discussion of this will be left for another paper.
6.3.1 Self-efficacy There were significant differences for all three individual self-efficacy questions. The first two are unexpected and indicate that the self-efficacy of males changes in various ways over time. A full discussion is considered to beyond the scope of this paper.
6.3.2 Career progress Men of different ages or at different stages in their careers viewed all the career progress issues significantly differently. This seems to match common sense predictions.
6.4 Hypotheses H3 and H5 H3: There are no significant differences regarding career choice between young CM men and young CM women.
Computer self-efficacy is the one difference that is evident solely between young CM males and young CM females.
H5: There are no significant differences regarding career choice between the older group of CM men and older CM women.
Hypotheses H3 and H5 are both rejected. For both the group
of students younger than 23 and those older than 27 significant differences were found between males and females regarding how important quality of life, financial resources and flexibility are when selecting courses in support of a career. The females considered all of these factors more important than the males did.
9
6.5 Hypothesis H4 H4: There are no significant differences regarding career
choice between the middle age group of CM men and the corresponding CM women.
This hypothesis is supported by the findings. This has been explained as showing that this group have fewer family responsibilities than the older group and are more independent financially than young group. These are, however, assumptions and need further research to verify them.
6.6 Hypotheses H6 H6: The significant differences between different age groups of CM women relate to the same career choice factors as the in the case of CM men.
Generally the CM women have fewer age related issues and they seem easily explained. The unexpected male age issues need further investigation.
7. CONCLUSION This paper can only be considered exploratory as it reports on responses obtained from students and that data set does not say where (in what sector) or in which type of capacity the
employed students are working. This is acknowledged as a serious limitation if we are attempting to address a research question relating to why people enter the ICT work force as a second career or after qualifying for some other field. In addition, as mentioned previously, the distribution of students according to age varied enormously at the different universities. The fact that the questions in the survey had little to do with learning or teaching does to some extent justify
combining the responses. An opportunity exists to do further research where a sample from residential universities is analysed separately from the sample from the distance university in order to check for university effect.
Nevertheless, this rather opportunistic research is intended to raise interest in a question that is regarded as being very relevant, namely, what factors prompt people to consider second careers in the ICT workforce. The claim is made that this group make up a very substantial portion of those
employed in this sector and also that more women „discover‟ the attractions of the sector once they have obtained their first degrees or tertiary qualifications than they did at school or when first selecting courses at higher education institutions.
The research being reported on here confirms that there are career factors which are more important to women irrespective of age than to men and that there are separate career factors that are seen to be relevant to particular age
groups. However, there is only one clear issue that seems to differentiate older women in particular and therefore there is no simple answer regarding what brings them into the ICT workforce late. That factor is computer self-efficacy where women „catch up‟ only later in their careers. This remedial „force‟ might happen at university or in the work place. This research cannot shed light on when this occurs as the respondents were first year students.
The late entrance of both males and females has implications regarding reskilling but also regarding the value of an initial ICT degree qualification. The fact that late entrants get jobs even in highly industrialised countries with advanced economies, despite the fact that they do not have IT-specific, formal qualifications (although they may well have relevant experience as end-users or may have obtained valuable experience within the working environment) may be
interpreted in various ways. Either, any degree is just evidence
of potential and on the job training is required by all new employees into the ICT workforce. Or there is a massive skills shortage and employees have no choice but to employ people with potential but no qualifications. A third possibility is that we (and remember this refers to educators in this set of
disciplines worldwide) are putting up barriers that prevent people with actual ability from entering our ICT education programmes. However, a fourth, and very important possibility is related to self-efficacy and we will divide this into 1) IT self-efficacy, that is the belief that you can in fact be successful a computing career and 2) computing self-efficacy, that is, the belief that you can successfully study computing. The late entrance of women into the IT workforce may be
related to low IT and computing self-efficacy at the time that these women leave school and improved self-efficacy in these two related forms later.
The choice to change to an ICT related career indicates that these people have only found out that this is work that they can do, enjoy doing and has opportunities and rewards, once they are exposed to it in a working environment. This would support other reports that young students are not getting the
information about computing careers and computer experience at school and university that is really useful.
8. BIBLIOGRAPHY [1] AALTIO, I. & HUANG, J. (2007) Women managers‟
careers in information technology in China: high flyers
with emotional costs? Journal of Organizational Change Management, 20, 227-244.
[2] AGOSTO, D. E., GASSON, S. & ATWOOD, M. (2008) Changing mental models of the IT professions: A theoretical framework. J of IT Education, 7, 205-221.
[3] AKBULUT, A. Y. & LOONEY, C. A. (2007) Inspiring students to pursue computing degrees. Communications of the ACM, 50, 67-71.
[4] AKBULUT, A. Y. & LOONEY, C. A. (2009) Improving
IS student enrolments: Understanding the effects of IT sophistication in introductory IS courses. J of IT Education, 8, 87-100.
[5] ALEXANDER, P., HOLMNER, M., LOTRIET, H., MATTHEE, M., PIETERSE, V., NAIDOO, S., TWINOMURINZI, H. & JORDAAN, D. (2010) Factors affecting career choice: Comparison between students from computer and other disciplines. Journal of Science
Education and Technology, OnlineFirst 16 Oct, 2010. [6] ALEXANDER, P. & PIETERSE, V. (2010) Indications of
personality trait difference between ICT and other students. In 18th European Conference of Information Systems (ECIS‟ 2010), 7-9 June 2010.
[7] BANDURA, A., BARBARANELLI, C., CAPRARA, G. V. & PASTORELLI, C. (2001) Self-Efficacy beliefs as shapers of children‟s aspirations and career trajectories.
Child Development, 72, 187-206. [8] BENOKRAITIS, V. J., SHELTON, R. D., BIZOT, B.,
BROWN, R. & MARTENS, J. (2009) Reasons for CS decline: Preliminary evidence. JCSC, 24, 161-162.
[9] BEYER, S. (2008) Gender differences and intra-gender differences amongst Management Information Systems students. J of Information Systems Education, 19, 10.
[10] BLIGNAUT, P. & NAUDE, A. (2008) The influence of
temperament style on a student‟s choice of and performance in a computer programming course. Computers in Human Behavior, 24, 1010-1020.
[11] BOVÉE, C., VOOGT, J. & MEELISSEN, M. (2007) Computer attitudes of primary and secondary students in South Africa. Computers in H B, 23, 1762-1776.
10
[12] CHETTY, M., BUCKHALTER, C., BEST, M., GRINTER, R. E. & GUZDIAL, M. (2007) Description of Computer Science higher education in sub-Saharan Africa: Initial explorations. http://citeseerx.ist.psu.edu/viewdoc/download?doi=10.1.1.
125.8376&rep=rep1&type=pdf. Accessed 2010/12/01. [13] COETZEE, L., SEETHARAM, D., BUTGEREIT, L. &
VAN GELDER, A. (2010) The SAFIPA-MERAKA Institute code-sprints program; A mechanism to enhance the development capacity of emerging developers - observations and lessons learnt. In IST-Africa 2010.
[14] COHEN, J. F. & PARSOTAM, P. (2010) Intentions to Pursue a Career in Information Systems and Technology:
An Empirical Study of South African Students. In KCKS 2010, IFIP AICT.
[15] COHEN, J. F. & PARSOTAM, P. (2010) Intentions to Pursue a Career in Information Systems and Technology: An Empirical Study of South African Students
In KCKS 2010, IFIP AICT 324 . [16] E-SKILLS UK About e-skills UK. http://www.e-
skills.com/About-us/1153 Accessed 14/05/2011.
[17] E-SKILLS UK (2008) Technology counts: IT & telecoms insights 2008. www.e-skills.com/Research-and-policy/Insights-2008/2205 Accessed 2008/02/14.
[18] E-SKILLS UK (2008) Women in the IT and Telecoms Workforce. http://www.e-kills.com/Research/Research-publications/ women-in-it/ Accessed 12/05/2011.
[19] GALPIN, V., SANDERS, I., TURNER, H. & VENTER, B. (2003) Computer self-efficacy, gender, and educational
background in South Africa. IEEE Technology and Society Magazine, Fall 2003, 43-48.
[20] HE, J. & FREEMAN, L. A. (2009) Are Men More Technology-Oriented Than Women? The Role of Gender on the Development of General Computer Self-Efficacy of College Students. J of IS Education, 21.
[21] HESA UK www.hesa.ac.uk Accessed 10 May 2011. [22] HILBERG, J. S. & MEISELWITZ, G. (2008)
Undergraduate fluency with Information and
Communication Technology: Perceptions and Reality. SIGITE '08, October 16-18, 2008,Ohio, USA.
[23] IDC (2009) Middle East & Africa Group: Aid to Recovery: The economic impact of IT, software, and the Microsoft ecosystem on the economy. IDC Economic Impact Study.
[24] JACOBS, C. & SEWRY, D. A. (2009) Learner Inclinations to Study Computer Science or Information
Systems at Tertiary Level. SACJ, 44. [25] JOHNSON, R. D., STONE, D. L. & PHILLIPS, T. N.
(2008) Relations among ethnicity, gender, beliefs, attitudes, and intention to pursue a career in IT. J of Applied Social Psychology, 38, 999-1022.
[26] KOCH, H. & KAYWORTH, T. (2009) Partnering with the Majors: A Process Approach to Increasing IS Enrollment. J of IS Education, 20, 439-449.
[27] LENT, R. W., BROWN, S. D. & HACKETT, G. (1994) Towards a unifying Social Cognitive Theory of career and academic interest, choice, and performance. J of Vocational Behavior, 45, 79-122.
[28] LENT, R. W., BROWN, S. D., TALLEYRAND, R., MCPARTLAND, E. B., DAVIS, T., CHOPRA, S. B., S, A. M., SUTHAKARAN, V. & CHAI, C.-M. (2002) Career choice barriers, supports, and coping strategies:
College students' experiences. J of Vocational Behavior, 60, 61-72.
[29] LOONEY, C. A. & AKBULUT, A. Y. (2007) Combating the IS enrolment crisis: The role of effective teachers in introductory IS courses. Communications of the Association for Information Systems, 19, 781-805.
[30] MERKOFER, P. & MURPHY, A. (2009) The e-skills
landscape in South Africa: The issues of demand and supply and the use of international benchmarks to inform the South African e-skills development context. Zeitschrift für Politikberatung, 4, 685 - 695.
[31] MITROVIC, Z. (2010) Positioning e-skills within an organisation: An information systems management viewpoint. SA Journal of Information Management, 12.
[32] NARASIMHAN, V. L. (2006) S second opinion on the
current state of affairs in Computer science education - An Australian perspective. Issues in Informing Science and IT, 3, 445-458.
[33] PANKO, R. R. (2008) IT employment prospects: beyond the dotcom bubble. European Journal of Information Systems, 17, 182-197.
[34] PANTELI, N. (2006) Returning to IT: Employment and development after a career break in the United Kingdom.
Labour & Industry, 16, 133-150. [35] PRETORIUS, H. W. & DE VILLIERS, C. (2009) An
analysis of the international discourse about women in Information Technology. In SAICSIT'09.
[36] PRETORIUS, H. W. & DE VILLIERS, C. (2010) ASouth African perspective of the international discourse about women in Information Technology. In SAICSIT'10.
[37] SEYMOUR, L., HART, M., HARALAMBOUS, P.,
NATHA, T. & WENG, C.-W. (2005) Inclination of scholars to major in Information Systems or Computer Science. SACJ, 35, 97-106.
[38] SLONIM, J., SCULLY, S. & MCALLISTER, M. (2008) Crossroads for Canadian CS enrolment. Communications of the ACM, 51, 66-70.
[39] SMITH, S. M. (2002) The Role of Social Cognitive Career Theory in Information Technology based Academic Performance. Information Technology,
Learning, and Performance Journal, 20. [40] TIMMS, C., LANKSHEAR, C., ANDERSON, N. &
COURTNEY, L. (2008) Riding a hydra Women ICT professionals‟ perceptions of working in the Australian ICT industry. IT & People, 21, 155-177.
[41] TRAUTH, E. L., QUESENBERRY, J. L. & HUANG, H. (2008) A multicultural analysis of factors influencing career choice for women in the Information Technology
workforce. J of Global Information Management, 16, 23. [42] TRAUTH, E. M. & HOWCROFT, D. (2006) Critical
empirical research in IS: an example of gender and the IT workforce. IT & People, 19, 272-292.
[43] TRAUTH, E. M., QUESENBERRY, J. L. & HUANG, H. (2009) Retaining women in the U.S. IT workforce: theorizing the influence of organizational factors. European Journal of Information Systems, 18, 476-497.
[44] WARDELL, M., SAWYER, S., MITORY, J. & REAGOR, S. (2006) Gender and IT professionals in the United States: A survey of college graduates. Labour & Industry, 16, 39-58.
[45] ZHANG, W. (2007) Why IS: Understanding undergraduate students' intentions to choose an Information Systems major. J of Information Systems Education, 18, 447-458.
[46] ZWEBEN, S. (2009) 2007-2008 Taulbee Survey. Computing Research News, 21.