the impact of preservice teachers’ emotions on computer use: a formative analysis
TRANSCRIPT
J. EDUCATIONAL COMPUTING RESEARCH, Vol. 36(4) 455-479, 2007
THE IMPACT OF PRESERVICE TEACHERS’
EMOTIONS ON COMPUTER USE:
A FORMATIVE ANALYSIS
ROBIN KAY
University of Ontario, Canada
ABSTRACT
Previous research on the effect of technology-based preservice education
programs has been assessed by examining changes in computer ability and
attitudes. Systematic exploration looking at the effect of these programs on
computer use has been noticeably absent. In addition, the role of emotions and
use of computers has been largely ignored with one exception, computer
anxiety. The purpose of the following study was to examine the impact of
four basic emotions (anger, anxiety, happiness, sadness) on use of computers
by preservice teachers in their coursework (university use) and in their
practice teaching (field use). Happiness was reported often while learning
new software—anxiety, anger, and sadness were experienced sometimes. All
four emotion constructs were significantly correlated with all four university
use constructs at the beginning of the laptop program. Increased positive
emotions (happiness) were significantly correlated with increased use of
computers at the university by the end of the program. Finally, increases in
positive emotions and decreases in negative emotions were significantly
related to teacher and student-based use of computers in the field.
TEACHER EDUCATION AND TECHNOLOGY
Over the past 10 years, a number of large scale meta-analyses (Baker, Gearhart,
& Herman, 1994; Kozma, 2003; Kulik, 1994; Mann, Shakeshaft, Becker, &
Kottkamp, 1999; Scardamalia & Bereiter, 1996; SIIA, 2000; Sivin-Kachala,
1998; Wenglinksy, 1998) have reported significant improvement in achievement
scores, attitudes toward learning, and depth of understanding when computers
455
� 2007, Baywood Publishing Co., Inc.
were integrated with learning. However, gains observed in these studies were
dependent on subject area (Kulik, 1994), type of software used (Sivin-Kachala,
1998), specific student population, software design, educator role, and level of
student access (Sivin-Kachala, 1998). This research has prompted educational
policy specialists and administrators to promote the presence of technology
in classrooms, specifically focusing on student-to-computer ratio, high speed
Internet access, and preservice teacher education (Bennett, 2000/2001; CEO
Forum on Education and Technology, 2000; Compton & Harwood, 2003;
ISTE/NCATE, 2003; McRobbie, Ginns, & Stein, 2000; National Council for
Accreditation of Teacher Education, 2003; OTA, 1995; Plante & Beattie, 2004;
U.S. National Center for Education Statistics, 2002).
A large number of nationally recognized organizations (e.g., CEO Forum on
Education and Technology, 2000; ISTE/NCATE, 2003—see Bennett, 2000/2001
for a review; National Council for Accreditation of Teacher Education, 2003;
OTA, 1995) have developed comprehensive standards for the use of technology in
teacher preparatory programs. While preservice teacher education programs
appear to be a natural place to start with respect to integrating technology into
education, the evidence suggests that these programs have not been successful
preparing new teachers to use technology effectively (CEO Forum on Education
and Technology, 2000; Kay, 2006; Moursund & Bielefeltdt, 1999; OTA, 1995;
U.S. Department of Education, 2000; Yildirim, 2000). However, research on the
integration of technology in preservice education has been hampered by poor
data collection instruments, vague sample and program descriptions, small
samples, an absence of statistical analysis, and vague anecdotal descriptions of
success (see Kay, 2006 for a review).
Kay (2006), in a review of 68 articles on technology and preservice education,
noted that computer attitude, ability, and use were the principal dependent vari-
ables assessed, although clear definitions of ability, attitude, and use were rarely
presented or theoretically justified. Computer ability was examined most often
(60%, n = 41 out of 68), followed closely by computers attitudes (56%, n = 38
out of 68). Computer use, on the other hand, was looked at in only one third of
the studies examined (33%, n = 23 out of 68). A closer look revealed that only
14 of 68 studies used reliable data collection methods combined with formal
statistics. Of those 14 studies, only three looked at computer use. Clearly,
computer use needs to be emphasized more, given that one of the ultimate goals
of a computer-based component in a preservice education program should be to
create meaningful and useful technological interactions in the classroom.
DEFINING COMPUTER USE
Computer use has been defined in variety of ways from the perspective of
the teacher and the student. With respect to teacher use of computers, definitions
have incorporated administrative tasks, lesson preparation, unit planning, the
456 / KAY
ability to use a wide range of software; delivery of lessons, and special education
(Compton & Harwood, 2003; Garland, 1999-2000; Maeers, Browne, & Cooper,
2000; Milbrath & Kinzie; 2000; Russell, Bebell, O’Dwyer, & O’Connor, 2003).
Regarding student use of computers, definitions have included the ability to use
a wide range of software tools, creativity, higher-order thinking skills, teacher-
directed student use, and time (Baylor & Ritchie, 2002; Halpin, 1999; Pope, Hare,
& Howard, 2002; Russell et al., 2003). A majority of computer use measures are
limited in focus and/or do not provide reliability and validity estimates (Baylor
& Ritchie, 2002; Halpin, 1999; Maeers et al., 2000; Milbrath & Kinzie, 2000;
Pope et al., 2002; Russell et al., 2003; Thompson, Schmidt, & Davis, 2003;
Wang & Holthaus, 1998-99).
EMOTIONS AND COGNITION
While traditional theorists view emotion and cognition as clearly separated
constructs (Goleman, 1997; Lazarus, 1991a, 1991b), there is increasing evi-
dence that emotion and cognition are integrated and intertwined (Fridja, 1986;
Gray, 1990; LeDoux, 1989; O’Regan, 2003; Simon, 1967). LeDoux (1989),
for example, claims that emotion and cognition are mediated by separate but
integrated systems of the brain. Gray (1990) adds that the brain systems mediating
emotion and cognition overlap. Finally, O’Regan (2003) notes that there has
been a “growing awareness that, far from being polar opposites [emotion and
cognition] are in fact inextricably connected” (p. 80). The current perspective,
then, is that emotion and cognition are more connected, than separate.
Emotion is considered critical in the process of adapting to unpredictable
environments or juggling multiple goals (Case, Hayward, Lewis, & Hurst, 1988;
Neisser, 1963; Oatley & Johnson-Laird, 1987; Simon, 1967). An emotional
reaction is likely when one is in danger of harm, being threatened, challenged, or,
conversely, if one is in a situation of benefit or readiness (Lazarus, 1991b).
Emotion could also be activated by a number of factors, including motivation,
communication, or survival (Rolls, 1990). Since learning new software can
be threatening, challenging, beneficial, motivating, and communicative, it is
reasonable to speculate that emotions play a important role.
EMOTIONS AND COMPUTER USE
While emotions and cognition appear to be inextricably linked, the connection
between emotions and use of computers has not been examined in a com-
prehensive and systematic way. In fact, only one emotion, anxiety, has been
studied extensively with respect to computers, however precise and consistent
definitions are lacking. Constructs have included confidence (Heinsen, Glass,
& Knight, 1987; Loyd & Gressard, 1984), positive or negative feelings (Beckers
& Schmidt, 2001; Ceyhan, 2006; Loyd & Gressard, 1984; Nickell & Pinto, 1986),
THE IMPACT OF PRESERVICE TEACHERS’ EMOTIONS / 457
intimidation (Heinsen, Glass, & Knight, 1987; Nickell & Pinto, 1986), fear
(Bronsan & Lee, 1998; Heinsen, Glass, & Knight, 1987), damaging anxiety
(Ceyhan, 2006; Russell & Bradley, 1997), equipment anxiety (Marcoulides &
Wang, 1990), learning or task performance anxiety (Ceyhan, 2006; Rosen &
Weil, 1995; Russell & Bradley, 1997), observation anxiety (Bronsan & Lee,
1998; Dyck, Gee, & Smither, 1998), anticipatory anxiety (Bronsan & Lee,
1998), state-anxiety (Guadron & Vignoli, 2002; Wilfong, 2006), fear of social
embarrassment (Russell & Bradley, 1997), general or non-specific anxiety (Hong
& Koh, 2002; Todman & Day, 2006; Yaghi & Abu-Saba, 1998), self-efficacy
(Beckers & Schmidt, 2001), and cognitive beliefs (Beckers & Schmidt, 2001).
This range of constructs makes it difficult to build theory and a coherent
knowledge base.
Only one study could be found looking at the role of another emotion, anger,
with respect to computer related behaviour. Wilfong (2006) reported that
computer anger was strongly related to self-efficacy, but not computer use or
experience. Emotions such as sadness or happiness have yet to be formally
evaluated in the context of computer use. In fact, considerable debate reigns on
what constitutes a basic emotion. It is generally agreed upon, though, that there are
at least four basic emotions: happiness, sadness, anxiety (fear), and anger (Arnold,
1960; Ekman, Friesen, & Ellsworth, 1972; Izard, 1969; James, 1884; Oatley &
Johnson-Laird, 1987; Plutchik, 1980; Tomkins, 1962).
PURPOSE
The purpose of this study was to examine the impact of four basic emotions
(anger, anxiety, happiness, sadness) on the use of computers by preservice
teachers in their coursework (university use) and practice teaching (field use).
Three key questions were addressed:
1. To what extent are emotions present when software is being learned?
2. How are emotions related to use of computers by preservice teachers at
their university?
3. How are emotions related to use of computers by preservice teachers during
their field placements?
METHOD
Sample
The sample consisted of 184, secondary (Grade 7-12), preservice teachers
(123 females, 61 males) from a variety of cultural backgrounds (20% reported
that their first language was not English), ranging in age from 23 to 58 years
(M = 33.4; SD = 8.7). Eighty-one percent of the subjects reported having 10 or
more years experience using computers. The total enrolment in the program
was 190 students, therefore the response rate was 97%.
458 / KAY
Description of the Program
The Bachelor of Education degree at this university is an eight-month con-
secutive program, focusing on Computer Science, Math, and Science (Physics,
Chemistry, Biology, and General Science) at the intermediate-secondary school
level (grades 7 to 12). All students were required to have a B.A. with five full
university courses in their first teachable area and three full university courses
in their second teachable area.
Every student in the preservice teacher education program was given an
IBM R51 ThinkPad at the beginning of the year, loaded with a wide range of
educational and application-based programs. All classrooms were wired with
high-speed Internet access through cable and a wireless network. In addition,
students had access to a wireless network throughout the university campus.
Model of Technology Use—Integration
An integrated model was used to incorporate technology into the preservice
education. In other words, students used their laptop computers in all courses
offered, but did not take a stand-alone course in technology use. All students
attended a four-hour introductory workshop at the beginning of the year to
introduce them to the basic operations of laptop computers and connecting to
the Internet. All students were offered voluntary two-hour workshops throughout
the year that focused on specific software skills in Word, PowerPoint, searching
the Web, Web Page Design, and Dreamweaver. Finally, there was one support
person available four hours per day, five days a week, to assist students with
individual problems.
All faculty members created assignments and projects that required students to
use the computer as a tool to solve meaningful, practical, and useful problems.
A majority of the activities used were based on well-grounded, learning theory
including cooperative learning (e.g., Kagan, 1997; Sharon, 1999), constructivism
(e.g., Bruner, 1983, 1986; Vygotsky, 1978), facilitation and coaching (e.g.,
Brown & Palinscar, 1989; Collins, Brown, & Newman, 1989), incorporating
a variety of learning styles (e.g., Gardner, 1983), problem-based learning
(e.g., Albanese & Mitchell, 1993; Collins et al., 1989), higher-level thinking
skills (e.g., Resnick, 1989), connecting concepts to real world knowledge (e.g.,
Lampert, 1986; Larkin, 1989; Sternberg, 1989), and actively applying knowledge
(Carroll, 1990; Caroll & Mack, 1984).
Data Sources
Survey
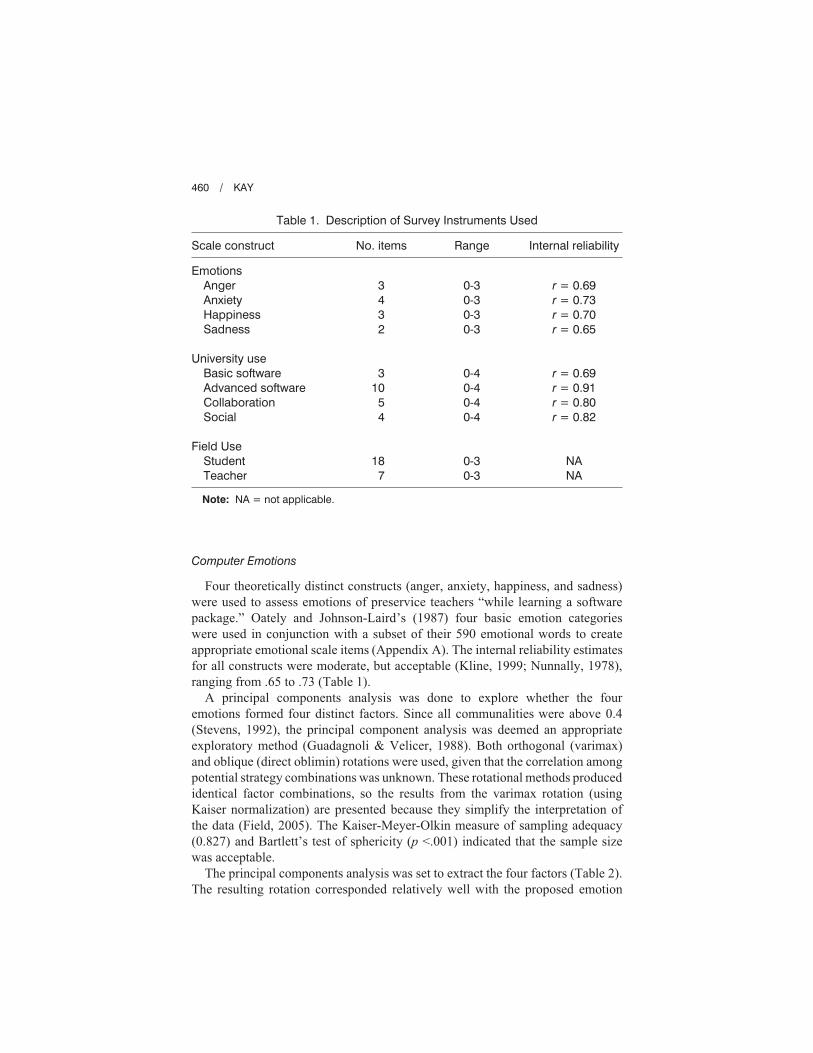
The survey consisted of 3 sections (59 items) focusing on emotions (12 items),
university use (22 times), and field use (25 items) (see Table 1).
THE IMPACT OF PRESERVICE TEACHERS’ EMOTIONS / 459
Computer Emotions
Four theoretically distinct constructs (anger, anxiety, happiness, and sadness)
were used to assess emotions of preservice teachers “while learning a software
package.” Oately and Johnson-Laird’s (1987) four basic emotion categories
were used in conjunction with a subset of their 590 emotional words to create
appropriate emotional scale items (Appendix A). The internal reliability estimates
for all constructs were moderate, but acceptable (Kline, 1999; Nunnally, 1978),
ranging from .65 to .73 (Table 1).
A principal components analysis was done to explore whether the four
emotions formed four distinct factors. Since all communalities were above 0.4
(Stevens, 1992), the principal component analysis was deemed an appropriate
exploratory method (Guadagnoli & Velicer, 1988). Both orthogonal (varimax)
and oblique (direct oblimin) rotations were used, given that the correlation among
potential strategy combinations was unknown. These rotational methods produced
identical factor combinations, so the results from the varimax rotation (using
Kaiser normalization) are presented because they simplify the interpretation of
the data (Field, 2005). The Kaiser-Meyer-Olkin measure of sampling adequacy
(0.827) and Bartlett’s test of sphericity (p <.001) indicated that the sample size
was acceptable.
The principal components analysis was set to extract the four factors (Table 2).
The resulting rotation corresponded relatively well with the proposed emotion
460 / KAY
Table 1. Description of Survey Instruments Used
Scale construct No. items Range Internal reliability
Emotions
Anger
Anxiety
Happiness
Sadness
University use
Basic software
Advanced software
Collaboration
Social
Field Use
Student
Teacher
3
4
3
2
3
10
5
4
18
7
0-3
0-3
0-3
0-3
0-4
0-4
0-4
0-4
0-3
0-3
r = 0.69
r = 0.73
r = 0.70
r = 0.65
r = 0.69
r = 0.91
r = 0.80
r = 0.82
NA
NA
Note: NA = not applicable.
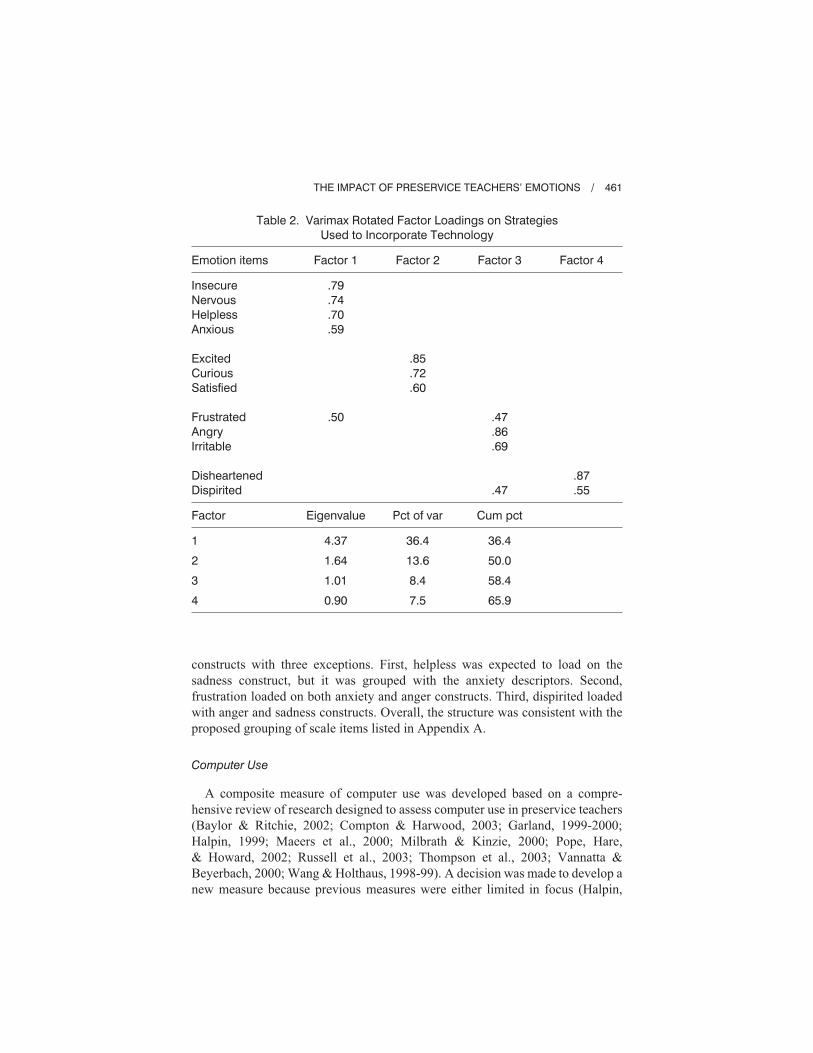
constructs with three exceptions. First, helpless was expected to load on the
sadness construct, but it was grouped with the anxiety descriptors. Second,
frustration loaded on both anxiety and anger constructs. Third, dispirited loaded
with anger and sadness constructs. Overall, the structure was consistent with the
proposed grouping of scale items listed in Appendix A.
Computer Use
A composite measure of computer use was developed based on a compre-
hensive review of research designed to assess computer use in preservice teachers
(Baylor & Ritchie, 2002; Compton & Harwood, 2003; Garland, 1999-2000;
Halpin, 1999; Maeers et al., 2000; Milbrath & Kinzie, 2000; Pope, Hare,
& Howard, 2002; Russell et al., 2003; Thompson et al., 2003; Vannatta &
Beyerbach, 2000; Wang & Holthaus, 1998-99). A decision was made to develop a
new measure because previous measures were either limited in focus (Halpin,
THE IMPACT OF PRESERVICE TEACHERS’ EMOTIONS / 461
Table 2. Varimax Rotated Factor Loadings on Strategies
Used to Incorporate Technology
Emotion items Factor 1 Factor 2 Factor 3 Factor 4
Insecure
Nervous
Helpless
Anxious
Excited
Curious
Satisfied
Frustrated
Angry
Irritable
Disheartened
Dispirited
.79
.74
.70
.59
.50
.85
.72
.60
.47
.86
.69
.47
.87
.55
Factor Eigenvalue Pct of var Cum pct
1
2
3
4
4.37
1.64
1.01
0.90
36.4
13.6
8.4
7.5
36.4
50.0
58.4
65.9
1999; Maeers et al., 2000; Milbrath & Kinzie, 2000) or not statistically reliable
(Baylor & Ritchie, 2002; Pope et al., 2002; Russell et al., 2003; Thompson et al.,
2003; Wang & Holthaus, 1998-99). Use was looked at in two environments—at
the university where preservice candidates took their classes and in the field
placement where preservice teachers practiced their teaching.
In the university environment, four categories of computer use were assessed:
basic software (r = 0.69), advanced software (r = 0.91), collaboration (r = 0.80),
and social (r = 0.82). A principal component factor analysis supported the validity
of this structure. Reliability estimates were moderate to high. Items for this
scale are presented in Appendix B.
In the classroom environment where preservice teachers did their practice
teaching (field placement), two categories of computer use were examined—
teacher-based and student-based. Teacher-based use of computers involved the
teacher employing computers to prepare and deliver lessons, where as student-
based use looked at students working with computers during a class. The items
from this scale were not designed to form coherent, reliable structures. The
scale was designed to be a comprehensive checklist of technology tools that
preservice candidates could use. However, given the wide range of tools examined
and the limited time in the field placement (six weeks), it was anticipated that
consistent and frequent patterns of use would be difficult to attain. Therefore a
factor analyses and internal reliability estimates were not calculated. Items for
this scale are presented in Appendix C.
PROCEDURE
Subjects were told the purpose of the study and then asked to give written
consent if they wished to participate. The emotion (Appendix A) and university
use surveys (Appendix B) were administered online at the beginning of the year
(September). Both surveys were re-administered coupled with a field use survey
(Appendix C) at the end of the year (April). In order to partially control for
extraneous influences, surveys at the beginning and end of the year were filled in
by subjects using their laptop computers in a large lecture hall. The survey battery
took from 8 to 12 minutes to complete.
RESULTS
Frequency of Emotions Expressed
At the beginning of the integrated laptop program, happiness (M = 1.83;
SD = 0.52) was the emotion that preservice teachers claimed they felt most
often while learning new software. The remaining emotions, anger (M = 0.70;
SD = 0.45), anxiety (M = 0.65; SD = 0.48), and sadness (M = 0.55; SD = 0.47)
were experienced far less often. This means that, on average, preservice teachers
felt happiness (curiosity, satisfaction, excitement) most of the time, and anger,
anxiety, or sadness some of the time (Appendix A).
462 / KAY
Emotion and University Use
Frequency of Use
Prior to the start of the integrated laptop program, basic use (M = 3.2; SD = 0.85)
was the most frequent type of activity, followed by social use (M = 2.4; SD = 0.93),
collaborative use (M = 2.0; SD = 1.03), and advanced use (M = 1.5; SD = 0.84).
This means that, on average, preservice teachers reported that they used com-
puters for basic activities often, social and collaborative use sometimes, and
advanced activities rarely (see Appendix B).
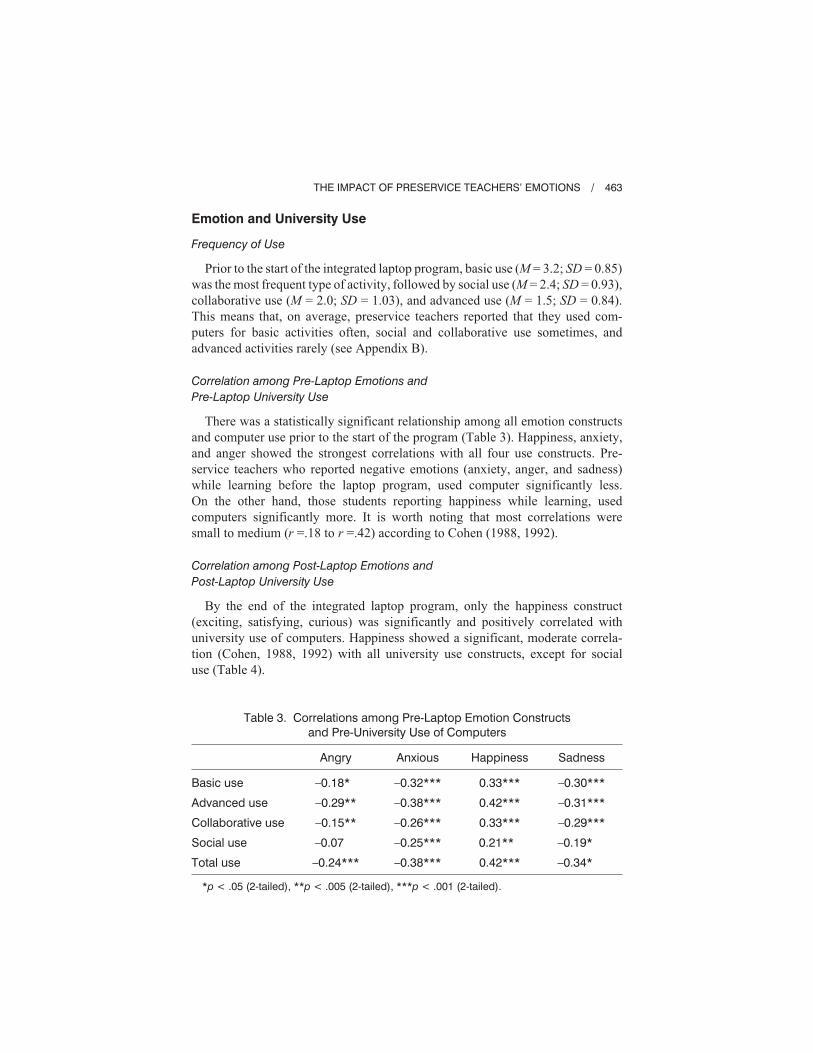
Correlation among Pre-Laptop Emotions and
Pre-Laptop University Use
There was a statistically significant relationship among all emotion constructs
and computer use prior to the start of the program (Table 3). Happiness, anxiety,
and anger showed the strongest correlations with all four use constructs. Pre-
service teachers who reported negative emotions (anxiety, anger, and sadness)
while learning before the laptop program, used computer significantly less.
On the other hand, those students reporting happiness while learning, used
computers significantly more. It is worth noting that most correlations were
small to medium (r =.18 to r =.42) according to Cohen (1988, 1992).
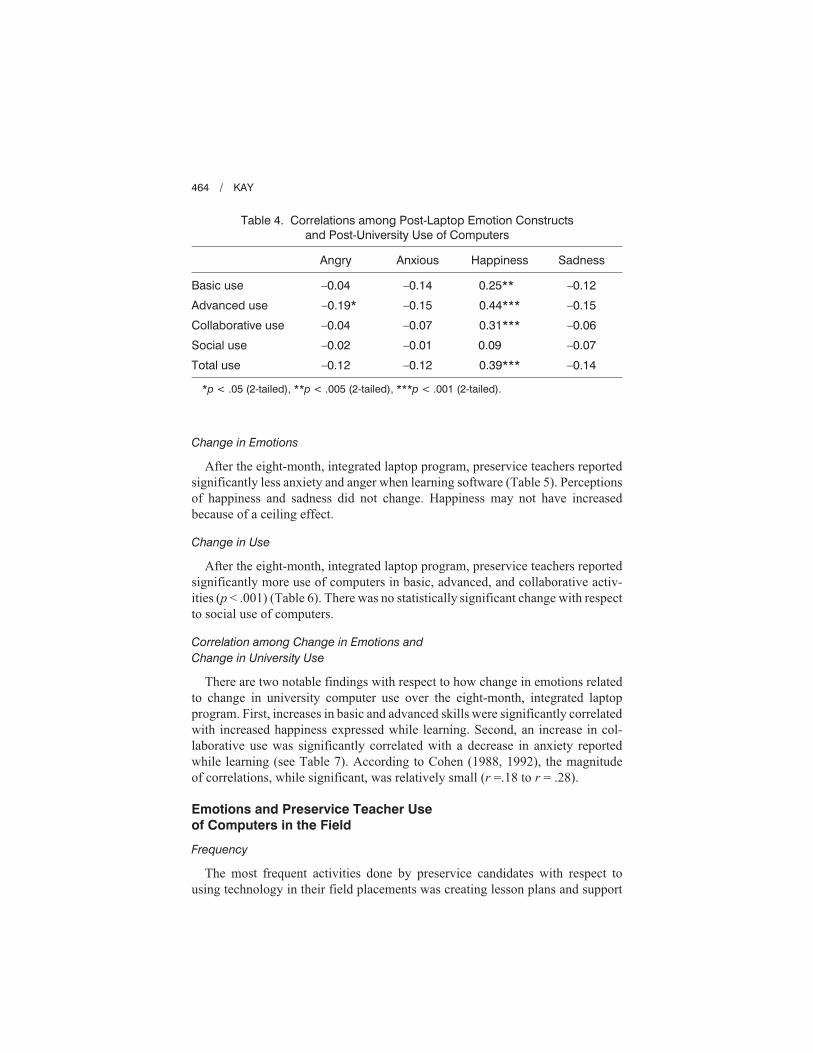
Correlation among Post-Laptop Emotions and
Post-Laptop University Use
By the end of the integrated laptop program, only the happiness construct
(exciting, satisfying, curious) was significantly and positively correlated with
university use of computers. Happiness showed a significant, moderate correla-
tion (Cohen, 1988, 1992) with all university use constructs, except for social
use (Table 4).
THE IMPACT OF PRESERVICE TEACHERS’ EMOTIONS / 463
Table 3. Correlations among Pre-Laptop Emotion Constructs
and Pre-University Use of Computers
Angry Anxious Happiness Sadness
Basic use
Advanced use
Collaborative use
Social use
Total use
–0.18*
–0.29**
–0.15**
–0.07
–0.24***
–0.32***
–0.38***
–0.26***
–0.25***
–0.38***
0.33***
0.42***
0.33***
0.21**
0.42***
–0.30***
–0.31***
–0.29***
–0.19*
–0.34*
*p < .05 (2-tailed), **p < .005 (2-tailed), ***p < .001 (2-tailed).
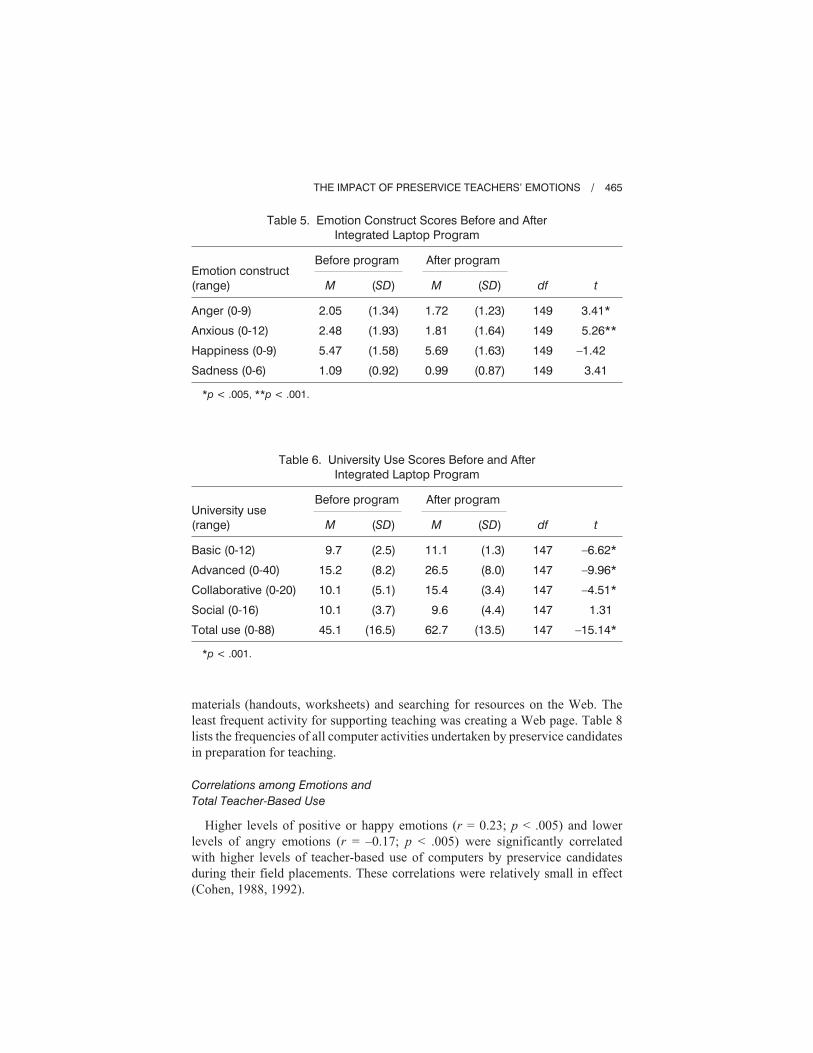
Change in Emotions
After the eight-month, integrated laptop program, preservice teachers reported
significantly less anxiety and anger when learning software (Table 5). Perceptions
of happiness and sadness did not change. Happiness may not have increased
because of a ceiling effect.
Change in Use
After the eight-month, integrated laptop program, preservice teachers reported
significantly more use of computers in basic, advanced, and collaborative activ-
ities (p < .001) (Table 6). There was no statistically significant change with respect
to social use of computers.
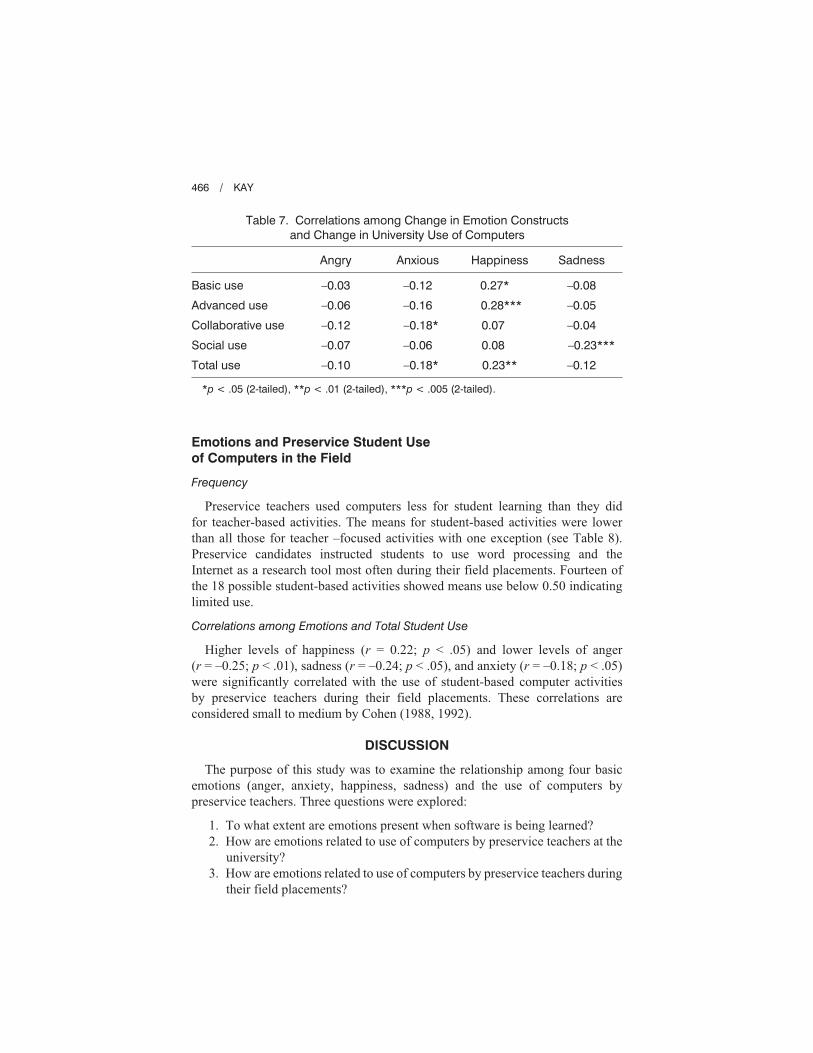
Correlation among Change in Emotions and
Change in University Use
There are two notable findings with respect to how change in emotions related
to change in university computer use over the eight-month, integrated laptop
program. First, increases in basic and advanced skills were significantly correlated
with increased happiness expressed while learning. Second, an increase in col-
laborative use was significantly correlated with a decrease in anxiety reported
while learning (see Table 7). According to Cohen (1988, 1992), the magnitude
of correlations, while significant, was relatively small (r =.18 to r = .28).
Emotions and Preservice Teacher Use
of Computers in the Field
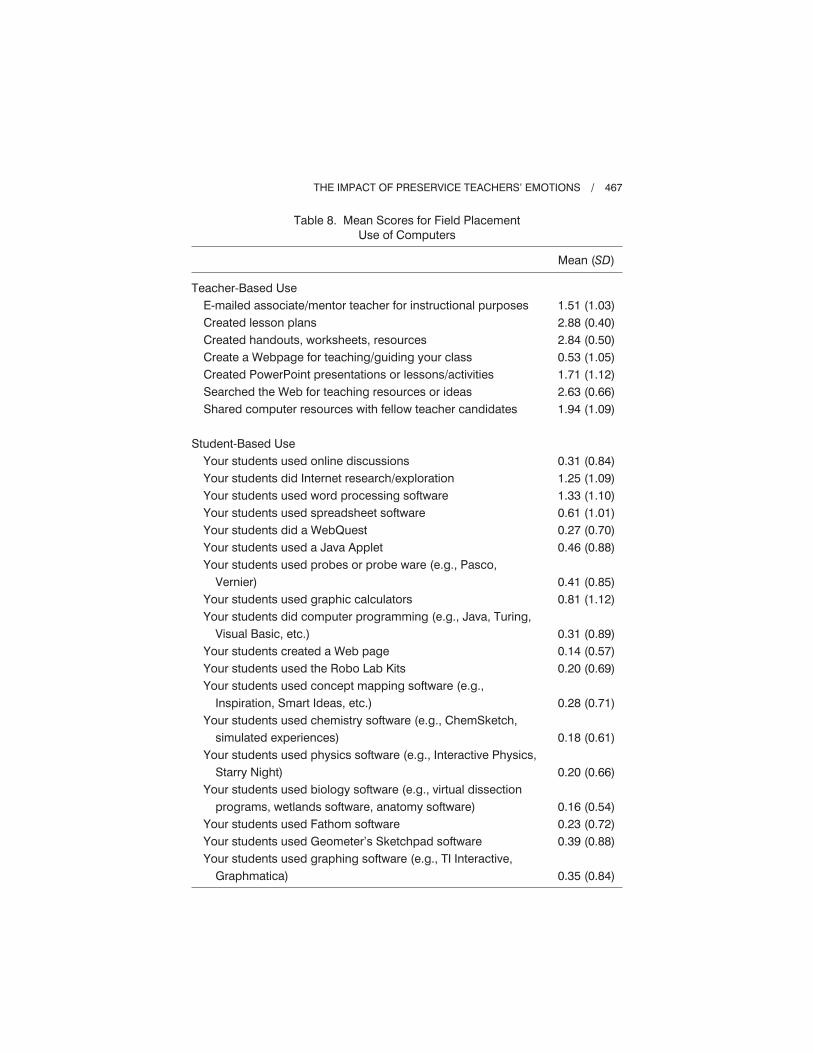
Frequency
The most frequent activities done by preservice candidates with respect to
using technology in their field placements was creating lesson plans and support
464 / KAY
Table 4. Correlations among Post-Laptop Emotion Constructs
and Post-University Use of Computers
Angry Anxious Happiness Sadness
Basic use
Advanced use
Collaborative use
Social use
Total use
–0.04
–0.19*
–0.04
–0.02
–0.12
–0.14
–0.15
–0.07
–0.01
–0.12
0.25**
0.44***
0.31***
0.09
0.39***
–0.12
–0.15
–0.06
–0.07
–0.14
*p < .05 (2-tailed), **p < .005 (2-tailed), ***p < .001 (2-tailed).
materials (handouts, worksheets) and searching for resources on the Web. The
least frequent activity for supporting teaching was creating a Web page. Table 8
lists the frequencies of all computer activities undertaken by preservice candidates
in preparation for teaching.
Correlations among Emotions and
Total Teacher-Based Use
Higher levels of positive or happy emotions (r = 0.23; p < .005) and lower
levels of angry emotions (r = –0.17; p < .005) were significantly correlated
with higher levels of teacher-based use of computers by preservice candidates
during their field placements. These correlations were relatively small in effect
(Cohen, 1988, 1992).
THE IMPACT OF PRESERVICE TEACHERS’ EMOTIONS / 465
Table 6. University Use Scores Before and After
Integrated Laptop Program
University use
(range)
Before program After program
M (SD) M (SD) df t
Basic (0-12)
Advanced (0-40)
Collaborative (0-20)
Social (0-16)
Total use (0-88)
9.7
15.2
10.1
10.1
45.1
(2.5)
(8.2)
(5.1)
(3.7)
(16.5)
11.1
26.5
15.4
9.6
62.7
(1.3)
(8.0)
(3.4)
(4.4)
(13.5)
147
147
147
147
147
–6.62*
–9.96*
–4.51*
1.31
–15.14*
*p < .001.
Table 5. Emotion Construct Scores Before and After
Integrated Laptop Program
Emotion construct
(range)
Before program After program
M (SD) M (SD) df t
Anger (0-9)
Anxious (0-12)
Happiness (0-9)
Sadness (0-6)
2.05
2.48
5.47
1.09
(1.34)
(1.93)
(1.58)
(0.92)
1.72
1.81
5.69
0.99
(1.23)
(1.64)
(1.63)
(0.87)
149
149
149
149
3.41*
5.26**
–1.42
3.41
*p < .005, **p < .001.
Emotions and Preservice Student Use
of Computers in the Field
Frequency
Preservice teachers used computers less for student learning than they did
for teacher-based activities. The means for student-based activities were lower
than all those for teacher –focused activities with one exception (see Table 8).
Preservice candidates instructed students to use word processing and the
Internet as a research tool most often during their field placements. Fourteen of
the 18 possible student-based activities showed means use below 0.50 indicating
limited use.
Correlations among Emotions and Total Student Use
Higher levels of happiness (r = 0.22; p < .05) and lower levels of anger
(r = –0.25; p < .01), sadness (r = –0.24; p < .05), and anxiety (r = –0.18; p < .05)
were significantly correlated with the use of student-based computer activities
by preservice teachers during their field placements. These correlations are
considered small to medium by Cohen (1988, 1992).
DISCUSSION
The purpose of this study was to examine the relationship among four basic
emotions (anger, anxiety, happiness, sadness) and the use of computers by
preservice teachers. Three questions were explored:
1. To what extent are emotions present when software is being learned?
2. How are emotions related to use of computers by preservice teachers at the
university?
3. How are emotions related to use of computers by preservice teachers during
their field placements?
466 / KAY
Table 7. Correlations among Change in Emotion Constructs
and Change in University Use of Computers
Angry Anxious Happiness Sadness
Basic use
Advanced use
Collaborative use
Social use
Total use
–0.03
–0.06
–0.12
–0.07
–0.10
–0.12
–0.16
–0.18*
–0.06
–0.18*
0.27*
0.28***
0.07
0.08
0.23**
–0.08
–0.05
–0.04
–0.23***
–0.12
*p < .05 (2-tailed), **p < .01 (2-tailed), ***p < .005 (2-tailed).
THE IMPACT OF PRESERVICE TEACHERS’ EMOTIONS / 467
Table 8. Mean Scores for Field Placement
Use of Computers
Mean (SD)
Teacher-Based Use
E-mailed associate/mentor teacher for instructional purposes
Created lesson plans
Created handouts, worksheets, resources
Create a Webpage for teaching/guiding your class
Created PowerPoint presentations or lessons/activities
Searched the Web for teaching resources or ideas
Shared computer resources with fellow teacher candidates
Student-Based Use
Your students used online discussions
Your students did Internet research/exploration
Your students used word processing software
Your students used spreadsheet software
Your students did a WebQuest
Your students used a Java Applet
Your students used probes or probe ware (e.g., Pasco,
Vernier)
Your students used graphic calculators
Your students did computer programming (e.g., Java, Turing,
Visual Basic, etc.)
Your students created a Web page
Your students used the Robo Lab Kits
Your students used concept mapping software (e.g.,
Inspiration, Smart Ideas, etc.)
Your students used chemistry software (e.g., ChemSketch,
simulated experiences)
Your students used physics software (e.g., Interactive Physics,
Starry Night)
Your students used biology software (e.g., virtual dissection
programs, wetlands software, anatomy software)
Your students used Fathom software
Your students used Geometer’s Sketchpad software
Your students used graphing software (e.g., TI Interactive,
Graphmatica)
1.51 (1.03)
2.88 (0.40)
2.84 (0.50)
0.53 (1.05)
1.71 (1.12)
2.63 (0.66)
1.94 (1.09)
0.31 (0.84)
1.25 (1.09)
1.33 (1.10)
0.61 (1.01)
0.27 (0.70)
0.46 (0.88)
0.41 (0.85)
0.81 (1.12)
0.31 (0.89)
0.14 (0.57)
0.20 (0.69)
0.28 (0.71)
0.18 (0.61)
0.20 (0.66)
0.16 (0.54)
0.23 (0.72)
0.39 (0.88)
0.35 (0.84)
Given that previous research on preservice teachers’ use of technology has
been hampered by a series of methodological problems including effective
scale development (see Kay, 2006 for a review), it is prudent to discuss quality
of measuring instruments used in the current study, before addressing the
main findings.
Measuring Emotions and Use
The four basic emotions addressed by the computer emotion scale were
selected based on extensive research (Arnold, 1960; Ekman, Friesen, & Elsworth,
1972; Izard, 1969; James, 1884; Oatley & Johnson-Laird, 1987; Plutchik, 1980;
Tomkins, 1962). The reliability of the emotion scales was acceptable (Kline,
1999; Nunnally, 1978), hovering around .70. That said, it might be advisable
to refine and possibly add items for the sadness scale, which had the lowest
reliability estimate. As well, a qualitative pilot test of items used should be
done to determine if the descriptors suggested by Oatley and Johnson-Laird
(1987) actually represented the intended constructs. A principal component
factor analysis confirmed that the four emotions assessed were relatively
distinct constructs.
The computer use scale, based on a composite of previous research efforts
(Baylor & Ritchie, 2002; Compton & Harwood, 2003; Garland, 1999-2000;
Halpin, 1999; Maeers et al., 2000; Milbrath & Kinzie, 2000; Pope, Hare, &
Howard, 2002; Russell, Bebell, O’Dwyer, & O’Connor, 2003; Thompson et al.,
2003; Vannatta & Beyerbach, 2000; Wang & Holthaus, 1998-99) resulted in
four statistical distinct factors (basic, advanced, collaborative, and social use) that
had moderate to high internal reliability estimates.
While the measures of emotions and university use of computers provided
acceptable levels of reliability and validity for the specific population studied,
more research needs to done to establish the integrity and longevity of these
new scales.
Question 1—Emotions Present While Learning
Preservice teachers reported that emotions were present in varying fre-
quencies when they learned new software. Happiness (curiosity, satisfaction,
excitement) was experienced frequently, while negative emotions (anxiety,
anger, and sadness) were experienced, on average, somewhere between never and
sometimes. The focus of previous research on computer anxiety (e.g., Beckers
& Schmidt, 2001; Bronsan & Lee, 1998; Ceyhan, 2006; Heinssen, Glass, &
Knight, 1987; Loyd & Gressard, 1984; Marcoulides & Wang, 1990; Nickell
& Pinto, 1986; Russell & Bradley, 1997) appears to have been too narrow.
Happiness, perhaps measured indirectly by confidence or self-efficacy in the
past, was a critical variable in this study and was significantly related to pre-
service teacher use of computers. Negative emotions, while not expressed as
468 / KAY
often during the learning process, still had a statistically significant impact on
use of computers at the university and in the field.
It is important to note that the emphasis on computer anxiety in past studies
is not without some merit. Anxiety was a critical emotion in this study. While
not reported often during learning, it decreased significantly after preservice
teachers participated in the laptop program. In addition, the anxiety construct was
significantly and negatively correlated with pre-laptop use of computers, changes
in computer use, and student use in the classes taught by preservice teachers.
Question 2—Relationship among Emotions
and University Use of Computers
There is evidence to support a significant relationship among emotions and
preservice teacher’s use of computers at the university. All four emotion con-
structs (anger, anxiety, happiness, and sadness) were significantly correlated
with all four use constructs (basic, advances, collaborative, and social) at the
beginning of the laptop program. This relationship among emotions and use was
not as strong after the laptop program. Only happiness was significantly and
positively correlated with university use after the laptop program. This result
is consistent with the statistically significant reduction in negative emotions
(anxiety and anger) observed at the end of the laptop program. In other words,
negative emotions played a reduced role in effecting use of computers at the
end of the laptop program because preservice teachers reported that they experi-
enced them less while learning new software. Finally, significant increases in
basic and advanced use appeared to be correlated with increases in happiness.
As well, a decrease in anxiety was significantly related to increases in the
collaborative use of computers.
The results provide moderate support that emotions and computer use are
related, however, the dynamics of the relationship need to be investigated further.
The main question that needs to be addressed in future studies is “do emotions
effect cognitions leading to changes in computer use?” or “does increased use,
as prescribed by the university laptop program, reduce negative emotions and
build positive emotions?”
Question 3—Relationship among Emotions
and Use of Computers in the Field
One goal of most technology-based teacher preparatory programs is to
promote the thoughtful use of technology by preservice teachers in the classroom.
In this study, there was a statistically significant relationship between emotions
and use of computers in preservice teacher field placements. Increased happi-
ness and decreased anger associated with learning new software was signifi-
cantly correlated with increased teacher-based use of computers. In addition, all
four emotion constructs were significantly correlated with student-based use of
THE IMPACT OF PRESERVICE TEACHERS’ EMOTIONS / 469
computers. One reasonable explanation for this result is that the emotional
reactions preservice teachers experience while learning new software tools in
the laptop program had an impact on their use of computers when they taught
in the classroom. If their emotional experiences were positive, use of computers
increased in the field. If their emotional experiences were negative, preservice
teachers were less inclined to employ computers as a teaching tool or strategy.
Caveats
The results of this study, while suggestive of a meaningful link between
emotions and computer use should be treated with caution for the following
reasons. First, self-report measures were used, therefore the responses need to be
validated, perhaps by checking actual emotions expressed while learning a new
software package. Second, subjects were asked, “In general, when I am learning
how to use a new software package, I feel.” While this prompt was intended
to gather an overall impression of emotions experienced, it is reasonable to
speculate that emotions expressed while learning may be largely dependent on
the software being learned. Easy to use software might bring about a narrow range
and limited expression of emotions, while more challenging software might
elicit more intense emotions. Third, given moderate reliability estimates for the
emotions scale, it would be wise to interview a sample of future subjects to
check if the items they select actually correspond to the intended emotion of a
construct. Fourth, the sample consisted of relatively advanced users, at least in
terms of years of computer experience. A more diverse population with a wider
range of computer experience is needed to be more confident in the generaliz-
ability of the results.
Finally, many of the correlations in this study, while significant, fell within
the small to medium range according to Cohen (1988, 1992). This means, that
emotions accounted for roughly 9% to 16% of the variance for computer use.
However, this magnitude of correlation is typical of many studies in social science.
While emotions play some role in accounting for computer use, it is likely
that other factors such as computer ability, access to computers in the practicum,
and attitude of the mentor teacher toward computers contribute to preservice
teacher use of computers. In other words, emotions are only one piece of the
computer use puzzle.
Implications for Education
Since this a formative study, the first to examine the relationship between
emotions and preservice teachers’ use of computers, it would not be prudent to
make any strong conclusions with respect to implications for education. Several
comments, however tentative, are worth noting.
First, exposing preservice teachers to an integrated laptop program, helped
to significantly reduce reported anxiety and anger levels in just eight months. It
470 / KAY
also helped to significantly increase the effective use of computers at the uni-
versity. While there are no comparison groups, ubiquitous access to computing
appears to play a significant role in altering computer related behaviours.
Second, the results of the study indicate that it is worth considering a full
range of emotions that a new user feels while learning a new software package,
not just anxiety levels. New users may experience emotions in private or may not
show them externally, but clearly anger, happiness, and sadness are also present
and important. Developing strategies to reduce excessively negative emotions or
to promote curiosity and excitement may be important with respect to promoting
use of computers at the university and in the field placements.
Third, emotions toward computers can be changed—they are not necessarily
fixed, innate, pre-ordained, or inevitable. With a steady infusion of integrated
computer use, more positive emotional responses can lead to increased use
of computers.
Future Research
There are several suggestions for future research that would help build on
the results obtained in this study, including:
1. expanding the number of emotional descriptors in Appendix A, through
qualitative interviews;
2. validating descriptors through an interview process;
3. observing users while they are learning a new software package and inter-
viewing them about the emotions they felt; and
4. exploring strategies that might help to promote positive emotion and reduce
negative emotions
THE IMPACT OF PRESERVICE TEACHERS’ EMOTIONS / 471
472 / KAY
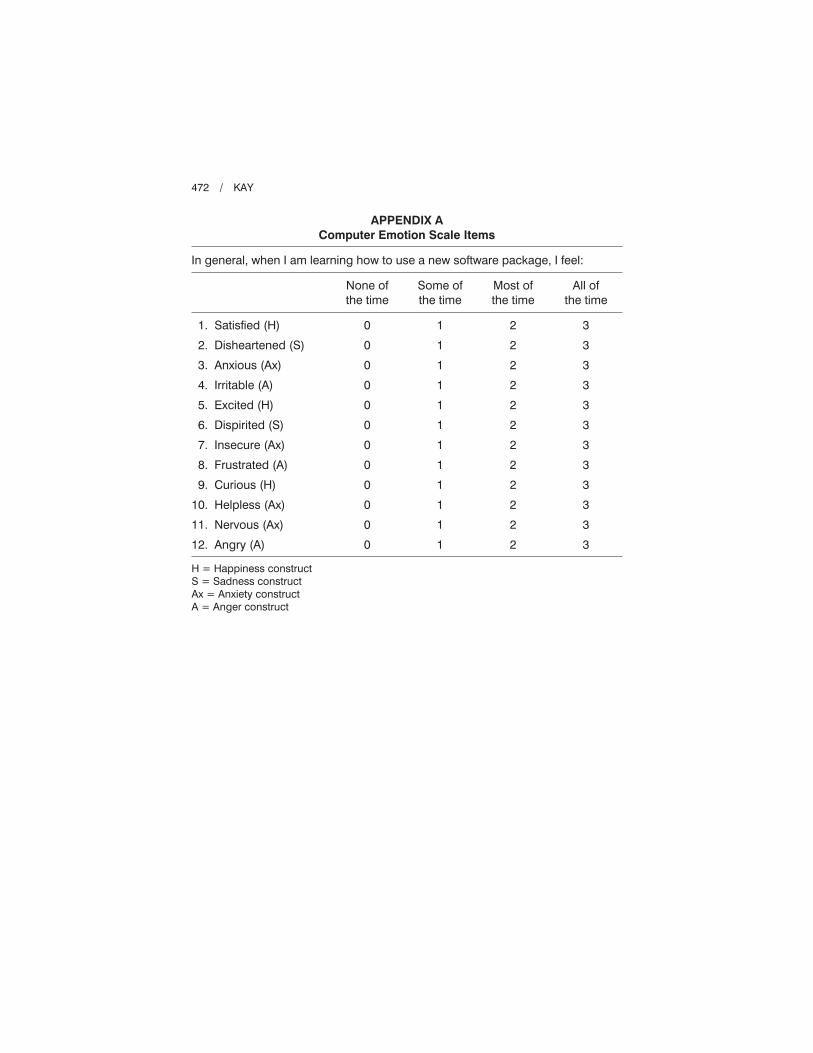
APPENDIX A
Computer Emotion Scale Items
In general, when I am learning how to use a new software package, I feel:
None of
the time
Some of
the time
Most of
the time
All of
the time
1. Satisfied (H)
2. Disheartened (S)
3. Anxious (Ax)
4. Irritable (A)
5. Excited (H)
6. Dispirited (S)
7. Insecure (Ax)
8. Frustrated (A)
9. Curious (H)
10. Helpless (Ax)
11. Nervous (Ax)
12. Angry (A)
0
0
0
0
0
0
0
0
0
0
0
0
1
1
1
1
1
1
1
1
1
1
1
1
2
2
2
2
2
2
2
2
2
2
2
2
3
3
3
3
3
3
3
3
3
3
3
3
H = Happiness construct
S = Sadness construct
Ax = Anxiety construct
A = Anger construct
THE IMPACT OF PRESERVICE TEACHERS’ EMOTIONS / 473
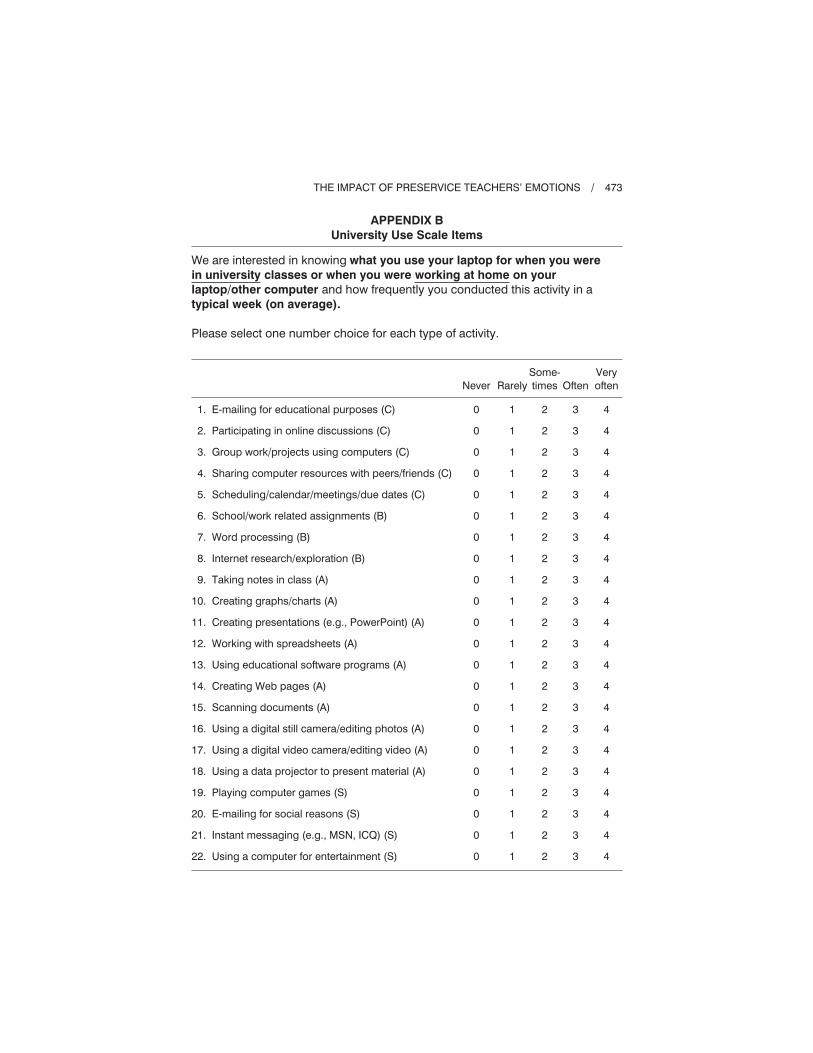
APPENDIX B
University Use Scale Items
We are interested in knowing what you use your laptop for when you were
in university classes or when you were working at home on your
laptop/other computer and how frequently you conducted this activity in a
typical week (on average).
Please select one number choice for each type of activity.
Never Rarely
Some-
times Often
Very
often
1. E-mailing for educational purposes (C)
2. Participating in online discussions (C)
3. Group work/projects using computers (C)
4. Sharing computer resources with peers/friends (C)
5. Scheduling/calendar/meetings/due dates (C)
6. School/work related assignments (B)
7. Word processing (B)
8. Internet research/exploration (B)
9. Taking notes in class (A)
10. Creating graphs/charts (A)
11. Creating presentations (e.g., PowerPoint) (A)
12. Working with spreadsheets (A)
13. Using educational software programs (A)
14. Creating Web pages (A)
15. Scanning documents (A)
16. Using a digital still camera/editing photos (A)
17. Using a digital video camera/editing video (A)
18. Using a data projector to present material (A)
19. Playing computer games (S)
20. E-mailing for social reasons (S)
21. Instant messaging (e.g., MSN, ICQ) (S)
22. Using a computer for entertainment (S)
0
0
0
0
0
0
0
0
0
0
0
0
0
0
0
0
0
0
0
0
0
0
1
1
1
1
1
1
1
1
1
1
1
1
1
1
1
1
1
1
1
1
1
1
2
2
2
2
2
2
2
2
2
2
2
2
2
2
2
2
2
2
2
2
2
2
3
3
3
3
3
3
3
3
3
3
3
3
3
3
3
3
3
3
3
3
3
3
4
4
4
4
4
4
4
4
4
4
4
4
4
4
4
4
4
4
4
4
4
4
474 / KAY
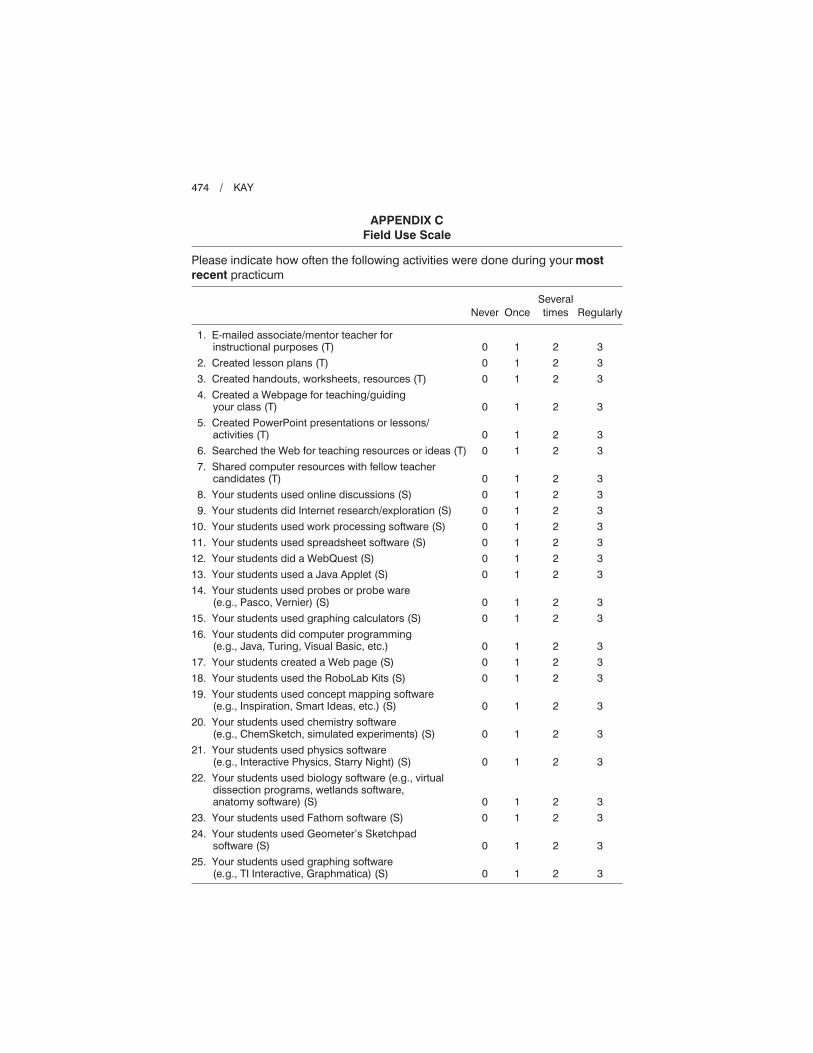
APPENDIX C
Field Use Scale
Please indicate how often the following activities were done during your most
recent practicum
Never Once
Several
times Regularly
1. E-mailed associate/mentor teacher forinstructional purposes (T)
2. Created lesson plans (T)
3. Created handouts, worksheets, resources (T)
4. Created a Webpage for teaching/guidingyour class (T)
5. Created PowerPoint presentations or lessons/activities (T)
6. Searched the Web for teaching resources or ideas (T)
7. Shared computer resources with fellow teachercandidates (T)
8. Your students used online discussions (S)
9. Your students did Internet research/exploration (S)
10. Your students used work processing software (S)
11. Your students used spreadsheet software (S)
12. Your students did a WebQuest (S)
13. Your students used a Java Applet (S)
14. Your students used probes or probe ware(e.g., Pasco, Vernier) (S)
15. Your students used graphing calculators (S)
16. Your students did computer programming(e.g., Java, Turing, Visual Basic, etc.)
17. Your students created a Web page (S)
18. Your students used the RoboLab Kits (S)
19. Your students used concept mapping software(e.g., Inspiration, Smart Ideas, etc.) (S)
20. Your students used chemistry software(e.g., ChemSketch, simulated experiments) (S)
21. Your students used physics software(e.g., Interactive Physics, Starry Night) (S)
22. Your students used biology software (e.g., virtualdissection programs, wetlands software,anatomy software) (S)
23. Your students used Fathom software (S)
24. Your students used Geometer’s Sketchpadsoftware (S)
25. Your students used graphing software(e.g., TI Interactive, Graphmatica) (S)
0
0
0
0
0
0
0
0
0
0
0
0
0
0
0
0
0
0
0
0
0
0
0
0
0
1
1
1
1
1
1
1
1
1
1
1
1
1
1
1
1
1
1
1
1
1
1
1
1
1
2
2
2
2
2
2
2
2
2
2
2
2
2
2
2
2
2
2
2
2
2
2
2
2
2
3
3
3
3
3
3
3
3
3
3
3
3
3
3
3
3
3
3
3
3
3
3
3
3
3
REFERENCES
Albanese, M. A., & Mitchell, S. A. (1993). Problem-based learning: A review of the
literature on its outcomes and implementation issues. Academic Medicine, 68, 52-81.
Arnold, M. B. (1960). Emotion and personality (Vols. I and II). New York: Columbia
University Press.
Baker, E. L., Gearhart, M., & Herman, J. L. (1994). Evaluating the Apple Classrooms
of Tomorrow (SM). In E. L. Baker & H. F. O’Neil, Jr. (Eds.), Technology assessment
in education and training (pp. 173-198). Hillsdale, NJ: Erlbaum.
Baylor, A. L., & Ritchie, D. (2002). What factors facilitate teacher skill, teacher
morale, and perceived student learning in technology-using classrooms? Computers &
Education, 39(4), 395-414.
Beckers, J. J., & Schmidt, H. G. (2001). The structure of computer anxiety: A six-factor
model. Computers in Human Behavior, 17 (1), 35-49
Bennett, L. (2000/2001). Technology standards for the preparation of teachers. Inter-
national Journal of Social Education, 15(2), 1-11.
Bronsan, M., & Lee, W. (1998). A cross-cultural comparison of gender differences in
computer attitudes and anxieties: The United Kingdom and Hong Kong. Computers
in Human Behavior, 14(4), 559-577.
Brown, A. L., & Palinscar, A. S. (1989). Guided, cooperative learning and individual
knowledge acquisition. In L. B. Resnick (Ed.), Knowing, learning, and instruction
(pp. 393-451). Hillsdale, NJ: Erlbaum Associates.
Bruner, J. (1983). Child’s talk. Learning to use language. Toronto, Canada: George J.
McLeod Ltd.
Bruner, J. (1986). Actual minds, possible worlds. Cambridge, MA: Harvard University
Press.
Carroll, J. B. (1990). The Nurnberg funnel. Cambridge, MA: MIT Press.
Carroll, J. M., & Mack, R. L. (1984). Learning to use a word processor: By doing, by
thinking, and by knowing. In J. C. Thomas and M. Schneider (Eds.), Human factors
in computer systems. Norwood, NJ: Ablex.
Case, R., Hayward, S., Lewis, M., & Hurst, P. (1988). Toward a neo-Piagetian theory
of cognitive and emotional development. Developmental Review, 8(1), 1-51.
CEO Forum on Education and Technology. (2000). Teacher preparation StaR chart:
A self-assessment tool for colleges of education—Preparing a new generation of
teachers. Retrieved August 30, 2004 from
http://www.ceoforum.org/downloads/tpreport.pdf.
Ceyhan, E. (2006). Computer anxiety of teacher trainees in the framework of personality
variables. Computers in Human Behavior, 22(2), 207-220.
Compton, V., & Harwood, C. (2003). Enhancing technological practice: An assessment
framework for technology education in New Zealand. International Journal of
Technology and Design Education, 13(1), 1-26.
Cohen, J. (1988). Statistical power analysis for the behavioural sciences (2nd ed.).
New York: Academic Press.
Cohen, J. (1992). A power primer. Psychological Bulletin, 112(1), 155-159.
Collins, A., Brown, J. S., & Newman, S. E. (1989). Cognitive apprenticeship: Teaching the
crafts of reading, writing, and mathematics. In L. B. Resnick (Ed.), Knowing, learning,
and instruction (pp. 453-494). Hillsdale, NJ: Erlbaum Associates.
THE IMPACT OF PRESERVICE TEACHERS’ EMOTIONS / 475
Dyck, J. L., Gee, N. R., & Smither, J. A. A. (1998). The changing construct of computer
anxiety for younger and older adults. Computers in Human Behavior, 14(1), 61-77.
Ekman, P., Friesen, W. V., & Ellsworth, P. (1972). Emotion in the human face: Guidelines
for research and a review of findings. New York: Pergamon.
Field, A. (2005). Discovering statistics using SPSS (2nd ed.) Thousand Oaks, CA:
Sage Publications.
Fulton, K. (1997). The skills students needs for technological fluency. Learning in a digital
age: Insights into the issues. Santa Monica, CA: Milken Exchange on Education
Technology.
Frijda, N. H. (1986). The emotions. Cambridge/New York: Cambridge University Press.
Gardner, H. (1983). Frames of mind. New York: Basic Books.
Garland. V. E. (1999-2000). Improving computer skills in colleges of education. Educa-
tional Technology Systems, 28(1), 59-66.
Gaudron, J. P., & Vignoli, E. (2002). Assessing computer anxiety with the interaction
model of anxiety: Development and validation of the computer anxiety trait subscale.
Computers in Human Behavior, 18(3), 315-325.
Goleman, D. (1995). Emotional intelligence. New York: Bantam Books.
Gray, J. A. (1990). Brain systems that mediate both emotion and cognition. Cognition
and Emotion, 4(3), 269-288.
Guadagnoli, E., & Velicer, W. (1988). On methods in the analysis of profile data.
Psychometrika, 24, 95-112.
Halpin, R. (1999). A model for constructivist learning in practice: Computer literacy
integrated into elementary mathematics and science teacher education. Journal of
Research on Computing in Education, 32(1), 128-138.
Heinssen, R. K., Glass, C. R., & Knight, L. A. (1987). Assessing computer anxiety:
Development and validation of the computer anxiety rating scale. Computers in Human
Behavior, 3(1), 49-59.
Hong, K. S., & Koh, C. K. (2002). Computer anxiety and attitudes toward computers
among rural secondary school teachers: A Malaysian perspective. Journal of Research
on Technology in Education, 35(1), 27-48.
ISTE/NCATE. (2003). ISTE/NCATE standards for educational technology programs.
Retrieved Aug 30, 2004 from http://cnets.iste.org/ncate/.
Izard, C. E. (1969). The emotions and emotion constructs in personality and culture
research. In R. B. Catell & R. M. Dreger (Eds.), Handbook of modern personality
theory (pp. 496-510). New York: Wiley.
James, W. (1884). What is an emotion? Mind, 9, 188-205.
Kagan, S. (1997). Cooperative learning (2nd ed.). San Jose Capistrano, CA: Resources
for Teachers.
Kay, R. H. (2006). Evaluating strategies used to incorporate technology into preservice
education: A review of the literature. Journal of Research on Technology and
Education, 38 (4), 383-408.
Kline, P. (1999). The handbook of psychological testing (2nd ed.). London: Routledge.
Kozma, R. B. (2003). Technology, innovation, and educational change. A global per-
spective. Eugene, OR: International Society for Technology in Education.
Kulik, J. A. (1994). Meta-analytic studies of findings on computer-based instruction.
In E. L. Baker & H. F. O’Neile, Jr. (Eds.), Technology assessment in education and
training. Hillsdale, NJ: Lawrence Erlbaum.
476 / KAY
Lampert, M. (1986). Teaching multiplication. Journal of Mathematical Behaviour, 5,
241-280.
Larkin, J. H. (1989). What kind of knowledge transfers? In L. B. Resnick (Ed.), Knowing,
learning, and instruction (pp. 283-305). Hillsdale, NJ: Erlbaum Associates.
Lazarus, R. S. (1991a). Cognition and motivation and emotion. American Psychologist,
46(4), 352-367.
Lazarus, R. S. (1991b). Progress on a cognitive-motivational-relational theory of emotion.
American Psychologist, 46(8), 819-834.
LeDoux, J. E. (1989). Cognitive-emotional interactions in the brain. Cognition and
Emotion, 3(4), 267-289.
Loyd, B. H., & Gressard, C. (1984). The effects of sex, age, and computer experience
on computer attitudes. Association for Educational Data Systems Journal, 17,
67-77.
Maeers, M., Browne, N., & Cooper, E. (2000). Pedagogically appropriate integration
of informational technology in an elementary preservice teacher education program.
Journal of Technology and Teacher Education, 8(3), 219-229.
Mann, D., Shakeshaft, C., Becker, J., & Kottkamp, R. (1999). West Virginia’s basic
skills/computer education program: An analysis of student achievement. Santa
Monica, CA: Milken Family Foundation.
Marcoulides, G. A., & Wang, X. B. (1990). A cross-cultural comparison of computer
anxiety in college students. Journal of Educational Computing Research, 6(3),
251-263.
McRobbie, C. J., Ginns, I. S., & Stein, S. J. (2000). Preservice primary teachers’ thinking
about technology and technology education. International Journal of Technology
and Design Education, 10, 81-101.
Milbrath, Y. L., & Kinzie, M. B. (2000). Computer technology training for prospective
teachers: Computer attitudes and perceived self-efficacy. Journal of Technology and
Teacher Education, 8(4), 373-396.
Moursund, D., & Bielefeltdt, T. (1999). Will new teachers be prepared to teach in a
digital age? A national survey on information technology in teacher education. Santa
Monica, CA: Milken Exchange on Educational Technology [Online]. Available:
http://www.mff.org/publications/publications.taf?page=154.
National Council for Accreditation of Teacher Education. (2003). International
Technology Education Association/Council on Technology Teacher Education
(ITEA/CTTE). Retrieved July 27, 2004 from
http://www.ncate.org/standard/programstds.htm.
Neisser, U. (1963). The imitation of man by machine. Science, 139, 193-197.
Nickell, G. S., & Pinto, J. N. (1986). The computer attitude scale. Computers in Human
Behavior, 2(4), 301-306.
Nunnally, J. C. (1978). Psychometric theory. New York: McGraw-Hill.
Oatley, K., & Johnson-Laird, P. N. (1987). Towards a cognitive theory of emotions.
Cognition and Emotion, 1(1), 29-50.
O’Regan, K. (2003). Emotion and e-learning. Journal of Asynchronous Learning
Networks, 7(3), 78-92.
OTA. (1995). Teachers and technology: Making the connection. OTA-EHR-616
(Washington, DC: U.S. Government Printing Office). Retrieved from
http://www.wws.princeton.edu/cgi-bin/byteserv.prl/~ota/disk1/1995/9541/9541.PDF.
THE IMPACT OF PRESERVICE TEACHERS’ EMOTIONS / 477
Plante, J., & Beattie, D. (2004). Education, skills and learning—Research papers con-
nectivity and ICT integration in Canadian elementary and secondary schools: First
results from the Information and Communications Technologies in Schools Survey,
2003-2004. Statistics Canada. Retrieved Aug 29, 2004 from
http://www.schoolnet.ca/home/documents/Report_EN.pdf.
Plutchik, R. (1980). Emotion: A psychoevolutionary synthesis. New York: Harper & Row.
Pope, M., Hare, P., & Howard, E. (2002). Technology integration: Closing the gap between
what preservice teachers are taught to do and what they can do. Journal of Technology
and Teacher Education, 10(2), 191-203.
Resnick, L. B. (1989). Introduction. In L. B. Resnick (Ed.), Knowing, learning, and
instruction (pp. 1-24). Hillsdale, NJ: Erlbaum Associates.
Rolls, E. T. (2000). Precis of the brain and emotion. Behavioral and Brain Sciences, 23(2),
177-234.
Rosen, L. D., & Weil, M. M. (1995). Computer anxiety: A cross cultural comparison
of university students in ten countries. Computers in Human Behavior, 11(1), 9-31.
Russell, G., & Bradley, G. (1997). Teachers’ computer anxiety: implications for profes-
sional development. Education and Information Technologies, 2(1), 17-30.
Russell, M., Bebell, D., O’Dwyer, L., & O’Connor, K. (2003). Examining teacher tech-
nology use: Implications for preservice and inservice teacher preparation. Journal
of Teacher Education, 54(4), 297-310.
Scardamalia, M., & Bereiter, C. (1996). Computer support for knowledge building com-
munities. In Koschmann (Ed.), CSCL: Theory and practice of an emerging paradigm.
Mahwah, NJ: Erlbaum.
Sharon, S. (Ed.). (1999). Handbook of cooperative learning methods. Westport, CT: Praeger.
SIIA. (2002). Report on the effectiveness of technology in schools. Washington, DC:
Software and Information Industry Association.
Simon, H. A. (1967). Motivational and emotional controls of cognition. Psychological
Review, 74(1), 29-39.
Sivin-Kachala, J. (1998). Report on the effectiveness of technology in school, 1990-1997.
Washington, DC: Software Publisher’s Association.
Sternberg, R. J. (1989). Domain-generality versus domain-specificity: The life and
impending death of a false dichotomy. Merrill-Palmer Quarterly, 35(1), 115-130.
Stevens, J. P. (1992). Applied multivariate statistics for the social science applications
(2nd ed.). Hillsdale, NJ: Erlbaum.
Thompson, A. D., Schmidt, D. A., & Davis, N. E. (2003). Technology collaboratives for
simultaneous renewal in teacher education. Educational Technology Research and
Development, 51(1), 73-89.
Todman, J., & Day, K. (2006). Computer anxiety: The role of psychological gender.
Computers in Human Behavior, 22(5), 856-869.
Tomkins, S. S. (1962). Affect, imagery and consciousness (Vol. 1, The positive affects).
New York: Springer.
U.S. Department of Education. (2000). E-learning: Putting a world-class education at
the fingertips of all children. [Report] Washington, DC. Retrieved August 30 from
http://www.ed.gov/about/offices/list/os/technology/reports/e-learning.pdf.
U.S. Department of Education, National Center for Education Statistics. (2002). Internet
access in U.S. public schools and classrooms: 1994-2002. Retrieved August 30, 2004
from http://nces.ed.gov/programs/digest/d02/tables/dt419.asp.
478 / KAY
Vannatta, R. A., & Beyerbach, B. (2000). Facilitating a constructivist vision of technology
integration among education faculty and preservice teachers. Journal of Research on
Computing in Education, 33(2), 132-148.
Vygotsky, L. S. (1978). Mind in society. Cambridge, MA: Harvard University Press.
Wang, Y., & Holthaus, P. (1998-99). Facing the world: Student teachers’ computer use
during practicum. Journal of Educational Technology Systems, 27(3), 207-223.
Wenglinsky, H. (1998). Does it compute? The relationship between educational tech-
nology and student achievement in mathematics. Princeton, NJ: Educational Testing
Service.
Wilfong, J. D. (2006). Computer anxiety and anger: The impact of computer use, com-
puter experience, and self-efficacy beliefs. Computers in Human Behavior, 22(6),
1001-1011.
Yaghi, H. M., & Abu-Saba, M. B. (1998). Teachers’ computer anxiety: An international
perspective. Computers in Human Behavior, 14(2), 321-336
Yildirim, S. (2000). Effects of an educational computing course on preservice and inservice
teachers: A discussion and analysis of attitudes and use. Journal of Research on
Computing in Education, 32(4), 479-495.
Direct reprint requests to:
Dr. Robin Kay
University of Ontario Institute of Technology
2000 Simcoe St.
North Oshawa, Ontario L1H 7K4
Canada
e-mail: [email protected]
THE IMPACT OF PRESERVICE TEACHERS’ EMOTIONS / 479