the impact of dynamic capabilities on resource access and development
TRANSCRIPT

THE IMPACT OF DYNAMIC CAPABILITIES
ON RESOURCE ACCESS AND DEVELOPMENT
CHRISTIAN STADLER, CONSTANCE E. HELFAT, GIANMARIO VERONA
Organization Science 24 (2013)
This study analyzes dynamic capabilities that support activities directed toward accessing resources and
further developing resources to make them commercially usable. We develop theory and empirically
investigate the impact of dynamic capabilities on the amount and success of these activities, and whether
the impact of dynamic capabilities differs between the two types of activities. Using unique data from the
upstream oil industry, we develop an objective measure of dynamic capability that is distinct from the
outcomes of utilizing these capabilities. We find that firms with more sophisticated dynamic capabilities
undertake greater amounts of activity to access resources and further develop them prior to commercial
use, and have greater success in these activities. Finally, these effects of dynamic capabilities are larger
for activities directed toward initially accessing resources than toward further developing them, consistent
with the potential for firms to rely on knowledge gained through resource access activity when
conducting subsequent activity to further develop resources.
Keywords: dynamic capabilities, resources, exploration, capability measurement, activities
Acknowledgements:
We gratefully acknowledge the assistance of Herold Inc. in providing us with data on the oil
industry. The first author also benefited from a fellowship from the Austrian Academy of
Sciences while in residence as a Visiting Scholar at the Tuck School. In addition, we received
research funding from the Tuck School of Business and from KiTeS at Bocconi University. The
usual caveat applies.

INTRODUCTION
Resources that firms own, control, or have access to on a semi-permanent basis affect competitive
outcomes (Amit and Schoemaker, 1993; Barney, 1991; Helfat and Peteraf, 2003; Peteraf, 1993;
Wernerfelt, 1984). Although firms sometimes stumble on valuable resources, firms often undertake
purposeful activities to obtain resources and further develop these resources prior to commercial use. In
carrying out these activities, firms may use dynamic capabilities, which can serve a variety of purposes,
including the creation, extension, and modification of resources (Helfat et al, 2007). In this study, we
analyze dynamic capabilities directed toward obtaining resources and further developing resources to the
point where they are commercially usable. Although new resources frequently require additional
development, research on dynamic capabilities generally has not investigated stages in bringing resources
to the point of commercial use. Here we develop theory and empirically investigate whether dynamic
capabilities affect the amount of activity that firms conduct to obtain and further develop resources, as
well as the success of these two types of activities. We also investigate whether the impact of dynamic
capabilities differs between these two activities.
Research on both firm resources and dynamic capabilities tends to focus on performance outcomes;
however, it is important to unpack how these outcomes come about, lest we draw spurious conclusions
(see e.g, Ketchen et al, 2007). For example, dynamic capabilities may affect not only the success of
activities directed toward change, but also how much of these activities firms undertake in the first place –
a distinction generally not addressed in prior research. Moreover, accurate assessment of the direct effect
of dynamic capabilities on the success of activities requires that we control for any indirect effect through
the amount and type of activity. In addition, research has yet to examine whether the effects of dynamic
capabilities differ between the initial obtaining of resources and further development of these resources.
In particular, because firms may be able to rely on knowledge gained through the activity of obtaining
resources when further developing resources for commercial use, firms may have less need for dynamic
capabilities during later stages of resource development.

2
Following similar usage by Wernerfelt (1984), Amit and Schoemaker (1993) and Helfat and Peteraf
(2003), in this study the term ‘resource’ denotes a tangible, intangible, or human asset that a firm owns,
controls, or has access to through other means on a semi-permanent basis.1 Firms can obtain resources in
many ways, including: creating new resources from scratch or recombining existing resources, such as
through business unit reorganization (Karim, 2009); finding resources that may exist in the external
environment but which the firm does not possess, such as not-yet-discovered physical assets; investing in
plant and equipment; buying resources from others, including through mergers and acquisitions (Capron
and Mitchell, 1998). In this study, we use the term ‘resource access’ (as a noun) to denote the obtainment
of resources, and ‘resource access activity’ to denote an activity directed toward obtaining resources.2 In
addition, firms sometimes may develop newly obtained resources further, such as through a process of
post-merger integration of acquired resources (Capron and Mitchell, 1998). Here the term ‘resource
development’ (used as a noun) denotes further development of resources subsequent to resource access,
and ‘resource development activity’ denotes an activity directed toward further resource development.
This study deals with access and development of resources prior to commercial use, as opposed to the
day-to-day procurement of inputs for ongoing commercial activity. Commercial use of a resource begins
when the resource is first used to support production, delivery, or sales of a product or service that can be
sold in the external market. This applies to intermediate as well as final products and services. For
example, semiconductors are intermediate products used in computers and other devices downstream in
the vertical chain; because semiconductors are products distinct from computers and other downstream
products, it is possible to analyze access and development of resources for semiconductors separately.
As noted above, dynamic capabilities may underpin activities directed toward both resource access
and resource development. Following Teece et al (1997), researchers have often viewed dynamic
capabilities as especially important in rapidly changing environments. But as Eisenhardt and Martin
1 As Helfat and Peteraf (2003) and Amit and Schoemaker (2012) note, ‘resources’ can be defined to include inputs to production
as well as assets. In most cases, inputs derive from assets of some type. In this study, we focus on assets. 2 This usage is consistent with dictionary definitions such as that in the Merriam-Webster online dictionary (http://www.merriam-
webster.com/dictionary/access), where access (as a verb) means ‘to gain access to’ or ‘to obtain.’ Firms can have access to a
resource through a variety of means, including owning or controlling the use of the resource.

3
(2000) observed, dynamic capabilities also matter in “moderately dynamic” environments. In addition,
Helfat and Winter (2011) noted that firms can and do utilize dynamic capabilities on a regular basis even
in relatively placid environments. In this study, we examine dynamic capabilities in an industry in which
the external environment shifted from relatively stable to much more variable, namely, the upstream oil
industry. Using unique hand-collected data, we analyze the extent to which dynamic capabilities affect the
amount of activity that firms direct toward access and development of resources in the form of oil and gas
reserves, and the success of these activities.
This study makes several contributions. First, we develop new theory regarding dynamic capabilities
through an analysis of: 1) stages of resource access and development prior to commercial use; 2) the
impact of dynamic capabilities on not only the success but also the amount of these activities; 3) how
knowledge gained during resource access activity may affect the need for, and impact of, dynamic
capabilities during resource development activity. In addition, we advance empirical analysis of dynamic
capabilities. Empirical research on dynamic capabilities is relatively sparse, and consists largely of case
studies (Di Stefano et al, 2010). Quantitative measurement of capabilities has posed a number of
challenges, including the difficulty of obtaining objective measures rather than those derived from
surveys, as well as the difficulty of measuring capabilities separately from outcomes of capability
utilization (Grant and Verona, 2012). Here we empirically test hypotheses derived from our theoretical
analysis using an objective, quantitative, relatively fine-grained measure of dynamic capabilities that
reflects the potential to conduct activities rather than subsequent outcomes.
In what follows, we first analyze theoretical issues relevant to our study and derive new hypotheses
regarding the impact of dynamic capabilities on the amount and success of activities directed toward
resource access and development, as well as differences in this impact of dynamic capabilities between
the two activities. We then describe the industry setting and our data, followed by an explanation of the
variables, including our empirical measure of dynamic capabilities. We also explain our statistical
methodology. We then present the empirical results and discuss the findings. The paper concludes with
implications for future research.

4
THEORETICAL DEVELOPMENT
Attributes of Dynamic Capabilities
Teece, Pisano, and Shuen (1997: 516) originally defined dynamic capabilities as “the firm’s ability to
integrate, build, and reconfigure internal and external competences.” Teece et al (1997: 515) explained
that this included “adapting, integrating, and reconfiguring internal and external organizational skills,
resources, and functional competences.” Eisenhardt and Martin (2000: 1107) subsequently defined
dynamic capabilities as “[t]he firm’s processes that use resources—specifically the processes to integrate,
reconfigure, gain and release resources” and “the organizational and strategic routines by which firms
achieve new resource configurations.” Helfat, Finkelstein, Mitchell, Peteraf, Singh, Teece, and Winter
(2007: 4) synthesized and refined these definitions in defining dynamic capabilities as “the capacity of an
organization to purposefully create, extend, or modify its resource base.”
In the definition of Helfat et al (2007), the term ‘resource base’ includes both the resources and
capabilities (also frequently termed ‘competences’ or ‘skills’) of an organization.3 Additionally, “the word
‘capacity’ refers to the ability to perform a task in at least a minimally satisfactory manner” Helfat et al
(2007: 5), and “implies that the function that a dynamic capability performs is repeatable and can be
reliably executed to at least some extent” (Helfat et al, 2007: 5). A dynamic capability therefore tends to
improve the execution of an activity, relative to one-time ad hoc problem solving (Winter, 2003). Helfat
and Winter (2011: 956) elaborated that ‘minimally satisfactory’ means that the output of a task or activity
is “recognizable as such, and functions at least minimally as intended,”4 but “implies nothing about
economic viability, much less superior performance.”5 Moreover, “because organizations vary in how
3 Firm resources include tangible assets such as plant and equipment, intangible assets such as reputation, relationships, and
knowledge, and human assets such as human capital (Amit and Schoemaker, 1993; Grant 2005). Helfat et al (2007) follow Amit
and Schoemaker (1993) in distinguishing an asset, termed a ‘resource’, from the ability to utilize it, termed a ‘capability.’ Teece
et al (1997) did not provide a precise definition of ‘competence’ or ‘skill,’ and the literature contains a variety of definitions and
usages of the terms ‘capabilities’, ‘competences’, and ‘skills.’ These terms are often used synonymously, and we do so here. 4 Helfat and Winter (2011: 956) note that: “Important concepts rarely have edges that are entirely sharp, and this case [of
dynamic capabilities] is no exception…an important ‘matter of degree’ issue lurks in the words ‘minimally satisfactory’ and also
in ‘reliable.’ Historical contexts and prevailing competitive standards are generally relevant to the practical interpretation here.” 5 Economic viability depends on demand for the output of an activity, and on competition in the market for the product that the
resource supports, in addition to at least minimally satisfactory performance of an activity (see Helfat et al, 2007).

5
well they perform an activity,” the definition of dynamic capability does not constitute a tautology with
respect to superior performance (Helfat and Winter, 2011: 956; see also Helfat et al, 2007). That is,
although the definition of a dynamic capability implies the capacity to perform a particular activity at a
minimally satisfactory threshold of performance, firms vary in how well their dynamic capabilities enable
them to accomplish an activity; to say that a firm has a dynamic capability says little about how well that
capability performs its intended function above some minimal standard of functionality or about the
resulting economic performance.
An organizational capability has been described in various ways, including as a “high-level routine
(or collection of routines)” (Winter, 2003: 991). Organizational routines are executed by teams of people
who understand the routines and utilize the routines when needed to carry out activities. The
characteristics of routines -- including the communication and coordination procedures involved -- are
critical attributes of a capability. A capability and its associated routines confer the potential to carry out
an activity. If and when a capability is called into use, the capability enables a firm to carry out an activity,
which in turn produces an outcome; through this route, capabilities affect the outcomes of activities. Like
all capabilities, dynamic capabilities typically are maintained through exercise (Winter, 2003). And like
all capabilities, dynamic capabilities may not always be exercised at their full potential. For example, a
product development team that executes the routines that comprise a dynamic capability may need to
devote more effort when seeking to add many new features to a product than when seeking to add a single,
easy-to-configure feature to the product. Thus, the extent to which an organization utilizes a particular
capability (dynamic or otherwise) depends on circumstances, including the difficulty of the task.
What differentiates dynamic from non-dynamic capabilities is the nature of the activities in question.
Non-dynamic capabilities, often termed ‘operational’ or ‘ordinary’ (Winter, 2003), are directed toward
maintaining the status quo. An operational capability “enables a firm to perform an activity on an on-
going basis using more or less the same techniques on the same scale to support existing products and
services for the same customer population” (Helfat and Winter, 2011: 956). In contrast, a dynamic
capability is directed toward altering how a firm earns a living (Winter, 2003; Helfat and Winter, 2011).

6
These capabilities have specific purposes and support specific activities within a particular context, and
are not “a generic capacity to undertake change” (Helfat and Winter, 2011: 957; see also Winter, 2003).
A firm may seek to alter how it makes a living in a variety of ways, such as by changing its products,
scale of operations, production processes, or markets served, which often entails alterations in the scale
and scope of resources (Winter, 2003; Helfat and Winter, 2011). Many activities directed toward altering
the scale and scope of resources may rely on dynamic capabilities, including activities associated with
R&D, new product development, investments, mergers and acquisitions, and alliances (Helfat, 1997;
Eisenhardt and Martin, 2000; Helfat et al, 2007). Firms also may use dynamic capabilities in an effort to
shape or reshape their external ecosystems (Teece, 2007), including by altering the scale or scope of
resources. For example, a firm may use its (dynamic) strategic planning capabilities to craft and
implement an investment in a new plant (a resource) with the intention of affecting the behavior of
competitors (Helfat and Winter, 2011). In this study, we focus on alterations in the scale and scope of
resources, and examine the impact of dynamic capabilities on the amount and outcome of activities that
firms undertake to obtain resources and, if needed, to further develop them prior to commercial use.
Helfat and Winter (2011) have noted that “although dynamic and operational capabilities differ in
their purposes and intended outcomes…it is impossible to draw a bright line” between the two types of
capabilities. Which capabilities then might reasonably be termed ‘dynamic,’ in the sense that they have
important dynamic aspects? Helfat and Winter (2011: 960) argued that capabilities that aim to “promote
economically significant change are dynamic, even if the pace of change appears slow or undramatic.”
Helfat and Winter (2011) provided several examples of dynamic capabilities that support arguably non-
radical yet economically significant resource change, including: Intel’s capability to repeatedly create
new semiconductor designs and thereby support new product introductions; Walmart’s capability to
repeatedly open new retail outlets and thereby extend the scale of operations and geographic scope of
markets; and oil company capabilities to repeatedly discover new reserves and thereby extend the scale
and characteristics of company resources. As these examples suggest, “dynamic capabilities often support

7
existing businesses,” but over time can irrevocably alter “the scale and scope of company resources,”
despite the seemingly gradual pace of change (Helfat and Winter, 2011: 961).
In some cases, resources develop over time through slow processes of resource accumulation
(Dierickx and Cool, 1989). Dynamic capabilities, however, may enable companies to speed up the
process of developing resources, as in Intel’s capability to create new semiconductor designs that enabled
commercial introduction of a new chip every 18-24 months (Helfat and Winter, 2011). In many industries,
the process through which resources move from inception to commercial use occurs in distinct stages.
Although firms obtain some resources that need no additional development prior to commercial use, such
as equipment that can be used without modification, many resources require further development.
Examples of Dynamic Capabilities Underpinning Resource Access and Development Activities
Industries in which firms utilize a staged process of resource access and development activity include
pharmaceuticals (Henderson, 1994; Severi Bruni and Verona, 2009), semiconductors (Leiblein and
Madsen, 2009), and platform product industries (Shane, 2009). For example, when pharmaceutical
companies seek new drugs for commercial production and sale, the process begins with research activity
directed toward discovery of new molecular compounds, termed ‘drug discovery.’ Companies in this
industry regularly seek to obtain resources in the form of new molecular compounds for at least two
reasons. First, drugs based on new molecular compounds can provide sources of revenue and growth.
Secondly, because drugs are significantly more profitable when they are patented than when they are not,
and because patents have a limited lifetime, pharmaceutical companies regularly seek new molecular
compounds. This involves screening large numbers of compounds to discover ones that may address a
particular disease or health problem. In addition, firms can attempt to create new compounds through
molecular manipulation. If drug discovery R&D results in a promising compound, a company may
undertake additional pre-clinical R&D to further analyze the properties of the molecules and assess
potential side effects and toxicity, conduct clinical trials in humans, and file for regulatory approval of the
drug. The term ‘drug development’ often is used to refer to activities in the pre-clinical and clinical stages

8
of development, and usage of the term sometimes includes filing for regulatory approval as well (see e.g.,
http://en.wikipedia.org/wiki/Drug_development).
When firms regularly conduct activities directed toward drug discovery and drug development, they
are likely to invest in developing the requisite capabilities. Such capabilities are dynamic, in that they
support activities to obtain new resources (molecular compounds and knowledge) through drug discovery,
and modify these resources through drug development, enabling firms to extend and modify their
resource bases. Although dynamic capabilities that support drug discovery and development activity can
result in fundamentally new drugs, these capabilities also can enable firms to obtain and further develop
molecular compounds that reflect incremental changes from the past – consistent with the observation that
dynamic capabilities need not result in radical change or in qualitatively new types of resources.
The semiconductor industry provides another example of resource access followed by resource
development. According to Leiblein and Madsen (2009: 721): “Throughout the industry’s history, and
particularly since the early 1980s, successive innovations in process technology have improved product
performance by reducing the physical dimensions of semiconductor devices.” Much of the success of this
industry has come from obtaining new process technologies (resources) that firms further develop and
incorporate into designs for new semiconductor devices. As an example, Leiblein and Madsen (2009)
describe the company SST (Silicon Storage Technology), which designed a flash memory chip based on
its ‘SuperFlash’ process technology.
Other industries in which resource access and development occur in stages include many product
platform businesses. A product platform is “a common technological base to which different features are
added, to create a family of products each targeted at different customers” (Shane 2009: 151). Although a
detailed description of product platforms is beyond the scope of this analysis, in Shane’s summary
description the common technological base can be considered a resource, which is then further developed
by adding different features. Platforms are used in many industries including automobiles, computers,
cameras, videogames, and websites.

9
The foregoing examples revolve around process technology innovation and new product development
activities, which often involve stages of resource access and development. These activities are common in
many sectors of the economy, including electronics, consumer products, and complex manufacturing. The
empirical setting in this study provides yet another example of access and development of resources in the
form of oil and gas reserves. In what follows, we develop hypotheses regarding dynamic capabilities that
underpin activities directed toward resource access and development prior to commercial use, and test
these hypotheses in the upstream U.S. oil and gas industry. Ongoing commercial use of a resource
involves operational rather than dynamic capabilities, and is not the subject of this study.
The Amount and Success of Resource Access and Development Activities
From an economic perspective, firms conduct activities to obtain and further develop resources in
order to generate profits in the future. When deciding whether to conduct specific activities directed
toward resource access and development, firms make a forecast of anticipated profits to these activities
(even if a rough forecast of whether or not these activities eventually may pay off), and then decide how
much effort and expenditure to devote to them.6 Dynamic capabilities may affect the anticipated financial
payoff from undertaking activities directed toward resource access and development, as next explained.
Within an industry, capabilities tend to vary across firms in their attributes (Nelson, 1991; Helfat,
1994a,b; Hoopes, et al, 2003; Helfat and Peteraf, 2003). The attributes of a dynamic capability, i.e., the
characteristics of its routines, confer the potential to achieve a particular outcome from conducting an
activity. Even when firms have the same type of dynamic capability, the cost of the capability is likely to
differ across firms, because the attributes of the capability differ between firms.7 In addition, differences
between firms in the attributes of a dynamic capability are likely to lead to differences in the potential
value of output (due to the amount or quality of output) or the cost of conducting an activity (other than
the cost of the capability itself). In the case of resource access or development, the output of an activity
6 Although future profits from resource access depend on further development of the resources, resource access activities may
have different characteristics than resource development activities, as explained below. It therefore is appropriate to analyze
resource access and development separately. 7 These costs include both fixed and marginal costs. In general, fixed costs include ongoing overhead costs as well as costs
expended prior to deployment. For dynamic capabilities, the latter are often sunk (non-recoverable) (Winter, 2003).

10
consists of a resource or set of resources that is obtained or developed, and costs include those of the
dynamic capability as well as the cost of conducting resource access or development activity. All else
equal, when the attributes of a dynamic capability have the potential to yield lower costs and/or higher
value of output from an activity, a firm has an economic incentive to undertake more of the activity that
the capability supports. Hypothesis 1 reflects this logic when applied to resource access and development:
Hypothesis 1: All else equal, when the attributes of dynamic capabilities confer greater potential for
lower costs and/or higher value of output, firms will undertake greater amounts of activity directed
toward resource access and greater amounts of activity directed toward resource development.
Dynamic capabilities and their attributes may also affect the success of activities directed toward
resource access and development, independent of an effect on the amount of activity. Certainly, all else
equal, conducting more of these activities is likely to enable firms to obtain and further develop more
resources. However, the impact of dynamic capabilities on the success of an activity does not necessarily
come only from an impact on the amount of activity. In particular, because firms face variation in the
opportunities available to them, different firms have different opportunities to undertake resource access
and development activities. As a result, the attributes of dynamic capabilities do not perfectly predict the
amount of activity that firms undertake to obtain or further develop resources. Instead, firms with similar
amounts of activity may differ in the attributes of their dynamic capabilities. Firms whose dynamic
capabilities have attributes that confer the potential for lower costs and/or higher value of output are likely
to have more successful outcomes of conducting an activity. This logic implies that:
Hypothesis 2: All else equal, when the attributes of dynamic capabilities confer greater potential for
lower costs and/or higher value of output, firms will have greater success in resource access and greater
success in resource development, controlling for the amount of the respective activity.
Resource Access Versus Resource Development
Both resource access and development can pose significant challenges for firms. The more difficult it
is to accomplish these activities, the more useful dynamic capabilities may be, because these capabilities
provide the capacity to carry out activities somewhat reliably. Although dynamic capabilities entail costs,
firms may be willing to bear them if the returns to the associated activities would otherwise be lower. For
less difficult activities, firms may be able to rely more heavily on ad hoc approaches, which do not entail

11
costs associated with dynamic capabilities (Winter, 2003). That is, even though ad hoc approaches may be
less reliable, for less difficult tasks the benefits conferred by dynamic capabilities may not be high enough
to warrant the extra cost.
The relative difficulty of activities directed toward resource access versus resource development
depends on many factors. In some cases, it may be easier to obtain a resource (such as purchasing an
asset) than to develop it into a commercially usable form. In other instances, it may be at least as or even
more difficult to obtain a resource (such as creating a new-to-the-world technology) than to develop it
further. In at least one respect, however, the difficulty of obtaining resources and the difficulty of
developing them further differs systematically. When seeking to obtain new resources that are not
identical to those that a firm already has, a firm generally lacks prior direct knowledge of the resources in
question, since the firm has yet to obtain them.
For example, in the pharmaceutical industry, firms engaged in drug discovery lack prior direct
knowledge of new molecular compounds that they seek but have yet to discover. In contrast, when firms
undertake activities to further develop or modify resources, they already have some prior direct
knowledge of the resources in question (even for a purchased asset, as a result of prior due diligence).
Thus, in the pharmaceutical industry, pre-clinical R&D activity to further develop a drug relies in part on
knowledge about a molecular compound gained during drug discovery (Severi Bruni and Verona, 2009).
Holding constant all other factors, the lack of this prior direct knowledge is likely to increase the
difficulty of resource access (e.g., drug discovery) relative to the difficulty of resource development (e.g.,
drug development). Consistent with this logic, drug development activity on average has much higher
rates of success than does drug discovery, due in part to prior direct knowledge of the compound in
question during drug development (McGahan, 1995).
In some instances, firms may have prior knowledge of resources that are similar but not identical to
those that they seek to obtain. This sort of indirect prior knowledge, however, does not entirely eliminate
the importance of direct knowledge of the resources in question. In the pharmaceutical industry, for
example, prior knowledge of a category of drugs may make it easier to formulate new drugs in this

12
category, but does not appear to greatly improve knowledge about whether or not the newly formulated
drug will actually work (Severi Bruni and Verona, 2009).
These arguments imply that, all else equal, firms may have less need to utilize dynamic capabilities
for activities directed toward resource development than resource access, because prior direct knowledge
of the resources in question reduces the difficulty of developing resources relative to obtaining them.
Therefore, dynamic capabilities and their attributes may have less impact on the anticipated returns to
resource development activities than on the returns to resource access activities, holding constant factors
other than lack of prior direct knowledge of the resources in question. Thus, when firms decide how much
activity to undertake in light of anticipated returns, the attributes of dynamic capabilities are likely to have
less impact on the amount of resource development activity than on the amount of resource access activity.
The following hypothesis summarizes this logic:
Hypothesis 3: All else equal, the attributes of dynamic capabilities will have less impact on the amount of
activity directed toward resource development than resource access.
Finally, the impact of dynamic capabilities and their attributes on the success of an activity may differ
for resource access and resource development. As just argued, dynamic capabilities may be less important
for resource development than resource access, due to differences in prior direct knowledge of the
resources in question. Consequently, holding constant factors other than prior direct knowledge of
resources and controlling for the amount of activity, the incremental impact of the attributes of dynamic
capabilities on the success of activities directed toward resource development is likely to be less than for
resource access. The following hypothesis reflects this logic:
Hypothesis 4: All else equal, the attributes of dynamic capabilities will have less impact on the success of
activity directed toward resource development than resource access, controlling for the amount of each
activity.
EMPIRICAL SETTING: UPSTREAM OIL INDUSTRY
The upstream oil industry provides an excellent setting in which to test the hypotheses. Activities in
this industry fall into three categories: oil exploration, oil development, and production. Through ‘oil
exploration,’ an industry term for activities directed toward obtaining oil and gas reserves, firms seek to

13
obtain new physical resources. Through what is termed ‘oil development’, firms undertake activities
aimed at developing oil and gas reserves to the point where they are commercially usable. If oil
development activity is successful, firms can then bring the reserves into commercial use through
production. Due to our interest in resource access and development, this study analyzes only oil
exploration and development, and does not analyze extraction of reserves through production.8
Oil exploration and development activities have many features in common with resource access and
development activities described earlier for the pharmaceutical industry. Drugs produced by the
pharmaceutical industry rest on discovery of new resources (molecular compounds); crude oil and natural
gas produced by the upstream oil industry rests on discovery of new resources (underground reserves).
Like molecular compounds, no two geologic reservoirs that contain reserves are the same, and they often
differ substantially.9 Moreover, firms in both industries have long since exhausted the easy-to-discover
resources; as a result, success in obtaining new resources in both industries is far from assured. In
addition, newly discovered resources in these industries require additional resource development activity
prior to commercial use, and success in further resource development is not a foregone conclusion. As in
the pharmaceutical industry, resource access and development in the upstream oil industry involves
activities that can benefit from dynamic capabilities, as explained in more detail below. Additionally, like
firms in the pharmaceutical industry, firms in the upstream oil industry regularly conduct resource access
and development activities in an effort not only to augment their revenue streams, but also to replace
previously highly productive resources that have fallen in value (due to patent expirations in the
pharmaceutical industry and oil reservoir depletion in the upstream oil industry).
As often occurs in the pharmaceutical industry, activities directed toward resource access and
development in the upstream oil industry do not necessarily result in radical changes to company
resources, but nevertheless may have a substantial impact on the resource base of a firm. Finch, Macmilan,
8 In this industry, oil and gas reserves are considered assets (or resources, in the terminology used here), and are treated this way
for accounting purposes. 9 A reservoir essentially is a ‘rock sponge.’ Hydrocarbons are trapped in the pores of the rock. Differences in reservoirs are due to
the type of rock (e.g., sandstone or limestone), the structure of the reservoir (e.g., flat layers, curved, or fractured rock), the depth
and physical location in which the reservoir is located, the pressure in the reservoir, and the composition of the reservoir (e.g.,
how much water it contains). These factors result in an endless variety of reservoirs.

14
and Simpson (2002: 969) observe that: “A critical activity for companies involved in the upstream oil and
gas industry is deciding whether or not to invest in developing hydrocarbon prospects.” As explained
below, activities directed toward obtaining and further developing reserves in this industry rely on
capabilities to deploy sophisticated and complex seismic imaging and well drilling technologies, which
are key to identifying hydrocarbon reservoirs and managing their development (Acha, 2002). These core
activities have important strategic implications. As Weston, Johnson, and Siu (1999) note, oil companies
tend to face declining stock prices when they fail to replace depleted oil reserves.
Resource Access and Development in Upstream Oil
The process that firms undergo in an effort to find and develop crude oil and natural gas reserves
prior to production is as follows.10
Companies first purchase or lease land in anticipation of searching for
oil in a specific location. Then firms collect and interpret seismic data regarding geologic formations
underground, from which they form a preliminary estimate of the amount of hydrocarbons that a tract
may hold. (In some instances, firms may also be able to conduct preliminary seismic imaging studies
prior to purchasing or leasing land.) Seismic technology has advanced from 2 dimensional (2-D) to 3
dimensional (3-D), and more recently to 4 dimensional (4-D) imaging.11
All upstream oil firms in
operation today can utilize 2-D technology. 3-D technology was less common in the 1990s, and is
becoming more standard today. 4-D imaging represents cutting edge technology, and only a small number
of firms can carry out this sort of imaging.
This process of seismic imaging entails the utilization of highly sophisticated equipment in the field
along with advanced computing technology, and interpretation of information gained from its use,
involving the coordination of teams of geologists, geophysicists, engineers, and project management
personnel. As Helfat and Winter (2011) note, the complexity and coordination of the tasks involved in
10 This process is well known in the industry; see e.g., Stoneley (1995), Finch et al (2002), Society of Petroleum Engineers (2004). 11 2-D technology provides two-dimensional images of the subsurface. In 3-D technology, 3-D images are presented in special
rooms that enable geologists and geophysicists to literally walk in the image while they interpret the data. 4-D seismic imaging
adds an additional parameter of time, enabling specialists to simulate the development of a reservoir over time, and to calculate
how production would affect a reservoir, enabling firms to better estimate the amount of oil they may be able to extract (Journal
of Petroleum Technology, 1999a).

15
seismic imaging activity, as well as its repeated nature, point to an underlying capability and associated
routines.
If the results of the seismic imaging studies appear promising, firms undertake exploratory drilling, in
order to obtain additional information about how much oil a tract of land may contain. The simplest and
least technologically sophisticated approach is to drill a vertical well using a rotary drill. Although this
technology has been in use since the early 20th century, it is still commonly employed today due to its
relatively low cost. In some cases, however, the topography of an oil reservoir makes it impossible to drill
effectively using only vertical wells. In the 1940s, the first experiments took place using directional wells,
which are drilled at an angle from the surface. A further advancement involved horizontal well drilling, in
which wells start as vertical shafts below the surface and then deviate at an angle. Finally, the most
sophisticated drilling technology is multilateral drilling, in which a drilled well starts with a single entry
point, and then splits into several deviated boreholes, increasing drilling reach.
The drilling of wells requires the deployment of technologically sophisticated equipment, often in
physically challenging terrain. Obtaining and interpreting information from deployment of this equipment
requires teams of geologists, geophysicists, and engineers. As the preceding description of some of the
more sophisticated technologies indicates, these are complex and difficult tasks requiring extensive
organizational coordination, suggestive of an underlying capability and set of routines for well drilling.
The coordination required may include that with specialized drilling firms. Nevertheless, particularly for
the more sophisticated technologies, it is difficult to interpret the results accurately without having an in-
depth understanding of the technologies gained from experience using them (Stadler, 2011). As a result,
upstream oil companies rarely outsource all exploratory drilling activities, and upstream oil companies
rather than specialist drilling firms often pioneer new drilling technologies.
If exploratory drilling indicates a high probability that a tract contains oil, firms estimate and report
the amount of “proved” reserves, which are defined in the U.S. as reserves that are predicted to be

16
economically viable under current price and cost conditions and to have a 90% probability of successful
recovery using existing technologies [U.S. Securities and Exchange Commission, 1978]).12
Firms cannot immediately use proved reserves to produce oil and gas. Instead, firms must ascertain
whether tracts for which exploration activity was successful in fact contain economically viable amounts
of oil and gas, and develop tracts to the point where production can occur. Firms again use the processes
described above to conduct additional seismic imaging studies to map reservoirs in detail, and then
conduct additional drilling of what are termed development wells, in order to ascertain if the tract
contains commercially viable amounts of oil or gas.
The capabilities that underpin activities directed toward resource access and development in the
upstream oil industry are dynamic in that they are directed toward economically significant change. In
particular, over time these capabilities can irrevocably alter the scale and scope of company resources.
Seismic imaging and well drilling activities can enable firms to locate and develop reserves in what are
often qualitatively new and different types of geologic formations. The capabilities that underpin these
activities support augmentation and replenishment of resources, or what Helfat et al (2007) refer to as
extending and modifying resources. Over a period of years, application of these capabilities can
substantially extend and reconfigure the composition of company resources that are essential for survival
in the upstream oil industry. As Helfat and Winter (2011) observe, capabilities that support economically
significant yet gradual change for an organization in its existing business nevertheless qualify as dynamic.
As the preceding description indicates, resource access and development in the upstream oil industry
consist of similar activities and utilize similar capabilities. Although this similarity of dynamic
capabilities for resource access and development does not apply in every industry, it is especially helpful
for empirical testing: we can conduct particularly clean tests of the hypotheses because we can examine
the impact of the same dynamic capabilities on both resource access and development.
In this industry, obtaining new resources in the form of reserves is particularly challenging. Although
firms often have had prior experience undertaking such activities, they always lack prior direct knowledge
12 Department of Energy, FAS 19 (adopted by the Securities and Exchange Commission on December 19, 1978 in ASR No. 257).

17
of geologic formations on new tracts. Even on new tracts in close proximity to existing proved reserves,
many tracts turn out not to contain hydrocarbons in economically viable quantities. In addition, as noted
earlier, no two reservoirs are the same, and their features often differ substantially. As a result, even when
seismic imaging studies suggest that reservoirs are promising enough to merit exploratory drilling,
success at finding proved reserves is far from assured; for example, only 52 percent of exploratory wells
in our data resulted in proved reserves. In contrast, oil field development is much less challenging, in part
because firms gain a great deal of information about the geologic formations in question through the
process of obtaining reserves (Stadler, 2011; Stonely, 1995). In our data, for example, 91 percent of
development wells successfully located economically viable amounts of oil and gas.
In summary, in the upstream oil industry, technologically sophisticated and organizationally complex
activities directed toward obtaining and further developing reserves are likely to be underpinned by
dynamic capabilities. As explained below, these capabilities vary substantially across firms, making this
industry an appropriate setting in which to test hypotheses 1 and 2. Resource development also relies
heavily on prior direct knowledge of the resources in question, namely, proved reserves on specific tracts.
This provides an appropriate setting in which to test hypotheses 3 and 4 regarding the impact of the
attributes of dynamic capabilities on resource access versus resource development.
METHODS
Sample and Data
Our sample consists of publicly-owned companies that appeared at least once in the annual list in the
Oil and Gas Journal (the primary industry trade journal) of the largest companies (in terms of assets)
operating in the upstream oil industry in the U.S. between 1993-2006.13
We included only publicly-held
companies in our sample, because we could not reliably obtain financial and oil and gas-related data for
13 When we began data collection in early 2008, the most recent publicly available data were for 2006. Given the lagged values of
the right-hand side variables, the earliest year of data for the sample is 1992. We did not collect data for earlier years for two
reasons. First, oil prices were extremely volatile in the years immediately preceding 1992, which could confound the analysis.
Secondly, it is difficult to obtain data for the full sample of firms prior to 1992. Financial and oil and gas operating data are not
available from online sources for years prior to 1992, and other sources of information this far back in time can be difficult to
obtain. In addition, some of these data are not available at all farther back in time, because firms were not required to report them.

18
privately-held and state-owned companies. We also included only firms that had 30 percent or more of
their total assets in upstream oil and gas for at least one year in which they appeared in the listing,
because firms for which upstream oil and gas was not an important business might make decisions
regarding upstream oil activities based on factors in their other businesses.14
For example, an oil refining
company might seek to obtain and further develop oil and gas reserves in order to ensure crude oil supply
for its downstream business (Weston, Johnson, & Siu, 1999). (A lower cutoff of 25 percent does not
substantially alter the results reported here.) Most of the excluded firms were electric utility, chemical, or
oil refining companies.
Table 1 reports descriptive statistics. Our sample consists of 244 firms, including large publicly-
owned foreign companies such as Shell and British Petroleum that file annual reports with the U.S.
Securities and Exchange Commission (SEC). The sample also includes relatively small firms: the four
smallest firms in the sample, as measured by asset size in the first year for which we have data, had asset
values ranging from $1,580 to $67,140. The inclusion of these firms suggests that the sample includes
most publicly-owned upstream oil companies with U.S. operations. The firms also vary widely in their
expenditures on oil exploration and development, their proved reserves, and their operating income
(EBITDA). In addition, table 1 shows that during the sample time period, 19 percent of the observations
are of firms that were vertically integrated into downstream operations, and 45 percent of the observations
are of firms that had offshore oil reserves in addition to onshore reserves. Finally, most of the firms had
primarily domestic reserves, with only 15 percent of proved reserves outside of the U.S.
***** Table 1 about here *****
Of the 244 firms, 44 reported data in all years in the sample. Firms exited the sample partway through
the time period either because they were acquired or merged with another firm (92 companies), or
because they declared bankruptcy and ceased to operate (37 firms). The firms that entered our sample
after 1993 did so for one of four reasons: 28 resulted from mergers between firms not previously in the
sample (such as privately-held firms that merged and became publicly-held), 6 were spin-offs of other
14 Total assets that companies report do not include the estimated value of proved reserves.

19
firms, 24 were newly established firms, and 63 firms existed previously as standalone entities that were
not publicly-held but became so partway through the sample period.
To compile the data, we first consulted the 10-K reports (20-F reports for foreign firms) that
companies file annually with the U.S. SEC, which contain financial information as well as data specific to
oil and gas operations.15
The reports also contain descriptive information regarding offshore and foreign
oil operations, whether or not the firms were vertically integrated, the seismic imaging and well drilling
capabilities of firms, and the backgrounds of firms that had not previously reported to the SEC. We
supplemented these data with information on mergers and acquisitions (M&A) from SDC Platinum. In
addition, we conducted a search of media coverage using LexisNexis to obtain information on mergers
and acquisitions not covered by SDC Platinum (primarily small firms or firms acquired by foreign
companies), and reasons why firms exited the sample. We also collected data on CEO education and work
experience from biographical descriptions in annual proxy statements filed with the SEC, Marquis’ Who
is Who database, Zoominfo, and articles in LexisNexis. To obtain information missing from these sources,
we conducted 117 brief interviews asking for factual information on CEO backgrounds, such as a CEO’s
university degree, with either the CEOs, their spouses, administrators from the CEOs’ former schools, the
human resources departments of their former firms, or fellow board members.
To gather additional information on firms’ seismic imaging and well drilling capabilities, we
supplemented descriptive information in the 10-K and 20-F reports with articles from the Journal of
Petroleum Technology, the Oil and Gas Journal, and Geology (the main journal of the Geological Society
of America). For 188 firms where publicly available information on capabilities was incomplete, we
contacted senior technical staff in these companies to obtain factual information. For some of the larger
firms, we conducted multiple interviews, because this information could not be obtained from a single
informant (e.g., the head geologist provided us with information on seismic imaging and a senior
reservoir engineer did the same for drilling technology).
15 We obtained some data contained in these reports from Compustat (income and asset data) and from Herold Inc., a leading
upstream oil research firm (data on proved oil reserves, wells drilled, and exploration and development expenditures). We
obtained the remainder of the information in these reports from the SEC website via the EDGAR database.

20
Estimation
Variables
All of the variables are constructed using annual data. The data for the dependent variables span the
years 1993-2006. We omitted 1999, because the Asian crisis caused oil prices to fall precipitously for a
single year; this anomalous situation could have caused companies to lower their expenditures on
activities directed toward resource access and development regardless of their dynamic capabilities.
(Inclusion of this year in the sample does not change the substance of the results reported here.) In order
to mitigate the possibility of reverse causation, most right-hand side variables are lagged one year. This is
an appropriate lag structure for the expenditure equations, in light of the decision-making processes in the
upstream oil industry, in which firms finalize their budgets for each year in the last month of the
preceding fiscal year (see Grant, 2003; Quick and Buck, 1984; Kukalis and Jungemann, 1995). This lag
structure also is appropriate for the regressions that analyze the success of resource access and
development activity, since drilling outcomes are generally reported with a lag of approximately a year
from when drilling commences. Data for all dollar-denominated variables are converted to real values
expressed in 2000 dollars, using the U.S. gross domestic product implicit price chain-type deflator
(http://www.eia.doe.gov/aer/txt/ptb1601.html).
Dependent Variables
We use two dependent variables to test hypothesis 1: annual expenditures on oil exploration (resource
access) and annual expenditures on oil development (resource development). We use expenditures to
measure the amount of resource access and development activity that companies undertake, because this
measure enables comparisons between companies. For example, even when companies drill wells using
similar technologies, some wells may entail greater effort and cost more to drill than others due to
differences in geologic formations and tract locations. Oil exploration expenditures include upfront
payments to lease a property (e.g., from the government) or purchase land, as well as expenditures

21
incurred during exploration activity.16
The latter include costs of topographical, geographical, and
geophysical studies, drilling and equipment costs, and personnel costs. Oil development expenditures are
incurred in fields where exploration has been successful and companies have booked proved reserves.
Development expenditures include costs of seismic and land surveys, drilling of additional wells, and
personnel and equipment costs. Expenditures on exploration and development include all expenditures
made in a given year, regardless of whether they are capitalized or expensed for accounting purposes.
Expenditures on oil exploration and development are highly skewed, due to a few large values and
many smaller values. To achieve a normal distribution, we converted the dollar values of expenditures to
natural logarithms. Because some firms had zero exploration or development expenditures in some years
(equivalent to a negative value in logarithmic terms), we followed a procedure similar to that suggested
by Cameron and Trivedi (2009: 532), and first converted the zero values to a value of one dollar and then
applied the natural log transformation (resulting in a natural log value of zero).17
In a second set of regressions that tests hypothesis 2 regarding the success of upstream oil resource
access and development activity, we use measures of success that are directly traceable to these activities.
The industry metric for the success of oil exploration and development activity is the number of wells
drilled for which oil was found, termed ‘successful wells drilled.’ To measure the success of resource
access activity, we use the number of successful exploratory wells drilled; these are wells for which
proved reserves are booked, because they are anticipated to contain economically viable amounts of oil.
To measure the success of resource development activity, we use the number of successful development
wells drilled; these are wells for which the presence of commercially viable amounts of oil is confirmed.18
Like expenditures, the distribution of the number of successful wells of both types is highly skewed, and
16 For further explanation, see: U.S. Financial Accounting Standards Board (FASB), 1977, Statement of Financial Account
Standards No. 19, Financial Accounting and Reporting by Oil and Gas Producing Companies,
http://www.fasb.org/cs/BlobServer?blobcol=urldata&blobtable=MungoBlobs&blobkey=id&blobwhere=1175818761298&blobhe
ader=application%2Fpdf; U.S Securities and Exchange Commission (SEC), Rule 17 CFR §210.4-10, pursuant to the U.S. Energy
Policy and Conservation Act of 1975, http://ecfr.gpoaccess.gov/cgi/t/text/text-
idx?c=ecfr&sid=935dfec5699,cbf45259c7576a1ab3298&rgn=div8&view=text&node=17:2.0.1.1.8.0.21.43&idno=17. 17 No non-zero expenditure values were as low as one dollar, so this transformation preserves the censoring threshold in our
original data. 18 Data are not available on the estimated amount of recoverable oil from newly drilled successful wells.

22
some firms have zero successful wells in some years. We therefore used the same procedure as for
expenditures to convert the number of successful exploratory and development wells to natural
logarithmic values (for a similar approach, see Acs et al, 2002; Leiblein and Madsen, 2009). Due to data
limitations, we are unable to assess the impact of dynamic capabilities on financial performance.
Available measures of financial performance such as return on assets or Tobin’s q depend on factors other
than upstream oil exploration and development that are difficult to control for (notably, oil production),
and include non-upstream businesses for some firms.
Explanatory Variable: Attributes of Dynamic Capability
Our explanatory variable captures the attributes of dynamic capabilities that have the potential to
affect the value of output (namely, oil and gas reserves) from resource access and development activities.
As explained earlier, these activities rely heavily on seismic imaging and well drilling technologies. To
develop a proxy measure of the attributes of dynamic capabilities, we used the technological
sophistication of a firm’s seismic imaging and well drilling technologies. Key attributes of a capability are
the characteristics of its routines, and as noted earlier, the use of both imaging and well drilling
technologies is likely to entail a set of routines. In addition, in order for a set of routines to qualify as a
capability, the routines must be sufficiently reliable to serve as a basis for regular use. In the upstream oil
industry, to say that a technology can be used on a reliable basis means that, at a minimum, the
technology can be used in full-scale applications, which are large scale projects aimed at obtaining and
further developing oil and gas reserves that have commercial potential. Because mistakes in using a new
imaging or drilling technology in projects at full scale can be extremely costly, firms generally conduct
pilot (test) projects at small scale first. Only when the firm’s use of the technology has reached a level of
reliability sufficient for full-scale applications does the company deploy the technology in such projects.
(This was confirmed during interviews with company personnel.) Thus, we focus on technologies used in
full-scale projects.
Seismic imaging technologies have a hierarchy of sophistication, as do well drilling technologies.
Within each hierarchy, use of a more sophisticated technology requires a thorough understanding of the

23
less sophisticated ones.19
Nevertheless, more sophisticated technologies require somewhat different
routines than less sophisticated technologies, because the technologies differ. For example, use of 3-D
imaging technology requires walking through a room of images, whereas 2-D technology does not.
Greater technological sophistication provides greater potential to locate and develop new reserves,
because firms can conduct oil exploration and development in a wider range of geologic formations. As a
result, the extent of technological sophistication, as a proxy for attributes of dynamic capabilities,
provides an indicator of the potential value of output of using these capabilities (i.e., reserves). Although
we are unable to directly measure the costs of deploying dynamic capabilities, in the empirical analysis
we control for firm-level effects and other factors that are likely to capture some of these costs.
In constructing a measure of the attributes of dynamic capabilities for each firm in each year, we
began by identifying the year in which a firm first utilized each level of technological advancement for
seismic imaging (2-D, 3-D, and 4-D imaging) and for well drilling (vertical, directional, horizontal, and
multilateral drilling) in a full-scale application. Given that oil exploration and development is ongoing in
upstream oil companies, once a firm starts to deploy one of these technologies in a full-scale application,
the firm generally retains its knowledge of the technology in subsequent years.20
(This was confirmed in
the interviews.) Therefore, for each level of technological sophistication in imaging or well drilling, a
firm was coded as having this attribute in the first year of full-scale use and all subsequent years.
To create a summary variable for the attributes of each firm’s dynamic capabilities in each year, we
first assessed the level of technological sophistication per firm for imaging and drilling separately. Firms
that had never conducted seismic imaging or well drilling would have received a value of zero for the
level of sophistication of each technology, but no firms fell into this category. For drilling, firms that
19 Studies of the evolution of oil and gas technology that document aspects of this hierarchy include those by Graebner, Wason,
and Meinardus 1981; Journal of Petroleum Technology 1999a; Lubinski 1950; Longbottom and Herrera 1997; Journal of
Petroleum Technology 1999b and 1999c. Although firms that have the ability to deploy a more sophisticated technique also
possess the ability to deploy less sophisticated techniques, a firm doesn’t have to have experience using the less sophisticated
techniques in order to deploy the more sophisticated ones. Information obtained during the factual interviews with company
technical personnel described earlier also confirmed the existence and nature of such a hierarchy of technological sophistication. 20 Most firms in the sample undertake a positive amount of either exploration or development (and often both) in a given year,
through which they maintain their capabilities. Although some firms may not use each technology every year, use of more
advanced technologies enables firms to maintain their capabilities for less advanced technologies (as explained in the previous
footnote). In addition, if firms fail to maintain their capabilities through use of the technologies, we will not find empirical
support for our hypotheses.

24
possessed only the least sophisticated technology of vertical drilling received a value of 1, firms that also
had directional drilling technology received a value of 2, firms with horizontal drilling technology
received a value of 3, and firms with multilateral drilling technology received a value of 4. For seismic
imaging, firms that possessed only the least sophisticated technology of 2-D imaging received a value of
1, firms with 3-D technology received a value of 2, and firms with 4-D technology received a value of 3.
Although imaging and drilling are distinct from one another, and entail different technologies and
knowledge bases, the two activities are interdependent. In particular, well drilling utilizes the results from
prior seismic imaging, but imaging alone does not determine drilling outcomes. Because these two
technologies work in concert, we combined imaging and drilling into a single measure of the attributes of
dynamic capabilities.
As noted at the start of this paper, empirical research on capabilities has often lacked data with which
to construct objective rather than subjective measures of capabilities. Our measure clearly is objective,
rather than derived from survey data. Even when researchers have been able to utilize objective measures,
these have sometimes taken the form of a single binary (0,1) variable that indicates whether or not a firm
possesses a capability of a particular type (Grant and Verona, 2012). The measure that we use is more
fine-grained, in that it incorporates a scale associated with level of technological sophistication. Our
measure of the attributes of dynamic capabilities also has the advantage that it does not reflect how
successfully firms have used these technologies beyond a minimal threshold of initial deployment. Instead,
by using a measure that reflects key underlying attributes of dynamic capabilities, we capture the potential
for a firm to obtain and develop new resources. In particular, as noted above, firms with more
technologically sophisticated capabilities for seismic imaging and well drilling have the potential to
undertake a broader range of projects than firms with less sophisticated capabilities. This greater
technological sophistication in turn provides the potential to locate and develop new resources with a
greater quantity and/or quality of output. Note, however, that technological sophistication is measured
independently of the amount and success of resource access and development activity.
Control Variables

25
The regressions include several variables that control for influences other than dynamic capabilities
on the amount and success of resource access and development activity. Table 2 explains the reasons for
including each control variable in the regressions and the construction of each variable. The regressions
for oil exploration and development expenditures contain controls for: crude oil price, CEO expertise,
total amount of reserves, type of reserves (foreign, U.S. offshore, U.S onshore), availability of internal
funds (cash flow), integration into downstream operations, new entrant status, firm exit, merger and
acquisition activity, and fixed firm effects through a pre-sample dependent variable. The latter is
explained in more detail below. The regressions for the success of oil exploration and development
control for expenditures on each activity, and include all of the control variables in the expenditure
regressions except oil price, cash flow, and integration, because these do not directly affect whether or not
drilled wells yield oil. We do not include dummy variables for individual years as controls, because they
are highly correlated with oil prices in the expenditure regressions and with expenditures in the success
regressions. The time period of our analysis, 1993-2006, covers both a period of relatively stable oil
prices as well as a more variable one with sharply increasing output prices.21
***** Table 2 about here *****
Statistical Methods
Because the dependent variables in the regressions cannot take on negative values and are censored at
zero, we use tobit maximum likelihood estimation. We use random effects tobit estimation to control for
firm-level effects that the included right-hand side variables may not capture. Because the value of the
capability variable changes slowly within firms over time, we cannot estimate standard fixed effects
regressions, since this would it make it impossible to estimate the capability effects. In addition, standard
fixed effects estimation cannot be used for tobit analysis.22
Instead, to control for firm-level fixed effects,
21 Crude oil prices remained largely within a relatively stable 20-30 dollar per barrel range from 1992 to 1998, before temporarily
dipping below 10 dollars per barrel during the Asian financial crisis of 1999. Annual average oil prices then rose in fits and starts
from 20 dollars per barrel in mid-2000 to more than 50 dollars per barrel at the end of 2006. 22 Wooldridge (2002: 541) provides an alternate technique for obtaining consistent coefficient estimates that control for fixed
effects in tobit regressions. Because this technique relies on the use of per-firm mean values of the right-hand side variables,
which are highly correlated with the slowly changing capability variable, we cannot use Wooldridge’s technique for the same
reasons as noted in the text.

26
we include a pre-sample dependent variable on the right-hand side of the regressions. Blundell, Griffith,
and Van Reenen (1995) suggested this approach for situations in which traditional fixed effects estimation
cannot be used. Blundell et al (1995) applied this approach to dynamic panel regressions for count data.
Following Blundell et al (1995), a number of studies in management have used a pre-sample dependent
variable to control for fixed effects (e.g., Ahuja and Katila, 2001; Ziedonis, 2004). The pre-sample
variable is the same (that is, fixed) for all observations of an individual firm. As Ahuja and Katila (2001:
204) note, the pre-sample dependent variable provides an instrument that “serves as a ‘fixed-effect’ for
the firms in the panel and helps to partial out unobservable differences across firms.” Blundell et al (1995)
used three years of data prior to the start of the sample to construct a pre-sample dependent variable. Due
to data limitations, in our study the pre-sample dependent variable is the value of this variable in the year
immediately preceding the first year in which the dependent variable for each firm appears in the sample.
We also conduct a robustness test that controls for firm-level fixed effects using ordinary least squares, as
explained later.
Because there is a lag between the time when firms conduct activities for resource access and
development and the time when the success of each of these activities is known (about a year on average),
this implies a recursive system of equations, such that firms first make expenditures directed toward
resource access and development, and subsequently learn how successful each of these activities were.
When equations are recursive, the error terms are uncorrelated, and therefore the regression for the
amount of each activity can be estimated independently of the regression for the success of each activity
(Pindyck and Rubinfeld, 1998). All regressions are estimated using Stata 11.
RESULTS
Table 3 reports correlation coefficients for the variables in the regressions. Our explanatory variable
for the attributes of dynamic capabilities is positively correlated with several control variables. We
calculated the variance inflation factor (VIF) for this variable when used in conjunction with the other
variables in the full models that test the hypotheses, and the results indicate that multicollinearity is

27
unlikely to affect the regression estimates. In all cases, the VIF for the dynamic capability variable is
below 1.7, well below the value of 10 or above commonly used to indicate that multicollinearity could
pose a problem (see e.g., Kutner et al, 2004). The VIF statistics for all of the other right-hand side
variables used in the full models also are low; all are below 3.65, and most values are well below 2.
***** Table 3 about here *****
Tables 4 through 7 report the regression results. These tables report marginal effects in addition to the
coefficient estimates, because the marginal effects adjust for the number of censored observations
(Greene, 1997) and enable comparisons across regressions. In discussing the results, we focus on the
estimated marginal effects, which are often nearly identical to the estimated coefficients. Given the
number of control variables, we utilize hierarchical regressions and estimate three models per dependent
variable. The first model includes financial and resource endowment control variables (along with the
pre-sample variable), the second model adds controls for other firm characteristics, and the full model
adds the dynamic capability variable. Due to space constraints, we discuss results only for the full models.
***** Tables 4, 5, 6, and 7 about here *****
Tables 4 and 5, which report the results of regressions for expenditures on oil exploration and
development, pertain to hypothesis 1. For both types of expenditures, in the full models, the marginal
effects of the control variables for oil price, total reserves, and the pre-sample dependent variable are
positive and statistically significant, and the marginal effects of foreign reserves and experienced entrant
status are negative and statistically significant. Exit via acquisition is significant (and negative) for oil
exploration activity, and exit due to bankruptcy is significant (and negative) for oil development activity.
Not surprisingly, firms appear to cut back on oil exploration and development activity in the year prior to
exit. The marginal effect of offshore oil reserves is positive and significant only for oil exploration; the
same holds for merger and acquisition activity. Surprisingly, CEO upstream expertise is negative and
significant for exploration activity; perhaps when CEOs have greater upstream expertise, their expertise
leads them to take fewer risks and therefore to undertake less exploration activity. Neither CEO variable
is significant for development activity.

28
Tables 4 and 5 provide support for hypothesis 1. The marginal effect of the dynamic capability
variable is positive and statistically significant in the regressions for both resource access (oil exploration)
and resource development (oil development). These effects are economically important as well. The
estimated marginal effects indicate that for a one unit increase in the dynamic capability variable,
expenditures on exploration increase on average by 0.48 (48 percent) and expenditures on development
increase by 0.27 (27 percent). In addition, a likelihood ratio test that the effect of the dynamic capability
variable is smaller for resource development (oil development) than for resource access (oil exploration)
is significant at less than the 0.001 level (based on the chi-squared statistic), indicating strong support for
hypothesis 3.
Tables 6 and 7, which report the results of regressions for the success of oil exploration and
development activity, pertain to hypothesis 2. In both regressions, in the full models, the marginal effects
of the control variables for expenditures on the activity in question, total reserves, and the pre-sample
dependent variable are positive and statistically significant. For oil exploration, merger and acquisition
activity has a positive and statistically significant effect. In contrast, experienced entrant status has a
negative and statistically significant effect; many of the experienced entrants were young firms that may
have had less effective organizational processes for the firm as a whole, which it turn may have impaired
their development activities. For oil development, exit due to bankruptcy and foreign reserves have a
negative and statistically significant effect; that latter result suggests that foreign reserves were in
geographic locations that were more challenging to develop.
Tables 6 and 7 provide support for hypothesis 2. The marginal effect of the dynamic capability
variable is positive and statistically significant for both resource access (oil exploration) and resource
development (oil development). These effects are economically important as well. The estimated
marginal effects indicate that for a one unit increase in the dynamic capability variable, the number of
successful exploratory wells drilled increases on average by 0.23 (23 percent) and the number of
successful development wells increases by 0.17 (17 percent). In addition, a likelihood ratio test that the
effect of the dynamic capability variable is smaller for resource development than for resource access is

29
significant at less than the 0.01 level (based on the chi-square statistic), indicating strong support for
hypothesis 4. Of note, all of these results hold after controlling for any indirect effect of dynamic
capabilities through expenditures on these activities.
Robustness Tests
We conducted several robustness tests. To begin, we utilized ordinary least squares estimation with
fixed effects as a robustness test to control for unobserved heterogeneity among firms. As noted above,
the dynamic capability variable does not vary greatly over time within firms, making it difficult to use a
standard fixed effects model. Therefore, following Reitzig and Puranam (2009), we employed a two-stage
estimation technique to control for firm-level fixed effects. For each dependent variable, we first
estimated a fixed effects OLS panel regression, omitting the dynamic capability variable and the pre-
sample variable from the right-hand side. We then regressed the firm-specific residual from the first-stage
regression on the average value of the dynamic capability variable for each firm. Reitzig and Puranam
(2009: 776) note that estimates “obtained in the second stage are unbiased in the sense that they do not
spuriously capture other elements of heterogeneity at the firm level.” Table 8 reports the results for all
four dependent variables. The dynamic capability variable is positive and statistically significant in all of
the regressions, providing additional support for hypotheses 1 and 2. In addition, these results provide
support for hypotheses 3 and 4. A Chow test indicates that the coefficient on the dynamic capability
variable in the second-stage regressions is statistically significantly greater (at less than the 0.01 level) for
expenditures on oil exploration than development, and is also statistically significantly greater (at less
than the 0.05 level) for success of exploratory wells than for development wells.
***** Table 8 about here *****
We conducted a number of additional robustness tests (detailed results available on request). First, to
investigate whether smaller firms might have disproportionately affected the results, we reran the tobit
regressions reported earlier for a subsample of firms that had greater than 25 million dollars in assets at
the start of the first year in which they were in the sample. We also conducted this analysis for only firms
with greater than 50 million dollars in assets. Both sets of results are substantively the same as those

30
reported here. Second, we omitted property acquisition costs from the dependent variable in the
expenditure regressions, and included only expenditures directly on exploration activity. The results are
substantively the same as those reported here. Third, in the model for exploration expenditures, we added
a variable for net purchases of reserves (lagged), to control for the possibility that firms might substitute
purchases of reserves for oil exploration activity. Firms can purchase reserves through purchases of land
or by acquiring firms that have proved reserves; firms also frequently sell proved reserves through sales
of land (Finch & Acha, 2009).23
This variable was not statistically significant. Fourth, we combined the
two CEO dummy variables into one, indicating whether the CEO had any upstream expertise at all. This
variable was not significant. Fifth, to investigate the possibility that CEOs might have a larger impact in
smaller firms, we reran the regressions for the subsample of firms with assets values of 25 million dollars
or less. The CEO variables remained insignificant for these firms.
As a sixth robustness test, in the model for successful development wells drilled, we added a variable
for successful exploratory wells drilled in the prior year, to control for the possibility that firms with
greater prior success in exploration might have greater development success. This variable was not
significant. Seventh, in the model for development expenditures, we added a variable for prior exploration
expenditures and a variable for prior exploration success, both separately and together in the same model.
In these regressions, the marginal effects of these variables were positive and statistically significant, but
the dynamic capability variable remained positive and statistically significant at the 0.01 level, with
similar marginal effects to that reported in table 5. Finally, we constructed an alternate dynamic capability
variable for the extent of technological sophistication for seismic imaging alone. Because imaging
precedes drilling, imaging might have a disproportionate impact on the amount and success of resource
access and development activity. The substantive results reported earlier continue to hold. The alternate
dynamic capability variable is positive and statistically significant in all of the regressions, providing
23 The net purchases variable is calculated as additions of new proved reserves through land purchases or company
acquisitions minus proved reserves sold through land sales. Because net purchases of reserves can be negative due to
sales of reserves, the values are not converted to natural logarithms.

31
additional support for hypotheses 1 and 2; the marginal effect also is substantially larger for exploration
than for development, providing additional support for hypotheses 3 and 4.
DISCUSSION
These results demonstrate the effect of dynamic capabilities on both the amount and success of
activities directed toward resource access and development in the upstream oil industry. When firms have
more sophisticated dynamic capabilities, they undertake more activity directed toward both resource
access (oil exploration) and resource development (oil development), consistent with hypothesis 1. The
estimated marginal effects are statistically and economically significant. In addition, the results show that
dynamic capabilities have a direct effect on the success of activities directed toward both resource access
and resource development, even after controlling for the amount of each activity, consistent with
hypothesis 2. Again, the estimated marginal effects are statistically and economically significant.
The results also show that, not surprisingly, upstream oil companies that undertake more resource
access and development activity have greater success in these activities. The expenditure variables, which
reflect the amount of activity undertaken, have economically important marginal effects on the success of
these activities. The marginal effect of expenditures on the success of resource access (oil exploration) is
0.27 (27 percent), and the marginal effect of expenditures on the success of resource development (oil
development) is 0.15 (15 percent). The economic and statistical significance of these expenditure
variables points to the importance of controlling for the amount of activity when analyzing the impact of
dynamic capabilities on the success of activities directed toward change.
We can compare the direct effect of dynamic capabilities on the success of resource access and
development activities with the indirect effect through the amount of activity undertaken. To estimate the
indirect effect of the dynamic capability variable on the success of each activity, we can multiply the
estimated marginal effect of the dynamic capability variable in each expenditure regression by the

32
estimated marginal effect of expenditures in the associated regression for successful wells drilled.24
For
resource access (oil exploration), this indirect marginal effect is 0.13 (0.48 x 0.27); for resource
development (oil development), the indirect marginal effect is 0.04 (0.27 x 0.15). This brings the
combined direct and indirect marginal effects of dynamic capabilities to 0.36 for resource access and 0.21
for resource development. The indirect effects constitute approximately 35 percent of the combined
effects of dynamic capabilities for resource access, and approximately 20 percent of the combined effects
for resource development. Thus, the indirect effects are economically important, but the direct effects of
dynamic capabilities on the success of each activity are much larger.
The results also support hypotheses 3 and 4 that dynamic capabilities have a smaller effect on the
amount and success of activity for resource development than for resource access. Our analysis provides a
particularly appropriate test of these hypotheses, in that resource development in the upstream oil industry
relies heavily on prior direct knowledge of oil and gas reserves gained through resource access activity.
Moreover, because the same dynamic capabilities underlie activity directed toward both resource access
and development, this makes it more likely that differences in the estimated effects of dynamic
capabilities for the two activities stem from differences in prior direct knowledge of resources, as opposed
to differences in the capabilities themselves. Notably, the difference in the estimated marginal effects for
resource access and resource development is sizeable. For expenditures, the marginal effect of the
dynamic capability variable is 1.78 times greater for resource access than for resource development. For
successful wells drilled, the marginal effect of the dynamic capability variable is 1.35 times greater for
resource access than for resource development.
Of the control variables, not surprisingly, firms with more upstream assets in terms of proved reserves
tended to conduct more activity directed toward resource access and development, and had greater
success. Oil prices also have a large impact on the amount of expenditures for resource access and
24 By definition, the first derivative of well drilling success with respect to dynamic capabilities via expenditures (the indirect
marginal effect) equals the first derivative of well drilling success with respect to expenditures (the marginal effect of
expenditures on well drilling success) multiplied by the first derivative of expenditures with respect to dynamic capabilities (the
marginal effect of dynamic capabilities on expenditures).

33
development activity. When prices are high, firms undertake more of these activities, and vice versa when
prices are low. The significance of this variable points to the importance of controlling for key factors in
the external environment when analyzing the impact of dynamic capabilities. Otherwise, there is a risk of
misattributing the influence of factors in the external environment to dynamic capabilities. To investigate
the potential for this sort of misattribution in our setting, we omitted the oil price variable from the
expenditure regressions. The estimated marginal effects of the dynamic capability variable rose
substantially, particularly during the second half of the time period when prices were rising, illustrating
the danger of omitting key environmental variables.
In most of the regressions, the CEO variables were insignificant. Unfortunately, we could not obtain
as precise information regarding CEO expertise as desirable. In addition, most firms had relatively few
CEOs, an average of 1.7 CEOs per firm; this low variation within firms makes it more difficult to detect
CEO effects in a fixed-effects type of model that primarily captures variation within firms over time.
Nevertheless, the results suggest that CEO expertise may be less important for resource access and
development than dynamic capabilities within the organization.
This analysis used a measure of the attributes of dynamic capabilities based on uniquely detailed data
specific to the industry in question. The results show that not only do dynamic capabilities have
statistically significant effects, but also the magnitudes of the effects are economically important. Firms in
the upstream oil industry that had more technologically sophisticated dynamic capabilities relied on them
to conduct greater amounts of activity directed toward resource access and development. Dynamic
capabilities also had a direct effect on the success of these activities – suggesting that dynamic
capabilities may contribute to competitive advantage in resource access and development.
CONCLUSION
This study enhances our understanding of dynamic capabilities in several ways. First, the analysis
advances our theoretical understanding of dynamic capabilities. We examine how dynamic capabilities
affect stages of resource access and development, in order to better understand the potential impact of

34
dynamic capabilities on resource extension and modification. The analysis shows that dynamic
capabilities are likely to affect not only the success of activities directed toward change, but also the
requisite investments in terms of expenditures to fund these activities. Additionally, the analysis suggests
that lack of prior direct knowledge of the resources in question may cause dynamic capabilities to have
greater importance for resource access than resource development.
Second, we empirically analyze dynamic capabilities in new ways. We separate the amount of each
activity that firms undertake from the success of the activity, and estimate the effect of dynamic
capabilities on each. We also estimate the indirect effect of dynamic capabilities on the success of
activities through the amount of these activities that firms undertake. In addition, we analyze how the
impact of dynamic capabilities may differ for resource access and development. Finally, we measure the
attributes of dynamic capabilities separately from the extent of success in utilizing these capabilities.
This study has several limitations. Notably, it is limited to one industry, and future research is needed
to ascertain whether the findings hold in other industries. In addition, due to data limitations, we were
unable to examine the impact of dynamic capabilities on financial performance. Available measures of
financial performance such as return on assets or Tobin’s q depend on factors other than resource access
and development that are difficult to control for in this industry (notably, oil production), and include
non-upstream businesses for some firms.
This study contains new theoretical analysis and findings that provide a foundation for future research
on the impact of dynamic capabilities on stages of resource access and development. More generally, the
question of how prior direct knowledge of resources, and the difficulty of an activity in general, affects
the usefulness and impact of dynamic capabilities are issues that would benefit from future research. Our
results suggest an important contingency in the study of dynamic capabilities, namely, that the impact of
these capabilities may depend on the type of activity in question.

35
REFERENCES
Acha V. 2002. Framing the Past and Future; The Development and Deployment of Technological Capabilities by the
Oil Majors in the Upstream Petroleum Industry, Science Policy Research Unit (SPRU), Vol. PhD. University of
Sussex: Brighton
Acs Z, Anselin, Varga. 2002. Patents and innovation counts as measures of regional production of new knowledge.
Research Policy 31: 1069–1085.
Adner R, Helfat CE. 2003. Corporate effects and dynamic managerial capabilities. Strategic Management Journal 24:
1011-1025
Ahuja G, Katila R. 2001. Technological acquisitions and the innovation performance of acquiring firms: A
longitudinal analysis. Strategic Management Journal 22: 197-220
Amit R, Schoemaker P. 1993. Strategic assets and organizational rent. Strategic Management Journal 14: 33-46
Amit R, Schoemaker P. 2012. Resources and capabilities. In Palgrave Encyclopedia of Strategic Management (DJ
Teece and M Augier, eds.) Palgrave MacMillan, UK. Forthcoming.
Barney, J. 1991. Firm resources and sustained competitive advantage. Journal of Management 17: 99-120.
Bertrand M, Schoar A. 2003. Managing with style: the effect of managers on firm policies. Quarterly Journal of
Economics 118(4): 1169-1208
Blundell R, Griffith R., Van Reenen J. 1995. Dynamic count data models of technological innovation. Economic
Journal 105(429): 333-344
Cameron AC, Trivedi PK. 2009. Microeconometrics Using Stata. Stata Press: College Station, TX
Capron, Laurence and Will Mitchell. 1998. Bilateral Resource Redeployment and Capabilities Improvement
Following Horizontal Acquisitions. Industrial and Corporate Change, 7(3): 453-483.
Daily CM, Certo ST, Dalton DR. 2000. International experience in the executive suite: the path to prosperity?
Strategic Management Journal 21(4): 515
Dierickx I, Cool K. 1989. Asset stock accumulation and sustainability of competitive advantage. Management
Science 35(12): 1504-
Di Stefano G, Peteraf MA, Verona G. 2010. Dynamic capabilities deconstructed: A bibliographic investigation into
the origins, development, and future directions of the research domain. Industrial and Corporate Change
Dosi G, Nelson RR, Winter SG. 2000. The Nature and Dynamics of Organizational Capabilities. Oxford University
Press: Oxford, England
Eisenhardt KM, Martin JA. 2000. Dynamic capabilities: what are they? Strategic Management Journal 21: 1105-
1121
Finch J, Acha V. 2009. Making and exchange of a second-hand oil field, considered in an industrial marketing setting.
Marketing Theory 8(1): 45-66
Finch JH, Macmilan FE, Simpson GS. 2002. On the diffusion of probabilistic investment appraisal and decision-
making procedures in the UK's upstream oil and gas industry. Research Policy 31(6): 970-989
Graebner R, Wason C, Meinardus H. 1981. Three-dimensional methods in seismic exploration. Science 211(4482):
535-540
Grant RM. 2003. Strategic planning in a turbulent environment: evidence from the oil majors. Strategic Management
Journal(6): 491-517
Grant RM. 2005. Contemporary Strategy Analysis, 5th
ed. Blackwell Publishing: Malden, MA.
Grant RM, Verona G. 2012. Measuring Organizational Competence. In Palgrave Encyclopedia of Strategic
Management (DJ Teece and M Augier, eds.) Palgrave MacMillan, UK. Forthcoming.
Greene WH. 1997. Econometric Analysis (Third Edition). Prentice-Hall: Upper Saddle River, NJ
Hambrick DC, Mason PA. 1984. Upper Echelons: The Organization as a Reflection of Its Top Managers. Academy of
Management Review 9(2): 193-206
Helfat CE. 1994a. Firm-specificity in corporate applied R&D. Organization Science 5(2): 173-184
Helfat, CE.1994b. Evolutionary trajectories in petroleum firm R&D. Management Science 40(12): 1720-1747.
Helfat CE. 1997. Know-how and asset complementarity and dynamic capability accumulation: The case of R&D.
Strategic Management Journal 18(5): 339-361
Helfat, CE, Peteraf MA. 2003. The dynamic resource-based view: capability lifecycles. Strategic Management
Journal, 24(10): 997-1010. Helfat CE, Finkelstein S, Mitchell W, Peteraf MA, Singh H, Teece DJ, Winter SG. 2007. Dynamic Capabilities:
Understanding Strategic Change in Organizations. Blackwell Publishing: Malden MA
Helfat CE, Winter SG. 2011. Untangling dynamic and operational capabilities: Strategy for the [n]ever-changing
world. Strategic Management Journal, 32: 1243-1250.

36
Henderson, R. 1994. The evolution of integrative capability: Innovation in cardiovascular drug discovery. Industrial
and Corporate Change 3(3): 607-630
Hoopes DG, Madsen TL, Walker G. 2003. Guest editors' introduction to the special issue: why is there a resource-
based view? Toward a theory of competitive heterogeneity. Strategic Management Journal 24(10): 889-902
Journal of Petroleum Technology. 1999a. Frontiers of Technology. Drilling Technology.
Journal of Petroleum Technology. 1999b. Frontiers of Technology. Horizontal and Multilateral Wells.
Journal of Petroleum Technology. 1999c. Frontiers of Technology. Seismic Technology.
Karim, S. 2009. Business Unit Reorganization and Innovation in New Product Markets. Management Science 55(7):
1237-1254.
Ketchen DJ Jr, Hult TM, Slater SF. 2007. Toward greater understanding of market orientation and the resource-based
view. Strategic Management Journal 28: 961-964.
Kukalis S, Jungemann M. 1995. Strategic planning for a joint venture. Long Range Planning 28(3): 46-56
Kutner, Nachtsheim, Neter. 2004. Applied Linear Regression Models, 4th edition, McGraw-Hill Irwin.
Leiblein M, Madsen T. 2009. Unbundling competitive heterogeneity: Incentive structure and capability influences
on technological innovation. Strategic Management Journal 30: 711-735.
Longbottom J, Herrera I. 1997. Multilateral Wells Can Multiply Reserve Potential. The American Oil & Gas
Reporter 53
Lubinski A. 1950. A Study of the -Buckling of Rotary Drilling Strings. Drilling and Production Practice: 178-215
McGahan, A. 1995. The Pharmaceutical Industry in the 1990s. Harvard Business School, Case #9-796-058.
Nelson RR. 1991. Why do firms differ, and how does it matter? Strategic Management Journal 12: 61-74
Peteraf MA. 1993. The cornerstones of competitive advantage: A resource-based view. Strategic Management
Journal 14:179-191
Pindyck RS, Rubinfeld DL. 1998. Econometric Models and Economic Forecasts, 4th
edition. Irwin/McGraw-Hill:
Boston, MA
Quick A, Buck N. 1984. Strategic Planning for Exploration Management. Prentice Hall: Boston
Reitzig M, Puranam P. 2009. Value appropriation as an organizational capability: The case of IP protection through
patents. Strategic Management Journal 30: 765-789
Severi Bruni D, Verona G. 2009. Dynamic Marketing Capabilities in Science-based Firms: An exploratory
investigation of the pharmaceutical industry. British Journal of Management 20: S101-S117.
Shane S. 2009. Technology Strategy for Managers and Entrepreneurs. Pearson Prentice Hall, London.
Society of Petroleum Engineers. 2004. Petroleum Reserves and Resources Definitions, retrieved 15.10.2004, from
http://www.spe.org/spe/jsp/basic/00,1104_1730,00html.
Stadler C. 2011. Process innovation and integration in process oriented settings: The case of the oil industry. Journal
of Product Innovation Management 28 (7): 44-62
Stoneley. 1995. Introduction to petroleum exploration for non-geologists. Oxford: Oxford University Press.
Teece DJ, Pisano G, Shuen A. 1997. Dynamic capabilities and strategic management. Strategic Management Journal
18: 509-533
Teece DJ. 2007. Explicating dynamic capabilities: The nature and microfoundations of (sustainable) enterprise
performance. Strategic Management Journal 28: 1319-1350.
U.S Securities and Exchange Commission. 1975. Rule 17 CFR §210.4-10, pursuant to the U.S. energy policy and
conservation act of 1975.
U.S. Securities and Exchange Commission. Department of Energy, FAS 19, adopted December 19, 1978 in ASR No.
257
Weston JF, Johnson BA, Siu JA. 1999. Mergers and restructuring in the world oil industry. Journal of Energy
Finance & Development 4(2): 149-183
Wernerfelt, B. 1984. A resource-based view of the firm. Strategic Management Journal 5(2): 171-180
Winter, SG. 2003. Understanding dynamic capabilities. Strategic Management Journal 24(10): 991-996
Wooldridge, JM. 2002. Econometric Analysis of Cross Section and Panel Data. MIT Press: Cambridge, MA
Wooldridge, JM. 2009. Introductory Economics: A Modern Approach, 4th edition.South-Western Cengage Learning:
Mason, OH
Ziedonis R. 2004. Don’t fence me in: Fragmented markets for technology and the patent acquisition strategies of
firms. Management Science 50(6): 804-820

37
Table 1: Descriptive Statistics, 1993-2006 (n=1897) Mean Std. Dev. Min Max
EBITDA, lagged (billion US$) 0.98 4.57 -0.14 82.20
Total Reserves, lagged (thousand barrel oil equivalent) 638,973.00 2,476,297.00 0 22,400,000.00
Log (Total Reserves, lagged) 9.98 2.90 0 16.92
Foreign Reserves / Total Reserves, lagged 0.15 0.29 0 1
Exploration Expenditures (US$ X .001) 139,000.00 467,000.00 0 12,000,000.00
Log (Exploration Expenditures) 14.61 5.64 0 23.20
Pre-sample Exploration Expenditures (US $ X .001) 66,900.00 223,000.00 0 1,800,000.00
Log (Pre-sample Exploration Expenditures) 14.18 5.30 0 30.14
Development Expenditures (US$ X .001) 306,000.00 1,060,000.00 0 13,600,000.00
Log (Development Expenditures) 15.88 4.46 0 23.33
Pre-sample Development Expenditures (US $ X .001) 163,000.00 639,000.00 0 4,920,000.00
Log (Pre-sample Development Expenditures) 15.06 3.68 0 27.39
Successful Exploratory Wells Drilled 9.00 23.00 0 344.00
Log (Successful Exploratory Wells Drilled X 100) 4.04 3.11 0 10.45
Pre-sample Successful Exploratory Wells Drilled 3.50 9.00 0 60.00
Log (Pre-sample Successful Exploratory Wells Drilled X 100) 2.80 2.92 0 8.70
Successful Development Wells Drilled 94.00 222.00 0 1972.00
Log (Successful Development Wells Drilled X 100) 6.22 3.40 0 12.19
Pre-sample Successful Development Wells Drilled 34.00 84.00 0 472.00
Log (Pre-sample Successful Development Wells Drilled X 100) 4.80 3.39 0 10.76
CEO with Upstream Expertise Only, lagged 0.28 0.45 0 1
CEO with both Upstream and Non-Upstream Expertise, lagged 0.37 0.48 0 1
Dynamic Capability, lagged 3.83 1.38 2 7
Non-integrated, lagged 0.81 0.39 0 1
M&A, lagged 0.10 0.30 0 1
Offshore Operations, lagged 0.45 0.50 0 1
New Entrant without Prior Experience, lagged 0.01 0.10 0 1
New Entrant with Prior Experience, lagged 0.04 0.20 0 1
Exit due to M&A 0.05 0.21 0 1
Exit due to Bankruptcy 0.02 0.14 0 1
Oil Price, lagged (US$ per barrel oil equivalent) 23.63 6.95 17.27 44.45

38
Table 2 Control Variables
Expenditure Regressions Variable Description
Crude Oil Price (lagged) Firms generally spend more to locate reserves and develop them when the price of the eventual output
is higher. Annual crude oil price is measured as the U.S. year-end refiner acquisition cost of crude oil
per barrel, available from the U.S. Energy Information Agency (EIA) at:
http://www.eia.doe.gov/pub/oil_gas/petroleum/data_publications/petroleum_marketing_monthly
/current/pdf/pmmtab1.pdf. Refiner acquisition cost reflects how much a firm can earn from selling a
barrel of crude oil to refiners in the U.S., and is a composite price for imported and domestic oil.
CEO Expertise (lagged) Because exploration and development of oil and gas reserves is both expensive and critical to firm
performance, top management is likely to play a role in decisions regarding these activities. In making
these decisions, top managers may rely on their accumulated expertise. Because complete information
on the educational backgrounds and work experience of the entire top management team for upstream
oil companies is not available, we collected data on CEOs. Research shows that CEOs can have a
significant impact on firm performance in general (e.g., Bertrand & Schoar, 2003; Daily, Trevis, Certo,
& Dalton, 2000), and in the oil industry in particular (Adner & Helfat, 2003). For education, we were
able to code the types of degrees that CEOs had received, which fell into three categories: 1) technical
(primarily engineering, geology, geophysics), 2) non-technical (primarily business, finance, economics,
and law), and 3) both (typically, a technical degree plus an MBA). For prior work experience, the only
information that we could obtain for the entire sample pertained to the functional areas and/or divisions
in which the CEOs had previously worked, based on their prior titles and the descriptions of their
careers. From this information, we were able to ascertain whether or not a CEO had any upstream work
experience. We also could ascertain whether the CEO had prior staff experience (including finance),
which we denote as non-upstream experience. These data enabled us to create three binary (0,1)
variables: 1) upstream expertise only, for CEOs with only technical education and upstream experience
(28% of the executives); 2) non-upstream expertise only, for CEOs with only non-technical education
and non-upstream experience (36% of the executives); 3) both upstream and non-upstream expertise, for
CEOs with a mix of educational backgrounds and work experience (36% of the executives). We include
the first and third variables in the regressions, since these CEOs have upstream oil expertise. The
reference case (and omitted variable) is non-upstream expertise only.
Logarithm of Total
Reserves (lagged) Firms with greater upstream assets may engage in greater oil exploration and development activity. Not
all firms report assets for their upstream operations, and publicly reported asset values do not include an
estimated value of oil and gas reserves. Therefore, we use the amount of proved reserves at year-end as
a proxy for upstream asset size. In addition, for development expenditures, since firms conduct
development activity only for proved reserves, the amount of reserves directly controls for the potential
that each firm has to undertake new development. Because the distribution of total reserves is skewed,
we use natural logarithmic values, computed using the same procedure as for expenditures.
Foreign Reserves
Divided by Total
Reserves (lagged) and
Offshore Operations
(lagged)
Firms differ in the types of reserves that they hold. Some geologic formations are more difficult to
explore and develop than others, and this tends to vary by geographic location. Some of the most
promising locations for exploration and development are outside of the U.S. or offshore in the U.S.
Exploration and development of foreign reserves also is subject to different laws and regulations than in
the U.S. To measure the relative importance of foreign reserves for each firm, we divided the amount of
proved foreign reserves by total proved reserves at year-end. Unlike for foreign reserves, firms do not
report the amount of U.S. offshore reserves. In order to ascertain whether or not firms had offshore
operations and reserves, we read the description of operations for all firms in the 10-K and 20-F reports,
and confirmed this in the interviews that we conducted with companies asking for factual information.
Based on this information, we coded a binary (0,1) variable indicating whether or not each firm had
offshore reserves in each year. The omitted variable is that for U.S. reserves onshore.
Cash Flow (lagged) The availability of internal funds may affect spending on exploration and development. We use
EBITDA to measure cash flow available to fund operations (Compustat Item 13). Because EBITDA
often has negative values, it is not converted to logarithms.
Level of Integration
(lagged) All else equal, firms that concentrate on upstream operations may be more likely than firms with more
diverse operations to undertake larger amounts of exploration and development. We coded a binary
(0,1) variable to indicate whether or not firms had non-upstream activities (a value of 1 indicates that a
firm had only upstream operations), based on the description of operations in the 10-K and 20-F reports
and information obtained from LexisNexis. (We were unable to construct a quantitative measure of the
extent of integration, because firms were not required to report relevant asset data on a divisional basis.
An alternate measure based on revenues would overestimate the size of downstream operations
drastically, due to accounting conventions.)

39
New Entrant with Prior
Experience (lagged) and
New Entrant without
Prior Experience (lagged)
When firms first enter a market, they may behave differently from established firms. New entrants to the
sample were of two qualitatively different types: those that previously existed in some form (including
as part of another company), and those that were completely new-to-the-world. Based on data in the 10-
K and 20-F reports and information from LexisNexis, we coded two binary (0,1) variables, indicating
whether or not a firm was in each of the foregoing categories. The new entrant variables have a value of
1 only for the year of entry of a firm; since the variables are lagged, they reflect entry in the year prior to
the year of observation for the dependent variables. These dummy variables also control for any partial
year reporting of other lagged right-hand side variables such as income for new entrants. The omitted
variable and reference case is for firms that were not new entrants in a given year.
Exit due to M&A and
Exit due to Bankruptcy Firms that cease to exist might behave in their last full year of existence, in anticipation of ending
operations as a standalone company. (Firms do not report information to the SEC in their final year of
existence if they exit mid-year, as most companies do.) We coded two binary (0,1) variables, one for
firms that exited through bankruptcy in the following year, and one for firms that exited via merger or
acquisition in the following year. The omitted variable and reference case is for firms that did not exit
the sample in a given year.
Mergers and Acquisitions
(lagged) Firms may behave differently in years when they make acquisitions or merge with another company.
For example, this could result in additional costs that might affect availability of funds for exploration
and development. Consistent data on the size of acquisitions are difficult to obtain, in part because
companies in this industry often acquire private firms or firms from abroad. We therefore coded a binary
variable (0,1) to indicate whether the firm completed any mergers or acquisitions in each year.
Pre-sample Dependent
Variable This variable is included as a control for firm-level fixed effects. For each firm, this variable is the one-
year lag of the first year in which the dependent variable is included in the sample.
Successful Wells Drilled Regressions Variable Description
Logarithm of
Expenditures on Oil
Exploration or Oil
Development (lagged)
All else equal, firms that undertake more resource access or development activity are likely to have
more success in each activity. For each activity, we therefore control for expenditures in the prior year.
The expenditure variables for oil exploration and development are calculated in the same way as the
dependent variables in the expenditure regressions.
CEO Expertise (lagged) Because top management may play a role in deciding which projects firms undertake, which in turn may
affect the success of resource access and development activity, we control for CEO expertise.
Logarithm of Total
Reserves (lagged) Large upstream companies may have preferred access to tracts of land awarded by governments or
national oil companies, which control some of the most promising reserves worldwide. These entities
often use a non-competitive process to award exploration and development rights, and frequently have a
preference for large, well-known companies with a track record of undertaking large-scale projects. The
amount of total reserves serves as a proxy for scale of upstream assets.
Foreign Reserves
Divided by Total
Reserves (lagged) and
Offshore Operations
(lagged)
The type of reserves may affect drilling success. Some foreign reserves may present richer opportunities
for successful drilling than onshore U.S. reserves in particular. Other foreign reserves are in difficult
locations for exploration and development (e.g., the Siberian Tundra). The technologically challenging
nature of offshore exploration and development could decrease drilling success. However, U.S. offshore
fields often have larger anticipated reserves than U.S. onshore fields.
New Entrant with Prior
Experience and New
Entrant without Prior
Experience
New entrants could differ from established firms in the success of their activities. For example, for
equivalent amounts spent on exploration or development, new entrants could have fewer successful
wells drilled than established firms because they are still trying to establish efficient procedures.
Exit due to M&A and
Exit due to Bankruptcy
Firms that cease to exist might behave differently in their last full year of existence, in anticipation of
ending operations as a standalone company. This may affect the success of resource access and
development activity. For example, in firms on the verge of bankruptcy, personnel may work less hard.
Mergers and Acquisitions
(lagged)
Firms may behave differently in years when they undertake mergers or acquisitions, which could affect
the success of resource access and development. For example, if oil exploration and development staff
must coordinate integration of an acquired firm, they may devote less attention to resource access and
development, reducing their success. Alternatively, if an acquired firm has performance-enhancing
procedures that an acquiring firm can easily adopt, this may improve success.
Pre-sample Dependent
Variable
This is included as a control for firm-level fixed effects. For each firm, this variable is the one-year lag
of the first year in which the dependent variable is included in the sample.
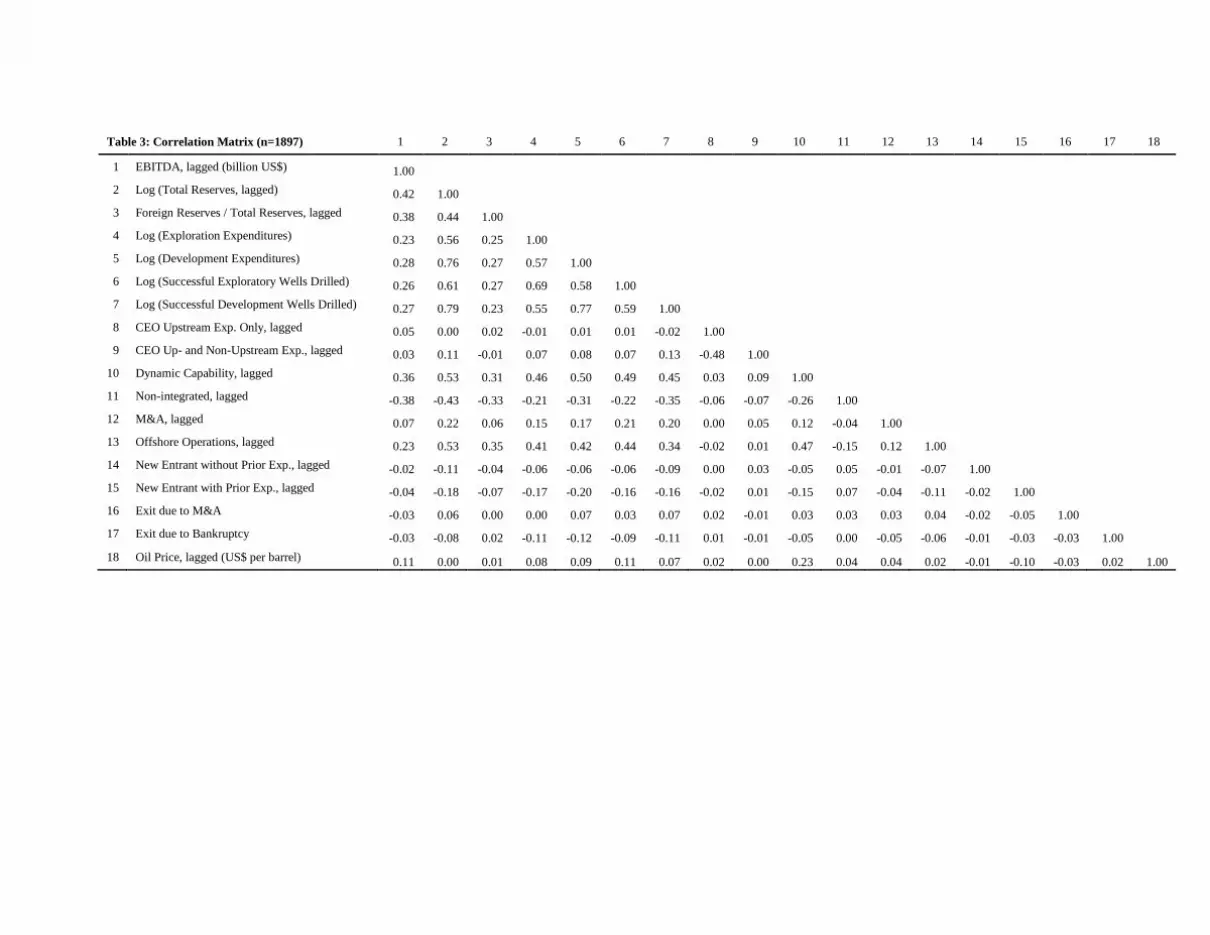
Table 3: Correlation Matrix (n=1897) 1 2 3 4 5 6 7 8 9 10 11 12 13 14 15 16 17 18
1 EBITDA, lagged (billion US$) 1.00
2 Log (Total Reserves, lagged) 0.42 1.00
3 Foreign Reserves / Total Reserves, lagged 0.38 0.44 1.00
4 Log (Exploration Expenditures) 0.23 0.56 0.25 1.00
5 Log (Development Expenditures) 0.28 0.76 0.27 0.57 1.00
6 Log (Successful Exploratory Wells Drilled) 0.26 0.61 0.27 0.69 0.58 1.00
7 Log (Successful Development Wells Drilled) 0.27 0.79 0.23 0.55 0.77 0.59 1.00
8 CEO Upstream Exp. Only, lagged 0.05 0.00 0.02 -0.01 0.01 0.01 -0.02 1.00
9 CEO Up- and Non-Upstream Exp., lagged 0.03 0.11 -0.01 0.07 0.08 0.07 0.13 -0.48 1.00
10 Dynamic Capability, lagged 0.36 0.53 0.31 0.46 0.50 0.49 0.45 0.03 0.09 1.00
11 Non-integrated, lagged -0.38 -0.43 -0.33 -0.21 -0.31 -0.22 -0.35 -0.06 -0.07 -0.26 1.00
12 M&A, lagged 0.07 0.22 0.06 0.15 0.17 0.21 0.20 0.00 0.05 0.12 -0.04 1.00
13 Offshore Operations, lagged 0.23 0.53 0.35 0.41 0.42 0.44 0.34 -0.02 0.01 0.47 -0.15 0.12 1.00
14 New Entrant without Prior Exp., lagged -0.02 -0.11 -0.04 -0.06 -0.06 -0.06 -0.09 0.00 0.03 -0.05 0.05 -0.01 -0.07 1.00
15 New Entrant with Prior Exp., lagged -0.04 -0.18 -0.07 -0.17 -0.20 -0.16 -0.16 -0.02 0.01 -0.15 0.07 -0.04 -0.11 -0.02 1.00
16 Exit due to M&A -0.03 0.06 0.00 0.00 0.07 0.03 0.07 0.02 -0.01 0.03 0.03 0.03 0.04 -0.02 -0.05 1.00
17 Exit due to Bankruptcy -0.03 -0.08 0.02 -0.11 -0.12 -0.09 -0.11 0.01 -0.01 -0.05 0.00 -0.05 -0.06 -0.01 -0.03 -0.03 1.00
18 Oil Price, lagged (US$ per barrel) 0.11 0.00 0.01 0.08 0.09 0.11 0.07 0.02 0.00 0.23 0.04 0.04 0.02 -0.01 -0.10 -0.03 0.02 1.00

41
Table 4: Amount of Resource Access Activity (Oil Exploration) (n=1897)
Dependent Variable Log (Oil Exploration Expenditures)
Coeff.
Std.
Error Coeff.
Std.
Error Coeff.
Std.
Error
Marg.
Effect
Std.
Error
Oil Price, lagged 0.0847 *** 0.0120 0.0807 *** 0.0122 0.0616 *** 0.0129 0.0615 *** 0.0129
Log (Total Reserves, lagged) 0.4340 *** 0.0699 0.4136 *** 0.0724 0.3546 *** 0.0728 0.3542 *** 0.0727
Foreign Reserves / Total Reserves, lagged -1.4519 ** 0.6086 -1.3125 ** 0.6099 -1.3997 ** 0.6038 -1.3982 ** 0.6031
EBITDA, lagged 0.0000
0.0000 0.0000
0.0000 0.0000
0.0000 0.0000
0.0000
Offshore Operations, lagged 1.0120 *** 0.3549 1.0188 *** 0.3542 0.7049 ** 0.3579 0.7042 ** 0.3575
Pre-sample Dependent Variable 0.6932 *** 0.0484 0.7043 *** 0.0492 0.6913 *** 0.0481 0.6905 *** 0.0480
CEO with Upstream Expertise Only, lagged
-0.7069 ** 0.3494 -0.7906 ** 0.3467 -0.7896 ** 0.3462
CEO with both Upstream and Non-Upstream Expertise, lagged
-0.4006
0.3077 -0.4506
0.3054 -0.4501
0.3050
Non-integrated, lagged
0.8198
0.6109 0.8657
0.5987 0.8645
0.5977
M&A, lagged
0.4388
0.2762 0.4574 * 0.2752 0.4570 * 0.2750
New Entrant without Prior Experience, lagged
-0.6093
0.8385 -0.6783
0.8354 -0.6774
0.8340
New Entrant with Prior Experience, lagged
-1.1883 *** 0.4018 -1.1504 *** 0.4002 -1.1485 *** 0.3993
Exit due to M&A
-0.7998 ** 0.3696 -0.9624 *** 0.3702 -0.9609 *** 0.3695
Exit due to Bankruptcy
-0.6121
0.6134 -0.6788
0.6105 -0.6778
0.6095
Dynamic Capability, lagged
0.4796 *** 0.1095 0.4791 *** 0.1094
Constant 3.5656 *** 0.8690 -2.3327 ** 1.1477 -2.7175 ** 1.1300
Log likelihood -4814.2 -4803.2 -4793.7
Notes: Models are estimated using tobit random effects maximum likelihood.
*** indicates significance at the 0.01 level or less, ** indicates significance at the 0.05 level or less, * indicates significance at the 0.10 level or less

42
Table 5: Amount of Resource Development Activity (Oil Development) (n=1897)
Dependent Variable Log (Oil Development Expenditures)
Coeff.
Std.
Error Coeff.
Std.
Error Coeff.
Std.
Error
Marg.
Effect
Std.
Error
Oil Price, lagged 0.0708 *** 0.0080 0.0679 *** 0.0081 0.0572 *** 0.0085 0.0572 *** 0.0085
Log (Total Reserves, lagged) 0.8846 *** 0.0458 0.8887 *** 0.0471 0.8547 *** 0.0477 0.8547 *** 0.0477
Foreign Reserves / Total Reserves, lagged -1.4211 *** 0.3861 -1.2735 *** 0.3882 -1.3328 *** 0.3864 -1.3328 *** 0.3864
EBITDA, lagged 0.0000
0.0000 0.0000
0.0000 0.0000
0.0000 0.0000
0.0000
Offshore Operations, lagged 0.0803
0.2265 0.0298
0.2263 -0.1476
0.2298 -0.1476
0.2298
Pre-sample Dependent Variable 0.4694 *** 0.0418 0.4774 *** 0.0426 0.4657 *** 0.0424 0.4657 *** 0.0424
CEO with Upstream Expertise Only, lagged
-0.0084
0.2234 -0.0604
0.2227 -0.0604
0.2227
CEO with both Upstream and Non-Upstream Expertise, lagged
0.0147
0.1985 -0.0147
0.1977 -0.0147
0.1977
Non-integrated, lagged
0.7812 ** 0.3734 0.8148 ** 0.3709 0.8148 ** 0.3709
M&A, lagged
-0.0216
0.1845 -0.0101
0.1838 -0.0101
0.1838
New Entrant without Prior Experience, lagged
0.6489
0.5500 0.6170
0.5478 0.6170
0.5478
New Entrant with Prior Experience, lagged
-0.6279 ** 0.2615 -0.6059 ** 0.2605 -0.6059 ** 0.2605
Exit due to M&A
0.2750
0.2444 0.1912
0.2444 0.1912
0.2444
Exit due to Bankruptcy
-0.7644 ** 0.3902 -0.7990 ** 0.3888 -0.7990 ** 0.3888
Dynamic Capability, lagged
0.2736 *** 0.0714 0.2736 *** 0.0714
Constant -1.5893 ** 0.6372 -2.3069 *** 0.8129 -2.4668 *** 0.8083
Log likelihood -4290.2 -4281.5 -4274.22
Notes: Models are estimated using tobit random effects maximum likelihood.
*** indicates significance at the 0.01 level or less, ** indicates significance at the 0.05 level or less, * indicates significance at the 0.10 level or less

43
Table 6: Success of Resource Access Activity (Oil Exploration) (n=1897)
Dependent Variable Log (Successful Exploratory Wells Drilled)
Coeff.
Std.
Error Coeff.
Std.
Error Coeff.
Std.
Error
Marg.
Effect
Std.
Error
Log (Oil Exploration Expenditures, lagged) 0.3402 *** 0.0227 0.3314 *** 0.0228 0.3142 *** 0.0229 0.2722 *** 0.0201
Log (Total Reserves, lagged) 0.3339 *** 0.0499 0.3103 *** 0.0509 0.2644 *** 0.0519 0.2290 *** 0.0451
Foreign Reserves / Total Reserves, lagged -0.5538
0.4025 -0.5800
0.4021 -0.6430
0.4002 -0.5569
0.3469
Offshore Operations and Reserves, lagged 0.4979 ** 0.2379 0.4824 ** 0.2375 0.3231
0.2398 0.2802
0.2081
Pre-sample Dependent Variable 0.3269 *** 0.0572 0.3483 *** 0.0577 0.3476 *** 0.0574 0.3010 *** 0.0497
CEO with Upstream Expertise Only, lagged
0.3422
0.2403 0.2845
0.2391 0.2477
0.2091
CEO with both Upstream and Non-Upstream Expertise, lagged
-0.1230
0.2118 -0.1695
0.2109 -0.1465
0.1820
M&A, lagged
0.3847 ** 0.1891 0.4056 ** 0.1880 0.3561 ** 0.1673
New Entrant without Prior Experience, lagged
-0.5651
0.6518 -0.6277
0.6506 -0.5279
0.5298
New Entrant with Prior Experience, lagged
-0.7318 ** 0.3359 -0.6747 ** 0.3334 -0.5674 ** 0.2715
Exit due to M&A
0.0759
0.2586 -0.0135
0.2581 -0.0117
0.2233
Exit due to Bankruptcy
0.2920
0.4796 0.2223
0.4769 0.1942
0.4203
Dynamic Capability, lagged
0.2704 *** 0.0727 0.2341 *** 0.0632
Constant -6.0727 *** 0.4816 -5.8178 *** 0.5088 -5.9991 *** 0.5065
Log likelihood -3327.8 -3320.6 -3313.7
Notes: Models are estimated using tobit random effects maximum likelihood.
*** indicates significance at the 0.01 level or less, ** indicates significance at the 0.05 level or less, * indicates significance at the 0.10 level or less

44
Table 7: Success of Resource Development Activity (Oil Development) (n=1897)
Dependent Variable Log (Successful Development Wells Drilled)
Coeff.
Std.
Error Coeff.
Std.
Error Coeff.
Std.
Error
Marg.
Effect
Std.
Error
Log (Oil Development Expenditures, lagged) 0.1571 *** 0.0200 0.1597 *** 0.0202 0.1500 *** 0.0203 0.1494 *** 0.0202
Log (Total Reserves, lagged) 0.7271 *** 0.0457 0.7149 *** 0.0461 0.6899 *** 0.0464 0.6874 *** 0.0462
Foreign Reserves / Total Reserves, lagged -1.2315 *** 0.3025 -1.1851 *** 0.3023 -1.2289 *** 0.3027 -1.2243 *** 0.3016
Offshore Operations and Reserves, lagged -0.1545
0.1763 -0.1622
0.1759 -0.2675
0.1787 -0.2665
0.1781
Pre-sample Dependent Variable 0.2770 *** 0.0379 0.2721 *** 0.0380 0.2707 *** 0.0383 0.2697 *** 0.0381
CEO with Upstream Expertise Only, lagged
-0.0255
0.1739 -0.0674
0.1741 -0.0672
0.1735
CEO with both Upstream and Non-Upstream Expertise, lagged
0.2368
0.1545 0.2128
0.1544 0.2120
0.1538
M&A, lagged
0.1380
0.1415 0.1430
0.1408 0.1425
0.1403
New Entrant without Prior Experience, lagged
-0.2532
0.4714 -0.2576
0.4690 -0.2564
0.4666
New Entrant with Prior Experience, lagged
0.1029
0.2141 0.1270
0.2130 0.1266
0.2123
Exit due to M&A
0.1276
0.1873 0.0733
0.1872 0.0731
0.1865
Exit due to Bankruptcy
-0.7522 ** 0.3303 -0.7928 ** 0.3294 -0.7878 ** 0.3262
Dynamic Capability, lagged
0.1697 *** 0.0532 0.1691 *** 0.0530
Constant -4.7896 *** 0.3529 -4.7707 *** 0.3756 -4.9204 *** 0.3778
Log likelihood -3488.1 -3482.7 -3477.7
Notes: Models are estimated using tobit random effects maximum likelihood.
*** indicates significance at the 0.01 level or less, ** indicates significance at the 0.05 level or less, * indicates significance at the 0.10 level or less

45
Table 8: Robustness Tests Using Two-Stage OLS Estimation
Stage 1 (n=1897)
Dependent Variable
Log (Oil Exploration
Expenditures)
Log (Oil Development
Expenditures)
Log (Successful
Exploratory
Wells Drilled)
Log (Successful
Development
Wells Drilled)
Coeff. Std.
Error Coeff.
Std.
Error Coeff.
Std.
Error Coeff.
Std.
Error
Oil Price, lagged 0.0885 *** 0.0116 0.0639 *** 0.0082
Log (Oil Exploration Expenditures, lagged)
0.1335 *** 0.0136 Log (Oil Development Expenditures, lagged)
0.0764 *** 0.0160
CEO with Upstream Expertise Only, lagged -0.7350 ** 0.3692 -0.0586
0.2613 0.4289 ** 0.2089 0.0394
0.1864
CEO with both Upstream and Non-Upstream Expertise, lagged -0.4058
0.3161 0.0915
0.2238 0.0468
0.1785 0.3238 ** 0.1592
Log (Total Reserves, lagged) 0.2367 *** 0.0815 0.8384 *** 0.0577 0.2836 *** 0.0460 0.6077 *** 0.0439
Foreign Reserves / Total Reserves, lagged -1.6887 ** 0.6933 -0.9830 ** 0.4907 0.1316
0.3929 -0.3561
0.3506
EBITDA, lagged 0.0000
0.0000 0.0000
0.0000
Non-integrated, lagged 3.3079 *** 1.0633 2.0342 *** 0.7527
M&A, lagged 0.4952 * 0.2559 -0.0347
0.1811 0.3667 ** 0.1460 0.1259
0.1296
Offshore Operations, lagged 0.8033 ** 0.3903 0.1929
0.2763 0.8625 *** 0.2189 0.5118 *** 0.1947
New Entrant without Prior Experience, lagged -0.6558
0.7780 0.6552
0.5507 -0.6554
0.4405 -0.1530
0.3930
New Entrant with Prior Experience, lagged -0.9835 *** 0.3563 -0.5551 ** 0.2522 -0.3303
0.2019 -0.0593
0.1801
Exit due to M&A -0.7313 ** 0.3393 0.2581
0.2401 0.1139
0.1920 0.1213
0.1715
Exit due to Bankruptcy -0.4728
0.5408 -0.5485
0.3828 0.2378
0.3063 -0.3458
0.2739
Constant 7.7916 *** 1.1709 4.4209 *** 0.8288 -1.2515 *** 0.4730 -1.3435 *** 0.4162
F(243, 1640) = 13.12 F(243, 1640) = 8.56 F(243, 1642) = 6.66 F(243, 1642) = 6.90
Prob > F = 0.0000 Prob > F = 0.0000 Prob > F = 0.0000 Prob > F = 0.0000
Stage 2 (n=244)
Dependent Variable Firm-specific Residual of Stage 1
Coeff. Robust
Std. Er. Coeff.
Robust
Std. Er. Coeff.
Robust
Std. Er. Coeff.
Robust
Std. Er.
Dynamic Capability (firm average), lagged 2.1806 *** 0.2630 0.9247 *** 0.1344 0.3588 *** 0.0818 0.1796 ** 0.0852
Constant -8.4895 *** 1.0815 -3.6056 *** 0.6081 -1.3749 *** 0.3196 -0.7029 * 0.3609
F(1, 242) = 68.75 F(1, 242) = 47.33 F(1, 242) = 19.22 F(1, 242) = 4.44
Prob > F = 0.0000 Prob > F = 0.0000 Prob > F = 0.0000 Prob > F = 0.0361
Notes: Stage 1 is estimated using OLS with fixed effects.
Stage 2 is estimated using OLS with robust standard errors.
*** indicates significance at the 0.01 level or less, ** indicates significance at the 0.05 level or less, * indicates significance at the 0.10 level or less