the great books program: a national survey - norc at the
TRANSCRIPT

THE GREAT BOOKS PROGRA
A National Survey
LIBRARYNATiONAL OPINION RESEARCH CE.NTER
Ul1iv"rsicycf Ch!';C!l1u
COpy
NATIONAL OPINION RESEARCH CENTER
University of Chicago
Report No. 68 September., ) 1958
NATIONAL OPINION RESEARCH CENTER
University of Chicago
Clyde W. Hart t DirectorHerbert Goldstein, Business Manager
Survey No. 408
James A. Davis , Senior Study Director
with the assistance of:
Lathrop Vickery Bealeand
Ruth Ursula Gebhard
This study was supported by the Fund for Adult Education.
In childhood and youth theirstudy, and what philosophy they learnshould be su ted to their tender years:du ring th is pe riod wh ile the y are grow-ing up towards manhood, the chief andspec ial care should be given to the t rbodies that they may have them to usein the service of philosophy; as lifeadvances and the intellect begins tomature, let them increase the gymnasticsof the soul..
The Republ icBook VI
- i
ACKNOHLEDGNENTS
The IIcredits" for any national survey bulk as large as thoseof an M. M. musical. We should like, however, to note the specialcontributions of the following:
G. H. Griffiths, Vice-President of the Fund for AdultEducation and Professor Carl Hovland of yale University, researchconsultant to the Fund, were constant aids throughout the study.At one time or another most of the staff of the Great Books Foundationwere involved in our survey, but we should like to thank Dr. JamesJarrett , Mr. Drace Johnson, Mrs. Frieda Goldman, and Miss Lily Durrfor their special assistance. In addition, Mr. Leonard Stein of theUniversity of Chicago Home Study Center; Professor James Coleman ofthe University of Chicago; Professor Peter H. Rossi of the Universityof Chicago; Hr. Charles E. Martin, New City, New York; and ProfessorM. R. Trabue , helped :us in many ways.
The entire staff of the National Opinion Research Center con-tributed in one way or another to the study, but special debts ofgratitude are owed to: Mrs. Mary Booth , who supervised the samplingand initial coding, Mrs. Grace Lieberman, who supervised the fieldwork; Irene Skolnick , Carolyn Goeti tah Field , Nrs. Ada FarberJonathan Wallach, and Sultan Hashmi , our merry and meticulous codingcrew; Harold Levy, Sanford Abrams , and Fred Meier , of NORC' s machineroom staff; IDrris Sunshine , graduate student of Northwestern University;Joseph Zelan, our indefatigable research assistant; lks. Georgia Grann,tireless proofreader; and Mrs. Ada B. Caplow and Mrs. Nella V. Siefert,probably the best typists around. Although not members of the projectstaff, Clyde W. Hart, Director, and Jacob J. Feldman, Senior Study Di-rector at NORC, were continual and vital consultants.
Since this is an evaluation study with some potential implica-tions for policy decisions in the world of adult education, the follow-ing responsibilities should be specifically acknowledged. Althoughstaff members of the Fund for Adult Education and the Great BooksFoundation were shown certain first drafts for their comments, theentire report is the sole responsibility of the National Opinion Res atchCenter, and ultimately, that of the Study Director. Part A, and ChapterI of Part B were done in entirety by the Study Director; the chapterson community involvement and reading were essentially the work ofLathrop V. Beale, and the remaining chapters were done by Ruth UrsulaGebhard and James A. Davis, jointly. Blame should be addressed to theproper person, but since the three of us consulted together day in andday out, any credit should go jointly to the three authors.
James A. Davis
August , 1958
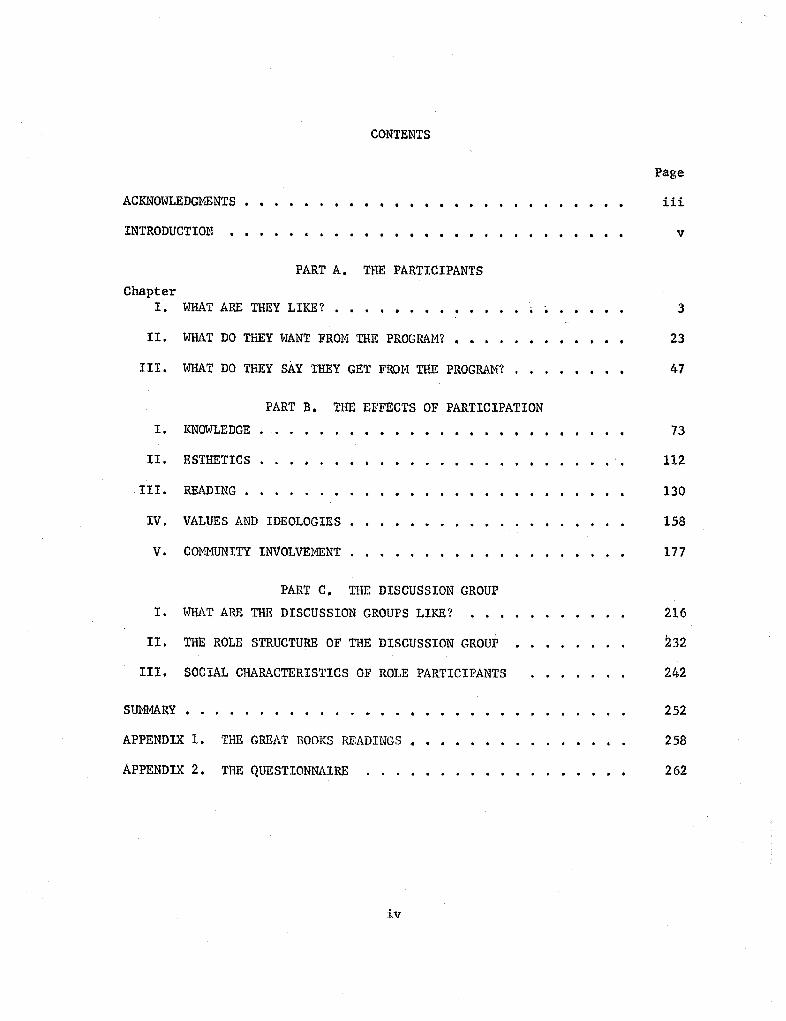
CONTENTS
ACKNOWLEDGMENTS
. . . . . . . . . . . .
INTRODUCTION
. . . .
PART A. THE PARTICIPANTS
ChapterI. WHAT ARE THEY LIKE?
. .
I . .
. . . .
II. HHAT DO THEY WANT FROM THE PROGRAM? II .. . .
. . . .
III. WHAT DO THEY SAY THEY GET FRON THE PROGRA? .
. .
PART B. THE EFFECTS OF PARTICIPATION
KNOWLEDGE
. . . . . . . . .
II. ESTHETICS
.. . . . . . . .
III. READING
. . . . . . " . . . . . . .
IV. VALUES AND IDEOLOGIES
. . . . . .
COMMITY INVOLVEMENT
. .. . .. . .
PART C. THE DISCUSSION GROUP
I. WHAT ARE THE DISCUSSION GROUPS LIKE?
II. THE ROLE STRUCTURE OF THE DISCUSSION GROUP
.. . . . .
III. SOCIAL CHARACTERISTICS OF ROLE PARTICIPANTS
. .
SUMRY
. .
APPENDIX 1. THE GREAT BOOKS READINGS.
. . . . . .
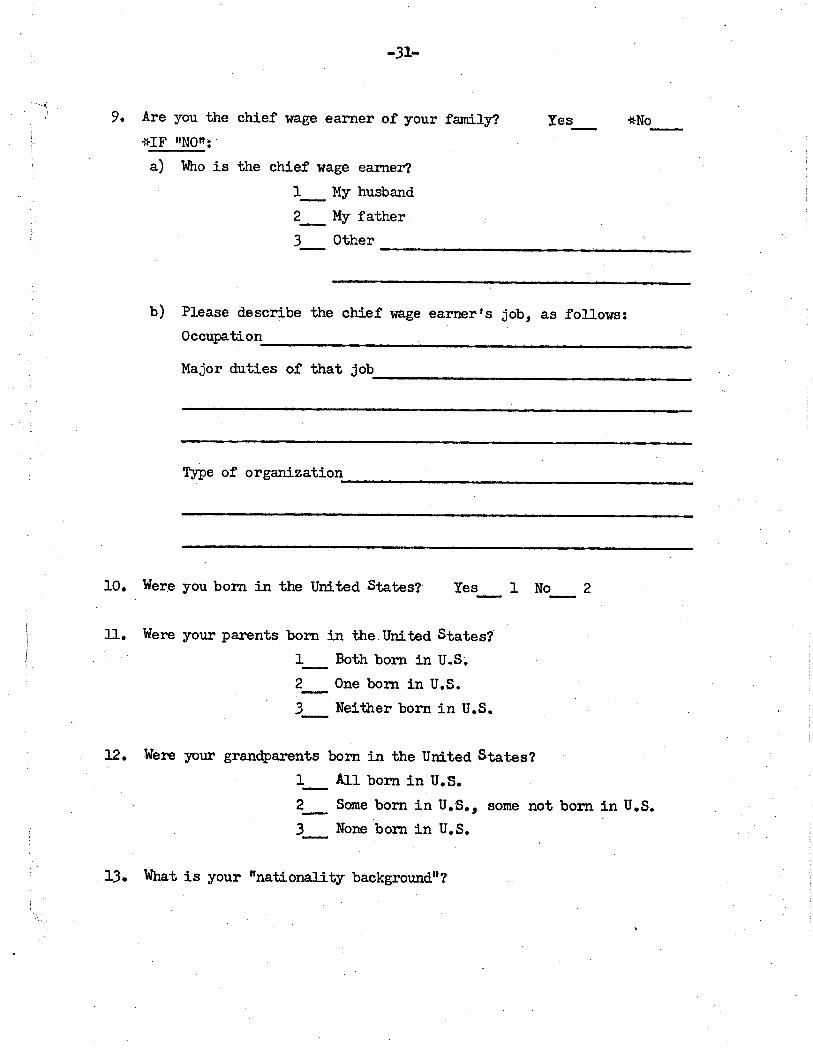
APPENDIX 2. THE QUESTIONNAIRE
. . . . . . , .
Page
iii
112
130
158
177
216
232
242
252
258
262

INTRODUCTION
Back round
In the summer of 1957 , the Fund for Adult Education, an independenteducational foundation established by the Ford Foundation, commissioned theNational Opinion Research Center of the University of Chicago to make a studyof the Great Books program. The major purpose of the study is to a!6ss theeffects of participation in the program in order to provide information toguide future policy in the field of adult education. The study specificallyexcludes any consideration of the administration or functioning of the GreatBooks Foundation, which sponsors the program, but rather, is concentrated onthe participants and their discussion groups.
The Great Books program itself is so well known that it need not bedescribed in detail. Great Books, which was originally developed by MortimerAdler. and Robert M. Hutchins, then of: the Universify of Chicago, is a nationalprogram for tho liberal education of adults. In 1957-1958 it consisted of some
960 discussion groups dispersed through the ' United States, with additionalgroups in Canada and overseas. Each group meets every other week from Septemberto June and at each meeting the members discuss a specific selection which theyhave read before the meeting. These readings are organized into blocks of oneyear each and, in theory, should be read in sequence. However, since membersoften enter on- going groups, the correlation between specific readings and yearsin the program is less than perfect. In our study we have focused on totalnumber of years completed rather than on the specific readings.
The groups vary in size (from around five to around 35 with an averageof about 11 in our sample); in sponsorship (most are affiliated with publiclibraries , but a number are sponsored by churches, business firms, and indi-viduals); and in leadership (some have a single leader, most have co-leaders,and a few rotate the leadership with each meeting); but generally they followthe pattern of small, informal discussion groups.
In order to understand the nature of the program, we should stress thefollowing characteristics. The leaders are not formally trained teachers, buta number have had brief training courses sponsored by the Great Books Foundationand many are long-time participants who are now leading groups studying earlieryears of the readings. The members do not pay any tuition or get any degreeor certificate for completing the program. In fact , no one can " complete" theprogram as additional years of readings are always available , currently up tothe 14th year. Members are encouraged to buy the readings from the Foundationbut are not required to do so. The Great Books Foundation itself is a non-profit organization which attempts to stimulate groups and provides readingsand publicity materials. It also provides advice and help to groups from thenational office or through local community coordinators in larger citie3. Sonecoordinators are full-time members of the Foundation staff, some are volunteeor have other jobs in adult education. Procedures
During December, 1957, NORC interviewers attended the meetings of 172groups, sampled in a manner described below. Members had not been informedbefore the meeting that they were to participate in the research that night,although SOme knew their group would be called on at some time.
The currcnt curriculum of reading is reproduced as Appendix 1 of thisreport.
Each member of the sampled groups filled out the self-administered question-naire which is reproduced as Appendix 2 to this report. By and large, wefound cooperation to be good, although a number of groups were visibly dis-appointed that they had to forgo their discussion, only one protocol was re-jected because inspection indicated that the writer did not give serious co-operation. One other schedule, from a member whose physical handicap resultedin an illegible questionnaire, was excluded, leaving a total of 1 909 casesfrom 172 groups.
The que.stionnaires were coded and punched onto IBM cards for analysis.Al though we do have some informal reports by the NORC interviewers, the mater-ials presented here are based on statistical analyses of these cards, exceptfor Chapter I in Part C. Coding, punching, and card cleaning were completedby June, 1958, and analysis and write-up took place during June , July, andearly August, 1958.
Sample
Our sample is a stratified (by year of reading) probability sample ofthe Great Books discussion groups which in November and December, 1957, weremeeting in MORC "primary sampling units. Since each member of the sampledgroups was asked to fill out a schedule, the number of individuals each groupcontributed to the total sample was obviously proportional to its size, henceour sample is also representative of " individuals" as well as groups, althoughthis procedure resul ts in the sample of individuals being heavily clustered.
NORC is set. up to take probability samples of the general population ofthe United States. In order to do so, it maintains a permanent field staff oftrained interviewers in a national sample of counties and standard metropolitanareas. These are known as "primary sampl ing units . 11 The counties were select-ed in such a way that by weighting the interviews, national estimates for across section of the general population are efficiently and accurately obtained,subject , of course , to random sampling error.
For technical reasons which are inherent in any such sample drawn byany research agency, bias is introduced when one attempts to sample a universewith a relatively small number of individuals such as Great Books groups. Thenet effect of this bias is that while the cases sampled are representative ofcases in their type of county in the country, too many cases are drawn fromlarge cities and too few cases are drawn from small towns and rural areas.
Our sample of Great Books groups, consequently, has too many cases fromlarge cities and too few cases from small cities. We knew this would happenwhen we began the study, but chose to use the method we did for the followingreasons:
1) The Great Books program, itself, is disproportionately urban. Thus,in 1955, the last year for which NaRC had complete data on the program avail-able, the standard metropolitan areas of the United States, which included56 per cent of the U. S. 1950 population, had 75 per cent of the Great Booksgroups.
2) Our budget precluded the use of trained interviewers for a truenational sample, and we felt that it was preferable to have national coverage,even with an urban bias, rather than to have perfect sampling of a limitedgeographical area such as the Nidwest.
vii
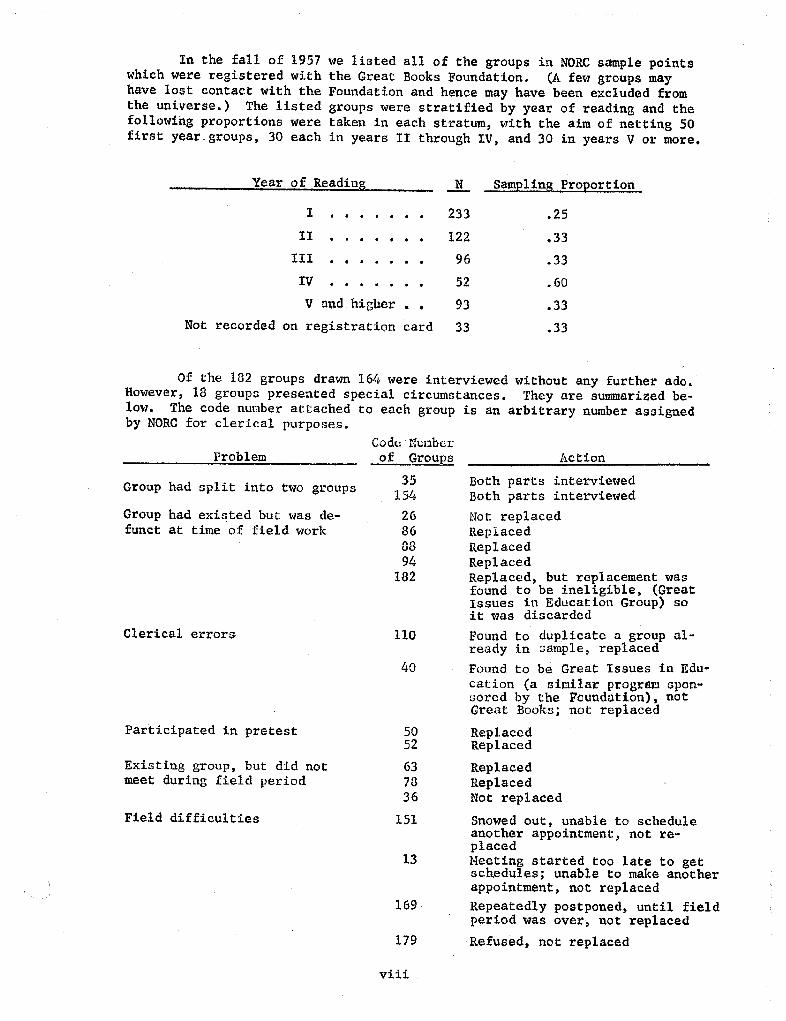
In the fall of 1957 we listed all of the groups in NORC sample pointswhich were registered with the Great Books Foundation. (A few groups mayhave lost contact with the Foundation and hence may have been excluded fromthe universe. The listed groups were stratified by year of reading and thefollowing proportions were taken in each stratum, with the aim of netting 50firs t year. groups, 30 each in years II through IV, and 30 in years V or more.
Year of Reading
III
. . * .
V aud . higher
. .
Not recorded on registration card
233
122
Sampling Proportion
Of the 182 groups drawn 164 were interviewed without any further ado.However, 18 groups presented special circumstances. They are summarized be-low. The code number attached to each group is an arbitrary number assignedby NORC for clerical purposes.
ProblemCode Nunbcrof Groups
154Group had split into two groups
Group had existed but was de-funct at time of field work
182
Clerical errors 110
Participated in pretest
151
Existing group, but did notmeet during field period
Field difficulties
169
179
viii
Action
Both parts interviewedBoth parts interviewed
Not replacedReplacedReplacedReplacedReplaced, but replacement wasfound to be ineligible, (GreatIssues in Education Group) soit was discarded
Found to duplicate a group al-ready in 8ample , replaced
Found to be Great Issues in Edu-cation (a similar prograD spon-ored by the Foundation), notGreat Books; not replaced
ReplacedReplacedReplacedReplacedNot replacedSnowed out, unable to scheduleanother appointment , not re-placedMeeting started too late to getschedules; unable to make anotherappointment, not replaced
Repeatedly postponed, until fieldperiod was over, not replaced
Refused, not replaced
Of the 16 groups which created problems, we m naged to replace eightwith another random selection from the proper stratum in the same samplepoint. For the remaining, either the stratum was exhausted or the difficultyturned up so far into the field work period that there was no time for re-placement. Only the four cases listed under II Fie1d difficu1ties ll representa serious problem. Our one flat refusal was from a leader in a large city inTexas. Group 169 was a fledgling group which was having difficul ties gettingstarted and the leader asked for repeated postponements until it was too lateto include the group in the study. The other two cases are the sort of specialdifficulties that arise in any field work situation.
The II take ratell we achieved is well within the norms for survey re-search, and we l,ay conclude that we ended up with a representative sample ofgroups fram our NORC priwury sampl ing units. Our urban disproportion, how-ever , remains , for the reasons noted above.
Of course, for a variable which is not related to city size , this biasis unimportant. In order to find out which variables might be affected bythis sampling problem, we divided the respondents into the following groups:
l) Those living within the city limits of Central Cities of aStandard Metropolitan Area of one million or more (303 cases).
. 4)
Those living within the city limits of Central Cities of aStandard Metropolitan Area of 250, 000 to 999, 999 (N = 526).Those living within 20 miles of the city limits of the CentralCity of a Standard Metropolitan Area, in a city with a popu-lation of 25 000 to 250, 000 (N = 231).Those living within 20 miles of the city limits of a CentralCity of a Standard Metropolitan Area, in a city with a popu-lation of 10, 000 to 24, 999 (N = 204).Those living within 20 miles of the city limits of a CentralCity of a Standard Metropolitan Area, in a city with a popu-lation under 10 000 (N = 315).Those living more than 20 miles from the cityCentral City of a Standard Metropolitan Area25, 000 or less (N = 256).
All other (N = 32).
limits of thein a city of
We can think of these types as follows: 1) Very large cities; Large cities; 3) Large s burbs and satellite cities; 4) . Medium suburbs and satellite cities; 5) Snlal1 suburbs and satellite cities; and 6) Small towns.
We compared the social characteristics of respondents from these sixtypes and found no consistent differences in:
1) Age
2) Education3) Feeling that the program has had a high impact4) Scores on the test of knowledge of liberal arts and humanities5) Self-definition as 1tintellectua111 or IInon-intellectua11t6) Interest in community affairswe should stress that the classification is crude. A number of Stand-
ard Metropolitan areas extend more than 20 miles beyond the core city. How-ever, we hope that our classification will give us some perspective on theproblem.
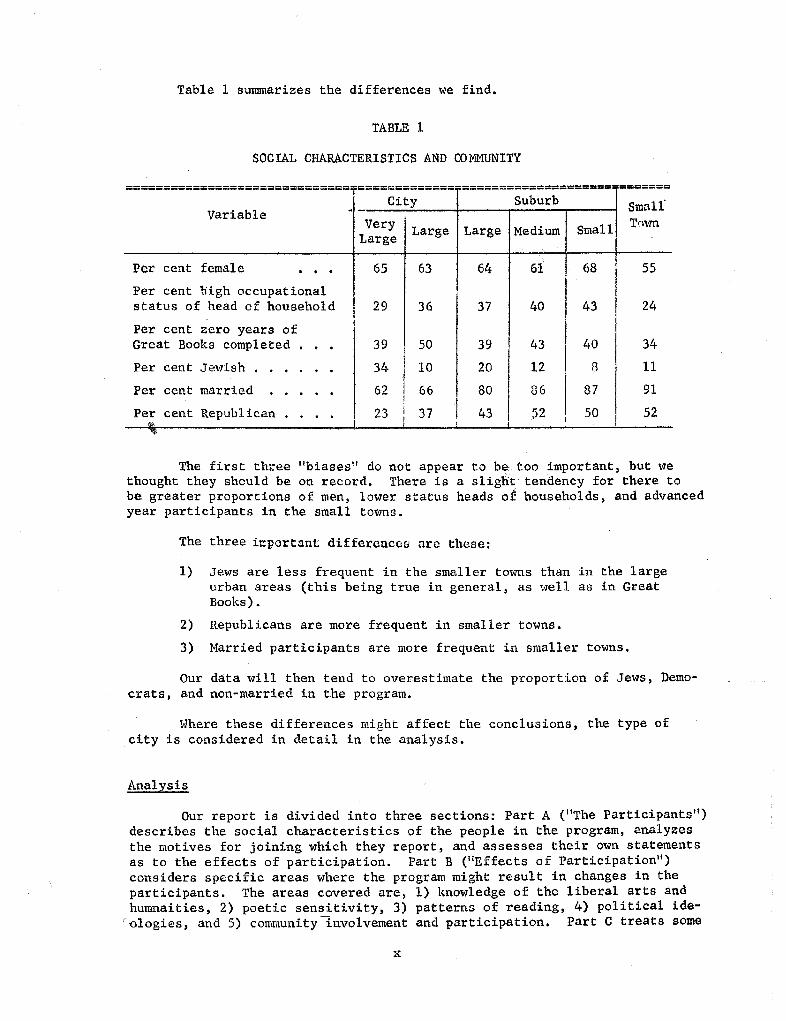
Table 1 summarizes the differences we find.
TABLE 1
SOCIAL CHARACTERISTICS AND COMMUNITY
==============================-=============-====================: --------------
City Suburb Small'VariableVery Large Large Medium Small Tn\m
Large
Per cent female
Per cent nigh occupationalstatus 0 f head of household
Per cent zero yearsGreat Books completed
Per cent JewishPer cent marriedPer cent Republican
The first three IIbiases tl do not appear to be too important, but wethought they should be on record. There is a slight tehdency for there tobe greater proportions of men , lower status heads o f households , and advancedyear participants in the small towns.
The three i portant diff rcnce arc these:
Jews are less frequent in the smaller towns than in the largeurban areas (this being true in general , as well as in GreatBooks) .
Republicans are more frequent in smaller towns.
Married participants are more frequent in smaller towns.
Our data will then tend to overestimate the proportion of Jews, Demo-crats , and non-married in the program.
Where these differences might affect the conclusions, the type ofcity is considered in detail in the analysis.
Analysis
Our report is divided into three sections: Part A (liThe Participantsdescribes the social characteristics of the people in the program, analyzesthe motives for joining which they report , and assesses their own statementsas to the effects of participation. Part B (IlEffects of Participationconsiders specific areas where the program might result in changes in theparticipants. The areas covered are, 1) knowledge of the liberal arts andhumnaities, 2) poetic sensitivity, 3) patterns of reading, 4) political ide-ologies, and 5) community:tnvolvement and participation. Part C treats some
characteristics of the discussion groups.
Looking at it another way, the basic questions of our study have beenthese:
What are the effects of Great Books on the participants?
We have come at this problem in two ways. First, we have simply askedthe participants what they think the effects are. These materials are report-ed in Chapter III of Part A. Second, we have contrasted beginning and ad-vanced participants. We know that the only sure answers about effects mustcome from a study following the same p rsons through time. Such a stu4y was,however, impossible, and we have attempted, to do what we could with "cross-sectional" data. In every case where statistical techniques would enable usto meet some of the difficulties arising from such a design, we have usedthem.
What are the participants like?
Throughout the study we have stressed the "social characteristicsof the members, their stage in the life cycle, their memberships, ther in-stitutional affiliations, and their self-conceptions. This is because wefeel it is not only important to know what the effects are, but also whatsorts of people are being affected. In particular , we have continuallystressed "institutional" characteristics, or the .,ays in whicp. the membersare related to the major organizations of their cOIlunity and society.. . theirchurch, their jobs, their political party, anq their community activities.This is because we believe that a liberal education is not only to be con-sumed, but also to be acted on, and it is important to know in what areas ofthe larger community and society we may expect to find Great Books partici-pants. The problem of the relationships between "books and action" has beena constant preoccupation of the study.
What are their cultural abilities and interests?
At times we have thought of the particip nts , not just as Great Booksmembers , but as specimens of highly educated Americans. We have absolutelyno statistical grounds for presenting them collectively as a repraseatativosample of the highly egucated, :Jut we did look a ong the for clues to answersto some general proble s that go beyond the scope of the program itself.We live in a time when continual cries of rage and anger are heard, claimingthat Americaps are deficient in their interests in what one can call "highculture. Now, there is quite a lot in print about "high brows, " becausehigh brows tel1d to draw attention to themselves. There is also a lot inprint about "low brows" because they are the happy hunting ground of thesociologist. Not a lot, however, is known about the cultural life of themiddle brow, " the Book of the Nonth reader , the occasional concert goer,
the subscriber to Harper and The Saturday Review. Since , for all practical purposes, our group of Great Books participants consists of 1, 909
h people, we have at times gone out of our way to present basic descrip-tive materials on their cultural characteristics and orientations, and thepatternings thereof.
Finally, we should note two areas which have been slighted consistent-ly in our analysis.
First , we have paid little or no attention to Ilpersonality" and thepersonality characteristics of Great Books participants. Both the diffi-culties of measurement and the theoretical bents of the authors discouragedus from exploring this important problem.
Second, with a few exceptions , we have grossly understressed theimportance of the discussion group as the vehicle through which the effectsof the program probably take place. This is not due to any lack of interest.In fact , from a professional point of view, the group data are probably themost interesting part of the study. Rather , in the limited time availableto us , the exceedingly complex technical problems of IBM analysis at thelevel of group characteristics precluded a thorough attack on this problem.We do know such things as the fact that a person who says that his group hasa 'vide heterogeneity in ideas and values is more likely to want to stay inthe program, and we do know that there are group differences inthe proporti onof people reporting nigh "impact" of Great Books... differences which are notexplained by the individual characteristics of the members of the group; butwe have not been able to engage in any systematic pursuit of these and sim-ilar leads.
Some Technical Matter
This is a statistical report, and no amount of verbal jollificationin the text can conceal the fact that the report consists of explanationsand comments about the tables, rather than the tables consisting of ;illus-trations of matter which is developed in the text. The reader who wishesthe major conclusions, without the detailed evidence and aliI' qualificationsof the conclusions, may find a bricf summary of the major findings at theend of the report. The bulk of the tables consists of sets of percentagesand does not require statistical training for interpretation. In a fewplaces we have used advanced statistical techniques which could not be ex-plained in completc detail. In these circumstances we have attempted to pre-sent the general strategy in strictly verbal terms but have not explained themathematics in full detail. Here and there esoterica for the hypotheticaltechnical" reader have been segregated in footnotes.
Although we do have a probability sample of respondents and haveattempted to generalize beyond our sample, we have not reported IItests ofsignificancell consistently. Survey research is currently in an era of de-bate on the use of these tests and we must say that we are on the side ofthose who f vor using them. However , we felt the labor of these computa-tions was not worth the trouble as we have reported without qualificationsonly statistical differences which we believe would appear significant ifformal tests were applied. If a critical reader should compute tests on ourmaterials and firtd that we have been overgenerous with ourselves, we wouldappreciate hearing fram im and would revise our interpretations.
Unless the text indicates something to the contrary, in all tables,the difference between the number of cases given in the table and l, 909,the sample size , is due to those respondents who fail d to answer the ques-
tions involved.
One final word, before we begin our report. Although the study isdesigned as an evaluation, we have attempted to refrain, with the exceptionof one footnote, from doing any evaluating. We hope that we have been ableto present materials which will enable evaluators to . make a fair judgment.
:tii

Where we have found effects, we have attempted to present anyould tend to "minimize" them, and where we have not, we havepresent any findings which would tend to "mitigate" the blow.sessment of the program must come from the reader.
xiii
findings whichattempted toAny net as-

PART A
THE PARTICIPANTS
-1*
Part A of this report deals with the 1, 909 members of
the 172 discussion groupo in our survey. Chapter I describes
the participants in terms of Game of their salient social
characteriatics and suggests some of the ways in which they
differ from non-participants. Chapter 11 explores the moti-
vat ions of the participants. It attempts to describe the
clusters of motives which bring people to the program and asks
what aorts of people have what sorts of motives. Chapter III
analyzes the respondents ' own testimony as to the effects of
the program, and attempts to pinpoint areas in which the pro-
gram app ars most and leaat effective.

-3-
CHAPTER I
tmAT ARE THEY LIKE?
-4-
Introduction
What are they like? What sorts of people are attracted to Great Books?In this chapter we shall attempt to describe the 1 909 pnrticipants in oursample in terms of their salient social characteristics.... education, familysituation, occupation, self conceptions , religious preference, and party prefer-ence. We have no data on their secret dreams and hidden motives, but we dohave the basic bricks from which to build a sociological description of themembers in terms of the roles which they play in their families , communities,and the larger society.
Vlhen tie say "What are they like?" tile usually mean "HO"1 are they differ-ent?II , which, in turn, raises the question of "different from whom?1I It ishardly necessary to document the ways in which 1,
909 adul t mericans differfrom, say, 1, 909 adult Chinese. What we would really like to know is how thepeople in Great Books differ from other people in their communities who hadan opportunity to join , but did not. Thus, the qucstion we raise really im-plies the necessity of having data from a control sample of people who mighthave been in the program, but are not. We have no such data in our study, buthere and there we can contrast ourmatcrials with certain already publishedfindings. The differences we find can be at best suggestive , &iven the meth-odological problems involved, but in this chapter we shall at least note them.
Education
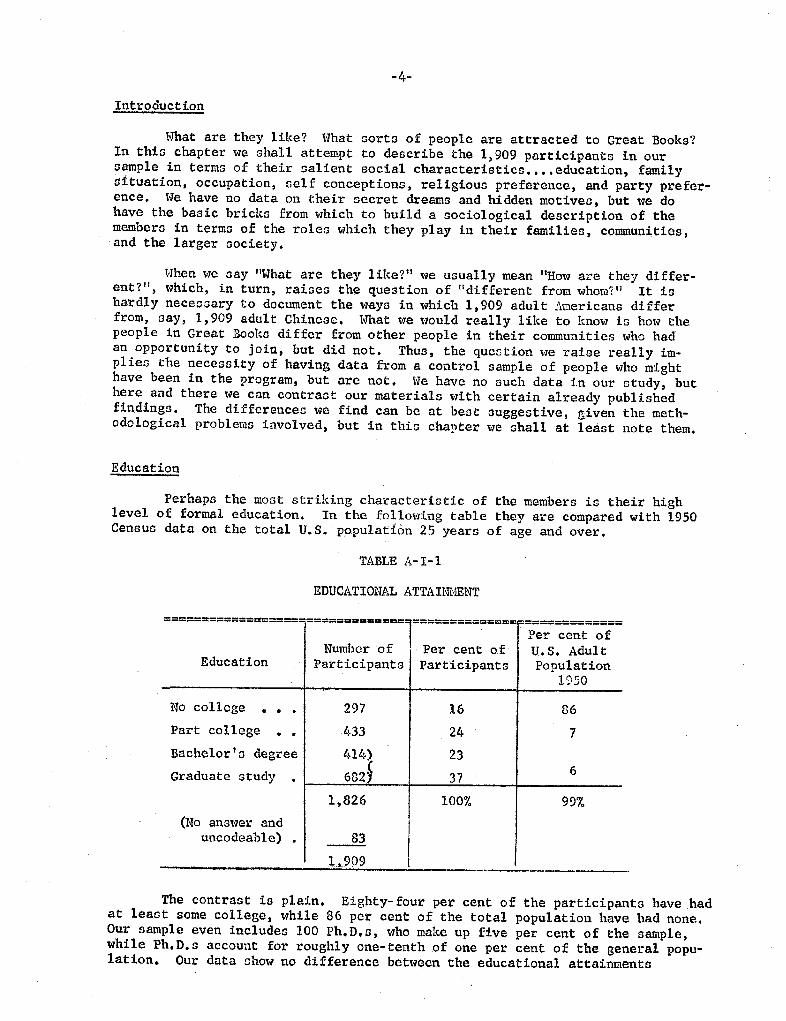
Perhaps the most striking characteristic of the members is their highlevel of formal education. In the following table they are compared with 1950Census data on the total U. S. population 2S years of age and over.
TABLE A-I-
EDUCATIONAL ATTAIID.ffNT
================== ============= ============== ==============
Per cent ofNumhcrof . Per cent of U. S. AdultEducation Participants Participants Population
1950
No college 297
Part college 433
Bachelor ' a degree 414)
Graduate study 682
826 100% 99%
(No answer anduncodeable)
909
The contrast is plain. Eighty- four per cent of the participants have hadat least some college , while 86 per cent of the total population have had none.Our sample even includes 100 Ph. s, who make up five per cent of the sample,while Ph. D. s account for roughly one- tenth of one per cent of the general popu-lation. Our data show no difference between the educational attainments
-5-
of the beginning and advancedformal education has a lot tofor continuation. (Chapter Imore complicated detail.
participants; hence, we may assume that whiledo with recruitment, it is not relevant per se
of Part B considers this question in som what .
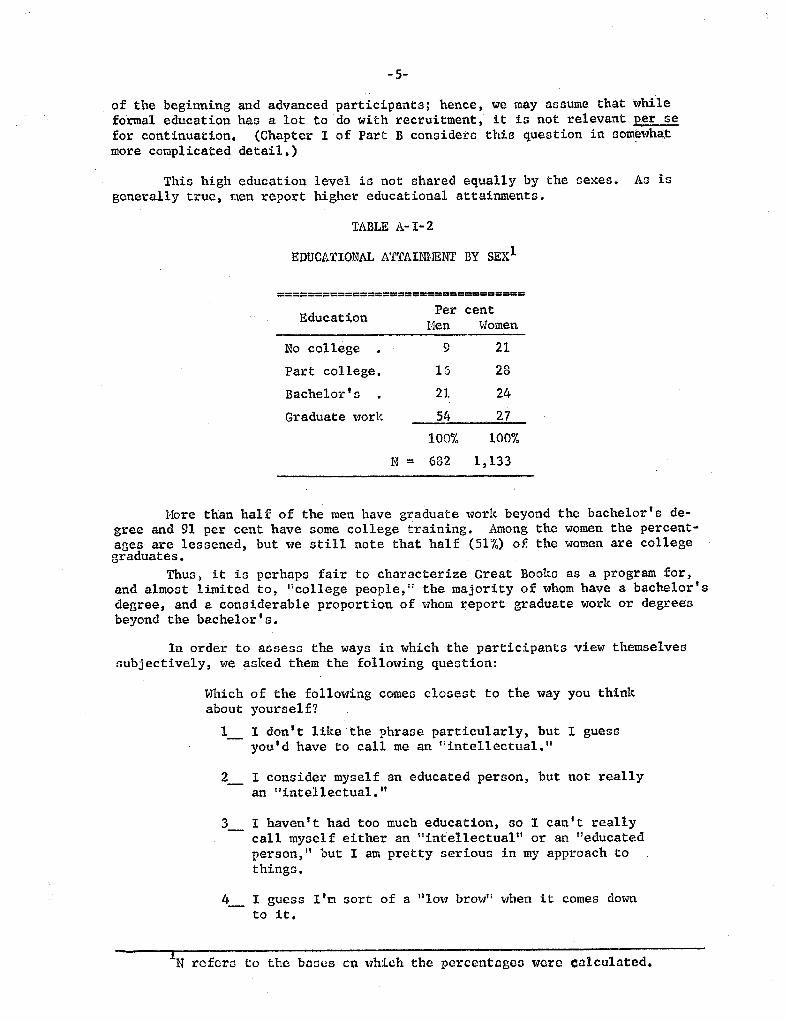
This high education level is not shared equally by thegenerally true, men report higher educational attainments.
:es . Aa is
TABLE A- 1- 2
EDUCATIONAL ATTAIID.ffNT BY SEX
=================================
Educat ionPer cent
Hen Women
No college
Part college.
Bachelor
Graduate work
100% 100%
N '" 682 133
More than hal f of the men have graduate work beyond the bachelor s de-
gree and 91 per cent have some college training. Among the women the percent-ages are lessened, but we still note that half (51%) of the women are collegegraduates.
Thus , it is perhaps fair to characterize Great Booka as a program for,and almost limited to
, "
college people, " the majority of whom have a bachelordegree, and a considerable proportion of whom report graduate work or degreesbeyond the bachelor I
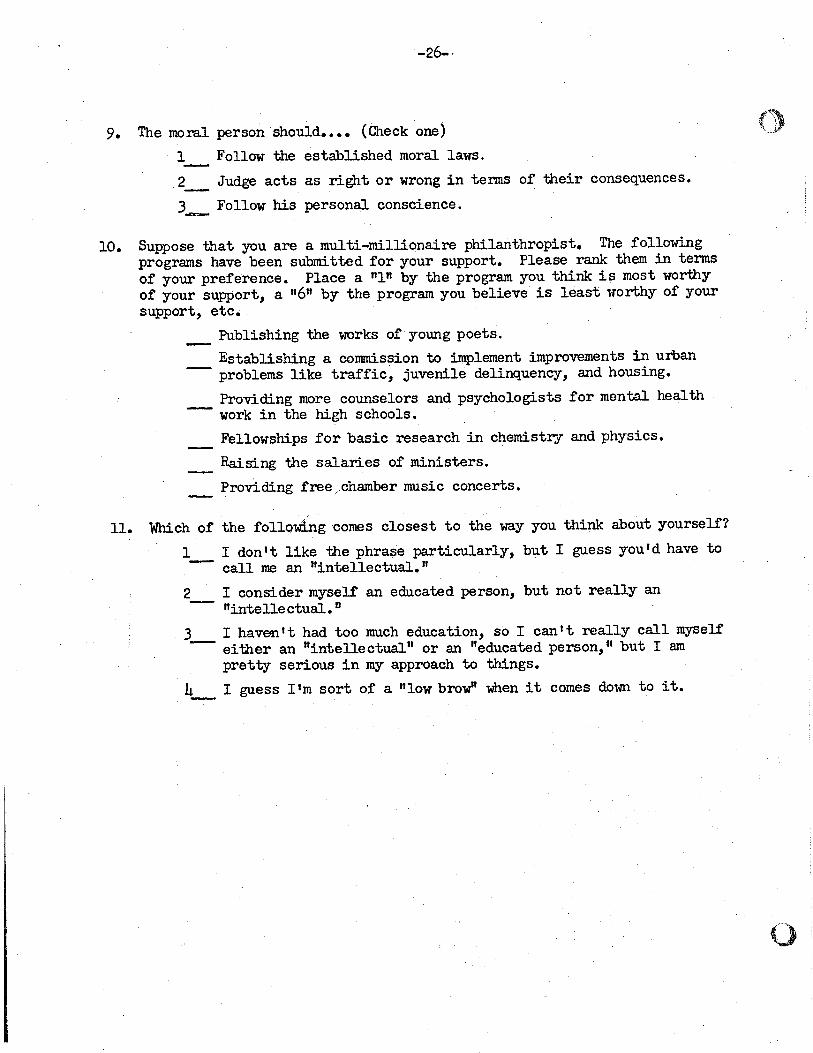
In order to assess the ways in which the participants view themselvessubjectively, we asked them the following question:
Which of the following comes closest to the way you thinkabout yoursel f?
I don I t like the phrase particularLy, but I guessyou d have to call me an " intellectual."
I consider myself an educated person, but not reallyan II intellectual. "
I haven I t had too much education, so 1 can I t reallycall myself either an " intellectual" or an educatedperson " but I am pretty serious in my approach tothings.
I guess I'm sort of a "low browll when it comes downto it.
N rcfcro to the bD:3CS en which the percentages were C:llculated.
-6-
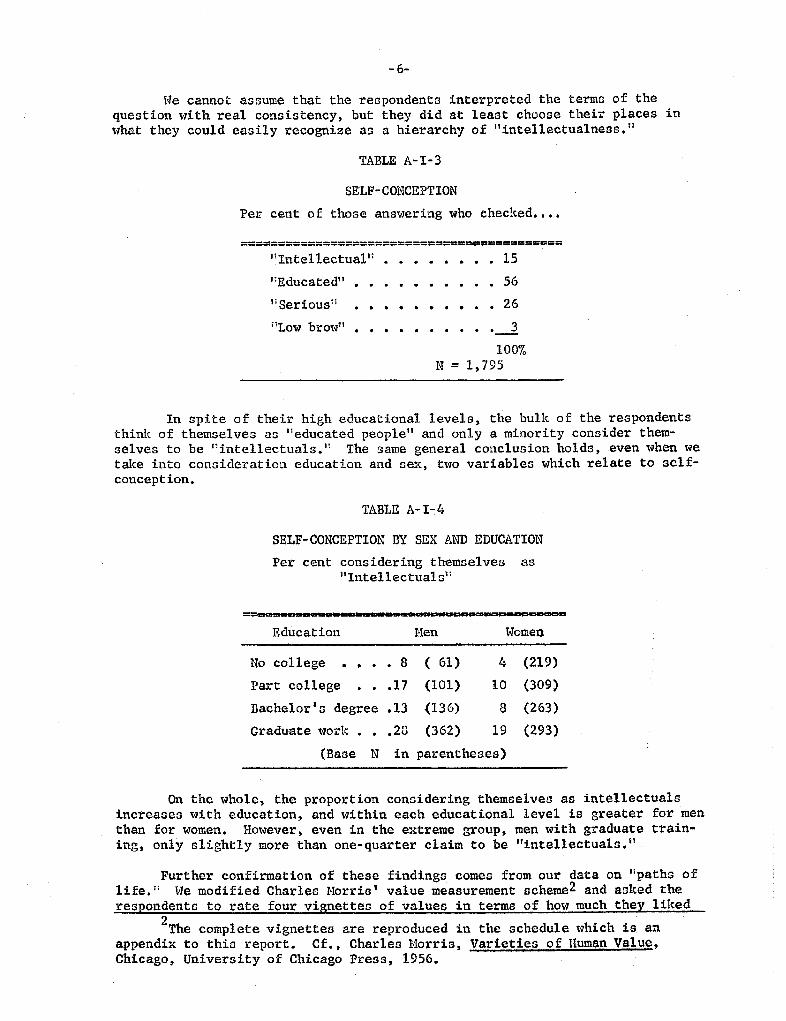
We cannot assume that the respondents interpreted the terms of thequestion with real consistency, but they did at least choose their places in\-hat they could easily recognize as a hierarchy of " intellectualness.
TABLE A-I-3
SELF- CONCEPTION
Per cent of those answering who checked....
===============================-===========
Intellectual"
. .
. . 15
Educated
. . . . .
. . 56
Ii Serious
'; .
. 26
Low brmvll .
. . . . . . .
100%N = 1, 795
In spite of their high educational levels, the bulk of the respondentsthink of themselves as " educated peoplell and only a minority consider them-selves to be " intellectuals. I: The same general conclusion holds, even when wetake into consideration education and se,c , two variables which relate to self-conception.
TABLE A- I-A
SELF- CQNCEPTION BY SEX AND EDUCATION
Per cent considering themselvesIntellectuals
=m= ema-aeD.e._m =.a aa-DaDm
Education Hen Women
No college . 8 6l) (219)
Part college (101) (309)
Bachelor s degree (136) (263)
Gradu:ate work (362) (293)
(Base in parentheses)
On the whole, the proportion considering themselvefJ as intellectualsincreases with education, and within each educational level is greater for menthan for women. However, even in the extreme group, men with graduate train-ing, only slightly more than one-quarter claim to be "intellectuals.
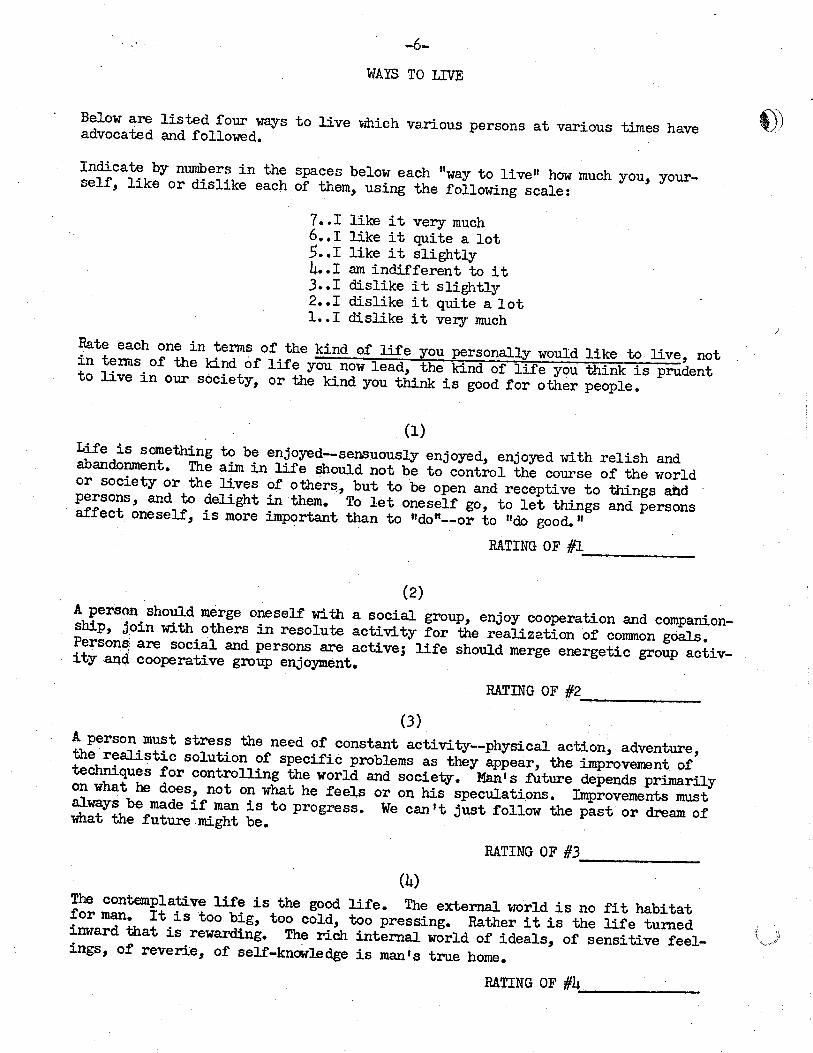
Further confirmation of these findings comes from our data on "paths oflife. II We modified Charles Morris I value measurement scheme2 and aaked the
respondents to rate four vignettes of va1ues in terms of hO\- much they likedThe complete vignettes are reproduced in the schedule which is an
appendi1c to this report. Cf., Charles Horris Varieties of Human ValueChicago, University of Chicago Press, 1956.
-7-
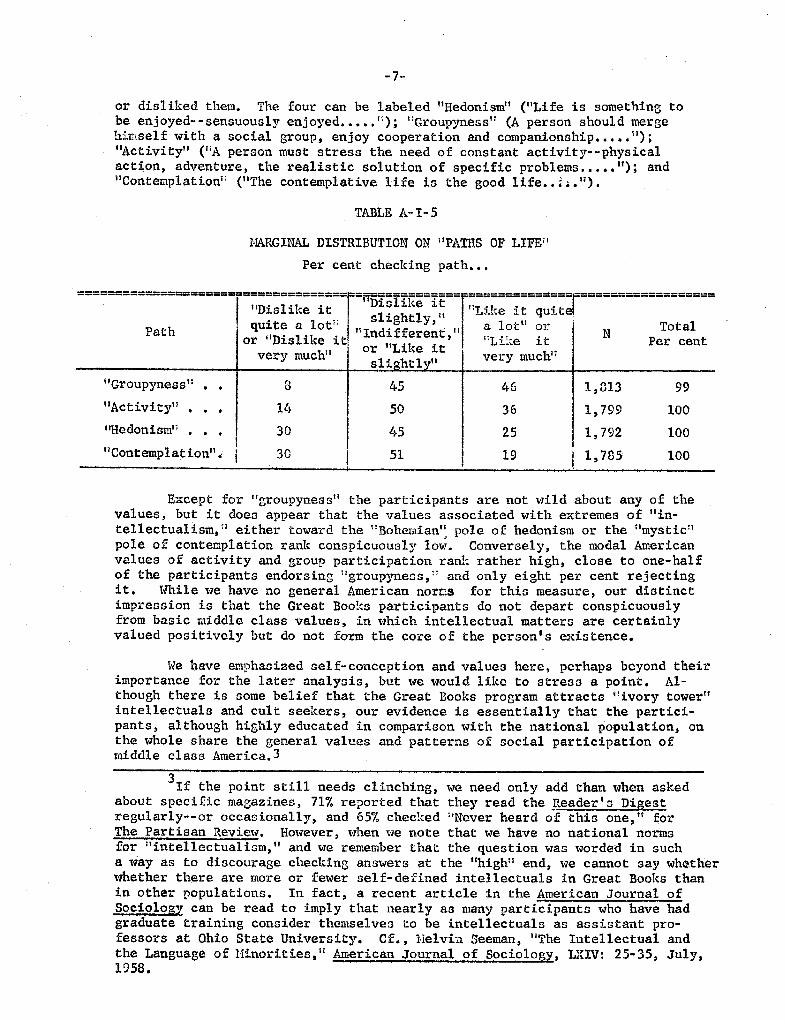
or disliked them. The four can be labeled "Hedonism
" ("
Life is something tobe enjoyed-- sensuouoly enjoyed.....
); "
GroupyneGs '! (A person should mergehit:lself with a social group, enjoy cooperation and companionship.... .Activity" (riA person must stress the need of constant activity--physicalaction, adventure, the realistic solution of specific problems..... "); andContemplation
" ("
The contemplative life iG the good life..
. . " ) .
TABLE A-I-S
NARGINAL DISTRIBUTION ON IIPATIS OF LIFE"
Per cent checking path...
-------------------------- ---------- -------------- -------------- ------------------------------------------------------ , --- --- -------------- ------------------. ..
J. G J. e 1 'r 1", 1:ee 1 :t L. 1. qUl.i1 '" 19 t y, tI . P th qUI. e u ot 11 a at 01. otan 1 erenor l.S 1. e J.C Lik . l.. l.t er cenli or e l.t very muc slightly very muc
Groupyness 813
Activity l, 799 100"Hedonism 792 100
Contemplation
,,
l, 785 100
ccept for "groupyness" the participants are not wild about any of thevalues, but it does appear that the values associated with extremes of tlin-tellectualism, II either toward the I' Bohemian" Dole of hedonism or the "mysticpole of contemplation rank conspicuously lo ' Conversely, the modal Americanvalues of activity and group participation rank rather high, close to one-halfof the participants endorsing !1groupyness : and only eight per cent rejectingit. While we have no general American nor for this measure, our distinctimpression is that the Great Boo s participants do not depart conspicuouslyfrom basic middle class values, in which intellectual matters are certainlyvalued positively but do not form the core of the person ' s e cistence.
We have emphasized self-conception and values here, perhaps beyond theirimportance for the later analysis, but we would like to stress a point. Al-though there is Gome belief that the Great Books program attracts Ilivory tower
intellectuals and cult seekers, our evidence is essentially that the partici-pants , although highly educated in comparison with the national population, onthe whole share the general values and patterns of social participation ofmiddle class America.
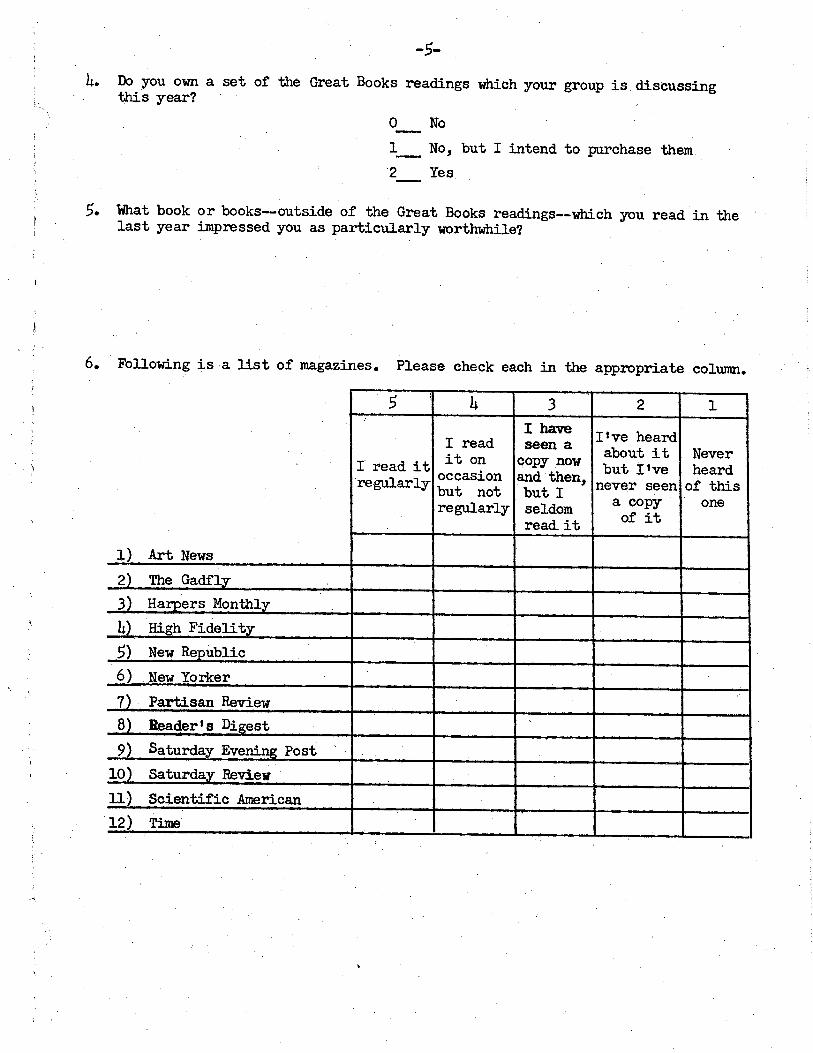
If the point still needs clinching, we need only add than when askedabout specific magazines, 71% reported that they read the Reader s Digestregularly--or occasionally, and 65% checked " cver heard of this one , II forThe Partisan Review. However , when we note that we have no national normsfor nintellectualism , II and we remember that the question was worded in sucha 'tiay as to discourage checking anm;'lers at the IIhigh" end, we cannot say whi'therwhether there are more or fewer self- defined intellectuals in Great Books thanin other populations. In fact , a recent article in the American Journal ofSociology can be read to imply that nearly as many participants who have hadgraduate training consider themselves to be intellectuals as assistant pro-fessors at Ohio State University. Cf., Helvia Seeman , HThe Intellectual andthe Language of l1inorities, American Journal of Sociology , LXIV: 25-35, July,1958.
-8-
Age, Sex, and Marital Status
Sociologists usually think of age, sex, and marital status as a clusterof variables which can be considered together as a person t s "life cycle role. By this, we mean only that , regardless of social status or region of residenceor religion , single, adolescent females have a lot in common; as do middle-agedmarried males.
Sixty-three per cent of our sample are women, 37 per cent , men , a dis-proportion which is undoubtedly 1:significantl1 in the sense that although inthe general population there are more women than men in the age rahges coveredby Great Bool s, the disproportion is not so great as in the program. Or, toput it another way, more women than men join Great Books. When we compare be-ginning participants with advanced- year members, we find no important differencein the IIsex ratio. Ii Hence, our guess is that although more women are recruitedinitially, their drop-out rate is about the same as that of their masculine com-patriots, this, in spite of the fact (Cf. Chapter II, Part C) that women seemstrikingly disadvantaged in their volume of talking in the discussion groups--folklore on the subject being dead wrong in this case.
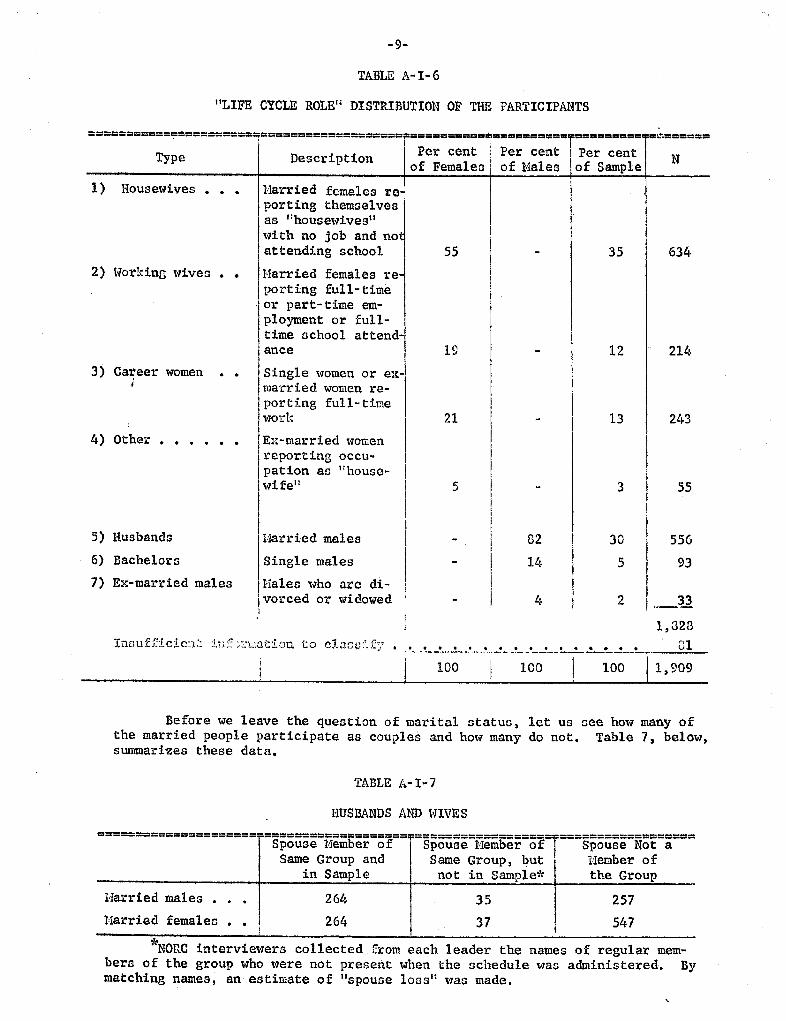
Three-quarters (74%) of the women are married; 15 per cent are single;and 11 per cent are widowed or divorced. The bulk of the married women are"housewives" \-lith no part-time job or studies; \-lhile almost all of the singlewomen are employed full time; and most of the ex-married women are employed.Almost all the men \.orl full time. There were very few "students" or "retired"in our sample. Of the men, 82 per cent are married, 14 per cent are single,and five per cent are widowed or divorced. The following table suumlarizesthese data.
Table 6 is sort of a "collage" made up of sej , marital status, and occu-patio in order to summarize the situation. We see that the bulk of the par-ticipants (65%) consists of husbands and housewives; another l2 per cent , of\'lOrldng wives; 13 per cent of "career" wotlcn; and the remaining 10 per centof other categories. Putting it another way, we find 35 per cent housewives;25 per cent working wives and career women; 30 per cent husbands; and 10 percent others.
Our analysis of the sample in the introduction suggests that there arerelatively more men in the small towns which are under-represented in our study.Even there thouZh! women form a slight majority
-9-
LIFE CYCLE ROLE Ii DISTRIBUTION OF THE PARTICIPANTS
TABLE A- 1- 6
=========== =========
ry===================
========== =========
r=========
======
Per cent : Per cent I Per cent ype escr on of Females I of Males . of Sample
Housewives
. .
2) Working wives
. .
3) Ca1(eer women
4) Other
5) Husbands
6) Bachelors
7) Ex-married males
Iaouff::tc;ic:1::
Married females re-porting themselvesas "house\olives
with no job and notattending school
Married females reporting full- timeor part-time em-ployment or full-time school attendance
Single women or married women re-porting full-time\olork
634
2It:.
married womenreport ing occu-
pation as " house-wife
Harried males
Single males
Nales 'olho are di- ! vorced or widowed
556
323): 1 f .
:.
Q. t ion
lOD
to c1.. aoc:
. ... ,.. !. .... - _. _! _. .. - ,- . --. .._ -!.._!._.
100 , 909100
Before we leave the question of marital status s let us see how many ofthe married people participate as couples and how many do not. Table 7, belowsummarizes these data.
TABLE A- 1-7
HUSBANDS AND HIVES
----------------------------------------- ._-------------------------------------- -
Spouse-fiember-of-- -Spouse-Member-of-Same Group and Same Group, butin Sample not in Sample*
---------------------
Spouse-Not-a---Hember ofthe Group
Harried males
. .
Married females
. .
264
264
257
547
NORC interviewers collected from each leader the names of regular mem-bers of the group who were not present when the schedule was administered. Bymatching names, an estimate of "spouse loss" was made.
-10-
For the married men, 54 per cent attend the group on a couple basis;for the married women, 36 per cent. The 264 "couples" thus make up 27 per centof our entire sample. More married women attend without their husbands thant:arried men without their wives. This discrepancy goes a long way toward eplaining the se c ratio of the program. If each spouse in the sample attendedwith his or her mate, the increased number of males would change the proportionof women from the observed 63 per cent to 54 per cent. Thus, our guess wouldbe that the se disproporti on in the program is partly a function of the differ-ential IIJoint attendance" of the two se ces.
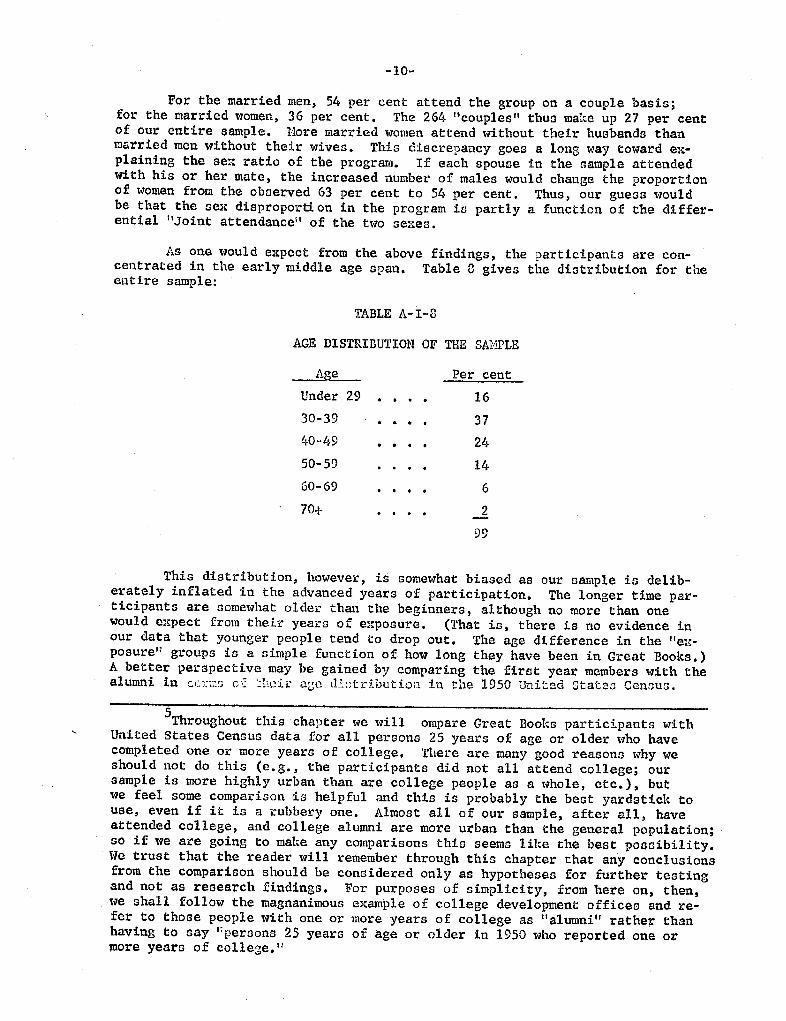
As one would e pect from the above findings, the participants are con-centrated in the early middle age span. Table 8 gives the distribution for theentire sample:
TABLE A- I-8
AGE DISTRIBUTION OF THE SAHPLE
Per cent
Under 29
30-39
40-49
50- 59
60- 69
70+
This distribution, however , is somewhat biased as our sample is delib-erately inflated in the advanced years of participation. The longer time par-ticipants are somewhat older than the beginners, although no more than onewould e tpect from their yearG of exposure. (That is, there is no evidence inour data that younger people tend to drop out. The age difference in the Hex-posurel1 groups is a simple function of how long they have been in Great Books.A better perspective may be gained by comparing the first year members with thealumni in tu:;;:s o' ::lieir aGe d:L: tributiQa in the 1950 Uni:: d StatCG CenaUG.
Throughout this chapter we will ompare Great Books participants withUnited States Census data for all persons 2S years of age or older who havecompleted one or more years of college. re are many good reasons why weshould not do this (e. g., the participants did not all attend college; oursample is more highly urban than are college people as a whole, etc. ), butwe feel some comparison is helpful and this is probably the best yardstick touse, even if it is a rubbery one. Almost all of our sample, after all, haveattended college, and college alumni are more urban than the general population;so if we are going to make any comparisons thia seems like the best possibility.We trust that the reader will remember through this chapter that any conclusionsfrom the comparison should be considered only as hypotheses for further testingand not as research findings. For purposes of simplicity, from here on, then,we shall follow the magnanimous example of college development offices and re-fer to those people with one or more years of college as tl alumni" rathe): thanhaVing to say " persons 25 years of age or older in 1950 who reported one ormore years of college.
11-
TABLE A-I-
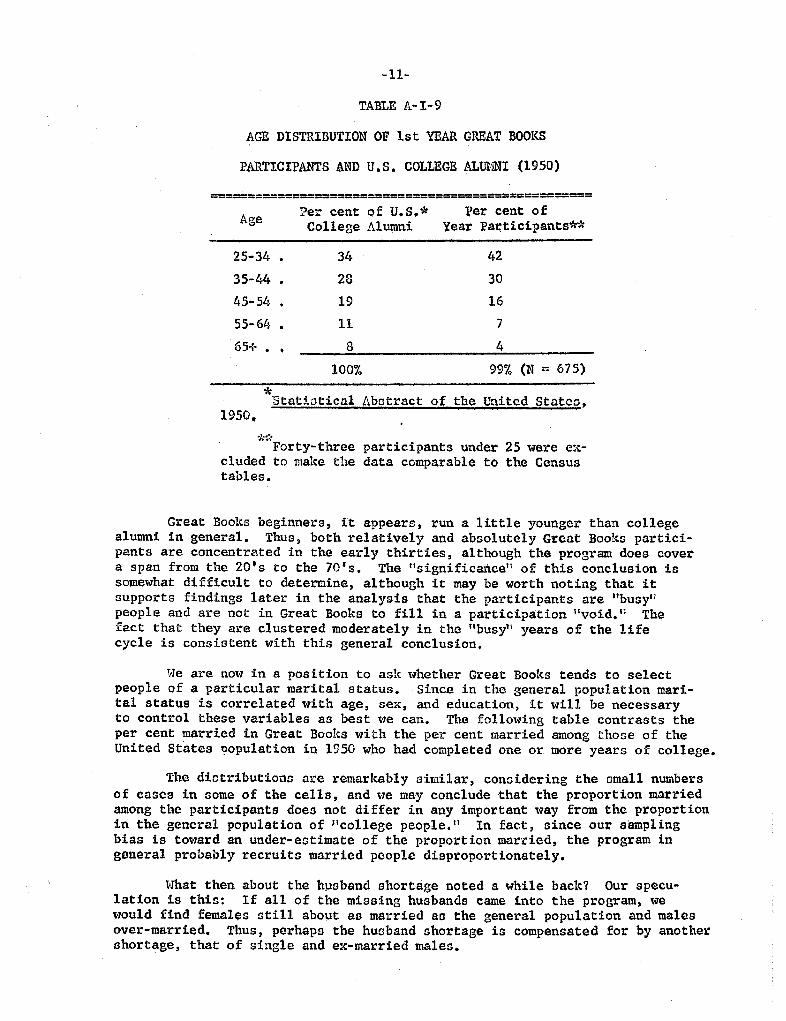
AGE DISTRIBUTION OF 1st YE GREAT BOOKSPARTICIPANTS AND U. S. COLLEGE ALUl1NI (1950)
=================================== ====== ===
Age Per cent Qf U. Per cent 0 fCollege Alumi Year Participants
25-34 .35-44 .45- 54 .
55-64 .65+ .
100% 99% (N 675)
Statistical Abotract of the United StateD,1950.
Forty-threecluded to make tbetables.
participants under 25 were ex-data comparable tQ the Census
Great Books beginners, it appears, run a little younger than collegealumni in general. Thus, both relatively and absolutely Great Books partici-pants are concentrated in the early thirties, although the program does covera span from the 20' s to the 70's. The Itsignificance" of this conclusion issomewhat difficult to determine , although it may be worth noting that itsupports findings later in the analysis that the participants are "busypeople and are not in Great Books to fill in a participation "void. 1t Thefact that they are clustered moderately in the "busy'1 years of the lifecycle is consistent with this general conclusion.
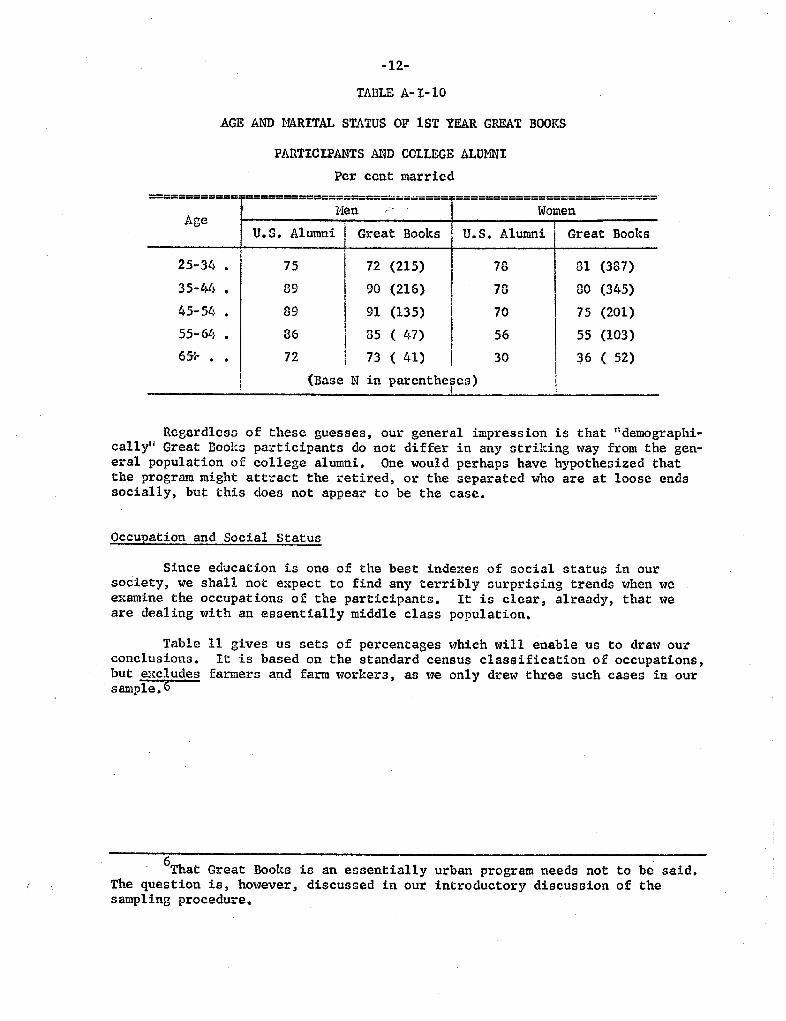
We are now in a position to ask whether Great Books tends to selectpeople of a particular marital status. Since in the general population mari-tal status is correlated with age , seJc , and education, it will be necessaryto control these variables as best we can. The following table contrasts theper cent married in Great Books with the per cent married among those of theUnited States 90pulation in 1950 who had completed one or more years of college.
The diotributions are remarkably similar, considering the Gmall numbers
of cases in some of the cells, and we may conclude that the proportion marriedamong the participants does not differ in any important way from the proportionin the general population of "college people. 1I In fac.t, since our samplingbias is toward an under-estimate of the proportion married, the program ingeneral probably recruits married people disproportionately.
What then about the h sband shortage noted a while back? Our specu-lation is this: If all of the missing husbands came into the program, wewould find females still about as married as the general population and malesover-married. Thus, perhaps the husband shortage is compensated for by anothershortage, that of single and ex-married males.
-12-
TABLE A-I-10
AGE AND MARITAL STATUS OF 1ST YEAR GRET BOOKS
PARTICIPANTS AND COLlEE ALUMNI
Per cent married
------------ =================== ==== ===================== =====------------
Hen WomenAge
Alumni Bool,s Alumni BooksU. S. Great U. S. Great
25-% (215) (387)
35-4l (216) (345)
45- 54 (135) (201)
55- 6l 47) (103)65-1- ( 41) 52)
(Base N in parentheses)
Regardless of these guesses, our general impression is that IIdemographi-cally" Great Books participants do not differ in any Gtriking \'1ay from the gen-eral population of college alumni. One would perhaps have hypothesized thatthe program might attract the retired , or the separated who are at loose endssocially, but this does not appear to be the case.
Occupation and Socia1 Status
Since education is one of the best indexes of social status in oursociety, we shall not expect to find any terribly surprising trends when we"amine the occupations of the participants. It is clear, already, that we
are dealing with an essentially middle class population.
Tableconclusions.but excludessample.
11 gives us sets of percentages which will enable us to draw ourIt is based on the standard census classification of occupations,farmers and farm workers, as we only drew three such cases in our
That Great Books is an essentially urban program needs notThe question is, however, discussed in our introductory discussionsampling procedure.
to be said.of the
-l3-
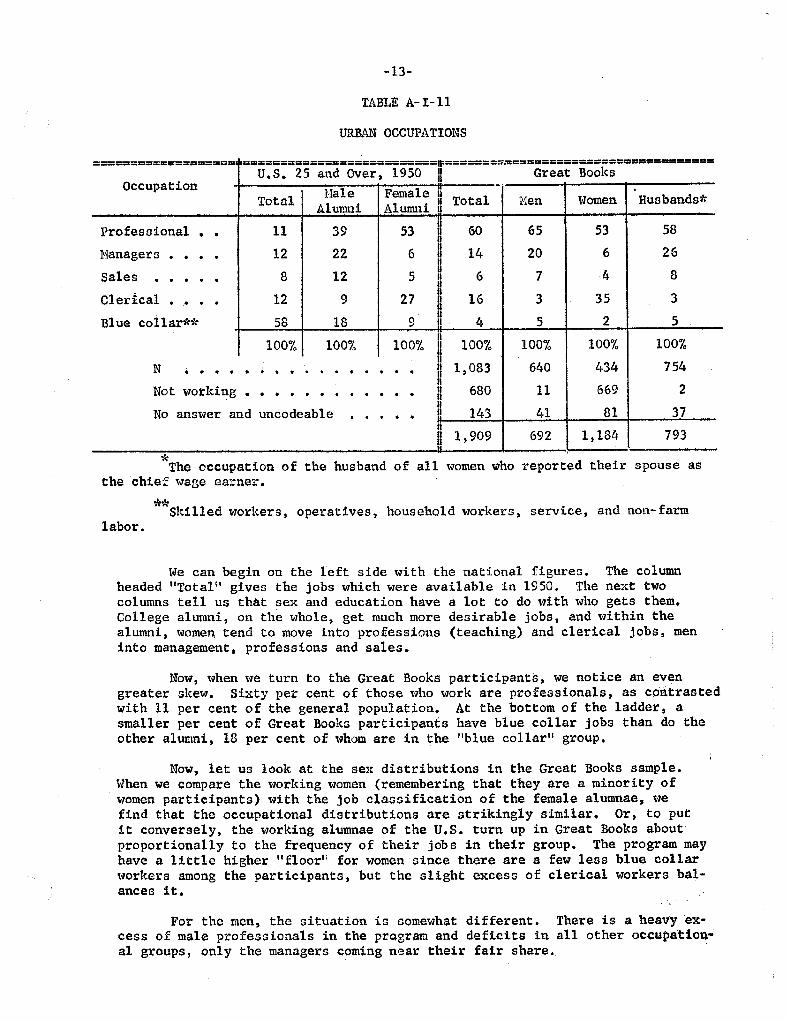
TABI.E A- I-
URBAN OCCUPATIONS
------------------- =:=;==;==============;==== ======= ===========================-------------------
OccupationS. 25 and Over, 1950 II Great Books
Hale FemaleTotal I Total Men Women Husbands*Al umni Alumni
ProfescionalManagers
SalesClerical 27
Blue co11ar**
" .
100% 100% 100% 100%lOO% 100% 100%
434 754
.;
083 640
669Not working 680
answer and uncodeab1e 143
793909 692 184
The occupation of the husband of all women who reported their spouse asthe chie wage earner.
Skilled workers, operatives, household workers , service, and non- farmlabor.
We can begin on the left side with the national figures. The columnheaded "Total" gives the jobs which were available in 1950. The tt two
columns tell us th t sex and education have a lot to do with who gets them.College alumni , on the whole, get much more desirable jobs, and within thealumni , women tend to move into professions (teaching) and clerical jobs, meninto management , professions and sales.
Now, when we turn to the Great Books participants, we notice an evengreater skew. Sixty per cent of those who work are professionals, as contrastedwith 11 per cent of the general population. At the bottom of the ladder, asmaller per cent of Great Books participants have blue collar jobs than do theother alumni, 18 per cent of whom are in the !1blue collar" group.
Now, let us look at the sex distributions in the Great Books sample.When we compare the working women (remembering that they are a minority ofwomen participants) with the job classification of the female alumnae, we
find that the occupational distributions are strikingly similar. Or , to put
it conversely, the working alumnae of the U. S. turn up in Great Books aboutproportionally to the frequency of their jobs in their group. The program mayhave a little higher II floorl1 for women since tbere are a few less blue collarworkers among the participants, but the sligbt excess of clerical workers bal-ances it.
For the men, the situation is somewhat different. There is a heavy ex-cess of male professionals in the prQgram and deficits in all other occupation.al groups, only the managers coming near their fair share.
14-
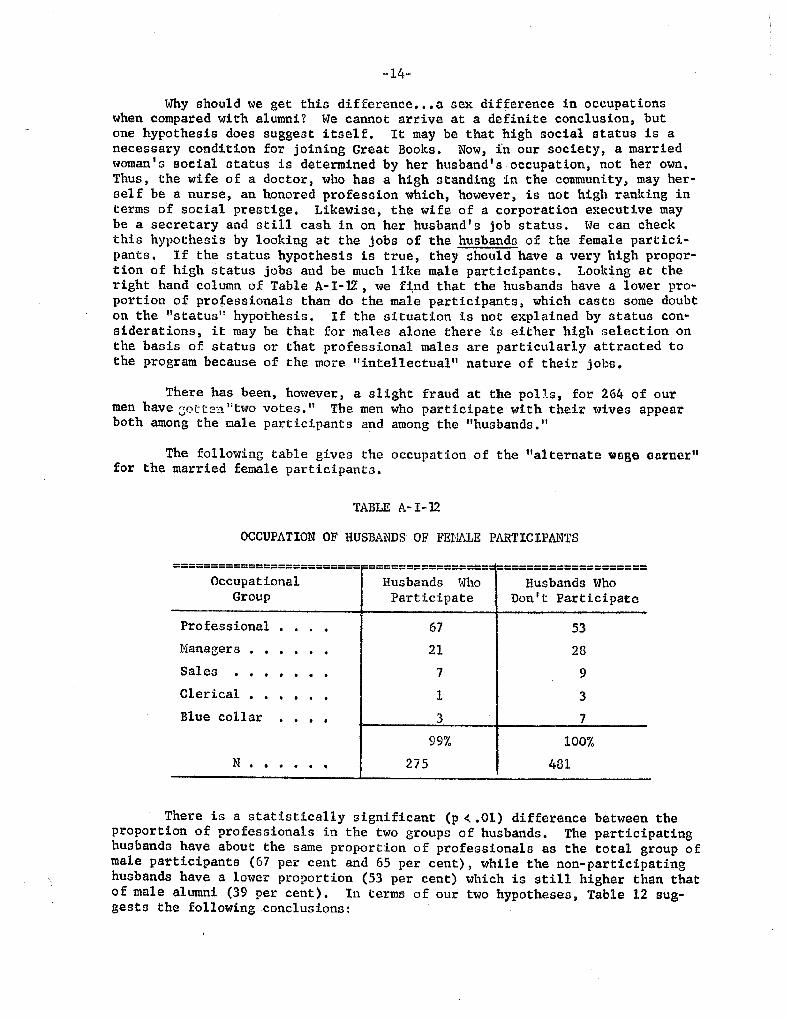
Why should we get this difference... a sex difference in occupationswhen compared with alumni? We cannot arrive at a definite conclusion, butone hypothesis does suggest i tsel f. It may be that high social status is anecessary condition for joining Great Books. Now, in our society, a marriedwoman ' G social status is determined by her husband' s occupation, not her own.Thus, the wife of a doctor , who has a high standing in the community, may her-self be a nurse , an honored profession which, however, is not high ranking interms of social prestige. Likewise , the wife of a corporation e tecutive maybe a secretary and still cash in on her husband I s job status. We can checkthis hypothesis by looking at the jobs of the husbands of the female partici-pants. If the status hypothesis is true , they should have a very high propor-tion of high status jobs and be much like male participants. Looking at theright hand column of Table A- 1-12 , we f nd that the husbands have a lower pro-portion of professionals than do the male participants, which casts some doubton the " status !! hypothesis. If the situation is not explained by status con-siderations, it may be that for males alone there is either high selection onthe basis of status or that professional males are particularly attracted tothe program because of the more "intellectua111 nature of their jobs.
There has been, however , a slight fraud at the polls, for 264 of ourmen ha.ve ::ot t 811 n two votes. The men who participate with their wives appearboth among the male participants and among the "husbands. \I
The following table gives the occupation of the "alternate wage earnerfor the married female participants.
TABLE A- 1-
OCCUPATION OF HUSBANDS OF FE!- LE PARTICIPANTS
=========================F================= ====================Occupational Husbands Who Husbands WhoGroup Participate Don t Participate
ProfessionalManager s
SalesClericalBlue collar
99% 100%
N . 275 481
There is a statistically significant
(p.(. .
01) difference between theproportion of professionals in the two groups of husbands. The participatinghusbands have about the same proportion of professionals as the total group ofmale participants (67 per cent and 65 per cent), while the non- participatinghusbands have a lower proportion (53 per cent) which is still higher than thatof male alumni (39 per cent). In terms of our two hypotheses , Table 12 sug-gests the following conclusions:
l5-
1) The difference between the participating and non- participating hus-bands suggests that for the males, occupational values and attitudes may be animportant variable in recruitment to Great Books. The professional, whose jobis more ti intellectual" in some ays, may be more attracted to the program thanthe "businessman.
2) The difference between the non-participating husbands and the malealumni and the lack of difference between the women and the female alumni sug-gest that occupational values are unimportant for the recruitment of women;but there may be a "social status 'l variable which tends to bring into the pro-gram wonen whose prestige position is above that of the average female alumna.
Read horizontally instead of vertically, Table 12 also gives us someclues to the mystery of the missing husbands. We find 45 per cent of the pro.fessional husbands accompanying their wives; 30 per cent of the manager hus-bands; and 32 per cent of the salesman husbands. This is entirely consistentwith our hunches about the interrelations of sex, status, and occupationalvalues in recruitment. If among males within the upper middle. class, occupa-tion is important for recruitment, it follows that women, who are not selectedon occupation, but perhaps more on social status, will frequently have business-man husbands who are less attracted to the program. Conversely, the men, mostof whom are professionals and of high status, do not meet with a comparablevariation among their wives. It should be noted, however, that this is not thewhole story, for men as a group still bring along a greater proportion of theirspouses (54 per cent) than women married to professionals (45 per cent), al-though the gap is narrowed considerably.
In short, even controlling crudely for educational levels, Great Booksstill has a disproportionately strong attraction for the male professional.Likewise, while women do not appear to be selected on the basis of their ownjobs, it appears that the husbands of women participants are more likely to bemanagers and professionals than the average male alumnus.
Socia1 Hobility
Occupational status always has a time dimension , and the question ofwhere a person is now, does not answer the question of where he came from.Status mobility 15 particularly relevant in any 5ocia1 analysis of a programlike Great Books. In a society characterized by relatively frequent mobilityas a consequence of a changing occupational structure (the proportion of pro-fessionals among employed workers has doublcd since 1910) people frequentlyend up much higher on the social ladder than their starting place. Since GreatBooks has a heavy proportion of professionals, an occupational group character-ized by relatively high upward mobility rates, we may expect to find a con-siderable number of people who have ascended the ladder. Since, in addition,it would seem that a program like Great Books would be useful for obtainingsocial and intellectual skills missed during the ascent , it would be interest-ing to know whether the program tends to attract mobile people in high numbers.
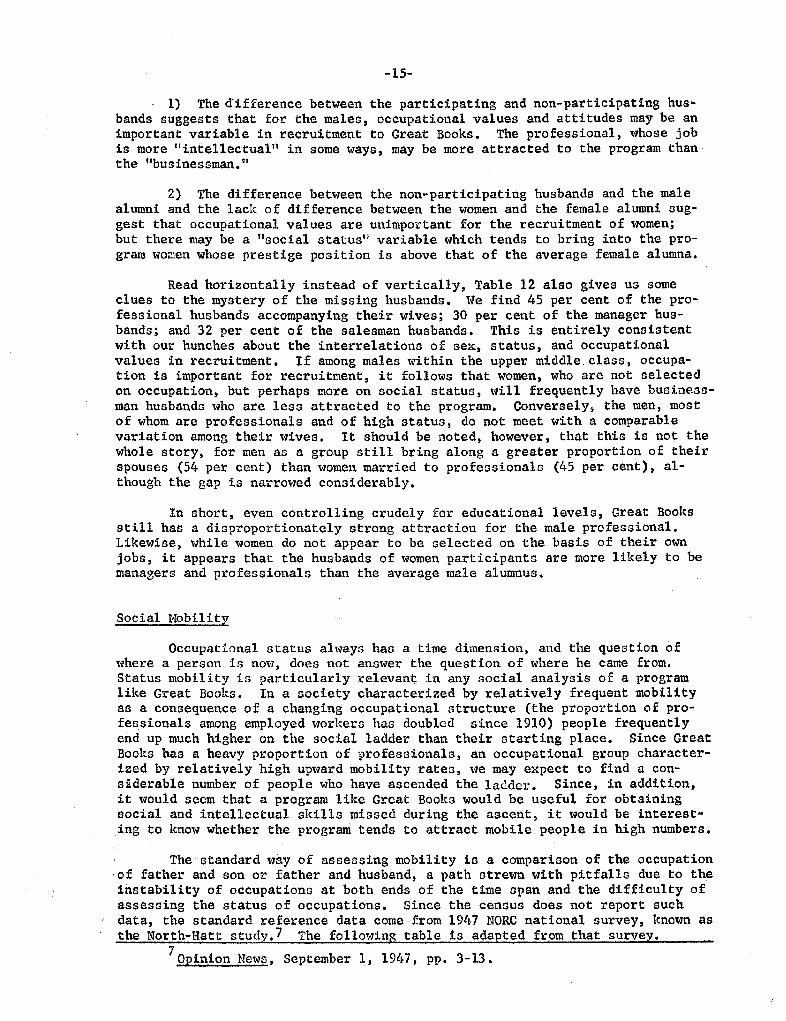
The standard way of assessing mobility is a comparison of the occupation. of father and son or father and husband, a path strewn with pitfalls due to theinstability of occupations at both ends of the time span and the difficulty ofassessing the status of occupations. Since the census does not report such
, data, the standard reference data come from 1947 NORC national survey, known asthe North-Hatt study. The following tab1e is adapted from that survey.
Opinion News , September 1, 1947, pp. 3-13.
16-
TABLE A- 1-13
110BILITY
Per cent whose fathers were skilled , semi-skilled
service, farm, or 1 abor.
---------------------------
PresentOccupation
=============-============
Great Books. . Males
======::=====
Great BooksWives *
ProfesGional (399) (413)Hanagers (116) (177)Sales 60) (57)
Base N in parenthesiG.
. "
roport on repol:t :':l2; " 0 ue co - m: or arm'occupation for father for all respondents reporting agiven current occupation , regardless of se
b = Proportion reporting nblue collar or farm
occupation for father for Great Books male partici-pants reporting a given current occupation.
c = proprtion reporting "blue collar or farm
occupatiOn for father for Great Books married womenreporting a given current occupation for their hus-bands.
The trend of the table is clear-cut. Great Books participants in highstatus occupations today are , if anything, considerably less mobile than the1947 American cross section. Whether this is because the program attractsless mobile people, or whether their high level of education required fatherswho were relatively comfortably fixed, it remains that the " self-made manand woman are relatively rare in our sample, although we do have 286 respond-ents (ignoring the spouse- less women whose current social position is diffi-cult to measure) who have made the transition from farm or blue collar originsto the upper white collar regions.
In spite of the relative situation, vis- a-vis the national sample, weshould go wrong if we decided that social mobility is not related to partici-pation in Great Books. One out of five of our respondents checked flbecomingmore sure of myself when talking with people of higher educational backgrounas a reason for joining the program (although, of course, not necessarily theonly one). The types of people volunteering this motivation and their feel-ings of satisfaction with the program are discussed at some length in the netwo chapters.
In summary: Great Books participants are selected from the upper ech-elons of the occupational structure , even when compared with American college
17-
alumni. Men, in particular, tend disproportionately to be I! professionalspossibly because of intrinsic aspects of their jobs. Women tend to be dis-proportionately recruited from the upper white collar levels, possibly becauseof status considerations. In terms of occupational origins, the participantsappear less mobile than the general population, altbough mobility- relatedmotivations are not uncommon among the reported reasons for joining GreatBooks.
Memberships and AlloRtencGs
In addition to education, family role, and occupation, one s socialinvolvement a so qonsists of a complicated web of formal and informal mem-berships which reach out beyond the immediate family to the larger socialworld. Since most of these are analyzed in some detail in the context ofeffects of the program" (Cf. Chapters I and IV of Part B), we shall merelysketch out the skeleton here.
Sociabil ity
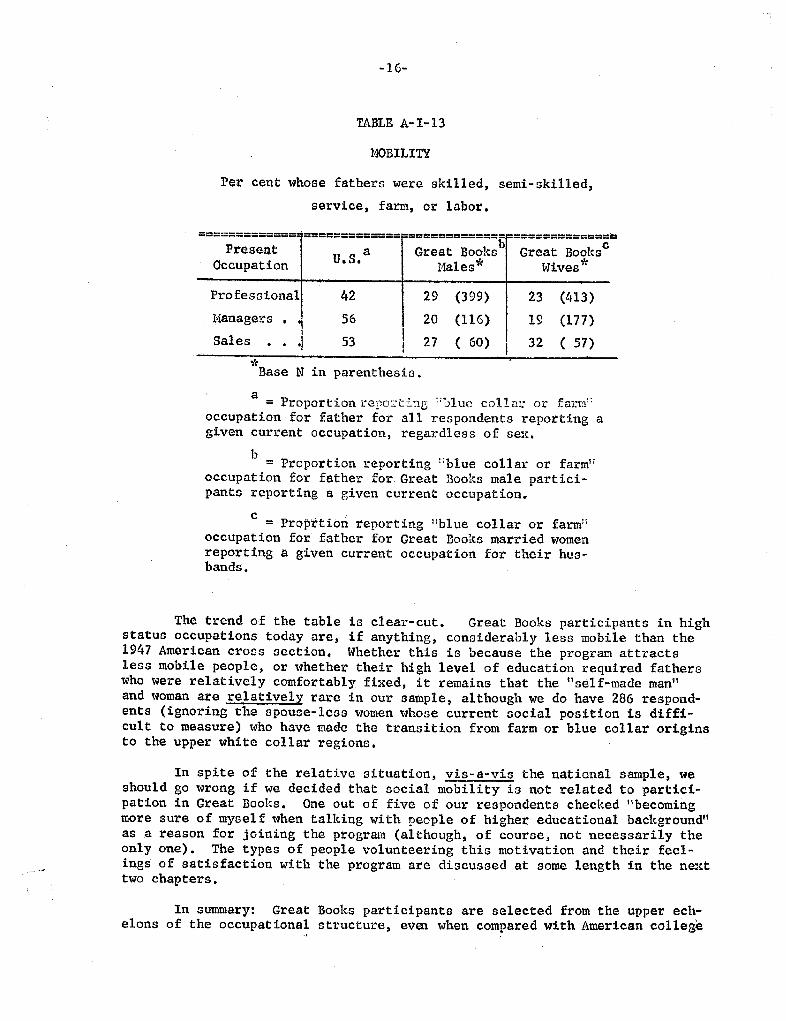
Among the myths about Great Books participants is the claim that theyare ivory towerists who have little or no connections with their community.While our chapter on community involvement (Chapter IV, Part B), analyzesthis question in some detail , we can here suggest that , at least in its ex-treme forms , the myth is incorrect. The following tables probably cover thesubject in all the detail it deserves at this point.
TABLE A- 1-14.
ATTACff;JNT TO THE COBHUNITY
Per cent checking each response in Answer to tbe quostion,IIWhat is your emotional feel:ing about your community?1I
Response Per cent
I feel I'm areal member of the community...
I do like the community, but I don t feel I'really a part of it.
" . . . . . . . . . . . . . . . . . .
I rather dislike the community, and I defi-nitely do not feel I' m a part of it. 1I .
. . .
N =100%
852
We have talked about professions at length without mentioning anyspecific on s. Considering only the respondents ' occupations, the followingpr.ofessions each contributed more than 25 respondents: engineers (123);teachers (102); lawyers (61); accountants (39); journalists (36); physicians(34); college teachers (31). These seven groups account for 66 per cent ofthe professionals; and along with business managers (129) and secretaries(91) account for 59 per cent of the total participants reporting an occu-pation.
13-
TABLE A- 1-
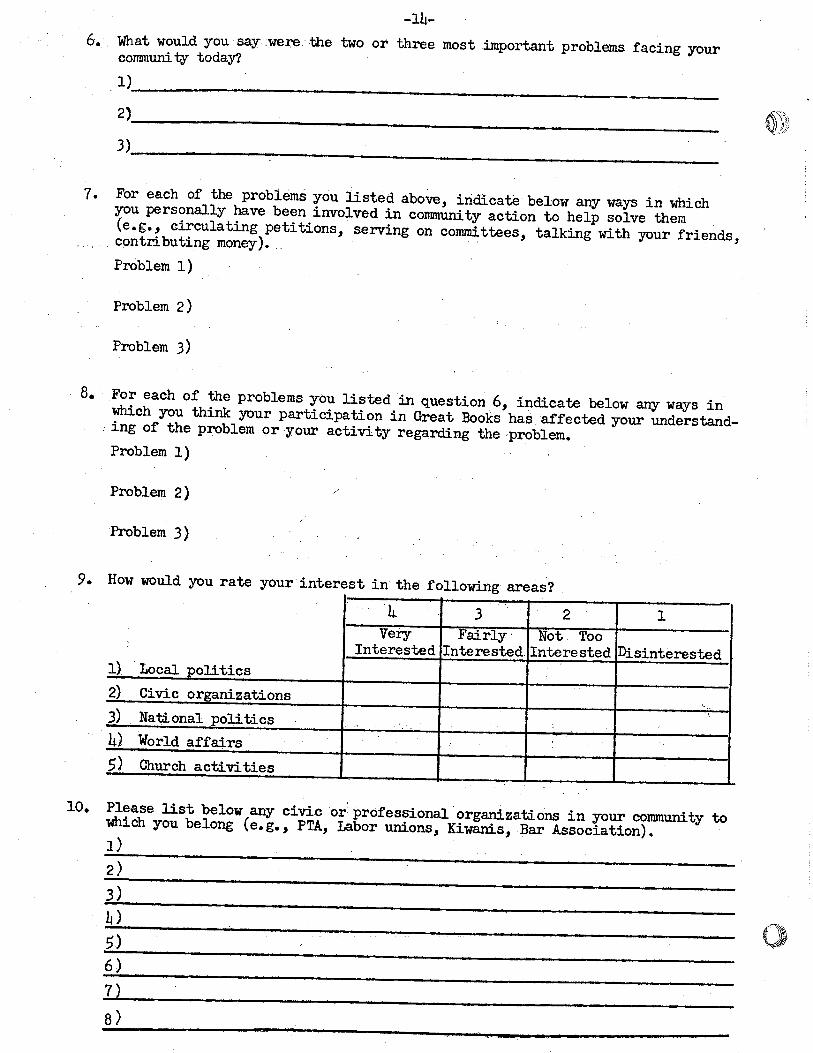
NUER OF CIVIC ORGANIZATIONS TO WHICH
PARTICIPANTS BELONG
Number 0 fic Organizations
Per cent
3 or more
99%
. .
. 1 , 505
No nswer 404
. . . . . .. . . . . .
909
Excluding religious organi-zntionlJrclatcd to a specific congre-gation, formal civic office, informalsociabili ty groups, and a.dult educat iongroups.
TABLE A-I-16
NUHBER OF EVENINGS PER HONTH SPENT IN
INFOIDiff VISITING AND ENTERTAINING
Number 0 fEveninRs Per cent
9 or more
. . . .
100%
772
l-4
. . . .
5-8
. . . .
N =
. .
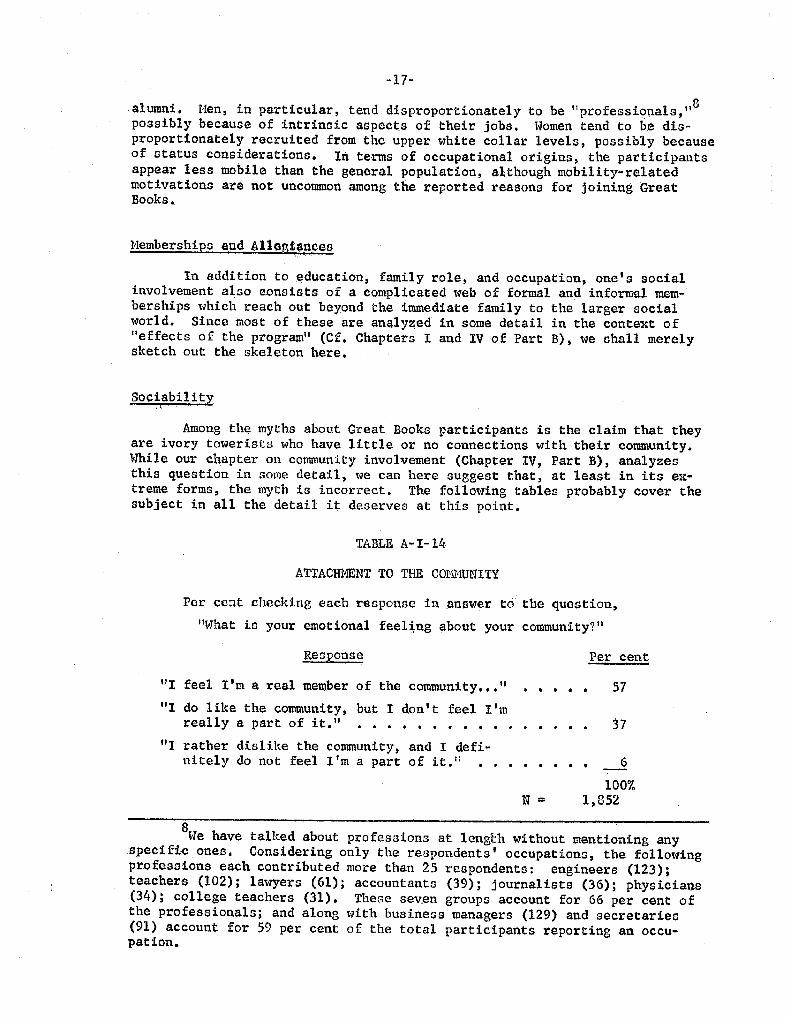
In brief, majorities of the respondents report that they f e1 theyare rea1 members of their communities; belopg to two or more civic organi-zations (if we assume that all of the no answerresponcient to this questionbelong to none, 43 per cent belong to two or more civic organizations) andget together informally more than once a week.
19-
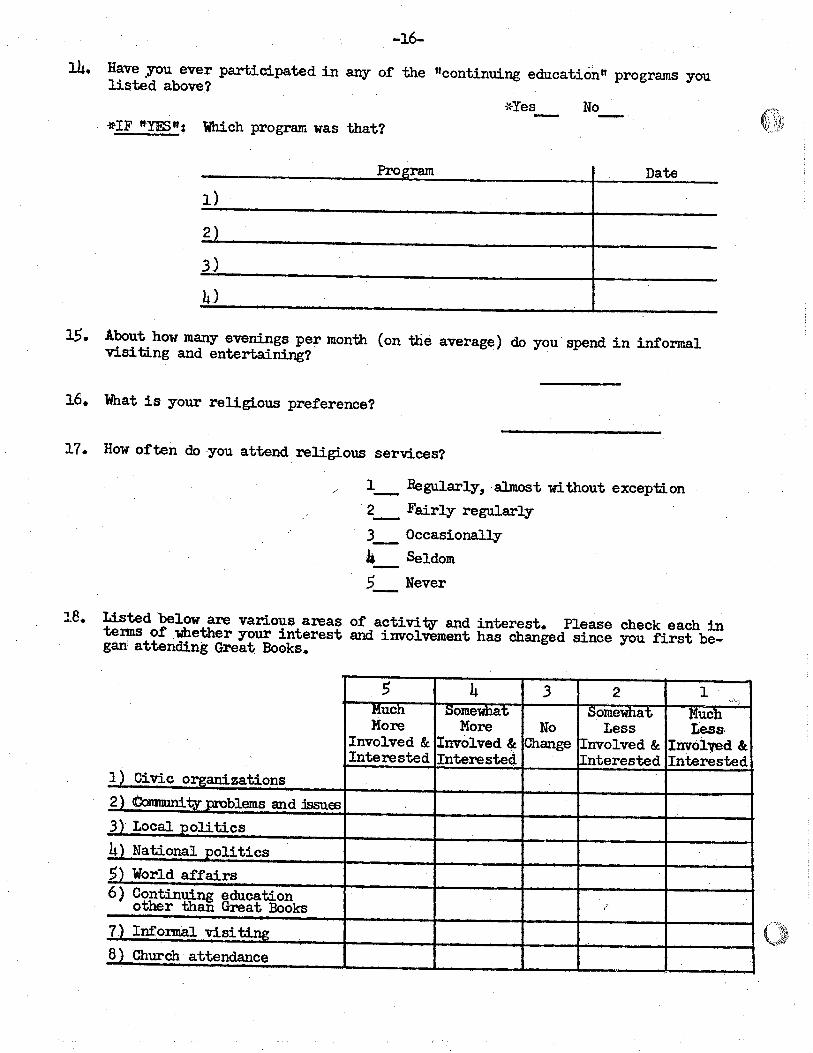
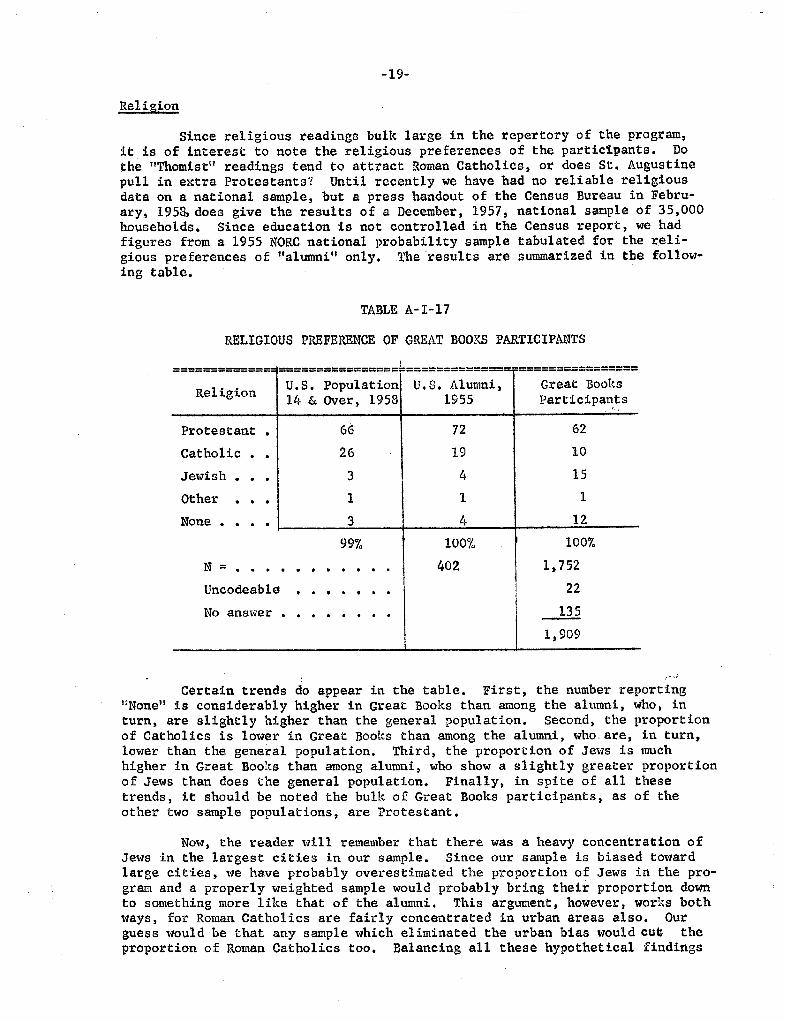
Rel igion
Since religious readings bulk large in the repertory of the program,it is of interest to note the religious preferences of the participants. Do
the "Thomist" readings tend to attract Roman Catholics, or does St. Augustinepull in extra Protestants? Until recently we have had no reliable religiousdata on a national sample, but a press handout of the Census Bureau in Febru-ary, 195 does give the results of a December, 1957, national sample of 35,000households. Since education is not controlled in the Census report , we hadfigures from a 1955 NORC national probability sample tabulated for the reli-gious preferences of "alumni" only. The results are summarized in tbe follow-ing table.
TABLE A-I-
RELIGIOUS PREFERENCE OF GREAT BOOKS PARTICIPANTS
=============: ============================== ================
Religion U. S. population U. S. Alumni Great BooksOVer, 1958 1955 participa
ProtestantCatholicJewishOther
None
99% lOO% lOO%
402 l, 752
Uncodeable
answer
909
Certain trends do appear in the table. First, the number reportingNone" is considerably higher in Great Books than among the alumni , who t inturn, are slightly higher than the general population. Second, the proportionof Catholics is lower in Great Books than among the alumni , who. are , in turn
lower than the general population. Third, the proportion of Jews is muchhigher in Great Books than among alumni , who show a slightly greater proportionof Jews than does the general population. Finally, in spite of all thesetrends , it should be noted the bulk of Great Books participants , as of theother two sample populations , are Protestant.
Now, the reader will remember that there was a heavy concentration ofJews in the largest cities in our sample. Since our sample is biased towardlarge cities, we have probably overestimated the proportion of Jews in the pro-gram and a properly weighted sample would probably bring their proportion downto something more like that of the alumni. This argument, however, works bothways, for Roman Catholics are fairly concentrated in urban areas also. Ourguess would be that any sample which eliminated the urban bias would cut theproportion of Roman Catholics too. Balancing all these hypothetical findings
20-
together, our inclination would be to advance the hypothesis that if one con-trols for educational level, the program as a whole may recruit a somewhatlower proportion of Catholics and a higher proportion of "nones, 11 but thatother differences in religious preference are probably minimal.
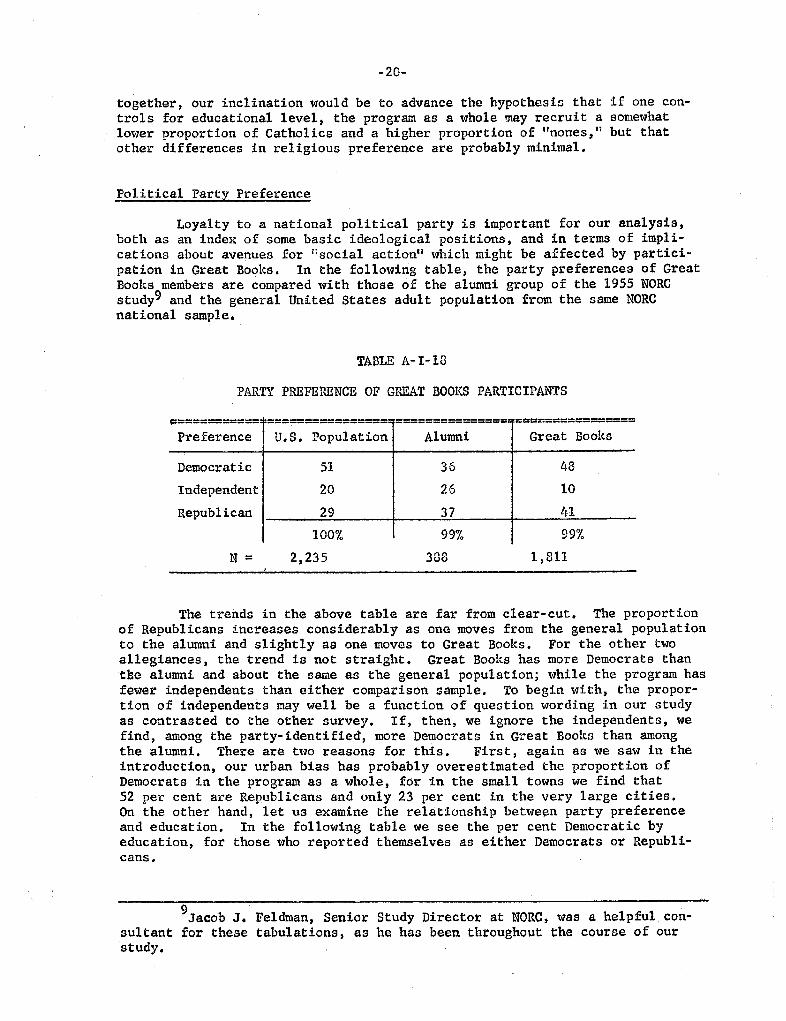
Political party Preference
Loyalty to a national political party is important for our analysis,both as an index of some basic ideological positions, and in terms of impli-cations about avenues for " social action" which might be affected by partici-pation in Great Books. In the following table, the party preferences of GreatBooks members are compared with those of the alumni group of the 1955 NORCstudy9 and the general United States adult population from the same NORCnational sample.
TABLE A- 1-18
PARTY PREFERENCE OF GREAT BOOKS PARTICIPANS
c:===========Preference
================: ================ ================
S. Population Alumni Great BooksDemocratic
Independent
Republican lfl
100% 99% 99%
235 388 , 811N =
The trends in the above table are far from clear-cut. The proportionof Republicans increases considerably as one moves from the general populationto the alumni and slightly as one moves to Great Books. For the other twoallegiances , the trend is not straight. Great Books has more Democrats thanthe alumni and about the same as the general population; while the program hasfewer independents than either comparison sample. To begin with, the propor-tion of independents may well be a function of question wording in our studyas contrasted to the other survey. If, then, we ignore the independents, wefind, among the party-identified, more Democrats in Great Books than amongthe alumni. There are two reasons for this. First , again as we saw in theintroduction, our urban bias has probably overestimated the proportion ofDemocrats in the program as a whole , for in the small towns we find that52 per cent are Republicans and only 23 per cent in the very large cities.On the other hand, let us examine the relationship betwe n party preferenceand education. In the following table we see the per cent Democratic byeducation, for those who reported themselves as either Democrats or Republi-cans.
Jacob J. Feldman, Senior Study Director at NORC, was a helpful . con-sultant for these tabulations, as he has been throughout the course of ourstudy.

21-
TABLE A-I-
EDUCATION AND PARTY PREFERENCE OF
GREAT BOOKS PARTICIPANTS
Per centEducation Democratic
Less than high school. ( 40)
High school (141)
Post high, non-college (100)
Part college (408)
Bachelor ' (403)
Some graduate work. (266)
l'aster I s degree (193)
Other graduate degree. ( 92)
Ph. D. ( 98)
13ase N in parentheses.
The relationship appears to be IIcurvi1 inear. That is , the proportionof Democrats declines steadily as one moves toward the middle of the educa-tional scale from either extreme . No V', compared to the general populationGreat Books has fewer low educated people, but it has many more highly edu-cated people. The Democrats it loses at the bottom, it may regain at the top.Thus , we doubt that even if a less biased sample raised the proportion ofRepublicans that it would put them into an over-whelming majority.
In short , the only hypothesis we would hazard is that a compensatingprocess may be at work. The high status level of Great Books participants mayraise the proportion of Republicans in comparison with the general population,or even in comparison with alumni. At the same time the disproportionatenumber of people with graduate training may insure that a fair proportion ofDemocrats are attracted. The net result of these two tendencies may be tp keepa fairly equal balance between adherents of the two parties.
Sumary
What are the participants like? They tend to be highly educated, quitemarried, somewhat female , disproportionately professional men and wives ofwhite collar husbands; infrequently " intellectuals ; under-mobile; possiblydisproportionately irreligious; possibly under-proportionally Catholic; soci-able; joining Republicans and Democrats.
Where participants can be compared with the national population ofcollege alumni , they tend to accentuate those qualities (mostly associatedwith high levels of interest and intellectual sophistication) which, in turn,differentiat the alumni from the general population.
In short, the participants are well educated, high status , sociallyactive; youngish adults.
22-
Let us, however, note two things which they are not:
First , our evidence suggests that they are not, despite their highlevel of education and later data on their intellectual abilities, GO immersedin ideas and culture that these have become the center of their lives. Thestereotype of the bookish, ivory tower, intellectual , does not apply to thesepeople., most of whom share basic middle class values and few of whom considerthemselves as intellectuals. The creative intellectual professions are rare. among them, and ties to the world of civic organization and political partyare strong.
Second, our evidence suggests that they are not, relative to theirsociety, men and women of high power and influence. A very few "elite:: GreatBooks groups have created the impression that this program reaches into theOlympian heights of money and power in this country. Our data do not supportthis idea. In the first place, only one out of our 909 respondents is anationally known figure, and that person is in the field of entertainment.In the second place, given a national social structure in which the sourcesof influence and power are disproportionately concentrated among male business-men, the tendency for the respondents to be women or male professionals meansthat few of them are located in the places in the social structure where keycommunity or national decisions are made. In fairness, we should note thatrelative to the general population, Great Books participants are extremelyhighly selected in terms of prestige and ability. At the same time, when oneconsiders, as we will throughout this analysis, the ramifications of GreatBooks e: perience in the social worlds of the participants, we must bear inmind that the participants tend to be an elite of talent, technical skill , andintellectual training, not an elite of persons in key decision making positionsin their community and society.

""."" ...- .q-, . -'" . . " ,,
CHAPTER II
WHAT DO THY \-lAN FROH THE PROGRAH?
23-
-24-
Introduction
vn1at do they want from the program? Probably the most importantaspect of this question is that we need to ask it. Unlike a course inbusiness English, French cooking, or arc welding, the purposes of anadult program in liberal education are not explicit. Proponents of suchprograms believe strongly that adult liberal education has purpose andconsequence, but these cannot be laid out in a neat outline fashion.To begin with, a good case can be made that the purpose of liberal edu-cation is liberal education, not life adjustment or social ameliorarion.At the saine time, it is also firmly believed that the liberally educatedman finds hiG education applicable in all the areas of his life.
One assumption with which we can start is that, for different people,the program will have different purposes. While the content of the read-ings and the pattern of discussion are a il constant, " the needs and lifee;cperiences \"hich the members bring to the program are probably the mostimportant factor in determing what purposes they see in it. People comeinto Great Books with motivations ranging from speed reading to solutionsof world problems , and one of the working assumptions of Great Books isthat the curriculum and discussion are rich enough artd broad enough tomeet a great variety of motivations.
. Therefore , our approach was to ask the participants what theywanted from the program. On the second page of our questionnaire welisted 23 specific motivations , based on our impressions from pilotstudies and conferences with administrators in Great Books and theFund for Adult Education.
We can besin by looking at the frequency diotribution.away we notice two characteristics of Table 1 , following.
Right
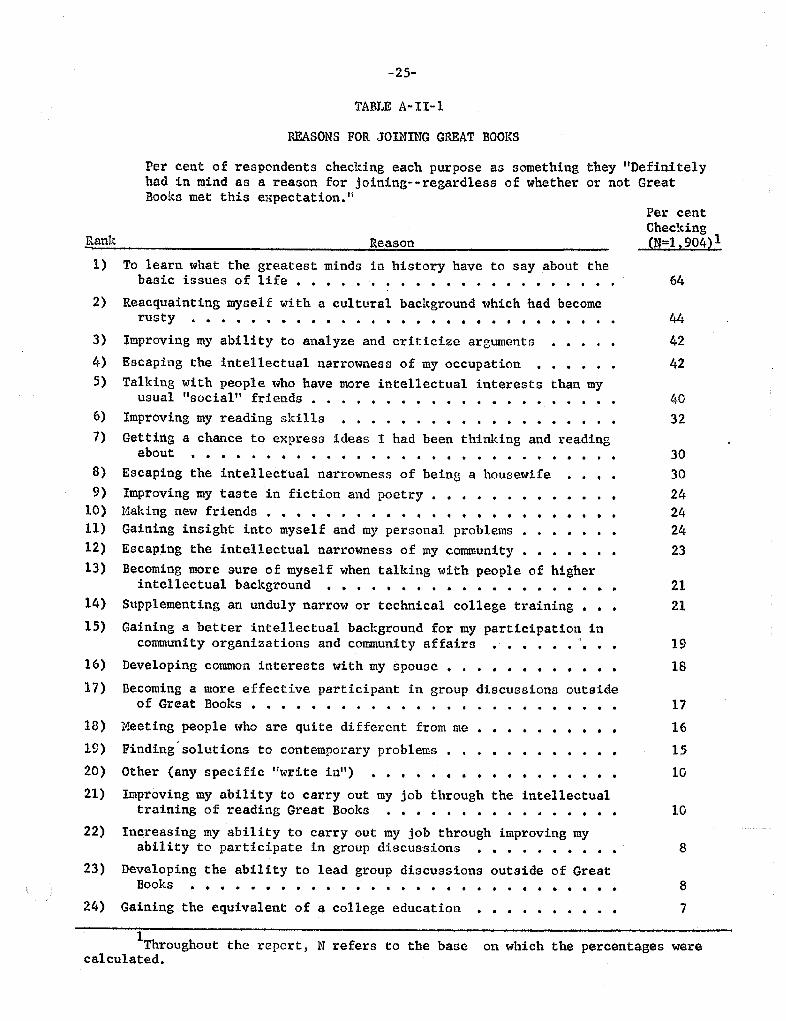
First, motivations other than those included in the list areseldom volunteered by the respondents (10 per cent volunteered an "otherreason) . Now, it is never fair to compare the volume of IIwrite-ins" withthose items which are listed in a questionnaire, but , in this case , thecomparison does seem to warrant the belief that there is probably no reallyimportant or frequent motive which is not tapped by our list.
Second, we notice that only one item on the list was checked bya majority, and the bulk were checked by between 10 and 30 per cent.This suggests that our hunch about di.versified motivations was probablycorrec t .
Diversity, however, is accompanied by aome degree of overlaRL_The motivations are not mutually e cclusive, and the participants tendedto check fairly high numbers of motives. (The forty respondents whomentioned only an "other" motive, and five who skipped this page areexcluded from Table 2.
25-
TABLE A-II-
REASONS FOR JOINING GREAT BOOKS
Per cent of respondents checking each purpose as something they "Definitelyhad in mind as a reason for joining--regardless of whether or not GreatBooks met this expectation.
,Bank Reason
To learn what the greatest minds in history have to say about thebas ic is sues 0 f 1 i fe
. . . .
. o
. . . . . . . . . . . . . . . .
Per centChecking(N::1, 904) 1
Reacquainting myself with a cultural background which had becomerUG ty
. . . . . . . . . . . . . . . . . . . . . . . . . . .
Improving my ability to analyze and criticize arguments
. . . .
Escaping the intellectual narrowness of my occupation
. . . . . .
Talking with people who have more intellectual interests than myusual "social" fri ends
. . . . . . . . . . . . . . . . . .
Improving my reading skills
. . . . . . . . . . . . . . . .
Getting a chance to express ideas I had been thinking and readingabout
. . . . . . . . . . . . . . . . . . . . . . . .
Escaping the intellectual narrowness of being a housewife
. . . .
Improving my taste in fiction and poetry. . . .
. . . . . . . .
Haking new friends
. . . . . . . . . . . . . . . . . . . . . .
10)11)12)13)
Gaining insight into myself and my personal problems
. . . . . .
Escaping the intellectual narrowness of my community
. . . . . . .
Becoming more sure of myself when talking with people of higherintellectual background
. . . . . . . . . . . . . . .
Supplementing an unduly narrow or technical college training
. .
Gaining a better intellectual background for my participation incommunity organizations and community affairs
. . . . . .
14)
15)
16)
17)
Developing common interests with my spouse
Becoming a more effective participant in group discussions outsideof Great Books
. . . . . . . . . . . . . . . . . .
18)
19)
Meeting people who are quite different from me
. . . . . .
Finding solutions to contemporary problems
. . . . . . . .
Other (any specific "write in
) . . . . . . . . .
Improving my ability to carry out my job through the intellectualtraining of reading Great Books
. . . . . . . . . . . .
Increasing my ability to carry out my job through improving myability to participate in group discussions
. . . . . . .
Developing the ability to lead group discussions outside of GreatBooks
. . . . . . . . . . . . . . . . . . . . . . . . . . .
20)
21)
22)
23)
24) Gaining the equivalent of a college education
Throughout the report , N refers to the basecalculated.
on which the percentages were
26-
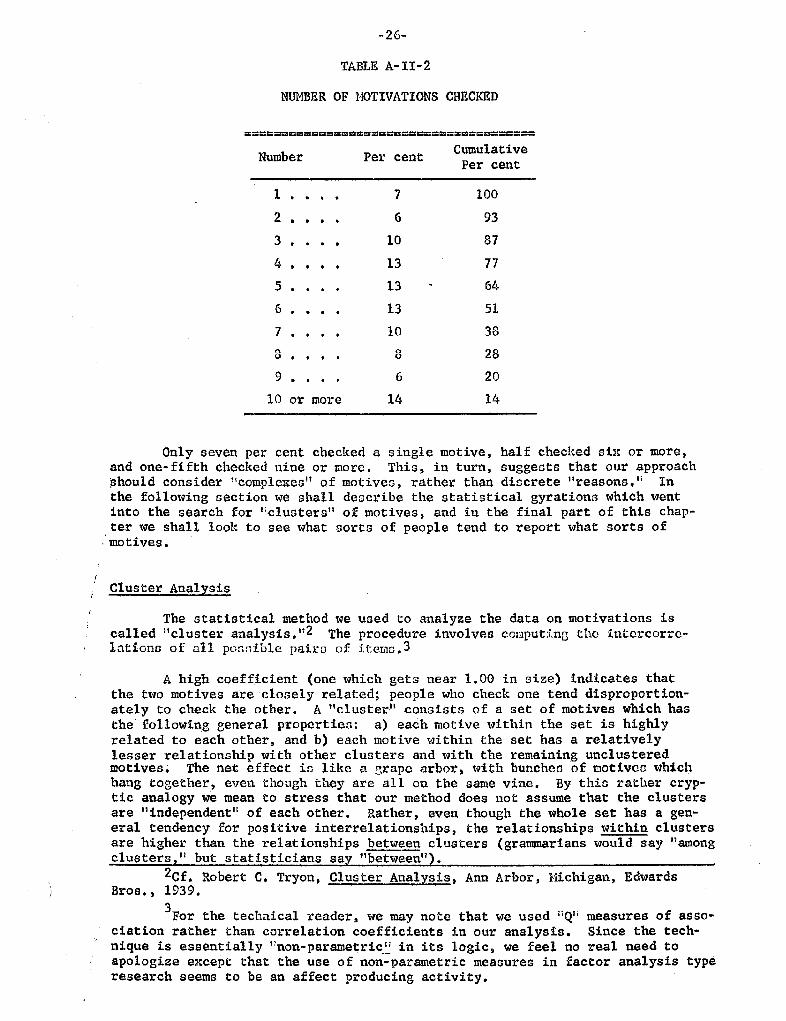
TABLE A- II-
NUMER OF NOTIVATIONS CHECKED
------------------------------------------------------------------------------
Number Per centCumulativePer cent
100
2 .
4 .5 .6 .
8 .9 .
10 or more
Only seven per cent checke4 a single motive, half checked sbc or more,and one- fifth checked nine or morc. This, in turn, suggests that our approachI3hould consider !;comple ces" of motives, rather than discrete "reasons. II Inthe following section we shall describe the statistical gyrations which wentinto the search for "clusters" of motives, and in the final part of this chap-ter we shall look to see what sorts of people tend to report what sorts of
" motives.
Cluster Analysis
The statistical method we used to analyze the data on motivations iscalled " cluster analysis."2 The procedure involves computinc the intercorrc-lations of all possible pairs of items.
A high coefficient (one which gets near l. OO in size) indicates thatthe two motives are closely related; people who check one tend disproportion-ately to check the other. A IIcluster'l .consists of a set of motives which hasthe following general properties: a) each motive within the set is highlyrelated to each other, and b) each motive within the set has a relativelylesser relationship with other clusters and with the remaining unclusteredmotives. The net effect io like a grape arbor with bunches af natives whichbang together, even though they are all on the same vine. By this rather cryp-tic analogy we mean to stress that our method does not assume that the clustersare \I independent II of each other. Rather, even though the whole set has a gen-eral tendency for positive interrelationships , the relationships within clustersare higher than the relationships betwe clusters (grammarians would say V1 amongclusters, II but statisticians say 'Ibetween
2Cf. Robert C. Tryon, Cluster Analysis , Ann Arbor, Michigan, EdwardsBros., 1939.
For the technical reader, we may note that we used ilQV; measures of asso-ciation rather than correlation coefficients in our analysis. Since the tech-nique is essentially nnon- parametricll in its logic, we feel no real need toapologize except that the use of nottparametric measures in factor analysis typeresearch seems to be an affect producing activity.
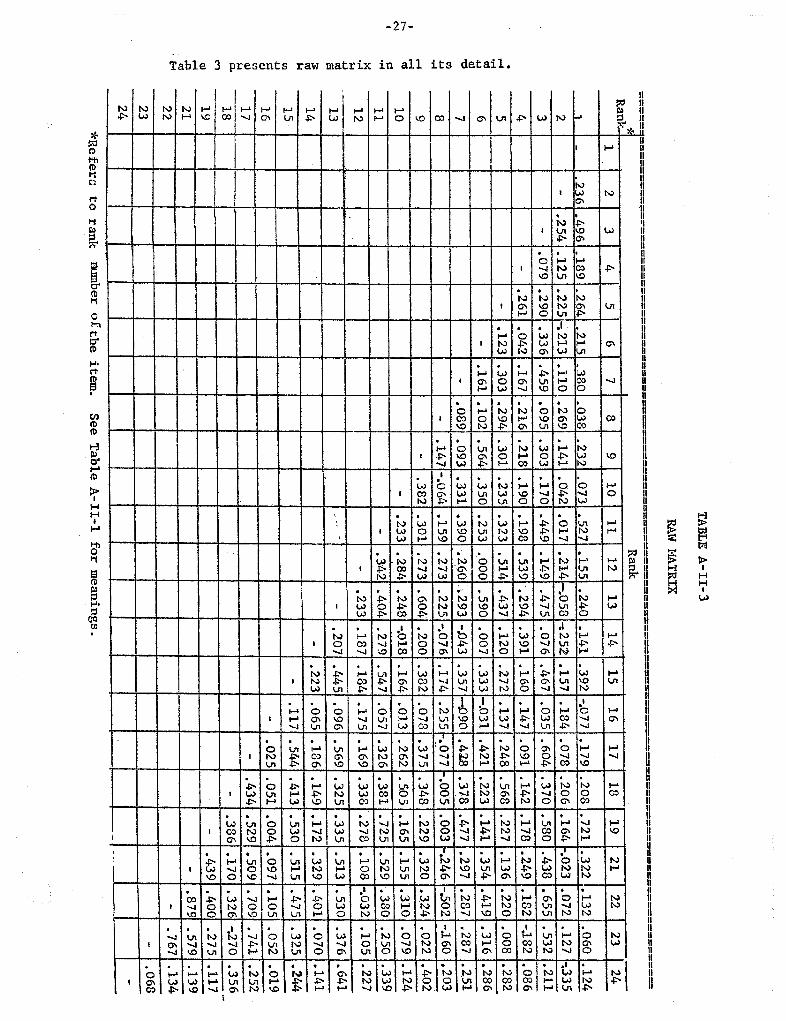
27-
Table 3 presents raw matrix in all its detail.
t: I
..
IU
\. ::
"" ,to
'11
1-,
.j
1-. IU II
VI
VI
t'"
""
'oJ
+'"
0\
"" '' ...
We notice that most of the rela onships are positive , and range frommild to medium tn strength. Analysis of the data indicated four clusters andseven "lone wolfli motives. Details of the analysis are presented in the fol-lowing table.
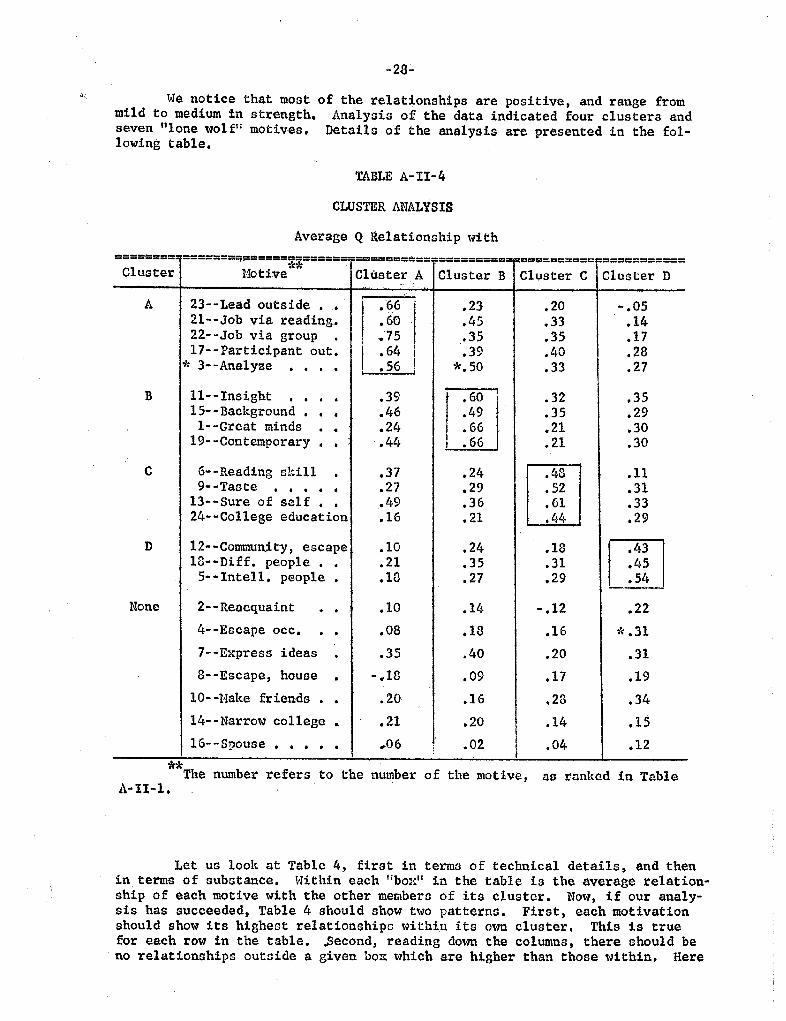
TABLE A-II-4
CLUSTER ANALYSIS
Average Q Relationship with
========-======= ======*;======-==========-========== ========== ===========
Cluster Hotive Cluster A Cluster B Cluster C Cluster D
23--Lead outside
- .
2l--Job via reading.22- -Job via group17-- Participant out. 64
3--Ana1yze
ll--Insight . 6015- - Background1--Great minds
19- -Contemporary
6- -Reading skill9--Taste
13--Sure of self24--College educat ion
12--Commum,ty, escape18--Diff. people
5-- Intell. people
None 2-- Reacquaint
- .
4--Escape occ.
7--Express ideas8- -Escape house
10--l1ake friends14--Narrow college
l6--Spouse
The number refers to the number of the motive,4\- 11-1.
B r nkad in Tnb1e
Let us look at Table 4, first in terms of technical details, and thenin term of substance. vJithin each "bo " in the table is the average relation-ship of each motive with the other members of its cluster. Now, if our analy-sis has succeeded, Table 4 should show two patterns. First, each motivationshould show its highest relationships within its own cluster. This is truefor each row in the table. $econd, reading down the columns, there should beno relationships outl3idea. given bo: which are higher than those within. Here
29-
we do find one exception. Motive 3 in Cluster A (Improving ability to analyzearguments) has a higher correlation with Cluster B than one of the Bs... (15:Background for participation). However, it has a still higher relationshipwith its own cluster A and is not a real member of B. We can probably saythat this motive tends to overlap both A and B. Motive 4, (Escaping the narrow-ness of my occupation) was a candidate for Cluster D, but it brought the with-in-cluster average down too much, so it was left out. With these two excep-tions , the pattern is that required by the definition of a cluster.
What , then, do these clusters mean?
Cluster A-- Stepping Stone
The tightest cluster is A, which is made up of the following:
23. Developing the abili ty to lead group discus-sions outside of Great Books.
21. Improving my ability to carry out my jobthrough the intellectual training of read-ing Great Books.
Increasing my ability to carry out my jobthrough improving my ability to participatein group discussions.
22.
17. Becoming a more effective participant in groupdiscussions outside of Great Books.
(We excluded Number 3 because of the evidence we found that it may bea fellow traveler in Cluster B.
What these seem to have in common is a focus on the job and on groupdiscussions outside of the program. Now, we should note that Number 4 (Es-caping the intellectual narrowness of my occupation) and Number 10 (Makingriends) have quite low relationships with this cluster, so the issue does
not seem to be Ii job" or l1groupyness per se Rather, it appears to us thatwhat these four motives have in common is a focus on learning specific tech-niques in Great Books that can be used as a tepping stone for success inother areas. The focus is not intellectual ('Learning what the great mindshave to 6ayl1 has a low relationship with this group), but rather on specificskills and techniques, cnd- e hate to say it--gimmicka. Cluster A appears tobe highly pragmatic. It is also relatively infrequent, containing only motivesof rank 17 or lower.
Cluster B-- "Content"
The four motives in Cluster Bare:
To learn what the greatest minds in history haveto say about the basic issues of life.
Gaining insight into 'myself and my personalproblems.
11.
15. Gaining a better intellectual background formy participation in community organizationsand community affairs.
Finding solutions to contemporary problems.19.

-30..
\le have called this cluster IIContent" because it seems to focus on thecontent of the books, and excludes group participation as a means or end. Itdoes involve areas outside the immediate program, like 11Stepping Stone, " butthese are quite intellectual and abstract, definitely not gimmicks. One mightthink of the II Content " cluster as the official motivation for the program. its general aspect, motive 1 , it is the most common reason; and in its appliedareas (self, community, and world) it includes less frequent motives, but notthe rare ones which are included in "Stepping Stone.
Cluster C-- Self-Help
Cluster C includes:
Improving my reading skills.
Improving my taste in fiction and poetry.
Becoming more sure of myself when talkingwith people of higher intellectual back-ground.
Gaining the equivalent of a college edu-cation.
13.
24.
One needs little ingenuity to figure out what underlies Cluster C. is what a nameless consultant to the study calls IIThey laughed when I sat downat the piano, but were they surprised when I began to talk about Plato " andwe have decided to call it "Sel f-Help. 1! It requires little comment, e ceptto say that it does not include group participation in any form, and its ele-ments have a wide range of frequency, being roughly less frequent as the aimsappear more ambitious.
Cluster D-- Cosmopolitanism
Cluster D is made up of:
Talking with people who have more intel-lectual interests than my usual " social!?friends.
12. Escaping the intellectual narrowness ofmy community.
Meeting people who are quite differentfrom me.
18.
As we have noted, a case c tld be made for the addition of Number 4(Escaping the intellectual narrowness of my occupation) here, although wechose not to.
Cluster D 113 made up of puahcG and pullG. The push apparcntly isfeeliugs of boredom and narrowness in the social world of the participantswhile the pull is the hope that in the program one can find people who aremore alert and intellectual. The elements here are both H social, 1\ sincemeeting people seems to be the cure , and " intellectual , 11 since the lackthereof, appears to be the cause. tIe felt that "Cosmopolitanism" camepretty close to e:; pressing the theme. Like the "Content" cluster, it in-cludes one high ranking motive and others that arc less common.
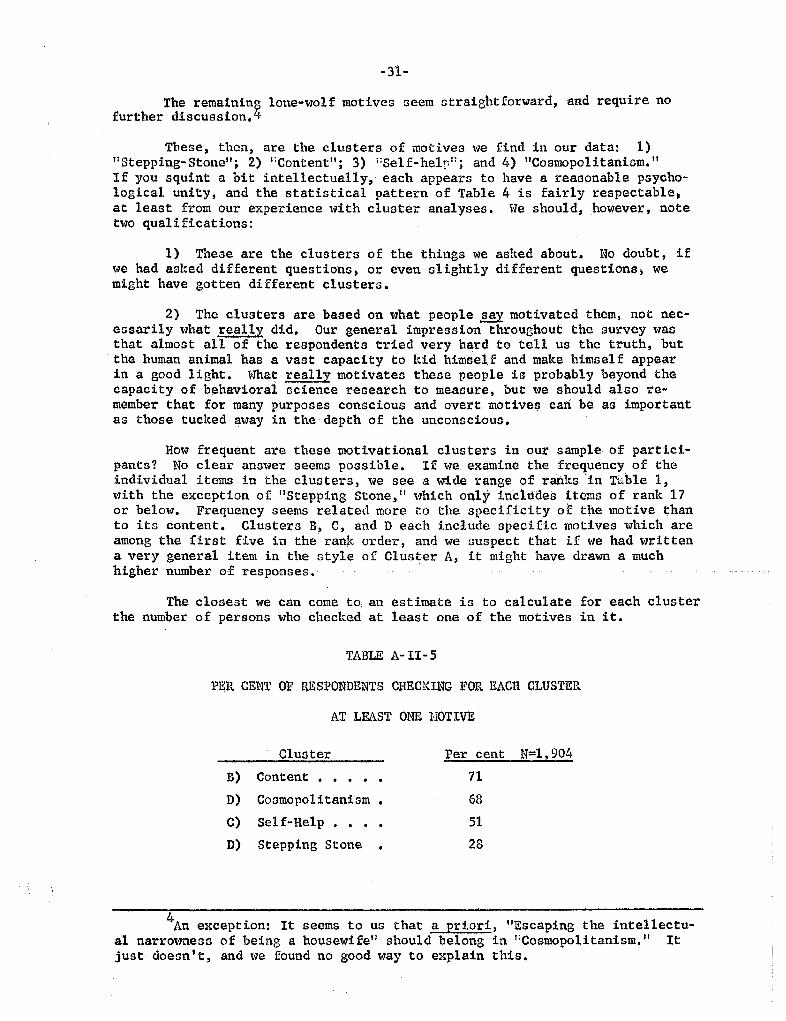
-31-
The remaining lone-wolf motives seem straightforward, and require nofurther discussion. 4
Tbese, then, are the clusters of motives we find in our data: Stepping-Stone ; 2) nContent" ; 3) I:Self-he1p ; and 4) "Cosmopolitanism.
If you squint a bit intellectually, each appears to have a reasonable psycho-logical unity, and the statistical pattern of Table 4 is fairly respectable,at least from our e2cperience with cluster analyses. We should, however, notetwo qualifications:
1) These are the clusters of the things we asked about. No doubt, ifwe had asked different questions, or even slightly different questions, wemight have gotten different clusters.
2) The clusters are based on what people motivated them, not nec-essarily what really did. Our general impression throughout the survey wasthat almost all of the respondents tried very hard to tell us the truth, butthe human animal has a vast capacity to kid himself and make himself appearin a good light. What really motivates these people is probably beyond thecapacity of behavioral science research to measure, but we should also re-member that for many purposes conscious and overt motives can be as importantas those tucked away in the depth of the unconscious.
How frequent are these motivational clusters in our sample of partici-pants? No clear answer seems possible. If we examine the frequency of theindividual items in the clusters, we see a wide range of ranks . in ble 1with the exception of IIStepping Stone , II which only d..ddes .it(;mG of rank 17or below. Frequency seems related more to the specificity of the motive thanto its content. Clusters B, C, and D each include specific motives which areamong the first five in the ran order, and we suspect that if we had writtena very general item in the style of Cluster A, it might have drawn a muchhigher number of responses.
The closest we can come to, an estimate is to calculate for each clusterthe number of persons who checked at least one of the motives in it.
TABLE A- II- 5
PER CENT Qt' P SPONDENTS CHECKING FOR EACH CLUSTER
AT LEAST ONE NOTIVE
Cluster Per cent N=l 904
Content
Cosmopolitanism.Self-HelpStepping Stone
An exception: It seems to us that a priori
, "
Escaping the intellectu-al narrowne3S of being a housewife" should belong in "Cosmopolitanism.just doesn I t, and we found no good way to explain this.
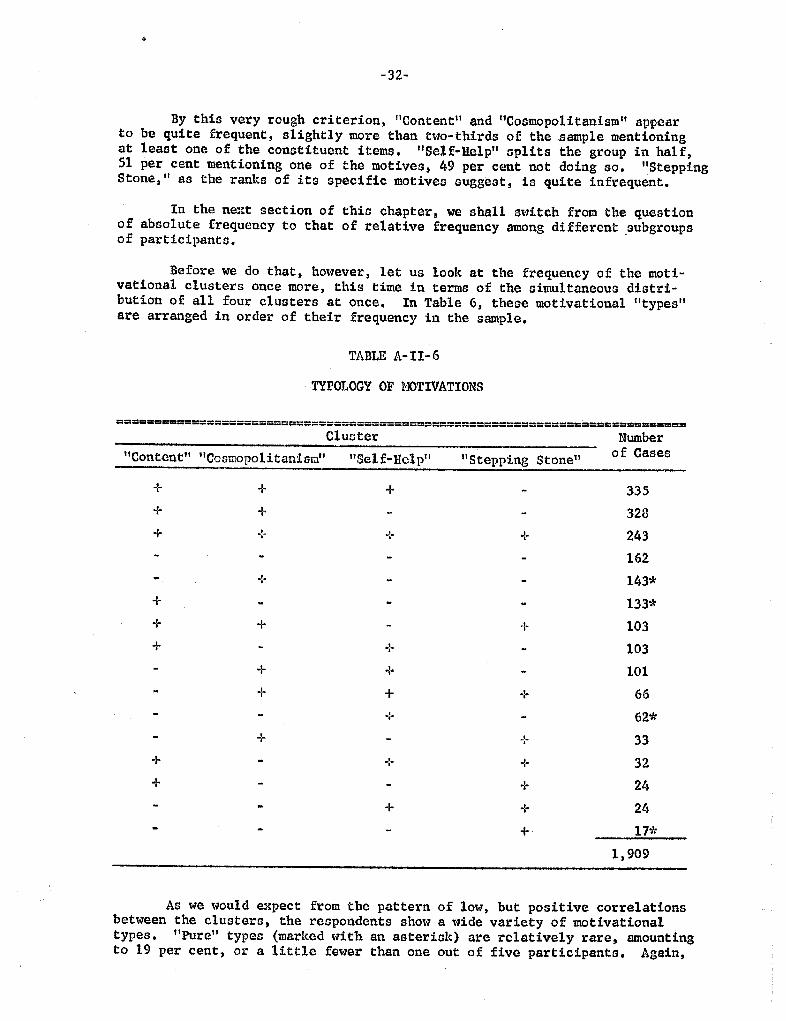
32-
By this very rough criterion, IIContent and "Cosmopolitanism" appearto be quite frequent, slightly more than two-thirds of the sample mentioningat leaat one of the constituent items. " Self-Help" opHts the group in half51 per cent mentioning one of the motives, 49 per cent not doing so. "SteppingStone , II as the ranks of its specific motivea suggest, is quite infrequent.
In the ne tt section of this chapter, we shall switch from the questionof absolute frequency to that of relative frequency among different .subgroupsof participants.
Before we do that, however , let us look at the frequency of the moti-vational clusters once more , this time in terms of the aimultaneouG distri-bution of all four clusters at once. In Table 6, these motivational " typesare arranged in order of their frequency in the sample.
TABLE A-II-
TYPOLOGY OF 1:OTIVATIONS
============================================================================
CluoterContent" "Cosmopolitaniam Sel f-Hcl p Stepping Stone
Numberof Cases
335
328
243
162
143*
133*
103
103
101
62*
17*
909
..:.. .:.. ..:-..:-
As we would expect from the pattern of low, but positive correlationsbetween the clustera, the respondents show a wide variety of motivationaltypes. "purell types (marked \\lith an asterisk) are relatively rare, amountingto 19 per cent , or a little fewer than one out of five participants. Again,
-33-
we note the high frequency of "Content II and I1Cosmopolitanism. Only 14 per centof the respondents checked none of the items in either cluster, and a littleover half (53 per cent) checked both. Thus, although in the following analysiswe shall treat each cluster separately, this is a little artificial , for it isclear that very few of the respondents have a II singlel1 purpose for their par-ticipation, but rather, they hope that Great Books can satisfy several typesof motivations.
Subgroup Differences in Motivations
Many of the motives in our list are quite specific and by definitioncan be found concentrated in a few subgroups in the sample. Thus , it wouldn t ttIDt our IBll machines much to find out that; there is a relationship bet '1een liEs-caping the intellectual narrowness of being a housewife" and sex and maritalstatus. (About 35 per cent of the sample are housewives and 30 per cent 0 f thesample checked this item. For our more abstract clusters , however , the pat-terns do not appear to be obvious. Therefore, we e""amined the statisticalrelationships between IIchecldnG one or more items in a given cluster and se-lected social chaJ:acteristics of the respondents. vIe shall consider each ofour four motivational clusters in turn.
" Cont en t II
The ammer for n Contentll is clear.. .very clear , for it doesn I t correlatewith anything at all. Actually, there are a few trends: 67 per cent of. theinfrequent church attcnders and 74 per cent of the frequent attenders check atleast one IIContent II item; the corresponding proportion for "no collegell b per cent; for those with graduate training, 72 per cent; for men, 68 per ceand for women, 73 per cent.
Content,1 also has a slight, but fairly consistent relationship withtype of community. It was mentioned by 64 per cent in the very big cities;70 per cent in the suburbs as a whole; 74 per cent in the big cities; and76 per cent in the small towns. Again, we would predict that the correctweighting of our cases by type of community would raise the overall totalchecking "Content, II although it is equally true that, regardless of the sizeof the community, "Contontll :Ls mentioned by two-thirds or more of the partici-pants, and there is no type of community where it is a IIminoritylt motivation.
Now, \-,hile e tended statistical magic might produce a few serviceabletables (since women have lower educational levels than men, controlling edu-
cation would undoubtedly produce a sex difference in favor of the women) themost meaningful conclusion is that in any subgroup created by dividing theparticipants in terms of age , education , sex eligion, years in the program,
scores on measures of intellectual ability, political party preference, etc.,etc., one will find very close to 70 per cent mentioning a lIContent" motiva-
tion.
Now, while candor forces us to admit that if correlations had turnedup, we probably could have made good sense out of them, when we turn on our
retrocpectoscope '1e find that this is not at all surprising. Presumably,Content'l is the basic motivation of the vast bulk of the participants, and
there is no reason why, within Great Books, single females or Democrats or
Roman Catholics should be more interested or less interested in Great Booksin a literal sense. Now, of course, subgroups may be expected to vary to agreat e2ttent in '1hat they believe the Great Books say and in terms of how
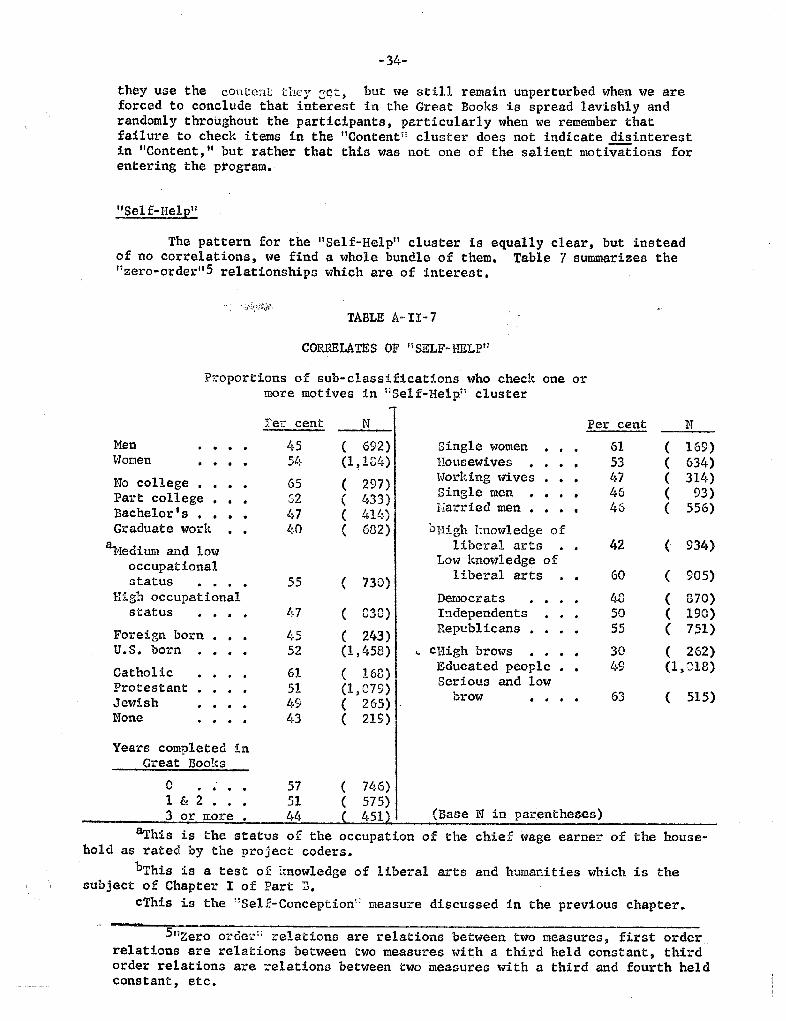
-34-
they use the cOntent they but we still remain unperturbed when we areforced to conclude that intereat in the Great Books is spread lavishly andrandomly throughout the participants, particularly when we remember thatfailure to check items in the "Content!: cluster does not indicate disinterestin "Content, " but rather that this was not one of the salient moti-;ions forentering theptogram.
Self-Re1p
The pattern for the nSelf-Helpll cluster is equally clear, but insteadof no correlations, we find a whole bundle of them. Table 7 summarizes thezero-order"S relationships which are of interest.
TABLE A.. II-
CORRELATES OF I1 SELF-HELPr;
Proportions of sub-classifications who check one ormore motives in Self-HelpH cluster
re:: cent Per cent
lien 692) Single tY'omen 169)V1 omen 184) HOllsewives 634)
college 297) tJorking tY'ives 314)Single men 93)Part college 02 433)Harried men 556)Bachelor H:.
Graduate wo;:k
'-:.
682) ol-lZh l:now1edge of
11ediuT1 and low liberal arts 934)occupational Low knowledge of
1i beral arts 905)Gtatus 730)Righ occupational Democrats 870)
status 038) Independents 190)Foreign born 243)
Republ icans 751)born (1 , 458) cHigh brows 262)
Catholic 168) Educated people 018)Serious and lowProtestant 079) brow 515)Jewish 265)
None 219)
Years completed inGreat Books
o . 57 ( 746)1 & 2 . . 51 ( 575)3 or more 44 ( 45l)
8This is the status of the occupation of the chief wage earner of the house-
hold as rated by the project coders.
bThis is a test of Imowledge of liberal arts and humanities which is the
subject of Chapter I of Pa;:t
cThis is the ::Self-Conception:: measure discussed in the previous chapter.
(Base N in parentheses)
Zero order ::elations are relations between two measures, first o;:de;: relations are ;:elations between two measures with a third held constant, thi;:dorder relations are ::elations between two measures with a third and fourth heldconstant , etc.
-35-
We should note that there are also a few characteristics that show little re-lationship to " Self-Help!! as a motive. Among them: frequency of churchattendance, age, and intention to continue in the program next year.
In spite of the wide variety in the apparent nature of the character-istics \lhich correlate with the t:Self-Helpll cluster, the content of Ta1Jle 7Gugeesto tbat 11100t of them are direct or incirect measures of intellectual train-ing and ability. If so , the point is that the people who want intellectualself-help are the people who need it. The relationship betwecn self-help andprogram exposure is not of this type , however. By and large, there are morepeople who say they were motivated by needs for self-help in the beginningyears than in the advanced years. Now, this suggests two possibilities.Either self-helpers tend to drop out of the program, or more self-helpers areentering proportionally as the years go by, or both.
In order to check our impression that intellectual training or abilityis the impol' tant variable underlying the II Self-Help" motivation, we re-examinedall the original relationships, controlling for education and years of exposure.We chose education aa our I1qualityll variable for three reasons: l) it is prob-ably quite reliably measured; 2) it is a powerful correlate of all the othermeasures of intellectual ability; and 3) unlike the test scores it is known bythe participant and hence is more likely to influence his conscious motiva-tions. In order to avoid getting entangled in the "drop-out" problem, we willconsider only first year participants here.
When we apply education as a control, 1hat happens is that the IIsociaplvariables, on the whole tend to evaporate, while the more overtly lIintellectu-a1" measures tend to remain related to "Self-Help.
Here is the table for sex and life-cycle role:
A third possibility is that members tend to forget their originalmotivations as the years go by, or to re..interpret them. As a matter offact, most specific motivations tend to decline very slightly with years ofexposure. However, since neither rrCoor.1oi?olltal1icnll nor I:Contcnt aD E), uotcrsshow any decline '1ith years of exposure , the decline in "Self-Help" probablycannot be explained as due to a lapse of memory of the original motivations.
Examination of the full tables shows the same trends In general inthe advanced years, except that , as is generally true in our analysis, "demo-graphic" relationships are reduced in the advanced years, presumably becauseprogram experience tends to lIover-ridell initial social differences as timegoes on.
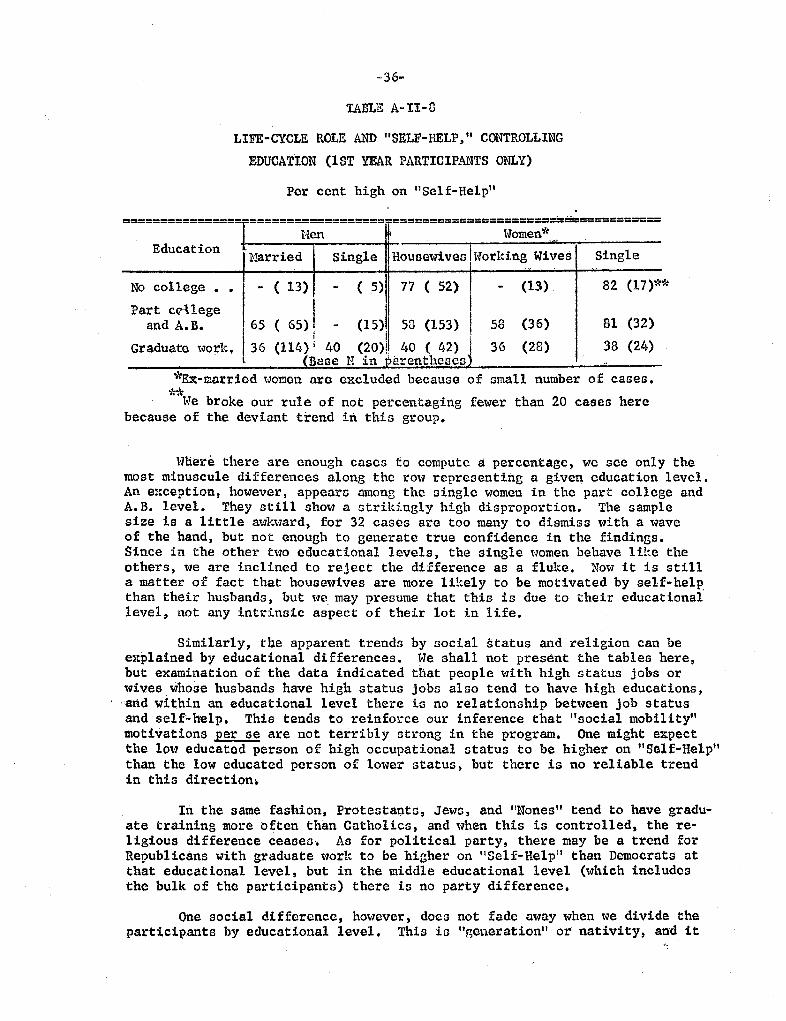
-36-
TABLE A- II-
LIFE-C''lCLE ROLE AND " SELF-HELP, " CONTROLLING
EDUCATION (1ST YEAR PARTICIPANTS ONLY)
Per cent high on I1 Self-Help
------------------------------------------------------=------=--========---------------- ------- -------- --------------- -----
Education Harried Single HOUOGwivGG !Working Wives Single
No college (13) (5) 52) (13). (17)*-
Part ce11ege( 65) and A. B. (15)1 (153) (36) (32)
Gr aduato work. (114) j 0)1 ( 42) (28) (24)io.,
(Bane N n p entheseu*Ex-marr1ed women arc excluded because of small number of cases.We broke our rule of not percentaging fewer than 20 cases here
because of the deviant trend in this group.
Where there are enough cases to compute a percentage, we see only themost minuscule differences along the row representing a given education level.An exception, however, appears among the single women in the part college and
B. level. They still show a strikingly high disproportion. The samplesize is a little awl vard, for 32 cases are too many to dismiss with a waveof the hand , but not enough to generate true confidence in the findings.Since in the other two educational levels , the single women behave like theothers, we are inclined to reject the difference as a fluke. Now it is stilla matter of fact that housewives are more likely to be motivated by self-helthan their husbands , but we may presume that this is due to their educationallevel , not any intrinsic aspect of their lot in life.
Similarly, the apparent trends by social status and religion can beexplained by educational differences. We shall not present the tables herebut e camination of the data indicated that people \'1ith high status jobs orwives whose husbands have high status jobs also tend to have high educations,nd wi hin an educational level there is no relationship between job status
and self.. help. This tends to reinforce our inference that "social mobilitymotivations per se are not terribly strong in the program. One might expectthe low educated person of high occupational status to be higher on "Self-Helpthan the low educated person of lower status, but there is no reliable trendin this direction.
In the same fashion, Protesta1;ts, Jews, and "Nones" tend to have gradu-ate training more often than Catholics, and when this is controlled , the re-ligious difference ceases. As for political party, there may be a trend forRepublicans with graduate worl to be higher on II Self-Help;l than Democrats atthat educational level, but in the middle educational level (which includesthe bulk of the participants) there is no party difference.
One social difference, however, does not fade away when we divid theparticipants by educational level. This is "generation" or nativity, and it
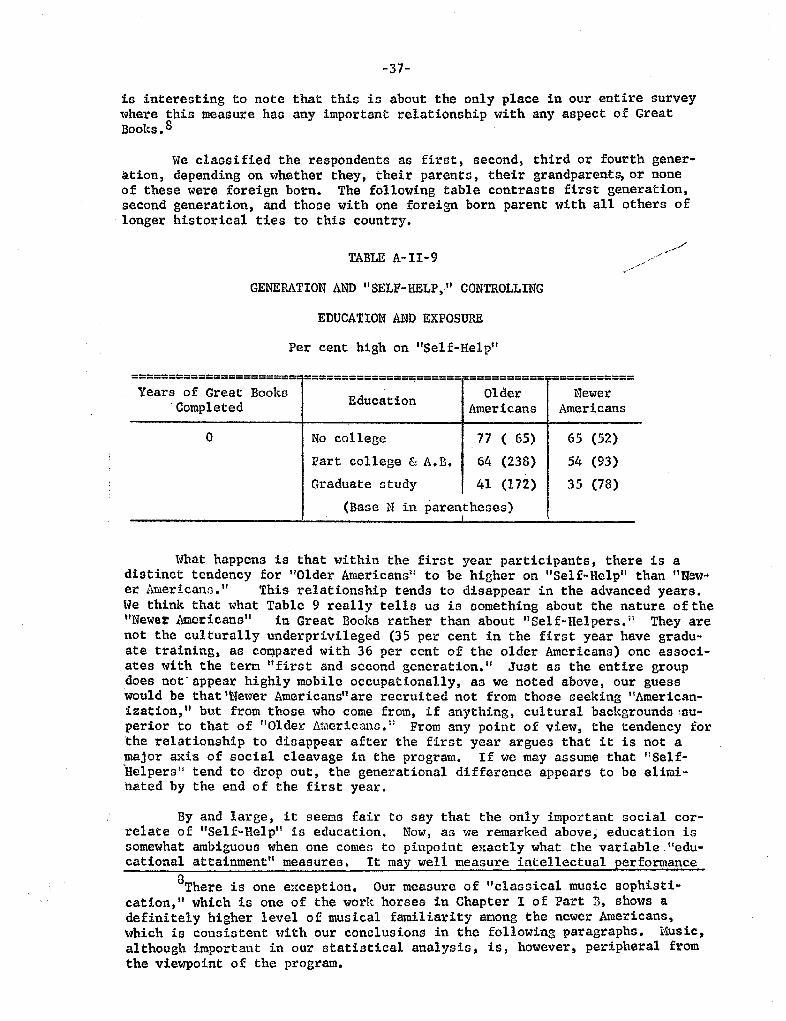
-37-
is interesting to note that this is about the only place in our entire surveywhere this measure has any important relationship with any aspect of GreatBooks.
We classified the respondents as first, second, third or fourth gener-ation, depending on whether they, their parents, their grandparent or noneof these were foreign born. The following table contrasts first generationsecond generation, and those with one foreign born parent with all others oflonger historical ties to this country.
TABLE A-II-9
GENERATION AND II SELF- HELP " CONTROLLING
EDUCATION AND EXPOSURE
Per cent high on "Self-Help
======================= =====================-==========-===========
Years of Great Books Older NewerEducationCompleted Americans Americans
No college
Part college & A.
Graduate study
(Base N in parentheses)
77 ( 65)
64 (238)
41 (172)
65 (52)
54 (93)
35 (78)
What happens is that within the first year participants, there is adistinct tendency for 110lder Americans . to be higher on "Se1f-He1pll than " New-er Americana. This relationship tends to disappear in the advanced years.We think that what Table 9 really tells us is something about the nature of the11 Newer Amoricans in Great Books rather than about "Self-Helpers. i1 They arenot the culturally underprivileged (35 per cent in the first year have gradu-ate training, as co pared with 36 per cent of the older Americans) one associ-ates with the term " first and second generation. Just as the entire groupdoes not- appear highly mobile occupationally, as we noted above, our guesswould be that ' Newer Americans" are recruited not from those seeking "American-ization , II but from those who come from, if anything, cuI tural backgrounds au-perior to that of 1I0lder Atilericanc. :: From any poit'lt of vie,,, , the tendency rorthe relationship to disappear after the first year argues that it is not amajor axis of social cleavage in the program. If we may assume that II Self-Helpers li tend to drop out, the generational difference appears to be eUm!-hated by the end of the first year.
By and large , it seems fair to say that the only important social cor-relate of "Self-Help" is education. Now) as \\1e remarked above, education issome,,,hat ambiguous when one comes to pinpoint e cactly what the variable. "edu-cational attainmentli measures. It may well measure intellectual performance
There is one e,cception. Our measure of " classical music sophisti-cation, " which is one of the ,,,ork horses in Chapter I of Part TI, shows adefinitely higher level of musical familiarity among the newer Americans,which is consistent with our conclusions in the following paragraphs. Musicalthough important in our statistical analysis, is, however, peripheral from
the viewpoint of the program.
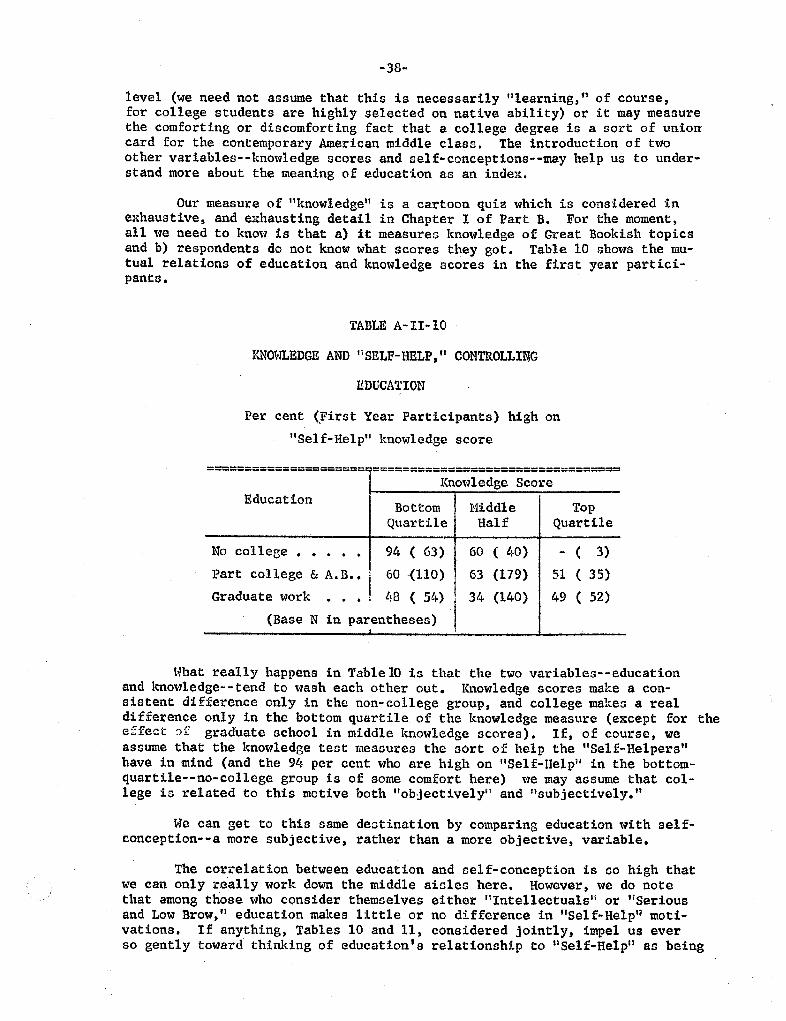
-38-
level (we need not assume that this is necessarily IIlearning, " of course,for college students are highly selected on native ability) or it may measurethe comforting or discomforting fact that a college degree is a sort of unioncard for the contemporary American middle class. The introduction of twoother variables--knowledge scores and self-conceptions--may help us to under-stand more about the meaning of education as an index.
Our measure of "knowledge" is a cartoon quiz which is considered inexhaustive, and exhausting detail in Chapter I of Part B. For the momentall we need to know is that a) it measureD knowledge of Great Bookish topicsand b) respondents do not know what scores they got. Table 10 shows the mu-tual relations of education and knowledge scores in the first year partici-pants.
TABLE A-II-IO
KNm EDGE AND Ii SELF- HELP, " CONTROLLI
EDUCM, ION
Per cent (Yirst Year Participants) high on
Self-Help" knowledge score
=====================-=================================
EducationKnowledge Score
Bo t tom
QuartileNiddleHalf
TopQuartile
No college.
Part college
Graduate work
94 ( 63)
& A. B.. I 60 (110)
( 54)
(Base N in parentheses)
. . . .
60 ( 40)
63 (179)
34 (140)
- (
51 ( 35)
49 ( 52)
What really happens in Table 10 is that the two variables--educationand knowledge- - tend to ash each other out. Knowledge scores make a con-sistent difference only in the non-college group, and college makes a realdifference only in the bottom quartile of the knowledge measure (except for theeffect ar graduate school in middle knowledge scores). If, of course, weassume that the knowledge test measures the sort of help the "Self-Helpershave in mind (and the 94 per cent who are high on "Self-Helpil in the bottom-quartile--no-college group is of some comfort here) we may assume that col-lege is related to this motive both "objectively" and lisubjectively.
We can get to this same destination by comparing education with self-conception--a more subjective, rather than a more objective, variable.
The correlation between education and self-conception is so high thatwe can only really work down the middle aisles here. However, we do notethat among those who consider themselves either I1 Intellectuals l1 or "Seriousand Low Brow, " education makes little or no difference in "Se1f-Help moti-vations. If anything, Tables 10 and 11 , considered jointly, impel us everso gently toward thinking of education s relationship to II Se1f-Help" as being
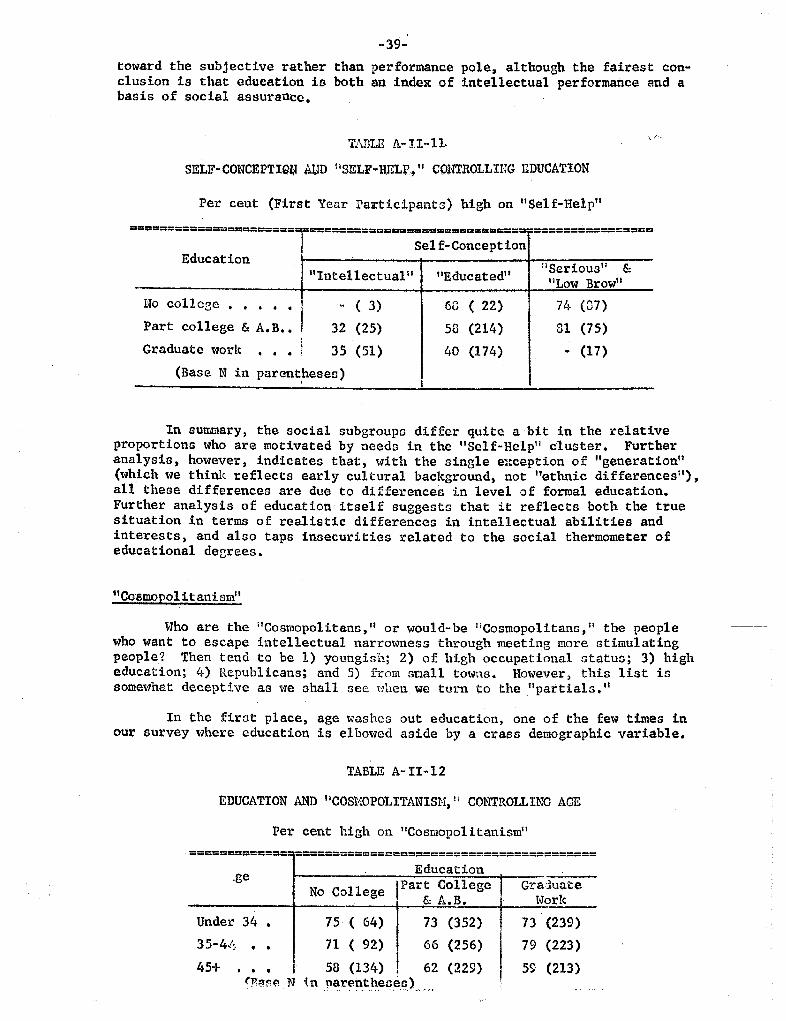
-39-toward the subjective rather than performance pole, although the fairest con-clusion is that education io both an index of intellectual performance 8nd abasis of social assurance.
...
TADLE A-II-
SELF-CONCEPTIO t"LID I1 SELF-UELV. " CO! TROLLING EDUCATION
Per cent (First Year Participanto) high on I1Self-Help
Sel f- Concept ion
=====;===;==;========= ==============================-
==============c=
EducationIntel1ectua111 "Educated!! Serious
" &
Low Brow
110 collC3C - ( 3)
32 (25)
35 (51)
6G ( 22)53 (214)
40 (174)
. . . .
Part college & A. B. .
Graduate 1ork . .
. j
(Base N in parentheses)
74 (07)
81 (75)- (17)
In summary, the social subgroups differ quite a bit in the relativeproportions who are motivated by needs in the "Self-Help" cluster. Furtheranalysis , however, indicates that, ,gith the single exception of "generation(which we think reflects early cultural bacl(ground, not "ethnic differencesall these differences are due to differences in level of formal education.Further analysis of education itself suggests that it reflects both the truesituation in terms of realistic differences in intellectual abilities andinterests , and also taps insecurities related to the social thermometer ofeducational deGrees.
Co.smopo1 itanism
Who are the ilCosmopolitans, " or would- be I1Cosmopolitans , II the peoplewho want to escape intellectual narrowness through meeting more stimulatingpeople? Then tend to be 1) youngish; 2) of high occupational statua; 3) higheducation; 4) Republicans; and 5) from snall towns. However, this list issome,ghat deceptive as ,ge shall see 'ohen . we turn to the "partials.
In the first place, age washes out education, one of the few times inour survey where education is elbowed aside by a crass demographic variable.
TABLE A-II-l2
Per cent high on "Cosmopo1itanism
EDUCATION AND HCOS110POLITANISH 1I CONTROLLING AGE
=============: ========================================
EducationNo College
part College& A.
75 ( 64) 73 (352)71 ( 92) 66 (256)58 (134) I 62 (229)are . 'M
Under 34 .35-4./:. . .
45+
. . .
(r1' e N in
Graduate\.Jork
73 (239)
79 (223)
59 (213)
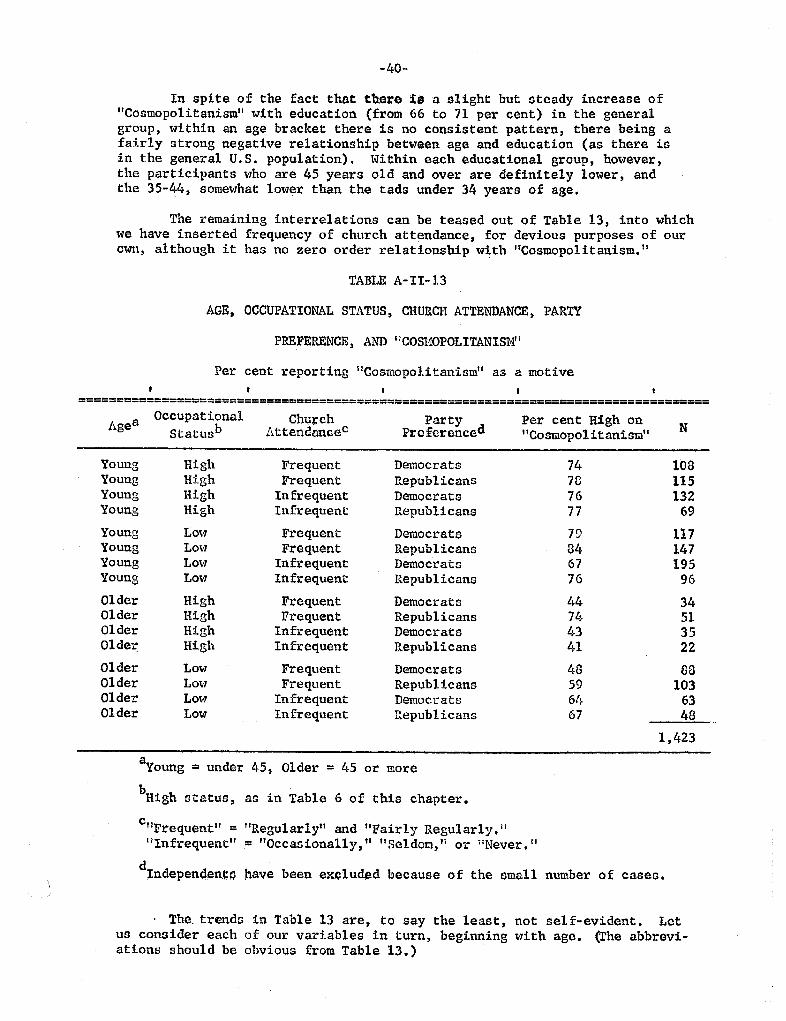
-40-
In spite of the fact that there 18 a slight but steady increase ofCosmopolitanismll with education (from 66 to 71 per cent) in the generalgroup, within an age bracket there is no consistent pattern, there being afairly strong negative relationship between age and education (as there isin the general U. S. population). Within each educational group, however,the participants who are 45 years old and over are definitely lower, andthe 35-44, somewhat lower than the tadsunder 34 years of age.
The remaining interrelations can be teased out of Table 13, into whichwe have inserted frequency of church attendance, for devious purposes of ourown, although it has no zero order relationship with "Cosmopolitanism. I!
TABLE A-II-
AGE, OCCUPATIONAL STATUS, CHURCH ATTENDANCE , PARTY
PREFERENCE , AND 'I COS110POLITANISNII
Per cent reporting IICosmopoJ.itanism" as a motive
============= ==========================================;=;=========================
AgeOccupational Church Party Per cent High on
Status Attendanccc Preferonce IICosmopol itanism
Young High Frequent Democrats 108Young High Frequent Republicans 115Young High Infrequent Democrats 132Young High Infrequent RepublicansYoung La,., Frequent Democrats 117Young Low Frequent Republicans 147Young Low Infrequent Democrats 195Young Lo,., Infrequent RepublicansOlder High Frequent DemocratsOlder lUgh Frequent RepublicansOlder High Infrequent Democrats01 de;; High Infrequent RepublicansOlder Low Frequent DemocratsOlder Low Frequent Republicans 103Older Low Infrequent Democrats01 der LO'"l Infrequent Republicans
423
Young = under 45, Older = 45 or more
High status, as in Table 6 of this chapter.
Frequentll = "Regularly" and "Fairly Regularly. rnfrequent" = IIOccasionally,
" "
Seldom, II or ;INever.
;Jndependent;: pave been e c(:u d because of the small number of cases.
. The. trends in Table 13 are , to say the least, not self-evident. Letus conaider each of our variables in turn, beginning with age. (rhe abbrevi-ations should be obvious from Table 13.
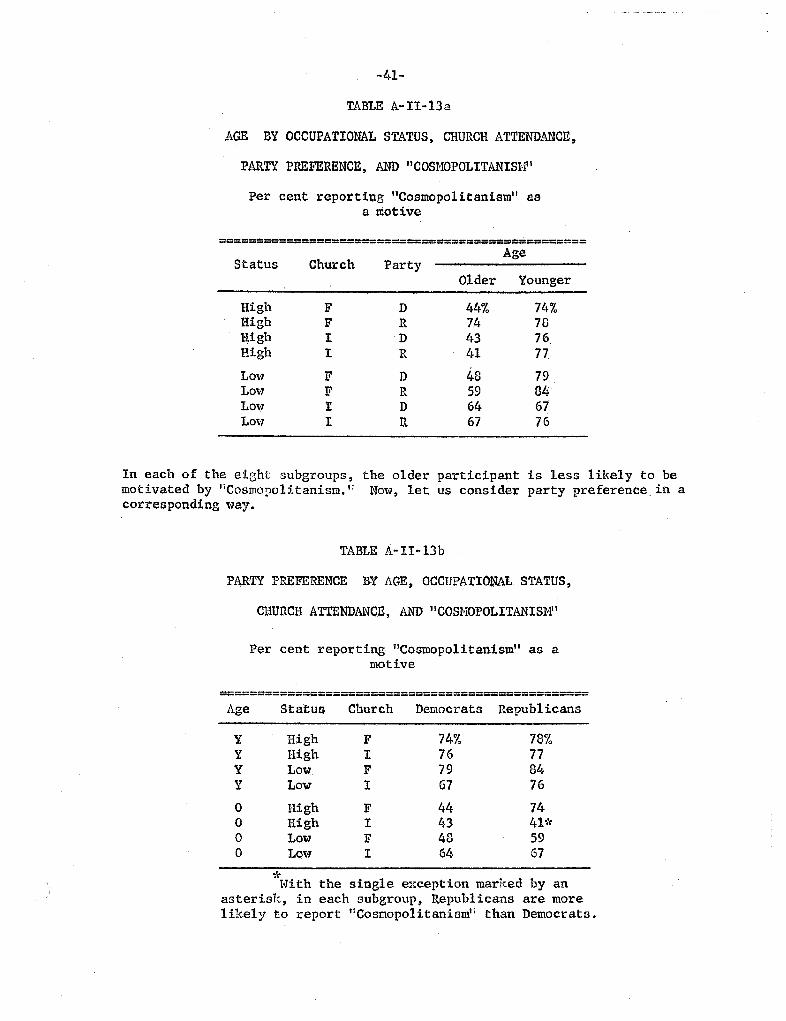
41-
TABLE A-II- 13a
AGE BY OCCUPATIONA STATUS, CHURCH ATTENDANCE
PARTY PREFERENCE, AND "COSMOPOLITANISH"
Per cent reporting "Cosmopolitanism llSa motive
===============:====== === ======================
ChurchAge
Status PartyOlder Younger
High 44% 74%HighHighHigh 77.
LowLowLowLO"1
In each of the eight subgroups , the older participant is less likely to bemotivated by "Cosmopolitanism. I! Now, let us consider party preference , in acorresponding way.
TABLE A-II-13b
PARTY PREFERENCE B-Y AGE, OCCUPATIQNAL STATUS
CHURCH ATTENDANCE, AND "COSHOPOLITANISMI1
Per cent reporting " CoGmopolitanism" as amotive
======;=;========= =============================
Age Statu!; Church Democrats Republicans
High 74% 78%HighLowLow
HighHighLowLow
With the single exception marked by anasterisk, in each subgroup, Republicans are morelikely to report IICosmopolitanismll than Democrats.
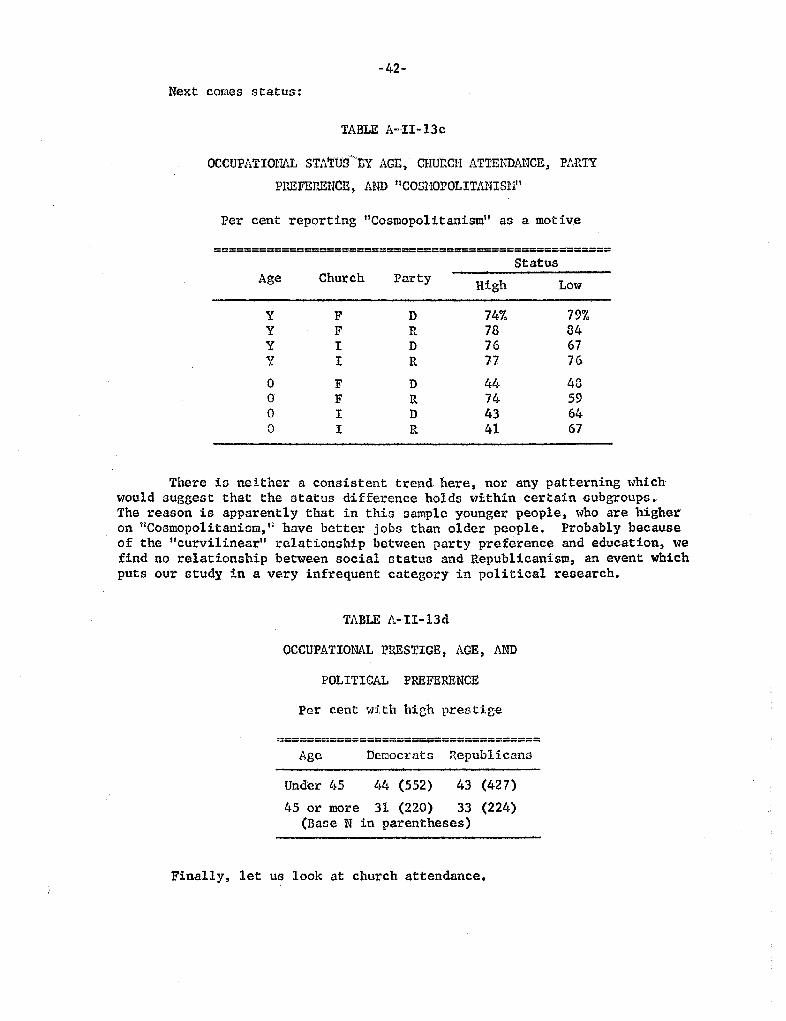
-42-
Next comes status:
TABLE A..II- 13c
OCCUPATIOIJi.L STt,truS" nY AGE CHURCH ATTENDANCE, Pf,RTY
PPJIJ!'P.ENC:B, AND " COSUOPOLITANISl1"
Per cent reporting "Cosmopolitanism" as a motive
====;==;;====================================;=======
StatusAge Church Party High Low
74% 79%
76-
There ia neither a consistent trend here, nor any patterning whichwould suggest that the atatus difference holds within certain oubgroups.The reason is apparently that in this sample younger people, who are higheron IICosmopo1itaniom, 11 have better jobs than older people. Probably becauseof the IIcurvilinearll relationship bet ..een party preference and education, wefind no relationship between social status and Republicanism, an event whichputs our study in a very infrequent category in political research.
TABLE A-II-13d
OCCUPATIONAL PRESTIGE , AGE , AND
POLITICAL PREFERENCE
Per cent with high prestige
-------------------------------------..---------------------------------
Age DefJocrats Republicans
Under l.4 (552) 45 or more 31 (220)
(Base N in parentheses)
(427)
(224)
Finally, let us look at church attendance.
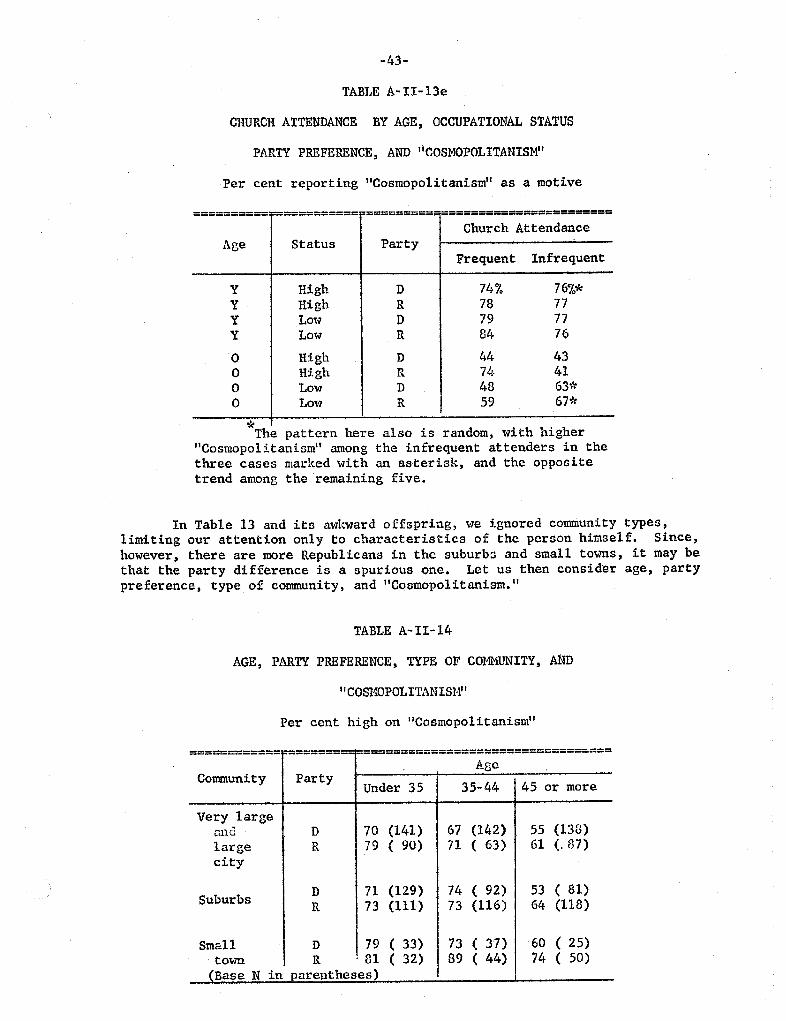
-43-
TABLE A-II-13e
CHURCH ATTENDANCE BY AGE , OCCUPATIONAL STATUS
PARTY PREFERENCE, AND "COSMOPOLITANISM"
Per cent reporting "Cosmopolitanism'! as a motive
==========-=========== :========= =======================
Church AttendanceAge Status Party
Frequent Infrequent
High 74% 76%*HighLO'-1
Low
HighHigh 74.
LowLow 67*
The pattern here also is random, with higherCosmopolitanism" among the infrequent attenders in thethree cases marked with an asterisk, and the oppositetrend among the remaining five.
In Table 13 and its awl ward offspring, we ignored community types,limiting our attention only to characteristics of the person himself. Since,however, there are more Republicans in the suburbs and small towns, it may be
that the party difference is a spurious one. Let us then consider age , partypreference, type of community, and "Cosmopolitanism. II
TABLE A-II-14
AGE, PARTY PREFERENCE, TYPE OF COMMITY, Mm
COSI10POLITANISH'I
Per cent high on "Cosmopolitanism
============ ========= -=================================
A8eCommunity Party
Under 35 35-44 45 or more
Very largeand (l4l) (142) (l38)large (90) 63) 87)city
Suburbs(129) (92) ( 81)
(Ill) (116) (118)
Small (33) (37) ( 25)
town ' 81 (32) (44) 50)(Base N in Darentheses)
-44-
All three characteristics appear to contribute to "Cosmopolitanism. IIIn each of the six rows the group under 35 is higher on "Cosmopolitanismthan the over 45s , and in four out of six the 35-44s are in the middle. Withonly one small exception (35-44 in the suburbs) Republicans are more interest-ed in IICosmopolitanism" than Democrats , even when one controls for age andcity size , both of which are related to party preference. Likewise, in eachcase the small town participant is more lik ly to report this motive than theperson from the big city, and the suburbanite tends to fall between them.
The three variables jointly produce a range from 55 per cent high amongolder, big city Democrats to more than 80 per cent among young, small townRepublicans, although we should note that in every cell in the table , IICosmo-politanism" is in the majority. There is no subgroup which is II loWIl O: thismotivation, but they do differ in how high they are.
The relationship ''lith city size appears obvious he need for IICosmo-
politanism" decreasing with the cosmopolitanism of the community. (We shouldmake clear , for the record, that we named this cluster before we knew of thiscorrelation. ) Likewise , the fact that younger people are higher seems reason-able either because of their generally higher interest in new stimuli or thefact that their social worlds are less structured and they are more " readyto find the new friends which are the cure defined in the cluster.
What is somewhat interesting, however, is that, of the three, probablyparty preference is the strongest predictor , in the sense that it shows thefewest and smallest exceptions in the table. Now, we do have some evidencethat Republicanism is associated with social conservatism in our sample andin the general population. However , the failure of social status or churchattendance to correlate here suggests that this is a blind alley, since bothof these are also indexes of social conservatism. Although we have had towrestle with it to wring out any coherent interpretations, one of the strikingaspects of these data is the frequency with which political preference is re-lated to intellectual interests and orientations , independent of the back-ground variables of education and social status. We shall see much more ofthe same in Chapters I and II of Part B.
Stepping Stone
The motivations we have called "Stepping Stone" revolve around the aimof learning techniques which can be applied in specific areas outside of GreBooks. These are, as we noted , rather infrequent among the program I s partici-pants. Further analysis shO''7s that, like "Self-Help, II and unlike IIContent"or hCosmopolitanism, 1I II Stcpping. Stonell is reported less frequently in the ad-vanced years--a situation which hints that it may be associated with droppingout of the program.
In terms of its subgroup associations, we find these aims more commonamong: a) those with weaker ties to the family and b) highly educated peoplein lower status jobs. As with "Content, II we shall consider only first yearparticipants here.
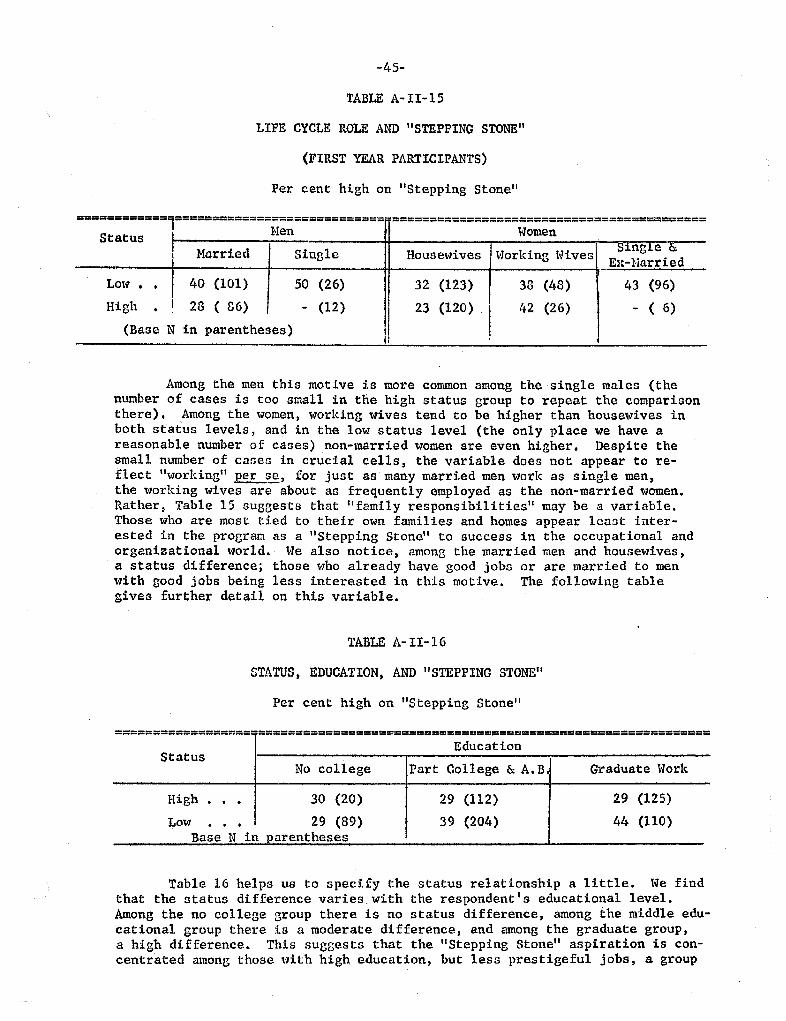
-45-
TABLE A-II-
LIFE CYCLE ROLE AND IISTEPPING STONE"
(FIRST YEAR PARTICIPANTS)
Per cent high on IIStepping Stone
============= ==;=======;===========;===== =================================== ======
Status Hen 'vomen
Married Single Housewives \'orking Hives SJ.ngLe:-Harried
Low (101) (26) (123) (48) (96)
High fl6) (12) (l20) (26)
(Base parentheses)
Among the men this motive is more common among the single males (thenumber of cases is too small in the high status group to repeat the camparisonthere). Among the women, working wives tend to be higher than housewives inboth status levels, and in the low status level (the only place we have areasonable number of cases) non-married women are even higher. Despite thesmall number of cases in crucial cells , the variable does not appear to re-:rect 1I \17orldng per sa , for just as many married men work as single menthe working wives are about as frequently employed as the non-married women.Rather , Table 15 suggests that 11 family responsibilities ll may be a variable.Those who are most tied to their own families and homes appear least inter-ested in the program as a IIStepping Stone" to success in the occupational andorganizational world. We also notice , among the married men and housewives,a status difference; those who already have good jobs or are married to menwith good jObs being less interested in this motive. The following tablegives further detail on this variable.
TABLE A-II-16
STATUS, EDUCATION, AND " STEPPING STONE"
Per cent high on "Stepping Stone
==================-============================================================
No college
EducationPart College & A. Graduate Work
Status
High
. .
30 (20)Low
. .
29 (89)Base N in parentheses
29 (112)
39 (204)
29 (125)
44 (110)
Table 16 helps us to specify the status relationship a little. We findthat the status difference varies with the respondent s educational level.Among the no college group there is no status difference, among the middle edu-cational group there is a moderate difference , and among the graduate group,a high difference. This suggests that the "Stepping Stone" aspiration is con-centrated among those \iith high education, but less prestigeful jobs, a group
-46-
which may be assumcd to have both a high drive for advancement in job and com-munity and sufficient intellectual background not to feel threatened by GreatBooks as too difficult. Again, we must note that Table 16 reinforces ourgeneral impression that mobility drives, in the Horatio Alger sense are notendemic in the program, and only seem to turn up in special circumstances suchas those hinted at by Table 16.
Since this cluster is fairly infrequent we need not pursue its analysisin finer detail , except to note that probably "Stepping Stone" motivations may
be concentrated among those who , freed from family ties, seem to see a gap be-tween their aspirations and their level of educational training.
Summary
What do the participants want out of Great Books? Different people seemto want different things , and most people seem to want several things. There-fore , we can think of the motives as being varied and complex.
Statistical analysis of the motivations reported by the participantsindicated that we could think of four major clusters of motives which tend tobe internally correlated but weakly related to other clusters. We gave thefour the names of: 1) "Content " 2) "Self-Help, " 3) "CoDmopoli. tanism, " and4) " Stepping Stone , II to indicate our impression that they involved: 1) inter-est in the content of the readings, 2) desires to make up for deficits in cul-tural background. 3) hopes of meeting intellectual people in order to escapea dull community or social world, and 4) aims of learning specific skills toapply in job or community organization. In terms of frequency, "Content" andCosmopolitanism" (in one or another of their specific motive forms) seemcharacteristic motives of. most of the group; " Self-Help" is sought by aboutone-half; and only a fe'l7 see Great Books as a Ii Stepping Stone.
We also explored differences in the motivations of specific social sub-groups and categories within the sample. Although correlations turned up, our
general impression is that, except for "Self-Help" the differences are notterribly important. Every type of motive is found in every type of partici-pant , and the differences we find are those of emphasis and shading. When wealso consider that people tend to report multiple rather than single moti-vations. we would be hard put to find social groups or categories that haveradically different motivationG up and down the line. The odds are prettymuch that, as they sit around the table, in spite of any differences in sex,job, religion, aBe, generation, etc., most of the people will be talking withothers who have pretty much the same aims, and very seldom will they be talk-ing across the table to someone who has a radically different conception ofthe purposes of the program.
In terms of specific motives, 'l7e found no correlates of "Content, " whichwe interpreted as meaning that this motivation is probably endcmic in the popu-lation. II Self-Help" is associated with a large number of variables (lifecycle role , religion , party preference, etc. ); but when the data is put throughthe statistical wringer the answer seems to be that level of formal education,which appears to be both an index of intellectual prowess and cerebral subject-ive self-confidence , accounts for almost all of these differences. I1Cosmopoli-
tanism" is definitely related to both YO\lth. Republicanism, and type of com-munity. Finally, "Stepping Stone" motivations appear more common among thowho are freed from family obligations and have lower social status, despitehlgher education.

CHAPTER III
WHAT DO THEY SAY THY GET FROM THE PROGRAM?
-47-
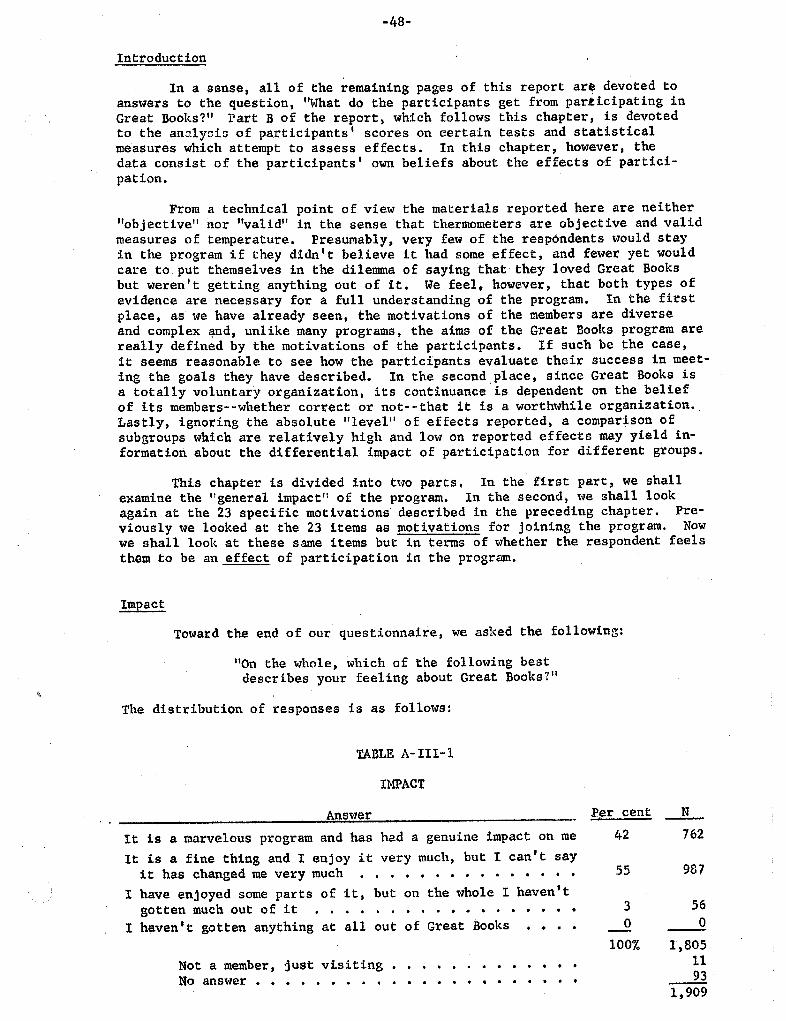
-48-
Introduction
In a sense, all of the remaining pases of this report ar devoted toanswers to the question, "What do the participants get from participating inGreat Books?" Part B of the report, which follows this chapter, is devotedto the analycio of participants ' scores on certain tests and statisticalmeasures which attempt to assess effects. In this chapter, however, thedata consist of the participants ' own beliefs about the effects of partici-pation.
From a technical point of view the materials reported here are neitherobjective" nor "valid" in the sense that thermometers are objective and valid
measures of temperature. Presumably, very few of the resp6ndents would stayin the program if they didn t believe it had some effect, 'and fewer yet wouldcare to put themselves in the dilemma of saying that they loved Great Booksbut weren t getting anything out of it. We feel, however, that both types ofevidence are necessary for a full understanding of the program. In the firstplace , as we have already seen, the motivations of the members are diverseand complex , unlike many programs, the aims of the Great Dooks program arereally defined by the motivations of the participants. If such be the case,it seems reasonable to see how the participants evaluate their success in meet-ing the goals they have described. In the second place, since Great Books isa totally voluntary organization, its continuance . is dependent on the beliefof its members--whether correct or not--that it is a worthwhile organization.Lastly, ignoring the absolute "level" of effects reported, a comparison ofsubgroups which are relatively high and low on reported effects may yield in-formation about the differential impact of participation for different groups.
This chapter is divided into two parts. In the first part, we shallexamine the "general impactll of the program. In the second 'tole shall look
again at the 23 specific motivations described in the preceding chapter. Pre-viously we looked at the 23 items as motivations for joining the program. Now
we shall look at these same items but in terms of whether the respondent feelsthem to be an effect of participation in the program.
Impact
Toward the end of our questionnaire, we asked the followi
On the whole, which of the following bestdescribes your feeling about Great Books?'1
The distribution of responses is as follows:
TABLE A- III-lIMPACT
Answer
!t is a marvelous program and has had a genuine impact on me
It is a fine thing and I eqjoy it very much, but I can t say
it has changed me very much
. . . . . . . . . . . .
I have enjoyed some parts of it, but on the whole I havengotten much out of it
. . . . . . . . . . . . . . .
I haven t gotten anything at all out ot Great Books
. . . .
r cent
762
Not a member, just visiting
. . . . . .
No answer
. . . . . . .. . .
987
100% 805
1 , 909
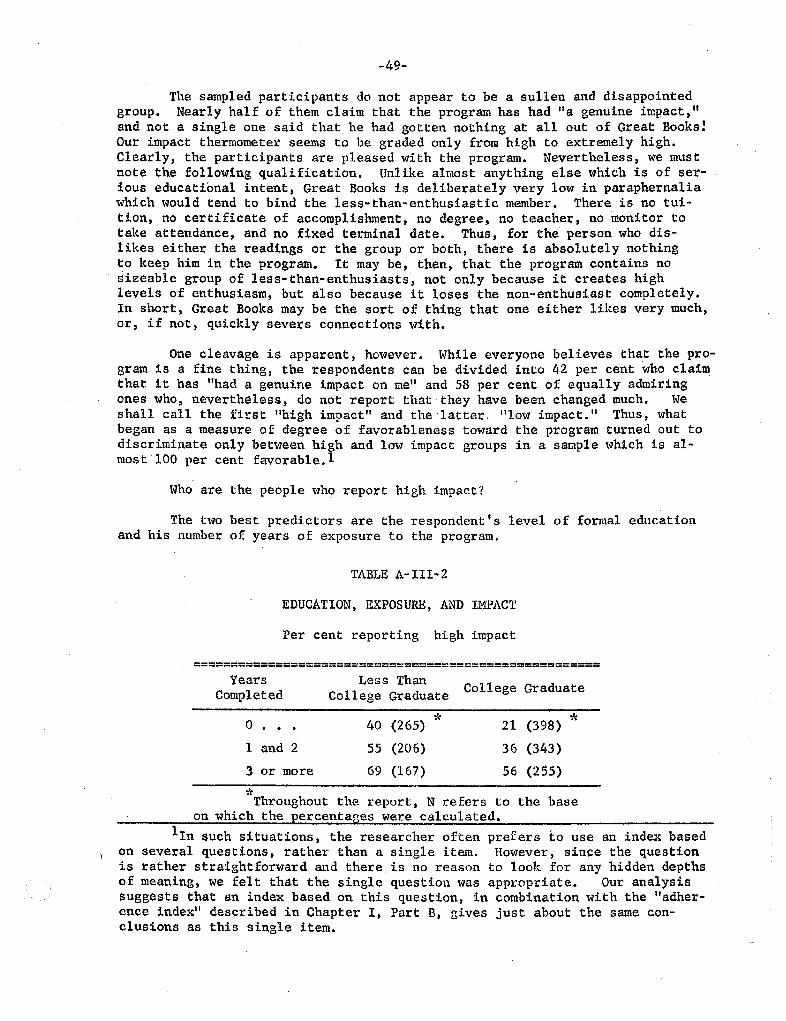
49-
The sampled participants do not appear to be a sullen and disappointedgroup. Nearly half of them claim that the program has had "a genuine impact , II
and not a single one said that he had gotten nothing at all out of Great Books!Our impact thermometer seems to be graded only from high to extremely high.Clearly, the participants are pleased with the program. Nevertheless, we mustnote the following qualification. Unlike almost anything else which is of ser-ious educational intent Great Books is deliberately very low in paraphernaliawhich would tend to bind the less- than-enthusiastic member. There is no tui-tion, no certificate of accompl ishment, no degree, no teacher, no monitor totake attendance, and no fixed terminal date. Thus, for the person who dis-likes either the readings or the group or both, there is absolutely nothingto keep him in the program. It may be, then, that the program contains nosieeable group of less-than- enthusiasts, not only because it creates highlevels of enthusiasm, but also because it loses the non- enthusiast completely.In short, Great Books may be the sort of thing that one either likes very much,
, if not, quickly severs connections with.
One cleavage is apparent, however. Hhile everyone believes that the pro-gram is a fine thing, the respondents can be divided into 42 per cent who claimthat it has "had a genuine impact on me" and 58 per cent of equally admiringones who , nevertheless, do not report that they have been changed much. shall call the first "high impact" and the latter. 11 10w impact. II Thus , whatbegan as a measure of degree of favorableness toward the program turned out todiscriminate only between high and low impact groups in a sample which is al-most 100 per cent favorable.
Who are the people who report high impact?
The two best predictors are the respondent I s level of formal educationand his number of years of exposure to the program.
TABLE A-III-2
EDUCATION, EXPOSURE, AND I11PACT
Per cent reporting high impact
======================================================
o . .
Less ThanCollege Graduate
40 (265)
55 (206)
69 (167)
College GraduateYears
Completed
1 and 2
:3 or more
21 (398) *36 (343)
56 (255)
Throughout the report, N refers to the baseon which the percentages were calculated.
In such situations, the researcher often prefers to use an index basedon several questions, rather than a single item. However, since the questionis rather straightforward and there is no reason to look for any hidden depthsof meaning, we felt th t the single question was appropriate. Our analysissuggests that an index based on this question, in combination with the "adher-ence index'i described in Chapter I, Part B, gives just about the same con-clusions as this single item.
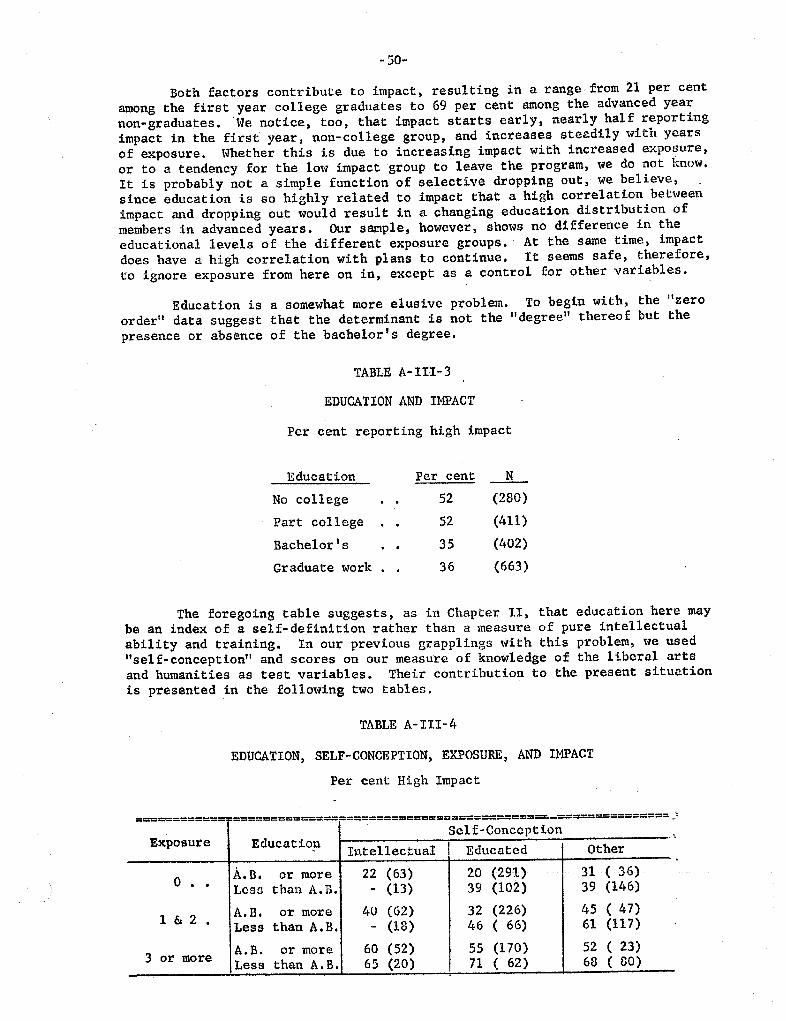
- 50-
Both factors contribute to impact, resul ting in a range from 21 per cent
among the first year college graduates to 69 per cent among the advanced yearnon-graduates. We notice , too, that impact starts early, nearly half reportingimpact in the first year , non-college group, and increases steadily with years
of exposure. Whether this is due to increasing impact with increased exposure
or to a tendency for the low impact group to leave the program, we do not know.It is probably not a simple function of selective dropping out , we believe,
since education is so highly related to impact that a high correlation betweenimpact and dropping out would result in a changing education distribution ofmembers in advanced years. Our sample , however, shows no difference in the
educational levels of the different exposure groups. At the same time , impactdoes have a high correlation with plans to continue. It seems safe, therefore,
to ignore exposure from here on in, except as a control for other variables.
Education is a somewhat more elusive problem. To begin with , the lIzeroorder" data suggest that the determinant is not the "degree" thereof but thepresence or absence of the bachelor s degree.
TABLE A-III-3
EDUCATION AND IMPACT
Per cent reporting high impact
Education Per cent
No college (280)
Part college (411)
Bachelor ((+02)
Graduate work (663)
The foregoing table suggests , as in Chapter II, that education here may
be an index of a self-definition rather than a measure of pure intellectualability and training. In our previous grapplings with this problem, we used
self-conception" and scores on our measure of knowledge of the liberal artsand humanities as test variables. Their contribution to the present situationis presented in the following two tables.
TABLE A-III-4
EDUCATION, SELF-CONCEPTION, EXPOSURE, AND IMACT
Per cent High Impact
====e:========
=========:==================================--==::===::======== "
Exposure EducationSclf Conccption
Intellectual Educatcci Other
or more (63) (291) ( 36)
Lese: than A. (13) (102) (146)
& 2or more (62) (226) 47)
Less than A. (18) 66) (117)
or more (52) (170) 23)or more Less than A. (20) 62) 80)
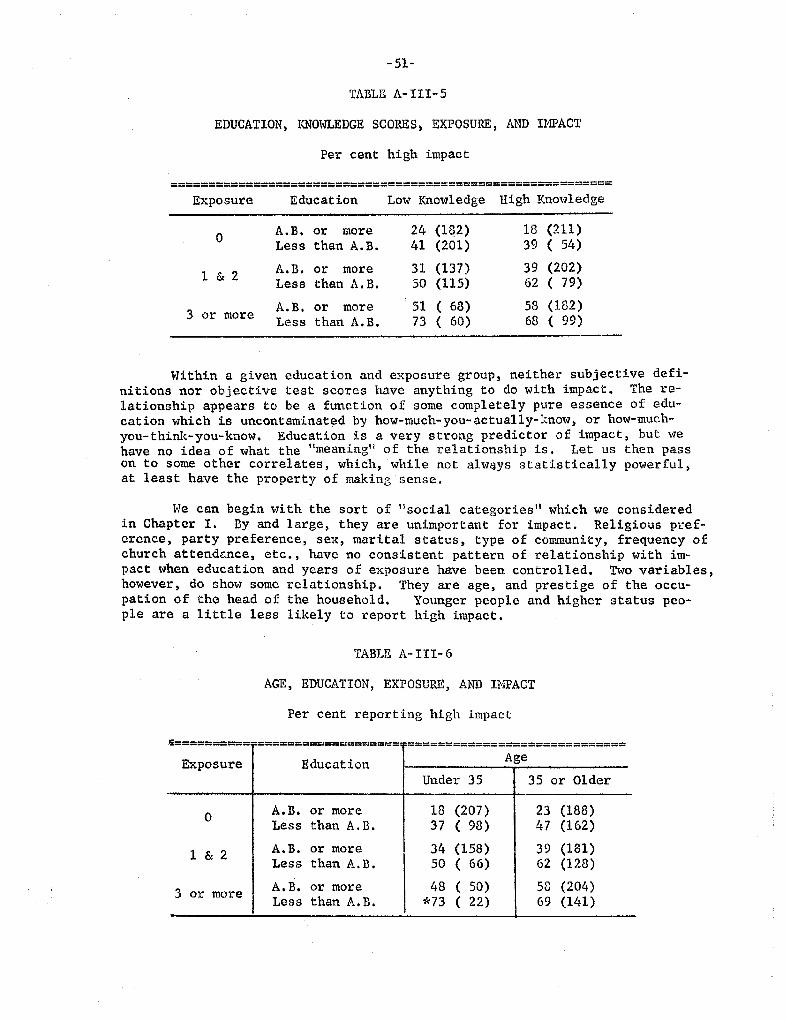
-51-
TABLE A-III-5
EDUCATION, KNO\-lEDGE SCORES, EXPOSURE , AND 111PACT
Per cent high impact
==================================================;========
Expo sure Education Low Knowledge High Knowledge
1 & 2A. B. or moreLess than A.
24 (182)41 (201)
31 (137)50 (115)
51 ( 68)73 ( 60)
18 (211)
39 ( 54)
39 (202)62 ( 79)
58 (182)68 ( 99)
B. or moreLess than A.
3 or moreA. B. or moreLess than A.
Within a given education and exposure group, neither subjective defi-nitions nor objective test scores have anything to do with impact. The re-lationship appears to be a function of some completely pure essence of edu-cation which is uncontaminated by how-much-you-actually- know, or how-much-
you-think-you-know. Education is a very strong predictor of impact , but wehave no idea of what the IImeaning" of the relationship is. Let us then passon to some other correlates , which , wltile not alwqys statistically powerfulat least have the property of making sense.
We can begin with the sort of Il social categories " which we consideredin Chapter I. By and large, they are unimportant for impact. Religious pref-erence, party preference, sex, marital status, type of cowmunity, frequency ofchurch a.ttend nce, etc., have no consistent pattern of relationship with im-pact when education and years of exposure have been controlled. Two variables,however, do show some relationship. They are age, and prestige of the occu-pation of the head of the household. Younger people and higher status peo-ple are a little less likely to report high impact.
TABLE A- III- 6
AGE , EDUCATION, EXPOSURE , AND INPACT
Per cent reporting high impact
==========-=================== =================;======;====
Exposure Educat ionAge
Under or 01 der
or more (207) (la8)Less than A. 98) (162)
& 2 or more (158) (18l)Less than A. 66) (128)
or more 50) (204)or more Less than A. *73 22) (141)
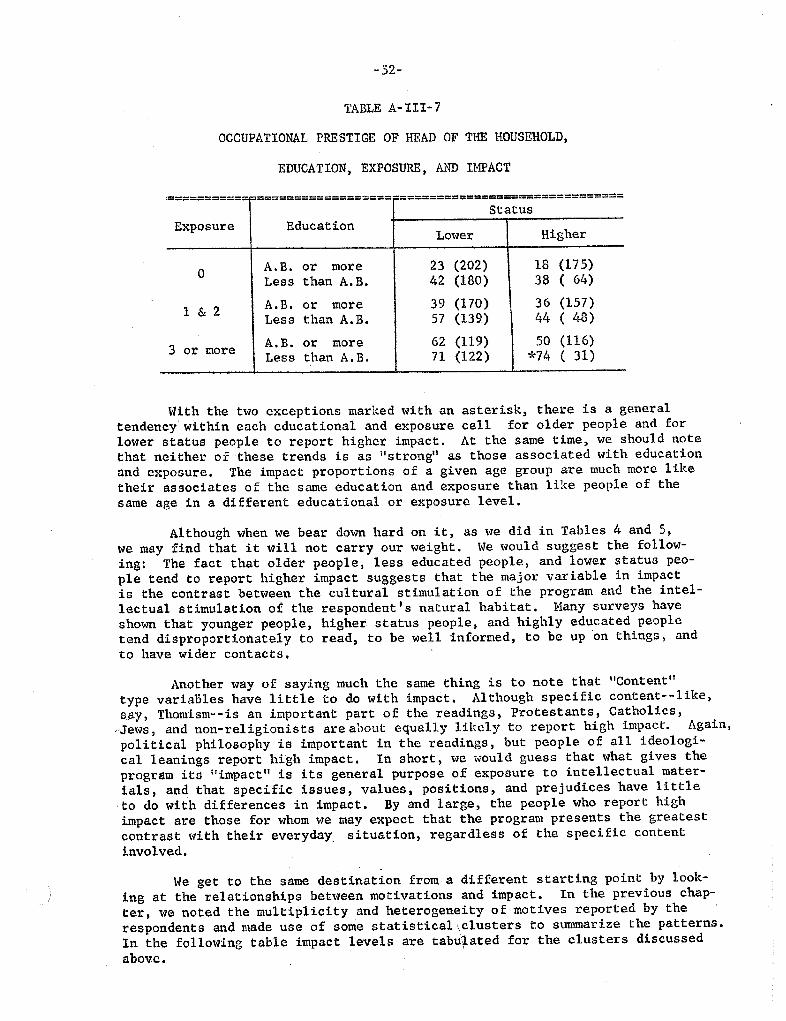
- 52-
TABLE A-III-7
OCCUPATIONAL PRESTIGE OF HEAD OF TH HOUSEHOLD
EDUCATION, EXPOSURE , AND IMPACT
,,::========= ::==================-==============================
StatusExposure Education
Lower Higher
more (202) (175)Less than A. (180) 64)
& 2 more (170) (l57)Less than A. (139) 48)
or moremore (119) (116)
Less than A. (122) *74 31)
With the two exceptions marked with an asterisk, there is a general
tendency within each educational and exposure cell for older people and for
lower status people to report higher impact. At the same time , we should notethat neither of these trends is as il strongll as those associated with educationand exposure. The impact proportions of a given age group are much more liketheir associates of the same education and exposure than like people of thesame age in a different educational or exposure level.
Although when we bear down hard on it, as we did in Tables 4 and
we may find that it will not carry our weight. We would suggest the follow-ing: The fact that older people , less educated people , and lower status peo-ple tend to report higher impact suggests that the major variable in impactis the contrast between the cultural stimulation of the program and the intel-lectual stimulation of the respondent
I s natural habitat. Many surveys haveshown that younger people , higher status people, and highly educated peopletend disproportionately to read, to be well informed, to be up on things, and
to have wider contacts.
Another way of saying much the same thing is to note that "Content"type varia~les have little to do with impact. Although specific content-- likeSi3Y, Thomism--is an important part of the readings, Protestants, Catholics,Jews , and non-religionists are about equally lil ely to report high impuct. 1\gain,political philosophy is important in the readings, but people of all ideologi-cal leanings report high impact. In short , we would guess that what gives the
program its lIimpact" is its general purpose of exposure to intellectual mater-
ials, and that specific issues, values, positions, and prejudices have littleto do with differences in impact. By and large, the people who report highimpact are those for whom we may expect that the program presents the greatestcontrast with their everyday. situation, regardless of the specific contentinvolved.
We get to the same destination from a different starting point by look-ing at the relationships between motivations and impact. In the previous chap-
ter, we noted the multiplicity and heterogeneity of motives reported by therespondents and made use of some statistical \clusters to summarize the patterns.
In the following table impact levels are tabu ated for the clusters discussed
above.
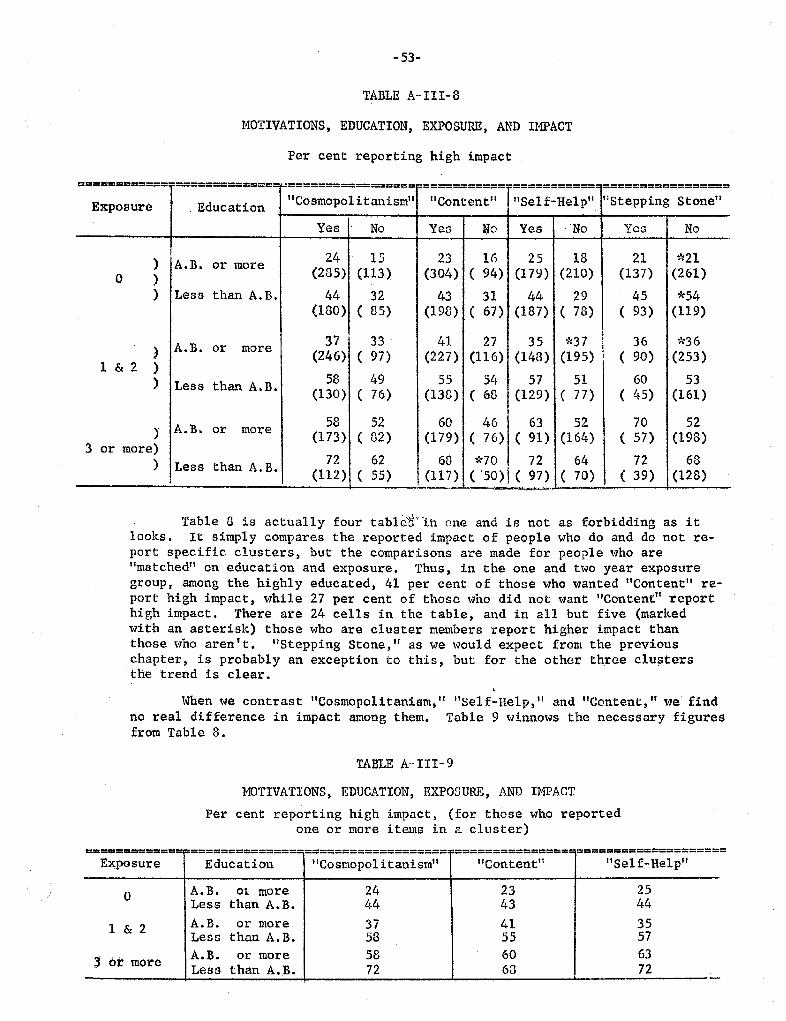
-53-
TABLE A..III-
HOTIVATIONS , EDUCATION, EXPOSURE, AND IMPACT
Per cent reporting high impact
============-==============
0 .
=================-===========-===========. =================
Exposure . Education Cosmopolitanism Content" "Self-Help Stepping Stone
Yes Yen Yes Yca
or more (285) (113) (304) ( 94) (179) (210) (137) (261)Less than A. *54
(180) ( 85) (198) ( 67) (187) (78) (93) (119)
*37 *36more (246) ( 97) (227) (116) (143) (195) 90) (253)1 & 2
Less than A. 5lf(130) ( 76) (13D) (68 (129) (77) (l!5) (161)
more (173) ( (2) (179) ( 76) ( 91) (164) (57) (198)3 or more)
*70Less than A. (112) ( 55) (ll7) 50)1 ( 97) 70) (39) (128)
Table (3 is actually four tab1e' :i'h one and is not as forbidding as itlooks. It simply compares the reported impact of people who do and do not re-port specific clusters, but the comparisons are made for people who arematched" on education and exposure. Thus , in the one and two year exposuregroup, among the highly educated, 41 per cent of those who wanted "Content" re-port high impact , while 27 per cent of those who did not want "Content" reporthigh impact. There are 24 cells in the table , and in all but five (markedwith an asterisk) those who are cluster members report higher impact thanthose who aren t. " Stepping Stone " as we \vould expect from the previouschapter, is probably an exception to this, but for the other three clu tersthe trend is clear.
oJhen we contrast "Cosmopolitanism,
" "
Sel f-Help, II and "Content, " we findno real difference in impact among them. Table 9 winnows the necessary figuresfrom Table 8.
TABLE A,'III-9
MOTIVATIONS, EDUCATION, EXPOSUR , AND IMPACT
Per cent reporting high impact, (for those who reportedone or more items in a cluster)
============= =============== =================== ================ ===================
Exposure Education Cosmopol itanism Content" Self-Help
01. moreLess than
moreLess than
moremore Less than
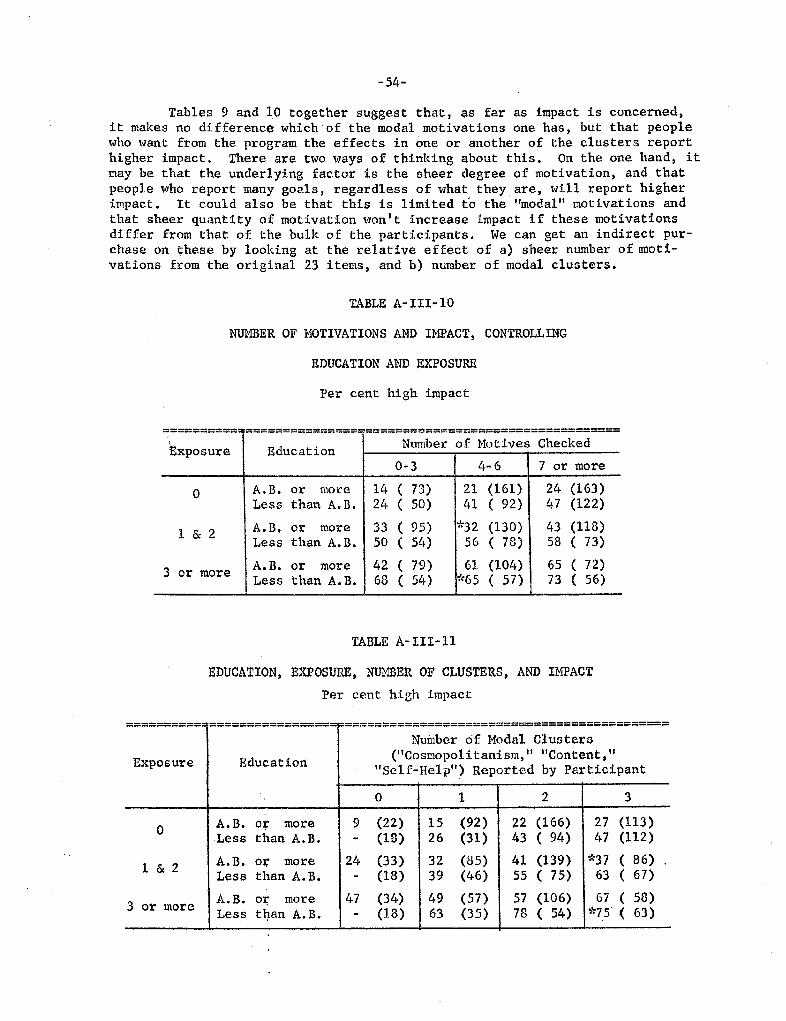
-54-
Tables 9 and 10 together suggest that, as far as impact is concernedit makes no difference which of the modal motivations one has , but that peoplewho want from the program the effects in one or another of the clusters reporthigher impact. There are two ways of thinking about this. On the one hand , itmay be that the underlying factor is the sheer degree of motivation , and thatpeople who report many goals , regardless of what they are, will report higherimpact. It could also be that this is limited to the "modal" motivations andthat sheer quantity of motivation won t increase impact if these motivationsdiffer from that of the bulk of the participants. We can get an indirect pur-chase on these by looking at the relative effect of a) sheer number of oti-vat ions from the original 23 items , and b) number of modal clusters.
TABLE A-Ill-
NUER OF HOTIVATIONS AND H1PACT, CONTROLLING
EDUCATION AND EXPOSURE
Per cent high impact
=========== ===============: ====================== ===========
Exposure Education Number of Motives Checked
0-3 4-6 or more
more 73) (161) (l63)Less than A. 50) 92) (122)
& 2 more 95) (130) (118)Less than A. 54) 78) 73)
or moreA. B. more 79) (104) 72)Less than A. 54) :65 57) 56)
TABLE A-III-ll
EDUCATION, EXPOSURE NUMER OF CLUSTERS, AND IMPACT
Per cent high impact
:;=:;======== -----------------
F=====================:;=:;:;=:;======:;:;:;:;==:;===
-----------------
Nuinber of Modal clustersCosmopolitanism Content. Exposure Education Self-Help Reported by Participant
A. B. more (22) (92) (166) (113)Less than A. (18) (3l) 94) (112)
& 2 A. B. 01; more (33) (85) (139) *37 86)Less than A. (18) (46) 75) 67)
01; more (34) (57) (106) 58)or more Less an A. B. (18) (35) 54) 75 ( 63)
- 55-
In both tables the proportion reporting high impact increases steadilywithin an educational and exposure group with the number of motivations report-
, either the number of specific motivations or the number of clusters. Whenone allows for the more extreme " spread" of the distribution of number of clus-ters, it appears that Table 10 and Table 11 show about the same degree of re-lationship. Therefore , we conclude that the more the participant wants fromthe program the more likely he is to report that the program has had a genuineimpact on him. Now, of course, this appears obvious (just as it would haveappeared obvious , if impact had been directly related to education instead ofinversely, that better preparation ma :eG the reading and discussion easier), butit would have also appeared obvious if the thing had gone the other way. Mar-riage , for e:cample , is an educational program, where people who have a long listof specific aims are often disappointed. Great Books, on the other hand, ap-pears to be the type of thing where "The more you want , the more you get,apparently with what you want being of lesser importance. This, too , confirmsour impression in Chapter II that what the participants want from the program
, probably outtveighsany formal list of purposes set out in advance by the spon-sors.
Is the program, then, a sort of giant ink blot onto which the partici-pants project their needs and desires , or does the program itself bave any ef-fects independent of the motivations of the individual members? Before we com-pletely accept the ink blot idea , we should remember that IIStepping Stonefailed to perform like the rest of the clusters, and hence , we may guess thatthere are some specific motives which differ in their "achievability. Beforewe turn to this problem in the second part of this analysis , however , we wantto consider -one other element in impact--that of participation in the discussiongroup.
It is possible to think of Great Books as a combination of two things--readings from a list of classics, and participation in informal discussions.Presumably any effect can stem from either or both. One could certainly expecteffects from reading without discussion , and also expect effects from discussionsabout topics other than the Great Books. We have only a few people who partici-pate in the groups but do none of the reading. For the vast majority who readwe do find differences in group participation. Chapter I of Part C developsin detail a role typology giving us eight different types of participants inthe discussion. For our purposes here we can simply divide the members intothose who are heavy participants and those who are not. The procedures are de-veloped in detail in Chapter I of Part C, and the reader who is interested inthe exact process may skip to that section. For the time being, we need onlysay that "actives " alOe people who report that they are above the average fortheir group in one or more aspects of the discussion. Table 12 shows the im-pact data in relation to active and less active group participation.
specifically, only eight respondents stated they did not spend any timereading in preparation for the discussion.
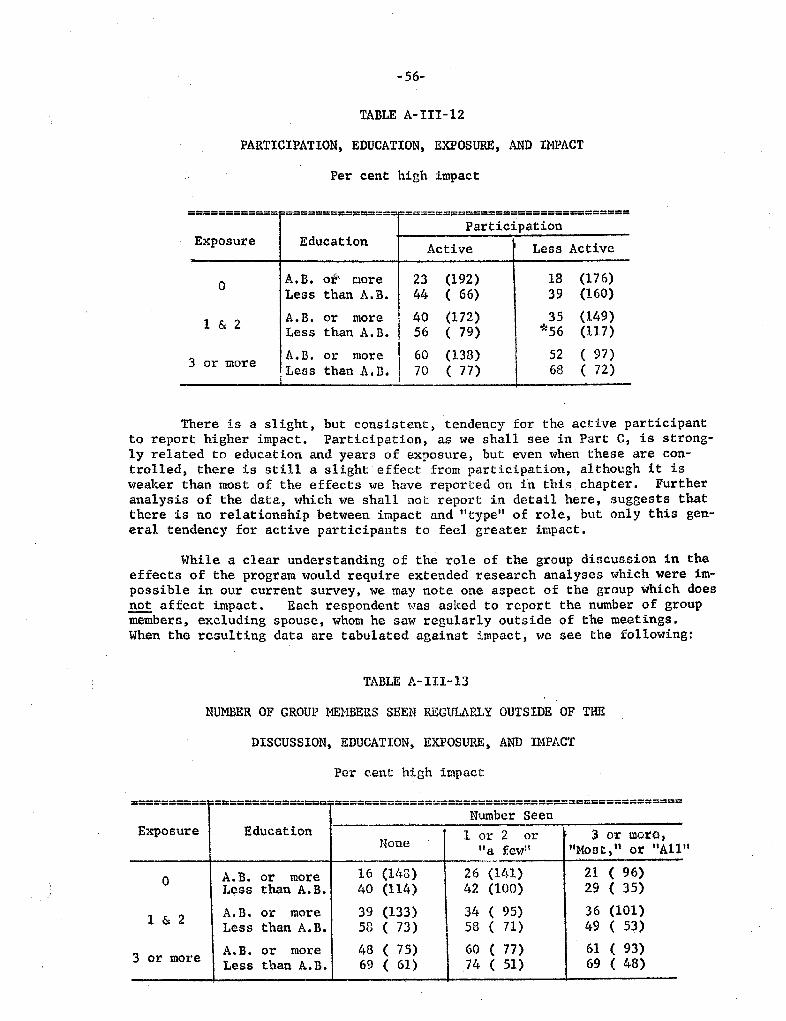
-56-
TABLE A-III-12
PARTICIPATION, EDUCATION, EXPOSURE, AND IMPACT
Per cent high impact
============-==============; ===============================
ParticipationExposure Education Active Less Active
A. B. o Dore (192) (l76)Less than A. 66) (160)
1 & 2A. B. more (172) (149)Less than A. 79) (117)
3 or moremore (138) (97)
Less than A. B. I (77) (72)
There is a slight , but consistent , tendency for the active participantto report higher impact. Participation , as we shall see in Part C, is strong-ly related to education and years of exposure, but even when these are con-trolled, there is still a slight effect from participation , although it isweaker than most of the effects we have reported on in this chapter. Furtheranalysis of the data, which we shall not report in detail here, suggests thatthere is no relationship between impact and " type" of role, but only this gen-eral tendency for active participants to feel greater impact.
Hhile a clear understanding of the role of the group discussion in theeffects of the program would require extended research analyses which were im-possible in our current survey, we may note one aspect of the group which does
affect impact. Each respondent was asked to report the number of groupmembers, excluding spouse, whom he saw regularly outside of the meetings.When the resulting data are tabulated against impact, we see the following:
TABLE A- III-
NUMER OF GROUP NEHBERS SEEN REGULRLY OUTSIDE OF THE
DISCUSSION, EDUCATION, EXPOSURE, AND IMPACT
Per cent high impact
========== ===============-====================================;=====;===
Number SeenExposure Education or moto,
None few MoG t, All
.---
more (ll (ll 96)Less than A. (114) (100) 35)
more (133) 95) (101)Less than A. 73) 71) 53)
more 75) 77) 93)or more Less than A. 6l) 51) 48)
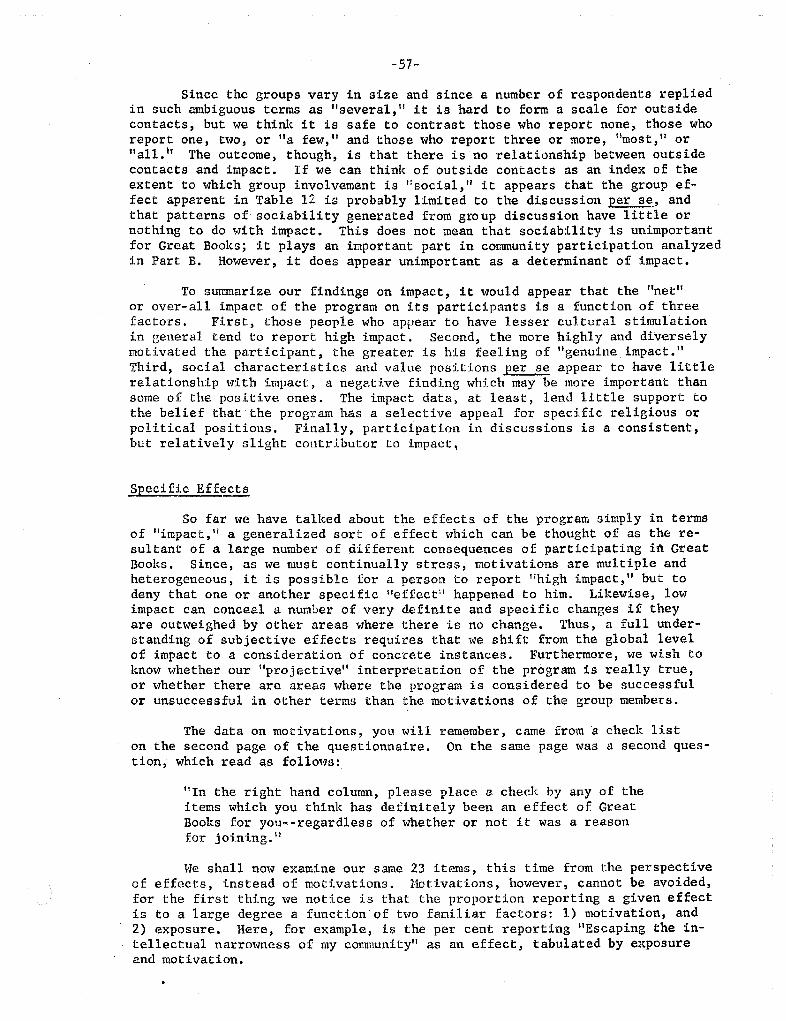
-57-
Since the groups vary in size and since a number of respondents repliedin such ambiguous terms as 11 several , II it is hard to form a scale for outsidecontacts, but we think it is safe to contrast those who report none, those whoreport one , two, or "a few , 'I and those who report three or more
, "
most 1I orall. The outcome, though, is that there is no relationship bet'o1een outside
contacts and impact. If we can think of outside contacts as an index of theextent to which group involvement is ': social !I it appears that the group ef-fect apparent in Table l2 is probably limited to the discussion per se , andthat patterns of sociability generated from gtOup discussion have little ornothing to do with impact. This does not mean that sociability is unimportantfor Great Books; it plays an important part in community participation analyzedin Part B. However, it does appear unimportant as a determinant of impact.
To summarize our findings on impact , it would appear that the "net"or over-all impact of the program on its participants is a function of threefactors. First , those people who appear to have lesser cultural stimulationin general tend to report high impact. Second, the more highly and diverselymotivated the participant , the greater is his feeling of IIgenuine impact. Third , social characteristics and value positions per se appear to have littlerelationship with impact , a negative finding which may be more important thansome of the positive ones. The impact data, at least , lend little support tothe belief that the program has a selective appeal for specific religious orpolitical positions. Finally, participation in discussions is a consistent,but relatively slight contributor to impact
Specific Effects
So far we have talked about the effects of the program simply in termsof "impact , Ii a generalized sort of effect which can be thought of as the re-sultant of a large number of different consequences of participating ifi GreatBooks. Since, as we must continually stress, motivations are multiple andheterogeneous, it is possible for a person to report 'i high impact " but todeny that one or another specific "effect: happened to him. Like o1ise , lowimpact can conceal a number of very definite and specific changes if theyare outweighed by other areas where there is no change. Thus , a full under-standing of subjective effects requires that we shift from the global levelof impact to a consideration of concrete instances. Furthermore , we wish toknow whether our "projective" interpretation of the program is really true,or whether there are areas where the program is considered to be successfulor unsuccessful in other terms than the motivations of the group members.
The data on motivations , you will remember, came from a check liston the second page of the questionnaire. On the same page was a second ques-tion , which read as follows:
In the right hand column , please place a checlc by any of theitems which you think has definitely been an effect of GreatBooks for you--regardless of whether or not it was a reasonfor joining.
We shall now examine our same 23 items , this time from the perspectiveof effects , instead of motivations. Notivations , however , cannot be avoided,for the first thing we notice is that the proportion reporting a given effectis to a large degree a function of two familiar factors: 1) motivation, and2) exposure. Here , for example , is the per cent reporting "Escaping the in-tellectual narrowness of my community" as an effect , tabulated by exposureand motivation.
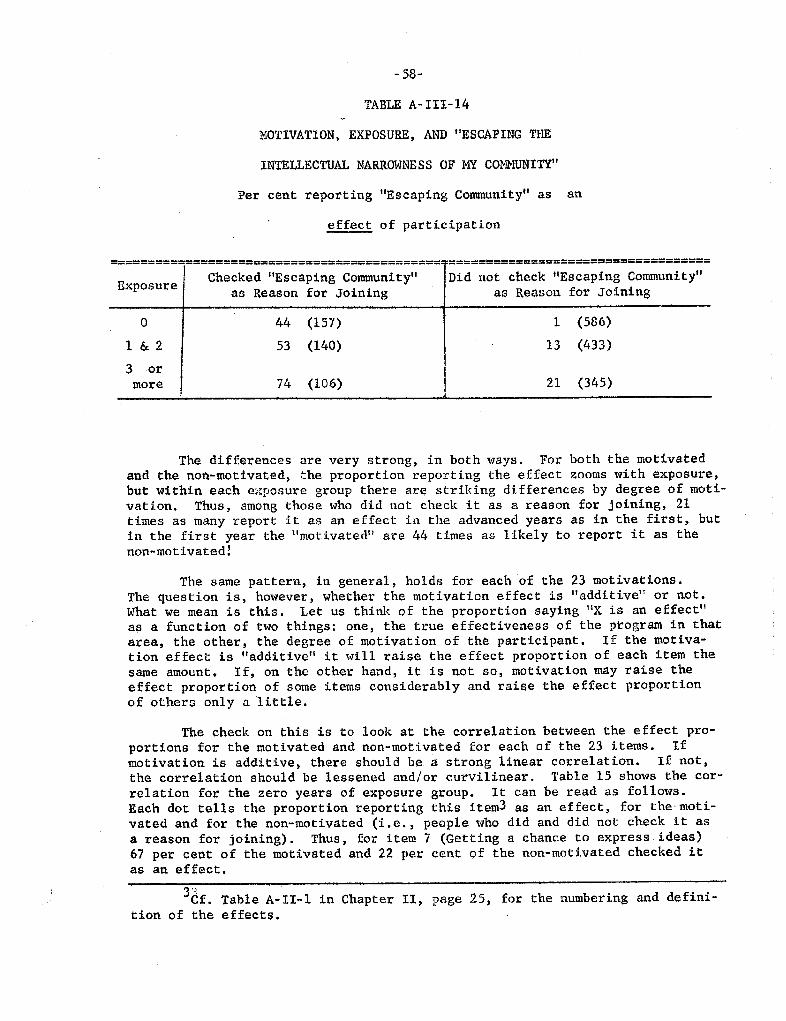
- 58-
TABLE A-III-
MOTIVATION, EXPOSURE, AND "ESCAPING THE
INTELLECTUAL NARROWNESS OF MY COMMUNITY"
Per cent reporting "Escaping Community" as
effect of participation
============================================ ===================================
Checked "Escaping Community Did not check "Escaping Communityas Reason for Joining as Reason for JoiningExposure
1 & 2
more
(157)
(140)
(586)
(433)
(106) (345)
The differences are very strong, in both ways. For both the motivatedand the non-motivated, the proportion reporting the effect zooms with exposure,but within each exposure group there are striking differences by degree of moti-vation. Thus , among those who did not check it as a reason for joining, 21times as many report it as an effect in the advanced years as in the first, but
in the first year the "motivated" are 44 times as likely to report it as thenon-mot! vated!
The same pattern, in general , holds for each of the 23 motivations.The question is, however , whether the motivation effect is "additive" or not.What we mean is this. Let us think of the proportion saying "X is an effect"as a function of two things: one , the true effectiveness of the program in thatarea, the other, the degree of motivation of th participant. If the motiva-tion effect is "additive" it ,.ill raise the effect proportion of each item thesame amount. If, on the other hand , it is not so , motivation may raise theeffect proportion of some items considerably and raise the effect proportionof others only a little.
The check on this is to look at the correlation between the effect pro-portions for the motivated and non-motivated for each of the 23 items. Ifmotivation is additive, there should be a strong linear correlation. If notthe correlation should be lessened and/or curvilinear. Table 15 shows the cor-relation for the zero years of exposure group. It can be read as follows.Each dot tells the proportion reporting this item3 as an effect , for the' moti-vated and for the non-motivated (i. e., people who did and did not check it asa reason for joining). Thus , for item 7 (Getting a chance to express ideas)67 per cent of the motivated and 22 per cent of the non-motivated checked itas an effect.
3 .Cf. Table A- 11-1 in Chapter II, page 25, for the numbering and defini-
tion of the effects.

-59-
Let us now examine the following table in detail. In the first place,the diagonal line running from the lower left to the upper right gives us thelocations of all points where the proporti n reporting the effect in the moti-vated and non-motivated is identical. Since all the entries are above thisline, we can conclude that motivation makes a big difference. There is nosingle case where the proportion reporting the effect among the non-motivatedcomes close to the proportion among the motivated.
What about the correlation? The pattern is not random, for items whichtend to be low for the motivated are also low for the non-motivated, and theitems which are very high for one are also very high for the other. The re-lationship, however , appears to be asymetrical (curvilinear). Items whichrank high for the non-motivated also tend to be high for the motivated; butitems which rank low for the non-motivated scatter all along the scale for themotivated. This suggests that we have three types of items here:
Items which are high on effectiveness for both motivatedand non-motivated.
Items which are high for the motivated but not high forthe non-motivated.
Items which are relatively low for both motivated andnon-motivated.
The first group can be thought of as the stron effects , since theyrank high for both groups. We can also infer that the program has somethingto do with them, since they turn up relatively frequently among the non-moti-vated who are under no psychological pressure to report the effects. The sec-ond group can be thought of as motivationally contingent ll since they are onlyfrequent among those who came into the program with these aims in mind. Thesemay still be thought f as true effects, though, since there is another groupof effects which ranks lower. The third group, weak e fects , consists of thoseitems which rank relatively low among both those who were motivated and non--motivated.
The vertical and horizontal lines in the table were drawn in an informalway to divide the effects according to our definitions. This gives us the fol-lowing classification for first year participants:
Relatively Strong Effects
To learn what the greatest minds in history have to say...
Reacquaintins myself with a cultural background which hadbecome rusty.
Improving my ability to analyze and criticize arguments
Talking with people who have more intellectual intereststhan my usual II social friends. Improving my reading ski lls.Getting a chance to expresc ideas I had been thinking andreading about.
Making new friends.Gaining insight into myself and my personal problems.
Meeting people who are quite different from me.
10.
11.
13.

60-
Motivationally Specific Effects
Escaping the intellectual narrowness of my occupation.
Escaping the intellectual narrowness of being a housewife.
Escaping the intellectual narrowness of my community.
Supplementing an unduly narrow or technical college training.Developing common interests with my spouse.
12.
14.
16.
Relatively Weak Effects
-'.
Improving my taste in fiction and poetry.
Becoming more sure of myself when talking with people ofhigher intellectual background.
Gaining a bettex intellectual background for my partici-pation in community organizations and community affairs.
Finding solutions to contemporary problems.
13.
15.
19.
21. Improving my ability to carry out my job through theintellectual training of reading Great Books.
Increasing my ability to carry out my job through im-proving my ability to participate in group discussions.
Developing the ability to lead group discussions outsideof Great Book::.
22.
23.
24. Gaining the equivalent of a college education.
Item 17 (Becoming a more efrective participant in group discussionsoutside of Great Books) is am iguous being somewhat higher relatively forthe non-motivated than for the motivated. Except for recalling the Biblicalinjunction that: ;;
...
frombimwho h s not; even what he has will be takenaway J II we shall not consider it any further, now.
The two following tables repeat the same procedure for the other twoexposure groups (one and two years completed, and three or more years com-pleted). Al though individual exceptions do appear J the general pattern ofthe correlation is similar in all three tables. This, in itself, is worthnoting, as it su gests that, unlike motivation, the effect of exposure isadditive. That is, in away, additional years of exposure increase the proba-bility of each effect to about the same tent. This means that our data donot suggest that there are 'i early, 1I "middle, Ii and "latell effects but rather
that the lo gera person has been in the program the more likely he is to re-port any effect.
Out of the total of 23 effects, 15 were classified the same way ineach of the three exposure groups, and eight were classified the same in twoand differently in the third. No effect was classified a different way ineach year.
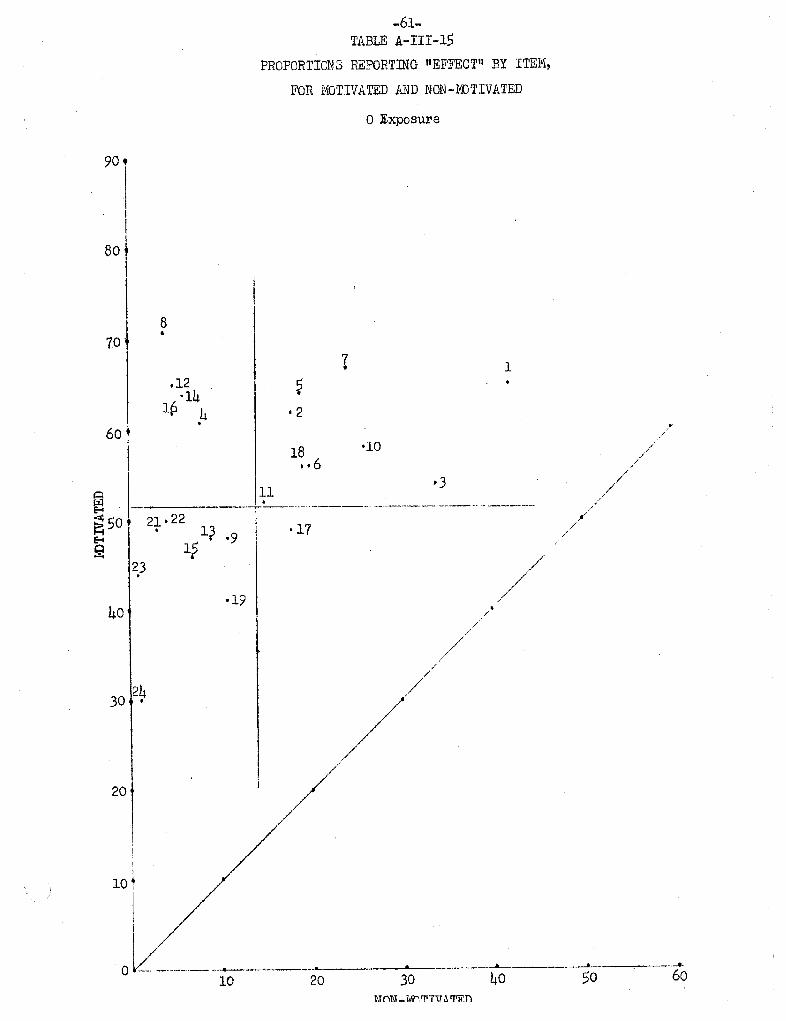
61-TABLE A-HI-
PROPORTIONS REPORTING "EFFECTII BY ITEM,
FOR MOTIVATED AND NON- J.TIVATED
o Exposure
90,
-14Ip '10
gso
-.---.----." ---.--..--..-----.. ---..---
21.. .9
-17
.19
30 2
.._.
10 NIi1\T_ j\lI'l'rnT 'ln
- - ---_._-_..
50 .
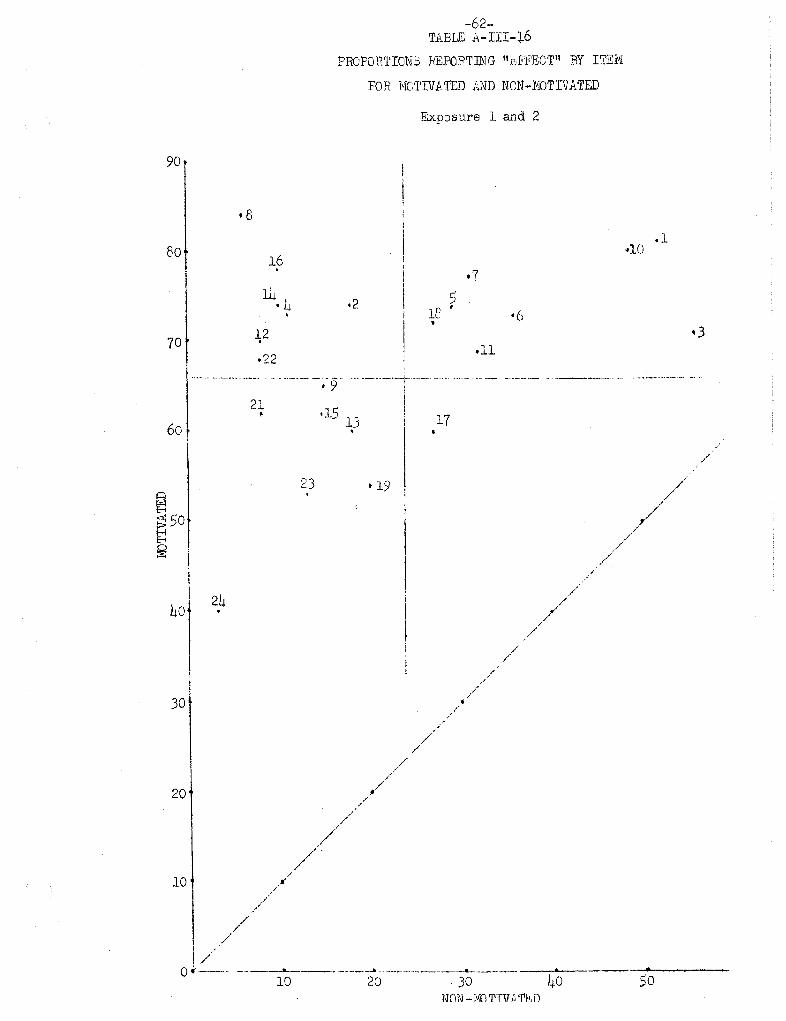
70 f
60 !
. ",.-,.-- ._. -_. ---
0..-.-'.
62-TABLE A- III-
PROPOHTIONd REPOPTThG Il roFF'ECTII BY ITEfiI
FOR MOTIVATED .AND NON-MOTIVATED
. 4
Exposure 1 and 2
Ie .
.22
.... "-'-' -.
' 9" ... .-..--
-\-.....-. .......
.15 13
.10
... -_._ -- .'- .__. _- -..... .. .- ---. --_._ ""-,--,_.--__. -.-.------ . - . _._. ._.--_._---
-A._---10 20 )0 Nn1\- jv(j 'TTV A 'PF.
. 19 .
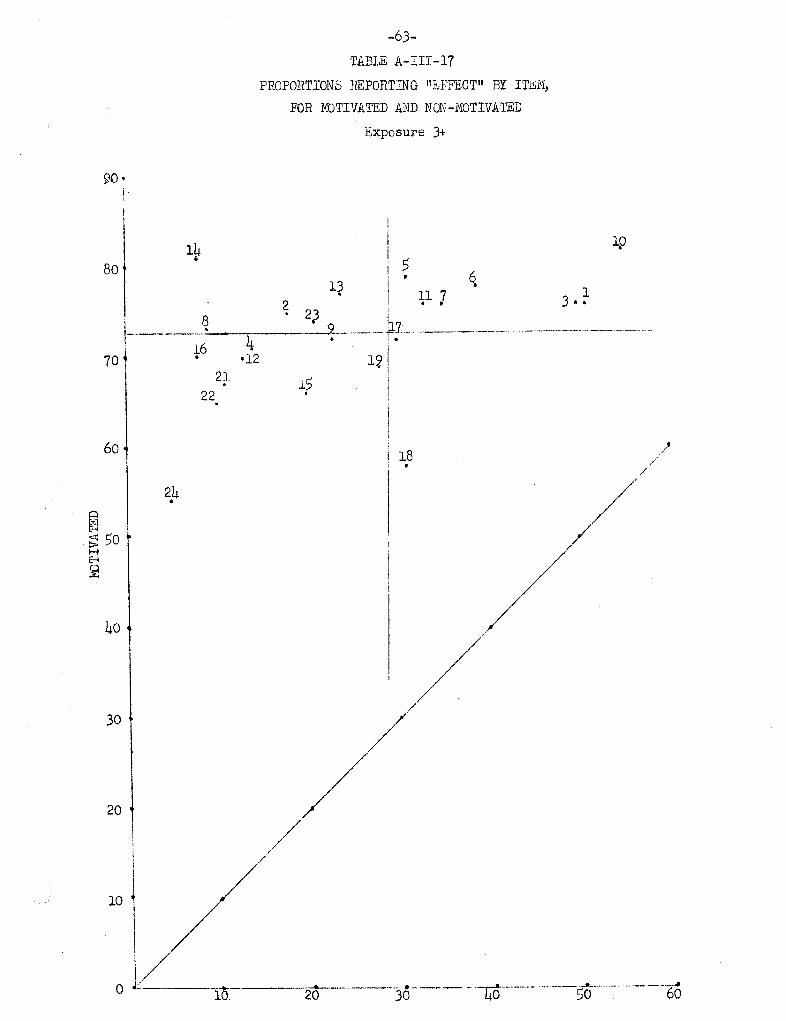
70 t '12
90 .
10 1
---63-
TABLE A-Ill-PROPORTIONS REPORTING "1FFECT" BY ITEH,
FOR MOTIVATED AND NON-NOTIVATED
Exposure 31.
I 5
2)
-----
ln_.
! .
19.1
3 . .11 7
..-.--"--'.-- . ----" ---'-" '-'--'-
i 18I .
20-------")0 - -----40---"---"-----50'--'---. "..-----.

II.
III.
64-
We can now make a tabular summary of the subjectively reported effects.
Re1atively Strong Effects in Each Exposure Group
Great minds...Analyze and criticize...
Talking with more intellectual
Improving my reading skills.
Express ideas...
Making new friends.Gaining insight into myself.
people. . .
10.
11.
Re1ative1y Strong Effects in Two Exposure Groups. Unclassifiablein One
18. Meeting people who are quite different.
Motivationally Contingent Effects in All Three Groups
2. Reacquainting myse1 f. . .
8. Escaping... housewife.14. Supplementing narrow college...
IV. in Two Ex osure Grou s. Relativel
l, . capi 3.. . occupatlon.
12.
16.
Esca ing.. . community.
Developing common interests with my spouse.
Relatively Weak Effects in Two Exposure Groups, MotivationallYContingent in the Third
13.
22.
23.
Becoming sure of myself.
Increasing. .. job ability... through group discussion.
Developing ability to lead discussions outside ofGreat Books.
VI. Relatively Weak Effects in AII Three Exposure GroupS
9. Improving my taste in fiction and poetry.l5. Gaining a better intellectual background for partici-
pation in community affairs.
Finding solutions to contemporary problems.
Improving my ability to carry out my job through theintellectual training of reading Great Books.
2l,. Gaining the equivalent of a college education.
19.
21.
VII. Unclassifiable in All Three Groups
17. Becoming a more effective participant in group dis-cussions outside of Great Books.
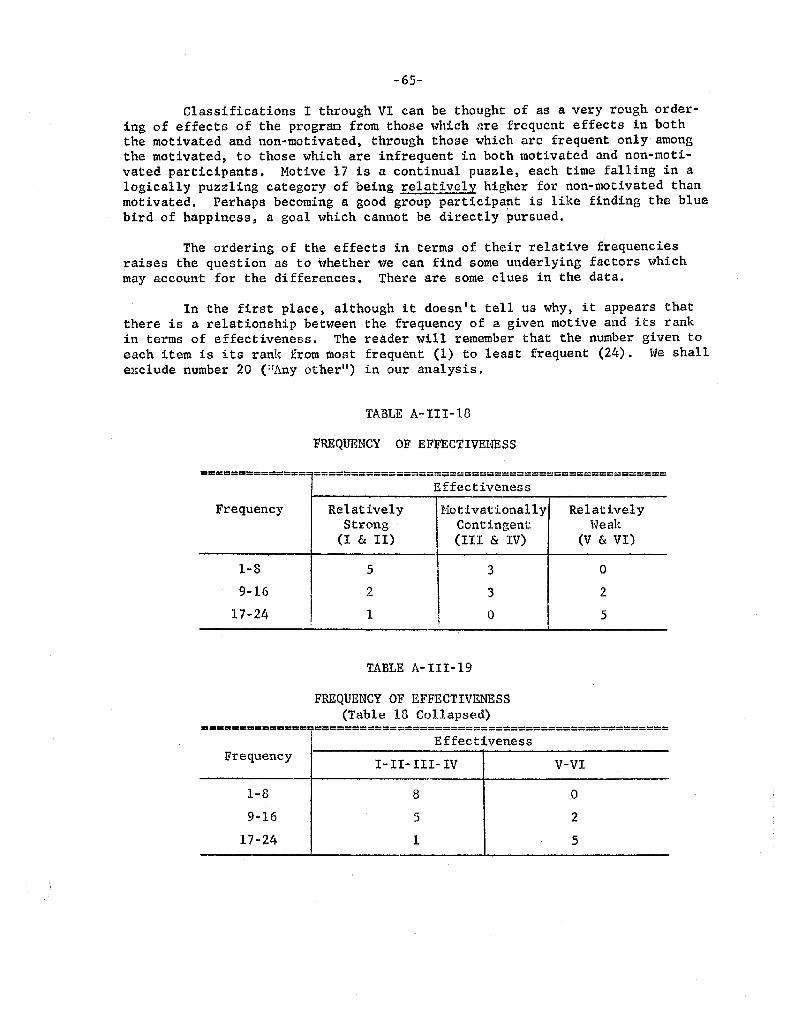
- 65-
Classifications I through VI can be thought of as a very rough order-ing of effects of the program from those which are frequent effects in boththe motivated and non-motivated , through those which are frequent only amongthe motivated, to those which are infrequent in both motivated and non-moti-vated participants. Motive 17 is a continual puzzle, each time falling in alogically puzzling category of being relatively higher for non-motivated thanmotivated. Perhaps becoming a good group participant is like finding the bluebird of happiness, a goal which cannot be directly pursued.
The ordering of the effects in terms of their relative frequenciesraises the question as to whether we can find some underlying factors whichmay account for the differences. There are some clues in the data.
In the first place, although it doesn t tell us why, it appears thatthere is a relationship between the frequency of a given motive and its rankin terms of effectiveness. The reader will remember that the number given toeach item is its rank from most frequent (1) to least frequent (24). We shallexclude number 20 ('IAny other ) in our analysis.
TABLE A-III-IS
FREQUENCY OF EFFECTIVENESS
=============== ===============================================
Effectiveness
1-8
17- 24
Relatively Noti vationally RelativelyStrong Contingent Heak(I & II) (II! & IV) (V & VI)
Frequency
TABLE A- III -
FREQUENCY OF EFFECTIVENESS(Table 13 Collapsed)
==============-==================== ==========================
EffectivenessFrequency
1- II- III- IV V-VI
1-8
9-16
17-
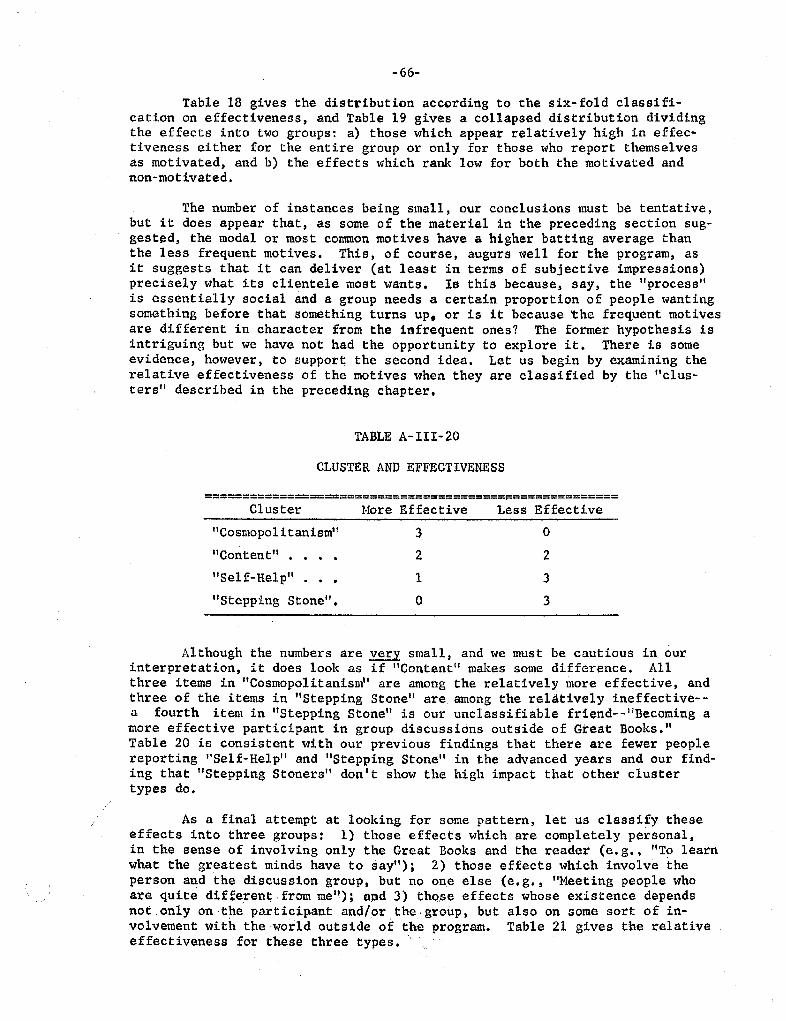
-66-
Table 18 gives the distribution according to the six-fold classifi-cation on effectiveness, and Table 19 gives a collapsed distribution dividingthe effects into two groups: a) those which appear relatively high in effec-tiveness either for the entire group or only for those who report themselvesas motivated, and b) the effects which rank low for both the motivated andnon-motivated.
The number of instances being small , our conclusions must be tentative,but it does appear that, as some of the material in the preceding section sug-gest d, the modal or most common motives have a higher batting average thanthe less frequent motives. This, of course, augurs well for the program, asit suggests that it can deliver (at least in terms of subjective impressions)precisely what its clientele most wants. Is this because, say, the "processis essentially social and a group needs a certain proportion of people wantingsomething before that something turns up. or is it because he frequent motivesare different in character from the infrequent ones? The former hypothesis isintriguing but we have not had the opportunity to explore it. There is someevidence, however, to support the second idea. Let us begin by examining therelative effectiveness of the motives when they are classified by the "clus-ters" described in the preceding chapter.
TABLE A-III-20
CLUSTER AND EFFECTIVENESS
================= ========
===s=========
===:==========
Cluster Hore Effective Less Effective
Cosmopol i tanism
Content" .Self-HelpStepping Stone
Although the numbers are very small , and we must be cautious in- ourinterpretation, it does look as if " Content" makes some difference. Allthree items in "Cosmopolitanism" are among the relatively ore effective, andthree of the items in "Stepping Stone" are among the relatively ineffective--
fourth item in "Stepping Stone" is our unclassifiable frie.nd-- Becoming amore effective participant in group discussions outside of Great Books.Table 20 is consistent with our previous findings that there are fewer peoplereporting "Self-Help" and "Stepping Stone in the advanced years and our find-ing that "Stepping Stoners" don I t show the high impact that other clustertypes do.
As a final attempt at looking for some pattern, let us classify theseeffects into three groups: 1) those effects which are completely personal,in the sense of involving only the Great Books and the reader (e. g., "To learnwhat the greatest minds have to say
);
2) those effects which involve theperson and the discussion group, but no one else (e. g., "Meeting people whoare quite different . from me ); o d 3) tho e effects whose existence dependsnot only on the partici ant and/or the ' group, but also on some sort of in-volvement with the world outside of the program. Table 21 gives the relativeeffectiveness for these three types. '
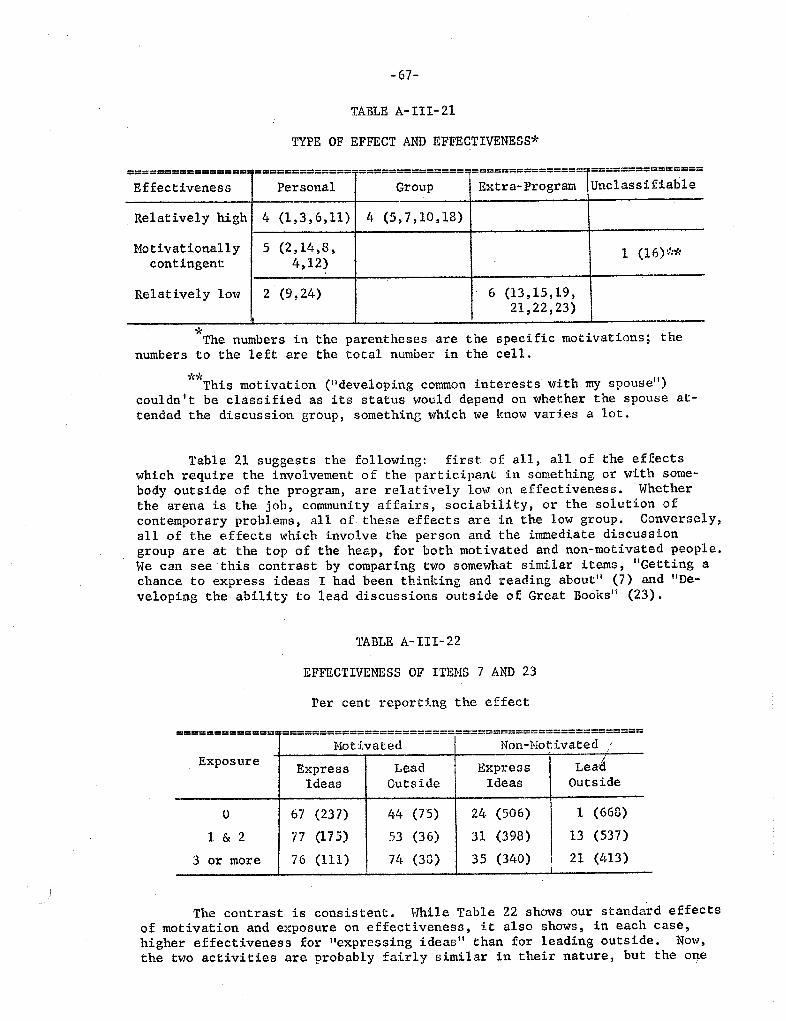
67-
TABLE A-III-
TYPE OF EFFECT AND EFFECTIVENESS*
================= =============-============== ================ ===============
Effectiveness Personal Group Extr a- Program Ul1classi fiab1e
Relatively high (1, 11) (5, 18)
Motivationally (2, 14, (16)1:*contingent 12)
Relatively low (9, 24) (13, 15, 19,21, 22, 23)
The numbers in the parentheses are the specific motivations; the
numbers to the left are the total numbe in the cell.
This motivation (lideveloping common interests with my spousecouldn t be classified as its status would depend on whether the spouse at-tended the discussion group, something which we know varies a lot.
Table 21 suggests the following: first of all , all of the effectswhich require the involvement of the participant in something or with some-body outside of the program, are relatively Iowan effectiveness. Whetherthe arena is the job, community affairs, sociability, or the solution ofcontemporary problems, all of these effects are in the low group. Conversely,all of the effects which involve the person and the immediate discussiongroup are at the top of the heap, for both motivated and non-motivated people.He can see . this contrast by comparing two somewhat similar items, IIGetting achance to express ideas I had been thinking and reading about" (7) and IIDe-veloping the ability to lead discussions outside of Grcat Books" (23).
TABLE A-III-22
EFFECTIVENESS OF ITEMS 7 AND 23
Per cent reporting the effect
=============: ========================,=========================
Hotivated Non-NotivatedExposure LeadExpress Express Lead
Ideas Outside ldeas Outside
(237) (75) (506) (668)
(175) (36) (398) (537)
more (111) (38) (340) (413)
The contrast is consistent. While Table 22 shows our standard effectsof motivation and exposure on effectiveness, it also shows, in each case
higher effectiveness for lIexpressing ideas" than for leading outside. Nowthe two activities are probably fairly similar in their nature , but the one
-68-
can be "consummated" immediately in the program , while the other requiresgetting involved in the world outside of the self and the program.
The purely "personal" things lie between these two, most having higheffectiveness, but two ("Improving my taste in fiction and poetry" and "Gain-ing the equivalent of a college education ) are both in the low area. \-1hythey should dif fer we don I t knot-T, really, except that our chapter on poetrydoes little to suggest that false modesty accounts for the finding. Rather,as the supporters of the program would be the first to acknowledge, we mightattribute it to the fact that purely esthetic matters are given little empha-sis in the readings. Maybe the best way to explain the college one (a veryrare motive , reported by only seven per cent of the respondents) is to saythat it is clearly impossible to gain the equivalent of a college educationfrom Great Books and no oue really claims that it should. These people , inef fec t , are looking for the wrong thing.
Now, it is about time to re-Dtress that our classification is relative.There is no subgroup in which there is 100 per cent effectiveness for ourhigh items l1 and no group with zero effectiveness for the low items. In factreference to Table 22 will show that in the advanced years , for the motivated74 per cent report high effectiveness for leading groups outside. (We , ofcourse , do not know how many people who had this motivation dropped out ifthey didn t feel they were accomplishing real improvement.
If we think of the advanced year , motivated group, as the most II sensi-tize ' we find no single effect with less than half reporting positive re-sults, regardless of the relative standing on the scale. To put this, itselfin further perspective, among the advanced year , non-motivated-- people wholiked the program well enough to stay in it, but didn t come seeking the spe-cific effects--we find more than 50 per cent reporting effectiveness for onlytt-TO things: "Learning t-That the great riiinds have to say" (54 per cent), andHaking new friends" (55 per cent). Instead of a crutch , r.elativity thus
appears to be a two-edged sword. Among the motivated , a relatively less ef-fective item still has a very high percentage, but among the non-motivated,a relatively highly effective item tends to have a rather low absolute per-centage.
We began with the question of whether we should think of the programas essentially a projective thing in which you got what you wanted (or maybewanted what you got) or whether there Were definite areas in which the natureof the program was a determinant regardless of mot ives. The answer is appar-ently that motivation is not the entire story. There are some effects whichare reported relatively frequently among both motivated and non-motivated;some effects which are reported relatively infrequently by both; as well asa number which appear to be definitely " contingent on motivation.
Summary
While "testimonial" evidence must be regarded t-Tith dread and forebodingby the " scientific" researcher, we felt that we would not be severing ourselvesfrom respectability if we asked what the participants thought they got out ofthe program. We began with the general question of "impact, " and saw thatthere were strong impact differences. Perceptions of impact: a) increasewith exposure either because of true changes or because of dropping outboth; b) decrease with education and age, controlling for education; c) higherfor the active group -participant but apparently unrelated to sociability pat-terns in the group; and d) increase with the total number of motives reported.
- 69-
When, subsequently, we turned to an analysis of specific motives, wefound that they, too, varied with exposure and mo ivation, but through somestatistical maneuvers we managed to arrive at the conclusion that motivationdoes not explain the whole thing. Rather , there appear to be three types ofeffects: a) relatively high effects which are reported frequently by bothmotivated and non-motivated; b) motivationally contingent effects , which areonly frequently reported by the people who are motivated to seek them (thenumber of men reporting that they have escaped the intellectual narrownessof being a housewife is quite small); and c) relatively low effects which areless often reported by both motivated and non-motivated. The major differ-ences bet\"een the stronger and weaker effects may be interpreted as reflecti.the difference between aims which may be reached within the program itself andaims which require a plunge into the frigid waters of the natural environmentbefore the shore is reached.
Can any of our analysis ans\"er the question
, "
Is the program effect-ive?1I We doubt it if the question is meant in the sense of giving Great Booksan A B, C, D, or F, in lIeffectiveness. However, we would like to suggestthe following generalizations which follow from the analysis of this chapter.
First, despite our worry about drop-out rates, we think that any in-formal organization which meets twice a month to talk about books must beconsidered seriously if from 20 to 70 per cent (depending on the exposureand educational group) say "It has had a genuine impact on me , II when thespeakers are drawn from the most highly educated strata of the country andare heavily involved in other community and civic affairs.
Second , we believe that Great Books must be considered from a specialpoint of view, given ou findings on motivation. Most adult programs of aneducational" nature have very specific aims, whether they are changing atti-tudes toward minority groups, teaching proficiency on the recorder, gettingpeople ready for jobs as hotel managers, or instruction in automobile repair-ing. In contrast, Great Books should probably be thought of as a "catalyst"whose essential function is to speed up or facilitate a chemical- like processinvolving the individual , the books, the group, and the real world in whichthe meaning of the books is to be acted on. If the reaction is sometimesslow or the energy produced minimal , it is hard to say that this is becauseof the program. Thus, while it is true that H finding solutions to contempo-rary problems" is not one of the program I s strongest points, at least partof the situation may be due to the fact that the program may not recruitpeople who are highly motivated to find these solutions in the readings (only15 per cent of the sample checked this as a motive) and another goodly part
If the authors may be permitted one statement ex cathedra in a studywhich other\i1ise attempts to be 110 per cent "objective " the mere fact thatan informal institution devoted to the reading of Aristotle , Calvin, LockeHume, and Sophocles, without the whip of an academic degree, survives in thecontemporary United States is, in itself, we believe, sufficient to providea II positive evaluation.
-70-
is probably due to the fact that in cont mporary society the probability thanyone individual can do much about any particular "social problem" is low.
Finally, we should note that ano her way of reading the results on ef-fectiveness is that while concrete changes in the "outside 'world" are rela-tively low on the effectiveness thermo eter, those things which are high havea gratifyingly "intellectual" tinge. While the professional sociologist ex-pects that any group which meets regularly over a period of years will, naymust , develop a high degree of "social" and II sociable" elements , the highranking effects are not of the "kaffe-klatsch" type , but include such cerebralthings as learning what the great minds have to say, analyzing and c iticizingarguments, expressing ideas , and gaining self-insight. Those motivations(other than "Cosmopolitanism " which, as we have noted , has a heavy intellectu-al component) which smack of social climbing, or patina polishing ("Self-Helpor the strictly gimmick-oriented stripe ("Stepping Stone ), are much less fre-quently reported as high on effectiveness. While some of the later chaptersmay, in truth, be read to suggest that many of the intellectual changes are notoverwhelming in strength and frequency, nothing in our data on motivationsand perception of effects suggests that the basic idea of the program--readingand discussion of Great Books--takes a subsidiary role in any important numberof groups.
The reader who is seriously interested in "evaluating" Great Booksshould read , in addition to this report , Philip Jacob' Changing Values inCollege, an evaluation of the effectiveness of American Universities whichdraws particularly disenchanted conclusions. Cf., Philip E. Jacob, ChangingValues in College, An Exploratory Study of the Impact of Col ege TeachingNew York , Harper & Brothers, 1957.

PART B
THE EFFECTS OF PARTICIPATION
71-

72-
The five chapters in this part of the report are analyses of the
consequences of participation in Great Books for specific areas of knowl
edge , taste , and behavior. Chapter I, "Knowledge " analyzes the r.elation-
ships between continued exposure to the program and knowledge of the liberal
arts and humanities. Chapter II
, "
Esthetics, " examines sophistication in
the areas of poetry and music and their relationships to program partici-
pation. Chapter III, "Reading, " deals with the patterns of book- and
magazine-reading outside of the program. Chapter IV , "Values and Ideologies
asks whether there is a trend toward certain ideological and value positions
associated with continued exposure to Great Books. Chapter V
, "
Community
Involvement " deals with the participants I interest and activity in local
community affairs.

" 73
CHAPTER I
KNOWLEDGE
..
Introduction
In this chapter we shall examine in some detail the "knowledge " ofthe participants , not in the sense of their general store of facts about
\ the batting averages of Babe Ruth or the members of the cabinet of Presi-dent Buchanan, but rather in the sense of their familiarity with that partpf the general culture which can be called "the liberal arts and humanitiesthei r store of informat ion about Martin Luther , Mozart, Aris tophanes, theFrench Revolution, Galileo , etc.
The analysis is divided into two sections. The first asks whethercontinued participation in Great Books apPears to change the participantslevels of knowledge. The second section considers the relatiors hips betweenknowledge of liberal arts and the participants ' locations in the societyinstitutional structure. The difference between these two questions canbe viewed in this way; The first section asks about the effects of GreatBooks on individual people; while the second asks about the potential ef-fects of Great Books on !lins ti tutions , II through the involvement of theparticipants in the major institutions of their communities.
EFFECTS OF PARTICIPATION
The question before the house is whether participation in the GreatBooks program resul ts in increased knowledge of the liberal arts and humanities.In the totality of potential effects, it is clear that sheer accumulation ofknowledge is not one of the major aims of Great Books. Rather, the programis aimed at promoting more subtle qualities, such as critical thinking,ability to analyze and evaluate readings , and increased intellectual sophis-tication. Thus, evidence that an increase in knowledge exists is not facto evidence that the program is succeediIlg in all of its aims. Neverthe-less, the failure of several years of exposure to Great Books to yield anyincrease in knowledge of the humanities would, in itself , probably be suffi-cient to cast doubt on any hypotheses about more sophisticated effects. short, if the important effects of the program are presumed to follow fromincreased acquaintance with the humanities , it is necessary to begin byasking whether such an increase actually occurs.
Development of definitive answers to this question would requirethat the same individuals be measured before and after their exposure to theprogram, under conditions which imposed controls on other factors that mightproduce an increase in knowledge. This we couH not do; but , by the use ofstatistical measures on our cross-sectional sample , we did attempt to arriveat the firmes,t possible answers , given the limitations of our study.
The Cartoon Quiz
The basic measure used in our study is the "cartoonof which is included as an appendix to this chapter. It isorthodox instrument of measurement and requires preliminarywe proceed to present our data.
quiz, " a copya somewhat un-discussion before
75-
The quiz consists of thirty two cartoons which originally appeared inLife magazine in 1950. The pictures were developed and drawn by Charles E.Martin, a professional artist. According to the text , they were devel-oped to reflect the famous Hcore curriculum" of Columbia University. far as Mr. Martin and we know, they have never been used for research pur-poses. Nevertheless, they appealed to us as a possible measure incur studyfor the following two reasons: a) to a striking extent, they cover thecurriculum of Great Books, twenty of the thirty-one directly referring tospecific Great Books readings, and many of the remainder referring to auth orsand ideas which are presumably frequently mentioned in the discussions; the whimsical quality of the cartoons appeared to us to be a good way tomotivate the cooperation of volunteer respondents who might well be threatenedor bored by an "outright" test. Our impression is that we were quite correcton the latter assumption , for our field interviewers reported that most groupswere quite taken wi th the cartoons , and we received a number of requests foranswers from the Great Books participants who took part in the study.
Since, however , in research , whimsical is as whimsical does , it isnecessary to consider some of the technical problems of the measurement qualityof the instrument. The first question is that of the "validity" of the test
e., what the test measures. Our working assumption is that the cartoonquiz measures the individual' s familiarity with certain "high points" ofWestern "high" culture. It does not , we must stress , probe into the finerquestions of analytical acumen or depth of knowledge. Thus , while we do nothave to believe tlll;Lt everyone who said "Don Quixote" to Cartoon No. 26 is anexpert on Spanish literature and culture , it is fairly reasonable to inferthat the respondent who said ''Hans Brinker " is not. 3 In short , we have lit-tle to offer but "face validity ; however , the pattern of correlations re-ported later in this memorandum (e. g., relations to formal education and tomusical taste; and data from the Northwestern University sample) in no waychallenges our assumptions about the qualities measured by the test. To sumup, both face validity and the pattern of correlates argue that our test isin some very general way a measure of knowledge in the area of humanities.The exact "depth" of this knowledge is, however, unknown.
As is traditional in sociological research, the paucity of our dataon validity is parUallyoffset by a fairly good set of data on internal con-sistency. Each answer to the cartoon test was scored simply as correct orincorrect, excluding any gradations of rightness or wrongness. Althoughthis undoubtedly resulted in scoring as "wrongtl a number of subjects whose
Life , Vol. 29, No. 16 (October 16, 1950), 23-33.
r. Martin , who holds the copyright to the pictures, very kindlygave us permission to use them in our research.
When, of course, you come to the respondent who answered riaCallas" for the Hagnerian dragon in Cartoon 28, the issue is somewhat lessclear , but fortunately only a handful of respondents took the task as achallenge to their wit instead of their memory. We were forced to excludeonly one out of 1909 cartoon quizzes on the grounds of unmitigated frivolous-nes s .
Joseph Ze1an of NORC had the task of making these 57 270 decisionsand his monotonous but vital contribution to the study is hereby acknowledged.
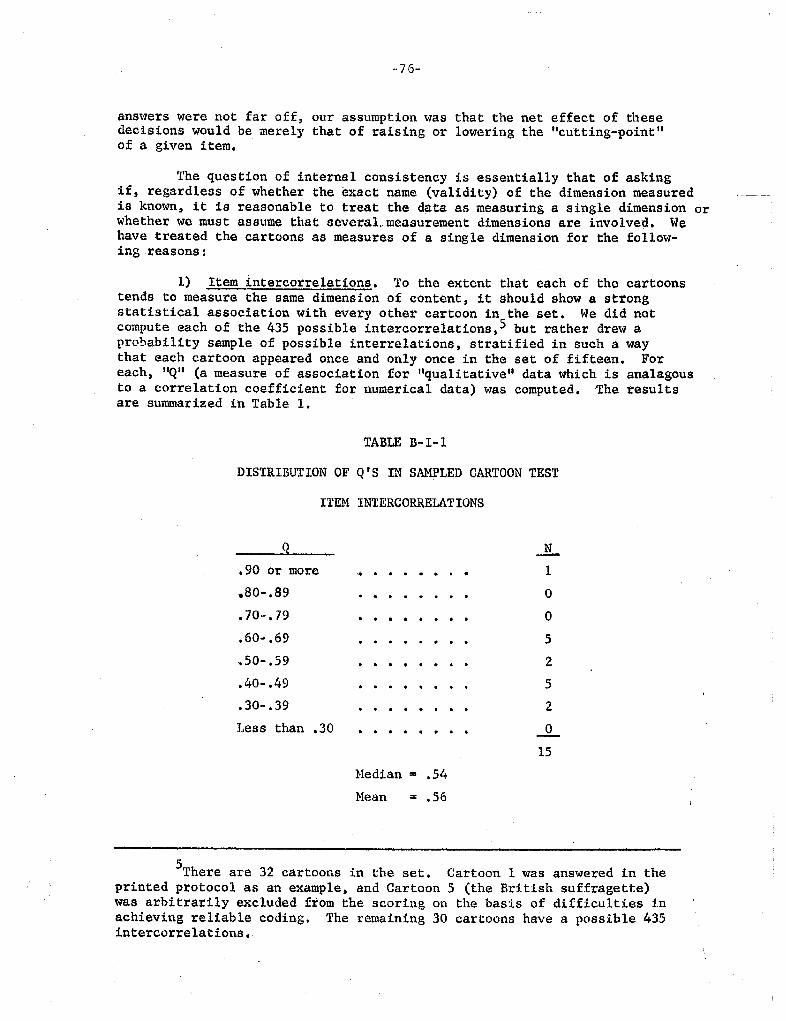
76-
answers were not far off our assumption was that the net effect of thesedecisions would be merely that of raising or lowering the "cutting-point"of a given item.
The question of internal consistency is essentially that of askingif, regardless of whether the exact name (validity) of the dimension measuredis known, it is reasonable to treat the data as measuring a single dimension orwhether we must assume that several. measurement dimensions are involve4. have treated the cartoons as measures of a single dimension for the follow-ing reasons:
1) Item intercorrelations . To the extent that each of the cartoonstends to measure the same dimension of content , it should show a strongstatistical association with every other cartoon in the set. We did notcompute each of the 435 possible intercorrelations, 5 but rather drew a
probability sample of possible interrelations, stratified in such a waythat each cartoon appeared once and only once in the set of fifteen. Foreach
, "
Q" (a measure of association for "qualitative " data which is analagousto a correlation coefficient for numerical data) was computed. 'The resultsare summarized in Table
TABLE B-I-
DISTRIBUTION OF Q t S IN SAMLED CARTOON TEST
ITEM INTERCORRELATIONS
. 90 or more
. . . . . .
80- .
70- . 79
60- .
50-
40- .ti9
30- . 39
. . . . . . . . . . . . . .
ess than .
. . . . . .
Median = .Mean = .
There are 32 cartoons in the set. Cartoon 1 was answered in theprinted protocol as an example, and Cartoon 5 (the British suffragette)was arbitrarily excluded from the scoring on the basis of difficulties inachieving reliable coding. The remaining 30 cartoons have a possible 435intercorrelations.
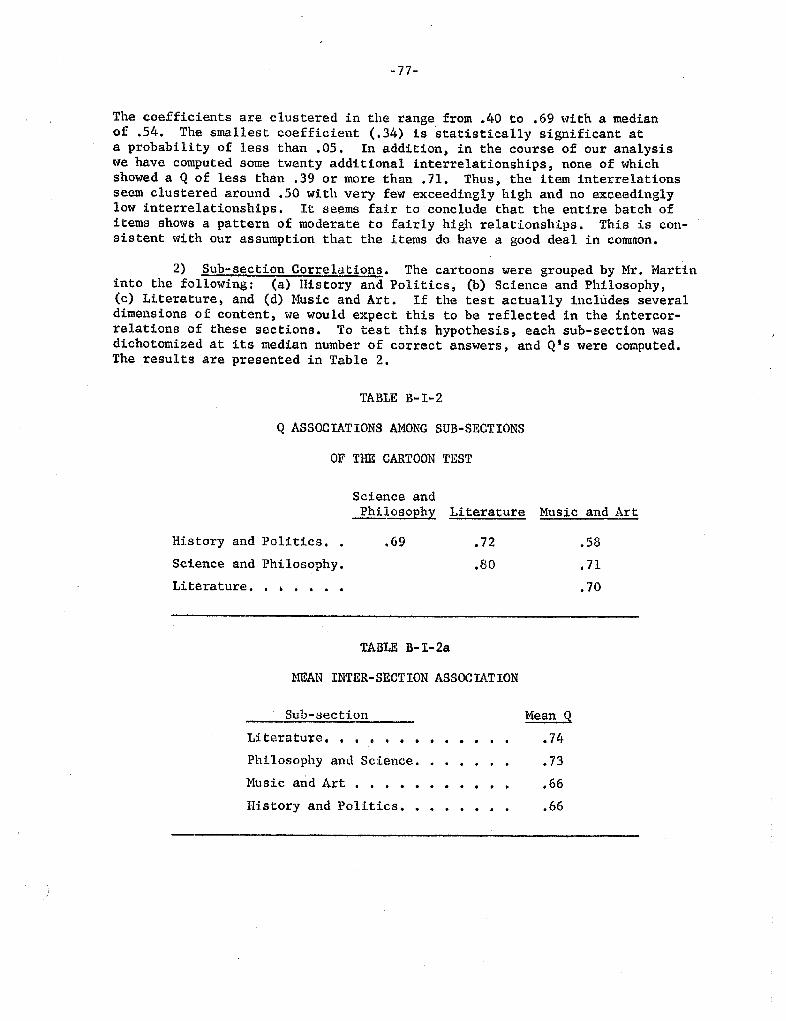
77-
The coefficients are clustered in the range from .40 to . 69 with a medianof . 54. The smallest coefficient (. 34) is statistically significant ata probability of less than . 05. In addition , in the course of our analysiswe have computed some twenty additional interrelationships , none of whichshowed a Q of less than . 39 or more than . 71. Thus , the item interrelationsseem clustered around. 50 with very few exceedingly high and no exceedinglylow interrelationships. It seems fair to conclude that the entire batch ofitems shows a pattern of moderate to fairly high relationships. This is con-sistent with our assumption that the items do have a good deal in common.
2) Sub-section Correlations . The cartoons were grouped by Mr. Martininto the following: (a) History and Politics , (b) Science and Philosophy,(c) Literature, and (d) Music and Art. If the test actually includes severaldimertsions of content , we would expect this to be reflected in the intercor-relations of these sections. To test this hypothesis, each sub-section wasdichotomized at its median number of correct answers, and Q t S were computed.The results are presented in Table 2.
TABLE 13-1-2
Q ASSOCIATIONS AMONG SUB-SECTIONS
OF THE CARTOON TEST
Science andPhilosophy Literature Music and Art
History and Politics.
Science and Philosophy.
Li te ra ture .
TABLE B-I-
mAN INTER-SECTION ASSOCIATION
--
Sub-sectionLiterature. . .
. .
Mean Q
Philosophy and Science.Music and Art
. . . .
History and Politics.
. . . . . . .
78-
The associations are fairly high , and there is no indication that anyone section has a pattern which would suggest that it taps a separate- dimen-sion.
3) Scalability. As the above evidencegenerate quite satisfactory Guttman scales. we have made a number of sgch scales, each wi
. over the conventional . 90.
suggests, these items willthe course of our analysisa reproducibility comfortably
4) Northwestern Sample In order to get some data for comparisonwith our sample ) we arranged to collect a small number of cartoort test pro-tocols from undergraduate students at Northwestern Universit y. 7 : T e testwas administered to all the members of two classes, a freshman couhe incomposition and literature , and an advanced course in American literaturefor upper-classmen, 97 cases in all. The sample is, of course , not a prob-ability sample of the Northewestern student body. We felt , however , thatsimilar data from a group of undergraduates at a high-ranking university wouldgive us some comparisons with our Great Books sample. . In terms of internalconsistency, it appears that the Northwestern sample gives back result s whichare essentially similar to our survey data. For the same fifteen sampleditem intercorrelations we got a mean Q of .55 and a median of . 51. Thesefigures, however, are not very reliable , as. tbey are based on a small sampleand many of the items had very small "marginals" (e.g., only four or fivecorrect answers to a given question). Since the marginal distribution ofthe items is of great importance in terms of the scalint criterion , we com-pared the rank order of the marginals for the thirty cartoons in the samples andfound a rank correlation of . 84, which suggests that the same cartoons tendedto be "easy" or IIdifficultll in the two groups. In short, there is nothing inthis comparison to indicate that the internal consistency reported for our sur-vey is spurious. It should be noted, however, that we have no evidence thatthe test would perform well in a non-college population, although a priorione may argue from the fact that our two samples are quite homogeneous oneducation (84 per cent of the Great Books sample reported some college train-ing), that administration of the test in a more heterogeneous population wouldraise , rather than lower, its operating qualit
In summary, a number of rule-of-thumb procedures suggest that we wouldbe in no serious danger if we treated the entire batch of cartoons as a measureof a single dimension of information about liberal arts and humanities. Letus now turn to the actual data.
the technically-oriented reader may wonder why, then, we have chosento use raw scores rather than scale scores in our data analysis. Our reason-ing was as follows: Scalability, by definition, insures a high correlationbetween scale position and raw score. If so , the contribution of the scale isessentially that of the assignment of "error types, " a process for which therationale is, to say the least , not completely codified as of 1958. We feltthat with thirty items , a quartile division on raw score would, in effect,achieve as efficient error-type assignment as any ad hoc rationale on six orseven i terns.
Morris Sunshine) graduate student in sociology at Northwestern , ad-ministered the questionnaires for us.
He cannot , however, assume that if we had truly numerical data, moresubtle techniques , such as factor analysis) would support these conclusions.
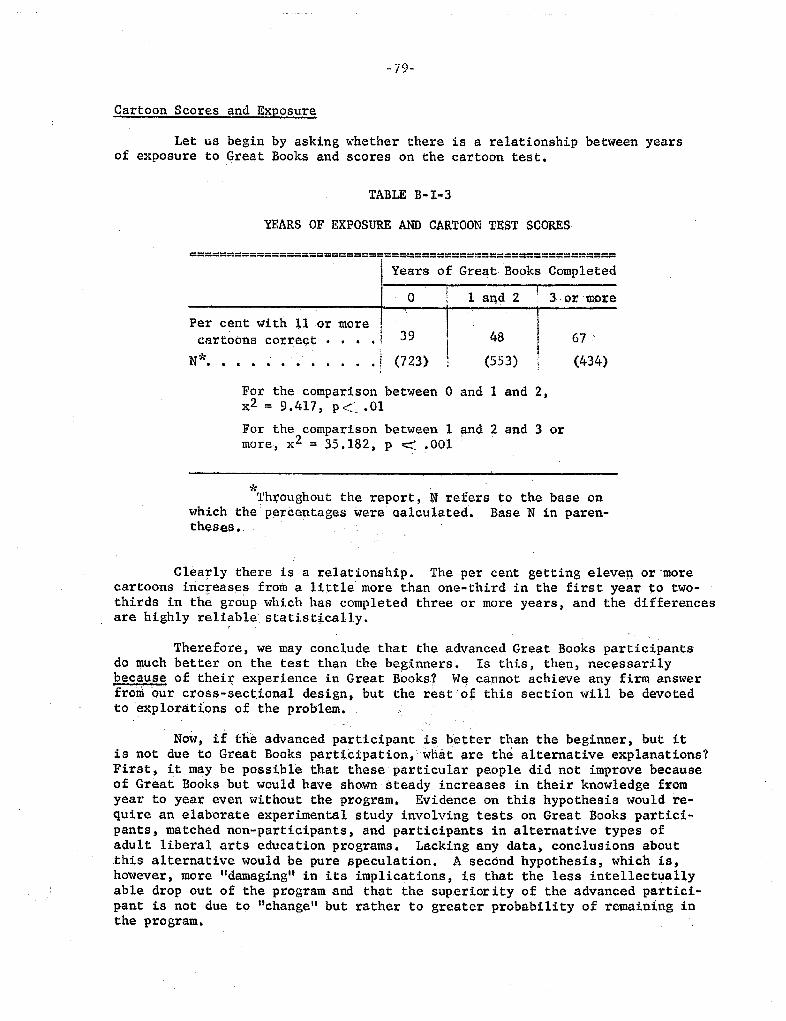
79..
Cartoon Scores and Exposure
Let us begin by asking whether there is a relationship between yearsof exposure to Great Books and scores on the cartoon test.
TABLE B-I-3
YEARS OF EXPOSURE AND CARTOON TEST SCORES
-============= =====-==-====; ============ ==== ===
Years of Great Bo ks Completed
1 aqd 2 3 or more
Per cent with lior more cartoons correct
. . . j
(553) (434)
. .
! (723)
For the comparison between 0 and land 2 = 9.
417, p
- .
For the comparison between 1 and 2 and 3 ormore , x2 = 35. 182
, p : .
0011( Throughout the report, N refers to the base on
which the percentages were Qalculated. Base N in paren-thesel'. Clearly there is a relationship. The per cent getting eleven or .more
cartoons iricreases from a little more than one-third in the first year to two-thirds in the group which has completed three or more years , and the differencesare highly reli ble stati8t cally.
Therefore, we may conclude that the advanced Great Books participantsdo uch better on the test than the beginners. Is this , then, necessarilybecause of their experience in Great BooksJ capnot achieve any firm answerfrom our cross-sectional design, but the rest of this section will be devotedto explorations of the problem.
Now if the advanced participant .is bet:ter than the beginner, but itis not due to Great Books participation, what are the alternative explanations?First , it may be possible that these particular people did not improve becauseof Great Books but would have shown steady increases in their knowledge fromyear to year even without the program. Evidence on this hypothesis would re-quire an elaborate experimental study involving tests on Great Books partici-pants, matched non-participants, and participants in alternative types ofadult liberal arts education programs. Lacking any data, conclusions aboutthis alternative would be pure speculation. A second hypothesis, which is,however, more "damaging" in its implications , is that the less intellectuallyable drop out of the program and that the superior ity of the advanced partici-pant is not due to "change II but rather to greater probability of remaining inthe program.
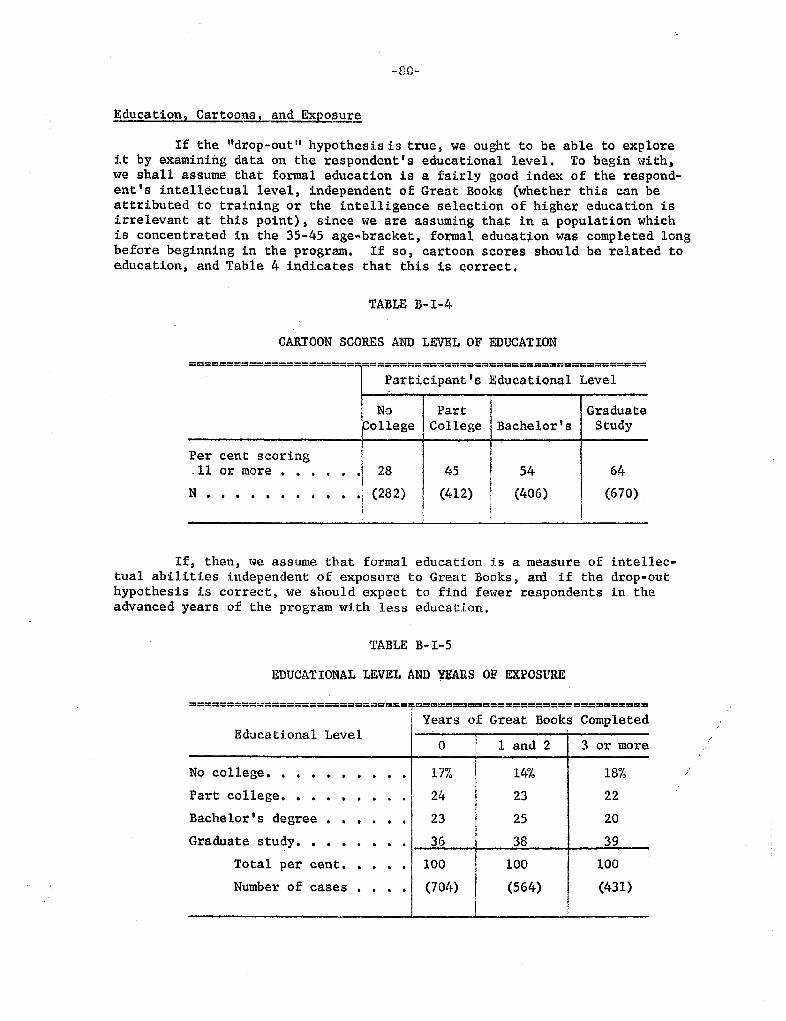
80-
Education. Cartoons, and E
If the "drop-out II hypothesis is true, we ought to be able to exploreit by examining data on the respondent' s educational level. To begin with,we shall assume that fOl-ml education is a fairly good index of the respond-ent' s intellectual level , independent of Great Books (whether this can beattributed to training or the intelligence selection of higher education isirrelevant at this point), since we are assuming that in a population whichis concentrated in the 35-45 age-bracket , forml education was completed longbefore beginning in the program. If so , cartoon scores should be related toeducation, and Table 4 indicates that this is correct.
TABLE B- I-
CARTOON SCORES AN LEVEL OF EDUCATION
----------------------------------------------=------------------------------------- ---------- ------------ --------------
Participant' Educational Level
Part Graduate:College College Bachelor Study
Per cent scoringor more
(282) (412) (406) (670)
If, then, we assume that formal education is a measure oftua1 abilities independent of exposure to Great Books , ani i. thehypothesis is correct , we should expect to find fewer respondentsadvanced years of the program with less education.
intellec-drop-outin the
TABLE B-I-5
EDUCATIONAL LEVEL AND YEARS OF EXPOSURE
--=~~~======;==; ============ ===============================
Educational Level1 and 2 3 or more
No college. 17% 14% 18%
Part college.
Bache lor s degree
Graduate study.Total per cent. 100 100 100
Number of cases (704) (564) (431)
Years of Great Books Completed
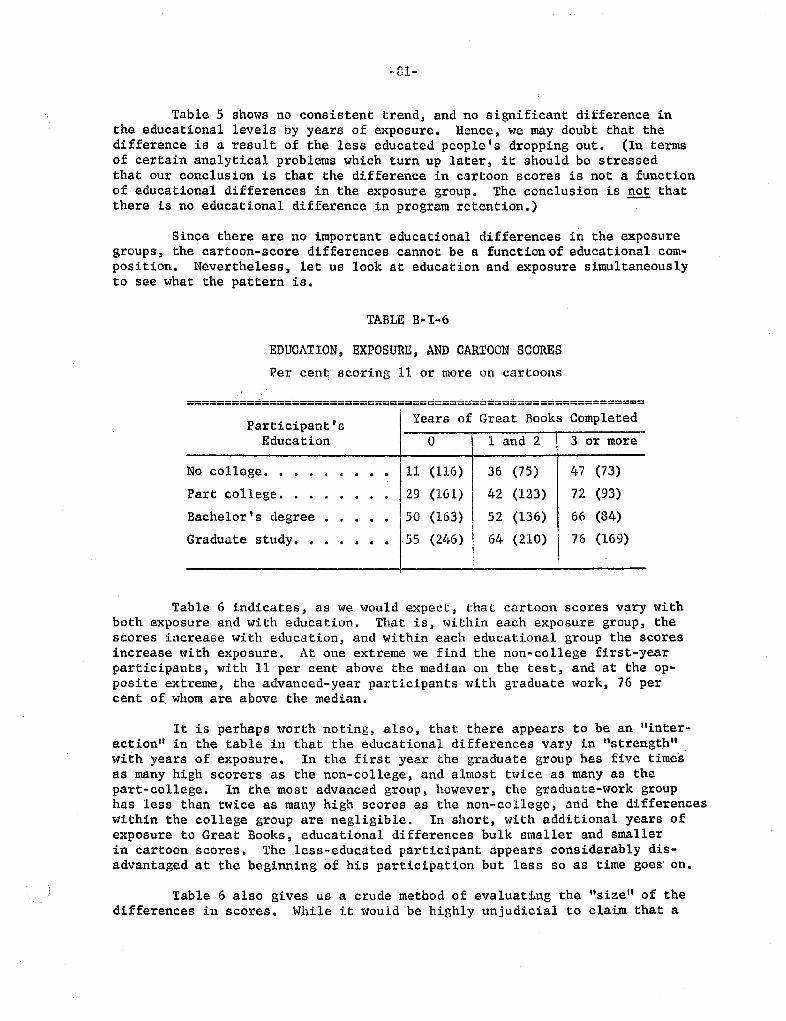
81-
Table 5 shows no consistent trend, and no significant difference inthe educational levels by years of exposure. Hence, we may doubt that thedifference is a result of the less educated people s dropping out. (In termsof certain analytical problems which turn up later, it should be stressedthat our conclusion is that the difference in cartoon scores is not a functionof educational differences in the exposure group. The conclusion is not thatthere is no educational difference in program retention.
Since there are no important educational differences in the exposuregroups , the cartoon-score differences cannot be a function of educational com-position. Nevertheless , let us look at education and exposure simultaneouslyto see what the pattern is.
TABLE B..I-6
EDUCATION, EXPOSURE , AND CARTOON SCORES
Per cent Bcoring 11 or more on cartoons
;====;========-========== ==========-===;=========;=====
Participant t Education
Years of Great Books Completed
1 and 2 3 or more
No college.
. .
Part college. . .
. .
Bachelor s degree
Gradua te study.
. .
11 (116)
29 (161)
. . '50 (163)
. .
55 (246)
36 (75)42 (123)
, 52 (136)
I 64 (210) I
47 (73)
72 (93)
66 (84)76 (l69)
Table 6 indicates, as we would expect , that cartoon scores vary withboth exposure and wi th education. That is, wi thin each exposure group, thescores increase with education , and within each educational group the scoresincrease with exposure. At one extreme we find the non-college first-yearparticipants , with 11 per cent above the median on the test , and at the op-posite extreme , the advanced-year participants with graduate work, 76 percent of whom are above the median.
It is perhaps worth noting, also, that there appears to be an "inter-action" in the table in that the educational differences vary in "strength",.,ith years of exposure. In the first year the graduate group has five timesas many high scorers as the non-college, and almost twice as many as thepart-college. In the most advanced group, however, the graduate-work grouphas less than twice as many high scores as the non-college, and the differenceswithin the college group are . negligible. In short, with additional years ofexposure to Great Books, educational differences bulk smaller and smallerin cartoon scores. The less-educated participant appears considerably dis-advantaged at the beginning of his participation but less so as time goes' on.
Table 6 also gives us a crude method of evaluating the "size" of thedifferences in scores. While it would be highly unjudicial to claim that a
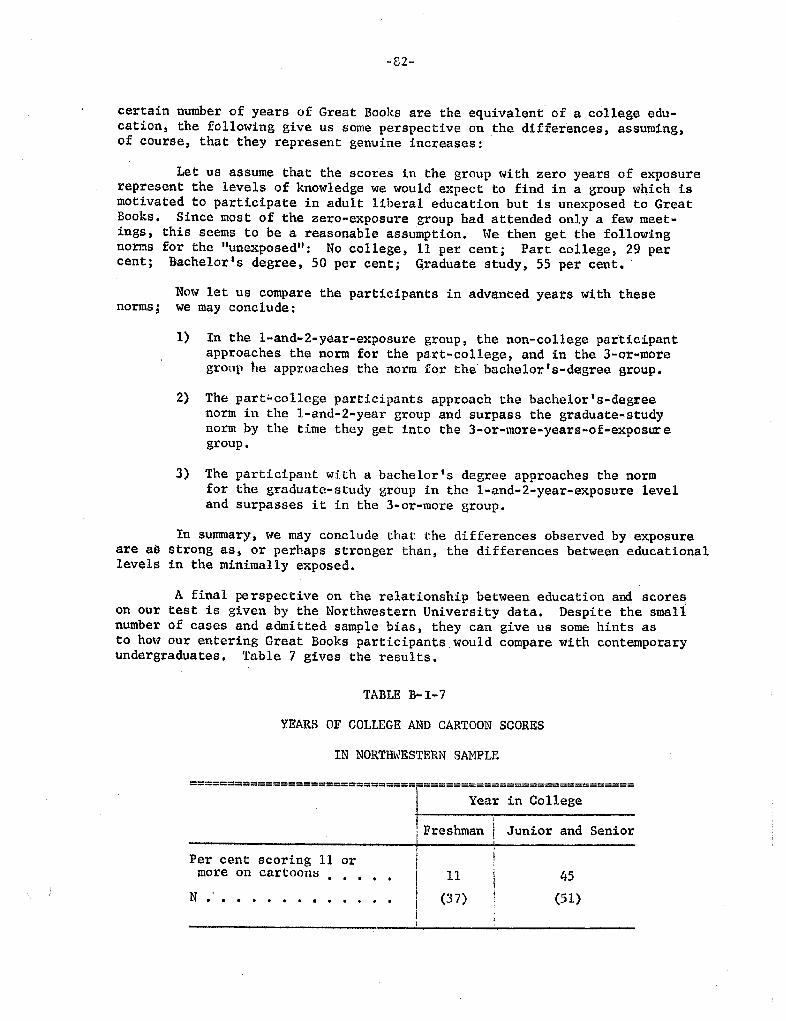
82-
certain number of years of Great Books are the equivalent of a college edu-cation, the following give us some perspective on the. differences , assuming,of course, that they represent genuine increases:
Let us assume that the scores in the group with zero years of exposurerepresent the levels of knowledge we would expect to find in a group which ismotivated to participate in adult liberal education but is unexposed to GreatBooks. Since most of the zero-exposure group had attended only a few meet-ings, this seems to be a reasonable assumption. We then get the foilowingnorms for the "unexposed" : No college, 11 per cent; Part college t 29 percent; Bachelor s degree, 50 per cent; Qraduate study, 55 per cent.
norms;Now let us compare the participants in advanced years with thesewe may conclude:
In the l-and-2- year-exposure group, the non-college participantapproaches the norm for the part-college, and in the 3-or-moregroup he approaches the norm for the bachelor s-degree group.
The part col1ege participants approach the bachelor degreenorm in the l-and-2-year group and surpass the graduate-studynorm by the time they get into the 3-or-more-years-of-exposur egroup.
The participant with a bachelor s degree approaches the normfor the graduate-study group in the l-and-2-year-exposure leveland surpasses it in the 3-or-more group.
In summary, we may conclude that the differences observed by exposureare as strong as, or perhaps stronger than , the differences between educationallevels in the minimally exposed.
A final perspective on the relationship between education and scoreson our test is given by the Northwestern University data. Despite the smallnumber of cases and admitted sample bias, they can give us some hints asto how our entering Great Books participants would compare with contemporaryundergraduates. Table 7 gives the results.
TABLE B- 1-7
YEARS OF COLLEGE AND CARTOON SCORES
IN NORTHWESTERN SAMPLE
===-==========-------===----
r--====
:;:=-==-=
I Freshman I Junior and Senior
Per cent scoring 11 or more on cartoons
. . . .
N .
. . . . . . . . . .
(37) (51)
83-
By the definitions used in our survey sample, all of the Northwesternstudents would have been scored as "part college, " but it may be of someutility to divide them roughly between the 37 freshmen who were only intheir second quarter of college and the 51 juniors and seniors Who weretoward the end of their undergraduate studies. Hhen we compaxe these groupswith the Great Books sample , we find that the freshmen score considerablylike the "non-college" Great Books participants, while the upper-classmenapproximate the "bachelor 1 s- degree" level for entering participants. OurGreat Books beginners seem to score neither conspicuously higher nor con-spicuous ly lower than the contemporary undergraduates. If, however, we takeinto consideration that Northwestern is a high-ranking university, and ourGreat Books participants enter the program usually more than a decade pasttheir undergraduate training, our guess would be that even on entry, GreatBooks people score somewhat higher than their formal level of training wouldindicate. Likewise, we may hazard the guess that the advanced-year GreatBooks participant, regardless of level of fu rmal education, compares ratherfavorably in his scores with persons still in the process of studying theliberal arts. This latter conclusion is reinforced when we note that theupper-classmen in the N. U. sample were drawn from an advanced English coursewhich probably attracts students especially interested in the humanities.
Music. Education, and Exposure
At this point we shall introduce another test variable
, "
musicalsophistication. Since improvement in musical taste is not an objective ofthe Great Books program , we should begin by explaining the research strategybehind the use of this variable. \.Jhi.e formal education has the useful propertyof being relatively unmodifiable by participation in Great Books, a good casecan be made that it is a pretty crude measure of "liberal arts" capacity,despite its high relations with the cartoon scores. In the first place, manyof our college graduates attended engineering and other technical schools,which, to say the least, did not stress liberal arts; and in the second,the time since graduaticn may have produced either a decline or an increasein liberal arts knowledge, depending on the motivations of the participantand his cultural climate.
Therefore, we should like to have a more "contemporary" controlvariable. It should, however, be one which probably does not vary with ex-posure to Great Books. Knowledge of classical music suggested itself as acandidate for these two reasons: such knowledge is probably correlated withgeneral intellectual sophisiticait:fort, a,nc; diang(. s in musical knowledge areprobably not a functicn of exposure to Great Books.
If these assumptions are correct, we would expect the following:
Musical sophistication should be related to scores on the cartoontest.
Musical sophistication should not be related to exposure to GreatBooks.
When we control simultaneously for education and musical sophis-tication, exposure groups should still vary in cartoon scores ifthe differences are due to exposure and riot to selectivity ofapt participants.
.-84-
Our measure of musical sophistication was developed as follows: In ourquestionnaire we listed thirteen "classicap. musical compositions. They wereselected arbitrarily on the assumption that they covered a range of musicalsophistication ranging from the "lower-middlebrow (The 1812 Ovel' ture NutcrackerSuite William Tell Ovex:ture) through the "upper-middlebrow" (Brahms SecondPiano Concerto , Beethoven ' s Seventh Symphony , Brahms First Symphony) to the"high-brow (Missa Papae Marcelli , by Palestrina, Ives Second SymphonyBeethoven Variations on a Theme by Diabelli
The respondents were given the following instructions:
Let' s assume that you are going to a concert tomorrow , and the fo lowing musical works might be on the program. Rate each in terms ofits familiarity, as follows:
Very familiar -- I I d recognize it if I heard it, even if thetitle wasn t announced.
Familiar -- I might not know the title just from hearing itplayed , but it' s something r've heard before and know a littleabout.
"3) Less familiar -- I don t know much about this specific workbut I am relatively familiar with the composer and the generaltype of music he is known for.
Unfamiliar -- As far as I know , I' ve never heard of this work,and I knm-t little or nothing about the composer.
Those who survived reading these lengthy instructions then proceeded to checkthe thirteen musical titles.
Inspection of the data from our survey sample indicated that the ef-fective range we could hope to get was between the non-musical and the uppermiddlebrow, since very few respondents checked the high-brow titles as familiar(only 45 out of l 09 checked the Diabelli variations as " ery familiar " andonly 72 checked the Ives symphony as "very familiar" .2 "familiar
From the titles with less extreme "marginals , 11 we selected four asthe possible components of a (no pun intended) musical scale. They were:The l8l2 Overture (80 per cent "very familiar" or "familiar ), BrahmsSymphony (59 per cent "very familiar" or "familiar ), Mozart' "Jupiter" Sym-phony (43 per cent livery familiar " or "familiar ), and Beethoven "Archduke!t (20 per cent ' 'very familiar " or "familiar
Table 8 indicates that these four items will make an excellent Guttman-type scale.
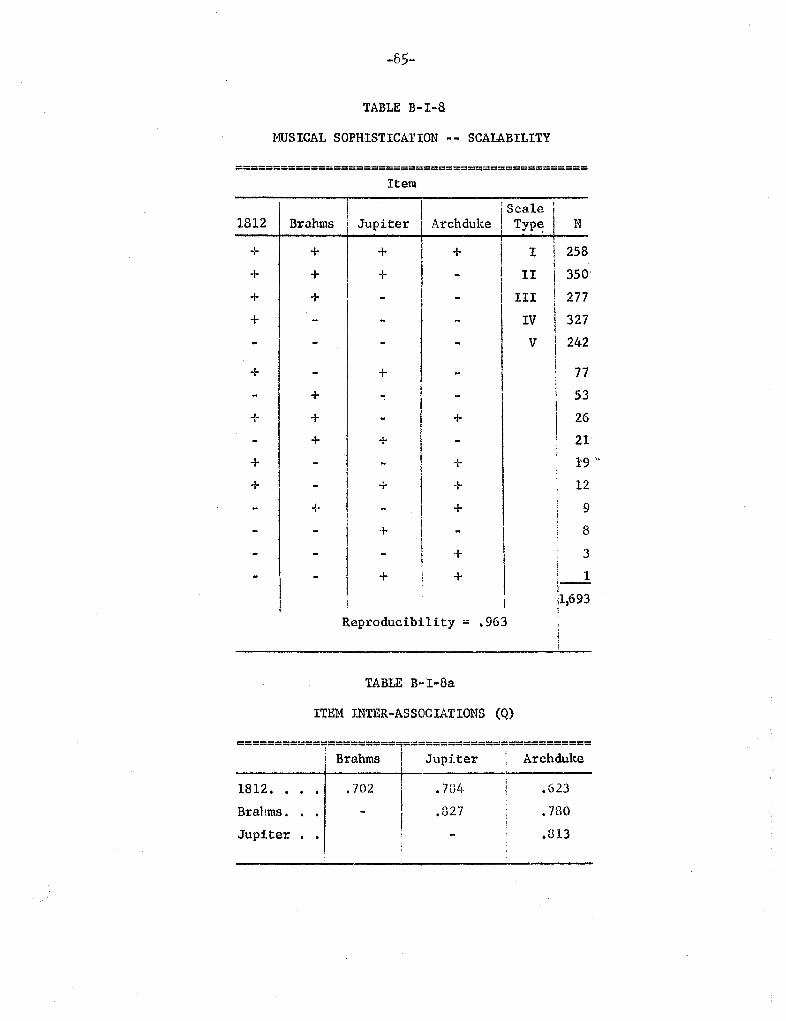
85-
TABLE B- 1-
MUSICAL SOPHISTICATION - - SCALABILITY
====;=;==========;=====;=================-;====
Item
I s1812 Br ahms ArchdukeJupiter
258
350
277III327
242
19"
693
Reproducibility 963
TABLE B-I-
ITEM INTER-ASSOCIATIONS (Q)
=========== =========,=========================
; Brahms Jupiter i Archduke1812. . 702 7GLj. 623
730Brahms.
Jupiter327
. .
B13
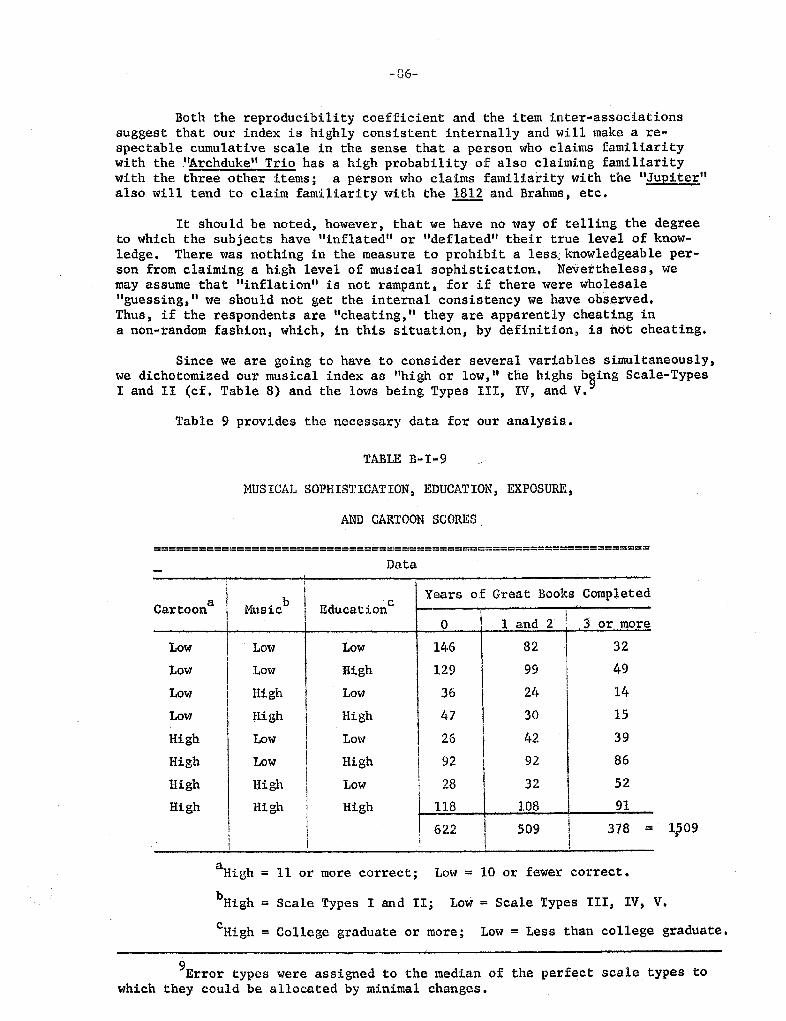
86-
Both the reproducibility coefficient and the item inter-associationssuggest that our index is highly consistent internally and will make a re-spectable cumulative scale in the sense that a person who claims familiaritywith the . Archdukell Trio has a high probability of also claiming familiaritywith the three othel: items; a person who claims familiarity with the "Jupiteralso will tend to claim familiarity with the l8l2 and Brahms , etc.
It should be noted, however, that we have no way of telling the degreeto which the subjects have "inflated II or "deflated" their true level of know-ledge. There was nothing in the measure to prohibit a less , knowledgeable per-son from claiming a high level of musical sophistication. evertheless, wemay assume that "inflation" is not rampant, for if there were wholesale
guessing, " we should not get the internal consistency we have observed.Thus, if the respondents are "cheating, II they are apparently cheating ina non-random fashion, which, in this situation, by definition, is n6t cheating.
Since we are going to have to consider several variables simultaneously,we dichotomized our musical index as "high or low " the highs b ing Scale-TypesI and II (cf. Table 8) and the lows being Types III, IV, and V.
Table 9 provides the necessary data for our analysis.
TABLE B-I-9
MUSICAL SOPHISTICATION, EDUCATION , EXPOSURE,
AND CARTOON SCORES
==================================================================
Data
Years 0 f Grea t Books CompletedCartoon ' b EducationUS1.C
1 and 3 or more
Low Low Low 146
Low Low High 129
Low High Low
Low High High
High Low Low
High Low High
High High Low
High High High 118 108
6 2 378509 l?09
High =
High =
II or more correct; Low = lO or fewer correct.
Scale Types I and II; Low = Scale Types III, IV, V.
High = College graduate or more; Low = Less than college graduate.
Error types were assigned to the median of the perfect scale types towhich they could be allocated by minimal changes.
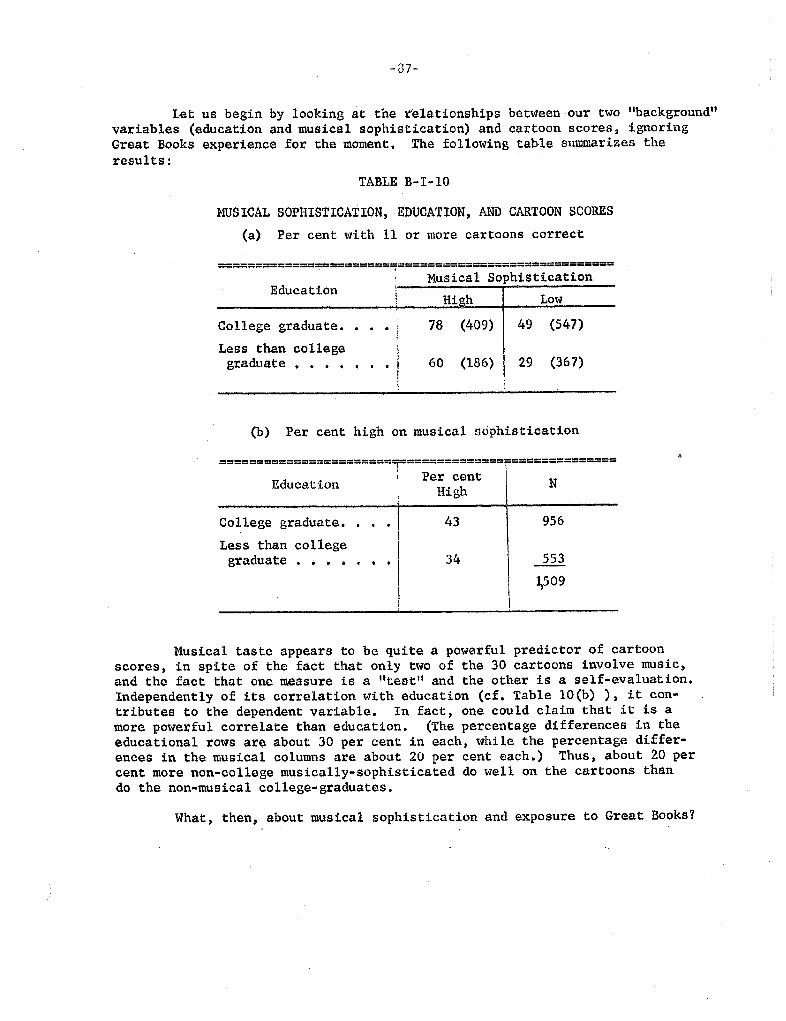
87-
Let us begin by looking at the relationships between our two "background"variables (education and musical sophistication) and cartoon scores , ignoring
Great Books experience for the moment. The following table summarizes theresults:
TABLE B-I-lO
MUSICAL SOPHISTICATION, EDUCATION, AND CARTOON SCORES
(a) Per cent with 11 or more cartoons correct
===;========= ========= ========;==;=================
EducationMusical SophisticationHigh Low
College graduate. .
. .
Less than collegegraduate
. . . .
(409) (547)
. . .
(186) I 29 (367)
(b) Per cent high on musical sophistication
=======================
9==============
==============
Per centEducatl.n High College graduate.Less than collegegraduate
. .
956
. .
553
509
Musical taste appears to be quite a powerful predictor of cartoonscores, in spite of the fact that only two of the 30 cartoons involve musicand the fact that one measure is a "test" and the other is a self-evaluation.Independently of its correlation with education (cf. Table 10(b) ), it con-tributes to the dependent variable. In fact , one could claim that it is amore powerful correlate than education. (The percentage differences in theeducational rows are about 30 per cent in each , while the percentage differ-
ences in the musical columns are about 20 per cent each. Thus, about 20 per
cent more non-college musically-sophisticated do well on the cartoons thando the non-musical college- graduates.
What , then about musical sophistication and exposure to Great Books?
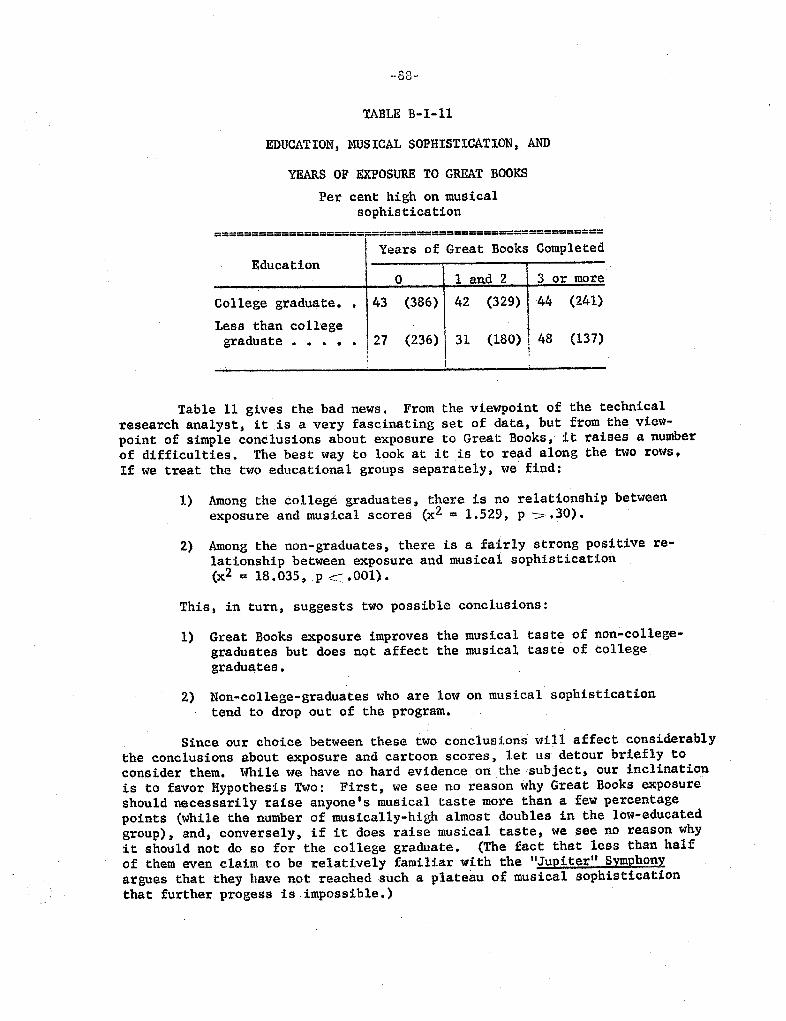
88-
TABLE B-I-
EDUCATION, MUS ICAL SOPHISTICATION , AND
YEARS OF EXPOSURE TO GRET BOOKS
Per cent high on musicalsophis tica tion
===;=-=============- ==;=========== ======:=========
Years of Great Books CompletedEducation
land 2 3 or more
College graduate. . 43
Less than collegegraduate
. . . .
; 27
(386 ) (329) (24l)
(236) (180) \ 48 (137)
Table 11 gives the bad news. From the viewpoint of the technicalresearch analyst , it is a very fascinating set of data , but from the view-point of simple conclusions about exposure to Great Books, it raises a numberof difficulties. The best way to look at it is to read along the two rows.If we treat the two educational groups separately, we find:
Among the college graduates , there is no relationship between
exposure and musical scores (x 2 = 1.529, p 30).
Among the non-graduates , there is a fairly strong positive re-lationship between exposure and musical sophistication
2 = 18. 035, p. 001).
This , in turn, suggests two possible conclusions:
Great Books exposure improves the musical taste of non-co11ege-graduates but does not affect the musical tast of college
graduates.
Non-coll ge-graduates who are low on musical sophisticationtend to drop out of the program.
Since our choice between these two conclusions will affect considerablythe conclusions about exposure and cartoon scores, let us detour briefly toconsider them. While we have no hard evidence on the subject, our inclinationis to favor Rypothesis Two: First , we see no reason why Great Books exposureshould necessarily raise anyone s musical taste more than a few percentagepoints (while the number of musically-high almost doubles in the low-educated
group), and; conversely, if it does raise musical taste, we see no reaSon whyit should not do so for the college graduate. (The fact that less than halfof them even claim to be relatively familiar with the Jupiter" Symphonyargues that they have not reached such a plateau of musical sophisticationthat further progess is impossible.

39-
The only statistical evidence on the subject comes from our index ofadherence" to the program. While we have no data on who did drop out of theprogram, we did ask the participants , in effect, whether they might do so inthe future. The two specific items are reproduced below:
Items in Adherence Index
How do you feel about continuing in Great Books?
-- I definitely plan to continue through the yearand next year too, if the program is still available
-- I definitely plan to continue through this year,but I III have to wait and see about next year
..
I mayor may not continue through this year
-- I probably won I t continue until the end of theyear
Even the most enthusiastic Great Books participantfinds some things that cut down his interest in theprogram. Please check any of the following that mighttend to decrease your interest in Great Books in thenear future.
My health
--
Increased family responsibilities
..
The program isn t sufficiently challenging intellectually
-- My group is getting a little stale
I want to get into other activities to apply the thingsve gotten out of Great Books
-- lIve become interested in another continuing educationprogram
--
The time or place of the meeting is inconvenient for me
-- lIve gotten into other community activities whichinteres t me more
-- 1'm cutting dowu on all of my outside activities
10 I have to give more time and attention to my job-- I don I t get much out of the readings
Personality clashes in the group 11m in
--
Great Books just isn I t for meOther
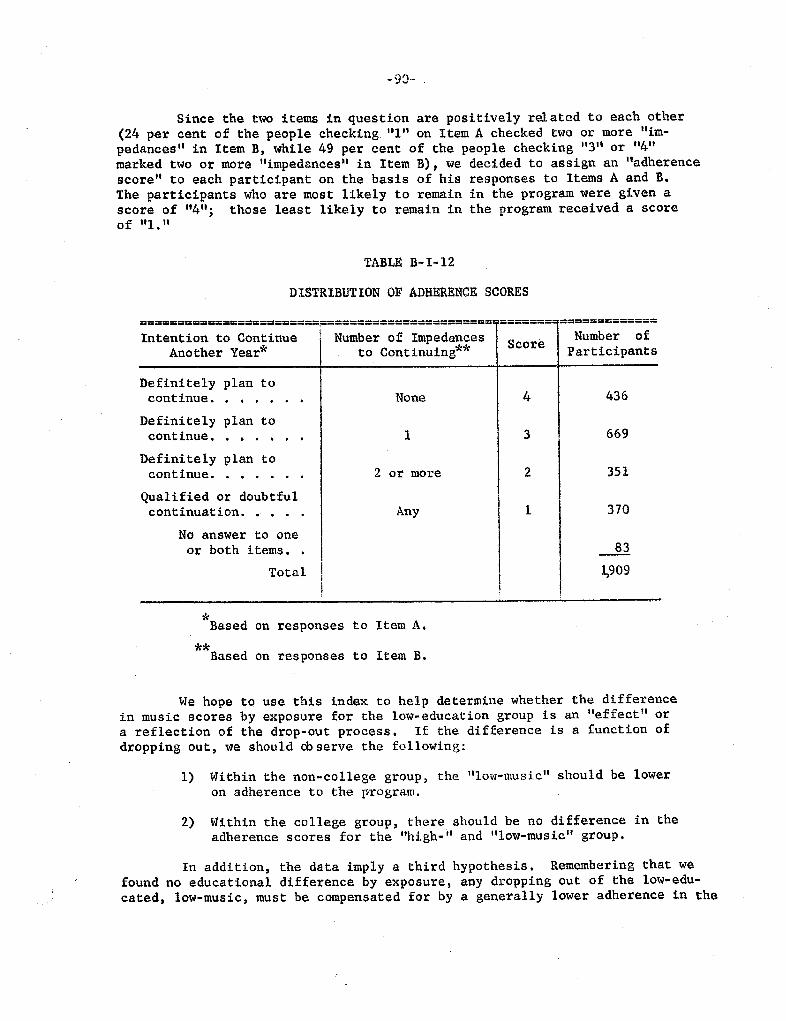
90-
Since the two items in question are positively related to each other(24 per cent of the people checking "1" on Item A checked two or more " im-pedances " in Item B, while 49 per cent of the people checking "3" or "411
marked two or more " impedances" in Item B), we decided to assign an "adherencescore" to each participant on the basis of his responses to Items A and B.The participants who are most likely to remain in the program were given ascore of "4" those least likely to remain in the program received a scoreof "
TABLE B-1-
DISTRIBUTION OF ADHERENCE SCORES
========================F======================
-------------- ---------------------------
Intention to ContinueAnother Year
I Number of Impedances
to ContinuingScore Number of
Participants
Definitely plan tocontinue. . .
. .
Definitely plan tocontinue. . .
. .
436
669
351
370
1,909
None
Definitely plan tocontinue.
. . . .
2 or more
Qualified or doubtfulcontinuation. . .
No answer to oneor both items. .
Any
Total
Based on responses to Item A.
Based on responses to Item B.
We hope to use this index to help determine whether the differencein music scores by exposure for the low-education group is an lIeffect" ora reflection of the drop-out process. If the difference is a function ofdropping out , we should Db serve the following:
Within the non-college group, the 1Ilow-music" should be lower
on adherence to the program.
Within the college group, there should be no difference in theadherence scores for the "high- and 1Ilow-music" group.
In addition, the data imply a third hypothesis. Remembering that wefound no educational difference by exposure, any dropping out of the low-edu-cated, low-music , must be compensated for by a generally lower adherence in the
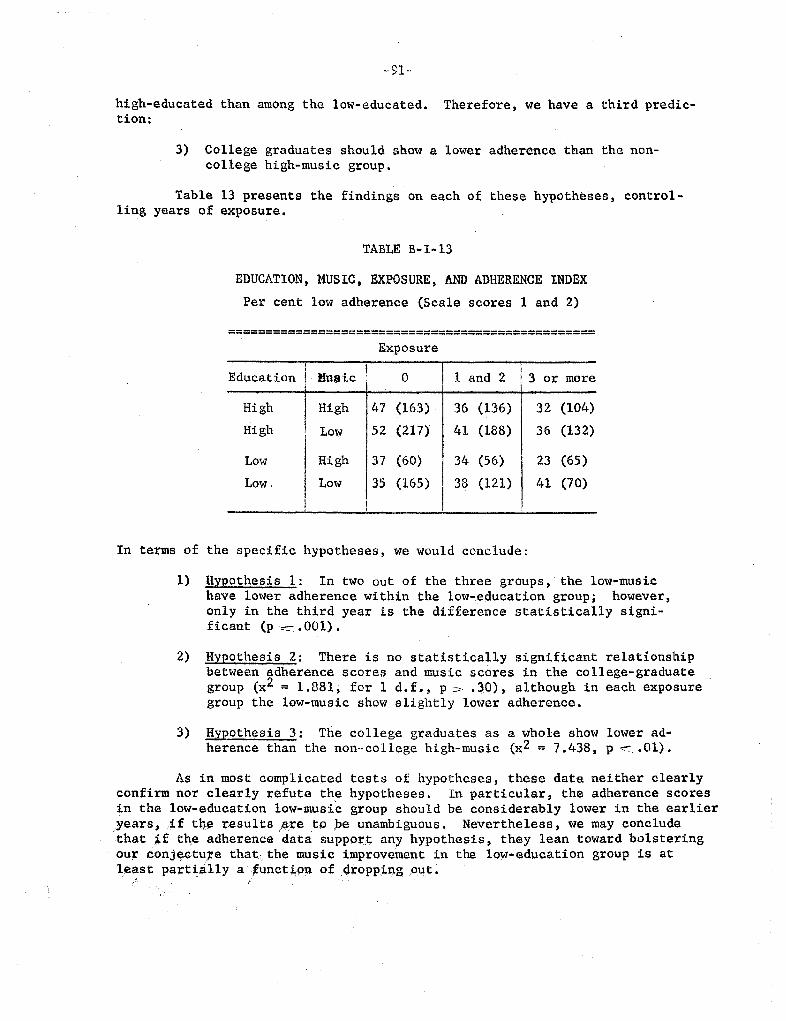
91-
high-educated than among the low-educated.tion:
Therefore, we have a third predic-
College graduates should show a lower adherence than the non-college high-music group.
Table 13 presents the findings on each of these hypotheses, control-ling years of exposure.
TABLE B- 1-
EDUCATION, MUSIC , EXPOSURE , AND ADHERENCE INDEX
Per cent low adherence (Scale scores 1 and 2)
================================================
Education ! Music
Exposure
1 and 2 I 3 or more
High High 47 (163) 36 (136) 32 (104)
High Low 52 (217) 41 (188) 36 (132)
j HighLow 37 (60) 34 (56) 23 (65)Low.
I Low
35 (165) 38 (121) 41 (70)
In terms of the specific hypotheses, we would conclude:
Hypothesis 1 In two out of the three groups , the low-musichave lower adherence within the low-education group; however,only in the third year is the difference statistically signi-ficant (p 001).
Hypothesis 2 There is no statistically significant relationshipbetween adherence scores and music scores in the college-graduategroup (x2 = 1.881, for 1 d. f., p . 3,0), although in each exposuregroup the low-music show slightly lower adherence.
Hypothesis 3 : The college graduates as a whole show lower ad-herence than the non-college high-music (x2 = 7. 438, p
. .
01).
As in most complicated tests of hypotheses, these data neither clearlyconfirm nor clearly refute the hypotheses. In particular, the adherence scoresin the low-education low-music group should be considerably lower in the earlieryear$, .if tb. +esuLtsf,'1e tp , be unambiguous. Nevertheless, we may concludethat f the adherence data sUPPOt:,t any hypothesis, they lean toward bolsteringou;r conje..tuJ!e that . the music improvement in the lOW-education group is at
ast pa;rtUlly a unctip'9 of . d:topping put
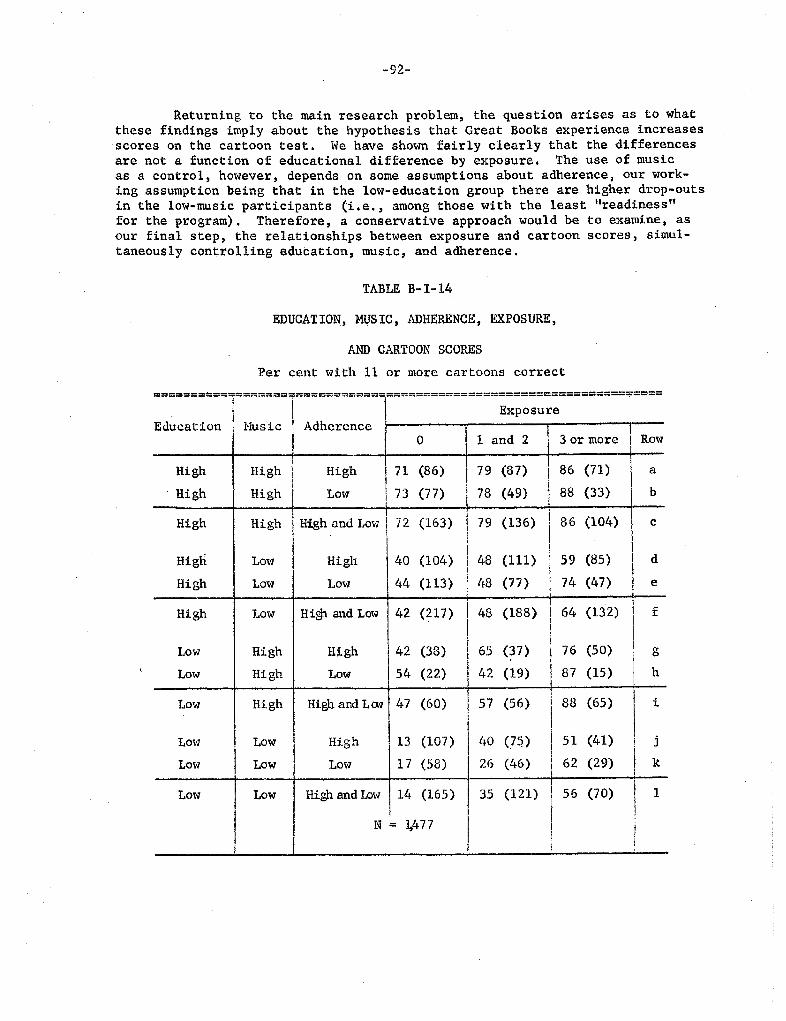
92-
Returning to the main research problem, the question arises as to whatthese findings imply about the hypothesis that Great Books experience increasesscores on the cartoon test. We have shown fairly clearly that the differencesare not a function of educational difference by exposure. The use of musicas a control, however, depends on some assumptions about adherence , our work-ing assumption being that in the low-education group there are higher drop-outsin the low-music participants (i.e., among those with the least "readinessfor the program). Therefore, a conservative approach would be to examine, asour final step, the relationships between exposure and cartoon scores, simul-taneously controlling education , music , and adherence.
TABLE B-I-
EDUCATION, MUSIC , ADHERENCE , EXPOSURE
AND CARTOON SCORES
Per cent with 11 or more cartoons correct
-------------------------------------------------------=============------------------------------
l------------------------ExposureEducation ; Music 1 Adherence I
land 2 . 3 or more \ Row
71 (86) 79 (87) 86 (71)High High High
High High Low 73 (77) 78 (49)i 88 (33)
High High High and Low i 72 (163) (136) j 86 (104)
High Low High 40 (104) (111) : 59 (85)
High Low Low 44 (113) (77) 74 (47)
High J.. H igj and Low 42 (217) I 48 (188) 64 (132)
Low High High 42 (38) 65 q7) (50)
Low High Low S4 (22)I 42
(19)I 87
(15)
(60) (56) (65)Low High High and Lcw
Low Low High (107) 51 (41)
Low Low Low 17 (58) (46) 62 (29)
Low Low High and lDw (165) (121) 56 (70)
N = 4 77
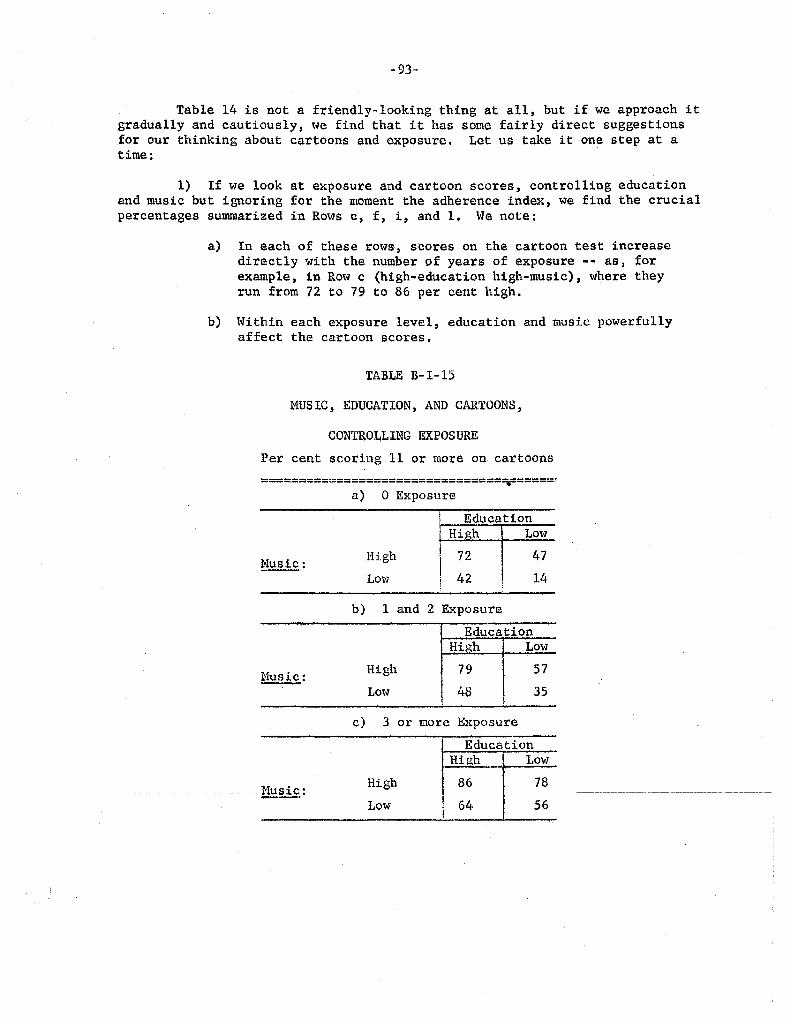
93-
Table 14 is not a friendly- looking thing at all, but if we approach itgradually and cautiously, we find that it has some fairly direct suggestionsfor our thinking about cartoons and exposure. Let us take it one step at atime:
1) If we look at exposure and cartoon scores, controlling educationand music but ignoring for the moment the adherence index , we find the crucialpercentages summarized in Rows c, f, i, and 1. We note:
In each of these rows, scores on the cartoon test increasedirectly with the number of years of exposure -- as , forexample , in Row c (high-education high-music), where theyrun from 72 to 79 to 86 per cent high.
Within each exposure level , education and music powerfullyaffect the cartoon scores.
TABLE B- 1-
MUS IC, EDUCATION , AND CARTOONS,
CONTRO LING EXPOSURE
Per cent scoring II or more on cartoons
==========::'=======================T=====:o Exposure
EducationHi h Low
Husic High
Low
l and 2 Exposure
EducationHigh Low
High
LmV'
3 or more Exposure
EducationHigh Low
High
Low
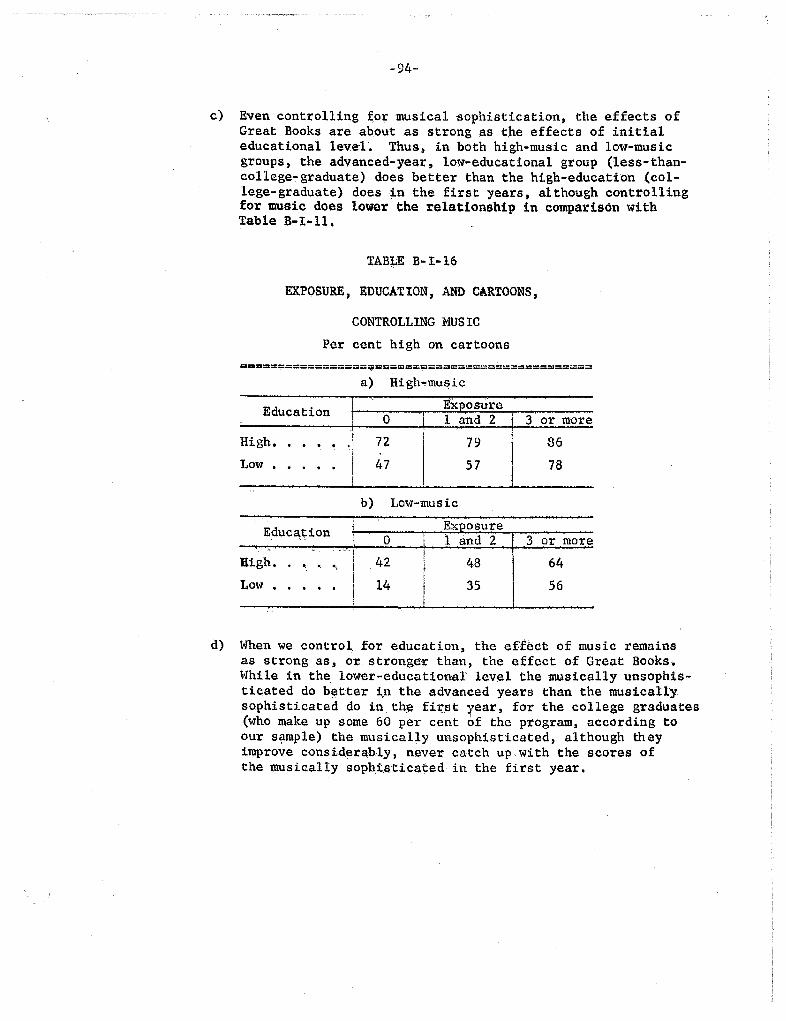
94-
Even controlling or musical ophistication , the effects ofGreat Books are about as strongast,he effects of initialeducational level. Thus in both high-music and low-musicgroups, the adyanc year, low-educational group (less-than-college- graduate) does better than the high-education (col-lege- graduate) doesj.n the first years , although controllingfor music does lower the relationship in comparison withTable B-1-11.
TABLE B- 1-16
EXPOSURE , EDUCATION, AN CARTOONS
CONTROLLING MUS
Per cent high on cartoons
;==== =========== ====-=-=====;===;==========
High music
ExpoSu1;Gland 2 3 or more
Education
Hi gh.
. .
Low
. .
Low-music
Education Exposureand more
- ,,
nigh.Low
When we control for education, the e.f,f t of music remainsas strong as" Or strongeor than, the affect of Great Books,While in the, lower-educational level the musically unsophis-ticated do better in the advanced years than the musicallysophisticated do in t fi1;.
rear, for the college gr.aduates
(who make up some 60 per cent of the program, according toour sample) the musical y unsophisticated, although theyimprove consid.erably, never catch up with the scores ofthe musically sophis.ticated in the first year.
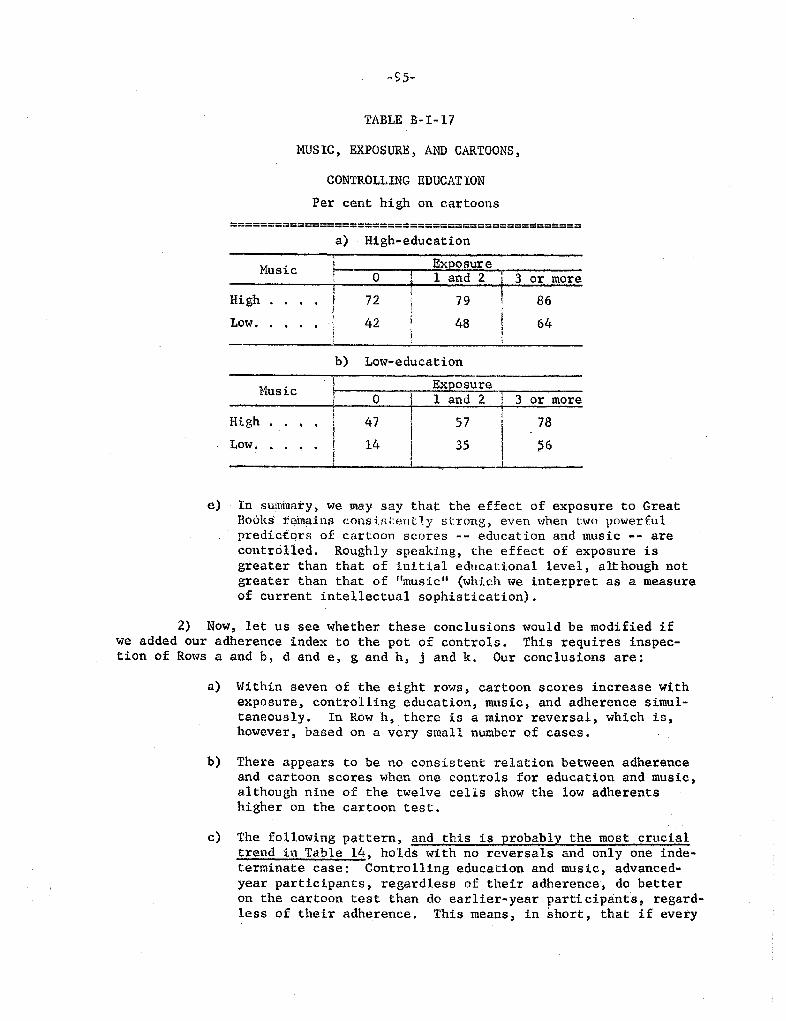
95-
TABLE B-I-
MUSIC , EXPOSURE , AND CARTOONS,
CONTROLLING EDUCAT ION
Per cent high on cartoons
===================================Q====
======
High- education
Music osure1 and 2 3 or more
High
Low. 48
Low-education
Music Exposureland 2 3 or more
High
Low.
In summary, we may say that the effect of exposure to GreatBooks' tem ins consistently strong, even when t\'I powerfulpredictors of cartoon scores
--
education and music
--
arecontrolled. Roughly speaking, the effect of exposure isgreater than that of initial educational level , although notgreater than that of "music II (which we interpret as a measureof current intellectual sophistication).
2) Now, let us see whether these conclusions would be modified ifwe added our adherence index to the pot of controls. This requires inspec-tion of Rows a and b, d and e, g and h , j and k. Our conclusions are:
Within seven of the eight rows, cartoon scores increase withexposure, controlling education, music, and adherence simul-taneously. In Row h, there is a minor reversal, which is,however, based on a very small number of cases.
There appears to be no consistent relation between adherenceand Cartoon scores when one controls for education and music,although nine of the twelve cells show the low adherentshigher on the cartoon tes t.
The following pattern and this is probably the most crucialtrend in Table 14 , holds with no reversals and only one inde-terminate case: Controlling education and music , advanced-year participants, regardless of their adherence, do betteron the cartoon test than do earlier-year participants , regard-less of their adherence. This means, in short , that if every
96-
single participant who was low on' adherence droppea out, theexposure differences in cartoon scores would still hold. fact, if anything, the tendency for high cartoon scores tobe low on adherence argues that there is a greater exposuredifference than our data indicate.
Summary
In thi section we have attempted to explore the hypothesis that expo-sure to Great Books increases the participant' s knowledge of the liberal artsand humanities . While this "effect" is not the most sophisticated and subtlewe argued that unless we can present evidence for it ) it would be useless toproceed to analyze effects which are assumed to flow from the increased knowl-edge.
In or er to meas re knowledge of the liberal arts and humanities , weused a "cartoon" test designed to assess knowledge of a curriculum similar tothat of Great Books. Al'alysis of the test itself indicated that it was inter-nally fairly consistent , both in the Great Books sample and in a judgmentalsample of Northwestern University undergraduates. While we have no "hard"evidence of its validity, its pattern of correlations with such variablesas education and musical sophistication is consistent with the assumptionswe have made about it.
Our data showed a fairly strong and statistically significant rela-tionship between number of years completed in the Great Books program andscores on our cartoon measure. It was admitted that in a "cross-sectional"design, no test could be made of the hypotheses that a) the participantswould have improved without Great Books, and b) the quality of recruits tothe program has declined.
In the remainder of the section , consideration was given to the pos-sibility that the observed difference could be spurious becaus e of a tendencyfor persons low on cartoon scores to drop out. Our analysis reached the fol-lowing conclusions:
1) No significant educational differences among the exposure yearswere found, and although education is related to cartoon scores , the rela-tionship bet ,een exposure and cartoon scores appeared not to be a functionof differences in education.
2) While "education" was cons idered as a fair test of general back-ground , we deemed it desirable to consicler other measures of intellectualability which were more contemporanepus. We chose "musical sophisticationon the assumption that it would relate to cartoon scores and not change withexposure to Great Books. It clearly relates to cartoon scores (being a more
10 For the record, the only shred of evidence on this subject is as
follows: A 1953 survey sJ)owed that 75 per cent of the participants reportedcollege" education , while our sample. sho "s 84 per cent with part college or
more. Th 1953 data failed to make clear whether "college" meant part collegeor college graduate; but if we follow the author s assumption that it meantpa.rt college or more , II our data indicate no decrease in the quality of a
variable which we know relates to cartoon SCQ.res.
97-
powerful predictor than education, and equal to or greater than exposure inpredictive power), but whether it changes with exposure to Great Books is amoot point. What we found was that among the non-co lIege- graduates musical-sophisitication scores increased with exposure. Our a priori reasoning sug-gested that low-education , low-music people tend to. drop out of the program.As a check on this , we introduced our "adherence " measure , which is based onthe respondent I s statements about his plans to continue in the program. Therelations between adherence , music , education, and exposure tended in a veryslight way to support the following hypotheses:
Low-education , low-music participants tend to drop out of theprogram.
High-education participants . regardless of their musicalscores , tend to drop out more frequently than low-educatiohigh-music participants.
If these cQnclusions are correct, and we must reiterate that ourevidence is very shaky, we may hazard the guess that program losses aregreater among the "least prepared, " who find Great Books too much of achallenge, and the "most prepared, II who either find it too little challengeor who are attracted to competing activities.
3) The indeterminacy of our conclusions about musical sophisticationas a control suggested that we test education, music , and adherence as simul-taneous controls. The results, almost without exception , were consistent withthe hypothesis that cartoon scores improve with exposure. Thus, although wedo not know what assumptions to make about the interrelations of intellectualabilities and drop-out , regardless of which assumptions we choose to makethe data are consistent with the original hypothesis and inconsistent withthe drop-out hypothesis.
4) In short , as far as we can tell, exposure to Great Books increasesthe participant I s knowledge of the liberal arts and humanities.
-98-
CHURCH , STATE ) AND CARTOON SCORES
In the preceding section we looked at scores on our test of liberalarts knowledge (the cartoon quiz) in terms of their relationships with GreatBooks exposure and their correlations wi tn other measures o.f intellectualprowess such as education and musical sophistication. In this section weshall consider the relations between cartoon scores and another order
variable -- "institutional involvement.
Sociologists tend to think of people as the "weighted" sum of theirmemberships " in the formal and informal organizations which make up thesociety. While this is a point of view which is guaranteed to incite therage o both psycholog sts and literary critics, it is still fairly safe topredict , for example , that , notwithstanding their individual differences,rural Southern Baptists share a lot of things which differentiate them fromurban Northern Catholics. Furthermore, the institutional context where onefinds one 1 S self has a lot to do with whether and how one can "apply" thedeas gained ftomeducation. Thus, it is rather doubtful that the Great
Books group which once existed in San Quentin Prison had the potential fordeveioping community le ders th t other groups in the Bay area had.
Other parts of our arialysis have indicated that) despite some folkloreto the contrary, Great Books participants are not refugees from the realworld but maintain a considerable volume of social relationships aside fromparticipation in their discussion groups. Thus, the problem we shall examineis not whether Great Books people are involved in anything else, butwh therthere are differentials in involvement which are related to gains from parti-cipation in Great Books.
The two "involvements " we shall consider are political-party preferenceand church attendance. (Chapter V of Part B considers in some detail involve-ment in local community affairs. ) We neer not; we . think , stress that of themajor institutions of our society; these two would rank near the top in termsof their "strategic location
In ,Chapter I of Part A we saw that our participants are fairly welldistributed among the pigeon-holes in these two large areas of involvement;all levels of exposure have generous portions of Republicans Democrats" Independ nts , non-religionists, Protestants" Catholics, and Jews. It is thethesiS of this section, however , that within our group of .partic pants themore able , in terms of knowledge of the liberal arts and humanities, are notso randomly distributed among these categories.
Let us begin our examination by looking at the relationship betweenparty preference and scores on the cartoon test.
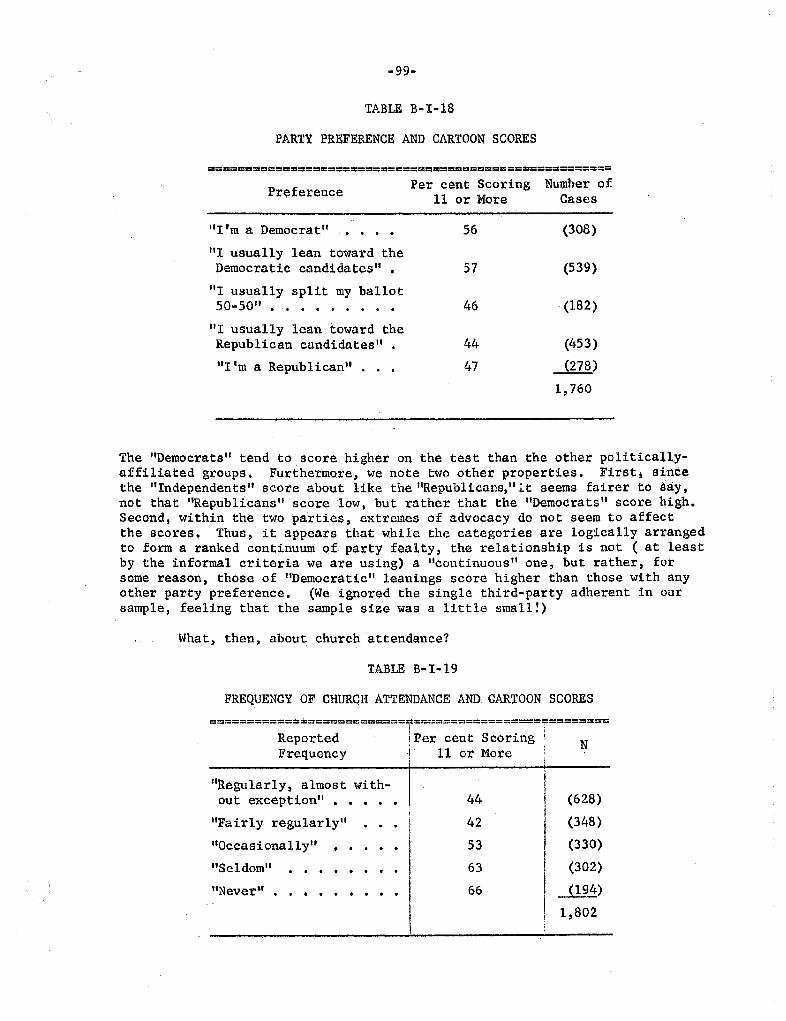
99-
TABLE B-I-18
PARTY PREFERENCE AND CARTOON SCORES
======================================================
I 1m a Democrat"
Per cent Scoring Number of11 or More Cases
(308)
(539)
(182)
(453)
(278)
760
Preference
"I usually lean toward theDemocratic candidates II .
I usually split my ballot50-50"
. . . .
I usually lean toward theRepublican candidates
" .
m a Republican
" .
The "Democrats" tend to score higher on the test than the other politicall,y-affiliated groups. Furthermore, we note two other properties. First; sirtcethe " Indepcndents " score about like the "Republicat1s, '' It seems fairer to say,not that "Republicans" score low , but rather that the "Democrats " score high.Second, within the two parties, extremes of advocacy do not seem to affectthe scores. Thus , it appears that while the categories are logically arrangedto form a ranked continuum of party fealty, the relationship is not ( at leastby the informal criteria we are using) a IIcontinuous " one , but rather, forsome reason , those of "Democratic" leanings score higher than those with anyother party preference. (We ignored the single third- party adherent in oursample , feeling that the sample size was a little small!)
What, then , about church attendance?
TABLE B-I-l9
FREQUENCY OF CHURCH ATTENDANCE AND CARTOON SCORES
============ =============
f=================f========Reported ! Per cent ScoringFrequency 11 or More
Regularly, almost with-out exception
" .
"Fairly regularly
"Occasionally
. . . .
"Never 1 .
. . . . . . . .
(628)
(348 )
(330)
(302)
--)
802
"Seldom
. . . . . .

. -100-
The trend here is even more clear-cut. Knowledge of the liberalarts and humanities decreases steadily with increased frequency of church
attendance, the "never" group providing half again as many high scorersproportionally as the "regularly, almost without exception" group.
Since, as we shall see , church attendance is correlated with partypreference, let us see whether these can be thought of as independent rela-tionships. In order to conserve cases , we collapsed party preference ast'Democratic
" ("
m a Democrat" and "I usually lean toward the Democ raticcandidates ) versus all others; and collapsed church attendance as ''Regu-larly" and "Fairly regularly" versus all others. The table below givesthe cartoon scores for both variables at once.
TABLE B- 1- 20
PARTY PREFERENCE , CHURCH ATTENDANCE , AND CM.TOON SCORES
Per cent scoring 11 or more on cartoons
============== ================ ===================
RegularChurch Attendance
Occasional. Seldom, NeverParty
Democrat.. . ' (379)
(559)
(456)
(342)Other. . .
In spite of the correlation between the two (45 per cent of the Demo-
crats are regular church-attenders, 62 per cent of the non-Democrats), theyapparently have independent relations to cartoon scores, the per cent ofhigh scorers rising in both columns and declining in the left category ofboth rows. At the extremes, 63 per cent more Democrats who are infrequentchurch-attenders than non-Democrats who are regular-attenders score high.
Let us now proceed to interpret these findings by the introductionof other variables into the table. We shall begin by asking whether therelationship might be a spurious one. We already know that cartoon scoresare strongly related to education and years of exposure to Great Books.Tables 21 and 22 show what happens to the political party church attendance
relation when these two variables are controlled. Table 23 shows what
happens when community type is controlled.
D 1fn R A '" 3 H C i'TE-R
t:R"" ,""N t. OV1N10 ::(r$'
NI\1'lV' u"hH!,..,ty "r .". 'f 1f\ C '
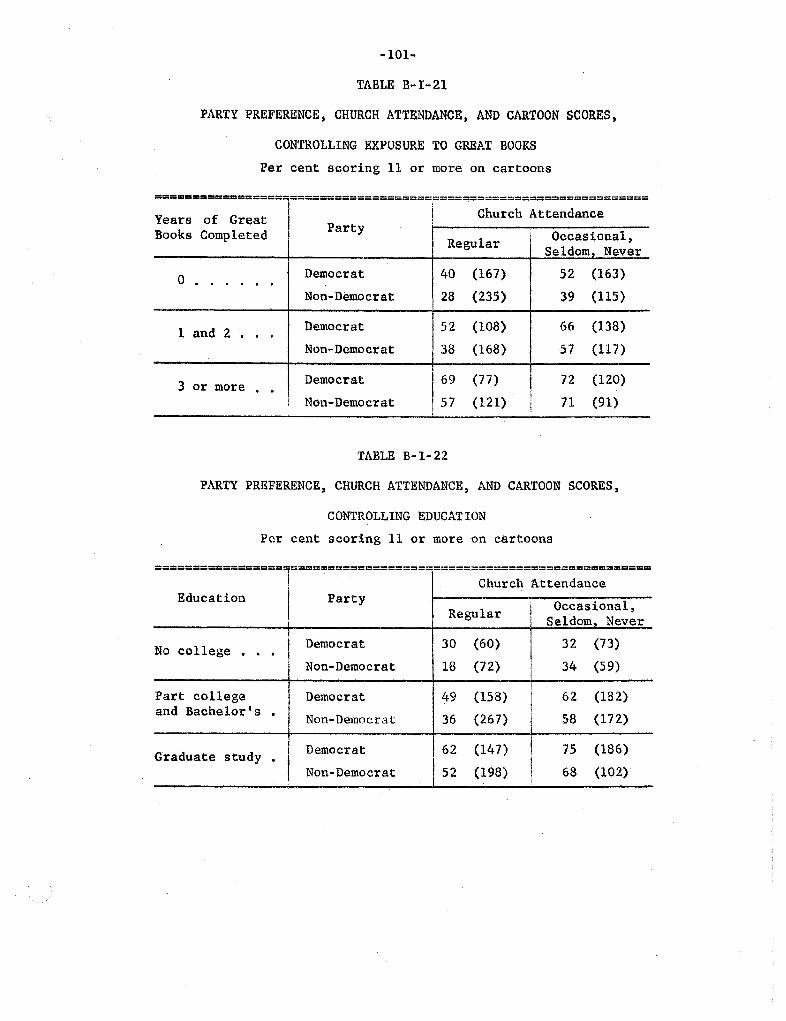
lOl-
TABLE B- 1- 21
PARTY PREFERENCE , CHURCH ATTENDANCE , AND CARTOON SCORES
CONTROLLING EXPOSURE TO GREAT BOOKS
Per cent scoring 11 or more on cartoons
===================================-====== =====================
Years Great Church Attendance
Books Completed PartyOccas ional,Regular Se Idom, Navel'
o . Democrat (167) (163)
Non- Democrat (235) (ll5)
1 and 2 . Democrat (108) (138)
Non-Democrat (168) (117)
3 or moreDemocrat (77) (120)
: Non-Democrat151
( 121) (91)
TABLE B-I- 22
PARTY PREFERENCE , CHURCH ATTENDANCE , AND CARTOON SCORES
CONTROLLING EDUCAT ION
Per cent scoring 11 or more on cartoons
================= ==================
I=============================Church Attendance
Party
DemocratNo college
. .
Non-Democrat
EducationRegular Occasional,
, Seldom Never
(60)
(72)
(73)
(59)
Part college Democrat (158) (182)and Bachelor
Non- Democrat (267) (172)
Graduate study Democrat I 62 (147) (186)
Non-Democrat I 52 (198) (102)
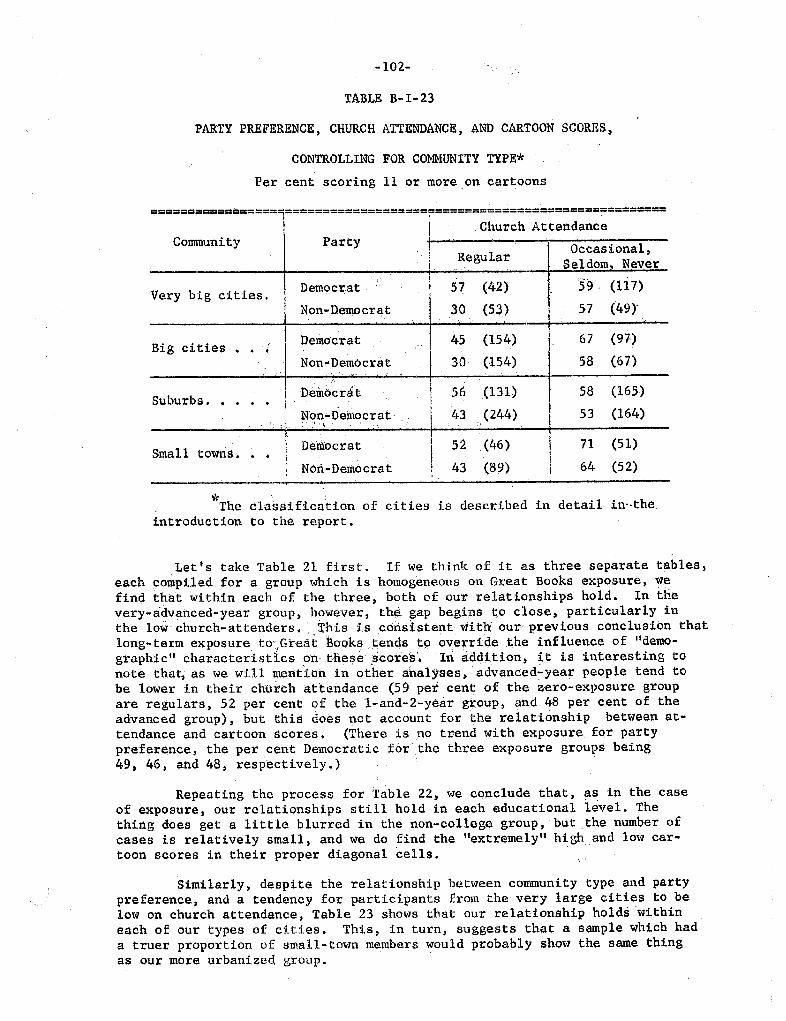
102-
TABLE B- 1- 23
PARTY PREFERENCE , CHURCH ATTENDANCE , AND CARTOON SCORES
CONTROLLING FOR COMMUNITY TYPE*
Per cent scoring 11 or more ,on cartoons
===== ==== === '== ========= ======
F========
=====================
Church AttendanceCommunity Party Occasional,Regular
S e 1 dam Never
very big cities. Democrat (42) 59, (117)
Non- Democrat (53) (49)'
l)emocrat (154) (97)Big ci ties
Non"DemOcrat 30, (154) (67)
Suburbs. Democdt (131) (l65)
Non-Democrat. (244) (164)
. " :. .
Small tm'1nS. . l' D tfocratNOl-Democrat
(46)
(89)
(51)
(52)
The Classificatj,on of cities is described in detail in- the.introduction to the report.
Let I S take Table 21 first. If we think of it as three separate tables,each compiled for a group which is homogeneous on Great Books exposure, wefind that within each of the three , both of our relationships hold. Irt thevery- advanced-year group, however, th gap begins 'to close, particularly inthe low church-attenders. ' This isc6ns1.stent with our previous conclusion thatlong-term exposure to' Gteat Books , tends tp overrtdethe influence of "demo-graphic" characterisdcs on. the e :score'S' In additiort, it is interesting to
note that, as we will mention in other halyses, advanced':year people tend tobe lower in their chut-::h attendance (59 per cent of the zero-exposure groupare regulars , 52 per cent of the l-and- year group, and 48 per cent of theadvanced group), but this does not account for the relationship between at-
tendance and cartoon scores. (There is no ' tr nd ';'lith exposure for partypreference, the per cent Democratic for the three exposure groups being49, 46, and 48, respectively.
Repeating the process for Table 22, we conclude that , as in the caseof exposure, our relationships still hold in each educational level. The
thing does get a little blurred in the non-college group, but . the number ofcases is relatively small, and we do find the "extremely" high and low car-toon scores in their proper diagonal cells.
Similarly, despite the relationship between community type and partypreference , and a tendency for participants from the very large cities to below on church attendance Table 23 shows that our relationship holds withineach of our types of cities. This , in turn , suggests that a sample which hada truer proportion of small-town members would probably show the same thingas our more urbanized group.
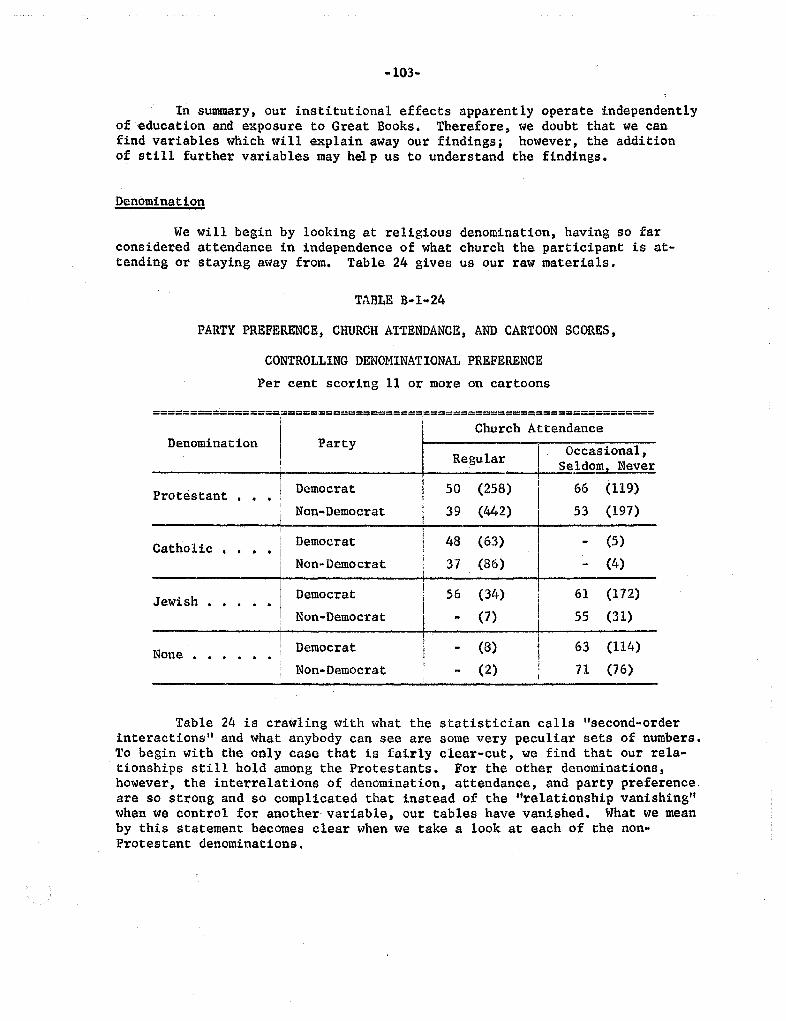
-103-
In summry, our institutional effects apparent ly operate independentlyof education and exposure to Great Books. Therefore, we doubt that we canfind variables which will explain away our findings; however, the additionof still further variables may heL p us to understand the findings.
Denomination
We will begin by looking at religious denomination, having so farconsidered attendance in independence of what church the participant is at-tending or staying away from. Table 24 gives us our raw materials.
'\BLE B..I-24
PARTY PREFERENCE, CHURCH ATTENDANCE , AND CARTOON SCORES
CONTROLLING DENOMINATIONAL PREFERENCE
Per cent scoring 11 or more on cartoons
;=;==========================; =====?=======================;======
Church AttendanceDenomination Party OccasionalRegular Seldom Never
Protestant Democrat (258) (119)
. '
Non-Democrat (442) (197)
(63) (5)Catholic Democrat
Non-Democrat (86) (4)
Jewish Democrat (3lf) (172)
Non"Democrat (7) (31)
Democrat (8) (114)None
. .
Non-Democrat (2) (76)
Table 24 is crawling oJith what the statistician calls ilsecond-orderinteractions " and what anybody can see are some very peculiar sets of numbers.To begin with the only case that is fairly clear-cut, we find that our rela-tionships still hold among the Protestants. For the other denominations,however, the interrelations of denomination, attendance, and party preference.are so strong and so complicated that instead of the "relationship vanishing"when we control for another variable , our tables have vanished. What we meanby this statement becomes clear when we take a look at each of the non..Protestant denominations.
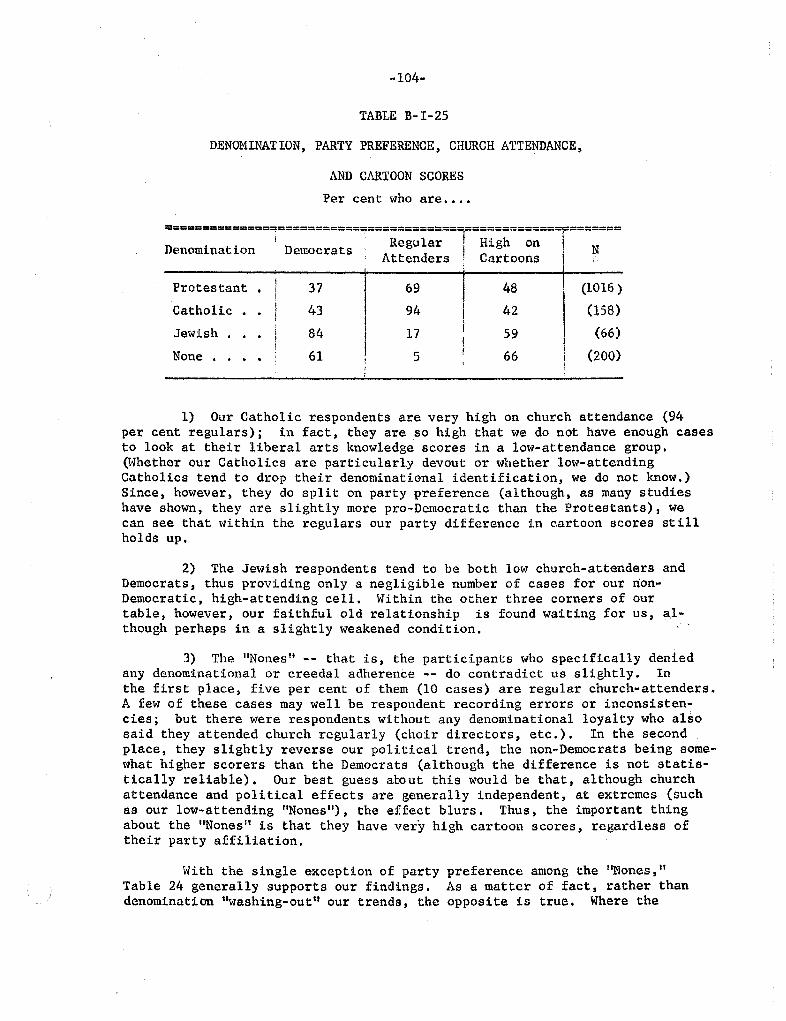
104-
TABLE B- 1-
DENOMINATION, PARTY PREFERENCE , CHURCH ATTENDANCE
AND CARTOON SCORES
Per cent who are....
::::::::::::== ::::::::= ;:;:=:;==
l===
:=== ===:===
tten era artoons Protes tant (1016 )
Catholic (l58)Jewish (66)
None (200)
1) Our Catholic respondents are very high on church attendance (94per cent regulars); in fact . they are so high that we do not have enough casesto look at their liberal arts knowledge scores in a low-attendance group.CWhether our Catholics are particularlY devout or whether low-attendingCatholics tend to drop their denominational identification, we do not know.Since, however, they do split on party preference (although, as many studieshave shown, they are slightly more pro-Democratic than the Protestants), wecan see that within the regulars our party difference in cartoon scores st illholds up.
2) The Jewish respondents tend to be both low church-at tenders andDemocrats , thus providing only a negligible number of cases for our non-Democratic , high-attending cell. Within the other three corners of ourtable , however, our faithful old relationship is found waiting for us , al-though perhaps in a slightly weakened condition.
3) The "Nones " -- that is, the participants who specifically dertiedany denominational or creedal adherence -- do contradict us slightly. the first place, five per cent of them (10 cases) are regular church-attenders.A few of these cases may well be respondent recording errors or inconsisten-cies; but there were respondents without any denominational loyalty who alsosaid they at tended church regularly (choir directors , etc.
).
In the secondplace , they slightly reverse our political trend, the non-Democrats being some-what higher scorers than the Democrats (although the difference is not statis-tically reliable). Our best guess about this would be that, although churchattendance and political effects are generally independent, at extremes (suchas our low-attending "Nones ), the effect blurs. Thus, the important thingabout the "Nones " is that they have very high cartoon scores, regardless oftheir party affiliation.
With the single exception of party preference among the "Nones, IITable 24 generally supports our findings. As a matter of fact, rather thandenomination "washing-out" our trends, the opposite is true. Where the
105-
comparisons can be made, the denominational differences disappear when wecontrol party preference and attendance. Thus, 59 per cent of the Jews asa whole are high on the cartoon test, as compared with 48 per cent of theProtestants, an eleven- percentage-point difference. Within the regular-attending Democrats , the percentage- point difference between Protestantsand Jews drops to six, within the low-attending Republicans to two , andwithin the low-attending Democrats we get a five-point difference in theopposite direction. Thus, when we control for party preference and churchattendance, we find no consistent denominational difference. While we haveno reason to assume that our findings would generalize to other groups notin Great Books, it is interesting to note that the intellectual superiorityof Jews in Great Books does not appear to be a function of the specific con-tent of their religion but rather of the fact that they don I t attend theirchurch frequently and tend disproportionately to identify with a specificsecular political position.
Our findings on denomination suggest that the "content" of a religiousposition has very little to do with the relationship between church attendanceand cartoon scores. Historically, it is fairly clear that Judaism places ahigh stress on intellectual values, Protestantism a medium stress, and Catholi-cism a lesser stress. Nevertheless, among our respondents we find no importantdifferences in the cartoon scores by denomination among the regular-attenders.Regardless of what content they are staying away from, the less-regular-atten-ders have higher scores.
This suggests) more by free association than by syllogistic reasoning,that what may lie behind our findings is not the content of the institutionalideologies, but rather the location of the institutions in the local socialorder. The respondents in our study are essentially upper middle-class,well-to-do adults. In the social world in which most of them move , thedominant institutional structures are the church and the Republican party,and the hallmark of solid integration into that social world is adherence toboth. Thus , what our high-scorers seem to have in common is distance fromthe major institutions in their neck of the woods. The farther they appearto move away from the majority institutions toward the Democratic party andaway from their churches, the higher their scores.
We have no way of making a specific test of so abstract an interpre-tation, but the following evidence may be considered. If the underlying factorhere is actually the degree of involvement in the "majority ll institutionswhere the majority-minority position of an institution reverses, the relation-ship should reverse also. While we can think of no community where non-church-going is more respectable than church- going) the relative standing of the twonational parties among upper middle-class people does vary with region. Thus,if our hypothesis is correct , when we look at the relationship between partyaffiliation and scores for respondents in the South , it should look quitedifferent. If our interpretation is correct, what should we expect to find?
In the South the negative relationship between Democratic-partyaffiliation and church attendance should disappear or reverse.
In all regions and party affiliations, church- going should stillshow its relationship.
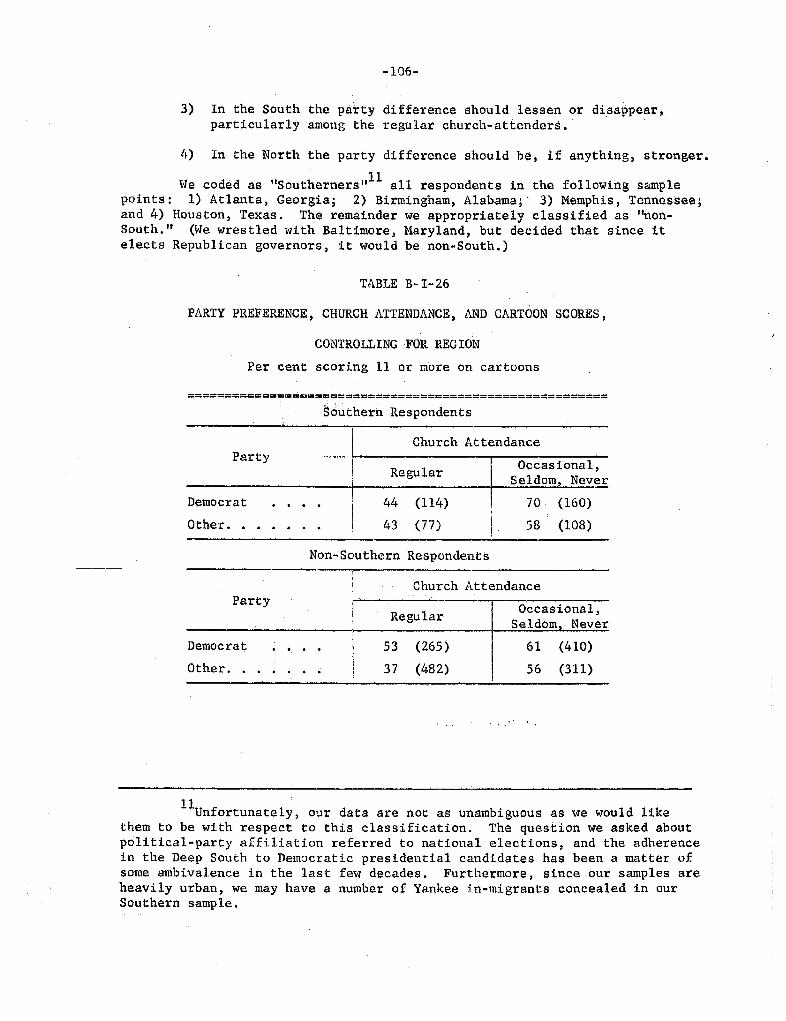
-106-
In the South the party difference should lessen or disappear,particularly among the regular church-at tenders . .
4) In the North the party difference should b , if anything, stronger.
We coded as "Southerners ,,11 all respondents in the following sample
points: 1) Atlanta , Georgia; 2) Birmingham , Alabama; 3) Memphis, Tennessee;and 4) Houston, Texas. The remainder we appropriately classified as "noI'-South. (We wrestled with Baltimore , Maryland, but decided that since itelects Republican governors, it would be non-South.
TABLE B- 1- 26
PARTY PREFERENCE , CHURCH ATTENDANCE , AND CARTOON SCORES
CONTROLLING FOR REC ION
Per cent scoring II or more on cartoons
========================================================
Southern Respondents
...._....
Church AttendanceParty
Regular Occas ional
Seldom Never
Democrat (114) (160)
Other. (77) (108)
Non-Southern Respondents
Church AttendanceParty
Regu larOccasional,
Seldom Never
Democrat
Other. .
" . . .
(265 )
(482)
(410)
(311)
, :
Unfortunate1y, our data are not as unambiguous as we would likethem to be with respect to this classification. The question we asked aboutpolitical-party affiliation referred to national elections, and the adherencein the Deep South to Democratic presidential candidates has been a matter ofsome ambivalence in the last few decades. Furthermore, since our samples areheavily urban , we may have a number of Yankee in-migrants concealed in ourSouthern sample.
107-
Now , let' s check this out agains t our hypotheses:
. 1) As we predicted, the correlation between Republicanism and church-ttendance disappears, although it does not reverse in the South , and (as . it
has to , algebraically) it increases in the non-South. (In the South, 42 percent of the Democrats and 42 per cent of the non-Democrats are regular church-attenders. In ,the non-South , 39 per cent of the Democrats are regulars, 61per cent of the non-Democrats.
2) In all six political- geographic groups, the church attendance re-lationship remains constant , as our hypotheses required.
3) and 4) If we consider only regular church- ttenders , our redic-tion about regional differences is essentially substantiated. In tbeS:outhamong the regular church-at tenders, the political-party differenoe disappears.In the non-South (we cab' t call it the North since we have large , samplEHs fromthe West Coast) , the patty difference is quite strong. Non-South D o6ratsscore the highest, followed by Southerners regardless of party; . followed byNorthern non-Democrats. Complete vindication is denied us, however, becausewe do not observe the same pattern among the "irregulars. In both South andnon-South, the Democrats do better among the irregulars , and the size of thedifferences is about equal in each. Now, it would be most advantageous forus to argue that in the South the non-church- going Demre rats are identifyingwith an aspect of the national Democrat:ic party which is not the same as thatattracting the church- goers (and we thinktnat anyone will have to admit thatthe Democratic party attracts the identification, of a greater variety of ideo-logical stances than does the ltepublican) , and that: the finding dQes not destroythe hypothesis'. A fairer concluslO'n might be this: The hypothesis of socialdi,stance :from major instit1Jtions cannot be 'ignored, for it doesmUke sensiblethe lack of denominational difference and the situation among Southern church-attenders; ' however, it fails to explain completely the relationships we haveobserved.
Summary
All . our evidence certainly indicates that participation in the programdoes raise the cultural level of its members. The evidence reviewed in thischapter ,. however , suggests that the c.mtput" of the program is not going tobe allocated randomly to the m jor social institutions -- the church and thepolitical p rty-- of the society. A :disproportionate number of the programmost .able members will not be involved in the dominant institutions of theirsocial Y'orld.
In short , if one thinks of the program as a way of reaching "people
" --
improving their cultural level -- all our evidence suggests that the partici-pants are reached. If , however , one thinks of the program as a mechanism forreaching "institutions " by means of improving the intellectual abilities ofthe people who man them, the effectiveness of the program must be qualifiedfor our evidence suggests that the abso lute levels of intellectual knowledge(we did not attempt to assess relative growth) are somewhat less for the peoplewho are more involved in the dominant institutions of the society than for thosewho are less involved.

108-
APPENDIX TO CllAPTER I
The Cartoon Quiz

Your Name
I oq(p)
Each of the 32 drawings on this and the following pagesshould suggest something - some book, person, episode, orwork of art. Please jot down next to each picture a word orphrase which identifies it. Guess if you are not certain. (Thefirst answer has been given as an example.
Sir Walter Ra leitj
preadintj hij cape
/01' Queen Ctzabeth "
HISTORY AND POLITICS
rn
--
1..
CONFIDENTIALNORC Survey 408
100(b\S C IE NeE AND PHI Ld SOP H
IO(Gv)liTERATURE
~~~~
MUS I C A N D ART lI0(

111-
ANSWERS TO CARTOON QUIZ
Sir Walter Raleigh spreading his cape for Queen Elizabeth.
King John signing M gna Carta.Tennis-court Oath, French Revolution.
Martin Luther and his ninety- five theses.
British suffragettes who chained themselvesHouses of Parliament.
to the fence outside the
(Prince should be a combination of the Lion andMachiavelli, The Princethe Fox.
Jean Marat , assassinated by Charlotte Corday during the French Revolution.
Rousseau s idea of the noble savage.
10.
11.
12.
13.
14.
15.
16.
17 .
18.
19.
20.
21.
22.
23.
24.
25.
26.
27.
28.
29.
30.
31.
Darwin s theory of evolution.
Karl Marx and his theory of capitalism.
Gali1eo testing his law of falling bodies
Isaac Newton and his law of gravity.
at the Tower of Pisa.
Freud, PsychoanalysisSaint Augustine stealing a pear. (Related in the Confessions
Nietzsche, theory of the Superman in Also Sprach ZarathustraMalthus and his theory of eventual overpopulation of the earth.John Locke.
Job.
Aristophanes The Clouds, The Birds, The Frogs
Dante, The InfernoShelley, Promethus Unbound
Rabelais, Gargantua
Milton, the fallen angels in Paradise Lost
Shakespeare, Birnam Forest coming to Dunsinane in Macbeth
Swift , Houyhnhnms in Gulliver I s Travels
Cervantes, Don Quixote
Voltaire, "Cultivate your own garden, " in Candide
. Wagner, Ring of the Niebelung
Michelangelo painting the ceiling of the Sistine Chapel.
Mozart.
Beethoven destroying dedication of the Third Symphony ("Er()icaNapoleon.
32. Renoir, who had the brush tied to his hand when arthritis depriv d him
of the free use of his hands.

CHAPTER II
ESTHTICS
112-
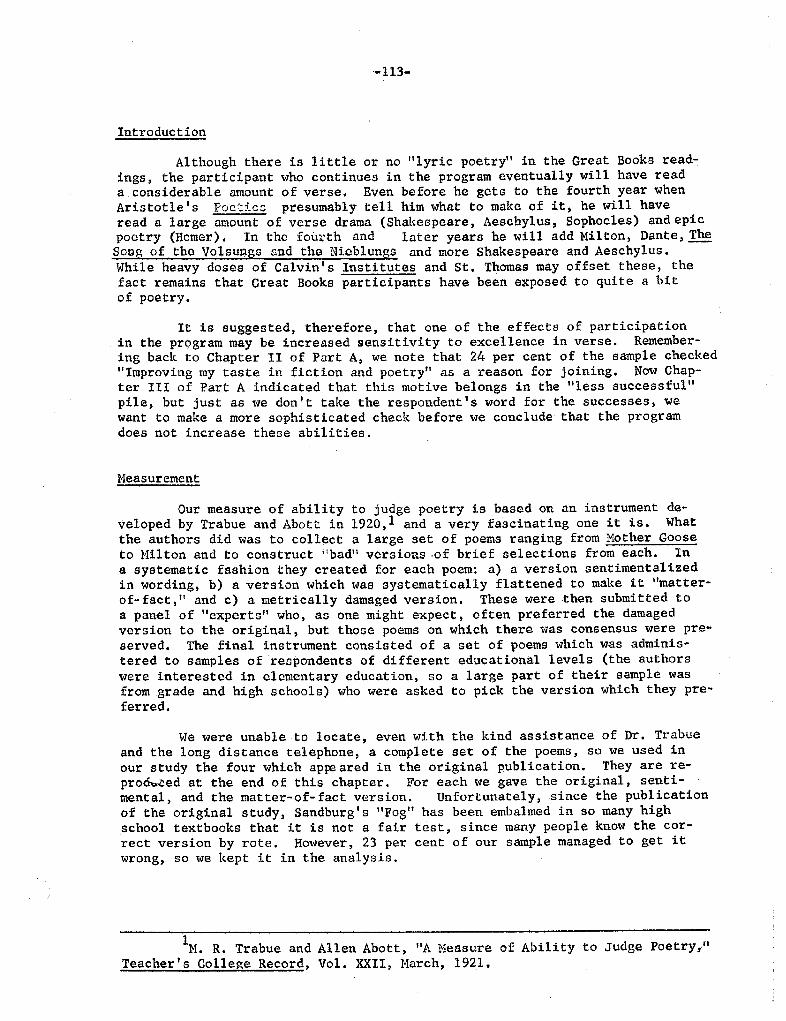
-113-
Introduction
Although there is little or no " lyric poetry" in the Great Books read-
ings, the participant who continues in the program eventually will have reada considerable amount of verse. Even before he gets to the fourth year whenAristotle Poc icc presumably tell him what to make of it, he will have
read a large amount of verse drama (Shakespeare, Aeschylus, Sophocles) and epicpoetry (Homer). In the foul"th and later years he will add Milton, Dante TheSoug of the Volsuugs end the Nieblunes and more Shakespeare and Aeschylus.While heavy doses of Calvin Institutes and St. Thomas may offset these , the
fact remains that Great Books participants have been exposed to quite a bitof poetry.
It is suggested, therefore , that one of the effects of participationin the program may be increased sensitivity to excellence in verse. Remember-ing back to Chapter II of Part A, we note that 24 per cent of the sample checkedImproving my taste in fiction and poetry" as a reason for joining. Now Chap-
ter III of Part A indicated that this motive belongs in the " less successful"pile, but just as we don t take the respondent s word for the successes, wewant to make a more sophisticated check before we conclude that the programdoes not increase these abilities.
Measurement
Our measure of ability to judge poetry is based on an instrument de-veloped by Trabue and Abott in 1920 1 and a very fascinating one it is. Whatthe authors did was to collect a large set of poems ranging from Mother Gooseto Milton and to construct ;' bad" versiolls .of brief selections from each. a systematic fashion they created for each poem: a) a version sentimentalizedin wording, b) a version which was systematically flattened to make it I1matter-of- fact, 11 and c) a metrically damaged version. These were then submitted toa panel of l1experts" who, as one might expect, often preferred the damagedversion to the original, but those poems on which there was consensus were pre-served. The final instrument consisted of a set of poems which was adminis-tered to samples of respondents of different educational levels (the authorswere interested in elementary education, so a large part of their sample wasfrom grade and high schools) who were asked to pick the version which they pre-ferred.
We were unable to locate, even with the kind assistance of Dr. Trabueand the long distance telephone , a complete set of the poems , so we used in
our study the four which appe ared in the original publication. They are re-pro ed at the end of this chapter. For each we gave the original, senti-mental , and the matter-of- fact version. Unfortunately, since the publicationof the original study, Sandburg I S "Fog" has been embalmed in so many highschool textbooks that it is not a fair test , since many people know the cor-rect version by rote. However , 23 per cent of our sample managed to get itwrong, so we kept it in the analysis.
M. R. Trabue and Allen Abott, "A Neasure of Ability to Judge Poetry/'Teacher s College Record , Vol. XXII, March, 1921.
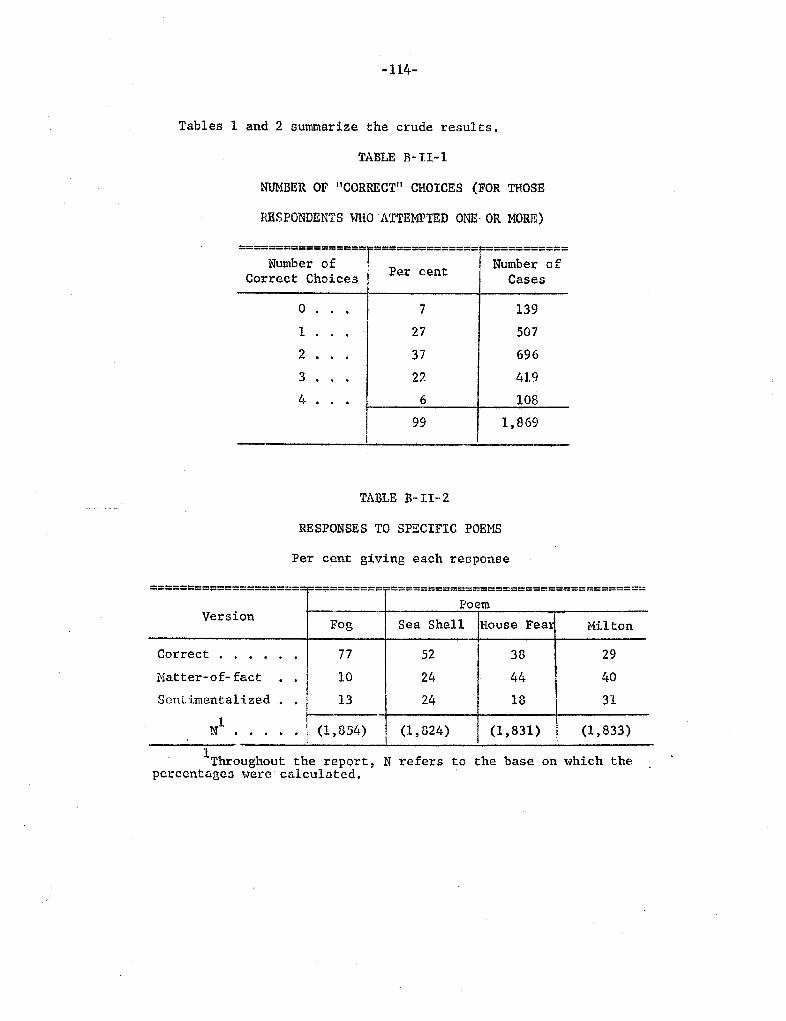
-114-
Tables 1 and 2 summarize the crude results.
TABLE B- II-
NUBER OF "CORRECT" CHOICES (FOR THOSE
RBSPONDENTS WHO ATTEMPTED ONE. OR MORE)
====;:: :;=:;====
r==
;====== :==== ;:: :;=:;=
Correct Choices er cen Cases
139
507
696
419
108
1 , 869
=====================F============================================Poem
Version Fog Sea Shell House Feal Mil ton
CorrectHatter-of- factSent imental ized
854) 824) 831) (l , 833)
TABLE B- II - 2
RESPONSES TO SPECIFIC POEMS
Per cent giving each response
Throughout the report , N refers to the base on which thepcrcentagc3 werc' calculated.
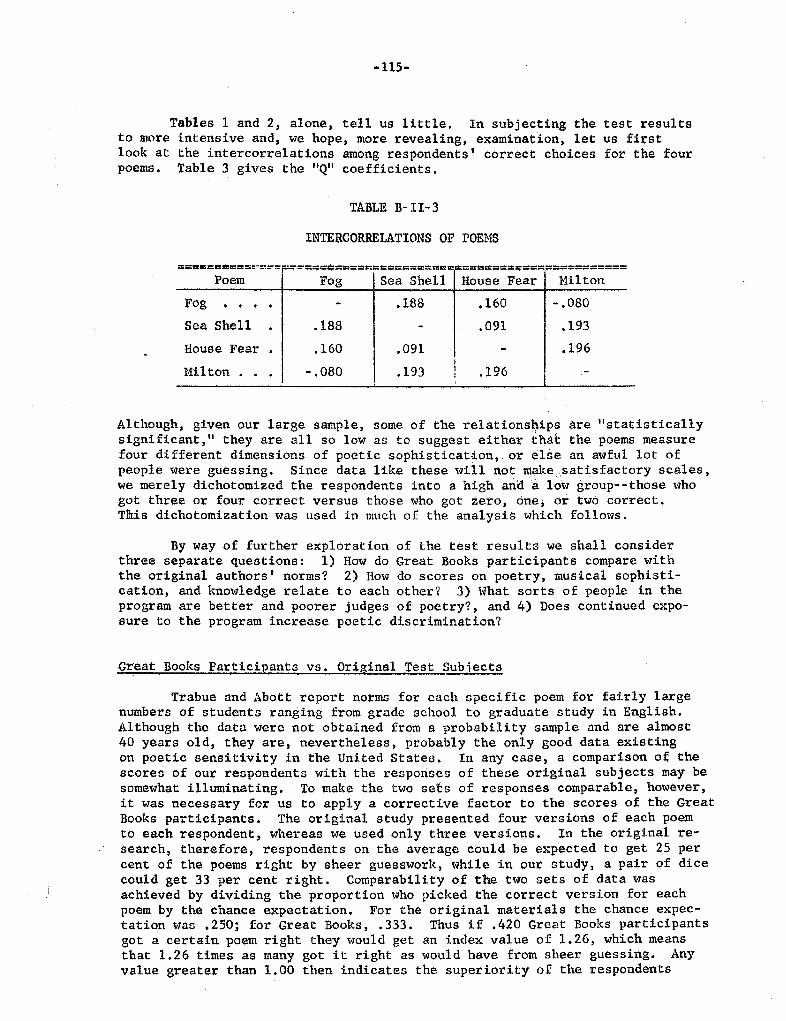
-llS-
Tables 1 and 2 , alone, tell us little. In subjecting theto more intensive and, we hope, more revealing. examination , letlook at the intercorrelations among respondents ' correct choicespoems. Table 3 gives the "Q" coefficients.
test resul tsus firstfor the four
TABLE B- II - 3
INTERCORRELATIONS OF POEMS
========= ~~~ #===============:=== ==== === ===== ===
Poem Fog Sea Shell House Fear MiltonFog 188 160
- .
080
Sea Shell 188 091 193
House Fear l60 091 196
Hilton , . I
- .
080 193 196
Although, given our large sample , some of the relations ips re " statisticallysignificant , It they are all so low as to suggest either that the poems measurefour different dimensions of poetic sophistication, or else an awful lot ofpeople were guessing. Since data like these will rtpt make satisfactory scaleswe merely dichotomized the respondents into a high ana a 10 group--those whogot three or four correct versus those who got zero, one, Or two correct.This dichotomization was used in much of the analysis which follows.
By way of further exploration of the test results we shall considerthree separate questions: 1) How do Great Books participants compare withthe original authors I norms? 2) How do scores on poetry, musical sophisti-cation, and knowledge relate to each other? 3) What sorts of people in theprogram are better and poorer judges of poetry? , and 4) Does continued expo-sure to the program increase poetic discrimination?
Great Books Participants vs. Original Test Subiects
Trabue and Abott report norms for each specific poem for fairly largenumbers of students ranging from grade school to graduate study in English.Although the data were not obtained from a probability sample and are almost40 years old, they are, nevertheless, probably the only good data existingon poetic sensitivity in the United States. In any case, a comparison o thescores of our respondents with the responses of these original subjects may besomewhat illuminating. To make the two sets of responses comparable, however,it was necessary for us to apply a corrective factor to the scores of the GreatBooks participants. The original study presented four versions of each poemto each respondent , whereas we used only three .versions. In the original re-search, therefore, respondents on the average cbuld be expected to get 25 percent of the poems right by sheer guesswork , while in our study, a pair of dicecould get 33 per cent right. Comparability of tbe two sets of data wasachieved by dividing the proportion who picked the correct version for eachpoem by the chance expectation. For the original materials the chance expec-tation wac . 250; for Great Books
, .
333. Thus if . 420 Great Books participantsgot a certain poem right they would get an ind x value of 1. , which means
that 1. 26 times as many got it right as would have from sheer guessing. Anyvalue greater than 1. 00 then indicates the superiority of the respondents
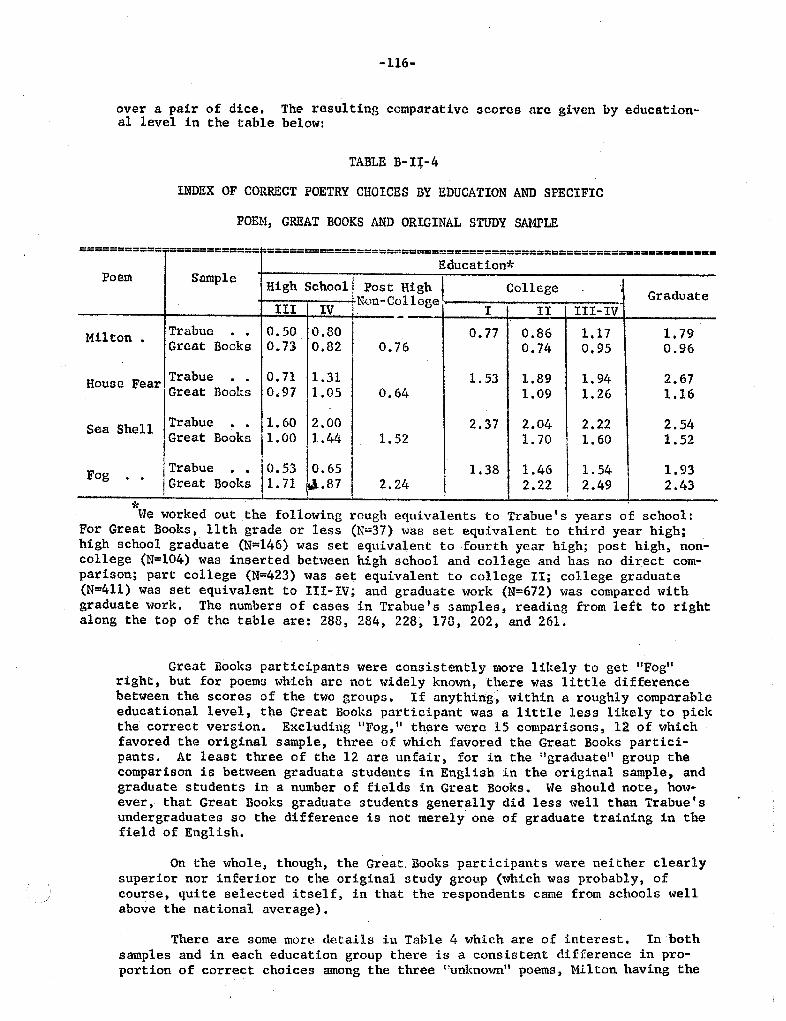
-116-
over a pair of dice. The resulting comparative scores arc given by education-al level in the table below:
TABLE B- I
INDEX OF CORRECT POETRY CHOICES BY EDUCATION AND SPECIFIC
POEM, GREAT BOOKS AND ORIGINAL STUDY SAMPLE
===========-============ =============================================================
Education*Poem Sample High School! Post High I College GraduateIII IV
Dn-c lloge III-IV
Mil ton Trabue 1.l7 1. 79Great Books
Hou3 C Fear Trabue 1.31 1.53 1.89Great Books 1.05 1.09 1.26 1.16
Sea Shell Trabue 1.60Great Books 1.00 1.44 1. 52 1. 70 1.60
Fog Trabue 1.38 1.46 1.54 1.93Great Books 1. 71
We worked out the following rough equivalents to Trabue s years of school:For Great Books, 11 th grade or less (N=-37) was set equivalent to third year high;high school graduate (N=l46) was set equivalent to fourth year high; post high , non-college (N=l04) was inserted between high school and college and has no direct com-parison; part college (N=423) was set equivalent to college II; college graduate(N=4ll) was set equivalent to III-IV; and graduate work (N=672) was compared withgraduate work. The numbers of cases in Trabue s samples , reading from left to rightalong the top of the table are: 288, 284, 228, 178, 202, and 261.
Great Books participants were consistently more likely to get "Fogright , but for poems which are not widely known, there was little differencebetween the scores of the two groups. If anything within a roughly comparableeducational level , the Great Books participant was a little le3s likely to pickthe correct version. Excluding IIFog, II there ''lere 15 comparisons, 12 of whichfavored the original sample, three of which favored the Great Books partici-pants. At least three of the 12 are unfair, for in the ;Jgraduate group thecomparison is between graduate students in English in the original sample, andgraduate students in a number of fields in Great Books. We should note, how-ever . that Great Books graduate 3tudents generally did less well than Trabueundergraduates so the difference is not merely one of graduate training in thefield of English.
On the whole, though, the Great. Books participants were neither clearlysuperior nor inferior to the original study group (which was probably, ofcourse, quite selected itself , in that the respondents came from schools wellabove the national average).
There are some more details in Table 4 which are of interest. Inbothsamples and in each education group there is a consistent difference in pro-portion of correct choices among the three I'unknmmll poems , Milton having the
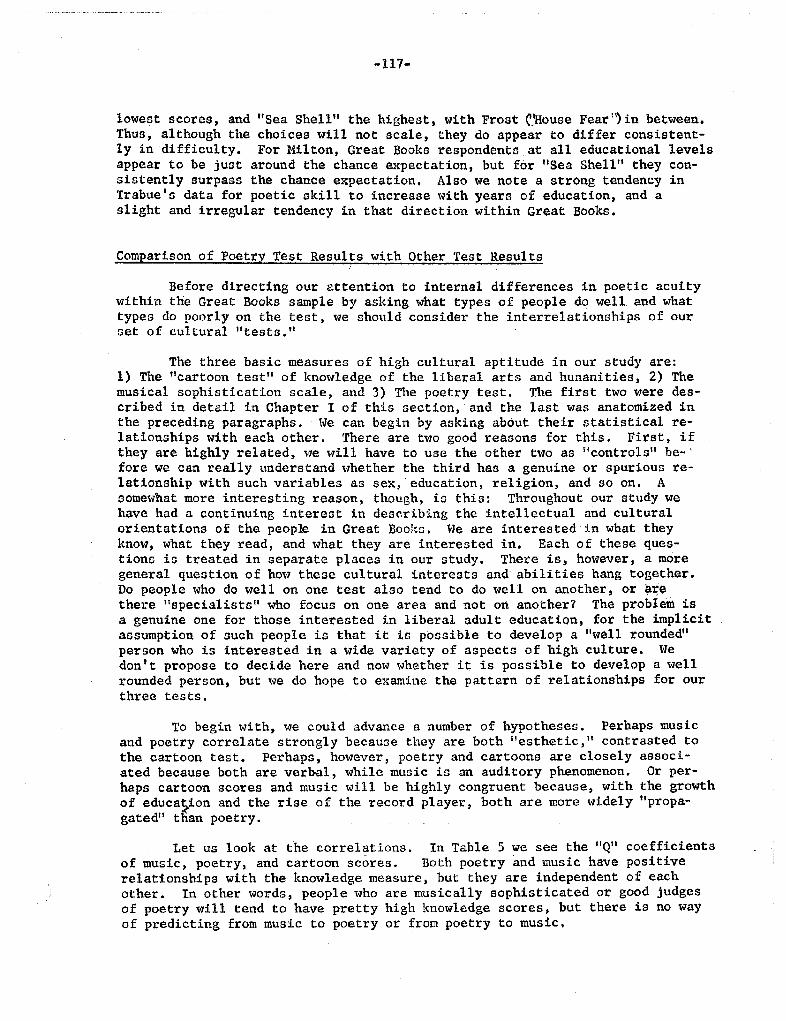
-117-
lowest scores, and "Sea Shell" the highest, with Frost C.'House Fear ')in between.
Thus , although the choices will not scale, they do appear to differ consistent-ly in difficulty. For Milton, Great Books respondents at all educational levelsappear to be just around the chance expectation, but for "Sea Shell" they con-sistently surpass the chance expectation. Also we note a strong tendency inTrabue s data for poetic skill to increase with years of education, and aslight and irregular tendency in that direction within Great Books.
Comparison of Poetry Test Results with Other Test Resul
Before directing our attention to internal differences in poetic acuitywithin the Great Books sample by asking what types of people do well and whattypes do poorly on the test , we should consider the interrelationships of ourset of cultural " tests.
The three basic measures of high cultural aptitude in our study are:1) The "cartoon test" of knowledge of the liberal arts and hunanities, 2) Themusical sophistication scale , and 3) The poetry test. The first two were des-cribed in detail in Chapter I of this section, and the last was anatomized inthe preceding paragraphs. We can begin by asking about their statistical re-lationships with each other. There are two good reasons for this. First, ifthey are highly related , ",e will have to use the other two as "controls" be-fore we can really understand whether the third has a genuine or spurious re-lationship with such variables as sex, ' education, religion, and so on. somewhat more interesting reason , though, io this: Throughout our study wehave had a continuing interest in describing the intellectual and culturalorientations of the peopJe in Great Bool G. He are interested in what theyknow, what they read, and what they are interested in. Each of these ques-tions io treated in separate places in our study. There is, however, a moregeneral question of how these cultural interests and abilities hang together.Do people who do well on one test also tend to do well on another, or atthere "specialists" who focus on one area and not 01' another? The problem isa genuine one for those interested in liberal adult educatiQn, for the implicitassumption of such people is that it is possible to develop a "well rounded"person who is interested in a wide variety of aspects of high culture. Wedon t propose to decide here and now whether it is possible to develop a wellrounded person, but we do hope to examine the pattern of relationships for ourthree tests.
To begin with, we could advance a number of hypotheses. Perhaps musicand poetry correlate strongly because they are both ;' esthetic , 11 contrasted tothe cartoon test. Perhaps, however , poetry and cartoons are closely associ-ated because both are verbal , while music is an auditory phenomenon. Or per-haps cartoon scores and music will be highly congruent because, with the growth
of educa ion and the rise of the record player, both are more widely "propa-gatedll than poetry.
Let us look at the correlations. In Table 5 we see the "Q" coefficientsof music, poetry, and cartoon scores. Both poetry and music have positiverelationships with the knowledge measure , but they are independent of eachother. In other words, people who are musically sophisticated or good judgesof poetry will tend to have pretty high knowledge scores, but there is no wayof predicting from music to poetry or from poetry to music.
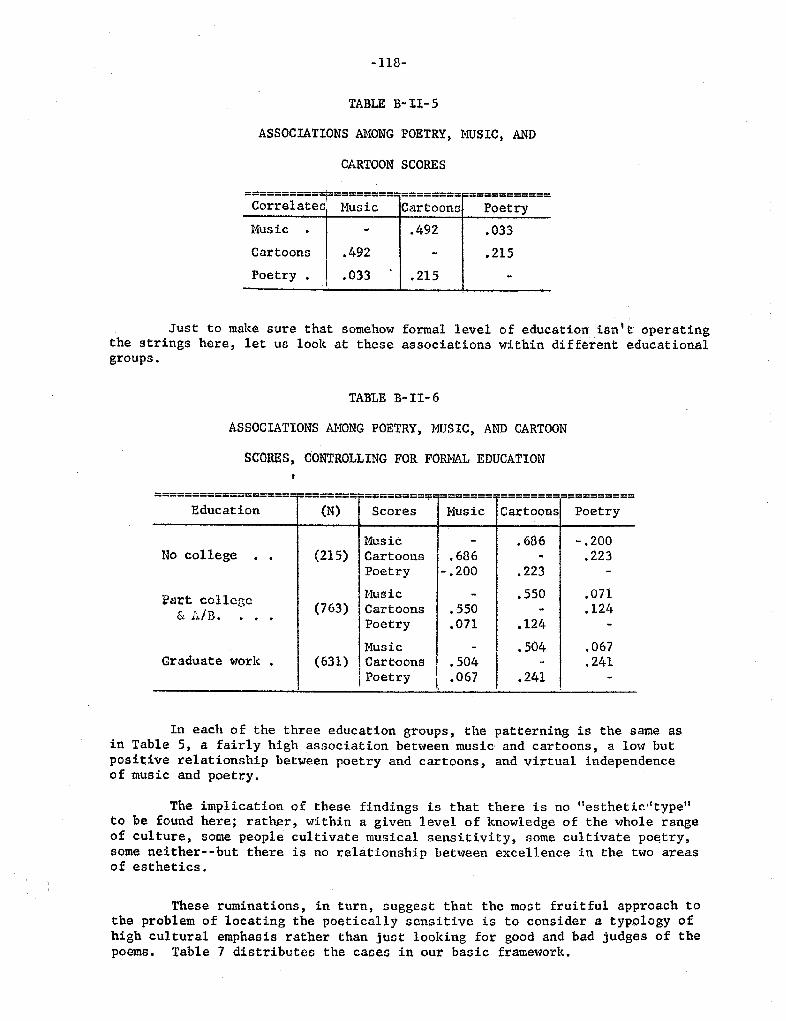
-118-
TABLE B- II- 5
ASSOCIATIONS AMONG POETRY, MUSIC , AND
CARTOON SCORES
;;;;;;;;==
=r;=======
==;===== ===========;
Correlates Music Cartoons PoetryMus ic 492 033
215Cartoons 492
033 215Poetry
Just to make sure that somehow formal level of education isn I t operatingthe strings here , let us look at these associations within different educationalgroups.
TABLE B- II - 6
ASSOCIATIONS AMONG POETRY, MUSIC, AND CARTOON
SCORES, CONTROLLING FOR FO L EDUCATION
==============;=;;
F=======?=========-
=======-==================
Education (N) Scores Music Cartoons Poetry
l1usic 686 - . 200college (215) Cartoons 686 223
Poetry
- .
200 223
Part college Music 550 071(763) Cartoons 550 l24
& A/n.
I Poetry
071 l24Music 504 067
Graduate work. (631) ! Cartoons 504 241
i Poetry 067 241
In each of the three education groups , the patterning is the same asin Table 5 , a fairly high association between music and cartoons , a low butpositive relationship between poetry and cartoons, and virtual independenceof music and poetry.
The implication of these findings is that there is no "esthetic' typeto be found here; rat r, within a given level of knowledge of the whole rangeof culture, some people cultivate musical sensitivity, some cultivate po try,some neither--but there is no relationship between excellence in the two areasof esthetics.
These ruminations , in turn, suggest that the most fruitful approach tothe problem of locating the poetically sensitive is to consider a typ logy ofhigh cultural emphasis rather than just looking for good and bad judges of thepoems. Table 7 distributes the cases in our basic framework.
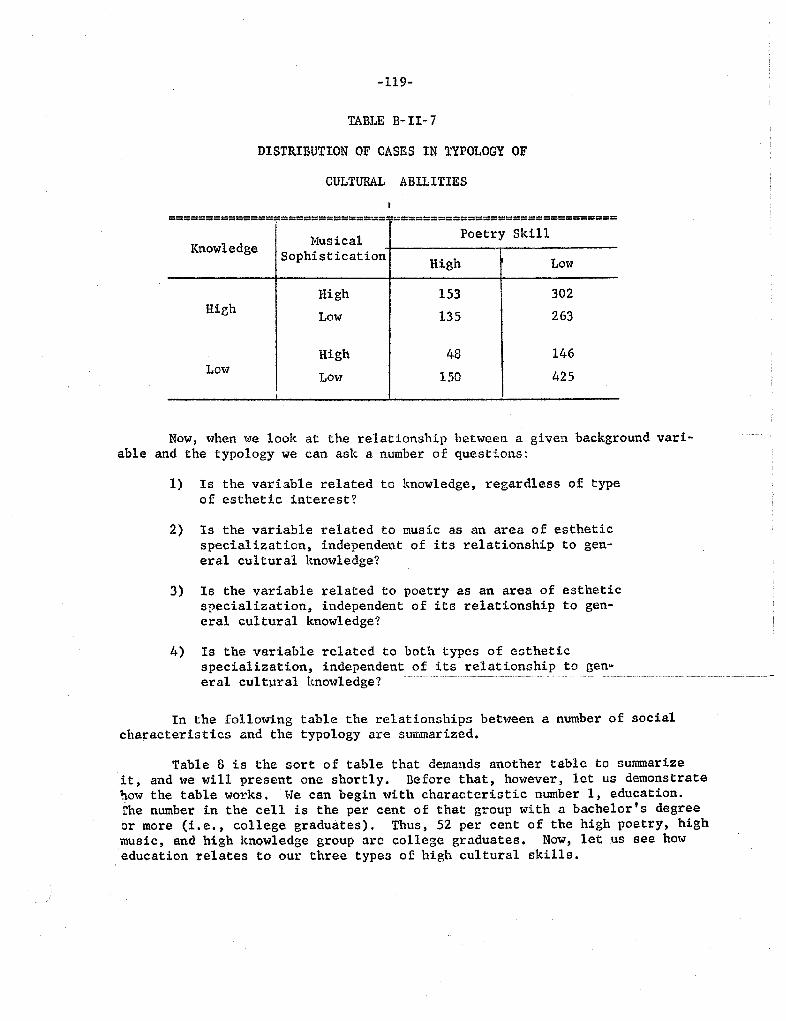
119-
TABLE B- II - 7
DISTRIBUTION OF CASES IN TYPOLOGY OF
CULTURAL ABILITIES
=======;=;================
w_-----------------------------
------------------------------
Knowledge MusicalSophistication
Poetry skill
LO\ol
High Low
153 302
135 263
146
150 425
HighHir;h
Low
High
Now, when we look at the relationship between a given background vari-able and the typology we can ask a number of questions:
Is the variable related to knowledge, regardless of typeof esthetic interest?
Is the variable related to music as an area of estheticspecialization, independent of its relationship to gen-eral cultural knowledge?
Is the variable related to poetry as an area of estheticspecialization, independent of its relationship to gen-eral cultural knowledge?
Is the variable related to both types of estheticspecialization independent of its relationship to gen-eral cult ral knowledge?
In the following table the relationships between a number of socialcharacteristics and the typology are summarized.
Table 8 is the sort of table that demands another table to summarizeit, and we will present one shortly. Before that, however, let us demonstratehow the table works. We can begin with characteristic number 1. education.rhe number in the cell is the per cent of that group with a bachelor s degree
or more (i. e., college graduates). Thus, 52 per cent of the high poetry, highmusic, and high knowledge group are college graduates. Now, let us see howeducation relates to our three types of high cultural skills.
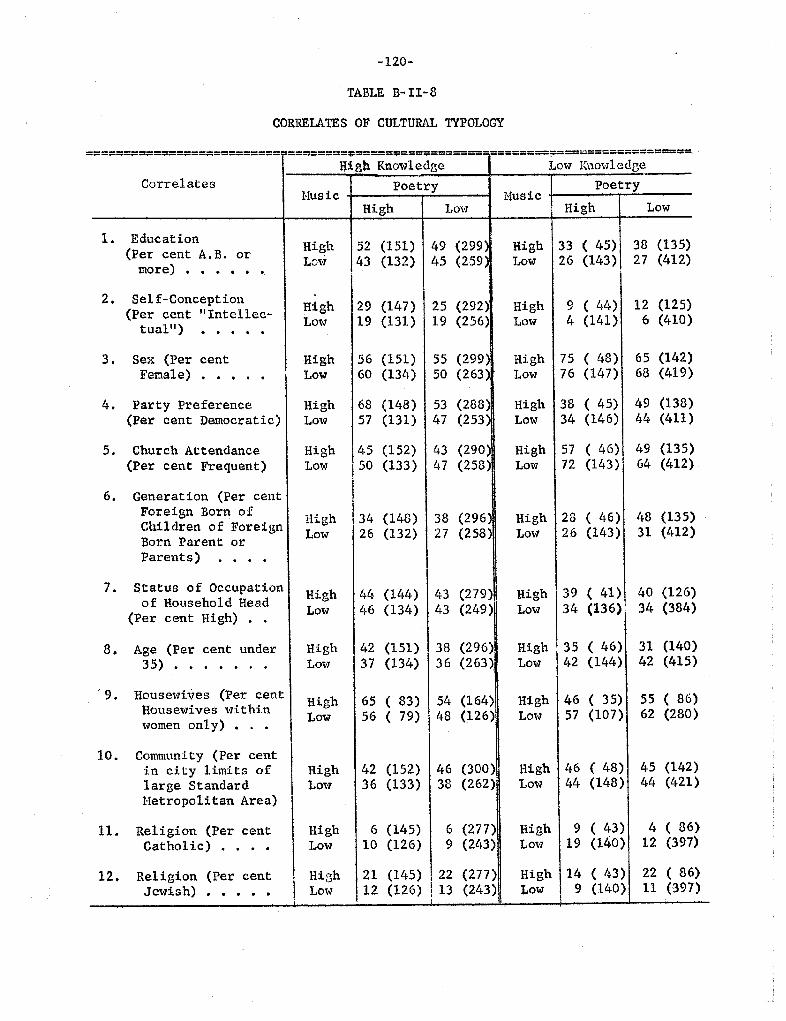
-120-
TABLE B- II - 8
CORRELATES OF CULTURAL TYPOLOGY
Correlates
==========================-======== =========;=======-======;=?;=== =--==========
Lml7 K.10V1ledge
1. Education(Per cent A. B. or
more)
. . . . . .
Sel f-Concept ion(Per cent It lntellec-
tual"
) .
Sex (Per centFemale) .
. . . .
Party Preference(Per cent Democratic)
Church Attendance(Per cent Frequent)
Generation (Per centForeign Born ofChildren of ForeignBorn Parent orParents) .
Status of Occupationof Household Head
(Per cent High) . .
8. Age (Per cent under35) . .
. .
9. Housewives (Per centHousewives withinwomen only)
10. Community (Per centin city limits oflarge StandardMetropolitan Area)
11. Religion (Per centCatholic) . .
. .
12. Religion (Per centJewish) . .
. . .
Busic
HighLow
HighLow
HighLow
HighLow
HighLow
HighLow
HighLow
HighLow
HighLow
HighLow
HighLow
HighLow
High Knowledge
PoetryHigh Low
52 (15l) 49 (299)43 (132) 45 (259)
29 (147) 25 (292)19 (131) 19 (256)
56 (151)60 (134)
55 (299)50 (263)
68 (148) 53 (288)57 (131) 47 (253)
45 (l52) 43 (290)50 (133) 47 (258)
34 (148) 38 (296)26 (132) 27 (258)
44 (144) 43 (279)46 (134) 43 (249)
42 (151) 38 (296)37 (134) 36 (263)
65 (83) 54 (164)56 ( 79) 48 (126)
42 (152) 46 (300)36 (133) 38 (262)
6 (145)10 (126)
6 (277)9 (2l
21 (145) I 22 (277)12 (126) ! l3 (243)
NusicPoetry
High Low
High 33 (45) 38 (135)Low 26 (143) 27 (412)
HighLow
9 (44) 12 (125)4 (141) 6 (410)
High 75 (48) 65 (142)Low 76 (147) 68 (4l9)
High 38 (45) 49 (138)Low 34 (146) 44 (411)
High 57 (46) 49 (135)Low 72 (143) 64 (412)
High 28 (46) 48 (135)Low 26 (l43) 31 (412)
High 139 (41)1 40 (126)Low 34 (136)' 34 (384)
High 35 (46) 31 (140)Low 42 (144) 42 (415)
High 46 (35) 55 ( 86)Low 57 (107) 62 (280)
High 46 (48) 45 (142)Low 44 (148) 44 (421)
HighLOvl
9 ( 43)19 (140)
4 ( 86)12 (397)
22 ( 86)11 (397)
High 14 ( /+3)Low 9 (140)
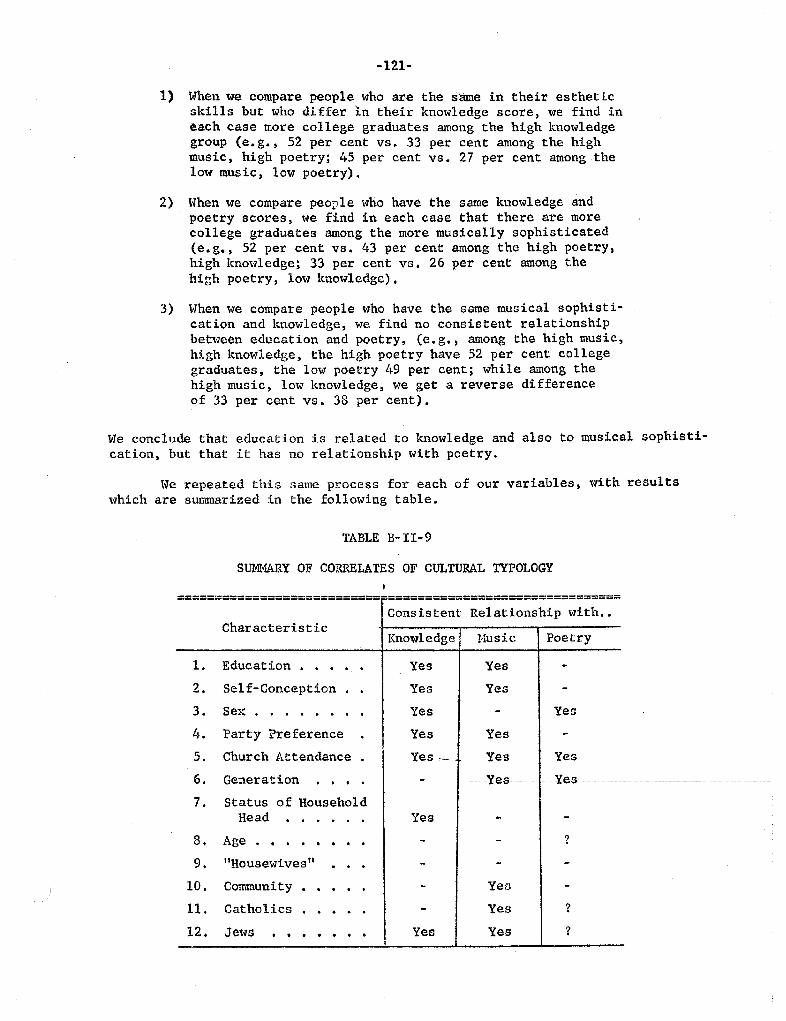
-121-
When 'We compare people who are the same in their estheticskills but who differ in their knowledge score , we find ineach case more college graduates among the high knowledgegroup (e.g., 52 per cent vs. 33 per cent among the highmusic, high poetry; 45 per cent vs. 27 per cent among thelow music, low poetry).
When we compare peovle who have the same knowledge andpoetry scores, we find in each case that there are morecollege graduates among the more musically sophisticated(e.g., 52 per cent vs. 43 per cent among the high poetry,high knowledge; 33 per cent vs. 26 per cent among thehigh poetry, low knowledge).
When we compare people who have the same musical sophisti-cation and knowledge, we find no consistent relationshipbetween education and poetry, (e. g., among the high musichigh knowledge, the high poetry have 52 per cent collegegraduates, the low poetry 49 per cent; while among thehigh music , low knowledge, we get a reverse differenceof 33 per cent vs. 38 per cent).
We conclude that education is related to knowledge and also to musical sophisti-cation, but that it has no relationship with poetry.
We repeated this same process for each of our variables, with resultswhich are summarized in the following table.
TABLE B-II-
SUMRY OF CORRLATES OF CULTURAL TYPOLOGY
===========================-===============================
Consistent ReI ations hi p with..Characteristic
Knowledge Busic Poetry
Education Yes Yes
Self-Conception Yes Yes
Sex Yes Yes
Party Preference Yes Yes
Church Attendance Yes ,"- Yes Yes
Generation Yes Yes
Status HouseholdHead Yes
Age
Housewi ves
10. Community YeG
11. Catholics Yes
l2. Jews Yes Yes
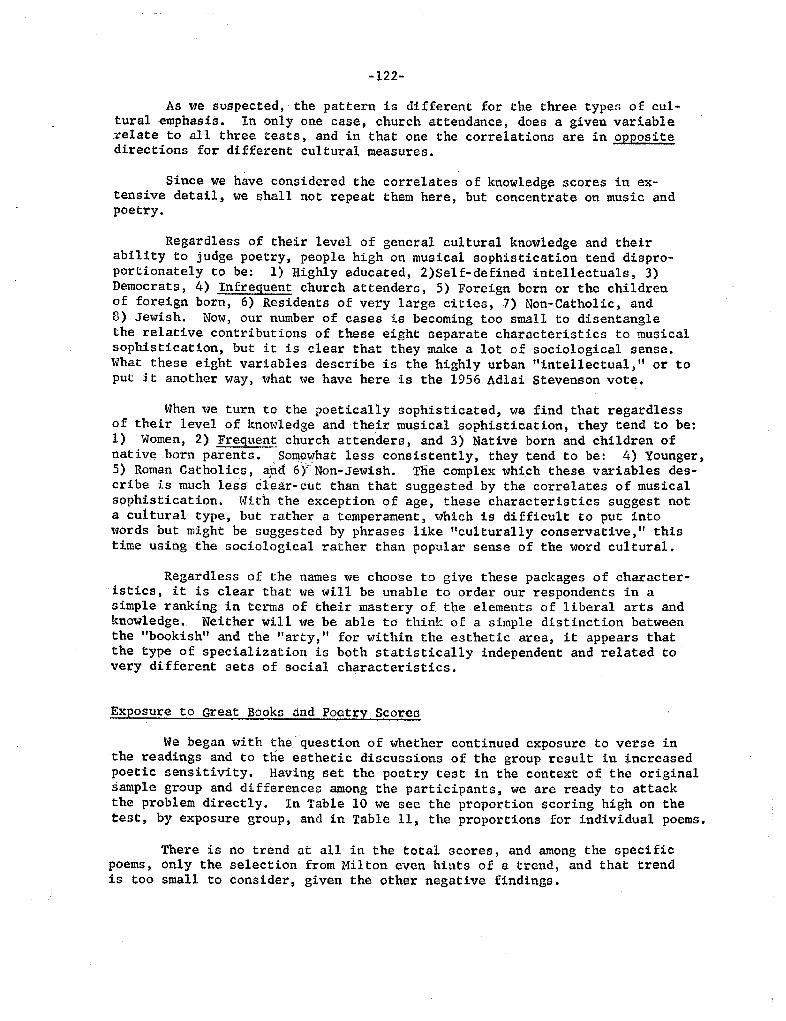
122-
As we suspected, the pattern is different for the three types of cul-tural mphasis. In only one case, church attendance, does a given variablerelate to all three tests, and in that one the correlations are in oppositedirections for different cultural measures.
Since we have considered the correlates of knowledge scores in ex-tensive detail, we shall not repeat them here, but concentrate on music andpoetry.
Regardless of their level of general cultural knowledge and theirability to judge poetry, people high on musical sophistication tend dispro-portionately to be: 1) Highly educated, 2)Self-defined intellectuals, 3)Democrats , 4) Infrequent church at tenders , 5) Foreign born or the childrenof foreign born , 6) Residents of very large cities, 7) Non-Catholic, and8) Jewish. Now, our number of cases is becoming too small to disentanglethe relative contributions of these eight separate characteristics to musicalsophistication, but it is clear that they make a lot of sociological sense.What these eight variables describe is the highly urban 11 intellectual , II or toput it another way, what we have here is the 1956 Adlai Stevenson vote.
When we turn to the poetically sophisticated, we find that regardlessof their level of kno vledge and their musical sophistication, they tend to be:1) Women , 2) Frequent church attenders, and 3) Native born and children ofnative born parents. S011.ewhat less consistently, they tend to be: 4) Younger,5) Roman Catholics , and: 6)'Non-Jewish. The complex .;hich these variables des-cribe is much les clear- cut than that suggested by the correlates of musicalsophistication. With the exception of age , these characteristics suggest nota cultural type, but rather a temperament , which is difficult to put intowords but might be suggested by phrases like IIculturally conservative , tI thistime using the sociological rather than popular sense of the word cultural.
Regardless of the names we choose to give these packages of character-istics, it is clear that we will be unable to order our respondents in asimple ranking in terms of their mastery of the elements of liberal arts andknowledge. Neither will we be able to think of a simple distinction betweenthe "bookish" and the "arty, 1I for within the esthetic area, it appears thatthe type of specialization is both statistically independent and related tovery different sets of social characteristics.
Exposure to Great Books and Poetry Scores
We began with the question of whether continued exposure to verse inthe readings and to the esthetic discussions of the group result in increasedpoetic sensitivity. Having set the poetry test in the context of the originalsample group and differences among the participants, we are ready to attackthe problem directly. In Table 10 we see the proportion scoring high on thetest , by exposure group, and in Table ll, the proportions for individual poems.
There is no trend at all in the total scores, and among the specificpoems , only the selection from Milton even hints of a trend, and that trendis too small to consider, given the other negative findings.
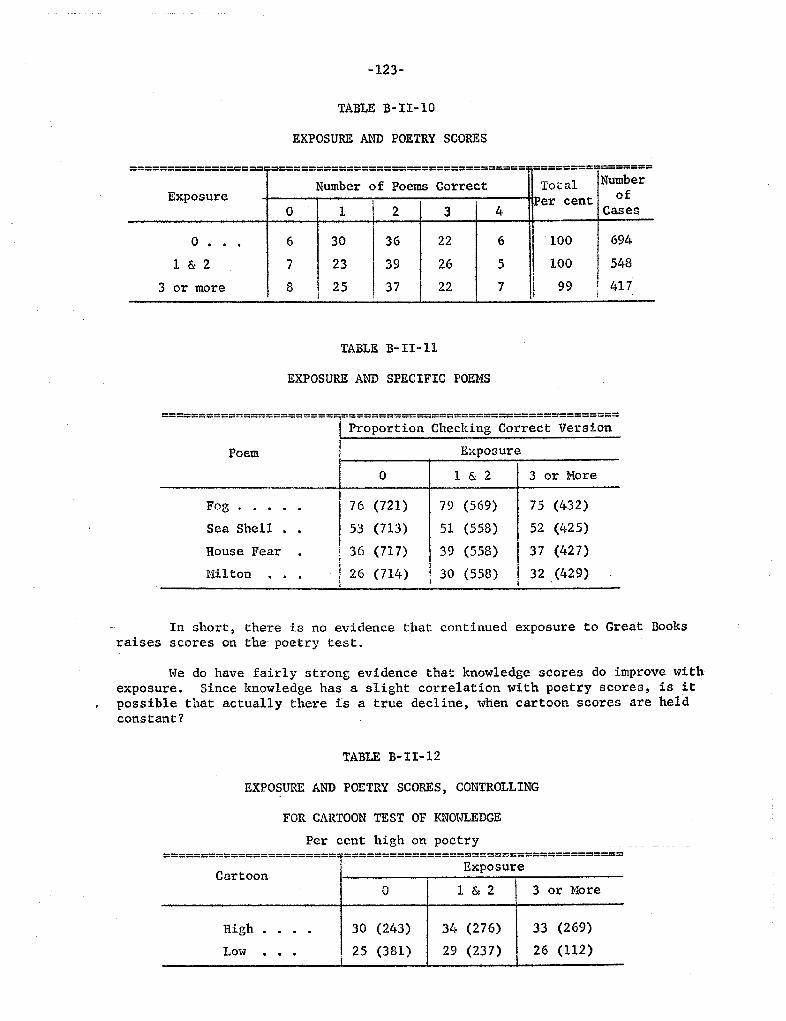
123-
TABLE B-II-10
EXPOSURE AND POETRY SCORES
================== ==== =========================;;== ========-=======
Number Poems Correct Total NumberExposure f.ler cent
Cases
100 694
100 548
more 417
TABLE B- II-
EXPOSURE AND SPECIFIC POEMS
========== ==================================================
Proportion Checking Correct Version
Poem Exposure
1 & 2 3 or More
76 (721) 79 (569) 75 (432)
53 (713) 51 (558) 52 (425)
i 36 (717)
39 (558)
I 37 (427)! 26 (714) ! 30 (558) . 32 (429)
Fog
. . . .
Sea ShellHouse Fear
loil ton
In short , there is no evidence that continued exposure to Great Booksraises scores on the poetry test.
We do have fairly strong evidence that knowledge scores do improve withexposure. Since knowledge has a slight correlation with poetry scores, is itpossible that actually there is a true decline, when cartoon scores are heldconstant?
TABLE B- II-
EXPOSURE AND POETRY SCORES , CONTROLLING
FOR CARTOON TEST OF KNOWLEDGE
Per cent high on poetry
=======================, ==== ==============:= ========== ====
Cartoon Exposure
Hore
High (243) 3l, (276) (269)
Low (381) (237) (112)
-124-
There is no pat tern in ei ther level 0 f knowledge scores.
He have only two comments to make on this negative finding. Firstfrom our previous analysis, it would appear that the sort of characteristicswhich are associated with high poetry scores are not the salient characteris-tics of Great Books participants. We remember from our earlier analysis thatmotivation appears to be a crucial determinant of "effect" and the motivationto " improve my taste in fiction and poetry" is mentioned by only 24 per centof the respondents, not all of whom would necessarily give equal weights tofiction and to poetry.
Second, other studies indicate that all programs have great difficultyn teaching poetic sensitivity. He remember that Trabue I s graduate studentsin English didn I t do quite twice as well as guessing on the Milton selection,which is probably the 08t distinguished piece of verse in the lot.
We would probably consider Cambridge University as a fairly effectiveeducational program. In 1929 I. A. Richards, the literary critic, publishedthe results of an informal experirnent , analagous in form to our study.gave untitled poems to adv nced undergraduates for their commnts, and fromtheir protocols evaluated the students I poetic sensitivity. His own comments
are judicial and calm, but the results have been more mordantly summarized byStanley Edgar Hyman:
What the protocols reveal, by and large, is probably the mostshocking picture, e thauGtively documentcd, of the generalreading of poetry ever presented. Perhaps the most frighten-ing single thing Richards got was eVidence that his students(and, presumably, all but a few particularly qualified readersand poets) lean absolutely on the authority of the writer I sname, and their sense of its rank in the pantheon, as a crutch. "
Richards I own conclusions may serve well for us.
It is not inevitable, or in the nature of things, that poetryshoul d seem such a remote, mysterious I unmanageable thing toso large a majority of readers. The deficiencies so noticeablein the protocol writers (and, if we, could be franker with our-selves, in our own reading) are not nat ve inalterable defectsin the average human mind. They are due in a large degree tomistakes that can be avoided , and to' bad training. In factdoes anyone ever receive any useful training in this matter'?"
1. A. Richards, Practical Criticism:London, Routledge & Kegan Paul , Ltd. , 1929.
Stanley Edgar Hyman The Armed Vision: A Study in theModern Literary Criticism, revised and abridged by the author.Vintage Books , 1955, p. 291.
Richards, Ope cit., p. 309.
A Stud of Literar Jud ment,
Methods ofNew York,

APPENDIX TO CHAPTER II
Poetry
-125-
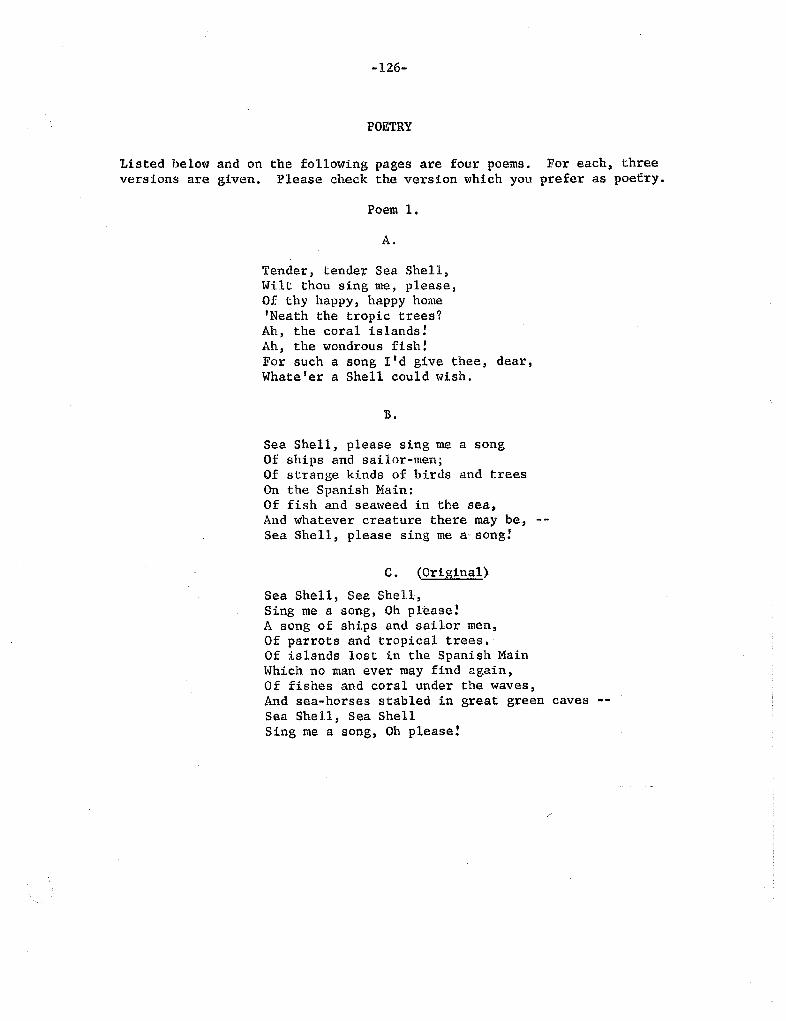
126-
POETRY
Listed below and on the following pages are four poems. For each, threeversions are given. Please check the version which you prefer as poetry.
Poem 1.
Tender , tender Sea ShellWilt thou sing me , please,
Of thy happy, happy home'Neath the tropic trees?
, the coral islands!, the wondrous fish!
For such a song I' d give thee,Whate er a Shell could wish.
dear,
Sea Shell , please sing me a songOf ships and sailor-men;Of strange kinds of birds and treesOn the Spanish Main:Of fish and seaweed in the seaAnd whatever creature there may be, --Sea Shell , please sing me a song!
C. OriginalSea Shell, Sea Shall,Sing me a song, Oh please!A song of ships and sailor men,Of parrots and tropical trees.Of islands lost in the Spanish MainWhich no man ever may find again,Of fishes and coral under the waves,And sea-horses stabled in great greenSea Shell , Sea ShellSing me a song, Oh please!
caves --
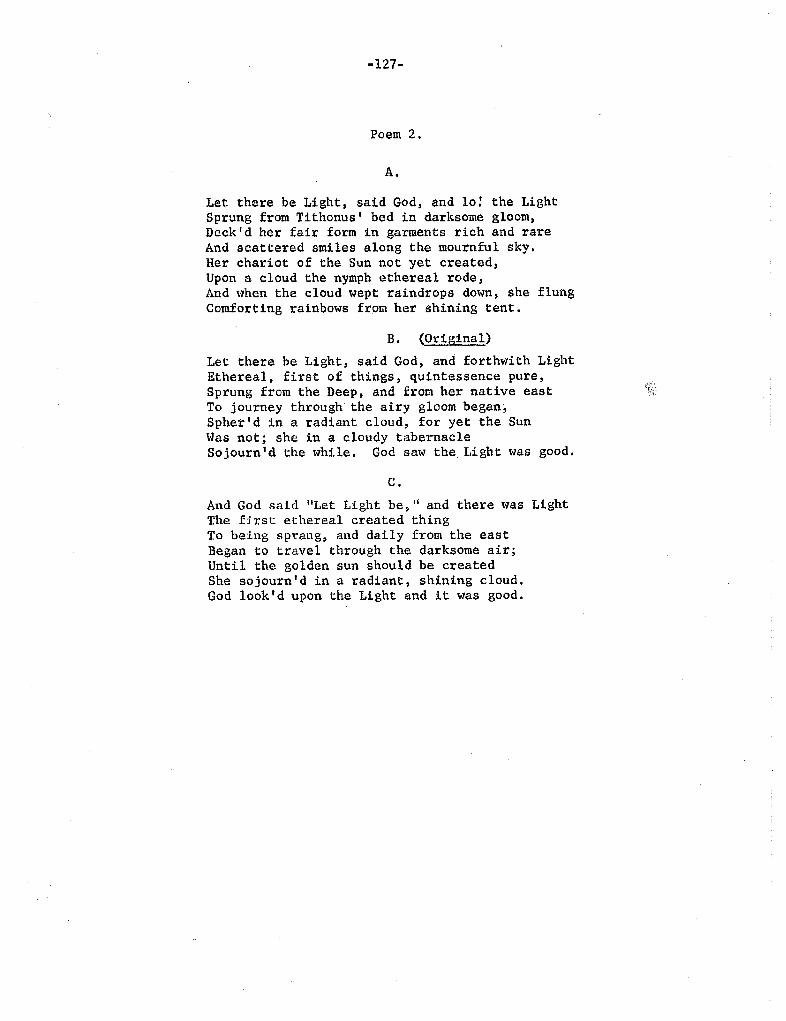
-127-
Poem 2.
Let there be Light, said God, and 10! the LightSprung from Tithonus I bed in darksome gloom,Deck I d her fair form in garments rich and rareAnd scattered smiles along the mournful sky.Her chariot of the Sun not yet created,Upon a cloud the nymph ethereal rode,And when the cloud wept raindrops down , she flungComforting rainbows from her shining tent.
B. (OriginalLet there be Light, said God, and forthwith LightEthereal, first of things, quintessence pure,Sprung from the Deep, and from her native eastTo journey through the airy gloom began,Spher d in a radiant cloud, for yet the SunWas not; she in a cloudy tabernacleSojourn 'd the while. God saw the Light was good.
And God said "Let Light be , Ii and there wasThe first ethereal created thingTo being sprang, and daily from the eastBegan to travel through the darksome air;Until the golden sun should be createdShe sojourn d in a radiant, shining cloud.God look' d upon the Light and it was good.
Light
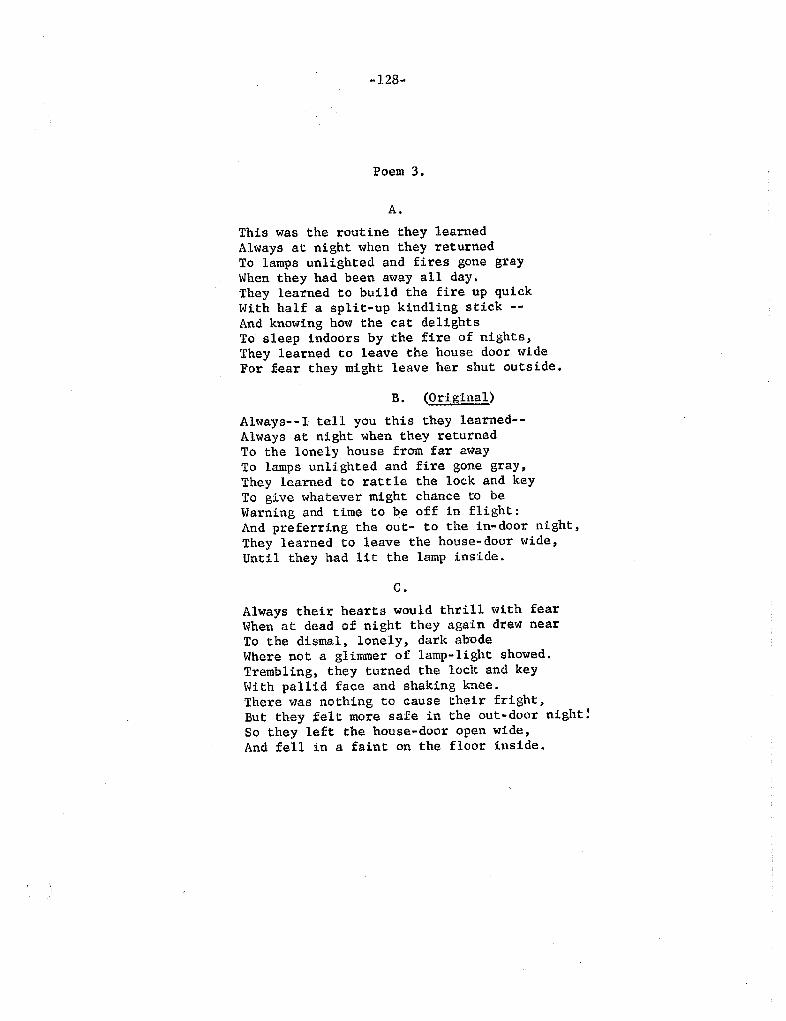
128-
Poem 3.
This was the routine they learnedAlways at night when they returnedTo lamps unlighted and fires gone grayWhen they had been away all day.They learned to build the fire up quickHith half a split-up kindling stick
And knO"V'ing how the cat delightsTo sleep indoors by the fire of nights,They learned to leave the house door wideFor fear they might leave her shut outside.
B. (Original
Always--l tell you this they learned--Always at night when they returnedTo the lonely house from far awayTo lamps unlighted and fire gone gray,They learned to rattle the lock and keyTo give whatever might chance to beWarning and time to be off in flight:And preferring the out- to the in-door night,They learned to leave the house- door wide
Until they had lit the lamp inside.
Always their hearts would thrill with fearWhen at dead of night they again drew nearTo the dismal, lonely, dark abodeWhere not a glimmer of lamp- light showed.
Trembling, they turned the lock and keyWith pallid face and shaking knee.There was nothing to Cause their fright,But they felt more safe in the out-door night!So they left the house-door open wide
And fell in a faint on the floor inside.
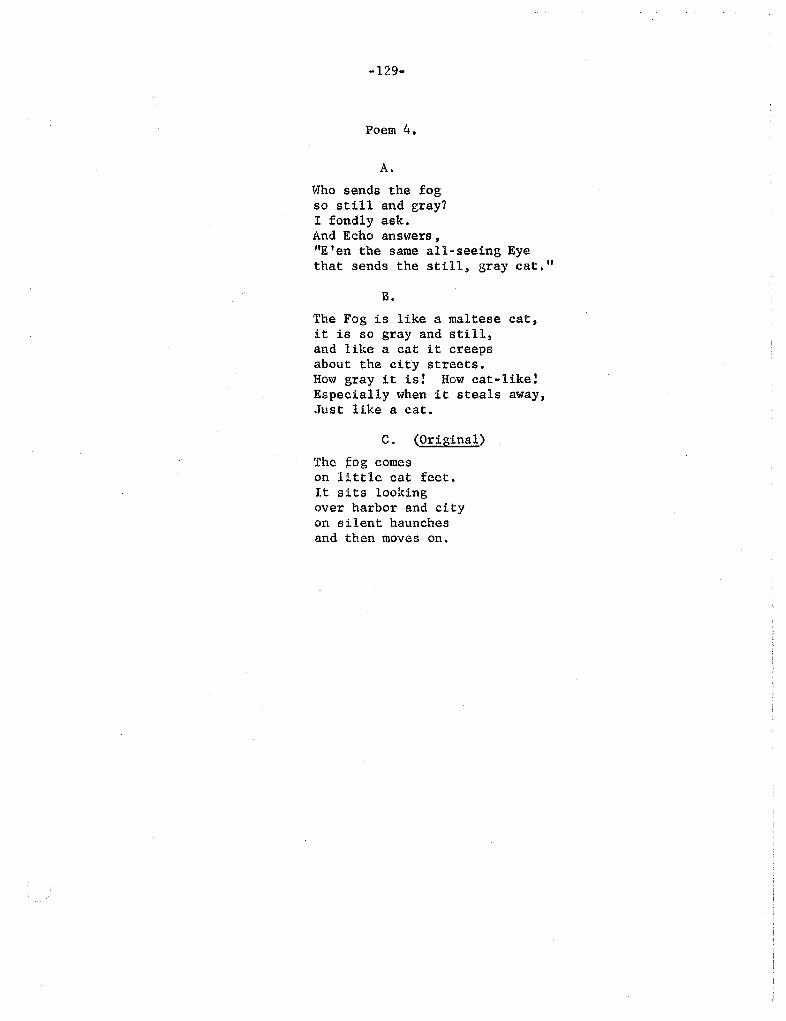
-129-
Poem 4.
Who sends the fogso still and gray?I fondly ask.And Echo answers,
E ' en the same all-seeing Eyethat sends the st ill ) gray cat.
The Fog is like a maltese cat,it is so gray and still,and like a cat it creepsabout the city streets.How gray it is! How cat-like!Especially when it steals away,Just like a cat.
OriginalThe ;fog comeson little cat feet.It sits lookingover harbor and cityon silent haunchesand then moves on.

CHAPTER III
READING
130-
-131-
Introduction
This chapter deals with the reading patterns of Great Books partici-pants, both in connection with the discussions and outside of the program.The discussion will cover three major areas:
The general pattern of reading which characterizes Great Booksparticipants.
Observed differences in the reading of people with differentlengths of program experience.
Changes in reading habits which members themselves attribute toparticipation in the program.
THE PARTICIPANTS' GENERAL PATTERN OF READING
How They Compare with Other Americans
Compared to the American public in general , or to the public of theirown educational level as studied in national surveys, Great Books participantsare outstanding as readers.
In 1945 NORC , on behalf of the American Librarr Association
, surveyedthe reading habits of a sample of adults in 17 cities. Of the people inthis sample who had attended college , 41 per cent reported that they spentseven or more hours a week in reading books. Because we separated readinginto "light" and "serious " rather than into the format of the material read,we do not have an exactly comparable question; however, 80 per cent of theGreat Books respondents spend at least seven hours a week on their totalreading, and 50 per cent spend 11 or more hours a week in reading. Even ifone assumes that almost a third of their total reading time is spent on news-papers and periodicals, the Great Books participants have a higher per centspending at least an hour a day reading books than does the college segmentof the urban public surveyed by NaRC.
A slightly more recent and comparable study done by the Universityof Michigan provides another basis of comparison. Table I below gives thedistribution of college (i. e., one year of college or more) people in theMichigan study on the number of books read in the preceding year.
National Opinion Research Center, What...Where...Why... Do People, Report No. 28 (1945), p. 6.
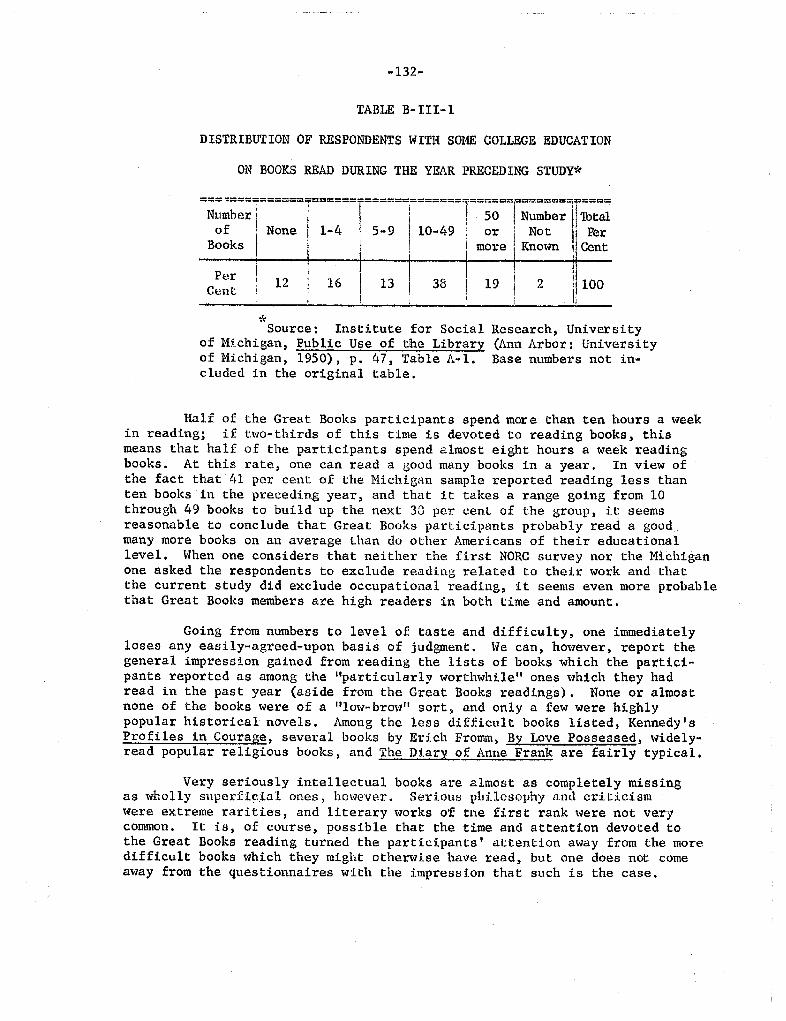
132-
TABLE B-III-
DISTRIBUTION OF RESPONDENTS WITH SOME COLLEGE EDUCATION
ON BOOKS READ DURING THE YEAR PRECEDING STUDY*
;:; :;!======
i======r======
i======I== r;:: i;oof . None ' ' 5- lO-49 ! or Not
Books I more Known ! Cent
' er l2 16 13 38 19 lOO.ent ' r 1
...
Source: Institute for Socialof Michigan Public Use of the Libraryof Michigan , 1950), p. 47, Table A-eluded in the original table.
Research , University(Ann Arbor: UniversityBase numbers not in-
Half of the Great Books participants spend more than ten hours a weekin reading; if two- thirds of this time is devoted to reading books, thismeans that half of the participants spend almost eight hours a week readingbooks. At this rate, one can read a good many books in a year. In view ofthe fact that 41 per cent of the Michigan sample reported reading less thanten books in the preceding year, and that it takes a range going from 10through 49 books to build up the next 33 per cent of the group, it seemsreasonable to conclude that Great Books participants probably read a goodmany more books on an average than do other Americans of their educationallevel. Hhen one considers that neither the first NORC survey nor the Mtchiganone asked the respondents to exclude reading related to their work and thatthe current study did exclude occupational reading, it seems even more probablethat Great Books members are high readers in both time and amount.
Going from numbers to level of taste and difficulty, one immediatelyloses any easily-agreed-upon basis of judgment. We can, however, report thegeneral impression gained from reading the lists of books which the partici-pants reported as among the "particularly worthwhile" ones which they hadread in the past year (aside from the Great Books readings). None or almostnone of the books were of a "low- brow" sort , and only a few were highlypopular historical novels. Among the less difficult books listed, KennedyProfiles in Courage , several books by Erich Fromm By Love Possessed , widely-read popular religious books , and The Diary of Anne Frank are fairly typical.
Very seriously intellectual books are almost as completely missingas wholly superfic al ones , however. Serious philosophy and criticismwere extreme rarities , and literary works of tne first rank were not verycommon. It is , of course , possible that the time and attention devoted tothe Great Books reading turned the participants I attention away from the more
difficult books which they might otherwise have read, but one does not comeaway from the questionnaires with the impression that such is the case.
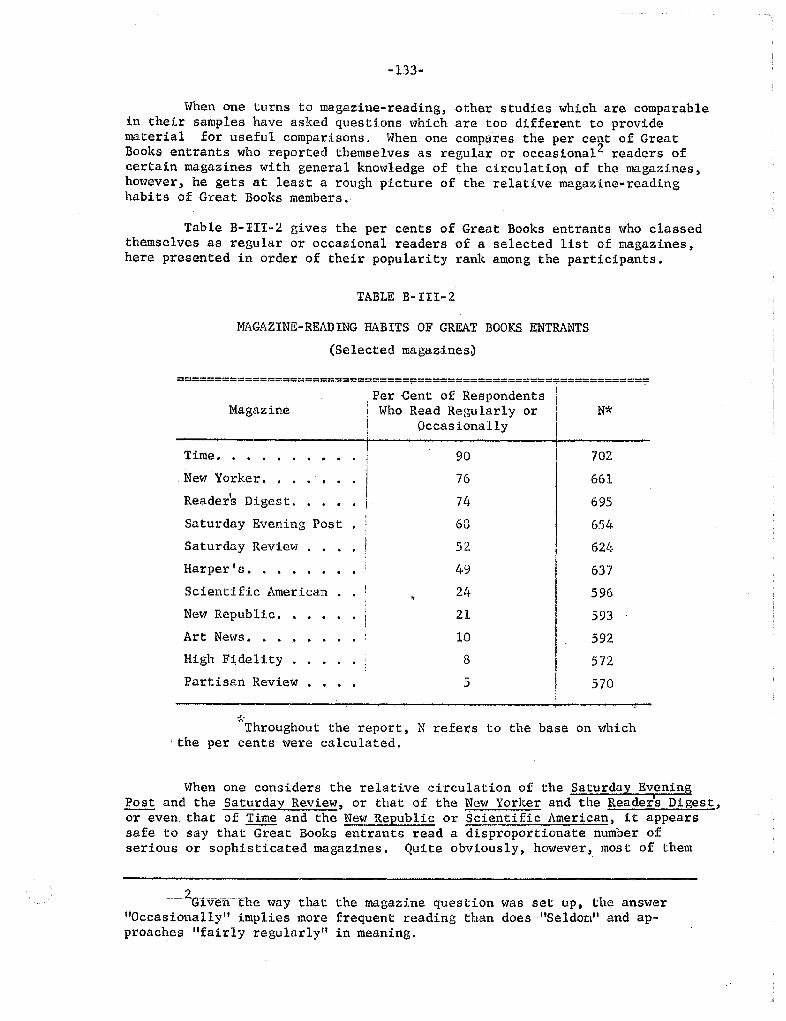
-133-
When one turns to magazine-reading, other studies which are comparablein their samples have asked questions which are too different to providematerial for useful comparisons. When one compares the per cent of GreatBooks entrants who reported themselves as regular or occasional 2 readers of
certain magazines with general knowledge of the circulation of the magazines,however, he gets at least a rough picture of the relative magazine-readinghabits of Great Books members.
Table B-III- 2 gives the per cent of Great Books entrants who classedthemselves as regular or occasional readers of a selected list of magazineshere presented in order of their popularity rank among the participants.
TABLE B- III- 2
MAGAZINE-READING HABITS OF GREAT BOOKS ENTRANTS
(Selected magazines
======= ======== ======= ==== =============== ===========
Magazine, Per Cent of Respondents! Who Read Regularly or
Occasionally
T imc . .
.. .. . .
New Yorker.
. . . .
Readers Digest. .Saturday Evening Post
Saturday Review
Harper s. .
. .
Scientific American
New Republic.
Art News. .
. . .. . . . .
High F:idelity .
.. " . .
Partisan Review
702
661
695
654
62L
637
596
593 .592
572
570
..,
Throughout the report, N refers to the base on which\ the per cents were calculated.
When one considers the relative circulation of the Saturday EveningPost and the Saturday Review , or that of the New yorker and the Readers Digestor even that of Time and the New Republic or Scientific American , it appearssafe to say that Great Books entrants read a disproportionate number ofserious or sophisticated magazines. Quite obviously, however , most of them
lvefC-Ehe 'l7ay that"Occasionally" implies moreproaches "fairly regularly
the magazine question was set up, the answerfrequent reading than does "Seldom" and ap-in meaning.
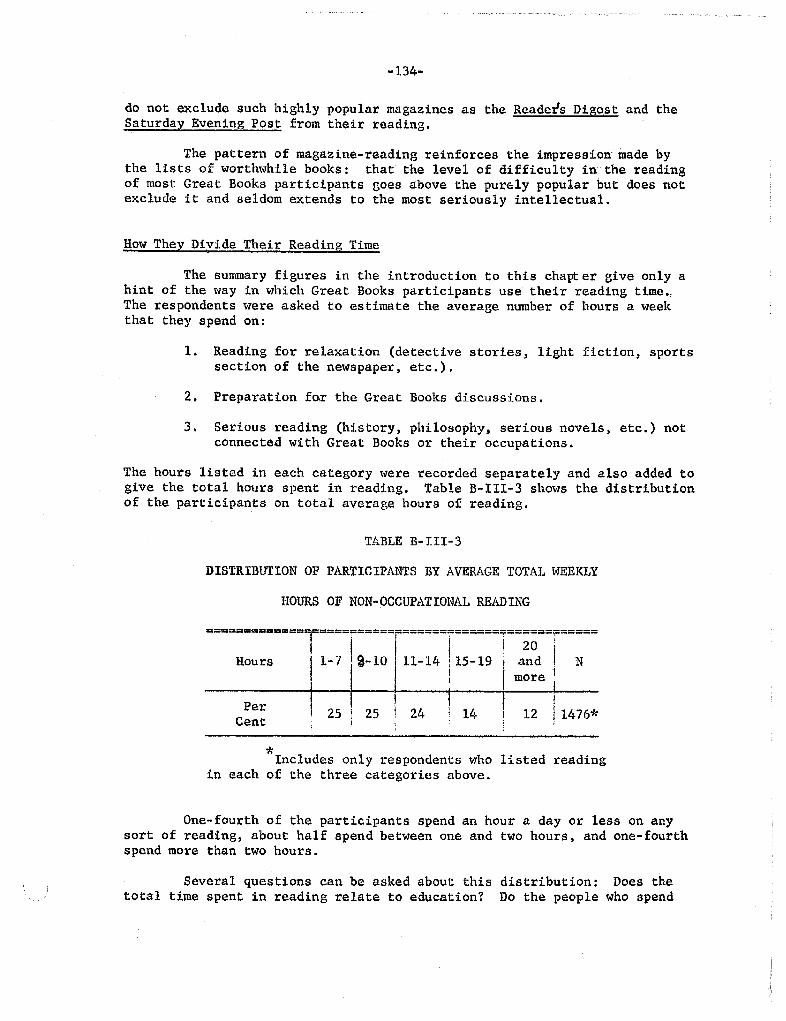
-134-
do not exclude such highly popular magazines as the Readers Di est and theSaturday Evening Post from their reading.
The pattern of magazine-reading reinforces the impression made bythe lists of worthwhile books: that the level of difficulty in the readingof most Great Books participants goes above the purely popular but does notexclude it and seldom extends to the most seriously intellectual.
How They Divide Their Reading Time
The summary figures in the introduction to this chapt er give only ahint of the way in which Great Books participants use their reading time.The respondents were asked to estimate the average number of hours a weekthat they spend on:
Reading for relaxation (detective stories, light fiction ) sportssection of the newspaper , etc.
Preparation fQr the Great Books discussions.
Serious reading (history, philosophy, serious novels, etc. ) notconnected with Great Books or their occupations.
The hours listed in each category were recorded separately and also added togive the total hours spent in reading. Table B-III- 3 shows the distributionof the participants on total average hours of reading.
TABLE B- III-3
DISTRIBUTION OF PARTICIPANTS BY AVERAGE TOTAL WEEKLY
HOURS OF NON-OCCUPATIONAL REAING
===========,===== =====
r====== ;=====9======r=====20 Hours 1- 7 9-10 11- 14 : 15-19 f and ! N
more
Per I 25 ( 25 ! 24 ; 14 12 j 1476*Cent
Includes only respondents vn10 listed readingin each of the three categories above.
One- fourth of the participants spend an hour a day or less on anysort of reading, about half spend between one and two hours, and one-fourthspend more than two hours.
Several questions can be asked about this distribution: Does thetotal time spent in reading relate to education? Do the people who spend
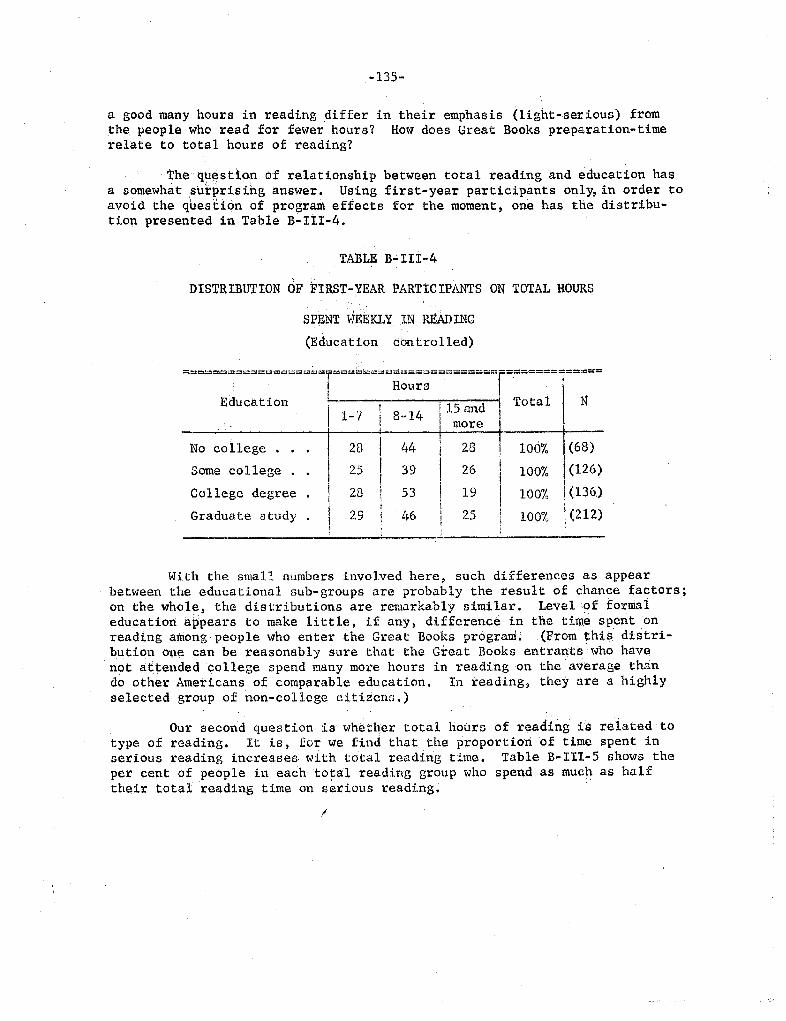
135-
a good many hours in reading differ in their emphasis (light- serious) fromthe. people who read for fewer hours? How does Great Books preparation-timerelate to total hours of r ading?
'the q\l sd.o.n of relationship between total reading and education hasa somewhatsutprising answer. Using first-year participants only, in order toavoid the question of program effects for the moment , one has the distribu-tion presented in Table B- 111-4.
TABLE B III..4
DISTRIBUTION OF FIRST-YEA ARTICIPANTS ON TOTAL HOURS
SPENT WEEKLY IN RgADING
(Education con trolled)
=== ===========
r========
~~~;;===== ====
Education
i l- I 8 -14 J l5 and Total
I Nore
+:-
No college 1+4 28 100% I
~~~
Some college 25 39 26 1001'0 ! (126)
College degree 23 53 19 10070 ! (136)
Graduate study 29 46 25 1001'0 : (212)
With the small numbers involved here , such differences as appearbetween the educational sub- groups are probably the result of chance factors;on the whole, the distributions are remarkably similar. Level?f formaleducation ppears to make little, if any, difference in the time spent ,reading among people who enter the Great Books pr9gram (From s, distri-bution One can be reasonably sure that the Great Books entrants who havenot attended college spend many more hours in reading on the . a\7erage thando other Americans of comparable education. In reading, they are a highlyselected group of non-college citizens.
Our second question is whether total hours of reading is reiated to
type of reading. It is, for we find that the proportioli. of time spent inserious reading increases with total reading time. Table B-III- 5 shows theper cent of people in each totaJ, reading group who spend as much as halftheir total reading time on seriolls reading;
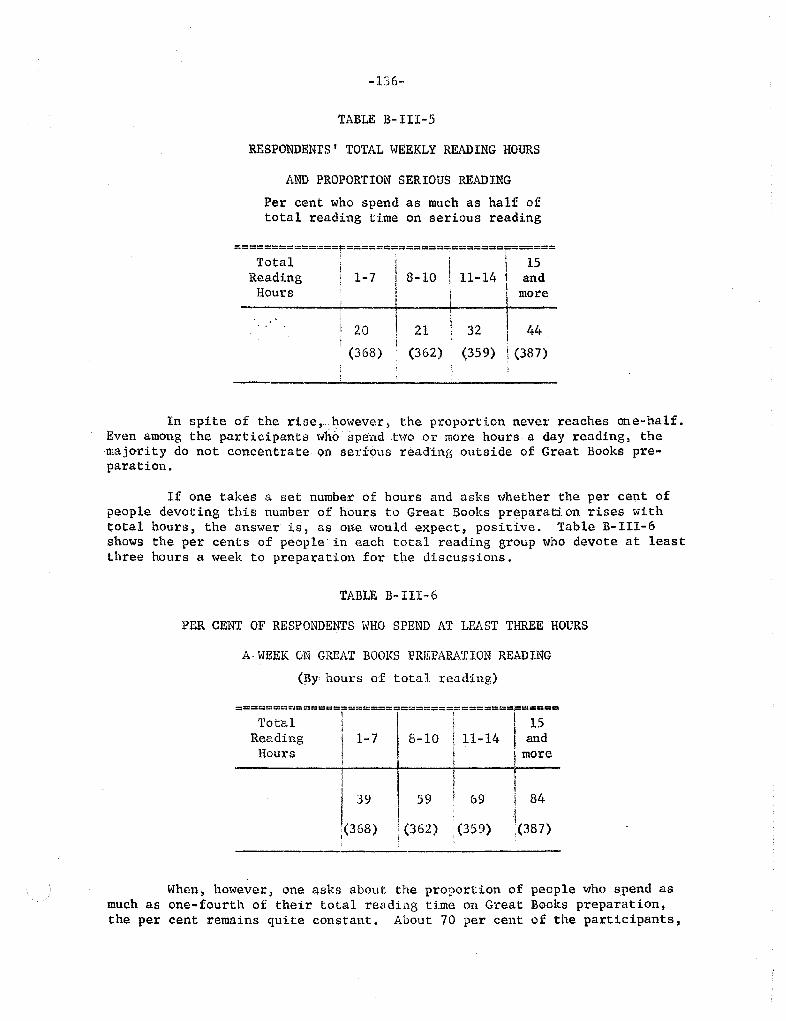
136-
TABLE B-III-5
RESPONDENTS' TOTAL '''EEKLY READING HOURS
AND PROPORTION SERIOUS READING
Per cent: who spend as much as half oftotal reading time on serious reading
================j:================:===========;:==========
! 1-7 i 11- 14 I andmore-t
!-
20 ! 21 \ 32 I 44. (368) (362) (359) ! (387)
TotalReading
Hours
. ,
In spite of the rise , ho\ve.ver, the proportion nevet' reaches one- half.Even among the participants wh6spend ,t\voor more hours a day reading, themajority do not concentrate 011 serrous reading outside of Great Books pre-paration.
If one takes a set number of hours and asks whether the per ce t of
people devoting this number of hours to Great Books preparati on rises withtotal hours , the answer is , as one would expect, positive. Table B-III-shows the per cents of people in each total reading group who devote at leastthree hours a week to preparation for the discussions.
TABLE B- 1II-
PER CENT OF RESPONDENTS WHO SPEND AT LEAST THREE HOURS
A HEEK ON GREAT BOOKS PREPARATION READING
y hours of totalreadil1g)
==============
F====== F======
=====
Total ! 15Reading 1 7 8-10 11- , andHours I more
(368) i (362) (359) (387)
When , however) one asks about the proportion of people who spend asmuch as onf -fourth of their total reading time on Great Books preparation,the per cent remains quite constant. About 70 per cent of the participants)

-137-
regardless of their total hours of readi.ng, spend as much as one- fourth oftheir reading time in preparation for the discussions.
The proportion of time spent in discu sion preparation does not seemto have much relationship to whether the rest of the respondent I s reading dominantly light or dominantly seriou!3; "light" and "serious " readers seemto spend about the same proportion of their time on Great Books preparation.
In summary, education does not influence the total amount of timeGreat Books participants spend in reading; the total time spent in readinghas almost no relationship to the proportion of it spent in Great Bookspreparation; the per cent of people who spend half or more of their readingtime in serious reading does rise with total reading but never includes halfthe participants.
The Range of Difficulty in the Participants ' Reading:the" Combinatio
Books azines
The amount of one I s reading and its level of difficulty may be twovery different matters , having different relationships with both educatiqnand experience in the program. We have two indications of the reading levelof Great Books participants: their own list of worthwhile books read in thepast year, and their pattern of magazine-reading from a list presented in thequestionnaire.
The relevant question on book-reading asked: hat book or books--outside of the Great Books readings--which you read in the last year impressedyou as particularly 'Il1orthtl1hile?" Six hundred and nine failed to list anybooks, and an additional 142 listed books which were impossible to classify,l7 including only the Bible and the rest listing books dealing with hobbiesreligious devotions, or special technical interests. Eleven hundred andfifty-eight people , however. did list books which could be classified asfiction or non- fiction and roughly rated as to level of difficulty or taste.We cannot make serious claims of scientific objectivity in the rating of thebooks as more and less difficult but can say that the division was made thought-fully by the study director and spot-checked for agreement by another staffmember. People were classified on the basis of whether their list of "worth-while books " included only the more difficult ones, only less difficult ones,or a mixture. To givs the reader an idea of the standards used, the listsbelow give some of the "particularly worthwhile " reading the participantslisted and our classification of it.
More Difficult Less Difficult
Barnett The Universe and Dr. Einstein
Camus , The Fa
Cozzens. By Love Possessed
Ferber,
Ortega y Gasset, Revolt of the Masses
Proust, Remembrance of Things Past
Fromm, The Art of Lovin
Hu lme The Nun s Story
Spinoza EthicsStrindb rg, Dance of Death
Lindbergh Gift from the Sea
Marshall Mr. Jones, Meet the aster
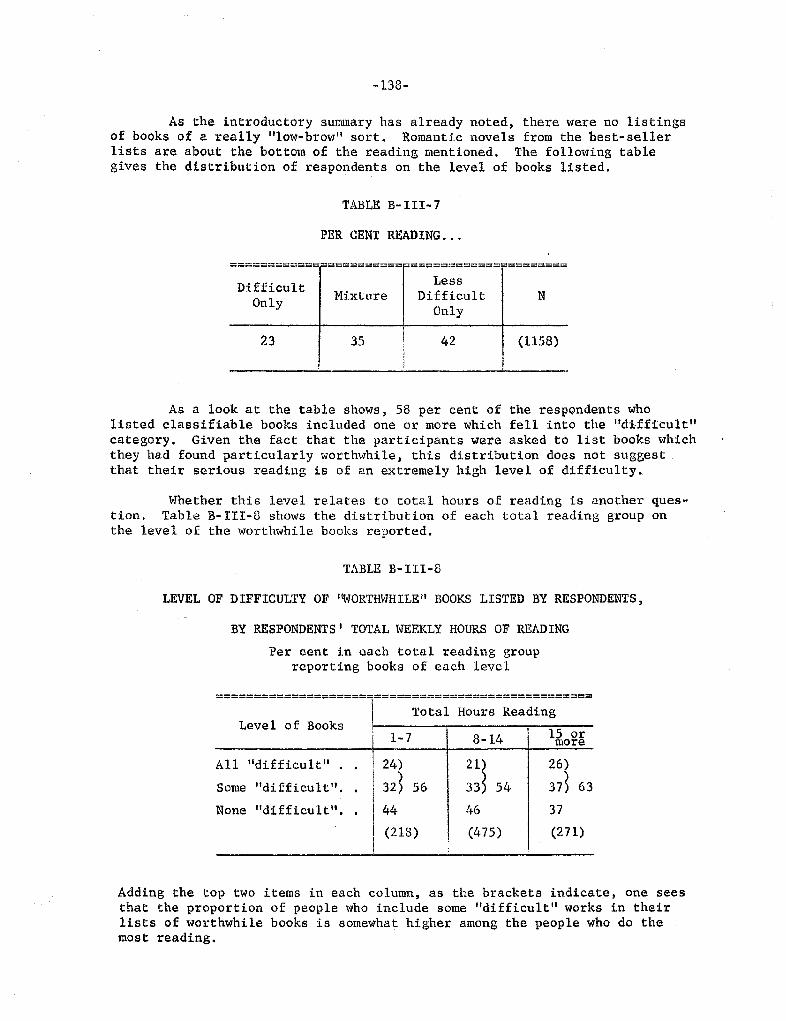
-138-
As the introductory summary has already noted , there were no listingsof books of a really "low-brow" sort. Romantic novels from the best-sellerlists are about the bottom of the reading mentioned. The following tablegives the distribution of respondents on the level of books listed.
TABLE B-III-
PER CENT READING...
=;; ;===;===;;=====;== ;============-========
LessDifficult
Only
DifficultOnly Mixture
(1158)
As a look at the table shows , 58 per cent of the respondents wholisted classifiable books included one or more which fell into the "diffic:ult"category. Given the fact that the participants were asked to list books whichthey had found particularly worthwhile , this distribution does not suggestthat their serious reading is of an extremely high level of difficulty
Whether this level relates to total hours of reading is another ques-tion. Table B- 111- 8 shows the distribution of each total reading group onthe level of the worthwhile books reported.
TABLE B- III-
LEVEL OF DIFFICULTY OF "WORTH\vHILE" nOOKS LISTED BY RESPONDENTS
BY RESPONDENTS I TOTAL WEEKLY HOURS OF READING
Per cent in l3ach total reading groupreporting books of each level
-----------------------------------------------------------------------..-------------- ---------------
To ta 1 Hours ReadingLeve 1 a f Books 15 ormore
All IIdifficul t" 24) 2l) 26)
Some "difficult" ! 32
None IIdifficultll If6
I (218) (475) (211)
Adding the top two items in each column, as the brackets indicate, one seesthat the proportion of people who include some "difficult" works in theirlists of worthwhile books is somewhat higher among the people who do themost reading.
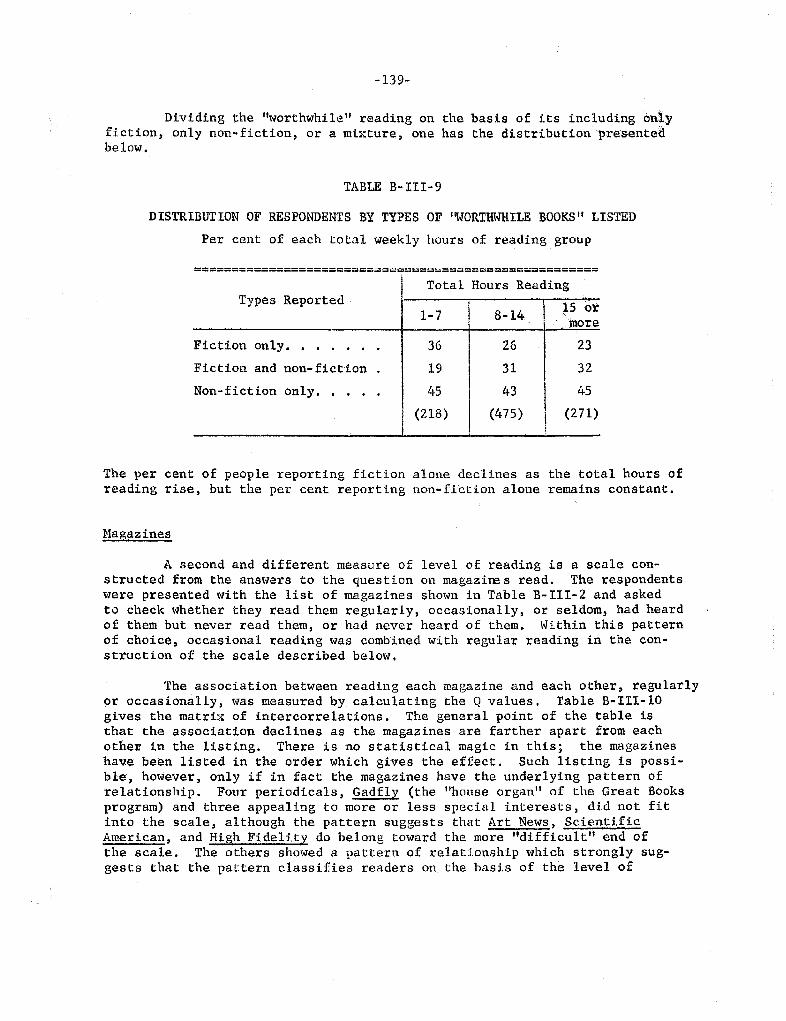
-139-
Dividing the "worthwhile" reading on the basis of its including onlyfiction , only non-fiction , or a mixture , one has the distributionprt=:sntedbelow.
TABLE B-III-9
DISTRIBUTION OF RESPONDENTS BY TYPES OF 'WORTHWHILE BOOKS" LISTED
Per cent of each total weekly hours of readi.ng group
========================-=--===--=====================
Total Hours ReadingTypes Reported
15 ormore
(271)
Fiction only.
(218) (475)
Fiction and non- fiction
Non- fiction only. . .
The per cent of people reporting fiction alone declines as the total hours ofreading rise , but the per cent reporting non- fiction alone remains constant.
Magaz ines
A second and different measure of level of reading is a scale con-structed from the answers to the question on magazine s read. The respondentswere presented with the list of magazines shown in Table B- 111- 2 and askedto check whether they read them regularly, occasionally, or seldom, had heardof them but never read them , or had never heard of them. Within this patternof choice, occasional reading was combined with regular reading in the con-s truc tion of the scale described below.
The association between reading each magazine and each other, regularlyor occasionally, was measured by calculating the Q values. Table B- III-gives the matrix of intercorrelations. The general point of the table that the association declines as the magazines are farther apart from eachother in the listing. There is no statistical magic in this; the magazineshave been listed in the order which gives the effect. Such listing is possi-ble , however , only if in fact the magazines have the underlying pattern ofrelationship. Four periodicals, Gadfly (the "house organ" of the Great Booksprogram) and three appealing to more or less special interests, did not fitinto the scale , although the pattern suggests that Art News ScientificAmerican , and High Fidelity do belong toward the more "difficult" end ofthe scale. The others showed a pattern of relationship which strongly sug-gests that the pattern classifies readers on the basis of the level of
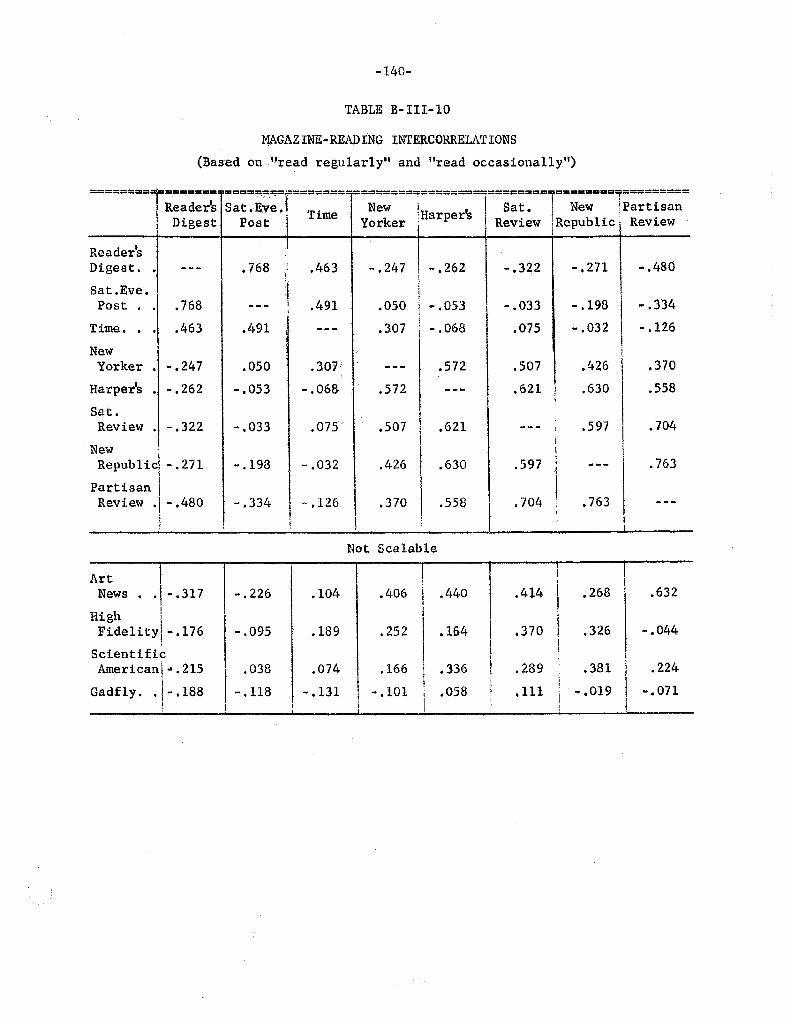
140-
TABLE B- III-
GAZINE-READING INTERCORRELATIONS
(Based on uread regularly" and "read occasionally
========= ======== ========
r=======-
==========================' ==================
Reader's sat' T' New 's I Sat. New tpartisanDigest l.me Y k : arper R bl" R oat or er eVl.ew epu l.C' eVl.ew
ReaderDigest.
---
768 463
- .
247
- .
262
- .
322 - . 271
- .
480
Sat . Eve.Post 768
---
491 050
- .
053
- .
033
- .
198
- .
334
Time. 463 491
---
3.07
- .
068 075
- .
032
- .
126
NewYorker - . 247 050 307'
---
572 507 426 370
Harper
- .
262
- .
053
- .
068 572
---
621 630 558
Sat.Review 322
- .
033 075- 507 621
---
597 704
NewRepublic 271
- .
198
- .
032 426 630 597
---
763
PartisanReview .1 - . 480
- .
334
- .
126 370 558 704 763
---
Not Scalable
ArtNews
. .
317
High Fidelity l- . l76
ScientificAmericanl.. 2l5
Gadfly. . 188
226 104 406 440 414
370
268 632
- .
095 189 252 164 326 - . 044
038
- .
1l8
074
- . 131
166
- .
lOl
336
058
289 . 381
111
! -
019
224
071
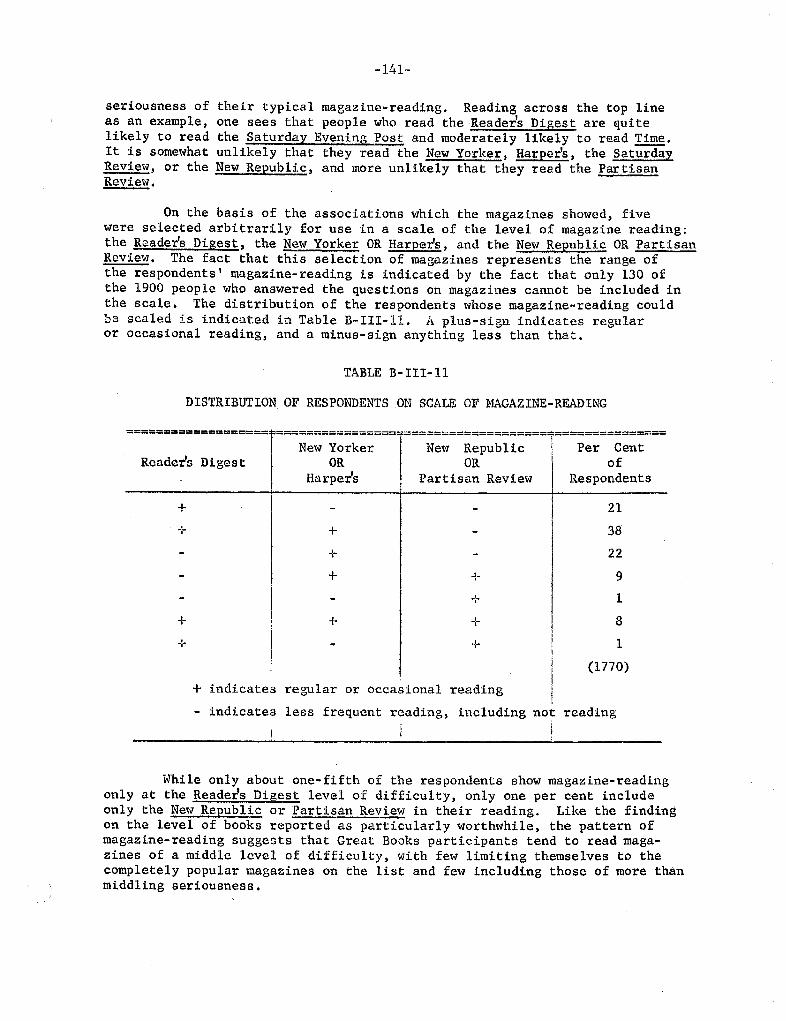
141-
seriousness of their typical magazine-reading. Reading across the top lineas an example, one sees that people who read the Readers Digest are quitelikely to read the Saturday Evening and moderately likely to read
It is somewhat unlikely that they read the New Yorker Harpers , the SaturdayReview , or the New Republic , and more unlikely that they read the PartisanReview.
On the basis of the associations which the magazines showed, fivewere selected arbitrarily for use in a scale of the level of magazine reading:the Readers Digest , the New Yorker OR Harpers , and the New Republic OR PartisanReview. The fact that this selection of magazines represents the range ofthe respondents I magazine-reading is indicated by the fact that only 130 of
the 1900 people who answered the questions on magazines cannot be included inthe scale. The distribution of the respondents whose magazine-reading couldbe scaled is indicated in Table B-III-ll. A plus-sign indicates regularor occasional reading, and a minus-sign anything less than that.
TABLE B-III-
DISTRIBUTION OF RESPONDENTS ON SCALE OF MAGAZINE-READING
===================
r===
;::=;:; :;===
1===
;::==;:;~~~~~=== ===;:;== =--
Reader's Digest OR OR Harpers Partisan Review Respondents
(1770)
+ indicates regular or occasional reading
- indicates less frequent reading, including not reading
While only about one- fifth of the respondents show magazine-readingonly at the Readers Digest level of difficulty, only one per cent includeonly the New Republic or Partisan Review in their reading. Like the findingon the level of books reported as particularly worthwhile, the pattern ofmagazine-reading suggests that Great Books participants tend to read maga-zines of a middle level of difficulty, with few limiting themselves to thecompletely popular magazines on the list and few including those of more thanmiddling seriousness.
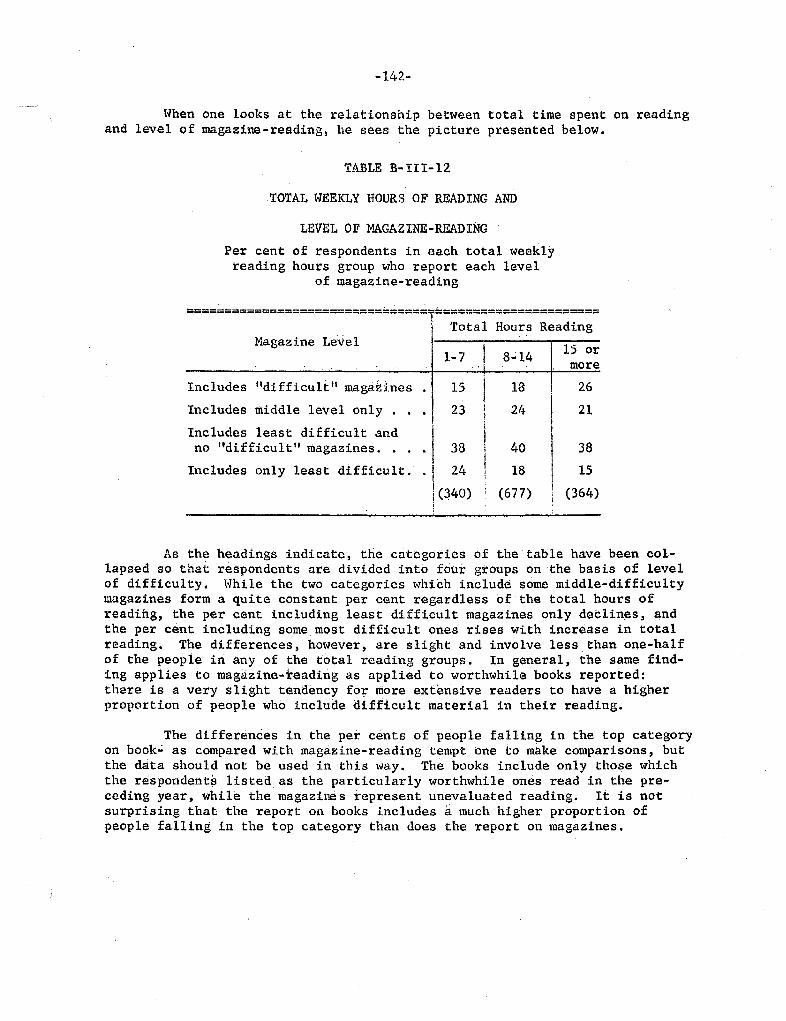
142-
When one looks at the relationship between total time spent on readingand level of magazine-reading, he sees the picture presented below.
TABLE B-III-
TOTAL WEEKLY HOURS OF READING AND
LEVEL OF MAGAZINE-READING
Per cent of respondents in each total weeklyreading hours group who report each level
of magazine-reading
================================
1======================Total Hours Reading
Magazine Level l5 or1- 7 8'; 14 more
, .
Includes only least difficult.
15 23
1 38 ! 24
\ (340) : (677)
Includes "difficult II magazines
Includes middle level only
Includes least difficult andno "difficultll magazines.
, (364)
As the headings indicate, the cat gories of the table have been col-lapsed so that respondents are divided into four groups on the basis of levelof difficulty. Hhile the two categories which include some middle-difficultymagazines form a quite constant per cent regardless of the total hours ofreading, the per cent including least difficult magazines only declines , andthe per cent including some . most difficult ones rises with increase in totalreading. The differences, however, are slight and involve less than one-halfof the peop1e iri any of the total reading groups. In general , the same find-ing applies to magazine-reading as applied to worthwhile books reported:there is a very slight tendency fo more extensive readers to have a higherproportion of people who include difficult material in their reading.
The differences in the per cents of people falling in the top categoryon book as compared with magazine-reading tempt bne to m ke comparisons, butthe data should not be used in this way. The books include only those whichthe respondents listed as the particularly worthwhile ones read in the pre-ceding year , while the magazine s represent unevaluated reading. It is notsurprising that the report on books includes much higher proportion ofpeople falling in the top category than does the report on magazines.
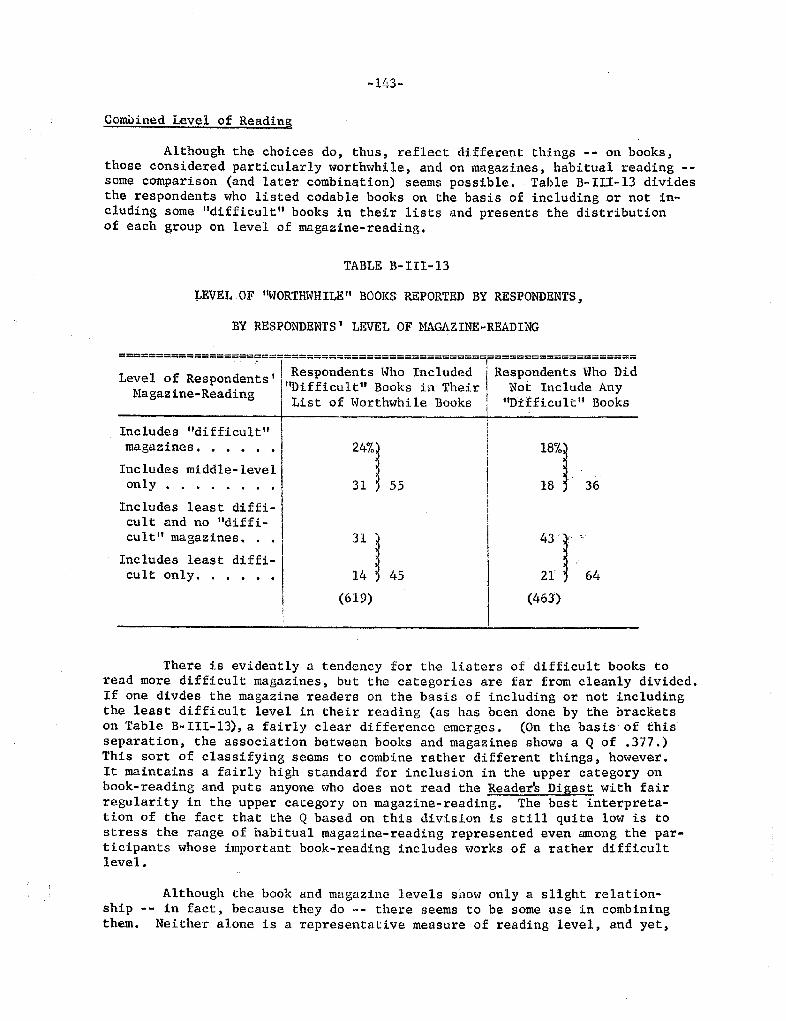
-1l:.
Combined Level of Reading
Although the choices do, thus, reflect different things -- on books,those considered particularly worthwhile, and on magazines, habitual reading --some comparison (and later combination) seems possible. Table B-III- l3 dividesthe respondents who listed codable books on the basis of including or not in-cluding some "difficult" books in their lists and presents the distributionof each group on level of magazine-reading.
TABLE B- I II-13
LEVEL OF IIWORTHWHILE" BOOKS REPORTED BY RESPONDENTS
BY RESPONDENTS 1 LEVEL OF MAGAZINE-READING
=================================================
F====
===============
Respondents Who Included ' Respondents Who Dideve 0 espon en s ,
. .
"D1.ff1culttl Books l.n The1.r. Not Include Anyagaz ne- ea l.ng I List of Worthwhile Books 1ID:tfficult" Books
Includes "difficult"magazincs. .
. . . .
24%
31
Includes middle- levelonly
. .
Includes least diffi-cult and no "diffi-
cult" magazines.
. .
Includes least diffi-cult only. . .
. .
31
14
(619)
18%
43 r
(463)
There is evidently a tendency for the listers of difficult books toread more difficult magazines, but the categories are far from cleanly divided.If one divdes the magazine readers on the basis of including or not includingthe least difficult level in their reading (as has been done by the bracketson Table B- 111- 13), a fairly clear difference emerges. (On the basis of thisseparation, the association between books and magazines shows a Q of . 377.This sort of classifying seems to combine rather different things, however.It maintains a fairly high standard for inclusion in the upper category onbook-reading and puts anyone who does not read the Reader Digest with fairregularity in the upper category on magazine-reading. The best interpreta-tion of the fact that the Q based on this division is still quite low is tostress the range of habitual magazine-reading represented even among the par-ticipants whose important book-reading includes works of a rather difficultlevel.
Although the book and magazine levels show only a slight relation-ship
--
in fact , because they do -- there seems to be some use in combiningthem. Neither alone is a representative measure of reading level , and yet
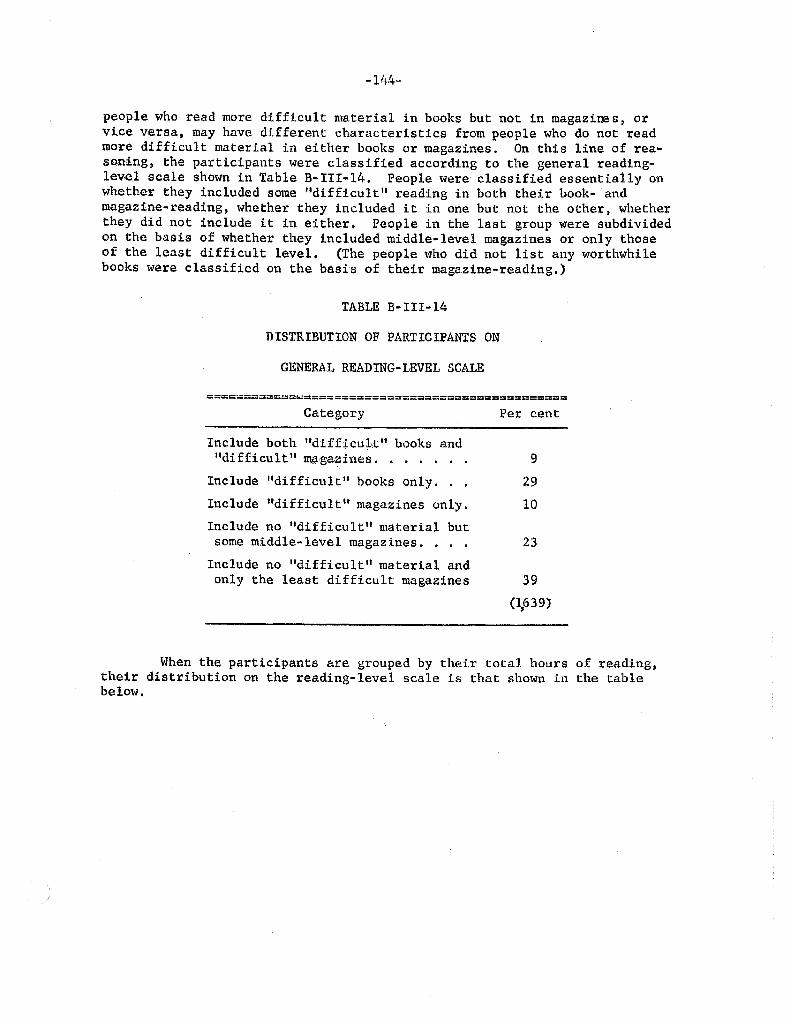
people who read more difficult material in books but not in magazine s , orvice versa, may have different characteristics from people who do not readmore difficult material in either books or magazines. On this line of rea-soning, the participants were classified according to the general reading-level scale shown in Table B- 111-14. People were classified essentially onwhether they included some "difficult" reading in both their book- andmagazine-reading, whether they included it in one but not the other , whetherthey did not include it in either. People in the last group were subdividedon the basis of whether they included middle-level magazines or only thoseof the least difficult level. (The people who did not list any worthwhilebooks were classified on the basis of their magazine-reading.
TABLE B- III-14
DISTRIBUTION OF PARTICIPANTS ON
GENERAL READING- LEVEL SCALE
==== ===== ;;--= =-===;== ========-==;==-=====
Ca tegory Per cent
Include both "difficutt" books and"difficult" m gazines. . .
Include "difficul t" books only. .
Include "difficult" magazines only.Include no "difficult" material butsome middle-level magazines.
Include no "difficult" material andonly the least difficult magazines
(1,639)
When the participants are grouped by their total hours of reading,their distribution on the reading-level scale is that shown in the tablebelow.
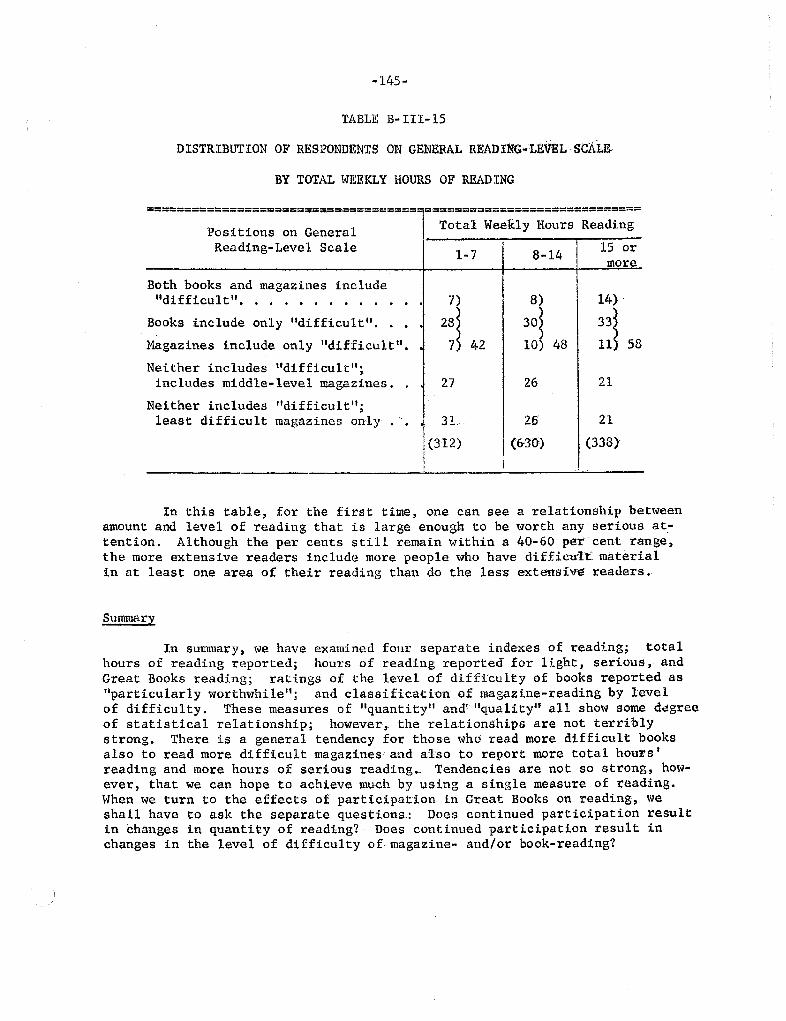
145 -
TABLE B- III-l5
DISTRIBUTION OF RESPONDENTS ON GENERAL READING-LEVELSCA1&
BY TOTAL WEEKLY HOURS OF READ ING
=====================
===s--=========
=============================
Positions on GeneralReading-Level Scale
Total Weekly Hours Reading
8-14 15 ormore
Both books and magazines include"difficult"
. . . .
10) 48
14)
Books include only "difficult "
. .
Magazines include only "difficult"
Neither includes "difficult"includes middle- level magazines.
Neither includes "difficult"least difficult magazines only
. -
(312) ! (&30) (3331
In this table , for the first time , one can see a relationship betweenamount and level of reading that is large enough to be worth any serious at-tention. Although the per cents still remain within a 40- 60 per cent rangethe more extensive readers include more people who have difficult: materialin at least one area of their reading than do the less extersiVE! readers.
Summary
In summary, we have examined four separate indexes of reading; totalhours of reading reported; hours of reading reported for light, serious, andGreat Books reading; ratings of the level of difficulty of books reported asparticularly worthwhile and classificathm of magazine-reading by levelof difficulty. These measures of "quantity" and' "quality" all show some d greeof statistical relationship; however, the relationships are not terriblystrong. There is a general tendency for those who read more difficult booksalso to read more difficult magazines and also to report more total hours reading and more hours of serious reading... Tendencies are not so strong, how-ever, that we can hope to achieve much by using a single measure of reading.When we turn to the effects of participation in Great Books on reading, weshall have to ask the separate questions: Does continued participation resultin changes in quantity of reading? Does continued participation result inchanges in the level of difficulty of magazine- and/or book-reading?
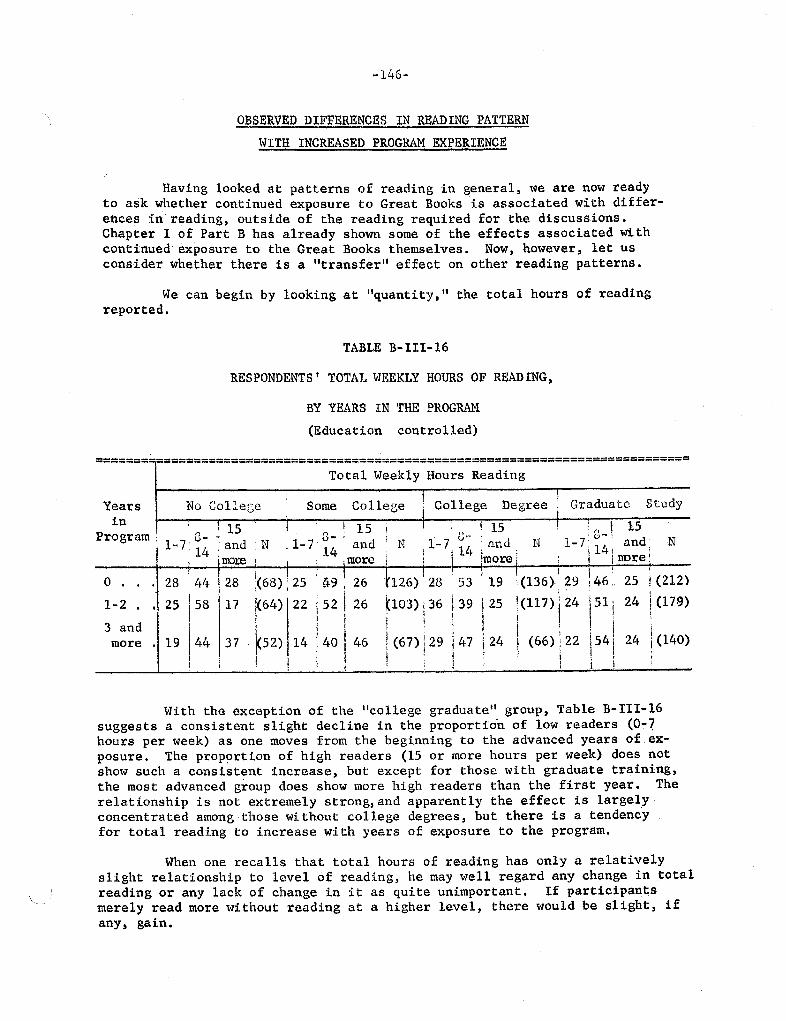
146-
OBSERVED DIFFERENCES IN READING PATTERN
WITH INCREASED PROGRAM EXPERIENCE
Having looked at patterns of reading in general , we are now readyto ask whether continued exposure to Great Books is associated with differ-ences in reading, outside of the reading required for the discussions.Chapter I of Part B has already shown some of the effects associated Wi continued exposure to the Great Books themselves. Now, however, let usconsider whether there is a "transfer" effect on other reading patterns.
We can begin by looking at "quantity, " the total hours of readingreported.
TABLE B-III-
RESPONDENTS t TOTAL WEEKLY HOURS OF READING
BY YEARS IN THE PROGRA
(Education controlled)
=======-=======================================================================
Years
Program:
No C6Eece
Total Weekly Hours Reading
Some College ; College Degree
! 15
more . 19
44 .
! 58 117
144 j 31
! N
k68) : 2S i &i9 , 26
64), 22
52) 14 . 40 1
Graduate Study
! g
7: 14, and , Ni llre
. 126) 28
tl03) j 36 I 39 I
1(67)129 j47 124
'(136) j 29 :
!(117) i 24 '
(66) \22 \54
25 ! (212)
24 ! (l7S)o . . 28
2 . . 25
3 and24 \ (l40)
With the exception of the "college graduate" group, Table B-IlI-suggests a consistent slight decline in the proportion of low readers (0-7hours per week) as one moves from the beginning to the advanced years of exposure. The prop rtion of high readers (15 or more hours per week) does notshow such a consistent increase. but except for those with graduate training,the most advanced group does show more high readers than the first year. Therelationship is not extremely strong, and apparently the effect is largelyconcentrated among those wi thout college degrees, but there is a tendencyfor total reading to increase wi th years of exposure to the program.
When one recalls that total hours of reading has only a relativelyslight relationship to level of reading, he may well regard any change in totalreading or any lack of change in it as quite unimportant. If participantsmerely read more without reading at a higher level, there would be slight. ifany, gain.
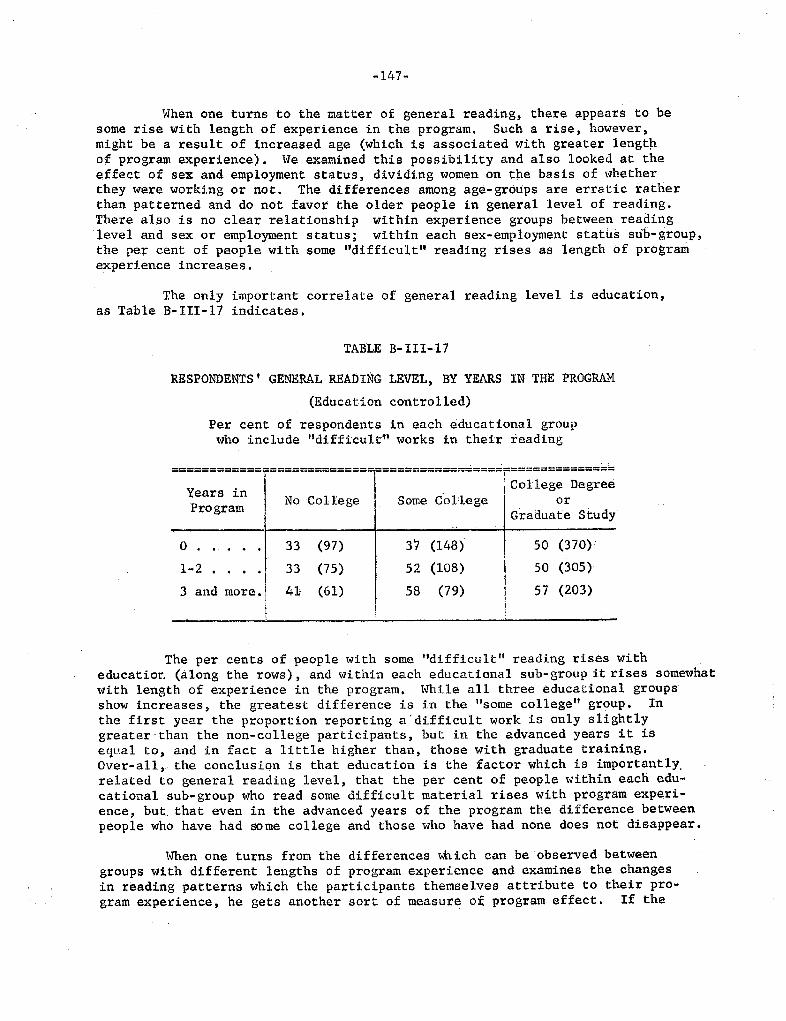
147-
When one turns to the matter of general reading, there appears to besome rise with length of experience in the program. Such a rise, however,might be a result of increased age (which is associated with greater lengthof program experience). We examined this possibility and also looked at theeffect of sex and employment status , dividing women on the basis of whetherthey were working or not. The differences among age- groups are erratic ratherthan patterned and do not favor the older people in general level of reading.There also is no clear relationship within experience groups between readinglevel and sex or employment status; within each sex-employment status sub- group,the per cent of people with some "difficult" reading riSes as length of programexperience increases.
The only important correlate of general reading level is education,as Table B- 111-17 indicates,
TABLE B- 1II-
RESPONDENTS t GENERAL REAIHNG LEVEL, BY YEARS IN THE PROGRA
(Education controlled)
Per cent of respondents in each educational groupwho include "difficultrt works in their reading
;::::=::==
r=.
::=:::::::--.=' ::::-=::::::== ;;::
Program Graduate study
o . (97) (148) 50 (370)'
2 , (75) 52 (108) 50 (305)
3 and more. (6l) (79) 57 (203)
The per cents of people with some "difficult" reading rises with educatior. (along the rows), and within each educational sub- group it rises somewhatwith length of experience in the program, While all three educational groupsshow i.ncreases ) the greatest difference is in the "some college" group. Inthe first year the proportion reporting a difficult work is only slightlygreater than the non-college participants , but in the advanced years it iseq11al to , and in fact a little higher than , those with graduate training,Over-all , the conclusion is that education is the factor which is importantly.related to general reading level, that the per cent of people within each edu-cational sub-group who read some difficult material rises with program exp ri-ence , but that even in the advanced years of the program the difference betweenpeople who have had some college and those who have had none does not disappear.
When one turns from the differences Which can be observed betweengroups with different lengths of program experience and examines the changesin reading patterns which the participants themselves attribute to their pro-gram experience, he gets another sort of measure of program effect. If the
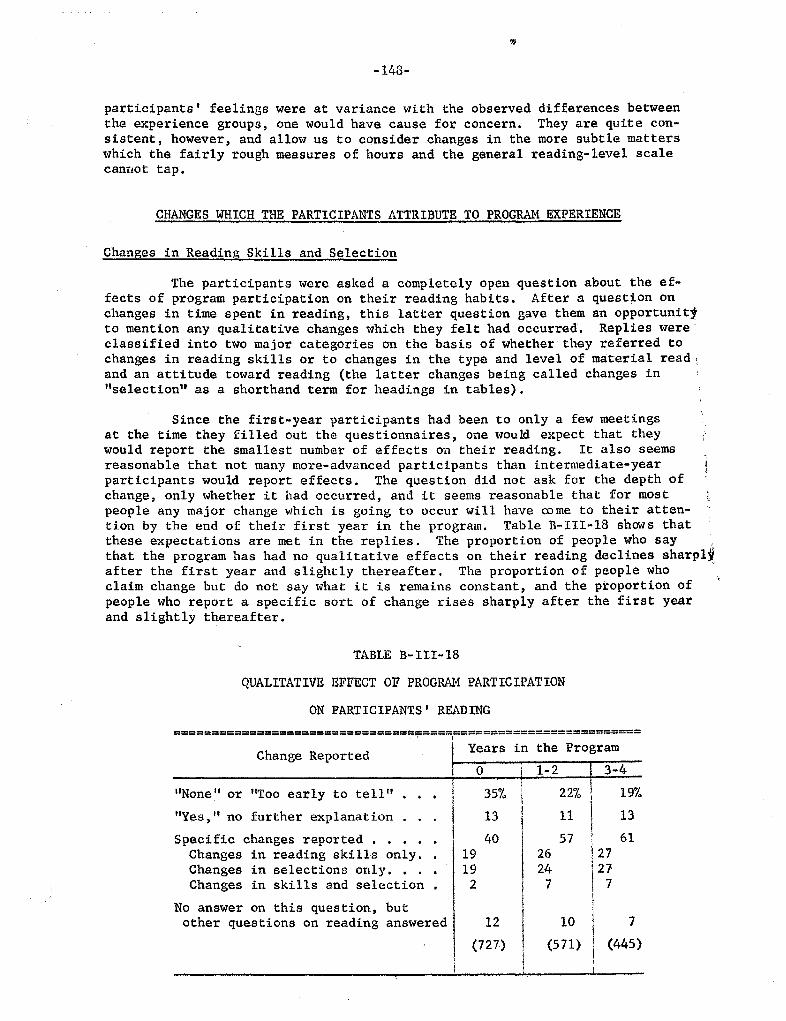
1!+3-
participants I feelings were at variance with the observed differences betweenthe experience groups, one would have cause for concern. They are quite con-sistent , however, and allow us to cQnsiderchanges in the more subtle matterswhich the fairly rough measures of hours and the general reading- level scalecannot tap.
CHANGES WHICH THE PARTICIPANTS ATTRIBUTE TO PROGRA EXPERIENCE
Chan es in Reading Skills and Selection
The participants were asked a completely open question about the ef-fects of program participation on their reading habits. After a question on changes in time spent in reading, this latter question gave them an opportunitito mention any qualitative changes which they felt had occurred. Replies wereclassified into two major categories on the basis of whether they referred tochanges in reading skills or to changes in the type and level of material read,and an attitude toward reading (the latter changes being called changes in selection as a shorthand term for headings in tables).
Since the first-year participants had been to only a few meetingsat the time they filled out the questionnaires , one wouM expect that theywould report the smallest number of effects on their reading. It also seemsreasonable that not many more-advanced participants than intermediate-yearparticipants would report effects. The question did not ask for the depth ofchange , only whether it had occurred , and it seems reasonable that for mostpeople any major change which is going to occur will have acme to their atten-tion by the end of their first year in the program. Table B-III- 18 shows thatthese expectations are met in the replies. The proportion of people who saythat the program has had no qualitative effects on their reading declines sharplafter the first year and slightly thereafter. The proportion of people whoclaim change but do not say what it is remains constant , and the proportion ofpeople who report a specific sort of change rises sharply after the first yearand slight ly thereafter.
TABLE B-III-
QUALITATIVE EFFECT OF PROGRA PARTICIPATION
ON PARTICIPANTS I READING
Change Reported
=============================== === ======= ======= ========
Years in the Program
None " or ItToo early to tell"Yes " no further explanat ionSpecific changes reportedChanges in reading skills only.Changes in selections only. Changes in skills and selection
No answer on this question , butother ques tions on reading answered
(72 7)
35% 19%
I 26
I 24
! 27i 27
I 7
(445 )
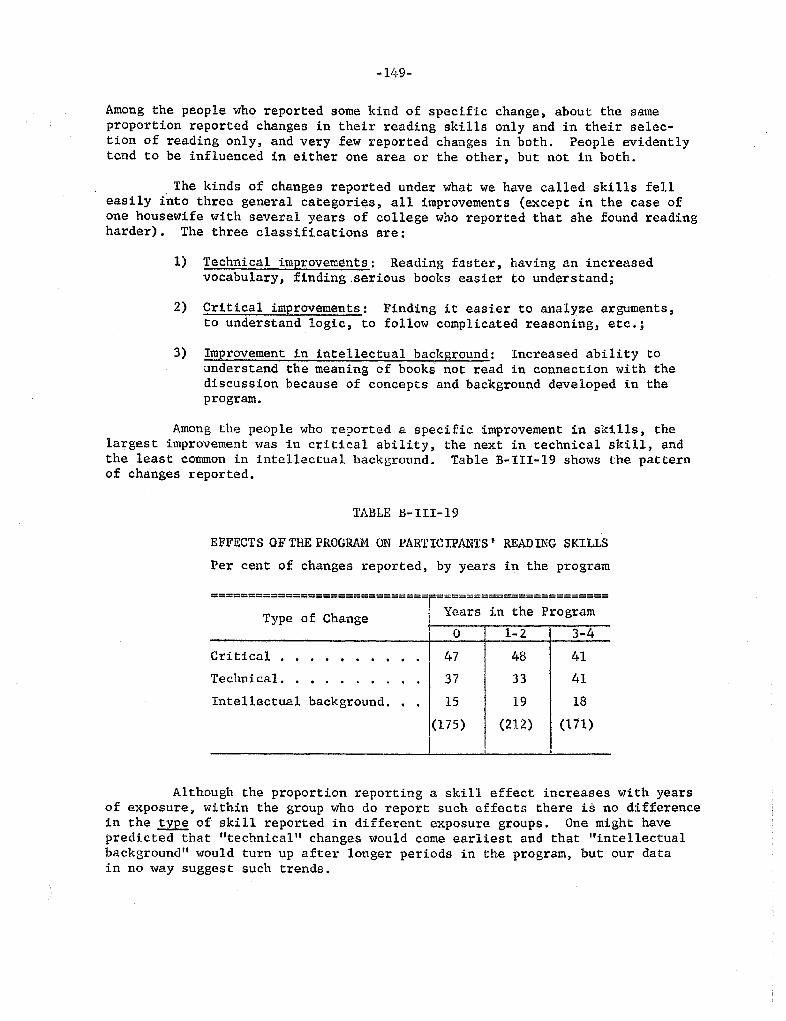
1L9-
Among the people who reported some kind of specific change , about the sameproportion reported changes in their reading skills only and in their selec-tion of reading only, and very few reported changes in both. People evidentlytend to be influenced in either one area or the other, but not in both.
The kinds of changes reported under what we have called skills felleasily into three general categories, all improvements (except in the case ofone housewife with several years of college who reported that she found readingharder) . The three classifications are:
Technica1 improvements : Reading faster, having an increasedvocabulary, finding .serious books easier to understand;
Critica1 improvements Finding it easier to analyze arguments,to understand logic, to follow complicated reasoning, etc.;
Improvement in intellectual background Increased ability tounderstand the meaning of books not read in connection with thediscussion because of concepts and background developed in theprogram.
Among the people who reported a specific improvement in skills , thelargest improvement was in critical ability, the next in technical skill, andthe least common in intellectual background. Table B-III- 19 shows the patternof changes reported.
TABLE B- III-
EFFECTS OF THE PROGRA ON PARTICIPANTS' READING SKILLS
Per cent of changes reported , by years in the program
CriticalTechnical. . .
======= :::=::= :::::======== ::;:= ;;::==
0 1-2 3-47 48 37 33 15 19 (175) (212) (171)
. .
Intellectual background.
Although the proportion reporting a skill effect increases with yearsof exposure , within the group who do report such effects there is no differencein the of skill reported in different exposure groups. One might havepredicted that "technical" changes would come earliest and that "intellectualbackground" would turn up after longer periods in the program, but our datain no way suggest such trends.
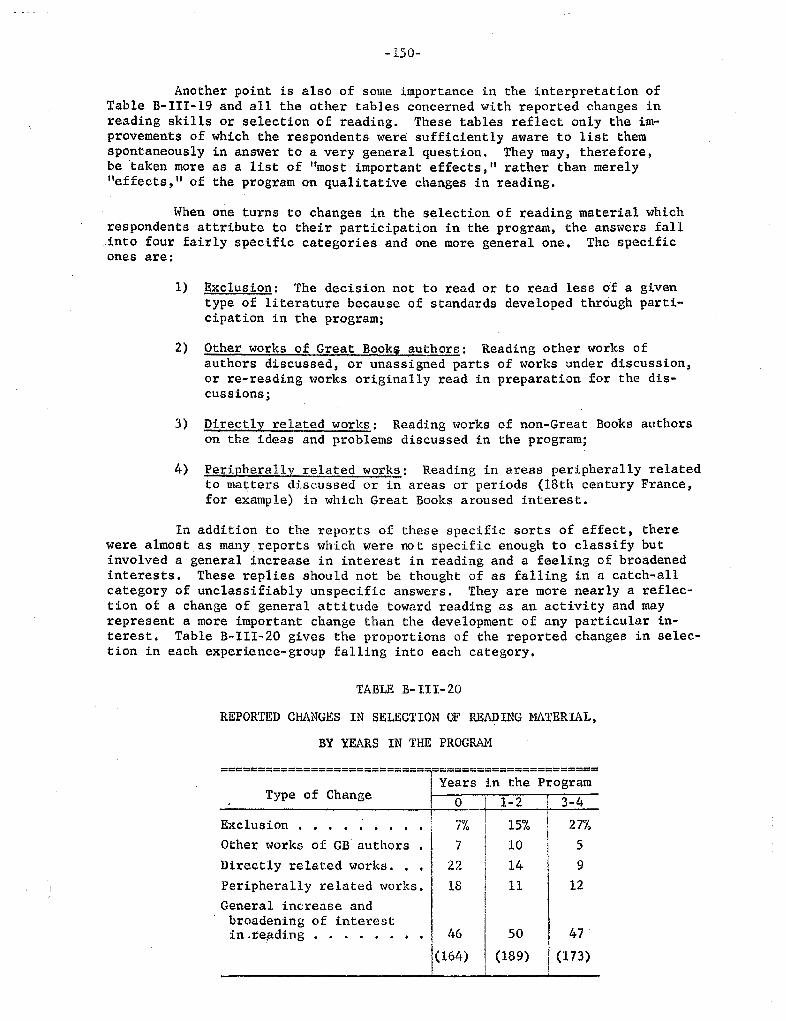
150-
Another point is also of some importance in the interpretation ofTable B- 111-19 and all the other tables concerned with reported changes inreading skills or selection of reading. These tables reflect only the im-provements of which the respondents were sufficiently aware to list themspontaneously in answer to a very general question. They may, therefore,betaken more as a list of "most important effects, " rather than merelyeffects lI of the program on qualitative changes in reading.
When one turns to changes in the selection of reading material whichrespondents attribute to their participation in the program, the answers fallinto four fairly specific categories and one more general one. The specificones are:
Exclusion : The decision not to read or to read less of a giventype of literature because of standards developed through parti-cipation in the program;
Other works of Great Booki authors Reading other works ofauthors discussed, or unassigned parts of works under discussionor re-reading works originally read in preparation for the dis-cussions;
Directly related works Reading works of non-Great Books authorson the ideas and problems discussed in the program;
Peripherally related works Reading in areas peripherally relatedto matters discussed or in areas or periods (18th century France,for example) in which Great Books aroused interest.
In addition to the reports of these specific sorts of effect, therewere almost as many reports which were no t specific enough to classify butinvolved a general increase in interest in reading and a feeling of broadenedinterests. These replies should not be thought of as falling in a catch-allcategory of unclassifiably unspecific answers. They are more nearly a reflec-tion of a change of general attitude toward reading as an activity and mayrepresent a more important change than the development of any particular in-terest. Table B-II1-20 gives the proportions of the reported changes in selec-tion in each experience- group falling into each category.
TABLE B- II I - 20
REPORTED CHANGES IN SELECTION OF REA ING MATERIAL
BY YEARS IN THE PROGRAM
=========================;=--=====================
Years the ProgramType Change
Exclusion 7"0 15'70 27%
Other works of GB authorsDirectly related works.
Peripherally related works.
General increase andbroadening of interestin . ding
I (173)(164) (189)
151-
As Table B-III- 20 indicates, almost half of the changes in selectionreported fall into the category of a general increase and broadening in inter-es t, and the proportion remains cons tant regardless of length of experience inthe program. Hith base numbers of the size involved here, per cent differencesof the size of those for "Other \yorks of Great Books authors " and IIPer:i.pherallyrelated works " had better not be interpreted as reflecting differences byprogram experience among the population of Great Books participants. Thecases of "Directly related works " and "Exclusion" are of a different sorthowever.
The increase in "Exclusion" involves the logical possibility that itmay be simply the mathematical reverse of the decrease in "Directly relatedworks. Other findings suggest, however, that this possibility is not a verylive one. As will be discussed later, time spent on serious reading is reportedas increasing with program experience , and the people who report an increasein serious reading tend to be the people who report changes in their selectionof readings. Given the logical direction of the changes , the most reasonableconclusion is that the exclusion of certain types of reading as a result ofstandards developed in the program does occur among increased numbers of participants as experience in the program increases. If so , the decline in theproportion of effects formed by the reading of related books may be largelythe mathematical result of the increase in "Exclusion" and may not reflect a
decline in the proportion of participants who read works related to the ideasdiscussed in the group meetings.
In sum , it appears that a general raising and roadening of interest
in reading is a major effect of program axperience and that it occurs veryearly and retains its importance regardless of length of experience. Theincreasing exclusion of certain types of reading because of standards developedin the program is probably a consequence of increased program experience. Theother specific effects mayor may not be either intensified or reduced byincreased program experience.
Education and Reported Changes in Reading Skills and Selection
In the preceding analyses our data suggested that changes in totalhours of reading are greatest for the no-college and part-college people andthat changes in quality are greatest for the part-college. Now, let us look
at the subjectively-reported changes in terms of education and years of ex-posure simultaneously.
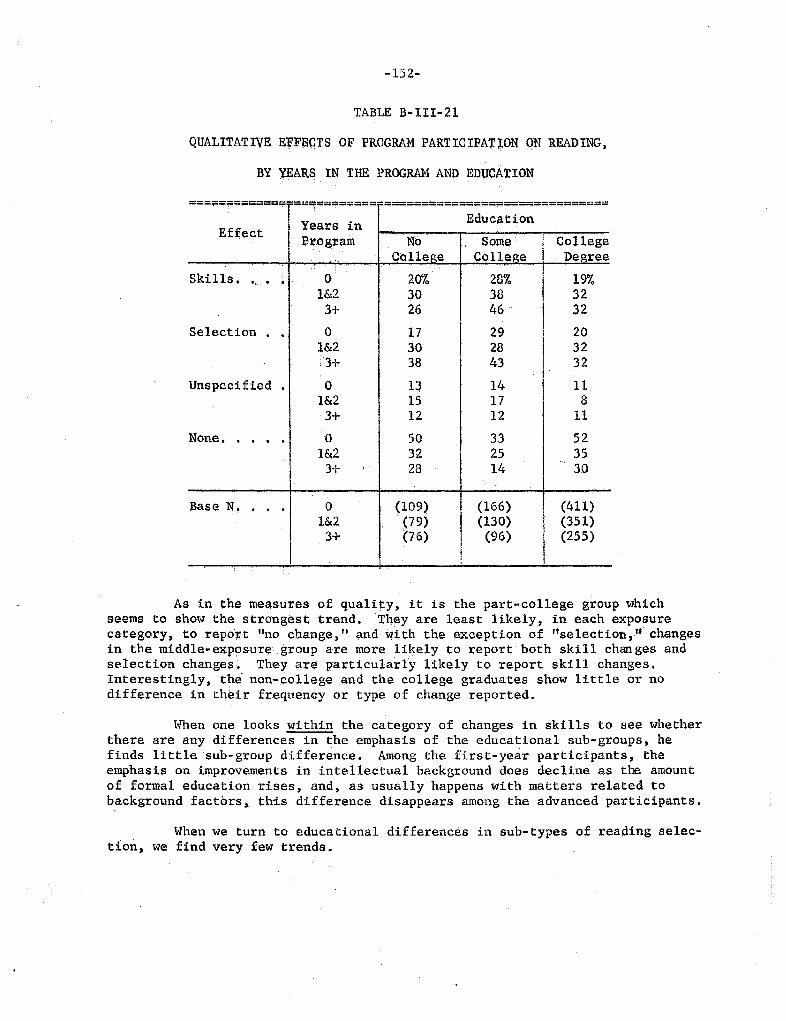
-152-
TABLE B- III-
QUALITATIVE EfFECTS OF PROGRAM PARTICIPATION QN READING
BY 'tEARS IN THE PROGRA AND EDUCATION
=== -?= ;===
==9=
;===-==;= ==;===; -== ===========
ars EducationEffect ogram
Skills. 20% 28% 19%1&2
Selection1&2
Unspecified1&2
None.1&2
Base (109) (166) (411)1&2 . (79) (130) (351)
(76) (96) (255)
As in the measures of quality, it is the part-college group whichseems to show the strongest trend. They are least likely, in each exposurecategory, to repo1;t "no change " and iththe exception of "selection/' changesin the middle-exposurE: group are more likely to report both skill changes andselection changes. . They. arep'articularfy likely to report skill changes.Interestingly, the non-college and the college graduates show little or nodifference in th ir frequency or type of change reported.
When one looks within the category of changes in skills to see whetherthere are any differences in the emphasis of the educational sub- groups, hefinds little sub- group difference. Among the first-year participants , the
emphasis on improvements in intellectual background does decline as the amountof formal education rises , and , as usually happens with matters related tobackground factors, tbis difference disappears among the advanced participants.
When we turn to educational differences in sub-types of reading selec-tion, we' find very few trends.
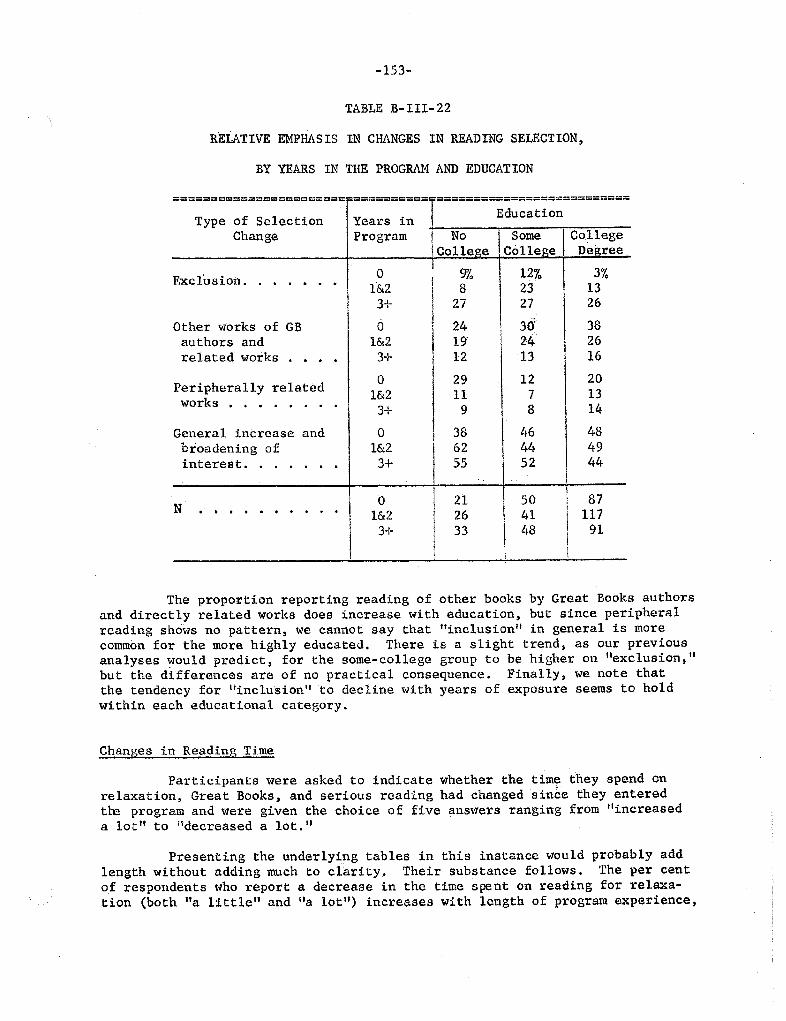
153-
TABLE B- III- 22
RELATIVE EMPHASIS IN CHANGES IN REDING SELECTION
BY YEARS IN THE PROGRA AND EDUCATION
;====================== ;::::=::==
r========
:::; :=========
Type of SelectionChange Program ! No Some CoJlege
\ Co llege College DeQ:ree
12%Excl'usion.1&2
Other works 30:authors and 1&2related works
Peripherally relatedworks
General increase andbroadening 1&2interest.
1&2 117
The proportion reporting reading of other books by Great Books authorsand directly related works does increase with education, but since peripheral
reading shows no pattern, we cannot say that " inc1usion ll in general is morecommon for the more highly educated. There is a slight trend, as our previousanalyses would predict , for the some-college group to be higher on "exclusion, IIbut the differences are of no practical consequence. Finally, we note thatthe tendency for "inclusion" to decline with years of exposure seems to holdwithin each educational category.
Chan es in Reading Time
Participants were asked to indicate whether the time they spend onrelaxation , Great Books, and serious reading had changed since they enteredt1: program and were given the choice of five answers ranging from "increaseda lot" to IIdecreased a lot.
Presenting the underlying tables in this instance would probably addlength without adding much to clarity. Their substance follows. The per centof respondents who report a decrease in the time spent on reading for relaxa-tion (both "a little" and "a lot") increases with length of program experience,
15!.t-
reaching 48 per cent of the respondents in the advanced groups. This decreaseis consistent with the fact that the hours which people report spending oneading for relaxation decline as length of program experience increases.
A few people (nine to ten per cent) report that their time on readingfor relaxation has increased, but this per cent seems to be unrelated to lengthof program experience. The dominant program effect appears to be a decline intime spent in light reading.
In the matter of changes in time spent on preparation for the discus-sions, people are presumably comparing their behavior when they first enteredthe program with that at the time they answered the question. For first-yearparticipants, the figures can show differences only between their first andlater few weeks of participation; for the others, the comparison should bebetween their first few weeks and the present. The chief point of interestis that the per cent of people who report some increase (lla lot II plus "a lit-tIe ) in their preparation time remains quite constant regardless of lengthof program experience. In other words, about three-quartem of the participant spend somewhat longer on preparation after a few weeks or months in the programthan they spent when they first entered.
The report of changes in time spent on serious reading indicates aconsiderable increase. Ten to fifteen per cent of the respondents report somedecrease , but the decrease does not seem to be related to length of programexperience. The per cent reporting an increase, however, rises with the lengthof experience in the program. The per cent of people reporting a slight in-crease (Ita little ) remains quite constant at about 30 per cent; it is theper cent of participants reporting a large increase which rises steadily andreaches 27 per cent among the people in advanced groups.
The next question concerns whether these changes are evenly distributedamong the various educational sub- groups or have a relation to formal education.In the case of time spent on Great Books preparation , the educational differencesare quite slight. The only one worth reporting is that somewhat fewer collegegraduates than others report an increase in their preparation time. Seriousreading presents a similar picture. The college graduates have a slightlysmaller per cent of people reporting an increase and are particularly low inthe per cent of people reporting a large increase. In light reading, thegraduates have the highest per cent of people reporting no change and are par-ticularly low in the per cent of people reporting a large decrease. In summary,college graduates, in comparison with people of less formal educatio , have. alittle less tendency to change their reading time as a result of program par-ticipation.
All of the differences discussed above are relatively slight. Thegeneral conclusion probably should be that education does not make any differ-ences that are important from the point of view of judging program effects.If 55 per cent of the participants who have had some college increase theirtime spent on serious reading, and only 44 per cent of the participants whohave completed college increase th irs, the difference is statistically sig-nificant , but it is still true that approximately half of the people in eachsub- group increase their serious-reading time and approximately half do not.The general finding that about one-half of the participants report an increase
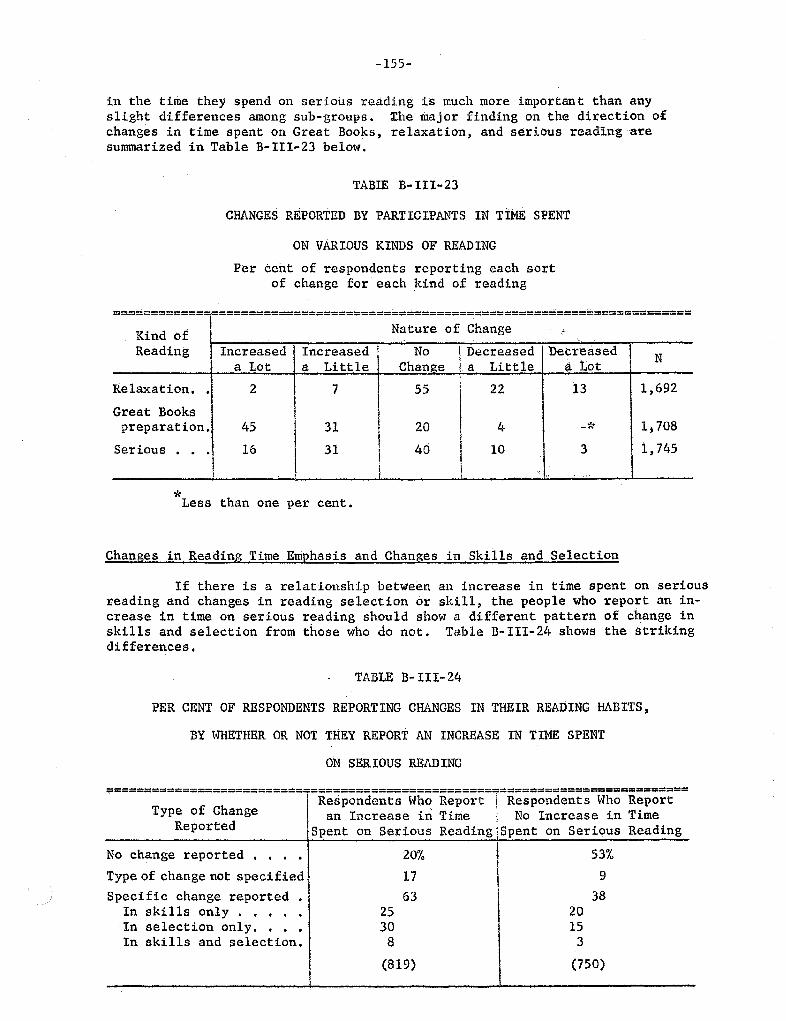
155-
in the time they spend on serious reading is much more important than anyslight differences among sub-groups . The maj or finding on the direction ofchanges in time spent on Great Books , relaxation , and serious readinga:resummarized in Table B- 111-23 below.
TABIE B- III-
CHANGES REPORTED BY PARTICIPANTS IN TIME SPENT
ON VARIOUS KINDS OF READING
Per cent of respondents reporting each sortof change for each kind of reading
---------------------------------------------------------- ---- ------------------------- ---------------------------------------------------------------
Kind Nature Change
Reading Increased Increased Decreased DecreasedLot Li t tIe Change Lit tIe tot
Relaxation. 1) 692
Great Bookspreparation. oJ. 1; 708
Serious 1 ) 745
Less than one per cent.
Changes in Reading Time Emphasis and Changes in Skills and Selection
If there is a relationship between an increase in time spent on seriousreading and changes in reading selection or skill , the people who report an in-crease in time on serious reading should show a different pattern of change inskills and selection from those who do not. Table B-III- 24 shows the trikingdifferences.
TABLE B- III- 24
PER CENT OF RESPONDENTS REPORTING CHANGES IN THEIR REAnING HABITS
BY WHETHER OR NOT THEY REPORT AN INCREASE IN TIME SPENT
ON SERIOUS READING
------------------------------------------------------------------------==-==-------------------------
;t;- ;t;- porType of Change an Increase in Time ; No Increase in Timeeported Spent on Serious Reading iSpent on Serious ReadingNo change reported
. .
Type of change not specifiedSpecific change reported
In skills only
. .
In selection only. . . In skills and selection.
20% 53%
(819) (750)
156-
A little over half of the people who have not increased time spenton serious reading since joining the program do not report any change in theirreading skiils or selection, while only one-fifth of th people who have in-creased their .serious reading fail to report a change. Apparently participa-tion in the discussions without change in serious reading outside of the pro-gram has left half of the participants without any recognized effect on theirreading skill or selection, whereas the joint effect of participation and in-crease in time on serious reading outside has been to change the reading skillsor selection of four- fifths of that group.
When ope looks at the differences bet (reen the groups on the specificchanges reported, he sees that all are in the expected direction but that theydiffer in amount. The change in skills has somewhat less logical connectionwith change in amount of serious reading and shows a difference which, althoughstatistically significant (p 05 on a two-tailed test), is quite small.
The other, change in selection , shows differences which are largeenough to be important. One may very safely conclude that one of the programmain channels for qualitative effects on reading habits, especially on theselection of materials read, is through its influence in raising the amountof time participants spend in serious reading beyond that assigned for themeetings.
SUMRY
Great Books participants , on the average , spend more time in readingthan do other Americans of comparable education.
Their level of reading extends above the purely popular but does notexclude it and seldom includes the most seriously intellectual.
There is little relation between the total time participants spendin reading and either reading-seriousness or time spent on Great Books prep-aration, although the heaviest readers do have a somewhat higher proportionof people who devote half or more of their reading time to serious reading.
Amount of formal education has little , if any, influence on the amountof the participants I reading but does influence its general level of difficulty.
Amount of time spent in reading increases slightly with lengthenedprogram-experience, as does the proportion of participants with a high generalreading level. This increase is general, including all educational sub-groups,but quantitative changes appear greater in the no-college and part-collegeparticipants, qualitative changes appear greater among the part-college. Thequality differential between participants who have attended college and thosewho have had no college remains even in the advanced groups.
The per cent of participants who attribute specific qualitativechanges in their reading habits to the program rises with length of program

- 157 -
experience. The commonest change reported is heightened and broadened interestin reading as an activity, and the commonest change in skill reported is thedevelopment of greater critical sharpness.
One of the chief means by which the program effects qualitativchanges in the participants I reading habits appears to be through- motivatingan increase in time spent in serious reading beyond that assigned for thediscussions.

CHAPTER tv
VALUES AND IDEOLOGIES
158-
159-
Introduction
Chapters I and II of this report can be interpreted as saying thatwhile the program appears to have little effect in the purely esthetic areasof the liberal arts and humanities, continued participation in the programgenerally yields a much broader knowledge of liberal arts and humanities.The impact of the program appears much higher in the "prose" arena than inthe "poetic.
Chapter I dealt at length with changes in this "prose" area of highculture but dealt with them only in terms of knowledge. Now , knowing that
the advanced-year participant is much more likely to recognize the gentlemanwith the beard as Karl Marx does not tell us much about the impact of readingthe Communist Manifesto . Likewise , the increased probability that one canidentify the pedagogue at the blackboard as John Locke, after being in theprogram two or more years , does not tell us whether the program is convertingits members to eighteenth-century. liberalism.
With the exception of the verse discussed in Chapter II and some highlyabstract works such as Euclid, a large proportion of the Great Books readingscan be thought of as discourses in social and political values -- that is,statements on what is preferable and desirable in the areas of political ot-ganization, religion , and social relationships. We need only think of Marx,St. Thomas, Thoreau , Mill , Adam Smith , Plato, and Aristotle to document thispoint.
Our impression is that the readings themselves betray no "party line,except that, as implied in the definition of the program, twentieth-century
thought and works of pure science receive lesser stress. The participantsread a range of political thought from Marx to Mill , and the Christian theo-
logians (St. Thomas and St. Augustine) are counter-balanced by Freud, Darwin,
Nietzsche, and a large number of classical "pagans.
Out of this welter of value positions , one wonders whether certain ones
take" better than others, and whether continued participation in the programis associated with any specific leanings on the social and political questionswhich loom so large in the readings.
Subjective Reports
We can begin by asking the respondents whether they think they have
changed in their basic positions. A pretty good index can be derived fromthe following two questions:
Since you began Great Books have there been any particularauthors or schoo of thought which you once disliked , but
now find more a.cceptable? If ' yes, ' which ones?"
"Since you began Great Books are there any particular authorsor schools of thought which you once accepted, but now findless acceptable? If ' yes, ' which ones? "
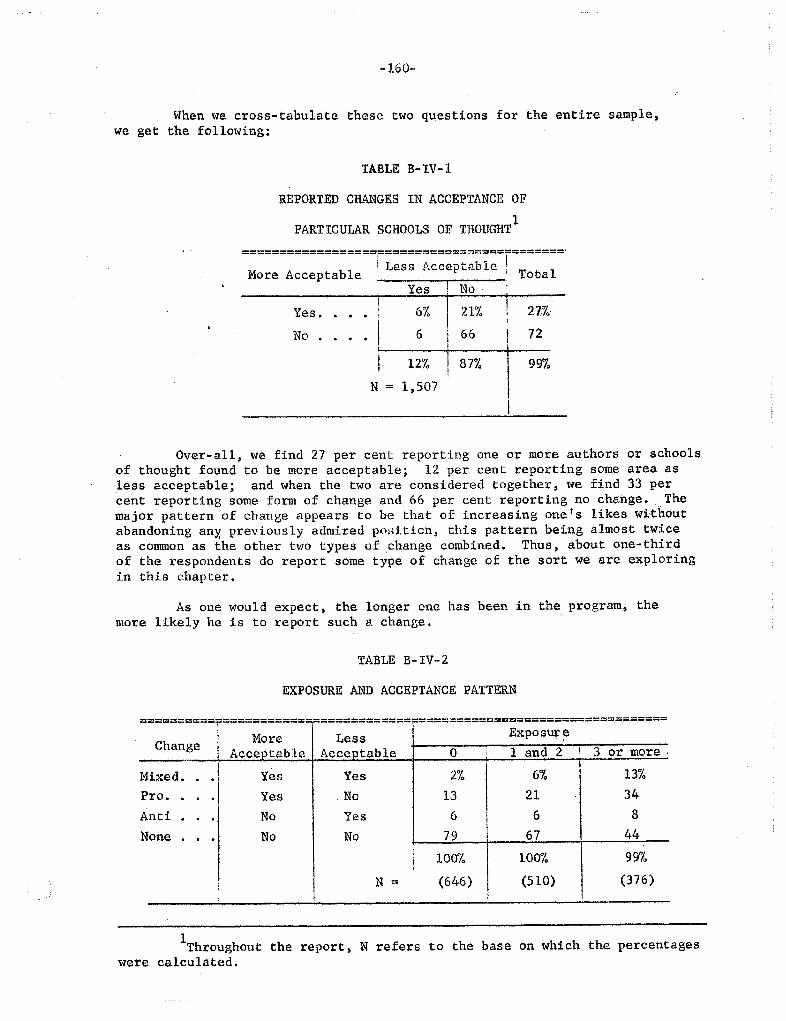
1.60-
When we cross-tabulate these two qQestions for the entire sample,we get the following:
TABLE B- IV-
REPORTED CHANGES IN ACCEPTANCE OF
PARTICULAR SCHOOLS OF THOUGHT
=:::=::::::::::== :;;: ;:::
Yes. . . I Y
::. :%
21%
No . . i 66 12% 87% 99%
N = 1, 507
Over-all , we find 27 per cent reporting one or more authors or schoolsof thought found to be more acceptable; 12 per cent reporting some area asless acceptable; and when the two are considered together, we find 33 percent reporting some form of change and 66 per cent reporting no change. Themajor pattern of change appears to be that of increasing one s likes without
abandoning any' previously admired pOid. ticn , this pattern being almost twiceas common as the other two types of change combined. Thus, about one-thirdof the respondents do report some type of change of the sort we are exploringin this chapter.
As one would expect , the longer one has been in the program, themore likely he is to report such a change.
TABLE B- IV - 2
EXPOSURE AND ACCEPTANCE PATTERN
----- ----- -- - -----------=---- =--======- ===========-==================;==-===-=------
More Less ExposChange Acceptable Acceptable and more.
Mixed. Yes Yes 270 13'1.
Pro. Yes . No
Anti: I
Yes
None
100% lOO% 99%
(646) (510) (376)
Throughout the report, N refers to the base on which the percentageswere calculated.
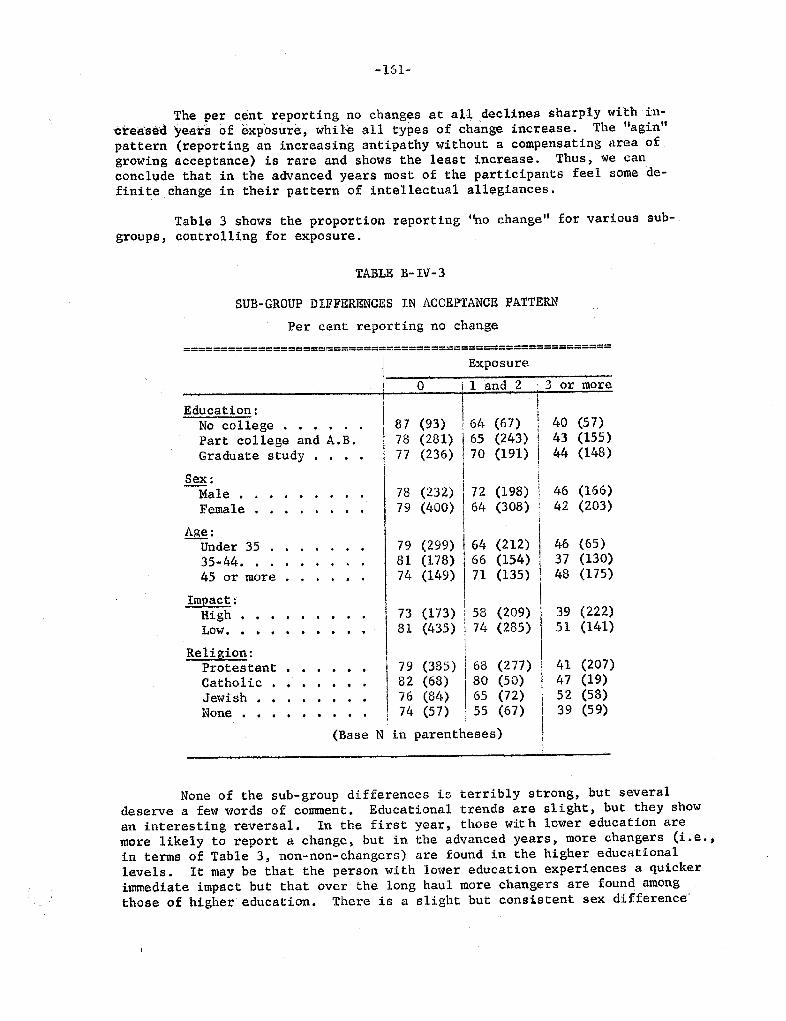
-l61-
The per cent reporting no changes at all declines sharply with in--crei:::9 ;dYears of e p'os\tre, whil all types of change increase. The "aginpattern (reporting an increasing antipathy without a compensating area ofgrowing acceptance) is rare and shows the leas t increase. Thus) we canconc1 de tha in the advanced years most of the participants feel some de-finite qchange in their pattern of intellectual allegiances.
Table 3 shows the proportion reporting "no change" for various sub-
groups, controlling for exposure.
SUB-GROUP DIFFERENCES IN ACCEPTANCE PATTERN
TABLE B- IV - 3
Per cent reporting no change
====================================================
EducationNo college
. .
Part college and A.Graduate study
. .
MaleFemale
AgeUnder 35 . 35-44. . 45 or more
. .
Impac t.High
. .
Low.
. . . .
Re li gionProtestant
. . . .
CatholicJewish
. .
None
. . . .
I 1 and 2 . 3 or more
I 87 (93) 164 (67) ! 40 (57)
I 78 (281) 65 (243) ! 43 (155)
I 77 (236) ! 70 (191) I 44 (148)
78 (232) I 72 (198) i 46 (166)
79 (400) 64 (308) 42 (203)
79 (299) I 64 (212) \81 (178) 66 (154) I74 (l49) 71 (135) j
posure
46 (65)37 (130)48 (175)
73 (l73)81 (435)
58 (209) : 39 (222)74 (285) 51 (l41)
79 (385)82 (68)76 (84)
: 74 (57)
68 (277)80 (50)65 (72)55 (67)
. 41 (207)! 47 (19)' 52 (58)
39 (59)
(Base N in parentheses)
None of the sub- group differences is terribly strong) but severaldeserve a few words of comment. Educational trends are sl ight, but they showan interesting reversal. In the first year, those wit h lower education are
more likely to report a change) but in the advanced years) more changers (i. e. ,in terms of Table 3, non-nan-changers) are found in the higher educationallevels. It may be that the person with lower education experiences a quickerimmediate impact but that over the long haul more changers are found amongthose of higher education. There is a slight but consistent sex difference
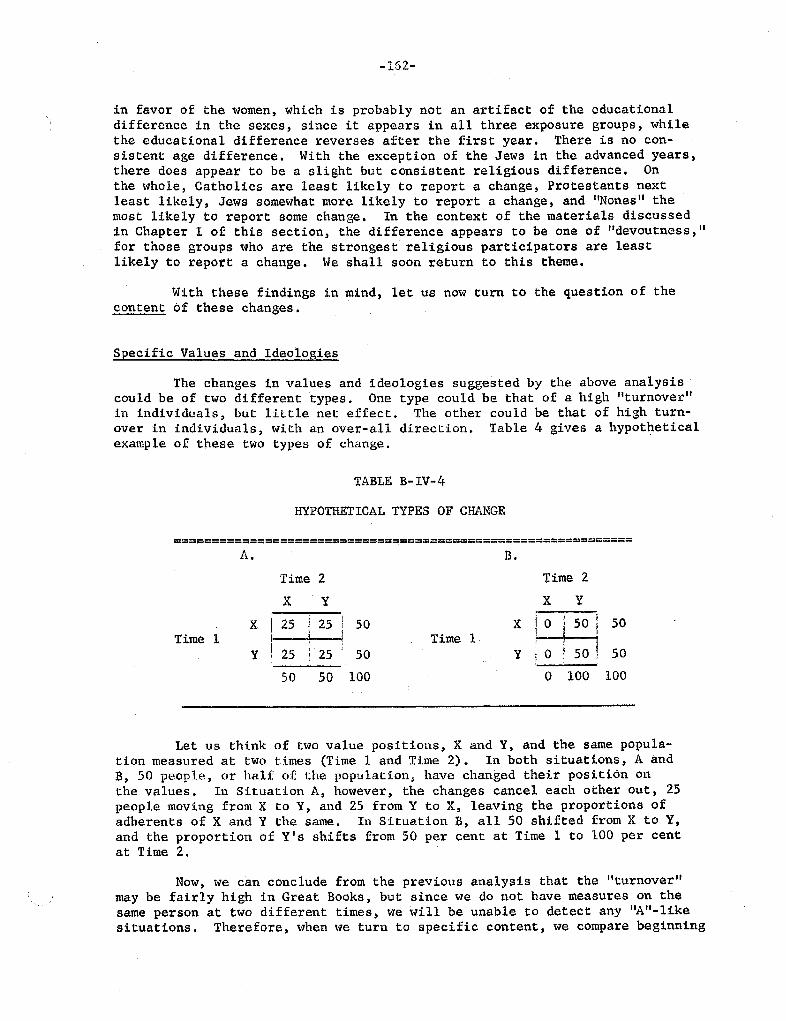
152-
in favor of the women, which is probably not an artifact of the educationaldifference in the sexes, since it appears in all three exposure groups, whilethe educational difference reverses after the first year. There is no con-sistent age difference. With the exception of the Jews in the advanced years,there does appear to be a slight but consistent religious difference. Onthe whole, Catholics are least likely to report a change, Protestants nextleast likely, Jews somewhat more likely to report a change, and "Nones" themost likely to report some change. In the context of the materials discussedin Chapter I of this section, the difference appears to be one of "devoutness,for those groups who are the strongest religious participators are leastlikely to report a change. We shall soon return to this theme.
With these findings in mind , let us now turn to the question of thecontent of these changes.
Specific Values and Ideolo ies
The changes in values and ideologies suggested by the above analysiscould be of two different types. One type could be that of a high " turnoverin individuals , but little net effect. The other could be that of high turn-over in individuals , with an over-all direction. Table 4 gives a hypotheticalexample of these two types of change.
TABLE B- IV-
HYPOTHETICAL TYPES OF CHANGE
=-====================-====== ===============================
Time 1
Time 2
X '25 i 25 ! 50! 25 i i 50
50 50 100
Time 2
Time 1 i 50 I: 0 ! ! 50
100 100
Let us think of two value positions, X and Y , and the same popula-tion measured at two times (Time 1 and Time 2). In both situations, A andB, 50 people , or half of the population , have changed their position on
the values. In Situation A , however , the changes cancel each other out, 25people moving from X to Y, and 25 from Y to X, leaving the proportions ofadherents of X and Y the same. In Situation B, all 50 shifted from X to Y,and the proportion of Y' s shifts from 50 per cent at Time I to 100 per centat Time 2.
Now, we can conclude from the previous analysis that the "turnovermay be fairly high in Great Books , but since we do not have measures on thesame person at two different times, we will be unable to detect any " likesituations. Therefore, when we turn to specific content, we compare beginning
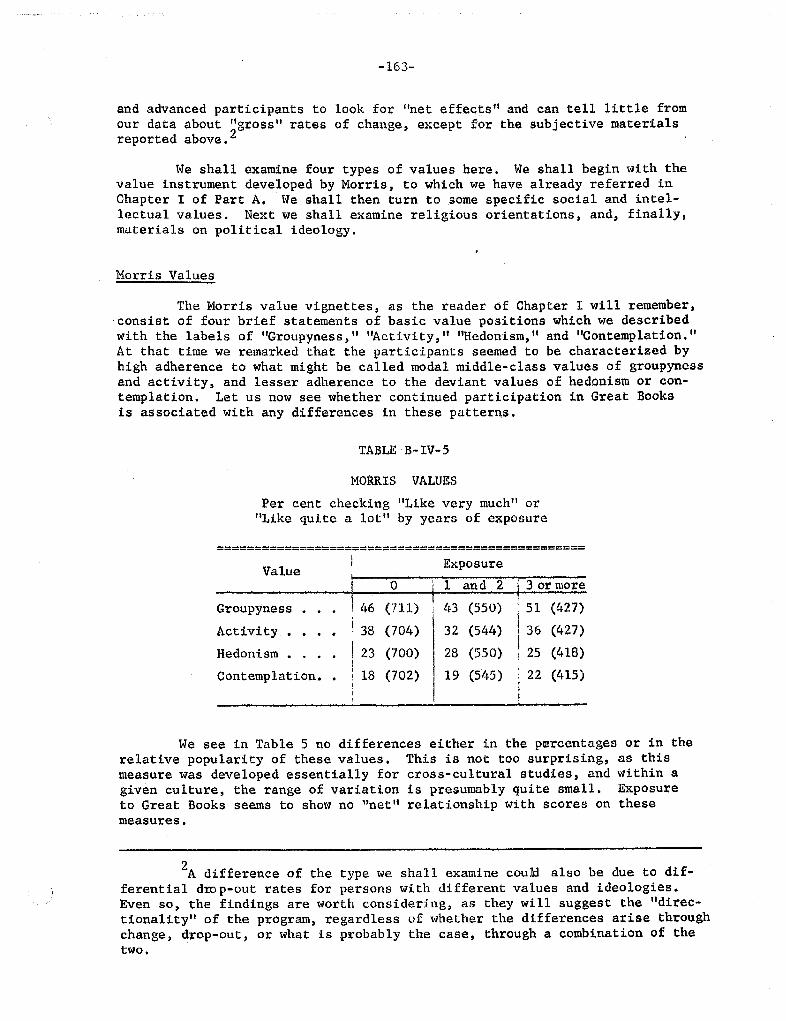
-163-
and advanced participants to look for Iinet effec;ts " and can tell little fromour data about "gross" rates of change, except for the subjective materialsreported above.
We shall examine four types of values here. We shall begin with thevalue instrument developed by Morris , to which we have already referred inChapter I of Part A. We shall then turn to some specific social and intel-lectual values. Next we shall examine religious orientations, and finally,materials on political ideology.
Morris Values
The Morris value vignettes, as the reader of Chapter I will remember,consist of four brief statements of basic value positions which we describedwith the labels of "Groupyness, " "Activity, " "Hedonism " and "Contemplation.At that time we remarked that the participants seemed to be characterized byhigh adherence to what might be called modal middle-class values of groupynessand activity, and lesser adherence to the deviant values of hedonism or con-templation. Let us now see whether continued participation in Great Booksis associated with any differences in these patterns.
TABLE B-IV-
MORRIS VALUES
Per cent checking "Like very much" orLike quite a lot" by years of exposure
--------------------------------------------------------------------------------------------------
Value
! 46 ( 11)i 38 (704)
23 (700)
l8 (702)
Exposure
i l and , 43 (550)
32 (544)
28 (550)
19 (545)
3 or more
: 51 (427)
I 36 (427)
! 25 (418)
: 22 (415)
Groupyn
ActivityHedonism.Contemplation.
We see in Table 5 no differences either in the percentages or in therelative popularity of these values. This is not too surprising, as thismeasure was developed essentially for cross- cultural studies, and within agiven culture the range of variation is presumably quite small. Exposureto Great Books seems to show no "net" relationship with scores on thesemeasures.
A difference of the type we shall examine couM also be due to dif-ferential dIP p-out rates for persons with different values and ideologies.Even so the findings are worth considering, as they will suggest the "direc-tionality" of the program. regardless of whether the differences arise throughchange , drop-out , or what is probably the case , through a combination of thetwo.
164-
The Multi-Millionaire Philanthropist
In order to assess values in a somewhat more concrete way than inthe Morris vignettes, we asked the respondents the following question:
Suppose that you are a multi-millionaire philanthropist.The following programs have been submitted for your sup-port. Please rank them in terms of your preference.Place a ' l' by the program you think is most worthy ofyour support , a ' 6' by the program you believe is leastworthy of your support , etc.
a) Publishing the works of young poets.b) Establishing a commission to implement improve-ments in urban problems like traffic, juveniledelinquency, and housing.c) Providing more counselors and psychologists formental health work in the high schools.
d) Fellowships for basic research in chemistry andphysics.e) Raising the salaries of mini sters.f) Providing free chamber mus ic concerts.
These items were designed as measures of the respondents ' relative evaluationof the areas of poetry, civic problems , mental health , natural-science researchorganized religion, and music , and , of course , they parallel to a large extentspecific problems and chapters of thi report. 3
Since many of the respondents , like real multi-millionaires, wereunable to choose unambiguously among the programs proffered , we coded the mater-tals in terms of whether the given item was in tbe highest "group " indicated bythe respondent. Thus , someone who put down three ones and three sixes wascoded as giving a "high" to all tbree of the items checked "l. The follow-ing table gives the proportion of "high' " by program and by exposure.
Had we included in this list the Greathave been interesting to see how it ranked. Butimpaired the value of the other rankings.
Books program, it wouMits inc lusion might have
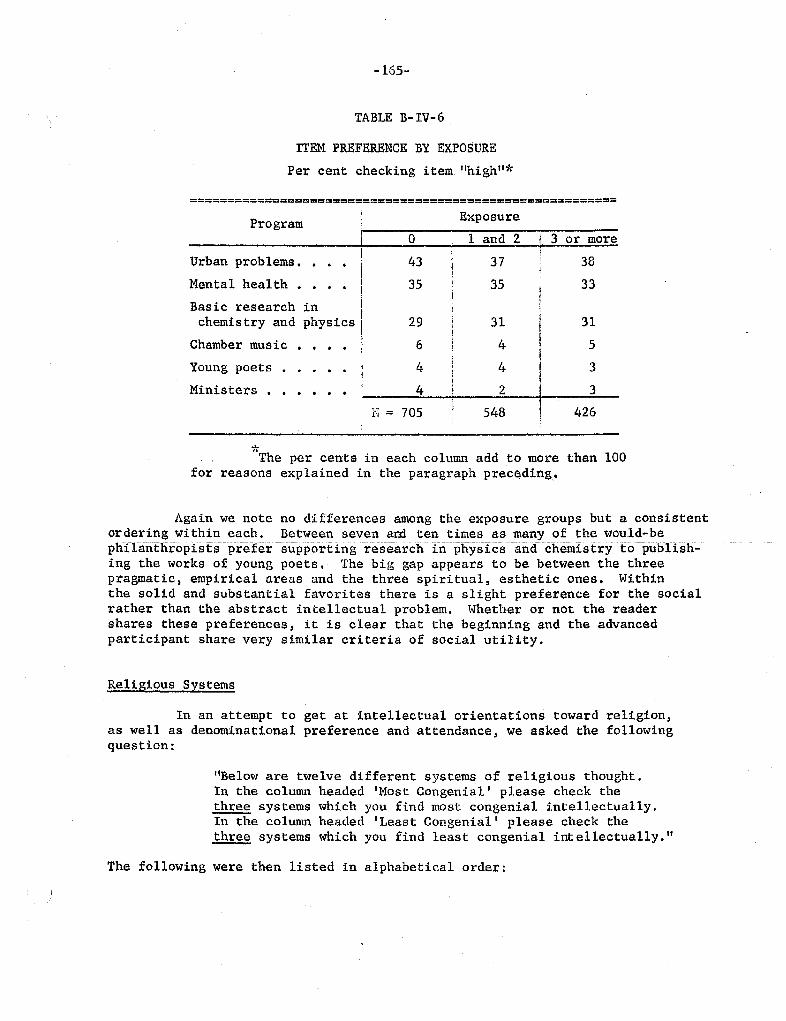
-165-
ITEM PREFERENCE BY EXPOSURE
TABLE B- IV - 6
Per cent checking item "high"*
Pro gr am
==========
======c====
================== ===============
Urban problems. .
. .
Mental health
Bas ic research in chemistry and p ys cs I
Chamber music
. . . .
Young poets
Ministers
. . . . . .
Exposure
land 2I 3 or more
= 705 426548
oJ.
. "
The per cents in each column add to more than 100for reasons explained in the paragraph preceding.
Again we note no differences among the exposure groups but a consistentordering within each. Between seven and ten times as many of the would-phrranfhrop:i sfspre :fer suppOrt :ingresearch . :iriphysIcs ancfchemis tryfopubIIsh;'ing the works of young poets. The big gap appears to be between the threepragmatic , empirical areas and the three spiritual , esthetic ones. Withinthe solid and substantial favorites there is a slight preference for the socialrather than the abstract intellectual problem. Whether or not the readershares these preferences, it is clear that the beginning and the advancedparticipant share very similar criteria of social utility.
Religious Systems
In an attempt to get at intellectual orientations toward religionas well as denominational preference and attendance , we asked the followingquestion:
Below are twelve different systems of religious thought.In the column headed 'Most Congenial' please check thethree systems which you find most congenial intellectually.In the column headed ' Least Congenial' please check the
systems which you find least congenial int ellectually.
The following were then listed in alphabetical order:
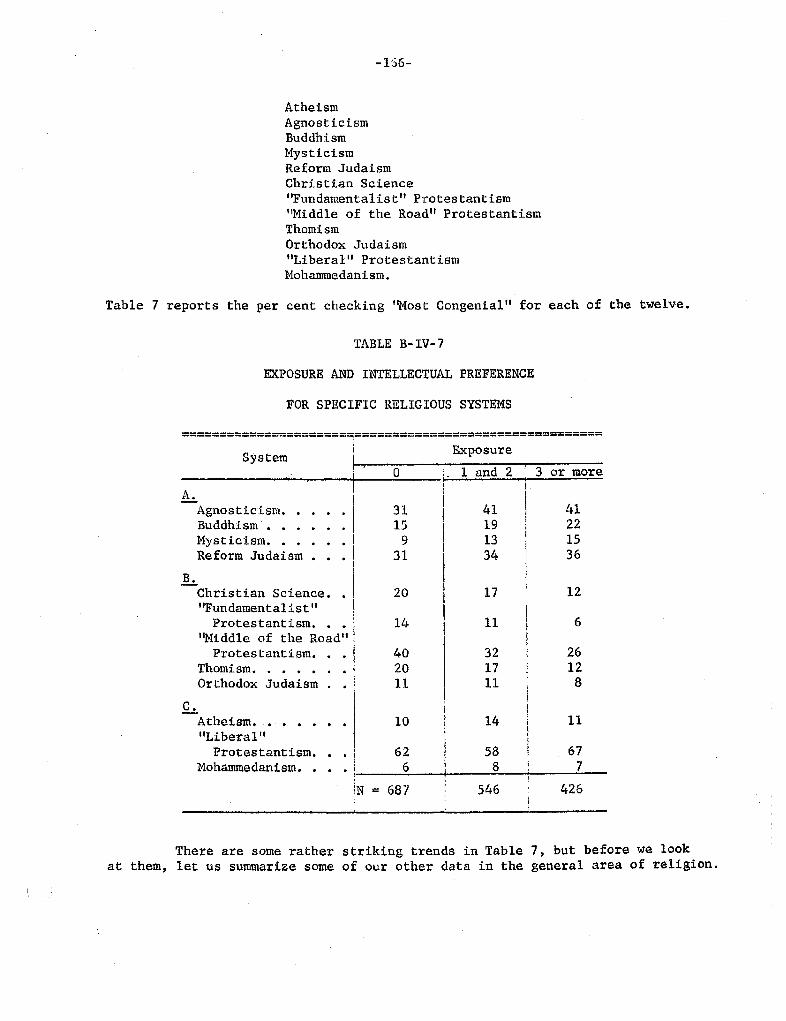
156-
AtheismAgnosticismBuddhismMysticismReform JudaismChristian Science"Fundamental is t" Protes tant ismMiddle of the Road" Protestantism
Thami smOrthodox JudaismLiberal" Protestantism
Nohammedanism.
Table 7 reports the per cent checking "Most Congenial" for each of the twelve.
TABLE B- IV-
EXPOSURE AND INTELLECTUAL PREFERENCE
FOR SPECIFIC RELIGIOUS SYSTEMS
System Exposure
========================================================
Agnosticism. . .Buddhism. . .
: .
Mysticism. . . I
Reform Judaism B. Christian Science. . "Fundamentalist" Protestantism. . . i
'lMiddle of the Road" :Protestantism. .
. IThomi sm.
. . . .
. iOrthodox Judaism
1 and 2
546
Atheism. . .
. .
Liberal IIProtestantism. .
.!
Mohammedanism. . . i iN = 687
3 or more
426
There are some rather striking trends in Table 7, but before we lookat them, let us summarize some of our other data in the general area of religion.
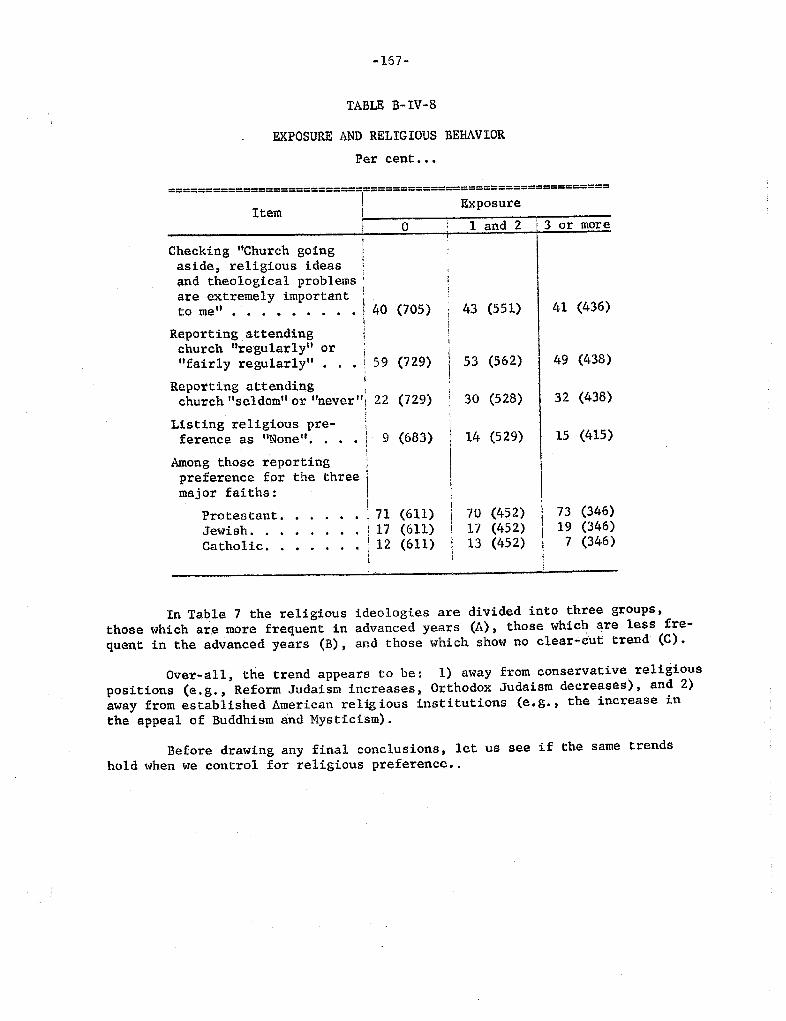
-167-
TABLE B-IV-
EXPOSURE AND RELIGIOUS BEHAVIOR
Per cent...
===========;:::==========
l=============
;:; ::;:============
! O land 2 I 3 or more
Checking "Church going aside , religious ideasand theological problems:are extremely important ito me
" . . . . . . . .
40 (705)
Reporting attendingchurch "regularly" or
"fairly regularly i 59 (729)
Reporting attending church "seldom" or "never ! 22 (729)
43 (551) 41 (436)
53 (562) 49 (438)
30 (528) 32 (438)
Listing religious pre- ference as "None \I
. . . !
9 (683) 14 (529) 15 (415)
Among those reporting preference for the three maj or fai ths :
Protestant. . . ! 71Je\'1ish. .
. .
. Il7Catholic. . .
(611)(611)(611)
70 (452)17 (452)13 (452)
73 (346)19 (346)7 (346)
In Table 7 the religious ideologies are divided into three groups,those which are more frequent in advanced years (A), those which are less fre-
quent in the advanced years (B), and those which show no clear-cut trend (C).
OVer-all ) the trend appears to be: 1) away from conservative religiouspositions (e.g., Reform Judaism increases , Orthodox Judaism decreases)) and 2)
away from established American relig ious institutions (e.g., the increase iTI
the appeal of Buddhism and Mysticism).
Before drawing any final conclusions, let us see if the same trendshold when we control for religious preference..
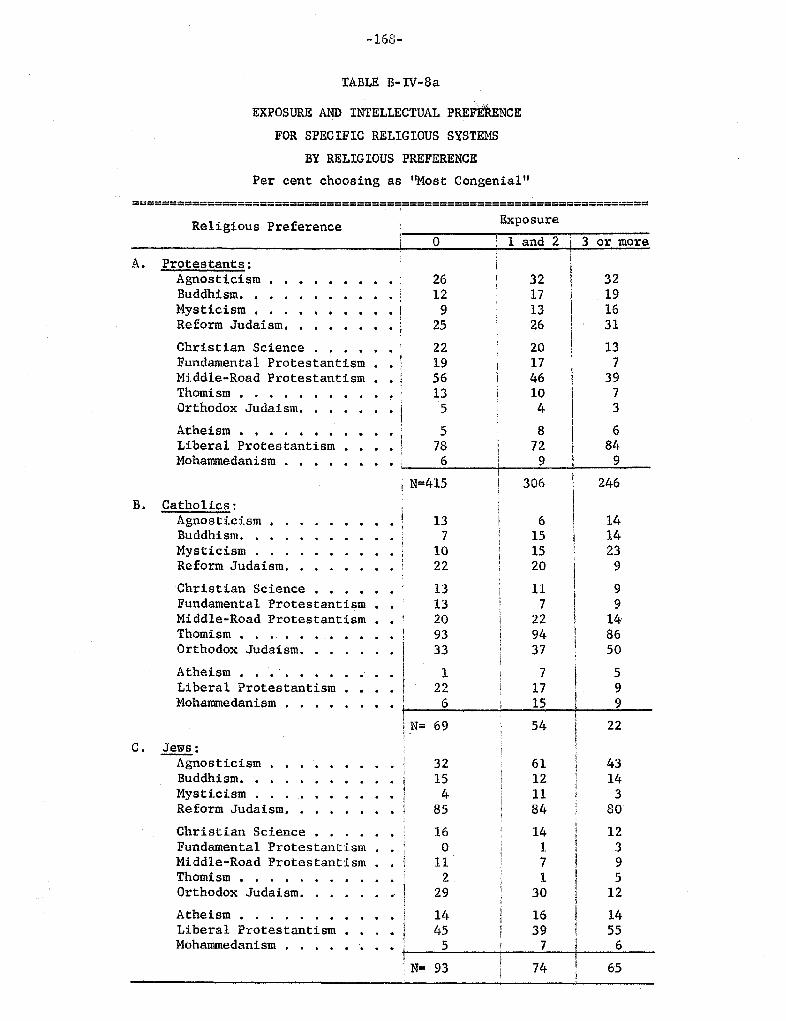
-168-
TABLE B-IV-
EXPOSURE AND INTELLECTUAL PREFE ENCE
FOR SPECIFIC RELIGIOUS SYSTEMS
BY RELIGIOUS PREFERENCE
Per cent choosing as "Most Congenial"
-=;;====-=;======================== =================== =============
Religious Preference Exposure
1 and 2 or more
Protestants:AgnosticismBuddhism.MysticismReform Judaism.Christian ScienceFundamental Protestantism . fMiddle-Road ProtestantismThomismOrthodox Judaism.
. IAtheism
. !
Liberal ProtestantismMohammedanism
i N=4l5 306 246
Catholics:AgnosticismBuddhism.MysticismReform Judaism.
Christian ScienceFundamental ProtestantismMiddle-Road ProtestantismThomismOrthodox Judaism.
AtheismLiberal ProtestantismMohammedanism
I N=
AgnosticismBuddhism.MysticismReform Judaism.
Christian ScienceFundamental ProtestantismMiddle-Road ProtestantismThomism
Orthodox Judaism.AtheismLiberal ProtestantismMohammedanism
. N=
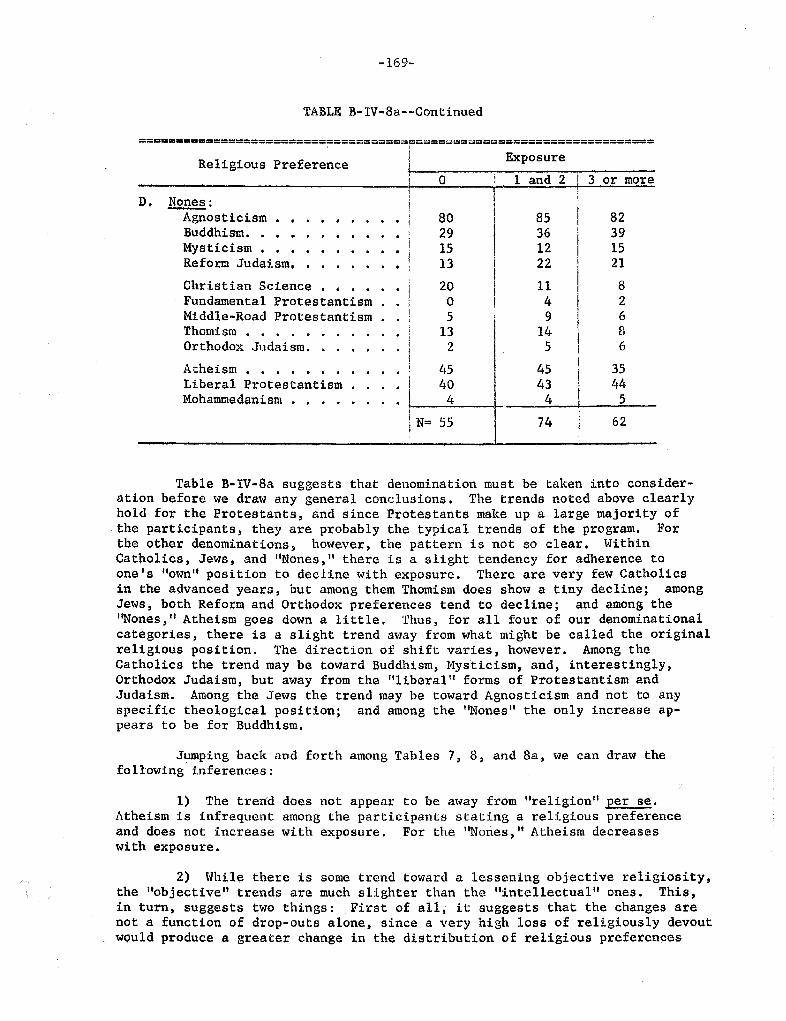
-169-
TABLE B- IV -8a- -Continued
===================================;=====;=================;=========
Religious Preference Exposure
and 2 or more
NonesAgnosticismBuddhism.MysticismReform Judaism.Christian ScienceFundamental Protes tantismMiddle-Road ProtestantismThomismOrthodox Judaism.AtheismLiberal Protes tantismMohammedanism
! N=
Table B-IV-8a suggests that denomination must be taken into consider-ation before we draw any general conclusions. The trends noted above clearlyhold for the Protestants, and since Protestants make up a large majority ofthe participants, they are probably the typical trends of the program. Forthe other denominations, however, the pattern is not so clear. WithinCatnolics, Jews, and "Nones, 1I there is a slight tendency for adherence toone s "own" position to decline with exposure. There are very few Catholicsin the advanced years, but among them Thomism does show a tiny decline; amongJews, both Reform and Orthodox preferences tend to dec line; and among theIINones " Atheism goes down a little. Thus, for all four of our denominationalcategories , there is a slight trend away from what might be called the originalreligious position. The direction of shift varies , however. Among theCatholics the trend may be toward Buddhism, Mysticism, and , interestingly,Orthodox Judaism, but away from the "liberal" forms of Protestantism andJudaism. Among the Jews the trend may be toward Agnosticism and not to anyspecific theological position; and among the "Nones " the only increase ap-pears to be for Buddhism.
Jumping back and forth among Tab les 7 , 8 , and 8a , we can draw thefollowing inferences:
1) The trendAtheism is infrequentand does not increasewi th exposure.
does not appear to be aT,'lay from " religion per seamong the participants stating a religious preferencewith exposure. For the "Nones " Atheism decreases
2) While there is some trend toward a lessening objective religiosity,the "objective" trends are much slighter than the "intellectual" ones. This,in turn, suggests two things: First of all, it suggests that the changes arenot a function of drop-outs alone, since a very high loss of religiously devoutwould produce a greater change in the distribution of religious preferences
- 17 g-
than we found. Second , it sugges ts that the changes may not be those ofabandoning or altering a fundamental religious stance , but rather they maybe those of changing evaluations of other viewpoints. What we mean by thisis that while the bulk of the respondents are practising Liberal Protestantsand remain so , religious ideologies such as Agnosticism, Buddhism, Mysticism
Reform Judaism, and Mohammedanism are viewed more favorably by the participantsin the advanced years than by the participants th fewer years of exposureto the program. Likewise , the more conservative ideologies such as FundamentalProtestantism, Thomism, and even Middle-of-the-Road Protestantism, are lessfavored among participants in the advanced years than in the beginning years.The general picture is not one of "reversals" or dramatic changes in religiousideas, but rather one of expansion of the breadth and scope of religious ideaswhich are considered within the pale , an expansion which is generally in the"liberal" rather than in the "conservative" direction.
Political Ideologies
We didn t plan it that way, but, curiously, throughout our studypolitical preferences have played an important part in the analyses. independence of its relationships with such variables as education, age, andstatus, party preference has turned up as a correlate of motivations for joiningthe program (Chapter I of Part A), knowledge of liberal arts and humanities(Chapter I of Part B), and musical and poetic sophistication (Chapter II ofPart B). Therefore, even aside from the fact that the readings in the programhave a heavy political emphasis, we shall be interested in the question of whe-ther political values, too, vary with exposure to Great Books.
The contemporary American political scene is a little too complicatedto be covered by two questions in a survey, but in designing our study we feltthat two important axes of political values today are the question of "civilliberties " and the question of "government control. II Many political observersof course , believe that in the late 1950' s political ideologies have becomeconsiderably less important in a national scene dominated by questions of foreignpolicy and by technical economic and administrative issues which don I t lend
themselves to simple ideological polarities. Nevertheless, we felt that thequestions of whether governmental activities have been extended too far ornot far enough (the continuing question of where one stands vis-a-vis the New
Deal), and whether a balance has been struck between the competing demands ofcivil liberties and national security (at one time the issue of ''McCarthyismnow , perhaps , where one stands in evaluating the Harren court), would stillprovide a basis of differen tiation.
Tables 9 and 10 give the specific items and the distribution of answersfor the total sample.
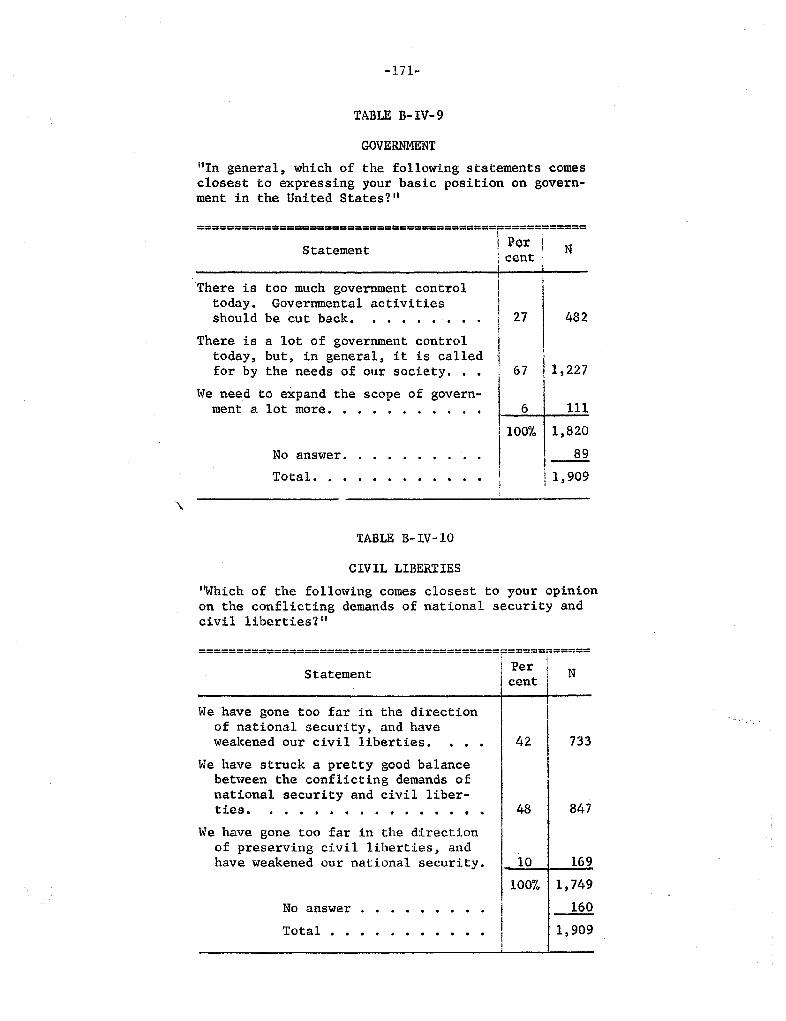
171-
TABLE B-IV-9
GOVERNENT
"In general , which of the following statements comesclosest to expressing your basic position on govern-ment in the United States'?"
=-----=-----=-------=---=----- =----------------- ----- -----
::::::: t
--- ----- - - ---
rp-
!--
; cen
I 27 482
: 67 fl, 227
111
100% 1) 820
No answer. .
. . . .
! 1, 909
There is too much government controltoday. Governmental activitiesshould be cut back.
There is a lot of government controltoday, but, in general, it is calledfor by the needs of our society. .
We need to expand the scope of govern-ment a lot more.
. . . .
Total. . .
TABLE B- IV -
CIVIL LIBERTIES
hich of the following comes closest to your opinionon the conflicting demands of national security andcivil liberties,?11
Statement
=============================================== ====
We have gone too far in the directionof national securi ty, and haveweakened our civil liberties.
We have struck a pretty good balancebetween the conflicting demands ofnational security and civil liber-ties. It . . .
. . . .
We have gone too far in the directionof preserving civil liberties , andhave weakened our national security.
No answer
Total
. . . . . . . .
Per cent I
10070
733
847
l69
749
909
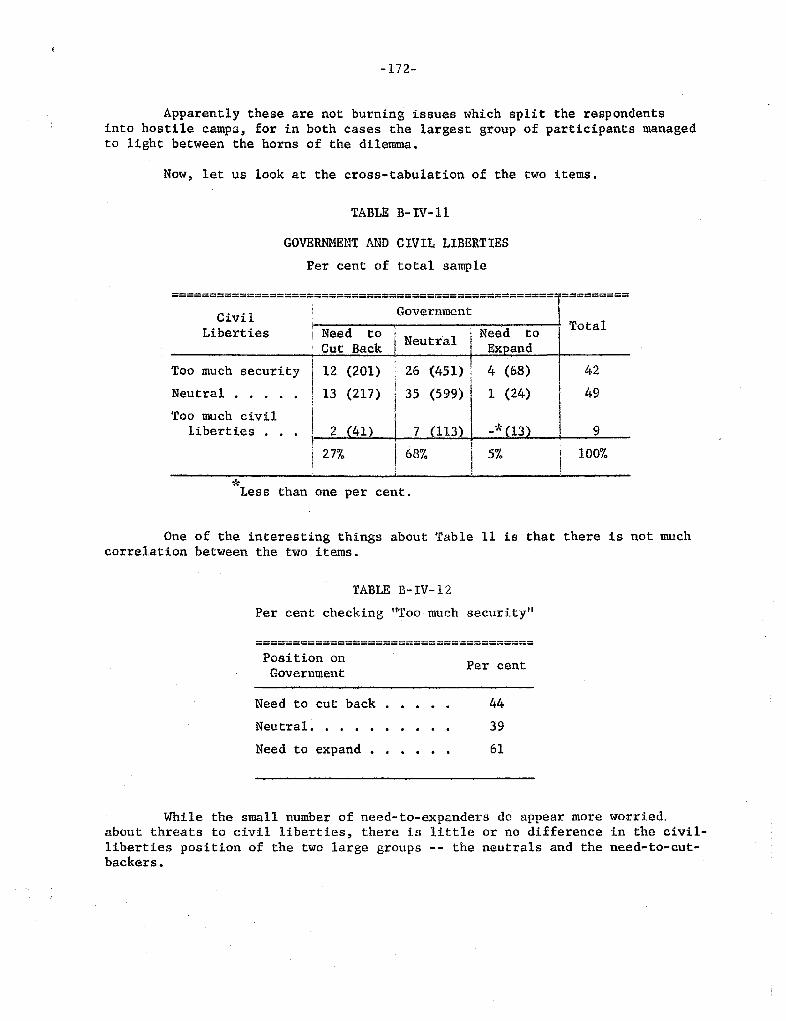
-172-
Apparently these are not burning issues which split the respondentsinto hostile camps , for in both cases the largest group of participants managedto light between the horns of the dilemma.
Now ) let us look at the cross-tabulation of the two items.
TABLE B- IV-
GOVERNMNT AND CIVIL LIBERTIES
Per cent of total sample
===== ===-=========================================-=====;=
CivilLiberties
Government
Too much security 1
Neutral : 13
Too much civil liberties . 2
i 27%
(201)
(217)
: 26 (451)
I 35 (599)
TotalI Need to Cut Back Neutral
100'70
Less than one per cent.
One of the interesting things about Table 11 is that there is not muchcorrelation between the two items.
TABLE B- IV-
Per cent checking "Too much security
----------------------------.-----------------------------------------------
Position onGovernment Per cent
Need to cut back
. . .. ..
Neu tral.
. .
Need to expand
While the small number of need-to-expanders do appear more worried.about threats to civil liberties , there is little or no difference in the civil-liberties position of the two large groups -- the neutrals and the need-to-cut-backers.
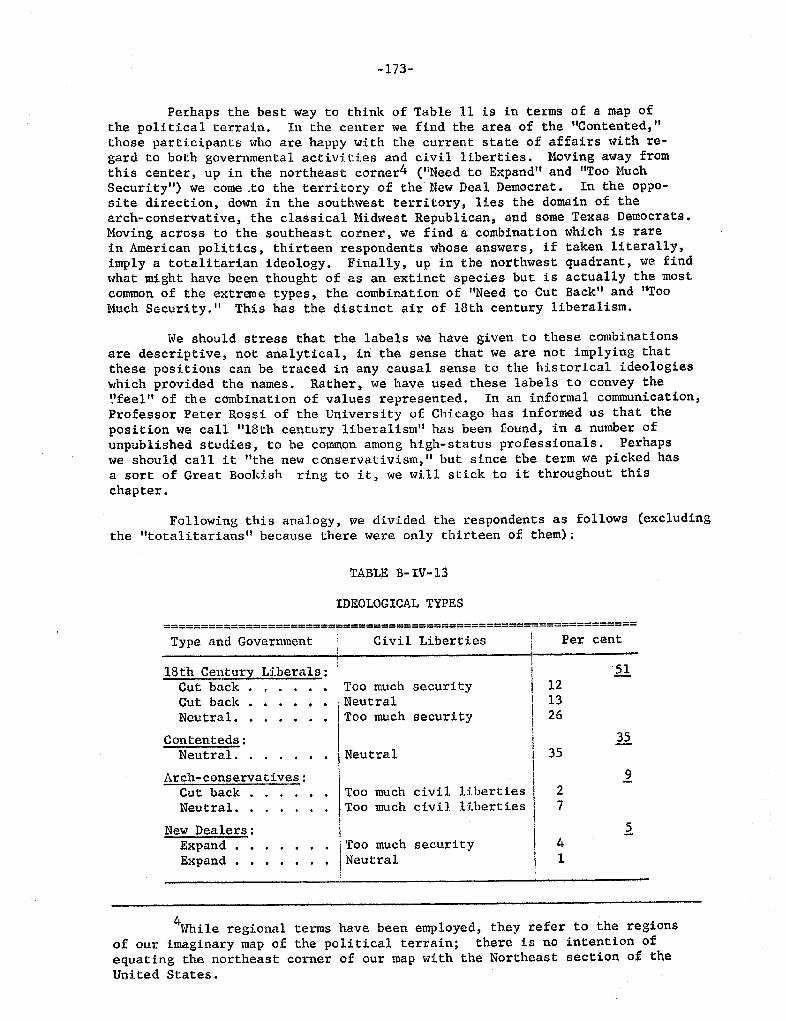
173-
Perhaps the best way to think of Table II is in terms of a map ofthe political terrain. In the center we find the area of the "Contented,those participants who are happy with the current state of affairs with re-gard to both governmental activities and civil liberties. Moving away fromthis center, up in the northeast corner4 ("Need to Expand" and "Too MuchSecurity ) we come .to the territory of the New Deal Democrat. In the oppo.site direction , down in the southwest territory, lies the domain of thearch-conservative, the classical Midwest Republican, and some Texas Democrats.Moving across to the southeast corner, we find a combination which is rarein American politics, thirteen respondents whose answers, if taken literally,imply a totalitarian ideology. Finally, up in the northwest quadrant , we find
what might have been thought of as an extinct species but is actually the mostcommon of the extrane types, the combination of "Need to Cut Back" and "TooMuch Security. This has the distinct air of 18th century liberalism.
We should stress that the labels we have given to these combinationsare descriptive, not analytical , in the sense that we are not implying thatthese positions can be traced in any causal sense to the historical ideologieswhich provided the names. Rather , we have used these labe Is to convey the'feel" of the combination of values represented. In an informal communicationProfessor Peter Rossi of the University of Chicago has informed us that theposition we call "18th century liberalism" has been found , in a number of
unpublished studies , to be common among high- status professionals. Perhapswe should call it "the new conservativism " but since the term we picked hasa sort of Great Bookish ring to it , we will stick to it throughout thischapter.
Following this analogy, we divided the respondents as follows (excludingthe "totalitarians" because there were only thirteen of them):
TABLE B- IV.13
IDEOLOGICAL TYPES
=======================
f==============================
========
Too much civil liberties Too much civil libertieS
Type and Government Civil Liberties
18th Century LiberalsCut back
. .
Cu t back
. .
Neutral. . .
. .
Too much security
I NeutralToo much security
ContentedsNeutral. . Neutral
Arch. conservatives
Cut backNeutral. . .
New DealersExpand Too muchExpand
. . . .
Neutralsecurity
Per cent
While regional terms have been employed, they refer to the regionsof our imaginary map of the political terrain; there is no intention ofequating the northeast corner of our map with the Northeast section of theUnited States.
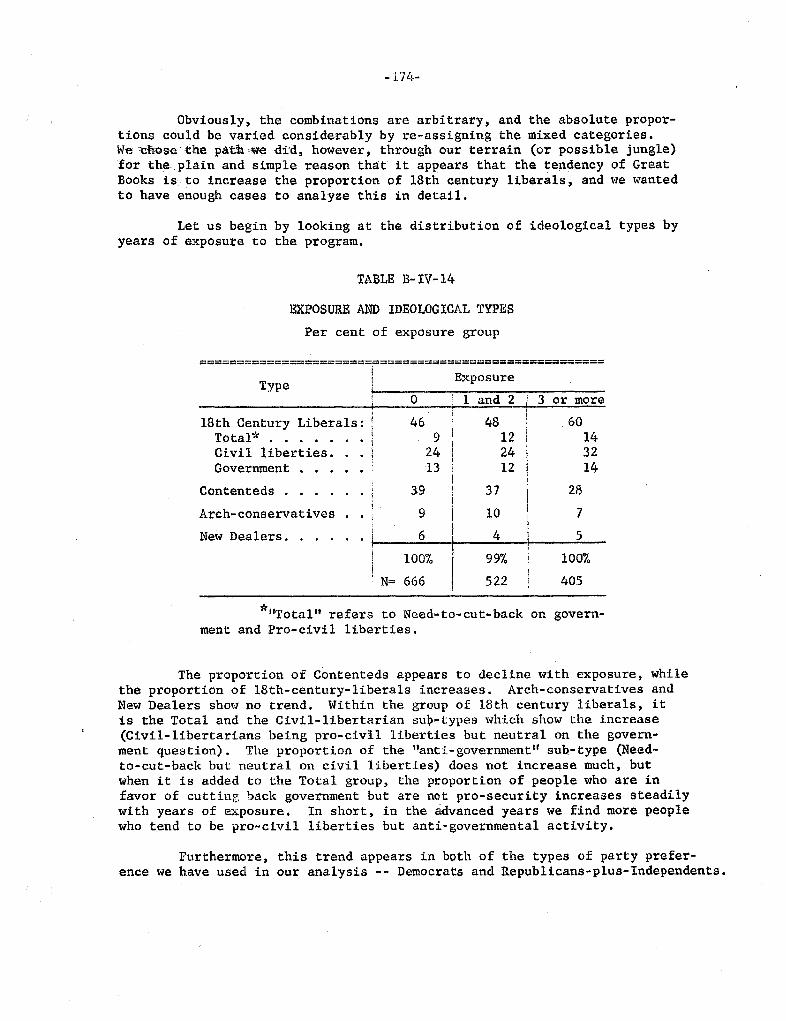
- 174-
Obviously, the combinations are arbitrary, and the absolute propor-tions could be varied conside ably by re-assigning the mixed categories.
:chosethe path We did, however, through our terrain (or possible jungle)for the plain and simple reason tha.t it appears that the tendency of GreatBooks is. to increase the proportion of 18th century liberals, and we wantedto have enough cases to analyze this in detail.
Let us begin by looking at the distribution of ideological types byyears of exposure to the program.
TABLE B- IV-14
EXPOSURE AND IDEOLOGICAL TYPES
Per cent of exposure group
Type
=======-;=- ;=====-=====;=====;==-=;-========-=======
Exposure
18th Century Liberals:Tota1* . . . iCivil liberties. .
. !
Government
. . . .
Contenteds .
. .
Arch-conservativesNew Dealers.
100%
: N= 666
: 1 and 2 3 or more
48 12 24 I 12 I
37 10
100%
405
99%
522
Total" refers to Need-to-cut-back on govern-ment and Pro-civil liberties.
The proportion of Contenteds appears to decline with exposure, whilethe proportion of l8th-century-liberals increases. Arch-conservatives andNew Dealers show no trend. Within the group of 18th century liberals, itis the Total and the Civil- libertarian su -types which show the increase(Civil- libertarians being pro-civil liberties but neutral on the govern-ment question). The proportion of the "anti-government" sub-type (Need-to-cut-back but neutral on civil liberties) does not increase much, butwhen it is added to the Total group, the proportion of people who are infavor of cutting hack government but are not pro-security increases steadilywith years of exposure. In short , in the advanced years we find more peoplewho tend to be pro-civil liberties but anti- governmental activity.
Furthermore, this trend appears in both of the types of party prefer-ence we have used in our analysis -- Democrats and Republicans-plus- Independents.
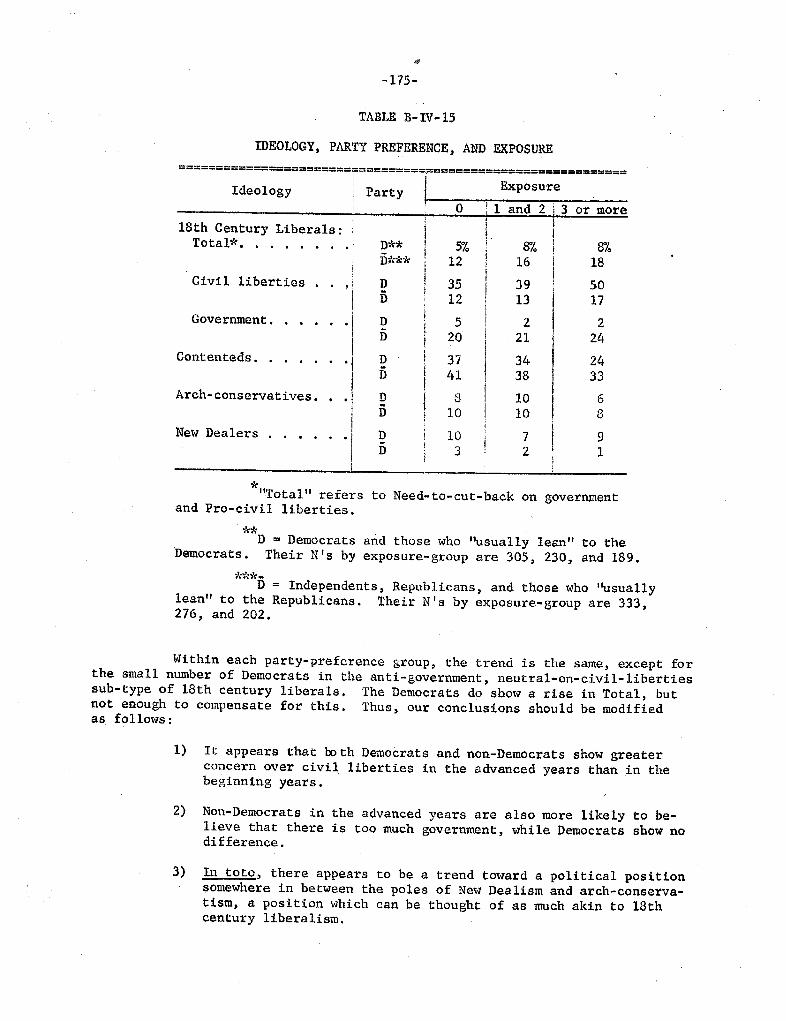
175-
TABLE B- IV -
IDEOLOGY, PARTY PREFERENCE , AND EXPOSUR
=======::::::::======== ;::::== ========= ::;:=========
! 1 and 2 3 or more
~~~~
. L
: . ;
D** i 5% 1.
8% 870I n*** 12 16 I .
Civil liberties ! i 35 39 12 13 Government. . . i 20 21
Contenteds. .
. . . j
37 34 41 38 Arch-conservatives. . 10 10 10 New Dealers
. .
Total" refers to Need-to-cut- back on governmentand Pro-civil liberties.
,'(
D = Democrats and those who "usually lean" to theDemocrats. Their N' s by exposure- group are 305 . 230 . and 189.
***-
D = Independents . Republicans , and those who "usuallylean" to the Republicans. Their N I s by exposure- group are 333,276, and 202.
Within each party-preference group, the trend is the same , except forthe small number of Democrats in the anti- government , neutral-on-civil-libertiessub- type of 18th century liberals. The Democrats do show a rise in Total, butnot enough to compensate for this. Thus. our conclusions should be modifiedas follows:
It appears that bo th Democrats and non-Democrats show greaterconcern over civil liberties in the advanced years than in thebeginning years.
Non-Democrats in the advanced years are also more likely to be-lieve that there is too much government . while Democrats show nodifference.
In toto . there appears to be a trend toward a political positionsomewhere in between the poles of New Dealism and arch-conserva-tism. a position which can be thought of as much akin to 18thcentury liberalism.
176-
Now , as usual , we must note that theseouts as well as to changes in political opinions,occur in both major political-preference types atideological" trend, not a selection on the basis
trends could be due to drop-but the fact that the trendsleast suggests tpat it is anof party affiliation.
We can only speculate as to why such a trend appears. It is probablynot a simple function of exposure to the readings, since, although-we have madeno content analysis, our guess would be that the readings have , if anything, aslight "authoritarianll political coloring (Plato and Nietzsche and St. Thomasare certainly not 18th century liberals), although Mill , Thoreau, th Declara-tion of Independence, Adam Smith, The Federalist , and the Areopagitica certainlywould provide persuasive arguments for those who wish to be persuaded. Somewhatmore fairly, it would probably be better to state that the readings have littleto lead one to the New Deal pole, although there are adherents of each of theother positions in large numbers among the readings.
Summary
In this chapter we explored the problem of whether continued exposureto Great Books tends to induce changes in the participant' s basic values andfundamental positions on social and political policy. We began by indicatingthat many respondents , quite a majority by the time they reach the advanced yearsdo report changes in ideas and schools of thought. Because we have a IIcross-sectional" design, we were unable to exaIline the possibility of changes whichcancel each other out , but by comparing beginning and advanced participants , wewere able to look for IInet effects. '. Our data suggested that in terms of basicvalues and in terms of areas of orientation : there is little or no change; howeverwithin the religious and within the political arenas, there is evidence ofshifting, some of which may be due to differential "dropping-out " but probablynot in entirety. In terms of intellectual approaches to religion , our data sug-gest that increased exposure is associated with greater acceptance of " liberal"and "non-Western" religious ideas , and a lesser acceptance of conservative andtraditional American religious positions. In terms of political ideologies, wenoted an apparent trend for increased concern about civil liberties, and a definitebut lesser trend toward opposition of government activities, the two togetherbeing interpreted as a trend toward an ideological position analogous to 18thcentury liberalism , or perhaps "new conservativism.

CHAPTER V
COHNUNITY INVOLVE!1ENT
-177-
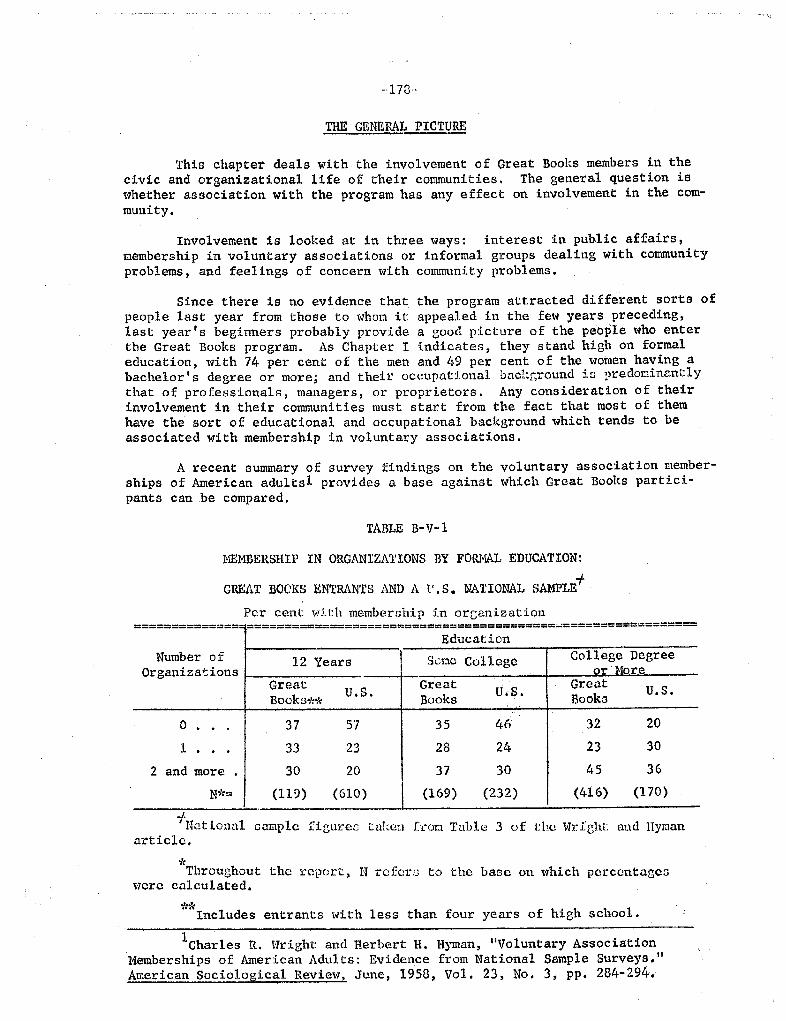
17G."
THE GENERAL PICTURE
This chapter deals with the involvement of Great Books members in thecivic and organizational life of their communities. The general question iswhether association with the program has any effect on involvement in the com-munity.
Involvement is looked at in three ways: interest in public affairs,membership in voluntary associations or informal groups dealing with communityproblems, and feelings of concern with community problems.
Since there is no evidence that the program attracted different sorts ofpeople last year from those to whom it appealed in the few years preceding,last year s beginners probably provide a good picture of the people who enterthe Great Books program. As Chapter I indicates , they stand high on formaleducation , with 74 per cent of the men and 49 per cent of the women having abachelor s degree or more; and their occupational bacl:ground in predominantlythat of professionals, managers , or proprietors. Any consideration of theirinvolvement in their communities must start from the fact that most of themhave the sort of educational and occupational background which tends to beassociated wi th membership in voluntary associations.
A recent summary of survey findings on the voluntary association member-ships of American adults l provides a base against which Great Books partici-
pants can be compared.
TABLE B-V-
HEMBERSHIP IN ORGANIZATIONS BY FOID1AL EDUCATION:
GREAT BOCKS ENTRANTS AND A e.S. NATIONAL SAMPLE
Per cent with memben;hip in oq:;anization
=============== ==================== ==================== ========= ======
EducationNumber Years SCI:C College College Degree
Organizations . MoreGreat Great Grent U. S.Books., Books BookG
and more
(119) (610) (169) (232) ( 416) (170)
National aample fizurefJ taI cn froI: Table 3 of the \.JtiCht: and Hymanarticle.
Throughout the report ) 1' refer:: to the baGc on which pcrcentngcGwere calculated.
Includes entrants with less than four years of high school.
Charles R. Hright and Herbert H. Hyman
, "
Voluntary AssociationMemberships of American Adults: Evidence from National Sample Surveys,American Sociological Review, June , 1958, Vol. 23, No. 3, pp. 284- 294.
-179-
A look at Table 1 inditatcs that participants are somewhat more involvedin organizations than are other Americans of comparable education. The entrantswho have not attended college have a strikingly lower percentage of people whodo not belong to any organizations and a higher percentage of people who belongto two or more; the part-college entrants show the same differences although inlesser degree; the college graduates have a higher percentage of people who donot belong to any organization but balance it by also having a higher percentagewho belong to two or more organizations. We excluded from the tally membershipin churches, organizations attached to particular congregations, and adul t edu-cation programs. Had we included them, all categories of Great Books pa1;tici-pants would almost certainly have shown more memberships than the people in thenational sample.
The program evidently selects people who are interested in what goes onin the world of public affairs. When asked about their degrees of interest inlocal , national , and world affairs , 76 per cent of the entrants said that theywere highly interested in at least one of the areas and most said that they werehighly interested in two or more.
There is some room for disagreement on how much the picture of peopleinterests and activities is distorted by the people who develop sudden enthusi-asms because they feel that the mere presence of the question indicates that thequestionnaire constructor felt that people should be interested or active inwhatever is under consideration.
The number of respondents who felt free to declare themselves only11 fairly" or II some\'1hat" interested in the matters discussed, however, and thestriking differences among the per cents of people highly interested in the dif-ferent areas of public affairs suggest that the figures are probably trust-worthy. The general seriousness with which group members treated the question-naire indicates that they . made an honest effort to estimate such things asaverage number of visits a month, and that, therefore, the general pattern canbe trusted even though there must be some error of memory in estimates of thiskind. Similar arguments support accepting the reasonable accuracy of the re-port on organizational memberships, especially as in this case the names of theorganizations were listed.
180-
SOURCES AND APPROACHES USED IN THE ANALYSIS
Sources
With the preceding sketch of the entrants I community involvement as asort of appetizer, we turn to the methods used in analyzing the data. Themajor sources for the analysis in this section lie in the part of the question-naire entitled "Great Books and the Community. They are indicated below.
The Participant I s Current Interest in the Area of Public Affairsand Social Activities
Interest in local politics , civic organizations, nationalpolitics, and world affairs (P. 14, Q. 9)
The Participant I s Civic and Social Activities
Civic or professional organizations to which the partici-pant belongs. (P. l4. Q. 10)
Action which the participant has taken about communityproblems. (P. 14, Q. 7)
Any local 0 ffices ever held by the participant.(P. 15, Q. 11)
Amount of informal visiting and entertaining.(P. 16, Q. 15)
Number of fellow group members seen outside of the dis-cussions. (P. 23, Q. 7)
Changes in Participant I s Perception of His Civic and SocialActivities and Interests.
Changes in interest and involvement in civic organi-zations, community problems and issues, local politicsnational politics , world affairs, and informal visiting.(P. 16 , Q. 18)
Effect of Great Books ort understanding of or actionconcerning community problems. (P. 14, Q. 8)
Approaches
Since the basic question of this section is the community involvement ofGreat Books participants , we need some way of describing people on the basis ofthe pattern of their public-affairs interests and organizational activities.With such a description in hand, we can then relate a number of attributes tosome other factor simultaneously rather than having to analyze each relationshipin turn.
The first question then becomes whether people have patterns in theirinterests and organizational activities. The answer is that they do, but thatanalyzing the patterns makes for some fairly complicated technical reading.
181-
With the technical section put first , however , one can then read the later sub-
stantive material without constant digressions for definitions and explanations.
Patterns of Interest in Public Affairs
The questionnaire asked about interest in local politics, civic organi-
zations , national politics , and gave choices of answers ranging from definitelack of interest to high iuterest in each of these areas. 3
Table 2 , below , measures the association between high interest in anyone of the areas and in each of the others.
The general meaning of the table, and of the individual tables fromwhich the Q. s were derived, is that there are definite patterns in areas ofinterests. People who say that they are highly interested in either worldaffairs or national politics in the great majority of cases also say that theyare highly interested in the other. Similarly, people who are highly interestedin civic organizations are usually interested in local politics and people high-ly nterested in local politics tend to be highly interested in civic organi-zations. There is also something of a political axis of interest: peoplehighly interested in local politics tend to be highly interested in nationalpol tics and the reverse. Rml7ever, this relationship is lower than the others.The more striking finding is that the participants ' interests split into two
geographical areas, local and what may be called the cosmopolitan. e should
stress that this use of the term is different from the use in Chapters I, II,and III of Part A.
Throughout the analysis "highly interested" equals "replied that they
are ' very interested'" in whatever matter is under consideration. "Rise inhigh interest" and similar phrases mean that the per cent of respondents say-ing that they are "very interested" rises. Sometimes the awkwardness of pre-cisely correct statistical terminology has led to refuge in "become more inter-ested" as a more readable way of saying that the per cent of people reportingthemselves "very interested" rises.
Cutting the replies at "very" interested rather than at "very or fairlyinterested probably needs some corn1cnt here. Given the three other categoriesopen to respondents, the choice of "very" means the choice of the highest cate-gory of interest offered and involves mentally separating oneself from peoplewho are only " fairly interested. Including the "fairly interested" not onlywould have brought in most of the sample in the most popular areas but wouldhave permitted inclusion of people ho hesitated to come out and say that
they were tlnot too intereste.d" and used " fairly interested" as a refuge fromcandor.
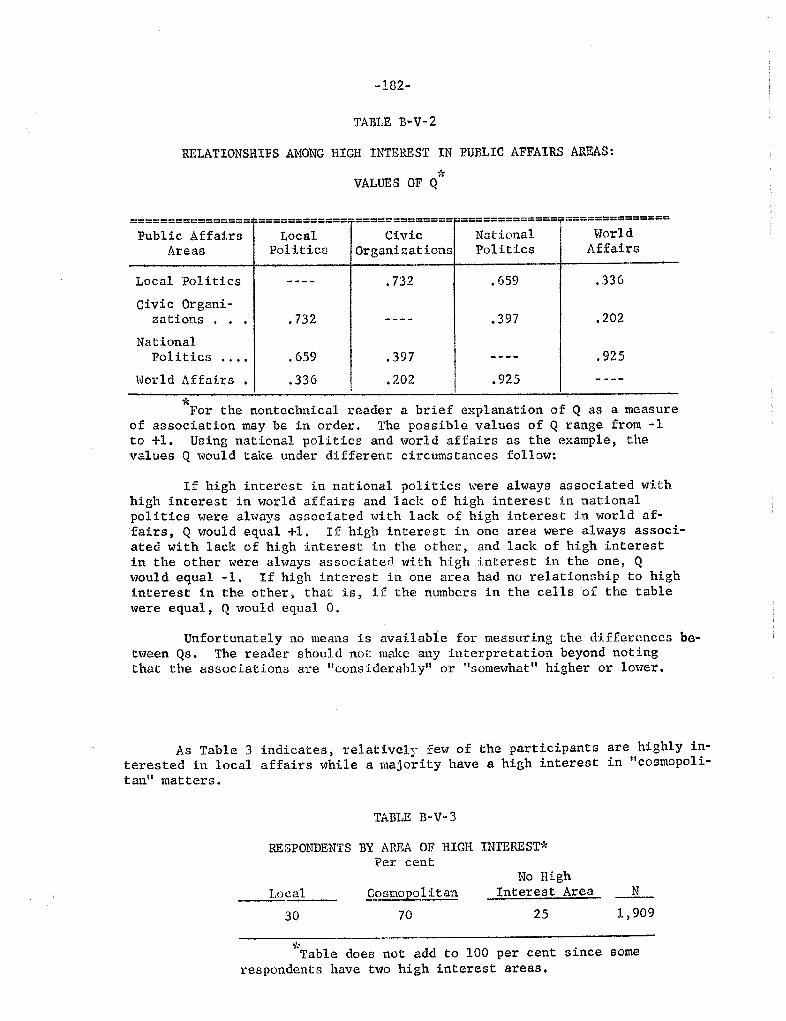
182-
TABLE B"V-
RELATIONSHIPS AMONG HIGH INTEREST IN PUBLIC AFFAIRS AREAS:
VALUES OF Q
========== ===== ============ =============
===========-=T===-==========Public Affairs
AreasLocal
PoliticoCivic
OrganizationsNationalPolitics
WorldAffairs
Local Politics 732 659 336
Civic Organi-zations . . 732
659 397
336 202
397 202
NationalPolitics
. . . .
Horld Affairs
925
925
For the nontechnical reader a brief explanation of Q as a measureof association may be in order. The possible values of Q range from -to +1. Using national politics and world affairs as the example , thevalues Q ould take under different circumstances follow:
If high interest in national politics were always associated withhigh interest in world affairs and lack of high interest in nationalpolitics were always associated with lack of high interest in world af-fairs , Q would equal +1. If high interest in one area were always associ-ated with lack of high interest in the other, and lack of high interestin the other were always associated with high interest in the one , Qwould equal -1. If high interest in one area had no relationship to highinterest in the other, that is , if the numbers in the cells of the tablewere equal , Q would equal O.
Unfortunately no means is available for measuring the differences between Qs. The reader should not make any interpretation beyond notingthat the associations are "considerably" or IIsomewhat" higher or lower.
As Table 3 indicates , relatively few of the participants are highly in-terested in local affairs while a majority have a high interest in "cosmopoli-tan" matters.
TABLE B-V-3
RESPONDENTS BY AREA OF HIGH INTERESTPer cent
opolitanNo High
Interest Area
909Local
Table does not add to 100 per cent since somerespondents have two high interest areas.
lG3-
In the course of a study of personal influence in a town on the Easternseaboard, Professor Robert Merton of Columbia University developed the distinc-tion between types of influential people: the local and the cosmopolitan. The
distinction does not refer to the area in which influence was exerted; in bothcases. the' influence \Vas personal and was limited to the local area. The dis-tinction Lay in the orientation to the town; for Nerton ' s "locals " the town
as the world 1\7hile for the "cosmopolitans" the town, while a pleasant placeto live , was one mongmany.
The questions asked in the Merton study and in this one are not identicalbut they get at sufficiently similar matters to provide a basis for comparison.It appears that among Great Books participants there is a distinction ..betweenpeople of high local interest and people without it , but the distinction cuts
the other way. Of the participants with a high local interest 85 per cent alsohave a high interest in national politics or world affairs; 5 but only 36 percent of those with " cosmopolitan" interests also have a high local interest.In this case the difference is not between having only a local orientation andhaving broader horizons; rather it is between includ'ing local matters in one
areas of high interest and reserving high interest for affairs beyond the locaiscene. 6 Rather than dividing into "locals" and "cosmopolitans, " Great Booksparticipants who have some area of high interest more nearly divide themselvesinto "locals and "nonloeals " that is , people who have a high interest in
local affairs and usually in tiol1al nnd 1'lOrld :lffairs tlG wen, and people1'ho Qre hiGhly intc:rc, tcd L1 aaticn.:l and i701:ld a.fh,i:ic but do :1ot includelocal politics or organizations in their arcas of high interest.
Robertfluentials" inGlencoe , Ill.,
K. Merton
, "
Patterns of Influence: Local and Cosmopolitan In-Robert K. Herton Social Theory and Social Structure . (Rev. edJ1957, pp. 387-420.
The low Qs between interest in national and world affairs and localpolitics and civic organizations in Table 3 occur because the respondentsinterested in local politics and civic organizations form only a relativelysmall per cent of the total and most of the people highly interested in nation-al and world affairs are not highly interested in local affairs. In other
words , the effect is largely one way.
It must , of course, be admitted that the distribution of cases wouldhave been somewhat different if the measure of local interest had been basedon questions of some other wordinG than that used. However , the consistencywith which respondents with high local interest by the criteria used differfrom others, strongly suggests that the particular questions used did succeedin getting at a real difference in orientation which is salient for a numberof matters of belief and attitude.
7 For the interested technical reader , the relevant Guttman scales and
their coefficients of reproducibility are given below.
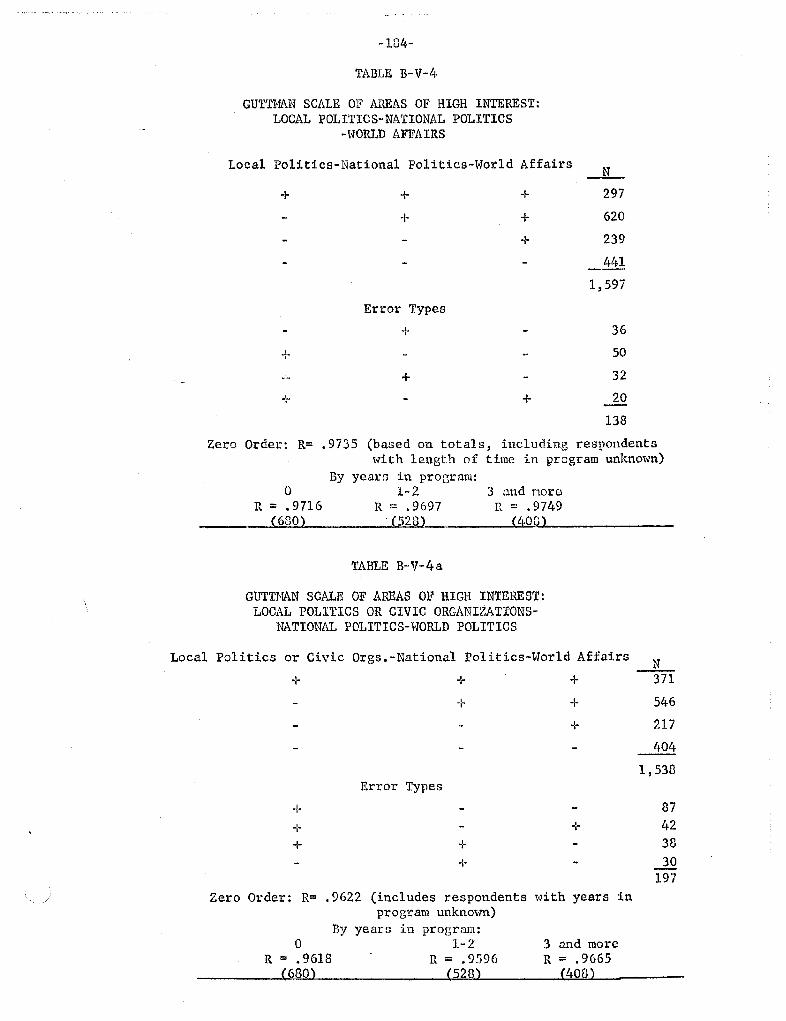
184-
TABLE B-V-4
GUTTMAN SCALE OF AREAS OF HIGH INTEREST:LOCAL POLITICS-NATIONAL POLITICS
-HORI. A1!'FAIRS
Local politics-National Politics-Horld Affairs
Error Types
297
620
239
597
138
Zero Order: R= . 9735 (based on totals , including respondentswith length of time in grogram unknown)
R = . 9716680
By yeara in pro ram:
R :: . 9697. (528)
3 and noroR :: . 9749
(408)
TABLE B-V-4a
GUTT N SCALE OF AREAS OF HIGH INTEREST:LOCAL POLITICS OR CIVIC ORGANIZATIONS-
NATIONAL POLITICS-WORLD POLITICS
Local Politics or Civic Orgs. -National Politics-World Affairs
Error Types
Zero Order: R= 9622 (includes respondentsprogram unknown)
By yeara in program:
R = . 9596(528)
:= .
96l8680
..:-
"lith years in
3 and moreR = . 9665
371
546
217
404
538
197
105-
Not all the Great Books participants can be classified as "local" ornonlocalll in their areas of high interest; some have no area of public affairsin which they are highly interested. They may be II fairly interested" in sever-al areas, of course , and many of them are. However, they are people who didnot feel great enough interest to put themselvcG in the top category of evenone of the four areas offered, In this they differ from the 77 per cent ofthe participants who have at least one area of high interest in public affairs,Table 5 below shows the distribution of participants in terms of interest areas.
TABLE B-V- 5
PER CENT DISTRIBUTION OF RESPONDENTS BY AREAS OF HIGH INTEREST
Local
. . . . . . . . . . . . . .
Local only
. . . . . .
Local and Nonlocal ,
. .
Nonlocal (National-Horld)No Area of High Interest
. .
, 26
. . . . . ,
. 46
. .
. . 23
. . . . .. . .
N ;: (1 849)
The local-nonlocal division fails to mark off the 27people of purely local interest from their 437 fellow " localswho also have broader interests but this makes fewer difficul-ties than a subcategory of only 87 cases \'1uld. The I1p1Jrelocals" are so small a proportion of the I1locals1l that theycannot usually have any important influence on findings con-cerning the Il localll group as a \'7hole.
So far , then, we have a division of people on the basis of their areas ofhigh interest (or lack or them) in public affairs. This provides a classifi-cation of community involvement in terms of the participant I s orientation onpublic affairs: toward the local community, away from the local community, andaway from high interest in public affairs in general.
Patterns of Participation in Voluntary Associations and Other Local Groups
On the basis of both common experience and studies of the organizationalparticipation of Americans it seemed sensible to assume that Great Books ?artici-pants would differ in their organizational li activeness" as \vell as in thenature and e tent of their interests, On this assumption it seemed reasonableto divide people within each area of interest into those who were relativelyactive and those who were relatively inactive in terms of organizational par-ticipation. The distinctions could not be fine ones even where the question-naire provided the data for making them because of the danger of coming outwith so few cases in a category that one could mistake s pling variabilityfor real differences. After both substantive and statistical considerationit was decided to use membership in at least two organizations as the criter-ion for beinp, lI act:i 1I8 'rhin, of course, provides a very looGe definition
people who failed to answer the question on their organizational mem-berships ,V'ere put in the U inactive" category. This \vas done because the un-usually high proportion of failures to answer the question on organizationscombined with low onresponse rates on the surrounding questions suggestedthat leaving the question blank had often been intended to indicate that therespondent did not belong to any organizations.
-lG6-
of It activeness. 11 One can belong to an organization and not take any part inits activities. On the other hand , having joined at least marks one off frompeople who have not even joined.9 If one belongs to at least two organizations,he is in the upper 36 per cent of Anlericans with college degrees according tothe national sample study quoted earlier .
Among the " active" people , it seems reasonable to make some distinctionsbased on the kinds of organizations to which they belong and the amount ofresponsibility they have carried. Especially among people with high localinterest two subtypes of lIactiveness " turned up often enough to justify aseparate category of liMA Active" locally interested people. They were hold-ing local office and carrying major responsibility in private organizationsworking for the melioration of some community problem.
Among people carrying less responsibility than these there still seemedto be a logical division based on the nature of the organization to which theybelonged. Nembership in purely social organizations, in professional organi-zations , or in organizations based on some special interest or social character-istic may reflect a different sort of relationship to one ' s community frommembership in organizations of a u ed Feather!! sort or in organizations con-cerned with policies and problems of the cOtnlunity as a whole. The lastwhether politi.cal "action" organizations such as the League of Women Votersor the county Republican Committee or nonpartisan civic action organizationssuch as Better Government Associations , seemed logically to represent a spe-cial sort of involvement in one I S comnunity and were used as the basis of acategory of activeness. (Partly because of the problem of sampling errorwhen numbers in categories get small and partly because most of the peoplebelonging to a "Red Feather" organization also belong to an 11 action" organi-zation, Tiember Jhip in "Red Feather!! orgimization:: mlS not used ao the baoia
of 11 separate category.
Out of all the considerations above came nine categories of a typology,the three categories of interest and divisionG of activeness within each cate-gory of interest. The " types" are not , of course , supposed to be related toany ideas of peraonality types or to any other set of ideas about " types" ofhuman beings. They are merely a reasonable way of collapsing relevant infor-mation about Great BOOKS participants into a manageable number of categorieswhich give names to recognizable patterns of behavior. The typology is out-lined on the followi.ng page and forms the basis for most of the analysis whichfollows.
0rganizations attached to a particular church or synagoguecluded from the count of organizational memberships but unions andal associations, if listed by name, were included.
were eprofession-
Union memberships, held by few college graduates, were excluded fromthe count in the quoted study while memberships in particular church organi-zations, held by many college graduates, were included. (Information fromJacob J. Feldman, Senior Study Director, NORC.
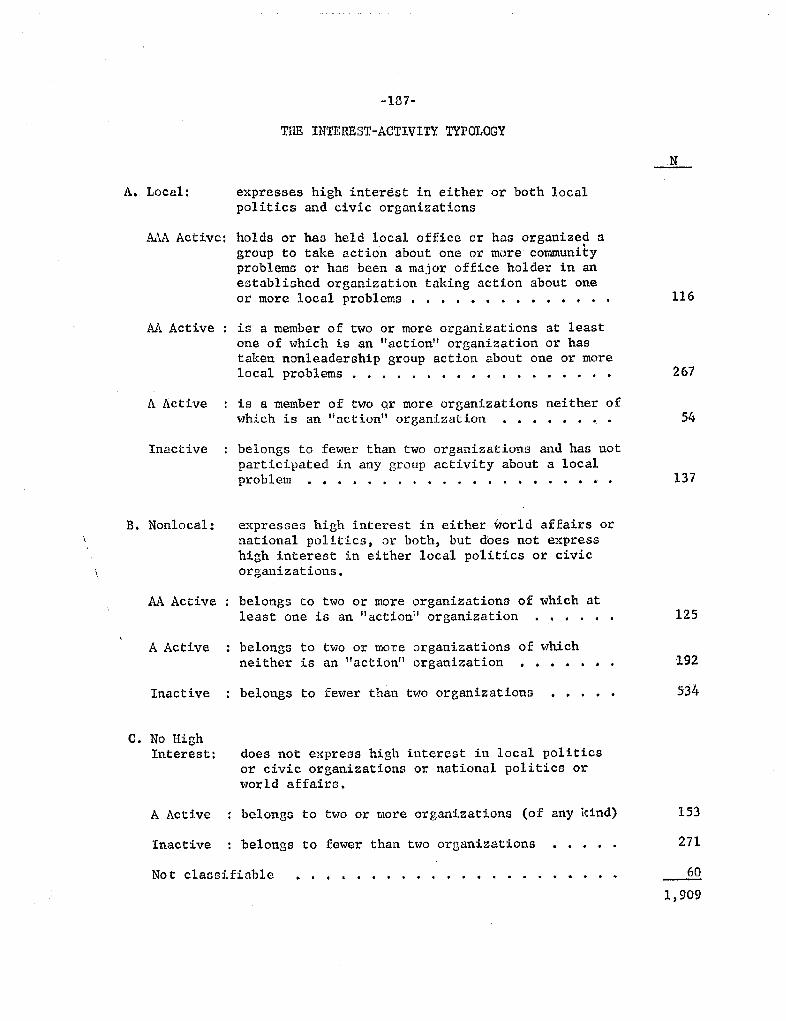
A. Local:
MA Active:
Ai Active
A Active
Inactive
B. Nonlocal:
-137-
TIm INTEREST-ACTIVITY TYPOLOGY
expresses high interest in either or both localpolitics and civic organizations
holds or has held local office or has organized agroup to take action about one or more communityproblems or has been a major office holder in anestablished organization taking action about oneor more local problems
. . . . . . . . . . . .
: is a member of two or more organizations at leastone of which is an "action" organization or hastaken nonleadership group action about one or morelocal problems
. . . . . . . . . . . .
: is a member of two Qr more organizations neither ofwhich is an " action" organization
. . . .
: belongs to fewer than two organizations and has notparticipated in any group activity about a localproblem
. . .. . .. . . .. . .. .. "
expresses high interest in either world affairs ornational pol itics , or both. but does not expresshigh interest in either local politics or civicorganizations.
AA Active : belongs to two or more organization$ of which atleast one is an "action organization
A Active
Inactive
C. No HighInterest:
A Ac tive
Inac t i ve
: belongs to two or more organizations of whichneither is an "action" organization
. .
: belongs to fewer than two organizations
.. .. . .
does not express high interest in local politicsor civic organizations or national politics orworld affairs.
: belongs to two or more organizations (of any kind)
: belongs to fewer than two organizations
.. .. .. ..
Not classifiable
. . " .
116
267
137
125
$34
153
271
1 , 909
188-
EXPERIENCE IN THE PROGRAM AND CHANGES IN INTERESTS AND ACTIVITY
The first use to which the typologysible effects of Great Books experienceorganizational activities. The generalmain parts:
,.;ill be put isconsideraUon of pos-on the participants ' interests and
question will be discussed in three
Objective differences in interests:
Do more participants become highly interested in public affairsas experience in the program increases?
Do the participants ' areas of high interest change with increasedexperience in the program?
Objective differences in activity: do more participants become activein community organizations aa program experience increases?
How do the participants feel that the program has influenced theirinterests and organizational activities?
The two sorts of questions outlined--whether the proportion of participantswith a given interest or activity increases and whether participants say thattheir interests and activities have increased--can have different answers with-out involving any inconsistency.
, for example , people who entered the program feeling only "fairly inter-ested" in a certain area, have gained a greater degree of interest but stillnot qu:Lte enough to put themselves in the "very interested" category, they willcheck "fairly interested" as describing their present situation but will alsoreport that their interest has increased since they entered the program. effect , the subjective and objective questions are measuring different thingsand in most cases. a di fference of category on the objective question requiresa greater difference of feeling than does the simple report that there is adifference of feeling. Hith this in mind one can reasonably use differentstandards in interpreting the two sets of findings.
Do Interests Differ with Different Lengths of Program Experience?
As is true throughout the study, the lack of data collected over time meansthat many of the conclusions about changes must depend on rather complicatedanalyses of the differences among people with different lengths of time in theprogram. This problem does not mean, however, that the conclusions must remainsuspect. The use of logical inference can result in a chain of reasoning whichattaches the conclusions quite tightly to the data. Unfortunately forging thechain may require patience on the part of the reader who is eager to get to theconclusions. The reward lies in being able to accept the conclusions with few-er doubts than would have been left if they had been presented with less docu-mentation.
Levels of Interest
Hith the above more or less in reserve for later tasks, '-1C nO\-1" turn to find-ings which at first seem clear enough to render further discussion unnecessa
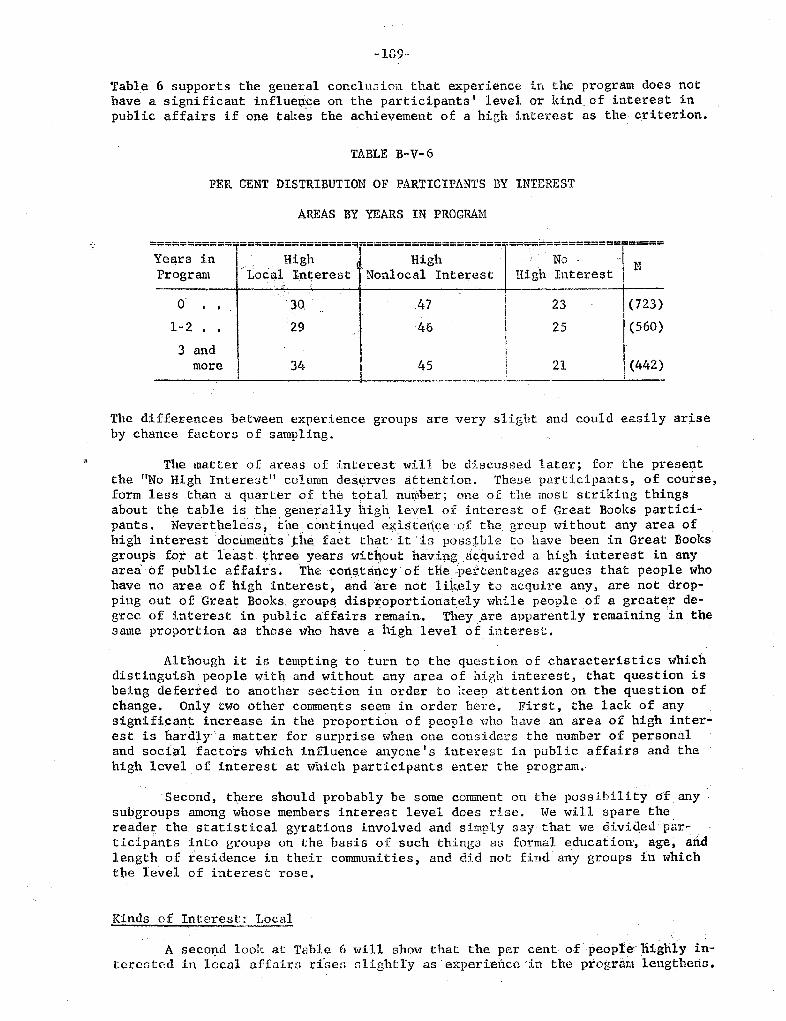
lG9..
fable 6 supports the general conclucJion that experience in the program does nothave a significant influe e on the participants I level or kind of interest public affairs if one takes the achievement of a high interest as the criterion.
TABLE B-V-6
PER CENT DISTRIBUTION OF PARTICIPANTS BY INTEREST
AREAS BY YEARS IN PROGRA
========;==-=============== ===============-==-;============== =====
Years in - High High . No.. Program Local lnt;erest Nonlocal Intet;6st Hi.gh Interest
30. (723)
1-2 (560)
3 andmore 21 . (442)
The differences between experience groups are very slight and could easily ariseby chance factors of sampling.
The matter of areas of interest will be discussed later; for the presentthe "No High Interest" column des rves attention. These participants , of course;form less than a quarter of the total mn,1ber; one of the most striking thingsabout the table is the gene ally high level of interest of Great Books partici-pants. Neverthelea's, 1:\1e conqm.\ed e iElterice oJ the group without any area ofhigh interest documei1ts 'J:he fact that: it. 1.8 possible to have been in Great Booksgroups for at least t;1:ree years without havinga:i;quired a high interest in anyarea of public affairs. Thecorts tattcy of tHe.percentages argues that people whohave no area of high interest , and are not likely to acquire any, are not drop-ping out of Great Books. group disproportionately while people of a great r de-
gree of interest in public affairs remain. . They ,are apparently remaining in thesame proportion as those who have a high level of interest.
Although it is tempting to turn to the question of characteristics whichdistinguish people with and without any area of high interest, that question isbeing deferred to another section in order to keep attention on the question ofchange. Only two other comments seem in order here. First , the lack of anysignifican1: increase in the proportion of people who have an area of high inter-est is hardly a matter for surprise when one con,;iders the number of personaland social factors which influence anyone I s interest in pub I ic affairS and thehigh level of interest at which participants enter the program.
Second, t1;ere should probably be some comment on the possibility of anysubgroups among whose members interest level does rise. We will spare thereader. the statistical gyrations involved and simply say that we dividedp';r-ticipants into groups on the basis of such things as formal education, age, aridlength of residence in their communities, and did not find any groups in whichthe level of interest rose.
Kinds of Interest: Local
A secolld look at Table 6 will show that the per cent ofpeop1e'llighly in-tcrcGted in local aIf.:irG riser; clightly ase:;:periencc ' in the program lengthena.
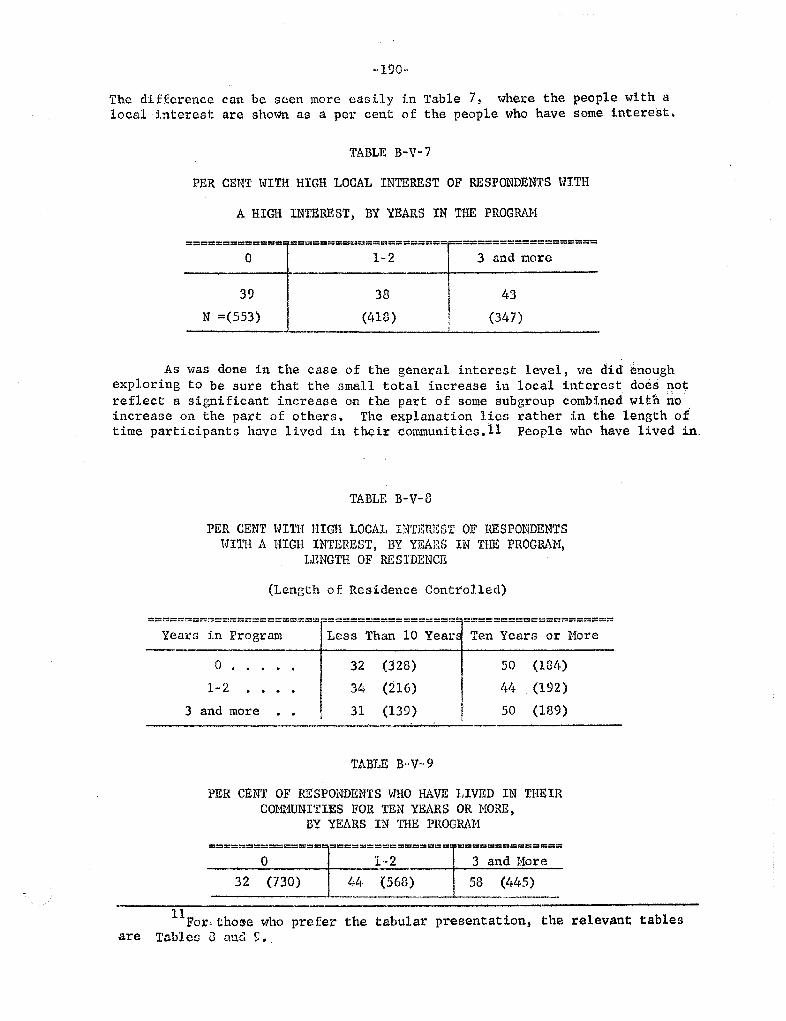
190-
The difference can be seen more easily in Table 7, where the people with alocal i.nterest are shown as a per cent of the people who have some interest.
TABLE B-V-7
PER CENT WITH HIGH LOCAL INTEREST OF RESPONDENTS WITH
A HIGH INTEREST, BY YEARS IN THE PROGRAM
=============-====================
=r===================0 1- tlnd more39 38 N =(553) (418) (347)
As was done in the case of the general inter st level, we did enoughexploring to be sure that the 3mall total increase in local interest does n01;reflect a significant increase on the part of some subgroup combined with noincrease on the part of others. The explanation lies rather in the length oftime participants have lived in their communities. 11 People whCl have lived in.
TABLE B-V-8
PER CENT \nTH HIGH LOCAL INTEREST OF HESPONDENTSWITH A HIGH INTEREST. BY YEARS IN THE PROGRAM,
LENGTH OF RE S IDENCE
(Length of Residence Controlled)
------------------------------ --------------- ---_._-- --------_.._-- -------- --------- -.---------------------------------------
Years in Program Less Than 10 Year Ten Years or More
(328) (184)
(216) !+4 (192)
3 and more (139) (189)
--------....-.
TABJ E B- V - 9
PER CENT OF RESPONDENTS V1H:O HAVE LIVED IN THEIR1UNITIES FOR TEN YEARS OR MORE
BY YEARS IN THE PROGRAM
================================-==============
(730)1..
(568 )
3 and More
(445)
For., tho&c who prefer the tabular presentation, the relevant tablesare Tableo 0 aUG
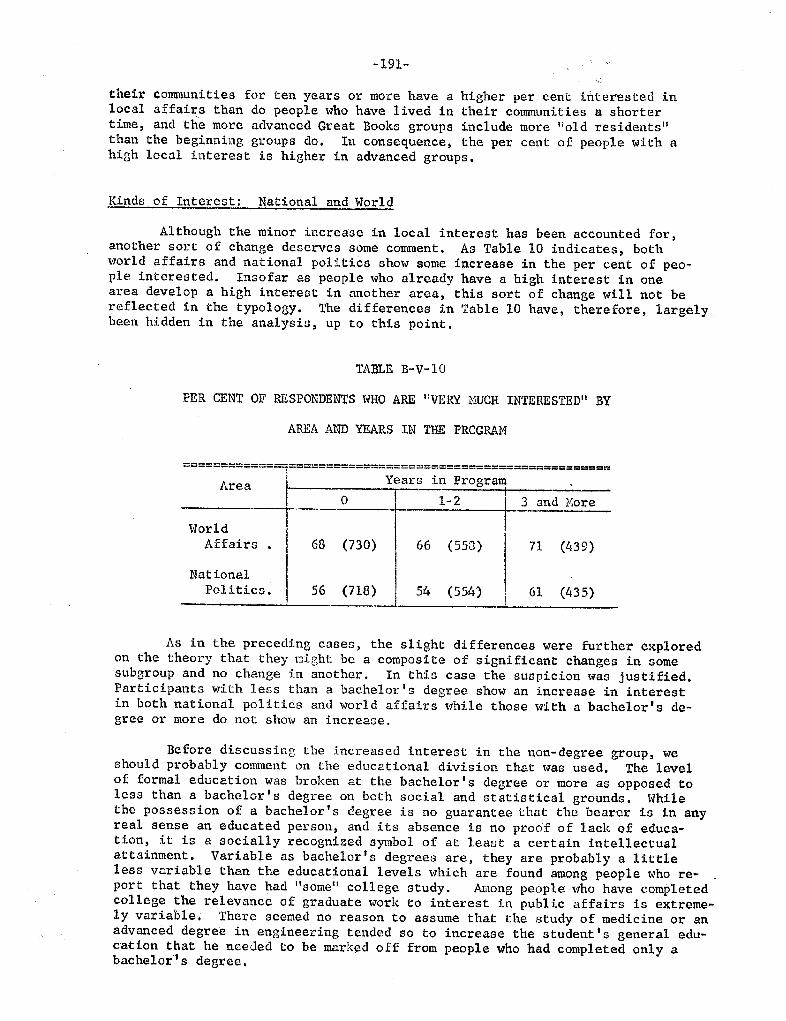
191-
their communities for ten years or more have a higher per cent inter sted inlocal affairs than do people who have lived in their communities a shortertime , and the more advanced Great Books groups include more "old residentsthan the beginning groups do. In consequence, the per cent of people with ahigh local interest is higher in advanced groups.
Kinds of Interest: National and World
Al though the minor increase in local interest has been accounted foranother sort of change deserves some comment. As Table 10 indicates, bothworld affairs and national politics show some increase in the per cent of peo-ple interested. Insofar as people who already have a high interest in onearea develop a high interest in another area, this sort of change will not bereflected in the typology. The differences in Table 10 have, therefore, largelybeen hidden in the analysis, up to this point.
TABLE B-V-lO
PER CENT OF RESPONDENTS HHO ARE liVERY HUCH INTEIlESTED" BY
AREA AND YEARS IN THE PROGRAM
============= ========================== ================
Years in Program
1-2Area
3 and Nore
\-1orldAffairs (730) (553) (439)
Nat ional
Politics. (718) (554) (435)
As in the preceding cases , the slight differences were further exploredon the theory that they oight be a composite of significant changes in somesubgroup and no change in another. In this case the suspicion was justified.Participants with less than a bachelor I s degree show an increase in interestin both national politics and world affairs while those with a bachelor I s de-gree or more do not show an increase.
Before discussing the increased interest in the non-degree group, weshould probably comment on the educational division that was used. The levelof formal education was broken at the bachelor I s degree or more as opposed toless than a bachelor I s degree on both social and statistical grounds. Hhilethe possess ion of a bachelor I s degree is no guarantee that the bearer i3 in anyreal sense an educated person, and its absence is no proof of lack of educa-tion, it is a socially recognized symbol of at least a certain intellectualattainment. Variable as bachelor s degrees are , they are probably a littleless variable than the educational levels which are found among people who re-port that they have had " some" college study. Among people who have completedcollege the relevance of graduate work to interest in public affairs is extreme"ly variable. There seemed no reason to assume that the study of medicine or anadvanced degree in engineering tended so to increase the student' s general edu-tion that he needed to be marked off from people who had completed only a
bachelor s degree.
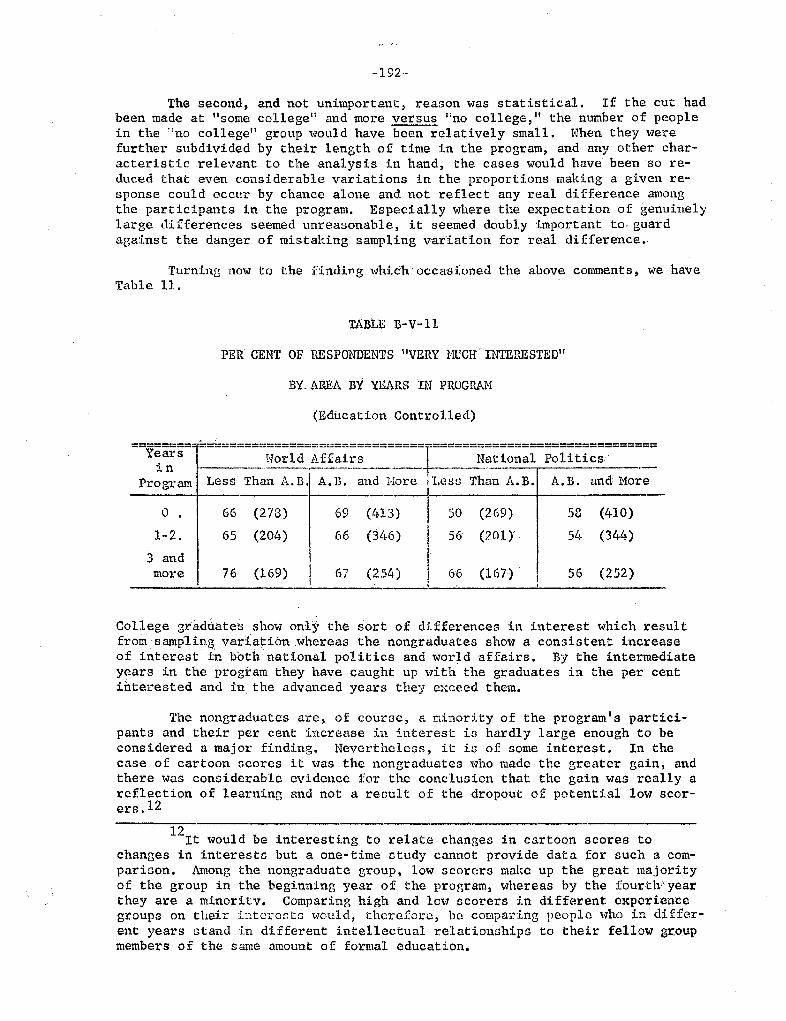
192-
The second , and not unimportant , reason was statistical. If the cut hadbeen made at "some college lt and more versus no college " the number of peoplein the "no collegell group would have been relatively small. VJhen they werefurther subdivided by their length of time in the program, and any other char-acteristic relevant to the analysis in hand, the cases would have been so re-duced that even considerable variations in the proportions making a given re-sponse could occur by chance alone and not reflect any real difference amongthe participants in the program. Especially where the expectation of genuinelylarge differences seemed unreasonable , it seemed doubly important to, guardagainst the danger of mistaking sampling variation for real difference..
Turning now to the finding which occasioned the above comments , we haveTable 11.
TABLE B- V-
PER CENT OF RESPONDENTS liVERY HUCrr ' INTERESTED"
BY, AREA BY YEARS IN PROGRAM
(Education Controlled)
~~~~=- =========
;ld= ff:
;;======== ====== ~~~~
:l=
~~~~;=======
1n - tProgram Less Than A. B. A. B. and Mo ass Than A.B. A. B. and More
o . 66 (273) 69 (413) . 50 (269) 58 (410)2. 65 (204) 66 (146) 56 (201 Y 54 (344)3 and more 76 (169) 67 (254) 66 (167) (252)
College gradtla.tea show only the sort of differences in interest which resultfrom sampling variatiOn whereas the nongraduates show a consistent increaseof interest :in bbthnational politics and world affairs. By the intermediateyears in the program they have caught up with the graduates in the per centinterested and in the advanced years they exceed them.
The nongraduates are, of course, a minority of the program s partici-pants and their per cent increase i11 interest is hardly large enough to beconsidered a major finding. Nevertheless, it is of some interest. In thecase of cartoon scores it was the nongraduates who made the greater gain, andthere was considerable evidence for the conclusion that the gain was really areflection of learning and not a result of the dropout of potential low scor-ers .
It would be interesting to relate changes in cartoon scores tochanges in interests but a one- time study cannot provide data for such a com-parison. Among the nongraduate group, low scorers make up the great majorityof the group in the beginning year of the program, whereas by the fourth-yearthey are a minority. Comparing high and low scorers in different experiencegroups on their i tcroc.tc would , therefore, be comparing people who in differ-ent years stand in different intellectual relationships to their fellow groupmembers of the same amount of formal education.
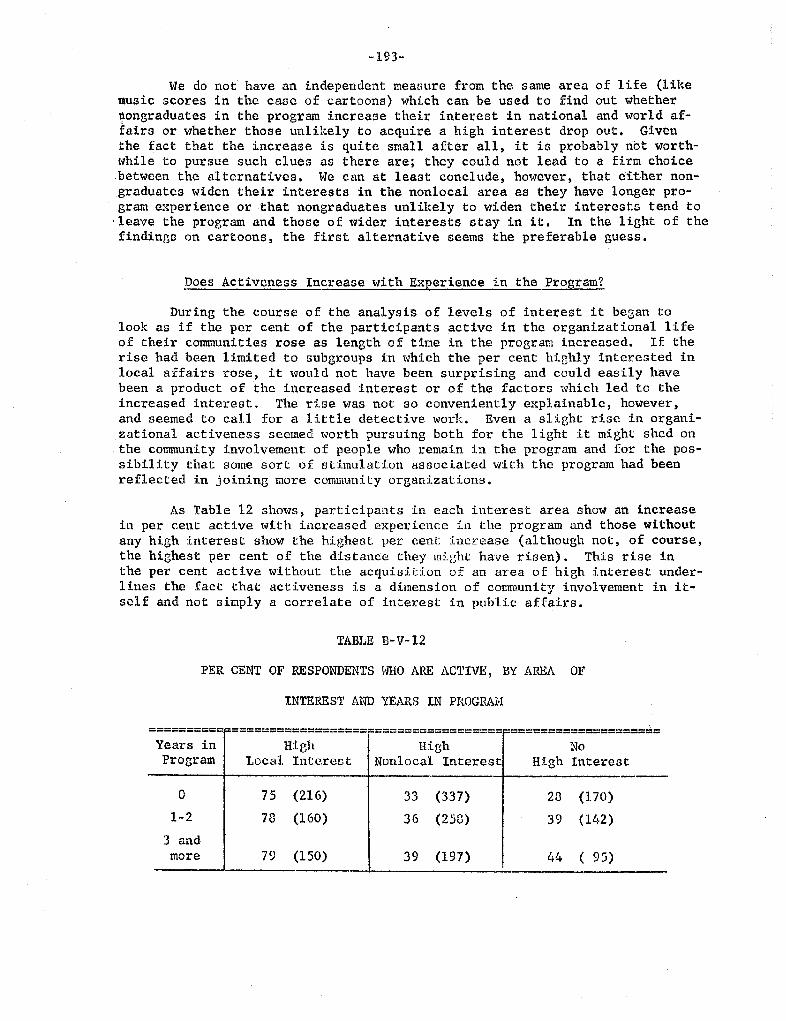
193-
We do not have an independent measure from the. same area of life (likenusic scores in the caae of cartoons) which can be used to find out whetherongraduates in the program increase their interest in national and world af-fairs or \vhether those unlikely to acquire a high interest drop out. Giventhe fact that the increase is quite small after all, it is probably not worth-while to pursue such clues as there are; they could not lead to a firm ehoicebet\'men the alternatives. He can at least conclude, hmvever, that efther non-graduates widen their interests in the nonlocal area as they have longer pro-gram experience or that nongraduates unlikely to widen their interests tend to,leave the program and those of ,dder interests stay in it. In the light of thefindings on cartoons, the first alternative seems the preferable guess.
Does Activcness Increase with Experience in the Program?
During the course of the analysis of levels of interest it began tolook as if the per cent of the participants active in the organizational lifeof their communities rose as length of time in the prograr:l increased. If therise had been limited to subgroups in which the per cent highly interested inlocal affairs rose , it would not have been surprising and could easily havebeen a product of the increased interest or of the factors which led to theincreased interest. The rise was not so conveniently explainable, however,and seemed to call for a little detective worL. Even a slight rise in organi-zational activeness seemed worth pursuing both for the light it might shed onthe community involvement of people who remain in the program and for the pos-sibility that some sort of stimulation associated with the program had beenreflected in joining more community organizations.
As Table 12 shows , participants in each interest area show an increasein per cent active with increased experience in the program and those withoutany high interest show the highest per cent increase (although not, of course,the highest per cent of the distance they might have risen). This rise inthe per cent active without the acquisition of an area of hi8h interest under-lines the fact that activeness is a dirnension of community involvement in it-self and not simply a correlate of interest in public affairs.
TABLE B-V-
PER CENT OF RESPONDENTS WHO ARE ACTIVE, BY ARE
INTEREST AND YEARS IN PROGP
;;;;;;;;;= :;=;================================= =====================
Years in High High Program Local Intercut Nonlocal Interest High Interest
(216)
(160)
(337)
(258)
(170)
(llf2)3 andmore (150) (197) ( 95)
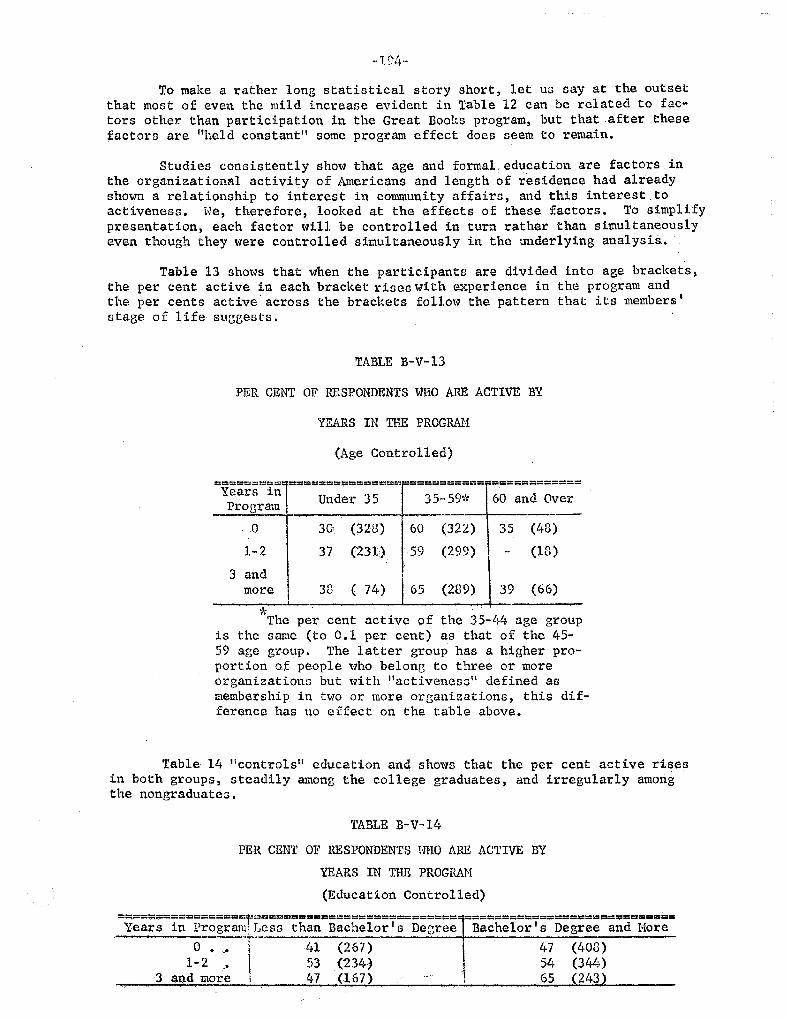
1. 04..
To make a rather long statistical story short , let us say at the outsetthat most of even the mild increase evident in Table 12 can be related to fac-tors other than participation in the Great Books program, but that after thesefactors are "held constant" some program effect does seem to remain.
Studies consistently show that age and formal ( education are factors inthe organizational activity of Americans and length of residence had alreadyshown a relationship to interest in community affairs, and this interest toactiveness. He, therefore, looked at the effects of these factors. To simplifypresentation, each factor will be controlled in turn rather than simultaneouslyeven though they were controlled simultaneously in the underlying analysia.
Table 13 shows that when the participants are divided into age brackets,the per cent active in each bracket rises with experience in the program andthe per cents active across the brackets follow the pattern that its membersstage of life suggests.
TABLE B- V-13
PER CENT OF RESPONDENTS WHO ARE ACTIVE BY
YEARS IN THE PROGPJU1
(Age Controlled)
Y;:
==== :;= ===
r==
:;;:== ::;=
30: (323) (322) (48)
(231) :59 (299) (18)andmore (289) (66)
The per cent active of the 35- 44 age groupis the same (to 0. 1 per cent) as that of the 45-S9 age group. The latter group has a higher pro-portion of people who belong to three or moreorganizations but with Itactiveness" defined asmembership in two or more organizations, this dif-ference has ! O effect on the table above.
Table 14 1' controls" education and shows that the per cent active risesin both groups, steadily among the college graduates, and irregularly amongthe nongraduates.
TABLE B-V-14
PER CE T OF RESPONDENTS WHO ARE ACTIVE BY
YEARS IN THE PROGRAH
(Education Controlled)
================ ===========================-============================
Years in prog es3 than BaChelor ' 3 Degree Bachelor s Degree and More
o . JO 41 (267) 47 (408)1- 2 (23 54 (344)
3 an.d luore 4"7 (167) .
. ..
65 (243)
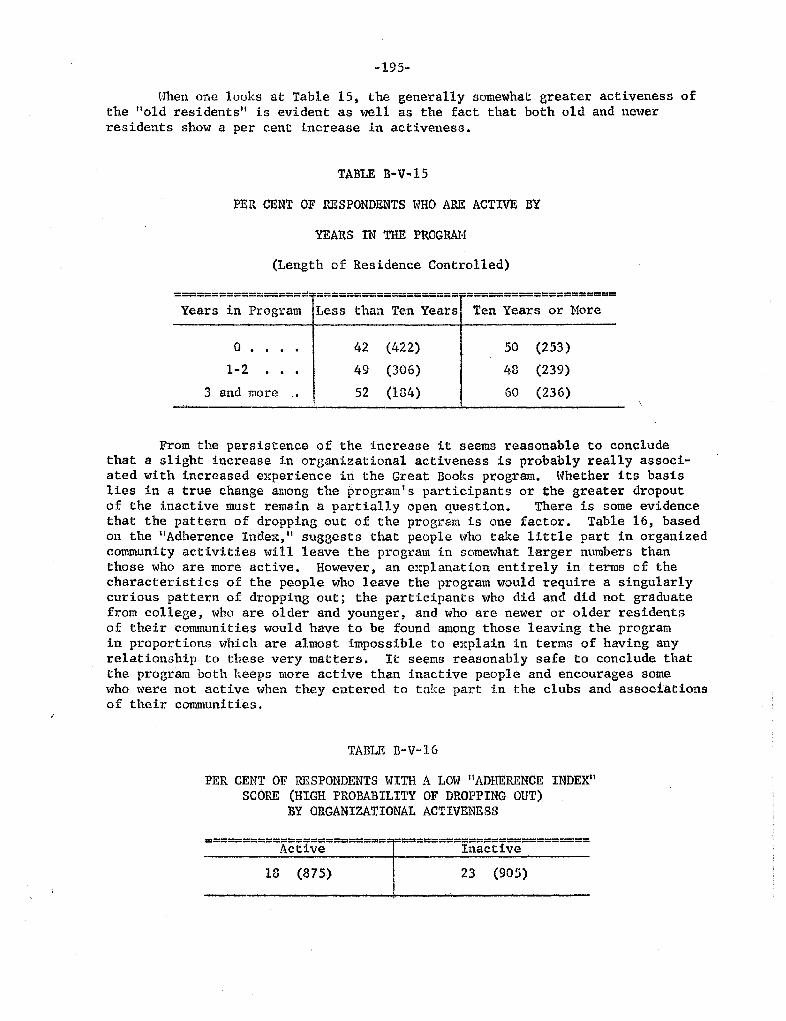
195-
t1hen one looks at Table l5, the generally somewhat greater activeness ofthe Hold residents" i.s evident as well as the fact that both old and ne'o1erresidents show a per cent increase in activeness.
TABLE B-V..
PER CENT OF RESPONDENTS t\IO ARE ACTIVE BY
YEARS IN THE PROGRAM
(Length of Residence Controlled)
------------.----------------- ------ ===============;===-====================
Years in Program Less than Ten Years Ten Years or More
. .
(422)
(306)
(134 )
(253)
(239)
(236)
o . .
. .
3 and more
From the persistence of the increase it seems reasonable to concludethat a slight increase in organizational activeness is probably really associ-ated with increased experience in the Great Books program. Whether its basislies in a true change among the progr n I s participants or the greater dropoutof the inactive must remain a partially open question. There is some evidencethat the pattern of dropping out of the program is one factor. Table 16, based011 the "Adherence Inde , II suggests that people who take little part in organizedcommunity activities will leave the progrwn in somewhat larger numbers thanthose who are more active. However , an e planation entirely in terms of thecharacteristics of the people who leave the program would require a singularlycurious pattern of dropping out; the participants who did and did not graduatefrom college , who are older and younger, and who are newer or older residentsof their cornnunities would have to be found among those leaving the programin proportions which are almost impossible to explain in terms of having anyrelationship to these very matters. It seems reasonably safe to conclude thatthe program both keeps more active than inactive people and encourages somewho \o1ere not active when they entered to take part in the clubs and associationsof their communities.
TABLE B-V-16
PER CENT OF RESPONDENTS tnTH A LOW IIADHERENCE INDEX"SCOP (HIGH PROBABILITY OF DROPPING OUT)
BY ORGANIZATIONAL ACTIVENESS
---------------------------------
Active-------
======== ~~~ =========
(875) (905)
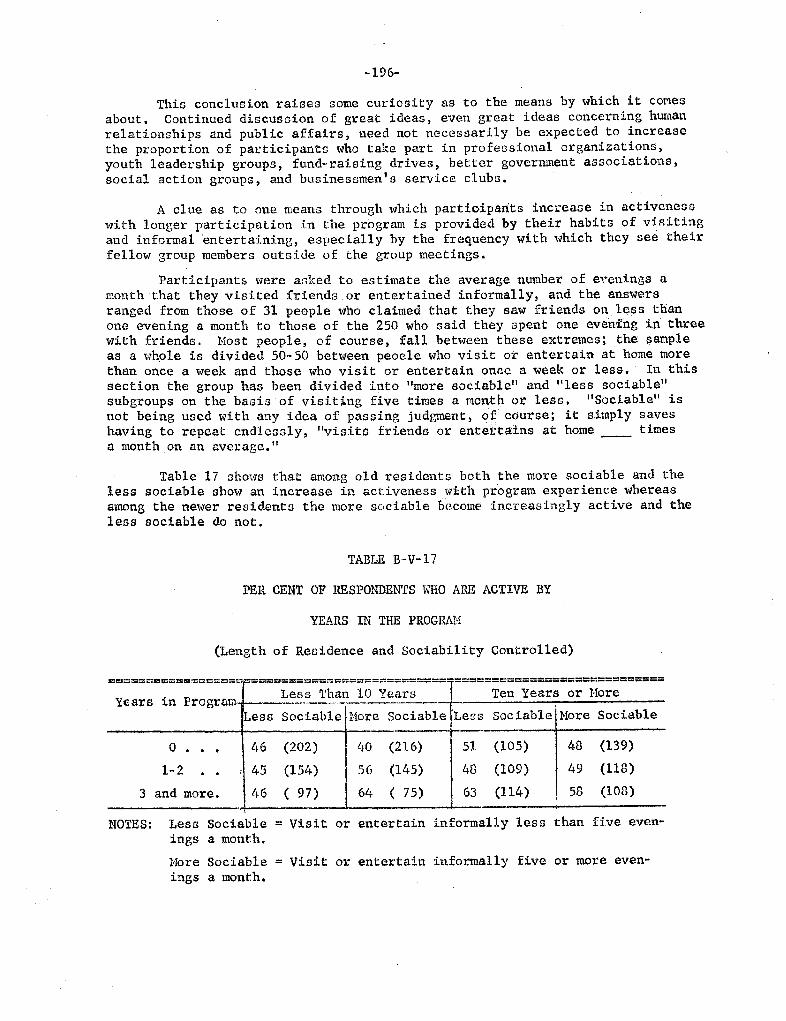
196-
This conclusion raises some curiosity as to the means by which it COMesabout. Continued discussion of great ideas, even great ideas concerning humanrelationships and public affairs, need not necessarily be e)cpected to increase
the proportion of participants who take part in professional organizations,youth leadership groups , fund-raising drives, better government associations,social action groups, and businessmen s service clubs.
A clue as to one means through which partic.iparits increace in activenesswith longer participation i.n the program is provided by their habits of vir,itingand informal
. .
entertaining, especially by the frequency with which they see theirfellow group members outside of the group meetings.
Participant& were aGked to estimate the average number of evenings amonth that they visited friends or entertained informally, and the answersranged from those of 31 people who claimed that they saw friends on less thanone evening a month to tllose of the 250 who said they spent one evening i threewith friends. Most people , of course, fall between these extremes; the sampleas a ,,yhole is divided 50- 50 between peocle who visit or entertain at home morethan once a week and those who visit or entertain once a week or less. In thissection the group has been divided into "more sociable'! and I1less sociablesubgroups on the basis of visiting five times a month or less. IISociable" isnot being used with any idea of passing judgment) of c6urse; it simply saveshaving to repeat endlessly, IIvisits friends or en:tet;tains at home timesa month on an average.
Table 17 shows that among old residents both the more sociable and theless sociable show an increas in activenesswitll program experience whereasamong the newer residents the more sociable Dccome increasingly active and theless sociable do not.
TABLE B"V-17
PER CENT OF RESPONDENTS HHO ARE ACTIVE BY
YEARS IN THE PROGRAM
(Length of Residence and Sociability Controlled)
================= =====
;h:
=:;:====
I=====
:;== ======
Years in 1?rogra
.." ----
Less Sociable Hore Sociable Less Sociable More Sociable
(202) (216) (105) (139)
l-2 (154) (145) (109) (118)
and more. 97) 75) (l14) (108)
NOTES: Less Sociable = Visit or entertain informally less than five even-ings a month.
More Sociable = Visit or entertain informally five or more even-ings a month.
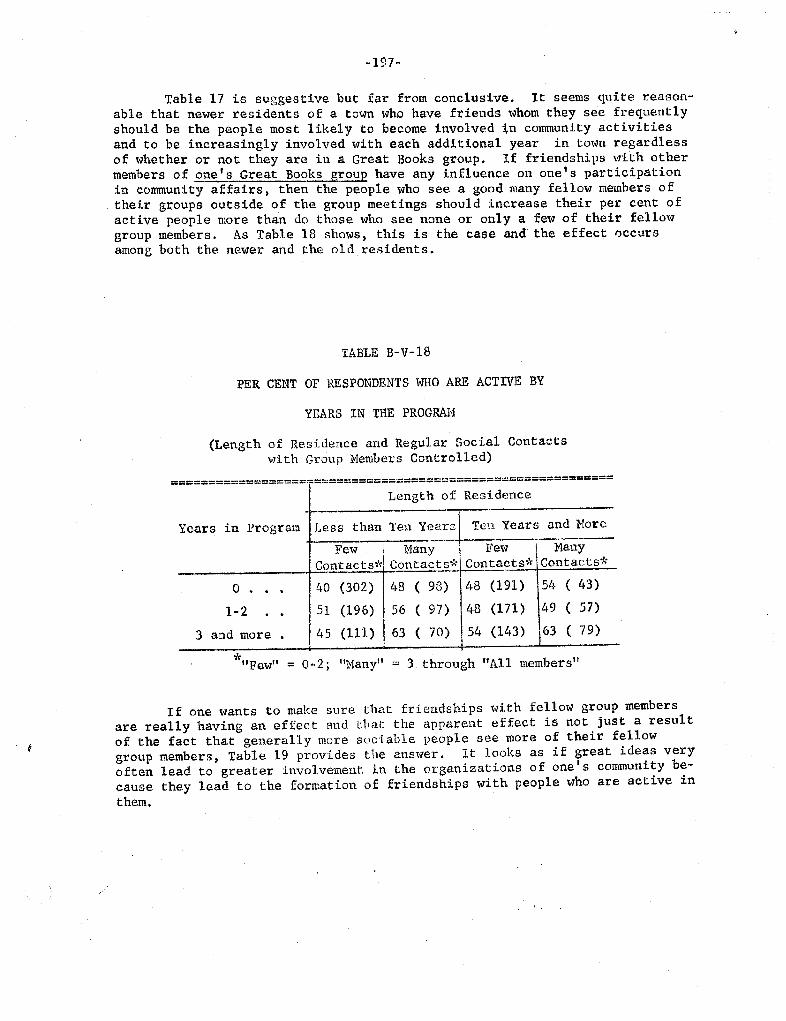
197-
Table 17 is suggestive but far from conclusive. It seems quite reason-able that newer residents of a town who have friends whom they see frequentlyshould be the people most likely to become involved in community activitiesand to be increasingly involved with each additional year in town regardless
of whether or not they are in a Great Books group. If friendships with othermembers of one s Great Books group have any influence on one s participationin community affairs, then the people who see a good many fellow members oftheir groups outside of the group meetings should increase their per cent ofactive people more than do those who see none or only a few of their fellowgroup members. As Table 18 shows, this is the case and the effect ccursamong both the newer and the old residents.
TABLE B-V-
PER CENT OF RESPONDENTS WHO ARE ACTIVE BY
YEARS IN HE PROGRAM
(Length of Residence and Regular Social Contactswith Group Menilers Controlled)
==================-========================================
Length of Residence
Years in Program Less than Ten Years Ten Years and More
Few Many Few ManyContacts*! Contacts* ntacts* Contacts*
.. .. .
40 (302)
51 (196)
45 (111)
48 ( 98)
56 ( 97)
63 ( 70)
48 (l91) 54 ( 43)
48 (l7l) 49 ( 57)
\54 (143) J 63 ( 79)
1-2
3 and more
Few" = 0-2; "Nany" ;; 3 through "All members
If one wants to make sure that friendships with fellow group membersare really having an effect and tha.t the apparent effect is not just a resultof the fact that generally more sod able. people see more of their fellowgroup members , Table 19 provides the answer. It looks as if great ideas veryoften lead to greater involvement in the organizations of one
I s community be-
cause they lead to the formation of friendships with people who are active inthem.
. .
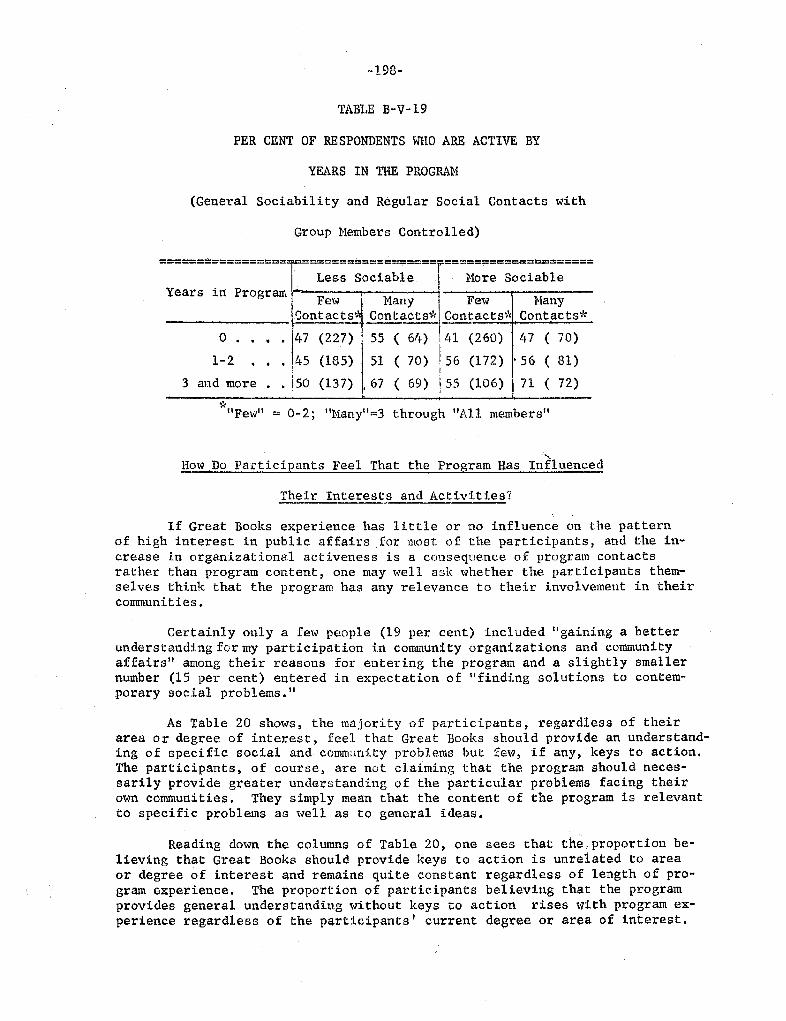
198-
TABLE B-V-
PER CENT OF RE SPONDENTS WHO ARE ACTIVE BY
YEARS IN THE PROGRAM
(General Sociability and Regular Social Contacts with
Group Members Controlled)
================= ================== ====================
ess Sociable More SociableYears in Program
r,"any ew Hany
Gont acts* ..ontacts ' Contactso . . . . 147 (227) . 55 ( 64) 41 (260) 47 ( 70)
1-2 . . . 145 (185) 5l ( 70) 56 (172) . 56 ( 81)3 and more . i50 (137) . 67 ( 69) 55 (106) 71 ( 72)
Few" = 0-2; "Hany =3 through "All members
How Do Pat"ticipants Feel That the Program Has Influenced
eir Inte ests and Activities
If Great Books experience has little or no influence on the patternof high interest in public affairs for most of the participants , and the in-crease in organizational activeness is a consequence of program contactsrather than program content , one may well ask whether the participants them-selves think that the program has any relevance to their involvement in theircommunities.
Certainly only a few people (19 per cent) included " gaining a betterunderstanding for my participation in community organizations and communityaffairs" among their reasons for entering the program and a slightly smallernumber (15 per cent) entered in expectation of "finding solutions to contem-porary social problems.
As Table 20 shows, the majority of participants, regardless of theirarea or degree of interest, feel that Great Books should provide an understand-ing of specific social and cornanity problems but fe,01, if any, keys to action.The participants, of course, are not claiming that the program should neces-sarily provide greater understanding of the particular problems facing theirown communities. They simply mean that the content of the program is relevantto specific problems as well as to general ideas.
Reading down the columns of Table 20 , one sees that the, proportion be-lieving that Great Books should provide keys to action is unrelated to areaor degree of interest and remains quite constant regardless of length of pro-gram experience. The proportion of participants believitlg that the programprovides general understanding without keys to action rises with program ex-perience regardless of the participants I current degree or area of interest.
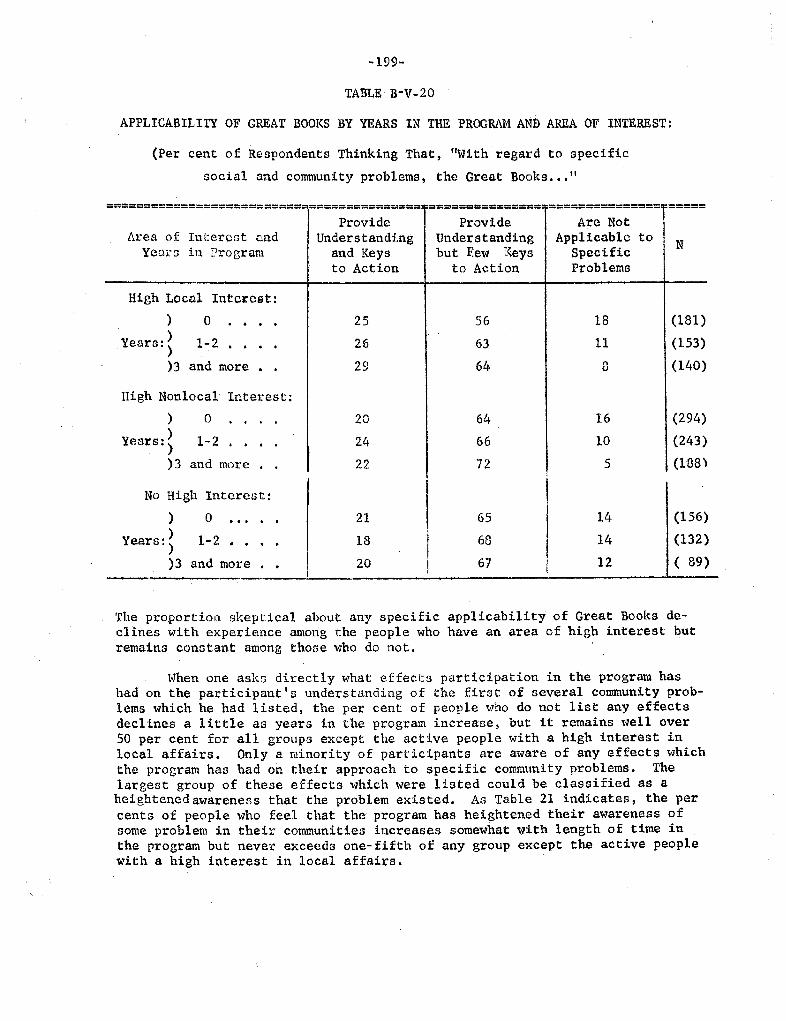
199-
TABLE B-
APPLICABILITY OF GREAT BOOKS BY YEARS IN THE PROGRAM AND AREA OF INTEREST:
(Per cent of Respondents Thinking That
, "
With regard to specific
social and community problems, the Great Books...
=================== ====== =============== ---------------- --------------- -------------------- ---------------
Provide Provide Are NotL\rea IntercfJt and Unders tanding Understanding Appl icablc
Year:J Pro gr am and Keys but F.ew Keys SpecificAct ion Action Problems
High Local Interes t:(181)
Years: (l53)and more (140)
High Nonlocal Interest:(294)
1-2 (243)Years:and more (188)
High Intere:3 t:
...
(l56)
Years: (132)
and more 89)
The proportion skeptical about any specific applicability of Great Books de-clines with experience among the people who have an area of high interest butremains constant among those who do not.
Hhen one aska directly what effects participation in the program hashad on the participant I s understanding of the first of several community prob-lems which he had listed, the per cent of people who do not list any effectsdeclines a little as years in the program increase, but it remains well over50 per cent for all groups e,ccept the active people with a high interest inlocal affairs. Only a minority of participants are aware of any effects whichthe program has had on their approach to specific community problems. Thelargest group of these effects which were listed could be classified as aheightened awareness that the problem existed. As Table 21 indicates, the percents of people who feel that the program has heightened their awareness ofsome problem in their communities increases somewhat with length of time inthe program but never exceeds one- fifth of any group except the active peoplewith a high interest in local affairs.
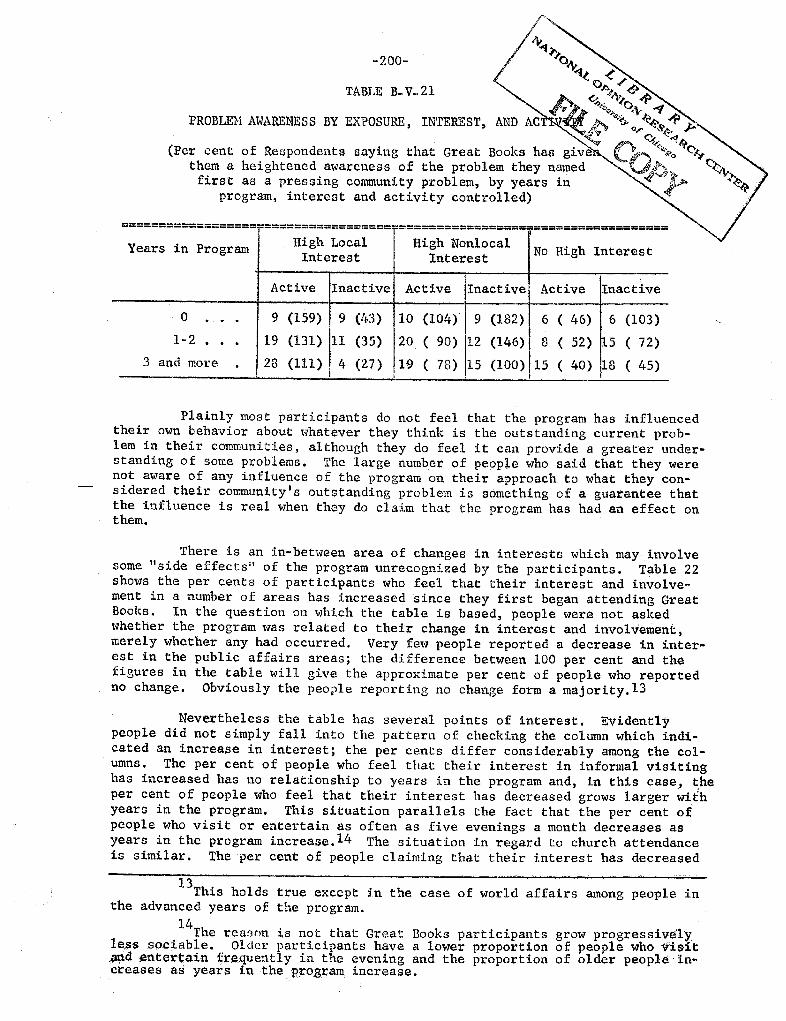
200-
TABLE B- V- 21
PROBLEM AWARENESS BY EXPOSURE , INTEREST
====================================-=================-==================
Years in Program High Local High Nonlocal No High Interes tInterest Interest
Active Inactive Active Inactive Active Inactive
9 (159) (lf3) 10 (104) 9 (182) 6 (46) 6 (103)
1- 2 . 19 (131) 11 (35) 20 ( 90) 12 (146) 8 ( 52) 15 ( 72)
3 and more 28 (111) , 4 (27) 19 ( 78) 15 (100) 15 ( 40) I ( 45)
Plainly most participants do not feel that the program has influencedtheir own behavior about whatever they think is the outstanding current prob-lem in their communities, although they do feel it can provide a greater under-standing of some problems. The large number of people who said that they werenot aware of any influence of the program on their approach to what they con-sidered their community s outstanding problem is something of a guarantee thatthe influence is real when they do claim that tbe program has had an effect onthem.
There is an in-between area of changes in interests which may involvesome " side effects" of the program unrecognized by the participants. Table 22shows the per cents of participants who feel that their interest and involve-ment in a number of areas has increased since they first began attending GreatBooks. In the question on which the table is based, people were not askedwhether the program was related to their change in interest and involvementmerely whether any had occurred. Very few people reported a decrease in inter-est in the public affairs areas; the difference between 100 per cent and thefigures in the table will give the approximate per cent of people who reportedno change. Obviously the people reporting no change form a majority. 13
Nevertheless the table has several points of interest. Evidentlypeople did not simply fall into the pattern of checking the column which indi-cated an increase in interest; the per cents differ considerably among the col-umns. The per cent of people who feel that their interest in informal visitinghas increased has no relationship to years in the program and, in this caseper cent of people who feel that their interest has decreased grows larger withyears in the program. This situation parallels the fact that the per cent ofpeople who visit or entertain as often as five evenings a month decreases asyears in the program increase. 14 The situation in regard to church attendanceis similar. The per cent of people claiming that their interest has decreased
This holds true except in the case of world affairs among people inthe advanced years of the program.
The reason is not that Great Books participants8$ s9ciable. Older participants have a lower proportiondentertai.n frequently in the evening and the proportion
creases as years in the program increase.
grow progressivelyof people who visitof older people in-
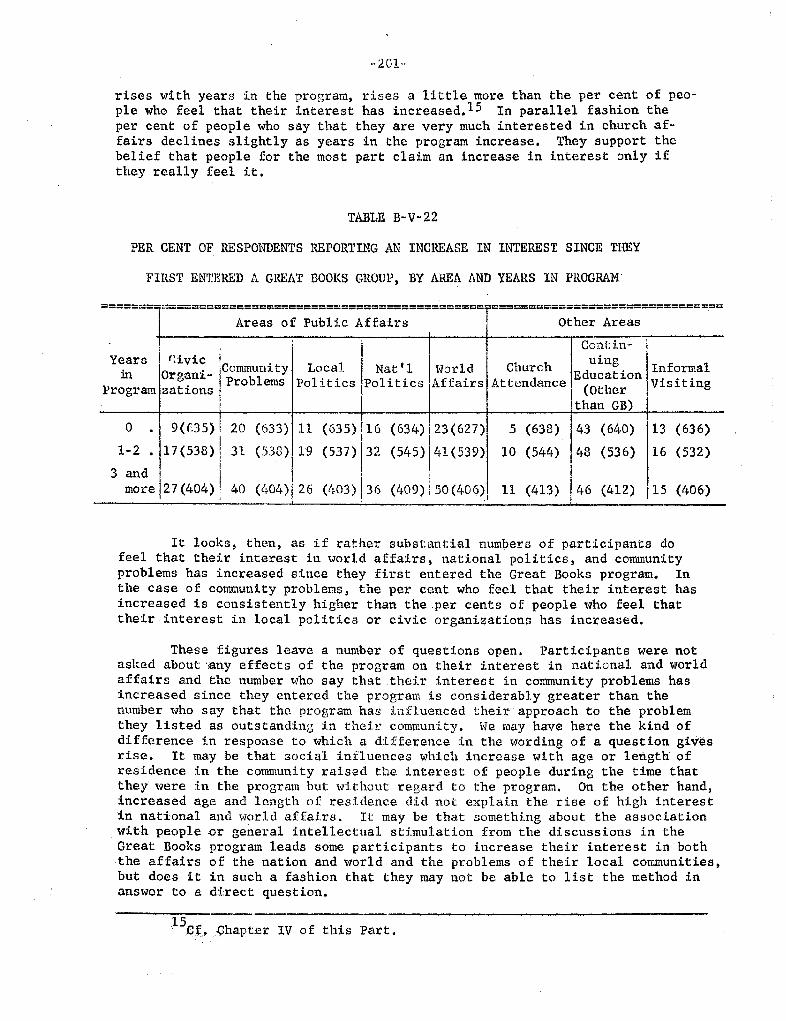
201"
rises with years in the program, rises a little more than the per cent of peo-ple who feel that their interest has increased. IS In parallel fashion theper cent of people who say that they are very much interested in church af-fairs declines slightly as years in the program increase. They support thebelief that people for the most part claim an increase in interest only ifthey really feel it.
TABLE B-V-22
PER CENT OF RESPONDENTS REPORTING AN INCREASE IN INTEREST SINCE THEY
FIRST ENTERED A GREAT BOOKS GROUP, BY AREA AND YEARS IN PROGRAM'
======
"1==--=
:;:::=: :;;:;;:.== ===-=--=====-=~~~:::::::: -====-=-==
Years ! ( ivic I I uing'Commun ty Local Nat Horld Church
!EdInformalJ. n1-
Problems Politics Politics Affairs Attendance : wn Visitingrogram zat1.ons
than GB)
9(05) 20 (633) 11 (635) 16 (634) 23(627) 5 (638) 43 (640) 13 (636)
17(538) I2 . 31 (538) 19 (537) 132 (54S) 41 (539) 10 (544) 48 (536) 16 (532)
3 and27 (404) Imore 40 (404)1 (/.03) (409) 50(406)1 11 (413) 46 (412) 15 (406)
It looks, then, as if rather substantial numbers of participants dofeel that their interest in world affairs, national politics, and communityproblems has increased since they first entered the Great Books program. the case of community problems, the per cent who feel that their. interest hasincreased is consistently higher than the per cents of people who feel thattheir. interest in local politics or civic organizations has increas€:d.
These figures leave a number of questions open. Participants were notasked about1any effects of the prog1."am on their interest in national and worldaffairs and the number who say that their interest in community problems hasincreased since they entered the program is considerably greater than thenumber who say that the program has influenced their approach to the problemthey listed as outstanding in their community. He may have here the kind ofdifference in response to which a difference in the wording of a question givesrise. It may be that social influences which incrcase with age or length ofresidence in the community raised the interest of people during the time thatthey were in the program but wi thout regard to the program. On the other handincreased age and length of residence did not explain the rise of high interestin national and world affairs. It may be that something about the associationwith people or general intellectual stimulation from the discussions in theGreat Books program leads some participants to increase their interest in boththe affairs of the nation and world and the problems of their local communities,but does it in such a fashion that they may not be able to list the method inanswer to a direct question.
(:hapter IV of this Part.
202-
Conc 1 u s ions
The findings of this subsection return us to the discussion with whichthe general section opened: differences in answers to the subjective and ob-jective questions. It appears that in general participants feel that GreatBooks are relevant to specific social problems insofar as they provide agreater understanding, and they feel that they have gained a somewhat greaterunderstanding and awareness from their participation in the program. When oneturns to the kinds of fairly great changes in interests to which the objectivequestions refer, one conc1 Jdes that the increases which the participants feelhave not been great enough to move many people from one category of interestto another. The felt changes are probably real enough but are not great enoughto change the pattern of high interests.
In general , Great Books experience seems to have little or no effect onthe participants ' tendency to focus their high interest on a given area of thecommunity or world. Increased program experience may be related to increasedactiveness within the relatively inflexible interest areas, however.
Regardless of whether objective changes occur as a result of programexperience , the generally high level of the participants I interests and activity
destroys any basis for the impression that they are people \1ho withdraw fromthe active world of affairs. Although they are relatively more interested inthe world and national scene, large numbers are interested in their home com-munities and take an active part in conmunity affairs.
Because of the focus of the analysis on possible changes with programexperience, the characteristics which distinguish people with high local andnonlocal interests have been withheld. One hint of them appears in the chapteron cartoon scores, and it is an important enough matter to deserve analysis ina section on community involvement. Whether or tlQt the participants I objectivecommunity involvement changeG as a result of 'program participation, it is ofconsiderable interest to know what factors influence the nature of the communityinvolvement of such a large sample of rather well-educated Americans as GreatBooks participants form. The next section turns to this analysis.
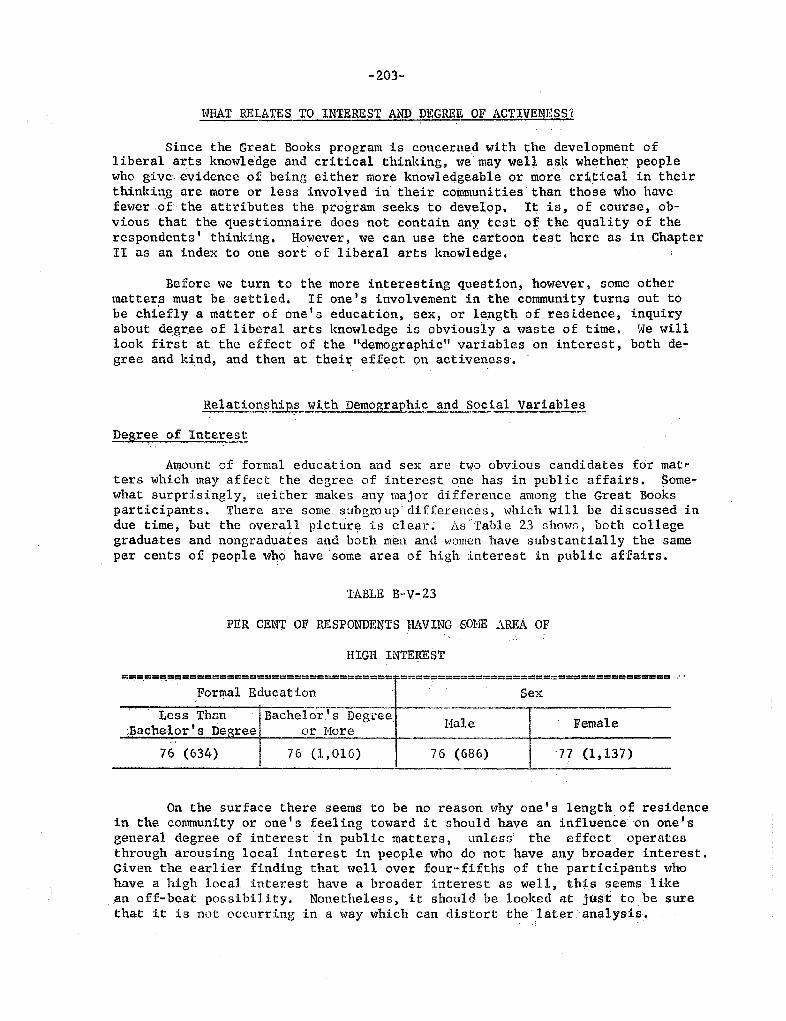
- 203-
WHAT RELATES TO INTEREST AND DEGREE OF ACTIVENESS?
Since the Great Books program is concerned with t,he development ofliberal arts knm-;ledge and critical thinking, 'l1emay well as.k whether peoplewho give- evidence of being either more knowlecJgeable or more critical in theirthinking are more or less involved in their communities than those who havefewer of the attributes the program seeks to develop. J:t. is, of course, ob-vious that the questionnaire does not contain any test . 0; the quality of therespondents ' thinking. However, we can use the cartoon test here as in ChapterII as an index to one sort of liberal arts knowledge.
Before we turn to the more interesting question, however, some othermatters must be settled. If one s involvement in the community turns out tobe chiefly a matter of one s education, sex, or length of residence, inquiryabout degree of liberal arts knowledge is obviously a waste of time. We willlook first at the effect of the "demographic" variables on interest, both de-gree and ki.nd, and then at thei1; effect on activeness.
Relation hiRS with DemoRraphic and Soc al Variables
pegree of Interest
Amount of forrnal education and sex are two obvious candidates for matters which may affect the degree of interest one has in public affairs. Some-what surprisingly, neither makes any major difference among the Great Booksparticipants. There are some subgIrup differences , which will be discussed indue time, but the overall picture is cleal Table 23 shomJ , both collegegraduates and nongraduai:es and both men and women have substantially the sameper cents of people who have some area of high interest in public affairs.
TABLE B-V-
PER CENT OF RESPONDENTS llAVINGSOrff REA OF
HIGH INTEREST
=== ============================ .--....----------------------------------"'''------------------- ---------------
Formal Educat ion Sex
Less Than Bachelor'S Degre Hale FemaleBachelor Degree More
(634) 016) (686) (1, 137)
On the surface there seerns to be no reason why one s length of residencein the community or one s feeling toward it should have an influence on onegeneral degree of interest in public matters, unlcsG' the effect operatesthrough arousing local interest in people who do not have any broader interest.Given the earlier finding that 'l1ell over four- fifths of the participants whohave a high local interest have a broader interest as well , this seems likean off-beat possibility. Nonetheless , it should be looked at just to be surethat it is not occurrin! in a ,-;ay which can distort the laterana.lysis.
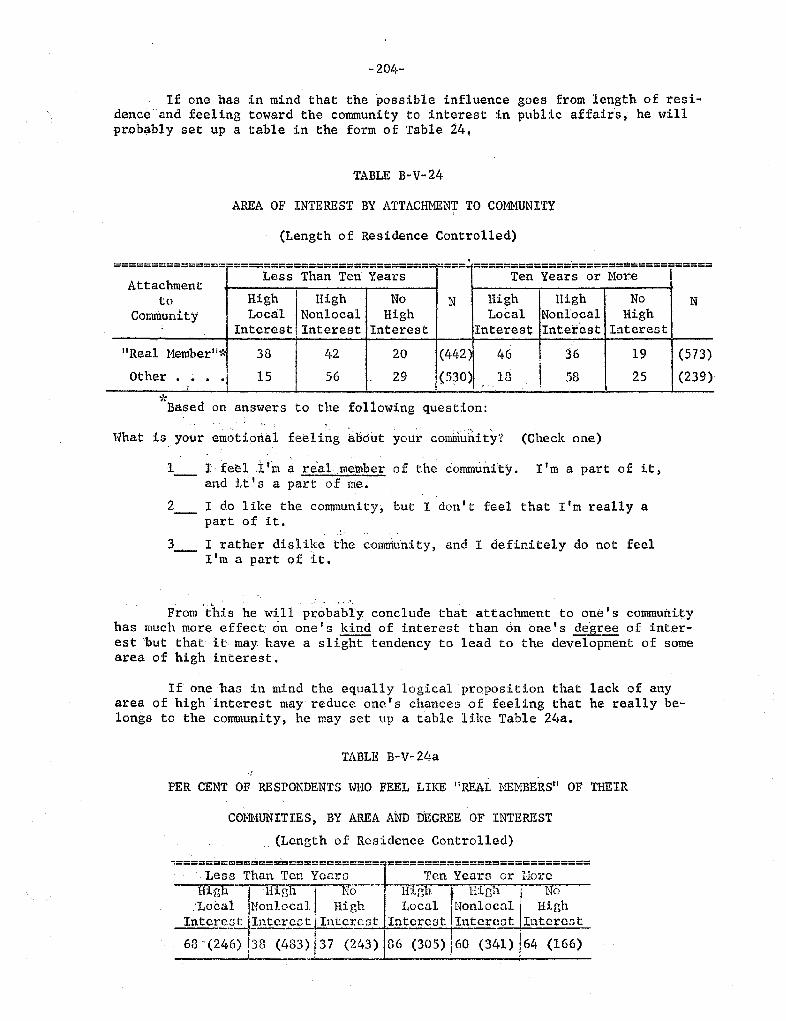
- 204-
If one has in mind that the possible influence goes from length of resi-denceand feeling toward the community to interest in public affairs, he willprobably set up a table in the form of Table 24.
TABLE B- V - 24
AREA OF INTEREST BY ATTACHMENT TO COMMUNITY
(Length of Residence Controlled)
=-============;:::-===========================....=== ==================== ;==-=======
AttachmentLess Than Ten Years Ten Years More
High High High HighCOrnunity Local Nonlocal High Local Nonlocal High
Interest Interest Interest Interest; Interest InterestReal l1ember ( 442 \ (573)
Other (530) (239),. C
?':
Based on answers to the following question:
Hhat is your emotiorial feeling about your commuhity? (Check one)
:t fe I 'in a realm mber of the community.and it' s a part of me.
I do like the community, but I don t feel that I' m really apart of it.
m a part of it,
, .
I rather dislike the community, and I definitely do not feelm a part of it.
'-
From this he will probably conclude that attachment to one I s communityhas much more effect on one I s kind of interest than on one degree of inter-est .but that it:. may have a s light tendency to lead to the development of somearea of high interest.
If one has in mind the equally logical proposition that lack of anyarea of high interest may reduce one s chances of feeling that he really be-longs to the community, he may set up a table like Table 24a.
TABLE B-V- 24a
PER CENT OF RESPONDENTS WHO FEEL LIKE "REAL MEMBERSII OF THEIR
COMMUNITIES , BY AREA AND DEGREE OF INTEREST
(Length of Residence Controlled)
=========================== ===========================
Less Than Ten Yearc Ten Yearo or IilrcHig No ..- mv. HiCLocal NonJ.ocal High Local
INonlocCll HighIntereE Jntcr ct Inter.cct Interect. Intcrcct Intercct68 - (246) 138 (483) 137 (243) 86 (305) 60 (341) 164 (166)
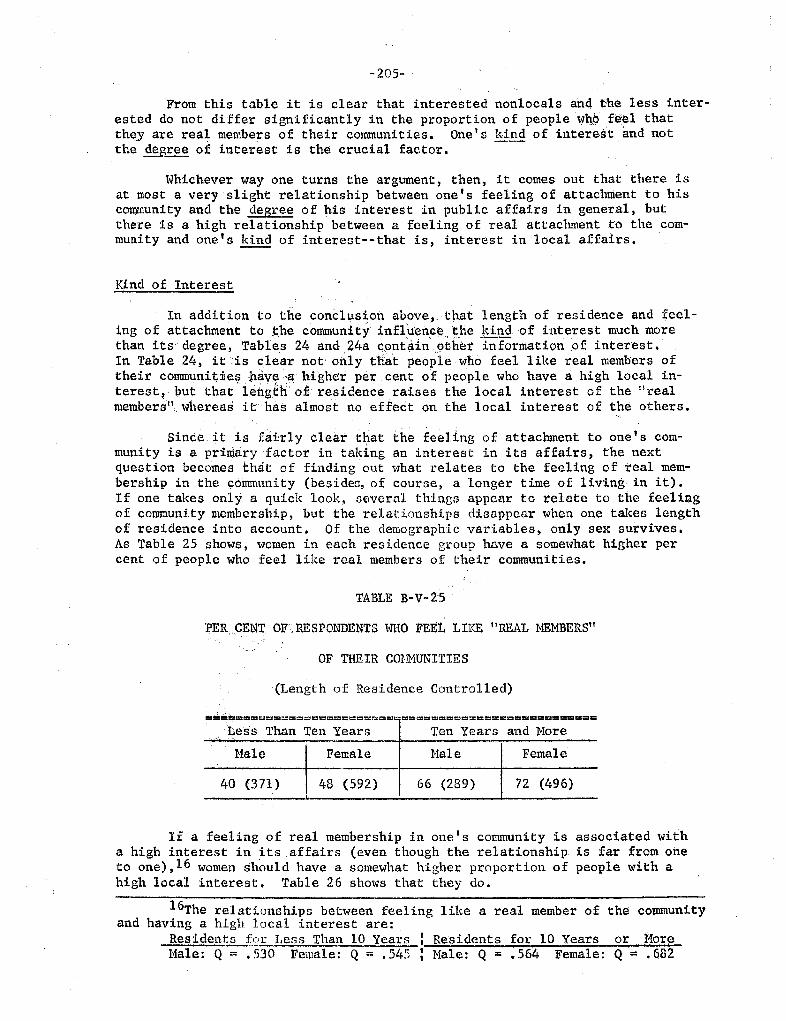
- 205-
From this table it is clear that interested nonlocals and the less inter-ested do not differ significantly in the proportion of peoplewhpf l thatthey are real members of their communities. One s kind of intere.st and notthe degree of interest is the crucial factor.
Whichever way one turns the argument , then , it comes out that there isat most a very slight relationship between one s feeling of attachment to his
ronity and the degree of his interest in public affairs in general, butthere is a high relationship between a feeling of real attachment to the com-munity and one of interest--that is , interest in local affairs.
Kind of Interest
In addition to the conclusion abov " that length of residence and feel-ing of attachment to the community inflhen he d.nd of interest much morethan its degree, Tables 24andZ4acont#n t;thet' information of interest.In Table 24, it is clear not. only tHat peOple who feel like real members oftheir communitie . paV a:. higher per cent of people who have a high local in-terest , but that letigtti of residence raises the local interest of the o realmembers" whereas it has almost no effect on the local interest of the others.
Since it is fairly clear t at the feeling of attachment to one I s com-
munity is a priclaryfactor in taking an interest in its affairs, the nextquestion becomes that of finding out what relates to the feeling of real mem-bership in the community (besidea, of course, a longer time of living in it).If one takes only a quick look, sover.nl thinp,s appear to relate to the feelingof community membership, but the relationships disappear when one takes lengthof residence into account. Of the demographic variables, only sex survives.As Table 25 shows, women in each residence group have a somewhat higher percent of people who feel like real members of their communities.
TABLE B-V-
PER CENTOF:.RESPONDENTS ,mo FEE:t LIKE I1 REAL MEMBERS"
OF THEIR COlMUNITIES
(Length of Residence Controlled)
=--=----_...._- ---=-_...._-----. -------------------------------------- ------.--- ----------------- ---------
Less Than Ten Years Ten Year:: and More
Male Female Male Female
(371) (592) (289) (496)
If a feeling of real membership in one I s community isa high interest in its affairs (even though the relationshipto one), 16 women should have a somewhat higher proportion ofhigh local interest. Table 26 shows that they do.
l6The relationships between feeling like a real member of the community
and having a high local interest are:Residents f r IJess Than 10 Years Residents for 10 Years or oreMale: Q :: :530 Female: Q ;; . 545 : Male: Q
:: .
564 Female: Q= . 682
associated withis far from ohepeople with a
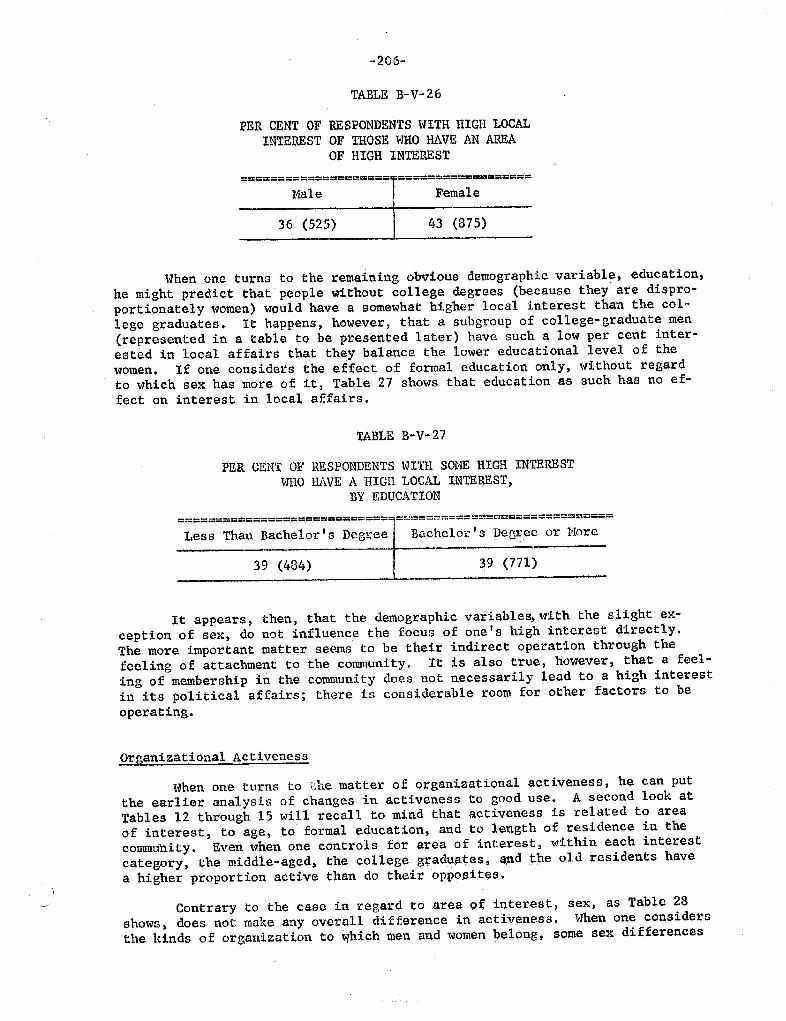
206-
TABLE B-V-
PER CENT OF RESPONDENTS WITH nIGH LOCALINTEREST OF THOSE WHO HAVE AN AREA
OF HIGH INTEREST
---------------------------------------- =====;============
Male Female
36 (525) 43 (875)
When one turns to the remaining obvious demographic variable, education,
he might predict that - people without college degrees (because they are dispro-portionately women) would have a somewhat higher local interest than the col-lege graduates. It happens, however , that a subgroup of college- graduate men
(represented in a table to be presented later) have such a low per cent inter-ested in local affairs that they balance the lower educational level of thewomen. If one considers the effect of formal education only, without regardto which sex has more of it, Table 27 shO\vs that education as such has no ef-fect on interest in local affairs.
TABLE B-V-
PER CENT OF RESPONDENTS WITH SOME HIGH INTERESTHHO HAVE A nIGH LOCAL INTEREST
BY EDUCATION
============================9=
===========================
Less Than Bachelor s Degree Bachelor I s De3ree or More
39 (484) 39 (771)
It appears, then , that the demographic variables, with the slight ex-
ception of sex, do not influence the focus of one s high interest directly.The more important matter seems to be their indirect operation through thefeeling of attachment to the community. It is also true, however, that a feel-ing of membership in the community does not necessarily lead to a high interestin its political affairs; there is considerable room for other factors to beoperating.
Organizational Activeness
When one turns to Lhe matter of organizational activeness, he can putthe earlier analysis of changes in activeness to good use. A second look atTables l2 through 15 will recall to mind that activeness is related to areaof interest , to age, to formal education, and to length of residence in thecommunity. Even when one controls for area of interest , within each interest
category, the middle-aged, the college grad
~~~
es, d tpe old residents have
a higher proportion active than do their opPO.SitE;E;.
Contrary to case in r gard to are of interest, sex, as Table 28
shows, does not make any overall difference in activeness. When one considers
the kinds of organization to Which men and women belong, some sex differences
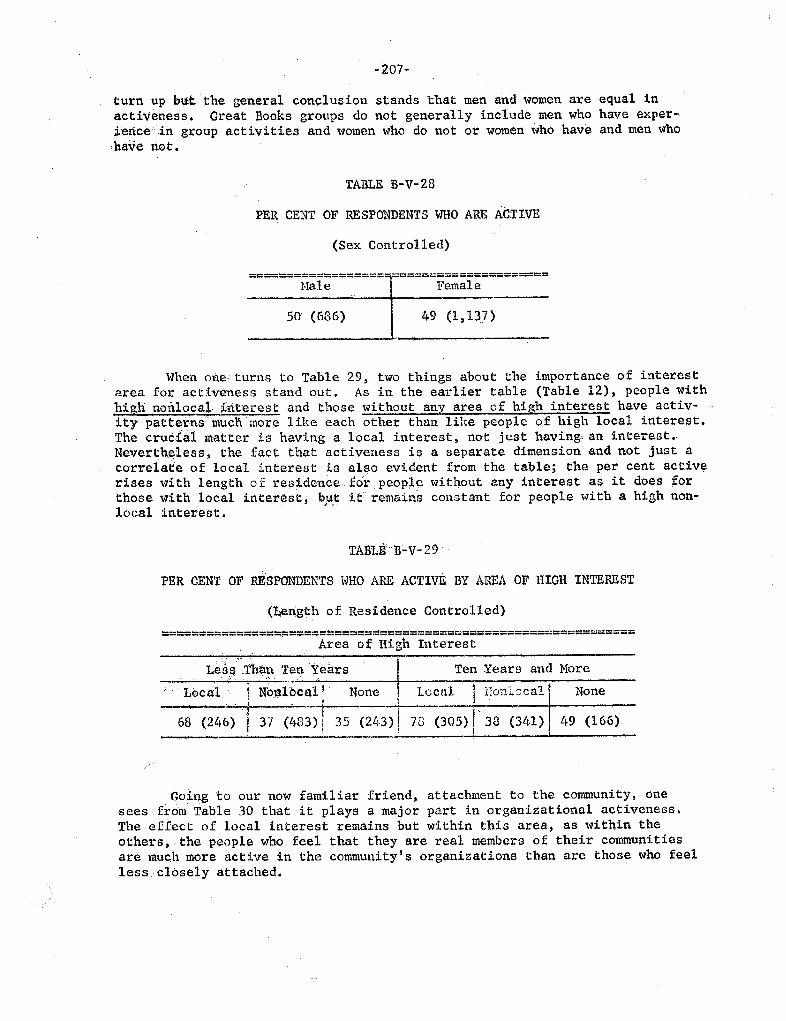
207-
turn up but the general conclusion stands that men and women areactiveness. Great Books groups do not generally include men '\Tho
i"ericein group activities and women who do not or women who havehave not.
equal inhave exper..and men who
TABLE B-V-28
PER CENT OF RESPONDENTS WHO ARE ACTIVE
(Sex Controlled)
------------------------------------- --------------------------------------------
Hale Female
50 (686). 49 (1 137)
When one turns to Table 29 , two things about the importance of interestarea for activeness stand out. As in the earlier table (Table 12), people withhigh nonlocal ;tnt-erest and those '\Tithout any area of high interest have activ-ity patternsmucnmore like each other than lih:e people of high local interest.The crucf8:1 matter is having a local interest , not just having. an interest.
Neverth less, the fact that activeness is a separate dimension and not just acorrelate of local interest is also evident from the table; the per cent activerises '-lith length of residcnccfOr peop e without any interest as it does Jorthose ..-lith local interest, b1Jt it remains constant for people with a high non-local interest.
TABi.. -'V-29
PER CENT OF RESPONDENTS HHO ARE ACTIVE BY AREA OF HIGH INTEREST
(Length of Residence Controlled)
=========================== ===========;===;===================
Area of High Interest
Less :than Ten Years Ten Years and More
. Loca ibcall None I local 1 HonlDcal f None
68 (241 ;
7 (483 35 (2LJ-3) i" ; (305) I ' 38 (341) 49 (166)
.-
Going to our now familiar friend, attachment to the community, onesees from Table 30 that it plays a major part in organizational activeness.The effect of local interest remains but within this area, as witnin theothers,. the people who feel that they are real members of their commu itiesare much more active in the community s organizations than are those who feelless closely ttached.
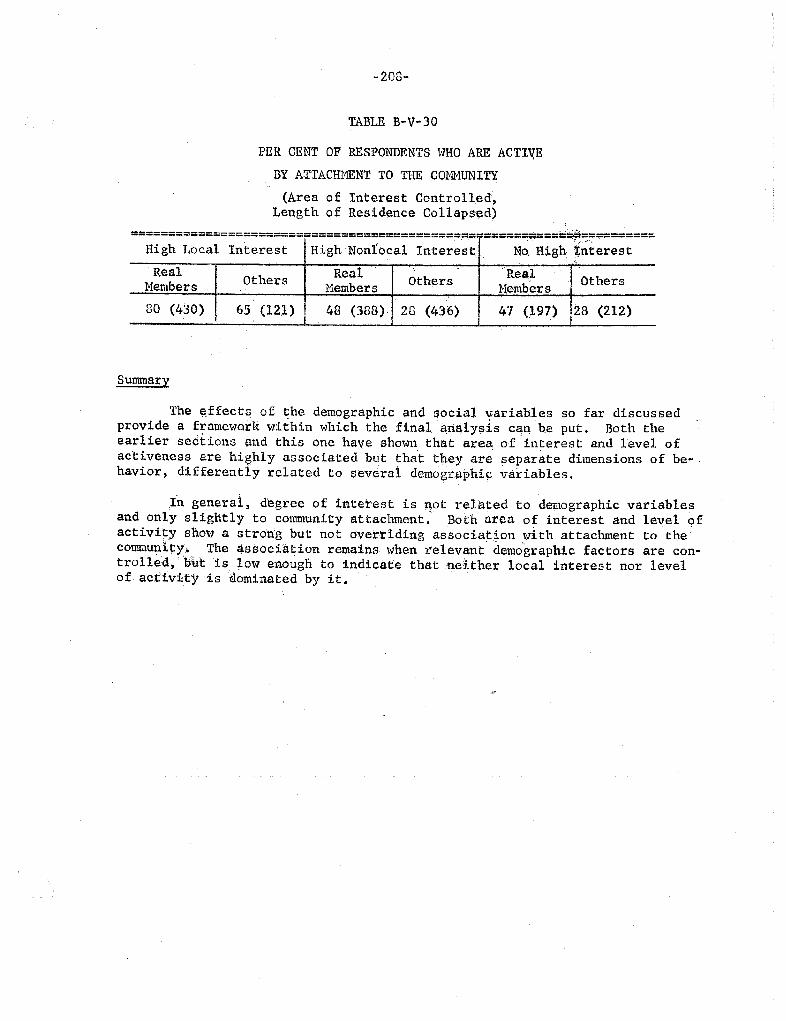
- 208-
TABLE B-V-30
PER CENT OF RESPONDENTS HHO ARE ACTI
BY ATTACHHENT TO THE COrvil'1UNITY
(Area of Interest ControlledLength of Residence Collapsed)
--- -- --- --=---- ---= ------------------------------------- ------- --- "--- --------------------------------------------------------
i';terestHigh Local Interest High Nonlbcal Interest No. HighReal Real Red
Members Others Hembers OthersMembers
Others
(430) (121) (388). (436) (197) (212)
Summary
The effects of the demographic and social ariables so far discussedprovide a framm-,brk within which the final ' analysis can, be put. Both theearlier sedtions and this one hayeshmm that area of . interest and level ofactiveness are highly associated but that they are separate dimensions of be- havior, differently related to severa1 demographi variables.
In general , degree of interest is not related to demographic variablesand only slightly to community attachment. Both arca of interest and level ofactivity show a strdt1g but not overriding association with attachment to thecommunity. The ssociation remains when relevant demographic factors are con-trollep; butis low enough to indicate that-nehher local interest nor levelof activity is dominated by it.
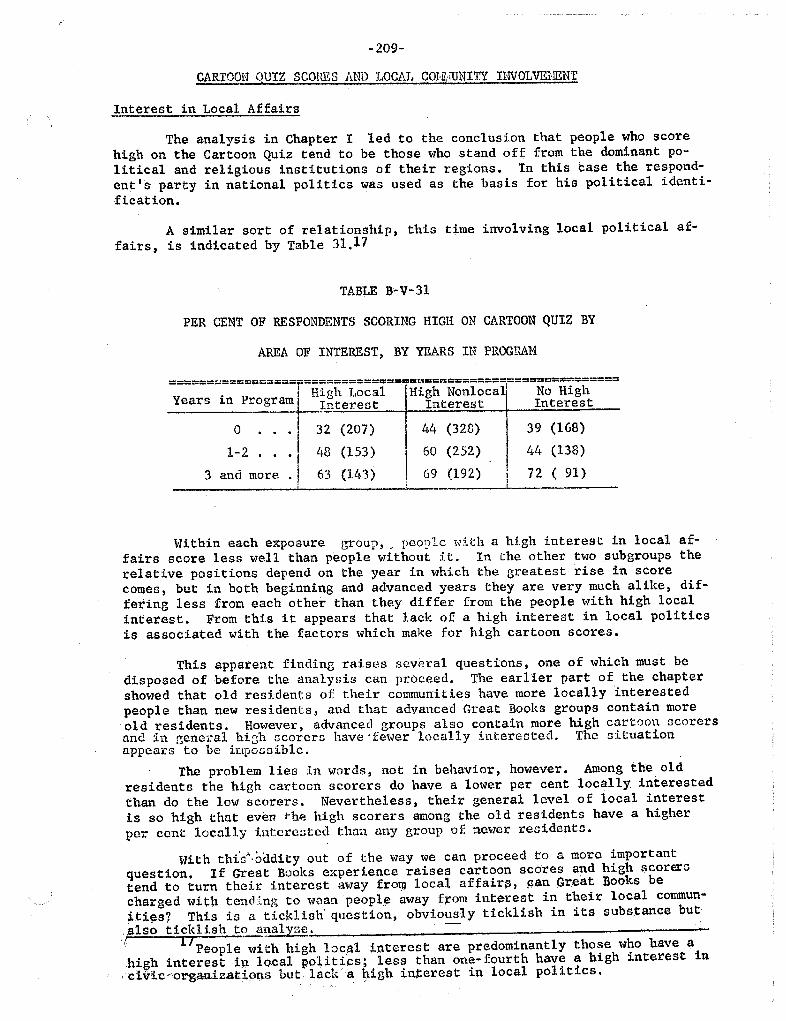
- 209-
CARTOON QUIZ sconES AND LOCAL COlJ1IUNITY HIVOLVEliENT
Interest in Local Affairs
The analysis in Chapter I led to the conclusion that people who scorehigh on the Cartoon Quiz tend to be those who stand off from the dominant po-litical and religious institutions of their regions. In this case the respond-
ent I s party in national politics was used as the basis for his political identi-fication.
A similar sort of relationship, this time involving local political af-fairs , is indicated by Table 31.
TABLE B-V-3l
PER CENT OF RESPONDENTS SCORING HIGH ON CARTOON QUIZ BY
AREA OF INTEREST, BY YEARS IN PROGRAM
====== ========== =====; ========================== ======
i High Local High Nonlacall No HighYears J.n Program Interest Interest Interest
1-2 . .3 and more
: I
32 (207)
48 (153)
63 (143)
44 (32B)
60 (252)
69 (192)
39 (168)
44 (138)
72 ( 91)
Within each exposure (;roup" pco;!lc HUh a hi.gh interest in local af-fairs score less well than people without it. In the other two subgroups the
relative positions depend on the year in which the greatest rise in scorecomes, but in both beginning and advanced years they are very much alike, dif-fering less from each other than they differ from the people with high localinterest. From this it appears that lack of a high interest in local politicsis associated with the factors which make for high cartoon scores.
This apparent finding raises several questions, one of which must bedisposed of before the analysis can proceed. The earlier part of the chaptershowed that old residents of their communities have more locally interestedpeople than new residents, and that advanced Great Books groups contain moreold residents. However, advanced groups also contain more high car.toon acorersand in gcnc al high ccorera have . fewer locally intereatcd. The situationappears to be iL oGGiblc.
The problem lies in words, not in behavior, however. Among the old
residents the high cartoon scorers do have a lower per cent locally interestedthan do the 10\11 scorers. Nevertheless, their general level of local interestis so high that even rh high scorers among the old residents have a higher
pcr cent locally lutcrcr;tcd thtm (lny group of ne"lcr residents.
With thioA oadity out of the way we can proceed to a more importantquestion. If Great Books e cperience raises cartoon scores and high scoreratend to turn their interest away fro local affair nGreat Books becharged with tel ding to ,,,can people away f om interest in their local commun-
s? This is a ticklish ' question, obviously ticklish in its substance butalso ticklish to analyze
People with high loca interest are predominantly those who have ahigh interest in local politics; less than one- fourth have a high interest in
dvi.c" o);ga.tU.zaHons but lacl a 1)igh int:erest in local politics.
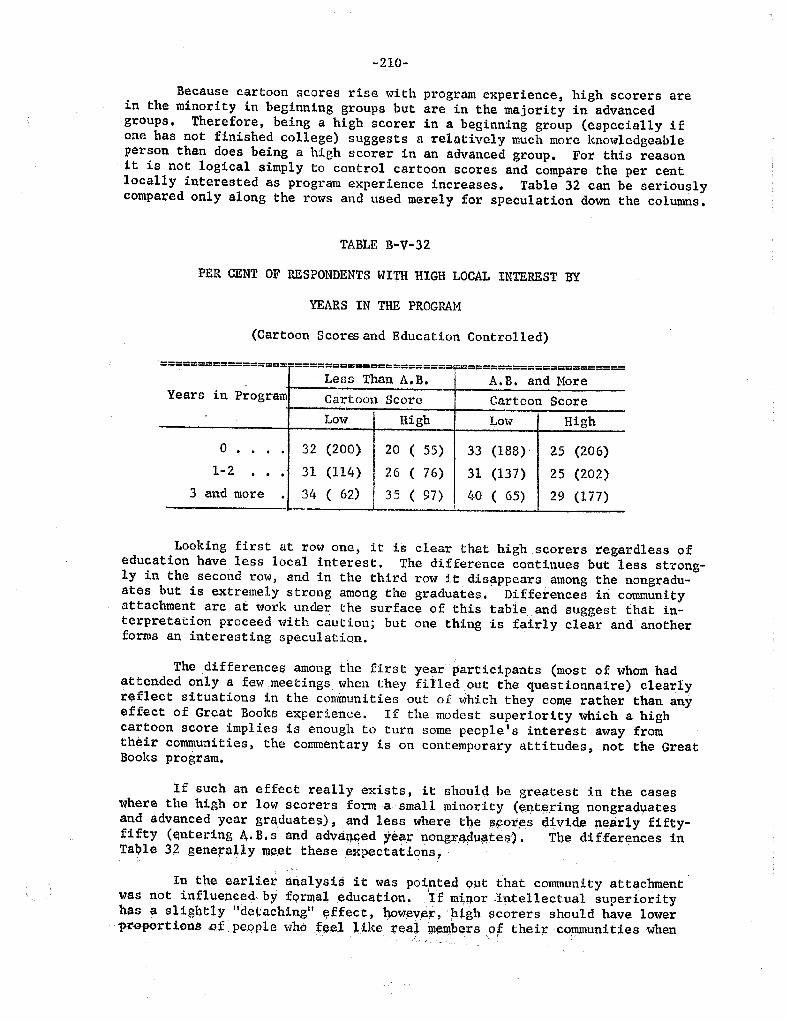
- 2l0-
Because cartoon scores rise with program experience, high scorers arein the minority in beginning groups but are in the majority in advancedgroups. Therefore , being a high scorer in a beginning group (especially ifone has not finished college) suggests a relatively much more knowledgeableperson than does being a high scorer in an advanced group. For this reasonit is not logical simply to control cartoon scores and compare the per centlocally interested as program experience increases. Table 32 can be seriouslycompared only along the rows and used merely for speculation down the columns.
TABLE B-V-32
PER CENT OF RESPONDENTS WITH HIGH LOCAL INTEREST BY
YEARS IN THE PROGRAM
(Cartoon Scoroo and Education Controlled)
=================-===================== =======================
Less Than A. B. A. B. and MoreYears Program Cartoon Score Cartoon Score
Low High Low High
(200) 55) (188). (206)1-2 (114) 76) (137) (202)
and more 62) 97) 65) (177)
Looking first at row one , it is clear that high scorers regardless ofeducation have less local interest. The difference continues but less strong-ly in the second row, and in the third row it disappears among the nongradu-ates but is extremely strong among the graduates. Differences iri communityattachment are at work under the surface of this table . and suggest that in-terpretation proceed with caution; but one thing is fairly clear and anotherforms an interesting speculation.
The differences among the first year participants (most of whom hadattended only a fe meetings '1hen they filled out the questionnaire) clearlyreflect situations in the communitieso\lt of V"hich they come rather than anyeffect of Great Books experience. If the modest superiority which a highcartoon score implies is enough to turn some people s interest away fromtheir communities, the commentary is on contemporary attitudes, not the GreatBooks program.
If such an effect really exists, it should be greatest in the caseswhere the high or low scorers forma small minority (e ing nongrad atesand advanced year graduates), and less where t fores divide near y fifty-fifty ( ntering A. B. s and adva .qed ;Vear n.ongra4u;:tes). Tbe differences inTaQle 3 gene aUy et these expectations
In the earlier analysis it was pointed 9 t that community attachmentwas not influenced by fQr a1 ducation. 'If m or , tellectual superiorityhas a slightly "detachinglf frffect, ho\V"ev,e,:, nigh scorers should have lower
portions,Qfpeople who like t'ea1 me bers9f their cO)1munitieswhen
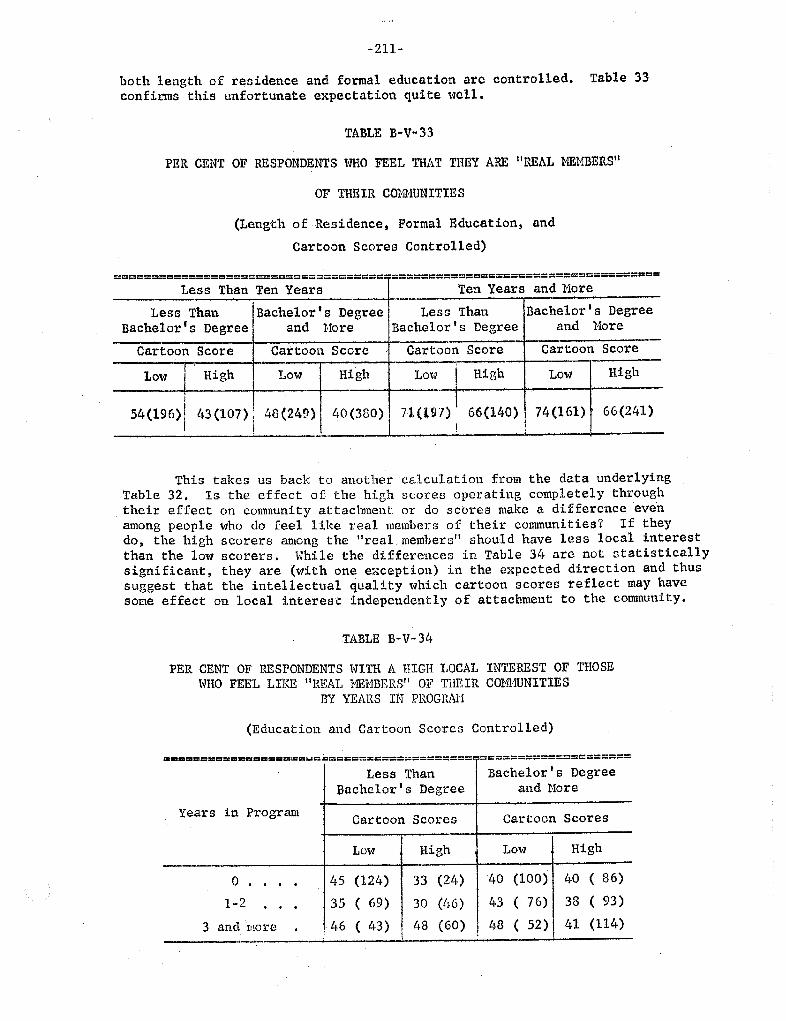
211-
both length of residence and formal education are controlled.confirms this unfortunate expectation quite well.
Table 33
TABLE B-V"33
PER CENT OF RESPONDENTS HHO FEEL THAT THEY ARE 11 REAI. NENBERS"
OF THEIR CO 1UNITIES
(Length of Residence, Formal Education, and
Cartoon Scores Controlled)
------==------=------------- ------------------- ------ -------------==-=--- ====-=====---====- ==;-------------
Less Than Ten Years Ten Years and l1are
Less Than Bachelor s Degree Less Than Bachelor s Degree
Bachelor s Degree and Hore Bachelor I s Degree and Hare
Cartoon Sc.ore Cartoon Score Cartoon Score Cartoon Score
Low High Low High Low High Low High
71 (UIl)
I 66(140)54(196) I 43(107); 4B (249) I 40(380) 74(161) 66(241)
This takes us back to another calculation from the data underlyingTable 32. Is the effect of the high scores operating completely throughtheir effect on community attachment or do scores make a difference evenamong people who do feel like real members of their comntunities? If theydo, the high scorers among the "real memhers" should have less local interestthan the low scorers. Hhile the differences in Table 34 arc not ctatisticallysignificant , they are (with one exception) in the expected direction and thussuggest that the intellectual quality which cartoon scores reflect may havesome effect on local interest independently of attachment to the community.
TABLE B-V-
PER CENT OF RESPONDENTS HITH A HIGH LOCAL INTEREST OF THOSEHHO FEEL LIl\E "REAL MEHBERS" OJ? THEIR CONHUNITIES
BY YEARS IN PROGRAN
(Education and Cartoon Scores Controlled)
--------------------. .- :.-:--------.....---------------------------------------------------- -----------.------ --------------------
Less Than Bachelor I DegreeBachelor s Degree and Nore
Years Program Cartoon Scores Cartoon Scores
Low High Low High
(l24) (24) (100) 86)
69) (lf6) 76) 93)
and more (43) (60) 52) (114)
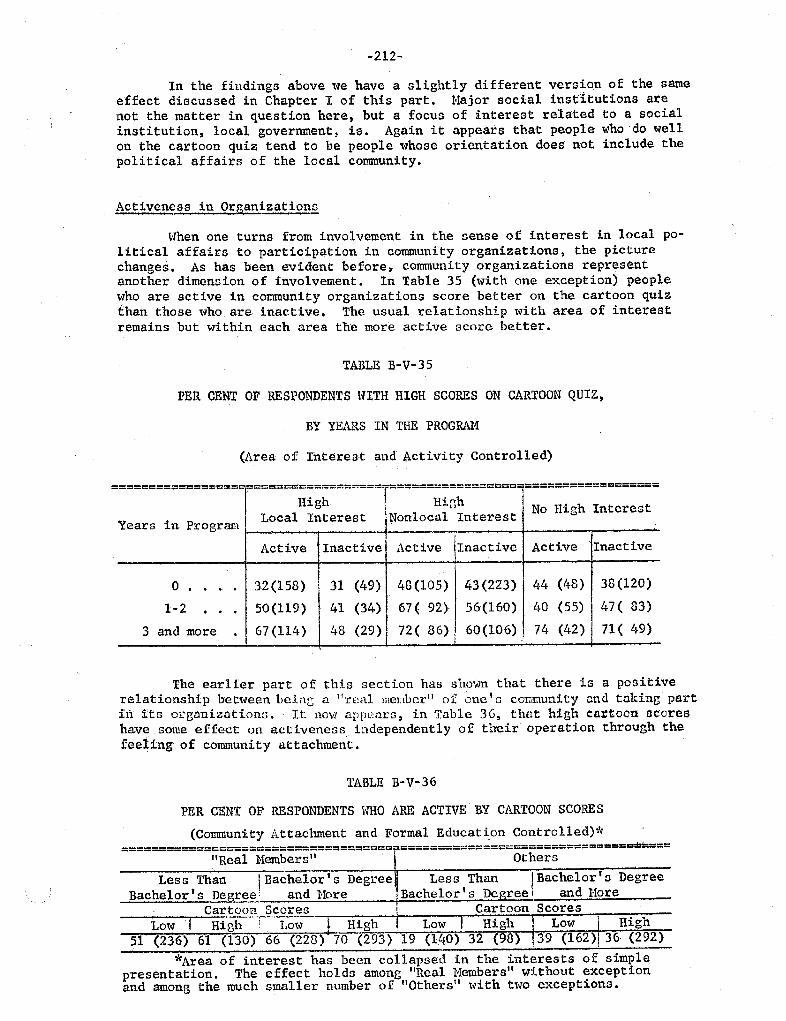
212-
In the findings above we have a slightly different version of the sameeffect discussed in Chapter I of this part. Major social institutions arenot the matter in question here, but a focus of interest related to a socialinstitution, local government, is. Again it appears that people. who do wellon the cartoon quiz tend to be people whose orientation does not include thepolitical affairs of the local community.
Activeness in Organizations
When one turns from involvement in the sen e of interest in local po-
litical affairs to participation in community organizations, the picturechanges. As has been evident before7 community organizations repr sentanother dimension of involvement. In Table 35 (with one exception) peoplewho are active in co munity organizations score better on the cartoon quizthan those who are inactive. The usual relationship with area of interestremains but within each area the more active score better.
TABLE B-V-35
PER CENT OF RESPONDENTS \HTH HIGH SCORES ON CARTOON QUIZ
BY YEARS IN THE PROGRAM
(Area of IntereGt and Activity Controlled)
=-----------------------------------------------------=----------------------------------- ------------------
T----------------- ,
------------------
High HiGh No High Interest
Year ' P Local Interest jNonlocal Interests 1li rogram
Active Inactive I Active Inactive Active ' Inactive
..
32 (158) 1 31 (49) 48(105) 43(223) (48) 38 (120)
50(119) (34) 67( 92)- 56(160) (55) 47 ( 83)
3 and more 67 (114) (29) 72( 86) 60(106)! (42) 71 ( 49)
The earlier part of this section has shown that there is a positiverelationship between bein:: C1 Il real mCT.ber!1 of one I 0 cor:,munity Clnd t-'king partin its organizC1tionr;. It no\\ app"D.rs , in Table 36, that high cartoon o-c:oreshave some effect on activeness independently of their operation through thefeeling of community attachment.
TABLE B-V-36
PER CENT OF RESPONDENTS WO ARE ACTIVE BY CARTOON SCORES
(Community Attachment and Formal Educat on Contro11ed)*
====================================-=============================== ===
Real l-lembers OthersLess Than I Bachelor s Degree Less Than I Bachelor I s Degree
Bachelor t s Dep;ree; and Bore Bachelor I S Degree and Nore
Cartoon Score Cartoon Scores
Low ' Higi;--' T
'--
L;-tv High Low I High ! Low High51 (236) 6l (130) 66 (228) 70 (293) 19 (lAO) 32 (98) 139 (l62)f 36 (292)
Area of interest has been collapsed in the interests of simplepresentation. The effect holds among "Real Members" without exceptionand among the much smaller number of "Others" \vith two exceptions.
Summary
- 2l3-
In agreement with the general finding of Chapter I , Part B, it appearsthat by and large people with high scores on liberal arts knowledge are lessinterested in official local affairs than are their lower scoring fellow par-ticipants.
However, within each interest level , the more able are more active incommunity organizations.
Thus high r levels of knowledge may be thought of as 1) divertinginterest from the local scene but also 2) increasing the level of organi-zational activity within any given interest area.
GENERAL CONCLUSIONS
The major conclusions of this chapter are outlined below.
Great Books e"perience seems to have little or no effecton the participants ' tendcnciea to focus their intereston a given area of the community or world.
Increased program perience may be t lated to increasedactivity within the participants I relatively inflexibleinterest areas, and it definitely is related to the par-ticipant!: I beliefs that Great Books are relevant to com-munity, national , and world affairs.
The survey gives no support to the belief that the par-ticipants are retreatists, uninterested in the realworld around them. Relatively more interested in theworld and national scenes , they nevertheless include' alarge number who identify with the local scene. Manywho do not , include it as an area of highest interestare active in its organizational life and conc.ernedabout local problems. Any changes or hints of changeswe have found are in the direction of increased involve-Ioent in the local cOITIunity, none suggest decreased in-volvement.
Aside from any effect of the program, the survey hintsthat the contemporary scene is of a sort to turn theattention of people knowledgeable in the liberal artsaway from interest in the political affairs of theirlocal conIDunities , but that their intellectual skillskeep them involved in the nongovernmental organizationsof their communi ties.

PART C
THE DISCUSSION GROUP
214-
215-
Here and there in the two previous parts of this report we have dealtbriefly with aspects of the group discussion process in the context of theirinfluence on the participants. In Part A we noted that those motivationswhich could be satisfied within the discussion group were among those forwhich highest rates of satisfaction were reported, and we also saw that activeparticipants in group discussions were somewhat more likely to report gener-ally high levels of impact from participation in the program. In Part B, inour discussion of community involvement , we found evidence which strongly sug-gested that social contacts with members of the discussion group were an im-portant vehicle for the changes we found.
In the three chapters of Part C, we shall turn our direct attention tothe discussion group, its social organization, and some of its processes. Thematerials reported here are not a bmplete analysis of the d scussion group asa factor in the Great Books program. Our major commission was to study theeffects of Great Books on the individual participants , and a thorough investi-gation of the "group- levell1 materials would have resul ted in too much diver-sion of money and staff from that purpose. The chapters in this section thenare reports on those aspects of the groups which came to light during thecourse of our analysis and are believed to be of some interest to the reader.
Chapter I describes briefly the salient characteristics of the groupsin our sample in terms of such things as size, meeting place, pattern osocial characteriGticG, and differences in effectiveness. Chapter :j:i.s discussion of the "participation roles, II the type of contributions differentmembers make to the discussions , and ends with a classification of the majortypes of participation. Chapter III, a companion to Chapter II, describes thesocial characteristics of the people who play the different roles.

- 216-
CHAPTER I
HHT ARE THE DISCUSSION CROUPS LIKE?
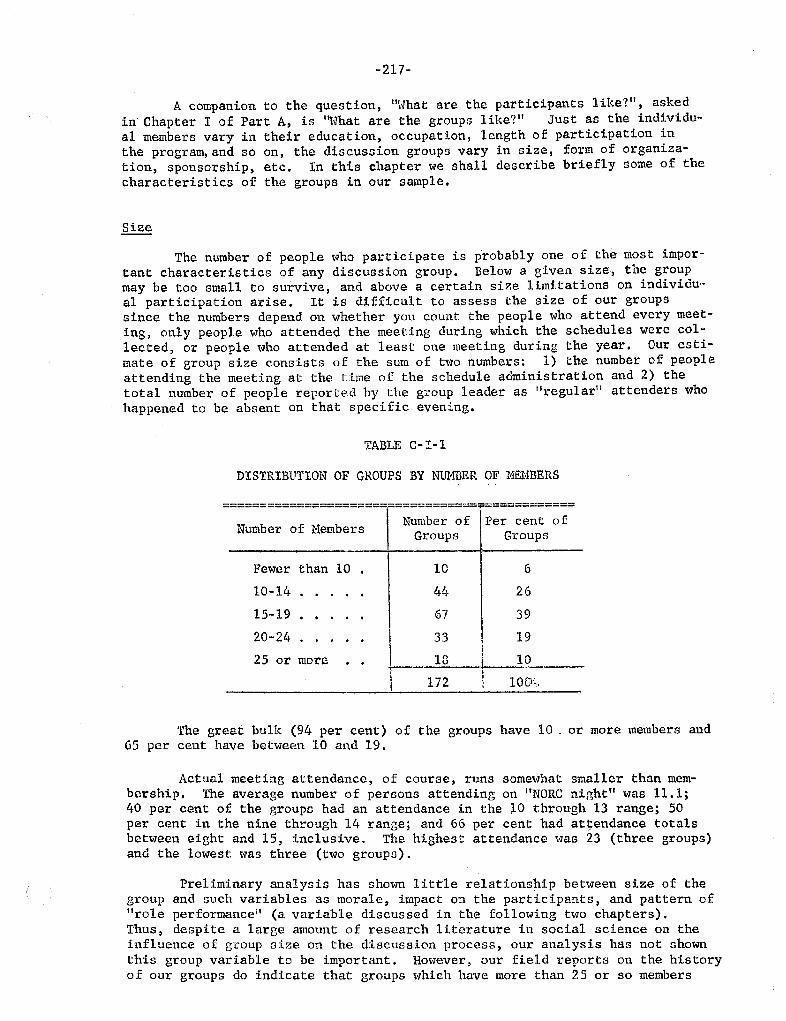
217-
A companion to the question, !!Hhat are the participants like?!! , askedin Chapter I of Part A, is I1What are the groups like?!! Just as the individu-al members vary in their education, occupation, length of participation inthe program, and so on, the discussion groups vary in size, form of organiza-tion, sponsorship, etc. In this chapter we shall describe briefly some of thecharacteristics of the groups in our sample.
Size
The number of people who participate is probably one of the most impor-tant characteristics of any discussion group. Below a given size, the groupmay be too small to survive , and above a certain size limitations on individu-al participation arise. It is difficult to assess the size of our groupssince the numbers depend on whether you count the people who attend every meet-ing, only people who attended the meeting during which the schedules were col-lected, or people who attended at least one meeting during the year. Our esti-
mate of group size consists of the sum of two numbers: 1) the number of peopleattending the meeting at the time of the schedule administration and 2) thetotal number of people reported by the group leader as " regular!! attenders who
happened to be absent on that specific evening.
TABLE C-I-l
DISTRIBUTION OF GROUPS BY NUMBER OF ffMBERS
======;======;;===;=======-======= =====; ====
Number of MembersNumber of Per cent of
Groups Groups
Fewer than 10
10-14 44.
15-19
20- 24
25 or more
172 100.:
The great bulk (94 per cent) of the groups have 10 . or more members and65 per cent have between 10 and 19.
Actual meeting attendance, of course, runs somewhat smaller than mem-bership. The average number of persons attending on "NaRC nighttl was 11.1;40 per cent of the groups had an attendance in the 10 through 13 range; 50per cent in the nine through 14 range; and 66 per cent had attendance totalsbetween eight and 15 , inclusive. The highest attendance was 23 (three groups)and the lowest was three (two groups).
Preliminary analysis has shown little relationship between size of thegroup and such variables as morale , impact on the participants , and pattern ofrole performance (a. variable discussed in the f'ollOtl1ing two chapters).
Thus, despite a large amount of research literature in social science on theinfluence of group size on the discussion process , our analysis has not shownthis group variable to be important. However , our field reports on the historyof our groups do indicate that groups which have more than 25 or so members
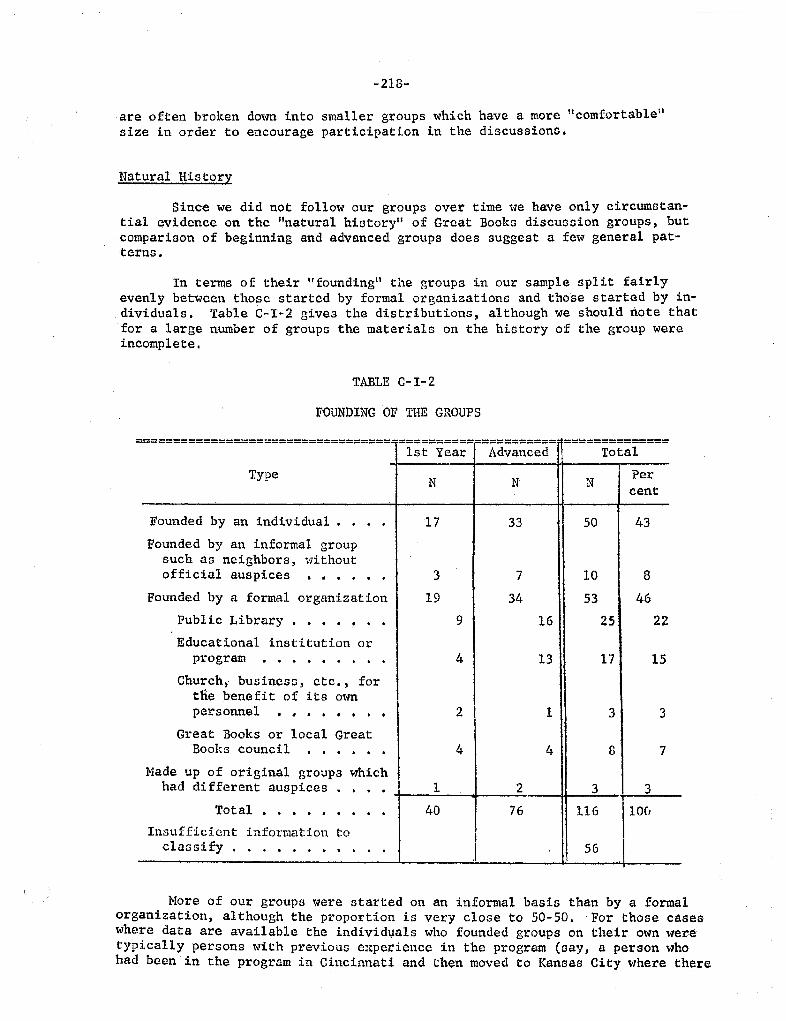
218-
are often broken down into smaller groups which have a more II comfortablesize in order to encourage participation in the discussions.
Natural History
Since we did not follow our groups over time we have only circumstan-tial evidence on the "natural history1' of Great Books discussion groups, butcomparison of beginning and advanced groups does suggest a few general pat-terns.
In terms of their " founding" the groups in our sample spl it fairlyevenly between those started by formal organizations and those started by in-dividuals. Table C-I-2 gives the distributions , although we should note thatfor a large number of groups the materials on the history of the group wereincomplete.
TABLE C- 1- 2
FOUNDING OF THE GROUPS
=================================-==========?========== ==============
1st Year Advanced 11 TotalType
Founded by an individual.
Founded by an informal groupsuch as neighbors , withoutofficial auspices
. . . .
Founded by a formal organization
Public Library
. .
Educational institution orprogram
. . . . . .
Church , business, etc., fortne benefit of its ownpersonnel
. . . .
Great Books or local GreatBooks council
. . . .
Made up of original groups whichhad di fferent auspices
. .
Tot al .
. .
Insufficient information toclassify
. . . .
Percent
116 lOG
More of our groups were started on an informal basis than by a formalorganization, although the proportion is very close to 50- 50. For those caseswhere data are available the individ als who founded groups on their own weretypically persons with previous experience in the program (say, a person whohad been in the program in Cincinnati and then moved to Kansas City where there
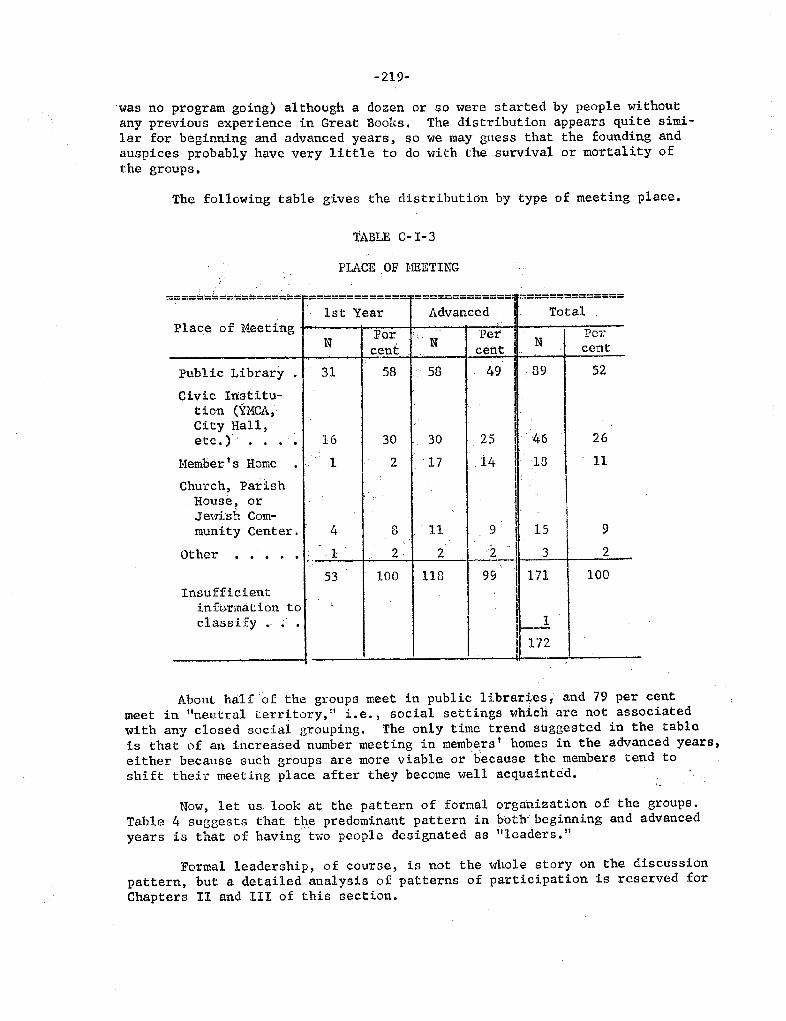
- 219-
was no program going) although a dozen or so were started by people withoutany previous experience in Great Books. The distribution appears quite simi-lar for beginning and advanced years, so we may guess that the founding andauspices probably have very little to do with the survival or mortality ofthe groups.
The following table gives the distributidn by type of meeting place.
TABLE C- 1-3
PL\CE OF NEETING
=== =========== ============= =============; --------------..,-------------
1st Year Advanced TotalPlace Meetirtg Per Per Per
cent cent cent
Public Library
Civic Instltu-tion (YMCA,City HS.l1etc.
Hember ' Home
Church ParishHouseJ ewi' s h Com-munity Center.
- I
Other100 118 171 100
Insufficientinfbrmationclassify
172
About half of the groups meet in public l:braries1 and 79 per centmeet in "neutral territory, II i.e.) social settings whicH are not associatedwith any closed social grouping. The only time trend suggested in the tableis that of an increased number meeting in members ' homes in the advanced years,
either because such groups are more viable or because the members tend toshift their meeting place after they become well acquainted.
Now, let us look at the pattern of formal organization of the groups.Table 4 suggests that the predominant pattern in l1oth' beginning and advancedyears is that of having two people designated as "leaders.
Formal leadership, of course, is not the whole story on the discussionpattern, but a detailed analysis of patterns of participation is reserved forChapters II and III of this section.
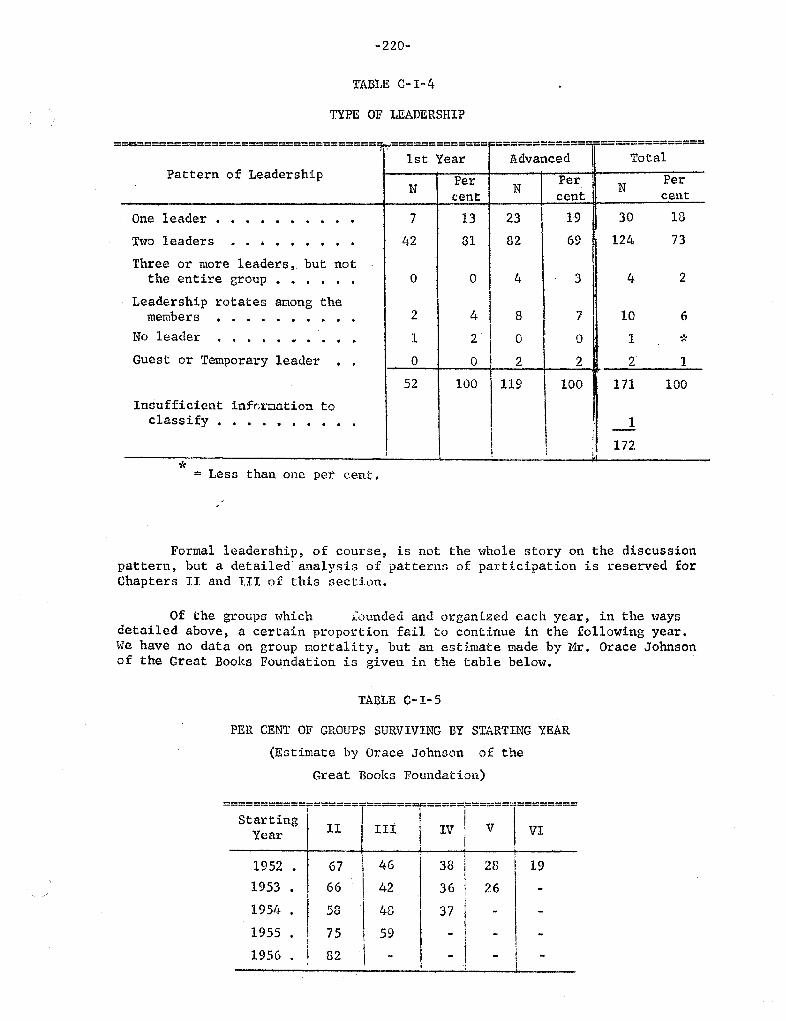
- 220-
TABLE C-I-4
TYPE OF LEADERSHIP
================================== ============= ==============-============-
1st Year Advanced TotalPattern Leadership Per Per Per
cent cent centOne leaderTwo leaders l2lThree more leaders, but not
the entire group
Leadership rotates among themembers
leader
-;':
Guest Temporary leader100 119 100 171 100
Insufficient infcrDationclass ify
172
= Less than one per cent.
Formal leadership, of course, is not the whole story on the discussionpattern , but a detailed analysis of patterns of participation is reserved forChapters II and III of this section.
Of the groups which ;ounded and organized each year, in the waysdetailed above, a certain proportion fail to continue in the following year.We have no data on group mortality, but an est imate made by Mr. Orace Johnsonof the Great Books Foundation is given in the table below.
TABLE C-I-5
PER CENT OF GROUPS SURVIVING BY STARTING YEAR
(Estimate by Grace Johnson of the
Great Books Foundation)
::=
f==
;;== :::===
r==
;;=
r==
:=== ;;====
. 46 38 28 ' 1942 36 i 2648 37
1952 .1953
1951,L .
1955 .
1956 .
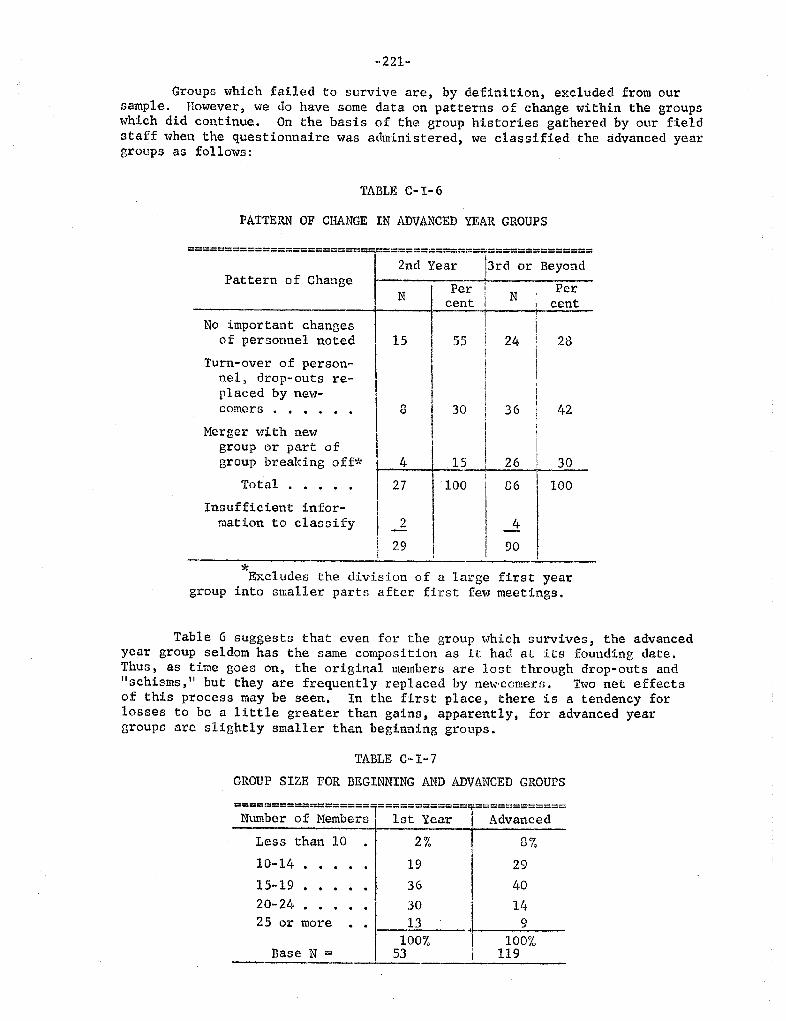
221-
Groups which failed to survive are , by definition, excluded from oursample. IIowever , we do have some data on patterns of change within the groupshich did continue. On the basis of the group histories gathered by our fieldstaff when the questionnaire was administered , we classified the advanced yeargroups as follows:
TABLE C-I-6
PATTERN OF CliANGE IN ADVANCED YEAR GROUPS
======;========= ===; ======= === ==============
2nd Year 13rd or BeyondPer i Per
cent I ; cent
55
Pattern of Change
No important changesof personnel noted
Turn- over of person-nel , drop- outs re-placed by new-comers
.. . . . .
Merger with newgroup 0r part ofgroup breaking off*
100 100Total
. . . .
Insufficient infor-mation to classify
Excludes the division of a large first yeargroup into smaller parts after first few meetings.
Table G suggests that even for the group which survives , the advancedyear group seldom has the same composition as it had at its founding date.Thus, as time goes on, the original members are lost through drop-outs andschisms, II but they are frequently replaced by new.ccmerfJ. THO net effects
of this process may be seen. In the first place , there is a tendency forlosses to be a little greater than gains , apparently, for advanced yeargroups are slightly smaller than beginning groups.
TABLE C- 1-7
GROUP SIZE FOR BEGINNING AND ADVANCED GROUPS
==================-
============T============Number of Nembers 1st Year I AdvancedLess than 10
10-14 .l5- 19
20-2425 or more
100% 100/0Base N = 119
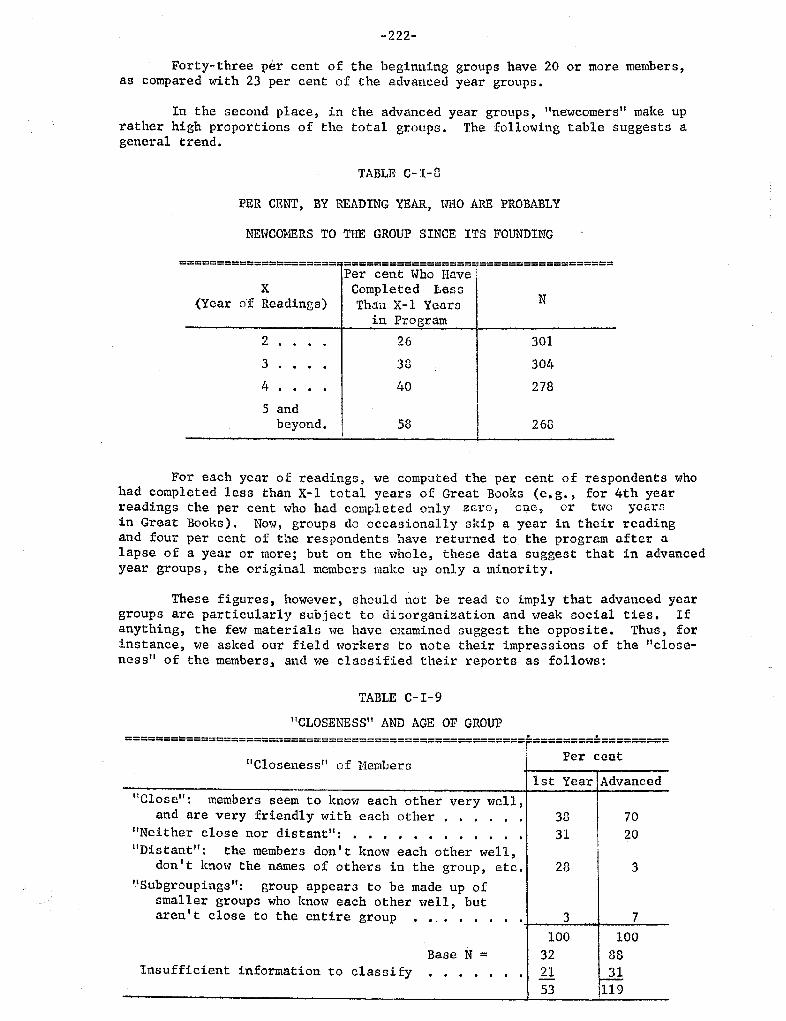
- 222-
Forty-three per cent of the beginning groups have 20 or more membersas compared with 23 per cent of the advanced year groups.
In the second place , in the advanced year groups , IInewcomers ll make uprather high proportions of the total groups. The following table suggests ageneral trend.
TABLE C-I-O
PER CENT, BY READING YEAR, HHO ARE PROBABLY
NEWCOMERS TO THE GROUP SINCE ITS FOUNDING
===== =============== ====================================
Per cent Who HCompleted Lesa
(Year of Readings) Than X- I Ycarain Program
301
304
278
5 andbeyond. 268
For each year or readings, we computed the per cent of respondents whohad completed less than X-I total years or Great Books (e. g., for 4th yearreadings the per cent who had completed only zero , o c, or two yearsin Great Books). Now, groups do occasionally skip a year in their readingand four per cent of the respondents have returned to the program after alapse of a year or more; but on the whole , these data suggest that in advancedyear groups, the original members make up only a minority.
These figures, however, should not be read to imply that advanced yeargroups are particularly subject to disorganization and weak social ties. anything, the few materials we have mtamined suggest the opposite. Thus, forinstance, we asked our field 'VlOrkers to note their impressions of the "close-nessll of the members) and vle classified their reports as follows:
TABLE C-I-9
CLOSENESSII AND AGE OF GROUP
===========-=====;===================;=============== ======== =========
Closeness" of Hembers
Close members seem to kno'Vl each other very vmlland are very friendly with each other
Neither close nor distant 11 :
. . . . . .
Distantll the members don t know each other welldon t know the names of others in the group, etc.
Subgroupings group appears to be made up ofsmaller groups who know each other well, butaren t close to the entire group
. ..
Base N =Insufficient information to classify
. .
Per ceut
1st Year Advanced
100 100
119
- 223-
There are too many cases wi th insufficient data to draw any firm con-
clusions, but the evidence does suggest that social relationships are oftenquite close in advanced year groups.
In summary, as time goes on, Great Books groups appear to be subject tothe demographic contingencies of birth, death , divorce, and marriage. A cer-tain number of groups fail to survive , another proportion combine with another
group or split into smaller groups; the original members gradually become fewer,and replacements are added. This raises such questions Q: What types of
groups fail? What types lose large numbers of members , but can replace them
and continue? What types of groups continue without any major change in per-sonnel? Is there a IIcritical" size, below which groups ,..ill fail to continue?Such intriguing problems are , however, topics for additional research on the
Great Books Program.
Social Characteristics
In addition to such group characteristics as type of leadership, spon-
sorship, history of mergers, etc., one of the important characteristics of anysocial group is its particular configuration of " individual" characteristics.Thus , a person s sex is an individual characteristic, but the degree to whichany group is " coeducational" is a group characteristic which may be quite im-portant in determining its organization and functioning.
In our data we have something like 400 individual characteristics takenfrom the schedules. For each of these we could examine the group distributions(e.g., the number of groups which have 70 per cent or more active in communityaffairs, the number of groups which have no participants who are musicallysophisticated, etc., etc. ) and look for patterns. e have not, the reader will
be gratified to find, done this, but we have looked at the group- level distri-butions of selected social characteristics. We shall report here the results
for: 1) Education, 2) Sex, 3) "Housewives, " 4) Religion, and 5) Age.
The first general question we may ask here is that of the degree ofhomogeneity of the social groups. If the program as a whole is characterizedby X per cent college graduates, we find three logical possibilities. First,it may be that the groups each tend to have about X per cent college graduatesand differ from each other only to the extent one would expect from a randomselection process. Second , it may be that the groups are significantly homo-geneous and that although the program as a whole has X per cent college gradu-ates, groups tend to be either almost all college graduates or almost none.Third , the groups could be significantly heterogeneous , in the sense that eachgroup would have a greater range of college education than one would predictfrom chance distributions.
For the five characteristics we cbecked, it turned out , as is usually
the case in social groups, that the groups tend significantly toward homogene-ity. Thus, while the program as a whole shows a narrower range of ages, re-ligions , educational levels , and GO on , than the general population, the indi-vidual groups , in turn , tend to be more homogeneous than the entire program.
Our tests wereproportion of collegeunder 35 years of agediscrepancies between
made as follows:graduates, womenwould be the samethese predictions
For each group, we predicted that itshousewives, Protes tants, and persons
as for the program as a whole. Theand the observed proportions of college
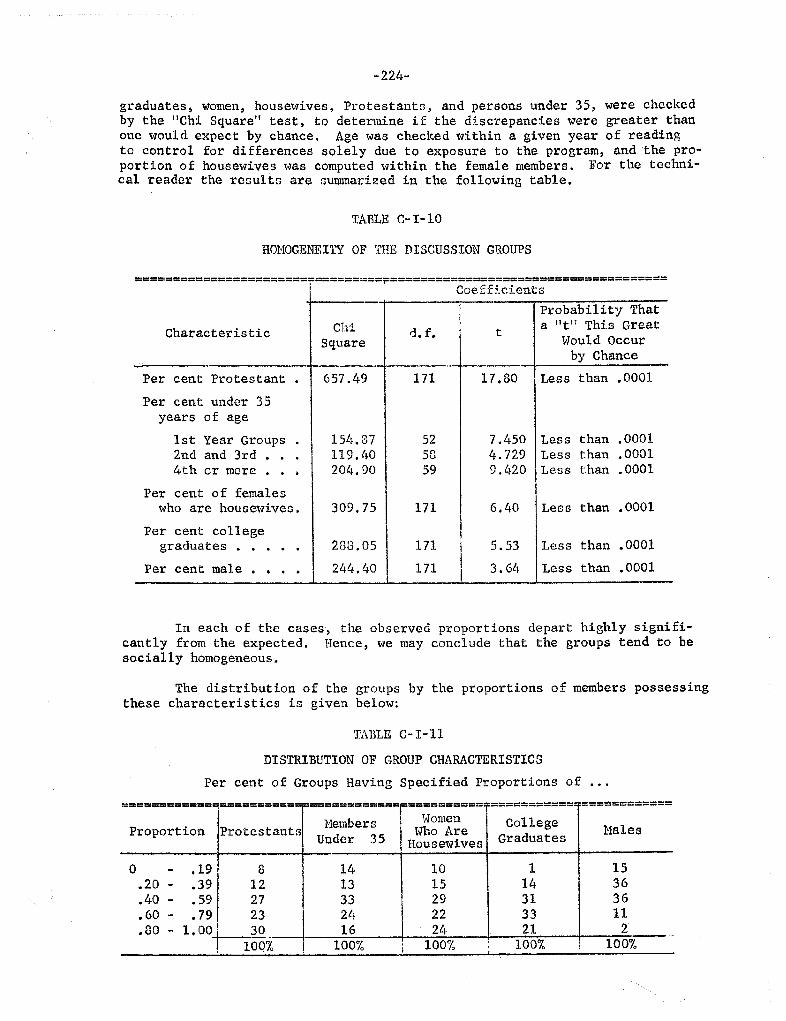
- 224-
graduates, women, housewives, Protestanta, and persons under 35, were checkedby the I1Chi Squarel1 test, to determine if the discrepancies were greater thanone would expect by chance. Age was checked within a given year of readingto control for differences solely due to exposure to the program, and the pro-portion of housewives was computed within the female members. For the techni-cal reader the rCGulta are Gummarized in the following table.
TABLE c- 1-10
H0110GENEITY OF THE DISCUSSION GROUPS
======================= ====== ==?;====================================
CoefficientsProbability That
Characteristic Chid. f.
a lI This Great
Square Hould Occurby Chance
Per cent Protestant 657. 171 17. Less than . 0001
Per cent under 35years of age
1st Year Groups l54. 37 450 Less than 00012nd and 3rd . 119. 40 729 Less than . 00014th or more 204. 420 Less than 0001
Per cent of femaleswho are housewives. 309. 171 Less than 0001
Per cent collegegraduates 238. as 171 Less than 0001
Per cent male 244. 171 Less than 0001
In each of the cases, the observed proportions depart highly signifi-cantly from the expected. Hence , we may conclude that the groups tend to besocially homogeneous.
The distribution of the groups by the proportions of members possessingthese characteristics is given below:
TABLE c-I-
DISTRIBUTION OF GROUP CHARACTERISTICS
Per cent of Groups Having Specified Proportions of
...============
===========F============r==========
T===========:
------------------------
Hembers Women College HalesProportwn Protestants U d 35 \-1ho Are d tn or Housewives ra ua es
1. OO!
...
10Q% 100% 100% 100% 100%
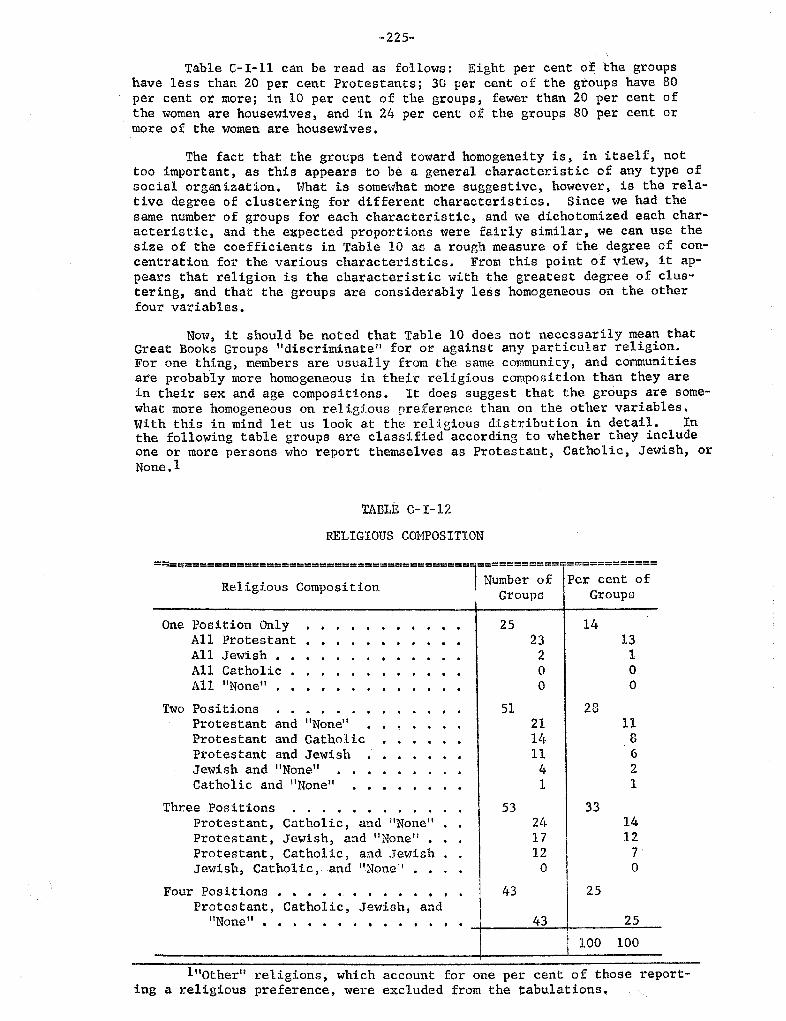
- 225-
Table c- I- ll can be read as follows: Eight per cent of the groupshave les s than 20 per cent Protes tants; 30 per cent 0 f the gtoups have 80per cent or more; in 10 per cent of the groups , fewer than 20 per cent ofthe women are housewives, and in 24 per cent of the groups 80 per cent ormore of the women are housewives.
The fact that the groups tend toward homogeneity is, in itself, nottoo important, as this appears to be a general characteristic of any type ofsocial organization. What is somewhat more suggestive, however, is the rela-tive degree of clustering for different characteristics. Since we had thesame number. of groups for each characteristic , and we dichotomized each char-acteristic, and the expected proportions were fairly similar , we can use thesize of the coefficients in Table 10 as a rough measure of the degree of con-centration for the various characteristics. From this point of view, it ap-pears that religion is the characteristic with the greatest degree of clus-tering, and that the groups are considerably less homogeneous on the otherfour variables.
Now, it should be noted that Table lO does not necessarily mean thatGreat Books Groups "discriminate !! for or against any particular religion.For one thing, members are usually from the same community, and communities
e probably more homogeneous in their religious composition than they arein their sex and age compositions. It does suggest that the groups are some-what more homogeneous on religious preference than on the other variables.
With this in mind let us look at the religious distribution in detail. the following table groups are classified according to whether they includeone or more persons who report themselves as Protestant, Catholic , Jewish, or
None. 1
TABLE C-I-
RELIGIOUS COMPOSITION
====::;;:::::=::::::::;:: ===========
;:m
:;=:;==;:; :::;=:;=
roups roups
One Position OnlyAll ProtestantAll JewishAll CatholicAll None
Two PositionsProtestant and NoneProtestant and CatholicP1"otestant and JewishJewish and NoneCatholic and None
ThreepositionsProtestant Catholic and NoneProtestant Jewish and II None
Protestant Catholic and JewishJewish Catholic
, ...
and" None
Four PositionsPrates tant, Cathol ic Jewish, and
None
100 lOa
11l0ther" religions, which account for one per cent of those report-ing a religious preference , were excluded from the tabulations.
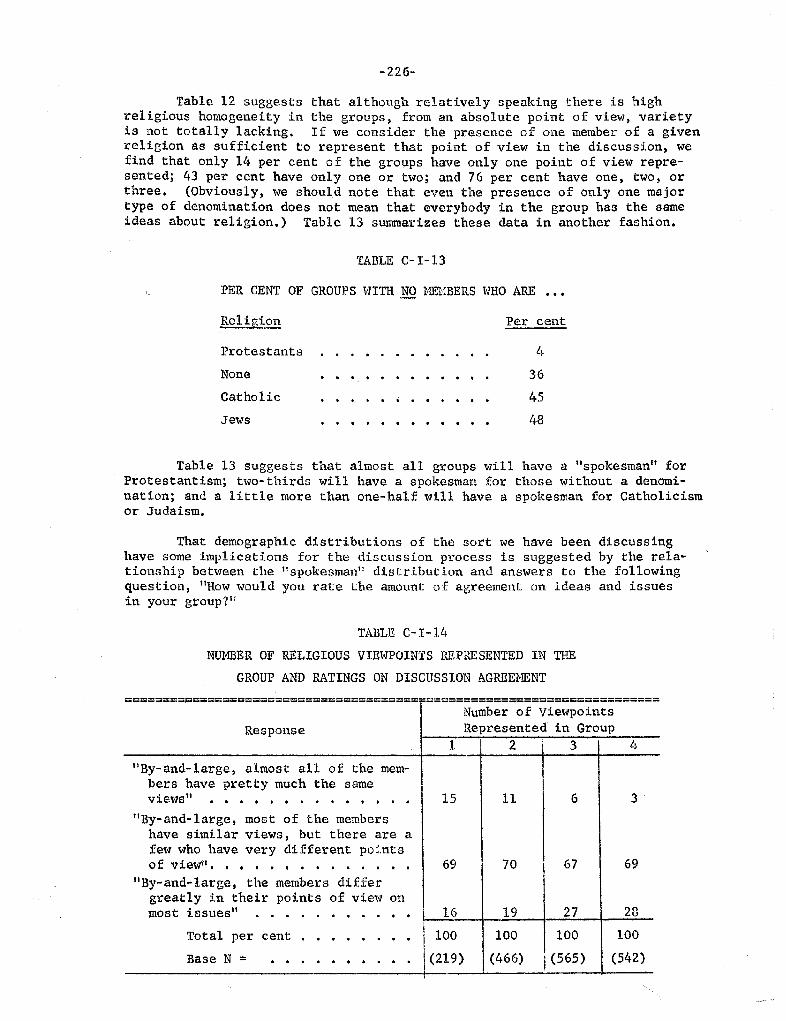
226-
Table 12 suggests that although relatively speaking there is highreligious homogeneity in the groups, from an absolute point of view, varietyis not totally lacking. If we consider the presence of one member of a givenreligion as sufficient to represent that point of view in the discussion, wefind that only 14 per cent of the groups have only one point of view repre-sented; 43 per cent have only one or two; and 76 per cent have one, two, orthree. (Obviously, we should note that even the presence of only one majortype of denomination does not mean that everybody in the group has the sameideas about religion. Table 13 summarizes these data in another fashion.
TABLE C- 1-
PER CENT OF GROUPS WITH NlSHBERS WHO ARE
...
Rel Per cent
Protestants
. .
I..
None
Catholic
. . . . . . .. . .
Jews
Table 13 suggests that almost all groups will have a "spokesman" forProtestantism; two-thirds will have a spokesman for those without a denomi-nation; and a little more than one-half will have a spokesman for Catholicismor Judaism.
That demographic distributions of the sort we have been discussinghave some implications for the discussion process is suggested by the rela-tionship between the " spokesman" distribution and answers to the followingquestion, "How would you rate the amount of agreement on ideas and issuesin your group?!:
TABLE C- 1-14
Nil1BER OF RELIGIOUS VIEWPOINTS REPlilSENTED IN TIm
GROUP AND RATINGS ON DISCUSSION AGREE mNT
---------------------- ------------- ------------------- --------------------
Response
=============----=============;
Number of ViewpointsRepresented in Group
By-and- large, almost all of the mem-bers have pretty much the sameviews ,t
. . .. . .
By-and- 1arge, most of the membershave similar views, but there are afew who have very different po ntsof view
. . . . . . .. . . .
Total per cent
. . . .
100 100 100 100
(219) I (466) 1(565)(542)
By-and-large , the members differgreatly in their points of view onmost issuesl1 .
. . . .
Base N =
. .
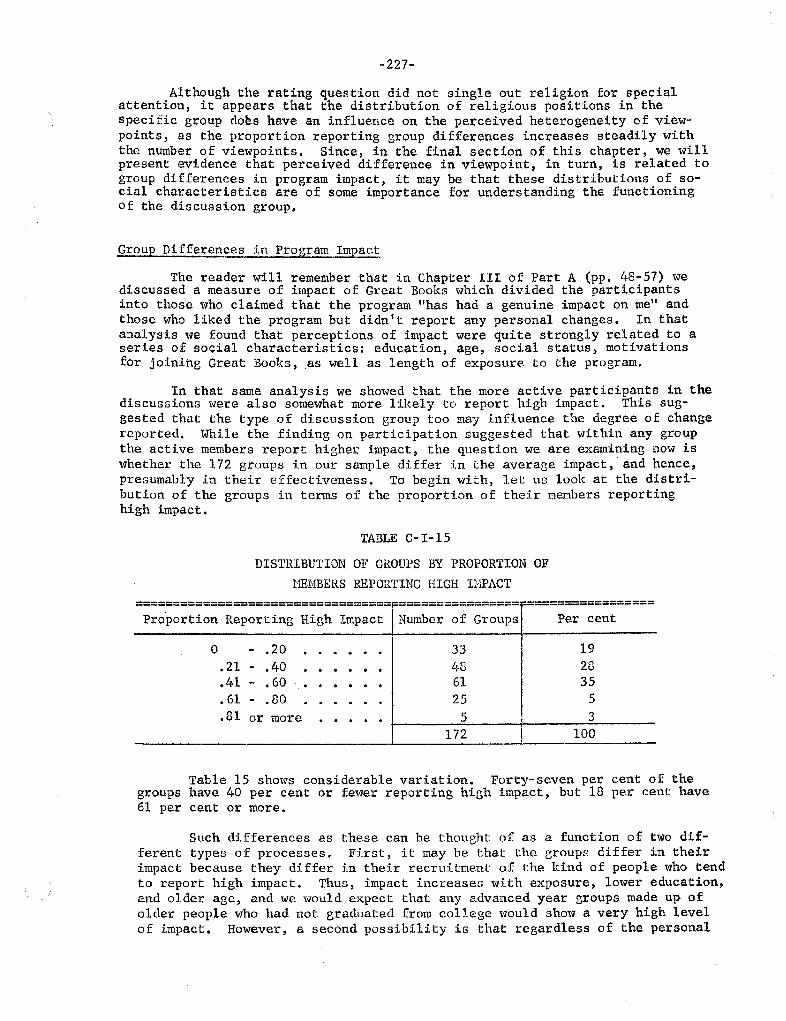
227-
Although the rating question did not single out religion for specialattention, it appears that the distribution of religious positions in thespecific group do s have an influence on the perceived heterogeneity of view-points, as the proportion reporting group differences increases steadily withthe number of viewpoints. Since, in the final section of this chapter, we willpresent evidence that perceived difference in viewpoint , in turn , is related togroup differences in program impact , it may be that these distributions of so-cial characteristics are of some importance for understanding the functioningof the discussion group.
Group Differences in Program Impact
The reader will remember that in Chapter III of Part A (pp. 48-57) wediscussed a measure of impact of Great Books which divided the participantsinto those who claimed that the program IIhas had a genuine impact on me" andthose who liked the program but didn I t report any personal changes. In thatanalysis we found that perceptions of impact were quite strongly related to aseries of social characteristics: education, age , social status , motivationsfor joining Great Books , as well as length of exposure to the program.
In that same analysis we showed that the more active participants in thediscussions were also somewhat more likely to report high impact. This sug-gested that the type of discussion group too may influence the degree of cllangereported. While the finding on participation $uggested that within any groupthe active members report higher impact , the question we are examining now iswhether the 172 groups in our sample differ in the average impact , and hence,presumably in their effectiveness. To begin with , let us look at the distri-bution of the groups in terms of the proportion of their members reportinghigh impact.
TABLE C-I-15
DISTRIBUTION OF GROUPS BY PROPORTION OF
lllMBERS REPORTING HIGH IMPACT
==================================F================ ==================Proportion Reporting High Impact Number of Groups Per cent
or more
172 100
Table 15 shows considerable variation. Forty- seven per cent of thegroups have 40 per cent or fewer reporting high impact , but 18 per cent have61 per cent or more.
Such differences as these can be thought of as a function of two dif-ferent types of processes. First , it may be that the groups differ in theirimpact because they differ in their recruitment of the kind of people who tendto report high impact. Thus , impact increases with exposure, lower education,and older age , and we would expect that any advanced year groups made up ofolder people who had not graduated from college would show a very high levelof impact. However , a second possibility is that regardless of the personal
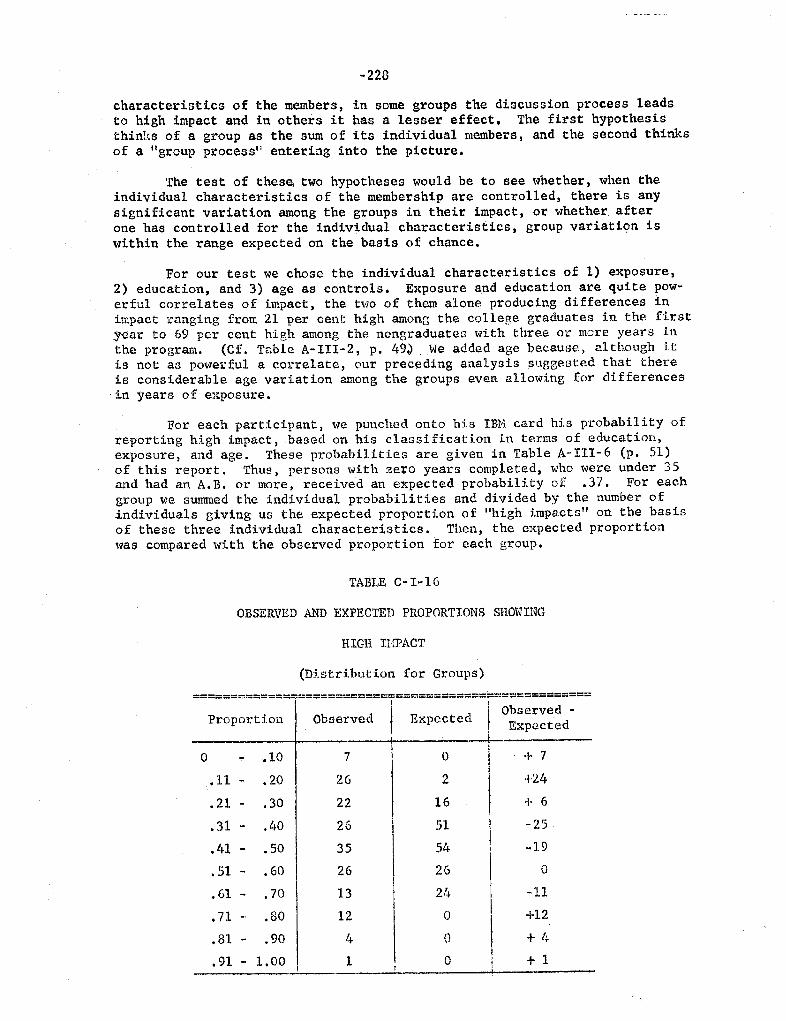
228
characteristics of the members, in some groups the discussion process leadsto high impact and in others it has a lesser effect. The first hypothesisthinks of a group as the sum of its individual members, and the second thinksof a I1group process'l entering into the picture.
The test of these two hypotheses would be to see whether, when theindividual characteristics of the membership are controlled, there is anysignificant variation among the groups in their impact, or whether afterone has controlled for the individual characteristics, group variation iswithin the range expected on the basis of chance.
For our test we chose the individual characteristics of 1) exposure2) education, and 3) age as controls. Exposure and education are quite pow-erful correlates of impact, the two of them alone producing differences inimpact ranging from 21 per cent high among the college graduates in the firstar to 69 per cent high among the nongraduates with three or more years in
the program. (Cf. Table A-III-2, p. 49.) We added age because , although itis not as powerful a correlate, our preceding analysis Suggested that thereis considerable age variation among the groups even allowing for differences,in years of e tposure.
For each participant , we punched onto his IBH card his probability ofreporting high impact , based on his classification in terms of education,exposure , and age. These probabilities are given in Table A-III- 6 (p. 51)of this report. Thus , persons with zero years completed, who were under 35and had an A. B. or more , received an expected probability of .37. For eachgroup we summed the individual probabilities and divided by the number ofi.ndividuals giving us the expected proportion of "high impacts" on the basisof these three individual characteristics. Thcn, the e tpected proportionwas compared with the obsetved proportion for cach group.
TABLE C-I-
OBSERVED AND EXPECTED PROPORTIONS SHOWING
HIGH IHPACT
(Distribution for Groups)
===== === =========== ===========================
Observed -Proportion Observed Expected i Expected
+ 7
ll - +24
21 - + 6
3l - -25
41 -51 -61 - 2!4
71 - +12
81 -1.00 + 1
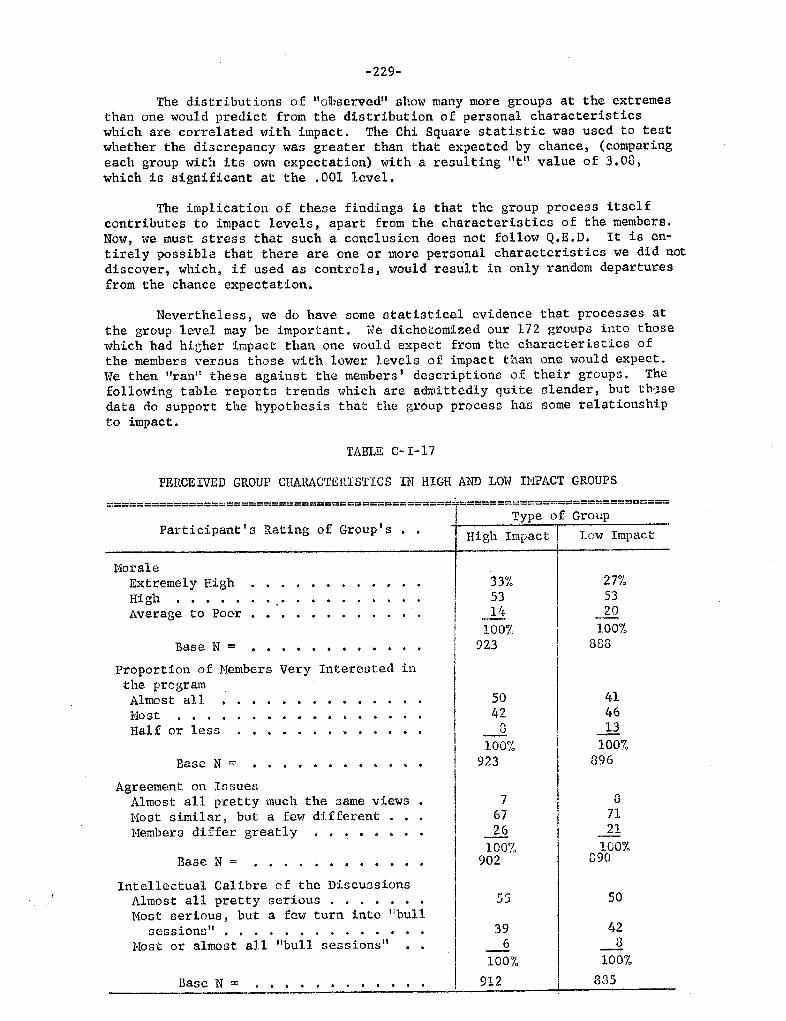
229-
The distributions of "o1bserved" show many more groups at the extremesthan one would predict from the distribution of personal characteristicswhich are correlated with impact. The Chi Square statistic was used to testwhether the discrepancy was greater than that expected by chance, (comparingeach group with its own expectation) with a reGulting lit" value of 3. 08,which is significant at the . 001 level.
The implication of these findings is that the group procesG itselfcontributes to impact levels, apart from the characteristics of the members.Now, we must stress that such a conclusion does not follow Q. D. It is en-tirely possible that there are one or more personal characteristics we did notdiscover, which, if used as controls, would result in only random departuresfrom the chance expectation.
Nevertheless, we do have some statistical evidence that processes atthe group level may be important. He dichotomized our 172 groups into thosewhich had hicher i pact than one would expect from the characteristics ofthe members versus those with lower levels of impact than one would expect.He then "ran" these against the members I descriptions of their groups. Thefollowing table reports trends which arc admittedly quite slender , but th
data do support the hypothesis that the group process has some relationshipto impact.
PERCEIVED GROUP CHARACTERISTICS IN HIGH AND LOH INPACT GROUPS
=============================================
T=======
====================
Type of GroupParticipant I s Rating of Group I J' actg 1 mpac ow mp
33% 27%53 14 100i" 100'70923 888
TABLE C- 1-
l10raleExtremely High
. . . .
High
. . . .
Average to Poor
. . . . . .
Base N =
Proportion of Members Very Interested inthe programAlmost all
. . . . . . . . . .
Host
. .
Half or lessli .
. . . .
li .
,. .
Base N ::
Agreement on IssuesAlmost all pretty much the same viewsMost similar, but a few differentMembers differ greatly
. . . .
Base N :: li . . Intellectual Calibre of the Discu3sionsAlmost all pretty serious
. . . .
Most serious , but a few turn into nbulloessions
. . . .
Most or almost all "bull sessions
Base N =
. .
100% 100%923 896
100% 100%902 890
100'70 100'7.
912 Ba5
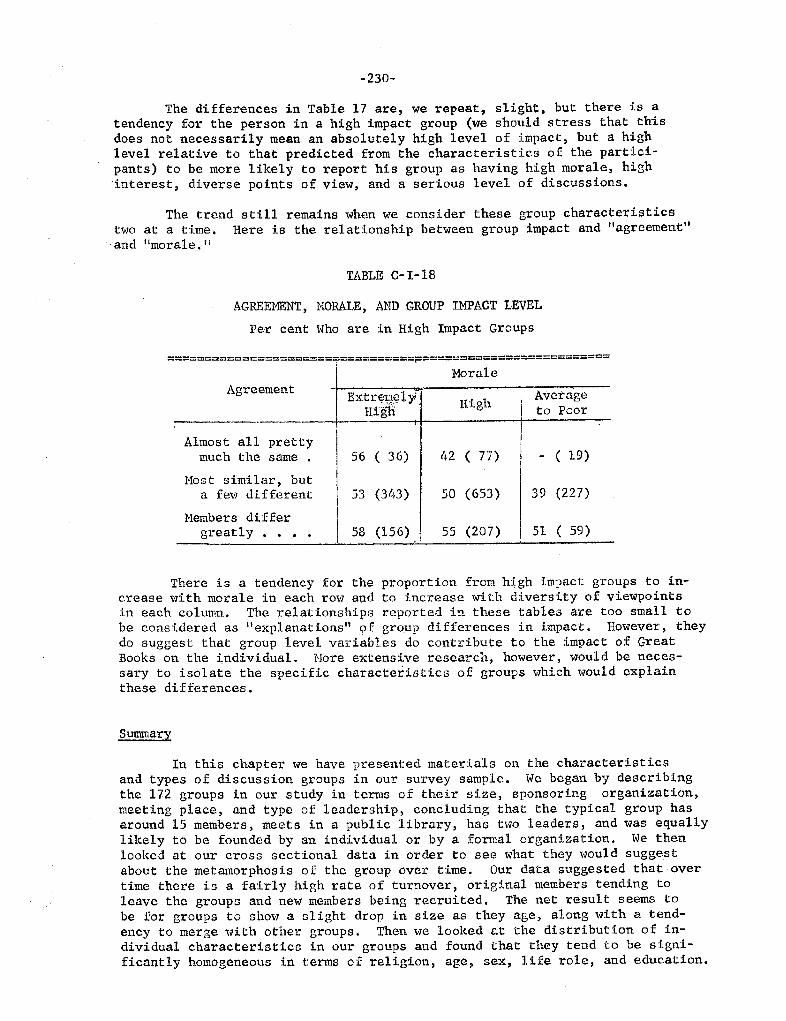
- 230-
The differences in Table 17 are, we repeat , slight. but there is atendency for the person in a high impact group (we should stress that thisdoes not necessarily mean an absolutely high level of impact , but a high
level relative to that predicted from the characteristics of the partici-pants) to be more likely to report his group as having high morale, highinterest , diverse points of view, and a serious level of discussions.
The trend still remains when we consider these group characteristicst\.JO at a time. Here is the relationship between group impact and "agreement!!and l'mora1e.
TABLE C-I-
AGREEMENT , MORALE, AND GROUP IMPACT LEVEL
Per cent Who are in High Impact Groups
==== ======== =======
7======== =F================
;====
Morl;1eAgreement Extr HGLi Average
Hign High to Poor
Almos t all prettymuch the same ( 36) 77) ( 19)
110st similar buta few different (343) (653) (227)
Members differgreatly (156) (207) ( 59)
. ,
There is a tendency for the proportion from high impact groups to in-crease with morale in each row and to increase with diversity of viewpointsin each column. The relationships reported in these tables are too small tobe considered as " explanations" of group differences in impact. However , theydo suggest that group level variables do contribute to the impact of GreatBooks on the individual. More extensive research, however, would be neces-sary to isolate the specific characteristics of groups which would explainthese differences.
Summary
In this chapter we have presented materials on the characteristicsand types of discussion groups in our survey sample. We began by describingthe 172 groups in our study in terms of their size , sponsoring organizationmeeting place , and type of leadership, concluding that the typical group hasaround l5 members, meets in a public library, has two leaders, and was equallylikely to be founded by an individual or by a formal organization. We thenlooked at our cross sectional data in order to see what they \vou1d suggestabout the metamorphosis of the group over time. Our data suggested that overtime thcre is a fairly high rate of turnover, original members tending toleave the groups and new members being recruited. The net result seems tobe for groups to show a slight drop in size as they age, along with a tend-
ency to merge 'vith other groups. Then we looked at the distribution of individual characteristics in our groups and found that they tend to be signi-ficantly homogeneous in terms of religion, age . sex, life role , and education.
231-
A closer look at religious composition indicated, however, that most groupsdo have Ii spokesmen" for more than one religious point of view and that themore points of view there are in a group, the more likely are the membersto report their group as having diversity of viewpoints in general. Finally,we examined group differences in impact upon the participants. We found that
even controlling for individual characteristics which are related to impact,groups differ significantly in theirlevEHs of impact , and that differences
in impact level are related, although slightly, . to such aspects of the groupas morale, interest of the members, seriousness of the discussions, and di-versity of viewpoints.

CHAPTER II
THE ROLE STRUCTURE OF THE DISCUSS ION GROUP
-232-
233-
Introduction
From one point of view , each of the 172 discussion groups in our study
consists of a dozen or so specific people who meet regularly to talk aboutGreat Books readings. From a more abstract perspective , however , each group
may be viewed as a system of social roles. Although the concept of IIroleis one of the bread-and-butter ideas he sociologist' s repertory, it isdifficult to find a definition which is agreed on by everyone in the profes-sion. For purposes of getting the point, it is probably just as easy tothink of a role as lithe parts one plays in a social group" as to use a formaldefinition; however , we can note that even this simple definition impliesme rather specific properties. Thus:
The role is not the same as the person. "Hamlet" is not thesame as Gie1gud; "The President of the United States " is not
always Dwight D. Eisenhower. It follows from this that a singleperson may play many roles.
Roles assume consensus. In order for roles to exist , the people
who play them must know what is expected , and the people with
whom they play must know what to expect.
Roles assume some action. By definition they are soreething you
"do , II not something you "are. " Thus , being "middle-class II is nota role; but being a "middle-class businessman" is a role.
Given our definition , it follows that "participant" in Great Books
is a social role. The participants are not "the same " as the people, since
the "people II do many other things; there is consensus in the groups as towhat a part icipant is; and being a participant involves the members in theaction of discussing the Great Books.
What we are concerned with , however , in this chapter is an anlysis
of the "kinds " of participation that arise in the discussion. We shall asksuch questions as:
Are there participation roles that are recognized by the parti-cipants?
If so, what are the basic "kinds
How are these roles organized?
In the following chapter we shall ask the additional question
, '
hat sorts of
people play what sorts of roles?!!
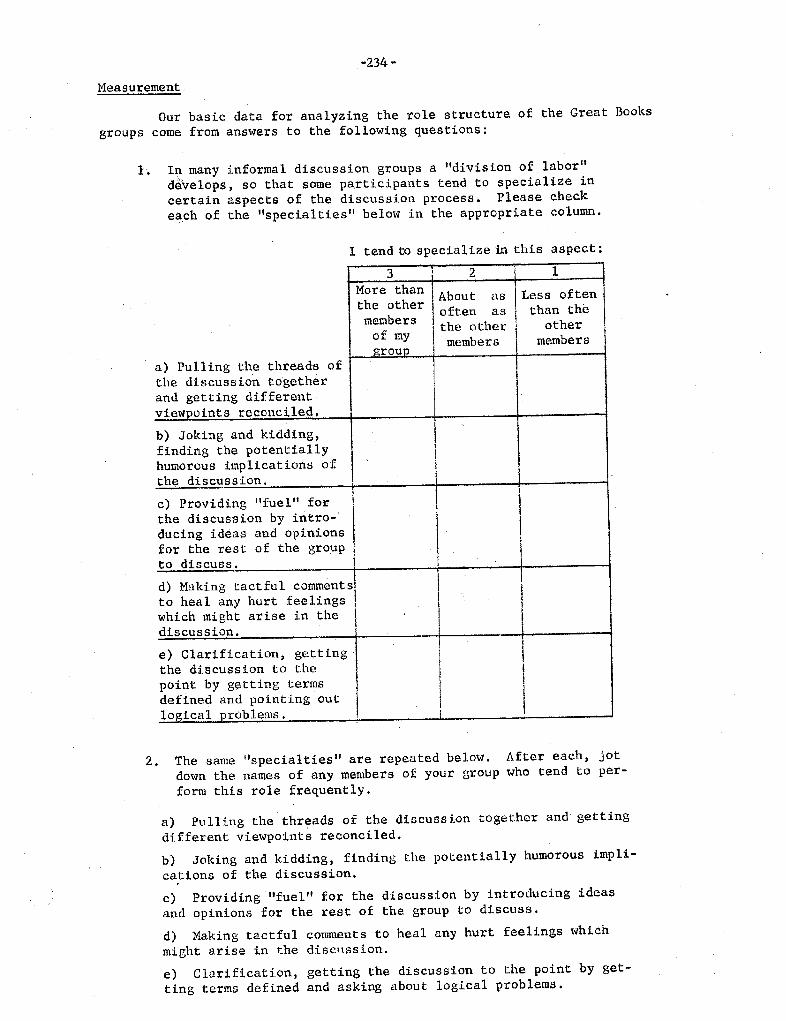
- 234 -
Measurement
Our basic data for analyzing the role structure of the Great Booksgroups come from answers to the following questions:
In many informal discussion groups a "division of labordevelops, so that some participants tend to specialize incertain aspects of the discussion process. Please checkeach of the "specialties" below in the appropriate column.
1 tend to specialize in this aspect:
More thanthe othermembersof mye:rOUD
About asoften as
, the othermembers
Less oftenthan the
othermembers
a) Pulling the threads ofthe discuss ion togetherand getting different.viewpoints reconciled.b) Joking and kidding,finding the potentiallyhumorous implications ofthe discussion.
c) Providing "fue I" forthe discussion by intro-ducing ideas and opinionsfor the rest of the group to discuss. d) Making tactful commentsto heal any hurt feelings 'which might arise in the discussion.
e) Clarirication , getting.
the discussion to thepoint by getting termsdefined and pointing out
logical problems.
The same "specialties !! are repeated below. After each , jotdown the names of any members of your group who tend to per-form this role frequently.
a) Pulling the threads of the discussion together and gettingdifferent viewpoints reconciled.
b) Joking and kidding, finding the potentially humorous impli-cations of the discussion.
c) Providing "fuel" for the discussion by introducing ideasand opinions for the rest of the group to discuss.
d) Making tactful comments to heal any hurt feelings whichmight arise in the discussion.
e) Clarification, getting the discussion to the point by get-ting terms defined and asking about logical problems.
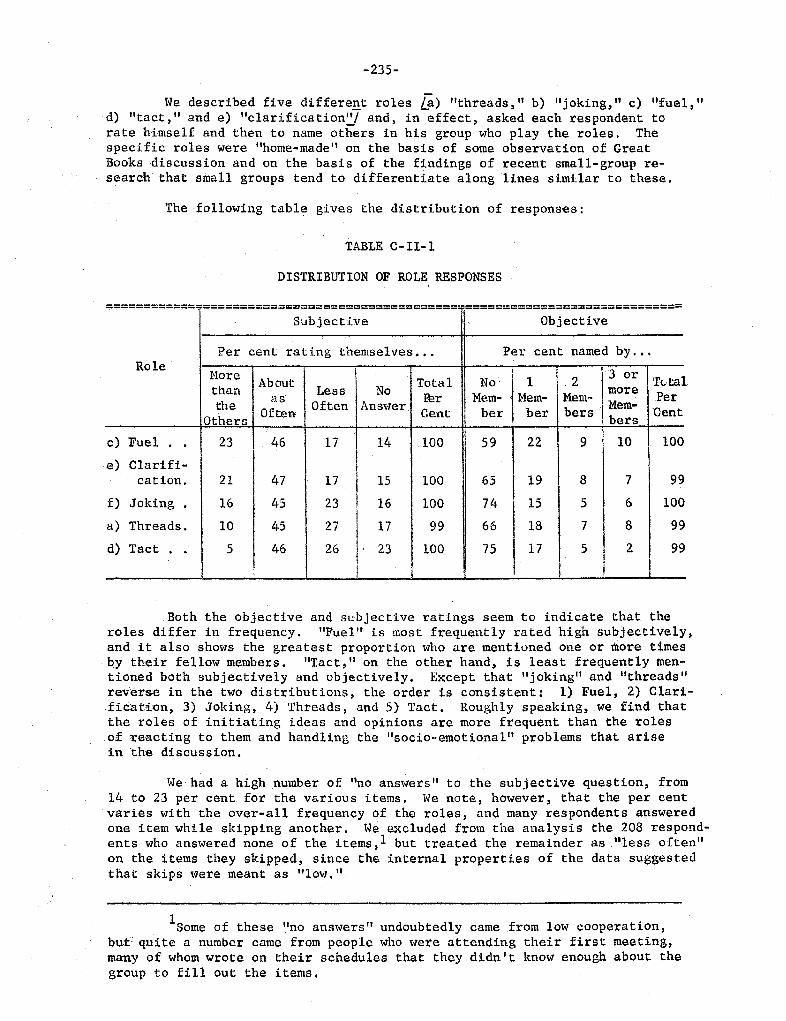
235-
We described five differe!!t roles La) threads , II b) " joking, II c) "fuel , II
d) "tact " and e) "clarifica tion:Y and , in effect , asked each respondent torate himself and then to name others in his group who play the roles. Thespecific roles were "home-made " on the basis of some observation of GreatBooks discussion and on the basis of the findings of recent small- group re-sear h that small groups tend to differentiate along lines similar to these.
The following table gives the distribution of responses:
TABLE C-II-
DISTRIBUTION OF ROLE RESPONSES
--------------------""--------------------------..------..-----------------------=---------------------------------------------- ----------------------------
Subjective Objective
Per cent rating themselves... Per cent named by...Role
l-10re 3 orAbout Tota 1
j M'!vtalthan Less I:r Mem- Mem-
more Perthe Often Answer Mem-
Others Often Cent ber ber bers bers Cent
c) Fuel lOa 100
Clarifi-cation. 100
Joking lOa 100
Threads.Tact 100
Both the objective an4 subjective ratings seem to indicate that theroles differ in frequency. "Fuel" is most frequently rated high subjectively,and it also shows the greatest proportion who are mentioned One or more timesby their fellow members. "Tact, " on the other hand, is least frequently men-tioned both subjectively and objectively. Except that " joking" and "threadsreverse in the two distributions the order is consistent: 1) Fuel, 2) Clari-ficat'ion , 3) Joking, lj.) Threads, and 5) Tact. Roughly speaking, we find thatthe roles of initiating ideas and opinions are more frequent than the rolesof reacting to them and handling the "socia-emotional" problems that arisein the discussion.
We had a high number of "no answers " to the subjective question , from14 to 23 per cent. for the various items. We note, however , that the per centvaries with the over-all frequency of the roles, and many respondents answeredone item while skipping another. We excluded from the analysis the 208 respond-ents who answered none of the items, 1 but treated the remainder as "less oftenon the items they skipped , since the internal properties of the data suggestedthat skips were meant as "low.
Some of these "no answers " undoubtedly came from low cooperationbut quite a number came from people who were attending their first meeting,many of whom wrote on their schedules that they didn t know enough about thegroup to fill out the items.
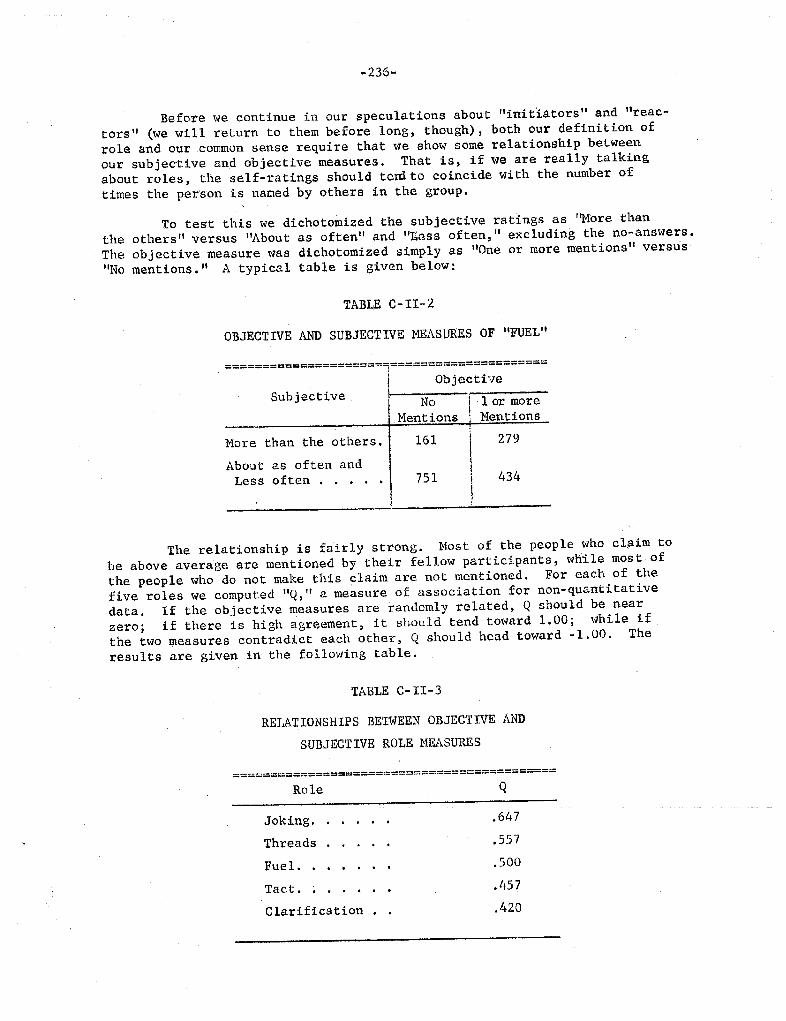
236-
Before we continue in our speculations about "inifiators " and "reac-tors " (we wi 11 return to them before long, though), both our definit ion ofrole and ourcornmon sense require that we show some relationship betweenour subjective and objective measures. That is, if we are really talkingabout roles. the self-ratings should terd to coincide with the number oftimes the person is named by others in the group.
To test this we dichotomized the subjective ratings as ore than
the others " versus "About as often" and "Less often " excluding the no-answers.
The objective measure was dichotomized simply as "One or more mentions" versus
"No mentions. " A typical table is given below:
TABLE C- II- 2
OBJECTIVE AND SUBJECTIVE MEASURES OF "FUEL"
=====================
9=====================ObjectiveSubjective No I 1 or more
Mentions ; Mentions
More than the others. 161 279
About as often andLess often
. .
751 434
The relationship is fairly strong. Most of the people who claim to
be above average are mentioned by their fellow participants, while most of
the people who do not make this claim are not mentioned. For each of the
five roles '-1e computed " " a measure of association for non-quantitativedata. If the objective measures are randomly related, Q should be nearzero; if there is high agreement , it should tend toward 1.00; while ifthe two measures contradict each other , Q should head toward -
1. 00. The
results are given in the following table.
TABLE C- II-
RELATIONSHIPS BETWEEN OBJECTIVE AND
SUBJECTIVE ROLE MEASURES
---------------------.-------------------------------_.._---------_._ ---- ----------------
Role
Joking. 647
Threads 557
Fuel. 500
Tact. 457
Clarification 420
237-
All the relationships are positive and, although not terribly highare strong enough to conclude that objective ratings tend to agree with sub-jective ones. Thus , we think it is fair to claim that our data meet thedefinitional requirement of "roles.
Role Structure
In addition to "roles, " small gro1.ps are believed to have "rolestructures " by which the sociologist means "the ways in which roles are
related to each other. The remainder of this chapter is devoted to thequestion of pinpointing the role structure of our discussion groups.
Hhen sociologist.s talk about the Uinterrelationships " of roles, wetend to slide off into a vague , verbal cloud of pious statements such as
Roles are dynamically interrelated. For purposes of research , however,
we need some very definite methods for specifying what we mean by "related"and what the possible kinds of "relatedness " can be.
To begin with , I:t this point we will consider only how the rolesrelate to each other "within a given person. By this we mean that the issue
is what combinations of roles a person may play, not how people who play onE!
role get along with people who play another.
Let us begin by considering only two roles at a time.that there are three logically possible relationships:
We suggest
The roles are positively related . That is, persons who performone role tend disproportionately to perform the other. Thus , the
roles of "wife ll and "mother" are positively related , althoughthe relationship is not perfect.
The roles are randomly related . That is, persons whC? performone role are about as likely to perform the other as persons whodon t perform the first. Thus, age and sex roles are probablyrandomly related , there bein.g just about as many female adoles-cents as female non-adolescents.
The roles are mutually exclusive That is, persons who tend to
perform a given role tend, disproportionately, not to perform theother. "Mother " and "father" are logically mutually exclusive,
and "mother " and ilpoliceman are probably statistically so.
These definitions of role relationships imply that some measure ofassociation or correlation will be sufficient to analyze any pair of roles.
Now , what about sets of roles? Most sociological thinking about roles
tends to consider them in batches much larger than the pair, but the methodologyfor doing research on these problems has not been formally worked out. begin with , techniques such as factor-analysis would probably be the theoret-ically most appropr.iate \oJay of looking at role clusters, but:fn the majorityof cases the data are not of a technical quality to justify this technique.
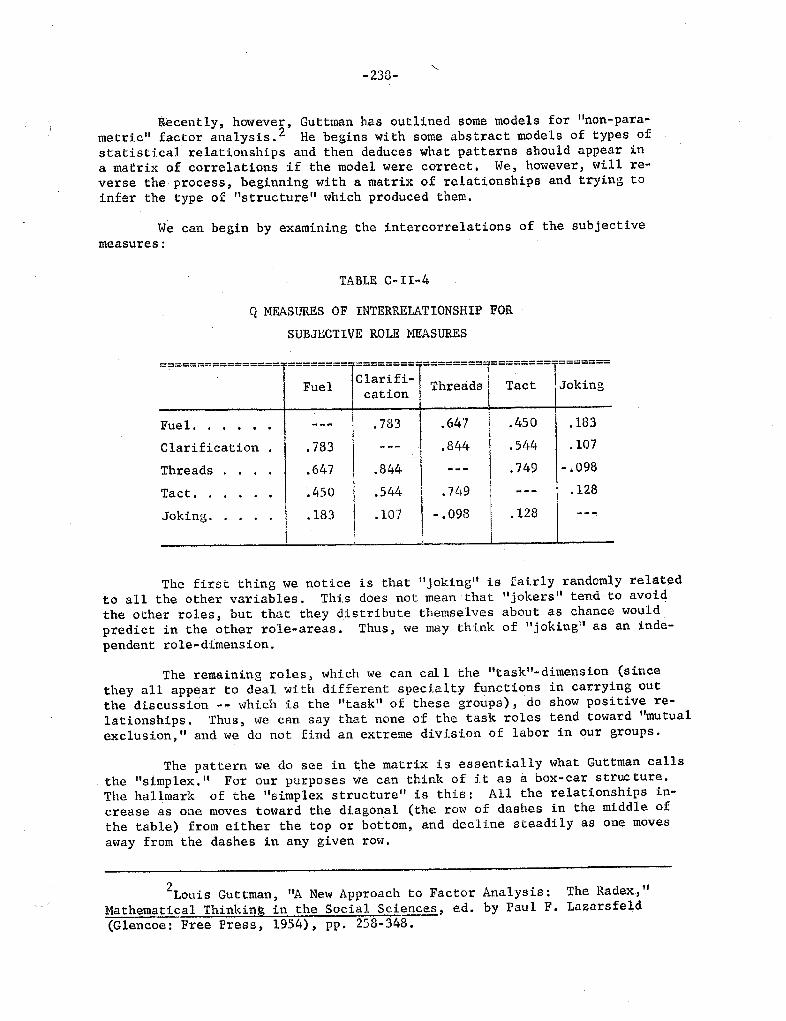
- 233-
Recently, however , Guttman has outlined some models for "non-para-metric" factor analysis. He begins with some abstract models of types of
statistical relationships and then deduces what patterns should appear ina matrix of correlations if the model were correct. We, however, will re-
verse the process J beginning with a matrix of relationships and trying toinfer the type of IIstructure" which produced them.
We can begin by examining the intercorrelations of the subjectivemeasures:
TABLE c-II-
Q MEASURES OF INTERRELATIONSHIP FOR
SUBJECTIVE ROLE MEASURES
-------------------------------- === ===
T========T========l========T=======!Clarifi-Fuel Threads I' Tact JokingI cat
Fuel. 450 183
Clarification 783 544 107
Threads 647 844 749
- .
098
Tact. 450 544 749 128
Joking. 183 107
- .
098 128
The first thing we notice is that U joking ll is fairly randomly relatto all the other variables. Thi.s does not mean that " jokers II tend to avoidthe other roles, but that they distribute themselves about as chance wouldpredict in the other role-areas. Thus , we may think of " joking 'l as an inde-pendent role-dimension.
The remaining roles , which we can call the Ittasklt dimension (sincethey all appear to deal with different specialty functions in carrying outthe discussion -- which is the It tasklt of these groups), do show positive re-lationships. Thus , we can say that none of the task roles tend toward Itmutualexclusion " and we do not find an extreme division of labor in our groups.
The pattern we do see in he matrix is essentially what Guttman calls
the "simplex. II For our purposes we can think of it as a box-car struc ture.The hallmark of the Itsimplex structure lt is this: All the relationships in-crease as one moves toward the diagonal (the row of dashes in the middle of
the table) from either the top or bottom, and decline steadi.ly as one moves
away from the dashes in any given row.
LouiS Guttman
, "
A New Approach to Factor Analysis:
Mathematical Thinkin in the Social Sciences , ed. by Paul F.
(Glencoe: Free Press , 1954), pp. 258-348.
The Radex,Lazarsfeld
239-
What this implies is this: The variables we observe are hooked togetherlike a train of box-cars , and each is highly related to its nearest neighborsin the train and more and more weakly related as one moves away in eitherdirection. In short , the suggestion here is that the four task roles tap asingle dimension, but each taps a different qualitative area on that dimensionwhich runs from IIfuel" at one extreme to " tactll at the other.
Now , what this sugges ts to us (and in candor we must stress that "factor-naming" is one of the most pleasurable and most dangerous games in research)is that the order involved is one of the " time-process " of discussion. We mayhazard the guess' that discussions tend to begin with "fuel" u ideas , commentsand sugges tions which are thrown out by certain members. This period is fol-lowed by a phase of "clarification, " in which the members think through andattempt to understand the material provided. Following this there may be aperiod when the group attempts to knit together and synthesize ("threadsthe ideas which have been presented Finally, there occasion lly may be thenecessity to deal with and heal any emotional rifts which have arisen in thediscussion ("tact"
).
While this is all highly speculative , this interpreta-tion is roughly congruent with the research findings of Bales and his coworkers in their laboratory studies of small groups.
Now, where our findings differ from Bales , however , is that we findno "gap ll between the various task roles, all of which show positive relation-ships; rather , we find (,ur respondents distributed along a continuum frominitiation to reaction. Taking off from the idea of a continuum, we can thinkof the task roles as distributed roughly as follows:
Initiators persons whose role is to provide fuel for the dis-cussion but who leave the later part of the IIwork" to others;
aeneralists persons who contribute to both the initiation andreaction phases of the discussion;
Reactors persons who contribute to the end phases of the dis-cussion but who leave the "fuel" stage to others.
Before we proceed to the construction of our actual role typology,let us check our conclusions by seeing whether the lIobjective" role-measuresgive us that same IIbox-car ll pattern of correlations.
The following table gives the Q interrelations of the objective men-t ions , dichotomized as before as "mentioned one or more times II versus IInotmentioned" :
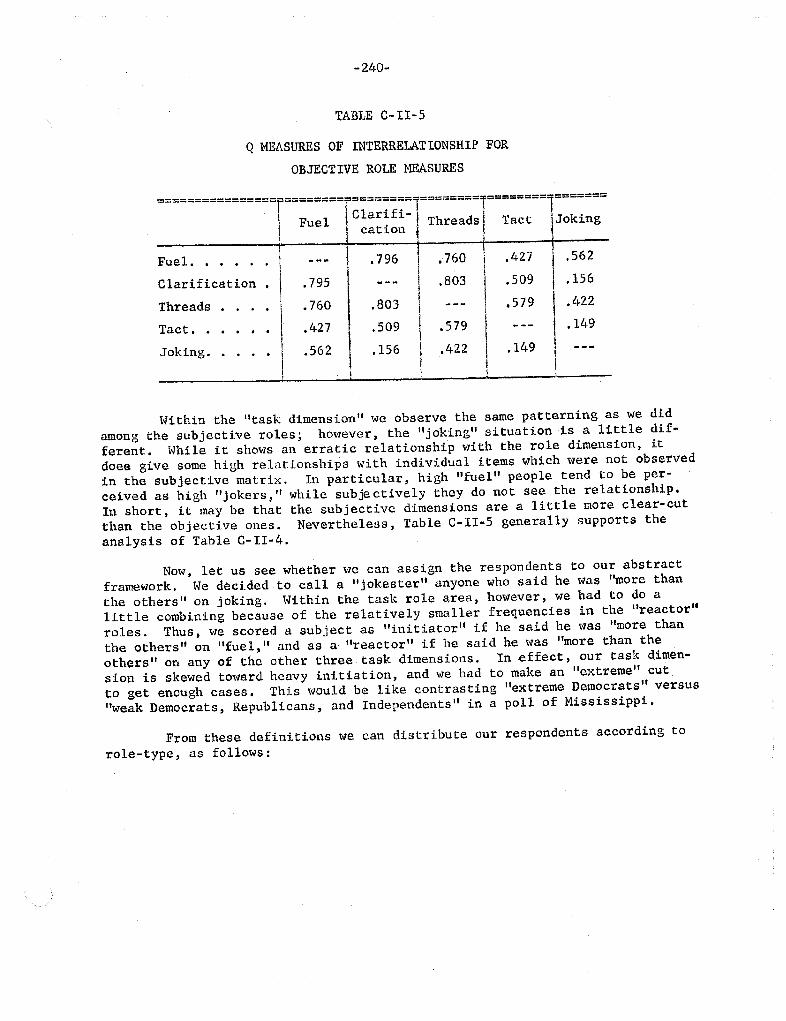
- 240-
TABI,E C- II-S
Q MEASURES OF INTERRELATIONSHIP FOR
OBJECTIVE ROLE MEASURES
================
f==
;:::==
;::::::I-
-::::-
"l:::::=I ca 10n Fuel. . .
--- .
796 760 1 .427 I .
562
Clarification
\ .
795
---
I .803 I . 509 t . 156
Threads
. .
760 .803
\ .
579 I . 422
Tact. . . .427 .509 I .579 I I .
149
Joking. . .
. .
I .562 . 156
! .
422 \ . 149 j
Within the "task dimension ll we observe the same patterning as we didamong the subjective roles; however , the II joking" situation is a little dif-ferent. While it shows an erratic relationship with the role dimension , itdoes give some high relationships with individual items which were not observedin the subjective matrix. In particular, high "fuel" people tend to be per-ceived as high " jokers " while subjectively they do not see the relationship.
In short , it may be that the subjective dimensions are a little more clear-cutthan the objective ones. Nevertheless , Table C-II-5 generally supports the
analysis of Table C-II-
Now , let us see whether we can assign the respondents to our abstractframework. We deci.ded to call a " jokester" anyone who said he V1as "more thanthe others " on joking. Wi thin the task role area , however, we had to do a
little combining because of the relatively smaller frequencies in the IIreactor
roles. Thus, we scored a subject as "initiator ll if he said he was "more thanthe others" on "fuel, " and as a IIreactor ll if he said he was "more than theothers II on any of the other three task dimensions. In effect , our task dimen-
sion is skewed tm-lard heavy initiation , and we had to make an "extreme" cut
to get enough cases. This would be like contrasting lIextreme Democrats ll versus
weak Democrats, Republicans, and Independents " in a poll of Mississippi.
From these definitions we can distribute our respondents according torole-type, as follows:
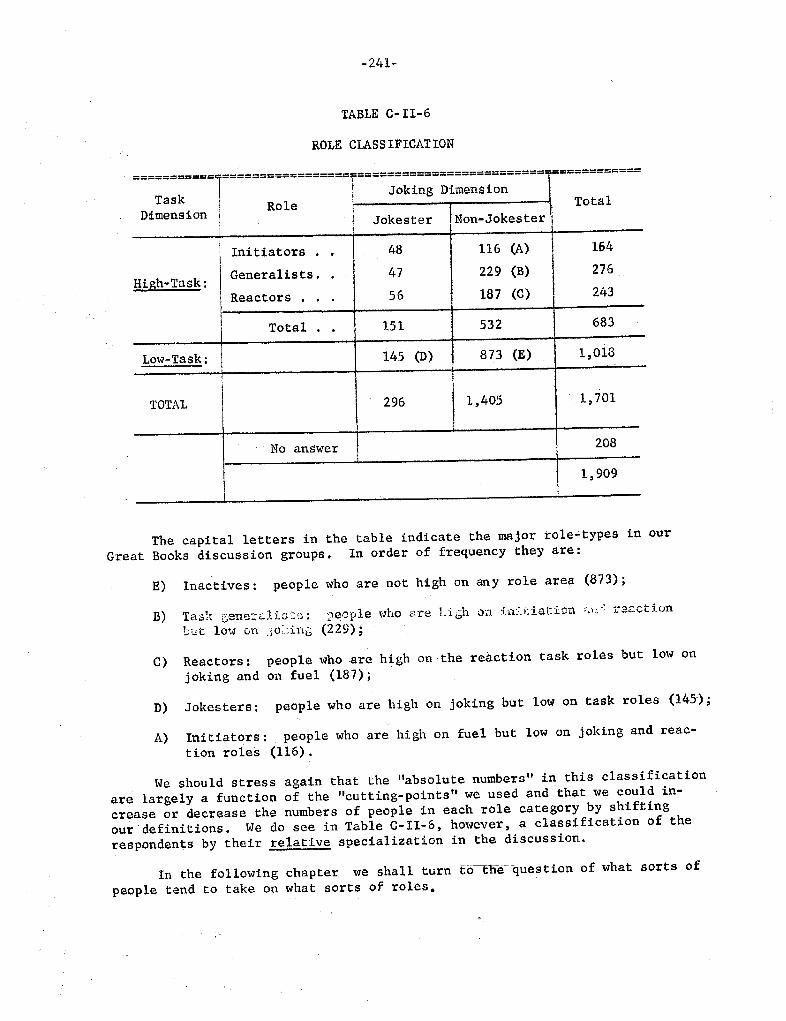
241-
TABLE C- II-
ROLE CLASS IF ICAT ION
-----------------------------
r-----'------------------
-;: =============--- ----
l----------------- ----
~~~~~~ ~~~~~~~~~-----
TotalRole1mens on Jokester Non-Jokester
Initiators 116 (A) 164
h-Task: Generalists. 229 (B) 276
Reactors 187 (C) 243
Total lSl 532 683
Low-Task: 145 (D) 873 (E) l, 018
TOTAL 296 405 701
anSwer 208
909
The capital letters in the table indicate the major role types in our
Great Books discussion groups. In order of frequency they are:
Inactives: people who are not high on any role area (873);
Tas \. ;3ello::d. is:'::1: ?eople ,,,ho are Li.;h 0;;1 :in: ation '
.,.
t'3G:ction
lo,. 0n jo:.:inS (229);
Reactors: people who are high on the reAction task roles but low onjoking and on fuel (187);
Jokesters: people who are high on joking but low on task roles (145);
Initiators: people who are high on fuel but low on joking and reac-
tion roles (ll6).
We should stress again that the "absolute numbers " in this classification
are largely a function of the "cutting-points" we used and that we could in-creas or decrease the numbers of people in each role category by shiftingour definitions. We do see in Table C- 11- 6) however) a classification of therespondents by their relative specialization in the discussion.
In the following chapter we shall turn to the question of what sorts of
people tend to take on what sorts of roles

CHAPTER III
SOCIAL CHARACTERISTICS OF ROLE PARTICIPANTS
-242-
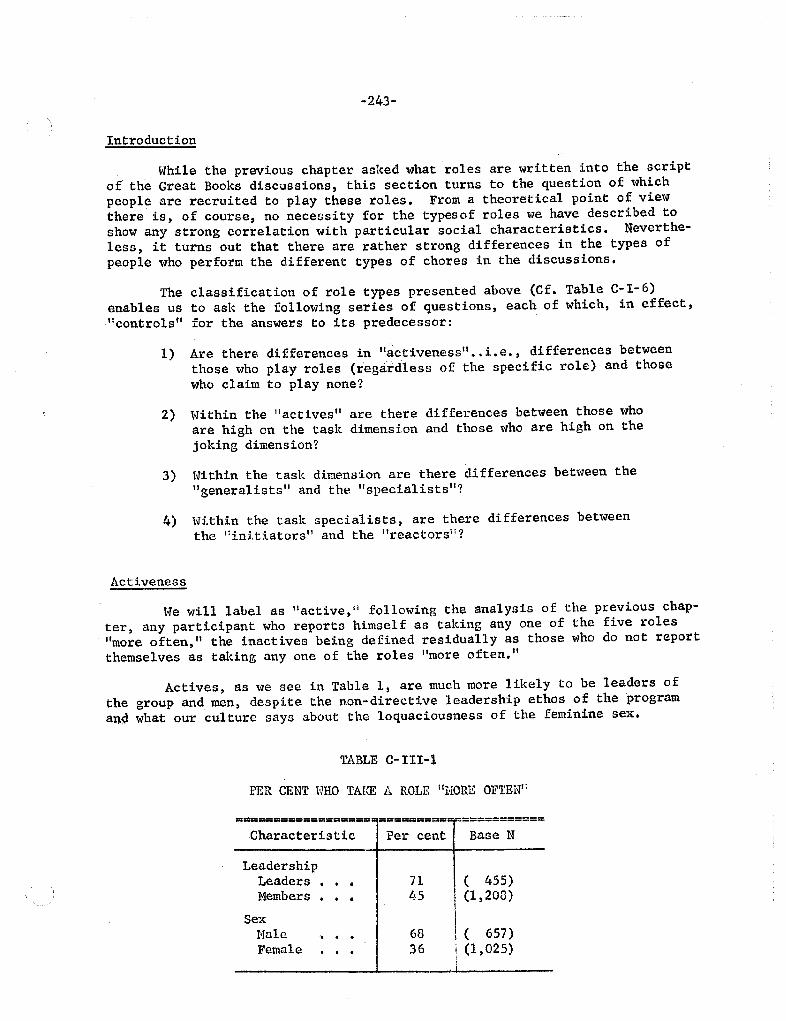
-243-
Introduction
While the previous chapter asked what roles are written into the scriptof the Great Books discussions, this section turns to the question of whichpeople are recruited to play these roles. From a theoretical point of viewthere is, of course, no necessity for the typesof roles we have described toshow any strong correlation with particular social characteristics. Neverthe-less, it turns out that there are rather strong differences in the types ofpeople who perform the different types of chores in the discussions.
Theenables uscontrols
classification of role types presented above (Cf. Table C- I- 6)
to ask the following series of questions, each of which, in effect,for the answers to its predecessor:
Are there differences in lIactiveness i.e., differences between
those who play roles (regardless of the specific role) and thosewho claim to play none?
Within the lIactives l1 are there differences between those whoare high on the task dimension and those who are high on thejoking dimension?
Within the task dimension are there differences between thegeneralists " and the IIspecialists
Within the task specialists, are there differences betweenthe l1initiatorsll and the I1reactors li?
Activeness
We will label as 11 act ive, Ii following the analysis of the previous chap-ter, any participant who reports himself as taking anyone of the five rolesmore often, " the inactives being defined residually as those who do not reportthemselves as taking anyone of the roles I1more often.
Actives, as we see in Table 1, are much more likely to be leaders of
the group and men, despite the non-directive leadership ethos of the programan. what our culture says about the loquaciousness of the feminine se'
TABLE C- III-l
PER CENT HHO TAKE A ROLE " l-rORE OFTEN"
================== ------------------ -----------------------
Characteristic Per cent Base N
LeadershipLeaders
. .
Members
. .
55)(1, 208)
SexNaleFemale
. .
I ( 657)i (l 025)
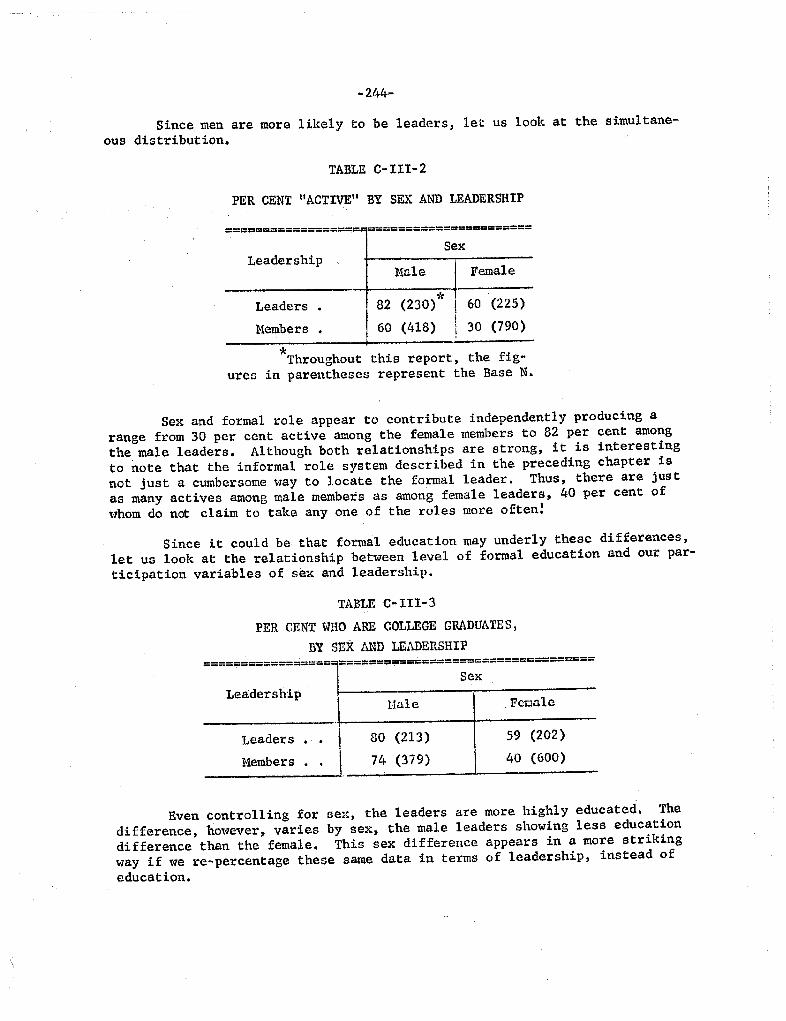
244-
Since men are more likely to be leaders, let us look at the simultane-ous distribution.
TABLE C-III-
PER CENT IIACTIVE" BY SEX AND LEADERSHIP
============;=.= ======================
SexLeadership
Mnle
82 (230)
60 (4l8)
Femal e
Leaders
Members
60 (225)
30 (790)
Throughout this report, the fig-ures in parentheses represent the Base
Sex and formal role appear to contribute independently producing arange from 30 per cent active among the female members to 82 per cent amongthe male leaders. Although both relationships are strong, it is interesting
to note that the informal role system described in the preceding chapter isnot just a cumbersome way to locate the formal leader. Thus, there are jus tas many actives among male members as among female leaders, 40 per cent of
whom do not claim to take anyone of the roles more often!
Since it could be that formal education may underly these differenceslet us look at the relationship between level of formal education and our par-ticipation variables of sex and leadership.
TABLE C-IIl-3
PER CENT WHO ARE COLLEGE GRADUATES,
BY SEX AND LEADERSHIP
================== =================================
SexLea.dership
Hale FC'Cale
Leader s
Members
80 (213)
74 (379)
59 (202)
40 (600)
Even controlling for sex, the leaders are more highly educated. The
difference, however, varies by sex, the male leaders showing less educationdifference than the female. This sex difference appears in a more strikingway if we re- percentage these same data in terms of leadership, instead ofeducation.
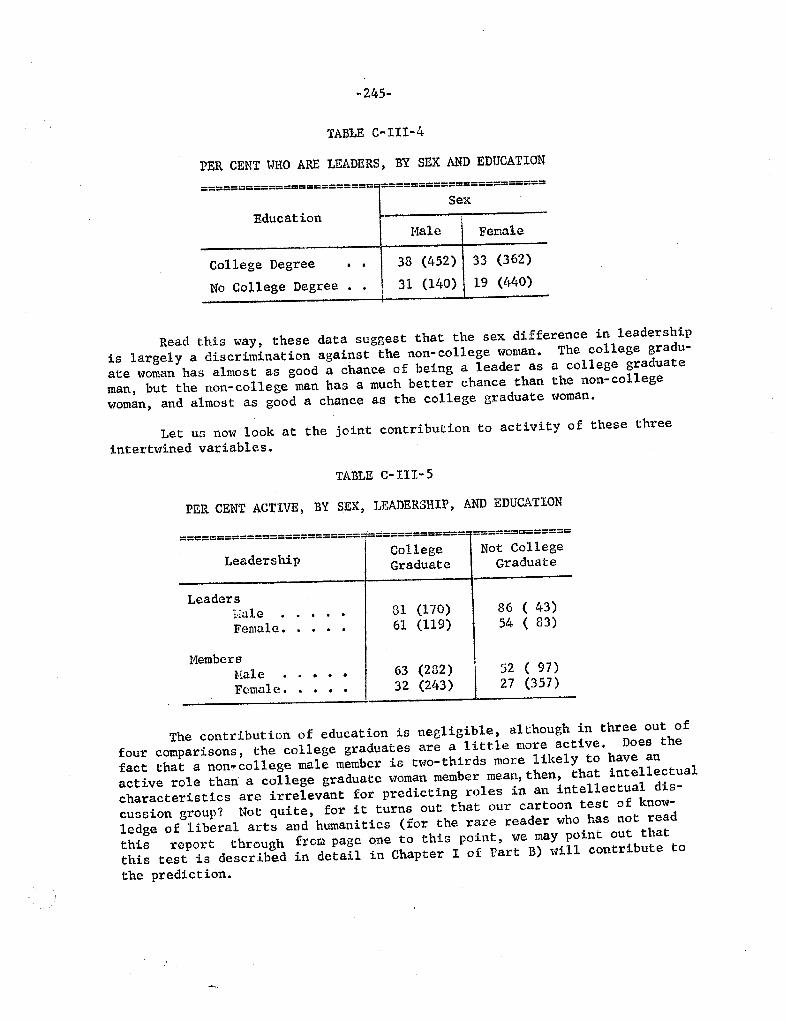
- 245-
TABl.E C-III-4
PER CENT WHO ARE LEADERS, BY SEX AND EDUCATION
;========="============ --------------------------------------------
SexEducation
Male Female
College Degree
. .
No College Degree
. .
38 (452) 33 (362)
3l (140) I 19 (440)
Read this way, these data suggest that the sex difference in leadershipis largely a discrimination against the non- college woman. The college gradu-ate woman has almost as good a chance of being a leader as a college graduateman, but the non-college man has a much better chance than the non-collegewoman, and almost as good a chance as the college graduate woman.
Let us now look at the joint contribution to activity of these threeintertwined variables.
TABLE C-I1I-S
PER CENT ACTIVE, BY SEX, LEADERSHIP , AND EDUCATION
======================== =============: =============
LeadershipCollege Not Colleg
Graduate Graduate
LeadersHale 81 (170) 86 ( 43)
Female. 61 (119) 54 ( 83)
MembersHale 63 (232) 52 ( 97)
Fcmal e . 32 (243) 27 (357)
The contribution of education is negligible, although in three out of
four comparisons, the college graduates are a little more active. Does the
fact that a non7college male member is two-thirds more likely to have anactive role than a college graduate woman member mean,
then, that intellectualcharacteristics are irrelevant for predicting roles in an intellectual dis-cussion group? Not quite, for it turns out that our cartoon test of know-
ledge of liberal arts and humanities (for the rare reader who has not readthis report through froPl page one to this point , we may point out thatthis test is described in detail in Chapter I of Part B) will contribute tothe prediction.
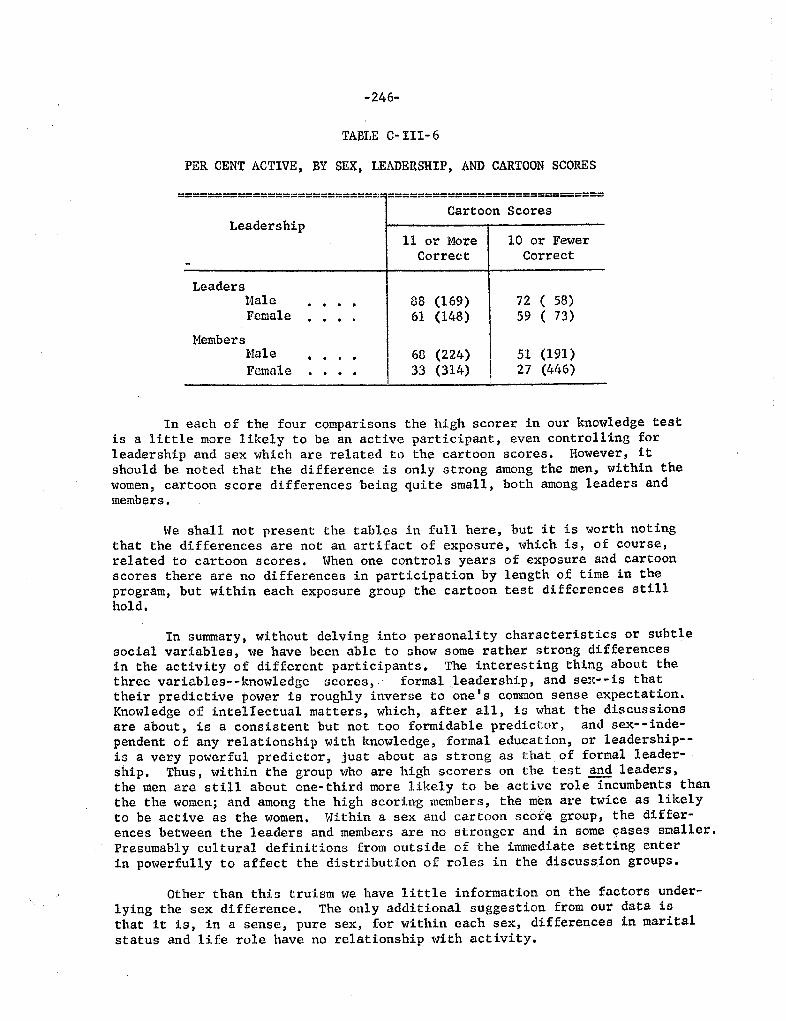
- 246-
TABJ"E C- III - 6
PER CENT ACTIVE, BY SEX, LEADERSHIP, AND CARTOON SCORES
============================ =============================
Cartoon ScoresLeadership
11 or More 10 or FewerCorrect Correct
LeadersNa1e 88 (169) 72 ( 58)Fm:mle 61 (148) 59 ( 73)
Members1'1ale 68 (224) 51 (191)
Female 33 (314) 27 (446)
In each of the four comparisons the high scorer in our knowledge testis a little more likely to be an active participant , even controlling forleadership and sex which are related to the cartoon scores. However, itshould be noted that the difference is only strong among the men. within thewomen , cartoon score differences being quite small , both among leaders andmembers.
We shall not present the tables in full here, but it is worth notingthat the differences are not an artifact of exposure, which is, of course,
related to cartoon scores. When one controls years of exposure and cartoonscores there are no differences in participation by length of time in theprogram, but within each exposure group the cartoon test differences stillhold.
In summary, without delving into personality characteristics or subtlesocial variables, we have been able to show some rather strong differencesin the activity of different participants. The interesting thing about thethree variables--know1edge scores,. ' formal leadership, and se --is that
their predictive power is roughly inverse to one I s coroion sense expectation.Knowledge of intellectual matters, which, after all , is what the discussions
are about, is a consistent but not too formidable predictor and sex--inde-pendent of any relationship with knowledge, formal education, or leadership--
is a very powerful predictor, just about as strong as that of formal leader-ship. thus, within the group who are high scorers on the test and leaders,the men are still about one-third more likely to be active role incumbents thanthe the women; and among the high scoring members , the men are twice as likely
to be active as the women. Within a sex and cartoon score group, the differ-ences between the leaders and members are no stronger and in some cases smaller.Presumably cultural definitions from outside of the immediate setting enterin powerfully to affect the distribution of roles in the discuss.ion groups.
Other than this truism we have little information on the factors under-lying the sex difference. The only additional suggestion from our data isthat it is , in a sense, pure sex, for within each sex, differences in maritalstatus and life role have no relationship with activity.
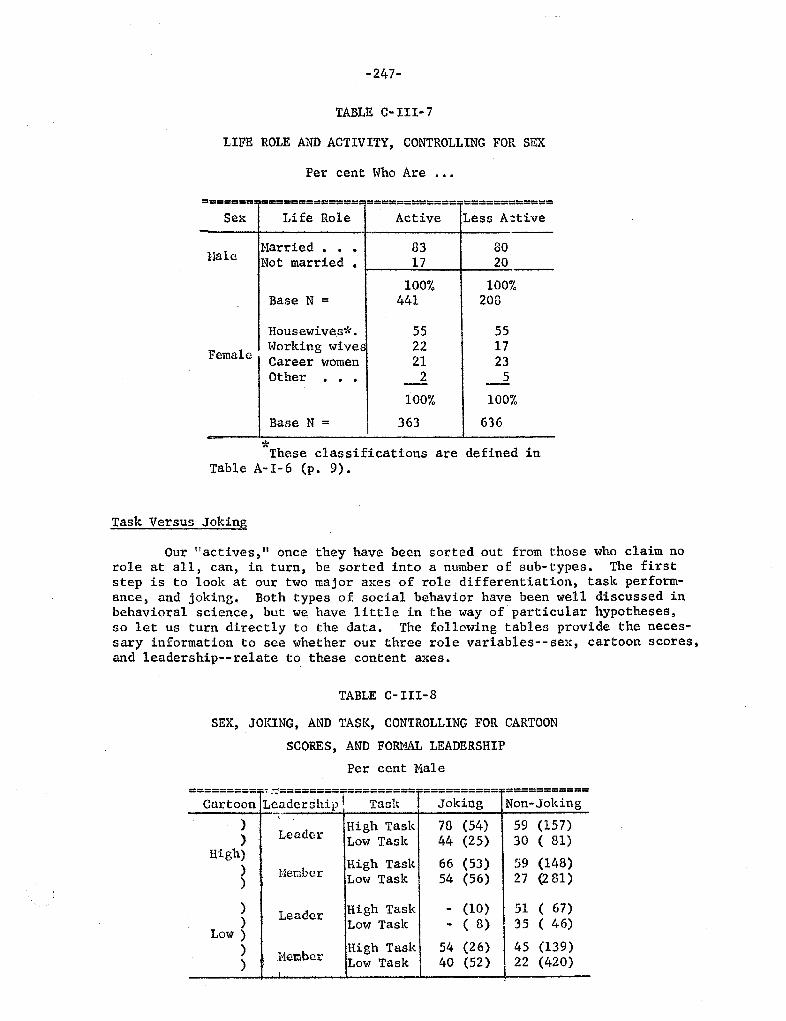
-247-
TABLE C- III-7
LIFE ROLE AND ACTIVITY, CONTROLLING FOR SEX
Per cent Who Are
...
-=====nr=============-
============-============
Sex Life Role Active Less A:tive
Hale Harried
Not married100% 100%
Base 441 208
Housewives
FemaleWorking wivesCareer womenOt her
100% 100%
Base 363 636
These classifications are defined inTable A-I- 6 (p. 9).
Task Versus Joking
Our tl actives, 1I once they have been sorted out from those who claim norole at all , can, in turn, be sorted into a number of sub-types. The firststep is to look at our two major axes of role differentiation, task perform-ance , and joking. Both types of social behavior have been well discussed inbehavioral science , but we have little in the way of particular hypotheses,so let us turn directly to the data. The following tables provide the neces-sary information to see whether our three role variables--sex, cartoon scores,and leadership--relate to these content axes.
TABLE C- 1II-
SEX, JOKING, AND TASK, CONTROLLING FOR CARTOON
SCORES, AND FO LEADERSHIP
Per cent Male
~~~ ~~~;;: ;!===;::
r==
;== ----------------------
Non-Joking
Leader High Task (54) (157)Low Task 4/+ (25) 81)
High)High Task (53) (148)
Berabor Low Task (56) (28l)
Leader High Task (10) 67)Low Task (8) ( 46)
Low)
HctlbcrHigh Task (26) (139)Low Task (52) (420)
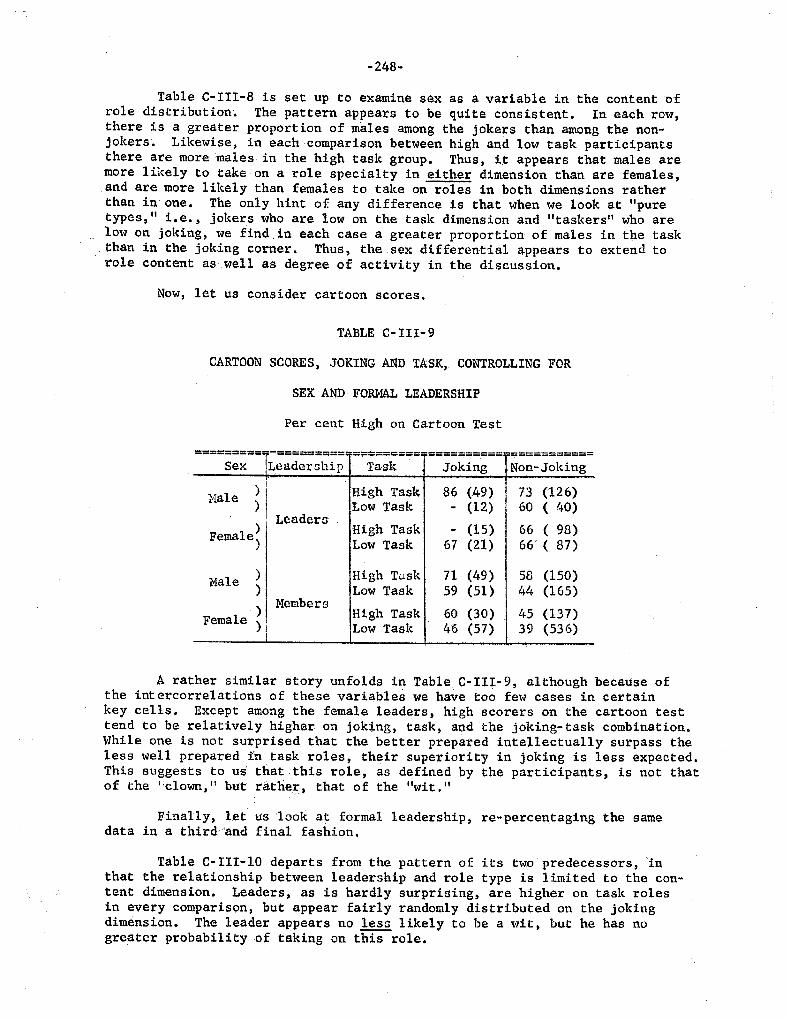
- 248-
Table C-III-8 is set up to examine sex as a variable in the content
role distribution' The pattern appears to be quite consistent. In each rowthere is a greater proportion of males among the jokers than among the non-jokers. Likewise , in each comparison between high and low task participantsthere are more males in the high task group. Thus, it appears that males aremore likely to take on a role specialty in either dimension than are females,and are more likely than females to take on roles in both dimensions ratherthan in one. The only hint of any difference is that when we look at "puretypes, II i. e., jokers who are low on the task dimension and " taskers l1 who are
. low on joking, we find in each case a greater proportion of males in the taskthan in the joking corner. Thus, the sex differential appears to extend torole content as well as degree of activity in the discussion.
Now, let us consider cartoon scores.
TABLE C-III-9
CARTOON SCORES , JOKING AND TASK, CONTROLLING FOR
SEX AND FORML LEADERSHIP
Per cent High on Cartoon Test
========== -=========;
=c===
====-===. ==========
Sex Leader::hip Task Joking Non-Joking
Nale High Task (49) (126)Low Task (l2) 40)
LendersHigh Task (l5) 98)Female Low Task (21) 66' ( 87)
Male High Tusk (49) (150)Low Task (51) (165)
MembersHigh Task (30) (137)Female
) ILow Task (57) ( 53 6 )
A rather similar story unfolds in Table C-III-9, although because ofthe int ercorrelations of these variables we have too few cases in certainkey cells. Except among the female leaders, high scorers on the cartoon testtend to be relatively higher on joking, task , and the joking- task combination.While one is not surprised that the better prepared intellectually surpass theless well prepared n task roles , their superiority in joking is less expected,This suggests to us that this role , as defined by the participants, is not thatof the !:clown , II but rather, that of the "wit.
Finally, let us look at formal leadership, re- percentaging the samedata in a third and final fashion.
Table C- III- I0 departs from the pattern of its t\o10 predecessors, inthat the relationship between leadership and role type is limited to the con-tent dimension. Leaders, as is hardly surprising, are higher on task rolesin every comparison, but appear fairly randomly distributed on the jokingdimension. The leader appears no likely to be a wit, but he has nogre.ater probability .of taking on this role.
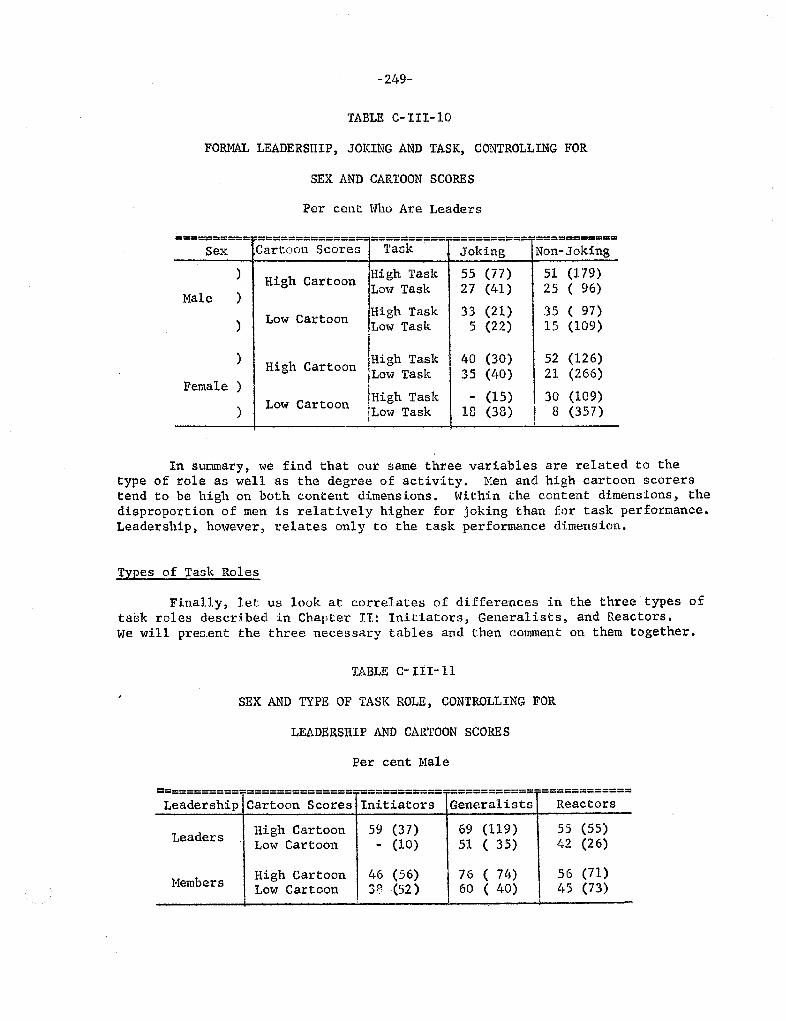
- 249-
TABLE C- III-lO
FORML LEADERSHIP, JOKING AND TASK, CONTROLLING FOR
SEX AND CARTOON SCORES
Per cent who Are Leaders
---------- =============== =;====;===-==========-===========----------
Sex Cartoon Scorea Tack Joking Non-Joking
High CartoonHigh Task (77) (179)
MaleLow Task (41) 96)
Low Cartoon High Task (21) 97)Low Task (22) (109)
IHigh TaskHigh Cartoon(30) (126)
ILOW Task
(40) (266)Female
High Task (15) (109)Low Cartoon !Low Task (38) (357)
In summary, we find that our same three variables are related to thetype of role as well as the degree of activity. Men and high cartoon scorerstend to be high on both content dimensions. Within the content dimensions , thedisproportion of men is relatively higher for joking than for task performance.Leadership, however , relates only to the task performance dimension.
Types of Task Roles
Finally, let us look at correlates of differences in the three types oftask roles described in Chapter II: Initiators , Generalists , and Reactors.
We will pres.ent the three necessary tables and then comment on them together.
TABLE C- III-llSEX AND TYPE OF TASK ROLE , CONTROLLING FOR
LEADERSHIP AND CARTOON SCORES
Per cent Nale
-------=========-==============-===========-========== ==;===------
Leadership Cartoon Scores Initiators Generalists Reactors
Leader s High Cartoon (37) (119) (55)Low Cartoon (10) 35) (26)
Hembers High Cartoon (56) 7L.) (71)Low Cartoon (52) 40) (73)
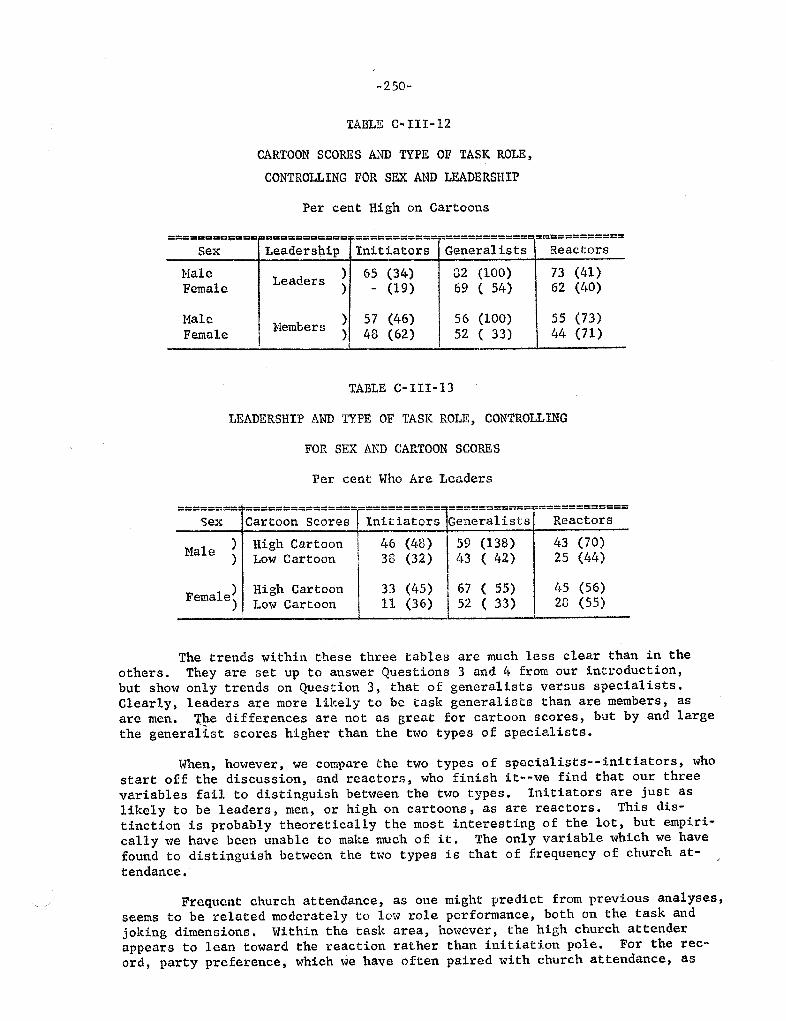
250-
TABLE Co. III-
CARTOON SCORES AND TYPE OF TASK ROLE,
CONTROLLING FOR SEX AND LEADERSHIP
Per cent High on Cartoons
============ =========== ===========-============== =========
Sex Leadership Initiators Generalists Reactors
Nale Leaders (34) (100) (41)Female (19) 54) (40)
MaleHember s
(46) (100) (73)Female (62) 33) (71)
TABLE C-III-13
LEADERSHIP AND TYPE OF TASK ROLE , CONTROLLING
FOR SEX AND CARTOON SCORES
Per cent Hho Are Leaders
-------- ==============--========== === ======= -------------------- ------------
Sex Cartoon Scores Initiators Generalists Reactors
High Cartoon (48)
159
(138) (70)Male Low Cartoon (32) 42) (44)
Female High Cartoon (45) 55) (56)Low Cartoon (36) 33) (55)
The trends within these three tables are much less clear than in theothers. They are set up to answer Questions 3 and 4 from our introductionbut show only trends on Question 3, that of gencral ists versus special ists.Clearly, leaders are more likely to be task generalists than are members , as
are men. T.he differences are not as great for cartoon scores, but by and largethe generalist scores higher than the two types of specialists.
When, however, we compare the two types of specialists--initiators, who
start off the discussion, and reactors, who finish it--we find that our threevariables fail to distinguish between the two types. Initiators are just aslikely to be leaders, men, or high on cartoons, as are reactors. This dis-tinction is probably theoretically the most interesting of the lot , but empiri-
cally we have been unable to make much of it. The only variable which we havefound to distinguish between the two types is that of frequency of church at-tendance.
Frequcnt church attendance, as one might predict from previous analyses,seems to be related moderately to low role performance, both on the task andjoking dimensions. Within the task area , however, the high church attender
appears to lean toward the reaction rather than initiation pole. For the rec-ord , party preference, which we have often paired with church attendance, as
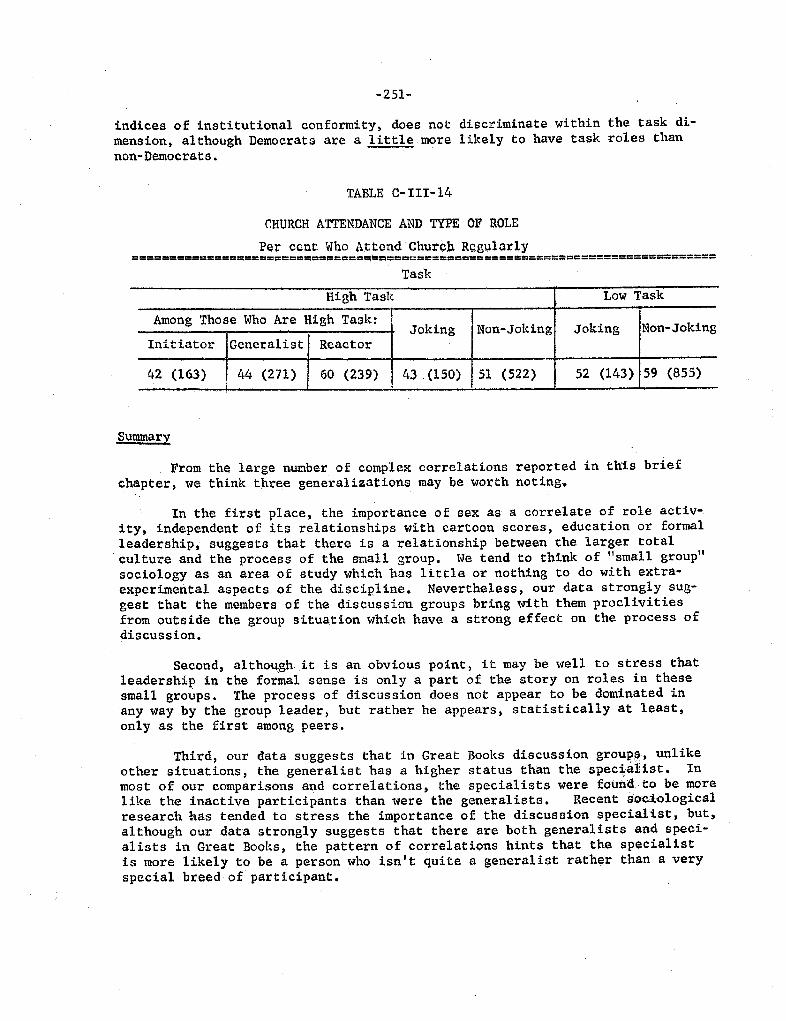
251-
indices of institutional conformity, does not discriminate within the task di-mension, although Democrats are a little more likely to have task roles than
non- Democrats.
TABLE c- 1II-
CHURCH ATTENDANCE AND TYPE OF ROLE
cpnt Who Attond churcbRQgularly
===================;=========== .==== ========================================
taskHigh Task Low Task
Among Those Who Are High Task:Joking Non-Joking Joking Non-Joking
Initiator Generalist Reactor
42 (l63) 44 (271) 60 (239) 43 (150) 51 (522) (143) S9 (855)
Summarx
From the large n ber of complex correlations reported in this briefchapter, we think three generalizations may be worth noting.
In the first place, the importance of sex as a correlate of role activ-ity, independent of its relationships with cartoon scores, education or formalleadership, sugge$ts that there is a relationship between the larger total
. culture and the process of the small group. We tend to think of " small groupsociology as an area of study which has little or nothing to do with extra-experimental aspects of the discipline. Nevertheless, our data strongly sug-gest that the members of the discussion groups bring with them proclivitiesfrom outside the group situation which have a strong effect on the process ofdiscussion.
Second, although it is an obvious point , it may be well to stress thatleadership in the formal sense is only a part of the story on roles in thesesmall groups. The process of discussion does not appear to be dominated inany way by the group leader , but rather he appears, statistically at least,only as the first among peers.
Third, our data suggests that in Great Books discussion group . unlike
other situations, the generalist has a higher status than the specia1ist. most of our comparisons and correlations , the specialists were foutia to be more
like the inactive participants than were the generalists. Recent soci logicalresearch has tended to stress the importance of the discussion specialist, but,a1 though our data strongly suggests that there are both generalists aad speci-alists in Great Books, the pattern of correlations hints that the specialistis more likely to be a person who isn t quite a generalist rather than a veryspecial breed of participant.

SUMMARY

SUMRY OF FINDINGS
--
Survey 408
The following paragraphs summarize the major findings of our surveyof the Great Books program. In the report itself , these conclusions aredeveloped from rather extensive statistical analysis and are subject to anumber of qualifications and speci.fications which we have left out of thesummary. We hope that any reader who wishes to make serious use of thesefindings will avail himself of the full text in addition to this briefover-view.
What Are the Participants Like
In a capsule, Great Books participants tend to be well-educated, high-status, socially active, youngish adults.
It is perhaps more interesting to note wha t they are not. They arenot "ivory-tower intellectuals, " but rather show "middle-brow" intellectualinterests; and far from being alienated from their society, they share itsmiddle-class values and norms of community participati n. Neither are theysocial misfits " for the old and the unmarried (people for whom society often
has no niche) are under-represented; and for most of the members) Great Booksis only among a fairly large number of formal and informal social groups towhich they belong. The "climber " while not unrepresented in the programis not a typical type , for if anything, the members are already highly edu-cated and less upwardly mobile socially than comparable adults.
What Do They Want from the Program
Great Books attracts people with a wide diversity of motivationsfrom those who want to learn speed-reading to those who want to solve theworld' s problems. Most of the members come with a varied collection of aims,some of which are abstractly intellectual and a lot of which are highly prag-matic. The discussion group itself appears to be important , for we foundmany member,s reporting a cluster of motives which indicated they were ccerned about the intellectual narrowness of their lives and wanted not justknowledge of great authors but also contact with other gxoup-members whoshared their intellectual orientations. It is the combination of the socialand the intellectual -- not one or the other -- which appears to be the hall-mark of the participants I motivations.
Hhat Do They Say They Get from the Program
Levels of satisfaction run high, partly because the dissatisfiedquickly drop out of the program. Large proportions of those who continuereported that participation in Great Books has had a "genuine impact" ontheir lives, high impact being more common among those who started from alower level of cultural sophistication. Specific "effects ft vary considerablyin their reported attainment , and two things seem to relate to differencesin the effectiveness of different program aims. First , it is always thecase that people who wanted a specific effect are more likely to reportachieving it. Great Books is apparently diffuse enough that the major
determinant of an effect is the participant t s motivations. Beyond this, wenoted that those things which "pay off" right in the discussion groups (e.g.)getting a chance to express ideas I had been thinking and reading about"seemed much more effective than those things which required application to theresistant world outside the immediate program (e.g., IIfinding solutions tocontemporary social problems
Specific Effectc
Knowledge
The strongest and clearest effect of continued participation in GreatBooks is increased knowledge of the liberal arts and humanities. Even when a
number of statistical controls are applied, the advanced year paJticipant isconsiderably more knowledgeable thau the first year participant. After threeyears or more in the program the participant with no college training scoresabout as well on the knowledge test as the beginning member who has a bache-lor s degree.
Even when one controls for such things as educational differences andlength of time in the program, levels of knowledge vary considerably withpolitical party preference and frequency of church attendance, in a way thatsuggested to us, as do several other findings in the study) that the most in-tellectually able among the participants are least likely to be involved inor identified with the dominant institutions of their social worlds.
Esthetics
The respondents were given a test of their ability to judge excellencein verse and a measure of their familiarity with classical music. It was ourconclusion that in neither case could we show that the program has any effectin these esthetic areas, advanced year members being no better judges of thesematters than beginners. Since the program excludes music, there is no reasonwhy musical tastes should improve; but the members do read a considerableamount of verse, apparently without gains in general poetic sensitivity.
Reading
The Great Books participants are heavy readers, and apparently readmore than people of comparable education, even aside from preparation for thediscussions. Their non-program reading is considerably less challenging thanthe curriculum of the program, and runs, metapborically speaking, somewherebetween the Book of the lionth Club and Book Find Club. Continued participa-tion in the program does seem to increase both the number of hour's spent inreading and the IIquality" level of vlhat is read.
Values and Ideolo ies
The advanced year participant has not only learned more about the con-tent of Great Books) but is also quite likely to report that he has been persuaded by them and has changed his mind on the value of some author or schoolof thought. Our survey was unable to detect any changes in basic values forthe participant , but we did find evidence of some shifts in religious and
political positions. Religious changes are different for different denomi-nations. In general, members of each major faith show a less single-mindeddedication to their own denominational position, and a greater acceptance ofal ternatives. The trend is not interpreted as one of dramatic changes infaith, but rather an expansion of the breadth and scope of religious ideaswhicll are considered to be worth seriQus attention. Political changes appearto be more clear-cut, the trend being for an increase in concern about lossof civil liberties accompanied by an increase in concern about too much gov-ernment; a syndrome which may be alte!;natively interpreted as "18th CenturyLiberalism" or "New Conservativism.
Comnunity IuvolvecQnt
He divided community involvement into two aspects, expressed interestin local and civic affairs, and overt activity in community organizations andevents. It turns out that different things happen in these two areas of in-vol vement "
In terms of interest , we find that the participants are quite inter-ested in the local scene and in civic affairs, but that relatively speakingthey show greater interest in the national and world arena than they do intheir home towns. Exposure to the program doesn I t seam to alter this picturetoward either increased or decreased localism. However, we do find thatthose people who do best on our measure of knowledge of the liberal arts andhumanities are least interested in the local scene, hence , some de-localiza-tion of interest may be a by- product of the greater knowledge the programproduces.
In terms of activities, we find that the participants are quite activein terms of memberships in organizations and participation in programs tochange or improve the community. Activity appears to increase with exposureto Great Books , particularly for those who are new in the community. The new-comer who finds his frlends in Great Books, finds them to be active peopleand presumably is drawn into local events through them. Within a given inter-est level , the more knowledgeable (in terms of our measure of liberal artsand humanities knowledge) are more active , and hence, while Great Books mayindirectly lower interest in local affairs, it also may tend to make its mem-bers more active than their interest level would predict , perhaps because theintellectual and discussion skills gained from participation are in great de-mand in local groups and organizat ions.
The Discussion Group
The final three chapters of the report sunnarize some of our findingson the discussion group itself. These groups average about l5 members andmost have two formal leaders who lead the discussions, although other patternsdo exist. Over time most of the groups are subjected to a process of memberloss and recruitment of substitutes which creates a continually changing mem-bership. Groups differ considerably in their social characteristics, tendingto be quite homogeneous in terms of such things as education, religion, age,and se c. Groups also differ considerably in their reported impact on the mem-bers, the high impact groups being somewhat more frequently characterized ashaving high morale, high level of discussion, and a wide variety of viewpointsrepresented.
o kinds of participants were isolated through statistical analysis,jokesters" who tend to be above average in terms of seeing the humerous side
of the discussion , and " task specialists" who tend to be above average in suchthings as providing ideas for discussion, clarifying issues, and drawing thethreads of the discussion together. Leaders, of course, tend to be more ac-tive than members, but the correlation is far from perfect. The highly edu-cated tend to be more active too, but the most powerful predictor of role per-formance is sex. Men, despite folklore to the contrary, tend to monopolizeboth the jokester and the task roles.
Any attempt to achieve a final balancing of the books here is beyondthe ability of the researcher, for it requires decisions about the relativeweight of the high success areas--increased knowledge , changes in ideologiesand participants ' subjective satisfactions; the areas of smaller change , suchas reading and community activity; and the areas of no effect at all , esthet-ics and basic values. In addition, even if such a balance could be determined,we would have no idea whether another program or a modified version of thecurrent program, would do as well , or better. Such final conclusions willhave to be drawn by the reader on the basis of his own system of values andhis evaluation of the practical possibilities in the world of adult educationin the liberal arts and humanities.

APPENDIXES
257-

25G-
APPENDIX 1
The Great Books Readings
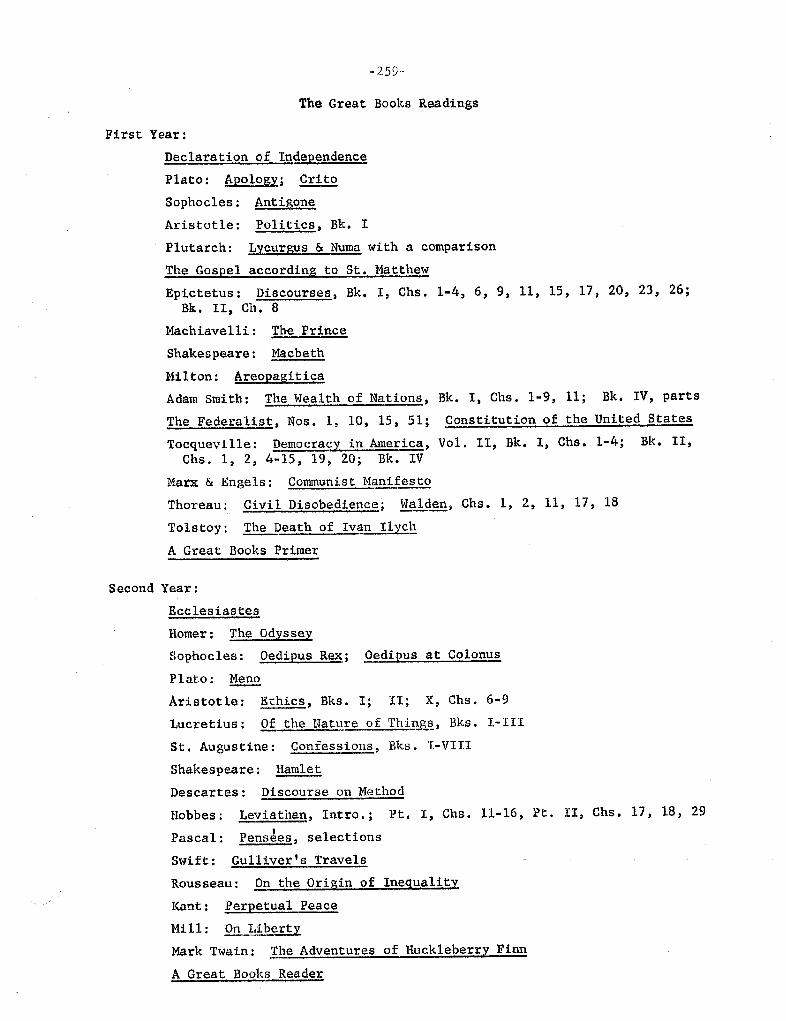
-259..
The Great Books Readings
First Year:
Declaration of Independence
Plato: Apology CritoSophocles: Antigone
Aristotle: Politics , Bk. I
Plutarch: Lycurgus & Numa with a comparison
The Gospel according to St. Matthew
Epictetus: Discourses , Bk.
Bk. II , Ch. 8Machiavelli: The Prince
Shakespeare: Macbeth
Milton: AreopagiticaAdam Smith: The Wealth of Nations , Bk. I , Chs. 1-9, 11; Bk. IV, partsThe Federalist , Nos. 1, 10, 15, 51; Constitution of the United States
I, Chs. 1-4, 6 , 9, 11, 15, 17 , 20, 23, 26;
Tocquevi1le: Democracy in AmericaChs. 1 , 2 4-15, 19, 20; Bk. IV
Marx & Engels: Communist Manifesto
Vol. II , Bk. I , Chs. 1- Bk. II,
Civil Disobediencej Walden , Chs. 1, 2 , ll, 17, 18Thoreau:
Tolstoy: The Death of Ivan Ilyc
A Great Books Primer
Second Year:
EcclesiastesHomer: The Odyssey
Sophocles: Oedipus Rex
Plato:
Aristotle: Ethics , Bks. I; II; X , Chs. 6-9
Lucretius: Of the Nature or Thip. , Bks. 1- IIISt. Augustine: Confessions , Bks. I-VIII
Shakespeare: Hamlet
Oedipus at Colonus
Descartes: Discourse on Method
Hobbes:
Pascal:Leviathan , Intra.;
Pens , selections
Gulliver I s Travels
Pt. I , Chs. 11- l6, Pt. II , Chs. 17, 18, 29
Swift:Rous seau : On the Origin of Inequality
Kant:
Mi 11 :
Perpetual Peace
ibertyMark Twain: The Adventures of Huckleberry Finn
A Great Books Reader
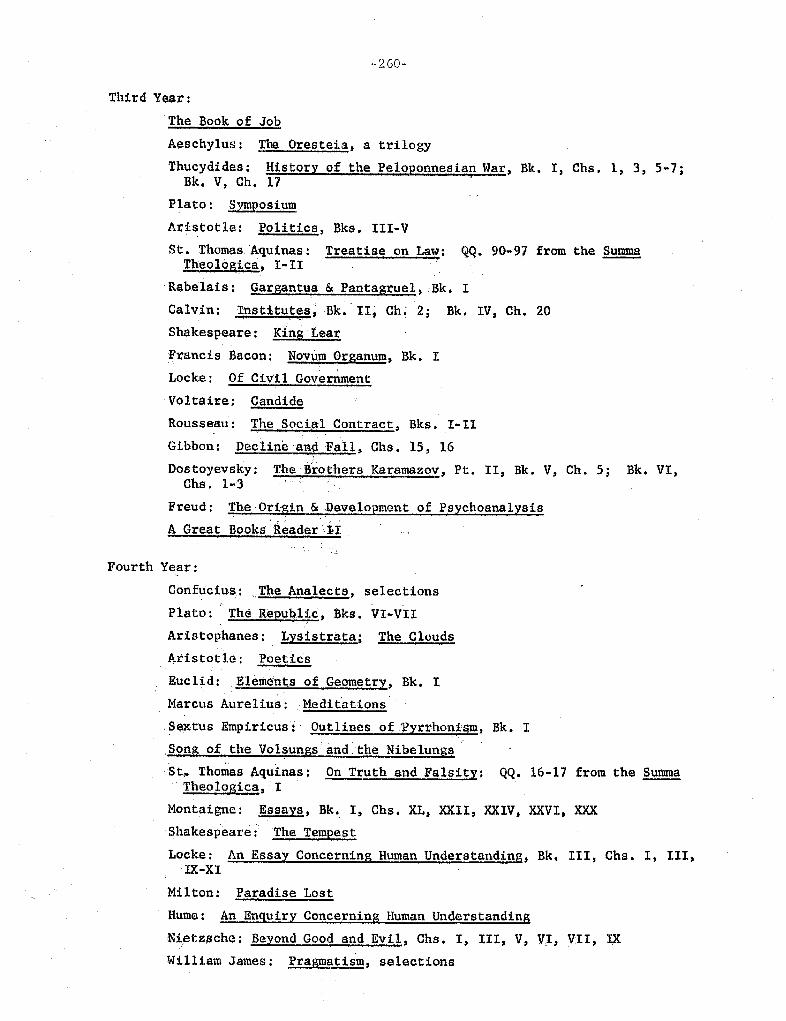
260-
Third Year:
The Book of Job
schylus : The Oresteia , a trilogy
Thucydides: History of the Peloponnesian War , Bk. I , Chs. 1 , 3, 5Bk. V, Ch. 17
Plato: Symposium
Aristotle: Polities , Bks. III
St. Thomas Aquinas Treatise on Law QQ. 90 97 from the Summaeo1ogica , I
Rabelais: Gargantua & Pantagruel Bk. ICalvin: Institutes ; Bk. II , Ch 2; Bk. IV, Ch. 20
. -
Shakespeare: Ki.ng , Lea r
rancis Bacon: Novum Organum, Bk. I
Locke: Of Civil Government
Voltaire; CandideRousseau: The Social Contract , Bks. I
Gibbon: Declineand Fall , Chs. 15, 16Dostoyevsky; The -Brothers Karamazov , Pt. II , Bk. V, Ch. 5;
Chs. l
..
Freud: The Origin & Development of Psychoanalysis
A Great Books Reader
Bk. VI
Fourth Year:
Confucius: , The Analects , selectionsPlato: The Republic , Bks. VI-VII
Aristophanes: Lysistrata The Clouds
Aristotle: PoeticsEuclid: Elements of Geometry , Bk. IMarcus Aurelius: Meditations
. Sextus Empiricus: Outlines of?yrrhonism, Bk. I
Song of , the Volsungs and the NibelungsSt/O Thomas Aquinas: On Truth and Falsity QQ. l6 17 from the Summa
Theologica , . I
Montaigne: l!ssavs , Bk.. I, Chs. XL, XXII, XXIV, XXVI , XXShakespeare : The Tempest
Locke: An Essay Concerning Human Understanding, Bk. III , Chs. I, III,
Mil ton: Paradise Lost
Hums: An Enquiry Concerning Human Understanding
etz che: Beyond Good and Evil , Chs I, III, V
William James: Pragmatism, selections
VI, VII , IX
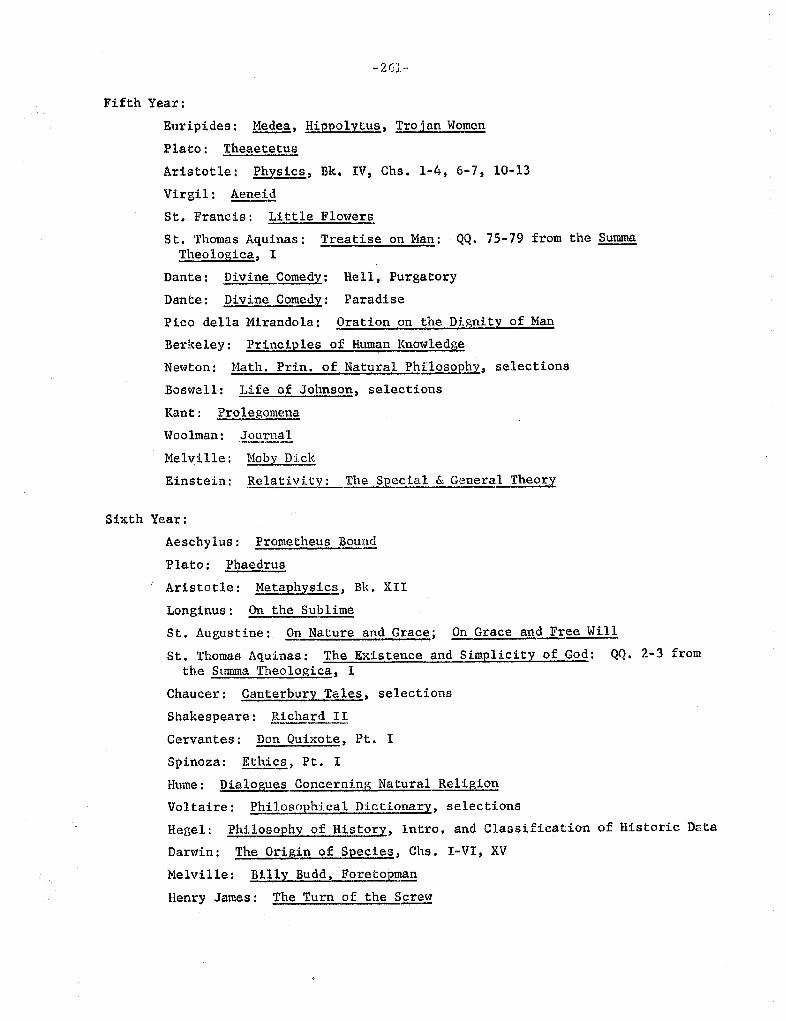
-26::.
Fifth Year:
Euripides: Hippolytus Trojan Homen
Plato: TheaetetusAristotle: PhYsics , Bk. IV, Chao 1-4, 6-7, 10-
Virgil : Aeneid
St. Francis: Little Flowers
St. Thomas Aquinas: Treatise on ManTheologica , I
Dante: Divine Comedy
QQ. 75- 79 from the
Dante: Divine Comedy
Hell, Purgatory
ParadiseOration on the Dignity of ManPico della Mirandola:
Berkeley: Principles of Human Knowledge
Newton: Math. Prin of Natural PhilosophY
Boswell: Life of Johnson, selections
Kant: Prolegomena
Woolman: Journal
selections
Einstein:Moby D:Lcli
Relativity: The S ecial & General Theor
Melville:
Sixth Year:
Aeschylus: Prometheus Bound
Plato: Phaedrus
Aristotle:Longinus :
Metaphysics , Bk. XII
On the Sublime
St. Augustine: On Nature and Grace On Grace an ee Will
St. Thomas Aquinas: The Existence andthe Summa Theologica , I
Chaucer: Canterbury T , selections
Shakespeare: Richard II
Simplicity of God QQ. 2- 3 from
Cervantes: Don Quixote , Pt. ISpinoza: Ethics , Pt. IHume: Dialogues Concerning Natural Religion
Vol taire: Philosophical Dictionary , selections
Hegel: Philosophy af History , Intra. and Classification
Darwin: The Origin of Species , Chs. I-VI, XV
Melville: Billy Budd , Foretopman
Henry James: The Turn of the Screw
of Historic Data

f)t'
...
U"'
APPENDIX 2
The Ques t ionnai re