the familial paradigm - ucl discovery
TRANSCRIPT

Measures of onset, progression and intervention in Alzheimer’s disease: the familial paradigm
William D. Knight MBChB MRCP(UK)
Submitted to University College London for the degree of Doctor of Medicine (Research)
UCL Institute of Neurology 2010

2
For Hannah and Elliot

3
I, William D. Knight confirm that the work presented in this thesis is my own. Where
information has been derived from other sources, I confirm that this has been indicated
in the thesis.
ABSTRACT
Familial Alzheimer’s disease (FAD) is a valuable paradigm for the study of the more
common sporadic AD (SAD). The two forms of the illness share many
neuropathological, clinical and radiological characteristics but it is not yet possible to
predict the onset of SAD or confirm its presence without histopathological analysis.
Fully penetrant amyloid precursor protein (APP), presenilin 1 (PSEN1) or presenilin 2
(PSEN2) gene mutations permit both, and therefore lend themselves to clinical research
with results which may be applied to the study of SAD. The identification of biomarkers
of onset and progression are vital in the selection of research participants and in the rapid
evaluation of new therapies.
This thesis further characterizes FAD with a number of studies. These address the use of
imaging biomarkers and help clarify the nature of the relationship between FAD and
SAD. Two reports of novel pathogenic FAD mutations are included as well as other
studies exploring the clinical and radiological (structural and molecular) phenotypes
associated with FAD. Key findings are as follows: the novel PSEN1 p. L166del and
S132A mutations are both associated with FAD; the APPV717G mutation can be
associated with pure progressive amnesia reflected in an atypical structural imaging
profile; APP locus duplication is a significant cause of early onset dementia in the UK
and the recognised phenotype should be expanded to include early seizures and

4
apparently sporadic disease; regional cortical thickness (CTh) decline accelerates after
diagnosis in FAD mutation carriers (MC) and differences between MC and controls are
detectable in presymptomatic mutation carriers more than 4 years prior to clinical
diagnosis; APP and PSEN1 mutations may produce different temporal and
topographical patterns of cortical change; increased 11C-PiB retention in a highly
heterogeneous pattern may be detected in presymptomatic PSEN1 mutation carriers.

5
CONTENTS
Abstract………………………………………………………………........................ 3
Contents………………………………………………………………....................... 5
Figures……………………………………………………………………………... 10
Tables………………………………………………………………............................ 12
Abbreviations…………………………………………………….………………... 13
The Problem………………………………………………………………………. 18
1.
INTRODUCTION………………………………………………………………. 23
1. 1. Normal ageing……………………………………………………. 23
1. 2. Dementia…………………………………………………………... 24
1. 3. Alzheimer’s disease………………………………….……………. 25
1. 3. 1. History……………………………………………………… 25
1. 3. 2. Epidemiology………………………........................................... 26
1. 3. 3. Risk factors…………………………………………………. 27
1. 3. 3. 1. Apolipoprotein E…………………………………………… 30
1. 3. 3. 2. Other risk genes……………………………………................ 32
1. 3. 4. Mild cognitive impairment.............................................................. 32
1. 4. Familial Alzheimer’s disease……………………………………... 34
1. 4. 1. ß-amyloid precursor protein gene.................................................. 35
1. 4. 2. APP locus duplication..................................................................... 38
1. 4. 3. Presenilin 1 gene…………………………………………….. 38
1. 4. 4. Presenilin 2 gene……………………………………………. 41
1. 5. Neuropathology…………………………………………………… 44

6
1. 6. Clinical features…………………………………………………… 53
1. 6. 1. Memory……………………………………………………... .54
1. 6. 2. Other cognitive domains……………………………………. .55
1. 6. 3. Behavioural & psychiatric features……………………………56
1. 6. 4. Olfaction……………………………………………………. .57
1. 7. Investigations ………………………………………...……………...58
1. 7. 1. Neuropsychological & functional scales...........................................58
1. 7. 2. Electroencephalography......................................................................60
1. 7. 3. Cerebrospinal fluid……......................................................................61
1. 7. 4. Magnetic resonance imaging……………………………….…...62
1. 7. 4. 1. Volumetric MRI………………………………………………..63
1. 7. 4. 2. Cortical thickness………………………………………………66
1. 7. 4. 3. 1H Magnetic resonance spectroscopy………………………... ...68
1. 7. 4. 4. Magnetization transfer ratio............................................................ ...69
1. 7. 4. 5. Diffusion-weighted & diffusion-tensor imaging……....................69
1. 7. 5. Positron-emission tomography..........................................................70
1. 7. 5. 1. 18Fluorodeoxyglucose PET………………………………….. ...70
1. 7. 6. Amyloid imaging………………….……..................................... ...71
1. 7. 6. 1. Pittsburgh compound B......................................................................72
1. 7. 6. 2. 18FBAY………………………………………………………...74
1. 7. 7. Single photon emission tomography………...................................74
1. 8. Alzheimer’s disease therapy.........................................................................77
1. 8. 1. Decreasing Aß production..................................................................77
1. 8. 2. Facilitating Aß clearance......................................................................78
1. 8. 3. Preventing Aß aggregation…..............................................................81
1. 8. 4. Neurotransmitter manipulation….....................................................81

7
2.
THE FAD PARADIGM
I: Structural neuroimaging…………………………………………………….….....84
2. 1. Methods……………………………………………………………. ...85
2. 1. 1. Subjects……………………………………………………... ...85
2. 1. 2. Image acquisition…………………………………………… ...86
2. 2. Cortical thinning in FAD: a cross-sectional study………………. ...87
2. 2. 1. Methods…………………………………………………….. ...87
2. 2. 2. Results………………………………………………………....88
2. 2. 3. Discussion…………………………………………………... ...91
2. 3. Cortical thinning in FAD: a longitudinal study……………………95
2. 3. 1. Methods…………………………………………………….. ...95
2. 3. 2. Results………………………………………………………....96
2. 3. 3. Discussion…………………………………………………... .105
3.
THE FAD PARADIGM
II: Molecular neuroimaging………………………………………...……………...109
3. 1. A longitudinal 11C-PiB PET study in FAD and SAD……………..109
3. 1. 1. Methods…………………………………………….………..109
3. 1. 1. 1. Image analysis……………………………………….……….111
3. 1. 1. 2. Statistical analyses…………………………………………… 112
3. 1. 2. Results……………………………………………………… 112
3. 1. 3. Discussion…………………………………………………... 119

8
4.
CHARACTERIZING FAD
I: Epistasis & single case studies........................................................................................122
4. 1. Methods……………………………………………………….…… .122
4. 2. FAD & the ApoE4 Polymorphism………………………………... .124
4. 2. 1. Methods…………………………………………………....... .125
4. 2. 2. Results…………………………………………....................... .130
4. 2. 3. Discussion...………………............................................................130
4. 3. Pure progressive amnesia & the APPV717G mutation.....................131
4. 3. 1. Case description…………………………………………….. .131
4. 3. 2. Discussion………………………………………..................... .140
4. 4. A novel presenilin 1 deletion (p.L166del).............................................. 143
4. 4. 1. Case description…………………………………………….. 143
4. 4. 2. Genetic analysis……………………………………………... 144
4. 4. 3. Discussion…………………………………………………... 146
4. 5. A novel presenilin 1 substitution (S132A)………………………... 147
4. 5. 1. Case description…………………………………………….. 147
4. 5. 2. Genetic analysis……………………………………………... 148
4. 5. 3. Discussion…………………………………………………... 149

9
5.
CHARACTERIZING FAD
II: APP locus duplication………………….…………………………...………….151
5. 1. Duplications of APP are a significant cause of early onset
dementia in a large UK referral series……………………………. 151
5. 1. 1. Methods…………………………………………………….. 152
5. 1. 2. Subjects……………………………………………………... 152
5. 1. 3. Samples……………………………………………………... 152
5. 1. 4. Real-time quantitative PCR (exon-qPCR)…………………… 152
5. 1. 5. Fluorescent microsatellite quantitative PCR (fm-qPCR)……... 153
5. 1. 6. Illumina 610 bead array……………………............................... 154
5. 1. 7. Results……………………………………………………… 154
5. 1. 7. 1. Laboratory findings…………………………………………. 154
5. 1. 7. 2. Clinical and investigation findings…………………………... 161
5. 1. 7. 2. 1. Proband 1…………………………………………………... 161
5. 1. 7. 2. 2. Proband & family 2……………………………………….… 163
5. 1. 7. 2. 3. Proband 3…………………………………………………... 166
5. 1. 7. 2. 4. Proband & family 4…………………………………………. 167
5. 1. 7. 2. 5. Proband & family 5…………………………………………. 167
5. 1. 8. Discussion……………………………………….………….. 170
6.
CONCLUSIONS………………………………………………………………..… 173

10
7.
APPENDICES…………………………………………………………………...... 178
7. 1. NINCDS-ADRDA criteria for the diagnosis of Alzheimer’s
disease (McKhann et al. 1984)……………………………………….. 176
7. 2. Neuropathological stageing of AD-related changes
(Braak and Braak 1991)……………………………................................179
7. 3. Publications related to this thesis……………………………………. 180
7. 4. Acknowledgements and statement of personal contribution………… 181
Figures
1. AD Prevalence by Age (Nussbaum and Ellis 2003)………..................................28
2. PSEN1: Known Pathogenic Mutations……………………………………... 43
3. Proteolytic Processing of APP………………....................................................... 46
4. The Amyloid Cascade Hypothesis………….......................................................... 52
5. Coronal Hippocampal Anatomy……………….................................................... 64
6. Diagrammatic 11C-PiB PET Process……………….............................................. 76
7. Surface maps of CTh…………………………………………………………90
8. Estimated mean CTh in MC, by years since clinical diagnosis……………….102
8a. Difference in mean cortical thickness between cases and controls, by years since
clinical diagnosis (with 90% CI)……………………………………………...103
9. Earliest Time (yrs), relative to clinical diagnosis, at which regional differences
emerge between MC & controls……………………...........................................104

11
10. Univariate scatter plot showing region: pontine 11C-PiB retention ratios for
PSEN1 subjects (f1-f7) vs. Controls………………………………………….114
11. Univariate scatter plot showing pontine 11C-PiB retention ratios for SAD subjects
(s1-s10) vs. Controls………………………………………………………….115
12. Transaxial 11C-PiB images (pontine reference region) in PSEN1 mutation
carriers showing heterogeneity of 11C-PiB binding pattern………….................118
13. Pedigree……………………………………………………………………...132
14. Neuropsychological data……………………………………………………..134
15. Longitudinal hippocampal & whole brain volumes…………………………..138
16. Fluid registration 1992-1997…………………………………………………139
17. Pedigree……………………………………………………………………...145
18. MRI brain, coronal T1 & axial T2……………………………………………145
19. Sequencing electropherogram for part of the reverse compliment of PSEN1 exon
6 showing a deletion of AAG (CTT in forward compliment, codon 166) ……146
20. Pedigree……………………………………………………………………. 149
21. APPd detection using alteration in the ratio of area under the curve of
microsatellite alleles on electropherogram traces……….......... ……………….157
22. Confirmation of APPd using Illumina array technology………………..…..... .159
23. Chr 21 diagram showing APPd regions with respect to genes………………...160
24. MRI scans from proband 1 showing extensive white matter abnormalities and
an amygdala haemorrhage........................................................................................... .162
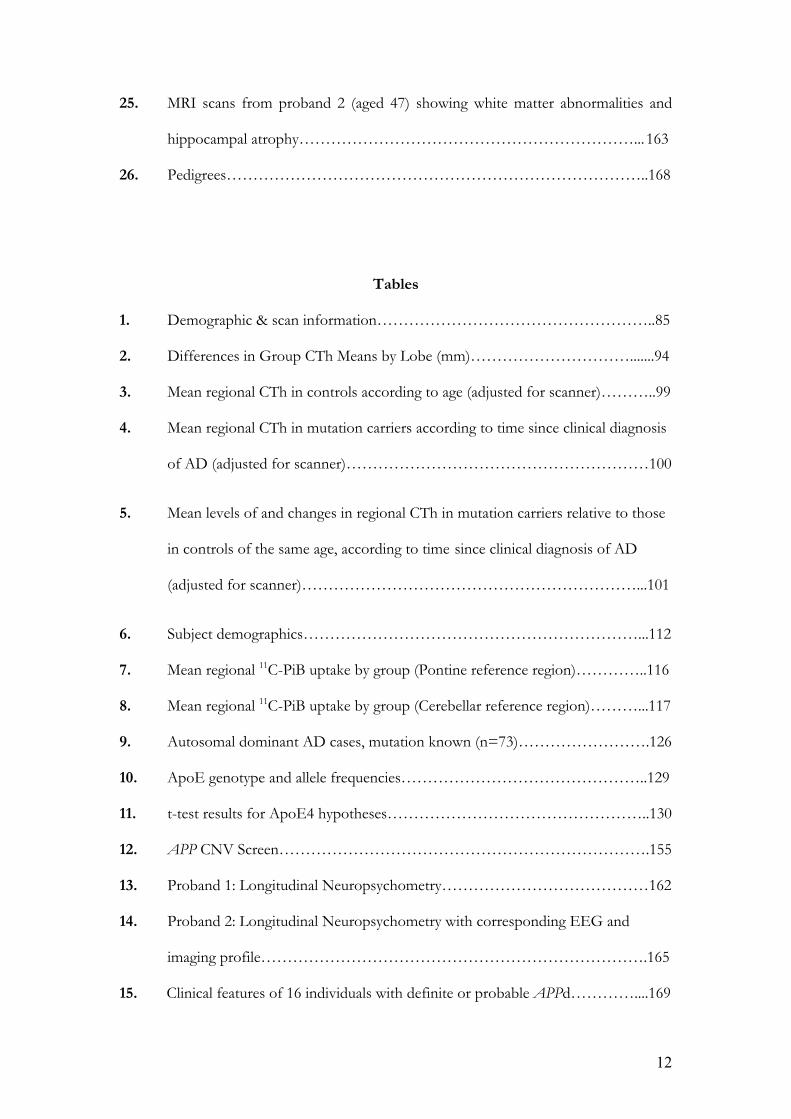
12
25. MRI scans from proband 2 (aged 47) showing white matter abnormalities and
hippocampal atrophy………………………………………………………... 163
26. Pedigrees……………………………………………………………………..168
Tables
1. Demographic & scan information……………………………………………..85
2. Differences in Group CTh Means by Lobe (mm)………………………….......94
3. Mean regional CTh in controls according to age (adjusted for scanner)………..99
4. Mean regional CTh in mutation carriers according to time since clinical diagnosis
of AD (adjusted for scanner)…………………………………………………100
5. Mean levels of and changes in regional CTh in mutation carriers relative to those
in controls of the same age, according to time since clinical diagnosis of AD
(adjusted for scanner)………………………………………………………...101
6. Subject demographics………………………………………………………...112
7. Mean regional 11C-PiB uptake by group (Pontine reference region)…………..116
8. Mean regional 11C-PiB uptake by group (Cerebellar reference region)………...117
9. Autosomal dominant AD cases, mutation known (n=73)…………………….126
10. ApoE genotype and allele frequencies………………………………………..129
11. t-test results for ApoE4 hypotheses…………………………………………..130
12. APP CNV Screen…………………………………………………………….155
13. Proband 1: Longitudinal Neuropsychometry…………………………………162
14. Proband 2: Longitudinal Neuropsychometry with corresponding EEG and
imaging profile……………………………………………………………….165
15. Clinical features of 16 individuals with definite or probable APPd…………....169

13
Abbreviations
AAO Age at onset
AAOf Mean family AAO
Aß ß-amyloid
ACE-R Addenbrooke’s Cognitive Examination (Revised version)
ACh Acetylcholine
AchE Acetylcholinesterase
AChEI Acetylcholinesterase inhibitor
AD Alzheimer’s disease
ADAS-Cog Cognitive Subscale of the Alzheimer’s disease Assessment Scale
ADCS-CGIC AD Co-operative Study-Clinical Global Impression of Change
ADL Activities of daily living
ALS Amyotrophic lateral sclerosis
aMCI Amnestic MCI
ApoE Apolipoprotein E
ApoB Apolipoprotein B
APP Amyloid precursor protein
APP Amyloid precursor protein gene
APPd Amyloid precursor protein gene locus duplication
BACE-1 ß-site amyloid precursor protein cleaving enzyme
BBSI Brain boundary shift integral
BuChE Butyrylcholinesterase
bvFTLD Behavioural variant of FTLD
CA-1 Cornu ammonis 1
CAA Cerebral amyloid angiopathy
14
CADASIL Cerebral autosomal dominant arteriopathy with subcortical infarcts
and leucoencephalopathy
CBS Corticobasal syndrome
CDR Clinical dementia rating
CERAD Consortium to Establish a Registry for Alzheimer's Disease
Cho Choline
Chr Chromosome
CMRglc Cerebral metabolic rate for glucose
CNS Central nervous system
CNV Copy number variants
Cr Creatine
CSF Cerebrospinal fluid
CT X-ray computed tomography
DAD Disability Assessment for Dementia
DLB Dementia with Lewy bodies
DNA Deoxyribonucleic acid
DRPLA Dentatorubropallidoluysian atrophy
DWI Diffusion-weighted imaging
DTI Diffusion-tensor imaging
ECE Endothelin-converting enzyme
EEG Electroencephalography
EOAD Early onset AD
ER Endoplasmic reticulum
ERC Entorhinal cortex
FAD Familial Alzheimer’s disease
18FDG 18Fluorodeoxyglucose

15
FLAIR Fluid-attenuated inversion recovery
fm-qPCR Fluorescent microsatellite quantitative PCR
FTLD Frontotemporal lobar degeneration
gDNA Genomic DNA
GMV Grey matter volume
GSK-3 Glycogen synthase kinase-3
Hcy Homocysteine
HA Homocysteic acid
HD Huntington’s disease
HIV Human immunodeficiency virus
HMG-CoA 3, 3-hydroxymethylglutaryl-Coenzyme A
HMPAO Hexamethylpropylene amine oxime
IDE Insulin-degrading enzyme
IFN Interferon
IMP Investigational medicinal product
IPD Idiopathic Parkinson’s disease
IVIG Intravenous immunoglobulin
LDL Low density lipoprotein
LRP-1 LDL receptor-related protein
MAPT Microtubule-associated protein tau
MC Mutation carrier
MCI Mild cognitive impairment
MHC Major histocompatibility complex
mI Myoinositol
MIDAS Medical information display and analysis system
MMSE Mini-mental state examination

16
MCI Mild cognitive impairment
MRI Magnetic resonance imaging
MRS Magnetic resonance spectroscopy
MS Multiple sclerosis
MSA Multi-system atrophy
MTL Medial temporal lobe
MTR Magnetization transfer ratio
NAA N-acetyl aspartate
NEP Neprilysin
NFT Neurofibrillary tangle
NINCDS-ADRDA National Institute of Neurological and Communicative Disorders
and Stroke-Alzheimer’s Disease and Related Disorders Association
NMDA N-methyl-D-aspartate
NSAID Non-steroidal anti-inflammatory drug
NT Neuropil thread
PCA Posterior cortical atrophy
PCR Polymerase chain reaction
PDAPP Platelet-derived growth factor promoter-expressing APP
PET Positron-emission tomography
PiB Pittsburgh compound B
PM Post-mortem examination
PNFA Progressive non-fluent aphasia
PPAR-! Peroxisome proliferated activated receptor-!
PS1 Presenilin 1 protein
PS2 Presenilin 2 protein
PSEN1 Presenilin 1 gene

17
PSEN2 Presenilin 2 gene
PSP Progressive supranuclear palsy
RAGE Receptor for advanced glycation end products
ROI Region of interest
ROS Reactive oxygen species
SNP Single nucleotide polymorphism
SPECT Single Photon-Emission Computed Tomography
SAD Sporadic AD
SALA Selective amyloid lowering agent
SD Standard deviation
TIV Total intracranial volume
TNF Tumour necrosis factor
vMRI Volumetric MRI
VaD Vascular dementia
VBSI Ventricular boundary shift integral
WAIS-R Wechsler Adult Intelligence Scale (Revised version)
18
The Problem
Alzheimer’s disease (AD) represents the most common form of dementia and, as such, is
costly both in personal and macroeconomic terms (Wimo et al. 2003). The sporadic form
(SAD) is thought to arise from the interaction of genetic and environmental factors,
though the aetiology has yet to be fully elucidated. The hallmark pathological lesions of
AD are the extracellular amyloid plaque and the intracellular neurofibrillary tangle (NFT),
although the extracellular accumulation of oligomeric amyloid-ß (Aß) species and altered
synaptic function are increasingly seen as important (Lesne et al. 2006). Selective regional
vulnerability to the pathology determines the distribution of neuronal loss, which in turn
dictates both the observable macroscopic features (atrophy) and the clinical phenotype.
Such change characteristically begins in the hippocampus and entorhinal cortex (ERC),
progressing to involve neocortical structures such as the posterior cingulate gyrus and
temporo-parietal association cortices (Braak and Braak 1991). Accordingly, early cross-
sectional imaging studies using X-ray computed tomography (CT) demonstrated that
examination of mesial temporal structures is most sensitive and specific for the detection
of early AD changes (Masdeu 1985).
Subsequently, magnetic resonance imaging (MRI) has permitted a more thorough
exploration of structural change in the AD brain. This is most often achieved through
analysis of atrophy, the downstream consequence of neuronal loss. However, the
regional distribution of pathology is also reflected in measures of regional metabolism
such as 18fluorodeoxyglucose positron-emission tomography (18FDG PET). Further, it is
now possible to visualize plaque amyloid, associated activated microglia, and
acetylcholinesterase (AchE) activity in vivo using radio-labelled ligands in combination
19
with PET or single photo-emission computed tomography (SPECT). The ligands
concerned are 11C-PiB (Klunk et al. 2004), 11C-(R)-PK1115 (Edison et al. 2008; Wiley et al.
2009; Okello et al. 2009) and 123I-5IA (O'Brien et al. 2007) respectively. Many of these
techniques have yet to be fully evaluated. Both the ‘amyloid cascade hypothesis’ (see 1.5.)
(Hardy and Allsop 1991) and early studies showing a positive association between ‘senile
plaques’ and severity of dementia before death (Tomlinson et al. 1968; Tomlinson et al.
1970) would suggest that non-invasive amyloid imaging represents a promising
development. However, more recent work has cast doubt over the strength of the
clinico-pathological association (Neary et al. 1986; Gomez-Isla et al. 1997), while others
have found evidence of similar amyloid plaque loads in cognitively normal individuals
(Davis et al. 1999a).
The development of disease-modifying agents for AD is vital in the context of rapid
demographic ageing, particularly in the developed world. As age is the most powerful of
risk factors for SAD, a corresponding sharp increase in its prevalence is anticipated in the
coming years. There is currently no agent that reproducibly modifies the natural history
of AD in humans, though novel therapeutic strategies are emerging, some with
encouraging data from murine models and early human trials (Bard et al. 2000; Gilman et
al. 2005; Grundman and Black 2008). Ultimately, such treatment strategies must be
judged against clinically meaningful functional and neuropsychological criteria. However,
use of such criteria as study outcome measures necessarily requires large sample sizes
over extended periods. Many are intrinsically reliant upon subjective impressions of
change, have ceiling and floor effects and are unreliable in distinguishing symptomatic
from genuine disease-modifying effects. Such considerations have galvanised the search
for biomarkers with high predictive and diagnostic power which can reliably identify
those at risk of developing AD (‘trait’) and those who are in the very earliest stages of the

20
disease (‘state’). Robust markers of progression are also required (‘rate’), particularly as a
means of evaluating attempts to modify the disease process. The demand for biomarkers
of this kind is a pervasive and topical issue in clinical research and is not unique to AD.
A number of neuroimaging modalities, notably MRI and 18FDG PET, are being explored
as surrogate markers of therapeutic efficacy using smaller sample sizes over shorter
periods (Alexander et al. 2002; Zamrini et al. 2004; Schott et al. 2005). Rates of neuronal
loss are known to be reflected in regional and whole brain atrophy rates (Jack et al. 2002)
which may be measured through both semi-automated and automated MRI techniques.
Where serial scans are performed on an individual, each study subject acts as their own
control, an approach which may entail digital matching (co-registration) of one image to
another. Global atrophy rates may then be assessed via direct volume comparison,
assessment of cerebrospinal fluid (CSF) compartment expansion or by automated
techniques such as the Brain Boundary Shift Integral (BBSI) (Fox and Freeborough 1997;
Freeborough and Fox 1997) or Ventricle Boundary Shift Integral (VBSI) (Schott et al
2005). However, the use of such techniques to assess novel therapies is a developing area
and has sometimes provided unexpected results: In immunotherapy trials, for example,
paradoxical changes have been observed with increased ventricular expansion and atrophy
rates accompanying administration of experimental therapy (Fox et al. 2005). This was
not easily reconciled with the broadly positive results of neuropsychological testing in the
same study.
In SAD it is known that AD neuropathology is already well established by the time
symptoms occur. Accordingly, evidence from the study of autosomal dominant familial
AD (FAD) has shown that regional and whole brain atrophy rates may differ significantly
from controls several years before AD is clinically detectable (Schott et al. 2003; Ridha et

21
al. 2006). Further, the accumulation of oligomeric Aß species may precede even this
(Lesne et al 2006). There appears, therefore, to be a very real potential for early
intervention provided agents are developed which offer disease modification and
techniques arise to identify preclinical disease.
In summary, we have entered an era in which the identification of potentially modifiable
risk factors and early disease markers are vital to the application of new, disease-specific
diagnostic tools and treatment modalities. The development of putative disease-
modifying therapies will demand the facility to identify this early therapeutic window
before irreversible, pathological structural change occurs. In this way preservation of
residual cognitive ability may be optimized and the currently inevitable
neurodegeneration arrested or prevented. We also require the facility to evaluate swiftly
the impact of novel therapies, particularly in light of increasing societal disease burden
and finite resources. FAD is a valuable paradigm for the study of AD, not least because it
is currently the only context in which truly reliable predictions about who will be affected
can be made. It permits the use of smaller study cohorts, removes diagnostic uncertainty
and represents a unique opportunity for characterization of the crucial presymptomatic
phase. It may, therefore, be a key to defining robust biomarkers of risk, onset and
progression.
Work undertaken for this thesis was carried out with two main aims: to characterize FAD
further, informing its current and future use as an AD paradigm, and to then use the
FAD model to examine potential imaging biomarkers of onset, progression and
intervention. Where possible, SAD cohorts were used to investigate the comparability of
the two forms, and hence the generalizability of FAD data to SAD. By studying patients
in both pre-symptomatic and symptomatic stages, the relationships between regional and

22
whole brain volumes, cortical thickness (CTh) and clinical phenotype were examined.
11C-PiB (11C-Pittsburgh compound B) PET has shown potential as a marker both of early
disease and therapeutic efficacy so imaging profiles in FAD and SAD cohorts are also
characterized.
23
1.
INTRODUCTION
The mind is its own place, and in itself
Can make a Heav’n of Hell, a Hell of Heav’n.
- John Milton, Paradise Lost
1. 1. Normal ageing
Full characterization of the anatomy and physiology of the ageing brain is essential if a
pathological departure from the norm is to be detected early. Such characterization is
therefore directly relevant to the central theme of this thesis. Cortical grey matter grows
until the age of five and then inexorably declines in volume with age thereafter
(Pfefferbaum et al. 1994). White matter growth accelerates throughout adolescence,
plateauing in the third decade. CSF spaces expand continuously with age at the expense
of grey matter with little volume change in the white matter volume (Resnick et al. 2003).
However, different patterns of ageing are seen in different brain regions. There is, for
example, selective vulnerability of the prefrontal cortex (Tang et al. 2001). Other grey
matter structures showing age-related volume decline include the cerebellum, thalamus
and insular cortex. Importantly, hippocampal volume seems to change little with healthy
ageing (Sullivan et al. 2005), and this can be exploited where hippocampal volume is used
to distinguish AD from healthy ageing (Colliot et al. 2008).
Quantitative diffusion tensor imaging (DTI) (see 1. 7. 4. 5.) has repeatedly demonstrated
a reduction in fractional anisotropy (FA) with increased diffusivity in white matter with
24
ageing (Pfefferbaum et al. 2000; O'Sullivan et al. 2001). FA decline and diffusivity increase
may exhibit an anterior-posterior gradient (Sullivan et al. 2001). This means that frontal
white matter, which develops relatively late (Sowell et al. 1999) and is under
proportionately greater environmental control than more posterior regions (Pfefferbaum
et al. 2001), is more vulnerable to age-related deterioration.
The resting electroencephalographic (EEG) (see 1. 7. 2.) changes with physiological
ageing, showing decreased " amplitude and global ‘slowing’ of background activity with
increased theta and delta activity (Klimesch 1999). Ageing effects on parieto-occipital "
rhythm are thought to reflect underlying default activity of the neural network in the
resting, awake brain. This activity is modulated by thalamo-cortical and cortico-cortical
interactions controlling the movement of sensorimotor information and the retrieval of
semantic information from cortical stores (Brunia 1999). Regions shown by other
modalities such as functional MRI (fMRI) to be active in the resting, default state may
also be particularly prone to the pathological changes associated with AD (Buckner et al.
2005).
1. 2. Dementia
The generic term ‘dementia’ is not a diagnosis in itself, rather it describes a clinical
syndrome of acquired, multi-domain cognitive impairment that, by definition, must
involve episodic memory and is often accompanied by changes in personality, behaviour
and mood. The American Psychiatric Association Diagnostic and Statistical Manual of
Mental Disorders version 4 (DSM-IV) (Am.Psychiatr.Assoc. 1994) (DSM-V is expected
in 2012) defines dementia as the development of cognitive dysfunction implicating
memory and at least one of: aphasia, apraxia, agnosia or executive function. These

25
deficits must arise in the context of full consciousness and must be sufficient to impair
normal social function and/or the ability to work. The list of aetiologies is extensive and
includes primary degenerative diseases such as AD, dementia with Lewy bodies (DLB)
and frontotemporal lobar degeneration (FTLD); potentially remediable processes such as
cerebral vasculitis, hypothyroidism and vitamin B12 deficiency; and dementia secondary
to other diseases such as human immunodeficiency virus (HIV) infection and multiple
sclerosis (MS). Degenerative processes predominate in the elderly population and
therefore make the most significant contribution to the societal burden of dementing
illness.
1. 3. Alzheimer’s disease
1. 3. 1. History
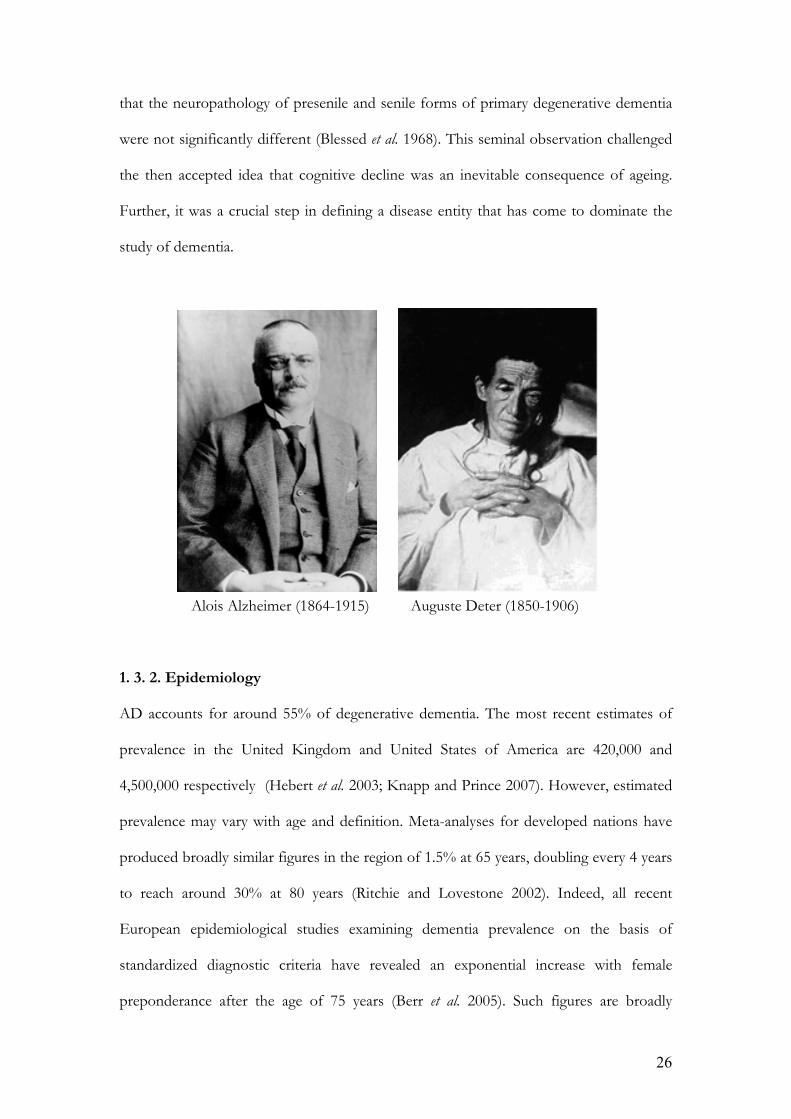
In 1906 in Tübingen, Germany the Bavarian psychiatrist and neuropathologist Aloysius
‘Alois’ Alzheimer reported post mortem findings in a 56 year-old patient from Frankfurt
whom he had first seen in 1901 (Alzheimer 1906). In life the patient, Auguste Deter, had
suffered from presenile dementia with multiple cognitive deficits including reduced
comprehension and memory, aphasia, disorientation, unpredictable behaviour, paranoia,
auditory hallucinations, and pronounced psychosocial impairment. Neuropathological
examination of the atrophic neocortex revealed plaques of dystrophic neurites, NFT and
arteriosclerotic change. Emil Kraepelin (1856-1926), the head of Alzheimer’s department
and himself a pioneer in neuropathology, later ensured that the illness gained its familiar
eponym: ‘Alzheimersche krankheit’ (Alzheimer’s disease).
For more than half a century thereafter the term ‘Alzheimer’s disease’ was used
exclusively to describe the rare forms of presenile dementia in which the pathological
changes of plaques and tangles were evident. However, in 1968 a study demonstrated
26
that the neuropathology of presenile and senile forms of primary degenerative dementia
were not significantly different (Blessed et al. 1968). This seminal observation challenged
the then accepted idea that cognitive decline was an inevitable consequence of ageing.
Further, it was a crucial step in defining a disease entity that has come to dominate the
study of dementia.
Alois Alzheimer (1864-1915) Auguste Deter (1850-1906)
1. 3. 2. Epidemiology
AD accounts for around 55% of degenerative dementia. The most recent estimates of
prevalence in the United Kingdom and United States of America are 420,000 and
4,500,000 respectively (Hebert et al. 2003; Knapp and Prince 2007). However, estimated
prevalence may vary with age and definition. Meta-analyses for developed nations have
produced broadly similar figures in the region of 1.5% at 65 years, doubling every 4 years
to reach around 30% at 80 years (Ritchie and Lovestone 2002). Indeed, all recent
European epidemiological studies examining dementia prevalence on the basis of
standardized diagnostic criteria have revealed an exponential increase with female
preponderance after the age of 75 years (Berr et al. 2005). Such figures are broadly

27
mirrored in North American studies (Alloul et al. 1998). Given the well-established
relationship between the incidence of dementia and increasing age, the primary factor
driving this phenomenon is likely to be increased longevity evident in developed nations.
The anticipated, concurrent reduction in those of working age able to offer care to
elderly, impaired individuals poses a further challenge. AD and other dementias now
constitute a global health and social care crisis and, as this problem has become better
publicised, the requirement for large-scale strategies has gained wider appreciation
(Department of Health 2009). Although the burden of the dementias in the developing
world is less well known, the problem is broadly regarded to be both under-recognised
and growing.
1. 3. 3. Risk factors
Although no single aetiology has yet been identified for SAD, the interaction of
environmental and genetic variables appears to be important. The same may be said of
other forms of dementia, such as vascular dementia (VaD). However, AD arguably has a
unique and emotive connection to the human condition, as the most powerful of its risk
factors is also the most inevitable, namely growing old.
Despite recent twin studies demonstrating heritability of up to 80% for SAD (Gatz et al.
2006), exogenous factors are clearly important in directly conferring risk, and in the
modification of genetic variables. One idea has been that low ‘cognitive reserve’
associated with reduced brain size or poor educational attainment may be an independent
risk factor (Mayeux 2003), or that it may act as a mechanism by which other factors, such
as head injury, exert their effect upon risk (Jellinger 2004). It remains possible, however,
that factors such as trauma and cerebrovascular disease (with its attendant association
with diabetes, smoking, systolic hypertension, obesity and hypercholesterolaemia – each

28
associated with a hazard ratio of about 2 (Tyas et al. 2003; Luchsinger et al. 2005;
Kivipelto et al. 2005; Freitag et al. 2006)) may have a more intimate, causative link with
the pathological cascade of AD rather than simply acting to reduce cognitive reserve and
hence the threshold for the appearance of symptoms. Research in this area continues,
typified by a recent study suggesting a link between increased cardiorespiratory fitness
and reduced brain atrophy (Burns et al. 2008).
Figure 1: Prevalence of AD as a function of age in men and women
(Nussbaum and Ellis 2003)
Data concerning the effects of dietary factors in AD are typically inconsistent and based
on a variety of study types. Indeed, no specific dietary advice has a sound evidence base

29
in relation to AD risk and there is considerable overlap in the relevant biological
hypotheses.
Levels of homocysteine (Hcy), vitamin B12 and folate have also been extensively studied,
with variable conclusions regarding their relationship to stroke and AD risk. Hcy is a
precursor of methionine and cysteine and its conversion to methionine requires folate
and vitamin B12, both co-factors for methionine synthetase. Studies have suggested a
link between elevated Hcy and increased AD risk (Seshadri et al. 2002); that homocysteic
acid (HA), an oxidized metabolite of Hcy, may induce intraneuronal accumulation of
Aß1-42 (Hasegawa et al. 2005) and that Hcy may increase neuronal vulnerability to Aß-
mediated toxicity (Kruman et al. 2002).
Data linking AD pathology with oxidative stress and the association of reactive oxygen
species with neuronal damage (Markesbery 1997) have led to increased interest in
antioxidant supplementation. However, the results of prospective studies of antioxidants
such as tocopherol (vitamin E), vitamin C and carotene are inconsistent and do not allow
confident assertions of their value (Luchsinger et al. 2003; Grodstein et al. 2003).
In short, despite considerable research and a long list of putative associations, no
environmental risk factor has yet been definitively linked to AD. However, many
clinicians find it reasonable to offer general advice on lifestyle and diet in view of the
potentially positive effect on risk for other disorders such as vascular disease. Greater
knowledge of the risk factors leading to AD aids selection of subjects for pre-
symptomatic studies and allows earlier, more accurate diagnosis – this is amongst the
aims of studies presented in chapters 2 and 3.

30
1. 3. 3. 1. Apolipoprotein E
The co-ordinated expression of Apolipoprotein E (ApoE) and its receptor, the
ApoE/ApoB (LDL) receptor, are important in cholesterol and phospholipid transport in
the brain. Individuals may have various combinations of ApoE alleles 2, 3 and 4 on
chromosome (Chr) 19: allele frequencies in the general population are 6.4%, 83.6% and
10% respectively (Carmo Martins et al. 2008). Changes in the balance of lipid transport,
synthesis and internalization via this pathway are necessary during synaptogenesis and
neuronal remodelling and, therefore, the brain’s response to injury. During these
reparative processes, neurones down-regulate the cholesterol-synthesising 3, 3-
hydroxymethylglutaryl-Coenzyme A (HMG-CoA) reductase enzyme, while increasing
cholesterol internalization.
Phospholipid homeostasis might also be important to the integrity of the cholinergic
system, known to be dysfunctional in AD. The ApoE allele may modify the efficacy of
cholinomimetic therapy in AD (Poirier 1999a), with E4 negative individuals deriving
more benefit (interestingly the reverse appears to be true for catecholaminergic therapies
(Poirier 1999b)). This may be explained by the reliance of the central nervous system
(CNS) on locally available lipids for acetylcholine (Ach) synthesis and raises the
possibility that genotyping may become a vital part of tailoring therapeutic regimens in
future. In addition, observations arising from transgenic mouse experiments have led to a
proposed role for ApoE in amyloid precursor protein (APP) processing and the
clearance of extracellular Aß (Poirier 2000).
The link between SAD and ApoE4 genotype was first reported in 1993 (Corder et al.
1993; Poirier et al. 1993). Subsequent meta-analysis demonstrated an additive risk profile
with three-fold and fifteen-fold risks in heterozygotes and homozygotes respectively

31
(Farrer et al. 1997). The ApoE4 polymorphism is now thought to account for the
majority of genetic risk for SAD (Raber et al. 2004). Its predominant effect appears to be
to modify age at onset (AAO) (Meyer et al. 1998), and there is evidence that it has a
similar influence on amyloid precursor protein gene (APP), though not presenilin one
gene (PSEN1) -related FAD (Hardy et al. 1993; Van Broeckhoven et al. 1994; Sorbi et al.
1995). It has also been suggested that the absence of the ApoE4 polymorphism may
direct pathology away from the MTL towards more posterior structures (Schott et al.
2006), a hypothesis arising from the under-representation of ApoE4 amongst sufferers of
posterior cortical atrophy (PCA). Human ApoE has since been associated with a
redistribution of pathology (fibrillar amyloid) in a transgenic mouse model of the Dutch
mutation (Xu et al. 2008). When compared with mice with an endogenous ApoE
background, human ApoE 3/3 or 4/4 genotype led to a marked reduction in cerebral
microvascular amyloid and the appearance of extensive, fibrillar, parenchymal plaque
amyloid with strong co-localization of ApoE proteins. A corresponding shift in the
distribution of activated microglia was observed. There was no difference between the
groups in the total levels of Aß40, Aß1-42 or total levels of soluble and insoluble amyloid
species. Recent data have indicated an additive effect of ApoE4 allele load upon grey
matter volume (GMV) in medial and anterior temporal lobes bilaterally (Filippini et al.
2008). However, the contrasting dominant effect of ApoE4 upon GMV in the left
temporal lobe raises the possibility that ApoE exerts any influence on susceptibility,
progression and lesion distribution via more than one mechanism. ApoE continues to
dominate the study of genetic SAD risk, its possible epistatic influence is investigated in
chapter 4.

32
1. 3. 3. 2. Other risk genes
A number of other genes have been investigated as potential risk factors for SAD or
modifiers of FAD. SORL-1, which encodes a neuronal sortilin-related receptor, directs
trafficking of APP into endocytic recycling pathways from the cell surface and, when
under-expressed, can result in APP being sorted into Aß-generating compartments.
Inherited variation in this gene has recently been associated with late onset AD (Rogaeva
et al. 2007). Polymorphisms in the promoter region of the nicastrin gene (as described
later, nicastrin is a component of the !-secretase complex which has a fundamental role
in amyloidogenesis) have not yet been excluded as a genetic risk factor for SAD,
although studies have yet to demonstrate conclusively that they have a role (Orlacchio et
al. 2004). Like nicastrin, the PEN-2 protein is a component of !-secretase. Both mis-
sense mutations and polymorphisms have been identified in the PEN-2 gene, although
the significance of these findings remains unclear (Frigerio et al. 2005). Genome-wide
association studies show great promise in identifying new risk genes: 3 were very recently
reported (see http://www.alzforum.org/new/detail.asp?id=2197): ApoJ (aka clusterin),
CR1 (which encodes a complement receptor), and PICALM (which encodes an
endocytic gene). Together these support key roles for innate immunity and cholesterol in
AD. Genome-wide association studies continue to revolutionize the study of genetic risk,
not least in AD. Related genetic screening techniques are employed in chapter 5.
1. 3. 4. Mild cognitive impairment
The gap between normal cognition and a diagnosis of AD is bridged via a heterogeneous
clinical construct: mild cognitive impairment (MCI). Originally believed to represent part
of a continuum of change related to normal ageing, MCI is now recognised as a
pathological entity, albeit an aetiologically and clinically heterogeneous one. Consensus
clinical criteria (Petersen et al. 1999; Winblad et al. 2004) require that the person is neither
33
normal nor demented; that there is evidence of cognitive deterioration shown by either
objectively measured decline over time and/or subjective report of decline by self and/or
informant in conjunction with objective cognitive deficits; and that activities of daily
living are preserved and complex instrumental functions are either intact or minimally
impaired.
To develop MCI does not guarantee a progression to dementia, or that any subsequent
dementia will be AD, but an increased AD risk is recognised relative to an age-matched
normal population with a conversion rate of 10-15% per year (Petersen et al 1999;
Petersen 2004). MCI is often divided into amnestic (aMCI) and non-amnestic subtypes,
with greater prognostic variation generally seen in the latter. Characterization of MCI is,
however, ongoing and disagreement over its nosological status and the most important
prognostic markers remains.
Atrophy of the hippocampus, ERC and temporal pole is greater in MCI subjects who
progress to AD within 4-5 years compared to cognitively normal controls or MCI
subjects who do not progress (Desikan et al. 2008). Microglial activation has been noted
(Okello et al 2009) and recent evidence supports the notion that impaired episodic
memory in non-demented people (including MCI) is strongly related to Aß deposition as
measured by 11C-PiB-PET (Pike et al. 2007). The relationship between these factors in
established AD is, however, far less clear with some data supporting a stable amyloid
load even in the face of clearly deteriorating cognition (Engler et al. 2006). The nature of
these relationships is crucial to the timely application of anti-amyloid therapies and in
defining the future role of 11C-PiB -PET as a potential biomarker. A clear understanding
of the nature of very early AD is a vital component of its detection at a stage amenable to

34
modification. Hence MCI is a pertinent concept in chapters 2 and 3, which attempt to
study patients in a period which includes this phase.
1. 4. Familial Alzheimer’s disease
Three genes have so far been implicated in autosomal dominant early-onset FAD: the
APP, PSEN-1 and the presenilin two genes (PSEN-2), with the majority of known
mutations found in PSEN-1. These may cause clinically manifest AD as early as the
fourth decade, with complete penetrance the rule. Where the presence of a mutation is
suspected and subsequently tested, the detection rate of sequence variations in these
three genes ranges from 57% (Finckh et al. 2005) to 68% (Janssen et al. 2003), suggesting
a role for as yet unidentified genes. Where the strictest criteria are applied, only around
1% of all AD is thought to fall into the autosomal dominant early onset AD (EOAD)
group (Campion et al. 1999), although about 25% of all AD is familial in a broader sense
(i.e., two or more persons in a family have AD) (Bird 2008).
FAD has served as a useful SAD paradigm for many years (Kennedy et al. 1995a; Fox et
al. 1998; Fox et al. 2001). Prospective studies of the early stages of sporadically occurring
illness have proved extremely difficult due to its insidious onset and the confounding
factors associated with co-morbidity and ageing. In contrast, FAD permits an accurate
ante-mortem diagnosis and the opportunity to perform targeted, longitudinal studies of
clinical, radiological and neuropsychological parameters at all stages. In addition, subjects
can be well matched for age, socioeconomic and other genetic factors. Such knowledge
has been incorporated into cellular models of the disease process and, more recently, has
permitted the development of transgenic mouse models and novel therapeutic strategies
(Schenk et al. 1999).

35
It is broadly accepted that differences exist between early and late onset forms of AD.
Although FAD and EOAD are strictly not equivalent entities, FAD is characterized by
early onset and previous studies have proposed a higher prevalence of impairment of
language or other neocortical functions (Jacobs et al. 1994), a relatively more rapid
progression (Rogaeva 2002), differences in the pattern of cortical thinning (Frisoni et al.
2007) and more prominent myoclonus (Kennedy et al. 1995b) in early onset forms as
compared to late-onset AD (LOAD). Further, in EOAD, there appears to be a strong
correlation between plaque and tangle burden and severity of clinical features – a
relationship not seen in the elderly (Prohovnik et al. 2006).
Despite these factors, the pathological and clinical similarities are clear, and the use of
research subjects at risk for FAD in studying the earliest stages of AD continues to yield
valuable information (Ringman 2005). Most studies show early episodic memory and
executive deficits in both forms (see 1. 6. 1. and 1. 6. 3.), as well as structural
neuroimaging changes 3-4 years before symptoms (Schott et al 2003), early cerebral
hypometabolism as demonstrated by 18FDG PET (Kennedy et al 1995a) and reduced
CSF Aß (Andreasen et al. 1999). More recent work has shown an increase in levels of
Aß1-42 in the plasma of presymptomatic FAD mutation carriers with a fall in these levels
immediately prior to symptom onset (Ringman et al. 2008). Further characterization of
the pathological, radiological and clinical hallmarks of FAD remains important, not least
because of its potential impact on our understanding of SAD. This issue is addressed in
chapters 4 and 5 of this thesis.
1. 4. 1. ß-amyloid precursor protein gene
The path to our present understanding of the genetic basis for FAD has been punctuated
by a number of landmarks. The first clue lay in the association of AD with trisomy 21, a
link which had been observed for many years and was supported by the characterization

36
of Aß in 1984 in the brains of individuals with AD and Down’s syndrome (Glenner and
Wong 1984). Some years later, the first mis-sense mutation in APP (also on Chr 21) that
co-segregated with autosomal dominant, early onset AD was discovered (Goate et al.
1991). This was the London mutation at position 717, significant not only for being the
first known mutation of its kind, but also for its position near the site at which !-
secretase cleaves Aß.
The APPV717I (London) mutation changes the Aß1-40: Aß1-42 ratio such that there is
relatively more of the fibrillogenic Aß1-42 species. This is assumed to lead to an
accumulation of neurotoxic amyloid species and the formation of plaques, thus causing
neurodegeneration and clinical disease of far earlier onset than the more common SAD.
With the exception of its early onset however, mutations at and around position 717 are
most often associated with a canonical AD phenotype akin to that seen in SAD. This
insidious, progressive impairment of episodic memory, in time leading to more
widespread cognitive deficits, has been observed in the numerous reported, unrelated
pedigrees with mutations around this site.
The Swedish mutation at positions 670 and 671 corresponds to the site of ß-secretase
cleavage (see Figure 3), and pedigrees have been reported with a typical AD phenotype.
There is an increase in the absolute quantities of Aß1-40 and Aß1-42 isoforms much like that
seen in trisomy 21 (Mehta et al. 2007). A number of mutations have been described
which cluster around the site of " -secretase cleavage within the Aß domain itself, and
are associated with haemorrhagic strokes and cerebral amyloid angiopathy (CAA). The
E693Q Dutch mutation (Levy et al. 1990) is known to cause hereditary CAA associated
with intra-cerebral haemorrhage (ICH), as is the E693K Italian mutation at the same
site (Tagliavini et al. 1999). The D694N Iowa mutation (Grabowski et al. 2001) also leads

37
to severe CAA and the A692G Flemish mutation (Hendriks et al. 1992b) has similar
effects, albeit in association with more typical clinical features of AD and. Any
generalization is, however, confounded by the presence of other rare mutations such as
the E693G Arctic mutation (Nilsberth et al. 2001) which seems to cause more typical
clinical AD.
Recent, significant discoveries have highlighted the importance of APP ‘gene dose’,
including the role of normal variation in disomic APP expression (Wavrant-De Vrieze et
al. 1999) in relation to SAD risk. Key observations so far have been that an increased
quantity of !-secretase substrate skews the Aß1-42: Aß1-40 ratio in favour of the former (Yin
et al. 2007); that mutations in the promoter region of APP may cause a neurone-specific
increase in APP transcriptional activity in patients with AD (Theuns et al. 2006a); and
that several independent duplications of the APP locus have been reported in French
families (Rovelet-Lecruz et al. 2006b) (see 1. 4. 2. and 3. 1.).
To date, 29 non-duplication APP mutations are known, of which 6 are not clearly
pathogenic (see http://www.molgen.ua.ac.be/ADMutations). Most are associated with
disease onset between 45 and 60 years and an initial amnestic syndrome progressing to
more widespread cognitive impairment. However, patients have been described with a
prolonged, isolated amnesia associated with the APPV717I (London) mutation (Gankam
Kengne et al. 2007) (see 2. 3.). A similar prolonged, isolated amnestic phase, albeit with
additional partial seizures and dysautonomia, has also been reported in association with
the V714A Iranian mutation (Lindquist et al. 2008b) although separate reports of this
mutation record a more typical AD clinical phenotype (Zekanowski et al. 2003). Chapter
2 includes a report of an isolated, progressive amnesia in association with a mutation at
the same locus as that described by Gankam Kengne et al.

38
1. 4. 2. APP locus duplication
Duplications of the APP locus (APPd) causing early-onset, autosomal dominant AD
have recently been described in five French families (Rovelet-Lecrux et al 2006; Cabrejo et
al. 2006), confirming a much earlier report of APPd in France (Delabar et al. 1987). The
prevalence of, and phenotypic spectrum associated with APPd are yet to be fully defined,
and the issue of copy number variations (CNV) at genetic loci is potentially of great
interest in the study of familial dementia per se. A variable phenotype with an autosomal
dominant mode of inheritance was seen in the APPd families, recently inviting
comparison with the Flemish mutation (Hendriks et al 1992b; Hardy 2006). Dementia
and CAA were universal with a quarter also suffering ICH (Cabrejo et al. 2006b).
Clinically it would appear that this disease falls somewhere between the canonical AD
phenotype observed in most APP mutations and the frequent, CAA-associated ICH seen
in most intra-Aß mutations. The prevalence of, and phenotypic spectrum associated with
APP duplications are yet to be fully defined and previous Finnish reports of suspected
autosomal dominant, EOAD where no causative mutation was identified (Remes et al.
2004a) may prove to be significant. Chapter 5 examines the prevalence and phenotype of
APPd as it is a part of the FAD ‘family’ and has the potential to strengthen our
understanding of the FAD: SAD relationship.
1. 4. 3. The presenilin 1 gene
PSEN1 is located on Chr 14q24.3. It has 13 exons but only 3-12 code for the PS1
integral membrane protein comprising 467 amino acids and eight transmembrane
domains (Sherrington et al. 1995). PS1 is highly conserved in evolution and is one of four
membrane proteins required to form an active !-secretase complex (the others are PEN-
2, nicastrin and APH-1 with a 1: 1: 1: 1 stoichiometry). PSEN1 inactivation abolishes
both PS1 expression and !-secretase activity (De Strooper et al. 1998). Some mutations in
Figure X: PIB-PET Scanning
39
PSEN1 lead to a small shift in the preferred cleavage site and, therefore, the
overproduction of the fibrillogenic form of beta amyloid peptide, Aß1-42 – an important
component of the amyloid plaques seen in AD. However, some uncertainty remains over
the precise mechanisms by which PSEN1 mutations exert their pathogenic effects, with
both gain and loss of function mechanisms postulated (Bentahir et al. 2006).
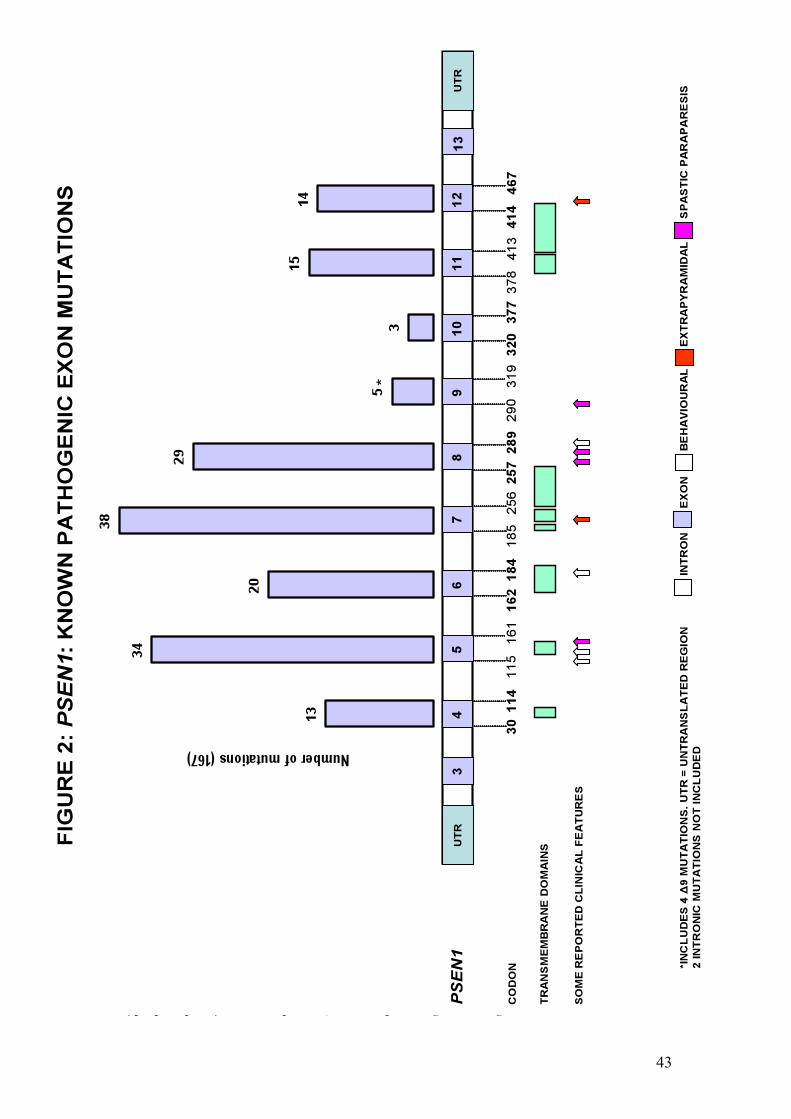
PSEN1 mutations tend to cluster in the regions coding for transmembrane domains and
are the most common cause of autosomal dominant FAD with 175 reported pathogenic
mutations (see http://www.molgen.ua.ac.be/ADMutations). Pathogenic mutations in the
other two genes known to be associated with FAD, namely APP and PSEN2, are far less
common. With the exception of their early onset, and despite evidence of phenotypic
heterogeneity (Menendez 2004; Larner and Doran 2006), the majority of PSEN1
mutations produce a clinical phenotype similar to that of SAD, with early memory
impairment followed by progressive, multi-domain cognitive dysfunction. The most
important exceptions are those mutations associated with early spastic paraparesis or a
presentation resembling that of behavioural variant FTLD (bvFTLD).
Mutations in exons 8 and 9 are responsible for many PSEN1-related FAD cases.
Examples of those associated with a mixture of spastic paraparesis, spastic dysarthria and
seizures include !9, R278T, N135S and V261L (Kwok et al. 1997; Rudzinski et al. 2008;
Jimenez Caballero et al. 2008). Spastic paraplegia has also been reported in a patient with
AD-like dementia and an unusual TTATAT insertion in a highly conserved
transmembrane domain 3 interface region of PSEN1 (Rogaeva et al. 2001).
Four deletions in exon 9 (!9 mutation) have been described (Crook et al. 1998; Houlden
et al. 2000; Smith et al. 2001; Brooks et al. 2003) in which the phenotype comprises
memory impairment and spastic paraparesis. These mutations destroy the splice acceptor
40
site for exon 9 resulting in deletion of exon 9 from the mutant mRNA transcript and an
amino acid substitution (S290C). This leads to deletion of residues 291-319 of the
protein, including the section coding for the cleavage site of PS1. The deletion
predictably has a major effect upon PS1 metabolism, although the S290C change alone
has just as profound an effect upon APP metabolism (Steiner et al. 1999). Cellular models
of such deletions show increased Aß1-42 production (Borchelt et al. 1996) and
neuropathological analysis shows unusual cortical ‘cotton wool’ plaques which are
immunoreactive for the Aß but lack a congophilic core. In these cases spastic paraparesis
often precedes cognitive impairment (Verkkoniemi et al. 2000). Such delay in the onset of
cognitive features would suggest a role for as yet unidentified modifying factors at exon
9.
At least 6 PSEN1 mutations have been linked with a clinical phenotype more akin to
bvFTLD than AD. These include a report of a behavioural presentation with relative
preservation of posterior functions associated with a L113P mutation (Raux et al. 2000).
Imaging in this case was consistent with bvFTLD. In addition, mutations such as P117R
(Styczynska et al. 2004) and F280A (Duarte et al. 2004) have been linked to similar
phenotypes. The M139V mutation has, in one African-American pedigree, been linked
with early personality change, psychosis, rigidity, dystonia and mutism (Rippon et al.
2003), although this mutation can present differently between kindreds, suggesting that
other factors are important in determining the phenotype. Those reports with
pathological confirmation include the G183V mutation (Dermaut et al. 2004) in which a
Pick-type tauopathy was demonstrated, with no extracellular Aß deposits, in a family with
a history of FTLD-like dementia. Interestingly, the insR352 mutation (Rogaeva et al 2001;
Tang-Wai et al. 2002) apparently does not increase Aß1-42 but rather acts as a negative
presenilin, leading to a partial inhibition of !-secretase (Amtul et al. 2002). This insertion

41
was not detected in more than 150 controls, 150 AD cases or 150 FTLD cases not linked
to a tau mutation or Chr 17.
An extra-pyramidal syndrome with dementia has been described in a 52 year-old man
with a family history of a similar illness (Ishikawa et al. 2005). This case was associated
with a three base-pair deletion in exon 12 of PSEN1 and, neuropathologically, cotton
wool plaques, Lewy bodies and CAA. Another mutation – G217D in exon 8 of PSEN1 -
has been described (Takao et al. 2002) with an extra-pyramidal syndrome and cotton
wool plaques in the cortex and striatum.
A particularly aggressive form of FAD is associated with the PSEN1 L166P mutation
which, unlike the deletion at the same site, leads to cognitive impairment beginning in
adolescence. It has been found to cause a profound over-production of Aß1-42 and also to
impair Notch signalling (Moehlmann et al. 2002).
1. 4. 4. The presenilin 2 gene
Pathogenic mutations in PSEN2 on Chr 1 causing autosomal dominant EOAD are rare,
with only ten so far described (see http://www.molgen.ua.ac.be/ADMutations). A
further four have been identified in which pathogenicity is either unknown or absent.
They were first described in Volga German families in 1995 (Rogaev et al. 1995) and
produce an AD phenotype which typically includes older AAO, though with a relatively
wide range (44-88 years). A longer disease duration has also been noted in some cases
(Sherrington et al. 1996). Specific examples of phenotypic heterogeneity include the
PSEN2 A85V mutation which may produce a DLB-like clinical phenotype associated
with synucleinopathy (widespread Lewy bodies) and AD pathology at post mortem

42
(Piscopo et al. 2008). Significant language impairment has been seen (Lindquist et al.
2008a), albeit in a mutation without conclusive evidence of pathogenicity (V393M). What
little is known about imaging profiles suggests involvement of areas common to other
forms of AD: 18FDG PET in PSEN2 N141I-associated FAD for example has shown left
parietal and precuneus hypometabolism with progressive hypometabolism of both
temporo-parietal and left frontal lobes (Nikisch et al. 2008).
43
1. 5. Neuropathology
The hallmark pathological lesions of AD are observed in the medial temporal lobes
(MTL) and neocortex and are the Aß (neuritic) plaque and the NFT (composed of
hyperphosphorylated tau protein). Other pathological changes associated with AD are

44
neuronal and synaptic degeneration, reduced synaptic plasticity, CAA and inflammatory
and oxidative stress. Changes in the neurochemistry of the AD brain are also important,
with neurotransmitter depletion a well-established consequence of synaptic and neuronal
loss. ACh release from fibres originating in the nucleus basalis of Meynert and projecting
to cortical areas is particularly affected (Francis et al. 1999). The main receptor types for
ACh in the CNS are muscarinic (subtypes M1 and M2) although nicotinic receptors are
also present.
Tau protein binds to microtubules, influencing their stability and the intracellular
transport they facilitate. The six known isoforms of tau, which range from 352 to 441
amino acids in length, are encoded by a single gene on Chr 17. Three isoforms have three
microtubule binding domains and three have four such domains (termed ‘three repeat
tau’ and ‘four repeat tau’ respectively) (Wischik and Harrington 2000). The
phosphorylation and dephosphorylation of tau, and hence the relative activity of kinase
and phosphatase enzymes, is a key means of regulating this process and is relevant in AD
as hyperphosphorylation promotes the aggregation of tau isoforms into the paired,
argyrophilic helical filaments of NFT and neuropil threads (NT). One important enzyme
responsible for phosphorylation of tau isoforms is glycogen synthase kinase-3 (GSK-3).
As an inhibitor of GSK-3, lithium has been proposed as a neuroprotective agent in both
AD and the ‘tauopathies’ (Engel et al. 2006; Engel et al. 2008). Mutations of the
microtubule-associated protein tau (MAPT) gene and/or accumulation of three or four
repeat tau are the basis for a number of other neurodegenerative diseases such as
corticobasal syndrome (CBS), progressive supranuclear palsy (PSP) and some cases of
FTLD.

45
It is the aberrant, proteolytic processing of APP that gives rise to the core component of
the amyloid plaque - a 40-43 amino acid peptide (Aß) which was purified and identified
only after the problem of plaque insolubility was overcome in the mid-1980s (Masters et
al. 1985). The pathological significance of Aß has been a central, if sometimes
controversial theme and the basis for the amyloid cascade hypothesis (Fig. 4) (Hardy and
Allsop 1991; Hardy and Higgins 1992). This postulates that it is the cascade from peptide
monomer to plaque, and altered Aß equilibrium, which drive AD pathogenesis. In this
model tau pathology is regarded as a downstream process although this view has not
gone unchallenged. The universality of tau pathology in AD (it forms the basis of the
Braak neuropathological criteria which describe its predictable progress in the AD brain
(Braak and Braak 1991)) and the poor correlation between total or extracellular fibrillar
amyloid and clinical status (Giannakopoulos et al. 2003), means it could legitimately be
considered a form of ‘tau-opathy’. Some critics of the amyloid cascade hypothesis have
gone further, asserting that amyloid pathology is a downstream protective response to
oxidative and metabolic change (Lee et al. 2007) and predicting that novel anti-amyloid
therapies will be ineffective or harmful (Smith et al. 2002). Pathological and imaging
studies indicating that amyloid deposition may be associated with apparently healthy
ageing (Davies et al. 1988; Davis et al 1999a; Mintun et al. 2006) further complicate the
debate. However, perceived inconsistencies in the amyloid hypothesis are increasingly
being addressed by new discoveries that tend to support the primacy of Aß. Recognition
of the role of variable APP expression and the association between FAD mutations

46

47
and parenchymal and vascular amyloidosis have contributed in this regard, although
another avenue of research has been particularly illuminating: Whether in vitro or in vivo,
Aß assembles itself into an array of structures ranging from soluble oligomers to large
insoluble fibrils and the latter, in the form of plaques, was historically considered to be
the most important entity in neurodegeneration. However, it has become clear that
various amyloid pools comprising different Aß species exist in dynamic equilibrium in
the AD brain and that soluble oligomers, whether intra- or extracellular, are the main
neurotoxic species with the more intimate link to clinical phenotype.
There are several candidate mechanisms for Aß oligomer toxicity, though no suggestion
that they are necessarily mutually exclusive. Binding to specific excitatory post-synaptic
sites has been demonstrated, with consequent impairment of long-term potentiation (a
measure of synaptic plasticity) in hippocampal neurones (Lambert et al. 1998; Lesne et al
2006), providing a plausible mechanism for impairment of memory formation. They also
disrupt neuronal calcium homeostasis such that cytosolic calcium is increased and cell
dysfunction/apoptotic processes ensue. This probably occurs via an increase in
membrane permeability with initial studies indicating that the formation of aberrant
membrane channels was responsible (Pollard et al. 1995). However, recent work has
suggested a less specific mechanism (Demuro et al. 2005). Increased intracellular calcium
also contributes to the formation of reactive oxygen species (ROS), mitochondrial
dysfunction and oxidative stress (Schubert et al. 1995). Aß oligomers also potentiate the
release of, and prevent re-uptake of the excitatory neurotransmitter glutamate in the
synapse, producing excito-toxicity (Harris et al. 1996; Fernandez-Tome et al. 2004) from
which memantine may offer some protection (Song et al. 2008). Amongst the most
important observations for the amyloid cascade hypothesis are that they also readily
induce tau hyperphosphorylation, in part via up-regulation of GSK-3 (Hoshi et al. 2003;

48
De Felice et al. 2008), and that increased levels correlate with NFT density (McLean et al.
1999). The specific sites at which oligomerization occurs and the precise nature of the
interactions between different Aß pools are not yet known. Also, the most important Aß
assembly, or combination of assemblies, has not yet been established, although the time
course of toxicity may depend upon the particular mixture of oligomers present
(Deshpande et al. 2006).
APP itself is a single transmembrane domain protein with eight possible isoforms. Of
these the 695, 751 and 770 amino acid forms are the most common in the brain. The
first is produced mainly in neurones whereas 751 and 770 are predominantly found in
glial cells. All three have Aß domains and are therefore potentially amyloidogenic. APP is
manufactured in the endoplasmic reticulum (ER) and subsequently moved through the
Golgi network to the cell surface where it is eventually re-internalized into the
endosomal/lysosomal system. The Aß domain is partially embedded in the plasma
membrane but also includes 28 residues outside the membrane and 14 in the
transmembrane domain. The function of APP in humans is not fully understood,
although its over-expression in hippocampal neurones leads to elevated Aß production
and consequent depression of excitatory transmission (Ting et al. 2007), suggesting a
possible role in modulating synaptic transmission. This effect is likely to be exerted via
Aß as mutant APP incapable of producing Aß has no such effect upon excitatory
transmission.
Initially thought to be an entirely abnormal protein, Aß was found to be a product of
normal cellular metabolism in 1992 (Haass et al. 1992). APP may undergo proteolytic
processing via two routes, termed amyloidogenic and non-amyloidogenic, the former
preserving the Aß moiety intact. The route depends upon which of three enzymes act to

49
sequentially cleave the APP molecule. The non-amyloidogenic pathway involves cleavage
by " -secretase (a member of the ADAM-10 disintegrin metalloprotease family) followed
by !-secretase. The former cuts APP within the Aß domain and the latter acts upon the
C-terminal fragment to produce P3 and C57/59 (Figure 3). The amyloidogenic pathway
entails cleavage by ß-secretase (active portion is termed BACE-1) releasing the
ectodomain of APP. The membrane-bound C-terminus, which contains the intact Aß
section within a 99-residue fragment (C99), is then cleaved by !-secretase to produce Aß1-
40/1-42 and a C57/59 fragment. The variation in the size of these fragments and, therefore,
the ratio of A!1-40 to A!1-42 is due to inherent small variations in the !-secretase cleavage
site. Point mutations in PSEN-1 (Figure 2) may affect the cleavage site of !-secretase,
changing the Aß1-40/1-42 ratio in favour of the more toxic, fibrillogenic species (Aß1-42).
!-secretase is a protease complex with four components: presenilin, nicastrin, APH-1 and
PEN-2. Presenilin (and therefore !-secretase activity) exists in both the ER/Golgi
network and nearer the plasma membrane, meaning that !-secretase-mediated APP
cleavage can occur at several sites in the cell. This means that two pools of Aß are
produced. Aß generated at or close to the plasma membrane (Aßsec) is secreted and
aggregates in the extracellular deposits (plaques) seen in AD. Aß1-42 is probably the
initially deposited species, and indeed the predominant species in the parenchymal
plaques of the AD brain (Miller et al. 1993; Iwatsubo et al. 1994). A proportion of the
deposits develop from amorphous ‘diffuse’ plaques into more circumscribed ‘immature’
plaques and finally into ‘mature’ (cored) plaques with their well-defined amyloid core and
halo of swollen neurites. As this ‘maturation’ proceeds they are more likely to become
Aß1-40 positive, an observation consistent with the ‘seeding’ hypothesis (Jarrett and
Lansbury 1993) whereby immature plaques begin with a seed of Aß1-42 and progressively
incorporate Aß1-40 - the major soluble species in extracellular fluid and CSF. Such seeding

50
would not however explain the striking scarcity of Aß1-40 positive plaques observed in
some cases of APPV717I mutation-associated FAD (Iwatsubo et al 1994). An alternative
explanation for the increased proportion of Aß1-40 observed over time is that the two or
three amino acids at the C-terminal of Aß1-42 are removed slowly in situ by
carboxypeptidases to produce Aß1-40. Aß1-40 and Aß1-42 appear to be equally abundant
amongst vascular amyloid deposits (Roher et al. 1993).
The other pool of Aß remains intracellular, may accumulate in AD and may be important
in its pathogenesis, possibly by facilitating neuronal death or increasing vulnerability to
neurotoxic factors (Chui et al. 1999). Interestingly, PSEN-1 mutations seem to have a
more profound effect upon !-secretase cleavage site specificity when it acts near the
plasma membrane to produce Aßsec than when it acts near the ER/Golgi complex to
produce intracellular Aß (Grimm et al. 2003).
Aß is degraded by peptidases including insulin-degrading enzyme (IDE), neprilysin
(NEP) and endothelin-converting enzyme (ECE) (Carson and Turner 2002). It may also
be cleared from the brain across the blood brain barrier (BBB) by low density lipoprotein
(LDL) receptor-related protein (LRP-1) (Tanzi et al. 2004). The receptor for advanced
glycation end products (RAGE) contributes to the trafficking of amyloid from plasma
into the CNS (Deane et al. 2004) and is now considered a potential therapeutic target
(Sturchler et al. 2008). To date there is no evidence for an abnormality affecting these
processes in the AD brain.
Although the MTL has an established role in episodic memory, it is clear that focus
should not fall solely upon the hippocampus and MTL when considering the earliest
pathological changes of AD. Rather, changes affect the whole of a distributed network

51
subserving episodic memory, with close links to the limbic system. This network includes
the MTL, mammillary bodies, dorso-medial thalamus and retrosplenial association
cortices (particularly posterior cingulate). Amyloid deposition does not appear to occur
especially early in the MTL and can appear early in other areas of the network (Braak and
Braak 1991; Edison et al. 2007). Instead, extracellular accumulation of soluble,
synaptotoxic, oligomeric Aß species (Lesne et al 2006) or abundant NFT (Bennett et al.
2004) are more prominent pathological findings.

FIG 4:
(Fibrillar/plaque) (Oligomeric)
(sec)

53
1. 6. Clinical features
AD is a slowly progressive disorder of insidious onset. Its cardinal features are the early,
progressive impairment of episodic memory with subsequent impairment of other
cognitive domains leading to apraxia, aphasia, and agnosia. However, the spectrum of
clinical features is by no means restricted to these. Dysexecutive features are common
and the balance of the clinical and pathological burden may vary, causing atypical
predominantly frontal or posterior (PCA) cortical syndromes. A preclinical phase of
neurodegeneration is recognised during which the pathological lesion load increases
before breaching a clinical threshold. This phase has been estimated to be as much as 2-3
decades in length (Davies et al 1988).
Clinical diagnostic criteria have been developed and include the National Institute of
Neurological and Communicative Disorders and Stroke-Alzheimer’s Disease and Related
Disorders Association (NINCDS-ADRDA) criteria (McKhann et al 1984) (Appendix 1),
and the Consortium to Establish a Registry for Alzheimer's Disease (CERAD) criteria
(Morris et al. 1989). Such criteria are necessarily qualitative and require the clinical
judgement of the supervising doctor in order to be successfully applied. They
nonetheless form an important framework in the absence of a single diagnostic test.
Revisions to the NINCDS-ADRDA criteria have recently been proposed in order to
incorporate CSF and imaging biomarkers (Dubois et al. 2007).
Evidence for the existence of atypical AD phenotypes is growing and a variety of
progressive, focal cortical syndromes have been reported in association with proven AD
pathology. In one recent series (Alladi et al. 2007) AD pathology was found to be
responsible for 100% of cases of PCA, 50% of CBS, 7.1% of bvFTLD, 44.1% of PNFA,
54
71.4% of mixed aphasia and 10% of semantic dementia. Atypical presentations are also
well established in FAD (see 1. 4.).
1. 6. 1. Memory
A decline in episodic memory function is an early feature of AD and a necessary
condition for clinical diagnosis. This is thought to reflect the earliest pathological changes
occurring in the MTL. However, like pathological change, memory disruption probably
precedes the full clinical syndrome necessary for an AD diagnosis (Chen et al. 2001).
There is increasing support for the notion that, after an initial decline, memory function
temporarily plateaus during the preclinical period (Smith et al. 2007). This is linked to the
concept of cognitive reserve: imaging studies indicate recruitment of pre-frontal and
posterior cortices by early AD patients during memory tasks (Grady et al. 2003), while
neurotransmitters and brain neurotrophic factors are maintained or up-regulated in pre-
clinical, though not established AD (Davis et al. 1999b; Mufson et al. 2003). Together
these changes suggest that the brain may attempt to compensate for early pathological
change and that further clinical decline corresponds with these compensatory
mechanisms being overwhelmed.
The nature of the memory deficit associated with early AD has been well characterized.
Patients exhibit problems with delayed recall of information, even when the demands of
retrieving that information are reduced via recognition tests (Delis et al. 1991).
Attenuation of the primacy effect and intrusion errors are seen, and semantic encoding is
less effective in improving memory retention than in cognitively normal subjects
(Backman and Small 1998). As the illness progresses, a semantic memory deficit emerges,
corresponding with a loss of general knowledge, increasing language problems (see
below) and a degree of retrograde amnesia Patients perform poorly on tests of

55
confrontational naming and recall of over-learned facts is impaired. Performance across
different tests of semantic memory suggest that there is a genuine loss from the semantic
store at this stage rather than a retrieval deficit alone (Chan et al. 1998).
1. 6. 2. Other cognitive domains
Executive function is impaired early in AD, resulting in problems with mental
manipulation of information, concept formation, problem-solving, self-monitoring,
sequencing and cue-directed behaviours (Perry and Hodges 1999). Neuropsychological
tools for detecting these problems include the modified Wisconsin Card Sorting Task
(Grant and Berg 1948; Nelson 1976), the Raven Progressive Matrices Task (Raven et al.
1976) and the Trail Making Test (Reitan 1958). A number of studies have indicated that
executive function and attention may be the first non-memory domains to be affected in
AD (Grady et al. 1988; Reid et al. 1996). Tasks involving the concurrent manipulation of
information and/or the division of attention are particularly affected and disruption of
cortico-cortical connections is probably important in producing early attentional
difficulty.
Progressive impairment of language may occur as part of a typical AD clinical
phenotype, occasionally as one of its earliest symptoms. Linguistic deficits arise at an
early stage in up to 10% of cases, with impairment of word fluency and semantic access
(Emery 2000). The latter is thought to result in the word finding difficulty commonly
manifested during discourse and in tasks of confrontational naming as the temporal lobe
semantic store deteriorates. The resulting speech is sometimes termed ‘logopenic’.
Articulatory and phonological impairments are relatively uncommon in these early stages
(Bayles and Kazniak 1987) although can occur (Croot et al. 2000). Later a wider range of
dysphasic deficits may emerge with a reduction in the grammatical complexity of

56
language, and aphasia (Kempler et al. 1998). The nature and degree of language deficit
appears to be influenced by the extent and distribution of the pathology rather than the
type of pathology per se. Thus, with an atypical distribution of AD neuropathology (such
as where the hippocampus and ERC are relatively spared compared to the perisylvian
region), phonological and articulatory disruption are, via similar mechanisms to acquired
speech and language disorders, more common. Deficits in posterior cortical functions
(e.g. visuospatial and visuoperceptual function) do occur in typical AD, but are usually
less prominent until the later stages of the disease. PCA is perhaps the bet known
exception to this.
1. 6. 3. Behavioural & neuropsychiatric features
These are an important group of symptoms and signs (Burns 2009), recognised
increasingly as a component of many neurological disorders, including AD. In AD,
apathy and depression are the most common and their presence is associated with
caregiver distress and poor functional and therapeutic outcome (Benoit et al. 2007).
Agitation is a relatively common problem and the poor side effect profile generally
associated with pharmacological measures has led to trials of alternative treatments such
as bright light therapy (Burns et al. 2009). Visual hallucinations are seen either as a
primary manifestation in severe disease, or when intercurrent systemic illness and
reduced cerebral reserve combine. They are an important cause of disability and have
been linked with an accelerated progression of dementia and early institutionalization
(Hauft et al. 1996). There is, therefore, substantial risk of morbidity, misdiagnosis and
inappropriate management if behavioural and psychiatric features go unrecognised.
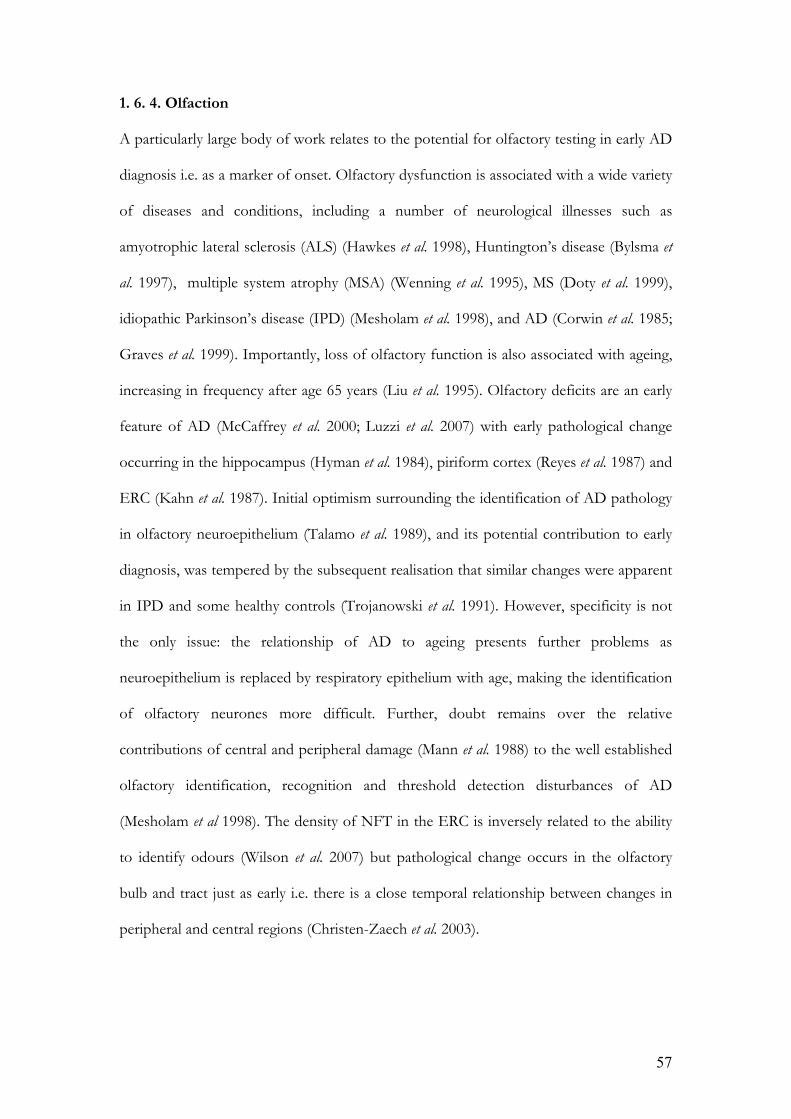
57
1. 6. 4. Olfaction
A particularly large body of work relates to the potential for olfactory testing in early AD
diagnosis i.e. as a marker of onset. Olfactory dysfunction is associated with a wide variety
of diseases and conditions, including a number of neurological illnesses such as
amyotrophic lateral sclerosis (ALS) (Hawkes et al. 1998), Huntington’s disease (Bylsma et
al. 1997), multiple system atrophy (MSA) (Wenning et al. 1995), MS (Doty et al. 1999),
idiopathic Parkinson’s disease (IPD) (Mesholam et al. 1998), and AD (Corwin et al. 1985;
Graves et al. 1999). Importantly, loss of olfactory function is also associated with ageing,
increasing in frequency after age 65 years (Liu et al. 1995). Olfactory deficits are an early
feature of AD (McCaffrey et al. 2000; Luzzi et al. 2007) with early pathological change
occurring in the hippocampus (Hyman et al. 1984), piriform cortex (Reyes et al. 1987) and
ERC (Kahn et al. 1987). Initial optimism surrounding the identification of AD pathology
in olfactory neuroepithelium (Talamo et al. 1989), and its potential contribution to early
diagnosis, was tempered by the subsequent realisation that similar changes were apparent
in IPD and some healthy controls (Trojanowski et al. 1991). However, specificity is not
the only issue: the relationship of AD to ageing presents further problems as
neuroepithelium is replaced by respiratory epithelium with age, making the identification
of olfactory neurones more difficult. Further, doubt remains over the relative
contributions of central and peripheral damage (Mann et al. 1988) to the well established
olfactory identification, recognition and threshold detection disturbances of AD
(Mesholam et al 1998). The density of NFT in the ERC is inversely related to the ability
to identify odours (Wilson et al. 2007) but pathological change occurs in the olfactory
bulb and tract just as early i.e. there is a close temporal relationship between changes in
peripheral and central regions (Christen-Zaech et al. 2003).
58
Olfactory testing may have potential as an early marker of AD risk (Doty 2003). Some
tests use microencapsulated odourants that are released on scratching an impregnated
strip (Doty et al. 1984; Doty et al. 1995), while others test detection threshold,
discrimination or odour memory. Olfactory identification scores have been determined
in individuals with MCI, with low scores associated with a greater risk of subsequently
developing AD (Devanand et al. 2000). Olfactory assessment may also be superior to the
MMSE in distinguishing AD from depression (McCaffrey et al 2000). Several studies
seem to suggest that threshold detection is better preserved than identification (Koss et
al. 1987; Hawkes and Shephard 1998), providing support for the view that damage to
central olfactory pathways predominates i.e. that signals are able to reach the brain under
the appropriate conditions but perceptual deficits prevent their correct interpretation.
Studies of olfaction in non-demented individuals at genetic risk of dementia (as
determined by ApoE status) suggest a higher rate of olfactory dysfunction amongst
ApoE4 positive subjects (Salerno-Kennedy et al. 2005), while others suggest that a
positive family history, rather than ApoE4 positivity per se, is associated with olfactory
deficits (Schiffman et al. 2002; Handley et al. 2006). These studies did not, however,
involve families with autosomal dominant disease and/or proven PSEN or APP
mutations. Individuals at risk of developing PSEN1-associated FAD by virtue of a
proven PSEN1 mutation in their family have been studied, although olfactory tests did
not predict mutation status or AAO (Nee and Lippa 2001).
1. 7. Investigations
1. 7. 1. Neuropsychological & functional scales
Where cognitive impairment is suspected, formal neuropsychological assessment may be
valuable in assisting diagnosis. By adopting a standardized, systematic approach bias is
minimised and a profile of performance across a number of cognitive domains is

59
produced. This profile may then be compared with age-specific control data or, to some
extent, with the estimated ‘premorbid’ abilities of the individual concerned. It helps in
confirming that a deficit genuinely exists (or that it does not), and in assessing patients
longitudinally in order to demonstrate improvement (as with practice effects in normal
ageing), stability or deterioration – a hallmark of neurodegenerative dementias such as
AD. There are a large number of available tests, each designed to interrogate a particular
cognitive domain. However, at the heart of any such assessment is the Wechsler Adult
Intelligence Scale (Revised version) (WAIS-R) (Wechsler 1981) which provides a global
measure of intelligence as well as two important sub-scores: the performance and verbal
IQ.
Neuropsychological assessment may have a role in detecting and defining the effects of
any intervention, although clinically meaningful functional outcome measures remain the
ultimate test of efficacy. The limitations of this approach in evaluating therapeutic
strategies have been outlined earlier, including the observation that up to ten times fewer
patients are required to detect a treatment effect where MRI or 18FDG PET are used
rather than clinical end-points (Alexander et al 2002; Jack et al. 2003). In chapters 4 and 5,
neuropsychometry is used to provide detailed information on the nature of clinical
deficits in two APP mutation related forms of AD.
Composite scales are widely used and may be valuable in monitoring global change.
Perhaps the best recognised quantitative cognitive function scale is the Mini-Mental State
Examination (MMSE) (Folstein et al. 1975). This validated 30-point assessment can be
administered rapidly, providing information on a number of cognitive domains including
temporal and topographical orientation, language, verbal recall, calculation and attention.
A maximum score of 30 is to be anticipated in cognitively normal subjects and a score

60
below 26 is considered supportive of a dementing illness. A similar bedside test sensitive
to early cognitive dysfunction is the Addenbrookes Cognitive Examination (Revised
version) (ACE-R) (Mioshi et al. 2006; Larner 2007). This has been widely adopted as a
screening tool and, at least in the setting of a university hospital clinic, has been reported
to be both sensitive and specific for detecting dementia. Both the MMSE and ACE-R are
deployed in research and clinical settings, unlike the Cognitive Subscale of the
Alzheimer’s disease Assessment Scale (ADAS-Cog) (Rosen et al. 1984) which is used
predominantly in research. The latter scale ranges from 0 (no impairment) to 70 (severe
impairment) and, like the MMSE, provides information about a number of cognitive
domains.
The most accurate indicator of functional impairment is a decline in the ability to
perform activities of daily living (ADL). A number of assessment scales focus particularly
upon this aspect, producing scores which help to quantify disability. One such scale is the
Disability Assessment for Dementia (DAD) (Gauthier et al. 1997) which generates a
score between 0 and 100 via a structured informant interview. The questions relate to
basic self-care and ADL. Other scales provide a composite score by assessing both
cognitive and functional variables together. These include the AD Co-operative Study-
Clinical Global Impression of Change (ADCS-CGIC) (Schneider et al. 1997) and the
Clinical Dementia Rating (CDR) (Morris 1993). These scales necessarily combine
information from patients, informants and health professionals in generating scores.
1. 7. 2. Electroencephalography
In EEG, waveforms are described by their frequency, amplitude and location. " waves
(8-13Hz) are seen in conscious adults and attenuate with attention (stress, eye opening,
etc). They are normally slightly higher in amplitude on the non-dominant side and

61
present more posteriorly than anteriorly. " rhythm in the lower frequency range (8-
10.5Hz) is associated with an individual’s global attentiveness whereas, in the higher
frequency range, it reflects the oscillating activity of neural systems elaborating
sensorimotor and semantic information (Klimesch 1999).
Beta waves (>13Hz) are variably present in adults and may be enhanced by various
drugs. Theta (3.5-7.5Hz) and delta (<3Hz) waves are collectively termed ‘slow waves’ and
are normally seen during sleep. Both are abnormal in the conscious adult.
The hallmark changes of AD include slowing of rhythms (increased theta/delta and
decreased " /beta) (Brenner et al. 1986) and a reduction in interaction, or ‘coherence’,
between the neural networks of different brain regions (Hogan et al. 2003). These
changes have been shown to correlate with severity of disease (Kowalski et al. 2001) and,
in mixed groups of cognitively normal and affected AD subjects, EEG provides
significant additional value in predicting future cognitive performance as compared with
cognitive measures alone (van der Hiele et al. 2008).
1. 7. 3. Cerebrospinal fluid
The combination of decreased Aß1-42 and increased tau protein is a characteristic finding
in the CSF of individuals with AD (Verbeek et al. 2003; Lewczuk et al. 2004). Normal
ranges are yet to be conclusively established for these variables but an upper limit of 445
pg/mL for total tau (ttau) and lower limit of 427 pg/mL for Aß1-42 have been proposed,
giving a sensitivity of 86% and specificity of 88% for both as predictors of AD (Wallin et
al. 2006). This CSF profile predicts the presence of AD pathology (Tapiola et al. 2009),
may help distinguish AD from both normal controls (Verbeek et al 2003) and VaD (de
Jong et al. 2006), and identifies early AD in patients with MCI (Hansson et al. 2006). CSF

62
Aß1-42, ttau and phosphorylated tau (ptau) also correlate with MTL atrophy (Herukka et al.
2008).
It appears that Aß equilibrium is distorted, possibly via the inhibition of soluble Aß
transport between brain and CSF by insoluble plaques and/or increased clearance of Aß
into plaques. Binding levels of the PiB ligand (see 1. 7. 6. 1.) to cerebral Aß have been
reported to correlate inversely with CSF Aß1-42 levels (Fagan et al. 2006), although the
same study found no relationship between PiB binding levels and Aß1-40, ttau or ptau,
plasma Aß1-40 or plasma Aß1-42. F2 isoprostanes are markers of lipid peroxidation and are
therefore also markers of inflammation. Concentrations have been shown to be elevated
in the CSF of individuals with MCI or AD (Pratico et al. 2002) though not in FTLD
(Yao et al. 2003).
In a recent study of 21 presymptomatic carriers of PSEN1 and APP mutations a low
CSF Aß1-40: Aß1-42 ratio and high CSF ttau, ptau and F2 isoprostanes were found compared
with normal controls (Ringman et al 2008). In the same study concentrations of Aß1-42 in
the plasma were raised in the presymptomatic stage, falling with disease onset and
progression.
1. 7. 4. Magnetic resonance imaging
Structural imaging of the neuraxis is an important component of modern neurological
diagnosis. The ability to examine the brain’s structure in vivo represented a major advance
in the diagnosis of the dementias, beginning with the emergence of CT in the early 1970s.
The first MRI scan of the human body followed in 1977, and structural imaging now
constitutes an essential part of the investigation of dementia (Knopman et al. 2001). For
some time, imaging was used primarily to exclude disease amenable to surgery, such as

63
tumours, haematomata or hydrocephalus. This remains an important role, but MRI
sequences are now increasingly used to differentiate dementia syndromes from one
another and from normal ageing. MRI parameters are now amongst the most promising
biomarkers for early disease detection, tracking progression and assessing intervention.
Its greater tissue resolution and differentiation, the facility to manipulate the sequences
used in order to emphasise the desired pathology or structure, and the absence of
ionizing radiation mean that MRI is now considered superior to CT in most situations.
Challenges remain however: MRI is more expensive and hence less widely available and
acquisition times are longer, increasing the possibility of movement artefact.
1. 7. 4. 1. Volumetric MRI
Cross-sectional MRI has been applied to the study of AD in three major ways. These
comprise region of interest (ROI) analysis, examination of lobar structure and whole
brain analysis. ROI studies rely upon manual delineation of the region concerned on
consecutive slices of the scan, before a computer calculates the volume of the defined
area by counting the voxels within it. Selection of regions a priori is a potential weakness
of such analysis as it introduces bias, although this can be minimised through careful
ROI selection. Ideal regions exhibit little anatomical variability between normal
individuals, so differences between subject and control groups are more easily seen,
changes can be reliably attributed to pathology rather than normal variation, and the
region can be reliably delineated. Equally, it is helpful to have an idea of the magnitude of
the expected difference between groups - usually achieved through neuropathological
analyses. Some regions, such as the inferior temporal lobe, are particularly prone to
artefact when imaged and can therefore be more challenging to assess.
Neuropathological studies have indicated that MTL structures are amongst the earliest
areas affected by AD pathology (Braak and Braak 1991) and hence they have provided a
64
focus for cross-sectional structural study. This region is known to subserve episodic
memory, typically the earliest function to be affected in AD, providing a rational clinico-
pathological link.
Hippocampal measurements are the best-established structural biomarker in AD whether
made using time-intensive manual segmentation or automated techniques. NFT
accumulate early in the hippocampus, especially in the subiculum and cornu ammonis 1
(CA1) regions (Figure 5), inducing neuronal cell death and atrophy (Convit et al. 1993).
Hippocampal volume is reduced in MCI and AD compared with normal controls, and is
a highly discriminating variable (Xu et al. 2000; Du et al. 2001) which can predict later
development of AD in preclinical cases with an accuracy of approximately 80% (Wang et
al. 2006).
Figure 5: Coronal Hippocampal Anatomy
65
Ante-mortem hippocampal volumes also correlate well with pathological (Jack et al 2002;
Silbert et al. 2003), though probably not clinical (Ridha et al. 2008) severity. Frequent
overlap in hippocampal volumes between AD subjects and controls can be problematic
and debate over the relative merits of linear and visual rating scales compared with the
more time-consuming volumetry clouds the issue still further (Pucci et al. 1998; Laakso et
al. 1998; Wahlund et al. 2000; Scheltens et al. 2002). Improvements can be made by
combining hippocampal measures with clinical data (Devanand et al. 2008) or by
performing serial longitudinal imaging to establish rates of atrophy. The latter approach
has been applied to both whole brain (Schott et al 2005) and hippocampal volumes
(Barnes et al. 2008; Morra et al. 2009; Henneman et al. 2009). Regional fluid registration
combines both automation and a longitudinal approach, and is more reliable than manual
delineation in assessing hippocampal atrophy rates (van de Pol et al. 2007).
A key advantage of the hippocampus over the nearby parahippocampal gyrus (PHG) and
ERC is that it is less laborious to evaluate. This is due to the availability of automated
techniques (Colliot et al 2008) and the fact that these other structures are prone to
artefact and relatively difficult to segment due to indistinct boundaries. The ERC, which
contains major afferent pathways into the hippocampus, is nonetheless profoundly
affected in the earliest stages of AD (Price et al. 2001) and has been studied in similar
detail to the hippocampus. The two structures yield comparable levels of accuracy in
distinguishing AD from normal controls (Bobinski et al. 1999; Juottonen et al. 1999;
Toledo-Morrell et al. 2000; Pennanen et al. 2004). Other regions studied include the
amygdala (Scott et al. 1991) and limbic/paralimbic structures (Callen et al. 2001).

66
1. 7. 4. 2. Cortical thickness
The ability to calculate MRI-derived cerebral CTh accurately and reproducibly is a
relatively new development. Initial attempts to characterize cortical thinning in a number
of disease have demonstrated that it may be complementary to existing radiological tools,
and that it can provide meaningful statistical and clinical information in even small
groups (Lerch and Evans 2005). Grey matter changes, often with regional specificity, are
seen in normal ageing (Jack et al. 1997), MCI (Singh et al. 2006) and in a number of
diseases. These include SAD (Thompson et al. 2003; Lerch et al. 2005; Frisoni et al 2007),
FTLD (Gold et al. 2005), Huntington’s disease (Rosas et al. 2002; Rosas et al. 2005), CBS
(Boeve et al. 1999), MS (Sailer et al. 2003), amyotrophic lateral sclerosis (ALS) (Kiernan
and Hudson 1994), schizophrenia (Kwon et al. 1999) and congenital perisylvian
syndrome (Kotini et al. 2004). Automated CTh analysis shares many of the advantages of
techniques like voxel-based morphometry (VBM), in that there is no requirement for a
priori identification of regions of interest. However, unlike voxel density, a measurement
of CTh at a given point may in itself be meaningful. The key limitation of CTh mapping
is that no information is provided on sub-cortical structures.
Historically, the main difficulties in developing a robust, automated technique for
measuring CTh have been the accurate delineation of the pial surface and the elaborate
invagination of the neocortex. Dealing with these issues is technically demanding,
particularly with current MRI resolution and the requirement for sub-millimeter accuracy
(the human cortex varies in thickness between 1 and 4.5mm). The use of manual
techniques with slice data has significant, inherent problems in that thickness cannot be
reliably measured unless the cortical surface is orthogonal to the viewing plane. Further,
partial volume effects may hinder the distinction of closely adjacent surfaces, particularly
in deep sulci. Several techniques have been used in an attempt to address these two major

67
issues (Fischl and Dale 2000; MacDonald et al. 2000; Yezzi and Prince 2003). Fischl and
Dale’s technique is based upon a deformable model, and first seeks to define the
grey/white boundary with sub-voxel accuracy before deforming outwards to find the pial
surface. This produces two surfaces, each a net of 81,920 polygons, with each white
matter vertex related to a grey matter equivalent. CTh is then defined as the shortest
distance between these linked vertices. Sub-voxel accuracy is achieved through
interpolation, using information about the intensity of each voxel, the nature of
surrounding voxels (continuity information), and the ability to assume that the radius of
surface curvature and thickness of tissue to be measured exceed the size of the voxels
themselves. Sufficient contrast-to-noise must also exist between the different tissue
classes. Because, on a millimetre scale, the cortex is smooth, representations of it at this
scale should also be smooth. Many techniques exist for constraining a surface to be
smooth but, by their nature, these constraints work by seeking to minimize curvature.
This means that they have problems faithfully representing highly curved regions such as
the fundi of sulci or crowns of gyri, and will therefore inaccurately represent them. Fischl
and Dale’s technique addresses this by first computing the curvature at patches of the
brain surface and then altering the representation of that surface so that, on a millimetre
scale, it also has this curvature.
Studies in SAD have shown a clear reduction in both regional and mean CTh with the
PHG most affected (Lerch et al 2005). The extent and nature of clinical deficits seem to
correlate with CTh in defined areas (including the MTL, left anterior cingulate and left
insula) and with a well-defined sequence of grey matter loss from temporal and limbic
cortices to the frontal and posterior regions, sparing sensory and motor cortices. This
sequence mirrors the spread of amyloid plaques and NFT observed in post mortem
studies (Braak et al. 1999). To date, one study has examined the different CTh patterns

68
associated with early and late onset forms of AD (Frisoni et al 2007), with AAO the sole
criteria for defining the groups. Chapter 2 examines how CTh measurement can assist in
the detection of cortical changes at a very early presymptomatic stage and explores the
nature and distribution of such changes.
1. 7. 4. 3. 1H magnetic resonance spectroscopy
Analysis of the biochemical and metabolic properties of brain tissue producing
spectroscopic profiles of healthy and disease states is possible, and several metabolites
have proved to be of interest in AD. N-acetyl aspartate (NAA) is located in neurones and
may be a useful marker of neurone density and viability. Myoinositol (mI) is found
predominantly in glial cells and is therefore found at increased levels in gliosis (Bitsch et
al. 1999). Choline (Cho) is found mainly in membrane-bound phospholipids and creatine
(Cr), being relatively stable in AD (Schuff et al. 2002), is often used as an internal
reference.
Regional reduction in the NAA/mI ratio is seen in AD patients with the most prominent
change seen in the parietal lobe grey matter (Zhu et al. 2006). Grey and white matter loss
in AD seems to reflect known neuropathological patterns with lower NAA/Cr ratios in
the posterior cingulate gyri but a normal ratio in the occipital cortex (Kantarci et al. 2000).
MRS has been used to successfully predict cognitive decline in established AD (Kantarci
et al. 2007), to predict progression from aMCI to AD (Metastasio et al. 2006) and to
identify changes in the brains of APP and PSEN1 mutation carriers several years before
clinical onset (Godbolt et al. 2006). Normalization of NAA levels after treatment of AD
with cholinesterase inhibitors has been reported (Modrego et al. 2006).
69
1. 7. 4. 4. Magnetization transfer ratio
Magnetization transfer ratio (MTR) imaging exploits the exchange of magnetization
between two distinct groups of protons. The first pool (approximately 80%) consists of
protons in intracellular or extracellular water molecules. These are relatively freely
mobile, unlike the protons of the second pool that form part of macromolecules such as
proteins and lipids. The two groups are connected by a constant exchange of
magnetization such that a radiofrequency pulse (MT pulse) applied to the restricted pool
will affect the free pool (which can be seen with MRI). The nature and extent of this
exchange depends upon the restricted: free proton ratio, the strength of the RF pulse
and, importantly, the physical and chemical microenvironment of the protons concerned.
Deductions regarding the microstructure of the tissue in question can therefore be made.
The most widely used expression of MT characteristics is the MTR, where magnetization
of the free pool is compared with and without the application of an MT pulse.
Pathological processes disrupt microscopic brain architecture and hence alter (reduce)
the MTR. Such microstructural change in remaining brain tissue, as measured by MTR
may accompany macrostructural change (atrophy) in AD (Ridha et al. 2007) or may occur
in the absence of atrophy in MCI (van der Flier et al. 2002). AD-related focal MTR
changes have been noted both in the MTL (Bozzali et al. 2001) and outside the temporal
lobes (van der Flier et al 2002).
1. 7. 4. 5. Diffusion-weighted & diffusion-tensor imaging
Diffusion-weighted imaging (DWI) and DTI allow visualization of the Brownian
movement of water at a sub-voxel level. Physical boundaries, such as the axon sheath of
a white matter fibre, both constrain diffusion (reducing diffusivity on DWI) and
influence its direction such that it is greater along the axis of that boundary than across it.

70
This is known as anisotropy, measured as fractional anisotropy (FA), which ranges
between 0 and 1 on a normalized scale, and is used in DTI to show the groups of parallel
fibres which characterise white matter tracts. Regions with little or no boundaries, such
as CSF have relatively unrestrained diffusion and appear isotropic on these sequences.
DWI may be particularly useful in clinical practice where pathological processes such as
ischaemic stroke lead to the death of tissue and the disruption of cellular boundaries to
diffusion, providing a sensitive means of detecting such problems.
1. 7. 5. Positron-emission tomography
1. 7. 5. 1. 18Fluorodeoxyglucose PET
18F is the most widely used positron emitter, usually conjugated to form 18FDG, which
allows regional metabolism (expressed as cerebral metabolic rate for glucose (CMRglc) in
"mol glucose/100 g/min units) to be assessed. It is created by proton bombardment of
18O which produces 18F and a neutron. 18F has a radioactive T# of 110 minutes meaning
that, unlike 11C (see 1. 7. 6. 1.), 18F-labelled tracers can be centrally manufactured and
distributed, allowing more widespread use. Glucose is the main substrate used by the
brain in producing energy for the maintenance of crucial ionic gradients, and hence
neuronal function. The first step in glucose metabolism is phosphorylation by
hexokinase, to which the 18FDG tracer is also subject, forming the basis for its use in
assessing metabolic activity. In the normal brain CMRglc varies by region but is invariably
higher in grey matter than in white.
Symmetrical temporoparietal, posterior cingulate and precuneus hypometabolism with
later involvement of the frontal association cortices is the characteristic pattern described
where 18FDG PET is applied to AD (Minoshima et al. 1997; Herholz 2003) although,
where asymmetry exists, it tends to persist. The technique is able to separate AD from

71
controls with as much as 93% accuracy (Herholz et al. 2002a) and regional posterior
cingulate or hippocampal/entorhinal metabolism are of prognostic value in MCI
(Minoshima et al 1997; de Leon et al. 2001). Sparing of the primary sensorimotor and
visual cortices, basal ganglia and cerebellum is usual, reflecting the predominant clinical
deficits associated with AD. Interestingly, metabolic deficit in the posterior association
cortices can be difficult to assess as these areas have inherently higher resting metabolic
rates in the normal brain meaning that, even when affected, these areas can appear much
the same as the surrounding cortex may have decreased global CMRglc has been observed
in individuals at risk for FAD by virtue of a family history two to three years before the
mean AAO for their family (Kennedy et al 1995a). In these cases the pattern of
hypometabolism was the same as that seen in established disease.
1. 7. 6. Amyloid imaging
The earliest attempts at quantitative in vivo imaging of Aß were based around radio-
labelling staining agents such as congo red (Klunk et al. 1994). A key problem was the
inability of such bulky, ionized molecules to cross an intact BBB. Consequently, research
became more focussed upon identifying derivatives of these substances, which
maintained their affinity for fibrillar amyloid but could access the CNS. With time,
progressively less ionized compounds with greater metabolic stability, brain uptake and
clearance have been developed. Clinical trials in humans began with the use of 18F-
FDDNP (Shoghi-Jadid et al. 2002), a tracer which binds to both amyloid plaques and
NFT. PET studies have subsequently been performed with a number of 11C and 123I-
based compounds (Verhoeff et al. 2004; Opazo et al. 2006; Newberg et al. 2006). The first
human studies of 11C-PiB were also performed in 2002 and were reported in 2004 (Klunk
et al 2004).

72
1. 7. 6. 1. Pittsburgh compound B
PET using 11C-PiB represents the most successful attempt so far to visualize amyloid
plaques in vivo. 11C-PiB is a thioflavin-based radio-ligand that shows good blood-brain
barrier permeability and binds with high affinity to both fibrillar and vascular amyloid
(Lockhart et al. 2005; Johnson et al. 2007; Lockhart et al. 2007), more weakly to NFT, but
not to soluble amyloid. High affinity binding sites do exist on " -synuclein filaments
present in Lewy bodies, although the density/availability of these sites in vivo is
significantly less than those associated with fibrillar amyloid and so Lewy body pathology
probably contributes very little to the retention of 11C-PiB (Ye et al. 2008).
11C-PiB PET discriminates clinically probable AD patients from healthy controls, with
AD cases showing two-fold greater retention in cingulate and neocortical association
areas known to be targeted by amyloid deposition (Klunk et al 2004). 11C-PiB retention
correlates with rates of cerebral atrophy in AD (Archer et al. 2006), with decreased levels
of Aß1-42 in the CSF of demented and non-demented subjects (Fagan et al 2006), with
post-mortem measurement of insoluble Aß levels (Ikonomovic et al. 2008) and inversely
with rates of resting cortical glucose metabolism (Klunk et al 2004). The combination of
11C-PiB PET and MRI seems to confer superior diagnostic accuracy to either modality
alone (Jack et al. 2008) and retention is not influenced by anticholinesterase medication.
Although 11C-PiB PET localises the distribution and density of Aß plaques, these
correlate inconsistently with the degree of functional or cognitive impairment
(Giannakopoulos et al 2003). It seems more likely that the density and distribution of
soluble, neurotoxic Aß oligomers are more relevant to neuronal dysfunction (Lesne et al
2006), but these are not detected by thioflavin based radio-ligands such as 11C-PiB
(Naslund et al. 2000).

73
11C-PiB retention is elevated in as many as 40% of cognitively normal elderly controls
(Mintun et al 2006; Rowe et al. 2007; Gomperts et al. 2008), in keeping with the 30% of
healthy people over 75 years of age with cerebral Aß deposition at post-mortem (Price
and Morris 1999). This suggests either that 11C-PiB imaging is sensitive for detection of
preclinical AD, or that some individuals may tolerate an amyloid burden without
developing symptoms. Longitudinal study in large cohorts will be necessary to resolve
this question. However, for now it seems most likely that such amyloid deposition is not
a consequence of normal ageing, but rather that it represents preclinical AD (Villemagne
et al. 2008).
11C-PiB retention is increased in around 50% of MCI patients (Kemppainen et al. 2007)
and these cases progress most rapidly to AD (Forsberg et al. 2008; Villemagne et al 2008)
suggesting the potential for a prognostic/predictive role. Positive 11C-PiB scans in MCI
resemble those of established AD and negative scans resemble normal controls
(Kemppainen et al 2007).
The 11C of 11C-PiB is produced by proton bombardment of standard nitrogen (14N). The
unstable 11C undergoes both beta-plus decay (with positron emission) (99.77%) and
electron capture (0.23%) to become the more stable boron isotope 11B. Half-life (T#) is
20.38 minutes. Unfortunately 11C’s 20 minute radioactive T#, means that its use is
restricted to sites with 11C radiochemistry expertise and cyclotron facilities. It cannot be
centrally produced and regionally distributed like 18F ligands and so is too expensive for
routine clinical use.

74
1. 7. 6. 2. 18F BAY94-9172
18F-labelled amyloid tracers are an attractive prospect due to the practical benefits of 18F
over 11C mentioned above but to date they have only demonstrated 9% greater uptake in
AD than healthy controls (Small et al. 2006). This does not compare favourably to 11C-
PiB, which has shown up to 70% greater cortical binding in AD (Rowe et al 2007).
Furthermore, the use of 11C-PiB-based compounds requires far less scanning time. There
is, therefore, a well-established need for an 18F tracer with binding characteristics similar
to those of 11C-PiB. 18F-BAY94-9172 or trans-4- (N-methyl-amino)-4’-{2-[2-(2-[18F]
fluoro-ethoxy)- ethoxy]-ethoxy}-stilbene (also known as 18F-AV1/ZK) is structurally
similar to PiB and competes for the same amyloid binding with similar affinity (Zhang et
al. 2005). There is evidence to suggest that neocortical binding of 18F-BAY94-9172 is
similar to that of 11C-PiB and that it is 57% greater than in normal controls (Rowe et al.
2008). This compares favourably with 11C-PiB without the half-life related disadvantages
discussed above.
1. 7. 7. Single photon emission computed tomography
SPECT has historically been the most widely available functional brain imaging modality.
The principles are similar to those of 18FDG PET, except that a !-emitting
radiopharmaceutical and a !-camera are employed. The most commonly used !-emitting
tracer for functional SPECT brain imaging is 99mTc-HMPAO (hexamethylpropylene
amine oxime) which is taken up by brain tissue in a manner proportional to cerebral
blood flow. The close link between blood flow and regional metabolism makes 99mTc-
HMPAO a good marker for the latter, although this link may be lost in cerebrovascular
disorders, and vessel calibre/blood flow is heavily dependent upon pCO2, making it
more variable than regional glucose metabolism. Like 18FDG PET and spin-labelled MRI
techniques, SPECT studies have implicated temporo-parietal regions in AD (Johnson et

75
al. 2004; Pakrasi and O'Brien 2005). The evidence suggests that, in some respects, 18FDG
PET may be worth any extra inconvenience as it is probably superior to SPECT as a
diagnostic test in AD (Herholz et al. 2002b). Nonetheless, accuracy of SPECT in AD
diagnosis may be as high as 88% (Bonte et al. 2006) and meta-analysis suggests that it is
superior to clinical criteria in its ability to differentiate AD from VaD, although inferior
in distinguishing AD from healthy controls (Dougall et al. 2004). This is perhaps
unsurprising if we consider that metabolic deficits are by nature more discrete in vascular
disease than AD and hence more amenable to detection using regional metabolic
imaging. In studies with clinico-pathological correlation, SPECT appears to be most
useful when there is greatest clinical uncertainty, adding least where the clinical diagnosis
is clear and most where is not (Jagust et al. 2001).
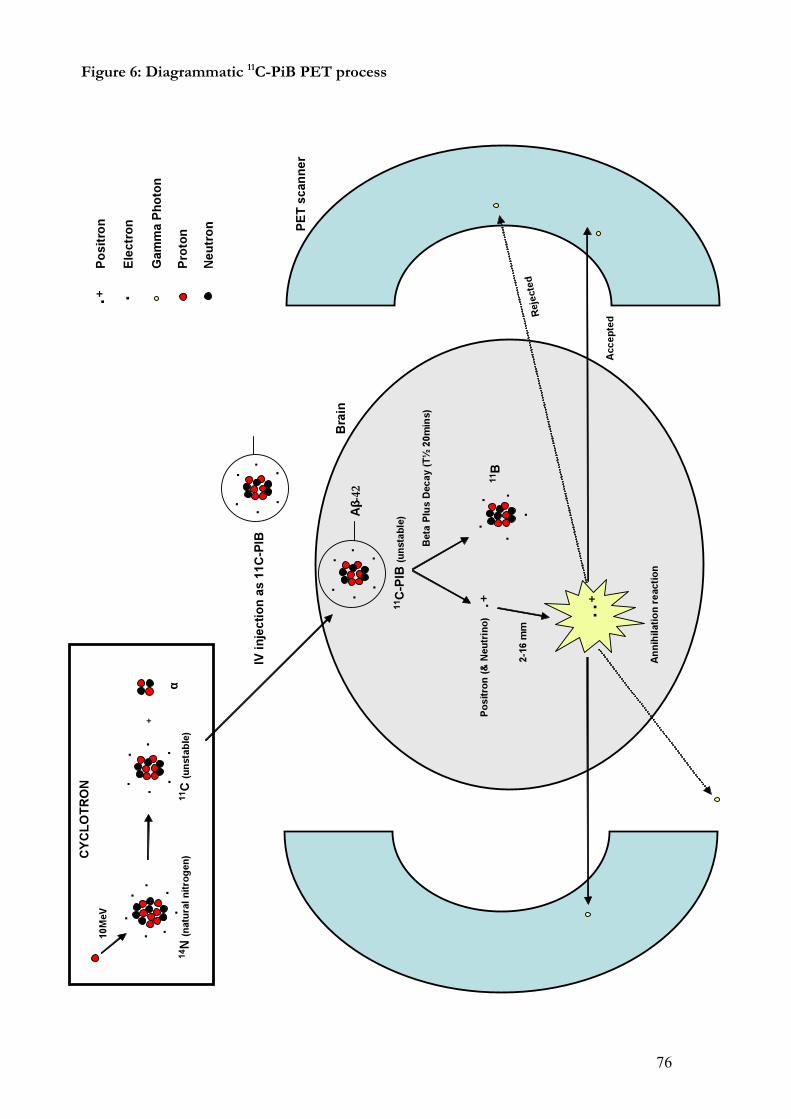
76
Figure 6: Diagrammatic 11C-PiB PET process

77
1. 8. Alzheimer’s disease therapy
A number of strategies exist for the treatment of AD, each addressing a distinct phase of
the pathological process. Many are still in the very early stages of research and a truly
disease-modifying agent remains elusive. In theory, it should be possible to intervene at
various stages of the amyloid cascade:
1. 8. 1. Decreasing Aß production
This requires intervention at a relatively early stage of the amyloid cascade. Since the
amyloidogenic pathway requires the action of ß-secretase (BACE-1) and !-secretase, both
are attractive targets for novel therapies. BACE-1 inhibitors are particularly promising as
BACE-knockout mice are apparently otherwise healthy, show no detectable ß-secretase
activity, and produce much less Aß from APP in primary cortical cultures (Roberds et al.
2001). Potent inhibitors have been developed which are effective in vitro and in transgenic
mouse models (Rockenstein et al. 2001) and early data in humans are beginning to emerge
(http://www.alzforum.org/new/detail.asp?id=1790). Just as BACE-1 may be up-
regulated by inflammation, it may be down-regulated by NSAIDs via the stimulation of
peroxisome proliferated activated receptor-! (PPAR-!). Treatment with specific PPAR-!
agonists (rosiglitazone) has previously been associated with significant cognitive
improvement in AD albeit only in ApoE4 negative individuals (Risner et al. 2006). Oral
administration of the GSK188909 BACE-1 inhibitor leads to significant reduction in
levels of Aß in the mouse brain (Hussain et al. 2007).
Inhibition of !-secretase is more problematic as the enzyme is responsible for cleaving a
number of other important proteins, such as the notch-1 protein, which has an important
role in normal growth. Despite this, there are currently several !-secretase inhibitors,
some ‘notch-sparing’, in phase II trials. A related strategy is to exploit the variability of

78
the !-secretase cleavage site in an attempt to increase the Aß1-40: Aß1-42 ratio. This ensures
that the shorter, more soluble, less toxic Aß species predominate. Agents capable of such
modulation are termed ‘Selective ß-Amyloid Lowering Agents’ or SALAs. They include
NSAIDs (Weggen et al. 2001) and Flurizan, a compound which reached phase III trials in
mild AD before it failed to achieve significant benefits in primary endpoints, prompting
recent discontinuation of its development.
As the action of " -secretase precludes the production of Aß, its potentiation is a further
theoretical option. This is achievable, for example, by stimulating muscarinic M1
receptors. The M1 agonist talsaclidine can affect CSF Aß1-42 (Hock et al. 2003), although
there are presently no clinical data to support the use of such agents.
1. 8. 2. Facilitating Aß clearance
Once the Aß has been allowed to form, an alternative approach is to enhance its
clearance and thus limit its toxicity. This is most effective if it is cleared prior to
oligomerization and may, in theory, be achieved by several means. Immunotherapy is a
promising and popular area and can facilitate the removal of Aß via a selection of
mechanisms. These include opsonization and Fc-dependent phagocytosis, direct
antibody-mediated dissolution and sequestration of amyloid in the plasma such that a
gradient is established which favours movement of amyloid out of the CNS. Chronic,
low level activation of innate immunity has been demonstrated in AD (Akiyama et al.
2000) , although microglia do not seem to effectively clear Aß deposits (Wisniewski et al.
1989). One recently tested strategy is the manipulation of cytokine signalling in peripheral
macrophages in an attempt to promote cerebral Aß clearance. Blockade of TGF-ß1, for
example, appears to attenuate parenchymal and vascular Aß (Town et al. 2008).

79
In 1999, Schenk et al. used transgenic platelet-derived growth factor promoter-expressing
APP (PDAPP) mice which over-expressed human mutant APP to investigate active
immunisation. These mice exhibit, in an age and brain region-dependent fashion, amyloid
lesions (though not tau pathology) similar to that seen in human AD (Games et al. 1995).
In younger mice, immunization with human Aß1-42 resulted in reduced plaque formation,
neuritic dystrophy and gliosis while in older mice there was a reduction in the
progression of the same. Clinical improvement was later demonstrated in a similar
experiment using a standard radial arm water maze with submerged platform (Morgan et
al. 2000). The first trial of passive immunotherapy in mice demonstrated that peripherally
administered immunoglobulin entered the CNS, decorated plaques and induced microglia
to clear plaque Aß via FcR-mediated phagocytosis and peptide degradation (Bard et al
2000). Synthetic Aß1-42 (AN1792) with an adjuvant T-helper (QS-21) was developed for
human trials which entered phase II in October 2001 (Gilman et al 2005). Of the 372 AD
patients randomized, 298 received AN1792. Two primary efficacy endpoints were
identified relating to the whole brain volume as measured by longitudinal MRI and
cognition as measured by the ADAS-cog. Only those who mounted an antibody
response to vaccination (serum titre >1: 2200) were evaluated. Unfortunately, 18 cases of
meningoencephalitis (Orgogozo et al. 2003) forced the trial to end prematurely. Blinding
was maintained along with the safety and tolerability assessments for the ensuing nine
months. Studies using peripheral blood mononuclear cells from AN1792-exposed
patients suggest that AN1792 can induce a class II MHC restricted Th1 type response
against itself. This, in combination with the neuropathological findings, suggests that an
aberrant T-cell response may have been responsible for the encephalitis observed. The
key efficacy signals from the AN1792 study were that antibodies selective for Aß cross
the BBB, that they are specific for the N-terminus of Aß and that a number of signals are
associated with an elevated titre. These signals included a significant reduction in brain
80
volume (Fox et al 2005), memory improvement at 12 months, less decline in executive
function at 12 months, clearance of Aß, lower CSF tau levels and improvement in
activities of daily living at 18 months. Post-mortem data indicated that neuropathological
findings were similar to those of the mice with focal depletion of Aß, persistent NFT and
immunoreactive macrophages showing aggregates of Aß. Encephalitis correlated with
numerous T-cell infiltrates and white matter change.
Passive, as opposed to active, immunotherapy has several potential advantages. It
bypasses the need for the recipient (who is usually elderly) to mount an antibody
response to the vaccine, has shown similar amyloid removal benefits in animal models
(Bard et al 2000) and allows antibody levels to be controlled by changing the dose and
frequency of administration. Also, it theoretically removes the risk of inducing the
aberrant T-cell response thought to be responsible for encephalitis. This strategy may,
however, have its own problems: cerebral haemorrhage has been linked with passive anti-
Aß therapy as clearance of Aß from vessels may damage their integrity (Pfeifer et al.
2002). A humanized monoclonal antibody has been tested in a phase II multiple
ascending dose study in mild to moderate AD (Grundman and Black 2008), and a phase
III trial is underway. PiB PET imaging techniques have been used to assess the success
of this approach (see chapter 3). IVIG, IFN-" and TNF-" blockade with etanercept are
currently in phase I trials (Dodel et al. 2004; Tobinick 2006; Yamamoto et al. 2007).
There are no clinical data concerning enzymatic degradation of Aß using
metalloproteases such as NEP, IDE and ECE, although preclinical experience is
promising. NEP knockout mice have elevated Aß levels (Hellstrom-Lindahl et al. 2008)
and Aß levels may be reduced in vitro by IDE, ECE and angiotensin converting enzyme
(ACE) (Eckman et al. 2006).

81
It may be possible to regulate the passage of Aß across the BBB in either direction by
targeting the receptors responsible for trafficking. Two main receptors are implicated:
RAGE and LRP-1. The former principally transports Aß into the brain from the
systemic circulation and the latter mediates its exit from the brain. The ratio of activity of
these receptors is therefore highly relevant and is raised in the AD brain. No clinical trials
addressing this strategy have been performed although statins (HMG-CoA reductase
inhibitors) are known to up-regulate LRP-1 (Deane et al 2004).
1. 8. 3. Preventing Aß aggregation
Inhibition of Aß aggregation into toxic oligomeric species is a further potential strategy.
Aß has binding sites for both zinc and copper and both have a role in its aggregation.
Early studies of agents such as cloquinol, which chelate metal ions, have shown promise
(Ritchie et al. 2003). However, the only aggregation inhibitor to reach phase III trials is
the synthetic glycosaminoglycan 3-amino-1-propaneosulfonic acid (3APS, tramiprosate
or ‘Alzhemed’) (Geerts 2004), an agent which interferes with the binding of Aß to
glycosaminoglycans, a necessary stage in the assembly of oligomers and fibrils. These
trials were recently discontinued due to disappointing results.
1. 8. 4. Neurotransmitter manipulation
Donepezil, galantamine and rivastigmine are currently licensed in the UK for the
management of moderately severe AD (NICE 2007). They belong to a group of drugs
that degrade acetylcholinesterase (AChE), the enzyme responsible for hydrolysing ACh.
The earliest such drugs were physostigmine and tacrine, which proved impractical for use
in AD due to poor penetration of the BBB and hepatotoxicity respectively. Amongst the
newer agents, randomized, double-blind, placebo-controlled trials have demonstrated
roughly equivalent efficacy in producing small but statistically significant improvements

82
in global function and cognition in mild to moderately severe AD (Birks 2006). There are
few direct comparisons however, and no strong evidence of important differences
between them: only one randomized, double blind study has compared two such agents
directly (Bullock et al. 2005). This showed no differences at two years for measures of
cognitive function and behavioural disturbance although donepezil was associated with
fewer adverse events. Indeed donepezil remains the most widely prescribed drug for AD,
at a maximum licensed dose of 10mg OD. Mild gastrointestinal side effects are common
with all AChE inhibitors, though they may attenuate with time and/or careful titration.
Galantamine was originally extracted from the snowdrop (Galanthus nivalis) although is
now procured from the more abundant daffodil (Narcissus pseudonarcissus). It has a dual
mechanism of action both enhancing the effect of ACh upon nicotinic receptors and
reversibly inhibiting AChE.
Rivastigmine is a reversible inhibitor of AChE and butyrylcholinesterase (BuChE) (unlike
donepezil and galantamine which show no functional inhibition of the latter). In
addition it displays a ten-fold greater affinity for brain AChE than for peripheral AChE.
It has been suggested that such dual inhibition may confer more sustained efficacy, or
even modify disease (Bullock 2002). The first transdermal AD treatment has recently
been developed in the form of a rivastigmine patch (Lefevre et al. 2008).
Introduced in 2002, memantine is an antagonist at the N-methyl-D-aspartate (NMDA)
receptor for glutamate and is thought to exert a beneficial effect in AD by ameliorating
excitotoxicity. Benefits in functional and global outcome measures were established in
moderate to severe AD some years ago (Reisberg et al. 2003) and it remains the only drug
licensed for severe dementia in the UK. However, evidence for statistically significant

83
improvement in ADAS-cog and CIBIC-plus scores in mild to moderate disease also now
exists (Bakchine and Loft 2008). Memantine may provide additional positive effects
when combined with donepezil (Tariot et al. 2004).
Dimebolin Hydrochloride (Dimebon), originally developed as a non-selective
antihistamine, is a weak inhibitor of BuChE and AChE, and a blocker of the NMDA
receptor (Bachurin et al. 2001). A neuroprotective capability has also been suggested
(Lermontova et al. 2001). A recent randomised, placebo-controlled study showed a
significant benefit as measured by ADAS-cog (Doody et al. 2008). A mean difference of 4
points was seen at 26 weeks while differences ranging from 1.5 points to 3.9 points have
been found in randomised clinical trials of AChE inhibitors (Kaduszkiewicz et al. 2005).
84
2.
THE FAD PARADIGM
I: Structural neuroimaging
Chapters 2 and 3 contain studies which apply the FAD paradigm to study early disease
features, circumventing problems inherent in the study of SAD. They help to further
characterize radiological phenotypes associated with FAD, SAD and normal ageing,
while assessing the potential of two relatively new imaging techniques as biomarkers of
onset, progression and intervention. The first such biomarker is CTh, a potentially more
reliable marker than volume as the cytoarchitectural structure of the grey matter is less
variable (Pakkenberg and Gundersen 1997; Singh et al 2006). Changes in the cortex are a
well established consequence of AD pathology with layer II of the ERC and layer III of
the neocortex preferentially affected (Pearson et al. 1985; Gomez-Isla et al 1996).
Furthermore, fully automated cortical surface reconstruction is now possible, providing
detailed information on the thickness of the cortical ribbon. This technique is
complementary to existing radiological tools, and may provide meaningful statistical and
clinical information even in small groups (Lerch and Evans 2005) (see 1. 7. 4. 2.).
Regional CTh measures in established AD, including that of the MTL, left anterior
cingulate, frontal and parietal lobes, correlates well with the severity and nature of clinical
deficits (Thompson et al 2003; Du et al. 2007; Dickerson et al. 2009) and its measurement
continues to show promise as a clinical and research tool (Lerch et al. 2008). However,
the potential of CTh as a biomarker in confirmed FAD mutation carriers has not yet
been fully defined. The objective of this study was to examine longitudinal patterns of
CTh in a cohort of initially pre-symptomatic FAD mutation carriers (MC) in a period
which included symptom onset and clinical diagnosis of AD.
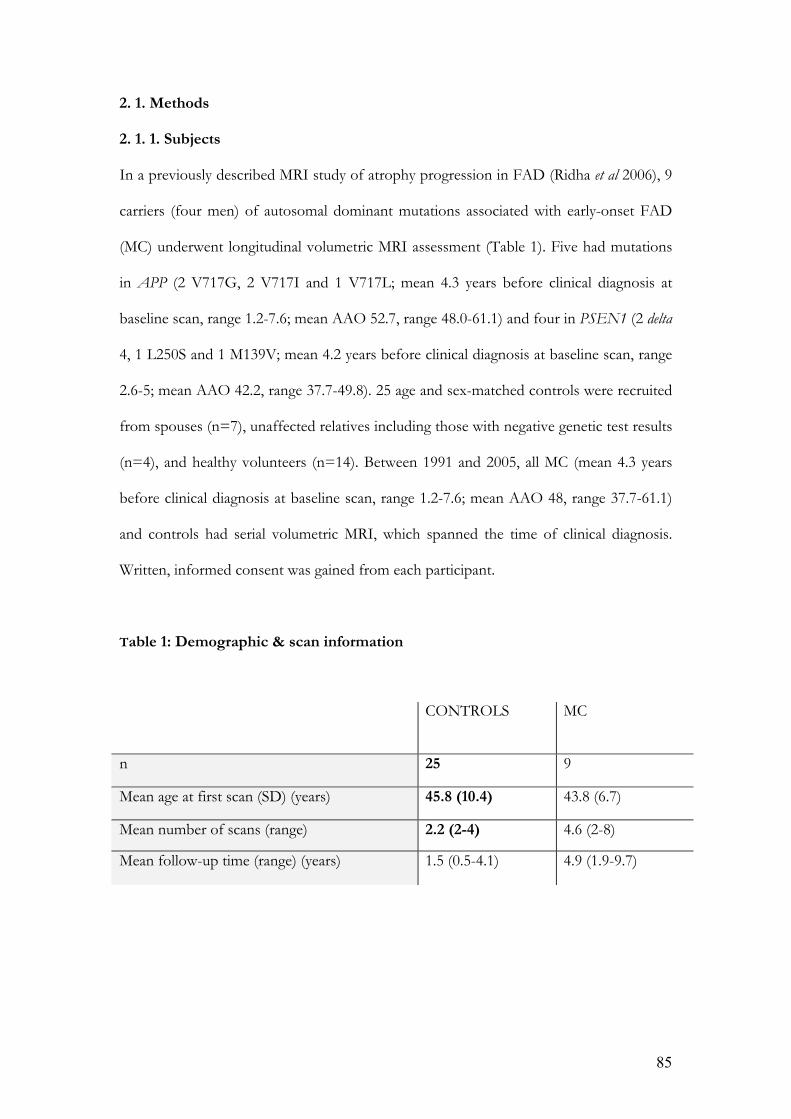
85
2. 1. Methods
2. 1. 1. Subjects
In a previously described MRI study of atrophy progression in FAD (Ridha et al 2006), 9
carriers (four men) of autosomal dominant mutations associated with early-onset FAD
(MC) underwent longitudinal volumetric MRI assessment (Table 1). Five had mutations
in APP (2 V717G, 2 V717I and 1 V717L; mean 4.3 years before clinical diagnosis at
baseline scan, range 1.2-7.6; mean AAO 52.7, range 48.0-61.1) and four in PSEN1 (2 delta
4, 1 L250S and 1 M139V; mean 4.2 years before clinical diagnosis at baseline scan, range
2.6-5; mean AAO 42.2, range 37.7-49.8). 25 age and sex-matched controls were recruited
from spouses (n=7), unaffected relatives including those with negative genetic test results
(n=4), and healthy volunteers (n=14). Between 1991 and 2005, all MC (mean 4.3 years
before clinical diagnosis at baseline scan, range 1.2-7.6; mean AAO 48, range 37.7-61.1)
and controls had serial volumetric MRI, which spanned the time of clinical diagnosis.
Written, informed consent was gained from each participant.
Table 1: Demographic & scan information
CONTROLS MC
n 25 9
Mean age at first scan (SD) (years) 45.8 (10.4) 43.8 (6.7)
Mean number of scans (range) 2.2 (2-4) 4.6 (2-8)
Mean follow-up time (range) (years) 1.5 (0.5-4.1) 4.9 (1.9-9.7)

86
2. 1. 2. Image acquisition
Baseline scans were performed between 1991 and 2001. Imaging between 1991 and 2000
was performed using a 1.5T GE Signa scanner (General Electric Medical Systems,
Waukesha, WI, USA). Volumetric T1-weighted coronal MRI scans were obtained with a
spoiled gradient echo technique (256$128 matrix, field of view 24$24 cm,
TR/TE/NEX/FA=35 ms/5 ms/1/35°) yielding 124 contiguous 1.5 mm thick slices.
Between 2000 and 2005 imaging was performed using a different 1.5T GE Signa scanner
running software version 5.8 (General Electric Medical Systems, Waukesha, WI, USA).
Volumetric T1-weighted coronal MRI scans were obtained using an inversion recovery
prepared fast spoiled gradient-echo technique (256$256 matrix, field of view 24$18 cm,
TR/TE/TI/NEX/FA=14 ms/5%4 ms/650 ms/1/15°) yielding 124 contiguous 1%5 mm
thick slices.
Detailed cortical surface construction and thickness estimation was achieved by applying
Freesurfer software (http://surfer.nmr.mgh.harvard.edu/) to the resulting images, a
technique previously described and validated (Dale et al. 1999; Fischl et al. 1999; Fischl
and Dale 2000). This was performed on a 64-bit Linux CentOS 4 Cluster managed by a
Sun Grid Engine. Briefly, the process involves initially generating an automatic grey
matter, white matter and CSF classification. The results of these segmentations were
visually inspected, and if needed, manually edited by adding control points. Finally, an
automatic reconstruction of the cortex was produced and CTh estimated by computing
the average shortest distance between the white matter boundary and the pial surface.
The standard Freesurfer processing stream was used apart from one modification: we
used locally-generated brain masks for the skull-stripping process. This brain mask was
produced using a semi-automated segmentation procedure that involved selection of

87
thresholds, followed by a series of erosions and dilations, yielding a brain region
separated from surrounding CSF, skull and dura.
2. 2. Cortical thinning in FAD: a cross-sectional study
2. 2. 1. Methods
In this study, baseline scans from PMC (mean 4.3 years before symptom onset, range
1.2-7.6) and controls were compared. Further comparison was made between the
baseline scans of APP (mean 4.3 years before symptom onset, range 1.2-7.6) and PSEN1
(mean 4.2 years before symptom onset, range 2.6-5) mutation carriers using two
approaches:
- Surface maps of all groups were generated following registration of cortical
reconstructions to a common average surface and then smoothed using a surface-based
Gaussian kernel of 20mm full width half-maximum. A vertex-by-vertex analysis using a
general linear model was performed to examine differences in CTh between the patient
group and the control group. CTh, C, was modelled as a function of group, controlling
for age, sex and the scanner used by including them as nuisance covariates. C=ß1 FAD
+ ß2 controls + ß3 age + ß4 sex + ß5 scanner + " + # (where " is a constant, and # is
error) with the contrasts of interest being the two-tailed t-test between the estimates of
the group parameters, i.e. ß1 and ß2. Thresholding the images of t-statistics at a 0.05
significance level generated maps of the differences between groups at this level of
significance. We repeated these analyses after sub-stratifying for mutation.
- Regions of interest generated during the Freesurfer processing stream were combined
to give mean thickness values for the frontal, temporal and parietal lobes as well as the
cingulate cortex in both hemispheres in each patient, and previously reported total

88
hippocampal volumes from the same cohort (Ridha et al 2006) retrieved for comparison.
Differences by patient group were investigated using regression analyses adjusted for age,
sex and scanner. Robust standard errors were used to address any differences in variance
between the patient groups. Mean hippocampal volumes were also compared using this
method.
2. 2. 2. Results
CTh maps (Figure 7) revealed distinct anatomical patterns of cortical thinning in the
FAD group and in each mutation subgroup. Figure 7a shows the distribution of
statistically significant (p<0.05), uncorrected differences between the FAD and control
groups. Compared with the healthy control group, the most prominent grey matter loss
in the FAD group as a whole was seen in the inferomedial temporal lobe, precuneus,
posterior cingulate, posterior superior temporal sulcus, parieto-occipital junction and
orbitofrontal cortex in both hemispheres. Figure 7b shows the distribution of statistically
significant (p<0.05), uncorrected differences between the APP and PSEN1 mutation
subgroups. The APP carriers had significantly thinner cortices than PSEN1 carriers in
the middle temporal, inferior temporal and parahippocampal gyri as well as the
precuneus. No changes survived statistical correction for multiple comparisons.
Comparison of group CTh means by lobe, as well as total hippocampal volume (Table 2)
broadly corroborated the patterns of change on CTh maps. The FAD group and APP
subgroup had lower mean thickness than controls in frontal, temporal and parietal lobes,
and in the cingulate gyrus, as well as lower mean total hippocampal volumes. Mean CTh
in the APP group was lower than the PSEN1 group across all regions examined, with the
most prominent CTh differences seen in the temporal lobes. The APP subgroup was
largely responsible for the differences observed between FAD and control groups,

89
despite the small (0.1 years) difference in the mean time before symptom onset between
the subgroups. Mean hippocampal volumes were lower in the FAD, APP and PSEN1
groups than in controls, and mean total hippocampal volume was lower in the APP than
the PSEN1 group.

90
Figure 7: Surface maps of CTh

91
2. 2. 3. Discussion
Using a fully automated method, we measured CTh across the entire brain in order to
investigate cross-sectional differences between presymptomatic FAD mutation carriers
and age- and sex-matched controls. The CTh profiles of carriers of the two most
common FAD gene mutations were also examined individually.
Cross-sectional comparison demonstrated differences between mutation carriers and
controls occurring several years before symptom onset and, although they did not
survive statistical correction for multiple comparisons, our findings are in keeping with
previous volumetric data in the same groups (Ridha et al 2006) and implicate regions
which are thought to be significant in early AD. There is much imaging and pathological
evidence that these regions comprise the limbic and heteromodal association cortices
(Minoshima et al 1997; Juottonen et al 1999; Xu et al 2000; Lerch et al 2005; Mosconi et al.
2006; Dickerson et al 2009).
In addition, VBM and CTh analyses, including a recent study of MCI patients destined to
progress to AD (Bakkour A et al. 2008), have confirmed that very early changes occur in
the medial temporal cortex, inferior temporal gyrus, superior parietal lobule, temporal
pole and precuneus with lateral temporal lobe and other areas of the neocortex affected
later (Chetelat et al. 2002; Singh et al 2006; Bakkour A et al 2008). Many of these regions
are highlighted as significant in Figure 7. A well-defined sequence of cortical thinning is
recognized thereafter, progressing from temporal and limbic cortices to the frontal and
posterior regions, sparing sensory and motor cortices. This spreading wave of grey matter
loss mirrors the spread of amyloid and tau pathology observed in post mortem studies
(Braak and Braak 1991; Braak and Braak 1996a). Such reports of early, significant change
in the MTL and retrosplenial cortex are also in keeping with our findings. Further, our
results are broadly consistent with observations made in established, late-onset SAD, in

92
which reduction of both regional and mean CTh has been documented with the PHG
and cingulate of particular importance in discriminating SAD from healthy controls
(Lerch et al 2005; Lerch et al 2008). Similarly, we found particular differences in the left
cingulate gyrus when comparing the PSEN1 group with controls. As mentioned earlier,
EOAD and FAD are not equivalent but FAD does form part of a broader group of early
onset disease. Previous contrasting descriptions of the cortical profiles of early and late
onset disease (Frisoni et al 2007) help to further establish historical context for our
results. In one study, patients were stratified by age of onset (before or after 65 years)
rather than genetic status and were symptomatic at the time of analysis. None of the
EOAD subjects had a history suggestive of autosomal dominant disease and groups were
matched for clinical severity. Statistically significant grey matter loss was confined to the
temporoparietal and retrosplenial cortices in LOAD, but was more widespread in
EOAD. The cortical signature of symptomatic LOAD therefore has similarities with the
pattern we have described in the presymptomatic FAD group. This may reflect more
aggressive pathological change in the early-onset sporadic forms of the disease, greater
functional cognitive reserve amongst EOAD subjects, or genuine differences in the onset
of ‘biological’ (i.e. pathological) change.
Cortical thinning in the frontal lobe, albeit in the dorsolateral rather than orbitofrontal
cortex, has been noted previously in symptomatic AD (Du et al 2007) though not, as we
found, in pre-symptomatic individuals destined to develop clinical disease. Also, primate
studies have previously confirmed close links between the hippocampal formation and
the orbitofrontal cortex (Barbas and Blatt 1995). The distribution of cortical changes we
have identified can be understood in terms of distributed but functionally connected
cortical networks: a limbic/para-limbic network comprising the mesial temporal
structures and their projections, and an overlapping but distinct posterior temporo-

93
parietal-prefrontal network. While this study does not address the issue of phenotypic
correlation, preferential involvement of these cortical networks might be predicted to
give rise to altered emotional and attentional processing, respectively, as early features in
FAD mutation carriers. Such functions are not well captured by conventional
neuropsychometric techniques, but do suggest a direction for future work.
In this study, cross-sectional differences in CTh between FAD and control groups were
driven largely by the APP rather than the PSEN1 carriers, as far more extensive
differences were noted in the former group. Furthermore, the APP group had more
cortical thinning than the PSEN1 group and hippocampal volume measurements, which
have previously been shown to separate presymptomatic FAD from controls (Ridha et al
2006), were smaller in the APP than in the PSEN1 group. The largest absolute CTh
differences were seen in the temporal lobes, although statistical significance at the 0.05
level selected was not demonstrated, possibly due to insufficient power associated with
small group sizes. These differences between the mutation subgroups were not
attributable to any discrepancy of interval from scanning to symptom onset between the
groups. In light of the substantially younger mean AAO of the PSEN1 compared with
the APP cases, it is possible that APP mutations produce earlier pathological changes
that subsequently progress more slowly, although larger groups would be required to
confirm that the groups genuinely have different imaging profiles at equivalent stages.
There are currently no data directly comparing the imaging characteristics of APP and
PSEN1 carriers at equivalent biological disease stage.

94
Table 2: Differences in Group CTh Means by Lobe (mm)
GROUPSCOMPARED
LOBE
(FAD) – (CONTROLS)
(95% CI)
(APP) – (CONTROLS)
(95% CI)
(PSEN1) – (CONTROLS)
(95% CI)
(APP) – (PSEN1)
(95% CI)
LEFT -0.02(-0.143, 0.11) p=0.8 -0.04(-0.23, 0.15) p=0.7 0.02(-0.13, 0.18) p=0.8 -0.06(-0.28, 0.17) p=0.6
FRONTAL
RIGHT -0.04(-0.16, 0.08) p=0.5 -0.06(-0.25, 0.14) p=0.5 -0.01(-0.12, 0.10) p=0.8 -0.04(-0.26, 0.17) p=0.7
LEFT -0.07(-0.19, 0.06) p=0.3 -0.13(-0.31, 0.05) p=0.1 0.02(-0.10, 0.14) p=0.7 -0.15(-0.36, 0.06) p=0.1
TEMPORAL
RIGHT -0.08(-0.22, 0.06) p=0.2 -0.13(-0.35, 0.08) p=0.2 -0.01(-0.11, 0.09) p=0.8 -0.12(-0.35, 0.11) p=0.3
LEFT -0.08(-0.20, 0.04) p=0.2 -0.10(-0.28, 0.07) p=0.2 -0.05(-0.20, 0.11) p=0.5 -0.06(-0.28, 0.17) p=0.6
PARIETAL
RIGHT -0.07(-0.21, 0.07) p=0.3 -0.09(-0.29, 0.11) p=0.4 -0.05(-0.21, 0.12) p=0.6 -0.04(-0.30, 0.21) p=0.7
LEFT -0.02(-0.14, 0.10) p=0.7 -0.11(-0.25, 0.03) p=0.1 0.10(-0.003, 0.21) p=0.06 -0.21(-0.37, -0.08) p=0.008
CINGULATE
RIGHT -0.03(-0.16, 0.09) p=0.6 -0.06(-0.75, 0.13) p=0.5 0.004(-0.14, 0.15) p=1.0 -0.07(-0.30, 0.17) p=0.6
TOTAL HIPPOCAMPAL VOLUME (mm3) -609(-1125, -94) p=0.02 -709(-1386, -31) p=0.04 -478(-1291, 335) p=0.2 -231(-1281, 820) p=0.7

95
2. 3. Cortical thinning in FAD: a longitudinal study
2. 3. 1. Methods
This longitudinal study made use of all the scans in order to examine CTh changes over a
period which included symptom onset. I identified four ROI in which there is existing
evidence for early structural and/or functional cortical change (see Discussion): ERC,
posterior cingulate, PHG and precuneus. I selected two control regions for their relative
preservation in typical AD: pericalcarine and paracentral.
For each region, a linear mixed model (developed with expert statistical support – see
acknowledgements) was used to describe the association between CTh and age in the
control group, adjusting for scanner. Denoting CTh and age (in years) at the jth scan for
the ith patient by CThij and aij respectively and with sij taking the values 0 and 1 according
to scanner:
(1)
with and independently .
A similar model was used to describe the relationship between CTh and years since
clinical diagnosis in the MC group. A fixed quadratic term describing acceleration in the
rate of decline over time was added. Denoting years since clinical diagnosis at the jth scan
for the ith patient by dij:
(2)
with and independently
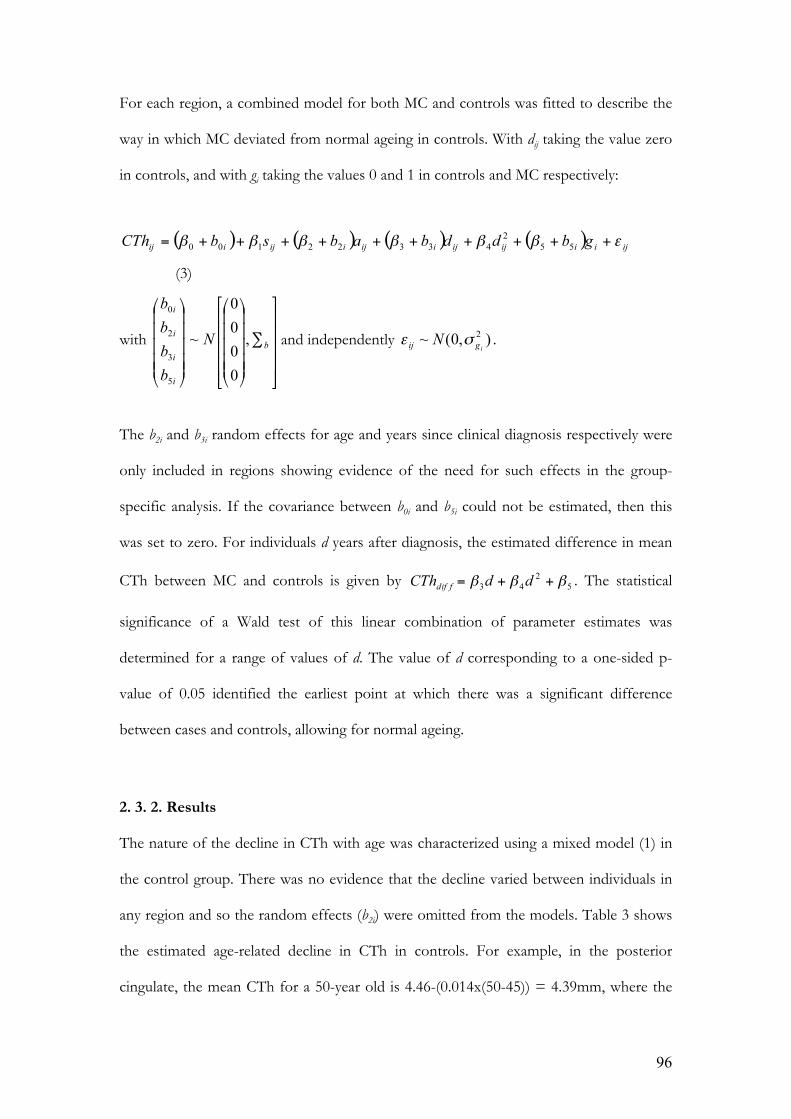
96
For each region, a combined model for both MC and controls was fitted to describe the
way in which MC deviated from normal ageing in controls. With dij taking the value zero
in controls, and with gi taking the values 0 and 1 in controls and MC respectively:
(3)
with and independently .
The b2i and b3i random effects for age and years since clinical diagnosis respectively were
only included in regions showing evidence of the need for such effects in the group-
specific analysis. If the covariance between b0i and b5i could not be estimated, then this
was set to zero. For individuals d years after diagnosis, the estimated difference in mean
CTh between MC and controls is given by . The statistical
significance of a Wald test of this linear combination of parameter estimates was
determined for a range of values of d. The value of d corresponding to a one-sided p-
value of 0.05 identified the earliest point at which there was a significant difference
between cases and controls, allowing for normal ageing.
2. 3. 2. Results
The nature of the decline in CTh with age was characterized using a mixed model (1) in
the control group. There was no evidence that the decline varied between individuals in
any region and so the random effects (b2i) were omitted from the models. Table 3 shows
the estimated age-related decline in CTh in controls. For example, in the posterior
cingulate, the mean CTh for a 50-year old is 4.46-(0.014x(50-45)) = 4.39mm, where the

97
age-related decline is estimated to be 0.014mm/year. There was strong evidence for a
decline in CTh with age in the posterior cingulate (change of -0.014mm/yr (95% CI -
0.023 to -0.004)), and borderline evidence for a decline in the precuneus (change of -
0.009mm/yr (95% CI -0.020 to 0.002)) and the paracentral region (change of -
0.011mm/yr (95% CI -0.024 to 0.001)). However, there was also borderline evidence of
an increase in the CTh of the ERC (change of 0.017mm/yr (95% CI -0.003 to 0.038)).
There was no evidence for a change in CTh in the PHG or pericalcarine regions with
age.
A similar analysis was carried out in the MC group to investigate changes in CTh with
respect to time since clinical diagnosis of AD. There was no strong evidence that the rate
of decline varied between individuals in any region and so the random effects (b3i) were
omitted from the models. There was evidence of accelerated decline in all four regions of
interest, but no evidence of acceleration in either of the control regions and so quadratic
acceleration terms were retained in each model. The estimated mean CTh in each region
according to years since diagnosis is displayed in Figure 8. Table 4 shows the estimated
change in CTh in MC in relation to years since diagnosis. For example, in the precuneus,
the estimated mean CTh at diagnosis is 3.11mm. The estimated reduction in mean CTh
in the final year before diagnosis is 0.10 mm, whilst that in the first year after diagnosis is
0.11mm, corresponding to acceleration in the rate of loss of 0.01mm/year2. From these
values the rate of loss in the penultimate year prior to diagnosis can be inferred to be
0.09mm/year and that in the second year post diagnosis to be 0.12mm/year etc. The
mean levels of CTh at two years prior to diagnosis, one year prior to diagnosis, at
diagnosis, one-year post-diagnosis and two years post-diagnosis are therefore 3.30mm,
3.21mm, 3.11, 3.00 and 2.88mm respectively.

98
The final analysis combined data from both MC and controls in order to adjust the
results in Table 4 for normal ageing. Table 5 shows departures from normal ageing
according to years since diagnosis in MC and also gives estimates of the number of years
before/after clinical diagnosis of AD at which MC had significantly different CTh than
controls. Since there was no strong evidence in the control/MC-specific models for
random effects with either age or years since clinical diagnosis, these terms were not
included in the combined model. The table reports estimated changes in mean CTh in
MC over and above those seen in controls of the same age according to the number of
years from diagnosis in the MC. For example, in the precuneus, the mean CTh at
diagnosis is 0.50mm below that of a control of the same age. The estimated reduction in
mean CTh in the final year before diagnosis is 0.09 mm greater than that in a control of
the same age, whilst that in the first year after diagnosis is 0.10mm greater, corresponding
to an acceleration in the rate of loss (relative to that in controls) of 0.01mm/year2. From
these values the rate of loss in the penultimate year prior to diagnosis can be inferred to
be 0.08mm/year greater than that in a control of the same age and that in the second
year post diagnosis to be 0.11mm/year greater etc. The mean levels of CTh at two years
prior to diagnosis, one year prior to diagnosis, at diagnosis, one-year post-diagnosis and
two years post-diagnosis are therefore respectively 0.33mm, 0.41mm, 0.50mm, 0.60mm
and 0.71mm lower than that in a control of the same age. In both the ERC and PHG,
the analysis suggested that CTh did not identify MC as significantly different from
controls until after clinical diagnosis. However, in the posterior cingulate and precuneus,
CTh measurements identified a significant difference between MC and controls 1.8 years
and 4.1 years before clinical diagnosis respectively. Figure 8a illustrates the difference in
mean CTh between cases and controls with respect to time since clinical diagnosis in the
cases. The point at which the upper bound of the 90% CI indicates this difference is zero
therefore corresponds to the years since diagnosis at which there is a significant

99
difference using a one-sided test. In contrast, in both the control regions, CTh did not
differ significantly between the two groups at any point in the study period. Surface maps
of regions differing early between MC and control groups are shown in Figure 9.
Table 3: Mean regional CTh in controls according to age (adjusted for scanner)
REGION Mean CTh at age 45 (mm) (95% CI)$
Change in mean CTh per year of age (mm) (95% CI)* p-value
ROI
ERC** 5.82 (5.15, 6.50)
0.017 (-0.003, 0.038), p=0.1
PHG 5.32 (4.78, 5.87)
-0.008 (-0.025, 0.009), p=0.4
Posterior cingulate 4.46 (4.16, 4.75)
-0.014 (-0.023, -0.004),
p=0.005
Precuneus 3.74 (3.40, 4.08)
-0.009 (-0.020, 0.002), p=0.1
CONTROL REGION Paracentral 3.49 (3.11, 3.87)
-0.011 (-0.024, 0.001),
p=0.08
Pericalcarine 2.59 (2.38, 2.80)
-0.003 (-0.010, 0.004), p=0.4
$ For scanner 1 * Positive values indicate gain with age ** One individual was removed from the analysis due to probable Freesurfer error in calculating cortical thickness

100
Table 4: Mean regional CTh in mutation carriers according to time since clinical diagnosis of AD (adjusted for scanner)
REGION Mean CTh at diagnosis$ (mm)
(95% CI)
Change in mean CTh in 1st year pre-diagnosis (mm)
(95% CI), p-value*
Change in mean CTh in 1st year post-diagnosis (mm)
(95% CI), p-value*
Acceleration in change in mean CTh (mm/ year2)
(95% CI), p-value*
ROI ERC** 5.93 (5.08, 6.79)
-0.11 (-0.16, -0.07)
p<0.0005 -0.15 (-0.21, -0.09)
p<0.0005
-0.04 (-0.06, -0.01) p=0.001
PHG 5.28 (4.71, 5.84)
-0.11 (-0.14, -0.08) p<0.0005
-0.14 (-0.19, -0.10) p<0.0005
-0.03 (-0.05, -0.02) p<0.0005
Posterior cingulate 4.05 (3.73, 4.38)
-0.08 (-0.11, -0.06) p<0.0005
-0.10 (-0.13, -0.07) p<0.0005
-0.01 (-0.02, -0.005) p=0.004
Precuneus 3.11 (2.72, 3.50)
-0.10 (-0.13, -0.07) p<0.0005
-0.11 (-0.15, -0.08) p<0.0005
-0.01 (-0.02, 0.001) p=0.07
CONTROL REGION
Paracentral 3.20 (2.65, 3.75)
-0.05 (-0.12, 0.008) p=0.09
-0.08 (-0.16, 0.01) p=0.08
-0.02 (-0.05, 0.009) p=0.2
Pericalcarine 2.99 (2.65, 3.33)
0.02 (-0.002, 0.05) p=0.07
0.02 (-0.01, 0.05) p=0.3
-0.004 (-0.02, 0.008) p=0.5
$ For scanner 1 * Change in each additional year post-diagnosis = change in 1st year post-diagnosis + [acceleration x (number of years post-diagnosis – 1)]. Similarly, change in each additional year pre-diagnosis = change in 1st year pre-diagnosis - [acceleration x (number of years pre-diagnosis – 1)] ** One individual was removed from analysis due to probable Freesurfer error in calculating cortical thickness
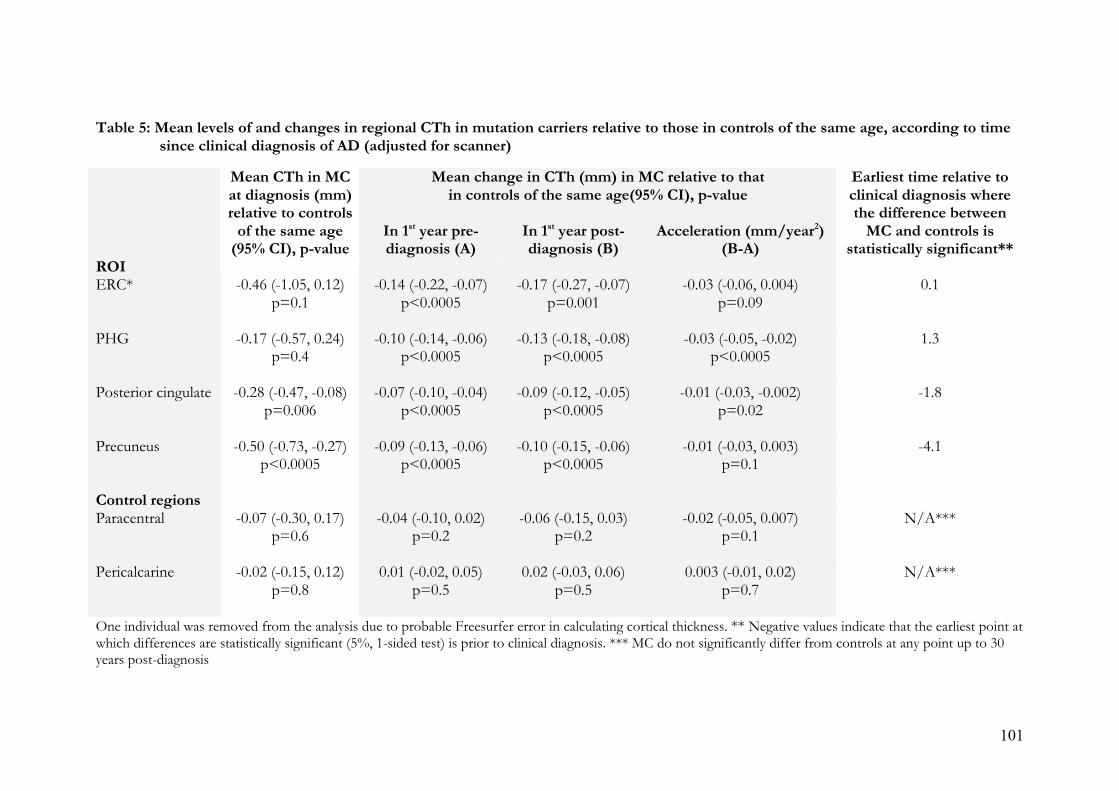
101
Table 5: Mean levels of and changes in regional CTh in mutation carriers relative to those in controls of the same age, according to time since clinical diagnosis of AD (adjusted for scanner)
Mean change in CTh (mm) in MC relative to that in controls of the same age(95% CI), p-value
Mean CTh in MC at diagnosis (mm) relative to controls
of the same age (95% CI), p-value
In 1st year pre- diagnosis (A)
In 1st year post-diagnosis (B)
Acceleration (mm/year2) (B-A)
ROI
Earliest time relative to clinical diagnosis where the difference between
MC and controls is statistically significant**
ERC*
-0.46 (-1.05, 0.12) p=0.1
-0.14 (-0.22, -0.07) p<0.0005
-0.17 (-0.27, -0.07) p=0.001
-0.03 (-0.06, 0.004) p=0.09
0.1
PHG
-0.17 (-0.57, 0.24) p=0.4
-0.10 (-0.14, -0.06) p<0.0005
-0.13 (-0.18, -0.08) p<0.0005
-0.03 (-0.05, -0.02) p<0.0005
1.3
Posterior cingulate
-0.28 (-0.47, -0.08) p=0.006
-0.07 (-0.10, -0.04) p<0.0005
-0.09 (-0.12, -0.05) p<0.0005
-0.01 (-0.03, -0.002) p=0.02
-1.8
Precuneus
-0.50 (-0.73, -0.27) p<0.0005
-0.09 (-0.13, -0.06) p<0.0005
-0.10 (-0.15, -0.06) p<0.0005
-0.01 (-0.03, 0.003) p=0.1
-4.1
Control regions Paracentral
-0.07 (-0.30, 0.17) p=0.6
-0.04 (-0.10, 0.02) p=0.2
-0.06 (-0.15, 0.03) p=0.2
-0.02 (-0.05, 0.007) p=0.1
N/A***
Pericalcarine
-0.02 (-0.15, 0.12) p=0.8
0.01 (-0.02, 0.05) p=0.5
0.02 (-0.03, 0.06) p=0.5
0.003 (-0.01, 0.02) p=0.7
N/A***
One individual was removed from the analysis due to probable Freesurfer error in calculating cortical thickness. ** Negative values indicate that the earliest point at which differences are statistically significant (5%, 1-sided test) is prior to clinical diagnosis. *** MC do not significantly differ from controls at any point up to 30 years post-diagnosis

102
Figure 8: Estimated mean CTh in MC, by years since clinical diagnosis

103
Figure 8a: Difference in mean cortical thickness between cases and controls, by years since clinical diagnosis (with 90% CI)

104
Figure 9: Earliest Time (yrs), relative to clinical diagnosis, at which regional differences emerge between MC and controls.

105
2. 3. 3. Discussion
Using a fully automated method, we have measured CTh in the brains of FAD mutation
carriers and age/sex-matched controls. CTh change was investigated via longitudinal
analysis of six regions in relation to age and time of clinical diagnosis of AD. ROI were
selected on the basis of existing evidence that they are significant in early AD and may
provide an early signal of disease. Histopathological and structural imaging studies
indicate that limbic and heteromodal association areas fall into this group, including the
MTL (particularly the PHG) and precuneus (Juottonen et al 1999; Xu et al 2000; Lerch et
al 2005; Dickerson et al 2009). Functional imaging modalities have also demonstrated
early change in the retrosplenial and posterior cingulate cortices (Minoshima et al 1997;
Mosconi et al 2006), which have a role in episodic memory function and some
visuospatial processing (Maguire 2001; Burgess et al. 2001). CTh measurement of sub-
regions of the hippocampal formation has been previously performed (Burggren et al.
2008) although assessing CTh in this region is less well-established than other regions
and is technically highly demanding due to the elaborate invagination of the cortex. This,
the presence of other candidate MTL regions, and our desire to avoid duplication
(previous hippocampal volumetric data in the same group has been reported (Ridha et al
2006)) led us not to select this as an ROI. Motor, sensory and primary visual cortices are
relatively spared in the early stages of AD (Braak and Braak 1996b; Rizzo et al. 2000;
Prvulovic et al. 2002) and were therefore selected as control regions.
Age-related grey matter loss has been well documented in all major lobes of the brain
(Allen et al. 1991; Van Petten et al. 2004; Salat et al. 2004). There is an historically
prominent view that such decline occurs with an anterior-posterior gradient although this
is not universally accepted and, frequently, widespread patchy thinning implicating both
primary and association cortices is found to accompany ageing (Raz and Rodrigue 2006).
106
In our healthy control group we demonstrated a very small degree of age-related CTh
decline across all regions except the ERC, the wide distribution of which was
commensurate with previously observed changes in normal ageing (Salat et al 2004). In
particular, the relative sparing of the PHG was familiar, although the prominence of
change in the posterior cingulate was unexpected. An implausible increase in ERC
thickness was also unforeseen, although this should be interpreted with caution in view
of well documented difficulties with surface reconstruction of this region using
Freesurfer (Han et al. 2006). The magnitude of this increase and of the age-related decline
in other regions in healthy controls was, in biological terms, exceptionally small.
However, it was fully consistent with previous high-resolution MRI studies, which have
demonstrated rates of global atrophy in healthy people of 0.2% per year at age 30-50 and
0.3-0.5% per year at age 70-80 (Fox and Schott Lancet 2004).
Analysis of the MC group provided insight into CTh change with respect to time since
clinical diagnosis of AD. It showed strong evidence of non-linear CTh decline in all four
ROI with acceleration over time. MTL structures showed the highest rates of thinning
and there was no evidence for thinning or acceleration in the control regions. These
findings support our initial hypothesis and choice of ROIs. They also echo previous
findings of prominent early cortical thinning in the MTL and precuneus in amnestic mild
cognitive impairment (aMCI) patients destined to progress to AD (Bakkour A et al
2008). Despite broad acceptance of an early role for the precuneus in particular, and
previous observations that it may be more affected in early onset forms of AD (Karas et
al. 2007), not all studies support a special role for the region relative to other areas of the
neocortex (Nelson et al. 2009). The limitations of the measurement technique again
demand the cautious interpretation of the effect shown in the ERC. Rates of whole brain
atrophy in aMCI patients have been shown to be non-linear, accelerating as individuals

107
progress to typical, late-onset AD (Jack et al 2008), while other studies of rates of
atrophy in AD also seem suggest acceleration (Chan et al. 2003). Our observation that
CTh in FAD similarly accelerates beyond diagnosis supports the notion that FAD is a
credible paradigm for sporadic, late-onset AD and that automated measurement of
cortical change can reproduce the patterns described where more established
neuroimaging techniques are deployed.
A combined analysis provided some evidence that CTh in the posterior cingulate and
precuneus differed between the MC and control groups prior to clinical diagnosis. In the
precuneus, a significant difference was apparent more than four years before diagnosis, a
comparable duration to that found in a previous volumetric study of the whole brain and
hippocampi in the same group (Ridha et al 2006). It was interesting that the PHG should
not be useful in this regard in view of previous observations about its significance
(Juottonen et al 1999; Xu et al 2000; Lerch et al 2005). Although the rate and acceleration
of loss in this region were similar to those observed in the posterior cingulate and
precuneus regions, the difference between the controls and cases at diagnosis was
smaller. As members of the MC cohort develop established AD, any variability in the rate
and acceleration of thinning between regions will lead to a change in the regions which
best distinguish them from controls. Further, it is important to emphasise that failure to
detect significant effects in certain regions does not necessarily imply the genuine
absence of an effect in those regions. MRI-derived measurements have limitations
inherent in their acquisition, and may have a lower sensitivity to detect change in certain
regions because different brain structures are variably affected by artefacts such as
susceptibility or inhomogeneity. The key advantage of CTh measurement over
volumetric studies is that it is automated, and hence more rapid and less operator-
dependent. However, as discussed above, there are important caveats to consider when

108
interpreting our findings, which relate to limitations of the technique and of the analysis.
These include the cross-scanner analysis, which relates to the extended nature of the
study. This does present a continuity problem, which we have attempted to mitigate
statistically. Further, the statistical analysis of our measurements was designed to answer
questions, which we felt the data were equipped to address. We cannot, for example,
conclude that CTh decline in the posterior cingulate and precuneus precedes such
changes in the ERC and PHG as this was not the hypothesis, and the analyses performed
were not designed to establish this relationship. Caveats surrounding the differential
sensitivity of MRI depending upon the size and location of brain region concerned are
again relevant, as this may have obscured an effect in one or more of the ROI. The use
of larger groups would certainly be helpful in further defining the utility of CTh analyses
although, in this study, the small groups reflect the rarity of this form of the illness and
the still greater rarity of cases whose genetic status has been established. The use of
subjects at risk for autosomal dominant AD here was advantageous in at least one
important sense: that we could study subjects who were certain to develop clinical AD
while they were still asymptomatic. Despite the many similarities between FAD and
SAD, the extent to which our findings are generalizable to the more common sporadic
disease remains unknown. However, our data do contribute to a growing body of
evidence that imaging biomarkers may be highly sensitive for detecting presymptomatic
AD (Dickerson et al 2009), perhaps years before the illness declares itself clinically. While
functional and structural neuroimaging techniques may be sensitive to change in different
brain regions, CTh analysis in AD would appear to implicate regions previously
highlighted by both. Perhaps CTh has the potential to reveal something interesting about
the functionally related network of MTL and retrosplenial structures, which is so crucial
in AD pathology. It certainly continues to show promise as a relatively practical, rapid
and sensitive technique, although further work is needed to evaluate its role in stratifying

109
different molecular pathologies, and to define the phenotypic correlates of the cortical
changes identified.
3.
THE FAD PARADIGM
II: Molecular neuroimaging
3. 1. A longitudinal 11C-PiB PET study in FAD and SAD
Previous studies have suggested prominent, early striatal 11C-PiB retention in FAD
(Klunk et al. 2007; Remes et al. 2008), a pattern not yet observed in SAD. In this study,
the aim was to further characterize the 11C-PiB PET profiles of PSEN1 mutation carriers
in the preclinical and early stages of their illness, and to compare these with profiles of
healthy controls and individuals with SAD. To achieve this early cross-sectional data
from a larger prospective, longitudinal 11C-PiB PET cohort study were used.
3. 1. 1. Methods
Table 6 details subject demographics. Seven presymptomatic and mildly affected
(MMSE!20) PSEN1 mutation carriers, 10 patients with SAD and 10 healthy controls
(including four members of autosomal dominant FAD families with negative predictive
tests for the causative mutation) had PET. PSEN1 mutations studied were Y115C (Cruts
et al. 1998), M139V (Clark et al. 1995), M146I (Jorgensen et al. 1996), L171P (Ramirez-
Duenas et al. 1998), E184D (Yasuda et al. 1997), R278I (Godbolt et al. 2004) and intron 4
(Tysoe et al. 1998; Janssen et al. 2003). Exclusion criteria comprised a current or recent
history of drug or alcohol abuse/dependence, pregnancy, inability to undergo PET
scanning (the most common reason envisaged was an inability to tolerate the process of

110
reclining supine for 90 minutes) and a history of cancer within the last 5 years (except
non-melanoma skin and prostate cancer).
Presymptomatic mutation carriers (PMC) were, on average, 7.2 years younger than the
documented mean AAO for their family. Mean MMSE (Folstein et al 1975) score for the
mutation carrier group was 27.2 (range 21-30). Whole brain and regional uptake from a
single, baseline 11C-PiB PET scan were examined. The study received approval from the
ethics committee of the National Hospital for Neurology and Neurosurgery and Institute
of Neurology and the Hammersmith Hospitals Trust. Permission to administer radiation
was granted by the Administration of Radioactive Substances advisory Committee
(ARSAC) UK.
Patients were approached by the investigators and oral and written information provided
prior to consent. All subjects and controls underwent 11C-PiB PET imaging at the
Hammersmith Hospital. PET scanning was performed using a Siemens ECAT EXACT
HR+ scanner in 3 dimensional mode as described previously (Edison et al 2007). Each
scan participant received a bolus administration of up to 370 MBq 11C-PiB intravenously
followed by a 90-minute dynamic PET scan.11C-PiB was manufactured by Hammersmith
Imanet, GE Healthcare and a 10-minute transmission scan was performed prior to the
injection of 11C-PiB.
All mutation carriers and controls had anatomical T1-weighted, volumetric MRI to allow
co-alignment of parametric PET images of 11C-PiB binding, permitting anatomical
localization of regions-of-interest (ROI). Where possible, MRI was performed on the
same day as the PET scanning, although an interval between the two scans of up to three
months was deemed acceptable.

111
3. 1. 1. 1. Image analysis
Amyloid plaques have been reported to be present in the cerebellar cortex in FAD cases
(Verkkoniemi et al 2001). Parametric ratio images of 11C-PiB retention were therefore
created using the pons as a reference region. The late (60 to 90-minute) summation
images of tracer uptake were co-registered to each subject’s MRI using SPM2 (Statistical
Parametric Mapping; Wellcome department of Imaging Neuroscience, University College
London, UK) software. Each late summation image was then normalized into Montreal
Neurological Institute (MNI) space using individual MRIs as a template. Activity in the
pons was sampled using an ROI placed manually on the corresponding normalized MRI
image, allowing the calculation of a pontine uptake value and subsequent creation of the
target region: pons ratio image. Using an individualized anatomical atlas, created using
analyze software and an in-house probabilistic brain atlas (Hammers et al. 2003), we
sampled 11C-PiB uptake for each subject in the anterior and posterior cingulate, the
thalamus, striatum and the frontal, temporal, parietal, occipital and cerebellar cortices. In
order to allow comparison with studies that have used the cerebellum as a reference
region we also calculated regional ratios relative to the cerebellum – these are given in
Table 8.

112
Table 6: Subject Demographics
SEX
GROUP F M
MEAN AGE (RANGE) MEAN MMSE
(RANGE)
CONTROLS
7 3 47.7 (25-66) n/a
SAD
4 6 61.9 (51-69) 21.7(12-26)
PSEN1 - AFFECTED
2 0 51.5 (40-63) 22(21-23)
PSEN1 - PMC
4 1 34.6 (31-40) 28.7(27-30)
PSEN1 - TOTAL
6 1 38.8 (31-63) 27.2(21-30)
3. 1. 1. 2. Statistical analyses
Statistical interrogation was performed using SPSS (release 17.0, SPSS Inc.). Mean
regional 11C-PiB region: pons ratios were analysed to detect significant differences.
Groups were compared using the Mann-Whitney test. P values were corrected for the
total number of comparisons using the Hochberg Correction combined with the p-plot
estimation of the number of Null-Hypotheses in the set (Turkheimer et al. 2001).
3. 1. 2. Results
Across all regions sampled, mean region: pons ratios demonstrated statistically significant
differences when the SAD group was compared with controls with the exception of
cerebellum. When PSEN1 and control groups were compared, all regions except the
cerebellum (p=0.133) showed significant differences that survived correction for multiple
comparisons. When the same comparison was made using the cerebellum as the
reference region, the temporal region was no longer significant, after correction for
multiple comparisons, but all other regions remained significantly different to controls.

113
When PSEN1 and SAD groups were compared, thalamus (PSEN1>SAD), frontal and
temporal regions (SAD>PSEN1) demonstrated significant differences that survived
multiple comparison corrections. When the same comparison was made using the
cerebellum as the reference region (Table 8) the sporadic group had significantly greater
PiB retention ratios in parietal and occipital as well as frontal and temporal regions.
Two mutation carriers (E184D and intron 4 mutations) had higher striatal 11C-PiB
retention ratios than the mean for the SAD group (1.71 and 1.54 respectively). Figures 10
and 11 demonstrate regional variation in11C-PiB retention for PSEN1 and SAD groups
when compared with controls. Figure 12 shows 3 transaxial 11C-PiB scans with different
binding patterns in three separate PSEN1 mutation carriers.

114
Figure 10: Univariate scatter plot showing region: pontine 11C-PiB retention ratios
for PSEN1 subjects (f1-f7) vs. Controls
f2 and f4 = affected/symptomatic PSEN1 mutations carriers

115
Figure 11: Univariate scatter plot showing pontine 11C-PiB retention ratios for SAD
subjects (s1-s10) vs. Controls

116
Table 7: Mean regional 11C-PiB uptake by group (Pontine reference region)
11C-PiB UPTAKE RATIO, ROI: PONS (SD)
ROI
PSEN1 SAD
CONTROLS
ANTERIOR CINGULATE 1.24 (0.22)† 1.44 (0.18)
†
0.69 (0.08)
POSTERIOR CINGULATE 1.24 (0.24)† 1.42 (0.18)
†
0.72 (0.05)
THALAMUS 1.09 (0.14)†* 0.88 (0.11)
†
0.68 (0.07)
STRIATUM 1.20 (0.35)† 1.25 (0.11)
†
0.71 (0.06)
FRONTAL 1.08 (0.17)†* 1.30 (0.13)
†
0.67 (0.08)
TEMPORAL 0.99 (0.14)†* 1.18 (0.14)
†
0.68 (0.07)
PARIETAL 1.09 (0.17)† 1.27 (0.15)
†
0.67 (0.07)
OCCIPITAL 1.04 (0.14)† 1.12 (0.18)
†
0.70 (0.08)
CEREBELLUM 0.75 (0.17) 0.63 (0.07)
0.62 (0.07)
† p<0.05 vs. controls * p<0.05 vs. SAD

117
Table 8: Mean regional 11C-PiB uptake by group (Cerebellar reference region)
11C-PiB UPTAKE RATIO, ROI: CEREB (SD)
ROI
PSEN1 SAD
CONTROLS
ANTERIOR CINGULATE
1.78 (0.56)
† 2.29(0.32)
†
1.09(0.07)
POSTERIOR CINGULATE
1.76 (0.50)† 2.25(0.29)
†
1.17(0.08)
THALAMUS
1.55 (0.40)
† 1.41(0.25)
†
1.09(0.11)
STRIATUM
1.74 (0.73)
† 1.98(0.26)
†
1.15(0.07)
FRONTAL
1.53 (0.37)
†* 2.07(0.26)
†
1.07(0.05)
TEMPORAL
1.39 (0.30)* 1.87(0.28)†
1.10(0.03)
PARIETAL
1.53 (0.35)
†* 2.02(0.28)
†
1.08(0.05)
OCCIPITAL
1.46 (0.27)
†* 1.78(0.27)
†
1.13(0.05)
† p<0.05 vs. controls * p<0.05 vs. SAD

118
Figure 12: Transaxial 11C-PiB images (pontine reference region) in PSEN1 mutation carriers showing heterogeneity of 11C-PiB binding
pattern.
(a) Increased cerebellar binding in PSEN1 M146I PMC.
(b) Increased striatal binding in an affected PSEN1 E184D mutation carrier (f2 in figure 10).
(c) Typical AD-like pattern in an affected PSEN1 R278I mutation carrier (f4 in figure 10).

3. 1. 3. Discussion
At a group level, we observed significantly higher global 11C-PiB uptake in established
SAD cases compared with the PSEN1 group, in which the majority were
presymptomatic and around seven years before the anticipated onset of symptoms.
However, we have confirmed previous findings (Klunk et al. 2007; Remes et al. 2008) that
it is possible to detect significantly elevated 11C-PiB retention in the brains of individuals
destined to develop clinical AD before symptoms arise. Structural and metabolic changes
are already known to occur early in FAD patients (Matsushita et al. 2002; Ridha et al.
2006) as they are in SAD (Minoshima et al. 1997; Desikan et al. 2008) and MCI
(Kemppainen et al. 2007). In SAD, the earliest 11C-PiB retention may occur in the
retrosplenial cortices, particularly the precuneus (Mintun et al. 2006) although early
retention has been noted in the striatum as well as the frontal, parietal, temporal, and
occipital cortices (Klunk et al. 2004).
The rarity of FAD mutations means that rather less is known about their associated 11C-
PiB PET profiles. One study of the PSEN1 C410Y and PSEN1 A426P mutations
showed elevated 11C-PiB retention beginning in the striatum of presymptomatic and
affected mutation carriers, with neocortical areas involved later (Klunk et al. 2007). A
similar pattern has been observed in those with early-onset disease associated with
atypical clinical (spastic paraparesis) and neuropathological (cotton wool plaques) features
(Koivunen et al. 2008) and in amyloid precursor protein (APP) gene duplication cases
(Remes et al. 2008). Such studies raise important issues about the neuropathological
profile of early-onset forms of AD, although the extent to which they are representative
remains unknown, particularly as other investigators have found a more typical, SAD-like
11C-PiB profile in symptomatic APP mutation-carriers (Theuns et al. 2006). Our study
included two individuals (E184D and intron 4 mutations) with higher striatal 11C-PiB
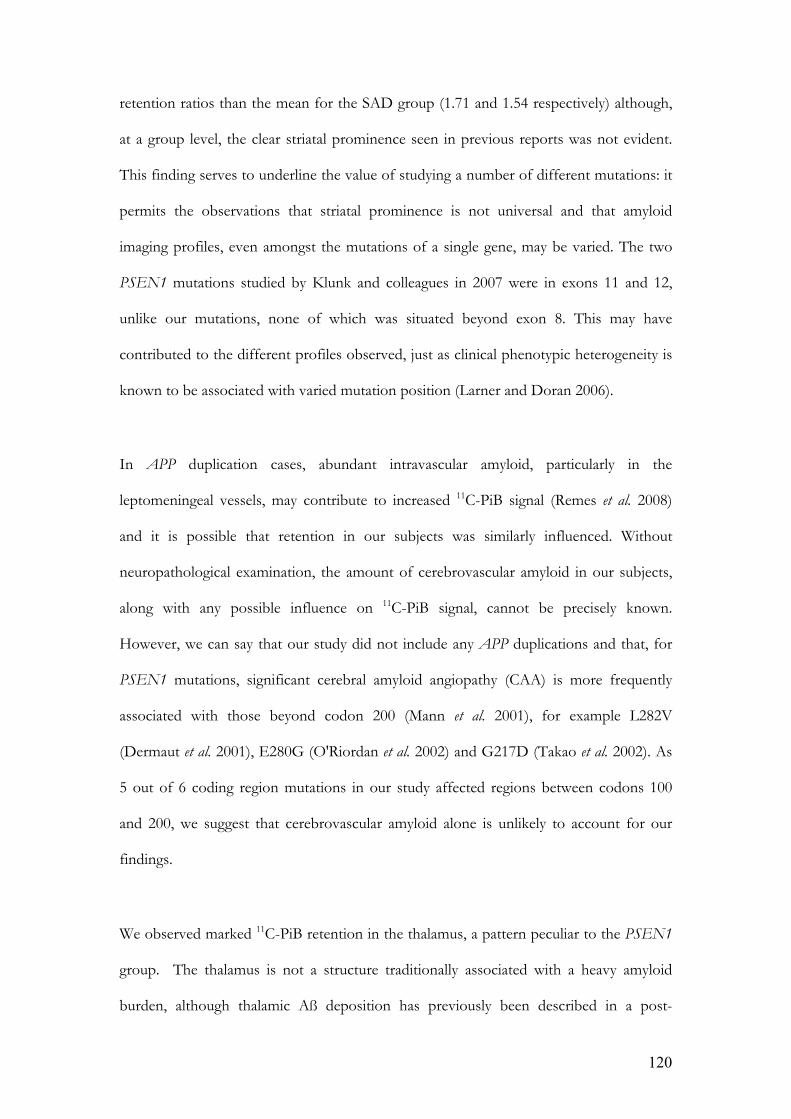
120
retention ratios than the mean for the SAD group (1.71 and 1.54 respectively) although,
at a group level, the clear striatal prominence seen in previous reports was not evident.
This finding serves to underline the value of studying a number of different mutations: it
permits the observations that striatal prominence is not universal and that amyloid
imaging profiles, even amongst the mutations of a single gene, may be varied. The two
PSEN1 mutations studied by Klunk and colleagues in 2007 were in exons 11 and 12,
unlike our mutations, none of which was situated beyond exon 8. This may have
contributed to the different profiles observed, just as clinical phenotypic heterogeneity is
known to be associated with varied mutation position (Larner and Doran 2006).
In APP duplication cases, abundant intravascular amyloid, particularly in the
leptomeningeal vessels, may contribute to increased 11C-PiB signal (Remes et al. 2008)
and it is possible that retention in our subjects was similarly influenced. Without
neuropathological examination, the amount of cerebrovascular amyloid in our subjects,
along with any possible influence on 11C-PiB signal, cannot be precisely known.
However, we can say that our study did not include any APP duplications and that, for
PSEN1 mutations, significant cerebral amyloid angiopathy (CAA) is more frequently
associated with those beyond codon 200 (Mann et al. 2001), for example L282V
(Dermaut et al. 2001), E280G (O'Riordan et al. 2002) and G217D (Takao et al. 2002). As
5 out of 6 coding region mutations in our study affected regions between codons 100
and 200, we suggest that cerebrovascular amyloid alone is unlikely to account for our
findings.
We observed marked 11C-PiB retention in the thalamus, a pattern peculiar to the PSEN1
group. The thalamus is not a structure traditionally associated with a heavy amyloid
burden, although thalamic Aß deposition has previously been described in a post-

121
mortem study of PSEN1 mutation carriers (Lippa et al. 1996). Specific mutations, such as
M146I, have since been associated with unusually high levels of Aß pathology in the
thalamus and mesencephalon (Gustafson et al. 1998) raising the possibility that such a
pattern is codon- or mutation-specific. Post-mortem histopathological analyses have
previously demonstrated immunopositive, diffuse Aß plaques in the thalamus of a
PSEN1 M139V carrier (Larner and du Plessis 2003) and small increases in thalamic 11C-
PiB have been noted (Kemppainen et al. 2006).
The cerebellum has long been used as a reference region for non-specific tracer binding
in 11C-PiB PET imaging as, in the SAD brain, it does not classically accumulate amyloid
or retain 11C-PiB (Svedberg et al. 2009). In accord with this we found that the sporadic
AD subjects did not have raised PiB retention – with almost identical cerebellum/pons
ratios when compared with the controls. However 11C –PiB retention does occur in the
cerebellum in FAD although there is considerable variability between subjects; this
suggests, in line with previous studies (Klunk et al. 2007), that the cerebellum may not be
an appropriate reference region in FAD and that the pons (as used here) is a suitable
alternative. In order to allow comparison with other studies in AD we subsequently also
calculated ratios with the cerebellum as the reference region. The respective pontine and
cerebellar ratios highlight slightly different regions, though with considerable overlap.
Full interpretation of these differences would require pathological correlation beyond the
current scope of this study. Our results also suggest that the distribution of tissue
pathology (at least in terms of plaque amyloid) associated with PSEN1 mutations may be
more varied than previously thought. This may have implications for the usefulness of
PiB imaging in evaluating new therapies (see 1. 8. 2.). Finally these findings raise
intriguing questions about why these different patterns of amyloid binding occur and

122
what their clinical and pathological implications may be – directions perhaps for future
research.
4.
CHARACTERIZING FAD
I: Epistasis & single case studies
Know your enemy…and you will not
be imperilled in a hundred battles.
- Sun Tzu, The Art of War.
Contemporary treatment strategies are increasingly reliant upon genetic models and
robust biomarkers for their development. Studies using transgenic mouse models and
human FAD pedigrees continue to inform our approach to AD although, for the FAD
paradigm to remain credible, clarification of the FAD/SAD relationship through an
understanding of FAD’s phenotypic spectrum is vital. Much progress has already been
made in this regard (see 1. 4.), helping to highlight both the promise and limitations of
this approach. Chapters 2 and 3, address this issue, examining the phenotypes associated
with several genetic defects as well as a potential epistatic influence on the clinical
phenotypes of known APP and PSEN mutations.
4. 1. Methods
An ongoing, longitudinal FAD cohort study of more than 20 years duration, has been
subject to various amendments, existing in its current form since 2002. Clinical,

123
neuroimaging and neuropsychology data from this ongoing study have been a vital
resource for a number of other studies, including those in this thesis.
This study currently involves 4 key cohorts, recruited primarily from a
tertiary/quarternary dementia service and stratified according to clinical/genetic status:
• Individuals at risk of AD by virtue of an autosomal dominant family history.
• Presymptomatic, FAD mutation carriers (PMC) in whom predictive genetic
testing has demonstrated a mutation (or duplication) in APP, PSEN1 or PSEN2.
• Symptomatic, confirmed FAD mutation carriers.
• Controls (spouses or siblings of individuals from all groups in whom predictive
genetic testing has shown no mutation).
Each participant is assessed annually. Subjects in the ‘at risk’ category were recruited
when they were 5 years below the 95% confidence interval for mean AAO in their
family. AAO was established through clinical assessment i.e. it corresponds to reported
age at onset of symptoms as recorded on Dementia Research Centre database. With
predictive genetic testing more widely available, and a greater number of pathogenic
mutations discovered, an amendment was made to the study in 2002 such that it was
possible to recruit presymptomatic individuals who had positive genetic tests from the
time of referral (by which time they had already have received their positive test result
from a geneticist). This was often at a much younger age than that stated in the original
study protocol and, where they remained unaffected, they participate until they are five
years older than the oldest known AAO in their family. Affected individuals participate
until it is no longer possible for them to tolerate the assessments, usually by virtue of the
severity of their illness. Each participant is given an information sheet and adequate time

124
to read and discuss it before signing a consent form. Both documents have been
approved by the National Hospital for Neurology and Neurosurgery and UCL Institute
of Neurology Joint Ethics Committee. Annual assessments comprise:
• Volumetric brain MRI: Imaging between 1991 and 1998 was performed on a
1.5T GE Signa scanner (General Electric Medical Systems, Waukesha, WI, USA).
Volumetric T1-weighted coronal MRI scans were obtained with a spoiled
gradient echo technique (256!128 matrix, field of view 24!24 cm,
TR/TE/NEX/FA=35 ms/5 ms/1/35°) yielding 124 contiguous 1"5 mm thick
slices. Between 2000 and 2006 imaging was undertaken on a different 1.5T GE
Signa scanner running software version 5.8 (General Electric Medical Systems,
Waukesha, WI, USA). Volumetric T1-weighted coronal MRI scans were obtained
using an inversion recovery prepared fast spoiled gradient-echo technique
(256!256 matrix, field of view 24!18 cm, TR/TE/TI/NEX/FA=14 ms/5"4
ms/650 ms/1/15°) yielding 124 contiguous 1"5 mm thick slices. An MRI Safety
questionnaire was completed prior to each scan.
• Magnetic resonance spectroscopy (PMCs and controls only). 1.5 T Signa 5X
system PROBE/SV, PRESS (TR=2000 msec, TE=30 msec, 192 avg).
• A T1-weighted spin echo sagittal scout is followed by six 5mm fast IR images
obtained in the axial plane. A 15mm thick VOI is placed within 3 adjacent slices
maximizing grey matter cingulate content, and minimizing partial volume effects
• Neuropsychological assessment.
• Clinical assessment (history, examination, MMSE).
4. 2. FAD and the ApoE4 polymorphism
Previous studies have demonstrated a modifying effect of the ApoE4 polymorphism on
age at symptom onset in APP-associated FAD (Hardy et al 1993; Sorbi et al 1995), though

125
not PSEN1-associated FAD (Van Broeckhoven et al 1994). The collation of data for our
FAD cohort allowed analysis of AAO, where known, in relation to ApoE genotype. The
aim was to establish whether these data supported existing evidence of the effect of
ApoE on AAO. Table 9 characterises available data on individuals with a known FAD
mutation and ApoE genotype. Table 10 shows ApoE genotype and allele frequencies for
these subjects and the corresponding data when an additional 64 subjects, in whom FAD
is clinically suspected but no mutation has been demonstrated, are added. Population
data from the literature are presented for comparison.
4. 2. 1. Methods
Subjects for this analysis (n=60) were selected purely on the basis that their ApoE
genotype, AAO and mean family AAO (AAOf) were known. f-tests were applied and
variance in the datasets found to be unequal throughout. Subsequent two-tailed, unpaired
heteroscedastic t-tests were used to test two hypotheses: That ApoE4 positive FAD
mutation carriers (5 APP, 17 PSEN1) had a different mean AAO to ApoE4 negative
FAD mutation carriers (11 APP, 27 PSEN1), and that the differences between mean
AAO and mean family AAO were greater in the ApoE4 positive group i.e. that ApoE4
carrier status modified AAO, hastening symptom onset.

Table 9: Autosomal dominant AD cases, mutation known (n=73)
Family No Gene Mutation AAO AAOf ApoE Genotype Pathology (where available)
19
APP
V717G
46
51.5
33
19 APP V717G 48 51.5 33 AD with CAA
19 APP V717G 47 51.5 33
19 APP V717G 50 51.5 33
19 APP V717G 47 51.5 34
19 APP V717G 45 51.5 34
23 APP V717I 53.7 33
23 APP V717I 51 53.7 33 AD with diffuse Lewy body disease
23 APP V717I 52 53.7 33
23 APP V717I 58 53.7 33 Diffuse Lewy body disease, AD, CAA
171 APP V717L 51 45.8 33 AD
171 APP V717L 48 45.8 33
172 APP V717I 56 52.5 33
172 APP V717I 47 52.5 33 AD with CAA
172 APP V717I 50 52.5 34
172 APP V717I 56 52.5 34
172 APP V717I 49 52.5 34 AD with vascular malformation of the thalamus
408 APP A692G 33
175 PSEN1 delta4 35 37.7 33 AD
175 PSEN1 delta4 37.7 33
177* PSEN1 L153V 36 35 34 AD
183 PSEN1 E280G 42 43.5 33
184 PSEN1 L250S 56 53.3 34
184 PSEN1 L250S 47 53.25 34
196 PSEN1 P267S 37 35.75 34
196 PSEN1 P267S 38 35.75 34
206‡ PSEN1 M139V 35 39 33

127
206‡ PSEN1 M139V 39 39 33
206‡ PSEN1 M139V 38 39 33
206‡ PSEN1 M139V 37 39 34
226* PSEN1 R269H 51 52.3 44 AD
267* PSEN1 L235V 44 33 AD
278 PSEN1 F283L 47 48 33
278 PSEN1 F283L 46 48 33
278 PSEN1 F283L 48 48 34
283* PSEN1 R377M 38 38 33 AD and cerebrovascular disease
342* PSEN1 delta4 33
346 PSEN1 R278I 23
353 PSEN1 A260V 33
364 PSEN1 E184D 41 40.5 33
364 PSEN1 E184D 40 40.5 33
37* PSEN1 F237L 47 34
53* PSEN1 delta167 43 52 44 AD
74 PSEN1 S290Cd9 39 42.8 23 AD and CAA
74 PSEN1 S290Cd9 44 42.8 33 AD and CAA
74 PSEN1 S290Cd9 42 42.8 33
102 PSEN1 E280G 40 41.8 33
102 PSEN1 E280G 40 41.8 33
102 PSEN1 E280G 41 41.8 34
102 PSEN1 E280G 41 41.8 34
105 PSEN1 delta4 36 37.4 33 AD
105 PSEN1 delta4 39 37.4 33 AD and CAA
105 PSEN1 delta4 39 37.4 33 AD and CAA
105 PSEN1 delta4 38 37.4 34 AD
105 PSEN1 delta4 33 37.4 44 AD and severe CAA
121 PSEN1 E120K 35 36.3 33 AD and CAA
134* PSEN1 G378V 43 44.71 33
134* PSEN1 G378V 47 44.71 33 AD

128
148‡ PSEN1 M139V 36 42.1 33
148‡ PSEN1 M139V 43 42.1 33
148‡ PSEN1 M139V 43 42.1 34
148‡ PSEN1 M139V 45 42.1 34
156 PSEN1 I143F 53 55.5 33 AD
156 PSEN1 I143F 59 55.5 33
156 PSEN1 I143F 55 55.5 33
168 PSEN1 E280G 43 42.2 33
168 PSEN1 E280G 47 42.2 34 AD, Lewy body pathology, pontine infarct
168 PSEN1 E280G 39 42.2 34
427 PSEN1 delta166 34
382 PSEN1 PS1 33 AD and CAA
428 PSEN1 Q222P 34
267* PSEN1 L235V 33
438 PSEN1 M139V 33
*also see Janssen et al, 2003 ‡also see Fox et al. 1997

129
Table 10: ApoE genotype and allele frequencies
Mutation Known
All FAD Subjects
n % n %
Expected SAD % (Poirier e t a l 1993;
Ashford and Mortimer 2002)
Expected population % (Ashford and Mortimer 2002; Carmo
Martins e t a l 2008)
22 0 0 1 0.7 0.1 1
23 2 2.7 4 2.9 4 12
24 0 0.0 3 2.2 3 2
33 46 63.0 61 44.5 35 61
34 22 30.1 59 43.1 42 22
44 3 4.1 9 6.6 16 2
Genotype
Total 73 100 137 100 100 100
2 2 1.4 9 3.3 3 6.4
3 116 79.5 185 67.5 59 83.6
4 28 19.2 80 29.2 38 10 Allele
Frequencies
Total 146 100 274 100 100 100

4. 2. 2. Results
Table 11: t-test results for ApoE4 hypotheses
4. 2. 3. Discussion
There were no significant differences between the ApoE4 positive and negative groups
in terms of their mean AAO or AAOf. E4 positive subjects, on average, developed
symptoms 1.13 years earlier than their family mean AAO compared to 0.83 years earlier
for ApoE4 negative subjects, although this difference was not significant. The same
analyses were performed after stratifying by FAD mutation and revealed no significant
differences.
These data do not, therefore, match previous findings of an epistatic effect of ApoE on
AAO in APP-associated FAD. This may have been due to the genuine absence of an
effect in this cohort. However, the groups have several characteristics that would hinder
Mean AAO
(SD)
Mean family AAO (SD) Mean
(AAO)-(AAOf) (SD)
ApoE4+ve
(n=22) 43.95 (6.34) 45.08 (6.82) -1.13 (3.58)
ApoE4-ve
(n=38) 44.42 (6.67) 45.26 (2.71) -0.83 (2.71)
p
0.79
0.92
0.74

131
detection of such an effect if present, making a type 2 error more likely. Although
previous reports have described ApoE’s influence on the clinical phenotype of APP
mutations (Hardy et al 1993; Sorbi et al 1995), no such effect has been shown in PSEN1
mutations. The large contribution of PSEN1 carriers to the groups may, therefore, have
masked any differences, especially as the ApoE4 positive group contained a smaller
proportion of APP carriers. The exclusion of PSEN1 cases or further stratification by
mutation may have rendered significant differences undetectable due to insufficient
power related to small group size. A further limitation of the analysis is related to an
inconsistency inherent in the source longitudinal study, namely that ascertainment of
AAO could not have been performed by the same individual across such an extended
period. Further study of the genetic basis for AD is a key requirement, not least on the
subject of potential epistatic influence. Our ever-expanding ability to analyse large
quantities of genetic data, using for example genome-wide association studies, will be
invaluable in this regard.
4. 3. Pure progressive amnesia and the APPV717G mutation.
An isolated, progressive amnestic clinical phenotype has previously been associated with
the APPV717I (London) mutation (Gankam Kengne et al 2007). The following describes
a similar pure progressive amnesia in association with a mutation at the same locus.
Additional longitudinal, volumetric MRI and neuropsychological data are presented.
4. 3. 1. Case description
Our patient (Designated VG in Figure 13) belongs to a family with an average AAO of
51.5 years (range 40-67) with pathologically proven AD in one affected member and an
APPV717G mutation demonstrated in the proband. The extended family tree (Figure 13)
is consistent with autosomal dominant inheritance:
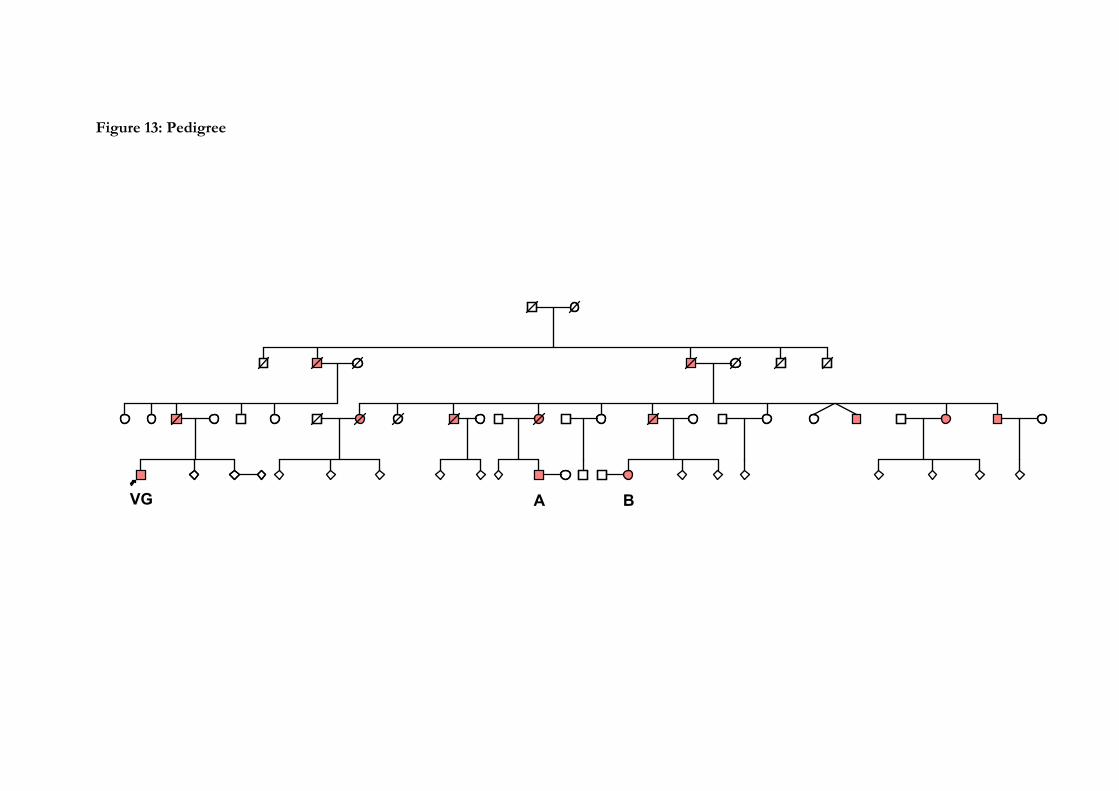
Figure 13: Pedigree
VG A B

133
The patient first developed memory problems at 44 years-of-age, with repetitious speech
and reliance upon written reminders. Over the ensuing 15 years a progressive, global
impairment of memory function occurred with striking preservation of his intellectual
capacity. This profile was demonstrated via longitudinal neuropsychological testing
(Figures 14a and 14b): He was tested approximately annually on the verbal and
performance subscales of the WAIS-R (Wechsler 1981) together with the Recognition
Memory Tests for words and faces (Warrington 1984; Warrington 1996). By 46 years, his
memory was globally impaired whereas his abilities on both the verbal and performance
subscales of the WAIS-R remained fairly static and close to the level achieved at his first
assessment.

134
Figure 14: Neuropsychological data
14a
14b
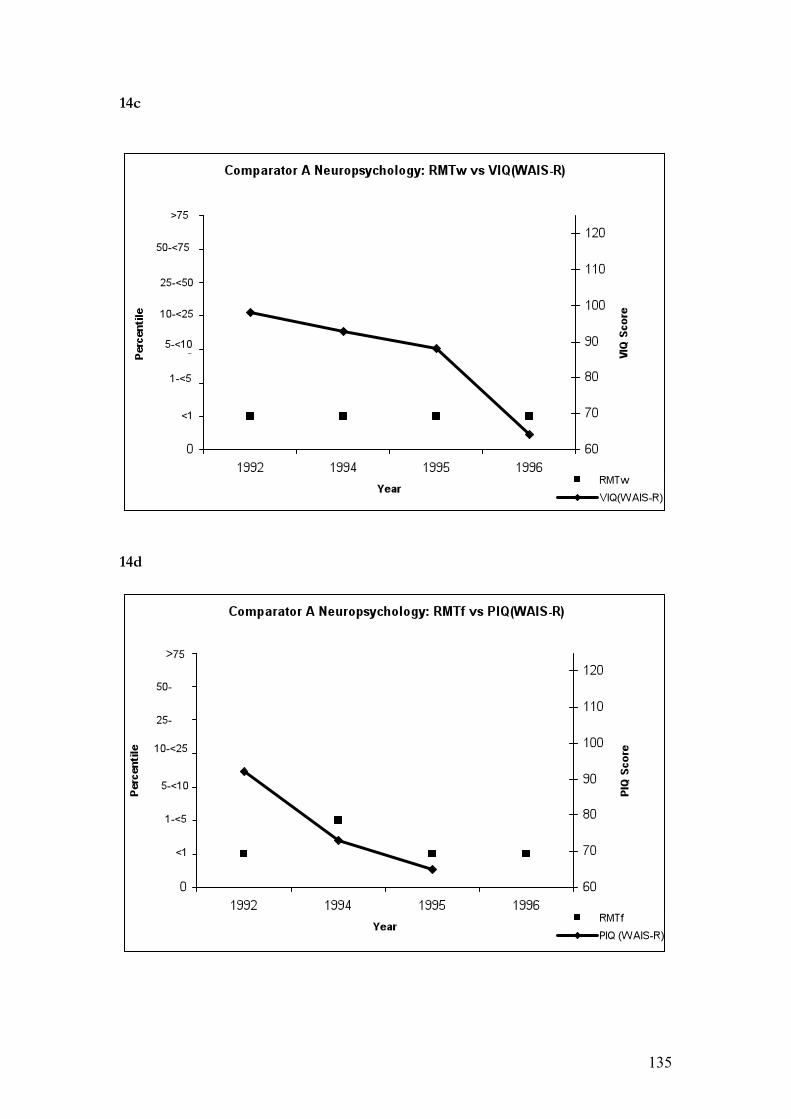
135
14c
14d

136
14e
14f
137
ApoE genotype was E3/3. Annual volumetric brain MRI (Figure 9) between 1991 and
1998 was performed using a 1.5T GE Signa scanner (General Electric Medical Systems,
Waukesha, WI, USA). Volumetric T1-weighted coronal MRI scans were obtained with a
spoiled gradient echo technique (256!128 matrix, field of view 24!24 cm,
TR/TE/NEX/FA=35 ms/5 ms/1/35°) yielding 124 contiguous 1"5 mm thick slices.
Between 2000 and 2006 imaging was undertaken on a different 1.5T GE Signa scanner
running software version 5.8 (General Electric Medical Systems, Waukesha, WI, USA).
Volumetric T1-weighted coronal MRI scans were obtained using an inversion recovery
prepared fast spoiled gradient-echo technique (256!256 matrix, field of view 24!18 cm,
TR/TE/TI/NEX/FA=14 ms/5"4 ms/650 ms/1/15°) yielding 124 contiguous 1"5 mm
thick slices. The software package MIDAS was used for all manual hippocampal and
whole brain segmentations (Freeborough et al. 1997). Fluid registration (Scahill et al.
2002) of volumetric images between 1992 and 1997 showed expansion of CSF spaces
with generalised cerebral volume loss, but clear predominance of hippocampal atrophy
(Figure 16).

138
Figure 15: Longitudinal hippocampal & whole brain volumes

139
Figure 16: Fluid registration 1992-1997.
VG’s father had been affected from the age of 59 years, and also had a relatively lengthy,
predominantly amnestic illness, dying at 74 years. Unfortunately, no more detailed
information on the nature of his illness is available. Longitudinal neuropsychological data
are available for two affected members of the same generation (designated A and B in
Figure 13). These both show a contrasting pattern characterized by deterioration in both
memory and non-memory domains (Figure 14).
Comparator A developed memory impairment at the age of 47 years. The initial
manifestation was difficulty in learning new tasks at work and he stopped work within a
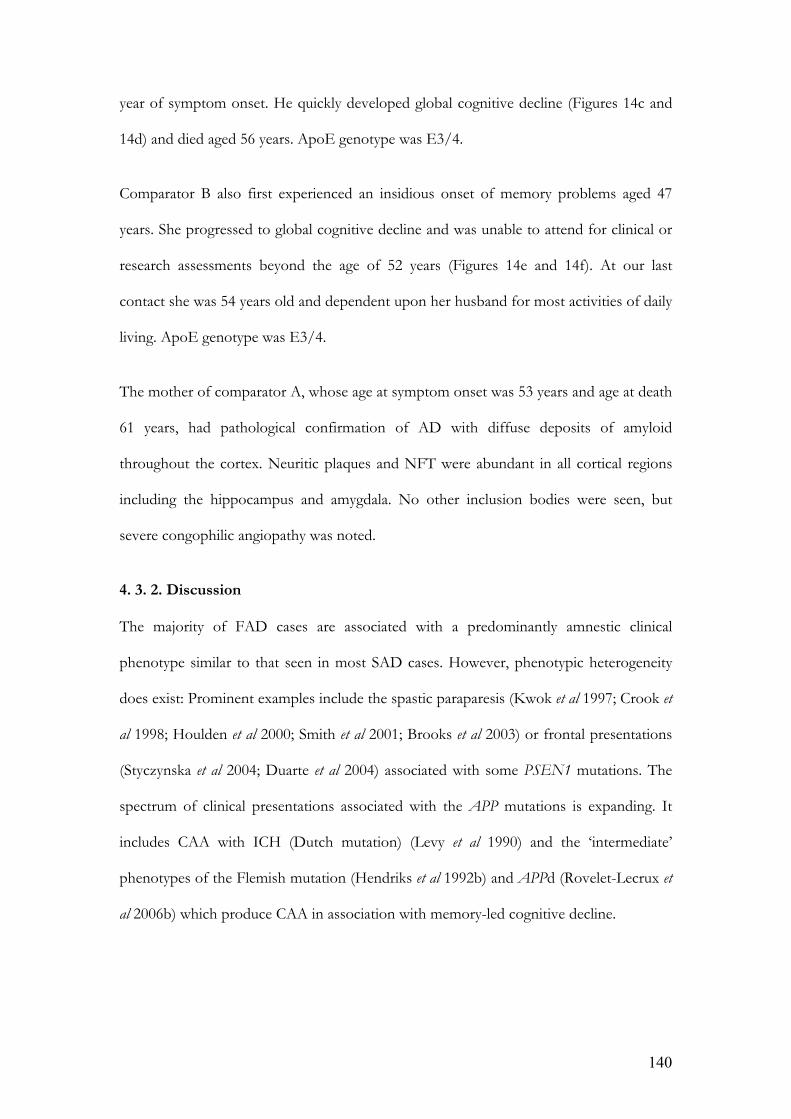
140
year of symptom onset. He quickly developed global cognitive decline (Figures 14c and
14d) and died aged 56 years. ApoE genotype was E3/4.
Comparator B also first experienced an insidious onset of memory problems aged 47
years. She progressed to global cognitive decline and was unable to attend for clinical or
research assessments beyond the age of 52 years (Figures 14e and 14f). At our last
contact she was 54 years old and dependent upon her husband for most activities of daily
living. ApoE genotype was E3/4.
The mother of comparator A, whose age at symptom onset was 53 years and age at death
61 years, had pathological confirmation of AD with diffuse deposits of amyloid
throughout the cortex. Neuritic plaques and NFT were abundant in all cortical regions
including the hippocampus and amygdala. No other inclusion bodies were seen, but
severe congophilic angiopathy was noted.
4. 3. 2. Discussion
The majority of FAD cases are associated with a predominantly amnestic clinical
phenotype similar to that seen in most SAD cases. However, phenotypic heterogeneity
does exist: Prominent examples include the spastic paraparesis (Kwok et al 1997; Crook et
al 1998; Houlden et al 2000; Smith et al 2001; Brooks et al 2003) or frontal presentations
(Styczynska et al 2004; Duarte et al 2004) associated with some PSEN1 mutations. The
spectrum of clinical presentations associated with the APP mutations is expanding. It
includes CAA with ICH (Dutch mutation) (Levy et al 1990) and the ‘intermediate’
phenotypes of the Flemish mutation (Hendriks et al 1992b) and APPd (Rovelet-Lecrux et
al 2006b) which produce CAA in association with memory-led cognitive decline.

141
The term pure progressive amnesia, as used by Barbeau et al. (2006), describes a rare
amnestic syndrome of insidious onset, with memory performance that can remain stable
or decline slowly over many years. Crucially, other cognitive domains and functional
independence are typically preserved throughout this period. It is generally held to be a
rare presentation of AD which results from MTL damage (Butters et al. 1996) and has
been reported in association with EOAD (Stokholm et al. 2005), SAD (Caselli et al. 1998),
the APPV717I (London) mutation (Gankam Kengne et al 2007) and in the context of
preserved semantic processing (Fossard et al. 2006). To date, all cases followed up have
progressed to dementia and several have had neuropathological AD confirmed (Caselli et
al 1998).
Although EOAD and autosomal dominant early onset FAD are not equivalent, FAD
forms part of a broader group of early onset disease, and it is interesting to note previous
descriptions of the clinical profile of EOAD which contrast with that of our patient. In
particular, previous studies have reported a higher prevalence of language impairment or
other neocortical functions (Jacobs et al 1994) as well as a relatively more rapid
progression (Rogaeva 2002) in EOAD as compared with LOAD. This contrasts starkly
with VG, in whom the isolated amnesia was stable over an extended period of at least 13
years. VG also differs from two comparators in the same generation of the same family,
both of whom show a decline in both memory and non-memory domains. This suggests
that the unusual phenotype seen in VG is not a function of the APPV717G mutation per
se.
ApoE genotype differs between VG (E3/3) and the comparators (both E3/4). ApoE
status has been reported to modify AAO in APPV717I-associated FAD via an epistatic
effect between the APP and ApoE genes (St George-Hyslop et al. 1994; Sorbi et al 1995).

142
This would suggest that the presence of the E4 allele predisposes to an earlier AAO,
although this is not what we observed (subject AAO 47 years, comparator’s AAO 47 and
45 years, mean AAO for family 51.5 years).
Neuroimaging in this case is consistent with the clinical features in that slow, progressive
cortical atrophy was demonstrated, though with disproportionate involvement of each
hippocampus. Medial temporal and posterior cingulate hypometabolism on SPECT and
focal hippocampal and ERC atrophy on MRI have been previously demonstrated in pure
progressive amnesia (Barbeau et al. 2006). However, little is known about the specific
radiological profile of FAD-associated pure progressive amnesia, although MRI has
previously been reported as normal (Gankam Kengne et al 2007). The rate and focality of
brain atrophy in VG differs from previous studies of early-onset, though non-autosomal
dominant, cases. For example, Frisoni et al. (2007) demonstrated more severe grey matter
atrophy in EOAD than LOAD with neocortical areas more profoundly affected in
EOAD and the hippocampus more profoundly affected in LOAD. Patients were
classified according to age only (<65 years), with no information on the presence of
FAD gene mutations or autosomal dominant family histories. The clinical and
radiological phenotypes are congruous in this case: the symptomatic decline, while
pathological, is not as rapid as one would expect in canonical AD. Similarly, the mean
rate of hippocampal volume loss over a period of more than 14 years is intermediate
(2.54%/year) between the values reported in cognitively normal subjects and those with
AD. Previous studies have found rates of 0.80% (Du et al. 2004) and 0.41% (Fox et al.
2000) for normal controls and 5-6% (Du et al 2004; Hashimoto et al. 2005) and 2.37%
(Fox et al 2000) for AD patients.
Our case provides further evidence for the existence of a protracted, purely amnestic
phenotype related to APP717 mutations, this time over at least 13 years. It also provides

143
new information regarding the nature of the regional brain volume changes associated
with this clinical syndrome.
4. 4. A novel presenilin 1 deletion (p.L166del)
4. 4. 1. Case description
The proband (II-4 Figure 17) is a member of a pedigree in which there is a history
consistent with autosomal dominantly inherited dementia. Her mother (I-2 Figure 17)
had died at the age of 46 years after suffering from progressive memory impairment
leading to dementia. The proband is a 40 year-old woman who presented with a two-year
history of insidious, progressive impairment of episodic memory first noticed by her
family. This would manifest chiefly as repeated questioning, forgetting names and the
mislaying of objects. Other early features included topographical memory impairment
and dyscalculia. Latterly, further problems had emerged such as emotional lability and an
inability to plan or order tasks.
Neurological examination was normal with no myoclonus, extrapyramidal or upper
motor neurone signs and a MMSE score of 16/30. At presentation she had clear,
widespread cognitive impairment, most notably of verbal and visual recall, working
memory and visuospatial abilities. Formal neuropsychometric testing was undertaken
showing variable performance across the subtests of the WAIS but low-average and
extremely low scores on verbal and performance IQ respectively. In addition she
performed very poorly on tests of information processing speed, visual reasoning
abilities, the Wechsler Memory Scale and Hopkins Verbal Learning Task. She achieved
average performances on tests of general knowledge and abstract verbal reasoning but
had substantial difficulty with mental arithmetic tasks.

144
MRI (Figure 18) revealed generalized, symmetrical cerebral atrophy most marked in the
MTL with a few foci of high signal within the peripheral white matter. EEG revealed
diffuse, poorly responsive theta activity at 4-6 Hz and frequent, intermittent runs of 3Hz,
raised amplitude, notched delta activity which was generalised but with a clear bilateral,
anterior emphasis. Small sharp waves were noted on occasion in the anterior regions.
CSF was normal.
4. 4. 2. Genetic analysis
Analysis of PSEN1 was conducted as described previously (Palmer et al. 1999). A novel
3bp CTT deletion at codon 166 was detected in the proband in both forward and reverse
sequencing of exon 6. This was not detected in any of 100 normal controls.
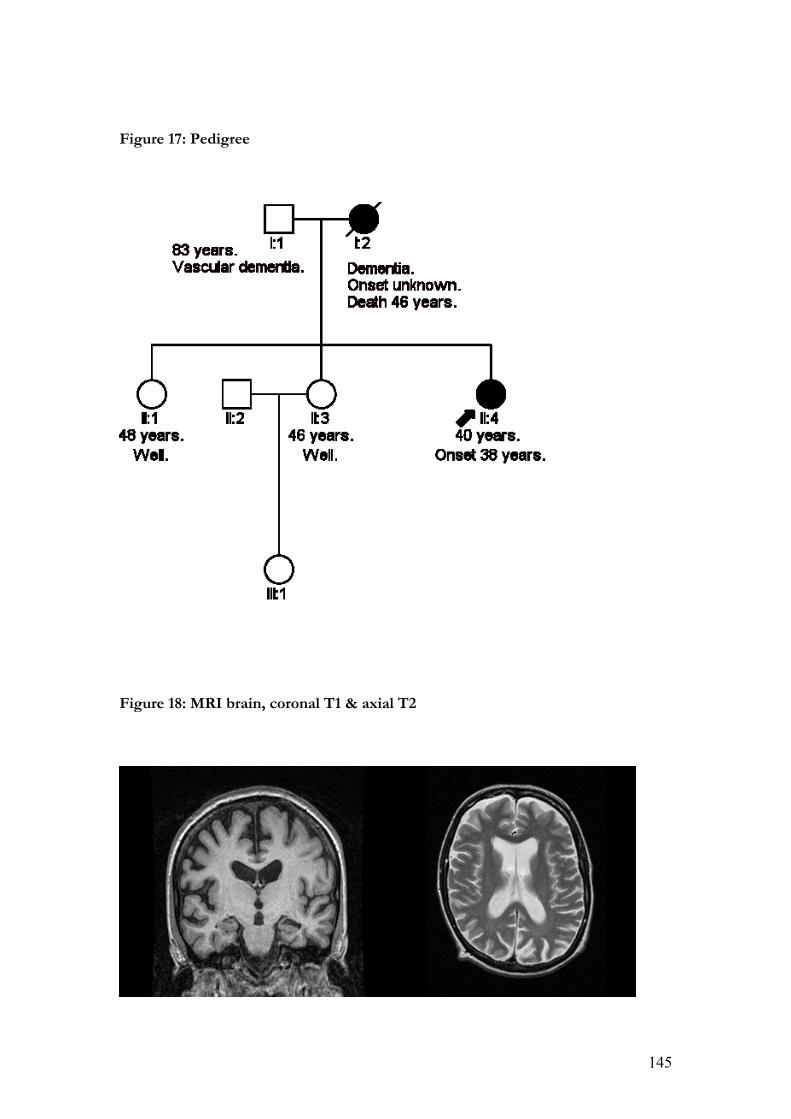
145
Figure 17: Pedigree
Figure 18: MRI brain, coronal T1 & axial T2

146
Figure 19: Sequencing electropherogram for part of the reverse compliment of
PSEN1 exon 6 showing a deletion of AAG (CTT in forward compliment, codon
166).
4. 4. 3. Discussion
Located in the third transmembrane domain of exon 6, amino acid position 166 of
PSEN1 shows significant phylogenetic conservation and in homologous proteins such as
PS2 and Sell2, suggesting that the position is of functional significance. Further, this
novel deletion was not detected in 100 healthy controls – suggesting that it is unlikely to
represent a common, non-pathogenic polymorphism. Mutations at this site co-
segregating with clinical disease have previously been reported (Ezquerra et al. 2000;
Moehlmann et al 2002; Pantieri et al. 2005) as has a deletion at codon 167 (Janssen et al
2003). In two of the former cases, a clinical phenotype similar to our proband is
described (Ezquerra et al 2000; Pantieri et al 2005). In the third (L166P), an aggressive
onset in adolescence occurs with later spastic paraparesis (Moehlmann et al 2002). Other
147
mutations, namely PSEN1 delta 290-319 and R278T, have been linked with spastic
paraparesis in some of the affected family members (Kwok et al 1997).
In contrast to deletions reported at other sites on PSEN1, our case was associated with
the ‘typical’ presentation of EOAD seen in most exon 6 mutations, and in most PSEN1
mutations per se. The presence or absence of cotton wool plaques that accompany some
other deletions remains unknown and, despite the evidence presented above, it remains
difficult to comment definitively upon the pathogenicity of this novel deletion. To do so
will require extending our knowledge of the family and revisiting the case in the light of
any future neuropathological or genetic evidence.
4. 5. A novel presenilin 1 substitution (S132A)
4. 5. 1. Case description
The proband was seen clinically at the National Hospital for Neurology and
Neurosurgery, London, presenting at the age of 64 years with a five-year history of
neuropsychiatric and cognitive symptoms. Visuoperceptual and agnostic problems,
reduplicative (Capgras) phenomena with persecutory delusions of imprisonment and
complex visual hallucinations of animals, workmates and deceased relatives were all
evident at this stage. Additional features included urinary incontinence, speech
production and comprehension problems. He was noted to have myoclonic jerks of his
arms and shoulders, bradykinesia, limb hypertonia and bilateral grasp and palmomental
reflexes.
His family history was consistent with an autosomal dominant pattern of inheritance
(Figure 20). A condition similar to that observed in the proband was noted in his mother
(who died age 61 years after an ICH), a maternal aunt, a maternal uncle (who died at 65
148
years) and his maternal grandmother who died at 76 years in an institution after a 10-year
illness associated with ‘cortical atrophy of (the) brain’.
EEG showed dominant slow wave activity and only occasional, poorly reactive !
rhythm. MRI was too poorly tolerated to be informative. Brain CT performed at age 64
years showed mild to moderate cerebral and cerebellar atrophy.
4. 5. 2. Genetic analysis
Analysis of PSEN1 was conducted as previously described (Palmer et al 1999). A novel
substitution at codon 132 was detected in the proband in both forward and reverse
sequencing of exon 5. The complete open reading frame of the prion protein gene was
also sequenced and no mutations were detected. The codon 129 genotype was
methionine valine heterozygous. It was not possible to confirm cosegregation through
testing other members of the family, although the mutation was not identified in 100
normal controls.
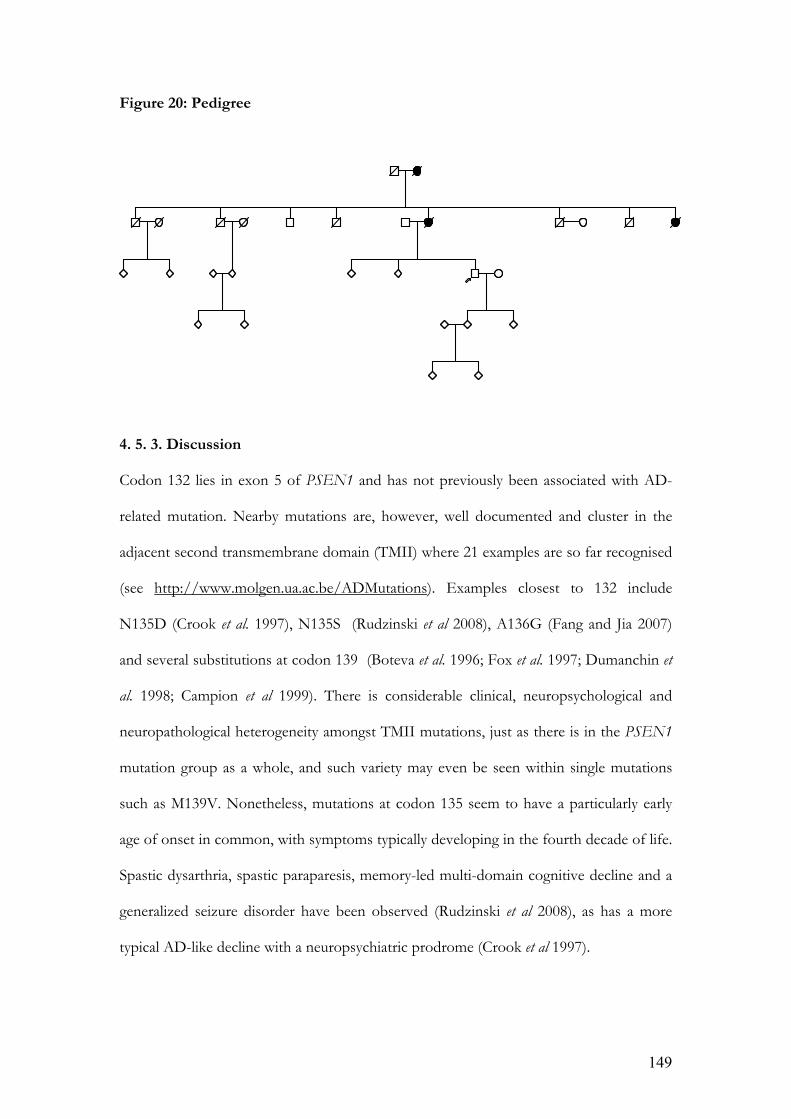
149
Figure 20: Pedigree
4. 5. 3. Discussion
Codon 132 lies in exon 5 of PSEN1 and has not previously been associated with AD-
related mutation. Nearby mutations are, however, well documented and cluster in the
adjacent second transmembrane domain (TMII) where 21 examples are so far recognised
(see http://www.molgen.ua.ac.be/ADMutations). Examples closest to 132 include
N135D (Crook et al. 1997), N135S (Rudzinski et al 2008), A136G (Fang and Jia 2007)
and several substitutions at codon 139 (Boteva et al. 1996; Fox et al. 1997; Dumanchin et
al. 1998; Campion et al 1999). There is considerable clinical, neuropsychological and
neuropathological heterogeneity amongst TMII mutations, just as there is in the PSEN1
mutation group as a whole, and such variety may even be seen within single mutations
such as M139V. Nonetheless, mutations at codon 135 seem to have a particularly early
age of onset in common, with symptoms typically developing in the fourth decade of life.
Spastic dysarthria, spastic paraparesis, memory-led multi-domain cognitive decline and a
generalized seizure disorder have been observed (Rudzinski et al 2008), as has a more
typical AD-like decline with a neuropsychiatric prodrome (Crook et al 1997).

150
There are very few similarities, therefore, between the reported features of nearby
mutations and the clinical phenotype observed in our proband. Although limb
hypertonia was observed, he displayed a relatively late AAO with prominent behavioural
and neuropsychiatric features, including visual hallucinosis. The psychiatric prodrome
described by Crook et al. was observed in only one member of the pedigree and was not
characterized by psychotic features, but rather by mood disturbance alone. The history of
ICH in the mother does raise the possibility of an associated CAA, although there was no
way to confirm this in the proband or mother and histopathology did not reveal
significant CAA in either of the codon 135 mutations discussed above. The poorly-
defined cerebellar atrophy apparent on the CT scan is consistent with previous reports of
cerebellar amyloid plaques in PSEN1 mutations (Verkkoniemi et al. 2001).
The possibility remains that the novel substitution observed here represents a non-
pathogenic polymorphism and, in the absence of confirmed cosegregation, this is
difficult to address. The strongly suggestive family history and failure to identify such a
change in a sample of normal controls does, however, lend some weight to the case for
its pathogenicity.

151
5.
CHARACTERIZING FAD
II: APP locus duplication
5. 1. Duplications of APP are a significant cause of early onset dementia in a large
UK referral series.
Patients presenting before old age with AD-like features and evidence of a familial
disease should be screened for FAD mutations. However, conventional sequencing will
not detect gene deletions or duplications. Over recent years it has become recognised
that copy number variation (CNV), caused by duplication or deletion of parts of
chromosomes, are relatively common and occur with a non-random distribution across
the genome (McCarroll and Altshuler 2007). The altered regions may include genes that
encode for proteins known to be implicated in disease.
The association between AD and Down’s syndrome has long been known, providing
evidence that a higher gene dosage of APP is sufficient to produce an AD phenotype.
Recently a number of small chromosomal duplications which include the APP locus have
been reported (see 1. 4. 2.) with an estimated frequency of 8% (Rovelet-Lecrux et al
2006b), about half the contribution of missense APP mutations to early onset, autosomal
dominant AD (Raux et al. 2005). Whilst these studies uncovered an important mutational
mechanism at APP, questions remain about the frequency of these mutations in larger,
less selected APP patient cohorts in different countries and the associated phenotypic
spectrum. The following study investigated the presence and frequency of CNV at APP
loci in a large referral cohort of UK patients, and presents an optimized methodology for
cost-effective high-throughput screening of patients for such structural variation. It also
examined the phenotype associated with APPd in this group.
152
5. 1. 1. Methods
5. 1. 2. Subjects
The AD cohort comprised two subgroups. One group was formed from a referral series
of 381 patients for a diagnostic test of AD gene mutation, average age was 53 +/- SD 10,
47% were male. This series were screened for mutations in APP, PSEN1, and PSEN2
although not all patients were screened for all genes as, for example, some patients were
referred prior to the identification of the presenilins as causal genes. This cohort largely
comprises probands with familial dementia followed-up at the Dementia Research
Centre, UCL Institute of Neurology. A further 492 patients comprise a collection of
patients thought to have AD but with insufficient clinical evidence to justify screening of
causal genes. All patients gave informed consent for genetic analysis. The University
College London Hospitals NHS Trust Local Ethics Committee gave ethical approval for
the study.
5. 1. 3. Samples
Genomic DNA (gDNA) was extracted from peripheral whole blood or post mortem
brain material using standard techniques. gDNA quality was assessed using agarose gel
electrophoresis. Only those gDNA samples of average molecular weight >10Kb were
included in the study. Concentration was assessed using a NanoDrop spectrophotometer
(ThermoScientific, NanoDrop Products, Wilmington, DE) and samples were diluted to
20ng/!l in 1X tris-EDTA buffer prior to use.
5. 1. 4. Real-Time Quantitative PCR (exon-qPCR)
APP alleles were quantified on an ABI 7000 Sequence Detection System (Applied
Biosystems, Foster City, CA, USA) using the 5’ nuclease assay and duplexed minor
groove binding (MGB) probes designed to detect APP (exon 5) and GRN (Chr 17,
153
exon1). Relative quantification of APP using GRN as the internal reference was
determined using the !Ct method. Twenty nanograms of gDNA were amplified in a 25"l
reaction volume containing 1X Expression Mix (Applied Biosystems), and the respective
primer (900nM) and probe (200nM) sets for both the gene of interest and the internal
reference using the universal protocol. Each sample was quantified in triplicate with each
replicate having a different plate reference to minimise the affect of inter-well variation.
One sample with trisomy 21 was included as a positive control on all plates. All samples
with a dosage quotient (expressed as a !CT) two standard deviations from the mean
were considered as potential CNVs.
5. 1. 5. Fluorescent Microsatellite Quantitative PCR (fm-qPCR)
APP alleles were quantified by the genotyping of two microsatellites located within
intron 1 of APP (196999; Chr21: 26,460,990 – 26,461,175) and 330kb centromeric from
APP (188463; Chr21: 25,841,358 – 25,841,530). Twenty nanograms of gDNA were
amplified by denaturation at 95˚C for 1 minute followed by 24 cycles of 95˚C for 30
seconds, 53˚C for 30 seconds and 72˚C for 1 minute. Amplicons were analysed using an
ABI 3130xl automated sequencer and GeneMapper software v.4.0 (ABI). In all
individuals heterozygous for a given marker the allelic ratio was assessed by relative peak
area. Cases were deemed CNV positive by fm-qPCR if allelic ratios were two standard
deviations from the mean and if i) both of a microsatellite pair had altered allelic ratio or
ii) one of a microsatellite pair had an altered peak ratio with the other genotyped as
homozygous or iii) only one of a microsatellite pair had an altered peak ratio but it was
the one nearest to the gene of interest.

154
5. 1. 6. Illumina 610 Bead Array
Samples identified as “potential CNV” by exon-qPCR and/or fm-qPCR were assayed
using the Illumina bead array system according to the manufacturers protocol. All
samples were assayed using the Illumina Human 610-Quad BeadChips (Illumina Inc, San
Diego, CA, USA) as per manufacturer’s instructions, using 200 ng of genomic DNA.
These BeadChips assay more than 610,000 tag single nucleotide polymorphisms (SNP)
and markers, including 60,000 CNV markers, based on the International Human
HapMap project release 23 (www.hapmap.org). All the samples genotyped had a
genotype success rate of more than 99%.
Individual chromosomes were examined using a method previously demonstrated to be
reliable for detecting genomic copy number mutations (van de Leemput et al. 2007;
Simon-Sanchez et al. 2008; Knight et al. 2008). We looked at the whole genome in each
sample, with particular interest in the region containing APP, in order to be able to
confirm the results previously obtained.
5. 1. 7. Results
5. 1. 7. 1. Laboratory findings
Using Exon-qPCR comparison was made between the amplification of APP and an
internal reference marker (APP-GRN). 21 samples from the AD cohort were considered
as potential CNVs based on the selection criteria of samples with a !Ct value greater than
2 standard deviations from the mean (see Table 12).

155
Table 12: APP CNV Screen
Total Sample Number
Double
homozygotes
Number
Screened
Positives
False Positive Rate
Exon-qPCR 873 N/A 873 21 16
fm-qPCR 873 54 819 42 37
Both 873 N/A 873 5 0
Illumina Array 5 N/A 5 5 N/A
Using fm-qPCR two polymorphic microsatellites within intron 1 and 330kB centromeric
to APP were amplified using a standard PCR protocol for analysis using fm-qPCR. A
comparison of peak area was made in all heterozygous individuals for either one or both
of the microsatellite pair. The samples screened were assessed for CNVs in this way with
only 6.1% of individuals being double homozygotes (see Table 12). 42 samples were
considered as potential CNVs. Three allelic peaks appeared on the electropherogram of
Proband 3 (microsatellite 196999). This was consistent with an unbalanced translocation
that does not appear to include Down’s syndrome critical regions.
Five samples from the APP cohort were deemed positive by both exon-qPCR and fm-
qPCR. All these samples were confirmed as heterozygote duplicates by the Illumina
array. The complementary use of these two techniques therefore represents a highly
accurate screening process for heterozygous duplications, using the Illumina array as the
gold standard assay.
The Illumina 610 Bead array was used for the verification of duplication in samples that
were identified as potential CNVs from exon-qPCR and fm-qPCR. These data showed

156
duplicated regions of Chr21q, which included the APP gene locus in all 5 probands
identified as CNVs by both exon- and fm-qPCR. There was considerable heterogeneity
in duplication size (2.77, 6.35, 4.96, 6.49Mb, see Figure 23), showing that these patients
represented separate duplication events. Although Proband 3 had been identified by fm-
qPCR as having three microsatellite alleles, the array revealed this patient to have an
extended discontinuous duplication of Chr21q. There are no available SNP for the p arm
of Chr21 so this could not be assessed. The large duplicated region is interrupted by a
region of unduplicated SNP (see Figure 16). In conjunction with the microsatellite
haplotyping, these data are consistent with an unbalanced translocation of Chr 21. Of the
five positive individuals of the AD cohort, 4 (1%), (Probands 1, 2, 3 and 5) originated
from the referral series of 381 patients for a diagnostic test of AD gene mutation and
screened for APP, PSEN1, PSEN2 and 1 (0.2%), (Proband 4) originated from 492
patients comprising a collection of patients thought to have AD but with insufficient
clinical evidence to justify screening of causal genes.

157
Figure 21: APPd detection using alteration in the ratio of area under the curve of
microsatellite alleles on electropherogram traces.
The histograms in Figure 21 illustrate the distribution of allelic peak area ratios. Variation
occurring among the ratios of microsatellite allelic areas appeared to be polymodal. This
observation was caused by ‘stutter’ peaks immediately preceding each microsatellite allele.
Microsatellite stutter peaks accentuate the peak of the shorter allele to a degree that is

158
based upon the size differential of the two alleles. Thus, the degree of difference in base
pairs between two alleles accounts for part of the variation in allelic ratios. When the two
microsatellite alleles are widely separated in length, the ratio is not affected by stutter
peaks, whereas when alleles are adjacent the ratio is affected most. This phenomenon
accounts for most of the false positives using this method alone.
Differences in base number between allelic pairs are illustrated by different colour.
Shaded areas highlight samples 2 standard deviations from the mean.
A) Microsatellite marker 188463: Proband 5 had a normal allelic peak ratio. Array
analysis confirmed that this marker lay outside the duplication boundary for this
individual.
B) Microsatellite marker 196999: Proband 3 had three microsatellite peaks. And
Proband 1 was uninformative due to homozygosity.

159
Figure 22: Confirmation of APPd using Illumina array technology
Heterozygous duplications in 5 probands. Regions of duplication are highlighted in red
boxes. In order to examine individual chromosomes for structural mutations the
visualization tool Genome Viewer version 3.2.9 within Beadstudio version 3.1.3.0
(Illumina Inc, San Diego, CA, USA) was used. An ideogram of Chr 21 and the B allele
frequency is illustrated. 1 pixel=56 KB.
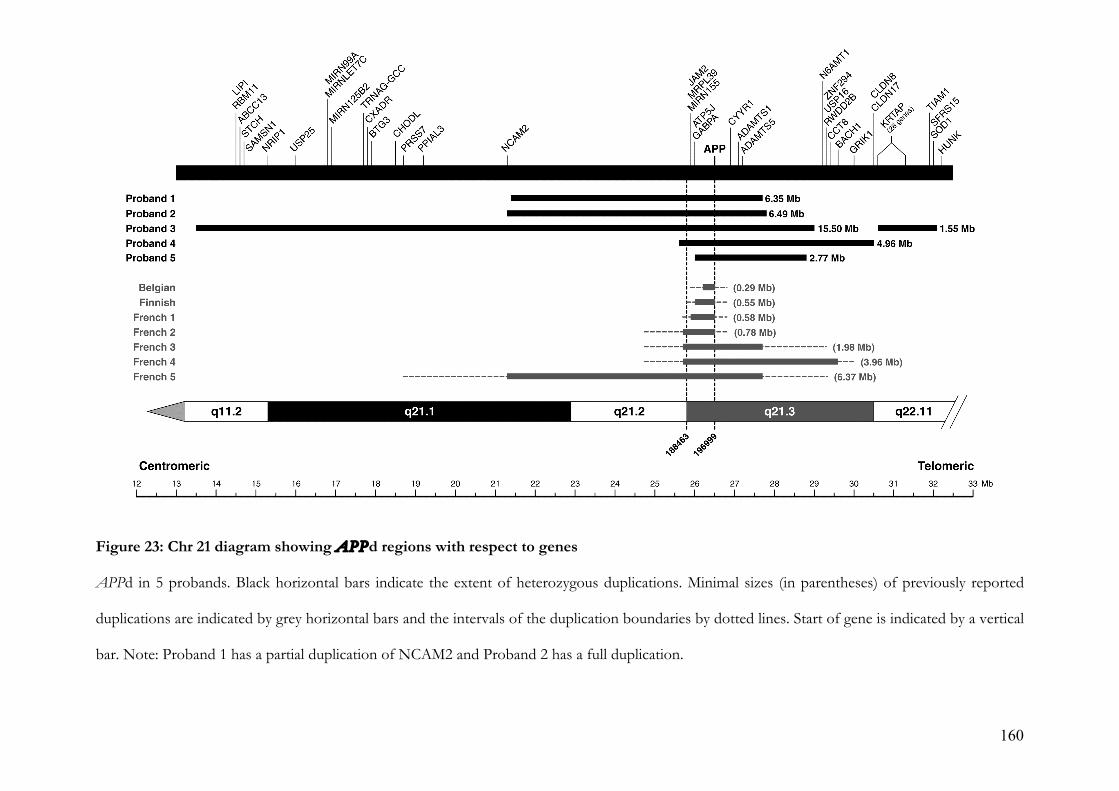
160
Figure 23: Chr 21 diagram showing APPd regions with respect to genes
APPd in 5 probands. Black horizontal bars indicate the extent of heterozygous duplications. Minimal sizes (in parentheses) of previously reported
duplications are indicated by grey horizontal bars and the intervals of the duplication boundaries by dotted lines. Start of gene is indicated by a vertical
bar. Note: Proband 1 has a partial duplication of NCAM2 and Proband 2 has a full duplication.

161
5. 1. 7. 2. Clinical and investigation findings
5. 1. 7. 2. 1. Proband 1
This 54y-old man had a progressive impairment of episodic memory, beginning
insidiously at the age of 48y. Impairment of verbal memory was clearly impaired at
presentation, although general intellectual functions were preserved. He went on to
develop an apperceptive agnosia, limb apraxia and dysexecutive features. He was a
former smoker. At 52y he had a generalized tonic-clonic seizure and elected not to
commence anti-convulsant treatment, although donepezil 10mg was prescribed around
this time. There was an autosomal dominant family history of EOAD: his father died at
62y after onset of disease in his late 40s, a paternal uncle died at 63y and a paternal aunt
died at 49y, both after an undefined dementing illness (Figure 26a).
Initial MRI brain scanning showed widespread T2 FLAIR white matter hyperintensities
consistent with subcortical vascular disease; multiple small, deep cerebral and cerebellar
haemorrhages on T2* imaging and an old left-sided amygdala haemorrhage (see Figure
24). EEG was unremarkable. There was no history of sustained hypertension and
cholesterol was 3.5mmmol/L. Tests for Notch 3 (CADASIL), ITM2B (Familial British
Dementia), APP, PSEN1, PSEN2, PRNP and MAPT mutations were all negative. CSF
analysis was unremarkable except for ttau of 555pg/mL and Aß1-42 of 128pg/mL.
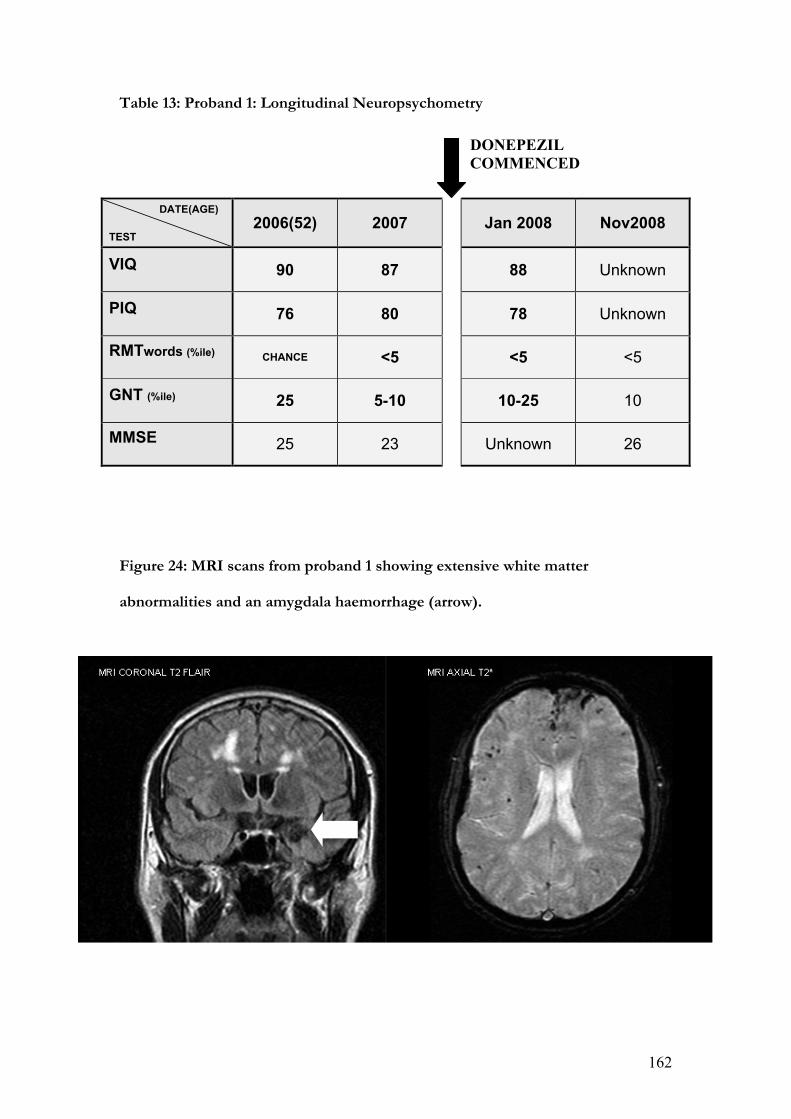
162
Table 13: Proband 1: Longitudinal Neuropsychometry
DATE(AGE)
TEST
2006(52) 2007
Jan 2008 Nov2008
VIQ
90 87
88 Unknown
PIQ
76 80
78 Unknown
RMTwords (%ile)
CHANCE <5
<5 <5
GNT (%ile)
25 5-10
10-25 10
MMSE
25 23
Unknown 26
Figure 24: MRI scans from proband 1 showing extensive white matter
abnormalities and an amygdala haemorrhage (arrow).
DONEPEZIL
COMMENCED

163
5. 1. 7. 2. 2. Proband and family 2
This man belongs to a family with a strong history of both early onset seizures and mid-
life cognitive impairment (Figure 26b). He developed a variety of seizure types from the
age of 11y with brief absences occurring up to five times per day and generalized tonic-
clonic seizures on average once per year. A flurry of seizures at the age of 40y heralded
increasing social withdrawal, apathy and an inability to follow simple commands. His
cognition progressively deteriorated, including problems with memory, mood and
wandering, as well as prominent myoclonus. From the age of 49y he had word-finding
difficulties, which progressed to the extent that he would barely speak. He became
increasingly immobile and incontinent of urine. He had no other past medical history,
though he had previously been a heavy smoker. On examination at the age of 50y he had
an MMSE score of 10/30, a paucity of speech, perseveration, poor concentration,
moderate limb dyspraxia and visuoperceptual difficulties.
Figure 25: MRI scans from proband 2 (aged 47y) showing white matter
abnormalities and hippocampal atrophy.

164
General neurological examination revealed a supranuclear gaze palsy affecting vertical
movements, a brisk jaw jerk and brisk limb reflexes. His final MRI brain scan at age 50y
revealed severe, generalized cerebral volume loss and bilateral hippocampal atrophy.
There was extensive periventricular white matter signal change, more so on the right than
the left. EEG showed an excess of slow wave activity with absent !-rhythm, while
telemetry revealed bifrontal spike activity. CSF was acellular with normal total protein,
negative oligoclonal bands and negative Whipple’s PCR. Genetic screening for APP,
PSEN1, PSEN2, ITM2B, DRPLA, HD and common mitochondrial mutations were
negative. White cell enzymes were normal. He also underwent skeletal muscle and skin
biopsies. The former showed no evidence of mitochondrial myopathy and the latter
showed no Lafora bodies. Longitudinal neuropsychological testing was undertaken
(Table 14) which demonstrated a relentless, slow, global cognitive decline. His sister also
developed both generalized and absence seizures at the age of 11y. From the age of 50y
she had a gradual, progressive impairment of episodic memory, with mild word-finding
difficulties, low mood and emotional lability. Her MRI brain scan showed scattered,
bilateral, peri-ventricular areas of high signal in the deep white matter, basal ganglia and
pons. There was also a high signal area in the right frontal lobe consistent with an old
infarct. CSF examination was unremarkable. Early onset seizures also affected his
mother, a maternal aunt, one of his sisters, the daughter and granddaughter of one of his
unaffected sisters as well as the grandson of another of his unaffected sisters although
samples are not available for testing of segregation in these individuals. His mother died
aged 64y with a long history of psychiatric problems. Lifelong generalized epilepsy was
complicated by post-ictal paranoid psychosis and, although little information is available
on her early life, problems with activities of daily living, self-care and an inability to
remember her medication were present at least from the age of 62y.
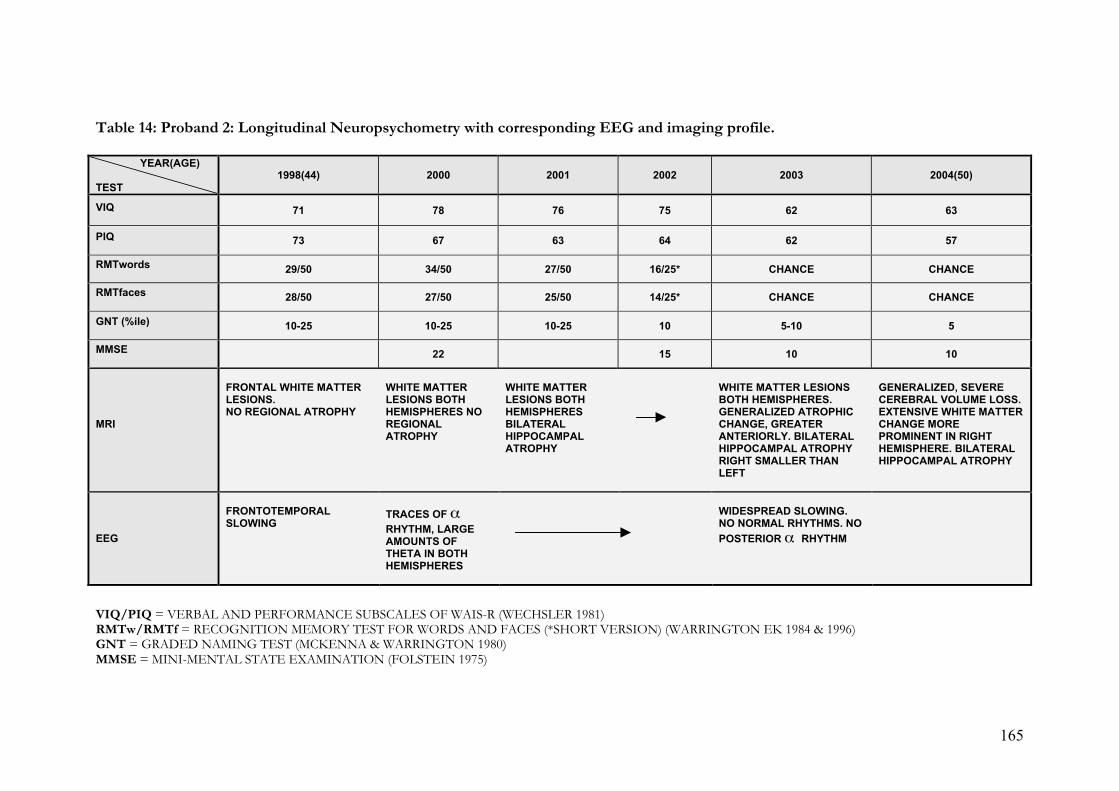
165
Table 14: Proband 2: Longitudinal Neuropsychometry with corresponding EEG and imaging profile.
YEAR(AGE) TEST
1998(44) 2000 2001 2002 2003 2004(50)
VIQ
71 78 76 75 62 63
PIQ
73 67 63 64 62 57
RMTwords
29/50 34/50 27/50 16/25* CHANCE CHANCE
RMTfaces
28/50 27/50 25/50 14/25* CHANCE CHANCE
GNT (%ile)
10-25 10-25 10-25 10 5-10 5
MMSE
22 15 10 10
MRI
FRONTAL WHITE MATTER LESIONS. NO REGIONAL ATROPHY
WHITE MATTER LESIONS BOTH HEMISPHERES NO REGIONAL ATROPHY
WHITE MATTER LESIONS BOTH HEMISPHERES BILATERAL HIPPOCAMPAL ATROPHY
WHITE MATTER LESIONS BOTH HEMISPHERES. GENERALIZED ATROPHIC CHANGE, GREATER ANTERIORLY. BILATERAL HIPPOCAMPAL ATROPHY RIGHT SMALLER THAN LEFT
GENERALIZED, SEVERE CEREBRAL VOLUME LOSS. EXTENSIVE WHITE MATTER CHANGE MORE PROMINENT IN RIGHT HEMISPHERE. BILATERAL HIPPOCAMPAL ATROPHY
EEG
FRONTOTEMPORAL SLOWING
TRACES OF ! RHYTHM, LARGE AMOUNTS OF THETA IN BOTH HEMISPHERES
WIDESPREAD SLOWING. NO NORMAL RHYTHMS. NO
POSTERIOR ! RHYTHM
VIQ/PIQ = VERBAL AND PERFORMANCE SUBSCALES OF WAIS-R (WECHSLER 1981) RMTw/RMTf = RECOGNITION MEMORY TEST FOR WORDS AND FACES (*SHORT VERSION) (WARRINGTON EK 1984 & 1996) GNT = GRADED NAMING TEST (MCKENNA & WARRINGTON 1980)
MMSE = MINI-MENTAL STATE EXAMINATION (FOLSTEIN 1975)
166
Information about histological post-mortem brain examination was limited, and hence
inconclusive. A cavity consistent with previous haemorrhage or infarct was noted in the
white matter, with abundant haemosiderin and surrounding gliosis. Several of the cortical
and leptomeningeal vessels had evidence of hyaline degeneration and scanty diffuse
amyloid plaques were present in the striatum.
5. 1. 7. 2. 3. Proband 3
This Greek man presented at 42 years old with a three-year history of mislaying items
and forgetting events. Later problems with route finding were noted with increasing
social withdrawal. Episodes of uncontrollable weeping occurred with associated malaise,
rolling of the eyes and post-ictal confusion. These episodes were responsive to anti-
convulsant therapy. He was an only child of two healthy parents and had no known
extended family history of dementia (Figure 26e). MRI brain scans revealed generalized
atrophy and EEG revealed an absence of ! rhythm with disorganised activity and delta
discharges. CSF analysis was unremarkable. Screening of APP, PSEN1 and PRNP was
negative. Neuropsychometry revealed a relatively preserved social façade, marked
difficulty with non-verbal reasoning, dysexecutive features and impaired episodic
memory. Comprehension was intact, word-retrieval problems and speech production
errors (in the form of substitutions, deletions and transpositions) were evident as well as
apperceptive agnosia. Reading, writing, calculation, visuoperceptual and visuospatial skills
were impaired and limb apraxia was present.
167
5. 1. 7. 2. 4. Proband and family 4
Little clinical information about this proband is available, although it is known that she
suffered from a progressive temporoparietal dementia. Later she developed
extrapyramidal features, although the sporadic use of dopamine antagonists may have
contributed. AAO is unknown but by 57y she was resident in a nursing home and had a
severe dementia with dysphasia, dyspraxia, motor perseveration, utilization behaviour
and wandering. We lost contact at this point, after obtaining the blood sample used for
this analysis and determining her ApoE genotype as E3E3. Nothing is known about her
only sibling but her mother is known to have died aged 49y from pathologically
confirmed ‘cerebral haemorrhage’ and ‘cystic degeneration of the brain’ after a presenile
dementing illness (Figure 26c shows pedigree).
5. 1. 7. 2. 5. Proband and family 5
This 55 year-old woman had progressive memory problems since the age of 48y when
she fell out of bed having had a focal seizure. Seizures consisted of an olfactory aura
followed by a focal seizure affecting her right arm. Complex partial and atonic seizures
progressed and were refractory to therapy. She developed progressive cognitive
symptoms. Aged 53y her MMSE was 16/30 and ACE 50/100. Aged 54y MMSE was
12/30 and a year later, MMSE was 4/30. Her cognitive profile was typical of AD. Apart
from generally brisk reflexes, neurological examination was normal.
MRI imaging showed atrophy of the left temporal lobe compared to the right. HMPAO
SPECT scan which showed some irregular diminution of perfusion of the left parieto-
occipital region compared to the right. These appearances were felt to represent
ischaemic change or AD.

168
The patient’s mother died aged 66y of cancer but had progressive cognitive problems for
5 years including word finding difficulties and neologisms (see Figure 26d for pedigree).
Figure 26: Pedigrees

169
Table 15: Clinical features of 16 individuals with definite or probable APPd.
Pedigree Proband APPd AAO Age of Death Clinical features Seizures ICH
AIII.1 1 (14660) Yes 48 - Memory loss, apraxia, dysexecutive
Late onset tonic-clonic Yes
AI.1 - - - - - -
AI.2 - - - - - -
AII.1 - - 63 Dementia No -
AII.2 - Late 40s 62 Dementia No -
AII.3 - - 49 Dementia No -
BIII.2 2 (8183) Yes 40 - Memory loss, myoclonus Early onset tonic-clonic
from age 11 No
BI.1 - - No Early onset -
BI.2 - - No Early onset -
BII.1 - - No Early onset -
BII.2 - - No Early onset -
BIII.1 - 50 - Memory loss, word finding difficulty, altered mood
Generalized and complex partial seizures
No
CII.1 3 (7015) Yes 39 - Memory loss, social withdrawal
Probably complex partial seizures
No
DII.1 4 (19505) Yes - - - - No
DII.2 - - 49 Dementia - Yes
EII.1 5 (17320) Yes 48 - Memory loss Late onset generalized
and complex partial No
EI.1 - 61 66 Memory loss, word finding difficulty
No No

170
5. 1. 8. Discussion
We describe the screening of a large and heterogeneous referral series to identify CNVs
causing early onset dementia. Five probands with APPd were identified in the screen,
four with evidence of familial dementia and one with a sporadic disease. The overall
frequency of mutation in our series was 0.57% (95% CI 0.19-1.33). Although we confirm
APPd to be relatively rare, the frequency in this series was comparable to that of
missense mutations (5 different APP missense mutations in the series). The previously
reported mutation frequency in FAD was 8% (95% CI 2.6-17.1) in a French series
(Rovelet-Lecrux et al. 2006a), 2.7% (95% CI 0.32-9.3) in a Dutch series of FAD (Sleegers
et al. 2006) and 0% in a Swedish and Finnish cohort of EOAD (95% CI 0-2.58) (Blom et
al. 2008). Our data are not directly comparable with more selected studies as two from
the five probands were not identified as having a familial disease until after mutations
were identified and this aspect of the history was reconsidered. Only one from the five
probands was considered likely to have CAA because of a scan finding of a small ICH.
In one proband (3) we detected a complex discontinuous APPd mutation associated with
sporadic EOAD. This individual had three microsatellite alleles at one locus and a double
allele dose at the second locus tested. The APPd patchily involved almost the entire
Chr21q, but critically did not include the Down’s Syndrome Critical Region around
21q22. The largest continuous region of duplication was 15.5Mb. These data are
consistent with a different mutational mechanism from other APPd, an unbalanced
translocation. In four probands, continuous duplications of 1.6-6.5 Mb including APP
were detected; one mutation was slightly larger than any previously reported.
Although the clinical phenotype of APPd may vary within families, it does not appear to
be influenced by the size of the duplication itself (Rovelet-Lecrux et al. 2007), a finding

171
supported by our results. Documented ages at onset range from 40-59y which is broadly
in keeping with our data (range 39-61y) (Remes et al. 2004b; Cabrejo et al. 2006a). No
clinical features of Down’s syndrome have yet been observed although dementia and
CAA seem universal, with a quarter also suffering ICH. There was also a high incidence
of seizures (57%) in published series. Our data corroborate these reports with a high
proportion of patients having seizures in the clinical course. One family (B) has an
autosomal dominant family history of partial seizures, with partial seizures from
adolescence in both patients subsequently affected by a cognitive disorder. Whether
these early seizures are coincidental, are caused by a linked gene abnormality, or
a very early manifestation of CAA is unknown. Clinically, APPd-related AD is
intermediate between the canonical AD phenotype observed in most APP mutations and
the frequent, CAA-associated ICH seen in the Dutch mutation. This intermediate
phenotype has already prompted comparison with the Flemish APPA692G mutation
(Hendriks et al. 1992a), which has similar characteristics. It seems likely that CAA does
indeed underlie ICH and white matter lesions in these patients given the clear evidence
of CAA-associated ICH in other APP mutations mentioned above. The anticipated
association with microhaemorrhage is confirmed only in Proband 1 through the use of
gradient echo/T2* MRI sequences (Figure 24). These sequences had not been
performed in other cases or were not available.
The methods used, successfully identified 5 patients where duplication had occurred. 5
further samples that showed borderline abnormalities on exon-qPCR were all normal
using the Illumina array. Each detection method has its own merits and neither can be
used exclusively for the detection of CNV. Although not fully accurate, exon-qPCR
cannot be confounded by genomic admixture due to accidental contamination. In
contrast the accuracy of fm-qPCR supercedes that of exon-qPCR but is susceptible to

172
admixture as well as requiring heterozygosity of the marker, although this is largely
resolved by typing two markers rather than one. In tandem the techniques are highly
complementary and extremely effective at detecting duplications. Screening large
numbers of samples as described here is a relatively powerful way of detecting and
characterizing rare genetic phenomena. However, it presents ethical as well as practical
challenges because the findings may have real clinical implications for the families
concerned. Many samples had been held for a number of years and contact had long
since been lost with individuals, meaning that the potential for communicating a positive
finding was minimal. Despite this, every effort was made to give the relevant individuals
the opportunity to discuss positive findings and to offer them the appropriate clinical
support. The issue of sample age is a key limitation of this study as the most modern
supportive investigations (such as the latest MRI sequences and CSF biomarkers) could
not be incorporated into the characterizations. This factor may also have influenced
diagnostic accuracy and therefore frequency estimation. The potential influence of CNVs
at other loci and in other genes/diseases is an intriguing prospect and a possible focus
for future research.
173
6.
CONCLUSIONS
Chapter 2 confirmed that structural measurement of the cerebral cortex is now both
feasible, and practical, with the potential to be a useful biomarker of onset, progression
and intervention. In this respect it could be considered to have achieved its aims. It
demonstrated that CTh analysis may detect the pathological onset of AD some years
before symptoms are apparent – the very period in which any new disease-modifying
therapy would ideally be introduced. It therefore constitutes further evidence of a
preclinical ‘window of opportunity’. Further, by showing that diagnosis accompanies an
acceleration of grey matter loss, it also highlights the consequences of failing to recognise
this window and intervene appropriately. Accelerated cortical thinning might be the
radiological correlate of accelerated clinical decline observed after a preclinical plateau
(see 1. 6. 1.). This plateau may represent the temporary success of compensatory
mechanisms and is possibly related to cognitive reserve. Particular regions in the MTL
and heteromodal association cortices are identified as significant in early disease, helping
to focus subsequent clinical and research imaging.
The precise nature of the relationship between cerebral Aß, macroscopic disease and
clinical state remains controversial and interpretation of the 11C-PiB PET data presented
herein (see chapter 3) is correspondingly challenging. However, several important issues
are raised by this study. It offers support for the notion of heterogeneity amongst
PSEN1 mutations both in terms of their molecular imaging profiles and, by inference,
their regional pathological profiles. Some individuals displayed widespread 11C-PiB
retention, some showed striatal prominence, while others had more retention in the
cerebellum than other areas of the brain. It is possible that, in future, 11C-PiB PET could

174
help to sub-classify FAD more precisely and that clinico-pathological studies may be able
to identify the clinical correlates of the various imaging profiles identified. Chapter 3 also
demonstrates that, just as presymptomatic disease may be detected with structural and
functional imaging techniques, so abnormal levels of fibrillar Aß can be detected in
clinically unaffected individuals destined to develop manifest AD. 11C-PiB PET is,
therefore, another technique with the potential to facilitate earlier diagnosis and monitor
the success of disease-modifying therapies. FAD and SAD subjects both demonstrated
elevated levels of brain Aß which distinguished them from controls. However,
differences were highlighted in the imaging profiles of these groups indicating that the
relationship of one to another is not simple and raising issues about the limitations of the
familial paradigm. As amyloid imaging becomes more widespread, confirmation that the
cerebellum may not be a universally appropriate reference region is an important
additional finding. So far such labour intensive, expensive structural and molecular
markers have provided only incremental advances in diagnostic sensitivity and specificity.
They are some way from being suitable or practical for use in the routine care of typical
AD, but this situation is likely to change in light of future research and improved
availability.
A viable familial paradigm demands as full a characterization of FAD as possible, and
variations in clinical phenotype within FAD families provide an ideal opportunity to
explore environmental and genetic factors which may underlie disease expression.
Chapters 4 and 5 contribute to this. Their component studies have identified two novel
pathogenic PSEN1 mutations (p. L166del and S132A), explored their clinical,
neuroimaging and neuropsychological features, and added to existing evidence of
heterogeneity in this group. Similarly, through the novel association of pure progressive
amnesia with the V717G substitution, they have expanded our understanding of the

175
varied APP mutation-associated syndromes. Single case studies of this kind, while useful
in generating hypotheses and alerting us to unusual phenomena, have important
limitations: In particular, they are descriptive rather than explanatory by nature and do
not allow conclusions to be drawn about populations. Such qualitative studies have no a
priori hypothesis and merely provide a modest, incremental contribution to an existing
body of knowledge on the FAD group. They also highlight the sometimes unreliable
phenotypic links between FAD and SAD and could be considered superficially damaging
to the FAD paradigm in this regard. However, the continuing discovery of mutations in
genes implicated in APP processing, which produce AD pathology and, in the vast
majority of cases, a typical AD clinical phenotype is in itself supportive of an intimate
link between FAD and SAD. In this respect these case descriptions strengthen the
FAD/SAD bond. It is important that such work continues into the future, with
heterogeneity a crucial area for study if we are to more precisely define said relationship.
At a group level, non-canonical FAD phenotypes emphatically remain the exception and,
while this situation persists, the paradigm at the heart of this thesis survives.
In chapter 5, APPd, to date a less well-defined phenomenon, was shown to be an
important, if rare cause of familial dementia in one of the largest groups so far examined,
and was found to have characteristic clinical and neuroimaging features. These include
dementia, CAA, ICH and generalized seizures. The descriptive portion of the study
contributes to the concept of a familial ‘model’ in the manner discussed above. Beyond
this, my initial hypotheses were two-fold: first that large-scale screening of samples for
these rare mutations was feasible and second that the prevalence of APPd was higher
than was widely appreciated, making such screening a desirable facility. The first was
proven while the second was, in a strict sense, inconclusive. However, if the unselected
nature of my cohort is taken into account, the mutation frequency is relatively high i.e. it

176
is not dissimilar to figures found in highly selected cohorts. That APPd may be more
common than first thought has real implications for the clinical care of families with
autosomal dominant dementia, especially in cases where no missense mutation or
deletion has yet been found. This study helps to highlight the ethical issues inherent in
translational research where patient autonomy and informed consent must be reconciled
responsibly with new discoveries, especially where they relate to long-held biological
samples. The prospect that CNVs may be important in other degenerative diseases is also
raised - a potential avenue for further research.
The known similarities and differences between FAD and SAD are summarized in
section 1.4. although, as discussed above, the former remain more numerous and hence
more compelling. The pros and cons of using this model are clear: there are persuasive,
enduring similarities between FAD and SAD, which currently provide the only realistic
opportunity to predict and make diagnoses with certainty. However, the apparently
strong relationship between the two is inexact and incompletely defined. Proof of the
validity of the FAD paradigm was not amongst the aims of this thesis and, therefore, no
component study was designed to specifically address this. Rather, reference to the
familial paradigm in the title was intended to reflect a methodological imperative – the
need to utilise FAD to explore the potential of imaging biomarkers in identifying,
monitoring and modifying AD per se. The validity of FAD as a model for SAD is not
refuted by any findings herein although the aims did include a better understanding of
relevant limitations of the paradigm through examination of comparatively rare
phenotypic variations attributable to equally rare specific mutations. These more
qualitative objectives were largely met through the descriptive studies presented. I can
make no more assertive a statement than to say that there are, in my opinion, more

177
reasons to suppose features of FAD are broadly generalizable to SAD than there are to
suppose they are not.
I believe this work offers grounds for optimism where the successful application of these
imaging biomarkers is concerned. It also supports the view that a small number of
families may hold the key to helping the many people living with AD, both now and in
the future. Each story is unique, most are humbling, but those who so kindly participated
in this research were united in their hope of sparing future generations their own burden.
To hear their stories and to join them in this aim has been a privilege.
Ich hab mich verloren (I have lost myself)
- Auguste Deter 1850-1906

178
7.
APPENDICES
7. 1. NINCDS-ADRDA criteria for the diagnosis of Alzheimer’s disease
(McKhann e t a l 1984).
Criteria for the clinical diagnosis of PROBABLE Alzheimer’s disease include:
Dementia established by clinical examination and documented by the MMSE or some
similar examination and confirmed by neuropsychological tests;
• deficits in at least two areas of cognition
• progressive deterioration of memory and other cognitive functions
• no disturbance of consciousness
• onset between ages 40 and 90
• absence of systemic disorders that in and of themselves could account for the
progressive deficits.
Diagnosis of PROBABLE Alzheimer's disease supported by:
Progressive deterioration of specific cognitive functions such as language (aphasia), motor
skills (apraxia) and perception (agnosia)
• impaired activities of daily living
• family history of similar disorders, particularly if confirmed neuropathologically
• normal CSF and EEG
• evidence of cerebral atrophy on CT with progression documented by serial observation
Features consistent with the diagnosis:
• plateaus in the course of the disease
• associated psychiatric symptoms

179
• neurological abnormalities with more advanced disease including increased tone,
myoclonus or gait disorder
• seizures in advanced disease
• CT normal for age
Diagnosis of PROBABLE Alzheimer’s disease unlikely if:
• sudden onset
• focal neurological signs
• seizures or gait disturbance early in the disease
DEFINITE Alzheimer’s disease if:
• clinical criteria for probable Alzheimer’s disease
• histopathological evidence obtained from biopsy or autopsy
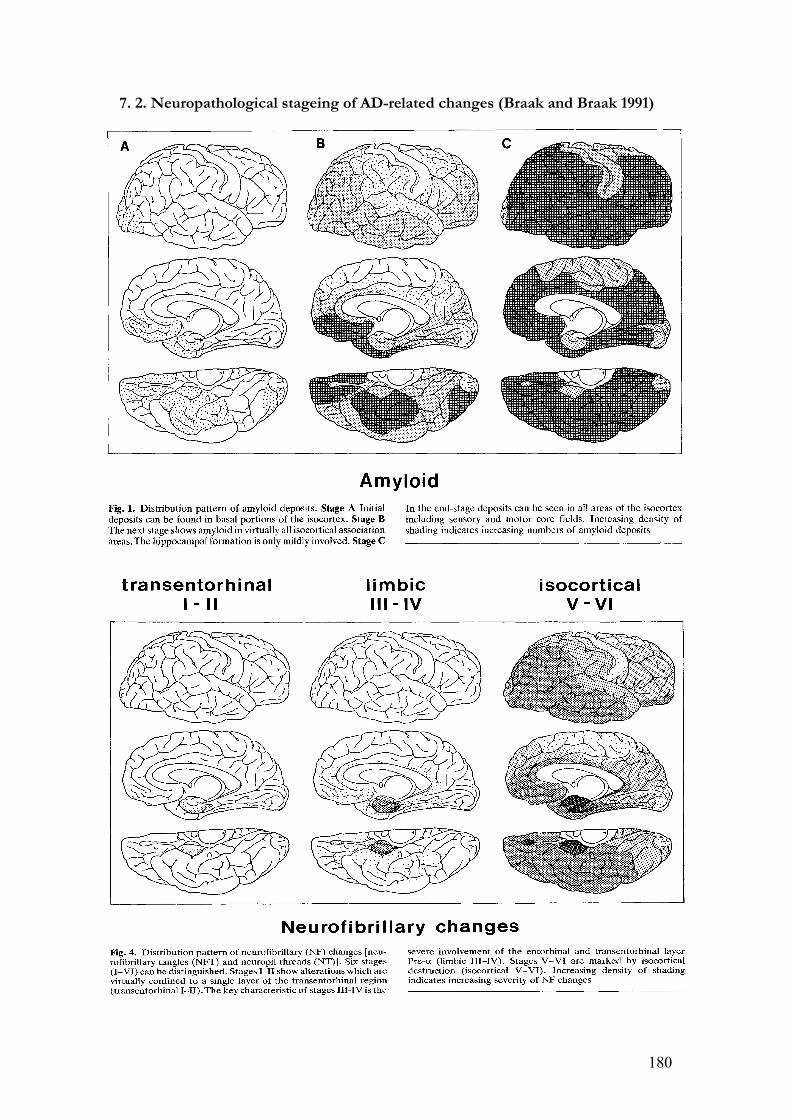
180
7. 2. Neuropathological stageing of AD-related changes (Braak and Braak 1991)
181
7. 3. Publications related to this thesis
Duplications of APP – but not PRNP – are a significant cause of early onset dementia in
a large UK referral series *McNaughton D., *Knight W. D. et al
In press Brain August 2010 (Joint first authorship)
Knight W. D., Kim L.G., Douiri A., Frost C., Rossor M. N., Fox N. C
Acceleration of cortical thinning in familial Alzheimer’s disease
Neurobiology of Aging 2009: In press (doi: 10.1016/j.neurobiolaging.2009.11.013)
W. D. Knight MRCP(UK), R. Laila. Ahsan MSc, Jessica Jackson BSc, Lisa Cipolotti
PhD, Elizabeth K. Warrington DSc, Nick C. Fox FRCP, Martin N. Rossor FRCP.
Pure Progressive Amnesia & the APPV717G Mutation.
Alzheimer Disease and Associated Disorders 2009; 23: 410–414.
W. D. Knight, N. C. Fox, M. N. Rossor and J. D. Warren.
The Cultural Context of Visual Hallucinations.
Postgraduate Medical Journal 2008; 84: 103-105.
Rohrer JD, Knight WD, Warren JE, Fox NC, Rossor MN, Warren JD
Word-finding difficulty: a clinical analysis of the progressive aphasias.
Brain 2008; 131(Pt 1): 8-38.
W. D. Knight, J. Kennedy, S. Mead, M. N. Rossor, J. Beck, J. Collinge, C. Mummery.
A Novel Presenilin 1 Deletion (p.L166del) Associated with Early Onset Familial
Alzheimer’s Disease. European Journal of Neurology 2007; 14: 829-831.

182
7. 4. Acknowledgements and statement of personal contribution
The work presented in this thesis was carried out at the Dementia Research Centre, UCL
Institute of Neurology, Queen Square, London under the directorship of Professor M.
N. Rossor, MA MD FRCP FMedSci. The work was carried out between 2005 and 2009
when I held the posts of clinical research fellow at the Dementia Research Centre, UCL
Institute of Neurology and honorary specialist registrar at the National Hospital for
Neurology and Neurosurgery, Queen Square and St. Mary's Hospital, Paddington,
London. Throughout this period I was also an investigator in a commercial phase IIa
clinical trial of passive immunotherapy in AD. At the time of writing a phase III trial of
the IMP (bapineuzumab) is about to commence.
The majority of this work was devised and performed personally although a substantial
minority was performed with the assistance of collaborators as detailed below.
An initially MRC-funded longitudinal study had been initiated by Professor Martin
Rossor which consisted of prospective clinical, radiological and neuropsychological
assessment of members of FAD families (see 4. 1.). This study was the major source of
data and participants for the studies described herein. Neuropsychological assessment
was performed in the Department of Clinical Neuropsychology, National Hospital for
Neurology and Neurosurgery under the supervision of Professor L. Cipolotti, and at the
Dementia Research Centre under the supervision of Professor E. Warrington and Dr. S.
Crutch.
MRI scanning was performed at UCL Institute of Neurology. I would like to
acknowledge the technical assistance of Dr. J. Rohrer and Dr. A. Douiri in the

183
manipulation of MR images for CTh analysis. I am also grateful to J. Foster for
performing hippocampal segmentation. PET scanning was performed at the MRC
Clinical Sciences Centre and Division of Neuroscience, Imperial College London by Dr.
A. Okello under the supervision of Professor D. Brooks.
Statistical support was kindly provided by C. Frost and L. Kim of the Medical Statistics
Unit, Department of Epidemiology and Population Health, London School of Hygiene
and Tropical Medicine and by Dr. F. Turkheimer of the MRC Clinical Sciences Centre,
Hammersmith Hospital, London.
The APPd study involved collaborators at several sites: neuropathological input was
received from Professor T. Revesz of UCL Institute of Neurology and Professor J. Lowe
of the University of Nottingham; PCR analysis of genomic DNA was performed at MRC
Prion Unit, Department of Neurodegenerative Disease, UCL Institute of Neurology by
D. McNaughton under the supervision of Dr. S. Mead and Professor J. Collinge.
Many members of staff at the Dementia Research Centre provided invaluable discussion,
advice, support and encouragement. Their help is gratefully acknowledged and in
particular Professor M. N. Rossor, Professor N. C. Fox, Dr. J. D. Warren, Dr. J. M.
Schott, Professor E. K. Warrington, Dr. E. J. Wild and Dr. J. D. Rohrer. Finally I extend
my sincere thanks to the patients and their families, to whom I owe a particular debt.

184
References
Akiyama H, Barger S, Barnum S, Bradt B, Bauer J, Cole GM, Cooper NR, Eikelenboom P, Emmerling M, Fiebich BL, Finch CE, Frautschy S, Griffin WST, Hampel H, Hull M, Landreth G, Lue LF, Mrak R, Mackenzie IR, Mcgeer PL, O'Banion MK, Pachter J, Pasinetti G, Plata-Salaman C, Rogers J, Rydel R, Shen Y, Streit W, Strohmeyer R, Tooyoma I, Van Muiswinkel FL, Veerhuis R, Walker D, Webster S, Wegrzyniak B, Wenk G, Wyss-Coray T. Inflammation and Alzheimer's disease. Neurobiology of Aging 2000; 21: 383-421.
Alexander GE, Chen K, Pietrini P, Rapoport SI, Reiman EM. Longitudinal PET Evaluation of Cerebral Metabolic Decline in Dementia: A Potential Outcome Measure in Alzheimer's Disease Treatment Studies. Am J Psychiatry 2002; 159: 738-745.
Alladi S, Xuereb J, Bak T, Nestor P, Knibb J, Patterson K, Hodges JR. Focal cortical presentations of Alzheimer's disease. Brain 2007; 130: 2636-2645.
Allen LS, Richey MF, Chai YM, Gorski RA. Sex-Differences in the Corpus-Callosum of the Living Human-Being. Journal of Neuroscience 1991; 11: 933-942.
Alloul K, Sauriol L, Kennedy W, Laurier C, Tessier G, Novosel S, Contandriopoulos A. Alzheimer's disease: a review of the disease, its epidemiology and economic impact. Archives of Gerontology and Geriatrics 1998; 27: 189-221.
Alzheimer , A. Uber einen eigenartigen schweren Erkrankungsproseß der Hirnrinde. Neurologisches Centralblatt 23, 113-114. 1906. Ref Type: Generic
Am.Psychiatr.Assoc. Diagnostic and Statistical Manual of Mental Disorders. Washington DC: 1994.
Amtul Z, Lewis PA, Piper S, Crook R, Baker M, Findlay K, Singleton A, Hogg M, Younkin L, Younkin SG, Hardy J, Hutton M, Boeve BF, Tang-Wai D, Golde TE. A presenilin 1 mutation associated with familial frontotemporal dementia inhibits !-secretase cleavage of APP and notch. Neurobiology of Disease 2002; 9: 269-273.
Andreasen N, Hesse C, Davidsson P, Minthon L, Wallin A, Winblad B, Vanderstichele H, Vanmechelen E, Blennow K. Cerebrospinal fluid beta-amyloid((1-42)) in Alzheimer disease - Differences between early- and late-onset Alzheimer disease and stability during the course of disease. Archives of Neurology 1999; 56: 673-680.
Archer HA, Edison P, Brooks DJ, Barnes J, Frost C, Yeatman T, Fox NC, Rossor MN. Amyloid load and cerebral atrophy in Alzheimer's disease: an 11C-PIB positron emission tomography study. Ann Neurol 2006; 60: 145-147.
Ashford JW, Mortimer JA. Non-familial Alzheimer's disease is mainly due to genetic factors. J Alzheimers.Dis 2002; 4: 169-177.
Bachurin S, Bukatina E, Lermontova N, Tkachenko S, Afanasiev A, Grigoriev V, Grigorieva I, Ivanov Y, Sablin S, Zefirov N. Antihistamine agent dimebon as a novel neuroprotector and a cognition enhancer. Neuroprotective Agents 2001; 939: 425-435.

185
Backman L, Small BJ. Influences of cognitive support on episodic remembering: tracing the process of loss from normal aging to Alzheimer's disease. Psychol Aging 1998; 13: 267-276.
Bakchine S, Loft H. Memantine treatment in patients with mild to moderate Alzheimer's disease: results of a randomised, double-blind, placebo-controlled 6-month study. J Alzheimers.Dis 2008; 13: 97-107.
Bakkour A, Morris JC, Dickerson BC. The cortical signature of prodromal AD: Regional thinning predicts mild AD dementia. Neurology 2008.
Barbas H, Blatt GJ. Topographically specific hippocampal projections target functionally distinct prefrontal areas in the rhesus monkey. Hippocampus 1995; 5: 511-533.
Barbeau EJ, Didic M, Felician O, Tramoni E, Guedj E, Ceccaldi M, Poncet M. Pure progressive amnesia: An atypical amnestic syndrome? Cognitive Neuropsychology 2006; 23: 1230-1247.
Bard F, Cannon C, Barbour R, Burke RL, Games D, Grajeda H, Guido T, Hu K, Huang JP, Johnson-Wood K, Khan K, Kholodenko D, Lee M, Lieberburg I, Motter R, Nguyen M, Soriano F, Vasquez N, Weiss K, Welch B, Seubert P, Schenk D, Yednock T. Peripherally administered antibodies against amyloid beta-peptide enter the central nervous system and reduce pathology in a mouse model of Alzheimer disease. Nature Medicine 2000; 6: 916-919.
Barnes J, Scahill RI, Frost C, Schott JM, Rossor MN, Fox NC. Increased hippocampal atrophy rates in AD over 6 months using serial MR imaging. Neurobiol Aging 2008; 29: 1199-1203.
Bayles, Kazniak. Communication and cognition in normal aging and dementia. Boston: College Hill Press, 1987.
Bennett DA, Schneider JA, Wilson RS, Bienias JL, Arnold SE. Neurofibrillary tangles mediate the association of amyloid load with clinical Alzheimer disease and level of cognitive function. Archives of Neurology 2004; 61: 378-384.
Benoit M, Andrieu S, Lechowski L, Gillette-Guyonnet S, Robert PH, Vellas B. Apathy and depression in Alzheimer's disease are associated with functional deficit and psychotropic prescription. Int J Geriatr Psychiatry 2007.
Bentahir M, Nyabi O, Verhamme J, Tolia A, Horre K, Wiltfang J, Esselmann H, De Strooper B. Presenilin clinical mutations can affect !-secretase activity by different mechanisms. Journal of Neurochemistry 2006; 96: 732-742.
Berger. Über das Elektrenkephalogramm des Menschen. Dritte Mitteilung. Arch Psychiatr Nervenkr 1931; 94: 16-60.
Berr C, Wancata J, Ritchie K. Prevalence of dementia in the elderly in Europe. European Neuropsychopharmacology 2005; 15: 463-471.
Bird TD. Genetic aspects of Alzheimer disease. Genetics in Medicine 2008; 10: 231-239.
186
Birks J. Cholinesterase inhibitors for Alzheimer's disease. Cochrane Database of Systematic Reviews 2006.
Bitsch A, Bruhn H, Vougioukas V, Stringaris A, Lassmann H, Frahm J, Bruck W. Inflammatory CNS demyelination: Histopathologic correlation with in vivo quantitative proton MR spectroscopy. American Journal of Neuroradiology 1999; 20: 1619-1627.
Blessed G, Tomlinson B, Roth M. Association Between Quantiative Measures of Dementia and of Senile Change in Cerebral Grey Matter of Elderly Subjects. British Journal of Psychiatry 1968; 114: 797-&.
Blom ES, Viswanathan J, Kilander L, Helisalmi S, Soininen H, Lannfelt L, Ingelsson M, Glaser A, Hiltunen M. Low prevalence of APP duplications in Swedish and Finnish patients with early-onset Alzheimer's disease. European Journal of Human Genetics 2008; 16: 171-175.
Bobinski M, de Leon MJ, Convit A, De Santi S, Wegiel B, Tarshish CY, Saint Louis LA, Wisniewski HM. MRI of entorhinal cortex in mild Alzheimer's disease. Lancet 1999; 353: 38-40.
Boeve BF, Maraganore DM, Parisi JE, Ahlskog JE, Graff-Radford N, Caselli RJ, Dickson DW, Kokmen E, Petersen RC. Pathologic heterogeneity in clinically diagnosed corticobasal degeneration. Neurology 1999; 53: 795-800.
Bonte FJ, Harris TS, Hynan LS, Bigio EH, White CL. Tc-99m HMPAO SPECT in the differential diagnosis of the dementias with histopathologic confirmation. Clinical Nuclear Medicine 2006; 31: 376-378.
Borchelt DR, Thinakaran G, Eckman CB, Lee MK, Davenport F, Ratovitsky T, Prada CM, Kim G, Seekins S, Yager D, Slunt HH, Wang R, Seeger M, Levey AI, Gandy SE, Copeland NG, Jenkins NA, Price DL, Younkin SG. Familial Alzheimer's disease-linked presenilin 1 variants elevate A beta 1-42/1-40 ratio in vitro and in vivo. Neuron 1996; 17: 1005-1013.
Boteva K, Vitek M, Mitsuda H, deSilva H, Xu PT, Small G, Gilbert JR. Mutation analysis of presenilin 1 gene in Alzheimer's disease. Lancet 1996; 347: 130-131.
Bozzali M, Franceschi M, Falini A, Pontesilli S, Cercignani M, Magnani G, Scotti G, Comi G, Filippi M. Quantification of tissue damage in AD using diffusion tensor and magnetization transfer MRI. Neurology 2001; 57: 1135-1137.
Braak E, Griffing K, Arai K, Bohl J, Bratzke H, Braak H. Neuropathology of Alzheimer's disease: what is new since A. Alzheimer? European Archives of Psychiatry and Clinical Neuroscience 1999; 249: 14-22.
Braak H, Braak E. Neuropathological Staging of Alzheimer-Related Changes. Acta Neuropathologica 1991; 82: 239-259.
Braak H, Braak E. Evolution of the neuropathology of Alzheimer's disease. Acta Neurologica Scandinavica 1996a; 93: 3-12.
Braak H, Braak E. Evolution of the neuropathology of Alzheimer's disease. Acta Neurologica Scandinavica 1996b; 93: 3-12.

187
Brenner RP, Ulrich RF, Spiker DG, Sclabassi RJ, Reynolds CF, Marin RS, Boller F. Computerized Eeg Spectral-Analysis in Elderly Normal, Demented and Depressed Subjects. Electroencephalography and Clinical Neurophysiology 1986; 64: 483-492.
Brooks WS, Kwok JBJ, Kril JJ, Broe GA, Blumbergs PC, Tannenberg AE, Lamont PJ, Hedges P, Schofield PR. Alzheimer's disease with spastic paraparesis and 'cotton wool' plaques: two pedigrees with PS-1 exon 9 deletions. Brain 2003; 126: 783-791.
Brunia CHM. Neural aspects of anticipatory behavior. Acta Psychologica 1999; 101: 213-242.
Buckner RL, Snyder AZ, Shannon BJ, LaRossa G, Sachs R, Fotenos AF, Sheline YI, Klunk WE, Mathis CA, Morris JC, Mintun MA. Molecular, structural, and functional characterization of Alzheimer's disease: Evidence for a relationship between default activity, amyloid, and memory. Journal of Neuroscience 2005; 25: 7709-7717.
Bullock R. The clinical benefits of rivastigmine may reflect its dual inhibitory mode of action: An hypothesis. International Journal of Clinical Practice 2002; 56: 206-214.
Bullock R, Touchon J, Bergman H, Gambina G, He YS, Rapatz G, Nagel J, Lane R. Rivastigmine and donepezil treatment in moderate to moderately-severe Alzheimer's disease over a 2-year period. Current Medical Research and Opinion 2005; 21: 1317-1327.
Burgess N, Becker S, King JA, O'Keefe J. Memory for events and their spatial context: models and experiments. Philosophical Transactions of the Royal Society B-Biological Sciences 2001; 356: 1493-1503.
Burggren AC, Zeineh MM, Ekstrom AD, Braskie MN, Thompson PM, Small GW, Bookheimer SY. Reduced cortical thickness in hippocampal subregions among cognitively normal apolipoprotein E e4 carriers. Neuroimage 2008; 41: 1177-1183.
Burns A. Another nail in the coffin of the cognitive paradigm of dementia. Br.J Psychiatry 2009; 194: 199-200.
Burns A, Allen H, Tomenson B, Duignan D, Byrne J. Bright light therapy for agitation in dementia: a randomized controlled trial. Int Psychogeriatr. 2009; 1-11.
Burns JM, Cronk BB, Anderson HS, Donnelly JE, Thomas GP, Harsha A, Brooks WM, Swerdlow RH. Cardiorespiratory fitness and brain atrophy in early Alzheimer disease. Neurology 2008; 71: 210-216.
Butters MA, Lopez OL, Becker JT. Focal temporal lobe dysfunction in probable Alzheimer's disease predicts a slow rate of cognitive decline. Neurology 1996; 46: 687-692.
Bylsma FW, Moberg PJ, Doty RL, Brandt J. Odor identification in Huntington's disease patients and asymptomatic gene carriers. J Neuropsychiatry Clin Neurosci 1997; 9: 598-600.
Cabrejo L, Guyant-Marechal L, Laquerriere A, Vercelletto M, De la Fourniere F, Thomas-Anterion C, Verny C, Letournel F, Pasquier F, Vital A, Checler F, Frebourg T,

188
Campion D, Hannequin D. Phenotype associated with APP duplication in five families. Brain 2006a; 129: 2966-2976.
Cabrejo L, Guyant-Marechal L, Laquerriere A, Vercelletto M, De la Fourniere F, Thomas-Anterion C, Verny C, Letournel F, Pasquier F, Vital A, Checler F, Frebourg T, Campion D, Hannequin D. Phenotype associated with APP duplication in five families. Brain 2006b; 129: 2966-2976.
Callen DJ, Black SE, Gao F, Caldwell CB, Szalai JP. Beyond the hippocampus: MRI volumetry confirms widespread limbic atrophy in AD. Neurology 2001; 57: 1669-1674.
Campion D, Dumanchin C, Hannequin D, Dubois B, Belliard S, Puel M, Thomas-Anterion C, Michon A, Martin C, Charbonnier F, Raux G, Camuzat A, Penet C, Mesnage V, Martinez M, Clerget-Darpoux F, Brice A, Frebourg T. Early-onset autosomal dominant Alzheimer disease: Prevalence, genetic heterogeneity, and mutation spectrum. American Journal of Human Genetics 1999; 65: 664-670.
Carmo Martins, Lima FL, Rodrigues MO, Albergaria I, Fonseca A. Influence of the APOE genotypes in some atherosclerotic risk factors. Acta Med Port. 2008; 21: 433-440.
Carson JA, Turner AJ. beta-amyloid catabolism: roles for neprilysin (NEP) and other metallopeptidases? Journal of Neurochemistry 2002; 81: 1-8.
Caselli RJ, Couce ME, Osborne D, Deen HG, Parisi JP. From slowly progressive amnesic syndrome to rapidly progressive Alzheimer disease. Alzheimer Disease & Associated Disorders 1998; 12: 251-253.
Chan AS, Salmon DP, Butters N. Semantic network abnormalities in patients with
Alzheimer's disease. Fundamentals of Neural Network Modeling. Cambridge MA: MIT Press, 1998: 381-93.
Chan D, Janssen JC, Whitwell JL, Watt HC, Jenkins R, Frost C, Rossor MN, Fox NC. Change in rates of cerebral atrophy over time in early-onset Alzheimer's disease: longitudinal MRI study. Lancet 2003; 362: 1121-1122.
Chen P, Ratcliff G, Belle SH, Cauley JA, DeKosky ST, Ganguli M. Patterns of cognitive decline in presymptomatic Alzheimer disease: a prospective community study. Arch Gen Psychiatry 2001; 58: 853-858.
Chetelat G, Desgranges B, de la Sayette V, Viader F, Eustache F, Baron JC. Mapping gray matter loss with voxel-based morphometry in mild cognitive impairment. Neuroreport 2002; 13: 1939-1943.
Christen-Zaech S, Kraftsik R, Pillevuit O, Kiraly M, Martins R, Khalili K, Miklossy J. Early olfactory involvement in Alzheimer's disease. Canadian Journal of Neurological Sciences 2003; 30: 20-25.
Chui DH, Tanahashi H, Ozawa K, Ikeda S, Checler F, Ueda O, Suzuki H, Araki W, Inoue H, Shirotani K, Takahashi K, Gallyas F, Tabira T. Transgenic mice with Alzheimer presenilin 1 mutations show accelerated neurodegeneration without amyloid plaque formation. Nature Medicine 1999; 5: 560-564.

189
Clark RF, Hutton M, Fuldner RA, Froelich S, Karran E, Talbot C, Crook R, Lendon C, Prihar G, He C, Korenblat K, Martinez A, Wragg M, Busfield F, Behrens MI, Myers A, Norton J, Morris J, Mehta N, Pearson C, Lincoln S, Baker M, Duff K, Zehr C, Pereztur J, Houlden H, Ruiz A, Ossa J, Lopera F, Arcos M, Madrigal L, Collinge J, Humphreys C, Ashworth A, Sarner S, Fox N, Harvey R, Kennedy A, Roques P, Cline RT, Phillips CA, Venter JC, Forsell L, Axelman K, Lilius L, Johnston J, Cowburn R, Viitanen M, Winblad B, Kosik K, Haltia M, Poyhonen M, Dickson D, Mann D, Neary D, Snowden J, Lantos P, Lannfelt L, Rossor M, Roberts GW, Adams MD, Hardy J, Goate A. The Structure of the Presenilin-1 (S182) Gene and Identification of 6 Novel Mutations in Early-Onset Ad Families. Nature Genetics 1995; 11: 219-222.
Colliot O, Chetelat G, Chupin M, Desgranges B, Magnin B, Benali H, Dubois B, Garnero L, Eustache F, Lehericy S. Discrimination between Alzheimer Disease, Mild Cognitive Impairment, and Normal Aging by Using Automated Segmentation of the Hippocampus. Radiology 2008.
Convit A, de Leon MJ, Golomb J, George AE, Tarshish CY, Bobinski M, Tsui W, De Santi S, Wegiel J, Wisniewski H. Hippocampal atrophy in early Alzheimer's disease: anatomic specificity and validation. Psychiatr.Q. 1993; 64: 371-387.
Corder EH, Saunders AM, Strittmatter WJ, Schmechel DE, Gaskell PC, Small GW, Roses AD, Haines JL, Pericakvance MA. Gene Dose of Apolipoprotein-e Type-4 Allele and the Risk of Alzheimers-Disease in Late-Onset Families. Science 1993; 261: 921-923.
Corwin J, Serby M, Conrad P, Rotrosen J. Olfactory Recognition Deficit in Alzheimers and Parkinsonian Dementias. Ircs Medical Science-Biochemistry 1985; 13: 260.
Crook R, Ellis R, Shanks M, Thal LJ, Pereztur J, Baker M, Hutton M, Haltia T, Hardy J, Galasko D. Early-onset Alzheimer's disease with a presenilin-1 mutation at the site corresponding to the Volga German presenilin-2 mutation. Annals of Neurology 1997; 42: 124-128.
Crook R, Verkkoniemi A, Perez-Tur J, Mehta N, Baker M, Houlden H, Farrer M, Hutton M, Lincoln S, Hardy J, Gwinn K, Somer M, Paetau A, Kalimo H, Ylikoski R, Poyhonen M, Kucera S, Haltia M. A variant of Alzheimer's disease with spastic paraparesis and unusual plaques due to deletion of exon 9 of presenilin 1. Nature Medicine 1998; 4: 452-455.
Croot K, Hodges JR, Xuereb J, Patterson K. Phonological and articulatory impairment in Alzheimer's disease: a case series. Brain Lang 2000; 75: 277-309.
Cruts M, Van Duijn CM, Backhovens H, Van den BM, Wehnert A, Serneels S, Sherrington R, Hutton M, Hardy J, George-Hyslop PH, Hofman A, Van Broeckhoven C. Estimation of the genetic contribution of presenilin-1 and -2 mutations in a population-based study of presenile Alzheimer disease. Hum.Mol.Genet. 1998; 7: 43-51.
Dale AM, Fischl B, Sereno MI. Cortical surface-based analysis - I. Segmentation and surface reconstruction. Neuroimage 1999; 9: 179-194.
Davies L, Wolska B, Hilbich C, Multhaup G, Martins R, Simms G, Beyreuther K, Masters CL. A4 Amyloid Protein Deposition and the Diagnosis of Alzheimers-Disease -

190
Prevalence in Aged Brains Determined by Immunocytochemistry Compared with Conventional Neuropathologic Techniques. Neurology 1988; 38: 1688-1693.
Davis DG, Schmitt FA, Wekstein DR, Markesbery WR. Alzheimer neuropathologic alterations in aged cognitively normal subjects. Journal of Neuropathology and Experimental Neurology 1999a; 58: 376-388.
Davis KL, Mohs RC, Marin D, Purohit DP, Perl DP, Lantz M, Austin G, Haroutunian V. Cholinergic markers in elderly patients with early signs of Alzheimer disease. JAMA 1999b; 281: 1401-1406.
De Felice FG, Wu D, Lambert MP, Fernandez SJ, Velasco PT, Lacor PN, Bigio EH, Jerecic J, Acton PJ, Shughrue PJ, Chen-Dodson E, Kinney GG, Klein WL. Alzheimer's disease-type neuronal tau hyperphosphorylation induced by A beta oligomers. Neurobiology of Aging 2008; 29: 1334-1347.
de Jong D, Jansen RWMM, Kremer BPH, Verbeek MM. Cerebrospinal fluid amyloid beta(42)/phosphorylated tau ratio discriminates between Alzheimer's disease and vascular dementia. Journals of Gerontology Series A-Biological Sciences and Medical Sciences 2006; 61: 755-758.
de Leon MJ, Convit A, Wolf OT, Tarshish CY, DeSanti S, Rusinek H, Tsui W, Kandil E, Scherer AJ, Roche A, Imossi A, Thorn E, Bobinski M, Caraos C, Lesbre P, Schlyer D, Poirier J, Reisberg B, Fowler J. Prediction of cognitive decline in normal elderly subjects with 2-[F-18]fluoro-2-deoxy-D-glucose/positron-emission tomography (FDG/PET). Proceedings of the National Academy of Sciences of the United States of America 2001; 98: 10966-10971.
De Strooper B, Saftig P, Craessaerts K, Vanderstichele H, Guhde G, Annaert W, Von Figura K, Van Leuven F. Deficiency of presenilin-1 inhibits the normal cleavage of amyloid precursor protein. Nature 1998; 391: 387-390.
Deane R, Wu ZH, Sagare A, Davis J, Yan SD, Hamm K, Xu F, Parisi M, Larue B, Hu HW, Spijkers P, Guo H, Song XM, Lenting PJ, Van Nostrand WE, Zlokovic BV. LRP/amyloid beta-peptide interaction mediates differential brain efflux of A beta isoforms. Neuron 2004; 43: 333-344.
Delis, Massman PJ, Butters N, Salmon DP, Cermak LS, Kramer JH. Profiles of
demented and amnesic patients on the California Verbal Learning Test: implications
for the assessment of memory disorders. Psychol.Assess. 1991; 19-26.
Demuro A, Mina E, Kayed R, Milton SC, Parker I, Glabe CG. Calcium dysregulation and membrane disruption as a ubiquitous neurotoxic mechanism of soluble amyloid oligomers. J Biol.Chem. 2005; 280: 17294-17300.
Department of Health. Living well with dementia: a National Dementia strategy. www.dh.gov.uk/en/Publicationsandstatistics/Publications/PublicationsPolicyAndGuidance/DH_094058 . 2009. Ref Type: Electronic Citation
Dermaut B, Kumar-Singh S, De Jonghe C, Cruts M, Lofgren A, Lubke U, Cras P, Dom R, De Deyn PP, Martin JJ, Van Broeckhoven C. Cerebral amyloid angiopathy is a

191
pathogenic lesion in Alzheimer's disease due to a novel presenilin 1 mutation. Brain 2001; 124: 2383-2392.
Dermaut B, Kumar-Singh S, Engelborghs S, Theuns J, Rademakers R, Sacrens J, Pickut BA, Peeters K, Van den Broeck M, Vennekens K, Claes S, Cruts M, Cras P, Martin JJ, Van Broeckhoven C, De Deyn PP. A novel presenilin 1 mutation associated with Pick's disease but not beta-amyloid plaques. Annals of Neurology 2004; 55: 617-626.
Deshpande A, Mina E, Glabe C, Busciglio J. Different conformations of amyloid beta induce neurotoxicity by distinct mechanisms in human cortical neurons. J Neurosci 2006; 26: 6011-6018.
Desikan RS, Fischl B, Cabral HJ, Kemper TL, Guttmann CR, Blacker D, Hyman BT, Albert MS, Killiany RJ. MRI measures of temporoparietal regions show differential rates of atrophy during prodromal AD. Neurology 2008; 71: 819-825.
Devanand DP, Liu X, Tabert MH, Pradhaban G, Cuasay K, Bell K, de Leon MJ, Doty RL, Stern Y, Pelton GH. Combining early markers strongly predicts conversion from mild cognitive impairment to Alzheimer's disease. Biol.Psychiatry 2008; 64: 871-879.
Devanand DP, Michaels-Marston KS, Liu X, Pelton GH, Padilla M, Marder K, Bell K, Stern Y, Mayeux R. Olfactory deficits in patients with mild cognitive impairment predict Alzheimer's disease at follow-up. Am J Psychiatry 2000; 157: 1399-1405.
Dickerson BC, Bakkour A, Salat DH, Feczko E, Pacheco J, Greve DN, Grodstein F, Wright CI, Blacker D, Rosas HD, Sperling RA, Atri A, Growdon JH, Hyman BT, Morris JC, Fischl B, Buckner RL. The cortical signature of Alzheimer's disease: regionally specific cortical thinning relates to symptom severity in very mild to mild AD dementia and is detectable in asymptomatic amyloid-positive individuals. Cereb.Cortex 2009; 19: 497-510.
Dodel RC, Du Y, Depboylu C, Hampel H, Frolich L, Haag A, Hemmeter U, Paulsen S, Teipel SJ, Brettschneider S, Spottke A, Nolker C, Moller HJ, Wei X, Farlow M, Sommer N, Oertel WH. Intravenous immunoglobulins containing antibodies against beta-amyloid for the treatment of Alzheimer's disease. Journal of Neurology Neurosurgery and Psychiatry 2004; 75: 1472-1474.
Doody RS, Gavrilova SI, Sano M, Thomas RG, Aisen PS, Bachurin SO, Seely L, Hung D. Effect of dimebon on cognition, activities of daily living, behaviour, and global function in patients with mild-to-moderate Alzheimer's disease: a randomised, double-blind, placebo-controlled study. Lancet 2008; 372: 207-215.
Doty RL. Odour perception in neurodegenerative diseases. Handbook of olfaction and gustation. New York: Marcel Dekker, 2003: 479-502.
Doty RL, Bromley SM, Stern MB. Olfactory Testing As An Aid in the Diagnosis of Parkinsons-Disease - Development of Optimal Discrimination Criteria. Neurodegeneration 1995; 4: 93-97.
Doty RL, Li C, Mannon LJ, Yousem DM. Olfactory dysfunction in multiple sclerosis: Relation to longitudinal changes in plaque numbers in central olfactory structures. Neurology 1999; 53: 880-882.

192
Doty RL, Shaman P, Kimmelman CP, Dann MS. University of Pennsylvania Smell Identification Test - A Rapid Quantitative Olfactory Function-Test for the Clinic. Laryngoscope 1984; 94: 176-178.
Dougall NJ, Bruggink S, Ebmeier KP. Systematic review of the diagnostic accuracy of Tc-99m-HWAO-SPECT in dementia. American Journal of Geriatric Psychiatry 2004; 12: 554-570.
Du AT, Schuff N, Amend D, Laakso MP, Hsu YY, Jagust WJ, Yaffe K, Kramer JH, Reed B, Norman D, Chui HC, Weiner MW. Magnetic resonance imaging of the entorhinal cortex and hippocampus in mild cognitive impairment and Alzheimer's disease. Journal of Neurology Neurosurgery and Psychiatry 2001; 71: 441-447.
Du AT, Schuff N, Kramer JH et al. Higher atrophy rate of entorhinal cortex than hippocampus in AD. 2004.
Du AT, Schuff N, Kramer JH, Rosen HJ, Gorno-Tempini ML, Rankin K, Miller BL, Weiner MW. Different regional patterns of cortical thinning in Alzheimer's disease and frontotemporal dementia. Brain 2007; 130: 1159-1166.
Duarte N, Lozano J, Pena M, Fernandez W, Arboleda G, Arboleda H. Fronto-temporal dementia syndrome with parkinsonism in a Colombian family with E280A presenilin-1 mutation. Movement Disorders 2004; 19: S361.
Dubois B, Feldman HH, Jacova C, DeKosky ST, Barberger-Gateau P, Cummings J, Delacourte A, Galasko D, Gauthier S, Jicha G, Meguro K, O'Brien J, Pasquier F, Robert P, Rossor M, Salloway S, Stern Y, Visser PJ, Scheltens P. Research criteria for the diagnosis of Alzheimer's disease: revising the NINCDS-ADRDA criteria. Lancet Neurol 2007; 6: 734-746.
Dumanchin C, Brice A, Campion D, Hannequin D, Martin C, Moreau V, Agid Y, Martinez M, Clerget-Darpoux F, Frebourg T. De novo presenilin 1 mutations are rare in clinically sporadic, early onset Alzheimer's disease cases. Journal of Medical Genetics 1998; 35: 672-673.
Eckman EA, Adams SK, Troendle FJ, Stodola BA, Kahn MA, Fauq AH, Xiao HD, Bernstein KE, Eckman CB. Regulation of steady-state beta-amyloid levels in the brain by neprilysin and endothelin-converting enzyme but not angiotensin-converting enzyme. Journal of Biological Chemistry 2006; 281: 30471-30478.
Edison P, Archer HA, Gerhard A, Hinz R, Pavese N, Turkheimer FE, Hammers A, Tai YF, Fox N, Kennedy A, Rossor M, Brooks DJ. Microglia, amyloid, and cognition in Alzheimer's disease: An [11C](R)PK11195-PET and [11C]PIB-PET study. Neurobiol Dis 2008; 32: 412-419.
Edison P, Archer HA, Hinz R, Hammers A, Pavese N, Tai YF, Hotton G, Cutler D, Fox N, Kennedy A, Rossor M, Brooks DJ. Amyloid, hypometabolism, and cognition in Alzheimer disease - An [11C]PIB and [18F]FDG PET study. Neurology 2007; 68: 501-508.
Emery VOB. Language impairment in dementia of the Alzheimer type: A hierarchical decline? International Journal of Psychiatry in Medicine 2000; 30: 145-164.
193
Engel T, Goni-Oliver P, Lucas JJ, Avila J, Hernandez F. Chronic lithium administration to FTDP-17 tau and GSK-3 beta overexpressing mice prevents tau hyperphosphorylation and neurofibrillary tangle formation, but pre-formed neurofibrillary tangles do not revert. Journal of Neurochemistry 2006; 99: 1445-1455.
Engel T, Goni-Oliver R, de Barreda EG, Lucas JJ, Hernandez F, Avila J. Lithium, a potential protective drug in Alzheimer's disease. Neurodegenerative Diseases 2008; 5: 247-249.
Engler H, Forsberg A, Almkvist O, Blomquist G, Larsson E, Savitcheva I, Wall A, Ringheim A, Langstrom B, Nordberg A. Two-year follow-up of amyloid deposition in patients with Alzheimer's disease. Brain 2006; 129: 2856-2866.
Ezquerra M, Carnero C, Blesa R, Oliva R. A novel presenilin 1 mutation (Leu166Arg) associated with early-onset Alzheimer disease. Archives of Neurology 2000; 57: 485-488.
Fagan AM, Mintun MA, Mach RH, Lee SY, Dence CS, Shah AR, LaRossa GN, Spinner ML, Klunk WE, Mathis CA, DeKosky ST, Morris JC, Holtzman DM. Inverse relation between in vivo amyloid imaging load and cerebrospinal fluid A beta(42) in humans. Annals of Neurology 2006; 59: 512-519.
Fang BY, Jia JP. [The effect of two newly Chinese presenilin-1 mutations on the sensitivity to trophic factor withdrawal in human neuroblastoma cells]. Zhonghua Yi.Xue.Za Zhi. 2007; 87: 336-340.
Farrer LA, Cupples LA, Haines JL, Hyman B, Kukull WA, Mayeux R, Myers RH, Pericakvance MA, Risch N, Vanduijn CM. Effects of age, sex, and ethnicity on the association between apolipoprotein E genotype and Alzheimer disease - A meta-analysis. Jama-Journal of the American Medical Association 1997; 278: 1349-1356.
Fernandez-Tome P, Brera B, Arevalo MA, de Ceballos ML. Beta-amyloid25-35 inhibits glutamate uptake in cultured neurons and astrocytes: modulation of uptake as a survival mechanism. Neurobiol Dis 2004; 15: 580-589.
Filippini N, Rao A, Wetten S, Gibson RA, Borrie M, Guzman D, Kertesz A, Loy-English I, Williams J, Nichols T, Whitcher B, Matthews PM. Anatomically-distinct genetic associations of APOE varepsilon4 allele load with regional cortical atrophy in Alzheimer's disease. Neuroimage 2008.
Finckh U, Kuschel C, Anagnostouli M, Patsouris E, Pantes GV, Gatzonis S, Kapaki E, Davaki P, Lamszus K, Stavrou D, Gal A. Novel mutations and repeated findings of mutations in familial Alzheimer disease. Neurogenetics 2005; 6: 85-89.
Fischl B, Dale AM. Measuring the thickness of the human cerebral cortex from magnetic resonance images. Proc Natl.Acad.Sci.U.S.A 2000; 97: 11050-11055.
Fischl B, Sereno MI, Dale AM. Cortical surface-based analysis - II: Inflation, flattening, and a surface-based coordinate system. Neuroimage 1999; 9: 195-207.
Folstein MF, Folstein SE, Mchugh PR. Mini-Mental State - Practical Method for Grading Cognitive State of Patients for Clinician. Journal of Psychiatric Research 1975; 12: 189-198.
194
Forsberg A, Engler H, Almkvist O, Blomquist G, Hagman G, Wall A, Ringheim A, Langstrom B, Nordberg A. PET imaging of amyloid deposition in patients with mild cognitive impairment. Neurobiol Aging 2008; 29: 1456-1465.
Fossard M, Rigalleau F, Puel M, Nespoulous JL, Viallard G, Demonet JF, Cardebat D. Working memory and semantic involvement in sentence processing: A case of pure progressive amnesia. Neuropsychologia 2006; 44: 335-338.
Fox NC, Black RS, Gilman S, Rossor MN, Griffith SG, Jenkins L, Koller M. Effects of Abeta immunization (AN1792) on MRI measures of cerebral volume in Alzheimer disease. Neurology 2005; 64: 1563-1572.
Fox NC, Cousens S, Scahill R, Harvey RJ, Rossor MN. Using serial registered brain magnetic resonance imaging to measure disease progression in Alzheimer disease - Power calculations and estimates of sample size to detect treatment effects. Archives of Neurology 2000; 57: 339-344.
Fox NC, Crum WR, Scahill RI, Stevens JM, Janssen JC, Rossor MN. Imaging of onset and progression of Alzheimer's disease with voxel-compression mapping of serial magnetic resonance images. Lancet 2001; 358: 201-205.
Fox NC, Freeborough PA. Brain atrophy progression measured from registered serial MRI: validation and application to Alzheimer's disease. J Magn Reson Imaging 1997; 7: 1069-1075.
Fox NC, Kennedy AM, Harvey RJ, Lantos PL, Roques PK, Collinge J, Hardy J, Hutton M, Stevens JM, Warrington EK, Rossor MN. Clinicopathological features of familial Alzheimer's disease associated with the M139V mutation in the presenilin 1 gene - Pedigree but not mutation specific age at onset provides evidence for a further genetic factor. Brain 1997; 120: 491-501.
Fox NC, Warrington EK, Seiffer AL, Agnew SK, Rossor MN. Presymptomatic cognitive deficits in individuals at risk of familial Alzheimer's disease - A longitudinal prospective study. Brain 1998; 121: 1631-1639.
Francis PT, Palmer AM, Snape M, Wilcock GK. The cholinergic hypothesis of Alzheimer's disease: a review of progress. Journal of Neurology Neurosurgery and Psychiatry 1999; 66: 137-147.
Freeborough PA, Fox NC. The boundary shift integral: an accurate and robust measure of cerebral volume changes from registered repeat MRI. IEEE Trans.Med Imaging 1997; 16: 623-629.
Freeborough PA, Fox NC, Kitney RI. Interactive algorithms for the segmentation and quantitation of 3-D MRI brain scans. Computer Methods and Programs in Biomedicine 1997; 53: 15-25.
Freitag MH, Peila R, Masaki K, Petrovitch H, Ross GW, White LR, Launer LJ. Midlife pulse pressure and incidence of dementia - The Honolulu-Asia Aging Study. Stroke 2006; 37: 33-37.

195
Frigerio CS, Piscopo P, Calabrese E, Crestini A, Campeggi LM, di Fava RC, Fogliarino S, Albani D, Marcon G, Cherchi R, Piras R, Forloni G, Confaloni A. PEN-2 gene mutation in a familial Alzheimer's disease case. Journal of Neurology 2005; 252: 1033-1036.
Frisoni GB, Pievani M, Testa C, Sabattoli F, Bresciani L, Bonetti M, Beltramello A, Hayashi KM, Toga AW, Thompson PM. The topography of grey matter involvement in early and late onset Alzheimer's disease. Brain 2007; 130: 720-730.
Games D, Adams D, Alessandrini R, Barbour R, Berthelette P, Blackwell C, Carr T, Clemens J, Donaldson T, Gillespie F, Guido T, Hagopian S, Johnsonwood K, Khan K, Lee M, Leibowitz P, Lieberburg I, Little S, Masliah E, McConlogue L, Montoyazavala M, Mucke L, Paganini L, Penniman E, Power M, Schenk D, Seubert P, Snyder B, Soriano F, Tan H, Vitale J, Wadsworth S, Wolozin B, Zhao J. Alzheimer-Type Neuropathology in Transgenic Mice Overexpressing V717F Beta-Amyloid Precursor Protein. Nature 1995; 373: 523-527.
Gankam Kengne, Vokaer M, Massat I, Fery P, Abramowicz M, Van Broeckhoven C et al. Pure Progressive Amnesia as a Variant of Genetically Proven Alzheimer's Disease. Neurodegenerative Diseases 4(suppl 1), 44-45. 2007. Ref Type: Abstract
Gatz M, Reynolds CA, Fratiglioni L, Johansson B, Mortimer JA, Berg S, Fiske A, Pedersen NL. Role of genes and environments for explaining Alzheimer disease. Archives of General Psychiatry 2006; 63: 168-174.
Gauthier S, Gelinas I, Gauthier L. Functional disability in Alzheimer's disease. Int Psychogeriatr. 1997; 9 Suppl 1: 163-165.
Geerts H. NC-531 (Neurochem). Curr.Opin.Investig.Drugs 2004; 5: 95-100.
Giannakopoulos P, Herrmann FR, Bussiere T, Bouras C, Kovari E, Perl DP, Morrison JH, Gold G, Hof PR. Tangle and neuron numbers, but not amyloid load, predict cognitive status in Alzheimer's disease. Neurology 2003; 60: 1495-1500.
Gilman S, Koller M, Black RS, Jenkins L, Griffith SG, Fox NC, Eisner L, Kirby L, Rovira MB, Forette F, Orgogozo JM. Clinical effects of A beta immunization (AN1792) in patients with AD in an interrupted trial. Neurology 2005; 64: 1553-1562.
Glenner GG, Wong CW. Alzheimers-Disease and Downs-Syndrome - Sharing of A Unique Cerebrovascular Amyloid Fibril Protein. Biochemical and Biophysical Research Communications 1984; 122: 1131-1135.
Goate A, Chartierharlin MC, Mullan M, Brown J, Crawford F, Fidani L, Giuffra L, Haynes A, Irving N, James L, Mant R, Newton P, Rooke K, Roques P, Talbot C, Pericakvance M, Roses A, Williamson R, Rossor M, Owen M, Hardy J. Segregation of A Missense Mutation in the Amyloid Precursor Protein Gene with Familial Alzheimers-Disease. Nature 1991; 349: 704-706.
Godbolt AK, Beck JA, Collinge J, Garrard P, Warren JD, Fox NC, Rossor MN. A presenilin 1 R278I mutation presenting with language impairment. Neurology 2004; 63: 1702-1704.

196
Godbolt AK, Waldman AD, MacManus DG, Schott JM, Frost C, Cipolotti L, Fox NC, Rossor MN. MRS shows abnormalities before symptoms in familial Alzheimer disease. Neurology 2006; 66: 718-722.
Gold BT, Balota D, Cortese MJ, Sergent-Marshall SD, Snyder AZ, Salat DH, Fischl B, Dale AM, Morris JC, Buckner RL. Differing neuropsychological and neuroanatomical correlates of abnormal reading in early-stage semantic dementia and dementia of the Alzheimer type. Neuropsychologia 2005; 43: 833-846.
Gomez-Isla T, Hollister R, West H, Mui S, Growdon JH, Petersen RC, Parisi JE, Hyman BT. Neuronal loss correlates with but exceeds neurofibrillary tangles in Alzheimer's disease. Ann Neurol 1997; 41: 17-24.
Gomez-Isla T, Price JL, McKeel DW, Jr., Morris JC, Growdon JH, Hyman BT. Profound loss of layer II entorhinal cortex neurons occurs in very mild Alzheimer's disease. J Neurosci 1996; 16: 4491-4500.
Gomperts SN, Rentz DM, Moran E, Becker JA, Locascio JJ, Klunk WE, Mathis CA, Elmaleh DR, Shoup T, Fischman AJ, Hyman BT, Growdon JH, Johnson KA. Imaging amyloid deposition in Lewy body diseases. Neurology 2008; 71: 903-910.
Grabowski TJ, Cho HS, Vonsattel JPG, Rebeck GW, Greenberg SM. Novel amyloid precursor protein mutation in an Iowa family with dementia and severe cerebral amyloid angiopathy. Annals of Neurology 2001; 49: 697-705.
Grady CL, Haxby JV, Horwitz B, Sundaram M, Berg G, Schapiro M, Friedland RP, Rapoport SI. Longitudinal study of the early neuropsychological and cerebral metabolic changes in dementia of the Alzheimer type. J Clin Exp.Neuropsychol 1988; 10: 576-596.
Grady CL, McIntosh AR, Beig S, Keightley ML, Burian H, Black SE. Evidence from functional neuroimaging of a compensatory prefrontal network in Alzheimer's disease. J Neurosci 2003; 23: 986-993.
Grant, Berg. A behavioral analysis of degree of reinforcement and ease of shifting to new responses in a Weigl-type card-sorting problem. J Exp.Psychol 1948; 38: 404-411.
Graves AB, Bowen JD, Rajaram L, McCormick WC, McCurry SM, Schellenberg GD, Larson EB. Impaired olfaction as a marker for cognitive decline: interaction with apolipoprotein E epsilon4 status. Neurology 1999; 53: 1480-1487.
Grimm HS, Beher D, Lichtenthaler SF, Shearman MS, Beyreuther K, Hartmann T. !-secretase cleavage site specificity differs for intracellular and secretory amyloid beta. Journal of Biological Chemistry 2003; 278: 13077-13085.
Grodstein F, Chen J, Willett WC. High-dose antioxidant supplements and cognitive function in community-dwelling elderly women. Am J Clin Nutr. 2003; 77: 975-984.
Grundman and Black. O3-04-05: Clinical trials of bapineuzumab, a beta-amyloid-targeted immunotherapy in patients with mild to moderate Alzheimer's disease. Alzheimer's & Dementia: The Journal of the Alzheimer's Association 4(4), T166. 2008. Ref Type: Abstract

197
Gustafson L, Brun A, Englund E, Hagnell O, Nilsson K, Stensmyr M, Ohlin AK, Abrahamson M. A 50-year perspective of a family with chromosome-14-linked Alzheimer's disease. Hum.Genet. 1998; 102: 253-257.
Haass C, Schlossmacher MG, Hung AY, Vigopelfrey C, Mellon A, Ostaszewski BL, Lieberburg I, Koo EH, Schenk D, Teplow DB, Selkoe DJ. Amyloid Beta-Peptide Is Produced by Cultured-Cells During Normal Metabolism. Nature 1992; 359: 322-325.
Hammers A, Allom R, Koepp MJ, Free SL, Myers R, Lemieux L, Mitchell TN, Brooks DJ, Duncan JS. Three-dimensional maximum probability atlas of the human brain, with particular reference to the temporal lobe. Human Brain Mapping 2003; 19: 224-247.
Han X, Jovicich J, Salat D, van der Kouwe A, Quinn B, Czanner S, Busa E, Pacheco J, Albert M, Killiany R, Maguire P, Rosas D, Makris N, Dale A, Dickerson B, Fischl B. Reliability of MRI-derived measurements of human cerebral cortical thickness: The effects of field strength, scanner upgrade and manufacturer. Neuroimage 2006; 32: 180-194.
Handley OJ, Morrison CM, Miles C, Bayer AJ. ApoE gene and familial risk of Alzheimer's disease as predictors of odour identification in older adults. Neurobiology of Aging 2006; 27: 1425-1430.
Hansson O, Zetterberg H, Buchhave P, Londos E, Blennow K, Minthon L. Association between CSF biomarkers and incipient Alzheimer's disease in patients with mild cognitive impairment: a follow-up study. Lancet Neurology 2006; 5: 228-234.
Hardy J. Amyloid double trouble. Nature Genetics 2006; 38: 11-12.
Hardy J, Allsop D. Amyloid Deposition As the Central Event in the Etiology of Alzheimers-Disease. Trends in Pharmacological Sciences 1991; 12: 383-388.
Hardy J, Houlden H, Collinge J, Kennedy A, Newman S, Rossor M, Lannfelt L, Lilius L, Winblad B, Crook R, Duff K. Apolipoprotein-e Genotype and Alzheimers-Disease. Lancet 1993; 342: 737-738.
Hardy JA, Higgins GA. Alzheimers-Disease - the Amyloid Cascade Hypothesis. Science 1992; 256: 184-185.
Harris ME, Wang Y, Pedigo NW, Jr., Hensley K, Butterfield DA, Carney JM. Amyloid beta peptide (25-35) inhibits Na+-dependent glutamate uptake in rat hippocampal astrocyte cultures. J Neurochem. 1996; 67: 277-286.
Hasegawa T, Ukai W, Jo DG, Xu XR, Mattson MP, Nakagawa M, Araki W, Saito T, Yamada T. Homocysteic acid induces intraneuronal accumulation of neurotoxic A beta 42: Implications for the pathogenesis of Alzheimer's disease. Journal of Neuroscience Research 2005; 80: 869-876.
Hashimoto M, Kazui H, Matsumoto K, Nakano Y, Yasuda M, Mori E. Does donepezil treatment slow the progression of hippocampal atrophy in patients with Alzheimer's disease? Am J Psychiatry 2005; 162: 676-682.

198
Hauft M, Romero B, Kurz A. Delusions and hallucinations in Alzheimer's disease: Results from a two-year longitudinal study. International Journal of Geriatric Psychiatry 1996; 11: 965-972.
Hawkes, Shephard. Olfactory evoked responses and identification tests in neurological disease. Olfaction and taste. New York: Ann NY Acad Sci, 1998.
Hawkes CH, Shephard BC, Geddes JF, Body GD, Martin JE. Olfactory disorder in motor neuron disease. Experimental Neurology 1998; 150: 248-253.
Hebert LE, Scherr PA, Bienias JL, Bennett DA, Evans DA. Alzheimer disease in the US population - Prevalence estimates using the 2000 census. Archives of Neurology 2003; 60: 1119-1122.
Hellstrom-Lindahl E, Ravid R, Nordberg A. Age-dependent decline of neprilysin in Alzheimer's disease and normal brain: Inverse correlation with A beta levels. Neurobiology of Aging 2008; 29: 210-221.
Hendriks L, van Duijn CM, Cras P, Cruts M, van Hul W, van Harskamp F, Warren A, McInnis MG, Antonarakis SE, Martin JJ, Hofman A, van Broeckhoven C. Presenile dementia and cerebral haemorrhage linked to a mutation at codon 692 of the !-amyloid precursor protein gene. Nature Genetics 1992a; 1: 218-221.
Hendriks L, Vanduijn CM, Cras P, Cruts M, Vanhul W, Vanharskamp F, Warren A, Mcinnis MG, Antonarakis SE, Martin JJ, Hofman A, Vanbroeckhoven C. Presenile-Dementia and Cerebral-Hemorrhage Linked to A Mutation at Codon-692 of the Beta-Amyloid Precursor Protein Gene. Nature Genetics 1992b; 1: 218-221.
Henneman WJ, Sluimer JD, Barnes J, van der Flier WM, Sluimer IC, Fox NC, Scheltens P, Vrenken H, Barkhof F. Hippocampal atrophy rates in Alzheimer disease: added value over whole brain volume measures. Neurology 2009; 72: 999-1007.
Herholz K. PET studies in dementia. Annals of Nuclear Medicine 2003; 17: 79-89.
Herholz K, Salmon E, Perani D, Baron JC, Holthoff V, Frolich L, Schonknecht P, Ito K, Mielke R, Kalbe E, Zundorf G, Delbeuck X, Pelati O, Anchisi D, Fazio F, Kerrouche N, Desgranges B, Eustache F, Beuthien-Baumann B, Menzel C, Schroder J, Kato T, Arahata Y, Henze M, Heiss WD. Discrimination between Alzheimer dementia and controls by automated analysis of multicenter FDG PET. Neuroimage 2002a; 17: 302-316.
Herholz K, Schopphoff H, Schmidt M, Mielke R, Eschner W, Scheidhauer K, Schicha H, Heiss WD, Ebmeier K. Direct comparison of spatially normalized PET and SPECT scans in Alzheimer's disease. Journal of Nuclear Medicine 2002b; 43: 21-26.
Herukka SK, Pennanen C, Soininen H, Pirttila T. CSF Abeta42, tau and phosphorylated tau correlate with medial temporal lobe atrophy. J Alzheimers.Dis 2008; 14: 51-57.
Hock C, Maddalena A, Raschig A, Muller-Spahn F, Eschweiler G, Hager K, Heuser I, Hampel H, Muller-Thomsen T, Oertel W, Wienrich M, Signorell A, Gonzalez-Agosti C, Nitsch RM. Treatment with the selective muscarinic m1 agonist talsaclidine decreases cerebrospinal fluid levels of A beta 42 in patients with Alzheimer's disease. Amyloid. 2003; 10: 1-6.

199
Hogan MJ, Swanwick GRJ, Kaiser J, Rowan M, Lawlor B. Memory-related EEG power and coherence reductions in mild Alzheimer's disease. International Journal of Psychophysiology 2003; 49: 147-163.
Hoshi M, Sato M, Matsumoto S, Noguchi A, Yasutake K, Yoshida N, Sato K. Spherical aggregates of beta-amyloid (amylospheroid) show high neurotoxicity and activate tau protein kinase I/glycogen synthase kinase-3beta. Proc Natl.Acad.Sci.U.S.A 2003; 100: 6370-6375.
Houlden H, Baker M, McGowan E, Lewis P, Hutton M, Crook R, Wood NW, Kumar-Singh S, Geddes J, Swash M, Scaravilli F, Holton JL, Lashley T, Tomita T, Hashimoto T, Verkkoniemi A, Kalimo H, Somer M, Paetau A, Martin JJ, Van Broeckhoven C, Golde T, Hardy J, Haltia M, Revesz T. Variant Alzheimer's disease with spastic paraparesis and cotton wool plaques is caused by PS-1 mutations that lead to exceptionally high amyloid-beta concentrations. Annals of Neurology 2000; 48: 806-808.
Hussain I, Hawkins J, Harrison D, Hille C, Wayne G, Cutler L, Buck T, Walter D, Demont E, Howes C, Naylor A, Jeffrey P, Gonzalez MI, Dingwall C, Michel A, Redshaw S, Davis JB. Oral administration of a potent and selective non-peptidic BACE-1 inhibitor decreases beta-cleavage of amyloid precursor protein and amyloid-beta production in vivo. Journal of Neurochemistry 2007; 100: 802-809.
Hyman BT, Vanhoesen GW, Damasio AR, Barnes CL. Alzheimers-Disease - Cell-Specific Pathology Isolates the Hippocampal-Formation. Science 1984; 225: 1168-1170.
Ikonomovic MD, Klunk WE, Abrahamson EE, Mathis CA, Price JC, Tsopelas ND, Lopresti BJ, Ziolko S, Bi WZ, Paljug WR, Debnath ML, Hope CE, Isanski BA, Hamilton RL, DeKosky ST. Post-mortem correlates of in vivo PiB-PET amyloid imaging in a typical case of Alzheimer's disease. Brain 2008; 131: 1630-1645.
Ishikawa A, Piao YS, Miyashita A, Kuwano R, Onodera O, Ohtake H, Suzuki M, Nishizawa M, Takahashi H. A mutant PSEN1 causes dementia with Lewy bodies and variant Alzheimer's disease. Annals of Neurology 2005; 57: 429-434.
Iwatsubo T, Odaka A, Suzuki N, Mizusawa H, Nukina N, Ihara Y. Visualization of A-Beta-42(43) and A-Beta-40 in Senile Plaques with End-Specific A-Beta Monoclonals - Evidence That An Initially Deposited Species Is A-Beta-42(43). Neuron 1994; 13: 45-53.
Jack CR, Dickson DW, Parisi JE, Xu YC, Cha RH, O'Brien PC, Edland SD, Smith GE, Boeve BF, Tangalos EG, Kokmen E, Petersen RC. Antemortem MRI findings correlate with hippocampal neuropathology in typical aging and dementia. Neurology 2002; 58: 750-757.
Jack CR, Lowe VJ, Senjem ML, Weigand SD, Kemp BJ, Shiung MM, Knopman DS, Boeve BF, Klunk WE, Mathis CA, Petersen RC. C-II PiB and structural MRI provide complementary information in imaging of Alzheimers disease and amnestic mild cognitive impairment. Brain 2008; 131: 665-680.
Jack CR, Petersen RC, Xu YC, Waring SC, Obrien PC, Tangalos EG, Smith GE, Ivnik RJ, Kokmen E. Medial temporal atrophy on MRI in normal aging and very mild Alzheimer's disease. Neurology 1997; 49: 786-794.

200
Jack CR, Slomkowski M, Gracon S, Hoover TM, Felmlee JP, Stewart K, Xu Y, Shiung M, O'Brien PC, Cha R, Knopman D, Petersen RC. MRI as a biomarker of disease progression in a therapeutic trial of milameline for AD. Neurology 2003; 60: 253-260.
Jacobs D, Sano M, Marder K, Bell K, Bylsma F, Lafleche G, Albert M, Brandt J, Stern Y. Age at Onset of Alzheimers-Disease - Relation to Pattern of Cognitive Dysfunction and Rate of Decline. Neurology 1994; 44: 1215-1220.
Jagust W, Thisted R, Devous MD, Van Heertum R, Mayberg H, Jobst K, Smith AD, Borys N. SPECT perfusion imaging in the diagnosis of Alzheimer's disease - A clinical-pathologic study. Neurology 2001; 56: 950-956.
Janssen JC, Beck JA, Campbell TA, Dickinson A, Fox NC, Harvey RJ, Houlden H, Rossor MN, Collinge J. Early onset familial alzheimer's disease: Mutation frequency in 31 families. Neurology 2003; 60: 235-239.
Jarrett JT, Lansbury PT. Seeding One-Dimensional Crystallization of Amyloid - A Pathogenic Mechanism in Alzheimers-Disease and Scrapie. Cell 1993; 73: 1055-1058.
Jellinger KA. Traumatic brain injury as a risk factor for Alzheimer's disease. Journal of Neurology Neurosurgery and Psychiatry 2004; 75: 511-512.
Jimenez Caballero PE, de Diego BC, Martin CE, Servia CM, Marsal AC. A novel presenilin 1 mutation (V261L) associated with presenile Alzheimer's disease and spastic paraparesis. Eur J Neurol 2008; 15: 991-994.
Johnson KA, Gregas M, Becker JA, Kinnecom C, Salat DH, Moran EK, Smith EE, Rosand J, Rentz DM, Klunk WE, Mathis CA, Price JC, DeKosky ST, Fischman AJ, Greenberg SM. Imaging of amyloid burden and distribution in cerebral amyloid angiopathy. Annals of Neurology 2007; 62: 229-234.
Johnson NA, Jahng GH, Weiner MW, Chui HC, Miller B, Jagust WJ, Schuff N. Patterns of cerebral hypoperfusion in Alzheimer's disease and mild cognitive impairment measured with arterial spin labeled MRI. Neurobiology of Aging 2004; 25: S273.
Jorgensen P, Bus C, Pallisgaard N, Bryder M, Jorgensen AL. Familial Alzheimer's disease co-segregates with a Met146I1e substitution in presenilin-1. Clin Genet. 1996; 50: 281-286.
Juottonen K, Laakso MP, Partanen K, Soininen H. Comparative MR analysis of the entorhinal cortex and hippocampus in diagnosing Alzheimer disease. American Journal of Neuroradiology 1999; 20: 139-144.
Kaduszkiewicz H, Zimmermann T, Beck-Bornholdt HP, van den Bussche H. Cholinesterase inhibitors for patients with Alzheimer's disease: systematic review of randomised clinical trials. British Medical Journal 2005; 331: 321-323.
Kahn J, Anderton BH, Miller CCJ, Wood JN, Esiri MM. Staining with Monoclonal-Antibodies to Neurofilaments Distinguishes Between Subpopulations of Neurofibrillary Tangles, Between Groups of Axons and Between Groups of Dendrites. Journal of Neurology 1987; 234: 241-246.

201
Kantarci K, Jack CR, Jr., Xu YC, Campeau NG, O'Brien PC, Smith GE, Ivnik RJ, Boeve BF, Kokmen E, Tangalos EG, Petersen RC. Regional metabolic patterns in mild cognitive impairment and Alzheimer's disease: A 1H MRS study. Neurology 2000; 55: 210-217.
Kantarci K, Weigand SD, Petersen RC, Boeve BF, Knopman DS, Gunter J, Reyes D, Shiung M, O'Brien PC, Smith GE, Ivnik RJ, Tangalos EG, Jack CR, Jr. Longitudinal 1H MRS changes in mild cognitive impairment and Alzheimer's disease. Neurobiol Aging 2007; 28: 1330-1339.
Karas G, Scheltens P, Rombouts S, van Schijndel R, Klein M, Jones B, van der Flier W, Vrenken H, Barkhof F. Precuneus atrophy in early-onset Alzheimer's disease: A morphometric structural MRI study. Neuroradiology 2007; 49: 967-976.
Kempler D, Almor A, Tyler LK, Andersen ES, MacDonald MC. Sentence comprehension deficits in Alzheimer's disease: a comparison of off-line vs. on-line sentence processing. Brain Lang 1998; 64: 297-316.
Kemppainen NM, Aalto S, Wilson IA, Nagren K, Helin S, Bruck A, Oikonen V, Kailajarvi M, Scheinin M, Viitanen M, Parkkola R, Rinne JO. Voxel-based analysis of PET amyloid ligand [11C]PIB uptake in Alzheimer disease. Neurology 2006; 67: 1575-1580.
Kemppainen NM, Aalto S, Wilson IA, Nagren K, Helin S, Bruck A, Oikonen V, Kailajarvi M, Scheinin M, Viitanen M, Parkkola R, Rinne JO. PET amyloid ligand [C-11]PIB uptake is increased in mild cognitive impairment. Neurology 2007; 68: 1603-1606.
Kennedy AM, Frackowiak RSJ, Newman SK, Bloomfield PM, Seaward J, Roques P, Lewington G, Cunningham VJ, Rossor MN. Deficits in Cerebral Glucose-Metabolism Demonstrated by Positron Emission Tomography in Individuals at Risk of Familial Alzheimers-Disease. Neuroscience Letters 1995a; 186: 17-20.
Kennedy AM, Newman SK, Frackowiak RS, Cunningham VJ, Roques P, Stevens J, Neary D, Bruton CJ, Warrington EK, Rossor MN. Chromosome 14 linked familial Alzheimer's disease. A clinico-pathological study of a single pedigree. Brain 1995b; 118 ( Pt 1): 185-205.
Kiernan JA, Hudson AJ. Frontal-Lobe Atrophy in Motor-Neuron Diseases. Brain 1994; 117: 747-757.
Kivipelto M, Ngandu T, Fratiglioni L, Viitanen M, Kareholt I, Winblad B, Helkala EL, Tuomilehto J, Soininen H, Nissinen A. Obesity and vascular risk factors at midlife and the risk of dementia and Alzheimer disease. Archives of Neurology 2005; 62: 1556-1560.
Klimesch W. EEG ! and theta oscillations reflect cognitive and memory performance: a review and analysis. Brain Research Reviews 1999; 29: 169-195.
Klunk WE, Debnath ML, Pettegrew JW. Development of Small-Molecule Probes for the Beta-Amyloid Protein of Alzheimers-Disease. Neurobiology of Aging 1994; 15: 691-698.
Klunk WE, Engler H, Nordberg A, Wang Y, Blomqvist G, Holt DP, Bergstrom M, Savitcheva I, Huang GF, Estrada S, Ausen B, Debnath ML, Barletta J, Price JC, Sandell J,

202
Lopresti BJ, Wall A, Koivisto P, Antoni G, Mathis CA, Langstrom B. Imaging brain amyloid in Alzheimer's disease with Pittsburgh Compound-B. Ann Neurol 2004; 55: 306-319.
Klunk WE, Price JC, Mathis CA, Tsopelas ND, Lopresti BJ, Ziolko SK, Bi W, Hoge JA, Cohen AD, Ikonomovic MD, Saxton JA, Snitz BE, Pollen DA, Moonis M, Lippa CF, Swearer JM, Johnson KA, Rentz DM, Fischman AJ, Aizenstein HJ, DeKosky ST. Amyloid deposition begins in the striatum of presenilin-1 mutation carriers from two unrelated pedigrees. Journal of Neuroscience 2007; 27: 6174-6184.
Knapp, M and Prince, M. Dementia UK (A report to the Alzheimer's Society on the prevalence and economic cost of dementia in the UK produced by King's College London and London School of Economics). 2007. Alzheimer's Society: London. Ref Type: Report
Knight MA, Hernandez D, Diede SJ, Dauwerse HG, Rafferty I, van de Leemput J, Forrest SM, Gardner RJM, Storey E, van Ommen GJB, Tapscott SJ, Fischbeck KH, Singleton AB. A duplication at chromosome 11q12.2-11q12.3 is associated with spinocerebellar ataxia type 20. Hum.Mol.Gen. 2008; 17: 3847-3853.
Knopman DS, DeKosky ST, Cummings JL, Chui H, Corey-Bloom J, Relkin N, Small GW, Miller B, Stevens JC. Practice parameter: Diagnosis of dementia (an evidence-based review) - Report of the Quality Standards Subcommittee of the American Academy of Neurology. Neurology 2001; 56: 1143-1153.
Koivunen J, Verkkoniemi A, Aalto S, Paetau A, Ahonen JP, Viitanen M, Nagren K, Rokka J, Haaparanta M, Kalimo H, Rinne JO. PET amyloid ligand [C-11]PIB uptake shows predominantly striatal increase in variant Alzheimer's disease. Brain 2008; 131: 1845-1853.
Koss E, Weiffenbach JM, Haxby JV, Friedland RP. Olfactory Detection and Recognition in Alzheimers-Disease. Lancet 1987; 1: 622.
Kotini A, Camposano S, Hara K, Salat D, Cole A, Stufflebeam S, Halgren E. Cortical thickness in a case of congenital unilateral perisylvian syndrome. Neurol Clin Neurophysiol. 2004; 2004: 4.
Kowalski JW, Gawel M, Pfeffer A, Barcikowska M. The diagnostic value of EEG in Alzheimer disease: correlation with the severity of mental impairment. J Clin Neurophysiol. 2001; 18: 570-575.
Kruman II, Kumaravel TS, Lohani A, Pedersen WA, Cutler RG, Kruman Y, Haughey N, Lee J, Evans M, Mattson MP. Folic acid deficiency and homocysteine impair DNA repair in hippocampal neurons and sensitize them to amyloid toxicity in experimental models of Alzheimer's disease. Journal of Neuroscience 2002; 22: 1752-1762.
Kwok JB, Taddei K, Hallupp M, Fisher C, Brooks WS, Broe GA, Hardy J, Fulham MJ, Nicholson GA, Stell R, George Hyslop PH, Fraser PE, Kakulas B, Clarnette R, Relkin N, Gandy SE, Schofield PR, Martins RN. Two novel (M233T and R278T) presenilin-1 mutations in early-onset Alzheimer's disease pedigrees and preliminary evidence for association of presenilin-1 mutations with a novel phenotype. Neuroreport 1997; 8: 1537-1542.
203
Kwon JS, McCarley RW, Hirayasu Y, Anderson JE, Fischer IA, Kikinis R, Jolesz FA, Shenton ME. Left planum temporale volume reduction in schizophrenia. Archives of General Psychiatry 1999; 56: 142-148.
Laakso MP, Soininen H, Partanen K, Lehtovirta M, Hallikainen M, Hanninen T, Helkala EL, Vainio P, Riekkinen PJ. MRI of the hippocampus in Alzheimer's disease: Sensitivity, specificity, and analysis of the incorrectly classified subjects. Neurobiology of Aging 1998; 19: 23-31.
Lambert MP, Barlow AK, Chromy BA, Edwards C, Freed R, Liosatos M, Morgan TE, Rozovsky I, Trommer B, Viola KL, Wals P, Zhang C, Finch CE, Krafft GA, Klein WL. Diffusible, nonfibrillar ligands derived from Abeta1-42 are potent central nervous system neurotoxins. Proc Natl.Acad.Sci.U.S.A 1998; 95: 6448-6453.
Larner AJ. Addenbrooke's cognitive examination-revised in day to day clinical practice. Journal of Neurology Neurosurgery and Psychiatry 2007; 78: 1014.
Larner AJ, Doran M. Clinical phenotypic heterogeneity of Alzheimer's disease associated with mutations of the presenilin-1 gene. Journal of Neurology 2006; 253: 139-158.
Larner AJ, du Plessis DG. Early-onset Alzheimer's disease with presenilin-1 M139V mutation: clinical, neuropsychological and neuropathological study. Eur J Neurol 2003; 10: 319-323.
Lee HG, Zhu X, Castellani RJ, Nunomura A, Perry G, Smith MA. Amyloid-beta in Alzheimer disease: the null versus the alternate hypotheses. J Pharmacol.Exp.Ther. 2007; 321: 823-829.
Lefevre G, Sedek G, Jhee S, Leibowitz M, Huang HL, Enz A, Maton S, Ereshefsky L, Pommier F, Schmidli H, Appel-Dingemanse S. Pharmacokinetics and pharmacodynamics of the novel daily rivastigmine transdermal patch compared with twice-daily capsules in Alzheimer's disease patients. Clinical Pharmacology & Therapeutics 2008; 83: 106-114.
Lerch JP, Evans AC. Cortical thickness analysis examined through power analysis and a population simulation. Neuroimage 2005; 24: 163-173.
Lerch JP, Pruessner J, Zijdenbos AP, Collins DL, Teipel SJ, Hampel H, Evans AC. Automated cortical thickness measurements from MRI can accurately separate Alzheimer's patients from normal elderly controls. Neurobiology of Aging 2008; 29: 23-30.
Lerch JP, Pruessner JC, Zijdenbos A, Hampel H, Teipel SJ, Evans AC. Focal decline of cortical thickness in Alzheimer's disease identified by computational neuroanatomy. Cerebral Cortex 2005; 15: 995-1001.
Lermontova NN, Redkozubov AE, Shevtsova EF, Serkova TP, Kireeva EG, Bachurin SO. Dimebon and tacrine inhibit neurotoxic action of beta-amyloid in culture and block L-type Ca(2+) channels. Bull.Exp.Biol.Med 2001; 132: 1079-1083.
Lesne S, Koh MT, Kotilinek L, Kayed R, Glabe CG, Yang A, Gallagher M, Ashe KH. A specific amyloid-beta protein assembly in the brain impairs memory. Nature 2006; 440: 352-357.

204
Levy E, Carman MD, Fernandezmadrid IJ, Power MD, Lieberburg I, Vanduinen SG, Bots GTAM, Luyendijk W, Frangione B. Mutation of the Alzheimers-Disease Amyloid Gene in Hereditary Cerebral-Hemorrhage, Dutch Type. Science 1990; 248: 1124-1126.
Lewczuk P, Esselmann H, Otto M, Maler JM, Henkel AW, Henkel MK, Eikenberg O, Antz C, Krause WR, Reulbach U, Kornhuber J, Wiltfang J. Neurochemical diagnosis of Alzheimer's dementia by CSF A beta 42, A beta 42/A beta 40 ratio and total tau. Neurobiology of Aging 2004; 25: 273-281.
Lindquist SG, Hasholt L, Bahl JM, Heegaard NH, Andersen BB, Norremolle A, Stokholm J, Schwartz M, Batbayli M, Laursen H, Pardossi-Piquard R, Chen F, George-Hyslop P, Waldemar G, Nielsen JE. A novel presenilin 2 mutation (V393M) in early-onset dementia with profound language impairment. Eur J Neurol 2008a; 15: 1135-1139.
Lindquist SG, Nielsen JE, Stokholm J, Schwartz M, Batbayli M, Ballegaard M, Erdal J, Krabbe K, Waldemar G. Atypical early-onset Alzheimer's disease caused by the Iranian APP mutation. Journal of the Neurological Sciences 2008b; 268: 124-130.
Liu HC, Wang SJ, Lin KP, Lin KN, Fuh JL, Teng EL. Performance on A Smell Screening-Test (the Modsit) - A Study of 510 Predominantly Illiterate Chinese Subjects. Physiology & Behavior 1995; 58: 1251-1255.
Lockhart A, Lamb JR, Osredkar T, Sue LI, Joyce JN, Ye L, Libri V, Leppert D, Beach TG. PIB is a non-specific imaging marker of amyloid-beta (A beta) peptide-related cerebral amyloidosis. Brain 2007; 130: 2607-2615.
Lockhart A, Ye L, Judd DB, Merritt AT, Lowe PN, Morgenstern JL, Hong GZ, Gee AD, Brown J. Evidence for the presence of three distinct binding sites for the thioflavin T class of Alzheimer's disease PET imaging agents on beta-amyloid peptide fibrils. Journal of Biological Chemistry 2005; 280: 7677-7684.
Luchsinger JA, Reitz C, Honig LS, Tang MX, Shea S, Mayeux R. Aggregation of vascular risk factors and risk of incident Alzheimer disease. Neurology 2005; 65: 545-551.
Luchsinger JA, Tang MX, Shea S, Mayeux R. Antioxidant vitamin intake and risk of Alzheimer disease. Arch Neurol 2003; 60: 203-208.
Luzzi S, Snowden JS, Neary D, Coccia M, Provinciali L, Ralph MAL. Distinct patterns of olfactory impairment in Alzheimer's disease, semantic dementia, frontotemporal dementia, and corticobasal degeneration. Neuropsychologia 2007; 45: 1823-1831.
MacDonald D, Kabani N, Avis D, Evans AC. Automated 3-D extraction of inner and outer surfaces of cerebral cortex from MRI. Neuroimage 2000; 12: 340-356.
Maguire EA. The retrosplenial contribution to human navigation: A review of lesion and neuroimaging findings. Scandinavian Journal of Psychology 2001; 42: 225-238.
Mann DM, Pickering-Brown SM, Takeuchi A, Iwatsubo T. Amyloid angiopathy and variability in amyloid beta deposition is determined by mutation position in presenilin-1-linked Alzheimer's disease. Am J Pathol. 2001; 158: 2165-2175.
Mann DMA, Tucker CM, Yates PO. Alzheimers-Disease - An Olfactory Connection. Mechanisms of Ageing and Development 1988; 42: 1-15.
205
Markesbery WR. Oxidative stress hypothesis in Alzheimer's disease. Free Radical Biology and Medicine 1997; 23: 134-147.
Masdeu J. CT findings in early Dementia. Aronson M. Gerontologist 25, 82. 1985. Ref Type: Generic
Masters CL, Simms G, Weinman NA, Multhaup G, Mcdonald BL, Beyreuther K. Amyloid Plaque Core Protein in Alzheimer-Disease and Down Syndrome. Proceedings of the National Academy of Sciences of the United States of America 1985; 82: 4245-4249.
Matsushita S, Arai H, Okamura N, Ohmori T, Takasugi K, Matsui T, Maruyama M, Iwatsubo T, Higuchi S. Clinical and biomarker investigation of a patient with a novel presenilin-1 mutation (A431V) in the mild cognitive impairment stage of Alzheimer's disease. Biological Psychiatry 2002; 52: 907-910.
Mayeux R. Epidemiology of neurodegeneration. Annual Review of Neuroscience 2003; 26: 81-104.
McCaffrey RJ, Duff K, Solomon GS. Olfactory dysfunction discriminates probable Alzheimer's dementia from major depression: a cross-validation and extension. J Neuropsychiatry Clin Neurosci 2000; 12: 29-33.
McCarroll, Altshuler. Copy-number variation and association studies of human disease. Nature Genetics 2007; 39.
McKhann G, Drachman D, Folstein M, Katzman R, Price D, Stadlan EM. Clinical diagnosis of Alzheimer's disease: report of the NINCDS-ADRDA Work Group under the auspices of Department of Health and Human Services Task Force on Alzheimer's Disease. Neurology 1984; 34: 939-944.
McLean CA, Cherny RA, Fraser FW, Fuller SJ, Smith MJ, Beyreuther K, Bush AI, Masters CL. Soluble pool of Abeta amyloid as a determinant of severity of neurodegeneration in Alzheimer's disease. Ann Neurol 1999; 46: 860-866.
Mehta PD, Capone G, Jewell A, Freedland RL. Increased amyloid beta protein levels in children and adolescents with Down syndrome. Journal of the Neurological Sciences 2007; 254: 22-27.
Menendez M. Pathological and clinical heterogeneity of presenilin 1 gene mutations. J Alzheimers.Dis 2004; 6: 475-482.
Mesholam RI, Moberg PJ, Mahr RN, Doty RL. Olfaction in neurodegenerative disease: a meta-analysis of olfactory functioning in Alzheimer's and Parkinson's diseases. Arch Neurol 1998; 55: 84-90.
Metastasio A, Rinaldi P, Tarducci R, Mariani E, Feliziani FT, Cherubini A, Pelliccioli GP, Gobbi G, Senin U, Mecocci P. Conversion of MCI to dementia: Role of proton magnetic resonance spectroscopy. Neurobiology of Aging 2006; 27: 926-932.
Meyer MR, Breitner JCS, Steffens DC, Anthony JC, Norton MA, Tschanz JT, Wyse BW, Welsh-Bohmer KA, Plassman BL. Onset of Alzheimer's disease in susceptible subjects: Influence of APOE. Biological Psychiatry 1998; 43: 58S.
206
Miller DL, Papayannopoulos IA, Styles J, Bobin SA, Lin YY, Biemann K, Iqbal K. Peptide Compositions of the Cerebrovascular and Senile Plaque Core Amyloid Deposits of Alzheimers-Disease. Archives of Biochemistry and Biophysics 1993; 301: 41-52.
Minoshima S, Giordani B, Berent S, Frey KA, Foster NL, Kuhl DE. Metabolic reduction in the posterior cingulate cortex in very early Alzheimer's disease. Annals of Neurology 1997; 42: 85-94.
Mintun MA, LaRossa GN, Sheline YI, Dence CS, Lee SY, Mach RH, Klunk WE, Mathis CA, DeKosky ST, Morris JC. [11C]PIB in a nondemented population: potential antecedent marker of Alzheimer disease. Neurology 2006; 67: 446-452.
Mioshi E, Dawson K, Mitchell J, Arnold R, Hodges JR. The Addenbrooke's Cognitive Examination Revised (ACE-R): a brief cognitive test battery for dementia screening. International Journal of Geriatric Psychiatry 2006; 21: 1078-1085.
Modrego PJ, Pina MA, Fayed N, Diaz M. Changes in metabolite ratios after treatment with rivastigmine in Alzheimer's disease - A nonrandomised controlled trial with magnetic resonance spectroscopy. Cns Drugs 2006; 20: 867-877.
Moehlmann T, Winkler E, Xia XF, Edbauer D, Murrelll J, Capell A, Kaether C, Zheng H, Ghetti B, Haass C, Steiner H. Presenilin-1 mutations of leucine 166 equally affect the generation of the Notch and APP intracellular domains independent of their effect on A beta(42) production. Proceedings of the National Academy of Sciences of the United States of America 2002; 99: 8025-8030.
Morgan D, Diamond DM, Gottschall PE, Ugen KE, Dickey C, Hardy J, Duff K, Jantzen P, DiCarlo G, Wilcock D, Connor K, Hatcher J, Hope C, Gordon M, Arendash GW. A beta peptide vaccination prevents memory loss in an animal model of Alzheimer's disease. Nature 2000; 408: 982-985.
Morra JH, Tu ZW, Apostolova LG, Green AE, Avedissian C, Madsen SK, Parikshak N, Hua X, Toga AW, Jack CR, Weiner MW, Thompson PM. Validation of a fully automated 3D hippocampal segmentation method using subjects with Alzheimer's disease, mild cognitive impairment, and elderly controls (vol 43, pg 59, 2008). Neuroimage 2009; 44: 1439.
Morris JC. The Clinical Dementia Rating (Cdr) - Current Version and Scoring Rules. Neurology 1993; 43: 2412-2414.
Morris JC, Heyman A, Mohs RC, Hughes JP, Vanbelle G, Fillenbaum G, Mellits ED, Clark C. The Consortium to Establish A Registry for Alzheimers-Disease (Cerad) .1. Clinical and Neuropsychological Assessment of Alzheimers-Disease. Neurology 1989; 39: 1159-1165.
Mosconi L, Sorbi S, de Leon MJ, Li Y, Nacmias B, Myoung PS, Tsui W, Ginestroni A, Bessi V, Fayyazz M, Caffarra P, Pupi A. Hypometabolism exceeds atrophy in presymptomatic early-onset familial Alzheimer's disease. Journal of Nuclear Medicine 2006; 47: 1778-1786.

207
Mufson EJ, Ikonomovic MD, Styren SD, Counts SE, Wuu J, Leurgans S, Bennett DA, Cochran EJ, DeKosky ST. Preservation of brain nerve growth factor in mild cognitive impairment and Alzheimer disease. Arch Neurol 2003; 60: 1143-1148.
Naslund J, Haroutunian V, Mohs R, Davis KL, Davies P, Greengard P, Buxbaum JD. Correlation between elevated levels of amyloid beta-peptide in the brain and cognitive decline. Jama-Journal of the American Medical Association 2000; 283: 1571-1577.
Neary D, Snowden JS, Mann DMA, Bowen DM, Sims NR, Northen B, Yates PO, Davison AN. Alzheimers-Disease - A Correlative Study. Journal of Neurology Neurosurgery and Psychiatry 1986; 49: 229-237.
Nee LE, Lippa CF. Inherited Alzheimer's disease PS-1 olfactory function: a 10-year follow-up study. Am J Alzheimers.Dis Other Demen. 2001; 16: 83-84.
Nelson HE. A modified card sorting test sensitive to frontal lobe defects. Cortex 1976; 12: 313-324.
Nelson PT, Abner EL, Scheff SW, Schmitt FA, Kryscio RJ, Jicha GA, Smith CD, Patel E, Markesbery WR. Alzheimer's-type neuropathology in the precuneus is not increased relative to other areas of neocortex across a range of cognitive impairment. Neurosci Lett. 2009; 450: 336-339.
Newberg AB, Wintering NA, Plossl K, Hochold J, Stabin MG, Watson M, Skovronsky D, Clark CM, Kung MP, Kung HF. Safety, biodistribution, and dosimetry of I-123-IMPY: a novel amyloid plaque-imaging agent for the diagnosis of Alzheimer's disease. Journal of Nuclear Medicine 2006; 47: 748-754.
Nikisch G, Wiedemann G, Kiessling B, Hertel A. [Familial Alzheimer's Disease with Presenilin 2 N141I Mutation.]. Fortschr.Neurol Psychiatr. 2008; 76: 606-609.
Nilsberth C, Westlind-Danielsson A, Eckman CB, Condron MM, Axelman K, Forsell C, Stenh C, Luthman J, Teplow DB, Younkin SG, Naslund J, Lannfelt L. The 'Arctic' APP mutation (E693G) causes Alzheimer's disease by enhanced A beta protofibril formation. Nature Neuroscience 2001; 4: 887-893.
Nussbaum RL, Ellis CE. Genomic medicine: Alzheimer's disease and Parkinson's disease. New England Journal of Medicine 2003; 348: 1356-1364.
O'Riordan S, McMonagle P, Janssen JC, Fox NC, Farrell M, Collinge J, Rossor MN, Hutchinson M. Presenilin-1 mutation (E280G), spastic paraparesis, and cranial MRI white-matter abnormalities. Neurology 2002; 59: 1108-1110.
O'Sullivan M, Jones DK, Summers PE, Morris RG, Williams SCR, Markus HS. Evidence for cortical "disconnection" as a mechanism of age-related cognitive decline. Neurology 2001; 57: 632-638.
Okello A, Edison P, Archer HA, Turkheimer FE, Kennedy J, Bullock R, Walker Z, Kennedy A, Fox N, Rossor M, Brooks DJ. Microglial activation and amyloid deposition in mild cognitive impairment: a PET study. Neurology 2009; 72: 56-62.

208
Opazo C, Luza S, Villemagne VL, Volitakis I, Rowe C, Barnham KJ, Strozyk D, Masters CL, Cherny RA, Bush AI. Radioiodinated clioquinol as a biomarker for beta-amyloid: Zn2+ complexes in Alzheimer's disease. Aging Cell 2006; 5: 69-79.
Orgogozo JM, Gilman S, Dartigues JF, Laurent B, Puel M, Kirby LC, Jouanny P, Dubois B, Eisner L, Flitman S, Michel BF, Boada M, Frank A, Hock C. Subacute meningoencephalitis in a subset of patients with AD after A beta 42 immunization. Neurology 2003; 61: 46-54.
Orlacchio A, Kawarai T, Polidoro M, Paterson AD, Rogaeva E, Orlacchio A, George-Hyslop PH, Bernardi G. Lack of association between Alzheimer's disease and the promoter region polymorphisms of the nicastrin gene. Neuroscience Letters 2004; 363: 49-53.
Pakkenberg B, Gundersen HJG. Neocortical neuron number in humans: Effect of sex and age. Journal of Comparative Neurology 1997; 384: 312-320.
Pakrasi S, O'Brien JT. Emission tomography in dementia. Nuclear Medicine Communications 2005; 26: 189-196.
Palmer MS, Beck JA, Campbell TA, Humphries CB, Roques PK, Fox NC, Harvey R, Rossor MN, Collinge J. Pathogenic presenilin 1 mutations (P436S & I143F) in early-onset Alzheimer's disease in the UK. Mutations in brief no. 223. Online. Hum.Mutat. 1999; 13: 256.
Pantieri R, Pardini M, Cecconi M, Dagna-Bricarelli F, Vitali A, Piccini A, Russo R, Borghi R, Tabaton M. A novel presenilin 1 L166H mutation in a pseudo-sporadic case of early-onset Alzheimer's disease. Neurol Sci. 2005; 26: 349-350.
Park CR. Cognitive effects of insulin in the central nervous system. Neuroscience and Biobehavioral Reviews 2001; 25: 311-323.
Pearson RCA, Esiri MM, Hiorns RW, Wilcock GK, Powell TPS. Anatomical Correlates of the Distribution of the Pathological-Changes in the Neocortex in Alzheimer-Disease. Proceedings of the National Academy of Sciences of the United States of America 1985; 82: 4531-4534.
Pennanen C, Kivipelto M, Tuomainen S, Hartikainen P, Hanninen T, Laakso MP, Hallikainen M, Vanhanen M, Nissinen A, Helkala EL, Vainio P, Vanninen R, Partanen K, Soininen H. Hippocampus and entorhinal cortex in mild cognitive impairment and early AD. Neurobiology of Aging 2004; 25: 303-310.
Perry RJ, Hodges JR. Attention and executive deficits in Alzheimer's disease. A critical review. Brain 1999; 122 ( Pt 3): 383-404.
Petersen RC. Mild cognitive impairment as a diagnostic entity. Journal of Internal Medicine 2004; 256: 183-194.
Petersen RC, Smith GE, Waring SC, Ivnik RJ, Tangalos EG, Kokmen E. Mild cognitive impairment: clinical characterization and outcome. Arch Neurol 1999; 56: 303-308.
209
Pfefferbaum A, Mathalon DH, Sullivan EV, Rawles JM, Zipursky RB, Lim KO. A Quantitative Magnetic-Resonance-Imaging Study of Changes in Brain Morphology from Infancy to Late Adulthood. Archives of Neurology 1994; 51: 874-887.
Pfefferbaum A, Sullivan EV, Carmelli D. Genetic regulation of regional microstructure of the corpus callosum in late life. Neuroreport 2001; 12: 1677-1681.
Pfefferbaum A, Sullivan EV, Hedehus M, Lim KO, Adalsteinsson E, Moseley M. Age-related decline in brain white matter anisotropy measured with spatially corrected echo-planar diffusion tensor imaging. Magnetic Resonance in Medicine 2000; 44: 259-268.
Pfeifer M, Boncristiano S, Bondolfi L, Stalder A, Deller T, Staufenbiel M, Mathews PM, Jucker M. Cerebral hemorrhage after passive anti-A beta immunotherapy. Science 2002; 298: 1379.
Pike KE, Savage G, Villemagne VL, Ng S, Moss SA, Maruff P, Mathis CA, Klunk WE, Masters CL, Rowe CC. beta-amyloid imaging and memory in non-demented individuals: evidence for preclinical Alzheimer's disease. Brain 2007; 130: 2837-2844.
Piscopo P, Marcon G, Piras MR, Crestini A, Campeggi LM, Deiana E, Cherchi R, Tanda F, Deplano A, Vanacore N, Tagliavini F, Pocchiari M, Giaccone G, Confaloni A. A novel PSEN2 mutation associated with a peculiar phenotype. Neurology 2008; 70: 1549-1554.
Poirier J. Apolipoprotein E4, cholinergic integrity and the pharmacogenetics of Alzheimer's disease. Journal of Psychiatry & Neuroscience 1999a; 24: 147-153.
Poirier J. Apolipoprotein E: a pharmacogenetic target for the treatment of Alzheimer's disease. Mol.Diagn. 1999b; 4: 335-341.
Poirier J. Apolipoprotein E and Alzheimer's disease - A role in amyloid catabolism. Alzeheimer'S Disease: A Compendium of Current Theories 2000; 924: 81-90.
Poirier J, Davignon J, Bouthillier D, Kogan S, Bertrand P, Gauthier S. Apolipoprotein-e Polymorphism and Alzheimers-Disease. Lancet 1993; 342: 697-699.
Pollard HB, Arispe N, Rojas E. Ion channel hypothesis for Alzheimer amyloid peptide neurotoxicity. Cell Mol.Neurobiol 1995; 15: 513-526.
Pratico D, Clark CM, Liun F, Lee VYM, Trojanowski JQ. Increase of brain oxidative stress in mild cognitive impairment - A possible predictor of Alzheimer disease. Archives of Neurology 2002; 59: 972-976.
Price JL, Ko AI, Wade MJ, Tsou SK, Mckeel DW, Morris JC. Neuron number in the entorhinal cortex and CA1 in preclinical Alzheimer disease. Archives of Neurology 2001; 58: 1395-1402.
Price JL, Morris JC. Tangles and plaques in nondemented aging and "preclinical" Alzheimer's disease. Annals of Neurology 1999; 45: 358-368.
Prohovnik I, Perl DP, Davis KL, Libow L, Lesser G, Haroutunian V. Dissociation of neuropathology from severity of dementia in late-onset Alzheimer disease. Neurology 2006; 66: 49-55.

210
Prvulovic D, Hubl D, Sack AT, Melillo L, Maurer K, Frolich L, Lanfermann H, Zanella FE, Goebel R, Linden DEJ, Dierks T. Functional imaging of visuospatial processing in Alzheimer's disease. Neuroimage 2002; 17: 1403-1414.
Pucci E, Belardinelli N, Regnicolo L, Nolfe G, Signorino M, Salvolini U, Angeleri F. Hippocampus and parahippocampal gyrus linear measurements based on magnetic resonance in Alzheimer's disease. European Neurology 1998; 39: 16-25.
Raber J, Huang YD, Ashford JW. ApoE genotype accounts for the vast majority of AD risk and AD pathology. Neurobiology of Aging 2004; 25: 641-650.
Ramirez-Duenas MG, Rogaeva EA, Leal CA, Lin C, Ramirez-Casillas GA, Hernandez-Romo JA, George-Hyslop PH, Cantu JM. A novel Leu171Pro mutation in presenilin-1 gene in a Mexican family with early onset Alzheimer disease. Annales de Genetique 1998; 41: 149-153.
Raux G, Gantier R, Thomas-Anterion C, Boulliat J, Verpillat P, Hannequin D, Brice A, Frebourg T, Campion D. Dementia with prominent frontotemporal features associated with L113P presenilin 1 mutation. Neurology 2000; 55: 1577-1578.
Raux G, Guyant-Marechal L, Martin C, Bou J, Penet C, Brice A, Hannequin D, Frebourg T, Campion D. Molecular diagnosis of autosomal dominant early onset Alzheimer's disease: an update. Journal of Medical Genetics 2005; 42: 793-795.
Raven, Court JH, Raven J. Manual for Raven's Progressive Matrices and Vocabulary Scales. H. K. Lewis & Co. Ltd., London, 1976.
Raz N, Rodrigue KM. Differential aging of the brain: Patterns, cognitive correlates and modifiers. Neuroscience and Biobehavioral Reviews 2006; 30: 730-748.
Reid W, Broe G, Creasey H, Grayson D, McCusker E, Bennett H, Longley W, Sulway MR. Age at onset and pattern of neuropsychological impairment in mild early-stage Alzheimer disease. A study of a community-based population. Arch Neurol 1996; 53: 1056-1061.
Reisberg B, Doody R, Stoffler A, Schmitt F, Ferris S, Mobius HJ. Memantine in moderate-to-severe Alzheimer's disease. N Engl J Med 2003; 348: 1333-1341.
Reitan. Validity of the trail making test as an indicator of organic brain damage. Percept.Mot.Skills 1958; 8: 271-276.
Remes AM, Finnila S, Mononen H, Tuominen H, Takalo R, Herva R, Majamaa K. Hereditary dementia with intracerebral hemorrhages and cerebral amyloid angiopathy. Neurology 2004b; 63: 234-240.
Remes AM, Finnila S, Mononen H, Tuominen H, Takalo R, Herva R, Majamaa K. Hereditary dementia with intracerebral hemorrhages and cerebral amyloid angiopathy. Neurology 2004a; 63: 234-240.
Remes AM, Laru L, Tuominen H, Aalto S, Kemppainen N, Mononen H, Nagren K, Parkkola R, Rinne JO. Carbon 11-labeled Pittsburgh Compound B positron emission
211
tomographic amyloid imaging in patients with APP locus duplication. Archives of Neurology 2008; 65: 540-544.
Resnick SM, Pham DL, Kraut MA, Zonderman AB, Davatzikos C. Longitudinal magnetic resonance imaging studies of older adults: A shrinking brain. Journal of Neuroscience 2003; 23: 3295-3301.
Reyes PF, Golden GT, Fagel PL, Fariello RG, Katz L, Carner E. The Prepiriform Cortex in Dementia of the Alzheimer Type. Archives of Neurology 1987; 44: 644-645.
Ridha BH, Anderson VM, Barnes J, Boyes RG, Price SL, Rossor MN, Whitwell JL, Jenkins L, Black RS, Grundman M, Fox NC. Volumetric MRI and cognitive measures in Alzheimer disease : comparison of markers of progression. J Neurol 2008; 255: 567-574.
Ridha BH, Barnes J, Bartlett JW, Godbolt A, Pepple T, Rossor MN, Fox NC. Tracking atrophy progression in familial Alzheimer's disease: a serial MRI study. Lancet Neurol 2006; 5: 828-834.
Ridha BH, Symms MR, Tozer DJ, Stockton KC, Frost C, Siddique MM, Lewis EB, MacManus DG, Boulby PA, Barker GJ, Rossor MN, Fox NC, Tofts PS. Magnetization transfer ratio in Alzheimer disease: Comparison with volumetric measurements. American Journal of Neuroradiology 2007; 28: 965-970.
Ringman JM. What the study of persons at risk for familial Alzheimer's disease can tell us about the earliest stages of the disorder: A review. Journal of Geriatric Psychiatry and Neurology 2005; 18: 228-233.
Ringman JM, Younkin SG, Pratico D, Seltzer W, Cole GM, Geschwind DH, Rodriguez-Agudelo Y, Schaffer B, Fein J, Sokolow S, Rosario ER, Gylys KH, Varpetian A, Medina LD, Cummings JL. Biochemical markers in persons with preclinical familial Alzheimer disease. Neurology 2008; 71: 85-92.
Rippon GA, Crook R, Baker M, Halvorsen E, Chin S, Hutton M, Houlden H, Hardy J, Lynch T. Presenilin 1 mutation in an African American family presenting with atypical Alzheimer dementia. Archives of Neurology 2003; 60: 884-888.
Risner ME, Saunders AM, Altman JFB, Ormandy GC, Craft S, Foley IM, Zvartau-Hind ME, Hosford DA, Roses AD. Efficacy of rosiglitazone in a genetically defined population with mild-to-moderate Alzheimer's disease. Pharmacogenomics Journal 2006; 6: 246-254.
Ritchie CW, Bush AI, Mackinnon A, Macfarlane S, Mastwyk M, MacGregor L, Kiers L, Cherny R, Li QX, Tammer A, Carrington D, Mavros C, Volitakis I, Xilinas M, Ames D, Davis S, Beyreuther K, Tanzi RE, Masters CL. Metal-protein attenuation with iodochlorhydroxyquin (clioquinol) targeting Abeta amyloid deposition and toxicity in Alzheimer disease: a pilot phase 2 clinical trial. Arch Neurol 2003; 60: 1685-1691.
Ritchie K, Lovestone S. The dementias. Lancet 2002; 360: 1759-1766.
Rizzo M, Anderson SW, Dawson J, Nawrot M. Vision and cognition in Alzheimer's disease. Neuropsychologia 2000; 38: 1157-1169.

212
Roberds SL, Anderson J, Basi G, Bienkowski MJ, Branstetter DG, Chen KS, Freedman SB, Frigon NL, Games D, Hu K, Johnson-Wood K, Kappenman KE, Kawabe TT, Kola I, Kuehn R, Lee M, Liu WQ, Motter R, Nichols NF, Power M, Robertson DW, Schenk D, Schoor M, Shopp GM, Shuck ME, Sinha S, Svensson KA, Tatsuno G, Tintrup H, Wijsman J, Wright S, McConlogue L. BACE knockout mice are healthy despite lacking the primary beta-secretase activity in brain: implications for Alzheimer's disease therapeutics. Human Molecular Genetics 2001; 10: 1317-1324.
Rockenstein E, Mallory M, Mante M, Sisk A, Masliaha E. Early formation of mature amyloid-beta protein deposits in a mutant APP transgenic model depends on levels of Abeta(1-42). J Neurosci Res. 2001; 66: 573-582.
Rogaev EI, Sherrington R, Rogaeva EA, Levesque G, Ikeda M, Liang Y, Chi H, Lin C, Holman K, Tsuda T, Mar L, Sorbi S, Nacmias B, Piacentini S, Amaducci L, Chumakov I, Cohen D, Lannfelt L, Fraser PE, Rommens JM, Stgeorgehyslop PH. Familial Alzheimers-Disease in Kindreds with Missense Mutations in A Gene on Chromosome-1 Related to the Alzheimers-Disease Type-3 Gene. Nature 1995; 376: 775-778.
Rogaeva E. The solved and unsolved mysteries of the genetics of early-onset Alzheimer's disease. Neuromolecular Medicine 2002; 2: 1-10.
Rogaeva E, Meng Y, Lee JH, Gu Y, Kawarai T, Zou F, Katayama T, Baldwin CT, Cheng R, Hasegawa H, Chen F, Shibata N, Lunetta KL, Pardossi-Piquard R, Bohm C, Wakutani Y, Cupples LA, Cuenco KT, Green RC, Pinessi L, Rainero I, Sorbi S, Bruni A, Duara R, Friedland RP, Inzelberg R, Hampe W, Bujo H, Song YQ, Andersen OM, Willnow TE, Graff-Radford N, Petersen RC, Dickson D, Der SD, Fraser PE, Schmitt-Ulms G, Younkin S, Mayeux R, Farrer LA, George-Hyslop P. The neuronal sortilin-related receptor SORL1 is genetically associated with Alzheimer disease. Nature Genetics 2007; 39: 168-177.
Rogaeva EA, Fafel KC, Song YQ, Medeiros H, Sato C, Liang Y, Richard E, Rogaev EI, Frommelt P, Sadovnick AD, Meschino W, Rockwood K, Boss MA, Mayeux R, George-Hyslop P. Screening for PS1 mutations in a referral-based series of AD cases - 21 Novel mutations. Neurology 2001; 57: 621-625.
Roher AE, Lowenson JD, Clarke S, Woods AS, Cotter RJ, Gowing E, Ball MJ. Beta-Amyloid-(1-42) Is A Major Component of Cerebrovascular Amyloid Deposits - Implications for the Pathology of Alzheimer-Disease. Proceedings of the National Academy of Sciences of the United States of America 1993; 90: 10836-10840.
Rosas HD, Hevelone ND, Zaleta AK, Greve DN, Salat DH, Fischl B. Regional cortical thinning in preclinical Huntington disease and its relationship to cognition. Neurology 2005; 65: 745-747.
Rosas HD, Liu AK, Hersch S, Glessner M, Ferrante RJ, Salat DH, van der Kouwe A, Jenkins BG, Dale AM, Fischl B. Regional and progressive thinning of the cortical ribbon in Huntington's disease. Neurology 2002; 58: 695-701.
Rosen WG, Mohs RC, Davis KL. A New Rating-Scale for Alzheimers-Disease. American Journal of Psychiatry 1984; 141: 1356-1364.

213
Rovelet-Lecrux A, Frebourg T, Tuominen H, Majamaa K, Campion D, Remes AM. APP locus duplication in a Finnish family with dementia and intracerebral haemorrhage. Journal of Neurology Neurosurgery and Psychiatry 2007; 78: 1158.
Rovelet-Lecruz A, Hannequin D, Raux G, Le Meur N, Laquerriere A, Vital A, Dumanchin C, Feuillette S, Brice A, Vercelletto M, Dubas F, Frebourg T, Campion D. APP locus duplication causes autosomal dominant early-onset Alzheimer disease with cerebral amyloid angiopathy. Nature Genetics 2006a; 38: 24-26.
Rovelet-Lecruz A, Hannequin D, Raux G, Le Meur N, Laquerriere A, Vital A, Dumanchin C, Feuillette S, Brice A, Vercelletto M, Dubas F, Frebourg T, Campion D. APP locus duplication causes autosomal dominant early-onset Alzheimer disease with cerebral amyloid angiopathy. Nature Genetics 2006b; 38: 24-26.
Rowe CC, Ackerman U, Browne W, Mulligan R, Pike KL, O'Keefe G, Tochon-Danguy H, Chan G, Berlangieri SU, Jones G, Dickinson-Rowe KL, Kung HP, Zhang W, Kung MP, Skovronsky D, Dyrks T, Holl G, Krause S, Friebe M, Lehman L, Lindemann S, Dinkelborg LM, Masters CL, Villemagne VL. Imaging of amyloid beta in Alzheimer's disease with 18F-BAY94-9172, a novel PET tracer: proof of mechanism. Lancet Neurol 2008; 7: 129-135.
Rowe CC, Ng S, Ackermann U, Gong SJ, Pike K, Savage G, Cowie TF, Dickinson KL, Maruff P, Darby D, Smith C, Woodward M, Merory J, Tochon-Danguy H, O'Keefe G, Klunk WE, Mathis CA, Price JC, Masters CL, Villemagne VL. Imaging beta-amyloid burden in aging and dementia. Neurology 2007; 68: 1718-1725.
Rudzinski LA, Fletcher RM, Dickson DW, Crook R, Hutton ML, Adamson J, Graff-Radford NR. Early onset familial Alzheimer Disease with spastic paraparesis, dysarthria, and seizures and N135S mutation in PSEN1. Alzheimer Dis Assoc Disord 2008; 22: 299-307.
Sailer M, Fischl B, Salat D, Tempelmann C, Schonfeld MA, Busa E, Bodammer N, Heinze HJ, Dale A. Focal thinning of the cerebral cortex in multiple sclerosis. Brain 2003; 126: 1734-1744.
Salat DH, Buckner RL, Snyder AZ, Greve DN, Desikan RSR, Busa E, Morris JC, Dale AM, Fischl B. Thinning of the cerebral cortex in aging. Cerebral Cortex 2004; 14: 721-730.
Salerno-Kennedy, Cusack S, Cashman KD. Olfactory function in people with genetic risk of dementia. IRISH JOURNAL OF MEDICAL SCIENCE 2005; 174: 46-50.
Scahill RI, Schott JM, Stevens JM, Rossor MN, Fox NC. Mapping the evolution of regional atrophy in Alzheimer's disease: unbiased analysis of fluid-registered serial MRI. Proc Natl.Acad.Sci.U.S.A 2002; 99: 4703-4707.
Scheltens P, Fox N, Barkhof F, De Carli C. Structural magnetic resonance imaging in the practical assessment of dementia: beyond exclusion. Lancet Neurology 2002; 1: 13-21.
Schenk D, Barbour R, Dunn W, Gordon G, Grajeda H, Guido T, Hu K, Huang JP, Johnson-Wood K, Khan K, Kholodenko D, Lee M, Liao ZM, Lieberburg I, Motter R, Mutter L, Soriano F, Shopp G, Vasquez N, Vandevert C, Walker S, Wogulis M, Yednock

214
T, Games D, Seubert P. Immunization with amyloid-beta attenuates Alzheimer disease-like pathology in the PDAPP mouse. Nature 1999; 400: 173-177.
Schiffman SS, Graham BG, Sattely-Miller EA, Zervakis J, Welsh-Bohmer K. Taste, smell and neuropsychological performance of individuals at familial risk for Alzheimer's disease. Neurobiology of Aging 2002; 23: 397-404.
Schneider LS, Olin JT, Doody RS, Clark CM, Morris JC, Reisberg B, Schmitt FA, Grundman M, Thomas RG, Ferris SH. Validity and reliability of the Alzheimer's Disease cooperative study - Clinical global impression of change. Alzheimer Disease & Associated Disorders 1997; 11: S22-S32.
Schott JM, Fox NC, Frost C, Scahill RI, Janssen JC, Chan D, Jenkins R, Rossor MN. Assessing the onset of structural change in familial Alzheimer's disease. Ann Neurol 2003; 53: 181-188.
Schott JM, Price SL, Frost C, Whitwell JL, Rossor MN, Fox NC. Measuring atrophy in Alzheimer disease: a serial MRI study over 6 and 12 months. Neurology 2005; 65: 119-124.
Schott JM, Ridha BH, Crutch SJ, Healy DG, Uphill JB, Warrington EK, Rossor MN, Fox NC. Apolipoprotein e genotype modifies the phenotype of Alzheimer disease. Arch Neurol 2006; 63: 155-156.
Schubert D, Behl C, Lesley R, Brack A, Dargusch R, Sagara Y, Kimura H. Amyloid peptides are toxic via a common oxidative mechanism. Proc Natl.Acad.Sci.U.S.A 1995; 92: 1989-1993.
Schuff N, Capizzano AA, Du AT, Amend DL, O'Neill J, Norman D, Kramer J, Jagust W, Miller B, Wolkowitz OM, Yaffe K, Weiner MW. Selective reduction of N-acetylaspartate in medial temporal and parietal lobes in AD. Neurology 2002; 58: 928-935.
Scott SA, DeKosky ST, Scheff SW. Volumetric Atrophy of the Amygdala in Alzheimers-Disease - Quantitative Serial Reconstruction. Neurology 1991; 41: 351-356.
Seshadri S, Beiser A, Selhub J, Jacques PF, Rosenberg IH, D'Agostino RB, Wilson PWF, Wolf PA. Plasma homocysteine as a risk factor for dementia and Alzheimer's disease. New England Journal of Medicine 2002; 346: 476-483.
Sherrington R, Froelich S, Sorbi S, Campion D, Chi H, Rogaeva EA, Levesque G, Rogaev EI, Lin C, Liang Y, Ikeda M, Mar L, Brice A, Agid Y, Percy ME, ClergetDarpoux F, Piacentini S, Marcon G, Nacmias B, Amaducci L, Frebourg T, Lannfelt L, Rommens JM, Stgeorgehyslop PH. Alzheimer's disease associated with mutations in presenilin 2 is rare and variably penetrant. Human Molecular Genetics 1996; 5: 985-988.
Sherrington R, Rogaev EI, Liang Y, Rogaeva EA, Levesque G, Ikeda M, Chi H, Lin C, Li G, Holman K, Tsuda T, Mar L, Foncin JF, Bruni AC, Montesi MP, Sorbi S, Rainero I, Pinessi L, Nee L, Chumakov I, Pollen D, Brookes A, Sanseau P, Polinsky RJ, Wasco W, Dasilva HAR, Haines JL, Pericakvance MA, Tanzi RE, Roses AD, Fraser PE, Rommens JM, Stgeorgehyslop PH. Cloning of A Gene Bearing Missense Mutations in Early-Onset Familial Alzheimers-Disease. Nature 1995; 375: 754-760.

215
Shoghi-Jadid K, Small GW, Agdeppa ED, Kepe V, Ercoli LM, Siddarth P, Read S, Satyamurthy N, Petric A, Huang SC, Barrio JR. Localization of neurofibrillary tangles and beta-amyloid plaques in the brains of living patients with Alzheimer disease. American Journal of Geriatric Psychiatry 2002; 10: 24-35.
Silbert LC, Quinn JF, Moore MM, Corbridge E, Ball MJ, Murdoch G, Sexton G, Kaye JA. Changes in premorbid brain volume predict Alzheimer's disease pathology. Neurology 2003; 61: 487-492.
Simon-Sanchez J, Scholz S, Matarin MDM, Fung HC, Hernandez D, Gibbs JR, Britton A, Hardy J, Singleton A. Genomewide SNP assay reveals mutations underlying Parkinson disease. Human Mutation 2008; 29: 315-322.
Singh V, Chertkow H, Lerch JP, Evans AC, Dorr AE, Kabani NJ. Spatial patterns of cortical thinning in mild cognitive impairment and Alzheimer's disease. Brain 2006; 129: 2885-2893.
Sleegers K, Brouwers N, Gijselinck I, Theuns J, Goossens D, Wauters J, Del Favero J, Cruts M, van Duijn CM, van Broeckhoven C. APP duplication is sufficient to cause early onset Alzheimer's dementia with cerebral amyloid angiopathy. Brain 2006; 129: 2977-2983.
Small GW, Kepe V, Ercoli LM, Siddarth P, Bookheimer SY, Miller KJ, Lavretsky H, Burggren AC, Cole GM, Vinters HV, Thompson PM, Huang SC, Satyamurthy N, Phelps ME, Barrio JR. PET of brain amyloid and tau in mild cognitive impairment. N Engl J Med 2006; 355: 2652-2663.
Smith GE, Pankratz VS, Negash S, Machulda MM, Petersen RC, Boeve BF, Knopman DS, Lucas JA, Ferman TJ, Graff-Radford N, Ivnik RJ. A plateau in pre-Alzheimer memory decline: evidence for compensatory mechanisms? Neurology 2007; 69: 133-139.
Smith MA, Atwood CS, Joseph JA, Perry G. Predicting the failure of amyloid-beta vaccine. Lancet 2002; 359: 1864-1865.
Smith MJ, Kwok JB, McLean CA, Kril JJ, Broe GA, Nicholson GA, Cappai R, Hallupp M, Cotton RG, Masters CL, Schofield PR, Brooks WS. Variable phenotype of Alzheimer's disease with spastic paraparesis. Ann Neurol 2001; 49: 125-129.
Song MS, Rauw G, Baker GB, Kar S. Memantine protects rat cortical cultured neurons against beta-amyloid-induced toxicity by attenuating tau phosphorylation. Eur J Neurosci 2008; 28: 1989-2002.
Sorbi S, Nacmias B, Forleo P, Piacentini S, Latorraca S, Amaducci L. Epistatic Effect of App717 Mutation and Apolipoprotein-e Genotype in Familial Alzheimers-Disease. Annals of Neurology 1995; 38: 124-127.
Sowell ER, Thompson PM, Holmes CJ, Jernigan TL, Toga AW. In vivo evidence for post-adolescent brain maturation in frontal and striatal regions. Nature Neuroscience 1999; 2: 859-861.
St George-Hyslop P, Mclachlan DC, Tuda T, Rogaev E, Karlinsky H, Lippa CF, Pollen D. Alzheimers-Disease and Possible Gene Interaction. Science 1994; 263: 537.

216
Steiner H, Romig H, Grim MG, Philipp U, Pesold B, Citron M, Baumeister R, Haass C. The biological and pathological function of the presenilin-1 Delta exon 9 mutation is independent of its defect to undergo proteolytic processing. Journal of Biological Chemistry 1999; 274: 7615-7618.
Stokholm J, Jakobsen O, Czarna JM, Mortensen HV, Waldemar G. Years of severe and isolated amnesia can precede the development of dementia in early-onset Alzheimer's disease. Neurocase 2005; 11: 48-55.
Sturchler E, Galichet A, Weibel M, Leclerc E, Heizmann CW. Site-specific blockade of RAGE-V-d prevents amyloid-beta oligomer neurotoxicity. Journal of Neuroscience 2008; 28: 5149-5158.
Styczynska, C.Zekanowski, B.Peplonska, A.Barczak, B.Kijanowska-Haladyna and S.Kotapka-Minc. Early onset Alzheimer's disease associated with a novel P117R presenilin 1 mutation and initial features of frontotemporal dementia. Eur J Neurol Suppl. 2, 190. 2004. Ref Type: Abstract
Sullivan EV, Adalsteinsson E, Hedehus M, Ju C, Moseley M, Lim KO, Pfefferbaum A. Equivalent disruption of regional white matter microstructure in ageing healthy men and women. Neuroreport 2001; 12: 99-104.
Sullivan EV, Marsh L, Pfefferbaum A. Preservation of hippocampal volume throughout adulthood in healthy men and women. Neurobiol Aging 2005; 26: 1093-1098.
Svedberg MM, Hall H, Hellstrom-Lindahl E, Estrada S, Guan Z, Nordberg A, Langstrom B. [(11)C]PIB-amyloid binding and levels of Abeta40 and Abeta42 in postmortem brain tissue from Alzheimer patients. Neurochem.Int 2009; 54: 347-357.
Tagliavini, Rossi G, Padovani A, Magoni M, Andora G, Sgarzi M, Bizzi A, Savoiardo M, Carella F, Morbin M, Giaccone G, Bugiani O. A new ?PP mutation related to hereditary cerebral haemorrhage. Alzheimer's Reports 1999; 2 Suppl 1: S28.
Takao M, Ghetti B, Hayakawa I, Ikeda E, Fukuuchi Y, Miravalle L, Piccardo P, Murrell JR, Glazier BS, Koto A. A novel mutation (G217D) in the Presenilin 1 gene (PSEN1) in a Japanese family: presenile dementia and parkinsonism are associated with cotton wool plaques in the cortex and striatum. Acta Neuropathologica 2002; 104: 155-170.
Talamo BR, Rudel RA, Kosik KS, Lee VMY, Neff S, Adelman L, Kauer JS. Pathological-Changes in Olfactory Neurons in Patients with Alzheimers-Disease. Nature 1989; 337: 736-739.
Tang Y, Whitman GT, Lopez I, Baloh RW. Brain volume changes on longitudinal magnetic resonance imaging in normal older people. Journal of Neuroimaging 2001; 11: 393-400.
Tang-Wai D, Lewis P, Boeve B, Hutton M, Golde T, Baker M, Hardy J, Michels V, Ivnik R, Jack C, Petersen R. Familial frontotemporal dementia associated with a novel presenilin-1 mutation. Dementia and Geriatric Cognitive Disorders 2002; 14: 13-21.
Tanzi RE, Moir RD, Wagner SL. Clearance of Alzheimer's A beta peptide: The many roads to perdition. Neuron 2004; 43: 605-608.
217
Tapiola T, Alafuzoff I, Herukka SK, Parkkinen L, Hartikainen P, Soininen H, Pirttila T. Cerebrospinal fluid {beta}-amyloid 42 and tau proteins as biomarkers of Alzheimer-type pathologic changes in the brain. Arch Neurol 2009; 66: 382-389.
Tariot PN, Farlow MR, Grossberg GT, Graham SM, McDonald S, Gergel I. Memantine treatment in patients with moderate to severe Alzheimer disease already receiving donepezil - A randomized controlled trial. Jama-Journal of the American Medical Association 2004; 291: 317-324.
Theuns J, Brouwers N, Engelborghs S, Sleegers K, Bogaerts V, Corsmit E, De Pooter T, Van Duijn CM, De Deyn PP, Van Broeckhoven C. Promoter mutations that increase amyloid precursor-protein expression are associated with Alzheimer disease. American Journal of Human Genetics 2006a; 78: 936-946.
Theuns J, Marjaux E, Vandenbulcke M, Van Laere K, Kumar-Singh S, Bormans G, Brouwers N, Van den Broeck M, Vennekens K, Corsmit E, Cruts M, De Strooper B, Van Broeckhoven C, Vandenberghe R. Alzheimer dementia caused by a novel mutation located in the APP C-terminal intracytosolic fragment. Human Mutation 2006b; 27: 888-896.
Thompson PM, Hayashi KM, de Zubicaray G, Janke AL, Rose SE, Semple J, Herman D, Hong MS, Dittmer SS, Doddrell DM, Toga AW. Dynamics of gray matter loss in Alzheimer's disease. Journal of Neuroscience 2003; 23: 994-1005.
Ting JT, Kelley BG, Lambert TJ, Cook DG, Sullivan JM. Amyloid precursor protein overexpression depresses excitatory transmission through both presynaptic and postsynaptic mechanisms. Proceedings of the National Academy of Sciences of the United States of America 2007; 104: 353-358.
Tobinick E. Spinal delivery of p38: TNF-! inhibitors. Plos Medicine 2006; 3: 2168.
Toledo-Morrell L, Goncharova I, Dickerson B, Wilson RS, Bennett DA. From healthy aging to early Alzheimer's disease: In vivo detection of entorhinal cortex atrophy. Parahippocampal Region 2000; 911: 240-253.
Tomlinson, Blessed, Roth. Observations on Brains of Non-Demented Old People. Journal of the Neurological Sciences 1968; 7: 331-&.
Tomlinson, Blessed., Roth. Observations on Brains of Demented Old People. Journal of the Neurological Sciences 1970; 11: 205-&.
Town T, Laouar Y, Pittenger C, Mori T, Szekely CA, Tan J, Duman RS, Flavell RA. Blocking TGF-beta-Smad2/3 innate immune signaling mitigates Alzheimer-like pathology. Nat.Med 2008; 14: 681-687.
Trojanowski JQ, Newman PD, Hill WD, Lee VMY. Human Olfactory Epithelium in Normal Aging, Alzheimers-Disease, and Other Neurodegenerative Disorders. Journal of Comparative Neurology 1991; 310: 365-376.
Tyas SL, White LR, Petrovitch H, Ross GW, Foley DJ, Heimovitz HK, Launer LJ. Mid-life smoking and late-life dementia: the Honolulu-Asia Aging Study. Neurobiology of Aging 2003; 24: 589-596.

218
Tysoe C, Whittaker J, Xuereb J, Cairns NJ, Cruts M, Van Broeckhoven C, Wilcock G, Rubinsztein DC. A presenilin-1 truncating mutation is present in two cases with autopsy-confirmed early-onset Alzheimer disease. American Journal of Human Genetics 1998; 62: 70-76.
Van Broeckhoven C, Backhovens H, Cruts M, Martin JJ, Crook R, Houlden H, Hardy J. APOE genotype does not modulate age of onset in families with chromosome 14 encoded Alzheimer's disease. Neurosci Lett. 1994; 169: 179-180.
van de Leemput J, Chandran J, Knight MA, Holtzclaw LA, Scholz S, Cookson MR, Houlden H, Gwinn-Hardy K, Fung HC, Lin X, Hernandez D, Simon-Sanchez J, Wood NW, Giunti P, Rafferty I, Hardy J, Storey E, Gardner RJM, Forrest SM, Fisher EMC, Russell JT, Cai H, Singleton AB. Deletion at ITPR1 underlies ataxia in mice and spinocerebellar ataxia 15 in humans. Plos Genetics 2007; 3: 1076-1082.
van de Pol LA, Scahill RI, Frost C, Lewis EB, Boyes RG, van Schijndel RA, Scheltens P, Fox NC, Barkhof F. Improved reliability of hippocampal atrophy rate measurement in mild cognitive impairment using fluid registration. Neuroimage 2007; 34: 1036-1041.
van der Flier WM, van den Heuvel DMJ, Weverling-Rijnsburger AWE, Bollen ELEM, Westendorp RGJ, van Buchem MA, Middelkoop HAM. Magnetization transfer imaging in normal aging, mild cognitive impairment, and Alzheimer's disease. Annals of Neurology 2002; 52: 62-67.
van der Hiele, Bollen EL, Vein AA, Reijntjes RH, Westendorp RG, van Buchem MA, Middelkoop HA, van Dijk JG. EEG Markers of Future Cognitive Performance in the Elderly. J Clin Neurophysiol. 2008; 25: 83-89.
Van Petten C, Plante E, Davidson PSR, Kuo TY, Bajuscak L, Glisky EL. Memory and executive function in older adults: relationships with temporal and prefrontal gray matter volumes and white matter hyperintensities. Neuropsychologia 2004; 42: 1313-1335.
Verbeek MM, de Jong D, Kremer HPH. Brain-specific proteins in cerebrospinal fluid for the diagnosis of neurodegenerative diseases. Annals of Clinical Biochemistry 2003; 40: 25-40.
Verhoeff NPLG, Wilson AA, Takeshita S, Trop L, Hussey D, Singh K, Kung HF, Kung MP, Houle S. In-vivo imaging of Alzheimer disease beta-amyloid with [C-11]SB-13 PET. American Journal of Geriatric Psychiatry 2004; 12: 584-595.
Verkkoniemi A, Kalimo H, Paetau A, Somer M, Iwatsubo T, Hardy J, Haltia M. Variant Alzheimer disease with spastic paraparesis: Neuropathological phenotype. Journal of Neuropathology and Experimental Neurology 2001; 60: 483-492.
Verkkoniemi A, Somer M, Rinne JO, Myllykangas L, Crook R, Hardy J, Viitanen M, Kalimo H, Haltia M. Variant Alzheimer's disease with spastic paraparesis - Clinical characterization. Neurology 2000; 54: 1103-1109.
Villemagne VL, Pike KE, Darby D, Maruff P, Savage G, Ng S, Ackermann U, Cowie TF, Currie J, Chan SG, Jones G, Tochon-Danguy H, O'Keefe G, Masters CL, Rowe CC. A beta deposits in older non-demented individuals with cognitive decline are indicative of preclinical Alzheimer's disease. Neuropsychologia 2008; 46: 1688-1697.

219
Wahlund LO, Julin P, Johansson SE, Scheltens P. Visual rating and volumetry of the medial temporal lobe on magnetic resonance imaging in dementia: a comparative study. Journal of Neurology Neurosurgery and Psychiatry 2000; 69: 630-635.
Wallin AK, Blennow K, Andreasen N, Minthon L. CSF biomarkers for Alzheimer's Disease: levels of beta-amyloid, tau, phosphorylated tau relate to clinical symptoms and survival. Dement Geriatr Cogn Disord 2006; 21: 131-138.
Wang PN, Lirng JF, Lin KN, Chang FC, Liu HC. Prediction of Alzheimer's disease in mild cognitive impairment: A prospective study in Taiwan. Neurobiology of Aging 2006; 27: 1797-1806.
Warrington. Manual for the Recognition Memory Test for words and faces. Windsor, UK: NFER-Nelson, 1984.
Warrington. The Camden Memory Tests. UK: Psychology Press, 1996.
Wavrant-De Vrieze F, Crook R, Holmans P, Kehoe P, Owen MJ, Williams J, Roehl K, Laliiri DK, Shears S, Booth J, Wu W, Goate A, Chartier-Harlin MC, Hardy J, Perez-Tur J. Genetic variability at the amyloid-beta precursor protein locus may contribute to the risk of late-onset Alzheimer's disease. Neuroscience Letters 1999; 269: 67-70.
Wechsler D. The Psychometric Tradition - Developing the Wechsler Adult Intelligence Scale. Contemporary Educational Psychology 1981; 6: 82-85.
Weggen S, Eriksen JL, Das P, Sagi SA, Wang R, Pietrzik CU, Findlay KA, Smith TE, Murphy MP, Butler T, Kang DE, Marquez-Sterling N, Golde TE, Koo EH. A subset of NSAIDs lower amyloidogenic A beta 42 independently of cyclooxygenase activity. Nature 2001; 414: 212-216.
Wenning GK, Shephard B, Hawkes C, Petruckevitch A, Lees A, Quinn N. Olfactory Function in Atypical Parkinsonian Syndromes. Acta Neurologica Scandinavica 1995; 91: 247-250.
Wiley CA, Lopresti BJ, Venneti S, Price J, Klunk WE, DeKosky ST, Mathis CA. Carbon 11-labeled Pittsburgh Compound B and carbon 11-labeled (R)-PK11195 positron emission tomographic imaging in Alzheimer disease. Arch Neurol 2009; 66: 60-67.
Wilson RS, Arnold SE, Schneider JA, Tang Y, Bennett DA. The relationship between cerebral Alzheimer's disease pathology and odour identification in old age. Journal of Neurology Neurosurgery and Psychiatry 2007; 78: 30-35.
Wimo A, Winblad B, Aguero-Torres H, von Strauss E. The magnitude of dementia occurrence in the world. Alzheimer Dis Assoc Disord 2003; 17: 63-67.
Winblad B, Palmer K, Kivipelto M, Jelic V, Fratiglioni L, Wahlund LO, Nordberg A, Backman L, Albert M, Almkvist O, Arai H, Basun H, Blennow K, de Leon M, DeCarli C, Erkinjuntti T, Giacobini E, Graff C, Hardy J, Jack C, Jorm A, Ritchie K, van Duijn C, Visser P, Petersen RC. Mild cognitive impairment - beyond controversies, towards a consensus: report of the International Working Group on Mild Cognitive Impairment. Journal of Internal Medicine 2004; 256: 240-246.

220
Wischik, Harrington. The role of tau protein in the neurodegenerative demenias. In: O'Brien J, Ames D, Burns A, editors. Dementia. London: Arnold, 2000: 461-92.
Wisniewski HM, Wegiel J, Wang KC, Kujawa M, Lach B. Ultrastructural Studies of the Cells Forming Amyloid Fibers in Classical Plaques. Canadian Journal of Neurological Sciences 1989; 16: 535-542.
Xu F, Vitek MP, Colton CA, Previti ML, Gharkholonarehe N, Davis J, Van Nostrand WE. Human apolipoprotein E redistributes fibrillar amyloid deposition in Tg-SwDI mice. J Neurosci 2008; 28: 5312-5320.
Xu Y, Jack CR, O'Brien PC, Kokmen E, Smith GE, Ivnik RJ, Boeve BF, Tangalos RG, Petersen RC. Usefulness of MRI measures of entorhinal cortex versus hippocampus in AD. Neurology 2000; 54: 1760-1767.
Yamamoto M, Kiyota T, Horiba M, Buescher JL, Walsh SM, Gendelman HE, Ikezu T. Interferon-! and tumor necrosis factor-a regulate amyloid-" plaque deposition and beta-secretase expression in Swedish mutant APP transgenic mice. American Journal of Pathology 2007; 170: 680-692.
Yao Y, Zhukareva V, Sung S, Clark CM, Rokach J, Lee VMY, Trojanowski JQ, Pratico D. Enhanced brain levels of 8,12-iso-iPF(2 " )-VI differentiate AD from frontotemporal dementia. Neurology 2003; 61: 475-478.
Yasuda M, Maeda K, Ikejiri Y, Kawamata T, Kuroda S, Tanaka C. A novel missense mutation in the presenilin-1 gene in a familial Alzheimer's disease pedigree with abundant amyloid angiopathy. Neurosci Lett. 1997; 232: 29-32.
Ye L, Velasco A, Fraser G, Beach TG, Sue L, Osredkar T, Libri V, Spillantini MG, Goedert M, Lockhart A. In vitro high affinity " -synuclein binding sites for the amyloid imaging agent PIB are not matched by binding to Lewy bodies in postmortem human brain. Journal of Neurochemistry 2008; 105: 1428-1437.
Yezzi AJ, Prince JL. An Eulerian PDE approach for computing tissue thickness. Ieee Transactions on Medical Imaging 2003; 22: 1332-1339.
Yin YI, Bassit B, Zhu L, Yang X, Wang CY, Li YM. !-secretase substrate concentration modulates the A beta 42/A beta 40 ratio. Journal of Biological Chemistry 2007; 282: 23639-23644.
Zamrini E, De Santi S, Tolar M. Imaging is superior to cognitive testing for early diagnosis of Alzheimer's disease. Neurobiol Aging 2004; 25: 685-691.
Zekanowski C, Styczynska M, Peplonska B, Gabryelewicz T, Religa D, Ilkowski J, Kijanowska-Haladyna B, Kotapka-Minc S, Mikkelsen S, Pfeffer A, Barczak A, Luczywek E, Wasiak B, Chodakowska-Zebrowska M, Gustaw K, Laczkowski J, Sobow T, Kuznicki J, Barcikowska M. Mutations in presenilin 1, presenilin 2 and amyloid precursor protein genes in patients with early-onset Alzheimer's disease in Poland. Exp.Neurol 2003; 184: 991-996.

221
Zhang W, Oya S, Kung MP, Hou C, Maier DL, Kung HF. F-18 stilbenes as PET imaging agents for detecting beta-amyloid plaques in the brain. J Med Chem. 2005; 48: 5980-5988.
Zhu X, Schuff N, Kornak J, Soher B, Yaffe K, Kramer JH, Ezekiel F, Miller BL, Jagust WJ, Weiner MW. Effects of Alzheimer disease on fronto-parietal brain N-acetyl aspartate and myo-inositol using magnetic resonance spectroscopic imaging. Alzheimer Dis Assoc Disord 2006; 20: 77-85.