the experiences of new zealand floriculture export
TRANSCRIPT
The Experiences of New Zealand Floriculture Export
Producers in the Changing International Market:
What Can Be Done to Strengthen the Sector’s
Capabilities?
Indra Ratnayake
MPhil
2016
The Experiences of New Zealand Floriculture Export
Producers in the Changing International Market:
What can be done to Strengthen the Sector’s
Capabilities?
Indra Ratnayake
A thesis submitted to Auckland University of Technology
in fulfilment of the requirements for the degree of
Master of Philosophy
Faculty of Culture and Society
2016

i
ii
Abstract
This research focused on the New Zealand floriculture industry, an important foreign
exchange earner and employment provider that has silently contributed New Zealand’s
national and regional economies over the past four decades.
Internationally the global floriculture industry and market is growing, providing
opportunities for many. At the same time, international industry dynamics are
constantly changing, bringing in challenges for industry stakeholders worldwide. This
has made it important to evaluate the New Zealand floriculture industry’s ability to face
future challenges. In view of that importance, this research was designed to develop a
knowledge base on New Zealand floriculture industry by investigating the floriculture
producers’ industry and export experiences in the changing international environment.
A mixed method approach was applied in this research to bring together evidence from
multiple sources, including documents, industry reports, production and trade statistics,
participant interviews, and author self-reflection. The analysis was designed to identify
the important developments in the international settings that impacted the New Zealand
export floriculture industry, and to draw lessons from the New Zealand grower
experiences in the dynamic and changing international marketplace.
The research revealed that a significant and rewarding floriculture industry was
established in New Zealand in the mid-twentieth century, earning a strong reputation for
product quality and consistency and becoming a leading and important supplier from the
region to Japan, USA and the major import markets in Europe by 2000.
As the global floriculture industry exhibited remarkable accelerated growth from the
early 2000s, it provided opportunities for many countries’ development of this sector. In
many developing countries, floriculture industries were developed within national
development agendas which provided government support in a number of areas, and
under trade facilitation schemes. Floriculture producers across the world reaped the
benefits of this growth, but the New Zealand floriculture industry did not enjoy
comparative expansion or rewards. The early competitive edge New Zealand
floriculture exporters had enjoyed in major international markets appeared to be in
decline.
Despite this, today the sector remains a significant source of production, employment
and export earnings for New Zealand. Current actors in the New Zealand floriculture
industry have proved their resilience in the face of demanding international challenges
and adversities. The research findings highlight the strengths that are apparent, and then
draws conclusions of how an appropriate national policy framework could be developed
to respond to future challenges and ensure a sustainable future for the New Zealand
floriculture sector.

iii
iv
Contents
Abstract ........................................................................................................................ ii
List of Figures .............................................................................................................. vi
List of Tables .............................................................................................................. vii
Attestation of Authorship ........................................................................................... viii
Acknowledgements ....................................................................................................... x
Ethics Approval ........................................................................................................... xi
Chapter 1 Introduction .................................................................................................. 1
1.1 Rationale ........................................................................................................ 1
1.2 Background .................................................................................................... 2
1.3 Structure of the Thesis .................................................................................... 3
Chapter 2 Methodology ................................................................................................ 5
2.1 Theoretical paradigm of methodology ............................................................. 5
2.2 Research design and procedures ...................................................................... 6
2.2.1 Quantitative research approach ................................................................ 7
2.2.2 Qualitative research approach .................................................................. 8
2.2.3 Reflection on the researcher’s own industry experiences .......................... 9
2.3 Analysis approach ........................................................................................... 9
Chapter 3 Literature review ......................................................................................... 13
3.1.1 Summary ............................................................................................... 17
Chapter 4 The international floriculture context .......................................................... 19
4.1 The historical development of the global floriculture industry ....................... 20
4.1.1 The Dutch and European floriculture Industry ....................................... 20
4.1.2 Japanese floriculture industry ................................................................. 21
4.1.3 Growth of the Israeli floriculture industry .............................................. 22
4.1.4 Dutch floriculture industry expansion (foreign investments) .................. 23
4.1.5 Development of USA and Central American flower industries ............... 24
4.1.6 Development of New Zealand floriculture industry ................................ 25
4.2 International support for floriculture industry development ........................... 29
4.2.1 International accelerated export development programmes .................... 29
4.2.2 International floriculture trade facilitation .............................................. 30
4.2.3 Floriculture industry development in developing countries .................... 31
4.3 The present status of world floriculture Industry ........................................... 33
4.3.1 Floriculture Production .......................................................................... 33
4.3.2 Analysis of the world floriculture production dynamics ......................... 35
4.3.3 World trade of floriculture products ....................................................... 37
4.3.4 World floriculture exports - historical trends .......................................... 38
4.4 The New Zealand floriculture industry .......................................................... 44
4.5 Researcher reflections on the New Zealand floriculture industry ................... 45
4.5.1 Summary ............................................................................................... 50
v
Chapter 5 Findings: Experiences of New Zealand export floriculture growers ............. 53
5.1 Introduction .................................................................................................. 53
5.2 Findings/Results ........................................................................................... 55
5.2.1 Phase 1: Lucrative period of the New Zealand floriculture industry
(mid 1980s to 2001) ............................................................................................ 55
5.2.2 Phase 2: The challenging period of the New Zealand floriculture industry
(2001-2008) ........................................................................................................ 60
5.2.3 Phase 3: Intense challenges and struggle for survival of the New Zealand
floriculture industry (2008 onward) ..................................................................... 62
5.2.4 Perceived importance of the industry and industry support ..................... 68
5.2.5 Participants’ response to the challenges ................................................. 69
5.2.6 Advantages and disadvantages of the New Zealand floriculture sector
from the participants’ perspectives ...................................................................... 71
5.2.7 What can be done? Participants’ suggestions for improvements ............ 74
5.2.8 Summary ............................................................................................... 78
Chapter 6 Discussion .................................................................................................. 79
6.1 New Zealand floriculture industry performance in the changing international
market ..................................................................................................................... 79
6.1.1 Phase 1: Mid 1980s-2000 Lucrative phase of the New Zealand floriculture
industry 83
6.1.2 Phase 2: 2000-2008 Challenging phase for the New Zealand floriculture
industry 84
6.1.3 Phase 3: 2008 onward – Intense challenges and struggle for survival ..... 90
6.2 What can be done to strengthen the sector’s capabilities? .............................. 95
6.2.1 Strengths of the New Zealand floriculture industry ................................ 95
6.2.2 Challenges for the New Zealand floriculture industry ............................ 96
6.2.3 What can we learn from others? ............................................................. 98
Chapter 7 Conclusion ................................................................................................ 101
7.1.1 What needs to be done ......................................................................... 101
7.1.2 Future research opportunities ............................................................... 102
7.1.3 Research Findings................................................................................ 103
Bibliography ............................................................................................................. 105
vi
List of Figures
Figure 4-1. Production area, value, and earnings per unit area of land by region, 2011 34
Figure 4-2. World floriculture exports by value and sector, 2001-2014........................ 40
Figure 4-3. New Zealand floriculture exports by value (NZ$) 1988-2015 .................... 44
Figure 6-1. Floriculture export total trends for world compared with New Zealand 1996-
2014............................................................................................................................ 80
Figure 6-2. New Zealand floriculture exports by sub-sector (NZ$) 1988-2015 ............ 81
vii
List of Tables
Table 4-1. Production area, value, and earnings per unit area of land by region, 2011 . 34
Table 4-2. Floriculture industry sub-sectors and export trade values ............................ 38
Table 4-3. World floriculture exports 1982-2014 by value (US$ billion) ..................... 38
Table 4-4. Worldwide floriculture exports by value and sector (US$ billion)............... 39
Table 4-5. Floriculture exports by main supplying countries (US$ million) ................. 41
Table 4-6. Floriculture exports by new supplying countries (US$ million) .................. 42
Table 4-7. Major importers of floriculture products by value (US$ billion) ................. 43
Table 4-8. Summary of the researcher’s experience in the New Zealand floriculture
industry ....................................................................................................................... 50
Table 5-1. New Zealand floriculture export code allocation ........................................ 54
Table 5-2. Periods of change in the floriculture export industry identified from interview
data ............................................................................................................................. 55
Table 6-1. Three phases of the New Zealand floriculture industry ............................... 82
Table 6-2. Key features of the period mid 1980s–2000 ................................................ 83
Table 6-3. Position of New Zealand in world floriculture export ranking 2001-2014 ... 84
Table 6-4. Key features of the period 2000-2008 ......................................................... 85
Table 6-5. New Zealand cut flower exports to main markets 2001-2008 (NZ$ million)86
Table 6-6. New Zealand floriculture exports to Japan and the USA by value (NZD
million), 2001-2015 .................................................................................................... 88
Table 6-7. Key features of the period 2008-2015 ......................................................... 90
Table 6-8. New Zealand cut-flower exports to main markets 2001-2015 (NZ$ million)
................................................................................................................................... 93
Table 6-9. New Zealand cut-flower exports to main markets 2007-2015 (NZ$ 000s) .. 94

viii
Attestation of Authorship
I hereby declare that this submission is my own work and that to the best of my
knowledge and belief, it contains no material previously published or written by another
person (except where explicitly defined in the acknowledgements), nor material which
to a substantial extent has been submitted for the award of any other degree or diploma
of a university or other institution of higher learning.

ix
x
Acknowledgements
I wish to express a sincere thanks to the participants from cut flower and cut foliage
industry who so graciously agreed to participate in my research and volunteered to share
with me their experience in the industry despite their demanding working schedules.
Without them, the completion of this study would not have been possible. I thoroughly
enjoyed listening to their stories analyses the experience gratefully to build up this
thesis.
I would like to give my utmost thanks to Dr. Carol Neill my supervisor who was there
with me through the entire process of this thesis. Under continuous work demands and
pressure associated with the industry I work with, I struggled to continue the research
work and her words of encouragement, and continuous support helped me to reach the
end. The countless hours that she has spent on this research with me is almost
unbelievable to me. Her perseverance, dedication and commitment to her students is
commendable. I feel in some ways that the completion of this is more a testament to her
impeccable quality as my mentor than my own capacity as a student.
My sincere thanks are expressed to Professor Ian Shirley (Professor of Public Policy,
Pro Vice –Chancellor) of AUT University. I consider myself very fortunate to study and
conduct research under a distinguished, renowned academic leader who has made an
enormous contribution to public policy both in New Zealand and internationally. His
knowledge and guidance helped vastly to shape this research thesis.
I express my appreciation for the support extended by the Ministry of Foreign Affairs
and Trade, by granting me the Trade and Investment Research Scholarship to carry out
this research.
I am very grateful to Sue Knox who helped me with the formatting to get the thesis as
an academic presentation despite her busy work schedule.
I highly appreciate and am grateful for the invaluable assistance given to me by
Margaret Linzell-Jones and John Moriarty towards editing this thesis.
Finally, my sons Dasith and Ransika for being there with me, helping me with
transcribing work and relieving me from daily housework, to spend time on this
research work.
This research has been an important exercise for me as the researcher to reflect on my
own experience in the industry, and to build a greater knowledge as to how my
experiences have related first to broad international trends, and to that of my peers in the
industry. Some of the views of participants confirmed my own views, and others
challenged them. I have enjoyed ensuring that the voices of the floriculture participants,
who work day to day in this challenging and complex industry, have been able to have
their views recorded in this research. My hope is that it contributes to real and positive
change for the floriculture industry in New Zealand.

xi
Ethics Approval
AUT ethical committee approval was granted for this research on 26th August, 2014.
Ref: 14/209
1
Chapter 1 Introduction
1.1 Rationale
This research focused on a significant export sector of New Zealand, namely,
floriculture. New Zealand is one of the world’s pioneers in the export floriculture
industry and has its roots in the 1970s. New Zealand floriculture has earned a
worldwide reputation for quality and consistency, and contributes to the national
economy by earning foreign exchange, and to regional economies through income and
employment generation.
Over the last decade, the international floriculture marketplace has become intensely
complex, dynamic and competitive. Internationally, floriculture has received special
treatment in developed and developing countries. Support in those countries for the
floriculture sector has been justified on the grounds of its ability to reduce
unemployment and its high foreign earning capacity. Active support through research
programmes, market/product development programmes, incentive schemes and various
other measures are in place in competitor countries to secure their industry’s viability.
Governments in countries such as China, India, Chile and South Africa have supported
the development of their domestic floriculture sectors by implementing development
programmes and incentive schemes and by conducting industry research. Development
in this area has also been supported by international development agencies.
All of these developments have presented challenges to New Zealand flower producers
and exporters for sustaining their businesses as floriculture exporters and in their ability
to compete in the international marketplace. It is evident that over time the New
Zealand industry has endured many setbacks, with changes in major product lines as
they became no longer viable and the shutting down of some production operations in
recent years. Nevertheless, the sector has survived and continues to earn important
foreign exchange for the New Zealand economy. The unfavourable New Zealand
exchange rate, modifications in traditional markets, advances in new markets and many
other factors have demanded that New Zealand growers continually make adjustments
to cope with external conditions to ensure survivability and growth. There has been only
very limited research conducted to study the status of floriculture and to explore
possibilities for strengthening the sector. This research aims to fill some of the gap in
2
this knowledge, and to provide an evidence base to inform strategies for the sector's
future development.
1.2 Background
This idea for this research started with the researcher’s work in the Graduate Diploma in
Economic Development at Auckland University of Technology which was completed in
2010. At that time, documentary-based research was conducted on the New Zealand
floriculture sector, investigating its historical development in relation to international
patterns of floriculture production and marketing. The most important findings of the
research were that firstly, the most developed countries offering markets for floriculture
are located in the northern hemisphere and New Zealand’s southern hemisphere location
provides seasonal advantage to supply during their off-season. Secondly, New Zealand
has sufficient natural resources to accommodate the development of the floriculture
sector, including flat land with supporting infrastructure (roads, electricity, and
telephone) and water availability. These are resources that are under pressure in many
countries. The next important finding was that floriculture demands very efficient
transport systems, and New Zealand has an excellent land and air transport system
linking all parts of the country to major airports and ports. There is also sufficient air
cargo capacity available for floriculture transportation, with regular frequency and at
competitive prices.
New Zealand has a reputation for world-class research and development in primary
sectors. This research is motivated by a desire to consider how this capacity could be
translated for the further development of the floriculture sector as it has in agriculture
and horticulture. It is my view that this capacity, together with advanced, efficient and
cost effective logistical systems, could be translated to other industries such as
floriculture without creating excessive competition for land and water resources.
A successful export floriculture industry has developed in New Zealand with very little
institutional, policy or development support. The profit margins for most of the export
products have been progressively reduced over the past two decades, international
competition has been countered through the introduction of new product lines. The
sector has nevertheless survived and continues to generate important foreign exchange
for New Zealand. In view of the sector’s relative importance to the New Zealand
national economy and to regional economies, the continuity of the export sector is
essential.
3
In order for the sector to further develop, a better understanding of the factors that have
enabled the New Zealand floriculture export sector’s successful development and
operation is required. It is apparent that no previous research has been conducted on
export market dynamics, growers’ specific experiences or associated factors. Any
research that has been done has tended to focus quite technically, on crops and
production aspects.
In finding ways to help further develop the sector in New Zealand, a strong evidence
base recording the real experiences of New Zealand producers needs to be established,
so that the strengths, weaknesses, and future opportunities of the sector can be
comprehensively understood.
This research has been designed to develop that knowledge base and identify the
strengths and weaknesses of the New Zealand sector, by investigating floriculture
producers’ experiences in the changing international marketplace. The objective has
been to use the knowledge gained to create a clear understanding of what is required to
support the further development of the sector and form realistic, well-informed
recommendations in that regard.
1.3 Structure of the Thesis
This thesis consists of six chapters. After this introductory chapter, Chapter 2 will
explain the methodology used in this research. This describes the theoretical basis of the
methodology, and justifies the decision to use a mixed methods approach. It also
explains the procedures that were followed in the evidence gathering and analysis
processes.
Chapter 3 identifies the main literature engaged with in this research, both from
academic and industry sources, which have provided the basis for understanding
previous research on the floriculture industry. The following Chapter 4 continues this
examination by giving an overview of the international floriculture context. It includes
an explanation of what has been learnt from the literature and other documentation
engaged with the floriculture sector’s operations worldwide and in New Zealand. This
includes information from both qualitative and quantitative sources which explain
historical trends and developments in the industry through to the contemporary context.
4
Chapter 5 presents findings from the primary research conducted for this thesis, the
participant grower interviews. The semi-structured interviews were conducted to gain
the perspectives of individuals who have worked for some time in the floriculture sector
in New Zealand. The findings presented in this chapter demonstrate the potential for
merging academic understanding and practice, and provide the basis for the analysis of
information and recommendations for the future of the industry.
A discussion chapter follows which brings together the findings from the participant
interviews with the learnings from Chapter 3 and 4. The analysis shows what has been
found in relation to the main research questions, and concludes with the
recommendations of steps that could provide for future development in New Zealand’s
floriculture sector.
5
Chapter 2 Methodology
2.1 Theoretical paradigm of methodology
This research is designed to encompass both quantitative and qualitative research
methods (mixed methods). The rationale for using mixed methods, is first and foremost,
to enable the research problem to be investigated and analysed from multiple
perspectives, to develop a complete understanding of the context of the research focus;
that is, the New Zealand floriculture sector.
Quantitative research is based on a positivist paradigm that depends on quantifiable
observations and data such as statistics (and is based on positivist philosophy).
Qualitative research, on the other hand, enables an interpretivist approach to analysing
textual and oral data. This type of research has its roots in the post-positivist interpretive
tradition. Using both quantitative and qualitative methods together enables information
to be collected from diverse fields. The methodology will provide the opportunity to
view the research question from a range of perspectives, ultimately to present enhanced,
enriched and meaningful outcomes (Denzin & Lincoln, 1994).
A mixed methods research framework has advantages in that multiple methods can be
incorporated in an in-depth and holistic approach in the research design. The framework
also allows for: the comparison, validation and triangulation of results; the provision of
illustrations of context (for example, to those shown in statistical trends); the
development of complementary representation; and for the researcher to examine
processes and experiences along with outcomes (Plano Clark &Creswell, 2007). The
use of diverse approaches gives primacy to the research problem and question, and
attributes value to both the objective and subjective knowledge that is gathered
(Morgan, 2007).
This research also incorporates case study methodology. The case study approach
allows for in-depth, longitudinal (over a long period of time) examination of a single
instance or event (Flyvbjerg, 2006). The methodology also fits with the use of multiple
methods and provides a systematic way of looking at events, collecting data, analysing
information, and reporting the results. Case study as a research methodology is an
effective research strategy for answering questions that begin with words such as
“what” “how” and “why” (Yin, 2003). It is the method of choice when the data to be
collected about a situation will come from many sources, including people, observations
6
and records (Yin, 2003). Case study methodology is also most useful when the research
is focused on a “specific, unique, bounded system” (Stake, 1998). It often employs a
combination of qualitative and quantitative data collection techniques (Yin, 2003). As a
result, the researcher may gain a better understanding of why the instance happened as it
did, and what might become important to look at more extensively in future research.
For this reason, case study methodology was regarded as an appropriate methodology to
conduct this investigation into the floriculture sector in New Zealand.
This case study approach fits with Yin’s (1993) characterisation of exploratory case
study. This type of research looks for patterns in the data and identifies models within
which to view these data. In this kind of research, data is collected first, then interpreted
through analysis and further related reading. Research questions for this kind of case
study can focus on “what” questions. Stake (1995) proposed further expansion to the
theoretical perspective by including three other types: intrinsic, when the researcher has
an interest in the case, instrumental, when the case is used to understand more than what
is obvious to the observer, and collective, when a group of cases is studied. This
research will follow the latter perspective in relation to individual participant interviews,
where they were recorded as multiple cases for the study. Using multiple cases offers
the advantage of allowing comparisons to be made across several cases and also allows
replication. Multiple cases are used when the researcher is interested in the same issue
in different situations, or to understand a particular situation from different perspectives
(Yin, 2003). Multiple cases will also help develop understanding of the key issues from
many players’ perspectives.
2.2 Research design and procedures
In researching the ultimate answers to the main question of this research, examining the
experiences of New Zealand floriculture export producers in the changing international
market, the following sub-questions were created:
What important developments have taken place in the international floriculture
marketplace over the past 15 years (1997-2012)?
What conditions and events have created changes in the international floriculture
marketplace?
What has been the production and marketing context for New Zealand’s
floriculture export activity over this period?
7
How have New Zealand export floriculture producers been affected by changes
in the international marketplace?
What have been the responses of New Zealand export floriculture producers to
international market changes, and what effects have they had?
What are the advantages and disadvantages that the New Zealand export
floriculture sector has, compared with its international competitors?
What opportunities and challenges have been highlighted for the future
sustainability of the New Zealand export floriculture sector by recent
experience?
What might be done to support the New Zealand export floriculture sector in its
future development?
In answering each of these questions, both quantitative and qualitative methods have
been employed. This section will describe and explain these methods in more detail.
2.2.1 Quantitative research approach
Quantitative methods have been used to provide overview perspectives of the
international and domestic contexts of the sector and its activities. This has firstly
involved mining and analysing floriculture production and trade statistics, and
developing an assessment of key global industry developments and trends. Statistical
analysis of the world floriculture industry and the New Zealand floriculture industry has
been done through sources from the ITC Trade Map and Statistics New Zealand data
sets. The statistical sets are complex, given the wide variety of products representing the
floriculture sector, and analysis of international trade has been guided by the four main
floriculture sector categories under the Harmonious System (HS) of classification.
The statistical analysis was carried out in the early stages of this research, in developing
an overall picture of the global industry and New Zealand’s domestic floriculture
context. Statistics were then referred back to through the course of the research, to
check other findings as they arose, for example, through the evidence received from
participant interviews. Secondary statistics from documentary sources such as industry
reports have also been used to triangulate the findings from the original statistical
analysis, as well as the qualitative evidence.
8
2.2.2 Qualitative research approach
Global floriculture market developments and New Zealand growers’ experiences are
assessed in this research using a combination of qualitative methods that complement
the statistical analysis. The main qualitative approaches are that of documentary
research and participant interviews.
The exploratory documentary research focused on the entire floriculture sector
worldwide and in New Zealand. Information and data have been gathered from industry
conference papers, audio and video resources, industry magazines, country papers on
floriculture production and trade, case studies on floriculture, reports of the World
Bank, United Nations Development Programme (UNDP), International Trade Centre
(ITC), the Centre for the Promotion of Imports from developing countries (CBI),
Japanese External Trade Organization (JETRO ) and other development agencies,
floriculture sector working papers, New Zealand Ministry of Primary Industries (MPI or
MAF) reports, and published research articles. The development programmes carried
out by these organisations with respect to the floriculture industry were studied and
documented.
Participant interviews were also sought to gain the individual stories of experienced
floriculture producers and exporters. It has been necessary to focus especially on the
floriculture sector and community to carry out an in-depth investigation, and uncover
the accumulated wealth of experience held by those participants. Capturing the
individual stories also brought to light important facts and information that provided
opportunities for further expansion and development of the sector.
Individual participants in this research were selected and interviewed following correct
ethical procedures as outlined through an AUTEC ethics approval process. Purposive
sampling was used in order to select participants who were considered to represent a
cross-section of the export floriculture industry, and who have had significant
involvement, and length of experience in the sector. The selection criteria are outlined
in more detail in the interview findings chapter.
Semi-structured interviews were conducted with five research participants from cut
foliage and cut flower sectors, with the interview questions being open-ended and
focusing on gaining the participants’ own views and stories of experiences within the
industry over the past ten years and more. These interviews formed an important part of
9
the research and analysis in providing ‘real world’ explanation of how the trends
observed through the trade statistics and industry reports affected individuals in the
sector in New Zealand. The interview transcripts were analysed separately and
comparatively, identifying key themes that emerged from the participants’ stories, and
triangulating these with other qualitative and quantitative data.
2.2.3 Reflection on the researcher’s own industry experiences
The researcher played a leading role in floriculture development in Sri Lanka prior to
migrating to New Zealand. During this period, she liaised with many international
development agencies and implemented integrated products, and supply, quality and
market development programmes to assist the national floriculture development agenda.
For over 12 years in New Zealand, the researcher has worked in the floriculture export
field, and during this period she has gained an insight into the New Zealand floriculture
industry. It was therefore recognised that the researcher’s knowledge and experience
were also important sources of information for this research. It was important to record
these prior to the interview process, to ensure that her views were captured. A section of
the research was developed to reflect on the researcher's perspective and knowledge of
the New Zealand floriculture industry, gained through years of experience within the
field. This provided another source of evidence on industry participants’ perspectives. It
was also noted, however, that the analysis had to include consideration of prior bias in
relation to the researcher’s experience and views of the industry. To deal with this, part
of the research approach included reporting, through taking research notes, the views
that came through the research that challenged or confirmed her views. It was also an
important part of reflections on the research that were shared during regular meetings
with the thesis supervisors.
2.3 Analysis approach
The combination of the quantitative, qualitative and researcher reflection approaches
has combined a diversity of approaches to investigate the floriculture export sector in
New Zealand. This is important when a holistic, in-depth investigation is needed
(Feagin, Orum, & Sjoberg, 1991).
The analysis was developed in two main phases. In the first phase, statistical and
documentary analysis were combined to develop in-depth understanding of the global
and New Zealand contexts of floriculture production and trading activities. The trade
statistics were first analysed to develop an understanding of the main production and
10
export centres worldwide, what New Zealand’s activity was and how it compared
internationally. This analysis was compared with evidence from secondary sources
which explained historical trends, and more contemporary industry developments.
Further, the statistical and documentary analysis was considered alongside the
researcher’s own experiences in the floriculture sector both in Sri Lanka and New
Zealand. This presented a complex range and amount of evidence which was sorted into
themes which were considered to provide a comprehensive overview of the floriculture
context. The analysis provides the basis of Chapter 4.
The second phase of analysis focused on participant interviews. Participant interviews
were reviewed at first separately in order to identify key themes and answers that
reflected and recorded the individual experiences. This followed four main steps
prescribed by Bryman (2008). In the first stage, first impressions were recorded through
a preliminary browse and review of the transcripts. Secondly, the transcripts were read
over repeatedly to gain detailed coding. In the third phase, major themes in the findings
were identified and labelled as categories that provided a structure for the analysis. The
fourth stage was to relate the findings to theory and make connections between the
themes.
Participant stories from the interviews were recorded as case studies in their own right,
but in the presentation of the interview findings these were based on comparisons of
their answers in relation to the key research questions, in order to locate similarities and
differences in responses. The analysis required reading and re-reading the interview
transcripts several times, and discussing the emerging themes with my academic
supervisors; particularly to check that my own experiences were not heavily influencing
my analysis. The interview findings are presented in Chapter 5.
The grower experience stories highlighted key phases in the New Zealand floriculture
industry’s development over the past few decades that seemed to affect growers in
similar ways. In working through the interview data, it was necessary to revisit industry
reports and statistical data to verify the trends that they described. This provided for
triangulation and verification of the findings and, at points, reinforced or challenged the
researcher’s own views of the industry. The range of information that was gathered for
this research and brought to the analysis stages was, accordingly, very vast. To manage
all of the information within the limits of the research, it was frequently necessary to

11
reflect on the research topic and aims. These helped to keep the analysis focused on the
New Zealand growers’ experiences and to find out how international developments,
competitor trends and other market changes have affected New Zealand growers, to find
out how growers have responded to those trends, changes and challenges, and to
consider how these experiences and their views could be relayed to develop an evidence
base for future industry development. The reflections of how the range of information
gained combined to provide overall analysis and answers to the research questions are
provided in the discussion, Chapter 6.

12
13
Chapter 3 Literature review
This section will provide summary of the relevant literature. The literature reviewed for
this research examined four groups of sources, according to the purpose that the
literature served in the research process. Those four groups are outlined below.
Group 1 literature: Historical perspectives
The first group of literature comprised writing that provided a historical perspective
with respect to developments outside New Zealand over time, including factors
influencing the evolution of the floriculture industry in various regions of the world.
The historical literature provides interesting stories of how the floriculture industry
developed originally, the rationale behind the industry’s development in various
countries, and why and how the international markets and supply centres developed to
their complex state today. There are many case studies, general articles and specific
information sources on this subject. The main writers in this literature area that have
been engaged with are Wernett (1998), Flower Council of Holland (2008), Ando
(2009), Kargbo, Mao and Wang, (2010), and Asea and Kaija (2000).
Wernett has been a particularly useful author in gaining a general insight into the
floriculture industry’s international development. In her article on cut flower
development and its potential in Asia, Wernett (1998) provides an excellent description
of how the floriculture industry began in Europe. She explains how the Dutch pioneered
techniques and technologies in the industry, and how Holland became “instrumental in
developing the industry within Europe and beyond the European boundaries” to the US
and Japanese markets (Wernett, 1998). Wernett also describes how the production
centres in Central America, Africa and Asia were supported in their development and
how new developments related to external facts such as the world energy crisis in the
early 1970s.
Group 2 literature: International industry dynamics
The Group 2 literature deals with industry statistical data and reports on industry
dynamics worldwide. These were used to identify key countries in the international
floriculture industry, and what factors and features have been analysed as strengths,
weakness, opportunities and threats for various countries. They have also been useful
for analysing the influence the wider floriculture context can have on New Zealand’s
14
industry. The literature comprises two general groups, which are described in more
detail below.
The first group included statistical data sources, which provided a basis for quantifying
the size of the global industry and how it is structured internationally. The statistical
data enabled analysis by country, by product categories, and for time series to provide
general information on the floriculture industry’s economic significance in countries of
interest. The statistical data was gathered from two of the most recognised and relevant
sources for the research. Firstly, the AIPH International Statistics Flowers and Plants
2014 is a publication by the International Association of Horticultural Producers (AIPH)
in association with Union Fleurs (the International Flower Trade Association) from the
extensive research and data compiled by Leibniz University of Hannover. This provides
production data from 46 countries, detailed country breakdowns for 37 countries,
product comparisons, market data and prices, and global trade data. This publication
was useful for providing recent production statistics and product information. Another
important source of statistical information has been the US International Trade
Commission (USITC) report on the cut flower industry published in 2003.
An important primary source of statistics has been from the United Nations
COMTRADE database (UNSO/ITC). This database is available via the COMTRADE
or Trade Map (International Trade Commission, ITC) websites, and is a repository of
detailed international trade statistics. The trade statistics are available by country and
by commodity in a web-based format, and it is possible to gain floriculture export
details in some detail. Using this database, it was possible to gain world trade data
including floriculture (and sub-sector) import and export values from 2001 onwards. De
Groot’s analysis was also useful in providing world trade statistics that dated earlier
than UN COMTRADE, back to the 1980s (de Groot, 1999). These data sources have
been important in this research, to provide for analysis of the international trade trends.
These are shown later in the context chapter and also give detail to the analysis in the
discussion chapter.
The second type of literature that comprised Group 2 is literature on industry dynamics
internationally. This sub group of literature addresses important factors in the industry’s
dynamics, including analysis of floriculture volumes and trade values, who the main
actors are, market analysis and consumption patterns, the industry forces that contribute
to market competitiveness and rivalry, and also notes developments such as emerging
15
technology. The main writers contributing to this section are de Groot, (1999), van
Uffelen and de Groot (2005),Van Liemt, (1999), Yun Jian, Xian Bao, Zhou, Shima and
Silva (2006), Kargbo, Mao and Wang, (2010) Shediac, Abouchakra, et al (2008), and
Rijswic (2015).
Van Uffelen and de Groot (2005) provide details on the worldwide production values
and trends, and identify traditional producers and new entrants to the floriculture sector.
They also analysed inter- and intra- continental trade and the influence of WTO
provisions on floriculture trade activity. Rabobank’s World Floriculture Map 2015,
written by van Rijswick (2015), is a more recent report which provides good updates on
the global industry’s status with its provision of export/import statistics, production
trends, and identification of new production centres.
Van Liemt (1999) and Yun Jian et al. (2006) focus their analysis on how internationally
advances in greenhouse technology, plant biotechnology, transportation, and marketing
strategies have enabled floriculture exporting to reach a historical high in activity and
competitiveness. Batt (2001) explains how in many countries market intelligence is
conveyed to the growers at a fast pace, to help them adapt to changing conditions.
Wijnand’s (2005) research paper evaluated sustainability measures in the flower
industry in a number of countries. This was useful for presenting an overview of the
floriculture industry worldwide, especially in the Netherlands and Kenya, in addition to
its analysis of sustainability strategies. The paper provided interesting highlights into
industry characteristics, codes of conduct and plant property rights. Martynovska’s
(2011) thesis investigating Ukrainian firms in the global floriculture industry value
chain was also useful in providing details about the international context.
A source which provides good information about the internationally important Japanese
market is the Japan External Trade Organisation (JETRO) publication Guidebook for
Export to Japan: Cut Flowers. This publication provides comprehensive information for
exporters to the Japanese market, including the country’s import regulations, procedures
and systems. It also provides some analysis on trade trends in relation to cut flower
imports into this market. Given the importance of Japan as an international importer of
cut flowers, this has been a useful source for this research.
16
Group 3 literature: International industry development
The literature in Group 3 analysed industry development aspects such as international
assistance and incentive schemes. Writing in this group was examined with the purpose
of obtaining an understanding of the knowledge already established on the subject and
to assess the position of the New Zealand industry in comparison with the world
players. The literature reviewed has mainly come from international organisations and
agencies such as the World Bank, from a particular government agency’s publication, or
by individual authors. These mostly comprise sector working papers, case studies and
general industry reports.
Asea and Kaija’s (2000) working paper on the flower industry in Uganda is an example
of one of the international sources in this group, which is insightful in highlighting the
reasons the Ugandan government developed policies to stimulate the rapid development
of that country’s flower industry. Information on government support measures for the
floriculture sector in Holland are also presented by Kargbo, Mao and Wang (2010), who
explain how in Holland, the floriculture sector has received continuous government
support to redefine and reinvent their production and marketing to cope with developing
pressures. Information such as this helps to create understanding of how Holland has
converted enormous competitive pressure from growing new centres to their advantage,
and moved from the traditional production role, to a hub for industry technology,
distribution and marketing; still maintaining its top position in the international
floriculture industry.
Group 4 literature: Sources on New Zealand floriculture
Group 4 is literature that has provided data and information on New Zealand’s
floriculture production and trade context. New Zealand Statistics Infoshare database
has been the main source of primary, statistical information regarding floriculture. New
Zealand statistics on trade and production were acquired from the Statistics New
Zealand database, especially from the Infoshare site. These provided data back to 1988
on annual floriculture export statistics, and were especially useful in their detail of
particular species exported.
Fresh Facts is an annual document jointly published by the New Zealand Institute of
Plant & Food Research Ltd and Horticulture New Zealand. The data booklet presents a
collection of industry measurements and financial figures from the New Zealand
horticulture industry. Published since 1999, this publication provides a valuable insight
17
into the growth of New Zealand's horticultural exports. The latest version of this
publication is from 2014.
The Ministry of Agriculture and Forestry’s Horticulture monitoring report of July 2004,
was a very comprehensive report detailing the industry status at the time, with emphasis
on the main export flower crops. The report identified many issues the New Zealand
floriculture industry was confronting at the time (Ministry of Agriculture and Fisheries
[MAF], 2004). An updated report in 2007 made some observations about the status of
the industry and gave updated export statistics (HortResearch, 2007). These are very
useful for analysing past changes in New Zealand’s floriculture sector. There has been
very little reporting that has focused in a comprehensive way on New Zealand’s
floriculture sector in more recent years. The limitation of the sources that have been
used is that they are not current, and therefore have not captured the many changes that
have taken place in the sector more recently both nationally and internationally.
3.1.1 Summary
This literature review has identified key sources of literature that have been engaged
with to build the body of evidence for this research. It is noted that there are some
sources which have developed good analysis of the status of the New Zealand
floriculture industry at specific times, but none are very recent. There has been research
carried out in New Zealand in relation to aspects of the floriculture industry, and these
mainly focus on production aspects of various crops. They tend to be technical in their
nature, and highlight the innovation capability which has been a strength in New
Zealand industry. Literature focused on business and product development and
marketing aspects was not so readily available. Also missing is real analysis of the
day-to-day operations of the industry, and how the New Zealand growers interact with,
and are influenced by, features, forces and developments in the international industry
context. This research seeks to go some way to filling this information gap. It starts in
the next chapter by presenting the analysis that is the result of examining documentary
and statistical data, and presents a picture of the international floriculture context and
how New Zealand floriculture fits within it.

18
19
Chapter 4 The international floriculture context
Floricultural products are universally accepted media for expressing sentiments such as
happiness, love, sympathy, gratitude, caring and celebration. These products have the
ability to enhance the atmosphere inside a house, a building or garden and in this respect
floricultural produce has been used by people all over the world for many centuries.
While religious or cultural traditions are the main reasons for the use these products in
the developing world, in more prosperous countries they are used as gifts or to uplift the
image or atmosphere for people in their daily lives and at times of celebration or
significance.
Floricultural production incorporates a wide variety of products such as cut flowers, cut
foliage, indoor/outdoor ornamental pot plants, flowering plants, bedding plants, garden
plants, and propagation material like bulbs and tubers, seeds and tissue culture plantlets.
Floriculture production activities can take place on small land areas under cover in
greenhouses, shade houses or temporary cover, and in these modes it is called intensive
production. Production can also take place on open ground, and on comparatively
extensive land areas per unit of production. The cultivation of floriculture products to
supply the floral industry or gardening industry (commercial floriculture) is a discipline
under the umbrella of horticulture.
This chapter consists five parts that present the overall findings from the documentary
analysis of primary and secondary literature as they were described in the previous
chapter.
The first part presents a historical explanation of the floriculture industry’s
development, with descriptions of the origins of that development within specific main
countries (Netherlands, Japan, and Israel) as well as New Zealand.
The second part covers the role of the international development agencies and intensive
development of the industry from the end of World War Two and in more recent
decades, where industry development was encouraged through external help between
countries and through international development and aid agendas.
The third part of this chapter covers the current status of the industry: the context of
global floriculture markets; measures that have favoured floriculture in developing
20
countries; the rules that regulate and at times restrict trade (such as rules that give rise to
biosecurity requirements); and global trade statistics and trends over time.
The fourth part covers the New Zealand floriculture industry, showing what is known of
the current status of New Zealand production and exporting from New Zealand, and of
the New Zealand floriculture production and marketing context.
A final part in this chapter is based on the knowledge and experience of the researcher.
It presents the researcher’s reflections on how she has participated in and observed
developments in the New Zealand floriculture industry since 2001.
4.1 The historical development of the global floriculture industry
4.1.1 The Dutch and European floriculture Industry
The contribution by the Dutch to the establishment and historical development of the
floriculture industry is renowned. Holland played an important role in inventing and
pioneering intensive production technologies in the areas of the greenhouse, irrigation,
breeding and other horticultural technologies. The crucial role of Holland’s Flower
Council, its auctions, developed infrastructure and constant government support for
research and development made Holland the world model and epicentre of floriculture
(Wernett, 1998). The country has maintained this role as the predominant international
floriculture exporter, and its export volume today accounts for 60 percent of world
exports (Market News Services, 2008; AIPH Union Fleurs, 2008; Market News
Services, 2014).
Examining the development of the floriculture industry around the main consumption
centres provides a historical perspective of the industry and the reasoning behind the
development of the industry worldwide. The demand around the world for cut flowers
which was originally satisfied by local cut flower production. That changed when
growing economies in the USA, Europe and Japan, and increased disposable income
brought about higher consumption of floricultural products. Increased demand from
these markets offered opportunities for expansion of commercial production of
floricultural products. This, along with continuous improvement in transport systems,
facilitated the distribution of products further away from production centres. The
industry expanded beyond domestic boundaries, and became a global production and
trading sector (Wernett,1998).
21
In Europe, demand for floriculture products grew over time and required a large supply
of cut flowers for gifts, occasions, and everyday use. Hence, cut flower production in
Europe, driven by the Dutch, was substantial. Gradually the development of
transportation systems made it possible to deliver cut flowers grown in southern areas of
Europe to northern areas of Europe. “Consequently, the European flower industry began
to extend its boundaries for cut flower production and along with this expansion grew
the influence of the European flower industry” (Wernett, 1998).
The Dutch flower sector exemplifies an integrated model with businesses, research
institutes and other stakeholders working closely together on production, research and
development, logistics, infrastructure and marketing. The industry was supported by
government through a conducive policy framework and development funding. The
Dutch sector is known to have a highly developed infrastructure of education,
knowledge, innovation, agronomy, information, and marketing services (The Flower
Expert, n.d.). The world’s largest flower auction was established in Holland, and the
Dutch auctions continue to provide an international platform for price-setting and
exchange of information on all aspects of the industry (FloraHolland, n.d; Wernett,
1998). They are considered to play a crucial role in presenting a world model for
floriculture trade, and Holland has led developments that caused the industry to extend
well beyond Europe and the US and Japanese markets (Wernett, 1998). This has
enabled Holland to keep its premier status in this sector internationally. In 2014, for
example, that country’s floriculture exports accounted for almost half (48.6 percent) of
world exports (UN COMTRADE, 2014).
4.1.2 Japanese floriculture industry
Japan is another country with a long history of floriculture. In Japan there are strong
traditions in the use of floriculture products that were developed under the influence of
Buddhism first, and strengthened under the Shogun’s rule (during the Edo period, 1603-
1868). At that time, special skills were developed, plant cultivar collections were built,
flower shows and flower markets became important recreational events, and “every
class of people … was fascinated with floriculture” (Nagase, 2011, p.1).
In Japan the offering of flowers on the altar in honour of Buddha is a traditional part of
worship. There is also the practice of offering flowers to the spirits of the dead. The
flower art called Ikebana evolved around these traditions and this art carries great
principles such as getting close to nature, appreciating beauty, and practicing spiritual
22
aspects such as relaxation for the mind, body, and soul. In later years, universities and
museums have played an important role in conveying the knowledge of unique Japanese
floriculture (Nagase, 2011).
In more recent history in the 1980s, Japan’s economy grew fast and discretionary
spending by the Japanese increased. This translated into demand for flowers as well as
other products, and imports from other countries grew. International flower export
products made “headway into the lucrative market in Japan” (Wernett, 1998). Other
countries followed the trend set by Japan, with economies in countries such as Korea,
Taiwan, Singapore and Hong Kong expanding and providing opportunities for the
flower industry to increase.
From that time, Japan became one of the most important markets for New Zealand
floriculture. It is also one of the largest markets in the world today. Japan is a
particularly large market for cymbidium orchids, a product which is highly priced in
comparison with other products (Japanese External Trade Organization [JETRO],
2011). New Zealand was recorded in 2011 as being the fourth largest supplier of orchids
to Japan, and fifth largest supplier of miscellaneous cut flower products to that country
(JETRO, 2011).
4.1.3 Growth of the Israeli floriculture industry
When the world energy crisis occurred in 1973, flower growers in the southern regions
of Europe were able to gain competitive advantage due to a price advantage over
growers located in northern regions. Cut flower production was more expensive for
northern growers during the winter season due to the increased energy costs required to
obtain quality flowers in controlled temperature greenhouses (Wernett, 1998). Israel
became an important exporter in the floriculture industry at this time and its entry into
the Dutch flower auction system created competition for the southern European flower
producers (Wernett, 1998). It is valuable to look into how the industry developed in that
country.
Israel identified and explored advantages in that country that gave them the ability to
produce cut flowers in open fields or plastic tunnels year-round, eliminating the need for
greenhouses and the expense of heating systems. However, they had two main limiting
factors to address to make the industry’s development successful. These were
transportation costs to Europe, and potential water shortages if production was to
23
expand. Water shortages are a feature of Israeli agriculture, given that half of the land
area of the country is defined as desert (Ministry of Agriculture and Rural Development,
n.d.). The agricultural sector’s high level of development has been achieved by the close
cooperation and interaction between scientists, extension advisers, farmers, and
agriculture-related industries. This was similar with the development of Israel’s
floriculture industry, with the Israeli government playing an important supporting role.
Policy solutions to support the development of the industry included providing
transportation subsidies and funding research on irrigation systems in the production of
cut flowers. The industry has developed with a high level of research, good coordination
between academic education institutions and the industry, a central marketing
organisation (Agrexco) and an active growers’ association (Halevy, 1994).
4.1.4 Dutch floriculture industry expansion (foreign investments)
The Dutch floriculture industry has held significant influence over development in areas
in the rest of Europe and the world. The 1970s energy crisis provided the catalyst for the
Dutch to engage with other regions for the industry’s development, and to provide
solutions for limitations caused by seasonal variations. Greater volume and variety of
products were able to enter the Dutch auctions, which are central to the international
marketing of floriculture products (Wernett, 1998).
Because of its size and influence, the Dutch industry have had the ability to make
predictions about future developments, and to resolve strategically issues that have
arisen in the international floriculture marketplace. Accordingly, it appears to be always
converting threats that arise into opportunities for the sector. The Dutch have led
innovation in all fields of the industry, including new technologies for production and in
breeding new varieties. They have also been leaders in exploring opportunities in
prospective production countries and selling to new market entrants the technology, new
varieties, breeding stocks, seeds and know-how for the industry’s development. Another
strategic approach has been to move production centres to cost-competitive countries,
through foreign investment (with full ownership by the Dutch), or the establishment of
partnerships. Such promotional activities were subsequently extended to prospective
developed economies such as the USA and Japan, and surrounding countries.
Floriculture consumption and sales were successfully extended to these markets.
24
4.1.5 Development of USA and Central American flower industries
The floriculture industries in North and Central America have been noteworthy for their
impact on international production and marketing. The USA is an established
floriculture production centre and international market in its own right. The country is
the third-largest producer of cut flowers in the world, with production valued at US$
424 million in 2001 (although this was down from US$ 472 million in 1997)
(Bonarriva, Jabara et al (2003).
Almost all production in the USA serves the domestic market, which has substantial
demand. The US market is also considered to be one of the most diverse cut flower
markets in the world.
American international assistance policies have supported the growth of the floriculture
industry in some Central American countries, and Colombia is a good example of this.
The Colombian floriculture industry was supported at first during the 1960s by a United
States Agency for International Development (USAID; the Alliance for Progress)
programme to combat communism and enhance economic cooperation between the
United States and Latin American countries. This programme promoted the
development of non-traditional agriculture products including flower production.
The Colombian industry was strengthened further in the 1990s by support given through
the Andean Trade Preference Act (ATPA) 1991, along with the ATPDE (Andean Trade
Promotion and Drug Eradication) 1992. The purpose of the Acts was to promote the
development of viable alternatives to the cultivation of drugs by offering duty-free or
other preferential treatment to imports of eligible goods (including flowers) from
Bolivia, Colombia, Ecuador, and Peru. Colombia was one of the most successful
recipients of that programme as it developed a successful industry because of climatic
conditions, the long equatorial days offering a year-long growing season, the
availability of resources such as fertile soil and water, and the low cost of labour. These
advantages combined with the important factor of close proximity to the US market, and
Colombian flower exports to the USA grew from just one percent in 1971 to 15 percent
in 1981, and up to 75 percent in 2013 (Conlon, 2015). This development has affected
domestic producers in the USA with Colombian producers now supplying most cut
flowers in the United States.
25
The floriculture industry in Colombia has developed as a highly consolidated
entrepreneurial hub of growers, suppliers and logistics. The Colombian Association of
Flower Exporters (Asocolflores; Asociación Colombiana de Exportadores de Flores),
established in 1972, is an organization that is extremely active at national and
international levels. It provides representation of Colombian flower producers and
exporters on trade policy and legal issues, mainly with the policy makers of Colombia,
the United States, and the European Union. Asocolflores also addresses sectoral issues
such as logistics, market intelligence, and research and development. The organisation
also attends to the welfare of the industry’s workers and other industry issues that arise.
The Colombia Trade Agreement (COTPA) that came into effect on 15 May 2012
strengthened Colombian access to the US flower market by lowering duties. As a result,
Colombian cut flowers have enjoyed remarkable growth, to become the second largest
cut flower exporter in the world. The US$0.61 billion exports of 2001 grew to a
US$1.34 billion industry in 2013 providing support for both the Colombian and US
economies (Conlon, 2015).
Central and South American countries exhibited remarkable growth in the sector in
response to the active promotion endeavours of their governments and development
agencies (UNCTAD, 2008). Ecuador has followed a similar trend to Colombia, based
on the US policies of duty free access and other incentives for its cut flower industry.
Ecuador has developed a very progressive cut flower industry to become the world’s
third largest cut flower exporter, with those exports totalling US$837 million in 2013
(Conefrey, 2015). In recent years, Ecuador has become the leading South American rose
producer, a position built on exports to the USA and more recently, the Russian market
has become very important (Conefrey, 2015). It is well known throughout the world for
its high quality, large headed roses that are the result of the high altitude at which the
country’s rose farms are located.
4.1.6 Development of New Zealand floriculture industry
The New Zealand floriculture industry has a long history that relates to its migrant past.
Floriculture skills were introduced to New Zealand as European migrants settled in New
Zealand (Wassilieff, 2008). Nurserymen from Europe established nurseries throughout
the country and sold their produce locally. With the development of railways and roads,
a few nurseries expanded to supply plants to distant buyers. With continuous
immigration, knowledge continued to move to New Zealand. Turners’ flower market,
26
the major business for marketing flowers in New Zealand, was established around 70
years ago (Floramax, n.d.).
The industry was at first built for domestic flower consumption. For most of the
twentieth century cut flowers were grown for the domestic market only. Growers
produced single or limited lines of flowers. Roses were the main domestic crop,
followed by carnations, chrysanthemums and lilies. They were grown indoors under
controlled conditions to ensure year-round production of flowering stems.
The export of cut flowers, bulbs and tubers developed in the 1970s when regular flights
were possible to export destinations such as Japan, Europe, and the United States. Japan
developed as the main export market, while exports were made to Australia and New
Caledonia and other Pacific islands. There were some exports to Europe and limited
exports to the United States. The development of export activities made production
expansion possible as well, and the floriculture sector grew throughout New Zealand.
The early high quality of New Zealand’s floriculture export products established a good
reputation for New Zealand floriculture. Appropriate climatic conditions and a skilled
grower base enabled New Zealand floriculture to earn a worldwide reputation for
quality and consistency.
In 2002, research into New Zealand’s comparative advantage identified 37 ‘star
performing’ export sectors in this country. Cut flowers and foliage and seeds sectors
were two of the star performing sectors that were identified (Ballingall & Briggs, 2002).
The world growth rates for the for both these sectors were high, and New Zealand’s
growth rate exhibited even higher growth rate than the world averages.
In the sector’s history, there is no evidence of a particular policy focus being placed on
the development of the sector, or any institutional support mechanisms similar to those
of competitor countries being provided for the sector. The national system of export
incentives established in the mid-1970s provided some attraction of investment to
export sectors, including floriculture (Briggs, 2003), but there is little evidence that this
motivated significant expansion in the industry. Support has since been limited to case-
specific support from New Zealand Trade and Enterprise (NZTE), for example towards
the commercialisation of New Zealand varieties (Kennedy, n.d.), or for trade fair
participation and other similar activities.
27
There has been some institutional infrastructure created between New Zealand
floriculture producers and exporters. Often this has been sub-sector specific, such as the
New Zealand Export Growers Orchid Association (NZEGO) which was incorporated in
1980. The association at first developed a grower-owned business called Flora Pacific
for cooperatively exporting orchids, and exploring market opportunities. Flora Pacific
was considered to be instrumental in shaping the young industry and in providing access
to export services and catering for about 80 percent of total orchid exports from New
Zealand. However, Flora Pacific was placed into receivership in early 1992 due to
internal challenges, and the NZEGO has existed more as an industry association since,
functioning mainly as a communication portal, lobby organisation, sharer of market
information and providing a basis for industry promotions (New Zealand Export
Growers Orchid Association [NZEGO], n.d). It has also funded and established a price
monitor for member growers to get general price and volume information and as a tool
to avoid unintentional price undercutting.
Floriculture producers today continue to operate individually in terms of their
day-to-day production and marketing activities. Associations do, however, appear to
play a role in supporting industry members. The New Zealand Flower Exporters
Association (NZFEA, n.d.) is another industry organisation established in 1994.
Presently there are seven members who are said to handle over 95 percent of New
Zealand exports (The New Zealand Flower Exporters Association [NZFEA], n.d.). The
NZEGO and NZFEA report that they work together to ‘encourage efficiency,
specialisation and most importantly, an entrepreneurial spirit among exporters to expand
markets and work towards a common interest that benefits outcomes for growers’
(NZEGO, n.d.).
Estimates were made in 2006 that there were approximately 1362 commercial flower
growers operating in New Zealand, and 2329 hectares of land were under floriculture
production. The estimated direct employment was 10,000 people (Fresh Facts, 2014;
MAF Farm Monitoring Report, 2006; Horticultural Monitoring Report, 2006). Making
use of the diversity of microclimates from Northland to Invercargill, growers produce a
range of products (tropical, temperate and cold climate) that generate income and
employment in both rural and urban settings (NZFEA, n.d.).
28
The industry operates in conjunction with many other economically significant sectors
in New Zealand, such as domestic and international aviation, freight forwarding, local
logistics and haulage, domestic courier services, and the packaging industry.
Not only in New Zealand but throughout the world, floriculture has been recognised as
providing an answer to land fragmentation on the periphery of urban centres (Marshall,
Waldman, MacGregor, Mehta, & Rahdhawa, 2009), because of the relatively low
amount of land required for operations.
The mainstay of New Zealand’s flower products for export is cymbidium orchids (Fresh
Facts, 2010). However, peonies, hydrangeas lilies, callas, proteas, nerines, sandersonias
and are also grown for export and provide important export revenue. The foliage of
native flaxes and pittosporums have also been popular in overseas markets (Wassilieff,
2009), and provided significant export revenue especially in the last two decades. Bulb
and seed production for export was developed in the late 1990s, largely driven by the
arrival of several large Dutch companies in Canterbury and Southland. This caused a
four-fold increase to northern hemisphere buyers between 1996 and 2006. Some 1,500
tonnes of bulbs grown on leased land were exported to the Netherlands in 2005
(Wassilieff, 2008).
Today New Zealand’s floriculture products are exported to many countries throughout
the world. Cut flowers valued at NZ$31.8m were exported to 38 countries in 2013
(Japan NZ$18.2m, the USA NZ$ 4.9m, Hong Kong NZ$1.7m). Orchids were the
dominant cut flower export crop, with NZ$19.6m (fob) exported to 33 countries (Japan
NZ$12.2m, the USA NZ$3.5m). Japan, the United States, Hong Kong and Canada tend
to be New Zealand’s largest markets (Statistics New Zealand, 2014).
In the late twentieth century Japan’s bubble economy, favourable exchange rates and
off-season festival demand made that country New Zealand’s main floriculture export
destination. New Zealand’s southern hemisphere location also provided seasonal
advantages to supply the northern hemisphere, so that it could find seasonal market
‘windows’ where it would not compete with the large European producers, especially
Holland (NZ Bloom, n.d).
29
4.2 International support for floriculture industry development
International organisations have had substantial influence over the international
development of floriculture production, especially in the last two decades. In the late
1990s international development agencies became active in international trade
promotion and in assisting developing countries to participate in non-traditional export
sectors and pursue export diversification strategies. Floriculture was a key industry
selected to be promoted as a foreign exchange earner and employment generator as part
of these programmes (Taylor and Smith ,2007).
The US International Trade Commission (USITC), the International Trade Centre
(ITC), World Bank (WB) , the Food and Agriculture Organisation (FAO), the
Netherlands Centre for Development (CBI), the Japanese External Trade Organization
(JETRO), the Commonwealth Secretariat (CWS), and the United States Development
Agency (USDA) were some of the key agencies provided packages of products
development and trade facilitation assistance and expertise to develop floriculture in
developing countries (World Bank, 2003). JETRO), the European Union and the World
Bank supported the South African flower industry (JETRO, 2000; ITC, 2000). The ITC,
FAO, CBI and CWS all had programmes which supported Asian and Pacific countries
in developing their floriculture industries (Papademetriou, 1998; Rao, 2006; JETRO,
2007, Wijnands, 2005).
4.2.1 International accelerated export development programmes
Under the UNDP and ITC, a number of production and export development
programmes have proceeded and had significant influence in establishing floriculture
production in ‘developing’ countries. One of these programmes is the Export Led
Poverty Reduction Programme (EPRP). This global programme focused on direct
interventions with ‘least developed countries’ (LDCs) and developing countries that
integrated poverty alleviation measures as a core element of national policies and trade
strategies. The EPRP is designed to work at the community level to promote the
establishment of export-oriented production activities. EPRP projects have been
implemented in several countries, including Bolivia, Brazil, Cambodia, China, Ethiopia,
El Salvador, India, Kenya, Mongolia, Vietnam and South Africa. Through the EPRP,
the ITC has provided technical and financial assistance to support institutions, sectors,
and national policy.
30
The African Growth and Opportunity Act (AGOA) is another example of support by the
USA to develop the international floriculture sector. The AGOA was signed into law to
improve economic relations between the USA and the African region and to increase
the level of trade and investment between Sub-Saharan Africa and the USA. The
legislation significantly enhances market access to the US for qualifying Sub-Saharan
African (SSA) countries (International Trade Centre [ITC], 2014).
As a result of AGOA, horticulture became a significant growth industry in Southern
Africa, and the cut flower industry was noted in 2010 as being a ‘lucrative trade
prospect for many African countries’ (Pasco, 2010). South Africa, Tanzania and Zambia
grew as exporters of cut flowers into the US market under the protection of AGOA
entitlements. In 2002, $432,000 worth of cut roses was exported from these countries to
the USA. Tanzania, led by primarily citizen-owned companies, substantially increased
their exports in cut roses from $16,000 in 2001 to $372,000 in 2002 as growers
increasingly worked together to supply orders and share transport costs to the US.
Kenya was also noted as doubling its exports to the USA from 2010 to 2014 to US$4.3
million (US Agency for International Development [USAID], 2015).
The new entrants to the international floriculture industry in these developing countries
have benefited from the support given by development agencies through programmes
and funding, with the results in terms of increased international supply, trade and
competition. Although these have all had implications for New Zealand floriculture
producers a mechanism to provide the information at that level about the changes in the
international marketplace, especially in relation to increased areas of competition, was
not evident.
4.2.2 International floriculture trade facilitation
As well as promoting production in developing countries, international development
agencies became active in international trade promotion and in assisting developing
countries to participate in world trade. International institutions such as the World Bank,
the International Monetary Fund (IMF), the General Agreement on Tariffs and Trade
(GATT), and the World Trade Organization (WTO) played very prominent roles in
liberalising trade, and floriculture was a part of the liberalisation agenda.
International development agencies continue to provide market promotion and
consultancy support to the efforts of developing countries’ in advancing floriculture
31
development (Clements-Hunt, 2004). The Netherlands is also very active in these
countries exploring their opportunities to expand their interests internationally.
Preferential trade agreements have also provided a market context by which the new
entrants have been able to flourish.
The Generalised System of Preferences (GSP) is a preferential trade scheme agreed
through the United Nations Conference on Trade and Development (UNCTAD) to
support developing countries and integrate them into the world economy. Preferential
treatment is given in the form of reduced or zero rates of customs duties on a range of
industrial and agricultural products originating in certain developing countries. These
are given preferential access to the markets of developed countries (Onguglo, 1999).
The European Union (EU) has used the GSP to provide preferential access for
floriculture imports from developing countries, under three distinct categories. These
include: zero duties on imports from countries designated ‘less developed’; preferential
access for ‘developing’ countries to the EU market; and special incentive arrangements
for sustainable development and good governance (Philipp, Rust & Baumhauer, 2014).
Likewise, the USA has used the GSP scheme to provide preferential or duty-free entry
to selected products from 129 designated beneficiary countries and territories. This
includes floriculture products from a number of countries with newly developed
floriculture production sectors (US Customs, 2015).
4.2.3 Floriculture industry development in developing countries
With international trade becoming more readily facilitated amongst developing
countries due to measures such as those noted above, a number of countries established
national institutional and policy frameworks under export development organisations to
actively support the development and growth of floriculture industries. The
governments of many developing countries accorded priority status to floriculture in
their national agriculture. Conducive export development policies and various tax
incentive packages were introduced to attract investments. The governments of India,
Thailand, Malaysia, Indonesia and Sri Lanka, for example, accorded priority status to
floriculture in their national agriculture and export policies, and various tax incentive
packages were introduced to attract investments. Subsequently, these countries made
quantum leaps in the growth of their floriculture sectors (Jong, Sadd & Hamir, n.d.;
Sahavacharin, 1998; Wijinads, 2005; Van Uffelen & de Groot, 2005). Some examples
of support mechanisms are described below.
32
Many tropical developing countries in Asia, Africa, and Central and Latin America
entered the floriculture industry during 1995-2000 period. These countries enjoyed
year-round favourable natural growing conditions ideal for floriculture production, so
the export ventures required less investment in climate control facilities for growing
than in the traditional flower-producing locations. The labour costs were also much
cheaper and currencies in the respective countries were weaker, making their exports
very price competitive in international markets.
Despite being new to the industry and with under-developed facilities in their countries,
these countries have progressed well with active support from their respective
governments and international development agencies. South African countries, Central
American countries and developing countries in Asia progressed with their export
floriculture industries.
China and India were later entries to the international floriculture export sector,
accelerating their endeavours around 2000 (Export-Import Bank of India [EXIM], 2006;
Ando, 2009). Both countries have ambitious agendas for the further development of the
sector. Various government incentives, promotional packages, tax holidays, seed and
equipment policies, including the use of Foreign Direct Investment (FDI) have been put
in place. Financial support has been offered in these countries for air-freight,
establishing cold storage, pre-cooling units, refrigerated vehicles and building
greenhouses, which has enabled increasing investment in the sector (Yang, Liu & Zhu,
1998; Xu, Chen & Li, 2008). In India, the National Horticulture Board (NHB), the
Agricultural and Processed Food Products Export Development Authority (APEDA)
and National Bank for Agriculture and Rural Development (NABARD) provided
support through various programmes for the development of horticulture including
flowers. APEDA especially has nurtured the floriculture industry through various
strategic measures and development assistance such as trade promotion assistance,
financial assistance schemes, infrastructure development, quality development
assistance, market development assistance, transport assistance.
In China, the Yunnan project has established a sizeable floriculture sector, having
developed to an area of 35,000 hectares under production and with an estimated
US$101 million in exports to 35 countries in 2008 (Dasgupta & Dadlani, 2011). High
incomes were possible from these agriculture holdings in Yunnan, with cut flowers
33
yielding high incomes, and contributing to increases in livelihood skills and
international marketing linkages for people of that province.
Other countries in Africa have enjoyed significant government support to develop the
floriculture industry. Uganda is an example, with the government supporting the
industry’s development to achieve rapid development (Asea & Kaija, 2000). Ethiopia
has also developed an export-oriented agricultural policy that has helped provide a
competitive edge for that country’s flower industry. Under the Ethiopian Investment
Code 2001, the Ethiopian Investment Agency provides attractive incentives for
investments in new enterprises or expansions of enterprises. The Ethiopian government
also provides a number of support mechanisms to the floriculture industry, including
duty-free imports and exemptions from export taxes. Along with privileged access to
the EU and USA markets, these factors led Belwal and Chala (2008) to describe the
Ethiopian floriculture industry as being remarkably successful and having “taken aback
stakeholders in the global flower industry” (Belwal & Chala, 2008).
4.3 The present status of world floriculture Industry
4.3.1 Floriculture Production
The extensive development of the world floriculture industry has resulted in a complex
map of production today. The 2014 AIPH report noted that the total area under
floriculture production in the world, both under protected area and open, is presently
estimated to be around 628,972 hectares. China (286,068 ha) and India (161,000 ha)
have the majority of the world acreage under cut flower and plant production, giving the
Asia-Pacific region the major share (75 percent) of the total world area under
floriculture production. Europe has a 10 percent share of the world’s floriculture
production by area. The acreage under flower cultivation in Africa is small (1.5
percent). With around 2200 hectares, Kenya is the largest producer of flowers and
plants in Africa, followed by South Africa and Zimbabwe both growing over 1000 ha of
flowers. Latin America has an 8 percent share in the world area under floriculture, with
Mexico having the largest area under flower production (21,129 hectares) (AIPH,
2014).
In terms of production value, the Netherlands (Euro 3901 million), the United States
(Euro 2992 million), Japan (Euro 2987 million), Italy (Euro 1627 million), Germany
(Euro 1289 million) and Canada (Euro 1067 million) are the largest producers of cut
flowers and plants (AIPH, 2014).
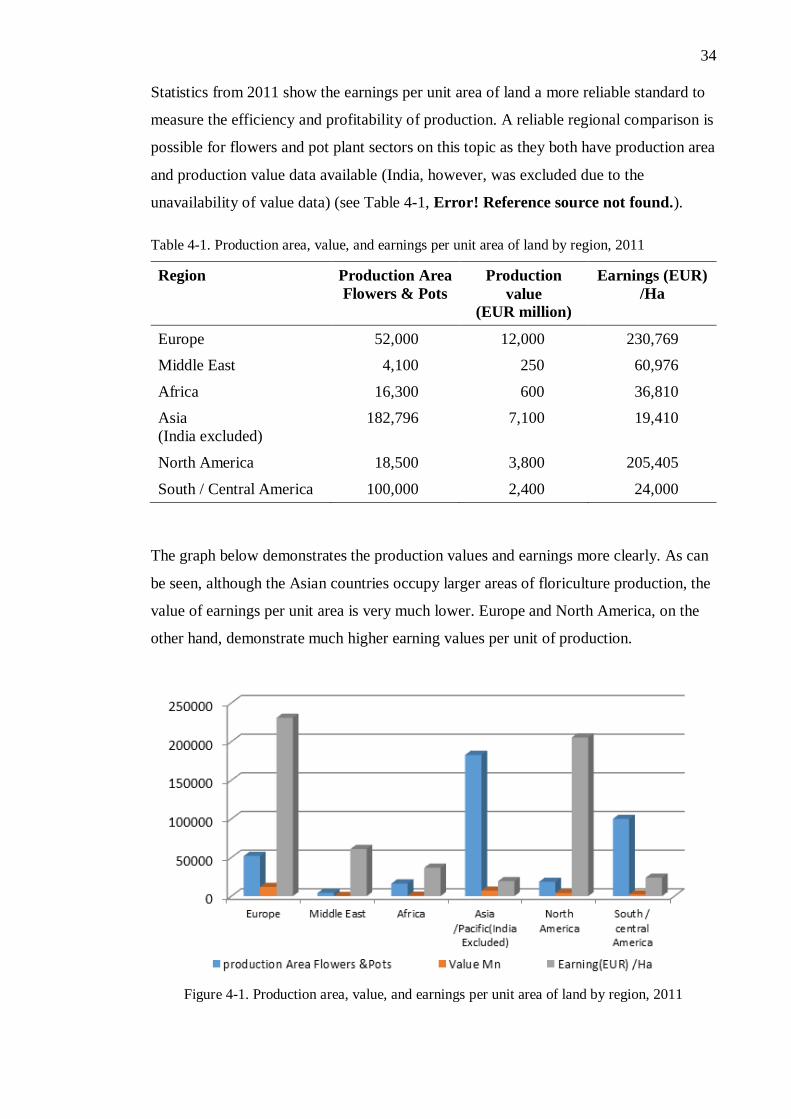
34
Statistics from 2011 show the earnings per unit area of land a more reliable standard to
measure the efficiency and profitability of production. A reliable regional comparison is
possible for flowers and pot plant sectors on this topic as they both have production area
and production value data available (India, however, was excluded due to the
unavailability of value data) (see Table 4-1, Error! Reference source not found.).
Table 4-1. Production area, value, and earnings per unit area of land by region, 2011
Region Production Area
Flowers & Pots
Production
value
(EUR million)
Earnings (EUR)
/Ha
Europe 52,000 12,000 230,769
Middle East 4,100 250 60,976
Africa 16,300 600 36,810
Asia
(India excluded)
182,796 7,100 19,410
North America 18,500 3,800 205,405
South / Central America 100,000 2,400 24,000
The graph below demonstrates the production values and earnings more clearly. As can
be seen, although the Asian countries occupy larger areas of floriculture production, the
value of earnings per unit area is very much lower. Europe and North America, on the
other hand, demonstrate much higher earning values per unit of production.
Figure 4-1. Production area, value, and earnings per unit area of land by region, 2011
35
4.3.2 Analysis of the world floriculture production dynamics
Analysis of the global floriculture industry is often based on statistical data such as that
above, which provides good insights into where production is located and how it is
faring. There has also been much research that analyses the development of flower
export industries in various countries, considering the success factors and attempting to
identify key models that create competitive advantage.
Wijnands (2005) summarised some dominant characteristics of the worldwide flower
industry. They identified the Dutch flower industry as the European hub, the USA as the
largest flower market, and Japan as the world’s second largest market. Wijnands’
analysis also extended to characterising some markets. These included the nature of
Israel’s floriculture innovation, and Uganda as an emerging flower business centre.
South Africa was also noted at that time as a production centre with high ambitions
(Wijnands, 2005). Van Rijswick (2015) presented an analysis which highlighted the
strengths of the cost efficient producers, favourable growing conditions of certain
locations, and the rising demand for competitively priced flowers and modern and
improved logistics. Van Rijswick noted that although Holland continues its dominance
in the world’s floriculture sector, its share of the world’s export market is
diminishing. The emphasis in her analysis was on the need for high cost growers to
differentiate and stay ahead of the competition (Van Rijswick, 2015).
An example of a broader analysis of the industry is the work of Batt (2000), who
analysed the flower export industries in Australia, Colombia, Israel and the Netherlands
using Porter's (1990) model of international competitive advantage. This analysis
concluded that the basic factors of production hold great importance in the evolution of
flower export industries (land, water, climate). However, if the natural resource
endowments are to be fully exploited, there is a need for a significant investment in
infrastructure and the development of a fully integrated supply chain from producer to
customer. These infrastructure investments are considered to be made more easily
where the industry is highly concentrated (clustered), where strong, cohesive flower
export councils have developed, and where government has provided appropriate macro
level incentives. However, Batt maintains that the most significant role of government is
its ability to negotiate and maintain preferential market access. While Porter (1990)
maintains that a large and highly sophisticated domestic market is an advantage, in the
flower export industry, a strong export culture is actually more important. With the
36
large amounts of foreign investment being made in the emerging flower export
countries, there is evidence to suggest that the double-diamond approach advocated by
Rugman (1992) may be more appropriate in an examination of the international
competitiveness of flower export nations.
Internationally floriculture varieties, origins of production, production techniques,
markets and retailing arrangements are all undergoing continuous change, which in turn
challenge the existing actors (Van Leimit, 1999). It is important, therefore, for changes
in the international market to be observed and understood. In many countries market
intelligence is conveyed (Batt, 2000) to the growers at a fast pace, to help them adapt to
changing conditions. In Holland, for example, the floriculture sector has received
continuous government supports to redefine and reinvent their production and
marketing to cope with developing pressures (Kargbo et al., 2010). One good example
is where, to overcome stringent Japanese phytosanitary regulation for flowers, the
Dutch government successfully negotiated to station Japanese pre-shipment quarantine
inspectors in Holland (Flower Council of Holland, 2008).
An interesting comparison made by Belwal and Chala (2008) was of how some
countries developed floriculture industries exclusively for export markets and some
countries found opportunities within the country due to economic growth and increased
prosperity. Israel, Africa and South and Central American countries are examples of
countries where the industry was developed with a focus on exporting. These countries
produce cut flowers mainly for export with no real consideration of the potential of the
domestic market. In contrast, in Asia, where cut flowers were initially produced for
export, the market potential has rapidly changed to include opportunities for supplying
the local market as well. This unique development was found to be due to the rapid
strengthening of economies in the region, high population densities, and the
changing consumers’ perception towards the importance of flowers in their lifestyle
(Belwal & Chala, 2008).
Globalisation, the consolidation of the industry and the explosive increase in knowledge
from scientific research requires a close interaction between industry and scientists.
Dons and Bino (2008) have analysed these factors and argued that it is important that
scientific discovery is accessed by industry and applied in order remain competitive in
the international marketplace (Dons & Bino, 2008).
37
International development agencies continue to provide market promotion and
consultancy support to the various efforts of developing countries at floriculture
development (Clements-Hunt, 2004). The Netherlands is also very active in many of
these countries, exploring their opportunities to expand their interests internationally. In
order to maintain the integrity and sustainability of its floriculture export sector in the
international marketplace, it is imperative for the New Zealand floriculture industry to
take measure of such developments for the domestic industry to be protected, and for
identification of the opportunities available for producers in this country in the
international production and marketing environments.
4.3.3 World trade of floriculture products
Internationally, the continuous advances in greenhouse technology, plant biotechnology,
transportation, and marketing strategies have enabled floriculture exporting to reach a
historical high in activity and competitiveness (Van Liemt, 2000; Yun Jian, et al., 2006).
This section maps some of those trends, to statistically view how trade and production
have progressed internationally. International data was mainly gained through
COMTRADE statistics, and compared with other statistical and documentary sources
for analysis. The statistics were used to understand and analyse the international
industry structure, export and import value trends, and major producers and markets.
Under international trade, floriculture represents a variety of products. They are
categorised under four main categories according to the Harmonious System of
Classification (HS) for trade. Table 4-2 below shows the four sectors which can be
briefly described as bulbs, plants, cut flowers and foliage. According to UN
COMTRADE statistics the world exports of floriculture products stood at US$22.4
billion in year 2014 and the contribution from each sector is given below. As can be
seen, internationally the plant and cut flower sectors are dominant, together comprising
86 percent of total export trade worldwide.
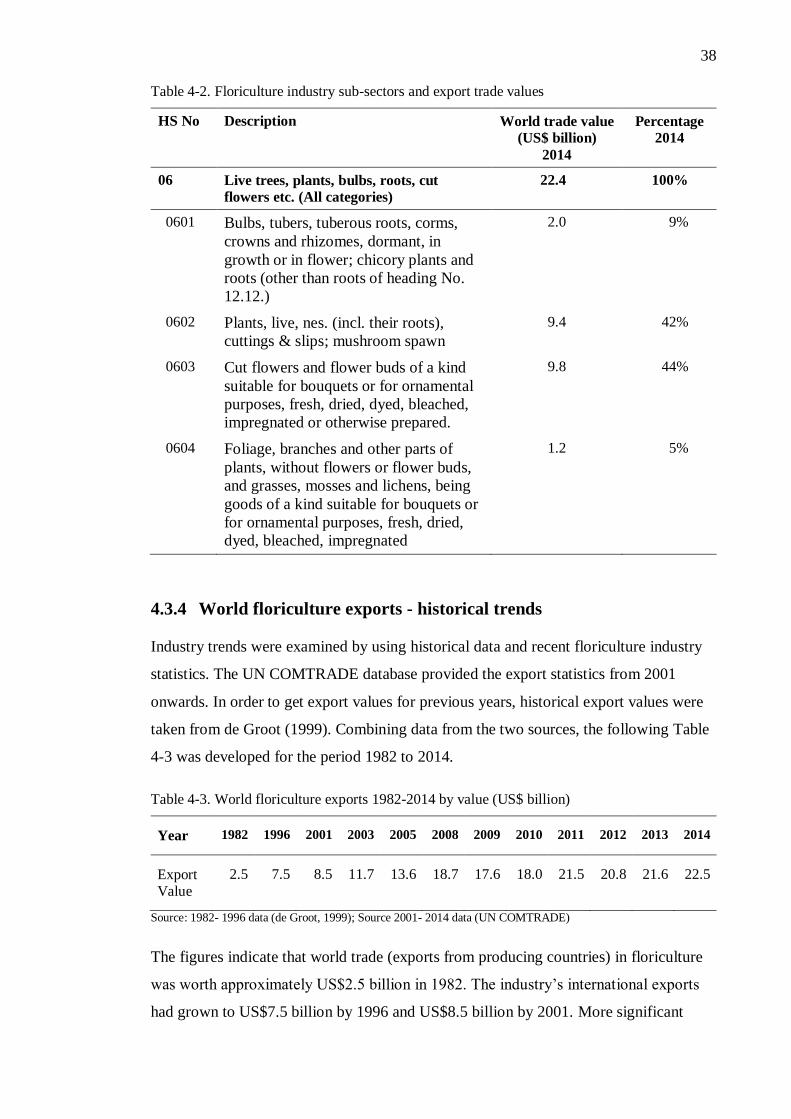
38
Table 4-2. Floriculture industry sub-sectors and export trade values
HS No Description World trade value
(US$ billion)
2014
Percentage
2014
06 Live trees, plants, bulbs, roots, cut
flowers etc. (All categories)
22.4 100%
0601 Bulbs, tubers, tuberous roots, corms,
crowns and rhizomes, dormant, in
growth or in flower; chicory plants and
roots (other than roots of heading No.
12.12.)
2.0 9%
0602 Plants, live, nes. (incl. their roots),
cuttings & slips; mushroom spawn
9.4 42%
0603 Cut flowers and flower buds of a kind
suitable for bouquets or for ornamental
purposes, fresh, dried, dyed, bleached,
impregnated or otherwise prepared.
9.8 44%
0604 Foliage, branches and other parts of
plants, without flowers or flower buds,
and grasses, mosses and lichens, being
goods of a kind suitable for bouquets or
for ornamental purposes, fresh, dried,
dyed, bleached, impregnated
1.2 5%
4.3.4 World floriculture exports - historical trends
Industry trends were examined by using historical data and recent floriculture industry
statistics. The UN COMTRADE database provided the export statistics from 2001
onwards. In order to get export values for previous years, historical export values were
taken from de Groot (1999). Combining data from the two sources, the following Table
4-3 was developed for the period 1982 to 2014.
Table 4-3. World floriculture exports 1982-2014 by value (US$ billion)
Year 1982 1996 2001 2003 2005 2008 2009 2010 2011 2012 2013 2014
Export Value
2.5 7.5 8.5 11.7 13.6 18.7 17.6 18.0 21.5 20.8 21.6 22.5
Source: 1982- 1996 data (de Groot, 1999); Source 2001- 2014 data (UN COMTRADE)
The figures indicate that world trade (exports from producing countries) in floriculture
was worth approximately US$2.5 billion in 1982. The industry’s international exports
had grown to US$7.5 billion by 1996 and US$8.5 billion by 2001. More significant
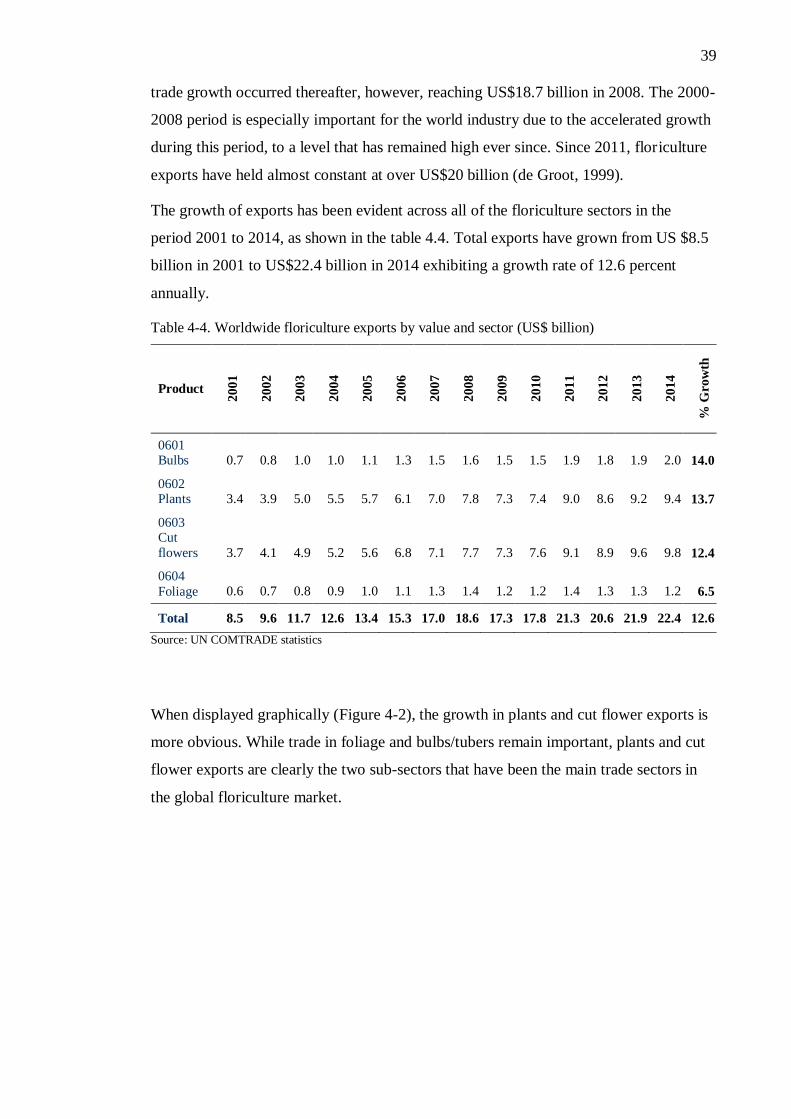
39
trade growth occurred thereafter, however, reaching US$18.7 billion in 2008. The 2000-
2008 period is especially important for the world industry due to the accelerated growth
during this period, to a level that has remained high ever since. Since 2011, floriculture
exports have held almost constant at over US$20 billion (de Groot, 1999).
The growth of exports has been evident across all of the floriculture sectors in the
period 2001 to 2014, as shown in the table 4.4. Total exports have grown from US $8.5
billion in 2001 to US$22.4 billion in 2014 exhibiting a growth rate of 12.6 percent
annually.
Table 4-4. Worldwide floriculture exports by value and sector (US$ billion)
Product
2001
2002
2003
2004
2005
2006
2007
2008
2009
2010
2011
2012
2013
2014
% G
row
th
0601 Bulbs 0.7 0.8 1.0 1.0 1.1 1.3 1.5 1.6 1.5 1.5 1.9 1.8 1.9 2.0 14.0
0602 Plants 3.4 3.9 5.0 5.5 5.7 6.1 7.0 7.8 7.3 7.4 9.0 8.6 9.2 9.4 13.7
0603 Cut
flowers 3.7 4.1 4.9 5.2 5.6 6.8 7.1 7.7 7.3 7.6 9.1 8.9 9.6 9.8 12.4
0604
Foliage 0.6 0.7 0.8 0.9 1.0 1.1 1.3 1.4 1.2 1.2 1.4 1.3 1.3 1.2 6.5
Total 8.5 9.6 11.7 12.6 13.4 15.3 17.0 18.6 17.3 17.8 21.3 20.6 21.9 22.4 12.6
Source: UN COMTRADE statistics
When displayed graphically (Figure 4-2), the growth in plants and cut flower exports is
more obvious. While trade in foliage and bulbs/tubers remain important, plants and cut
flower exports are clearly the two sub-sectors that have been the main trade sectors in
the global floriculture market.
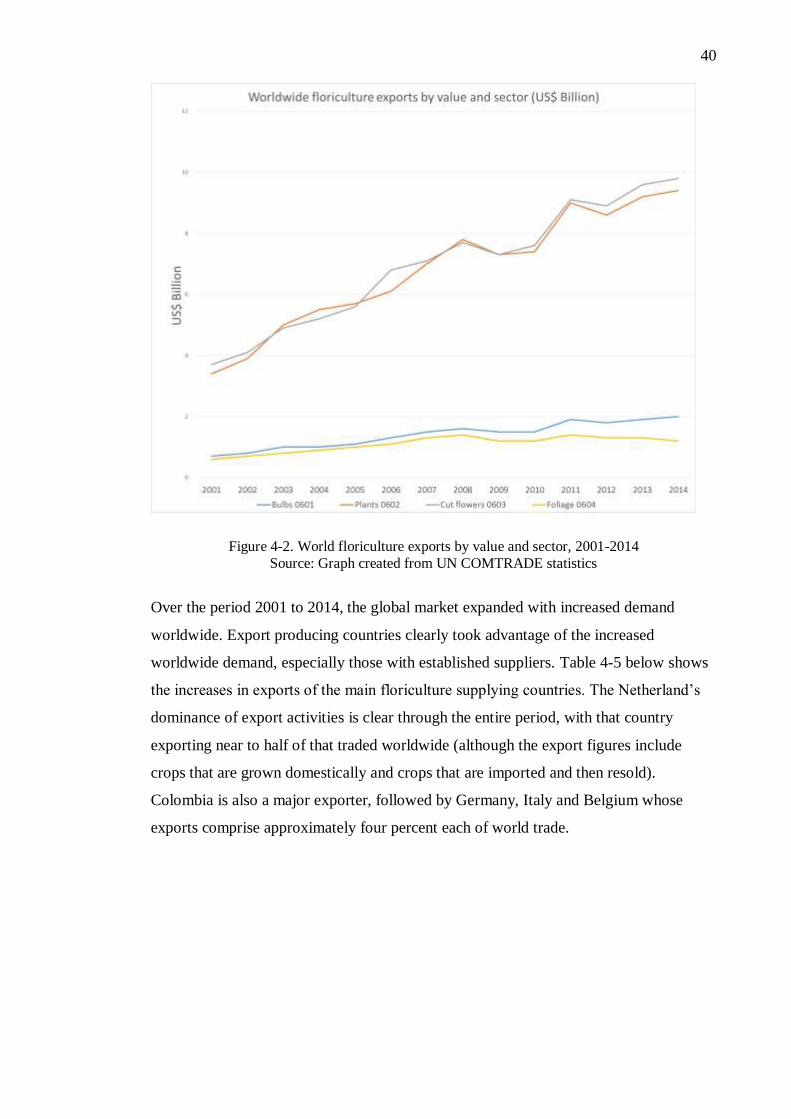
40
Figure 4-2. World floriculture exports by value and sector, 2001-2014
Source: Graph created from UN COMTRADE statistics
Over the period 2001 to 2014, the global market expanded with increased demand
worldwide. Export producing countries clearly took advantage of the increased
worldwide demand, especially those with established suppliers. Table 4-5 below shows
the increases in exports of the main floriculture supplying countries. The Netherland’s
dominance of export activities is clear through the entire period, with that country
exporting near to half of that traded worldwide (although the export figures include
crops that are grown domestically and crops that are imported and then resold).
Colombia is also a major exporter, followed by Germany, Italy and Belgium whose
exports comprise approximately four percent each of world trade.
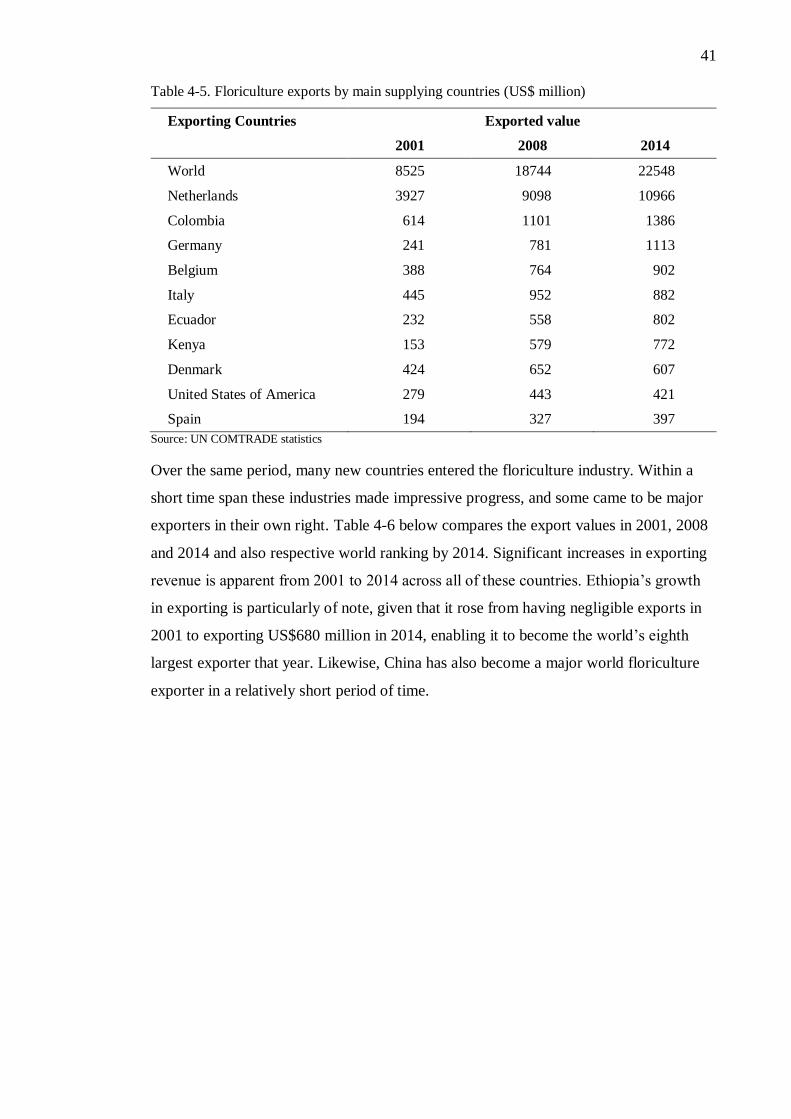
41
Table 4-5. Floriculture exports by main supplying countries (US$ million)
Exporting Countries Exported value
2001 2008 2014
World 8525 18744 22548
Netherlands 3927 9098 10966
Colombia 614 1101 1386
Germany 241 781 1113
Belgium 388 764 902
Italy 445 952 882
Ecuador 232 558 802
Kenya 153 579 772
Denmark 424 652 607
United States of America 279 443 421
Spain 194 327 397
Source: UN COMTRADE statistics
Over the same period, many new countries entered the floriculture industry. Within a
short time span these industries made impressive progress, and some came to be major
exporters in their own right. Table 4-6 below compares the export values in 2001, 2008
and 2014 and also respective world ranking by 2014. Significant increases in exporting
revenue is apparent from 2001 to 2014 across all of these countries. Ethiopia’s growth
in exporting is particularly of note, given that it rose from having negligible exports in
2001 to exporting US$680 million in 2014, enabling it to become the world’s eighth
largest exporter that year. Likewise, China has also become a major world floriculture
exporter in a relatively short period of time.
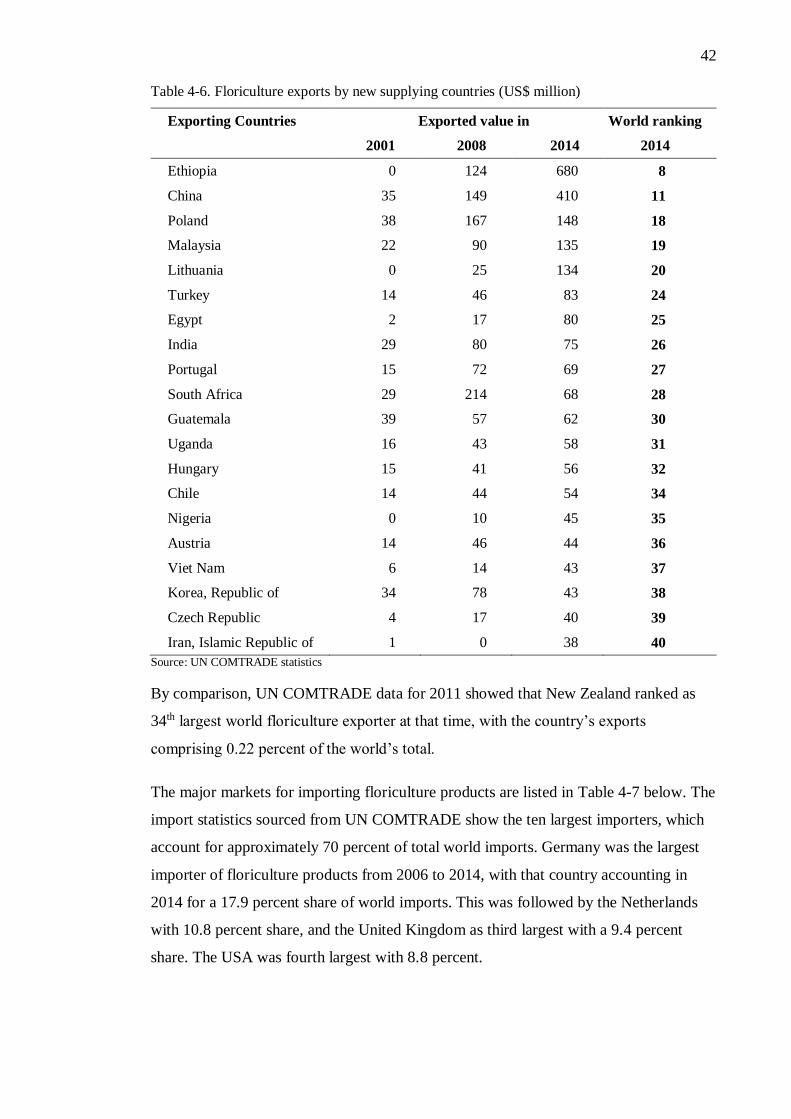
42
Table 4-6. Floriculture exports by new supplying countries (US$ million)
Exporting Countries Exported value in World ranking
2001 2008 2014 2014
Ethiopia 0 124 680 8
China 35 149 410 11
Poland 38 167 148 18
Malaysia 22 90 135 19
Lithuania 0 25 134 20
Turkey 14 46 83 24
Egypt 2 17 80 25
India 29 80 75 26
Portugal 15 72 69 27
South Africa 29 214 68 28
Guatemala 39 57 62 30
Uganda 16 43 58 31
Hungary 15 41 56 32
Chile 14 44 54 34
Nigeria 0 10 45 35
Austria 14 46 44 36
Viet Nam 6 14 43 37
Korea, Republic of 34 78 43 38
Czech Republic 4 17 40 39
Iran, Islamic Republic of 1 0 38 40
Source: UN COMTRADE statistics
By comparison, UN COMTRADE data for 2011 showed that New Zealand ranked as
34th largest world floriculture exporter at that time, with the country’s exports
comprising 0.22 percent of the world’s total.
The major markets for importing floriculture products are listed in Table 4-7 below. The
import statistics sourced from UN COMTRADE show the ten largest importers, which
account for approximately 70 percent of total world imports. Germany was the largest
importer of floriculture products from 2006 to 2014, with that country accounting in
2014 for a 17.9 percent share of world imports. This was followed by the Netherlands
with 10.8 percent share, and the United Kingdom as third largest with a 9.4 percent
share. The USA was fourth largest with 8.8 percent.
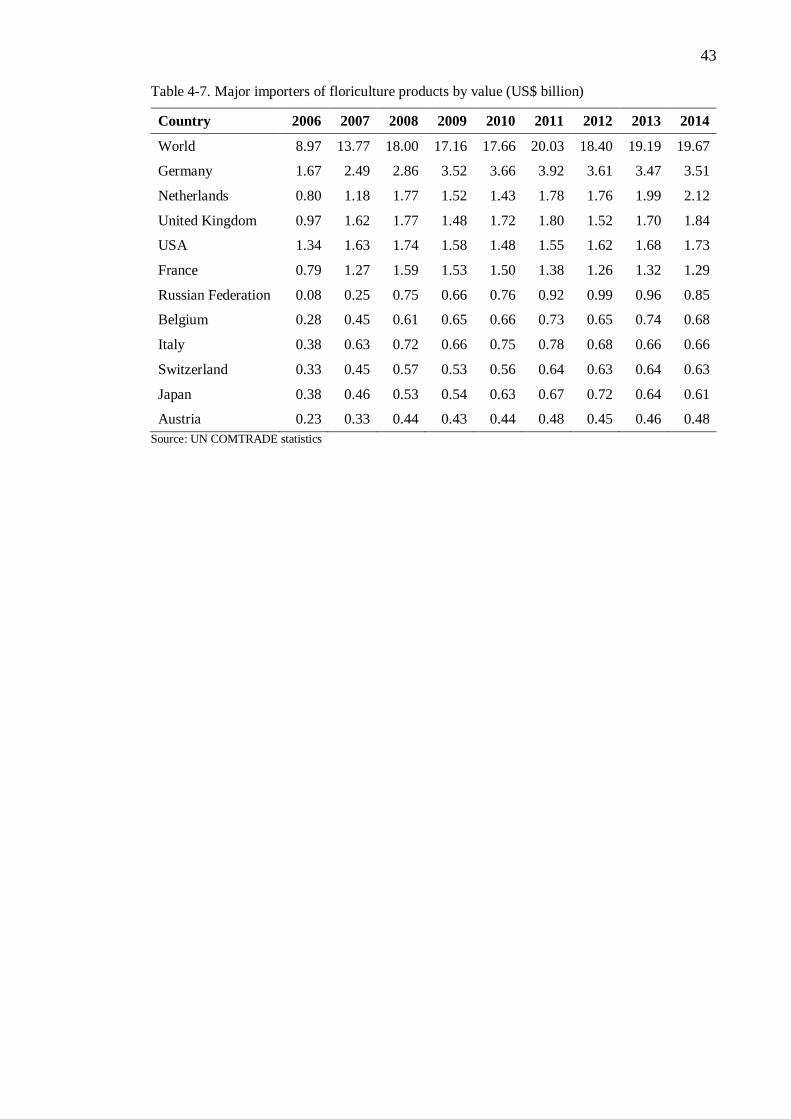
43
Table 4-7. Major importers of floriculture products by value (US$ billion)
Country 2006 2007 2008 2009 2010 2011 2012 2013 2014
World 8.97 13.77 18.00 17.16 17.66 20.03 18.40 19.19 19.67
Germany 1.67 2.49 2.86 3.52 3.66 3.92 3.61 3.47 3.51
Netherlands 0.80 1.18 1.77 1.52 1.43 1.78 1.76 1.99 2.12
United Kingdom 0.97 1.62 1.77 1.48 1.72 1.80 1.52 1.70 1.84
USA 1.34 1.63 1.74 1.58 1.48 1.55 1.62 1.68 1.73
France 0.79 1.27 1.59 1.53 1.50 1.38 1.26 1.32 1.29
Russian Federation 0.08 0.25 0.75 0.66 0.76 0.92 0.99 0.96 0.85
Belgium 0.28 0.45 0.61 0.65 0.66 0.73 0.65 0.74 0.68
Italy 0.38 0.63 0.72 0.66 0.75 0.78 0.68 0.66 0.66
Switzerland 0.33 0.45 0.57 0.53 0.56 0.64 0.63 0.64 0.63
Japan 0.38 0.46 0.53 0.54 0.63 0.67 0.72 0.64 0.61
Austria 0.23 0.33 0.44 0.43 0.44 0.48 0.45 0.46 0.48
Source: UN COMTRADE statistics
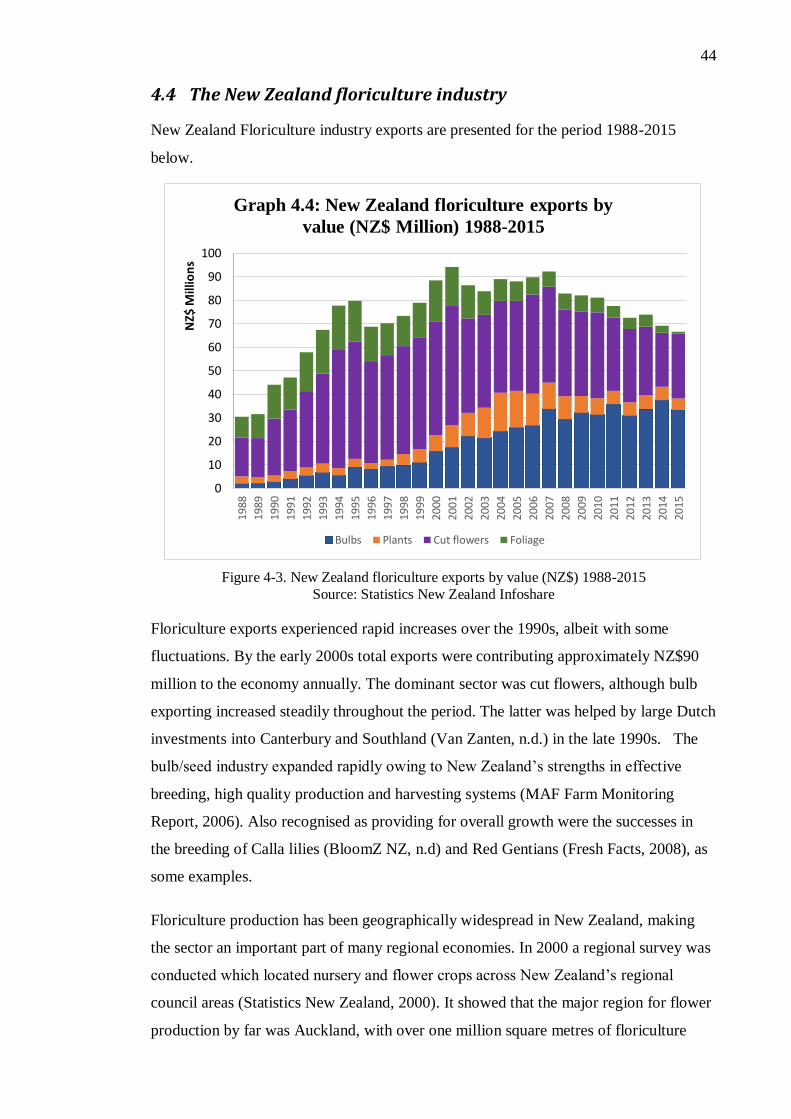
44
4.4 The New Zealand floriculture industry
New Zealand Floriculture industry exports are presented for the period 1988-2015
below.
Figure 4-3. New Zealand floriculture exports by value (NZ$) 1988-2015
Source: Statistics New Zealand Infoshare
Floriculture exports experienced rapid increases over the 1990s, albeit with some
fluctuations. By the early 2000s total exports were contributing approximately NZ$90
million to the economy annually. The dominant sector was cut flowers, although bulb
exporting increased steadily throughout the period. The latter was helped by large Dutch
investments into Canterbury and Southland (Van Zanten, n.d.) in the late 1990s. The
bulb/seed industry expanded rapidly owing to New Zealand’s strengths in effective
breeding, high quality production and harvesting systems (MAF Farm Monitoring
Report, 2006). Also recognised as providing for overall growth were the successes in
the breeding of Calla lilies (BloomZ NZ, n.d) and Red Gentians (Fresh Facts, 2008), as
some examples.
Floriculture production has been geographically widespread in New Zealand, making
the sector an important part of many regional economies. In 2000 a regional survey was
conducted which located nursery and flower crops across New Zealand’s regional
council areas (Statistics New Zealand, 2000). It showed that the major region for flower
production by far was Auckland, with over one million square metres of floriculture
0
10
20
30
40
50
60
70
80
90
1001
98
8
1989
19
90
19
91
19
92
19
93
1994
19
95
19
96
19
97
19
98
1999
20
00
20
01
20
02
20
03
2004
20
05
20
06
20
07
20
08
20
09
20
10
20
11
20
12
20
13
20
14
20
15
NZ$
Mill
ion
s
Graph 4.4: New Zealand floriculture exports by
value (NZ$ Million) 1988-2015
Bulbs Plants Cut flowers Foliage
45
production. Also important were Northland, Waikato and Canterbury regions, which
together comprised about 800,000 square metres of production (Statistics New Zealand,
2000).
At the time of the survey of regional capacity in floriculture, Japan was by far New
Zealand’s major floriculture market. In 2001, New Zealand exported NZ$13 million
worth of flowers to Japan, which was 79 percent of total flower exports (Statistics New
Zealand Infoshare statistics).
From 2001 to 2014, New Zealand cut flower exports dropped from NZ$50 million to
NZ$23 million (Table 4-8). Much of that drop can be attributed to the decrease in
exports to Japan of NZ$25.9 million from 2001 to 2014. It is also noticeable that
exports to all of the main export markets declined (Table 4-8).
Table 4-8. New Zealand cut flower (product 0603) exports to main markets 2001, 2014 by value
Country Year 2001 (NZ$m) Year 2014 (NZ$m)
Total 50.6 22.9
Japan 34.6 8.7
USA 7.7 4.9
Canada 1.1 0.78
Netherlands 0.85 0.62
Italy 1.4 0.10
Korea 0.13 0.17
Source: Statistics New Zealand Infoshare
4.5 Researcher reflections on the New Zealand floriculture industry
This section presents the researcher’s reflection on her own experience in the
floriculture industry. It was developed as a part of the research process to engage in the
research as a participant researcher, and to record her ideas prior to the interviews so
that she could compare them with those of the producer participants. The reflections
below are presented from a personal, first person perspective.
I started working in the New Zealand floricultural export industry in 2001, after
migrating to New Zealand from Sri Lanka, where I had also worked in the floriculture
industry. The New Zealand floriculture industry around that time was very dynamic,
46
extensive and lucrative. New Zealand produced and exported a large assortment of
flowers and foliage products to overseas markets
My role in the export industry involved sourcing information on the availability of
products for export and compiling export price lists. Upon receipt of the orders from
overseas buyers, I then coordinated with growers to fulfil the order requirements. This
provided me with great opportunities to receive first-hand information about what was
being produced by New Zealand growers, and to hear what was happening in overseas
markets from the buyers.
In 2000 demand for New Zealand products was high and there was no great need to
chase orders. Once the product availability and export prices – based on grower prices –
were presented to the buyers, the orders for the listed products flowed easily. There
were year-round and continuous exports to all of New Zealand’s regular markets, and
New Zealand producers grew a great variety of flowers which sold to the international
markets. As well, special events in various countries created additional demand for
regular products as well as special products.
Chinese New Year, Valentine’s Day, Mother's Day and festivals in Japan, are a few of
such special events that created additional demand for New Zealand floriculture
products. As a result, export volumes peaked in relation to each of these particular
events. Most growers received supply contracts from buyers from Hong Kong,
Singapore and Japan to cater to the demands from special events so that growers could
plan production to meet the contracts. The floriculture production collectively formed
significant volumes and the export volumes grew so New Zealand floriculture exports
tended to be high during this period.
In January, growers tended to be busy preparing the export products for two major
events, Chinese New Year and Valentine’s Day. Chinese New Year has been a major
event for New Zealand floriculture growers to market towards. In addition to regular
flowers, special flowers such as sandersonia (Chinese lantern), hypericum, limonium
and lilies (particularly the Casablanca lily) were some of the products grown in
significant volumes to cater to consumers for Chinese New Year. The supply was not
limited to large scale growers, there were many medium and small scale growers
involved in export production for this event. Valentine's Day was the other early year
event that similarly provided opportunities for many growers to grow a wider array of
47
floricultural crops. Although roses were the main item sold during the event, demand
for other flowers also increased; New Zealand chrysanthemums, carnations, alstromeria,
calla lily, protea, and hydrangea were grown in significant volumes in order to meet this
demand.
Other events through the year have been important for flower producers in planning
production. In March, Japan celebrates the Spring Equinox with the O-Higan festival.
This event has also provided opportunities for New Zealand growers to produce and
export high volumes of leucadendron, pittosporum, other foliage, as well as
chrysanthemum and other flowers. Easter and Mother’s Day events also provide a
market for many New Zealand native and exotic floricultural products to be sold. Many
varieties of erica (flowering foliage) were especially grown for Mother’s Day exports
(such as Mother’s Day Erica). The Obon Festival in Japan that is devoted to the
celebration of ancestors is a particularly significant event in Japan that generates a high
demand for flowers. Every family takes flowers to the graveyards of their ancestors and
to the temples. New Zealand cymbidium orchids have been the most prominent product
exported at this time and at the same time a large array of other products were added to
this export assortment. Ramadan, All Saints Day, Christmas and the New Year were the
other events that resulted in the peaking of export volumes from New Zealand. Many of
the products produced were outdoor crops and a very large number of small scale
growers were involved.
Around 2002, the lucrative New Zealand floriculture industry showed signs of losing
the prominent place it held in the Asian markets, especially in Hong-Kong, Japan and
South Korea as well as the European markets. I was aware that there were intense
development programmes in some countries and producers in those locations received
support from internal and external aid programmes. This helped the producers in those
countries to start many floricultural enterprises and bring their products to the markets
at very competitive prices. I was concerned by the fact that New Zealand industry was
working in isolation, it lacked a mechanism to receive market intelligence, and that
producers were possibly being shielded from the understanding of the forthcoming
challenges and threats in the international marketplace.
At the same time the escalation of the New Zealand dollar against major trading
currencies imposed enormous pressure on the export industry. When the market place
became intensely competitive with many products available from low cost suppliers, the
48
New Zealand products gradually lost demanding power for higher prices and this
resulted less returns from exports.
It was painful to witness how the strong and lucrative New Zealand floriculture industry
struggled and suffered severely under these conditions. New Zealand producers could
no longer command the same high prices. Year-round products like roses,
chrysanthemums, alstroemeria, lilies, celosia, and many others lost their
competitiveness rapidly. With that downturn, I was aware that several large flower
production ventures closed their operations. Others downsized their businesses to suit
domestic markets, although the small New Zealand population did not have the market
capacity to absorb large volumes of products. This caused many small-scale and hobby
growers supplying the domestic market to disappear. The impact was evident in
supporting industries; for example, some flower carriers transporting flower crops
downsized or closed operations or moved into other businesses.
At the end of 2005, a change in my role provided an opportunity for me to be actively
involved in integrated production and marketing activities and to appreciate the view of
the international market from the New Zealand producer’s perspective.
In the international marketplace, competition continued to grow and markets and
international buyers became more selective and price driven. At the same time the costs
of production in New Zealand continued to rise. It was important to find ways to help
gain profits within the pressures of increasing costs and decreasing returns. Some of the
strategies implemented included reducing greenhouse heating, minimizing labour
activities and trying to find ways to increase labour efficiency. In employment, late
hiring and early lay-off for seasonal labour were some measures many growers
implemented in attempts to reduce the costs. From a management perspective, there
was a great need to adopt integrated product, supply, and quality management
programmes. It was important to be very strategic in marketing in order to maximise
profits, as the margins were getting thinner and thinner.
In 2007/2008, the New Zealand floriculture industry faced a devastating experience. A
newly introduced insecticide partially or totally destroyed the crops of 19 orchid
growers in the North Island and top of the South Island (The Independent, 2008). It
caused the closure of some of those businesses. Pioneering and leading cymbidium
49
orchid operations, that had generated research and development efforts and provided a
wealth of unique varieties, were lost forever.
Another major hurdle arose for the New Zealand floriculture industry at the end of
2008. This was a new, stringent US compliance and accreditation process. Until then,
market entry to the USA for New Zealand producers had been largely unrestricted. The
USDA authorities had permitted New Zealand floriculture products to pass through the
borders with just the usual phytosanitary clearance. The USDA compliance programme
to eradicate Brown Apple Moth came into existence at the end of 2008. Under the
compliance programme, New Zealand flower and plant products were now required to
have a form of accreditation to enter USA markets and each shipment had to be
presented with an additional declaration to certify that products were free from the
moth. This was a shockwave to the industry, as the cost of going through the
accreditation process was unaffordable for many. Many small growers opted not go
through the accreditation process because of the high cost involved. Their focus then
switched to the Japanese market, which resulted in significant volumes overloading the
single Japanese consignment market. The effect was lower prices in that market for
growers.
It was expected that the US economic downturn in 2008 would also impose severe
pressures on the industry, but the impact for New Zealand was more noticeable in
terms of buyer behaviour. In the early days, buyers bought many products on
speculation and when the demand prevailed, products moved swiftly. Following the
economic downturn the world’s buyer behaviour changed considerably. Buyers now
tend to wait for the actual orders to be placed by customers before they order these
products from overseas sources. Consequently, exporters and growers tend to receive
orders at the last minute, resulting in the need to work under pressure to organise orders
and to catch last-minute flights in order to meet export deadlines.
Contrary to the good times when orders flowed in freely, nowadays there is a greater
need to chase orders with direct overseas buyers. Now, more time has to be spent on
seeking orders for products. Price negotiation also always work in favour of the buyers.
Along with this, another recent development has been delayed payment cycles. Buyers
have to wait for their customers to pay and the delays in payments then affect payments
to the exporters and growers. This creates additional pressure for local producers.
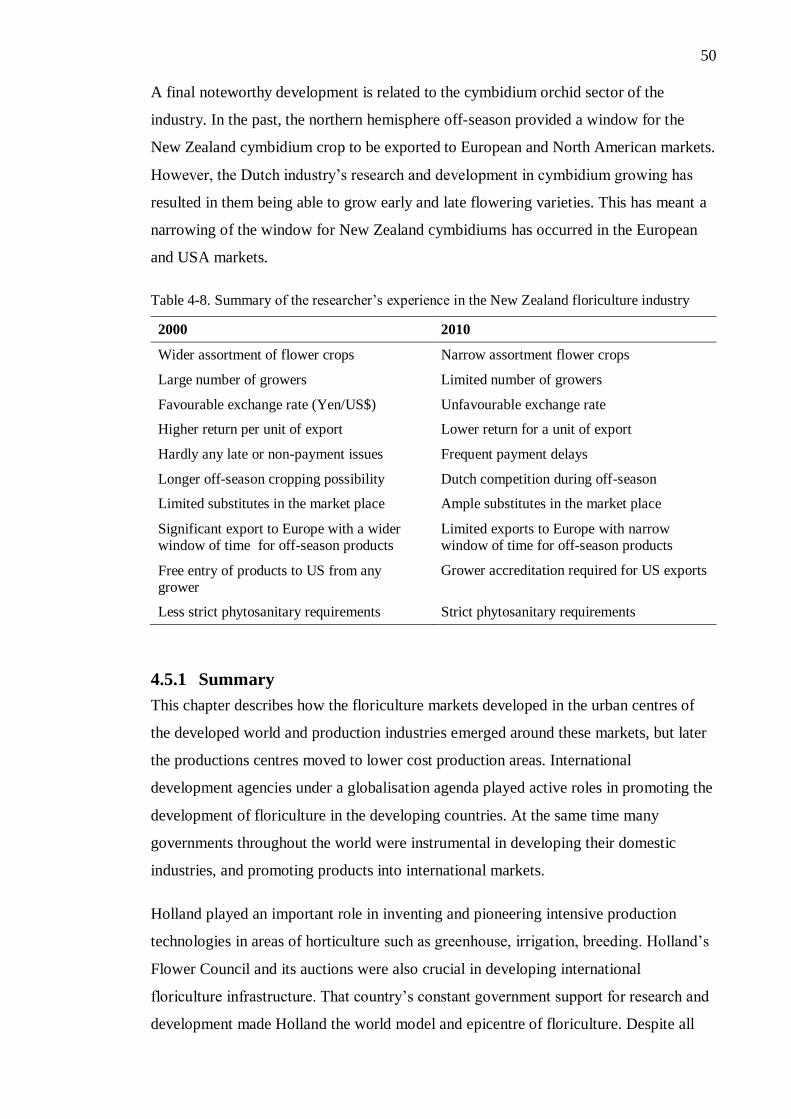
50
A final noteworthy development is related to the cymbidium orchid sector of the
industry. In the past, the northern hemisphere off-season provided a window for the
New Zealand cymbidium crop to be exported to European and North American markets.
However, the Dutch industry’s research and development in cymbidium growing has
resulted in them being able to grow early and late flowering varieties. This has meant a
narrowing of the window for New Zealand cymbidiums has occurred in the European
and USA markets.
Table 4-8. Summary of the researcher’s experience in the New Zealand floriculture industry
2000 2010
Wider assortment of flower crops Narrow assortment flower crops
Large number of growers Limited number of growers
Favourable exchange rate (Yen/US$) Unfavourable exchange rate
Higher return per unit of export Lower return for a unit of export
Hardly any late or non-payment issues Frequent payment delays
Longer off-season cropping possibility Dutch competition during off-season
Limited substitutes in the market place Ample substitutes in the market place
Significant export to Europe with a wider window of time for off-season products
Limited exports to Europe with narrow window of time for off-season products
Free entry of products to US from any grower
Grower accreditation required for US exports
Less strict phytosanitary requirements Strict phytosanitary requirements
4.5.1 Summary
This chapter describes how the floriculture markets developed in the urban centres of
the developed world and production industries emerged around these markets, but later
the productions centres moved to lower cost production areas. International
development agencies under a globalisation agenda played active roles in promoting the
development of floriculture in the developing countries. At the same time many
governments throughout the world were instrumental in developing their domestic
industries, and promoting products into international markets.
Holland played an important role in inventing and pioneering intensive production
technologies in areas of horticulture such as greenhouse, irrigation, breeding. Holland’s
Flower Council and its auctions were also crucial in developing international
floriculture infrastructure. That country’s constant government support for research and
development made Holland the world model and epicentre of floriculture. Despite all
51
the subsequent developments and expansion in the industry around the world, Holland
has continued to maintain its predominant position as the main international floriculture
exporter.
The evidence engaged with through this chapter shows that New Zealand developed a
successful and reputed export floriculture industry before many of today’s supplier’s
entered the industry. Flowers, foliage sectors were once ‘star performer’ industries for
New Zealand. There was, however, no specific or formal national agenda in New
Zealand to develop the sector or to collaboratively record and respond to the
developments in the international market place. The next chapter presents the findings
from the interviews with current floriculture producers, in order to understand their
first-hand experiences in this ever-changing international context.

52
53
Chapter 5 Findings: Experiences of New Zealand export
floriculture growers
5.1 Introduction
This chapter presents the findings from the participant grower interviews conducted to
answer the overall question, “What have been the experiences of New Zealand
floricultural export producers in the changing international market?”
Many in the floriculture grower community in New Zealand have accumulated a wealth
of experience during their production journeys. Interviews with participants who have
been in the industry for 15 years (selected through purposive sampling) took place for
this research, and were designed to uncover and bring to light their experiences within
their respective businesses. The participants’ recollection of their experiences revealed
how the broader international context has affected the growers and how they have
responded to the changes in their production processes, marketing strategies and other
business practices. These findings are used to form an evidence base for analysing what
might best inform the industry’s future development strategies.
The interviews were designed to ensure the growers’ experiences were recorded as
freely as possible. From the key research question, sub-questions were developed to
provide a framework to guide the participants in their responses. The five participants
were each asked to convey, from their perspectives, the following:
● What important developments have taken place in the international floriculture
marketplace in the period from 1997 to 2012?
● What conditions and events have created changes in the international floriculture
marketplace?
● What has been the production and marketing context for New Zealand’s
floriculture export activity over this period?
● How have New Zealand export floriculture producers been affected by changes
in the international marketplace?
● What have been the responses of New Zealand export floriculture producers to
international market changes and what effects have they had?
54
● What are the advantages and disadvantages that the New Zealand export
floriculture sector has, compared with its international competitors?
● What opportunities and challenges have been highlighted for the future
sustainability of the New Zealand export floriculture sector by recent
experience?
● What might be done to support the New Zealand export floriculture sector in its
future development?
The questions were used to guide the conversations with the participant growers to
reflect on the changes in the international marketplace, how the changes have
influenced and affected participant growers, and how they have responded to these
changes.
After the interviews, the transcripts were analysed according to each participant’s
answers. Specific codes were assigned to identify each participant grower (in order to
maintain confidentiality) and the responses were grouped and analysed, using pre-
assigned codes.
The code allocation is given below:
Table 5-1. New Zealand floriculture export code allocation
Production Scale Cut flower producer (C) Foliage producer (F)
Large Scale (L) CL
Medium Scale (M) CM FM
Small Scale (S) CS FS
The interview data were analysed following three main steps. Firstly, listened to
interview recordings multiple times to grasp the holistic picture and to comprehend the
full story of the industry experiences of the participant grower. Secondly, the interview
scripts were read over repeatedly to identify emerging common themes and the details
related to these respective themes. The emerging themes were listed and discussed with
the academic supervisors; particularly to check that my own experiences were not
heavily influencing my analysis.
The third step was to establish the descriptions under each theme from each participant,
considering the relationships and patterns emerging, observation of aspects such as
expressions and emotions, and the implications of these, to create a meaningful holistic
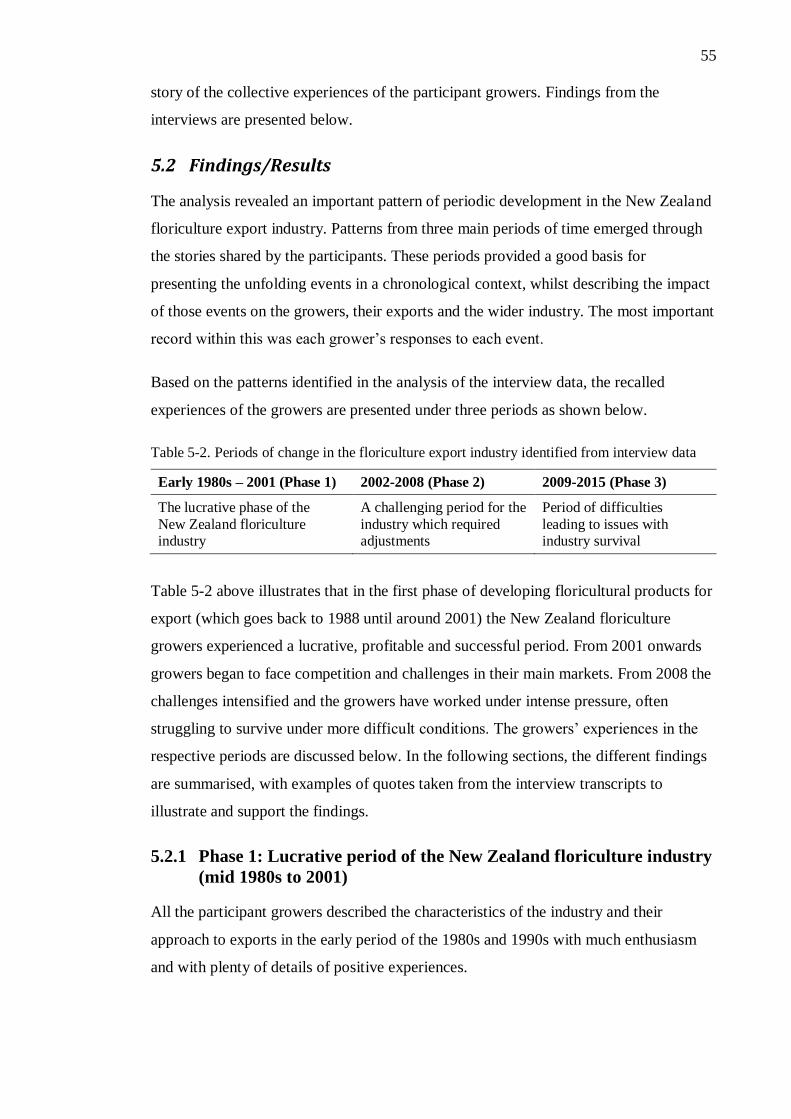
55
story of the collective experiences of the participant growers. Findings from the
interviews are presented below.
5.2 Findings/Results
The analysis revealed an important pattern of periodic development in the New Zealand
floriculture export industry. Patterns from three main periods of time emerged through
the stories shared by the participants. These periods provided a good basis for
presenting the unfolding events in a chronological context, whilst describing the impact
of those events on the growers, their exports and the wider industry. The most important
record within this was each grower’s responses to each event.
Based on the patterns identified in the analysis of the interview data, the recalled
experiences of the growers are presented under three periods as shown below.
Table 5-2. Periods of change in the floriculture export industry identified from interview data
Early 1980s – 2001 (Phase 1) 2002-2008 (Phase 2) 2009-2015 (Phase 3)
The lucrative phase of the
New Zealand floriculture industry
A challenging period for the
industry which required adjustments
Period of difficulties
leading to issues with industry survival
Table 5-2 above illustrates that in the first phase of developing floricultural products for
export (which goes back to 1988 until around 2001) the New Zealand floriculture
growers experienced a lucrative, profitable and successful period. From 2001 onwards
growers began to face competition and challenges in their main markets. From 2008 the
challenges intensified and the growers have worked under intense pressure, often
struggling to survive under more difficult conditions. The growers’ experiences in the
respective periods are discussed below. In the following sections, the different findings
are summarised, with examples of quotes taken from the interview transcripts to
illustrate and support the findings.
5.2.1 Phase 1: Lucrative period of the New Zealand floriculture industry
(mid 1980s to 2001)
All the participant growers described the characteristics of the industry and their
approach to exports in the early period of the 1980s and 1990s with much enthusiasm
and with plenty of details of positive experiences.
56
During the interviews all the participants expressed great interest in talking about their
industry’s history. Growers’ remarks, such as the examples below, explain the export
and production atmosphere, which was pleasant for them in the early days.
[In] those early days the situation was looking very promising… (FM).
We went well with exporting flowers, we had a really, really liked
product over there (CL)
Likewise, all participants very passionately reflected on their growing experience in the
1980s and 1990s and added more descriptions to their story. Many subthemes emerged
from the stories and these are discussed below. The sub-headings highlight the
sentiment of those themes.
Pioneers in the international market
A highlight recalled by the interview participants was that New Zealand growers played
a role in pioneering the international floricultural sector from the region during the early
days. New Zealand introduced many novelty products to the global floricultural sector.
As one participant recalled:
At the beginning in 1981 my father was really a pioneer in exporting
these products, there basically was none of these varieties of foliage or
any other similar foliage exported anywhere. So the industry started
basically with him for this particular product line. (FM)
The participant described how New Zealand breeders developed many varieties of
novelty products and he especially mentioned many varieties of Calla Lily flowers were
introduced and exported to the global market in the first phase. These have rapidly
spread worldwide due to their popularity.
Being pioneers of the industry, cut foliage growers have faced many
challenges while learning how to grow novelty products. (FM)
There was no competition, but there was also no knowledge of anything
and that was the hard point to start to get things introduced. (FM)
Markets found alone
The findings revealed that New Zealand products have made their way to the markets
basically through consolidation by export companies or by direct shipping. In contrast
to competitors from other countries, New Zealand growers and exporters have had no
57
institutional support for accessing industry information, developing and adopting
products for export or exploring and developing the markets.
Finding places for things to go was expensive. The first markets we did
was piggy backing with Cymbidium exporters to United States and in to
Canada. They were the first two main ones. Also we had a few in
Europe; a customer we had in Switzerland, one in Holland and one in
France. So right at the start they were the basic ones. (FM)
One participant’s case was unique, as they experienced direct exporting their products
to markets, which is in contrast to other growers who relied on other agencies. Their
approach seems to have been holistic in that they integrated both production and export
functions of their business.
I went through all the tracks of getting and doing my [export] process
organised; even further than that, I actually went all the way to find our
customer base. ...I targeted the big movers who were shifting [flowers]
into cold supermarket stores. Plus I also supplied wholesalers … that
supplied flowers to florists. (CL)
He further explained his perception,
To get an insight we had to pay visits to the markets. We did it by our
own. We personally visited all markets and learnt all the procedures. I
went through all the tracts of inspection: getting approved, MPI
procedures, find our customer base within the country. (CL)
The importance of fully understanding and studying the supply chain from farm gate to
customer was also emphasised.
[We studied the full process of shipping] then watching my product
coming off the plane, coming through to the quarantine, going through
the quarantine, watching what they do, how they handle a product. I was
very passionate about watching it all the way to the customer. (CL)
From the growers’ descriptions it was understood that in the early years the important
main markets for New Zealand floricultural products were Japan, Europe and
USA/Canada (North America).
New Zealand exporters as price makers
The growers described how they enjoyed the freedom to command good prices for their
products in the early days.
58
Well they were basically fixed prices and we set the price. So we were
happy with it. (FM)
Before, when we exported to overseas the price was very high from $80
to $90 [box] and we got quite a good income, so we were happy to do it.
(CM)
Competition-free markets
The participants conveyed the perception that they had experienced seemingly no
competition in the international marketplace during the early days. The novelty nature
of the products and lack of suppliers in the marketplace had largely contributed to this
competition-free marketing climate. Demand was continuous and growers easily
exported the products to their customer base.
There were no suppliers of these varieties of cut foliage grown
domestically or anywhere in the world at that time. (FM)
We had continuous demand for our flowers. (CL)
The buyer always wanted my products for his orders. (CM)
Special remarks were made on the Japanese market:
In the early days the situation was looking very promising, especially in
the Japanese market. (FM).
Quality-driven production
In the early days the quality of exports was the prime production focus of growers.
We invested in technologies for improved quality, we hired more people.
Our changes influenced our business by creating better quality varieties.
We got a better price from customers and did everything to satisfy the
customers’ demands. We made improvements to our greenhouses. I
remember when we had just started the business we played music when
we were tying [flowers], we played music to help aid flower growth. We
gave compassion and love to them. So the quality increased and we got a
higher pay in return. (CM)
The participant explained how careful they were to select the best insect control
equipment to lessen the insects and to improve the greenhouses to provide the right
sunshine conditions to get more and higher quality production.
59
We know that one of my customers, he chooses a particular variety from
our company, [and he said] I just want [our farm] Orchids flowers. Why
did he want a particular variety from me? Because the quality is much
better. Our changes influenced our business by creating better quality, a
good variety and got us a better price from customers. (CM)
Another participant confirmed the reputation of the quality of the New Zealand
products.
[When referring to] quality, I have seen some samples from Vietnam
with poor quality; also in South Africa. We do grow superior, good
quality flowers in New Zealand, I do believe that. We have got very
good quality light levels. There’s a lot in our favour, we don’t try enough
as New Zealand growers to actually market New Zealand flowers. (CL)
The higher quality was perceived to create continuous demand and attract higher prices.
Higher returns supported reinvesting profits for improving quality and these activities
ultimately resulted in a high reputation in the international market place. Quality was
considered the unique selling point for New Zealand floricultural exports in the global
marketplace.
Favourable exchange rates
All the participants reported that they had been very comfortable with the exchange rate
they worked with in the early period. With a favourable exchange rate the New Zealand
product prices were attractive for overseas buyers for importing.
Exchange rate was really favourable at that time. (FM)
New Zealand dollar was really good for export. (CL)
Grower CL, whose unique experience as a direct exporter was reported earlier,
elaborated that the production approach had been a holistic one, in that they integrated
both production and export functions of their business. The operation of their flower
growing history spanned many years, going back to 1980. He elaborated that the
production factors in New Zealand had been easy to access without restriction.
I didn’t have any restrictions in terms of our resources locally here in
terms of water, land or sunlight. Got everything in our favour here; that
certainly is one of our strengths. (CL)
He also explained that the conditions at that time had been conducive for exports.
60
When I first got my [export process in place] the exchange rate was
really, really favourable. The freight was reasonable and we had a really,
really liked product over there in the [markets]. (CL)
These experiences of the participant growers provide evidence that in the early days of
the floriculture industry (1988 until around 2001), New Zealand floriculture growers
experienced a lucrative, profitable and successful export industry.
5.2.2 Phase 2: The challenging period of the New Zealand floriculture
industry (2001-2008)
Interview participants described how the New Zealand floriculture export industry
started to face challenges from 2001 onwards. These challenges were perceived as
external to New Zealand as changes in the international floricultural industry and
marketplace started impacting New Zealand floriculture exports. The participant
growers’ experience of these adversities is described below.
Adversities in the markets
Emotions were quite noticeable when participant growers started to talk about adverse
events, imposed conditions and challenges and difficulties. The passion and enthusiasm
disappeared. Their voices became sad. These reactions alone revealed the adversity
experienced throughout the previous decade. For all of the participants, the journey with
floriculture became a mission with many challenges. The message in their words was
that at that time the industry had arrived at a volatile, vulnerable junction. The future
had become unknown and unpredictable. The stories of all the participants were similar.
Uncertainties in the USA market following the September 11, 2001 terrorist attack were
the first challenge. Around the same time, competition from supply from the developing
world began in New Zealand’s main markets. Declining prices in the markets due to
supply from low-cost producing countries, an increasing New Zealand exchange rate
against the major trading currencies and escalating New Zealand production costs were
some of the challenges the growers faced.
One participant explained how the September 11, 2001 (9/11) terrorist attack in New
York brought the first waves of challenges to the industry. According to her, the impact
was immediate.
61
Before, when we exported to overseas the price was very high, from $80
to $90, and we got quite a good income. After 9/11, when the terrorists
attacked the twin towers, the prices went down. (CM)
Competition from other countries
The growth of competition in the international marketplace at this time was noted.
The cut foliage participant described his experience around competition for his products
within New Zealand and within his markets.
There has been competition from inside New Zealand and outside New
Zealand, there is competition from locally grown cut leaves in the States
and there is competition even from local Japanese production of foliage.
(FM)
The next area of competition was from international suppliers. Growers talked about the
competition within international markets from new entrants, and increases in supply and
diversification of products by existing suppliers. Varieties once limited to New Zealand
growers had moved to competitors.
We were always consigning to Japan right from the beginning, so we
always relied on the Japanese market on consignment. … Yes, definitely
for a couple of the crops that we grow, there is a lot of competition from
Australia and South Africa. (FM)
This international competition was also reported as having been supported by particular
countries’ governments.
In Holland the government gives them quite a lot of support and this
makes them able to reduce the price; but in New Zealand the situation is
different. (FM)
At this stage, there was no explanation from the interviewees of countermeasures that
they may have taken against the competition.
Unfavourable exchange rate
The New Zealand exchange rate had been favourable for exports in the early days. The
growers had reaped and enjoyed the benefits of this favourable exchange rate until
around 2001. Participants described how the New Zealand dollar started to increase in
relative value from 2001 onwards and that this was against important currencies for
62
export, such as the US dollar and the yen. Since the USA and Japan were major export
destinations, the impact on the floricultural exporters was significant.
Exporters talked about the adversity of the currency factor.
Our currency is returning less and less money for the same sale price
(FL)
Our exchange rate is critical, since the USD and yen is more than 35
percent disadvantaged compared to our currency. (FM)
5.2.3 Phase 3: Intense challenges and struggle for survival of the New
Zealand floriculture industry (2008 onward)
A number of factors were identified as having contributed to the challenges over this
more recent period. The key areas that the participants considered impeded the industry,
and their views, are presented below.
Regulations in the USA & Canada on imports of floriculture products
All the research participants had concerns over the United States Department of
Agriculture (USDA) regulations on cut flower imports from New Zealand. From 2008,
New Zealand products encountered major obstacles for entry to the USA. The new rules
were introduced by the USDA in their effort to regulate and control the light brown
apple moth.
All indoor and outdoor grown cut flowers and foliage imported to the USA since 2008
require an additional declaration in export certification. Production sites must follow
compliance procedures and obtain accreditation status to indicate compliance and to be
able to issue additional declarations before shipping to the USA. A participant
commented how these regulations had affected them:
Before, we could export orchids to many countries: USA, China and
Middle East. From 2008 [onwards], if you wanted to export orchids to
the USA you needed to apply to get a USA number. If you had the
number you had the qualification to export to the USA. Every year we
needed to reapply and it’s cost us a lot of money every year. (CM)
Similar concerns were expressed by the cut foliage participants. They described how the
situation had been very challenging and had placed a significant burden on growers.
63
A big challenge for us has been the situation in the United States, with
that light brown apple moth. It has been a significant burden for us to be
then having to register to get our products in, apart from the time we
were banned; and just the compliance costs, more paper work recording
and you know all these things that just make it difficult and that’s just
one situation where things have got worse. (FM)
Global economic downturn
Participants described how, since 2009, the USA recession hit the industry hard just
after the USDA compliance programme came into existence. The US economic
downturn, followed by the housing market collapse, resulted in high unemployment and
reduced incomes and it was expected that floriculture sales would be impacted. Given
the nature of the floriculture sales, which is heavily income driven, it was expected that
demand for floriculture products would drop in a recession.
Opinions on the trends in the market were also expressed.
Just focusing on the trends, I guess there has been a big trend globally I
think to buy, you know the public buy commodities other than flowers.
Of course, there are still a lot of flowers sold; [but] the other countries
growing more flowers, the global financial crisis (GFC) that has
impacted a lot on flower sales, I believe that from 2007 to 2013 trade
was impacted by the GFC, but going forward from now I think it is much
better. And of course the dollar is not favourable. (CL)
Strengthening New Zealand exchange rates
Participants explained how the stronger exchange rate affected the industry.
Our exchange rate really has been the most critical thing in our industry
...compared to the Japanese yen and the US dollar, it basically went 35
percent against our favour, so it has almost made it uneconomical to
export to what was our biggest market. Eighty-five percent of our
production was going to Japan, I hate to think. So the exchange rate has
basically got a lot to do with it, how we can make money, find other
ways to supply a lot more to the New Zealand market because of the
exchange rate. (FM)
Most of our product is exported to Japan, but this year the Japanese yen
was 92 or 93; so when we get yen and exchange it to the New Zealand
dollar it's much less money. (CM)
64
Sea freight possibilities
A cut foliage participant described how technological advancements have contributed to
logistics improvements for distant competitors to challenge New Zealand exports.
Now coming out of South America, Columbia, being able to sea freight
[cut foliage] from South America into our markets in Japan has been
quite a big influence on production going into the Japanese market, so
there’s been a lot of competition since we started. (FM)
New Dutch research and development
The participants explained how Dutch research and development has enabled Dutch
cymbidium growers to produce early and continue until late into the season. Dutch late
varieties, which seem more appealing to markets and buyers, overlap with the New
Zealand early season varieties of cymbidiums.
Growers explained that the New Zealand early season varieties require more heating
and the cost of production is higher due to investment in heating facilities. New Zealand
growers have experienced the impact of the progress in Dutch technology, and they are
left with a narrow window to supply products in the European off-season.
Additionally, the Dutch industry has acquired an advantage by being pioneers in flower
production, marketing and processing, together with the unique strength of having the
ability to supply a full assortment of other flowers in addition to Cymbidium orchids.
The US and other markets do not open for New Zealand’s seasonal crop until Dutch
products disappear.
Our biggest competitor is from Holland. Their selling prices are
competitive so nobody wants to buy New Zealand flowers when they
have flowers. That’s why we tried to avoid supplying when their product
is in season. If they don’t have any product available, then we can export.
(FS)
Competition from imports
In talking about the first phase, the participants only talked about selling to the
international market. At this stage, the participants started to talk about the domestic
market because they needed to find alternative buyers.
The domestic market provided New Zealand export growers opportunities to sell excess
production, export rejects and cancelled orders. Increasing imports into the country is
posing another challenge for growers.
65
There are definitely a lot of challenges now with supplying in the local
market, with increased production of imports coming in here. Imports
were up nearly 30% in two years, so the importation into our local
markets is really affecting the supply of flowers, which basically brings
down the overall spend on flowers. It’s just more flowers for sale and
prices are coming down. Increased coming in is huge. (FM)
Growers view the rebuild of Christchurch as creating higher domestic demand and
providing an interim temporary solution.
The one good thing is the rebuild in Christchurch. There is a lot more
money around in Christchurch compared to Auckland and Wellington, so
I think that’s affecting the prices they can pay for luxury goods. But
that’s only going to be a short-term thing. When the money is spent from
the rebuild I can't see it going to be anymore: but that’s been a positive
with the local market in Christchurch for us. (FM)
Challenges of compliance
During the interview, while detailing the export process one participant explained his
experience with regard to how some regulations/compliance procedures hinder the
process.
I just found it very exasperating in trying to deal with government
departments [in importing countries] and getting reasons for why things
would be fumigated this time not next time. Why they fumigate, even if
it is an un-actionable pest. They shouldn’t fumigate an un-actionable
pest, but the reality is, when they find something at the border it is
impossible actually to prove it that it’s un-actionable in the time frame
you have. That is very, very frustrating. They might find a two-spotted
mite (Tetranychus urticae) for example, but actually to prove it is, and be
done at that point. And they have to stay waiting for object identification:
it just takes a long time to get the information back. Ah, that was a
frustrating thing. (CL)
When asked about the challenges faced, the participant pointed out once again that
compliance procedures were the most critical area and were very challenging for
growers.
My biggest worry is a bug with exporting. That really, really is. If we
had an alternative to methyl bromide that worked and didn’t have a
detrimental effect on the flowers we would be in a better situation.
Methyl bromide adds to your compliance costs, adds to clearance by a
lot. There is nothing more depressing than growing a beautiful product
66
and get it all the way to the other side of the world and the person says its
crap. I just found it really distressing. Because we knew when it left here
it was in perfect condition. It’s largely because methyl bromide is too
harsh. Breaks in the cool chain can be dramatic, getting too cold – those
things are overcomeable [sic.], but methyl bromide – that’s harsh. (CL)
From his perspective the required compliance methods was the area that required
priority attention in order to help the export process.
The biggest frustration I have with the whole system is that there needs
to be an alternative to methyl bromide for fumigation. We are dealing
with a live perishable product, which is grown in environments where
these are open to wasps and to anything. You know, even if you are in a
glasshouse you are still going to get a mosquito come in. There needs to
be some other system that the New Zealand government needs to be
coming up with, for fumigating; other than methyl bromide. Because
methyl bromide just impacts on the quality of the flowers so fast, so
that’s something that I see that the New Zealand government should be
doing more about. There are other substances coming, but they are
expensive. (CL)
When asked about strengths in addition to those mentioned earlier, this participant
indicated that he didn’t face any restrictions in terms of local resources. This included
water, land and sunlight in New Zealand, which favours growers. He considered this to
be a great strength for New Zealand.
He also talked about the general labour availability as another strength.
Another one for our strength is the labour. Labour is okay to source out
here. I mean it’s difficult to get quality trained labour, but just labour is
doing picking and packing and that’s not too bad. But it's harder to find
someone with computer skills, for managing, who understands growing.
But in some other countries, like Holland, there are lots of those people
available. (CL)
Impact of rising costs on production and selling price
Alongside the lower currency valuation, which meant lower returns, costs were reported
as having increased. The cut flower participants looked at their situation and described
how prices have not gone up, but costs continue to increase.
Well, the situation is that the prices we are receiving are almost the same
as 30 years ago, so with inflation, increasing labour costs ...the costs
67
have all gone up, but prices per stem are basically where we started
(FM).
The issue of labour costs was emphasised by another participant, as were the falling
prices and rising costs squeezing their margins.
New Zealand labour costs are going higher and higher. (CS)
When asked about industry weaknesses, the lack of institutional support was
highlighted. He believed that government agencies’ slowness to support flower growers
may be because of the small gross domestic returns from the sector in comparison with
an industry like kiwifruit.
Within New Zealand, definitely, if you want to know something you got
to go and look for it. There is nothing I can find in New Zealand. If you
want to find out something you really have to go to the other side of the
world and find how they do things professionally over there, and bring
that same knowledge back to your own operation. That applies to the
varieties and all the breeding done over there; procedures how to steam
sterilise the soil and fertiliser regimes and lots of these things. That
support is not here in New Zealand. (CL)
At the same time, he identified the distance from global markets as an added weakness.
When asked about opportunities, all the participants indicated New Zealand’s location
in the southern hemisphere was an opportunity, as it provides a seasonal advantage to
supply the markets of the northern hemisphere during their off seasons. This participant
also mentioned the same fact and raised his concerns of the real effect in the Dutch and
surrounding markets with the latest advancements in Dutch growing techniques.
We are opposite to the northern hemisphere, but I am not sure if it has
any effect. Holland seems to grow Cymbidiums all year round. The
Dutch season goes longer and starts earlier and doesn’t make it easy.
(CS)
During the interviews, opportunity was given to participants to come up with their own
suggestions for improvements. Participants also made some valid suggestions for
improvements.
In Holland they work very much differently, like a cooperative. They are
all sending their flowers to the one market. [In New Zealand] Yes, it is
certainly not supported from the government angle. There could be
68
probably more marketing done. Government promotion of flowers, some
sort of waivers or subsidies to the New Zealand Export Council or
something like that. Attendance at trade fairs: maybe they could set up at
trade fairs; you know, there are trade fairs that display all the flowers, all
the products produced by different countries. I was at two different trade
fairs in Holland in 2013 and there all the countries were represented, like
Columbia and Educator and Kenya. There were all these different places
that were growing, supporting selling flowers on a worldwide scale.
There was not one representative from New Zealand to say we are
Cymbidium growers or anything. There was no representation from any
New Zealand company or organisation, which was disappointing. I think
we can have a better impact on marketing our products. I was thinking at
that time, where New Zealand’s representation is here? (CL)
We have a very good climate from that point of view; we just need the
support to make it work. If we could monitor the dollar, we can make the
dollars stack up. (CL)
5.2.4 Perceived importance of the industry and industry support
Further discussion took place regarding the perceived importance of the industry and
industry support.
I found another thing dealing with [Government agencies] was that
they’re not really interested unless it has got a huge dollar value and
return to New Zealand. The flower industry is probably nothing
compared to the wine industry or kiwifruit industry or avocado industry,
that’s where they prioritise resources to work with. (CL)
Answering the question about the kind of support received from government to develop
the industry:
No we haven’t had any support from any government agencies to assist
us in what we were doing. I have done all that by myself. I have gone to
the end, you know, gone to all the markets, all the florist shops, lots of
supermarkets, to the chain stores, bouquet markets, gleaning that
information directly myself. In New Zealand I am not aware of any one
place to get information anyway. In New Zealand I am not aware of any
place to get this information. That was one thing dealing with other
exporters. It is difficult to get information on what sort of varieties
various markets like. No, you really have to find out yourself to get any
information. You really have to be in there yourself at the coalface
finding it directly, by yourself. (CL)
69
The participant went on to talk about the difficulties in the industry to achieve
economies of scale in New Zealand if a grower focuses on the limited domestic market
only, which has a small population. As a result, it is difficult to justify high capital
outlay in the domestic market rather than focusing on the international market.
The other difficulty we have here in New Zealand is just simply our
economies of scale. We are only talking about 4 million people in New
Zealand. You know you don’t spend 5 million dollars on capital outlay to
grow fancy flowers for export: you want to be sure the market’s going to
be stable. (CL)
I guess that’s one thing that impacted on New Zealand growers. Because
we haven’t had the confidence to invest large sums on infrastructure, we
have fallen behind some of the countries like Holland, European
countries, and even Australia for that matter, which have that base of
people that you can sell to. (CL)
I have always looked at exporting as an extra to my main business. I
have never based my business solely on exports. I wouldn’t like to be in
that situation. I would like to have a mixture of domestic and export; and
the trouble in New Zealand is actually to put a huge capital outlay in to
infrastructure, into, maybe, fancy glasshouses to grow [flowers] isn’t
really justified when we have only 4 million people to sell to. If we had
16 million people in New Zealand, it would probably be a totally
different story. To have a 5-million-dollar infrastructure out there
growing to the same… like what they do in Holland. (CL)
5.2.5 Participants’ response to the challenges
A new question that was posed was how participants handled and responded to the
challenges they faced.
Growers used various means to overcome the challenges and conditions forced on them.
These were varied, and included shifting production strategies to move from quality-
driven production to low-cost production, or downsizing production scale. Others
reported having moved away from markets with high restrictions, or expanding their
supply to domestic markets.
The important observation was that the position of the New Zealand grower as price
maker rapidly changed to become that of a price taker. Production then shifted from
quality-oriented production to low-cost oriented production.
70
Our selling price was very low and also the New Zealand dollar was very
high, plus the transport, labour and materials, even the water and
electricity costs, have increased, making our costs too high and since we
get less money it’s not enough to pay our labour. So that’s why we use
the [devices to save labour with some initial investment] but it can save
us labour, so that’s why we do this, otherwise we can’t survive. Now we
have no ability to hire [off season staff] in the holidays normally after the
season. Because the selling price is too low we can’t hire them to come
to do the job ... we need to save and reduce our costs. So now the
environment is very hard for growers to survive. (FM)
We were geared up to supply high volumes. The markets have moved a
lot since 2007 and the global financial crisis. Flowers are sold mostly
through supermarkets and big online areas. There is a lot of online
business. The florists’ shops are going down. Really they are doing it just
for the love of them. We are always looking for some other thing to
grow, with good demand. We look for that in flowers or other products.
We are going to continue what we are doing and keep focusing on
quality and not volume. Adding value where we can. [We have
diversified products] flowers and herbs. (CL)
Some growers tried to shorten the supply chain by direct export, then focused on doing
volume for a mixture of big supermarket chains and also florists, and to get a better
price by reducing shipping cost by using PMC loads [Air Cargo Unit] and to get the
bulk of markets. Growers have also tried to maximise their weight to volume ratio.
The dollar had a huge effect on us. The dollar is not favourable, I meant.
(CS)
I really focused hard on making sure we were always getting complete
shipments. Put a lot of pressure on systems. It was good, it went,
unfortunately a lot of things can go wrong too. (CL)
Growers also indicated how they began to diversify into other products to maximise
resource use and minimise risks:
With that change we decided [to diversify in to other products] while the
dollar was so horrible. So we merged with [another business] so it made
sense to come together …to overhead structure over a bigger base. (CL)
71
5.2.6 Advantages and disadvantages of the New Zealand floriculture
sector from the participants’ perspectives
The later part of the interviews focused on gaining participants’ perspectives on the
advantages and disadvantages of the New Zealand export floriculture sector in
comparison with its international competitors.
The advantages
Participants identified several advantages, including location, off-season demand,
resources, climate, infrastructure, and reputation.
All the participants recognised New Zealand’s location in the southern hemisphere as a
primary advantage that provided many opportunities for growing, especially in alternate
seasons to countries in the northern hemisphere. They explained that the major
floricultural markets are in the northern hemisphere and that due to this, New Zealand’s
location provides ideal opportunities to supply products to cater for the off-season
demand in those markets.
In New Zealand we are in the southern hemisphere so we have different
seasons and so we can export to other countries when they don’t have
flowers. We have seasonal advantages. (CS)
From the participants’ perspective, New Zealand is very fortunate and blessed with
many resources. All the participants viewed New Zealand as a resource-rich country in
comparison with many competing countries.
Land availability for production and expansion provides a significant strength that many
competitor countries simply don’t have. Secondly, New Zealand is unique when
compared to competitor countries, in the sense that there is an absence of population
pressure on land, whilst competitor countries, for example Holland, Thailand, Taiwan,
India, Malaysia and South Africa, have high population pressure. This population
impact results in the scarcity of land for horticultural purposes. Conversely, New
Zealand is a country with less population and has sufficient land available for
production.
In New Zealand, compared to other countries, it is easy to get land since
it has a lower population, so growers can expand their business. There is
enough land for people and growing. (CM)
72
We didn’t have any restriction in terms of our resources: water, land,
sunlight ... certainly one of our strengths in our favour. (CL)
Participants also recognised that New Zealand’s land terrain is conveniently flat,
facilitating excellent road systems and infrastructure which leads to efficient production
and transport.
We are lucky we live in a country where the land is quite flat, but in
other countries they need to transport flowers from hill to hill. Transport
is easier than other countries like China, India or Taiwan. (CM)
Growers also noted the improvements seen in infrastructure.
We live in the rural country, but now telecommunication has advanced.
It’s much better, we pay the same fees as the cities. (CM)
The environment was also mentioned repeatedly by the participants. The presence of
clean air and pure water provides ideal conditions for quality growing and enhanced
product vase life.
I think New Zealand has a good environment, good air and pure water;
these conditions help my business because it makes the quality better.
The air and the cooler weather help us keep shipments longer. (CM)
Another factor that was brought up was the expansion possibilities present in the
New Zealand market.
If you look at the increase in production per unit area possible it is very
high, especially when compared to how much land dairy farming uses.
(FM)
Participants highlighted how government assistance is important in order to achieve this
expansion.
The government needs to look to the exchange rate so we can go
forward; and to make grants available, because there is definitely
potential for the big markets. But with this type of exchange rate it is not
easy. There’s no money left over for anything really, just surviving,
survival mode. Which is not great. (FM)
One participant made special remarks on New Zealand’s reputation, which has been
built over the years and which still acts as a strength to New Zealand growers.
73
A strength for New Zealand is definitely our reputation for quality. There
is a pretty much good understanding with the places we send to that the
quality coming out of New Zealand is high, if not higher than anywhere
else. So we have definitely got a good reputation as a country. That is
something that other countries are quite envious of, because we do have
a good reputation. I think that’s the strong point for us. (FM)
Growers also indicated that New Zealand has a highly knowledgeable grower
community and that some grower operations have been growing floriculture products
for two or three generations. The accumulated wealth of knowledge certainly came
through as a perceived key strength of the sector.
Disadvantages
Participants identified many areas of disadvantage, particularly the limited domestic
market, large capital outlay, lack of market information, a shortage of institutional
support and an absence of industry recognition, among many others.
New Zealand is a country with a small population and the domestic market for
floriculture products is easily saturated. Countries with large domestic markets provide
growers with the opportunity to produce for local markets with much fewer risks.
Companies can then expand into global markets. Smaller domestic markets prevent any
capital outlay occurring on a favourable scale, which is common among smaller low-
income economies.
The domestic market provides New Zealand export growers with opportunities to sell
their excess production, export rejects, cancelled orders and so on. However, the
increasing amount of floriculture imports into the country is posing another challenge
for growers.
There are definitely a lot of challenges now with supplying in the local
market, with increased production of imports coming in here, which were
up nearly 30% in two years. So the importation into our local markets is
really affecting the supply of flowers, which basically is bringing down
the overall spend of flowers. It is just more flowers for sale and prices
are low. (FM)
Import duty was also reported as creating a disadvantage for New Zealand exporters in
the European market. New Zealand products have additional competition from products
entering the EU where the preferential tariffs are enjoyed by some competitor countries.
74
In addition, participants highlighted the lack of market information as a disadvantage
hindering the export sector.
There isn’t any [market information] coming to me; it’s not that easy to
find out. We rely basically on our export companies to tell us the
situation or the actual import companies themselves that we deal through
in Japan to tell us what’s happening in the market, and that’s it. (CS)
A question was asked about how frequently growers have visited their markets. The
responses indicated interest in doing so, but a challenge from lack of resources.
We can’t afford it. I have not been to any other markets for seven years.
So that’s just the state of the industry. There’s not enough money to
spend on developing new markets by ourselves. We have had to rely on
our export companies to market for us, which isn’t great. We need a bit
of assistance. (FM)
I would be definitely more than willing to do it [if there is support]. (FM)
Participants also lamented a lack of institutional support for the floriculture industry,
especially from government.
There’s nothing, there just seems to be nothing forthcoming from the
government to help us in our business. From how we run to day to day.
I’m not saying there isn’t anything but we are just not aware of it. (FM)
5.2.7 What can be done? Participants’ suggestions for improvements
In the final stage of the interviews, participants were asked for suggestions that could
help strengthen the floriculture sector in New Zealand. A number of the responses were
based on ways that support could be provided for the industry.
The first area of recommendation was in market access and entry. Interviewees
indicated the need for them to enter new markets in order to sustain growth and
suggested this should be done with the aid of government support such as growers
receive in other countries.
Help on opening new markets, especially the Australian market. I think a
lot of effort should be made there, it’s five times bigger than our market
and it’s the closest market. For me, if I can sell 20% of our production in
New Zealand that would open up 80% in Australia; then we wouldn’t
need our other markets like Japan and the American market. So I think
the future is in Australia as a focused market. Definitely there are a lot of
75
other places that we can focus on, but it’s the cost of setting up and
visiting that we can’t afford to do ourselves as a small grower. (FM)
Having help to break into the Australian market; it is a massive market
with basically my products never seeing anything in. So I think there is
quite a bit of work that can be done building the closest market no one’s
ever really attended to. (FM)
Well, from my understanding it just seems to be in the too hard basket
for a lot of exporters to regularly supply our products to Australia. There
seems to be too many problems. If we can export everywhere else that
surely should be easiest. (FM)
Some participants suggested they would like to receive assistance towards training their
staff.
New Zealand has an unemployment benefit, I think if the government
can help growers and using this money then we can offer the jobs for
employment, I think this can balance the market and also can reduce
our costs. (CM)
The grower comments already quoted in this chapter have shown that most of the
growers believe there is a need for the New Zealand government to adopt a more
helpful agenda for this industry. On this topic, one grower commented:
In Holland they work very much differently like a cooperative, they are
all sending their flowers to the one market. [In New Zealand] it is
certainly not supported from the government angle. There could be
probably more marketing done. Government promoting flowers, some
sort of waivers or subsidies to New Zealand Export Council or
something like that attend trade fairs. Maybe they could set up at trade
fairs, you know there are trade fairs that display all the flowers. Trade
fairs, they display all the products produced by different countries. (CS)
His disappointment was expressed when he shared his experience in an international
exhibition visit, where he witnessed no New Zealand representation whilst all other
flower producing countries were well represented in these forums.
I was at two different trade fairs in Holland in 2013 and there were all
the countries were represented like Columbia and educator and Kenya.
There were all these different places that were growing supporting
selling flowers on a worldwide scale. There's not one representative from
New Zealand to say we are Cymbidium growers or anything. . There’s
no representation from any New Zealand company or organisation which
76
was disappointing. I think we can do better impact on marketing our
products. I was thinking at that time where New Zealand’s representation
here is. (CL)
We have a very good climate from that point of view, we just need the
support to make it work. If we could monitor the dollar, we can make the
dollars stack up. (CL)
The participants expressed their views that the present measures available to maintain
phytosanitary conditions are too harsh on flowers, and the hope for an alternative to
methyl bromide fumigation.
We were on a system in Australia on a pathway where you had to have
ten clean consecutive consignments with no insects found to be allowed
to go straight onto a pathway without mandatory fumigation. This is
from June to September. They found one mosquito in a consignment and
then it went back to mandatory fumigation again. It is very difficult in
Australia from that angle. So, if we were able to fumigate on the New
Zealand side, just as a precaution something that is cheap it would be
better. That’s where research needs to be put in. Flora gas is not a
registered DAFF product, and the same is true for methyl formate. BOC
are trying to get it registered. That’s something our government and
MAF can work on. MPI should be able to work on another gas that
doesn’t have a detrimental effect on the fresh product. (CL)
[In New Zealand] even though we pay a higher tax [Before we paid 38%
tax but were given no support towards new technology or research.]
Before we were happy, because we had a higher income to pay for the
tax; but now we can’t pay the higher tax because our selling price is too
low. Now the economy in this sector is changing, so I think if the
government can reduce the tax or control the exchange rate and not let it
get too high, I think this will be quite helpful for the growers. But we do
not know if the government can do this, especially since 9/11 and
everything changing. It’s not only me, you can check with every grower;
it is hard to survive for everybody. We hope the government does
something. They can help growers with new technology or we can build
a new variety and then we can fill orders from other countries. We can
have more income and pay for labour and hire more people. We can
build more jobs. But now, the environment, the financial environment, is
not good for growers. That’s why quite a lot of orchid farms are for sale.
(CM)
One participant suggested the huge expenses involved in biosecurity procedures should
be eased.
77
The biosecurity threats like the light brown apple moth and its being
banned from being shipped into the United States or Canada is a concern.
So being able to get assistance from our government to get access into
the markets we are using now. Definitely something I think they should
safeguard against, because if we are chopped off we are relying on just
our small market and that’s not so good. (FM)
Another suggestion was to implement new technology to take advantage of our seasonal
differences.
We need to learn how to keep flowers longer so we can make seasonal
shipments without flowers deteriorating. Then we need to choose a
certain period like when there are no flowers from Holland available, to
avoid the overlap periods. (FM)
One key challenge that arose in all interviews was related to the exchange rate. One
participant suggested that policy support that helped offset the exchange rate
disadvantage for exporters could help them feel more optimistic about the future of the
industry.
It’s not looking bright. If they want to rely on us being an exporting
country having the dollar lower would be a huge advantage. They need
to make it easier for us. Bring down the exchange rate so we can go
forward. (FM)
Continued commitment to the industry
Overall, the participants expressed their commitment to the industry and appreciated the
opportunity to express their views about it, through this research. Comments included:
I hope I haven’t painted a too bad picture of the flower industry. I have
been passionate all my life about the flower industry. (CL)
Thank you for this opportunity to share the feelings of all growers,
because growers work hard; but they just want the government to do
something and support growers because they want to have their own
business. We have had our business for eighteen years. We don’t like to
give up. We just want to contain our costs. The maintenance for our
greenhouse is very high. We don’t have enough to repair the greenhouse
if it gets damaged, but we are lucky we have insurance. But the insurance
price is getting high. That’s why the cost is getting higher. We have a
grower meeting; what we say is what all the growers are feeling. They
try to keep their business, but it’s just enough for their survival. (CM)
78
Now we mostly export to Japan and a small percentage to other
countries, but I think it’s quite a pity. So I hope the government can help
growers to expand the overseas market and help enjoy beautiful flowers
in New Zealand, especially the New Zealand product. We like the
country, we like our flowers, we like people to enjoy the flowers and say
they are beautiful; that’s what all the growers want. But better quality
means better income; so, please, our government can help us to expand
our export market. More people can enjoy our beautiful flowers,
especially from New Zealand. Thank you very much for this opportunity,
I quite appreciate it; but no matter how hard it is I still work hard,
because I enjoy when people enjoy my flowers and say they are
beautiful. I think that is a good reward to me. I like to do this no matter
how old I am. I like people to say New Zealand product are better
quality. It’s not only me, all the growers like to hear that they like to buy
New Zealand’s flowers because they are so beautiful. (CM)
5.2.8 Summary
The findings presented in this chapter found similar stories of change in the growers’
experiences through the three ‘phases’ of development. How these experiences of those
related to what was observed in the international production and trade stories and
statistics will be presented through the discussion in the next chapter.
79
Chapter 6 Discussion
This research has investigated the experiences of New Zealand floriculture export
producers in changing international markets to answer the question, “What can be done
to strengthen the sector’s capabilities?” Answering that question has involved a number
of methods and analytical stages: reviewing the relevant literature and documentary
reports, analysing international and domestic statistics, and conducting and analysing
participant interviews. This discussion chapter brings together the information from all
those sources to present an overall analysis to answer the main research question.
The discussion is presented in two sections. The first section analyses growers’
experiences in relation to what was identified in the documentary data and statistical
information. How global trends relate to New Zealand industry issues and responses
will be discussed in this section. Wherever applicable, the researcher's own experience
will also be reflected on.
The second part of this chapter will discuss the views of the interviewed participants, in
relation to the researcher’s own experience and that of international actors, about what
could be done to strengthen the New Zealand floriculture sector’s capabilities for the
future.
6.1 New Zealand floriculture industry performance in the changing international market
New Zealand’s floriculture industry exports have reflected world trends, and the trade
statistics have illustrated the story of how they have fared in the face of a changing
competitive context in the international marketplace.
In the global scenario, the international floriculture export industry grew from the
1990s, and the period 2001 to 2008 stands out as exhibiting especially remarkable
accelerated growth. The global economic downturn of 2008 appeared to interrupt that
growth, but the industry quickly returned to a growth trajectory by 2009 and has since
continued to grow. During the accelerated growth period, many new countries engaged
in floriculture export activities and expanded their industries by taking advantage of the
market opportunities available.
Dedicated growers established a significant and rewarding industry in New Zealand by
2000, and New Zealand became an important supplier of floricultural products from the
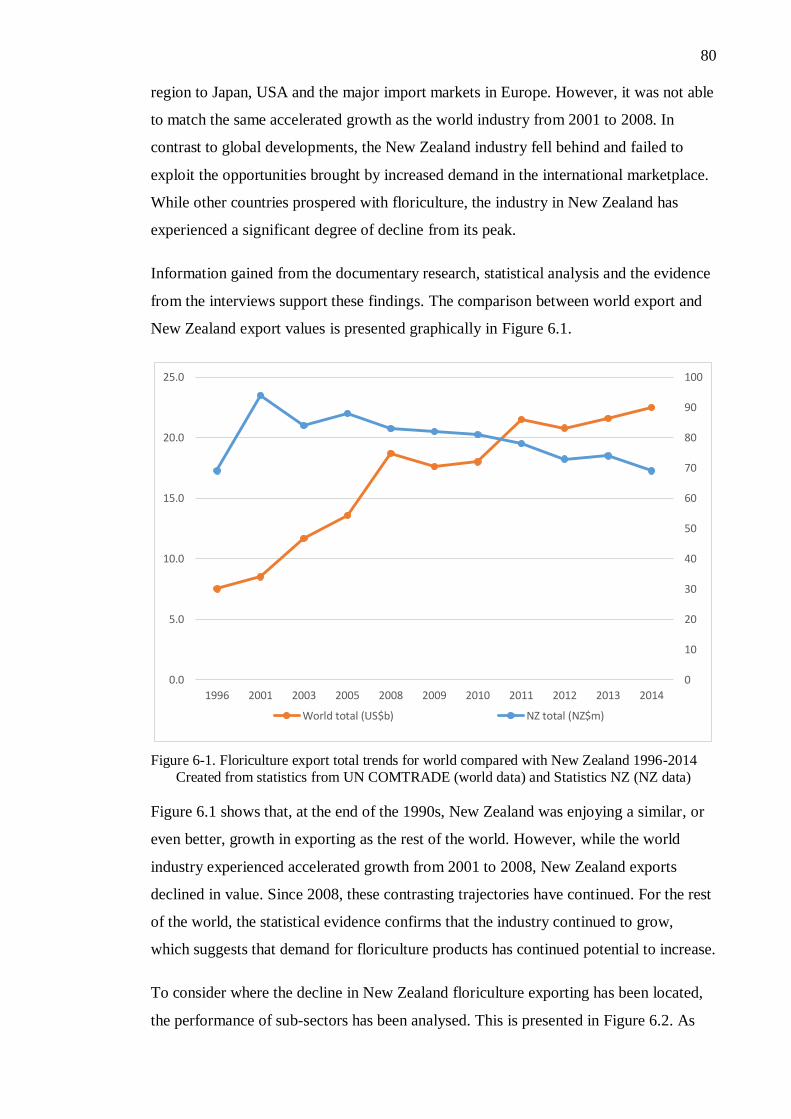
80
region to Japan, USA and the major import markets in Europe. However, it was not able
to match the same accelerated growth as the world industry from 2001 to 2008. In
contrast to global developments, the New Zealand industry fell behind and failed to
exploit the opportunities brought by increased demand in the international marketplace.
While other countries prospered with floriculture, the industry in New Zealand has
experienced a significant degree of decline from its peak.
Information gained from the documentary research, statistical analysis and the evidence
from the interviews support these findings. The comparison between world export and
New Zealand export values is presented graphically in Figure 6.1.
Figure 6-1. Floriculture export total trends for world compared with New Zealand 1996-2014
Created from statistics from UN COMTRADE (world data) and Statistics NZ (NZ data)
Figure 6.1 shows that, at the end of the 1990s, New Zealand was enjoying a similar, or
even better, growth in exporting as the rest of the world. However, while the world
industry experienced accelerated growth from 2001 to 2008, New Zealand exports
declined in value. Since 2008, these contrasting trajectories have continued. For the rest
of the world, the statistical evidence confirms that the industry continued to grow,
which suggests that demand for floriculture products has continued potential to increase.
To consider where the decline in New Zealand floriculture exporting has been located,
the performance of sub-sectors has been analysed. This is presented in Figure 6.2. As
0
10
20
30
40
50
60
70
80
90
100
0.0
5.0
10.0
15.0
20.0
25.0
1996 2001 2003 2005 2008 2009 2010 2011 2012 2013 2014
World total (US$b) NZ total (NZ$m)
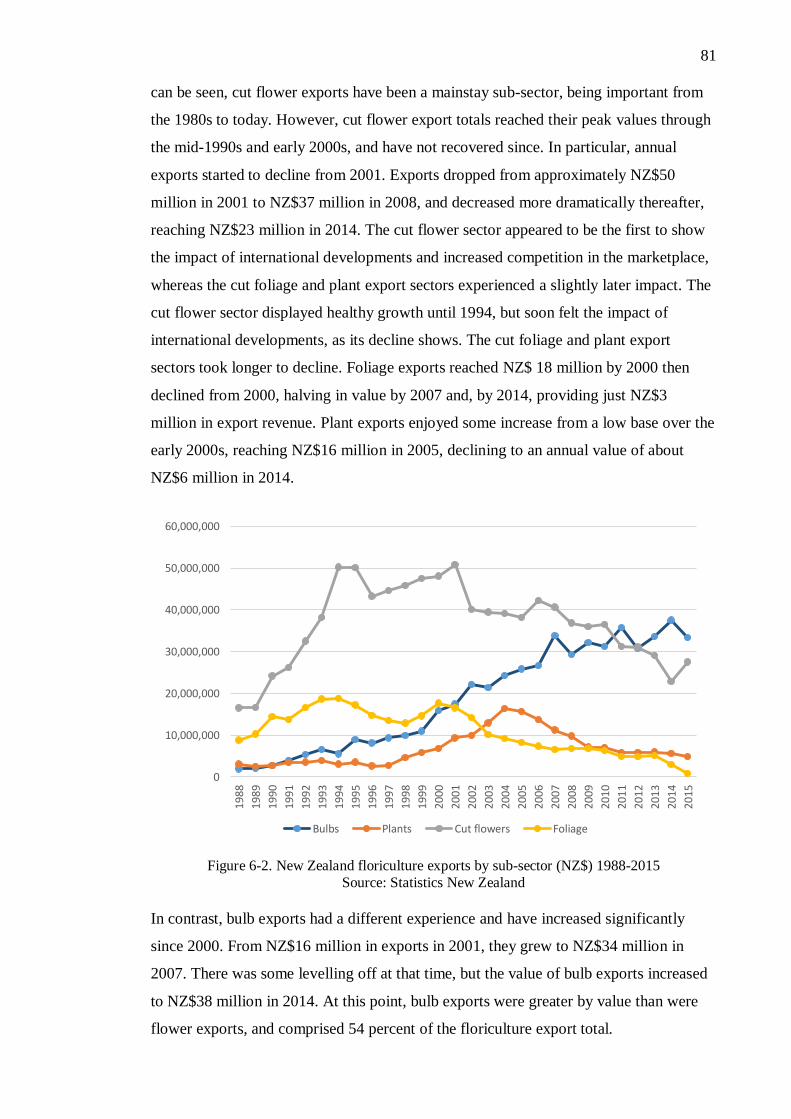
81
can be seen, cut flower exports have been a mainstay sub-sector, being important from
the 1980s to today. However, cut flower export totals reached their peak values through
the mid-1990s and early 2000s, and have not recovered since. In particular, annual
exports started to decline from 2001. Exports dropped from approximately NZ$50
million in 2001 to NZ$37 million in 2008, and decreased more dramatically thereafter,
reaching NZ$23 million in 2014. The cut flower sector appeared to be the first to show
the impact of international developments and increased competition in the marketplace,
whereas the cut foliage and plant export sectors experienced a slightly later impact. The
cut flower sector displayed healthy growth until 1994, but soon felt the impact of
international developments, as its decline shows. The cut foliage and plant export
sectors took longer to decline. Foliage exports reached NZ$ 18 million by 2000 then
declined from 2000, halving in value by 2007 and, by 2014, providing just NZ$3
million in export revenue. Plant exports enjoyed some increase from a low base over the
early 2000s, reaching NZ$16 million in 2005, declining to an annual value of about
NZ$6 million in 2014.
Figure 6-2. New Zealand floriculture exports by sub-sector (NZ$) 1988-2015
Source: Statistics New Zealand
In contrast, bulb exports had a different experience and have increased significantly
since 2000. From NZ$16 million in exports in 2001, they grew to NZ$34 million in
2007. There was some levelling off at that time, but the value of bulb exports increased
to NZ$38 million in 2014. At this point, bulb exports were greater by value than were
flower exports, and comprised 54 percent of the floriculture export total.
0
10,000,000
20,000,000
30,000,000
40,000,000
50,000,000
60,000,000
198
8
1989
199
0
199
1
199
2
199
3
199
4
199
5
1996
199
7
199
8
199
9
200
0
200
1
200
2
200
3
200
4
200
5
200
6
200
7
200
8
2009
201
0
201
1
201
2
201
3
201
4
201
5
Bulbs Plants Cut flowers Foliage
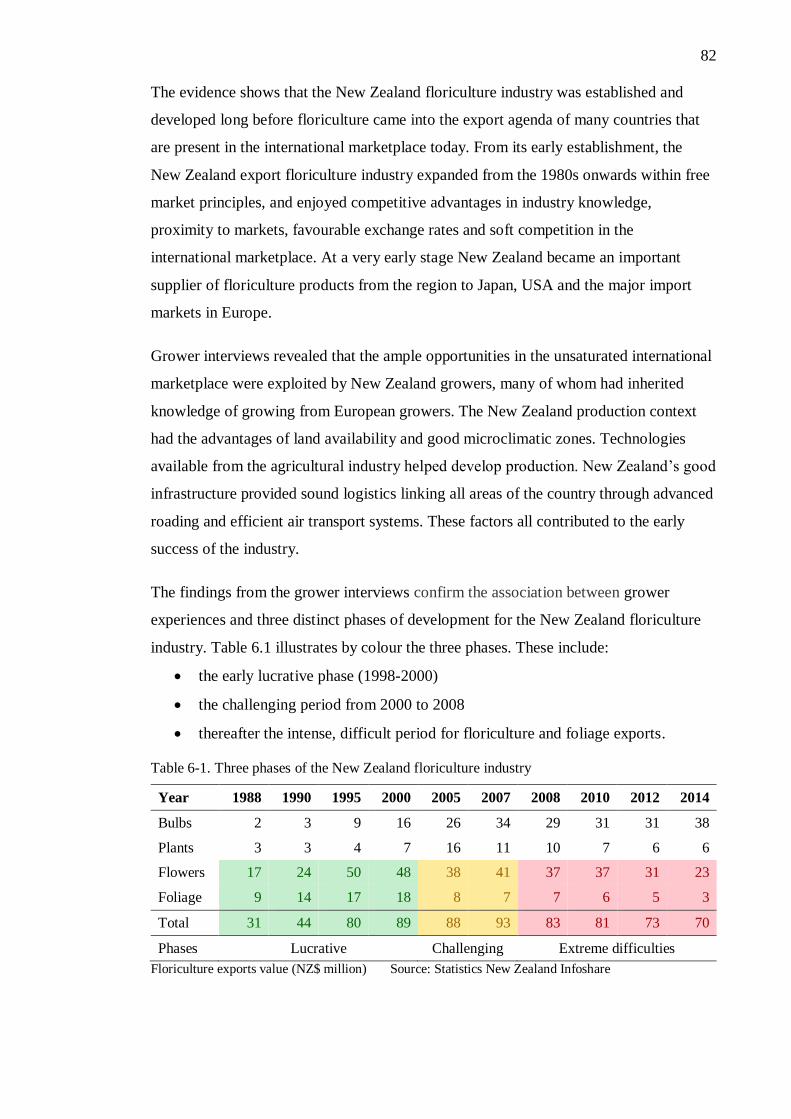
82
The evidence shows that the New Zealand floriculture industry was established and
developed long before floriculture came into the export agenda of many countries that
are present in the international marketplace today. From its early establishment, the
New Zealand export floriculture industry expanded from the 1980s onwards within free
market principles, and enjoyed competitive advantages in industry knowledge,
proximity to markets, favourable exchange rates and soft competition in the
international marketplace. At a very early stage New Zealand became an important
supplier of floriculture products from the region to Japan, USA and the major import
markets in Europe.
Grower interviews revealed that the ample opportunities in the unsaturated international
marketplace were exploited by New Zealand growers, many of whom had inherited
knowledge of growing from European growers. The New Zealand production context
had the advantages of land availability and good microclimatic zones. Technologies
available from the agricultural industry helped develop production. New Zealand’s good
infrastructure provided sound logistics linking all areas of the country through advanced
roading and efficient air transport systems. These factors all contributed to the early
success of the industry.
The findings from the grower interviews confirm the association between grower
experiences and three distinct phases of development for the New Zealand floriculture
industry. Table 6.1 illustrates by colour the three phases. These include:
the early lucrative phase (1998-2000)
the challenging period from 2000 to 2008
thereafter the intense, difficult period for floriculture and foliage exports.
Table 6-1. Three phases of the New Zealand floriculture industry
Year 1988 1990 1995 2000 2005 2007 2008 2010 2012 2014
Bulbs 2 3 9 16 26 34 29 31 31 38
Plants 3 3 4 7 16 11 10 7 6 6
Flowers 17 24 50 48 38 41 37 37 31 23
Foliage 9 14 17 18 8 7 7 6 5 3
Total 31 44 80 89 88 93 83 81 73 70
Phases Lucrative Challenging Extreme difficulties
Floriculture exports value (NZ$ million) Source: Statistics New Zealand Infoshare
83
The cut flower and cut foliage sectors are highlighted because they relate to the sub-
sectors in which interview participants are active. The characteristics of each phase are
elaborated on in each of the following sections.
6.1.1 Phase 1: Mid 1980s-2000 Lucrative phase of the New Zealand
floriculture industry
The export statistics in 6.2 show that from 1988 to 2000, New Zealand’s cut flower
exports grew from NZ$17 million to NZ$50 million. Foliage exports also doubled from
NZ$9 million to NZ$18 million. These figures confirm the grower accounts of the
successful lucrative phase of the industry. The growers’ interview evidence indicates
that they enjoyed a pleasant, successful and profitable industry during this early period.
This success led growers to invest time and energy into their businesses, to lift the
industry to a high level.
Key features of the period are outlined in the table below.
Table 6-2. Key features of the period mid 1980s–2000
Phase One – key features and forces
Floriculture production Floriculture markets
Customer-focused and quality-oriented growing
Unsaturated markets
Growers were price makers Easy market entry
Consistent and continuous orders Simple / affordable quarantine procedures were
Value facilitated quality improvements; Improvements led to quality
Insignificant competition
Reputation and image were established for New Zealand quality
Favourable exchange rate
Profitable export production Continuous demand
Lucrative export floriculture industry
During this period, high priority was given to satisfying customers by striving for the
highest quality products and providing consistent supply. Interviewees recollected that
they had worked hard to understand customers’ needs and had made their best efforts to
satisfy those requirements.
Growers’ best efforts were invested in quality and to ensure the best responses to
customers’ needs. This quality-driven production facilitated uninterrupted demand and,
in this environment, the grower could easily determine the value (price) of the products.
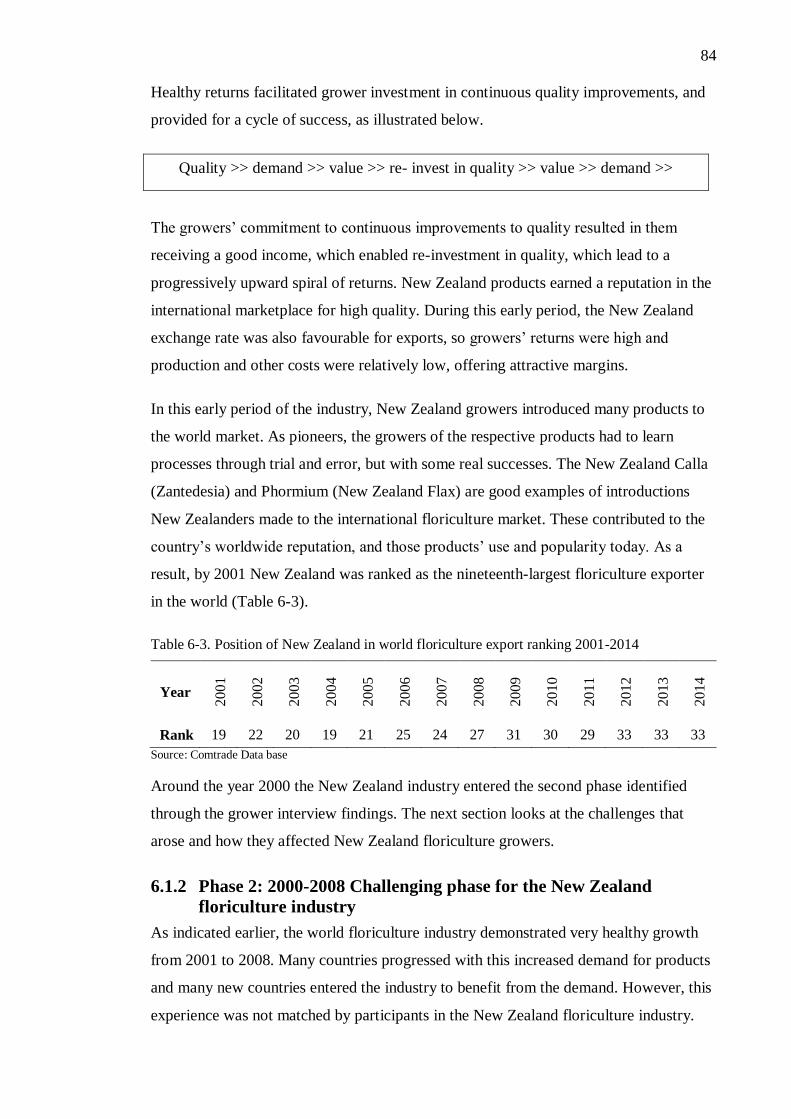
84
Healthy returns facilitated grower investment in continuous quality improvements, and
provided for a cycle of success, as illustrated below.
Quality >> demand >> value >> re- invest in quality >> value >> demand >>
The growers’ commitment to continuous improvements to quality resulted in them
receiving a good income, which enabled re-investment in quality, which lead to a
progressively upward spiral of returns. New Zealand products earned a reputation in the
international marketplace for high quality. During this early period, the New Zealand
exchange rate was also favourable for exports, so growers’ returns were high and
production and other costs were relatively low, offering attractive margins.
In this early period of the industry, New Zealand growers introduced many products to
the world market. As pioneers, the growers of the respective products had to learn
processes through trial and error, but with some real successes. The New Zealand Calla
(Zantedesia) and Phormium (New Zealand Flax) are good examples of introductions
New Zealanders made to the international floriculture market. These contributed to the
country’s worldwide reputation, and those products’ use and popularity today. As a
result, by 2001 New Zealand was ranked as the nineteenth-largest floriculture exporter
in the world (Table 6-3).
Table 6-3. Position of New Zealand in world floriculture export ranking 2001-2014
Year
2001
2002
2003
2004
2005
2006
2007
2008
2009
2010
2011
2012
2013
2014
Rank 19 22 20 19 21 25 24 27 31 30 29 33 33 33
Source: Comtrade Data base
Around the year 2000 the New Zealand industry entered the second phase identified
through the grower interview findings. The next section looks at the challenges that
arose and how they affected New Zealand floriculture growers.
6.1.2 Phase 2: 2000-2008 Challenging phase for the New Zealand
floriculture industry
As indicated earlier, the world floriculture industry demonstrated very healthy growth
from 2001 to 2008. Many countries progressed with this increased demand for products
and many new countries entered the industry to benefit from the demand. However, this
experience was not matched by participants in the New Zealand floriculture industry.
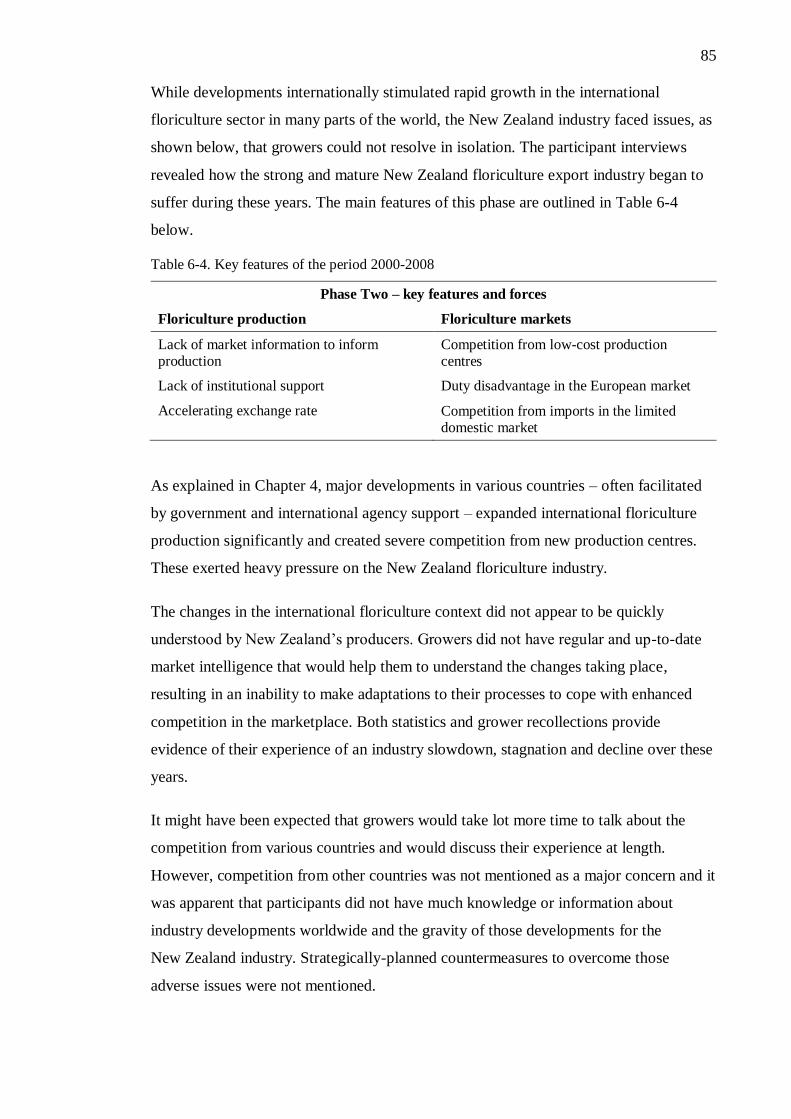
85
While developments internationally stimulated rapid growth in the international
floriculture sector in many parts of the world, the New Zealand industry faced issues, as
shown below, that growers could not resolve in isolation. The participant interviews
revealed how the strong and mature New Zealand floriculture export industry began to
suffer during these years. The main features of this phase are outlined in Table 6-4
below.
Table 6-4. Key features of the period 2000-2008
Phase Two – key features and forces
Floriculture production Floriculture markets
Lack of market information to inform production
Competition from low-cost production centres
Lack of institutional support Duty disadvantage in the European market
Accelerating exchange rate Competition from imports in the limited domestic market
As explained in Chapter 4, major developments in various countries – often facilitated
by government and international agency support – expanded international floriculture
production significantly and created severe competition from new production centres.
These exerted heavy pressure on the New Zealand floriculture industry.
The changes in the international floriculture context did not appear to be quickly
understood by New Zealand’s producers. Growers did not have regular and up-to-date
market intelligence that would help them to understand the changes taking place,
resulting in an inability to make adaptations to their processes to cope with enhanced
competition in the marketplace. Both statistics and grower recollections provide
evidence of their experience of an industry slowdown, stagnation and decline over these
years.
It might have been expected that growers would take lot more time to talk about the
competition from various countries and would discuss their experience at length.
However, competition from other countries was not mentioned as a major concern and it
was apparent that participants did not have much knowledge or information about
industry developments worldwide and the gravity of those developments for the
New Zealand industry. Strategically-planned countermeasures to overcome those
adverse issues were not mentioned.
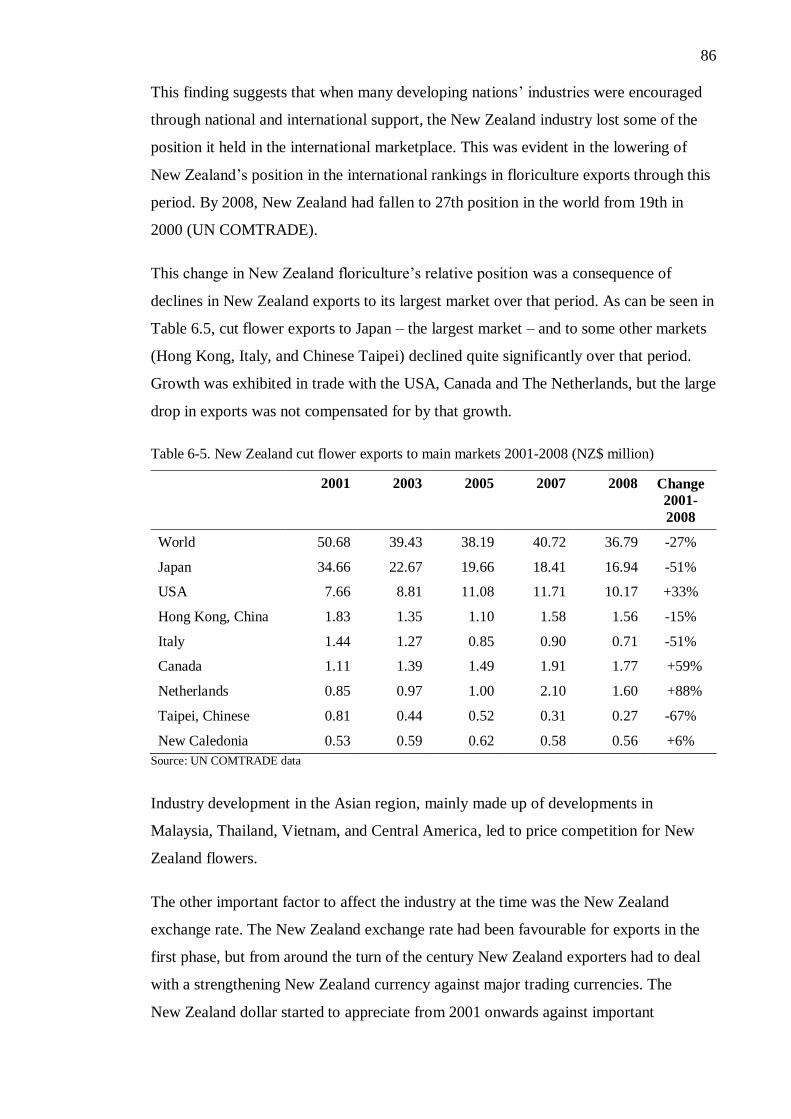
86
This finding suggests that when many developing nations’ industries were encouraged
through national and international support, the New Zealand industry lost some of the
position it held in the international marketplace. This was evident in the lowering of
New Zealand’s position in the international rankings in floriculture exports through this
period. By 2008, New Zealand had fallen to 27th position in the world from 19th in
2000 (UN COMTRADE).
This change in New Zealand floriculture’s relative position was a consequence of
declines in New Zealand exports to its largest market over that period. As can be seen in
Table 6.5, cut flower exports to Japan – the largest market – and to some other markets
(Hong Kong, Italy, and Chinese Taipei) declined quite significantly over that period.
Growth was exhibited in trade with the USA, Canada and The Netherlands, but the large
drop in exports was not compensated for by that growth.
Table 6-5. New Zealand cut flower exports to main markets 2001-2008 (NZ$ million)
2001 2003 2005 2007 2008 Change
2001-
2008
World 50.68 39.43 38.19 40.72 36.79 -27%
Japan 34.66 22.67 19.66 18.41 16.94 -51%
USA 7.66 8.81 11.08 11.71 10.17 +33%
Hong Kong, China 1.83 1.35 1.10 1.58 1.56 -15%
Italy 1.44 1.27 0.85 0.90 0.71 -51%
Canada 1.11 1.39 1.49 1.91 1.77 +59%
Netherlands 0.85 0.97 1.00 2.10 1.60 +88%
Taipei, Chinese 0.81 0.44 0.52 0.31 0.27 -67%
New Caledonia 0.53 0.59 0.62 0.58 0.56 +6%
Source: UN COMTRADE data
Industry development in the Asian region, mainly made up of developments in
Malaysia, Thailand, Vietnam, and Central America, led to price competition for New
Zealand flowers.
The other important factor to affect the industry at the time was the New Zealand
exchange rate. The New Zealand exchange rate had been favourable for exports in the
first phase, but from around the turn of the century New Zealand exporters had to deal
with a strengthening New Zealand currency against major trading currencies. The
New Zealand dollar started to appreciate from 2001 onwards against important
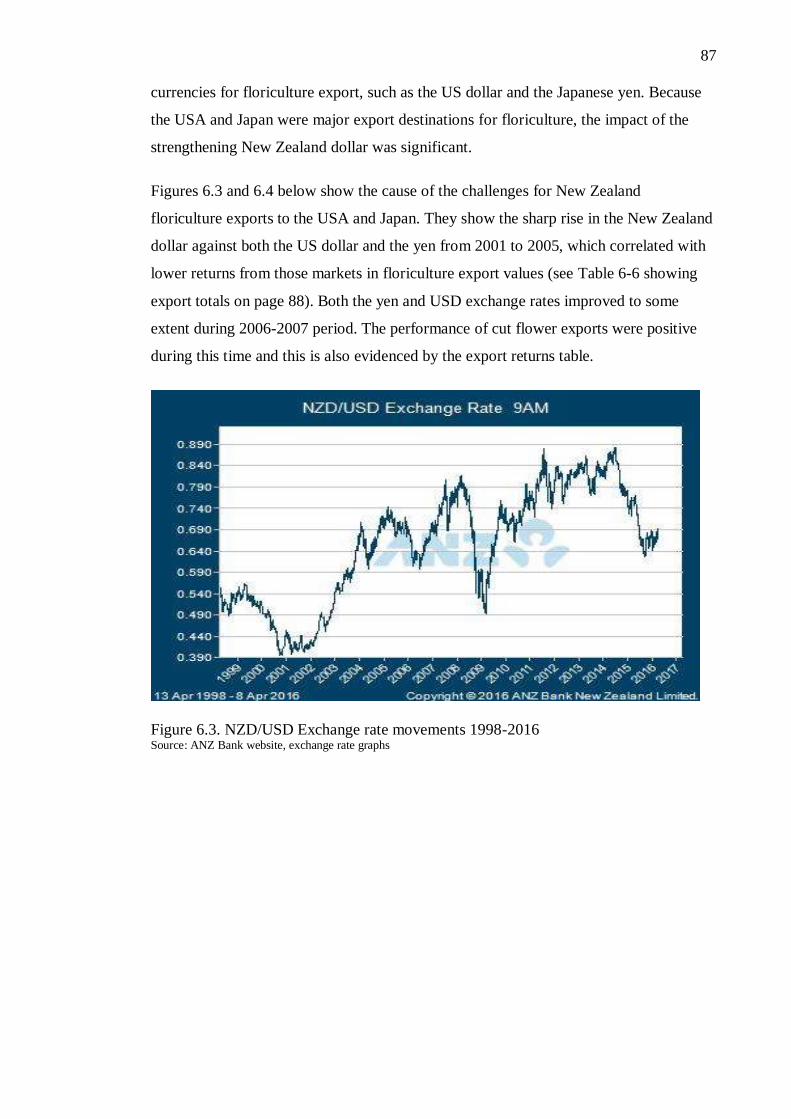
87
currencies for floriculture export, such as the US dollar and the Japanese yen. Because
the USA and Japan were major export destinations for floriculture, the impact of the
strengthening New Zealand dollar was significant.
Figures 6.3 and 6.4 below show the cause of the challenges for New Zealand
floriculture exports to the USA and Japan. They show the sharp rise in the New Zealand
dollar against both the US dollar and the yen from 2001 to 2005, which correlated with
lower returns from those markets in floriculture export values (see Table 6-6 showing
export totals on page 88). Both the yen and USD exchange rates improved to some
extent during 2006-2007 period. The performance of cut flower exports were positive
during this time and this is also evidenced by the export returns table.
Figure 6.3. NZD/USD Exchange rate movements 1998-2016 Source: ANZ Bank website, exchange rate graphs
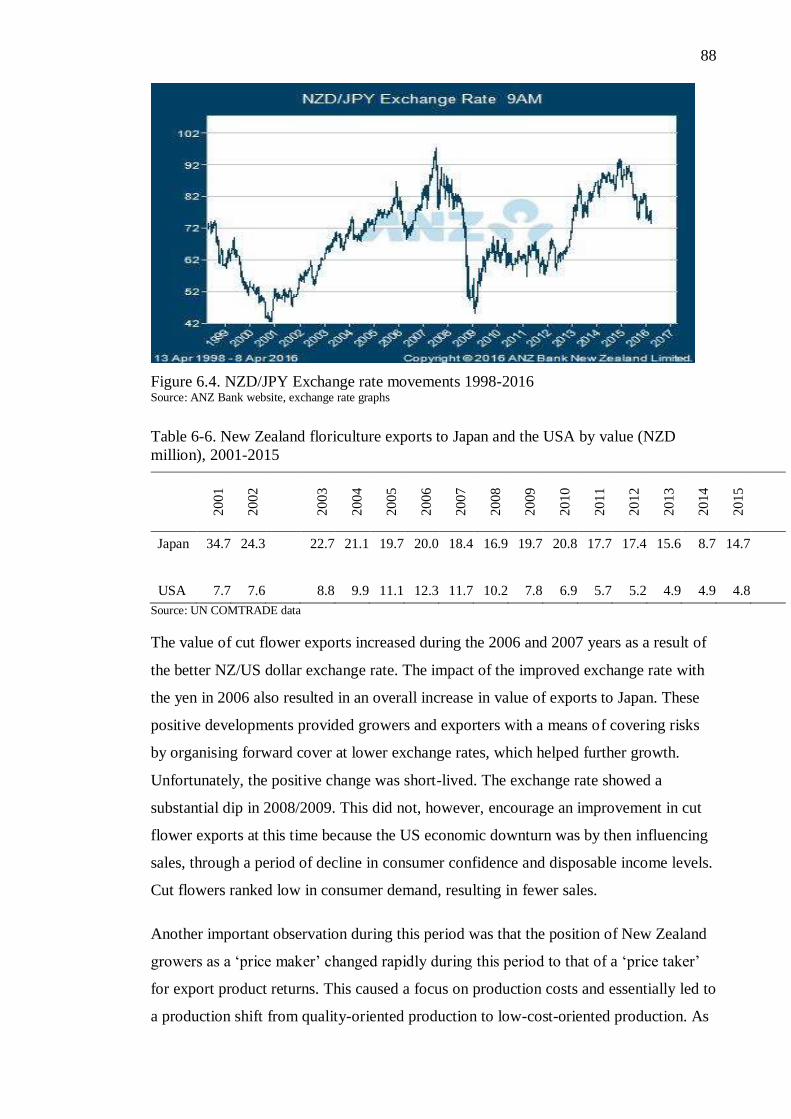
88
Figure 6.4. NZD/JPY Exchange rate movements 1998-2016 Source: ANZ Bank website, exchange rate graphs
Table 6-6. New Zealand floriculture exports to Japan and the USA by value (NZD
million), 2001-2015
2001
2002
2003
2004
2005
2006
2007
2008
2009
2010
2011
2012
2013
2014
2015
Japan 34.7 24.3 22.7 21.1 19.7 20.0 18.4 16.9 19.7 20.8 17.7 17.4 15.6 8.7 14.7
USA 7.7 7.6 8.8 9.9 11.1 12.3 11.7 10.2 7.8 6.9 5.7 5.2 4.9 4.9 4.8
Source: UN COMTRADE data
The value of cut flower exports increased during the 2006 and 2007 years as a result of
the better NZ/US dollar exchange rate. The impact of the improved exchange rate with
the yen in 2006 also resulted in an overall increase in value of exports to Japan. These
positive developments provided growers and exporters with a means of covering risks
by organising forward cover at lower exchange rates, which helped further growth.
Unfortunately, the positive change was short-lived. The exchange rate showed a
substantial dip in 2008/2009. This did not, however, encourage an improvement in cut
flower exports at this time because the US economic downturn was by then influencing
sales, through a period of decline in consumer confidence and disposable income levels.
Cut flowers ranked low in consumer demand, resulting in fewer sales.
Another important observation during this period was that the position of New Zealand
growers as a ‘price maker’ changed rapidly during this period to that of a ‘price taker’
for export product returns. This caused a focus on production costs and essentially led to
a production shift from quality-oriented production to low-cost-oriented production. As
89
growers presented it, this appeared for many to be the only alternative for growers to
save their investments in the industry.
A possible explanation for New Zealand’s relative decline is that international threats
were not recognised in time, with a consequent lack of appropriate response to these
changes. This may reflect a lack of support or the absence of a national agenda for the
industry, which many competitor nations have for their floriculture industries. This
period also coincided with the inception of the use of computer information in industry.
This meant that late adopters of technology might have had difficulty accessing
international development information. Consequently, a lack of information and
understanding hampered producers in the industry from adjusting their activities and/or
devising strategic plans to respond to the new competitive market context. The only
option appeared to be to accept the conditions forced by the external developments
passively, and adjust production to deal with the constraints in revenue. Responses
appear to have been merely of a short-term, or ‘survival’, nature, rather than
strategically seeking to manage issues for long-term industry stability.
The effects of the downturn caused some growers to down-size or close their
floriculture operations. Some also down-sized to suit the local market, and also
diversified into growing many crops for local markets, instead of single export
production lines. This had effects in the domestic market, however. When production
from export growers was diverted to the local market, these volumes saturated supply
and were significant enough to eliminate many smaller growers. Broader effects were
that the number of flower couriers dropped, and employment in other related services
also experienced decline.
When New Zealand exporters lost market share as a result of cost and price
disadvantages, certain product lines failed to survive. These included chrysanthemums,
oriental lilies, roses, carnations and sandersonia. By 2005, the export potential for these
crops had been lost, and production of these crops for export became very low.
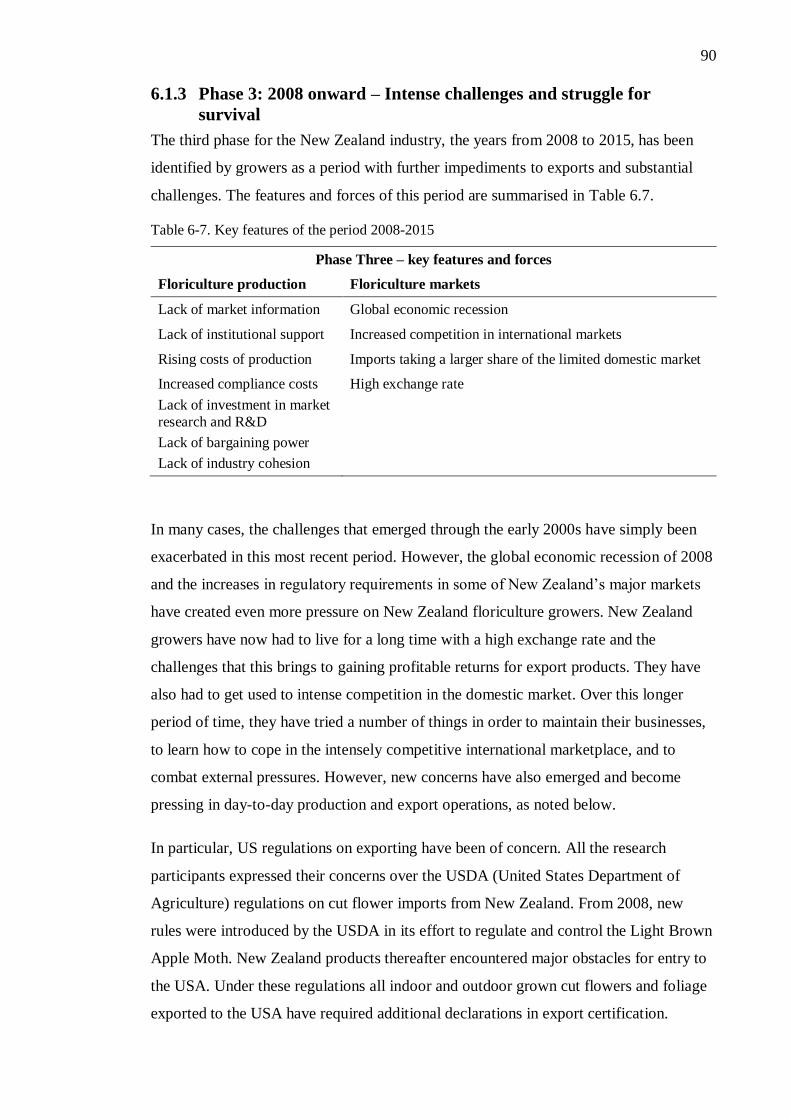
90
6.1.3 Phase 3: 2008 onward – Intense challenges and struggle for
survival
The third phase for the New Zealand industry, the years from 2008 to 2015, has been
identified by growers as a period with further impediments to exports and substantial
challenges. The features and forces of this period are summarised in Table 6.7.
Table 6-7. Key features of the period 2008-2015
Phase Three – key features and forces
Floriculture production Floriculture markets
Lack of market information Global economic recession
Lack of institutional support Increased competition in international markets
Rising costs of production Imports taking a larger share of the limited domestic market
Increased compliance costs
Lack of investment in market
research and R&D
Lack of bargaining power
Lack of industry cohesion
High exchange rate
In many cases, the challenges that emerged through the early 2000s have simply been
exacerbated in this most recent period. However, the global economic recession of 2008
and the increases in regulatory requirements in some of New Zealand’s major markets
have created even more pressure on New Zealand floriculture growers. New Zealand
growers have now had to live for a long time with a high exchange rate and the
challenges that this brings to gaining profitable returns for export products. They have
also had to get used to intense competition in the domestic market. Over this longer
period of time, they have tried a number of things in order to maintain their businesses,
to learn how to cope in the intensely competitive international marketplace, and to
combat external pressures. However, new concerns have also emerged and become
pressing in day-to-day production and export operations, as noted below.
In particular, US regulations on exporting have been of concern. All the research
participants expressed their concerns over the USDA (United States Department of
Agriculture) regulations on cut flower imports from New Zealand. From 2008, new
rules were introduced by the USDA in its effort to regulate and control the Light Brown
Apple Moth. New Zealand products thereafter encountered major obstacles for entry to
the USA. Under these regulations all indoor and outdoor grown cut flowers and foliage
exported to the USA have required additional declarations in export certification.
91
Production sites are required to follow compliance procedures and to obtain
accreditation status, to comply with and to be able to issue additional declarations
before shipping to the USA.
Essentially, for some growers the process required to gain accreditation to export to the
USA was too great a barrier for them to continue. Many growers who do not have
accreditation – mainly due to the limited size of their operations – opted not to go
through the costly accreditation process. They have instead diverted their products to
other markets. Many of these products are directed to the Japanese consignment market,
which causes overload of that market, and consequently only low prices are achieved
there. There are many such growers, whose collective production is significant, and they
need assistance and support to enable them to diversify their export markets.
The global recession in 2008, centred in the US economy, hit the floriculture industry
hard just after the USDA compliance programme came into existence. The US
economic downturn, followed by a housing market collapse, resulted in high
unemployment and reduced incomes and it was generally expected that floriculture
sales would be negatively impacted. This was especially the case given the nature of
floriculture sales, as they are heavily income driven. It is always expected that demand
for floriculture products will drop in a recession. Interestingly, the industry experienced
only a relatively short decline and regained its growth momentum quickly, showing
healthy growth in the last few years.
New Zealand’s geographical advantage, with complementary seasons to the Dutch, had
been important in the early years for giving the country’s floriculture products a
window into the European market without Dutch competition. This was especially the
case in the cymbidium market. However, in recent years Dutch research and
development has enabled Dutch cymbidium growers to produce very early in the
season, and continue until very late into the season. Dutch late varieties, which seem
more appealing to markets and buyers, overlap with the New Zealand early season
varieties of cymbidiums. New Zealand growers have been left with a very narrow
window of time to supply European products in the Dutch off-season. This has been
made more difficult by the need of the early season varieties in New Zealand for higher
heating. The cost of production of these varieties is, therefore, high.
92
Competition from the Dutch in cymbidiums has also become more challenging in other
markets. The Dutch industry has a huge market advantage, acquired through its
reputation as pioneers in flower production and marketing. Because the Dutch industry
has the unique strength of being able to supply a full assortment of other flowers in
addition to cymbidium orchids, it has become the preferred supplier in the US and other
markets, which do not tend to open for New Zealand’s seasonal crop until Dutch
products disappear.
In talking about the early phases of the floriculture industry’s development, participants
did not see the significance of the domestic market and only talked about selling to the
international market. However, consideration of the domestic market was important
when discussing later stages in the industry. The domestic market has provided New
Zealand export growers opportunities to sell products that are excess production or
export rejects or order cancellations. However, an increase in floriculture imports
threatens the ability of New Zealand producers to gain important income from this
market.
It was observed that in more recent years there has been some success in market
diversification of New Zealand floriculture products. In cut flowers, for example, a
number of new markets have become important. Table 6-8 shows New Zealand’s top 20
cut-flower export destinations. As can be seen, Australia has grown in importance as a
market since 2008, as have French Polynesia, China, the United Arab Emirates and
Saudi Arabia; along with countries such as Qatar, Kuwait, Bahrain, Indonesia, Malaysia
and the Philippines, which exports have grown to since 2001.
It is clear, however, that the USA and Japan currently remain New Zealand’s main
markets. While the growth in importance of the new markets provides some
encouragement for the future, it must be said that these diversification efforts need
support so that New Zealand exporters can work on a ‘level playing field’ alongside
their international competitors.
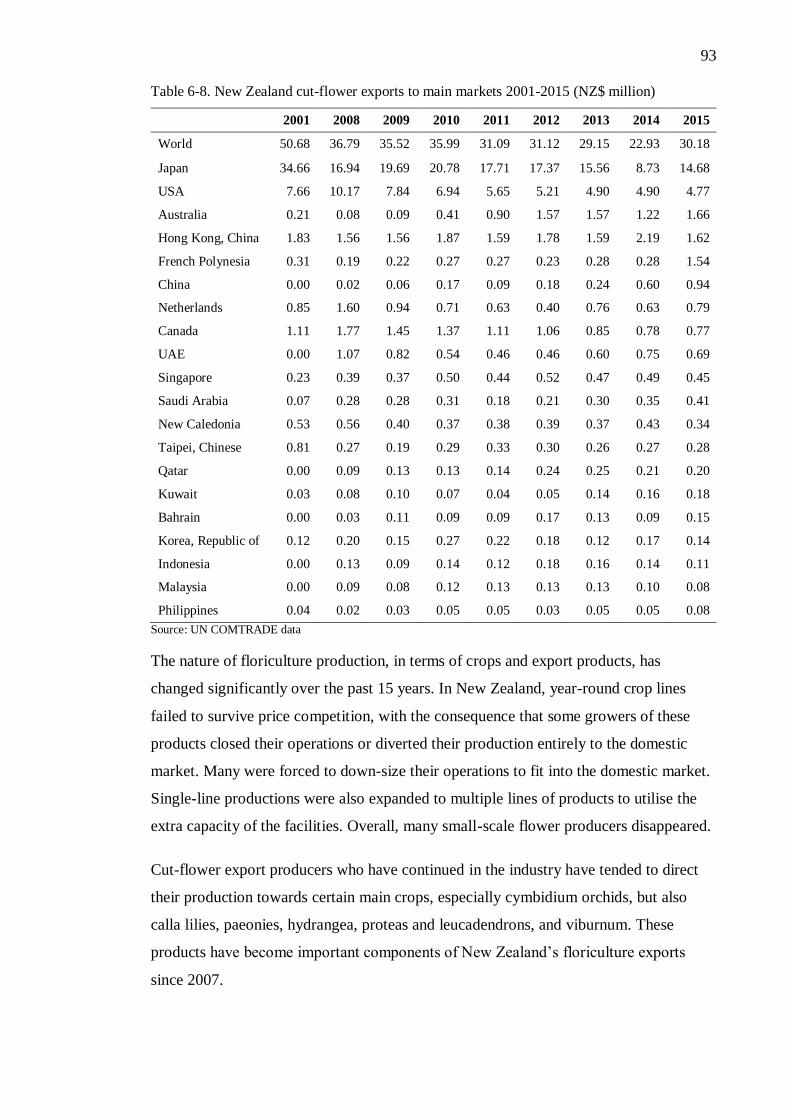
93
Table 6-8. New Zealand cut-flower exports to main markets 2001-2015 (NZ$ million)
2001 2008 2009 2010 2011 2012 2013 2014 2015
World 50.68 36.79 35.52 35.99 31.09 31.12 29.15 22.93 30.18
Japan 34.66 16.94 19.69 20.78 17.71 17.37 15.56 8.73 14.68
USA 7.66 10.17 7.84 6.94 5.65 5.21 4.90 4.90 4.77
Australia 0.21 0.08 0.09 0.41 0.90 1.57 1.57 1.22 1.66
Hong Kong, China 1.83 1.56 1.56 1.87 1.59 1.78 1.59 2.19 1.62
French Polynesia 0.31 0.19 0.22 0.27 0.27 0.23 0.28 0.28 1.54
China 0.00 0.02 0.06 0.17 0.09 0.18 0.24 0.60 0.94
Netherlands 0.85 1.60 0.94 0.71 0.63 0.40 0.76 0.63 0.79
Canada 1.11 1.77 1.45 1.37 1.11 1.06 0.85 0.78 0.77
UAE 0.00 1.07 0.82 0.54 0.46 0.46 0.60 0.75 0.69
Singapore 0.23 0.39 0.37 0.50 0.44 0.52 0.47 0.49 0.45
Saudi Arabia 0.07 0.28 0.28 0.31 0.18 0.21 0.30 0.35 0.41
New Caledonia 0.53 0.56 0.40 0.37 0.38 0.39 0.37 0.43 0.34
Taipei, Chinese 0.81 0.27 0.19 0.29 0.33 0.30 0.26 0.27 0.28
Qatar 0.00 0.09 0.13 0.13 0.14 0.24 0.25 0.21 0.20
Kuwait 0.03 0.08 0.10 0.07 0.04 0.05 0.14 0.16 0.18
Bahrain 0.00 0.03 0.11 0.09 0.09 0.17 0.13 0.09 0.15
Korea, Republic of 0.12 0.20 0.15 0.27 0.22 0.18 0.12 0.17 0.14
Indonesia 0.00 0.13 0.09 0.14 0.12 0.18 0.16 0.14 0.11
Malaysia 0.00 0.09 0.08 0.12 0.13 0.13 0.13 0.10 0.08
Philippines 0.04 0.02 0.03 0.05 0.05 0.03 0.05 0.05 0.08
Source: UN COMTRADE data
The nature of floriculture production, in terms of crops and export products, has
changed significantly over the past 15 years. In New Zealand, year-round crop lines
failed to survive price competition, with the consequence that some growers of these
products closed their operations or diverted their production entirely to the domestic
market. Many were forced to down-size their operations to fit into the domestic market.
Single-line productions were also expanded to multiple lines of products to utilise the
extra capacity of the facilities. Overall, many small-scale flower producers disappeared.
Cut-flower export producers who have continued in the industry have tended to direct
their production towards certain main crops, especially cymbidium orchids, but also
calla lilies, paeonies, hydrangea, proteas and leucadendrons, and viburnum. These
products have become important components of New Zealand’s floriculture exports
since 2007.
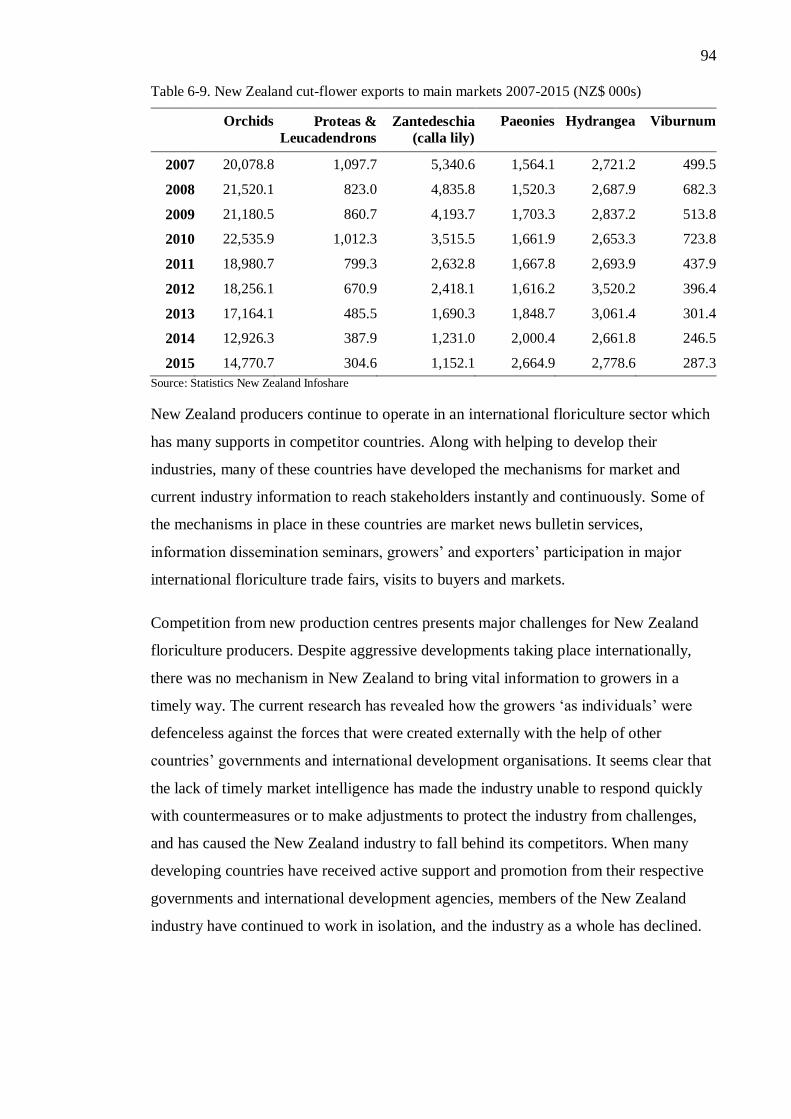
94
Table 6-9. New Zealand cut-flower exports to main markets 2007-2015 (NZ$ 000s)
Orchids Proteas &
Leucadendrons
Zantedeschia
(calla lily)
Paeonies Hydrangea Viburnum
2007 20,078.8 1,097.7 5,340.6 1,564.1 2,721.2 499.5
2008 21,520.1 823.0 4,835.8 1,520.3 2,687.9 682.3
2009 21,180.5 860.7 4,193.7 1,703.3 2,837.2 513.8
2010 22,535.9 1,012.3 3,515.5 1,661.9 2,653.3 723.8
2011 18,980.7 799.3 2,632.8 1,667.8 2,693.9 437.9
2012 18,256.1 670.9 2,418.1 1,616.2 3,520.2 396.4
2013 17,164.1 485.5 1,690.3 1,848.7 3,061.4 301.4
2014 12,926.3 387.9 1,231.0 2,000.4 2,661.8 246.5
2015 14,770.7 304.6 1,152.1 2,664.9 2,778.6 287.3
Source: Statistics New Zealand Infoshare
New Zealand producers continue to operate in an international floriculture sector which
has many supports in competitor countries. Along with helping to develop their
industries, many of these countries have developed the mechanisms for market and
current industry information to reach stakeholders instantly and continuously. Some of
the mechanisms in place in these countries are market news bulletin services,
information dissemination seminars, growers’ and exporters’ participation in major
international floriculture trade fairs, visits to buyers and markets.
Competition from new production centres presents major challenges for New Zealand
floriculture producers. Despite aggressive developments taking place internationally,
there was no mechanism in New Zealand to bring vital information to growers in a
timely way. The current research has revealed how the growers ‘as individuals’ were
defenceless against the forces that were created externally with the help of other
countries’ governments and international development organisations. It seems clear that
the lack of timely market intelligence has made the industry unable to respond quickly
with countermeasures or to make adjustments to protect the industry from challenges,
and has caused the New Zealand industry to fall behind its competitors. When many
developing countries have received active support and promotion from their respective
governments and international development agencies, members of the New Zealand
industry have continued to work in isolation, and the industry as a whole has declined.
95
6.2 What can be done to strengthen the sector’s capabilities?
The New Zealand floriculture industry has weathered international industry
competition, sacrificed some product areas and lost some of its members over the last
two decades. However, it has survived and still generates approximately NZ$70 million
per year for the national economy from export activities. This in itself is proof that it is a
strong industry capable of fighting all the adversities to survive in an international
market where competitors are supported by artificial means, incentives and facilitative
policies. This industry should not be ignored and neglected. The current industry has
many strengths, which are strong reasons New Zealand can develop a very sound,
sustainable and profitable floriculture industry in the long term.
6.2.1 Strengths of the New Zealand floriculture industry
A strong advantage for the industry is that New Zealand provides a very stable
democratic political environment for business to engage in. Many countries suffer from
political instability and corruption which could threaten the long-term viability of their
industries. Also, instability in economies can affect markets for fashionable products
like floriculture, which are often used to supply delicate and sensitive markets like
weddings, functions and funerals. These markets require stability to form long-term
sustainability.
The needs of floriculture fit well with New Zealand’s natural landscape and resources.
The sector provides an ideal avenue to diversify horticulture without creating excessive
competition for land and water resources. Floriculture is complementary to New
Zealand’s large dairy and horticulture economies because it requires less land.
Participants perceived that New Zealand is very fortunate to be blessed with many
resources. Firstly, the availability of land for production and expansion provides a
significant strength that many competitor countries simply do not have. Secondly, when
compared to competitor countries such as The Netherlands, Thailand, Taiwan, India,
Malaysia and South Africa, New Zealand is unique in the sense that there is an absence
of population pressure on land. Many countries are constrained regarding suitable land
with the right terrain and facilities for floriculture. New Zealand is a larger country with
a small population, and has sufficient land available for production.
New Zealand has well established supporting infrastructure for floriculture through
roads, air transport, electricity, telephone and broadband. Floriculture demands very
96
efficient transport systems because of the perishable nature of its products. New
Zealand has an excellent land and air transport system linking every corner of the
country to major airports and ports. New Zealand also has sufficient air cargo capacity
available, with a daily frequency and at competitive prices. New Zealand has proved the
efficiency of the transport network by producing highly perishable peonies in the South
Island, getting them to Auckland overnight and to overseas markets within 24 hours.
Most developed countries and floriculture markets in the world are located in the
northern hemisphere. New Zealand’s location in the southern hemisphere provides
seasonal advantage to the New Zealand floriculture industry, which enables producers
here to create products for the northern hemisphere’s off season. New Zealand also has
a very advanced plant export certification and compliance system where certification
authority is managed well by a delegation of tasks to which producers work.
Floriculture as an industry is subject to fashions. One way to achieve success in the
industry is through innovation and the creation of new cultivars. The New Zealand
industry has the resources to achieve this. New Zealand has a reputation for world-class
research for dairy and horticulture and biotechnology (New Zealand Trade &
Enterprise, n.d). An advanced dairy and horticulture industry is spread all over the
country, serviced by a very efficient and cost effective logistical system that is available
for any other industry to make use of.
Producing flowers for the international market requires a strong international orientation
and very specific agronomic knowledge. New Zealand has developed an industry with a
high reputation for quality that remains today, regardless of the difficulty that the
country’s producers have weathered.
6.2.2 Challenges for the New Zealand floriculture industry
Market intelligence is vital for an industry such as floriculture, because in a fashion-
oriented industry it is essential for investors and growers to make investment and
production decisions based on knowledge of the market. For this reason, export
development agencies in both developed and developing countries tend to work as
umbrella organisations to design industry strategies, to study industry trends, and to
support such industries by creating an appropriate policy climate and funding
environment that individuals can benefit from. There is currently no umbrella support of
this nature provided to the New Zealand floriculture industry.
97
Countries with large populations provide a sufficiently large domestic market for
producers to experiment in the market, with low risk. This is evident in countries such
as India, China, the United States, and countries within the European Union. In
countries with a limited domestic market, the sector depends more completely on
foreign markets. With a population of fewer than five million, New Zealand’s market is
limited and already saturated, and testing new products in such a market context is very
uncertain for New Zealand producers. Growers need extra support to test new foreign
markets.
There is a certain precariousness in the market for floriculture products. From one
perspective, when the spending power of consumers improves, floriculture’s potential is
limitless by comparison with food-type horticulture products, which might be limited by
food consumption capacities. On the other hand, flowers are a product people can live
without. Consequently, marketing potential tends to exist only in medium-high income
countries.
Floriculture has received special treatment in both developed and developing countries.
This study has shown that in a majority of flower exporting countries the industry has
developed with strong support from government and private sector initiatives. The
support was justified on the grounds of floriculture’s ability to reduce unemployment
and its high foreign earning capacity. In contrast, in New Zealand, any support for
industries has been commonly misunderstood as subsidies. Industries in their infant
stages are treated in the same way as mature industries. There is limited assistance to
overcome disadvantages caused to New Zealand’s floriculture industry by external
forces. Within an environment lacking such support, New Zealand growers work in
isolation and find it hard to observe and understand the developments that happen
overseas. However, they do experience the negative outcomes of these developments.
New Zealand floriculture producers are largely isolated from other world players.
Where the New Zealand industry is fragmented, enterprises in the rest of the world
cooperate with each other. Because of this, it is very difficult for new producers IN New
Zealand to enter the floriculture sector, and potential ventures tend to fail at the infant
stage.
At the individual level, growers cannot resist global development forces. Technology
tends to become out-dated quickly, and varieties tend to go out of fashion even more
98
quickly. Some markets emerge, some markets disappear. A constant and current
information flow is vital for decision-making in any export industry, and especially in
the floriculture industry.
In the ever-changing floriculture industry, New Zealand actors need to watch
developments in countries and regions that have a similar climate and location in the
Southern Hemisphere to New Zealand. Australia (Tasmania), South Africa and Chile
are potential locations where competition could emerge. Developments in these
countries are very important to New Zealand growers and need to be thoroughly
investigated.
6.2.3 What can we learn from others?
New Zealand’s experience of increased competition and pressures in the international
marketplace has not been unique. Other established floriculture-producing countries
have experienced the same changes from the 1990s. Most of these other countries have
managed to develop sustainable industries by making necessary adaptations to their
industry in response to the increased pressures in the international marketplace.
Therefore, it is worth considering how other countries have handled the situation within
their own domestic contexts.
The Dutch experience is important to consider, given that they have managed to weather
international changes and remain globally dominant in this sector. Growers in The
Netherlands faced a similar threat of not being able to compete with low-cost
production centres. They worked with their respective authorities and responded
strategically, which helped the industry to convert the threat to an opportunity. They
understood that a large number of developing countries were hungry for knowledge and
technology. International funding agencies had ample money in the form of assistance
to donate to developing countries and there was support within those countries in the
form of tax relief, free entry to inputs, tax-free access to funds and so on. The Dutch
took a leading role in assisting the development of floriculture in new countries, for
example through schemes to support breeders to protect plant variety rights and
subsidies to support SMEs, and carrying out business in emerging markets or
developing countries. Leading growers formed joint ventures or technical partnerships
with developing countries (Netherlands Enterprise Agency, n.d.).
99
The Dutch government institution CBI was instrumental in sharing market trends with
Dutch growers and other industry stakeholders in a timely manner, and assisted in
formulating strategies to cope with the situation. In Holland, industry knowledge and
marketing capabilities were turned into strategic resources to fight international
competition. The Dutch government also has schemes to support industry development
breeders in the protection of plant variety rights. With these schemes, the Dutch
floriculture industry converted threats to opportunities. All stakeholders have supported
the industry to innovate and be sustained. As a result, more products have been
produced and auctions have grown bigger. As trade has grown, so too have all the
related services.
Israel is the other example of a country that has avoided falling to international
competition by focusing on niche products and new breeds and that has taken them to
new markets directly by making direct contacts with importers in the USA and new
countries. These opportunities might have been available to New Zealand if more
coordinated responses by the industry had been possible.
The stories of these countries present examples of how the New Zealand floriculture
sector could be better supported to survive and grow a profitable, sustainable industry.
Despite many weaknesses, exporters have found opportunities to develop in the
changed, pressured marketplace, and with close cooperation between the industry and
various governments and authorities, the industries have moved forward.

100
101
Chapter 7 Conclusion
The New Zealand floriculture industry has its roots in the 1970s and is one of the
pioneering and significant exporters in the international floriculture market place. The
New Zealand floriculture industry has earned a high reputation in the international
marketplace for quality and consistency. A diversified export base is vital for the
economic stability and long-term sustainability of export-dependent countries such as
New Zealand and floriculture is a sector which has been a silent contributor to the wider
New Zealand economy and regional economies through its contribution to foreign
exchange earnings, employment generation and connections to service industries.
Rapid developments and changes with respect to players and competitive dynamics in
the global floriculture industry have made it important to evaluate the New Zealand
floriculture industry’s ability to face both internal and external challenges. In view of
that importance, this research was designed to develop a knowledge base on the New
Zealand floriculture industry by investigating the industry and the export experiences of
floriculture producers in the changing international environment.
The research was designed to encompass many aspects that analysed the past and
present status of the floriculture industry so as to identify its strengths and the
opportunities upon which future development tasks could be focused. This information,
and the evidence base that has been at the centre of this research programme, will
promote a better understanding of the New Zealand floriculture industry in order to help
policy makers, industry stakeholders and academic disciplines to make robust strategic
decisions for the future progress of the industry.
7.1.1 What needs to be done
Floriculture industries in Holland, Colombia, Kenya, Ecuador, South Africa, India,
China, Malaysia, Ethiopia, Israel, and many other countries developed with strong
support from their respective governments. The development activities and assistance in
these countries were not framed as subsidies, but as the development tools and
mechanisms necessary for new floriculture businesses to pass their infancy stages, and
to play strategic roles to support the industry’s viability and long-term sustainability.
These support frameworks have been rewarded by the industries in turn, as the
investments have generated a series of benefits reflected in the growth and sustainability
of floriculture and in the enhancement of domestic economies.
102
The New Zealand floriculture industry has survived in spite of the rigorous conditions
enforced on the sector by international forces for over fifteen years, with few supporting
mechanisms to offset these disadvantages. This suggests that the New Zealand
floriculture industry is not weak or incidental to the domestic economy. Rather, as this
research suggests, it has been very resilient in the face of demanding international
challenges and adversities.
The world floriculture export industry continues to exhibit long-term sustainable growth
and despite adverse international conditions it continues to expand and provide
opportunities in both developing and developed countries in terms of employment and
economic growth. New Zealand is a unique country having appropriate resources,
infrastructure, knowledge and, most importantly, the political stability required to
sustain a strong floriculture export industry. The actors in the industry contribute a
wealth of historical experience and an expert, dedicated grower force. There is also
strong marketing expertise based on product and market knowledge, and diverse
language skills including English, Japanese, Chinese, Dutch, German, French, Russian,
Mandarin, and Hindi available within the industry.
For a sustainable future, the important industry issues raised by the stakeholders in this
research have to be dealt with in a suitable forum and with discussion motivated to find
long-term solutions. At the individual business level, growers and exporters do not have
the capability to resist global development forces. With better industry-wide
coordination and support, they should be able to work smarter and more innovatively to
take advantage of the opportunities in the ever-expanding international marketplace. An
appropriate policy framework based on a national agenda is needed to actively respond
to industry challenges, to exploit the resource strengths, knowledge base (especially the
existing people who are instrumental in the industry) and to assure a sustainable future
for the New Zealand floriculture Industry.
The research evidence, along with the recommendations of the interview participants,
provides a strong argument for the floriculture sector to be supported and organised
under one ‘umbrella’ in New Zealand.
7.1.2 Future research opportunities
This research has provided a start towards understanding the complexities facing the
New Zealand floriculture sector, with the intention that it instigates meaningful dialogue
103
for the future development of the industry. It is recognised that the scope of this
research was inevitably limited, especially in terms of interviewing participants from
only two of the industry sub-sectors. Further research opportunities exist in
investigating the other industry sectors in more depth; particularly in comparing how the
bulb sector exports have grown in contrast to the cut-flower and foliage sectors. This
research also looked at the industry experience only from the grower perspective. It
would be important in future to research the New Zealand exporters’ role and
experiences in more depth, as they potentially play a vital part in marketing and
disseminating a wealth of information on all aspects of the industry.
7.1.3 Research Findings
A significant and rewarding floriculture industry was established in New Zealand long
before many of the industry actors of today entered the sector. In its early stages the
New Zealand floriculture industry earned a strong reputation in the international
marketplace for quality and consistency. New Zealand became an important supplier of
floricultural products from the region to Japan, the USA and the major import markets
in Europe by 2000.
The global floriculture industry has flourished in the past two decades, exhibiting
remarkable accelerated growth since the early 2000s, and providing opportunities for
many countries. Leading floriculture producers have reaped the benefits of this growth.
Under the globalisation of world trade, floriculture became a major horticulture export
commodity in many developing countries. The industry was developed to provide many
positive attributes for these countries, including its ability to contribute to local
economies through generation of employment for both educated and unskilled labour
and by promoting foreign exchange potential.
Floriculture industries in developing countries were advanced under national
development agendas, with almost every country devising incentive schemes, integrated
products, supply, quality, market development and promotional programmes. These
various facets of production were integrated into domestic economies in general and
industry development in particular. Many trade-facilitation schemes, development
programmes and considerable funding were available to producers in developing
countries. The new entrants benefited not only from substantial support from their
104
respective governments but also from the active support of international development
agencies in the form of funding, consultancy and market facilitation.
This research revealed that the New Zealand industry lost its earlier competitive edge in
the face of the world industry’s accelerated growth since 2000. The New Zealand
floriculture industry has fallen behind world growth trends, and in the process it has
failed to exploit market opportunities and the potential available for growth in the
international marketplace.
Despite floriculture being a significant and rewarding industry for the New Zealand
economy, there has been neither a specific development agenda nor a conducive policy
environment to understand global trends. Growers have operated in isolation and have
lacked sufficient industry cohesion to overcome adversities in a collective or
collaborative way. In the absence of any specific mechanisms to access or disseminate
industry information or market intelligence, New Zealand growers and exporters failed
to understand the impact on their businesses of industry developments taking place
overseas. The consequence of these challenges for the industry in New Zealand has
been relative decline, and, as this research has highlighted, there is an urgent need to
actively devise strategic alternatives for the future sustainability of the industry in this
country.
This research has revealed that there is no country agenda, designated policy
framework, umbrella organisation or task force in New Zealand supporting the
development and sustainability of the floriculture industry. There is no designated
authority, forum or mechanism for the growers, exporters and other stakeholders to
present industry issues, constraints and grievances to find timely, strategic solutions to
challenges that arise. The actors in New Zealand’s floriculture sector, therefore, find it
is difficult to respond effectively to the international forces that have shaped their
industry and the different sectors of that industry in which they work.
105
Bibliography
Ando, T. (2009). Asia flower market. Presentation by regional manager Asia,
international sales and marketing department Takii & Co. Ltd. Retrieved from:
http://wenku.baidu.com/view/7dd6ae3b5a8102d276a22fbd.html?re=view
ANZ. (n.d.). Migrants, travel and foreign exchange. Retrieved from:
https://www.anz.co.nz/personal/migrants-travel-foreign-exchange/fx/exchange-
rate-graphs/nzd-usd/ and http://www.anz.co.nz/personal/migrants-travel-foreign-
exchange/fx/exchange-rate-graphs/nzd-jpy/
Asea, P.K. & Kaija, D. (2000). Impact on the flower industry in Uganda. Geneva: ILO
Working Paper 148.
Asocolflores. (2004). Retrieved from:
http://www.asocolflores.org/info/info_datosin_ingles.php
Bafana, B. (n.d.). Zimbabwe’s farmers show a flair for flowers, New Agriculturist on
line. Retrieved from: www.new-agri.co.uk/01-5/focuson/focuson9.html
Bain, C., Deaton, J. & Busch, L. (2005). Reshaping the agri-food system: the role of
standards, standards makers and third-party certifiers. In Higgins, V. (ed.).
Agricultural Governance: Globalisation and the New Politics of Regulation.
London: Routledge, pp.71-83.
Baris, M.E. & Uslu, A. (2009). Cut flower production and marketing in Turkey, African
Journal of Agricultural Research, 4(9), 765-771.
Ballingall, J. & Briggs, P. (2002). A look at New Zealand's comparative advantage:
Updating the Porter Study's analysis of exports. NZIER Working Paper 2002/04.
Retrieved from: http://nzier.org.nz/publications/
Batt, P.J. (2001). Strategic lessons to emerge from an analysis of selected flower export
nations, Journal of International Food and Agribusiness Marketing, 11 (3), 41-54.
Retrieved from:
http://www.informaworld.com/smpp/content~db=all~content=a903857510
Belwal, R. & Chala, M. (2008). Catalysts and barriers to cut flower export: A case study
of Ethiopian floriculture industry. International Journal of Emerging Markets, 3(2),
216-235.
Black, G. (1990). History of floriculture industry, Horticulture News, 1(8), 4-5.
BloomZ New Zealand. (n.d.). Home page. Retrieved on December 12 ,2015 from
http://www.bloomz.co.nz
Bonarriva, J., Jabara, C., & Burket, S. (2003). Industry and trade summary—Cut
flowers. US International Trade Commission. 3 June 2013.
Bonoma, T.V. (1985). Case study research in marketing: opportunities, problems and a
process. Journal of Marketing Research, 12, 199-208.
Brumfield, R. (2001). Monroe county greenhouse industry market research study.
Report prepared for the Monroe County Department for Planning and
Development. Retrieved from: http://www.monroecounty.gov/p/farm-
GreenhouseReport.pdf
Bryman, A. (2008). Social research methods, 3rd ed., Oxford, UK: Oxford University
Press.
106
Business Report. (2005). Zambia move to keep air routes alive. Retrieved from
http://www.busrep.co.za
CBI. (2008a). The cut flowers and foliage market in the EU.CBI Market Survey.
Retrieved from: https://www.cbi.eu/market-information/cut-flowers-foliage/
CBI. (2008b). The cut flowers and foliage market in the United Kingdom. CBI Market
Survey. Retrieved from www.cbi.eu.
CBI. (2008c). CBI sector alert cut flowers. CBI Market Information Database.
Retrieved from: https://www.cbi.eu/market-information/cut-flowers-foliage/
CBI. (2010). Plant and young plant market in the EU. Retrieved from:
http://www.cbi.eu/marketinfo/cbi/docs/the_plants_and_young_plant_material_mark
et_in_the_eu
Centre for Promotion of Imports from Developing Countries (CBI). (2007). The cut
flowers and foliage market in the EU. CBI Market Survey. Retrieved from:
https://www.cbi.eu/market-information/cut-flowers-foliage/
Charles, K., Turner, S. & Mullins, D. (2003). Impacts of the African Growth and
Opportunity Act (AGOA) on Southern Africa: Progress report. Chemonics
International Inc., Gaborone, Botswana.
Clements-Hunt, A. (2004). Reducing poverty sectors with potential. Cut flowers: A
multi-million dollar industry blooms in rural China. International Trade Centre,
International Trade Forum, Issue 4.
Comtrade, U. N. (2014). United Nations Commodity Trade Statistics Database,
2010. Retrieved from: http://comtrade. un. org/db
Conefrey, M. (2015). Roses with altitude: Why Ecuador’s flower industry stands out.
Gardens, ft.com. Retrieved from: http://www.ft.com/cms/s/0/eb5114d6-d846-11e4-
ba53-00144feab7de.html
Conlon, M. (2015). The history of the Colombian flower industry and its influence on
the United States. USDA Foreign Agriculture Service, Global Agricultural
Information Network. Retrieved from:
http://gain.fas.usda.gov/Recent%20GAIN%20Publications/The%20Colombian%20
flower%20industry%20and%20its%20partnership%20with%20the%20U.S._Bogot
a_Colombia_2-6-2015.pdf
Coralline Holmen. (n.d.). A history of floriculture. Retrieved from:
http://www.articleintelligence.com/Art/155139/484/A-history-of-floriculture.html
Crotty, M. (1998). The foundations of social research: Meaning and perspective in the
research process. St Leonards, NSW: Allen & Unwin.
Dasgupta, S. & Dadlani, N.K. (2011). Expert consultation on floriculture development
in Asia, 7-9 January 2010. Food and Agriculture Organization of the United
Nations Regional Office for Asia and the Pacific Kunming, China.
Davis, R. (2000). The impact of globalization on local communities: A case study of the
cut-flower industry in Zimbabwe. ILO/SAMAT Discussion Paper No. 13.
de Groot, N.S.P. (1999). Floriculture worldwide trade and consumption patterns. Acta
Horticulturae. 495, 101-122. DOI:
http://dx.doi.org/10.17660/ActaHortic.1999.495.4
Denzin, N. & Lincoln, Y. (1994). Handbook of qualitative research. California: Sage
publications.
107
Dons, H.J.M. & Bino, R.J. (2008). Innovation and knowledge transfer in the Dutch
horticultural system. In Hulsink, W. and Dons, H. (eds). Pathways to High-Tech
Valleys and Research triangles. Dordrecht: Springer verlag, pp.119 – 137.
Dutch Ministry of Agriculture. (2000). The Dutch floriculture sector. Holland: Dutch
Ministry of Agriculture, Nature Management and Fisheries.
Dutch Product Board for Horticulture. (2000). Dutch horticulture in facts and figures,
2000. Dutch Ministry of Agriculture.
Easterby-Smith, M., Thorpe, R. & Lowe, A. (1991). Management research: An
introduction. London: Sage Publications.
Embassy of Ethiopia. (n.d.). Investing in Ethiopia: Floriculture. Embassy of Ethiopia
Economy and Business Section. Retrieved from:
http://www.ethiopianembassy.org/pdf/investingflower.pdf
Everything2. (n.d.). The human cost of flowers. Retrieved from:
http://everything2.com/title/Floriculture
EXIM Bank of India. (2006). Floriculture: A sector study. Occasional Paper No. 12,
Retrieved from:
https://www.academia.edu/7484635/Floriculture_A_Sector_Study_EXPORT-
IMPORT_BANK_OF_INDIA
FAO. (2002). A thorn on every rose for Kenya's flower industry. Floriculture presents
challenges as well as opportunities for Kenyan smallholders. Rome: Food and
Agriculture organization of the United Nations Report, 18th April.
Feagin, J., Orum, A. & Sjoberg, G. (eds). (1991). A case for case study. Chapel Hill,
NC: University of North Carolina Press.
Finch, J. (1986). Research and policy. London, UK: The Falmer Press.
Flower Council of Holland. (2008). Facts and figures. Retrieved from: http://www.
flowercouncil.org/us/marketinformation/
Flyvbjerg, B. (2006). Five misunderstandings about case-study research. Qualitative
Inquiry, 12(2), 219–245.
Glesne, C. (1999). Becoming qualitative researchers: An introduction. New York:
Longman.
Grant, B.M. & Giddings, L.S. (2002). Making sense of methodologies: A paradigm
framework for the novice researcher. Contemporary Nurse, 13, 10-28.
Gummesson, E. (1991). Qualitative methods in management research. California: Sage
Publications.
Gursharan, S.K. (1996). Export potential of Indian agriculture. New Delhi: Regency
Publications.
Halevy, A.H. (1994). The development of the floriculture industry in Israel: Close
interaction between research, extension, production and marketing. Acta
Horticulturae, 353, 57-64.
Hartley, J. (1994). Case studies in organizational research. In Casell, C. and Symon, G.
(eds). Qualitative Methods in Organizational Research. London: Sage
Publications, 208-229.
Holland, F. (2013). Flora Holland in facts and figures 2012. Koninklijke Coöperatieve
Bloemenveiling Flora Holland UA.
108
Horticulture New Zealand , New Zealand Institute of Plant and Food Research (2005).
Fresh Facts: New Zealand horticulture. Retrieved from:
http://www.freshfacts.co.nz/files/fresh-facts-2005.pdf
Horticulture New Zealand , New Zealand Institute of Plant and Food Research (2006).
Fresh Facts: New Zealand horticulture. Retrieved from:
http://www.freshfacts.co.nz/files/fresh-facts-2006.pdf
Horticulture New Zealand , New Zealand Institute of Plant and Food Research (2007).
Fresh Facts: New Zealand horticulture. Retrieved from:
http://www.freshfacts.co.nz/files/fresh-facts-2007.pdf
Horticulture New Zealand , New Zealand Institute of Plant and Food Research (2008).
Fresh Facts: New Zealand horticulture. Retrieved from:
http://www.freshfacts.co.nz/files/fresh-facts-2008.pdf
Horticulture New Zealand , New Zealand Institute of Plant and Food Research (2009).
Fresh Facts: New Zealand horticulture. Retrieved from:
http://www.freshfacts.co.nz/files/fresh-facts-2009.pdf
Horticulture New Zealand , New Zealand Institute of Plant and Food Research (2010).
Fresh Facts: New Zealand horticulture. Retrieved from:
http://www.freshfacts.co.nz/files/fresh-facts-2010.pdf
Horticulture New Zealand , New Zealand Institute of Plant and Food Research (2011).
Fresh Facts: New Zealand horticulture. Retrieved from:
http://www.freshfacts.co.nz/files/fresh-facts-2011.pdf
Horticulture New Zealand , New Zealand Institute of Plant and Food Research (2012).
Fresh Facts: New Zealand horticulture. Retrieved from:
http://www.freshfacts.co.nz/files/fresh-facts-2012.pdf
Horticulture New Zealand , New Zealand Institute of Plant and Food Research (2013).
Fresh Facts: New Zealand horticulture. Retrieved from:
http://www.freshfacts.co.nz/files/fresh-facts-2013.pdf
Horticulture New Zealand , New Zealand Institute of Plant and Food Research (2014).
Fresh Facts: New Zealand horticulture. Retrieved from:
http://www.freshfacts.co.nz/files/fresh-facts-2014.pdf
Horticulture New Zealand , New Zealand Institute of Plant and Food Research (2015).
Fresh Facts: New Zealand horticulture. Retrieved from:
http://www.freshfacts.co.nz/files/fresh-facts-2015.pdf
HortResearch. (2007). Horticultural monitoring report: A short-term financial and
physical forecast. Wellington: Ministry of Agriculture and Forestry. Retrieved
from: http://maxa.maf.govt.nz/mafnet/rural-nz/statistics-and-forecasts/farm-
monitoring/2004/horticulture/horticulture-2004-07.htm 2004
International Association of Horticultural Producers. (2004). International statistics
flowers and plants. Vol. 52. Report for Institut für Gartenbauökonomie der
Universität Hannover.
International Association of Horticultural Producers. (2014). International statistics
flowers and plants. Vol. 62. Hanover, Germany: Centre for Business Management
in Horticulture and Applied Research Leibniz. Retrieved from: http://aiph.org/wp-
content/uploads/2015/04/AIPH-and-Union-Fleurs-launch-International-Statistics----
-Flowers-and-Plants-2014.pdf
109
International Trade Centre. (2004). Cut flowers: A multi-million dollar industry blooms
in rural China. International Trade Centre, International Trade Forum, Issue 4/2004.
Retrieved from: http://www.tradeforum.org/Cut-Flowers-A-Multi-million-Dollar-
Industry-Blooms-in-Rural-China/
International Trade Centre. (2014). AGOA: Trade and investment performance
overview. USITC publication 4461. Retrieved from:
http://www.usitc.gov/publications/332/updated_Errata_version_AGOA_pub4461.p
df
International Trade Centre. (n.d). Home page. Retrieved from: http://www.intracen.org
Japanese External Trade Organisation. (2000). Japanese market report cut flowers:
regulations and practice. JETRO Report 58. Retrieved from:
http://www.jetro.go.jp/en/market/reports/jmr/058.pdf
Japanese External Trade Organisation. (2007). JETRO White paper on international
trade 2000: World trade increasingly affected by information technology. JETRO
report summary. Retrieved from:
http://www.jetro.go.jp/en/reports/white_paper/trade2000.pdf
Japanese External Trade Organisation. (2011). Guidebook for export to Japan: Cut
flowers. Japan: JETRO Development Cooperation Division, Trade and Economic
Cooperation Department. Retrieved from:
https://www.jetro.go.jp/ext_images/en/reports/market/pdf/guidebook_cut_flowers.p
df
Japanese External Trade Organisation. (n.d.). Pilot projects. Retrieved from:
http://www.jetro.go.jp/jetro/activities/oda/pilot_projects/2007leaflet_en.pdf
Johnson, D. (1994). Research methods in educational management. Essex: Longman
Group.
Jong, L.M., Saad, M.R.M. & Hamir, N.A. (2007). Cut flower production Malaysia.
FAO. Retrieved from:
www.fao.org/docrep/005/ac452e/ac452e0c.htmhttp://www.fao.org/docrep/005/ac45
2e/ac452e0c.htm
Joyce, D., Dunne, A., Gordon, I. & Johnston, M. (2006). Sustainable native agriculture.
Acta Horticulturae, 716, 73-82.
Kargbo, A., Mao, J. & Wang, C. (2010). The progress and issues in the Dutch, Chinese
and Kenyan floriculture industries. African Journal of Biotechnology, 9(44), 7401-
7408.
Kennedy, G. (n.d.). High value floriculture exports. Retrieved from:
http://www.nzte.govt.nz/features-commentary/Features/Our-economy/Pages/High-
value-floriculture-exports.aspx?pageId=0
Kerr, J. P., Hewett, E. W., & Aitken, A. G. (1999). New Zealand Horticulture, Facts
and Figures. HortResearch, Auckland.
Kerr, J. P., Hewett, E. W., & Aitken, A. G. (2000). New Zealand Horticulture, Facts
and Figures. HortResearch, Auckland.
Kerr, J. P., Hewett, E. W., & Aitken, A. G. (2001). New Zealand Horticulture, Facts
and Figures. HortResearch, Auckland.
Kerr, J. P., Hewett, E. W., & Aitken, A. G. (2002). New Zealand Horticulture, Facts
and Figures. HortResearch, Auckland.
110
Kerr, J. P., Hewett, E. W., & Aitken, A. G. (2003). New Zealand Horticulture, Facts
and Figures. HortResearch, Auckland.
Kerr, J. P., Hewett, E. W., & Aitken, A. G. (2004). New Zealand Horticulture, Facts
and Figures. HortResearch, Auckland.
Kumar, R. (2005). Research methodology step by step guide for beginners. London:
Sage Publishers.
Market Research. (2004). Fresh flowers and plants in China. Retrieved from:
http://www.marketresearch.com/product/print/default.asp?g=1&productid=100575
9
Marshall, C. & Rossman, G.B. (1995). Designing qualitative research (2nd ed.).
California: Sage Publications.
Marshall, F., Waldman, L., MacGregor, H., Mehta, L. & Randhawa, P. (2009). On the
edge of sustainability: Perspectives on peri-urban dynamics. STEPS Centre
working paper. Retrieved from: http://steps-centre.org/wp-content/uploads/Peri-
urban-online-version.pdf
Martsynovska, O. (2011). Global floriculture industry chain: Position of the Ukranian
firms in the floriculture business. Masters thesis, Lund University.
Mason, J. (2002). Qualitative researching (2nd ed.). London: Sage Publications.
Matthee, M., Naudé, W. & Viviers, W. (2006) Challenges for the floriculture industry in
a developing country: A South African perspective. Development Southern Africa,
23(4), 511–528.
Maxwell, J.A. (2005). Qualitative research design: An interactive approach (2nd ed.).
Thousand Oaks, CA: Sage.
McIntyre, J. (1999). Vast European market set to dominate world trade, Flowertech,
2(4).
Merriam, S. (1988). Case study research in education: A qualitative approach.
California: Jossey-Bass Publishers.
Ministry of Agriculture and Fisheries. (2006). Farm monitoring report 2006. Retrieved
from: http://www.maf.govt.nz/mafnet/rural-nz/statistics-and-forecasts/farm-
monitoring/2006/horticulture/horticulture-2006-06.htm#Issues
Ministry of Agriculture and Forestry (MAF). (2004). Horticulture monitoring report.
Wellington: Ministry of Agriculture and Forestry. Retrieved from:
http://maxa.maf.govt.nz/mafnet/rural-nz/statistics-and-forecasts/farm-
monitoring/2004/horticulture-2004.pdf
Marshall, C. & Rossman, G.B. (1995). Designing qualitative research (2nd ed.).
California: Sage Publications.
Marshall, F., Waldman, L., MacGregor, H., Mehta, L., & Randhawa, P. (2009). On the
edge of sustainability: perspectives on peri-urban dynamics. Working Paper 35,
Brighton: STEPS Centre
Morgan D.L. (2007). Paradigms lost and pragmatism regained: Methodological
implications of combining qualitative and quantitative methods. Journal of Mixed
Methods Research 1(1), 48–76.
Morgan, G. & Smircich, L. (1980). The case for qualitative research. Academic
Management Review, 5(4), 491-500.
111
Morgan, J. (2008). How growers nipped themselves in the bud. The Dominion Post.
Retrieved from: http://www.stuff.co.nz/business/farming/547274/i-How-growers-
nipped-themselves-in-the-bud-i
Nagase. (2011). Japanese floriculture development in the Edo period (1603-1868).
HortResearch, No.65, 1-5. Retrieved from: http://mitizane.ll.chiba-
u.jp/metadb/up/irwg8/6511hortresearch.pdf
Netherlands Enterprise Agency. (n.d.). Dutch good growth fund. Retrieved from:
http://english.rvo.nl/subsidies-programmes/dutch-good-growth-fund-dggf
New Zealand Export Growers Orchid Association. (n.d.). Retrieved from:
http://www.nzego.com/content/about-us
New Zealand Flower Exporters Association (n.d) Retrieved from:
http://www.nzflowers.com/about_nzfea.asp
New Zealand Trade and Enterprise. (n.d.). Biotechnology. Retrieved from:
https://www.nzte.govt.nz/en/buy/our-sectors/biotechnology/
Onguglo, B. (1999). Developing countries and unilateral trade preferences in the new
international trading system. In Mendoza, M.R., Low, P. and Kotschwar, B. (eds).
Trade Rules in the Making: Challenges in regional and multilateral negotiations.
Washington, DC: The Brookings Institution Press/Organization of American States.
Papademetriou, P. (1998). Cut flower production in Asia: Introductory remarks. Food
and Agriculture Organisation of the United Nations Regional Office for Asia and
the Pacific Bangkok, Thailand. RAP Publication 1998/14.
Pasco, R. (2010). AGOA Countries: Challenges and Considerations in Exporting
Horticultural Products to the United States. Washington, D.C.: International Food
and Agricultural Trade Policy Council & the Partnership to Cut Hunger and
Poverty in Africa. Retrieved from: http://www.oecd.org/tad/ntm/48633098.pdf
Patton, M.Q. (1990). Qualitative evaluation and research methods. Beverly Hills, CA:
Sage.
Peter, K.V. (2007). Underutilized and underexploited horticultural crops.Vol.02.
New Delhi: New India Publishing.
Philipp, S., Rust, J. & Baumhauer, J. (2014). Tariff preferences for sustainable products:
A summary. 419-430. In Schmitz-Hoffmann, C., Schmidt, M., Hansmann, B. and
Palekhov, D. (eds). Voluntary Standard Systems 2014. Berlin: Springer-Verlag.
Plano Clark, V.L. & Creswell, J.W. (2007). The mixed methods reader, London: Sage
Publications.
Porter, M.E. (1990). The competitive advantage of nations. New York: Free Press.
Rao, R. (2006). Indian floriculture industry: Challenges and opportunities. India News
and features Alliance (INFA). Retrieved from:
www.infa.in/index.php?option=com_content&task=view&id=626&Itemid
Riisgaard, L. (2009). Global value chains, labor organization and private social
standards: Lessons from East African cut flower industries. World Development,
37(2), 326-340.
Rugman, A.M. (2002). International business: Critical perspectives on business and
management. Volume 4. London: Routledge.
112
Sahavacharin, O. (1998). Cut flower production in Thailand. FAO. Retrieved from:
http://www.fao.org/docrep/005/ac452e/ac452e09.htm
Scher, J. (2007). The cut flower trade: Cut flower exports of Africa. Retrieved from:
http://idtools.org/id/cutflowers/key/Cut_Flower_Exports_of_Africa/Media/Html/Ot
her/Cut_flower_trade.htm
Schukat, P., Rust, J., & Baumhauer, J. (2014). Tariff Preferences for Sustainable
Products: A Summary. In Voluntary Standard Systems (pp. 419-430). Springer
Berlin Heidelberg.
Sikazwe, D. (n.d.). Zambian exports set to soar? New Agriculturist Online. Retrieved
from: http://www.new-agri.co.uk/01-5/focuson/focuson7.html
Shediac, R., Abouchakra, R., Moujaes, C. N., & Najjar, M. R. (2008). Economic
Diversification: The Road to Sustainable Development. Booz & Co. Retrieved
from: http://www.ideationcenter.com/media/file/Economic_diversification2.pdf
Stake, R. (1995). The art of case research. Thousand Oaks, CA: Sage Publications.
Stake, R. (1998). Case studies. In Denzin, N. and Lincoln, Y. (eds.). Strategies of
Qualitative Inquiry. Thousand Oaks: Sage Publications.
Statistics New Zealand. (2000). Horticulture for the year ended 30 June 2000. Retrieved
from: http://www.stats.govt.nz/browse_for_stats/industry_sectors/agriculture-
horticulture-forestry/horticulture-2000.aspx
Statistics New Zealand. (2007). Agricultural Census Tables. Retrieved from:
http://www.stats.govt.nz/browse_for_stats/industry_sectors/agriculture-
horticulture-forestry/2007-agricultural-census-tables/horticulture.aspx#5
Taylor, I., & Smith, K. (2007). United Nations Conference on Trade and Development
(UNCTAD). Routledge.
Tenenbaum, D. (2002). Would a rose not smell as sweet? Environmental Health
Perspectives, 110(5). Retrieved from: http://ehp.niehs.nih.gov/members/2002/110-
5/EHP110pa240PDF.PDF
The Independent. (2008). Millions of orchids lost in spray botch. Retrieved from:
http://www.stuff.co.nz/business/farming/497308/Millions-of-orchids-lost-in-spray-
botch
Tracy, S.J. (2013). Qualitative research methods: Collecting evidence, crafting
analysis, communicating impact. Chichester, UK: Wiley-Blackwell, E-book.
Trade Map. (2010). ITC Trade statistics for international business development.
Retrieved from: http://www.trademap.org
United Nations Conference on Trade and Development, UNCTAD (2008) Export
performance following trade liberalization: some patterns and policy perspectives,
Economic Development in Africa, 2008 series, UNCTAD, Geneva.
http://www.unctad.org/en/docs/gdsafrica20031_en.pdf.
United Nations Industrial Development Organization, UNIDO, (2005) Capability
building for catching-up; historical, empirical and policy dimensions. Industrial
Development Report 2005, Vienna.
U.S. Agency for International Development. (2015). AGOA Success stories: Coming up
roses. Agency for International Development, Telling our story. Retrieved from:
https://issuu.com/eatradeandinvestmenthub/docs/usaid_agoa_success_story_cut_flo
wer
113
UNCTAD. (n.d). Relationship with other agencies. Retrieved from:
http://unctad.org/en/Pages/About%20UNCTAD/Relationship-with-other-agencies.aspx
U.S. Customs and Border Protection. (2015). Generalized system of preferences (GSP).
Retrieved from: https://help.cbp.gov/app/answers/detail/a_id/266/~/generalized-
system-of-preferences-%28gsp%29
United States Department of Agriculture. (1996). World horticultural trade and U.S.
export opportunities. U.S. Foreign Agricultural Services.
United States Department of Agriculture. (2008). Floriculture crops. Retrieved from:
http://www.ers.usda.gov/Briefing/floriculture/Background.htm
United States Department of Agriculture. (2010). Cut flowers and greenery import
manual. Retrieved from:
www.aphis.usda.gov/import_export/plants/manuals/ports/downloads/cut_flower_i
mports.pdf
United States Department of Agriculture. (2014). Cut flowers and greenery import
manual. Retrieved from:
www.aphis.usda.gov/import_export/plants/manuals/ports/downloads/cut_flower_i
mports.pdf
U S International Trade Commission (USITC). (2003). Industry & trade summary: Cut
flowers. USITC Publication 3580. Retrieved from:
https://www.usitc.gov/publications/332/pub3580.pdf
UNSO/ITC Comtrade Database System. Floriculture statistics. Retrieved from:
www.trademap.org
United Nations. (2015). UN comtrade database.
Van Liemt, G. (1999). The world cut flower industry: Trends and prospects.
International Labour Organisation (ILO). Sectoral Activities Programme. SAP
2.80/WP.139.
Van Rijswick, C. (2015). World floriculture map 2015: Gearing up for stronger
competition. Rabobank Industry Note #475, January 2015.
Van Uffelen, R.L.M. & de Groot, N.S.P. (2005). Floriculture worldwide: Production,
trade and consumption patterns show market opportunities and challenges. Paper
no. 29148, Agricultural Economics Research Institute (LEI) Paper Series.
Van Zanten. (n.d.). Van Zanten Flower Bulbs Ltd. Retrieved from:
http://www.nzflowers.com/members_page.asp?id=7
Wassilieff, M.(2008). Market gardens and production nurseries - Production nurseries
and cut flowers, Te Ara - the Encyclopedia of New Zealand. Retrieved from:
http://www.TeAra.govt.nz/en/market-gardens-and-production-nurseries/page-7
Wernett, H.C. (1998). Evolution of the world cut flower market place. In Potential of
commercial floriculture in Asia: Opportunities for cut flower development. FAO.
Retrieved from: www.fao.org/docrep/005/ac452e/ac452e0c.htm
Wijnands, J. (2005). Sustainable international networks in the flower industry: bridging
empirical findings and theoretical approaches. International Society for
Horticultural Science (ISHS).Retrieved from:
http://www.actahort.org/chronica/pdf/sh_2.pdf
114
Wijnands, J., Bijman, J. & Huirne, R. (2007). Impact of institutions on the performance
of the flower industry in developing countries. Wageningen University. Retrieved
from: http://www.isnie.org/assets/files/papers2007/wijnands.pdf
Williams, A. (2007). Comparative study of cut roses for the British market produced in
Kenya and the Netherlands. Natural Resources Management Institute. Department
of Natural Resources. Cranfield, Bedford: Cranfield University.
World Bank. (2003). Sustainable development in a dynamic world. World Development
Report 2003. Washington: World Bank.
World Integrated Trade Solution. (n.d.). Retrieved from: http://wits.worldbank.org/
Xu, X., Chen, Y. & Li, C. (2008). Chinese flower international trade status analysis in
2007. CFNA Flower Branch 100062; Beijing Huake Runnong Consulting Ltd
100125.
Yanai, C. N., Gautam, M. P., & Bijl, B. (2007). Advisor services on export development
of priority sectors of Nepal, Sector Study on Floriculture (June-September
2007). Project NEP/A1/01A.International Trade Centre UNCTAD/WTO.
Abouchakra,R., Moujaes,C., Najjar,M., & Shediac,R.,(2008). Economic Diversification:
The Road to Sustainable Development, Booz Allen Hamilton, 2008.
Yang. X., Liu, G. & Zhu, L. (1998). Cut flower production in China. Cut flower
production in Asia. FAO Regional office for Asia and the Pacific. Bangkok,
Thailand. RAP publication, 1998/14.
Yin, R. (1993). Application of case study research. California: Sage Publications.
Yin, R., (1984). Case study research: Design and methods. California: Sage
Publications.
Yin, R.K. (2003). Case study research: Design and methods. Thousand Oaks: Sage
Publications.
Xia, Y., Deng, X., Zhou, P., Shima, K., & da Silva, J. A. T. (2006). The World
Floriculture Industry: dynamics of production and markets. Floriculture,
Ornamental and Plant Biotechnology Volume IV, Global Science Books UK.