the environment and us section 3: the human environment
TRANSCRIPT

The Environment and Us
A short treatise on the relationship of the physical and biological worlds, and we that live in
them, mostly from our point of view
By your humble servant Dr. Avram Primack

This book is copyright by
© Avram Primack July, 2014
All rights reserved
ProphetPress Publishing, St. Thomas, US Virgin Islands
This study was partially supported by VI-EPSCoR under National Science Foundation
Grant #0814417. Any opinions, findings, conclusions, or recommendations expressed in the
material are those of the authors and do not necessarily reflect the views of NSF.

Dedication
This book is dedicated to my daughter Terah, who has suffered through the process of my
discovery of the need to write and the process of actually writing. Most of my unconventional
ideas were first tested on her. Unfortunately, she has adopted some of them. Youth are so easily
corrupted. She has been the prime motivation for me to finish this project. I hope that she
appreciates how influential she has been in my life and how influential I hope she continues to
be.
In addition, to Dr. Daniel Willard, who got me to see the end of my nose so that I could
see past it. His unconventional insights into the working of ecology and public policy are
responsible for allowing me the freedom to develop many of my own unconventional ideas. He
taught me to be fearless. It is unfortunate that he is not here to appreciate the fruits of his labors.
And, to Dr. Gene Willeke, who taught me that theory is important, among other things.
Without theory it is too easy to forget how things work. When you forget how things work you
start assuming they work how you think. This is always dangerous, as those of us who know a
little and assume it is more than a little should already know. Unfortunately, the most of us who
know only a little don’t know how little it is that we know, which is first step in the creation of
most problems. As I have grown older I have realized that I know less and less. I am now at the
point where I will admit to knowing almost nothing.
And to my parents, who set me on course to where I am now. Even though they have not
always approved of my ideas, many of them came from them, or in reaction to them. There is no
escaping responsibility for your offspring. I absolve them of all errors and omissions, and take
full responsibility for my own actions.
And to all of the students who lasted through me finding my way to the words in this text.
I made too many bad jokes and told too many bad stories as I found my way to what I hope are
the good stories. I hope that they learned as much from me as I learned from them, although I
suspect that I learned a lot more than they did.
And finally, to my daughter Terah once again and to all the other young people out there.
They are the future. I hope that it works out as well for them as it has for us who are alive now.

Table of contents
The Environment and Us
Dedication
Table of contents
Section 3: The human biome
Chapter 10: Agriculture
Introduction
The development of agriculture
How do we increase output?
Energy and agriculture
Will there be enough food in the future?
Last word
Summary
Chapter 11: Fisheries and oceans
Introduction
A very short history of fishing
How do we catch more fish?
And fishing deeper
How many fish can we catch?
How fish many should we catch?
Catch per unit effort
Are we fishing sustainably?
The byproducts of modern life
Will we be able to get more fish?
Chapter 12: Water
Water is a limiting resource
Civilization was founded on water
Settled life required improved sanitation
Contaminated water causes disease

Which led to the public sanitation movement
And sewage treatment plants
A modern wastewater treatment plant
Septic tanks
Drinking water is sterilized
Sources of water pollution
Water pollution comes in many forms
Water carries disease
Instream uses of water
Water use laws
Where is all that water
Summary
Chapter 13: Energy
Introduction
Energy and civilization
Wood
Hydropower
Wind power
Fossil Fuels
Nuclear Power
Alternative energy
What energy source is missing?
Energy use
Energy in the past and future
Where should we get electricity?
Energy policy
Summary
Chapter 14: Air
Air is all around us
Air quality and history

London and coal
Air pollution
The good ozone
The greenhouse effect
Atmospheric brown clouds
Urban Heat Islands
Indoor versus outdoor air
The clean air act
Summary
Chapter 15: Land
Introduction
Land conversion and erosion
Forests
Wangari Maathai and the Greenbelt Movement
Wetlands
Deserts
Solid waste
Sanitary landfills
How much we generate
Waste is a resource
Urbanization
Land use and nature
Summary
Notes

Section 3: The human biome
Natural resources are normally described as renewable and nonrenewable, but they
actually come in several flavors. Most nonrenewable resources come from the ground, are
processed and concentrated through the application of energy, used for some purpose during
which they wear out, and are returned to the ground again as waste. They are subject to the
second law of thermodynamics that requires that with use they become more spread out and
difficult to concentrate unless an outside source of energy is applied to making them more
concentrated again. They do not grow back like renewable biological resources. They may be
replaced by geologic processes, but at geologic rates, which are much longer than a human
lifetime. Nonrenewable resources come in two flavors, single use, and reusable resources.
Single use resources, such as oil when it is refined into gasoline, are used once. Gasoline
is converted into carbon dioxide and water as it is burned. It cannot be burned again and gasoline
left in a container does not grow more gasoline.
Minerals are reusable resources if they are not converted into forms that are
uneconomical to recover. Aluminum is a nonrenewable mineral resource. Although it is the third
most abundant element after oxygen and silicon it is rarely found in pure form because of its
reactive nature. It is refined from bauxite ores by electrolysis. The ore is dissolved in an acid
bath and an electric current is passed through the solution, forcing aluminum ions to deposit on
one of the electrodes. Because this is an expensive and energy intensive process aluminum waste
has a high value.
We could call used aluminum and other recyclable materials a reusable resource, one that
can be recycled in order to preserve the effort and energy already invested in it or to conserve the
supply of a resource that is scarce. In the end though, aluminum is a nonrenewable resource.
When aluminum is sent to a landfill it and the energy invested in it are lost and we need to mine
and process more. When we run out of economically usable ore we will run out of the ability to
add more aluminum to the existing stock. In many places we have already done this with gold,
iron, copper, nickel, and other important mineral resources. We are only able to maintain the rate
of extraction of these resources by applying more efficient systems for extracting them and by
applying more energy in the process of extracting them.

Renewable resources come in three flavors: flowing, reusable and growing. Flowing
resources include sunlight that flows into the environment and back out again, and air and water
that cycle through the environment driven by the energy from sunlight. Reusable resources can
be recycled into the same or new products, but they are subject to the second law of
thermodynamics, so they are not really renewable. Recycling only delays their ultimate loss.
Growing biological resources are renewable if we wait long enough for them to recover and
reproduce. Using renewable resources faster than they recover or flow resources faster than they
cycle are the same as using them as if they are nonrenewable.
Air and water are reusable in the global sense. It is only at local scales where the demand
exceeds their rate of flow that they can become limiting. Water can be scarce locally when
precipitation fails to arrive as expected and when withdrawals from nature are greater than what
nature supplies. When demand is less than what nature supplies we undertake engineering
projects to change the way natural systems work. We cope with local shortages of water by
engineering systems that store it when it arrives so it can be used later when it is needed if the
energy cost is not too high. We also transport it to where it is needed. Air supply is only a
problem for trapped miners, divers and where air quality has been reduced to the point where it
poses a threat to human health. When air circulation is too slow to carry off atmospheric
pollutants we can think of it as a nonrenewable resource. Oxygen can be in local shortage in
ponds, lakes, and oceans under some natural and man induced conditions, but normally recovers
with time if left alone.
Fish, plants, and trees are biological renewable resources. They take time to renew
themselves, and only renew themselves under conditions that allow them to reproduce and grow.
If they are harvested faster than they replace themselves they become like any other
nonrenewable resource, and disappear completely once they have been consumed to the point of
extinction.
Natural resources are the basic materials out of which we construct all the tangible items
used in growing food, building shelter, and transporting ourselves from place to place. Without
these we would not have the ability to create the less tangible art, music, and entertainment that
we enjoy. Every activity that we undertake involves the use of some form of natural resources,
even if it is only the electricity used to run your iPod.

Chapter 10: Agriculture
Introduction
Agriculture is one of the features that mark the beginning of settled human civilizations,
the transition from living wild with the animals to living as “civilized” and settled peoples. Early
agriculture began in rivers valleys fed by the yearly spring floods that fertilized the floodplains.
As the valleys filled agriculture spread into the forests and plains as people struggled to break the
ground and cut the trees.
The modern farm landscape.
Public domain from http://en.wikipedia.org/wiki/File:Edward_Hicks_-_The_Cornell_Farm.jpg.
Today, the total area covered by agriculture rivals the size of the largest natural terrestrial
biomes and has been transformed from a simple technology of planting seeds in holes scratched
in the ground with a stick to an extremely technological, highly integrated, ecological and
economic system. Today’s farming practices are designed to extract the maximum food yield
from the minimum area of land in the shortest amount of time. Even after 250 years of the
agricultural revolution we are still making great strides in efficiency using computers, satellites
and GPS systems to tell tractors when and where to deliver fertilizer and irrigation water.
The development of early cultures is closely bound to the development of agriculture. At
first agriculture did not produce a large surplus of food, but it was enough so that some people

could be supported without growing their own, and so the priest, soldier, and noble classes of
people were born. Even lawyers were made possible by early agriculture.
The changes that gave rise to agriculture were a collection of technologies and
knowledge about plants, climate, engineering, and soils that were discovered by accident and by
necessity as game animals became scarce. They included water diversion schemes that led to
irrigation systems, the use of human and animal manure for fertilizer, the scratch plow to open
the soil, domestic animals as muscular labor instead of wives and children, and the Archimedes
screw as a simple water pump.
In spite of the continual development of agricultural technologies and techniques, most
people raised their own food and have been in danger of going hungry. It is only in the last 250
years that a series of revolutions in agricultural practice have transformed civilization from one
in which the average person’s labor is invested in cultivation, to one in which only a very small
percent of the population are necessary to grow enough food to feed all of us, even in bad times.
Agriculture also faces great challenges. Will there be enough food in the future to feed
the population that will result from the population growth we currently expect? Over the past two
hundred and fifty years the population of the Earth has grown faster than at any other time in
history. More than 60 million people have been added to the earth’s population each year for the
last 30 years. Improvements in agricultural production are a large factor in allowing this
unprecedented population growth.
Archimedes screw is still used to pump irrigation water
Public domain in Chambers's Encyclopedia (Philadelphia: J. B. Lippincott Company, 1875).
Can we go on like this? Are there physical limits to the amount of food we can extract
from the soil? What other purposes are competing for agricultural land? Are the present practices

sustainable in the long term, or are we using up our renewable resources as if they were precious
metals to be mined as fast as possible? Over the past 50 years, agricultural output per hectare has
at least doubled, and the production of food has increased by at least 20 percent per capita.
Although the rate of population increase has slowed the absolute number of people added every
year is still greater than 60 million Can the increase in total food production continue to keep
pace with the rate of population increase? The history of agriculture has been one of continual
development of new technologies that have increased the carrying capacity of the earth for
humans but these developments are not predictable or always timely. Will we continue to live the
good life, or will we return to the periodic famines that characterized most of history?
The development of agriculture
Agriculture developed in only a few places that were endowed with good climate and
suitable wild crops between ten and four thousand years ago as people discovered the secrets of
seed preservation and germination. Wheat, barley, and oat cultivation spread from Central Asia
and the Middle East into the Mediterranean, central and northern Europe, and into North Africa.
Rice developed in China and India, spreading into south East Asia, the Pacific Islands and later
into the Middle East and Africa. Sweet potatoes were developed in New Guinea, corn in Central
America, and Potatoes in Peru. Many vegetable and other minor crops were developed in
Ethiopia (coffee), the plains of North America (sunflowers), the Amazon (rubber), and Central
America (chocolate). Many of these crops have been moved around the world so the people now
planting them do not remember their arrival, believing that they were always there.1

For most of history agriculture has been accomplished by human labor
Public domain by US AID from http://en.wikipedia.org/wiki/Image:Rice_Field.jpg
There have been many agricultural revolutions in history. Each made great changes in the
way we live. At the outset of the first revolution ten thousand years ago the total human
population was between one and ten million. Before agriculture, early humans were hunters and
gatherers, depending on being in the right place at the right time in order to capture enough food
to maintain them. They were at the mercy of what the earth produced for them, and when it
produced it. Slowly, the hunter gatherers learned the mysterious life cycle of plants. They
realized that food plants grew on the refuse piles of old campsites where the remains of their
food had been discarded. They must have seen germinating seeds, and realized that they grew
into the food plants that they harvested. Perhaps they intentionally planted food crops in places
they knew they would return to when the plants would be ready for harvest. From these
observations grew the early understanding of plant husbandry that led to the intentional planting
of seeds.
The life of a hunter-gatherer was precarious. Agriculture made the food supply more
predictable. Intentionally planting and protecting crops reduced gathering time and increased the
harvest. As agriculture contributed more calories to the food mix it changed the human carrying
capacity by stabilizing the amount of food energy available. The human population increased.
During the six thousand years in which agriculture developed and spread around the globe the
human population increased five times, from 10 million to 50 million. It continued to grow,
reaching 300 million by 1000 BCE, and 800 million by 1750 AD. Even the plagues that came
with the Black Death did not slow growth significantly in spite of reducing the population of
Europe by at least a third.

Human population growth
Public domain by El T from http://en.wikipedia.org/wiki/File:Population_curve.svg
The second agricultural revolution began in the 1700’s. It introduced the idea of active
selective breeding to increase the size of domesticated animals and the yield of crop plants.
Population growth accelerated, reaching 2.5 billion by 1950.
Less than a century later the human population has grown to more than seven billion, due
in some part to improvements in public health measures but also due to the third agricultural
revolution, the chemical and genetic revolution. This started as the Green Revolution in which
the cross breeding was used to produce hybrid seed produced a much bigger crop when used
with the right mix of water and fertilizer than the local landraces that farmers had passed down
from generation to generation. Herbicides and pesticides further reduced losses. More recently
recombinant DNA has sped up the processes of creating new more productive crop plant
varieties.
The improvements in agriculture and public health improved the standard of living of
most people around the world in spite of continued increases in population. In order for this trend
to continue into the future, the rate of increase in food production must continue to be greater
than the rate of increase in population. In order for the increase of food production to be
sustainable into the future there must sustainable exploitation of soil, water, fertilizers, and other
essential resources or there have to be increases in the efficiency with which these resources are
used.

How do we increase output?
There are only two basic approaches. We can increase the area that is planted with crops,
or increase the yield of crops per unit of area planted. The only way to increase the area planted
is to find new suitable areas on which to grow them or make areas that are unsuitable today more
suitable tomorrow. The only way to improve the yield per unit area planted is to employ new and
more sophisticated technologies that reduce competition from nonfood plants and animals,
increase the investment in food parts over body parts by crop plants, reduce waste and loss in
harvesting by farmers, and provide crop plants and domestic animals with all the necessary
nutrients they can absorb.
Area as a limiting factor
Agriculture happens on a two dimensional surface. It is limited by the area that is
available for planting. There has to be a field to plant before there can be a harvest, even if the
field is a hydroponic garden in a multistory building supported by artificial lights and piped
water with the measured addition of essential plant nutrients. The upper limit is the two
dimensional area that can be planted. The lengths that civilizations will go to increase
agricultural land area is shown by the slope of the hillsides that the Inca choose to terrace for
growing corn and the Chinese currently use for growing rice. The rice terraces of central Luzon
in the Philippines have been in use for thousands of years.

Rice terraces along both sides of a mountain ridge in Guangxi province, China
By Molluo under GNU 1.2 license from http://en.wikipedia.org/wiki/Image:Terrace_field_guangxi_longji_china.jpg
Gains in area are achieved by applying technology to open new lands for cultivation.
Early civilizations used stone and bronze axes to cut down trees. They had uses for the trees, but
they also had uses for the land after it was cleared: it was used to grow crops.
The Fertile Crescent was originally surrounded by dry woodland hills. The hills of
Lebanon, Palestine, Luzon, Nepal, Cyprus, Crete, Greece, Macedonia and Italy were once
wooded with the type of deep dark forests described in fairy tales. As the trees covering the hills
were cut for firewood, charcoal, bark, and lumber they were terraced and used as cropland. In
many places around the world, this kind of agriculture is still being practiced.

Hillside terracing installed by the Incas is still used today
By Torox under the GNU 1.2 license at http://en.wikipedia.org/wiki/File:Pisac_Terrassen_medium.jpg
Increasing yield through technology
Plowing and irrigation were early technological improvements in farming. They allowed
farmers to move into new areas and increase yield at the same time. Later technologies include
terracing, importing crops from distant lands, manure, and crop rotation.
Even with irrigation and the plow there is an upper limit to how much land can be put
into production. There are only so many acres of good flat soils. There is a limit to the amount of
water that is available, and even with enough water there may not be enough land available to
irrigate. When there is no more land to bring into cultivation or irrigate the output of agriculture
can only be increased by using new tools to increase the yield per unit area of the land that is
already farmed through the use of new and improved technology. Over the last several thousand
years the major force in improving food production has been the invention of new techniques
and technologies.
The plow opened up opportunity
The earliest farmers sowed their seed directly on the ground. They had no way of creating
a furrow without domestic animals, and they hadn’t domesticated them yet. They cleared the
land with a hoe and used a pointed stick to make a hole for the seed.

The earliest plows were sticks dragged across the ground to make a shallow furrow in
which to plant seeds. Cattle dragged later plows as the plowman pressed the point of a stick into
the ground. These farmers lifted up on the plow handles to press the point of the wooden
plowshare into the ground and scratch out the furrow, an arduous task.
Around 100 BC the Chinese invented the moldboard. The moldboard plow turned the top
layer of soil over killing weeds by burying their seeds and disturbing plant-eating insects
developing underground. By turning the soil farmers brought plant nutrients to the surface and
aerated the ground around crop roots, increasing yields.
In the 1700’s iron became readily available. Because iron was more durable than wood it
was used to build metal clad plowshares. Plows with wheels were developed that allowed
farmers to ride instead of walk. These were big improvements over directing a wooden plow
board around roots, rocks and clods of dirt while walking behind.
A farmer and his wife plowing.
Public domain from http://www.gutenberg.org/ebooks/10940.
The final improvements leading to the modern tractor drawn plow were contributed by an
Illinois blacksmith named John Deere. Early iron moldboards were not smooth. They caught at
the thick clay soils as Illinois farmers tried to convert the tall grass Midwestern prairies into
farms. John Deere saw that a smooth polished steel surface slid through the thick clinging clay
soils without sticking. He began building polished steel plows in the early 1830’s. By the 1850’s
he had a factory turning out more than 10,000 a year.

Deere plows were strong enough to cut the tough surface of the prairie soils in Indiana,
Illinois, and farther west, where farmers had had a hard time breaking through the tough root
masses. The tractor, corn harvester, hay bailer, seed planter, and other machinery that are central
to modern mechanized farming came along soon after. These technologies opened the Corn Belt.
Changes in technology continue today. The modern plow is drawn by a tractor that
contains a motor driven by fossil fuels, and draws a steel plow with several cutting blades shaped
to penetrate a set distance into the soil. New tractors open the subsoil without disturbing the
topsoil. Tractors do the hoeing, inject seeds into the soil, and place just the right amount of
fertilizer in just the right place for growing roots to find it. These innovations greatly increase the
efficiency of farmers, allowing individual farms to grow from the standard 40 acres in the US to
hundreds and hundreds of acres.
A modern tractor with four bladed plow turning the soil
Public domain by Joevilliers from http://en.wikipedia.org/wiki/Image:Plough.JPG
Irrigation
When the natural variability of rainfall is high crops occasionally fail. Where rainfall
can’t sustain rain fed agriculture the only way to practice agriculture is by using irrigation. Most
of the grain belt in the United States has dry years which limits the growth of crops. In these
areas irrigation is necessary.

Where irrigation is used
By Roke under GNU 1.2 license from http://commons.wikimedia.org/wiki/File:Irrigated_land_world_map.png
Irrigation was probably the third important agricultural technology, developed after seed
saving and planting seeds in holes. It developed in Mesopotamia and Egypt, both dry places with
rivers running through them. They both developed complex systems of canals for collecting
water, keeping it until it was needed, and distributing it to the fields.
Egypt is a country in which almost no rain falls. Early Egyptians refer to their country as
the gift of the Nile because it is the Nile floods that make Egypt possible. The Nile was the
foundation of a powerful and independent society based on irrigation that lasted over 4,000 years
before they were taken over by the Babylonians, followed by the Persians, Greeks, Romans, and
Turks.
Egypt is still the gift of the Nile, but the technologies used to control and manage its
waters became more sophisticated and intensive as time passed. The most recent step was the
building of the Aswan Dam to control flooding and make use of floodwaters trapped behind the
dam to irrigate yet more area. Irrigation was also important for the Maya, Inca, Anasazi, Moche,
Ifugao, Chinese, Koreans, Japanese, and countless other civilizations that have flourished with
irrigation and disappeared without it.
Since irrigation works are large projects that require management it is likely they were
one of the early factors in creating governments. Building and maintaining irrigation systems
required engineers to design them, accountants to keep track of water distribution, scientists to
keep records, track seasons, and observe the patterns of water availability, and politicians to
convince people that they needed them. It might be argued that managing the environment for

the public good was the original function of central governments, and that irrigation was the .one
of the first facets of the environment that needed management.
Irrigation technology
Early irrigation technology consisted of reservoirs that captured floodwaters. These were
connected to canals that could be used to flood fields directly by gravity when the water was
needed. Later, water was lifted from canals using simple devices like Archimedes screw, or
animals on treadmills connected to a chain of buckets. Windmills were also used to pump water
to the surface. The water meter was invented in the 1400’s in Korea to keep track of how much
water each irrigation user had withdrawn. Modern irrigation systems use pumps to draw water up
from over a hundred feet below the surface and systems of aqueducts and canals to distribute
water from hundreds of miles away. The epitome of modern irrigation technologies are center
pivot sprinklers that water a circle of up to one mile in diameter. Still in development are drip
systems that bring water directly to the roots off plants rather than spraying it into the air.
A center pivot irrigation system in use in New Jersey.
By Paulkondratuk3194 under CCA 3.0 license from http://en.wikipedia.org/wiki/Image:Irrigation1.jpg
Irrigation is the most important technology for increasing the area available for
agriculture. Anyone from California knows that agriculture in the Central Valley is made
possible by pumps and canals that carry water from all over the state. Without this water, most of
California's central valley would not be suitable for the carrots, eggplant, peanuts, peas,
chickpeas, grapes, almonds, oranges, grapefruit, cabbages, celery, broccoli, Brussels sprouts,

artichokes, lettuce, arugula, avocados, tomatoes, onions, peaches, nectarines, plums, apricots,
pears, watermelons, cantaloupe, garlic, potatoes, cauliflower, turnips, beets, green, yellow,
purple, pinto, and other beans, jalapenos, green, red, yellow, Anaheim, ancho, poblano, pequin,
habanero and other peppers, basil, thyme, and other crops that those of us who live on the east
coast eat every day. If you don’t believe me, examine the packaging your food comes in to see
where it was grown the next time you go to the store. Anyone who has flown over Kansas or
Nebraska and seen the circles on the ground has seen irrigation in action. That is where the corn
that is feed to cattle that are used to make burgers is grown using water out of the Ogallala
aquifer.
The location of irrigated farmland in the United States.
Public domain by USDA/NASS census of agriculture from http://www.epa.gov/oecaagct/images/usirrig97.gif
Over 2.7 million square kilometers (700 million acres) are under irrigation today and new
projects are underway in Turkey, Brazil, Zambia, Mali, China, India, the United States, Mexico,
Syria, Israel, Egypt, Libya, Saudi Arabia, and other countries around the world. There is even
occasional talk of diverting water from Canada or the Great Lakes to irrigate the arid American
south west and reversing the flow of rivers in Siberia so they will flow into dry central Asia.

Each circle represents up to one mile in diameter of irrigation.
Public domain by NASA at http://earthobservatory.nasa.gov/Newsroom/NewImages/images.php3?img_id=17006
Irrigation limited by water availability
More than 70 percent of all water withdrawn from natural sources is used for irrigation.
In dry regions more than 90 percent of the available natural water supply is used for irrigation.
Today, all of the water in the Colorado is used before it reaches the Gulf of California. The Aral
Sea has been steadily shrinking since its main tributaries were diverted for irrigation. In arid
regions the only way to increase agricultural yield or area is to use the available irrigation water
more efficiently.
The value of irrigation makes it difficult to allow any water to escape. In tropical regions
irrigation can allow several crops in one year. In India, the increase in crop yields is almost
double when irrigated fields are compared with rained agriculture.
The efficiency of irrigation depends on the technology used to distribute water to and
onto the fields. Water conveyed in unlined canals leaks back into the ground. Water held in open
canals and reservoirs for long periods in hot dry climates evaporates. The simplest way to apply
water is to produce a temporary flood over the field. This method loses much of the water to
infiltration into the ground where it is not needed, and wastes water by not applying it directly
where it is needed, on the roots of the crop plants. Center pivot irrigation systems are used for

tall crops such as corn. They roll through the fields, spraying water into the air where a large
proportion of it evaporates and lands far from the roots of plants. Many irrigation systems are old
and not well kept, adding to water losses. Many of these countries do not generate enough
revenue to keep the systems working.
The most efficient modern irrigation water delivery systems put water only where it is
needed when it is needed. They slowly drip water onto the roots of plant only when it is needed,
but they require the installation of expensive piping, pumps and meters. Most people who use
irrigation cannot afford this kind of sophistication and make do with cheaper to build less
efficient systems.
Irrigation and salinization
Irrigation can also damage land if it is overused. Salts dissolve from minerals in the soil
and bedrock. Where rainfall is high enough the salts are leached down into the soil below the
root zone and carried away. Where there is not enough rainfall to wash them away salts build up.
Most rainwater contains at least a tiny bit of salts. When this slightly salty water is used for
irrigation some evaporates. When it is taken up by plants the water is transpired and the salts are
left behind. Both of these processes increase what is already in the soil.
Water containing small amounts of salts evaporates, leaving the salts behind
Public domain by Nico Dusing from http://en.wikipedia.org/wiki/File:Salinity_from_irrigation.png
Over irrigation raises the water table, sometimes to the root zone or the soil surface.
When this happens, groundwater laden with salts comes to the surface and evaporates, leaving
the salts behind. High salt concentrations in the root zone interfere with the plants ability to
extract water and minerals from soil, limiting crop production. The only way to remove salts
from salinized soils is to wash them out, a water, energy, and time intensive process.

Salinization is an important problem in irrigated areas. Many farmers do not understand
the dangers and unwittingly waterlog their soils under the assumption that more water is better.
In Egypt marginal lands near the Aswan dam are being irrigated by inexperienced farmers to the
point that they are ruined. It is also a problem in China, Colorado, Texas and Iraq. In many areas
the gains due to increased irrigation are being offset by losses to salinization.
Irrigation and aquifer depletion
Aquifers are underground rivers and lakes of water that are recharged by water
infiltration through the soil from the surface. Surface aquifers eventually have a layer of
impervious rock underneath them. Even these slowly leak water to lower aquifers that recharge
very slowly, the water in them sometimes having accumulated over thousands of years. The
upper limit to what can be sustainably withdrawn from any aquifer is the rate at which it is
recharged from above.
Water level changes in the Ogallala aquifer in the Midwest of the United States
Public domain by USGS at http://en.wikipedia.org/wiki/Image:Ogallala_changes_in_feet_1980-1995_USGS.gif

Over pumping an aquifer lowers its water level. Shallow surface aquifers that do not have
an overlying layer of confining rock are recharged from the surface more quickly than lower
lying aquifers. Lower level aquifers are recharged more slowly as water has to infiltrate through
the overlying layers of rock, sand, and soil. The lowest layers are replenished very slowly,
having accumulated over long periods, perhaps thousands of years.
The Ogallala is an important aquifer in the central plains of the United States. It supplies
water to 27 percent of the irrigated land in the US, and lies under the major corn producing states
in the Great Plains region. Full-scale exploitation of the Ogallala began after World War II as
electricity became available in the rural plains. Electrical pumps were used to obtain water from
the aquifer which was spread using center pivot sprinkler systems.
The Ogallala aquifer transformed the High Plains from the region that produced the
dustbowl in the 1930’s into a highly productive agricultural region. Even though it is relatively
shallow the aquifer contains fossil water that has accumulated slowly over the last 10,000 years.
It is really an ancient underground lake that contains water trapped since the retreat of the latest
glaciers. It recharges very slowly because soils over the aquifer contain mineral layers that slow
down infiltration.
Water level changes in the Ogallala aquifer at Lamb, Texas.
Public domain by USGS.
Lower aquifer levels affect how farmers crop their lands. As more farmers installed wells
the ancient water was extracted faster than it was replaced and the level in the aquifer dropped, in
some places more than 60 feet since pumping began. As the water level dropped the cost of
pumping increased and wells needed to be drilled deeper. Lower water levels have forced some
farmers in the Texas panhandle to give up irrigation altogether and return to dry land farming.
Farmers in eastern Colorado have switched to crops that are less water demanding. Other farmers

have made investments in more efficient water delivery systems or installed deeper wells to
follow the falling groundwater levels. If the aquifer continues to drop more farmers will have to
abandon irrigation and return to rain fed farming methods.
Aquifer water levels are dropping worldwide because of over pumping for crops and
urban water supplies. Water levels are dropping on the Manchurian plain in China, throughout
India, in Mexico, Iran, Libya, Israel, and Pakistan. In some places this is intentional. Saudi
Arabia and Libya are supporting their agriculture on fossil deposits of water that they know will
run out. They are hoping that economic growth generated from using these nonrenewable
resources will allow them to import instead of growing their own food. Many of these countries
are also facing increasing water stress due to increasing populations.
Soil fertility
Maintaining soil fertility is a major challenge in farming. Crops grow best when they are
well fed. The major limiting nutrients in soils are nitrogen and phosphorus, but calcium and other
trace minerals can be limiting also. Crop plants capture and hold essential nutrients from the soil.
When the crop is removed, the nutrients go along too. Nutrients are also lost through leaching
and erosion. Soils that are continually cropped lose nutrients and produce lower crop yields.
Farming societies have developed many ways of adapting to nutrient depletion. Farmers
have always known that floodplain soils are more fertile than upland soils, and they invaded new
areas by spreading up river valleys. This happened as agriculture spread from the Middle East
into Europe and as European farmers moved into New England. American Indians who farmed
did so along river floodplains.
Away from floodplains soil fertility declines as soil nutrients are taken up by plants or
leached away after the soil is exposed. In upland areas farmers had to find ways to maintain
nutrients in the soil. They developed a cropping system called slash and burn farming. They cut
the trees on a small patch, burned them, and farmed using the nutrients released from the burnt
trees. In the next years they burned the remaining wood until the soil ran out of nutrients. When
the soil was exhausted they moved on to a new patch and started again.
Slash and burn farming has one major drawback. It only works when population densities
are low and each field has an opportunity to rest long enough to recover soil fertility through
natural processes. In many places this may take years to decades. As population densities

increase eventually there is no room to move on to another patch, and other farming systems
must be developed that more actively maintain soil fertility.
Some farmers maintained soil productivity by alternating between crop and fallow
periods. During the fallow period nutrient levels recovered and grain yields increase when the
field is brought back into cultivation. The Romans used this two-field crop rotation. Medieval
European farmers used a three field cycle that included winter wheat, spring oats or barley, and a
year of fallow grazing.
The three-field system kept grain production up, but did not provide winter feed for
animals. Under the three-field system, the non-breeding domestic animal stock was slaughtered
in the fall to reduce the need for keeping hay through the winter for animals. This meant that
animal proteins were scarce and working farm animals were small.
A four-field crop rotation system was developed in Flanders in the late 16th century and
spread to England in the 18th century. This system was the beginning of the second agricultural
revolution. The rotation included the normal grain crops of wheat and barley, and added turnips
and clover. The four-field rotation system had several advantages. Clover is a member of the
bean family. Plants in the bean family have a special relationship with soil bacteria that capture
nitrogen from the atmosphere. The clover replaced nitrogen in the soil that was removed by the
grains and it replaced the fallow period with a crop that could be used for livestock grazing. The
added soil nitrogen increased grain productivity. The turnips were used as winter forage for
people and animals and allowed more livestock to be kept through the winter. The manure from
the livestock kept over the winter was spread on the fields as fertilizer which also increased crop
productivity.
Fertilizer and the fertilizer wars
Farmers learned that they could add material to the soil to increase fertility. Calcareous
marl was dredged from the bottom of lakes and added to the soil to maintain good chemistry.
Animal and plant manures were added to return organic matter and nitrogen to the soil and
contained minerals important for plant growth. Cover crops were plowed into the soil as a green
manure along with the decayed remains of the previous year’s harvest.
The value of manures as fertilizer was recognized before the Romans. We have several
Roman texts on methods for preparing manures that go into great detail on when and how they

were to be applied. Manure is still the major crop fertilizer around the world, especially where
farmers are too poor to buy manufactured inorganic fertilizers.
As European populations grew in the late 1800’s it was important for agricultural
production to keep up. In the late 1800’s the US and European nations began looking for
supplies of other fertilizers. We did not yet have the ability to create chemical fertilizer, so we
went looking for deposits of animal manure such as bat and bird guano. Bats living in large
colonies deposit their wastes on the floor of their caves. Seabirds have been depositing guano on
the isolated islands where they nest for hundreds of years. Some of these deposits are hundreds
of feet deep.
Boats anchored at the Chincha Islands off the coast of Peru waiting to be loaded with bird
guano for export to Britain
Public domain from The Illustrated London News, 1863
When economically valuable deposits of seabird guano were discovered they were the
cause of wars for their possession. In 1856, the United States passed the Guano Island Act that
allowed any US citizen to exploit any guano deposit not already under the jurisdiction of another
government. Over 100 islands were claimed in this manner, including Baker Island, Jarvis
Island, Howland Island, Kingman Reef, Johnston Atoll, Palmyra Atoll and Midway Atoll.
Several others claimed by the US are still disputed territory, also claimed by Haiti, Honduras,
and Columbia.
Sometimes access to guano bearing islands were the cause of war. When Peru won its
independence in the 1820’s it took with it the guano rich Chincha islands. These eventually
produced 40% of the Peruvian foreign exchange. In 1884 Spain occupied the islands in order to
wring political concessions from Peru. Chile fought with Bolivia and Peru for access to mineral

rich areas in the Atacama Desert with the support of Britain. Britain’s aim was to maintain
access to cheap resources, including bird guano and phosphate deposits on nearby offshore
islands.
Inorganic fertilizers
By the end of the 19th century we knew which chemical elements were important in
limiting crop plant growth. We began to seek industrial ways of obtaining nitrogen, and
phosphorus. Phosphorus was obtained by mining and milling phosphate rock, so obtaining more
involved finding deposits and developing the machinery to extract it. Nitrogen is also used in
gunpowder and explosives which means that there is a national defense interest in having access
to more. There were not enough rock and guano deposits to guarantee national food and military
security.
The effect of using phosphate fertilizer on plant growth in an agricultural field
Public domain by the Tennessee Valley Authority,
The pressure to find more nitrogen meant there was ample support for research into
methods of capturing it from the atmosphere and converting it into a chemically usable form,
which led to the development of the Haber process in the early 1900’s. The Haber process
involves compressing air to a high pressure and temperature and passing a lightning bolt through

it. It is energy intensive, so it was only possible to use the Haber process on a large scale after the
development of large hydropower dams at the end of the 1800’s.
After WWI the Haber process was used to make inorganic nitrogen fertilizers but real
commercial success did not occur until after WWII when inorganic nitrogen fertilizers were
widely adopted by farmers. Production increased from less than one million tons in 1945 to more
than ten million tons per year in 1985.
Inorganic fertilizers are one of the pillars of modern mechanized farming. It changed the
way farming is practiced by reducing reliance on crop rotation and organic fertilizers to maintain
soil fertility. Where it is possible modern industrial grain farmers use a two crop rotation
between corn and soybeans and there is no fallow period. Nutrient deficits in the soil are made
up by the application of nitrogen and phosphorus fertilizers.
Fertilizer use comes at an environmental cost. Nitrogen and phosphorus are limiting
nutrients in the natural environment as well as in agriculture. Where they are overused they
produc changes in the structure and function of aquatic ecosystems. Increased nutrients change
the structure of aquatic systems. Many normally nutrient poor ecosystems that received large
nutrient increases became eutrophic. Eutrophication can lead to excessive growth of algae and
anoxic conditions that kill fish and other organisms. Where nutrient laden rivers drain
agricultural land reach the sea the extra nutrients to produce red tide algae that make neurotoxins
that kill fish and humans. In extreme cases, the additional nutrients produce anoxic dead zones in
shallow marine systems near the mouth of these rivers such as in the Baltic Sea and the Gulf of
Mexico.
Selective breeding
A major theme in the improvement of agricultural output is increased yield through
selection. The wild progenitors of crops and livestock had many characteristics that made them
less useful than the domesticated plants and animals into which they developed. They were
“improved” by farmers who selected those plants and animals that had fewer undesirable and
more desirable characteristics. Selective breeding concentrated the desirable characteristics in the
domesticated gene pool and removed the undesirable characteristics.

A spikelet of grass. The grain is enclosed between the palea and lemma
By Aelwyn under CCA 2.5 license from http://en.wikipedia.org/wiki/Image:En_Anatomia.png
Emmer, einkorn, and barley are three grains that were domesticated very early. Their
relatives still grow wild in Europe and the Middle East. The wild forms still interbreed with
cultivated varieties but there are significant differences between them. The seeds of wild emmer
are enclosed in thick woody structures called glumes, the palea, and the lemma that protect the
edible seeds and must be removed before they can be eaten. As in most grasses the seed are
borne on brittle stalks that break from the plant facilitating seed dispersal. Both of these
characteristics make wild emmer less valuable as a food crop. In the domesticated varieties the
glumes are thinner and easier to remove through threshing and the stalks stay attached to the
stem of the plant so they can be easily gathered.

Spikelets of emmer, the earliest domesticated form of wheat. Emmer is found at
archeological sites in Syria up to 19,000 years old.
Public domain by USDA ARS from http://en.wikipedia.org/wiki/Image:Usdaemmer1.jpg
The earliest differences between wild and domestic plant varieties must have developed
through the accidental selection of plants that had more desirable characteristics. Hunters
harvested from plants with more persistent stalks because they were easier to gather. They
brought them back to their campsites, where some of the seeds accidentally dropped on the
ground and grew, concentrating the genes for persistent stems. When they returned to their
campsite they found a population of plants with characteristics that were better for them. This
worked on other plant characteristics too. If thinner glumes were the result of genetic differences
between plants, the consequence of preferentially harvesting them was to concentrate the genes
for thinner glumes in the population of emmer growing at old campsites.

Spikelets of modern wheat contain more seeds that stay on the stalk when ripe.
By DavidMonniaux under the CCA 3.0 license from http://en.wikipedia.org/wiki/Image:Wheat_P1210892.jpg
Thus early hunter-gatherers were the unwitting agents of natural selection. Each time
they returned to the same campsite they found food plants that were better adapted for their
needs. Eventually, these proto-farmers saved a supply of seeds from the best proto-crop plants
for intentional planting in the next year. We know this through archaeological remains of early
farming sites show the gradual change of wild seeds into more modern forms.
The domestication of animals took place through a similar process. Most animal
populations include belligerent and cooperative individuals. If the basis for the difference in
these behaviors is genetic, killing and eating the more belligerent individuals leaves behind a
more docile and cooperative population.

Awassi, a breed of sheep common in the Middle East, were bred for fat in their tails which
was used in cooking
By Effib under CCA 3.0 license from http://en.wikipedia.org/wiki/Image:SheepInhaelavalley.jpg
One of the latest animals to be domesticated are laboratory mice. These are much more
docile than their wild relatives because the laboratory mice that bite are killed, removing the
aggressive genes from the population.2 Practicing the same selection processes on wild wolves
and foxes results in animals that closely resembles domesticated dogs in body form and
behavior.
The process of selection for desirable traits that makes plants and animals more useful to
humans has continued. Animals that gave more milk were used for breeding; those that did not
were eaten. Fruits that grew larger were kept for seed. Small ones were eaten. As the idea that
desirable traits could be passed from parents to offspring became understood there was conscious
selection and breeding for superior types of individuals. Since most farmers only exchanged
seeds or animals with their close neighbors this lead to the development of local varieties that
were well adapted to their local environments. In the last few decades many tomato varieties
have disappeared as a square tomato with thick skin that packs and travels well has taken over.

The Zebu cattle from India that are specially adapted to heat
Public domain by USDA from http://en.wikipedia.org/wiki/Image:Bos_taurus_indicus.jpg
Early agricultural revolutions
At first, advancements using selective breeding proceeded very slowly. The only plants
available to most farmers were their own and their neighbors. The result was that crops and
domestic animals were highly selected for adaptation to local conditions, but only with local
genotypes because that was all that was available. If a desirable characteristic was not present in
the available local populations it could not be produced. When cultural exchanges began between
people from distant regions one of the things that was exchanged was plants and animals which
allowed new opportunities for agricultural improvement and introduced new crops to places far
from where they originated.
The insular nature of farming methods and crop selection changed in the middle ages.
The spread of the Moslem religion from Spain to Indonesia facilitated the transfer of crops
between East and West. Moslem scientists started scientific agronomy, introducing the idea of
scientific testing of crops through the development of experimental farms. They studied where
crops grew best, building an understanding of their ecological limits and moved crops from
where they were first developed to the rest of their empire. They brought sugarcane and citrus to
the West from the Far East, along with many other crops we now take for granted. Their efforts

led to an increase in the number of crops available for farmers, and improved the diet of
everyone involved. The European colonial powers also brought corn, potatoes, pumpkins, and
tomatoes from the new world.
The British develop intentional scientific selective breeding in the 1700’s. By this time
the feudal system was disappearing, replaced by farms run by landed gentlemen. Gentleman
farmers began to run their farms as if they were businesses instead of personal estates. They had
the time and interest to expend in improving their crops, and had access to many different crop
and animal varieties in Europe and throughout their empire. They were the first to adopt the 4-
field crop rotation developed across the English Channel in Flanders.
One of the important ideas they developed was active selective breeding. Until the mid-
1700’s, English cattle had been bred for pulling plows, not for meat. They were small. In 1700
the average weight of a castrated bull for sale at market was 370 pounds. Most calves were killed
in their first year before they had time to reach their full potential weight because there was no
fodder to keep them over the winter. Over the next century selective breeding for meat
production more than doubled the average weight of cattle at market to 840 pounds. The English
also bred improvements in sheep for wool and mutton, and draft horses for pulling. Their
example set the pace for the science of selective breeding around the world, and influenced the
thinking of Gregor Mendel and Charles Darwin in their studies of genetics and evolution. The
English Agricultural revolution also paved the way for the Industrial Revolution. As English
farms and English farmers became much more productive they released laborers for craft work
and later for work in factories.
Genetics and centers of crop diversity
Selective breeding greatly increased agricultural productivity in Europe in the mid-
nineteenth century, but it did not extend to crops and agricultural systems in the Americas,
Africa, and Asia. In these places, traditional agricultural practices with unimproved animals and
seeds continued as they always had.
In the Americas, the original seed stocks for cereals were brought over by immigrants
when they crossed the ocean. The climate in Italy and Poland is not like Nebraska. The seeds
they brought were not from the right climate or soils, and did not do very well. By the late 19th
century experts were predicting food shortages and famine in the US because increasing

population would overtake our ability to grow wheat. In 1898, the US Department of Agriculture
sent special agent Mark Carleton, a father of plant science in the US, to look for new and better
varieties of wheat in Central Asia. He left armed with the knowledge that plant varieties were
genetically adapted to their local environmental conditions. His plan was to find wheat in Asia
growing under those conditions.
Wheat was originally domesticated in Central Asia. It was the place where the greatest
diversity of wheat crop types might be found. It has a climate similar to the North American
Midwest. It was the most likely place to find new wheat varieties that selected by similar
environmental conditions that would do well under American climate conditions. He brought
back new durum and hard red wheat varieties that were drought resistant from the prairies of
Asia. Five years after the introduction of the new varieties they had spread throughout the wheat
belt. Their disease resistant properties and increased yields made them immediately popular.
Having the right seeds made all the difference.3
This and later expeditions to the original centers of crop and domestic animal diversity
initiated a new era of crop improvement. By the early 20th century many crops were being grown
in regions far from where their seeds had originated. Potatoes were brought from Peru to Ireland,
Poland, and Germany. Tomatoes went to Italy. Coffee came from Ethiopia to many tropical
regions around the world. Sugarcane comes from New Guinea and sunflowers from the central
US. Often only a few genetic strains of these transplanted crops were cultivated in their new
homes. This made them susceptible to pests and disease in their new homes. One of the reasons
for the Irish potato famine was that almost all Irish potatoes were of one genetic strain. Since
there was little genetic variability in the potato crop there was little resistance to the potato
blight.
Green Revolution crops
The next step revolution crop improvement was to employ the discoveries in genetics
made at the beginning of the 20th century and the genetic diversity available in the 1,000’s of
varieties of the major crop plants. Many developed countries began exploring regions from
which crops had been domesticated and cultivated. The seeds that were brought back were kept
in gene banks and used as a source for finding new and useful traits with which to improve crop
yields. Experimental farms crossed varieties with different characteristics and genetic histories.

When these were useful their seeds were planted and the progeny selected for desired traits until
they bred true. Gene banks and experimental farms greatly increased the variety of crop traits
available for scientists trying to improve their locally preferred crops. Crossbreeding between
different varieties began in the 1930’s and developed into the plant breeding programs that are
now known as the Green Revolution.
Selective crossbreeding programs went into high gear when the Mexican government
established a program to improve wheat cultivars after the Second World War. Mexico was
faced with a growing population and low agricultural production. The Rockefeller and Ford
Foundations provided funds for the establishment of an agricultural research station to improve
the varieties of wheat grown in Mexico. The initial goal was to increase wheat yield and reduce
the incidence of wheat rust, a common disease that greatly reduced wheat yields. Most wheat
populations are only resistant to the strain of rust that produced the latest outbreak. Wheat rusts
are continually evolving to circumvent the genetic resistance of wheat. The way to reduce the
effect of wheat rust is to use selective breeding to develop a variety of wheat that is resistant to
several strains of wheat rust.
Wheat yields in increased as a result of the Green Revolution
By Brian0918 in the public domain from http://en.wikipedia.org/wiki/Image:Wheat_yields_in_selected_countries,_1951-2004.png
Breeding disease resistant wheat was only the beginning of the green revolution project.
Many strains of wheat grow thin and tall in order to compete for light. Tall wheat plants produce
large seed heads that tend to fall over, ruining the crop. They also grow tall after growth spurts

due to inputs of nitrogen fertilizer. To combat this and make better use of fertilizer tall plants
were crossed with dwarf varieties that have multiple thick stems. The shorter thicker stems of the
hybrid did not fall over as often and they had more energy to invest in growing seeds rather than
stems.
Dwarf wheat varieties had improved survival and better yield per plant that greatly
increased yield per unit area. They were the first Green Revolution crop. Over the next forty
years wheat yields in Mexico increased by more than five times. Other countries became
interested repeating the Green Revolution program. Dwarf wheat varieties were soon introduced
to India and Pakistan, where wheat yields also increased more than five times. The same process
was used to breed new varieties of corn, rice, and other major crops. Food production in
countries that depended on them more than doubled.
Green Revolution crops did not produce equal gains everywhere. They have been very
successful in Asia and South America where grains such as corn, rice, and wheat are the major
food crops. They have been less successful in Africa where there are many more localized grain
and root crops with smaller markets. Sorghum, millet, and sweet potatoes have not attracted the
same attention as the big three grains from seed companies that do most of the seed improvement
work today. There are currently efforts in Africa to get Green Revolution breeding programs off
the ground for these crops.
Modern agriculture
Farming began as small plots planted with a variety of crops by individuals growing food
for themselves. It has evolved into a large mechanized almost industrial business in which food
is produced for people far away from the land that produces it. Industrial agriculture stands on
four legs: machinery, fertilizers, seeds, and anti pest chemistry. It is managed through an
approach that recognizes the importance of Liebig’s law of control by the minimum available
resource and niche theory to find the optimum point along the water and nutrient resource axis. It
uses all of the chemical tools available to eliminate plant and insect competitors through the use
of pesticides and herbicides, all of this delivered with powerful machinery.

Chemical control agents
Weeds are unwanted plants that compete for water, nutrients and sunlight. Crop plants
are also the food of insects and other pests that compete with us for the fruits of our labor. They
have existed since the beginning of agriculture. They include insects, slugs, snails, fungi, rust,
viruses, plant diseases, and birds. Many of them have been with us since the beginning of
recorded history. Since the beginning of agriculture we have looked for ways to lessen their
share of the take.
In traditional cropping systems, our competitors were kept at low levels by using
ecological approaches. Since early farmers were planting for themselves they planted the many
different kinds of crops that they themselves wanted and needed. They planted many different
fields of different crops so that there were only small islands of each crop scattered over the
landscape. The small size of their habitat islands kept pest and disease populations low. The
distance between crop islands kept movement between plots low. Because each farmer planted
their own seed the different plots were also different genetically. When crops in one area failed
they did not fail in all areas, which helped protect the general food supply, if not each farmer. In
this way, farmers unintentionally used the rules of island biogeography to protect themselves
from their natural enemies.
We could call these methods of ensuring crop success the natural controls. Organic
farmers use them and have studied them extensively.
Natural controls have been gradually abandoned as traditional cropping practices have
changed into industrial farming. Industrial farming gains production from economies of scale
that come from planting large fields with the same crop grown from genetically similar seeds.
This reduces the natural ecologic and genetic resistance to pests and weeds. Without genetic
resistance from varied crops on a varied landscape and with only large habitat islands that are
close together pests and diseases can spread rapidly. Modern agriculture depends on the
application of herbicides and pesticides to replace the natural genetic and spatial resistance to the
spread of insect pests, weeds and crop diseases.

Pesticides
Chemical applications to kill crop pests have been used since before 2500 BC. The
earliest pest deterrent that we know of was powdered elemental sulfur used in Sumeria. Over the
next four thousand years arsenic, mercury and lead were added to the arsenal.
Next came plant extracts. Nicotine sulfate was extracted from tobacco leaves in the 17th
century and used as an insecticide. Plant extracts, such as Pyrethrum, Rotenone, and Neem oil
were used in the 19th century. Pyrethrum is obtained from the seeds of chrysanthemums.
Rotenone is extracted from the roots of tropical plants. Neem oil is obtained from the seeds of
the Neem tree.
Synthetic chemistry came to the rescue in the early 20th century. DDT was first
synthesized in 1874, but its insecticidal properties were not discovered until 1939. When they
were, DDT was quickly put to use controlling insect borne diseases such as malaria. After the It
quickly developed into the first widely used synthetic insecticide. Since the introduction of DDT,
many other synthetic organic pesticides have been created. They fall roughly into two categories,
chlorinated hydrocarbons and organophosphates.
Chlorinated hydrocarbon pesticides
Chlorinated hydrocarbon pesticides include DDT, methoxychlor, heptachlor, chlordane,
and endosulfan. They work by opening sodium ion channels in nerve cells, causing spasms and
eventual death. When first produced they seemed to be a miracle product. They were cheap, easy
to apply, and very effective. They appeared safe, even when applied to people. The first uses of
chlorinated hydrocarbons were in the fight against mosquitoes that carry malaria in developed
countries in Europe and North America. DDT and others quickly became an integral part of
summer mosquito control programs in the US, and a favored tool of farmers. The solution to any
pest problem soon became the application of more chemicals rather than improved understanding
of the pest biology.
The honeymoon was soon over. The ideal chemical control agent has three qualities. It
only kills what it is intended to, it only lasts for a short time in the environment, and, it has no
effects on nontarget species. Most synthetic pesticides and herbicides violate at least one of these
qualities. DDT violates all three. It is persistent in the environment and it kills a broad spectrum
of both pest and non-pests. Since the predator populations that are the natural controls recover

more slowly than undesirable herbivore pests treatment with too much DDT reduces the strength
of natural ecological controls, and can increase pest problems. It also kills some fish,
crustaceans, and earthworms.
Biomagnification of DDT in the food chain.
Public domain by US Fish and Wildlife Service at
http://www.fws.gov/pacific/ecoservices/envicon/pim/reports/Olympia/HoodCanalEagle.htm
DDT and its decomposition products are persistent in the soil where it has a half-life of
up to 15 years. When it breaks down it forms products that retain similar chemical properties and
are persistent so it accumulates and its effects appear in nontarget species far from the point of
application. DDT and its breakdown products are lipophilic. They do not dissolve in water, but
they do dissolve in fats and oils. When DDT enters an aquatic ecosystem it dissolves in very
small quantities. When it is ingested or absorbed by one-celled aquatic algae it is stored in the fat
reserves. It is not easily metabolized so it accumulates in the fat droplets inside the algae. When
algae are eaten by zooplankton the DDT is passed up the food chain. Because zooplankton eat
many algae the concentration of DDT in them is much higher than in the algae. When the
zooplankton gets eaten by animals further up the food chain the DDT becomes even more
concentrated, sometimes over ten million times the concentration in the environment.

As the body load increases the biological effects of DDT also increase. At high
concentrations it acts as a hormone disruptor, interfering with the metabolism of its biological
container. In birds it interferes with calcium metabolism. Birds that prey on fish from aquatic
ecosystems that contain high levels of DDT lay eggs that have thinner shells. As DDT
concentrations increase their egg shells became thin enough so that they broke during incubation.
Top predators such as peregrine falcons, pelicans, osprey, and bald eagles were heavily affected.
In the 1960’s their populations declined, causing public outcry and aiding the passage of the
Endangered Species Act of 1973. DDT also accumulates in humans, where it is found in fat and
fat containing secretions, such as breast milk.
Opposition to the use of DDT began in the early 1960’s when Rachel Carson published
her book Silent Spring describing its effects on songbirds after applications to control mosquitos.
It focused attention on the side effects of chemical pesticides and alerted the public to their
dangers when Silent Spring was chosen as a Book of the Month Club selection.
As scientists and the public became aware of the side effects of DDT its was banned in
the US in the late 1960’s and early 1970’s. In 2001, it was placed on the Stockholm Convention
list of banned toxic chemicals. Its current approved use is restricted to mosquito control in
malaria endemic areas where it is used applied to surfaces or in mosquito netting fabric. During
the peak period of its use, over 90,000 tons of DDT per year were manufactured. Over 2 million
tons total were produced and used. Today, only 1,000 tons per year are used for malaria control
mainly in Africa.
Similar stories could be told for other organochlorine pesticides. At first they appeared to
be wonderful tools. As we learned more about them it became clear that they were special
dangerous tools to be used with extreme caution. Many of them have been banned or their use is
severly restricted.
We are still living with many of these chemcials even though they have not been used in
decades. Even though DDT has not been widely used for over 30 years it and its breakdown
products, are still present, sometimes far from from its originally use. Once released into the
environment, DDT undergoes chemical distillation. In warm climates it evaporates. It condenses
in cooler climates. There are measurable amounts of DDT in the fur of Polar bears, which have
never been directly exposed. The Grasshopper Effect also happens with other toxic chemicals

which is why native peoples in the Arctic have some of the highest body burdens of persistent
synthetic organic chemicals.
The final problem with organochlorine pesticides is that they select for immunity in the
pest populations. When they were first introduced they killed more than 90 percent of pest
insects. A few survived because they had genetic immunity. The next time the pesticide was used
a few more survived. As time has passed the effectiveness of most pesticides has declined as
they force evolution to occur in the pest species.
Repeated application of pesticides selects for resistant individuals.
By Delldot under CCA 3.0 license from http://en.wikipedia.org/wiki/File:Pest_resistance_labelled_light.svg
Other pesticides
Organochlorine pesticides have been replaced by chemicals from the organophosphate
and carbamate chemical families. These are less persistent in the environment and act by
blocking acetyl cholinesterase, shutting down the nervous system. Because their mode of action
is similar to nerve gas they are dangerous to handle. Luckily, they break down in sunlight after
contact with soil after a few hours.
Many plants produce compounds that deter insects from eating them. Some of these, such
as pyrethrum, rotenone, and nicotine, are effective enough that they are used as pesticides.
Pyrethrum is toxic to insects and fish but less toxic to mammals than synthetic pesticides.
Rotenone is used traditionally to catch fish by poisoning streams and ponds. Nicotine sulfate is

produced by tobacco plants in the roots and translated to the leaves where it functions as an
insect deterrent. Synthetic nicotine derivatives are widely used in agriculture, on golf courses,
and to control termites. Plant products are attractive as pesticides because they are biodegrade in
nature without long lived byproducts in the soil and water.
Some bacteria are also used as pesticides. Bacillus thuringiensis (Bt) produces toxic
proteins that react with the gut lining of susceptible insects. The digestive system is paralyzed,
and the insects die from starvation. Bt is close to the ideal pesticide. It only kills a few types of
organisms, there are several genetic strains that appear to be very restrictive in the range of
insects they kill, the chemical does not appear to affect non-target organisms, and it quickly
breaks down in the environment. The genes that produce Bt toxins have been isolated and used
to produce genetically modified versions of corn, soybeans, and several other crops that produce
Bt toxin in their cells. This allows farmers to reduce the application of pesticides because insects
eating these plants get their dose directly from the plant without the need for repeated spraying.
Herbicides
Crop plants face competition from other plants. They compete for water, light, and
nutrients. Weeds are plants growing where we don’t want them which farmers control with
herbicides. The earliest herbicide was probably the sweat off the farmers back. They coped with
weeds as best they could, spending long hours in the fields hoeing out weeds. Modern farming
uses synthetic chemical herbicides to do what was formerly called stoop labor.
Synthetic herbicides first became widely available after WWII. They were based on new
understandings of how plants regulate their metabolism and growth. The first commercially
available synthetic chemical herbicides were similar to the plant hormone auxin. We called them
2,4-D and 2,4,5-T. These were followed by Atrazine and its relatives. The last major group of
herbicides to arrive on the scene was based on Glyphosate.

The grass seedling on the left is a monocot. On the right is a dicot.
By Peter Halasz under CCA 2.5 license at http://en.wikipedia.org/wiki/File:Monocot_vs_dicot_crop_Pengo.jpg
Auxin is the plant hormone that controls growth. 2,4-D and 2,4,5-T mimic the biological
effects of auxin. They cause uncontrolled growth that exhausts the plants energy and nutrient
reserves. Treated plants grow so fast that they die.
There are two main types of plants. Dicots have two leaves when they emerge from the
seed. Monocots have only one leaf. Most weeds are broadleaved and the important food grains
are all monocots. 2,4-D and 2,4,5-T both work exclusively on dicots so they are heavily used on
grain crops such as wheat, rice, and corn. 2,4-D is still used today on cereals, hayfields, lawns
and golf courses and in Christmas tree plantations.
These auxin mimics were used in the Agent Orange in the Vietnam War to defoliate
forests that were being used as infiltration routes from the north into the south. They were
manufactured in large quantities with low quality control, which meant that they contained high
levels of contaminant byproducts. One contaminant was the chemical dioxin. Dioxins have been
linked to cancer, acne and birth defects in humans, and are probably one of the causes of the
unusual medical symptoms observed in soldiers on both sides after the war. 2,4,5-T has been
banned because it is difficult to manufacture without contamination.

Atrazine and its relatives were developed in the 1950’s as the second generation of
herbicides. They act by inhibiting photosynthesis, starving the plant to death.
Conventional tillage reduces weeds by plowing the soil, breaking the surface, and turning
it, exposing it to erosion. Conservation tillage does not involve plowing. Instead seeds are
planted using a drill that places them at the correct depth for germination. Weeds are controlled
by herbicides. Conservation tillage reduces soil erosion at the cost of using more herbicides.
Atrazine is the favorite herbicide of conservation tillage farmers, but requires very high
application rates in order to achieve adequate control. Although Atrazine breaks down in most
soils high application rates result in some Atrazine reaching the water table and high aquatic
ecosystems.
The rate of Atrazine application in 2002 in the United States.
Public domain by USGS from http://water.usgs.gov/nawqa/pnsp/usage/maps/show_map.php?year=02&map=m1980.
The third generation of herbicides was released in 1974. Glyphosate disrupts the
metabolism of plants by interfering with the synthesis of amino acids that are necessary for cells
to function properly. It breaks down in the soil after a short period of time. There are genes for
Glyphosate resistance that have been used to create genetically modified resistant corn and
soybeans so it can be used to control weeds during the growing season. Glyphosate is also
widely used in conservation tillage.

Hormones and antibiotics
We also use chemicals in raising and producing food from animals. As we better
understood their biochemistry we started producing hormones to make them grow faster and
more productive, and antibiotics to resist infections and disease so we can grow them in higher
densities.
Hormones regulate milk production in female animals. In cows we use them to stimulate
milk production. Often we are so successful that the cow’s udders get infected unless we treat
them with antibiotics. Growth hormones make young calves gain weight faster so we can grow
them on less feed and slaughter them when they are younger. Hormones also stimulate chickens
to be more efficient at converting food into muscle.
A recent development in farming has been the concentration of animals in intensive
growing facilities. Pigs and chickens no longer roam free. They are confined in pens where
movement is restricted and they are fed diets that lead to rapid weight gain. When animals are
concentrated stress and poor sanitary conditions lead to chronic low-grade infections. Constant
treatment with feed that includes a low dose of antibiotics keeps infection low and promotes
weight gain.
Crowded conditions produce low grade infections.
Public domain by ITamar K.from http://en.wikipedia.org/wiki/Image:Industrial-Chicken-Coop.JPG
Using hormones raises moral and ethical issues about the treatment of food animals.
Dairy cows treated with hormones have a higher incidence of infection and disease in the udders

and problems with their hooves. Do we need to produce more milk at the cost of increased
discomfort and disease?
Genetically modified organisms
The last 25 years have seen a tremendous increase in knowledge of genetics. We now
know how to identify sequences of DNA that code for particular chemical products inside cells,
obtain those sequences, and move them between organisms. This has led to the development of
new types of seeds that contain resistance to pesticides and herbicides. We have moved genes for
the production of biologically important chemicals into animals and bacteria that can be used as
living biochemical factories. Many genetically modified organisms have been created for
research and experimentation, including florescent fish and pigs. Some of the first genetically
modified organisms (GMO’s) were bacteria used to produce insulin for treating diabetes and
blood clotting factors to treat hemophilia.
There are many agricultural uses for GMO’s. Some plants have been given genes for
resistance to herbicides. The genes for resistance to the herbicide Glyphosate have been inserted
into corn and soybeans so that they can be sprayed with this herbicide while they are growing
without effect. Because of this Glyphosate has become an extremely popular herbicide. The
genes that code for the Bt toxin that kills insects have been incorporated into many crop plants to
protect them from leaf eating insects. They are expressed in the plant during growth. Insects
eating these plants also ingest the toxins, and die. Bt toxins have been incorporated into Corn,
Peanuts, and Soybeans, among others.
GMO techniques are also being used to increase the nutritional value of crops. Vitamin A
deficiency causes blindness and other infirmities in many underdeveloped countries where
people are unable to afford a good diet. The genes for the biosynthesis of beta carotene, the
precursor to Vitamin A, have been incorporated into a rice called Golden Rice. The Golden Rice
genes are being incorporated into widely used existing rice varieties that will be planted in
Vitamin A deficient areas.

Golden rice is a GMO that contains the gene for vitamin A.
CCA 2.5 license by International Rice Research Institute from http://www.flickr.com/photos/ricephotos/5516789000/in/set-
72157626241604366
Genetically modified plants and animals have the potential to revolutionize many food
and material production processes. Spider silk is as strong as steel, yet we can’t use it
commercially because we can’t find a spider that produces enough of it on demand. Geneticists
are currently working on isolating the genes that produce spider silk and inserting them into
mammals. They hope that the silk proteins can be converted into threads when the animal is
milked. Don’t be surprised if in the near future you hear of goats that produce spider silk.
The green glow on the left and right mice is because of a genetic modification that gave
them DNA from a jellyfish that glows under florescent light.
By Moen et al 2012 under CCA 2.0 license from http://en.wikipedia.org/wiki/File:GFP_Mice_01.jpg

As with any technology, there are benefits and costs to transferring genes between
species. Plants have viruses that are known to move DNA between species. If the genes for
Glyphosate resistance escaped into a weedy species we would lose an important agricultural tool.
If the genes for making Bt toxins escape into non crop plants in the environment they will effect
non-target insect communities. On the other hand recombinant DNA techniques offer promise
that many previously neglected crops can be improved in the near future.
Cloning
The newest tool in the agricultural toolbox is cloning. Cloning allows scientists to create
an exact genetic copy of an animal by taking the nucleus from one of its cells and injecting it into
a undifferentiated stem cell from which the nucleus has been removed. An undifferentiated stem
cell has the capability to develop into any kind of tissue, even a complete organism. Cloning is
currently expensive, but it allows the creation of many copies of superior individuals. Bulls that
produce superior offspring can be as valuable as race horses. Having more than one copy of a
bull allows faster production of semen to produce superior beef or milk cows.
A major potential drawback of cloning is that we will allow much of the existing genetic
variability disappear if we are not watchful. A similar loss of genetic diversity has been
happening as hybrid and now GMO seed have become common and the traditional heirloom
varieties are lost. Some genetic diversity is maintained in seed banks where seeds are kept
dormant in freezers. It is harder to keep animals in a gene bank because we need to keep a viable
population alive and growing in order to maintain their genes.
Farming impact
What are the environmental costs if industrial farming? Soils are the basis for all farming.
What is the impact of mechanized farming on soils? How is farming connected to other
resources? These are some of the questions that we need to ask to assess the sustainability of
industrial farming practices.
Pests and evolving immunity to chemical controls
Herbicides and pesticides are agents of natural selection, and natural selection is
inventive. Just as bacteria have evolved immunity to many antibiotics, weeds and insects have

evolved immunity to the application of agricultural chemicals meant to kill them. The evolution
of immunity is accelerating as plants, insects, and other agricultural pests gain more experience
with them.
Insects were among the first to evolve immunity. They evolve faster because they
produce several generations in a year. More generations means more opportunities for selection.
Farmers apply pesticides several times during the year, accelerating the process. More than 500
insect and mite species have evolved immunity to chemical controls. Crop plants reproduce
annually, so they have been slower to evolve in response to herbicides but they are catching up.
As plant diseases, weed plants, and pest insects evolve to become immune to the
chemical control agents provided by nature and chemistry we lose these powerful tools. We have
two alternatives. We can use more technology to invent new killing agents, or we can change the
way we apply the ones we have.
The more technology option is already in full swing. The companies that sell agricultural
chemicals are developing new and different chemical technologies and they want us to use them.
The other option involves changing the behavior of farmers through the use of integrated
pest management (IPM). Integrated pest management stresses the use of observation, population
biology, and landscape ecology in crop management. Under this approach we attempt to
understand pest population biology and look for ways to use it to minimize the impact of pests
on crops. Under this approach we only use chemical control measures as the last resort,
incorporating natural predators and timing into our management strategy.
People who use IPM recognize that pests cannot be completely eradicated from the
agricultural ecological system. Knowing the life cycle of the insects and their actual population
in the field allows farmers to assess whether they are going to reach population levels that will
damage crops so they can resort to targeted countermeasures. These include manual removal of
insects by hand or vacuums, cultivating the soil during insect mating periods, selecting only
crops that are healthy growing in the local climate, and releasing predators that feed on crop
pests.
Soils
Soil is a combination of sand, clay, and silt. Sand is the grains of rock that feel gritty
when you rub soil between your fingers. Silt particles are smaller grains abraded by wind, water

and ice from rocks. They have the consistency of flour when rubbed between the fingers. It is
easily blown by the wind. Where it lands, it forms deep deposits called loess. The American
Midwest is covered by silty loess blown off the Rocky Mountains. Clay soils are composed of
very small mineral particles formed by weathering of rock crystals into the smallest particles.
Soil composition triangle.
Public domain from USDA at http://www.nrcs.usda.gov/wps/portal/nrcs/detail/soils/edu/kthru6/?cid=nrcs142p2_054311
Soil contains the remains of once living organic matter that we call humus. Humus is
captures water and free nutrients, keeping them in the soil. It also contains the tiny organisms
that live in the soil that feed the larger organisms that turn the soil. Mites, worms and other tiny
animals survive by eating the soil, mixing it in their intestines, digesting the bacteria that break
down the organic remains, and depositing their feces back into the soil.
The physical properties of a soil determine how easy it is to farm. Soils that are mostly
clay are heavy, and difficult to work, but retain moisture in the tiny holes between clay particles.
Sandy soils lose moisture quickly as it flows through the large pores between sand grains but
they are easy to work with plows. Silty soils are a good combination of both. They retain water,
and contain mineral plant nutrients. Humus is also important in maintaining the nutrient content
of the soil.
Soils form slowly from the weathered remains of rocks under the influence of rainfall and
plants. It may take more than 100 years to form one inch of fertile topsoil. Upland soils that form

in place grow much more slowly than floodplain soils that have the benefit of receiving
sediments left behind by floods.
Well-developed soils are separated into layers. On top there is a thin layer of decaying
remains of plants and animal feces (the O or organic layer). This is mixed into the top layer of
mineral soil (the A layer) by worms, insects, and burrowing mammals. Most soil life occurs in
the A layer. It is rich organisms that eat it for food, mix it in their travels, and create air spaces
that aerate it. The majority of plant roots are in the A layer where plant nutrients are most
plentiful.
A typical soil profile.
Public domain by USDA from http://soils.usda.gov/education/resources/k_12/lessons/profile/profile.jpg
The B layer is like the A layer except it contains more mineral components than organic
materials. The content of the B layer is often dominated by the chemical processes that result
from infiltration of water through the O and A layers. Water percolating from the surface
dissolves minerals in the O and A layers of the soil and carries them down to the B layer, which
accumulates iron, clay, and aluminum. If the soil is high in iron this layer may take on a reddish
color. Plant roots penetrate into the B layer in search of mineral nutrients and water.
The C layer is mostly weathered and broken but recognizable pieces of the parent
bedrock material, with little organic material and few roots. Roots may penetrate this far in
search of water, or in order to help hold the plant in place against wind.

The O and A layers make up what we know as the topsoil. The other layers make up what
we know as the subsoil. Good agricultural soils are made from bedrock that contains nutrients
and plenty of organic matter to hold water. Bedrock that does not readily breakdown, such as the
granites of New England and the Adirondacks, create poor soils.
A soil cross section in Irish glacial till
Public domain by HolgerK at http://en.wikipedia.org/wiki/Image:Stagnogley.JPG
Erosion
Farming disturbs the soil surface. Under natural conditions, plant roots hold it in place.
Conventional farmers remove their plant competitors and make it easy for crop roots to penetrate
the soil by plowing. Plowing eliminates the old root matrix that kept the soil in place, exposes
the subsoil, and allows the fertile upper layers to be carried off. Thus, a major environmental
impact of most farming practices is soil erosion.

Erosion in a wheat field
Public domain by Agricultural Research Service at http://www.ars.usda.gov/is/graphics/photos/k5951-1.htm.
Farming has had a tremendous impact on soil erosion rates throughout history. Since the
early Bronze Age agriculture has reworked the surface of the Mediterranean landscape. When
times were good, Greek farmers terraced the hills. Terracing kept the soil in place but required
constant upkeep to keep them from washing away during the occasional heavy rains. During bad
economic times the cost and effort of maintaining the hillside terraces was too great and they
were abandoned. Without maintenance, the terraces washed away into the streams. Rivers
carried the soil out into coastal harbors which were eventually filled. Many Greek and Roman
era cities had to move their harbor more than once to maintain access to the sea.

These rice terraces in central Luzon have been in use for over 2000 years.
Copyright Avram Primack.
The amount of erosion depends on the soil type and the cultivation practices used. Loose
sandy and silty soils are more easily eroded than heavy clay. Erosion is higher on sloping
hillsides than on flat plains Light sandy soils in arid regions are prone to erosion during
occasional heavy rainfall and from wind. Many farmers till soil in the fall after harvesting crops,
leaving it without any vegetation and open to erosion during the winter snowmelt and spring
rainstorms. Soil erosion is promoted by overgrazing livestock and through forestry practices that
leave hillsides exposed and the soil disturbed.
Soil loss is a major problem worldwide. In the southeastern US more than 75 percent of
the original topsoil has been lost. More than 25 percent of topsoil had been lost over more than
half of the lower 48 states by 1974.
Lost soil enters streams and rivers, changing sediment loads and affecting aquatic life.
Eventually these sediments reach lakes and oceans where they form deltas. Eroded soil fills
reservoirs, reducing the lifespan of irrigation reservoirs and power generation dams. Nutrients
attached to soil particles stimulate aquatic plant growth, changing the clarity of lakes and
composition of communities. In extreme cases, the extra nutrients increase the rate of
decomposition so that oxygen in the water is exhausted, forming a dead zone. Large dead zones
have formed in the Gulf of Mexico, the Black Sea, the Baltic Sea, Chesapeake Bay, and around
other river mouths around the world that drain agricultural watersheds.

Energy and agriculture
Another aspect of industrial agriculture is that it is built on practices that substitute fossil
fuel energy for manual and animal labor, and depends on fossil fuels to make many of its
necessary inputs. Energy is built into agriculture directly through the use of machines that till,
tend, and harvest the crops, and indirectly in the energy embodied in the creation of the
pesticides, herbicides, and fertilizers, used to produce them. This means that food produced from
industrial farming is really reconstituted sunlight from early epochs.
These practices developed when the cost of energy was relatively cheap. Farming using
these methods assumes that energy will continue to be cheap. As long as the cost of energy stays
cheap, so will the cost of food. If the cost of energy goes up we should expect the cost of food to
follow.
The cost of energy fluctuates in response to demand and political unrest in oil producing
nations. In the last decade there have been several oil shocks and market fluctuations driven by
speculators. More recently China and India have undergone tremendous growth that has
increased their demand for fuel. At the same time, world production of oil seems to have peaked.
This has prompted some people to take an interest in growing agricultural crops for the purpose
of making biofuels. Some countries have turned to producing their own gasoline substitutes by
growing corn and sugar cane to ferment into ethanol. For many decades Brazil has grown its own
sugar cane to make alcohol as fuel for cars and trucks. The US has long had a program of making
ethanol from corn. Many brands of gasoline in the US are a mixture of ethanol and gasoline
known as gasahol. Other crops and crop wastes are also under consideration as source material.
Until recently, the main purpose of agriculture has been to grow food. If agricultural
crops become an energy source, the cost of food will become more closely tied to the cost of
energy and food production will start to compete with fuel production for access to good
farmland. As this competition becomes stronger increases in the cost of energy will cause us to
turn to biofuels, increasing the cost of food. Using crops for fuel will increase pressure to
develop more land to grow fuel crops. This will put pressure on nations that still have virgin land
to open it for fuel production and increase the cost of food on world markets.

Will there be enough food in the future?
Will there be enough food in the future? This question was on the minds of many thinkers
in the 17 and 1800’s. It was mentioned in many books on economics as an important problem
that needed to be solved. Thinkers at this time often had direct firsthand experience with going
hungry and had seen or heard of famines in nearby regions close to where they lived.
Small and large famines occurred constantly somewhere around the world until only
recently. Famine is less common today because of improvements in food production, storage,
and distribution. Food production technology means that there is normally a global surplus stored
somewhere. Improved communication and weather prediction identifies when and where
famines are likely to occur before they happen. Storage allows the preservation of surplus food in
better condition and for longer than ever before, and transportation allows it to be moved quickly
to where it is needed. Today famines occur only in remote and impoverished areas where it is
politically difficult to deliver food. Will there be enough to feed growing populations into the
future? This is a central question in agriculture and for the world in general.
Malthusian theory
Famine from crop failure was common in the 16th, 17th, and 18th centuries. At the start of
the 16th century, famine killed one third of the Russian population. There was famine in England
in 1623, 1649, and 1727-1728. Famines occurred in France in 1650-1652, 1661-1662, 1693-
1694, 1706-1707, 1709-1710, 1738-1739 and 1788. Many areas were in a state of near famine all
of the time. China and India regularly suffered devastating famines in some part of their territory.
Ethiopia and other regions of Africa also had recurring events of mass starvation.
"...in all societies, even those that are most vicious, the tendency to a virtuous attachment is so
strong that there is a constant effort towards an increase of population. This constant effort as constantly
tends to subject the lower classes of the society to distress and to prevent any great permanent
amelioration of their condition."
"The power of population is so superior to the power of the earth to produce subsistence for man,
that premature death must in some shape or other visit the human race. The vices of mankind are active
and able ministers of depopulation. They are the precursors in the great army of destruction, and often
finish the dreadful work themselves. But should they fail in this war of extermination, sickly seasons,
epidemics, pestilence, and plague advance in terrific array, and sweep off their thousands and tens of

thousands. Should success be still incomplete, gigantic inevitable famine stalks in the rear, and with one
mighty blow levels the population with the food of the world."
Excerpts from: Thomas Malthus, (1798). An Essay on the Principle of Population, As It Affects
the Future Improvement of Society, with Remarks on the Speculations of Mr. Godwin, M. Condorcet,
and Other Writers, 1st edition, London: J Johnson.
Thomas Robert Malthus was an English pastor and college professor who lived at the end
of the 18th century. As an early economist and demographer he studied the population and
economic conditions that led to famines and the events that happened between them. He noticed
that famines temporarily reduced population and population growth. Between famines,
population grew again. Eventually populations got large enough that people began to go hungry
again.
The Reverend Thomas Robert Malthus wrote about the relationship between population
and agricultural growth.
Public domain from http://en.wikipedia.org/wiki/Image:Thomas_Malthus.jpg.
During his time, there was plenty of forested land available for conversion to agricultural
use. He observed that when too many people went hungry forested land was converted to food

production by landowners using the cheap labor of the hungry poor. During hard times,
population growth was slowed by war, infanticide, disease, murder, delayed marriage that
reduced the birth rate, and other unfortunate events that increase the death rate. When food
production increased good times returned, people had more children, and population grew again.
Malthus thought of the interaction of population growth and agricultural productivity as
an endless treadmill. He saw that every time there was increased agricultural output there was an
equal or greater response from population that was later checked by bad times. Population
always seemed to be able to grow beyond the ability of agriculture to feed it. His ideas were a
particularly early statement of the ecological concept we now know of as carrying capacity and
population overshoot.
Malthus based his conclusions on actual data from actual places in a time when most
people could not migrate to escape bad times. It would be difficult to make the same
observations today when there have been so many changes in food distribution, human mobility,
and medicine. Still, we might be able to duplicate his observations in places like Ethiopia and
Somalia where there have been famines recently if we took the time.
Certainly, the gains in food production made through the agricultural revolutions of the
last 300 years have been unprecedented. Our agricultural systems are many times more
productive than they were from the Bronze Age up to the Age of Enlightenment. At the same
time, there has been a tremendous increase in the number of people clamoring for a seat at the
table. Better food, better sanitation, better medicines, and better education have decreased infant
mortality and increased the lifespan of the average person. Even though the number of children
born to each woman has gone down over the last 4 decades the world population continues to
increase at a rate of around 60 million people per year. In order to maintain the current per capita
rate of food consumption in the face of a growing population we will have to maintain the rate of
increase in food production at the same level or higher. If we can’t, we will find ourselves in a
classic example of a “Malthusian” catastrophe.
Food production per capita
The Food and Agriculture Organization (FAO) of the United Nations started publishing
agricultural data for the world in 1961. Their data includes yield and area planted. The US

Census bureau keeps records of world population. These data can be used to make an analysis of
world food production compared to world population growth.
Most people’s diets are based on rice, corn, and wheat. According to the FAO, the cereal
grain yield per unit area has increased by 2.5 times over yield in 1961. During the same period,
the world population increased from 3.1 billion to 6.63 billion, an increase of 2.15 times. By this
analysis, food production per capita has increased by a little under 20 percent in the last 50 years.
If the benefits were evenly distributed to everyone, we all should be fatter and happier.
Will this trend continue into the future? To do this we will need more land to invest into
crop production. FAO data suggest that the area invested in crops went up between 1960 and
1980, declined between 1980 and 2000 when it started growing again. This suggests that there is
some land still available so long as the other requirements for using it (water, fertilizers,
pesticides, and fuels) are met.
Another option is to increase the yield per unit area planted. To do this we need to
continue improving the yield of the main staple crops. We have had great success with increasing
grain production by reordering the priorities of crop plants so they invest more in seed
production and less in plant biomass. We do not know how far we can continue doing this. There
may be a physiological limit to how productive we can make them. In that case, we will need to
invest in the lesser crops in Africa that grow better in their climate that have not been brought up
to the yield rate of other crops.
We can get a sense or the potential for future increases in production by looking at how
the rate of increase in yield has changed, again using FAO yield data. This suggests that the rate
at which yield increased in the early decades of the Green Revolution has not been maintained in
recent years. During the 1960’s and 70’s yield increased more than 2 percent per year. This fell
to about 1.5 percent per year in the 1980’s and 90’s, and continued to fall into the early new
millennium. The reasons for the decline may include decreasing area planted, cyclic weather
changes, and political instability. It also may be that we have reached the limits of possible crop
improvement using available crops and technologies.

Grain yield compared to population increase as a ratio of the 1961 value. Grain yield is the
upper line, population is the lower.
Cereal data from FAO at http://www.fao.org/corp/statistics/en/. Population data from the US Census Bureau.
We currently have between 60 and 90 days surplus grain supply stored away. It is
troubling that in some years the rate of increase in grain yields way underperformed the rate of
increase in population, suggesting that worldwide shortages could develop if yield increases fell
short of population increases for several years.
Population and total crop yield growth for the world between 1965 and 2005. Each line
displays the 5 year centered moving average of the data to smooth some of the variability.
Population data from the US Census Bureau. Crop yield data from the Food and Agriculture Organization.
Geographic inequalities
Gains in grain production are not equal over the globe. If we examine grain production
per capita by region we can see that some regions have done well and others have not. Asia has

benefited greatly from the Green Revolution. South America has increased grain production at
close to the world average. They are mainly dependent on wheat, rice, and corn, the main Green
Revolution crops. The large drop in the former Soviet Union is probably due to political and
market instability after the change in government in 1990, and lack of organization in farming
and markets as large collective farms became privatized. Ethiopia has lagged behind because it
has several disadvantages. It suffers from drought, lack of organization and political instability.
Many African crops are localized and different from the rest of the world, and have not
benefitted from Green Revolution advances. African soils are also particularly old and leached of
nutrients, making them less productive.
Rising expectations and the future
Another factor that will change food demand in the future are the rising expectations of
people in developing nations. Millions of people in India, China, and other developing countries
are achieving the purchasing power of the American middle class. The diet of these people has
been mainly grains and vegetables. As they become more affluent their diet preferences change
towards animal proteins. Producing animal proteins takes grain. Beef production requires more
than ten pounds of grain feed to obtain one pound of meat. Fish and poultry are more efficient. It
takes only 2 pounds of feed to produce one pound of fish or chicken. Eating animal protein
reduces the supply of grain, increases the demand and raises the price, increasing the demand for
more land, water, and fertilizer with which to grow it.
Changes in per capita food production by geographic region.

By Masaqui under CCA 3.0 license from http://en.wikipedia.org/wiki/File:FAO_kcal_his.png.
As long as economic development continues to improve the lot of poor people around the
world there will be accelerated demand for more grain and grain based animal protein products.
This is already having effects in China, where the demand for pork has increased by more than 5
times in the last 40 years. During the same period, demand for fish, poultry, and other meats has
more than doubled, and grain fed to meat animals has increased by more than five times. At the
same time, aquifers Chinese grain belt in Manchuria are dropping.
Last word
One last and final word on the future of agriculture. Farmers are creatures of habit. They
do not take to new practices easily. Most farmers live or die by the success of this year’s crops.
They do not have a readily available supply of food for bad times other than the seeds they have
saved for next year’s planting and the crops they have harvested last year and preserved. They do
not like to experiment with their lives or livelihood.
Farmers know what practices and crops worked last year, and they expect the same or
similar crops to work again this year. They expect the climate for this year to be roughly similar
to last year. When it changes farmers have to adapt or perish. Many famines are associated with
unusual weather, or a series of years in which weather was consistently different than what
farmers expected as normal.
Weather is not a creature of habitat. It may stay constant for a few years and then change.
It goes through cycles. El Nino and La Nina years create precipitation patterns that are very
different from what we would like to call normal. Other weather variations happen on longer
time scales. Volcanic eruptions change weather catastrophically and the effects may last several
years. One of the functions of early governments was to store grain in good years for use in bad
years. In China and Egypt, this was made the direct responsibility of the Emperor and Pharaoh.
During bad times, it was cause for removing them from office.
One limiting resource for the development and maintenance of human civilizations is
energy. Today, the main source of energy is fossil fuels. Burning fossil fuels releases CO2 into
the atmosphere. Over the last 200 years, the industrial and personal use of fossil fuels has
released enough CO2 into the atmosphere to almost double its concentration. The concentration

of CO2 in the atmosphere is highly correlated with past temperatures. During the recent cold ice
ages CO2 levels were low. During the intermediate warm periods it was high.
Atmospheric scientists have predicted that high CO2 levels will result in climate
warming. A warmer atmosphere means a change in the weather pattern. As the climate warms,
the pattern of rainfall will change and the average temperature will increase. Models of the
response of crops to these changes show gains in some places and losses in others. The effect on
corn growing in the United States may be a small decline in production for most states except in
the north where it is limited by the length of the growing season.
We do not know what the full effects of climate change will be on agriculture, but we can
anticipate that it will require many farmers in many places to change their way of doing business.
If climate changes happens as it is predicted it will certainly put more stress on farmers and
agricultural systems already trying to cope with producing more food and energy for a growing
population. Even though farming is a small percent of GNP we all need to eat. Current food
prices are a demonstration of our ability to produce a surplus in our current climate. There is no
assurance that we will be able to maintain production levels if there is significant climate change.
Even a decrease in production of only a few percent may be enough to allow population increase
to catch up with the rate of increase in food production.
Summary
Agriculture is a basic human endeavor, necessary for maintaining civilization. It is one of
the original cultural forces that led to the creation of governments and laws. It is from agriculture
that we developed our original ideas about private property, and developed our first policies to
ensure that public resources were used for the public good.
Agricultural practice has evolved as the understanding of the natural world and
communication between different parts of the globe improved. It is one of the sources of early
scientific knowledge and thought about the workings of nature. Research on the biology of
agricultural plants and animals was very important in early studies of genetics and natural
selection. It led to revolutions in agricultural practice and increases in agricultural productivity
that have fed the world and allowed the unprecedented expansion in population over the last 250
years.

In the last century our understanding and mastery of organic and inorganic chemistry and
the development of advanced genetic techniques has led to even more mastery over productivity
and our plant and insect competitors. This mastery has come at a cost. Pesticides and herbicides
are now common constituents of the air, water and soil around us and we have lost much of the
genetic diversity of crop plants grown for millennia.
Will we be able to continue expanding agricultural productivity into the future, or are we
in the classic Malthusian bind, where population is in the process of expanding beyond the
ability of our current technology to feed it? It is hard to predict the future development of
technology. Based on what have now, the rate of increase in crop yield has slowed to about the
rate of population growth. If yield increases slower than population growth in the future, per
capita food availability will decline, food prices will increase, and famine may occur in poor
regions of the world.
The price and availability of food will be further affected by rising expectations in India,
China, and other developing countries. As more people become affluent they prefer more meat in
their diet, which diverts grain from directly feeding humans. Another competitor for food crops
is the conversion of agricultural biomass for energy production.
A final question is the potential for changes in crop productivity due to changes in
temperature and weather patterns as a result of human induced climate change. Farming is a
system that relies on dependable climate patterns from year to year. Climate warming threatens
to change these patterns in ways we do not yet understand.

Chapter 11: Fisheries and oceans
Introduction
Fishing is one of the oldest human occupations. The earliest bands of humans in Africa
lived near lakes and rivers, and probably ate large amounts of fish and shellfish. We know this
from the piles of discarded fish bones and shells found near their earliest settlements along the
lakes of the rift valley in Africa. Fish and shellfish were popular because they are food resources
that can be gathered without the work of raising and protecting crops or the danger of killing
large animals. Midden piles from 40,000 years ago, the garbage dumps of early human
settlements, contain many fish bones and mollusk shells. It is possible that the search for new
fishing grounds stimulated the migration of early people out of Africa, along the coast of Arabian
Peninsula, into India, Southeast Asia, and down into Australia.
A Stone Age fish hook made from bone.
Public domain from http://runeberg.org/nfcf/0686.html where it is part of the Källa:Nordiskfamiljebok (1917), band 26,
artikeln 'Stenåldern'.
Fishing is still a major human occupation but on a different scale. People have fished
wherever they could put nets into the water, and still do. Fishermen from many countries gather
fish from the ocean. Countries that depend on fish for a large part of their protein budget are
looking for them everywhere. At this moment, large fishing fleets from China, Japan, Poland,
England, Spain, Peru, Russia, South Korea and many other maritime countries are exploiting
every available fish stock for which there is a use. What is not used for human food is used for
pet food, chemical feed stocks, fertilizers, and paving materials.

Shellfish and finfish are the largest source of human food gathered from the wild. Most
fisheries resources are captured, not raised through active management on fish farms, but this is
changing as we learn how to force fish, shrimp, clams, and other marine organisms to spawn and
grow in controlled conditions.
Fish are an important source of protein and raw natural resources. How do we catch fish?
How much do we catch? Are we taking more than we should? What is the impact of our fishing
on ocean communities and ecosystems? How should we manage fisheries so that they are
sustainable into the future? Fisheries are self-renewing biological resources. If allowed, they
replace themselves over time. Understanding how they replace themselves is important to
understanding how to keep them sustainable into the future.
The answers to these questions can also be applied to harvesting other terrestrial
biological resources. Game animals and trees are also self renewing biological resources. Our
approaches to managing sustainable fisheries should also apply to managing these other
renewable natural resources.
A very short history of fishing
A major theme in the history of fishing has been finding ways to increase the catch.
“How do I catch more fish?” has been on the mind of every fisherperson since the art of fishing
was developed. The history of fishing is about the gradual development of ever more powerful
technologies that allow people to fish farther from the shore, deeper into the water, a longer time
away from the land, with more efficiency at catching more of whatever is there faster.
Fishing started with the earliest humans who used very simple technologies. They
gathered shellfish by hand or foot from waters that they could wade into and constructed bone
hooks for catching fish in deeper water where they could not wade. As fibers that could be made
into rope and string were developed, so were fishing nets and traps. These technologies allowed
us to extend our reach into regions that previously could not be harvested.

An Indian subsistence fisherman using a throwing net.
By Sujit Kumar under the CCA 3.0 license from http://en.wikipedia.org/wiki/File:Fishing_In_Orissa.JPG
The behavior of fish aided fishermen in catching them. Some fish migrate up rivers and
streams for spawning, or arrive seasonally in large schools. Others gather in large spawning
swarms in shallow water. These behaviors allowed fishing peoples to gather many more fish than
they could eat at one time. These people developed ways of exploiting and preserving these
bonanzas for later. They gutted and salted larger fish. Tiny fish were made into a salty paste or
broth that was used as a condiment and protein supplement that some of us know as anchovy
paste. For a long time, fish paste, and salted fish were important parts of fishing people’s cuisine.
The codfish that for a long time graced the tables of Catholics on Friday was salted. The
remnants of this time are with us today as the anchovies that no one likes on pizza.
The size of boats limited where fishermen could go. Small boats were used to fish within
sight of the coast. Larger boats with sail and rowing power could venture out of site of the shore.

Irish fishermen in traditional coracles
Public domain by Velela at http://en.wikipedia.org/wiki/File:Coracles_River_Teifi.jpg.
Trade in preserved fish products grew as large areas became more economically
integrated. This created an incentive to catch fish for export to other places. The Romans
produced many different kinds of salty fish sauce called garum that they traded throughout the
Mediterranean and into Europe and Asia along with wine and olive oil. Fish sauce is still a
common condiment used throughout China and Southeast Asia.
Eventually, fishermen developed boats that could stay at sea for longer periods. Clever
navigators learned to follow the currents, and read the winds and stars at night as they learned to
exploit offshore shoals of fish. Eventually they learned to cross large oceans to find unexploited
shores. The Basque and Norse found the fishing shoals of the Grand Banks off of Canada long
before Columbus found Hispaniola and was credited with discovering the Americas. They didn’t
tell anyone where they were going because they didn’t want anyone else to know where their fish
were coming from. The cod that they found on the Grand Banks, and Georges Bank and caught
with only hook and line fed most Europeans the salted cod fish that they ate every Friday for
more than 600 years. The tradition of eating bacalao, or slated codfish, is still alive and well in
the Caribbean and some northern European countries.

Codfish from the Grand Banks and Georges banks supplied Europeans with their Friday
meal for hundreds of years.
Public domain by NOAA from http://www.photolib.noaa.gov/htmls/figb0314.htm
For many centuries, the technology of actually catching fish remained hook and line from
rowboats or sail driven boats. This changed, as the industrial revolution provided technologies
that allowed men to gain more mastery over the seas. As in many other areas of the economy, the
industrial revolution in fishing was about becoming more efficient, producing more with less
effort and using fewer resources. This involved bigger boats, new materials, types of gear,
chemistry, and electronics. Iron hulled boats with winches could haul larger nets father out to sea
and explosive harpoons made catching whales safer and simpler. Now fishermen can drop their
nets in almost any part of the ocean to almost any depth if there is a catch worth the effort. For
the last 50 years, the race has been on, the race to catch all the fish possible before guy next door
can catch them.
How do we catch more fish?
Anyone who has been to a store that sells fishing tackle knows that there is a large and
bewildering array of fishing gear on display from which to choose. Most of the tackle claims that
it will make fish rush to bite your hidden hook so you will not have to spend hours waiting in
solitude, only minutes. The fishing tackle is colored just right, has the shiny part in the right
place, and has chemical fish attractants added, and so on. All of these enticements are there so
that when you go fishing you will catch more fish with less effort, providing you with more
opportunities to tell a good story about the one that didn’t get away.

A green highlander fly used for catching salmon.
By MichaelMaggs under CCA 3.0 license at http://en.wikipedia.org/wiki/File:Green_Highlander_salmon_fly.jpg
Commercial fishermen have the same interests as recreational fishermen. They want to
catch more fish with less effort. Fish are an important component of the world protein budget,
and there is an almost endless demand for fish, fish meal, fish oil, and other fish products. How
to catch more fish, quickly, and with less muscular, machine, or monetary effort, are the major
interests of all fishermen and the industries allied with fishing.
Over the last 250 years, the desire to catch more fish has driven interest in developing
new fishing methods. Fishermen are constantly looking for new ways to increase the number of
fish they catch. Governments encourage fishermen with subsidies and technical assistance so
they will catch more so that food made from fish will be plentiful and cheap. Companies that
supply equipment to fishermen want to sell more products. All of these pressures result in
increased catches from three basic strategies: fish a larger area, fish more intensively, and fish
more efficiently.
Fishing a larger area
The simplest way to catch more fish is to fish in more places. Expanding the area of
fishing grounds has the same effect as expanding the area planted in agriculture. Fishing a larger
area gives access to more fish stocks, and more species of fish. Fishing a larger area is possible
through building boats that can go farther from shore without having to return, can hold more
fuel, and store more catch.
Over the last 250 years fishing boats have gained motorized propulsion, a metal hull,
freezers, exploding harpoons, motorized winches, trawl nets, monofilament line, loran and GPS

navigation, radio, and ever larger size. In the beginning of the 19th century, boats were wooden
hulled and driven by sail that fished near the shore. At the end of the 20th century fishing was
conducted by fleets of motorized steel and fiberglass boats that go almost anywhere almost all
year round. These fleets include giant factory ships that process and freeze fish on the spot in the
middle of the ocean. Fleets of smaller vessels catch the fish, bring supplies, and take off
processed seafood to return to port. These floating factory towns stay out at sea for years at a
time, travelling to where the fish are and remaining there as long as they want. The most
sophisticated factory boats never come back to shore until they need repairs that cannot be
accomplished at sea.
The grand expansion of fishing grounds from near the home shores to a global enterprise
happened after World War II. The expansion of the Japanese tuna fishing fleet is an example.
Between the late 1950’s and the mid 1980’s they expanded their fishing reach from just near
Japan to covering most of the world oceans.
Other countries with maritime coasts and a taste for fish also developed large ocean going
fleets to harvest the world’s offshore fish resources. Others with only short coasts but big
appetites for fish such as Poland and South Korea developed fleets that could go far from home
to fish in the home waters of other countries.
Led to new maritime laws
As the reach of fishing boats expanded countries began prospecting for new areas to fish.
Countries that have exceptionally rich fishing grounds soon found foreign fishing boats in what
they thought were their own private fishing grounds. This caused conflict that sometimes
escalated to war. There were brief skirmishes between the English and Iceland over codfish
grounds in the 1950’s and 1970’s. The English fishermen had exhausted their own stocks in
English waters and went looking for more in Icelandic waters. More recently, Somali fishermen
have turned to piracy because their own government can’t keep foreign boats from taking their
fish. Conflicts between fishing nations led to the development of new laws of the sea and treaties
between nations.

The story of Salmon
Salmon are an example of the potential for conflict over fishing rights, and the need for
good regulation. Their complex life cycle creates many points of conflict between fishermen of
different nations, stream managers, and landowners.
The life cycle of the King Salmon includes a juvenile stage in rivers and streams and time
at sea growing to adult size before they spawn and die in the headwaters of streams.
Public domain by US Army Corps of Engineers at http://www.nww.usace.army.mil/lsr/reports/save_salmon/salmontoc.htm
Several salmon species are found in the Pacific from northern California to Japan. They
spend most of their adult life in the open ocean where fish from many areas mix in large schools.
When they are large enough to spawn they separate into individual breeding stocks and return to
the headwaters of their birth streams. Once there, the adult fish search out well aerated gravel
beds, spawn, and die. The young spend several months in the gravel beds and the upper reaches
of these streams growing to a size where they can swim in the swift currents. Eventually they
hear the call of the ocean and return back downstream through rapids and waterfalls back to the
salt water. Once back in the ocean they spend several years growing and storing energy until it is
their turn to make the upstream journey, spawn, and die.
Is the development of technology
Salmon fisheries in the 1800’s appeared to be without end. At the time fisheries managers
thought they were without limit, and said so often. The fishing boats were small, and the fish

were mainly consumed locally. The methods of preserving and shipping fish were limited at this
time. Most fish were eaten fresh, and close to where they were caught. The introduction of
canneries in the late 1800’s changed this. With this new technology fishermen were able to catch
fish, preserve them, and send them to distant population centers hungry for cheap food. It gave
more men an incentive to become salmon fishermen. More men fishing meant more boats
fishing. More boats meant more fishing pressure on salmon populations.
Salmon species from the North Pacific.
Public domain by the National Marine Fishery Service from http://en.wikipedia.org/wiki/File:Salmon_01_transparent.png
Early salmon fishermen were limited by the technology at hand. At first they caught fish
as they entered streams to spawn using small boats and weirs. Later, gill nets were introduced
which caught fish in the ocean as they came in to spawn. Gradually fishing pressure was
extended so that it occurred anywhere the salmon chose to go. There was no escape.
Another source of increased pressure on salmon are land use changes in the headwaters
of the rivers and watersheds that they used for spawning. Lumbering on the wooded slopes near
streams released more silt into the water, changing the characteristics of the stream bottoms.
Development of agriculture, towns and roads removed forests and created impervious surfaces
which increased the rate at which surfacewater ran off the land. Both of these changes reduced
the habitat available for spawning. The construction of hydroelectric and irrigation dams further
reduced habitat by restricting access to many spawning areas restricting the migration of adults
and young fish.

This clear cutting operation in Oregon
By Calibas under the CCA 3.0 license at http://en.wikipedia.org/wiki/File:Clearcutting-Oregon.jpg
That led to conflict
In a few short decades salmon populations were reduced to a fraction of what they had
been on many streams. The reduction of salmon stocks lead to political conflicts between
fishermen over gear choices, between fishermen and lumbermen who owned the spawning
grounds, dam managers who controlled stream flow for power generation, and citizens who
wanted dam designs to allow for fish passage. Resource managers addressed some of these
problems by regulating forestry practices near streams, making dam designers include fish
ladders in their plans, and restricting the use of gill nets in open water. Eventually they resorted
to growing their own salmon smolts in hatcheries.
The extension of territorial control
The growth of oceangoing fishing boats after WWII introduced a new factor into salmon
management. Now boats far from home began fishing for adult salmon in the open ocean before
they had a chance to return to their breeding streams. Fish schools in the open ocean contain
salmon from many regions that were caught without reference to where they came from. Many
of these boats were far from home, outside their native waters and no international law existed.
Nations where salmon are produced saw these boats as poachers on their fishery resources.
Fishermen complained about threats to their livelihood and politicians responded with treaties
that limited foreign access to fishing grounds and controlled the gear used.

The richest fisheries are over the continental shelf just offshore of continents which
stimulated nations with fisheries to assert national sovereignty. The original limit of territorial
sovereignty in maritime waters was three miles, about the distance that cannon could fire. This
was extended to 12 miles, and then a 200 mile exclusive economic zone was recognized in the
1980’s. The 200 mile exclusive economic zone allows nations with coastlines to control access
to natural resources in the zone, including oil, minerals, and fisheries that are found within the
200 mile zone.
And restrictions on fishing rights
On their return trip most Pacific salmon swim along the coast, within the exclusive
economic zone of some country. It has become popular to catch returning salmon before they
reach their native river using offshore drift nets and trawlers. Recently the Soviet Union, Canada
and the US have tried to ban drift nets and trawls. Their actions control access to most coastal
salmon fishing areas in the northern Pacific. Japan is a major fishing nation with a large appetite
for salmon but few salmon spawning streams of their own object to these controls which limit
access by their salmon fishing fleets.
Extending territorial waters has helped control pressure from nations that travel far from
home looking for fish. It has not solved cross border problems between neighbors such as
Canadian and US fishermen who catch salmon bound for streams in each other’s waters. There
have been a series of skirmishes and treaties between Canada and the US aimed at improving
management of these shared resources.
None of these measures have been completely successful at protecting Pacific salmon.
Many stocks are still threatened by dams and land use practices in their spawning areas. Fishing
pressure is still high and difficult to control. Fisheries managers have attempted to compensate
for the loss of natural breeding habitat by building hatcheries which release millions of young
salmon each year, but are not able to increase stocks back to historical levels. Hatcheries have
also introduced diseases and increased parasite levels because of the high densities they use to
raise fish. Most salmon stocks continue to decline in the face of changes in land use that lead to
loss of habitat and increased recreational and commercial fishing pressure.

And fishing deeper
Fishing is different from agriculture. It happens in a three dimensional world. The
shallow continental shelf is where most fish are found. The oceans away from the shelf average
several miles deep. The deep oceans have many fewer fish, but they are still enough to attract
fishermen. As boats covered the surface of the oceans, fishermen began to make use of the ocean
depths too using fishing gear developed to go deeper than ever before. Several popular fish were
first encountered by these deep fisheries as little as 50 years ago including Orange Roughy (180
to 1,800 meters) and Chilean Sea Bass (50 to 4,000 meters).
Orange Roughy is found between 180 and 1800 meters depth off the coasts of New Zealand
and South America.
Public domain by Robbie Cada from http://en.wikipedia.org/wiki/File:Orange_roughy.png
Deep sea fish have more limitations than nearshore fish. They live in a less productive
environment. In order to survive they grow slower, have longer life spans, and mature later than
fish that live in the more productive shallow continental shelf. Orange Roughy and Chilean Sea
Bass may live up to 100 years, and may take 20 years to reach reproductive size. Because they
grow very slowly, and mature later in life, their reproductive potential is lower and they are more
vulnerable to overfishing. Already both are in decline.
As you read this, fishermen continue to look for new as yet unexploited fish stocks that
they can turn into food for you or your pets, or can be feed to food animals that you might eat. A
recent fad was monkfish, a type of goosefish that lies hidden on the bottom waiting for its prey to
swim or walk by. When likely food comes close enough it opens its cavernous mouth and
swallows it whole. The name monkfish was invented to distract shoppers from its ugly
appearance. Your favorite seafood of the next year may come from the abyssal depths and look

like nothing you have ever seen before. You may not even recognize it if it arrives at your table
in ground and reconstituted form.
A monkfish for sale at market. In England the name monkfish is a way of referring to a
monster from the deep.
By Alexander Mayrhofer under CCA 3.0 license at http://en.wikipedia.org/wiki/File:Monkfish.jpg
Fishing more intensively
Another way to catch more is to fish more intensively. More intensive fishing means with
more effort. The simplest way to increase effort is to fish longer hours. Using larger gear or a
larger boat is also an increase in effort.
A common measure of fishing success is catch per unit effort. Catch per unit effort is
equal to the total catch divided by the total amount of effort.
CPUE (Catch per unit effort) = amount caught / effort spent catching
Catch is any measure of what is caught. It can be the number of tuna harvested, or the
pounds of oysters shucked. Effort is the amount of time or dollars spent catching, usually
measured in boat hours and adjusted for the size of the gear, number of men aboard, and the size
of the boat. Gear, labor and boat costs can be converted into dollars, so effort could also be
measured in dollars spent, and catch per unit effort could be converted to dollars spent per pound
of fish caught.

As long as the value of the catch is high enough to pay the costs of making the extra
effort, fishermen will work harder and longer hours. Many deepwater boats fish around the clock
while they are at sea because the cost (and hence the effort) of getting to the fishing grounds is
too high to lay idle when fish can be caught. Many of the gear innovations in the last 200 years
have allowed fishermen to increase the intensity (and efficiency) of fishing to pay for the
increased effort of arriving where the new stocks of fish are.
Until recently, most deep sea fishing boats used the traditional hook and line gear with
one line and one hook. This was not intensive enough to pay for boats to reach deep water
fishing grounds. The technique called longlining was developed to make this type of fishing
more intensive and efficient.
Longline fishing gear .
Public domain from by NOAA from http://www.nmfs.noaa.gov/sfa/hms/BiOp_FSEIS6.htm
Long lining increases fishing intensity by increasing the number of hooks. Long liners
use many sets of hook and line attached to one long line suspended on buoys from the surface.
Baited hooks are suspended at the correct depth to catch the desired fish, from near the surface,
to resting on the bottom. Long liners can let out many sets of fishing lines at the same time, each
many miles long, each with thousands of baited hooks to catch swordfish, tuna, and halibut.

Gillnet set to catch fish that swim near the bottom.
Public domain by NOAA at http://www.nero.noaa.gov/prot_res/scutes/students/elementary/threats.htm
Another recently popular intensive fishing method is gill or drift netting. Gill nets were
first used by American Indians in the Pacific Northwest to catch salmon. These are strung in the
water like fences and drift with the current. Fish swim into the net, are caught by their gill
covers, and can’t back out. Gill nets became popular in the 1930’s along with gas powered boats
and winches. The arrival of nylon in the 1960’s made gill nets more durable than the natural
fibers that had been in use. Today they can be miles long. The longer the gillnet the more
intensive the fishing effort.
Checking the catch in a gillnet.
Public domain by Fish Wildlife Service at http://www.fws.gov/digitalmedia/FullRes/natdiglib/11141.jpg
Another measure of fishing effort is boat time spent out fishing. More boats also mean
more intensive fishing. In most fisheries no one person owns access to the fishing grounds. Many
fisheries regions are open for anyone to enter and no one is watching how long each boat stays
out. So long as a person can make their gear payments they can try their hand at fishing. This
means that there will be a continual supply of fishermen out to increase the total catch, and that
many fishermen will work long hours when fish are available to be caught.

Fishing more efficiently
The other component of fishing technique is efficiency. An increase in efficiency is an
increase in catch without an increase in effort. Many of the technological innovations that
increased fishing intensity also increased fishing efficiency. Long lines caught many more fish in
the same amount of time as simple hook and line because there were many more hooks and more
line. Nylon allowed gillnets to be less visible so they caught more fish than cotton fiber nets.
Many technological innovations in fishing have been introduced that increase efficiency.
Oysters
Oysters are hard-shelled bivalves that live in brackish water near the mouths of rivers in
temperate seas. Today they are a delicacy, but for hundreds of years they were a staple in the diet
of rich and poor alike.4 They spawn directly into the water. A single female can release millions
of tiny eggs that are fertilized in the water. Their larvae float in the plankton for several weeks as
they develop and grow large enough to settle. Once they settle on the bottom, they attach to
something hard and never move again.
Oysters are filter feeders as adults. They prefer to settle in areas in which a gentle current
brings them food with low sedimentation rates so they are not smothered by mud. Oyster beds
form where larvae settle on rocks and other solid substrate and survive.
Major oyster fisheries are located in the Hudson River estuary surrounding New York
City, in the Delaware River, and Chesapeake Bay. Starting almost the moment the 13 colonies
were settled, oyster fishing was a major seafood industry. Oysters were eaten fresh, fried, boiled,
broiled, poached, baked, pickled, canned, in pies and pastries, and in soups.

Rakes used in Oystering.
Public domain
Early oyster fisheries developed using very simple gear. In the beginning they were
collected by hand from shallow water. As shallow waters were depleted fishermen used rakes to
pull them out of deeper water. As the areas that could be easily harvested by wading from shore
were exhausted tongs were used to grab them off deeper bottoms using small boats.
These methods proved adequate for several centuries. Although the easiest to reach
oyster beds were soon depleted of large adults they were always replenished by spat from other
beds that were not fished because they were too difficult to reach. The fishermen caught what
they could, and the oysters had a refuge from exploitation that allowed them to recover. These
simple systems of harvesting oysters were sustainable because the oystermen did not have the
technology or the numbers to reach all the oysters. They reached their limit of possible intensity
and efficiency without catching enough oysters to do serious damage to the fishery. These
methods were used for hundreds of years before more efficient technology changed the game.
The next step in increasing the intensity and efficiency was the introduction of the oyster
dredge, a bar of iron with teeth along the leading edge that is dragged along the bottom behind a
boat. Clumps of oysters that pass over the bar and are caught in a mesh bag dragged behind. At
first oyster dredges were sail powered. Later they were steam powered. An oyster dredge
dragged behind a steam powered boat was so efficient that independent oystermen without

dredges in New York harbor and Chesapeake Bay immediately called for regulation to limit the
size of the dredge and the hours in which they could be used. They feared that dredges would
overharvest the beds leaving nothing for the less technologically sophisticated fishermen.
Overharvesting would mean the ruination of a natural resource that had fed the poor of New
York City and employed many fishermen for two hundred years, and sent live and canned
oysters around the world as one of the first important exports of the City of New York.
Raking for oysters and using sail powered dredges.
Public domain from L’Ecnyclopedie 1771
Oyster dredges were responsible for some of the earliest regulations in fisheries. In the
Thames estuary outside London calls for regulation were rejected on the theory that the fecundity
of nature could not be overcome by the feeble efforts of man. The English lords were wrong and
their oyster beds were quickly depleted to less than one tenth of their historical yield. In
Chesapeake Bay the first regulations were put in place in the 1820’s, limiting dredge operations
to only two days a week from non-motorized vessels. The oysters in Chesapeake Bay lasted
another one hundred years until nutrient pollution changed the natural balance of algae in the
Bay and reduced oxygen levels in the water. These led to the decline of oysters in the Bay.
As time passed our impacts on oysters came from more than dredging. Industrial
development along the shore and on rivers released sediments and water pollution that further
depleted oyster beds. As this happened it was discovered that oysters could be planted by

transplanting newly settled oyster spat from places where they naturally occurred to places where
they were wanted. At first spat were collected from naturally occurring oyster shells harvested
from the bottom. Later artificial substrates were put out for them to settle on. These were first
planted in old depleted oyster beds and later in actively managed oyster farms. Oystermen found
that oysters even grew well in many places they had not been previously found. Planting oyster
beds became a new aquaculture industry. It allowed oystermen to intensify the fishery by moving
oysters to where it was convenient for them, and to become more efficient with the available
natural resources by managing them directly.
Harvesting tiles with settled oyster larvae for transplanting
Public domain from the Illustrated London News
The story of oystering is the continual development of technology to increase intensity
and efficiency, and then the development of regulation and more technology to protect the
oysters from being driven extinct by the power of the technologies that increase harvesting
efficiency. Wherever fisheries have been sustainable for long periods it has been because of the
balance of technologies and regulations and natural refuges for the fish. Similar stories could be
told for salmon, shrimp, tilapia, trout, whitefish, cod, tuna, and several marine and freshwater
fisheries that are now complemented by aquaculture industries around the world. Where the
technologies allow fishermen too much power in harvesting they have to be balanced by
regulations that reduce the amount of effort fishermen are allowed to invest.
Trawling
Trawling is a fishing technology that allowed fishermen to catch fish at any depth below
the surface in open water. Before trawling became popular hook and line and seine nets were
used in open water.

Seine nets are shaped like a fence that is drawn around a fish school in the open ocean,
lakes and ponds. As fishing boats became larger and motorized in the late 19th century they had
more power to move forward in the water and they started hauling nets. Early trawlers hauled
with the net off the side of the boat. In the 1950’s new designs and more powerful motors
allowed fishermen to place the trawl off the stern, a much more efficient arrangement.
A trawl net is like a large mesh bag with an open moth that is spread by two “otter”
boards. Fish overtaken by the mouth of the net as it is drawn through the water are caught in the
“cod” end of the net. This is tied shut and fitted with a smaller mesh to keep fish from escaping.
The “otter” boards that act as wings, holding open the mouth of the net as it is drawn through the
water. They also help set the depth at which the net travels.
A trawl net in action
Public domain by Anilocra from http://en.wikipedia.org/wiki/File:Benthictrawl.jpg
Trawl nets can be hauled at four feet or 4,000 feet or directly on the bottom. Nets that are
designed to move along the bottom have tires and weights attached along the lower edge to
protect it from damage and keep it down. The otter boards and bottom line can be set to drag the
bottom and produce noises and other disturbances that attract fish to be caught. Large trawl nets
have mouths the size of football fields. Over the past 75 years trawls have greatly increased the
efficiency of fishing boats that use them.

The stern of a Norwegian trawler showing the otter boards.
By Mahlum under CCA3.0 license from http://en.wikipedia.org/wiki/File:Togari.jpg
A drawback to trawling is the damage that it does to the sea bottom. The ocean bottom is
an important part of the food chain. It supports a community of filter feeders and scavengers who
live on what falls from above. These provide the food that grows the desirable fish that we want
to catch. Where bottom trawlers have been used for a long time they have so damaged the
physical structure of the bottom that it no longer supports these communities. Trawlers stir
sediments sending nutrient laden sediments back into the water column, promoting algal blooms
that lower oxygen levels in the water column. The Grand Banks and George’s Banks, places that
have been fished for hundreds of years, have been closed to fishing for the last 15 years because
of damage from trawlers.
Trawlers off the coast of Louisiana leave mud trails in the water.
Public domain by NASA government at http://landsat.gsfc.nasa.gov/?p=384

Technology improved navigation
A major increase in the efficiency of fishing arrived recently in the form of electronic
navigational equipment. For most of history, fishermen did not know where they were on the
open ocean without seeing landmarks on the shore. They only knew that fish were there by trial
and error and the accumulated memories of their fathers. They only knew how deep the water
was by dropping weighted lines over the side of the boat. They collected this information
through direct experience and maintained it through personal communication.
Sextants are used for measuring the angle of the sun to the horizon.
By Joaquim Alves Gaspar under the CCA 3.0 license from http://en.wikipedia.org/wiki/File:Marine_sextant.svg
For centuries, lighthouses have been a major source of positional information for
fishermen. These warned boats of dangerous waters and provided information on where you
were relative to a known point on the shore but they were no help in finding out where you were
on the high seas out of sight of land.
The main tool for navigation in the open ocean was the stars. In order to navigate away
from the coast and to cross oceans with precision, navigators needed better tools. As the
Venetians, Dutch, Portuguese, and British began to explore farther from the sight of lands they
knew into the Tierra Incognita of open water they developed technologies that told them where
they were.
Maps, a compass, sextant, and clock were early navigation tools. The compass told you
what direction you were facing and allowed you to stay on a steady course in a general direction.

By measuring the angle of the sun at your local noon to the horizon with a sextant you had some
idea of how far north or south you were. Recording the time when the sun was directly overhead
on a clock set to the time in Greenwich, England told you how far east or west you were. These
simple tools allowed boats to cross the open ocean out of sight of land beginning in the 1500’s.
For a while they were not terrible precise, but they improved, and they were the state of the art
until radio signals were used for navigation.
The next big innovation was radio. Radio stations that broadcast the time and station
identification were placed along the shore. Boats at sea received the signal from several stations
at once. Using the time differential between signals from two stations at known locations a boat
could determine where it was up to 1200 miles from shore using the LORAN (Long Range Aid
to Navigation) system. This has since been replaced by GPS (Global Positioning System), which
uses time signals broadcast from satellites and covers the whole globe. It allows a user to
determine where they are, which way they are traveling, and how fast. It also allows them to
return to the same point whenever they want to.
Sonar
Loran and GPS tell you where you are. What remains for the fisherman is to discover
how to find the fish below the surface. Sonar (Sound Navigation and Ranging) uses echoes to
locate objects. Bats and dolphins emit a strong pulse of sound and use the echoes to locate their
insect and fish prey, and avoid obstacles. The first human use of sonar was on boats for finding
icebergs after the sinking of the unsinkable Titanic in 1912. It quickly made its way onto
submarines, and warships that needed to find submarines in WW1. More recently, cheap
electronics made simple depth sounders and fish finders available to recreational and commercial
fishermen everywhere.

Sport fisherman’s portable sonar showing where fish are in the water column.
By Andrew Tawker under the CCA 3.0 license at http://en.wikipedia.org/wiki/File:Sport_Fishfinder.jpg
Fish finders are used by sport and commercial fishermen to find their prey. Commercial
fishermen use sonar to find schools of fish in the ocean. Once they know where a school of fish
is located trawlers can adjust the depth and location of their nets and drag them right through the
school of fish. Recreational fishermen use them to find out where the bass are in the water. Cod
fishermen use them to find schools of cod. Sonar allows fisherman to zero in on where the fish
are instead of spending hours looking and allows them to catch more fish in a shorter time
period. It makes them more efficient.
How many fish can we catch?
Some anthropologists think humans started out as fishermen. For most of our existence
the number of fish we could catch has been limited by the technology available. Hook and line
could only catch one fish at a time. Boats were too slow and nets were too small to do significant
damage before the late 1800’s. Fish had refuges in places we couldn’t reach. Until recently,
fisheries were sustainable because we did not have the ability to catch enough fish to matter.
That was then. What about now?
These technological limitations did not mean we had no effect on fisheries. Archeological
evidence shows that people had significant effects on localized fisheries. Wherever there was

high level of effort invested in fishing over a long period there was an effect on local
populations. Many fishing people made piles of discarded bones and shells near their
communities that show the changes in size and abundance of birds and shellfish. These show that
the largest snails, oysters, and clams were eaten first, leaving only smaller ones for later
generations. Where birds were available to eat the bones of the easy to catch species disappear
first. As long as local harvesting intensity was high many tasty shellfish species that could grow
large were present as only small individuals. As the more desirable species were consumed they
were replaced by less desirable ones that also dwindled in size. People consumed the most
valuable food first, and when it became hard to get, they substituted less valuable food in its
place.5
We have had a strong influence on local fish and shellfish communities wherever we
harvest them. Locally depleted fisheries were replenished by the overflow from harder to reach
places. This kept local fisheries sustainable in spite of the high intensity of effort expended on
harvesting from them. We did not have the technological ability to reduce the global population
of most fish stocks, only local fish stocks. The only way to overharvest globally was to improve
technology so we could fish in the refuges that were previously unattainable. Improved
technology led to more efficient fishing which led to global species declines. We eventually did
reduce the global population of some species. These species have life histories that made them
vulnerable. The most vulnerable species grow slowly and have low reproductive potential.
Whales
“We struck that whale and the line paid out,
But she made a flunder with her tail;
And the boat capsized and four men were drowned,
And we never caught that whale, brave boys,
We never caught that whale.”
A verse from the traditional song Greenland Whale Fisheries
Whales were hunted for thousands of years by coastal peoples using simple harpoons. In
the 1700’s Europeans began to hunt them for their oil, which was used for lamps and as a base
for cosmetics. Their mouth parts were used for women’s fashion accessories. We ate their meat.

The Japanese, Norwegians, and some native North Americans still do. There are many species,
most of which once had populations of hundreds of thousands.
The story of the destruction of the large whales is the story of technological change. Early
whalers went out with hand held harpoons in small boats. These were dangerous jobs, as is
reflected in the songs that whaler men sang about their work. As we became better sailors we
built larger boats, and improved the technology used to catch them. Thrown harpoons with
barbed hooks launched from rowboats were replaced with canon fired harpoons armed with
exploding tips shot from motorized launches. Most economically important whale species in the
north Atlantic were driven to near extinction in the late 1800’s followed by those in the southern
oceans by the 1930’s, when about 50,000 large whales were being taken per year.
Right whales were given their name because they were the right whale to hunt. They
were the Right Whale because they swam slowly near the shore and often float after they are
killed, making it much easier to process them into whale blubber, bones, and meat. The earliest
mention of hunting Right Whales began in the 11th century by the Basque people of Spain.
Today, after more than 80 years of practically no whaling there are still only very small
populations of Right Whales. The same story can be told for Blue Whales, which once numbered
more than 300,000 in Antarctica. Today there are only 12,000, with smaller populations scattered
in other places. Despite regulation of whaling starting in 1931 many species are still in danger.
A major reason that whales declined so fast is that they take between 5 and 10 years to
mature sexually, calves are carried for up to a year, and females may not produce another calf for
4 or 5 years. Even though large whales may live for more than 70 years females are not likely to
produce more than 10 calves in their lifetime.
Sharks and snails
Sharks are also vulnerable because of their life history. Large sharks grow slowly and
reproduce sparingly after many years of adolescence. They produce only a few eggs per year,
and many species produce live young. Sharks around the world are caught for their fins and
occasionally their meat. Many are caught accidentally when they investigate struggling fish
caught in fishing gear. Most species for which we have good records are currently in decline in
numbers and size.

Many sharks lay a few large eggs or bear a few live pups
By Xtylee under CCA 3.0 license from http://en.wikipedia.org/wiki/File:Mermaidpurse.jpg
Large snails are also in danger from overharvesting. For a long time large and tasty
marine snails have been harvested by free diving from the surface. These were protected by the
short time a free diver could spend underwater. Scuba diving has allowed divers more time
underwater to search. These too take time to grow to adulthood, only produce few eggs, and are
getting harder to find.
Large predatory snails are endangered around the globe
Public domain by Merlin Charon from http://en.wikipedia.org/wiki/File:Charonia_tritonis_a1.jpg

Fish
The list of fish in danger of extinction from overharvesting could go on to include
swordfish, tuna and marlin. These are large predatory fish prized as trophies for the wall and
eating in restaurants. The average size when these fish are caught has declined to about the size
at which they become sexually mature. In fish and many invertebrates, the number of eggs
produced grows exponentially as they grow larger. We have caught most of the large marlin,
swordfish, bluefin tuna, grouper, and other large food and sport fish, greatly reducing their
reproductive capacity. As their average size approaches the size at which they become sexually
mature, we are in danger of catching the fish that will be producing the next generation before
they have had a first chance to reproduce.
Today, we have navigation technology that allows us to find any fish wherever they try to
hide and gear that makes it possible for us to catch them no matter how deep or remote. Increases
in fishing intensity and efficiency have reduced the biological advantages that fish, snails,
oysters and clams have over whales. Today there are no refuges left. Previously safe stocks are
now under pressure everywhere.
How fish many should we catch?
Perhaps a better question is how many fish should we catch? Fisheries are different than
minerals and other inanimate resources. Mineral resources do not grow or reproduce. They are
nonrenewable resources. The supply of raw minerals only goes up when more is discovered and
then only in the sense that we know where to get more until it runs out. The supply of
nonrenewable mineral and chemical resources only decreases as they are extracted from the
ground and turned into products. Biological resources are renewable if a few restrictions are
followed: they can only replace themselves if allowed enough time to reproduce. Fish, lobsters,
crabs and clams are biological resources. They are renewable, just like livestock, crops, trees,
and other wildlife. But, the amount of fish, and any other biological resource, harvested this year
has an impact on the amount that is available next year.
How many fish can we catch before we have an impact on what we can catch next year?
The answer is less than the number of new individuals that are recruited into the population this
year. The inflow of new recruits has to be larger than the outflow of fish removed by natural and
capture mortality in order for the population size to remain sustainable. If more individuals are

caught and killed than new individuals enter the population the storage of fish in the future
environment will decline. We could also substitute mass for numbers. Fish grow at a certain rate.
If we remove more weight of fish than is replaced by bodily growth the mass of fish to be caught
will decline. We also need to maintain a population of large reproductive size fish. Larger female
fish produce many more eggs than smaller fish, more than the simple ratio of their sizes. If we
catch all the larger fish we are reducing their reproductive potential much faster than if we catch
small or medium sized fish.
Managing fisheries requires data on the size and age distribution of a fish population. In
order to know how many fish are available to be caught, we need to know how many there are,
how many will be added in the next year, and the number and size that are currently being
caught. From this we can predict the change in population size just as we can use the same data
to predict the change in size of the human population.
Unfortunately these data are not easy to obtain. Fish species are spread over
geographically large areas as several separate populations. Each fish stock may use a different
part of the species range and have to be managed as individually separate units. Each stock has
its own habitat space that includes where it spawns, where it spends time as juveniles, where it
feeds as adults, what it feeds on at each life stage, and when it becomes old enough to reproduce.
Because many of these events take place out of sight in deep water and when the fish are too
small to easily track, we still don’t have all of the facts for most species. The difficulty in
obtaining even this basic data makes it difficult to manage fisheries.
Calculating maximum sustainable yield
Fisheries management is a tradeoff between the catch today and the catch tomorrow. The
amount available in the future depends on how much remains at the end of today and how fast it
grows. A central objective of fisheries management is to make sure that today’s harvest does not
reduce tomorrow’s harvest. When management meets this goal we have achieved a sustainable
fishery. The goal of traditional fisheries management is to obtain the maximum yield that is
sustainable (MSY). Maximum sustainable yield is the maximum number of fish that can be
harvested this year without reducing the harvest in future years. If too many fish are taken this
year future reproduction will be too small to replace what was taken and the fishable population
will be reduced when we come back to catch them again in the future. When this happens even

once fishermen lose the opportunity to make a future profit from catching the fish that were
never born. If this happens year after year the fishery grows smaller, fishermen leave the fishery,
and the overfished species becomes in danger of extinction.
Finding maximum sustainable yield
The maximum potential yield is the size at which a population grows the fastest. It is easy
to calculate theoretically. The potential for population growth depends on the population size in
relation to its carrying capacity. Populations add biomass and individuals at different rates
depending on how close they are to their environmental carrying capacity. As a population
approaches its carrying capacity its growth rate slows and is reduced to zero by environmental
resistance. At the carrying capacity, there is no room in the environment to cram in another
organism and population growth stops. For a population at carrying capacity the potential for
growth is high because there are many individuals who would like to reproduce, but the actual
growth is zero because the environment will not allow it.
At a very low population size the opposite occurs. The environment is empty so there is a
lot of unused capacity available but a small population does not contain enough adults to take
advantage of it. In a small population the potential for growth is low even though the
environment will permit it, but actual growth is low because there are not enough individuals to
take advantage of the opportunity. As the number of reproductive adults increases so does their
power to produce young and the speed of population growth increases until the environment
begins to resist the addition of more individuals. After this point the rate of population growth
begins to decrease, eventually falling to zero when the population reaches its carrying capacity.
The growth curve of this theoretical population is the familiar S shaped sigmoid curve
from population biology. The X-axis of this curve is time. The Y-axis is the number of
individuals in the population. The rate of growth in the population at any point in time is equal to
the slope of the curve at that moment. When the curve bends upward the rate of growth is
increasing. When it bends toward the horizontal the rate of population growth is decreasing. The
moment at which the slope is highest is the point of maximum potential yield. This is the size at
which the population is growing fastest and will yield the most production for harvest. It is the
point of maximum sustainable yield.

We can see this by graphing the slope of the sigmoid curve. This gives an inverted U
shape that describes the population growth rate as the population increases from very small to its
carrying capacity. The X-axis for this curve is population size, ranging from zero to the carrying
capacity. The Y-axis is the number of individuals or biomass added per time period starting at
that population size. The height of this curve tells us how much will be produced for any
population size between zero and carrying capacity.
Maximum sustainable yield curve
Public domain from http://en.wikipedia.org/wiki/File:Growthratevs.populationsize.jpg
The U shaped yield curve shows that the rate of population growth is small at low size
and increases until the population reaches ½ of the carrying capacity. After this point growth
decreases until it reaches zero as the population reaches carrying capacity. From this we can see
that the population size that produces the largest amount of new growth, and hence the maximum
possible yield, is at ½ of carrying capacity.
A more difficult problem is to keep the yield sustainable. Harvesting only yearly growth
is sustainable at any population size, even when the population is very small and way below its
carrying capacity. Harvesting at less than the current rate of growth will result in a growing
population until the population reaches carrying capacity. Continually harvesting at higher than
the current growth rate will eventually drive any population extinct.
Now comes the hard part. Can we actually use this model on a real population to
consistently obtain the maximum sustainable yield? In order to construct an MSY management
model we need to know three things:
1) the environmental carrying capacity of the species,

2) the rate at which the species grows as its population increases from very small to its
carrying capacity, and
3) the current population size of the species.
Species that are fished commercially are certainly below their carrying capacity. Thus,
the current population level is not a good indicator of how many fish the environment could hold
if it were allowed, and since the species is being actively exploited there are no populations that
are undisturbed to gather data from. In order to guess at carrying capacity we will have to
estimate it from other data.
There are three ways to infer carrying capacity. One is to look at historically high
population sizes inferred from old fishing and other records. The second is to compare the fished
population with a reference population that is not fished. The third is to create a refuge that acts
like a reference population, and compare what happens inside the refuge with what happens
outside.
Old records show that many fish stocks were once much larger than they are now,
suggesting that current stocks have been greatly reduced. There are some difficulties using old
records though. They have to be used in the context of the time in which they were collected.
Using an overestimate of population size may lead to setting the carrying capacity too high
which changes the estimated population size at ½ of carrying capacity. Setting the yield curve
too high gives the impression that there are more fish available than there actually are, and
results in overharvesting the fishery until the yield curve is corrected. Overharvesting today
lowers harvests tomorrow and requires a reduction in fishing intensity until fish populations
recover.
The second method is to compare the fish population in an area that is exploited with the
fish population in another similar area that is not exploited. The unexploited population acts as a
reference to what the exploited population would be if it were left alone. Unfortunately, most
areas with fish are also areas with fishermen. In today’s ocean there are practically no
unexploited stocks of fish. Since there are very few pristine reference populations left to compare
with fished populations it is very difficult to take this approach.
The third way is to create an area in which fishing is stopped and watch what happens.
When fish populations increase within the refuge it suggests that fish populations outside the
refuge are being kept low by fishermen and other human influences on the environment. Fish

start leaving a refuge when it has reached carrying capacity. They become a source of
recruitment into other nearby populations. Refuges are an increasingly popular way to maintain,
study, and understand fish populations around coral reefs. They have become a popular
management tool in small-scale fisheries where local communities control access. They are also
being used in large scale commercial fisheries to protect spawning areas and fish schools that
form before spawning.
Fish growth rates
Fish stocks grow by adding biomass to individuals and adding individuals to the
population. An estimate of biomass growth with age can be obtained by collecting a sample of
fish and looking at their size distribution by age. How do we determine the age of a fish? Even in
the ocean there are seasons in which fish grow faster and slower. As they grow, the bones in their
ears grow too. During seasons of slow growth, the density of the bone deposited is higher than
during the seasons of fast growth. This shows up as rings in the bone, just like the rings that form
in the wood of trees in temperate zones. The weight of the fish and the number of rings in the
otoliths can be used to construct a model of how this fish species grows over time. Knowing the
population size at each age and the biomass at that age allows you to calculate biomass for the
whole population. Adding the expected recruitment into the population and subtracting the
expected catch and natural mortality gives an estimate of the future population size.
Fish reproductive success varies
Age specific growth rates are not the only factor involved in calculating maximum
sustainable yield. You also have to know the number of fish in the population. Population theory
says that the sigmoid curve predicts the size of a population, but only if the environment stays
constant. Unfortunately, there are abiotic and biotic factors that affect population size. Abiotic
factors include variable weather and water currents that influence algal growth and where fish fry
that cannot swim are located. Biotic factors include competition with other species and predation
by larger fish of the same and other species.
Fish grow through several life stages on their way to becoming adults. They start as tiny
eggs and hatch as helpless fry, a form of plankton. They cannot swim against the current, and are
at its mercy to bring them food. They have to grow large enough to be able to swim and hunt for

themselves before they take control over their lives. If they have bad luck they may end up where
there is no food, and starve. As juveniles and fry they are prey for larger organisms that eat most
of them. Finally they enter the adult population where they have to compete with other fish for
food and mates and avoid being prey for still larger fish.
Most fish live longer than one year and take several years to mature. Pacific salmon may
live to be 8 or 9 years old before they climb their birth river again, spawn, and die. Other fish
may live more than 150 years, slowly storing up enough energy until they can afford to spend
some of it on reproduction.
Juvenile recruitment into the adult population is variable. Some years will be successful
while others may be complete failures. Small differences in the timing of weather and currents
affect the availability of shelter and food for young fry. The presence of predators, competitors,
or lack of food can change a good year into a bad year. Since it takes several years to grow large
enough to become an adult what is being caught today is the result of events that may have
happened several years before, and the size of each year class is likely to be different from the
one before and the one after. Fishing each fish cohort as if it were the same will result in
overfishing in some years and under fishing in others. In order to be successful and sustainable,
fisheries managers have to continually adjust the size of the yearly fish catch in response to that
year’s recruitment success. When they don’t, too many fish are caught in years with low success
for the population to recover in years of high potential growth.
Take haddock for example
Gulf of Maine Haddock are an example of what happens when catch is not adjusted to
reflect the changes in population. Haddock were common in the 1950’s and 1960’s. Haddock
landings stayed high even when haddock populations declined. When fish became scarce in the
late 1960’s fishermen did not quit immediately, driving populations even lower. When haddock
suffered a minor recovery in the late 1970’s and early 1980’s fishermen returned to focus on
them. They stayed focused even after fish populations dropped, catching fish as if they were still
plentiful. As a result, haddock almost disappeared in the 1990’s and have showed no sign of
recovery for the more than a decade afterward.

Haddock population and harvest in the Gulf of Maine. Fishermen responded to the small
peak in the 1970’s by catching as many fish as they caught in the 1960’s when the
population was several times larger, which reduced the Haddock population to near zero in
the following years.
Public domain by NOAA from http://www.nefsc.noaa.gov/sos/spsyn/pg/haddock/
The maximum sustainable yield model is attractive because of its simplicity, but difficult
to put into practice because it is hard to obtain good data and hard to get fishermen to comply
with regulation. It is also difficult to get fisheries managers to set fishing quotas that reflect real
population sizes rather than those that are politically acceptable. Other models have been
developed that are easier to measure. These models have other difficulties.
Catch per unit effort
An alternative approach is to use actual catch statistics to estimate catch per unit of effort.
The actual catch that is landed and sold is recorded for most commercial species. Effort is
estimated by the number of boat hours invested in fishing adjusted for boat and net size. Catch
per unit effort (CPUE) tells us if fish are becoming easier or harder to catch. As long as the catch
per unit effort is not declining the fishery should be sustainable in its current form. Over the long
term, the number of fishermen and the gear used are certain to change and must be factored into
the analysis, or at least understood.
Catch per unit effort statistics show that catch is declining for many marine species, even
in the face of increased effort. Adding more boats to catch the same number of fish results in
fewer fish per boat, spreading the economic benefits between more people. Fishing for more
hours to catch the same number of fish results in fewer fish per hour. When catch per unit effort

is declining using more efficient technology simply catches the few that are left more quickly,
reducing the wild population size left to be caught.
Sharks are in decline
An example of a large marine species in decline is the silky shark. The silky shark lives
in most open oceans in warm water near the edge of the continental shelf. Although we do not
encounter them often they are one of the most common sharks, and one of the most commonly
caught.
Map of the silky shark distribution
Public domain by Ysx from http://en.wikipedia.org/wiki/File:Carcharhinus_falciformis_rangemap.png
Silky sharks are caught for their fins, which are made into shark fin soup, a delicacy in
China. Usually only the dorsal fin of the shark is kept and the body discarded. In some places
they are also dried or salted. Sometimes they are the object of sport fisheries. They are often
found following schools of tuna, one of their favorite foods. In the late 1980’s up to 900,000
were caught accidentally in the Pacific tuna long line fishery.
Silky sharks have gone into a steep decline in the last two decades. Reported catches have
declined by up to 90 percent. Because of their migratory nature and low reproductive potential
(only a few live young are born every year) they have not been able to withstand the intense
reported and unreported fishing pressure. Because of lack of integration of data and their
widespread and migratory population that mainly lives in the open ocean, their decline was not
well understood or noticed as it happened.
The Silky shark population decline is typical of other more familiar shark species such as
the Mako, Tiger, Hammerhead, and White Tip sharks. They all have similar reproductive
strategies. They only produce a few large eggs or live young per year. These grow slowly, not

maturing for several years. They might live for up to 40 or more years in the wild. They are
subjected to fishing pressure similar to Silky sharks, and have undergone similar population
declines. Because we do not see them in our everyday lives we do not notice their passing.
The catch of sharks has increased by more than 3 times in the last 60 years
By Con-struct under the CCA 3.0 license from http://en.wikipedia.org/wiki/File:Global_shark_catch.svg
As the population of Silky sharks has declined international conservation organizations
have become more interested and more effort has been put into monitoring them. A main
problem in managing their population is that they like to follow tuna schools. In order to protect
them regulations will have to be put in place that change how the long line fishery for tuna
operates. It will be difficult to put effective conservation measures into place that do not also
affect the economics of the tuna fishery.
Are we fishing sustainably?
If I had the wings of a gull, my boys
I would spread them and fly home
I'd leave old Greenland's icy grounds
For of right whales there is none

Traditional sea shanty from the late 1800’s
Are we fishing sustainably? The short answer is no. Over last 100 years we have
developed technology that makes it possible to find and catch even elusive fish anywhere at any
depth. Fish have lost their ability to hide as we have developed technologies that can see into the
ocean and bring them back from any depth. Coelacanths, a primitive fish that has been around
for hundreds of millions of years, living deep in the Indian Ocean off the continental shelf of
southern Africa, are currently in danger as the accidental catch of large fishing boats. Bluefin
tuna, the cheetah of the ocean is used to make sushi. Each full size Bluefin may weigh more than
500 pounds. Individual fish can be worth more than $250,000 at the dock in Japan. Because they
are so valuable, these tuna have been fished almost into extinction. Many species of whales are
still recovering from near extinction as a result of fishing for oil and meat. The cod, halibut,
flounder, and other fin fish that used to team off the northeast coast of North America are
practically gone after 800 years of sustainable fishing. Sharks, sea turtles, marlin, swordfish, and
many other species are under intense pressure and in decline around the world. What are the
signs of unsustainable fishing? Individuals are getting smaller, mature earlier, and there are
fewer of them.
Fish are smaller
The size of fish when they are caught gives an indication of the sustainability of the
fishery. When the average size of fish in a population declines it is an indication that the rate of
capture is higher than the rate of biomass growth. It means that large fish are being removed
faster than smaller fish can grow up to be large fish. This is undesirable because larger fish have
more reproductive potential than smaller fish. Selectively removing large fish reduces
reproductive potential. If the size of the average fish reduced below the size at which the fish
become reproductive the species may disappear all of a sudden as it is fished below the threshold
necessary to reproduce itself.
This is the story of Swordfish. The international longline fleets target swordfish and tuna
because they are the most valuable. Swordfish is on the average restaurant seafood menu, and in
most supermarket fish freezers. The flesh is firm and doesn’t taste too fishy for the average
squeamish palate. It is also a popular sport fish. A mounted swordfish looks good on the wall of
the intrepid fishermen.

The first recorded sale of an Atlantic swordfish was in 1817. The average size landed
commercially declined from between 400-500 lbs. in 1861, 300-400 lbs. by the end of the
1800’s, to around 266 lbs. Before 1961 swordfish were caught with harpoon, hand line, and rod
and reel. Since the 1960’s these methods have been replaced by long lining. The average size of
swordfish sold at the dock has declined to 88 lbs today. Female Swordfish don’t mature until the
age 5 when they weigh 150 pounds. Males do not mature until they reach 72 pounds at age 3.
Almost two out of three swordfish that are caught today have not yet had an opportunity to
reproduce.
Current fishing regulations actually promote waste of many young swordfish. The current
minimum swordfish size unloaded at the dock is 41 pounds, but long lines catch anything that
bites the bait. Longliners discard 40 to 50 percent of the swordfish they catch because they are
too small to legally sell. Most of the released fish die because of the trauma of being caught. In
1998 433 metric tons of baby swordfish were discarded. World catch has declined to a fraction
of what it once was. The continued high level of effort is maintained because of the high price in
the market. Being rare actually increases the economic value of the desirable fish, stimulating
more fishing pressure.
Mature earlier
The life history of a species changes when it is under intense fishing pressure. Fishing
catches the largest individuals. These are the oldest members of the population that have the
greatest reproductive potential.
When there is competition for mates, the older mature individuals suppress the younger
less mature individuals. As the oldest and largest individuals are removed by fishing, the smaller
previously excluded individuals become more successful. This selects for sexual maturity at a
younger age, and the size and age at maturity declines. Male deer are hunted more intensively
than the females. Does are not hunted to keep the reproductive potential of the population high.
Since it only takes one male to fertilize many females the deer reproduction remains high even
though there are not many males in the population. Male deer are valued for their horns. The
older they are the more points they have on their horns, the more attractive they are to hunters.
Intense hunting pressure selects for smaller males with smaller racks of horns, which is what we
find in many deer populations today.

And there are fewer of them
The Food and Agriculture Organization at the United Nations has kept track of fisheries
landings since the 1950’s. Their statistics record the trends in fish landings for important ocean
regions around the world. FAO statistics show that fish landings in the 1970’s were about 60
million tons, triple the 20 million tons caught in 1950. This increase in landings corresponds with
the increase in size and number of fishing vessels after World War Two and the introduction of
gill nets and stern trawlers using nylon nets. Fish landings leveled off briefly in the 1970’s until
more new technologies came along, this time improved Loran, GPS, SONAR and long lining. At
the same time, fishing boats became larger, indicating increased effort to find and exploit new
fishing grounds. Assisted by these new technologies and bigger boats, landings increased again.
By the 1990’s, fisheries landings reaching almost 100 million tons per year. Since the 1990’s, the
world yield in marine fisheries has leveled off between 85 and 90 million tons per year.
World marine fisheries catch has peaked.
By Epipelagic under the CCA 3.0 license at http://en.wikipedia.org/wiki/File:Global_wild_fish_capture.png
Hidden in this data is the worldwide switch from wild caught fish to aquaculture. Over
the last 40 years we have learned to grow many species in fish farms. These include salmon,
trout, tilapia, whitefish, shrimp, oysters, and most recently swai, a fish from Viet Nam that will
grow even in very poor water quality conditions. We are currently working on how to farm tuna,
bluefish, and many more high value species. Aquaculture has increased since the beginning of
the 1990’s, replacing declining stocks of wild caught fish. Most farmed fish are fed on fish meal

pellets made from undesirable wild caught fish. Since farmed fish are included in FAO data, and
these are fed on other marine fish, it is likely that FAO data understates the decline in the wild
catch.
Increases in fisheries production are mainly from aquaculture
By Epipelagic under the CCA 3.0 license from
http://en.wikipedia.org/wiki/File:Global_fisheries_wild_versus_farmed.png
Lumping all of the world’s catch together into one number data hides the geographic
origin of the fish. While world data shows that catch is holding steady, some regions are doing
better than others, and some regions are in steep decline. The fishing regions most accessible to
China, Japan, Europe and North America are being fished out while the farthest and least
exploited regions are being brought into production. The declining catch in these regions has
been replaced by increased take from the Indian and Antarctic Oceans.
These patterns suggest that current fishing intensity and efficiency are unsustainable in
the long run. The collapse of cod, haddock, and flounder off the east coast of the United States
and Canada are symptoms of a larger worldwide pattern that we are just becoming aware of. The
formerly free environmental service of food production from the ocean been almost completely
appropriated by humans as we developed better technologies to catch it. Evidence of the decline
in free environmental fish production services is how far we have internalized fish production in

fish farms and fish hatcheries. If we want to protect and maintain these environmental services
into the future we will have to accept regulation of when, where, and how much we catch.
Where to catch cod and cod populations showing the northwest Atlantic collapse
First by Aotearoa under CCA 3.0 license from http://en.wikipedia.org/wiki/File:Gadus_morhua-Atlantic_cod.png. Second by
Epipelagic under CCA 3.0 license from http://en.wikipedia.org/wiki/File:Time_series_for_global_capture_of_all_cod_2.png
Fishermen make mistakes
In addition to the official catch statistics there is the unrecorded accidental catch. Many
big and small fish are caught unintentionally in the pursuit of other fish. Many fishermen lose
their gear at sea. Lost gear does not stop fishing even though it is lost. Aquaculture may be
extremely productive, but it also creates localized sources of pollution and requires feed to raise
the farmed fish. Often the feed is other fish caught at sea that were not fit or legal for human
consumption.
Fishermen are human. They make mistakes, and so does their gear. They sometimes
catch the wrong fish or young fish where they would rather have adults. The mistakes are called
bycatch. Bycatch is the unintentional capture of one fish or bird or mammal while in pursuit of
another. Many fish caught as bycatch are too small to be landed and sold commercially, or
caught out of the legal season, or not of the correct species for the boat. Most bycatch is thrown
overboard. Some are ground up and turned into food for other fish or animals.
Every year fishermen catch more than 27 million tons of bycatch. This means that actual
fishing pressure is 25 to 30 percent higher than the 90 million tons reported by the FAO. Since
most of the bycatch are the young of desirable fish, or food fish lower on the food chain of
desirable fish, bycatch depresses the rate at which desirable fish populations grow. This implies
that official landing statistics underestimate the mortality rate of many species by a large amount

and give a false impression of where catch limits should be set to obtain maximum sustainable
yield.
One source of bycatch is fishing gear that is not selective enough for size. The size of the
gill or trawl net mesh selects which fish will be caught in trawls and gill nets. Bigger mesh size
catches fewer small fish. Hook size selects what will be caught by long lines. Increasing mesh
and hook size decreases bycatch, but also decreases catch and profits for the fishing boat and
increases price for consumers.
Another source of bycatch is when fishermen catch the wrong fish. Some fish are caught
because they swim in schools with other fish. Sometimes a large predator comes to eat what the
fishermen have already caught, and gets caught in turn. Sometimes this is an unwanted shark,
sometimes it is a seabird, sometimes it is a sea turtle.
The beautiful
Many species affected by bycatch are charismatic enough to create worldwide campaigns
to protect them. These include sea turtles, and dolphins. Many others, such as sharks and
albatross are not charismatic enough. Citizen boycotts and campaigns change fishing rules and
regulations and sometimes force fishermen to use less damaging gear.
Shrimp are caught using several different methods. Trawl nets are popular in open water.
Because shrimp are small, the mesh on the net also has to be small, catching unintended animals.
In the Gulf of Mexico bycatch can be up to three times the amount of shrimp caught.

A shrimp net fitted with a turtle exclusion device.
Public domain by NOAA from http://www.photolib.noaa.gov/bigs/fish0818.jpg
Air breathing sea turtles are a common unintended bycatch of shrimpers. Shrimpers fish
in areas that have high concentrations of sea turtles. When they get caught in shrimp nets the
turtles drown. Sea turtles are a charismatic species that even people who will never see one care
about. The death of so many sea turtles got the public involved in protecting seat turtles, and
shrimpers were required to add turtle exclusion devices to their nets. Exclusion devices include
bars to keep large animals from the net and a door to allow them to escape. The exclusion
devices have reduced turtle mortality but many shrimpers dislike them because they also reduce
shrimp catch. It is hard to enforce their use at sea, and many fishermen may disable them while
fishing.
Dolphins are another charismatic species. They swim in large family groups and use
cooperation to catch their food. Some species like to follow schools of tuna. In fact, many tuna
boats find tuna by following dolphin pods.

Tuna are caught using purse seines. A purse seine is a large net that is drawn around a
school of fish forming a bag and hauled out of the water. Whatever is inside the net is caught.
Dolphins inside the net drown unless they are let out.
The bad publicity from dolphin deaths created enough hot feelings to cause a boycott of
tuna in the United States. This led to the Agreement on the International Dolphin Conservation
Program in 1999 and guidelines for certification of some tuna as dolphin free. People interested
in the fate of dolphins began buying dolphin free brands over unlabeled brands. This led many
brands to demand fishermen supply tuna caught without harming dolphins which forced
fishermen to change how they caught tuna.
Since the adoption of the Dolphin Conservation Program there has been a dramatic
reduction in dolphin death rates. Dolphin bycatch in tuna fishing in the Eastern Tropical Pacific
has dropped from 500,000 per year in 1970 to 100,000 per year in 1990 to 3,000 per year in 1999
to 1,000 per year in 2006. Market forces and public opinion forced fishermen to change. This
works when the species of bycatch involved holds the public interest and the solution can be
monitored without great expense.
Another source of bycatch are fish and birds that can’t tell the difference between food
and fishing gear. Fishing with nonselective gear means that many nontarget species are exposed
to the opportunity to become caught. Many can’t resist. Albatross catch fish and squid by diving
near the surface. They also eat carrion, and actively follow long line fishing boats as they bait
their hooks and set their gear. Every year up to one hundred thousand albatross are caught on
baited long line gear set to float near the surface. They see the bait, dive in, and that’s all for
them. Sharks attracted to fish struggling to get free are another common bycatch.

A pair of Blackfooted Albatross resting together.
Public domain by USGS from
http://alaska.usgs.gov/science/biology/seabirds_foragefish/photogallery/Picture_of_Month/pom.php?pomid=51
And the fed
Aquaculture has its good and bad points. It does produce large amounts of food fish. It
has been practiced in Southeast Asia, China, and several other places around the world for
thousands of years. It started as an extensive practice in which the fish were kept in ponds at low
densities, almost as if they were living in the wild. The farmed fish found food for themselves in
the pond where they were being raised. At low densities they did not foul their own water so
there was no need to change it often.
Modern aquaculture has intensified the process. Salmon, catfish, trout, shrimp, and other
species are raised in high concentrations in intensive operations. They are so crowded together
they could not hope to feed themselves in the space they are allotted. Feed is brought to them on
a daily basis. Often there are so many of them that oxygen has to be supplied by aerators driven
by electricity. They need their water changed on a regular basis or they will die from the effects
of living in their own poop. The water that is exhaled from fish and shrimp ponds contain such
high levels of nutrients and low levels of oxygen that it pollutes the water bodies into which it is
released.
Shrimp ponds in South Korea are equipped with aerators and canals.
Public domain by NOAA from http://www.lib.noaa.gov/retiredsites/korea/main_species/chinesefleshy.htm

The fact that fish are farmed gives the impression that they are an increase in the
productivity of the ocean, but farmed fish still need to be fed, and feed has to come from
somewhere. Most of the feed used to raise fish and shrimp comes from nonfood fish caught from
the ocean. These are ground up, mixed with grains, and turned into pellets just like dog and cat
food.
Since many of these “trash” fish were destined to become food for desirable wild fish, the
fish produced by aquaculture are at most a substitute, and may actually be a drag on food
production from the ocean. Aquaculture reduces the effort needed to obtain fish biomass, but it
does not necessarily increase the biomass that we get in the end.
Another byproduct of aquaculture is that the streams and estuaries that receive water
drained from the ponds receive high concentrations of nitrogen and phosphorus that changes the
nutrient status of the receiving water. Often these started out as low nutrient systems, and this
influx of new nutrients promotes the growth of unwanted algae in near shore areas and estuaries.
Effluent water also contains concentrated diseases of whatever is being raised, and
increases the disease burden in the wild population. Often the feed includes antibiotics to protect
what is being raised from bacterial disease. This selects for resistant disease organisms
stimulating fish farmers to use more, just as plant farmers use more pesticides as insect pests
become more resistant to pesticides.
Intensive aquaculture depends on technology that functions all the time. Farm cultured
shrimp and other pond raised fish need aerators and pumps. Aerators and pumps need electricity.
If the electricity should fail and the pumps and aerators go off the crop will asphyxiate and
smother in its own wastes. Often fish pond operations have to duplicate the public services that
we take for granted, buying their own generator so they have power when the public supply goes
out.
The byproducts of modern life
The byproducts of modern life also have impacts on fisheries and the oceans. These
include used resources that unintentionally escaped into the ocean, the effects of resource
extraction in the ocean, and the chemistry of human wastes released into water.

Plastics travel far
Chief among the solid byproducts of modern life are plastics. Plastic and some other
byproducts of life happen to float. Plastic bottles, bottle tops, beer holders, bags, and other
floating debris get lost in the oceans. Eventually they wash up on the beaches of remote islands
and continents all around the world.
Several accidents on cargo boats carrying exports from China to the United States
provide examples of how floating garbage moves over long distances. In 1990 three containers
of Nike shoes on their way from China to the US washed overboard into the Pacific. Three years
later 34,000 ice hockey gloves went overboard. Several months later these floating objects
finished their transit of the Pacific Ocean, washing up on beaches along the Pacific coast of
North America. Most recently debris from the earthquake and tsunami in Japan has started
arriving on the Pacific coast of North America.
Rubber duckies that washed overboard are an example of how man made materials move
long distances in the world’s oceans.
By NordNordWest under the CCA 3.0 license from http://en.wikipedia.org/wiki/File:Friendly_Floatees.png.
The most famous examples of traveling floating jetsam are bath toys that washed
overboard in the central Pacific in the early 1990’s. They were made to float and float they did.
Some went south to Australia and Chile. Others went north and washed up on the Pacific coast of
North America. Still others made the Northwest Passage through the Arctic Ocean into the
Atlantic. In 2003 they had reached the Hebrides, islands off the north coast of Great Britain.
Some of them are still traveling, their brilliant colors bleached white by the sun. These rubber

duckies show how long some of the materials we casually discard by the side of the road last,
and how far they can travel before they reach land.
While these accidents have helped us understand ocean currents they also impact the
world oceans. Boats and landfills have released many times the amount of what was let go in
these well publicized accidents. Some of the debris looks like food to sea birds, sharks, sea
turtles, and other sea animals. It is the right size, and color to be what they naturally eat. They eat
the debris and feed it to their young. Many don’t have the ability to pass solid and indigestible
food out in their feces. They can’t regurgitate it either. It stays in their stomachs, taking up space
that would otherwise be filled with proper seabird food. As their stomachs fill with these
indigestible materials they starve because they don’t have room for real food.
Remains of a Lysan Albatross chick fed plastic waste by its parents
Public domain by US Fish and Wildlife at http://en.wikipedia.org/wiki/File:Albatross_chick_plastic.jpg
We have also learned that plastic breaks down very slowly, perhaps over a period of
decades. Eventually it is broken into small pellets the size of plankton. The small pellets also
behave like plankton. They are concentrated by the currents in the same way and in the same
places as plankton. There can be more small pieces of plastic present than plankton.
Hydrophobic organic chemicals concentrate on the surface of these plastics. Filter feeding
animals that eat them get a high dose of plastics laced with pollutants. The pellets of plastic and
the chemicals attached to them become part of the food chain. Some tuna and dolphins have high
enough concentrations of mercury in their flesh to warrant government cautions against their
consumption. We are at the apex of this food chain.

Most plastic in the ocean does not come from accidents or garbage disposal on ships at
sea. The majority comes from the land. It escaped from landfills or was discarded by careless
people. It enters rivers and streams and is carried away into the oceans.
Many developed countries have efficient garbage disposal systems. Even though the rate
of escape is low, the total amount of garbage is high. A small percent of a large amount is still
large. In spite of their efforts to control garbage disposal, the actual amount that escapes is
significant.
This flotsam washed up on a Philippine beach in the late 1980's is full of plastic snack
wrappers
Copyright Avram Primack
In many developing countries plastic is also a problem where bags and drink bottles have
been introduced before the systems and behavior to properly dispose of them have been
developed. Since most of their historic garbage has been organic, and decomposes, they do not
have a culture of garbage disposal. It is only natural to throw plastic bags and bottles by the side
of the road as if they were banana peels. Because of this, the use of plastic bags for carrying
home groceries and other purchases is banned in some cities around the world.
Garbage washed up on beaches is at the least an eyesore. Sometimes it is also dangerous
to humans. A famous incident involves plastics blown from the Freshkills landfill on Staten
Island, New York. Some of the windblown wastes were hospital syringes that washed up on
beaches in New Jersey. This medical waste caused a stir and stimulated a cleanup. Until recently
it was common for large cities to dispose of their garbage at sea. This has become less common
as the effects of the garbage that gets away have been discovered and understood.

A sea turtle trapped in lost fishing gear.
Public domain by NOAA from http://www.noaanews.noaa.gov/stories2005/s2429.htm
Still, there is a lot of plastic free in the ocean that washes up on the beach. In developed
countries there are active campaigns to clean up these wastes. Some of these involve volunteer
organizations. Others use taxpayer’s money and public employees. In either case, the cost of the
environmental bad of seeing ugly beaches is internalized and the removal costs are paid by
society. On remote islands and beaches there is no one to collect the waste, and it is left up to
nature to provide the service of disposal.
An important component of the lost plastic waste is fishing gear. Fishing gear made of
nylon does not break down the way gear made of natural fibers used to. When it is left floating in
the water it continues to catch fish and other animals. If it happens to wash up on a shore that is
being used as a nursery or hauling out place by birds, seals, or turtles, it continues to catch any
hapless individual that happens to blunder into it. Remote islands all around the world have their
share of lost fishing gear and other plastic wastes washed up on the beach.
A proposed solution to the problem of lost fishing gear is to include natural fibers in them
in such a way that the fishing gear will come apart as the natural fibers decompose. Fishermen
are opposed to this idea because it will result in them having to replace their gear more often.
Resources from the ocean
Resource extraction from the ocean usually means fish, but not always. The oceans
contain mineral and energy resources in addition to their biological resources. Deposits of oil

occur offshore as well as onshore, and there are deposits of methane and manganese sitting on
the bottom waiting for us to vacuum them up.
Oil deposits exist under the continental shelf as well as on land. Offshore oil drilling
began on a small scale at the end of the 1800’s with wells drilled in shallow water in calm lakes.
Gradually, the technology progressed so that wells could be drilled on floating platforms
offshore in thousands of feet of salt water in places like the Gulf of Mexico and the North Sea.
Between then and now the wells have gotten larger, turned into floating platforms that cost
billions, and crept further offshore into more than 2,000 meters of water. As the technologies
have become more complex and the environments they are used in more extreme the risks have
increased.
Aside from the obvious risks from bad weather and human error, a major risk from
drilling offshore is running into pockets of compressed methane gas and frozen methane
clathrates. Methane clathrates are methane gas surrounded by water crystals. They form when
methane gas is chilled as it comes in contact with water. Both methane gas and methane
clathrates expand as they come up the drill pipe. Gas coming up from thousands of feet below
the surface can expand so fast as it rises that it drives the petroleum and mud above it out of the
drill tube causing an explosion and fire at the well head. If the well head is destroyed, gas and
liquid petroleum spew from the pipe out of control. This is part of what happened in the Gulf of
Mexico in 2010.
Oil also escapes from time to time. Some of the spills are large and make an impression
on our memory that lasts for a while. The Exxon Valdez did not spill the most oil ever, but we
remember it because of where it was and the condition of the captain when the ship went
aground. The oils spill in the Santa Barbara channel in 1969 was fantastic when it happened, and
led to a national ban on offshore drilling in the US, but it has been replaced in our minds by the
Torrey Canyon, the Exxon Valdez, and more recently, the oil spill in the Gulf of Mexico in the
summer of 2010.
These spills are fantastic in size and attract a lot of news coverage, but large oil spills are
not the source of most of the oil spilt. Everywhere that oil is transferred from one container to
another or from shore to ship, or ship to shore, small amounts escape. More is added from
accidents on the land that make their way into water. Gasoline accidentally spilled at filling
stations, motor oil intentionally discarded down storm drains, and drops of transmission or brake

fluid make their way into aquatic systems and sometimes into the oceans. Much of this settles in
sediments and is slowly released back into the water where it is taken into the food chain and
concentrated. Taken individually each tiny spill is inconsequential. Together, they add up to
more oil than all of the large spills that have made the news over the past few decades.
Ocean water is also full of extractable minerals, including gold, silver, phosphorus, and
iron. Unfortunately, most dissolved minerals are not present at commercially exploitable
concentrations. However, methane and mineral nodules are present in some places in
commercially viable quantities.
Methane deposits form on the ocean bottom where there is organic material and low
oxygen conditions at low temperatures. Under low oxygen conditions bacteria degrade the
organic material to methane instead of carbon dioxide. If the temperature is right, the methane
forms a crystal with water molecules. In some places these methane clathrates are concentrated
enough to vacuum them off the bottom. Russia is currently investigating ways to exploit these
deposits off their northern coast.
Mineral nodules also form under the proper chemical conditions. They begin to form
around small objects on the ocean bottom and grow slowly as more mineral crystallizes around
them. The mineral nodules contain manganese, iron, and other metals. Commercial ventures
have been formed to map their occurrence in the ocean, find exploitable deposits, and develop
technologies to obtain them.
Will we be able to get more fish?
Fish are an important component of the world protein budget. For poor people they are a
low cost source of food that they can gather for themselves. For rich people they are a delicacy
that is affordable. For growing nations they are a source of low cost food, feed for animals and
nitrogen for fertilizer.
Major increases in production occurred during the 1950’s and the 1970’s. Since then
increases have come much slower as wild fisheries have become fully exploited. As we have
learned to cover the surface of the ocean we have also learned to fish into its depths. Fisheries
that supplied us with food for centuries have been decimated and replaced by fish farms feed
with fish we do not want for our own food. Recent increases in fisheries have come from the

increased use of aquaculture and mariculture, technologies that depend on feed manufactured
from less desirable fish.
If we are to harvest more fish in the future we will have to have the restraint to let
existing stocks recover and learn how to produce more farmed fish without harming the natural
infrastructure required for harvesting wild fish. We will have to become better managers of what
we have now so that we can have more in the future.
Luckily, the biological resources of the oceans are resilient to overharvesting. If left alone
long enough they will recover under their own power. Where we are pumping extra nutrients into
the water they may end up more productive than they are now. For this to happen we have to
give them time to recover, and then manage them in a sustainable manner.
Unfortunately, biological resources in the ocean are not as resilient to the destruction of
their physical habitat. Marine fish will not spawn in rivers blocked by dams or full of soils
eroded from the land. Oil soaked beaches and seagrass beds may take decades or longer to
recover completely. Sea bottom broken by the repeated passage of trawl nets will take time to
recover the biological infrastructure that makes possible the food chain that produces fish that we
like to eat.
What happens in the future depends on the demand for marine resources. If the past is
prologue we can only expect demand to go up. Since populations continue to rise in most parts of
the world demand for marine resources is not likely to come down. As long as energy is cheap
boats will continue to search the oceans for all the fish they can sell as food or fertilizer and we
can expect more species to be put in danger of extinction.

Chapter 12: Water
“The things which have the greatest value in use have frequently little or no value in exchange; and, on
the contrary, those which have the greatest value in exchange have frequently little or no value in use.
Nothing is more useful than water; but it will purchase scarce any thing; scarce any thing can be had in
exchange for it. A diamond, on the contrary, has scarce any value in use; but a very great quantity of
other goods may frequently be had in exchange for it.”
Adam Smith, Wealth of Nations6
Water is a limiting resource
The passage above is much discussed by economists as the paradox of water and
diamonds. It amounts to the question of why useless things have great value and useful things
don’t. In the case of water, the low value of any one glass of water must be understood in
relation to the availability of water. It is normally abundant and almost never in such short
supply that we would have to exert effort to get it. If it were in actual short supply its price would
not be nothing and we would not be complacent living without while others had plenty in front
of us. There are enough Western movies in which a war is fought over access to water to know
this.
Water is perhaps the most essential resource. It is a limiting factor of existence to us, to
other living organisms, and to civilizations past, present, and future. You and I can only live
without it for three or four days before we die of dehydration. Many animals can survive without
water for longer, but not forever. Some have evolved ingenious methods of capturing, storing,
and conserving water, from the fatty hump of camels to the bumps on the back of some desert
beetles used to condense water from the air, but, without enough water eventually all living
things die.
Living cells are about 70% water. All of the biochemical reactions of life take place
dissolved in water. All civilizations need water for irrigation, mixing cement, making pottery,
power transfer from falling water, and as a coolant in electrical generators. Our blood has the
same salinity as sea water, reminding us of the influence of the past on our present biology. In
order to live well we need to maintain our inner level of hydration so that we can digest food and

transport it around our body without difficulty. Even our bodily wastes are removed using water
as a propellant. In order to stay healthy we should drink at least six cups per day.
Water is what irrigates crops. We move materials from place to place on it. We play on
and in it, and we drink it. We use it in industry and manufacturing to wash and dissolve
materials. We are intimately tied to the availability of it, when it arrives, how much there is, how
long it stays where we are, and how clean it is when it gets to us.
Societies and civilizations are not alive in the sense of individual organisms, but they
grow and contract depending on what resources are available. Water is certainly one of the
resources that are important to their growth and survival. Without sufficient and a reliable supply
you cannot practice agriculture. Without agriculture, you can’t grow food. Without food,
civilizations collapse.
The Roman aqueduct in Segovia, Spain
Public domain by Bluedot423 at http://en.wikipedia.org/wiki/File:Segovia_Aqueduct.JPG
The success of Egypt for more than the last 7000 years is due to the Nile and its water.
Egypt is in a region with practically no rainfall. Without the Nile it would be desert. The floods
of the Nile provide water and fertilizer. Without water from the Nile, there would have been no
Egyptian civilization. During dry spells the Egyptian civilizations collapsed. The Anasazi lived
in the dry American southwest. They survived on irrigated agriculture. When the climate became
drier, their agriculture failed and they moved away.7

Civilizations and societies need water for more than agriculture. They use it to produce
metals, cement and other materials necessary to produce buildings, weapons, cars, and the other
implements of everyday life. They invest time and money to ensure that they have a consistent
and reliable supply. The Romans built aqueducts to bring it from long distances to their city to
keep Rome clean and well supplied and the supply the needs of industry and its citizens.
History shows that civilizations disappear when their water dries up, or even just
becomes more variable. This happens when changes in climate alter when and where
precipitation falls, and when societies themselves produced changes in the landscape that alter its
availability and quality.
The failure of Sumer as an early world power was linked to its inability to maintain its
irrigation water systems. When the Nile floods varied so that agricultural output fell, the
government of Egypt fell too. For four hundred years the Moche used rivers flowing from the
Andes into the Pacific Ocean to irrigate crops in the deserts of coastal Peru. Their cropping
systems failed during a 30-year drought that was punctuated by large floods. The drought forced
them to live closer to the rivers they used for irrigation and the floods destroyed their irrigation
systems. The catastrophic floods that have hit Haiti in recent years are due to the fact they no
longer have trees to hold soil on their hillsides.8 Without soil, precipitation runs off immediately
instead of slowly infiltrating into groundwater. When enough rain falls there are flash floods that
carry sediments into populated areas. Between precipitation events, their rivers and other
drinking water sources dry up. The way they have changed their landscape has changed the way
their landscape provides them with water. The floods and droughts place great hardships on the
Haitian people and we see them in the news. The effects of having to travel large distances and
wait for water on a daily basis are not so obvious.
Water is a multipurpose resource
Water is a multipurpose resource. The same water is often used for several purposes
simultaneously. Water flowing in a river is being used to maintain natural ecosystems at the
same time that it is being used for recreation and transportation. Downstream, the same water
may be used for irrigation, drinking and carrying away wastewater.
Some of the ways that we use water are essential, others are benign, and others are
potentially dangerous to people and to natural systems. Drinking water is mostly obtained from

surfacewater and groundwater. Many towns and cities use the same rivers and lakes from which
they obtain their drinking water to carry off their human, animal, and industrial wastes. Water
contaminated with animal and human feces is a potential carrier of disease. Industrial wastes
include toxic, carcinogenic, explosive and corrosive compounds.
Water flowing in streams, rivers, and lakes, is used for transportation that supports
commerce. Controlling water based transportation routes are important military objectives in war
and commercial objectives in peace. The North fought hard to gain control over the Mississippi
and other rivers during the War Between the States.
Many rivers are now so altered by the dams and flow control structures that make them
navigable that they function as a series of interconnected long and thin lakes. Water is used for
cooling power plants. And finally, water is used for drinking, fishing, recreation, and maintaining
the services of the natural environment.
Water is reusable
Contrary to what most people think water is not a renewable resource. It is reusable in the
sense that the natural environment filters out what we put into it and returns it to condition where
it can be used again. But these natural services are not without limit and do not happen
instantaneously. It takes time for nutrients to be absorbed in a wetland. Large ones provide more
service than small ones. If we want more water purification services we have to allow space and
time for the natural environment to produce them or we have to engineer our own solutions.
Water can be reused many times as it travels from where it fell as precipitation back to
the ocean. On this journey, it can be frozen, a liquid, or it can evaporate once again, condense in
the atmosphere, and fall somewhere else as rain. As it flows it can be taken up by a plant and
held in place until the plant dies, releasing it back into the soil, or up into the air. It can flow over
the surface, or infiltrate into the ground where it becomes available to plants, or part of the
underground flow of water in an aquifer. Surfacewater eventually enters streams that flow into
rivers, and lakes, and back into the ocean. Along its journey the same water molecule can be
used for drinking, cooking, irrigation, cooling, dilution, flotation, pass through animals and
plants, and be evaporated, to fall again as precipitation.9

Water can be consumed
Many uses of water are non-consumptive. Transportation and recreation use water where
it is without diminishing its quantity. Other uses of water are consumptive or transfer it between
watersheds. Coolant towers for power plants evaporate water into the air, consuming it by
removing it from the local hydrologic system. Transfers between watersheds move water from
where it is to where it is not. The watershed losing water experiences consumption, the
watershed receiving water experiences production.
Consumptive water use lowers downstream water supplies, lowering stream flow rates
and groundwater levels, and changes the chemistry of the water that remains behind. Interbasin
transfers change the hydrologic system in both watersheds, raising the underground water table
where water is added and lowering it where it was removed.
The Colorado River carries the snow and rain that falls in the central Rockies down to the
Gulf of California. On its way, it supplies drinking and irrigation water to Wyoming, Colorado,
Utah, Nevada, Arizona, New Mexico, California, Chihuahua and Baja California. It flows
through a series of dams that generate electricity and provide recreation. In the reservoirs behind
the dams water evaporates. Downstream so much water is removed for irrigation and drinking
that by the time it reaches the Gulf of California there is virtually no flow left unless the year is
particularly wet. What water gets to its delta in the Gulf of California carries high concentrations
of agricultural chemicals that don’t evaporate altering the chemistry, biology, and physical
processes of the delta.

The Colorado River flows through seven US and two Mexican states.
By Karl Musser under the CCA 3.0 license at http://en.wikipedia.org/wiki/File:Colorado_watershed.png.
Water resources require management
Water provides benefits to all who have access, but it flows from place to place, and its
availability changes with the seasons and the years. In order to maintain the quality and quantity
of water resources they need to be managed, regulated, and protected so upstream users do not so
alter the character of the water so downstream users are excluded from its use and users in spring
do not consume what is needed in summer and fall. Where water is not plentiful the costs of
bringing it from where it is plentiful must be internalized by the society. Where water is used for
industry, governments must regulate what is put into it to protect downstream user who depend
on its cleanliness.
Where water use is limited by the quantity available someone must identify who has
priority access. Where water is only available part of the year someone must decide when and
how much to store and how much to withdraw. Water managers ensure that the supply of water
in the future is consistent with the supply in the past, predictable for those who have the rights to
use it, and sometimes, equitably distributed between natural and human users.

Water access produces conflicts
Often different uses for the same water conflict and compete with one another. In the arid
American west, the rights to use water were assigned on the basis of who got there first. Later
arrivals got fewer water rights and less access. Agriculture uses much more water than industry
for each dollar produced, but farmers, who arrived before towns and industry developed, own
most of the water rights. Many western US cities have to buy water rights from rural landowners
in order to continue growing, or they have to promote water conservation practices. Some pay
their own citizens to promote behaviors that lead to water conservation.
New York City is one of the few large cities that it does not chlorinate its drinking water.
It gets its water from reservoirs in the nearby Catskill Mountains. The city pays farmers to adopt
practices that protect the water quality. Los Angeles is a giant city in a desert. In the middle of
the last century it bought up land and water rights in the Owens Valley, forcing farmers to
abandon irrigation.10Las Vegas, another city in the desert, pays citizens to remove grassy lawns
that need regular watering and replace them with rock gardens and cactus that do not.
Should US cities in the west be allowed to force farmers to give up their water so that
they can continue to grow? Should farmers be allowed continued access to irrigation water below
its real cost while cities and industry go begging? Should any water be reserved for maintaining
natural services such as streams that flow when fish expect water to be available for spawning?
These are important public policy questions concerning who should get how much water and
when. What should the actual cost of water be and what should it be used for? Should it be close
to its real cost, or should it be subsidized for some uses and not for others?11 Should we do what
we have always done or should we make changes to reflect changing needs?
Where water is scarce, the final users should be the result of a public policy making
process that balances the conflicting interests of nature, human health, and aesthetic, recreational,
and economic uses. Often, political and economic power are important factors in the debate.
Since scarcity is a function of the number of users as well as the supply, water is almost always
scarce somewhere. Water shortages regularly occur in the west and even occasionally in the
eastern US. The process of deciding who has access to how much is occasionally based on
science, often political and contentious, and always necessary where water is one of the limits to
growth.

A section of the Owens River Aqueduct that brings water 288 miles (544km) from the
Sierra Nevada to Los Angeles.
By Los Angeles under CCA 3.0 license at http://en.wikipedia.org/wiki/File:First_Los_Angeles_Aqueduct_Cascades,_Sylmar.jpg
Water crosses boundaries
Water resources flow across political boundaries. When they do, they can be the cause of
political, legal and other conflicts. Canada and the United States both border on the Great Lakes.
The Colorado River flows through the United States, but it enters the Gulf of California through
Mexico. The Danube flows through or borders upon Germany, Hungary, Croatia, Romania,
Austria, Serbia, Slovakia, Bulgaria, Ukraine, and Moldova, before exiting into the Black Sea. Its
watershed also includes parts of Bosnia and Herzegovina, the Czech Republic, Slovenia,
Switzerland, Italy, Poland, and Albania. Countries all along the way make independent decisions
on how to manage flow and what to put into the river.
Where water resources cross international boundaries their use can be the object of armed
conflict. One source of conflict between Israel and the Palestinians on the West Bank is access to
the aquifers under the West Bank and the Jordan River. These are vital to Israeli agriculture and
would be threatened by an independent water hungry Palestinian state. Another potential source
of conflict is the Tigris and Euphrates Rivers which are shared between Turkey, Iraq, and Syria.
Turkey currently has plans to divert the Tigris for irrigation projects. Iraq and Syria are not
happy such planned changes in their most important sources of drinking and irrigation water.

Ethiopia has plans to dam sections of the Blue Nile that supplies Lake Nasser and Egypt. The
consumption of Nile water in Ethiopia will reduce the amount of water available for irrigation in
Egypt. Ironically, using reservoirs in cooler Ethiopia would reduce evaporation losses in Lake
Nasser, if Ethiopia, Sudan and Egypt could agree to get along.
Local water resources can also be a source of conflict when central governments interfere
with local water rights relationships. China just completed the building of the Three Gorges dam,
which displaced several million people. These people lost their land for the greater good of the
nation. Were they compensated appropriately? Wherever dams are built, they displace people
and raise questions about just compensation, scale of impacts, and how the benefits of the new
distribution of resources should be divided.
The Danube watershed
By Shannon under the CCA 3.0 license at http://en.wikipedia.org/wiki/File:Danubemap.jpg
Civilization was founded on water
The exploitation of water resources played a central role in the development of early
civilizations. Early farming communities were located in river valleys to take advantage of the
nutrients and soil left behind by spring floods. Irrigation in these valleys helped increase the area
that could be planted, and produced a larger and more predictable crop yield. Increased crop
yield allowed populations to grow. Irrigation allowed many civilizations to flourish in arid
regions where otherwise there would have been little to live on.

Wherever irrigation developed civilizations followed. Sumer, Akkad, and Egypt in the
Middle East all developed because of irrigation. As agriculture spread into Europe and Asia
irrigation followed close behind. The Inca, Aztec, Maya, Olmec, Anasazi, Moche and other
cultures in Central and South America were all made possible through the use of irrigation.
Irrigation also made possible waypoints along trade routes, such as Samarkand along the Silk
Road and Timbuktu in the middle of the Sahara.
Part of a quanat irrigation system in China.
By Colegota under CCA 2.5 license at http://commons.wikimedia.org/wiki/Image:Turpan-karez-museo-d02.jpg
Irrigation systems started out simple and became more complex. Early Egyptian systems
just captured water and held it in shallow lakes until it could be channeled over the fields during
dry times. More complex irrigation systems routed water away from a rivers main channel,
directing it through dry fields in a system of canals and back into the river downstream. Others
obtained water by tunneling into the sides of mountains until they reached groundwater. The
tunnels let water out into reservoirs and fields. Later, water engineers developed simple pumps
and windmills for moving water uphill, out of the ground, and out of rivers and onto fields. Many
of these devices are still in use around the world today.

Center pivot irrigation system operating in New Jersey, USA
By Paulkondratuk3194 under the CCA 3.0 license at http://en.wikipedia.org/wiki/File:Irrigation1.jpg
Irrigation is an increasingly important technology. Many nations (Egypt, Mexico, India,
China, The Philippines, The United States, Saudi Arabia, Iran, Iraq, Pakistan, Indonesia,
Australia, Turkey, Syria, Israel, Japan and many other nations) depend on irrigation to feed their
people and produce specialized crops. Without irrigation many countries would have difficulty
feeding their current population.
In many places, irrigation techniques are still the same as they have always been,
depending on the seasons and gravity to deliver surfacewater to fields. In rich countries,
irrigation depends on the use of pumps, aqueducts, and other technologies, to move water over
mountains and across hundreds of miles. In places where there is not adequate surfacewater,
irrigation water is pumped from underground aquifers that have built up slowly over thousands
of years.
As nations become more developed they learn to exploit sources of water that cannot be
obtained by gravity. Advances in irrigation depend on pumps run by gas and electricity instead
of gravity, tying the availability of irrigation water to the supply of energy.
At all stages there was a need for managers to ensure that the expectations of water users
were satisfied according to custom and law as it existed. Irrigation made the availability of water
resources more predictable, increasing the supply of food. Building and maintaining irrigation
systems required the development of property rights and accounting systems. They required
public taxes to fund and communal labor for construction and maintenance to harness the unused
potential services of the natural environment for the public good.

Irrigation in Saudi Arabia uses fossil water deposited thousands of years ago
Public domain by NASA from http://en.wikipedia.org/wiki/Image:Saudi_arabia_irrigation.jpg.
As irrigation systems developed, so did the customs, laws, and regulations that controlled
who had access to water and when, and who contributed labor and money for the upkeep of the
irrigation works. We might say that the development of engineering works to manage water
availability and the maintenance of these works was one of the forces that led to cooperation
between large groups of individuals and eventually the development of government.
Irrigation provided more food, which allowed more people to survive and populations to
grow to the point where they could not survive without well-functioning irrigation. The operators
of these systems were entrusted with seeing that they functioned well, and were often held
personally responsible if they didn’t. The penalty for crop failure in Egypt was regime change
that involved the death of the Pharaoh. Other cultures had equally severe penalties for
administrators whether the fault was their own or the variability of natural cycles.
The people who coordinated early irrigation systems decided how, when, and where to
distribute water were different from the hunters and farmers that made up most of the population.
They may have started as people who had a special interest in nature, but they ended up as the
first scientists and engineers. They acquired an intimate knowledge how much rain fell in
different parts of the year. That knowledge was gathered over years from personal experience,

and passed as between generations in select families. They knew how to survey accurately
enough to design tunnels that could be started on both sides of a mountain and would meet in the
center. They could calculate volumes of water that fell in watersheds and build reservoirs that
would catch the water and not flood catastrophically. They were the first practicing engineers.
Many less informed people regarded these irrigation managers as gods, or the confidants
of gods. They became the first accountants and mathematicians. They became the wise men,
priests, and administrators in government. They managed labor and kept track of water
withdrawals.
Modern irrigation managers are university trained engineers with advanced degrees who
understand mathematics, soils, farming practices, and climate patterns. Often they operate
complex systems for storing and delivering water over distances of hundreds of miles that may
include hundreds of pumps and many reservoirs. These systems may be as large as the state of
California and service hundreds of thousands of farmers, or small ones that only serve a single
valley and a few farmers.
Settled life required improved sanitation
“In days of old,
when nights were cold,
and men (and women) a little bolder,
they disposed of waste,
without much haste,
in a house just made to hold ‘er. “
Anonymous
As we converted from nomadic wanderers to settled agriculturalists there were new social
and environmental challenges. In the Stone Age people lived in small migratory bands that
followed game animals. Human waste was disposed of in the nearest convenient place. When the
smell of one place became bad we moved to another a few miles away, or on to the next valley.
Parasites and disease stayed under control because population densities were low and people did
not stay in one place for long. When we returned, nature had cleaned up for us. Even so, the need
to take care of human waste in a tasteful manner was recognized by early legal codes. An
example of early waste control law is Deuteronomy 23:13, which reads: "and you shall have a

stick with your weapons; and when you sit down outside, you shall dig a hole with it, and turn
back and cover up your excrement."
As the earth warmed and the glaciers retreated local and regional climates changed.
Herds of migratory animals disappeared or altered their migration routes and plants became more
important in the diets of people. Agriculture developed. Food plants had to be tended and
protected as they grew. This led to the creation of settlements where people lived at least during
the growing period. Because agriculture provided a more dependable supply of food than hunting
and gathering populations of settled agriculturalists grew while populations of nomads shrank.
Small seasonal agricultural settlements eventually became larger permanent
concentrations of people. This marked a revolution in how people disposed of human wastes. It
was no longer possible to move continually and still watch the fields that produced food.
Besides, by this time other settled communities occupied the other good places. There was no
way to continue to be a nomadic agriculturalist. Living at higher population density required the
development of methods of dealing with higher concentrations of human waste. Poop happened,
and it needed a proper place.
The first cause for the development of government may have been to protect land and
water rights so farmers could be sure they would be the ones to reap what they had sown and
would have water enough to reap what they had sown. Close behind was the need to provide
protection from the smell and adverse health effects of the presence of settled neighbors and their
personal wastes. To achieve this government coordinated the development of systems to remove
human wastes and enforced behaviors that kept people from depositing these wastes out of their
proper place. In doing this, government acted to improve the health and quality of life of their
citizens, and maintain property values, still major functions of government today.
Early urban sewage disposal used water
When settlements were small, taking care of human wastes was simple: Wastes were
walked out of town and disposed of in common pits or pools, or on the land. In small
communities, this was effective. As communities grew larger the investment of personal time
became too large. Solutions that were more complex had to be developed, and technologies were
invented that helped dispose of personal wastes with less investment of personal labor.

Sewage disposal technology was developed very early. There are toilets in the Orkney
Islands from around 3,000 BC where waste was drained into the sea through channels that led
from homes. Homes in the ancient city of Babylonia between 4,000 and 2,500 BC had bathrooms
that fed human wastes into porous clay tanks under the ground where they were allowed to
percolate into the soil through leach fields of broken pottery, a form of early septic system. Early
cities in the Indus Valley, in what is now Pakistan and India, had extensive sanitation works,
including sewage drains, cesspools that separated liquids and solids, and septic tanks buried
under houses for receiving human wastes. The palace of the King of Crete had what is perhaps
the first flush toilet. It contained a latrine on the ground floor and a rooftop reservoir for
collecting rainwater used to “flush” wastes down a channel that lead to the outside. Piping was
used in Egypt and Greece to connect the homes of the nobility and aristocracy directly to
underground sewers. During its heyday Athens had sewers that led to a cesspit outside the walls
of the town. Water from the cesspit was led onto fields for disposal as fertilizer. In the poor areas
of many classical Greek and Roman towns wastes were thrown out onto the streets where they
were flushed into sewers using water brought in by aqueducts. Public latrines with underground
drainage were built around the city to reduce the amount of feces thrown into the streets. These
bathrooms became a part of the social life of the Romans. Their administrators used the public
latrines as meeting places to conduct the business of the city. They were a kind of early country
club.
Ruins of a public latrine at Ostia, the port of Rome.
Public domain by Fubar Obfusco at http://commons.wikimedia.org/wiki/File:Ostia-Toilets.JPG

After the fall of Rome
After the fall of Rome sewers and toilet technologies were forgotten and neglected in
Europe. Cities and towns became smaller so the problem was reduced in size. In most towns,
human waste was thrown out into the street where it mixed with horse manure and other refuse.
From there it was carried off by rainwater in ditches and canals dug into the street. Some towns
had street sweepers who gathered the filth into wagons to be disposed of on the land.
Without sanitation cities became incredibly filthy with human and horse manure. To
escape the smell and disease rich people maintained homes in the countryside.
There were some efforts to manage human wastes in public places. Some cities provided
urns near the city gates for travelers to use. Medieval European castles had bathrooms built into
the walls that delivered wastes to the outside or to the moat.
Chamber pots collected human waste to be thrown into the street.
By Ceridwen under the CCA 2.0 license at http://upload.wikimedia.org/wikipedia/commons/8/81/Pot_de_chambre_4.jpg
Some waste disposal technologies were not as successful as others. Later, well to do
houses had bathrooms that emptied into a cesspit below the floor of the house. These were not

only smelly they were dangerous. Occasionally the floor gave way and dinner guests fell into the
cesspit below. The decaying fecal matter in cesspits generated methane gas that sometimes
exploded, setting the house on fire. People who could afford the latest technologies saved their
personal wastes first in chamber pots, later in water closets, privies, and various other
contraptions that protected them from direct contact with their poop. In rural places a small
building was built away from the main house for people to sit in called an outhouse. These are
still in use in some rural areas.
Without the availability of public bathrooms in Europe there was a decline in public
modesty. Both sexes used their surroundings whenever they needed to go to the bathroom in a
public place. Any aversion to performing bodily functions in public disappeared to the point that
the British Royal Court posted this warning in the stairwells of Parliament in 1589: "Let no one,
whoever, he may be, before, at, or after meals, early or late, foul the staircases, corridors; or
closets with urine or other filth."
Urbanization made sewers necessary
As towns grew larger and became more prosperous, Europeans rediscovered the
advantages of a constructed covered sewer system. Most urban roads eventually had rock or
brick lined trenches down the center to aid in draining storm water filled with human sewage and
animal wastes. Some of these trenches still exist in the streets of older European towns where
they are used to carry off stormwater.

This ditch on a street in Freiberg, Germany is the remains of an old sewage system.
By Arroww under the CCA 3.0 license at http://en.wikipedia.org/wiki/Image:Friburgo_Ruscelli_nel_Centro_--
_Freiburg_with_the_city_center_streams.jpg
Many towns grew up along streams that fed into larger rivers. These were first used as
open storm sewers and later deepened and channelized to carry away wastewater more
efficiently. Finally, they were covered to protect the public from odor and contamination. Houses
along these streams began piping wastes directly into them through underground pipes and the
sewer was born.
The campaign to build underground sewers throughout towns and cities started in earnest
in the early 1800’s. In London the need became painfully obvious when Parliament had to shut
down for the summer of the Great Stink in 1858. The Thames was then the major receiving body
for wastewater for a city of over 2 million. The sewers entered into the river above Parliament.
Flow in the river was weak that year so the sewage was not carried away. The river became one
large stinking cesspit and the stink became strong enough that grown men fainted.
As a result of the Great Stink new sewer lines were constructed that carried sewage away
from the Parliament and into the Thames below the drinking water intakes. The sewers were
extended into the city away from the river in order to capture more storm flow and sewage.
Underground sewers were first built along the main streets. Later there were branch lines down
the side streets. Building owners were strongly urged to connect to the sewers and include
sanitation in their building plans. It took a Big Stink to get it started. Sewer building was now off
and running as a matter of civic pride.

Using leaky septic tanks near drinking water wells allowed sewage to enter the drinking
water supply.
Public domain from Plate 7 of Sewers: Ancient & Modern, by Cyrenus Wheeler, Jr.
Contaminated water causes disease
After the Great Stink, sewer building in London began in earnest. At first it was with only
aesthetic and practical goals in mind: stormwater needed to be removed quickly to avoid
flooding, and wastewater was unpleasant and stinky. The link between sewage contaminated
water and waterborne diseases, such as cholera, was not established until the late 1850’s, and it
was not accepted immediately for reasons of Victorian delicacy. No genteel person wanted to
consider the ultimate resting place of his or her bodily wastes.
Cholera is a disease caused by waterborne bacteria. It originated in India, and like many
other diseases, spread to the rest of the world inadvertently through commerce. It causes acute
watery diarrhea that can cause death from dehydration in a few hours or days. Around 10 percent
of its victims die.
In the middle of the 19th century, doctors and scientists did not understand that
microorganisms like bacteria caused disease. They thought undetected miasmas in the air that

emanated from swamps caused cholera, typhoid, and other common diseases. They did not know
what bacteria were or what they did.
In the 1800’s in London, most people got their water from shallow wells fed by
groundwater. Many of these wells barely penetrated the groundwater table. They were taking
water from that was contaminated with sewage infiltrating from the surface and from leaking
shallow septic tanks.
John Snow, a doctor studying disease transmission in London was the first to show the
connection between cholera and contaminated water. During the 1850’s there were regular
outbreaks in the city. During one in 1855 Dr. Snow made a map of the buildings sick people
lived in and looked for nearby factors that could cause the disease. The most likely cause seemed
to be a drinking water well. He stopped people from using the well by taking the pump handle
and the cholera epidemic went away. The likely source of contamination was sewage
overflowing from a nearby privy. Dr. Snow concluded that cholera was caused by something
waterborne. Even though he had not identified the disease causing agent he had provided a
human health justification for the separation of human feces from drinking water. Eventually this
discovery led to the development of sewage treatment works and drinking water treatment.
The original map used by John Snow to identify the source of the cholera outbreak on
Broad Street in 1855.
Public domain from http://en.wikipedia.org/wiki/File:Snow-cholera-map-1.jpg

Which led to the public sanitation movement
Once it was accepted that contaminated water was the cause of many communicable
diseases sewer building accelerated. As the general populace became aware that improved
hygiene and sanitation would lower their death rate they demanded active measures to improve
public sanitation. They formed civic improvement clubs that worked for public health that
advocated the construction of public works with the goal of improving living conditions. In order
to do this they even advocated new forms of taxation to pay for the construction and operation of
sewers and water treatment plants.
The clear public health benefits of maintaining clean drinking water by isolating it from
sewage led to new public health laws that restricted the rights of private landowners to release
sewage into public waterways and onto the ground. They provided funds for the construction of
new water works for the purposes of filtering and sterilizing drinking water and the safe disposal
of wastewater. They created standards for septic systems and water quality leaving sewage
treatment works. The externalities created by the disposal of human and animal wastes were
internalized in the form of restricted personal behavior, the collection of taxes to pay for
engineered services to replace natural ones, and the introduction of fines and other penalties for
non-cooperators.
Early sewage systems
As immigrants came to the US and population grew many rural areas were converted to
towns and cities. At first there were no rules to guide builders in the connection of their new
projects to existing public sewer pipes that were being laid down in public streets. Private
subdivision developers built sewer systems according to whatever plan suited them.
Developers are not engineers. They are in business to make money. Some built poorly
designed cheap systems that did not work well. When maintenance became onerous to the
developer or the underground piping system failed the developers donated them to local public
health agencies which had to spend public monies to get them to work. These practices led to the
passage of laws about construction standards, and eventually a takeover of sewage and
stormwater system design and construction by public health and sanitation agencies. It also led to
zoning that regulated land subdivision to ensure proper sewage disposal was included in the
building plans.

Combined sewage and stormwater system.
Public domain by EPA from http://en.wikipedia.org/wiki/File:CSO_diagram_US_EPA.jpg
Many early urban water management systems were designed for combined sewage and
storm water removal. This was cheaper than building two separate systems but it also created
technical problems. Connecting the stormwater removal system to the sewage disposal system
provided an exit point for sewage wherever stormwater entered the system. Under severe rainfall
conditions these systems overflowed, carrying raw sewage into the streets and basements of
houses. Eventually, it became necessary to require separate systems for storm water and personal
sewage wastes. Most systems built in the US since the 1930’s are separated but, there are still
some older cities that have combined sewer and stormwater systems. Many of them have been
slow to upgrade because of the cost if digging up streets.
An early impediment to building sewage systems was the shortage of reliable piping.
Early piping was made by hollowing out a log and fixing the ends so they connect. These last
until the wood rots, allowing the contents of the pipe to seep into the ground. Later, clay piping
became more common. Metal piping was scarce until the late 1800’s when the use of coal made
metal smelting cheaper. It was not until the beginning of the 1900’s that cast iron piping became
widely available. Many houses from this period still have cast iron piping in them. Good cheap
piping allowed the building of sewage systems took off.

Sewer overflow
Public domain by EPA from http://en.wikipedia.org/wiki/File:Overflowepa.gif
As more sewage systems were built, a new problem arose. Most were designed to remove
the problem, not to clean it up. They terminated at the end of a pipe that emptied the raw sewage
directly into rivers, streams, and lakes. They followed the maxim that the solution to pollution is
dilution. The theory was that if the receiving stream was large enough and the sewage flow small
enough it would clean itself before it came to the next user. As more systems delivered more
sewage the load became larger than many streams could bear without showing an impact.
This large concrete pipe is part of a sanitary sewer system.
Public domain by USGS from http://en.wikipedia.org/wiki/File:Orfice.jpg
Sewage is concentrated food for algae and bacteria. It contains high levels of nitrogen
and phosphorus. The characteristics of streams and lakes began to change as nutrients in the

sewage raised the carrying capacity for algae. As the natural nutrient limitations were relaxed
new less desirable algae and fish species entered streams. Often the community of fish changed
in ways that were not welcomed by anglers. People with waterside homes began to experience
unpleasant odors. Lakes that were clear became darker. People who had thought themselves far
from the city found that it had come to them. Sewage systems that emptied into rivers, lakes, and
streams cleaned up local public health problems by transporting them downstream.
Sewage is a density dependent problem
While cities and towns and their sewer systems were being built populations also
increased. Higher populations produced more sewage in each settlement, and more settlements
meant towns and cities were closer together. More sewer systems in more towns and cities meant
more sewage exported to streams, rivers and lakes. Eventually, the ability of the environment to
assimilate raw human wastes was overwhelmed by the volume of wastes produced.
As the density of people increased it became more difficult for anyone to escape the
effects of others around them. As streams become more crowded it became difficult for the next
person downstream to draw water without being exposed to what the previous upstream user put
into it. This problem became more acute as the density of populations increased. It is what
ecologists might call a density dependent problem.
Blue and violet are areas of high population density where sewage treatment is required.
Public domain from the National Atlas at http://www.nationalatlas.gov/.

Piping sewage into rivers and streams solved local problems by speeding it away from
where it was produced, diluting it, and spreading it around the environment. It removed sewage
from the local environment, and used the previously untapped assimilative capacity of the larger
environment to absorb it. Eventually, the density of sewage in the larger environment reached a
level that overwhelmed even its ability to assimilate more. As the concentration of sewage
continued to increase, the quality of the free natural goods and services provided by the larger
environment declined. The cumulative impact of the many small and independent actions of
people changed the way the larger systems function.
What do humans do when confronted by deterioration of the natural environment? The
normal response is for those who can afford it to move away to a place of lower exposure leaving
behind those who can’t afford to move. As sewage became an inescapable problem two new
environmental technologies came to the rescue, sewage treatment works and water treatment
plants. When there is no place to run to we internalize the costs by developing new technologies
that are paid for by raising taxes and by passing laws that require better individual and collective
behavior.
And sewage treatment plants
Early sewage treatment began with what was simple. Filtering drinking water was easier
and cheaper than sterilizing sewage water. Some cities began filtering drinking water through
beds of sand. This cleared the water, but did not remove the disease causing bacteria. As public
awareness of how disease organisms spread developed this became a politically inadequate
solution for protecting public health and the public demanded better methods for treating and
sterilizing sewage before its release.
The simplest way to dispose of sewage so that it doesn’t impact aquatic ecosystems is to
collect the solid sludge and apply it to the land in what was called sewage farming. Many small
and large cities in the US did this until the mid 1930’s. The farms were used to grow beans,
tomatoes and corn. The fruits and vegetables were sold in city markets. Prejudice against
vegetables raised on sewage soil eventually put them out of business. Where they could, sewage
farms were replaced with sewage outfalls into aquatic ecosystems that were intended to send the
sewage downstream.

Releasing sewage into aquatic ecosystems also introduces nutrients to the system. An
important strategy in reducing nutrient impact is to reduce the quantity released. Sometimes, the
volume of sewage material was reduced by capturing the solids in a settling tank using lime, iron
sulfate, or other chemicals to form a flocculent that settled to the bottom. This produced smelly,
hard to handle sludge, so it was not popular with engineers and hard to dispose of.
Later efforts included filtration and digestion of sewage sludge on beds of sand and
gravel. Raw sewage water was sprayed onto the filters at a constant rate and bacteria on the
surface of the sand and gravel digested the solids, purifying the water, and reducing the volume
of sludge. This method is still in use in some areas.
Another method used a large tank that separated solids and liquids in two chambers.
These were later separated into two tanks, one for settling and the other for digestion of the
sludge. New sludge was constantly added to the digestion tank from the settling tank. The
volume of sludge in the digestion tank was reduced by anaerobic digestion by bacteria producing
methane gas that was either burned or vented to the atmosphere. Sludge that resisted digestion
was removed from the tank, composted, and spread on the land. This method is still used in some
places, and it is making a comeback since the methane can be burned as an energy source.
A primary goal of sewage treatment plant operation is to reduce the volume of the sludge.
The next major innovation was to digest the sludge aerobically using bacteria in a water bath.
The activated sludge method uses a settling tank and digestion tank. Settled solids are pumped
from the settling tank into the digestion tank. The sludge is activated by bubbling oxygen into the
digestion tank to promote the growth of bacteria. After a while the remaining undigested sludge
is removed. Some is recycled back to the settling tank to seed new sludge with bacteria. The rest
is dried and composted to further reduce its volume and sterilize it before it is spread on the soil.
The activated sludge process has become the preferred method for sewage treatment, in part
because the sludge at the end of the process is lower and has a higher value as fertilizer than
what is produced by other processes.
The final addition to the sewage treatment process is to sterilize the treated water before
it is released back into the environment. Where effluent was discharged into tidal waters that
were also used for mariculture, or into public drinking water supplies, it became customary to
treat the effluent with chlorine.

The final form of the modern sewage treatment plant developed in the beginning of the
20th century. As of the 1940’s many large cities had treatment plants or were preparing to build
them. We now assume that it is a government responsibility to protect public and environmental
health, and every small city that can afford a treatment plant should build one. In the US, federal
subsidies for the construction of treatment plants help in this effort. This did not keep several
large cities from delaying as long as possible. Some of them finally built treatment plants when
they were mandated and subsidized by the federal government in the early 1970’s.12 A few large
cities still have combined sewage and stormwater systems that release sewage directly into
aquatic ecosystems.13
A modern wastewater treatment plant
A typical modern activated sludge wastewater treatment plant contains some or all of the
following systems.
A secondary sewage treatment plant.
By Leonard G. under the CCA 2.5 license at http://upload.wikimedia.org/wikipedia/en/5/54/ESQUEMPEQUE-EN.jpg
1) Sewage treatment plants contain physical and biological components. Both need to be
protected from damage by the contents of the influent water.

The biological components of a treatment plant are the bacteria used to digest the sewage
solids. They are kept highly concentrated in the settling and digestion tanks to speed up the
process and provide feedstock for recycling back into the settling tank.
These tanks are built to handle a certain level of water flow. Above this level and the
bacteria will be washed out of the plant, reducing its ability to digest incoming sewage. Where
treatment plants serve systems that include combined sewage and surface runoff the quantity of
influent water can exceed the ability of the plant to treat it without losing its bacteria. During
these high flow events, some influent water may be diverted into a holding tank to protect the
treatment tanks. When the storm flow is too large to handle raw sewage is released directly into
the environment. This causes some damage to the environment in the short term, but insures that
the sewage treatment plant will return to full function as quickly as possible.
2) The physical components of a wastewater treatment plant need to be protected too.
Incoming water can contain rocks, sediments, plastic bags, sanitary napkins, and other objects
that can get caught in the machinery if they are allowed to enter the wastewater treatment plant.
They are removed before in a pretreatment tank where heavy objects to settle to the bottom and
floating objects are caught with skimmers. The pretreatment stage is where lost diamond rings
are sometimes found.
3) Incoming water contains floating oil and soaps that form a scum on top of the water
that interferes with aeration of the sludge in the digestion tanks. They are removed by bubbling
air through the sewage to form a frothy scum on the surface and removed with a skimmer.
4) The influent is now ready to begin treatment. The first step involves settling out solids
and priming them with recycled sludge returned from later in the treatment process. The primed
sludge is pumped into the aeration tank.
Some wastewater treatment plants do no further treatment. These primary treatment only
systems feed the effluent water directly into step 8 where it is sterilized and released into the
environment. Plants of this design stop at what is called primary treatment. They are usually
found in small communities with low sewage volume.
5) At the end of step four, the activated sludge from the primary treatment tank is primed
and ready to be digested. All it needs is time for the bacteria to work. This happens in the
secondary treatment tank.

Secondary treatment tanks are continually agitated and aerated in order to keep the sludge
from settling. Agitation keeps the sludge in contact with aerated water and the bacteria, which
eat the organic carbohydrates in the sludge releasing carbon dioxide and taking up some
nutrients. Some of this “activated” sludge is recycled back into the primary settling tank to kick-
start the process of digesting new sludge.
6) The next step is to separate the remaining sludge from the effluent water. Some of the
sludge is made of organic materials that resist decomposition, such as the lignin in paper. The
recalcitrant sludge is passed into a settling tank where liquid is drained off to begin the drying
process. When it has lost enough water, it is composted and applied to the land, or taken to a
methane `generation plant for further anaerobic digestion. In Milwaukee, a city in the state of
Wisconsin, the dried sludge is sold as fertilizer under the name Milorganite.
7) In some cities the liquid sewage effluent still contains too many nutrients, metals, or
organic toxic waste products to be released back into the environment. In this case, the
wastewater effluent is put through a tertiary treatment process where it is passed through sand
filters or activated charcoal that capture heavy metals, nutrients, and other toxic materials.
Tertiary treatment is used in many big cities to capture chemical wastes added by small business
and manufacturing plants.
8) In the final steps, the clarified liquid effluent is taken through a settling tank to remove
the few remaining floating solids. From here, it passes into a chlorine contact tank to the kill the
remaining bacteria. Before it is released, the effluent water is tested to make sure that it conforms
to clean water standards.

Sewage treatment plant in Cuxhaven, Germany.
By Martina Nolte under the CCA 3.0 license from http://en.wikipedia.org/wiki/File:2012-05-
28_Fotoflug_Cuxhaven_Wilhelmshaven_DSCF9867_(crop).jpg
After spending up to 24 hours in the chlorine tanks, the finished effluent water is released
back into a receiving body of water, either a stream, river, lake, or the ocean. It still may contain
large amounts of nitrogen and phosphorus. Often the water is released into lagoons or wetlands
that are used to absorb these remaining nutrients. The natural services provided by the
environment continue the process of assimilating nutrients, sequestering metals, and consuming
organic compounds not removed by the wastewater treatment plant.
Septic tanks
Many rural homes in the US are not connected to publicly operated sewage collection
systems. As low as ten percent of homes in urbanized counties and up to 80 percent of homes in
rural counties may be using septic systems for wastewater treatment. Septic systems are
miniature wastewater treatment plants designed for limited use that are buried in the ground next
to the home that they serve.
Septic systems use tanks to hold and treat sewage. These are large containers that receive
wastewater from sinks and bathrooms. They are constructed so that liquids, heavy solids, and
floating oil and grease are separated inside the tank. Solids settle to the bottom where they are

digested by anaerobic bacteria. Floating oil and grease is captured in the top of the tank and
skimmed off when it is emptied, which should be every few years. Liquid effluent from the
middle of the tank is slowly released into the soil through a leach field that contains layers of
sand and gravel that acts as a filter to keep solids and bacteria from entering the groundwater.
A septic tank ready for installation
Public domain by EPA from http://www.epa.gov/region4/sesd/reports/2001-0141/photos-collectionsystem.html
In order to function properly a septic tank needs to be deep enough underground so that
effluent does not reach the surface, exposing people to partially treated sewage and high enough
above the groundwater table so that released effluent takes some time to reach it. Undigested
solids and scum need to be removed every few years to maintain space in the tank. The removed
material is taken to a wastewater treatment plant.
The effectiveness of a septic tank depends on how well it is installed and maintained.
Shallow soils and soils that drain poorly and become waterlogged are likely to allow sewage to
come to the surface after a heavy rainfall. Tanks installed in light soils that allow water to
quickly move through them allow sewage effluent to reach groundwater before it has been
adequately treated. Tanks installed with leach fields that are too small will not fully treat wastes
before they return to the surface or reach groundwater. These restrictions mean that septic tanks
cannot be used in many areas without some engineering to create a proper leach field.

Homeowners often do not understand how their septic systems operate and do not want to
spend money on having them cleaned so many systems do not function as well as they are
intended. Tanks need to be cleaned on a regular basis to remove contents that do not break down.
If they become clogged they release sewage water into the soil before it is adequately treated.
Septic systems have a maximum capacity for daily treatment. Many homes that are on septic
have been renovated to hold more people without increasing the size of the septic tank or the
leach field. This overloads the treatment capacity of the tank releasing sewage into the soil.
A household septic system.
Public domain by USGS at http://en.wikipedia.org/wiki/File:Landpeople_s_cc8.PNG
Leaking septic systems affect their local environment. Leaking tanks near aquatic
ecosystems become a source of waterborne disease. They also release nutrients that supplement
the growth of algae and bacteria. Contaminated groundwater can enter drinking water wells and
is difficult to clean up. Groundwater contamination may cause some drinking water sources to be
abandoned. Where there are many leaking septic systems in the watershed of a lake their
combined and cumulative effects can change the ecology of the lake.
Drinking water is sterilized
Septic tanks and sewage treatment plants are not 100 percent effective at killing bacteria.
Sewage treatment plants do not run all the time. Not every community has one. Many treatment
plants are allowed to overflow during high rainfall. Septic systems leak as they age and many of
them are not well maintained. They become clogged and leak when they are not cleaned often
enough. Although sewage treatment plants and septic systems have reduced water

contamination, they have not fixed the problem of making contaminated water clean enough to
drink. As population continues to increase it becomes more difficult to escape using water
contaminated by the last upstream user.
Sewage is not the only contaminant in drinking water. Surfacewater impounded in
reservoirs often has contaminants from road and agricultural runoff. Dead animals and wild
animal feces also enter the surface drinking water sources. Urban street runoff has high levels of
motor oil, phosphorus, and the pesticides, herbicides and fertilizers you apply to your lawn.
Most public drinking water sources are filtered and sterilized before the water is fit for
human consumption. Active filtration of drinking water began in the early 20th century. At first,
the water was passed through screens and sand beds that removed small floating particles. When
it became clear that filtration was not enough to remove harmful bacteria and other organisms we
began adding chlorine to kill the organisms that remained after pretreatment. As a public service,
a small amount of fluoride is also added to most public drinking water sources to reduce the
formation of cavities in teeth.
Runoff from city streets contains the chemical residues of modern life: motor oil, brake
fluid, and lawn chemicals. Industrial wastewater contains solvents, acids, and other chemical
residues. These are removed by passing prospective drinking water through activated charcoal
just like the filters used in aquaria. Some filtration plants use even more complex and costly
methods where these are not enough to reduce contamination to acceptable levels.
Sometimes the best available source of drinking water is recycled sewage water. Many
cities in arid areas have begun passing their own treated sewage water through reverse osmosis
filters and reusing it as drinking water. Reverse osmosis filtration separates water from
contaminants by pumping it through membranes with very small pores that only allow water
molecules and similar sized objects to pass. Most chemical pollutants and bacteria are too large
to fit through. Reverse osmosis is costly to run and maintain and requires pumps and energy to
push water through the filters. The filters are delicate and must be replaced when they become
contaminated.

A reverse osmosis water treatment system
Public domain by US EPA at http://www.epa.gov/region09/water/recycling/images/treat-w-basin-2c.jpg
Sources of water pollution
Sewage is only one of many kinds of water pollution. Because water is a resource,
receptacle and transport mechanism it interacts with almost every human activity, carrying
resources to and wastes from all parts of the human habitat.
Water pollution comes from industry, farming, mines, and urban landscapes. Where the
polluted water comes from the end of a pipe it is called point-source pollution. Contributors to
point-source pollution are easy to find, they are normally at the upstream end of the pipe. Point
source pollution can be monitored by watching what comes out of a pipe, and controlled by
regulating and testing what is released.
Non-point source pollution does not come from the end of a pipe. It is the remains left
behind by many activities spread out over the landscape. Non point sources of pollution include
nutrients from agriculture, sediments lost by development, lawn care products, rubber lost from
tires, and road clearing salts. Non-point source pollution is controlled by monitoring and
regulating the behavior of people as they use the land. Point sources of pollution that are easy to
locate and monitor are much better controlled than non-point source pollution.

Chemical waste
Chemical wastes are the unwanted byproducts of making, using and disposing of
industrial and consumer products. Most chemical pollution ends up deposited on, or in the
ground, and eventually reaches water.
You might think that large manufacturing companies are the only sources that produce
chemical pollution, but many small businesses work with chemicals, and every household has
paint, oil, and cleaning supplies that have to be disposed of. Chemical wastes include caustic
chemicals, the byproducts of large scale cleaning operations, such as metal plating or
semiconductor manufacturing, paper processing wastes that include dyes and bleach, paint
residues, the remains of electrical equipment that contain PCB’s and the byproducts of small-
scale business operations, such as dry cleaners that use carbon tetrachloride, and auto repair
shops that change motor and transmission oil. Few people are able to pump gas without letting a
few drops fall on the ground.
The usual industrial sources of chemical pollution are stationary, so the amount and type
of material they emit can be well monitored. Stationary sources include chemical production
industries, industries that use chemicals in processing paper and metal, and the places where
waste chemicals are stored when they become unusable. Large mining operations can also be
stationary sources if they use chemicals to clean ore before it is shipped out. Mobile sources that
emit chemical pollution include trains, planes, boats, trucks, and cars.
At the start of the industrial revolution in the late 1800’s we began making many new
chemicals and many old ones in quantities far greater than before. The byproducts of these
processes were disposed of as if they were any other garbage, in open dumps across the nation.
Many places were contaminated by chemical wastes before we understood how they move
through the soil and into the groundwater. As we have learned about the behavior of these wastes
we have responded with laws and regulations to protect the public.
Love Canal
An early lesson about the dangers of chemical wastes and water was learned at Love
Canal, formerly a residential community in Niagara Falls, New York. It began in the early 20th
century as a canal for shipping from the Niagara River to nearby Lake Ontario bypassing

Niagara Falls. That venture failed but left behind a short open waterway that passed to the south
of the city.
Residents protesting at Love Canal
Public domain by EPA from http://en.wikipedia.org/wiki/File:Love_Canal_protest.jpg.
For some time the city of Niagara Falls used the canal as a garbage dump. They sold it to
the Hooker Chemical company in 1942 for use as a chemical dumping site. Hooker excavated
the ground and installed a clay liner to contain spills. For the next ten years, they buried 55
gallon drums in it. The buried wastes included caustic agents, fatty acids, chlorinated
hydrocarbons, solvents, dyes and chemical resins. When the dumpsite was full, they placed an
impermeable clay cap over it that was supposed to seal in the toxic wastes.
In the late 1950’s, the city of Niagara Falls was looking for a location to build a public
school. The Hooker Chemical dumpsite was closing, and the city was growing around it. Love
Canal was then surrounded by developing residential neighborhoods that needed public services.
The school board was looking for places to build new schools. Despite warnings from Hooker
that the area was potentially dangerous one corner of the dumpsite was taken over by the school
district as the site for a primary school for at least 400 students. The architect designing the

school warned the school board again that the dumpsite was not suitable because its foundation
was likely to shift due to unstable soils. The school board, still desperate to build a school, went
ahead anyway. During construction, the cap on the dumpsite was broken in several places, and
the barrels inside began to leak.
In the late 1950’s the city began building infrastructure for the surrounding
developments. Sewer beds were dug that again broke the cap on the landfill. Now the local
groundwater table gained a connection to the previously isolated dump. The residents who
moved into the surrounding homes did not know about the history of the canal or the presence of
the chemical landfill. There was no monitoring of the dumpsite, no planning that accounted for
its presence, or evaluated the types of chemicals buried in it. Later, the LaSalle expressway was
built around the lower edge of the dumpsite. It restricted groundwater flow out of the canal
towards the Niagara River, and groundwater levels in the dump rose. The clay cover began to
crack, letting water in and chemicals out. In 1977 there was a wet winter and spring in which
water collected in the canal. Restricted from flowing out by the expressway, it began to back up
into people’s basements.
In the late 1970’s Love Canal residents noticed that there was an exceptionally high rate
of miscarriage and birth defects in the neighborhood. This led to newspaper stories that reported
the presence of the dump and the formation of a residents association. Eventually the residents
association sued for damages. The school board, the city, and the chemical company tried to
avoid liability by pinning responsibility on each other. The state health commissioner for New
York advised people to restrict the use of their basements and not to eat food grown in their
gardens. President Jimmy Carter announced a federal health emergency at the end of 1978, and
allocated disaster relief funds, the first time national disaster funds were used for something
other than a natural disaster. Lawsuits over liability dragged on into the 1990’s before Occidental
Petroleum, which had bought Hooker Chemical, settled for 129 million dollars.
Other dumpsites
Love Canal is not the only contaminated site around the country. The Meadowlands of
New Jersey, only five miles from Manhattan, was once one of the most polluted places in the
United States. It was near the center of the industrial revolution in the United States and received
unregulated deliveries of garbage and industrial wastes for almost a century. While it has been

substantially cleaned up, it is still leaking mercury into streams. There are hundreds of equally
dangerous known chemical dumping sites in small towns like Dayton and Hamilton, Ohio,
Hammond, Indiana, and Wheeling, West Virginia that were part of the industrial revolution and
there are many others waiting to be discovered.
Valley of the Drums in Bullitt County, Kentucky.
Public domain by EPA from http://en.wikipedia.org/wiki/File:Valleyofdrums.jpg
Love Canal, Times Beach Missouri, where roadsides contaminated with dioxins sprayed
to keep down dust, and the valley of the Drums in Kentucky, a large dumpsite filled with drums
of toxic waste, were three key sites that changed our attitude towards chemical contamination.
The Comprehensive Environmental Response, Compensation, and Liability Act (CERCLA) was
passed in 1980, shortly after Love Canal became a household word. Commonly known as the
Superfund act, this law gives the Environmental Protection Agency the ability to identify parties
responsible for chemical pollution, and demand payment for cleanup. It was the first step in
setting up the national system that keeps track of how much hazardous waste is generated, where
the waste is located, and how it is disposed of.
We remember Love Canal because it made the news. It made people think about their
own exposure to chemicals in the places that they live and it contributed to the passage of laws
designed to protect the public from exposure to hazardous chemical wastes in the ground and in
water.

A newt with exposed gills behind its head.
By Andre Karwath under the CCA 2.5 license at http://en.wikipedia.org/wiki/File:Smooth_Newt_larva_(aka).jpg
Acid drainage
Another source of water pollution is the acid drainage that occurs when rocks bearing
sulfur minerals, such as iron pyrite, are exposed to water, converting the sulfur into sulfate,
creating sulfuric acid. As the acid rock dissolves it also releases iron, manganese, copper, and
other heavy metals that dissolve in the water. Exposed acid producing minerals react with
oxygen and water to produce sulfate that is converted into sulfuric acid. Piles of mine tailings
and bedrock exposed in road cuts also produce acid drainage.
Streams and lakes are affected by acidity in the water and the deposition of iron and other
heavy metals in rainfall and on dust. Amphibians, fish, and aquatic insects breathe using gills.
High acidity affects their ability to regulate the permeability of the their gills, causing problems
with regulation of their blood chemistry
Acid drainage also carries high amounts of iron and can liberate aluminum from clay
minerals in the soil. When dissolved aluminum comes in contact with the gill surfaces of fish and
amphibians it precipitates, covering the gill surface and killing the unlucky organism.
Acid drainage is a serious problem in regions with many mines. The Allegheny and
Monongahela watersheds cover almost 19,000 square miles in western Pennsylvania. They have
been subject to coal mining since the early 1800’s, and have more than 9,000 active and more
than 3,500 abandoned mines. Acid drainage in these watersheds has resulted in almost 2,400
miles of streams without fish.

Runoff from a mine in Missouri is staining this stream orange with iron oxide.
Public domain by USGS from Environmental Contaminants; Status and Trends of the Nations Biological Resources
by D. Hardesty, USGS Columbia Environmental Research Center.
Mineral processing
Mineral extraction is another source of pollution. Miners use mercury and cyanide to
separate gold dust from the sediments and minerals in which they are found. Where veins of gold
reach the surface they are eroded by streams and tiny flecks of gold are carried downstream to be
buried in sediments. These deposits are mined by individuals panning for gold, or by using
hydraulic dredges to disturb and suck up the sediments and pass them through troughs where the
heavier gold stays behind and the lighter sediments are washed away.
When gold is present as tiny flecks in sediments it is difficult to separate the two. In the
Amazon, Ghana, Indonesia, where individuals still pan for gold, it is concentrated by adding
mercury. The mercury binds with the gold, forming a heavy amalgam that settles out of
suspension more rapidly than the lighter sediments. The gold is separated from the amalgam by
burning, which releases the mercury into the air where it is a health hazard for miners and the
nearby environment.

Hydraulic mining for gold in California.
Public domain from the Library of Congress at http://www.loc.gov/pictures/resource/cph.3c00735/
Large gold mines create tailings piles that still contain tiny amounts of gold that were
uneconomical to extract when they were first mined. As chemical extraction procedures
improved and the cost of chemicals has fallen or the price of gold risen these tailings piles are
mined once again, this time using a sodium cyanide solution that leaves behind a sludge
containing cyanide and heavy metals. The contaminated sludge is stored in tailings ponds that
occasionally leak and escape containment into nearby rivers and streams.
Urban chemical pollution
Urban areas are a major source of water pollution. Ever wonder where all the rubber from
worn out tires goes? Or the motor oil from dripping leaky oil pans? Or the spray paint that
doesn’t make it onto the surface of what’s being painted? Runoff from urban and suburban areas
contain all of the materials lost into the environment in our daily lives. Runoff from urban areas
contains nutrients from lawn fertilizer, car fluids, dry cleaning compounds, pesticides, paint, oils,
food wastes, and any other material we use and lose in the course of daily life. The motor oil,
transmission fluid, spray paint and other lost materials, are carried from parking lots, gas
stations, lawns and streets to drains and into the streams and rivers from which we drink and in
which we swim.
The presence of human birth control hormones in fish is another aspect of the intrusion of
people into every corner of the earth. Birth control hormones excreted in women’s urine travel
through sewage treatment plants into aquatic ecosystems where they are assimilated by algae and

then concentrated in the food chain. In marine systems, estrogens from birth control pills inhibit
the settlement of coral larvae. It is not clear what else these compounds do in nature, or to us.
Farm pollution
Farming is the other great human activity that dirties water. It covers about 15 percent of
the lands surface where it creates both point and non-point source pollution. The point source
pollution comes from large scale animal raising operations in which hundreds of cattle, chickens,
and pigs are raised in confined conditions that create concentrations of manure. Non point
pollution comes from the land use practices used to manage grazing animals and crops. Plowing
and grazing opens the soil, increasing erosion that carries off animal manure and topsoil into
streams along with fertilizers and farm chemicals. Farms that practice concentrated animal
confinement create piles of manure that need to be stored and disposed of. Animals that have
access to streams erode stream banks, disturb stream bottoms, and deposit manure directly in the
stream’s floodplain.
Runoff contains sediments mixed with farm chemicals.
Public domain by NRCS from http://en.wikipedia.org/wiki/File:Runoff_of_soil_%26_fertilizer.jpg.
Non-point source pollution is much more difficult to manage than point source pollution.
It is distributed over the landscape and results from the behavior of individual farmers. The main
tools available to manage it are the carrots and sticks of public policy. A major public policy
carrot is the payment of subsidies to farmers to encourage better land management practices.
These payments for are for behaviors such as fencing streams so animals do not have direct

access to the streambed, spreading manure when it is less likely to be washed directly into
aquatic ecosystems, and storing manure in lined pits so that it will not be carried into streams by
runoff or infiltrate into groundwater. They include not using chemicals when they are likely to be
carried away by surface runoff, and protecting soil from erosion by leaving vegetated buffers
around streams and rivers to keep nutrients and chemicals away from them.
Water pollution comes in many forms
Water pollution is the addition of nutrients, chemicals, heat, and sediments, to water that
alter the functioning of the natural system, or are a potential source of hazard or discomfort to
humans. Sediments are solids added to water through erosion of upland rocks and soils.
Chemicals added to water include caustic agents, such as strong acids and bases, biological
nutrients, carcinogens, teratogens, explosive and flammable compounds, toxins, and hormones
that are active in humans and animals. Even chemicals that are not soluble in water, such as oil,
can cause significant water pollution problems.
Rivers can burn
The Cuyahoga River runs through the heart of one of the oldest manufacturing areas in
the US. The industries that grew up along it in the early 1900’s were located there because of its
access to the interior of Ohio and the Great Lakes. They included chemical factories, breweries,
metal processing plants, and oil refineries. Raw materials such as grain and iron ore arrived
through the Great Lakes and by railroads from the Midwest. Oil came from the nearby oil fields
in Pennsylvania. Finished products were shipped down the Erie Canal and later by the St.
Lawrence Seaway to the rest of the country and the world.

The Cuyahoga River on fire in 1952. The 1969 fire is one of the events that triggered the
environmental movement.
Public domain by NOAA from http://celebrating200years.noaa.gov/events/earthday/cuyohoga_fire.html
These industries were part of the American industrial revolution of the early 20th century.
They developed in the same way that industry located in other towns along the Ohio,
Mississippi, and countless other rivers with access to resources and water transportation, and the
same things that happened to the Cuyahoga happened to them.
In 1969, the Cuyahoga River caught fire. According to Cleveland’s fire chief it was no
big deal. Fires had happened every few years since at least 1932, and on other industrial rivers in
Cincinnati, Gary, New Orleans, and other places with a similar industrial history all around the
country. They happened because the industries that operated along the rivers were using them to
dispose of flammable chemicals and oil refinery wastes.
The 1969 fire in Cleveland would not have been a big deal except that it was covered in
Time, a magazine with national circulation. It came when people were already focused on the
environment because of other events and because of these events the story would not go away.
The burning of the Cuyahoga became one of the motivations behind passing the Clean Water Act
(CWA) Amendments of 1972 to protect the nation’s waterways from chemical, nutrient, and
other pollution. It mandated the cleanup of pollution in all the rivers and streams in the United
States so they would all be swimmable and fishable.
Oil doesn’t mix with water
Oil and refined petrochemicals are ubiquitous water pollutants. They normally float on
top of water, but they can settle into sediments where they stay, slowly diffusing back into the
water column over periods of years to decades. They are released in many small, normally
unnoticed spills, such as when you allow a drop of gasoline to fall on the ground when filling up
your car, and in large dramatic spills that capture the public attention for weeks as the
responsible party tries to shut off the flow of oil and clean up the consequences.
A large, but not the largest oil spill, is what happened in Prince William Sound, Alaska,
on March 24, 1989. On that day, the Exxon Valdez, a single hulled oil tanker went aground,
spilling 10.8 million US gallons of crude oil. Prince William Sound’s remote location made
controlling and cleaning up the oil difficult. The spill covered 1,300 square miles of ocean

causing damage to tourism, fish, fishermen, seals, sea otters, seabirds, and fouling natural areas
along the shores.
The oil spill control technology of the day tried to burn off the oil, dissolve it in seawater
using chemical dispersants and capture it with booms and skimmers. These efforts were only
partly successful and the oil slicks reached land where it was deposited on the rocky beaches
along the shore. Under public pressure, Exxon employees and 11,000 Alaskans began to clean
the beaches using hot water under pressure. The steam treatment removed the oil, and everything
else alive including the naturally occurring fungi and bacteria that aid in the natural remediation
and biodegradation of oil.
The US Navy cleaning up a beach fouled by the Exxon Valdez oil spill.
Public domain by the US Navy from http://en.wikipedia.org/wiki/File:Exxon_Valdez_Cleanup.jpg.
Recent studies suggest that more than 26,000 gallons of oil remain in the sandy soil along
the Prince William shoreline. More than 20 years later there are still small but measureable
biological effects. The Exxon Valdez is the tip of the iceberg when it comes to oil spills. It is not
the biggest oil disaster, but it is one of the better known. Every year more oil than was lost in this
one well publicized accident is lost in urban harbors, at oil transfer points at sea, in drips lost at
gasoline stations, from leaking underground storage tanks, and other minor spills. Cars are
continually leaking small amounts of motor oil, transmission oil, and brake fluids onto the
ground. Spills on soil infiltrate into the groundwater where they are difficult and costly to clean
up. Spills in water enter the food chain and are concentrated as they move up the food chain into
the top carnivores that we like to eat.

Pollutants make you sick
Toxic pollution makes you sick. You can live for a long time with low-level symptoms
from chronic exposure to many toxic pollutants, but you will die quickly as the result of acute
exposure to a large enough dose. Long-term exposure to low-levels of toxins causes illnesses that
are hard to explain. Exposure to different toxins over a period of time may cause symptoms that
are difficult to tease apart. Important toxic pollutants include mercury, arsenic, lead, fluorine, and
DDT. Many toxic chemicals, such as lead and mercury have organic chemical forms that become
concentrated during their passage up the food chain. It is for this reason that eating some species
of tuna fish, a top marine predator, can be dangerous.
Mercury
Elemental mercury is a silvery liquid at room temperature, hence its ancient name,
quicksilver. The Chinese thought eating it improved health. Greeks, Romans, and Egyptians used
it in cosmetics. Until recently, it was used in mercury thermometers.
Mercury sources and sinks in the environment.
By Ground Truth Trekking under CCA 3.0 license at http://en.wikipedia.org/wiki/File:MercuryFoodChain-01.png
Mercury affects the nervous system, dulling intelligence and eventually producing a kind
of madness. It was used to make beaver felt hats in Europe in the 1700’s and 1800’s. After long

exposure many of the hatters went slightly mad, which led to the derogatory English saying
“Mad as a hatter” which explains why the mad hatter in Alice in Wonderland behaves the way he
does.
Mercury is released into the environment naturally through volcanic eruptions. It is also
naturally present in some soils and sediments. Its major anthropogenic source is from the
combustion of coal. It is also released by burning contaminated household and industrial garbage
in incinerators.
Mercury is highly toxic to living organisms. In the environment it is converted by
bacteria to methyl mercury which is very similar to the amino acid methionine. Because of this,
it is able to travel throughout the body, even across the brain blood barrier and into the placenta.
In low doses, it has subtle neurological effects that slow the thinking process and reduce
intelligence. In higher doses it affects the skin, can cause heart problems, and causes more
obvious neurological disabilities. In water, methyl mercury is concentrated in the food chain, so
the highest concentrations are in the top predators such as dolphins and tuna. For this reason, it is
recommended that pregnant women and children limit their intake of swordfish, shark, and tuna.
Much of what we know about acute mercury poisoning in humans comes from
intentional release of mercury into Minimata Bay in Japan by the Chisso Corporation. The
Chisso Corporation started manufacturing fertilizers in 1908. Later they branched out to produce
other organic chemicals. At the time, they were one of the most advanced chemical facilities in
Japan. In the early 1950’s they started releasing methyl mercury into Minimata Bay as a
byproduct. In 1956, fishermen and their families started to report strange neurological symptoms
that were later linked to consuming large amounts of seafood from the Bay, seafood that had
accumulated high levels of mercury.
The government and the company’s own scientists linked the symptoms to mercury
poisoning that could only have come from the chemical plant. In spite of clear evidence, the local
authorities and national government were reluctant to blame the chemical plant because of its
economic importance. People with mercury poisoning were shunned by other local citizens, who
wrongly thought it was a communicable disease, and paid a small amount by the Japanese
government` as compensation for their illness. When the source of the Mercury was made known
fishermen stopped harvesting from the polluted waters. Although new cases of mercury

poisoning continued to be reported in Minimata and in a few other places, the company was
allowed to continue normal operations until 1968 when they finally stopped releasing mercury.
The official reaction to Minimata disease shows the attitude of many governments
towards the effects of environmental pollution on human health. Often they value the economic
activity causing the pollution more than the people and natural resources affected. The result in
this case was about 3000 people showed acute effects of mercury poisoning, and fish and
shellfish harvesting from Minimata Bay and other nearby areas was halted. The political value of
operating the chemical plant was greater than the value of clean food and healthy locals.
Mercury is present in the natural environment in some soils. It tends to evaporate from
warm areas and concentrate in cold areas. This means that soils in the arctic that are far from
cities and industry still can have high levels of mercury. In dry soils mercury stays where it is,
however once the soils are flooded organic mercury dissolves in water and enters the food chain
where it ends up in the top predators through bioaccumulation. This is what happened in James
Bay.
James Bay is connected to Hudson Bay in northern Canada. Several large rivers flow into
it in regions that are sparsely populated with native Indians and Inuit. In the late 1960’s the
potential for hydroelectric development was recognized and several large projects were built,
generating electricity for the large city of Montreal and the rest of the province of Quebec. The
project also produces a large surplus that is sold to the US state of New York to the south.
The native populations that live south of James Bay survive on a mostly subsistence diet
of fish and meat obtained from local sources. One of the proposed benefits of building the James
Bay project was that local people would be able to gain subsistence from fishing in the
reservoirs. When the reservoirs of the hydroelectric dams began to fill their soils became
waterlogged. Mercury in the soils entered the water and passed into the food chain, ending up in
the fish that the natives depended on for their livelihood. They began to develop mercury
poisoning.
The Canadian and Quebec governments conducted a long series of studies that eventually
found the connection between industrial mercury releases in the south, northern organic soils
where it was deposited, and newly released mercury from soils under the reservoirs. The
Canadian government provided guidance on what fish posed a lower risk to native subsistence
fishermen, and provided alternative protein sources where it was necessary. The contaminated

soils are expected to run out of Mercury after 30 years, so the exposure levels in the James Bay
region are going down, but the problem still exists in other areas where northern organic soils
that have been flooded.
Arsenic
Arsenic has a long association with humans in history. At one time, it was taken orally by
women to make their skin seem pale and as a stimulant. It has several agricultural uses as
insecticides, and until recently, it was used as a preservative in wood to prevent rot.
Arsenic can cause skin, bladder, liver, and kidney disease, and, in large doses has been
used as a poison.14 As the nature of its effects on humans in even small quantities has been
understood we have abandoned most of its uses or found less toxic arsenic compounds as
substitutes.
Regions with arsenic contamination.
By Matze6587 under CCA 3.0 license at http://en.wikipedia.org/wiki/File:Weltkarte_arsenrisikogebiete.gif
One of the main sources of exposure to arsenic today is through groundwater that has
passed through arsenic bearing rock or sediment. One place where this has happened is on the
Bengali coast in India and Bangladesh. Surface water quality in the Bengali coast is very poor.
The population density is very high, and most people live without access to sanitation. Many
rivers that act as open sewers, and repeated flooding due to monsoon rains mean that mortality
rates from waterborne diseases are high.
The simplest way to lower mortality rates is to find a better supply. In the 1970’s,
UNICEF proposed that new sources of drinking water could be obtained by drilling tube wells

into aquifers that were below the contaminated surface aquifers. In the next few decades millions
of wells were dug. These had the desired effect of reducing mortality from diarrhea by more than
50%. Unfortunately, some of these aquifers also contained arsenic bearing sediments, and in the
early 1990’s people in some villages began to develop symptoms of arsenic poisoning. It turns
out that one in five wells was drilled into these sediments. As they have been discovered these
contaminated wells have been replaced by deeper uncontaminated ones.
Carcinogens, teratogens, mutagens, and hormones
One of the miracles of modern life is how we have mastered chemistry and how it has
helped us improve our lives. We have the power and understanding to produce chemicals never
before seen on earth. The newness of these chemicals means that living organisms have not had
time to adapt to their effects. Many mimic natural chemicals that are important to the proper
development and the functioning of our bodies. We know that these new chemicals have specific
effects when used as intended, but we do not always know what their unintended effects are
when they escape into the environment.
Chemicals that interfere with a developing fetus are teratogens that can cause a fetus to
have too many limbs or not enough, or other problems with the orderly physical development of
a normal healthy baby. Mutagens cause changes in DNA. When these occur in eggs or sperm
that develop into a fetus the fetus will be affected. The effects can be similar to exposure to a
teratogen, or subtle changes in biochemistry, or changes in the function of the nervous or
endocrine systems. Carcinogens cause cancers to develop in otherwise normal individuals.
Hormones are part of the endocrine systems that our cells use to communicate from one organ to
another. Hormones in the environment can change the way organ systems such as the
reproductive system work by being present all the time instead of when the body needs them and
in quantities larger than normal.
Many chemicals used in agriculture have hormonal effects when they escape into the
environment. Some medicines are also teratogens and mutagens, and are only used under special
circumstances. Carcinogens are used in industry and are generated in backyard grilling. Many of
these chemicals are now present in the environment in small amounts. We are not always aware
of where and to what types of new chemicals we are being exposed, but many of them get to us
in the water we drink.

Carcinogens in the environment
Normal cells in the body only divide a few times only under tightly controlled conditions.
After completing their lifecycle they undergo planned and controlled death. Cancer cells have
escaped from these controls. They grow without stopping, interfering with the machinery of the
body.
There are many cancer-causing agents in the human environment including hydrocarbons
from cigarette smoke and charred meat cooked on a barbecue. Many industrial and agricultural
chemicals are possible carcinogens and many agricultural pest control agents and herbicides are
suspected of having some carcinogenic properties. Benzene, a constituent of gasoline, is
carcinogenic. Carcinogenic chemicals are in common use in wood treated to prevent rot,
industrial washing solutions, printing chemicals, and electrical equipment.
As we have learned about the environmental and public health effects of these
compounds we have brought their use under tighter control or banned them altogether. Even so,
many carcinogenic compounds are persistent and many of them are concentrated as they move
up the food chain. The concentration of toxic chemicals in fish has resulted in public health
advisories cautioning against consuming them from many bodies of water, including the Great
Lakes and the Hudson River. We protect ourselves by shifting the costs to human health to the
cost of engineered water purification systems. Even after this public expense, many people do
not trust their tap water and spend more money on water filtration and bottled water.
PCB’s
Polychlorinated biphenyls, commonly known as PCB’s, are a class of compounds widely
used in paints, plastics, and fire retardant fabrics from the early 1900’s until recently. A major
use of PCB’s was in electrical transformers and capacitors where their ability, to withstand high
heat and remain chemically stable are important in the design of electrical transformers.
We knew from very early on that PCB’s were toxic because people accidentally exposed
to high doses in the 1920’s developed disfiguring acne. PCB’s in the body affect liver function,
and high levels of exposure are suspected to cause liver cancer. In the 1960’s high concentrations
of PCB’s were found in dead wildlife showing that it was persistent and could move about in the
environment.

Before its environmental effects were well understood, waste PCB’s were disposed of
directly into waterways. Once in the environment PCB’s move through the air from the
equatorial regions towards the poles like mercury using the Grasshopper effect. They evaporate
more readily from warm places than cold places and condense more readily in cold places than
hot places. That means that chemicals in the environment move from where they were actually
used toward the poles. PCB’s can be found today in the fur of Polar Bears.
As the effects of PCB’s became better known their use was restricted until they were
banned in the late 1970’s and 1980’s.One of the original attractions of PCB’s is that they are
chemically stable. This is also one if their Achilles heels. They persist in nature for a long time.
Even though they have not been produced for the last 25 years they are still present in high
enough concentrations in some places to cause public health concerns.
Where PCB’s were disposed of into rivers and streams high concentrations remain in
sediments and food chains. In spite of extensive remediation of some harbors in the Great Lakes
fish and shellfish still have high enough concentrations to warrant restrictions on their
consumption. Major dump sites in the Hudson River near Albany and outside of Bloomington,
Indiana are still being cleaned up, with millions of cubic yards of sediments removed to landfills.
Teratogens
Teratogens are another class of harmful agents. They cause birth defects in growing
fetuses when they are exposed to them during pregnancy. In high doses many everyday
chemicals become teratogens. Small amounts of alcohol can be safely consumed over long
periods of time, but pregnant women who drink heavily cause fetal alcohol syndrome, resulting
in babies born with low growth rates, impaired nervous function, and reduced intelligence.
Teratogens include the measles, radiation, some industrial chemicals, and some medical
drugs. A recent notorious example is thalidomide, a sedative used in the 1950’s and 60’s. When
given to pregnant women it caused newborns to have missing limbs and extra appendages. The
cause was quickly discovered, and its use on potentially pregnant women was banned. In the
United States, this resulted in the passage of legislation that requires new drugs to be tested for
teratogenic effects during pregnancy.

Hormones
Artificial hormones and hormone mimics are a new class of water contaminants.
Hormones are used on food animals to induce them to grow larger and faster. Some pesticides
and herbicides contain plant hormones that have chemical similarities to human hormones. Small
amounts of the estrogens used in human birth control pills are excreted in urine by the women
who use them. Trace amounts of animal, human and plant hormones also get into the
environment and find their way into water. Once in the environment even in very small amounts
these can affect the reproductive cycles of people and animals. Sometimes they are blamed for
the trend towards lower sperm counts in men over the last 50 years.
Caustic wastes and byproducts
Caustic agents are chemicals that are strong enough to cause corrosion. They include
inorganic acids and bases such as hydrochloric acid and sodium hydroxide, oxidizing agents such
as hydrogen peroxide, dehydrating agents such as zinc chloride and elemental halides such as
fluorine.
Acids and bases are common and important industrial chemicals. Sulfuric acid is used to
remove rust from steel before painting in the auto and appliance industries and to make
phosphoric acid in the fertilizer industry. Sodium hydroxide is a strong base used to prepare
aluminum ore for smelting. Hydrogen peroxide is used as an antiseptic and a bleaching agent in
papermaking. Fluorine is a byproduct of some industrial processes, and was used to make
chlorofluorocarbons for refrigeration. It is still added to public drinking water supplies to reduce
dental cavities.
One of the largest sources of caustic acids in the environment is water draining from
surface and pit mines. Deep mining into the earth for coal and other minerals occurs below the
groundwater level. In order to work the mine it has to be dry, so groundwater that leaks in has to
be pumped out. Once mines are abandoned, groundwater floods them and oxygen in the water
reacts with the newly exposed rock. Bacteria that live in these extreme chemical situations
catalyze the release of acids. Water leaving the mine has a much higher acidity than when it
entered. Acid drainage also occurs where roads cut into mountains, and from exposed coal mine
tailings, and geological events that expose unweathered rocks to the action of water.

Another source of acids in aquatic systems is from the burning of coal. Coal releases
sulfur dioxide into the atmosphere where it is converted to sulfuric acid. The acid is dissolved in
rainfall and falls as acid rain. Where soils are not chemically well buffered the acidity in rainfall
changes the acidity of the soil which changes the chemistry of the runoff. Acidified soils release
aluminum that is carried into lakes and ponds where it is toxic to living organisms. Acid
precipitation is common downwind from most industrial regions, especially where power is
generated from high sulfur bearing coal. As a consequence, many lakes in New England,
Scandinavia, and Eastern Europe have become too acid to support fish.
Thermal pollution
Thermal pollution is any change in water temperature that is great enough to affect
natural communities living in the water. Most thermal pollution is from the addition of heat to
water by the warm outflows from industrial processes and coolant water warmed by electrical
generating plants, but it can also be from the withdrawal of heat when these are shutdown. It can
also occur when cold water is released from the base of dams into otherwise warm water
ecosystems.
Cooling towers reduce the impact of this power plant by sending most of the waste heat
into the atmosphere.
Public domain by PD-USGOV at http://en.wikipedia.org/wiki/Image:Susquehanna_steam_electric_station.jpg

When water temperature changes so do the natural communities that live in it. Most of
these changes are unnoticed except by fishermen and the people who live along the water.
Fishermen know that cutting streamside forests lets more sunlight reach stream water, warming it
so cold water species such as trout are replaced by less desirable warm water fish. Waterfront
residents notice when algal communities change because the water color changes. Sometimes the
algae smell when they die and decompose on the shore.
Adding heat changes the physical properties of water. Warm water holds less oxygen
than cold water. Most aquatic organisms are cold blooded. Living in warmed water increases
their metabolic rate. Plants grow faster in warm water than in cold water and dead plants
decompose faster in warm water, increasing the demand for oxygen and lowering the
concentration in the water. If decomposition lowers oxygen levels too far, fish and invertebrates
die from asphyxiation.
Natural communities eventually change in response to long term addition of heat but they
are strongly affected when heat is suddenly added or removed. Aquatic plants and animals go
into thermal shock when heat is suddenly added or withdrawn. Shutting down or starting up a
heat outflow causes fish kills as warm water fish attracted by the heat are suddenly forced to
adapt to cold water. Many species that are attracted to warm water swim up a temperature
gradient to be trapped in industrial coolant intake pipes. In many rivers more eggs, juvenile and
adult fish are killed each year by power plants than are taken by fishermen.
Many power plants are situated on lakes and rivers for easy access to coolant water. Cold
water was withdrawn and warm water was returned. Nowadays, rather than return heated water
directly to the body from which it was taken the returning warmer water is passed through a
cooling tower that converts most of the heat into steam and removes it into the atmosphere.
A less common and unobvious source of thermal pollution is the release of cold bottom
waters from a dam into a warm water stream. Many reservoirs are deep enough so the bottom
waters stay cold all year long. When cold waters are released into a shallow warm stream
downstream water temperatures decrease. Fish and insects caught in the unexpected flow of cold
water die from thermal shock.

Sediments are not just dirt
The movable materials that make up the bottom of streams, rivers and lakes are called
sediments. They consist of silt, sand, gravel, rocks and boulders that are moved by the flow of
the water. Larger particles, such as rocks and boulders, are gradually worn down by constant
grinding against one another until they are reduced to grains of sand and silt. As boulders and
rocks become smaller they are carried further and faster toward the still waters of lakes and
ponds, or out into the oceans, where they build up into deposits that are eventually turned back
into sedimentary rocks.
Sediment loads consist of the bed load that is too heavy to lift but still moves, the suspended
load of small particles carried in water, and the dissolved load.
Public domain by PSUEnviroDan from http://upload.wikimedia.org/wikipedia/commons/9/9c/Stream_Load.gif
Sediments influence the physical form and biological content of streams. Those with high
slopes have high energy that carries small silt and sand particles away, leaving only larger
gravel, and boulders. As the slope of a stream decreases it loses energy and smaller size
sediments are deposited on the streambed. Deposited sediments deflect the path of the stream,
creating a meandering shape. If the stream contains more sediments than the water can carry its
channel branches out into a braided form. When the stream finally reaches the ocean or a large
lake the remaining very tiny particles are deposited on an alluvial fan or delta that gradually
expands over time. Thus, a stream acts as a giant sorting system, leaving behind the heavier
particles it does not have energy to carry, and depositing lighter particles as it loses the strength
to carry them.

The Songhua Riverin northeast China carries so much sidiment its channel is constantly
changing.
Public domain from NASA at http://earthobservatory.nasa.gov/IOTD/view.php?id=6139
We have changed the sediment budget of most watersheds through agriculture, home and
road building and deforestation. Often these changes are to our detriment. Streams that receive
sediments beyond what they can carry can rise up out of their streambed, moving sediments and
flooding surrounding areas as they look for an easier path downstream. Sometimes these floods
are high enough to get sediment moving downstream a slurry that covers everything in its path.
In 2004 a flood like this killed 3000 people in Haiti in the city of Gonaives in Haiti.

This Haitian stream buried this settlement in eroded sediments after the forest in its
watershed was removed.
Copyright Avram Primack.
Dams and flow control structures reduce the normal flow of sediments. When streams are
deprived of sediment they pick it up from their surroundings, eroding stream banks, and
deepening stream channels. Dams trap sediments Water leaving a dam has less sediment than it
can carry. and picks it up from what is available downstream causing the stream to dig deeper
into its channel. As a stream deepens it also lowers the surrounding water table, depriving
floodplains and uplands of water.
When the amount of water flowing in a stream changes the ability of the stream to carry
sediments also changes. Water channeled into streams acts like a flash flood, carrying away
sediments and deepening the channel. When stream flow is reduced sediments build up in the
streambed. When high flows return the sediments in the stream channel force it to take a
different course.

Rivers change shape over time.
Public domain from http://en.wikipedia.org/wiki/Image:RiverMeanderingCourse.jpg.
Biological effects
Changing the sediment supply affects the biological communities living in and near a
stream that make use of particular sizes and types of sediments. Many fish only spawn in loose
gravel beds where their eggs are aerated and their fingerlings can hide. Many insects burrow into
sand. Freshwater clams and mussels spend their whole life partially buried in loose gravelly
sediments. When silt covers these sediments these are smothered. Many floodplain plants only
germinate in new sediments left above the mean water level by floods. Changing stream flow
patterns changes flooding and sediment deposition patterns in the floodplain, and may not create
the appropriate conditions for seed germination. Adding fine muddy sediments to gravel beds
clogs them so fish cannot spawn and larval fish and insects that live in the gravel beds suffocate.
Extra sediments raise the stream channel and delay the exit of storm waters, causing larger and

more destructive floods that rearrange stream communities. Lack of sediments reduces
floodplain deposits, limiting germination for plants that specialize in growing in new deposits.
Salmon lay their eggs in sand and gravel where they are protected from predation and
strong currents.
By Uwe Kils under CCA 3.0 license from http://en.wikipedia.org/wiki/Image:Salmonlarvakils.jpg
Sediments carry less soluble chemicals into aquatic ecosystems
Sediments also carry nutrients and other chemicals from the land into the water.
Sediments from urban areas contain oils and hydrocarbons that have washed off cars and
nutrients and pesticides applied to lawns and golf courses. Once these enter an aquatic system
they are buried along with the sediments to reappear later dissolved in the water from which they
enter the food chain and undergo bioaccumulation. Many industrial harbors contain sediments
that have been made toxic in this way.
Streams and lakes in agricultural regions often become eutrophic by receiving
phosphorus in sediments eroded from farmland.15

Nutrients and biological oxygen demand
Adding nitrogen and phosphorus to an aquatic ecosystem increases the biological demand
for oxygen (BOD). Nutrients increase ecosystem productivity by increasing the potential to grow
more plants. As the biomass available for decomposition increases so does the population of
decomposers along with their demand for oxygen. When the demand for oxygen is not satisfied
by the oxygen available the water becomes anoxic. Any living organism that can’t escape the
anoxic water dies increasing the amount of material available for decomposers and the potential
oxygen deficit.
Increased biological oxygen demand creates dead zones in the oceans wherever rivers
carrying nutrients meet the ocean. Large dead zones exist in the Gulf of Mexico off the mouth of
the Mississippi, in the Baltic and Aegean Seas.
Luckily, the environment provides natural cleaning services in rivers and streams.
Adding nutrients causes an immediate sag in oxygen levels downstream as bacteria attempt to
absorb the windfall of nutrients. As the water moves downstream the nutrients are consumed and
oxygen mixes back into the water. Anyone can see this happen when they paddle their canoe past
the outfall of a sewage treatment plant.
Lakes are less resilient. The water in a lake is replaced much more slowly than rivers and
streams, so phosphorus that enters a lake tends to stay in the sediments, forming a reserve that
keeps the phosphorus level in the water column permanently high. As phosphorus levels increase
lakes become darker. Communities living around some of these lakes tried to limit nutrient
inputs by regulating development and controlling nutrient uses in the watershed.16 Others have
tried to manage vegetation by harvesting and removing biomass. When nutrient enrichment
becomes a nuisance it is controlled by building a sewage treatment plant that removes the
nutrients from the water.17

A fish kill in the dead zone of the Baltic sea
By Uwe Kills under CCA 3.0 license from http://en.wikipedia.org/wiki/Image:Fishkillk.jpg
Phosphorus and water
In the last century human releases of phosphorus have become large enough to rival
natural sources. Phosphorus compounds were added to laundry soap starting in the 1950’s to
help it perform better in hard water with high levels of calcium and magnesium that interfere
with the ability to remove grease. Some laundry detergents contained between 10 to 15 percent
phosphorus by weight.
Since each pound of phosphorus can grow 700 pounds of algae, the effect of the added
phosphorus was huge. Lake Erie is the shallowest of the five Great Lakes. It was hard hit by the
addition of 10 tons per day. More phosphorus was recycled from its sediments back into the
water column than in the other Great Lakes. During the 1960’s, mats of attached algae developed
around the shore and large dead zones developed in the lake. The impacts were so severe that for
many years people referred to Lake Erie as a dead lake.
The situation in Lake Erie gave added force to the passage of the Clean Water Act
Amendments in 1972 that allowed regulation of phosphorus in detergents but it left the actual
regulations up to local jurisdictions. Many state and local governments passed laws outlawing
phosphorus detergents. Others did less or nothing, depending on the local perception of
eutrophication in lakes and streams. Since then many large cities, the major point sources of
phosphorus, have built tertiary sewage treatment plants that recapture phosphorus. The problem

was solved by partially internalizing the costs of cleaning up phosphorus and limiting the amount
released into the environment through the regulation.
Phosphorus is still added to laundry and dishwasher detergents in many areas but
regulations that limit the amount of phosphorus added also remain in force. Where lakes and
streams are particularly sensitive, governments have undertaken legal and regulatory actions to
limit its impact. Many of these efforts involve large regions that have exceptional natural and
economic value as fisheries and drinking water sources. Two of these ecosystems are the
Catskills in New York State and the watershed of Chesapeake Bay.
One of the many ways in which New York City is unique is that it is a very large city but
does not have to treat its drinking water in order to make it potable. Watersheds in the nearby
Catskill Mountains are its major source of drinking water. They are forested, with some farms on
rolling hills. Building water treatment plants would cost several billion dollars plus yearly
operating costs. Instead New York City is paying landowners in the Catskills to behave so they
do not make the water dirty. The City has entered into cooperative agreements with farmers that
limit the use of fertilizer and keep animals out of the streams.
Chesapeake Bay is a major fishery for crabs, oysters, and menhaden. It receives its waters
from the Potomac, Susquehanna, and other smaller rivers in Virginia and Maryland. These rivers
receive sewage from large cities and run through some of the best farmland in the eastern United
States. The Bay is shallow and does not receive enough freshwater inflow to flush it rapidly, so
nutrients have been building up in the sediments. During the summer the shallow bay filled with
nutrients becomes very productive, driving oxygen concentrations very low, threatening to drive
the waters in the bay anoxic. In order to prevent it from dying the states in its watershed have
agreed to promote landuse practices that lower nutrient inflows into it.
Red Tide
Once phosphorus reaches the ocean it stimulates the growth of algae and dinoflagellates
that cause red tide. Some of these produce poisons that shellfish and other filter feeding
organisms concentrate in their bodies. Blooms have become more common in the last 75 years as
more nutrients are present in streams and rivers. This has required governments that have
jurisdictions along the seashore to monitor ocean conditions, test seafood for toxicity, and close
beaches for swimming and harvesting when they do not meet health standards. Since red tides

are the result of human activities elsewhere in the environment they should be thought of as an
externality. Thus, the economic benefit of whatever activity released these nutrients is partly
consumed by the expense of avoiding poisonous seafood. In this case, the activity that releases
the nutrient gets the economic benefit without paying the health, livelihood and monitoring costs
that are absorbed elsewhere by other people.
Cultural eutrophication
Lakes and ponds have a natural life cycle. They often start out as clear, unproductive,
nutrient poor ecosystems. As they age over hundreds or thousands of years they accumulate
nutrients from their watersheds and their water darkens as more algae grows in it.
Red tide off the coast of La Jolla, Ca.
Public domain by Alejandro Diaz at http://en.wikipedia.org/wiki/File:La-Jolla-Red-Tide.780.jpg
The natural process of accumulating nutrients is called eutrophication. High nutrient
lakes are called eutrophic. When the nutrients come from human land use management it is
called cultural eutrophication. Red tides and anoxic zones in the ocean are the result of cultural
eutrophication. Most cultural eutrophication happens on a very small scale, from the pipes
leaving vacation homes that empty into lakes, to seabird colonies that form to feed on our
garbage dumps that deposit their guano in nearby lakes.
Water carries disease
Diseases are infectious if they can be passed from one person to another. They can be
passed through the air, as in the common cold, or through direct contact, as in chicken pox and

smallpox, or through the bite of a flea or mosquito, as in bubonic plague and malaria, or through
drinking water, as in typhoid, cholera, and salmonella.
Water is a major reservoir for disease. These include viruses (polio), bacteria (cholera,
salmonella, and typhoid), amoebas (dysentery), and multicellular parasitic organisms.
Waterborne infectious diseases have played an important role in human history. There are
records of polio in humans since at least 1300 BC. Typhoid fever may be the plague that infected
Athens during the Peloponnesian War.
Cholera
Cholera is a bacterial disease that causes acute and sudden diarrhea. As in many intestinal
diseases, the symptoms are part of its method of transmission. It is spread through inadequate
sanitation and contact with food or water contaminated with infected feces. When not controlled
by antibiotics and doses of electrolyte salts it can be quickly fatal. The death rate is about ten
percent in most outbreaks. In extreme cases, death can occur in only a few hours.
Cholera has been largely eliminated in developed regions of the world where drinking
water and sewage are both treated with chlorine. Even in developing nations, it has been greatly
reduced by simple public health measures such as the construction of pit toilets that keep people
from defecating on the ground. In spite of this, there are still outbreaks in regions in which public
health measures are not well maintained and in which political disruption interrupts protection of
the public. The 1992 outbreak in Peru affected more than 350,000 people and caused almost
3,000 deaths. The recent breakdown in political organization in Zimbabwe resulted in disruption
of public health services and an outbreak of cholera.
The incidence of cholera is in part dependent on the density of available victims, and in
part dependent on the effectiveness of public sanitation. Poor people living in crowded quarters
with poor sanitation are more likely to contract the disease. For centuries before the discovery of
the role of bacteria it was thought that poor people brought illness on themselves. Following the
discovery of bacteria and their role in causing disease, eliminating cholera became a major
motivation behind the public health, public sanitation, and sewer construction movements of the
early 20th century.
We have managed to nearly eradicate polio through sanitation and vaccination because
it’s only natural reservoir is in humans. Unfortunately, cholera has a natural reservoir in aquatic

ecosystems. Free living cholera bacteria are maintained in brackish water ecosystems where
there are high levels of nutrients. We encounter free living cholera through bathing and drinking
contaminated water. The diarrhea caused by cholera helps insure that it gets spread. The presence
of a wild reservoir means that were are condemned to have to always follow good sanitation
practices if we want to live at high population densities.
Typhoid fever
Another waterborne disease is typhoid fever. It is a caused by a form of the salmonella
bacteria. The disease may last for several weeks, starting with high fever, leading to diarrhea and
intestinal hemorrhage. There are many less dangerous forms of salmonella that produce less
severe symptoms. When public health officials warn of an outbreak of salmonella poisoning they
are really talking about a form of typhoid fever.
Mary Mallon was known as Typhoid Mary.
Public domain from the New York American 1909 at http://en.wikipedia.org/wiki/File:Mallon-Mary_01.jpg
Typhoid is spread by contaminated water and food. It is not fatal to everyone and some of
those who contract it end up as carriers. They don’t show symptoms but they are still able to
infect others when they don’t practice good personal hygiene.

The most famous case of a carrier is Typhoid Mary, a poor immigrant who worked as a
cook. She worked at several places where people caught typhoid. Upon discovering that she was
a carrier she was quarantined against her will by public health authorities. When she promised to
find other employment she was released. Failing to find other work, she returned to cooking
under a different name. When that was discovered, she was taken back into quarantine where she
spent the last 26 years of her life. She was responsible for infecting at least 58 people, 3 of whom
died.
Salmonella is common in the intestines of chickens, pigs and cows. It can be spread onto
processed meat by improper handling during slaughtering. Preventing its transmission is one of
the reasons that food workers are required to wash their hands after going to the bathroom. Many
recent cases of salmonella poisoning in peanut butter, chocolate, and other foods, can be traced
back to improper personal sanitation. Others can be traced to crop fields contaminated by the
feces of wild and feral animals.
When an outbreak is traced to a particular food there can be devastating economic
impacts to the producers of that food, whether or not they are involved in the outbreak. Because
there are so many natural reservoirs for the salmonella bacteria we are not likely to ever
completely eliminate the threat of it, so one of the costs of living at high population densities is
being vigilant against behavior that may spread the disease.
Polio
Polio is a paradoxical viral disease. The polio virus is mainly found in the intestine where
it is harmless but causes severe symptoms if it manages to enter the bloodstream. If it reaches the
nervous system it causes atrophy in the motor neurons that result in loss of motor control and
wasting of the muscles. In extreme cases it causes death, but many people who are infected
survive and live their lives with bodies that are permanently impaired. A famous polio victim is
Franklin Delano Roosevelt who was elected president of the United States four times.

President Franklin Delano Roosevelt was barely able to walk due to polio.
Public domain from the Franklin D. Roosevelt library at http://www.fdrlibrary.marist.edu/fdrpho50.html
Polio is transmitted in contaminated water and through oral contact. Where the virus
occurs naturally almost everyone was infected, and before the 1800’s most people gained
immunity through childhood exposure. As public sanitation movements gained force in Europe
and the United States in the late 1800’s the level of childhood exposure and immunity declined.
As the proportion of the population without childhood immunity increased the incidence of adult
onset disease increased and affected adults developed more severe symptoms than children. It
became a disease of affluent people, who had access to better sanitation, and were less likely to
gain childhood immunity. As the population of people without childhood immunity in the early
20th century increased polio epidemics became more common and hundreds of thousands of
cases were reported each year.

An Egyptian stele from 1350 BC showing a person who seems to have polio.
By German Green Cross under CCA 3.0 license from http://en.wikipedia.org/wiki/File:Polio_Egyptian_Stele.jpg
Public outcry over the danger of polio stimulated early publicly funded health research
efforts to find a cure. After many years of effort, the Salk vaccine was released in 1952, followed
by the Sabin vaccine in 1962. These quickly reduced the incidence of polio from hundreds of
thousands, to thousands of cases per year.
The polio virus is unusual in that it only infects humans. There is no natural reservoir in
other animals or in the soil, which makes the eradication of other diseases difficult. Since
vaccines for poliovirus were developed there has been a concerted international effort to
eliminate polio as a disease everywhere. Today it only exists in a few areas in Africa and India
where there are focused public health efforts to eradicate it. The major problem in finally
eradicating this disease is religious suspicion of health workers and vaccination.
New infectious diseases
Infectious diseases were present before people took up settled life, but they became
serious problems as cities and towns developed. The increased density of people created better
conditions for transmission than the low density isolated groups that came before. As we have
moved from the farming era in which most people stayed very close to home, to the flying era
where you can be on the other side of the globe tomorrow and come back the next day, it has

become even easier for disease organisms to move from host to host, and the new host may live
far from the person who infected them.
As we have become more mobile we have also penetrated into new remote regions that
have diseases that have yet emerged because of how remote they used to be. Hunger and political
disruption has driven some people to eat new foods and into remote regions where they have
encountered new diseases. HIV Aids is suspected to originally have come from eating monkey
meat killed by refugees in the forests of Africa. Ebola virus was probably contracted through
eating fruit bats that are immune to the virus.
We should expect to continue finding new diseases as we penetrate into the remaining
ecosystems with which we have had no experience. We need to be continually vigilant of their
spread in a world in which people move between continents faster than the incubation period of
the diseases they carry. The 2009 outbreak of influenza in Mexico caused more cases in the
United States than in Mexico and spread to Europe and China through infected individuals
traveling on airplanes for business and vacations.
We should also be aware of the spread of diseases in the environment that affect plants
and animals. Many amphibian species are in danger of extinction because of the arrival of fungal
parasites for which they have no defense. Chestnut blight and Dutch Elm disease have made
great changes in the Eastern Deciduous forest. They came before most people alive today were
born so we might not notice any difference in the way these forests look today.
Parasitic organisms
Not every waterborne disease is caused by single celled bacteria or virus that spends its
whole life in the water. Many multicellular parasites spend a large portion of their lifecycle in
water or are dependent on aquatic organisms to complete their life cycles. Some of them infect
their hosts outside of water. Others, such as intestinal roundworms and tapeworms take the
normal route to find new hosts: they live in the gut, and produce large amounts of eggs, hoping
that one of them will be accidentally eaten by an appropriate new host. The two most important
parasitic diseases in humans are malaria and schistosomiasis.

Malaria
The plasmodium organism that causes malaria spends no time in the water as a free-
living organism, but they are dependent on mosquitoes which spend the larval part of their life in
water. Once they hatch, female mosquitoes go looking for blood meals with which to feed their
eggs. While they are taking a bite out of you they transfer some of the disease causing agents
into your bloodstream in their saliva. These migrate to your liver where they multiply asexually
by feeding on liver cells, then transfer to the blood stream where they again multiply by feeding
on your red blood cells. As they grow they break out of the red blood cells to find more blood
cells, causing the chills and fever so often associated with malaria. Eventually they transform
into male and female forms and wait for another mosquito to take up infected human blood.
Once back in the mosquito they mate and form new infective individuals that wait to be injected
back into humans in the next mosquito bite.
Malaria needs mosquitoes and humans to complete its life cycle.
Public domain by CDC from http://phil.cdc.gov/phil/details.asp?pid=7861
Malaria is most often controlled by eliminating the mosquitoes that carry it and by
reducing the opportunity for them to bite humans. The most common mosquito control strategy
is to attack the mosquito larvae where they grow, in isolated bodies of water where there are no
fish to eat them. They are controlled by draining isolated pools and ponds, speeding up water
movement in sluggish streams, and introducing fish that eat mosquito larvae into isolated ponds.
Mosquito bites are reduced by sleeping under nets that keep them from biting at night
when they are most active and by treating homes with DDT, an effective mosquito insecticide
when used in targeted locations.

While there have been heroic efforts to develop vaccines against the malarial organisms
they have been unsuccessful so far. The fact that part of the malarial lifecycle takes place inside
liver and blood cells instead of out in the bloodstream makes it difficult for the immune system
to find and recognize them.
Malaria used to be common throughout the world at latitudes up to 45 degrees north and
south, an area that includes Chicago, central New Hampshire, and most of northern Europe. In
northern continents it has been eradicated by eliminating mosquito habitat. It is still very
common in tropical climates where it is difficult to drain every isolated pond and there is no cold
season to stop mosquitoes. It is still common in Southeast Asia and India, mostly in rural areas,
but most cases of malaria today are in sub Saharan Africa, where public health expenditures have
been far lower than elsewhere around the world. Most of the 250 million cases reported every
year involve children less than five years old, resulting in more than one million deaths per year.
Side effects from infection at a young age include reduced performance on IQ tests. When
malaria control becomes effective there is a measurable improvement of school performance by
children.
The prospects for further limiting malaria are not promising. Cases of malarial fever used
to be controlled with quinine and its chemical relatives but malarial parasites have gained
immunity in recent decades. Mosquitoes have also been gaining immunity to DDT and other
insecticides that have been used to control them. In the last decade the number of cases has not
declined, and may be increasing as our chemical technology becomes less effective in the face of
the inventiveness of evolution.
Schistosomiasis
Schistosomiasis, also known as bilharzia, is caused by a trematode parasite. Trematodes
are a type of roundworm that has two hosts in their lifecycle. They spend a large part of their life
cycle in freshwater snails where they go through many asexual divisions until they turn into the
infective cercaria form. These leave the snail and swim around looking for a human host. They
are attracted by agitated water and chemicals that signal our presence. Once they locate a host
they burrow through its skin and migrate to the liver where they mate and release eggs into the
intestines. Eggs leave with the hosts feces. If they reach freshwater they develop into a
swimming form that searches for a freshwater snail in which to start the cycle over.

The life cycle of Schistosomiasis involves freshwater snails and people.
Public domain from US Department of Health and Human Services at
http://en.wikipedia.org/wiki/File:Schistosomiasis_Life_Cycle.png
While schistosomiasis usually does not kill its host, it produces chronic and debilitating
health effects, especially in children. The outward symptoms include fever, fatigue, diarrhea and
abdominal pain. These are the signs of internal damage to the intestine, urinary tract, and nervous
system. It is present in most tropical countries in low levels, but is most damaging in Africa.
Over 200 million cases have been reported, most of them in Africa.
Schistosomiasis is most common in Africa.
By Lokal_Profil under CCA 2.5 license from http://en.wikipedia.org/wiki/File:Schistosomiasis_world_map_-_DALY_-
_WHO2002.svg
There are several treatments that kill the worms in people, but since the major reservoir
of infection is freshwater snails the only way to eradicate the disease is to eliminate the snails

that it uses as an alternate host. This was tried in China with some success. In many areas
eliminating schistosomiasis has been made more difficult by the expansion of poorly designed
irrigation works that have increased the contacts between snails and humans.
Keeping water safe and clean
Safely disposing of sewage, obtaining clean drinking water, and protecting the public
from water pollution and infectious diseases is difficult. It requires the cooperation of many
people who must behave well, pay in to common funds, and understand the science of
controlling infectious waterborne diseases. In order to understand the urgency of dealing with
these problems we first had to understand what causes infectious diseases and the processes by
which they are spread, and the action of chemicals in the environment. Once we understand that
an effort by politicians, scientists, and people was required to bring about changes in public
policy and private behavior. As our understanding of chemistry and biology developed, so did
our knowledge of the policies and technologies necessary to minimize the problems they posed.
Drinking water purification and sewage treatment are examples of the internalization of
formerly free services provided by the environment. At low population densities, clean drinking
water is provided for free by the environment. At high population densities, we either provide an
engineered technology, or accept the human cost of a higher death rate and shorter life
expectancy. In recent decades the ability of the natural environment to provide many of these
services has been overrun by the high density of the human population. As this happened the
services of the natural environment were replaced with technological solutions. Looking at the
quality of life in the period in which we did not have clean drinking water or sanitary sewage
disposal there are few people who would voluntarily go back. By paying for the replacement of
free environmental services we change our carrying capacity by lowering the environmental
resistance to our presence.
The consequences of not paying for these services become clear in the recent cholera
epidemics in Peru and Zimbabwe. In 1994, an exceptionally warm El Nino event led to increased
cholera organisms in the sea off Peru. Cholera contaminated shellfish which were eaten raw,
passing the infection to people. Poor personal sanitation practices, lack of effective sewage
treatment and inadequate drinking water treatment did the rest. The cholera epidemic that
followed spread through South America, affecting more than 350,000 people and killing more

than 2,500. The breakdown in government after failed elections in Zimbabwe in 2008 led to the
shutdown of the water treatment facilities in the capital city of Harare and closure of many
hospitals. Cholera established itself as people turned to unsafe sources of drinking water. In both
cases, as people fled the epidemics for other places they took the disease with them.
Instream uses of water
Water is used for more than washing and drinking. It is also used for transportation,
recreation, irrigation, and habitat for fish, insects, mollusks, and other forms of life. Wet and
wetland habitats are the primary refuge for wild species living in urban and agricultural areas,
where there often is no other suitable natural habitat available.
Transportation
Water was the original mode of long distance and local transportation. Early man used it
to leave Africa for the Arabian Peninsula, and probably used it to get to the Americas along the
ice covered coasts of Alaska. The Phoenicians and Greeks founded empires on their ability to
sail the sea. During the early years of the industrial revolution it was the transportation mode of
choice. Before the advent of the railroad England and the United States built canal systems that
rivaled the highway systems of today. The Erie Canal in New York connected the Great Lakes
with the Hudson River, opening access to the interior of the United States, and prompting
immigration away from the hardscrabble hills of New England to the fertile plains of Ohio and
Indiana.
Rivers and canals are still important highways for commerce. The Rhine, Danube, Ohio,
Missouri, Nile, Mississippi, Volga, and many other rivers have been channelized and controlled
with locks to make them safe for navigation. Oceans are also important avenues of commerce.
So important that we dug connecting channels between the Mediterranean and the Red Sea, and
the Atlantic and Pacific oceans. The Suez and Panama canals are so important to world
commerce that any threat of interruption to the shipping affects world economies and raises the
possibility of armed intervention.18

Canals made transporting grain, coal, and other commodities easy.
By Bill Blevins under CCA 2.0 license at http://en.wikipedia.org/wiki/File:The_tugboat,_Herbert_P._Brake.jpg
Recreation
As we become more affluent we look for new ways in which to spend our wealth. One
outlet is to play at what used to be work. Instead of sailing or fishing for profit, people with
sufficient money sail for fun or go fishing for recreation. In some places, recreational boating
and fishing has become the driving force of the economy. The shortage of recreation
opportunities is demonstrated by the fact that some lakes are created and managed primarily for
the purpose of having fun. The recreational value of water is demonstrated by the number of
people who will drive or fly long distances in order to get to the water to swim, fish and boat, get
a tan, or go diving. Indeed, the economy of many small islands in the Mediterranean, Pacific, and
Caribbean is driven by tourist dollars attracted by the opportunity to drink beer in the water
where it is warm. Often these recreational tourism dollars drive the local economy, determining
what type and size fish fishermen want to catch19, who is allowed on the beach, and changing
mangrove forests into white sand beaches.

Brighton beach in England in the 1890's, an early recreation destination.
Public domain at http://en.wikipedia.org/wiki/File:Brighton_aquarium_photochrom.jpg
Natural values
Water has more than direct economic value. It is also the medium that provides free
natural water purification services, habitat for fish and other species to complete their life cycle,
and maintains floodplain vegetation by depositing seeds and soil during floods. These free and
natural services are maintained on what is left over after the economic value of water has been
extracted. Often extracting economic value involves removing water from the system for
irrigation, regulating its flow to when it is economically convenient and preventing extreme high
and low water events. A major water policy question is how much water should be left to support
natural services when there is still demand for irrigation water, flood and drought mitigation, and
pollution assimilation.

The water system that supports the Everglades starts in the headwaters of the Kissimmee
in central Florida.
By Karl Musser under CCA 3.0 license at http://en.wikipedia.org/wiki/File:Evergladesareamap.png
Sometimes we don’t discover the value of these natural services until after an ecosystem
has been altered from its natural form. The Everglades National Park is an example.
Before it was settled, south Florida was an impenetrable maze of wetlands, swamp
forests, and water birds. Most of it was flat or gently sloping, so water tended to spread out over
the landscape rather than flow in channels. The porous limestone bedrock soaked up surface
water, also reducing the ability of water to dig channels. The Kissimmee River flowed down a
fault in the bedrock that created a channel. When it reached Lake Okeechobee the water spread
out until it became deep enough to flow over a natural dam made of peat deposited by plants.
When the climate was wet the lake overflowed at its southern edge, releasing a sheet of water
rather than a river that flowed into the river of grass and occasional hummocks that we call the
Everglades.20
At the beginning of the 20th century South Florida was in the process of being converted
from wetland wilderness into farms, towns and cities. Early settlements began along the east
coast of Florida, stimulated by the building of a railroad, and then by Governor Broward’s
promise to drain the Everglades. The land boom became so frenzied that many people bought
without looking at what they were buying. This is where the saying “If you believe that I have

some swamp land to sell you” came from. Early settlements along the south Florida coasts were
spurred by tourism, and moved inland for farming vegetables, citrus, and sugar cane as more of
the Everglades was drained.
The actual Everglades is a small part of a much larger system that moves water from the
Kissimmee River through Lake Okeechobee and the Everglades into Florida Bay and the Gulf of
Mexico. Attempts to drain the Everglades south of Lake Okeechobee and convert it to
agriculture began in the 1880’s. More canals were constructed at the turn of the century that
paved the way for sugarcane cultivation and urbanization.
Florida has always had hurricanes. Because South Florida is so flat and without major
rivers to drain it there is flooding when it rains. When hurricanes come it rains a lot. The
Okeechobee hurricane of 1928 came ashore north of Miami as a category five and passed over
the lake. The leading edge of the storm pushed water over the natural dike at the south end of the
lake flooding out homes and carrying them away into the Everglades to the south. As the storm
passed the trailing edge pushed water in the opposite direction over its northern edge. The final
toll from the flooding was more than 2,500 killed. The outcome was better building standards to
resist hurricanes and the construction of flood control structures including the Herbert Hoover
Dike that surrounds the lake today.
In the early 1900’s people in South Florida became interested in protecting the
Everglades. In 1923 that interest led the Florida State Legislature to form a commission to study
the creation of a park. Congress authorized the creation of a park in 1934 but voted no funding
until 1939. They also drew the boundaries of the current park smaller than it was originally
designed. The Everglades National Park was finally dedicated by President Truman in 1947.
Hurricanes struck again in 1947, prompting local communities to ask for aid reducing the
flooding. In 1954 Congress authorized the Army Corps of Engineers to conduct flood mitigation
studies on the Kissimmee River, a slow moving winding stream that passed through swamps
lined with bird colonies. They decided to channelize it and create a drainage system in the
agricultural zone south of the lake that would speed water out of the system. Between 1962 and
1970 the river was straightened, shortening it from a 103 mile to just 56 miles cutting off the
oxbows that slowed the river and kept the surrounding wetlands wet. Immediately the wetlands
downstream began to dry up, and bird populations were significantly reduced.

The Kissimmee River was straightened in order to speed the departure of water.
Public domain by US Army Corps of Engineers http://en.wikipedia.org/wiki/File:Kissimmee_River_canal_section.jpg
Meanwhile, sugarcane started moving in south of Lake Okeechobee and urban areas
developed along the coast of South Florida. As part of the flood control plan and in order to drain
an agricultural zone south of the lake more than one thousand miles of canals were dug. These
diverted water normally destined for the Everglades to coastal cities for drinking, and from them
into the Atlantic Ocean cutting the Everglades off from its main water supply. By the late 1960’s
the Park area was suffering low water levels which restricted wildlife to those areas that stayed
wet and dried out the organic peat soils of the rest, promoting wildfires that burn up soils that
took thousands of years to create.
The Everglades is a naturally nutrient poor ecosystem. There isn’t much natural
phosphorus or nitrogen in the ecosystem. The Florida peninsula is underlain with porous
limestone that absorbs precipitation but returns very few nutrients. The soils of the Everglades
and its feeder areas are composed of absorbent peat. Ecologically we might call it the largest
region of fen vegetation on earth.
The agricultural area and the canals that drain it introduced more nutrients into the water
flowing into the Everglades. Immediately after the Kissimmee River was channelized 40,000
acres of river floodplain began to dry out. Straightening the river conveyed water to Lake
Okeechobee more rapidly, so the wetlands along the floodplain of the new constructed
Kissimmee did not have time to absorb even the naturally available nitrogen and phosphorus. By
the mid 1970’s nutrient concentrations in the lake were up.

The higher nutrients also changed the vegetation in the Everglades. When nitrogen and
phosphorus from the sugarcane fields began to flow into the Everglades the vegetation changed
from sparse clumps of sawgrass to thicker clumps of cattails. The cattails changed the animal
communities because they were more difficult for birds and alligators to nest in. Higher nutrient
concentrations allowed invasive species to gain a foothold, changed the chemistry of the peat so
that it began to decompose.
In addition to Lake Okeechobee and the Everglades there were impacts on the coastal
aquifers that supply drinking water to Miami and other coastal cities. Water withdrawals were
large enough that there wasn’t enough groundwater to keep saltwater from flowing into the
aquifers from the ocean.
It took only a few decades to realize the impact of the channelization and nutrient
additions on the thousands of years old hydrologic system of the Everglades. By the 1990’s the
Congress instructed the Corps of Engineers to remove the channelization of the Kissimmee River
and return it to its previous meandering condition so it would retain water on its floodplain for
longer and the natural functions and services of the floodplain could capture nutrients before
going into the lake. They were also instructed to study ways to reengineer drainage from the lake
and the agricultural zone so nutrients were captured before they entered the remaining
Everglades.
Management zones in the Everglades water management system.
Public domain by USGS from http://sofia.usgs.gov/publications/fs/171-95/

The Corps studied the necessary changes during the 1990’s and began implementing
restoration plans in 2000. In the last ten years there has not been much progress towards
restoring hydrologic integrity of the Kissimmee Everglades system because of the high cost,
lobbying by the sugar industry for delays and increases in the allowed nutrient releases, budget
problems in Florida and at the federal level, the national distraction in Iraq, and the economic
troubles since 2008.
The hydrologic system is not the only way in which the Everglades has been damaged.
There were many negative impacts on wildlife that depend on the macroecology of the region.
The Everglades used to be a Mecca for water birds. Hat makers used these same water birds to
adorn fancy ladies hats at the turn of the century. Many of them were hunted mercilessly until
they were protected in the 1920’s. Next on the list of hunted animals were alligators, whose skin
was used to make leather shoes and handbags. They too were protected in at the end of the
1920’s.
In the meantime, people began bringing exotic plants and animals into the Everglades.
Brazilian pepper was introduced in as an ornamental plant in the 1890’s. It escaped and now
covers thousands of acres. Melaleuca trees were introduced from Australia for landscaping. They
are so thirsty that they lower the local water table. Seeds were broadcast by airplane over the
park. Today they form tall dense stands that wading birds cannot fly through or nest in. Park
agents are currently using herbicides and an insect predator to reduce their importance. A
number of fish, insects, and mollusks have also made their way into the Everglades where they
are altering lake bottoms, changing plant communities, and consuming native species. There are
also colonies of pets and zoo animals that were either deliberately abandoned, or escaped. These
include Monk Parakeets who nest in large colonies, sometimes on power lines, Burmese pythons
that grow to be 20 feet long and eat small mammals and alligators, and Nile monitor lizards that
climb trees and eat bird eggs.
The story of the last 100 years in the Everglades has been the failure of attempts to
engineer the hydrologic systems of the Everglades to satisfy human desires for economic growth
and resource extraction while maintaining the natural environment in its original state. All this
has been done without understanding the impacts of our environmental engineering on its
ecological systems. While many people have become affluent it has been at the expense of the
larger natural system. As the urban and agricultural interests tried to manage more land and

water the ecological systems that make up the Everglades and the Kissimmee River were
disrupted so that they threatened to change their form.
Water use laws
As we discover more about the public health consequences of water pollution and the
private interests in protecting water quality have become more diverse and powerful we have
developed customs, laws, and regulations designed to protect the public from the actions of
individuals that negatively affect water. These laws determine who has rights to withdraw water
and can dump wastes and sediments into water, and the management of navigation and
commerce upon the water.
Water rights
Access to water is not always guaranteed, nor is water always available or plentiful. Since
water is a public good that can be used many times by many people it must be returned clean
enough to be reused after each use. Who has rights to water and who does not is often a complex
and contentious issue, an issue that is resolved by custom and by law.
Customary rights to water depend on the type of resource and the priority of access. In
many legal systems ownership of the land does not confer ownership of the water that flows
through it. Sometimes the land owner owns the land under the body of water, but not the water
itself. In other systems landowners only own up to the shore of a body of water. In still others,
the owner owns the water and the land under it. In streams and rivers riparian rights extend to the
person who has ownership of the bank and transfer with the sale of property. They often allow
the owner of the bank the right to expect historical norms of quantity, quality, and pattern of flow
from upstream users. In many places the land owner does not have the right to exclude members
of the public from using boats to travel through their property on the water, or to prohibit beach
access, even though the access may be over what is otherwise their private property. In some
countries streams, lakes, and beaches are declared public property that no one person can control
or limit access to. In others, only national citizens are allowed to have rights.
Many people who use water do not actually have direct contact with the rivers or lakes
from which the water comes. They get use based rights. These are water allotments based on a
customary order of priority. In some places people get access to water based on their place in the

historical order of arrival. This is the system used in the western US, where the first people on
the land got first rights to water. Often this means that the farmers who were first on the scene
have first rights to riparian and groundwater and cities and industry have to either buy water
from them or find other sources. Where water is in short supply use based rights help establish a
market price that encourages conservation of water. Interested parties who have water rights and
those who want water negotiate a price and allocation.
The rights to water and the availability of water determine the carrying capacity of a
town, watershed, region, or nation. However they are arrived at, the rights to water decide who
can farm, what types of industry can succeed, and how large towns can become. Other laws
determine how water is used by those who have the right to access.
Rivers and Harbors Act
Navigation is an important function provided by rivers and streams. In the US it is
protected by the Rivers and Harbors Act. The original Rivers and Harbors Act is the oldest
federal environmental law, first passed in 1824, with appropriations for the Army Corps of
Engineers to improve navigation on the Ohio and Mississippi rivers. Since its inception it has
been amended and changed many times to support projects in the national interest and regulate
the use of navigable waters. The amendments of 1899 prohibited changes in navigable waters
through excavation, placing fill, and changing the course, condition, or capacity of any port,
harbor, or channel without a permit. These powers were used almost one hundred years later to
promote wetland protection. The Act also gave the Corps responsibility for protecting and
improving navigation. These powers led to the Corps construct flood control structures and aids
to navigation on major navigable rivers including the Ohio, Missouri, and Mississippi.
Clean water act
The major law covering water, pollution, and discharges into surface water is the Clean
Water Act. Laws concerning clean water were passed starting in 1948, but the main provisions of
current law were passed in 1972, spurred by the Cuyahoga fire and other environmental
disasters. Later amendments were passed in 1977, and 1987.
The Clean Water Act is the federal response to the water pollution issues of the 1950’s
and 1960’s. It established rules covering releases from fixed point sources such as factories, and

dispersed non-point sources such as stormwater runoff and street drains. It mandated the need to
use the best available technology to reduce impacts to water quality. Rules were established that
required pollution sources to apply for permits and to ensure that they stayed within established
limits for releases. The Act also made available funding for the construction of sewage treatment
works in towns and cities still without adequate treatment facilities.
Safe Drinking Water Act
The Safe Drinking Water Act (SWDA) contains was first passed in 1974. It established
standards for public drinking water supplies including health goals and maximum permissible
contaminant levels allowable lead in drinking water and limits to the lead content in pipes and
solder used in plumbing. Other standards include fluorine content, which is sometimes present in
groundwater used for drinking and allowable levels of bacteria. The 1996 amendments to the act
required that the benefits of new water quality regulations must outweigh the costs of
implementing them.
Comprehensive environmental response, compensation, and liability Act
There are thousands of small medium and large dumpsites around the country. Many of
them contain only harmless household wastes. Others contain mixtures of household and
commercial waste. Still others contain labeled and unlabeled industrial wastes. Where these
wastes were toxic or hazardous and were deposited without isolation from the soil below them
they are a hazard to groundwater and surfacewater.
Until the Comprehensive Environmental Response, Compensation, and Liability Act
(CERCLA) there was no way to track or identify where potentially toxic and hazardous wastes
were disposed of. There certainly was no system to clean them up either. CERCLA was passed
to create a system for assigning liability and to force polluters to clean up old dumpsites,
including the environmental disasters at Times Beach Missouri, Love Canal, New York, and the
Valley of the Drums in Kentucky.

Superfund sites are concentrated near early industrial sites.
By skew-t under CCA 3.0 license at http://en.wikipedia.org/wiki/File:Superfund_sites.svg
Once a dump containing hazardous materials is located there is a search for the
responsible parties. Since it is often impossible to decide which party deposited which waste all
parties that can be linked with a dangerous dumpsite were made jointly and separately liable for
whatever dangerous wastes are present. Joint and separate liability means that all parties that
could be found shared in the financial responsibility for cleaning up the dump and of only one
party could be found, they were responsible for the entire cleanup. Where responsible parties
could not be found the act authorizes the Environmental Protection Agency (EPA) to clean it up
itself using funds from a special “Superfund” created by Congress for this purpose. The
Superfund law allows the EPA to immediately remove any hazardous wastes that are causing
imminent danger to the public and take remedial action to reduce long-term risks associated with
hazardous wastes sites where no responsible party has been found.
CERCLA covers old actions. Current production, use, and disposal of toxic and
hazardous wastes are covered by The Resource Conservation and Recovery Act (RCRA). RCRA
requires that current users and manufacturers of toxic and hazardous chemicals keep a manifest
they have on site and a record of where they are disposed of when they are moved offsite. Only
approved and properly constructed disposal sites can be used for final disposal. The manifest
travels with the wastes, maintaining a cradle to grave record of where they have been and who
has handled them.
Federal insecticide, fungicide and rodenticide act
One of the major sources of water contamination is the chemicals used to kill agricultural
animal and plant pests. Many of these are applied in ways that allow them to escape into the

aquatic environment. The Federal Insecticide, Fungicide, and Rodenticide Act (FIFRA),
regulates how these chemicals are applied in homes and in agriculture. Many of them have
harmful effects on a broad range of plants and animals. Some remain for a time in soils and
sediments and are soluble in water. Some are concentrated by the process of bioaccumulation
leading to high concentrations in fish and aquatic birds. FIFRA establishes the conditions under
which they can be applied, the methods that can be used to prepare and apply them, and the
quantities that can be used. This is to protect the health of the applicators, the natural values at
risk in the environment, and the environmental exposure of people in the general public.
The first generation pesticide DDT is an example of the hazards involved in using
chemicals to manage ecosystems without reference to what they do to non-target organisms. It
was heavily used in the 1950’s. It has a long half-life in the environment and bioaccumulates in
top predators. In the 1960’s it was found to be the cause egg shell thinning in Bald Eagles,
Pelicans, and Peregrine Falcons.
The farm bill
One of the major sources of human impacts on aquatic systems is farming practices. The
federal government attempts to influence farming practices through the Farm bill. The Farm bill
contains programs that pay farmers to take environmentally sensitive farmland out of production
in order to protect valuable environmental functions and services. In exchange for rent payments
the farmers agree to manage their sensitive land for wildlife preservation, erosion control, and
nutrient absorption.

Expenditures on conservation programs in the Farm Bill.
Public domain from USDA at http://www.ers.usda.gov/Briefing/ConservationPolicy/background.htm
The Farm Bill also contains subsidies for farmers to produce commodities such as milk
and barley, provisions for farm insurance, food assistance for the poor, and assistance for rural
communities, all of which affect the natural environment of farms. Since 1985, the Farm Bill
requires farms that want these subsidies to also make some effort to improve their environmental
practices. Payments for farm behaviors that preserve environmental benefits and services are
becoming common around the world.
Where is all that water
There is plenty of water on the earth but most of it is not available or fit for human use.
For the billions of years that there have been oceans dissolved salts have been carried down into
them from the land. The average salinity of ocean water is about 3.5%, or 35 parts of salt per
1000 parts of water. This is equal to the salinity of our blood but more than is safe to drink or use
for irrigation. Over 97.5% of water on the earth is saltwater. Only 2.5% is freshwater that we
could drink or use for other purposes if it were in the right place. That may sound like a lot but
most of it is not located where it can be used. More than two thirds is frozen in the Antarctic and
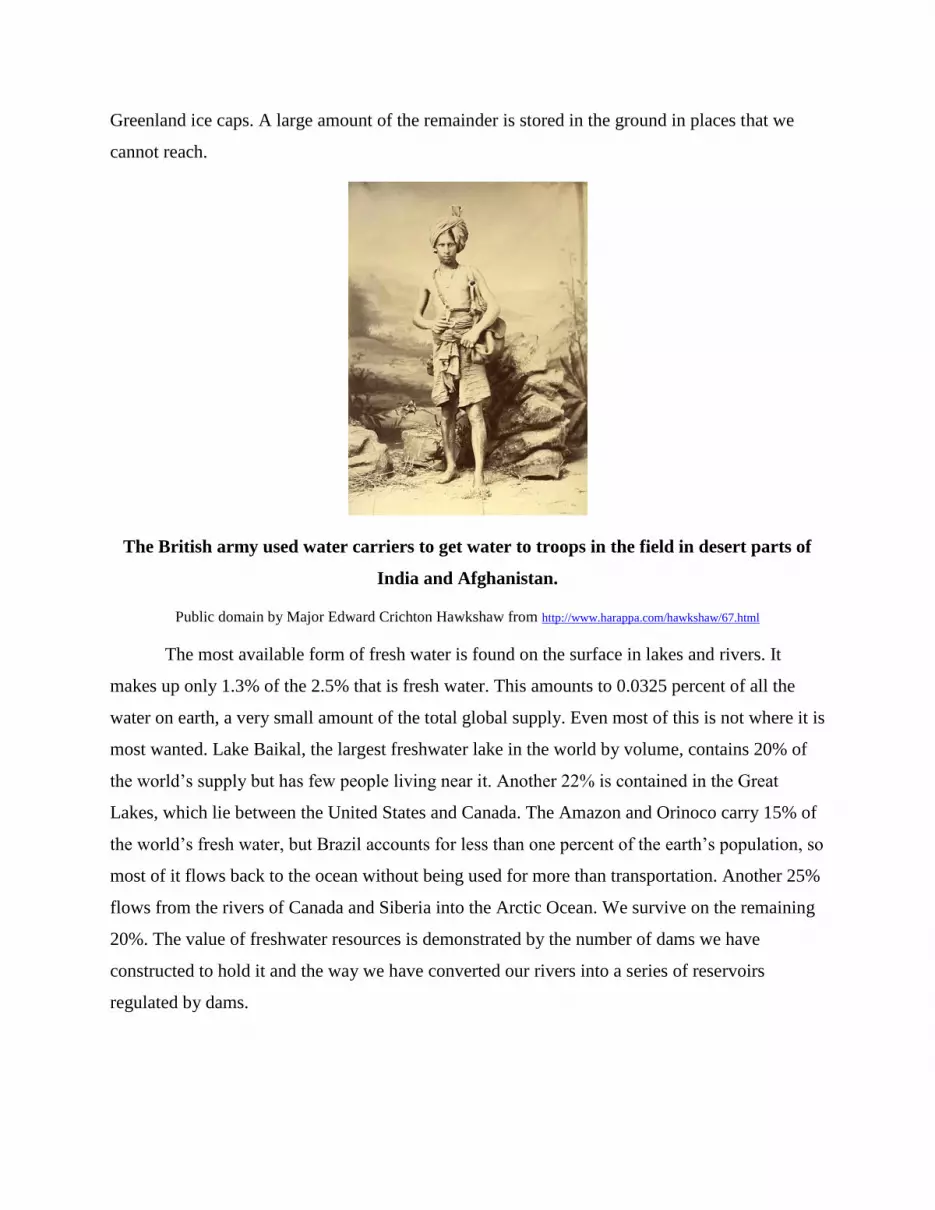
Greenland ice caps. A large amount of the remainder is stored in the ground in places that we
cannot reach.
The British army used water carriers to get water to troops in the field in desert parts of
India and Afghanistan.
Public domain by Major Edward Crichton Hawkshaw from http://www.harappa.com/hawkshaw/67.html
The most available form of fresh water is found on the surface in lakes and rivers. It
makes up only 1.3% of the 2.5% that is fresh water. This amounts to 0.0325 percent of all the
water on earth, a very small amount of the total global supply. Even most of this is not where it is
most wanted. Lake Baikal, the largest freshwater lake in the world by volume, contains 20% of
the world’s supply but has few people living near it. Another 22% is contained in the Great
Lakes, which lie between the United States and Canada. The Amazon and Orinoco carry 15% of
the world’s fresh water, but Brazil accounts for less than one percent of the earth’s population, so
most of it flows back to the ocean without being used for more than transportation. Another 25%
flows from the rivers of Canada and Siberia into the Arctic Ocean. We survive on the remaining
20%. The value of freshwater resources is demonstrated by the number of dams we have
constructed to hold it and the way we have converted our rivers into a series of reservoirs
regulated by dams.

Water from a stone
We would prefer to use surface water when it is available, but sometimes it is not, and
demand for water in dry regions is always greater than the supply. As surfacewater travels over
the land some of it infiltrates into the ground and joins the groundwater reservoir. Groundwater
flows back towards the ocean but much more slowly than surface water since it has to force its
way through pores in the soil and rock. Still, in some places groundwater has had hundreds and
thousands of years to accumulate. Where the groundwater table meets the surface it gushes out as
artesian springs.
Where there isn’t enough surfacewater to satisfy demand, people turn to groundwater. In
the Bronze Age that was accomplished by tunneling into hillsides until the tunnel intersected
groundwater. Occasionally these tunnels were miles long. Many of them are still in use in
Central Asia and the Middle East. In other places where there were no mountains to burrow into
wells were dug down to the groundwater table and water was lifted by human or animal muscle
power. In other places wind power was used to run pumps that raised water from the ground. It is
only in the last hundred or more years that we have been able to harness fossil fuel or electric
driven pumps to raise water from even deeper in the ground. This has allowed us use fossil
deposits of groundwater in places like the deserts of Saudi Arabia and Libya that accumulated
over centuries.
The distribution of water on the Earth.
Public domain by USGS from http://ga.water.usgs.gov/edu/earthwherewater.html
Unfortunately, in most places groundwater is recharged much more slowly than it is
withdrawn. Most of these groundwater bonanzas will probably be depleted by the end of the 21st

century. In many of them the water level is already dropping, so that farmers in the Great Plains,
Saudi Arabia, and other regions are being forced to give up irrigation, Mexico City, Los Angeles,
Phoenix, Peking, Las Vegas, and many other cities that depend on groundwater are having to
search farther from home to satisfy their growing populations.
Engineering water
The thirst for water in dry regions has led to the construction of heroic engineering
projects to insure at least the current availability of water. Many of the rivers that flow into the
Central Valley of California have been diverted by irrigation projects. The Nile, Colorado, Indus,
Ganges, Missouri, and Tennessee have all fallen under the yoke of dams that manage the
availability of water, generate electricity, and regulate levels. Where rivers that flow into lakes
and inland seas have been diverted for irrigation, the loss of water to evaporation has resulted in
falling water levels. In the last century the level of the Dead Sea and the Sea of Galilee in the
Middle East, Lake Mono in California, Lake Chad in the Sahara, the Okavango delta in
Botswana, and many other large bodies of water around the world have been lowered as their
freshwater inputs have been diverted to other uses.
The Aral Sea, once the world’s fourth largest inland sea, is an example of how we can
change large environmental systems. In the early 1900’s the Soviets planned to turn the desert
around the Aral Sea into a cotton growing region. Starting the in the 1920’s, canals were built to
divert its two major tributaries, the Amu Darya and Syr Darya, to feed irrigation projects. Canal
building started in earnest in the 1940’s. By the 1960’s most of the water flowing into the Aral
Sea was diverted to the cotton fields. The sea began to shrink. It accelerated in the 1970’s as
cotton production took off. Cotton production has more than doubled since then and the Sea has
continued to shrink.

The Aral Sea as it was in 1989 and in 2003.
Public domain by NASA at http://en.wikipedia.org/wiki/Image:Aralzee.jpg
What are the costs? As the Sea has decreased in size and depth its salinity has increased
more than fivefold, killing most what lived in it. Today it covers less than 25% of its original
area. Communities that used to be on the shore are now miles from the water. The fishing
industry that employed 40,000 people disappeared. The muskrat industry along the river deltas
dried up along with the marshes in which they lived. The dried bed of the former sea is covered
with salt crystals that blow off in the wind to land on nearby croplands and towns causing
respiratory illness. In other regions nearby, where water is being pumped from the aquifer that
lies closest to the surface groundwater is falling below the level that plant roots can reach.
To have and have not
Water can be plentiful or scarce depending on where you are in the world. It is physically
scarce in desert regions, but can be equally scarce on a per capita basis in wet regions with high
population density. Afghanistan is physically dry, but it has more water per person than Great
Britain, an island with a reputation for fog, rain and damp and a much higher population density.
Even where water is physically plentiful, it may be economically scarce for lack of the
economic resources with which to harvest it and put it to good use. Many countries in Africa

have plenty of water but no way to get it to where it is needed. They have no funds to install
pumps or irrigation works to make efficient economic use of it. In regions with economic
scarcity a large portion of the population drinks contaminated water.
Population growth in water poor regions is also a potential cause for concern, as the
available water is often stretched between domestic, irrigation, and industrial uses. In order to
function well in industry, agriculture and domestic sectors, a country needs about 1,700 cubic
meters per capita per year. Below 1,000 cubic meters, water scarcity hampers development,
human health, and well-being.
Even in water rich countries there are water poor regions. The metropolitan region that
surrounds the city of Los Angeles stretches 220 miles from Mexico to Santa Barbara. It contains
22 million people, but it is a near desert. Drinking water for Los Angeles is imported from as far
away as the Colorado River and the Owens Valley. The City uses many technological
innovations to conserve water. Los Angeles has recently begun recycling its treated wastewater
as drinking water after passing it through reverse osmosis filtration.
Many rich but extremely water poor countries in the Middle East obtain drinking water
from reverse osmosis of seawater for desalinization. The Saudis can do this only because they
are converting their oil income into electricity, and the pumps and other things necessary to build
and run their desalination plants. We could say that they have found a way to drink oil.
Population growth in some dry areas is putting increased stress on the available natural
water delivery systems, and changes in forests and soils in others are altering how the hydrologic
cycle functions. Deforestation in Haiti and Madagascar has resulted in erosion of topsoil,
exposing subsoil that does not absorb water as well. Precipitation falling on the exposed subsoil
runs off more quickly, causing flash floods and eroding more soil. People who live on these soils
can’t make a living farming them so they move on to deforest other places, where the soil is
better. This feedback loop reduces the productivity of the land and reduces the availability of
water resources at the same time.
Even in water rich areas water may be more available in some seasons and less available
in others. In the dry central western United States the major source of water is from the winter
snow pack in the Rocky Mountains. When the snowpack is thin, or the dry spring is early, the
water level of reservoirs drops, and there is less water available for irrigation.

The climate systems also go through cycles. They have wet and dry periods that may last
for years or decades. Areas that grew up depending on water that arrives in one season to fund its
water needs in other seasons are disrupted when water fails to show up in the expected quantities
or shows up in excess of what was normal. The disruption is greater when there is less room for
maneuver such as when populations are high and a good year produces no surplus to save for a
bad year.
Often planning is conducted on the basis of past observations that are not repeated in
present experience. When present experience is below the expectations created by past
experience there can be trouble. The flow in the Colorado is divided up between several western
states based on a period in which flow was high. Each state was given an allotment based on the
high flows in this period. Since then flows have been lower. If all of the states were using all of
their allotments there would be a deficit. Even so, the river does not reach the Gulf of California
in most years.
Conservation
Water is used in homes, businesses, in industry, and in agriculture. Many of the ways in
which it is used are inefficient technologies that depend on there being a surplus of water
available. When water is chronically in short supply, the only place to get more is through
conservation.
Conservation starts at home by promoting an ethic of efficiency in water use that reduces
the demand for water while still extracting the same amount of services. Water conservation can
be achieved by turning off the tap while brushing your teeth, using low flow toilets and faucet
aerators, and using shower and sink water again for watering gardening and lawns. Rainwater
can also be captured and used for washing and for watering plants. It is possible to take a shower
in as little as two quarts of water instead of the gallons that many people use up to twice a day.
Unfortunately, most voluntary reductions in water use depend on personal behavior, and
most people will only change what they normally do if there is an incentive in doing so. The
most effective way of getting people to change their behavior seems to be through adjusting the
price of water at the tap. When it goes up enough people start to use less.

US postage stamp supporting the idea of water conservation.
Public domain from US Postal Service at http://en.wikipedia.org/wiki/File:Water-conservation-stamp-1960.jpg
Unfortunately, many irrigation schemes promote themselves by offering water at very
low cost, much below the actual cost of obtaining and delivering it. This insures that more people
are interested in farming and they use the cheap water to produce a surplus that keeps food prices
steady and low but provides no incentive for farmers to conserve water.
Many irrigation schemes use open unlined ditches that allow water to evaporate into the
air and infiltrate into the soil, losing a significant percentage of the water supply before it is
delivered to the plants. Many irrigation systems distribute the water by flooding the fields,
adding much more water than is necessary. Others use sprinklers to spray water onto crops,
losing much of the applied water to evaporation and overwatering in parts of the field.
There are much more efficient irrigation systems available, but they involve using more
complex technologies that cost more to install and manage. One method involves only watering
when soil moisture sensors say there is a water deficit, and using drip irrigation that delivers
water directly to the soil near plant roots rather than spraying it into the air. This kind of
irrigation system involves computers, sensors, piping, and technology that is beyond the
management skills and economic capabilities of many farmers.
A major problem with reducing water use is that it often does not reduce the actual
demand for water, only the per capita use. As water is freed up by one person’s conservation
other farmers and families move in to take advantage of what is newly available.
A final difficulty in managing water supplies is finding good datasets on which to base
water use projections. In the American west planning for the Colorado River was done during a
period of water abundance. As in most projections based on statistical extrapolation from limited
data, the projections assumed that the climate will continue to behave as it did when the data was

collected. It turns out that the projections were based on water rich decades, and water deliveries
from nature will not live up to our expectations.
What we know about environmental patterns is based on historical records. For most
places we have yearly data that might go back two hundred years. This is not long enough to
fully understand the variability and trends in the climate. Climate events are sometimes described
by how often they recur. A one hundred year flood is supposed to be a rare event only likely to
recur every one hundred years. It is not unheard of to suffer through two one hundred year floods
in one week.21 This points out the need to take historical records as a guide to what future events
might be, not a contract for what they will be.
Water in politics
The uneven distribution of water also has political ramifications. The hundreds of major
rivers that cross national boundaries are potential causes of conflict between users in the upper
and lower parts of their watershed. Upstream countries would like to have carte blanche to do as
they like with rivers before they leave their territory. Downstream countries argue that they
should be able to receive what they are accustomed to receive, and have been receiving for
hundreds to thousands of years. The growing scarcity of water as populations increase, urban
areas grow, expectations of food availability rise, and industry demands more water may bring
nations to the point of open warfare in the near future.
The Tigris and Euphrates flow from the hills of Turkey into Syria and Iraq. Turkey has
been building dams and irrigation works in the headwaters. Iraq and Syria are expecting to build
their own dams and irrigation works using the same water. Diversions by Turkey mean less for
Syria and Iraq. The three countries have come to a division of the waters but the downstream
nations are still worried.
The tributaries of the Nile flow through Ethiopia, Sudan and several other countries
before the Nile gets to Egypt. Many of these countries are water and energy poor. Ethiopia is
currently considering building dams and irrigation works along the Blue Nile for power
generation that would divert and consume waters that Egypt uses to run its irrigation and feed its
growing population. The paradox is that Lake Nasser in Sudan loses a lot more water to
evaporation than would be the case if the water were stored in the cooler hills of Ethiopia.

Ethiopia has not been able to execute its plans because of political disorganization, but each time
they seem about to commence building dams Egypt threatens them.
As populations continue to grow where water is in short supply for economic or physical
reasons, as in Africa, the Middle East, and Central Asia, it can only be expected that conflicts
over water will increase. Access to water is part of the conflict between Israel and the
Palestinians. Israel currently takes a significant portion of the water under the West Bank for its
own agricultural needs. The Palestinians want control over their own water resources. India and
Bangladesh have had discussions on the use of the Ganges, the mother of all rivers.22
Summary
Water is a limiting resource for living organisms and for civilizations. As we developed
irrigation we had to develop governments to manage and regulate its use. Water management
resulted in the development of civil and public engineering, and the science of hydrology.
A consequence of the development of agriculture is that we also began to live a settled
life, staying in one place and raising our own food rather than migrating in search of it. A
challenge of living a settled life is the management of human waste and infectious disease. Many
infectious diseases are contracted from contact from water contaminated with human and animal
feces. Others diseases are transmitted by insect and snails that depend on water for some part of
their life cycle.
Infectious diseases become more common as the density of their human hosts increased.
As we learned how bacteria and other parasites are transmitted prevention has become one of the
primary public health functions of government. Protecting the public from disease has required
the internalization of formerly free natural services through the construction of drinking water
purification works and sewage treatment systems. In both cases, we replaced free natural
services with engineered solutions that require maintenance and management.
Another new source of water pollution is the many new organic and inorganic chemicals
that have been disposed of in water and on the landscape. Until recently our policy for disposing
of personal and industrial wastes has been that dilution is the solution and out of sight equals out
of mind. These attitudes led us to ignore the danger we placed ourselves in and surprise when we
discovered our faulty reasoning. As we understood the dangers we had created for ourselves we

introduced laws that limit our exposure to toxic and hazardous materials and require industries
that produce and use these materials to account for them.
Water has uses other than for agriculture and drinking. We use it in transportation,
industry, recreation, and in the production of fisheries and other natural values. All of these uses
have the potential to conflict with one another, and require political solutions to determine who
has access to what resources when.
Water is not evenly distributed around the globe or during the year. Many regions of the
world suffer from physical and economic water shortages. The value of water for drinking and
agriculture is demonstrated by the large number of heroic engineering projects built in the last
100 years, most with the intention of delaying the exit of water downstream so it could be used
for other economic purposes.
In many regions of the world water management projects have aided and abetted
improvements in agriculture and electric power generation that have allowed populations and
industries to grow to the point where these water management systems are essential for
maintaining economic and social stability, even in the face of extreme environmental damage in
other parts of the environment. The people who live near the Aral Sea are addicted to irrigation
even though it is killing the Sea, the local environment, and possibly themselves.
The growing scarcity of water in some regions has the potential to cause political
problems that may lead to international disagreements about the management of shared river
watersheds. Since many important water resources cross national boundaries, and populations in
many of these regions are growing, we should expect tensions over access to water resources to
increase.
The future of water use is clear. Over the last 100 years the quantity of water used has
increased by more than tenfold, almost three times the rate of population growth. As more people
live in what we call developed countries their thirst for water with which to bathe, raise animals
and crops, conduct manufacturing, and recreation increases. Even in countries with abundant
rainfall, water availability is becoming an issue as water supplies become fully developed and
people continue to become more affluent, leading to higher demands for ever more water.

Chapter 13: Energy
Introduction
To a physicist energy is the ability to do work. Most of us think of work as the ability to
move a mass over some distance, but work can be any change in the arrangement of matter in the
environment. This includes the work involved in chemical reactions and electrical flows. In order
to do work you have to have access to a storehouse of energy. Until it is expressed the stored
energy only has the potential to do work. We might call it potential energy. To have potential
energy is to have the potential to cause change, and therefore the ability to do work. Once it is
expressed energy dissipates into the environment and no further work can be accomplished until
a new store of energy is accumulated.
Energy comes in many different forms. Kinetic energy is the energy possessed by an
object with mass in motion, and is released when its motion is interrupted by a collision with
another object. Nuclear, chemical, electromagnetic, gravitational, electrical, and heat are other
forms of energy. Nuclear energy is released when a radioactive atom breaks apart to form two
smaller atoms. Chemical energy is released when a chemical reaction occurs. Photons of light are
packets of electromagnetic energy that give up their energy when they encounter electrons that
are raised into more energetic orbits in atoms. Gravitational energy is potential kinetic energy
that is gained by moving away from the center of the Earth or any other body with mass, and
released when falling back towards its center. Electrical energy is the pressure of electrons
moving along an electrical conductor from a region of surplus to a region of deficit of electrons.
Heat is the energy of motion of individual molecules.
Although each type of energy is a separate physical phenomenon, each type of energy
can be converted into each other type. Electromagnetic energy comes from the Sun in the form
of visible light that is absorbed by chlorophyll molecules in green plants and stored as chemical
energy on sugar molecules. Chemical energy stored in compressed fossilized dead plant bodies
that we call coal is converted into heat energy as it is burned. The heat energy that is released is
converted into kinetic energy when it is used to convert liquid water into expanding gaseous
steam. The kinetic energy generated by liquid water expanding to become gaseous steam can be
used to spin the blades of a turbine, transferring the kinetic energy of the expanding steam to the

kinetic energy of the spinning turbine. The kinetic energy in the spinning blades of the turbine
move magnets over coils of wire, creating electrical energy in a generator. When the electrical
energy is passed through the filament of an incandescent light bulb it is converted back into light
energy. Some of the electrical energy is converted to heat by the resistance of the tungsten
filament in an incandescent light bulb to the passage of electrons. Electrical energy can be
converted into gravitational energy when it is used to pump water out of the ground. The second
law of thermodynamics comes into play in each conversion when a little energy is lost to heat or
unintended chemical reaction.
The first energy sources used by humans were wood, water, and wind. These gave way to
the fossil fuels coal, oil, and natural gas. Nuclear, solar, and the return of wind power are more
recent developments. More recently, the interest in renewable and sustainable sources of energy
has led to the development of biogas, biofuels, geothermal, tidal power, and a whole host of
alternative energy sources.
Energy and civilization
Energy is one of the basic and key resources of modern and ancient civilizations. For
most organisms the only form of energy available to hunt and gather food is chemical energy
liberated from food and stored until needed by the muscles. Certainly for primitive humans the
only energy available to run each person’s metabolism, obtain more food, build shelter, and
produce the other niceties and necessities of life was the energy that they and their extended
family hunted, gathered and shared among themselves.
Slowly, technologies developed that made more and new sources of energy available.
Fire was tamed, and used to cook meat, so that the body did not have to do all of the work of
digestion. Plant seeds, roots and stalks were processed and cooked, to make the energy in them
more accessible. As plants and animals were domesticated we appropriated a greater portion of
their energy for our needs. Agriculturalists modified the behavior of grains through natural
selection so that they produced more, larger, and easier to harvest seeds for us. Early agricultural
technology increased grain harvests through irrigation, and by using animals to till the soil.
Domesticated animals carried heavy burdens from place to place, substituting their
energy for human energy. Another source of energy is the muscular power of people. Slaves
made it possible for slave owners to supervise work rather than do it themselves. Slave owners

appropriated slave energy to wash laundry, cook food, and clean house, as if slaves were another
form of domesticated animal.
Slaves provided the energy necessary to accomplish many tasks.
Public domain
From these modest beginnings, technologies developed that depended on the production
of non-muscular energy. Cooking required wood fires. From cooking we developed pottery,
metal smelting, and the burning of lime for concrete. Each of these new industrial technologies
depended on the use of new and greater sources of wood, a source of stored solar energy.
As early civilizations developed into kingdoms and empires there were three main source
of energy that did not depend on personal muscular power: wood, domesticated animals, and
slaves. Wood was burned to cook food and provide the energy for industrial chemical reactions.
Animals provided power to turn the soil, produce food energy and travel long distances instead
of using our legs. Slaves provided muscle power for menial daily household and agricultural
tasks, and the power to build buildings and monuments. The Pyramids of Egypt and the Great
Wall of China were built by the muscle power of slaves. Sumeria, Persia, Athens, Sparta, and
Rome were built and maintained by forced slave labor.
Coal and oil were known in the ancient world, but were not easily converted into an
energy source. Coal burned too hot and was not easy to control. Oil still needed to be refined
before it could be used. For many thousands of years wood was the only energy source available.

Until the 1800’s wood remained the major source of energy used for cooking and
industrial processes. Wind and water eventually became important components of the energy
mix, but only where they were consistently available. As the Industrial Revolution took off it
was powered by falling water. It took a long time to develop the ability to control and focus the
extreme heat generated by coal, but once that was accomplished there were plentiful supplies in
Europe and North America, and it became the energy source of choice. At the end of the 1800’s
oil and electricity began to take over.
In the last century wood has given way to electricity generated from coal, water and
nuclear fuels as the major source of energy in everyday life. Although more than half the world’s
population still cooks with wood, people have switched over to natural gas and electricity
wherever possible as they are more convenient and less messy. In the developed world most
houses are now heated with oil, natural gas or electricity, not wood. Coal used to be important in
heating houses, but it is also messy. Even animal and wind power that used to be the dominant
sources of energy in transportation have been superseded by coal and oil. Most recently we have
begun switching from fossil fuels back to wind and solar power.
Wood
Until recently the key energy resource has been wood. Even until quite recently wood in
the form of charcoal was the only way of producing the high temperatures necessary to produce
pottery, cement, plaster, copper, tin, bronze, and iron. Pottery and metal smelting developed
between 8,000 and 5,000 BC. Firing pottery required considerable heat to cook the clay. Some
was painted with glaze to seal it so it could hold liquids. Many of the glazes contained metals
that were accidentally produced in the process of firing the pottery. Later, the accidents became
intentional. Copper was found first. Tin came soon after. Tin and copper were used to make
bronze and we moved from the Stone Age to the Bronze Age. Copper and bronze were important
improvements in forestry and warfare technology. In forestry they were used to make axes,
which allowed more wood to be cut, increasing the supply. Bronze was a much better killing and
maiming tool than the sharp stones that were the state of the art in the Stone Age.23

Ancient civilizations needed wood
As settled Middle Eastern Bronze Age populations became larger access to wood based
energy became important. Warfare allowed one group to take over the agricultural surplus of
another, and make slaves of their population, providing a new source of energy to the victor.
Defensive and offensive warfare required metal, and metal required access to wood. Cities and
towns that could not defend themselves from their neighbors eventually became their servants
and slaves.
The first large settled civilizations developed in the Fertile Crescent. The Mesopotamian
forests were thin, and did not regenerate quickly, so their supply of wood was not the best. For a
while the advantage of practicing agriculture was enough to balance the lack of good timber
supplies, and timber was imported from anywhere they could get it. Eventually the neighbors
also learned agriculture, pottery, and metal smelting, and success became a matter of access to
wood
The great Sumerian hero epic, the Gilgamesh tells of his expedition to the mountains of
Persia for the purpose of cutting down a great forest. Before they could do this Gilgamesh and
his friend Enkidu had to kill the guardian spirit of the forest. They succeed and return home
victorious, invigorated by their conquest of nature, but later they pay the price of taking too
much from nature without respect for its gods. In the story, they die of the wrath of the gods. In
real life, the forests they overharvested got their revenge. The forests held the northern Sumerian
mountain soils in place. When the infrequent rains of Mesopotamia came, they fell in torrents.
Without trees to hold it back, the soil eroded, moving down stream and filling the Sumerian
irrigation ditches which required the investment of human energy to keep open. Eventually the
cost of losing their trees became greater than they could bear and they were conquered by their
neighbors.
Similar stories can be told for other early civilizations of the region. The climate was dry
and their forests did not regenerate quickly. The shortage of wood is reflected in the
administrative writings of the early empires in Sumer, Akkad, Crete, and Mycenae. As the
nearby forests were cut obtaining timber became more costly. Finally, their empires collapsed
and were replaced by others founded in areas that were better supplied with wood. Sumer and
Akkad gave way to Crete and Mycenae, which gave way to Greece, which gave way to
Macedonia, and eventually Rome. The effects of their consumption of forests are with us today

in the ecology of Mediterranean landscape. It is shown by the denuded and scantily forested hill
slopes that myth and history tells us were once covered with a trackless forest wilderness so
dense that people were afraid to enter and by the soil eroded from forested hillsides that now
clogs the mouths of rivers where were once were thriving Mediterranean trading cities, now
separated from the ocean by sediments washed down from inland hillsides.
Cyprus is named after its copper
The importance of Cyprus in early metal trade is obvious: Either copper is named after
the island, or vice versa. It began producing before the start of the Bronze Age in 5000 BC, and
was the largest producer and exporter of copper throughout the second millennium BC. Today,
the island is covered with slag heaps that suggest the production of at least 200,000 metric tons
over a period of about 3,500 years.
Before copper smelting began Cyprus was covered with pine forests. It takes about 300
kg of charcoal to extract 1 kg of copper metal from the ores in Cyprus. The charcoal came from
cutting down and burning the pine forests. The average production of one hectare of forest in
Cyprus was 80 cubic meters of pinewood. If one cubic meter of wood produces between 50 and
80 kg of charcoal it took 12 to 20 cubic meters of wood to produce 1000 kg of charcoal. 1000kg
of charcoal is enough to produce about 3 kg of copper. At this rate, one hectare of forest
produces 80 cubic meters of wood which is the equivalent of at best 6,400 kg of charcoal, which
produces about 20 kg of copper. At a rate of 20 kg per hectare you would need at least 50
hectares to smelt enough ore to make one ton of copper. For 200,000 tons of copper you would
need to harvest 10 million hectares of forest. At 100 hectares per square kilometer that is 100,000
square kilometers. Considering that the surface area of Cyprus is only 9,300 square kilometers it
is probable that all the forests of Cyprus were cut at least 11 times to produce the energy that was
necessary for just its copper mining industry. If charcoal production was 50 kg per cubic meter
instead of 80 the amount of forest necessary could have been almost twice as much.
Historical evidence suggests that all of the wood required to operate the copper smelting
industry on Cyprus came from Cyprus itself. Copper smelting also had to compete with
shipbuilding and timber exports to Egypt, increasing the burden on forests. Cyprus is covered
with steep hills and mountains. Each time the forests were cut some of the soil eroded away.
Eventually the soils were exhausted and eroded past their ability to produce trees. As wood

production declined the methods of smelting were adjusted so they used less and then smelting
was abandoned. Dating of the slag heaps suggest that the copper industry collapsed around 300
AD because the island ran out of wood fuel.
Other bronze age civilizations
As the Bronze Age continued localized timber shortages spread westward into the
Mediterranean. New technologies were developed that increased the demand for energy, and
therefore the demand for wood. Improved axes made it easier to fell timber so that it could be
obtained with less effort. As forests disappeared there was an irreversible change in the
vegetation and landscape. The classic Mediterranean climate has a long dry season with winter
rains that washed the exposed topsoil on deforested slopes downhill. Eventually tree seedlings
had difficulty regenerating the forest. In this manner coastal forests in Greece, Italy, southern
France and Spain were slowly converted to the scrubby Mediterranean vegetation we see today.
Crete, a leading center of early Bronze Age civilization after the decline of Sumer, went
into decline as its forests disappeared around 1600 BC. Near the end, smelting and building
practices changed to reflect the lack of good local supplies of wood.
Scrub forest in France.
By Hugo Soria under CCA 3.0 license from http://en.wikipedia.org/wiki/File:Garrigue_herault.jpg
One of the pillars in the success of Athens was the silver mines at nearby Laurion. Over a
300 year period, the mines at Laurion probably consumed over 1 million tons of charcoal from
2.5 million acres of forest in the production of 3,500 tons of silver. As nearby sources of wood

ran out, smelting moved from the inland site of the mines to the coast because the silver ore was
cheaper to transport than the wood necessary to smelt it. The mines finally stopped working from
lack of inexpensive fuel, not from lack of ore. Leading metal mining areas in the Roman Empire
came and went as the forests near them were consumed and the cost of bringing in fuel or
carrying out ore increased.
As the coastal Mediterranean forests were converted to fuel and other uses, deforestation
resulted in soil erosion. The process of erosion was described by Greek writers at the time. Plato,
a Greek Philosopher wrote that the region was “a mere relic of the original country.... What
remains is like the skeleton of a body emaciated by disease. All the rich soil has melted away,
leaving a country of skin and bone.” He was writing in a time when people still remembered the
original state of the landscape.
Metal smelting gradually moved west into Europe, where the supply of fuel often became
an important determinant of the success of operations. The Island of Elba, off the coast of France
was an important mining location. When timber supplies on the island ran out in the first century
BC, the Romans had to ship ore to the mainland. By late medieval times even the forests of
Germany could only support iron smelting for three months a year.
More recent history
Wood was in short supply in Europe when the colonies in North American were founded.
In England in the 1600’s the Royal Navy was buying boards and masts from Sweden to build its
ships. The cost of firewood was going up as metal smelting consumed large amounts of forest.
When the extent of the forests of New England was appreciated, the more commercial minded
land speculators advertised the plentiful supplies of wood as an enticement to attract more
colonists. The price of firewood in England and Europe was high enough that it paid to ship
wood back to England from the colonies during the 17th and 18th centuries.
Wood is still used as the primary cooking and home heating fuel by more than half of the
world’s population, mainly, but not always, in developing countries. In many places in the
developing world, the demand for wood for cooking has stripped forests of undergrowth and
threatens to reduce the number of trees. Women and children, who do the gathering in most
cultures, spend a large portion of their day collecting the wood necessary to cook the evening
meal. The effect of wood gathering on natural forests is abundantly clear in places like Haiti and

arid sub Saharan Africa, where the demand for wood has far outstripped the ability of the land to
replace what is collected. In developed countries the use of wood as a main source of energy has
declined with the exploitation of fossil fuels for heating, cooking, and industrial processes
requiring heat.
Wood is about to reenter the fuel mix in developed countries to replace dwindling
supplies of gasoline. New processes are being developed that digest cellulose to make alcohols
that can be burned in internal combustion engines. Wood waste is also being burned in small
electrical generating plants in regions where timber is harvested for lumber and paper pulp. Over
the last few decades wood burning stoves have come back into fashion as home heating fuels
have increased in price. If wood continues to increase in importance as a source of energy it is
possible that states like Vermont, that are now 70 percent forested and 30 percent cleared, but
were once 70 percent cleared and 30 percent forested, could start losing forest cover again.
Hydropower
Hydropower is perhaps the second oldest source of external energy. When water
evaporates from the ocean and rises into the air it is storing up gravitational energy that is
released on its way back downhill back to the ocean. Hydropower is generated by capturing this
and converting it into mechanical or electrical energy.
The earliest references to the use of water wheels for grinding grain or driving the
bellows in metal works date from 200 to 500 BC in India and China. It is probable that the actual
use of water power is much older. Many of these original sites are still being used, sometimes
with similar technologies.

Wheels an early way to harness water energy to do work
By Heretiq under the CCA 3.0 license from http://en.wikipedia.org/wiki/File:Hama-3_norias.jpg
Water power was developed where stream flow could be used to turn wheels which were
used to turn other machinery that did useful work. The power of water was harvested wherever
dams could be used to constrict its flow. Old textile mill towns are everywhere on the landscape
of the early industrial revolution. Where water power was available often determined the pattern
of settlement during the spread of colonists in North America. Many early mill towns grew into
the modern centers of industry.
At the end of the 1800’s Thomas Edison and Nikola Tesla developed ways of generating
electricity and transmitting it through wires. They also developed the generator and the electric
motor. When these were connected to water falling through a dam the hydroelectric generating
station was born. As a result, water powered wheels have been replaced by electric motors driven
by electricity from hydroelectric generating stations. The first large scale hydropower electrical
generating station was built at Niagara Falls in the late 1800’s by Nicola Tesla.

The development of alternating current, the incandescent light bulb and the electric motor
increased the demand for electricity and spurred the building of hydropower dams. Today more
than 2,000 dams are used for power generation in the US. That is a small proportion of the more
than 80,000 dams that currently exist along waterways in the US. Many of these were
constructed for flood control or recreation and could be converted to power generation. Many
remaining sites have high potential for electrical generation but are limited by competing uses for
rivers and by the presence of human settlements and infrastructure that would be flooded by dam
construction. Hydropower supplies seven percent of the electricity used in the US today. It is
more important in the Pacific Northwest where the Columbia and other rivers supply a larger
proportion of electrical power.
The yellow circles show where the 2000 existing hydropower stations are located. The
brown spots show where more could be built if necessary. The purple patches are national
parks and forests where hydro development is excluded.
Public domain from the National Atlas at http://nationalatlas.gov/articles/people/a_energy.html
Hydropower dams operate by impounding water behind them. Electrical energy is
generated by converting the potential energy of the water in the reservoir to kinetic energy as it
flows through turbines. After flowing through the turbines the water, now depleted of potential
energy, is released back into the river.

Potential energy is converted to kinetic energy as it flows through the generator.
By Tomia under the CCA 2.5 license at http://en.wikipedia.org/wiki/File:Hydroelectric_dam.svg
The higher the dam the more potential energy can be trapped in the water inside the
reservoir and the more electricity can be generated by the dam. The Hoover dam, once the largest
in the world, is 726 feet high and 1244 feet wide at the top, large enough to contain a high school
football field, the stands, and a large part of the parking lot.

The Hoover dam was the largest concrete structure and the largest electrical generating
plant in the world when it was completed in 1935.
Public domain by the Bureau of Reclamation from http://en.wikipedia.org/wiki/File:HooverDamFrontWater.jpg
The amount of water available is also important. The Three Gorges dam on the Yangtze
in China is the world’s largest hydroelectric project. It is almost the same height as the Hoover
Dam but it is much wider, trapping more water behind it. The Three Gorges dam is 607 feet high
and 7,661 feet wide at the top. The average flow on the Yangtze River is 50 times the flow on the
Colorado. It will have a final capacity of over 22 million kilowatts when it is finished, 10 times
the power generated at the Hoover dam.
Costs and benefits
Dams are large structures that affect regional environment downstream by changing flow
regimes in the dammed waterway, the affect the social and cultural environment by flooding out
farms, homes, businesses, and cultural sites, and they affect the economic environment by
changing the availability of energy, creating recreation opportunities, providing flood control and
transportation.
A major benefit from building power dams is the low cost of the electricity generated
compared to other sources of energy. The climate system does the work of moving water uphill
from the oceans and we harvest the stored energy on its way back downhill. Low cost
hydropower attracts jobs through industries such as aluminum manufacture and metal plating
that require large amounts of electricity.

The watershed of the Columbia River contains over 200 dams.
Public domain by the US Army Corps of Engineers at http://www.nwd-wc.usace.army.mil/report/colmap.htm
Dams provide benefits in addition to power generation. They regulate river flow, reduce
and control flood risk, create recreational opportunities in the impoundment behind the dam,
provide water for irrigation, and improve navigation. Often these benefits are as important as the
electricity generated by the dam. In developing countries these benefits improve food
independence.
Dams also have environmental costs. They regulate the flow of water, changing the
timing and extent of flooding. Floodplain ecosystems depend on the nutrients and sediments
delivered in flood waters for growth and regeneration. Dams change the timing and size of
floods, so that floodplain forests are starved for both.
Dams block the flow of migratory fish and other animals up and down a river system.
Tremendous runs of salmon used to ascend rivers in the Pacific Northwest every year. Returning
salmon migrate inland over a thousand miles up the Columbia to lay their eggs in the headwaters
streams of the Snake River and its tributaries in the mountains of Idaho. In the last 100 years the
Columbia and its tributaries have been dammed more than 200 times for hydropower and various

other purposes. Salmon runs have been reduced from millions of fish per year to merely
thousands. As the salmon declined public interest in their difficulties grew until dams were
required to build ladders to help the fish up and around them. Fish traveling the other direction
are helped by transporting them downstream in barges so they won’t have to run the gauntlet
through the power generating turbines.
A fish ladder on the John Day dam in the Columbia River.
Public domain by the US Army Corps of Engineers at http://en.wikipedia.org/wiki/File:John_Day_Dam_fish_ladder.jpg
The construction of dams for any purpose also creates social costs. Dams flood large
areas that are already occupied by people making their daily living. The Aswan Dam flooded a
large portion of the traditional Nubian homeland. The Three Gorges Dam in China will displace
over 1.5 million people when its reservoir is completely filled. There are questions about
equitable distribution of the benefits the dam after construction. Local people are forced to move
while the majority of the benefits accrue to people who live far away and did not suffer any of
the costs of displacement and disruption.
Wind power
Wind has been a source of energy for transportation since sails were developed more than
5,000 years ago. Starting in the Middle East around 600 AD wind power was harnessed for
mechanical energy. Early Persian and European windmills were used to grind grain. Later
windmills produced mechanical power to run machinery in textile mills and water pumps for
irrigation and to keep mines dry. Windmills provided electrical power and pumped water for
farms in the rural US in the early 20th century. As other power generation technologies were

developed, windmills were replaced by steam engines run by wood and coal, and later electricity
obtained from fossil fuels.
The windmills at La Mancha, Spain that were fought by Don Quixote in Man of La
Mancha by Miguel Cervantes.
By Lourdes Cardenal under the CCA 3.0 license at
http://en.wikipedia.org/wiki/Image:Campo_de_Criptana_Molinos_de_Viento_1.jpg
Today, giant windmills are being built to generate electricity wherever wind velocities
are steady and high enough. The first windmill to generate electricity was built in Scotland in
1887 It powered the lights and equipment in a university laboratory. The first windmill to supply
commercial electricity was built in Denmark in 1896. During the last century windmills have
been used on farms to charge batteries and pump water, and on submarines to recharge batteries
while at sea.
Efforts to use windmills to generate commercial electricity have come and gone as the
cost of oil has gone up and down. Recently, states with good supplies of wind, such as
California, have offered subsidies to build wind farms and these have stimulated the
development of new and more efficient designs and lighter materials.
he rise in oil prices since 2003 has produced fears that we are nearing peak world oil
production. Fears that oil prices will continue to rise have stimulated growth in the wind power
industry. Many European countries have made supporting wind power a part of their national
energy policy. Denmark, Germany, the United States, Spain, and many other countries have
active construction programs. Wind power generates up to 21 percent of electricity in Denmark,

18 percent in Portugal, 16 percent in Spain, and 14 percent in Ireland. Worldwide, wind power
currently supplies about 2 percent of electrical generating capacity, and installed wind power is
growing at a rate of about 25% per year. Despite shortages of some materials forecasts see this
trend continuing.
Wind power generating capacity has increased.
By S-kei under the CCA 1.0 license at http://en.wikipedia.org/wiki/File:GlobalWindPowerCumulativeCapacity.png
Fossil Fuels
Wind and water have been largely supplanted by the fossil fuels. Wood is still an
important fuel in many of the lesser developed parts of the world but it has been replaced in
developed countries, whose main use for wood today is for heating homes in winter.
Fossil fuels have been a part of human culture for thousands of years, but only recently
exploited as energy sources. Oil tar has been used since the Bronze Age to seal wooden boats
and in medicine. When General Washington was at Valley Forge, and his troops were suffering
from the cold, the Indians showed them how to use oil tar to treat frostbite. Natural gas seeps
occur under some Greek temples, and may have produced the trance state of the Greek oracles
when predicting the future. Small quantities of coal were used for heating by the Chinese,
Romans and Britons.
Fossil fuels are the preserved remains of plants and animals. They consist of volatile
natural gas, liquid petroleum, and solid coal. They were formed from the fossilized remains of
plants and single cell organisms that for one reason or another were not completely decomposed.
Over the years, they were compressed and heated, changing chemically into the form that we
find them today. Fossil fuels make up a large part of the world’s energy consumption. Wood,

hydroelectric and nuclear are a distant second, third, and fourth, with less wind and solar only
making up a tiny fraction
Coal and coal like fuels
Coal and its relatives peat and lignite, are the carbonized remains of land plants that grew
from thousands to hundreds of millions of years ago. The oldest coal deposits were laid down
during the Carboniferous period between 360 and 300 million years ago. Sea levels were low,
and coastal plains were covered in swampy forests dominated by newly evolved giant tree ferns.
Other coal and coal like deposits have been created between then and now. The youngest coal
like deposits are still forming today in peat environments.
Surface coal mine in Germany.
© RaimondSpekking / CC-BY-SA-3.0 (via Wikimedia Commons)
http://en.wikipedia.org/wiki/File:Tagebau_Garzweiler_Panorama_2005.jpg
Peat
Peat is the most recently formed coal like deposit. Most peat deposits were created in the
last 10,000 years as the latest glaciers retreated. It is the compressed remains of modern bog
moss growing in mostly northern environments where decomposition was slower than growth.
The cold climate resulted in the slow and steady accumulation of organic peat deposits. Older
peat was buried and gradually compressed by newer growth building thick deposits in Canada,
Scandinavia, and northern Europe.

Peat harvesting in Frisia in Germany.
By Christian Fischer under the CCA 3.0 license at http://en.wikipedia.org/wiki/File:Torfabbau-.jpg
Peat has many uses. In some places deposits are deep enough to mine and it is used as
fuel for power plants. It has long been used as home heating fuel in Ireland, Scotland and other
northern countries. It is used in power plants in Ireland, Scotland, Russia, and other Scandinavian
countries. It is the least rewarding fossil fuel. It has the lowest carbon content, and contains the
highest level of impurities. It is usually dried to lower its water content and often compressed
and milled into pellets to improve its fuel value before it is burned.
Lignite
Lignite, otherwise known as brown coal, is the compressed remains of plants and wood
deposited in the last 65 million years. There are deposits of lignite up to 300 feet thick in
northern Europe. Lignite still contains many impurities and water, which lowers its heating value
relative to harder forms of coal. Because of this it is not worth transporting far from where it is
mined. It is used in electrical generation and for providing power and heat to industrial plants in
Eastern Europe where it is the common form of coal.

Lignite strip mine near Koln, Germany. the machine in the center is several stories tall.
The yellow color at the bottom is lignite.
By Ekem under the CCA 3.0 license at http://en.wikipedia.org/wiki/File:Garzweiler.strip.mine.jpg
Because of its high level of impurities lignite is responsible for air pollution where it is
used. Burning lignite releases sulfur which creates acid rain in the surrounding environments.
Recently processes have been developed to eliminate some of these impurities through
distillation of the lignite before it is burned. These further lower its heating value.
Hard coal
Anthracite and bituminous are the two remaining types of coal. These were deposited in
the swamp forests that grew along the margin of shallow inland seas starting around 300 million
years ago. They began forming as tree ferns evolved into giant forms. Trunks of these early
giants fell into the swamps and were buried in anoxic mud that slowed their decomposition. As
the sea slowly rose and fell extensive beds of coal were created. In the intervening millions of
years, more sediment was deposited on top. The weight of the later sediments transformed the
fern trunks into soft bituminous coal, a form that is found in many places. Where soft coal
bearing rocks were heated by the intense pressures generated by mountain building some of the
bituminous coal was transformed into anthracite, or hard coal.
Bituminous coal comes in grades depending on how much heating and compression it has
received. Though heating and compression can lower its water content to between 60 and 15
percent it still contains sulfur and other impurities that are released when it is burned.

Bituminous coal is common in Appalachia and the Midwestern United States and is the most
common form of coal burned.
A lump of bituminous coal.
Public domain by USGS from http://en.wikipedia.org/wiki/File:Coal_bituminous.jpg
Anthracite is bituminous coal that has undergone metamorphic processes. The
sedimentary rocks in which it was originally deposited have been heated and compressed driving
off most of the water and other impurities and leaving almost pure carbon. It burns cleaner than
other forms of coal, but there is less of it so we cannot abandon bituminous coal in favor of
anthracite. Most of the easy to reach deposits of anthracite have already been mined and burned.
Anthracite coal is hard and shiny.

Public domain by USGS from http://resourcescommittee.house.gov/subcommittees/emr/usgsweb/photogallery/images/Coal,%20anthracite_jpg.
Coal production
Generating electrical power with coal is an industrial process. As in any other industrial
process there is a production cycle that involves mining, transportation, use, and disposal of
waste products. At each step along the pathway there are environmental costs and benefits, and
alternatives that may or may not be better.
Coal producing regions in the United States.
Public domain by USGS at http://pubs.usgs.gov/of/1996/of96-092/index.htm
What are the benefits of coal? The energy in coal is more concentrated than in any other
fuel except Uranium. Coal is cheap to extract and easy to transport. In the United States, coal
provides more than 50% of the energy for generating electrical power. There are no substitutes
available except natural gas. There appears to be a lot of it in the ground if we are willing to pay
the environmental costs necessary to dig it up.
Pit mining
Surface outcrops that were mined by the Chinese, Romans, and Britons have long since
been used up. Underground mining was, and still is one of the most dangerous occupations.
Subsurface mining was first done with shafts that followed the coal seams into the ground. Some
shaft mines still operating today are over a mile deep.

The orange stains are water leaching from the coal face carrying iron and sulfur.
By Michael C. Rygel under CCA 3.0 license at http://en.wikipedia.org/wiki/File:Sydney_Mines_Point_Aconi_Seam_038.JPG
In the beginning, miners went in with hand tools to cut away at the face of the deposit. At
first the coal was carried to the surface by boys using buckets, later it was loaded onto mules, and
still later it was moved on small rail cars. Modern miners use heavy machinery and explosives to
loosen the coal, and trucks to get it back to the surface.
As mines became deeper, they became more hazardous. Some of these hazards are not
visible. Gas can seep into the mineshaft and smother miners before they realize they are not
breathing air. Early miners brought canaries with them as an early warning system. When the
canaries stopped singing they knew they had to get out. Gas explosions and cave ins can also
happen. Hundreds of miners are killed every year in mining accidents around the world.
Even with good shaft ventilation many miners work long hours breathing in coal dust that
settles in their lungs. Prolonged exposure causes a disease called black lung. Miners with black
lung have symptoms similar to smokers with emphysema.
Strip mining
Some coal is close enough to the surface to be mined using heavy machinery to remove
the soil and rock layers. Strip mining is attractive because it recovers more of the coal present
and can be used to work smaller deposits more economically than pit mining.
Strip mining avoids the health and cave in hazards of deep coal mining but creates other
impacts of its own. It involves stripping off the surface layers until the coal is reached,

sometimes removing whole mountaintops. Mountain top removal is practiced in West Virginia
and Kentucky where there may be several layers of coal near the surface. The overburden of rock
is first used to fill adjacent valleys, covering streams and forests, and then piled up behind the
machinery as it moves back over what used to be the mountain top. After the coal is exhausted
the spoils are spread over the land and it is left flat instead of restoring it to its original contour.
The overburden from strip and pit mining is left exposed on the surface. Pit mining opens
a hole into the ground, letting surface water come in contact with long buried layers of rock that
contain iron and sulfur. These react with forming acid mine drainage. If this chemical laden
water reaches the surface it poisons waterways until it has traveled far enough to be assimilated
into the environment.
Mountaintop removal involves removing the mountain top to the valley, and then
systematically removing the coal while piling the spoils to one side. Finally, the spoils are
regraded and vegetation is planted.
Public domain by US EPA from http://en.wikipedia.org/wiki/File:EPA_Mountaintop_Removal-Step5.jpg

Coal combustion and its byproducts
After it is mined and cleaned coal is loaded on barges, trains, or boats, or put into a slurry
pipeline, and taken to a power plant. The coal is unloaded into an onsite storage pile from which
it is fed into the plant. First the coal is pulverized so it burns quickly and evenly. The pulverized
coal is converted into slurry so the amount injected into the combustion chamber can be
controlled and preheated so that when it is injected into the combustion chamber it burns quickly.
Very pure water is pumped up pipes in the sides of the combustion chamber where it is quickly
heated to more than 5500C. The extremely hot water is released into a boiler where it
immediately converts into steam. The high pressure gas generated by converting the water to
steam is passed through several turbines. The turbines generate electricity which is passed out of
the plant and into a power substation. The steam flows into a cooling tower where it is condensed
back into water and fed back into the combustion chamber. The heated gases from the
combustion chamber are passed out into the air after passing through pollution control devices.
A typical coal fired power generation plant.
By BillC under the CCA 3.0 license at http://en.wikipedia.org/wiki/File:PowerStation2.svg

Ash
Coal contains impurities that are not combustible. Fly ash and bottom ash are left at the
end of the burning process that must be disposed of. Bottom ash is material that is too heavy to
be carried out by the flue gases that collects on the bottom of the combustion chamber. Fly ash is
light material that is carried off with the hot air leaving the combustion chamber. Both contain
heavy metals, including arsenic, mercury, strontium, and thallium.
Until recently fly ash was allowed to vent into the atmosphere along with flue gases.
When it became clear that fly ash contained toxic materials that caused significant human and
environmental damage air pollution laws were amended to require its capture. Fly ash is captured
with two types of devices, electrostatic precipitators and baghouses. An electrostatic precipitator
uses charged electric plates to capture particles from the flue gas as they pass by. A bag house
captures particles by passing flue gasses through large cloth filter bags. Some of the ash is
disposed of in landfills. More of it is used as the filler in cement, or sold as clinker for
landscaping and fill in construction.
Flue gases
Flue gases consist of carbon dioxide and water that are the normal byproducts of
combustion, unburned nitrogen, and oxygen from the atmosphere, sulfur, methane, and sulfur
oxides from the impurities in the coal, and nitrogen oxides. Once they are released into the
atmosphere the flue gases react with light and other atmospheric components to form smog.
Smog has serious health effects on people with respiratory problems, and can cause death in
vulnerable people.
The strength of the environmental impacts of flue gases emitted from coal burning power
plants depends on the area over which they are spread. Early coal fired power plants had low
smokestacks that released flue gases near the ground and had negative effects on local air
quality. In order to lessen local impacts these short stacks were replaced by very tall stacks that
released flue gases far enough above the ground so they were distributed over a much larger
area. Many tall stacks are now hundreds of feet high, with stacks of over one thousand feet not
unusual.
Flue gases also contain sulfur and nitrogen oxides that form acids in the atmosphere.
Most recently built coal fired power plants have flue desulfurization filters installed that capture

sulfur before it leaves the stack. Flue gas desulfurization works by putting flue gases in contact
with calcium carbonate or other alkaline compounds that form solid salts when they come in
contact with acids. One method of doing this is to pass the flue gases through a fine mist of water
and alkali on their way up the flue stack.
Flue desulfurization was first developed in the 1850’s in England. It was put into use
when the construction of large scale power plants started in England in the 1930’s. These early
efforts at pollution control were abandoned during the Second World War, and no new plants
were built until the 1970’s in the US and Japan. Since then, air pollution laws have required
sulfur scrubbers on most new coal burning power plants around the world.
Desulfurization systems cost hundreds of millions of dollars to install. The costs involved
are an example of using engineering to internalize costs so that environmental goods are
protected. In this case, we have made the conscious choice to pay for reductions in
environmental damage in order to protect human health and preserve environmental amenities.
Heat
The final form of waste from fossil fuel and nuclear power plants is heat. Not all the heat
of combustion can be converted into electrical energy. Some escapes up the smokestack carrying
fly ash and aerosols of sulfur with it. The rest is carried off in cooling water or evaporated away
in cooling towers. Long term releases of heat into a body of water attract a community of
organisms that is adapted to a higher temperature regime than normal. Waste heat can be
disruptive to environmental systems when it is suddenly turned on or off, stranding organisms
that have adapted to the previous temperature regime. This can result in fish and algae kills that
at the least produce unpleasant conditions as the dead plants and animals decay. Many recent
power plants include a cooling tower in their design to shunt waste heat into the atmosphere
rather than into a receiving body of water.
Costs and benefits
Coal is a dirty fuel. It creates environmental impacts at almost every stage of handling,
from the mine to the disposal of ash and waste heat. Laws about when and where it can be used
date back to London in the 1300’s, where burning coal in poorly designed fireplaces caused rich
noblemen to object to some of the world’s earliest manmade regional scale air pollution. When

coal smoke is released into the atmosphere it contains a mixture of small particles, carbon
monoxide gas and other trace impurities. In the atmosphere these react with sunlight to form
chemical smog. The negative health effects of breathing this polluted air are significant and
include respiratory disease from breathing ozone. The acids in coal smoke erode building stone
and art works. Mining kills hundreds of miners every year and pollutes streams and groundwater,
and alters the land surface. Coal also produces waste heat that must be diluted into a body of
water or the air.
Considerable effort has been put into improving the technologies and methods used to
burn coal more cleanly. These efforts have resulted in scrubbers and sulfur removal technologies
that can greatly reduce pollutant emissions into the air. Still, there are significant air pollutant
emissions, including CO2, a leading cause of global warming, and ash and other materials need
to be put somewhere where they will not damage water or human health.
On the other hand, coal is the major source of fuel used to generate electricity worldwide,
so we cannot easily do without it. The next generation of coal technologies will include coal
gasification to remove more chemical pollutants, and systems for capturing CO2 gas, converting
it to some manageable form, and sequestering it away from the atmosphere for a long period of
time. Many of these technologies are in the pilot stage, and new coal burning plants are not built
overnight so it will be at least several years before we know which ones are effective and
economical.
How much coal do we have?
Reserves are an estimate of what we have in the ground yet to mine. Any estimate must
be uncertain since we can’t see into the ground to be sure that what we think is there is really
there and we can’t include deposits that we haven’t found. An estimate of existing reserves gives
us the best guess of what we think we have and allows us to plan for the future.
Coal is mined in about 100 countries around the world, and on all continents except for
Antarctica. The largest reserves are found in the United States, with a little more than 22 percent,
followed by Russia (14%), China (12.5%), and Australia (almost 9%). Estimated world reserves
in 2000 were 900,000 million tons. Yearly consumption is about 6,750million tons. Not allowing
for increases in consumption there is about 140 years supply using today’s reported reserves.

Currently coal consumption is increasing at about 2% per year, so known reserves should last
less than the current projection.
It is likely that the reserves reported are only those that are economically recoverable. As
supplies dwindle it should be expected that prices will increase. As they increase coal that is less
economically attractive today will be added to what is counted as reserves.
Oil and natural gas
Oil and natural gas deposits formed under the ground in places that used to be shallow
lakes and seas. Diatoms and other one-celled algae that grew in the surface waters of these seas
died and sank to the bottom where they were buried by sediments. In some shallow sea basins
high productivity and low circulation kept the oxygen level in bottom sediments low enough that
the algae did not decompose. As more sediments arrived and continental plates moved the buried
algae were carried deep underground where heat and pressure broke their complex carbohydrates
into simpler tars, oils, and natural gas. These later moved back towards the surface where they
were intercepted by impermeable cap rocks which trapped the oil and natural gas deposits that
we exploit today.
An example of how oil gets trapped under impermeable shale in a geologic formation.
By Oceanh under the CCA 3.0 license at http://en.wikipedia.org/wiki/Image:Structural_Trap_%28Anticlinal%29.svg
Crude oil
Crude oil has been used for thousands of years in the Far and Middle East. Surface
deposits of asphalt near Babylon were mined and used to pave the streets and line the walls of
the city. It was burned in China to provide heat for extracting salt from brine.

Crude oil, or oil just out of the ground, was not a welcome sight until the late 19th
century. American pioneers who dug wells for drinking water or brine to make salt were
disappointed when they struck oil. Oil made the well taste bad and it was messy to handle. Its
main use was in medicine as the original snake oil sold as a cure all by quack doctors.
As chemistry was better understood methods were developed for separating crude oil into
different fractions that might be more usable. Methods for extracting kerosene were developed in
the 1850’s. The kerosene lamp was first developed in 1854 producing cheap lighting so that
people could “burn the midnight oil”. At first kerosene was made from coal. By the late 1880’s
most of it came from refining crude oil. The first oil wells were drilled by Edwin Drake in 1859
at Titusville in western Pennsylvania. He struck black gold at 69 feet. He sold his oil in 44 gallon
barrels for $20 apiece. Others adopted his technology and the oil age was in full swing.
Crude oil distillation column.
By Utain under CCA 3.0 license from http://upload.wikimedia.org/wikipedia/commons/3/3c/Crude_Oil_Distillation.png
Methods for refining crude oil through fractional distillation were developed at Yale
University in 1855. Fractional distillation separates the components of crude oil by the
temperature at which they evaporate. To separate crude oil into fractions it is heated and passed

into a column with partitions at several levels that are kept at different temperatures. As the
evaporated crude oil passes up the column different fractions condense and are taken out. The
heavier asphalt, waxes and oils have the highest boiling point. They condense near the bottom of
the fractionation column. Fuel oils come off next, followed by diesel, kerosene, and gasoline.
Natural gas has the lowest boiling temperature and comes off the top of the column. The first
active oil refinery was in Baku in the Caucasus region of Russia, built to refine oil gathered from
surface seeps. At first only kerosene was extracted. The gasoline, asphalt, and other byproducts
were burned off or discarded. There was no established use for them until the development of
electricity, automobiles, and airplanes.
Early automobiles ran on ethanol distilled from corn. As they became more common,
gasoline engines were developed to make use of what the former waste product. As
transportation in cities and towns converted from horses to automobiles, the streets were paved
with asphalt, the heaviest hydrocarbons left over at the end of the refining process.
1859 2,000 barrels
1869 4,215,000 barrels
1879 19,914,146 barrels
1889 35,163,513 barrels
1899 57,084,428 barrels
1906 126,493,936 barrels.
Oil extraction more than doubled every decade in the early years.
Encyclopedia Britannica 11th Edition, 1910.
The last 100 years can be thought of as the age of oil. In this short time it went from a
minor resource to the key natural resource necessary for a modern industrial economy and
national defense. The early center of the oil industry was in western Pennsylvania. As the
demand for kerosene and gasoline exploded oil exploration spread to other parts of the US and
the rest of the world. Early oil fields were discovered in east Texas where a single gusher at
Spindletop near Beaumont Texas tripled US oil production.

The Lucas gusher at Spindletop in Texas came in at 100,000 barrels a day, tripling US oil
production.
Public domain from http://en.wikipedia.org/wiki/Image:Lucas_gusher.jpg
Prior to the development of the Pennsylvania fields 90 % of the world’s oil supply came
from Baku in Russia. Early oil fields were developed in Texas, Oklahoma, Ohio, Indiana,
Michigan, Louisiana, and California. Significant early oil fields had been discovered by 1885 in
the Dutch East Indies, 1910 in Canada, and 1908 in Iran. Peru, Venezuela, and Mexico also had
significant finds. Today there are major reserves of oil in Saudi Arabia, Iraq, Iran, Kuwait, and
the United Arab Emirates. There are also large reserves in Russia, Venezuela, Nigeria, Libya,
and Mexico. Smaller but significant reserves of oil exist in Brunei, Indonesia, Ecuador, and
Norway.
Oil has become a major item in international trade. As the deposits in developed
countries have become depleted and new countries develop industrial capacity demand has
increased. Today crude oil is shipped around the world in ever larger tankers. Pipelines are being
constructed to bring it from central Asia to the coasts where it is shipped to North America,
China, and Japan.

Uses
Oil is the most important form of energy resource, surpassing coal in the amount used in
the 1950’s. It is the primary transportation fuel for good reason. Gasoline and diesel fuel contains
the highest concentration of energy per unit of mass. Both contain more than twice the energy
content in methanol and one and half times the energy content of ethanol, the closest
commercially produced substitutes. Gasoline and diesel are easier and safer to transport than
compressed gas. Other fuels with a lower energy concentration provide less power when used in
internal combustion engines, and therefore lower miles per gallon. Gasoline is so important as a
natural resource that people will hand carry it into remote regions so they can run chain saws to
cut down rainforest trees and run generators to watch televisions.
Oil is also a basic feedstock for the chemical industry. Most plastics are made from it.
Plastics are used to make insulators for electric wire, containers for fluids, to make fibers used in
clothing, imitation leather, in paints, as parts for cars and machinery, to make bags, rugs, floor
tiles, roofs, cd’s, the boards that printed circuits are printed on, and other computer parts. Oil is
also used in making fertilizers, pesticides, fungicides, and other chemicals for agriculture. Right
now, everyone who is reading this page is dependent on oil in one form or another.
Natural gas
Heat and pressure break down the hydrocarbons in coal and oil into smaller components.
With enough heat and pressure they can be broken down into natural gas, which is composed of
methane and other light gases. Natural gas is naturally present in coal seams, oil deposits, and
natural gas fields. Until recently, most natural gas was obtained from oil wells where it was an
unwanted byproduct. Where there was no ready market for it, it was burned off at the wellhead.
Natural gas was first as a fuel for lighting street lamps in the late 1800’s. As gas handling
technology improved it was used in homes for lighting, heating and cooking. As the plastics
industry developed in the mid-20th century the purity of natural gas made it the feedstock of
choice.
Natural gas is difficult and expensive to transport. It is explosive and not worth the cost
unless it is compressed or liquefied. As demand increased pipelines were built to transport it
from the gas and oil fields to where it was wanted.

As oil fields became depleted new systems were developed for pumping natural gas back
into the ground to keep the oil pressure up and store the gas for later extraction. Natural gas from
isolated fields is purified, compressed and liquefied. In the last 50 years liquefied natural gas
tankers have begun moving it between continents.
The increase in gasoline prices in the last few decades has created intense economic
interest in increasing natural gas reserves and bringing new supplies into production. During this
time the price increased to the point of revisiting old fields and bringing new but less rewarding
fields online.
Fracking
Much of our natural gas reserves are located in shale rock formations without the natural
cracks and channels that make gas extraction easy elsewhere. This leaves considerable reserves
unavailable and in the ground. In the last decade the development of new technologies had made
extraction from these fields possible. The main method for extracting from these deposits is to
pump fluids into them at very high pressure, fracturing the rock and creating channels for gas
and oil to flow to the main well shaft. This method is called fracking by the gas industry. New
drilling techniques have allowed side wells to be drilled at an angle to the main shaft, reaching a
large region from one single well.
Although fracking shows promise as a way to gain access to vast natural gas reserves it
also has environmental problems. During drilling fluids are passed into the well to lubricate the
drill. Many of these fluids are toxic. If the fracturing creates a connection between gas deposits
and groundwater it is possible to contaminate drinking water with drilling fluids and gas. This
appears to have happened in some places in Pennsylvania. Where fracking allows gas to escape
into drinking water wells or to the surface there is the danger of explosions. The health
consequences of breathing gas and drilling fluids are not well known. Health anomalies in some
areas have been blamed on fracking by residents. The penetration of fracking into populated
areas is relatively recent, and the health and other environmental impacts are not well known.
Whether or not we allow fracking to continue depends on where we think the burden of
proof lies, either on the public to prove it is harmful, or on the drillers to prove that it is not.
While we can expect most wells to operate well there will be a few that do not. A large part of

our decision will revolve around the perceived need for more energy. If we are convinced that
we need the energy at all costs we will allow drilling at all costs.
Nuclear Power
Nuclear power is a modern invention that developed from our growing understanding of
physics and chemistry. During the late 19th century scientists developed methods for separating
many new chemical elements from the compounds in which they were found in nature. As they
learned the rules of how chemicals combined and behaved their understanding of chemistry was
assembled into the periodic table of elements.
A few elements were not like the others. These released forms of energy that were later
identified as particles emitted from the nucleus and high energy photons. Stranger still, they
often changed from one element to another afterwards. In the early 20th century, our
understanding of these ‘radioactive’ elements suggested that they could be used to liberate
energy from the nucleus of atoms in a controlled way. This led to the development of the atomic
bomb and the nuclear power reactor.
What is radioactivity?
As the universe cooled after the Big Bang, energy began to coalesce into particles that
formed the basic building blocks of atoms: electrons, protons, and neutrons. Most of the atoms of
the early universe were hydrogen, the simplest element, composed of one proton and one
electron. Hydrogen is still the most common element in the universe, floating as clouds of
interstellar gas in the immense spaces between the stars. Stars form from these clouds of
interstellar gas brought together by the attraction of gravity. The average small to medium sized
star burns hydrogen to make helium. Massive stars can burn helium to make other larger
elements. When these large stars explode in a supernova larger elements with more neutrons and
protons in their nuclei are formed. These include uranium, thorium and the other unstable
radioactive forms of elements that break down to form smaller more stable atoms.
Atoms larger than hydrogen contain more protons and a new particle, neutrons. A
neutron is a proton combined with an electron. Protons have a negative charge. Electrons have a
positive charge. Neutrons are without a charge, neutral as their name suggests. Atoms can also
have an electrical charge. An atom without charge has as many electrons as protons. An atom

with more protons than electrons has a negative charge and is willing to collect electrons until
they are equal. An atom with more electrons than protons has a positive charge, and is willing to
give up electrons to any atom it encounters that want one.
The nucleus of Helium, the next largest element contains two protons and two neutrons.
Because the number of protons is important in determining the chemical and physical properties
of an atom they are classified according to the number in their nucleus. Lithium has three protons
in its nucleus, Beryllium four, and so on.
The radioactive decay sequence from Thorium to lead.
By Tosaka under the CCA 3.0 license at http://en.wikipedia.org/wiki/File:Decay_chain(4n,Thorium_series).PNG
We call atoms of the same protons that have different numbers of neutrons isotopes. The
electrical and chemical properties of two isotopes of the same element are almost the same.
Because they contain different numbers of neutrons, they have a different mass, and they can be
separated using a centrifuge.
Neutrons stabilize the interaction of the protons in the nucleus of an atom. If the number
of neutrons is too small or too large, the nucleus becomes unstable and breaks down
spontaneously. Atoms that break down spontaneously are radioactive. They release photons,
electrons, helium nuclei, and neutrons, and can break apart to form still other elements which are
also often radioactive. Beta decay involves the conversion of a neutron into a proton and the

emission of an electron and a gamma ray. A gamma ray is a high-energy photon. Alpha decay
involves the release of a particle that contains two protons and two neutrons.
The number of protons in the nucleus determines the chemical characteristics of an atom,
and hence which element it is. The atomic weight of an atom is equal to the number of protons
plus the number of neutrons. During beta decay, an electron is emitted as one neutron transforms
into a proton. The atom left behind is transmuted into a new chemical element. When Lead 214
emits a beta particle, its atomic weight does not change but it is transmuted from Lead 214 to
Bismuth 214.
Radioactive elements can also produce an alpha particle. An alpha particle is the
equivalent of a helium nucleus with no electrons. Alpha particles are very good at breaking
bonds between atoms. The alpha particle emitter Polonium 210 which is present in tobacco is
suspected of playing a role in causing lung and bladder cancer related to smoking.
Some isotopes undergo radioactive decay by nuclear fission. They break apart releasing
two smaller nuclei, gamma rays, and neutrons. Uranium 235 is the only naturally occurring
fissionable isotope. The nucleus of U235 can also absorb neutrons. When this happens it forms
an atom of U236 which also fissions releasing more neutrons. If there is enough U235 present
and the conditions are right a chain reaction starts in which an ever increasing number of
neutrons are released causing an ever increasing number of fissions. The process also releases a
large amount of energy which is converted into heat once it encounters air. This is what happens
in the explosion of a nuclear bomb.
The half-life of radioactive elements
Many radioactive elements decay into other radioactive elements. The process is so
regular that we can use the rate of decay of some elements as clocks. The time it takes for one-
half of the atoms of a radioactive element to decay is called its half-life. Some radioactive
isotopes are very short lived, breaking down in fractions of a second. These isotopes are not
known in nature: they are only produced by nuclear explosions or in nuclear reactors. The half-
life of Polonium 214 is 180 microseconds, or about one fifth of a second. In each fifth of a
second the amount present decreases by half. In the first fifth of a second it decreases from one
gram to one half gram. In the second fifth of a second it decreases from one half gram to one
quarter gram. In just one second a one-gram mass of Polonium 214 has decreased from one gram

to 1/25, or 1/32nd (1/(2raised to the number of half-lives of time that have elapsed)) of a gram, leaving behind almost
31/32nd of a gram of Lead 210, the product of the radioactive decay. Lead 210 is also radioactive,
and in 22 years, half of the Lead 210 will be transmuted to Bismuth 210. Some radioactive
isotopes, such as Uranium 238 or Thorium 230 have half-lives of thousands to billions of years.
Uranium 238 decays to Lead 210 over a long series of steps, each of which can take from
seconds to billions of years. Using the ratio of different isotopes present in an object, and an
understanding of the length of time it takes for them to decay we can make estimates of its age.
The regular and predictable decay rate of these long-lived radioactive isotopes is very useful in
dating ancient rocks and carbon deposits.
Nuclear reactors
Coal fired power plants create steam by burning it in a combustion chamber in which the
burning coal heats water to a very high temperature. The water is converted to steam and used to
turn a turbine, which turns a generator. A nuclear power plant doesn't have a combustion
chamber. Instead it has a nuclear reactor. The energy to turn the turbine in a nuclear power plant
comes from heat captured by water from controlled radioactive decay inside the nuclear reactor.
The design of a typical light water reactor.
Public domain by NRC at http://en.wikipedia.org/wiki/File:PressurizedWaterReactor.gif
There are several commercial nuclear reactor designs in use today. Except for the Russian
graphite reactors like the ones at Chernobyl, they are variations of the pressurized water reactors
(PWR) in use in the United States. The description that follows here is for a pressurized water
reactor.

Natural uranium ores consist of 99 percent U238, with only 0.7 percent U235, not enough
to produce a chain reaction unless helped by concentrating the amount of U235 to between 3 and
4 percent. Weapons grade U235 is enriched to 90%. Uranium enrichment is accomplished by
converting the mixture of uranium isotopes to a gaseous form and putting it in a centrifuge that
separates the heavier isotopes from the U235. Once the uranium reaches the required balance of
isotopes it is converted to solid uranium dioxide and formed into pellets.
A pellet of nuclear fuel.
Public domain by NRC from http://en.wikipedia.org/wiki/File:Fuel_Pellet.jpg
A nuclear reactor consists of a core housed in a containment building along with its
cooling systems. The containment building is constructed out of reinforced concrete several feet
thick designed to contain the reactor core in case of an accident, keeping the contents of the core
from escaping into the air or melting through the bottom of the building.
The reactor core houses the fuel rods which consist of fuel pellets housed in rods made of
zirconium alloy. Zirconium absorbs few neutrons so it does not slow down the chain reaction.
The rate of reaction is controlled by rods of cadmium or boron, both of which absorb neutrons.
These can be inserted or removed to control the rate of the nuclear reaction.
A reactor is started with the control rods fully inserted. As it warms up they are slowly
removed until the chain reaction becomes self-sustaining. As the nuclear fuel ages the amount of
U235 decreases and fission byproducts that absorb neutrons build up. To counter this, the control
rods are withdrawn further. Eventually the chain reaction cannot be maintained by withdrawing
the rods any farther and the nuclear fuel must be replaced.

Pressurized light water reactors have three coolant loops. The primary coolant loop has
two jobs. It circulates through the reactor core and out to a heat exchanger and it moderates the
speed of neutrons emitted by the nuclear fuel. Freshly emitted neutrons travel at 14,000 km per
second. This is too fast to cause fission in another atom of U235 so reactors use the coolant water
to slow the neutrons down. Fast moving neutrons that collide with water molecules slow down
and transfer their kinetic energy to the water, heating it. When the slowed neutrons find another
atom of U235 they transform it into an unstable atom of U236 which fissions, releasing more
neutrons. The coolant water carries off the energy produced in the process.
The water in the primary cooling loop is kept under pressure so it won’t form steam
bubbles which cause explosions and interfere with pumps. If the primary coolant loop were to
leak outside the core it would release superheated radioactive steam into the environment. If the
pipes or pumps in the primary coolant loop fail the reactor core will warm up, possibly causing a
meltdown.
Cooling the primary coolant water is accomplished by circulating it through a secondary
coolant loop outside the core. This requires piping and pumps that operate under high heat and
pressure and redundant pipes and pumps to make sure that there is no coolant failure if one set of
equipment fails. This design redundancy to insure safety is part of what makes nuclear power
plants expensive to build and operate.
The secondary coolant loop receives heat from the core and generates steam to drive the
turbines and generate electricity. The secondary coolant system also has many built in
redundancies to ensure that if it fails the heat from the primary coolant loop can still be
dissipated before the reactor melts down. The secondary loop is cooled by the tertiary loop,
which releases waste heat into the atmosphere through a cooling tower, or into a river, lake, or
ocean.
The final fallback emergency cooling system is supposed to flood the reactor containment
building with water from the outside in the case of an emergency.
Radioactive waste
Once nuclear fuel is used and removed from the reactor it is called spent fuel. There are
about 120 nuclear plants operating in the United States and about 440 worldwide. The first plant

began operating in Shippingsport, Pennsylvania in 1954. Most US plants have been in operation
for 30 to 40 years.
One-third of the fuel assemblies in a reactor are removed every three to five years. A
1000 megawatt reactor contains 100 tons of nuclear fuel and produces more than ten tons of
other radioactive wastes every year. There are about 60,000 tons of accumulated high-level
radioactive waste stored somewhere in the United States today.
Dry cask storage of nuclear waste.
Public domain by NRC at http://www.nrc.gov/reading-rm/photo-gallery/index.cfm?&cat=Nuclear_Reactors
Newly removed spent fuel is very hot in temperature and radiation. It contains many
radioactive elements that are the result of neutron and particle absorption. These include many
isotopes with short half-lives actively undergoing radioactive decay. Many of the smaller fission
products are isotopes of elements such as iodine and calcium that are used by living organisms.
There are also some larger radioactive elements, including Plutonium, which can be used as
reactor fuel and to make nuclear weapons.
Newly removed spent fuel is immersed in a pool of water for the first five years. The
water acts as a coolant and absorbs the radioactive emissions. As the short-lived isotopes decay,
and the radioactivity and heat level declines fuel rod assemblies are removed to dry storage casks
on land where they stay for another 20 years as isotopes with intermediate half-lives decay.
So far, all of the spent nuclear fuel generated in the United States is still being stored at
the reactor sites where it was generated. After 20 years, spent fuel is radioactively much cooler

but it is still dangerous. It will need to be kept out of the environment for at least another 10,000
years.
Keeping it at the reactor site is not a good solution. As the amount of waste increases
simply accounting for it becomes more difficult. As reactors are decommissioned in the next few
decades the reactor sites will become storage sites, requiring continuous watching. It would
make much more sense to consolidate waste in one or a few properly designed locations where
security problems can be minimized.
The design and location of a long-term storage system for the spent fuel has been under
investigation since 1978. Originally, six sites were under study. These were narrowed to three in
1984, including Yucca Mountain, in Nevada, the Hanford nuclear site in Washington, and Deaf
Smith County in the panhandle of Texas. Deaf Smith County was discarded because of the
danger of contaminating the Ogallala aquifer. The Hanford plant in Washington is where early
nuclear research for the Manhattan project and plutonium production for nuclear weapons took
place. It has a history of intentional and unintentional release of radioactive materials into the
Columbia River. The site opened in 1942 and the research reactors closed down in the 1960’s.
Hanford still has large quantities of high-level nuclear waste waiting for a permanent repository.
In 1987, Congress directed the Department of Energy to restrict its study to only Yucca
Mountain.
Yucca Mountain is located in the desert 80 miles north of Las Vegas adjacent to the
Nevada Proving Ground where over a 1000 nuclear weapons test explosions were conducted by
the Department of Energy. Most of the tests were underground, but at least 90 atmospheric tests
were conducted. Because of the contamination resulting from the tests the area is not likely to be
inhabited in the near future.

Aerial view of Yucca mountain north of Las Vegas.
Public domain by OMB at http://www.whitehouse.gov/omb/budget/fy2004/energy.html
Yucca Mountain was formed in a series of gigantic volcanic eruptions around 12 million
years ago. The mountain itself is composed of a layer of tuff that was later tipped up on edge,
forming a ridge. The proposed repository design is to construct a tunnel into the ridge leading to
1200 feet below the surface. In the depths of the mountain a gallery of tunnels will branch off the
main tunnel in which casks of radioactive wastes will be buried.
Yucca Mountain has several characteristics that suggest it might be appropriate for long-
term storage of nuclear wastes. The major pathway by which wastes might leave the repository is
through groundwater, and the current groundwater level is 1000 feet below the repository level.
There is very low rainfall, and waste repository tunnels are approximately 800 feet above the
current groundwater level. Even though the region is subject to earthquakes, these are expected
to have low impact on the repository. If wastes do manage to escape the region is a desert with
very few people living in it.
Of course, these are the conditions as they exist today. In order to be successful the
repository has to provide containment for 10,000 years. Critics point out that the volcanic tuff
that makes up the mountain has cracks that might allow escaping radioactivity to migrate to the
water table faster than expected and that rainfall patterns change over time. Rainfall in the region
has been higher in the recent past, but not high enough to raise the water table to the level of the
proposed repository.

Yucca Mountain was expected to be open and receiving waste shipments in 1998. Final
approval for the site was received from President Bush in 2002. Strong opposition from the
citizens of Nevada and other environmental groups has delayed its opening. Despite continued
strong opposition from the government of the state of Nevada the final permit application
documents have been submitted to the Nuclear Regulatory Commission by the Department of
Energy. Following approval there will be a series of public hearings and safety studies by the
Nuclear Regulatory Commission. If approved, the current timetable is to begin construction in
2013 and finish in 2017. Even this timetable is not assured since the project is subject to the
congressional power of the purse. To date, the project has cost 9 billion dollars and it is expected
to cost more than 500 million a year for its 100-year life.
Plan of the proposed nuclear waste repository at Yucca Mountain in Nevada.
Public domain by NRC at http://www.nrc.gov/waste/hlw-disposal/design.html
If Yucca Mountain is approved and built, it will soon be too small. It was originally
designed and proposed to hold 70,000 tons of commercial reactor waste. Almost this much waste
is already stored at the commercial reactors around the country, and there is about the same
amount stored in government weapons facilities. The license of many reactors is about to expire.
Wastes from cleanup and decommissioning reactors will add to the spent fuel already waiting to
be stored. It is likely that many of the expiring licenses will be extended, and it is possible that in
the face of pressure to generate more electrical energy we will decide to build more reactors.

Taking all this into account it is likely that we will need to store twice the amount that Yucca
Mountain is designed to hold by the time that the repository is ready to be opened.
Several other countries with sizable quantities of nuclear waste have plans for deep
geological disposal of nuclear waste in various stages of preparation. Canada, China, France,
Germany, Great Britain, Japan, Russia, and several other countries have conducted pilot studies.
As the number of countries and the number of nuclear power plants grow, the need for proper
disposal and the danger of delay also grows.
Nuclear reactor accidents
A major concern with nuclear reactors is the consequence of a reactor accident. The
reactor fuel is not concentrated enough to cause an explosion on the scale of a nuclear bomb, but
it can cause smaller explosions if it is allowed to get hot enough to melt the reactor core, and if
the contents of the core escape containment any area contaminated with radiation will become
uninhabitable for decades to centuries before radiation levels return to levels tolerable by people.
The most likely cause of a reactor accident is when coolant systems fail or control rods
malfunction, leading to core meltdown. When that happens, emergency cooling systems are
supposed to flood the reactor containment building in order to keep the core cool. If the core gets
hot enough it will melt through the reactor vessel into the containment building.
If the core does melt it is likely to contaminate the coolant water, and release radioactive
steam and hydrogen gas in the containment building. The containment building is designed to
protect the core from earthquakes, airplanes, and explosions from the outside but it is not
intended to keep escaped gases inside. When there are significant releases of gases from a
meltdown inside the containment vessel they are usually vented into the atmosphere and
dispersed into the surrounding environment.
Another point of vulnerability is that the pumps, valves, gages, welded joints, and other
mechanical and electronic features can fail. The water in the primary cooling loop that flows
through the reactor core must be kept liquid even though it is at a temperature much higher than
needed to boil water. This means that any leak in a pipe fitting, bad weld, or malfunctioning
valve will release superheated steam. Because the mechanical and electrical systems are so
important power plant designs include several redundant systems. Even with this amount of
redundancy these systems still fail, occasionally causing major accidents.

The reactor features that are most difficult to control are the humans that run them. When
they do happen, accidents can cause complete loss of the reactor in only a few minutes. The
reactor staff must be well trained in the processes and equipment they are using. They must
recognize unusual behavior and come to a rapid diagnosis of any problems that arise.
In the more than 60 years that nuclear power generating stations have been in commercial
operation there have been several accidents that led to a partial or total meltdown of the reactor
core. In most cases the core shutdown systems worked and very little radioactivity escaped. In a
few they didn’t. The best known reactor accidents happened at the nuclear power generating
stations in Three Mile Island outside of Harrisburg, Pennsylvania, and at Chernobyl in what is
now the Ukraine but was the Soviet Union when the accident occurred. The most recent accident
occurred at the Fukushima Daiichi power plants in Japan after they were flooded by the 2011
tsunami. The following are brief accounts of what happened in each of these accidents to the best
of our knowledge.
Three Mile Island
The accident at Three Mile Island (TMI) happened because of a combination of
equipment failure, lack of equipment, and misunderstanding by the operators. It started in TMI
reactor 2 at 4:00 AM on March 28, 1979. The feed water pumps in the steam generation loop of
the cooling system shut down. Once these shut down the steam generators also shut down.
Without the steam generators in operation first the turbine and then the reactor shut down. Even
though the reactor shut down, radioactive decay continued inside the core, and pressure in the
primary coolant loop of the reactor increased. To prevent pressure in the coolant loop from
blowing seals a pressure relief valve opened automatically, venting steam into the containment
building. Later the pressure relief valve sent back a signal that it was closed but failed to actually
close. Primary coolant water continued to escape from the valve allowing the core to overheat.
For several hours operators did not realize the core was losing coolant because they assumed that
if there was water in the relief valve at the top of the reactor there must be water in the core also.
They did not have a method for confirming this because cutbacks during the construction of the
reactor had eliminated this safety system. Turbulence caused by escaping steam gave the
impression that the valve had water in it.

Elsewhere, pumps in the emergency feed water system started up as they were supposed
to but accidentally closed valves kept the water from reaching the stream generators. The valves
had been left closed as part of a test of the emergency cooling system two days before. These
were quickly discovered and opened before they could do any harm.
Schematic drawing of the TMI-2 reactor mechanism.
Public domain y NRC from http://www.nrc.gov/reading-rm/doc-collections/fact-sheets/3mile-isle.html#tmiview
By this time, steam voids had developed in the primary reactor coolant loop that
prevented heat transfer from the reactor to the steam generators. The presence of steam voids in
the reactor core confused the operators. They thought that there was rising water in the primary
coolant loop when there was not so they turned off the emergency coolant pumps.
During all of these events the pressure relief valve at the top of the core was still open
and venting steam. The pressure relief valve including a quenching tank to capture the released
steam, condense it back into water, and to hold it so the reactor vessel did not get contaminated
with radioactivity. The steam condensed into water, which overflowed the quenching tank and
spilled out onto the containment building floor activating the building sump pump and setting off
an alarm in the reactor room. The alarm, higher temperatures in the relief valve discharge line,
and high pressure and temperatures in the containment building were sure signs of a loss of
coolant accident. The reactor operators did not believe them because they mistakenly thought
there was coolant water in the reactor.
The lid on the quenching tank connected to the pressure relief valve blew off at 4:15, and
radioactive coolant water was pumped from the containment building to an auxiliary tank until
the sump pumps were shut off at 4:39. At 5:20, the pumps in the primary coolant loop began to
cavitate as steam bubbles reached them. Cavitation creates noise and vibration as bubbles of gas

are compressed back to liquid, causing wild swings in pressure in the primary coolant fluid. The
pumps were shut down on the assumption that normal thermal gradients would keep the primary
coolant circulating. At 6:10, the top of the reactor core was exposed and the intense heat caused a
reaction to occur between the steam and the zirconium coating on the fuel rods. This damaged
the fuel rods, released more radioactivity into the reactor coolant, and produced hydrogen gas
which caused a small explosion later that day.
The shift changed at 6:00 AM. A new arrival noticed that the temperature in the overflow
holding tanks was high and shut off the pressure relief valve using an auxiliary valve. By this
time 250,000 gallons of cooling water had already leaked from the reactor core. At 6:40 AM
radiation alarms began to go off as radiation from the coolant water began to reach detectors. At
7:00 AM, a “Site area emergency” was declared and upgraded to a “General Emergency” at
7:24.
The control room staff did not understand what had happened until later in the day. They
took manual readings of the temperature inside the reactor and collected water for testing from
the primary coolant loop. Later in the day they pumped new water into the reactor core and
opened a relief valve to reduce pressure. The primary coolant loop pumps were turned on again
and the core temperature began to fall.
The extent of the damage to the reactor was not understood until later in the week. Over
the next week, gases were removed from the reactor by venting them into the atmosphere. Most
of them were nonradioactive and nonreactive noble gases. Only a little radioactive iodine 131
was reported released. Later investigation showed that half of the core had melted but the reactor
vessel had maintained integrity and contained the damaged fuel. No one died or was injured
while the accident was developing and studies suggest that no one in the nearby vicinity has died
due to exposure to radiation as a result of the accident.
The cause of the accident was mechanical failure followed by operator error and the
operator’s unwillingness to believe several signs that they were wrong. A major lesson from this
accident is that operators will tend to believe what they think they know without confirming
whether it us actually true.

Chernobyl
Chernobyl was a quiet region in the Ukraine near the border with Belarus and Russia
with a sleepy history before reactor number four at the Chernobyl nuclear power station blew up.
Once a city of 15,000 people Chernobyl is only nine miles from the reactor site. Pripyat, the city
built to house the plant workers is even closer. It is empty today. The 45,000 people who lived
there before the catastrophic meltdown on the night of April 25, 1986 were forcibly evacuated
along with 105,000 other people. In all more than 150,000 people had to leave their homes.
The reactors at Chernobyl were constructed with a different design than the ones at Three
Mile Island. They were made with the nuclear fuel in a network of pipes surrounded by a pile of
graphite. The graphite worked as the moderator for the reaction, slowing neutrons down so they
would cause fission reactions. The nuclear fuel was kept cool by pumping water through the
tubes that contained the nuclear fuel. These were not kept under pressure. Power was generated
directly from the primary reactor coolant by allowing steam to form in the tubes near the top of
the reactor. The coolant system worked so long as there was sufficient water in the pipes to keep
the pile covered. The reactor design did not include a containment building or a container for the
core. It was similar to the “nuclear pile” used in the Manhattan project.
On April 25th, 1986, reactor number four was scheduled to undergo a low power test of
the emergency cooling system while it was being shut down for maintenance. The test was to
make sure that the reactor would shut down properly under an external power failure that would
attempt to draw more power from the reactors than they could supply. They were supposed to
respond with an automatic emergency shutdown. In this kind of emergency, a shutdown without
power, there would be no pumps to run the reactor coolant systems until emergency generators
started up and came to speed, a process that took a little more than a minute. In the meantime,
there would be no pumps circulating water in the reactor core coolant system.
The reactor was designed so that it needed circulating coolant even when it was
shutdown. Even with the control rods fully inserted into the core, the reactor produced heat
because of the buildup of radioactive fission products inside the pile. Without an actively
operating cooling system, the core would overheat and melt.
The one minute gap between the start of the emergency shutdown and the start of the
emergency power generators that were supposed to keep the core cool in the case of loss of
power was considered unacceptable. The test scheduled for the reactor on April 25 was to see if

the steam turbine that generated electricity could be used to deliver power to the cooling pumps.
Once the external power shut off, the turbine was supposed to slowly stop, but as it stopped it
could be used to generate power to run the cooling pumps. The problem was that as the turbine
slowed it delivered variable voltage that needed to pass through a voltage regulator so it could be
used to run the coolant pumps. A voltage regulating system was installed but the system had
never been tested. The expectation was that the system would keep the pumps running for about
45 seconds, theoretically enough time for the backup generators to come on line and keep
everything cool.
The test of this system was supposed to have been completed before the reactor became
fully operational, but because the completion of construction was rushed there wasn’t time. The
reactor had been operating for two years before a good opportunity arose. The test had been set
up for during the day. Special personnel were present to test the new system. At 11AM, the grid
controller for Kiev called to ask say that they had lost one of the regional power stations and ask
if Chernobyl could postpone its test until the evening so the afternoon peak demand could be
satisfied. The reactor personnel put the test off until the evening. By this time, the day and
afternoon shift had left, leaving the unprepared night shift to look after the reactor test.
Transcripts of reactor operators’ telephone conversations show that they did not
understand how the test was to be conducted. The reactor was supposed to be shut down to 30
percent power before starting. Instead, the control rods were inserted all the way and the reactor
was nearly fully shut down.
At very low power levels this type of reactor behaves in unexpected ways. Under normal
operating conditions Iodine 135 is produced as a fission byproduct, which decays to Xenon 135,
which is a superb neutron absorber. With the control rods fully inserted, large amounts of Iodine-
135 were produced, which were converted to large amounts of Xenon 135, which shut down the
chain reaction in the reactor.
The operators did not understand what was happening. They thought that the low power
was due to a malfunctioning power regulator and withdrew the control rods. When this did not
work they withdrew them completely from the reactor, beyond the normal stopping point. They
continued the test even though the reactor was operating at less than a third of the power level
called for by the experiment. The test plan called for extra water to be pumped into the reactor,
which was pumped in at 1:05 AM. The extra water absorbed more neutrons, which decreased

reactor power further. In response to the low power in the reactor the operators removed the
manually operated control rods.
At 1:23, the actual experiment began. Steam to the turbines was shut off and steam began
to form in the reactor. Steam is not as good at absorbing neutrons as liquid water, so reactor
power and neutron production went up. The power of the Xenon 135 to absorb neutrons was
swamped and heat and neutrons inside the reactor increased. These conditions should have
prompted the reactor safety systems to initiate an emergency shutdown but the system had been
shut off as part of the test.
At 1:24, the operators ordered the control rods reinserted and the reactor shut down.
Paradoxically, this made the situation worse. Inserting the control rods reduced the space for
coolant, and the temperature went up. Before the control rods could be fully reinserted the power
output of the reactor spiked to ten times the normal output. A rapid increase in steam pressure
inside the reactor disrupted the structure of the pile. Coolant pipes broke and fuel rods began to
melt. 20 seconds into the experiment a steam explosion took place that damaged the top of the
reactor building and ejected pieces of the reactor. The steam reacted with the Zirconium lining of
the fuel rods releasing hydrogen which caused a second explosion. Burning pieces of the
graphite reactor moderator flew up through the roof and onto the surrounding area.
Firefighters who arrived to put out the fires and protect the coolant systems for the other
three reactors did not know what they were dealing with They had no equipment to protect
themselves from the radioactive materials. Many of them died later from radiation poisoning.
The fires outside the reactor were extinguished by 5 AM but the fire in the graphite pile
continued to burn for several weeks. While the fire burned radioactive smoke and gases were
released into the atmosphere through the open roof of the reactor building.

Radiation levels near Chernobyl after the accident.
By Makeemlighter under the CCA 3.0 license from http://en.wikipedia.org/wiki/File:Chernobyl_radiation_map_1996.svg
The fire was finally put out by helicopter airdrops of sand, lead, clay, and neutron
absorbing boron. The cleanup in the months that followed included shoveling up the radioactive
debris that had fallen outside and covering the reactor in a concrete sarcophagus that isolated the
melted core remains from the soil and atmosphere. Work on ensuring the continued containment
of the destroyed reactor continues even today, more than 20 years after the accident.
Immediately after the steam explosion that removed the reactor cover radioactive gases
escaped into the atmosphere. Other fission products escaped attached to small particles carried in
the smoke of the fire. Some of these were the highly radioactive and biologically active isotopes
Iodine 131, Strontium 90, and Cesium 137 that accumulate in the food chain. Strontium 90 is
chemically similar to Calcium and is incorporated into bones, where it causes cancer. It has a
half-life of 28.8 years, which means that it will remain at dangerous levels for several
generations. Iodine concentrates in the thyroid gland where it is used in synthesizing thyroid
hormones. Radioactive iodine kills the thyroid gland leading to death. At lower doses it causes

thyroid cancer. Iodine 131, with a half-life of 8 days, rapidly decays to safe levels. Cesium 137 is
chemically similar to potassium, a micronutrient in all living organisms. Cesium is water-soluble
and can cause cancer even in small amounts. It’s has a half-life of 30.23 years, long enough to
contaminate the environment for several generations.
Initially the Soviet Union attempted to keep the accident a secret. It was discovered when
radiation alarms at the Forsmark Nuclear Power Plant in Sweden went off without explanation.
There was nothing wrong there, so the radiation had to be coming from upwind from the Soviet
Union.
The accident released a radioactive cloud that settled in more than 30 European and
Asian countries in an irregular pattern depending on the weather conditions and topography.
Most of the contamination fell outside the Ukraine in Belarus. Norway and Sweden were in the
direct path of the wind when the accident happened. Switzerland was hit hard because
radioactive rainfall occurred as wet clouds travel up and over mountains.
The total amount of radioactivity released was 30 to 40 times what was released in the
bombings of Hiroshima and Nagasaki. Of the people directly exposed, 237 suffered from acute
radiation sickness, of which 31 died during the first three months. Many countries passed laws
restricting consumption of various foods from the Ukraine.
Radioactive contamination spread into the local environment in the weeks and months
following the accident. The Pripyat River next to the reactor flows into the Dnieper, one of the
largest river systems in Europe. Radioactivity in rivers was high in the months immediately
following the accident but fell as water carried contamination downstream into the Black Sea.
Concentration in the food chain led to high levels in some fish near the reactor and places in
Europe where heavy doses of fallout were deposited in rainfall. The short-lived radionuclides
quickly decayed and the long-lived ones were captured in the soil before they could reach the
groundwater.
Immediately after the accident there were impacts on flora and fauna. The pine forests
around the reactor died and animals in the most contaminated zones near the reactor died or
stopped reproducing. As the years have passed wildlife that was rare before the accident has
returned and is thriving in the exclusion zones set aside after the accident. There is even fungus
growing today on the walls of the damaged reactor.

The cause of the accident was using untrained and unprepared staff to conduct a test that
should have been conducted before the reactor was turned on. The untrained staff created reactor
conditions that they did not understand and then made them worse by pretending that things were
going according to plan. The reactor responded with changes that occurred too fast for the
operators to respond and it blew its top. Emergency workers were unprepared and suffered as a
result.
Fukushima Daiichi
The latest major accident occurred at the Fukushima Daiichi nuclear plant in Japan
following the 9.0 Richter scale quake on March 11, 2011. The reactors were not able to
withstand the 15 meter high tsunami wave that arrived 50 minutes later. Luckily, three of the six
reactors were already shut down for maintenance. The other three lost power to operate their
coolant pumps and the reactor cores melted. Hydrogen explosions happened in the three
operating reactors when the cores became exposed. The containment vessel on at least one and
perhaps all three of the damaged reactors was breached and began to leak radioactive water.
Spent fuel rods in the storage pools also got very hot as electrical systems failed and pumps
stopped supplying the storage pools with coolant water. Radioactivity levels rose within the
plants, and some radioactive steam and water was released to reduce the threat of larger
uncontrolled releases.
There was a design flaw in the reactors. Critical pumps and electrical control systems
were placed under the containment vessels or in areas that got flooded. This made it difficult to
restart coolant operations because the pumps and electrical systems were under water. When it
became clear that the in plant emergency coolant systems could not be repaired in time to avert a
larger accident the reactor cores were flooded with seawater, permanently damaging them.
In the assessment of what went wrong afterwards, many people pointed the finger at the
lax attitude of the Japanese Nuclear Regulatory Agencies. Regulators were reluctant to demand
better safety measures in part because they often went to work for the very companies they were
regulating after leaving their agency.
The damaged plants are shut down and will probably never reopen. Other nuclear plants
around Japan have also been shut down because of fears of another earthquake. Before the quake
nuclear power generated more than 25 percent of Japans electricity. After the quake, the Prime

Minister of Japan is calling for an energy policy that has less reliance on nuclear power and more
on renewable energy sources.
Lessons from these three reactor accidents
There are several lessons that might be learned from these stories.
1) Nuclear power accidents develop very quickly in ways that are not always easy to
anticipate. The first two accidents took only a few minutes to develop.
2) Simple steps were not taken that could have avoided accidents. At Three Mile Island,
for lack of a way to check that the pressure relief was valve closed the whole reactor was lost. At
Chernobyl impatience and stubbornness to conduct the low power experiment under less than
ideal conditions was responsible for the destruction of the reactor. At Fukushima the poor design
of electrical and cooling systems lead to the destruction of the reactors.
3) Even very well trained operators do dumb things. At Three Mile Island the operators
did not want to believe that the reactor was compromised long after it was obvious that
something was wrong. They erred on the side of generating successes for themselves rather than
caution in dealing with the reactor. The reactor safety systems were resilient enough that they
eventually convinced them that there was a problem. Luckily this happened before too much
radioactive steam escaped from the containment building. In plain English the redundant safety
features worked to protect the public from the plant operators. That might not have been needed
have had the operators been receptive to shutting down the reactor sooner.
At Chernobyl it was the heroics of the firefighters that saved the day, not the reactor
personnel. The reactor personnel were operating under a conflict of interest. They chose their
own interests over the interests of the reactor and the public. Poor communication between
government and industry at Fukushima Daiichi prolonged the crisis and may have contributed to
it.
4) Collusion between plant operators and regulators leads to conflict of interest that
reduces safety. Regulators at Fukushima Daiichi may have chosen their own careers over public
safety. Operators at Chernobyl chose to please their bosses rather than protect the reactor.
5) Unexpected things do happen. They happen more often than we expect, and in ways
we don’t expect.

The political fallout
The accident at Three Mile Island put an almost immediate halt to the expansion of
nuclear power in the United States. There already was an active anti-nuclear movement before
the accident. Afterwards it became more effective. Public opinion turned against building more
reactors as questions of public safety and the interests of the operators and owners in the event of
an accident were raised. Inadequate escape routes and emergency planning became subject to
public scrutiny. It was noted that many nuclear power plants were built in places that made it
difficult if impossible to evacuate nearby centers of population.
In the United States, nuclear power plants nearing completion after Three Mile Island
were finished but those still on the drawing board were canceled, or converted to coal. New
regulations required that existing plants be retrofitted with costly new safety equipment.
Construction costs for new plants and potential liability costs for accidents scared utilities out of
the business in spite of hefty government subsidies to come in. Since then research has been
conducted on new safer reactor designs, but no utility has tried building one. For thirty years the
cost of the electricity that was supposed to be ‘too cheap to meter’ has been barely competitive
with other more conventional sources of power.
In Europe, several countries have continued their nuclear programs in spite of Chernobyl.
A few countries decided to abandon nuclear power and shut down their reactors. Some of these
have made considerable investments in wind technology and currently obtain as much electricity
from wind as others obtain from nuclear power. Others turned to coal.
The political fallout in Japan is not yet clear. The Japanese people have had close and
personal experience with nuclear bombs but tolerated the construction of many nuclear power
plants near the ocean in zones vulnerable to earthquake and tsunamis. The fallout from the
Fukushima accident is likely to be increased public resistance to new nuclear power plants, and
increased interest in the building of alternative sources of energy.
Alternative energy
Oil, coal and nuclear power are conventional forms of energy because they are produced
on a large scale. Oil comes from the ground and is obtained in large amounts moved in large
ships, processed in large chemical plants. These three are produced by large corporations and

distributed from centralized systems, not in someone’s back yard. If your neighbor had his or her
own private nuclear power plant you would be worried.
Alternative energy sources are usually smaller scale and come in forms that individuals
can produce for themselves. Many alternative energy sources are much older than conventional
energy and might be better described as traditional energy. Wood and charcoal certainly fall in
this category as they have been used forever and still are the main cooking fuel of most poor
people around the world. Others were used only on very small scale by enthusiasts. Many forms
of what we used to call alternative are entering the mainstream, so we will need a new name for
them in the near future. Green energy seems to be the new popular name.
Wind and solar energy started out as small scale alternative energy sources for people
who wanted to move themselves off the public grid. Lately they have entered the industrial
phase, so instead of calling them alternative we might call them decentralized energy. As they
grow in importance they may return to the category of conventional energy.
Biofuels
The original conventional form of energy was biofuels. Biofuels are made from biomass.
The original biofuels are simple things like dried cow dung and wood. In recent decades many
other biofuels have developed, often as an effort to extract more resources from other activities.
Other biofuels include wood pellets, grass, leaves, agricultural crop waste, and more recently
agricultural crops grown especially to produce fuels.
Animal dung
Animal dung is an important source of biofuel in pastoral environments, especially where
there are no trees or shrubs. Dung is light, and easy to carry, and it can be stored for later use.
Nomads that tend to cows and other large animals often use dried dung for cooking fuel. Dung
patties are used for fuel in India, China, and Africa, and used to be used in rural areas in Europe.
Dung patties and other biofuels have negative health effects when burned in an enclosed
space. Dung, wood and charcoal produce tiny soot particles that cause respiratory disease in
those who are exposed to indoor cooking smoke. In most regions where biofuels are used in
cooking that means women and children.

Gathering dung also affects local ecosystems. As herding populations grow they remove
more dung from their fields. Dung contains the nutrients captured by the grass as it grew. When
too many patties are gathered and removed from the pasture soil fertility suffers. This is an
example of a density dependent effect that lowers the future ability of the soil to produce good
grazing for the animals that produce the dung and eventually lowers the carrying capacity of the
land for humans.
Cow dung being dried before it is used for cooking fuel in India.
By Claude Renault under CCA 2.0 license. http://en.wikipedia.org/wiki/File:Drying_cow_dung.jpg
Firewood and charcoal
Firewood is the other major biofuel. It is used where there are no other economical
alternatives. It is still the major fuel in rural Mexico despite the presence of significant national
reserves of oil and natural gas. People in the Philippines burn coconut husks and coconut shell
charcoal when it is available. Most of sub Saharan Africa burns brush and wood for cooking.
In most cases, gathering firewood is women’s work. Where populations are growing and
forests are receding women and children may have to travel up to six kilometers in order to reach
forests and brush lands, a journey which consumes a significant portion of their day.
People have impacted the ecosystems from which they harvest firewood. Sudan has
undergone civil war for the last two decades. In many places people have been forced to flee
their homes and live off the land where they have harvested trees for firewood. The impact of
their grazing and gathering firewood is shown by the reversion of their abandoned pasture and
agricultural lands to shrubs.

An African firewood market.
By Stephen Codrington under CCA 2.5 license from http://en.wikipedia.org/wiki/File:Selling_fuelwood.jpeg
Cooking with wood and charcoal, especially in closed unventilated spaces has health
consequences. Wood fires produce soot particles that settle in the lungs. Since women and
children do most of the cooking and spend more time inside the home than men their health is
disproportionately affected by wood smoke.
In many places firewood is converted into charcoal before it is used. In order to make
charcoal a pile of wood is covered with soil and burned in the absence of oxygen. Water and
other volatile components are driven off, leaving mostly pure carbon. Charcoal is lighter and
easier to transport than wood, but making it consumes a large percentage of the available energy,
reducing the total amount of fuel available to the end user. Wood charcoal is the fuel of choice in
rural Haiti and the Philippines.24
Most traditional wood cooking stoves are very inefficient. International development
organizations have spent considerable time and effort designing new stoves that meet local
requirements in Cambodia, Mexico, and many other places. Often the new designs include
features that reduce the amount of smoke and soot that is emitted.
In many northern countries, woodstoves are used to provide home heating. After the first
oil crisis in 1973 the use of wood as a heat and energy source grew and new stove types were
developed to increase their efficiency. The latest technological innovation is the conversion of
wood waste into wood pellets. In places where wood processing waste is available small wood
pellet electrical power generating plants are being built.

Biogas
Biogas is methane generated from the breakdown of organic wastes and residues in an
anaerobic digester. Biogas digesters can be very simple machines that only require some tubing
and some steel drums or they can be complex anaerobic composting machines with feed lines to
input materials into the digester and compressors to take off the gas.
Household scale biodigester
Public domain by SNV from http://en.wikipedia.org/wiki/File:Biogas_plant_sketch.jpg
More than two million biogas generators are in use in farms and villages in India and
Pakistan, and another six million in China. They generate cooking gas from human wastes and
animal manure. As few as six pigs or three cows are enough to generate enough cooking gas for
one household.
In Sweden apartment buildings have been designed with built in biogas generators that
collect all the sewage produced in the building. The gas is used to generate electricity and heat
for the building, reducing the buildings carbon footprint and reliance on the power grid.
Compressed biogas can also be used to power vehicles. Great Britain has built several
sewage biogas plants that use gas generated from sewage to run generators that feed power into
the national power grid. Biogas is also generated as a byproduct of anaerobic digestion in
landfills. In fact, if the gas is not removed, the landfills are in danger of exploding.
Many people think of biogas as a renewable resource. Actually it isn’t. Biogas is an extra
product produced from organic wastes that still contain energy and likely would have been
discarded. Rather than losing the remaining energy digesters capture it as one more useful
product. In order for it to be a renewable resource it would have to regenerate itself at the end of
the process. The solid and liquid byproducts that remain after digestion can also get one more
use as fertilizer, closing the circle on the plant nutrients that went into the original biomass.

Fermentation
Biofuels can also be generated through aerobic fermentation in which aerobic bacteria
produce ethanol from sugar and other carbohydrates. The sugars can come from any economical
source, such as sugar cane, corn, and beets. Research is currently on the trail of a way to use
cellulose as a feedstock. Cellulose molecules are long chains of sugars that would provide a large
reservoir of material for conversion into ethanol. They include corn stalks, fast growing grasses,
trees, and paper waste.
Ethanol was the original fuel used in internal combustion engines starting in the 1860’s.
It was the fuel for automobiles until the early 1900’s until it was replaced by gasoline. It is now
used to stretch gasoline supplies in the United States, Brazil, the European Union, and Canada
where there are grasslands that produce surplus corn and sugar cane.
Other gasoline additives
Other additives have been used in gasoline to reduce pollution and improve the efficiency
of internal combustion engines. Starting in the 1920’s tetra ethyl lead was added to gasoline to
reduce premature ignition in the engine that damaged engine pistons. This allowed higher power
engines and faster cars. It also resulted in widespread low level contamination of the urban and
natural landscape with lead.
The practice of adding lead to gasoline was stopped in the early 1970’s because of its
human health effects. It was replaced with methyl tert-butyl ether (MBTE) which is synthesized
from oil and natural gas. This compound changes the taste of water even at very low
concentrations. At high concentrations MTBE is probably a human carcinogen. Eventually it got
into the drinking water of several towns in California through accidents and spills where it cost
millions to remove.
Faced with a possible carcinogen that could make drinking water taste bad many states
banned MTBE in favor of ethanol. Ethanol is used in gasoline in mixtures up to 10% the US and
25% in Brazil. It has the benefits of lowering engine knock problems, reducing engine emissions,
and reducing the need to import oil.
In spite of its economic and environmental benefits, it is not clear that ethanol is a net
plus. Ethanol is produced from agricultural crops that could also be used as food for humans and

feed for animals. Growing crops for fuel increases the environmental impact of agriculture and
raises the cost of food when fuel production competes with food for access to agricultural land.
Ethanol provides a net energy surplus over the energy used in its production, but it is not
clear how large the surplus is, and it varies by crop and location. In the United States corn is the
crop of choice. The net gain of energy produced over energy used to grow and transport corn is
thought to be about 1.3:1, or only a 30% gain on energy output over energy input. Sugar cane
grown in Brazil gives a return of 8 times on energy invested. Ethanol crops have been touted as a
way for developing countries to improve their balance of payments, but perhaps at the expense of
local food production and the need for small farms to aggregate into economically viable large
farms.
Geothermal power
Geothermal energy comes from the ground where water has come in close contact with
heat from center of the earth. It is used for space heating, water heating, and for generating
electricity when it is hot enough.
Geothermal energy has been used since at least the 3rd century BC when it was used to
heat the emperors’ bath in the Qin dynasty in China. The Roman baths at Bath, England used hot
springs to warm the water. In cold regions with volcanic activity such as Iceland and Sweden,
geothermal hot water is distributed to homes and business as heat in winter.
At the boundary between tectonic plates water temperatures may reach as high as
300oFahrenheit (147oC). Geothermal electricity is obtained by drilling wells to inject water into
the hot rock formations and an extraction well to recover it so that it can be converted into steam
to drive an electrical power generation turbine.
Unfortunately some geothermal sites are not renewable. Sometimes the heat in the
formation is carried away faster than it can be replenished and new wells have to be drilled
continuously to obtain new supplies of heat. Sometimes the subterranean rock needs to be
fractured in order to allow the more direct contact between with the hot rocks and the water. The
hot water can carry dissolved carbon dioxide, sulfur dioxide, methane, and ammonia that come
from the rock formations. When released to the atmosphere these are greenhouse gases and
produce acid rain.

On the plus side, geothermal power plants have a much smaller environmental footprint
than nuclear and coal power plants. They do not require large cooling towers on site since the
extracted water can be injected back into the ground to keep the process running and there are no
fuels that need to be mined or wastes that need to be land filled as part of the process. As long as
the rocks continue to produce heat geothermal power plants can supply themselves with the
energy necessary to keep themselves running.
Wind power is available along the coasts and in a belt running north to south in the Plains
states.
Public domain by National Renewable Energy Laboratory
http://en.wikipedia.org/wiki/File:United_States_Wind_Resources_and_Transmission_Lines_map.jpg
Geothermal energy supplies power in at least 24 countries. It supplies twenty five percent
of electrical power in the Philippines and is in use in the US, Iceland, Indonesia, Iran, and El
Salvador.
Heat pumps also use the ground as source and sink for thermal energy. Only a few feet
below the soil surface stays a cool 55 oF. By laying pipes for heat exchange in the soil fluids can
be circulated through the soil picking up or delivering heat depending on what is wanted at the
time. In the summer a house can be cooled by pumping warm fluids into the ground and taking
cool fluids back. In the winter the temperature of air can be raised to 55 oF before it goes into a
furnace, lowering the amount of energy invested to bring it up to the desired temperature inside
the house.

Wind power
Wind power has been used for more than a thousand years first in the Middle East and
later in many other places around the world. Wind power is usually thought of as an alternative
source energy because for the last 100 years it has only been used in small or limited installations
run by users for themselves. More recently, wind power has become commercially viable, and
large wind farms are being installed. In the US wind speeds and constancy are best along the
coasts and in a north to south belt through the Great Plains states.
A wind farm in Bangui, Ilocos Norte, in the Philippines
By John Ryan Cordova under CCA 2.0 license from http://en.wikipedia.org/wiki/File:Bangui_Windfarm_Ilocos_Norte_2007.jpg
Wind power is moving from being an alternative source of power to a conventional
mainstream supplier. Energy subsidy policies in many European countries and China are driving
where the bulk of wind power installations are currently being constructed. A factor in where
wind power is being installed at the local level is the way it changes the appearance of the
landscape. Wind farms and the power lines that serve them have been opposed in rural Germany
and England and offshore on Martha’s Vineyard in the United States.
Solar
The amount of solar energy reaching the earth in one hour is far greater than we use for
electricity, industry, transportation, and all other energy combined in a year. Solar power is
available all around us in the form of ambient heat, and what plants capture in order to grow. We

use solar energy passively by how we build and site buildings, and actively through solar panels
and other constructed systems that capture solar light and heat and convert it into space heat and
electricity.
Solar energy potential in the United States
Public domain by DOE from http://www.eere.energy.gov/states/alternatives/csp.cfm
Passive solar
Passive solar technology uses solar energy acting directly to do work. It has been used to
dry, cook, heat water, and make water potable. Perhaps one of the first uses of solar power was
to evaporate seawater leaving behind sea salt. Many salt works still use solar energy to evaporate
water. Solar salt evaporation industries go back thousands of years.25
Almost anything that can be made in an electric slow cooker can also be made in a solar
oven. They work by concentrating solar rays into an insulated box. They can be used to cook rice
and beans, foods that normally take long periods of time and fuel gathered by hand to prepare,
and for a much lower cost. Solar stills can be used to make sterilized and distilled water through
evaporation and direct heating.

The area covered by the six black dots what is needed supply the current world energy
needs using solar panels at an 8% efficiency
By Mlino76 under CCA 3.0 license from http://www.ez2c.de/ml/solar_land_area/
Solar hot water heaters use tubes to collect heat from the sun and store it in an insulated
container using only thermal gradients to move the water. Hot water can also be generated by
running pipes through the wall of the house facing the sun during the day. As the masonry warms
up it transfers heat to the water in the tubes.
Sterilizing drinking water in Ghana with a solar stove
Public domain by Tom Sponheim at http://en.wikipedia.org/wiki/File:Solar-Panel-Cooker-in-front-of-hut.jpg

Understanding solar energy can be used to reduce home heating and cooling energy
needs by including thermal mass in the construction of the building and shading it from the sun.
Adobe houses in arid areas maintain a more even temperature because of their high thermal
mass. The thick walls retain heat into cool nights and stay cooler during the day because they
take time to warm up. Trees placed on the sunny side of a house in summer shade the house,
reducing temperatures. Placing the edge of the roof in the right location lets the low winter sun in
windows but keeps the high summer sun out.
Active solar
Active solar technologies convert solar energy into a form that can be stored or moved.
This can be done by concentrating solar heat to create steam to run electrical generators or by
converting solar energy into electricity using photovoltaic panels.
The first, probably exaggerated, story of the use of concentrated solar power is
Archimedes use of a large burning glass to set fire to an invading Roman fleet at Syracuse in
Sicily in 212BC. Perhaps the first actual use of concentrated solar energy was to make steam for
a steam engine connected to an irrigation pump in 1866.
Thermal solar power is produced by concentrating the sun’s rays on a heat acceptor and
then using that heat to generate steam and drive a turbine. Heat acceptors can be water or molten
pure salt. Molten salt is used because it has a high heat capacity and retains heat so that power
generation can continue after the sun goes down.
Solar power plants that use concentrated thermal energy for the generation of electricity
are being built in Spain and the US, in places where there is consistent and intense sunlight and
few cloudy days. Current plans are to install plants in India, China and the Sahara Desert.
While current costs are higher than the cost of power from coal fired plants the
expectation is that conventional fossil fuels will go up in price, and the cost of concentrated
thermal power will decline as components are mass produced. It is likely that in the near future
this type of solar power will provide a significant portion of electricity in regions with sunlight
and no fossil fuels.
Photovoltaic solar power operates because of the photovoltaic effect. Discovered in 1839,
it happens when a semiconductor material is exposed to photons that have the power to cause

electrons to jump from where they are tightly controlled to where they are loosely held. These
lightly held electrons produce an electric charge that can be turned into electric current.
Solar panels on the side of this building in Spain make use of sunshine, and help cool the
building
Public domain by Chixoy from http://en.wikipedia.org/wiki/File:Fa%C3%A7ana_Fotvoltaica_MNACTEC.JPG
Photoelectric cells developed in the 1950’s were not very efficient. They were used in
place of batteries in toys and solar calculators and where no other power source could be used
such as on satellites in space. As power conversion improved and manufacturing costs declined
solar cells became viable power options in place of batteries in marine warning buoys, children’s
toys, and highway signs.
Solar cells were not used for generating commercial electricity until the 1970’s when the
first oil shock got companies interested in new ways to meet future resource needs. They
anticipated that the price of fossil fuels would rise and started investing in solar panel research.
In the past 20 years improvements in solar panels, reductions in their costs, and subsidies
by governments have made them competitive with rising oil and coal prices. Currently solar
power is being actively promoted in over 100 countries, with commercial scale power plants
built or in construction in China, Taiwan, the European Union, Japan, and the US. It is projected
that solar cells will be producing more than ten percent of world electric demand in the near
future.

Photovoltaic power works through cells constructed of silicate with a coating of
photoreactive material. Many cells are wired together to make a panel, and many panels can be
wired together to form an array. Commercial solar cell power plants may consist of tens of
thousands of arrays arranged over hundreds of acres. Smaller installations can be installed on
homes. The roof area of the average home is more than enough to generate the electrical demand
of that home. Many modern buildings, especially in Europe, have solar cells built into the design.
Solar cell production
Public domain by S-Kei from http://en.wikipedia.org/wiki/File:SolarCellProduction-E.PNG
Solar photovoltaic power has a few limitations. The biggest is that it only generates
electricity when the sun is shining. Homes with solar power that want to have electricity at night
have to have battery storage or they have to be connected to the outside electric grid.
Photovoltaic cells produce direct or DC current, while the electric grid runs on
alternating, or AC power. Before it can be used electricity coming from solar panels has to be
run through an inverter. When connected to the power grid, surplus power generated from home
panels during the day can be run out to other customers.
Many states allow surplus solar power to be credited back to the home owner by running
their electric meter backwards. Homes that generate solar power have to have a cutoff switch to
stop outgoing power when there is a general power failure or linemen working to restore power
may be injured by power coming from an unexpected direction.

The Tehri dam and pumped storage facility in India
By Arvind Iyer under CCA 2.0 license from http://en.wikipedia.org/wiki/File:Tehri_dam_india.jpg
Commercial scale solar power cells only generate during the day. An electrical power
system that depends on commercial solar power needs to have a way to store surplus power for
use in the night, or another power generation system to take up the slack. One way to store
surplus power is to use it to pump water uphill into a reservoir, later regenerating electrical
power by letting it run back downhill when it is needed. Another way to store power is by
generating hydrogen gas through the electrolysis of water, and later burning it to generate
electricity.
Commercial scale solar power has the advantage that it does not generate operating waste
like nuclear and coal powered plants. Its main impacts are in the production of panels and their
disposal, and in the space needed. Compared to other power generation systems the carbon
footprint of solar thermal and solar photovoltaic power is much smaller.
Tidal and wave power
An attractive but as yet not well developed source of energy is the motion of sea water,
either with the tides, or waves. Either could become large sources of energy if we could find a
way to reliably harness them to a generator and make electricity.
Many pilot engineering projects are underway with the goal of converting water motion
into electricity. Some of these involve building dams where there is a considerable tidal flow. On

proposal is to build a dam across the Bay of Fundy where the tidal range is greater than 45 feet.
The dam would let water in, and use it to generate electricity on its way out. Other ideas involve
finding ways of converting wave motion into a way to drive a generator. There are a large
number of different ways to do this. Some involve building flexible piers on the water that
capture energy as they move. Another proposal is to use currents created by rivers and tides to
turn generators. Others involve suspending buoys in the water that convert up and down motion
into mechanical energy that is used to drive a generator.
What energy source is missing?
There are certainly many new forms of energy and ways of handling it that have not been
mentioned that the informed reader will be only too willing to point out. The effort to find as yet
unexploited energy sources is intense and continual. The willingness of people to riot when fuel
costs go up and countries to go to war over access to energy resources speaks of the importance
of maintaining access to energy.
One new form of fuel is hydrogen. Hydrogen burns with oxygen to produce only water.
One of the reasons we are interested in using it is because we think it is a clean burning fuel,. Is
hydrogen really a new source of energy or merely an old source repackaged in a new form?
Where do we get it?
Only a very small amount of hydrogen is available from natural sources. The rest has to
be manufactured by passing electricity into water to break it into its constituent parts, oxygen and
hydrogen. The main source of this electrical power is currently electricity generated by burning
coal. Seen in this light hydrogen is not really a new or clean fuel. It is really a carrier for energy
that originally came from coal. It is a means to move the energy away from the environmental
damage caused by mining and burning coal. So long as hydrogen is manufactured from coal its
impact is the same as the coal plus the second law of thermodynamics losses in converting coal
to electricity to hydrogen. Hydrogen could also be generated from excess electricity generated by
solar power. Even using solar power to generate hydrogen is not completely clean since there is
still some pollution produced in the manufacture of the infrastructure used to capture the solar
power and move the hydrogen from where it is created to where it will be used.

Conservation and efficiency
The one true energy source that has not been mentioned is energy that is not consumed
through conservation and efficiency. Conservation uses behavior and technology to decrease
personal energy demand and efficiency makes the energy that is used go farther by doing more
with less. This conserves the supply of energy resources and makes the conserved energy
available for others to use. Your father probably bugged you to turn off the lights when you leave
a room. Mine still does. They wanted to save money on their electric bill and in the process
conserved energy.
There are many ways to promote conservation and energy efficiency. Electric motors are
much more efficient today than they used to be. New florescent and LED lights use a fraction of
the energy that incandescent bulbs use. On demand hot water heaters use less energy to output
the same amount of hot water as a constant temperature 20 gallon hot water heater uses. If you
make sure that the tires on your car are inflated to the proper air pressure, keep your car tuned
and drive at a sedate pace you can increase your gas mileage by up to 25%. If you insulate your
house you lose heat to the outside less rapidly. Converting from conventional dial to
programmable thermostats that lower the temperature at night can reduce heating costs by
between 10 and 30 percent if you believe the packages that the thermostats come in. Replacing
single pane windows can reduce heating losses from leaky window glazing. Using public
transportation is more efficient in terms of passenger miles per gallon than using personal cars.
Replacing old household appliances with new energy efficient appliances reduces electricity
consumption. These new devices and behaviors may cost more upfront in time and money but
pay back over time in lower energy costs.

The energy star label on appliances signifies that they are designed for low energy
consumption
Public domain by US EPA.
The energy made available from conservation and efficiency is the aggregate result of all
of us working in our own personal interest to lower our own energy costs. The benefits accrue to
the whole of society in greater energy security and lower prices that benefit those with the least
ability to pay. The amount of energy not used through conservation is probably large, but can’t
be measured exactly because it is a function of our aggregate personal behavior.
There are several policy mechanisms that can be used to promote conservation and
efficiency. Moral persuasion to just do the right thing works up to a point. We can subsidize
products that we want to promote as when we give a tax break to people who buy hybrid cars.
When these two are not enough we can manipulate prices to discourage consumption of what we
want to conserve and promote consumption of alternatives.
We would prefer that the necessities and niceties of life were cheap, so price is a good
mechanism for altering behavior. Making gasoline more expensive seems to result in some
people choosing more gas efficient vehicles, as has happened in each of the oil shocks over the
last 50 years. Making public transportation cheap and gasoline expensive should result in people
choosing the bus over driving themselves.
Promoting conservation and efficiency also involves educating the public to the choices
that are available. If you do not know about alternatives choices, you will choose what you

always have. In the US the EPA certifies energy efficient appliances and allows them to display
the Energy Star label. All new appliances are required to have stickers that show how much
energy they consume in a year. New cars carry labels that show how many miles per gallon the
average driver will get. Most cars and appliances last a long time, so what you choose today will
control your energy consumption for many years into the future.
Maintaining the energy gains from conservation and efficiency depend on each and every
one of us consistently making good choices. They depend on us altering our behavior to use less
energy in everyday life and to choosing more efficient alternatives when buying long lived
equipment. Governments promote better choices by mandating that more efficient alternatives
are available and adjusting their price so they will appear attractive to consumers when they need
to make choices. Remember this when you buy your next house, car, or refrigerator.
Stopped going up here
Energy use
Where we use energy today is a guide to where conservation is possible. At the national
scale energy consumption is measured in quads, which stands for one quadrillion BTU’s. A BTU
is the amount of energy needed to raise the temperature of one pound of water one degree
Fahrenheit. In metric measure, it is the equivalent of 1.055 X 10¹⁸ joules. One quad is the
equivalent of 8 billion gallons of gasoline, 36 million tons of coal, or almost one trillion cubic
feet of natural gas.
The United States has been using between 90 and 100 quads of energy per year over the
last decade. In 2009 it used 94.6 quads from all reported sources. Most of this supplied in the
form of fossil fuels as petroleum (35.27 quads), natural gas (23.37 quads), coal (19.76 quads),
and nuclear power (8.35 quads). The rest comes from renewable biomass (3.88 quads),
hydroelectric power (2.68 quads), wind (0.7 quads), geothermal (0.37 quads), and solar energy
(0.11) quads.
Energy is used for generating electricity and transportation fuel, home heating, and
industry. Not all of these energy use sectors are as efficient as others. Transportation uses 26.98
quads but loses 20.23 quads back to the environment without producing useful locomotion for an
efficiency of about 25 percent. Some energy is lost to pollution control devices that keep
particulates and pollutant gases out of the air, but most is lost as waste heat out of the tailpipe.

Electrical generation is less than 35% efficient, losing more than 25 quads of the more than 38
quads invested.
The flow of energy from sources to sinks in the United States for the year 2009
Public domain by Lawrence Livermore National Laboratory from
https://flowcharts.llnl.gov/content/energy/energy_archive/energy_flow_2009/LLNL_US_Energy_Flow_2009.png
Transportation
Petroleum provides most of the energy used for transportation (25.34 quads). The
preference for gasoline and diesel, and the lack of good substitutes is because gasoline and diesel
are the most convenient and powerful forms of fuel available. Gas and diesel are easy to
transport and contain more energy per unit weight than other fuels.
The only readily available substitutes for petroleum products are wood, alcohols, and
natural gas. Natural gas is used in some large commercial vehicles and some public
transportation buses. As fracking has increased the supply there is interest in converting more
vehicles. Alcohol is used as an additive in gasoline, but rarely by itself. When gasoline and diesel
are difficult to obtain internal combustion engines can be made to run on wood, but wood
gasification devices are clumsy to fit on vehicles, and don’t deliver the same power from the
engine as gasoline. Wood burning vehicles were used in many countries during World War II,
when gasoline was hard to get, but were abandoned once the war ended. We are currently
developing electric cars, but so far these are good for only short trips before their batteries run

down. Until these vehicles become more versatile and common we might not pay much attention
to electricity as a transportation fuel.
Truck with a wood gasifier attached to the side of the vehicle
By the Per Larssons Museum under the CCA 2.5 license at http://en.wikipedia.org/wiki/File:Wood_gasifier_on_epa_tractor.jpg
The whole transportation sector is not very fuel efficient. Most of it runs on oil This is a
potential national security issue since a large portion of imported oil comes from countries that
have unstable political systems and don’t like us, as the recent disturbances in the Middle East,
Venezuela, and Nigeria attest.
Many car manufacturers are trying to build vehicles with better mileage. There are also
several short distance electric cars on the drawing board or in production. These efforts reflect
the slow realization that there are consumers interested in new ways to conserve energy and
lower their costs.
Electric power
Almost 40 percent of the US energy budget (38.19 quads) is used to generate electricity.
The major sources of energy used to generate electrical power the US are coal and natural gas,
both fossil fuels, and nuclear power, with contributions from hydropower, biomass, petroleum,
and geothermal. A very small but increasing amount comes from solar and wind power.
Electrical generation with fossil and nuclear fuels is also inefficient. More than two thirds
of the potential energy available in the input fuels leaves the generating plants via the coolant
rather than through the transmission lines and more energy is lost in the transmission lines on the
way to its point of use. This is not as much of a national security issue as with oil imports for

transportation because most coal and natural gas consumed in the US is produced in the US.
Wind and solar power are increasing their share of electrical energy generated and new wind and
solar power plants can be put into service much faster than coal or nuclear power plants that
require intensive environmental planning and review, and may take decades to site, permit, and
build.
Residential, commercial and industry
The residential and commercial sectors use natural gas and heating oil to provide hot
water and warm air in buildings. Heat comes from electrical space heaters, furnaces that burn
fuel oil, natural gas, wood, and coal. These appear to be more efficient than transportation and
electrical generation because the energy is transformed and used in place as heat. In the
transportation and electricity sectors heat is an unwanted byproduct that is thrown away. We also
have to take into account the electricity and transportation sectors serve homes and businesses.
A large percentage of the industrial use of coal, oil, and gas, is in the chemical industry.
The chemical industry is much more efficient in the transformation of these inputs into finished
chemical products than market sectors that capture energy from combustion. Chemical
companies have a much greater direct interest in being resource efficient and they have lower
barriers to improvement than home owners who buy a house constructed by someone else. Many
homeowners do not want to make the investment in energy consumption efficiency, especially
rental landlords who do not pay the heating bills of their renters.
The overall efficiency of the energy cycle in the US is only a little more than 40 percent.
This means that if we had the correct technology, or were willing to make the investment we
could find considerable savings, certainly not all of the 54.64 quads wasted in 2009, but enough
to significantly reduce the rate of energy consumption per person.
Many technologies are currently in development that show some promise. Hybrid
vehicles allow increased gas mileage by converting excess power from the engine into electricity
and storing it in a battery. New florescent light bulbs produce the same illumination as
incandescent light bulbs for lower wattage. Light emitting diodes (LEDs) use even less power
than florescent bulbs to produce the same illumination. Homes are continually being upgraded so
they have better insulation and windows and more efficient appliances.

Of course, we should realize that gains in efficiency are not free. Hybrid cars run on
batteries that require lithium. Lithium is a rare resource. As we change to hybrid cars we are
adding lithium to oil as a potential limiting resource. Florescent light bulbs have a longer life
span than incandescent bulbs, but one of the essential ingredients in making florescent light
bulbs work is mercury in the powder coating on the inside of the bulb. Even though newer bulbs
have less mercury a wholesale conversion from incandescent to florescent bulbs will increase the
amount of mercury released into the environment when they are disposed of.
Jevons paradox
Conservation and efficiency both result in lower energy consumption per person.
Conservation is the voluntary reduction of personal consumption through good behavior, as
when you turn off your faucet while you are brushing your teeth, only using the water when you
need to rinse your mouth or toothbrush. Buying better light bulbs is an investment in improved
technological efficiency that results in lower costs for you the consumer. Both lead to reduction
in the per capita demand for resources but not necessarily a reduction in the total amount used.
William Stanley Jevons .
Public domain from Popular Science Monthly Volume 11.

William Stanley Jevons was a British economist who studied the coal market in the late
1800’s. He was worried about the possibility of Britain running out of coal He noticed that as
improvements in the efficiency of coal driven steam and internal combustion engines were
introduced the demand for energy increased.
His explanation for this unexpected outcome was that increasing energy efficiency is felt
in the market as a decrease in price. When prices fall we respond by spending on goals that we
thought were out of our budget. In economics this is called the “rebound effect”. We are also less
vigilant about wasting, and we feel more willing to satisfy our desire for luxury. This is called
the “income effect”. Falling costs also let new users into the market increasing demand by
adding buyers. Thus, improvements in efficiency lower costs and increase demand.
The difference between conservation and efficiency is that conservation results in a per
capita reduction in resource use from voluntary changes in behavior. Since it is voluntary people
may choose to conserve or not depending on their personal temperament. Improved
technological efficiency results in a reduction in per capita cost. Reduction in cost leads to an
increase in per capita consumption. We are driven to adopt efficient technologies by their price,
not our own personal temperaments. People who have no interest changing their personal
behavior will still lower their consumption when they buy cheaper more efficient technology.
If our goal were to decrease resource consumption we might take an economic approach.
Since appealing for good behavior gets variable results the best policy is to use the levers that
drive behavior. The simplest policy is to drive behavior through changing prices. If lowering
price increases demand then raising prices lowers demand. Raising prices creates an incentive to
reduce waste and invent more efficient technologies. This is the European approach.
Most European countries do not have their own supplies of oil. They have to import
them, paying the world price and using currency gained through external trade to buy them. In
order to make sure that oil is used in an efficient way they tax gasoline and diesel fuel at a high
rate. As a result, the average fuel efficiency of European cars is much higher than American cars.
They have motivated energy users to seek out energy efficiency in home heating, lighting,
transportation, and the location of housing in relation to work through the stick of economics
rather than relying on their citizens to spontaneously behave in a morally upright manner.

Energy in the past and future
How much energy will be available in the future? What kind will it be? The demand for
energy for transportation and electricity has been growing since the industrial revolution started
as mechanical power replaced muscle power and more recently computers have replaced brain
power . Energy consumption is so closely related to gross domestic product that you might say
that it is necessary for energy consumption to grow for economic development to occur. The rate
of growth in GDP in most countries is closely correlated to the rate of growth in oil consumption.
In the early decades of industrial expansion it may be even faster. In Japan oil consumption
increased faster than GDP in the post war industrialization period until the oil shocks of the
1970’s, then declined to about equal the growth of GDP.
Energy consumption and GDP are closely related
Public domain by Feministo from http://en.wikipedia.org/wiki/File:Japan_energy_%26_GDP.png
The correlation between GDP and oil consumption means that we should expect that the
demand for energy in developing nations like India and China will only increase. In 2010 oil
consumption in China increased by nine percent, the equivalent of an increase of more than one
million barrels of oil per day, or about five percent of current US consumption. If the rate of
increase in China is like the 6.5 percent per year increase in oil consumption that occurred in the
US during a large part of the late 1900’s we can expect that their increased demand will easily
exceed 2010 until their rate of economic growth slows.
The Chinese population is at least three times the size of the population of the United
States. Their current total consumption is one half of the United States. If their whole population

were to rise to the same level of consumption as the United States they would consume three
times the present consumption of the United States. India is growing a little slower than China.
The population of India is as larger than the population of China. On top of this we could add the
populations of Brazil and Indonesia, each of which have more than half the population of the US
and are developing rapidly.
World energy consumption per capita in 2003
By SG under the CCA 3.0 license at http://en.wikipedia.org/wiki/File:Energy-consumption-per-capita-2003.png
Oil reserves and peak oil
Oil reserves are what is still in the ground that we think we can extract. It is calculated on
the basis of past experience and the present yield of oil fields, how long they have been in
service, and our imperfect knowledge of the geology of the rock formations in which they were
found. It is an imprecise science, but one that we are slowly getting better at. Even if our
estimates of reserves in the ground are accurate, there is the question of how much oil we will
actually be able to get out of the field.
Oil comes out of a new well under natural pressure. As the initial pressure is released the
oil needs to be pumped out of the ground. Pumping costs energy, so it is only economically
rewarding up to a point. When pumping fails to deliver more there is still plenty left in the
ground that can be extracted by more energy intensive methods such as injecting steam and
detergents to force the oil out of the pores and underground channels in the rock. The
uncertainties in our knowledge of the extent of underground deposits and the cost of pumping
and injection methods make the prediction of recoverable reserves an art. Even so, many
countries have projected reserves that will last from a decade to many decades based on current
rates of consumption. A few have reserves that may last for longer.

Active exploration and drilling has been going on for 150 years. It has gone from a
simple process of looking in places where oil was already known to exist at the surface, to a
sophisticated process that includes information about the structure and types of rocks thousands
of feet under the ground. Oil wells have gone from the first shallow well drilled at Titusburg,
Pennsylvania in 1858 to wells tens of thousands of feet deep drilled in thousands of feet of water
in the Gulf of Mexico and the North Sea.
There are only so many places to look. In the beginning we looked in the obvious and
easy places. The first offshore drilling was done on piers built out from shore. Land based
drilling went from a few hundred to a few thousand feet. As we got better, we looked in the
moderately difficult places. Offshore drilling moved to platforms in hundreds of feet of water far
from land. Land based drilling went down thousands of feet, sometimes at an angle, and
sometimes with several drill pipes heading off to the sides of the main drill pipe.
As we drill more wells there are fewer new places to explore. There have been over two
million oil wells drilled in the continental United States. It is highly unlikely that there will be
major new discoveries here. Now we are left with the actually very difficult places, offshore in
the Arctic, or in tens of thousands of feet of water in the open ocean, or in truly remote areas on
land such as Siberia or Kazakhstan that have not yet been well explored because of their distance
from markets. There may be new fields in remote and difficult places such as offshore in the
Gulf of Mexico and the North Slope of Alaska. Places that have been at war for long periods of
time, such as Iraq, may have undiscovered oil deposits.
We can use this process of learning how to exploit, actively exploiting, and then looking
for difficult to exploit reserves to draw a picture of the pattern of resource availability. This
approach can also be applied to other non-renewable renewable resources, including coal, natural
gas, water, fisheries, iron, nickel, lithium, tuna fish and uranium. They all follow the same
pattern. In the beginning, finding and exploiting reserves grows almost exponentially. As we get
good at finding new deposits we explore all of the likely spots until the rate at which new
reserves are found decreases and finally no new reserves are discovered.
At the same time as reserves are being discovered they are being extracted and used. In
the beginning the rate of production is low because the technology of extraction is not very
efficient and the market for the resource is not very well developed. As the efficiency of
extraction increases and the resource market develops the rate of production increases,

withdrawing from the reserves. During this period, the resource is scarce because of the
economic inability to extract it fast enough to satisfy demand. As time passes this is remedied by
introducing new technological innovations and installing more capacity.
Hubbert's curve projecting oil supplies in the United States based on what was known in
1956.
By Hankwang under the CCA 3.0 license from http://en.wikipedia.org/wiki/File:Hubbert_peak_oil_plot.svg
Eventually the rate of withdrawal exceeds the rate of addition of new reserves and there
is a peak in the amount of reserves still left to be exploited. As time goes on, the easy to extract
reserves are consumed, and we are left with only the reserves that are more difficult to extract.
When these cannot be exploited fast enough to satisfy demand we have reached the peak in
resource production after which the resource will become increasingly scarcer. This will happen
in spite of technological innovations that just can’t find more of what isn’t there.

Oil production in Norway agrees with Hubbert's curve analysis.
By Raminagrobis under the CCA 3.0 license from http://en.wikipedia.org/wiki/File:Norway_Hubbert.svg
The events in the lifecycle of a resource can be represented as a curve showing its
reserves over time. This kind of analysis was first practiced by the oil geologist M. King Hubbert
in the 1950’s and is summarized in Hubbert’s curve. Based on the data that was available he was
able to predict that US oil production would peak in the early 1970’s which is about the time that
it actually did peal. Similar studies in other countries show good agreement with curves
constructed using Hubbert’s method. The same analysis for world oil production suggests that
we will reach world peak oil production in the next decade if we have not already reached it.

US oil production along with Hubbert's predictions from 1956.
By S. Foucher under the CCA 2.5 license from http://en.wikipedia.org/wiki/File:Hubbert_US_high.svg
The effect of peak oil will be felt in developed and developing countries alike. Since oil
and GDP are closely linked there will be a slowdown in economic growth as competition for
access to existing oil does not produce additional supply from dwindling reserves. That effect
will probably be strongest in countries which import a large portion of their oil, such as the
United States, India, China, and most of Europe. As oil continues to become more difficult to
obtain it will provoke conflicts between consuming nations over access to exporting regions.
Oil production for countries outside of OPEC and the former Soviet Union.

Public domain from “Strategic Significance of America's Oil Shale Resource Volume I Assessment of Strategic
Issues” by the US energy office at http://www.fossil.energy.gov/programs/reserves/npr/publications/npr_strategic_significancev1.pdf
Since most oil is used as transportation fuel, the price of gasoline will increase after peak
oil. After the price rises beyond a certain point people who need to get to work will abandon
luxuries like movies and eating out. If the price continues to rise they will begin seeking places
to live closer to where they work and sell low mileage vehicles in favor of high mileage ones.
The increase in oil price will make clear where energy is an important input in commodities such
as food, clothing, and plastics. There will also be an increase in calls for conservation and a
search for other sources of energy. The current interest in wind and solar power is the beginning
of this transformation.
Oil imports by country.
By Roke under the CCA 3.0 license from http://en.wikipedia.org/wiki/File:Oil_imports.PNG
Energy Return on Investment
Another way to understand the future of fossil fuels is through the energy return on
investment (EROI). The EROI is the ratio of energy obtained in exchange for the energy invested
in obtaining it. For oil wells it is the energy invested in building the well and operating it in
relation to the energy in the oil produced. For biofuels it is the amount of energy invested in
producing the corn or sugar cane that makes up the feedstock in relation to the alcohol produced.
An EROI of 1 is the same as saying that there is no energy gain. In order for there to be a
net gain in energy the EROI has to be greater than one. The greater the EROI, the greater the
energy yield. EROI can be used to examine trends in energy yield in time, or from a particular
energy production project, and to evaluate new policy options for the production of energy from
energy inputs.

One way to use EROI is to examine changes in the energy return over time. EROI for oil
has definitely declined in the last 100 years. In the 1930’, the ratio was 100 energy units obtained
for each unit invested. The ratio was high because most oil fields were new and were producing
on the basis of natural internal pressure in the oil fields. Once the internal pressure of the fields
was released pumps had to be used to obtain more. This meant that they had to be built,
transported, installed, and powered, all of which are additional energy and economic costs. Once
the ability of pumps to draw oil out of the ground was exhausted oil was obtained by pumping
fluids down into the ground to produce pressure to force additional oil out. That also cost more
energy, further reducing the efficiency of the energy finally obtained. Eventually pumping fluids
into wells did not yield more oil and we started pumping detergents to wash oil out of the pores
in the rock, adding yet another layer of costs.
In the last century the EROI of oil in the US has fallen from 100 to one to about 20 to
one. Falling EROI also suggests that even if estimates of oil reserves in the ground are correct,
the net energy obtained at the well head will be less than expected as EROI continues to decrease
and the price of oil will continue to increase as more energy is needed to obtain energy.
EROI in history
Attica is the region around Athens that was its home territory during the classic age of
Greece. It was originally covered by trees, but these were largely cut down in the Athenian
golden age. Plato, an Athenian philosopher, recalls them in one of his writing. In it he describes
the ancient condition of the land as if it were flowing with milk and honey, containing all the
fruits one could want, plentiful water from springs, and good soil for growing things too. He
contrasts this with a description of his Attica, all wasted away by deluges which have carried
away the soil, leaving only the bare bones of what used to be. These changes took place in the
lifetime of Plato or a little before.26
One of the factors that made changed the landscape so drastically were the nearby silver
mines at Laurium to the south of Athens. The silver refined from this mine was an important
source of the Athenian wealth during its Golden Age. At the time, silver ore was obtained by
building a fire under the ore bearing rocks in order to get them to crack. These were removed
from the mine by hand, and pulverized to powder. The powder was heated in a crucible to

separate the silver from the lead and other metals. The fuel to maintain the smelting and ore
cracking came from trees on the surrounding hillsides.
After many decades of tree cutting the Attic hills were eroded and bare and the wood to
make silver had to come from somewhere else. Smelting silver became more costly as wood was
carted up the hills from further and further away until finally it was cheaper to truck the ore to
where wood was available. The cost of transporting in wood eventually shut down the mines.
The cost of fuel was important in many other industrial regions. The hills of Lebanon
were once covered with the Cedars of Lebanon which supplied the source of Phoenician power
in the region through bronze and glass manufacture. As the trees went, so did Phoenician power.
These hills are still denuded, kept that way by inhabitants that practice the same industries. The
loss of forests on Cyprus forced the Cypriots to change the way they smelted copper to one that
produced a less pure copper with less wood. Several mines in Roman Europe periodically shut
down, not because they ran out of ore, but because they ran out of wood with which to smelt the
ore. Roman and Cypriot mines operated while there were forests, shut down when the forests
were exhausted, and started up again when the forests had recovered.27
In the 1600’s when declining forests drove up the price of firewood in England there was
competition between the needs of iron forges and the winter heating needs of local residents.
Builders needed access to large timbers in order to build warships for defense of national
commerce. For a while, the British were importing timber from Sweden. They were saved from
energy and shipbuilding collapse by the invention of new methods to use coal and by the
discovery and exploitation of new virgin forests in the American colonies. One of the selling
points of moving to the colonial wilderness was the availability of cheap energy in the form of
trees. It was so cheap in the colonies and so expensive in Britain that ships often loaded a cargo
of firewood as ballast for the return voyage to England.

Energy return on energy investment for the US energy mix in 2005.
From http://www.theoildrum.com/node/3949 where it was released under the CCA 3.0 license.
Comparative energy yields
Energy return on investment can also be used to compare energy yield between the
different options available for managing future supplies. Analysis of EROI for oil shows that it
was high in the 1930’s but had declined considerably by the 1970’s. Since then energy return has
continued to decline. Currently the most available and energy efficient fuel is coal with an
energy return of between 50 and 80 times energy invested in its production. Natural gas yields
about 20 times the energy used in production. Hydro power yields between 20 and 40 times
energy invested, but the opportunity for placing new dams is limited by the availability of sites
for their construction. Nuclear energy is the least rewarding conventional fuel, in large part
because of the massive concrete structures that are required to house the reactors and the effort
needed to keep spent nuclear fuel safe. Firewood yields about 30 times the energy involved in
harvesting it, but the new growth capacity of forests is not enough to replace more than a fraction
of the energy we obtain from gas or oil. Shale oil is just now coming into production as the world
price of oil hovers around 100 dollars a barrel. In order to separate the oil the shale has to be
pulverized and then steamed, resulting in just less than a ten to one energy yield, slightly more
than solar thermal and photovoltaic energy. Yields for solar technology are this low because of
the energy involved in making the solar cells and all the piping involved in active thermal solar.
These technologies are rather new so there is the possibility they will improve as the number of

installations goes up. Ethanol and biodiesel (essentially vegetable oils used as diesel fuel) both
have the lowest energy return on investment, and should only be thought of as final options, or to
extract the last possible bit of value from what would otherwise be waste. The most rewarding
current alternative energy source is wind, which produces at a little more than 20 to one.
EROI values for the US.
By Mrfebruary under CCA 3.0 license at http://en.wikipedia.org/wiki/File:EROI_-_Ratio_of_Energy_Returned_on_Energy_Invested_-
_USA.svg
Transportation tomorrow
We need to find a replacement for oil as it becomes harder to get. The EROI of US
ethanol production of 1.3 in the United States makes it unlikely that biofuels will become
anything more than an additive. We can convert natural gas and coal into gasoline substitutes,
but these come with an additional second law charge on the final efficiency of the conversion,
and additional environmental impacts from the polluting byproducts that make them unattractive.
We are now in the process of shaking out the economics and energy costs of using electricity as a
substitute for gasoline. Electricity comes with several limitations. Electric cars use batteries that
are heavy and take time to charge, and so far have limited capacity for traveling long distances.
We are currently seeking better battery technology, but batteries need to be charged from
somewhere, so it is likely that electric cars will compete with other demands for electricity,

creating demand for energy sources that create electricity. Since coal and nuclear power plants,
the largest suppliers of electricity, take up to ten years to site, permit, and build, it is likely that
new electricity for transportation will come from wind and solar power, both currently
developing at a rapid pace. In addition, there is some interest in storing surplus electricity
generated by solar power in the form of hydrogen that can be moved around in pipelines and
converted into electricity by burning or by new fuel cell technologies.
World electrical generation by fuel, 2005
Public domain by EIA from the 2013 Annual energy outlook at
http://en.wikipedia.org/wiki/File:United_States_electricity_generation_by_fuel_1990-2040.png
Where should we get electricity?
Like oil, the amount of electricity consumed per capita is highly correlated with gross
national product and other measures of standard of living. Producing more electricity is a major
goal in most countries. We are told in grade school that Abraham Lincoln read in the evening by
candle light, and by that means learned to practice law. If this is true then there are many more
like him out there studying by candle light today who need electricity in the night to read by.
World demand for electricity is expected to more than double in the next twenty years.
Most of the increase will be in developing countries. They will need considerably more electrical
generation capacity. Where should they get it?
Most electricity is generated by burning coal. Coal accounts for 40.3 percent of
worldwide electrical generation. In the United States, a country with plentiful coal resources, it

accounts for 48.9 percent. Natural gas and nuclear power are also used extensively to generate
electricity, each accounting for around 20 percent worldwide. Hydro power accounts for another
16 percent worldwide and 7.1 percent in the US. Oil is used in oil rich countries and small
islands where no better alternative has been developed. It accounts for 6.6 percent worldwide and
1.6 percent in the US. Incinerators and biomass burning account for another 6.2 percent of world
capacity. Between three and four percent is generated by wind, geothermal, and solar energy.
Sources of electricity in the United States in 2009
By Daniel Cardenas under CCA 3.0 license at
http://en.wikipedia.org/wiki/File:2008_US_electricity_generation_by_source_v2.png
Oil has already been phased out as a fuel for generating electricity where it is not the only
option. Dams for hydro power continue to be built around the world but the number of dam sites
is limited. Hydro power will increase in places where the politics and benefits of dams cannot be
denied but they are not a solution for everywhere. Natural gas is currently cheap because many
gas fields held in reserve are currently being developed, but this is only temporary. This leaves
nuclear and coal as the two widely used technologies available for generating more electrical
power. It takes years to decades to site, permit, and construct new coal and nuclear plants so we
are making choices now for the future.
What should we build? The best way to approach the choice is to weigh the costs and
benefits of coal and nuclear power. The costs involved are to the environment and public health,
and the depletion of nonrenewable resources. The benefit is the electricity generated. The costs
can be identified by following the trail of coal and uranium through mining from the ground,

production of a usable fuel, its use and disposal. How do they compare along the trail? How do
they compare to the other alternatives?
Comparison of nuclear and coal power plants
The energy content of Uranium 235 is thousands of times more than a similar mass of
any other fuel. One kilogram of U235 can produce as much electricity as 1500 tons of coal. Coal
and uranium are both obtained through mining. The higher energy content of nuclear fuel means
that less has to be mined. One uranium mine serves many power plants. The land impacts from
mining uranium and building nuclear power plants are much smaller and local than the land
impacts of coal. It often takes many much smaller coal mines to supply one coal burning power
plant. By some estimates, one quarter of streams in the US are impacted by coal mining.
Coal and uranium ore are both mined and transported in rail cars. Coal is usually stored
in a large pile until it is burned. Uranium ore is processed to enrich the concentration of U235
ore before it can be used. Processing plants can build up large piles of tailings. Tailings piles
have some radioactivity and need to be protected from blowing or running off into the
surrounding environment. They can’t be used for paving or make building block. The finished
fuel grade uranium is fashioned into pellets that are built into fuel assemblies. Coal mines build
up large amounts of waste rock at the mine that need to be covered with good soil before
vegetation will grow on it again.
Open pit uranium mine in Namibia.

By Ikiwaner under the GNU 1.2 license from http://en.wikipedia.org/wiki/File:Arandis_Mine_quer.jpg
Under normal conditions radioactive releases from nuclear power plants are close to zero.
On the other hand, coal contains a small amount of uranium and thorium that are vaporized
during combustion. Each year more uranium and thorium are released into the air from the
burning of coal than from all nuclear plants. In fact, the major source of radioactivity released
into the environment today is combustion of coal, not nuclear power. People living near coal-
fired power plants are exposed to higher radiation doses than those living near nuclear power
plants.
US and world release of uranium and thorium from coal combustion over the last 75 years.
Public domain by Oak Ridge National Lab at http://www.ornl.gov/info/ornlreview/rev26-34/text/colmain.html
Nuclear power plants produce much less solid waste than coal fired plants, but the public
needs to be kept from contact with these wastes for a much longer time before they are safe to
handle. Spent nuclear fuel has to be stored for hundreds to thousands of years before it is safe to
handle without protection.
Coal fired plants produce fly ash and bottom ash, both of which contain toxic heavy
metals, other compounds and contribute to acid rain. Coal burning power plants create far more
air and water pollution and solid waste than nuclear power plants. Since the 1960’s new coal
fired power plants have installed electrostatic precipitators that capture fly ash. Bottom ash and

fly ash are stored onsite in sludge ponds. The retaining walls of the sludge ponds have
occasionally given way, releasing a wave of coal sludge into nearby waterways.
Nuclear power plants do not have stack emissions, but the construction of a nuclear
power plant requires cement, and cement is made by burning lime in a kiln. This releases some
carbon dioxide, but not nearly as much as is released by the daily burning of coal. Coal plants
also release sulfur and nitrogen dioxides, ozone, particulates, mercury, and other air pollutants
that are among the major causes of smog, acid rain, and the environmental and health problems
that are associated with them. Every year, the emissions of coal plants contribute to asthma,
bronchitis, and heart disease that cause more than 30,000 premature deaths in the United States.
Death rates are much higher in China where the coal is of lower quality and the coal fired power
plants are built with fewer pollution control devices. The Chinese suffer these health effects
because until recently they have had no other option. Perhaps they have invested so heavily in
solar because they would rather choose anything but nuclear or coal.
A coal sludge pond in Pennsylvania.
Public domain by Czsargo at http://en.wikipedia.org/wiki/Image:Coalsludge.JPG
Compared to nuclear, solar, wind and natural gas, the death rates and health problems
caused by coal are much greater. Given the health and environmental costs of coal why do we
continue to use it? Perhaps it is because there is a lot available and it is easy to extract from the
ground. Perhaps it is because the logistical systems to mine, transport and burn coal are already
developed and have well organized constituencies that support its continued use. Perhaps it is

because the interests that stand to benefit from the use of coal are few and able to coordinate
their efforts while the people who are damaged by coal are many, dispersed, and unorganized.
Why do we not build more nuclear power plants? Even though the health and
environmental benefits are clear there are many reasons why people resist them. Many people
object simply because they don’t want either form of power plant built near them. They may also
object to sanitary landfills, group homes, and other institutions that benefit the community at
large but subject them in particular to some risk. They make their decisions from what some
people call the NOT IN MY BACKYARD, or NIMBY point of view. Nuclear power plants
suffer from NIMBY more than most other large engineering works mainly because of the public
perception of the difference between the consequences of an accident at a coal fired plant and a
nuclear plant. An explosion at a coal plant only affects those in the plant and immediately
nearby. An accident at a nuclear plant affects the plant, the immediate neighborhood, anywhere
that contaminated water goes and anywhere that contaminated air is carried on the wind for
decades. Even though the risks of a nuclear accident appear to be smaller the uncertainties of
where radiation will travel and how long it will remain makes people anxious about the
consequences of an accident. We would rather suffer a sure death of a thousand paper cuts than
wait on the chopping block not knowing when or if the axe will fall.
Many countries have decided to shut down their existing nuclear plants. Plants in Italy,
Austria, Denmark, the Philippines, and North Korea have been shut down. In Germany and
Sweden there have been national decisions to phase out existing nuclear power plants. Sweden is
doing this in spite of the fact that nuclear plants supply more than 40 percent of its electrical
power. In Germany nuclear power generates 17 percent of electrical power. New Zealand is a
nuclear free zone. There are no nuclear reactors, and even boats carrying nuclear weapons are
banned from New Zealand waters.
Still, some countries are dedicated to using nuclear power. France generates 80 percent of
its electricity from nuclear power plants. Many countries with limited coal supplies or large
populations and unmet energy needs, are looking to build nuclear power plants. China, India,
Pakistan, and most countries in Europe and the former Soviet Union, have reactors, and are
considering building more. In South America, Brazil and Argentina have active nuclear
programs. Even Japan, the only country on which nuclear weapons have been used, is reliant on
nuclear power. Japan imports more than 80 percent of its domestic energy requirements. It has an

active policy of promoting nuclear power since the 1970’s. Before the recent earthquake and
accident at the nuclear power stations at Fukushima Daiichi nuclear power was supplying 30% of
Japans electrical power. Following the accident public opinion has turned and there is talk of
shutting down some or all reactors as alternatives are developed.
Energy policy
We are currently at a crossroads. Our supply of fossil fuel is limited and obtaining it is
environmentally damaging. Demand for petroleum is going up while the efficiency of petroleum
production is going down. We have coal reserves that will last much longer than current reserves
of oil, but they are dirty to obtain and use, and they are a main contributor to increasing carbon
dioxide in the atmosphere that is linked with global warming. There are opportunities to build
more hydroelectric plants but water is a multiple use resource. New dams will result in fisheries
and other environmental damage on the rivers on which they are constructed.
There are good environmental reasons to build nuclear power plants if we could trust
managers and designers. Aside from the accidents at Chernobyl and Fukushima Daiichi they
have a safety record at least equal to coal. Uranium for nuclear fuel is readily available but it
takes many years to site, design, and build a nuclear power plant. Where there is reliable cooling
water they can be built very large. The major problem with building more of them is public trust
in the agencies and companies that run them. Ignoring the problem of waste disposal, the three
major accidents suggest that political and scientific managers are the weakest links in safe
implementation of nuclear power. Public opposition to nuclear power after the accidents at
Chernobyl and Fukushima Daiichi are making it less likely that we will turn in that direction.
Natural gas is the only fuel for which reserves are increasing but this is because of
changes in technology, involves drilling in many regions with population, and is a fossil fuel that
we will eventually run out of. Most biofuels cost too much in terms of energy input for the
energy output to make them worth turning to them for the long term. Solar and wind power are
just now becoming economically viable but they are new technologies that still only supply a
small portion of total energy needs.
In the next few decades there will by many proposals to change energy delivery systems.
How should we evaluate these proposals? What are the important criteria? Here are three criteria
that we should use:

1) Are we just trading one limiting factor for another?
2) How difficult will it be to incorporate the new energy sources into the existing
infrastructure? and
3) What will be the environmental costs and benefits of the new system?
Summary
Energy is a key resource. Without it nations have difficulty developing and maintaining a
modern technologically based lifestyle. Our original energy source was muscular power. This
was later supplanted by wood, water and wind. More recently we have turned to the fossil fuels
coal, oil, and natural gas. These provide tremendous benefits as sources of energy drawn from
the fossil and not the current energy account. More recently we developed nuclear power to
supplement fossil fuels and are exploring wind and solar energy. In the last decade wind power
generation has made significant gains in efficiency and cost and installations are increasing at a
rapid pace. Solar power has also made great strides, as the cost of building solar panels has gone
down and their efficiency has gone up. Nuclear power plants continue to be built, but at a slow
pace due to fears of the effects of an accident and lack of confidence in plant operators to be
truthful about the seriousness of accidents.
Fossil fuels make up more than 75% of the energy used around the globe with significant
portions of the rest of the energy mix coming from nuclear and hydropower. Most energy is used
in the generation of electricity and transportation. Recently there have been advances in
transportation efficiency, as hybrid and electric cars arrive on the market in response to increases
in gasoline prices.
Along with the benefits come costs in the form of environmental damage where fossil
fuels are extracted and human health and environmental damage where they are used. Early coal
burning technologies were efficient mechanisms for releasing small particulate matter into the air
and lungs. Under some climate conditions, the exhaust from cars, trucks and electric power
plants is converted into chemical smog that exacerbates lung problems in people forced to
breathe it for long periods. Coal extraction leaves behind landscapes with altered chemistry that
take decades to return to a semblance of what they were. Where groundwater runs off from coal
mines it affects rivers many miles downstream. Oil spills cause tremendous immediate damage,
and low level chronic damage for many years afterwards.

Nuclear power also has dangers, as we have seen at Three Mile Island, Chernobyl, and
more recently at the Fukushima Daiichi. Should we trust ourselves to nuclear power when it has
the capability of causing so much widespread damage over large areas, even though the energy
yield is significant? Should we continue to trust people to operate them with truthfulness and
candor when we see that they have lied about the extent of damage in all three major accidents?
Should we continue using such a dangerous technology when we have not yet developed the
means to dispose of the wastes that it produces? These are as yet unanswered questions
concerning the use of nuclear power.
As the price of energy has risen there has been increasing interest in solar and wind
power. These exist in practically unlimited supply if we can build the infrastructure necessary to
use them. Wind power is increasingly popular, especially in Europe. Solar power still suffers
from the need to develop efficient panels but has made great strides in efficiency and cost.
Other power sources are in development and use. Often these are limited to special
locations, but some of them show great promise. Geothermal power is used extensively in some
areas where there is volcanic activity that provides heat at economical drilling depths. Methane
gas is generated from waste organic matter at large and small scales around the world. In
particular it is gathered as part of the management program at many landfills where methane is
generated naturally and has to be managed so that the landfill does not suffer a serious fire or
explosion. Methane is also generated in small operations for village level cooking use. The
movement of water in the oceans due to tidal motion is being studied as a potential source of
energy but no commercial tidal power plants are in operation.
Finally, there is renewed interest in one of the largest potential sources of energy,
conservation. There are tremendous possible savings in insulating homes and changing windows
so they retain heat more efficiently. There are also tremendous gains to be made in switching
from incandescent light bulbs to florescent and from florescent to light emitting diodes.
Current energy policy is the result of conflict between entrenched energy producers,
manufacturers of existing energy using technologies, and new energy forms and technologies
that have less well developed interest groups. As the price of energy from existing technologies
goes up and the costs of new technologies come down we will shift towards the more efficient
and cheaper sources. The economic question is will these new sources become available at the
same relative cost as current sources.

Chapter 14: Air
Air is all around us
Anyone who goes swimming knows that breathing air is important. We live in an ocean
of air that is 78 percent Nitrogen, 21 percent Oxygen, and about 1 percent carbon dioxide and
other trace gases. We inhale so we can take in oxygen, which is necessary for respiration, and
exhale to get rid of carbon dioxide, the product of respiration. The atmosphere provides many
services including regulating the temperature of the earth and shielding us from harmful
electromagnetic radiation. The nitrogen is almost chemically inert. The carbon dioxide is used by
plants to build the sugars and carbohydrates that fuel the rest of the living world. The atmosphere
filters out the ultraviolet rays of the sun, protecting us from harm, traps heat, keeping us warm,
and distributes heat and water as it moves. It carries water vapor that condenses to form clouds
and fall as rain.
The air also removes our gaseous personal and industrial gaseous wastes. They consist of
at least carbon dioxide, methane, sulfur dioxide, carbon monoxide, and nitrogen oxides. It can
also include other organic and inorganic compounds, and dust particles that come from the soil
and from smokestack emissions. Some of these are chemically active, both in the air and when
they land again, often far from where they were created. This air pollution comes from stationary
combustion sources such as dry cleaners, power plants and your home, and mobile sources, such
as airplanes, boats, cars and trucks.
Air quality and history
Early towns were founded on water management led to the formation of governments to
create water management policy and regulation. The need for air pollution control only became
necessary much later. Early concerns with air quality had to do with avoiding disease brought by
flying insects, and the smell of human and animal personal waste.
Well to do people dealt with these problems by where they choose to build their homes.
Part of the preference of English gentry for living in the countryside was to escape the smell of
the Thames, which was the main sewer of the City of London. Rich people lived at the top of the
hill to escape what they called the “mal aria” at the bottom of the hill. They were escaping more

than the smell. Many early cities were built near rivers that had swamps whose air was thought to
carry disease. The people who lived near the swamps were more likely to get sick. Even though
they did not understand that the diseases were caused by insects and bacteria associated with this
bad air, moving away was effective.
Early assaults on air quality came from the smoke produced from burning wood and coal
to cook food that contained tiny particles that attacked the lungs. In cities where the winter air
did not circulate the polluted air could hang around for days, causing respiratory distress in those
that had to breathe it. Once in the atmosphere the chemicals and tiny particles of soot in the
smoke reacted with sunlight to form more toxic chemicals. Later, industrial processes added
more hydrocarbons to the mix, and the concept of smog was invented.
London and coal
One of the first cities to suffer from air pollution was London. It suffered from lack of
nearby supplies of firewood. When ships began bringing coal down from Newcastle in the
1200’s craftsmen and small holders adopted it as a cheap substitute for wood. It was used for
winter heat, cooking, and by craftsmen.
At first it was only tradesmen and the poor who used it. Cooking was often done over an
open fireplace indoors. Coal smoke made air quality horrible for those who had to breathe it,
contributing to high mortality rates in urban centers. The nobility stuck to wood because they
could afford it. They complained about the smell of coal fires that permeated the air, and in 1306
they got the King to ban its use. Of course, the ban was not well enforced, and eventually the
needs of commerce outweighed the delicate sensibilities of the rich. In later centuries, even they
succumbed to the desire for cheap energy and they too burned coal.

Visibility was reduced to a few yards in London during the Great Fog of 1952
N T Stobbs under CCA 3.0 license at http://en.wikipedia.org/wiki/File:Nelson%27s_Column_during_the_Great_Smog_of_1952.jpg
As forests in England declined firewood became generally scarce and coal became the
fuel of choice even though the byproducts of coal combustion hung around in the air creating a
fog that lowered visibility, made sunsets more beautiful, and caused respiratory illness in the
infirm. It is how Londoners earned the nickname of “pea soupers”. The visibility was so bad it
was like they were living in pea soup.
Coal was the key resource that made the British industrial revolution possible. It was
tolerated as a necessary evil. This changed in 1952, when for four days in December London was
the scene of what was called the Great Smog. The city was suffering from a temperature
inversion in which a layer of warm light air sits on top of a layer of cold dense air. The lower
layer of cold air was trapped in place along with all of its contents. The power stations that fed
electricity to the city were burning low quality coal, the good stuff being sent out of the country
to earn hard currency after the Second World War. The city had just abandoned its electric bus
system in favor of diesel buses which added more exhaust particles and chemically reactive
hydrocarbons to the air. A few days before the fog the weather turned cold. To keep warm
people began running their home coal burners. All of these emissions were trapped when the
temperature inversion occurred. Pollutants in the air built up to the point where sports and
entertainment events were canceled because of inability to see. Movie houses were closed for
inability to see the screen. It was difficult to drive, and even ambulances stopped running.

The smoke rising from this Scottish town is being held down by a temperature inversion.
By Johan the Ghost under CCA 3.0 license at http://en.wikipedia.org/wiki/File:SmokeCeilingInLochcarron.jpg
For several days there was no wind to turn over the inversion and disperse the trapped
pollutants. It was not until afterwards that the full health effects of the fog became known. Health
officials reported that tens of thousands of people, especially the young and old, had suffered
from respiratory complaints and that somewhere between four and six thousand deaths could be
linked to the fog. More recent research suggests that death toll as a result of the fog was closer to
12 thousand.
While London had suffered from fog before, none in recent memory had lasted as long,
or had produced as great a health impact. As a result, London and Great Britain began to pass
laws that regulated power plant emissions and promoted the cause of cleaner air, starting with the
British Clean Air Act in 1956.28
Killing fogs occurred in other places before and after the Great Fog of London. As the
health effects of breathing highly polluted air became better known governments took action to
improve air quality. After ‘Black Tuesday’ in St. Louis in 1939 the city made sure that better
quality heating coal was ordered for 1940. Donora is a steel and coal town in the Monongahela
valley in western Pennsylvania. It was visited by a killing fog in October 1948 that stayed for
four days, lasting until the local steel plants shut down and it began to rain, clearing the air.
During the event visibility got so bad that driving was curtailed. One person reported that they
drove on the left side of the road with their head out the window so they could see the curb. Fire
fighters and doctors made house calls, bringing oxygen and providing care for those affected.

More than half of the town’s population of 14,000 was sickened and at least 20 people died of
the immediate effects. The long term consequences included lower property values and increased
mortality rates for the survivors over the next decade.29
Starting in the 1950’s, laws that protect air quality have been passed in many countries
around the world, mandating that air pollution control technologies must be used by large
industrial and commercial plants, and that vehicles must undergo periodic inspection. These laws
and regulations have improved air quality for the moment by reducing air pollution emitted per
capita, but gains in air quality are still threatened by growth in population and affluence that lead
to higher total emissions.30
For most of our time on earth, we have not had the capability to change the atmosphere.
We could cause local changes through burning wood or fossil fuels, but these effects quickly
dissipated. As people become more numerous and lived in more crowded conditions the local
effects of air pollution stayed around for longer, sometimes aided and abetted by local
atmospheric conditions. It is only recently that we have been able to affect the atmosphere over
larger spatial scales and finally at the level of the whole atmosphere. Today we affect the
atmosphere at all scales. At the global scale, we have changed ozone and greenhouse gas levels.
At the regional scale, we have released sulfur and the other acids that cause acidic precipitation.
At the local scale, combustion of fossil fuels power generation, transportation, and industry cause
smog and ozone that act as respiratory irritants.
Air pollution
Air pollutants are airborne substances that harm humans or the environment. Primary
pollutants are in the form in which they were emitted into the atmosphere. Secondary pollutants
form when primary pollutants react with other each other, with chemicals already in the
atmosphere, or with sunlight to become something different. Once in the air pollutants can be
carried for hundreds to thousands of miles before they come back down to earth.
Primary pollutants
Primary pollutants are the direct result of human activities. They are pollutants released
into the air before they have had time to be chemically altered. Coal and petroleum contain many
impurities such as sulfur, mercury, lead, and arsenic. Burning fossil fuels often results in

incomplete combustion, which releases carbon monoxide, nitrogen oxides, and volatile organic
compounds. Once in the atmosphere many primary pollutants dissolve in water droplets and
begin the chemical reactions often catalyzed by the presence of light that lead to the formation of
secondary air pollutants.
Sulfur dioxide dissolves in water to form droplets of sulfuric acid which later fall as the
acid rain, a significant air pollution problem in many regions around the world. In the last 150
years we have increased the amount of sulfuric acid in rainfall by hundreds of times, leading to
changes in ecosystems that are not resilient to changes in acidity. High acidity rainfall leaches
nutrients from the soil, lowering its fertility and damages buildings and outdoor works of art.
Nitrogen oxides are the byproducts of incomplete high temperature combustion in
vehicles and power generation plants. There are several different types collectively called NOX.
In the atmosphere, they form nitric acid. NOX take part in reactions with volatile organic
compounds (VOC’s) in the atmosphere in the presence of light to form the active ingredients in
smog. They also contribute to the formation of acid rain when they dissolve in water droplets or
attach to dust particles and fall with the rain.
Volatile organic compounds (VOC’s) are light organic chemicals that readily evaporate
into the air such as benzene, one of the hydrocarbons in gasoline that contributes to the
characteristic smell of a gas station. They come from many sources, including the odors emitted
by plants and soil microbes. Anthropogenic sources include paints and coatings, and dry cleaning
compounds. Fossil fuels and their combustion are a major source of volatile organic compounds
through the evaporation of gasoline before it is burned, and as incomplete production products
from vehicle exhaust.
Smog
The word smog was first coined in 1905 at a public health congress in application to the
air quality of London. The new word was a combination of the words smoke and fog. Soon
afterwards, it was applied to Los Angeles and other industrial cities where chemicals in the air
created a brown cloud that hung around.

A foggy day in London painted by Claude Monet in 1904.
Public domain from http://en.wikipedia.org/wiki/File:Claude_Monet_015.jpg
Smog events are especially severe when a temperature inversion occurs that shuts off
convection currents that normally mix the air and disperse pollutants. In the absence of mixing,
primary and secondary pollutants build up in the trapped air. Inversions and smog events occur
frequently in large cities in sunny climates surrounded by mountains, including Mumbai, Los
Angeles, Mexico City, and Tehran.
Once in the atmosphere, VOC’s react with NOX in the presence of sunlight to form the
polyaromatic hydrocarbons and that we call secondary pollutants, petrochemical smog, or just
plain PAH. These react with the oxygen in the air to produce ozone. Ozone breaks apart the
bonds in organic compounds in skin, lungs and leaves, forcing people, plants and animals that
live in ozone rich air to continually be on the defensive. Ozone can reduce plant growth rates by
several percent as they spend energy repairing ozone damage rather than on new leaves, flowers,
and seeds. Smog aggravates the lungs in animals. In children, this promotes asthma. In older
people this irritates emphysema and bronchitis. In everyone, it aggravates membranes in the nose
and throat, and interferes with the body’s ability to fight infections.

Ozone damages plant leaves.
Public domain by NASA at http://earthobservatory.nasa.gov/Features/OzoneWx/
Many large cities have attempted to reduce emissions by mandating controls on car
emissions and regulating the amount of materials that electric power generating plants can emit.
New York, London, and Mexico City have tried to improve air quality by regulating car access
to the city center. In London and New York cars pay a tax for entering the City. These measures
have been partially successful, but very controversial. Drivers do not like the idea of being
charged for crossing from one side of the street to another.
Los Angeles Optimists Club wearing gas masks during a smog event.
Public domain from http://en.wikipedia.org/wiki/File:LA_smog_masks.jpg

Incinerators
For most of our existence wastes were inert pottery or organic wastes that decomposed
naturally. During the last 100 years the amount of garbage generated per household has increased
tremendously and become much more diverse. Before the development of rubish heaps and
landfills many households reduced the volume of their waste by burning it.
Incinerators can be art too.
By Grator under CCA 3.0 license at http://en.wikipedia.org/wiki/File:District_heating_plant_spittelau_ssw_crop1.png
Open fires are still permitted in many rural areas and are common in developing countries
where there is no garbage collection. When home garbage contained only dried biomass it
burned cleanly with minimal pollution and health effects. As modern life began to produce more
manufactured products they became important parts of the waste stream. Modern household
waste contains plastics, and a mixture of other potentially toxic materials. The byproducts of
technology include lead and mercury from batteries and plastics.
Household and municiple garbage are also potential resources. The plastics and papers it
contains are a potential source of energy. Incinerators are a technology for converting waste into

energy and reducing the volume that needs to be put into landfills. They are especially popular in
countries such as Japan that have limited disposal space.
Early incinerators were nothing more than small scale barrel burning technology built
large. They did not separate out unwanted materials or remove recyclables. As we learned about
the health risks involved with burning plastics we developed regulations to limit the amount of
toxic materials in municiple wastes, and to burn the wastes so that they produce the least amount
of dioxins and furans.
The emissions of an incinerator are similar to the emissions from a coal burning power
plant, so they need the same control devices. The fly ash contains the non combustible toxic
materials that came in with the garbage fuel, and has to be disposed of in a proper manner.
Automobiles
Internal combustion engines were first developed in the 1800’s as stationary sources of
power for farming. Gradually these were developed into more powerful and compact forms that
were used on the self propelled vehicles that we now call cars and trucks.
Early internal combustion engines took air in and mixed it with alcohol in a combustion
chamber. Later engines used kerosene, and then gasoline. A spark passed into the chamber
ignited the mix, and drove a piston, converting the energy of the expanding air in the cylinder
into the kinetic energy of motion of pistons, crankshafts, and wheels. These simple engines were
not very efficient at burning their fuel so some unburned gasoline passed through them back into
the atmosphere along with their exhaust.
As we undertood the health effects and atmospheric chemistry of vehicle emissions we
began looking for technological means to lower them. Manufacturers did what they could easily
do, but balked at extending themselves beyond what was simple out of fear for their bottom line.
Eventually the the public requested regulations to mandaate that all manufacturers do what was
technologically possible to further reduce car emissions.
Air pollution regulation was at first in the hands of state and local governments who
created a system of laws and regulations. This small scale and patchwork legislation was
ineffective until California passed comprehensive rules. California was followed by NewYork.
These two large states made it difficult for car companies to comply with the rules without
implementing them nationwide. When it became clear that nationwide standards were needed the

Environmental Protection Agency was made responsible for creating national air pollution
standards.
A catalytic converter converts pollutants in exhaust to less damaging gases.
Public domain by Ahanix1989 http://en.wikipedia.org/wiki/File:DodgeCatCon.jpg
Air pollution control agencies began by looking for technological changes that would
reduce engine emissions. An early innovation was to require positive crankcase ventilation that
forced hydrocarbon laden crankcase gases through the combustion chambers in the engine before
they were released back into the atmosphere. As time went on, other recirculation and emission
control devices were added until the loss of engine efficiency was so great that increased fuel
consumption offset pollution abatement.
In 1975 regulators added catalytic converterswhich pass exhaust gases pass in close
proximity to a platinum metal catalyst that converts the pollutants to less damaging forms. At the
same time lead was removed from gasolines because it contaminated the platinum catalysts.
One of the responsibilities of the EPA is to establish health standards for air pollution and
determine which areas of the country are not in compliance. Where pollution exceeds these
health levels they can require specially formulated gasoline and regular inspections to ensure that
vehicles are operating at their peak of efficiency. These efforts cost money and annoy drivers,
but they are offset by lowered public and private health costs.

The good ozone
There is good ozone and there is bad ozone. Bad ozone is formed near the surface of the
earth as part of the chemical reactions that bring us smog. Good ozone is formed in the
stratosphere by the interaction of ultraviolet radiation and oxygen. It forms the essential part of
the atmospheric shield that protects life on and near the earth’s surface from damaging ultraviolet
and other high-energy radiation coming from the sun and outer space.
Good ozone
The natural formation of ozone begins when a photon of ultraviolet light encounters a
molecule of oxygen (O2), which splits to become two charged O= atoms. When these encounter
another O2 molecule they join to form a molecule of O3, or ozone.
Ozone absorbs ultraviolet radiation much more readily than O2 molecules. When a
molecule of ozone encounters a photon of ultraviolet light it breaks down into the original O2
molecule and another O= ion. If the O= ion finds another O2 molecule it will form another ozone
molecule. If it encounters another O= ion they will join together to form an O2 molecule. Since
O2 molecules are more plentiful than O= ions many more new ozone molecules are regenerated
than O2 molecules reform.
Ozone forms in the stratosphere where oxygen captures ultraviolet light.
Public domain by NASA from http://en.wikipedia.org/wiki/File:Atmospheric_ozone.svg
It also takes much more energy to break apart an O2 molecule than an O3 molecule, so
natural formation of ozone by breaking O2 apart is much slower. O3 molecules are more reactive
with ultraviolet radiation than O2 molecules, so they provide the majority of the atmospheric

protection from UV radiation. This process takes place in the upper stratosphere where the
atmosphere begins to thicken and oxygen molecules become common. This is where most UV
radiation is absorbed and most good ozone is formed.
The technological imperative
Modern industrial chemistry started at the beginning of the 1900’s in response to three
events. First, the discovery of oil and methods for pumping it out of the ground were developed.
Second, oil, gas, coal, and hydro power were harnessed to provide energy for industrial scale
chemical industry. Third, we began to unlock the secrets of organic chemistry and use them to
make new chemicals, again from oil, coal, and natural gas.
Among the new chemicals that were invented were refrigerants and aerosol propellants.
Chlorofluorocarbons (CFCs) are very effective at performing both tasks. When most gases are
compressed they heat up as their molecules resist being closer together. Strangely, when CFCs
are compressed they absorb heat from their surroundings, leaving them colder. This property is
what makes refrigerators and air conditioners work. Once compressed into a liquid the CFC’s
absorb heat. Pumping the CFC to where it can expand releases the captured heat. CFC’s are also
very chemically stable. They don’t react with other chemicals or they would change form
chemical form. This makes them good propellants in aerosols cans and good foaming agents for
plastics.
The Ozone hole
Chlorofluorocarbons appeared to be the perfect chemical. They do not easily break down
even when heated. They don’t cause negative health effects in humans and did not seem to react
with chemicals in the atmosphere. It was assumed that they were safe to use without any more
thought to the consequences. They did what they were intended and appeared to do no harm.
The air conditioners and refrigerators that use CFC’s were important technological
improvements in the quality of life. They allowed us to keep food longer and reduced the stress
of living in hot climates. Production of CFC’s went into high gear in the 1950’s. As the number
of air conditioners and refrigerators increased they leaked CFC’s into the atmosphere, spreading
from near the ground throughout the atmosphere.

We began sending up satellites to investigate the earth from outer space in the 1960’s. In
1978 we sent up the Total Ozone Mapping Spectrometer (TOMS) instrument. The TOMS sensor
measures the total ozone concentration in the column of air underneath it over the whole globe.
We have been collecting ozone measurements ever since.
A TOMS satellite view of ozone distribution from the side. The white area at the south pole
is the ozone hole.
Public domain by NASA from http://en.wikipedia.org/wiki/File:Toms-2004-09-06-FULLDAY_GLOB.PNG
In the 1980’s the ozone concentration in the upper atmosphere began to drop. At first,
scientists thought there was a problem with the satellite. The observations were so far from what
they expected that they did what good scientists should always do. They checked all of the
software and hardware, including the calibration of the sensors and the various other factors that
they could control. When these checked out the only other explanation was that they had left
something out of their theories and models. They needed to find what was missing from their
understanding of the chemistry of the atmosphere. What they discovered was that the CFCs that
were stable and non-reactive in the lower atmosphere behaved differently in the upper
atmosphere where they were catalyzing the breakdown of ozone.

The ozone cycle.
Public domain by NASA from http://en.wikipedia.org/wiki/File:Ozone_cycle.svg
In the upper atmosphere CFC’s encountered UV radiation strong enough to break the
bonds between carbon and chlorine atoms. Free chlorine ions react with ozone to produce
oxygen and chlorine monoxide (ClO). Chlorine monoxide reacts with an ozone molecule to
produce two oxygen molecules and another free chlorine ion. The result is two less ozone
molecules, three more oxygen molecules, and a chlorine ion that is ready to continue consuming
ozone. This cycle repeats until one free chlorine ion finds another and combines to form chlorine
gas (Cl2) or drifts into outer space and is lost from the earth’s atmosphere.
The destruction of ozone is particularly pronounced at the South Pole, where special
climatic conditions speed up its destruction. During the South Polar winter, the air over the Pole
is virtually isolated from the rest of the global air circulation pattern. As the air cools down to as
low as -80oC clouds of ice crystals form and nitric acid precipitates onto their surface. As the
first rays of sunlight reach the ice crystals in spring the nitric acid catalyzes the breakdown of
many CFC molecules at once, releasing many more chlorine ions than are found elsewhere in the
atmosphere. The free chlorine ions attack any nearby ozone and quickly convert them back into
normal oxygen molecules. The result is rapid depletion of ozone in the South Polar air mass and
a hole in the ozone layer.31

Ozone measurements in Antarctica.
Public domain by NASA from http://macuv.gsfc.nasa.gov/images/Ozhole_Minimum_graph.JPG
As the sun rises higher in the Antarctic spring, the ice clouds dissipate, and the wind
pattern that keeps the polar air isolated breaks down. As the isolated Antarctic air rejoins the
general circulation the low ozone air from Antarctica mixes with air from the rest of the globe,
and worldwide ozone levels drop. The rest of the atmosphere also loses ozone but at a much
lower rate because it does not experience the same conditions as occur in Antarctica.
Loss of ozone in the upper atmosphere lets more ultraviolet radiation into the lower
atmosphere. The increased UV creates bad ozone that damages living cells. It causes cancer, and
cataracts in humans, whales and other animals. It is suspected it is also responsible for decreased
algal production in the upper ocean, and reduced agricultural production. Decreased algal
production in the oceans disrupts food chains, and may lower the number of fish we can catch.
Reduced agricultural production also means less food for us and our animals.

Images of the ozone hole at the South Pole taken by the Total Ozone Mapping
Spectrometer.
Public domain by NASA.
The ozone hole was discovered in 1985. By that time, the atmospheric chemistry of CFCs
was known well enough to connect the two together. The dangers of losing the ozone layer were
immediately clear to all nations, and work began on an international agreement – The Montreal
Protocol – to reduce CFC use and find less harmful chemical substitutes. In 1989 the Protocol
came into force. It set a timetable for phasing out ozone depleting chemicals in favor of less
damaging alternatives starting in 1990. The current alternatives are less damaging than CFCs.
They will also be phased out when we find even less damaging alternatives. The rate of ozone
decline has slowed, and is expected to reverse in the next few decades, but ozone destroying
chemicals have a long lifetime, and will continue to have measurable effects for decades to
come.

The greenhouse effect
What is the weather forecast for the next century? The accuracy of meteorologists has
been increasing but can they really tell us what the climate will be like in more than 10 years?
They can now tell us with reasonable accuracy what the weather for today will be. They can
sometimes predict the weather for the next few days. But, they have a lot of difficulty with what
the weather will be over periods much longer than a week.
Climatologists are weathermen who predict long term trends. They think that they can
adequately predict what the climate will be like over the next 50 years. Not day to day, but the
general trend and direction of temperature and precipitation. They believe the climate is going to
get warmer. According to them carbon dioxide emissions over the last 250 years from increased
use of fossil fuels has intensified the greenhouse effect, trapping heat in the atmosphere,
increasing the intensity of the geophysical systems that move heat, and warming the earth.
The greenhouse effect was first described in 1896 by the Swedish scientist, Svante
Arrhenius. He was trying to find an explanation for the occurrence of ice ages when he hit upon
carbon dioxide and its effect on the earth’s energy balance. He suggested that changes in carbon
dioxide in the past caused the series of ice ages that were present in the fossil record and that
anthropogenic carbon dioxide emissions could change the atmosphere enough to do the same.
The mechanism that causes the greenhouse effect is very simple. The glass of a
greenhouse lets energetic electromagnetic radiation inside where it is converted into less
energetic heat energy. It traps heat energy in the greenhouse, keeping the greenhouse warmer
than it would be if the glass were not there. Gases in the atmosphere act like the glass. They let
light energy into the atmosphere and trap heat energy on its way out. More greenhouse gases
mean a more effective heat trap. A more effective heat trap means a warmer atmosphere.
Carbon
Dioxide
Methane Nitrous oxide CFC-11
Current
concentration
370 ppmv 1720 ppbv 312 ppbv 260 pptv
Preindustrial
concentration
280 ppmv 850 ppbv 285 ppbv 0
Annual rate
of increase
0.4% 0.6% 0.25% 0
Atmospheric
lifetime
50-200 years 12years 120 years 50 years
Atmospheric concentration of important greenhouse gases.

After http://www.cmar.csiro.au/e-print/open/holper_2001b.html
The possibility that we have the power to change the earth’s temperature by burning
fossil fuels was ignored until the 1960’s. Until then, atmospheric scientists were convinced that
we were about to enter a new glacial period produced by the cooling effect of the changes in the
Milankovitch cycle. They had realized that the recent series of ice ages were related to changes
in the earth’s orbit but they did not have a mechanism to describe how Milankovitch cycles
changed the climate. We now suspect that ice ages are caused when the Milankovitch cycle
reduces solar energy income enough so that winter ice does not melt. This increases the albedo
of the earth, reflecting more energy into outer space. Eventually the cold freezes carbon in polar
soils so it is removed from the atmosphere. Lower carbon dioxide levels result in lower intensity
of the greenhouse effect, which results in more cooling. This feedback loop continues and we
enter an ice age.
The Greenhouse effect captures energy on its way out of the atmosphere and sends it back
to the surface.
After Steve Cooley under GNU 1.2 license from http://en.wikipedia.org/wiki/File:Greenhouse_Effect.svg
The ice age continues until the solar constant increases, changing the climate so more
carbon dioxide is released from oceans and soils. Eventually the solar constant increases enough
so the forcing effect of the increased carbon dioxide levels creates positive feedback in the
direction of warming.

Carbon dioxide levels over the last 400,000 years.
By Global Warming Art under CCA 3.0 license at http://en.wikipedia.org/wiki/File:Carbon_Dioxide_400kyr.png
The carbon dioxide we have released and are continuing to release mimic the warming
part of the Milankovitch cycle, increasing the strength of the Greenhouse effect, forcing the earth
to store more heat. As the earth stores more heat it may set off new positive feedback that leads it
to become even warmer.
Greenhouse gases
Several gases play a part in the causing the greenhouse effect. The major ones are water
vapor, carbon dioxide, methane, and ozone. Carbon dioxide is released as a product of cellular
respiration and decomposition, and taken up by plants as part of photosynthesis. We could call
the burning of fossil fuels a form of much delayed respiration. Even though methane is only
present in the atmosphere in trace amounts it is a highly effective greenhouse gas that is
produced by anaerobic respiration in the stomach of cows and rice paddies. Ozone is naturally
produced in the stratosphere when oxygen molecules capture ultraviolet light. The act of
capturing UV light keeps energy from reaching the earth’s surface lowering the quantity of
energy available to take part in the greenhouse effect. Chlorofluorocarbons that destroy ozone
lower the protective effect of the ozone layer letting more energy penetrate further into the
atmosphere, increasing the greenhouse effect. Clouds and ice change the albedo, or reflectivity,
of the earth.

Carbon dioxide in the atmosphere has been increasing.
Public domain by NASA.
Carbon dioxide
The concentration of carbon dioxide in the atmosphere has been increasing since the start
of the industrial revolution. Ice cores and other proxy records of past climates show that it was
about 200 parts per million during the coldest part of the recent series of ice ages. During the
warm periods it came back up to about 280 parts per million. Over the last hundred and fifty
years the concentration of CO2 has increased from 280 to close to 390 parts per million, more
than the difference between historical warm and ice ages. The period of increase is correlated
with the start of the industrial age, so it is unlikely that we are not the source.

Average world temperature has increased over the last 100 years.
Public domain by NASA
CO2 is associated with fluctuations in temperature throughout the geologic record. High
concentrations of CO2 have only occurred during the warm interglacial periods in the last
400,000 years. We have recently reentered what should be the cooling part of the current
Milankovitch cycle yet the world average temperature has been getting warmer for the last three
decades.
There are several positive feedback mechanisms that may come into play in the near
future that will add CO2 to the atmosphere. Soils in northern boreal forests and tundra contain
stores of frozen carbon that have built up over the last ten thousand years. As those environments
become warmer they will release methane and carbon dioxide as their soils decompose.
The oceans are also warming, and as they warm gases dissolved in them become less
soluble. They could release even more dissolved carbon dioxide back into the atmosphere.
Warmer oceans will melt the polar ice caps, lowering the albedo of the earth so it absorbs more
of the sun’s rays, warming the poles more rapidly than equatorial regions. These changes in the
world carbon and energy cycles will accelerate the greenhouse effect and interact with one
another to cause positive feedback.
Methane
Methane is another important greenhouse gas. It is normally present in the atmosphere in
very small amounts. Before the Industrial Revolution, atmospheric methane levels were 700

parts per billion. Today they are closer to 1750 parts per billion. Parts per billion may sound like
a small number, but the greenhouse effect of methane is more than 20 times the effect of carbon
dioxide, so an additional thousand parts per billion of methane is large.32
Natural sources of methane are from anaerobic decomposition. It comes from the gut of
ruminant animals, from anaerobic decomposition of organic matter in wetlands, and melting
saturated northern peatland soils. While we have greatly reduced the amount of natural wetlands
worldwide, we have replaced them with paddy rice culture which also releases methane. We
have also greatly increased the number of ruminant domestic animals, both of them sources of
additional methane. Human sources include landfills, coal mining, manure, and wastewater
treatment. Almost a third of methane emissions come from handling oil and natural gas.
Recent changes in atmospheric methane levels are directly related to population growth
and human affluence. As we become more affluent, we eat more meat. As there are more of us,
there are more of us to eat meat, landfills become larger, there is more wastewater to treat, more
consumption of fossil fuels and more methane in the atmosphere.
The rate of increase in atmospheric methane is related to the size of the human population
and to the number of domestic animals.
Public domain by NASA
If climate change continues to increase the global average temperature natural reservoirs
of methane will get released into the atmosphere. Permafrost soils in the tundra contain large
amounts of frozen organic soil. As they warm and melt they become waterlogged and
decomposition happens through anaerobic processes that release methane. Another reservoir are

the solid methane clathrates (crystals of methane and water) deposits on the ocean floor. If the
oceans warm enough for them to melt, they could convert into gaseous form and bubble out of
the oceans into the atmosphere.
Methane is relatively short lived in the atmosphere. In spite of this, its greater
effectiveness as a greenhouse gas could result in a rapid and drastic change if enough of what is
stored is released in a rapid burst.33
Water vapor
Water vapor is the most important greenhouse gas in terms of the magnitude of its effect,
but its concentration in the atmosphere is the result of feedback rather than direct release. Water
vapor enters the atmosphere through evaporation from the surface as part of the system that
distributes energy around the globe. The amount that evaporates is related to temperature, the
warmer it is the more water evaporates, and the warmer the air is the more water vapor the air
can hold. The more water vapor in the air the more heat is absorbed.
Water vapor also has a negative feedback effect on climate warming. As it builds up it
condenses into clouds. The bright shiny surfaces of the clouds increase the albedo of the earth,
reflecting more incoming solar energy back into outer space. Unlike other greenhouse gases,
water vapor concentrations vary between locations and at different times during the year. This
makes its effect as a greenhouse gas difficult to measure so we do not have a reliable way of
knowing how its concentration in the atmosphere is changing.
Climate changes
We need good long term predictions of weather and climate in order to avoid risks to
important economic activities and to our lives. In the short term, not knowing what the weather is
doing in the next few days exposes us to the risk of cutting hay the day before a rainstorm and
having it spoil on the ground. In the medium term changing climate exposes us to the risk that
our plans for water management will give us the wrong signals on when to release stored water
resources in order to avoid drought, or the risk of making bad forecasts of crop harvests such as
what happened in 2012 when spring forecasts were for bumper crops that had to be revised after
summer drought.34

Models of the effect of greenhouse gases on global temperature show that they have
increased by 0.5 degree in the last fifty years, and are likely to increase by at least 1 degree
in the next 50 years.
By Robert A. Rhode under CCA 3.0 license from http://en.wikipedia.org/wiki/File:Global_Warming_Predictions.png
The ability to predict the future is a way of purchasing cheap insurance. Good predictions
allow us to anticipate the probability of future problems, prepare for them, and avoid costs. Bad
predictions induce people to take extra risks or avoid opportunities.
Weathermen and climatologists have gotten much better at making reliable predictions
through the use of models. Short term weather models include the effects of local features such
as lakes and mountains and use measurements of past temperature and precipitation to predict
what might happen in the next few days to weeks. Long term climate models contain highly
detailed representations of the physical process that move heat and water between the
atmosphere, the ocean, and the land surface. They include models that project the movement of
heat, energy, and water vapor in the atmosphere that allow us to predict climate in the long term.
They are tested by seeing how well they predict past climates for which we have good data, and
by comparing their predictions of the future with each other.
These models do a very good job of predicting past climates, and generally agree about
current climate. The models can also be used to test alternative scenarios of the future by
adjusting them to reflect expected changes in the concentration of greenhouse gases. Using what
we know about past and current trends in greenhouse gas emissions the global climate models
suggest that world temperature has increased by 0.5oC over the last fifty years, driven by changes

in greenhouse gases. Assuming that emission current trends continue and there are no
catastrophic changes in how the earths physical systems work the models predict that world
temperature will increase by another 1 to 2oC in the next fifty years. Unexpected changes in ice
cover in the Arctic, melting and decomposition of the permafrost, or methane emissions from the
oceans will speed up the warming. Because the models predict at regional as well as global
scales they allow us to estimate where temperature and precipitation might change and by how
much. Knowing the likely trends in future climate we can begin to ask whether they are worth
taking action to avoid.
Historical change in the thickness of glaciers.
By Robert A. Rhode under CCA 3.0 license from http://en.wikipedia.org/wiki/File:Glacier_Mass_Balance.png
Melting Glaciers
One of the effects of higher air temperatures is to upset the energy balance of glaciers,
polar icepacks and permafrost that depend on the timing and intensity of cold weather during the
year.

Where mountain glaciers are retreating.
By Robert A. Rhode under CCA 3.0 license from http://en.wikipedia.org/wiki/File:Glacier_Mass_Balance_Map.png
The Himalayas contain the third largest store of land ice after Antarctica and Greenland.
Records of the depth and extent of many glaciers have been kept for several hundred years. They
show that glaciers are retreating in the Himalayas, the Rocky Mountains, the Alps, and the
Andes. In some places they have left behind lakes trapped behind terminal moraines. A danger is
that one of these moraines will fail, releasing trapped water and resulting in a catastrophic flood.
A more chronic effect is the change in timing and quantity of meltwater running off the
glaciers. Many regions are dependent on glacial runoff for irrigation and drinking water. At the
current moment, flows are higher because of higher rates of melting but as glaciers diminish in
size they will yield less water. This will affect irrigation along the Andes in South America and
many countries in Central and Southern Asia that depend on runoff from the Himalayas, and
drinking water reservoirs and irrigation projects in the Rocky Mountains that feed agricultural
regions in Colorado and California.

Sea level has been rising.
By Robert A. Rhode under CCA 3.0 license from http://en.wikipedia.org/wiki/File:Recent_Sea_Level_Rise.png
Sea Level
As terrestrial ice melts and flows into the ocean it will raise sea level. The major ice
continents of Greenland and Antarctica are melting. It is difficult to determine how rapidly but
floating ice sheets along their margins have been releasing large icebergs and icebergs are
calving from glaciers where they meet the sea at higher rates than in the past.
While it will take some time for these large continental ice sheets to melt it is probable
that melting will accelerate as warming increases. If all of the ice on Greenland melts sea level
will rise by 7.3 meters (about 25 feet). Antarctica contains enough ice to raise sea level by 60
meters. The ice continents will not melt all at once but even raising sea level by one meter will
cause serious problems for coastal communities around the world.
A second source of sea level rise will come from the thermal expansion of sea water as it
warms. The sheer volume of the ocean makes this expansion noticeable, important, slow, and
steady. It will be slow because only the ocean surface is in contact with the warming atmosphere
and expansion in the deep ocean will only take place as surface heat is moved into the deeps.
Historical records of sea level go back several hundred years but it is only in the past
century that we have consistently collected data at many stations. These suggest that sea level

has gone up by about 20 centimeters. Current models suggest that sea level will rise more than
one meter over the next century.
Sea level change will flood coastal regions
By GRID-Arendal from http://www.grida.no/publications/vg/climate/page/3086.aspx.
The impacts from sea level rise will be felt in low lying coastal areas. Rising tidal
influence will change coastal geology, eroding beaches and bluffs that now contain highways,
homes, and recreation areas. The rising sea will penetrate inland extending tidal influence up
river to areas that currently don’t have them. It will bring seawater into coastal aquifers that
supply drinking water. It will raise groundwater levels, creating new marshes where the water
table moves closer to the ground surface. It will cover infrastructure built at or just above sea
level. What would have been average and infrequent floods will become catastrophic and
normal. Imagine if the recent floods in New Jersey and New York City from hurricane Sandy
became regular events.
More than 650 million people live within 10 meters of sea level. Infrastructure that will
be affected includes major ports and most major cities of greater than five million people. Sea
level rise will flood some of these cities and make others more vulnerable to storm events that
involve sea surge. Large parts of the Netherlands were reclaimed from the sea over the last 250
years and are maintained by a series of dikes and pumping stations. After seeing the damage
caused by Hurricane Katrina the Dutch government commissioned a study of what the
Netherlands would need to do in order to avert damage from global warming. The commission
concluded that they would have to prepare for a rise of at least 1.3 meters by 2100 and 2.3 to 4

meters by 2200. They concluded that to ensure safety and preparedness they would have to spend
144 billion dollars.
As sea level rises, still more cities and their surroundings will need to invest to protect
coastal infrastructure. The main coastal road in Charlotte Amalie, the capital of the US Virgin
Islands is only a foot above sea level. The main highway along the coast in Negros Oriental, a
province in the Philippines, is only a few feet above sea level between Bais City and the
provincial capital at Dumaguete.35
The direct cost of damage from Katrina was more than 81 billion 2005 dollars. We can
blame this catastrophe on poor maintenance of the dikes that failed, and even worse disaster
management afterwards. We can also use the events around Katrina as an example of the
potential social, economic, and environmental effects of sea level rise. At the time of Katrina
New Orleans was actually below sea level. It is difficult to estimate the indirect costs of this
storm that caused more than 1,800 deaths, and the destruction of tens of thousands of homes, and
the migration of thousands of people out of the region.
The city of New Orleans is actually below sea level.
By Alexdi under CCA 3.0 license from http://en.wikipedia.org/wiki/File:New_Orleans_Elevations.jpg
Marine circulation
A less obvious impact of polar ice melting is the effect that it may have on the marine
thermohaline circulation– the process that moves water between the surface and the deep ocean.
It is driven by the northward flowing warm Gulf Stream current that keeps the continent of

Europe warm. As it flows farther north it the warm water evaporates into the cooler arctic air
leaving behind denser more saline water which sinks to the bottom of the North Atlantic,
carrying heat and dissolved gases with it. If this pump that brings heat to Europe fails its climate
will become much cooler.
The last time the North Atlantic heat pump failed was at the end of the last ice age when
large lakes trapped behind the melting North American ice pack were suddenly released into the
North Atlantic. The salinity of the North Atlantic was lowered and the heat pump stopped,
triggering a return to near glacial maximum conditions for almost one thousand years.
The As the Greenland and Arctic ice melts the fresh water released lowers the salinity of
polar oceans. Will they lower it far enough to stop the thermohaline circulation? We don’t know
yet.
Terrestrial climate changes
Climate change will also affect the terrestrial environment. Climate is an important part
of the earth’s energy redistribution system. The greenhouse effect increases the amount of energy
needing redistribution. Redistribution happens through changes in the intensities of wind and
storm, and in the amount and distribution of rainfall.
Climate warming is happening more rapidly around the North Pole and in continental
Asia.
Public domain by NASA from http://earthobservatory.nasa.gov/IOTD/view.php?id=42392
The climate system is extremely complex. We are still learning how its parts work
together. Our current understanding of the changes that have occurred in the last 150 years

suggest global warming intensifies the existing climate. Places that are wet will get wetter.
Places that are dry will get drier. The number of medium and low level energy tropical storms
has declined, while the number of stronger hurricanes has increased.
Biological effects
An important part of what defines terrestrial ecosystems is their climate. The geologic
record shows that when the climate is stable, communities are also stable. When climates change
communities change due to the migration of the physical climate characteristics that define a
species range.
There are five great extinction events in the geologic record. The first occurred 450
million years ago at the border between the Ordovician and Silurian periods when the
Gondwana, a large continent, passed into the South Polar Region triggering the formation of a
polar ice cap and a drop in sea level. At that time there were few terrestrial organisms, but the
changes in ocean circulation and weather caused the extinction of more than 60% of marine
invertebrates.
The second great extinction happened near the end of the Devonian period. We are not
sure what caused it, but that was a period of intense evolution of land plants. They began as puny
things, only 30 centimeters high with rudimentary roots and no associations with soil bacteria.
They evolved to more than 30 meters in height, and developed roots that reached deep into the
soil. Their evolution caused a drawdown in atmospheric carbon dioxide. The changes altered
oxygen levels in the ocean and produced periods of cooler temperatures. Together, these caused
large scale extinction events.36
The fifth great extinction happened 65 million years ago at the border between the
Cretaceous and Tertiary periods when the dinosaurs died out. We think that this event was
caused by the impact of an asteroid off the coast of the Yucatan peninsula that sent a huge dust
cloud into the atmosphere. The dust cloud reduced sunlight reaching the surface of the earth by
10 to 20% and took more than ten years to dissipate, putting pressure on plants and marine algae
that traveled up the food chain to herbivores and carnivores.37

Range change
Climate sets the boundaries of species ranges. Weather changes during the year set
species behavior patterns so they can be successful migrating and reproducing. Some
relationships between species also depend on the timing of climate events.
The most basic biological effect of global warming will be a shift in species ranges
towards the poles. Mobile species will simply abandon the equatorial part of their range and
move into suitable new areas closer to the poles. But, not all species are mobile, and some
mobile species move slower than the rate at which climate has changed over the last few
decades. If climate changes too rapidly it will leave some of these species out of their normal
range.
Most trees move only as far as their seeds spread from the parent tree. For trees with
large seeds, this may be as small as 20 meters per year. During the recent ice age northern
hemisphere forests were far south of where they are now. As the glaciers retreated the trees
advanced northward, stopping where we find them now. If the current climate continues to warm
their ranges will continue to move farther north. It is possible that the viable range of some trees
will move completely out of their current range.
The current and projected range of beech trees according to two climate models.
Public domain by US EPA from http://maps.grida.no/go/graphic/forest-composition-case-study-in-north-america
Beech trees have large seeds that are dispersed by squirrels who bury them in the ground.
The projected range of American Beech trees overlaps with its current range in only a small area
along its southern border. In order for Beech and other slow moving plants to reach their new

range we may have to assist them in getting there. We will have to do the same with other
economically important trees, including oaks, maples, and cherry.
Warming will also affect the health of plants. Trees at the equatorial limit of their range
will become stressed as the environment exceeds their tolerance. That will create opportunities
for insects and diseases to spread towards the poles. It has already resulted in higher frequency of
forest fires as stressed trees undergo mass mortality providing increased levels of fuel. In central
Mexico pine species at the southern edge of their range are currently suffering from bark beetle
infestations that result in the death of whole stands.38
Plants and animals will have a harder time migrating in response to this climate change
event than they did in past. During the last interglacial warming species migrated through a
natural environment that did not include humans and their alterations. Today, they will have to
migrate through the environment as it is, through and around the human biome that now
dominates most continents. In order to reach their future habitat they will have to migrate around
cities and through the croplands that have replaced the grasslands and forests that existed before
we dominated the environment, breaking up the more natural environments into small islands.
Some species will be able to successfully run the gauntlet, others won’t. The species that won’t
will likely include large predators and herbivores, and species that have tight symbioses with
slow moving plants.
Each bright light represents a city or town joined together by roads and highways.
Public domain by NASA.

In mountain areas vegetation zones will move uphill. In Sweden they have moved uphill
by several hundred meters in the last 75 years. Many mountaintops have isolated communities
that were left behind as their cold adapted cousins moved north. The tallest peaks in the
Adirondacks of upstate New York have a few small communities of Arctic plants stranded there
during the retreat of the glaciers. Their nearest cousins can be found by traveling five hundred
miles north into Canada. Today these isolated mountain top communities are being forced off
their high altitude islands by warming. They can’t go north, and they are at the extreme of how
far they can go up.39
The effect of climate change on mountain vegetation zonation.
By GRID-Arendal from http://www.grida.no/publications/vg/climate/page/3081.aspx
As climate ranges move towards the poles so will the species ranges of disease
organisms, parasites, and insect pests. The poleward movement will include crop and human
diseases, and their vectors of dispersal. Temperate continents may suffer the return of diseases
that were at the northern extreme of their range in the last century but will be in the middle of
their range by the end of the greenhouse century. Evidence of the coming disease environment
may be the outbreaks of upland malaria in the mountains of Kenya in the last decade.40

Dengue fever is a mosquito borne tropical disease. Areas in red have reported cases. Areas
in blue have carrier mosquitoes and no disease.
Public domain by US Agricultural Research Service from http://en.wikipedia.org/wiki/File:Dengue06.png
Malaria used to be common in North America and Europe. It was wiped out by
aggressive measures to control the mosquitoes that carry it. Although we were able to easily fend
it off before we may not have it as easy in the future. The future climate will be wetter in some
places, and new mosquito carriers that are immune to the currently available methods of
chemical control may move farther north.
Decoupling ecological systems
Animals and plants receive signals from the environment that stimulate them to begin
flowering, migrating, and mating. These signals may be temperature changes, day length,
rainfall, the appearance of some combination of these, or some other signal harder to identify.
Birds migrate from places of low food availability towards high food availability in
preparation for nesting. The energy and survival cost of migration are offset by the higher
survival rate of offspring in their destinations. Their migrations are timed to the availability of
food. They are controlled by hormones that are coordinated and triggered by day length. If the
plants and insects that serve as food at the other end of their trip change the timing of their
presence the birds will not find what they expect at the end of their migration.

Bird migration routes.
“Migration routes” by L Shymal in the public domain from http://en.wikipedia.org/wiki/File:Migrationroutes.svg
Plants and their pollinators have the same problem. Plants flower in response to
environmental cues that are changing. If their pollinators respond to other environmental cues
then there is danger that they will get out of sync. An example is the Glacier Lily and its
bumblebee pollinators in Colorado. A 17 year long experiment showed that the amount of seed
that the lilies produce was declining over time, especially in flowers that opened earlier in the
season. The flowers open as early as possible in response to air temperature. The bumblebees are
more conservative, not changing the date of their emergence as quickly. As the region warmed
earlier in the year the early flowers lost their pollinators and set less seed.41

Glacier Lily.
By Walter Siegmund under CCA 3.0 license from http://en.wikipedia.org/wiki/File:Erythronium_grandiflorum_0756.JPG
The glacier lily grows in an isolated area with few human impacts in their environment
other than climate change. It is possible that other plants are suffering similar temporal
dislocations that we can’t see because other human impacts get in the way.
Agricultural Effects
Finally, climate change will have an impact on agricultural systems. Crop plants are
selected to respond to day length, temperature regime, and water delivery. Changing climate
alters these relationships. Studies over the last decade have documented changes in crop behavior
that can be attributed to climate warming. Fruit trees flower earlier in the season in some parts of
Europe. Farmers in France and Germany are using earlier planting dates for corn, sugar beets and
potatoes. Wine culture is sensitive to temperature. The more days above 10oC the better the
quality of wine produced. Over the last 45 years the number of days with temperature above
10oC in Europe has increased from 170 to 210 days. As the growing season gets warmer and
longer wine growers are thinking of moving into Great Britain, a region formerly too cold for
grapes.

Modeled effects of climate change on crop yields.
By GRID-Arendal from http://www.grida.no/publications/vg/climate/page/3089.aspx.
Not all the news is good. As climate warming continues, crop zones will move. Coffee is
important in Uganda. The zone in which coffee culture is successful will contract from more than
half the country to less than 20 percent. Even the remaining 20 percent will move from one part
of the country to another. Cereal crops make up the bulk of the calories consumed by people.
Models of the effect of climate change on cereals suggest that there will be an increase in yield in
temperate developed countries but yields in equatorial countries are likely to decrease.
Global warming will reduce the area of Uganda available for growing coffee.
By GRID-Arendal from http://www.grida.no/publications/vg/climate/page/3090.aspx.

Atmospheric brown clouds
We can think of the greenhouse effect as a chronic illness slowly worsening. Other
atmospheric changes have a more acute and immediate effect. In several areas around the world
there are large, long lived, regional sized, brown atmospheric clouds formed from secondary
chemical pollutants that change climate at both the regional and global scales.42
Smoke rising from forest fires in Borneo.
Public domain by NASA at http://earthobservatory.nasa.gov/NaturalHazards/view.php?id=40182
The cloud that sometimes covers China and Southeast Asia is an example. Local
economies contribute many uncontrolled pollutants to the atmosphere. China is currently
building power plants that burn high sulfur coal with few pollution controls. Rural farmers in
Indonesia and Malaysia add to the cloud by cutting and burning tropical forests for cropland. In
Borneo, where some tropical forests have peat soils, there are underground fires burning out of
control in the soil. Smoke and particles from these fires drift generally westward.43 Car
ownership in the region is up as Thailand, Vietnam, China, and India industrialize. All of these
activities release primary chemical pollutants that are converted to secondary pollutants, creating
the regional brown cloud. The formation of the cloud is intensified by a regional climate that has
been in a dry period during with less precipitation to wash pollutants out of the atmosphere. The

semi-permanent cloud was first noticed in 1999, and has appeared several times afterwards.
Similar clouds form over the Bengal and Arabian seas.
The Asian brown cloud over China.
Public domain by NASA at http://www.nasa.gov/vision/earth/environment/brown_cloud.html
Atmospheric brown clouds have two climate effects. Because they absorb light coming
into the atmosphere they lower the amount reaching the ground. They also contain tiny particles
of black soot that are more effective at capturing heat than carbon dioxide. When the dark soot
settles out on the snowpack of the Himalayas, or the Arctic, or Greenland it promotes faster
melting than we would expect from the effects of carbon dioxide alone, which will result in
faster melting of the polar and glacial ice, contributing to faster sea level rise than is predicted by
models that only include gases as atmospheric forcing factors.
The brown clouds also move local and regional weather patterns. The monsoon system
that brings rainfall to India and China has shifted southward, increasing rainfall over northern
Australia and causing drought in northern China where water is already scarce. The brown cloud
may also be making cyclones in the Arabian Sea more intense by changing surface wind
patterns. If these changes become part of the “new normal” the people who depend on the old
normal will have to make adjustments.

Urban Heat Islands
We also influence local and regional weather through our settlement patterns. In the last
century there has been a tremendous shift from living in small rural communities to large urban
concentrations. Until the beginning of the 20th century cities of more than 1 million people were
considered large and all of them could be counted on your fingers and toes. Now cities that size
are normal and there are too many of them to count.44 Cities that large create their own islands of
heat that influence their regional climate, especially downwind.
The heat island effect.
Public domain by NASA from http://en.wikipedia.org/wiki/File:UHI_profile.gif
Heat islands are caused by the emissions of the urban area itself and by the change in
albedo caused by buildings and pavement. Cement, dark pavement and roof surfaces are more
effective heat absorbers than the vegetation that they replaced. These are dry surfaces, so there is
no water to evaporate and carry off the heat as there would be if vegetation were present. During
the night, these hot surfaces release the energy stored in them during the day. On windless nights
an inversion layer can form, trapping the heat over the urban area.

The city of Atlanta viewed by its heat emissions.
Public domain by NASA from http://en.wikipedia.org/wiki/File:Atlanta_thermal.jpg
Urban heat islands make their own weather and affect local health. Heat rises, causing
convection currents that lead to cloud formation and rainfall. Precipitation downwind of large
urbanized areas can be as much as 100% greater than upwind. Urban heat islands affect health by
raising temperature and creating ozone is created near the ground. The temperature effect on
health is greatest in temperate cities where people are not as acclimated to heat.45
Indoor versus outdoor air
Which would you rather breathe, indoor or outdoor air? That is not always a trivial
question today. Certainly, in some areas it is better to be inside, away from nearby sources of
pollution that is disposed of by dumping it into the air. However, breathing indoor air can also be
bad for your health.
Throughout most of history there was little difference between indoor and outdoor air
quality, except in poorly ventilated cooking areas. Historically the main fuel for cooking was
charcoal, wood, or animal dung. Burning these fuels inside a room in an open fire creates smoke
consisting of tiny particles that settle in the lungs. Most of the poor health effects are experienced
by women and children, who do most of the cooking, and spent more time indoors than men who
farm or work outside the home.46
Smoke from cooking and heating are no longer the only sources of indoor air pollution.
Over the last century the mostly natural materials used in home construction have been replaced

with fiberglass, plastics, and other materials that emit aerosols and fibers into the air. New
construction methods have also made homes much tighter, so the exchange of inside air with
outside air is much reduced. This means that whatever air is inside the building stays inside
longer. The longer the air is retained inside a building the more opportunity there is for the
growth of mold. Some buildings become “sick” releasing fumes and spores that make people ill.
Some people are so sensitive that they cannot live or work in these “sick” buildings.
The clean air act
The main piece of legislation that protects air quality in the United States is the Clean Air
Act, which was first passed as a regulatory program under the public health service. It was
amplified in 1970 to include provisions for state and federal regulatory programs to control
emissions from stationary and mobile sources of air pollution. The law created programs to
establish ambient air quality standards to protect human health and public welfare from adverse
effects of pollutants, and listed six important pollutants: ozone, methane, carbon monoxide,
sulfur and nitrogen oxides, and particulate matter that were to be controlled. Several of these are
components of smog that have health consequences. Others become acid in the atmosphere and
fall elsewhere as acid precipitation.
The Act also created a system for establishing standards for new stationary sources of
pollution. Existing stationary sources were grandfathered under the law. They were allowed to
continue business as usual. New sources constructed after the amendments were passed were
required to incorporate the best available technology into their construction. New sources
included landfills that emit methane, industrial and power generation boilers and turbines
powered by fossil and nuclear fuels, petroleum refineries, and wastewater treatment plants that
had air emissions. Later amendments to the act established ambient air quality standards. They
required that areas not in attainment of the air quality standards take stricter efforts to reduce
emissions, and areas in attainment of take measures to prevent deterioration. The 1990
amendments added market based mechanisms to control the emission of acid rain precursors
from stationary sources of pollutant.

Increases in the efficiency of car and truck engines by one third led to a one fourth increase
in miles driven.
Public domain as by the Energy Information Administration.
The Clean Air Act also established emissions and fuel efficiency standards for
automobiles. Despite the protests of the automobile manufacturers, it succeeded in reducing
emissions and increasing fuel efficiency. For a time, the fuel efficiency standards improved air
quality, but they also reduced the cost of driving as cars went farther on the same amount of
gasoline. As the cost of driving went down the number of miles people drove went up, and part
of the environmental gains from improved technology were consumed by increased gasoline
consumption due to reduced costs.47
Summary
We are surrounded by an ocean of air. Until recently we did not have the ability to affect
more than the local air quality. In the last hundred years we have gained the ability to affect air
chemistry at the regional and global scales too. Air mixes, so whatever we put into it locally
eventually ends up being distributed globally.
We have changed the global atmosphere through the addition of chemical catalysts that
speed the breakdown of ozone and by the addition of gases that change its transparency to heat
leaving the earth. These gases have the potential to affect the radiation reaching the earth’s
surface, and the global mean temperature, with potentially far reaching impacts to marine and
terrestrial ecosystems.

At the regional scale we have added particulates and reactive gases and chemicals to the
air that make it less healthy to breath. Some of these gases change the acidity of precipitation.
Acidic precipitation changes the chemistry of the land surface on which it falls, killing aquatic
organisms and ecosystems and eroding buildings and other cultural monuments. Even indoor air
has become toxic to people sensitive to chemicals in the air.
We have attempted to minimize our impact on air through international treaties that ban
the production and sale of CFC’s that damage the ozone layer, and by laws that put a price on the
release of carbon into the atmosphere, internalizing the cost of their effects on global climate. On
a regional scale we use laws and markets to ensure that industry and transportation that produce
air pollution use the best available technologies and keep their machinery in good working order.

Chapter 15: Land
Introduction
Land is a reusable resource. When treated well it can be reused indefinitely, but there is a
finite supply, poor treatment reduces its potential, and bad treatment ruins it. When land is badly
treated it no longer serves its most preferred use, and may not serve any other. Poor land use
practices reduce land use options until the functions and services provided by the land have had
time to recover. Often this takes much longer than it took to damage the land in the first place.
Hunter gatherers took the land the way it was. They made their living by extracting
resources from the bounty made available by nature. They gathered wild plants, hunted wild
animals, and captured fish and shellfish wherever they found them. As they developed an
understanding of natural cycles they learned to control and manipulate plants and domesticated
wild animals.
Erosion in Madagascar.
By Frank Vassen under CCA 2.0 license at http://en.wikipedia.org/wiki/File:Madagascar_erosion.jpg
When man became dependent on agriculture for food he also became dependent on the
quality and quantity of land. The quantity and quality of land became important resources that
could be obtained through warring for access to new soil, and better land use management
practices on old soil.48
Management can improve the value of land, or ruin it. Irrigation enhanced the
productivity of early agriculture. Early agriculture was practiced in hot and dry places. Over

irrigation brought saline water tables near to the surface where evaporation left salts behind.
Land degradation of this type is repaired only by washing the salts out of the soil, which happens
very slowly.
Salt deposits on rangeland in Colorado.
Public domain by NRCS from http://www.nrcs.usda.gov/news/archive/2004newsroom.html
Early technology used wood for building boats and houses, heating, cooking, and as its
primary fuel for smelting, making pottery, and cement. Most of the hills along the Mediterranean
coast were once covered by forests. After they were cut many of them were converted to terrace
gardening. During times of economic or political upheaval, many of these terraces were
abandoned, and the soil that covered the hills washed away in the rain. This soil can be found
today clogging the mouth of rivers that flow through cities that there were once ancient
Mediterranean seaports, now separated from open water by river deltas built from this soil.49
We live by converting land from natural ecosystems to our own purposes. We convert
forests, grasslands and wetlands into pasture, farmland, mines, and urban areas. In the process
we change hydrologic regimes, erosion rates, and create new disturbance regimes. In the end we
use the land to dispose of wastes that we can’t transform into something on the land . It is very
difficult to manufacture new land. Only the Dutch have made a business of doing this. For
intents and purposes, what we have is what we’ve got.
Land conversion and erosion
At first we didn’t have the technological power to do more than clear land by burning.
During this time agriculture was practiced by clearing a small area, cropping it for a short time.

When population densities were low there was a lot of forest and there was no need to return to
the same patch for a long time. During this time the soil and nutrients had time to recover.
Shifting agriculture is still practiced in remote areas where there is a low level of technology. In
some places it is called swidden. In Mexico it is called milpa. A form of shifting agriculture was
even used in Europe until the 1700’s.
A temporary forest clearing in northern Palawan, an isolated island in the Philippines.
Copyright Avram Primack
There have been three waves of land conversion leading to erosion and soil degradation
in the last 10,000 years. The first came after the development early metal working technologies.
Discovering how to make axes using metal allowed us to cut down whole forests. This allowed
more agriculture and led to population growth. Increased population shortened the return times
on farmland and eventually made it impossible to continue to practice shifting agriculture. The
result was the development of technologies that made it easier to farm the same land repeatedly.
These included terrace farming, the simple plow, and the preparation of manure from plant
waste, animal urine and dung. This form of agriculture is still practiced in most of the third
world. Some of it has proved sustainable, and has been practiced in the same way in the same
place for thousands of years.
For the next few thousand years, technology made incremental changes in land
management practices. The iron axe was more durable than bronze. The metal plowshare turned
the soil instead of merely scratching it. Irrigation canals brought water from reservoirs when it
was needed, not when it happened to fall. Hillside terraces slowed the rate of erosion, but did not
stop it.

Hillside terraces above Port au Prince, Haiti.
Copyright Avram Primack
The second great wave of land conversion happened during the first agricultural
revolution after 1750 and the discovery of new territories in Siberia, the North American, and
Australia. Better crop rotation systems improved the fertility and productivity of the soil and
selective breeding led to more productive plants and animals. This allowed population to expand
again. In response farmers expanded into forests and grasslands farther from floodplains with
less productive soils. Up until this period there were still considerable forests in many areas.
Now these too began to be converted to farmland.
During the second wave of land conversion exploration also led to the discovery of new
regions of farmland in North and South America, and Australia, opening vast stretches of forest
and prairie to the plow. From these new areas came new erosion. Movement of colonial power
into Africa and Asia brought new economic systems and new farming methods not well adapted
to where they were imposed. These added to global soil erosion.
The third great erosion episode started after World War II during the giant leap forward
against disease, the development of fossil fuels, pumped irrigation, and the Green Revolution.
These improvements increased our power and need to convert land from forest, grassland and
wetlands in order to fuel better diets for larger populations fed on improved crops. At the same
time there was a tremendous expansion in population as result of the great leap forward in
sanitation and disease control. Most of the new population was fed by the Green Revolution, but
there were still many who missed the boat and survive on what they can grow themselves on

what land they can find. A lot of this land is highly erodible sloping lands on hillsides that are
too steep to farm by industrial farming methods.
Each episode of land conversion led to changes in natural habitat, changes in species
migration patterns, reduction in the extent of forest and grasslands, and increases in soil erosion.
After each revolution in land management new technologies were introduced to limit erosion.
Often these technologies made great improvements, but never restricted erosion to natural levels.
Losses to erosion are normally invisible to the general public who don’t farm, and don’t
live near farms. As recently as the 1980’s, the United States was losing more than 1.7 billion tons
of soil a year to erosion. More than 40 percent of US soils are currently eroding faster than they
can be replaced. In some places the rate of soil loss is high enough to destroy the value of land
for farming. The UN estimates that we were losing 0.3 to 0.5 percent of arable lands every year
in the 1990’s, which partly explains the continuing pressure of subsistence farmers looking for
land on forests.
Forests
The deep dark forbidding forest is present in the mythology of most cultures that came
into contact with it. The trees were big, and forests were bigger. They were dark. In the
beginning, people lived in the spaces between the forests, in the valleys where there were rivers
and streams. Here the land was flat and fertile and people slowly beat the forests back, first with
stone tools, and later with bronze and steel axes.
Eventually the forests were beaten up the hill slopes, and the memory of what they were
moved to the realm of myth and magic. The witches and wolves of the forests terrified people
who lived in the open fields and cities and didn’t ever go into the forest. The Sumerians had
Humbaba, Macbeth spoke to three witches who he met in the woods, and the Greeks and
Romans had the satyrs, dryads, and naiads, not all of whom were friendly to lost travelers. A
modern version of this attitude of fear of the deep dark forest might be the novel “Heart of
Darkness” by Joseph Conrad.

There are 32 people dancing on the top of this sequoia stump.
Public domain from http://en.wikipedia.org/wiki/File:Giant_sequoia_exhibitionism.jpg
We do remember the retreat of forests in the new world because it was recent, and we
were there while it happened. Indeed, many early American authors wrote about it. High school
students in the United States used to have to read On Walden Pond by Henry Thoreau. There are
many photographs of loggers in Michigan and other places showing the giant size of the pines
and other trees that they went into the forest each winter to cut. You can still drive through some
larger than car width sequoias in California.
Deforestation in the US from 1620 to 1992.
Public domain
Once upon a time, it was possible to enter the eastern deciduous forest in New Jersey and
leave in Illinois, or start in Maine and go to Georgia. Many of these forests were cleared to make

way for agriculture and to supply timbers for building new cities, and sometimes rebuilding them
after they burned down. Chicago was rebuilt on timbers cut from the virgin pine forests of
Michigan after Mrs. O’Leary’s cow kicked over a lantern and started the great fire that burned
down a third of the city in 1871.50 During the 1800’s lumbermen steadily moved west as they cut
the forests of Ohio, then Michigan, then Wisconsin, and finally the far mountain west.
Forests around the world are under siege from loggers, ranchers, and people seeking land
for subsistence farming. The only remaining large pristine forest blocks are in the Amazon,
boreal Asia and boreal North America, and even these are under pressure. The Amazon was
largely intact until Brazil started building roads into it in the 1960’s. Since then more than
600,000 km2 (225,000 square miles, almost the size of Texas) have been converted to soybeans,
pasture, and subsistence farming. The areas where forests have been removed are large enough to
see with the naked eye from outer space. The rates of deforestation in the Amazon continue to
increase as poor Brazilians seek their fortune in the forest only to turn their fields over to
ranchers when the poor soils no longer contain enough fertility to support them. Although
deforestation has decreased in the last five years at its peak more than 20,000 km2 are deforested
per year (9,000 square miles).51
In England, the only original forests that still exist were hunting preserves for the rich
nobility. Other forests were cut for firewood and to make charcoal for the iron industry. Forests
in tropical Africa and the Eastern US are much smaller than they once were. What were large
continuous forests between India and China in Asia, central Europe and Turkey, Siberia, West
Africa, and the Amazon in Brazil are steadily being broken into smaller and smaller blocks.
Estimates suggest that we have lost between 25 and 50 percent of the originally forested
area worldwide. Most of this happened in the last 100 years after the use of chain saws became
widespread and as roads were constructed into previously isolated and inaccessible areas. There
are two driving forces behind deforestation. One is poverty. In Brazil, Africa and India large
portions of the population still live off of what they can harvest from the land. They cause
deforestation through opening new lands for subsistence farming and gathering firewood for
home cooking.
The other driving force is logging by affluent people for pasture, paper pulp, plywood,
and rare woods for building. Japan has had a long tradition of forest management. In the late
1700’s and early 1800’s Japans forests were maintained by careful management. In the late

1800’s this policy was abandoned as they strove to industrialize. By the early 1900’s forests were
shrinking as they were used in industry and as charcoal for cooking. During the wars of the
1930‘s and 1940’s, other fuels became scarce. Reconstruction after WWII made more demands
on forests. After the war the Japanese gained access to the fossil fuels that had been part of their
motivation for fighting. They reduced their need for wood for cooking and returned to old forest
management traditions. This reduced pressure on their forests, and their islands became green
again. As they developed they again needed wood. Instead of using domestic supplies, they
bought lumber from the Pacific Northwest, the Philippines, and Indonesia. At this moment Japan
has recovered to more than 70 percent forest cover in the home islands, more than any other
temperate country except Finland.
Deforestation began in the late 1600’s in Indonesia when Dutch colonizers discovered the
durability of teak. During the next 250 years they cut back teak forests for shipbuilding and
export. During this time, the population of Java grew tenfold, from 4 million to more than 40
million (and now more than 100 million). Japanese occupation and civil war following World
War II led to more deforestation, opening up forests on Sumatra and Borneo where their
remoteness, poor soils, and low populations had previously limited the rate of deforestation. As
forests in the Philippines were cut in the 1970’s Japanese logging companies switched their
operations to the sparsely populated outer islands of Indonesia. Logging dried out the soils in
Borneo and Indonesia, resulting in the great fires of the late 1990’s that often left the region in a
pall of smoke for months.
Deforestation in the northeastern United States started after colonists arrived in the
1600’s. Wood was sent back to England in boatloads just to give them a cargo in the early days.
Settlers who arrived in colonies in the 1700’s were kept from migrating west by the Indian wars
and the Appalachian Mountains. Without better land, subsistence farmers cut the forests and
farmed the hillsides. When Kentucky, and then Ohio were opened up by Daniel Boone, poor
eastern farmers gave up their hillside farms and moved west. The rate of migration increased
after the United States got control of the Northwest Territories, bought the Louisiana Purchase,
and opened the Erie Canal. Departing farmers left the least productive rocky hillside lands to
revert back to forest. In the intervening centuries parts of New England that were once 70
percent deforested and 30 percent forested have reverted to 70 percent forested.

The recovery of northeastern forests had some unexpected effects on wildlife. As farmers
retreated forests began to regrow on their lands. Early secondary forests are good habitat for
deer. The return of natural drainage and the presence of young forests are also good for beaver.
Deer and beaver populations have expanded into these recovering forests to the point where they
have become a nuisance, beaver flooding adjacent lands with ponds and deer eating spring
wildflowers to the point where some of them are locally endangered. As forest islands and
corridors between them have regrown some of the larger predators and browsers have returned.
Moose also moved south from Canada into Vermont and crossed into the Adirondack Park,
following the departing farmers, following the recovering forests. Wolves were extirpated from
the area covered by the park in the 1800’s. They have since hybridized with coyotes and are
returning to the park region.52
Wangari Maathai and the Greenbelt Movement
In many dry regions in Africa firewood has become scarce. Rising populations and
communal land ownership systems make it difficult for trees to regenerate. On communal lands
there is no personal interest in planting or leaving trees grow if they will be harvested by your
neighbors. The result is declining natural supplies and increasingly more effort invested in
finding the same amount of firewood. Since most of this effort is invested by women this places
the increasing burden on them.
The Greenbelt Movement started in 1974 as an organization for planting trees in rural
Kenya. The strategy was to plant long strips of tree seedlings to act as windbreaks, maintain local
diversity, provide shade, and provide firewood for communities. The first projects were small.
Each project involved teaching participants how to plant and grow seedlings in nurseries
culminating in planting and protecting the seedlings in the community. Later projects required
participants to training other communities. It led to a national system of tree nurseries, thousands
of locally supported planting projects, and millions of trees planted. The program was so
successful in Kenya that it was copied in several other African nations. Later, the movement
included livelihood and community empowerment projects. The movement was so successful
that it spread around the world to regions where people still depend on forests for the production
of fuel wood. Its founder and director, Wangari Maathai, won the Nobel Peace Prize in 2004.53

Wetlands
Wetlands are areas that are saturated with water, either permanently or seasonally. They
are characterized by vegetation and soil characteristics that distinguish them from their
surrounding ecosystems. They vary in how long they are wet, and in how much water is present
while they are wet. They may often appear to the same as their surrounding uplands until water
around them rises.54
Wetlands provide many environmental goods and services, including water storage and
purification, nutrient and sediment capture, and feeding and breeding habitat for many more
species than would be indicated by their size. Wetlands often have fertile soils that would make
good farmland if they were drier. Because of this they are often drained and are one of the most
heavily impacted ecological landscape types.
Wetlands in the US
We have difficulty estimating the original extent of wetlands in long settled areas of
Europe and Asia but we have a fairly good idea of the original extent of wetlands in the United
States before colonization.55 Here we have actual settler’s reports, the accounts of surveyors in
the National Land Surveys for most areas west of the Appalachians and soil maps that indicate
where water was present on or near the surface for long periods. These suggest that there were
around 221 million acres of wetlands of various types in the 48 lower states. If put all together in
one place this would cover the states of Texas and Oklahoma.

The distribution of wetlands in the 1780's and 1980's.
Public domain by USGS from http://www.npwrc.usgs.gov/resource/wetlands/wetloss/fig_3_4.htm
Many states originally contained more than 3 million acres of wetland. There were large
complexes on either side of the Mississippi that extended up along valleys of its major
tributaries. The Chesapeake Bay was a complex of islands and marshes penetrating up the
Potomac, Susquehanna, and other rivers and included marshes that are now covered by
Washington DC. New York harbor and the Hudson River were joined to large tidal wetland
complexes in New Jersey and up the Connecticut coast. Large wetlands existed south of Lake
Erie and Lake Michigan that were drained to create farmland and what is now the city of
Chicago.56 Large areas of California’s central valley were wetlands before they were drained and
converted into lettuce fields.
In a little more than 200 years more than half these wetlands were drained and converted
into urban areas and farmland. The federal government, in the interest of developing economies,
improving navigation, and protecting public health, actively supported much of this drainage
starting the in the early 1800’s. It is only recently that we have begun to examine the wisdom of
this policy and put in place policies to protect wetlands. These policies have slowed wetland loss,
which was as much as 250,000 acres per year as recently as 198057.

States in red lost 50 to 90 percent of their wetlands between 1780 and 1980.
Public domain by US fish and Wildlife from Wetland Status and Trends in the Conterminous United States, mid
1970’s to mid1980’s at athttp://www.fws.gov/wetlands/Documents/Wetlands-Status-and-Trends-in-the-Conterminous-United-States-Mid-
1970s-to-Mid-1980s.pdf
Okavango story
Many large wetlands are under threat around the world. When the Amazon River and its
tributaries flood they create a complex wetland area. The deltas of the Mississippi, Mekong,
Ganges, Rhine, Nile, Danube, and Volga have long been places where humans harvested fish and
shellfish. Important wetlands were formed where water drains into basins such as the Aral Sea in
central Asia, the Dead Sea in the Middle East, the Pantanal between Brazil, Paraguay, and
Bolivia.

The Pantanal is a large wetland complex in central South America
Public domain by NASA from http://en.wikipedia.org/wiki/File:Pantanal_55.76W_15.40S.jpg
The Okavango is one of the longest rivers in Africa but never reaches the sea. The
headwaters of the Okavango rise in Angola and Namibia and join together to form the river
which flows into Botswana and the Kalahari Desert. As the river flows into the desert it spreads
out to form a delta that supports wildlife throughout central Botswana. The delta waxes and
wanes with the rainy season. When there is enough water it overflows into the dry salt pans in
the desert, creating a feeding paradise for flamingos and other wetland birds.
The Okavango also flows through one of the driest regions on earth. While Angola,
Namibia and Botswana have formed a joint water management commission whose goal is to
coordinate in managing the water resources of the river in a sustainable manner the commission
also has the goal of satisfying the social and economic needs of the three states.

The Okavango flows into the Kalahari desert and spreads out
Public domain by NASA from http://earthobservatory.nasa.gov/IOTD/view.php?id=51190
The river is largely undeveloped for irrigation, industry or urban uses even though it
flows through a region thirsting for water. In its current state it supports half a million people on
the basis of its natural products, and tourism. In Botswana tourism is the second largest earner of
foreign currency. Populations and agriculture are growing and there is demand to divert more
water take care of these needs. Withdrawing more for other purposes will have direct
consequences for the natural ecosystems but Angola and Namibia both want a share to support
growing economies and populations. 58
Deserts
One of the places where human impacts on vegetation, soils, and landscape are most
likely to show up is on the edges of deserts. Deserts are formed near the thirtieth parallel north
and south where dry air descends sucking up moisture. As rainfall increases deserts transform
into scrub and grassland. Normally they are covered with scattered trees and bushes and thin
grasslands.
Semi desert regions are not good candidates for agricultural cropping but they make
adequate pasture if treated kindly. The people who live in these regions are often herders who
know how to maintain the land in a sustainable manner.
Many of these regions are in developing countries where overpopulation is pushing
people onto marginal lands. The Sahel region south of the Sahara desert is a good example. The
remains of the colonial social system have changed how the people who live here use the land.
These countries are undergoing rapid population growth in wet agricultural regions. Their
governments want to increase agricultural production and reduce political unrest by promoting
migration to semi desert regions.

Regions in red are vulnerable to desertification from human activities.
Public domain by NRCS from http://soils.usda.gov/use/worldsoils/mapindex/dsrtrisk.html
The migrants come from rain fed farming regions so they are not culturally equipped to
live in semi desert ecosystems. The farmers open the soil and remove trees and bushes that keep
the soil in place. They force nomads to move further into the desert where their herds are too
large for the grazing available and overgraze the available land. The farmers and the grazers
leave the soil without vegetation making it vulnerable to wind erosion which carries away the
thin fertile topsoil further impoverishing the ecosystem and its inhabitants. If this continues for
long enough the vegetation fails to recover during the occasional wet years and the desert
expands, pushing nomads and farmers to migrate. As long as the population remains higher than
the land can support the process repeats itself and the desert moves outward.
Similar processes are happening in other semi desert regions. India used to support wet
and dry forests. Haiti used to be tropical rainforest. In the last two centuries these have been cut
and the top soil has eroded away. This has changed the hydrology of their ecosystem so rain
quickly runs off the hard subsoil leaving parched land that grows less and less behind.
Solid waste
Early nomads did not worry about where their personal garbage went. It was all
biodegradable and was completely recycled. When the pile behind the cave or settlement became
too large, they pulled up stakes and moved to the next nice campsite. By the time they came
back, the smell was gone and the soil had reclaimed their wastes.

Model of an outhouse which opened into a pigpen used in ancient China and still in use in
the rural Philippines.
By John Hill under the CCA 3.0 license at
http://en.wikipedia.org/wiki/File:Green_glazed_toilet_with_pigsty_model._Eastern_Han_dynasty_25_-_220_CE.jpg
It was only when people lived in the same place for long periods that waste became a
problem. Early settlements were only occupied for part of the year. The earliest houses consisted
of a room with four walls entered through a hole in the roof. Early people dumped their garbage
in a corner of the room. When the room filled up they built a new one. It wasn’t worth taking the
garbage out. As settlements became more permanent, midden heaps developed. The garbage in
the middens was still mostly organic bones and shells and inert pottery shards.
Garbage disposal was one of the first factors in promoting centralized government with
laws. By the Golden Age of Athens there were laws that controlled what could be disposed of
where. You had to carry your garbage at least one mile outside of the city walls before you could
dump it. Rome may have had the earliest garbage pickup system. They used two man teams
whose duty it was to patrol the city streets collecting waste into a wagon. Benjamin Franklin
started the first municipal garbage pickup service in the US in 1759. He used slaves to transport
waste from Philadelphia downstream before throwing it into the Delaware River.59
Many cities had free roaming animals until recently. Until the 1850’s most European and
US cities had herds of free ranging pigs that ate food waste thrown out into the streets. By 1900,
there were 3 million horses in American cities each producing more than 20 pounds of manure

per day which was left on the streets. When animals died their bodies were disposed of by
throwing them on the street. This was banned between 1850 and 1900 as part of the public health
movement. As the 19th century wound down cities began providing garbage and sewage
collection service. Cities along rivers dumped their garbage directly into the waterway.
Manhattan dumped its garbage into the East River until the 1870’s when it started barging the
garbage it to Long Island Sound.
During the 1880’s many cities built incinerators to burn trash. Many of these were
abandoned in the early 1900’s when transportation became cheap and landfill disposal became
possible. Many small towns and cities also ran piggeries. The pigs were fed on raw and cooked
food waste. As garbage services spread fees for disposing of garbage accompanied them.
Littering was now a crime. There sprang up a class of economic free riders who attempted to
escape the fees by throwing their trash in vacant lots, rivers and streams, and into the road.
In the last half of the 19th century and early part of the 20th, consumer products started to
make an appearance in trash. Celluloid was invented in the 1860’s and used in billiard balls and
shirt collars. Beer bottles came equipped with metal caps in the early 1890’s. The first
Woolworths opened in 1879 in Utica, New York. The goods came with packaging to make them
harder to steal. Gillette invented the disposable razor in 1895. Paperboard came into widespread
use in the early 1900’s. Montgomery Ward’s began its mail order operation when the Post Office
allowed the first “junk mail” postal rates in 1904. Paper cups came into use in 1908 in water
vending machines, replacing the tin cup that was used by everyone. In 1912, cellophane was
invented, beginning the product packaging revolution.
Not all of these manufactured products were biodegradable, and some were toxic. Their
production marked the beginning of the consumer economy, and the need for places to put the
wastes generated by the consumer economy. This meant the development of publicly and
privately managed systems for disposal and laws to protect the public and the natural
environment from the disposal of hazardous materials.
By 1900 each American was annually producing between 80 and 100 pounds of food
waste, 50 to 100 pounds of rubbish and between 300 and 1,200 pounds of wood or coal ash. As
the 20th century continued more consumer products with more packaging were developed that
required disposal. Manufacturing wastes grew along with them. In 1899 congress passed

amendments to the Rivers and Harbors Act, a law which protects navigation. One provision
prohibited dumping trash into waterways. This was the start of regulation of garbage in the US.
The Meadowlands: first in garbage
Large scale solid waste disposal began with the development of the open dump. Cities
and towns began to seek out places where they could put their growing heaps of trash. By the
early 1920’s wetlands become the favored place. The philosophy was that they were wastelands
that need to be reclaimed for more productive purposes.
New York City used the nearby Meadowlands. Once the Meadowlands were more than
35,000 acres of tidal cedar forests, salt marshes, and freshwater wetlands that covered the New
Jersey shore from Newark to Hackensack. These wetlands were important to the regional global
ecological systems. There were part of the Atlantic migratory bird flyway and contained marshes
and forests that fed the oyster beds and estuarine ecosystems in the New York harbor region.60
The Meadowlands were the perfect dumping spot. They are only 5 miles from
Manhattan. Thomas Edison’s workshops were also nearby and many of his early factories. The
ports of New York and New Jersey also attracted early industry. The cities and towns that gave
rise to the American Industrial revolution surrounded the Meadowlands and all were looking for
cheap and convenient places to put what was no longer wanted.
Over the next century 35,000 acres of wetland were reduced to less than 9.000 as garbage
was trucked in from New Jersey and New York City. Newark airport and the port facilities at
Elizabethtown, New Jersey were constructed on the former wetlands after they were filled with
New York City municipal trash and building wastes. The sports complex that houses the New
York Giants football team is built on a landfill in the Meadowlands.
The Meadowlands were once filled with dumps, both legal and illegal. The mafia and
some large companies are rumored to have had operations that were only open after dark. Jimmy
Hoffa is rumored to be buried under the end zone in the Giants football field.
The early dumps received a mix of household, construction, and industrial wastes. During
the late 19th and early 20th century plastics, paints, and many other toxic chemicals were mass
produced in large quantities for the first time. The toxic wastes include mercury, organic and
inorganic compounds with which we have very little experience. Many were sited in places
where they contaminated groundwater sources of drinking water. Few records were kept of what

was dumped where. Companies seeking to avoid fees for proper disposal dumped their wastes
wherever they could.
The Meadowlands dumps were deposited over tens of square miles, almost wherever
trucks could gain access to the edge. The early dumps were haphazard, with garbage piled up
wherever it was convenient. They were open to the elements, without safeguards to keep garbage
from blowing off into nearby communities. Occasionally they caught fire. When the fires
escaped underground they could burn for weeks and months. The fires dropped ash and spread
toxic fumes into the surrounding municipalities, damaging property and the health of children,
the elderly and the infirm.
The loss of natural habitat in the 1950’s and 1960’s coupled with the fires and
groundwater contamination in the 1960’s brought the Meadowlands to the forefront of
environmental protection issues in New Jersey and led the state to create the New Jersey
Meadowlands Commission. The Commission was given the responsibility of overseeing land use
in the remaining Meadowlands and the dumps that surrounded them.
The Commission took charge of regulating garbage disposal. As a result, most of the
dumps were closed, and cleanup plans were put in place to reduce the environmental impacts. As
the environmental impacts came under control and the remaining wetlands were protected the
commission turned its attention to economic development in the surrounding depressed
communities. In the last few decades the focus of the Commission has changed from cleaning up
to managing the wetlands and promoting environmental education.
One of the unforeseen environmental consequences of closing down the dumps in the
Meadowlands was the creation of a regional market for waste disposal. Before it was closed, the
Meadowlands received garbage from many areas in southern New Jersey and from New York
City. As the local capacity was reduced these places had to look elsewhere to take their garbage.
They decided to export it to the Midwest. One of the consequences is that many commercial
shipping trucks that bring freight and food into the region leave with a load of garbage that they
take to dumpsites in in Pennsylvania, Ohio, and sometimes as far as Indiana.
Ocean Dumping
Another of waste disposal for many years was dumping at sea. Cities that had access to
the ocean used it as a convenient and cheap place for disposal.

New York City began dumping garbage, sewage sludge, and other undesirables 12 miles
offshore in the New York Bight in 1938. The dumping created a mound of underwater sludge
high enough to mark on navigation charts. The in addition to garbage and construction waste the
material included more than 100 million tons of waste petroleum products, millions of tons of
acid chemical wastes, and 100,000 tons of organic chemical wastes.61
Ocean dumping was halted in 1972 when Congress banned ocean dumping as part of the
Marine Protection Research and Sanctuaries Act.62 For the next 4 years, New York moved the
daily deposit of 400 tons of sewage sludge another 100 miles offshore. In 1992 it stopped
altogether, instead composting the sludge and deposited it in a landfill. The biological oxygen
demand at the sewage dump site was strong enough to drive the oxygen level in the water to 10
percent of saturation. Fish and shellfish that live near the dumpsite still have toxic levels of
heavy metals more than 30 years after dumping stopped. It was not until 1988 that radioactive
waste was added to the list of banned materials. Between 1950 and 1988 the US dumped almost
90,000 containers of radioactive wastes in the Pacific and Atlantic.
The Khian Sea
New York City was not the only municipality to try to dump its garbage in the ocean. As
awareness of the liabilities and dangers of handling of toxic wastes grew dumpsites refuses to
take it. Philadelphia used incinerators to reduce the volume of its garbage and generate a little
heat and electricity. Incinerators generate ash as a waste product. The ash contains all of the left
over noncombustible toxic and hazardous materials.
In 1984 the state of New Jersey decided not to receive any more waste from the
Philadelphia incinerators. In 1986 they tried to dispose of it by loading 14,000 tons on the
freighter Khian Sea. They sent it to a manmade island in the Bahamas. When they were refused
the city refused to pay the owner of the ship. Over the next 16 months the freighter tried to
unload in the Dominican Republic, Honduras, Panama, Bermuda, Guinea Bissau and the Dutch
Antilles. They did manage to offload 4,000 tons near Gonaives in Haiti, but were warned off by
the Haitian government before they could finish. The Khian Sea then went to Europe and Africa
and was refused again. During their travels the name of the ship changed twice but still no one
would accept the wastes. Finally it turned up in Singapore empty. It seems the ash that no one

wanted was dumped at sea. Several years later some of the ash left on Haiti was returned to a
landfill in Pennsylvania.63
Basel Convention
The Khian Sea and several other similar incidents led to the Basel convention in 1988
and passage of laws regulating the disposal of hazardous waste. The Resource Recovery Act in
the United States and sister laws in other developed countries made disposing of hazardous waste
in landfills so expensive that unscrupulous disposal companies went looking for cheap
unregulated places to use for disposal. Some of them found undeveloped countries with little or
no regulation where they left piles of hazardous, toxic, corrosive, and mutagenic materials
indiscriminately laying around. In 1988, an Italian company shipped 8,000 barrels of hazardous
waste to a farm in the town of Koko in Nigeria, which they had rented for 100 dollars a year.
Other nations have unwittingly accepted hazardous and toxic wastes that have infiltrated
groundwater and damaged human health. Controversy continues today over the shipment of
electronic wastes to poor countries for recycling by untrained workers who do not understand the
health risks of burning plastics and metals to recover recyclables.
The Basel Convention regulates international trade in hazardous waste by encouraging
generating countries to keep the waste close to home, and by discouraging disposal of wastes in
countries not technically able to manage them. It requires that nations receiving hazardous waste
be notified of the contents of shipments, and sign a statement of prior informed consent before
accepting the materials. Additional protections added later regulated trade in recyclable materials
that result in the generation of hazardous wastes and provided for a system to establish liability
for spills and an emergency response fund to ensure that spills are cleaned up in a timely
manner.64

This open landfill in Poland has no liner to keep water from seeping out.
By Cezary under the CCA 3.0 license at http://en.wikipedia.org/wiki/File:Wysypisko.jpg
Sanitary landfills
During the last century we developed from societies that produce mainly organic and
inert wastes which were safe to ones that produce wastes of many kinds, including chemical,
hazardous, toxic, reactive, and carcinogenic. Along this journey we changed the technologies we
use in waste disposal. We started with simple open dumps located on convenient pieces of land.
For older houses this meant the back yard, where bones, broken pottery, old toys, and other food
wastes were thrown out the back door. Where the back yard was not good enough we developed
open dumps where garbage was simply spread on the land. As we urbanized we developed
incinerator technologies that reduced the volume of wastes but produced ash. When we
discovered that toxic materials leaked from old open dumps into the groundwater, or ran off into
surfacewater, we invented new technologies that led to the development of the modern sanitary
landfill.65
The modern sanitary landfill contains systems that ensure that solid, liquid and airborne
wastes don’t escape into the environment at large. Protection starts at the base of the landfill,
which is designed to prevent surfacewater from leaking from the landfill into the groundwater.
The lowest layer consists of a compacted clay liner several feet thick, which creates a stable
base, and is impervious to water flow.

Above clay liner are layers designed to capture and remove water for treatment. They
consist of a bed of sand and gravel with embedded drainage pipes that capture water that has
passed through the garbage and pump it to a treatment facility. This containment system is
backed up by wells outside the landfill that test for change in groundwater contents.
Cutaway of the design of a sanitary landfill.
Public domain by EPA from http://www.epa.gov/superfund/students/clas_act/haz-ed/ff_06.htm
Garbage fill is added on a regular basis. It comes from many different sources and
sometimes has to be found after it has been deposited. In order to keep track of what was
deposited where the fill is deposited in cells sealed with a covering of soil at the end of the day.
The soil covering also keeps garbage from blowing away, keeps out animals, and reduces odor.
A storm fence around the perimeter also helps capture windblown garbage. Landfills located
near residential areas spray scented water into the air to keep down dust and reduce odors.
When a landfill is filled to capacity it needs to be closed. At this point, it has to be
protected from rainfall, winter temperatures, wind, and animals. Most of this is accomplished by
capping it with another layer of clay followed by a layer of soil that is planted with vegetation.
Following closure, the landfill has to be monitored for shifts and cracks in the cap.
Landfills also generate gases from decomposition. Methane can explode if not allowed to
escape so landfills have to install methane monitoring and harvesting systems. Many landfills

harvest enough methane to sell. Rumpke Mountain is one of the ten largest waste dumpsites in
the country. It serves Cincinnati and the surrounding area in southwestern Ohio. In the last few
decades it has become the sixth highest point in Ohio. It harvests enough methane to power
25,000 homes.
The most recently designed landfills have included systems to maximize methane
production by promoting controlled decomposition. This increases the rate of methane
production by promoting decomposition which reduces the volume of material in the landfill,
increasing its longevity.
Sanitary landfills are expensive operations that require large pieces of land to operate.
They are hard to enlarge when cities grow up around them. Since they charge by the ton or cubic
yard it makes sense for municipalities to reduce the flow of wastes. They do this by appealing to
our better natures and by introducing a scale of increasing costs for what they pick up. Some
cities have stopped accepting yard waste, or separate it from household garbage and compost it.
Larger municipalities often offer recycling to remove metals and paper. They often offer toxic
waste pickup or drop off to keep batteries, paints, and other household toxics out of landfills.
Many landfills no longer accept appliances and construction waste. Many municipalities have
changed from a flat fee for pickup to a fee per container. This induces people to reduce the
amount of garbage they generate by buying products with less packaging, and finding ways to
reuse and recycle more.

Mount Rumpke is the sixth highest point in Ohio.
By Littelt889 in the public domain at http://en.wikipedia.org/wiki/File:Mount_Rumpke.jpg
One way that we appeal to our better natures is through the popular slogan: Reduce,
Reuse, Recycle. The main intention behind the three R’s is to reduce our demand for resources,
but it also has the consequence of reducing waste materials at the other end of the product use
cycle. Reducing the amount of materials used in the production and packaging of commercial
products also reduces the amount of waste that goes into a landfill. Enclosing a new product in
thick plastic surrounding a box that contains paper inserts produces much more waste than a
cardboard card.
How much we generate
Solid waste is what is left over after resources have been used to accomplish some task or
create some thing. It can be divided into industrial and municipal waste. Industrial wastes are the
remains of manufacturing. They include cleaning chemicals that may be toxic, caustic,
teratogenic, or carcinogenic, and paper that was cut from the edges of large rolls. Municipal

waste includes food, packaging, and other garbage generated by households, businesses, and
towns and cities. It includes the end products of consumer goods and food including the
packaging used in transporting them and making them attractive to consumers. It includes the
mineral remains of rock used for making gravel, cement, and the ash from burning coal and
incinerating garbage. To this we could add consumer waste in the form of plastic used as rugs,
home siding, drink bottles, and clothing. On top of this we could add discarded glass and metals,
including iron, copper, and aluminum, paper, cardboard, wood, yard, and food waste. A new and
growing category is discarded electronic goods, such as printers, computer monitors, cell phones,
and televisions. Finally, we could add the oil, transmission fluid, coolant and tires necessary to
keep transportation moving.
Instead of using gross national product or income per capita to describe the affluence of a
country an environmental scientist might instead use pounds of waste discarded per capita. Data
for most what is discarded are collected national governments. These show that developed
countries such as the United States, France and Luxembourg, countries with oil such as Norway,
and countries with very low population density in relation to their natural resources such as New
Zealand, Canada, and Norway, produce more than 1000 pounds of waste per person per year.
Developing and landlocked nations such as Poland, Turkey, Hungary, and Mexico produce less.
Nations with steep topography such as Japan and Korea also produce less.
Newly generated municipal wastes weighs between 1200 and 1600 hundred pounds per
cubic yard. After it is buried and compressed the density may go up to between 1700 and 1900
pounds per cubic yard. Using 2000 pounds per cubic yard makes the division problem easier but
gives us an underestimate of the cubic yards of waste generated per person per year. Multiplying
this times population gives the total cubic yards of waste generated per year.
The total amount of garbage generated gives us a measure of the garbage burden of each
country. The prize for the maximum total amount of wastes generated goes to the United States,
with more than 232 million cubic yards of waste generated per year, followed by Germany and
Japan at a distant second with close to 55 million cubic yards each. These countries lead because
they have large and affluent populations. Turkey, France, Italy, and Spain are highly developed
countries with moderate populations. They come in third with somewhere between 30 and 40
million cubic yards per year. Mexico barely makes it into this group because it is developing and
has a high population. Norway, Denmark, and Ireland, all countries with high per capita rates of

waste generation also have very small populations, and thus come in at less than 10 million cubic
yards or less per year.
We can also use this data to look at the national intensity of land use. The resources used
to make the garbage had to come from somewhere. At the end of the journey the waste generated
has to go somewhere. When we look at the total amount of wastes generated per unit of national
land area we get an idea of how much land is needed on which to hide the wastes after we are
done using it. Assuming that all of the resources necessary to produce the wastes came from the
country in which they are being disposed we also have a measure of the intensity of resource
production in the country. Since countries import and export this is not likely to be true, but it
provides a starting point and allows us to identify unusual cases that need to be explained.
Dividing total cubic yards by the national territory we get the cubic yards of waste
produced per square mile of national territory. By this measure the country that is using its
territory most intensely is the Netherlands at 686 cubic yards of waste generated per square mile
of national territory, followed by South Korea, Belgium, Germany, and Japan, all somewhere
between 375 and 525 cubic yards per square mile. The only reason the United States is not in this
group is that it is a large country with large barely occupied regions. Nations in this group are
using their environment intensely for agriculture, and engage in trade at the world level. Nations
at the low end of the scale, such as Iceland, Australia, Canada, and New Zealand have high
levels of waste production and low population density.
Nations that generate a large number of cubic yards of waste per square mile of territory
also have to watch where they put these wastes. They have comparatively less space in which to
site and place landfills. If these landfills leak they are more likely to be near important rivers,
lakes, cities and agricultural areas too. They ship their garbage more than 500 miles away to
dumps in Indiana and Ohio.
Country
Pounds
per
person
Cubic
yards
Population
(millions
in 2000)
Million
cubic
Yards
Area
(1000 mi2)
Cubic
Yards
Per
square
mile
of
territory
Yards
deep
over
one
square
mile
Norway 1672 0.84 4.6 3.8 125 30.7 1.2
US 1650 0.83 281.4 232.2 3717 62.5 75.0
Denmark 1628 0.81 5.4 4.4 16.6 265.0 1.4
Ireland 1628 0.81 4.1 3.3 27.1 123.2 1.1

Luxembourg 1562 0.78 0.465 0.4 1 363.2 0.1
Australia 1518 0.76 19 14.4 3000 4.8 4.7
Spain 1430 0.72 43 30.7 195.3 157.4 10.0
Switzerland 1430 0.72 7.25 5.2 15.9 326.0 1.7
Canada 1408 0.70 31.5 22.2 3855 5.8 7.6
Netherlands 1364 0.68 16.3 11.1 16.2 686.2 3.6
Germany 1320 0.66 82 54.1 137.9 392.5 17.5
New
Zealand 1232 0.62 4 2.5 270.5 9.1 0.8
Austria 1232 0.62 8.2 5.1 32.4 155.9 1.7
France 1188 0.59 59 35.0 247.4 141.7 11.3
Italy 1188 0.59 57.6 34.2 116.3 294.2 11.0
Iceland 1144 0.57 0.295 0.2 103 1.6 0.1
Sweden 1056 0.53 9 4.8 173.9 27.3 1.5
Finland 1034 0.52 5.25 2.7 130.7 20.8 0.9
Portugal 1304 0.65 10.5 6.8 35.6 192.3 2.2
Belgium 1012 0.51 10.4 5.3 11.8 446.0 1.7
Hungary 1012 0.51 10.1 5.1 35.9 142.4 1.7
Greece 968 0.48 11.1 5.4 50.9 105.5 1.7
Turkey 968 0.48 73.2 35.4 302.5 117.1 11.4
Japan 880 0.44 127 55.9 145.9 383.0 18.0
South Korea 836 0.42 48 20.1 38.5 521.1 6.5
Mexico 748 0.37 97 36.3 758.5 47.8 11.7
Poland 550 0.28 38.5 10.6 120.7 87.7 3.4
Municipal garbage generation in selected countries.
Area and population data were obtained from the CIA Factbook for 2011. The density of 2000 pounds per square
yard is an overestimate of the 1600-1900 pounds per square yard available from
http://www.environmentalistseveryday.org/publications-solid-waste-industry-research/information/faq/municipal-solid-waste-landfill.php
making the area calculations an underestimate. Pounds generated per person from OECD.
Another way to look at waste is by asking how much land must be set aside for land
filling. This depends on how high we allow the landfill to grow. The largest landfill in the United
States was the Fresh Kills landfill. It grew to cover more than 2200 acres and rose to around 225
feet high, 75 feet taller than the Statue of Liberty, before it was shut down in 2001. Many other
landfills have also approached this height. Taking this as the maximum, we can look at how
rapidly a nation would fill up a landfill of one square mile. Dividing the number of cubic yards
generated per year by the number of yards in a square mile gives the number of garbage yard
miles (square miles covered one yard deep in waste) per year. This gives us an underestimate of
the height that the garbage would reach since it does not include the soil added to seal garbage

cells when they are filled. Taking these assumptions as valid, the US has to generate a new
square mile to use as a landfill site more than once a year, Germany and Japan almost every 5
years, and Mexico, Italy, France and Spain at least every 7 years. Most other developed nations
are small enough that they can wait between 15 and 20 years before their square mile of landfill
is filled.66
Waste is a resource
Even though landfills cover a small area they are expensive to build and maintain, and
finding the right spot on which to put them is difficult. They are what some people call a LULU,
an acronym for locally unwanted land use. When they are proposed for location they cause many
prospective neighbors to go NIMBY on the proposal. NIMBY is an acronym for not in my back
yard. The cost of siting a landfill, public opposition, the rising cost of labor, equipment and land,
and the growing cost of obtaining virgin resources has increased interest in decreasing the waste
stream so that landfills receive less waste and last longer. This has led to the development of the
waste management hierarchy as a set of guiding principles.
The waste management hierarchy.
By Stannered under CCA 3.0 license at http://en.wikipedia.org/wiki/File:Waste_hierarchy.svg
Prevention and reuse
The first principle is to prevent the creation of wastes in the first place. Business offices
used to use a lot of paper for keeping records and communication. As computer programs have
become more sophisticated they have reduced the need for paper. Now many activities that
required paper have been replaced by the use of computers. We view documents, read books,

send letters and keep records all without paper. We could say that computers have become an
economic substitute for paper.
One way to prevent the use of resources is to create products that can be reused many
times. The idea for reusable beverage bottles was developed in Britain and Ireland in the early
1800.’s. Sweden introduced the bottle deposit in the late 1880’s. In the US milk, beer, and Coca-
Cola used to come in thick bottles that were returned to the bottling plant, washed, and reused.
Well-made recyclable bottles can be reused more than 20 times. Most countries outside the US
still use returnable bottles for beer and soda and charge a hefty deposit to make sure that they get
returned. Charging for the use of the bottle ensures that the user or some other person has an
economic interest in returning them, keeps them off the roads and out of the woods where less
conscientious people leave them, and uses less energy. In many countries there is higher than a
90 percent return rate of deposit bottles sold in supermarkets.
Milk bottles waiting outside the front door..
By Unisouth under CCA 3.0 license at http://upload.wikimedia.org/wikipedia/commons/8/82/Milk_Bottles_on_Doorstep.jpg
Minimizing waste through reduction
Another way to reduce the amount of resources entering the waste stream is to minimize
the amount to create a product. Metal cans for beer and soda pop fist came into general use in the
1930’s. During the next 50 years they slowly replaced returnable bottles as convenience became
more important that conservation. The first ones were made out of steel and were heavy. You
opened them with a can opener. In the 1950’s we learned how to make steel cans with aluminum

tops with a pull tab to open them. These weighed less, and of course were more convenient.
Later on the all-aluminum can was developed with very thin walls. They weighed much less than
the all steel cans, allowing bottlers to minimize the amount of metal used.
We have been undergoing the same process with plastic water bottles. As people have
become more suspicious of public water supplies they have switched to buying water in plastic
bottles. Older bottles contained much more plastic than what is available today. Minimization is
the current mantra of the computer industry, which has managed to shrink a machine the size of a
room down to what can fit in a pocket. Of course, Jevons Paradox still applies. If products
become cheaper because they use less resources and we demand more products because they are
cheaper then the only thing that is being minimized is the amount of resources used per product.
A pull tab from the 1970's.
Public domain by G. Allen Morris III from http://en.wikipedia.org/wiki/File:Beverage_pull_tab.jpg
Recycling
If there is no other option but to discard a product then almost the last resort is to recycle
the materials from which it was made. Hopefully good design reduced the amount of materials to
be recycled and made them easy to disassemble so discarded products can be easily reduced to
component parts.
Unfortunately this is not always the case. The introduction of bimetallic beverage cans in
the 1950’s made them harder to recycle which was a motivation for developing all aluminum
cans. It is hard to recycle mixed plastics but, in order to make sure that they close securely,
plastic bottle manufacturers use a different plastic in the cap than in the bottle. The bottles are
made from polyethylene terephthalate, commonly known as PET and the caps are made from

polypropylene, which abbreviates to PP. When recycled drink bottles are prepared for processing
into new products they are chipped into tiny flakes and melted. PP has a melting point much
lower than PET. If they are processed together they tend to separate naturally resulting in a
product that weaker and with less than optimal characteristics. For this reason, most
municipalities only take bottles without caps. Both are recyclable, but they need to be separated
before they can be processed. Separation takes time and money, so they opt for accepting what is
easiest to deal with, which in this case is the bottles.
We have practiced recycling since antiquity on high value materials. Before the industrial
revolution metals were expensive. Broken and worn tools were taken back to the smithy to be
reworked into the metals that made their replacements. In cities where coal was burned the ash
was collected by dustmen and used for making bricks. Recycling this ash saved on disposal costs
and the costs of obtaining other materials for brick making. This practice also reduced the need
for municipal waste disposal systems at the time. The word shoddy comes from a process
developed in the early 1800’s in which rags and discarded woolen cloth were converted into felt
like materials.67 Early peddlers did more than carry goods around to sell in rural areas. They also
collected unwanted materials and brought them to craftsmen who could recycle them. They also
picked through garbage heaps for usable materials, much like many poor people in developing
nations around the world today. Scrap metals were always easier to use and cheaper than
obtaining new metals from ore. Early railroads were often in the business of buying, transporting
and selling scrap metals.

Garbage pickers in a dump in Brazil.
By Marcello Casal Jr. under CCA 2.5 license at
http://www.agenciabrasil.gov.br/media/imagens/2008/02/20/1325MC0175.jpg/view/normal
The World Wars were a great stimulus for recycling. They caused shortages of materials
that could be recycled which saved energy and farmland for other uses.. 68 Shortages of almost
every important raw material drove nations to mount recycling drives, exhorting their citizens to
save fiber, metal, oils, rubber, and other material that could be reused and recycled.
After the wars the need to recycle receded, and people went back to doing what was
convenient. The availability of cheap energy made using raw materials cheaper than recycling,
even with transportation costs thrown in. The growth of consumerism and waste generation went
on until the oil shocks of the 1970’s made energy, and thus everything else, more expensive.
Since then most large communities in developed countries have developed programs for
recycling glass, metals and paper. Municipal recycling programs have continued to spread as
energy costs have continued to rise.
Poster promoting recycling from the Second World War.
Public domain by Office for Emergency Management War Production Board at
http://en.wikipedia.org/wiki/File:Scrap%5E_Will_Help_Win._Don%27t_Mix_it_-_NARA_-_533983.jpg

One important requirement for a successful recycling program is a consistent supply of
materials and demand for those materials. Often this is accomplished through laws that set up
systems to create supply. Container deposit legislation puts a price on throwing them out of car
windows and creates an incentive for consumers to return them to get their deposit back. This
creates a steady supply of aluminum, glass, and plastic that manufacturers can count on. Often
governments mandate the recycled content of what they buy and who they buy from, creating a
market for recycled products. Many businesses have jumped on the bandwagon, promoting their
products on the basis of how much recycled material they contain.
The rate of recycling has gone up since the development of municipal recycling programs
in the early 1990’s.
Public domain by US EPA at http://www.epa.gov/epawaste/nonhaz/municipal/index.htm
In spite of rising energy costs, virgin raw materials are often cheaper to buy than recycled
materials. This is often because the full benefits of recycling to society are not reflected in the
price of recyclable raw materials. This price does not include the benefit of the landfill space
saved or the environmental damage avoided by diverting materials that may be hazardous or
toxic from being deposited in landfills or on the landscape, or the benefit of having them
deposited into a controlled recycling process where they can be disposed of so they will do the
least harm. These externalities in the value of recyclables are not included because the people
who gain are not paying for their gains.

Many of the materials found in municipal waste contain energy.
Public domain by USEPA from http://www.epa.gov/epawaste/nonhaz/municipal/index.htm
Recycling has caught on in the last few decades, starting from very little to more than 30
percent of some types of discarded materials. Most auto batteries are recycled because they
sellers ask when you buy a new one. This keeps lead out of landfills. Newspaper and steel cans
also have a high rate of recycling, probably because they are consumed at home where most
recycling starts. Glass, aluminum, and plastics have a lower rate of recycling, possibly because
they are consumed out of the home and away from opportunities for recycling.69

Per capita generation of solid waste is declining. The total amount generated has leveled
off.
Public domain by US EPA at http://www.epa.gov/epawaste/nonhaz/municipal/index.htm
Recovery and disposal
When recycling is not possible the only option left is to recover energy and dispose of
what is left in a properly run landfill. The energy content of municipal waste depends on what is
in it. Paper, plastics, rubber, and wood have high heat content. Food and yard waste have
intermediate heat content. Metals and glass have almost no heat content.
Recycling rates for components of municipal waste.
Public domain by US EPA at http://www.epa.gov/epawaste/nonhaz/municipal/index.htm
About 15 percent of municipal waste is used to generate electricity in incinerators.
Another thirty percent is removed for recycling, leaving around 55 percent to go to a landfill.
Between the 1960’s and the 1990’s the total and per capita rate of creation of municipal waste
went up as consumerism took hold on the economy. As the recycling programs of the 1980’s
took hold both the personal and total rate of waste creation leveled off. While there is not enough
data to evaluate future trends, we can hope that the trend is downwards.

European Green Dot laws
One way to ensure that waste reduction programs are effective is to require
manufacturers to provide for the recovery and recycling of their own products. This gives them
an incentive to minimize the material used in their products and make them easy to repair, reuse,
and recycle. In the European Union the recycling laws require that all manufacturers to recycle
their wastes when consumers are finished with them or pay into a centralized fund that provides
for waste collection and recycling. This gives manufacturers an incentive to reduce the use of
resources.
Urbanization
Industrialization and improved efficiency in agriculture has produced population growth
that was no longer needed in the countryside. Now, more than half the population of the world
lives in urban areas with suburban regions around them.
Urbanization around the world.
By Rotterdamu1234 under CCA 3.0 license at http://en.wikipedia.org/wiki/File:Urbanisation-degree.png
Foodsheds
Over the last 1000 years the distance from which food can be brought has steadily
increased as preservation methods have improved, and transportation became more efficient and
faster.
Most food spoils if left too long. Simple ways of preserving food include fermenting
grapes into wine, smoking ham, or salting fish. The Basque people who first discovered Georges

Bank and the Grand Banks brought back their fish by salting it. The Eskimo’s of Alaska preserve
salmon by burying it in the permafrost and allowing it to ferment in the ground.
Food preserved by canning.
Public domain by Library of Congress at http://en.wikipedia.org/wiki/File:PreservedFood1.jpg
The development of canning, railroads, and later freezers allowed the production of food
to move away from where it was consumed. It was not until the early 1800’s that the process of
canning was developed. The French navy was looking for a way to feed its sailors at sea so they
would not get scurvy, a disease that occurs when the body does not get enough vitamin C. They
hit upon the practice heating food to kill bacteria and sealing it so no new bacteria could enter.
As the source of food got farther away from the point of consumption urban areas began
to develop foodsheds. Foodsheds are like watersheds. Watersheds are the area from which water
was gathered in order for it to flow through a river or stream, or point in space. Foodsheds are

the area from which food comes to reach a point of consumption. Wheat to feed the people of
Rome came from North Africa and Egypt. They were part of its foodshed. The foodshed of
modern urban areas reach around the world. Grapes come from Chile, cheese from France, wine
from Australia, salmon from Scotland.
Cities and migration
Until the growth of transportation and preservation cities got their food from the
surrounding countryside. New Jersey is called the Garden State because it used to be where the
vegetables for New York and Philadelphia were grown. When New York City was small
Brooklyn and Manhattan were covered with small farms. Long Island had potato farms. Large
cities are now too large for their immediate surroundings to supply them with or resources. Many
of them have grown over the lands that used to supply them as they have grown outward, also
driven by the revolution in transportation that allows people to live far from their jobs. Many of
them are continuing to grow as people move from the countryside to the city.
US census data showing the migration of young people away from rural Pocahontas
County towards urban Johnson County, Iowa.
By Artur Jan Jijalkowski under CCA 3.0 license from http://en.wikipedia.org/wiki/File:Rural_flight.jpg

At 4000 BC the largest cities in Mesopotamia were only a few thousand people. By 3000
BC Uruk and Abydos may have had populations of more than 10,000. By 1500 BC there may
have been a few cities with a population of more than 100,000. It took until about 0 BC for
Chang’an, Rome and Alexandria to reach a population of 1 million. Until 1900 the number of
cities with populations larger than one million could be counted on the hands. Now you have
stop at cities with populations greater than 20 million if you don’t want to run out of fingers and
toes. The top ten metropolitan areas today are Tokyo at more than 34 million, Guangshou at 26
million, Jakarta, Shanghai, and Seoul at more than 25 million, Mexico City and Delhi at around
24 million, and Karachi, Manila, and New York city at around 22 million. The list ends with Sao
Paulo and Mumbai at just over 21 million each.70
Urban areas are growing because people migrate from one place to another. Geographers
think of the forces stimulate people to move as push and pull factors. Push factors involve the
deficiencies of the local social and economic environment. When local conditions are very bad
people try to move away from them. Pull factors draw people towards them. The perception that
conditions are better elsewhere draws people seeking the opportunity to improve the conditions
of their life. Irish immigrants left during the potato famine because local conditions were
extremely bad. They continued to leave because of the allure of better conditions elsewhere.
Afghans left Afghanistan during their war with the Russians and during Taliban rule because
living conditions were bad. Some of them returned after the Taliban were driven out because
they anticipated that economic and social conditions would improve and they could take
advantage by arriving early. Often migrants are young and aspiring individuals who leave to find
greener pastures. Rural counties in the US are losing population to local and regional urban
centers because these offer better wages, opportunities to find suitable mates, and more pleasant
social opportunities. Often people with schooling and training are more mobile than people who
only have their muscles to offer, leading to local, regional and international brain drains as
people move to where their education and experience can give them better opportunities than
their place of birth.71
Land use regulation
As urban areas grow and become more complex economically and culturally the value of
protecting the landscape and how it functions becomes important. This leads to land use

regulations that attempt to preserve environmental or aesthetic values, and protect people from
the consequences of the actions of their neighbors. Zoning laws developed in the United States
following the example of New York City in the 1860’s. They restricted where buildings could be
built based on the activity in them and the rights of neighbors to have access to their customary
environment. Since then zoning laws and land use planning practices have been formalized in
most urban and rural areas in accordance with residents desire to maintain property and aesthetic
values.
Telegraph, telephone, and electrical wires were a stimulus for zoning laws starting in New
York around 1885.
Public domain by Library of Congress at http://en.wikipedia.org/wiki/File:Broadway-1885-APL.jpeg
The major legal restrictions on land use and zoning laws in the US are the 5th and 14th
amendments to the constitution. The 14th amendment requires that all citizens get equal
protection under the law. This requires that land use and zoning laws not be targeted at any one
group of person. The 5th amendment requires that the law not completely restrict a landowners
use and enjoyment of their property. Zoning laws give all landowners the ability to participate in
the design of their neighborhood and often give them the ability to limit land uses so that liquor
schools are not placed near schools and industrial areas are not created in the middle of
residential neighborhoods.

Land use and nature
How we use the land affects how the landscape functions and produces natural goods and
services. Land management affects how surface flow erodes the landscape. Under natural
conditions sediment production from the land is minimized by vegetation. When vegetation is
removed by overgrazing in arid lands surface water flow is more rapid and carries away more
stream bottom sediment, deepening streambeds and lowering water tables. Where groundwater
tables are lowered there can be improved farming as salty groundwater is lowered below the root
zone of plants, but it can also result in more severe flash floods in some places. Trails in arid
areas can create new streams where there formerly were none. Watersheds that are disturbed by
roads and home construction can release more than 50 times the sediments of other nearby
watersheds.72
Dams change how runoff from the land affects the deltas of rivers. Although the
Mississippi does not have a large dam on it similar to the Aswan Dam on the Nile, the deltas of
both rivers are receding and sinking because the sediments that used to reach them are now
trapped behinds locks and dams in the watershed or in canals and irrigation ditches in the deltas.
Loss of the Nile delta will have serious consequences for the more than 50 percent of Egyptians
who live there. Deltas are also shrinking on the Yangtze and Colorado.
We affect how wildlife use natural areas by changing how they migrate through the
landscape. Even small roads in a forest affect the availability of habitat to shy birds that will not
cross even small forest openings. Roads make it difficult for slow moving animals that do not
understand the danger and cannot cross very fast. A major source of mortality in turtles is
crossing roads to get to ponds to breed.
In the last fifty years we have developed and converted almost all of the land available
for agriculture. The final limitation on how large our population can grow is how much energy is
captured by plants through photosynthesis. Current estimates suggest that we divert more than 40
percent of the of energy captured by plants in some way to our use, either by eating it, feeding it
to animals that we eat, or by capturing animals from the wild that have eaten it.73 This suggests
that we can only allow world population to double one more time before we reach a population
size which involve having some impact on all of the biotic production of the earth. This assumes
that everyone stays at their current level of affluence.

Summary
The state of land is a strong indicator of how we are caring for the environment around
us. In the last 250 years forests and wetlands have retreated while deserts have advanced. This
suggests that we are overusing one our most important resources. Wetlands in the United States
have declined by about 50 percent. Large wetlands are threatened in many places around the
world. Forest and grasslands that show promise for agriculture have been converted, increasing
erosion. Management of rivers and streams for navigation and irrigation have changed the way
uplands feed sediments to lowlands, shrinking river deltas around the world.
At the same time the land has become the recipient of choice for our personal and
industrial wastes. Even though we have made great efforts at reducing the amount of materials
that go to landfills by recycling and reusing some of the waste stream still more than 50 percent
of what we generate is not recovered.
We continue to lose good farmland to the growth of urban areas. This growth often
consumes the very land that used to produce food as prime farmland is paved over and developed
for suburban and new urban space.


Notes
1 I lived in a corn planting region in the Philippines. When I asked people where corn came from they told
me it had always been there.
2 I was an agent in this process when I managed mice that were used in teaching biology.
3 See “The Agronomic Legacy of Mark A. Carleton” by G. Paulson in the Journal of Natural Resources
Life Science Education volume 30, 2001 for more.
4 Most of this story comes from Mark Kurlansky, “The Big Oyster”, an account of oysters and New York
City.
5 In ecology this is one of the patterns that people who study optimal foraging find.
6 This quote comes from the end of Chapter 4 which is page 30 in my edition of “The Wealth of Nation” by
Adam Smith, available at http://www2.hn.psu.edu/faculty/jmanis/adam-smith/wealth-nations.pdf.
7 Jared Diamond, “Guns Germs and Steel”
8 I travelled in Haiti before and after the floods in 2004.
9 This idea is described much more eloquently by Aldo Leopold in “A Sand County Almanac”
10 The film “Chinatown” is about this.
11 See “Cadillac Desert” by Marc Reisner, and “The Monkeywrench Gang” by Edward Abbey
12 Boston did not have adequate sewage treatment even in the late 1980’s. It became a campaign issue
when Michael Dukakis, former governor of Massachusetts ran for president in 1988.
13 Cincinnati still has combined sewer stormwater systems in the valley of Mill Creek that overflow
spreading sewage into basements. The sewers in Cleveland occasionally overflow during rainstorms, releasing raw
sewage into Lake Erie.
14 See Cary Grant in the old comedy “Arsenic and Old Lace”.
15 Lake Monroe in Indiana received so much sediment from farmland in its watershed that despite its high
nutrient content it was too dark to support algae.
16 Lake Tahoe and Lake George
17 Lake Washington near Seattle is one of the earliest examples of this.
18 For a long time the Panama Canal was a US protectorate. England and France did take over the Suez
canal for a short time in 1956.
19 When Red hind, a popular restaurant fish in the US Virgin Islands they were protected by closing their
breeding area from fishing. The closed area was very successful in increasing the number and size of Red Hind. As
the population of Red Hind increased fishermen complained that they had gotten larger than the size that restaurants
liked to buy. Apparently you can argue with success. Story heard from Dr. Tyler Smith.
20 “The Everglades: River of Grass” is the title of a book by Marjorie Stoneman Douglas published in
1847, the same year as the opening of the Everglades National Park. It described the degradation of the Everglades

by water diversion, nutrient enrichment, and water management that changed the natural hydrologic pattern of the
region.
21 I had this experience during the summer of 2004 in Oxford, Ohio. I wanted to take stream water quality
samples for high and low flow during a period in which there were two 100 year floods in the same week.
22 See “Water: The Fate of Our Most Precious Resource” by Mark Villiers.
23 Some of this and what follows is based on “A Forest Journey: The Story of Wood and Civilization” by
John Perlin. Any misinterpretations and overreaching are my own.
24 At least it was when I visited them. In Haiti conversion of wood to charcoal is in large part to blame for
the almost complete lack of trees on most of the Haitian landscape.
25 See “Salt” by Kurlansky for an account of ancient and modern salt making.
26 Plato describes these changes in the “Critias”, one of his dialogs.
27 Perlin.
28 An account of London’s killer fog can be found in “Killer Smog: The World's Worst Air Pollution
Disaster” by William Wise,
29An account of the Donora smog and other environmental pollution stories can be found in “When Smoke
Ran Like Water: Tales Of Environmental Deception And The Battle Against Pollution” by Devra Davis.
30 Lower per vehicle emissions can be overcome by people who have more vehicles than when emissions
were lowered.
31 “Earth Under Siege: From Air Pollution to Global Change” by Richard Turco contains an excellent
account of smog formation.
32 The ratio of the effect of methane to carbon dioxide is on a per weight basis. The ratio greater than 20
comes from the USEPA at http://epa.gov/climatechange/ghgemissions/gases/ch4.html.
33 There are many doomsday scenarios that involve the rapid release of methane. These include
explosions, changes in oxygen levels in the ocean, and others. Here is an example Benjamin J. Phrampus, “Recent
changes to the Gulf Stream causing widespread gas hydrate destabilization”, Nature490,527–530(25 October 2012)
34 US farmers expected a bumper corn crop in early 2012 when the weather was promising. A drought that
affected 80 percent of agricultural land developed in summer which lowered expectations. An account of the
impacts of climate on corn and the rest of the economy can be found at http://www.ers.usda.gov/topics/in-the-
news/us-drought-2012-farm-and-food-impacts.aspx.
35 These are my personal observations from places where I have lived.
36 There are several suggested mechanisms for the Devonian extinctions. Bond and Wignalla suggest sea
level change (Bond, DPG and PB Wignalla (2008). “The role of sea-level change and marine anoxia in the
Frasnian-Famennian (Late Devonian) mass extinction”. Paleogeography Palaeoclimatology Palaeoecology
263:107-118) Algeo and Scheckler (Algeo, T.J. and SE Schekler(1998). “Terrestrial-marine teleconnections in the
Devonian: links between the evolution of land plants, weathering processes, and marine anoxic events”.
Philosophical Transactions of the Royal Society B: Biological Sciences 353 (1365): 113–130.) suggest that the
evolution of plants changed how soils worked exporting nutrients from the land to shallow marine environments,

causing anoxia and death in reef communities. They discuss similar events affecting the Great Barrier Reef in
Australia today.
37 Keller G, Abramovich S, Berner Z, Adatte T (1 January 2009). “Biotic effects of the Chicxulub impact,
K–T catastrophe and sea level change in Texas”. Palaeogeography, Palaeoclimatology, Palaeoecology: 271 (1–2):
52–68.
38 This is happening in the Sierra Gorda Biosphere Reserve in the Mexican state of Queretaro.
39 See “Distribution of Alpine Tundra in the Adirondack Mountains of New York, U.S.A” by
Carlson, Bradley Z.; Munroe, Jeffrey S.; Hegman, Bill in Arctic, Antarctic & Alpine Research;Aug2011,
Vol. 43 Issue 3, p331 for an accounting of the climatic influences on arctic tundra in the Adirondack mountains of
New York.
40 The World Health Organization is currently preparing programs to deal with changing malaria ranges
(http://www.who.int/globalchange/projects/adaptation/en/index6.html). Models of malaria behavior suggest some
expansion of malaria into higher elevations as a result of changing climate ( FC Tanser, B Sharp, 2003. “Potential
effect of climate change on malaria transmission in Africa”. The Lancet Volume 362, Issue 9398: 1792–1798)
41 The changes in flowering phenology in Glacier Lily are described in Lambert, AM, AJ Miller-Rushing
and DW Inouye, 2010. “Changes in snowmelt date and summer precipitation affect the flowering phenology of
Erythronium grandiflorum (glacier lily; Liliaceae)” Am. J. Bot. 97:1431-1437
42 Brown clouds are a new feature in our understanding of global warming. Their effect on Asia is
described in “Warming trends in Asia amplified by brown cloud solar absorption” by V Ramanathan, MV Ramana,
G Roberts, D Kim, C Corrigan, C Chung and D Winker in Nature 448, 575-578 in 2007.
43 An account of fires in Borneo can be found in Spatiotemporal fire occurrence in “Borneo over a period
of 10 years” by A Langner and F Siegertin Global Change Biology 15:48–62, in 2009. A global view of the effects
of brown clouds on regional climate and the snowpack of the Himalayas can be found in the UNEP report
Atmospheric Brown Clouds: Regional Assessment report with focus on Asia which can be obtained at
http://www.unep.org/pdf/ABCSummaryFinal.pdf.
44 For an account of the growth of cities see Tertius Chandler, “Four Thousand Years of Urban Growth“
published by Edwin Mellen Pr., 1987.
45 Robert E. Davis, Paul C. Knappenberger, Patrick J. Michaels, and Wendy M. Novicoff (November
2003).”Changing heat-related mortality in the United States”. Environmental Health Perspectives 111(14): 1712–
1718. Also see New Jersey Department of Environmental Protection (2006-06-13).Weather and Air Quality.
46 Ezzati M, Kammen DM (November 2002).”The health impacts of exposure to indoor air pollution from
solid fuels in developing countries: knowledge, gaps, and data needs. Environ Health Perspect.” 110(11): 1057–68.
47 This could be understood as a consequence of Jevon’s paradox where higher efficiency lowers price
increasing demand.
48 One of Hitler’s major motivations in the Second World War was to obtain lebensraum for the German
people. This was the motivation for deporting Poles, Ukrainians, and Russians from conquered territory and
genocide against those who were not deported. An ecologist might call this successful competition. See his book

“Mein Kampf” for a more complete description of his plans. Hitler’s ideas were not original to him, and have since
been applied to the political discourse in other aggressive modern nations.
49 Some of this is my own. Some of it comes from “A New Green History of the World: The Environment
and the Collapse of Great Civilizations” by Clive Ponting. Other parts come from Something new under the sun by
JR McNeill. Both books discuss the interaction of technology and the environment from a historical perspective.
50 The story about the cow may have been made up. In any case the fire quickly burned a huge area of the
city aided by piles of firewood, wooden sidewalks and streets, and firefighters tired from fighting a different blaze
the day before. You can find out more about the fire at http://www.thechicagofire.com/.
51 Statistics drawn from reports by the Center for International Forestry Research 2004 and Barreto, P.;
Souza Jr. C.; Noguerón, R.; Anderson, A. &Salomão, R. 2006, “Human Pressure on the Brazilian Amazon Forests”
available at http://www.globalforestwatch.org/common/pdf/human_pressure_final_english.pdf.
52 The return of moose, beaver, and coyote-wolf hybrids is documented in Peter Aagaard’s PhD thesis
“The Rewilding of New York’s North Country: Beavers, Moose, Canines and the Adirondacks” available at
http://etd.lib.umt.edu/theses/available/etd-05122008-125833/.
53 The Greenbelt Movement is an example of the developing idea of Social Entrepreneurship in which a
business is started that results in social transformation and empowerment. An account of several of these can be
found in “Social Entrepreneurship and Social Transformation: An Exploratory Study” by SH Alvord, LD Brown,
and CW Letts, published by the Hauser Center for Nonprofit Organizations as Working Paper No. 15. Available at
SSRN: http://ssrn.com/abstract=354082 or http://dx.doi.org/10.2139/ssrn.354082
54 Wetlands are somewhat protected under the Clean Water Act. Section 404 of the act gives the Army
Corps of Engineers responsibility for regulating the placing of dredged or filled materials in the navigable
waterways of the United States. Under some conditions this includes wetlands. In the 1987 Corps of Engineers
Wetlands Delineation Manual wetlands are defined as having vegetation, water present at the surface for at least part
of the year, and soils that contain evidence of the regular presence of water. Wetland vegetation lists are published
by the Fish and Wildlife Service and hydric soils lists are published by the National Soil Conservation Service. The
EPA has the right to review decisions of the Army Corps of Engineers.
55 A history of wetland condition and loss in the US can be found at
http://water.usgs.gov/nwsum/WSP2425/history.html.
56 Gene Porter Stratton wrote about these swamps in northeastern Indiana and the people who lived in
them in “A Girl of the Limberlost” and “Freckles” published in 1904 and 1909. Her descriptions tell of a place with
huge trees and many butterflies. Once covering more than 13,000 acres, most of it was drained and converted into
farmland.
57 Wetland loss in the US has been summarized by USGS at
http://www.npwrc.usgs.gov/resource/wetlands/wetloss/index.htm#contents.
58 Most of this story comes from “Water: The Fate of Our Most Precious Resource” by Marq de Villiers.
59 Franklin may have been the first environmentalist in the New World. In 1739 he and his friends
petitioned Pennsylvania to stop tanneries and other business from dumping wastes into the Delaware River. His

argument was based on protecting property values and the public good. In 1757 he started the first municipal street
cleaning operation. See http://www.environmentalistseveryday.org/publications-solid-waste-industry-
research/information/history-of-solid-waste-management/early-america-industrial-revolution.php
60 For more information about the Meadowlands see “The Meadowlands Before the Commission: Three
Centuries of Human Use and Alteration of the Newark and Hackensack Meadows” by Stephen Marshall at
http://www.urbanhabitats.org/v02n01/3centuries_full.html.
61 According to a study by the National Academy of Sciences reported by the EPA at
http://water.epa.gov/type/oceb/mprsa_before.cfm.
62 The Marine Protection, Research, and Sanctuaries Act of 1972 was amended in 1988 to include medical
waste.
63 The story of the Khian Sea is notorious in the annals of solid waste. Versions of it can be found in “The
Export of Nonhazardous Waste by Lori Gilmore” in Environmental Law 19:879 (1988-1989) available from
http://heinonline.org/HOL/LandingPage?collection=journals&handle=hein.journals/envlnw19&div=47&id=&page=
64 More information on the Basel Convention can be found at http://www.basel.int/. A copy of the treaty
can be found at http://archive.basel.int/pub/simp-guide.pdf
65 A view of the anatomy of a landfill is available at
http://www.wm.com/about/community/pdfs/Anatomy_of_a_Landfill.pdf.
66 Landfills can be quite tall if allowed. They are limited by their stability, soils, and nearby infrastructure.
This one is currently filled to a depth of 200 feet: http://www.rirrc.org/customers/hauler/central-landfill/.
67 The process of making shoddy and mungo fabrics was developed by Benjamin Law around 1813.
68As early as 1919 Popular Science Monthly was publishing articles on how to use unwanted materials in
urban environments. Out of the Garbage-Pail into the Fire: fuel bricks now added to the list of things salvaged by
science from the nation's waste, Science monthly, February 1919, page 50-51,
69 The EPA publishes data on the fate of Municipal Solid Waste. For 2010 they can be found here
http://www.epa.gov/osw/nonhaz/municipal/msw99.htm.
70 There are lots of confusing statistics about the size of cities. The main problem is distinguishing
between political boundary, which is meaningless unless you are a politician, and metropolitan area, which includes
extended urban areas around the outside of the formal political boundary. These numbers are from
http://www.citypopulation.de/world/Agglomerations.html , and include population in the metropolitan area.
71 Try Lee’s laws of migration as described in Everett S. Lee (1966).”A Theory of Migration”. University
of Pennsylvania, for a full picture of push and pull factors.
72 Measurements of sediments going into Coral Bay on Saint John in the US Virgin Islands show an
increase of more than 50 times in the last 50 years compared to when there was no disturbance in the watershed.
73 The estimate of greater than 40 percent comes from Stuart Pimm in The World According to Pimm
published in 2007.