"the english pronunciation teaching in europe survey (epties): initial results & useful...
TRANSCRIPT
AUTHOR‘S PROOF: Please do not quote without contacting
Henderson, A. (2013). The English Pronunciation Teaching in
Europe Survey (EPTiES): Initial results & useful insights for
collaborative work. In Waniek-Klimczak, E. & L. Shockey, (eds.),
Teaching and researching English accents in native and non-native
speakers, Springer: Berlin, pp 123-140.
Alice Henderson
Université de Savoie, Chambéry, France
The English Pronunciation Teaching in Europe Survey
(EPTiES): Initial results & useful insights for collaborative work
Abstract
The English Pronunciation Teaching in Europe Survey (EPTiES) is an on-line survey
which aims to collect information about English pronunciation teaching practices in
European countries, following the work of Canadian (Breitkreuz, Derwing and Rossiter
2002) and Australian (Macdonald 2002) studies. Jointly prepared by teachers in ten
European countries (Finland, France, Germany, Ireland, Macedonia, The Netherlands,
Poland, Spain, Sweden and Switzerland), the survey has 57 questions organised into 9
categories. Initial results for 598 respondents are briefly presented in relation to six
categories: characteristics of participants (e.g. age, gender, years teaching experience);
teachers‘ self-evaluation of their own pronunciation skills; teachers‘ views on the
pronunciation-related training they received; assessment of pronunciation; exposure outside
the classroom (e.g. subtitled TV, live interaction with native and non-native speakers,);
varieties and norms inside the classroom (e.g. for receptive & productive work). Some of
the advantages and drawbacks of such collaborative research projects are also addressed.
1. Introduction
In the last decade, English pronunciation teaching has been the subject of
several surveys which have provided much useful quantitative and qualitative
data. These studies have been done not only in English-speaking countries, such as
Canada (Breitkreuz, Derwing and Rossiter 2002) and Australia (Macdonald 2002)
but also in Europe. For example, Walker (1999) surveyed teachers in Spain and
included questions about their training related to teaching English pronunciation.
Two other studies focused on this type of training amongst teachers in Britain
2
(Bradford and Kenworthy 1991; Burgess and Spencer 2000). The Council of
Europe itself has issued numerous reports related to plurilingual and/or
intercultural education, regional and/or minority languages, or language as a
subject and/or for teaching subjects, etc.1. However, no study has specifically
addressed how English pronunciation is taught or compared such teaching in
several European countries.
The English Pronunciation Teaching in Europe Survey (EPTiES) seeks to fill
this gap. This on-line survey is the result of a collaborative effort by teachers in
ten European countries: Finland, France, Germany, Ireland, Macedonia, The
Netherlands, Poland, Spain, Sweden and Switzerland. As a reaction to a lack of
knowledge about what goes on in classrooms across Europe, EPTiES formalises
common topics of conversation amongst teachers. The survey is based on two
underlying assumptions:
1) On-line surveys enable people to explain what they do, so they can
contribute useful information about what is actually going on in a given
context;
2) Teachers want to know – and benefit from knowing – more about what
other teachers are doing.
The time required to carry out such collaborative work should not be
underestimated. After initial brainstorming at the Accents2008 conference in
Łodz, Poland, the survey took nearly two years to develop. However, in the end
the long development span worked to our advantage, as it allowed us to discuss
what information would be truly useful, and to propose and modify questions to
elicit that information. We were then able to assure uniformity and, especially in
the final stages, to correct previously unnoticed typing mistakes. Most
importantly, we were also able to draw in more developers from other countries.
Cross-border collaborative work does not necessarily require expensive travel
or the most technologically advanced communication tools. In this project, one
person is responsible for each country: for developing the questions and, in future,
for analysing the data and writing up a book chapter. To date, all discussions have
taken place by e-mail, except for a brief meeting of five developers at a
conference in June 2009. Video-conferencing or flash meetings have not been
used, as they can be difficult to organise from both technological and practical
points of view. Although asynchronous interaction between ten people via e-mail
can be long and at times frustratingly piecemeal, it has the advantage of leaving
time for quiet thought and analysis. This ―slow time‖ feature of asynchronous
communication can be beneficial, not just when developing on-line surveys, but
also for any collaborative generation of robust new knowledge.
It is important to mention that different countries or states have legal
frameworks which may influence the feasibility of such work. At present we are
1 See http://www.coe.int/t/dg4/linguistic/langeduc/le_platformintro_EN.asp?
3
not allowed to use the results for Germany, as our study has not received the
necessary ministerial approval.
2. Survey
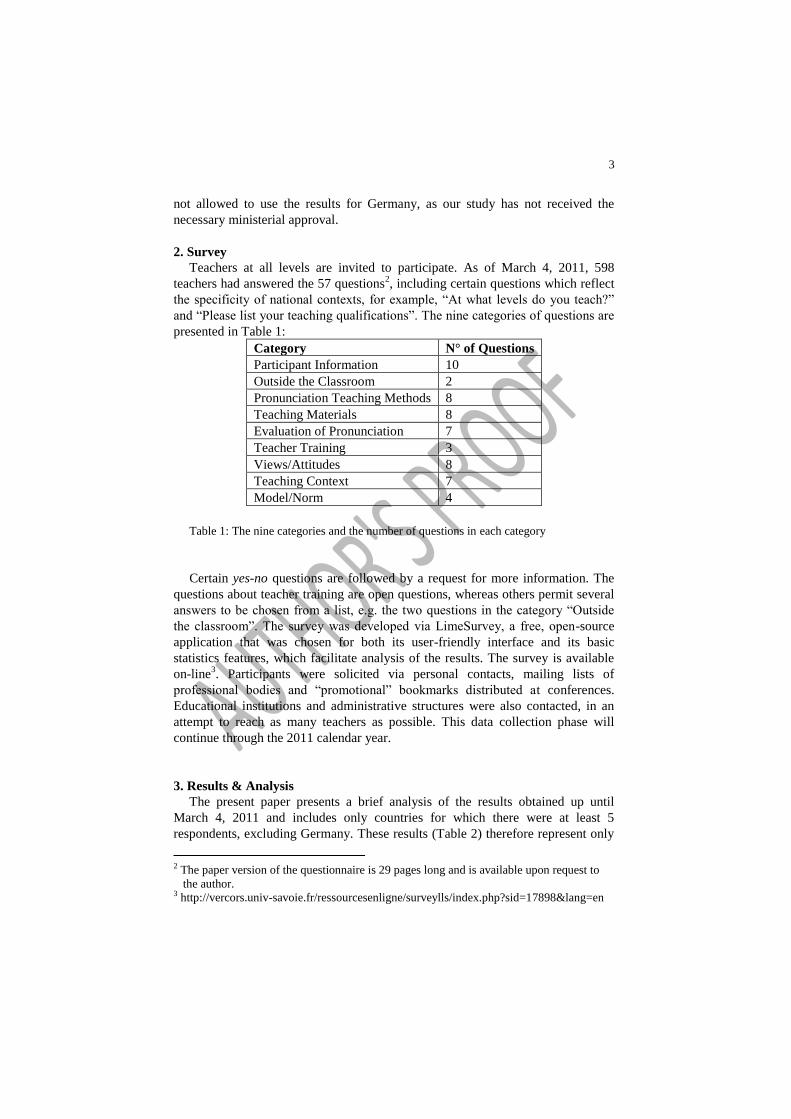
Teachers at all levels are invited to participate. As of March 4, 2011, 598
teachers had answered the 57 questions2, including certain questions which reflect
the specificity of national contexts, for example, ―At what levels do you teach?‖
and ―Please list your teaching qualifications‖. The nine categories of questions are
presented in Table 1:
Category N° of Questions
Participant Information 10
Outside the Classroom 2
Pronunciation Teaching Methods 8
Teaching Materials 8
Evaluation of Pronunciation 7
Teacher Training 3
Views/Attitudes 8
Teaching Context 7
Model/Norm 4
Table 1: The nine categories and the number of questions in each category
Certain yes-no questions are followed by a request for more information. The
questions about teacher training are open questions, whereas others permit several
answers to be chosen from a list, e.g. the two questions in the category ―Outside
the classroom‖. The survey was developed via LimeSurvey, a free, open-source
application that was chosen for both its user-friendly interface and its basic
statistics features, which facilitate analysis of the results. The survey is available
on-line3. Participants were solicited via personal contacts, mailing lists of
professional bodies and ―promotional‖ bookmarks distributed at conferences.
Educational institutions and administrative structures were also contacted, in an
attempt to reach as many teachers as possible. This data collection phase will
continue through the 2011 calendar year.
3. Results & Analysis
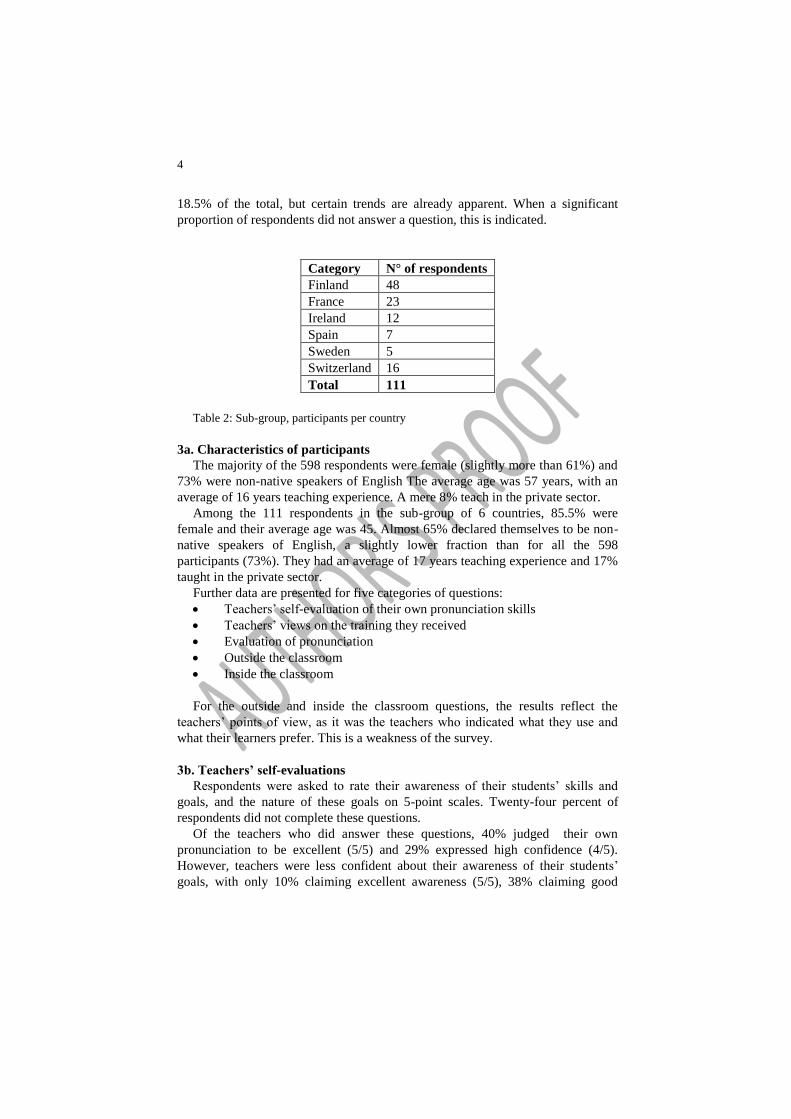
The present paper presents a brief analysis of the results obtained up until
March 4, 2011 and includes only countries for which there were at least 5
respondents, excluding Germany. These results (Table 2) therefore represent only
2 The paper version of the questionnaire is 29 pages long and is available upon request to
the author. 3 http://vercors.univ-savoie.fr/ressourcesenligne/surveylls/index.php?sid=17898&lang=en
4
18.5% of the total, but certain trends are already apparent. When a significant
proportion of respondents did not answer a question, this is indicated.
Category N° of respondents
Finland 48
France 23
Ireland 12
Spain 7
Sweden 5
Switzerland 16
Total 111
Table 2: Sub-group, participants per country
3a. Characteristics of participants
The majority of the 598 respondents were female (slightly more than 61%) and
73% were non-native speakers of English The average age was 57 years, with an
average of 16 years teaching experience. A mere 8% teach in the private sector.
Among the 111 respondents in the sub-group of 6 countries, 85.5% were
female and their average age was 45. Almost 65% declared themselves to be non-
native speakers of English, a slightly lower fraction than for all the 598
participants (73%). They had an average of 17 years teaching experience and 17%
taught in the private sector.
Further data are presented for five categories of questions:
Teachers‘ self-evaluation of their own pronunciation skills
Teachers‘ views on the training they received
Evaluation of pronunciation
Outside the classroom
Inside the classroom
For the outside and inside the classroom questions, the results reflect the
teachers‘ points of view, as it was the teachers who indicated what they use and
what their learners prefer. This is a weakness of the survey.
3b. Teachers’ self-evaluations
Respondents were asked to rate their awareness of their students‘ skills and
goals, and the nature of these goals on 5-point scales. Twenty-four percent of
respondents did not complete these questions.
Of the teachers who did answer these questions, 40% judged their own
pronunciation to be excellent (5/5) and 29% expressed high confidence (4/5).
However, teachers were less confident about their awareness of their students‘
goals, with only 10% claiming excellent awareness (5/5), 38% claiming good
5
awareness (4/5) and 27% claiming moderate awareness (3/5). As might be
expected, teachers showed greater confidence in their awareness of their students‘
skills, with 17% claiming excellent awareness, 43% claiming good awareness
(4/5) and 14.5% claiming moderate awareness (3/5). Only 4 teachers out of 111
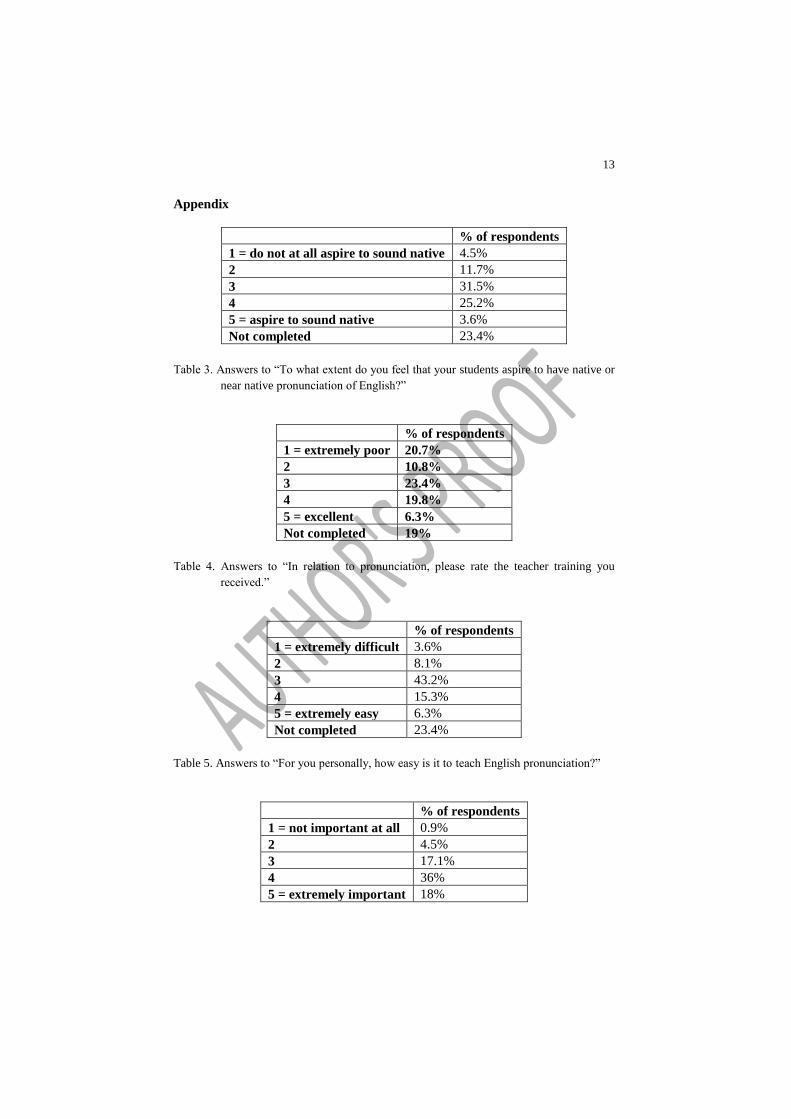
indicated that their students aspire to sound 100% native-like (Table 3). Three of
these four teachers were from France and one was from Sweden. None of the
teachers from Finland, Ireland, Spain or Switzerland indicated that their students
want to sound native or near-native. The final survey may provide more robust
data that will allow us to explain this difference, but it may depend more on the
type of course or student and less on the nationality.
3c.Views on teacher training
Detailed replies to this question were provided by 83 of the 111 respondents
(Table 4), more than half of whom expressed a lack of satisfaction with the
training they had received. An astonishing 20.7% indicated that their training was
―extremely poor‖ (1/5), 10.8% indicated it was ―very poor‖ (2/5) and 23.4% said it
was ―moderately poor‖ (3/5). Some mentioned a specific university programme,
set books or teachers who influenced them. One teacher‘s remarks were quite
humorous, if depressing: ―Not much intelligence, just recycling of tradition, rather
like medical doctors practising blood letting for 3,000 years and harming millions
in the process‖. Several mentioned learning the IPA symbols or being self-taught.
In one manner or another, these teachers have developed the necessary skills
themselves. This is apparent in their responses to the question asking them to rate
the difficulty of teaching English pronunciation (Table 5). Based on Likert scale
data, only 3.6% said they find teaching English pronunciation extremely difficult
(1/5) whereas 6.3% find it extremely easy (5/5), 15.3% find it very easy (4/5) and
a significant 43.2% find it moderately difficult (3/5).
If teachers have taught themselves, it may be the result of their recognising the
importance of pronunciation in relation to the other language skills which compete
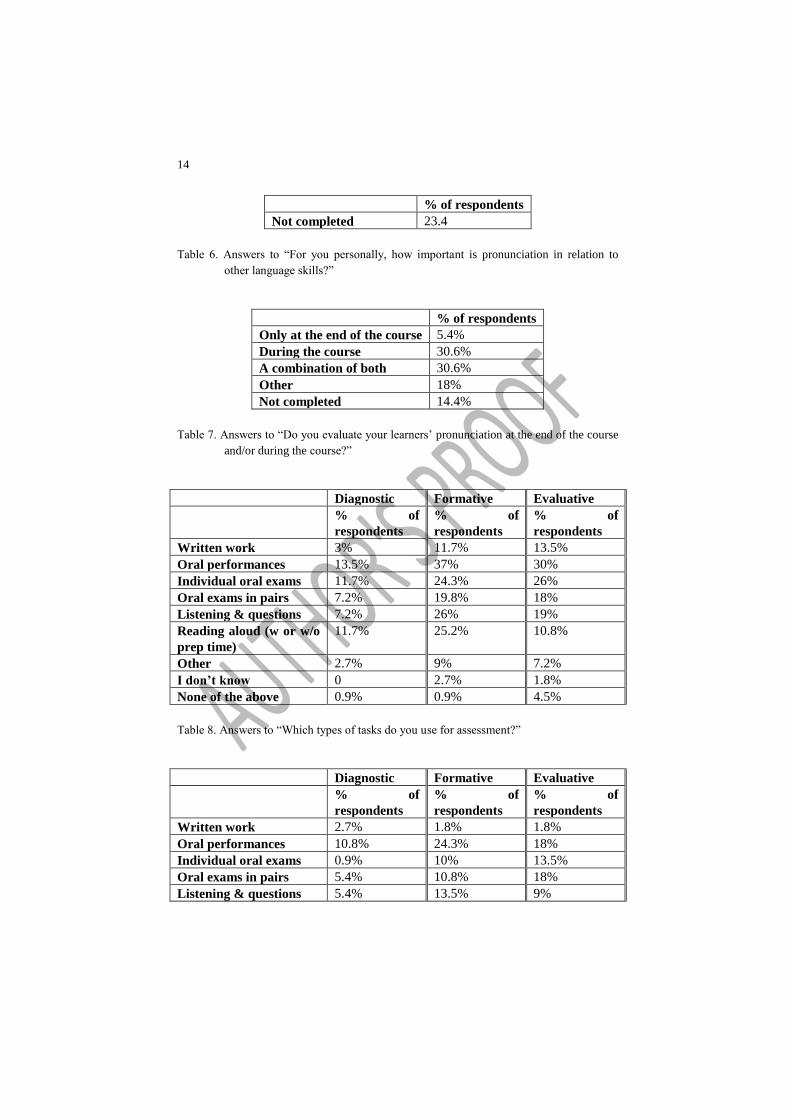
for teaching time. When asked how important they feel pronunciation is in relation
to other language skills (Table 6), 18% consider it to be extremely important, 36%
consider it very important (4/5) and 17.1% consider it moderately important (3/5).
Only 4.5% consider it to be not very important (2/5), and less than 1% consider it
to be ―not important at all‖ (1/5).
3d. Evaluation of pronunciation
Participants were asked whether or not their assessments of learners‘
pronunciation were linked to an established scale, for example a national or
international scale, and 56% indicated that this was not the case. Only 29% of
respondents (32 individuals) indicated that a scale was explicitly used; one teacher
in Switzerland referred to the BULATS and one teacher in Sweden referred to
national tests, as did two teachers in Finland. The other 28 respondents referred to
the Common European Framework of Reference for Languages.
6
Several questions deal with the types and frequency of assessment of learners‘
pronunciation. In terms of types of assessment, only 30% of respondents stated
that they do an initial diagnostic assessment. Only 7% of respondents in Finland
said that they do an initial assessment and an astonishing 49% did not answer the
question4. However, assessments need not be done only at the beginning of a
course (Table 7). Assessments can be done during the course and 30.6% of
respondents indicated that this is how they function. Another 30.6% indicated they
use a combination of assessments both during and at the end of the course. It is
pedagogically reassuring that a mere 5.4% indicated that pronunciation is
evaluated only at the end of the course. The ―other‖ category was chosen by 18%
of respondents. ―Other‖ may correspond to a different combination of
assessments, for example one that includes evaluations at the beginning of the
course. In other words, certain participants may have included initial diagnostic
types of assessment in their answers to the question about assessment during
and/or at the end of the course. It may be that the distinction between these two
questions was unclear.
The types of tasks used for diagnostic, formative and evaluative assessment are
quite varied (Table 8). Participants could choose more than one from the list of
possible answers. The overall proportion of participants choosing the ―I don‘t
know‖ option was quite low across the three types of assessment (0%, 2.7% and
1.8% for diagnostic, formative and evaluative tasks respectively). However, the
proportion of participants who chose the ―None of the above‖ category was only
0.9% for diagnostic assessments but 4.5% for evaluative assessment; here the
survey should have provided space for an open response. Data from participants in
Finland is presented separately (Table 9) as they were directed to a separate
question which included Finnish terms for the types of assessment.
In terms of the types of tasks used in diagnostic assessments (Table 8), 13.5%
of respondents said they use oral performances, such as short skits, presentations
or dialogues. Individual oral exams and reading aloud, with or without
preparation, were chosen by 11.7% of respondents. Oral exams in pairs and
listening tasks followed by questions were chosen by 7.2%. Few participants (3%)
said they use written work for diagnostic assessments. Only 2.7% indicated that
they use another form of diagnostic assessment.
For formative assessments, the respondents indicated that they use the variety
of possible tasks more frequently than for diagnostics. The highest percentages are
attributed to oral performances (37% of respondents), listening tasks with
questions (36%) and reading aloud (25.2%). Just under 20% use oral exams in
pairs in formative assessments, a figure that is only slightly lower (18%) for
evaluative assessments. Participants indicated that they use written work more
frequently in formative assessments (11.7%) and evaluative assessments (13.5%)
than in diagnostic assessments (3%). This may or may not be linked to work with
4 However, this last figure should be disregarded, as many more teachers replied to the
country-specific questions about types of tasks, as will be shown separately in Table 9.
7
phonetic symbols. As students show more mastery of the symbols, teachers may
find it easier to test certain types of knowledge without evaluating speaking
ability. This might also partly explain why oral performances are used less
frequently in evaluative tasks (30%), than they are in formative tasks (37%). In
addition, reading aloud is used less frequently in evaluative assessments (10.8%)
compared with formative assessments (25.2%). Only 26% of respondents chose
the category ―listening followed by questions‖ for formative assessments,
compared to 19% in evaluative ones. The highest percentage for the ―other‖
choice (7.2%) was found in evaluative assessments. The fact that participants were
not given space to explain this choice is a design flaw of the survey.
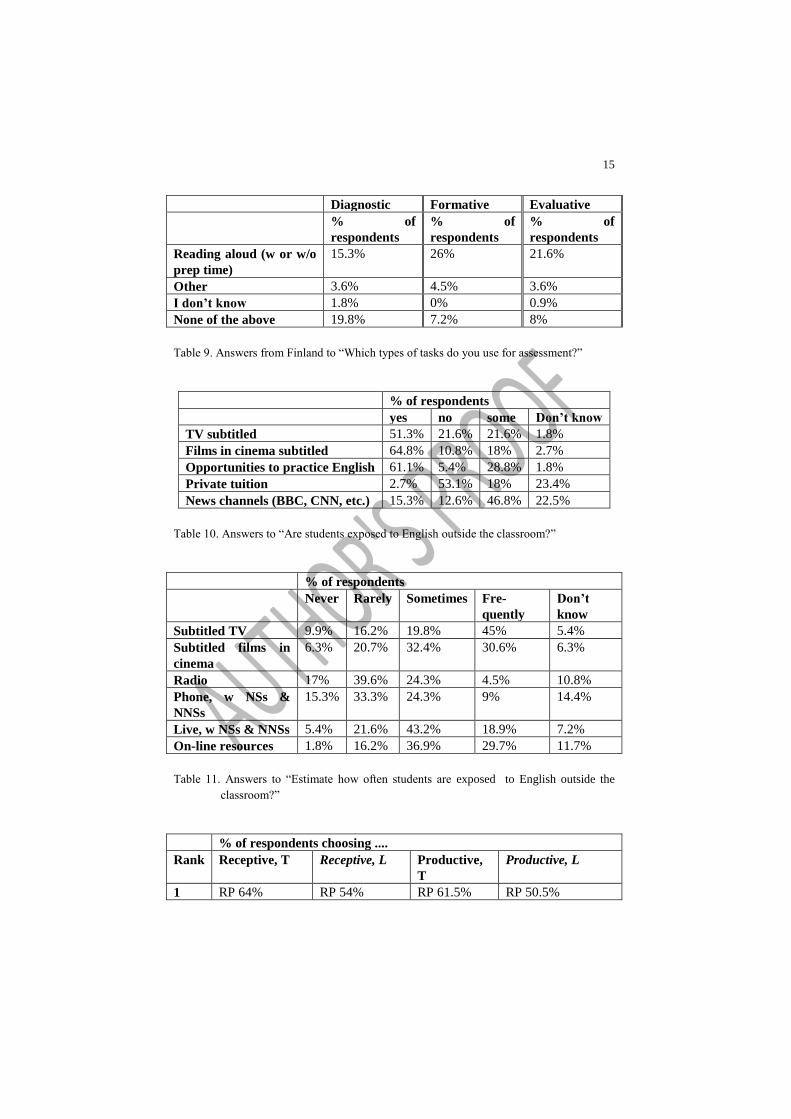
Respondents in Finland answered separate, country-specific questions on
assessment. For some questions the results for Finland (Table 9) were similar to
the results for the overall data. For example the proportion of participants
choosing the ―I don‘t know‖ option was quite low for all three types of
assessment: diagnostic (1.8%), formative (0%) and evaluative (0.9%). However,
perhaps the most striking difference with the results for the five other countries is
found in the ―None of the above‖ category, where the proportion of participants
who chose it is for diagnostic assessment (19.8%) is much higher than the 7.2%
for formative and the 8% for evaluative assessment. The corresponding figures
were much lower for the group of other countries: 0.9%, 0.9% and 4.5%
respectively. The 19.8% who chose ―None of the above‖ in Finland, may suggest
a preference for either using tasks not listed in the survey or for avoiding
diagnostic assessments. Given that the Finnish questions used terms in Finnish to
reduce any ambiguity, more in-depth analysis of a greater number of responses is
required, perhaps including comparison with other country-specific factors, before
any conclusions can be made regarding Finnish assessment preferences.
Amongst respondents in Finland, the two most popular forms of diagnostic
assessment were reading aloud (15.3%) and oral performance (10.8%). Oral
exams in pairs and listening tasks with questions were chosen by only 5.4% of
respondents, and written work was chosen by 2.7% or respondents. The latter
figure is close to the 3% of respondents from the other countries who chose
written work. Individual oral exams seem to be extremely rare across all three
types of assessment, as this type of exam was chosen by 0.9% of respondents for
diagnostic assessments, and by 1.8% of respondents for both formative and
evaluative assessment. The figures for individual oral exams are much higher for
the other countries: 11.7% for diagnostic, 24.3% for formative and 26% for
evaluative assessment.
The respondents in Finland showed a preference similar to the overall survey
figures, by choosing oral performances as the most popular choice of task for
formative assessments (24.3%) and then indicating that they use them less in
evaluative assessments (18%). A listening task followed by questions was chosen
by 13.5% of respondents in Finland, compared to only 5.4% who indicated using
in formative assessments and 9% in evaluative ones. Reading aloud was also
8
chosen by fewer respondents for diagnostic purposes (15.3%) than for formative
(26%) or evaluative (21.6%) ones.
Oral exams in pairs for diagnostics were indicated by 5.4% of respondents in
Finland, but 10.8% of them indicate using such orals for formative and 18% for
evaluative assessments; eighteen percent is exactly the same proportion as in the
overall figures for oral exams in pairs for evaluative purposes. It is, however,
worth noting that 26% of participants from the five other countries chose
individual oral exams for evaluative assessments, compared to only 13.5% of
participants in Finland. Other striking differences in the results for evaluative
assessment tasks include:
Written work: only 1.8% of participants in Finland chose written work,
compared to 13.5% of the other participants;
Listening and questions: only 9% of participants in Finland chose listening
and questions, compared to 19% of the other participants;
Oral performances: only 18% of participants in Finland chose oral
performances, compared to 30% of the other participants.
3e. Outside the classroom
It is a common belief that learners somehow ―pick up‖ the language via their
environment, much as children pick up their mother tongue. While this may
account for some learning in a native English speaking country such as Ireland, it
is difficult to imagine that it can explain learning in the other five countries
explored here. The apparent facility with English displayed by certain cultures is
frequently attributed to widespread exposure to subtitled films and television
programs. This is especially so with reference to northern European countries:
‖What else‖, it is asked, ―could explain their seeming superiority in learning
English?‖ In light of research into the role of personality and affective factors
(Arnold 1999), we suggest that these ―outside the classroom‖ influences should be
seen as merely facilitating opportunities for encountering English; it remains for
learners to take advantage of them.
With the goal of investigating this question, teachers were asked to indicate
whether or not and to what extent their learners encountered certain sources of
English outside the classroom. Perhaps the most surprising result concerns private
tuition, where 53.1% of teachers indicated that their students do not have recourse
to such support (Table 10). In addition, the highest percentages for the ―I don‘t
know‖ option were private tuition (23.4%) and whether or not learners watch
news channels (22.5%). If students are using these sources, their teachers are not
aware of it. On the other hand, the respondents were fairly confident in indicating
that their students are exposed to subtitled films (64.8%) and television
programmes (51.3%), and that they have opportunities to use their English
(61.1%). This figure was only very slightly skewed by respondents in Ireland, as
these 12 respondents provided only 8 of the 68 yes answers for this question. The
proportion of incomplete answers was 2.7% for all of these questions.
9
In terms of frequency of exposure to English outside the classroom, 45% of
respondents indicated that their students are frequently exposed to subtitled
television programmes (Table 11). Even though the data in Table 11 are merely
teachers‘ estimations of their learners‘ behaviours, not factual accounts from the
learners themselves, it is interesting that television should be singled out. The data
for films are less categorical (rarely = 20.7%: sometimes = 32.4%: frequently =
30.6%), whereas the contribution of radio was estimated to be less important
(never = 17%: rarely = 29.6%: sometimes = 24.3%). On-line resources are
important sources, with respondents estimating that 36.9% of their students
sometimes use these resources and that 29.7% of students frequently use them.
As in Table 10, the proportion of incomplete answers was 2.7% for all of these
questions.
3f. Inside the classroom
Sixty percent of the learners were between the ages of 9 and 25 years and 63%
have had 2 to 9 years of instruction. Sixty-one percent had 1-3 hours of English
instruction per week, in groups that were not streamed (43%) or only slightly
streamed (9%). For the streamed groups, almost 69% of respondents did not
describe how the groups were determined. The 35 teachers who did reply to this
question indicated a variety of methods, including written or grammar tests,
internationally recognized certifications, short interviews, comprehension tests,
self-assessments, or by asking a learner‘s previous teacher.
The most intriguing results come from the questions about the norms or models
of English used by teachers and those preferred by learners. There is not enough
space in this paper to explore the differences between countries but this will be
investigated at a later stage in the survey. For each question, respondents could
choose one or more of the following categories: British “RP”, GAE, Can Eng,
Irish Eng, Scottish Eng, Welsh Eng, Austr. Eng, NZ Eng, South Af Eng, Internat’l
Eng, Another, No Pref, I don’t know.
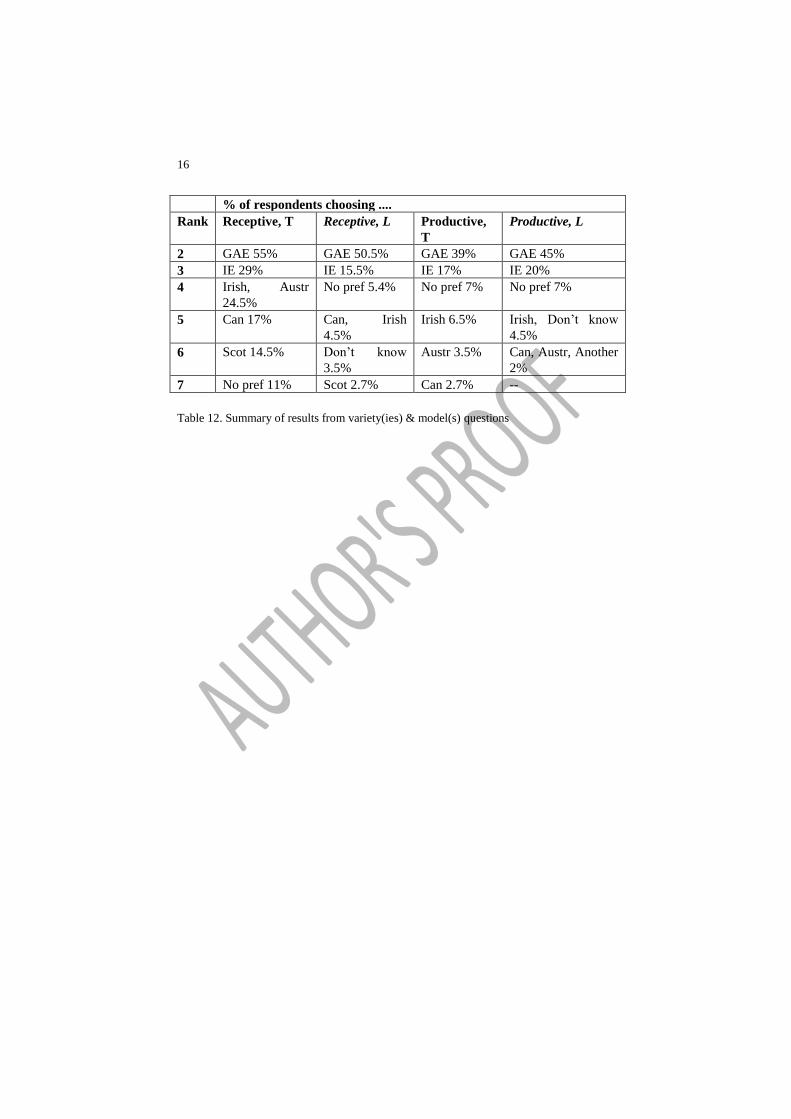
The top seven choices for the varieties teachers said they use in the classroom
and the varieties teachers felt their learners prefer (in italics) were ranked
according to how frequently they were cited by the respondents (Table 12). The
questions were:
―For receptive work (listening, reading), which variety(ies) or model(s) of
English do you use in your classes?‖ and ―…of English do your learners
generally prefer?‖
―For productive work (speaking, writing), which variety(ies) or model(s) of
English do you use in your classes?‖ and ―…of English do your learners
generally prefer?‖
The results confirm the predominance of two varieties, British ―RP‖ and
General American English, in both receptive and productive work. The third rank
of ―A Type of International English‖ is surprising as IE remains an imprecise
10
notion. It is true that The Journal of English as an International Language has
existed since 20075 and some recent textbooks do include the words in their title
(e.g., International English Coursebook 1, Lucantoni and Kellas 2008). However,
it is doubtful that among teachers the term IE has as stable a description as RP or
GAE. In a Council of Europe discussion paper, Seidlhofer tries to clarify the term:
'International English' can be read as shorthand for 'English as an international
language' (EIL). The longer term is, however, though more unwieldy, more
precise because it highlights the international use of English rather than
suggesting, wrongly, that there is one clearly distinguishable, unitary variety
called 'International English'. (2003, 8)
The choice ―no preference‖ was the fourth most frequent response for three of
the four questions and does not seem noteworthy. The fourth place ranking of Irish
and Australian varieties (24.5%) by teachers for receptive work is more difficult to
explain. Although the inclusion of Ireland-based respondents may be responsible
for some of this, the importance given to a variety from the other side of the world
is puzzling. It might be motivated by local factors, such as teachers from that
country or close relations between the teaching institution and an Australian
education or business partner. It might also be related to a popular movie or a
singer and therefore reflect a faddish interest. A Canadian variety also makes a
strong showing for receptive work for reasons that are not clear, with 17% of
teachers choosing it and 4.5% of learners being said to prefer it. The relatively
strong showing of a Scottish variety, chosen by 14.5% of teachers for receptive
work, could easily be explained by teachers‘ origins, geographical proximity or
institutional links. However, it remains for other research to explore such
questions and correlated factors. A prime example is the 2007 nationwide study of
Finns‘ uses of and attitudes to English, which was carried out in order to inform
language education policies (VARIENG 2011).
4. Conclusion
This article presents a handful of initial results from the EPTiES on-line survey
of teaching practices related to English pronunciation. Three main findings stand
out:
Teachers are not satisfied with the training they receive for teaching
pronunciation. However, because they see pronunciation as an important
skill, they independently acquire enough skills to find teaching pronunciation
not extremely difficult.
Teachers feel relatively confident in their assessments of their learners‘ skills
but they know less about learners‘ goals.
5 http://www.eilj.com/introduction.php , providing ―free on-line access to all those involved
in the research, teaching and learning of English as an International Language.‖
11
Two varieties (RP and GAE) remain predominant in both receptive and
productive work, although the presence of a type of English as an
international language seems strongly recognised.
Unfortunately, the survey only provides the teachers‘ perspectives on aspects of
learning outside and inside the classroom. This lack of direct information from
learners is a weakness of the survey. Future surveys will need to reveal more
about learners‘ perspectives. Moreover, at this stage the number of respondents
from each country is too low to allow significant conclusions to be drawn.
As well as presenting the preliminary results of the EPTiES survey, this article
shows the value of collaboration as an essential yet vastly underused research
mode. Collaborative research promotes certain essential features upon which
research communities depend, including a spirit of openness and a genuine desire
to share, debate and discuss. However, this mode of research seems less common
in the humanities than in the so-called ―hard‖ sciences. The EPTiES survey has
shown how rich collaborative work can be. Such pooling of expertise and
constructive criticism of each other‘s ideas can help generate solid results and
analyses, which in turn strengthen the research process - for the good of the entire
field.
References
Arnold, Jane (ed.). 1999. Affect in Language Learning.Cambridge: Cambridge
University Press.
Beaumont, Michael and Teresa O‘Brien. 2000. Collaborative Research in Second
Language Education. Stoke-on-Trent: Trentham Books.
Bradford, Barbara and Joanne Kenworthy. 1991. Phonology on teacher training
courses, Speak Out!, 9 pp 12—14.
Breitkreutz, Judith A., Tracey M. Derwing and Marian J. Rossiter. 2002.
Pronunciation teaching practices in Canada. TESL Canada Journal, 19: 51-61.
Burgess, John and Sheila Spencer. 2000. Phonology and pronunciation in
integrated language teaching and teacher education. System, 28: 191-215.
Henderson, Alice et al. 2010. English Pronunciation Teaching in Europe Survey.
Available at
http://vercors.univ-savoie.fr/ressourcesenligne/surveylls/index.php?sid=17898&lang=en.
LimeSurvey 1.90 (open source software). Available at http://www.limesurvey.org/
Lucantoni, Peter and Lydia Kella. 2008. International English Coursebook 1.
London: Hodder Education.
Macdonald, Shem 2002. Pronunciation - views and practices of reluctant teachers.
Prospect. 17. 3: 3-18.
Maxwell, Joseph A. 1996. Qualitative Research Design: An Interactive Approach.
Thousand Oaks, California: Sage.
Seidlhofer, Barbara 2003. A Concept of international English and related issues:
from ‗real English‖ to ‗realistic English?‘. (discussion paper). Strasbourg :

12
Language Policy Division DG IV, Council of Europe. Available at
http://www.coe.int/t/dg4/linguistic/source/seidlhoferen.pdf
VARIENG (Research Unit for Variation, Contacts and Change in English,
Jyväskylä unit). forthcoming, 2011. Findings of the national survey of English
in Finland. Available at http://www.helsinki.fi/varieng/journal/volumes/index.html
Walker, Robin 1999. Proclaimed and perceived wants and needs among Spanish
teachers of English, Speak Out! 24 pp 25—32.
Zuber-Skerritt, Ortrun (ed). 1996. New Directions in Action Research. London:
Falmer Press.
13
Appendix
% of respondents
1 = do not at all aspire to sound native 4.5%
2 11.7%
3 31.5%
4 25.2%
5 = aspire to sound native 3.6%
Not completed 23.4%
Table 3. Answers to ―To what extent do you feel that your students aspire to have native or
near native pronunciation of English?‖
% of respondents
1 = extremely poor 20.7%
2 10.8%
3 23.4%
4 19.8%
5 = excellent 6.3%
Not completed 19%
Table 4. Answers to ―In relation to pronunciation, please rate the teacher training you
received.‖
% of respondents
1 = extremely difficult 3.6%
2 8.1%
3 43.2%
4 15.3%
5 = extremely easy 6.3%
Not completed 23.4%
Table 5. Answers to ―For you personally, how easy is it to teach English pronunciation?‖
% of respondents
1 = not important at all 0.9%
2 4.5%
3 17.1%
4 36%
5 = extremely important 18%
14
% of respondents
Not completed 23.4
Table 6. Answers to ―For you personally, how important is pronunciation in relation to
other language skills?‖
% of respondents
Only at the end of the course 5.4%
During the course 30.6%
A combination of both 30.6%
Other 18%
Not completed 14.4%
Table 7. Answers to ―Do you evaluate your learners‘ pronunciation at the end of the course
and/or during the course?‖
Diagnostic Formative Evaluative
% of
respondents
% of
respondents
% of
respondents
Written work 3% 11.7% 13.5%
Oral performances 13.5% 37% 30%
Individual oral exams 11.7% 24.3% 26%
Oral exams in pairs 7.2% 19.8% 18%
Listening & questions 7.2% 26% 19%
Reading aloud (w or w/o
prep time)
11.7% 25.2% 10.8%
Other 2.7% 9% 7.2%
I don’t know 0 2.7% 1.8%
None of the above 0.9% 0.9% 4.5%
Table 8. Answers to ―Which types of tasks do you use for assessment?‖
Diagnostic Formative Evaluative
% of
respondents
% of
respondents
% of
respondents
Written work 2.7% 1.8% 1.8%
Oral performances 10.8% 24.3% 18%
Individual oral exams 0.9% 10% 13.5%
Oral exams in pairs 5.4% 10.8% 18%
Listening & questions 5.4% 13.5% 9%
15
Diagnostic Formative Evaluative
% of
respondents
% of
respondents
% of
respondents
Reading aloud (w or w/o
prep time)
15.3% 26% 21.6%
Other 3.6% 4.5% 3.6%
I don’t know 1.8% 0% 0.9%
None of the above 19.8% 7.2% 8%
Table 9. Answers from Finland to ―Which types of tasks do you use for assessment?‖
% of respondents
yes no some Don’t know
TV subtitled 51.3% 21.6% 21.6% 1.8%
Films in cinema subtitled 64.8% 10.8% 18% 2.7%
Opportunities to practice English 61.1% 5.4% 28.8% 1.8%
Private tuition 2.7% 53.1% 18% 23.4%
News channels (BBC, CNN, etc.) 15.3% 12.6% 46.8% 22.5%
Table 10. Answers to ―Are students exposed to English outside the classroom?‖
% of respondents
Never Rarely Sometimes Fre-
quently
Don’t
know
Subtitled TV 9.9% 16.2% 19.8% 45% 5.4%
Subtitled films in
cinema
6.3% 20.7% 32.4% 30.6% 6.3%
Radio 17% 39.6% 24.3% 4.5% 10.8%
Phone, w NSs &
NNSs
15.3% 33.3% 24.3% 9% 14.4%
Live, w NSs & NNSs 5.4% 21.6% 43.2% 18.9% 7.2%
On-line resources 1.8% 16.2% 36.9% 29.7% 11.7%
Table 11. Answers to ―Estimate how often students are exposed to English outside the
classroom?‖
% of respondents choosing ....
Rank Receptive, T Receptive, L Productive,
T
Productive, L
1 RP 64% RP 54% RP 61.5% RP 50.5%
16
% of respondents choosing ....
Rank Receptive, T Receptive, L Productive,
T
Productive, L
2 GAE 55% GAE 50.5% GAE 39% GAE 45%
3 IE 29% IE 15.5% IE 17% IE 20%
4 Irish, Austr
24.5%
No pref 5.4% No pref 7% No pref 7%
5 Can 17% Can, Irish
4.5%
Irish 6.5% Irish, Don‘t know
4.5%
6 Scot 14.5% Don‘t know
3.5%
Austr 3.5% Can, Austr, Another
2%
7 No pref 11% Scot 2.7% Can 2.7% --
Table 12. Summary of results from variety(ies) & model(s) questions