the effects of physical activity on academic achievement in - d
TRANSCRIPT
THE EFFECTS OF PHYSICAL ACTIVITY ON ACADEMIC ACHIEVEMENT IN KINDERGARTEN AGED CHILDREN
by
Amy Kathleen Shannonhouse
BS, Gannon University, 1988
MS, Frostburg State University, 1991
Submitted to the Graduate Faculty of
School of Education in partial fulfillment
of the requirements for the degree of
Doctor of Philosophy
University of Pittsburgh
2012
ii
UNIVERSITY OF PITTSBURGH
SCHOOL OF EDUCATION
This dissertation was presented
by
Amy Kathleen Shannonhouse
It was defended on
March 22, 2012
and approved by
Heather J Bachman, PhD, Associate Professor, Psychology in Education
Mary E Duquin, PhD, Faculty Emeritus, Health and Physical Activity
Robert J Robertson, PhD, Faculty Emeritus, Health and Physical Activity
Nancy Sayre, Professor, College of Education, Clarion University
Dissertation Advisor: Jere D Gallagher, PhD, Associate Professor, Health and Physical Activity

iii
Copyright © by Amy Kathleen Shannonhouse
2012
iv
THE EFFECTS OF PHYSICAL ACTIVITY ON ACADEMIC ACHIEVEMENT IN
KINDERGARTEN AGED CHILDREN
Amy Kathleen Shannonhouse, PhD
University of Pittsburgh, 2012
Increasing time in physical activity could help combat childhood obesity. In addition to physical
health, daily physical activity’s benefits on the brain and cognitive functioning have been
extensively researched and provide support for incorporating more physical activity into physical
education and the school day. This research investigated the effects of physical activity on
academic achievement in kindergarten children across the 2008/09 school year. The main
hypothesis examined in the study was whether children who participated in the Interactive
Physical Activity Center (IPAC) would perform better academically than the control group on
the Dibels Oral Reading Fluency, Retell Fluency, and Group Mathematics Assessment and
Diagnostic Evaluation (G-Made) achievement tests. To ensure that children in the experimental
group were physically active, participation, changes in heart rate, activity scores and perceived
exertion were examined across the year. Third, school attendance was examined to determine if
the experimental group had fewer school absences than the control group. A longitudinal non-
equivalent control group design was used to investigate the relationship between physical
activity and academic achievement. To determine if the children were active in the IPAC, a one-
way ANOVA examined changes in fitness variables. For the main question of the study
concerning physical activity and academic achievement a two-way (Group X Time) ANOVA
was used to compare academic progress of the experimental and control group. To assess school
attendance of the two groups, a one-tailed independent samples t-test was used. Results
v
demonstrated that kindergarten children who received the IPAC program increased their physical
activity and reached the academic performance level of the control group by the end of the
school year. The experimental group experienced a greater rate of improvement over time in
three out of four of the Dibels subtests compared to the control group, and improved the same as
the controls in the Growth Scale Value of the G-Made. These results expand previous research
on the relationship between physical activity and academic performance in kindergarten children.
Results of this study are important for administrators and teachers because quality physical
activity experiences have the potential to impact cognitive, physical and academic outcomes in
our schools.

vi
TABLE OF CONTENTS
PREFACE ..................................................................................................................................... X
1.0 INTRODUCTION ........................................................................................................ 1
1.1 BENEFITS OF PHYSICAL ACTIVITY .......................................................... 4
1.1.1 Effects of Physical Activity on the Brain ....................................................... 5
1.1.2 Physical Activity Effects on Cognitive Functioning ..................................... 9
1.2 ELEMENTARY SCHOOL INTERVENTIONS ............................................ 12
1.2.1 Physical activity, physical education, and academic achievement ............ 14
1.2.2 Physical activity, physical fitness, and academic achievement .................. 29
1.3 RESEARCH QUESTIONS ............................................................................... 38
2.0 METHODS ................................................................................................................. 40
2.1 DESIGN .............................................................................................................. 40
2.2 SAMPLE SELECTION .................................................................................... 40
2.2.1 BMI, and Attendance data collection .......................................................... 42
2.2.2 Equipment ...................................................................................................... 43
2.2.3 Academic Measures ....................................................................................... 48
2.2.4 Buddy Training .............................................................................................. 49
2.2.5 Procedures ...................................................................................................... 50
2.3 DATA ANALYSIS ............................................................................................. 53
vii
3.0 RESULTS ................................................................................................................... 59
3.1 RESEARCH QUESTION 1 .............................................................................. 59
3.2 RESEARCH QUESTION 2 .............................................................................. 65
3.3 RESEARCH QUESTION 3 .............................................................................. 69
4.0 DISCUSSION ............................................................................................................. 70
4.1 IMPROVEMENT IN IPAC SCORES ............................................................. 71
4.2 RELATIONSHIP OF IPAC SCORES AND ACADEMIC ACHIEVEMENT
73
4.3 SCHOOL ABSENCE ........................................................................................ 77
4.4 LIMITATIONS .................................................................................................. 77
4.5 CONCLUSIONS ................................................................................................ 78
4.6 FUTURE RESEARCH ...................................................................................... 80
BIBLIOGRAPHY ....................................................................................................................... 82
APPENDIX A .............................................................................................................................. 88
APPENDIX B .............................................................................................................................. 90
APPENDIX C .............................................................................................................................. 93
APPENDIX D .............................................................................................................................. 95
APPENDIX E .............................................................................................................................. 97
APPENDIX F ............................................................................................................................ 100

viii
LIST OF TABLES
Table 1. Summary of findings of Elementary School Interventions with physical activity,
physical education, and academic achievement. ........................................................................... 13
Table 2. Summary of findings of Elementary School Interventions with physical activity,
physical fitness, and academic achievement. ................................................................................ 14
Table 3. Daily Data Collection Sheet ........................................................................................... 52
Table 4. BMI data based on group ................................................................................................ 54
Table 5. BMI data based on gender ............................................................................................. 54
Table 6. Dates for Group 1 and 2 .................................................................................................. 55
Table 7. Correlations for insta pulse and carotid pulse ................................................................. 56
Table 8. Hypotheses 1, 2, and 3 .................................................................................................... 58
Table 9. Average and percent attendance of children at the IPAC ............................................... 60
Table 10. Correlations of LNF & ISF scores with GMGSV scores (beginning) .......................... 65
Table 11. Means & Standard Deviations for LNF, PSF, & NWF beginning scores .................... 69
Table 12. Means & Standard Deviations for School Absences .................................................... 69

ix
LIST OF FIGURES
Figure 1. Interactive Physical Activity Center ............................................................................. 43
Figure 2. Insta-Pulse Heart Rate Monitor ..................................................................................... 44
Figure 3. DDR Cobalt Flux ........................................................................................................... 45
Figure 4. Xavix Power Boxing ..................................................................................................... 46
Figure 5. Recumbent Bike ............................................................................................................ 47
Figure 6: Three-Kicks Machine .................................................................................................... 48
Figure 7. Before/After Heart Rate by Week ................................................................................. 61
Figure 8. DDR-Steps by Week ..................................................................................................... 62
Figure 9. Boxing Calories by Week .............................................................................................. 62
Figure 10. 3-Kicks by Week ......................................................................................................... 63
Figure 11. Biketime by week ....................................................................................................... 64
Figure 12. Session Perceived Exertion by week ........................................................................... 64
Figure 13. Beginning and End of School year Means on the LNF by Group .............................. 66
Figure14. Middle and End of School Year Means on the PSF by Group ..................................... 67
Figure 15. Middle and End of School Year Means on the NWF by Group ................................. 68

x
PREFACE
There are many people who have supported me during my doctoral journey whom I
would like to thank, beginning with my advisor, Jere Gallagher. I am thankful for all of her time,
support and encouragement. She has taught me so much about research, attention to detail and
perseverance. I am forever grateful and appreciative of her commitment to mentoring me in
research.
Next, I would like to thank my outstanding doctoral committee for all of their time,
feedback, and valuable input. Among them are Heather Bachman, Mary Duquin, Robert
Robertson and Nancy Sayre. Their support has been crucial throughout the entire process.
Also, I would like to thank my friends and family who have supported me and my
children over the years. I am grateful for my wonderful friends and family.
Finally, I would like to thank my children Elizabeth and Roland for their patience,
support, sacrifice, and encouragement throughout the years. Their unconditional love and
support has meant the world to me.
This dissertation is dedicated to my mother and father, Nancy and John Como. Their
dedication and sacrifice for our family was an inspiration to me. I appreciate all their
encouragement and support throughout the years.
1
1.0 INTRODUCTION
Despite continued dramatic increases in children’s health issues, physical education programs are
being cut more than ever to make room for more core academic time. This trend continues even
though the current evidence shows physical education to be positively related to increased
academic performance; when time is allocated for quality physical education, there is no
detriment to academic achievement (Smith & Lounsbery, 2009). Therefore, it is critical that
physical education (PE) programs in schools continue to be analyzed to further show the value of
physical activity through physical education programs. Increasing time in physical activity
could help address a serious health concern for children, which is the increasing incidence of
overweight and obesity. According to the Centers for Disease Control and Prevention, the
number of overweight children has more than tripled since 1980, with 16% (over nine million)
of children and teens aged 6- to 19- years overweight (Satcher, 2005).
Healthy People 2010 (US Department of Health and Human Services Public Health
Service, 2000) lists physical activity as a leading health indicator and goals have been
established to improve physical activity among adults, adolescents, and children. In addition,
Healthy People 2010 indicates that being overweight or obese is a major contributor to several
preventable causes of death. Adverse health consequences from obesity include the risk of
hyperlipidemia, hypertension, abnormal glucose metabolism, type II diabetes, coronary heart
disease, asthma, orthopedic problems, and an 80% probability of adult obesity. Other
2
consequences for the obese child include psychosocial issues (social stigma and discrimination),
and low self-esteem.
The rise in obesity has been attributed to sedentary behaviors, decrease in daily physical
activities, decrease in daily physical education classes and poor nutrition. Research has
investigated the levels of physical activity, the amount of physical education and the level of
fitness in relation to obesity. It is important to differentiate physical activity, physical education,
and physical fitness as there is often confusion among these terms. First, physical activity is
defined as any bodily movement produced by skeletal muscles that require energy expenditure.
Physical education involves a developmentally appropriate curriculum conducted by a qualified
physical education professional, that develops physically educated individuals who have the
knowledge and skills needed for lifetime physical activity. Finally, physical fitness refers to a
set of attributes people have or achieve, and are related to their ability to perform physical
activity. There is health-related physical fitness, (cardiovascular fitness, body composition,
flexibility, muscular endurance, and muscular strength) and skill-related physical fitness (agility,
balance, coordination, power, speed, and reaction time). The effects of physical activity which
falls under the category of health-related physical fitness is examined in this paper.
For children, a major contributing issue to obesity is that they are leading more sedentary
lifestyles (Sibley & Etnier, 2003). For example, children tend to spend more time in sedentary
activities such as computer use, electronic games, and watching TV. With the increase in
sedentary activities, there is a steady decrease in daily physical activity. For instance, the Shape
of the Nation Report (2001) demonstrated that there were more children watching daily TV
(about 40% for three hours daily) than there were children participating in daily physical activity
(about 30% daily). More recently, according to the Shape of the Nation Report (2010), vigorous
3
physical activity for at least 20 minutes that increased heart rate and created perspiration, was
observed in only one-third of children aged 6- to 17-years of age. In addition, there has been a
steady decline in the number of students that participate in daily physical education classes. The
School Health Policies and Programs Study (2000) demonstrated only 8% of elementary schools
and 6.4% of middle/junior high schools, and 5.8% of senior high schools provide daily PE
during the school year. Additionally, the percentage of schools that require physical education
has declined with only 50% in grades 1 through 5, to 25% in grade 8, to only 5% in grade 12
(cdc.gov/shpps). The main reason cited by administrators for this decline has been budget
restrictions and the need to spend more time on academics to increase standardized test
performance.
In contrast there are many educators and researchers who believe that PE and physical
activity positively impact the brain, learning and academic success. For example, three
longitudinal studies (as cited in Shephard, 1997) in France, Australia, and Canada showed
increased time in PE was associated with physical benefits and either improvements or no
change in academic performance.
First, the study conducted in France involved an increase of required physical activities
every afternoon, while the academic instruction was decreased by 26%. The school day was
lengthened and included two daily siestas and vitamin supplements. The results demonstrated no
difference in academic performance between the experimental group and the controls. However,
students in the experimental group were more attentive and displayed fewer discipline problems
and had fewer absences than the controls.
Second, The School Health, Academic Performance and Exercise (SHAPE) (as cited in
Shephard, 1997), study involved 519 fifth grade children from seven selected schools in
4
Australia. There was random assignment to one of three programs for 14-weeks: fitness, skill or
control. Results demonstrated a larger gain of arithmetic scores for the fitness group despite the
reduction in academic time. Additionally, there were no significant intergroup differences for
the fitness and skill groups in gains of mathematic or reading skills, despite the reduction in
academic time. Finally, the Trois Rivieres study (as cited in Shephard, 1997), of urban and rural
schools in Canada included 546 primary school students. This study also demonstrated greater
academic performance by the experimental group, with the girls outperforming the boys in
academic scores. The details of this study are covered later in the paper.
Due to the decrease in physical activity and physical education in schools and the
increase in children who are overweight or obese, the relationship between physical activity and
academic performance is important to understand. Does increasing physical activity in schools
through physical education negatively or positively impact academic performance?
The purpose of this research is to investigate the relationship between physical activity
and academic performance. The following sections review the benefits of physical activity, the
impact of physical activity and physical education on cognitive and academic performance, and
the elementary school interventions that have been conducted on the relation of physical activity,
fitness, and physical education on academic performance. Physical activity benefits are discussed
next.
1.1 BENEFITS OF PHYSICAL ACTIVITY
Regular physical activity is a factor in healthy living. According to the Surgeon General’s report
on physical activity and health, the benefits of regular physical activity for children and
5
adolescence include: building and maintaining healthy bones, muscles and joints, reducing
feelings of depression and anxiety, and promotion of psychological well-being. In addition,
physical activity helps control weight, reduce fat, build lean muscle, and assists academic
performance (cdc.gov/nccdphp/sgr/index.htm).
Researchers and educators agree that movement is essential to learning as the brain is
activated during physical activity. Therefore, by incorporating physical activity, physical
education can have beneficial affects on both academic learning and physical activity patterns of
students. According to several researchers, (Etnier, Salazar, Landers, Petruzzello, Han &
Nowell, 1997; Hillman, Castelli, & Buck, 2005; Hollmann & Struder, 1996; Ploughman, 2008;
Shephard, 1997; Trudeau & Shephard, 2010; Sibley & Etnier, 2003) when the brain is activated
during physical activity, existing brain cells are rejuvenated and new ones are stimulated.
Specifically, there is an increase in cerebral blood flow, enhancement of arousal level, changing
hormone secretions, and enhanced nutrient intake. The next section 1.1.1 looks at effects of
physical activity on the brain, and section 1.1.2 examines physical activity effects on cognitive
functioning.
1.1.1 Effects of Physical Activity on the Brain
Physical activity effects on the brain have been extensively researched (Etnier, et al., 1997;
Ploughman, 2008; Trudeau & Shephard, 2010; Sibley & Etnier, 2003). Physical activity benefits
for the brain have included: increase in cerebral blood flow (moderate to high intensities of
exercise have shown large increases), changes in neurotransmitters (acute bouts of exercise cause
changes), increases in norepinephrine and serotonin (after an acute bout of exercise and chronic
exercise influences more long-term increases in neurotransmitters), and permanent structural
6
changes in the brain. The increases in cerebral blood flow benefit cognitive functioning due to
the increased nutrient and oxygen supply to the brain. Additionally, the increases in
norepinephrine found in humans are significant due to the fact that studies on rats have shown
high levels of norepinephrine associated with improved memory. For example, Isaacs,
Anderson, Alcantara, Black, and Greenough, (1992) conducted an experiment where rats were
assigned to one of four conditions. The first group was a motor skill learning group that trained
for 30 days on a obstacle course that was periodically increased in difficulty. The second group
was also trained for 30 days to walk rapidly and then jog one hour each day. The third group
was housed individually with a running wheel, and the activity was voluntary. The fourth group
was an inactive group with identical cages as the other groups. Their results found that both the
motor skill learning group and the repetitive physical activity group had permanent changes in
the brain which demonstrated that physical activity and motor skill learning stimulated
angiogenesis (a physiological process in the body that involves the growth of new blood vessels).
More recently a review conducted by Trudeau and Shephard (2010) highlighted the
relationship of physical activity to brain health and academic performance of schoolchildren. The
experimental studies on physical activity and cognition on rats and humans focused on the
hippocampus which is related to memory. The focus of these investigations was on long-term
hippocampal potentiation (LTP). This is a necessary process in the consolidation of memory and
is characterized by an increase in synaptic efficacy. The LTP appears to be facilitated by
physical activity through the following mechanisms: improved synaptic transmission, increased
concentrations of neurotrophins, protection against the adverse effects of free radicals, and
increased neurogenesis (development of neurons). Similar to the Isaac et al. (1992) study,
Trudeau and Shephard (2010) reviewed several experimental studies showing improved synaptic
7
transmission after running, and faster learning of maze pathways for rats. Additionally, several
adult animal studies have demonstrated increases in brain-derived neurotrophic factor (BDNF)
and other growth factors in response to physical activity (Ploughman,2008; Trudeau & Shephard,
2010). For young human adults the BDNF increases have been observed with acute bouts of
physical activity. BDNF promotes neural growth and protects neurons from oxidative damage.
The increase of antioxidants in the brain of trained animals has been observed, and this increase
further protects the hippocampal cells from damage (Shephard & Trudeau, 2010; Ploughman,
2008; Etnier, 1997). Also, studies in elderly humans have demonstrated that endurance physical
activity is protective against cognitive decline, and the previously mentioned increase in
antioxidants from the physical activity could protect the brain against functional loss
(Ploughman, 2008; Shephard & Trudeau, 2010).
The next three studies discuss functional magnetic resonance imaging (fMRI) techniques
to assess the effects of physical activity on brain functions. fMRI is a neuroimaging technique
used to study brain activity to determine which structures are active during specific mental
functions. The first study (Colcombe, Kramer, Erickson, Scalf, McAuley, and Cohen (2004 a,b)
examined adults using the magnetic imagining techniques (fMRI) to assess brain functions prior
and following a 6-month aerobic walking program for 29 sedentary older men. The men in the
program were able to perform complex decision tasks more rapidly than those who did not
participate. The (fMRI) detected that physical activity had modified brain function in the
prefrontal cortical area of the brain that regulates and controls behavior.
Most recently, two recent studies are the first to explore changes in the preadolescent
brain by use of (fMRI) techniques. Chaddock, Erickson, Prakash, VanPatter, et al. (2010)
explored the association between childhood aerobic fitness and basal ganglia structure and
8
function. The researchers used the MRI technique to detect changes in the basal ganglia that is
involved in attentional control. Their results demonstrated that higher-fit children (aged nine and
10) showed superior performance on an attention and inhibition task, and greater volumes in the
basal ganglia area of the brain were observed, compared to similar aged lower fit children. The
conclusion of the research was that aerobic fitness in children is connected to the increased
volumes in the brain which is related to enhanced cognitive control. The second study conducted
by Chaddock, Erickson, Prakash, Kim, et al. (2010), was also performed on nine- and 10- year-
old children, and extended the previous research on animals and elderly adults that have
demonstrated aerobic physical activity’s connection to increased memory. The structure of the
brain studied through the MRI was the hippocampus. Researchers compared the hippocampus
volume of high versus low- fit children, and whether the differences were related to performance
on an item and relational memory task. The results were consistent with previous research on
animals and elderly adults in that higher-fit children demonstrated greater bilateral hippocampus
volumes and superior relational memory task performance compared to the lower fit children.
These findings are the first to demonstrate the positive effects of aerobic fitness on the structure
and function of preadolescent brains.
Overall, the above mentioned mechanisms of increased cerebral blood flow, changes in
neurotransmitters and permanent structural changes in the brain have shown a potential for
enhancing learning and memory in adult rats, and in adults there is evidence that regular physical
activity increases the protection for the brain against functional loss. In young animals this
evidence for the benefits of physical activity on the brain have not yet been demonstrated, but it
is possible that the evidence to date on adult animals may have a greater influence on the more
plastic brains of young children (Trudeau & Shephard, 2010).
9
In the very young children (infancy (one month to one year) through early childhood
(one year to six years), research demonstrates that daily movement is crucial in brain
development as sensory pathways in the brain are developing (Blakemore, 2003;Leppo, Davis, &
Crim, 2000; Sibley & Etnier, 2003). Developing control of muscles and movement is important
for the infant and child’s ability to interact with her environment (Leppo et.al., 2000; Sibley &
Etnier, 2003). Movement contributes to the organization of neural circuits that develop through
the process of synaptogenesis, which permits children to learn to develop control over their
sensory abilities and motor functions. Cognitive functioning is also facilitated by the process of
myelinization stimulated by movement. In addition, the cerebellum is affected by children’s
movement especially in the first few years of life as cells are forming functional circuits in the
cerebellum which in turn affect spatial perception, memory, selective attention, language,
handling of information, and decision making (Blakemore, 2003; Leppo et,al. 2000; Sibley &
Etnier, 2003).
The importance of physical activity for the very young and the older adults is well
supported. John Ratey, (2008) integrates hundreds of scientific studies and research papers to
demonstrate physical activity improves brain function at every age level. Ratey emphasizes that
physical activity enables the cells in the brain to be optimal, which maintains and improves brain
functioning, and therefore gives us the ability to learn and focus.
1.1.2 Physical Activity Effects on Cognitive Functioning
A significant positive relationship has been observed in the research on the relationship between
cognition and physical activity. For example, Sibley and Etnier (2003) conducted a meta-
analysis of 44 studies that showed a positive correlation with a significant overall effect size of
10
0.32 between physical activity and seven categories of cognitive performance (perceptual skills,
intelligence quotient, achievement, verbal tests, mathematics tests, developmental level and
academic readiness) among school-aged children. Additionally, the review demonstrated that all
design types and different types of physical activity produced cognitive function benefits.
Examining children with and without clinical disorders, a review by Tomporowski,
(2003) demonstrated positive acute exercise effects on children’s behavior and cognitive
performance. Cognitive performance was measured in several ways depending on the study. The
variety of measures used was: letter-cancellation speed, mathematics computation, Woodcock-
Johnson Test, WISC-R: Digit Span coding, memory, abbreviated symptom questionnaire, self-
stimulation, attention, stereotyped behaviors, classroom behavior, class disruptions, and
aggression and hyperactivitiy.
More recently Tomporowski, et al. (2008) reviewed research studies that examined
physical activity effects on children’s intelligence, cognition, and academic achievement. The
studies were evaluated in light of the executive function hypothesis. Executive function
involves scheduling, response inhibition, planning, and working memory. In the studies physical
activity effects on executive function in adults have experienced the most significant results out
of the four types of cognition’s mental processing: executive function, controlled processing,
visuospational processing, and speeded processing. When the executive and non-executive
cognitive processes in older adults were assessed following an aerobic training and non-aerobic
toning program, there were post-training differences. The aerobic training group performed tests
that required executive function more efficiently and rapidly than the non-physical activity
group.
11
Adult research on the executive function hypothesis can be extended to predict the
physical activity related improvements in children’s cognitive function. The cross-sectional
studies (Tomporowski, et al., 2008) reviewed by the researchers indicated that the children who
were physically fit performed cognitive tasks more rapidly and displayed greater mobilization of
brain resources than less fit children.
For the experimental studies reviewed by Tomporowski, et al. (2008), academic
achievement was the common outcome measure with the most evidence for chronic physical
activity having positive effects on academic achievement. Due to variation in methods with few
randomized studies, the overall conclusion from these studies was that the children’s academic
progress was not hindered due to the time spent in physical education.
Overall, the evidence so far indicates gains in children’s mental functioning from the
physical activity interventions on tasks that involve executive functions. There are many
unanswered questions, for instance, if the cognitive benefits decline when the physical activity is
terminated, and if there is a relationship to the type, duration, or intensity of the programs.
(Tomporowski, Davis, Miller, & Naglieri, 2008).
With the many physiological benefits of physical activity to the positive effects
on brain development and cognition, it is evident that physical activity enhances learning. The
next section addresses elementary school physical activity interventions.
12
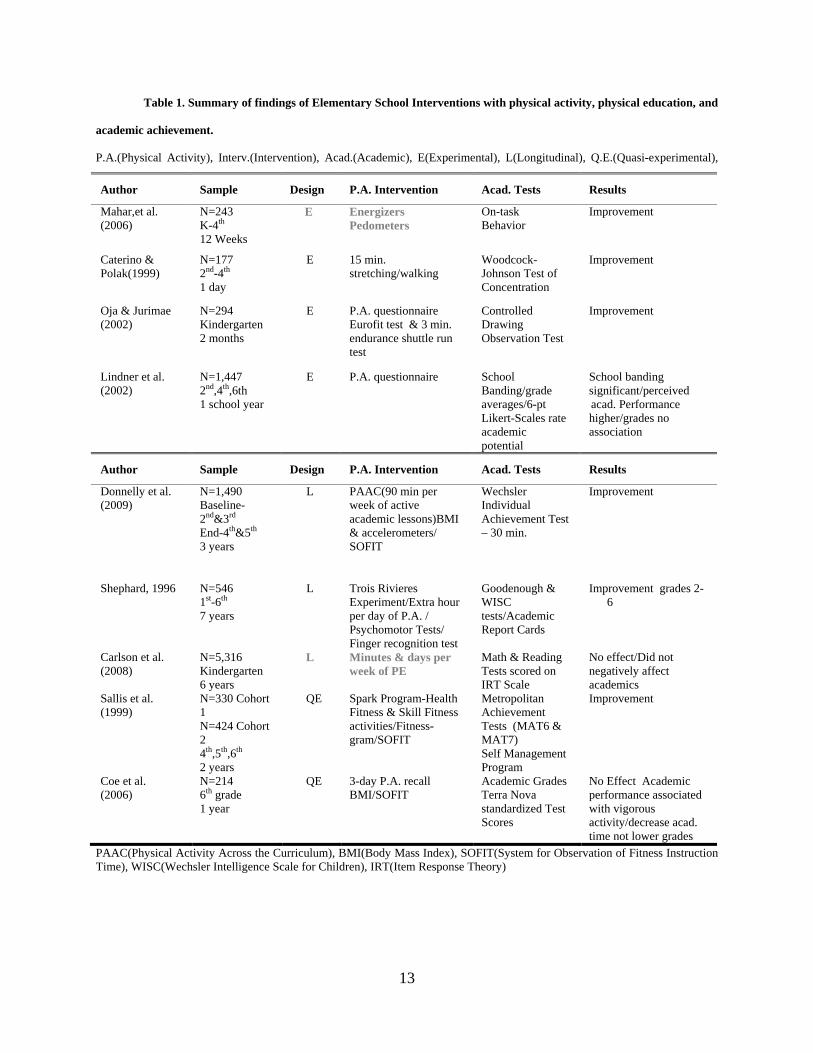
1.2 ELEMENTARY SCHOOL INTERVENTIONS
In his book, Robert Fulghum, (2003) refers to everything we need to know about how to live,
what to do, and how to be. Fulghum neglects to mention the importance of daily physical activity
that can also be learned in kindergarten. The benefit of daily physical activity for children’s
health is evidence to include strenuous activity through play at recess, activity breaks and
physical education classes on a daily basis. Not only does physical activity promote fitness, but
recent research demonstrates its contribution to learning. Because so many physical education
programs have been reduced or eliminated to make room for more academic time, researchers
have studied the link between physical activity and academic achievement. The following 16
elementary school intervention programs examine the relationship among physical activity,
physical education and academic achievement; and physical activity, physical fitness and
academic achievement. (see Table 1 and 2 below).
13
Table 1. Summary of findings of Elementary School Interventions with physical activity, physical education, and
academic achievement.
P.A.(Physical Activity), Interv.(Intervention), Acad.(Academic), E(Experimental), L(Longitudinal), Q.E.(Quasi-experimental),
PAAC(Physical Activity Across the Curriculum), BMI(Body Mass Index), SOFIT(System for Observation of Fitness Instruction Time), WISC(Wechsler Intelligence Scale for Children), IRT(Item Response Theory)
Author Sample Design P.A. Intervention Acad. Tests Results
Mahar,et al. (2006)
N=243 K-4th 12 Weeks
E Energizers Pedometers
On-task Behavior
Improvement
Caterino & Polak(1999)
N=177 2nd-4th
1 day
E 15 min. stretching/walking
Woodcock-Johnson Test of Concentration
Improvement
Oja & Jurimae (2002)
N=294 Kindergarten 2 months
E P.A. questionnaire Eurofit test & 3 min. endurance shuttle run test
Controlled Drawing Observation Test
Improvement
Lindner et al. (2002)
N=1,447 2nd,4th,6th 1 school year
E P.A. questionnaire School Banding/grade averages/6-pt Likert-Scales rate academic potential
School banding significant/perceived acad. Performance higher/grades no association
Author Sample Design P.A. Intervention Acad. Tests Results
Donnelly et al. (2009)
N=1,490 Baseline-2nd&3rd End-4th&5th 3 years
L PAAC(90 min per week of active academic lessons)BMI & accelerometers/ SOFIT
Wechsler Individual Achievement Test – 30 min.
Improvement
Shephard, 1996 N=546 1st-6th 7 years
L Trois Rivieres Experiment/Extra hour per day of P.A. / Psychomotor Tests/ Finger recognition test
Goodenough & WISC tests/Academic Report Cards
Improvement grades 2-6
Carlson et al. (2008)
N=5,316 Kindergarten 6 years
L Minutes & days per week of PE
Math & Reading Tests scored on IRT Scale
No effect/Did not negatively affect academics
Sallis et al. (1999)
N=330 Cohort 1 N=424 Cohort 2 4th,5th,6th 2 years
QE Spark Program-Health Fitness & Skill Fitness activities/Fitness-gram/SOFIT
Metropolitan Achievement Tests (MAT6 & MAT7) Self Management Program
Improvement
Coe et al. (2006)
N=214 6th grade 1 year
QE 3-day P.A. recall BMI/SOFIT
Academic Grades Terra Nova standardized Test Scores
No Effect Academic performance associated with vigorous activity/decrease acad. time not lower grades
14
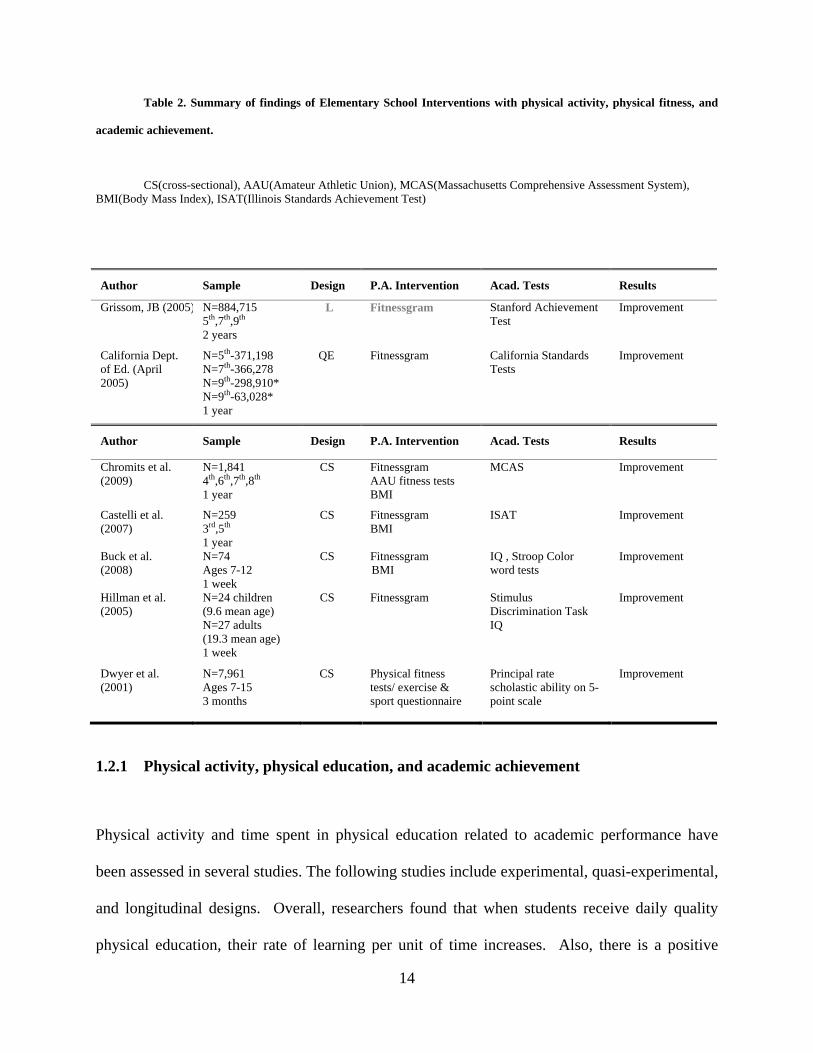
Table 2. Summary of findings of Elementary School Interventions with physical activity, physical fitness, and
academic achievement.
CS(cross-sectional), AAU(Amateur Athletic Union), MCAS(Massachusetts Comprehensive Assessment System),
BMI(Body Mass Index), ISAT(Illinois Standards Achievement Test)
1.2.1 Physical activity, physical education, and academic achievement
Physical activity and time spent in physical education related to academic performance have
been assessed in several studies. The following studies include experimental, quasi-experimental,
and longitudinal designs. Overall, researchers found that when students receive daily quality
physical education, their rate of learning per unit of time increases. Also, there is a positive
Author Sample Design P.A. Intervention Acad. Tests Results
Grissom, JB (2005) N=884,715 5th,7th,9th 2 years
L Fitnessgram Stanford Achievement Test
Improvement
California Dept. of Ed. (April 2005)
N=5th-371,198 N=7th-366,278 N=9th-298,910* N=9th-63,028* 1 year
QE Fitnessgram California Standards Tests
Improvement
Author Sample Design P.A. Intervention Acad. Tests Results
Chromits et al. (2009)
N=1,841 4th,6th,7th,8th 1 year
CS Fitnessgram AAU fitness tests BMI
MCAS Improvement
Castelli et al. (2007)
N=259 3rd,5th 1 year
CS Fitnessgram BMI
ISAT Improvement
Buck et al. (2008)
N=74 Ages 7-12 1 week
CS Fitnessgram BMI
IQ , Stroop Color word tests
Improvement
Hillman et al. (2005)
N=24 children (9.6 mean age) N=27 adults (19.3 mean age) 1 week
CS Fitnessgram Stimulus Discrimination Task IQ
Improvement
Dwyer et al. (2001)
N=7,961 Ages 7-15 3 months
CS Physical fitness tests/ exercise & sport questionnaire
Principal rate scholastic ability on 5-point scale
Improvement
15
relationship with physical education and increased academic performance, and when time is
allocated for quality physical education a negative impact on academic achievement does not
exist. Finally, when physical education time is reduced, improvement in academic achievement
is not guaranteed (Smith & Lounsbery, 2009).
The studies in this section are reviewed based on design: experimental, quasi-
experimental, and longitudinal. Two of the experimental studies Mahar et al. (2006) and Caterino
and Polak, (1999) examined the effects of physical activity on cognition. Mahar et al. (2006)
assessed kindergarten (K) to fourth graders in a classroom-based physical activity program. The
intervention included a daily classroom-based activity break and on-task behavior assessment.
The classroom-based activity break, named Energizers, involved one 10 minute integrated
(academic concepts) classroom-based physical activity conducted each day for 12 weeks.
Teachers led the Energizer activities that involved an integrated grade-appropriate academic
content with movement. The intervention group that received the daily Energizer activity
included two classes from each grade level (K-four) except grade three had only one intervention
class (nine classes). These intervention classes were randomly selected. The control group
included six classes that did not receive the Energizers program.
All students wore pedometers to assess their daily in-school physical activity levels.
Pedometers were given to all students at the beginning of each school day, and collected at the
end of the school day. For the intervention classes (N-135 children) the number of steps
accumulated before children performed an energizer activity, the number of steps they had after
completion of the Energizers activity, and the number of steps they had at the end of the school
day were recorded. For the six control classes (N= 108 children), only the number of steps taken
16
at the end of the school day was recorded. The children or teachers recorded the steps for the
intervention and control classes, and all knew the purpose of the pedometers.
The second part of the intervention was an assessment of on-task behavior. Two
randomly selected third and fourth grade classes were assessed for one week. On-task behavior
was defined as verbal or motor behavior that followed class rules and was appropriate to the
learning situation. Off-task behavior was coded as either motor off-task, noise off-task, or
passive/other off-task. A multiple-baseline across-classrooms design was used to assess whether
participation in the Energizer activities affected the intervention group’s on-task behavior during
academic instruction. The trained observers randomly selected which students to observe each
week. The students and teachers were not aware of who was being observed at a given time.
The results demonstrated an increase in both daily in-school physical activity and on-task
behavior during academic instruction for the intervention group. Specifically, the intervention
classes averaged approximately 782 more daily in-school steps than the control classes. There
was a statistical significance (P<0.05) between the intervention and control classes in school
steps, and the size of the difference was moderate (ES=0.49). On-task behavior improved by
eight percent between the pre-Energizers and post-Energizers (P<0.017), and the size of the
difference was moderate (ES=0.60). Additionally, the least on-task students also improved in
on-task behavior by 20% (P<0.001) with ES=2.20 (Mahar, 2006). A limitation of the study
included teacher bias for those that supported increasing physical activity during the school day,
in rating classroom behavior. Another limitation was that observers knew if students had
received the Energizers activities. The next experimental study focused on the affect of physical
activity on a test of concentration.

17
Caterino and Polak (1999) examined these effects of physical activity on second (54),
third (71) and fourth (52) grade children utilizing the Woodcock-Johnson test of concentration.
The children were randomly assigned to either the intervention group (physical activity) or
control group (classroom activity).
The physical activity group participated for one day in 15 minutes of stretching and
aerobic walking in the gymnasium. Immediately following the physical activity they reported to
the library for the test of concentration. The Woodcock-Johnson Test of Concentration (3 minute
timed test), consisted of 19 picture symbols where five of the 19 must be matched to an identical
criterion symbol. In the 30 rows of picture symbols, students matched the criterion picture
symbol by crossing out five identical pictures in that row. The classroom activity group did not
participate in the physical activities in the gymnasium. First, the students participated in teacher
prepared lessons that followed the normal school curriculum. After classroom instruction, they
went to the library for the test of concentration only.
The results demonstrated that overall the physical activity groups had significantly higher
concentration scores than the classroom activity groups. Also, the fourth grade children, after
participating in the physical activity, had significantly better performance than children in the
other grades. There were no differences observed for the second and third graders. The
researchers concluded that physical activity prior to a test of concentration did not interfere with
performance on the test. Overall, the intervention students had significantly higher scores than
the control students. Limitations of the study included a small sample size, one day intervention,
and no consideration of sex or socio-economic status. Additionally, the school was a private
school where many of the students achieved high academic scores. Therefore there was not a
variety of academic scores. (Caterino & Polak, 1999).
18
The next two experimental design studies were both conducted in 2002, and they used
physical activity questionnaires. First, Oja and Jurimae (2002) assessed different groups of
kindergarten children in Tartu, Estonia. The study was conducted over two months, and the
objective was to study the relationships between physical activity, motor ability, and school
readiness in 6-year old children. There were 294 kindergartners studied (161 boys; 157 girls)
from eight different kindergartens in Tartu. All of the children were of Estonian origin, and body
mass index was calculated for each child. The parents supplied the information on daily physical
activities through a questionnaire for indoor and outdoor activities in minutes, and the children
participated in two obligatory PE lessons per week conducted by a PE teacher. The classroom
and PE teacher recorded the child’s in-school activities both inside and outside. Both parents and
teachers recorded level of intensity as either low to moderate (heavy breathing not expected) or
moderate to vigorous (heavy breathing). Motor tests were used from the Eurofit test battery, and
a controlled drawing observation was used as a predictor of school readiness and mental
development. The controlled drawing test included three parts: 1) preparation of the sheet of
paper for drawing, 2) drawing mathematical figures (lines, triangles, circles, and squares), and 3)
drawing everyday objects.
The results demonstrated significant differences between boys and girls on all evaluated
physical activities except for outdoor activities on weekdays and weekends. Girls had a higher
total time and percentage of indoor activities which were moderate to vigorous. This is not
typical, but the researchers believe the six year old girls had an advantage due to the fact that
most of the girls were participating in aerobic activity or dancing lessons. A multiple regression
analysis was used with the independent variables being physical activity scores and motor test
scores, and the dependent variable was the Control Drawing Observation scores. The results
19
showed that various physical activities accounted for 19-25% in the variance of Control Drawing
Observation scores, and motor fitness items accounted for 17-21% in the variance. Also, children
with the highest level of physical activity had better scores on the subtest of fine motor control.
Overall, the researchers concluded that indoor physical activities during the week were more
related to school readiness than outdoor activities for both boys and girls. Additionally, motor
tests that are demanding of children’s total concentration (Controlled Drawing Observation)
appear to be closely related to school readiness (Oja & Jurimae, 2002). This study showed how
physical education is important in helping to improve children’s critical thinking skills, and it
demonstrated that physical activities are important in attention, concentration and school
readiness. Limitations of the study were small sample size, Duration of intervention only two
months, and accuracy of parent’s reporting on physical activity questionnaire. The next study
uses objective measures of scholastic achievement, and the effect of banding (academic
tracking).
The relationship between academic performance and physical activity participation using
the effect of banding and objective measures of scholastic achievement was assessed in both
boys and girls. The students were grouped into high (more than one-half standard deviation
above the mean hours per week), medium, and low (below one-half standard deviation below the
mean) participation time groups in order to answer the questions: (a) Is there a relationship
between academic performance and activity participation, and is school band a factor in this
relationship? (b) Are there differences in physical activity participation between students
attending differently banded schools? (c) Do students who participate extensively in physical
activities have better academic results (actual or perceived) than students who participate less?
(Lindner, 2002, pg.157)
20
The sample included 1,447 children in grades two, four, and six. The boys (736) and
girls (711) were evenly distributed over the three grade levels sampled. From the cooperating
schools two or more classes were randomly selected from each of the grade levels of two, four,
and six. Grades from the past year were provided by the schools that completed the physical
activity questionnaire. The physical activity questionnaire included: questions on the student’s
participation in sport and physical activity during the 1998-1999 school year (type, frequency,
and duration of up to 5 activities, question to rate their own academic potential and performance
in the past year using a 6-point Likert-type scales, and biographical information).
The analysis was performed separately for boys and girls due to girl’s value for academic
performance being greater than their value for sport participation, and the reverse is the case for
the boys. Results showed that students from the higher-banded schools had greater participation
time than lower-band students. Also, the perceived academic performance and perceived
potential was higher for students with more participation time in physical activity, especially for
the males. There was no relationship found for the middle and high band students, and a slight
negative relationship for low-band students. In addition, when considering actual academic
grades and banding, there was no association found. The researchers concluded that there was a
slight positive link between academic performance and activity participation due to the higher-
band students who had significantly better school results. These students also demonstrated more
participation in physical activities in terms of time commitment when compared to the lower-
band students. This was significantly more so for the boys (Lindner,2002). This study is
important because of the positive link between academic performance and the observed physical
activity participation. However, a limitation of the study is that different school bands may be
encouraged to participate differently. In addition, high-band schools usually have better sports
21
programs and facilities than the low-band schools. Therefore there may be more encouragement
for participation in sports and physical activity for the high-band schools. The next three studies
are longitudinal studies that look at time spent in physical activity compared to academic
achievement.
The first longitudinal study to be reviewed was conducted in 2009, and assessed changes
in a curriculum that promoted physical activity, and looked at the affects on body mass index
(BMI) and academic achievement scores (Donnelly et al., 2009). Physical Activity Across the
Curriculum (PAAC) was a three-year cluster randomized controlled trial. Twenty-six
elementary schools in Northeast Kansas were cluster randomized to PAAC as intervention or
control group. PAAC promoted 90 minutes per week of moderate to vigorous physically active
academic lessons, delivered by the classroom teacher intermittently throughout the school day.
The primary outcome was BMI (height and weight collected at the beginning and end of all three
years), and the secondary outcomes were daily physical activity (accelerometers worn four
consecutive days (two weekdays and two weekend days) and academic achievement (Wechsler
Individual Achievement Test administered for 30-minutes). The intensity of the physical activity
was monitored through the System for Observation of Fitness Instruction Time procedure
(SOFIT). The participants were in grades two and three, and they were followed to grades four
and five. All of the students in the intervention schools received PAAC, while the control
schools received only regular classroom instruction (Donnelly et al., 2009).
Twenty-four schools completed the study and overall change in BMI was significant only
from baseline to end of the three year study. The PAAC school children exhibited 27% greater
levels of moderate to vigorous intensity compared to control school children. For academic
achievement, significant improvements were observed in the PAAC schools for composite,
22
reading, mathematics, and spelling scores. It was also demonstrated that teachers who modeled
physical activity in the PAAC lessons had greater SOFIT scores, which meant their students
were more active than the students with teachers at lower levels of modeling physical activity.
One limitation of the study was self-report by teachers of continuation of PAAC after the
intervention. An objective report should be used in the future. Also, 20% of the school days
were missed due to assemblies, field trips, etc., and this limited exposure to PAAC. In
conclusion, the study found that the PAAC program promotes daily physical activity and
academic achievement in elementary school children (Donnelly et al., 2009). This study is
important because it demonstrates that classroom teachers can effectively increase students’
daily physical activity at a low cost while teaching academic lessons.
The next two studies, Shephard (1996) and Carlson et al. (2008) assessed student’s
academic data and compared it with time spent in physical activity through physical education.
Shephard reviewed the Trois Rivieres Experiment that he conducted with Dr. Hugues Lavallee in
the Province of Quebec between 1970 and 1977. The design was quasi-experimental and
longitudinal and involved 546 primary school students. The experimental students (grades one-
six) received an extra hour per day of additional physical activity taught by a physical activity
specialist. The control students were from the same schools and received the same academic
environment but spent 13-14% more time on academic instruction. Additionaly, there were 2,282
academic report cards (884 urban school report cards, 1398 rural school report cards) evaluated
of primary school students in the St. Maurice region of Quebec. The academic tests were the
Goodenough and Wechsler Intelligence Scale for Children (WISC). The Goodenough required
students’ to draw a man, and they are judged on 73 items pertaining to accuracy, detail,
perspective and proportion of the man drawn. The WISC is an intelligence test comprised of ten
23
core subtests and five supplemental ones. The psychomotor tests included perception of body
size and perception of vertical. The Nadine Galifret-Granjon finger recognition test was also
administered. Cognitive and psychomotor measurements were taken annually.
Results demonstrated that in the first year the control students on average had better
grades than the experimental students. However, in grades two through six the experimental
students out-performed the control children, which was significant in grades two, three, five and
six in the cognitive tests. Additionally, the girls outperformed the boys in all grades. Several
limitations and explanation of the results were discussed. First, the experimental students
performed better academically in grades assigned by homeroom teachers, thus indicating a
possible “halo” effect. It was reported that 80% of the teachers favored the program, and 20% of
teachers had a neutral attitude. However the authors explained that in any given year the
homeroom teachers assigned grades for either experimental or control group, and they were
unaware that the experiment had more of a positive impact on the academic performance of girls
than the boys. Secondly, it was difficult to determine if homeroom teacher’s quality of
instruction was better in the years of the experimental program. Lastly, the physical activity
program may have aided the students in more attention to instruction at the end of the day, and
the increase in motor skills and body build may have improved self-esteem. This could have led
to more of a desire to learn and better classroom behavior. However, since all students were
exposed to the same program the authors argue strongly against this explanation. The teachers
did have a daily one-hour break during these years, and possibly they returned to class better
prepared and rejuvenated. The teachers may have assigned higher grades to students that they
viewed to be in the better program. The researchers concluded that the rate of academic learning
24
per unit of class time is enhanced in the students who participated in daily physical activity even
though they spent less time in academics (Shephard, 1996).
Carlson et al. (2008) examined the data from the Early Childhood Longitudinal Study
(kindergarten class of Fall 1998 through Spring 2004). The sample consisted of 5,316
kindergarten through fifth grade students, and examined the association between time spent in
physical education and academic achievement. The time spent in physical education was
collected by the classroom teachers, and the academic achievement (math and reading)
assessments were collected, and Item Response Theory (IRT) scale scores were calculated for
each child. The IRT scale scores represent estimates of the number of items students would have
answered correctly at each point in time for all assessment questions on reading and
mathematics. The measurement of academic achievement was a standardized test administered at
five time points and included a reading and math test. Time spent in physical education was
recorded by the classroom teachers who reported the number of times per week, and the minutes
per day students participated in physical education. The groups were labeled low (0-35 minutes
per week), medium (36-69 minutes per week), and high (70-300 minutes per week).
Results on time spent in physical education showed students had physical education one
to two times per week. The most common reported duration was 16-30 minutes for kindergarten
and first grade, and 31-60 minutes for third and fifth grade. The large database was a strength
of the study, however statistical weights did not adjust for the largest source of missing data,
which was time in physical education. The absence of this data may have biased the sample
because students with complete data were more likely to be White and less likely to be Black,
and their family income was more likely to be more than $75,000 and less likely to be less than
$25,000. Another limitation was there was not any indirect measurement of concentration,
25
memory, or classroom behavior. Additional limitations were lack of valid measurements on time
in physical education, quality of physical education, and there were no yearly time points as data
was not collected in second and fourth grades. The overall results demonstrated a small
significant academic benefit in mathematics and reading for girls in the higher amount of PE
group (70-300 min. per week) versus the lowest exposure (0-35 minutes). There was no
association observed for the boys (Carlson, et al., 2008).
These previous two studies are important because they demonstrate that health and
physical activity related benefits can occur for primary school children without negatively
impacting academic achievement. Therefore, the researchers have demonstrated that PE should
be promoted by all for the benefits, and schools should strive to meet the national health
objectives for daily PE.
The next two studies are quasi-experimental and examine the influence of physical
activity and physical education on academic achievement. First, Sallis, McKenzie, Alcaraz,
Kolody, Faucette, & Hovell (1999) conducted a randomized study of physical education over
two years with a program called Sports, Play, and Active Recreation for Kids (Project Spark).
The sample came from a single school district in Southern California, and enrollment for the
program included seven, kindergarten to grade five, schools with 955 students total. The students
were randomly assigned to one of three conditions: specialist condition (certified PE specialist),
trained teacher condition (classroom teacher trained by research staff), or control condition
(classroom teacher conducted usual PE program). There were two consecutive cohorts of
students that entered the study as fourth graders. The final sample size was n=330 in Cohort 1
and n=424 in Cohort 2. Achievement test data was available at post-test for 754 students in the
fifth and sixth grades.

26
The Spark Program included physical activity in and out of school three days a week,
with lessons that lasted 30 minutes and contained health-fitness activity (15 min.) and skill
fitness activity (15 min.). Also included was a self-management program that emphasized
teaching student’s behavior change skills taught in weekly 30- minute classroom sessions. Self-
report and fitness measures were collected at the beginning and the end of each school year.
Specifically, self-reported physical activity for out-of-school was assessed with a one day recall,
and out-of-school physical activity was monitored one weekday per semester and one weekend
per school year with an accelerometer. For fitness and anthropometric measures, the Fitness-
Gram with adaptations was used. The System for Observing Fitness Instruction Time (SOFIT)
was used to observe physical education classes each year for two weeks. Academic scores were
measured using the Metropolitan Achievement Tests (MAT6 and MAT7, Psychological Testing
Corporation, 1990). These two tests are norm-referenced tests that provide scores for reading,
mathematics, language, and a composite score known as the Basic Battery. The control schools
participated in the usual PE program and did not begin the Spark Program until completion of the
research. The objective was to evaluate the two- year health-related physical education program
by looking at the effects on academic achievement with standardized tests.
Results showed students in the trained teacher condition in both cohorts performed better
than students in the control condition on three scales. Reading, language, and the summary score
were all favorably affected by the trained teacher condition. Mathematics was the only score that
did not show an effect. Limitations of the study included a high-achieving school district which
limits the variety of students and the splitting of the sample into Cohort 1 and 2 decreased the
statistical power, but the separate analyses did show a replication of positive effects. Overall, the
Spark program was found to have enhanced academic achievement and promote self-
27
management among students outside school hours (Sallis et.al., 1999). This program is
important because the results support the need for a certified physical education specialist for all
grade levels. The physical education specialists were more successful than the trained classroom
teachers in three areas. They spent more time with the students in physical education classes,
provided more physical activity for students, and they enhanced fitness in female students. For
the teacher-training program, the elementary classroom teachers taught more physical education
and provided more physical activity for the students than the control teachers. Therefore,
effective teacher training and support can help to increase physical activity for children in the
classroom. Finally, the results showed no negative effects on academic achievement. The final
quasi-experimental study to be discussed assessed physical activity levels of intensity on
academic achievement.
Coe, Pivarnik, Womack, Reeves, & Malina (2006) determined the effect of PE class
enrollment and overall physical activity on academic achievement of sixth grade students over
the course of one year. A sample of 214 students from one public school in Michigan were
randomly assigned to one of four teams and then placed into one of two groups. The students
were randomly assigned to first or second semester physical education class. The semester that
the students did not have physical education they were enrolled in one of the exploratory classes
(art or music). One teacher from each of the core academic classes was assigned to a team of
students. These teachers were in charge of the exploratory classes, and all classes met every day
for 55 minutes to ensure all students received the same amount of increased physical activity, or
time in the exploratory classes. There were two physical education teachers that taught the
physical education class and one classroom teacher for each of the exploratory classes. Each
student was assessed at the beginning of the school year, middle, and end of school year. The
28
following information was collected at these three times: the SOFIT, BMI, and three-day
physical activity recall. Academic achievement was based on the individual scores in the core
classes by converting the letter grades to numeric data. Also, a standardized test score (Terra
Nova norm-referenced nationally standardized achievement test) was used.
The results of the study showed a significant difference between groups in BMI. The
midpoint and posttest data is presented for BMI. The academic achievement scores and Terra
Nova standardized test scores were not affected by physical education class enrollment.
However, the students that succeeded in performing vigorous physical activity (according to the
Healthy People 2010 guidelines) in both groups achieved higher academic scores compared with
the students in the exploratory groups, both the first and second semesters (Coe et al., 2006) It
was determined by the SOFIT assessment that an average of 19 minutes of the 55-minute
physical education class period was spent in moderate to vigorous activity. Therefore, it was
concluded that this low level of activity may not be adequate for influencing academic
achievement. The main limitation of the study was that Socio-economic status data was not
collected. The authors concluded that academic performance was associated with vigorous but
not moderate physical activity and decreased classroom time did not result in a lower academic
performance (Coe et al., 2006). This study is important because it demonstrates the importance
of increased levels of physical activity and the potential for vigorous physical activity to affect
academic achievement. Additionally, the results concur with the above three studies of Carlson
et al. (2008), Shephard, (1996), and Sallis et al. (1999) indicating that increased time in physical
activity through physical education did not decrease academic achievement.
In summary, the above reviewed studies demonstrate that whether physical activity is
increased through the classroom or physical education classes, the overall result is an increase in
29
academic achievement. Additionally, when time is allocated for quality physical education there
are no detrimental effects on academic achievement. Finally, recent evidence points to the
quantity (time) and quality (intensity) of physical activity. Four published reviews (Kirkendall,
1986; Sibley & Etnier, 2003; Taras, 2005; Tomporowski, 2003) examine the relationship
between quantity and quality of physical activity and academic performance. In the above Coe
et al. (2006) study more vigorous physical activity was more strongly associated with academic
achievement than lower intensity physical activity. Tomporowski, (2003) referred to several
studies that found improvements in cognitive performance after acute bouts of vigorous physical
activity, and improvements in academic performance with acute bouts of physical activity at
different lengths of time. Sibley and Etnier, (2003) also found positive effects on the quality and
quantity of physical activity on cognition through a meta-analytic review of experimental and
quasi-experimental studies. Overall these authors found all design types and physical activity
types to have positive effects on cognition (Smith & Lounsbery, 2009).
Physical fitness levels have also been related to academic achievement. The next section
of the paper will address research in elementary schools that focus on physical activity, physical
fitness and academic achievement.
1.2.2 Physical activity, physical fitness, and academic achievement
There has been less research on the relationship of physical fitness and academic achievement,
and most of these studies have used cross-sectional and correlational designs. A weakness in
these designs is that causality cannot be inferred from the data that physical fitness increased or
improved academic achievement. Also, there has been little research in this area due to the fact
that it is difficult to obtain a large sample of students, and valid and reliable measures for both
30
physical fitness and academic achievement on the same subjects. However, the following
studies included in this review have found correlations between physical activity, physical fitness
and improved academic performance along with other cognitive performance measures. The
following studies include longitudinal, cross-sectional, and correlational.
The California Department of Education (2002), as reported by Grissom (2005),
confirmed a strong relationship between physical fitness and academic performance. The study
used the Fitnessgram (six-faceted measure of fitness), and student mathematics and reading
scores from the Stanford Achievement test (9th edition), a standardized norm-referenced test. The
Fitnessgram measures aerobic capacity, body composition, abdominal strength and endurance,
trunk strength and flexibility, upper body strength and endurance, and overall flexibility.
Performance for the fitnessgram is classified as: 1) in the healthy fitness zone (HFZ) or 2) needs
improvement. Students must meet all of the fitness standards to be considered fit, and the
possible test scores range from: zero (none of the test scores were met) or 6 (all of the test scores
were met or exceeded). The academic scores were matched with fitness scores of 884,715
students in grades five, seven, and nine of the California public school system in 2002. In the
spring of 2001 the California Department of Education (CDE) began reporting the Physical
Fitness Test (PFT) results each year for students in grades five, seven, and nine. This
longitudinal study used data from the Spring 2001 and 2002 tests, and sample sizes for 2001 and
2002 were 634,112 and 884, 715 students. The sample size increased in 2002 because of
increased PFT participation, and therefore because of the increase in sample sizes this study
reports the 2002 results.
The results demonstrated that as the overall PFT score improved, the mean SAT/9
reading and mathematics normal curve equivalent (NCE) scores also improved consistently. In
31
addition, the analysis revealed a statistically significant positive linear relationship between
fitness and achievement. A statistically significant interaction between fitness and achievement
was greater for females than males. Also, the relationship between fitness and achievement was
stronger for higher socioeconomic status (SES) students than low SES students. Researchers
acknowledge that the results should be examined with caution as this data did not infer that
physical fitness causes academic achievement to improve. Also, another limitation is that higher
SES is generally associated with better health and higher academic achievement. In addition, the
researchers viewed this as a preliminary study, the influence that physical and mental processes
have on one another is ongoing (Grissom, 2005). A follow-up study conducted in 2005 found
similar results from over one million children’s scores gathered in 2004 on the California
Standards Test and physical fitness tests that measured aerobic capacity, body composition,
strength, and flexibility. The fitness scores of children in grades fifth, seventh, and ninth were
very strongly correlated with academic achievement, and the girls had a stronger relationship
than the boys. The limitations were the same as for the previous study discussed (California
Department of Education, April, 2005).
A more recent cross-sectional study with a large number of subjects (N=1,841)
examining physical fitness related to academic achievement was conducted in a racially and
economically diverse urban public school district in Massachusetts (Chomitz et al., 2009).
School record data of standardized test scores, fitness, and BMI information for students enrolled
in grades fourth, sixth, seventh, and eighth during the 2004-2005 academic years were included.
Academic achievement was measured with the Massachusetts Comprehensive Assessment
System (MCAS) which includes Math and English components. Fitness was measured by the
number of physical fitness tests (endurance cardiovascular test, abdominal strength test,
32
flexibility test, upper body strength test, and an agility test) passed out of five from the Amateur
Athletic Union (AAU) and Fitnessgram. Body Mass Index was measured between March and
April of 2005. Gender and SES was provided by the school administration records. The overall
results showed a significant positive relationship between fitness and Math and English academic
scores, with a stronger correlation with Math achievement. The limitations of the study include
the cross-sectional design means the results do not indicate causality, and the fitness data was
collected for curricular reasons, so the reliability of the data is unknown. Also, although known
confounders were accounted for in relation to physical fitness and academic achievement, it is
possible that unmeasured confounding factors explain the results. These results are similar to the
previous studies mentioned above and encourage support for increased opportunities for physical
activity throughout the school day (Chomitz et al., 2009).
A correlational cross-sectional study with smaller numbers of children found positive
relationships between fitness and academic achievement. Castelli, Hillman, Buck, and Erwin,
(2007) replicated the California 2002 findings. The researchers analyzed the relationship
between components of physical fitness (aerobic capacity, muscle fitness, and body
composition), with academic achievement (mathematics and reading) on the Illinois Standards
Achievement Test (ISAT), during a single school year. Four schools were selected out of 11 in a
single school district with an effort to balance socioeconomic and academic performance in the
sample. Of the four schools selected two schools had 76.3% of the students meet or exceed the
standard in mathematics and 86.4% in reading. The researchers considered these two schools to
be academically effective, whereas the other two schools had only 46.2% of the students meet or
exceed the standard in mathematics and 40.4% in reading. The two academically effective
schools had 24.3% of students that received free/reduced lunches/breakfast. The other two
33
schools students that received free/reduced meals were 66%. Overall, 50% of the study sample
received free/reduced lunches. Addtionally, despite socio-cultural variables, each student
received the same amount of physical activity within the school day.
For the study’s subjects and physical fitness test included were 259 third and fifth graders
(mean age 9.5), that completed five components of the Fitnessgram physical fitness test and two
content areas of the ISAT. The ethnic distribution was 78% Caucasian, 12% African American,
5% Asian, 3% Hispanic, and 2% other. The results demonstrated that several of the fitness tests,
particularly aerobic capacity, were positively related with academic achievement in reading and
mathematics throughout the four schools. In addition, BMI was positively related to
achievement in reading and math, while muscle strength and flexibility fitness were unrelated to
achievement test performance. For all the schools, whether considered academically effective or
not, a low BMI and higher aerobic fitness level positively related to mathematics and reading
achievement. Overall, even with the variables such as age, sex, school characteristics and
poverty index, the children with higher levels of physical fitness were more likely to have higher
standardized test scores in reading and mathematics. This notion of physically fit students
performing better on standardized academic tests is in support of the study conducted by the
California Department of Education in 2001 and 2004. The limitations of the study discussed
included first, that student motivation may have accounted for some of the variance between
physical fitness and academic performance. Also, the field tests used for physical fitness
measures have restrictions on the evaluation of fitness in children, and the sample was not
random which prohibits generalization to other populations (Castelli et al., 2007).
The next two cross-sectional studies to be reviewed were small samples of pre-adolescent
children who were assessed on the Fitnessgram and different cognitive measures. First, Buck,
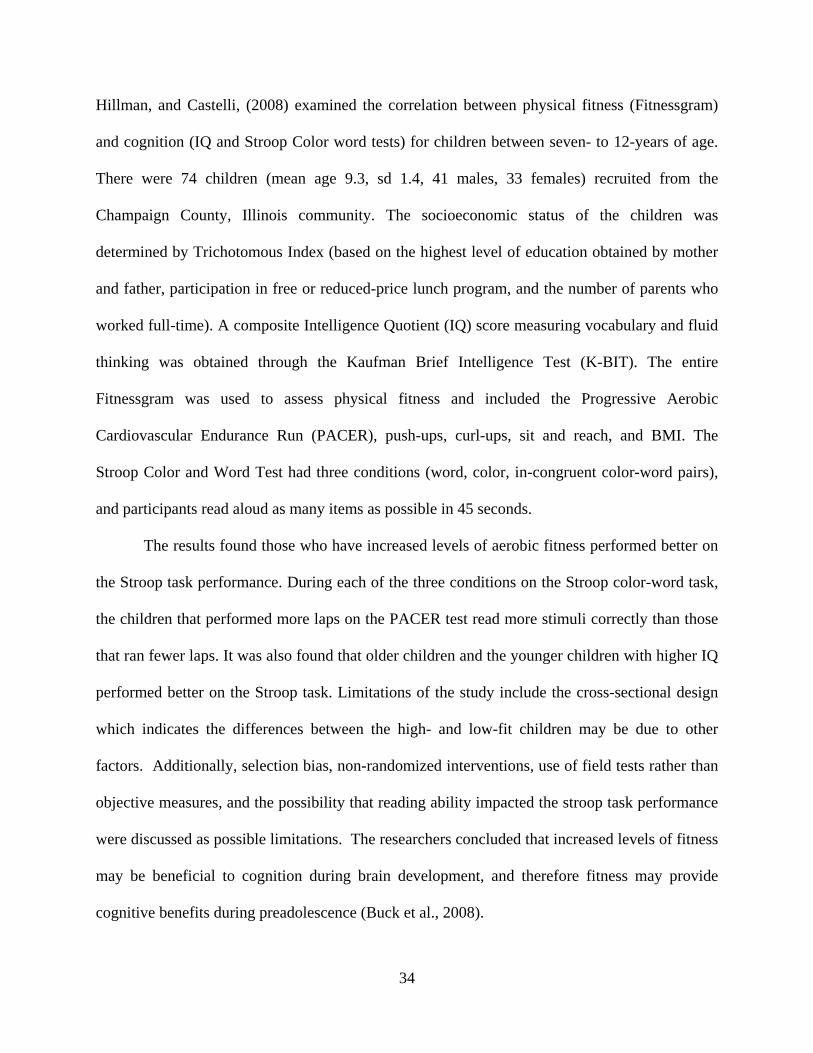
34
Hillman, and Castelli, (2008) examined the correlation between physical fitness (Fitnessgram)
and cognition (IQ and Stroop Color word tests) for children between seven- to 12-years of age.
There were 74 children (mean age 9.3, sd 1.4, 41 males, 33 females) recruited from the
Champaign County, Illinois community. The socioeconomic status of the children was
determined by Trichotomous Index (based on the highest level of education obtained by mother
and father, participation in free or reduced-price lunch program, and the number of parents who
worked full-time). A composite Intelligence Quotient (IQ) score measuring vocabulary and fluid
thinking was obtained through the Kaufman Brief Intelligence Test (K-BIT). The entire
Fitnessgram was used to assess physical fitness and included the Progressive Aerobic
Cardiovascular Endurance Run (PACER), push-ups, curl-ups, sit and reach, and BMI. The
Stroop Color and Word Test had three conditions (word, color, in-congruent color-word pairs),
and participants read aloud as many items as possible in 45 seconds.
The results found those who have increased levels of aerobic fitness performed better on
the Stroop task performance. During each of the three conditions on the Stroop color-word task,
the children that performed more laps on the PACER test read more stimuli correctly than those
that ran fewer laps. It was also found that older children and the younger children with higher IQ
performed better on the Stroop task. Limitations of the study include the cross-sectional design
which indicates the differences between the high- and low-fit children may be due to other
factors. Additionally, selection bias, non-randomized interventions, use of field tests rather than
objective measures, and the possibility that reading ability impacted the stroop task performance
were discussed as possible limitations. The researchers concluded that increased levels of fitness
may be beneficial to cognition during brain development, and therefore fitness may provide
cognitive benefits during preadolescence (Buck et al., 2008).
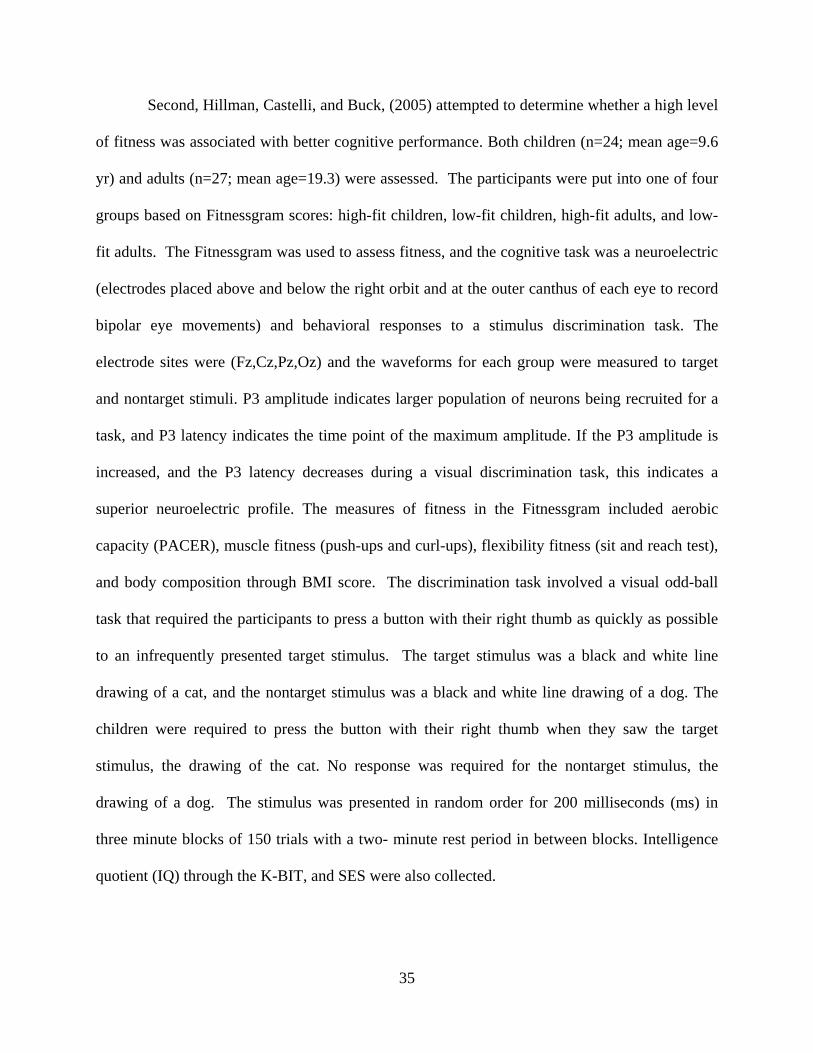
35
Second, Hillman, Castelli, and Buck, (2005) attempted to determine whether a high level
of fitness was associated with better cognitive performance. Both children (n=24; mean age=9.6
yr) and adults (n=27; mean age=19.3) were assessed. The participants were put into one of four
groups based on Fitnessgram scores: high-fit children, low-fit children, high-fit adults, and low-
fit adults. The Fitnessgram was used to assess fitness, and the cognitive task was a neuroelectric
(electrodes placed above and below the right orbit and at the outer canthus of each eye to record
bipolar eye movements) and behavioral responses to a stimulus discrimination task. The
electrode sites were (Fz,Cz,Pz,Oz) and the waveforms for each group were measured to target
and nontarget stimuli. P3 amplitude indicates larger population of neurons being recruited for a
task, and P3 latency indicates the time point of the maximum amplitude. If the P3 amplitude is
increased, and the P3 latency decreases during a visual discrimination task, this indicates a
superior neuroelectric profile. The measures of fitness in the Fitnessgram included aerobic
capacity (PACER), muscle fitness (push-ups and curl-ups), flexibility fitness (sit and reach test),
and body composition through BMI score. The discrimination task involved a visual odd-ball
task that required the participants to press a button with their right thumb as quickly as possible
to an infrequently presented target stimulus. The target stimulus was a black and white line
drawing of a cat, and the nontarget stimulus was a black and white line drawing of a dog. The
children were required to press the button with their right thumb when they saw the target
stimulus, the drawing of the cat. No response was required for the nontarget stimulus, the
drawing of a dog. The stimulus was presented in random order for 200 milliseconds (ms) in
three minute blocks of 150 trials with a two- minute rest period in between blocks. Intelligence
quotient (IQ) through the K-BIT, and SES were also collected.
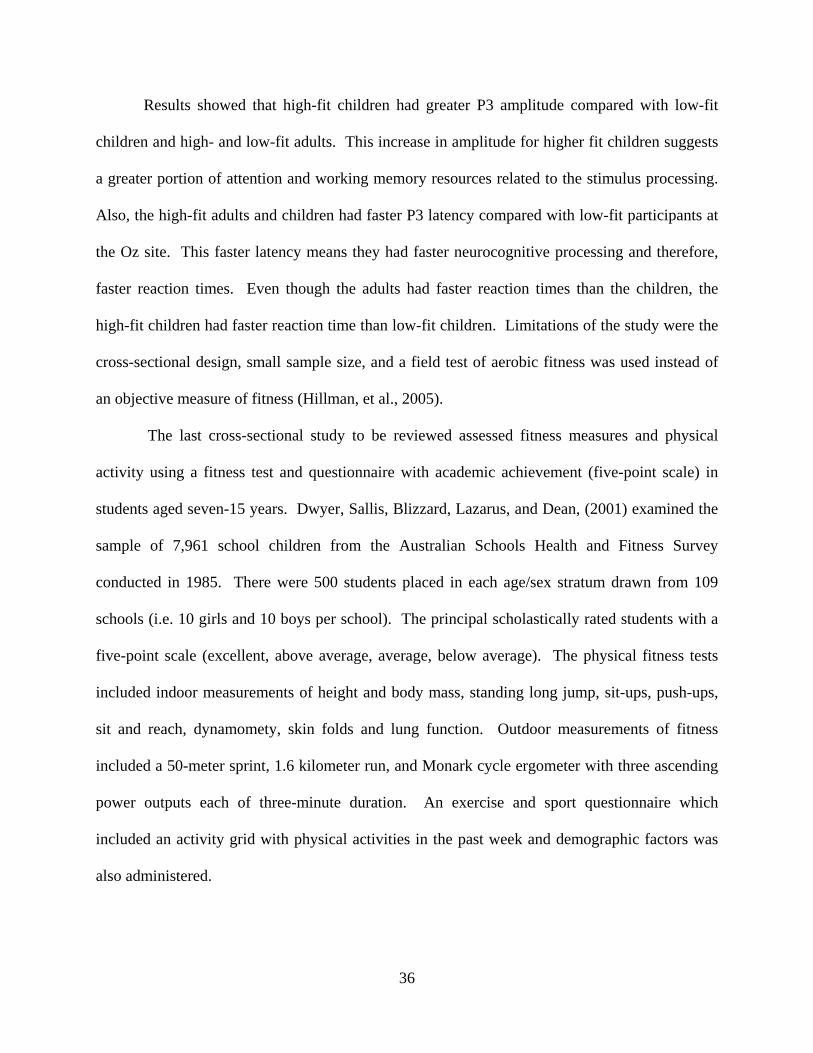
36
Results showed that high-fit children had greater P3 amplitude compared with low-fit
children and high- and low-fit adults. This increase in amplitude for higher fit children suggests
a greater portion of attention and working memory resources related to the stimulus processing.
Also, the high-fit adults and children had faster P3 latency compared with low-fit participants at
the Oz site. This faster latency means they had faster neurocognitive processing and therefore,
faster reaction times. Even though the adults had faster reaction times than the children, the
high-fit children had faster reaction time than low-fit children. Limitations of the study were the
cross-sectional design, small sample size, and a field test of aerobic fitness was used instead of
an objective measure of fitness (Hillman, et al., 2005).
The last cross-sectional study to be reviewed assessed fitness measures and physical
activity using a fitness test and questionnaire with academic achievement (five-point scale) in
students aged seven-15 years. Dwyer, Sallis, Blizzard, Lazarus, and Dean, (2001) examined the
sample of 7,961 school children from the Australian Schools Health and Fitness Survey
conducted in 1985. There were 500 students placed in each age/sex stratum drawn from 109
schools (i.e. 10 girls and 10 boys per school). The principal scholastically rated students with a
five-point scale (excellent, above average, average, below average). The physical fitness tests
included indoor measurements of height and body mass, standing long jump, sit-ups, push-ups,
sit and reach, dynamomety, skin folds and lung function. Outdoor measurements of fitness
included a 50-meter sprint, 1.6 kilometer run, and Monark cycle ergometer with three ascending
power outputs each of three-minute duration. An exercise and sport questionnaire which
included an activity grid with physical activities in the past week and demographic factors was
also administered.
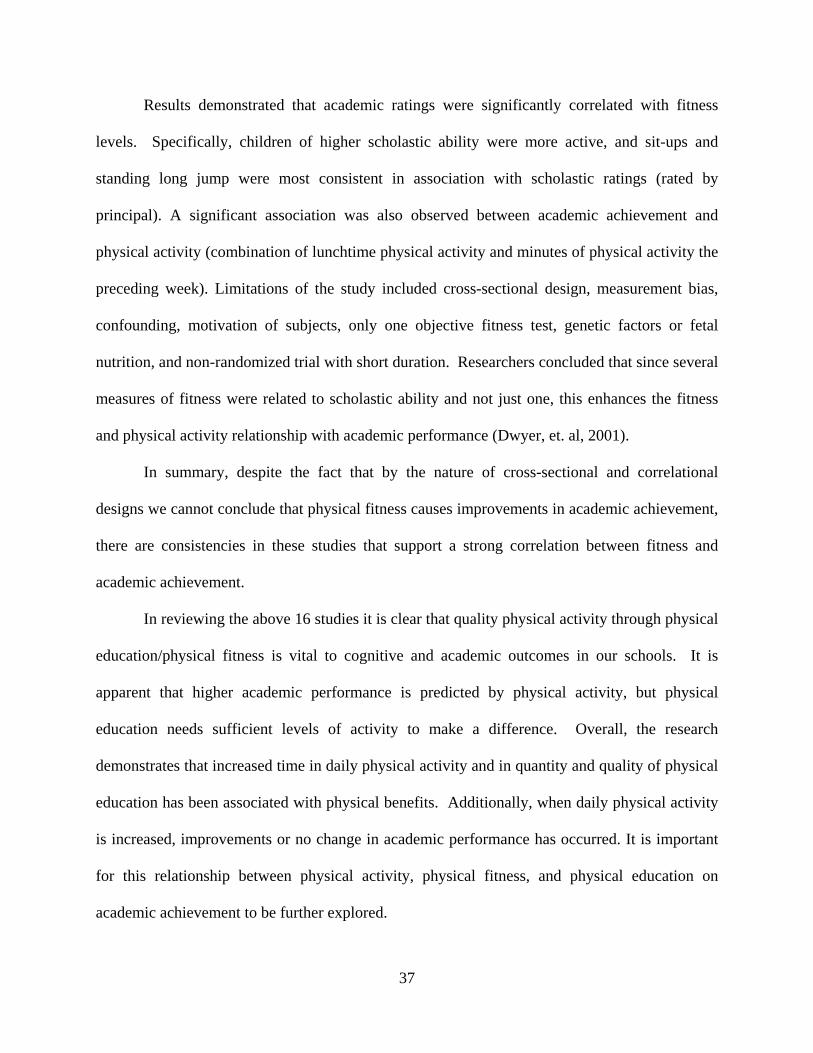
37
Results demonstrated that academic ratings were significantly correlated with fitness
levels. Specifically, children of higher scholastic ability were more active, and sit-ups and
standing long jump were most consistent in association with scholastic ratings (rated by
principal). A significant association was also observed between academic achievement and
physical activity (combination of lunchtime physical activity and minutes of physical activity the
preceding week). Limitations of the study included cross-sectional design, measurement bias,
confounding, motivation of subjects, only one objective fitness test, genetic factors or fetal
nutrition, and non-randomized trial with short duration. Researchers concluded that since several
measures of fitness were related to scholastic ability and not just one, this enhances the fitness
and physical activity relationship with academic performance (Dwyer, et. al, 2001).
In summary, despite the fact that by the nature of cross-sectional and correlational
designs we cannot conclude that physical fitness causes improvements in academic achievement,
there are consistencies in these studies that support a strong correlation between fitness and
academic achievement.
In reviewing the above 16 studies it is clear that quality physical activity through physical
education/physical fitness is vital to cognitive and academic outcomes in our schools. It is
apparent that higher academic performance is predicted by physical activity, but physical
education needs sufficient levels of activity to make a difference. Overall, the research
demonstrates that increased time in daily physical activity and in quantity and quality of physical
education has been associated with physical benefits. Additionally, when daily physical activity
is increased, improvements or no change in academic performance has occurred. It is important
for this relationship between physical activity, physical fitness, and physical education on
academic achievement to be further explored.

38
1.3 RESEARCH QUESTIONS
This research study expands the body of literature by investigating the relationship between
physical activity and academic performance in a group of kindergarten children. This study is
unique due to the specific focus on kindergarten children and the relationship of physical activity
to academic performance in reading and mathematics as measured by the Dibels Oral Reading
Fluency and Retell Fluency, and Group Mathematics Assessment and Diagnostic Evaluation (G-
Made). The data is also collected over the school year. The research questions are:
1. Did the children attend the physical activity session and were they physically active?
a. In order to investigate the relationship between physical activity and academic
performance, it must be demonstrated that the children attended the program and were actively
engaged. It was expected that the children attended the program and that they were active as
demonstrated by high attendance and a significant difference between the weekly averages of
pre- and post- physical activity heart rate scores.
b. A companion variable that analyzes active engagement is perceived exertion.
This variable was recorded each Thursday at the end of the activity during the academic year. It
was expected over time, that the children reduced their ratings of perceived exertion due to
improved performance at a fixed exercise intensity.
c. Across time, it was expected that the children in the physical activity group would
improve their physical activity scores on the machines. A group difference was expected
between initial scores and ending scores for Dance, Dance Revolution, Xavix Power Boxing,
Cateye Recumbent Game Bike Pro, and Striveis Three-kicks scores. The scores were expected to
be higher at the end of the year.
39
2. Did the children who participate in the interactive physical activity center (IPAC) perform
better academically?
a. The children who participate in the IPAC were expected to perform better than
the control group on the: Dibels Oral Reading Fluency and Retell Fluency, Group Mathematics
Assessment and Diagnostic Evaluation (G-Made).
3. Do the children who participate in the IPAC have fewer school absences compared to the
control group?
a. It was expected that the participants of the IPAC would have fewer school
absences than the control group due to their interest in the activities.
40
2.0 METHODS
2.1 DESIGN
This longitudinal study used a non-equivalent control group design to investigate the relationship
between physical activity and academic achievement in kindergarten children. There were two
components to this research: participation in IPAC and academic performance. Prior to
examining the difference in academic performance, the participation level of the children
engaged in IPAC was examined. The design was within group (beginning and ending of school
year). The dependent variables explored included IPAC attendance, IPAC machine scores, heart
rate, and perceived exertion. To examine the effects of physical activity on academic
performance the independent variable was participation in the IPAC. The academic scores
included assessment of reading (Dibels Oral Reading Fluency and Retell Fluency) and
mathematics (Group Mathematics Assessment and Diagnostic Evaluation (G-Made).
Differences in school attendance were also examined.
2.2 SAMPLE SELECTION
The data was provided by a rural public elementary school in Western Pennsylvania which
included a total of 96 kindergarten students. The physical education teachers asked the author to
41
analyze the data. An exempt existing data Institutional Review Board (IRB) was approved for
use of the data (see Appendix A for IRB approval). Information on the method of data collection
follows.
Prior to the required kindergarten orientation, the Assistant Superintendent sent a letter to
all parents of kindergarten children introducing IPAC (see Appendix B). All kindergarten
children and their parents attended the kindergarten orientation August 25, 2008; they were told
about the project and provided the opportunity to participate. As part of the orientation, the
physical education specialists offered the parents and kindergarten children a tour of IPAC, and
provided parents a handout on the details of the project (see Appendix B). Initially the parents
were able to enroll their child between the orientation date and September 2nd, the starting date of
the project. There were five children enrolled through this recruitment. Since the program was
before school, many parents did not enroll their child due to lack of transportation. The school
district is rural where a majority of the students travel at least 30 minutes into school.
Due to insufficient enrollment from the orientation, parents of the students on the early
buses were contacted by the physical education specialist to determine if their interest in
enrolling their child. This request resulted in an additional attendance of 19 children from the
morning buses, and five children who were dropped off by their parents. There were 6 early
buses that arrived at 8:20am and the last 19 that arrived at 8:50 am. All 25 buses first pick up
and drop off high school students at 7:50 am, then travel at varying times and distances to pick
up the elementary school students. The buses cover a 105 square mile area to pick up students.
The physical education specialists were only able to recruit 9 additional students from 6 early
buses, so they contacted parents from the 19 8:50 am buses and were able to recruit an additional
15 students. The parents of the 5 students that were dropped off also traveled from varying
42
distances and arrived at either the 8:20am or 8:50 am time. From the 25 buses and parent drop-
offs, two groups of IPAC participation were formed. Group 1 consisted of 9 children that arrived
at 8:20 and participated in the IPAC from 8:25am-8:50am, and Group 2 consisted of 15 children
that arrived at 8:50am and participated from 8:50-9:15am. After the children finished in the
IPAC they were escorted to their classrooms. The control group rode the same buses as the
experimental group. Thus a total of 24 students participated in the interactive physical activity
center for the duration of the 2008/09 school year.
All children in the school participated in IPAC one day per week. The children who
were part of the physical activity group also participated daily in IPAC (Monday through
Thursday), thus the IPAC group participated in the center four days per week, plus a session
during their physical education class. Those not enrolled in the IPAC group participated only
once per week from December 2008 to March 2009. All the children attended IPAC through out
the year, no one dropped out of the study. All children had physical education with a specialist
one day per week.
2.2.1 BMI, and Attendance data collection
The school nurse collected height and weight data from the children within the first month of
school. The nurse then entered the data into the Prosoft computer program. Age at the time of
the screening was built into the calculations to determine risk. BMI data was only collected at
the beginning of the 2008/09 school year.
The Assistant Superintendent provided school attendance and BMI data to the author.
Active reporting where all absences are counted and recorded with a system was conducted at
the school. Tardiness is not included in the full day absence.
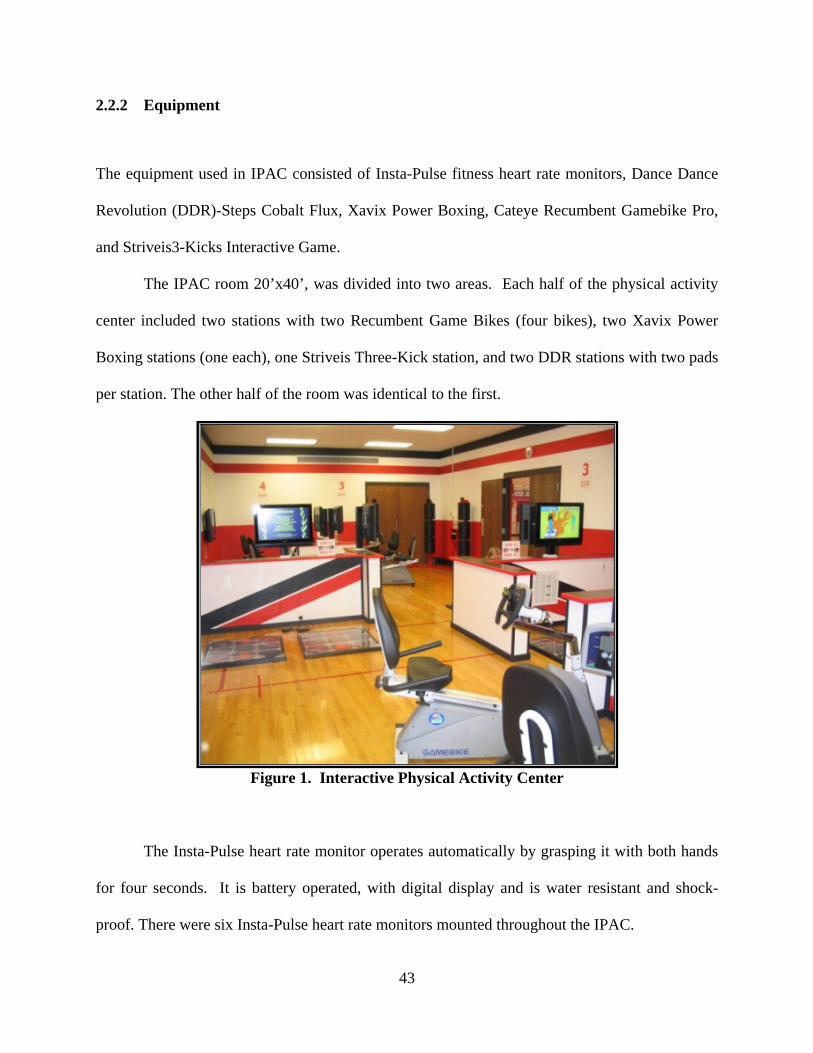
43
2.2.2 Equipment
The equipment used in IPAC consisted of Insta-Pulse fitness heart rate monitors, Dance Dance
Revolution (DDR)-Steps Cobalt Flux, Xavix Power Boxing, Cateye Recumbent Gamebike Pro,
and Striveis3-Kicks Interactive Game.
The IPAC room 20’x40’, was divided into two areas. Each half of the physical activity
center included two stations with two Recumbent Game Bikes (four bikes), two Xavix Power
Boxing stations (one each), one Striveis Three-Kick station, and two DDR stations with two pads
per station. The other half of the room was identical to the first.
Figure 1. Interactive Physical Activity Center
The Insta-Pulse heart rate monitor operates automatically by grasping it with both hands
for four seconds. It is battery operated, with digital display and is water resistant and shock-
proof. There were six Insta-Pulse heart rate monitors mounted throughout the IPAC.
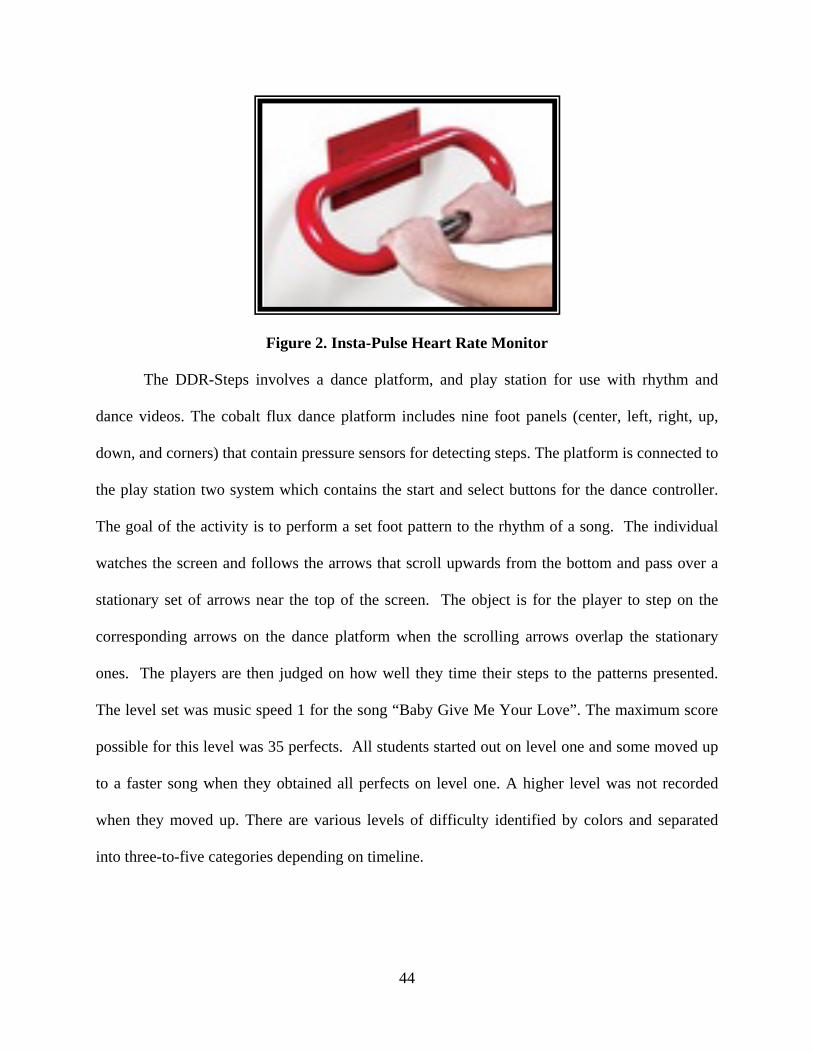
44
Figure 2. Insta-Pulse Heart Rate Monitor
The DDR-Steps involves a dance platform, and play station for use with rhythm and
dance videos. The cobalt flux dance platform includes nine foot panels (center, left, right, up,
down, and corners) that contain pressure sensors for detecting steps. The platform is connected to
the play station two system which contains the start and select buttons for the dance controller.
The goal of the activity is to perform a set foot pattern to the rhythm of a song. The individual
watches the screen and follows the arrows that scroll upwards from the bottom and pass over a
stationary set of arrows near the top of the screen. The object is for the player to step on the
corresponding arrows on the dance platform when the scrolling arrows overlap the stationary
ones. The players are then judged on how well they time their steps to the patterns presented.
The level set was music speed 1 for the song “Baby Give Me Your Love”. The maximum score
possible for this level was 35 perfects. All students started out on level one and some moved up
to a faster song when they obtained all perfects on level one. A higher level was not recorded
when they moved up. There are various levels of difficulty identified by colors and separated
into three-to-five categories depending on timeline.
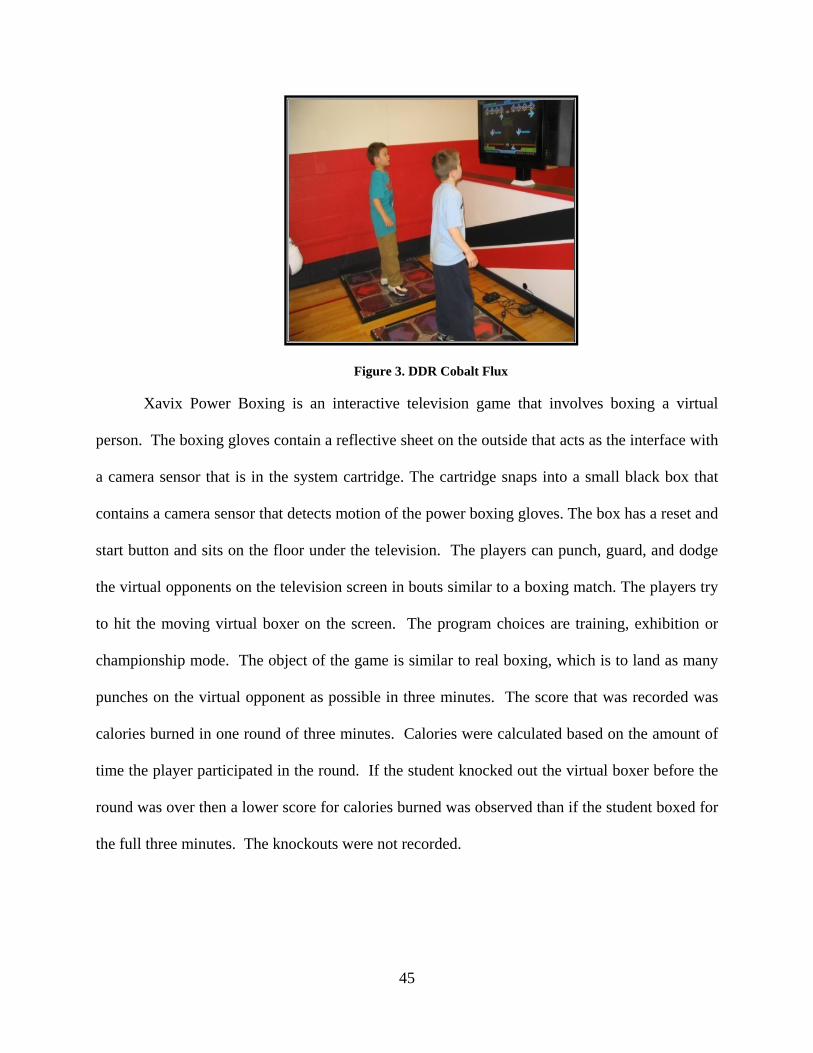
45
Figure 3. DDR Cobalt Flux
Xavix Power Boxing is an interactive television game that involves boxing a virtual
person. The boxing gloves contain a reflective sheet on the outside that acts as the interface with
a camera sensor that is in the system cartridge. The cartridge snaps into a small black box that
contains a camera sensor that detects motion of the power boxing gloves. The box has a reset and
start button and sits on the floor under the television. The players can punch, guard, and dodge
the virtual opponents on the television screen in bouts similar to a boxing match. The players try
to hit the moving virtual boxer on the screen. The program choices are training, exhibition or
championship mode. The object of the game is similar to real boxing, which is to land as many
punches on the virtual opponent as possible in three minutes. The score that was recorded was
calories burned in one round of three minutes. Calories were calculated based on the amount of
time the player participated in the round. If the student knocked out the virtual boxer before the
round was over then a lower score for calories burned was observed than if the student boxed for
the full three minutes. The knockouts were not recorded.
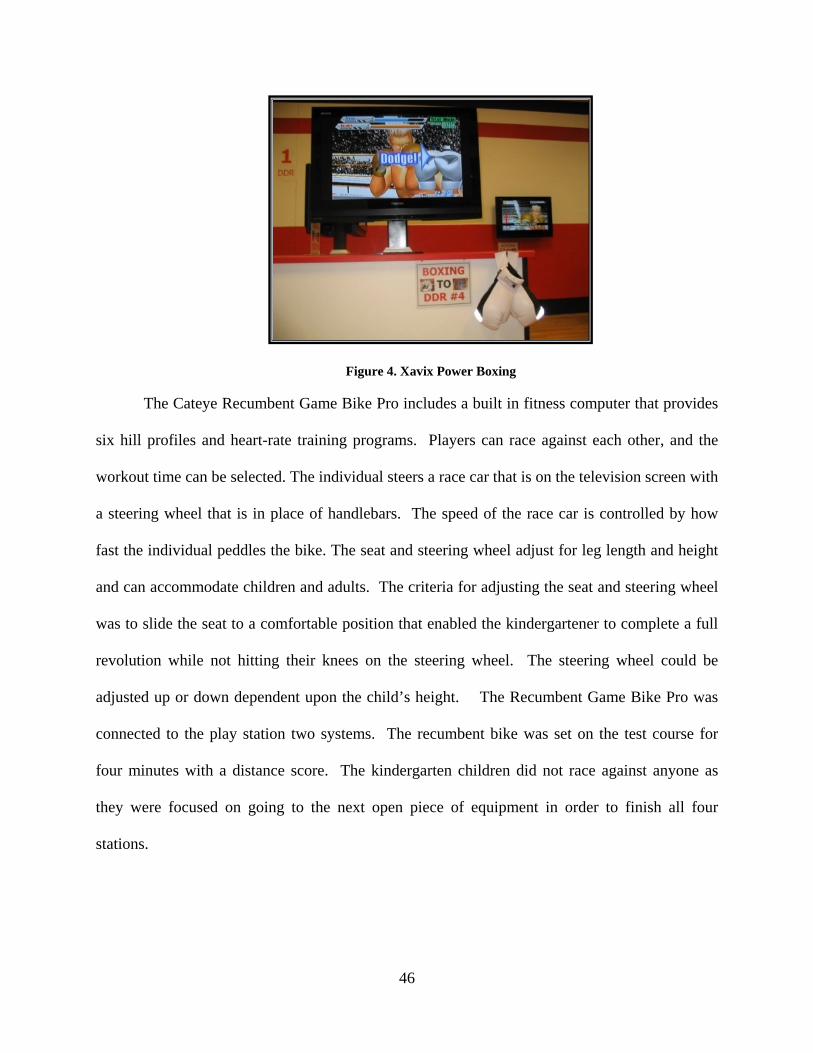
46
Figure 4. Xavix Power Boxing
The Cateye Recumbent Game Bike Pro includes a built in fitness computer that provides
six hill profiles and heart-rate training programs. Players can race against each other, and the
workout time can be selected. The individual steers a race car that is on the television screen with
a steering wheel that is in place of handlebars. The speed of the race car is controlled by how
fast the individual peddles the bike. The seat and steering wheel adjust for leg length and height
and can accommodate children and adults. The criteria for adjusting the seat and steering wheel
was to slide the seat to a comfortable position that enabled the kindergartener to complete a full
revolution while not hitting their knees on the steering wheel. The steering wheel could be
adjusted up or down dependent upon the child’s height. The Recumbent Game Bike Pro was
connected to the play station two systems. The recumbent bike was set on the test course for
four minutes with a distance score. The kindergarten children did not race against anyone as
they were focused on going to the next open piece of equipment in order to finish all four
stations.
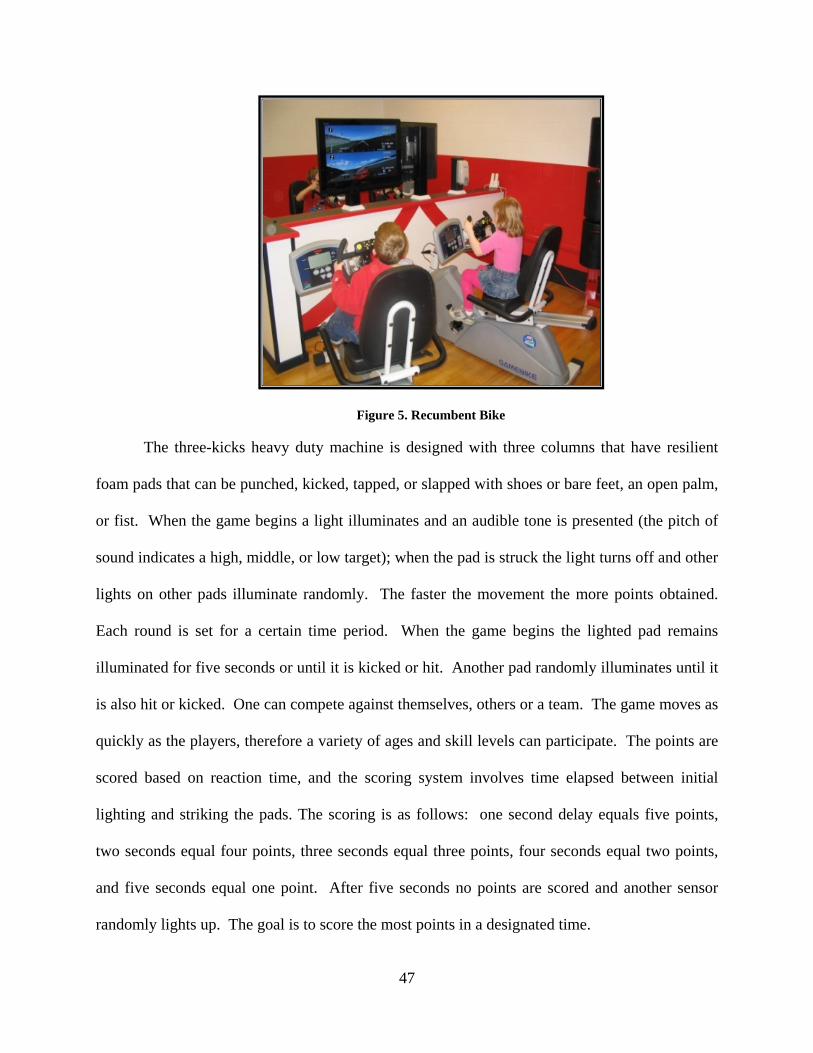
47
Figure 5. Recumbent Bike
The three-kicks heavy duty machine is designed with three columns that have resilient
foam pads that can be punched, kicked, tapped, or slapped with shoes or bare feet, an open palm,
or fist. When the game begins a light illuminates and an audible tone is presented (the pitch of
sound indicates a high, middle, or low target); when the pad is struck the light turns off and other
lights on other pads illuminate randomly. The faster the movement the more points obtained.
Each round is set for a certain time period. When the game begins the lighted pad remains
illuminated for five seconds or until it is kicked or hit. Another pad randomly illuminates until it
is also hit or kicked. One can compete against themselves, others or a team. The game moves as
quickly as the players, therefore a variety of ages and skill levels can participate. The points are
scored based on reaction time, and the scoring system involves time elapsed between initial
lighting and striking the pads. The scoring is as follows: one second delay equals five points,
two seconds equal four points, three seconds equal three points, four seconds equal two points,
and five seconds equal one point. After five seconds no points are scored and another sensor
randomly lights up. The goal is to score the most points in a designated time.
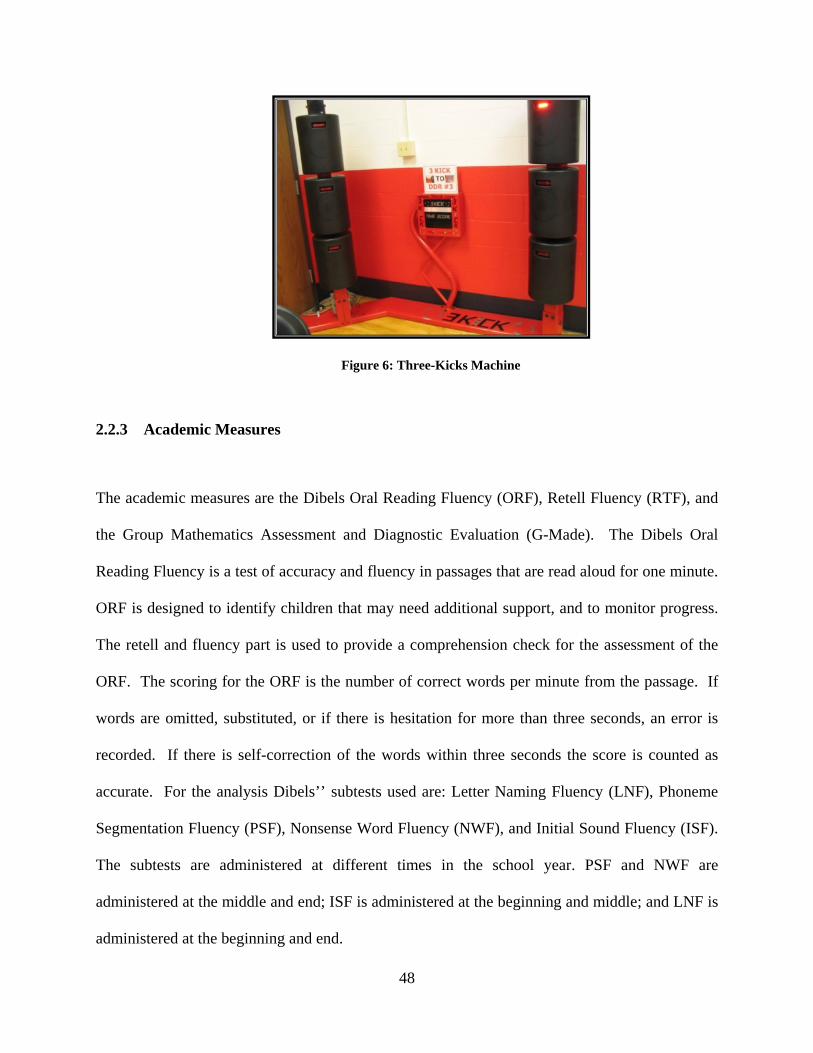
48
Figure 6: Three-Kicks Machine
2.2.3 Academic Measures
The academic measures are the Dibels Oral Reading Fluency (ORF), Retell Fluency (RTF), and
the Group Mathematics Assessment and Diagnostic Evaluation (G-Made). The Dibels Oral
Reading Fluency is a test of accuracy and fluency in passages that are read aloud for one minute.
ORF is designed to identify children that may need additional support, and to monitor progress.
The retell and fluency part is used to provide a comprehension check for the assessment of the
ORF. The scoring for the ORF is the number of correct words per minute from the passage. If
words are omitted, substituted, or if there is hesitation for more than three seconds, an error is
recorded. If there is self-correction of the words within three seconds the score is counted as
accurate. For the analysis Dibels’’ subtests used are: Letter Naming Fluency (LNF), Phoneme
Segmentation Fluency (PSF), Nonsense Word Fluency (NWF), and Initial Sound Fluency (ISF).
The subtests are administered at different times in the school year. PSF and NWF are
administered at the middle and end; ISF is administered at the beginning and middle; and LNF is
administered at the beginning and end.
49
The G-Made is a diagnostic mathematics test used to measure student skills in the areas
of math identified by the National Council of Teachers in Mathematics. The skills measured in
the G-Made include: concepts and communication, operations and computation, and process and
application. It is a norm-referenced test that helps educators identify areas where students may
need further instruction. The scores that are recorded include: stanines, percentiles, grade
equivalents, age equivalents, standard scores, normal curve equivalents and growth scale values.
For the analysis the growth scale values were recorded because it measures math progress
throughout the school year.
2.2.4 Buddy Training
The data collection was done by high school students (buddies) that were assigned to the
kindergarten children. The ratio of high school students to kindergarten children was one high
school buddy to one or two kindergarten children. Nine high school buddies worked with two
children each while six worked with one child. The high school buddies were given a syllabus
with responsibilities and went through training that was conducted by the two physical education
specialists (see Appendix C). During training the high school volunteers were instructed in the
use of all the interactive equipment in the physical activity center. This included use of the
Xavix Power Boxing, DDR-Steps, Striveis 3 Kick, and Cateye Recumbent Game Bike.
Additionally, the high school volunteers were trained to use the Insta- Pulse heart rate monitors,
stop watches, and how to take the carotid pulse. Without the kindergarten children, they spent
four mornings using the equipment, and practicing heart rate measurement via manipulation and
pulse meters, learning the perceived exertion scale, and overall familiarizing themselves with the
set up and equipment functions. They were also instructed on data collection which included the
50
procedures for recording IPAC attendance, machine scores, heart rate, and perceived exertion.
Additionally, procedures for storage of clipboards, recording sheets, stop watches and pencils
were covered.
Other responsibilities listed in the syllabus included: escorting kindergarten children to
and from their classrooms. When a fitness buddy was absent from school, another high school
buddy recorded the data. On days the child was absent, the fitness buddy would assist other
peers in collecting data. On Wednesdays, all fitness buddies would transfer data from a daily
sheet to a weekly sheet. On all days fitness buddies would report to physical education specialists
with any problems and return data sheets to the drawer in fitness center. One physical education
specialist was always present in the IPAC to supervise the high school buddies and kindergarten
children.
2.2.5 Procedures
Data collection occurred during the 2008/09 school year. There were two groups of children.
The children in Group One started September 16, 2008 while the children in Group Two started
October 20, 2008. The reason for the delay in Group Two children was due to availability of
high school buddies. Both groups 1 and 2 included children who arrived via bus and parental
transportation. The children in the first group arrived at the school at 8:20am and met their high
school buddy who assisted them in the IPAC from 8:25-8:50am (Group 1=9 children). A second
group of children participated from 8:50-9:15am (Group 2=15 children).
The high school buddies met their kindergarten partner either as they left the buses or
entered the lobby, and escorted them to the IPAC. They would take the child’s resting carotid
pulse and Insta-Pulse. First, they would take the carotid pulse by placing their first two fingers on

51
the child’s carotid artery, counting the beats for ten seconds and record the number. Next, they
would have the child grip the Insta-Pulse for four seconds, and record the Insta-Pulse readings on
the data sheet. They would then start at any station that was not occupied, but the child had to
participate at all four stations in the time period. The high school buddies recorded information
on data collection sheets daily that included: name, gender, age, grade, before and after physical
activity carotid pulse and Insta-Pulse heart rates, DDR-Steps score, Xavix power boxing calories
burned, recumbent game bike distance score, striveis three - kick strikes score, perceived
exertion score (Thursdays), and recorded a Large A through all the boxes if a student was absent.
Daily data collection sheets were transferred to weekly data collection sheets (see Appendix D)
on Thursdays (see Table 3). For perceived exertion the high school buddies asked the
kindergartener how hard do you think you worked, and they pointed to the perceived exertion
charts for the kindergarten child to give them a number after they completed all their stations.
(see perceived exertion charts in Appendix E)

52
Table 3. Daily Data Collection Sheet
DATE: ____________________
#1 STUDENT
NAME_____________________
M/F________________________
AGE/GRADE_______________
#2 STUDENT
NAME______________________
M/F_________________________
AGE/GRADE________________
FITNESS BUDDY
NAME:____________________
BEFORE X-HR
(INSTA-PULSE)
BEFORE X-HR
(CAROTID PULSE)
DDR-STEPS
BOXING CALORIES
BURNED
BOXING KNOCKOUTS
BIKE – CALORIES BURNED
BIKE-TIME/DISTANCE
3-KICKS – STRIKES
AFTER X-HR (INSTA-PULSE)
AFTER X-HR
(CAROTID PULSE)
PERCEIVED EXERSION
(THURSDAY ONLY)
KEY: IF STUDENT IS ABSENT MARK THE LETTER A IN THE BOX.
When the children were at the DDR-Steps station the high school buddy would set the
dance video game to “Baby Give Me Your Love” at music speed one. The time the station
lasted was five minutes. The score of successful step moves was recorded. At the Xavix Power
Boxing station the high school buddy set the game for one three-minute round of boxing. The
number of boxing calories burned was recorded. For the recumbent bike, the high school buddy
53
set the game on the test course for four minutes. A distance score was then recorded on the
child’s data sheet. The Striveis Three-Kick was set at two minutes and at the end of the time the
number of points was recorded on the data sheet by the high school buddy. Thus, total
participation time was 14 minutes. At the end of the fourth station the high school buddy
recorded the child’s after exercise carotid pulse and insta pulse reading. After completing the
circuit, the data sheets were placed in the designated drawer and the kindergarten children were
then escorted back to class by the high school buddies.
2.3 DATA ANALYSIS
Prior to examining the main hypotheses regarding the relationship between physical activity and
academic performance, preliminary analyses were calculated. To determine if the children were
physically active in the IPAC, a one-way ANOVA (time) examined changes in the following
variables: IPAC attendance, pre-physical activity heart rate, post-physical activity heart rate,
perceived exertion, and the IPAC machine scores).
The main question of the study used a non-equivalent control group design. A two-way
(Group X Time) ANOVA was used to compare the academic progress of the two groups.
Examination of measures of skewness and kurtosis did not reveal extreme departure from
normality. The Group (physical activity, no physical activity) X Time (beginning or middle of
school year, end of school year) ANOVA with repeated measures on the last factor was
calculated for each of the academic dependent variables: Dibels Oral Reading Fluency and Retell
Fluency, and Group Mathematics Assessment and Diagnostic Evaluation (G-Made). It was
expected that the activity group would perform significantly (p<.05) better than the control group
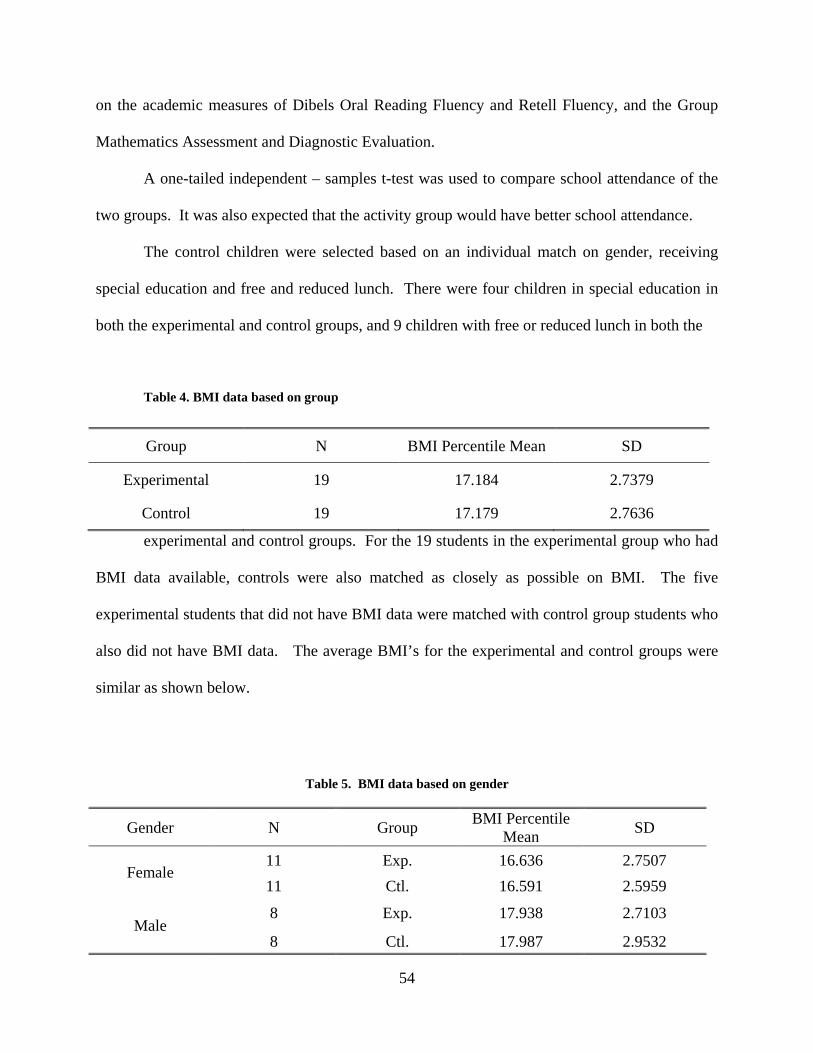
54
on the academic measures of Dibels Oral Reading Fluency and Retell Fluency, and the Group
Mathematics Assessment and Diagnostic Evaluation.
A one-tailed independent – samples t-test was used to compare school attendance of the
two groups. It was also expected that the activity group would have better school attendance.
The control children were selected based on an individual match on gender, receiving
special education and free and reduced lunch. There were four children in special education in
both the experimental and control groups, and 9 children with free or reduced lunch in both the
Table 4. BMI data based on group
experimental and control groups. For the 19 students in the experimental group who had
BMI data available, controls were also matched as closely as possible on BMI. The five
experimental students that did not have BMI data were matched with control group students who
also did not have BMI data. The average BMI’s for the experimental and control groups were
similar as shown below.
Table 5. BMI data based on gender
Group N BMI Percentile Mean SD
Experimental 19 17.184 2.7379
Control 19 17.179 2.7636
Gender N Group BMI Percentile Mean SD
Female 11 Exp. 16.636 2.7507 11 Ctl. 16.591 2.5959
Male 8 Exp. 17.938 2.7103
8 Ctl. 17.987 2.9532
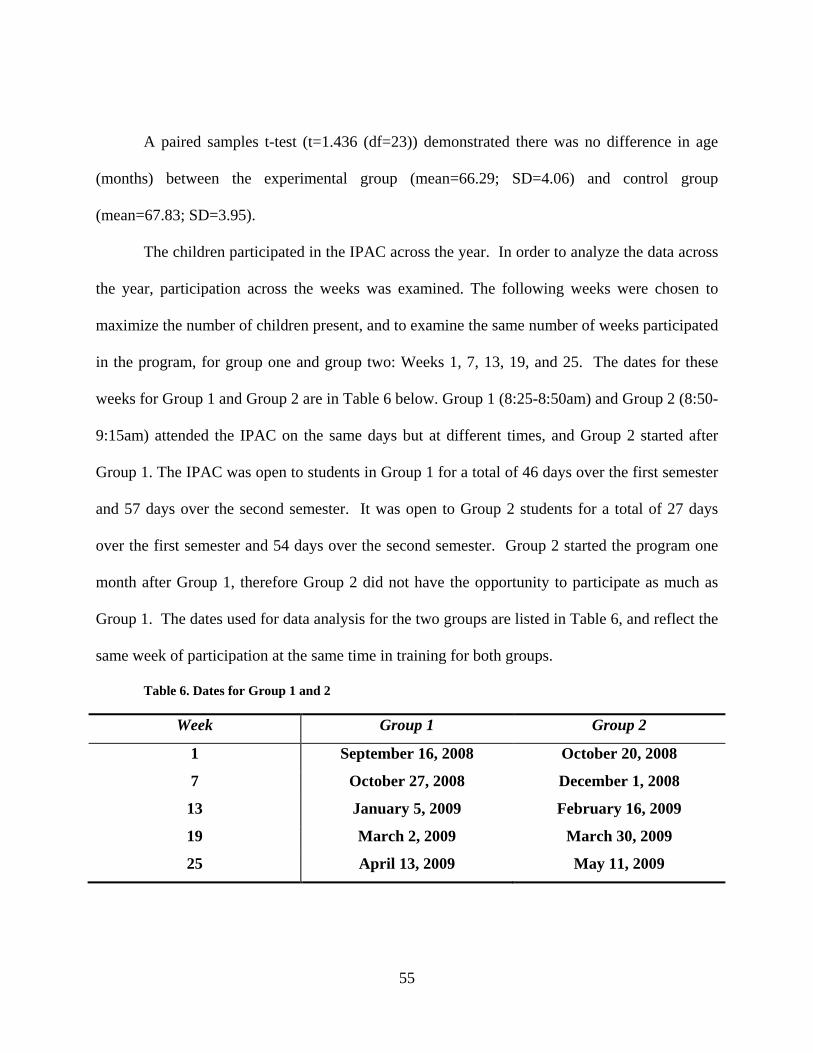
55
A paired samples t-test (t=1.436 (df=23)) demonstrated there was no difference in age
(months) between the experimental group (mean=66.29; SD=4.06) and control group
(mean=67.83; SD=3.95).
The children participated in the IPAC across the year. In order to analyze the data across
the year, participation across the weeks was examined. The following weeks were chosen to
maximize the number of children present, and to examine the same number of weeks participated
in the program, for group one and group two: Weeks 1, 7, 13, 19, and 25. The dates for these
weeks for Group 1 and Group 2 are in Table 6 below. Group 1 (8:25-8:50am) and Group 2 (8:50-
9:15am) attended the IPAC on the same days but at different times, and Group 2 started after
Group 1. The IPAC was open to students in Group 1 for a total of 46 days over the first semester
and 57 days over the second semester. It was open to Group 2 students for a total of 27 days
over the first semester and 54 days over the second semester. Group 2 started the program one
month after Group 1, therefore Group 2 did not have the opportunity to participate as much as
Group 1. The dates used for data analysis for the two groups are listed in Table 6, and reflect the
same week of participation at the same time in training for both groups.
Table 6. Dates for Group 1 and 2
Week Group 1 Group 2
1 September 16, 2008 October 20, 2008
7 October 27, 2008 December 1, 2008
13 January 5, 2009 February 16, 2009
19 March 2, 2009 March 30, 2009
25 April 13, 2009 May 11, 2009
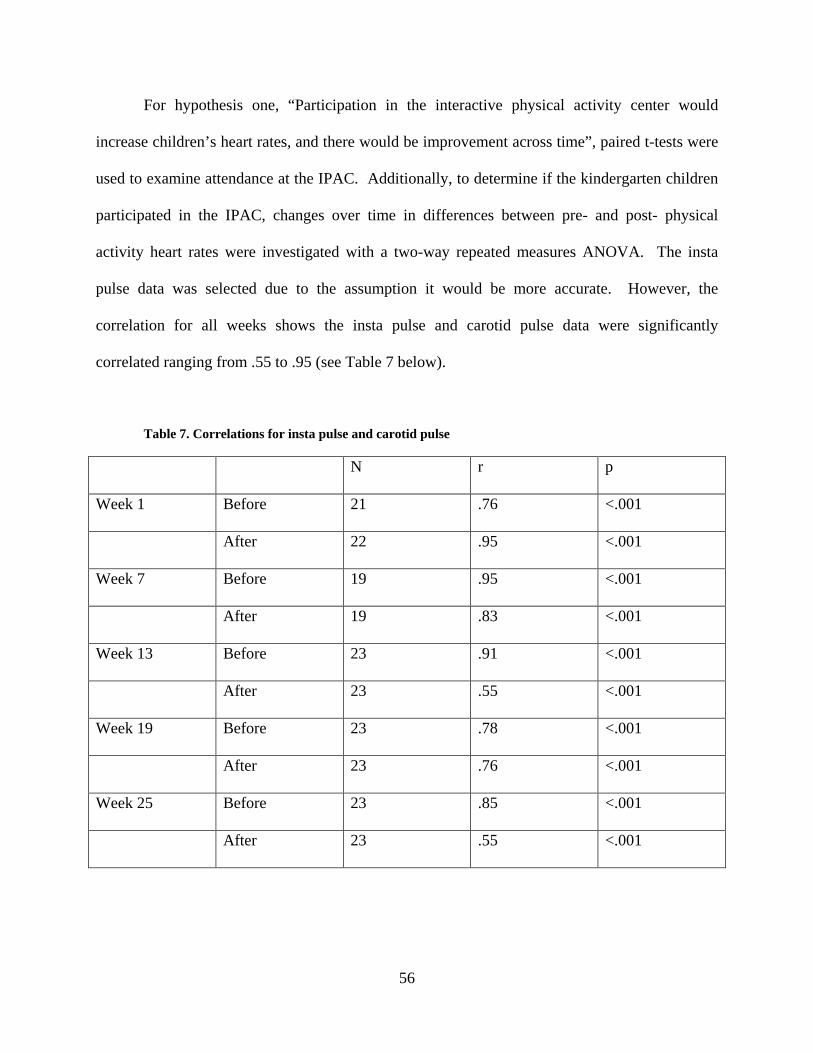
56
For hypothesis one, “Participation in the interactive physical activity center would
increase children’s heart rates, and there would be improvement across time”, paired t-tests were
used to examine attendance at the IPAC. Additionally, to determine if the kindergarten children
participated in the IPAC, changes over time in differences between pre- and post- physical
activity heart rates were investigated with a two-way repeated measures ANOVA. The insta
pulse data was selected due to the assumption it would be more accurate. However, the
correlation for all weeks shows the insta pulse and carotid pulse data were significantly
correlated ranging from .55 to .95 (see Table 7 below).
Table 7. Correlations for insta pulse and carotid pulse
N r p
Week 1 Before 21 .76 <.001
After 22 .95 <.001
Week 7 Before 19 .95 <.001
After 19 .83 <.001
Week 13 Before 23 .91 <.001
After 23 .55 <.001
Week 19 Before 23 .78 <.001
After 23 .76 <.001
Week 25 Before 23 .85 <.001
After 23 .55 <.001
57
Also, for hypothesis one to determine if the kindergarten children improved across time
in IPAC machine scores and their ratings of perceived exertion a one-way repeated measures
ANOVA was used to evaluate changes over time within the activity group on the following
variables: the average of the daily scores for each interactive video gaming machine: (dance,
dance, revolution steps, boxing calories, 3-kicks, and biking time) and perceived exertion.
For the main hypothesis, to determine if the experimental group of kindergarten children
who participate in the IPAC center perform better academically, a two-way Group X Time
ANOVA was calculated on the Dibels Oral Reading Fluency and Retell fluency subtests Letter
Naming Fluency (LNF), Phoneme Segmentation Fluency (PSF), Nonsense Word Fluency
(NWF), and Initial Sound Fluency (ISF), and the Group Mathematics Assessment and Diagnostic
Evaluation tests’ Growth Scale Values (GSV). Lastly, for hypothesis three to determine if the
children who participate in the IPAC center have fewer school absences than the control group, a
one-tailed independent-samples t-test was calculated between groups.
A summary of the data analysis for all hypotheses is in Table 8 below. Included is the
measure for the IPAC, Dibels and G-Made academic measures, school absences and the tests
used.
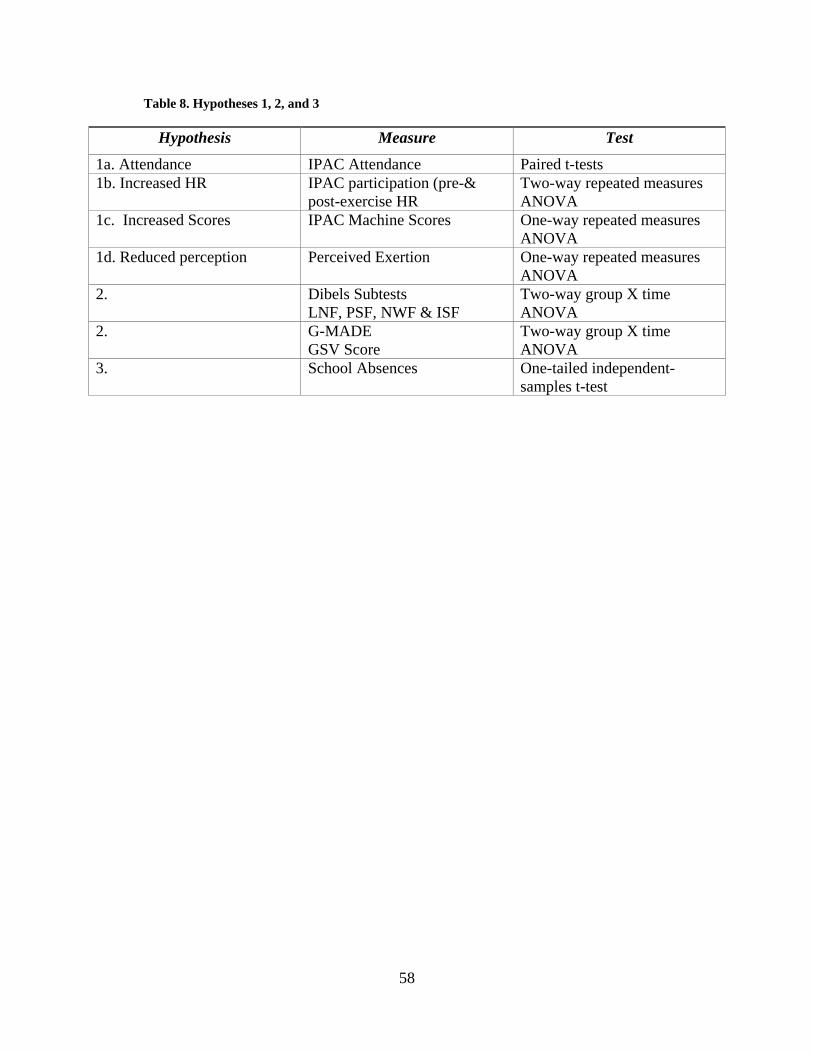
58
Table 8. Hypotheses 1, 2, and 3
Hypothesis Measure Test
1a. Attendance IPAC Attendance Paired t-tests 1b. Increased HR IPAC participation (pre-&
post-exercise HR Two-way repeated measures ANOVA
1c. Increased Scores IPAC Machine Scores One-way repeated measures ANOVA
1d. Reduced perception Perceived Exertion One-way repeated measures ANOVA
2. Dibels Subtests LNF, PSF, NWF & ISF
Two-way group X time ANOVA
2. G-MADE GSV Score
Two-way group X time ANOVA
3. School Absences One-tailed independent-samples t-test

59
3.0 RESULTS
This chapter is organized according to the three research questions. 1. Did the experimental
group of kindergarten children attend the sessions and were they physically active during the
activity sessions? Also, did they improve in the IPAC machine scores and reduce their perceived
exertion? 2. Did the kindergarten children in the experimental group who participated in the
physical activity center perform better academically at the end of the school year when compared
to those children who did not participate in extra physical activity? 3. Did the children who
participated in the physical activity center have fewer school absences compared to the group of
children who did not participate?
For each research question, the significance is presented in the text and the statistical
tables are in Appendix F. The probability for significance was set at .05.
3.1 RESEARCH QUESTION 1
The first question to consider is whether the children attended the IPAC. Paired t-tests were
calculated on attendance for Group one and two. The children enrolled in the IPAC increased
center attendance throughout the year, they participated more in the second semester. The
increases in IPAC attendance were significant from semester one to semester two for Group one
(t=2.60), Group two (t=6.24), and both groups combined (t=5.55). For Group one there was a
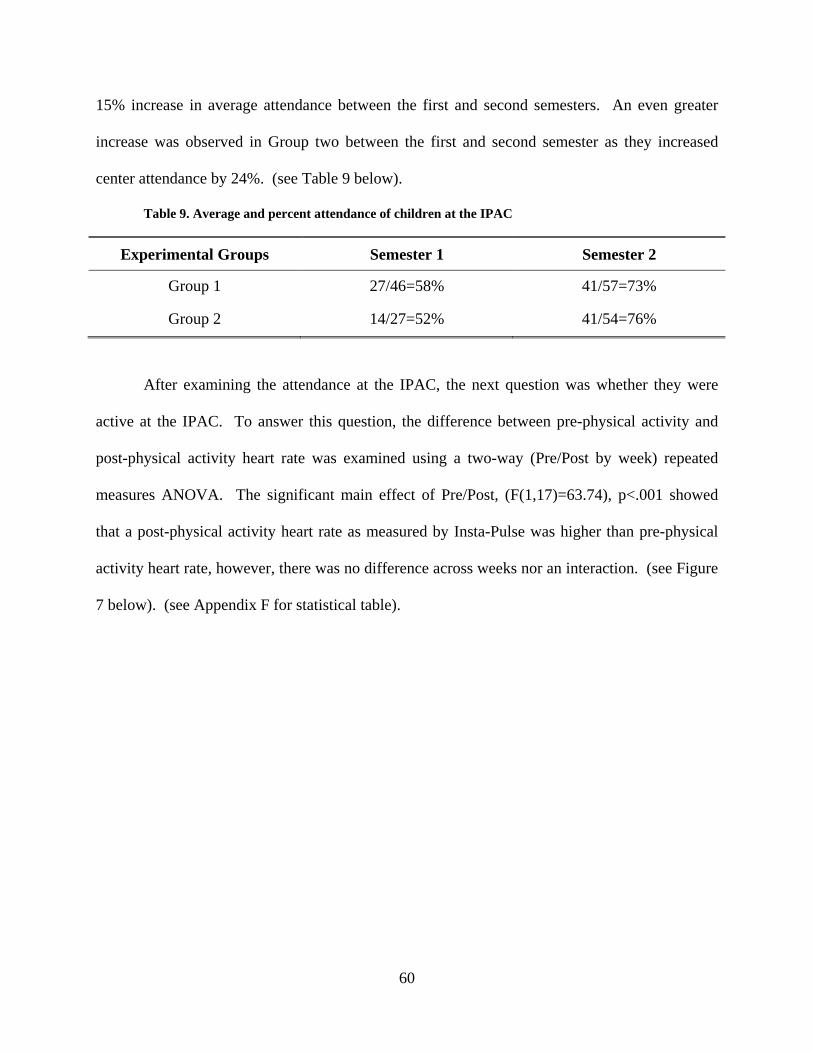
60
15% increase in average attendance between the first and second semesters. An even greater
increase was observed in Group two between the first and second semester as they increased
center attendance by 24%. (see Table 9 below).
Table 9. Average and percent attendance of children at the IPAC
Experimental Groups Semester 1 Semester 2
Group 1 27/46=58% 41/57=73%
Group 2 14/27=52% 41/54=76%
After examining the attendance at the IPAC, the next question was whether they were
active at the IPAC. To answer this question, the difference between pre-physical activity and
post-physical activity heart rate was examined using a two-way (Pre/Post by week) repeated
measures ANOVA. The significant main effect of Pre/Post, (F(1,17)=63.74), p<.001 showed
that a post-physical activity heart rate as measured by Insta-Pulse was higher than pre-physical
activity heart rate, however, there was no difference across weeks nor an interaction. (see Figure
7 below). (see Appendix F for statistical table).
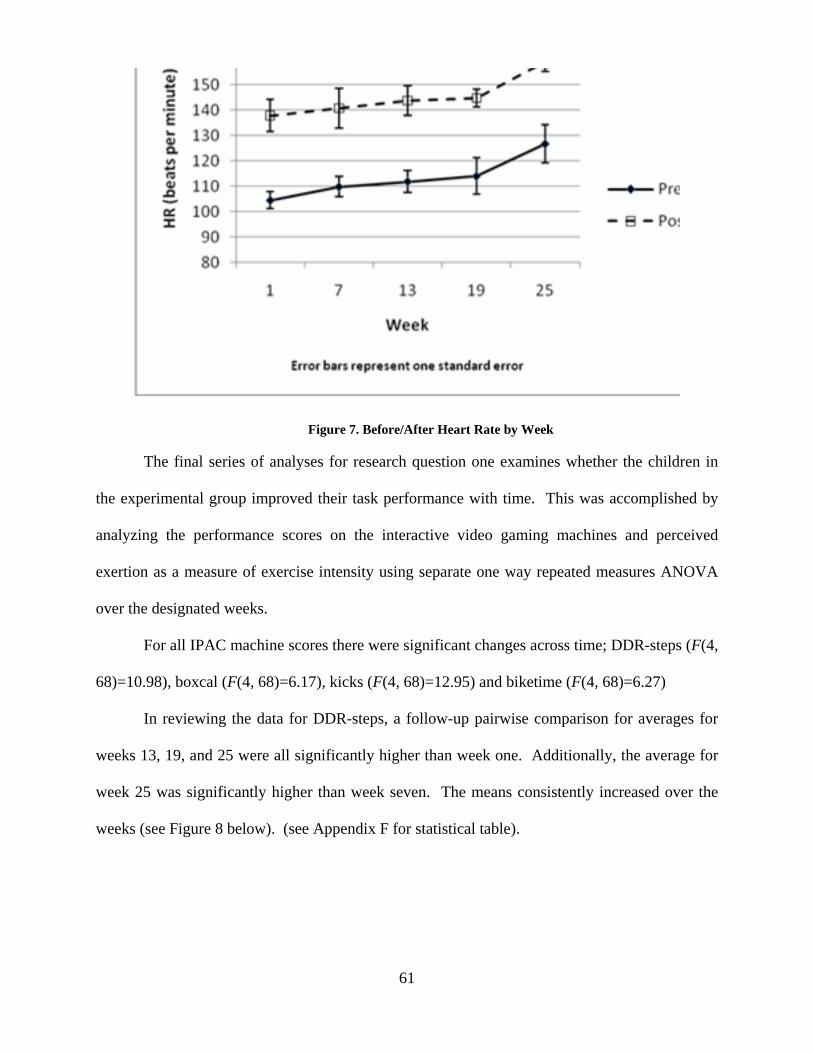
61
Figure 7. Before/After Heart Rate by Week
The final series of analyses for research question one examines whether the children in
the experimental group improved their task performance with time. This was accomplished by
analyzing the performance scores on the interactive video gaming machines and perceived
exertion as a measure of exercise intensity using separate one way repeated measures ANOVA
over the designated weeks.
For all IPAC machine scores there were significant changes across time; DDR-steps (F(4,
68)=10.98), boxcal (F(4, 68)=6.17), kicks (F(4, 68)=12.95) and biketime (F(4, 68)=6.27)
In reviewing the data for DDR-steps, a follow-up pairwise comparison for averages for
weeks 13, 19, and 25 were all significantly higher than week one. Additionally, the average for
week 25 was significantly higher than week seven. The means consistently increased over the
weeks (see Figure 8 below). (see Appendix F for statistical table).
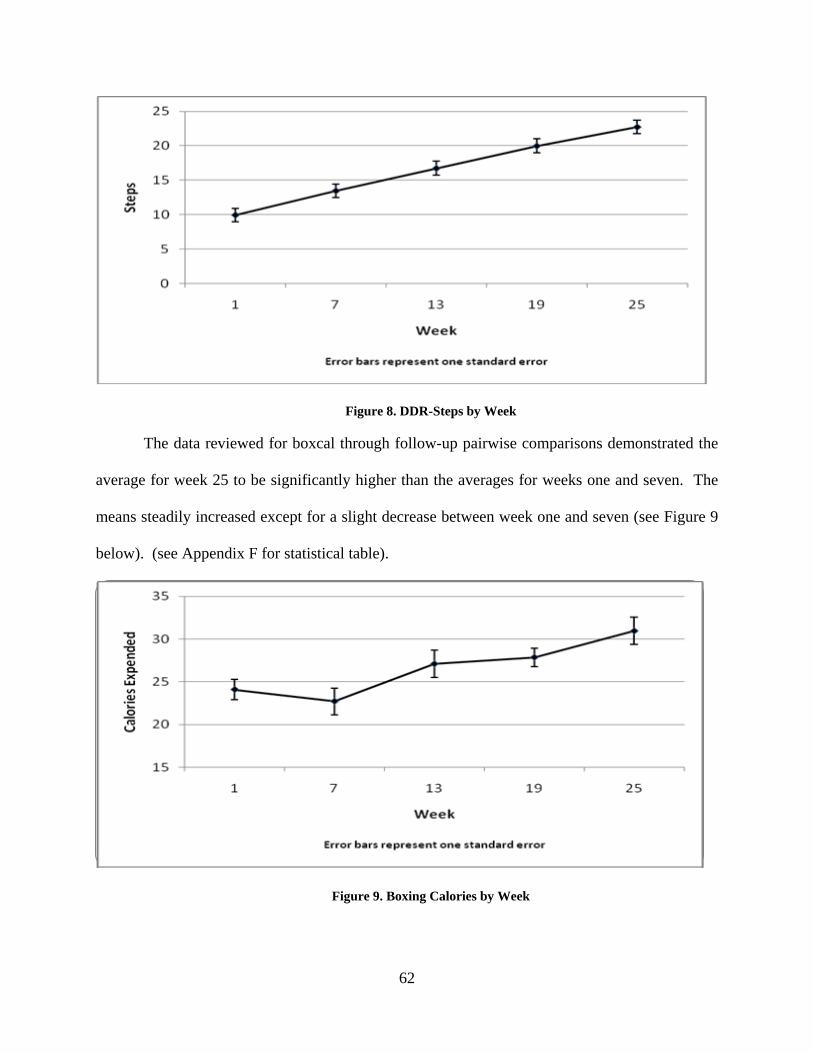
62
Figure 8. DDR-Steps by Week
The data reviewed for boxcal through follow-up pairwise comparisons demonstrated the
average for week 25 to be significantly higher than the averages for weeks one and seven. The
means steadily increased except for a slight decrease between week one and seven (see Figure 9
below). (see Appendix F for statistical table).
Figure 9. Boxing Calories by Week
Calo
ries E
xpen
ded
Week
Error bars represent one standard error
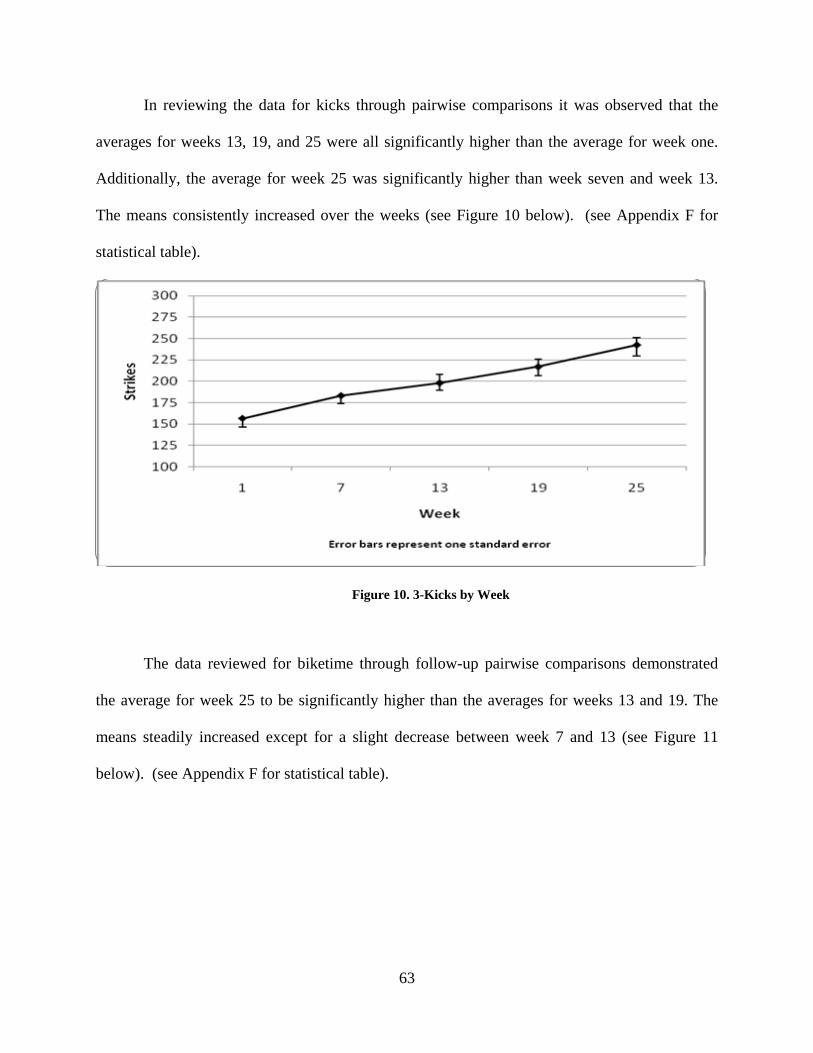
63
In reviewing the data for kicks through pairwise comparisons it was observed that the
averages for weeks 13, 19, and 25 were all significantly higher than the average for week one.
Additionally, the average for week 25 was significantly higher than week seven and week 13.
The means consistently increased over the weeks (see Figure 10 below). (see Appendix F for
statistical table).
Figure 10. 3-Kicks by Week
The data reviewed for biketime through follow-up pairwise comparisons demonstrated
the average for week 25 to be significantly higher than the averages for weeks 13 and 19. The
means steadily increased except for a slight decrease between week 7 and 13 (see Figure 11
below). (see Appendix F for statistical table).
Strik
es
Week
Error bars represent one standard error
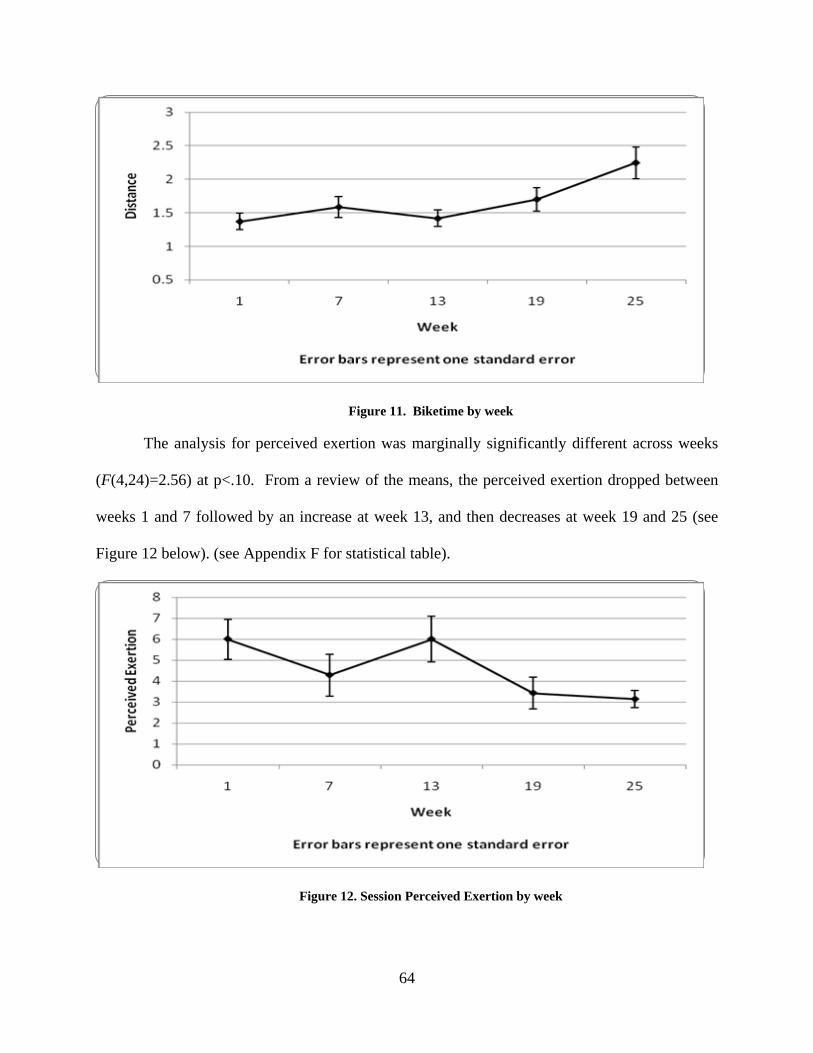
64
Figure 11. Biketime by week
The analysis for perceived exertion was marginally significantly different across weeks
(F(4,24)=2.56) at p<.10. From a review of the means, the perceived exertion dropped between
weeks 1 and 7 followed by an increase at week 13, and then decreases at week 19 and 25 (see
Figure 12 below). (see Appendix F for statistical table).
Figure 12. Session Perceived Exertion by week
Dist
ance
Week
Error bars represent one standard error
Perc
eive
d Ex
ertio
n
Week
Error bars represent one standard error
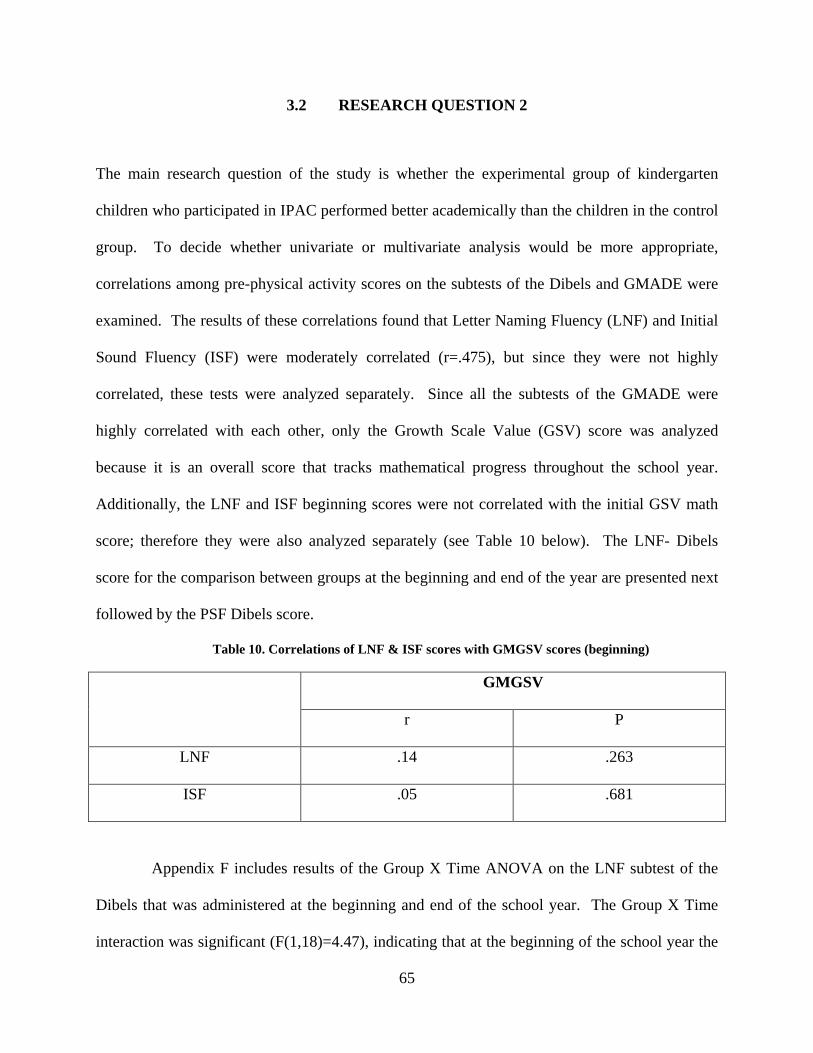
65
3.2 RESEARCH QUESTION 2
The main research question of the study is whether the experimental group of kindergarten
children who participated in IPAC performed better academically than the children in the control
group. To decide whether univariate or multivariate analysis would be more appropriate,
correlations among pre-physical activity scores on the subtests of the Dibels and GMADE were
examined. The results of these correlations found that Letter Naming Fluency (LNF) and Initial
Sound Fluency (ISF) were moderately correlated (r=.475), but since they were not highly
correlated, these tests were analyzed separately. Since all the subtests of the GMADE were
highly correlated with each other, only the Growth Scale Value (GSV) score was analyzed
because it is an overall score that tracks mathematical progress throughout the school year.
Additionally, the LNF and ISF beginning scores were not correlated with the initial GSV math
score; therefore they were also analyzed separately (see Table 10 below). The LNF- Dibels
score for the comparison between groups at the beginning and end of the year are presented next
followed by the PSF Dibels score.
Table 10. Correlations of LNF & ISF scores with GMGSV scores (beginning)
GMGSV
r P
LNF .14 .263
ISF .05 .681
Appendix F includes results of the Group X Time ANOVA on the LNF subtest of the
Dibels that was administered at the beginning and end of the school year. The Group X Time
interaction was significant (F(1,18)=4.47), indicating that at the beginning of the school year the
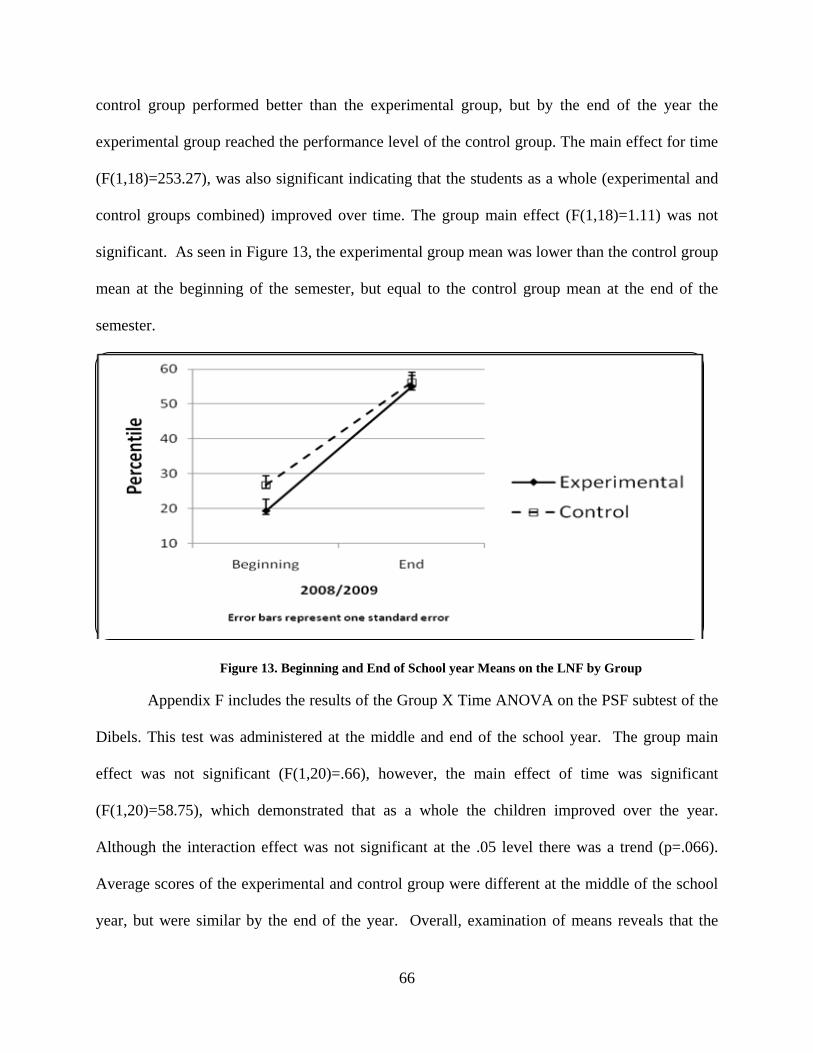
66
control group performed better than the experimental group, but by the end of the year the
experimental group reached the performance level of the control group. The main effect for time
(F(1,18)=253.27), was also significant indicating that the students as a whole (experimental and
control groups combined) improved over time. The group main effect (F(1,18)=1.11) was not
significant. As seen in Figure 13, the experimental group mean was lower than the control group
mean at the beginning of the semester, but equal to the control group mean at the end of the
semester.
Figure 13. Beginning and End of School year Means on the LNF by Group
Appendix F includes the results of the Group X Time ANOVA on the PSF subtest of the
Dibels. This test was administered at the middle and end of the school year. The group main
effect was not significant (F(1,20)=.66), however, the main effect of time was significant
(F(1,20)=58.75), which demonstrated that as a whole the children improved over the year.
Although the interaction effect was not significant at the .05 level there was a trend (p=.066).
Average scores of the experimental and control group were different at the middle of the school
year, but were similar by the end of the year. Overall, examination of means reveals that the
Perc
entil
e
2008/2009
Error bars represent one standard error
Experimental
Control
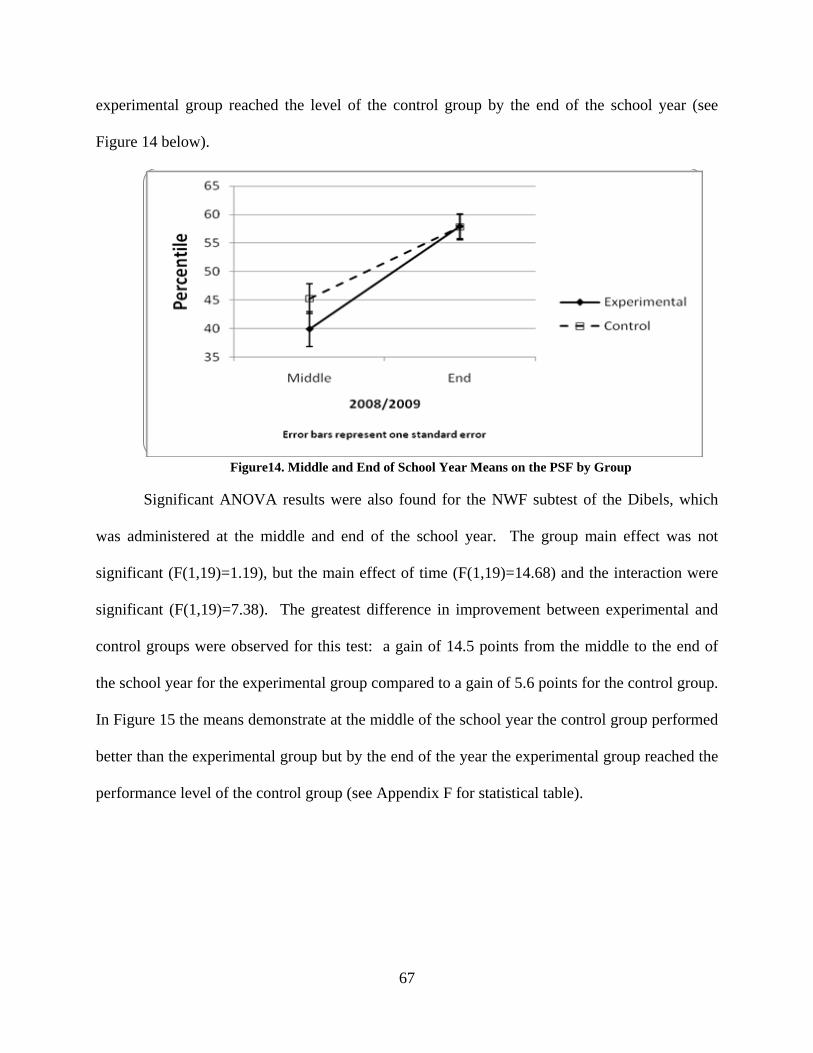
67
experimental group reached the level of the control group by the end of the school year (see
Figure 14 below).
Figure14. Middle and End of School Year Means on the PSF by Group
Significant ANOVA results were also found for the NWF subtest of the Dibels, which
was administered at the middle and end of the school year. The group main effect was not
significant (F(1,19)=1.19), but the main effect of time (F(1,19)=14.68) and the interaction were
significant (F(1,19)=7.38). The greatest difference in improvement between experimental and
control groups were observed for this test: a gain of 14.5 points from the middle to the end of
the school year for the experimental group compared to a gain of 5.6 points for the control group.
In Figure 15 the means demonstrate at the middle of the school year the control group performed
better than the experimental group but by the end of the year the experimental group reached the
performance level of the control group (see Appendix F for statistical table).
Perc
entil
e
2008/2009
Error bars represent one standard error
Experimental
Control
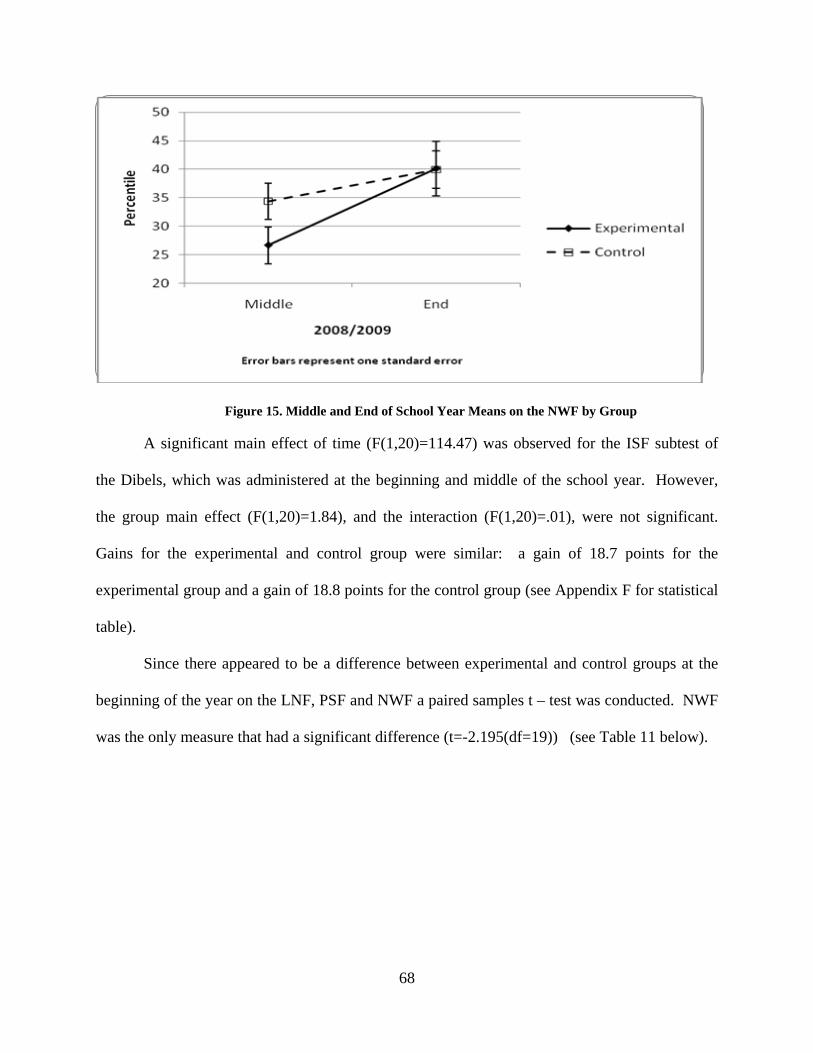
68
Figure 15. Middle and End of School Year Means on the NWF by Group
A significant main effect of time (F(1,20)=114.47) was observed for the ISF subtest of
the Dibels, which was administered at the beginning and middle of the school year. However,
the group main effect (F(1,20)=1.84), and the interaction (F(1,20)=.01), were not significant.
Gains for the experimental and control group were similar: a gain of 18.7 points for the
experimental group and a gain of 18.8 points for the control group (see Appendix F for statistical
table).
Since there appeared to be a difference between experimental and control groups at the
beginning of the year on the LNF, PSF and NWF a paired samples t – test was conducted. NWF
was the only measure that had a significant difference (t=-2.195(df=19)) (see Table 11 below).
Perc
entil
e
2008/2009
Error bars represent one standard error
Experimental
Control
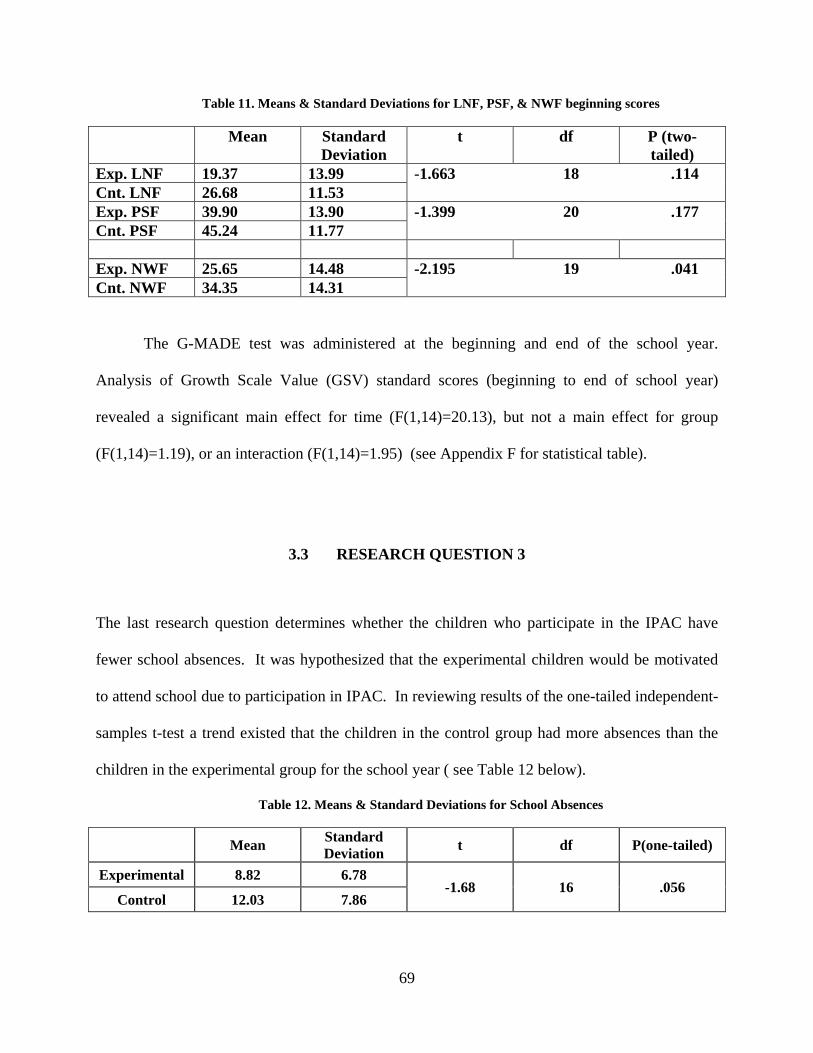
69
Table 11. Means & Standard Deviations for LNF, PSF, & NWF beginning scores
Mean Standard Deviation
t df P (two-tailed)
Exp. LNF 19.37 13.99 -1.663 18 .114 Cnt. LNF 26.68 11.53 Exp. PSF 39.90 13.90 -1.399 20 .177 Cnt. PSF 45.24 11.77 Exp. NWF 25.65 14.48 -2.195 19 .041 Cnt. NWF 34.35 14.31
The G-MADE test was administered at the beginning and end of the school year.
Analysis of Growth Scale Value (GSV) standard scores (beginning to end of school year)
revealed a significant main effect for time (F(1,14)=20.13), but not a main effect for group
(F(1,14)=1.19), or an interaction (F(1,14)=1.95) (see Appendix F for statistical table).
3.3 RESEARCH QUESTION 3
The last research question determines whether the children who participate in the IPAC have
fewer school absences. It was hypothesized that the experimental children would be motivated
to attend school due to participation in IPAC. In reviewing results of the one-tailed independent-
samples t-test a trend existed that the children in the control group had more absences than the
children in the experimental group for the school year ( see Table 12 below).
Table 12. Means & Standard Deviations for School Absences
Mean Standard Deviation t df P(one-tailed)
Experimental 8.82 6.78 -1.68 16 .056
Control 12.03 7.86
70
4.0 DISCUSSION
As children’s health issues continue to rise, physical education programs are being reduced or
eliminated due to the focus on more academic time in the school day. The current literature
review demonstrated that when physical activity is increased through classroom participation or
inclusion of physical education classes, the overall result is an increase in academic achievement.
Also, when time is allocated for quality physical education there are no detrimental effects on
academic achievement. Therefore, it is important that children are provided opportunities to
participate in daily physical activities as the research has demonstrated a positive effect on
academic performance.
This trend of rising health issues for children can be reversed by educating administrators
and classroom teachers on the benefits of increasing daily physical activity. Programs can be
implemented in the schools to involve children and staff in creating an atmosphere of a healthy
active school. Based on the literature review and this research study, Kindergarten teachers can
implement activity breaks in the classroom, brain breaks, active academics (ie. Pedometer math,
fitness journals, etc…), activity calendars, walking clubs, physical activity dvds; and school wide
programs such as a principal walk, partnering with physical education specialist on curriculum,
after school physical activity programs, physical activity field days, walk and bike to school
programs, and increasing quality and time at recess. When physical activity is increased during
71
the school day, there is improvement or no detrimental effect on academic achievement.
Therefore, providing information and resources to schools is imperative (naspeinfo.org).
The data from this study expands the body of literature on the relationship between
physical activity and academic performance in kindergarten children. In the following sections
explanations for the observed results of the three research questions are discussed in addition to
limitations, conclusions and future research considerations.
4.1 IMPROVEMENT IN IPAC SCORES
For research question 1, it was important to determine if the kindergarten children attended the
activity sessions, and whether they were active. The children needed to attend and be physically
active throughout the year in order to meet the requirements of the experimental condition. It
was found that the children increased their attendance throughout the year in both Group 1 and
Group 2, with greater attendance in the second semester. Due to holiday breaks, school
assembly days, and snow days there were also more days available for participation in the spring
semester as compared to the fall semester.
To determine if the children were physically active during the activity sessions, findings
on pre- and post- physical activity heart rate and IPAC scores demonstrated that the children
were active. The children significantly increased their heart rate during the IPAC sessions,
averaged over all weeks. In addition, over time the kindergarten children in the experimental
group improved their performance on the IPAC machines. Because the difficulty level of the
72
machines stayed the same over time, their perceived exertion scores decreased; they mastered the
routines and perceived the routines to be easier with practice. The IPAC machine scores
significantly changed across time with steady increases in the means, with only a slight decrease
between week one and seven for boxcal, and a slight decrease between week 7 and 13 for
biketime.
73
4.2 RELATIONSHIP OF IPAC SCORES AND ACADEMIC ACHIEVEMENT
With respect to research question two that examines whether the children who participate in the
IPAC perform better academically than the children in the control group, greater improvements
were observed in the experimental group for three of the four academic measures of the Dibels
Oral Reading Fluency and Retell Fluency, but there was no difference between groups in the
overall Growth Scale Value of the Group Mathematics Assessment and Diagnostic Evaluation.
For the Dibels, the experimental group initially performed lower than the children in the control
group but by the end of the school year their scores were similar.
Previous research has demonstrated the physical and academic benefits of increasing
daily physical activity. This study supports these results by the experimental group reaching the
level of the control group by the end of the school year. Three longitudinal studies conducted in
France, Australia and Canada found increases in amounts of physical activity through physical
education to benefit student’s academic performance even when academic time was reduced to
allow more time for daily physical activity (Trudeau & Shephard, 2010). Results of a review by
Sibley and Etnier (2003) also support current findings of a positive relationship between physical
activity and academic performance. Sibley and Etnier found evidence of improved cognitive and
academic performance in both published and unpublished research. The current study is unique
due to the specific focus on kindergarten children and the relationship of physical activity to
academic performance as measured by math and reading scores.
Carlson et al. (2008) focused on math and reading for children in kindergarten through
fifth grade. The measurement of academic achievement was a standardized test administered at
five time points, and time spent in physical education was recorded as number of times per week
and the minutes per day. The association of time spent in physical education with academic
74
achievement (math and reading) found positive findings for increased physical activity and
academic achievement.
Throughout the school year significantly greater increases in reading fluency were
observed in the experimental group compared to the control group, however the experimental
group started out lower in their scores, then caught up to the controls at the end of the year.
Improvement over time on the Dibels LNF, PSF and NWF were significantly greater for the
experimental group allowing the experimental group to reach the level of the control group by
the end of the school year. The GMADE scores for both groups improved across time. Previous
research has demonstrated similar results. For example, the Spark program evaluated a two-year
physical education program by examining effects of the program on academic achievement with
standardized tests, and found reading and language scores improved for the experimental group,
but no effects were found for math scores (Sallis et.al., 1999). In addition other studies,
(Donnelly et al., 2009, Shephard, 1996, Carlson et.al., 2008, Coe et. al., 2006) indicated
increased time in physical activity was associated with increased academic scores in reading and
math or there was no change in the academic scores.
Results of the Physical Activity Across the Curriculum (PAAC) (Donnelly et al., 2009)
study were consistent with results of the current study regarding the effect of physical activity on
reading achievement, although the PAAC study included children in grades two through five. In
the PAAC study, Donnelly and colleagues found that among the 24 elementary schools, the
experimental groups had significantly greater improvements in their daily physical activity and
academic achievement in reading; unlike the current study, the PAAC study also found a
significant difference between groups in math. Supporting these findings, Sallis et al. (1999),
used the Metropolitan Achievement tests for reading, mathematics and language assessment.
75
The primary finding was that spending more time in daily physical activity through physical
education had significant effects on the reading and language academic scores, and did not have
a significant effect on mathematics scores. Specific details on the Dibels Reading Subtests are
next.
The Dibels scores are dynamic indicators of basic early literacy skills and the difficulty of
the tests increase over the school year. The Letter Naming Fluency (LNF) score is recorded at
the beginning, middle and end of the year; Phoneme Segmentation Fluency (PSF) and Nonsense
Word Fluency (NWF) are recorded at the middle and end of the school year; and Initial Sound
Fluency (ISF) is recorded at the beginning and middle of the school year. The one minute
fluency measures monitor the development of pre-reading and early reading skills. Overall the
fluency measures assess whether children are reading whole words or still sounding out words.
The NWF specifically looks to see if the students can apply their skills to any word.
The greatest difference in improvement between the experimental and control
group over time was observed in the NWF (middle to end of the year); students in the
experimental group improved at a faster rate over time in applying their skills of letter sound
correspondence and ability to blend letters into words. However, they started below the control
children but reached their level of performance by the end of the year. The children in the
experimental group had lower scores at the beginning of the year for the LNF, PSF and NWF.
However, there was only a significant difference between the experimental and control NWF
beginning scores. Therefore, caution should be taken when interpreting the NWF results.
Possible internal validity issues include age difference, attrition, and selection-maturation. The
difference could be attributed to an age difference, with the experimental group being younger
than the children in the control group, however this was not the case. Attrition was not an issue
76
as no one dropped out of the study. Selection-maturation of the fan-spread type (shows the
treatment overcame such an effect if there were one) is ruled out by the outcome of the NWF
results, however other patterns of selection-maturation could be applied. Another possible
internal validity threat is that of selection-history which involves other events occurring between
the beginning and ending of the study, that could have caused the outcome (Campbell, Cook, &
Shadish, 2002).
For the LNF (beginning to end of the year) the experimental group improved at a faster
rate than the control group over time in naming upper- and lower- case letters (in one minute)
that were arranged in random order. However, similar to the NWF, they started below the control
children, and then caught up to them by the end of the year. Improvement was faster for the
children in the experimental group in PSF (middle to end of the year), which was their ability to
segment three to four phoneme words into their individual phonemes fluently. But, like the NWF
and PSF they started below the controls, and therefore were similar in performance to the control
children by the end of the year. Lastly, there were similar gains for ISF (beginning to middle of
the year) between the children in the experimental and control groups. This involved the child’s
ability to recognize and produce the initial sound in an orally presented word, and to select a
picture that begins with the sound produced orally by the examiner.
Overall the children in the control group began the year ahead of the children in the
experimental group but by the end of the year the children in the experimental group were at the
same level as the children in the control group.
77
4.3 SCHOOL ABSENCE
With respect to question three that addresses whether the children who participate in the IPAC
have fewer absences than the controls, there was a trend for the experimental kindergarten
children to have greater school attendance than the controls. It was anticipated that due to the
interest in the new IPAC center, that the experimental kindergarten students would be more
motivated to attend school. Additionally, attendance may have been better for the experimental
group due to parental support. Because it was a new program that parents agreed to have their
children participate in, they may have provided greater support for attendance as they saw
potential benefits for their children.
4.4 LIMITATIONS
Methodological limitations in the current study must be considered. The limitations discussed
are design type, data collection, sample size, academic measures, and measures of physical
activity.
First, because the children were not randomly assigned to treatment group, no statements
can be made about causality regarding physical activity and academic achievement. Second, the
data was preexisting and collected at a school by physical education specialists and high school
students, thus ecologically valid but not controlled. Third, like other studies in the literature
(Buck et al., 2008; Hillman et al., 2005), the current study made use of a small sample: only 24
of 96 kindergarten students enrolled in the physical activity program. Since the program was
scheduled early in the morning, it was difficult or impossible for parents who lived far from the
78
school to provide transportation for their children. Only children who rode to school on the early
buses and five that were driven by their parents had the opportunity and/or motivation to
participate. In addition to the negative effect on sample size, the transportation issue also
prevented random assignment of students to groups. Another limitation was that the sample was
drawn from a single school in a rural area, which affects the generalizability of the findings.
Also important to mention is that although standardized scores were used, there were no
measures for concentration, attention or classroom behavior, which are factors that influence
learning and achievement.
Finally, many studies use indirect measures of physical activity such as self-report or
questionnaires, and therefore the direct observation of physical activity are considered a strength
of the current study. Differences between before and after activity heart rate were measured by
the Insta- Pulse monitors to determine how active the students were during the IPAC session.
On the other hand, the use of accelerometers could have provided a more accurate measure of
physical activity.
4.5 CONCLUSIONS
The present study found that kindergarten children who received the IPAC program increased
their physical activity, and reached the academic performance level of the control group by the
end of the school year in reading (despite scoring lower than the controls in the beginning), but
not math. Thus over time the experimental group caught up to the controls in three out of the
four Dibels academic scores compared to the controls, or improved the same as the controls in
the Growth Scale Value of the G-MADE, who did not receive the IPAC program. With physical
79
activity being a leading health indicator according to Healthy People 2010, the results of this
study demonstrate the importance of providing a variety of daily physical activities for
kindergarten students to have the opportunity to improve their physical health. This study did
not address whether there was any negative impact, however IPAC was conducted before school
and academic time was not reduced. This is important when considering curricular intervention
to increase physical activity. A number of previous cross-sectional studies (Carlson et al., 2008;
Caterino & Polak, 1999; Coe et al., 2006; Donnely et al., 2009; Lindner, 2002; Mahar et al.,
2006; Oja & Jurimae, 2002; Sallis et al., 1999; Shephard, 1996; Sibley & Etnier, 2003) have also
found that physical activity had a positive effect or had no negative effect on academic
achievement. Evidence of the positive effect of physical activity was also found in the three
longitudinal studies reviewed by Shephard (1997). Additionally, recent literature reviews
address the importance of quantity and quality of physical activity, and have found that acute
bouts and higher intensities of activities have a stronger association with improved academic
performance. Positive effects on academic performance and cognition are observed in a variety
of physical activities and design types (Coe et al., 2006; Kirkendall, 1986; Sibley & Etnier, 2003;
Smith & Lounsberry, 2009; Taras, 2005; Tomporowski, 2003). Therefore, with the available
evidence suggesting positive effects or no effect from a variety of physical activity designs,
intensities and types, further exploration of these relationships between physical activity and
academic achievement are warranted.
It is important for research on this topic to be continued because quality physical activity
experiences have the potential to impact cognitive, academic and health outcomes in our schools.
Despite the fact that there have been more small scale cross-sectional studies than larger
longitudinal ones, there are consistencies that support a strong relationship between physical
80
activity and academic achievement. Therefore, the following are suggestions for continued
research in this area.
4.6 FUTURE RESEARCH
The current study supports previous findings that indicate increased daily physical activity of
children in kindergarten can have a positive impact on academic achievement, or the effect is not
detrimental to the student’s academic performance. In light of the previous research and current
findings several suggestions follow. First, intervention studies that explore both acute and
chronic physical activity are needed, along with larger sample sizes to achieve adequate
statistical power. Second, designs are needed that control potential confounding variables to
better establish possible causal relationships. Additionally, randomized experiments with longer
duration that assess longitudinal effects of physical activity on academic achievement are also
suggested. Third, further exploration into types, duration, and intensity of physical activity that
specifically examines the effect of the exercise dosage, which may benefit cognition and
academic achievement, is recommended. Additionally, new methods of assessing children’s
physical activity levels that are more accurate are needed.
Future research as follow-up to the current study may include the following: First, a
match on initial academic test scores would assist in equalizing the groups in the beginning.
Second, a more detailed analysis of difference scores for the fitness variables through all weeks
in order to identify any potential group differences by looking at how much change was
occurring through the weeks. For example, perhaps some students were working harder than
others, and had a difference in pre/post heart rate that was 30 compared to some that may have a
81
difference of 10. Third, an examination of the fitness data that explores gender differences
between the IPAC machines. Fourth, compare high versus low dosage groups to see if there is a
difference between numbers of days participated in the physical activity center. Fifth, examine
experimental group attendance to see if there is a sub group that did not participate as much as
the others. Lastly, follow-up with BMI data for the experimental and control group in the first
and second grade, to examine any long term effects on BMI from the intervention.
In addition to future research, educators should continue to push for policies that require
schools to meet the National Health Objectives of daily physical education with developmentally
appropriate quantities and quality of physical activity. Also, more education is needed for school
administrators and parents on the importance of implementing daily quality physical education
programs that begins at the primary level. Lastly, advocacy for federal and state mandates of
daily physical activity through physical education as part of the school’s curriculum should be a
high priority for our schools.
82
BIBLIOGRAPHY
Beurden, E.V., Barnett, L.M., Zask, A., Dietrich, U.C., Brooks, L.O., & Beard, J. (2003). Can we skill and activate children through primary school physical education lessons? “Move it Groove it” – a collaborative health promotion intervention. Preventive Medicine, 36, 493-501.
Blakemore, C.L. (2003). Movement is essential to learning. Journal of Physical Education, Recreation, & Dance, 74 (9), 22-25 & 41. Buck, S.M., Hillman, C.H., & Castelli, D.M. (2008). The relation of aerobic fitness to stroop task performance in preadolescent children. Medicine & Science in Sports & Exercise, 40(1), 166-172. California Department of Education. (April, 2005). A study of the Relationship between physical fitness and academic achievement in California using the 2004 test results. Sacramento, CA: 1-9. Carlson, S.A., Fulton, J.E., Lee, S.M., Maynard, M.L., Brown, D.R., & Kohl, H.W. (2008). Physical education and academic achievement in elementary school: Data from the Early childhood longitudinal study. American Journal of Public Health, 98, 721-727. Castelli, D.M., Hillman, C.H., Buck, S.M., & Erwin, H.E. (2007). Physical fitness and academic achievement in third and fifth grade students. Journal of Sport & Exercise Psychology, 29, 239-252. Caterino, M.C., & Polak, E.D. (1999). Effects of two types of activity on the performance of second, third, and fourth grade students on a test of concentration. Perceptual Motor Skills, 89, 245-248. cdc.gov/nccdphp/sgr/index.htm. (2011) Retrieved 1-10-11. cdc.gov/shpps/index.htm. (2011) Retrieved 1-11-11. Chaddock, L., Erickson, K.I., Prakash, R.S., Kim, J.S., Voss, M.W., VanPatter, M., Pontifex, M.B., Raine, L.B., Konkel, A., Hillman, C.H., Cohen, N.J., & Kramer, A.F. (2010). A neuroimaging investigation of the association between aerobic fitness, hippocampal volume, and memory performance in preadolescent children. Brain Research, 1358,
83
172-183. Chaddock, L., Erickson, K.I., Prakash, R.S., VanPatter, M., Voss, M.W., Pontifex, M.B., Raine, L.B., Hillman, C.H., & Kramer, A.F. (2010). Basal ganglia volume is associated with aerobic fitness in preadolescent children. Developmental Neuroscience, 32, 249-256. Chomitz, V.R., Slining, M.M., McGowan, R.J., Mitchell, S.E., Dawson, G.F., & Hacker, K.A. (2009). Is there a relationship between physical fitness and academic achievement?
Positive results from public school children in the northeastern United States. Journal Of School Health, 79(1), 30-37. Coe, D.P., Pivarnik, J.M., Womack, C.J., Reeves, M.J. & Malina, R.M. (2006)
Effect of Physical education and activity levels on academic achievement in children. Medicine & Science in Sports & Exercise, 38(8), 1515-1519.
Colcombe, S.J., Kramer, A.F., Erickson, K.I., Scalf, P., McAuley, E., & Cohen, N.J. et al.
(2004a,b). Cardiovascular fitness, cortical plasticity, and aging. Proceedings of the National Academy of Science, 101(9), 3316-3321.
Colcombe, S.J., Kramer, A.F., McAuley, E., Erickson, K.I., & Scalf, P. (2004b). Neuro- Cognitive ageing and cardiovascular fitness. Journal of Molecular Neuroscience, 24, 9-14. Datar, A., Sturm, R., & Magnabosco, J.L. (2004). Childhood overweight and academic perform- ance: National study of kindergartners and first-graders. Obesity Research, 12(1), 58-68. Davis, S.M., Clay, T., Smyth, M., Gittelsohn, J., Arviso, V., Flint-Wagner, H., Rock, B.H., Brice, R.A., Metcalfe, L., Stewart, D., Vu, M., & Stone, E.J. (2003). Pathways curriculum and family interventions to promote healthful eating and physical activity in American Indian school children. Preventive Medicine, 37, S24-S34. Donnelly, J.E., Greene, J.L., Gibson, C.A., Smith, B.K., Washburn, R.A., Sullivan, D.K., DuBose, K., Mayo, M.S., Schmelzle, K.H., Ryan, J.J., Jacobsen, D.J., & Williams, S.L. (2009). Physical activity across the curriculum (PAAC): A randomized
controlled trial to promote physical activity and diminish overweight and obesity in elementary school children. Preventive Medicine, 49, 336-341.
Dwyer, T., Blizzard, L., & Dean, K. (1996). Physical activity and performance in children. Nutrition Reviews, 54(4), S27-S31. Dwyer, T., Coonan, W.E., Leitch, D.R., Hetzel, B.S., & Baghurst, R.A. (1983). An investigation of the effects of daily physical activity on the health of primary school students in South Australia. International Journal of Epidemiology, 12(3), 308-313. Dwyer, T., Sallis, J.F., Blizzard, L., Lazarus, R., & Dean, K. (2001). Relation of academic Performance to physical activity and fitness in children. Pediatric Exercise Science,
84
13, 225-237. Etnier, J.L., Salazar, W., Landers, D.M., Petruzzello, S.J., Han, M., & Nowell, P. (1997). The Influence of physical fitness and exercise upon cognitive functioning: A meta-analysis. Journal of Sport & Exercise Psychology, 19, 249-277. Fulghum, Robert. (1989). All I Really Need to Know I Learned in Kindergarten. Ivy Books. Gortmaker, S.L., Cheung, L.W.Y., Peterson, K.E., Chomitz, G., Cradle, J.H., Dart, H., Fox, M.K., Bullock, R.B., Sobol, A.M., Colditz, G., Field, A.E., & Laird, N. (1999). Impact of a school-based interdisciplinary intervention on diet and physical activity among urban primary school children. Archives of Pediatrics & Adolescent Medicine, 153, 975-983. Grissom, J.B. (2005). Physical fitness and academic achievement. Journal of Exercise Physiology, 8(1), 11-25. Hillman, C.H., Castelli, D.M., & Buck, S.M. (2005). Aerobic fitness and neurocognitive function in healthy preadolescent children. Medicine & Science in Sports & Exercise, 37(11), 1967-1974. Hollar, D., Messiah, S.E., Lopez-Mitnik, G., Hollar, L., Almon, M., & Agatston, A.S. (2010). Effect of a two-year obesity prevention intervention on percentile changes in body mass index and academic performance in low-income elementary school children. American Journal of Public Health, 100, 646-653. Hollmann, W., & Struder, H.K. (1996). Exercise, physical activity, nutrition, and the brain. Nutrition Reviews, 54(4), S37-S43. Isaacs, K.R., Anderson, B.J., Alcantara, A.A., Black, J.E., & Greenough, W.T. (1992). Exercise and the brain: Angiogenesis in the adult rat cerebellum after vigorous physical activity and motor skill learning. Journal of Cerebral Blood Flow & Metabolism, 12(1), 110-119. Harrell, J.S., McMurray, R.G., Bangdiwala, S.I., Frauman, A.C., Gansky, S.A., & Bradley, C.B. (1996). Effects of a school-based intervention to reduce cardiovascular disease risk factors in elementary-school children: The cardiovascular health in children (CHIC) study. The Journal of Pediatrics, 128(6), 797-805. Kain, J., Uauy, R., Albala, Vio, F., Cerda, R., & Leyton, B. (2004). School-based obesity prevention in Chilean primary school children: Methodology and evaluation of a controlled study. International Journal of Obesity, 28, 483-493. Kirkendall, D.R. (1986). Effects of physical activity on intellectual development and academic Performance. Champaign, IL: Human Kinetics, 49-63. Leppo, M.L., Davis, D., & Crim, B. (2000). The basics of exercising the mind and body.
85
Childhood Education, 142-146. Lindner, K.J. (2002). The physical activity participation-academic performance relationship revisited: Perceived and actual performance and the effect of banding (Academic Tracking). Pediatric Exercise Science, 14, 155-169. Luepker, R.V., Perry, C.L., McKinlay, S.M., Nader, P.R., Parcel, G.S., Stone, E.J., Webber,
L.S., Elder, J.P., Feldman, H.A., Johnson, C.C., Kelder, S.H., & Wu, M. (1996). Outcomes of a field trial to improve children’s dietary patterns and physical activity: The child and adolescent trial for cardiovascular health (CATCH). The Journal of the American Medical Association, 275(10), 768-776.
Mahar, M.T., Murphy, S.K., Rowe, D.A., Golden, J., Shields, A.T., & Raedeke, T.D. (2006). Effects of a classroom-based program on physical activity and on-task behavior. Medicine & Science in Sports & Exercise, 38(12), 2086-2094. National Association for Sport and Physical Education. (2012). www.naspeinfo.org Resources for Physical Activity Breaks. (retrieved 7-20-12) National Guidelines for Physical Activity. (2009). www.aahperd.org/naspe/standards/national Guidelines/PAguidelines.cfm (retrieved 1-12-11) NASPE Oja, L., & Jurimae, T. (2002). Physical activity, motor ability, and school readiness of 6-Year- Old children. Perceptual and Motor Skills, 95, 407-415. Pate, R.R., Davis, M.G., Robinson, T.N., Stone, E.J., McKenzie, T.L., & Young, J.C. (2006). Promoting physical activity in children and youth: A leadership role for schools: A scientific statement from the American heart association council on nutrition, physical activity, and metabolism (Physical Activity Committee) in collaboration with the councils on cardiovascular disease in the young and cardiovascular nursing. Circulation, 114, 1214-1224. Pica, R. (1997). Beyond physical development: Why young children need to move. Young Child- ren, 4-11. Ploughman, M. (2008). Exercise is brain food: The effects of physical activity on cognitive function. Developmental Neurorehabilitation, 11(3), 236-240. Ratey, John J. (2008). SPARK: The Revolutionary New Science of Exercise And The Brain. New York: Little, Brown and Company. Sahota, P., Rudolf, M.C.J., Dixey, R., Hill, A.J., Barth, J.H., & Cade, J. (2001). Evaluation of implementation and effect of primary school based intervention to reduce risk factors for obesity. British Medical Journal, 323, 1-4.
86
Sallis, J.F., McKenzie, T.L., Alcaraz, J.E., Bohdan, K., Faucette, N., & Hovell, M.F. (1999). The effects of a 2-year physical education program (SPARK) on physical activity and fitness in elementary school students. American Journal of Public Health, 87(8), 1328-1334. Salmon, J., Booth, M.L., Phongsavan, P., Murphy, N., & Timperio, A. (2007). Promoting phys- ical activity participation among children and adolescents. Epidemiologic Reviews, 29(1), 144-159. Satcher, D. (2005). Healthy and ready to learn. Educational Leadership, 63(1), 26-30. Sattelmair, J., & Ratey, J.J. (2009). Physically active play and cognition: An academic matter? American Journal of Play, 365-374. Shadish, W.R., Cook, T.D., & Campbell, D.T. (2002). Experimental & Quasi-Experimental Designs for Generalized Causal Inference (2nd ed.). Boston: Houghton-Mifflin. Shape of the Nation Report. (2010). www.aahperd.org/NASPE/publications/upload/Shape-of- the-Nation-2010-Final.pdf (retrieved 1-12-11) NASPE & American Heart Association, page 5. Shephard, R.J. (1996). Habitual physical activity and academic performance. Nutrition Reviews, 54(4), S32-S36. Shephard, R.J. (1997). Curricular physical activity and academic performance. Pediatric Exercise Science, 9, 113-126. Shephard, R.J., & Trudeau, Francois. (2005). Lessons learned from the Trois-Rivieres physical education study: A retrospective. Pediatric Exercise Science, 17, 112-123. Sibley, B.A., & Etnier, J.L. (2003). The relationship between physical activity and cognition in Children: A meta-analysis. Pediatric Exercise Science, 15, 243-256. Smith, N.J., & Lounsbery, M. (2009). Promoting physical education: The link to academic Achievement. Journal of Health, Physical Education, Recreation, & Dance, 80(1), 39-43. Stevens, T.A., To, Y., Stevenson, S.J., & Lochbaum, M.R. (2008). The importance of physical education in the prediction of academic achievement. Journal of Sport Behavior, 31(4), 368-388. Stone, E.J., McKenzie, T.L., Welk, G.J., & Booth, M.L. (1998). Effects of physical activity Interventions in youth: Review and synthesis. American Journal of Preventive Medicine, 15(4), 298-315. Taras, H. (2005). Physical activity and student performance at school. Journal of School Health, 75(6), 214-218.

87
Tomporowski, P.D. (2003). Cognitive and behavioral responses to acute exercise in youths: A review. Pediatric Exercise Science, 15, 348-359. Tomporowski, P.D., Davis, C.L., Miller, P.H., & Naglieri, J.A. (2008) Exercise and children’s intelligence, cognition, and academic achievement. Educational Psychology Review, 20, 111-131. Tomporowski, P.D., & Ellis, N.R. (1986). Effects of exercise on cognitive processes: A review. Psychological Bulletin, 99(3), 338-346. Tremblay, M.S., Inman, J.W., & Willms, J.D. (2000). The relationship between physical activity, self-esteem, and academic achievement in 12-Year-Old children. Pediatric Exercise Science, 12, 312-323. Trudeau, F., Laurencelle, L., Tremblay, J., Mirjana, R., & Shephard, R.J. (1999). Daily primary school physical education: effects on physical activity during adult life. Medicine & Science in Sports & Exercise, 31(1), 111-117. Trudeau, F., & Shephard, R.J. (2008). Physical education, school physical activity, school sports and academic performance. International Journal of Behavioral Nutrition and Physical Activity, 5(10), 1-12. Trudeau, F., & Shephard, R.J. (2010). Relationships of physical activity to brain health and the academic performance of school children. American Journal of Lifestyle Medicine, 4(2), 138-150. US Department of Health and Human Services Public Health Service. (2000). Healthy People 2010- retrieved 1-12-11. Vindfeld, S., Schnohr, C., & Niclasen, B. (2009). Trends in physical activity in green-landic school children, 1994-2006. International Journal of Circumpolar Health, 68(1), 42-52. Welsh, M.C., & Labbe, E.E. (1994). Children and aerobic exercise: A review of cognitive and behavioral effects. Journal of Experimental Child Psychology, 58, 405-417.

88
APPENDIX A
[IRB]
89
University of Pittsburgh Institutional Review Board
3500 Fifth Avenue
Pittsburgh, PA 15213
(412)383-1480
(412)383-1508 (fax)
http://www.irb.pitt.edu
Memorandum
To: Amy Shannonhouse
From: Christopher Ryan , Ph.D., Vice Chair
Date: 8/10/2010
IRB#: PRO10050103
Subject: The Effects of Physical Activity on Academic Achievement in Kindergarten.
The above-referenced project has been reviewed by the Institutional Review Board. Based on
the information provided, this project meets all the necessary criteria for an exemption, and is
hereby designated as "exempt" under section
45 CFR 46.101(b)(4) Existing data, documents, or records
Please note the following information:
• If any modifications are made to this project, use the " Send Comments to IRB Staff" process from the project workspace to request a review to ensure it continues to meet the exempt category.
Upon completion of your project, be sure to finalize the project by submitting a "Study Completed" report from the project workspace. Please be advised that your research study may be audited periodically by the University of Pittsburgh Research Conduct and Compliance Office.

90
APPENDIX B
[LETTERS TO PARENTS]

91
Dear Parent:
During the second semester, you will become aware of some exciting additions to
the Mohawk Kindergarten curriculum. As a result, of a grant obtained by the elementary physical
education teachers, a fitness center is being equipped with a variety of state of the art interactive
fitness equipment.
As part of the grant, we are specifically looking at the impact of exercise on
academic success. Research shows a direct correlation between physical activity and math and
literacy achievement.
Once the equipment is installed, ½ of our kindergarten students will be randomly
selected to participate in 15 minute sessions in the fitness center. We are working on a schedule
to determine how often these sessions can be held. Based on the results we obtain, we plan to
repeat the process with the other ½ of of our kindergarten students during the last nine weeks.
Thank you for your continued support.
Sincerely,
Kathleen Kwolek
Assistant Superintendent

92
KINDERGARTEN PARENT AGENDA
Introductions: Myself and Larry, we team teach and see kindergarten twice in the 6 day
cycle….see your teachers for days.
Important: that your child wears the proper clothes and footwear…it is a safety issue.
Fridays: We see them every other Friday for Action Based Learning. It uses movement to
link the basic movement concepts of letters, numbers, colors and shapes.
Interactive Fitness Center: had a vision…the only one at the elementary level in the state.
We need your help…research study….we have chosen kindergarten and plan to show
that physical activity will improve their academic performance.
1. It is voluntary.
2. Students must be at school at 8:25am.
3. From 8:25-8:50am they will be partnered with a high school fitness buddy who records
data like heart rate and perceived exertion.
4. At 8:50am they will have breakfast and then report to class.
5. We would like to record data on at least 48-50 students. The first semester (the first 2
nine weeks) 24 students and then switch the last semester (the last two nine weeks).
6. If you sign up you will be notified through school reach. The study would start
Tuesday, September 2nd, 2008.

93
APPENDIX C
[SYLLABUS FOR HIGH SCHOOL BUDDIES]

94
COURSE SYLLABUS
INSTUCTORS: Ms. Miller and Mr. Carr
COURSE TIME: 8:20-8:50 (Elementary Time) Monday, Tuesday, Thursday, Friday
COURSE DESCRITION: To record fitness data for a kindergarten research project.
RESPONIBILITIES:
• You will be required to meet your elementary fitness buddy in their classroom at 8:55. • Once you pick them up, you will escort them to the fitness center and begin to collect
data • You are responsible for collecting the data for your buddies. • When you have collected all your data, you will escort them back to class. • If you know that you will not be at school to record your buddies fitness data, you must
make arrangements with someone to record the data for you. • If your elementary buddy is absent that day, you will assist another peer in collecting data
that day. • If one of you are absent, someone must step up and record data for that person. Mr.
Carr and Ms. Miller will not always be available. You must problem solve it. • On Wednesday’s, you are to report to the fitness center to compile your data (we will
explain). • You must report to Ms. Miller or Mr. Carr if you are having any problems (your buddy is
not behaving, cooperating or absent a lot). • Please let us know when you are starting to get low on forms so we can make more
copies.
Please Note: Any school delays (two hour delays, snow day etc) there will be no data
collection. See the attached sheet for data collection instructions.

95
APPENDIX D
[WEEKLY DATA COLLECTION SHEET]

96
Weekly Data Collection Sheet
#1 STUDENT
NAME:________________________
M/F___________________________
AGE/GRADE__________________
MONDAY
DATE:_______
TUESDAY
DATE:________
WEDNESDAY
DATE:_______
THURSDAY
DATE:________
FITNESS BUDDY
NAME:________________________
BEFORE X-HR
(INSTA-PULSE)
BEFORE X-HR
(CAROTID PULSE)
DDR-STEPS(PERFECT)
(BABY GIVE ME YOUR LOVE,
MUSIC SPEED 1)
TIME: 5 MINUTES
BOXING CALORIES BURNED
(ONE ROUND)
TIME: 3 MINUTES
BIKE-TIME/DISTANCE
(TEST COURSE)
TIME: 4 MINUTES
3-KICKS-STRIKES
2 MINUTES
AFTER X-HR
(INSTA-PULSE)
AFTER X-HR
(CAROTID PULSE)
PERCEIVED EXERTION
(THURSDAY ONLY)
KEY: IF STUDENT IS ABSENT
MARK THE LETTER A IN THE
BOX.
97
APPENDIX E
[PERCEIVED EXERTION CHARTS]
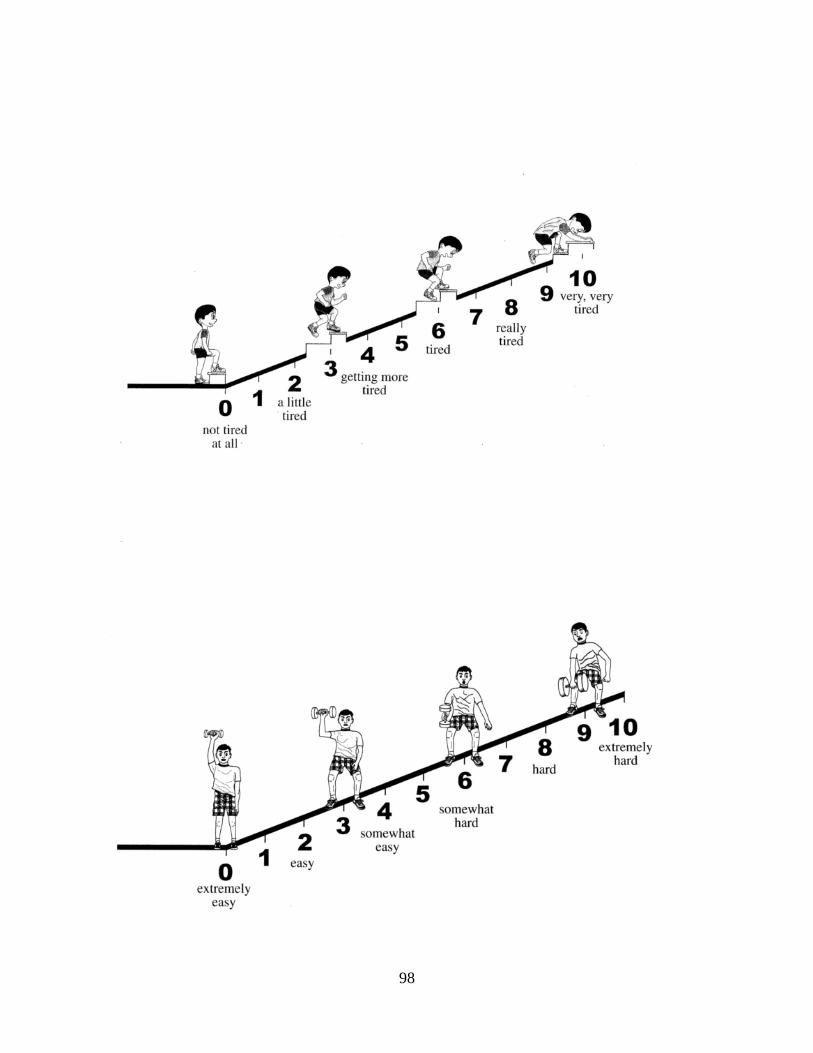
98
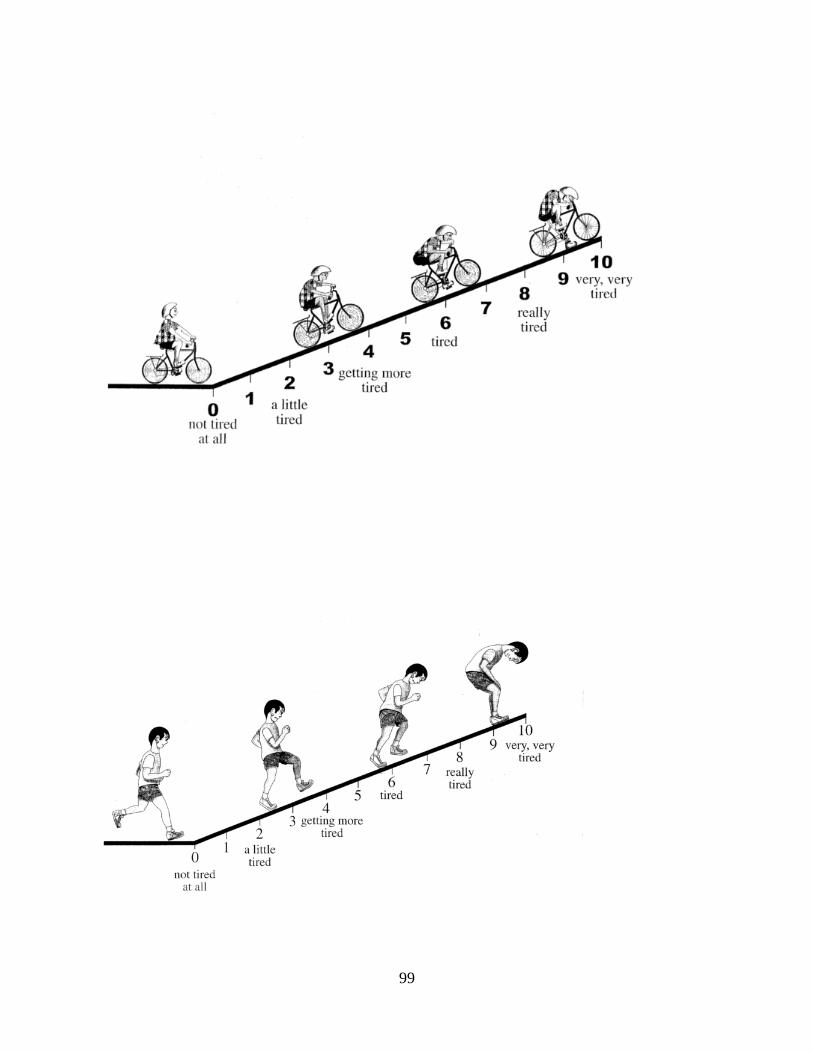
99

100
APPENDIX F
[ANNOVA TABLES & MEANS AND STANDARD DEVIATION TABLES]
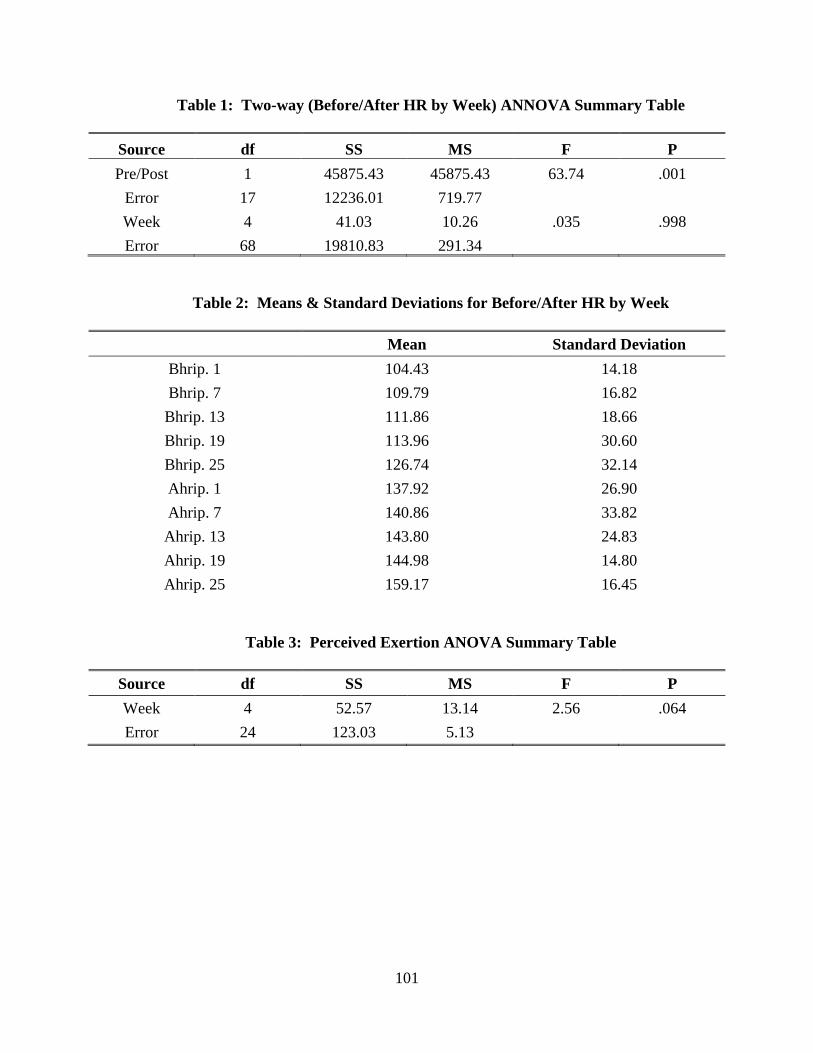
101
Table 1: Two-way (Before/After HR by Week) ANNOVA Summary Table
Source df SS MS F P Pre/Post 1 45875.43 45875.43 63.74 .001
Error 17 12236.01 719.77 Week 4 41.03 10.26 .035 .998 Error 68 19810.83 291.34
Table 2: Means & Standard Deviations for Before/After HR by Week
Mean Standard Deviation Bhrip. 1 104.43 14.18 Bhrip. 7 109.79 16.82 Bhrip. 13 111.86 18.66 Bhrip. 19 113.96 30.60 Bhrip. 25 126.74 32.14 Ahrip. 1 137.92 26.90 Ahrip. 7 140.86 33.82 Ahrip. 13 143.80 24.83 Ahrip. 19 144.98 14.80 Ahrip. 25 159.17 16.45
Table 3: Perceived Exertion ANOVA Summary Table
Source df SS MS F P Week 4 52.57 13.14 2.56 .064 Error 24 123.03 5.13
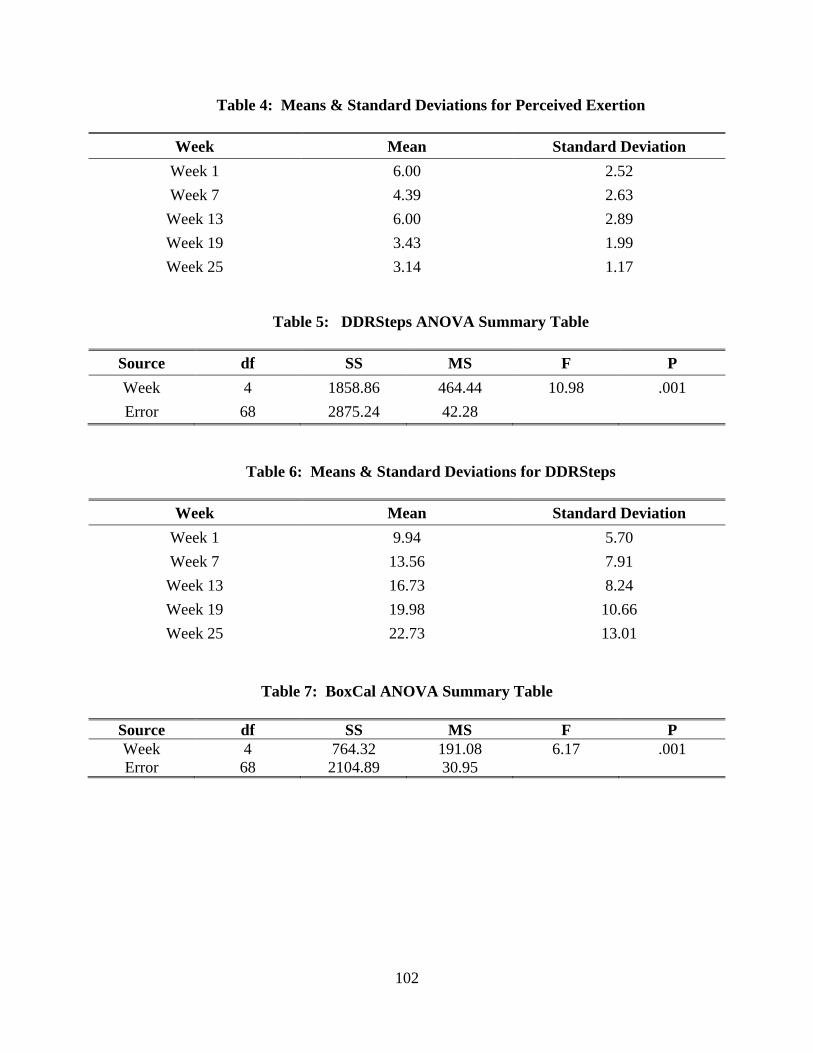
102
Table 4: Means & Standard Deviations for Perceived Exertion
Week Mean Standard Deviation Week 1 6.00 2.52 Week 7 4.39 2.63 Week 13 6.00 2.89 Week 19 3.43 1.99 Week 25 3.14 1.17
Table 5: DDRSteps ANOVA Summary Table
Source df SS MS F P Week 4 1858.86 464.44 10.98 .001 Error 68 2875.24 42.28
Table 6: Means & Standard Deviations for DDRSteps
Week Mean Standard Deviation Week 1 9.94 5.70 Week 7 13.56 7.91 Week 13 16.73 8.24 Week 19 19.98 10.66 Week 25 22.73 13.01
Table 7: BoxCal ANOVA Summary Table
Source df SS MS F P Week 4 764.32 191.08 6.17 .001 Error 68 2104.89 30.95
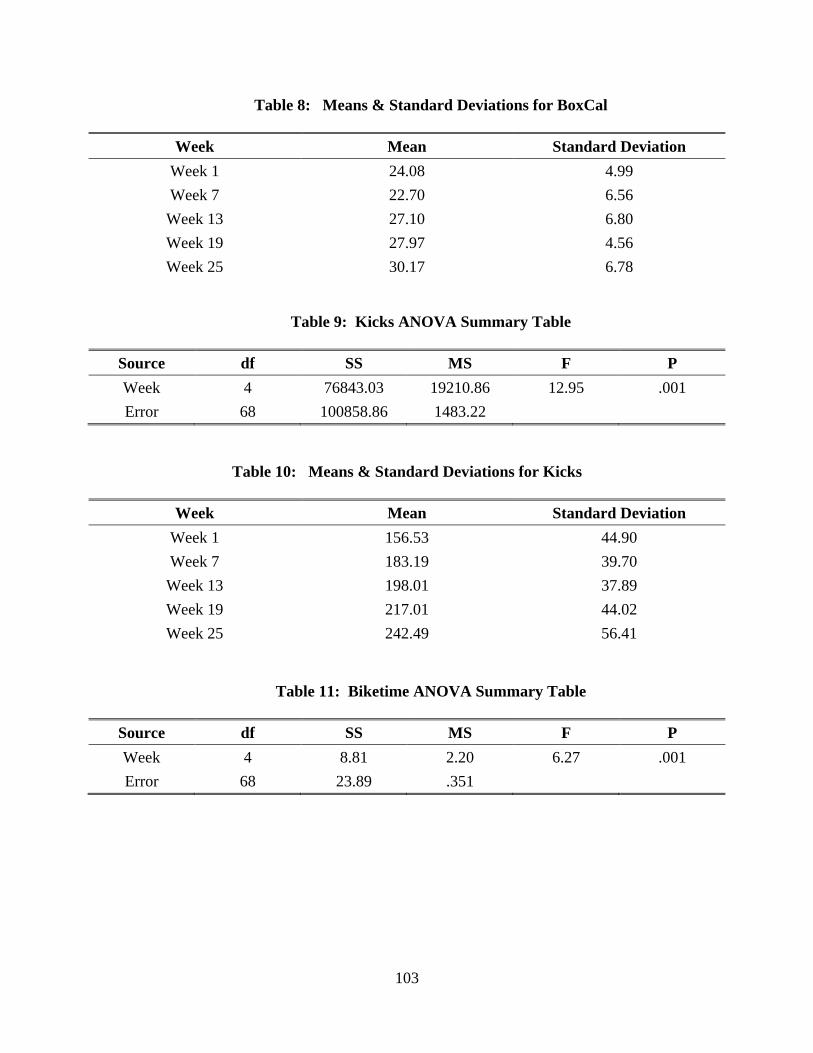
103
Table 8: Means & Standard Deviations for BoxCal
Week Mean Standard Deviation Week 1 24.08 4.99 Week 7 22.70 6.56 Week 13 27.10 6.80 Week 19 27.97 4.56 Week 25 30.17 6.78
Table 9: Kicks ANOVA Summary Table
Source df SS MS F P Week 4 76843.03 19210.86 12.95 .001 Error 68 100858.86 1483.22
Table 10: Means & Standard Deviations for Kicks
Week Mean Standard Deviation Week 1 156.53 44.90 Week 7 183.19 39.70 Week 13 198.01 37.89 Week 19 217.01 44.02 Week 25 242.49 56.41
Table 11: Biketime ANOVA Summary Table
Source df SS MS F P Week 4 8.81 2.20 6.27 .001 Error 68 23.89 .351
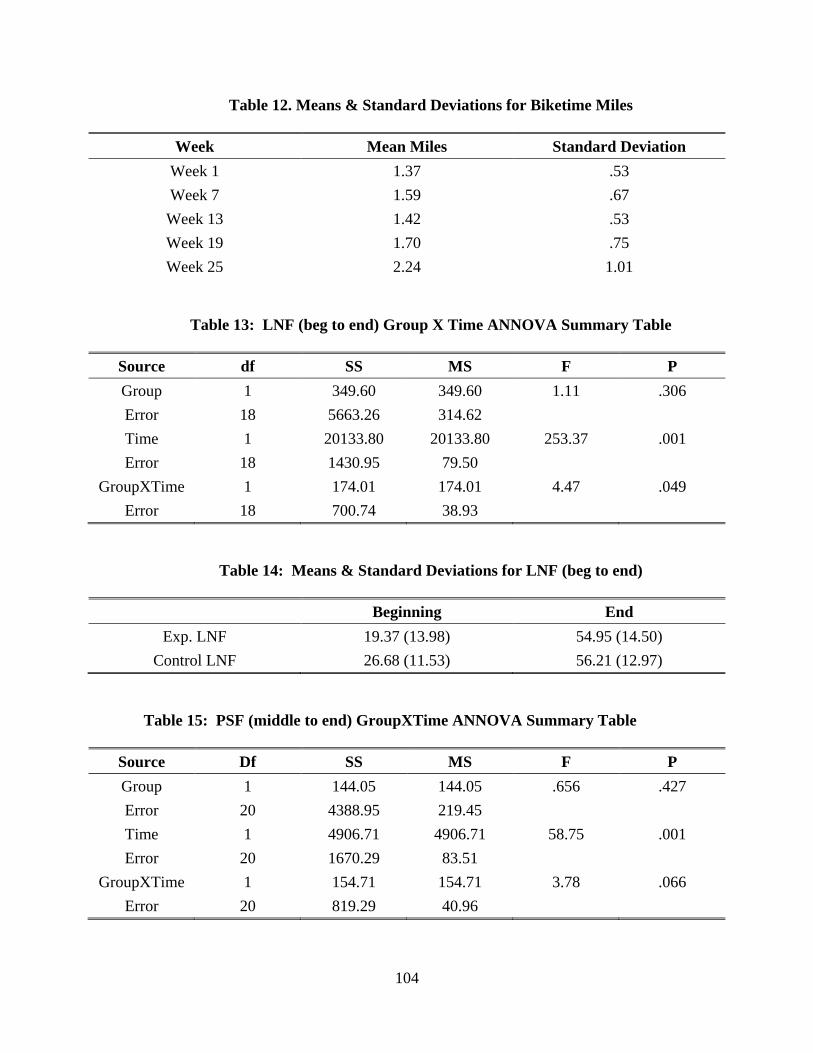
104
Table 12. Means & Standard Deviations for Biketime Miles
Week Mean Miles Standard Deviation Week 1 1.37 .53 Week 7 1.59 .67 Week 13 1.42 .53 Week 19 1.70 .75 Week 25 2.24 1.01
Table 13: LNF (beg to end) Group X Time ANNOVA Summary Table
Source df SS MS F P Group 1 349.60 349.60 1.11 .306 Error 18 5663.26 314.62 Time 1 20133.80 20133.80 253.37 .001 Error 18 1430.95 79.50
GroupXTime 1 174.01 174.01 4.47 .049 Error 18 700.74 38.93
Table 14: Means & Standard Deviations for LNF (beg to end)
Beginning End Exp. LNF 19.37 (13.98) 54.95 (14.50)
Control LNF 26.68 (11.53) 56.21 (12.97)
Table 15: PSF (middle to end) GroupXTime ANNOVA Summary Table
Source Df SS MS F P Group 1 144.05 144.05 .656 .427 Error 20 4388.95 219.45 Time 1 4906.71 4906.71 58.75 .001 Error 20 1670.29 83.51
GroupXTime 1 154.71 154.71 3.78 .066 Error 20 819.29 40.96
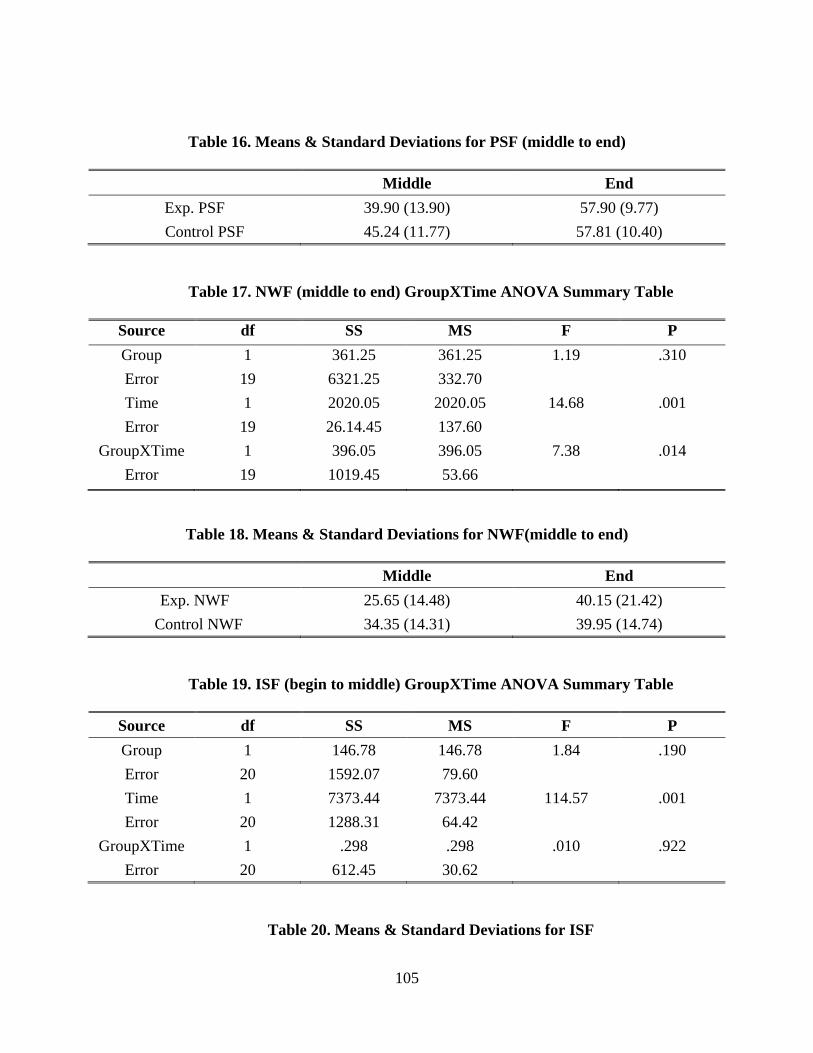
105
Table 16. Means & Standard Deviations for PSF (middle to end)
Middle End Exp. PSF 39.90 (13.90) 57.90 (9.77)
Control PSF 45.24 (11.77) 57.81 (10.40)
Table 17. NWF (middle to end) GroupXTime ANOVA Summary Table
Source df SS MS F P Group 1 361.25 361.25 1.19 .310 Error 19 6321.25 332.70 Time 1 2020.05 2020.05 14.68 .001 Error 19 26.14.45 137.60
GroupXTime 1 396.05 396.05 7.38 .014 Error 19 1019.45 53.66
Table 18. Means & Standard Deviations for NWF(middle to end)
Middle End Exp. NWF 25.65 (14.48) 40.15 (21.42)
Control NWF 34.35 (14.31) 39.95 (14.74)
Table 19. ISF (begin to middle) GroupXTime ANOVA Summary Table
Source df SS MS F P Group 1 146.78 146.78 1.84 .190 Error 20 1592.07 79.60 Time 1 7373.44 7373.44 114.57 .001 Error 20 1288.31 64.42
GroupXTime 1 .298 .298 .010 .922 Error 20 612.45 30.62
Table 20. Means & Standard Deviations for ISF
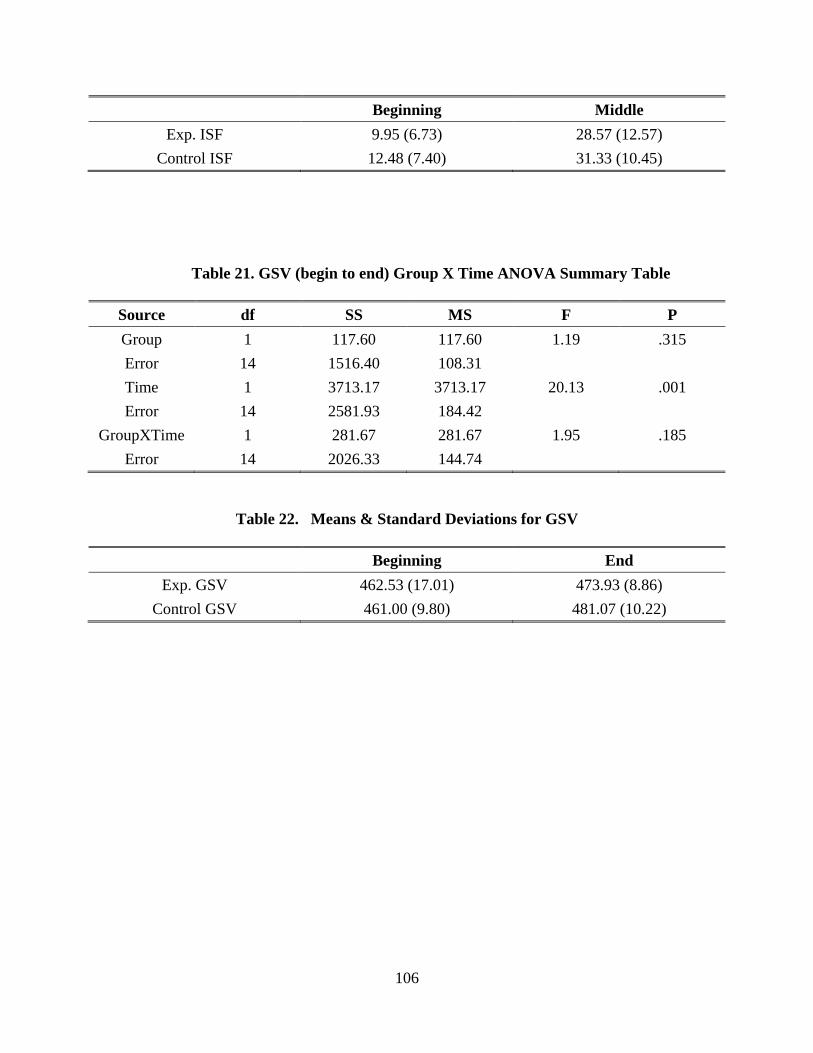
106
Beginning Middle Exp. ISF 9.95 (6.73) 28.57 (12.57)
Control ISF 12.48 (7.40) 31.33 (10.45)
Table 21. GSV (begin to end) Group X Time ANOVA Summary Table
Source df SS MS F P Group 1 117.60 117.60 1.19 .315 Error 14 1516.40 108.31 Time 1 3713.17 3713.17 20.13 .001 Error 14 2581.93 184.42
GroupXTime 1 281.67 281.67 1.95 .185 Error 14 2026.33 144.74
Table 22. Means & Standard Deviations for GSV
Beginning End Exp. GSV 462.53 (17.01) 473.93 (8.86)
Control GSV 461.00 (9.80) 481.07 (10.22)