raising minority academic achievement - american youth
TRANSCRIPT
��������������
��� ����� ����������
�������������� ������
��������������������
��������������
�����������
����� �
�������������������������

����������������
Glenda Partee, President and Co-Director, American Youth Policy Forum, served as Project Director forall products under our grant from the William T. Grant Foundation.
JoAnn Jastrzab, Senior Research Associate at Abt Associates, provided an expert external review of thedocument with an eye to evaluation quality.
Susan Kim, an independent writer specializing in youth policy, wrote the first drafts of more than a dozenevaluation summaries.
Our advisory board members, listed below, were invaluable in their assistance through advisory meetings,individual meetings and numerous electronic updates and feedback.
Advisory Board Members
� Paul Barton, Director, Policy Information Center, Educational Testing Service� Elaine Bonner-Tompkins, Senior Project Associate, Resource Center on Educational Equity, Council
of Chief State School Officers� Gordon Cawelti, Research Consultant, Educational Research Service� Anthony Colon, Vice-President, National Council of La Raza� Hilda Crespo, Government Relations Director, The ASPIRA Association, Inc.� Ronald Ferguson, Associate Professor, John F. Kennedy School of Government, Harvard University� Larry Gladieux, Independent Education Policy Consultant� Jeff Glebocki, Senior Program Officer, The George Gund Foundation� Edmund Gordon, Professor Emeritus, Yale University� Harry Holzer, Visiting Fellow, The Urban Institute� JoAnn Jastrzab, Senior Research Associate, Abt Associates, Inc.� Eric Jolly, Senior Scientist and Vice President, Education Development Center, Inc.� Arnold Kee, Coordinator for Minority Services, American Association of Community Colleges� Julia Lara, Assistant Director, Resource Center on Educational Equity, Council of Chief State School
Officers� Phyllis P. McClure, Independent Education Policy Consultant� L. Scott Miller, Educational Consultant� Susan Poglinco, Research Specialist, Consortium for Policy Research, University of Pennsylvania� Nancy Protheroe, Director of Special Research, Education Research Service� Andrea Reeve, Director, National TRIO Clearinghouse, The Council for Opportunity in Education� Cheryl Robinson, Director, Office of Minority Achievement, Arlington County Public Schools� Iris Rotberg, Research Professor of Education Policy, Graduate School of Education and Human
Development, George Washington University� Paul Ruiz, Principal Partner, The Education Trust� Jay Sherwin, Program Officer, Nellie Mae Foundation� Steve Silver, Director, Teacher Quality Initiatives, Education Reform Department, National Alliance of
Business� Gerald Sroufe, Government and Professional Liaison, American Educational Research Association� Andrea Todd, Research Associate, National Clearinghouse for Bilingual Education, George
Washington University� Watson Scott Swail, Vice President, Planning and Research, The Council for Opportunity in
Education� Mala Thakur, Director, Capacity Building Initiatives, National Youth Employment Coalition

Many thanks to all the members of the Advisory Board.
Thanks also to David Grissmer of RAND; Marcia Silverberg, Assistant Director, National Assessment ofVocational Education (NAVE) and David Goodwin, Division Chief, Postsecondary, Adult and VocationalDivision, both of the Planning and Evaluation Service, U.S. Department of Education; Monica Martinez,Director of Outreach, National Clearinghouse for Comprehensive School Reform; and others who repliedto our numerous questions.
Thanks to each: reviewers of the full manuscript including AYPF Co-Directors Glenda Partee and BetsyBrand, AYPF Founder and Senior Fellow Samuel Halperin; Jelena Lewis who proofed the document;Rafael Chargel, who formatted the document for publication; Banu Dole, Program Associate, AYPF;Ayana Rockett and Jamie Stubbs, Interns, AYPF who also assisted.
Thank you to the William T. Grant Foundation for financial support and for their individual support: KarenHein, President, Robert Granger, Senior Vice President for Programs, and Lonnie Sherrod, formerly of theWilliam T. Grant Foundation and now a Professor at Fordham University.
Thank you also to all the program directors and evaluators who forged ahead on the difficult path ofevaluating their programs, helped provide us with the evaluations to summarize, and who reviewed andcorrected the summaries of their programs before publication.
Although each of these contributors provided a wealth of suggestions and ideas, the views expressed inthis publication are the sole responsibility of AYPF.
About the Authors
Donna Walker James, Senior Program Associate at the American Youth Policy Forum, has directed thecreation and publication of three previous compendia for AYPF: Some Things DO Make a Difference forYouth, More Things DO Make a Difference for Youth, and Raising Academic Achievement. She alsoedited two AYPF volumes on juvenile justice issues. Ms. James has over 15 years experience in youthpolicy and education. She has administered a youth program in West Philadelphia, taught English andsocial studies in diverse urban high schools, and worked on school-to-work issues at the U.S. Departmentof Labor. She also served as a consultant on school-to-work issues for the Council of Chief State SchoolOfficers, Scholastic, Inc. and others. She earned a Master’s in Education from the University ofPennsylvania.
Sonia Jurich has served as Senior Research Advisor to AYPF and co-authored More Things That DOMake a Difference for Youth and Raising Academic Achievement. An MD with a specialization incommunity psychiatry, she held professorships at Catholic and Federal Universities in Rio de Janeiro, Braziland served as director of the Psychiatric Outpatient Clinic at Federal University Hospital, and of mentalhealth clinics in the Washington, D.C. area. Dr. Jurich is the author or translator of over a dozenpublications on youth development, youth with disabilities, mental illness and psychiatry.
Steve Estes was a Research Associate with the American Youth Policy Forum and co-authored RaisingAcademic Achievement. A PhD in history from the University of North Carolina, he now teaches at theCollege of Charleston (Charleston, SC). He has also taught at Towson University (Baltimore, MD) and theSunflower County Freedom Project (Sunflower, MS). His research focuses on race relations in Americanhistory, and he has published articles in the Avery Review of African American History and Labor History.
��������
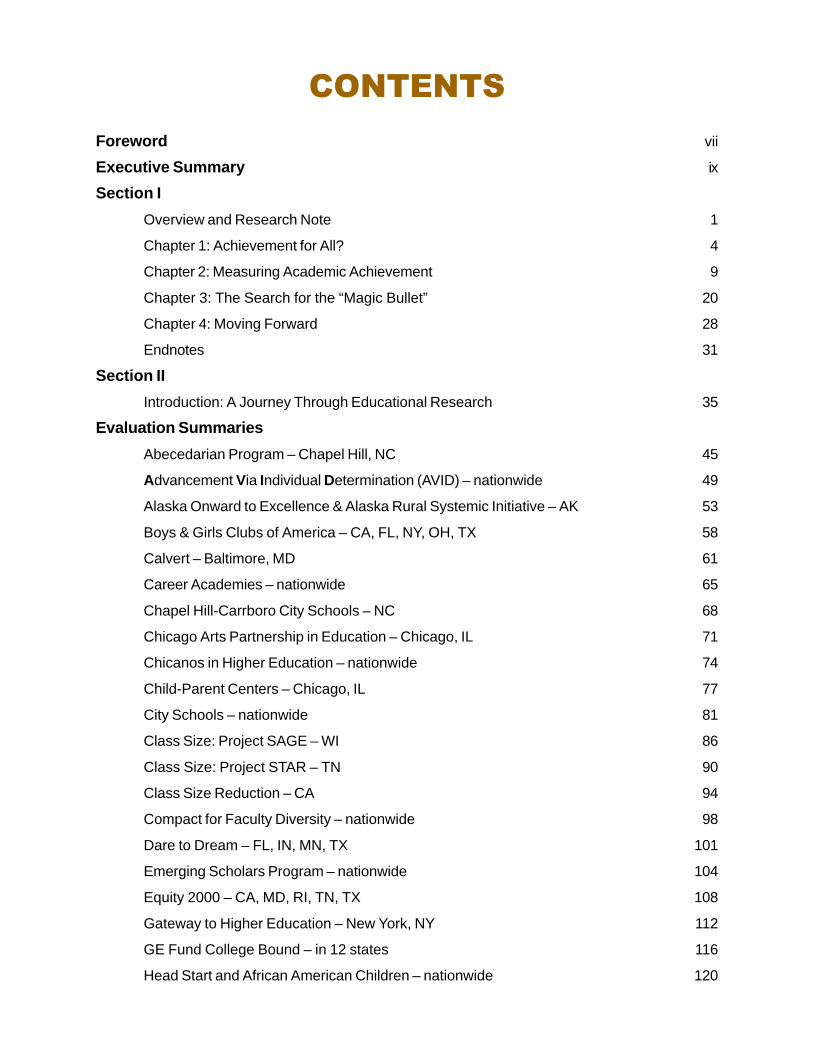
Foreword vii
Executive Summary ix
Section I
Overview and Research Note 1
Chapter 1: Achievement for All? 4
Chapter 2: Measuring Academic Achievement 9
Chapter 3: The Search for the “Magic Bullet” 20
Chapter 4: Moving Forward 28
Endnotes 31
Section II
Introduction: A Journey Through Educational Research 35
Evaluation Summaries
Abecedarian Program – Chapel Hill, NC 45
Advancement Via Individual Determination (AVID) – nationwide 49
Alaska Onward to Excellence & Alaska Rural Systemic Initiative – AK 53
Boys & Girls Clubs of America – CA, FL, NY, OH, TX 58
Calvert – Baltimore, MD 61
Career Academies – nationwide 65
Chapel Hill-Carrboro City Schools – NC 68
Chicago Arts Partnership in Education – Chicago, IL 71
Chicanos in Higher Education – nationwide 74
Child-Parent Centers – Chicago, IL 77
City Schools – nationwide 81
Class Size: Project SAGE – WI 86
Class Size: Project STAR – TN 90
Class Size Reduction – CA 94
Compact for Faculty Diversity – nationwide 98
Dare to Dream – FL, IN, MN, TX 101
Emerging Scholars Program – nationwide 104
Equity 2000 – CA, MD, RI, TN, TX 108
Gateway to Higher Education – New York, NY 112
GE Fund College Bound – in 12 states 116
Head Start and African American Children – nationwide 120
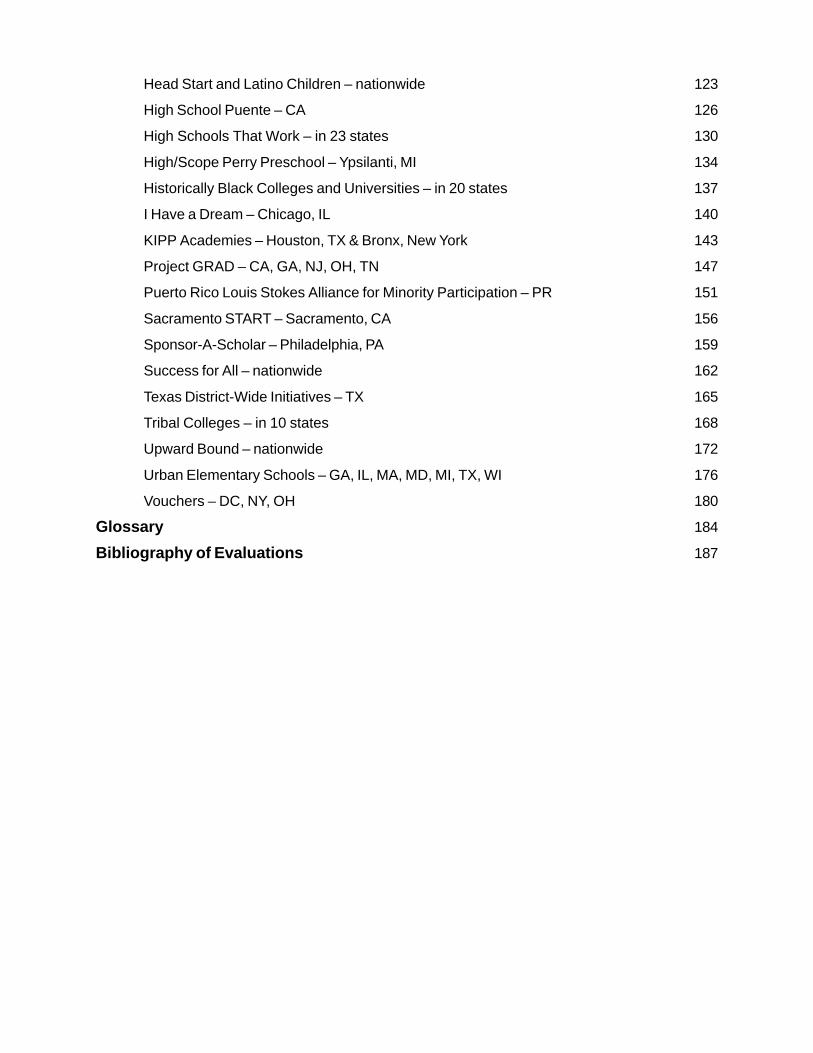
Head Start and Latino Children – nationwide 123
High School Puente – CA 126
High Schools That Work – in 23 states 130
High/Scope Perry Preschool – Ypsilanti, MI 134
Historically Black Colleges and Universities – in 20 states 137
I Have a Dream – Chicago, IL 140
KIPP Academies – Houston, TX & Bronx, New York 143
Project GRAD – CA, GA, NJ, OH, TN 147
Puerto Rico Louis Stokes Alliance for Minority Participation – PR 151
Sacramento START – Sacramento, CA 156
Sponsor-A-Scholar – Philadelphia, PA 159
Success for All – nationwide 162
Texas District-Wide Initiatives – TX 165
Tribal Colleges – in 10 states 168
Upward Bound – nationwide 172
Urban Elementary Schools – GA, IL, MA, MD, MI, TX, WI 176
Vouchers – DC, NY, OH 180
Glossary 184
Bibliography of Evaluations 187
Raising Minority Academic Achievement vii
American Youth Policy Forum
��������Since 1993, the America Youth Policy Forum(AYPF) has studied and highlighted strategies andreforms that provide youth with high qualityeducation and preparation for fulfilling careers. Partof AYPF’s mission is to publicize best practices inthe education and youth development fields to helppolicymakers and practitioners make informeddecisions. As a non-partisan professionaldevelopment organization, AYPF explores manyoptions supported by a variety of philosophicalunderpinnings. Central to our approach is our focuson whether positive outcomes are achieved byyoung people. Our focus has not been explicitly on“high performing schools,” “high performingprograms” or “high performing administrators andstaff” but on high performing young people. Weconsider schools, programs, administrators and staffto be high performing when they have positiveeffects on young people.
Understanding this focus of AYPF’s work on highperforming youth provides an important guide tousing this volume. AYPF has spent five yearscollecting empirical evidence of youth outcomes andcompiling them into readable volumes. This reportcontinues our commitment to placing soundresearch and evaluation at the service ofpolicymakers and practitioners as they wrestle withsome of America’s most enduring challenges—achieving true equality of educational opportunityand equity in educational outcomes.
In 1997, AYPF published its first compendium ofsummaries of evaluations of programs and practicesthat were found to be successful in propelling youthto rewarding careers and postsecondary education,reducing risky or illegal behaviors, and providingopportunities to youth who had dropped out ofschool or were leaving the juvenile justice system.That report, called Some Things DO Make aDifference for Youth: A Compendium of SuccessfulYouth Practice and Programs, was so well receivedthat AYPF produced a second volume, More ThingsThat DO Make a Difference for Youth in 1999. Inthis era of increased national attention to academic
achievement, many of the profiled programs in thesetwo volumes were able to document academicachievement gains, as well as other positive outcomes.
Funding from the William T. Grant Foundationallowed for a re-analysis to determine exactly whatthe evaluations in the previous compendia could tellus about outcomes related to academicperformance. This analysis is published in RaisingAcademic Achievement: A Study of 20 SuccessfulPrograms (2000)—programs with both the strongestachievement gains and the strongest evaluations.Five of the 20 programs directly addressed thequestion of minority student success. In particular,Alliance for Achievement (no longer in operation) andGateway to Higher Education (currently expanding)illustrated (1) the long way minority students still haveto go to eliminate the academic achievement gap,because despite their intellect and initiative, they areunderepresented in higher level courses, SAT test-taking, college enrollment, and other avenues to higherachievement; and (2) how much these programshelped increase the numbers of minority students athigher and higher levels of achievement.
Again with William T. Grant Foundation support, amuch longer journey was begun to find evaluationsof educational programs that are working to raisethe academic achievement of minority students. Onthis journey there were a few surprises, includingthat many well-known programs we had hoped todocument had no evaluations. Often, we foundevidence of success from other, less well-knownprograms. We learned of the width of the academicachievement gap between African American, Latinoand Native American youth and their white and Asianpeers, yet were encouraged by the many programs thatrecognized the gap and were working hard to increaseacademic achievement for their young people.
Since beginning this volume, we have witnessed anescalating concern about the “minority achievementgap.” Some have even called it the education issueof the new millennium in policy circles and themedia. We hope that this volume can help provide
Raising Minority Academic Achievementviii
American Youth Policy Forum
guidance on what works for minority youth to reachhigher levels of academic achievement.
A Few Words about our Focus on AcademicAchievement
This report focuses only on academic achievement,not on the broader range of indicators of the firsttwo compendia, such as employment and earningsdata and reductions in risky behavior. In ourcompendia, the focus is on “hard data” primarily to“prove” the effectiveness of these programs,especially to those who are skeptical of softermeasures. This decision coupled with thepresentation of brief summaries of each evaluation,means that much rich information about otheroutcomes for youth may have been omitted.
In the first two compendia, information wasprovided on a range of strategies used bysuccessful programs. The report, RaisingAcademic Achievement, narrowed the focus to whatthe program evaluations had to say about one set ofoutcomes. The current volume narrows the focusfurther to academic outcomes for minoritystudents. Yet, within this academic achievementcategory, the focus is deep, seeking outcomes alongan optimal pathway of academic achievement wewish all young people could take.
It is our hope that all young people will—
� attend school, arrive on time, go to all classes� read at grade level or above� do well in the sciences, mathematics and
technology� persist to high school graduation� be appropriately identified and served for any
special needs� obtain good grades (C or higher)� have access to and do well in academically
challenging courses� have opportunities to apply their knowledge
while in school (through work-based learningor service-learning)
� follow a coherent course sequence leading topostsecondary education
� take standardized and college entrance exams(e.g. Stanford 9, California Achievement Test,SAT, ACT, Achievement, and AdvancedPlacement tests) and obtain competitive scores
� make thoughtful guided decisions aboutcollege attendance and financing
� enroll in college� have no need for remedial education in college� sustain academic achievement and good
grades in college� sustain financial aid (reapply as needed)� sustain college enrollment� graduate from college� and successfully pursue graduate/professional
school degrees or fulfilling work in theirchosen career.
Information was sought for each level ofeducational achievement along this pathway.Information was also sought in the youthdevelopment literature about youth that are not inschool, but there was little data on academicachievement to be found here. There was however,a great deal of writing on the topics of minorityover-representation in special education,misidentification for special education, under-representation in gifted and talented programs,Advanced Placement, Honors and other advancedclasses, and over-representation in the juvenilejustice and adult penal systems. The research beingconducted on these areas of concern is of greatimportance to the issue of minority academicachievement. However, summarizing the researchon these topics was far beyond the scope of thisreport.
Additionally, within the pool of evaluations that metour rigorous criteria, there were few that provideddetailed descriptions of the programs evaluated andthe strategies used. So, while it is possible toidentify strategies believed to be effective,practitioners wishing to implement these strategiesor seeking to influence other types of youthachievement should use the contact informationprovided in each of the program summaries.
Raising Minority Academic Achievement ix
American Youth Policy Forum
����� ��������Background
Raising Minority Academic Achievement: ACompendium of Educational Programs andPractices reports on a 22-month effort to identify,summarize and analyze evaluations of school andyouth programs that show gains for minority youthacross a broad range of academic achievementindicators, from early childhood through advancedpostsecondary study.
Purpose
The purpose of this report is to inform policymakingand funding decisions by providing easy-to-read,accessible, concrete, research-proven evidence ofacademic achievement gains for minority youth andinformation on successful program strategies. Thereport also aims to provide information that
researchers, practitioners (school administrators,youth program directors, teachers, counselors,youth workers), families, community members andyoung people can use to evaluate, design,implement and advocate practices shown to beeffective in raising minority academic achievement.
Programs
An exhaustive search of journals, researchdatabases, and other sources yielded over 200documents pertaining to education programs. To beincluded in the report, these documents had to usesound methodology and have measurable academicachievement data on racial or ethnic minorities.Those documents that met the criteria for inclusionwere summarized in three to five pages andsubjected to a review process that resulted in 38being chosen for final inclusion:
Abecedarian Program – Chapel Hill, NCAdvancement Via Individual Determination (AVID) –
nationwideAlaska Onward to Excellence & Alaska Rural Systemic
Initiative – AKBoys & Girls Clubs of America – CA, FL, NY, OH, TXCalvert – Baltimore, MDCareer Academies – nationwideChapel Hill-Carrboro City Schools – NCChicago Arts Partnership in Education – Chicago, ILChicanos in Higher Education – nationwideChild-Parent Centers – Chicago, ILCity Schools – nationwideClass Size: Project SAGE – WIClass Size: Project STAR – TNClass Size Reduction – CACompact for Faculty Diversity – nationwideDare to Dream – FL, IN, MN, TXEmerging Scholars Program – nationwideEquity 2000 – CA, MD, RI, TN, TXGateway to Higher Education – New York, NY
GE Fund College Bound – in 12 statesHead Start & African American Children – nationwideHead Start & Latino Children – nationwideHigh School Puente – CAHigh Schools That Work – in 23 statesHigh/Scope Perry Preschool – Ypsilanti, MIHistorically Black Colleges and Universities – in 20 statesI Have a Dream – Chicago, ILKIPP Academies – Houston, TX & Bronx, New YorkProject GRAD – CA, GA, NJ, OH, TNPuerto Rico Louis Stokes Alliance for Minority
Participation – PRSacramento START – Sacramento, CASponsor-A-Scholar – Philadelphia, PASuccess for All – nationwideTexas District-Wide Initiatives – TXTribal Colleges – in 10 statesUpward Bound – nationwideUrban Elementary Schools – GA, IL, MA, MD, MI, TX, WIVouchers – DC, NY, OH
Raising Minority Academic Achievementx
American Youth Policy Forum
Outcomes
� Early Childhood—Evaluation findings wereparticularly strong and positive at the earlychildhood level. When compared to controlgroups, minority children who attend earlychildhood development programs are morelikely to remain in school, complete more yearsof education, and require less special education.
� Elementary Through Middle School—Theelementary through middle school evaluationswere almost exclusively focused on test scores.In most cases, improvements were incrementaland even where minority academic achievementincreased, the disparities in achievementbetween minority and white youth were highlyapparent. Texas is probably the only statewhere achievement gaps between minorities andwhite students are being halved or cut evenmore. However, Texas students are measuredon passing rates on only a minimumcompetency test. The question of whetherhigher levels of achievement are eventuallyreached remains unanswered.
� District or State Initiatives/K-12—The reportreviews several district or state initiatives,including class size reduction and voucherstudies. Additionally, reforms in Texas, NorthCarolina and Alaska are reviewed. Theseevaluations tend to focus more on increasedattention to accountability than on specificstrategies used to increase minority academicachievement.
� High School/Transition—Because they focuson more than test scores, the high school/transition programs offer a better perspective ofwhat is actually happening with their minoritystudents. Among the positive findings fromthese programs were one or more of thefollowing: increased high school graduation,more high school credits earned, higher GPAsearned or maintained, more college prep andAdvanced Placement courses taken, increasedenrollment in higher level mathematics and
science classes, more college entrance exam-taking and higher scores, less need forremediation in college, higher levels of collegeenrollment at two- and four-year colleges,higher levels of college retention andgraduation, and continuation in science-related majors or professions. Success is arelative word for most programs. Studentsmay be entering college at a higher rate buttheir GPAs may be similar to peers in regularclassrooms, or more students may be enrollingin academically challenging courses but alsofailing these courses in higher numbers.Evaluations of Upward Bound, Sponsor-A-Scholar and Career Academies show thatimprovements were most significant for thosewith higher risk of school failure and/or lowerinitial expectations, especially as they stayed inthe program longer and participated moreintensely. However, selective programs, suchas Gateway for Higher Education and HighSchool Puente, also indicate that high achievingstudents can perform at still higher levels whenchallenged.
� Postsecondary—Fewer quality evaluationswere available at the postsecondary level withdata disaggregated by race or ethnicity. Thepostsecondary programs included in the reportshow African American, Latino and NativeAmerican youth succeeding in demandingcareers and postsecondary education.However, their numbers are still quite small.
Strategies
The school initiatives and youth programs includedin this report provide concrete examples of effortsto increase achievement for minority youth.However, no “magic bullet” was found, that is, noone strategy was found to guarantee programsuccess. Rather, it is recommended thatpractitioners implement a comprehensive set of thefollowing strategies and continuously evaluate theireffects. The ten most frequent strategies identifiedin this report are listed below from most to leastfrequently cited in the program evaluations.
Raising Minority Academic Achievement xi
American Youth Policy Forum
� Program quality. Quality of implementation,leadership and accountability are three essentialcomponents of effective strategies that helpensure high program standards.
� Academically demanding curriculum. Allearly childhood programs included in this reportprovide preschool-aged children withchallenging educational activities that are alsodevelopmentally appropriate. Concern withchallenging curricula was equally apparent in K-12 programs.
� Professional development. Many of theevaluations report professional developmentactivities including staff orientation, summersessions, ongoing training during the school yearand/or when changes in curriculum or schoolstructure are implemented. Programs that relyon tutors or mentors offer them training andsupervision.
� Family involvement. Approximately 40% ofthe evaluations report activities geared towardimproving communication with families, orincreasing family involvement with theprograms. Although such efforts are concentratedon initiatives for young children, at least two highschool programs also include activities to promotegreater involvement of families.
� Reduced student-to-teacher ratios. Manyprograms showing academic gains for minoritystudents include a range of strategies to reducestudent-to-teacher ratios, including smallerclasses, small learning communities, teacheraides, team teaching, tutoring, mentoring andother ancillary supports.
� Individualized supports. For students who arestruggling academically, individualized supportmay be the difference between falling behindand moving ahead. Many programs utilizecommunity members, college students,employers and other groups as tutors andmentors to address the academic needs ofspecific students, or offer support, feedbackand encouragement.
� Extended learning time. Several programs uselonger school hours, extra school days,Saturday and summer courses to providestudents with more learning time.
� Community involvement. Several programsinvolve communities, both individuals livingclose to the program and the larger communitysuch as employers, museums and artists.Community participation takes many forms, fromreinforcing cultural traditions and knowledge, toadvocating for improved academic achievement ofminority students, to offering work-based learningopportunities for students.
� Long-term (multiple-year) supports for youth.Several programs encourage long-term, stablerelationships between participants andknowledgeable adults, from two to five years inmost cases.
� Scholarships and/or financial support.Several K-12 programs offer financial help tostudents who demonstrate high academicperformance.
Recommendations
Based on AYPF’s reflections on the reportedevaluations, following are actions policymakers,practitioners, researchers, parents and communitymembers can take to improve minority academicachievement.
1. Focus on Improved Academic Achievement andOutcomes for All.
� National leaders should continue to buildconsensus around acceptable achievementgains and require that these gains be shown forall student groups. National attention shouldfocus on achievement differences among thestates and ways to eliminate these differences.
� States should create benchmarks forimproving academic achievement for allstudent groups and provide resources forschool districts to attain those benchmarks.
Raising Minority Academic Achievementxii
American Youth Policy Forum
� States and school districts should support andmaintain high quality leadership and ensurethe adequate implementation of programs toenhance minority academic achievement.
� School districts and schools should expecthigh achievement from all students andprovide academically demanding curricula thatare meaningful and available across schools andgrade levels to bring all students to higher levelsof knowledge and achievement.
� States and localities should develop a multi-layered “check” of achievement using avariety of test measures, such as NAEP, state-mandated tests, Stanford-9 or ITBS; and alsouse indicators that provide a broad perspectiveabout students, such as classroom-basedassessments, attendance, behavior (disciplinaryincidents), course enrollment and passing rates,types of courses completed and graduationrates, among other measures.
� School districts and schools should provideprofessional development and support toensure that teachers (and other involved adults,as appropriate) have a deep understanding ofcurriculum, are familiar with innovativeinstructional methods, and have knowledge andinterpersonal competence with cultures otherthan their own.
� Schools should provide students, families andcommunities with specific information onwhat constitutes high academic standards andsupport their expectations for excellence in theeducational system.
� Families, youth advocates and communitiesshould hold schools accountable for highlevels of achievement for all students, reinforceacademic skills learned both at home and atschool, and ensure that every child has anadvocate outside of the school system orprogram.
2. States and Localities Should Provide theNecessary Supports to Ensure Student Success,including:
� Reduced student-to-teacher ratios. A range ofstrategies should be employed by schools andprograms to provide more personal teaching andlearning environments to foster higher levels ofacademic achievement. These strategies mayinclude smaller classes, small learningcommunities, teacher’s aides, team teaching,tutoring, mentoring and ancillary supports.
� Extended learning time. To accelerate andreinforce student learning, programs shouldencourage or require additional time andopportunities (such as longer days, weekendsand summer courses).
� Long-term supports. Programs shouldencourage student participation over anextended time (two years or more) to create andsustain stable relationships between participantsand knowledgeable adults, and to help youthmake successful transitions as they progress upthe educational ladder.
� Scholarships and/or financial support.Programs should provide financial support toyouth as needed to motivate participation andpersistence in quality educational experiences.Programs should also provide continualguidance to youth and monitor the impact of thefunds on student achievement, retention andgraduation.
3. Start Early, Don’t Stop.
� National leaders, states and school districtsshould prevent minority students from fallingbehind by expanding early childhood programsand providing continuous guidance and supportsthrough the elementary and high school years.
� National leaders, states and school districtsshould boost efforts to increase minoritystudents’ entry into and graduation frompostsecondary education.
Raising Minority Academic Achievement xiii
American Youth Policy Forum
A Note on Educational Research
The introduction to Section II, in which theEvaluation Summaries are presented, describes theobstacles and discoveries along the way to selectingthe 38 evaluations included in this report.Observations garnered from the work of creatingthis report include the following:
� Finding useful evaluations of educationalprograms is a difficult task, particularly whencriteria for assessing quality are used.
� The most useful research is based on simple butmethodologically sound design and providesinformation that is clear and easy to understand.
� Without rigorous research, programpractitioners may be perpetuating failing ormediocre interventions whose long-termconsequences are costly to young people andsociety.
� Disaggregating data for analysis is essential tohighlight areas that require improvement, aswell as areas of proven success. Programs thatclaim overall success without disaggregatingtheir data may be helping one group of studentswhile masking the low achievement of othergroups.
� Evaluations frequently “spin” results into“success” or hide less than successful results,rather than present a thoughtful and balancedanalysis of what worked and what did not.
Based on the experience with this and the previouscompendia, recommendations for improvingeducational research in the area of programevaluation include:
� A large-scale, national and comprehensiveeducational research agenda should bedeveloped to (a) determine which strategies andpolicies have resulted in the most benefit, forwhom, and at what cost, (b) provide guidanceto evaluators on what type of research would be
most useful to policymakers and practitionersand (c) provide guidance to practitioners onhow to initiate and use program evaluation.
� Public and private funding sources shouldrequire and support high quality programevaluations and utilize findings to improvepolicy and practice.
� Data should be disaggregated by race,ethnicity, limited English proficiency,disability status, gender and poverty level andbe made publicly accessible to researchers,educators, policymakers, families and the publicat large.
� Researchers should look into a range ofachievement indicators including, numbers ofstudents enrolled and dropping out, attendance,test scores, GPAs, graduation, suspensions,expulsions, and special education referrals.They should also translate their findings intolanguage that is accessible to policymakers,practitioners, educators, families and students,so that research findings can be translated intomore effective education policies and practices.
Conclusion
At almost every educational level, schools andcommunity-based programs across the country arereporting good news about the academicachievement of the minority students they areserving. Although gaps overall are still large, andmost reported achievement gains are small, theseprograms have proven there is every possibility ofsucceeding in raising achievement for all.Implementing the recommendations above couldhelp the nation move beyond a feeling ofhelplessness regarding achievement gaps byproviding specific information on program designand strategies about “what works” to enhanceacademic achievement. The larger challenge iscreating the national will to set in placemechanisms that will eliminate differences inacademic achievement among students correlatedwith race or ethnicity.


��������

Raising Minority Academic Achievement 1
American Youth Policy Forum
� �� ������������������
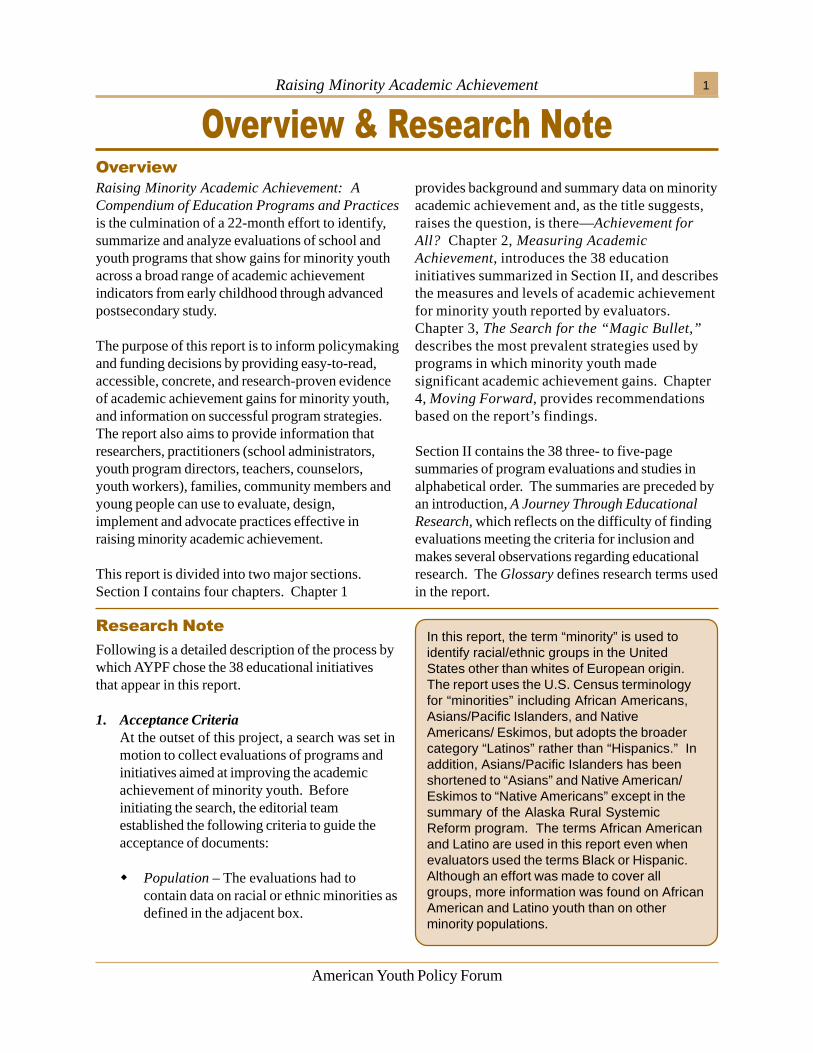
Raising Minority Academic Achievement: ACompendium of Education Programs and Practicesis the culmination of a 22-month effort to identify,summarize and analyze evaluations of school andyouth programs that show gains for minority youthacross a broad range of academic achievementindicators from early childhood through advancedpostsecondary study.
The purpose of this report is to inform policymakingand funding decisions by providing easy-to-read,accessible, concrete, and research-proven evidenceof academic achievement gains for minority youth,and information on successful program strategies.The report also aims to provide information thatresearchers, practitioners (school administrators,youth program directors, teachers, counselors,youth workers), families, community members andyoung people can use to evaluate, design,implement and advocate practices effective inraising minority academic achievement.
This report is divided into two major sections.Section I contains four chapters. Chapter 1
provides background and summary data on minorityacademic achievement and, as the title suggests,raises the question, is there—Achievement forAll? Chapter 2, Measuring AcademicAchievement, introduces the 38 educationinitiatives summarized in Section II, and describesthe measures and levels of academic achievementfor minority youth reported by evaluators.Chapter 3, The Search for the “Magic Bullet,”describes the most prevalent strategies used byprograms in which minority youth madesignificant academic achievement gains. Chapter4, Moving Forward, provides recommendationsbased on the report’s findings.
Section II contains the 38 three- to five-pagesummaries of program evaluations and studies inalphabetical order. The summaries are preceded byan introduction, A Journey Through EducationalResearch, which reflects on the difficulty of findingevaluations meeting the criteria for inclusion andmakes several observations regarding educationalresearch. The Glossary defines research terms usedin the report.
Following is a detailed description of the process bywhich AYPF chose the 38 educational initiativesthat appear in this report.
1. Acceptance CriteriaAt the outset of this project, a search was set inmotion to collect evaluations of programs andinitiatives aimed at improving the academicachievement of minority youth. Beforeinitiating the search, the editorial teamestablished the following criteria to guide theacceptance of documents:
� Population – The evaluations had tocontain data on racial or ethnic minorities asdefined in the adjacent box.
In this report, the term “minority” is used toidentify racial/ethnic groups in the UnitedStates other than whites of European origin.The report uses the U.S. Census terminologyfor “minorities” including African Americans,Asians/Pacific Islanders, and NativeAmericans/ Eskimos, but adopts the broadercategory “Latinos” rather than “Hispanics.” Inaddition, Asians/Pacific Islanders has beenshortened to “Asians” and Native American/Eskimos to “Native Americans” except in thesummary of the Alaska Rural SystemicReform program. The terms African Americanand Latino are used in this report even whenevaluators used the terms Black or Hispanic.Although an effort was made to cover allgroups, more information was found on AfricanAmerican and Latino youth than on otherminority populations.
�����������
� �� ���
Raising Minority Academic Achievement2
American Youth Policy Forum
� Measurements – The studies had to includemeasurable (quantitative) data related toacademic achievement of minorities.Preferably, they would present a set ofmeasures including: school attendance;grades; credits completed; test scores onstate mandated tests and/or nationalachievement tests (such as SAT, ACT,Achievement Tests and AdvancedPlacement Tests); high school graduation,college access, retention, and receipt ofundergraduate and graduate degrees.
� Methodology – Since expected findings werequantitative, the evaluations should adhere toaccepted standards for quantitative research.Therefore, the following requisites weredelineated: (a) research design – experimentalor quasi-experimental, pre- and post-treatment, and longitudinal studies; (b)research period – the study should cover atleast one school year; (c) researcher –preferably independent, that is, not directlyassociated with the program’s funding sourceor implementing organization to avoid bias; (d)sample – randomized sampling procedures,control and comparison groups should bematched to the treatment group bydemographics and level of academicachievement; and (e) the data should beanalyzed statistically with levels of significancenot to exceed 5% (for discussion about themethodology used in the evaluations, seeSection II, Introduction).
� Period – Preferably, programs and initiativesshould be current. For this reason, the searchwas limited to evaluations conducted withinthe past five years, with two exceptions:ongoing longitudinal studies, such as theAbecedarian report, and studies that are stillfrequently cited in discussions of initiatives,such as the Tennessee STAR research.
� Scope – In a departure from previous AYPFcompendia dedicated solely to successfulprograms and practices, we decided toinclude studies of large, well-known
programs and relevant federal initiatives thatfit these criteria, even if they had mixed ornegative findings. Another group ofacceptable studies were qualitative researchthat provided a voice to minorities on thefactors that they saw as influencing theiracademic success.
2. Search StrategiesThe search for evaluations included thefollowing sources:
� Large databases, including theEducational Resources InformationCenter (ERIC) and library collections.
� Internet search of over 50 associationsand research centers dedicated toeducation and minorities.
� Direct contact with program coordinators,policymakers, funding officers, andresearchers.
� Distribution of flyers requestingevaluations during forums, conferencesand similar events.
� A request for evaluations posted at theAYPF web site (http://www.aypf.org).
The search also relied on the expertise of theproject’s Advisory Board to indicate relevant reportsand researchers who specialized in this field.
3. The Review ProcessThe written summaries passed through a reviewprocess divided into four steps:
� Internal review – The editorial teamreviewed all summaries, making comments,and suggesting changes or documents to beeliminated.
� External review – The summaries approvedin this first review were then sent to anexternal reviewer to assess once more thequality of the research, propose
Raising Minority Academic Achievement 3
American Youth Policy Forum
improvements, and suggest furtherelimination of weaker documents. At thisstage, members of the Advisory Board alsohad the opportunity to read the summariesand make comments and suggestions.
� Researchers’ review – After another roundof editing, the summaries were provided toall the program evaluators and directors toreview for accuracy.
� Final review – The AYPF directors and theeditorial team read the summaries oncemore for final editing and approval.
Of the more than 200 documents reviewed, 38made the final cut. Although this report is acollaborative effort, it should be reiterated that thefinal decision on which summaries to include andthe opinions expressed in the report are the soleresponsibility of AYPF.
Raising Minority Academic Achievement4
American Youth Policy Forum
���������������� ����������� !Schooling is a top concern of many Americans,including the subject of presidential and legislativedebates. No matter how wide ranging the issue, theoverriding question is: “How can we raise academicachievement?”
This question has been approached with increasinggusto since the 1983 A Nation at Risk1 reportdecried “mediocrity” in education and hasintensified after results from the Third InternationalMathematics and Science Study (TIMSS) showedU.S. students trailing students from other developednations. The reaction has been a heightened interestin testing student achievement and a flurry ofeducation reforms, many of which have not beensubjected to strict analysis and rigorous evaluation.
We know from a number of indicators that progressis being made in advancing academic achievementin American schools. In 2000, Do You Know theGood News about American Education? reportedpositive information about our public schools,including decreases in high school dropout rates;increases in the number of students taking morechallenging courses; improvements in mathematicsand science achievement; increased SAT and ACTtest scores; more students taking AdvancedPlacement classes; more students going on to highereducation; and more Americans completing four-year college degrees.2
However, there is evidence that these gains are notevenly distributed across populations of students.Are higher average indicators hiding pockets of lowperformance or large gaps in achievement? Whilethis question is relevant to many categories ofstudents (e.g. across gender, socio-economic statusand disability status) the focus of this publication ison racial and ethnic minorities.
Are we keeping the promise?
In effect, A Nation at Risk set the bar of highachievement—“Our goal must be to develop thetalents of all to their fullest.” It also provided the
caveat: “that a public commitment to excellenceand educational reform must [not] be made at theexpense of a strong public commitment to theequitable treatment of our diverse population.”Finally, it honed in on the repercussions of failure toinclude all young people in these elevatedexpectations. The concern with excellence wasmaintained in the educational legislation thatfollowed, including the Goals 2000: EducateAmerican Act, the Improving America’s SchoolsAct and others. States have also enacted legislationrequiring high standards for all students and moreaccountability for public schools.
The question is, are we keeping the promise?—apromise echoed over and again in challenges to“leave no child behind” and reflected in thecollective voice of many education leaders thatminority academic achievement may be the mostimportant educational and social issue of thecentury.3
Despite the encouraging statistics on educationalachievement for young people in the aggregate,there is no denying that, for the majority of AfricanAmerican, Latino and Native American youth in theUnited States, the educational system is not fulfillingits promise. In fact, when data is disaggregated byrace or ethnicity, disparities appear. Assessments ofkindergarteners already show that African Americanand Latino children are over-represented in thelowest quartiles of achievement tests.4
As minority children move through their schoolyears, the differences persist. For the past 30 years,minorities (except for Asians) have scoredconsistently lower than whites on all NationalAssessment of Educational Progress (NAEP) tests.5
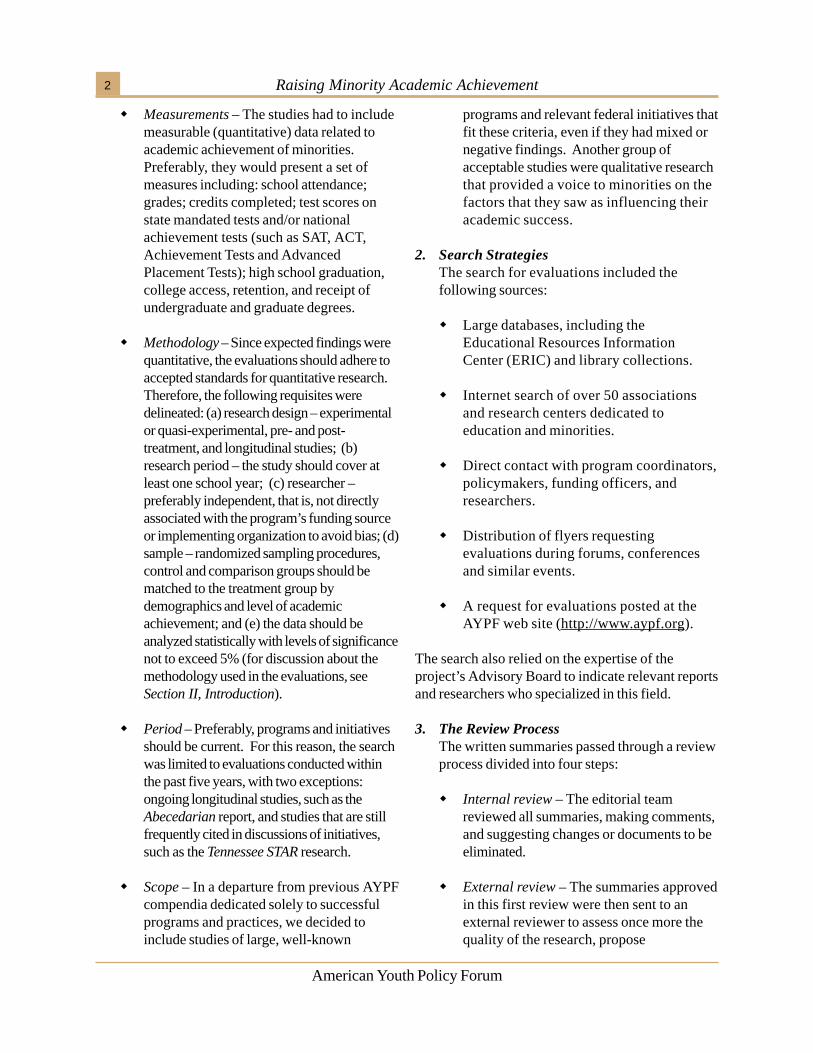
For instance, the average 1975 NAEP readingscores for 9-year-old African American and Latinostudents were about 30 points lower than theaverage scores for white students. After someimprovement in the early 1980s, the gap in 1996went increased again, as shown in Figure 1. For 17-year-old students, the 1980s represented a period of
Raising Minority Academic Achievement 5
American Youth Policy Forum
Fig. 1 - Average NAEP reading scoresof 9-year-old students
by race/ethnicity: 1975-1996
Source: Adapted from U.S. Department of Education,National Center for Education Statistics, The Condition ofEducation 2001, NCES 2001–072, Washington, DC: U.S.
Fig. 2 - Average NAEP reading scoresof 17-year-old students byrace/ethnicity: 1975-1996
Source: Adapted from U.S. Department of Education,National Center for Education Statistics, The Condition ofEducation 2001, NCES 2001–072, Washington, DC: U.S.
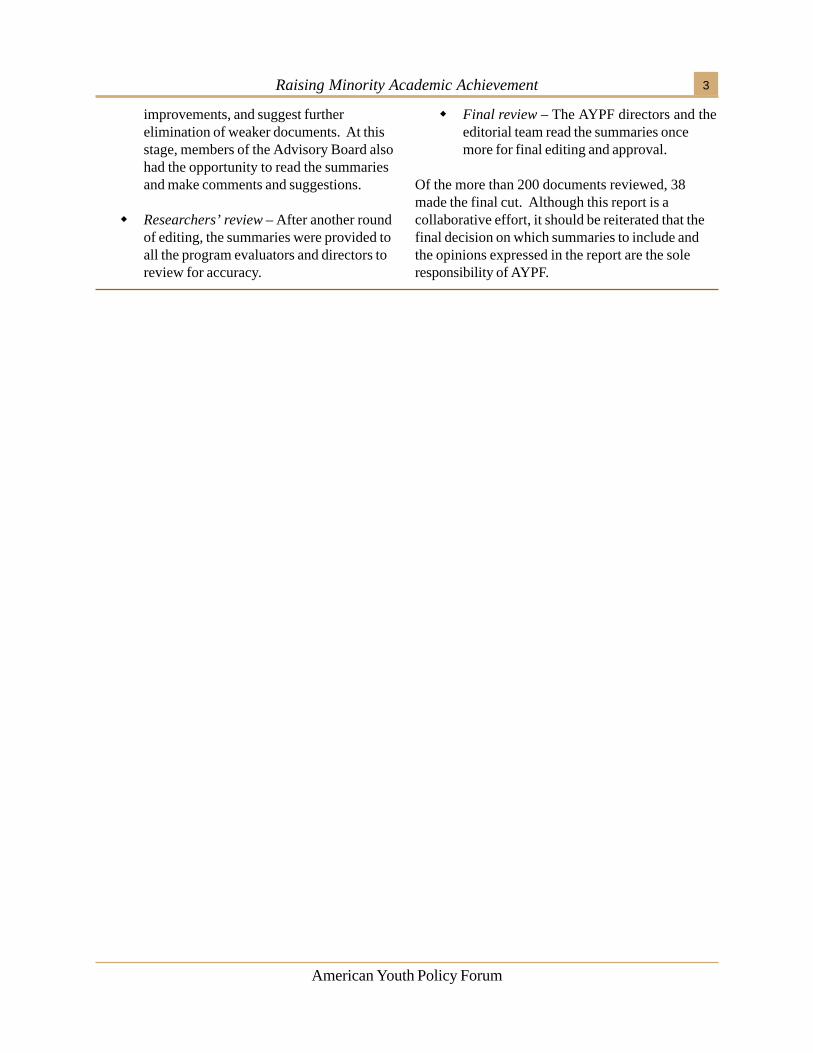
improvement, with gaps in average scores beingreduced by 40 points for African Americans andmore than 20 points for Latinos, but again falling,although less sharply, in the 1990s (Figure 2).
It is true though that more Americans are graduatingfrom high school now than 30 years ago, and thegraduation gap between white and minority studentshas narrowed significantly. In 1971, 82% of whitesin their mid-twenties had graduated from highschool compared to 59% of African Americans and48% of Latinos. In 1999, white and AfricanAmerican high school graduation rates were muchcloser at 93% and 89%, respectively. However, theLatino high school graduation rate still lags farbehind both white and African American highschool graduation rates at 62%.6
Similarly, SAT scores reveal an increase in minorityacademic achievement in recent years, yet a gapremains. The gap is largest for African Americanstudents, whose mean scores on the math andverbal sections of the SAT are approximately 100points lower than the mean score of white students.Latino and Native American students have less of agap, between 45 and 75 points lower than the mean
score of white students. Asian students outscorewhite students by 35 points on the math test, buthave a mean that is about 30 points lower on theverbal test.7
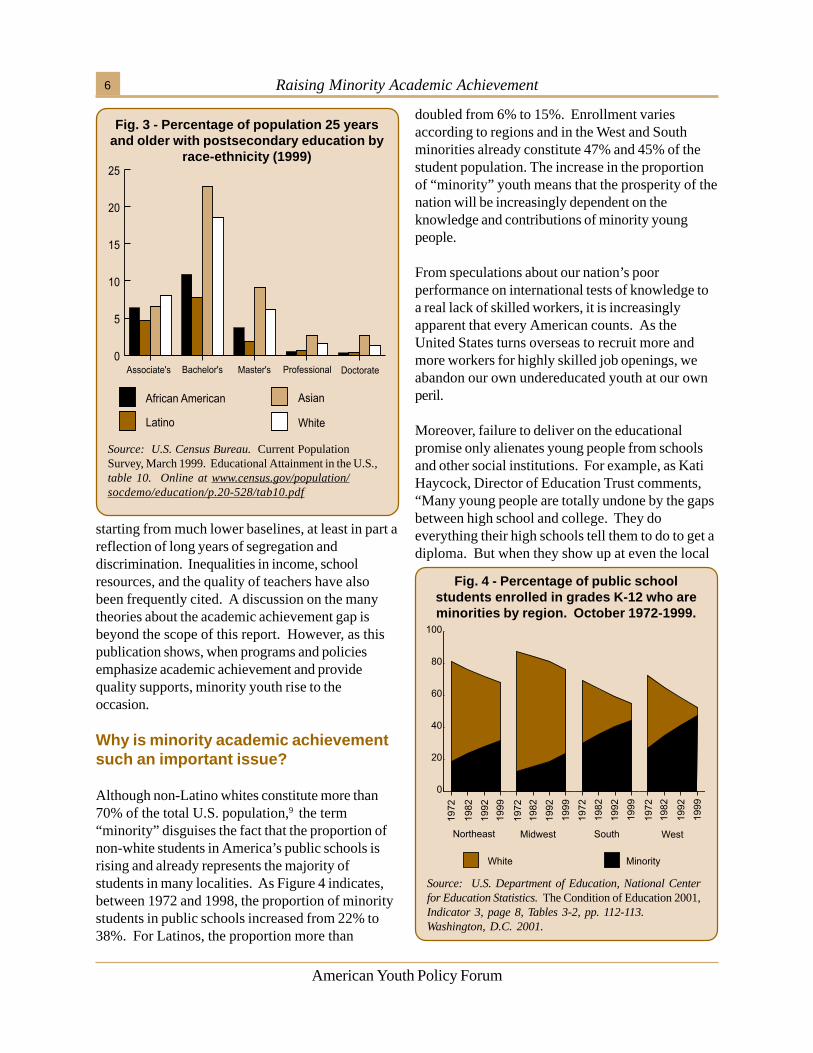
Although college access for minority students hasincreased in the past 30 years, an achievement gapstill remains. Between 1971 and 1999, thepercentage of white high school graduates whocompleted a bachelor’s degree or higher increased13%, from 23.1% to 36.1%. In this same period,the increase was only 5% for African Americans,from 11.5% to 16.9%, and 4% for Latinos, from10.5% to 14.4%.8 As Figure 3 indicates, in 1999whites were twice as likely to obtain a bachelor’sdegree than their African American and Latinopeers. Asians out-performed all other subgroups inthe completion of postsecondary degrees, except forthe associate’s degree.
In summary, minority youth have showed steadygains in many academic indicators in the pastdecades, but they still have a long way to go toreach parity with their white peers. Explanationsabout the reasons for this discrepancy are many andagreements are few. On average, minorities are
Raising Minority Academic Achievement6
American Youth Policy Forum
Fig. 3 - Percentage of population 25 yearsand older with postsecondary education by
race-ethnicity (1999)
Source: U.S. Census Bureau. Current PopulationSurvey, March 1999. Educational Attainment in the U.S.,table 10. Online at www.census.gov/population/socdemo/education/p.20-528/tab10.pdf
starting from much lower baselines, at least in part areflection of long years of segregation anddiscrimination. Inequalities in income, schoolresources, and the quality of teachers have alsobeen frequently cited. A discussion on the manytheories about the academic achievement gap isbeyond the scope of this report. However, as thispublication shows, when programs and policiesemphasize academic achievement and providequality supports, minority youth rise to theoccasion.
Why is minority academic achievementsuch an important issue?
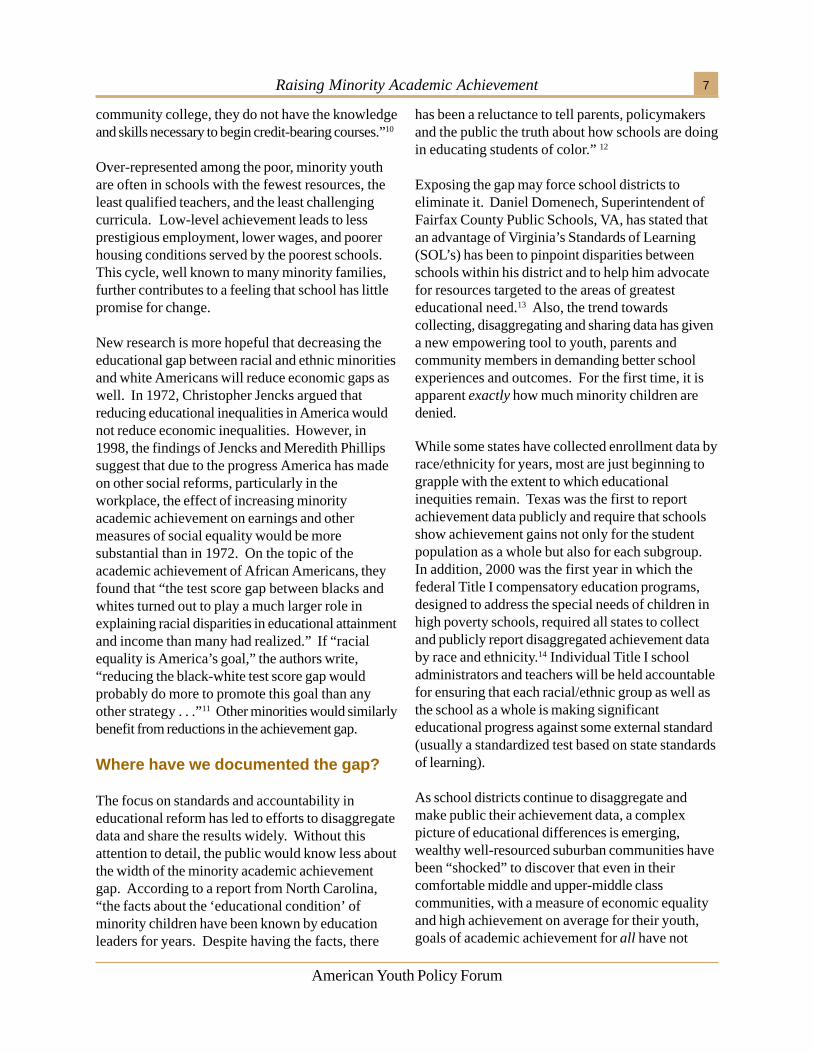
Although non-Latino whites constitute more than70% of the total U.S. population,9 the term“minority” disguises the fact that the proportion ofnon-white students in America’s public schools isrising and already represents the majority ofstudents in many localities. As Figure 4 indicates,between 1972 and 1998, the proportion of minoritystudents in public schools increased from 22% to38%. For Latinos, the proportion more than
doubled from 6% to 15%. Enrollment variesaccording to regions and in the West and Southminorities already constitute 47% and 45% of thestudent population. The increase in the proportionof “minority” youth means that the prosperity of thenation will be increasingly dependent on theknowledge and contributions of minority youngpeople.
From speculations about our nation’s poorperformance on international tests of knowledge toa real lack of skilled workers, it is increasinglyapparent that every American counts. As theUnited States turns overseas to recruit more andmore workers for highly skilled job openings, weabandon our own undereducated youth at our ownperil.
Moreover, failure to deliver on the educationalpromise only alienates young people from schoolsand other social institutions. For example, as KatiHaycock, Director of Education Trust comments,“Many young people are totally undone by the gapsbetween high school and college. They doeverything their high schools tell them to do to get adiploma. But when they show up at even the local
Fig. 4 - Percentage of public schoolstudents enrolled in grades K-12 who areminorities by region. October 1972-1999.
Source: U.S. Department of Education, National Centerfor Education Statistics. The Condition of Education 2001,Indicator 3, page 8, Tables 3-2, pp. 112-113.Washington, D.C. 2001.
Raising Minority Academic Achievement 7
American Youth Policy Forum
community college, they do not have the knowledgeand skills necessary to begin credit-bearing courses.”10
Over-represented among the poor, minority youthare often in schools with the fewest resources, theleast qualified teachers, and the least challengingcurricula. Low-level achievement leads to lessprestigious employment, lower wages, and poorerhousing conditions served by the poorest schools.This cycle, well known to many minority families,further contributes to a feeling that school has littlepromise for change.
New research is more hopeful that decreasing theeducational gap between racial and ethnic minoritiesand white Americans will reduce economic gaps aswell. In 1972, Christopher Jencks argued thatreducing educational inequalities in America wouldnot reduce economic inequalities. However, in1998, the findings of Jencks and Meredith Phillipssuggest that due to the progress America has madeon other social reforms, particularly in theworkplace, the effect of increasing minorityacademic achievement on earnings and othermeasures of social equality would be moresubstantial than in 1972. On the topic of theacademic achievement of African Americans, theyfound that “the test score gap between blacks andwhites turned out to play a much larger role inexplaining racial disparities in educational attainmentand income than many had realized.” If “racialequality is America’s goal,” the authors write,“reducing the black-white test score gap wouldprobably do more to promote this goal than anyother strategy . . .”11 Other minorities would similarlybenefit from reductions in the achievement gap.
Where have we documented the gap?
The focus on standards and accountability ineducational reform has led to efforts to disaggregatedata and share the results widely. Without thisattention to detail, the public would know less aboutthe width of the minority academic achievementgap. According to a report from North Carolina,“the facts about the ‘educational condition’ ofminority children have been known by educationleaders for years. Despite having the facts, there
has been a reluctance to tell parents, policymakersand the public the truth about how schools are doingin educating students of color.” 12
Exposing the gap may force school districts toeliminate it. Daniel Domenech, Superintendent ofFairfax County Public Schools, VA, has stated thatan advantage of Virginia’s Standards of Learning(SOL’s) has been to pinpoint disparities betweenschools within his district and to help him advocatefor resources targeted to the areas of greatesteducational need.13 Also, the trend towardscollecting, disaggregating and sharing data has givena new empowering tool to youth, parents andcommunity members in demanding better schoolexperiences and outcomes. For the first time, it isapparent exactly how much minority children aredenied.
While some states have collected enrollment data byrace/ethnicity for years, most are just beginning tograpple with the extent to which educationalinequities remain. Texas was the first to reportachievement data publicly and require that schoolsshow achievement gains not only for the studentpopulation as a whole but also for each subgroup.In addition, 2000 was the first year in which thefederal Title I compensatory education programs,designed to address the special needs of children inhigh poverty schools, required all states to collectand publicly report disaggregated achievement databy race and ethnicity.14 Individual Title I schooladministrators and teachers will be held accountablefor ensuring that each racial/ethnic group as well asthe school as a whole is making significanteducational progress against some external standard(usually a standardized test based on state standardsof learning).
As school districts continue to disaggregate andmake public their achievement data, a complexpicture of educational differences is emerging,wealthy well-resourced suburban communities havebeen “shocked” to discover that even in theircomfortable middle and upper-middle classcommunities, with a measure of economic equalityand high achievement on average for their youth,goals of academic achievement for all have not
Raising Minority Academic Achievement8
American Youth Policy Forum
Raising Academic Achievement vs.Reducing the “Achievement Gap”
Much of the discussion on raising the academicachievement of minority students focuses onreducing the “achievement gap” between whiteand Asian students, on one hand, and AfricanAmerican, Latino and Native American students,on the other. For non-Asian minority students, apolicy that focuses solely on closing theachievement gap has several pitfalls:
First, gaps may close because the performanceof higher achievers falls, and equity is achievedthrough the lowest common denominator.
Second, gaps may stay the same because theperformance of all groups increases. Or, gapsmay also increase, because even though allgroups perform better, the program has astronger impact on high achieving groups. Forexample, the GE Fund College Bound programwas successful at raising the college enrollmentof all students, but white students experiencedgreater gains. Though this was a positiveoutcome, it actually increased the collegeenrollment gap between white and AfricanAmerican participants.
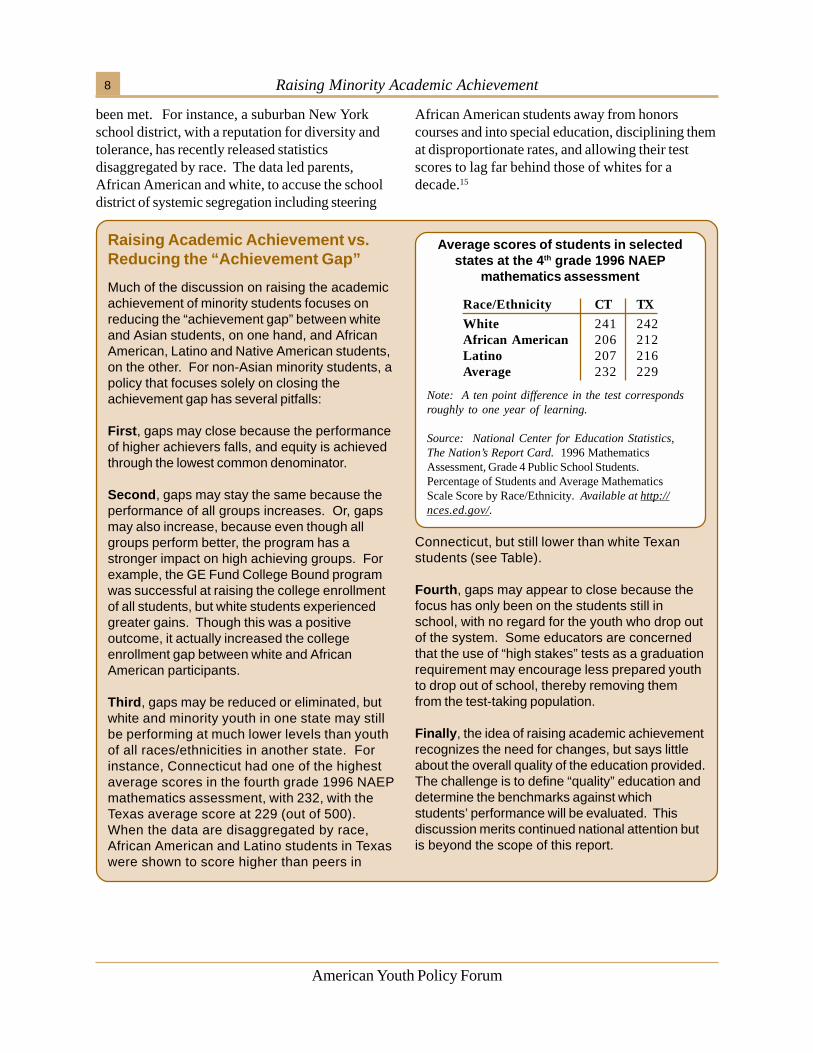
Third, gaps may be reduced or eliminated, butwhite and minority youth in one state may stillbe performing at much lower levels than youthof all races/ethnicities in another state. Forinstance, Connecticut had one of the highestaverage scores in the fourth grade 1996 NAEPmathematics assessment, with 232, with theTexas average score at 229 (out of 500).When the data are disaggregated by race,African American and Latino students in Texaswere shown to score higher than peers in
Connecticut, but still lower than white Texanstudents (see Table).
Fourth, gaps may appear to close because thefocus has only been on the students still inschool, with no regard for the youth who drop outof the system. Some educators are concernedthat the use of “high stakes” tests as a graduationrequirement may encourage less prepared youthto drop out of school, thereby removing themfrom the test-taking population.
Finally, the idea of raising academic achievementrecognizes the need for changes, but says littleabout the overall quality of the education provided.The challenge is to define “quality” education anddetermine the benchmarks against whichstudents’ performance will be evaluated. Thisdiscussion merits continued national attention butis beyond the scope of this report.
Average scores of students in selectedstates at the 4th grade 1996 NAEP
mathematics assessment
Note: A ten point difference in the test correspondsroughly to one year of learning.
Source: National Center for Education Statistics,The Nation’s Report Card. 1996 MathematicsAssessment, Grade 4 Public School Students.Percentage of Students and Average MathematicsScale Score by Race/Ethnicity. Available at http://nces.ed.gov/.
Race/Ethnicity CT TX
White 241 242African American 206 212Latino 207 216Average 232 229
been met. For instance, a suburban New Yorkschool district, with a reputation for diversity andtolerance, has recently released statisticsdisaggregated by race. The data led parents,African American and white, to accuse the schooldistrict of systemic segregation including steering
African American students away from honorscourses and into special education, disciplining themat disproportionate rates, and allowing their testscores to lag far behind those of whites for adecade.15
Raising Minority Academic Achievement 9
American Youth Policy Forum
��������"���#������$�������
���� �����This chapter addresses the question of “what ishappening in programs and initiatives that aim toimprove the achievement of minority youth?” Wediscuss the findings of the 38 evaluations chosen forthis report, taking a journey through the schoolexperience of minority youth, from early childhoodto postsecondary education. The report relies onmeasures and indicators imposed by states, schooldistricts or researchers. Their findings are based ondifferent populations and varying programobjectives and strategies. Recognizing theselimitations, no attempt is made to create a commondenominator to define “success” or to compareprograms among themselves.
Early Childhood Programs
OverviewThis report includes five summaries of four earlychildhood programs. The Abecedarian Project andHigh/Scope Perry Preschool were experimentalpreschools funded in the 1960s and 1970s to servelow-income, African American children. Both areno longer in operation, although the High/Scopecurriculum is used in preschools around the country.Child Parent Centers (CPC) is an ongoing Title I-funded program with multiple sites in high-povertyChicago neighborhoods that are not served by HeadStart. Head Start is a federal program established in1964 as part of the federal government’s “War onPoverty.” It provides matching funds to localitiesfor comprehensive programs that offer low-incomechildren, ages 3 to 5, with supports and stimuli toimprove their chances of academic success.
All summaries describe longitudinal studies ofparticipants. The evaluations of the AbecedarianProject, High/Scope and CPC compare programparticipants to matched control groups, followingthe two groups through more than 20 years. Thesmall sample sizes (except for CPC with a sample
size of 1500), determined in part by the longitudinalnature of the studies, leave the conclusions open toquestions. While it is difficult to identify preciselywhat factors influence an individual’s behavior over20 years, the duration of these evaluations offers arare view of the potential impact of earlyinterventions on participants’ lives. The two HeadStart evaluations review ten years of nationaldatabases. The 1995 evaluation compares theimpact of the program for African American andwhite children, and the 1999 evaluation comparesLatino and white children.
AnalysisFindings are quite similar in all five early childhoodevaluations. When compared to control groups,children who attended childhood developmentprograms are more likely to remain in school,complete more years of education, and are lesslikely to attend special education. AttendingAbecedarian, for instance, cut in half the likelihoodof participants receiving special education. Lowergrade retention rates are cited in CPC and HeadStart. The 1995 Head Start evaluation refers to anearly 50% reduction in the likelihood that aprogram participant will repeat a grade in elementaryschool. Participation in Head Start was found tocut between one-quarter and one-third of theLatino-white score gap on the vocabulary, math andreading sections of the Peabody tests.
This improved schooling may partially explain thepositive social and work outcomes for programparticipants. High/Scope and CPC evaluationsreport a decline in arrests for youth who attendedearly childhood programs, while High/Scope andAbecedarian report that participants, now in theirtwenties, have more skilled, better paid jobs. (CPCreports that men benefit more than women.)According to the CPC evaluation, longer attendanceproduces stronger results.
Raising Minority Academic Achievement10
American Youth Policy Forum
In contrast to long-term gains reported in the High/Scope and Abecedarian studies, the 1995 HeadStart evaluation found a decline in the academicgains of African American children after leaving theprogram. The benefits gained from Head Startwere gradually lost and, by age ten, AfricanAmerican participants retained no gains, while whiteparticipants still retained an overall gain of fivepercentage points. The evaluators hypothesize thatdifferences in the two sub-groups of children explainthe loss of gains, since African American children inHead Start are more likely to be poor, live in poorerneighborhoods and attend schools with fewerresources than their white peers.
Critics contend that evaluations of early childhoodprograms have biased samples, since parents whotake time and effort to enroll their children in theseprograms are already more involved than parents ofchildren outside the programs. This may be true,although it is a leap to imagine that all children whoare not in early childhood programs haveuninvolved or uninterested parents. Many reasonsaffect a parent’s decision not to use an earlychildhood program, from lack of programs neartheir neighborhoods to cultural tradition. As the1999 Head Start evaluation found, Puerto Ricanchildren who remained home did better in schoolthan those who went to Head Start or otherpreschools. Remaining home in this case was notan indication of inadequate parental motivation orinvolvement with the child. True randomizedcontrol-treatment groups bypass this discussion, butsuch groups are difficult to define in real life. It isalso true that early childhood programs can only doso much for an individual’s life and that many otherfactors will contribute to one’s success or failure 20years later.
Even with such caveats, the evaluations of earlychildhood programs show a strong pattern: suchprograms increase the chances for low-incomechildren, including minority children, to do well inschool and in life. In education, as in the healthcare field, investing in prevention is a cost-effectivestrategy. However, as no health care system canrely solely on preventive care, no education systemcan be satisfied without good K-12 schools to
maintain and expand the educational gains of theearly years.
Elementary Through Middle SchoolPrograms
OverviewThe majority of evaluations focused on the earlyelementary years, with only a few presenting datafor grades six to eight. After-school programs wereincluded in the search for evaluations, but for mostof them, academic achievement was only a minorfocus of a broader social mission, mainly to offerchildren a safe and supportive environment. Twoafter-school programs had evaluations with enoughdata on academic achievement and strong enoughmethodology to justify their inclusion in this report:Boys and Girls Clubs of America (B&GCA) andSacramento START.
B&GCA is a private, not-for-profit organization withclubs nationwide. The evaluation focused on anacademic enrichment program offered to school-aged children who live in public housing projects.The program showed statistically significantincreases on a variety of measures for programparticipants. During the 18-month evaluation,participants’ school attendance rates nearly doubledand their average grades increased from three to sixpoints in different subject areas, while thecomparison groups showed a decline in bothmeasures in the same period. Sacramento START isan after-school enrichment program for elementaryschool children in low-income neighborhoodsfinanced by the City of Sacramento, CA. Theevaluation used school district data and matchedcomparison groups. It showed some improvementsfor all students, with striking improvements in testscores for students who had started the programwith the lowest grades.
Among the school programs included in thiscategory, Calvert is a traditional, highly structuredelementary school program transplanted from apredominantly white, middle-class private schoolinto an all-African American low-income publicschool in Baltimore City. The evaluation uses a pre/post-treatment design with three cohorts. Before its
Raising Minority Academic Achievement 11
American Youth Policy Forum
implementation, no first grade in the public schoolhad scored above the second quartile on theMaryland state tests. Three years later, thepercentage of students scoring above the secondquartile was 42%. For third graders, only 6% hadscored in the third quartile before the program; oneyear later, 38% of the students had reached thisquartile. The program’s 97% attendance rate wasamong the highest in the city.
The Chicago Arts Partnership in Education(CAPE) proposes an innovative approach to learningthat involves arts in all subjects, taught by teams ofteachers and artists. The program targets low-income K-12 schools with large numbers of AfricanAmerican and Latino students. The evaluatorsfound a 50% increase in sixth grade scores on theIowa Test of Basic Skills (ITBS) and nearly a two-year increase in the reading level of ninth graders, asmeasured by the Test of Achievement andProficiency (TAP) for CAPE students between1992-1998.
KIPP Academies are charter schools that serve low-income African American and Latino students fromgrades five to nine. The academies offer acurriculum that focuses on “high standards” andcollege preparation. Within two years, the passingrates on the Texas Assessment of Academic Skills(TAAS) for KIPP students in Houston, TX,increased from 33% in mathematics and 63% inreading to approximately 100%. The KIPPAcademy in the Bronx, New York, has beenfrequently rated the highest performing middleschool in the area in terms of average attendance,reading and mathematics.
Success for All is a reading program that hasbecome one of the largest elementary educationinitiatives in the country. It uses small readinggroups based on skill level rather than age, one-on-one tutoring, and a structured school day. Of themany evaluations of Success for All, this reportincludes a recent review of the TAAS database.Project GRAD is a comprehensive K-12 school-wide reform that uses a mix of strategies, includingSuccess for All and others. The evaluation focuseson Texas schools and compares test scores for
Project GRAD students with students in matchedschools. Urban Elementary Schools reports on nineschools across the country that are increasing thescores or passing rates of minority students ondifferent tests, including the TAAS.
All three evaluations show increases in thepercentage of students passing the TAAS. Successfor All students show higher rates of improvementin comparison to students statewide, and a three-fourths reduction (from 25% to 6%) in the TAASscore gap between African American and whitestudents from 1995 to 1998 (statewide, the gap wasreduced from 25% to 14%). Project GRADdoubled the TAAS passing rates, particularly inmath. In addition, it reduced disciplinary referralsby 74%. Urban Elementary Schools describes aschool in San Antonio (Baskin Elementary) thateliminated the gap in passing rates for AfricanAmericans and Latinos within four years. Anotherschool in Houston (Lora B. Peck Elementary)raised passing rates for Latino students on thewriting section of TAAS from zero to 90% in thesame period.
AnalysisUnlike the early childhood programs that followstudents to the next level of schooling, theelementary through middle school evaluationsappear more compartmentalized, providinginformation only within the elementary throughmiddle school boundaries. The school adopting theCalvert Program is showing incrementalimprovements in the Maryland state test, althoughscores are still below the state’s satisfactory levels inall grades and subjects.16 No research on Successfor All was found that follows students beyondelementary school grades. Therefore, it cannot bedetermined whether improvement in these testscores is reflected in better performance at the highschool level.
In most cases, improvements appear quite modestwhile the disparities in achievement are striking. Texasis probably the only place where achievement gapsbetween minorities and white students are halved orcut even deeper, but these students are being measuredon passing rates on a minimum competency test.
Raising Minority Academic Achievement12
American Youth Policy Forum
As the report indicates, many schools are workinghard to improve achievement indicators for allstudents and not only a privileged few. The schoolsthat are improving their students’ academicperformance are starting from extremely low levelsand through incremental gains are approaching apoint closer to the middle. How these programsaffect minority students who are already beyond themiddle point is not clear. This observation is not acriticism of those schools or their districts andstates. On the contrary, these schools deservekudos and support for making a concerted effort toraise the achievement of their students. Moving thestudents from unsatisfactory levels to basic is agood start. However, the ultimate objective must beto bring all students, including minority students tomuch higher levels of knowledge.
District or State Initiatives (K-12)
OverviewAmong the large initiatives covered in this report arethree statewide projects on reduced class sizes(Project STAR in Tennessee, Project SAGE inWisconsin and Class Size Reduction in California);the evaluation of three citywide experiments withvouchers (Voucher Schools); a statewide initiativefor Eskimo and Native American students in AlaskaOnward to Excellence/Alaska Rural SystemicInitiative; a review of the statewide accountabilityreform in Texas, focusing on four school districts(Texas School Reform); a compilation of data on 48urban public school systems nationwide (CitySchools); and a district wide initiative to improvethe academic achievement of African Americanstudents in North Carolina (Chapel Hill-CarrboroCity Schools).
Project STAR was a groundbreaking study on theimpact of reduced class size on academicachievement, mandated by the Tennessee legislaturein 1985. The evaluation involved 7,500 children ingrades 1 to 3 and compared children taught inclasses of 17 students per teacher with children inlarger classes with and without a teacher’s aide.Evaluators found that students in small classes did
better than both control groups on all tests. Theeffect size of small classes on African Americanstudents was double that of white students. Afollow-up study of Project STAR followedparticipants from grades 4 through 6 and reportedongoing, albeit small gains (effect sizes of 0.2 orless) for students who were taught in small classes.(See Glossary for an explanation of “effect size.”)
A decade later, Wisconsin implemented the SAGEproject, a pilot study involving more than 3,000kindergartners and first graders statewide. Inaddition to using a control group in regularclassrooms (30 students), the evaluation alsocompared different strategies to reduce student-to-teacher ratio, small classes being one of them. Aswith the Project STAR, evaluators found increasesin test scores for all students, particularly AfricanAmerican students in the first year of the project.In the second year though, the score gap betweenAfrican American and white students had increasedagain. Different from Project STAR, the SAGEevaluation found that score gains were not limited tosmall classes. Other strategies that reduced student-to-teacher ratio, such as team teaching or floatingteachers, were equally effective.
Unlike Wisconsin and Tennessee, California decidedto forgo a pilot program; instead, launching amassive, statewide Class Size Reduction (CSR)initiative that affected approximately 1.8 millionstudents by its third school year of implementationin 1998-99. The state funded the initiative on a perpupil basis only after small classes had beenimplemented. Therefore, in the first years ofimplementation, schools that did not have thefacilities to create small classes—often high-povertyschools with large populations of minoritystudents—received an average of $100 less perstudent than wealthier, predominantly white schools.When these schools did create new classrooms,they often did so at the expense of existing facilitiesused for special education, child-care, music, art,computers and libraries. After three years, theevaluators noted small (but statistically significant)achievement gains, with no differential impact forminorities.
Raising Minority Academic Achievement 13
American Youth Policy Forum
School Vouchers analyzes three privately fundedexperiments to test the impact of vouchers onstudents in urban school districts with highpercentages of minority youth (Dayton, OH, NewYork City and Washington, D.C.). The vouchers,awarded by a lottery system, covered only part ofthe private school tuition with the recipients’families paying for the remaining tuition costs.African Americans constituted about 70% of theapproximately 3000 students who received vouchersin the three experiments. Using the CaliforniaAchievement Test (CAT) as the measure of studentperformance, the evaluators found a reduction forvoucher recipients of approximately one-third of thetest score gap between African American and whitestudents. There was no positive or negative effectof statistical significance for any other ethnic groupin the study. When controlling for familybackground, the overall difference between voucherand non-voucher students was not significant inDayton and New York City,17 but was significant atthe .01 level in D.C.
The Alaska Onward to Excellence/Alaska RuralSystemic Initiative began a decade ago through apartnership between public schools, universities, andEskimo and Native American communities in ruralAlaska. Most participant districts involve smallfishing villages with difficult access. The projectincorporated the cultural traditions of the nativepopulation with an academically demandingcurriculum. One of the evaluations compares thescores of students in a single project district on anumber of standardized tests (ITBS, CAT, ACT) toscores statewide, where white students are themajority. A ten-year trend analysis verified a steadyincrease in all standardized test scores forparticipating students. In the ACT test, forinstance, the district experienced an increase in thenumber of seniors taking the test and a reduction ofabout 14% in the score gap between local seniorsand the state average. The percentage of projectstudents attending college rose from 10% in 1988-89 to 50% in 1996-97.
Texas requires that a specific percentage of studentsin each school pass the state assessment in reading,
writing and mathematics skills. Schools that do notattain this percentage risk losing their stateaccreditation. As part of the state reform, anemphasis has been given to monitoring theperformance of minority students. The TexasSchool Reform summary covers four school districtswith diverse populations. TAAS passing ratesincreased for all students in the four districts, butthe increase for African Americans and Latinos wassteeper. For instance, in the Aldine district, with83% minority students, between 1994 and 1999,passing rates for African Americans almost doubled(from 36% to 73%) and the rate for Latinosincreased by 63% (from 49% to 80%). In the sameperiod, white students’ passing rates increased by29%, from 68% to 88%. Similar findings areshown for the other districts. Evaluators did nothighlight strategies developed by the districts,emphasizing the role of the state accountabilitysystem as the catalyst for change.
The City Schools compilation cites a number ofurban school districts in Texas and elsewhere thathave improved academic indicators for minoritystudents. These indicators range from movingstudents up to basic levels of performance (such aspassing the TAAS), to earning higher-level diplomas,to reading at or above grade level. El Paso cut byhalf the gap in TAAS passing rates between AfricanAmerican and white students and Fort Worthreduced the passing rate gap between Latino andwhite students by 42%. The El Paso school did notadopt any special policy, while the Fort Worthschool adopted a series of strategies with emphasison professional development and support.Memphis schools doubled the number of AfricanAmerican students earning honors diplomas afterthe district eliminated lower level courses in thecurricula. Boston schools increased the percentageof African American students scoring at the basiclevels in the Stanford-9 tests after raising academicstandards became a priority for the district in everysubject and every grade. Charlotte schools alsoincreased the percentage of African Americanstudents reading at or above grade level after thedistrict adopted achievement goals to reducedisparities in academic achievement.
Raising Minority Academic Achievement14
American Youth Policy Forum
Recognizing that their African American studentswere lagging academically, Chapel Hill-CarrboroCity Schools (CHCCS) formed a “Blue RibbonPanel” to analyze the problem and proposerecommendations. Composed of schooladministrators, teachers, parents, and students, thepanel presented a multifaceted plan thatincorporated nationally known programs likeReading Recovery and AVID, and homegrownsolutions like “Sister-to-Sister” (a mentoringprogram that pairs minority women in the nearbymedical school with African American female highschool students). The results for the AfricanAmerican students were mixed, with largeincreases in the mathematics scores, but lowerincreases, and even some decreases, in thewriting assessments. After one year, theacademic gap between African American andwhite students was still noteworthy. For instance,93% of the white tenth graders achievedproficient reading scores on the state test,compared to only 43% of their African Americanpeers. However, the reform promoted a four-foldincrease in the percentage of African Americanstudents in Gifted and Talented programs (from2% to 8%).
AnalysisAs was found in the previous category, the dataindicate that minority students start from a positionof serious academic disadvantage and must walk along path before they can reach basic levels ofcompetency. The accountability movement haspushed these differences to the front stage. Thecondition of public schools, particularly fundingdifferentials that lead to large class sizes, lowteacher pay, lack of support or unprepared teachersmay explain some of the large gaps betweenstudents at the high end (generally white middleclass) and the low end (generally low-incomeminority) of the achievement spectrum.
It is also possible that even at very early ages,society creates stereotypes about students who cansucceed and those who cannot, and futureinteractions in school will be based upon these
stereotypes. As indicated in Chicanos in HigherEducation, which reports on interviews with 50Mexican American professionals with MD, PhD orJD degrees, poor minority students do not fit theidealized image of the successful, college-boundstudent. Teachers and counselors often tell thesestudents that they cannot succeed and should nottake challenging courses or apply to challengingschools. It took a highly focused and publicizedreform for Chapel Hill teachers to find a “newgroup” of African American students able to attendGifted and Talented classes, when these studentshad probably been ready for such a program formany years. Teacher preparatory schools shouldseriously examine their role in helping teachers toovercome such stereotyping behavior.
The fact that schools across the country are raisingthe scores of students, including minority students,on different tests is commendable. It brings thehope that someday achievement gaps based on raceor ethnicity will be only a memory. However, infairness to the children, a note of caution must besounded. By relying solely on test scores, theseevaluations and reports miss other indicators thatprovide important information on academicachievement, including: dropout, expulsion andretention rates; referral to special education; andcurriculum changes that may be occurring due to anemphasis on tests, such as the elimination of “non-testable” subjects (like music and art), or anemphasis on “testable” subjects at the expense ofbroader content. Moreover, since no follow-up ofgraduates is included (except for the Alaska reform),nothing is known about what happens with studentsfrom these districts or states after they leave K-12schools. Texas, for instance, despite its successwith TAAS, ranks 34th among 50 states and theDistrict of Columbia for the percentage of graduateswho go immediately on to two- or four-yearcolleges, and 45th on the percentage of graduateswho enroll in college within four years ofgraduation.18 The debate on how to measurestudent achievement and the type of education thatthe country needs are essential components of thediscussion on improving the academic achievementof minority youth.
Raising Minority Academic Achievement 15
American Youth Policy Forum
High School/Transition Programs
OverviewThis category reflects a mix of whole schoolprograms and add-on interventions that propose tofacilitate college access for students under-represented in postsecondary institutions, that is,low-income, minority students and students with“average” academic performance. Three are four-year, school-based programs geared toward studentswith a grade point average of C or better and whoare motivated to pursue postsecondary education.All three programs have large proportions (80% ormore) of minority students and require students toenroll in academically demanding courses.
AVID is a nationwide program that targets C-average students who would be the first in theirfamilies to attend college. AVID offers one-on-onetutoring by college students, workshop classes onstudy skills and other supports. High SchoolPuente aims to increase Latino participation inhigher education by raising student skills andaspirations through critical thinking and writingassignments, college counseling and mentoring.Gateway to Higher Education is a New York Cityprogram with an emphasis on careers in science,medicine, and technology serving 95% minoritystudents. To enter Gateway, students must score atleast at the 50th percentile on New York City’smath and reading tests, have regular attendance, andGPA’s of 80 or better (on a 100-point scale).Summer and Saturday enrichment programs,tutoring and internships are some of Gateway’sstrategies.
Three other evaluations describe high schoolprograms with a college focus but do not mentionselection criteria: Dare to Dream, Equity 2000 andGE Fund College Bound. Dare to Dream includesprojects that propose a greater role for schoolcounselors in keeping postsecondary options openfor all students, including those who are consideredat high-risk for school failure. The schools involvedin the project were located in poor neighborhoods,with large proportions of minority students, and lowlevels of academic achievement. Equity 2000 is awhole school reform that requires all students to
take advanced mathematics courses while in highschool. The program provides extra support tostudents through voluntary Saturday mathacademies and summer math programs. Minoritiesmake up 72% of Equity 2000 participants. LikeEquity 2000, the GE Fund College Bound providesblock grants to schools and communities to instituteprograms that increase college access. UnlikeEquity 2000, however, the GE Fund College Boundallows for greater flexibility in the strategies used bythe grantee schools.
Career Academies is the only representative in thisreport of high school programs dedicated topreparing students for fulfilling careers that are notnecessarily dependent on a college degree. CareerAcademies are schools-within-schools that offerstudents an integrated academic and occupationalcurriculum and work-based learning experiences.More than 50% of the students in the Academiesstudied were Latinos and 84% had GPAs of 2.1 andabove.
The evaluation of I Have a Dream (IHAD) includestwo Chicago programs, one predominantly Latinoand another 100% African American. IHADconnects low-income, inner city public school sixthgraders with wealthy sponsors who providementorship and supports to help the youth pursuepostsecondary education. The program offers long-term relationships from sixth grade until high schoolgraduation, or even longer. Like IHAD,Philadelphia’s Sponsor-A-Scholar program providesacademic supports to economically or academicallydisadvantaged high school students with B or Caverage grades who want to attend college. In thisevaluation, 93% of participants were minorities ofwhom 76% were African American. The programmatches these youth with trained mentors whoaccompany them from ninth grade through thefreshman college year. Both IHAD and Sponsor-A-Scholar offer financial help to participants to defraytuition costs.
Upward Bound operates parallel to the regular four-year high school, with students participating in after-school and Saturday classes often on collegecampuses. Upward Bound is the oldest of a set of
Raising Minority Academic Achievement16
American Youth Policy Forum
TRIO initiatives established by the HigherEducation Act of 1965. TRIO programs aim athelping low-income and first generation collegestudents enter and successfully completepostsecondary education. This national evaluationcovers 67 sites with approximately 1,500participants. Nationwide, half of the UpwardBound participants are African American, 22% areLatino and 21% white.
AnalysisUnlike the elementary school program evaluations,and despite the increasing numbers of high schoolsrequiring standardized tests for graduation, the highschool evaluations had little emphasis on testscores.19 The broader range of academicachievement measures examined offers a betterperspective of what is actually happening withstudents. Most documents include data on highschool graduation and credits taken. A few havedata on college entrance tests, such as the SAT andAP, and dropout rates. Follow-up is mostly limitedto college enrollment, but GE Fund College Boundhas data on college retention and Gateway forHigher Education collects college graduationinformation.
All three programs that indicate some type ofselection criteria for admission show good results,suggesting that a large group of C average studentsare ready to move up the academic ladder ifprovided adequate supports. AVID studentsmaintain an average GPA of 2.94 and a 95% collegeenrollment rate. African American, Asian and LatinoAVID students have disproportionately highenrollment rates in the California State and theUniversity of California systems. High SchoolPuente students, in relation to a matchedcomparison group, were more likely to take collegeentrance tests (SAT, ACT), complete more highschool credits, and attend college, particularly four-year colleges, although no statistical differenceswere found in dropout rates and grade point average(GPA). The lack of difference in grades may reflectthe fact that Puente students attend moreacademically demanding courses than the controlgroup. African American students in Gateway aremore likely to take chemistry and physics in high
school than African American high school graduatesnationwide. They are also more likely to havehigher SAT scores. A 1996 survey with 330Gateway alumni revealed that 74% had graduated orwould graduate from four-year colleges oruniversities within five years and 59% had remainedin a science-related major or profession.
The majority of programs featured in this report didnot include cost data, but cost information wasavailable for these three programs. The annual costper student for Gateway in 1997 was $1,600 abovethe mean per pupil expenditure in New York City.The state’s annual per pupil expenditure for HighSchool Puente was $480, but training costs werepartially subsidized by the University of California.The average cost of AVID for schools and districtsin Year One per student per year outside ofCalifornia is $540 (about $3 per day). By yearthree, the cost drops, on average, to under a dollarper student per day. In California, where AVID is astate-supported program with 11 regional centers,the average cost of AVID for schools and districts isabout $180 per student per year.
Of the programs that do not indicate admissioncriteria, most Dare to Dream high schools doubledthe enrollment of African American and/or Latinostudents in Advanced Placement and collegepreparatory courses (the report did not publishpassing rates). Districts adopting the Equity 2000program also showed increased enrollment ofminority students in college gateway courses.However, passing rates in these courses did notincrease accordingly. The number of studentstaking college entrance exams (SAT, ACT)increased in all GE Fund College Bound schoolsafter five years, but the program had little impact ontest scores, high school graduation rates, or dropoutrates. When compared to a national database, GEFund students, particularly Latino students, hadhigher college enrollment and retention rates. Theevaluation of Career Academies found statisticallysignificant improvements for students who hadentered the program with high risk of school failurebut not for those in the middle and low riskcategories (see the summary’s methodology for anexplanation of the risk categories).
Raising Minority Academic Achievement 17
American Youth Policy Forum
Evaluators of I Have a Dream used a matchedgroup of students taken from other sixth gradeclasses in the same schools as IHAD participants.Participants were twice as likely to graduate fromhigh school and three times more likely to enroll incollege than the comparison group. The Sponsor-A-Scholar evaluation examines a sample of highschool graduates from 1993 through 1997. Thesample was divided into matched sub-groups ofprogram participants and non-participants andcompared in terms of GPAs and college enrollmentone year and two years after high school graduation.In general, program students had statisticallysignificant higher GPA and enrollment rates thannon-participants. Gains were higher for studentswho started the programs with lower grades, stayedin the program longer, and met more frequently withtheir mentors.
For Upward Bound, program participants werecompared to a matched control group. Differencesbetween the two groups were not statisticallysignificant for average GPA and enrollment inpostsecondary institutions (including vocational/technical schools). Latino and white participantsearned two more high school credits than peers inthe control group while African Americans earnedmore Advanced Placement credits. Results werecorrelated to time in the program and expectationabout attending college at the onset of the program.The longer the student remained in the program andthe lower the initial expectation, the stronger theresults. However, more than 55% of theparticipants left the program before high schoolgraduation, a finding evaluators attributed tostudents’ needs for paid employment competingwith Upward Bound’s after-school and Saturdayclasses.
Overall, programs that provide extra attention andsupports to high school students, particularly thosewho average C or better, are succeeding in movingthem to postsecondary education. The majority ofthe evaluations do not describe what happens whenthe students get to the next level. However, a fewdo: GE Fund College Bound students have highercollege retention rates; a small group of Gatewaystudents show high college graduation rates; and
Upward Bound students are less likely to needremedial classes while in college.
Postsecondary School Programs
Despite the intensive search for evaluations ofpostsecondary programs that serve minoritystudents and disaggregated the data, few studieswere found and most of them were not evaluations,but descriptive reports. At the beginning the ofsearch, we contacted a large number oforganizations that provide college scholarships forminority youth. None had evaluations. Wereceived suggestions and indications about “greatstudies” being done in one state or another, only tofind that these studies would not meet theacceptance criteria for rigorous evaluationsdisaggregated by race or ethnicity. The landscapeof evaluations of postsecondary interventions forminority students with disaggregated data is as aridas the programs are numerous.20
The six postsecondary reports are examples of thevariety of programs that are being implemented atthe postsecondary level to help minority studentsbreak the barrier of the K-12 years and enter highereducation. Three summaries describe programs thatsupport minority students at different points alongthe journey through college and graduate school:the Emerging Scholars Program (ESP) helpsundergraduates to remain in college; the PuertoRico Louis Stokes Alliance for MinorityParticipation (PR-LSAMP) offers support forwomen and minorities pursuing graduate degrees;and Compact for Faculty Diversity provides abridge for minority students as they complete theirdoctorates and enter college or university teachingpositions. While Compact does not emphasize aparticular specialization or field, both ESP and PR-LSAMP focus on the fields of mathematics, sciencesand engineering, where minorities have beentraditionally under-represented. Two studies focusingon Historically Black Colleges and Universities andTribal Colleges offer descriptive data on the role ofthese institutions in the lives of African Americans andNative Americans. Chicanos in Higher Education isan example of a number of qualitative studies thatprovide a voice to minority individuals and shed
Raising Minority Academic Achievement18
American Youth Policy Forum
some light on factors that influence theirprofessional success.
The Emerging Scholars Program (ESP) wasinitially developed at the University of California, inthe 1970s, to improve the retention and success ofminority students who enter mathematics-relatedmajors. Currently operating under several differentnames in over 100 universities across the country,the basic ESP model utilizes extended discussionseminars and small study groups to help studentssucceed in the calculus course sequence at thebeginning of their majors. With additional professorand peer support, these students form small learningcommunities that work as teams. Evaluations inTexas and Wisconsin revealed that ESP studentswere two to five times more likely to get As and Bsin calculus than their peers outside the program. Astudy at the California Polytechnic Institute showedthat only 15% of ESP students had changed majorsor left college within three years, compared with52% of the students in a control group. They werealso more likely to complete their mathematicsrequirement one academic quarter earlier than thecontrol group.
The Puerto Rico Louis Stokes Alliance forMinority Participation (PR-LSAMP), funded bythe National Science Foundation and the federalgovernment, has a dual goal: to foster theinvolvement of women and minorities in the fieldsof mathematics, science, and engineering; and topromote innovative teaching strategies that improvestudents’ performance in those fields. According tothe report, of all bachelor’s degrees in science, mathand engineering earned by Latinos in the U.S. in1997, 25% went to PR-LSAMP students. From1993 to 1998, PR-LSAMP students earned 11% ofengineering PhDs and 17% of natural science PhDsreceived by Latinos nationwide.
Compact for Faculty Diversity is a consortium ofregional education organizations and universities thatprovides financial support and a peer network forminority graduate students. The Compact’s annualInstitute for Teaching and Mentoring brings togetherminority graduate students and professors fromacross the country to discuss possibilities and pitfalls
in the world of higher education. Of the 435scholars served by the program, 92% hadcompleted or were continuing their degrees. Of theCompact alumni who had earned a PhD, 70% werein tenure-track faculty positions and 18% were inpost-doctoral positions. As with the ESP model,Compact promotes a small supportive community ofpeers and professionals that guides the graduatestudents into careers in higher education.
Historically minority-serving institutions continue toplay a crucial role in minority higher education, andthis report includes studies of Historically BlackColleges and Universities (HBCUs) and TribalColleges.21 The study of HBCUs shows thatHBCUs graduate more African American studentsthan other institutions. In the mid-1990s, 21% of allAfrican American undergraduates attended HBCUs,but 28% of African American graduates got theirdegrees from HBCUs and 33% of the AfricanAmerican college students taking the GraduateRecord Examination came from HBCUs.
Tribal Colleges’ original purpose was to facilitateaccess to higher education for Native Americansliving on reservations and to provide educationalopportunities without forcing assimilation intomainstream white culture. Today, there are 33Tribal Colleges serving more than 10,000 NativeAmerican students. Tribal Colleges have animportant role in diversifying faculty composition.Compared to other institutions of higher educationthat employ on average less than 1% NativeAmerican faculty and staff, 30% of the faculty and70% of the staff at Tribal Colleges are NativeAmericans.
Chicanos in Higher Education reports oninterviews with 50 Mexican American professionalswith MD, PhD or JD degrees. All came from low-income, immigrant families, composed mostly offarm workers and other unskilled laborers. Mostbegan school with Spanish as their primarylanguage, yet all completed a doctoral-leveleducation from the country’s most prestigiousinstitutions. The interviewees stressed theimportance of supportive parents and a familyenvironment that was conducive to learning. At
Raising Minority Academic Achievement 19
American Youth Policy Forum
least half cited the presence of a caring adult outsidethe family who functioned as a mentor, encouragingand prodding them toward academic success.Though most of them eventually got into collegepreparatory programs in high school, they had tofight a system that insisted on tracking them intoless demanding curricula. Latino recruitmentprograms, scholarships for high-achieving scholars,stipends for low-income students, and a lot of hardwork complete the list of factors that, according tothe interviewees, contributed to their success.
Conclusion
All the selected evaluations of early childhoodprograms included follow-up, and some of them forsubstantial time periods. They also provided avariety of data to indicate that these programs areattaining their objectives of providing low-incomechildren, including minority children, with moreresources to succeed in later years. The evaluationsof K-8 programs and district or statewide schoolinitiatives have a limited focus on test scores. Theytell us that many schools and states are raising thescores of minority students on different tests or areraising their passing rates in these tests. What thisrepresents for the children’s future is not clear.
However, it must be emphasized that, at least theprograms and initiatives are raising these children’sscores and passing rates. Doing nothing would bemuch worse. Rather than being a criticism of theexisting data, this comment represents a longing formore data.
The evaluations of the high school programsdiversify their measures. Although little is saidabout students’ test scores, the information indicatesthat minority students in those programs are, ingeneral, graduating from high school and going tocollege in greater numbers. The summaries onpostsecondary education end this chapter with amessage of hope, showing minorities who aresucceeding in demanding careers, such as thoserelated to sciences, mathematics and technology,and attaining faculty positions in universities. Thismessage cannot be missed, because, as thesummary on Chicanos in Higher Educationsuggests, many of those successful youth start theirschool years in the “high risk” category. On thewhole, the summaries in this report highlight the factthat no student should be discounted as a lost cause.The opportunities and supports necessary to achievesuccess at the highest levels of our educationalsystem must be available to all.
Raising Minority Academic Achievement20
American Youth Policy Forum
��������%���&����������������
'#�$��( ��)What makes programs successful? What do theyoffer so that young people challenge themselves andsucceed? These questions are at the core of thisreport as they were in AYPF’s two previouscompendia and of a more recent AYPF report,Raising Academic Achievement: A Study of 20Successful Programs.22 That report identified fiveoverarching strategies shared by programs thatraised academic achievement:
� High standards for participants, programs andstaff, including strategies that ensured thequality of implementation, and demanded highperformance from youth and staff alike.
� Personalized attention, that is, strategies thatenable the staff to know the programparticipants as individuals, with unique needs,strengths and weaknesses.
� Innovative structures where the needs of thestudents, rather than tradition or bureaucracy,guide the teaching/learning process.
� Experiential learning, bridging school andsociety.
� Long-term support that gave youth time tocreate trust and develop stable relationships andsupports.
For this report, the same analytical process wasused. A matrix was created with the programcomponents and “contributing factors” as cited inthe evaluations and program literature. Through aprocess of coding, the differences and similaritiesamong components were highlighted and/oraggregated into categories, until a group of tenstrategies remained that were shared by nine ormore of the programs. In contrast to the previous
reports that focused solely on “successful”programs, this report includes programs that haveboth positive and negative findings. We include allevaluations in the analysis, regardless of findings, inan attempt to understand whether good results canbe attributed to specific components, to a specificmix of components, or to some other variable thatmerits further investigation. In the case of reportsdescribing different programs, the shared strategiescited in the documents were also included.
The overarching strategies found in RaisingAcademic Achievement are again reflected in thisreport except for “Experiential Learning,” which iscited only once in connection with the CareerAcademies summary. “High Standards” isrepresented here by the three most frequentcomponents: program quality, academicallydemanding curricula and professional development.“Personalized Attention” is discussed in twocontexts: school strategies to reduce the student-to-teacher ratio and strategies to provide youth withextra, individualized supports. The two remainingoverarching strategies, “Innovative Structures” and“Long-term Supports,” are also represented.
This chapter discusses the strategies used byprograms whose evaluations we have summarized.However, a few words of caution must be shared.First, no “magic bullet” was found, that is, no onestrategy is common to all programs that havegood findings. Second, the sample is limited to 38reports, several of which have less than stellarevaluations. Therefore, these findings should beconsidered as guidelines for further inquiry ratherthan prescriptions for success.
The ten most frequent strategies identified in thisreport are listed below from most to least frequentlycited in the program evaluations:
Raising Minority Academic Achievement 21
American Youth Policy Forum
� Program quality� Academically demanding curriculum� Professional development� Family involvement� Reduced student-to-teacher ratios� Individualized supports� Extended learning time� Community involvement� Long-term supports for youth� Scholarships and/or financial support
Program Quality
“High standards” is a catch phrase in today’seducation policy debates. Virtually all programsaffirm their commitment to “high standards”without defining the concept. AYPF’s perspective isthat high standards must include a concern with thequality of the program and its staff before demandsare made from participants. Quality ofimplementation, leadership and accountability arethree essential strategies that help ensure highprogram standards.
Quality of implementationThe quality of implementation is demonstratedthrough careful planning and timely and efficientresources that are targeted to specific goals. For aschool to receive certification as an AVID center, itmust fulfill a series of requisites, including trainingfor the site administrator, program coordinator,teachers and tutors; identification of resources forimplementation and sustainability; selection ofstudents; and integration between the program andthe regular school day. When the Calvert Programwas introduced at the Woodson School, a full-timecoordinator was hired to oversee implementation ofthe program and its daily operations. GE FundCollege Bound stresses the substantial size andlong-term support of its GE Fund grants—at least$250,000 for five years—as giving adequate timeand resources to plan and implement the reformsnecessary to improve school-wide academicachievement. Evaluators note that one reason thatClass Size Reduction in California may not haveshown minority academic achievement gains wasthat the program did not include timely and
sufficient resources for successful implementation inhigh-poverty, predominantly-minority schools.
LeadershipLeadership is essential to ensure program qualityand sustainability. As charter school principals, thedirectors of KIPP Academies have complete controlover budget and personnel decisions, thus allowingthem to be better leaders at the school level. KIPPprincipals lead by example. In addition to beingadministrators, they are teachers who do nothesitate to step out of their offices and into theclassroom to do the nitty gritty work of education.With the help of Gap, Inc., they have also started afellowship program that will train a corps ofeducational leaders to found their own charterschools across the country serving disadvantagedyouth. Gateway for Higher Education has had thesame co-directors since its founding in 1986 and,according to the evaluators, this continuity hascontributed to the program’s strong sense ofpurpose. Dare to Dream and the Alaska Onward toExcellence/Alaska Rural Systemic Initiative arebased on the concept of shared leadership. In theprojects described in Dare to Dream, schooladministrators, teachers, school staff, outside expertteams and students work together to find solutionsfor existing problems or to propose new options.The Alaska project relies on a sense of sharedownership between program staff and community.GE Fund College Bound describes some of theirprogram efforts as being enhanced by strongleadership exhibited by the schools and their GEpartners, while others were hampered by frequentleadership turnover or weak support from principalsand school administrators.
AccountabilityPublic school “accountability” is a growing concernof local, state and federal governments. Tests,particularly state-developed tests and school reportcards, are tools commonly used to providestakeholders with feedback about the performanceof their schools and students. In many states,schools that do not attain some pre-establishedbenchmark on the state tests are threatened withsanctions. The accountability movement has been
Raising Minority Academic Achievement22
American Youth Policy Forum
particularly well documented in Texas. The TexasAssessment of Academic Skills (TAAS) is acriterion-referenced test administered annually thatmeasures student achievement in reading and math(for grades 3-8 and 12), in writing (for grades 4, 8,and 12), and in science and social studies (grade 8).Texas students must pass the TAAS to graduatefrom high school. The evaluations of programsusing TAAS data show schools increasing thepercentage of minority students passing the TAASby 40% or more, while in many other states, testscore improvements for minorities are incremental.Yet successful school programs in Texas are quitevaried. In fact, the evaluation of four school districts(Texas District Wide Initiatives) attributes theirsuccess to the politically-imposed accountability systemrather than to specific strategies.
It appears that the political climate favoringaccountability has positive facets that must beconsidered. As states begin to require all children toperform, even those labeled “at risk,” educatorsmust pay attention to all children, defining clearexpectations for all, and find ways to help thosewho are failing to achieve academically. It isimportant to observe that accountability should notbe confused with high standards, since many states,including Texas, still rely on minimum competencytests. How to fairly and equitably use theadvantages of accountability for minority academicachievement gains is still an open question.
Academically Demanding Curricula
All early childhood programs included in this reportprovide pre-school aged children with challengingeducational activities that are also developmentallyappropriate. Abecedarian’s curriculum includesarts, language, and literacy, in addition to fine motorskills development. The Child-Parent Centercurricula emphasize language and mathematicsthrough a variety of learning experiences. HeadStart programs have incorporated academicactivities with their full-service mission. High/Scope Perry Preschool offers a well-structuredcurriculum with emphasis on language, literacy,music and mathematics.
Concern with challenging curricula was equallyapparent in K-12 programs. The Calvert Programemphasizes reading comprehension and requiredweekly compositions even for first graders. SinceMemphis City Schools (described in the CitySchools report) eliminated lower level courses inhigh schools, the percentage of African Americansgraduating with an honors diploma doubled. TheAlaska Onward to Excellence/Alaska RuralSystemic Initiative is based on a dual commitmentto equity and excellence. Eskimo and NativeAmerican children from rural villages are takingcollege-entrance tests and going to college in highernumbers since the introduction of the program. AllGateway for Higher Education students areexpected to complete a minimum of three AdvancedPlacement courses.
However, the requirement to attend academicallydemanding courses must be accompanied byappropriate supports. The low algebra passing ratesfor students in Equity 2000 may have been due tothe limited supports for students enrolled in algebraand lack of support relating to other types of highschool coursework or college attendance. Thepersistent gap between minority and white studentsin High Schools That Work, which eliminatesgeneral education and sets high standards for all,indicates a need for additional supports gearedtoward these students.
Professional Development
To maintain the quality of any program, it is notenough to create mechanisms for quality control.Staff must be prepared to respond to the challenge.Gateway, which creates a school-within-a-school foracademically talented students, carefully selects itsteachers based on their background, experience, anddedication. For other programs, particularly thosewith less ability to select staff, professionaldevelopment and training is an important programcomponent.
AVID and High/Scope require staff training beforeimplementation. Success for All provides a three-day summer training session and continued on-site
Raising Minority Academic Achievement 23
American Youth Policy Forum
staff training during the year. Project GRAD offerstraining and ongoing support for teachers to reduceturnover. According to the evaluator, as thefacilitators operate outside the teachers’ assessmentprocess, teachers feel comfortable asking for helpwith classroom problems. The schools described inUrban Elementary Schools introduce professionaldevelopment activities at the time when changes incurriculum or school structure are implemented.Programs that rely on tutors or mentors, such asHigh School Puente, I Have a Dream and Sponsor-A-Scholar, offer them training and supervision. Atthe Boys and Girls Clubs of America, trained staffprovides support to volunteers.
However, as the CAPE evaluators observed,offering professional development does notnecessarily ensure that teachers will profit from it.CAPE offered extensive professional developmentto teachers and artists, including nearly a dozenworkshops throughout the year. Yet, mostparticipants attended no more than three workshopsdue to lack of time.
Family Involvement
Approximately 40% of the selected evaluationsreport activities geared toward improvingcommunication with families, or increasing familyinvolvement with the programs. Although suchefforts are concentrated on initiatives for youngchildren, at least two high school programs also includeactivities to promote greater involvement of families.
Early childhood programs focus on helping parentsprovide adequate support for their child’sdevelopment. Therefore, these programs offer arange of activities that include family education,advocacy and support. Information on childhooddevelopment, health and nutrition is provided in allthe programs, either through workshops or homevisits. In High/Scope, families and staff metmonthly to discuss developmental issues. Programstaff also made weekly home visits to families,meeting with the child and the family to modelclassroom activities. Abecedarian and Head Startused home visits with the objective of informationand support and involve families on advisory boards
and committees with planning and managerialfunctions.
The two after-school programs in this report, Boys& Girls Clubs of America and Sacramento START,include families in their activities, generally asvolunteers, although START hires participants’families to staff the program. Among the K-12programs, AVID, Alaska Onward to Excellence/Alaska Rural Systemic Initiative, Calvert Program,Chapel Hill-Carrboro City Schools, High SchoolPuente and Project GRAD have family involvementcomponents. Of these, AVID and High SchoolPuente are exclusively for high school-aged youth,and Calvert is an elementary school program. Theremaining initiatives serve K-12 students.
AVID emphasizes communication between familiesand the program, offers workshops on the collegeapplication process, and includes families on itsadvisory board. Local families and communitymembers are also part of advisory boards in theschools involved with the Alaska reforms thatencompass grades K to 12. Another K-12 initiativein the Chapel Hill-Carrboro City Schools includesfamilies as volunteers and members of the BlueRibbon panel that designed the reform. Teachersand administrators are encouraged to set upmeetings in families’ homes or workplaces tofacilitate participation. In addition, the schools offerassistance for students who are parents with aYoung Parent Institute and the Adolescent ParentingProgram that provide monthly support groups andinfant health education. Project GRAD implementsa comprehensive family outreach program thatincludes activities to recruit students and theirparents. During its community-wide Walk forSuccess, alumni, teachers, staff, mentors, universityvolunteers, and community leaders go door todoor to over 1,600 families per year to raiseawareness of the program. Project GRAD alsohas Parent Universities to improve parentalliteracy and involvement. In addition, alongsideteachers, principals and other communitymembers, Project GRAD families participate indecision-making committees that manage theproject’s feeder schools (elementary and juniorhigh schools).
Raising Minority Academic Achievement24
American Youth Policy Forum
Reduced Student-to-Teacher Ratios
Many selected programs that show academic gainsfor minority students include strategies to reducestudent-to-teacher ratios. Tennessee’s ProjectSTAR and Wisconsin’s SAGE are statewideexperiments with reduced class sizes for grades onethrough three. STAR used classes with 17 studentsper teacher and SAGE’s classes averaged 15students per teacher, compared with traditionalclasses of 20 to 25 students. Participants in thesmall classes, particularly African Americans, hadhigher average test scores than students in the largerclasses. STAR did not find gains when two teachersor a teacher and teacher’s aide were in theclassroom, but SAGE found similar gains instrategies that reduced student-to-teacher ratio byincreasing the number of teachers in regularclassrooms, including team teaching and floatingteachers. In California, as described in Class SizeReduction, classes were reduced from 30 to 20students or less. Different from STAR and SAGE,two carefully designed and implemented reformsthat began as pilots, the Californian project wasimposed statewide and, particularly in those in low-income areas, the class reduction occurred at theexpense of other resources, such as musicinstruction and school libraries.
Rather than reducing the number of children perclassroom, Child-Parent Centers increase thenumber of staff, placing two teachers for eachclassroom of 17 toddlers or 25 kindergarteners.The Chicago Arts Partnership in Education usesthe co-teaching system, with a teacher and an artistworking together to integrate arts into the academiccurriculum. Career Academies are schools-within-schools that provide self-contained environmentswithin larger institutions where students have closerinteraction with staff. KIPP Academies are smallcharter schools with no more than 300 to 400students. High School Puente selects about 30students per cohort. Success for All uses smallreading groups divided by literacy level, rather thanage; this program is also a component of ProjectGRAD. The Urban Elementary Schools reportindicates that some schools also reduced the numberof students per class.
Cost is an issue in projects that demand expansionin buildings and/or personnel, but only one of thestudies (Child-Parent Centers) included a costbenefit analysis. It is important to observe thatother programs such as those described in TexasDistrict Wide Initiatives and City Schools thatshow significant academic gains, particularly forminority students, do not report the use of smallerclasses or small learning environments.
Individualized Supports
For students who are struggling academically,individualized support may be the differencebetween falling behind and moving ahead. Inaddition to the involvement of the students’families, many programs utilize communitymembers, college students, employers and othergroups as tutors and mentors to address theacademic needs of specific students, or offersupport, feedback and encouragement. Tutors ormentors can also function as role models, guidingthe youth through difficult transitions and into acollege and/or career path.
Tutors and mentors are found at all levels of theeducational ladder. For instance, Success for All,a program for elementary school children, usestrained tutors to help students in need. Minoritystudents from the University of North Carolinaprovide tutoring for elementary, middle, and highschool youth at Chapel Hill-Carrboro CitySchools. Their “Sister to Sister” program pairsAfrican American females in medical school withninth grade “sisters” for support and rolemodeling. At the undergraduate level, EmergingScholars pairs a teaching assistant with one totwo undergraduate students to tutor calculus.Compact for Faculty Diversity organizes anannual institute where university and collegeprofessors share their experiences with PhDcandidates and mentor them through the processof moving from graduate students to facultymembers.
The use of tutors and mentors is frequent amonghigh school programs as well. AVID uses collegestudents to provide one-on-one tutoring to C-
Raising Minority Academic Achievement 25
American Youth Policy Forum
average high school students who dream ofentering college. Employers are actively involvedin Career Academies, sitting on boards, helpingwith curriculum planning, and also mentoringstudents in work-based experiences. Gateway toHigher Education offers after-school tutoringprograms. At High School Puente, “peerpartners” help the students to transition frommiddle to high school. In addition, adult mentorswork with the students throughout high school. ACommunity Mentor Liaison (CML) is dedicatedto recruiting, training and matching the mentorswith the students. GE employees tutor studentsat GE Fund College Bound schools, offeringhomework assistance and other supports. Tutorsare also procured among community volunteers.I Have a Dream, Sponsor-A-Scholar and UpwardBound all use mentors. The mentors in I Have aDream and Sponsor-A-Scholar are intenselyinvolved with the students, monitoring theiracademic performance, providing opportunitiesfor recreational activities, and internships, andoffering financial support through college.
Using tutors and mentors is a less expensive strategyto reduce the student-to-adult ratio than usingcertified teachers, but it is also a riskier strategy.Unqualified, untrained and unsupervised tutors ormentors can sometimes do more harm than good.
Extended Learning Time
Some programs use longer school hours, extraschool days, Saturdays and summer courses toprovide students with more learning time. Forpreschool aged children, any formal instruction timemay be considered extra time, and that is offered byall early childhood programs in this report.Abecedarian functioned 8 hours a day, 5 days aweek for 50 weeks. Child-Parent Center preschoolprograms are offered for 3 hours in the morning orin the afternoon, and kindergarten programs areeither half day or full day. High/Scope PerryPreschool had 12 ½ hours of instruction per week.
Boys and Girls Clubs of America (B&GCA) andSacramento START are after-school programs thatprovide low-income, mostly minority children with
extra educational supports. B&GCAs are open 5 to6 days a week, 6 to 7 hours a day. In addition torecreational and social activities, some clubs offeran educational program that includes homeworksupport, structured discussions on educationaltopics, 1 to 2 hours a week of writing, 4 to 5 hoursper week of reading, and additional time foreducational games, such as word and math games.For middle to high school students, the clubs alsooffer technology training and career explorationprograms. Sacramento START functions 9 hours aweek and also includes homework assistance,literacy training and other educational activities.The program staff maintains ongoingcommunication with the schools to align curriculaand learning goals for their participants. Children inboth programs show academic gains.
Among the school programs that offer extra-time,Gateway functions for 11months a year and ProjectGRAD offers after-school programs. EmergingScholars and Equity 2000 have Saturday andsummer activities, although attendance is voluntaryin Equity 2000. The activities in I Have a Dream,Sponsor-A-Scholar and Upward Bound are all anadded value to the regular school day. The KIPPmotto is that “there are no shortcuts,” and the timecommitment of students and teachers exemplifiesthis philosophy. Students attend class from 7:30AM until 5:00 PM Monday through Thursday anduntil 4:00 PM on Fridays. They spend four hoursat the school on most Saturdays and attendadditional courses four weeks every summer.
Community Involvement
Alaska Onward to Excellence/Alaska RuralSystemic Initiative and Chapel Hill-Carrboro CitySchools (CHCCS) highlight the power ofcommunities to promote and support schoolchanges. The Alaska reform was guided bycommunity members upset with the state of theirschools. Community participation is essential to theprogram, reinforcing cultural traditions andknowledge that are interwoven with the moretraditional curricula. In North Carolina, communityrepresentatives sat on the Blue Ribbon panel thatproposed the CHCCS strategies to improve the
Raising Minority Academic Achievement26
American Youth Policy Forum
academic achievement of African Americanstudents in the school district.
CAPE represents an innovative way to involveartists and community organizations in schools toenhance education through arts. Career Academiesinvolve the business community in planning andsupporting the program, in addition to offeringwork-based opportunities for the students. Some ofthe Urban Elementary Schools also report businessinvolvement, while Gateway has partnerships withmuseums and research centers to provide studentswith educational and internship opportunities.
Long-Term Supports for Youth
Several programs encourage long-term, stablerelationships between participants andknowledgeable adults. Abecedarian, Child-ParentCenters and High/Scope are all five-year programswith long follow-up. Abecedarian also includes asummer program to help participants in theirtransition to public school. The mentor-youthrelationship in I Have a Dream and Sponsor-A-Scholar remains for more than five years, and helpsyouth transition into postsecondary education.Evaluations of Sponsor-A-Scholar and UpwardBound found that the longer youth stay in theprograms, the greater their academic gains. Sincetransitions are important periods in any person’s life,particularly for youth who have weak socialsupports, it is puzzling that so few of the programsreviewed offer extra supports during transition,particularly from middle to high school.
Scholarships and/or Financial Support
Several K-12 programs offer financial help tostudents who demonstrate high academicperformance. CHCCS offers scholarships toAfrican American students who enroll in two- orfour-year colleges. Scholarships are also providedin some GE Fund programs. I Have a Dream andSponsor-A-Scholar supplement the costs of collegethat are not covered through other scholarships orloans. The voucher movement proposesscholarships to defray the costs of private schooltuition for families whose children are in failing
public schools. The summary of School Vouchersdescribes a three-city experiment. The reportindicates that the scholarships did not cover the fulltuition but does not explain how low-incomefamilies were able to cover the remaining costs, arequirement that may hamper the use of vouchersfor families in the lowest income brackets.
Among the postsecondary programs, only EmergingScholars does not report financial aid. Chicanos inHigher Education, which interviewed Latinos whoexcelled professionally, cites the importance ofminority recruitment programs, scholarships forhigh-achieving students, and stipends for low-income students as tools to break the cycle ofpoverty for low-income minority students whoaspire to a college education. Compact for FacultyDiversity works with states and graduate institutionsto ensure continuity of funding and supports forminority students as they complete their doctoraldegrees and enter academic life. The Puerto RicoLouis Stokes Alliance for Minority Participationoffers stipends for low-income students who excelacademically and pays travel costs of students whoparticipate in conferences.
Conclusion
These evaluations highlight programs that aresucceeding in improving the academic achievementof African American, Latino and Native Americanstudents. Most programs are bringing minoritystudents at the lowest level of academicperformance to the minimum required level ofcompetency for their grades, such as thosedescribed in Texas District Wide Initiatives. A few,like AVID, are helping students already at the middleto attain higher levels of achievement, whileprograms like Gateway improve the performance ofstudents who are close to becoming high achievers.Evaluations such as those for the GE Fund andUpward Bound reinforce the value of investing inlow achieving students, proving that they can profitfrom supportive interventions.
What can be learned from this chapter? The firstlesson is to intervene preventively, even before thechild enters school, to avoid the gap between high
Raising Minority Academic Achievement 27
American Youth Policy Forum
and low achievers. A concern with earlyintervention does not imply abandoning youth whoare struggling academically in the remaining schoolyears. The evaluation of Head Start shows adecline in academic gains as the child movesthrough grades, and so does the evaluation ofProject STAR. Indeed, learning is a dynamicprocess that must be supported throughout theschool years.
The second lesson learned is that no one approachguarantees academic success, although a fewstrategies carry more promise than others. Highlystructured programs, such as Calvert or Success forAll, have successful outcomes, but so does acreative, flexible program such as CAPE. Overall,the summaries suggest that demanding highperformance from programs, staff and students isessential for a successful program. Most programsthat show positive results implement mechanisms toensure program quality, maintain well-trainedteachers and support staff, and provideacademically demanding courses.
A lesson from the less successful programs is thatpushing youth who are already strugglingacademically into demanding courses without thenecessary supports may simply create a wave offailures and frustration that will eventually drive theyouth out of schools, rather than toward graduation.This finding, far from leading to the defeatistconclusion that these youth have no hope, shouldguide us to the question of “what needs to be donethat these programs are not doing?” Strategies tosupport students are varied and many successfulprograms mix strategies to reduce the student-to-teacher ratio (such as reduced class sizes, smallschools and team-teaching) with the presence of
volunteers, tutors or mentors to ensure moreindividualized attention for all students. In addition,good programs provide high quality professionaldevelopment for staff, tutors, and mentors.
Financial support is essential for low-incomestudents who dream of pursuing postsecondaryeducation. Programs that encourage theparticipation of families and communityrepresentatives increase the support network andcreate a culture of academic achievement aroundthe student.
The evaluations summarized here also teach aboutthe power of persistence. The Texas accountabilitysystem and the Alaska reforms are a decade old.Changes in education do not occur in a short periodof time. Unfortunately, many reforms come and goabruptly, leaving educators without time toimplement them adequately, and students withouttime to profit from them.
One common denominator among the selectedprograms is a heightened level of attention towardall students in an attempt to reach benchmarks thatwere established by the school, district or state.Interviews with successful Mexican Americanprofessionals (Chicanos in Higher Education)suggest that educators tend to give up on low-income, minority students who do not fit theiridealized image of the successful, college-boundstudent. By disaggregating their data, schooldistricts highlight inequalities within their system, anecessary step toward correcting them. A finallesson that may be taken from these evaluations isthat commitment to all students, more thanspecific strategies, appears to prevail as the maincontributing factor of success.
Raising Minority Academic Achievement28
American Youth Policy Forum
��������*���#� ��$��������Summary of Findings
In this report, a detailed picture is presented of theavailable research on programs that have beenfound to improve minority academic achievement.Despite continuing achievement gaps, the youthprograms and school initiatives included in thisreport provide concrete examples of efforts toincrease achievement for minority youth.
� Evaluation findings were particularly strong andpositive at the early childhood level. Whencompared to control groups, minority childrenwho attend early childhood developmentprograms are more likely to remain in school,complete more years of education, and requireless special education. These evaluations showa pattern of improvement that cannot be denied.The message from this body of evidence is thatearly childhood programs increase the chancesfor minority children to do well in school and inlater life. However, no education system can besatisfied with good early intervention programswithout strong K-12 schools that will maintain andexpand the educational gains of the early years.
� The elementary through middle schoolevaluations were almost exclusively focused ontest scores. In most cases, improvements wereincremental and even where minority academicachievement increased, the disparities inachievement between minority and white youthwere highly apparent. Texas is probably theonly state where achievement gaps betweenminorities and white students are being halvedor cut even more. However, Texas students aremeasured on passing rates on only a minimumcompetency test. The question of whetherhigher levels of achievement are reachedremains unanswered.
� Because they focus on more than test scores,the high school/transition programs offer abetter perspective of what is actually happeningwith their minority students. Among the
positive findings of some of these programswere one or more of the following: increasedhigh school graduation, more high school creditsearned, higher GPAs earned or maintained,more college prep and Advanced Placementcourses taken, increased enrollment in higherlevel mathematics and science classes, morecollege entrance exam-taking and higher scores,less need for remediation in college, higherlevels of college enrollment at two- and four-year colleges, higher levels of college retentionand graduation, and continuation in science-related majors or professions.
� Fewer quality evaluations were available at thepostsecondary level with data disaggregated byrace or ethnicity. The postsecondary programsincluded in the report show African American,Latino and Native American youth succeedingin demanding careers and entering universitiesnot just as students, but as professors as well.However, their numbers are still quite small.
Recommendations
Based on AYPF’s reflections on the reportedevaluations, following are actions policymakers,practitioners, researchers, parents and communitymembers can take to improve minority academicachievement.
1. Focus on Improved Academic Achievement andOutcomes for All.
� National leaders should continue to buildconsensus around acceptable achievementgains and require that these gains be shown forall student groups. National attention shouldfocus on achievement differences among thestates and ways to eliminate these differences.
� States should create benchmarks forimproving academic achievement for allstudent groups and provide resources forschool districts to attain those benchmarks.
Raising Minority Academic Achievement 29
American Youth Policy Forum
� States and school districts should support andmaintain high quality leadership and ensurethe adequate implementation of programs toenhance minority academic achievement.
� School districts and schools should expecthigh achievement from all students andprovide academically demanding curricula thatare meaningful and available across schools andgrade levels to bring all students to higher levelsof knowledge and achievement.
� States and localities should develop a multi-layered “check” of achievement using avariety of test measures, such as NAEP, state-mandated tests, Stanford-9 or ITBS; and alsouse indicators that provide a broad perspectiveabout students, such as classroom-basedassessments, attendance, behavior (disciplinaryincidents), course enrollment and passing rates,types of courses completed and graduationrates, among other measures.
� School districts and schools should provideprofessional development and support toensure that teachers (and other involved adults,as appropriate) have a deep understanding ofcurriculum, are familiar with innovativeinstructional methods, and have knowledge andinterpersonal competence with cultures otherthan their own.
� Schools should provide students, families andcommunities with specific information onwhat constitutes high academic standards andsupport their expectations for excellence in theeducational system.
� Families, youth advocates and communitiesshould hold schools accountable for highlevels of achievement for all students, reinforceacademic skills learned both at home and atschool, and ensure that every child has anadvocate outside of the school system orprogram.
2. States and Localities Should Provide theNecessary Supports to Ensure Student Success,including:
� Reduced student-to-teacher ratios. A range ofstrategies should be employed by schools andprograms to provide more personal teaching andlearning environments to foster higher levels ofacademic achievement. These strategies mayinclude smaller classes, small learningcommunities, teacher’s aides, team teaching,tutoring, mentoring and ancillary supports.
� Extended learning time. To accelerate andreinforce student learning, programs shouldencourage or require additional time andopportunities (such as longer days, weekendsand summer courses).
� Long-term supports. Programs shouldencourage student participation over anextended time (two years or more) to create andsustain stable relationships between participantsand knowledgeable adults, and to help youthmake successful transitions as they progress upthe educational ladder.
� Scholarships and/or financial support.Programs should provide financial support toyouth as needed to motivate participation andpersistence in quality educational experiences.Programs should also provide continualguidance to youth and monitor the impact of thefunds on student achievement, retention andgraduation.
3. Start Early, Don’t Stop.
� National leaders, states and school districtsshould prevent minority students from fallingbehind by expanding early childhood programsand providing continuous guidance and supportsthrough the elementary and high school years.
� National leaders, states and school districtsshould boost efforts to increase minoritystudents’ entry into and graduation frompostsecondary education.
Raising Minority Academic Achievement30
American Youth Policy Forum
At almost every educational level, schools andcommunity-based programs across the country arereporting good news about the academicachievement of the minority students they areserving. Although gaps overall are still large, andmost reported achievement gains are small, theseprograms have proven there is every possibility ofsucceeding in raising achievement for all.Implementing the recommendations above could
help the nation move beyond a feeling ofhelplessness regarding achievement gaps byproviding specific information on program designand strategies about “what works” to enhanceacademic achievement. The larger challenge iscreating the national will to set in placemechanisms that will eliminate differences inacademic achievement among students correlatedwith race or ethnicity.
Raising Minority Academic Achievement 31
American Youth Policy Forum
��������1. National Commission for Excellence in
Education. A Nation At-Risk: The Imperative forEducational Reform. Washington, D.C.: U.S.Department of Education, 1983.
2. Do You Know the Good News about AmericanEducation, Washington, DC: Center on EducationPolicy and American Youth Policy Forum, 2000.
3. Benno C. Schmidt, Jr., Chairman of the Board ofDirectors of Edison Schools, Inc. and formerPresident of Yale University said, “Education is theonly current opportunity. The Civil Rights struggleis in the classroom. This is the most challengingof all issues.” At the same conference, RobertSlavin, creator of the Success for All program,stated that the achievement gap “is one of the mostimportant educational and social problems in thecountry.” The Brookings Institution, Brown Centeron Education Policy and Edison Schools.“Closing the Gap: Promising Approaches toReducing the Achievement Gap.” Washington,DC. February 2, 2001.
4. U.S. Department of Education, National Center forEducation Statistics. The Condition of Education2000. Washington, DC: U.S. Government PrintingOffice, 2000.
5. For a succinct explanation of the NAEP test, seeGlossary.
6. U.S. Department of Education, op. cit, indicator38, p. 56.
7. The College Board, College-Bound SeniorsNational Report. Washington, D.C, 2000.
8. U.S. Department of Education, op. cit., Table 38-3,p. 156.
9. U.S. Department of Commerce, U.S. CensusBureau. Overview of Race and Hispanic Origin.Census 2000 Brief. Washington, D.C., March2001.
10. Quoted in the New York Times, Education Life,Section 4A, pages 37-38, Sunday, April 9, 2000.According to the Department of Education, 29%
of first time freshmen were enrolled in remedialcourses in 1995 (the latest data available). Kelly,Karen. “Seeking a Cure for Senior-Year Slump.”Harvard Education Letter. Research Online.July/August 2001. http://www.edletter.org/current/.
11. Jencks, Christopher and Meredith Phillips (Eds).The Black-White Test Score Gap. Washington,DC: The Brookings Institution, 1998, p. 4-7.
12. Exposing the Gap: Why Minority Students AreBeing Left Behind in North Carolina’sEducational System. Raleigh, NC: North CarolinaJustice and Community Development Center andthe North Carolina Education and Law Project,2000.
13. A dinner discussion with Daniel Domenech,Superintendent of Fairfax (VA),” American YouthPolicy Forum, June 15, 1999 available atwww.aypf.org/forumbriefs/1999/db061599.htm.
14. Section 1111(b) (3) (I) of Title I of the Elementaryand Secondary Education Act of 1994 reads, “Stateassessments shall – Enable results to bedisaggregated within each State, local educationalagency, and school by gender, by each major racialand ethnic group, by English proficiency status, bymigrant status, by students with disabilities ascompared to nondisabled students, and byeconomically disadvantaged students as comparedto students who are not economicallydisadvantaged” and suggests disaggregating data ifno less than ten students are in a single group.
15. Zernike, Kate. “Racial Gap in Schools Splits aTown Proud of Diversity.” New York Times,August 4, 2000.
16. Maryland Department of Education, MarylandSchool Performance Report, available at http://msp.msde.state.md.us; see Baltimore city schools,Dr. Carter Goodwin Woodson Elementary School.
17. Although the authors consider New York Citydifferences significant at the 10% level, educationalresearch tends to limit significance to the 95%confidence level (or 5% level of significance).
Raising Minority Academic Achievement32
American Youth Policy Forum
18. Jerald, Craig D. Real Results, RemainingChallenges: The Story of Texas EducationReform. Washington, D.C.: The BusinessRoundtable, 2001, p.32.
19. We speculate that there must be some lag timebetween the implementation of so many highschool testing requirements and the use of thesetest scores in the evaluation of high schoolprograms.
20. The lack of evaluations for the manypostsecondary programs that targetunderrepresented minority students is also
reported in Gándara, Patricia. Priming the Pump:Strategies for Increasing the Achievement ofUnderrepresented Minority Undergraduates.New York: The College Board. 1999.
21. Though there has been no formal evaluationconducted on Hispanic-Serving Institutions (HSIs)of higher learning, data on the 203 HSIs can befound at www.ed.gov/offices/OIIA/Hispanic/hsi/.
22. Jurich, Sonia and Steve Estes. Raising AcademicAchievement: A Study of 20 SuccessfulPrograms. Washington, D.C.: American YouthPolicy Forum, 2000.

��������

Raising Minority Academic Achievement 35
American Youth Policy Forum
+������������,������&���$�
�������� ��������Educational researchers would prefer to think thattheir trade is a precise, scientific discipline with well-defined concepts and standardized proceduresleading to uncontested results. However, betweenthe ideal and reality there is usually a wide gap.Social phenomena are generally too complex to beisolated and measured, rigorous research methodsmay clash with ethical concerns, and the search forobjectivity may be clouded by program advocacy.Good researchers strive for a balance between whatshould be done (the “perfect” research) and whatcan be done. For those dealing with secondarysources, that is, research done by others, thenegotiation between ideal and reality is even morefrustrating. Jargon-laden research must be decodedinto intelligible language, large amounts of workmust be reviewed to select a few evaluations forinclusion, and at the end, the questions thatpropelled the search may remain unanswered.
The making of this report reflects all thesechallenges. The journey that started 18 months agorequired reviews of hundreds of articles, reports,books, unpublished manuscripts, and otherdocuments to produce the summaries included inthis report. This chapter briefly describes the pathtraveled, its obstacles and discoveries along the way.(For a description of the report methodology, seeOverview and Research Note)
The Journey and Its Obstacles:
The U.S. is perpetually awash in ‘new’ andself-proclaimed ‘highly effective’ programs forimproving students’ academic achievement . . .The evidence that most of these programs‘work’ has always been modest, and evidenceof generalizability of effects is, for themajority of programs, non-existent (SamStringfield1 ).
Finding evaluations of any quality is a difficult task,except for federal initiatives or grantee programsthat mandate such studies. Program evaluation is atime-consuming process that may take money awayfrom direct services. For many educators andyouth program practitioners, already struggling withfunding shortages, the idea that some of this moneywill be diverted from services to support research isanathema. However, without research, programpractitioners may be perpetuating failing ormediocre interventions whose long-termconsequences are much costlier to the young peopleand society. Although common sense indicates thatinterventions without a proven record of successshould not be replicated, the search for the “magicsolution” seems to overcome common sense. Anon-scientific estimate of the literature searchsuggests a ratio of five “how to” reports – that is,reports on how to implement a specific but oftenuntested intervention – to one evaluation of aprogram or strategy.
The search process for this report was particularlychallenging, more so than for the two previousAYPF compendia. Over 200 documents werecollected for an initial selection of less than 50. Asdescribed in the Research Note, the acceptance ofevaluations for the report was dependent on fivecriteria that included population, measurements,methodology, length of research and scope. Thefollowing paragraphs discuss some of the obstaclesencountered in satisfying the criteria and how theyinfluenced this report’s outcome. For readers whoare interested in research but not familiar with itsbasic terminology and standards, a brief explanationis provided at the end of the chapter, under the title“Basic Principles of Educational Research.”Definitions of research terms are included in theGlossary.
Raising Minority Academic Achievement36
American Youth Policy Forum
PopulationThe most important caveat about the documentsreviewed was their treatment of the population.First, although the initial purpose was to includeevaluations and programs for youth from allminority racial/ethnic groups, the final reportincludes few studies related to Native American andAsian/Pacific Island youth. The report’s primaryemphasis on African American and Latino youthreflects rather a lack of information on the othergroups than a search process that focused on thesetwo groups.
Second, most evaluations report on the studentpopulation as a homogeneous group, wheredemographics, such as race/ethnicity, appear as partof a description, but are rarely taken into account inthe analysis. Few evaluations disaggregated theirfindings by sub-groups – ethnicity, gender, socio-economic status, English proficiency or baselineacademic achievement. Disaggregating datarequires more work during the data collection phase,demands a larger pool of students to providestatistically meaningful results, and risks exposingprogram weaknesses. However, this type ofanalysis is essential to highlight areas that requireimprovement and areas of proven success, thusoffering key information for school administratorsand program implementers.
The evaluations of Chapel Hill-Carrboro CitySchools (CHCCS) and GE Fund College Bound aregood examples of the value of disaggregating data.Results from the CHCCS program showedimproved levels of proficiency in mathematics andreading for African American students with areduction in the score gap between these studentsand their white peers. Yet the writing scores forAfrican American students actually declined duringthe period of the study. The evaluation for the GEFund indicated an overall increase in collegeenrollment rates for all participants, but more so forLatinos. However, the gap in enrollment betweenAfrican Americans and whites increased. Facultyinvolved with the two projects can use the data toexamine their strategies toward each group ofstudents, to replicate the strategies that are boostingminority achievement and revise the strategies that
are not working. Programs that claim successwithout disaggregating their data may be helping onegroup of students while the other groups continue tofail. In fairness to the student population as awhole, these programs are not achieving theirobjectives.
Outcome MeasurementsThe initial criteria for acceptance of evaluationsrequired a set of outcome measures that wouldprovide a broad picture of the students’performance, such as test scores, number and typeof credits taken, GPA, dropout and attendancerates, as well as postsecondary education oremployment data. This requirement was based onthe principle that relying on a single measure toassess a program may lead to incomplete, and manytimes, misguided conclusions. For instance, theevaluation of Equity 2000, a program that proposesacademically challenging curricula for all high schoolstudents, shows a 30% increase in studentenrollment in advanced mathematics classes. It alsoshows an increase of about 50% in failure rates inthese same classes. While the enrollment datasuggest an accomplishment, the data on passingrates indicate the need for much work before theprogram claims success.
Despite efforts during the search period, fewevaluations reported more than two measures ofachievement, the most frequent being test scores. Itis inadvisable to use tests as the sole measure ofstudent knowledge for many reasons. For instance,multiple-choice tests measure only one type oflearning (memorization); some tests have beencriticized as being culturally biased against minoritystudents; some students are great test-takers whileothers are not; tests evaluate the student on one dayout of 180 or more per school year, and on one setof specific competencies; tests do not necessarilyassess the students’ mastery of essential skills, suchas problem solving, communicating complex ideas,using different strategies to reach a solution, orworking in groups.2 Notwithstanding the myriadproblems with testing, the reality is that tests arebeing used across the country as a measure of schoolaccountability and student achievement, and asgateways to advancement along the educational ladder.
Raising Minority Academic Achievement 37
American Youth Policy Forum
Programs that raise the test scores of minority youthdo increase the youths’ chances of high schoolgraduation, college admission and success in later life.
Acceptance of test scores as a valid measure ofstudent achievement does not solve the question ofwhether it should be the sole measure. There aremany methodological limitations associated with anoveremphasis on test scores, such as:
� Habituation – Although questions change withdifferent administrations of a test, students getused to the logic behind the test and its style.With time, scores in that specific test tend to goup due to habit, rather than actual improvementof student performance.
� Lack of reliability – Few of the currentstatewide tests are submitted to statisticalanalyses to assess their validity and reliability.3
� Political pressure – Tests may be weakened toaddress parental opposition and, in this case,increased test scores within a period of timemay reflect a change in the tests (becomingeasier or lowering the cut-off scores) rather thanbetter-prepared students.
� Teaching to the test – Higher test scores mayreflect the schools’ emphasis on teaching to thetest. With teachers focused on preparing thestudents to take the test, it is expected thatscores will go up, even if the students still missimportant competencies for future careers,sacrifice depth for breadth, and do not work onproblem solving and critical thinking skillsimportant for democratic citizenship and thenew job market.
� “Cheating” the system – Higher test scoresmay also hide an increase in dropout rates or inthe number of students identified as havinglimited English proficiency or in need of specialeducation (generally, these students areexempted from statewide tests). As the studentswho test poorly for various reasons are pushedout of the system, the average scores of theremaining students increase. Without other
measurements, such as trend data on specialeducation enrollment, dropout rate, collegeattendance and retention, enrollment in remedialcourses in college, or type of employment,conclusions based solely on test scores arelimited.
All this being said, with the current emphasis ontesting it is understandable that researchers rely ontests to evaluate the success of a program. Indeed,the vast majority of evaluations found used testscores as the sole measure (at least, the solequantifiable measure) to assess a program’sperformance.
Evaluations that use scores on only one test toassess a program create a serious obstacle forcomparisons across programs. For example, is a30% increase on the Texas Assessment ofAcademic Skills (TAAS) a greater feat than a 10%increase on the California Achievement Test (CAT)?Evaluations using the National Assessment ofEducational Progress (NAEP) can be compared,since this is a nationwide assessment (although theNAEP is not conducted yearly and scores are notreported for individual students), but few studiesreviewed used NAEP data. 4 Another question thatremains unanswered by a raw test score is itsimpact on the student’s life. What does a three-point increase in a test represent for the student? Isthis student now at the expected grade level? Howmuch more does the student need to be proficient inthe subject?
Translating results into grade levels or percentilesfacilitates comparisons. For instance, after theCalvert model was implemented at the Dr. CarterGoodwin Woodson Elementary School, an allAfrican American inner city school in Baltimore, thefirst grade average reading comprehension scoreswent up 31 points, from the 18th to the 49th
percentile. This measure indicates that beforeCalvert was implemented, Woodson students werescoring on average below 82% of all students whotook the Maryland test. One year into the newprogram, the average score of Woodson studentsplaced them close to the middle. This informationdoes not answer the question of how well the test
Raising Minority Academic Achievement38
American Youth Policy Forum
assessed what students need to know to succeed inlife, but very few tests, if any, have such predictivepower.5
MethodologyDesign - Methodological rigor should be a concernfor any researcher, but the standards of rigorousresearch are not so clear in the educational field.Evaluations using control or comparison groupswere rarely found in the search for this report. Themajority of the documents that we found comparedthe program or school with existing databases at thedistrict or state levels. As the methodological rigorweakens, the findings become less reliable orgeneralizable, and the research process turns into anexpensive, but fruitless exercise. Researchers whodeal with limited budgets must carefully choose adesign that provides the required informationwithout unjustifiable expense. Interestingly enough,despite complaints of lack of research funding, thesearch produced a number of evaluations withhighly complex, costly but inefficient designs.
Use of indicators – To evaluate performancechanges, the data collected must be comparedagainst either a baseline performance (how thestudents performed before the program) or someestablished indicator (how the students wereexpected to perform). A claim that 70% of Latinostudents in a program graduated is meaninglesswithout information on how many studentsgraduated before the program, or the overallgraduation rate for Latino students in that specificschool district or state. An enrollment of 80% in analgebra class may seem high until we discover thatalgebra is a mandatory course for graduation in thatschool district, and the enrollment should be 100%.Numbers gain meaning only within a context. Thiscomment should be obvious, but a number ofrejected evaluations claimed the success of aprogram without that context.
Statistical treatment of data – In addition toincluding baseline data and/or contextual indicators,researchers should calculate the statisticalsignificance of their findings. A 12% decline in thetest score gap between African Americans and whitestudents in a specific program could reflect either
the positive impact of the program or normalfluctuations in test scores. Statistical tests areneeded to separate random occurrences fromtreatment effects. If these test scores areperformed, researchers must report results,including levels of significance. Again, reportingstatistical significance is a basic research principlethat was frequently forgotten among the documentsreviewed.
Researcher bias – It is not uncommon in theeducational field that a research institution or anindividual researcher monopolizes the evaluation ofspecific programs or initiatives. In an ideal world,third parties (“outsiders”) with no direct interest inthe program should conduct the evaluation to ensurethe impartiality of analysis. In reality, however, it isoften cheaper and easier for an “insider” oradvocate with the appropriate research skills toconduct an internal evaluation. Fortunately, thereview conducted for this report shows that“insider” evaluations can be just as rigorous andimpartial as third-party evaluations. For example,many school evaluations are conducted throughschool district staff. Depending on the local politicalclimate, these studies can be quite independent,particularly when they are intended as internal toolsof assessment. The Chapel Hill-Carrboro CitySchools evaluation is an example of an impartialinsider research. In contrast, a number of“outsider” evaluations were rejected because theycontained blatantly biased analysis.
Scope
If we do not describe the possible dystopias weshall be left only with [our] utopias. If we donot insist on bringing research findings (whichmay be politically inconvenient) into thepublic arena, we contribute to the erosion ofdemocracy (Gipps6 ).
It is well-known that academic journals in anyscience (not only education) tend to publishevaluations that show success, while studies withnegative findings are politely rejected. To ensure amore balanced perspective of programs gearedtoward minorities, the search included manuscripts
Raising Minority Academic Achievement 39
American Youth Policy Forum
and unpublished grant reports in addition topublished articles. Yet, whether the evaluation waspublished or not made little difference. A tendencyto spin results into success or hide less thansuccessful results was common to the majority ofthe documents. Chapel Hill- Carrboro CitySchools, GE Fund College Bound and HighSchools That Work deserve commendation for thecourage to show accomplishments andshortcomings. Without this courage, programevaluation becomes little more than statisticalcheerleading. Evaluators who hide negative resultsor use their trade as a tool for ideological positionsare doing a disservice to policymakers, who willmake decisions based on questionable information.By perpetuating misinformation, these evaluatorsare also doing a disservice to the educationalprocess and to the youth, victims of failed strategiesdisguised as success.
The first conclusion resulting from the searchprocess is that the most useful research isbased on simple but methodologically sounddesign and provides information that is clearand easy to understand. This type ofinformation is essential for educators andprogram practitioners who need to convinceskeptics, placate critics, or expand support fortheir programs. Less useful aremethodologically unsound evaluations, orevaluations that are so complex and hard toread that, high quality or not, they provide littleusable information to policymakers andpractitioners.
Report Overview
A brief overview of the evaluations selected for thisreport reflects the following characteristics:
� Range. The selected evaluations present amix of policy initiatives and public or privateprograms. Together, the summaries span theeducational ladder, from early childhood tograduate education. Although some district-wide reforms address all grades from K-12,evaluations of programs or initiatives thatspecifically target middle school studentswere not found. The search, albeit quite
extensive, may have missed such programs,but this finding is worrisome, since manystudents who drop out of school start fallingbehind in middle school.
� Population. Few programs and initiativestarget specific racial/ethnic groups. Themajority serve a large number of minoritystudents for two basic reasons. First, themajority of evaluations dealt with programsand initiatives targeting Title I schools, that is,schools with large numbers of students livingat or below the poverty level. Althoughpoverty is by no means an exclusive problemof minorities, minority children and youth areover-represented among the poor. Second,some programs are located in areas where aspecific minority group predominates, such asLatinos in Puerto Rico and some schoolsdistricts in California, and African Americansin Washington, DC, and Baltimore. ThePopulation textbox in each of the evaluationsummaries in Section II reports thepopulation in each study by racial/ethnicgroup, income level, geographical location,and program targeted level.
� Methodology. The studies summarized in thiscompendium vary in design andmethodological rigor. Nineteen out of the 38summaries use a control or comparisongroup, four are longitudinal studies, nineemploy the pre/post-treatment method andeleven compare their findings against district,state or national databases (some use morethan one method). Four summaries aredescriptive only.
� Measures. For K-12 programs, test scores arethe most common measure of academicachievement. Most evaluations rely on onetype of test, often the state-mandated test. Afew studies use standardized tests adoptednationwide, such as the Iowa Test of Basic Skills(ITBS) and the Stanford-9 (SAT-9).7 Amongother indicators, high school programs frequentlycite college enrollment data, while postsecondaryeducation programs look at retention rates. Few
Raising Minority Academic Achievement40
American Youth Policy Forum
reports provide data on employment, includingTribal Colleges, Compact for Diversity and thethree long-term studies of early childhoodprograms (Abecedarian, Child Parent Centersand High/Scope).8
This analysis discussed utopias and dystopias, thepolitically inconvenient but statistically significant.The hope is to contribute information that can guideeducators and policymakers to better informedchoices of strategies and initiatives that improve theacademic achievement of minority youth; and fostera better understanding of the need for evaluationstudies that look at facts, rather than dreams, andreality, rather than rhetoric. This hope is translatedin the recommendations below.
Recommendations
� A large-scale, national and comprehensiveeducational research agenda must bedeveloped to (a) determine which strategies andpolicies have resulted in the most benefit, forwhom, and at what cost, (b) provide guidanceto evaluators on what type of research would bemost useful to policymakers and practitioners,
and (c) provide guidance to practitioners onwhy quality research is needed, how to initiate itand use it.
� Public and private funding sources mustrequire and support high quality programevaluations and utilize findings to improvepolicy and practice, rather than to punishprograms.
� Data must be disaggregated by race, ethnicity,limited English proficiency, disability status,gender and poverty level and be made publiclyaccessible to researchers, educators,policymakers, families and the public at large.
� Researchers should look into a range ofachievement indicators including, numbers ofstudents enrolled and dropping out, attendance,test scores, GPAs, graduation, suspensions,expulsions, and special education referrals.They should also translate their findings intolanguage that is accessible to policymakers,practitioners, educators, families and students,so that research findings can be translated intobetter education policies and practices.
Addendum: Basic Principles ofEducational Research
The next paragraphs attempt to provide readerswho are not familiar with research with some verybasic tools to help them navigate the summariesand use the findings to make their own assessmentabout the programs. These paragraphs reflect themany discussions about research among themembers of the editorial team. However, itsinclusion is not without a certain hesitation sincea large amount of information is necessarily omitted.
Control GroupsThe use of control groups provides the mostrigorous design to assess the effect of anintervention, but it also raises important ethicalquestions. In educational research that uses controlgroups, two groups of individuals are randomlyselected – one group attends the program (treatment
group) and the other does not (control group).When using a control group, the researcher ensuresthat the two groups are as similar as possible andlimits the factors that may interfere with theeducation process. This control enables theresearcher to attribute later differences between thetreatment and the control groups to the program’seffect with some degree of certainty (total certaintyis an unattainable ideal). However, a control groupsupposes that the evaluators, with the consent ofprogram directors or implementers, made a choiceto provide a strategy that may help a group of needyyouth while refusing it to another needy group, adifficult decision for any concerned individual.Programs that have more applicants than openings andselect students through a lottery process have a naturalcontrol group in the students who do not win thelottery. The lottery is a totally random process thatexcludes the possibility of personal bias from admissionpersonnel, but few programs use this system.
Raising Minority Academic Achievement 41
American Youth Policy Forum
Comparison GroupsEvaluators can solve this problem in part by findinga comparison group, that is, an existing group ofstudents similar to the treatment group who will notattend the program. For instance, students in twoschools that are demographically and academicallysimilar where one school implements the programand the other does not. A popular comparison ineducational research is between students in aspecific program and district wide, statewide ornationwide data. This type of comparison group isthe easiest to identify, because the data alreadyexists, but is the least reliable, since large databasesinclude schools with different academicachievement, socio-economic background, type ofpersonnel, and funding levels.
MatchingControl and comparison groups must be matchedfor demographics, socio-economic status, and prioracademic performance to ensure that they aresimilar. If the groups are not matched on all thesefactors, the evaluators cannot infer whether thefindings reflect program effect or the initialdifferences between the groups. A treatment groupstarting at a higher academic level than thecomparison or control group is more likely to showhigher scores even without the program. Or theconverse may be true. The treatment group may havemore students who are struggling academically. In thiscase, results may favor the control or comparisongroup even if the program is working. Although thisexplanation appears obvious, we found evaluationstudies that claimed program success based oncomparisons of groups that differ in their basicdemographics and performance characteristics.
Pre- and Post-Treatment DataResearch using pre- and post-treatment data doesnot have the problem of group differences, butbrings up other concerns, such as differences intests used to measure progress, natural studentmaturation, or interferences due to the exit andentrance of students, changes in school personnel,and other factors.
Timing and Longitudinal StudiesTime is an important factor in evaluations. A studyconducted too early, before the strategies are fullyimplemented, will not show clear results. Studieswhere the data is collected only once do not provideinformation about the program’s ability to promotechanges on an ongoing basis. It is not unusual thata program shows positive short-term changes as aresult of the attention generated during its initialimplementation. If this is the case, results maydecline the following year, when the novelty haspassed and the attention wanes. Longitudinalstudies provide the best information to assess theprogram’s performance. However, longitudinalstudies are both difficult to implement andexpensive. In addition, as the time passes, contactwith research participants becomes more difficult,the initial treatment and control group dwindle, andresults from such small samples become less proneto generalization. The Abecedarian Project, ChildParent Centers and High/Scope Perry Preschoolare examples of the advantages and difficulties oflong-term longitudinal research.
Use of SamplesIn research, population is the generic name for whatis being studied (it can be rats, as in experimentalpsychology research, as well as schools, studentsand teachers). Studies of small programs that existin one school should include all the students as theresults will be more reliable. However, for largestudies, such as programs implemented in manyschools or large school districts, it may becomeimpossible to manage the study using the wholestudent population and the use of samples becomesimperative. In general, samples are randomlyselected using some type of lottery, computer-generated numbers, or similar process. Researcherscan also select samples to answer specific researchquestions. For instance, they can select only thebest schools in a district to compare with the bestschools in another district, or they can select onlymale students to analyze how a program affectsmales. When researchers select the sample, theyshould explain their selection process.
Raising Minority Academic Achievement42
American Youth Policy Forum
Sample SizeThe size of the sample is important to ensure thatresults can be generalized to the total population.If the sample is too small, it may not be suitablefor statistical tests. One of the problems withdisaggregating data is that, when the total sampleis divided, each sub-group must be large enoughto provide statistically significant results. Termssuch as large or small are relative to the initialsize of the population and the type of study beingconducted, including the questions asked and thetype of tests required.9
Statistical SignificanceAfter ensuring the quality of the comparisons,evaluators must also identify whether the results
Following are 38 summaries of evaluations on programs and practicesthat influence the academic achievement of minority youth.
have statistical significance, that is, where resultscannot be attributed solely to chance. There mustbe some degree of confidence that the results can beattributed to the program. In educational research,a 95% confidence level is considered good; inmedical research, where life and death are at stake,5% uncertainty may be too much. This confidencestatement can be expressed in levels of significance.A difference in test scores between two groups ofstudents that is significant at the 5% level meansthat only 5 out of 100 students got that test score bychance. For the other 95, the change in grade is aneffect of the program. Levels of significance (p) aregenerally written as a mathematical expressionwhere p�0.5 (for a 5% significance level) or p�0.2(2% significance level) and so on.
1. Stringfield, Sam. “Underlying the Chaos: FactorsExplaining Exemplary U.S. Elementary Schools and theCase for High-reliability Organizations.” In Restructuringand Quality Issues for Tomorrow’s Schools, edited by T.Townsend. London: Routledge, 1993.
2. For a discussion of tests as measures of academicperformance, see Bracey, Gerald. Thinking About Testsand Testing: A Short Primer in Assessment Literacy.Washington, D.C.: American Youth Policy Forum, 1999(available at http://www.aypf.org/BraceyRep.pdf );Natriello, Gary and Aaron Pallas. The Development andImpact of High Stakes Testing. Paper presented at theHigh Stakes K-12 Testing Conference, sponsored by TheCivil Rights Project, Harvard University, Teachers College,Columbia University, and Columbia Law School, 1998(http://www.law.harvard.edu/groups/) ; Rotberg, Iris. “FiveMyths about Test Score Comparisons,” SchoolAdministrator, 53 (1996): 30-31, 34-35.
3. Validity refers to whether the test measures what it issupposed to measure (for instance, does the test measurethe knowledge in English expected from a 5th grader inTexas?). Reliability refers to whether the test results canbe replicated (do Texan 5th graders well-versed in Englishalways score within a same range every time they take thetest or are the results too unpredictable?). For moreexplanation on this topic, see Bracey, op. cit.
4. For a discussion of comparisons between TAAS and othertests, including the NAEP, see Jerald, Craig D. (2001).Real Results, Remaining Challenges: The Story ofTexas Education Reform. Washington, D.C.: TheBusiness Roundtable.
5. Bracey, op. cit., has a discussion on the use of the SAT on“predicting” student performance in college.
6. Gipps, Caroline. The Role Of Educational Research InPolicy Making In The U.K. Paper presented at theAmerican Educational Research Association (AERA)Conference, Atlanta, Georgia, 1993, p.16.
7. For explanations about the tests used in each evaluation, thereader is referred to the Study Methodology section at theend of each summary. For a brief description of the tests,please refer to Glossary.
8. Employment data in the Early Childhood evaluations wasnot included in the summary but can be accessed in the fulldocument.
9. A very accessible, easy-to-read introduction to sampling isSudman, Seymour. Applied Sampling. New York:Academic Press, 1976.
�� ������
���������

Raising Minority Academic Achievement 45
American Youth Policy Forum
Begun in 1972, the Abecedarian program was anexperimental pre-school program serving thechildren of low-income, African American familiesin Chapel Hill, North Carolina. The full-day, year-round program served the children from theirinfancy until the age of five. The program providedfree diapers, food, and transportation as well asacademic, physical, and social enrichment activities.As children entered kindergarten, the programfurther divided the control and treatment groups,providing “school-age support” to half of eachgroup, so evaluators could determine the differenteffects of pre-school and primary schoolinterventions. The “school-age support” wasprovided by a Home-School Resource Teacher fromthe program who served as a liaison between thestudents’ families and school officials for the firstthree years that the children attended public schools.Abecedarian staff also provided parents withindividualized curriculum packets to help them workwith their children at home on academic lessons.The experimental program ended by design in themid-1980s in order for researchers to track the
POPULATIONAt the outset of the longitudinal study, thedirectors selected 111 healthy infants (averageage of 4.4 months), who were found to be at“high risk” because of family income andmaternal education level. (The mothers were alllow-income. They had on average a tenth gradeeducation and their average age was 20.)Although ethnicity was not a selection criterion,98% of the children were African American,because a higher percentage of poor people inthe locality served were African Americans. Ofthe 111 infants in the original sample, 57 wererandomly assigned to enroll in the Abecedarianprogram and the remaining 54 were assignedto the control group. The control groupchildren experienced a range of early careincluding parental care and other child-careprograms available in low-income communities.Half of the children in each group were chosenat random to receive additional academicsupport in the first 3 elementary school grades.For the 21-year follow up study, the evaluatorsinterviewed and tested 104 of the originalparticipants in Abecedarian.
�-���������.��$���������������
� �� ���
“The Development of Cognitive andAcademic Abilities: Growth Curves from anEarly Childhood Educational Experiment”(2001) Developmental Psychology 37(2) 231-242.By Frances A. Campbell, Elizabeth P. Pungello,Shari Miller-Johnson, Margaret Burchinal, andCraig T. Ramey.
“Early Intervention and MediatingProcesses in Cognitive Performance ofChildren of Low-Income African AmericanFamilies” (October 1997) Child Development68(5): 935-954. By Margaret R. Burchinal,Frances A. Campbell, Donna M. Bryant, Barbara H.Wasik, and Craig T. Ramey.
Focus����� Early Childhood����� Primary School
Middle SchoolSecondary SchoolPostsecondaryExtended Learning
“Cognitive and School Outcomes for High-Risk African American Students at MiddleAdolescence: Positive Effects of EarlyIntervention” (Winter 1995) AmericanEducational Research Journal 32(4): 743-772. ByFrances A. Campbell and Craig T. Ramey.
Raising Minority Academic Achievement46
American Youth Policy Forum
������������
The strongest effects of the Abecedarian preschoolprogram occurred while the youth and their familieswere participating in the project. But the studiessummarized here focus on the academicachievement effects that endured through the teenyears and early twenties, more than a decade afterparticipants had left the program.
Relative to their peers in the control group at age15, the program participants:
� Had a lower rate of grade retention in grades K-9 (31.2% vs. 54.5%; p=.02).
� Were less likely to need special education ingrades K-9 (24.5% vs. 47.7%; p=.02).
� Had a higher adjusted mean reading score onthe Woodcock-Johnson test (93.5 vs. 86.7;effect size of .45).
� Had a higher adjusted mean math score on theWoodcock-Johnson test (91.6 vs. 86.1; effectsize of .37).
Relative to their peers in the control group at the ageof 21, the program participants:
effects of the program on cognitive ability andacademic performance of participating students asthey continued up the educational ladder. The basicelements of this program were replicated in the
Infant Health and Development program providedfor nearly 1000 low-birth-weight children at 8 sitesacross the nation.
� Had completed more years of school (12.2 vs.11.6; p<.05).
� Were more likely to have attended a four-yearcollege (35.9% vs. 13.7%, p<.05).
� Were more likely to be in school (42% vs. 20%,p<.05).
� Were more likely to be engaged in skilled jobs(47% vs. 27%; p<.05),
In terms of gender, women who had been in thepreschool program earned 1.2 years more educationthan their peers in the control group (12.6 vs. 11.3;p<.05), but the difference for men was notsignificant.
���������������
The Abecedarian program was designed as anexperiment to determine the effect of high qualityeducational childcare on children from low-incomefamilies. These longitudinal studies include all of theprogram participants and a randomly assignedcontrol group that did not participate in the earlychildhood program. The program provided half ofeach group with additional academic support fromfirst through third grade in a “school-ageintervention” to determine the impact ofintervention timing.
� From infancy to age 5 (when publickindergarten began), children attended theprogram eight hours a day, five days a week,fifty weeks a year.
� At infancy, the caregiver to child ratio was 1:3.A specially designed Abecedarian infantcurriculum covered cognitive and fine motordevelopment, social and self-help skills,language and gross motor skills. Diapers, foodand transportation were provided to allparticipants.
“The [Abecedarian] outcomes show that highquality educational childcare can make adramatic difference in the lives of youngAfrican American adults reared in poverty.”
—Frances Campbell andCraig Ramey, evaluators
Raising Minority Academic Achievement 47
American Youth Policy Forum
Early InterventionEvaluators determined that “the preschool treatmentwas more strongly associated with the improvementin academic achievement than was the later school-age intervention.” Yet they admit that variables suchas duration and strategy of intervention (directinstruction vs. parent-mediated home activities)made it difficult to determine why this was so.
Long-term SupportFull-time, year-round childcare for five years wasavailable to children from low-income families, andthe continuity of service seemed to be a factor inthe program’s results.
� As children grew to become toddlers, the staffto child ratio decreased to 1:6. The curriculumincluded interest centers for art, housekeeping,blocks, fine-motor manipulatives, language andliteracy. A special emphasis on languageacquisition required daily or semi-weeklyindividual sessions with each child.
� Before the participants entered kindergarten,they participated in a six-week summertransition program that included other childrenfrom the community to facilitate socialization ofthe Abecedarian participants.
� Parents of Abecedarian students served on thecenter’s advisory board, attended social eventsat the center and received counseling by thecenter’s medical staff on child health anddevelopment.
� Half of the participants and the control groupalso received a “school-age intervention” fromgrades K-3 (with a staff to child ratio of 1:14).This phase of the program was designed toinvolve parents in their children’s education.One Home-School Resource Teacher (HST)served groups of 14 children and their families,providing them with individualized curriculumactivities to reinforce math and reading skillslearned in school. The HST visited classroomsevery other week to consult with teachers aboutthe students’ needs and on alternate weeksdelivered a curriculum to the parents. The HSTalso “functioned like a social worker” servingother needs of the family and referring them toappropriate agencies for services.
������������������
Individualized AttentionThe high staff to student ratios at every stage of theAbecedarian program allowed staff to individualizeenrichment activities, language lessons and higherlevel academic curriculum activities for each child.
Raising Minority Academic Achievement48
American Youth Policy Forum
STUDY METHODOLOGYFor an explanation of the random selection of 111participants in the treatment and control groups,see the “Population” section of this summary. Theevaluators measured the social and intellectualdevelopment of both groups at ages 3, 4, 5, 6.5and 8 years old with the Stanford-Binetintelligence scale and the Wechsler Preschooland Primary Scale of Intelligence. TheWoodcock-Johnson Psycho-Educational Battery(a standardized achievement test) wasadministered to the students at age 8, 12, 15, and21 to measure math and reading achievement. Ofthe initial 111 participants in the treatment andcontrol groups, 104 were available for testing andinterviews at the age of 21.
EVALUATION FUNDINGThe 21-year follow-up studies of the AbecedarianProject were funded by the Maternal and ChildHealth Bureau of the Department of Health andHuman Services, the Office of EducationalResearch and Improvement, the Department ofEducation and the David and Lucile PackardFoundation. The program and earlier phases ofthe research were primarily funded by a series of
grants from the Mental Retardation andDevelopmental Disabilities Branch of the NationalInstitutes of Child Health and Human Developmentand the State of North Carolina.
GEOGRAPHIC AREASChapel Hill, NC
CONTACT INFORMATIONResearch ContactsFrances A. CampbellFrank Porter Graham Child Development Center,CB# 8180University of North CarolinaChapel Hill, NC 27599-8180Phone: 919.966.4529http://www.fpg.unc.edu/~abc/[email protected]
Craig Ramey, DirectorCivitan International Research CenterUniversity of Alabama, Birmingham1719 Sixth Avenue, SouthBirmingham, AL 35233Phone: [email protected]
Raising Minority Academic Achievement 49
American Youth Policy Forum
������������
Since AVID is a college preparatory program,evaluators used longitudinal studies to determine theprogram’s impact on college access and success.
Two English teachers at Clairemont High School inSan Diego, CA founded Advancement ViaIndividual Determination (AVID) in 1980, becausethey were concerned with the large number ofstudents unlikely to pursue postsecondary education.Research has shown that well-behaved, C-averagestudents from low-income families tend to receivethe least attention from teachers and schoolcounselors. Subsequently, these students enroll inless demanding courses that do not prepare them toenter four year colleges. AVID provides thesestudents with a college preparatory program thatrelies on teacher professional development, arigorous course of study, and the use of collegestudents as tutors and role models. Everyparticipant of the program takes an additionalelective class during the regular school day, whichemphasizes writing skills and cultivates critical
�� ��������/���+��� ���
0�������������1�/+02������������
� �� ���
“AVID: A 20th Anniversary” (2000)Unpublished Report, The AVID Center. By MaryCatherine Swanson.
“Longitudinal Research on AVID, 1999-2000: Final Report” (June 2000) Center forResearch Evaluation and Training in Education.By Larry F. Guthrie and Grace Pung Guthrie.
“AVID Research and Information: AnnualReport, 1998-99” (1999) Unpublished Report,The AVID Center. By Mary Catherine Swanson.
POPULATIONAVID serves more than 70,000 students enrolledin over 1000 middle and high schools in 20states and 14 countries. Demographiccharacteristics of participants vary by schooland state. Some schools have a largepopulation of Latino students, others of AfricanAmericans. The program serves all studentsregardless of their ethnicity or socioeconomicstatus, but it focuses on low-income studentswho are the first in their families to have theopportunity to attend college.
inquiry. AVID has received a number of awards,including the Golden Bell Award of 1995 for theCalifornia School Boards Foundation, the A+ forBreaking the Mold Award from the US Departmentof Education and the Pioneering Achievement inEducation Award from the Charles A. DanaFoundation.
� Nearly 95% of AVID’s graduates enroll in college.
� Seventy-seven percent of AVID’s graduates enrollin four-year colleges.
FocusEarly ChildhoodPrimary School
����� Middle School����� Secondary School
PostsecondaryExtended Learning
“Constructing School Success: TheConsequences of Untracking Low-AchievingStudents” (1996) Cambridge University Press. ByHugh Mehan, Lea Hubbard, et al.
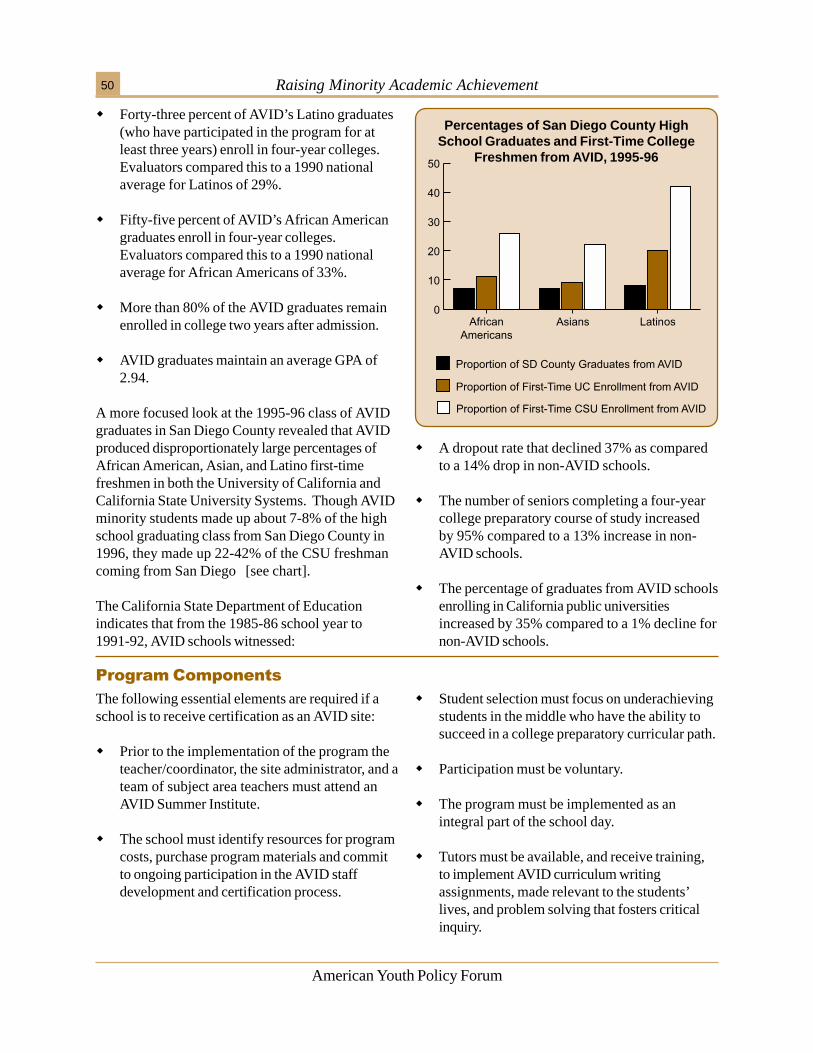
Raising Minority Academic Achievement50
American Youth Policy Forum
���������������
The following essential elements are required if aschool is to receive certification as an AVID site:
� Prior to the implementation of the program theteacher/coordinator, the site administrator, and ateam of subject area teachers must attend anAVID Summer Institute.
� The school must identify resources for programcosts, purchase program materials and committo ongoing participation in the AVID staffdevelopment and certification process.
� Student selection must focus on underachievingstudents in the middle who have the ability tosucceed in a college preparatory curricular path.
� Participation must be voluntary.
� The program must be implemented as anintegral part of the school day.
� Tutors must be available, and receive training,to implement AVID curriculum writingassignments, made relevant to the students’lives, and problem solving that fosters criticalinquiry.
Percentages of San Diego County HighSchool Graduates and First-Time College
Freshmen from AVID, 1995-96
� Forty-three percent of AVID’s Latino graduates(who have participated in the program for atleast three years) enroll in four-year colleges.Evaluators compared this to a 1990 nationalaverage for Latinos of 29%.
� Fifty-five percent of AVID’s African Americangraduates enroll in four-year colleges.Evaluators compared this to a 1990 nationalaverage for African Americans of 33%.
� More than 80% of the AVID graduates remainenrolled in college two years after admission.
� AVID graduates maintain an average GPA of2.94.
A more focused look at the 1995-96 class of AVIDgraduates in San Diego County revealed that AVIDproduced disproportionately large percentages ofAfrican American, Asian, and Latino first-timefreshmen in both the University of California andCalifornia State University Systems. Though AVIDminority students made up about 7-8% of the highschool graduating class from San Diego County in1996, they made up 22-42% of the CSU freshmancoming from San Diego [see chart].
The California State Department of Educationindicates that from the 1985-86 school year to1991-92, AVID schools witnessed:
� A dropout rate that declined 37% as comparedto a 14% drop in non-AVID schools.
� The number of seniors completing a four-yearcollege preparatory course of study increasedby 95% compared to a 13% increase in non-AVID schools.
� The percentage of graduates from AVID schoolsenrolling in California public universitiesincreased by 35% compared to a 1% decline fornon-AVID schools.
Raising Minority Academic Achievement 51
American Youth Policy Forum
� The AVID curriculum must provide the basisfor instruction in the classroom.
� Program implementation and student progressmust be monitored and results analyzed.
� The school must feature an active,interdisciplinary Site Team.
Upon entering the AVID program, students:
� Enroll in advanced level college preparatoryclasses that fulfill four-year college entrancerequirements.
� Are tutored by college students and exemplaryhigh school peers, who have been trained to usespecific teaching methodologies and materials.
� Attend sessions with guest speakers fromeducational institutions and the businesscommunity.
� Participate in field trips to places of educationaland cultural interest.
Parental ParticipationOngoing home contact in the form of regulartelephone calls, letters and meetings for parentsand students, and the presence of a Parent’sAdvisory Board, are vital to the success of theprogram. AVID provides a parent-trainingcurriculum designed to assist families with thecollege-going process.
Redefinition of Roles and ResponsibilitiesAVID expects parents, businesses and universitiesto share in the task of preparing and motivatingstudents to continue their education beyond high
������������������
school. Students assume the responsibility forlearning, while receiving support and help fromthe community. AVID provides the forum inwhich students are nurtured and challenged.
Peer SupportWorking in groups, students are taken out of theisolation that characterizes the traditional highschool program. They become a part of a new peergroup that shares their goals. Learning groups helpstudents realize the connection between power andlearning, and once that connection is established,students become independent learners.
� Receive classes on notetaking, study skills, testtaking, time management, effective textbookreading, library research skills, preparation for theSAT/ACT, college entrance and placement exams.
� Receive help preparing college applications andfinancial aid forms.
A staff development program integrates curriculumstandards with specific student achievement goals.The program focuses on improving students’ gradesin college preparatory courses and improvingmotivation among students from under-representedgroups. Professional development is providedduring the AVID Summer Institutes and monthlyfollow-up workshops.
For schools outside of California, the cost ofimplementing the AVID program is $540 per student(about $3 per day) in year one. By the third year ofimplementation, the cost drops to about $1 per dayper student. For schools and districts in Californiathe per-pupil cost is about $180 per year. InCalifornia, AVID is a state-supported program.
Raising Minority Academic Achievement52
American Youth Policy Forum
STUDY METHODOLOGYThe 1998-99 report drew data from 521 AVIDsites that included 292 high schools, 223middle schools, and 5 other sites. In total,these sites served 29,799 students. Thelongitudinal study undertaken by researchers atCREATE compiled data for 26 California highschools in 8 different regions of the state. TheAVID 20th Anniversary Report included data on645 program sties, including 326 high schools,289 middle schools, and 30 other sites, serving36,839 students.
EVALUATION & PROGRAM FUNDINGSchool districts as well as state and localeducation contracts funded the evaluation. Theprogram is funded by a combination of site anddistrict resources. In California, AVID is a state-funded program with 11 regional centers.
GEOGRAPHIC AREASIn the school year 2000-01, AVID wasimplemented in AZ, CA, CO, FL, GA, ID, IL, IN,KS, KY, MA, MD, NE, NV, NJ, NC, SC, TN, TX,
VA, and Department of Defense DependentsSchools Overseas. Canada is among the 14countries with AVID programs.
CONTACT INFORMATIONResearch ContactsLarry Guthrie, Director &Grace Pung Guthrie, Co-DirectorCenter for Research,Evaluation, and Training in Education (CREATE)1011 Cabrillo AvenueBurlingame, CA 94010Phone/Fax: [email protected]
Program ContactMary Catherine Swanson, Executive DirectorThe AVID Center5353 Mission Center Rd., Suite 222San Diego, CA 92108Phone: 619.682.5050Fax: [email protected]
Raising Minority Academic Achievement
American Youth Policy Forum
53
These studies evaluated two mutually reinforcingreforms called Alaska Onward to Excellence(AOTE) and the Alaska Rural Systemic Initiative(AKRSI). Funded by the Meyer Memorial Trustand implemented by the University of AlaskaSoutheast and the Alaska Comprehensive RegionalAssistance Center, AOTE was adopted by villagesand school districts striving to create educationalpartnerships between schools and the communitiesthey served. Funded by the National ScienceFoundation and directed by the University of Alaskaat Fairbanks, AKRSI integrated the indigenousknowledge system and the formal education system.In turn, this meant engaging communities deeply ineducation; fully integrating native culture, languageand ways of knowing into the curriculum; andmeeting Alaska’s state-driven academic standardsand benchmarks. In AOTE, school districts andvillage schools worked closely with communitystakeholders (parents, elders, other communitymembers and students) to establish a mission andstudent learning outcomes. Village improvementteams then designed action steps to achieve districtgoals. AKRSI strove to provide a solid foundationfor academic growth and learning in ten content
� ��3��������������� �����
� ��3����� ���������+������� �������������
� �� ���
“Study of Alaska Rural Systemic Reform:Final Report” (October 1999) NorthwestRegional Educational Laboratory and University ofAlaska Fairbanks. By James W. Kushman and RayBarnhardt.
“Closing the Gap: Education and Change”(October 1999) Northwest Regional EducationalLaboratory and University of Alaska Fairbanks. ByJerry Lipka.
areas: reading and writing, math, science, worldlanguages, history, geography, government andcitizenship, technology, arts and skills for a healthylife. Most schools incorporated learning activities inthe native language of the village into English-basedcurriculum.
POPULATIONThe studies focused on 7 rural Alaskacommunities — primarily subsistencecommunities serving Eskimo and NativeAmerican students — that had implementedAOTE. The vast majority of families withchildren in these schools relied on subsistencehunting and fishing for a significant portion oftheir livelihood. Their average cash income isless than $20,000 per year, and unemploymentruns from 25-37%. The 7 communitiescovered in the studies — all isolated villages ortowns reached by small airplane — range insize from approximately 125 to 750 residents.Most villages were comprised of 90-98% AlaskaNative people. The schools served as few as 20or as many as 200 students in grades K-12. Ofthe 2,368 teachers in Alaska’s rural schools in1998-99, nearly one-third were new to theirpositions.
FocusEarly Childhood
����� Primary School����� Middle School����� Secondary School
PostsecondaryExtended Learning
Raising Minority Academic Achievement54
American Youth Policy Forum
������������
Evaluators investigated whether the schools andcommunities that had implemented AOTE anytimefrom 1992-1996 had been able to work together forthe good of students.
Southwest Region Schools (SWRS) — the districthighlighted in Lipka’s case study — was the districtable to implement the program most closely to themodel and showed the most positive impacts.
� The percent of students attending college rosedramatically (from 10% in 1988-89 to 50% in1996-97) among SWRS [see chart].
� SWRS high school seniors experienced a steadyincrease in ACT scores between 1991-98.From 1995-96, differences in test scoresbetween students graduating from SWRS andtaking the ACT test and state and nationalaverage scores narrowed. The differences intest scores between SWRS and the stateaverage declined from 6.9% to 5.96%,narrowing the gap by approximately 14%.
� The SWRS school superintendent set goals forthe district: 80% or more of each class had tomeet the required competencies for its gradelevel and 100% of the competencies for theprevious grade level. In 1996-97, 100% of firstand second graders mastered 80-100% ofrequired grade-level language arts skills,compared with 67% of first graders and 92% ofsecond graders in 1995-96. Other gradesshowed less significant impacts.
� In 1996-97, 100% of first graders and 92% ofsecond graders mastered 80-100% of requiredgrade-level math skills, compared with 68% of
first graders and 66% of second graders in1995-96. In 1995-96, the number of eighth-grade students scoring in the top quartile on themath achievement test was more than thenumber of students scoring in the bottomquartile.
Students from Tatitlek in the Chugach SchoolDistrict performed better on the CAT/5, WoodcockReading and Six-Trait Writing assessments after theAOTE initiative.
For the Klawock School District, there wereimprovements in bringing up the bottom quartile ingrade 4 reading, grade 4 math, and grade 8 languageon state-sponsored achievement tests (Iowa Test ofBasic Skills and California Achievement Test).These improvements occurred during five years ofschool reforms in that district including AOTE,initiatives in strategic planning, outcomes-basededucation and curriculum alignment with statestandards.
The AKRSI evaluation compared dropout rates,college enrollment and choice of major for alumnifrom rural AKRSI districts and from comparablerural districts without the initiative.
� Between 1995 and 1998, the dropout rate inAKRSI schools declined .9%, while the declinein comparable non-ARKSI rural schools was.3%. Yet in 1998 AKRSI schools continued tohave higher dropout rates over all (3.5% vs.2.4%).
“The case studies tell what happened as ruralschools embarked on a change journey throughAOTE and other reform activities, payingattention to important educationalaccomplishments and setbacks, communityvoices and the experiences and learning ofstudents.”
—James Kushman and Ray Barnhardt,evaluators, Alaska Onward to Excellence
“It is easy to start new reforms but difficult tokeep up the momentum in order to bring aboutdeep changes in teaching and learning.”
—James Kushman and Ray Barnhardt,evaluators, Alaska Onward to Excellence
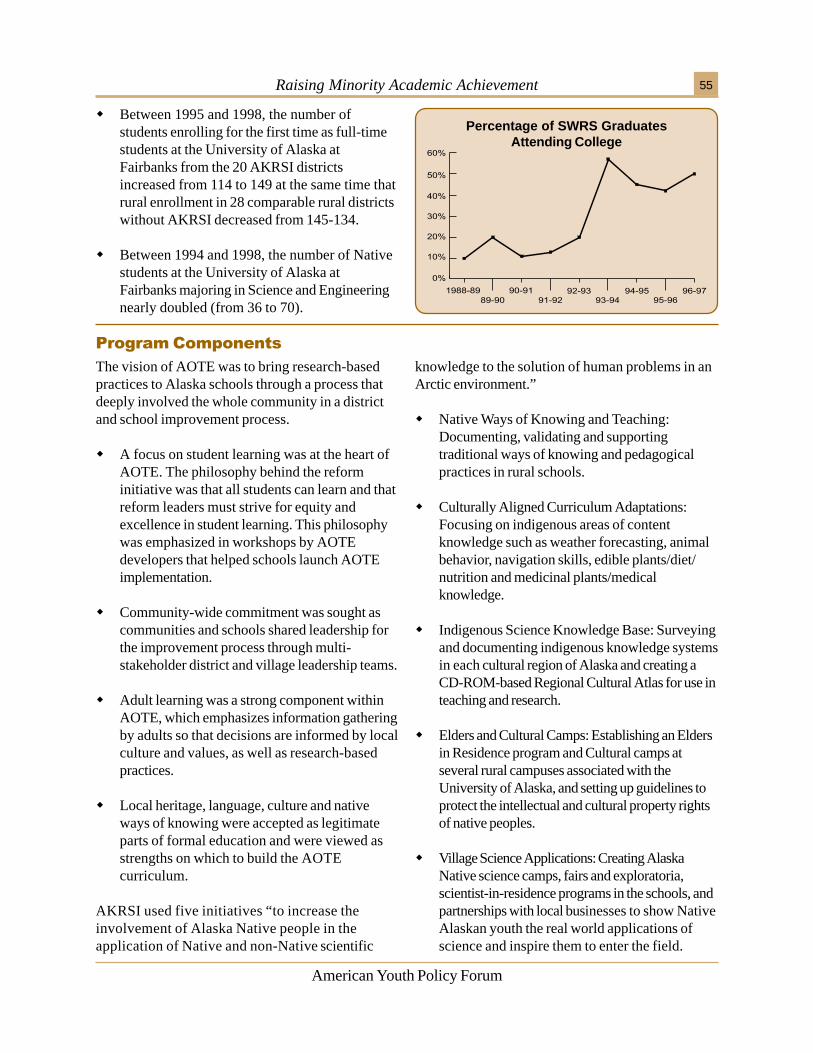
Raising Minority Academic Achievement
American Youth Policy Forum
55
���������������
The vision of AOTE was to bring research-basedpractices to Alaska schools through a process thatdeeply involved the whole community in a districtand school improvement process.
� A focus on student learning was at the heart ofAOTE. The philosophy behind the reforminitiative was that all students can learn and thatreform leaders must strive for equity andexcellence in student learning. This philosophywas emphasized in workshops by AOTEdevelopers that helped schools launch AOTEimplementation.
� Community-wide commitment was sought ascommunities and schools shared leadership forthe improvement process through multi-stakeholder district and village leadership teams.
� Adult learning was a strong component withinAOTE, which emphasizes information gatheringby adults so that decisions are informed by localculture and values, as well as research-basedpractices.
� Local heritage, language, culture and nativeways of knowing were accepted as legitimateparts of formal education and were viewed asstrengths on which to build the AOTEcurriculum.
AKRSI used five initiatives “to increase theinvolvement of Alaska Native people in theapplication of Native and non-Native scientific
knowledge to the solution of human problems in anArctic environment.”
� Native Ways of Knowing and Teaching:Documenting, validating and supportingtraditional ways of knowing and pedagogicalpractices in rural schools.
� Culturally Aligned Curriculum Adaptations:Focusing on indigenous areas of contentknowledge such as weather forecasting, animalbehavior, navigation skills, edible plants/diet/nutrition and medicinal plants/medicalknowledge.
� Indigenous Science Knowledge Base: Surveyingand documenting indigenous knowledge systemsin each cultural region of Alaska and creating aCD-ROM-based Regional Cultural Atlas for use inteaching and research.
� Elders and Cultural Camps: Establishing an Eldersin Residence program and Cultural camps atseveral rural campuses associated with theUniversity of Alaska, and setting up guidelines toprotect the intellectual and cultural property rightsof native peoples.
� Village Science Applications: Creating AlaskaNative science camps, fairs and exploratoria,scientist-in-residence programs in the schools, andpartnerships with local businesses to show NativeAlaskan youth the real world applications ofscience and inspire them to enter the field.
Percentage of SWRS GraduatesAttending College
� Between 1995 and 1998, the number ofstudents enrolling for the first time as full-timestudents at the University of Alaska atFairbanks from the 20 AKRSI districtsincreased from 114 to 149 at the same time thatrural enrollment in 28 comparable rural districtswithout AKRSI decreased from 145-134.
� Between 1994 and 1998, the number of Nativestudents at the University of Alaska atFairbanks majoring in Science and Engineeringnearly doubled (from 36 to 70).
Raising Minority Academic Achievement56
American Youth Policy Forum
Sustaining Reform & LeadershipSchools that kept momentum when implementingAOTE saw the most dramatic differences.
Staff/Leadership RetentionThe most persistent barrier to sustaining reformefforts was high teacher, principal andsuperintendent turnover. According to theevaluators, turnover derailed reform efforts and ledto a cycle of reinventing schools every two or threeyears. But in successful schools AOTE could “helpalleviate the turnover problem by creating leadershipwithin the community, especially when respectedcommunity elders and other leaders are brought intothe process.”
Unified ApproachIndependent reform activities or goals that weredisconnected were of little use in smallcommunities. AOTE helped set a clear directionand vision for student success and providedopportunities for school personnel and communitymembers to think and talk about how everyoneshould work together to educate children in achanging world.
������������������
Shared Leadership“Leadership needs to be defined as shared decision-making with the community rather than seekingadvice from the community,” noted the evaluators.Shared leadership created community ownershipthat moved educational changes through frequentstaff turnover.
Personal RelationshipsGood relationships between school personnel andcommunity members made a marked difference inhow well AOTE was implemented. In the smallcommunities studied, personal relationships weremore central than formal decision processes as away to get things done.
New RolesIn schools that successfully implemented AOTE,the attitude that parent and teacher domains areseparate, changed. Strong AOTE schools openedavenues for parents, elders and other communitymembers to be involved in school as volunteers,teacher aides, other paid workers and leadershipteam members.
Raising Minority Academic Achievement
American Youth Policy Forum
57
STUDY METHODOLOGYThe two studies used participatory researchmethods (action research) that treated schoolpractitioners and community members as co-researchers rather than subjects of the study.For each case study, a senior researcher fromthe Northwest Regional Educational Laboratory orUniversity of Alaska Fairbanks led a small team of3 to 5 school and community researchers whohelped plan each case study, formulate guidingquestions, collect data and interpret results. Atypical team consisted of a school districtpractitioner, a village school practitioner, at leastone non-school community member, and in somecases a high school student. The AKRSI studyalso compared 20 districts (serving 133communities) with AKRSI programs to 28 schooldistricts (serving 120 communities) in ruralAlaska that did not have AKRSI programs. Theevaluators did not appear to conduct a formalmatching of these districts based on race,ethnicity or income. In addition to comparingdropout rates, college enrollment and choice ofmajor for students from these districts, theevaluators examined scores for fourth and eighthgraders on the California Achievement Test, 5th
Edition (CAT-5). For the sake of brevity, thissummary does not include the CAT-5 data.
EVALUATION FUNDINGThe evaluations were funded by the NationalScience Foundation and the National Institute onEducation of At-Risk Students, Office ofEducational Research & Improvement, U.S.Department of Education. Implementation ofAOTE was funded by school districts withassistance from the Alaska ComprehensiveAssistance Center. The design of AOTE wasfunded through a foundation grant from the
Meyer Memorial Trust, the Alaska StaffDevelopment Network and the Northwest RegionalEducational Laboratory.
GEOGRAPHIC AREASThe studies centered on villages and schooldistricts spanning western, central and southeastAlaska. Districts included Chugach, Klawock,Kuspuk, Lower Kuskokwim, Southwest, Tuluksakand Yukon-Koyukuk.
CONTACT INFORMATIONResearch ContactsJames W. KushmanNorthwest Regional Educational LaboratorySchool Improvement Program101 S.W. Main Street, Suite 500Portland, OR 97204-3297Phone: 503.275.9629 Fax: [email protected]
Jerry LipkaUniversity of Alaska FairbanksCenter for Cross Cultural StudiesP.O. Box 756480Fairbanks, AL [email protected]://www.ankn.uaf.edu/arsi.html
Program ContactMike Travis, DirectorAlaska Onward to ExcellenceAKRAC, Anchorage Office900W 5th Avenue, suite 302Anchorage, AK 99501Phone: 907.349.0651Fax: [email protected]://akrac.k12.ak.us/aindex.html
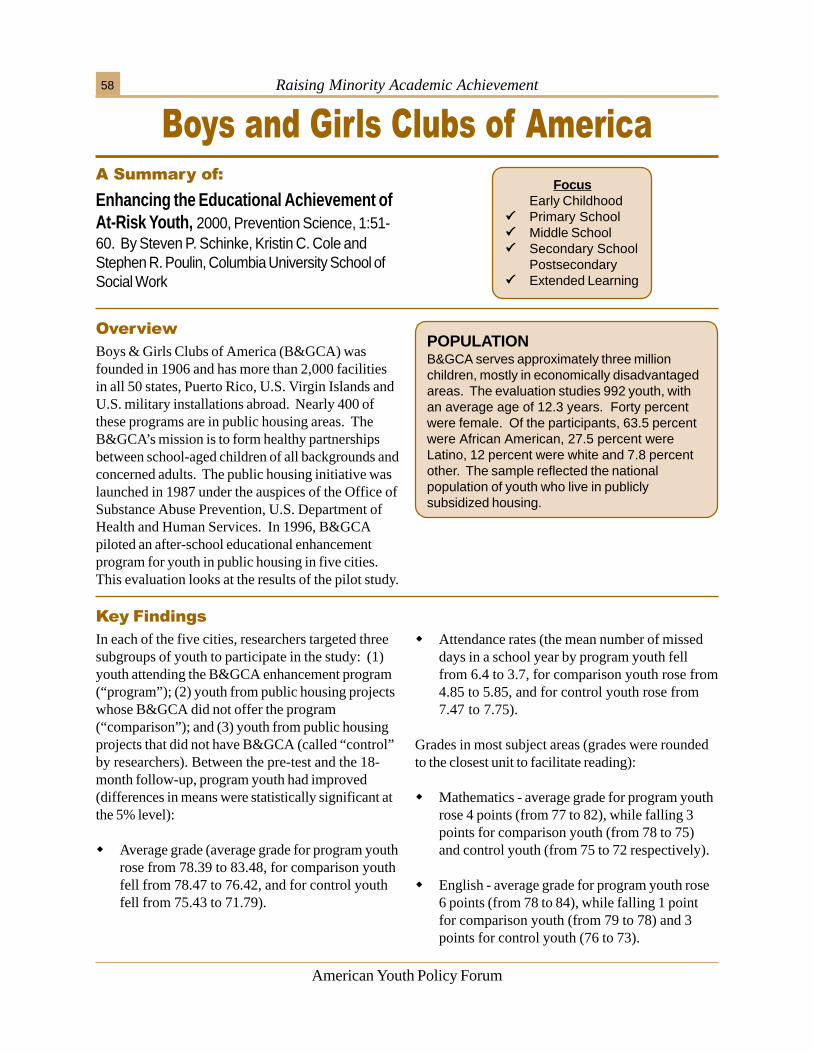
Raising Minority Academic Achievement58
American Youth Policy Forum
(��������4�� ��� -�����������������������
Enhancing the Educational Achievement ofAt-Risk Youth, 2000, Prevention Science, 1:51-60. By Steven P. Schinke, Kristin C. Cole andStephen R. Poulin, Columbia University School ofSocial Work
Boys & Girls Clubs of America (B&GCA) wasfounded in 1906 and has more than 2,000 facilitiesin all 50 states, Puerto Rico, U.S. Virgin Islands andU.S. military installations abroad. Nearly 400 ofthese programs are in public housing areas. TheB&GCA’s mission is to form healthy partnershipsbetween school-aged children of all backgrounds andconcerned adults. The public housing initiative waslaunched in 1987 under the auspices of the Office ofSubstance Abuse Prevention, U.S. Department ofHealth and Human Services. In 1996, B&GCApiloted an after-school educational enhancementprogram for youth in public housing in five cities.This evaluation looks at the results of the pilot study.
� �� ���POPULATIONB&GCA serves approximately three millionchildren, mostly in economically disadvantagedareas. The evaluation studies 992 youth, withan average age of 12.3 years. Forty percentwere female. Of the participants, 63.5 percentwere African American, 27.5 percent wereLatino, 12 percent were white and 7.8 percentother. The sample reflected the nationalpopulation of youth who live in publiclysubsidized housing.
In each of the five cities, researchers targeted threesubgroups of youth to participate in the study: (1)youth attending the B&GCA enhancement program(“program”); (2) youth from public housing projectswhose B&GCA did not offer the program(“comparison”); and (3) youth from public housingprojects that did not have B&GCA (called “control”by researchers). Between the pre-test and the 18-month follow-up, program youth had improved(differences in means were statistically significant atthe 5% level):
� Average grade (average grade for program youthrose from 78.39 to 83.48, for comparison youthfell from 78.47 to 76.42, and for control youthfell from 75.43 to 71.79).
������������
� Attendance rates (the mean number of misseddays in a school year by program youth fellfrom 6.4 to 3.7, for comparison youth rose from4.85 to 5.85, and for control youth rose from7.47 to 7.75).
Grades in most subject areas (grades were roundedto the closest unit to facilitate reading):
� Mathematics - average grade for program youthrose 4 points (from 77 to 82), while falling 3points for comparison youth (from 78 to 75)and control youth (from 75 to 72 respectively).
� English - average grade for program youth rose6 points (from 78 to 84), while falling 1 pointfor comparison youth (from 79 to 78) and 3points for control youth (76 to 73).
FocusEarly Childhood
����� Primary School����� Middle School����� Secondary School
Postsecondary����� Extended Learning
Raising Minority Academic Achievement 59
American Youth Policy Forum
Each week, within the B&GCA facility or in outsidesessions, the trainers engaged youth in structuredactivities, such as:
� Four to five hours a week of discussions withknowledgeable adults.
� One to two hours a week of writing.
� Four to five hours a week of leisure reading.
� Five to six hours a week of required homework.
� Two to three hours a week of communityservice (tutoring other children, for instance).
���������������
� Four to five hours a week of educational games,such as word and math games.
Participation was voluntary and, to entice the youthto participate, program sites used many incentives,such as field trips, school supplies, computer time,special privileges, certificates, gold stars and praise.
Parents were also encouraged to participate withtheir children in the educational activities. Parentsand youth attended an orientation meeting, afterwhich parents were invited to serve as volunteersand to attend the cultural events presented by theyouth.
Staff, volunteers and parents attended ongoingtraining.
Structured ProgramSome comparison and control sites also offeredtutoring and homework help, but did not have thestructure offered by the B&GCA program, did notrequire homework and tutoring, and did not engageroutinely in educational games to enhance thelessons being taught.
������������������
Trained staffAnother difference between B&GCA program andthe comparison and control sites was the presence ofa trained staff solely focused on educationalenhancements.
� Writing - average grade for program youth rose5 points (from 80 to 85), while falling 1 pointfor comparison youth (from 79 to 78) andcontrol youth (from 73 to 72).
� Science -average grade for program youth rose6 points (from 78 to 84), while falling 2 pointsfor comparison youth (from 79 to 77) and 4points for control youth (from 75 to 71).
� Social studies - average grade for program youthrose 5 points (from 79 to 84), while falling 2points for comparison youth (from 78 to 76)and 4 points for control youth (from 77 to 73).
Raising Minority Academic Achievement60
American Youth Policy Forum
CONTACT INFORMATIONResearch ContactSteven Paul Schinke, ProfessorSchool of Social WorkColumbia University622 West, 113th StreetNew York, NY 10025Phone: 212.854-8506Fax: [email protected]
Implementing ContactMylo Carbia-PuigDirector, Prevention ServicesBoys & Girls Clubs of America1230 West Peachtree Street NWAtlanta, GA 30309-3447Phone: 404.815.5766Fax: [email protected]
STUDY METHODOLOGYThis study used both a comparison and a“control” group. Participation in the groups wasvoluntary (not randomized). Comparison andcontrol groups mirrored the age, gender andethnic/racial background of program youth.Some of the youth in the comparison and controlgroups received tutoring, but did not attend astructured after-school program. The attritionrate at the end of the study was 13.91 percent,with no significant differences betweensubgroups. Researchers used students’ surveys,teacher ratings and school records to collect dataat the beginning of the program (pre-test), sixmonths later (post-test) and 18 months later(follow-up). Findings were consistent across allmeasures. This summary presents only schooldata.
EVALUATION FUNDINGCarnegie Corporation of New York.
GEOGRAPHIC AREASPublic housing projects in Cleveland, OH;Edinburgh, TX; New York City, NY; Oakland, CA;Tampa, FL.
Raising Minority Academic Achievement 61
American Youth Policy Forum
������������
Evaluators used the Comprehensive TestingProgram III to assess the impact of the program.They compared average percentile scores of firstand second graders at Woodson prior to theimplementation of the program (the “comparisongroup” for this study) with scores of the threecohorts of first graders who were taught under theprogram during school years 1994-95 to 1996-97(see table).
� In first grade reading comprehension, theaverage score for the comparison group was atthe 18th percentile. After one year in the
The report evaluates the Calvert program after itwas implemented at Dr. Carter Goodwin WoodsonElementary School (Woodson Elementary). Calvertis a private elementary school with a long history ofproviding a high-quality education to severalgenerations of children from many of Baltimore’smost affluent families. Woodson Elementary is apublic school located in a predominantly AfricanAmerican community, and more than 90% of itsstudents are eligible for free or reduced-pricelunch. Calvert’s philosophy of education includeshigh expectations, time-on-task, rapid pace ofinstruction, frequent evaluations, immediatefeedback and student accuracy. The students arerequired to learn with attention to detail, includingcorrect spelling and punctuation. Each month,
�� ���������������
� �� ���
“Implementing a Highly Specialized,Curricular, Instructional, and OrganizationalSchool Design in a High-Poverty, UrbanElementary School: Three-Year Results”(July 1998) Johns Hopkins University. By BarbaraMcHugh and Sam Stringfield.
POPULATIONDuring the 1996-97 school year, 90% of thestudents attending Calvert were white, 6% wereAfrican American and 4% were Asian orLatino. One hundred percent of Woodson’s400 students in grades K-5 were AfricanAmerican. The tuition at Calvert was $9,000per year. The percentage of Woodsonstudents (90%) eligible for free or reduced-price lunch was nearly triple the 1996 Marylandstate average (31.1%) and well above theBaltimore City average of 70.4%.
parents receive report cards and representativesamples of students’ academic work. Calvertproduces a “book” of each student’s nine monthlyfolders of work and presents the book to the studentat the end of each year.
program, the first cohort of students scored onaverage at the 49th percentile, the second cohortscored at the 40th percentile and the third cohortscored at the 49th percentile. The programeffect size was calculated in +2.8, +2.1 and+2.9 respectively.
� In terms of first graders reading at the lowestlevels, 72% of the comparison group scored inthe lowest quartile, compared to 16% of thefirst cohort, 35% of the second cohort and 6%of the third cohort.
FocusEarly Childhood
����� Primary SchoolMiddle SchoolSecondary SchoolPostsecondaryExtended Learning
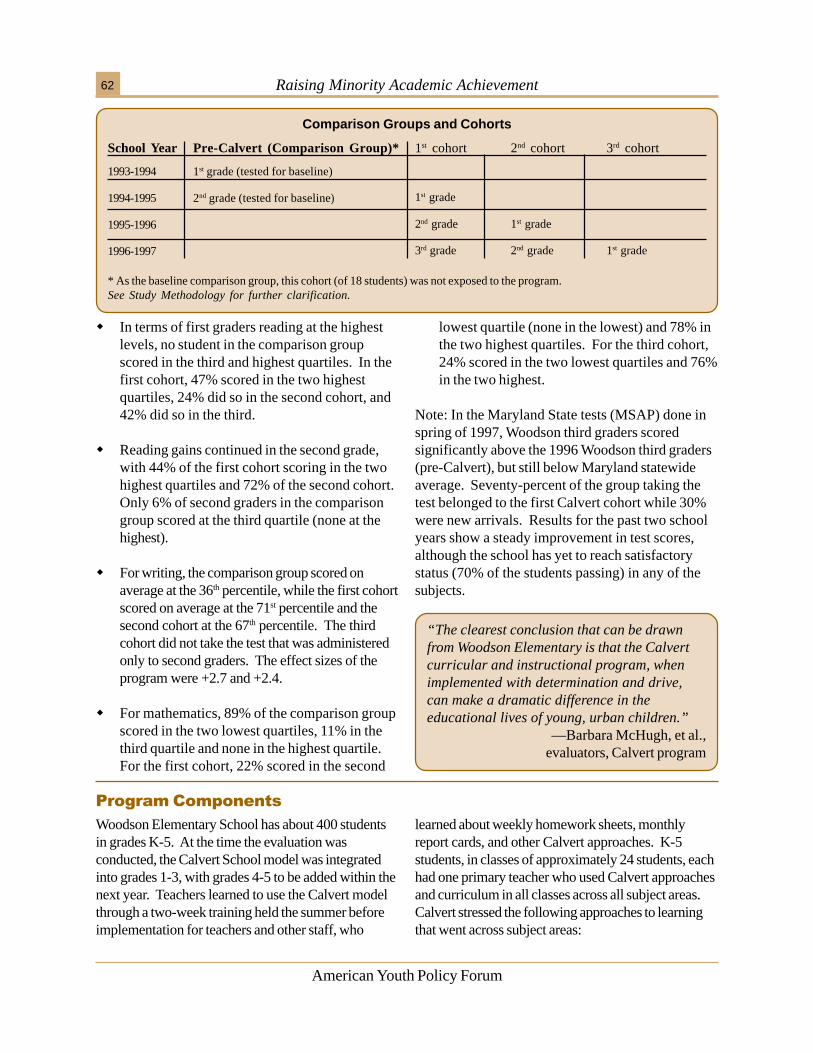
Raising Minority Academic Achievement62
American Youth Policy Forum
���������������
Woodson Elementary School has about 400 studentsin grades K-5. At the time the evaluation wasconducted, the Calvert School model was integratedinto grades 1-3, with grades 4-5 to be added within thenext year. Teachers learned to use the Calvert modelthrough a two-week training held the summer beforeimplementation for teachers and other staff, who
learned about weekly homework sheets, monthlyreport cards, and other Calvert approaches. K-5students, in classes of approximately 24 students, eachhad one primary teacher who used Calvert approachesand curriculum in all classes across all subject areas.Calvert stressed the following approaches to learningthat went across subject areas:
� In terms of first graders reading at the highestlevels, no student in the comparison groupscored in the third and highest quartiles. In thefirst cohort, 47% scored in the two highestquartiles, 24% did so in the second cohort, and42% did so in the third.
� Reading gains continued in the second grade,with 44% of the first cohort scoring in the twohighest quartiles and 72% of the second cohort.Only 6% of second graders in the comparisongroup scored at the third quartile (none at thehighest).
� For writing, the comparison group scored onaverage at the 36th percentile, while the first cohortscored on average at the 71st percentile and thesecond cohort at the 67th percentile. The thirdcohort did not take the test that was administeredonly to second graders. The effect sizes of theprogram were +2.7 and +2.4.
� For mathematics, 89% of the comparison groupscored in the two lowest quartiles, 11% in thethird quartile and none in the highest quartile.For the first cohort, 22% scored in the second
lowest quartile (none in the lowest) and 78% inthe two highest quartiles. For the third cohort,24% scored in the two lowest quartiles and 76%in the two highest.
Note: In the Maryland State tests (MSAP) done inspring of 1997, Woodson third graders scoredsignificantly above the 1996 Woodson third graders(pre-Calvert), but still below Maryland statewideaverage. Seventy-percent of the group taking thetest belonged to the first Calvert cohort while 30%were new arrivals. Results for the past two schoolyears show a steady improvement in test scores,although the school has yet to reach satisfactorystatus (70% of the students passing) in any of thesubjects.
School Year
1993-1994
1994-1995
1995-1996
1996-1997
Pre-Calvert (Comparison Group)*
1st grade (tested for baseline)
2nd grade (tested for baseline)
1st cohort 2nd cohort 3rd cohort
1st grade
2nd grade 1st grade
3rd grade 2nd grade 1st grade
* As the baseline comparison group, this cohort (of 18 students) was not exposed to the program.See Study Methodology for further clarification.
“The clearest conclusion that can be drawnfrom Woodson Elementary is that the Calvertcurricular and instructional program, whenimplemented with determination and drive,can make a dramatic difference in theeducational lives of young, urban children.”
—Barbara McHugh, et al.,evaluators, Calvert program
Comparison Groups and Cohorts
Raising Minority Academic Achievement 63
American Youth Policy Forum
Gradual Implementation/Faithful ReplicationWoodson adopted the Calvert model grade bygrade, allowing full implementation in one gradebefore moving on to another. All teachers were pre-trained and a full-time facilitator (funded by theAbell Foundation) was onsite throughout theimplementation. For the most part, Woodsonteachers seemed to faithfully replicate the Calvertmodel with few exceptions.
High ExpectationsThe Calvert model was built on high expectationscombined with a high degree of structure. Thecurriculum centered around a rapid pace ofinstruction and student accuracy – including correct
������������������
spelling and punctuation – was consideredfundamental. Timed drills – particularly in math –were used on nearly a daily basis.
Frequent Evaluations/Immediate FeedbackThe Calvert program not only gave immediatefeedback to students through teacher commentaryand grading but also shared frequent evaluationswith parents and school administrators regardingoverall student performance. Parents receivedmonthly report cards accompanied by representativesamples of a student’s work. In addition, the full-time facilitator mentioned in the Overview, above,provided constant feedback to staff during theimplementation process.
“These kindergarten through third-graderesults leave little doubt that impoverishedurban children, given appropriate curriculumand instruction, are capable of achieving atlevels that are much higher than current urbanaverages.”
—Barbara McHugh, et al.,evaluators, Calvert program
� Each school day began with a 30-minute“correction period” for students to correctprevious work, complete unfinished work,perfect folder papers, read independently or doother instructionally related tasks.
� Getting meaning out of reading was stressed inearly grades. Students were taught to read for aspecific purpose, and there was also time duringeach school day to read for enjoyment.
� Sight words and phonemic skills were aformal part of the Calvert curriculum, as weretimed fact drills on basic mathematics facts.
� Beginning in January of first grade, allstudents wrote a composition each week.
� Teachers coordinated students’ compilationsof “error-free” papers for insertion intostudents’ monthly folders. The folders weresent home at the end of each month and werepart of school-parent communications.
School-parent interactions were both formal andinformal. All parents received folders of studentwork at the end of each month. Some parentsand grandparents, mainly in first grade, helpedout during the corrections period. Additionalactivities such as a trip to the movies, bowling
alley or skating rink, were scheduled periodicallyfor students with perfect attendance. The schoolalso made daily announcements of which classeshad perfect attendance on the previous day.
After the Calvert School agreed to share its modelwith Woodson, the Abell Foundation financed theimplementation, including funds to pay teachersor other staff from Calvert who trained Woodsonstaff. Besides paying for staff costs, Calvert didnot charge a “usage fee” for its model. Afterproviding the curriculum and initial training,Calvert staff were available on an informalconsultative basis, though their formalinvolvement in training ended. Woodson sharedits evaluation information and reports withCalvert. The Abell Foundation also reviewedevaluations and student progress reports, thoughthe foundation was not directly involved inimplementation of the model.
Raising Minority Academic Achievement64
American Youth Policy Forum
Focus on ResultsThe Calvert model was a results-oriented one.Student attendance, work quality and performanceon national tests were regularly monitored andevaluated. Students were consistently required tocorrect work until it was error free. Even studentsin upper grades were given weekly spelling tests.
Professional DevelopmentIn addition to the two-week training and supportfrom the full-time facilitator, Woodson teachers alsoparticipated in school-wide seminars in whichteachers exchanged ideas and discussed problems.Woodson teachers also reviewed lessons on their
own time through Calvert’s home-schoolingcurriculum. Teacher input was used to decide whichtextbooks to purchase in order to increaseimplementation success.
Communication with FamiliesIn addition to monthly report cards, parents andgrandparents also participated in monthly parent’smeetings. Parents and grandparents were asked tovolunteer to be on site in the classroom helpingstudents complete or correct work. Parents andgrandparents also helped arrange classrooms,participated in recreational activities and listened tostudents read.
STUDY METHODOLOGYThe school implemented the Calvert programgradually, starting with kindergarten and firstgrade, and adding another grade every year.The report focuses on the third year of theprogram implementation. Data is given percohort. The comparison group started first gradein September 1993 before the program wasimplemented (18 students). The first cohortstarted first grade in September 1994, when theprogram was implemented (32 students). Thesecond cohort started first grade in September1995 (29 students), and the third cohort startedfirst grade in September 1996 (50 students).There was no attrition of these cohorts. Allstudents were tested on the ComprehensiveTesting Program III, a norm-referenced test usedin private schools. Their scores, given in NormalCurve Equivalent (NCE), were compared to thoseof students who were in first grade prior to theimplementation of the program. Results of theanalyses were then converted to percentiles.Effect sizes were calculated as cohort mean NCEminus comparison mean NCE diveded bycomparison standard deviation.
EVALUATION & PROGRAM FUNDINGThe evaluation was funded by Johns HopkinsUniversity. Implementation of the Calvert programat Woodson was funded by the Abell Foundation.Before funding implementation at Woodson, TheAbell Foundation also funded implementation ofthe Calvert program at another public Baltimoreschool, Barclay Elementary and Middle School.
GEOGRAPHIC AREASCalvert and Woodson are located in Baltimore.The program has also been implemented atBarclay Elementary and Middle School. Some16,000 children worldwide are home-schooledusing the Calvert program.
CONTACT INFORMATIONResearch ContactsSam Stringfield, ProfessorCenter for Social Organization of SchoolsKrieger School of Arts & SciencesJohns Hopkins University3003 N Charles St, Suite 200Baltimore, MD 21218Phone: 410.516.8834Fax: [email protected]
Program ContactsMerrill Hall, HeadmasterCalvert School105 Tuscany Rd,Baltimore, MD 21210Phone: 410.243.6030
Johnetta Neal, PrincipalWoodson Elementary School2501 Seabury Rd.Baltimore, MDPhone: 410.396.1366Fax: [email protected]
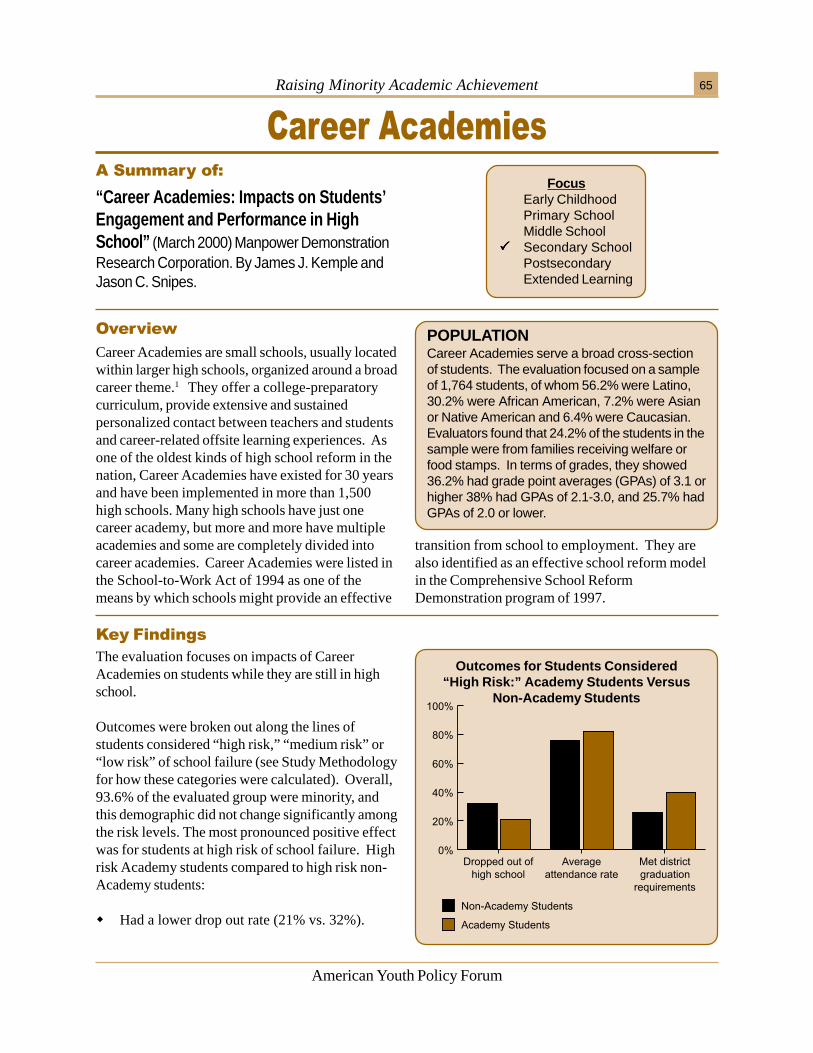
Raising Minority Academic Achievement 65
American Youth Policy Forum
Outcomes for Students Considered“High Risk:” Academy Students Versus
Non-Academy Students
������������
The evaluation focuses on impacts of CareerAcademies on students while they are still in highschool.
Outcomes were broken out along the lines ofstudents considered “high risk,” “medium risk” or“low risk” of school failure (see Study Methodologyfor how these categories were calculated). Overall,93.6% of the evaluated group were minority, andthis demographic did not change significantly amongthe risk levels. The most pronounced positive effectwas for students at high risk of school failure. Highrisk Academy students compared to high risk non-Academy students:
� Had a lower drop out rate (21% vs. 32%).
Career Academies are small schools, usually locatedwithin larger high schools, organized around a broadcareer theme.1 They offer a college-preparatorycurriculum, provide extensive and sustainedpersonalized contact between teachers and studentsand career-related offsite learning experiences. Asone of the oldest kinds of high school reform in thenation, Career Academies have existed for 30 yearsand have been implemented in more than 1,500high schools. Many high schools have just onecareer academy, but more and more have multipleacademies and some are completely divided intocareer academies. Career Academies were listed inthe School-to-Work Act of 1994 as one of themeans by which schools might provide an effective
���������������������������
� �� ���
“Career Academies: Impacts on Students’Engagement and Performance in HighSchool” (March 2000) Manpower DemonstrationResearch Corporation. By James J. Kemple andJason C. Snipes.
POPULATIONCareer Academies serve a broad cross-sectionof students. The evaluation focused on a sampleof 1,764 students, of whom 56.2% were Latino,30.2% were African American, 7.2% were Asianor Native American and 6.4% were Caucasian.Evaluators found that 24.2% of the students in thesample were from families receiving welfare orfood stamps. In terms of grades, they showed36.2% had grade point averages (GPAs) of 3.1 orhigher 38% had GPAs of 2.1-3.0, and 25.7% hadGPAs of 2.0 or lower.
transition from school to employment. They arealso identified as an effective school reform modelin the Comprehensive School ReformDemonstration program of 1997.
FocusEarly ChildhoodPrimary SchoolMiddle School
����� Secondary SchoolPostsecondaryExtended Learning
Raising Minority Academic Achievement66
American Youth Policy Forum
���������������
Career Academies have three importantcharacteristics in common:1
A Career Academy is a school-within-a-school orsmall learning community, in which groups ofstudents share several classes every day and havesome or all of the same teachers from year to yearfor at least two years of high school. The numberof students is relatively small—usually 150 to 300—and the teachers work as a team and share indecision making.
The curriculum combines and integrates academicand career-related subjects. Academic courses meethigh school graduation and college entrance
requirements; career-related courses center on abroadly defined career theme such as health,business and finance, electronics or travel. CareerAcademies may cover culinary arts and foodscience, computer science and technology, theperforming arts and a myriad of other career tracks.
Local employers are involved as partners and serveon an advisory board with teachers and schooldistrict staff. A coordinator typically serves asliaison among employers, the academy, and theschool district. Employer representatives serve asspeakers and mentors, provide internships, giveadvice on curriculum and contribute financial orother in-kind support.
Small Learning CommunityThe school-within-a-school structure of CareerAcademies, with a small group of studentsinteracting with a core group of teachers over time,provides many benefits for students includingbuilding relationships with caring adults andreceiving personalized attention. Adults also get toknow the strengths and weaknesses of studentswithin their academy and work in a team to assisteach student. Evaluators found that at CareerAcademies that had a high impact on studentsuccess, teachers also worked together on creatinglesson plans in small groups.
Personalized AttentionThe Career Academy structure naturally allows formore personal student-teacher contact becauseteachers work with a contained group of studentsover several years. Evaluators said that the mosteffective Academies had a higher-than-averagedegree of interpersonal support for students from
������������������
both their teachers and their peers. Academystudents also receive personal attention from work-site mentors during their internships.
Alternative Learning StrategiesCareer Academies provide several alternativelearning strategies through their focus on a careertheme. Academic and career-focused instruction areintegrated. Applied hands-on lessons suggestthemselves from the career theme – for example,students in a Finance Academy might participate in aVirtual Enterprise competition with other highschools as a means of learning about finance and
“The Career Academies substantially improvedhigh school outcomes among students at highrisk of dropping out.”
— James J. Kemple and Jason C. Snipes,Manpower Demonstration
Research Corporation
� Had a higher average attendance rate (82% vs.76%).
� Were more likely to earn enough credits to meetdistrict graduation requirements (40% vs. 26%).
For medium and low risk groups, Career Academiessaw similar—but less pronounced—positive effects.
Raising Minority Academic Achievement 67
American Youth Policy Forum
honing their math and history skills. Additionally,Career Academies allow for work-based learning ininternships with partnering employers, usually in thesummer between their junior and senior years.They may also participate in field trips to jobsites, job shadowing and presentations given byemployers at the school site.
Innovative StructureMany Career Academies also use block schedulingin which classes last for about 90 minutes instead ofthe usual 45. Four classes may be offered eachsemester, rather than eight classes offered over thecourse of a year. This structure allows for longerclass periods for in-depth learning and alsoprovides teachers with structured time to plan
lessons with other Academy teachers usually oncea week. Career Academies are offered over threeor four years within a high school. During this time,students stay with the same group of teachers.
Employer InvolvementEmployers serving on the board of advisors foreach Academy help keep the curriculum up-to-date and interesting. They also ensure thatstudents are prepared for careers that exist intheir communities and that they have access tohigh quality, motivating, work-based learningpositions. Additionally, employers provide youngpeople with additional adult role models throughwork-site mentoring and school visits.
STUDY METHODOLOGYEvaluators analyzed 10 Career Academies thathad fully implemented the model. Researcherscompared Academy students with ademographically similar control group of non-Academy students. The Career Academiesexamined received twice as many applications asthey could accept. Half – or 952 – of the studentswere randomly selected into Career Academies(the study group), while the other half was notselected (the control group). Students werecategorized into subgroups based on whetherthey were at “high risk,” “medium risk” or “lowrisk” of dropping out of school. Factorsdetermining the degree of risk were: previousschool attendance rate, credits earned in ninthgrade, GPA, the rate of school mobility, whether astudent was overage for his or her grade level,and whether he or she had a sibling who droppedout of high school.
EVALUATION & PROGRAM FUNDINGThe evaluation was funded by the U.S.Departments of Education and Labor, the Centerfor Research on the Education of StudentsPlaced At Risk (CRESPAR), and 16 foundations.
Career Academies across the nation are fundedby a combination of state and local monies, withsmall amounts of federal funding.
GEOGRAPHIC AREASThe locations of the Academies studied were notprovided. More than 1,500 high schoolsnationwide have one or more Career Academies.
CONTACT INFORMATIONResearch ContactsJames J. Kemple and Jason C. SnipesManpower Demonstration Research Corporation16 East 34 StreetNew York, NY 10016Phone: [email protected]
For Further Information on Career Academies,please contact:
The Career Academy Support Network (CASN)Web site: http://casn.berkeley.edu.
The National Academy Foundation.Web site: www.naf.org.
1. Descriptions of Career Academies are taken from Stern,David, Charles Dayton and Marilyn Raby. CareerAcademies and High School Reform December 1998. CareerAcademy Support Network. University of CaliforniaBerkeley.
Raising Minority Academic Achievement68
American Youth Policy Forum
������������
Overall, between 1992 and 1999, more AfricanAmerican students in grades 3-8 at the CHCCSearned proficient scores in reading and mathematics.
� Reading: The proportion of African Americanstudents proficient in reading rose from 45% in1992-93 to 64% in 1998-99.
� Math: The proportion of African Americanstudents proficient in mathematics rose from40% to 65% from 1992 to 1999.
Between 1996 and 1999, the proportion of AfricanAmerican CHCCS high school students who earnedproficient scores in math:
In 1993, the School Board in the Chapel Hill-Carrboro City Schools (CHCCS) began toimplement curriculum and program reformsrecommended by a Blue Ribbon Task Force(BRTF) on the Education of African AmericanStudents. Comprised of 70 parents, students,teachers, administrators and university professors,the Task Force recommended multiple strategies toheighten sensitivity to the cultural needs of minoritystudents, motivate struggling learners, maintain higheducational expectations and increase parentinvolvement. Since 1999, the district has expandedthe scope of its efforts to address the needs ofLatino youth and other minorities. The Fifth
����� �5� �6�����-������������� �������������
� �� ���
“Fifth Annual Status Report on the BlueRibbon Task Force Recommendations,1998-1999” (October 1999) Chapel Hill-CarrboroCity Schools. By Josephine Harris.
POPULATIONIn 2000, CHCCS served just under 9000students. The CHCCS high schools serve over2600 students, 75% of whom are white, 15%African American, 10% Asian, Latino, andother. The BRTF recommendations focusexclusively on African American students.
Annual Report compares the effect of the BRTFrecommendations in the School Year 1998-99, withstudent achievement data from the 1992 baselineyear. CHCCS is a member of the Minority StudentAchievement Network, a group of 15 urban andsuburban high school districts first organized in1999 to raise minority academic achievement.
� Increased from 42% to 45% in algebra I.� Increased from 48% to 53% in geometry.� Increased from 40% to 61% in algebra II.
However, relative to African American studentsacross the state, proficiency in writing has declinedfor most African American CHCCS students (excepttenth graders). When compared to the average writingscores of African Americans statewide:
� African American fourth graders in CHCCSscored on average 5% lower.
� African American seventh graders in the districtscored on average 11% lower.
FocusEarly Childhood
����� Primary School����� Middle School����� Secondary School
Postsecondary����� Extended Learning
Raising Minority Academic Achievement 69
American Youth Policy Forum
���������������
The CHCCS strategy to improve minority academicachievement used special programs, mentors,scholarships, as well as data collection andassessment:
� The district uses several programmaticinitiatives such as Reading Recovery for firstgraders, Attitude Changes Everything (ACE) forAfrican American males, pre-college programsfor minority students interested in math andscience careers, and Advancement ViaIndividual Determination (AVID) to improve theacademic success of minority students (for thesummary of AVID, see page 49). In 1999, forinstance, 56% of the AVID students wereAfrican Americans and 94% of AVID’s firstgraduating class entered four-year colleges.
� Mentoring programs with minority studentsfrom the University of North Carolina (UNC)serve elementary, middle and high schools in
CHCCS. For example, the Sister to Sisterprogram pairs African American females inthe ninth grade with African American femalementors from the UNC School of Medicine.
� Local community organizations and supportfrom the Blue Ribbon Task Force matched150 students with summer enrichmentprograms at the Museum of Life and Science,Arts Center, Orange County 4-H, OutwardBound and numerous residential camps.
� Four different scholarship programs supportmore than 25 minority graduates fromCHCCS, who continue their education in two-and four-year colleges or universities.
� CHCCS uses student portfolio assessment, aswell as traditional grades to determinepromotion or retention of students in fifth andeighth grades across the district.
� African American tenth graders in the districtscored on average 2% higher,
Between 1992 and 1999 the proportion of AfricanAmerican students in the gifted and talentedprogram increased from 1.8% to 7.8%.
An achievement gap remained between AfricanAmericans and white high school students inCHCCS. In 1999:
� 43% of African American tenth graders inCHCCS earned proficient reading scores versus94% of white tenth graders in the district.
� 47% of African American tenth graders inCHCCS earned proficient math scores versus92% of white tenth graders in the district.
Focus on Minority AchievementBy focusing time, resources and public will onminority student success over a five-year period,an entire school district made considerableprogress on several measures of minorityacademic achievement.
Comprehensive ApproachThe district did not rely on one program initiativeor reform model to raise academic achievement.Administrators, teachers and university officials
������������������
came up with a system-wide program that gavenumerous academic supports to minority studentsat every age and achievement level.
Professional DevelopmentAll new school staff participate in ten hours ofmulticultural education workshops that coverissues of cultural diversity, multiculturalcommunication styles, African American history,gender discrimination, physical disabilities andsexual orientation.
Raising Minority Academic Achievement70
American Youth Policy Forum
STUDY METHODOLOGYThe annual report analyzed school data, pre-and post-tests and a longitudinal analysis ofstandardized test scores. The evaluators usedthe Metropolitan Achievement Tests and HighSchool Comprehensive Reading and Math Teststo get quantitative measures of academicachievement across the district. Theycompared African American studentachievement to white student achievement inCHCCS and to average district and statescores. Scores for other racial/ethnicsubgroups were not reported in the evaluation.The report does not address potential causesfor the drop in writing scores for AfricanAmerican students in the district.
EVALUATION & PROGRAM FUNDINGCHCCS funded the evaluations and theprograms suggested by the BRTF. Schools
were allocated $25,000 in 1998-99 toimplement or supplement programs thataddressed BRTF goals. The evaluation did notreport the allocations for the first four years ofthe BRTF implementation.
GEOGRAPHIC AREASChapel Hill and Carrboro, North Carolina.
CONTACT INFORMATIONResearch ContactsJosephine Harris,Director of Special ProgramsChapel Hill—Carrboro City SchoolsLincoln Center, Merritt Mill RoadChapel Hill, NC 27516Phone: 919.967.8211Fax: [email protected]/
Parent InvolvementIncreasing parent involvement was a major thrustof CHCCS minority achievement initiative fromthe outset when parents participated in the BRTFthat set the reform agenda. Special activities suchas “Family Nights Out” bring minority parentsand school officials together. A concerted effortis made by the teachers and advisors to meet withall minority parents between August andNovember either at school or in parents’ homesor workplaces.
Community Involvement/PartnershipsPartnering with community-based organizationsallowed CHCCS to provide services not availableto the district such as a variety of after-schooland summer camp activities. In addition, CHCCSprovided financial and staff support tocommunity-based organizations with academicenrichment activities.
High StandardsAll high school students in the CHCCS must taketwo years of a second language as well as the mathand science curriculum that meets the requirementsfor admission to state universities. CHCCS keepstrack of minority student participation andcompletion of these advanced classes.
MentoringMentors from the university community, especiallyminority college students, serve as role models forminority youth in the district.
Extra-Curricular ActivitiesThe CHCCS District mandates that “every AfricanAmerican student will be personally encouraged bythe faculty and the administrators to participate in atleast one extracurricular activity.” Support for thismandate comes in the form of free transportation,Minority Support Groups, the Prudential YouthLeadership Initiative and other initiatives.
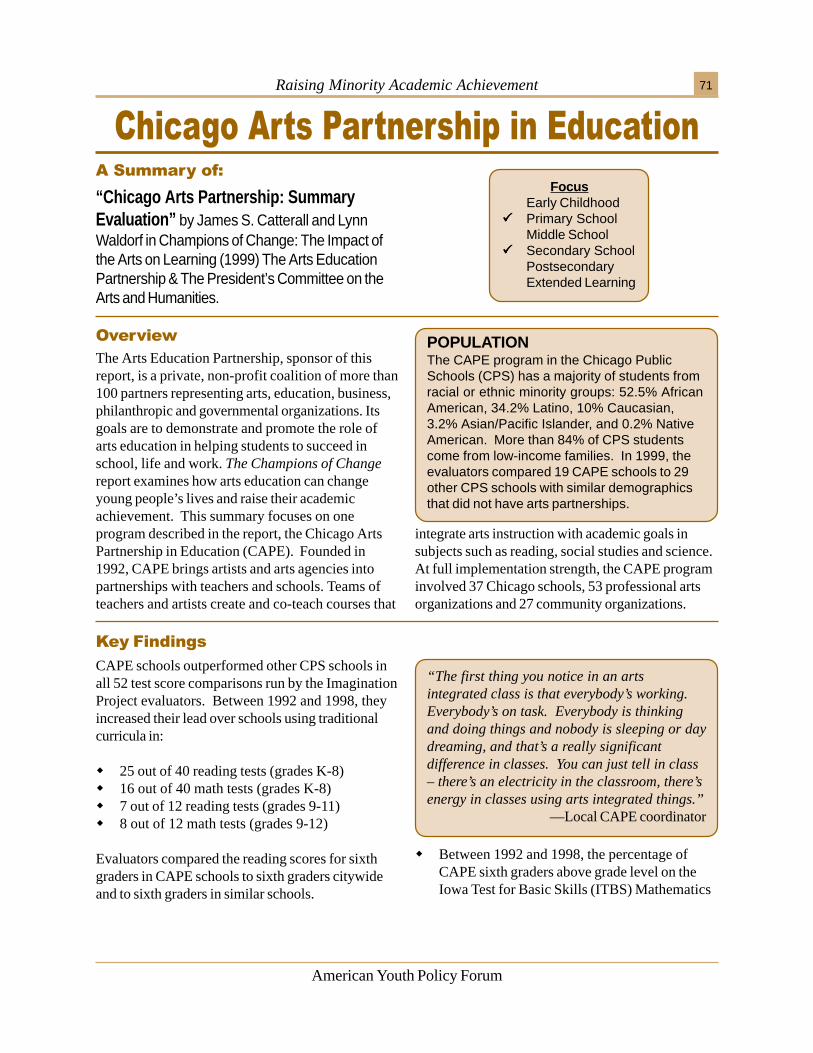
Raising Minority Academic Achievement 71
American Youth Policy Forum
������������
CAPE schools outperformed other CPS schools inall 52 test score comparisons run by the ImaginationProject evaluators. Between 1992 and 1998, theyincreased their lead over schools using traditionalcurricula in:
� 25 out of 40 reading tests (grades K-8)� 16 out of 40 math tests (grades K-8)� 7 out of 12 reading tests (grades 9-11)� 8 out of 12 math tests (grades 9-12)
Evaluators compared the reading scores for sixthgraders in CAPE schools to sixth graders citywideand to sixth graders in similar schools.
The Arts Education Partnership, sponsor of thisreport, is a private, non-profit coalition of more than100 partners representing arts, education, business,philanthropic and governmental organizations. Itsgoals are to demonstrate and promote the role ofarts education in helping students to succeed inschool, life and work. The Champions of Changereport examines how arts education can changeyoung people’s lives and raise their academicachievement. This summary focuses on oneprogram described in the report, the Chicago ArtsPartnership in Education (CAPE). Founded in1992, CAPE brings artists and arts agencies intopartnerships with teachers and schools. Teams ofteachers and artists create and co-teach courses that
����$�������.���������������������������������
� �� ���
“Chicago Arts Partnership: SummaryEvaluation” by James S. Catterall and LynnWaldorf in Champions of Change: The Impact ofthe Arts on Learning (1999) The Arts EducationPartnership & The President’s Committee on theArts and Humanities.
POPULATIONThe CAPE program in the Chicago PublicSchools (CPS) has a majority of students fromracial or ethnic minority groups: 52.5% AfricanAmerican, 34.2% Latino, 10% Caucasian,3.2% Asian/Pacific Islander, and 0.2% NativeAmerican. More than 84% of CPS studentscome from low-income families. In 1999, theevaluators compared 19 CAPE schools to 29other CPS schools with similar demographicsthat did not have arts partnerships.
integrate arts instruction with academic goals insubjects such as reading, social studies and science.At full implementation strength, the CAPE programinvolved 37 Chicago schools, 53 professional artsorganizations and 27 community organizations.
“The first thing you notice in an artsintegrated class is that everybody’s working.Everybody’s on task. Everybody is thinkingand doing things and nobody is sleeping or daydreaming, and that’s a really significantdifference in classes. You can just tell in class– there’s an electricity in the classroom, there’senergy in classes using arts integrated things.”
—Local CAPE coordinator
� Between 1992 and 1998, the percentage ofCAPE sixth graders above grade level on theIowa Test for Basic Skills (ITBS) Mathematics
FocusEarly Childhood
����� Primary SchoolMiddle School
����� Secondary SchoolPostsecondaryExtended Learning
Raising Minority Academic Achievement72
American Youth Policy Forum
increased by 50% (from 40% to 60%) whilenon-CAPE sixth graders increased by 30%(from 28% to 40%).
� During this same period, 14% more CAPE sixthgraders scored above grade level on the ITBSReading test compared to a matched group ofsixth graders in non-CAPE schools.
Due to the small number of CAPE high schoolsparticipating in the study, score differences were notstatistically significant at this age level. However,ninth graders in CAPE high schools did exhibitpositive gains (one grade level) on reading testsrelative to CPS ninth graders more generally.
���������������
In CAPE schools, more than half of the teachersinclude at least one unit during the year that is co-taught by an artist, and about a quarter of theteachers plan four or five units which integrate artsinto academic subjects.
A wide variety of artists, including musicians,dancers, actors, painters, writers, and others,worked in classes across the academic spectrum,from chemistry and physics to English and history.Math proved the most difficult subject to integratewith arts instruction.
Teacher-artist pairs planned unit curricula togetherand co-taught classes during the regular school day,integrating arts education into both humanities andscience curricula. In one classroom, fourth graderscreated a musical composition tied to the history of
Chicago. In another, an artist taught high schoolstudents about the history of textiles and dyes, whilethe chemistry teacher helped them link thisknowledge to principles of chemistry.
Sample lesson plans and curricula shared thefollowing components:
� Planning for an artistic product.
� Explaining academic goals.
� Connecting artistic goals to state academicstandards.
� Assessing students’ achievement of academicand artistic goals.
Alternative Learning StrategiesSurveys with teachers, artists, coordinators andprincipals indicate that CAPE contributes to thedevelopment of skills such as speaking, decision-making, writing and creative thinking. Integratingarts with traditional subjects has offered alternativelearning strategies for all students, and this appearsto be especially beneficial to students struggling withtraditional curricula.
Reduced Class SizeCAPE provides two adults for every classroom.Team teaching allowed both teachers and artists togive students more individualized attention andinstruction.
������������������
Professional DevelopmentBoth teachers and artists have opportunities toparticipate in extensive professional development. Inaddition to the benefits of team-teaching, CAPEoffers nearly a dozen workshops throughout theyear for teachers and artists to work together,planning lessons and learning how to integrate artsinto the classroom. However, because teachers andartists often have different work schedules,evaluators noted that participation was not as highas it should have been with the average teacher andartist attending only 1-3 workshops a year.
Raising Minority Academic Achievement 73
American Youth Policy Forum
Clear Program GoalsA survey of teachers and artists involved in CAPEexplained that well-defined learning objectives,matched to assessment, were crucial to theprogram’s success. A well-planned schedule wasnecessary to facilitate artist school visits.
Administrative Support/Staff CommitmentProgram staff also indicated that supportiveprincipals, highly skilled artists and adventuresome,risk-taking teachers contributed to CAPE’s success.The program ran well when teachers worked withart forms that they themselves liked.
Community InvolvementArtists from the community serve as role models forinspiring the youth, but they are not the onlymembers of the community critical to thesustainability of arts education. Without the supportof parents, families, artists and arts organizations,school boards, superintendents and schoolprincipals, CAPE and other arts education initiativescannot survive.
STUDY METHODOLOGYThe CAPE evaluation included in the Championsof Change incorporates data from a long-termstudy by the North Central Regional Laboratory(NCREL) and a 1998-99 study by the ImaginationProject at the University of California, LosAngeles (UCLA). Evaluators collected data onstudent achievement in reading and mathematicson standardized tests such as the Iowa Test ofBasic Skills (ITBS) and the Illinois GoalsAssessment Program (IGAP) test. The NCRELstudy also used large-scale surveys of teachersand students to obtain an overall view ofclassroom practices. The Champions of Changeresearchers also summarized an earlier study ofCAPE conducted by the Imagination Project. Thisstudy focused on comparisons between CAPEand non-CAPE schools with similar racial/ethnicand socio-economic student populations.Students at CAPE schools were already doingslightly better than those in non-CAPE schoolsbefore the program, so evaluators tried todetermine whether the CAPE schools’ advantagegrew over the course of program implementation.The evaluators reported that findings forelementary school students were significant, butthat due to the small sample size of CAPE highschools in the study the data from this age groupwere not statistically significant.
EVALUATION FUNDINGChampions of Change was funded by The GEFund and the John D. and Catherine T.MacArthur Foundation. The Chicago PublicSchools funds CAPE.
GEOGRAPHIC AREASThough this summary focuses on Chicago,Illinois, Champions of Change includessnapshots of arts programs across the country.
CONTACT INFORMATIONResearch ContactsRichard DeasyArts Education PartnershipCouncil of Chief State School OfficersOne Massachusetts Avenue, NW, Suite 700Washington, DC 20001-1431http://aep-arts.orgwww.pcah.gov
James Catterall, ProfessorGraduate School of Education3341 Moore Hall, Box 951521University of California at Los AngelesLos Angeles, CA [email protected]
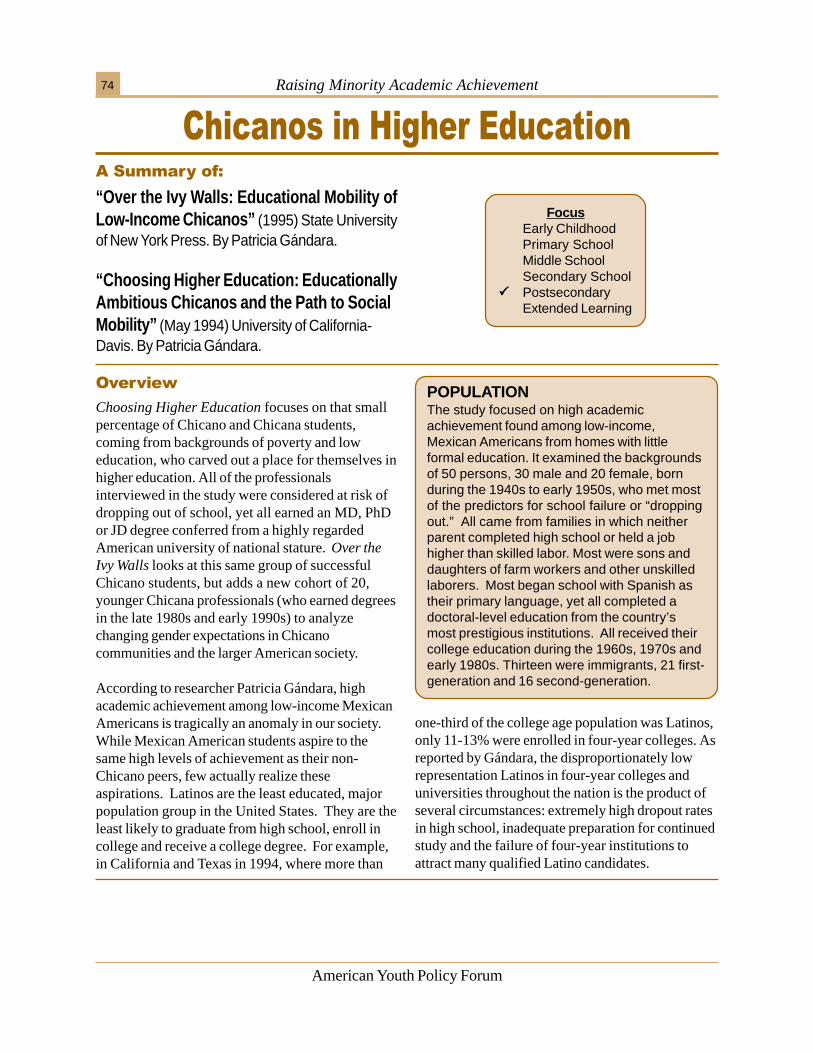
Raising Minority Academic Achievement74
American Youth Policy Forum
Choosing Higher Education focuses on that smallpercentage of Chicano and Chicana students,coming from backgrounds of poverty and loweducation, who carved out a place for themselves inhigher education. All of the professionalsinterviewed in the study were considered at risk ofdropping out of school, yet all earned an MD, PhDor JD degree conferred from a highly regardedAmerican university of national stature. Over theIvy Walls looks at this same group of successfulChicano students, but adds a new cohort of 20,younger Chicana professionals (who earned degreesin the late 1980s and early 1990s) to analyzechanging gender expectations in Chicanocommunities and the larger American society.
According to researcher Patricia Gándara, highacademic achievement among low-income MexicanAmericans is tragically an anomaly in our society.While Mexican American students aspire to thesame high levels of achievement as their non-Chicano peers, few actually realize theseaspirations. Latinos are the least educated, majorpopulation group in the United States. They are theleast likely to graduate from high school, enroll incollege and receive a college degree. For example,in California and Texas in 1994, where more than
�����������5�$�����������������������
� �� ���
“Over the Ivy Walls: Educational Mobility ofLow-Income Chicanos” (1995) State Universityof New York Press. By Patricia Gándara.
“Choosing Higher Education: EducationallyAmbitious Chicanos and the Path to SocialMobility” (May 1994) University of California-Davis. By Patricia Gándara.
POPULATIONThe study focused on high academicachievement found among low-income,Mexican Americans from homes with littleformal education. It examined the backgroundsof 50 persons, 30 male and 20 female, bornduring the 1940s to early 1950s, who met mostof the predictors for school failure or “droppingout.” All came from families in which neitherparent completed high school or held a jobhigher than skilled labor. Most were sons anddaughters of farm workers and other unskilledlaborers. Most began school with Spanish astheir primary language, yet all completed adoctoral-level education from the country’smost prestigious institutions. All received theircollege education during the 1960s, 1970s andearly 1980s. Thirteen were immigrants, 21 first-generation and 16 second-generation.
one-third of the college age population was Latinos,only 11-13% were enrolled in four-year colleges. Asreported by Gándara, the disproportionately lowrepresentation Latinos in four-year colleges anduniversities throughout the nation is the product ofseveral circumstances: extremely high dropout ratesin high school, inadequate preparation for continuedstudy and the failure of four-year institutions toattract many qualified Latino candidates.
FocusEarly ChildhoodPrimary SchoolMiddle SchoolSecondary School
����� PostsecondaryExtended Learning
Raising Minority Academic Achievement 75
American Youth Policy Forum
������������������
Family InvolvementWhether it took the form of providing educationalmaterials at home or becoming an active decisionmaker within the child’s school, parentalinvolvement was cited by interviewees as animportant component in their educational lives.Many reported they perceived their mother wasmore supportive than their father. “While fathersfrequently indicated they wanted their children to dowell in school, they were more ambivalent in themessages they conveyed to their children,” notedthe evaluator. In cases where the father was notfully supportive of the child’s educationalachievement, usually the mother intervened on thechild’s behalf.
Environment of AchievementMost interviewees reported the availability of somereading material in the home, and more than halfreported that one of their parents was an avid readerdespite a low level of formal education. Several ofthe parents held strong views on social issues, orwere well-versed in history or literature and sharedthis love of inquiry and ideas with their children.When asked about the availability in their homes ofan encyclopedia, dictionary, daily newspaper,magazine subscriptions and more than 25 books,98% of the subjects had at least two of the five
things and almost 70% had an encyclopedia as theywere growing up. Sixty-two percent recounted howdiscussions of politics and world events wereroutine topics in their households.
ResiliencySome interviewees were dogged by weak test scoresor negative impressions that had to be overcomebefore they were permitted to enter the collegepreparatory track. Almost all of the study subjectswere eventually tracked into college preparatorycourses when they were in high school. Once there,the college prep track had an enormous impact onthem, not only because they were able to participatein classes that would lead to college, but alsobecause of the new, challenging peer group itdefined for them.
Integrated EducationIn almost every case, these students got into classesor schools in which they were the only – or one offew – Chicanos in their academic peer group. Inboth elementary and high school, 60-70% of thesubjects reported that they attended mostly white(and usually middle- to upper middle-class) ormixed schools in which at least half the studentswere Anglo.
Financial AidAll of the interviewees were from low-incomefamilies so financial aid became necessary for manyto attend college. Through aid provided by Latino
������������
This study selected a group of successful adults andinterviewed them to determine what led to theirsuccess. In terms of youth outcomes, the keyfinding is simply that all of the Chicanoprofessionals in the study were considered at risk of
dropping out of school, yet all earned an MD, PhDor JD degree conferred from a highly regarded,American university of national stature. The factorsthat led to the success of these adults are detailedbelow under “Contributing Factors.”
“This is not a study about ‘successful’individuals…but about people who choseeducation as a vehicle for social or economicmobility or personal fulfillment.”
— Patricia Gándara, evaluator
“When I was in the tenth grade, I took thatspecial stupid test they give you, and it cameout that I would have been a fantasticmechanic…so they tracked meaverage…again…which precluded me fromtaking college prep classes, and I had alreadytaken geometry and Spanish and biology andsome other courses in junior high.”
—Chicana lawyer
Raising Minority Academic Achievement76
American Youth Policy Forum
STUDY METHODOLOGYTo locate the subject group, the evaluator contacteduniversities and government offices across thecountry and asked them to nominate individuals. Toa smaller extent, the evaluator pulled names frommembership lists of professional organizations,class lists and university rosters. After reviewingliterature on achievement, motivation and minorityschooling, the evaluator interviewed subjects withboth closed and open-ended questions, thenhighlighted areas of broad commonality.
EVALUATION & PROGRAM FUNDINGThe evaluation was funded by the University ofCalifornia-Davis.
GEOGRAPHIC AREASThe evaluator, while pulling subjects from across thenation, chose to keep their hometowns, places ofschooling and current location anonymous.
CONTACT INFORMATIONResearch ContactsPatricia GándaraUniversity of California-DavisOne Shields AvenueDavis, CA 95616Phone: [email protected]
The evaluator noted that the higher proportion ofmen in the study was not by design but was dictatedby the difficulty of finding female subjects. Theevaluator determined that the high level of educationachieved by the subject group was much moredifficult for Chicanas to achieve without at least oneparent breaking into the middle class before them,most typically a mother who had attained the statusof a clerical or secretarial position.
�!������������
recruitment programs, scholarships for high-achieving scholars or stipends for low-incomestudents, the subjects were able to break the cycleof poverty in their families.
MentoringHalf the interviewees reported having mentors (definedby the evaluator as “a person who encouraged,showed the way and nurtured the subject’s aspirationsto pursue higher education”) outside the family. Thementor relationships were informal, positiverelationships with supportive adults from thecommunity. In some cases, mentoring took the formof an exceptional interest in the academic nurturing ofa subject, even early on. Thirty percent of the womeninterviewees cited a person outside of the family ashaving had a major influence on setting and/orachieving educational goals; 60% of the male subjectscited such a person.
A Focus on Minority Achievement and onTransitionFifty-two percent of the interviewees attributed theircollege and/or graduate school attendance, at least inpart, to recruitment programs for Chicanos, whichbrought both information and financial aid. One-thirdof the subjects used junior colleges as their entry pointinto higher education, lacking adequate financialsupport to go directly to universities.
Hard WorkBy their own accounts, the professionals interviewedin the study were not the “smartest” students, but theywere among the hardest workers. Almost two-thirds ofthem reported having a period in school in which theydid not do well. However, hard work at home was inevidence for nearly all the subjects, many of whomheld jobs to help financially support the family, caredfor younger siblings and took on a large share ofhousehold chores.
Since the group of subjects does not include thosecompleting their education since the early 1980s, theevaluator acknowledged that the study leaves openthe question of how representative the experiencesof this group were compared to those of morerecent graduates.
Raising Minority Academic Achievement 77
American Youth Policy Forum
������������
Relative to children in the matched comparisongroup, the participants in the CPC program had thefollowing academic achievement gains:
� Higher rates of high school completion (49.7%vs. 38.5%; significant at the .01 level).
Established in 1967 through funding from Title I ofthe Elementary and Secondary Education Act(1965), the Child-Parent Center (CPC) programprovides comprehensive educational and familysupport services to economically disadvantagedchildren from pre-school through early elementaryschool. The program serves children in highpoverty neighborhoods where there is no readyaccess to Head Start facilities. Before enrolling theirchildren in CPC, parents must agree to work withthe program for a half a day per week. CPCprovides half-day pre-school to children (for ages 3-4), half- or full-day kindergarten (for ages 4-6) andsupplementary services to primary school children(ages 6-9) and their families.
��� �7.�������������������������
� �� ���
“The Child-Parent Center Program andStudy” (2000) Success in Early Intervention: TheChicago Child-Parent Centers pp. 22-63.University of Nebraska Press. By Arthur J.Reynolds.
“Long-term Effects of An Early ChildhoodIntervention on Educational Achievementand Juvenile Arrest” (May 2001) Journal of theAmerican Medical Association 285(18): 2339-2346.By Arthur J. Reynolds, Judy A. Temple, Dylan L.Robertson, and Emily A. Mann.
POPULATIONSince 1967 CPC has served about 100,000Chicago families. Currently, the programoperates in 23 centers throughout the ChicagoPublic School system. The longitudinal studycompared 989 children, who attended 20 CPCsites in Chicago’s highest povertyneighborhoods during the mid-1980s, to a non-randomized, matched comparison group of 550children, who participated in alternative earlychildhood programs and then full-daygovernment-funded kindergarten. The vastmajority of students in both groups wereAfrican American (93%), from low-incomefamilies (84%) or living in single-parenthouseholds (70%). The expected high schoolgraduation year for youth in the study was1998-99 and 84% of the original participantswere still involved in the study in 2000.
� More years of completed education (10.6 vs.10.2; significant at the .03 level).
� Lower school dropout rates (46.7% vs. 55%;significant at the .047 level).
Focus����� Early Childhood����� Primary School
Middle SchoolSecondary SchoolPostsecondaryExtended Learning
Raising Minority Academic Achievement78
American Youth Policy Forum
���������������
CPC is founded on the assumption that schoolsuccess is facilitated by a stable and enrichedlearning environment during the entire period ofearly childhood (ages 3-9). The followingcomponents are shared by the majority of CPCprogram sites:
� CPC pre-school and kindergarten programs areaffiliated with elementary schools, but they arelocated in a separate building or wing of theschool. The staff include a head teacher, parent-resource teacher, classroom teachers, teacheraides and school-community representatives.These programs serve from 130 to 210students, and they have 6 classrooms onaverage. CPC primary school programs are alllocated in elementary schools and they servefrom 90 to 420 students in 4-18 classes.
� Half-day CPC pre-school programs are offeredfor 3 hours in the morning and 3 hours in theafternoon. CPC kindergarten programs areeither half day (2.5 hours) or full day (6 hours).Both programs run throughout the regular nine-month school year and for 8 weeks eachsummer.
� The child to teacher ratio in CPC pre-schoolprograms is 17:2, while the ratio in kindergarten
and primary school programs is 25:2. Thepresence of parent volunteers further reducesthe child to adult ratio in CPC classrooms.
� Parents get involved in numerous ways withCPC programs, from volunteering in theclassroom to joining reading groups in theparent-resource room. CPC staff conducthome visits and parents are encouraged to readwith their children, attend parent-teacherconferences, enroll in parent education classesand attend social events organized by CPCstaff. Parent involvement is required during pre-school and kindergarten, and encouraged duringthe primary grades.
� The CPC curriculum emphasizes basic skills inlanguage arts and math through a variety oflearning experiences including whole classexercises, small groups, individualized learningactivities, and field trips. In conjunction withthese academic enrichment activities CPCfosters the psychosocial development ofchildren.
� Health screening, referrals, speech therapy andnursing services, as well as free breakfast andlunch are available to CPC students andfamilies.
� Lower cases of juvenile arrests (16.9% vs.25.1%; significant at the .003 level).
� Lower rates of violent arrests (9.0% vs. 15.3%;significant at the .002 level).
The longer children and their families participated inCPC programs, the stronger the effects on academicachievement. Relative to children with lessextensive participation in the program, children whoparticipated from pre-school through second or thirdgrade:
� Experienced lower rates of grade retention ingrades K-12 (21.9% vs. 32.3%; .001significance level).
� Were less often classified as needing SpecialEducation (13.5% vs. 20.7%; .004 significancelevel).
In terms of gender, the CPC program had thestrongest effect on boys. The group ofpredominantly African American males from CPCexperiencing a 47% higher rate of high schoolcompletion than the males in the comparison group.
CPC program attendance rates regularly exceed92%, which is four to six percentage points higherthan other Title-I programs.
Raising Minority Academic Achievement 79
American Youth Policy Forum
Early InterventionProgram evaluators believed that earlyintervention had the greatest impact because itfocused on the early childhood years “whenchildren and parents are most receptive tochange.”
Parent InvolvementBefore children are accepted for the program,parents must commit to participating at least ahalf day per week. The evaluators observed that“many parents do not often participate to thisextent,” but they ranked various parentinvolvement activities. The highest parentparticipation occurred in parent-resource rooms,organized school activities and home supportactivities. Evaluators ranked parent participationin classroom volunteering as “moderate,” andparent enrollment in formal adult educationcourses was ranked “low.” Parent-centerresource rooms located in every CPC site serveas the focal point for parent services andinvolvement.
������������������
Community InvolvementEach CPC program site has a full-time communityliaison, who has usually grown up in theneighborhood around the school. This staffmember identifies families in need of CPC servicesand goes door-to-door to recruit prospectivefamilies. The community representative alsoconducts at least one home visit per enrolled child.
Program Continuity/Long-term supportEvaluators argued that one of the key factors thatcontributed to program success was the durationand continuity of support received by CPC childrenfrom age 3 to 9, especially in contrast to therelatively haphazard academic support available toother children from similar socio-economicbackgrounds. This continuity facilitated studenttransitions from pre-K to kindergarten and fromkindergarten to the elementary school grades.
Individualized Attention/Small Classes“The relatively small class sizes and the presence ofseveral adults enable a relatively intensive, child-centered approach to early childhood development,”according to the evaluator.
� The average annual cost of the half-day pre-school program in CPC was $4350 per child.The average annual cost of the primaryschool CPC program (grades K-3) was $1500
per student above the cost of normal schoolprogramming. Both figures given in 1996dollars.
Raising Minority Academic Achievement80
American Youth Policy Forum
STUDY METHODOLOGYThis quasi-experimental, longitudinal study originallyincluded all children who enrolled in the 20 CPCswith pre-school and kindergarten programsbeginning in the fall of 1983 and who werekindergarten graduates. Children who were age 3or 4 when they enrolled could participate in theprogram up to age 9 in the spring of 1989. Thecomparison group included children who did nothave a systemic intervention from pre-schoolthrough third grade, though some had participatedin Head Start and most had attended an all-daykindergarten called the Chicago Effective SchoolsProject (CESP). These two groups were matchedfor race/ethnicity, gender and family income. Theparents of CPC program participants had a higherhigh school graduation rate than the parents ofchildren in the comparison group (66% vs. 60%),but evaluators took these differences into accountwhen measuring program effects. By the age of20, 83% of the original sample of 1,539 childrenwere still involved in the longitudinal study.
EVALUATION & PROGRAM FUNDINGTitle I of the Improving America’s Schools Actfunds the pre-school and kindergartencomponents of the CPC program, while theState of Illinois funds the primary schoolcomponent of CPC. The evaluation was fundedby the National Institutes of Health and the U.S.Department of Education.
GEOGRAPHIC AREASChicago, Illinois
CONTACT INFORMATIONResearch ContactsArthur J. Reynolds, Associate ProfessorThe School of Social Work1350 University Ave.Madison, WI 53706Phone: [email protected]
Raising Minority Academic Achievement 81
American Youth Policy Forum
In 1999, the nation’s urban public schools educatedabout 40% of all students of color, 35% of studentseligible for free and reduced price lunch, and 30% ofEnglish language learners in the nation. The Councilof the Great City Schools’ National Task Force onClosing Achievement Gaps compiled and examinedefforts and data from 48 major urban school systemsacross the nation. The evaluators discussedachievement gaps in the context of two generalobservations: 1) African American, Latino, NativeAmerican and other students score lower, as groups,than white students on standardized achievement tests;2) students of lower socio-economic status scorelower, as groups, than students of middle or highersocio-economic status on standardized achievementtests. Some school districts had the goal of boostingachievement specifically for minority populations;others tried to boost the achievement of every studentwith the thought that minority achievement increaseswould follow.
��������� �������������
� �� ���
“Beating the Odds: A City-By-City Analysis ofthe Student Performance and AchievementGaps On State Assessments” (May 2001)Council of the Great City Schools. By Sharon Lewisand Michael Casserly.
“Closing the Achievement Gaps in UrbanSchools: A Survey of Academic Progress andPromising Practices in the Great City Schools”(October 1999) Council of the Great City Schools. BySharon Lewis, Jack Jepson and Michael Casserly.
POPULATIONThe school districts observed were of varyingsizes and had varying mixtures of minoritypopulations. Depending on the minoritypopulations present, each urban school districtchose to concentrate its “closing the gap”efforts on different groups. Some focused ongroups of a certain socio-economic statusrather than on groups of a certain race. Forexample, in Dallas, schools concentrated onclosing the achievement gap for Latinostudents, while in Baltimore and Birmingham –both with more than 85% African Americanstudent populations – schools concentrated onboosting the achievement of all students. InDes Moines, schools focused on improvingachievement for all students, but then broke outachievement data by socio-economic status/income in order to shape future efforts.
FocusEarly Childhood
����� Primary School����� Middle School����� Secondary School
Postsecondary����� Extended Learning
������������
This report shares a variety of findings from urbandistricts around the nation. A sampling of thesefindings show many cities increased the achievementof African American and Latino students onstandardized tests and reduced the gap between
minority and white students, by differing amounts.Some of the initiatives described here also increasedwhite achievement. Below, data from several cities arereported, though readers should use caution incomparing the school districts (see EvaluatorComments below).
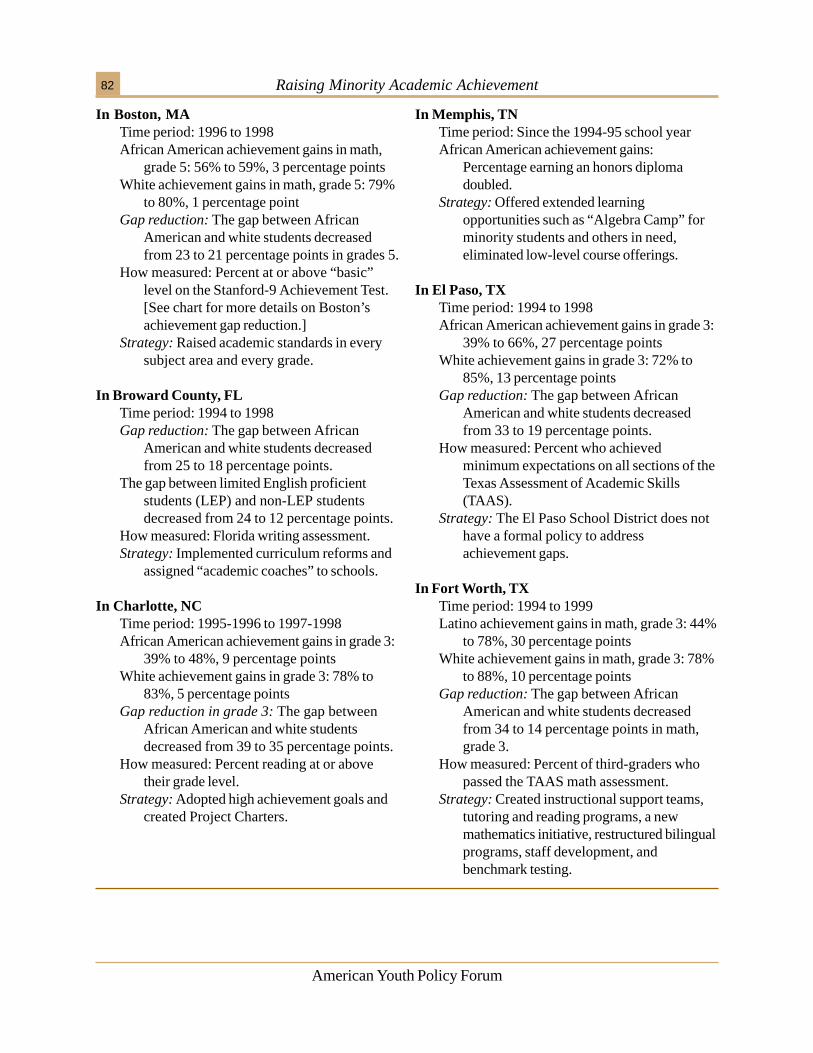
Raising Minority Academic Achievement82
American Youth Policy Forum
In Boston, MATime period: 1996 to 1998African American achievement gains in math,
grade 5: 56% to 59%, 3 percentage pointsWhite achievement gains in math, grade 5: 79%
to 80%, 1 percentage pointGap reduction: The gap between African
American and white students decreasedfrom 23 to 21 percentage points in grades 5.
How measured: Percent at or above “basic”level on the Stanford-9 Achievement Test.[See chart for more details on Boston’sachievement gap reduction.]
Strategy: Raised academic standards in everysubject area and every grade.
In Broward County, FLTime period: 1994 to 1998Gap reduction: The gap between African
American and white students decreasedfrom 25 to 18 percentage points.
The gap between limited English proficientstudents (LEP) and non-LEP studentsdecreased from 24 to 12 percentage points.
How measured: Florida writing assessment.Strategy: Implemented curriculum reforms and
assigned “academic coaches” to schools.
In Charlotte, NCTime period: 1995-1996 to 1997-1998African American achievement gains in grade 3:
39% to 48%, 9 percentage pointsWhite achievement gains in grade 3: 78% to
83%, 5 percentage pointsGap reduction in grade 3: The gap between
African American and white studentsdecreased from 39 to 35 percentage points.
How measured: Percent reading at or abovetheir grade level.
Strategy: Adopted high achievement goals andcreated Project Charters.
In Memphis, TNTime period: Since the 1994-95 school yearAfrican American achievement gains:
Percentage earning an honors diplomadoubled.
Strategy: Offered extended learningopportunities such as “Algebra Camp” forminority students and others in need,eliminated low-level course offerings.
In El Paso, TXTime period: 1994 to 1998African American achievement gains in grade 3:
39% to 66%, 27 percentage pointsWhite achievement gains in grade 3: 72% to
85%, 13 percentage pointsGap reduction: The gap between African
American and white students decreasedfrom 33 to 19 percentage points.
How measured: Percent who achievedminimum expectations on all sections of theTexas Assessment of Academic Skills(TAAS).
Strategy: The El Paso School District does nothave a formal policy to addressachievement gaps.
In Fort Worth, TXTime period: 1994 to 1999Latino achievement gains in math, grade 3: 44%
to 78%, 30 percentage pointsWhite achievement gains in math, grade 3: 78%
to 88%, 10 percentage pointsGap reduction: The gap between African
American and white students decreasedfrom 34 to 14 percentage points in math,grade 3.
How measured: Percent of third-graders whopassed the TAAS math assessment.
Strategy: Created instructional support teams,tutoring and reading programs, a newmathematics initiative, restructured bilingualprograms, staff development, andbenchmark testing.
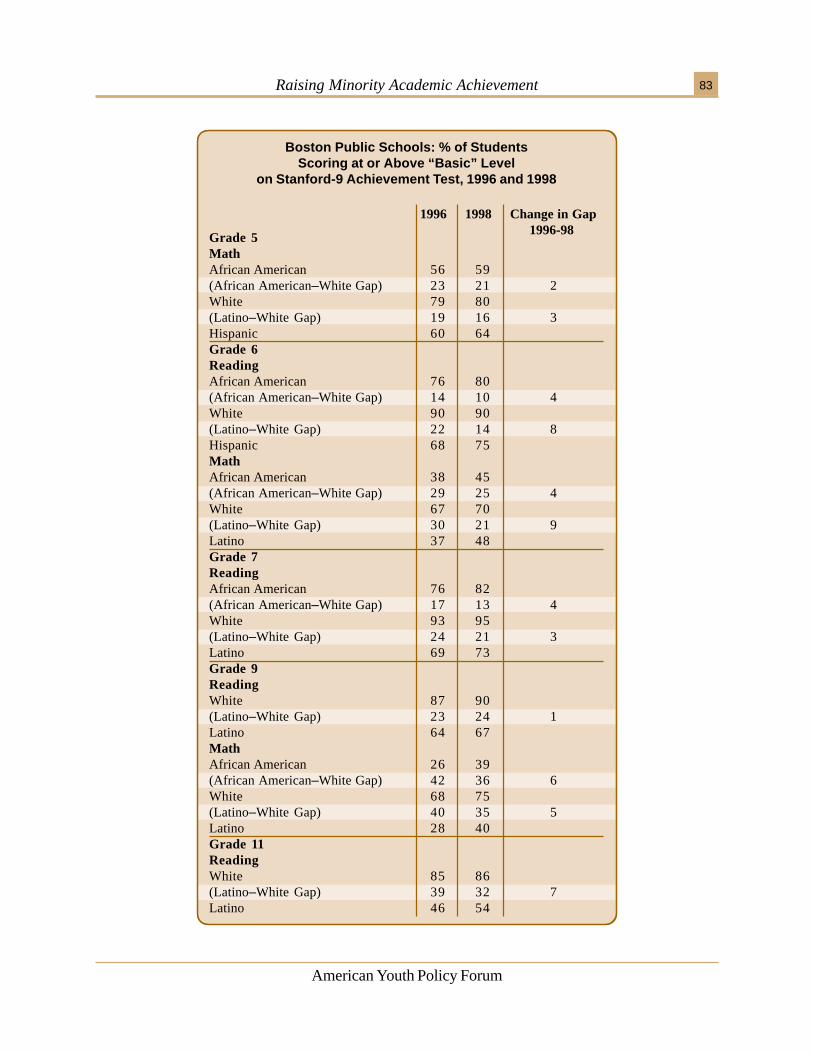
Raising Minority Academic Achievement 83
American Youth Policy Forum
1996 1998 Change in Gap 1996-98Grade 5
MathAfrican American 56 59(African American–White Gap) 23 21 2White 79 80(Latino–White Gap) 19 16 3Hispanic 60 64Grade 6ReadingAfrican American 76 80(African American–White Gap) 14 10 4White 90 90(Latino–White Gap) 22 14 8Hispanic 68 75MathAfrican American 38 45(African American–White Gap) 29 25 4White 67 70(Latino–White Gap) 30 21 9Latino 37 48Grade 7ReadingAfrican American 76 82(African American–White Gap) 17 13 4White 93 95(Latino–White Gap) 24 21 3Latino 69 73Grade 9ReadingWhite 87 90(Latino–White Gap) 23 24 1Latino 64 67MathAfrican American 26 39(African American–White Gap) 42 36 6White 68 75(Latino–White Gap) 40 35 5Latino 28 40Grade 11ReadingWhite 85 86(Latino–White Gap) 39 32 7Latino 46 54
Boston Public Schools: % of StudentsScoring at or Above “Basic” Level
on Stanford-9 Achievement Test, 1996 and 1998
Raising Minority Academic Achievement84
American Youth Policy Forum
Focus on Minority AchievementMany districts began their reform efforts afteranalyzing data that clearly showed theachievement gaps between minority students andother students, or between low-income studentsand other students.
Extended LearningMany districts attributed success in part to longerschool days, longer school years, summer school,
������������������
���������������
The 48 urban school districts evaluated varied intheir approaches, but some common threadsemerged:
� Reducing class size was a structural change thataccompanied many of the school reforms.
� New learning standards were adopted by mosturban school districts.
� Academic coaches, instructional advisory teams,curriculum specialists and other school reformspecialists were hired by school districts to helpoffer technical assistance to schools on a full-timeor part-time basis.
� Training for principals or teachers was commonlyoffered before implementation began.
� School-wide “learning philosophies” or“covenants” were often used as a way to buildstudent, parent and staff enthusiasm for aschool-wide reform.
� Summer learning academies or otherintervention strategies were employed as a wayto supplement curriculum.
� Many districts established and annuallyreviewed achievement goals, measuringachievement with multiple assessments.
“Few goals could be more important toAmerican public education today than closingthe achievement gaps among students by race,income, language and gender.
—Michael Casserly, Executive Director,Council of the Great City Schools
“Improving our data, and hence our ability tomonitor trends, should be one of our highestpriorities.”
—Michael Casserly, Executive Director,Council of the Great City Schools
after-school tutorials or Saturday enrichmentopportunities.
Increased Emphasis on ReadingAn increased emphasis on reading, particularly inthe early grades, helped boost both achievementscores and student confidence.
Community InvolvementSome districts developed linkages withcommunity organizations or private businessesthat offered equipment, facility improvements,mentors for students, and other resources.
Planning, Implementation and EvaluationThe districts that showed the most dramaticprogress had detailed reform planning andevaluation procedures.
Raising Minority Academic Achievement 85
American Youth Policy Forum
STUDY METHODOLOGYThe evaluators mailed a survey developed by theNational Task Force on Closing AchievementGaps to curriculum and research directors in theCouncil of the Great City Schools’ 55 cities.Response rate was 87%. Achievement data wasself-reported by the districts and was rounded tothe nearest whole number.
EVALUATION & PROGRAM FUNDINGThe study was conducted and funded by theCouncil of the Great City Schools. Reformsdiscussed were funded in a variety of ways butmost commonly through state, district or Title Imonies.
GEOGRAPHIC AREASThe study covered a national span.
CONTACT INFORMATIONResearch ContactsSharon Lewis and Michael CasserlyCouncil of the Great City Schools1301 Pennsylvania Avenue, N.W., Suite 702Washington, D.C. 20004202.393.2427Fax: [email protected]
The evaluator noted that there are limitations in thecomparisons that can be drawn between the datafrom various school districts in the Key Findingssection of the summary:
� It is difficult to compare some achievement dataacross states, because each state has developedits own assessment, administration guidelines,testing timelines, and grades to be tested.
�!������������
� Trend lines may vary in duration from state tostate. Some districts have trend data spanningfour to six years, while others may have datafor only two years.
Each state reports its results in differing metrics orstatistical units. The metrics can affect how good orbad the scores look and can influence the directionof the trends.
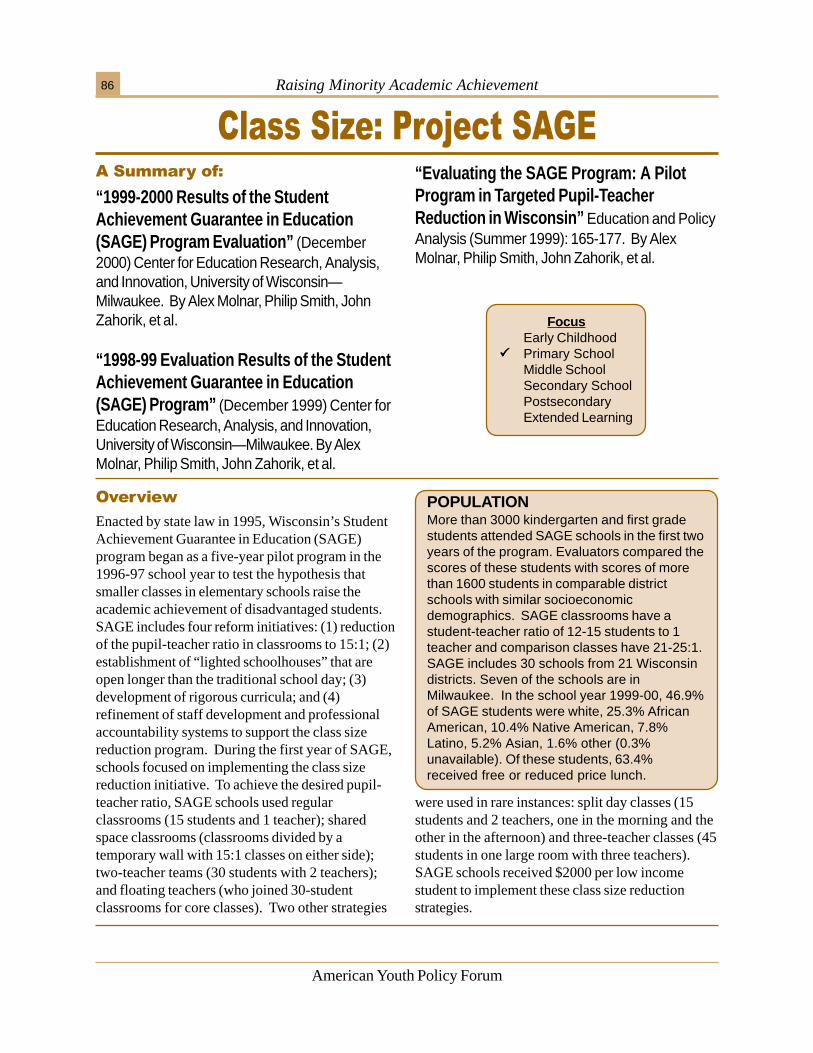
Raising Minority Academic Achievement86
American Youth Policy Forum
Enacted by state law in 1995, Wisconsin’s StudentAchievement Guarantee in Education (SAGE)program began as a five-year pilot program in the1996-97 school year to test the hypothesis thatsmaller classes in elementary schools raise theacademic achievement of disadvantaged students.SAGE includes four reform initiatives: (1) reductionof the pupil-teacher ratio in classrooms to 15:1; (2)establishment of “lighted schoolhouses” that areopen longer than the traditional school day; (3)development of rigorous curricula; and (4)refinement of staff development and professionalaccountability systems to support the class sizereduction program. During the first year of SAGE,schools focused on implementing the class sizereduction initiative. To achieve the desired pupil-teacher ratio, SAGE schools used regularclassrooms (15 students and 1 teacher); sharedspace classrooms (classrooms divided by atemporary wall with 15:1 classes on either side);two-teacher teams (30 students with 2 teachers);and floating teachers (who joined 30-studentclassrooms for core classes). Two other strategies
� ������8���.��9�����4�������������
� �� ���
“1999-2000 Results of the StudentAchievement Guarantee in Education(SAGE) Program Evaluation” (December2000) Center for Education Research, Analysis,and Innovation, University of Wisconsin—Milwaukee. By Alex Molnar, Philip Smith, JohnZahorik, et al.
“1998-99 Evaluation Results of the StudentAchievement Guarantee in Education(SAGE) Program” (December 1999) Center forEducation Research, Analysis, and Innovation,University of Wisconsin—Milwaukee. By AlexMolnar, Philip Smith, John Zahorik, et al.
POPULATIONMore than 3000 kindergarten and first gradestudents attended SAGE schools in the first twoyears of the program. Evaluators compared thescores of these students with scores of morethan 1600 students in comparable districtschools with similar socioeconomicdemographics. SAGE classrooms have astudent-teacher ratio of 12-15 students to 1teacher and comparison classes have 21-25:1.SAGE includes 30 schools from 21 Wisconsindistricts. Seven of the schools are inMilwaukee. In the school year 1999-00, 46.9%of SAGE students were white, 25.3% AfricanAmerican, 10.4% Native American, 7.8%Latino, 5.2% Asian, 1.6% other (0.3%unavailable). Of these students, 63.4%received free or reduced price lunch.
FocusEarly Childhood
����� Primary SchoolMiddle SchoolSecondary SchoolPostsecondaryExtended Learning
“Evaluating the SAGE Program: A PilotProgram in Targeted Pupil-TeacherReduction in Wisconsin” Education and PolicyAnalysis (Summer 1999): 165-177. By AlexMolnar, Philip Smith, John Zahorik, et al.
were used in rare instances: split day classes (15students and 2 teachers, one in the morning and theother in the afternoon) and three-teacher classes (45students in one large room with three teachers).SAGE schools received $2000 per low incomestudent to implement these class size reductionstrategies.
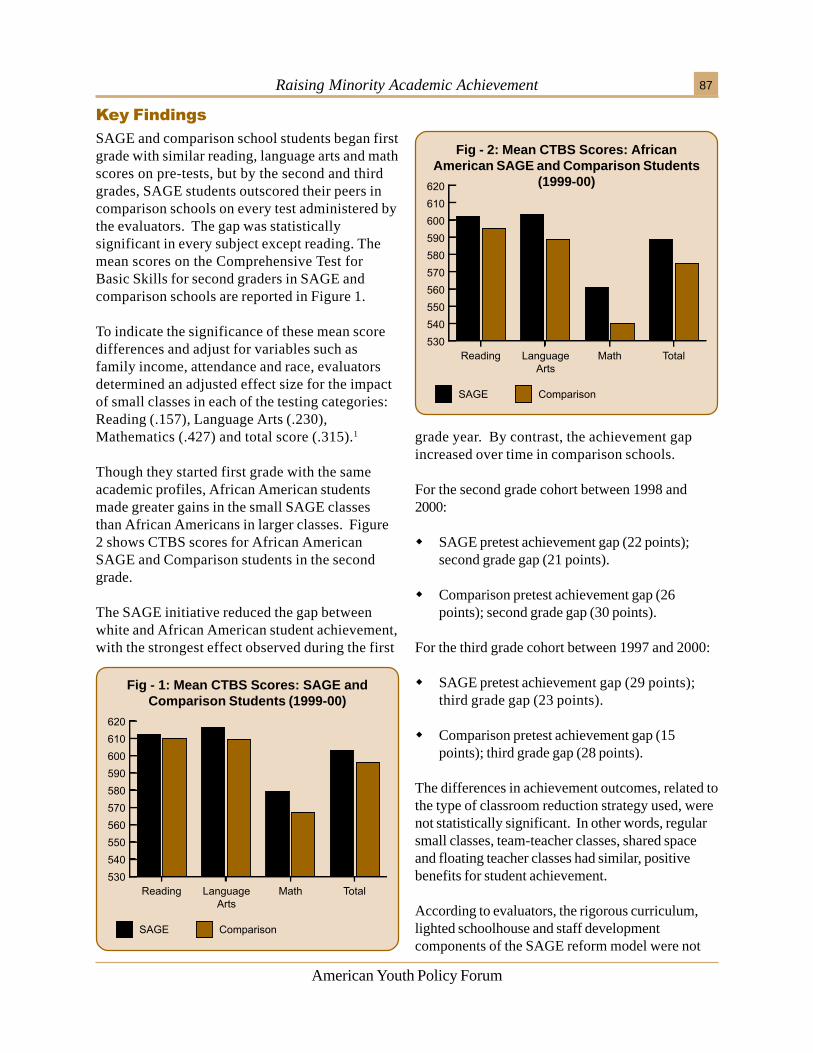
Raising Minority Academic Achievement 87
American Youth Policy Forum
������������
SAGE and comparison school students began firstgrade with similar reading, language arts and mathscores on pre-tests, but by the second and thirdgrades, SAGE students outscored their peers incomparison schools on every test administered bythe evaluators. The gap was statisticallysignificant in every subject except reading. Themean scores on the Comprehensive Test forBasic Skills for second graders in SAGE andcomparison schools are reported in Figure 1.
To indicate the significance of these mean scoredifferences and adjust for variables such asfamily income, attendance and race, evaluatorsdetermined an adjusted effect size for the impactof small classes in each of the testing categories:Reading (.157), Language Arts (.230),Mathematics (.427) and total score (.315).1
Though they started first grade with the sameacademic profiles, African American studentsmade greater gains in the small SAGE classesthan African Americans in larger classes. Figure2 shows CTBS scores for African AmericanSAGE and Comparison students in the secondgrade.
The SAGE initiative reduced the gap betweenwhite and African American student achievement,with the strongest effect observed during the first
grade year. By contrast, the achievement gapincreased over time in comparison schools.
For the second grade cohort between 1998 and2000:
� SAGE pretest achievement gap (22 points);second grade gap (21 points).
� Comparison pretest achievement gap (26points); second grade gap (30 points).
For the third grade cohort between 1997 and 2000:
� SAGE pretest achievement gap (29 points);third grade gap (23 points).
� Comparison pretest achievement gap (15points); third grade gap (28 points).
The differences in achievement outcomes, related tothe type of classroom reduction strategy used, werenot statistically significant. In other words, regularsmall classes, team-teacher classes, shared spaceand floating teacher classes had similar, positivebenefits for student achievement.
According to evaluators, the rigorous curriculum,lighted schoolhouse and staff developmentcomponents of the SAGE reform model were not
Fig - 1: Mean CTBS Scores: SAGE andComparison Students (1999-00)
Fig - 2: Mean CTBS Scores: AfricanAmerican SAGE and Comparison Students
(1999-00)
Raising Minority Academic Achievement88
American Youth Policy Forum
���������������
SAGE used the following strategies to reduce classsize, given the constraints of existing facilities andpersonnel in participating elementary schools:
� Small Classroom: student-teacher ratio of 15:1in one room.
� Two-Teacher Teams: student-teacher ratio of30:2 in one room.
� Three-Teacher Teams: student-teacher ratio of45:3 in one large room.
� Shared Space Classroom: one large room with atemporary divider and two classes with 15:1student teacher ratios on either side.
� Floating Teacher: a roving teacher joins 30:1classrooms for core classes each day.
� Split Day: 2 teachers with 15 students, eachinstructs for half of the day.
According to a survey of 150 first- and second-grade teachers in SAGE schools, the smaller classsizes allowed for new teaching strategies, including:
� individualized instruction� classroom discussion� hands-on activities� more content coverage� less time dealing with disciplinary problems
Reduced Class SizeAccording to the evaluators, the most significantfactor affecting individual student performance ontests was socioeconomic status (SES), but when thisvariable was accounted for, class size had the mostsignificant effect on student scores. All of the classsize reduction strategies used by SAGE had similar,positive effects.
Individualized AttentionAccording to SAGE teachers, the most significantfactor in improving the learning environment andstudent achievement in smaller classes was theindividualized instruction and attention that theseclasses allow. In small classes, the teachersunderstood the strengths and weaknesses of eachstudent and tailored their instructional strategies tothese students’ unique needs.
������������������
Classroom ManagementThe majority of the teachers in small classesreported fewer discipline problems. Throughclassroom observation and student achievementdata, the evaluators found that the more effectiveteachers used a consistent, decisive and assertivemanagement style to enhance the disciplinarybenefits of small class size.
Innovative Instructional StrategiesBecause they have fewer discipline problems, smallclasses allow for student-directed lessons andcreative problem-solving assignments, butevaluators warned that these innovative instructionalstrategies must be grounded in drills that instill anunderstanding of basics and fundamentals.
uniformly or immediately implemented across theschools, so that they had little impact onachievement in SAGE classroom performance in thefirst few years. As these initiatives were fullyimplemented, they positively influenced class sizefindings.
1. In terms of effect size, a positive figure less than0.25 is a modest effect; 0.25 to 0.5 is a moderateeffect; a figure of 0.5 or above is a large effect.
Raising Minority Academic Achievement 89
American Youth Policy Forum
STUDY METHODOLOGYSAGE legislation mandated annual evaluation ofthe program’s effects. The evaluation used aquasi-experimental, comparative change design.The evaluators chose this method because theycould not randomly assign students and teachersto classrooms or keep classroom cohorts intactfrom year to year. The lack of incentives forparticipating in the comparison group made itimpossible for the evaluators to use matched-paircomparison schools. But scores from theComprehensive Test of Basic Skills for bothSAGE students and non-SAGE students allowedevaluators to determine the influence of class sizeon academic achievement. Evaluators collectedclassroom organization profiles and teacherquestionnaires as well as conducted site visits toSAGE classes and interviews with SAGEteachers. The evaluators gave both SAGE andnon-SAGE schools the option of not testingstudents who had special needs or who spokeEnglish as a second language.
EVALUATION & PROGRAM FUNDINGSAGE and the SAGE evaluations are funded bythe state of Wisconsin. The state has provided$37 million to bring the SAGE program toapproximately 400 new schools in the 2000-01school year and an allocation of $3 million to
reimburse school districts for 20% of theconstruction costs for new classroom facilities.
GEOGRAPHIC AREASSAGE has now been implemented in 46 schooldistricts throughout the state of Wisconsin.Legislation is pending to bring this pilot programto scale in all of the state’s school districts.
CONTACT INFORMATIONResearch ContactsAlex Molnar, ProfessorDepartment of Curriculum and InstructionUniversity of Wisconsin—MilwaukeePO Box 413Milwaukee, WI 53201Phone: 414.229.4592Fax: 414.964.4209www.uwm.edu/Dept/CERAI/[email protected]
Program ContactJanice Zmrazek, SAGE Program CoordinatorWisconsin Department of Public InstructionPO Box 7841Madison WI 53707-7841Phone: 608.266.2489www.dpi.state.wi.us/dpi/oea/sage/[email protected]
Raising Minority Academic Achievement90
American Youth Policy Forum
Tennessee was at the vanguard of states inconducting studies to determine the academicachievement effects of reducing class size. InProject STAR, the Lasting Benefits Study andProject Challenge, Tennessee evaluators wereespecially interested in the effect of reducing classsizes for minority student achievement. ProjectSTAR (Student/Teacher Achievement Ratio) was afour-year educational reform experiment conductedfrom 1985-1989 by the state of Tennessee. It wasintended to test whether students attending smallclasses in grades K-3 had higher academicachievement than their peers in larger classes. The79 participating elementary schools throughout thestate randomly assigned students enteringkindergarten to one of three class types: small (S)with 13-17 pupils; regular (R) with 22-26 pupils orregular with a full time teaching aide (RA) with 22-26 pupils. With few exceptions, students remainedin these class categories for four years. The teachersin these schools received no special instruction in
� ������8���.��9����&��������������
� �� ���
“Would Smaller Classes Help Close theBlack-White Achievement Gap?” (March2001) Princeton University Industrial RelationsSection Working Paper #451. By Alan B. Kruegerand Diane M. Whitmore.
“The Enduring Effects of Small Classes”(2001) Teachers College Record 103(2): 145-183.By Jeremy Finn, Susan Gerber, Charles M.Achilles, and Jayne Boyd-Zaharias.
“Class Size and Students At-Risk: What IsKnown? What is Next?” (April 1998) Office ofEducational Research and Improvement, U.S.Department of Education. By Jeremy D. Finn.
POPULATIONNearly 12,000 students in more than 300classrooms participated in Project STAR.Approximately one quarter of the students inProject STAR were minorities, primarily AfricanAmericans from Tennessee’s large metropolitanareas. In the Lasting Benefits Study,evaluators continued to track the academicprogress of between 4,000 and 6,000 of theSTAR participants annually from 1990-1994.
FocusEarly Childhood
����� Primary SchoolMiddle SchoolSecondary SchoolPostsecondaryExtended Learning
“The Tennessee Study of Class Size in theEarly School Grades” (May 1995) AmericanAcademy of Arts and Sciences. By FrederickMosteller.
the first year of the program, and they wererandomly assigned to the different types of classesevery year. After Project STAR’s fourth and finalyear, the state continued to track the academicachievement of STAR students as they reenteredregular classes for grades 4-6. (This follow-upresearch was called the Lasting Benefits Study.)Convinced that small classes were effective,Tennessee implemented Project Challenge in 1989,creating small classrooms for grades K-3 in the 17districts with the lowest average incomes and testscores in the state.
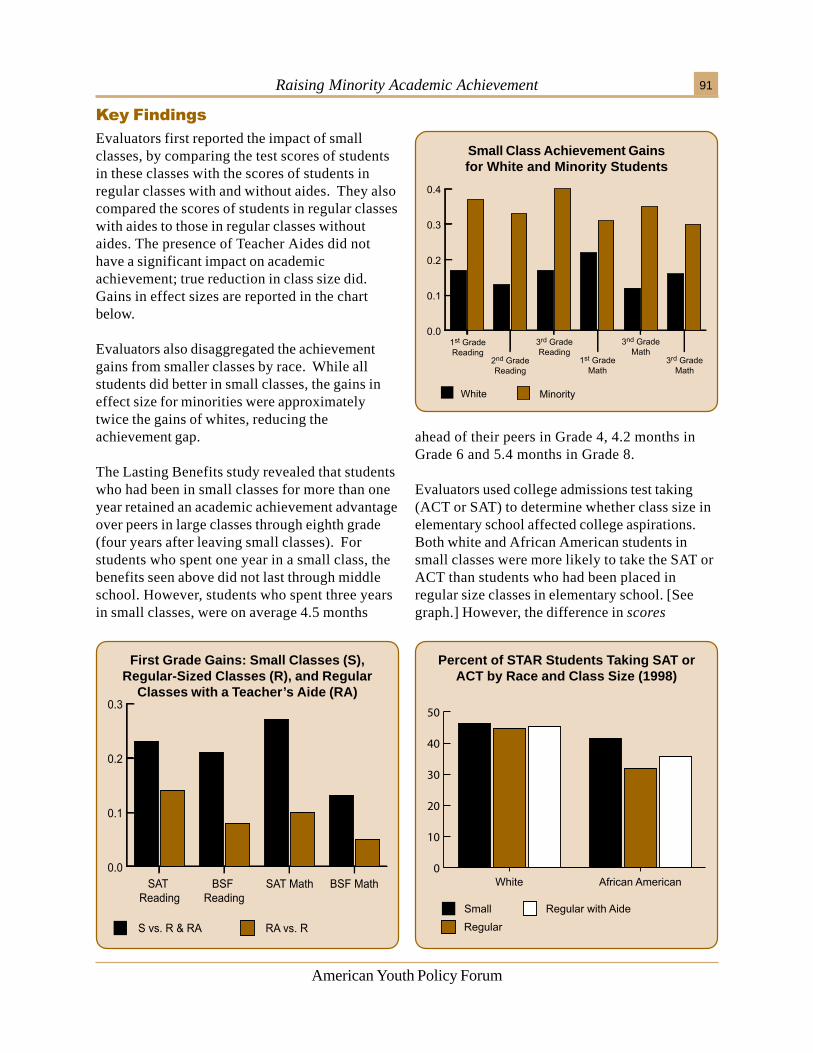
Raising Minority Academic Achievement 91
American Youth Policy Forum
������������
Evaluators first reported the impact of smallclasses, by comparing the test scores of studentsin these classes with the scores of students inregular classes with and without aides. They alsocompared the scores of students in regular classeswith aides to those in regular classes withoutaides. The presence of Teacher Aides did nothave a significant impact on academicachievement; true reduction in class size did.Gains in effect sizes are reported in the chartbelow.
Evaluators also disaggregated the achievementgains from smaller classes by race. While allstudents did better in small classes, the gains ineffect size for minorities were approximatelytwice the gains of whites, reducing theachievement gap.
The Lasting Benefits study revealed that studentswho had been in small classes for more than oneyear retained an academic achievement advantageover peers in large classes through eighth grade(four years after leaving small classes). Forstudents who spent one year in a small class, thebenefits seen above did not last through middleschool. However, students who spent three yearsin small classes, were on average 4.5 months
ahead of their peers in Grade 4, 4.2 months inGrade 6 and 5.4 months in Grade 8.
Evaluators used college admissions test taking(ACT or SAT) to determine whether class size inelementary school affected college aspirations.Both white and African American students insmall classes were more likely to take the SAT orACT than students who had been placed inregular size classes in elementary school. [Seegraph.] However, the difference in scores
First Grade Gains: Small Classes (S),Regular-Sized Classes (R), and Regular
Classes with a Teacher’s Aide (RA)
Small Class Achievement Gainsfor White and Minority Students
Percent of STAR Students Taking SAT orACT by Race and Class Size (1998)
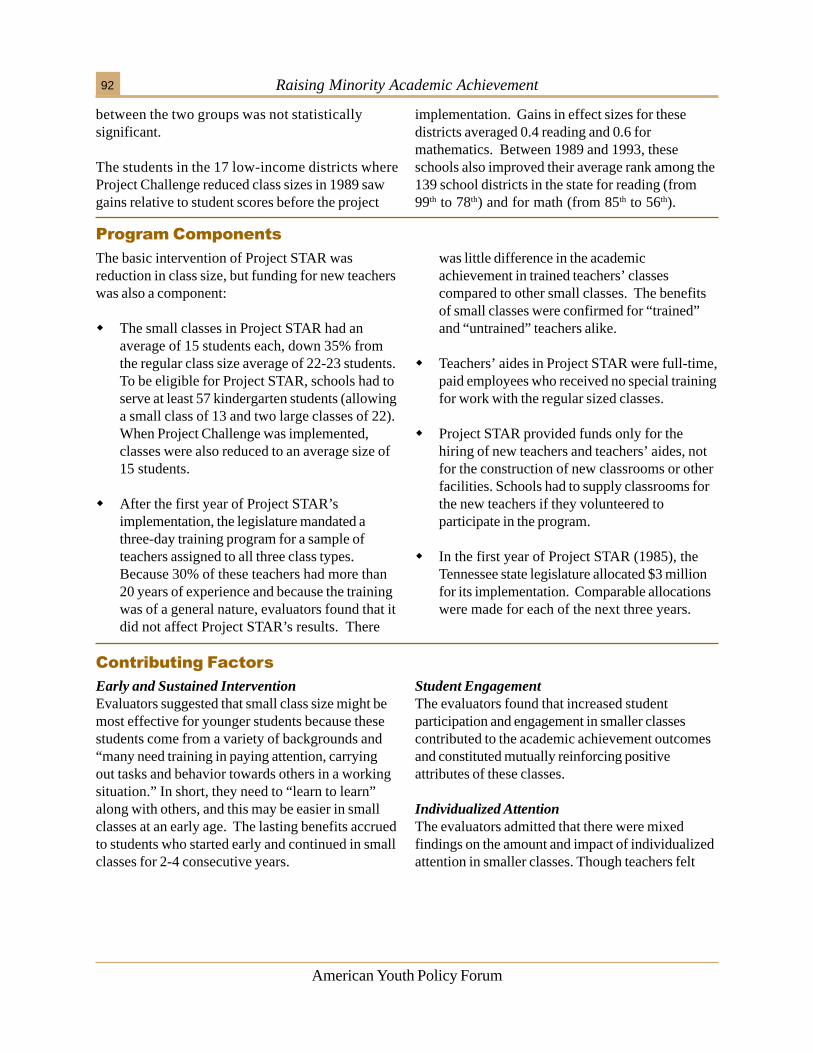
Raising Minority Academic Achievement92
American Youth Policy Forum
between the two groups was not statisticallysignificant.
The students in the 17 low-income districts whereProject Challenge reduced class sizes in 1989 sawgains relative to student scores before the project
implementation. Gains in effect sizes for thesedistricts averaged 0.4 reading and 0.6 formathematics. Between 1989 and 1993, theseschools also improved their average rank among the139 school districts in the state for reading (from99th to 78th) and for math (from 85th to 56th).
���������������
The basic intervention of Project STAR wasreduction in class size, but funding for new teacherswas also a component:
� The small classes in Project STAR had anaverage of 15 students each, down 35% fromthe regular class size average of 22-23 students.To be eligible for Project STAR, schools had toserve at least 57 kindergarten students (allowinga small class of 13 and two large classes of 22).When Project Challenge was implemented,classes were also reduced to an average size of15 students.
� After the first year of Project STAR’simplementation, the legislature mandated athree-day training program for a sample ofteachers assigned to all three class types.Because 30% of these teachers had more than20 years of experience and because the trainingwas of a general nature, evaluators found that itdid not affect Project STAR’s results. There
was little difference in the academicachievement in trained teachers’ classescompared to other small classes. The benefitsof small classes were confirmed for “trained”and “untrained” teachers alike.
� Teachers’ aides in Project STAR were full-time,paid employees who received no special trainingfor work with the regular sized classes.
� Project STAR provided funds only for thehiring of new teachers and teachers’ aides, notfor the construction of new classrooms or otherfacilities. Schools had to supply classrooms forthe new teachers if they volunteered toparticipate in the program.
� In the first year of Project STAR (1985), theTennessee state legislature allocated $3 millionfor its implementation. Comparable allocationswere made for each of the next three years.
Early and Sustained InterventionEvaluators suggested that small class size might bemost effective for younger students because thesestudents come from a variety of backgrounds and“many need training in paying attention, carryingout tasks and behavior towards others in a workingsituation.” In short, they need to “learn to learn”along with others, and this may be easier in smallclasses at an early age. The lasting benefits accruedto students who started early and continued in smallclasses for 2-4 consecutive years.
������������������
Student EngagementThe evaluators found that increased studentparticipation and engagement in smaller classescontributed to the academic achievement outcomesand constituted mutually reinforcing positiveattributes of these classes.
Individualized AttentionThe evaluators admitted that there were mixedfindings on the amount and impact of individualizedattention in smaller classes. Though teachers felt
Raising Minority Academic Achievement 93
American Youth Policy Forum
STUDY METHODOLOGYProject STAR was a controlled randomizedexperiment on a large scale, and as such, it is oneof the most rigorous evaluations in thiscompendium. Schools chose to participate in thestudy and 79 fit the criteria (they had to commit tothe study for four years, had to supply the extraclassrooms, and had to enroll at least 57kindergarteners). Participating elementary schoolsthroughout the state, randomly assigned studentsentering kindergarten to one of three class types:small (S), regular (R), or regular with a full-timeteaching aide (RA). Students remained in theseclass categories for the next four years. Teacherswere randomly assigned to the different types ofclasses every year. Norm referenced and criterion-referenced achievement tests (the StandfordAchievement Tests and Tennessee Basic SkillsTests, respectively) were administered at the end ofeach school year. Finn’s report summarizesdifferent class size studies including STAR, theLasting Benefits Study, and Project Challenge.
EVALUATION & PROGRAM FUNDINGProject STAR was funded by the state ofTennessee. The Office of Educational
that smaller class size facilitated individualizedattention for students, observers suggested that“teachers did not alter the proportion of their timespent interacting with the whole class, with groupsor with individual pupils.”
Decreased Disciplinary ProblemsEvaluators found that decreased disciplinaryproblems contributed to a more positive learningenvironment in which there were fewer distractionsfrom academics.
One researcher noted that “moving incompatiblechildren” from the small class groups to the controlgroup had an indeterminate impact on the study.From the first year cohort of students in smallclasses, 108 out of 1678 (6.4%) students weremoved to the other groups, perhaps siphoning off
�!������������
Research and Improvement in the U.S.Department of Education funded work on theFinn monograph and the American Academy ofArts and Sciences funded Mosteller’s report.
GEOGRAPHIC AREASTennessee
CONTACT INFORMATIONResearch ContactsJeremy D. Finn, ProfessorGraduate School of Education409 Baldy Hall, North CampusState University of New York at BuffaloBuffalo, NY 14260-1000Phone: [email protected]
Alan B. Krueger, ProfessorEconomics and Social PolicyWoodrow Wilson SchoolPrinceton UniversityPrinceton, NJ 08544-1013Phone: 609.258.4046Fax: [email protected]
students with behavior problems or academicdeficiencies.
Evaluators were also careful to point out thatProject Challenge results were not compared to acontrol group.
Raising Minority Academic Achievement94
American Youth Policy Forum
In the wake of Tennessee’s Project Star study ofacademic achievement in smaller, elementary schoolclasses, California’s legislature enacted a majorClass Size Reduction (CSR) initiative to createsmaller classes for all public school students ingrades K-3. Begun in 1996, CSR aimed at reducingaverage class size in these grades from 30 studentsto 20 or fewer students. During the 1996-97school year, California gave $650 per student toschools that had implemented smaller classes andthe state allocated an additional $400 million fornew facilities. In the 1998-99 school year, the stateprovided $800 per student in small classes. Averageexpenditures per student in these districts beforeCSR ranged from about $4100 to $4800.
� ������8���������������������
� �� ���
“Class Size Reduction in California: The1998-99 Evaluation Findings” (June 2000)CSR Research Consortium. By G. W. Bohrnstedtand B. M. Stechter, eds.
“Class Size Reduction in California: EarlyEvaluation Findings, 1996-1998” (June 1999)CSR Research Consortium. By G. W. Bohrnstedtand B. M. Stecher, eds.
POPULATIONBy the third year of CSR (1998-99), nearly 1.8million (92%) kindergarten through third gradestudents in California public schools wereattending smaller classes (with an average of20 or fewer students). California’s K-12 publicschool enrollment was 41% Latino, 39% white,11% Asian/Pacific Islander, 9% AfricanAmerican and 1% Native American. One-thirdof these students are considered EnglishLanguage Learners (ELL) and one-fourth comefrom families who receive Aid to Families withDependent Children (AFDC). The state’s K-3teacher workforce has grown by 38% since thestart of the initiative (22,000 new K-3 teacherswere hired in the first two years).
FocusEarly Childhood
����� Primary SchoolMiddle SchoolSecondary SchoolPostsecondaryExtended Learning
������������
Evaluators reported only third grade achievementscores “because of the rapid implementation of thereform.” These scores revealed a small, butstatistically significant, positive impact of CSR onthe proportion of students scoring above the 50th
percentile on the SAT-9 test. Between 1% and 4%more third graders scored above the national medianin schools that had implemented CSR.
CSR had a similar, positive impact for all studentsregardless of race, family income or language group.However, evaluators noted that the effect of CSRwas quite small when compared to the effect ofrace, ethnicity or income on student scoredifferentials. The differences between white andminority student scores were much greater than thedifference between CSR and non-CSR studentscores. For instance, the effect size of race on
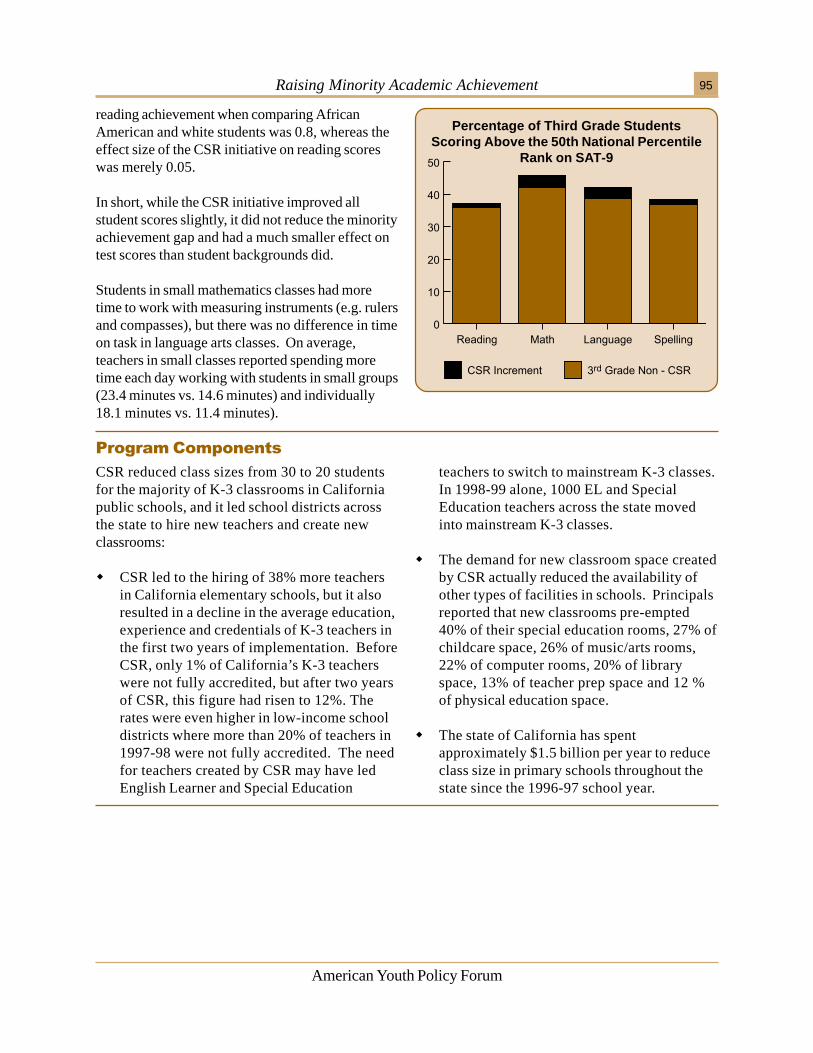
Raising Minority Academic Achievement 95
American Youth Policy Forum
���������������
CSR reduced class sizes from 30 to 20 studentsfor the majority of K-3 classrooms in Californiapublic schools, and it led school districts acrossthe state to hire new teachers and create newclassrooms:
� CSR led to the hiring of 38% more teachersin California elementary schools, but it alsoresulted in a decline in the average education,experience and credentials of K-3 teachers inthe first two years of implementation. BeforeCSR, only 1% of California’s K-3 teacherswere not fully accredited, but after two yearsof CSR, this figure had risen to 12%. Therates were even higher in low-income schooldistricts where more than 20% of teachers in1997-98 were not fully accredited. The needfor teachers created by CSR may have ledEnglish Learner and Special Education
teachers to switch to mainstream K-3 classes.In 1998-99 alone, 1000 EL and SpecialEducation teachers across the state movedinto mainstream K-3 classes.
� The demand for new classroom space createdby CSR actually reduced the availability ofother types of facilities in schools. Principalsreported that new classrooms pre-empted40% of their special education rooms, 27% ofchildcare space, 26% of music/arts rooms,22% of computer rooms, 20% of libraryspace, 13% of teacher prep space and 12 %of physical education space.
� The state of California has spentapproximately $1.5 billion per year to reduceclass size in primary schools throughout thestate since the 1996-97 school year.
Percentage of Third Grade StudentsScoring Above the 50th National Percentile
Rank on SAT-9
reading achievement when comparing AfricanAmerican and white students was 0.8, whereas theeffect size of the CSR initiative on reading scoreswas merely 0.05.
In short, while the CSR initiative improved allstudent scores slightly, it did not reduce the minorityachievement gap and had a much smaller effect ontest scores than student backgrounds did.
Students in small mathematics classes had moretime to work with measuring instruments (e.g. rulersand compasses), but there was no difference in timeon task in language arts classes. On average,teachers in small classes reported spending moretime each day working with students in small groups(23.4 minutes vs. 14.6 minutes) and individually18.1 minutes vs. 11.4 minutes).
Raising Minority Academic Achievement96
American Youth Policy Forum
Unintended ConsequencesThe increased demand for new teachers due toCSR unintentionally led to a decline in averageeducation level, experience and credentials ofteachers, especially in high poverty and highminority districts. Similarly, the increased demandfor new rooms, without an adequate amount offunds for additional construction, led to a lossspace for childcare, music, arts, specialeducation, library and computer facilities.
Funding DisparitiesBecause the state funded schools on a per pupilbasis only after implementation, schools that didnot implement smaller classes quickly receivedless CSR money. This led to a disparity infunding for school districts serving higherproportions of minority and low-income studentsthat lacked the facilities to implement CSR. Inthe 1997-98 school year, districts with fewer than17% minority students received an average of $100
������������������
more per K-3 student from CSR than districtswhere minority students made up two-thirds of thestudent population.
Yet in places where CSR was fully implemented,the evaluators pointed to two factors that may havecontributed to the academic achievement benefitsthat accrued from the program.
DisciplineTeachers in smaller classes reported spendingslightly less time each day dealing with disciplineproblems when compared to teachers in largeclasses.
Individualized AttentionThe teachers in small classes reported spendingmore time giving “sustained attention” to studentswho needed special assistance with reading andmore time “addressing individual students’ personalneeds” than teachers with large classes.
AYPF culled the above contributing factors fromthese studies for comparison with other summariesin the volume. However, the CSR Consortiumresearchers were quick to point out that thesestudies were not based on experimental data, andtherefore, they were unable to draw clear causalinferences from the CSR research.
�!������������
Above all, the researchers noted that it is too earlyto pass a final judgement on the effectiveness of theCSR initiative. “No one has ever implemented aclass size reduction reform on this scale before, andit is difficult to establish criteria for success at thisjuncture. Additional time and experience areneeded if we are to measure the cumulative effectsof reduced classes,” they concluded.
Raising Minority Academic Achievement 97
American Youth Policy Forum
STUDY METHODOLOGYEvaluators from the American Institutes ofResearch (AIR), the University of California-Riverside’s California Education ResearchCooperative (CERC), RAND, Policy Analysis forCalifornia Education (PACE), WestEd andEdSource make up the CSR ResearchConsortium. AIR and RAND researchers are theco-principals leading the investigation.Researchers used statewide school demographicdata, achievement data from SAT-9 tests,interviews and surveys with parents, teachers andadministrators to assess the impact of CSR. Theresearchers focused on 99 districts, surveying 99superintendents (88% responded), 432 principals(78% responded), 1485 teachers (65%responded) and 2112 parents (52% responded).Because California also enacted a ReadingInitiative, the Teaching Reading Program and theMathematics Program Advisory at the same timeas CSR, they found it difficult to control for theeffects of these and other simultaneous reforminitiatives in improved student scores.
EVALUATION & PROGRAM FUNDINGThe CSR Research Consortium evaluation wasfunded by the California Department ofEducation, the US Department of Education,the Walter and Elise Haas Fund, the William
and Flora Hewlett Foundation, the Walter S.Johnson Foundation, the San FranciscoFoundation and the Stuart Foundation. CSRwas funded by the state of California.
GEOGRAPHIC AREASCalifornia
CONTACT INFORMATIONResearch ContactsGeorge Bohrnstedt,Senior Vice President for ResearchAmerican Institutes for Research (AIR)PO Box 11131791 Arastradero RoadPalo Alto, CA 94302-1113Phone: 650.493.3550Fax: [email protected]
Brian M. Stecher,RAND1700 Main StreetSanta Monica, CA 90407-2138Phone: 310.393.0411Fax: [email protected]
Raising Minority Academic Achievement98
American Youth Policy Forum
Since its inception in 1993, the Compact for FacultyDiversity has linked three regional educationalassociations to create programs that supportminority graduate students as they complete theirdoctorates and enter college or university teachingpositions. The Southern Regional Education Board(SREB), the New England Board of HigherEducation (NEBHE) and the Western InterstateCommission on Higher Education (WICHE)administer and oversee the Compact for FacultyDiversity in their respective regions. While eachregion’s implementation strategy is unique, all havetwo broad goals. First, the Compact for FacultyDiversity works with states and graduate institutionsin each region to ensure that minority doctoralstudents have continuous funding and financial aidas they complete their doctorates. Second, theCompact fosters a community of establishedminority scholars and peers who support minoritydoctoral students as they complete their degrees and
������������� ���0� ������������������
� �� ���
“Progress and Promise: An Evaluation ofthe Compact for Faculty Diversity” (January2000) Southern Regional Education Board. ByDaryl Smith and Sharon Parker.
POPULATIONFrom 1993 to the end of 1999, the programserved 435 minority scholars: 259 (60%) werewomen, 305 (70%) African Americans, 82(19%) Latino, 31 (7%) Native American, 13(3%) Asian American, and 4 (1%) other.Though the evaluators did not give data oneconomic backgrounds of students, they wrotethat “most of the [Compact scholars] do notcome from highly privileged backgrounds.Moreover, they have not usually attended eliteundergraduate institutions in which attendanceat graduate school is part of the culture.”
FocusEarly ChildhoodPrimary SchoolMiddle SchoolSecondary School
����� PostsecondaryExtended Learning
������������
By the end of 1999, 92% of graduates served bythe Compact for Faculty Diversity had completed orwere continuing their degree programs. Eighty-fourof the Compact scholars had completed their Ph.D.,and of these:
� Seventy percent had earned faculty positions.
� Eighteen percent were in post-doctoralprograms
� Twelve percent worked in collegeadministration, industry, federal policy or asadjunct faculty
Evaluators favorably compared Compact’s 92%retention rate with a persistence figure of 40-50%regularly reported in general literature on graduateeducation.
enter the professional world. One way that theCompact for Faculty Diversity fosters thiscommunity is through an annual Institute forTeaching and Mentoring, which brings togetherminority graduate students and professors fromacross the country to discuss the possibilities andpitfalls in the world of higher education.
Raising Minority Academic Achievement 99
American Youth Policy Forum
���������������
Compact’s most visible component is the long-term financial support for minority graduateeducation; however, other program featuresaccompany the financial aid:
� Environments of support were provided forscholars in their departments throughorientation programs, faculty and peermentors, academic activities and teachingactivities.
� An annual institute for teaching andmentoring prepared Ph.D. candidates forcollege and university teaching. At theinstitute, participants shared their “lessonslearned.”
� Materials about minority recruitment andretention were distributed to participatingschools.
� Assistance with faculty job searches was alsoprovided.
� Committees that included the scholars themselves,key administrators, mentors and other interestedcommunity members, were established to checkon the progress of the student, intervene if issuesemerged and provide general oversight.
� Continuity of funding helped students know thattheir academic paths would not be interrupted. In2000, the SREB component of the Compact forFaculty Diversity provided an annual stipend of$12,000 for three years plus $500 in generalacademic support and $1500 to attend the annualCompact institute. Partnering universities waivedtuition and fees for Compact graduate studentsand provided an additional $12,000 stipend for thefourth and fifth years of the degree program.
Support NetworkIt was not only funding, but a close network ofpersonal support that retained Compact students.Regular contact with mentors, advisors and peershelped graduate students who may have otherwisefelt isolated in their programs and on theircampuses. According to the evaluators, “there arenumerous opportunities at the campus, institute andprogram level where students can seek support andadvice, and where interventions can take place thatmaximize opportunities for success.”
Professional Socialization“For the scholar, the institute provides locations forstudents to discuss, in a relatively safe environment,concerns, issues, successes and failures,” noted theevaluators. The institute also allowed scholars toachieve “professional socialization” by providing anopportunity for meeting other scholars and facultythroughout the country and by providing an
������������������
environment that develops a professionalunderstanding of the faculty role, particularly in arapidly changing higher education environment.
Peer and Professional MentorsThe Compact program connected participatinggraduate students to mentors of all backgroundsthroughout the country who were committed tothem personally and to diversity in higher education.
“The results of the evaluation reflectextraordinary success for studentsparticipating in the Compact.”
—Daryl Smith and Sharon Parker, evaluators,Compact for Faculty Diversity
“Given the intensity of graduate study, giventhe sense of isolation that many studentsexperience in their programs and on theircampuses, given limited access to family andpeers who understand what they are doing, thedesign of the Compact is precisely what isrequired.”
—Daryl Smith and Sharon Parker, evaluators,Compact for Faculty Diversity
Raising Minority Academic Achievement100
American Youth Policy Forum
Evaluators pointed out that, while the number ofscholars served by the Compact program may havebeen small in comparison to other widespreadnational school programs, the impact is widened bythe network of Compact alumni who then serve asmentors and role models for future scholars.
�!������������
An added benefit of this national connection tomentors was it naturally transformed into a jobnetwork.
Alumni InvolvementSome Compact scholars developed an alumni groupthat provided support to current scholars. Compactalumni also formed a cadre of experts in diversifyingfaculty and graduate education.
Individualized AttentionThrough the Compact program, many scholarsreceived what would be their only opportunity towork one-on-one with a faculty member. Individualfaculty members often developed a serious interestand engagement in the scholars and theirexperiences.
STUDY METHODOLOGYThe evaluators examined data and documentsthroughout the six years of the program, includingannual surveys of all students and annualevaluations of the Institute for Teaching andMentoring in addition to conducting phoneinterviews, focus groups and campus visits.Finally, data from other minority graduate studentfellowships allowed them to evaluate the relativeimpact of the strategies employed by theCompact for Faculty Diversity. Compact scholarsare chosen for the program, so there is a self-selection bias in the study sample.
EVALUATION & PROGRAM FUNDINGThe Ford Foundation and Pew Charitable Trustfunded the research and development of theCompact for Diversity. The SREB, NEBHE and
WICHE jointly covered the operating expense ofthe program. The Ford Foundation funded theevaluation of the program in the late fall of 1998.
GEOGRAPHIC AREASThe graduate students served by the Compact forFaculty Diversity attended 103 graduateinstitutions in 35 states.
CONTACT INFORMATIONResearch ContactsDr. Ansley Abraham, DirectorSREB Doctoral Scholars Program592 Tenth Street, NWAtlanta, GA 30318-5790Phone: [email protected]
Raising Minority Academic Achievement 101
American Youth Policy Forum
The “Dare to Dream” study is about school changeaimed at higher achievement, greater postsecondaryoptions and productive futures for all Americanchildren. It focuses on one cluster of such efforts,operating through three projects: Keeping theOptions Open, Partners for Educational Excellenceand the Indiana School Guidance and CounselingLeadership Project. All three initiatives werefinanced by foundations, and all embracededucational guidance as a fundamental function ofthe public schools, thereby creating an enhancedrole for professional school counselors. Theprojects were implemented in 1990 in more than 50schools across the nation. In these projects,counselors became spokespeople for studentstraditionally underserved in schools. The broad goalwas to keep postsecondary options open for allstudents, not just historically high-achievers incollege preparatory tracks.
0�������0����������������
� �� ���
“Dare to Dream: Educational Guidance forExcellence” (1996) Lilly Endowment. By JonSnyder, Gale Morrison and R.C. Smith.
POPULATIONEvaluators concentrated on 10 sites,processing 317 faculty and staff surveys, and2,370 student surveys. The report includescase studies of 7 high schools and one middleschool (see Geographic Location, below, forlocations of schools) which successfullyimplemented (i.e. achieved the best resultsfrom) the counseling reforms. All the schoolsfaced school-wide achievement challenges ofone kind or another. At Pike High School noneof the African American students wereregistered in Advanced Placement courses.Elkhart Central High School had a lowpercentage of its African American studentbody enrolling in college prep English. FranklinMiddle School had a high percentage of “at-risk” students. Indian Creek High School had alow percentage of its rural students taking thePSAT and aspiring toward college. NorthsideHigh School had a low percentage of AfricanAmerican students in its “minimum rigorouscurriculum.” Pickens County High School waslocated in an Appalachian community whereonly 37% of the adult population had graduatedfrom high school. Port St. Joe High School hada 50% college-going rate. Robert E. Lee HighSchool served a predominantly Latinopopulation with low math achievement.
FocusEarly ChildhoodPrimary School
����� Middle School����� Secondary School
PostsecondaryExtended Learning
Raising Minority Academic Achievement102
American Youth Policy Forum
���������������
Funders of the “Dare to Dream” initiatives broughttogether teams of education stakeholders interestedin reform at each site. These teams came up withsite-specific strategic plans to strengthen counselingservices for underserved student populations. First,teams were presented a statistical summary of thecrisis in American public schooling, stemming fromhigh student dropout rates and low studentachievement, especially among minorities and kidsfrom impoverished backgrounds. Second, teamscompiled data on dropout rates and achievementgaps at their own schools. Third, teams devisedways to help low-achieving students find avenues tosuccess in their schools. Fourth, teams createdvision-to-action plans to foster change and theattitude that “all kids can learn.” Finally, the teamswere charged with bringing their action plans to
fruition. As enacted, the Dare to Dream action plansfacilitated the following changes:
� Guidance became school-wide instead of beingconfined to the office of the guidance counselor.Students were provided the direct informationand encouragement to locate further informationthemselves, regarding possible future education.
������������
The schools were linked conceptually by their useof educational guidance as the lever for schoolchange. After the schools offered enhancedguidance counseling, students accomplished thefollowing:
� Pike High School increased registration inAdvanced Placement courses from 16 students(0% African American) in 1991-92 to 249students (19% African American) in 1993-94.
� Between 1994 and 1995, Robert E. Lee HighSchool increased the number of minoritystudents enrolled in pre-calculus from 61students to 104 and doubled the enrollment incalculus from 52 to 104 (maintaining the priorpassing rates in each).
� Elkhart Central High School increased thenumber of African American seniors enrolled incollege prep English from 26% to 69% andraised the number of African Americanfreshmen enrolled in college prep English from50% to 84% between 1992 and 1995.
� Northside High School increased the percentageof African American males in its “minimumrigorous curriculum” from 16% to 42.8%between 1993 and 1995 and the percentage ofAfrican American females from 29.4% to43.3% during the same two-year period.
� Pickens County High School increased thepercentage of students attending four-yearcolleges from 31% to 53% and the percentageof students attending either four-year or two-year colleges from 42% to 74% between 1989and 1995.
� Indian Creek High School increased PSATtaking from 28% in 1990 to 53% in 1994. Thepercentage of students committed to pursuingpostsecondary education rose from 53% to 97%in the same time span.
� Port St. Joe High School raised its college-goingrate from 50% in 1986 to 72% in 1994.
� Franklin Middle School increased the number ofstudents taking freshmen algebra, upon enteringhigh school, from 121 to 201 between 1990 and1992.
“School change begins with the ethicalcommitment that all children – regardless ofrace, ethnicity, gender or economic back-ground – can achieve educational goalsbeyond high school and construct a future oftheir own choosing.”
—Jon Snyder, et al., evaluators
Raising Minority Academic Achievement 103
American Youth Policy Forum
Team CounselingWorking in teams “led to improved communicationand eventually to greater possibilities of coordinatingefforts around the strengths, interests and needs ofchildren, rather than regulations or traditional roleboundaries,” noted the evaluators. A typical teamincluded a school’s principal, guidance counselors,teachers and parents, as well as local college andcommunity representatives.
Broad Base of SupportDistrict personnel, funding agencies, researchers,state boards of education and policymaking groups
������������������
had a role and a responsibility in each school’schange. Though the schools did the workthemselves, these other groups created anenvironment where more localized leaders coulddevelop and use the knowledge, skills anddispositions, onsite, to make a difference forchildren and young adults.
Student-Guided ChangeSchools relied on students to guide the change.Program direction was based on the strengths,interests and needs of the learners.
School guidance counselors were identified asthe linchpin for change, but educationalguidance became part of the total touch of eachschool. Professional school counselors becamethe “orchestrators” of educational guidance.
� Curriculum shifts helped ensure that academic“tracks” were less rigid, but equally rigorous asbefore, and that students considered “at-risk”were mixed into classrooms with those whowere not.
� Shared leadership between schooladministrators, teachers, staff, outside expertteams and the students themselves helped eachgroup push for new opportunities.
� “College centers,” or other locations housinginformation about higher education, wereinstalled in the schools.
STUDY METHODOLOGYThe case studies were not randomly chosen by theevaluators, but were selected because of quality,implementation and outcome results. Research forthe case studies included school data, student“shadowing” days, and focus groups discussions,as well as interviews with students, participatingfaculty and non-participating faculty. Evaluators alsoconducted five surveys with students, teachers andadministrators focusing on school demographics,student aspirations and barriers, faculty guidanceresponsibilities and strategies for change.Evaluators did not chart the changing totaldemographics for each school, which would havehelped to contextualize the findings.
EVALUATION & PROGRAM FUNDINGThe evaluation was funded by the Lilly Endowment.The guidance projects were supported by the LillyEndowment and the Jesse Ball duPont Foundation.
GEOGRAPHIC AREASLocations of schools were: Elkhart Central HighSchool, northern Indiana; Franklin MiddleSchool, Minneapolis, MN; Indian Creek HighSchool, Trafalgar, IN; Northside High School,Fort Wayne, IN; Robert E. Lee High School,San Antonio, TX; Pickens County High School,Georgian Appalachians; Pike High School,Indianapolis, IN; Port St. Joe High School, GulfCounty, FL.
CONTACT INFORMATIONResearch ContactsJon SnyderDean of the Graduate SchoolBank Street College of Education610 W. 112th StreetNew York, NY [email protected]
Raising Minority Academic Achievement104
American Youth Policy Forum
The Emerging Scholars Program (ESP), modeled afterthe Mathematics Workshop at the University ofCalifornia at Berkeley, aims to increase the number ofcollege freshmen excelling in calculus who come fromgroups historically under-represented in mathematics-based disciplines, in particular women, Latinos, AfricanAmericans and students from rural areas. ESP isconsidered an “honors-level” program and it has beenreplicated by more than 100 colleges and universitiesacross the country. At the heart of ESP are itsdiscussion sections, which are linked to calculus lecturesections. ESP discussion sessions are longer than non-ESP discussion sections, and also have fewer students– usually a maximum of 24 as opposed to 40 in a non-ESP section. Students work individually or in smallgroups on specially crafted problems that are unusuallychallenging. ESP also provides a social support groupamong students with similar academic goals byplanning activities that link social interests withscholarly ones.
����$��$���� ����.��$���������������
� �� ���
“Success and Diversity: The TransitionThrough First-Year Calculus in theUniversity” (November 1999) American Journalof Education. By Susan E. Moreno and ChandraMuller.
“Impact of the Wisconsin EmergingScholars First-Semester Calculus Program”(July 1997) University of Wisconsin-Madison. BySteve Kosciuk.
POPULATIONIn 1993, 7992 mathematics, science orengineering degrees were awarded to Latinos,9549 to African Americans and 132,254 towhites. In 1994, 35% of African American and38% of Latino freshmen in four-year colleges
FocusEarly ChildhoodPrimary SchoolMiddle SchoolSecondary School
����� PostsecondaryExtended Learning
“Increasing Minority Students’ Success inCalculus” (1995) New Directions for Teachingand Learning. By Martin Vern Bonsangue andDavid Eli Drew.
intended to major in science and engineering,while only about 12% of African Americans and14% of graduating Latinos earned a degree inmathematics, science and engineering.
From the program’s inception at the University ofTexas at Austin in fall 1988 through fall 1995, 445students participated in ESP, first-semestercalculus sections. About 46.5% were Latino,19.3% were African-American, and 32.4% werewhite. About 57.3% of the participants were menand 42.7% of the participants were women.
The University of Wisconsin-Madison evaluationalso provided another snapshot of an ESPstudent population: During the fall semesters from1993-1996, 169 students attended the ESPworkshop, including 50% from minority groups,and 50% white students, most from ruralbackgrounds.
The California Polytechnic evaluation byBonsangue and Drew compared a group of 133Latinos and African American students whochose to attend ESP workshops with threegroups of students in the same calculussection: a group composed of 187 AfricanAmerican and Latino students, a group with208 white students and a group with 198 Asian/Pacific Island students.
Raising Minority Academic Achievement 105
American Youth Policy Forum
���������������
Universities adopt the following ESP components tofit their local resources, strengths and needs:
� Upon acceptance to a participating college oruniversity, African American, Latino and NativeAmerican students who had the potential todeclare mathematics-based majors received aletter and personal telephone call from a facultymember or student workshop leader invitingthem to attend an informational meetingexplaining the program. In addition, recruitmentof students occurred at college and universitysummer orientation programs, during which,ESP staff informed potential students about theopportunity to participate.
� ESP discussion sessions were connected tofreshman calculus lectures. ESP sessions metfor longer than non-ESP sessions (six hours perweek compared with two hours per week).ESP sessions also met for two hours at a timerather than one. ESP sessions, which typicallyincluded no more than 24 students, weresmaller than average discussion sessions, whichincluded up to 40 students. Peers – a graduatestudent teaching assistant as well as 1-2undergraduate ESP alumni – led the discussionsessions. Specially crafted problems weredistributed to discussion sessions encouragingstudents to explore the challenging aspects ofmathematics.
������������
The University of Texas at Austin evaluationindicated that ESP students were more successfulthan non-ESP students. Students who participatedin ESP had odds of earning an A or B almost fivetimes higher than non-participants. The differencesbetween African American and Latino participantsand non-participants were significant at the .01level.
University of Wisconsin-Madison evaluatorsreported that ESP students were twice as likely toreceive a B or better in calculus than their non-participating counterparts. The Wisconsinevaluation also suggested that the positive effects ofESP persisted: ESP students maintained highersuccess rates in second and third semester calculusthan non-participants. But the same evaluators alsofound that participation in ESP had no visible effecton retention rates in mathematical-based fields ofstudy.
At California State Polytechnic University, Pomona:
� ESP participants achieved a mean grade incalculus more than six-tenths of a grade pointabove non-ESP students (on a four-point gradepoint scale).
� Within three years after entering the institution,52% of non-ESP students had withdrawn fromthe institution or changed to a non-mathematicsbased major, compared with 15% of ESPstudents.
� As a result of course failure, non-ESP studentsrequired an average of one quarter more tocomplete their three-quarter calculus sequence.Nearly half of non-ESP students required fiveor more quarters to complete a three-quartercalculus sequence, compared with 17% of ESPstudents. Ninety-one percent of ESP studentswho were still enrolled in a mathematics-basedmajor after three years had completed theirmathematics requirement in their major,compared with 58% of non-ESP students.
� Of Latino women still enrolled after three years,86% of ESP students remained in amathematics-based major compared with 52%of non-ESP participants from the same group.
“ESP helps me spend more time on math than Imight on my own.”
— ESP student
Raising Minority Academic Achievement106
American Youth Policy Forum
Comprehensive Academic AdvisingESP staff advised students not only on academicmatters but also on non-academic matters that couldpossibly derail a student’s academic career. ESPstaff kept themselves apprised of current academicand social supports available for students, and theyhelped students make informed choices about theiracademic careers.
Small Learning CommunitiesESP discussion sessions became an integral part ofthe academic structure of the host schools. ESPstudents and staff alike never felt they wereparticipating in a separate or adjunct program, butdid feel they were part of a close-knit learningcommunity.
������������������
Engaged Learners and InstructorsESP’s combination of academic and social outletsled to often lively discussions with studentsexplaining their solutions to both academic and non-academic problems. Bonsangue and Drew, in their1995 evaluation, found that there was often aninformal element in ESP discussion sessions, withstudents munching popcorn or pizza while theyworked. This setting fostered a high level ofpersonal involvement from the ESP instructor, whowas often the first to become aware of students’personal, financial or logistical problems.
Rigorous CurriculumESP instructors crafted problems that wereexceptionally difficult, but still related to the currentlecture sessions. As the group struggled together,their information exchange became unusuallyefficient and their love for mathematics andconfidence in pursuing mathematical careers seemedto follow.
� A connection between students’ academic andsocial lives was fostered through organizedactivities in which ESP students are encouragedto participate, such as common meal time,workshops coordinated by local employers andconcerts.
Raising Minority Academic Achievement 107
American Youth Policy Forum
STUDY METHODOLOGYThe University of Texas, Austin, evaluation byMoreno et al. reviewed the records of 1565students who had attended a calculus class withan associated ESP section. Of the students, 445participated in the program. Students withquantitative SAT scores below 460 were excludedfrom the analysis. Calculus success was definedas students earning A or B in the course.
The Wisconsin University evaluation by Kosciukanalyzed scores of all first-semester freshmen,18 or 19 years old, who were enrolled in the firstsemester calculus lectures. Success wasdefined as a B or above in courses and retentionin the College of Engineering or in a science,math or technology major. Researcherscompared 169 program participants with 3,871non-participants. Researchers matched theparticipant and comparison groups in terms ofrace, ethnicity, gender, income level and priorachievement (through SAT scores). Results aresignificant at the .05 level.
The California Polytechnic evaluation byBonsangue and Drew was the first longitudinalstudy of the effects of ESP on persistence andachievement of minority students enrolled inmathematics, science and engineering majors.Evaluators compared a group of Latinos andAfrican Americans who had attended at least oneESP workshop to peers who were attending thesame lecture sections of first-quarter calculus,but had not participated in the workshops. Therewere no statistically significant differencesbetween minority students in the workshop andcomparison group in four pre-college academicmeasures (SAT-Math, SAT-Verbal, high school
GPA and score on the precalculus placementexam). The two minority groups (workshop andcomparison) had lower pre-college measuresthan their white and Asian peers.
EVALUATION & PROGRAM FUNDINGThe evaluations were either published articles ineducation-related journals, or were funded byuniversities that host ESP. ESP is funded by thehost colleges and universities. Within thosesponsoring universities, often, ESP funding isshared by the Office of the Dean and math andscience departments.
GEOGRAPHIC AREASESP – or programs similar to it – are in place inmore than 100 colleges and universitiesnationwide.
CONTACT INFORMATIONResearch ContactsSusan MorenoCenter for Mexican American Studies323 Agnes Arnold HallUniversity of HoustonHouston, TX 77204-3001Phone: 713.743.3136
Program ContactOffice of the DirectorCharles A. Dana CenterThe University of Texas at AustinDEV Building, Suite 2.2002901 Horth IH-35Austin, TX 78722-2348Phone: 512.232.2271 or 512.471.6190Fax: 512.471.6193
Raising Minority Academic Achievement108
American Youth Policy Forum
The College Board first piloted the Equity 2000program in 1990 in Fort Worth, Texas in anattempt to increase college acceptance,attendance and success rates for minoritystudents. The standard that drives this district-wide reform model is an expectation that allstudents will take Algebra I in the ninth grade andgeometry in the tenth grade. Equity 2000promotes academic enrichment for all studentsthrough the elimination of low-level curriculumtracking. Teachers trained by College Board staffimplement an improved curriculum in all AlgebraI and geometry classes, and extra help is offeredto students struggling to meet the new standards.In short, the aim of Equity 2000 is “todemonstrate that a single, relatively simple policychange, requiring Algebra I and geometry for allstudents linked to specific programmatic
�:����";;;������������
� �� ���
“The Equity 2000 Evaluation, a SummaryReport: Impact and Implementation, ReportNo. 86” (December 1997) Pelavin ResearchCenter. By Carlos Ródriguez, Nidhi Khattri, andMei Han.
“The Senior Survey Analysis of Cohorts 1,2, and 3, Report No. 87” (September 1999)American Institutes for Research. By GeorgeBohrnstedt, Pamela Jakwerth, Carlos Ródriguez,and Sherri Quiñones.
POPULATIONSince 1990, over 700 schools and more than500,000 students in 14 school districts havetaken part in the Equity 2000 program. Thenational evaluations focused on students in 7school districts: Fort Worth, TX; Milwaukee,WI; Nashville, TN; Prince Georges County, MD;Providence, RI; San José and East Side Union,CA. During the final school year of the nationalevaluation (1995-96), the student population inEquity 2000 districts was 47% AfricanAmerican, 28% white, 17% Latino, 6% AsianAmerican, and less than 1% Native American.The proportion of minority students in most, ifnot all, of these districts has increased sincethe 1995-96 school year.
FocusEarly ChildhoodPrimary SchoolMiddle School
����� Secondary SchoolPostsecondaryExtended Learning
������������
Between 1991 and 1996, the percentage ofstudents enrolling in and passing Algebra I andgeometry (or more advanced math classes) by theninth and tenth grades, increased in the 7districts.
� The proportion of students enrolled inAlgebra I or higher-level math courses by the
ninth grade increased for African Americans(45%-72%), Asians (63%-78%), Latinos(40%-72%) and whites (59%-75%).
� The proportion of students passing Algebra I bythe end of ninth grade increased for AfricanAmericans (34%-41%), Asians (60%-65%),Latinos (31%-38%), and whites (49%-54%).
“Getting to the Right Algebra: The Equity2000 Initiative in Milwaukee PublicSchools” (April 1999) Manpower DemonstrationResearch Corporation, by Sandra Ham and EricaWalker.
interventions, could reduce the under-representation of minority and disadvantagedstudents in higher education.”
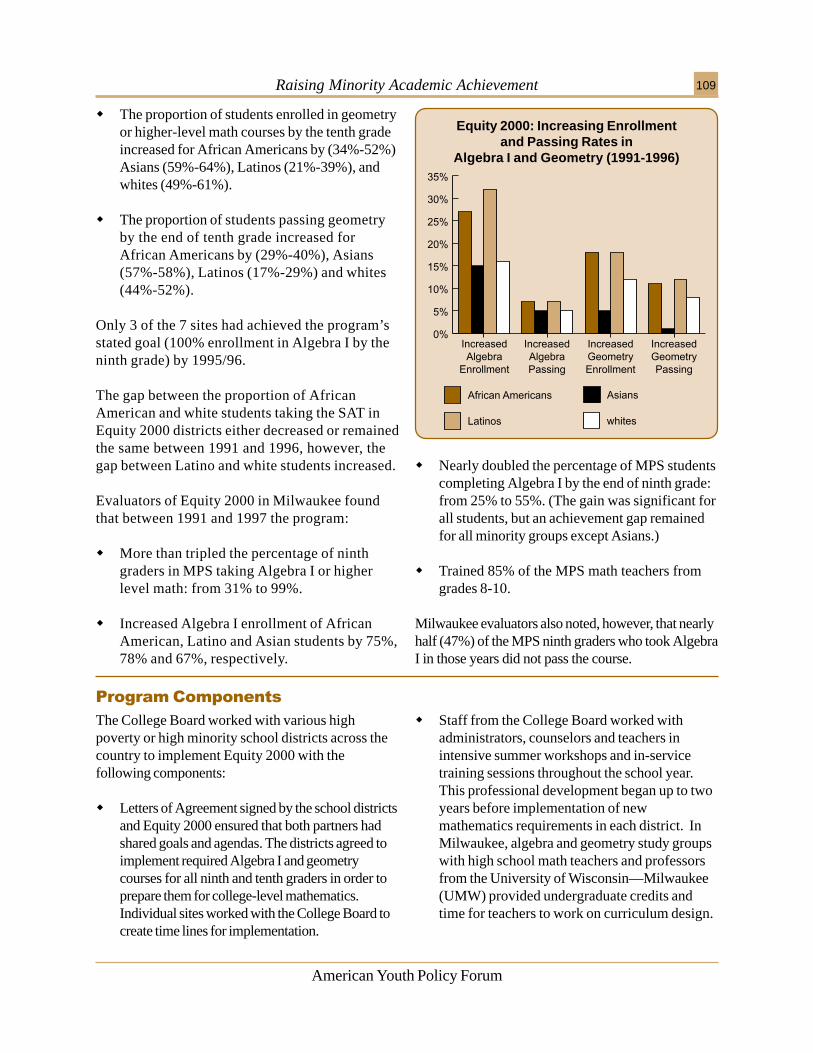
Raising Minority Academic Achievement 109
American Youth Policy Forum
���������������
The College Board worked with various highpoverty or high minority school districts across thecountry to implement Equity 2000 with thefollowing components:
� Letters of Agreement signed by the school districtsand Equity 2000 ensured that both partners hadshared goals and agendas. The districts agreed toimplement required Algebra I and geometrycourses for all ninth and tenth graders in order toprepare them for college-level mathematics.Individual sites worked with the College Board tocreate time lines for implementation.
� Staff from the College Board worked withadministrators, counselors and teachers inintensive summer workshops and in-servicetraining sessions throughout the school year.This professional development began up to twoyears before implementation of newmathematics requirements in each district. InMilwaukee, algebra and geometry study groupswith high school math teachers and professorsfrom the University of Wisconsin—Milwaukee(UMW) provided undergraduate credits andtime for teachers to work on curriculum design.
Equity 2000: Increasing Enrollmentand Passing Rates in
Algebra I and Geometry (1991-1996)
� The proportion of students enrolled in geometryor higher-level math courses by the tenth gradeincreased for African Americans by (34%-52%)Asians (59%-64%), Latinos (21%-39%), andwhites (49%-61%).
� The proportion of students passing geometryby the end of tenth grade increased forAfrican Americans by (29%-40%), Asians(57%-58%), Latinos (17%-29%) and whites(44%-52%).
Only 3 of the 7 sites had achieved the program’sstated goal (100% enrollment in Algebra I by theninth grade) by 1995/96.
The gap between the proportion of AfricanAmerican and white students taking the SAT inEquity 2000 districts either decreased or remainedthe same between 1991 and 1996, however, thegap between Latino and white students increased.
Evaluators of Equity 2000 in Milwaukee foundthat between 1991 and 1997 the program:
� More than tripled the percentage of ninthgraders in MPS taking Algebra I or higherlevel math: from 31% to 99%.
� Increased Algebra I enrollment of AfricanAmerican, Latino and Asian students by 75%,78% and 67%, respectively.
� Nearly doubled the percentage of MPS studentscompleting Algebra I by the end of ninth grade:from 25% to 55%. (The gain was significant forall students, but an achievement gap remainedfor all minority groups except Asians.)
� Trained 85% of the MPS math teachers fromgrades 8-10.
Milwaukee evaluators also noted, however, that nearlyhalf (47%) of the MPS ninth graders who took AlgebraI in those years did not pass the course.
Raising Minority Academic Achievement110
American Youth Policy Forum
Evaluators from the Pelavin Research Centerconcluded: “Although a greater proportion and alarger number of minority students enrolled in andpassed Algebra I and geometry, they [still] laggedbehind their white peers.”
�!������������
High Standards/High ExpectationsEquity 2000 was founded on the expectation that allstudents can complete the math requirementsnecessary for college admission. Programcounselors encouraged all students to take advancedmath courses in high school and investigate collegeopportunities.
Extra SupportsVoluntary Saturday Academies and math summerprograms were extended learning opportunities thatserved as “safety nets” to catch students who beganto falter when districts mandated tough new mathstandards. Yet, because of the optional nature of theextended learning opportunities, teachers reportlower than expected attendance.
������������������
Professional DevelopmentEvaluators indicated that ongoing professionaldevelopment was crucial to the implementation ofthe demanding curriculum changes mandated byEquity 2000.
Transition FocusMandating mathematics courses that wereprerequisites for college admissions facilitated accessto higher education for all students in the district.Field trips to HBCUs and other colleges expandedstudents’ educational aspirations.
Unintended ConsequencesHigh failure rates of mathematics courses were anunintended consequence of the new Algebra I andgeometry mandates, despite the fact that eachdistrict planned and trained teachers for two yearsbefore implementing the tough math requirements.
� Voluntary Saturday Academies (for students)and summer math programs provided additionaltutoring, algebra readiness classes, practice forhigh school proficiency exams and make-upcourses for students in grades 8-12 whostruggled with, or did not pass, the newlymandated requirements. In Milwaukee,Saturday Academies were sometimes held onthe UMW campus.
� Parent Academies and program counselorshelped parents understand the importance ofmath literacy to students’ college access andsuccess. Parents also joined students andcounselors on field trips to the HistoricallyBlack Colleges and Universities (HBCUs).
Evaluators did not explain the fall off in collegeattendance for Asian students reported in thefollow-up study.
Raising Minority Academic Achievement 111
American Youth Policy Forum
STUDY METHODOLOGY“The Equity 2000 Evaluation” focused on the five-year demonstration project of Equity 2000 in 7sites. The sites were chosen to participate due totheir commitment to minority achievement.Evaluators collected data from students’ records,surveys of teacher and counselors, observationof mathematics classes and focus groups withschool personnel. The 7 sites had over 300,000students. “Getting the Right Algebra” evaluatesthe implementation of Equity 2000 in Milwaukeeand utilizes district and program data collectedannually. They also used interviews and focusgroups with school administrators, teachers,guidance counselors and funding staff.
EVALUATION & PROGRAM FUNDINGThe College Board funded both the evaluationand the program, providing more than $25 millionto the districts that implemented the reformbetween 1991 and 2000. The Milwaukee studywas a preliminary report conducted by MDRC.Funding for a full MDRC study nevermaterialized.
GEOGRAPHIC AREASThe Equity 2000 sites covered by the evaluationwere in Fort Worth, TX; Milwaukee, WI;Nashville, TN; Prince George’s County, MD;
Providence, RI; San Jose Unified School Districtand East Side Union, CA.
CONTACT INFORMATIONResearch ContactsGeorge Bohrnstedt & Sherri QuiñonesAmerican Institutes for Research3333 K Street, NWWashington, DC 20007-3541Phone: 202.342.5000Fax: 202.342.5033www.air-dc.org/
Carlos RódriguezPelavin Research CenterAmerican Institutes for Research1000 Thomas Jefferson Street, NWWashington, DC 20007-3835Phone: 202.944.5300Fax: [email protected]
Sandra HamManpower Demonstration Research Corporation19th Floor16 East 34 StreetNew York, NY 10016-4326Phone: 212.532.3200Fax: 212.684.0832www.mdrc.org
Raising Minority Academic Achievement112
American Youth Policy Forum
Started in 1986, Gateway to Higher Education is anintermediary organization that now supports acomprehensive four-year, secondary schoolprogram in 11 New York City high schools. Theorganization is administered through the CityUniversity of New York and it prepares students forhigher education and for careers in science,medicine and technology. Gateway includessummer enrichment programs, Saturday Academies,tutoring, counseling, internships, college visits,cultural awareness activities, advanced laboratorywork, SAT preparatory classes and requiredAdvanced Placement courses.
4����������5�$�����������������������
� �� ���
“Science and Technology Entry Program:1999-2000 Final Report” (2000) City Universityof New York Medical School. By Morton Slater andElisabeth Iler.
“Make It Possible for Students to Succeedand They Will: An Evaluation of theGateway to Higher Education Program”(January 1997) Education Development Center. ByPatricia B. Campbell, Ellen Wahl, Morton Slater,Elisabeth Iler, Babette Moeller, Harouna Ba, andDaniel Light.
POPULATIONGateway is aimed at students who are under-represented in mathematics, science andmedical careers. To enter Gateway, studentsmust score at least at the 50th percentile onNew York City’s Seventh Grade Math test andthe Degrees of Reading Power test, haveregular attendance, and generally have gradesof 80 or better (on a 100-point scale). Since1986, Gateway has served more than 3500students. In the 1999-00 school year, theprogram served 801 students. In that year,67% of the students were African American,31% Latino, 1% Asian and 1% other. Nearlytwo thirds (62%) of the participating studentswere female. Through an analysis of students’zip codes and census data, the author of the1997 evaluation determined that Gatewaystudents come primarily from low-income orlower-middle income families. The racial/ethnicdemographics of the program at the time of the1997 study were as follows: 57% AfricanAmerican, 26% Latino, 12% Asian, 5% NativeAmerican, Caucasian and other.
FocusEarly ChildhoodPrimary SchoolMiddle School
����� Secondary SchoolPostsecondary
����� Extended Learning
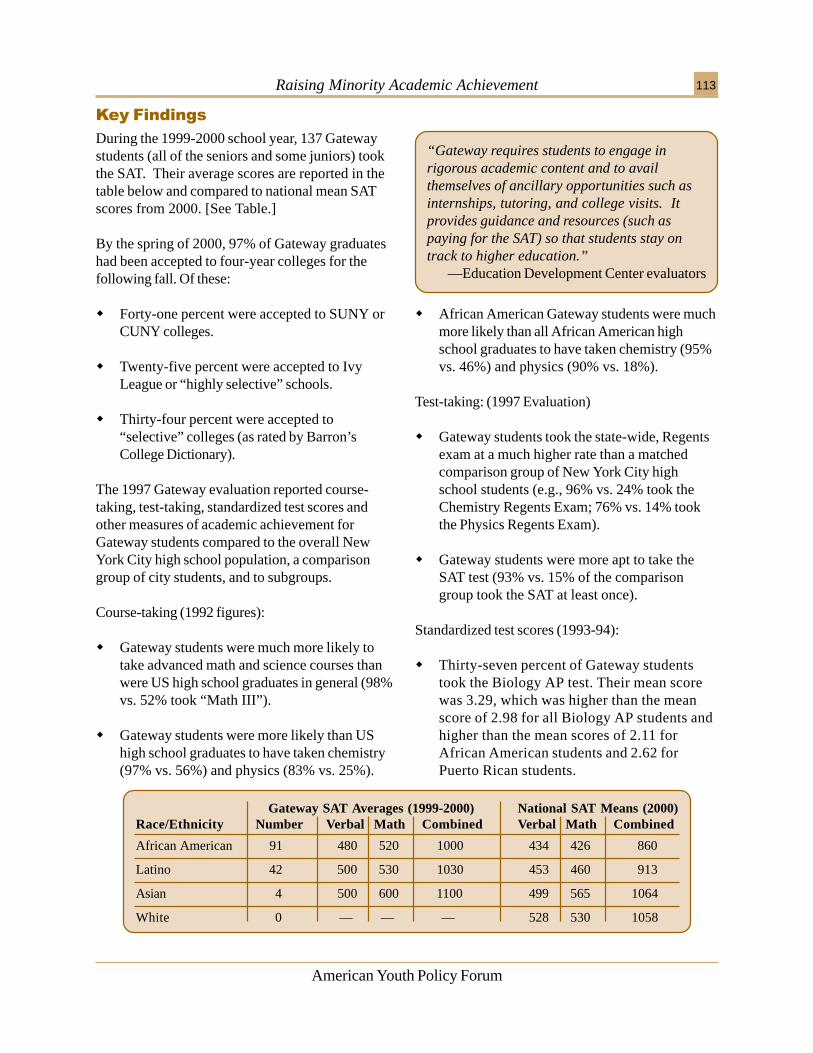
Raising Minority Academic Achievement 113
American Youth Policy Forum
������������
During the 1999-2000 school year, 137 Gatewaystudents (all of the seniors and some juniors) tookthe SAT. Their average scores are reported in thetable below and compared to national mean SATscores from 2000. [See Table.]
By the spring of 2000, 97% of Gateway graduateshad been accepted to four-year colleges for thefollowing fall. Of these:
� Forty-one percent were accepted to SUNY orCUNY colleges.
� Twenty-five percent were accepted to IvyLeague or “highly selective” schools.
� Thirty-four percent were accepted to“selective” colleges (as rated by Barron’sCollege Dictionary).
The 1997 Gateway evaluation reported course-taking, test-taking, standardized test scores andother measures of academic achievement forGateway students compared to the overall NewYork City high school population, a comparisongroup of city students, and to subgroups.
Course-taking (1992 figures):
� Gateway students were much more likely totake advanced math and science courses thanwere US high school graduates in general (98%vs. 52% took “Math III”).
� Gateway students were more likely than UShigh school graduates to have taken chemistry(97% vs. 56%) and physics (83% vs. 25%).
� African American Gateway students were muchmore likely than all African American highschool graduates to have taken chemistry (95%vs. 46%) and physics (90% vs. 18%).
Test-taking: (1997 Evaluation)
� Gateway students took the state-wide, Regentsexam at a much higher rate than a matchedcomparison group of New York City highschool students (e.g., 96% vs. 24% took theChemistry Regents Exam; 76% vs. 14% tookthe Physics Regents Exam).
� Gateway students were more apt to take theSAT test (93% vs. 15% of the comparisongroup took the SAT at least once).
Standardized test scores (1993-94):
� Thirty-seven percent of Gateway studentstook the Biology AP test. Their mean scorewas 3.29, which was higher than the meanscore of 2.98 for all Biology AP students andhigher than the mean scores of 2.11 forAfrican American students and 2.62 forPuerto Rican students.
“Gateway requires students to engage inrigorous academic content and to availthemselves of ancillary opportunities such asinternships, tutoring, and college visits. Itprovides guidance and resources (such aspaying for the SAT) so that students stay ontrack to higher education.”
—Education Development Center evaluators
Gateway SAT Averages (1999-2000) National SAT Means (2000)Race/Ethnicity Number Verbal Math Combined Verbal Math Combined
African American 91 480 520 1000 434 426 860
Latino 42 500 530 1030 453 460 913
Asian 4 500 600 1100 499 565 1064
White 0 — — — 528 530 1058
Raising Minority Academic Achievement114
American Youth Policy Forum
���������������
Each Gateway school has a coordinator and a teamof teachers who stay with the students throughouttheir four years in high school. The program isbased on a strong belief that high expectations for allstudents, a demanding curriculum and a strongsupport system can lead to student success. Thougheach high school has a slightly different Gatewayinitiative, the shared program components are:
� An extended school day, including a doubleperiod of mathematics or science with alaboratory component and after-school tutorials.
� An extended school year (11 months), includinga month-long summer program for studentsentering the ninth grade and academic summerprograms for juniors and seniors at high-leveluniversities and research institutes.
� Classes composed solely of Gateway students,especially in mathematics and science, with amaximum enrollment of 25 students.
� Four years of regents-level science,mathematics, social science, foreign languagecourses and an average of three AdvancedPlacement courses for all Gateway students.
� The expectation that all Gateway students willtake the SAT (and the program pays for thetest).
� Information about college, beginning in theninth grade, including an annual college fair,college visits, PSAT and SAT preparatoryclasses and seminars for parents.
� Enriching activities, including exposure toprofessionals in science, field trips to museums,the theater, opera and symphonies and after-school experiential internships.
In 1997, Gateway cost $1,600 more per student peryear than the mean New York City per pupilexpenditure (mean not given in report).
� Gateway students’ mean AP Chemistry scorewas 2, lower than the national mean of 2.86 andthe mean score for Puerto Rican students (2.3),but at the same level as the mean AP Chemistryexam score for African Americans (2.02).
College Retention (1996):
� A 1996 survey of 330 Gateway alumni,administered by the program, revealed that 74%of the alumni had graduated or would graduatefrom four-year colleges or universities withinfive years. Only 8% of the respondents had
“High expectations for all students have beenpart of the rhetoric for several decades, [but]until recently, responsibility for success wasstill laid mainly on the student and barely onthe system. Gateway was developed based onthe assumption that responsibility for successneeds to be equally shared by the student andthe system.”
—Education Development Center evaluators
Staff QualificationsTeachers for Gateway are carefully selected, basedon their qualification to teach the assigned course,their teaching experience, their willingness to put inthe time and effort required to push Gatewaystudents and their ultimate belief that the studentscan succeed.
������������������
Teacher Investment and Collaboration“The commitment above and beyond their contractthat Gateway teachers invest, and the opportunitythat teachers have to talk with each other and bepart of a team of educators” is important for theprogram’s success, according to EDC evaluators.
dropped out of college. Fifty-nine percent ofthem remained in a science-related major orprofession.
Raising Minority Academic Achievement 115
American Youth Policy Forum
High ExpectationsAccording to the EDC evaluators, “Highexpectations for all students have been part of therhetoric for several decades, [but] until recently,responsibility for success was still laid mainly on thestudent and barely on the system. Gateway wasdeveloped based on the assumption thatresponsibility for success needs to be equally sharedby the student and the system.”
Small Learning CommunityAll of the participants in Gateway (students,teachers, and program administrators) talked about“the sense of connectedness they enjoy as part of asmall entity within a large institution.”
Leadership ContinuityGateway has had the same co-directors since it wasfounded in 1986, contributing to its consistent senseof purpose and mission.
Community PartnershipsGateway has formed institutional partnerships withthe Museum of Natural History, colleges,universities, medical schools and laboratories. Forinstance, a partnership with Cold Springs HarborDNA Learning Center involves students inadvanced scientific research.
STUDY METHODOLOGYThe 1999-2000 report was not a formal,independent evaluation, and it did not include acomparison group. Instead, the report focusedon the achievement of Gateway students atvarious high schools, with special attention to howjuniors and seniors in the program did onRegents’ tests, AP tests, college entranceexaminations and in-college enrollment. In the1997 evaluation, researchers comparedoutcomes for 136 Gateway students who hadexpected to graduate in 1993 (because they hadbaseline scores on seventh grade math andreading tests) to those of a comparison group of136 non-Gateway students. These groups werematched according to age, gender, race/ethnicityand math and reading scores. They lived inneighborhoods with similar levels of poverty.Researchers also analyzed an existing database,conducted a series of interviews and focusgroups with program participants and graduates,visited 5 Gateway high schools, interviewedcollege admissions staff and administered asurvey to 1990 and 1991 Gateway graduates.They also compared SAT and Achievement testscores of Gateway students with nationalaverages.
EVALUATION & PROGRAM FUNDINGThe 1997 evaluation was funded by the AaronDiamond Foundation. The Gateway program andthe 1999-00 Final Report were funded by the CityUniversity of New York Medical School and theNew York State Education Department. ThroughSTEP, the New York State Department ofEducation funds 10% of the Gateway andrequires an evaluative annual report.
GEOGRAPHIC AREASGateway operates in 11 New York City publichigh schools, including: Adlai Stevenson HighSchool, Bayard Rustin High School for theHumanities, Brooklyn Technical High School,Erasmus Hall Campus Magnet, Jamaica HighSchool, John F. Kennedy High School, PortRichmond High School and others.
CONTACT INFORMATIONResearch ContactsMorton Slater and Elisabeth Iler, DirectorsGateway to Higher Education94-50 159th StreetScience Building, Room 112Jamaica, NY 11451Phone: 718.523.6301Fax: [email protected]@aol.com
Raising Minority Academic Achievement116
American Youth Policy Forum
The GE Fund began the College Bound program in1989 as a funding initiative to reform high schools(especially in inner-city communities) near GeneralElectric Company facilities. GE provided five-yeargrants of between $250,000 and $1,000,000 to 19high schools in 17 communities. The goal of theprogram was to double or significantly improve thecollege-going rates either for schools as a whole orfor substantial, targeted groups of students withinthese schools. The funds were for both school-widereforms and efforts targeted at smaller groups ofstudents. Although the GE Fund required recipientsto make changes in the curriculum, professionaldevelopment and services necessary to improvecollege-going significantly, the fund did not stipulatewhat these changes should be, only that GEemployees be involved with the program design andas volunteers in its implementation. The schoolsand their GE partners came up with a mix ofstrategies that included design of new, college-oriented classes, professional development,homework assistance, college counseling, tutoring,mentoring, after-school/summer school programs,SAT preparation courses and college visits.
4�������� �$��(���������������
� �� ���
“Expanding College Access, StrengtheningSchools: Evaluation of the GE Fund CollegeBound Program” (January 2000) Center forHuman Resources, Heller Graduate School,Brandeis University. By Lawrence Neil Bailis, AlanMelchior, Andrew Sokatch, and Annabel Sheinberg.
POPULATIONLocated in both urban and rural areas acrossthe eastern United States, the schools involvedin the College Bound program range in racialand ethnic diversity, in students’ family incomeand in college-going rates before the program.The overall student demographics of theCollege Bound schools are: 45.4% white,39.4% African American and 13.1% Latino,with 43.4% of the total student populationeligible for free or reduced-price lunch. Thebase year (pre-College Bound) college-goingrates of graduates also varied across the sites,ranging from 21.8% at East High School inErie, Pennsylvania to 92% in New York City’sManhattan Center for Science andMathematics.
FocusEarly Childhood
����� Primary School����� Middle School����� Secondary School
Postsecondary����� Extended Learning
After reviewing the evaluation findings in 2000, theGE Fund board of directors approved a $10 million,five-year extension of the program. The expansionof the College Bound initiative will stress K-12 orK-16 programming, continuation of activities at thesites that have demonstrated effectiveness andinclusion of new program sites.
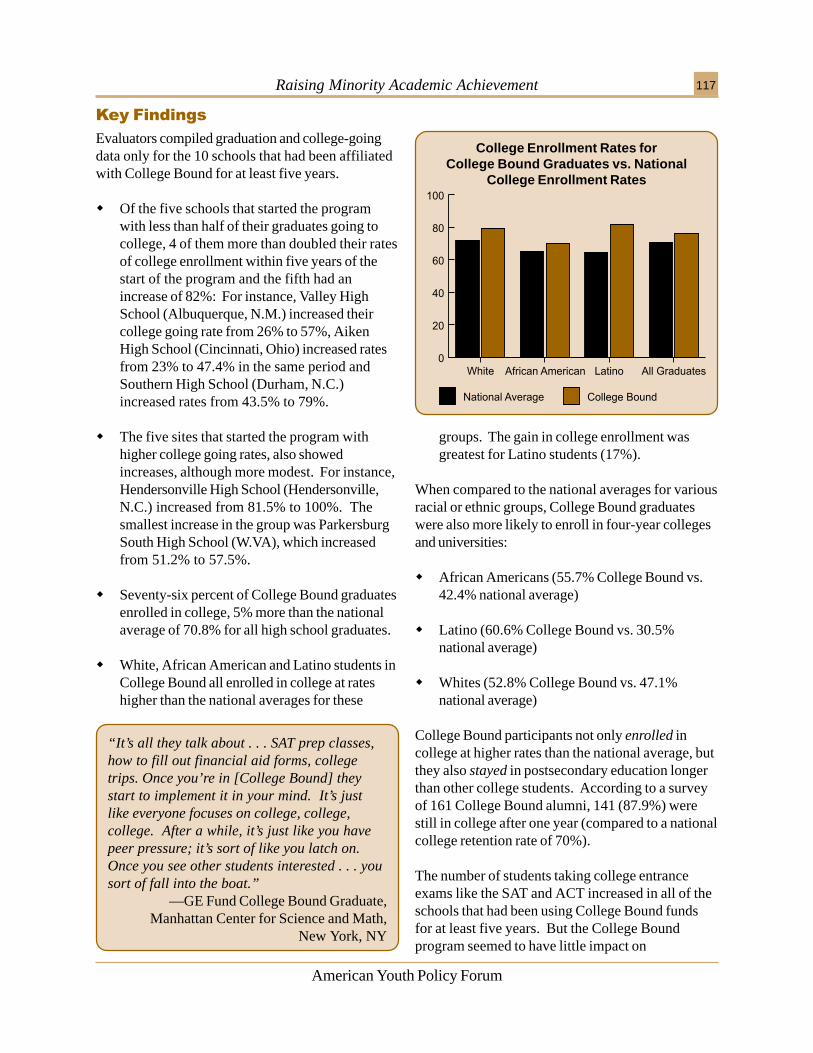
Raising Minority Academic Achievement 117
American Youth Policy Forum
������������
Evaluators compiled graduation and college-goingdata only for the 10 schools that had been affiliatedwith College Bound for at least five years.
� Of the five schools that started the programwith less than half of their graduates going tocollege, 4 of them more than doubled their ratesof college enrollment within five years of thestart of the program and the fifth had anincrease of 82%: For instance, Valley HighSchool (Albuquerque, N.M.) increased theircollege going rate from 26% to 57%, AikenHigh School (Cincinnati, Ohio) increased ratesfrom 23% to 47.4% in the same period andSouthern High School (Durham, N.C.)increased rates from 43.5% to 79%.
� The five sites that started the program withhigher college going rates, also showedincreases, although more modest. For instance,Hendersonville High School (Hendersonville,N.C.) increased from 81.5% to 100%. Thesmallest increase in the group was ParkersburgSouth High School (W.VA), which increasedfrom 51.2% to 57.5%.
� Seventy-six percent of College Bound graduatesenrolled in college, 5% more than the nationalaverage of 70.8% for all high school graduates.
� White, African American and Latino students inCollege Bound all enrolled in college at rateshigher than the national averages for these
groups. The gain in college enrollment wasgreatest for Latino students (17%).
When compared to the national averages for variousracial or ethnic groups, College Bound graduateswere also more likely to enroll in four-year collegesand universities:
� African Americans (55.7% College Bound vs.42.4% national average)
� Latino (60.6% College Bound vs. 30.5%national average)
� Whites (52.8% College Bound vs. 47.1%national average)
College Bound participants not only enrolled incollege at higher rates than the national average, butthey also stayed in postsecondary education longerthan other college students. According to a surveyof 161 College Bound alumni, 141 (87.9%) werestill in college after one year (compared to a nationalcollege retention rate of 70%).
The number of students taking college entranceexams like the SAT and ACT increased in all of theschools that had been using College Bound fundsfor at least five years. But the College Boundprogram seemed to have little impact on
“It’s all they talk about . . . SAT prep classes,how to fill out financial aid forms, collegetrips. Once you’re in [College Bound] theystart to implement it in your mind. It’s justlike everyone focuses on college, college,college. After a while, it’s just like you havepeer pressure; it’s sort of like you latch on.Once you see other students interested . . . yousort of fall into the boat.”
—GE Fund College Bound Graduate,Manhattan Center for Science and Math,
New York, NY
College Enrollment Rates forCollege Bound Graduates vs. National
College Enrollment Rates
Raising Minority Academic Achievement118
American Youth Policy Forum
Program Funding and LongevityThe substantial size and long-term support of GEFund grants—at least $250,000 for five years—gave adequate time and resources to plan andimplement the reforms necessary to improveschool-wide academic achievement. Seven of the 12College Bound sites that had completed their initialgrants at the time of the evaluation continued toimplement College Bound program and curriculuminnovations. The 5 others had not sustained theirinitial efforts for a variety of reasons.
Clear and Simple MissionThe clear goal of doubling or significantly increasingcollege attendance for program graduates gaveschools and students an identifiable measure ofprogram success.
������������������
Individualized Student Support“Conversations with College Bound students tend toecho a single theme: it was a person and not aprogram that made the difference in their lives. Insome cases it was school staff, in others it was amentor from GE. But the consistent message wasthat the encouragement and support of adults helpedstudents move through the system,” according tothe evaluation team.
���������������
The GE Fund supported innovative curriculumchanges and program activities to improve collegeaccess for students at the selected schools.Evaluators examined 15 College Bound schools andthe majority of them used the followingcomponents:
� College visits (100%)� Partnerships with a college or university (93.3%)� In-school tutoring/homework assistance (93.3%)� Individual college counseling (93.3%)� SAT/ACT preparation courses (93.3%)� Tutoring from non-GE volunteers (93.3%)� Computer equipment/labs (86.7%)� Financial aid and choosing a college workshops
(86.7%)� Parent information sessions (80%)� Summer workshops and summer school (80%)� Science equipment/labs (73.3%)� Career Centers (73.3%)� Community service/service-learning (73.3%)
� Mentoring with GE employees (73.3%)� College application assistance (66.7%)� New Advanced Placement classes (66.7%)� Enhanced professional development (66.7%)� Enhanced business partnerships (66.7%)� GE scholarships (60%)� Tutoring by GE employees (60%)� Mentoring by non-GE employees (60%)
“This little program, it just gives you that extrayou need to get over. When I first started doingCollege Bound this year, at the beginning ofthe year [I started] filling out applications andall the money stuff; that’s a long process. Youknow without this program and Ms. K. and Mr.C. I’d still be trying to figure out certain thingsand get my applications filled out.”
—GE Fund College Bound Student,Aiken High School, Cincinnati, OH
standardized test scores, overall graduation rates orthe dropout rates of the schools as a whole.
“GE and strong companies realize that merelycompeting to hire the exceptions, merelyharvesting the best from the blighted fields ofour urban school systems, is a practice devoidof vision and ultimately self-destructive.”
—John F. Welch, Jr., Former Chairman andCEO of General Electric Company
Raising Minority Academic Achievement 119
American Youth Policy Forum
STUDY METHODOLOGYThe evaluation team collected school data oncollege-going and program characteristics andsupplemented this information with student focusgroups and telephone surveys of two cohorts ofCollege Bound graduates. They visited all 17College Bound sites at least once and conductedinterviews with program staff, school and districtadministrators, and GE staff and volunteers.Comparisons were made with national data fromthe U.S. Department of Education.
EVALUATION & PROGRAM FUNDINGThe evaluation was conducted by the Center forHuman Resources at Brandeis University(currently known as the Center for Youth andCommunities). Support for the College Boundprogram and its evaluation came solely from theGE Fund.
GEOGRAPHIC AREASAt the time of the study, GE Fund College Boundsites were located in Lowndes County, AL;Louisville, KY; Lynn, MA; Albuquerque, NM; NewYork City, Ossining, and Schenectady, NY;Durham, Hendersonville, and Wilmington, NC;Cincinnati and Cleveland, OH; Erie, PA;
Florence, SC; Houston, TX; Richmond, VA; andParkersburg, WV. New sites have been addedsince the study was completed.
CONTACT INFORMATIONResearch ContactsLawrence N. BailisAssociate Research ProfessorCenter for Youth and CommunitiesBrandeis University60 Turner StreetWaltham, MA 02453Phone: 617.489.2487Fax: 781.736.3773http://www.heller.brandeis.edu/research/pages/[email protected]
Program ContactGE Fund3135 Easton TurnpikeFairfield, CT 06431Phone: 203.373.3216Fax: [email protected]
Strong LeadershipFrequent leadership turnover or weak supporthampered programmatic reform efforts. Strongleadership exhibited by the schools and their GEpartner “champions” proved essential for programsustainability.
Comprehensive ReformThe evaluation team noted that the comprehensivenature of the reforms was key to the success of theGE Fund program. “While targeted programs canimpact a limited number of young people, school-wide efforts are more likely to reach to the core of
the school’s educational processes and the changesthat they bring about . . . are more likely to sustainimprovements beyond the term of any single grant.”
Employer InvolvementThe evaluation team documented the fact that morethan two-thirds of the schools had GE mentors andhalf had GE tutors. However, the total number ofmentors and tutors involved in the program eachyear was relatively small (218 for over 4000students). Twenty-nine percent of the sites offeredsummer jobs for students and 14% had a GEinternship program.
Raising Minority Academic Achievement120
American Youth Policy Forum
5�������������
������������������ ����������������
“Does Head Start Make a Difference?,”1995, American Economic Review, vol. 85, no. 3,pp. 341-364. By Janet Currie, Department ofEconomics, University of California, Los Angeles,and Duncan Thomas, RAND
Head Start is a federal matching program started in 1965as part of the “War on Poverty.” It offers acomprehensive array of services to economicallydisadvantaged children, ages three to five, includinghealth care, learning activities and social skillsdevelopment. The goal is to provide children in povertywith the necessary health and intellectual support sothey can start elementary school with foundationssimilar to more advantaged children. The programrequires that 90% of participants come from familiesliving below the poverty line. Ten percent of theopenings must be set aside for children with disabilities.The Head Start Bureau indicates that, since itsbeginning, Head Start has served nearly 17 millionchildren and their families. In Fiscal Year 1997,793,809 children have been served in both Head Startclassrooms and home-based programs. Of these, 36%were African American, 31% white and 26% Hispanic.Sixty-one percent of the families served had incomes ofless than $9,000 a year. Federal funding for theprogram in FY 1997 was nearly $4 billion, with anaverage cost per child of $4,882.
� �� ���POPULATIONThe sample for this study was taken in 1990 andincluded 4,787 children aged three years andolder, who had at least one sibling over threeyears old. Of these, 69% were white and 31%were African American. Among the whitechildren, 14% had attended Head Start, 35%went to a non-Head Start program and 51% didneither. Among the African American children,32% had been in Head Start, 25% went toanother type of preschool and 43% did neither.The sample showed that Head Start children,when compared to those attending preschool,tend to have families with lower income levels,and mothers and grandmothers who have feweryears of schooling. African-American mothersof Head Start children are better educated thanwhite mothers of Head Start children, but tend tolive in households with lower income levels.Family income levels of Head Start children arealso lower than those for children who attendedno preschool.
When differences between families are controlled,the following outcomes were observed:
Academic Outcomes
� Children who participated in Head Startshowed statistically significant (nearly sevenpercentage points) increases in vocabulary
������������
test scores when compared to their siblingswho did not attend the program.
� White children who participated in Head Startwere 47% less likely to repeat a grade later inelementary school when compared to theirsiblings who did not attend the program.
FocusEarly Childhood
����� Primary School����� Middle School����� Secondary School
PostsecondaryExtended Learning
Raising Minority Academic Achievement 121
American Youth Policy Forum
Head Start provides comprehensive services forchildren from low-income families, aged three tofive. The program is administered by theAdministration for Children and Families (ACF),U.S. Department of Health and Human Services.
Grants are awarded to public or private non-profitagencies by ACF Regional Offices and the HeadStart Bureau’s American Indian and MigrantPrograms Branches. The community has to matchtwenty percent of the program cost.
According to information provided by the U.S.Department of Health and Human Services,Administration for Children and Families, HeadStart programs are tailored to the local needs of theparticipating children and the community served.However, all Head Start programs must focus on:
� education� nutrition� socio-economic development� physical and mental health� parental involvement
���������������
� African American children were found to losebenefits gained from Head Start faster thanwhite children and, by age 10, they retained nogains, while white children still retained anoverall gain of five percentage points.
� Participation in other types of preschoolprograms had no statistically significant effecton test scores or grade repetition.
Measures of health status
� All children who attended Head Start were 8%more likely to be immunized than children whohad not attended the program.
� Younger siblings of children who attended HeadStart were more likely to be immunized thanyounger siblings of children who did not attendthe program.
� No statistically significant differences werefound in growth rates for children who attendedHead Start compared to children who did notattend the program.
Discussing the different outcomes of Head Startacross racial groups, the researchers observed thatAfrican American children in Head Start tend tocome from more disadvantaged homes and live inpoorer communities. Differences in retention ofHead Start gains may also be due to differences inthe types of schools that these children attendedafter they left the program.
Head Start programs are expected to provideactivities that foster the child’s intellectual, socialand emotional growth, while respecting his or herethnic and cultural characteristics. The healthcomponent includes immunizations, medical, dentaland mental health services. Another requiredcomponent of the program is to provide childrenwith nutritious meals.
Parental involvement is an essential component ofHead Start. Parents serve as members of policycouncils and committees and participate inadministrative and managerial decisions. They alsoparticipate in classes and workshops on childdevelopment, health and nutrition education.Program staff conduct home visits and work withparents in educational activities that can take placeat home.
Among other services provided to families of HeadStart children are community outreach, needsassessment, recruitment and enrollment of children,information and referrals, emergency assistanceand/or crisis intervention.
“If the factors preventing African Americanchildren from maintaining the gains theyachieve in Head Start could be removed, theprogram could probably be judged anincontrovertible success.”
—Currie and Thomas, 1995
Raising Minority Academic Achievement122
American Youth Policy Forum
Early Intervention for the Most VulnerableChildrenResearch indicates that children who areintellectually stimulated from early ages, and receiveappropriate health care, will be more likely tosucceed later in school and in life. Head Startprograms focus on the most vulnerable children,those who live in poverty and/or have disabilities.
Parental SupportThe programs do not focus solely on the child.They offer education, information and referralservices to participating families, empowering them
������������������
to raise their children in a healthier and moresupportive environment.
Comprehensive ServicesHead Start offers a comprehensive array of servicesfor participating children and their families. Theprogram also encourages the communities to usenon-Head Start resources so that more children canbe reached. In 1996, nearly 68% of Head Startchildren were enrolled in the Early PeriodicScreening, Diagnosis and Treatment (EPSDT), aMedicaid program that pays for preventive medicaland dental care for children.
GEOGRAPHIC AREASAll 50 states, the District of Columbia and PuertoRico have Head Start programs.
CONTACT INFORMATIONResearch ContactJanet Currie, Ph.D., Department of EconomicsUniversity of California, Los AngelesBunch Hall 9371Los Angeles, CA 90095-9528Phone: 310.825.1011Fax: [email protected]
Duncan Thomas, RAND1700 Main StreetSanta Monica, CA 90407-2138Phone: 310.393-0411Fax: 310.393.4818www.rand.org
Implementing ContactHelen TaylorAssociate Commissioner for Head StartAdministration for Children and FamiliesU.S. Department of Health and Human Services330C Street, SW, Room 2050Washington, DC 20201Phone: 202.205-8572Fax: [email protected]/programs/hsb
STUDY METHODOLOGYResearchers used a sample from two nationaldatabases: the National Longitudinal Survey ofYouth (NLSY) and the National LongitudinalSurvey’s Child-Mother (NLSCM). The NLSYstarted in 1979 and has annually surveyed 6,283women. As of 1990, the women, aged 25-32, hadgiven birth to over 8,500 children. The NLSCMincludes the NLSY mothers and their children. Tocontrol for family background and differentialtreatment among children, the researcherscontrasted children enrolled in Head Start withsiblings not enrolled in the program. Thesesiblings were further divided between those whohad not attended preschool and those enrolled ina non-Head Start type of preschool program.To measure academic gains, researchers usedthe Picture Peabody Vocabulary Test score(PPVT) and the absence of grade repetition. Theimpact of Head Start on children’s health wasmeasured by immunization status (specificallywhether the child had been immunized formeasles) and growth rates. Regression analysiswas used to estimate the effects of participation ornon-participation in Head Start in the fourmeasures.
EVALUATION FUNDINGThe Alfred P. Sloan Foundation and the NationalScience Foundation.
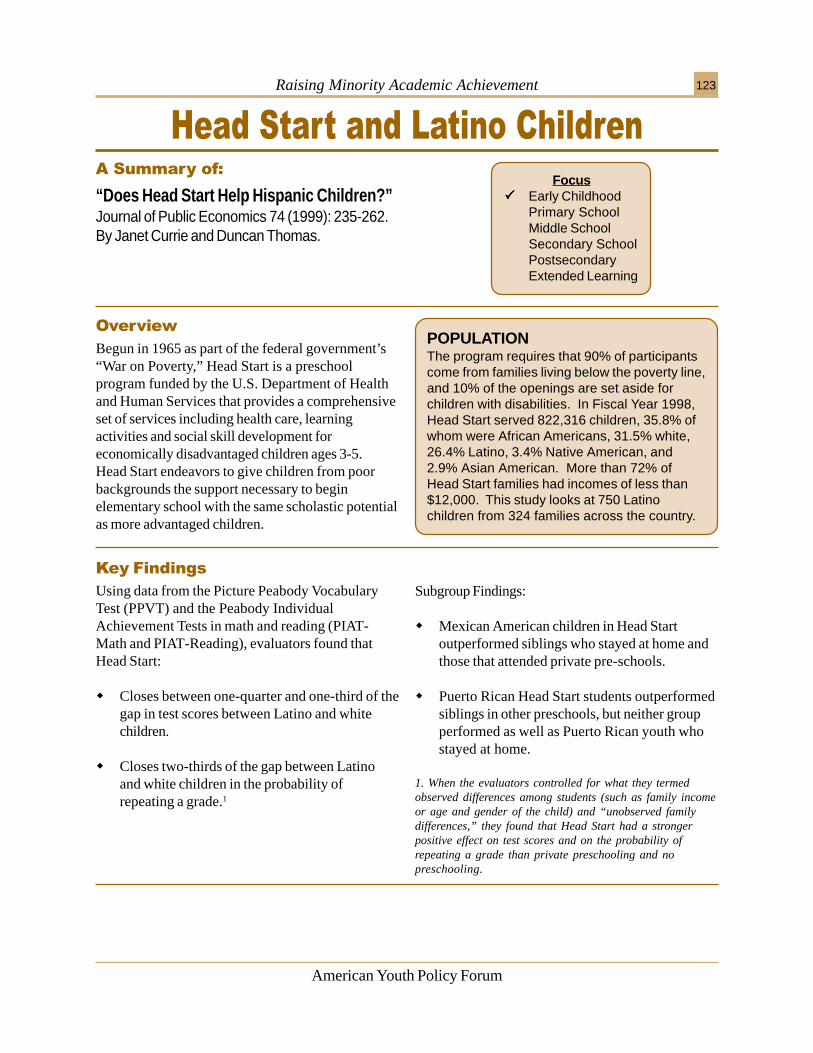
Raising Minority Academic Achievement 123
American Youth Policy Forum
5��������������<��������� ����������������
“Does Head Start Help Hispanic Children?”Journal of Public Economics 74 (1999): 235-262.By Janet Currie and Duncan Thomas.
Begun in 1965 as part of the federal government’s“War on Poverty,” Head Start is a preschoolprogram funded by the U.S. Department of Healthand Human Services that provides a comprehensiveset of services including health care, learningactivities and social skill development foreconomically disadvantaged children ages 3-5.Head Start endeavors to give children from poorbackgrounds the support necessary to beginelementary school with the same scholastic potentialas more advantaged children.
� �� ���
Using data from the Picture Peabody VocabularyTest (PPVT) and the Peabody IndividualAchievement Tests in math and reading (PIAT-Math and PIAT-Reading), evaluators found thatHead Start:
� Closes between one-quarter and one-third of thegap in test scores between Latino and whitechildren.
� Closes two-thirds of the gap between Latinoand white children in the probability ofrepeating a grade.1
������������
Subgroup Findings:
� Mexican American children in Head Startoutperformed siblings who stayed at home andthose that attended private pre-schools.
� Puerto Rican Head Start students outperformedsiblings in other preschools, but neither groupperformed as well as Puerto Rican youth whostayed at home.
1. When the evaluators controlled for what they termedobserved differences among students (such as family incomeor age and gender of the child) and “unobserved familydifferences,” they found that Head Start had a strongerpositive effect on test scores and on the probability ofrepeating a grade than private preschooling and nopreschooling.
Focus����� Early Childhood
Primary SchoolMiddle SchoolSecondary SchoolPostsecondaryExtended Learning
POPULATIONThe program requires that 90% of participantscome from families living below the poverty line,and 10% of the openings are set aside forchildren with disabilities. In Fiscal Year 1998,Head Start served 822,316 children, 35.8% ofwhom were African Americans, 31.5% white,26.4% Latino, 3.4% Native American, and2.9% Asian American. More than 72% ofHead Start families had incomes of less than$12,000. This study looks at 750 Latinochildren from 324 families across the country.
Raising Minority Academic Achievement124
American Youth Policy Forum
Head Start is administered by the Administration forChildren and Families (ACF) in the Department ofHealth and Human Services. Grants are awarded topublic or private non-profit agencies and thecommunity must match 20% of the program costs.Though there is flexibility for local variation andadaptation, all Head Start programs focus on:
� education� nutrition� socio-economic development� physical and mental health� parental involvement
���������������
With these various components, Head Startprograms foster children’s intellectual, social, andemotional growth, while respecting their ethnic orcultural heritage. Head Start’s health servicesinclude immunizations, medical, dental and mentalhealth care. Head Start agencies also emphasizecommunity outreach, needs assessment, emergencyassistance and/or crisis intervention, and servicereferral.
Early InterventionResearch indicates that children who receiveintellectual stimulation and adequate health carefrom an early age are more likely to succeed inschool and later life. Head Start is an earlyintervention to ensure that the most vulnerablechildren—those who live in poverty and/or havedisabilities—have the same preparation for successas children from more fortunate backgrounds.
Cultural Sensitivity and AwarenessHead Start programs provide activities that fosterchildren’s intellectual, social, and emotional growth,while respecting children’s ethnic and culturaltraditions. Evaluators suggest that this mix ofculturally sensitive social development componentshelped the children of Hispanic immigrants learnEnglish and assimilate into American culture.
������������������
Parental InvolvementParents serve as members of advisory councils andthey participate directly in managerial andadministrative decisions for local Head Start centers.They also attend workshops and classes on childdevelopment, health and nutrition education. HeadStart staff members also conduct home visits andwork with parents on educational activities that cantake place in the home.
CostThe Head Start preschool programs cost an averageof $4000 per child, per year (1993). Evaluatorscompared that figure to the amount an averagefamily with a working mother spent on childcare inthe early 1990s ($3000) to argue that the government-funded program “may be of higher quality than whatmany families could afford to buy on their own.”
Raising Minority Academic Achievement 125
American Youth Policy Forum
CONTACT INFORMATIONResearch ContactJanet Currie, ProfessorDepartment of EconomicsUniversity of California, Los AngelesBunch Hall 9371Los Angeles, CA 90095Phone: 310.825.1011Fax: [email protected]
Duncan Thomas, Senior EconomistRAND1700 Main StreetSanta Monica, CA 90407-2138Phone: 310.393.0411Fax: 310.393.4818
STUDY METHODOLOGYEvaluators used data recorded from the 1970s tothe 1990s in the National Longitudinal Survey ofYouth (NYLS) and the National LongitudinalSurvey Child-Mother (NLSCM) files. The studycompared the achievement of Latino children whoenrolled in Head Start with their siblings who didnot, with Latino children from other families whoattended another preschool or no preschool at all,and with non-Latino Head Start students. Theevaluators also disaggregated data for children ofimmigrants from Mexico and Puerto Rico.
EVALUATION FUNDINGThe National Science Foundation and the NationalInstitute of Child Health and Human Development.
GEOGRAPHIC AREASAll fifty states, the District of Columbia and PuertoRico have Head Start programs.
Raising Minority Academic Achievement126
American Youth Policy Forum
������������
The May 1998 evaluation reported collegeadmissions test-taking for matched comparisongroups of Puente and non-Puente students, showingthat Puente students were more likely to take thePSAT in grades 9-10 and the ACT or SAT in grades11-12. [See Table.]
The December 1998 study included a comparisonof the college-going rates of Puente and non-Puentestudents (N=144). Puente students were twice aslikely to attend a school in the University ofCalifornia system (7% vs. 4%) or the CaliforniaState University system (33% vs. 15%).
High School Puente (named for the Spanish wordfor bridge) is a program to help more Latinoadolescents successfully bridge the transition fromhigh school to four-year colleges. Latino studentsconstituted the largest population group in theCalifornia public schools (41% of the K-12 studentpopulation), but they had the lowest participationrates in higher education of all groups. Out of every100 Latino students in tenth grade, only fourqualified for the University of California (UC)system and only one actually enrolled. Puente aimsto increase Latino participation in higher educationby raising student skills and aspirations throughcritical thinking and writing instruction, collegecounseling and mentoring. It provides a focused,supportive and culturally sensitive learningenvironment that fosters student success. Puentecurrently operates in 30 high schools across thestate of California.
5�$������ �.����������������
� �� ���
“Final Report of the Evaluation of HighSchool Puente: 1994-1998” (December 1998)The Carnegie Corporation of New York. By PatriciaGándara with Maria Mejorado, Dianna Gutiérrezand Miguel Molina.
POPULATIONPuente was initially designed to target non-immigrant, English-speaking, MexicanAmerican students as they enter high school inthe ninth grade, although Latino students fromother countries also participate, as do studentsof other races/ethnic groups. Classes arecomprised entirely of a heterogeneously-skilledPuente cohort of 25-30 students. Puente triesto serve students who demonstrate a sinceredesire to excel or improve in school and who“buy into” a college-preparatory ideology.Teachers and counselors from feeder middleschools nominate students, who are selectedon the basis of fitting into one of fourcategories (described under Key Findings).
The 3 Puente case study sites examined in theevaluations collectively included 75 Puentestudents who began ninth grade in 1994 and acomparison group of 75 non-Puente students(due to student attrition, the final evaluatedgroup was 144 students). The 3 sites chosenwere deemed to be representative of all Puentesites with respect to urbanicity, populationdemographics, location and gender andethnicity of staff.
FocusEarly ChildhoodPrimary SchoolMiddle School
����� Secondary SchoolPostsecondaryExtended Learning
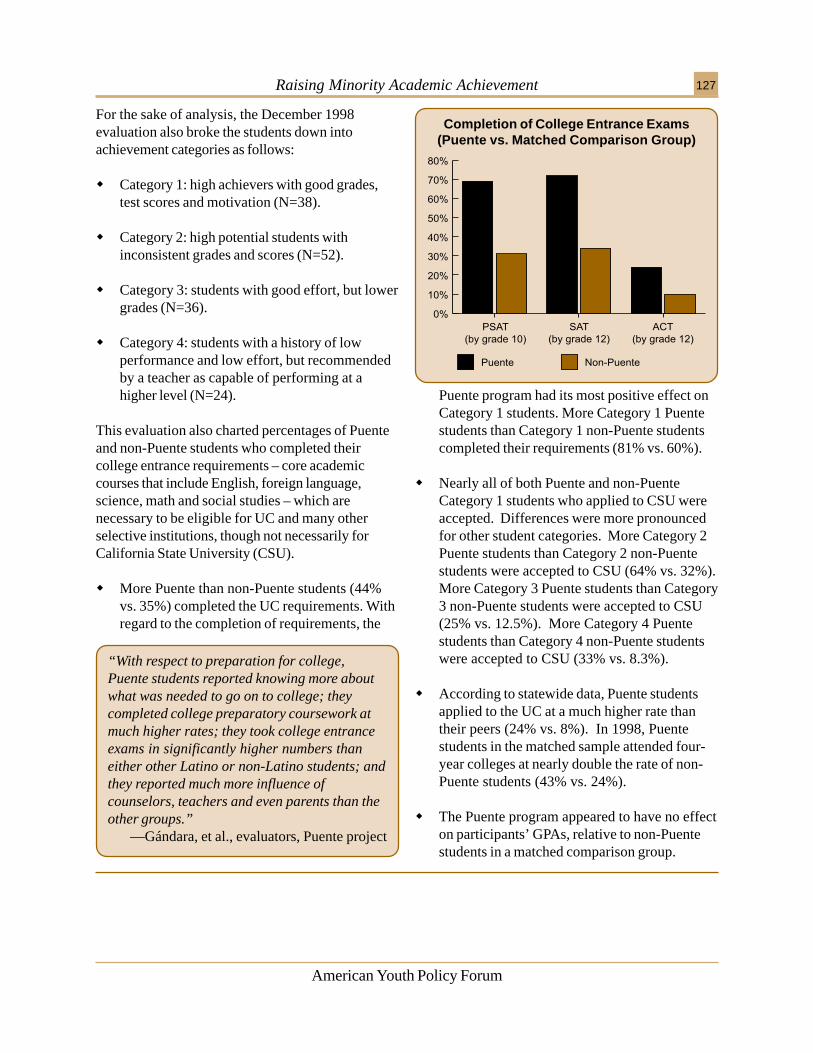
Raising Minority Academic Achievement 127
American Youth Policy Forum
“With respect to preparation for college,Puente students reported knowing more aboutwhat was needed to go on to college; theycompleted college preparatory coursework atmuch higher rates; they took college entranceexams in significantly higher numbers thaneither other Latino or non-Latino students; andthey reported much more influence ofcounselors, teachers and even parents than theother groups.”
—Gándara, et al., evaluators, Puente project
Completion of College Entrance Exams(Puente vs. Matched Comparison Group)
For the sake of analysis, the December 1998evaluation also broke the students down intoachievement categories as follows:
� Category 1: high achievers with good grades,test scores and motivation (N=38).
� Category 2: high potential students withinconsistent grades and scores (N=52).
� Category 3: students with good effort, but lowergrades (N=36).
� Category 4: students with a history of lowperformance and low effort, but recommendedby a teacher as capable of performing at ahigher level (N=24).
This evaluation also charted percentages of Puenteand non-Puente students who completed theircollege entrance requirements – core academiccourses that include English, foreign language,science, math and social studies – which arenecessary to be eligible for UC and many otherselective institutions, though not necessarily forCalifornia State University (CSU).
� More Puente than non-Puente students (44%vs. 35%) completed the UC requirements. Withregard to the completion of requirements, the
Puente program had its most positive effect onCategory 1 students. More Category 1 Puentestudents than Category 1 non-Puente studentscompleted their requirements (81% vs. 60%).
� Nearly all of both Puente and non-PuenteCategory 1 students who applied to CSU wereaccepted. Differences were more pronouncedfor other student categories. More Category 2Puente students than Category 2 non-Puentestudents were accepted to CSU (64% vs. 32%).More Category 3 Puente students than Category3 non-Puente students were accepted to CSU(25% vs. 12.5%). More Category 4 Puentestudents than Category 4 non-Puente studentswere accepted to CSU (33% vs. 8.3%).
� According to statewide data, Puente studentsapplied to the UC at a much higher rate thantheir peers (24% vs. 8%). In 1998, Puentestudents in the matched sample attended four-year colleges at nearly double the rate of non-Puente students (43% vs. 24%).
� The Puente program appeared to have no effecton participants’ GPAs, relative to non-Puentestudents in a matched comparison group.
Raising Minority Academic Achievement128
American Youth Policy Forum
���������������
Puente is operated in public high schools. In eachhigh school, 25-30 students are identified forprogram participation. These students:
� Enroll in ninth and tenth grade English classesspecially designed for Puente. These classesfocus on writing and literature, with anemphasis on Latino literature and culturalawareness. Puente teachers receive specialtraining in the curriculum used in these classes.The classes, considered college-preparatory, arefor credit and replace English classes studentswould otherwise take.
� Continue the program as eleventh and twelthgraders by receiving intensive, collegepreparatory counseling. Counseling servicesinclude ensuring that students are placed incollege preparatory classes, that any deficienciesare quickly noted and addressed and thatstudents are supplied with informationnecessary to ensure high school success and togain admission to postsecondary education.
� Have two types of mentors. A “peer partner”who acts as a guide through the early transitionsinto high school and an adult mentor whointroduces the students to new opportunitiesand roles. A Community Mentor Liaison(CML) seeks out appropriate mentors from thecommunity for the students, trains them andmatches them to students in the program. TheCML also works with counselors to arrange for
appropriate activities for students and mentorsand monitors these relationships.
� Attend meetings held at least monthly, withteachers and/or advisors during the school day,after school and in the evenings to discussspecific challenges, develop mentorrelationships and talk about current issuesimpacting life choices. Teachers constantlyweave “life lessons” (discussed in ContributingFactors, below) into these meetings.
Puente also ensures that parents have information toensure high school success and college admission.Parental involvement begins early in the Puenteprogram. A student cannot be accepted into theprogram unless a parent or guardian requests it andis willing to sign a statement agreeing to support thestudent in a variety of ways, including by attendingparent meetings and events. Parent nights areusually “family affairs” with food, informalconversation, presentations in both Spanish andEnglish and materials and information that are ofcritical importance to parents, such as informationabout financial aid or special programs that can helpboth students and families.
Puente also has as its goal, changing theconsciousness of the school and the communityabout the potential of these students. One result isthat the program creates local support networks thatcan assist Puente by offering resources, financialdonations and visibility.
Family and Peer InvolvementThe program design allowed for extensive parent-to-student as well as peer-to-peer involvement.Puente provides a framework through which suchrelationships can be developed and nurtured.
Personal AttentionEvaluators found that Puente was successful intaking students from where they were and
������������������
maximizing their potential. Researchers foundthat Puente students were far better preparedthan non-Puente students for preparing collegeapplications, and the personal counseling theyreceived from both teachers and counselorsevidently led them to make critically importantdecisions that resulted in their taking theappropriate courses and examinations to beeligible for selective institutions such as UC.
Raising Minority Academic Achievement 129
American Youth Policy Forum
STUDY METHODOLOGYThis study is the final of four qualitative studieson High School Puente. For the quantitativeanalysis, the evaluator matched 75 Puentestudents from across several representative siteswith a 75-student, non-Puente control group (dueto student attrition, the final evaluated group was144 students). The evaluator matched students inthe control and treatment groups by schoolattended, gender, ethnicity, socioeconomicbackground, grades and reading scores uponentering the ninth grade. Data was collected onthe two groups over four years. The studentswere further separated into categories (see KeyFindings). Teachers indicated students for eachcategory. The study also includes surveys;school, community and classroom observations;and formal and informal conversations withadministrators, teachers, counselors, parents andstudents (qualitative data was not summarized).
EVALUATION & PROGRAM FUNDINGThe Puente evaluation was funded by TheCarnegie Corporation of New York. The originalPuente pilot projects were supported by theDeWitt Wallace Reader’s Digest Fund. ThenPuente became largely funded by the state – not
by the individual schools – and in 1998 it costroughly $480 annually, per student. Training ofstaff to implement the program was partiallysubsidized by the University of California in theform of in-kind personnel costs.
GEOGRAPHIC AREASThe Puente project is in 30 high schoolsthroughout California.
CONTACT INFORMATIONResearch ContactsPatricia GándaraProfessor of EducationUniversity of California, DavisOne Shields Ave.Davis, CA 95616Phone: [email protected]
Program ContactThe Puente ProjectUniversity of CaliforniaOffice of the President300 Lakeside Drive, 7th FloorOakland, CA 94612-3550www.puente.net
Note: For additional research on High School Puente andother programs to raise Latino student achievement see“Capturing Latino Students in the Academic Pipeline”(1998) Chicano/Latino Policy Project Report. Edited byPatricia Gándara. Available through the Institute for theStudy of Social Change, University of California atBerkeley, 2420 Bowditch Street, #5670, Berkeley, CA94720-5670.
Quality StaffStrong, supportive principals who wove Puente intothe culture of the school and quality teachers whowove personal “life lessons” into the curriculumwere evident at the most effective Puente sites.These successful Puente sites also showed highlevels of dedication and enthusiasm from teacherswilling to work in the evenings and after school.
Community InvolvementEvaluators noted that community support, whichwas not dependent on one key individual, helpedensure the ongoing strength of a Puente program.The more widespread the community support, themore mentors and opportunities available tostudents.
Raising Minority Academic Achievement130
American Youth Policy Forum
High Schools That Work (HSTW) began in 1987and is designed to help states raise the academicachievement levels of career-bound students.HSTW, a project of the Southern RegionalEducation Board (SREB), was first replicatedamong mostly southern states, but by 2001 morethan 1,000 schools in 26 states were using theprogram. The main goal of the program is tohelp participating schools replace their generaland vocational tracks with an academic core ofhigh-level math, science and English courses,integrated with quality vocational studies, thushelping to raise achievement and broadenstudents’ educational and career opportunities.Schools choosing HSTW, implement systemicreform by changing their curricula, schedulingand resource allocations. To assess results,schools use an HSTW Assessment based on abattery of tests drawn from the NationalAssessment of Educational Progress (NAEP).(Findings below refer to these tests.) Thissummary includes a case study of Los FresnosHigh School, just north of the Mexican border inTexas. In the early to mid 1990s, Los Fresnos High
5�$������ ��&����=��3������������
� �� ���
“HSTW Assessment Scores for AfricanAmerican and White Students” (2001)Southern Regional Education Board (InternalDocuments). By Gene Bottoms.
“Academic and Vocational Teachers CanImprove the Reading Achievement of MaleCareer-Bound Students” (1999) SouthernRegional Education Board. By Mark Forge andGene Bottoms.
POPULATIONNearly 55,000 seniors from HSTW schoolsacross the country took the HSTW Assessmentin 2000. That year, 66% of the studentsassessed were white, 25% African American,4% Latino and 5% other. Of the studentsassessed in urban HSTW sites, 72% wereAfrican American, 22.5% white, 2.5% Latinoand 3% other. In the “Academic andVocational Teachers” research brief, scores of444 students who participated in HSTWbetween 1996 and 1998 are analyzedaccording to gender and ethnicity. The HSTWcase study focused on the Los Fresnos HighSchool, which is in one of the poorest schooldistricts in Texas. Eighty-nine percent of thestudents are Latino and more than 80% qualifyfor free or reduced-price lunches. The stateclassifies 70% of the student population as “at-risk.”
FocusEarly ChildhoodPrimary SchoolMiddle School
����� Secondary SchoolPostsecondaryExtended Learning
was labeled a “low performing school” by the stateof Texas. The school began to work with HSTW in1993 to raise graduation requirements and studentexpectations. The case study summarized in thisreport charts the achievement gains that ensued.
“A High Schools that Work Case Study: LosFresnos High School” (2000) SouthernRegional Education Board. By Gene Bottoms.
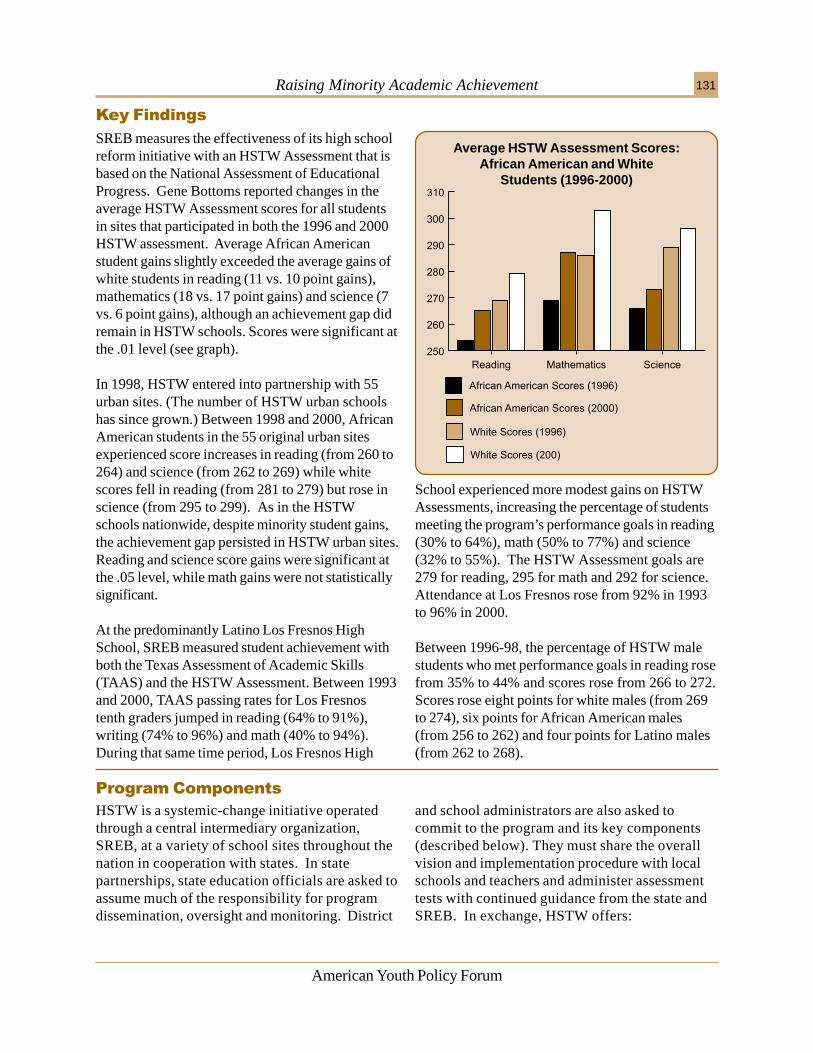
Raising Minority Academic Achievement 131
American Youth Policy Forum
Average HSTW Assessment Scores:African American and White
Students (1996-2000)
������������
SREB measures the effectiveness of its high schoolreform initiative with an HSTW Assessment that isbased on the National Assessment of EducationalProgress. Gene Bottoms reported changes in theaverage HSTW Assessment scores for all studentsin sites that participated in both the 1996 and 2000HSTW assessment. Average African Americanstudent gains slightly exceeded the average gains ofwhite students in reading (11 vs. 10 point gains),mathematics (18 vs. 17 point gains) and science (7vs. 6 point gains), although an achievement gap didremain in HSTW schools. Scores were significant atthe .01 level (see graph).
In 1998, HSTW entered into partnership with 55urban sites. (The number of HSTW urban schoolshas since grown.) Between 1998 and 2000, AfricanAmerican students in the 55 original urban sitesexperienced score increases in reading (from 260 to264) and science (from 262 to 269) while whitescores fell in reading (from 281 to 279) but rose inscience (from 295 to 299). As in the HSTWschools nationwide, despite minority student gains,the achievement gap persisted in HSTW urban sites.Reading and science score gains were significant atthe .05 level, while math gains were not statisticallysignificant.
At the predominantly Latino Los Fresnos HighSchool, SREB measured student achievement withboth the Texas Assessment of Academic Skills(TAAS) and the HSTW Assessment. Between 1993and 2000, TAAS passing rates for Los Fresnostenth graders jumped in reading (64% to 91%),writing (74% to 96%) and math (40% to 94%).During that same time period, Los Fresnos High
School experienced more modest gains on HSTWAssessments, increasing the percentage of studentsmeeting the program’s performance goals in reading(30% to 64%), math (50% to 77%) and science(32% to 55%). The HSTW Assessment goals are279 for reading, 295 for math and 292 for science.Attendance at Los Fresnos rose from 92% in 1993to 96% in 2000.
Between 1996-98, the percentage of HSTW malestudents who met performance goals in reading rosefrom 35% to 44% and scores rose from 266 to 272.Scores rose eight points for white males (from 269to 274), six points for African American males(from 256 to 262) and four points for Latino males(from 262 to 268).
���������������
HSTW is a systemic-change initiative operatedthrough a central intermediary organization,SREB, at a variety of school sites throughout thenation in cooperation with states. In statepartnerships, state education officials are asked toassume much of the responsibility for programdissemination, oversight and monitoring. District
and school administrators are also asked tocommit to the program and its key components(described below). They must share the overallvision and implementation procedure with localschools and teachers and administer assessmenttests with continued guidance from the state andSREB. In exchange, HSTW offers:
Raising Minority Academic Achievement132
American Youth Policy Forum
� A model design with key components.
� Continuity, guidance and technical assistance –in addition to the national office, an HSTWcoordinator, employed by the state, is trained tofacilitate most aspects of the program.
� Staff development guides.
� An annual, professional developmentconference for teachers and administrators,which provides instructional support andguidance on managing the program.
� An HSTW assessment system for studentsbased on a battery of tests drawn from theNational Assessment of Educational Progress(NAEP).
� Assistance with program evaluation – HSTWconducts evaluations of its schools andcompares them to each other on a variety ofmeasures.
� Help locating new funding sources.
With this assistance, HSTW schools are expectedto:
� Set higher expectations and get more students tomeet them by having students complete achallenging program of study with an upgradedacademic core and career major. The higherexpectations include increased graduationrequirements for general and vocational trackstudents to include four years of college
preparatory English, completion of algebra inmiddle school, four years of math in high school(including pre-calculus, Algebra III or calculus)and three years of science.
� Increase access to intellectually challengingvocational and technical studies, with a majoremphasis on using high-level math, science,language arts, problem-solving skills and toacademic studies that teach the essentialconcepts from the college prep curriculum byencouraging students to use academic contentand skills to address real-world projects andproblems.
� Provide work-based learning, collaborativelyplanned by educators and employers, resultingin an industry-recognized credential andemployment opportunities.
� Allow common planning time for academic andvocational teachers to work together to provideintegrated instruction.
� Structure guidance so that each student and hisor her parents are involved in a career guidancesystem.
� Provide extra help to assist students who maylack adequate preparation for an acceleratedprogram of study.
� Use student assessment and program evaluationdata to continuously improve curriculum,instruction, school climate, organization andmanagement.
High ExpectationsStudents who were required to prepare majorresearch papers, short writing assignments, oralpresentations and to read several books a year anduse computers to prepare assignments had higheraverage reading scores than other students. At
������������������
successful HSTW sites, high expectations andstandards were adopted by general and vocationalstudents, as well as by parents, school staff and thebusiness community. These translated into toughnew graduation requirements for English, math andscience.
Raising Minority Academic Achievement 133
American Youth Policy Forum
STUDY METHODOLOGYAll of these studies relied on test results from theHSTW Assessment, as well as statewide testresults, school data, site visits and student andstaff interviews. The HSTW Assessment is basedon a battery of tests drawn from the NationalAssessment of Educational Progress (NAEP).The 2000 HSTW Assessment was administeredto nearly 55,000 high school seniors at HSTWsites across the country.
EVALUATION & PROGRAM FUNDINGHSTW is funded by states that, in turn, fund theimplementing schools. Funds for special HSTWprojects are provided by the AppalachianRegional Commission, the Charles Stewart MottFoundation, the DeWitt Wallace-Readers DigestFund, the Novartis US Foundation, Project Lead
the Way, the U.S. Department of Education andthe Whitehead Foundation.
GEOGRAPHIC AREASHSTW is headquartered in Atlanta, GA. By 2001,the HSTW program was in place in more than1,000 schools in 26 states: AL, AR, DE, FL, GA,HI, ID, IN, KS, KY, LA, MA, MD, MI, MO, NJ, NY,NC, OH, OK, PA, SC, TN, TX, VA and WV.
CONTACT INFORMATIONResearch and Program ContactsGene Bottoms, Senior Vice PresidentSouthern Regional Education Board592 10th Street, NWAtlanta, GA 30318Phone: 404.875.9211 Fax: 404.872.1477www.sreb.org
Specific Learning StrategyEvaluators found that improved readingachievement was associated with students taughtwith a “Preparation, Assistance and Reflection(PAR)” research-based framework. During eachlesson, teachers prepare students to readpurposefully, assist students with their reading andask students to reflect on what they have read.
Continuous ImprovementStudent assessment and program evaluation datawere used to continuously improve curricula,instruction, school climate, organization andmanagement – all with the goal of raising studentachievement.
Raising Minority Academic Achievement134
American Youth Policy Forum
5�$�>�����.�����.������ ������������
“Significant Benefits: The High/ScopePerry Preschool Study through Age 27.Monographs of the High/Scope EducationalResearch Foundation” No. 10, 1993, High/Scope Educational Research Foundation. ByLawrence J. Schweinhart, H.V. Barnes & D. P.Weikart.
In the early 1960s, two pioneering projectshelped introduce early childhood education inAmerica to young children living in poverty: TheHigh/Scope Perry Preschool Program and HeadStart. Both aimed to improve the academicsuccess of low-income children by offering themsettings and activities that their homeenvironments did not provide. Head Start,initiated in 1965, was part of the federalgovernment’s “War on Poverty.” The projectwas designed by a committee of experts in thefields of preschool education, health, childdevelopment and mental health and offered acomprehensive array of services to the child andthe family. The High/Scope Perry Preschoolproject was developed by the Division of SpecialServices of the Ypsilanti School District,Michigan between 1962 and 1967. The projectplaced a higher emphasis on education than did
� �� ���
High/Scope Perry Preschool participants at age 27,compared with members of the control group, hadthe following statistically significant findings (at the0.05 level):
� Higher monthly earnings (29% vs. 7% earned$2,000 or more per month).
� Higher percentages of home ownership (36%vs. 13%) and second-car ownership (30% vs.13%).
������������
� Higher level of schooling completed (71% vs.54% completed 12th grade or higher).
� Lower percentage receiving social services atsome time between ages 18 and 27 (59% vs.80%).
� Fewer arrests (7% vs. 35% having five or morearrests), including crimes of drug making ordealing (7% vs. 25%).
Focus����� Early Childhood
Primary SchoolMiddle SchoolSecondary SchoolPostsecondaryExtended Learning
POPULATIONThe High/Scope Perry Preschool Programserved 58 African American children, 3-4 yearsof age, from low-income homes and deemed atrisk of school failure because of environmentalfactors and low IQ scores. The childrenparticipated in the program for approximatelytwo years. In addition to defined classroomactivities, teachers visited the children’s homesweekly and had monthly group meetings withparents. The longitudinal study trackedparticipants and control group members untilage 27. The study maintained contact withapproximately 95% of the initial group.
Head Start. Follow-ups of project participantsand a control group were conducted by the High/Scope Educational Research Foundation at ages14-15, 19 and 27. This summary reports on thelast follow-up, done in 1993.
Raising Minority Academic Achievement 135
American Youth Policy Forum
In addition, as measured on earlier follow-ups,participants, when compared to members of thecontrol group, showed higher:
� Scores on the Adult Performance Level Surveyat age 19.
� School achievement at age 14 as measured bythe California Achievement Tests.
� Performance on the Stanford-Binet IntelligenceScale from age 4 through 7.
When compared to women in the control group,women who attended the High/Scope PerryPreschool Program had significantly:
� Higher monthly earnings at age 27 (48% vs.18% earned over $1,000) because they hadhigher employment rates (80% vs. 55%).
� Fewer children out-of-the wedlock (57% vs.83% of births) and more program women weremarried at age 27 (40% vs. 8%).
� Lower participation in special educationprograms (8% vs. 37%).
When compared to men in the control group, menwho attended High/Scope Perry Preschool Programhad significantly:
� Higher monthly earnings at age 27 (42% vs. 6%earned over $2,000).
� Higher percentage of home ownership at age 27(52% vs. 21%).
� Lower receipt of social services at some timebetween ages 18 and 27 (52% vs. 77%).
An analysis of criminal behavior between programparticipants and non-participants showed that:
� The mean number of arrests for participantmales was 3.8 vs. 6.1 for non-participants.
� The mean number of arrests for participantfemales was 0.4 vs. 2.3 for non-participants.
� Twelve percent of participant males had beenarrested five or more times vs. 49% of non-participant males.
� No participant females had been arrested five ormore times vs. 16% of non-participant females.
The average cost of the program per participant was$12,356 (in 1992 dollars) and the average amountof economic benefits was estimated at $88,433 perparticipant. Benefits included: savings on unneededspecial education services, welfare assistance, thecriminal justice system process, and higher taxespaid by participants due to higher earnings. Savingsby potential crime victims were calculated based onin-court and out-of-court settlements. The benefit-cost ratio of the program was $7.16 returned to thepublic for every dollar invested in the program.
The educational approach used in the High/ScopePerry Preschool Program is based on the work ofJean Piaget and views the child as an active learner.The main characteristics of the program are:
� A well-defined classroom program operating atleast 12 ½ hours each week and relying on aplan-do-review routine.
���������������
� Developmentally appropriate practices thatencourage child-initiated learning activities (theHigh/Scope Curriculum is used nationwide inmany early childhood initiatives, including someHead Start programs).
� Emphasis on language and literacy, socialrelations and initiative, movement, music,classification, numbers, space and time.
“It is essential that we invest fully in high-quality, active learning preschool programs forall children living in poverty. Since thenational Head Start program and state-fundedpre-school programs now serve fewer than halfof these most vulnerable of our children, thenation is ignoring tremendous human andfinancial potential.”
—Schweinhart, Barnes & Weikart, 1993.
Raising Minority Academic Achievement136
American Youth Policy Forum
STUDY METHODOLOGYOf an initial group of 123 children who wereeligible for the High/Scope Perry PreschoolProgram, 58 were randomly assigned to theprogram and the remaining 65 were assigned to acontrol group. Data were collected on bothgroups annually from ages 3 through 11, andfollow-ups were conducted at ages 14, 15, 19 and27. Significant Benefits reports on the follow-upsthrough age 27.
EVALUATION FUNDINGHigh/Scope Educational Research Foundation.
GEOGRAPHIC AREASThe High/Scope Perry Preschool Program waslocated in Ypsilanti, MI.
CONTACT INFORMATIONResearch and Implementing ContactHigh/Scope Educational Research Foundation600 North River StreetYpsilanti, MI 48198-2898Phone: 734.485-2000Fax: 734.485.0704www.highscope.org
������������������
Empowering ChildrenIn the High/Scope Perry Preschool model, thechildren were seen as active learners, continuouslyinvolved in a “plan-do-review” process. They wereencouraged by supportive adults to plan their ownlearning activities, were offered a materials-richenvironment to implement these activities, and hadto report on results afterwards. The role of the adultwas basically that of guidance and support.
Empowering ParentsTeachers visited parents at least once a week forapproximately an hour and a half. The visitsinvolved the child and the parents in discussion andmodeling of the child’s activities in the classroom.Monthly group meetings helped parents to
understand their children’s development andabilities. The focus was on helping parents toprovide the necessary supports for their child todevelop intellectually, socially and physically.
Empowering TeachersTraining and supervision were integral to theprogram and aimed both to improve theeffectiveness of the program and support theteachers. A trained curriculum specialist providedteachers with hands-on workshops, observation andfeedback. Currently, the High/Scope Foundationhas a nationwide certified trainers program withsystematic evaluation. Each High/Scope trainerworks with an average of 25 teachers and assistantteachers.
� Small groups to develop closer relationshipsbetween the teacher and the child (the teacherplans the materials but allows children to choosehow to use them).
� Circle time (the whole class meets together withan adult for about 15 minutes to play games,sing or exercise).
� Staff highly trained in early childhood education.
� Supportive adults, both in and outside the school(school staff maintained intensive outreach toparents, including weekly home visits).
� A child-staff ratio of no more than 10 childrenper adult.
� Consistent staff supervision and training (use ofa train-the-trainers system).
Note: A comparative analysis of Head Start and High/Scope programs can be found in “Is the High/Scope PerryPreschool Better Than Head Start? Yes and No,” EarlyChildhood Research Quarterly (1994), 9, pp. 269-287, byEdward Zigler and Sally J. Styfco.
Raising Minority Academic Achievement 137
American Youth Policy Forum
Most Historically Black Colleges and Universities(HBCUs) were founded during an era when AfricanAmerican students were barred from attendingtraditionally white, postsecondary institutions.Since the Civil Rights Movement opened the doorsof traditionally white colleges and universities tominority students, some policymakers havechallenged the continued existence of HBCUs,arguing that they serve no purpose in an integratedsystem of higher education. In fact, the SupremeCourt decision in U.S. v. Fordice (1992) requiredstates to “educationally justify or eliminate” allvestiges of segregation, including HBCUs. Thestudy summarized here addressed this issue byassessing the educational benefits of attending anHBCU for both white and minority students. Theresearcher examined data on general undergraduateretention rates, retention in the fields of science andengineering (disciplines in which minorities arehistorically under-represented) and post-graduateaspirations.
5������� ��( �3
�� �$�������?�� ��������������������
� �� ���
“Historically Black Colleges andUniversities: Their Aspirations andAccomplishments” (1999) Educational TestingService. By Harold Wenglinsky.
POPULATIONToday, there are nearly 300,000 studentsattending 103 HBCUs across the country. Onaverage, 13.1% of HBCU students are whiteand the vast majority of the remaining studentbody is African American. In terms of gender,the percentage of male students in HBCUs hasdecreased in recent years (from 47% in 1976to 40.9% in 1990). The parents of HBCUstudents have significantly lower adjusted grossincomes than the parents of students attraditionally white institutions. This study lookedat a database of students who took thegraduate record examination (GRE) in 1993and an Association of Universities/Associationof Graduate Schools (AAU/AGS) database ofgraduate student completion (1989-1994). TheGRE database of 351,017 undergraduates withaspirations to go to graduate school included30,203 African Americans (10,669 attendedHBCUs). The AAU/AGS database included14,000 graduate students enrolled in 40research universities between 1989 and 1994.Out of the 14,000 graduate students in thedatabase, 284 students were AfricanAmericans and 34 had attended HBCUs asundergraduates.
FocusEarly ChildhoodPrimary SchoolMiddle SchoolSecondary School
����� PostsecondaryExtended Learning
Raising Minority Academic Achievement138
American Youth Policy Forum
������������
This study compared undergraduate completionrates, post-graduate aspirations, choice of majors,graduate program retention and completion ofstudents who attended HBCUs and traditionallywhite institutions.
Twenty-one percent of all African Americanundergraduates currently attend HBCUs, and28% of all degrees awarded to African Americansare from HBCUs.
Using the GRE database of 351,017 students(30,203 African American), the researcherlearned that:
� A higher proportion of African AmericanHBCU students aspire to go to graduateschool than African American students attraditionally white institutions. About 33% ofAfrican Americans who took the GRE in1993 went to HBCUs, even though only 28%of all African American college graduates hadattended HBCUs.
� African American males at HBCUs weremore likely to choose a graduate major inscience than their peers at traditionally whiteinstitutions (22% vs. 15%).
� African American females at HBCUs weremore likely to choose a graduate major inscience than their peers at traditionally whiteinstitutions (16% vs. 9%).
Using the AAU/AGS database of graduatestudents enrolled in 40 universities between 1989and 1994, the researcher compared the retentionand completion rates for African AmericanHBCU alumni (n=34) and African Americanalumni of traditionally white institutions (n=250):
� By 1994, HBCU alumni were more likely toremain in graduate school or have achievedtheir PhD than alumni of traditionally whiteinstitutions (82% vs. 66%).
� HBCU alumni finished their PhDs faster (5.57years) than their peers who had attendedtraditionally white instititions (6.14 years).
� HBCU alumni earned their PhDs at slightlyhigher rates than alumni of traditionally whiteinstitutions (21% vs. 18%), but the smallnumbers of African American PhDs in thedatabase limited the significance of this finding.
The researcher found that African Americanstudents do not have more interactions with facultyat HBCUs than their minority peers at traditionallywhite institutions. African American HBCU studentsare also no more likely to engage in communityservice than minority students at traditionally whiteinstitutions.
Relative to traditionally white institutions, HBCUsdo cost less to attend. According to the NationalPost-Secondary Student Aid Study (1989-90), theaverage student enrolled in an HBCU paid $1945 intuition annually compared to the $3309 for theaverage student attending a traditionally whiteinstitution.
“[HBCUs] better prepare Blacks for thoseprofessions in which they are mostunderrepresented. This benefit applies both toBlacks who would have attended atraditionally white institution and to Blackswho might not have attended anypostsecondary institution.”
—Harold Wenglinsky, ETS Researcher
Raising Minority Academic Achievement 139
American Youth Policy Forum
Affordability“The affordability of HBCUs . . . may encouragestudents, who might otherwise either attend acommunity college or no college at all, to attend afour-year institution.” This affordability issueseemed especially important for the minoritystudents who chose HBCUs, since these studentscame from families with lower incomes than thecomparable group of minority students attraditionally white institutions.
������������������
���������������
HBCUs vary greatly in size, mission and funding.There are 103 HBCUs located in 19 states and theDistrict of Columbia. About half (53) of these areprivate schools. Eighty-nine HBCUs offer four-year degrees and 24 offer two-year degrees and/orcertificates. The average enrollment at HBCUsvaries from 1000 students to more than 8000students.
Historically, HBCUs have had two roles: preparingAfrican American students for positions ofleadership within their communities and preparingthem for graduate and professional schools. Theauthor of this study traces these two educationalphilosophies back to the teachings of AfricanAmerican educators W.E.B. DuBois and Booker T.Washington.
General Graduate PreparationThe researcher interpreted the data on retention andcompletion of graduate degrees to suggest thatHBCUs prepare African American students betterfor graduate school, though he did not explain whataspects of the undergraduate experience at HBCUsspecifically contribute to graduate preparedness.
Encouragement of Participation in the SciencesHBCUs appear to be more successful thantraditionally white institutions in preparing AfricanAmerican students for post-graduate work in thevarious fields of science, fields in which minoritystudents are often under-represented.
STUDY METHODOLOGYThe author of this study analyzed informationfrom the 1993 database of Graduate RecordExaminations (GRE) test registrants and alongitudinal database of the AmericanAssociation of Universities/Association ofGraduate Schools (AAU/AGS) Project forResearch on Doctoral Education. Though therewas no attempt to match the comparison groupson educational achievement, the researcher diddetermine that the African American studentswho attended HBCUs in both databases comefrom lower socio-economic backgrounds thantheir peers in traditionally white institutions. Theirparents had lower average incomes and feweryears of formal education.
EVALUATION & PROGRAM FUNDINGThe evaluation was funded by the EducationalTesting Service. HBCUs are funded by a mix ofpublic and private funds as well as by studenttuition.
GEOGRAPHIC AREASThere are 103 HBCUs in operation today in theUnited States. They are located in AL, AR, DE,DC, FL, GA, KY, LA, MD, MI, MS, MO, NC, OH,OK, PA, SC, TN, VA, and WV as well as theVirgin Islands.
CONTACT INFORMATIONResearch ContactsHarold Wenglinsky, DirectorPolicy Information Center, Educational TestingServiceRosedale Road, MS 04-RPrinceton, NJ 08541Phone: 609.734.1317Fax: [email protected]
Raising Academic Acheivement140
American Youth Policy Forum
“I Have a Dream” (IHAD) is a youth organizationproviding financial, academic and social support toinner-city public school students throughout thecountry. Local sponsors, generally wealthy families,adopt an entire class of sixth graders, randomlychosen, and guarantee “last dollar” scholarships forall those who graduate from high school (thesponsor pays for college costs above those covered,for example, by grants and other scholarships).Besides maintaining personal relationships with the“Dreamers,” the sponsors hire a project coordinatorto facilitate and coordinate services, such as tutoring,employment, volunteering activities, counseling,health and social services. In the two case studies,the coordinators were helped by volunteers from aPrinceton program and AmeriCorps members. Thepremise is that, with personal support and financialresources, inner-city youth will be able to pursuepostsecondary education and/or be better preparedto succeed in the workplace. For another study ofIHAD, see Some Things DO Make a Difference forYouth, p. 149.
������������
Researchers compared Dreamers to students fromprevious sixth grade classes at the same schoolswho had not participated in the program. Whencompared to the control groups, Dreamers showed:
� Higher graduation rates from high school(graduation rates for Dreamers were 71% and69%, double the 37% and 34% rates for thecontrol groups; 6% of the Dreamers in the WestSide program passed the GED).
+�5� ����0����������������
� �� ���
“The Role of Social Capital in YouthDevelopment: The Case of I Have a Dream”(1999) Educational Evaluation and Policy Analysis,21 (3): 321-43. By Joseph Kahne and Kim Bailey,University of Illinois at Chicago.
POPULATION“I Have a Dream” serves inner-city children, fromsixth grade until their graduation from high school.The study focuses on two programs in Chicago.La Familia was based in a youth organization onthe city’s West Side and served 52 Dreamers.Of these, 31 were Mexican American, 14 PuertoRican, five bi-racial, one white and one AfricanAmerican. The majority were female (56 percent)and for more than 70%, both parents had notcompleted high school. Seventy percent hadfamilies with incomes below $20,000. Ninety-fourpercent of the initial Dreamers stayed in theprogram until graduation. Project Success waslocated in a church on the South Side of Chicagoand served 40 Dreamers, all African Americans.Fifty-eight percent were female. The mothers of55% of the group had some high schooleducation (the researchers could not gatherreliable data on more than half of the fathers).Eighty percent lived in families with incomesbelow $20,000. Ninety percent of ProjectSuccess’ Dreamers stayed in touch with theprogram beyond graduation.
� Higher enrollment rates in two- and four- yearcolleges (63% and 67% of the Dreamersenrolled in college, almost three times thecontrol group rate, estimated at 20% and 18%).
Of the Dreamers who went to college, 78% enrolledin 4-year institutions.
FocusEarly Childhood
����� Primary School����� Middle School����� Secondary School
PostsecondaryExtended Learning
Raising Academic Acheivement 141
American Youth Policy Forum
������������������
Building Social TrustTime is important to build trust among inner-cityyouth. By accompanying the students from thesixth grade, the project coordinator has time to buildstrong relationships with Dreamers. Projectcoordinators for both programs remained in touchwith at least 90% of their original Dreamers three ormore years after they had left the program.
Relationships as Vehicles for SupportInner-city youth generally deal with social pressuresthat tend to undermine success. The majority ofDreamers were victims of physical, sexual orsubstance abuse in the home and/or had participatedin gang activities. Interviews indicated that atrusting relationship with IHAD staff helpedDreamers deal with such major concerns.Relationships with staff and sponsors were also animportant tool for job opportunities and access toservices and programs.
Implementation QualityIHAD’s major challenge is to hire staff able toprovide the intense support and commitmentrequired by the target population. Studies of otherIHAD programs that did not show graduation ratesas high as these indicate that more successfulprograms have low turnover of project coordinators,work with both private and public schools, andbenefit from volunteer help. In the case studies,AmeriCorps members and volunteers from thePrinceton Project 55 Program added two full-timestaff members to each of the two programs. Theseindividuals added extra hours of staff work, besidesoffering more opportunities for Dreamers toestablish meaningful relationships (some volunteerswere able to establish positive interactions withDreamers who were resistant to approaching theIHAD coordinators).
The programs are tailored to the needs of theindividual Dreamer. Key components, common toall programs, are:
� Long-term personal relationships (the projectcoordinator and the sponsors maintain personalcontact with the Dreamers throughout theduration of the program and, in many cases,even after the Dreamer enters college).
� Working with the families (services are procurednot only for the Dreamers, but also for theirfamilies, when needed; despite some conflictswith a few parents, mostly on issues of values,the relationship between staff and familiestended to be supportive).
� Linkage to existing community services(Alcoholics Anonymous, battered women’sshelters, foster care, legal services, plannedparenthood, summer jobs or homeless shelters).
� Help with finding jobs and enrichmentprograms.
���������������
� Focus on peer support to promote and maintainpro-social behaviors.
� Academic support through tutoring andmentoring accompanied by high expectations(some Dreamers were transferred to privateschools, paid by the sponsors, because staff feltthat they were not receiving adequate attentionand guidance in the public schools or because ofgang-related problems).
The average cost per student per year for six yearswas $1,482 for the program on the city’s West Sideand $2,829 for that on the South Side. Privateschool tuition represented 19% and 55% of the cost,respectively. To help improve public schools ininner city areas, the IHAD Foundation is developinga charter school, one sponsor has initiated acomprehensive neighborhood development program,and another IHAD group has initiated a publicly-funded school that provides after-school programs.
Raising Academic Acheivement142
American Youth Policy Forum
STUDY METHODOLOGYResearchers studied two IHAD programs for twoand a half years and used a sixth grade class atthe Dreamers’ schools that had not been part ofthe program as a control group (assignmentswere randomized). The programs were chosenbecause they were consistent with the IHADmodel, maintained contact at least with 90 percentof the Dreamers and their Dreamers were alreadymaking the transition to college. Researchersinterviewed Dreamers, staff, parents andsponsors, observed program operations on over100 occasions, ran focus group sessions withstaff, sponsors and students, conducted surveys,and used school records to obtain data forDreamers and the control groups.
EVALUATION FUNDINGSteans Family and Polk Brothers Foundations,The Chicago Community Trust and the Center forUrban Educational Research at the University ofIllinois at Chicago.
GEOGRAPHIC AREASBoth programs are located in Chicago, IL.
CONTACT INFORMATIONResearch ContactJoseph Kahne, ProfessorDepartment of EducationMills College5000 MacArthur Blvd.Oakland, CA 94613-1301Phone: 510.430.3275, Fax: [email protected]
Implementing ContactYvonne Butchee, Executive Director“I Have a Dream” Foundation - Chicago1335 W. Harrison St.Chicago, IL 60607-3318Phone: 312.421.4423, Fax: [email protected]://www.ihad.org
Raising Minority Academic Achievement 143
American Youth Policy Forum
In 1994, former Teach For America instructorsfounded the first Knowledge Is Power Program(KIPP) in Houston, Texas. One year later, theKIPP Academy became a charter school in theHouston Independent School District (HISD).Since its inception, the KIPP Academy hasprovided underprivileged students in grades 5-9 witha rigorous academic curriculum that prepares themfor success in college and careers. The KIPPAcademy classes are taught in more than a dozentemporary trailers in the southwest quadrant ofHouston. A second KIPP Academy was set up as aschool within a school, in the Bronx, with a similarcommitment to serving minority students.
@+..���������������������
� �� ���
“KIPP Results: Stanford AchievementTests, New York State Standardized Tests,and the Texas Assessment of AcademicSkills” (2001) KIPP Academies (InternalDocuments). Compiled by Michael Feinberg.
“No Excuses: Lessons from 21 HighPerforming, High Poverty Schools” (2000)The Heritage Foundation. By Samuel CaseyCarter.
POPULATIONEnrollment in KIPP is based on a lotterysystem, which randomly selects students froma pool of applicants. Before the children startschool, KIPP staff meets with parents andstudents to discuss a commitment contract.Approximately 320 students in grades 5-9attend the KIPP Academy in Houston. Ninety-seven percent of the Houston KIPP studentsare African American or Latino and 90% ofthem are eligible for federal breakfast andlunch programs. Of the approximately 250KIPP students in the Bronx Academy, 45% areAfrican American, 55% are Latino and morethan 95% are eligible for federal breakfast andlunch programs.
FocusEarly Childhood
����� Primary School����� Middle School
Secondary SchoolPostsecondary
����� Extended Learning
“The KIPP Academy: An Innovative andEffective Framework for Public Schools”(2000) The KIPP Academies. By MichaelFeinberg.
������������
One way that the KIPP in Houston measuresstudent achievement is through the Stanford-9achievement tests. The following graphs chart theincreases in Stanford reading and math scores forvarious classes after one, two, and three years at theKIPP Academy between 1998 and 2001. Inreading, students came into the school scoringbetween the 35th and 57th percentile. After threeyears at KIPP, they were scoring between the 60th
and 75th percentile on the reading test. KIPP had asimilar, positive effect on math achievement (seecharts).
Another measure of KIPP’s effect on academicachievement is the percent of students who pass thestandardized Texas Assessment of Academic Skills(TAAS) tests in math and reading.
� Before attending KIPP, between 33% and 66%of the incoming students had passed TAAS testsfor their grade level.
� After one year of KIPP instruction, more than90% of each class passed the tests and aftertwo years, nearly 100% passed.
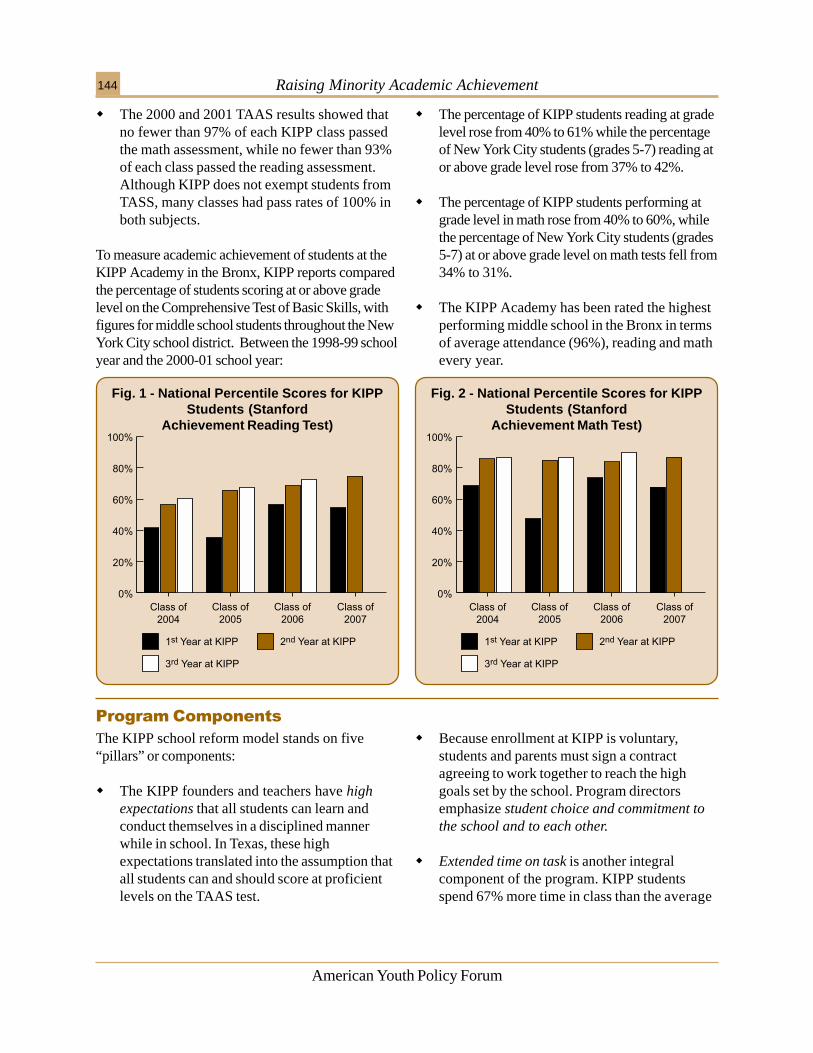
Raising Minority Academic Achievement144
American Youth Policy Forum
���������������
The KIPP school reform model stands on five“pillars” or components:
� The KIPP founders and teachers have highexpectations that all students can learn andconduct themselves in a disciplined mannerwhile in school. In Texas, these highexpectations translated into the assumption thatall students can and should score at proficientlevels on the TAAS test.
� Because enrollment at KIPP is voluntary,students and parents must sign a contractagreeing to work together to reach the highgoals set by the school. Program directorsemphasize student choice and commitment tothe school and to each other.
� Extended time on task is another integralcomponent of the program. KIPP studentsspend 67% more time in class than the average
Fig. 1 - National Percentile Scores for KIPPStudents (Stanford
Achievement Reading Test)
Fig. 2 - National Percentile Scores for KIPPStudents (Stanford
Achievement Math Test)
� The 2000 and 2001 TAAS results showed thatno fewer than 97% of each KIPP class passedthe math assessment, while no fewer than 93%of each class passed the reading assessment.Although KIPP does not exempt students fromTASS, many classes had pass rates of 100% inboth subjects.
To measure academic achievement of students at theKIPP Academy in the Bronx, KIPP reports comparedthe percentage of students scoring at or above gradelevel on the Comprehensive Test of Basic Skills, withfigures for middle school students throughout the NewYork City school district. Between the 1998-99 schoolyear and the 2000-01 school year:
� The percentage of KIPP students reading at gradelevel rose from 40% to 61% while the percentageof New York City students (grades 5-7) reading ator above grade level rose from 37% to 42%.
� The percentage of KIPP students performing atgrade level in math rose from 40% to 60%, whilethe percentage of New York City students (grades5-7) at or above grade level on math tests fell from34% to 31%.
� The KIPP Academy has been rated the highestperforming middle school in the Bronx in termsof average attendance (96%), reading and mathevery year.
Raising Minority Academic Achievement 145
American Youth Policy Forum
Extended LearningThe extended school day, Saturday classes andsummer sessions provide additional time for KIPPstudents to learn. This is not simply additional “seattime,” however. These extra hours spent in classseem crucial for achieving the high academicstandards set by KIPP.
Parent SupportEnrollment in the KIPP Academies is voluntary.Parents choose to send their children to KIPPschools. Both parents and students must sign acontract committing to the extended class time.Parents also agree to supervise their children’shomework assignments every night.
Small Learning CommunitiesIn both Houston and the Bronx, KIPP has set upsmall learning communities of 250 to 300 studentswho stay together for four years from the fifth
������������������
through the ninth grades. The small size of thiscommunity fosters a sense of belonging to theschool.
Teacher/Administrator CommitmentTeachers commit to the same extended class time asstudents. They remain “on call” to help students oranswer parent questions 24 hours a day with cellphones and toll-free numbers provided by theschool. Teachers also regularly visit students intheir homes and work with parents to get theminvolved in student work.
Professional DevelopmentKIPP pays for teachers to travel to observe themaster teachers who inspired the program. With theFisher Fellowship, the KIPP founders providedevelopmental opportunities for teachers and othersinterested in education reform to become schooladministrators in their own right.
public school student. During the normalschool year, KIPP students arrive at school at7:30 a.m. and depart at 5:00 p.m. Mondaythrough Thursday, getting out a little early (4:00p.m.) on Fridays. In addition, students agree toattend four hours of school most Saturdays andfour weeks of school every summer.
� KIPP directors want to lead the school reformmovement by example, emphasizing what theyterm the power to lead. As charter schoolprincipals, they have complete control over theirbudget and personnel decisions. In 2000, KIPPpartnered with the founders of Gap, Inc., tostart a Fischer Fellowship program, which willtrain a corps of education reformers to foundtheir charter schools across the country to servedisadvantaged youth. The fellowship involves asummer institute on school management at theUniversity of California at Berkeley followed bya fall residency in KIPP network schools and a
spring planning period. Fellows are expected toopen up their own schools after their fellowshipconcludes.
� A focus on results is the final component ofKIPP Academies, which includes evaluatingprogram outcomes with state and nationalstandardized test scores.
In addition to the above components, both KIPPAcademies integrate music into the schoolcurriculum. For example, in the New York KIPPAcademy, all students play instruments in the schoolorchestra. Orchestra performances have garneredlocal fame and funds, which have allowed theschool to provide instruments to students.
“There are no shortcuts.”—KIPP motto from Rafe Esquith,
1992 Disney Teacher of the Year
Raising Minority Academic Achievement146
American Youth Policy Forum
STUDY METHODOLOGYThis was not a formal evaluation, but an analysisof data taken from the state educational agenciesin Texas and New York. The editor of the “NoExcuses” report visited the two academies andinterviewed the KIPP superintendents and districtofficials. Test score data came from the TexasAssessment of Academic Skills (TAAS) test, theStanford-9 Achievement Test, the CaliforniaAchievement Test-5 and the Comprehensive Testof Basic Skills. Comparisons are made withnational, state and citywide data.
EVALUATION & PROGRAM FUNDINGCasey Carter’s research on KIPP was funded bythe Heritage Foundation. KIPP Academies arefunded by the public school systems in Houstonand New York City as well as numerousindividuals, foundations and private corporations.The list of private funders includes The BrownFoundation, The Fondren Foundation, HoustonAnnenberg Challenge, Rockwell Fund and manyothers.
GEOGRAPHIC AREASKIPP Academies are located in Houston, Texasand the Bronx in New York, New York. By August2001, three additional schools based on the KIPPmodel had opened their doors to students: The3D Academy (Houston, TX), Gaston CollegePreparatory (Gaston, NC) and Key Academy(Washington, DC).
CONTACT INFORMATIONResearch ContactsSamuel Casey CarterNew Academy Ventures, LLC5345 Chevy Chase Pkwy, NW, Suite 300Washington, DC [email protected]
Program ContactMichael Feinberg, SuperintendentKIPP Academy10811 CollinghamHouston, Texas 77099Phone: [email protected]
Raising Minority Academic Achievement 147
American Youth Policy Forum
Project GRAD (Graduation Really AchievesDreams) began as a scholarship program inHouston, Texas in 1988-89. It has now grown intoa private, not-for-profit organization that works inpartnership with high schools and their feederschools to implement multiple reform models thatlead to higher graduation and college attendancerates. When a school system comes to ProjectGRAD for assistance, the staff institutes a series ofinterventions to improve classroom managementand discipline, student reading and mathproficiency, parent and community involvement,and finally, high school graduation and collegeacceptance rates. First, Project GRAD uses aConsistency Management and CooperativeDiscipline program that facilitates teacher/studentcooperation in instructional consistency andbehavior management. Second, Project GRADimplements educational initiatives, such as Success-for-All and MOVE IT Math, to supplement basicelementary and middle school reading and mathcurricula. Third, the initiative works throughCommunities in Schools to improve the quality andlevel of parental and community support for schoolactivities. Finally, Project GRAD implements acomprehensive outreach program which includes acommunity-wide Walk for Success to recruitstudents and their parents, Parent Universities to
.��9���4��0������������
� �� ���
“Project GRAD: Program EvaluationReport, 1998-99” (December 1999) University ofHouston. By Kwame A. Opuni, Ph.D.
POPULATIONProject GRAD sites are located in inner-cityschools, serving primarily minority studentsfrom low-income families. Nationally, ProjectGRAD serves approximately 68,000 students in92 schools. The 24 Houston schools examinedin the evaluation belong to the 2 high schoolfeeder systems that have piloted the program inHouston: Jefferson Davis High School andJack Yates High School. The evaluator detailedthe socio-economic characteristics of thecommunities around the Davis and Yates highschool feeder systems. Only 44% of the adultsin the Davis community and 66% of those inthe Yates community have completed highschool. These feeder systems serve 26,000students, the vast majority of whom wereAfrican American and Latino youth. In 1999,89% of the students at Davis High School wereLatino, 9% African American, 2% white, 18%limited English proficiency and 76% receivedfree or reduced price lunch. That same year,89% of Yates High School students wereAfrican American, 10% Latino, 1% Asian and57% of the students received free or reducedprice lunches.
FocusEarly Childhood
����� Primary School����� Middle School����� Secondary School
Postsecondary����� Extended Learning
improve parental literacy and involvement levelsand intensive summer institutes and collegescholarships for students.
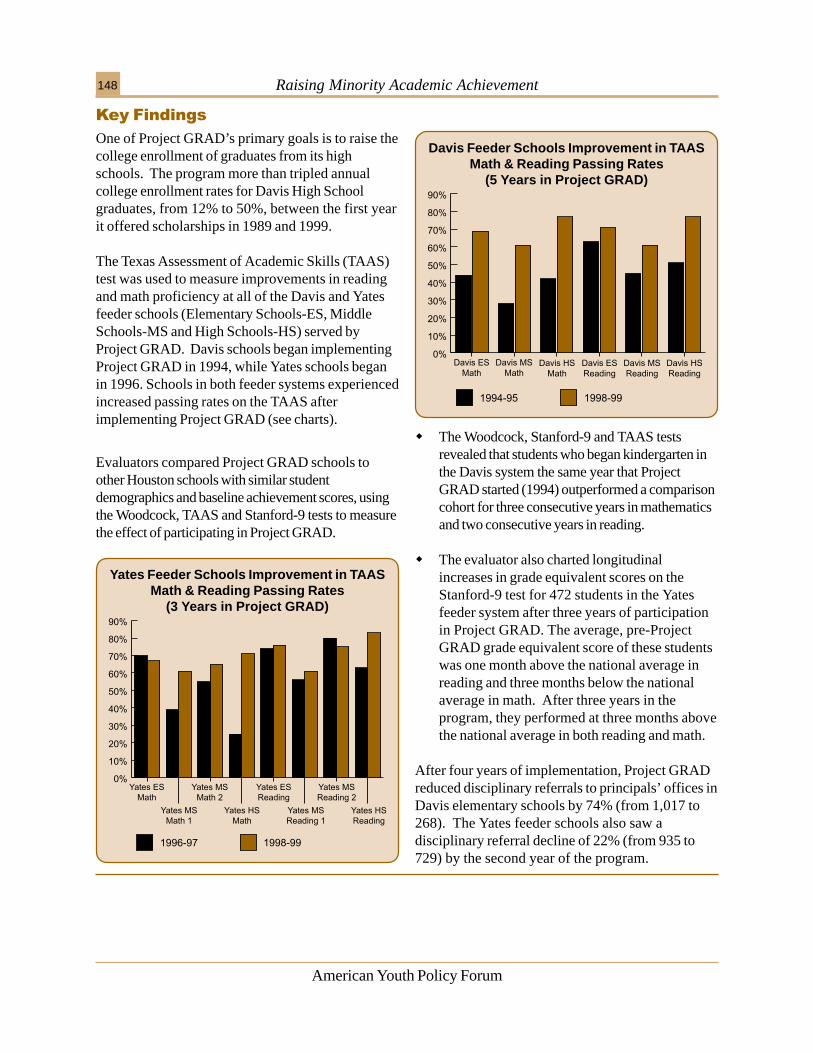
Raising Minority Academic Achievement148
American Youth Policy Forum
Davis Feeder Schools Improvement in TAASMath & Reading Passing Rates
(5 Years in Project GRAD)
Yates Feeder Schools Improvement in TAASMath & Reading Passing Rates
(3 Years in Project GRAD)
������������
One of Project GRAD’s primary goals is to raise thecollege enrollment of graduates from its highschools. The program more than tripled annualcollege enrollment rates for Davis High Schoolgraduates, from 12% to 50%, between the first yearit offered scholarships in 1989 and 1999.
The Texas Assessment of Academic Skills (TAAS)test was used to measure improvements in readingand math proficiency at all of the Davis and Yatesfeeder schools (Elementary Schools-ES, MiddleSchools-MS and High Schools-HS) served byProject GRAD. Davis schools began implementingProject GRAD in 1994, while Yates schools beganin 1996. Schools in both feeder systems experiencedincreased passing rates on the TAAS afterimplementing Project GRAD (see charts).
Evaluators compared Project GRAD schools toother Houston schools with similar studentdemographics and baseline achievement scores, usingthe Woodcock, TAAS and Stanford-9 tests to measurethe effect of participating in Project GRAD.
� The Woodcock, Stanford-9 and TAAS testsrevealed that students who began kindergarten inthe Davis system the same year that ProjectGRAD started (1994) outperformed a comparisoncohort for three consecutive years in mathematicsand two consecutive years in reading.
� The evaluator also charted longitudinalincreases in grade equivalent scores on theStanford-9 test for 472 students in the Yatesfeeder system after three years of participationin Project GRAD. The average, pre-ProjectGRAD grade equivalent score of these studentswas one month above the national average inreading and three months below the nationalaverage in math. After three years in theprogram, they performed at three months abovethe national average in both reading and math.
After four years of implementation, Project GRADreduced disciplinary referrals to principals’ offices inDavis elementary schools by 74% (from 1,017 to268). The Yates feeder schools also saw adisciplinary referral decline of 22% (from 935 to729) by the second year of the program.
Raising Minority Academic Achievement 149
American Youth Policy Forum
���������������
When Project GRAD partners with a schoolfeeder system, it brings a constellation of reformefforts that cover each level of schooling fromkindergarten through high school.
� Consistency Management & CooperativeDiscipline (CMCD) is a classroommanagement initiative that builds consistencyin instructional and disciplinary practices byinvolving teachers, students and parents in abehavioral management partnership.
� MOVE IT Math (MOVE IT is an acronymfor Math Opportunities, Valuable Experiencesand Innovative Teaching) uses songs, games,literature and hands-on manipulatives to teachconcepts and the importance of mathematicsto students in grades K-6. Students learnbasic math (arithmetic) and advanced math(algebra) at an early age.
� Success for All (SFA) is a research-based,school-wide reading and writing program forgrades K-5 (see pp. 162-164).
� Communities in Schools (CIS) is a non-profit,dropout prevention and social service program thattailors counseling, guidance and family case-management services to individual students andtheir families.
� Walk for Success is a grassroots effort to informparents and recruit student applicants for theProject GRAD scholarship program. Alumni,teachers, staff, mentors, university volunteers andcommunity leaders go door to door to raiseawareness of the program.
� Scholarships of $1,000 per year for college areguaranteed to students who: graduate on time froma Project GRAD high school; take a minimum ofthree years of mathematics, including algebra I,geometry and algebra II; maintain a 2.5 gradepoint average in core academic subjects andcomplete a minimum of two summer institutessponsored by the program at local universities.
Professional Development and SupportProject GRAD recognized that the high turnoverrates of teachers in inner-city schools necessitatedongoing training of all teachers hired after the firstyear of intensive training and projectimplementation. Facilitators from Project GRADtherefore provide on-going material and curricularsupport in CMCD and SFA. According to theevaluator, teachers feel free to come to thesefacilitators with their problems because of the factthat the facilitators “operate outside of the teacherappraisal process.” In addition, a Social Worker/Project Manager is housed at each school to workwith students, teachers and parents to supportvarious aspects of the program.
������������������
Sustainability“Unlike many educational initiatives that promise aquick fix and then often cut funding prematurelybefore meaningful results occur, Project GRAD’sprogrammatic perspective and commitment are long-term,” noted the evaluator. Project GRAD also relieson diverse funding sources for support of its programs.
Ongoing Evaluation and Model RefinementTeachers, administrators and Project GRADfacilitators track student test scores, discipline reportsand evaluation findings to ensure that students receiveadequate support and benefits from the program.Benchmark data also ensure that the program is havinga positive, aggregate impact on the schools.
Raising Minority Academic Achievement150
American Youth Policy Forum
Project GRAD schools must work on retainingteachers, according to the evaluator, because of thehigh turnover rates of teachers in inner-city schools.Such turnover rates mean the loss of many hours ofprogram training. The evaluator found that the
�!������������
Comprehensive ReformProject GRAD recognizes that a reform modelfocusing only on high school might be hampered byweak elementary or middle schools in the highschool’s feeder pattern. The evaluator believed thatthe scope of the reform initiative, involving teachersand administrators from all of the feeder schools hasbeen crucial to Project GRAD’s success.
Parent and Community EmpowermentProject GRAD empowers parents and communitymembers by involving them in school reformsthrough CIS initiatives (GED programs, CitizenshipClasses and health and employment referrals, forexample). Shared Decision-Making Committees(principals, parents, teachers and communityleaders) manage Project GRAD feeder schools.
STUDY METHODOLOGYThe evaluator used school data, statewide andnational test scores, as well as teacher surveysto chart the increases in academicachievement among the cohorts of ProjectGRAD students. Because of high, annualstudent mobility rates (24%) in the pilotschools, the evaluator also used a quasi-experimental design involving matchedcomparison schools with similar studentdemographics and baseline achievement datato determine the effect of Project GRAD onstudent achievement. Site visits, interviews withstudents and teacher surveys offered a morequalitative evaluation of the program.
EVALUATION & PROGRAM FUNDINGThe evaluation was funded by the University ofHouston System. More than 65 public andprivate foundations, organizations andcorporations fund Project GRAD. Some ofthese funding initiatives are multi-year, multi-million dollar grants, to expand and replicatethe Project GRAD model.
GEOGRAPHIC AREASProject GRAD began in Houston, Texas, but it hasnow been replicated in Los Angeles, California;Atlanta, Georgia; Newark, New Jersey; Columbus,Ohio and Nashville, Tennessee. Future plansinclude the possibility of replicating the program inSan Antonio, Texas.
CONTACT INFORMATIONResearch ContactsKwame A. Opuni, Ph.D., DirectorCenter for Research on School Reform (CRSR)University of St. Thomas3800 Montrose Boulevard.Houston, TX 77006Phone: [email protected]
Program ContactRobert Rivera, Associate DirectorProject GRAD1100 Louisiana, Suite 450Houston, TX 77002Phone: 713.654.7083Fax: 713.654.7763www.projectgrad.org/[email protected]
most substantive criticism of the program fromteachers pertained to the perceived, rigid structureand lack of phonics-based instructional emphasis inSuccess for All, one component of Project GRAD’sreform strategy.
Raising Minority Academic Achievement 151
American Youth Policy Forum
Founded in 1991, The Puerto Rico Louis StokesAlliance for Minority Participation (PR-LSAMP) isone of several nationwide initiatives sponsored bythe National Science Foundation to increase thenumber of minority students that receive abaccalaureate degree in science, math, engineeringand technology (SMET) fields. The NationalScience Foundation awarded two five-year grants(1991-1996 and 1996-2001) to implement thisinitiative to the Resource Center for Science andEngineering of the University of Puerto Rico.Thirteen campuses of four major higher educationinstitutions on the Island are members of the PR-LSAMP alliance. The Resource Center serves asthe umbrella organization of this alliance, promotingthe maximum collaboration of all institutions. Themajor goal of the Resource Center is to transformthe teaching/learning process in SMET disciplinesfor ALL students in Puerto Rico. The center ofPR-LSAMP has been the revision of theundergraduate SMET curriculum and theincorporation of teaching strategies that have provensuccessful in improving student academic
.���������<�������3���� ��������
#��������.�����������������������
� �� ���
“Puerto Rico Louis Stokes Alliance forMinority Participation: 1999-2000, 1998-99and 1997-98 Annual Progress Reports.”Submitted to the National Science Foundation bythe University of Puerto Rico Resource Center forScience and Engineering. By Dr. Ana C. Piñero.
POPULATIONAccording to National Science Foundationdata, 202,607 baccalaureate degrees wereawarded nationwide in 1997 in science,mathematics and engineering fields. Of these,11,187 were awarded to Latinos. Graduatesfrom PR-LSAMP institutions represented one-fourth of the 11,187 degrees awarded toLatinos that year. In the nine years that theprogram has existed (1991-2000), PR-LSAMPinstitutions have awarded a total of 23,525 BSdegrees in the different SMET disciplines. Ofthese, 7,809 were in Life Sciences, 6,074 inEngineering, 3192 in the core sciences(Chemistry, Physics and Mathematics) and theothers in science related fields, such asComputer Science.
FocusEarly ChildhoodPrimary SchoolMiddle SchoolSecondary School
����� PostsecondaryExtended Learning
������������
Since the goal of PR-LSAMP is to increase theeffectiveness and efficiency of the undergraduateSMET programs, evaluators measured: SMETenrollment, SMET graduation rates, the Index of
Course Efficiency (i.e. the number of times studentsmust take a course to pass it with at least a C) andthe number of BS graduates that go on to graduateschool and obtain a Ph.D. in an SMET area.
performance. Jointly with the curriculum revision,PR-LSAMP offers direct student services toundergraduate students, such as mentoring andresearch opportunities, to enhance their skills,increase their motivation to remain in SMET careersand strengthen their qualifications for graduatestudies.
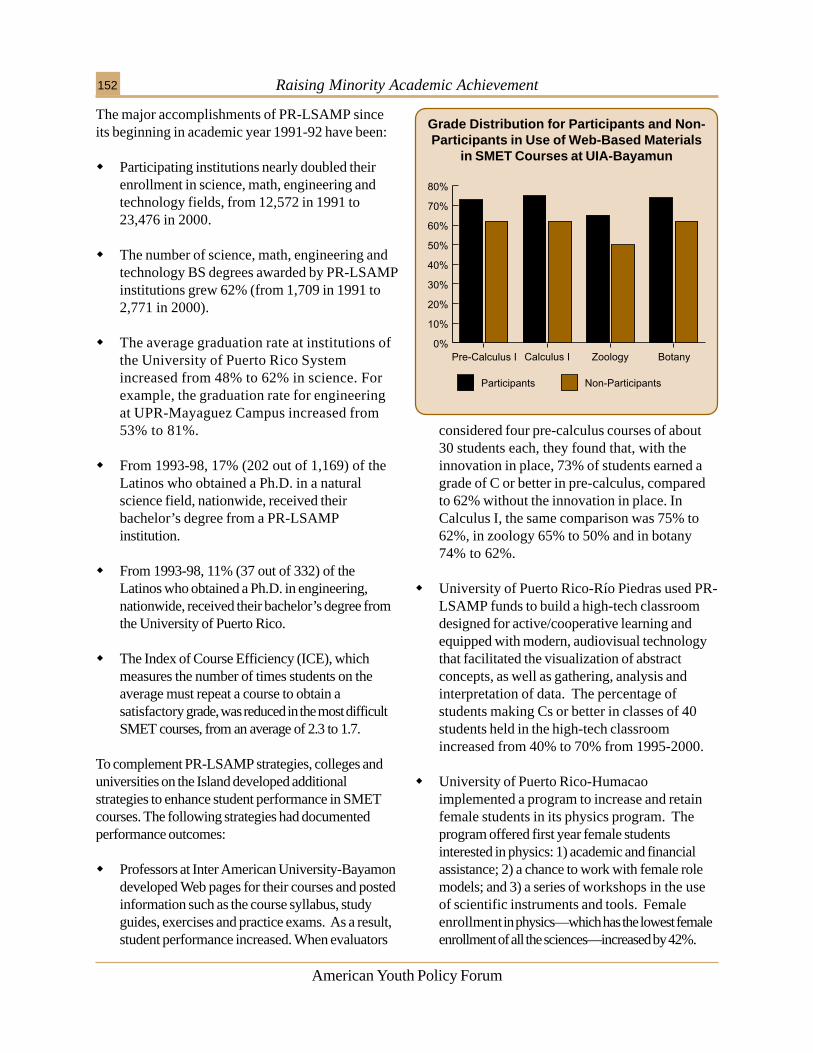
Raising Minority Academic Achievement152
American Youth Policy Forum
Grade Distribution for Participants and Non-Participants in Use of Web-Based Materials
in SMET Courses at UIA-Bayamun
The major accomplishments of PR-LSAMP sinceits beginning in academic year 1991-92 have been:
� Participating institutions nearly doubled theirenrollment in science, math, engineering andtechnology fields, from 12,572 in 1991 to23,476 in 2000.
� The number of science, math, engineering andtechnology BS degrees awarded by PR-LSAMPinstitutions grew 62% (from 1,709 in 1991 to2,771 in 2000).
� The average graduation rate at institutions ofthe University of Puerto Rico Systemincreased from 48% to 62% in science. Forexample, the graduation rate for engineeringat UPR-Mayaguez Campus increased from53% to 81%.
� From 1993-98, 17% (202 out of 1,169) of theLatinos who obtained a Ph.D. in a naturalscience field, nationwide, received theirbachelor’s degree from a PR-LSAMPinstitution.
� From 1993-98, 11% (37 out of 332) of theLatinos who obtained a Ph.D. in engineering,nationwide, received their bachelor’s degree fromthe University of Puerto Rico.
� The Index of Course Efficiency (ICE), whichmeasures the number of times students on theaverage must repeat a course to obtain asatisfactory grade, was reduced in the most difficultSMET courses, from an average of 2.3 to 1.7.
To complement PR-LSAMP strategies, colleges anduniversities on the Island developed additionalstrategies to enhance student performance in SMETcourses. The following strategies had documentedperformance outcomes:
� Professors at Inter American University-Bayamondeveloped Web pages for their courses and postedinformation such as the course syllabus, studyguides, exercises and practice exams. As a result,student performance increased. When evaluators
considered four pre-calculus courses of about30 students each, they found that, with theinnovation in place, 73% of students earned agrade of C or better in pre-calculus, comparedto 62% without the innovation in place. InCalculus I, the same comparison was 75% to62%, in zoology 65% to 50% and in botany74% to 62%.
� University of Puerto Rico-Río Piedras used PR-LSAMP funds to build a high-tech classroomdesigned for active/cooperative learning andequipped with modern, audiovisual technologythat facilitated the visualization of abstractconcepts, as well as gathering, analysis andinterpretation of data. The percentage ofstudents making Cs or better in classes of 40students held in the high-tech classroomincreased from 40% to 70% from 1995-2000.
� University of Puerto Rico-Humacaoimplemented a program to increase and retainfemale students in its physics program. Theprogram offered first year female studentsinterested in physics: 1) academic and financialassistance; 2) a chance to work with female rolemodels; and 3) a series of workshops in the useof scientific instruments and tools. Femaleenrollment in physics—which has the lowest femaleenrollment of all the sciences—increased by 42%.
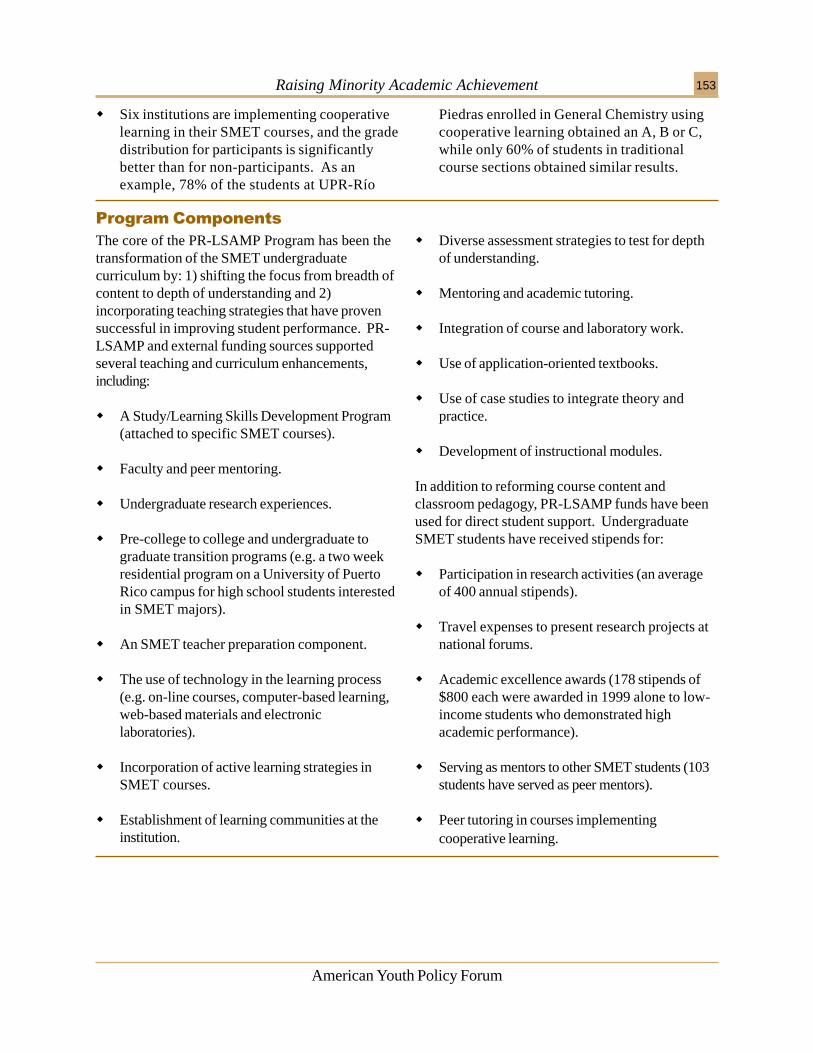
Raising Minority Academic Achievement 153
American Youth Policy Forum
� Six institutions are implementing cooperativelearning in their SMET courses, and the gradedistribution for participants is significantlybetter than for non-participants. As anexample, 78% of the students at UPR-Río
Piedras enrolled in General Chemistry usingcooperative learning obtained an A, B or C,while only 60% of students in traditionalcourse sections obtained similar results.
���������������
The core of the PR-LSAMP Program has been thetransformation of the SMET undergraduatecurriculum by: 1) shifting the focus from breadth ofcontent to depth of understanding and 2)incorporating teaching strategies that have provensuccessful in improving student performance. PR-LSAMP and external funding sources supportedseveral teaching and curriculum enhancements,including:
� A Study/Learning Skills Development Program(attached to specific SMET courses).
� Faculty and peer mentoring.
� Undergraduate research experiences.
� Pre-college to college and undergraduate tograduate transition programs (e.g. a two weekresidential program on a University of PuertoRico campus for high school students interestedin SMET majors).
� An SMET teacher preparation component.
� The use of technology in the learning process(e.g. on-line courses, computer-based learning,web-based materials and electroniclaboratories).
� Incorporation of active learning strategies inSMET courses.
� Establishment of learning communities at theinstitution.
� Diverse assessment strategies to test for depthof understanding.
� Mentoring and academic tutoring.
� Integration of course and laboratory work.
� Use of application-oriented textbooks.
� Use of case studies to integrate theory andpractice.
� Development of instructional modules.
In addition to reforming course content andclassroom pedagogy, PR-LSAMP funds have beenused for direct student support. UndergraduateSMET students have received stipends for:
� Participation in research activities (an averageof 400 annual stipends).
� Travel expenses to present research projects atnational forums.
� Academic excellence awards (178 stipends of$800 each were awarded in 1999 alone to low-income students who demonstrated highacademic performance).
� Serving as mentors to other SMET students (103students have served as peer mentors).
� Peer tutoring in courses implementingcooperative learning.
Raising Minority Academic Achievement154
American Youth Policy Forum
Project AdministrationOne of the contributing factors to the success ofPR-LSAMP has been its coordination by theResource Center for Science and Engineering ofthe University of Puerto Rico. By nature, theResource Center operates as a collaborativenetwork among the major institutions of highereducation in Puerto Rico, thus providing access toa broad pool of resources and promoting theoptimization of efforts. The Resource Centerforms partnerships with businesses and nationalreform leaders to help PR-LSAMP institutionsdevelop educational strategies, objectives andbenchmarks to measure program impact.
Network of Information SharingThe Resource Center operates as a virtualorganization. The human resources needed toachieve its goals are distributed among the diverse,institutional settings, while the strategic planning,coordination of efforts and communication, linksacross institutional boundaries allow for theorchestration of a coherent reform strategy. Thisnetwork is flexible and adapts to the changing needsof participating institutions and faculty.
Education System AlignmentBy working with all levels and visualizing theeducational system as a K-16+ continuum, theResource Center ensures that initiatives such as PR-LSAMP build on other reform efforts, and that allinitiatives are harnessed into a coherent systemicreform strategy. The Resource Center coordinatesother systemwide reform efforts at the K-12 level
������������������
(i.e. the Puerto Rico Statewide Systemic Initiative)and at the graduate level (i.e. the ExperimentalProgram to Stimulate Competitive ResearchEPSCoR) of the educational pipeline. Thisarticulation of efforts also allows PR-LSAMPstudents and institutions to gain access to additionalfunds for minorities in the science, math,engineering and technology fields.
External FundingThe National Science Foundation requires cost-sharing by participating institutions. For example, in1999-2000, the Cooperative Agreement signed bythe University of Puerto Rico (the leading institutionin PR-LSAMP) and the National ScienceFoundation required for that year a $2.29Mcontribution from participating institutions for a$1.2M award from NSF. Participating institutionsactively seek additional external funds to strengthenSMET education. In 1999-2000, a total of $15.9Mwas obtained from different funding sources (i.e.USDE, NASA, NIH, USDOE) to develop andimplement educational strategies to enhance theteaching/learning process at their institutions.
Technology and PedagogyPR-LSAMP programs used technology in a varietyof ways to enhance student learning.
MentoringPeer and professional mentoring provided academicsupport and role models for Latino and/or first yearcollege students entering fields in which they arehistorically under-represented.
The evaluator noted that:
� In academic year 1999-2000, the number ofbaccalaureate degrees in SMET disciplinesawarded by PR-LSAMP institutions remainedflat and did not continue the upward trend ofprevious years.
�!������������
� Although many faculty members areimplementing new teaching strategies in theirSMET courses to improve studentperformance, only a few professors aredocumenting performance outcomes in terms ofgrade improvements or test scores of currentstudents under new teaching methologies –vs-previous students taught with traditionalteaching methods.
Raising Minority Academic Achievement 155
American Youth Policy Forum
� Although a student tracking system wasdeveloped by PR-LSAMP to obtain data onhow many BS, SMET graduates, the results areskewed toward students who remained inPuerto Rico because of the difficulty in gettingresponses from students who had moved to theU.S. mainland.
STUDY METHODOLOGYThe researcher used institutional and centraladministration data, with partial use of data fromthe new student tracking system. Studentachievement outcomes from PR-LSAMPinstitutions are compared to related nationaloutcomes provided by the National ScienceFoundation. Site visits and case studiescomplemented the quantitative data used in thestudy.
EVALUATION & PROGRAM FUNDINGThe study was conducted by the University ofPuerto Rico Resource Center for Science andEngineering as an annual requirement of the NSFto evidence program achievements. The NationalScience Foundation funds the PR-LSAMPprogram, with participating institutionscontributing a significant share in institutionalfunds. PR-LSAMP institutions actively seekmoney from other federal and local governmentagencies and from the private sector, specificallylocal research and development companies.Some of the sources of external funding are theNational Institutes of Health, the U.S. Departmentof Education, other National Science Foundationprograms, NASA and the U.S. Department ofEnergy.
GEOGRAPHIC AREASThe administration of PR-LSAMP isheadquartered at the University of Puerto RicoResource Center for Science and Engineering,located at the Río Piedras Campus. PR-LSAMPinstitutions are located across the Island inArecibo, Aguadilla, Bayamon, Cayey, Gurabo,Humacao, Mayaguez, Ponce, Rio Piedras, SanGerman and San Juan.
CONTACT INFORMATIONResearch ContactsDr. Ana C. PineroAssociate DirectorUniversity of Puerto RicoResource Center for Science and EngineeringP.O. Box 23334San Juan, PR 00931-3334Phone: 787.764.8369 Fax: [email protected]
Ana M. Feliciano,Management CoordinatorPuerto Rico Louis StokesAlliance for Minority ParticipationP.O. Box 23334San Juan, PR 00931-3334Phone: 787.765.5170 Fax: [email protected]
Note: The Puerto Rico Statewide Systemic Initiative is oneof eight SSI nationwide projects currently funded by NSF.In 1979, the NSF started the Experimental Program toStimulate Competitive Research (EPSCoR) in response tonational concerns regarding inequitable geographicdistribution of research funding. Broadly put, EPSCoR’smission is to improve the quality of science and increase theability of scientists in eligible states to compete successfullyfor federal funds. For additional information on EPSCoRplease consult James Hoehn, Annual Report FY 2000:Experimental Program to Stimulate Competitive Research.August 2000. Arlington, VA. National Science Foundation.
Raising Minority Academic Achievement156
American Youth Policy Forum
Sacramento’s Students Today Achieving Results forTomorrow (START) program is an after-schoolacademic enrichment program that provides a safe,positive learning environment for elementary schoolstudents from low-income families. START wasfounded in 1995 by the City of Sacramento to helpthese students “succeed academically and socially”and to “connect neighborhoods with schools” byemploying adults from the community and students’parents as part-time, after-school instructors. At thetime of this evaluation, START operated for two-and-a-half hours a day four days a week, andstudents received homework assistance and helpwith reading while also participating in recreationalactivities.
�����������&��&������������
� �� ���
“Sacramento START: An Evaluation Report,September 1996 — May 1997” (January 1998)Sacramento Neighborhood Planning andDevelopment Services Department. By JudithLamare.
POPULATIONCurrently, START spans 5 school districts in theSacramento metro area, and it enrolls over7,000 students. At the time of the evaluation(1996-97), there were 2,000 students in theprogram: 87% of START students qualified forfree lunch, 83% belonged to racial or ethnicminority groups and 58% came from homeswhere English is not the primary languagespoken. The Natomas School District’s samplewas composed of 46 students from secondthrough fifth grades, the North SacramentoSchool District includes 105 third through sixthgrade students and Sacramento City UnifiedSchool District had 653 third through sixthgrade students. Approximately three-quartersof the students began the program scoringbelow the 50th percentile in reading and mathproficiency. Parents or community membersmade up 73% of START staff.
FocusEarly Childhood
����� Primary SchoolMiddle SchoolSecondary SchoolPostsecondary
����� Extended Learning
������������
The evaluator used various standardized test scoresfrom the different START schools and districts,reporting the data in Normal Curve Equivalent(NCE) scores, based on national test performance.
In the three districts evaluated, more than half ofSTART students showed improvement in NCEscores:
� START students in the Sacramento City UnifiedSchool District (SCUSD) improved an average5.4 NCE points.
� START students in the North SacramentoSchool District (NSSD) improved an average of4.6 NCE points.
� START students in the Natomas School District(NSD) improved an average of 4 NCE points.
START had the greatest impact on students whobegan the program in the lowest quartile ofstandardized reading test scores. In SCUSD, 83%of START students who began the program in thelowest quartile improved on average 22 NCE pointsin third and fourth grades and 15 NCE points in fifthand sixth grades.
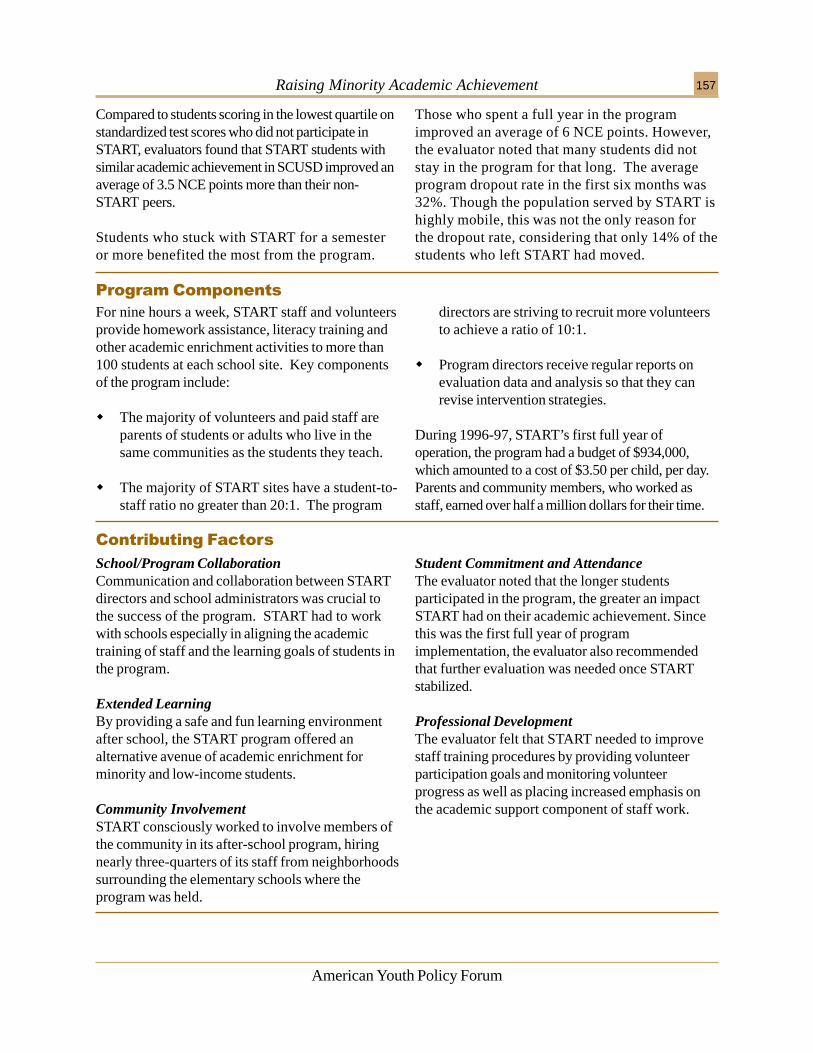
Raising Minority Academic Achievement 157
American Youth Policy Forum
Compared to students scoring in the lowest quartile onstandardized test scores who did not participate inSTART, evaluators found that START students withsimilar academic achievement in SCUSD improved anaverage of 3.5 NCE points more than their non-START peers.
Students who stuck with START for a semesteror more benefited the most from the program.
Those who spent a full year in the programimproved an average of 6 NCE points. However,the evaluator noted that many students did notstay in the program for that long. The averageprogram dropout rate in the first six months was32%. Though the population served by START ishighly mobile, this was not the only reason forthe dropout rate, considering that only 14% of thestudents who left START had moved.
���������������
For nine hours a week, START staff and volunteersprovide homework assistance, literacy training andother academic enrichment activities to more than100 students at each school site. Key componentsof the program include:
� The majority of volunteers and paid staff areparents of students or adults who live in thesame communities as the students they teach.
� The majority of START sites have a student-to-staff ratio no greater than 20:1. The program
directors are striving to recruit more volunteersto achieve a ratio of 10:1.
� Program directors receive regular reports onevaluation data and analysis so that they canrevise intervention strategies.
During 1996-97, START’s first full year ofoperation, the program had a budget of $934,000,which amounted to a cost of $3.50 per child, per day.Parents and community members, who worked asstaff, earned over half a million dollars for their time.
School/Program CollaborationCommunication and collaboration between STARTdirectors and school administrators was crucial tothe success of the program. START had to workwith schools especially in aligning the academictraining of staff and the learning goals of students inthe program.
Extended LearningBy providing a safe and fun learning environmentafter school, the START program offered analternative avenue of academic enrichment forminority and low-income students.
Community InvolvementSTART consciously worked to involve members ofthe community in its after-school program, hiringnearly three-quarters of its staff from neighborhoodssurrounding the elementary schools where theprogram was held.
������������������
Student Commitment and AttendanceThe evaluator noted that the longer studentsparticipated in the program, the greater an impactSTART had on their academic achievement. Sincethis was the first full year of programimplementation, the evaluator also recommendedthat further evaluation was needed once STARTstabilized.
Professional DevelopmentThe evaluator felt that START needed to improvestaff training procedures by providing volunteerparticipation goals and monitoring volunteerprogress as well as placing increased emphasis onthe academic support component of staff work.
Raising Minority Academic Achievement158
American Youth Policy Forum
STUDY METHODOLOGYEvaluators analyzed school data for students ingrades 3 through 6 who attended the program.Only students with test scores in the Fall 1996and Spring 1997 were incorporated in theresearch. The school districts recorded studentachievement on a range of standardized testsincluding the California Achievement Test (CAT)and the Sacramento Achievement Levels Test(SALT). Scores were translated in Normal CurveEquivalency (NCE), an equal interval scale thatindicates variations in academic growth (NCE iszero for a normal growth). Three out of the fiveschool districts that have implemented STARTprovided test score data; four of twenty STARTschools did not provide data. Since the Cityinitiated the project and the evaluation, schooldistricts covered in the study were those withinthe jurisdiction of the City of Sacramento.
EVALUATION & PROGRAM FUNDINGThe City of Sacramento funded the evaluation.The START program is funded by a public/privatepartnership that included the City of Sacramento,
five school districts and numerous corporations,foundations and individuals.
GEOGRAPHIC AREASSacramento, California: Sacramento City UnifiedSchool District, North Sacramento SchoolDistrict, Natomas School District, Del PasoSchool District and Elk Grove School District.
CONTACT INFORMATIONResearch ContactsJudith Lamare, PhD1823 11th St.Sacramento, CA 95814Phone: 916.447.4956 Fax: [email protected]
Program ContactAndria Fletcher, Program DirectorSacramento START6005 Folsom BoulevardSacramento, California 95819Phone: 916.277.6115. Fax: 916.277.6074www.sacto.org/recreation/sacstart.htm
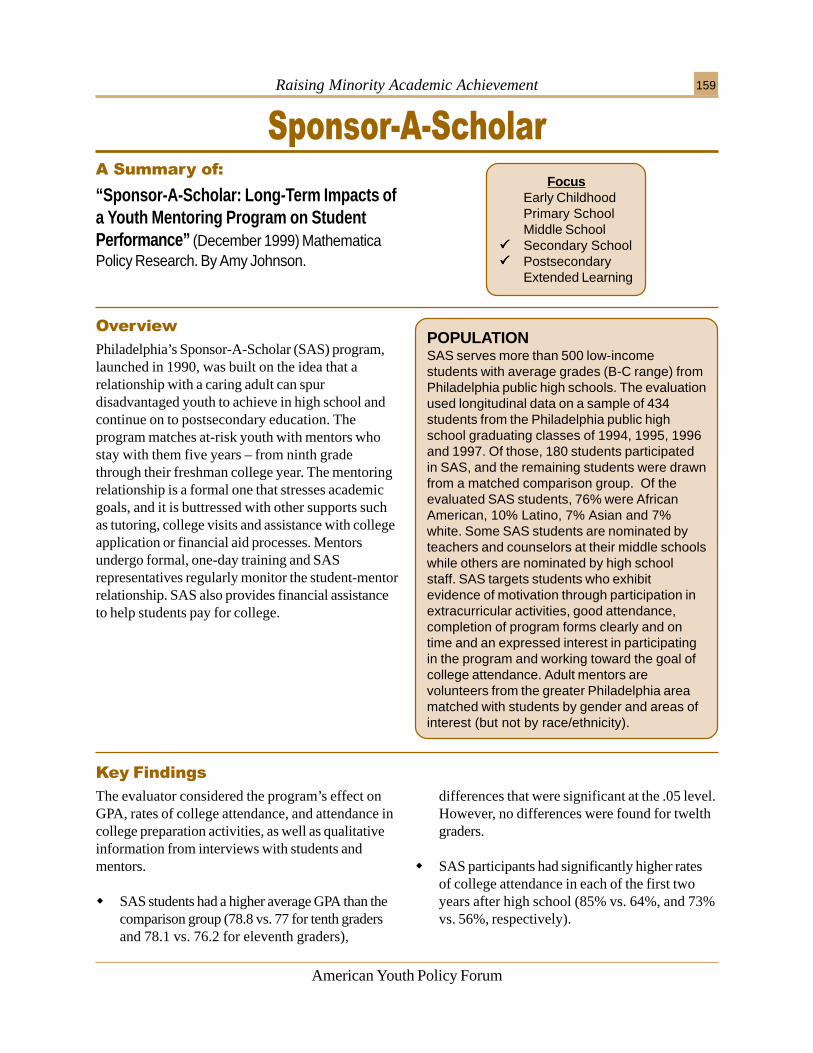
Raising Minority Academic Achievement 159
American Youth Policy Forum
Philadelphia’s Sponsor-A-Scholar (SAS) program,launched in 1990, was built on the idea that arelationship with a caring adult can spurdisadvantaged youth to achieve in high school andcontinue on to postsecondary education. Theprogram matches at-risk youth with mentors whostay with them five years – from ninth gradethrough their freshman college year. The mentoringrelationship is a formal one that stresses academicgoals, and it is buttressed with other supports suchas tutoring, college visits and assistance with collegeapplication or financial aid processes. Mentorsundergo formal, one-day training and SASrepresentatives regularly monitor the student-mentorrelationship. SAS also provides financial assistanceto help students pay for college.
�������7�7��� ��������������
� �� ���
“Sponsor-A-Scholar: Long-Term Impacts ofa Youth Mentoring Program on StudentPerformance” (December 1999) MathematicaPolicy Research. By Amy Johnson.
POPULATIONSAS serves more than 500 low-incomestudents with average grades (B-C range) fromPhiladelphia public high schools. The evaluationused longitudinal data on a sample of 434students from the Philadelphia public highschool graduating classes of 1994, 1995, 1996and 1997. Of those, 180 students participatedin SAS, and the remaining students were drawnfrom a matched comparison group. Of theevaluated SAS students, 76% were AfricanAmerican, 10% Latino, 7% Asian and 7%white. Some SAS students are nominated byteachers and counselors at their middle schoolswhile others are nominated by high schoolstaff. SAS targets students who exhibitevidence of motivation through participation inextracurricular activities, good attendance,completion of program forms clearly and ontime and an expressed interest in participatingin the program and working toward the goal ofcollege attendance. Adult mentors arevolunteers from the greater Philadelphia areamatched with students by gender and areas ofinterest (but not by race/ethnicity).
FocusEarly ChildhoodPrimary SchoolMiddle School
����� Secondary School����� Postsecondary
Extended Learning
������������
The evaluator considered the program’s effect onGPA, rates of college attendance, and attendance incollege preparation activities, as well as qualitativeinformation from interviews with students andmentors.
� SAS students had a higher average GPA than thecomparison group (78.8 vs. 77 for tenth gradersand 78.1 vs. 76.2 for eleventh graders),
differences that were significant at the .05 level.However, no differences were found for twelthgraders.
� SAS participants had significantly higher ratesof college attendance in each of the first twoyears after high school (85% vs. 64%, and 73%vs. 56%, respectively).
Raising Minority Academic Achievement160
American Youth Policy Forum
“Mentoring requires an intense commitmentthat goes well beyond incidental and sporadicencounters between mentors and students.”
— Amy Johnson, evaluator
“A mentoring program that stresses academicgoals can improve high school and collegeoutcomes.”
— Amy Johnson, evaluator
� The program is more likely to help studentswho have lower academic achievement thanhigher achievers. Researchers comparedstudents with low ninth grade GPAs whoattended the program with those who did notattend on the following measures: tenth-gradeGPA, eleventh-grade GPA and first-year andsecond-year college attendance. Low ninth-gradeGPA students who attended SAS did significantlybetter on all the measures (comparisons weresignificant at the .05 and .01 levels).
� Mentor behaviors, such as frequentcommunication and getting to know a student’s
family significantly, affect student performance.Students whose mentors contacted them mostoften (at least once a week) did significantlybetter on tenth-grade GPA, eleventh-grade GPA,first-year college attendance, second-year collegeattendance and college retention (comparisonswere significant at the .05 and .01 levels).
� The strength of mentor-student relationshipsvaried widely, reported the evaluator, with 33%of mentors saying they had a strong relationshipwith their student, 35% saying they had amoderate relationship and 33% saying they hada weak relationship.
���������������
SAS mentoring services were delivered to studentsprimarily at their schools on a one-to-one or smallgroup basis. Mentors and students met monthly andstayed in contact by phone between meetings.Mentors monitored the student’s academic progress,helped with financial aid and college applicationprocesses, contacted program staff on a regularbasis to discuss the evolving relationship with andprogress of the student and participated in programevents. Fostering individual relationships betweenthe students and their mentors was the primaryfunction of SAS, and the following programcomponents further defined or supported thisrelationship:
� A formal commitment was affirmed by signing astatement of intent in which the student agreedto comply with numerous responsibilitiesassociated with participation: maintaining regularattendance in school, earning grades of C orabove, asking for academic support whenneeded, keeping appointments with the mentor,communicating regularly by telephone with thementor and program staff, attending programevents, enrolling in college preparatory coursesand sharing each report card.
� Mentor training was offered at an initial orientationsession. Then, mentors were contacted monthlyby program staff to assess and develop strategiesfor each relationship’s progress. Mentors alsoparticipated periodically at mentor roundtables andreceived a regular newsletter.
� A part-time coordinator was employed by SAS towork with groups of 30 student-mentor pairs tofoster effective student-mentor relationships bymaintaining monthly contact with both the studentand the mentor and monitoring the progress of therelationship.
� Academic support services offered by SASincluded tutoring assignments, SAT prep classes,workshops on study skills and summeropportunities. In addition, students were offeredworkshops on obtaining financial aid, selecting acollege, the application process and other relatedtopics.
� Financial assistance — totaling $6,000 — wasoffered to SAS students who attended college.The money was provided by the mentor or bycompanies/organizations that donated the funds.
Raising Minority Academic Achievement 161
American Youth Policy Forum
High-Quality Mentoring RelationshipSAS recognized the importance of mentoring as anintensive commitment that went well beyondincidental and sporadic encounters between mentorand student. Mentors were expected to build arelationship based on mutual respect and trust andto work with students’ families to nurture thestudents’ potential. As one mentor said, there wasno “magic formula” to mentoring.
Constant Emphasis on Academics“A constant emphasis on academic skills reinforcesthe commitment of all parties – students, mentorsand staff – to the primary goal of increasing collegeattendance,” noted the evaluator.
������������������
Sustainable GrowthThe evaluator believed that, in any community, onlya limited number of adults were capable ofestablishing effective mentor relationships. “Aprogram should not sacrifice quality – andpotentially significant impacts – for quantity innumber of participants,” the evaluator noted.
Family Support and Student MotivationAlthough students from families that providedstrong support – independent of SAS participation –did significantly better than others on a number ofoutcome measures, SAS participation significantlyimproved outcomes among students whose familiesprovided low and moderate levels of support.Evaluators found that SAS similarly benefitedstudents with the lowest levels of motivation and thelowest GPAs as they entered the SAS program.
STUDY METHODOLOGYThe study was conducted over a 4-year period,from 1993 to 1997 and included four cohorts ofSponsor-A-Scholar students (high schoolgraduating classes of 1994 through 1997). Thecomparison group was selected by matchingeach SAS participant with two non-SAS studentsof the same race, gender and school attended.The comparison group was also matched foracademic achievement by selecting the twodemographically comparable students whoseGPAs were closest (one higher, one lower) to thatof the matched SAS student. Two variables onwhich students could not be matched wereincome eligibility and motivation for pursuing acollege career. Given the high percentage ofstudents from low-income families in the city’spublic schools, the evaluator explained, there is ahigh likelihood that most comparison studentsalso fit the SAS program income criteria.
EVALUATION & PROGRAM FUNDINGThe evaluation was funded by TheCommonwealth Fund. SAS is funded andoperated by the nonprofit organization,
Philadelphia Futures, the education affiliate of theGreater Philadelphia Urban Affairs Coalition. Theannual operating cost of SAS was estimated at$365,429.
GEOGRAPHIC AREASSAS serves the Philadelphia public schools.
CONTACT INFORMATIONResearch ContactsAmy JohnsonMathematica Policy ResearchPO Box 2393Princeton, NJ 08543Phone: 609.936.2714 Fax: [email protected]
Program ContactJoyce Mantell, DirectorSponsor-A-Scholar Program (SAS)230 South Broad Street, 7th FloorPhiladelphia, PA 19147Phone: 215.790.1666x13 Fax: [email protected]
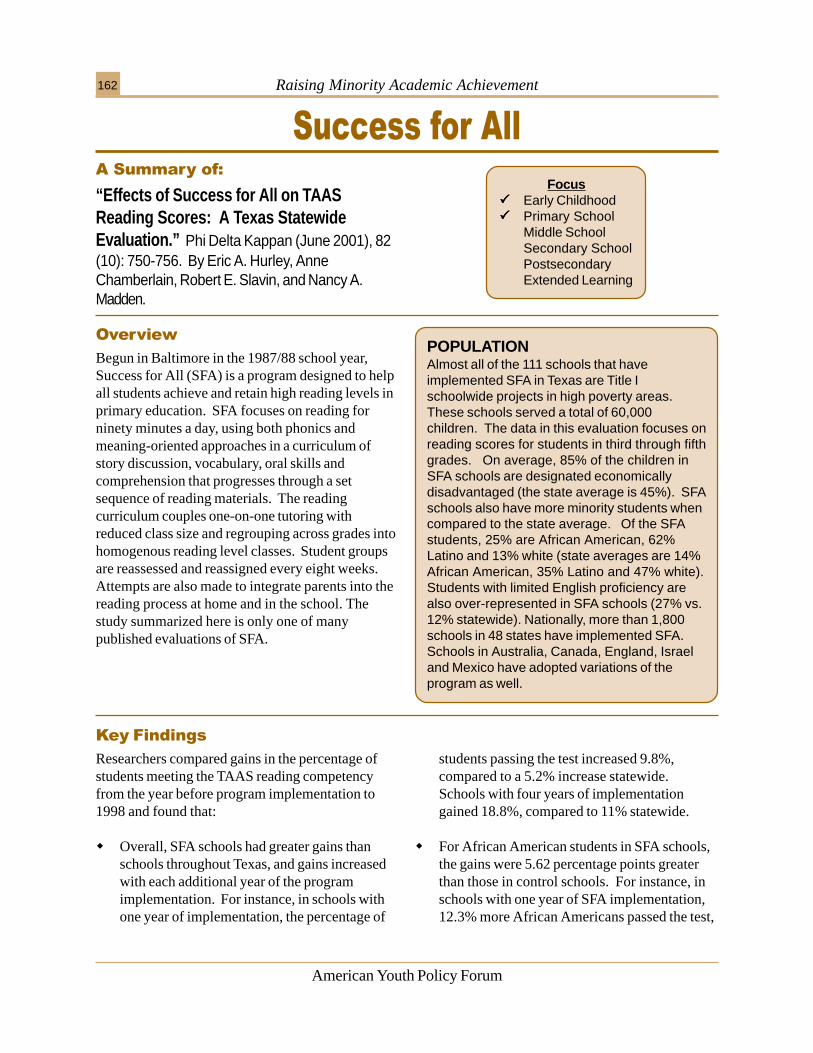
Raising Minority Academic Achievement162
American Youth Policy Forum
Begun in Baltimore in the 1987/88 school year,Success for All (SFA) is a program designed to helpall students achieve and retain high reading levels inprimary education. SFA focuses on reading forninety minutes a day, using both phonics andmeaning-oriented approaches in a curriculum ofstory discussion, vocabulary, oral skills andcomprehension that progresses through a setsequence of reading materials. The readingcurriculum couples one-on-one tutoring withreduced class size and regrouping across grades intohomogenous reading level classes. Student groupsare reassessed and reassigned every eight weeks.Attempts are also made to integrate parents into thereading process at home and in the school. Thestudy summarized here is only one of manypublished evaluations of SFA.
���������� ������������
� �� ���
“Effects of Success for All on TAASReading Scores: A Texas StatewideEvaluation.” Phi Delta Kappan (June 2001), 82(10): 750-756. By Eric A. Hurley, AnneChamberlain, Robert E. Slavin, and Nancy A.Madden.
POPULATIONAlmost all of the 111 schools that haveimplemented SFA in Texas are Title Ischoolwide projects in high poverty areas.These schools served a total of 60,000children. The data in this evaluation focuses onreading scores for students in third through fifthgrades. On average, 85% of the children inSFA schools are designated economicallydisadvantaged (the state average is 45%). SFAschools also have more minority students whencompared to the state average. Of the SFAstudents, 25% are African American, 62%Latino and 13% white (state averages are 14%African American, 35% Latino and 47% white).Students with limited English proficiency arealso over-represented in SFA schools (27% vs.12% statewide). Nationally, more than 1,800schools in 48 states have implemented SFA.Schools in Australia, Canada, England, Israeland Mexico have adopted variations of theprogram as well.
Focus����� Early Childhood����� Primary School
Middle SchoolSecondary SchoolPostsecondaryExtended Learning
������������
Researchers compared gains in the percentage ofstudents meeting the TAAS reading competencyfrom the year before program implementation to1998 and found that:
� Overall, SFA schools had greater gains thanschools throughout Texas, and gains increasedwith each additional year of the programimplementation. For instance, in schools withone year of implementation, the percentage of
students passing the test increased 9.8%,compared to a 5.2% increase statewide.Schools with four years of implementationgained 18.8%, compared to 11% statewide.
� For African American students in SFA schools,the gains were 5.62 percentage points greaterthan those in control schools. For instance, inschools with one year of SFA implementation,12.3% more African Americans passed the test,
Raising Minority Academic Achievement 163
American Youth Policy Forum
���������������
� In Success for All, students learn with same-agepeers for the majority of the day, but they breakinto cross-grade groups, by reading level, forninety-minute classes. Teachers and tutors canthen instruct at the appropriate levels withoutstigmatizing students with “all day tracking.”Reevaluation of group assignments everyeight weeks also avoids tracking stigma.
� SFA begins in kindergarten with anintroduction to letters and letter soundsthrough, for instance, interaction with apuppet named “Alphie” who teaches thestudents a letter of the day. The “ReadingRoots” program emphasizes phonetically
decodable text, partner reading, creativewriting, comprehension instruction andcooperative learning.
� The SFA program continues through the fifthgrade, offering increasingly difficult reading,discussion and comprehension assignments asthe students’ reading levels rise. Emphasis is oncooperative learning, meta-cognitive skills,comprehension and writing.
� SFA costs approximately $160 per student inthe first year and $60 thereafter. Most schoolspay for the program with Title I funds, oftensupplemented with CSRD grants.
compared to 8.4% more for AfricanAmericans in statewide schools. For schoolswith four years of implementation, the gainsfor African Americans were 22.7%, comparedto 17% for African Americans in statewideschools.
� In addition, the score gap between AfricanAmerican and white students in SFA schoolssignificantly narrowed. At the pretest, AfricanAmerican students in the 1995 cohort trailedwhite students by 24.6%, while at the post-test(1998) the gap was 6.4%. For AfricanAmericans statewide, the gap was 13.8%.
� Latino students in SFA schools also showedstatistically significant gains in relation to statewideLatinos. For one-year SFA schools, thepercentage of Latinos passing the test increased by12.2%, compared to 7.6% statewide. Latinos infour-year schools gained 18.2% compared to the13.4% gain for statewide Latinos.
� White students showed the same trends, withstudents in SFA schools gaining more than otherwhite students, but the difference, whenanalyzed at the school level, was not statisticallysignificant. White students in the four-yearcohort gained 19%, while those in the state as awhole gained 13%.
Staff Development and Model FidelityA program facilitator works in all of the sites toensure accurate implementation of the SFAdesign. Three-day summer training sessions andcontinued on-site staff training during the yearfurther support program implementation.Teachers receive detailed manuals and readinglists. While this contributes to successfulreplication of the model, some teachers find thestructure of SFA restrictive.
������������������
Individual TutoringEach SFA program evaluated had a tutoringcomponent, with one-on-one tutoring lastingtwenty minutes a day. SFA focuses tutoringinitiatives on first graders having difficultyreading, but it provides tutoring for other studentsas well.
Raising Minority Academic Achievement164
American Youth Policy Forum
STUDY METHODOLOGYThe evaluators reviewed statewide data from theTexas Assessment of Academic Skills (TAAS),including all schools that had begun the programfrom 1994 to 1997 (111 schools). They comparereading score gains in the TAAS from the yearpre-SFA to 1998 (in 1999 the state significantlychanged the TAAS administration makingcomparisons with earlier data unreliable). SFAschools were also compared to all schools in thestate. Effect sizes are given to all comparisonsand vary between +0.17 (gains for whitestudents) to +0.59 (overall gains). A +0.25 effectsize is a moderate effect. The data is aggregatefor the state, although researchers observe largevariations among SFA schools.
EVALUATION & PROGRAM FUNDINGIn 2001, SFA programs were located in 1,800schools in 48 states and variations of the programhad been implemented in Australia, Canada,Israel and Mexico. This study focuses on Texasschools.
GEOGRAPHIC AREASSAS serves the Philadelphia public schools.
CONTACT INFORMATIONResearch and Program ContactsRobert E. SlavinCenter for Research on the Education ofStudents Placed at Risk (CRESPAR)Johns Hopkins University200 W. Towsontown Blvd.Baltimore MD 21204Phone: 410.616.2310 Fax: 410.324.4440www.successforall.net
Nancy A. MaddenSuccess for All Foundation200 West Towsontown Blvd.Baltimore, MD 21204-5200Phone: 800.548.4998 Fax: 410.324.4440www.successforall.net/
Anne ChamberlainSuccess for All Foundation200 West Towsontown Blvd.Baltimore, MD 21204-5200Phone: 800.548.4998 Fax: 410.324.4440www.successforall.net/
Parent InvolvementIn some SFA sites parents participate on theprogram advisory board or as classroom volunteers.A family support team teaches parents to help theirchildren read with “Raising Readers” (or “CreandoLectores”) programs and provides support for
students with health or family problems. Thefamily support team includes the school’s Title Iparent liaison, vice-principal (if any), counselor (ifany), program facilitator and other appropriateschool staff.
Raising Minority Academic Achievement 165
American Youth Policy Forum
In 1999, four Texas school districts — Aldine,Brazosport, San Benito and Wichita Falls — wereselected for study by the evaluators because theyhad brought about widespread academic success forchildren from low income homes and children ofcolor. Researchers found five common themesamong the districts. First, Texas developed a StateContext of Accountability for achievement andequity, making a change from input-drivenaccountability to results-driven accountability. Thechange required schools to get a specific percentageof students to pass a state assessment of reading,writing and mathematics skills in order to maintainstate accreditation. Second, Local Equity Catalystspressured the district into improving. Thesecatalysts included revitalized federal desegregationorders, monitors assigned to the districts by thestate due to dysfunctional district governance andlocal activists or community groups concernedabout accountability data evidence of inequitablestudent achievement. Third, the Ethical Responseof District Leadership involved district leadersdeciding to develop a district in which all studentgroups achieve at high levels. Fourth, DistrictTransformation involved changing teaching andlearning practices in the classroom. Finally, an
&�����0������7=����+������� ��������������
� �� ���
“Equity-Driven Achievement-FocusedSchool Districts: A Report on SystemicSchool Success in Four Texas SchoolDistricts Serving Diverse StudentPopulations” (September 2000) University ofTexas at Austin. By Linda Skrla, James Scheurichand Joseph Johnson, Jr.
POPULATIONAldine: Of 49,453 students in 56 schools in1999, 36% were African American, 47% wereLatino, and 14% were white. Seventy-onepercent were low-income.
Brazosport: Of 13,247 students in 19 schools,9% were African American, 33% were Latino,and 56% were white. Thirty-nine percent werelow-income.
San Benito: Of 8,697 students in 17 schools,0% were African American, 97% were Latinoand 3% were white. Eighty-seven percent werelow-income.
Wichita Falls: Of 15,293 students in 31schools, 16% were African American, 18%were Latino, and 63% were white. Forty-sixpercent were low-income.
FocusEarly Childhood
����� Primary School����� Middle School����� Secondary School
PostsecondaryExtended Learning
attitude of “Everyday Equity” was adopted andprofoundly changed many educators’ outlooks. As aresult of developing reform along these fivecommon themes, all four districts demonstratedwhat evaluators called “impressive gains” in passingrates for all student groups on all TAAS tests oversix years.
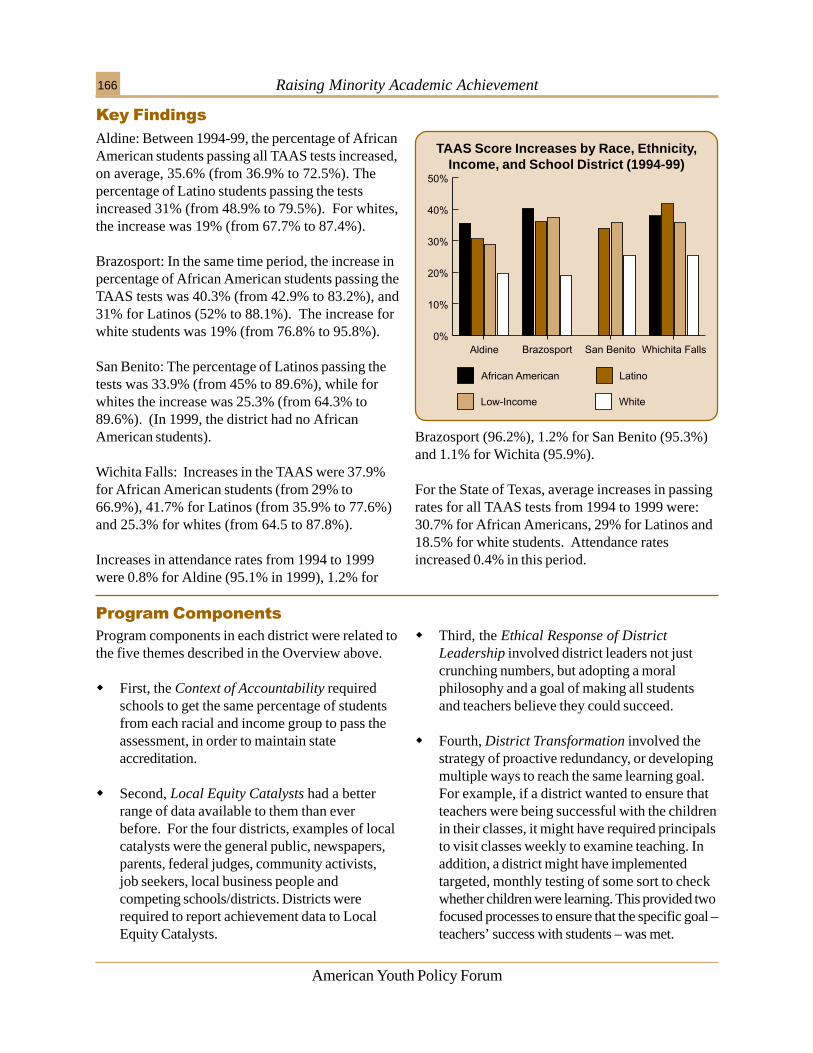
Raising Minority Academic Achievement166
American Youth Policy Forum
TAAS Score Increases by Race, Ethnicity,Income, and School District (1994-99)
������������
Aldine: Between 1994-99, the percentage of AfricanAmerican students passing all TAAS tests increased,on average, 35.6% (from 36.9% to 72.5%). Thepercentage of Latino students passing the testsincreased 31% (from 48.9% to 79.5%). For whites,the increase was 19% (from 67.7% to 87.4%).
Brazosport: In the same time period, the increase inpercentage of African American students passing theTAAS tests was 40.3% (from 42.9% to 83.2%), and31% for Latinos (52% to 88.1%). The increase forwhite students was 19% (from 76.8% to 95.8%).
San Benito: The percentage of Latinos passing thetests was 33.9% (from 45% to 89.6%), while forwhites the increase was 25.3% (from 64.3% to89.6%). (In 1999, the district had no AfricanAmerican students).
Wichita Falls: Increases in the TAAS were 37.9%for African American students (from 29% to66.9%), 41.7% for Latinos (from 35.9% to 77.6%)and 25.3% for whites (from 64.5 to 87.8%).
Increases in attendance rates from 1994 to 1999were 0.8% for Aldine (95.1% in 1999), 1.2% for
Brazosport (96.2%), 1.2% for San Benito (95.3%)and 1.1% for Wichita (95.9%).
For the State of Texas, average increases in passingrates for all TAAS tests from 1994 to 1999 were:30.7% for African Americans, 29% for Latinos and18.5% for white students. Attendance ratesincreased 0.4% in this period.
���������������
Program components in each district were related tothe five themes described in the Overview above.
� First, the Context of Accountability requiredschools to get the same percentage of studentsfrom each racial and income group to pass theassessment, in order to maintain stateaccreditation.
� Second, Local Equity Catalysts had a betterrange of data available to them than everbefore. For the four districts, examples of localcatalysts were the general public, newspapers,parents, federal judges, community activists,job seekers, local business people andcompeting schools/districts. Districts wererequired to report achievement data to LocalEquity Catalysts.
� Third, the Ethical Response of DistrictLeadership involved district leaders not justcrunching numbers, but adopting a moralphilosophy and a goal of making all studentsand teachers believe they could succeed.
� Fourth, District Transformation involved thestrategy of proactive redundancy, or developingmultiple ways to reach the same learning goal.For example, if a district wanted to ensure thatteachers were being successful with the childrenin their classes, it might have required principalsto visit classes weekly to examine teaching. Inaddition, a district might have implementedtargeted, monthly testing of some sort to checkwhether children were learning. This provided twofocused processes to ensure that the specific goal –teachers’ success with students – was met.
Raising Minority Academic Achievement 167
American Youth Policy Forum
Onsite Technical AssistanceThe districts provided peer review teams who gavesupport and onsite technical assistance to low-performing schools. Schools that needed helpmonitoring or assessing data also received technicalassistance.
Common Sense of MissionEvaluators reported that teachers, principals andsupport personnel in all four districts shared acommon sense of mission, and that missionstatements were backed by a true sense ofcommitment. Within each district, evaluatorsfound, what they called, “a remarkable consistency”in messages about academic achievement goalstransmitted to educators, parents, students andcommunity members.
������������������
� Finally, the districts reached an attitude ofEveryday Equity when their high expectationssnowballed. For example, as TAAS scores rose,districts reported that more students begantaking advanced placement courses.
Information Sharing“In Wichita Falls, a website available to all staff wascreated for each specific aspect of the state tests,and this was integrated with potential test questionsand exemplary ways to teach the specific skill,”noted the evaluators. In all four districts, staffdevelopment was based largely around informationsharing — whether online, person-to-person ordocumented in published resources — aboutinstructional practices.
Standards-Based CurriculumInstructional practices were revised based on specificlearning goals in core subjects for each grade.
EvaluationReform leaders carefully studied data and othermeasurable outcomes to determine how well school-wide changes were working.
STUDY METHODOLOGYTAAS data is taken from the state database. Tounderstand the changes that have occurred in thedistricts, a team of six researchers made two,three-day visits to the Aldine, San Benito andWichita Falls districts. A single, three-day visitwas made to Brazosport since this district hadbeen part of an earlier pilot study. While in thedistricts, researchers interviewed boardmembers, superintendents, central office staff,principals, teachers, parents, communitymembers and business leaders.
EVALUATION & PROGRAM FUNDINGThe evaluation was funded by the Sid W.Richardson Foundation. The school districtsfunded the reform efforts, with low-achievingschools receiving extra funds or special technicalassistance on an as-needed basis to implementreform.
GEOGRAPHIC AREASThe school districts were located in Texas. Aldineis in the northwest Houston metropolitan area,Brazosport is located on the Texas Gulf Coast,San Benito is in the Rio Grande Valley area andWichita Falls is in northwest Texas.
CONTACT INFORMATIONResearch ContactsLinda SkrlaEducational Administration and HumanResources Development Department4226 TAMUTexas A & M UniversityCollege Station, TX 77843-4226Phone: [email protected]
Raising Minority Academic Achievement168
American Youth Policy Forum
The first Tribal Colleges were set up in the late-1960s in the wake of the civil rights movement, andthe American Indian “self-determination”movement, as a way to increase access to highereducation for youth growing up on reservations.Tribal Colleges have a dual education philosophythat combines instruction in Native Americanlanguage, history and culture with a generalcurriculum of English literature, mathematics,science and technology. The colleges are locatedprimarily on rural reservations, so they can betterserve Native American students and communities.A primary goal of Tribal Colleges is to providehigher education for Native American studentswithout forcing assimilation into mainstream whiteculture. Although each institution has a uniquehistory, every Tribal College began as a two-yearinstitution with open admissions policies. Today,several Tribal Colleges offer four-year degrees, anda few offer graduate degrees, but the majorityremain two-year institutions focusing on certificate
&��-� ��� �$��������������
� �� ���
“Building Strong Communities: TribalColleges as Engaged Institutions” (May2001) American Indian Higher EducationConsortium (AIHEC) and the Institute for HigherEducation Policy (IHEP) and the American IndianCollege Fund. By Alisa Federico Cunningham andChristina Redmond.
“Creating Role Models for Change: ASurvey of Tribal College Graduates” (May2000) AIHEC, IHEP, and the American IndianCollege Fund. By Alisa Federico Cunningham andKenneth E. Redd.
“Tribal College Contributions to LocalEconomic Development” (February 2000)AIHEC, IHEP, and the American Indian College
POPULATIONMost Tribal Colleges serve small student bodies,predominantly Native Americans living onreservations. In 1996, 61% of the studentsenrolled in Tribal Colleges were NativeAmericans. In the fall of that year, 10,234Native American students enrolled in Americantribal colleges compared with 131,902 NativeAmerican students in non-tribal institutions ofhigher education. More nontraditional studentsattend Tribal Colleges than mainstreamcolleges. Age, family obligations and povertyare some of the factors that make collegecompletion difficult for those students. Theaverage age of students at Tribal Colleges is31.5 years old compared to an average age of18-24 years old for traditional college students.About 85% of Tribal College students live at orbelow the poverty line. Half of Tribal Collegestudents attend part-time and 64% are women.
FocusEarly ChildhoodPrimary SchoolMiddle SchoolSecondary School
����� PostsecondaryExtended Learning
Fund. By Alisa Federico Cunningham, VeronicaGonzales, James Merisotis, Eileen O’Brien, et al.
“Tribal Colleges: An Introduction” (February1999) AIHEC, IHEP, and the American IndianCollege Fund. By Alisa Federico Cunningham,Veronica Gonzales, James Merisotis, EileenO’Brien, et al.
and associate degree programs. There are 32 TribalColleges in the U.S. and there is one in Canada.
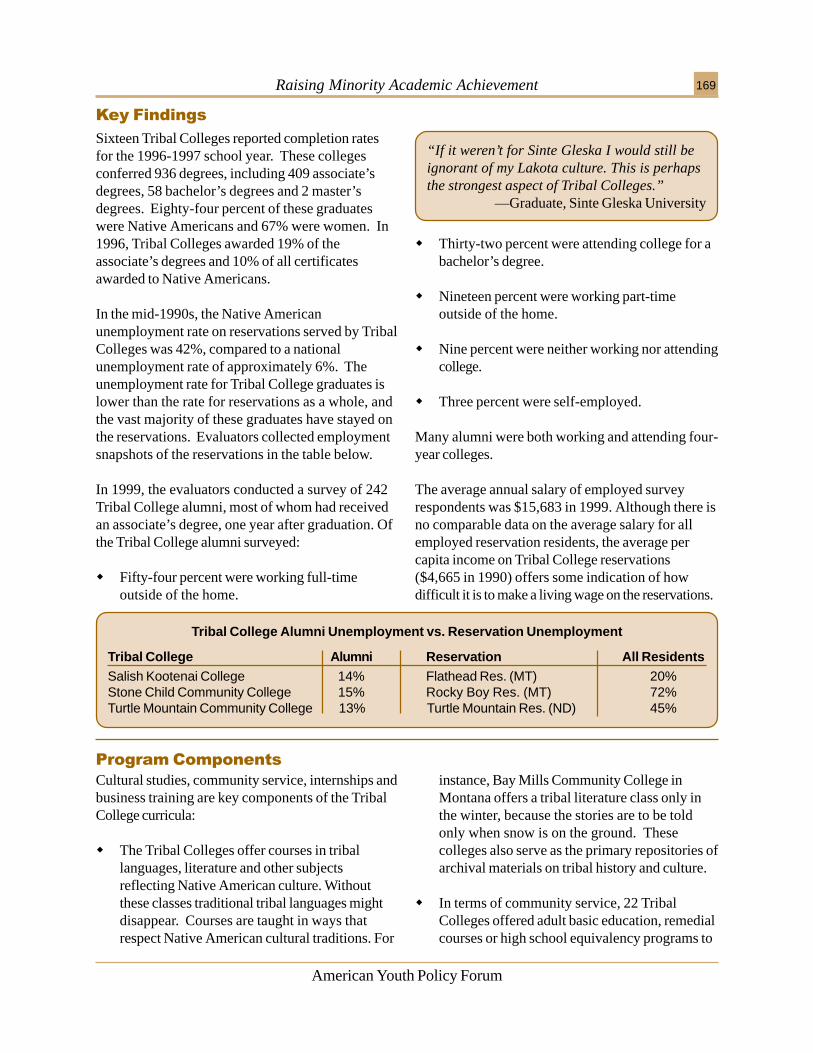
Raising Minority Academic Achievement 169
American Youth Policy Forum
Tribal College Alumni Reservation All ResidentsSalish Kootenai College 14% Flathead Res. (MT) 20%Stone Child Community College 15% Rocky Boy Res. (MT) 72%Turtle Mountain Community College 13% Turtle Mountain Res. (ND) 45%
Tribal College Alumni Unemployment vs. Reservation Unemployment
������������
Sixteen Tribal Colleges reported completion ratesfor the 1996-1997 school year. These collegesconferred 936 degrees, including 409 associate’sdegrees, 58 bachelor’s degrees and 2 master’sdegrees. Eighty-four percent of these graduateswere Native Americans and 67% were women. In1996, Tribal Colleges awarded 19% of theassociate’s degrees and 10% of all certificatesawarded to Native Americans.
In the mid-1990s, the Native Americanunemployment rate on reservations served by TribalColleges was 42%, compared to a nationalunemployment rate of approximately 6%. Theunemployment rate for Tribal College graduates islower than the rate for reservations as a whole, andthe vast majority of these graduates have stayed onthe reservations. Evaluators collected employmentsnapshots of the reservations in the table below.
In 1999, the evaluators conducted a survey of 242Tribal College alumni, most of whom had receivedan associate’s degree, one year after graduation. Ofthe Tribal College alumni surveyed:
� Fifty-four percent were working full-timeoutside of the home.
� Thirty-two percent were attending college for abachelor’s degree.
� Nineteen percent were working part-timeoutside of the home.
� Nine percent were neither working nor attendingcollege.
� Three percent were self-employed.
Many alumni were both working and attending four-year colleges.
The average annual salary of employed surveyrespondents was $15,683 in 1999. Although there isno comparable data on the average salary for allemployed reservation residents, the average percapita income on Tribal College reservations($4,665 in 1990) offers some indication of howdifficult it is to make a living wage on the reservations.
“If it weren’t for Sinte Gleska I would still beignorant of my Lakota culture. This is perhapsthe strongest aspect of Tribal Colleges.”
—Graduate, Sinte Gleska University
���������������
Cultural studies, community service, internships andbusiness training are key components of the TribalCollege curricula:
� The Tribal Colleges offer courses in triballanguages, literature and other subjectsreflecting Native American culture. Withoutthese classes traditional tribal languages mightdisappear. Courses are taught in ways thatrespect Native American cultural traditions. For
instance, Bay Mills Community College inMontana offers a tribal literature class only inthe winter, because the stories are to be toldonly when snow is on the ground. Thesecolleges also serve as the primary repositories ofarchival materials on tribal history and culture.
� In terms of community service, 22 TribalColleges offered adult basic education, remedialcourses or high school equivalency programs to
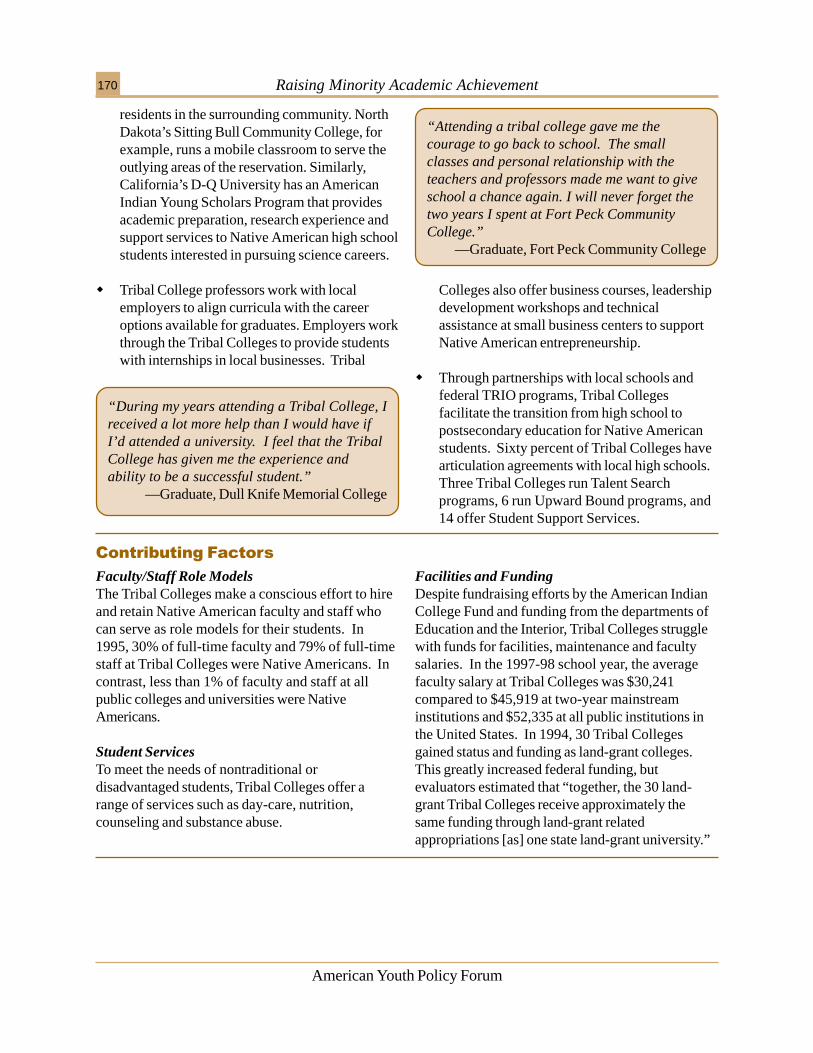
Raising Minority Academic Achievement170
American Youth Policy Forum
Faculty/Staff Role ModelsThe Tribal Colleges make a conscious effort to hireand retain Native American faculty and staff whocan serve as role models for their students. In1995, 30% of full-time faculty and 79% of full-timestaff at Tribal Colleges were Native Americans. Incontrast, less than 1% of faculty and staff at allpublic colleges and universities were NativeAmericans.
Student ServicesTo meet the needs of nontraditional ordisadvantaged students, Tribal Colleges offer arange of services such as day-care, nutrition,counseling and substance abuse.
������������������
“During my years attending a Tribal College, Ireceived a lot more help than I would have ifI’d attended a university. I feel that the TribalCollege has given me the experience andability to be a successful student.”
—Graduate, Dull Knife Memorial College
“Attending a tribal college gave me thecourage to go back to school. The smallclasses and personal relationship with theteachers and professors made me want to giveschool a chance again. I will never forget thetwo years I spent at Fort Peck CommunityCollege.”
—Graduate, Fort Peck Community College
residents in the surrounding community. NorthDakota’s Sitting Bull Community College, forexample, runs a mobile classroom to serve theoutlying areas of the reservation. Similarly,California’s D-Q University has an AmericanIndian Young Scholars Program that providesacademic preparation, research experience andsupport services to Native American high schoolstudents interested in pursuing science careers.
� Tribal College professors work with localemployers to align curricula with the careeroptions available for graduates. Employers workthrough the Tribal Colleges to provide studentswith internships in local businesses. Tribal
Colleges also offer business courses, leadershipdevelopment workshops and technicalassistance at small business centers to supportNative American entrepreneurship.
� Through partnerships with local schools andfederal TRIO programs, Tribal Collegesfacilitate the transition from high school topostsecondary education for Native Americanstudents. Sixty percent of Tribal Colleges havearticulation agreements with local high schools.Three Tribal Colleges run Talent Searchprograms, 6 run Upward Bound programs, and14 offer Student Support Services.
Facilities and FundingDespite fundraising efforts by the American IndianCollege Fund and funding from the departments ofEducation and the Interior, Tribal Colleges strugglewith funds for facilities, maintenance and facultysalaries. In the 1997-98 school year, the averagefaculty salary at Tribal Colleges was $30,241compared to $45,919 at two-year mainstreaminstitutions and $52,335 at all public institutions inthe United States. In 1994, 30 Tribal Collegesgained status and funding as land-grant colleges.This greatly increased federal funding, butevaluators estimated that “together, the 30 land-grant Tribal Colleges receive approximately thesame funding through land-grant relatedappropriations [as] one state land-grant university.”
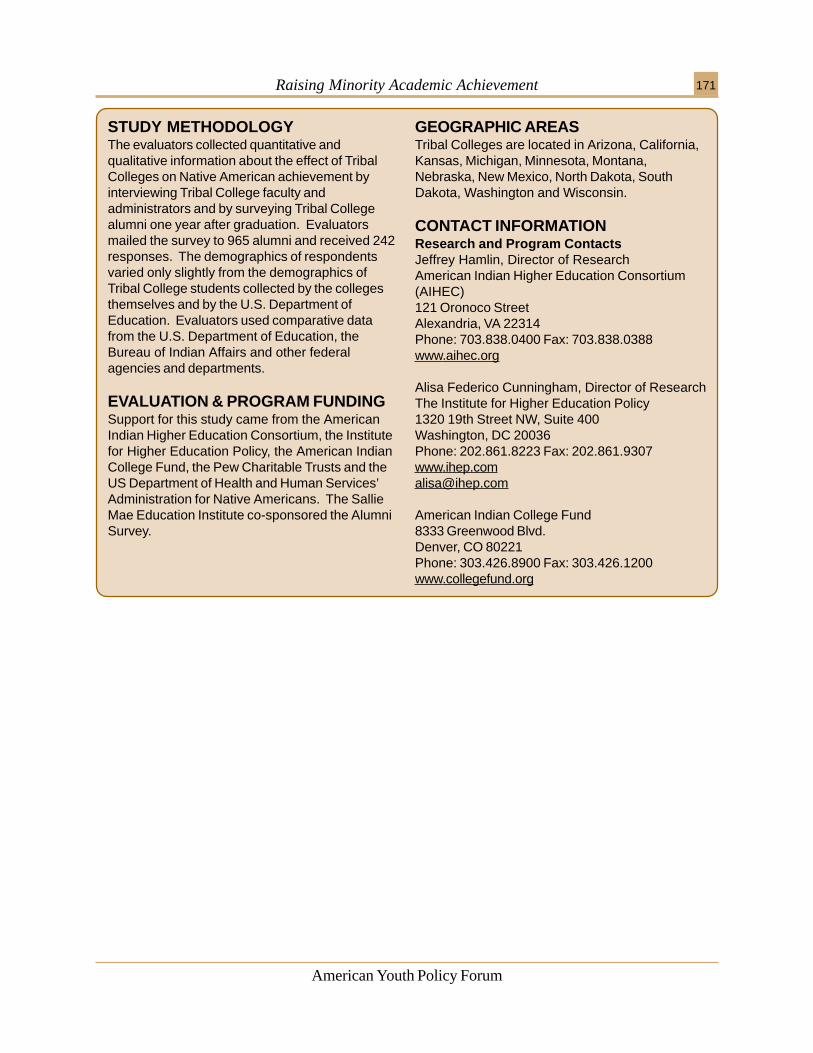
Raising Minority Academic Achievement 171
American Youth Policy Forum
STUDY METHODOLOGYThe evaluators collected quantitative andqualitative information about the effect of TribalColleges on Native American achievement byinterviewing Tribal College faculty andadministrators and by surveying Tribal Collegealumni one year after graduation. Evaluatorsmailed the survey to 965 alumni and received 242responses. The demographics of respondentsvaried only slightly from the demographics ofTribal College students collected by the collegesthemselves and by the U.S. Department ofEducation. Evaluators used comparative datafrom the U.S. Department of Education, theBureau of Indian Affairs and other federalagencies and departments.
EVALUATION & PROGRAM FUNDINGSupport for this study came from the AmericanIndian Higher Education Consortium, the Institutefor Higher Education Policy, the American IndianCollege Fund, the Pew Charitable Trusts and theUS Department of Health and Human Services’Administration for Native Americans. The SallieMae Education Institute co-sponsored the AlumniSurvey.
GEOGRAPHIC AREASTribal Colleges are located in Arizona, California,Kansas, Michigan, Minnesota, Montana,Nebraska, New Mexico, North Dakota, SouthDakota, Washington and Wisconsin.
CONTACT INFORMATIONResearch and Program ContactsJeffrey Hamlin, Director of ResearchAmerican Indian Higher Education Consortium(AIHEC)121 Oronoco StreetAlexandria, VA 22314Phone: 703.838.0400 Fax: 703.838.0388www.aihec.org
Alisa Federico Cunningham, Director of ResearchThe Institute for Higher Education Policy1320 19th Street NW, Suite 400Washington, DC 20036Phone: 202.861.8223 Fax: [email protected]
American Indian College Fund8333 Greenwood Blvd.Denver, CO 80221Phone: 303.426.8900 Fax: 303.426.1200www.collegefund.org
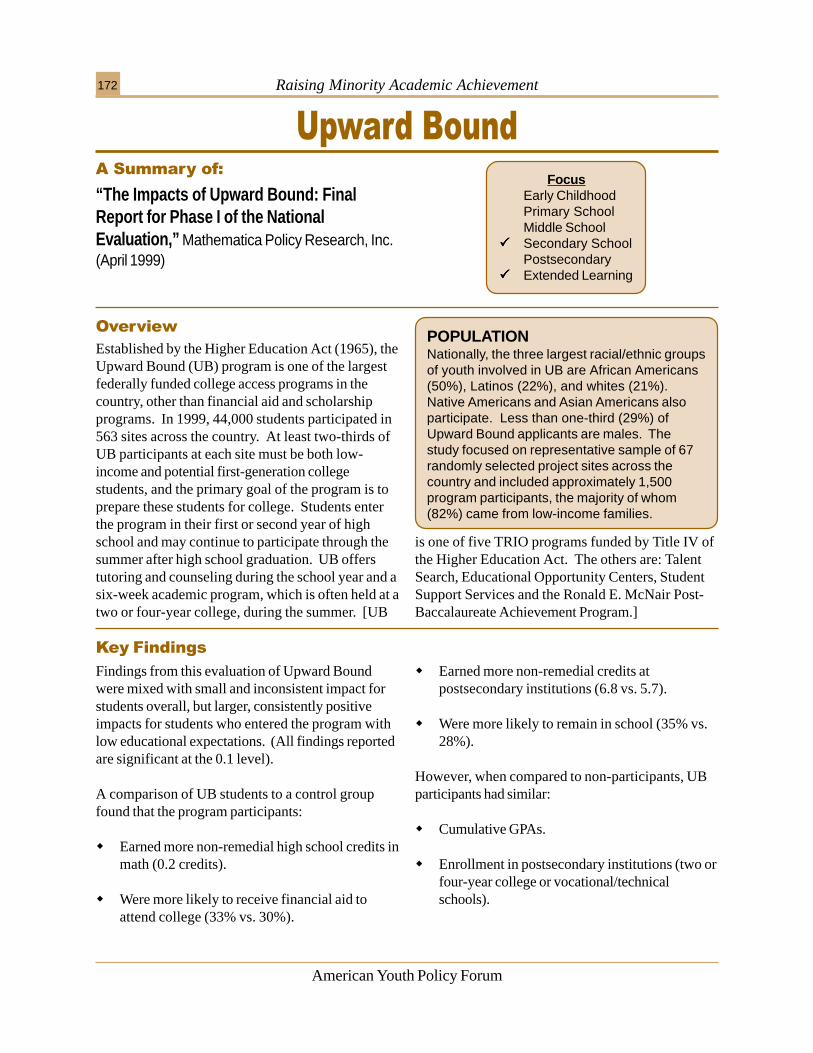
Raising Minority Academic Achievement172
American Youth Policy Forum
Established by the Higher Education Act (1965), theUpward Bound (UB) program is one of the largestfederally funded college access programs in thecountry, other than financial aid and scholarshipprograms. In 1999, 44,000 students participated in563 sites across the country. At least two-thirds ofUB participants at each site must be both low-income and potential first-generation collegestudents, and the primary goal of the program is toprepare these students for college. Students enterthe program in their first or second year of highschool and may continue to participate through thesummer after high school graduation. UB offerstutoring and counseling during the school year and asix-week academic program, which is often held at atwo or four-year college, during the summer. [UB
?������(���������������
� �� ���
“The Impacts of Upward Bound: FinalReport for Phase I of the NationalEvaluation,” Mathematica Policy Research, Inc.(April 1999)
POPULATIONNationally, the three largest racial/ethnic groupsof youth involved in UB are African Americans(50%), Latinos (22%), and whites (21%).Native Americans and Asian Americans alsoparticipate. Less than one-third (29%) ofUpward Bound applicants are males. Thestudy focused on representative sample of 67randomly selected project sites across thecountry and included approximately 1,500program participants, the majority of whom(82%) came from low-income families.
FocusEarly ChildhoodPrimary SchoolMiddle School
����� Secondary SchoolPostsecondary
����� Extended Learning
������������
Findings from this evaluation of Upward Boundwere mixed with small and inconsistent impact forstudents overall, but larger, consistently positiveimpacts for students who entered the program withlow educational expectations. (All findings reportedare significant at the 0.1 level).
A comparison of UB students to a control groupfound that the program participants:
� Earned more non-remedial high school credits inmath (0.2 credits).
� Were more likely to receive financial aid toattend college (33% vs. 30%).
� Earned more non-remedial credits atpostsecondary institutions (6.8 vs. 5.7).
� Were more likely to remain in school (35% vs.28%).
However, when compared to non-participants, UBparticipants had similar:
� Cumulative GPAs.
� Enrollment in postsecondary institutions (two orfour-year college or vocational/technicalschools).
is one of five TRIO programs funded by Title IV ofthe Higher Education Act. The others are: TalentSearch, Educational Opportunity Centers, StudentSupport Services and the Ronald E. McNair Post-Baccalaureate Achievement Program.]
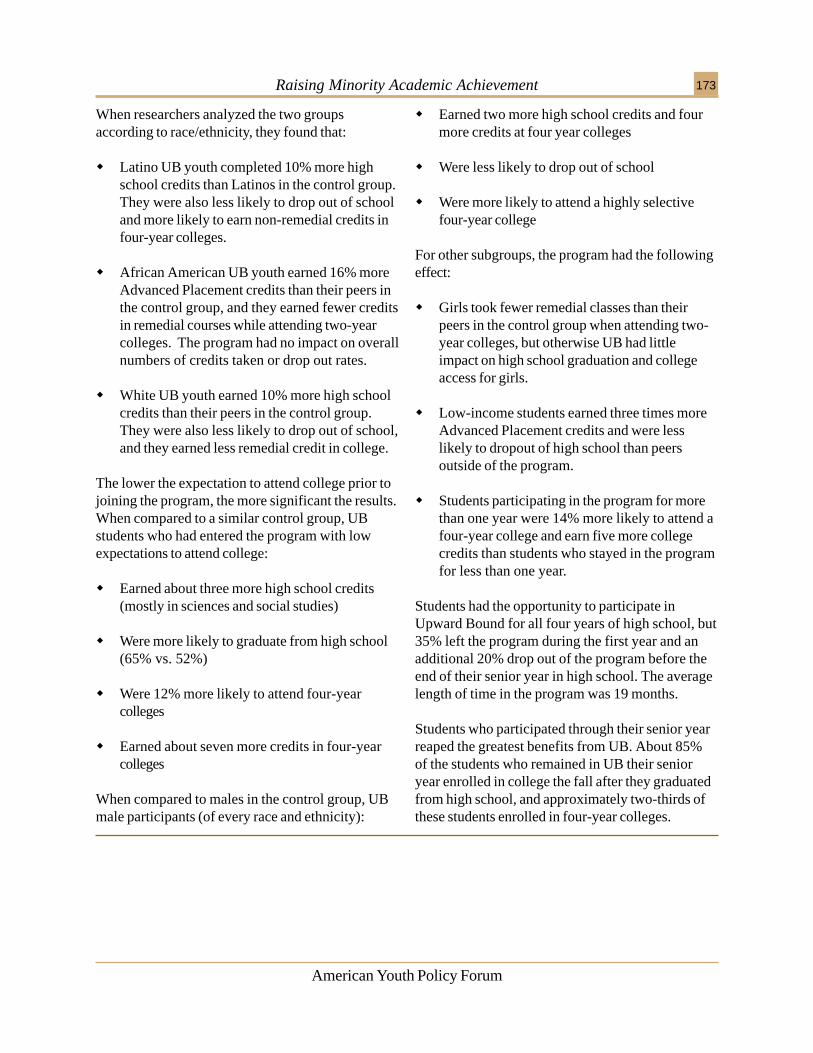
Raising Minority Academic Achievement 173
American Youth Policy Forum
When researchers analyzed the two groupsaccording to race/ethnicity, they found that:
� Latino UB youth completed 10% more highschool credits than Latinos in the control group.They were also less likely to drop out of schooland more likely to earn non-remedial credits infour-year colleges.
� African American UB youth earned 16% moreAdvanced Placement credits than their peers inthe control group, and they earned fewer creditsin remedial courses while attending two-yearcolleges. The program had no impact on overallnumbers of credits taken or drop out rates.
� White UB youth earned 10% more high schoolcredits than their peers in the control group.They were also less likely to drop out of school,and they earned less remedial credit in college.
The lower the expectation to attend college prior tojoining the program, the more significant the results.When compared to a similar control group, UBstudents who had entered the program with lowexpectations to attend college:
� Earned about three more high school credits(mostly in sciences and social studies)
� Were more likely to graduate from high school(65% vs. 52%)
� Were 12% more likely to attend four-yearcolleges
� Earned about seven more credits in four-yearcolleges
When compared to males in the control group, UBmale participants (of every race and ethnicity):
� Earned two more high school credits and fourmore credits at four year colleges
� Were less likely to drop out of school
� Were more likely to attend a highly selectivefour-year college
For other subgroups, the program had the followingeffect:
� Girls took fewer remedial classes than theirpeers in the control group when attending two-year colleges, but otherwise UB had littleimpact on high school graduation and collegeaccess for girls.
� Low-income students earned three times moreAdvanced Placement credits and were lesslikely to dropout of high school than peersoutside of the program.
� Students participating in the program for morethan one year were 14% more likely to attend afour-year college and earn five more collegecredits than students who stayed in the programfor less than one year.
Students had the opportunity to participate inUpward Bound for all four years of high school, but35% left the program during the first year and anadditional 20% drop out of the program before theend of their senior year in high school. The averagelength of time in the program was 19 months.
Students who participated through their senior yearreaped the greatest benefits from UB. About 85%of the students who remained in UB their senioryear enrolled in college the fall after they graduatedfrom high school, and approximately two-thirds ofthese students enrolled in four-year colleges.
Raising Minority Academic Achievement174
American Youth Policy Forum
Challenging Academic EnvironmentThe advanced academic coursework after schooland during the summer programs is comparable tocollege preparatory programs enjoyed by moreadvantaged students. Exposure to college levelwork on college campuses gives disadvantagedstudents a vision of themselves undertaking andsucceeding in postsecondary education.
Student-Centered InitiativeRather than focusing on reforming an entire schoolor intervening in the families and communities ofyoung people, UB focuses on raising the academicachievement of each individual student.
������������������
Student CommitmentThe benefits of the program were greatest forstudents who committed to the program for all fouryears of high school, but not all students couldcommit for that long. Many left the program inorder to get jobs or because transportation toprogram sites was unavailable.
���������������
Upward Bound is a year-round academicenrichment program for disadvantaged students(grades 9-12) that includes counseling, after schoolclasses during the year, and intensive summerprograms.
� During the school year, UB staff provideweekly, academic support for programparticipants through high school visits, tutoringand mentoring relationships.
� After school, UB participants can take advantageof high level courses usually taught at nearby two-and four-year colleges, but sometimes held at ahigh school or community-based organization.
The summer programs, often hosted by two- andfour-year colleges, provide intensive academictraining with classes in math, the sciences, arts,literature, and other subjects. The summerprograms run six weeks, and they provide UBparticipants a vision of the possibilities and promisesof higher education.
Evaluators argued that since the impact of theprogram on students entering with lowerexpectations was consistently positive across a rangeof achievement outcomes, UB might be moreeffective if students with lower educationalexpectations and poorer academic records wererecruited in greater numbers by, for instance,targeting ninth graders with C and D averages.
�!������������
To address the high program dropout rate ofparticipants seeking paid employment, evaluatorssuggest that UB provide “employment opportunitiesthat complement the design and curriculum” of theprogram.
Raising Minority Academic Achievement 175
American Youth Policy Forum
STUDY METHODOLOGYMathematica researchers examined longitudinalsurvey data from a group of program applicantswho were randomly assigned to participate ineither the program (1,479 UB participants) or acontrol group (1,320 members). The groups wereselected during the 1992-93 and 1994-95 schoolyears. The almost 3,000 youth in the study camefrom a sample of 67 UB sites, also randomlyselected. The groups were subdivided intosubgroups according to gender, race/ethnicity,expectation to attend college, low-income andpotential first generation of college student.These youth filled out baseline questionnairesbetween 1992 and 1994, and follow up surveys in1994 and 1996. Researchers also collected highschool and (when available) college transcripts,as well as project staff evaluations of students.This was an interim report of a longitudinal study,so most of the participants had completed highschool, but few were of an age to have finishedcollege. Findings are most reliable with regard tohigh school outcomes. Future studies will reportmore accurate data on postsecondaryachievement.
EVALUATION & PROGRAM FUNDINGThe U.S. Department of Education conductedand funded the evaluation. The program isfunded by the federal government under theHigher Education Act.
GEOGRAPHIC AREASUB sites are located in all fifty states and theDistrict of Columbia. Mathematica did not indicatethe location of specific sites examined for theevaluation.
CONTACT INFORMATIONResearch ContactsAllen Schirm and David MyersMathematica Policy Research, Inc.600 Maryland Avenue, SW, Suite 550Washington, DC 20024-2512202.484.9220www.mathematica-mpr.comdmyers@mathematica-mpr.com
David GoodwinU.S. Department of EducationPlanning and Evaluation Services400 Maryland Avenue, SW, Room 6W306Washington, DC 20202www.ed.gov/offices/OUS/[email protected]
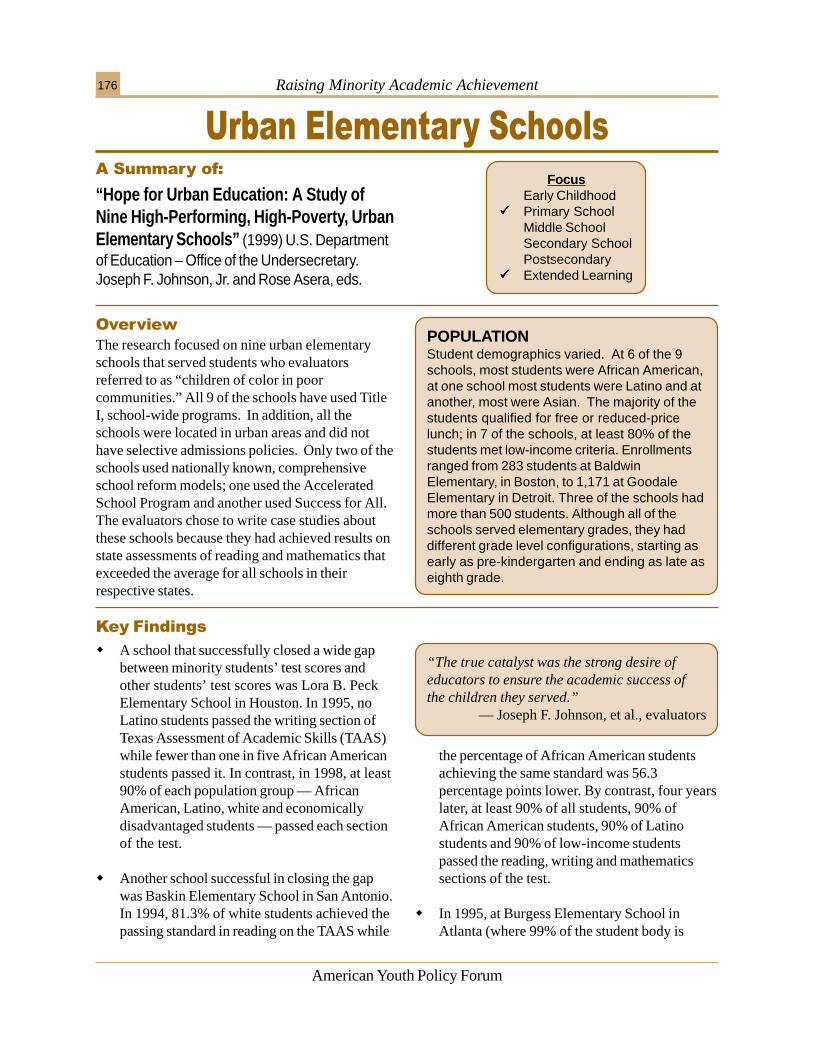
Raising Minority Academic Achievement176
American Youth Policy Forum
The research focused on nine urban elementaryschools that served students who evaluatorsreferred to as “children of color in poorcommunities.” All 9 of the schools have used TitleI, school-wide programs. In addition, all theschools were located in urban areas and did nothave selective admissions policies. Only two of theschools used nationally known, comprehensiveschool reform models; one used the AcceleratedSchool Program and another used Success for All.The evaluators chose to write case studies aboutthese schools because they had achieved results onstate assessments of reading and mathematics thatexceeded the average for all schools in theirrespective states.
?�-���� ������������� �������������
� �� ���
“Hope for Urban Education: A Study ofNine High-Performing, High-Poverty, UrbanElementary Schools” (1999) U.S. Departmentof Education – Office of the Undersecretary.Joseph F. Johnson, Jr. and Rose Asera, eds.
POPULATIONStudent demographics varied. At 6 of the 9schools, most students were African American,at one school most students were Latino and atanother, most were Asian. The majority of thestudents qualified for free or reduced-pricelunch; in 7 of the schools, at least 80% of thestudents met low-income criteria. Enrollmentsranged from 283 students at BaldwinElementary, in Boston, to 1,171 at GoodaleElementary in Detroit. Three of the schools hadmore than 500 students. Although all of theschools served elementary grades, they haddifferent grade level configurations, starting asearly as pre-kindergarten and ending as late aseighth grade.
FocusEarly Childhood
����� Primary SchoolMiddle SchoolSecondary SchoolPostsecondary
����� Extended Learning
������������
� A school that successfully closed a wide gapbetween minority students’ test scores andother students’ test scores was Lora B. PeckElementary School in Houston. In 1995, noLatino students passed the writing section ofTexas Assessment of Academic Skills (TAAS)while fewer than one in five African Americanstudents passed it. In contrast, in 1998, at least90% of each population group — AfricanAmerican, Latino, white and economicallydisadvantaged students — passed each sectionof the test.
� Another school successful in closing the gapwas Baskin Elementary School in San Antonio.In 1994, 81.3% of white students achieved thepassing standard in reading on the TAAS while
the percentage of African American studentsachieving the same standard was 56.3percentage points lower. By contrast, four yearslater, at least 90% of all students, 90% ofAfrican American students, 90% of Latinostudents and 90% of low-income studentspassed the reading, writing and mathematicssections of the test.
� In 1995, at Burgess Elementary School inAtlanta (where 99% of the student body is
“The true catalyst was the strong desire ofeducators to ensure the academic success ofthe children they served.”
— Joseph F. Johnson, et al., evaluators
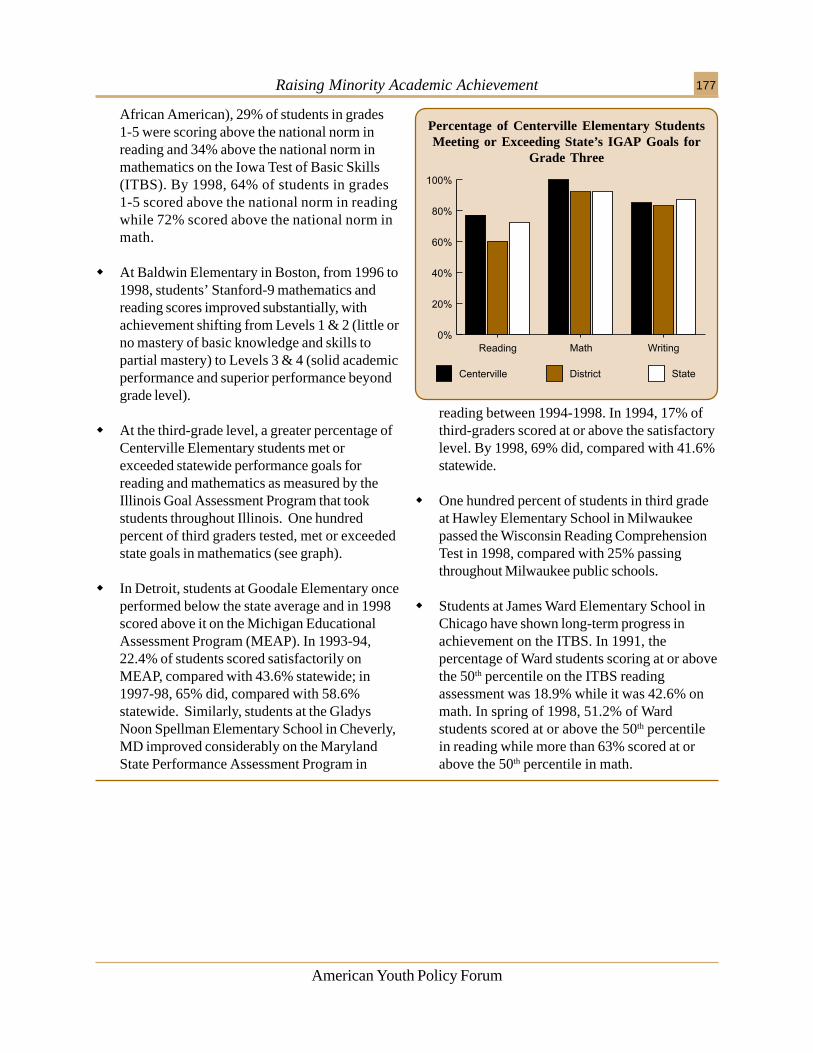
Raising Minority Academic Achievement 177
American Youth Policy Forum
Percentage of Centerville Elementary StudentsMeeting or Exceeding State’s IGAP Goals for
Grade Three
African American), 29% of students in grades1-5 were scoring above the national norm inreading and 34% above the national norm inmathematics on the Iowa Test of Basic Skills(ITBS). By 1998, 64% of students in grades1-5 scored above the national norm in readingwhile 72% scored above the national norm inmath.
� At Baldwin Elementary in Boston, from 1996 to1998, students’ Stanford-9 mathematics andreading scores improved substantially, withachievement shifting from Levels 1 & 2 (little orno mastery of basic knowledge and skills topartial mastery) to Levels 3 & 4 (solid academicperformance and superior performance beyondgrade level).
� At the third-grade level, a greater percentage ofCenterville Elementary students met orexceeded statewide performance goals forreading and mathematics as measured by theIllinois Goal Assessment Program that tookstudents throughout Illinois. One hundredpercent of third graders tested, met or exceededstate goals in mathematics (see graph).
� In Detroit, students at Goodale Elementary onceperformed below the state average and in 1998scored above it on the Michigan EducationalAssessment Program (MEAP). In 1993-94,22.4% of students scored satisfactorily onMEAP, compared with 43.6% statewide; in1997-98, 65% did, compared with 58.6%statewide. Similarly, students at the GladysNoon Spellman Elementary School in Cheverly,MD improved considerably on the MarylandState Performance Assessment Program in
reading between 1994-1998. In 1994, 17% ofthird-graders scored at or above the satisfactorylevel. By 1998, 69% did, compared with 41.6%statewide.
� One hundred percent of students in third gradeat Hawley Elementary School in Milwaukeepassed the Wisconsin Reading ComprehensionTest in 1998, compared with 25% passingthroughout Milwaukee public schools.
� Students at James Ward Elementary School inChicago have shown long-term progress inachievement on the ITBS. In 1991, thepercentage of Ward students scoring at or abovethe 50th percentile on the ITBS readingassessment was 18.9% while it was 42.6% onmath. In spring of 1998, 51.2% of Wardstudents scored at or above the 50th percentilein reading while more than 63% scored at orabove the 50th percentile in math.
Raising Minority Academic Achievement178
American Youth Policy Forum
Instructional CoachingPrincipals tended to spend a large percentage oftheir time in the classrooms observing teachers,reinforcing good teaching techniques and helping toimprove instruction. Some schools created a new“instructional guide” position, separate from otheradministrative positions. Instructional guides providedinstructional coaching and support for teachers.
Clear AccountabilityThe schools created “clear, measurable and rigorousschool accountability provisions,” observed theevaluators. A focus on adequate yearly progress,they added, was insufficient.
Capacity-Building StrategiesStates and districts set high expectations for theschools but also provided adequate support for
������������������
them to meet these expectations. One of themost important supports was time for schoolpersonnel to align instruction to standards andassessments.
High Quality TrainingPrincipals and school decision-making committeeshad high quality training that helped them usedata to focus resources on critical areas ofinstructional need.
Extended Learning TimeThe schools had resources that enabled them toincrease the quantity of time available forinstruction. The evaluators cited after-schoolprograms, “Saturday Schools” and extended-yearprograms as important vehicles for ensuring thatstudents met challenging standards.
“Even though there are far too many well-documented stories of intellectually vapidschools that perpetuate cycles of povertyand further limit the life choices ofchildren, there are some urban schoolsthat are giving new life to theircommunities and transforming the futuresof the children they serve.”
— Joseph F. Johnson, et al., evaluators
���������������
These were all public schools that used federal TitleI dollars to create Title I school-wide programs. Theypooled all of their resources to improve achievementthroughout the entire school instead of targeting federalresources to only those children who met eligibilitycriteria based on financial need. Though achievement-boosting initiatives varied from school-to-school, therewere some common components:
� A visible and attainable, initial goal helped schoolsmove toward broader, more ambitious goals.
� A sense of responsibility was fostered amongstudents for appropriate behavior, cutting downon time spent with discipline and enhancinginstructional time.
� The use of data helped schools to identify,acknowledge and celebrate strengths whilefocusing attention and resources on areas of need.
� Instruction was aligned to the standards andassessments required by the state and/or theschool district.
� Professional development for teachers wasadded in tandem with school-wide or curriculumchanges. School leaders made sure thatteachers felt like they had adequate materials,equipment and training.
� Confidence and respect of parents was pursuedby educators, primarily by improving theachievement of students.
Raising Minority Academic Achievement 179
American Youth Policy Forum
STUDY METHODOLOGYTeams of researchers made two-day visits to all 9schools during which they interviewed campusand district administrators, teachers, parents andother school personnel. They also observedclassrooms, hallways, playgrounds and variousmeetings. Finally, they reviewed various schooldocuments and achievement data.
EVALUATION & PROGRAM FUNDINGThe U.S. Department of Education funded theevaluation. The schools were all public schoolsthat used federal Title I dollars to create Title Ischool-wide programs.
GEOGRAPHIC AREASThe high-performing, urban schools selectedwere: Harriet A. Baldwin School, Boston, MA;Baskin Elementary School, San Antonio, TX;
Burgess Elementary School, Atlanta, GA;Centerville Elementary School, East St. Louis, IL;Goodale Elementary School, Detroit, MI; HawleyEnvironmental Elementary School, Milwaukee,WI; Lora B. Peck Elementary School, Houston,TX; Gladys Noon Spellman Elementary School,Cheverly, MD and James Ward ElementarySchool, Chicago, IL.
CONTACT INFORMATIONResearch ContactsMary RaglandThe Charles A Dana CenterThe University of Texas at Austin2901 North IH-35, Suite 2.200Austin, TX 78722-2348Phone: 512.471.6190Fax: [email protected]
PROGRAM CONTACTSWilliam Batchelor, PrincipalGoodale Elementary School9835 Dickerson StDetroit, MI 48213Phone: 313.852.8500
Burnett Butler, PrincipalCenterville Elementary School3429 Camp Jackson RdEast St Louis, IL 62206Phone: 618.332.3727
Gwendolyn Carter, PrincipalBurgess Elementary School480 Clifton St SEAtlanta, GA 30316Phone: 404.371.4853
LaWanna Goodwin, PrincipalLora B. PeckElementary School5130 Arvilla LnHouston, TX 77021Phone: 713.845.7463
Robert Helminiak, PrincipalHawley EnvironmentalElementary School5610 W Wisconsin AveMilwaukee, WI 53213Phone: 414.475.7096
Suzanne Lee, PrincipalHarriet A. Baldwin School121 Corey RoadBrighton, MA 02135Phone: 617.635.8460
Janet Lopez, PrincipalGladys Noon SpellmanElementary School3324 64th AveCheverly, MD 20785Phone: 301.925.1944
Carmen Payne, PrincipalBaskin Elementary School630 Crestview DrSan Antonio, TX 78201Phone: 210.735.5921
Sharon Wilcher, PrincipalJames Ward ElementarySchool2701 S Shields AveChicago, IL 60616Phone: 773.534.9050
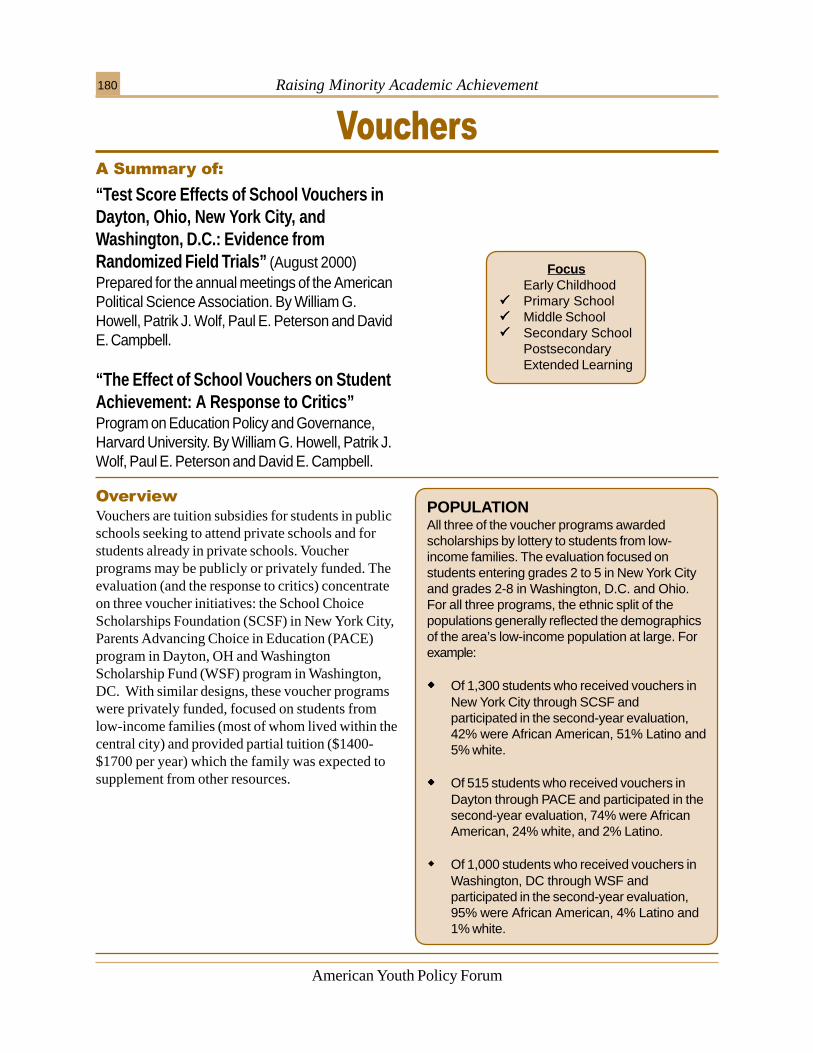
Raising Minority Academic Achievement180
American Youth Policy Forum
Vouchers are tuition subsidies for students in publicschools seeking to attend private schools and forstudents already in private schools. Voucherprograms may be publicly or privately funded. Theevaluation (and the response to critics) concentrateon three voucher initiatives: the School ChoiceScholarships Foundation (SCSF) in New York City,Parents Advancing Choice in Education (PACE)program in Dayton, OH and WashingtonScholarship Fund (WSF) program in Washington,DC. With similar designs, these voucher programswere privately funded, focused on students fromlow-income families (most of whom lived within thecentral city) and provided partial tuition ($1400-$1700 per year) which the family was expected tosupplement from other resources.
/�����������������
� �� ���
“Test Score Effects of School Vouchers inDayton, Ohio, New York City, andWashington, D.C.: Evidence fromRandomized Field Trials” (August 2000)Prepared for the annual meetings of the AmericanPolitical Science Association. By William G.Howell, Patrik J. Wolf, Paul E. Peterson and DavidE. Campbell.
“The Effect of School Vouchers on StudentAchievement: A Response to Critics”Program on Education Policy and Governance,Harvard University. By William G. Howell, Patrik J.Wolf, Paul E. Peterson and David E. Campbell.
POPULATIONAll three of the voucher programs awardedscholarships by lottery to students from low-income families. The evaluation focused onstudents entering grades 2 to 5 in New York Cityand grades 2-8 in Washington, D.C. and Ohio.For all three programs, the ethnic split of thepopulations generally reflected the demographicsof the area’s low-income population at large. Forexample:
����� Of 1,300 students who received vouchers inNew York City through SCSF andparticipated in the second-year evaluation,42% were African American, 51% Latino and5% white.
����� Of 515 students who received vouchers inDayton through PACE and participated in thesecond-year evaluation, 74% were AfricanAmerican, 24% white, and 2% Latino.
� Of 1,000 students who received vouchers inWashington, DC through WSF andparticipated in the second-year evaluation,95% were African American, 4% Latino and1% white.
FocusEarly Childhood
����� Primary School����� Middle School����� Secondary School
PostsecondaryExtended Learning
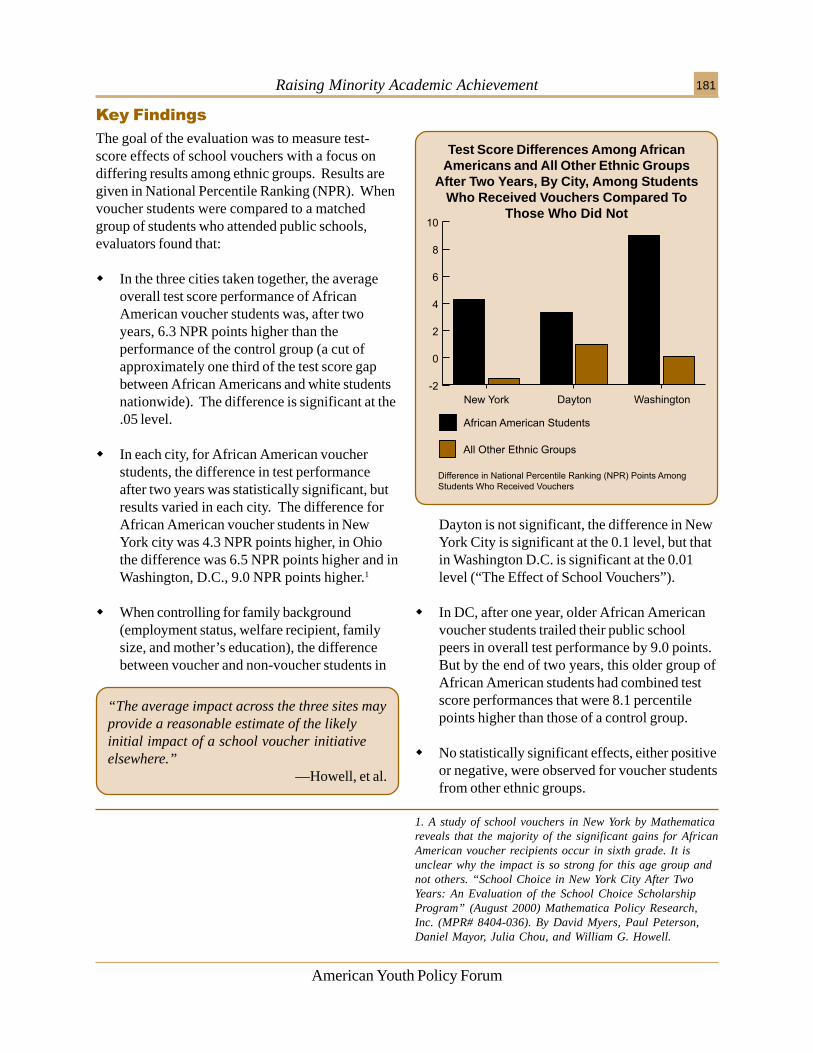
Raising Minority Academic Achievement 181
American Youth Policy Forum
������������
The goal of the evaluation was to measure test-score effects of school vouchers with a focus ondiffering results among ethnic groups. Results aregiven in National Percentile Ranking (NPR). Whenvoucher students were compared to a matchedgroup of students who attended public schools,evaluators found that:
� In the three cities taken together, the averageoverall test score performance of AfricanAmerican voucher students was, after twoyears, 6.3 NPR points higher than theperformance of the control group (a cut ofapproximately one third of the test score gapbetween African Americans and white studentsnationwide). The difference is significant at the.05 level.
� In each city, for African American voucherstudents, the difference in test performanceafter two years was statistically significant, butresults varied in each city. The difference forAfrican American voucher students in NewYork city was 4.3 NPR points higher, in Ohiothe difference was 6.5 NPR points higher and inWashington, D.C., 9.0 NPR points higher.1
� When controlling for family background(employment status, welfare recipient, familysize, and mother’s education), the differencebetween voucher and non-voucher students in
Dayton is not significant, the difference in NewYork City is significant at the 0.1 level, but thatin Washington D.C. is significant at the 0.01level (“The Effect of School Vouchers”).
� In DC, after one year, older African Americanvoucher students trailed their public schoolpeers in overall test performance by 9.0 points.But by the end of two years, this older group ofAfrican American students had combined testscore performances that were 8.1 percentilepoints higher than those of a control group.
� No statistically significant effects, either positiveor negative, were observed for voucher studentsfrom other ethnic groups.
1. A study of school vouchers in New York by Mathematicareveals that the majority of the significant gains for AfricanAmerican voucher recipients occur in sixth grade. It isunclear why the impact is so strong for this age group andnot others. “School Choice in New York City After TwoYears: An Evaluation of the School Choice ScholarshipProgram” (August 2000) Mathematica Policy Research,Inc. (MPR# 8404-036). By David Myers, Paul Peterson,Daniel Mayor, Julia Chou, and William G. Howell.
“The average impact across the three sites mayprovide a reasonable estimate of the likelyinitial impact of a school voucher initiativeelsewhere.”
—Howell, et al.
Test Score Differences Among AfricanAmericans and All Other Ethnic Groups
After Two Years, By City, Among StudentsWho Received Vouchers Compared To
Those Who Did Not
Raising Minority Academic Achievement182
American Youth Policy Forum
The evaluators acknowledge that they have yet todetermine which specific factors could have led tothe positive outcome they found for AfricanAmerican students who switched from public toprivate school. But the evaluators, as well as othersresearching voucher programs, have theorized thatthe following factors may have contributed to theachievement gains:
������������������
���������������
SCSF: In early 1997 SCSF provided 1,300scholarships, worth up to $1,400 annually for threeyears to children from low-income families currentlyattending public schools. The scholarship could beapplied toward the cost of attending a privateschool, either religious or secular. To be eligiblefor a scholarship, children had to be enteringgrades 1 to 5, live in New York City, attend apublic school and come from families with incomeslow enough to qualify for the U.S. government’sfree school lunch program.
PACE: For the 1998-99 school year, PACE offeredscholarships for four years to 515 students whowere in public schools and 250 students who werealready enrolled in private schools. Students whowere from low-income families and who wereentering grades K-12 qualified. The maximumaward was a $1,200 annual voucher guaranteed forfour years.
WSF: After a large infusion of philanthropic fundsin October 1997, WSF expanded an existingvoucher program to offer more than 1,000scholarships, with a majority going to students notpreviously in a private school. To qualify, applicantshad to be entering grades K-8 in fall 1998. WSFawarded recipients, from families with incomes at or
below the poverty line, vouchers that equaled 60%of tuition or $1,700, whichever was less. Recipientsfrom families with incomes above the poverty linereceived smaller scholarships.
The three voucher programs evaluated shared somekey components.
� All focused on students from low-incomefamilies who lived in the central city, and alloffered partial tuition scholarships.
� A lottery system decided the final scholarshiprecipients after initial eligibility was determined,giving each family an equal chance to be chosen.All three programs had hundreds more familiesapply for vouchers than could be awarded.
� Vouchers could be used to attend any privateschool within the metropolitan area.
� All three of the voucher programs wereprivately funded.
� Most voucher recipients had to supplement thevoucher funds with their own money or otherscholarships to meet the private school tuitioncosts.
� Classroom Environment: Parents of voucherrecipients believed that classes in privateschools had less cheating, fighting, propertydestruction, racial conflict, truancy andabsenteeism.
� Peer Groups: Evaluators allowed that positivepeer influences could have contributed to theincreased achievement, but their research didnot prove or disprove this hypothesis.
Raising Minority Academic Achievement 183
American Youth Policy Forum
STUDY METHODOLOGYThe evaluator used randomized field trials, usingthe students who had applied for vouchers but didnot win the lottery system as a control group.Vouchers were provided to students who attendedboth public and private schools, but the evaluationincluded only those students who were attendingpublic schools. Students entering the lottery hadsimilar academic achievement as tested by theIowa Test of Basic Skills. Families of voucherstudents in New York and D.C. had higherincomes than the families of non-voucherstudents. The opposite was true in Dayton.Differences between voucher and non-vouchergroups were mathematically adjusted. Eachstudent was given an NPR score in math andreading that may vary between 0 and 100.Nationwide, median student performance is 50.Results are reported for math, reading and acombined score that is the average of the mathand reading scores.
EVALUATION & PROGRAM FUNDINGThe evaluation was funded by grants from thefollowing foundations: Achelis Foundation,Bodman Foundation, Lynde and Harry BradleyFoundation, William Donner Foundation, ThomasB. Fordham Foundation, Milton and Rose D.Friedman Foundation, John M. Olin Foundation,David and Lucile Packard Foundation, Smith-Richardson Foundation, Spencer Foundation andWalton Family Foundation. The voucherprograms considered in the evaluation are allprivately funded.
GEOGRAPHIC AREASSCSF was in New York City, PACE was inDayton, OH and WSF was in Washington, DC.Voucher programs are in place in other statesacross the nation as well.
CONTACT INFORMATIONResearch ContactsPaul Peterson, Research AssociateProgram on Education Policy and GovernanceKennedy School of Government79 J.F. Kennedy St.Harvard UniversityCambridge, MA 02138Phone: 617.495.7976 Fax: 617.496.4428http://data.fas.harvard.edu/pepg/[email protected]
Program ContactsSchool Choice Scholarships Foundation730 5th Avenue, 9th FloorNew York, NY 10019
T. J. WallaceParents Advancing Choice in Education6450 Sand Lake Road, Suite 100Dayton, OH 45414Phone: 937.264.4800
Danny Labry, Executive DirectorWashington Scholarship Fund1133 15th St NW # 550Washington, DC 20005Phone: 202.293.5560 Fax: 202.293.7893www.wsf-dc.org
Raising Minority Academic Achievement184
American Youth Policy Forum
4 ������American College Test (ACT): A standardized
examination first created in 1959 by the AmericanCollege Testing Program and used primarily byschools in the Midwest and West to determinestudent readiness for postsecondary education. TheACT includes 215 multiple choice questions,focusing on four subject areas: English, mathematics,reading, and science. Composite scores range from0 to 36. Approximately 40% of high school seniorsin the United States take the ACT.
Advanced Placement (AP): College-level academiccourses taken during high school that confercollege credit if students pass standardizedexaminations at the end of the courses.
After-School Programs: Programs run by schoolsand/or community based organizations that providerecreational and learning activities for studentsafter the end of the regular school day (usuallyfrom about 3:00 PM to 6:00 PM) or on theweekends. Some of these programs are supportedthrough federal 21st Century Community LearningCenter legislation. The legislation defines acommunity learning center as “an entity within apublic elementary, middle or secondary schoolbuilding that (1) provides educational,recreational, health, and social service programsfor residents of all ages within a local community,and (2) is operated by a local educational agency(LEA) in conjunction with local governmentalagencies, businesses, vocational educationprograms, institutions of higher education,community colleges, and cultural, recreational,and other community and human service entities.”
Alignment: Matching the skills and knowledgeimparted by school or program curricula with therequirements of state standards and tests as well asthe demands of postsecondary education andemployment.
Applied Curriculum: A course of study that usesreal-world problem solving assignments to teachtheoretical concepts and academic skills.
California Achievement Test (CAT): A series ofnorm-referenced standardized tests used acrossthe country to measure academic achievement ofelementary, middle, and high school students in sixsubject areas: reading, language, spelling,mathematics, study skills, and science. Percentilescores are reported rather than raw scores.
Comparison Group: An existing collection ofindividuals, similar enough to the treatment group,but who do not participate in the program orinitiative being studied and whose achievement ismeasured against the treatment group to assess theintervention’s effectiveness. For instance, a groupof students in the same school but whose classdoes not participate in a determined program.Comparison groups are identified, but not created,by the researcher. Comparison groups are not asrigorous as Control Groups. See also ControlGroup, Experimental Design, Treatment Group andMatched Comparison/Control Group.
Control Group: A group of individuals who comefrom the same pool as the treatment group, but areassigned, preferentially through random processes(such as a lottery) not to receive the program orintervention and whose achievement is measuredagainst that of the treatment group. Controlgroups are created by the researcher as part of theexperimental design. See also Comparison Group,Experimental Design, Treatment Group andMatched Comparison/Control Group.
Correlation Coefficient: An index that describes theextent to which two sets of data are related or ameasure of the relationship between two variables.Correlation does not imply a causal relationship.It simply indicates whether two variables (such asgrades and attendance) are related.
Criterion-Referenced Test: A test that measuresstudent achievement in relation to established skilland/or content standards rather than against theperformance of other students (as in norm-referenced tests).
Raising Minority Academic Achievement 185
American Youth Policy Forum
Effect Size: A measure of the impact of an initiativebased on the difference between the mean scoresof the treatment and comparison/control groupsand the spread (or standard deviation) of eachgroup’s scores. See also Standard Deviation.
Experimental Design: The design of an evaluationstudy that randomly assigns students to treatmentand control groups and holds all other factors orvariables (e.g. socio-economic, demographic,environmental, etc.) constant as the students gothrough the education process so that thedifferences between the two groups can beattributed to the treatment employed (ineducational research, the treatment is the programor school initiative).
High-Stakes Tests: Examinations that implyconsequences for the future educational trajectoryof students, teachers, principals, and schools. Forstudents, failure carries penalties, such as notadvancing to the next grade level or graduating,regardless of other measures of achievement. Forschools, high failure rates might mean districttake-over or revoked accreditation.
Iowa Test of Basic Skills (ITBS): A norm-referenced, standardized test used across thecountry to measure aptitude and achievement ofstudents in grades K-8 in several areas: listening,word analysis, vocabulary, reading,comprehension, language skills, mathematics,social studies and science. Percentile scores arereported rather than raw scores. The RiversidePublishing Company, a subsidiary of HoughtonMifflin, publishes the ITBS.
Longitudinal Research: Evaluation that measures theeffect of a program or school initiative on onegroup of students at different points over time.This entails tracking students’ achievement whilethey participate in an initiative and for a number ofyears after they exit.
Matched Comparison/Control Group: Acomparison or control group where students aresimilar (matched) to the treatment group invariables that are important for the research, suchas race/ethnicity, age, gender, income level andacademic level. The comparisons will be valid andgeneralizable only when the two groups(comparison or control and treatment groups) aresimilar or matched.
National Assessment of Educational Progress(NAEP): Also called “the Nation’s Report Card,”NAEP was begun in 1969 as a continuousassessment of student knowledge and achievementin eight subject areas: reading, mathematics,science, writing, U.S. history, civics, geography,and the arts. A national sample of students ingrades 4, 8 and 12 take NAEP tests. NAEP ismandated by Congress and funded through theNational Center for Education Statistics in theU.S. Department of Education. Scores arereported for race/ethnicity and other subgroups ofstudents nationally and by state but not forindividual students or schools.
Normal Curve Equivalent (NCE): A standardizedscale of scores developed by the U.S. Departmentof Education that allows comparison betweendifferent types of tests and different groups ofstudents taking the same test. NCE scores have anormal curve distribution with a mean of 50 andstandard deviation of 21.
Norm-Referenced Test: A test that measures theperformance of individuals against the meanperformance of the other students taking the testrather than against a set of skill or contentstandards. Scores on norm-referenced tests arerelative and usually reported as percentiles. (Seealso Criterion-Referenced tests.)
Percentile: The standing of an individual in relationto a larger group of students taking the same test(e.g., a student scoring at the 75th percentilescored higher than 75% of the students taking thetest, but did not necessarily get ¾ of the answerson the test correct). [Percentiles are values thatdivide a sample of data into one hundred groupscontaining equal numbers of observations. Forexample, 50% of the data values lie below the 50thpercentile.]
Sample Size: The number of students included in anexperiment or evaluation, usually smaller than thetotal number of students participating in theprogram or school initiative but large enough torepresent the entire group.
Scholastic Aptitude Test (SAT): A standardizedexamination first developed by the College Boardin 1926 to determine student readiness forpostsecondary education. Today, the SAT focuseson two subject areas, measuring verbal and
Raising Minority Academic Achievement186
American Youth Policy Forum
mathematical ability. It is one of the most populartests used by college admissions officials (inconjunction with other application materials) todetermine whether to accept prospective students.Scores range from 200 points to 800 points on theVerbal and Mathematics sections of the test with amaximum potential score of 1600. Approximately40% of high school seniors in the United Statestake the SAT.
Small Learning Communities: The organization of aschool or youth program that is small enough toallow for personalized attention by staff andteachers for each student. The U.S. Department ofEducation supports small learning communitiesthrough Part A of Title X of the Elementary andSecondary Education Act (ESEA), which providesgrants to implement career academies, schools-within-schools, mentoring, career clusters andother strategies to restructure large schools.
Standard Deviation: Standard deviation is a measureof the spread or dispersion of a set of data. Themore widely the values are spread out, the largerthe standard deviation. For example, if a group ofstudents was given two exams and their scoresvaried from 30 to 98 on the first exam and from80 to 98 on the second exam, the standarddeviation is larger for the first exam.
Stanford-9 (SAT-9): A norm-referenced,standardized test used in schools nationwide tomeasure student achievement in grades K-12. Forelementary and middle school students, the testfocuses on vocabulary, reading, writing, spelling,and math. The subject areas for high schoolstudents are reading, writing, history/socialscience, math, and science. The Harcourt BraceEducational Measurement division publishes theSAT-9. Percentile scores are reported rather thanraw scores.
Texas Assessment of Academic Skills (TAAS): Acriterion-reference test administered annually bythe Texas Education Agency that measures studentachievement in reading and math (for grades 3-8and 12), in writing (for grades 4, 8, and 12), and inscience and social studies (grade 8). Spanishlanguage versions are available for grades 3-6.Texas students must pass the TAAS to graduatewith a high school diploma.
Treatment Group: In education research, this is thecollection of students who participate in a programor school initiative. Their attitudes or achievementoutcomes are often measured against control orcomparison groups to determine the effectivenessof the program or school initiative. See alsoControl Group and Comparison Group.
Note: For more information on testing and educationalresearch terms, see Gerald W. Bracey, “Thinking About Testsand Testing: A Short Primer in ‘Assessment Literacy’”(Washington: American Youth Policy Forum, 2000).Available on line at www.aypf.org/BraceyRep.pdf.
Raising Minority Academic Achievement 187
American Youth Policy Forum
(�- ��$�����Bailis, Lawrence Neil, Alan Melchior, Andrew Sokatch,
and Annabel Sheinberg. Expanding CollegeAccess, Strengthening Schools: Evaluation of theGE Fund College Bound Program. Waltham,Mass.: Center for Human Resources, HellerGraduate School, Brandeis University, 2000.
Bohrnstedt, George W. and Brian M. Stecher, eds.Class Size Reduction in California: The 1998-99Evaluation Findings. California: CSR ResearchConsortium, 2000.
Bohrnstedt, George W. and Brian M. Stecher, eds.Class Size Reduction in California: EarlyEvaluation Findings, 1996-1998. California:CSR Research Consortium, 1999.
Bohrnstedt, George, Pamela Jakwerth, CarlosRódriguez, and Sherri Quiñones. The SeniorSurvey Analysis of Cohorts 1, 2, and 3, ReportNo. 87. Washington, D.C.: American Institutes forResearch, 1999.
Bonsangue, Martin Vern and David Eli Drew.“Increasing Minority Students’ Success inCalculus,” New Directions for Teaching andLearning 61 (1995): 23-33.
Bottoms, Gene. “HSTW Assessment Scores ofAfrican-American and White Students.” SouthernRegional Education Board, Atlanta, Ga., 2001.Facsimile.
Bottoms, Gene. A High Schools that Work CaseStudy: Los Fresnos High School. Atlanta, Ga.:Southern Regional Education Board, 2000.
Bottoms, Gene and Mark Forge. Academic andVocational Teachers Can Improve the ReadingAchievement of Male Career-Bound Students.Atlanta, Ga.: Southern Regional Education Board,1999.
Burchinal, Margaret R., Frances A. Campbell, DonnaM. Bryant, Barbara H. Wasik, and Craig T. Ramey.“Early Intervention and Mediating Processes inCognitive Performance of Children of Low-Income African American Families.” ChildDevelopment 68 (1997): 935-954.
Campbell, Frances A., Elizabeth P. Pungello, ShariMiller-Johnson, Margaret Burchinal, and Craig T.Ramey. “The Development of Cognitive andAcademic Abilities: Growth Curves from an EarlyChildhood Educational Experiment.”Developmental Psychology 37 (2001): 231-242.
Campbell, Frances A. and Craig T. Ramey. “Cognitiveand School Outcomes for High-Risk AfricanAmerican Students at Middle Adolescence:Positive Effects of Early Intervention.” AmericanEducational Research Journal 32 (1995): 743-772.
Campbell, Patricia B., Ellen Wahl, Morton Slater,Elisabeth Iler, Babette Moeller, Harouna Ba, andDaniel Light. Make It Possible for Students toSucceed and They Will: An Evaluation of theGateway to Higher Education Program. NewYork: Education Development Center, 1997.
Carter, Samuel Casey. No Excuses: Lessons from 21High Performing, High Poverty Schools.Washington, D.C.: Heritage Foundation, 2000.
Catterall, James S. and Lynn Waldorf. “Chicago ArtsPartnership: Summary Evaluation.” In Championsof Change: The Impact of the Arts on Learning.Ed. Edward B. Fiske. Washington, D.C.: ArtsEducation Partnership and President’s Committeeon the Arts and Humanities, 1999.
Currie, Janet and Duncan Thomas. “Does Head StartHelp Hispanic Children?” Journal of PublicEconomics 74 (1999): 235-262.
Currie, Janet and Duncan Thomas. “Does Head StartMake a Difference?” American Economic Review85 (1995): 341-364.
Feinberg, Michael. “KIPP Results: StanfordAchievement Tests, New York State StandardizedTests, and the Texas Assessment of AcademicSkills.” KIPP Academies, Houston, Tex., 2001.Photocopy.
Feinberg, Michael. The KIPP Academy: An Innovativeand Effective Framework for Public Schools.Houston, Tex.: KIPP Academies, 2000.
Raising Minority Academic Achievement188
American Youth Policy Forum
Finn, Jeremy, Susan Gerber, Charles M. Achilles, andJayne Boyd-Zaharias. “The Enduring Effects ofSmall Classes.” Teachers College Record 103(2001): 145-183.
Finn, Jeremy D. Class Size and Students At-Risk:What Is Known? What is Next. A special reportprepared for the Office of Educational Researchand Improvement, U.S. Department of Education.Washington, D.C., 1998.
Gándara, Patricia. Over the Ivy Walls: EducationalMobility of Low-Income Chicanos. New York:State University of New York Press, 1995.
Gándara, Patricia. “Choosing Higher Education:Educationally Ambitious Chicanos and the Path toSocial Mobility.” Education Policy AnalysisArchives 2, no. 8 (1994), <http://epaa.asu.edu/epaa/v2n8.html> (21 February 2000).
Gandara, Patricia with Maria Mejorado, DiannaGutiérrez and Miguel Molina. Final Report of theEvaluation of High School Puente: 1994-1998.New York: Carnegie Corporation of New York,1998.
Guthrie, Larry F. and Grace Pung Guthrie.Longitudinal Research on AVID, 1999-2000:Final Report. Burlingame, Calif.: Center forResearch Evaluation and Training in Education,2000.
Ham, Sandra and Erica Walker. Getting to the RightAlgebra: The Equity 2000 Initiative inMilwaukee Public Schools. Princeton, N.J.:Manpower Demonstration Research Corporation,1999.
Harris, Josephine. Fifth Annual Status Report on theBlue Ribbon Task Force Recommendations,1998-1999. Chapel Hill, N.C.: Chapel Hill-Carrboro City Schools, 1999.
Howell, William G., Patrick J. Wolf, Paul E. Petersonand David E. Campbell. “Test Score Effects ofSchool Vouchers in Dayton, Ohio, New York City,and Washington, D.C.: Evidence from RandomizedField Trials.” Paper prepared for the annualmeeting of the American Political ScienceAssociation, Washington, D.C., September 2000.
Howell, William G., Patrik J. Wolf, Paul E. Petersonand David E. Campbell. “The Effect of SchoolVouchers on Student Achievement: A Response toCritics.” Occasional Paper, Program on EducationPolicy and Governance, Harvard University,Cambridge, Mass., <http://www.ksg.harvard.edu/pepg/> (5 September 2001).
Hurley, Eric A., Anne Chamberlain, Robert E. Slavin,and Nancy A. Madden. “Effects of Success for Allon TAAS Reading Scores: A Texas StatewideEvaluation.” Phi Delta Kappan 82 (June 2001):750-756.
Johnson, Amy. Sponsor-A-Scholar: Long-TermImpacts of a Youth Mentoring Program onStudent Performance. New York: CommonwealthFund, 1999.
Johnson, Joseph F. Jr. and Rose Asera, eds. Hope forUrban Education: A Study of Nine High-Performing, High-Poverty, Urban ElementarySchools. A special report prepared for the Officeof the Undersecretary, U.S. Department ofEducation, Washington, D.C., 1999.
Kahne, Joseph and Kim Bailey. “The Role of SocialCapital In Youth Development: The Case of ‘I Havea Dream.” Educational Evaluation and PolicyAnalysis 21 (1999): 321-43.
Kemple James J. and Jason C. Snipes. CareerAcademies: Impacts on Students’ Engagementand Performance in High School. Princeton, N.J.:Manpower Demonstration Research Corporation,2000.
Kosciuk, Steve. Impact of the Wisconsin EmergingScholars First-Semester Calculus Program.Madison: Lead Center, University of Wisconsin-Madison, 1997.
Krueger, Alan B. and Diane M. Whitmore. “WouldSmaller Classes Help Close the Black-WhiteAchievement Gap?” Working paper #451,Princeton University Industrial Relations Section,Princeton, N.J., 2001.
Kushman, James W. and Ray Barnhardt. Study ofAlaska Rural Systemic Reform: Final Report.Portland, Ore.: Northwest Regional EducationalLaboratory; Fairbanks, Alaska: University ofAlaska Fairbanks, 1999.
Raising Minority Academic Achievement 189
American Youth Policy Forum
Mathematica Policy Research. The Impacts of UpwardBound: Final Report for Phase I of the NationalEvaluation. Washington, D.C.: MathematicaPolicy Research, 1999.
Lamare, Judith . Sacramento START: An EvaluationReport, September 1996 — May 1997.Sacramento, Calif.: Sacramento NeighborhoodPlanning and Development Services Department,1998.
Lewis, Sharon and Michael Casserly. Beating theOdds: A City-By-City Analysis of the StudentPerformance and Achievement Gaps On StateAssessments. Washington, D.C.: Council of theGreat City Schools, 2001.
Lewis, Sharon, Jack Jepson and Michael Casserly.Closing the Achievement Gaps in UrbanSchools: A Survey of Academic Progress andPromising Practices in the Great City Schools.Washington, D.C.: Council of the Great CitySchools, 1999.
Lipka, Jerry. Closing the Gap: Education andChange. Portland, Ore.: Northwest RegionalEducational Laboratory; Fairbanks, Alaska:University of Alaska Fairbanks, 1999.
McHugh, Barbara and Sam Stringfield. Implementing aHighly Specialized, Curricular, Instructional,and Organizational School Design in a High-Poverty, Urban Elementary School: Three-YearResults. Baltimore, Md.: Johns HopkinsUniversity, 1998.
Mehan, Hugh, Irene Villanueva, Lea Hubbard, andAngela Lintz. Constructing School Success: TheConsequences of Untracking Low-AchievingStudents. Cambridge: Cambridge UniversityPress, 1996.
Molnar, Alex, et al. 1999-2000 Results of the StudentAchievement Guarantee in Education (SAGE)Program Evaluation. Milwaukee: Center forEducation Research, Analysis, and Innovation,School of Education, University of Wisconsin-Milwaukee, 2000.
Molnar, Alex, et al. 1998-99 Results of the StudentAchievement Guarantee in Education (SAGE)Program Evaluation. Milwaukee: Center forEducation Research, Analysis, and Innovation,School of Education, University of Wisconsin-Milwaukee, 1999.
Molnar, Alex, et al. “Evaluating the SAGE Program: APilot Program in Targeted Pupil-TeacherReduction in Wisconsin.” Educational Evaluationand Policy Analysis 21 (1999): 165-177.
Moreno, Susan E. and Chandra Muller. “Success andDiversity: The Transition Through First-YearCalculus in the University.” American Journal ofEducation 108 (1999): 30
Mosteller, Frederick. The Tennessee Study of ClassSize in the Early School Grades. Cambridge,Mass.: American Academy of Arts and Sciences,1995.
Opuni, Kwame A. Project GRAD: Program EvaluationReport, 1998-99. Houston, Tex.: University ofHouston, 1999.
Piñero, Ana C. Puerto Rico Louis Stokes Alliance forMinority Participation: 1999-2000, 1998-99and 1997-98 Annual Progress Reports.Arlington, Va.: National Science Foundation, 2000.
Reynolds, Arthur J. Success in Early Intervention:The Chicago Child-Parent Centers. Lincoln:University of Nebraska Press, 2000.
Reynolds, Arthur J., Judy A. Temple, Dylan L.Robertson, and Emily A. Mann. “Long-termEffects of An Early Childhood Intervention onEducational Achievement and Juvenile Arrest.”Journal of the American Medical Association285 (2001): 2339-2346.
Ródriguez, Carlos, Nidhi Khattri, and Mei Han. TheEquity 2000 Evaluation, a Summary Report:Impact and Implementation, Report No. 86.Washington, D.C.: Pelavin Research Center, 1997.
Schinke, Steven P., Kristin C. Cole, Stephen R. Poulin.“Enhancing the Educational Achievement of At-Risk Youth.” Prevention Science, 1 (2000): 51-60.
Raising Minority Academic Achievement190
American Youth Policy Forum
Skrla, Linda, James Scheurich and Joseph Johnson, Jr.Equity-Driven Achievement-Focused SchoolDistricts: A Report on Systemic School Successin Four Texas School Districts Serving DiverseStudent Populations. Austin: University of Texasat Austin, 2000.
Slater, Morton and Elisabeth Iler. Science andTechnology Entry Program: 1999-2000 FinalReport. New York: City University of New YorkMedical School, 2000.
Smith, Daryl and Sharon Parker. Progress andPromise: An Evaluation of the Compact forFaculty Diversity. Atlanta, Ga.: Southern RegionalEducation Board, 2000.
Snyder, Jon, Gale Morrison and R.C. Smith. Dare toDream: Educational Guidance for Excellence.Indianapolis, Ind.: Lilly Endowment, 1996.
Swanson, Mary Catherine. AVID: A 20th Anniversary,Yearbook 2000. San Diego, Calif.: AVID Center,2000.
Swanson, Mary Catherine. AVID Research andInformation: Annual Report, 1998-99. SanDiego, Calif.: AVID Center, 1999.
Tribal College Research and Database Initiative.Building Strong Communities: Tribal Collegesas Engaged Institutions. Alexandria, Va.:American Indian Higher Education Consortium;Denver, Colo.: Institute for Higher EducationPolicy, 2001.
Tribal College Research and Database Initiative.Creating Role Models for Change: A Survey ofTribal College Graduates. Alexandria, Va.:American Indian Higher Education Consortium;Denver, Colo.: Institute for Higher EducationPolicy; Washington, D.C.: American IndianCollege Fund, 2000.
Tribal College Research and Database Initiative. TribalCollege Contributions to Local EconomicDevelopment. Alexandria, Va.: American IndianHigher Education Consortium; Denver, Colo.:Institute for Higher Education Policy, 1999.
Tribal College Research and Database Initiative. TribalColleges: An Introduction. Alexandria, Va.:American Indian Higher Education Consortium;Denver, Colo.: Institute for Higher EducationPolicy, 1999.
Wenglinsky, Harold. Historically Black Colleges andUniversities: Their Aspirations andAccomplishments. Princeton, N.J.: PolicyInformation Center, Educational Testing Service,1999.

