the effect of the images depicted on food packaging on
TRANSCRIPT

2018 111
Ignacio Gil Pérez
The effect of the imagesdepicted on food
packaging on consumerperception and response
Departamento
Director/es
Ingeniería de Diseño y Fabricación
LIDÓN LÓPEZ, IVÁNREBOLLAR RUBIO, RUBÉN

© Universidad de ZaragozaServicio de Publicaciones
ISSN 2254-7606
Reconocimiento – NoComercial –SinObraDerivada (by-nc-nd): No sepermite un uso comercial de la obraoriginal ni la generación de obrasderivadas.
Ignacio Gil Pérez
THE EFFECT OF THE IMAGESDEPICTED ON FOOD PACKAGING ON
CONSUMER PERCEPTION ANDRESPONSE
Director/es
Ingeniería de Diseño y Fabricación
LIDÓN LÓPEZ, IVÁNREBOLLAR RUBIO, RUBÉN
Tesis Doctoral
Autor
2018
UNIVERSIDAD DE ZARAGOZA
Repositorio de la Universidad de Zaragoza – Zaguan http://zaguan.unizar.es

2018 PhD thesis
supervisors Rubén Rebollar RubioIván Lidón López
Ignacio Gil Pérez
THE EFFECT OF THE IMAGESDEPICTED ON FOOD PACKAGINGON CONSUMER PERCEPTION AND RESPONSE

The effect of the images depicted on food packaging on consumer perception and response
Ignacio Gil Pérez
Rubén Rebollar Rubio
Iván Lidón López
Author
Supervisors
Escuela de Ingeniería y Arquitectura 2018
PhD Thesis
Análisis de la influencia de la imagen mostrada en los envases alimentarios en la percepción y expectativas del consumidor
Doctoral dissertation
Presented by:
Ignacio Gil Pérez
Supervisors:
Dr. Rubén Rebollar Rubio
Dr. Iván Lidón López
In order to obtain the PhD degree within the Doctoral Program
in Design and Manufacturing Engineering
of the University of Zaragoza.
Cover icons created by Wojciech Zasina.
Zaragoza, September 2018

A María
y su sonrisa.

The body of this thesis consists in a compilation of six manuscripts, of which
five have been published in international JCR scientific journals of the
Food Science and Technology category and one has been submitted for pub-
lication:
• Rebollar, R., Gil, I., Lidón, I., Martín, J., Fernández, M. J., & Rivera, S.
(2017). How material, visual and verbal cues on packaging influence
consumer expectations and willingness to buy: The case of crisps (po-
tato chips) in Spain. Food Research International, 99, 239–246. https://
doi.org/10.1016/j.foodres.2017.05.024
• Rebollar, R., Lidón, I., Gil-Pérez, I., & Martín, J. (2018). Images used to
convey that a natural yogurt is sweetened influence consumer expec-
tations and willingness to buy. Submitted to the Journal of Dairy Science.
• Rebollar, R., Lidón, I., Gil, I., Martín, J., Fernández, M. J., & Riveres,
C. E. (2016). The influence the serving suggestion displayed on soft
cheese packaging has on consumer expectations and willingness to
buy. Food Quality and Preference, 52, 188–194. https://doi.org/10.1016/j.
foodqual.2016.04.015
• Lidón, I., Rebollar, R., Gil-Pérez, I., Martín, J., & Vicente-Villardón,
J. L. (in press). The influence the image of the product shown on food
packaging labels has on product perception during tasting: Effects
and gender differences. Packaging Technology and Science. https://doi.
org/10.1002/pts.2407
• Gil-Pérez, I., Rebollar, R., Lidón, I., Piqueras-Fiszman, B., & van Trijp,
H. C. M. (2019). What do you mean by hot? Assessing the associations
raised by the visual depiction of an image of fire on food packaging.
Food Quality and Preference, 71, 384–394. https://doi.org/10.1016/j.food-
qual.2018.08.015
• Gil-Pérez, I., Rebollar, R., Lidón, I., Martín, J., van Trijp, H. C. M., &
Piqueras-Fiszman, B. (2019). Hot or not? Conveying sensory informa-
tion on food packaging through the spiciness-shape correspondence.
Food Quality and Preference, 71, 197–208. https://doi.org/10.1016/j.food-
qual.2018.07.009

Acknowledgements
Thanks to my thesis supervisors Iván Lidón and Rubén Rebollar for their
tireless and continuous support, their invaluable advice, and our meetings
around meals of fried eggs. Needless to say, I could not have written this thesis
without you. No less can be said about Javier Martín, whose remarkable pa-
tience in helping me understand the obscure mysteries of statistical methods
cannot be overestimated. Thank you for not giving up.
Thanks to Betina Piqueras-Fiszman and Hans van Trijp, for welcoming me
to the Wageningen University Marketing and Consumer Behaviour group. Our
discussions helped me to find my path and to carry out this work, and the won-
derful people I met there turned quickly from colleagues to friends.
I would also like to thank the international experts who evaluated a first draft
of this document, and whose comments and suggestions allowed me to improve
it substantially.
No querría pasar por alto lo mucho que me han ayudado las personas que me
acompañan en mi día a día. Estoy muy agradecido a mis amigos, a quienes ha
parecido no importar el poco tiempo que les he dedicado en los últimos años.
De algún modo, siempre conseguís mejorar los momentos buenos, y hacer que
los malos no lo sean tanto.
Gracias también a mi padre, de quien tanto he aprendido y a quien hubiera en-
cantado verme llegar hasta aquí, y a mi madre, cuyo amor, actitud y vitalidad
me inspiran cada día. Gracias por vuestro ejemplo.
Y por supuesto a ti, María. Gracias por compartir la vida conmigo.

Abstract | xi
Abstract
Food shopping is a low-involvement process in which consumers spend little
time and cognitive resources evaluating products and deciding which to choo-
se. Literature shows that people unconsciously rely on heuristics to make jud-
gements and use the different packaging cues as diagnostic tools by which they
infer product attributes and information; thus, each packaging cue should be
designed considering what its role will be in this process. Although a great deal
of research studies how the different packaging cues convey meaning and the-
reby affect perception, the role of packaging imagery has barely been studied,
despite being a prominent visual sign that draws attention at the point of sale
and requires a type of unconscious and unintentional processing. Specifically,
the influence of some image’s features such as its subject (i.e. what is depicted
on it) on consumer perception and response is still almost unexplored. Moreo-
ver, images tend to be intrinsically ambiguous stimuli since they can elicit di-
fferent interpretations (e.g. depicting fire on a bag of nuts can convey either
roast flavour or spiciness). Thus, for designers, it is not easy to foresee how an
image will be interpreted, since the underlying mechanisms of this process
have only attracted modest scientific attention to date.
Therefore, the aim of this thesis is twofold. First, it seeks to study how manipu-
lating the subject shown on packaging imagery influences consumer expecta-
tions, perception, and response towards the product. Second, it aims to inves-
tigate how consumers infer meaning from ambiguous images. These objectives
are addressed across six research studies by using an array of methods and te-
chniques such as questionnaires, self-report scales, projective techniques, and
speeded classification tasks. The results show that both manipulating what is
depicted on the image and the way it is depicted influence consumer expecta-
tions and response, since the attributes of the products displayed on the packa-
ging tend to influence the evaluation of the product contained within (although
xii | Abstract
the effect is stronger for expectations than for perception during tasting). In
addition, the work compiled here demonstrates that the congruence between
the image’s possible meanings and the product’s potential attributes plays a
key role in how the image is interpreted, since the more congruent meaning
tends to be favoured. Moreover, the results also show that the interpretation
given to an image can be modulated by manipulating the image’s shape. Overa-
ll, these findings contribute to research on design, semiotics, sensory science,
and consumer psychology, and thus are discussed under an interdisciplinary
approach.
This thesis has been carried out following the official procedure for the com-
pletion of an International PhD, for which the candidate did a three-month re-
search stay at the Wageningen University Marketing and Consumer Behaviour
group (in The Netherlands). The main body of this dissertation consists of a
compilation of six manuscripts, of which five have been published in inter-
national JCR scientific journals of the Food Science and Technology category,
and one has been submitted for publication.
Resumen | xiii
Resumen
Comprar comida es un proceso de baja implicación en el que los consumidores
invierten poco tiempo y recursos cognitivos decidiendo qué comprar. La lite-
ratura muestra que la gente se apoya inconscientemente en juicios heurísticos
y usa los diferentes elementos del envase como herramientas diagnósticas en
base a las que inferir atributos e información del producto, por lo que cada ele-
mento del envase debe diseñarse considerando cuál será su papel en este proce-
so. Aunque un gran número de investigaciones estudia el modo mediante el que
los distintos elementos del envase comunican información (y por lo tanto afec-
tan a la percepción), el papel específico de las imágenes en este proceso ha sido
escasamente estudiado a pesar de ser un importante elemento visual que atrae
la atención en el punto de venta y requiere un tipo de procesado inconsciente
y no intencional. Específicamente, tan apenas sabemos nada respecto a la in-
fluencia que tienen algunas características de la imagen, como su motivo (es
decir, qué se muestra), en la percepción y respuesta del consumidor. Además,
las imágenes tienden a ser estímulos intrínsecamente ambiguos que pueden
evocar distintos significados (por ejemplo, en un paquete de frutos secos, una
imagen de fuego puede interpretarse como que los frutos secos son tostados o
que son picantes). Por ello, para los diseñadores no es fácil anticipar cómo in-
terpretarán los consumidores una imagen ya que los mecanismos subyacentes
a este proceso han sido hasta la fecha poco estudiados.
Esta tesis tiene por tanto un doble objetivo. Primero, busca estudiar cómo la
manipulación del motivo mostrado en las imágenes de un envase influye en
las expectativas, percepción y respuesta del consumidor. Segundo, preten-
de investigar el proceso mediante el que los consumidores infieren significa-
do a partir de imágenes ambiguas. Estos objetivos se abordan a través de seis
estudios de investigación utilizando un conjunto de técnicas y métodos tales
como cuestionarios, escalas de auto-evaluación, técnicas proyectivas y prue-
bas de clasificación rápida. Los resultados muestran que tanto manipular qué
se muestra en una imagen como cómo se muestra influye en la percepción y
respuesta del consumidor, puesto que los atributos de aquello representado en
el envase tienden a influir en la evaluación del producto contenido en su in-
terior (aunque el efecto es mayor en las expectativas que en la percepción en
cata). Además, el trabajo reunido aquí demuestra que la congruencia entre los
posibles significados de la imagen y los atributos potenciales del producto jue-
ga un papel crucial en el modo en que la imagen es interpretada (puesto que
tiende a favorecerse los significados más congruentes), y que la interpretación
dada a una imagen puede modularse mediante la manipulación de su forma. En
general, estos resultados contribuyen a los campos del diseño, la semiótica, la
ciencia sensorial y la psicología del consumidor y por lo tanto se discuten desde
un enfoque interdisciplinar.
Esta tesis se ha desarrollado siguiendo el procedimiento oficial para conseguir
un doctorado internacional, para lo que el doctorando realizó una estancia de
investigación de tres meses en el Marketing and Consumer Behaviour group
de la Universidad de Wageningen (Países Bajos). El cuerpo principal de esta te-
sis consiste en una compilación de seis artículos, de los que cinco han sido
publicados en revistas científicas indexadas en la categoría Food Science and
Technology del JCR y uno se encuentra en revisión.
xiv | Resumen
Table of contents | xv
Table of contents
AbstractResumenList of figuresList of tables
Introduction
Starting point
BackgroundFood perception
Packaging influence on food perception
Packaging imagery influence on food perception
Methodological considerations
Rationale and objectives
Thesis outline
Thesis outline
Summary of publicationsStudy 1: How material, visual and verbal cues on pac-
kaging influence consumer expectations and willing-
ness to buy: The case of crisps (potato chips) in Spain
xi
xiii
xviii
xix
1
3
6
6
9
14
20
24
27
29
32
32
1.
2.
1.2.1.
2.2.1.
1.1.
2.1.
2.2.
1.2.
1.3.
1.4.
1.2.2.
1.2.3.
xvi | Table of contents
Study 2: Images used to convey that a natural yogurt
is sweetened influence consumer expectations and
willingness to buy
Study 3: The influence the serving suggestion
displayed on soft cheese packaging has on consumer
expectations and willingness to buy
Study 4: The influence the image of the product shown
on food packaging labels has on product perception
during tasting: Effects and gender differences
Study 5: What do you mean by hot? Assessing the
associations raised by the visual depiction of an image
of fire on food packaging
Study 6: Hot or not? Conveying sensory information
on food packaging through the spiciness-shape
correspondence
Publications
Study 1: How material, visual and verbal cues on packaging influence consumer expectations and willingness to buy: The case of crisps (potato chips) in Spain
Study 2: Images used to convey that a natural yogurt is sweetened influence consumer expectations and willingness to buy
Study 3: The influence the serving suggestion displayed on soft cheese packaging has on consumer expectations and willingness to buy
Study 4: The influence the image of the product shown on food packaging labels has on product perception during tasting: Effects and gender differences
Study 5: What do you mean by hot? Assessing the associations raised by the visual depiction of an image of fire on food packaging
36
40
44
48
51
55
57
67
109
119
131
3.
2.2.4.
2.2.5.
2.2.6.
2.2.2.
2.2.3.
3.1.
3.2.
3.3.
3.4.
3.5.

Table of contents | xvii
Study 6: Hot or not? Conveying sensory information on food packaging through the spiciness-shape correspondence
General discussion
ContributionsObjective 1: How manipulating the subject shown
on packaging imagery influences consumer
expectations, perception and response towards the
product
Objective 2: How consumers infer meaning from an
ambiguous image
Practical implications
Methods used
Limitations and future work
Conclusions
Conclusions
Conclusiones
References
Appendices
Publications’ impact factors
Co-authorship contribution
Related research activities
145
159
161
162
165
166
169
171
175
177
179
181
205
207
209
212
3.6.
4.1.
4.2.
5.1.
5.2.
7.1.
7.2.
7.3.
4.3.
4.
5.
6.
7.
4.1.1.
4.1.2.
4.1.3.
xviii | List of figures
List of figures
Fig. 1. Results of the multidimensional scaling (Study 1).
Fig. 2. Stimuli used in part II of Study 1.
Fig. 3. Stimuli used in Study 2.
Fig. 4. Results of the multidimensional scaling (Study 2).
Fig. 5. Stimuli used in Study 3.
Fig. 6. Results of the multidimensional scaling (Study 3).
Fig. 7. Stimuli used in Study 4.
Fig. 8. Canonical representation of the cohort (Study 4).
Fig. 9. Examples of the stimuli (salad, tabasco, and skewers) without fire
and with fire used in Study 5.
Fig. 10. Mean reaction times in milliseconds as a function of (a) product
congruency with the literal meanings of fire (i.e. barbecue, roasted) and
the depiction of fire and (b) product congruency with the metaphorical
meaning of fire (i.e. spicy) and the depiction of fire.
Fig. 11. Example of an angular fire icon and a rounded fire icon bag of
nuts used in Study 6.
Fig. 12. Mediation analysis conducted in Study 6.
34
35
37
39
41
43
45
47
49
50
52
53

List of tables | xix
List of tables
Table 1. List of objectives addressed in each study. 26


Introduction | 1
INTRODUCTION1.

Introduction | 3
Starting point
Almost every marketed product comes in some form of packaging. This is true
not only throughout the different phases of the supply chain but also at the
point of sale, where it is difficult to find a single product which is marketed
completely unpackaged (Azzi, Battini, Persona, & Sgarbossa, 2012). As a visit
to any supermarket shows, packaging has become a common part of the con-
sumption process (Mumani & Stone, 2018). However, the importance of pac-
kaging within this process has been gaining traction over the years, since to-
day its role goes far beyond the mainly functional role that it was supposed to
play (Mumani & Stone, 2018; Nancarrow, Wright, & Brace, 1998). A package is
not only expected to protect the product, but also to promote it by effectively
communicating its characteristics. It can be defined as a system of product,
package, and distribution, which perform functions of protection, utility, and
communication in physical, atmospheric, and human environments (Lockhart,
1997). Overall, packaging has become a key marketing cue which is capable, by
itself, of drawing attention and creating desire (Klimchuk & Krasovec, 2012).
Marketing/communication dimensions of packaging are particularly relevant
for low-involvement products such as food. Visits to the supermarket are re-
petitive (e.g. once a week) and require making many decisions in a short period
of time, since it is a routine purchase in which consumers must discriminate
and decide between dozens of products very similar to each other (Park, Iyer, &
Smith, 1989). Thus, consumers decide which food products to buy by spending a
limited amount of time and cognitive resources. Instead of reading and evalua-
ting all the available information from each product (which would imply a great
cognitive load), consumers instead rely on certain available cues that allow
them to infer a sufficient degree of information relative to the product and its
attributes, in order to make quick decisions. Thus, packaging helps consumers
decide which product to choose by capturing their attention and convincing
1.1.
4 | Introduction
them that it contains the product which best suits their needs (Clement, 2007;
Underwood & Ozanne, 1998). As will be further elaborated in the next sections,
this means that packaging cues such as shape (Becker, van Rompay, Schiffers-
tein, & Galetzka, 2011), colour (Spence, 2018a), or imagery (Underwood & Klein,
2002) influence consumer perception and response towards the product.
In addition, food packaging has two particularities that reinforce its relevan-
ce as a marketing tool. On the one hand, packaging is always present at the
point of sale (even in an online environment, where an image of the packaged
product is usually shown), so that packaging always mediates the relationship
between the product and the consumer at the time of purchase. This is espe-
cially important in light of some studies that show that unplanned shopping
and in-store decision making have increased in recent years (Gilbride, Inman,
& Stilley, 2015). On the other hand, it is worth noting that on many occasions,
packaging is also present at the time of product consumption. Products such as
drinks, jams, preserves, or snacks are consumed directly from the packaging
or with the packaging in sight, and some estimates indicate that the number of
products that are consumed directly from their package amounts to one third
of the total (Spence, 2017). This implies that packaging cues such as colour (Pi-
queras-Fiszman & Spence, 2011), weight (Piqueras-Fiszman & Spence, 2012),
or even the way the package sounds (Krishna, Cian, & Aydınoğlu, 2017; Spence,
2016) can exert influence on consumer perception, not only at the buying stage
(i.e. when expectations are set) but also on the overall consumption experience.
Given the above, it is easy to realize that the decisions made by the designer
during the food packaging design process may influence consumers well be-
yond mere aesthetic acceptance (for the role of aesthetics on consumer atti-
tude and response, see e.g. Chitturi, Raghunathan, & Mahajan, 2008; Hoegg &
Alba, 2008; Reimann, Zaichkowsky, Neuhaus, Bender, & Weber, 2010). When
designing a food package, designers have to make many decisions regarding
functional aspects of the package. For example, they have to consider the most
appropriate size for the packaging in order to favour its handling and storage
(besides containing the product), the material that best preserves the protec-
tive atmosphere without being very expensive or difficult to open, and so on
(Mumani & Stone, 2018). The outcome of all these decisions has obvious po-
tential impacts on production costs, logistics, and safety, so the study of these
aspects has attracted great scientific interest so far (Azzi et al., 2012). In con-
trast, the consequences of design decisions relating to purely visual aspects of
Introduction | 5
packaging on consumer perception have traditionally been less studied. Given
that consumer choice is considered to be mostly driven by the product’s visual
appearance (Bloch, 1995; Creusen & Schoormans, 2005), visual packaging cues
like colour, imagery, or typographies were analysed from an aesthetic point of
view (Deng, Hui, & Hutchinson, 2010; Hagtvedt & Patrick, 2014; Hoegg, Alba,
& Dahl, 2010) or regarding its ability to capture the attention of the consumer
(Clement, Kristensen, & Grønhaug, 2013; Maynard, Munafò, & Leonards, 2013).
Only recently have we begun to be aware of the ability of the visual aspects of
food packaging to influence the multisensory experience and the attitude of
the consumer (Piqueras-Fiszman & Spence, 2015; Spence, 2016).
According to one of the most common design approaches, a key role of design
is organising visual communication (Byrne, 1990; Yang & Hsu, 2015). As Fras-
cara (1988, p. 21) puts it, design should not be understood in isolation but only
within a communication system. Thus, a packaging designer should not only
look for a result that guarantees that all functional requirements are met, but
also that has the desired effect on consumer perception and that communicates
in an efficient way (Hembree, 2008; Munari, 1973/2016). Consumers infer mea-
ning from each packaging cue (e.g. colours, images, or packaging shape, Ares et
al., 2011; Smith, Barratt, & Selsøe Sørensen, 2015; Thomson, 2016), so each cue
should be designed with consideration as to what will be its role in the com-
munication process. However, for the designer, it is not easy to anticipate what
specific meaning consumers will infer from each of the packaging cues (Smith
et al., 2015), although it is crucial to anticipate how each cue will be interpreted
and what its effect will be on consumer perception. This is particularly true
for the images depicted on the packaging. While images are one of the more
salient package features for both designers and consumers and are a prominent
communication device (Ampuero & Vila, 2006; Smith et al., 2015; Underwood
& Klein, 2002), relatively little research has been devoted to understand their
effect on consumer expectations and response. The present dissertation aims
to shed light on this matter by assessing, across six studies, how the images
depicted on food packaging affect expectations, perception, and response, and
the mechanisms by which they are interpreted.
6 | Introduction
Background
Food perception
There has been a huge growth of interest in the topic of food perception in
recent years. According to Solomon, Bamossy, Askegaard, & Hogg (2008), the
perceptual process can be divided in three phases: selection, organisation, and
interpretation. The process starts when some of the body sensory receptors re-
ceive an input (e.g. when the light reflected from an object reaches the eyes)
and the brain selects what parts of it will be processed. Although we receive a
huge amount of raw data at every moment through our sensory receptors, only
a fraction is further processed; in other words, the brain interprets the world
that surrounds us only from fragments. What part of the information is se-
lected and what part is left behind is mainly determined based on consumers’
previous experiences (which influences their expectations) and motives (their
interests, needs, etc.), which implies that even the same person may perceive
differently the same object at different times (Schiffman, Hansen, & Kanuk,
2012). In the next phase, selected information is organised into groups accor-
ding to the principles described by Gestalt psychology (Spillmann & Ehrens-
tein, 1996). This process allows consumers to perceive each bit of information
not as an isolated stimulus but rather as part of something bigger, which is
composed of a pattern of different pieces (Schiffman et al., 2012). Finally, the
stimulus is interpreted according to the outcome of the previous processes.
However, it should be noted that other factors may have an effect on interpre-
tation, as is the case of the clarity of the stimulus (Schiffman et al., 2012) or the
existence of individual differences. In addition to aspects such as consumers’
previous experiences or motives, physiological factors such as gender may lar-
gely contribute to the subjectivity of the interpretation given to the stimuli
(Knez & Kers, 2000; Oliveira-Pinto et al., 2014; Rebollar, Lidón, Guzmán, Gil, &
Martín, 2017).
1.2.
1.2.1.
Introduction | 7
Regarding food products, literature distinguishes among two groups of cues
that influence consumer perception: intrinsic and extrinsic cues (Asioli et al.,
2016; Olson & Jacoby, 1972). Intrinsic cues refer to properties belonging to the
food product itself, which cannot be changed without physically changing the
product (e.g. its aroma, taste, colour, or texture). Unsurprisingly, intrinsic cues
play a key role in the way consumers experience and perceive food, and the-
refore have a leading role in consumers’ expectations and responses (Olson
& Jacoby, 1972). Indeed, when thinking about food and perception, tastes and
flavours quickly come to mind as key attributes influencing food perception.
Although many researchers emphasise that taste and flavour are different con-
cepts, their contribution to food perception is beyond doubt (Spence, Smith, &
Auvray, 2014). Basic tastes refer to the specific gustatory sensations that occur
when the receptors located on the tongue are stimulated (i.e. bitter, sweet, sal-
ty, sour, and umami; Velasco, Woods, Petit, Cheok, & Spence, 2016), whereas
flavour is considered a complex multisensory concept which raises from gusta-
tory, olfactory, and trigeminal inputs (Spence et al., 2014; Spence, 2015a). Even
the sound produced by the food when it is being chewed (e.g. the crunchiness
of a crisp) is considered to contribute to flavour perception, which in turn may
have an effect on overall product perception (Zampini & Spence, 2004).
On the other hand, the extrinsic cues of a food product are all those attribu-
tes that surround the product but are not part of it, so they can be changed
without altering the product’s physical characteristics (Olson & Jacoby, 1972).
Although less obvious at first, the influence of food products’ extrinsic cues
on consumer perception has been well documented (see Piqueras-Fiszman &
Spence, 2015; Spence, 2017; Spence & Piqueras-Fiszman, 2014b; for reviews).
For example, research has shown that food extrinsic cues such as tableware
(e.g. its material, Piqueras-Fiszman, Laughlin, Miodownik, & Spence, 2012; its
shape, Lefebvre & Orlowski, 2018; its colour, Tu, Yang, & Ma, 2016; its texture,
Biggs, Juravle, & Spence, 2016; its weight, Piqueras-Fiszman, Harrar, Alcaide, &
Spence, 2011), atmospheric lighting properties (e.g. illuminance, Rebollar et al.,
2017; light colour, Yang, Cho, & Seo, 2016), or packaging may have an effect on
consumer expectations, perception, and the overall consumption experience.
In fact, packaging has been proven to be a prominent extrinsic cue capable of
even influencing sensory perception during tasting (e.g. Krishna et al., 2017;
Spence, 2016), although it should be noted that packaging’s main contribution
to consumer perception occurs during the generation of expectations since the
majority of times it is seen prior to consumption.
8 | Introduction
The brain generates expectations by integrating previously experienced infor-
mation and all the product-related cues available at the time, which may in-
clude intrinsic cues such as the food’s visual appearance or aroma (Andersen,
Brockhoff, & Hyldig, 2018) and extrinsic cues such as its packaging, the plate on
which it is served, or environmental background music (Piqueras-Fiszman &
Spence, 2015). Indeed, packaging is a relevant food product extrinsic cue which
influence on consumer food perception has been widely recognized. Given that
in the majority of cases packaging is available at the buying stage (i.e. prior to
food consumption), consumers use it as a diagnostic tool with which to identify
and categorise the product (Loken, 2006; Loken, Barsalou, & Joiner, 2008) and
to infer the intrinsic attributes of the food (Schifferstein, Fenko, Desmet, Lab-
be, & Martin, 2013). Thus, packaging plays a prominent role in setting sensory,
non-sensory, and hedonic expectations. Indeed, it has been shown to affect
sensory expectations, such as the product’s flavour (Becker et al., 2011; Pique-
ras-Fiszman & Spence, 2011); non-sensory expectations, such as the product’s
healthfulness (Rebollar et al., 2017; van Ooijen, Fransen, Verlegh, & Smit, 2017),
naturalness (Machiels & Karnal, 2016; Yang et al., 2016), or quality (Fernqvist &
Ekelund, 2014; Walters & Long, 2012); and hedonic expectations (Caporale, Poli-
castro, Carlucci, & Monteleone, 2006; cf. Cardello, 2007). In addition, literature
shows that high palatability, healthfulness, quality, naturalness, or hedonic
expectations contribute to boosting willingness to buy (e.g. Annett, Muralid-
haran, Boxall, Cash, & Wismer, 2008; Ares, Giménez, & Gámbaro, 2008; Bower,
Saadat, & Whitten, 2003; Fernqvist & Ekelund, 2014; Lee, Shimizu, Kniffin, &
Wansink, 2013; Machiels & Karnal, 2016; Román, Sánchez-Siles, & Siegrist,
2017), which highlights the potential effect that packaging has on food choice.
Moreover, previous research has shown that each of the different packaging
cues (e.g. colours, imagery, or shape) impact higher-level food inferences, as
consumers use symbolic information connoted by each cue to set product ex-
pectations and beliefs (Festila & Chrysochou, 2018; Magnier & Schoormans,
2017). Thus, each of the packaging cues is interpreted by consumers and has the
potential to affect consumer perception (Becker et al., 2011; Thomson, 2016).
Therefore, the question arises as to what happens if the interpretation of one
of the package cues is different to that of another one. Take for example the
case of a package where the textual claim sends a different message to that of
the image depicted on its front. When the interpretation given to a package cue
does not match the interpretation elicited from a different one (i.e. the package
is perceived as being ambiguous), the package may be considered confusing (or
Introduction | 9
worse, misleading; Schifferstein et al., 2013; Underwood & Ozanne, 1998). Li-
terature shows that both confusion and ambiguity increase the cognitive load
needed to interpret stimuli, which in turn may negatively affect consumers’
processing fluency and overall attitude (Alter & Oppenheimer, 2009). In addi-
tion, this may probably lead to a disconfirmation of expectations (i.e. a dis-
parity between what was expected and what was actually perceived), which in
the context of food packaging relates to negative responses toward the product
(cf. Deliza & MacFie, 1996; Piqueras-Fiszman & Spence, 2015). Thus, designers
should be able to anticipate how consumers will interpret the different packa-
ging cues so as to prevent confusing or deceptive messages (Smith et al., 2015;
Smith, Møgelvang-Hansen, & Hyldig, 2010). To that end, it is key to know how
the communication process with the consumer works by looking at the effect of
the different packaging cues on consumer perception.
Packaging influence on food perception
Several approaches to classify packaging cues have been proposed aiming to
study the processes by which they convey information and thereby influence
consumer expectations and perception (Festila & Chrysochou, 2018). Thus, Un-
derwood (2003) made a distinction between graphic (e.g. colour, typeface, logos)
and structural (e.g. shape, size, material) cues, Silayoi & Speece (2007) rather
classified them as visual (graphics, colour, images, size, and shape) or informa-
tional (labels, textual claims), and more recently Festila & Chrysochou (2018)
combined both approaches by proposing to classify them as informational, gra-
phic, or structural. This latter approach is meant to highlight the different ways
by which each of these cues generate product-related inferences and influen-
ce consumer behaviour, and also allows to distinguish them both by the form
they take and by how explicitly they convey information (Festila & Chrysochou,
2018). Thus, informational cues are those characterised by communicating the
message most explicitly (namely, textual claims), graphic cues are those which
convey meaning through symbolic associations and are usually printed on the
label (e.g. colour, images, or typographies), and structural cues are those that
have a mainly functional role (although still are used by consumers to infer
implicit meaning, such as packaging shape or material).
From a semiotic point of view, any of these approaches is characterised by con-
sidering each packaging cue as a sign from which consumers infer meaning (cf.
1.2.2.
10 | Introduction
Opperud, 2004). Based on the definition of Peirce (1867-1893/1992), Smith et al.
(2010, p. 1019) refer to a sign as “something that stands for something (else) to
somebody.” Thus, each packaging sign (i.e. each packaging cue such as colour,
images, shape, and so on) is used to identify the product, to categorise it, and to
infer expectations about its attributes (Smith et al., 2015). Also drawing on the
semiotic theory developed by Peirce (1867-1893/1992), Ares et al. (2011) propose
that two main types of signs can be distinguished in the context of food pac-
kaging: linguistic signs and visual signs. According to this approach, linguistic
signs are those that produce meaning mainly by social convention (e.g. textual
claims), whereas visual signs produce meaning mostly by resemblance (e.g. co-
lours, shapes, and images).1
The role played by packaging linguistic signs in consumers’ communication
and perception processes has been widely studied to date (Lähteenmäki, 2013;
Piqueras-Fiszman & Spence, 2015; Spence & Piqueras-Fiszman, 2014a). In a gi-
ven food package, it is common to find one or more of the following linguistic
signs: a description of the product/trade name, which may also include infor-
mation about the subcategory to which it belongs; claims about its sensory or
hedonic characteristics, about its functional benefits, or about how it has been
processed; besides nutritional information or indications about its origin. Li-
terature shows that each of these signs have been shown to have an effect on
consumer expectations and response. For example, Yeomans, Chambers, Blu-
menthal, & Blake (2008) found that participants who evaluated a smoked-sal-
mon ice-cream labelled as “ice-cream” disliked it more and judged it as being
saltier and tastier than participants who tasted it labelled as “frozen savoury
mousse” or “food 386,” and discussed their results in terms of a strong dis-
confirmation of expectations. However, although the role of linguistic signs is
mainly to inform the consumer and to communicate explicit meaning, it should
be noted that linguistic signs may also be misinterpreted due to their intrinsic
degree of ambiguity (Smith et al., 2015, p. 72) or to the influence of cognitive
biases such as the halo effect (Nisbett & Wilson, 1977). Hence, research sug-
gests that consumers tend to associate unrelated concepts such as ‘organic’
1 However, it is worth noting that visual signs can also produce meaning through conventions
(e.g. milk packaging colour codification), and linguistic signs can sometimes produce meaning
through resemblance (e.g. onomatopoeias).
Introduction | 11
and ‘healthy’ (Schuldt, Muller, & Schwarz, 2012), and that labelling foods as
‘healthy,’ ‘light,’ or ‘low-calorie’ may lead consumers to overestimate the food’s
health benefits (Roe, Levy, & Derby, 1999) or may lead to overconsumption in
restrained eaters (Cavanagh, Kruja, & Forestell, 2014). For example, Sütterlin
& Siegrist (2015) demonstrated that describing sugar as ‘fruit sugar’ instead
of just ‘sugar’ in the nutritional information of breakfast cereals made people
judge them as being more healthful due to the health associations raised by
the word ‘fruit.’
In contrast, visual signs operate by generating higher-level inferential pro-
cesses that are used to set expectations and to interpret meaning (Festila &
Chrysochou, 2018), so they have also been shown to influence consumer ex-
pectations and response to food. In contrast to linguistic signs, visual signs
mostly convey meaning in symbolic and metaphorical terms, so its interpre-
tation is less unequivocal (Smith et al., 2015). Their communicative potential
mostly relies on their iconicity and their indexicality (i.e., their immediate re-
semblance to the object they stand for and their association to real-life expe-
rience, respectively), but it also may be based in symbolic meanings assigned
by convention (as in particular cases in which colour is used to code subcate-
gories within a wider product category) (Smith et al., 2010). Images, colours,
typefaces, and even mainly functional cues such as packaging shape and ma-
terial are among the most common visual signs that communicate meaning in
any food package.
Indeed, literature shows that the communicative ability of packaging sha-
pe and material should not be overlooked. Aiming to assess how consumers
categorise food products, Arboleda & Arce-Lopera (2015) demonstrated that
packaging shape communicates the category to which the product belongs by
conducting an experiment in which participants had to categorise a number of
bottle silhouettes. In addition, Parise & Spence (2012) showed that packaging
shape has the ability to convey specific brand attributes such as “powerful”
or “gentle,” implying that the shape of a package can elicit associations that
influence consumer behaviour. Similarly, Festila (2016) and van Ooijen et al.
(2017) demonstrated that packaging shape can be used to convey healthfulness.
On the other hand, some studies have documented that consumers judge pro-
duct naturalness and sustainability by relying on packaging material (Labbe,
Pineau, & Martin, 2013; Magnier & Schoormans, 2015, 2017; Magnier, Schoor-
mans, & Mugge, 2016). However, other researchers have shown that consumers’
12 | Introduction
sustainability evaluations based on packaging material may not be accurate,
since they can be misled by the package’s other visual signs (Steenis, van Her-
pen, van der Lans, Ligthart, & van Trijp, 2017).
Typefaces are other key visual signs commonly used in food packaging. The
textual claims shown on a package do not only convey meaning by their se-
mantic message, but also through the typographic font chosen to depict them.
Designers have intuitively known for many years the expressive capacity of
typographies, and there are many books and web pages devoted to unders-
tanding the peculiarities of typefaces and their recommended uses (e.g. Brin-
ghurst, 2004; Carter, Meggs, Day, Maxa, & Sanders, 2015; Lupton, 2010). From
a scientific point of view, the interest in understanding the mechanisms by
which typographic fonts emit meaning began several decades ago and has con-
tinued since then (Tannenbaum, Jacobson, & Norris, 1964). As a result, we know
that typefaces do not only have a denoted meaning (i.e. the semantic meaning
of the text they stand for), but also carry their own connotative meaning (i.e.
the emotional associations and symbolisms they elicit). Therefore, a typeface
is considered appropriate in relation to other stimulus when the connotative
meaning of both coincides (Bottomley, Doyle, & Bottomley, 2002; Childers &
Jass, 2002; Doyle & Bottomley, 2004, 2009). Moreover, a typeface’s connotative
meaning has been suggested to be processed prior to text’s semantic meaning,
which may influence subsequent information processing (Velasco, Woods, &
Hyndman, 2015). Although the effect of typefaces’ elicited meaning has not
yet been systematically assessed in the context of food packaging, some stu-
dies shed light on its relevance as a package visual sign. Thus, typefaces have
been shown to be able to communicate the exotic origin of a product (especially
when both the font’s connotative meaning and the text’s denotative meaning
are congruent, Celhay, Boysselle, & Cohen, 2015) and can be used to suggest
specific product attributes such as its healthfulness (but only to individuals
with a high health-promotion focus, Karnal, Machiels, Orth, & Mai, 2016) or its
taste (with rounded fonts enhancing sweetness expectations and angular fonts
boosting sourness expectations, Velasco, Salgado-Montejo, Marmolejo-Ramos,
& Spence, 2014; Velasco, Woods, & Hyndman, 2015).
In contrast to other visual signs such as packaging shape, material, or typefaces,
the role of colour as a visual sign in the context of food packaging has attracted
great scientific interest and is now well known. All packages are coloured and the
colour occupies a large part of the surface of the pack, which makes it a key visual
Introduction | 13
sign to communicate to consumers (Kauppinen-Räisänen, 2014; Wei, Ou, Luo, &
Hutchings, 2014) and to understand purchasing and food choice processes (La-
brecque, Patrick, & Milne, 2013; Singh & Satyendra, 2006). Colour is considered
to be the visual sign that triggers the fastest response (Swientek, 2001) and to
have a lasting effect on consumers (Kauppinen-Räisänen, 2014). However, whe-
reas some effects of colour on consumer perception are thought to be automatic
and universal (such as the effect it produces on arousal and excitement, Labre-
cque & Milne, 2012; see also Spence, 2015b, 2015c; Spence & Piqueras-Fiszman,
2016), it should be noted that the symbolic meanings associated to colour are
culture-dependent (Aslam, 2006; Madden, Hewett, & Roth, 2000; Saito, 1996).
As opposed to the colour of other elements that surround food (such as tablewa-
re, e.g. Tu et al., 2016; walls, e.g. Schifferstein, Howell, & Pont, 2017; or lighting,
e.g. Yang et al., 2016), packaging colour is assumed to communicate informa-
tion related to the product. In fact, according to estimates, more than 90% of
food brands use colour as a visual sign with which to communicate what kind
of product can be found inside the package (Spence, 2018a). Thus, consumers
use packaging colour to infer specific product attributes such as its flavour or its
healthfulness. Regarding flavour, Piqueras-Fiszman, Velasco, & Spence (2012)
showed that consumers may infer the flavour of a product contained within a
package either because a learned association with the brand already exists or
because the colour of the container represents the colour of its primary named
ingredients. Moreover, Piqueras-Fiszman & Spence (2011) demonstrated that
consumers may be unable to identify the flavour of a product if the congruence
between packaging colour and product flavour is manipulated. As for the product
healthfulness, Schuldt (2013) showed that consumers consider more healthful a
candy bar that comes in a green package than in a red one, even when caloric in-
formation remains the same. In addition, other colour properties such as satu-
ration/brightness or perceived weight have been proven to influence consumer
interpretation and response. Thus, Tijssen, Zandstra, de Graaf, & Jager (2017)
and Mead & Richerson (2018) suggest that consumers associate muted and wa-
tered packaging colours with healthful foods (in contrast to vivid and saturated/
bright colours), although Tijssen et al. (2017) warn that consumers also associate
muted colours with less tasty and less attractive products (thus potentially redu-
cing their appeal). Finally, Karnal et al. (2016) demonstrated that colour-percei-
ved weight affects product-perceived healthfulness, sugar content, and calorie
content: in their experiment, a package with a light colour (yellow) was judged as
being more healthful than a package with a heavy colour (red).

14 | Introduction
Packaging imagery influence on food perception
Many of the food packages that can be found in any supermarket come with one
or more images depicted on their front, which makes imagery a key element in
packaging visual appearance (Ampuero & Vila, 2006; Liao, Corsi, Chrysochou, &
Lockshin, 2015; Rebollar, Lidón, Martín, & Puebla, 2015). For designers, it is one
of the graphic elements that offers the most possibilities, both in terms of aes-
thetics and communication. For consumers, it is particularly important since it
lets them know about the visual aspect of the product before buying it, thereby
making it a key element in the generation of expectations (Jaeger & MacFie,
2001; Underwood & Klein, 2002). Despite being a prominent package cue, the
study of packaging imagery has attracted modest scientific attention thus far
(see Hine, 1995, for an historical account on the topic). However, the devoted
literature shows that each of the different features of the images depicted on
food packaging has the ability both to convey meaning and to affect consumer
perception. Some of the image’s features that have been studied to date are the
image’s subject, size, pictorial style, and location.
One of the most prominent features of packaging imagery is what is depicted in
it (i.e., its subject). Depicted subjects vary, although the most common case is
to show the product contained inside the package (Underwood & Klein, 2002).
It can be displayed in its raw form, during cooking, or ready for consumption;
by itself, in a serving suggestion (i.e. accompanied by other products not in-
cluded within the package), or maybe with or without tableware (e.g. Kobayashi
& Benassi, 2015; Underwood & Klein, 2002). Additionally, packages may display
images of environments that idealize the supposed origin of the product (e.g. a
farm, a natural landscape, Celhay & Remaud, 2018; Tempesta et al., 2010) or the
ingredients that confer it its main flavour (e.g. wheat, a cow, Smith et al., 2015).
Moreover, packages occasionally show people adopting different roles (e.g. cook,
prescriber, or consumer, Bone & France, 2001) or celebrities’ endorsements
(Dixon et al., 2014), not to mention trade characters that create a product iden-
tity and promote brand personality (Castonguay, Kunkel, Wright, & Duff, 2013).
Overall, images can be classified as those that show the product and those that
show other subjects. This distinction is useful due to the fact that food images
are salient stimuli that quickly and involuntarily attract consumer attention (di
Pellegrino, Magarelli, & Mengarelli, 2011; Nijs, Muris, Euser, & Franken, 2010;
Spence, Okajima, Cheok, Petit, & Michel, 2015), increase salivation and appe-
1.2.3.
Introduction | 15
tite (Spence, 2011; Wansink, 2004), and, thereby, may enhance willingness to
buy (Wilcock, Pun, Khanona, & Aung, 2004). Indeed, some studies suggest that
consumers increasingly demand to see the product before opening the package
(Azzi et al., 2012), which can be done through images or transparent materials.
In fact, mainly due to technological progress and the development of new ma-
terials, more and more packages display transparent windows that allow the
consumer to see directly the product contained inside, so that its influence on
the consumer has begun to attract a scientific interest (Deng & Srinivasan, 2013;
Simmonds & Spence, 2017; Simmonds, Woods, & Spence, 2017).
Underwood & Klein (2002) conducted one of the first studies which analysed
the effect of packaging images on consumer judgments and beliefs towards the
product. They assessed the effect of showing an image of the product on the
packages of three product categories (candy, bacon, and margarine), and they
found that consumers consistently preferred the packaging which depicted the
image of the product above those which did not (both for familiar and non-fa-
miliar brands). In fact, the packages displaying an image of the product were
judged as being more palatable, more healthful, and more attractive, indeed
suggesting the influence of packaging imagery on consumer expectations. Sin-
ce then, a modest but growing number of studies have assessed how showing
food imagery on packaging influences consumer expectations and response.
Thus, Miraballes, Fiszman, Gámbaro, & Varela (2014) demonstrated that de-
picting the product on the packaging elicits sensory associations related to
texture, appearance, and taste, whereas Gvili et al. (2015) and Gvili, Tal, Amar,
& Wansink (2017) indicated that showing the product moving rather than still
increases perceived freshness, food acceptance, and taste expectations. Mo-
reover, Smith et al. (2015) showed that depicting the major taste-giving ingre-
dient increased the quantity of natural product believed to have been used in
the product elaboration (although consumers’ food knowledge level modera-
tes this effect). In one of the few studies that assessed the effect of the image
not on expectations but on actual perception (together with that of Machiels &
Karnal, 2016), Sakai & Morikawa (2006) and Mizutani et al. (2010) showed that
seeing product-congruent and positive-valenced images during consumption
led to higher taste evaluations and a positive attitude towards the product (as
opposed to seeing product-incongruent or negative-valenced images).
On the other hand, images that don’t depict the product contained within the
package usually have a symbolic meaning and require a metaphorical (rather

16 | Introduction
than a literal) interpretation. Thus, these kinds of images do not intend to re-
present objective depictions of reality, but rather are visual metaphors capable
of producing higher-level inferences about the product’s expected attributes
(Festila & Chrysochou, 2018). Although not many yet, a number of studies have
assessed how visual metaphors are interpreted in food packaging and how
they influence consumer expectations and responses (Fenko, Vries, & Rom-
pay, 2018; Festila, 2016; Machiels & Karnal, 2016). In this regard, Bone & France
(2001) conducted a seminal study in which participants had to estimate the
caffeine content of two cola drinks: whereas one label was red and depicted
a football player (high-caffeine graphic), the other was blue and depicted a
sleeping man under a palm tree (low caffeine graphic). Caffeine content was
therefore symbolically conveyed through the attitude of the persons depicted
on the packaging and through background colour. Despite both labels displa-
ying the same textual information, in which the caffeine level of the product
was explicitly indicated, they found that consumers interpreted both labels in
the intended way, as the high-caffeine graphic label was judged as having a
higher caffeine content (and the opposite happened for the low-caffeine gra-
phic label). However, it should be noted that their findings cannot be attribu-
ted solely to the effect of the image, since both images and colours varied in
each manipulation. More recently, Fenko et al. (2018) demonstrated that the
perception of a product’s attribute (in their experiment, coffee strength) can
be enhanced if it is conveyed through a visual metaphor (the image of a lion),
whereas Chrysochou & Grunert (2014) suggested that perceived healthfulness
can be enhanced by the depiction of health imagery (i.e. images that have a
symbolic health-related meaning, such as people exercising). Furthermore,
Liao et al. (2015) showed that packaging images can be used to modulate con-
sumer emotional response, which can be measured by self-report or through
physiological measures.
Regarding other features of packaging imagery beyond their subject, some
studies have analysed how the size of the image influences consumer percep-
tion. Thus, Neyens, Aerts, & Smits (2015) demonstrated that children increase
milk and cereal consumption when exposed to a large serving suggestion ima-
ge size as compared to a smaller image. Similarly, Madzharov & Block (2010)
found that the number of product units displayed on the package biases the
estimation about the number of product units contained within and influences
consumption (the more units displayed, the more there are believed to be, and
more is consumed). Szocs & Lefebvre (2017) documented a similar heuristic
Introduction | 17
judgment regarding product presentation, since they found that consumers
perceive portions as smaller when are depicted vertically (i.e. stacked on the
plate) than if depicted horizontally (i.e. spread across the plate). However, in
contrast to Madzharov & Block’s (2010) results, participants consumed less
when the perceived quantity was larger. Moreover, Versluis, Papies, & Mar-
chiori (2015) demonstrated that conveying serving size recommendations
through images rather than verbally helps people to modulate consumption,
diminishing the pack size effect (by which people tend to increase food con-
sumption from large packages). As for the image’s pictorial style, Deliza, Mac-
Fie, & Hedderley (2003) and Smith et al. (2015) studied whether displaying a
drawing or a photograph of the product influences consumer expectations.
Interestingly, whereas Smith et al. (2015) failed to find such an effect, Deli-
za et al. (2003) found that the image was an influential cue in almost all the
case studies since the juice packages showing a drawing (rather than a pho-
tograph) of a passion fruit raised higher sensory, non-sensory, and hedonic
expectations. In addition, they found that the effect of the image was parti-
cularly important for participants with low need for cognition, i.e. those who
tended to pay attention to the details. Regarding the image’s orientation, Ve-
lasco, Woods, & Spence (2015) indicated that for some products, the orientation
in which the image is shown has also the ability to affect evaluations, since
some images’ orientations were preferred over others. However, consumers
were not always willing to pay more for the packages in which the preferred
orientation was displayed, showing that further investigation is needed in this
vein. Finally, regarding where the image is placed within the package, Deng
& Kahn (2009) found that the image’s spatial location can convey the notion
of heaviness: placing the image on the visually heavier locations (i.e. bottom,
right, or bottom-right positions of the package) enhanced willingness to buy
(cf. Kahn & Deng, 2010; see also Fenko et al., 2018).
Since the images depicted on packaging are key visual signs from which consu-
mers infer meaning and set expectations, it is relevant for the designer to un-
derstand the processes and mechanisms by which this interpretation process
takes place. According to Sperber & Wilson’s (1995) principle of relevance, and
regardless of the subject depicted in the image, consumers will assume that the
image is situationally relevant and will therefore try to interpret it according
to its context. In other words, consumers will expect that any information sent
through the package cues will be relevant in that context, so the cues’ possible
meanings will be limited to those that make sense in that context. For example,

18 | Introduction
if a food product is depicted on a food package, consumers will assume that the
product depicted represents the product contained in the package (so if the di-
fference between the two is very large, consumers will probably feel deceived,
Schifferstein et al., 2013; Underwood & Ozanne, 1998).
Once the image’s situational relevance has been set (e.g. whether it represents
the product itself, the product flavour, or a metaphor about the product’s attri-
butes), it has to be further processed in order to determine its definitive me-
aning (Smith et al., 2015). However, it should be highlighted that the percep-
tual and cognitive mechanisms by which consumers interpret an image are far
from being straightforward, since they greatly differ from those needed to in-
terpret a linguistic sign. For several decades, researchers have taken different
approaches in order to study the differences between how texts and images are
interpreted (cf. Smith et al., 2015). Literature shows that regarding cognitive
processes, images produce different responses and require different processing
levels (Kauppinen-Räisänen, Owusu, & Abeeku Bamfo, 2012). In fact, images
are more vivid and their processing requires less cognitive effort, so they have
been suggested to generate expectations more quickly than linguistic signs
(Kisielius & Sternthal, 1984; Mueller, Lockshin, & Louviere, 2009; Underwood
& Klein, 2002).
Based on Messaris’s (1994, 1997) elaboration on the trichotomy of signs origi-
nally proposed by Peirce (1867-1893/1992), Smith et al. (2015) expound the three
main properties that distinguish images from linguistic signs according to
semiotic theory: iconicity, indexicality, and propositional (syntactic) indetermi-
nacy. Iconicity refers to the fact that, contrarily to linguistic signs, images do
resemble the objects they depict (although this is not always the case; see also
Scott, 1994). Their processing thus involves the visual system, which in turn
has associative connections to other systems such as those underlying taste
and reward. As it has already been discussed, this helps to explain why seeing
food activates processes related to appetite and salivation (Spence, 2011; Wan-
sink, 2004). Regarding images, indexicality alludes to the fact that photographs
are direct physical imprints of the object they depict, since they are created by
capturing the light reflected by the physical object (Messaris, 1997). Although
the degree of this documentary status varies depending whether the image is
a photograph or an illustration, the indexical ability of an image clearly sets it
apart from linguistic signs (Messaris, 1997).

Introduction | 19
Finally, according to Messaris (1997, p. xiii), propositional (syntactic) indeter-
minacy is the characteristic syntactic property of visual syntax. It refers to the
fact that an image by itself is ambiguous and can evoke many interpretations in
the mind of the consumer, since it lacks the syntactic devices necessary to emit
an explicit propositional meaning (Messaris, 1997; Smith et al., 2015). Take for
example the case of depicting a strawberry on a yoghurt package. Consumers
could interpret it as meaning that the yoghurt is made with strawberries, has
strawberries on it, has strawberry flavour, and so on, and nothing in the ima-
ge will give a clue as to which is the correct interpretation (Smith et al., 2015).
Thus, consumers will make sense of the image according to the image situatio-
nal relevance (Sperber & Wilson, 1995) and by using mechanisms such as those
proposed by the slot/filler and analogy approaches (Smith et al., 2015). Whereas
the slot/filler approach states that the probabilities of opting for one of the pos-
sible meanings of the sign (filler) will be greater the better it fits with any of the
possible attributes of the object (slot) (Fillmore & Baker, 2010; Lynott & Connell,
2010; Smith, Osherson, Rips, & Keane, 1988), the analogy approach proposes
that the interpretation that has proved valid in similar past combinations will
be preferred (Estes & Jones, 2006; Gagné & Spalding, 2006; van Jaarsveld, Coo-
len, & Schreuder, 1994; see also Gregan-Paxton & John, 1997).
Overall, despite the fact that some authors have suggested that an image’s pro-
positional indeterminacy should be considered a strength (rather than a weak-
ness) in persuasion contexts such as advertising (Messaris, 1997), or that some
contextual elements such as linguistic signs have been proposed to narrow the
possible interpretations given to the image due to an anchoring effect (see Bar-
thes, 1977), communication through images is considered to be “weak” since
the receptor can never be sure what the sender had in mind or the way in which
the stimulus should be interpreted (Sperber & Wilson, 1995, p. 175). Indeed, this
is the main reason by which designers find it so hard to anticipate the mea-
ning that consumers will infer from a given image: they must understand and
untangle the codes and language used by consumers (Frascara, 1988; Laing &
Masoodian, 2016) in order to posit the desired message as unambiguously as
possible, since confusion or misunderstanding could lead to setting erroneous
expectations.
20 | Introduction
Methodological considerations
From a methodological point of view, previous research regarding these issues
has relied on techniques coming mostly from the fields of experimental psy-
chology and sensory science (cf. Ares & Varela, 2018a, 2018b), and to a lesser
extent, from neuroscience (Stasi et al., 2018). Thus, consumer perception and
response are commonly measured by means of self-report scales, projective
techniques, psychophysical experiments, implicit behavioural tasks, neuros-
cience techniques, or a combination of those. Indeed, some studies have con-
ducted experiments in which several techniques have been combined in order
to get deeper insights of the processes studied (e.g. eye-tracking and word as-
sociation, Piqueras-Fiszman, Velasco, Salgado-Montejo, & Spence, 2013). Given
that research in this field seeks to understand human perception and human
behaviour, it is mainly based on human subject research. Besides the obvious
ethical considerations that this entails, investigating with people implies that
the techniques by which perception and response are measured can be classi-
fied depending on the consciousness level of the responses given by the parti-
cipants (De Houwer, Teige-Mocigemba, Spruyt, & Moors, 2009; Gawronski & De
Houwer, 2014). Thus, measurement techniques can be classified as being either
explicit or implicit.2
1.3.
2 However, it should be noted that the line separating the explicit (conscious) from the implicit
(unconscious) processes is not as clear as one might think, and the debate of how truly automa-
tic are some of the processes traditionally regarded as implicit is still ongoing (Getz & Kubovy,
2018; Spence & Deroy, 2013). Moreover, some researchers consider that techniques such as
word association (or other projective techniques) may be located somewhere in the middle of
the explicit-implicit scale, since they are thought to allow access to implicit consumer associa-
tions but also imply a certain degree of reasoning (Stacy, Ames, & Grenard, 2006). Nonethe-
Introduction | 21
Explicit measurement techniques are quick and easy to conduct, and have been
proven to offer a reliable approach to understand consumer perception and to
anticipate consumer response (Ares & Varela, 2018a; Asioli et al., 2016; Hen-
drick, Fischer, Tobi, & Frewer, 2013; Petty & Cacioppo, 1996; Thomas & Cham-
bault, 2016). Methods such as conjoint analysis (e.g. Deliza et al., 2003; Kim,
Lopetcharat, & Drake, 2013; Silayoi & Speece, 2007), Likert scales and ques-
tionnaires (e.g. Becker et al., 2011; Te Vaarwerk, van Rompay, & Okken, 2015;
Van Rompay & Pruyn, 2011), check-all-that-apply (e.g. Puyares, Ares, & Carrau,
2010), focus groups (e.g. Fernqvist, Olsson, & Spendrup, 2015; Schifferstein et
al., 2013), projective techniques (e.g. Ares & Deliza, 2010; Piqueras-Fiszman et
al., 2013) or semiotic analysis (e.g. Ares et al., 2011; Celhay & Remaud, 2018; Pi-
queras-Fiszman, Ares, & Varela, 2011) have been used to study how packaging
cues influence consumer perception and response (cf. Thomas & Chambault,
2016) from different perspectives. These techniques can be conducted both in
the laboratory and also on the web thanks to online testing platforms such as
Survey Monkey, Mechanical Turk, and Prolific Academic, which allows reaching
a greater number of participants and even selecting specific cohorts of people
(Woods, Velasco, Levitan, Wan, & Spence, 2015).
On the other hand, implicit measurement techniques allow researchers to ac-
cess a type of mental structure and information currently inaccessible from
other means (Bar-Anan & Nosek, 2014; Nosek, Hawkins, & Frazier, 2011; see
also chapters 9-12 from Ares & Varela, 2018b). These insights have proven to
be valuable for predicting human behaviour, since most human cognition oc-
curs without the individual being aware of it: indeed, literature shows that un-
conscious cognition has a strong effect on consumer judgments, attitude, and
perception (Greenwald & Banaji, 1995; Nosek et al., 2011). Thus, the access that
these methods give to implicit cognition and the development of reliable and
cheap technology devoted to this purpose help to explain their growing po-
pularity (Kraus & Piqueras-Fiszman, 2018; Nosek et al., 2011; Teige-Mocigem-
ba, Klauer, & Sherman, 2010). Traditional implicit techniques mostly rely on
time-based measurement methods (Bar-Anan & Nosek, 2014; Goodall, 2011)
less, the classification of methods according to their implicitness is overall regarded as useful
as it reflects the underlying processes proposed by dual process theories (Dijksterhuis, 2013;
Gawronski & Creighton, 2013).
22 | Introduction
and can be divided into those based on the Implicit Association Test (IAT,
Greenwald, McGhee, & Schwartz, 1998; Greenwald, Nosek, & Banaji, 2003; Lane,
Banaji, Nosek, & Greenwald, 2007) and those based on sequential priming para-
digms (Gawronski & De Houwer, 2014; Goodall, 2011; Wentura & Degner, 2010).
Although still modest, the number of studies that have used these techniques
to assess how packaging cues affect consumer perception have grown in recent
years (Fulcher, Dean, & Trufil, 2016; Kraus & Piqueras-Fiszman, 2018). Thus,
speeded classification tasks (such as IAT) have been used to investigate the as-
sociations between packaging colour and product flavour (Piqueras-Fiszman
& Spence, 2011; Piqueras-Fiszman et al., 2012), between packaging colour and
product healthfulness (Mai, Symmank, & Seeberg-Elverfeldt, 2016), between
packaging typefaces and product healthfulness (Karnal et al., 2016), or between
packaging shape and brand attributes (Parise & Spence, 2012). In turn, more
recent implicit techniques coming from the field of neuroscience are commonly
based on measuring eye movements, physiological responses from the autono-
mic nervous system, or the exploration of brain activity (Spinelli & Niedziela,
2016; Stasi et al., 2018). While methods such as eye-tracking have been widely
used to investigate consumer response towards food packaging (e.g. Pique-
ras-Fiszman et al., 2013; Rebollar et al., 2015; van Herpen & Trijp, 2011), other
physiological measurements such as skin conductance response (SCR), facial
electromyography (EMG), or functional magnetic resonance imaging (fMRI)
have been barely used thus far (e.g. see Liao et al., 2015; and Reimann et al.,
2010; respectively).
To summarize, both explicit and implicit measurement techniques have their
own limitations. Whereas explicit techniques do not guarantee that partici-
pants’ responses reflect their true attitudes (Fulcher et al., 2016; Petty & Ca-
cioppo, 1996), the IAT does not allow addressing the mechanisms driving its
effects (Goodall, 2011). In addition, some studies have questioned the ability
of implicit techniques such as the IAT to access purely implicit attitudes, since
they have shown that IAT results can be faked under certain circumstances (De
Houwer, Beckers, & Moors, 2007). In turn, the cost, the invasiveness and the
lack of ecological validity have hindered the popularization of neuroscience te-
chniques such as EMG, SCR, or fMRI (Spinelli & Niedziela, 2016). Thus, literature
suggests that an appropriate combination of methods is key to understanding
the mechanisms underlying the processes of consumer perception and respon-
se (Karmarkar & Plassmann, 2015; Perugini, 2005; Spinelli & Niedziela, 2016).
Whereas explicit measurement techniques such as self-report scales, projective
Introduction | 23
techniques, or psychophysical experiments may allow reliably studying consu-
mer perception and response towards packaging imagery (Thomas & Chambault,
2016), conducting speeded classification tasks would be useful in order to assess
implicit consumer associations (Kraus & Piqueras-Fiszman, 2018).
Furthermore, in recent years there has been a growing interest in increasing
the ecological validity of the experiments in this field (Ares & Varela, 2018a,
2018b; Lawless & Heimann, 2010). Given that most of the research is done in
a laboratory setting and uses ad-hoc designed stimuli, many researchers
question the extent to which the results obtained in the lab represent what
happens in the outside world. Regarding where the experiment is conducted,
several approaches have been taken in the literature. Whereas some resear-
chers have sought a more realistic and immersive experience by using virtual
environments (Bangcuyo et al., 2015; Ploydanai, van den Puttelaar, van Her-
pen, & van Trijp, 2017; van Herpen, Immink, & van den Puttelaar, 2016), others
have conducted their studies directly on the consumption environment (e.g.
at a supermarket, Becker et al., 2011; in a winery, Oberfeld, Hecht, Allendorf,
& Wickelmaier, 2009; or in the home environment of the participants Lagerk-
vist, Okello, Muoki, Heck, & Prain, 2016). Regarding stimuli design, Deliza et al.
(2003) were among the first to use computer-generated images of the packages
to be evaluated, and since then most research has relied on ad-hoc designed
stimuli in order to avoid bias from previous experience. In order to increase the
ecological validity of the experiment, participants should believe that the sti-
muli they are evaluating are not mock-ups but rather real products. However,
it is worth noting that this has been a common limitation of previous research
devoted to assessing the influence of packaging cues on consumer perception
and response, since computer images or other elements have rather been used
as proxies for actual packages (e.g. Becker et al., 2011; Machiels & Karnal, 2016;
Mizutani et al., 2010). In other words, to achieve an immersive experience, li-
terature suggests that not only the setting, but also the stimulus used in the
experiment should be as realistic as possible (Bangcuyo et al., 2015).
24 | Introduction
Rationale and objectives
Each packaging cue should be designed considering what will be its role in the
communication process, since consumers use them to infer information and set
expectations about the product. Thus, the message elicited by each packaging
cue should be aligned in order to avoid confusion and misinterpretation: in fact,
research has shown that even using accurate verbal labelling does not avoid any
misunderstanding presented graphically (Bone & France, 2001), since visual sig-
ns are processed more rapidly than linguistic signs. In other words, designers
should be aware of both the way in which all the different cues present in the
package will be interpreted and the effect that these may have on consumer per-
ception, since all cues must convey a coherent message to allow for consumer
understanding and market success (Piqueras-Fiszman & Spence, 2015).
Although a great deal of research has been made trying to understand how pac-
kaging cues convey meaning and thereby affect perception, we are still far from
fully understanding how the different cues contribute to this process. Specifi-
cally, the role of packaging imagery has only received modest attention thus
far, despite being a prominent visual sign from which consumers infer mea-
ning. For example, the influence of the image’s own features (e.g. its subject,
its shape, its rhetorical style) on consumer expectations and response is still
almost unexplored, and the same is true for the image’s impact on perception
during tasting. However, it is essential for designers to know the impact of
packaging imagery decisions since images may affect consumer perception and
response in an unintended way.
In addition, images tend to be ambiguous due to their propositional indetermi-
nacy (Smith et al., 2015), which makes it difficult to anticipate how they will be
interpreted by the consumer. Yet little is known about the mechanisms by which
images are interpreted despite it being crucial to ensure desired meanings are
1.4.
Introduction | 25
elicited. Moreover, according to sensory science literature, it is also reasonable
to wonder whether it would be possible to use some certain image features such
as its shape to convey product information to consumers, thus helping to break
the indeterminacy of the image (Velasco et al., 2016). In sum, it is in the interest
of not only designers, but also producers and policymakers to be able to antici-
pate how consumers will interpret the images depicted on the package so as to
prevent confusing or deceptive messages (Smith et al., 2010, 2015).
Given the above, two main and five secondary objectives are addressed in this
thesis across six research studies (Table 1):
Objective 1.
To study whether manipulating the subject shown on packaging imagery in-
fluences consumer expectations, perception, and response towards the product.
Objective 2.
To study how consumers infer meaning from an ambiguous image.
To study whether manipulating how a product attribute is conveyed
through imagery affects consumer expectations and willingness to buy.
To study whether manipulating the way in which the product is depicted
affects consumer expectations, consumer beliefs towards the product,
willingness to buy, and perception during tasting.
To study the mechanism by which meaning is inferred from an ambi-
guous image.
To study the influence of the image rhetorical style (i.e. whether it is lite-
ral or metaphorical) on the cognitive effort needed to process it.
To study whether the interpretation given to an image can be modulated
by manipulating its shape.
Ob 1.1.
Ob 1.2.
Ob 2.1.
Ob 2.2.
Ob 2.3.
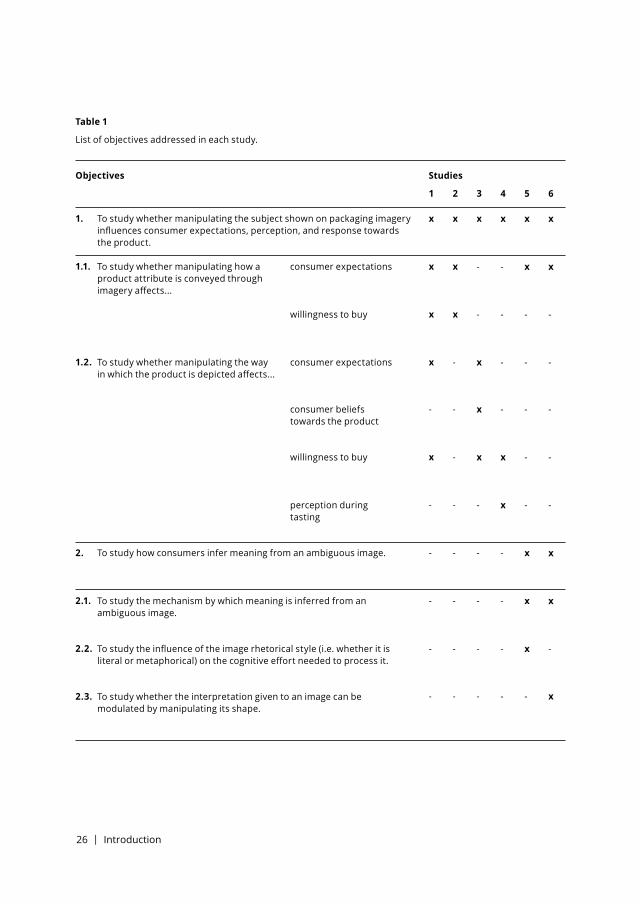
26 | Introduction
To study whether manipulating the subject shown on packaging imagery influences consumer expectations, perception, and response towards the product.
To study how consumers infer meaning from an ambiguous image.
Objectives
Table 1
List of objectives addressed in each study.
1.
2.
1.1.
1.2.
2.1.
2.2.
2.3.
Studies
1
x
x
x
x
-
x
-
-
-
-
-
2
x
x
x
-
-
-
-
-
-
-
-
3
x
-
-
x
x
x
-
-
-
-
-
4
x
-
-
-
-
x
x
-
-
-
-
5
x
x
-
-
-
-
-
x
x
x
-
6
x
x
-
-
-
-
-
x
x
-
x
To study whether manipulating how a product attribute is conveyed through imagery affects...
To study whether manipulating the way in which the product is depicted affects...
To study the mechanism by which meaning is inferred from an ambiguous image.
To study the influence of the image rhetorical style (i.e. whether it is literal or metaphorical) on the cognitive effort needed to process it.
To study whether the interpretation given to an image can be modulated by manipulating its shape.
consumer expectations
consumer expectations
consumer beliefs towards the product
willingness to buy
willingness to buy
perception during tasting

Thesis outline | 27
THESIS OUTLINE2.

Thesis outline | 29
Thesis outline
Across six studies, this thesis investigates how packaging imagery influences
consumer perception and response by taking an interdisciplinary approach.
The first four studies assess how manipulating the subject shown on the im-
ages depicted on food packaging influences consumer expectations, percep-
tion and response towards the product (objective 1), whereas the remaining
two studies investigate the mechanism by which meaning is inferred from
an ambiguous image depicted on food packaging (objective 2). From a meth-
odological point of view, these objectives are addressed from an interdisci-
plinary approach by conducting different experimental methods and by using
realistic stimuli. Thus, the body of this thesis consists in a compilation of six
manuscripts, of which five have been published in international JCR scientific
journals and one has been submitted for publication:
• Study 1 p. 57
Rebollar, R., Gil, I., Lidón, I., Martín, J., Fernández, M. J., & Rivera, S.
(2017). How material, visual and verbal cues on packaging influence
consumer expectations and willingness to buy: The case of crisps (po-
tato chips) in Spain. Food Research International, 99, 239–246. https://
doi.org/10.1016/j.foodres.2017.05.024
• Study 2 p. 67
Rebollar, R., Lidón, I., Gil-Pérez, I., & Martín, J. (2018). Images used to
convey that a natural yogurt is sweetened influence consumer expec-
tations and willingness to buy. Manuscript submitted for publication to
the Journal of Dairy Science.
2.1.
30 | Thesis outline
• Study 3 p. 109
Rebollar, R., Lidón, I., Gil, I., Martín, J., Fernández, M. J., & Riveres,
C. E. (2016). The influence the serving suggestion displayed on soft
cheese packaging has on consumer expectations and willingness to
buy. Food Quality and Preference, 52, 188–194. https://doi.org/10.1016/j.
foodqual.2016.04.015
• Study 4 p. 119
Lidón, I., Rebollar, R., Gil-Pérez, I., Martín, J., & Vicente-Villardón,
J. L. (in press). The influence the image of the product shown on food
packaging labels has on product perception during tasting: Effects
and gender differences. Packaging Technology and Science. https://doi.
org/10.1002/pts.2407
• Study 5 p. 131
Gil-Pérez, I., Rebollar, R., Lidón, I., Piqueras-Fiszman, B., & van Trijp,
H. C. M. (2019). What do you mean by hot? Assessing the associations
raised by the visual depiction of an image of fire on food packaging.
Food Quality and Preference, 71, 384–394. https://doi.org/10.1016/j.food-
qual.2018.08.015
• Study 6 p. 145
Gil-Pérez, I., Rebollar, R., Lidón, I., Martín, J., van Trijp, H. C. M., &
Piqueras-Fiszman, B. (2019). Hot or not? Conveying sensory informa-
tion on food packaging through the spiciness-shape correspondence.
Food Quality and Preference, 71, 197–208. https://doi.org/10.1016/j.food-
qual.2018.07.009
Specifically, we addressed the thesis objectives by first investigating whether
the manipulation of the subject shown on packaging imagery influences con-
sumer perception and response. Thus, Study 1 (p. 57) assesses whether pack-
aging material, the way in which the main product is depicted, and convey-
ing an attribute of the product through images or texts influence sensory and
non-sensory expectations and willingness to buy. Aiming to delve deeper into
this latter issue, Study 2 (p. 67) analyses how the image used to convey a specif-
ic product attribute (i.e. that a natural yoghurt has been sweetened) influences
consumer expectations and willingness to buy, besides exploring the concepts
raised by the different images evaluated by means of a word association task.
Thesis outline | 31
In turn, Study 3 (p. 109) adopts a slightly different approach than that of Study
1 in order to analyse the way in which the product is depicted, and investigates
how the food shown accompanying the main product in the serving suggestion
displayed on the package influences sensory expectations, non-sensory expec-
tations and willingness to buy, besides assessing its effect on the time of day
considered most appropriate for consumption. Subsequently, Study 4 (p. 119)
aims to see whether the effects found in the previous studies do not only affect
expectations but also perception during tasting. Thus, it is assessed how the
visual appearance of the product depicted on the package influences perception
during tasting and, based on related literature, the moderating role of gender
differences is examined.
Once we had gained deeper insights regarding the effects of packaging imag-
ery on consumer perception and response, we sought to explore the processes
by which consumers generate meaning from ambiguous images depicted on
food packaging. Thus, Study 5 (p. 131) investigates the role of the congruence
between the product and the image’s possible meanings on how the image is
interpreted, and also examines the cognitive effort necessary to process it re-
garding the image rhetorical style (i.e. whether the image interpretation is lit-
eral or metaphorical). Finally, we wanted to go one step further into disentan-
gling the mechanism by which packaging imagery is interpreted by analysing
the case of pairing an ambiguous image with an ambiguous product. Building on
cross-modal correspondence literature, Study 6 (p. 145) proposes and demon-
strates that the shape of the image can be used to convey product information
and thus modulate consumer interpretation, thereby affecting expectations. In
addition, the underlying mechanism of this process is also investigated. Over-
all, the thesis objectives were addressed from an interdisciplinary approach by
looking at different aspects of how packaging imagery affects consumer per-
ception and response.
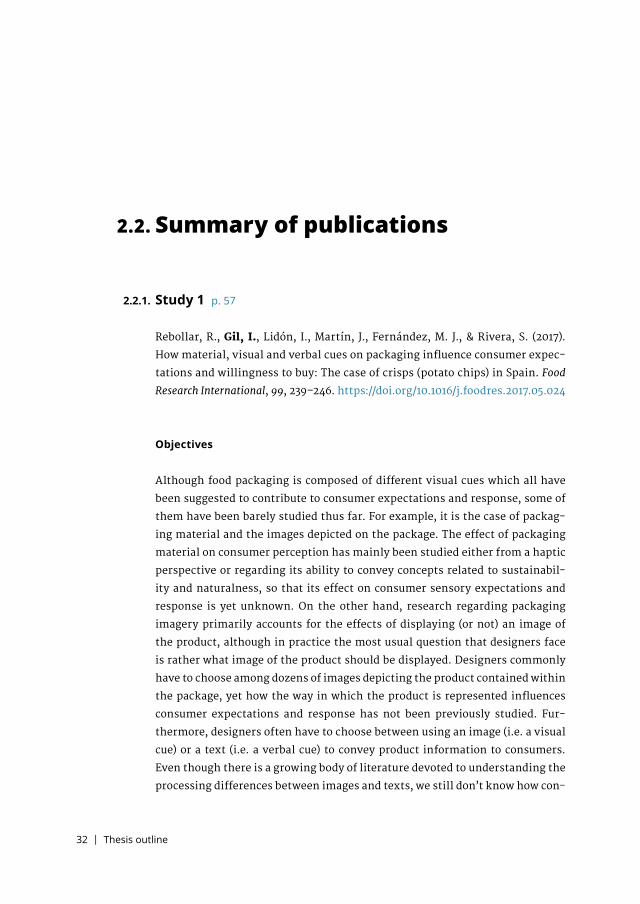
32 | Thesis outline
Summary of publications
Study 1 p. 57
Rebollar, R., Gil, I., Lidón, I., Martín, J., Fernández, M. J., & Rivera, S. (2017).
How material, visual and verbal cues on packaging influence consumer expec-
tations and willingness to buy: The case of crisps (potato chips) in Spain. Food
Research International, 99, 239–246. https://doi.org/10.1016/j.foodres.2017.05.024
Objectives
Although food packaging is composed of different visual cues which all have
been suggested to contribute to consumer expectations and response, some of
them have been barely studied thus far. For example, it is the case of packag-
ing material and the images depicted on the package. The effect of packaging
material on consumer perception has mainly been studied either from a haptic
perspective or regarding its ability to convey concepts related to sustainabil-
ity and naturalness, so that its effect on consumer sensory expectations and
response is yet unknown. On the other hand, research regarding packaging
imagery primarily accounts for the effects of displaying (or not) an image of
the product, although in practice the most usual question that designers face
is rather what image of the product should be displayed. Designers commonly
have to choose among dozens of images depicting the product contained within
the package, yet how the way in which the product is represented influences
consumer expectations and response has not been previously studied. Fur-
thermore, designers often have to choose between using an image (i.e. a visual
cue) or a text (i.e. a verbal cue) to convey product information to consumers.
Even though there is a growing body of literature devoted to understanding the
processing differences between images and texts, we still don’t know how con-
2.2.
2.2.1.
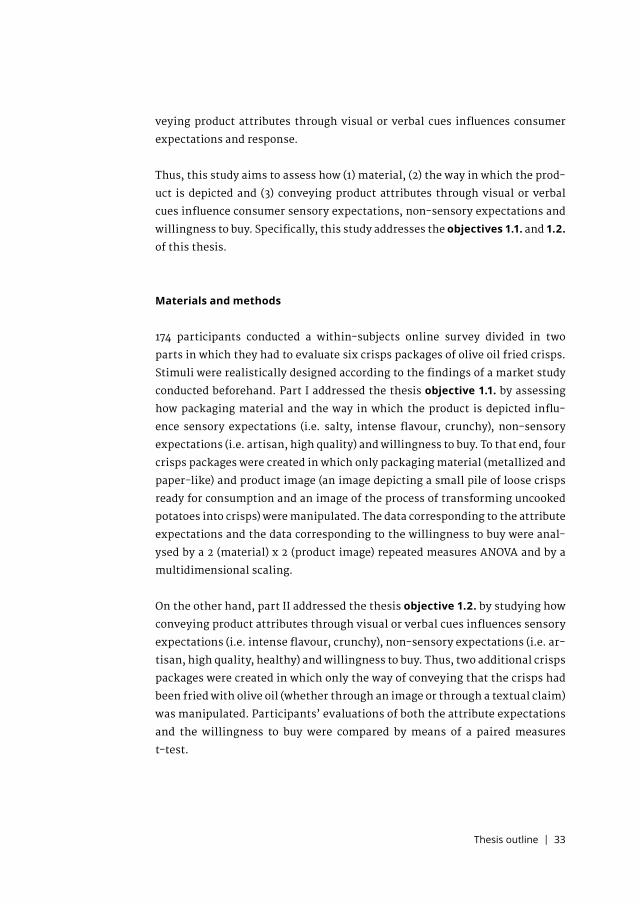
Thesis outline | 33
veying product attributes through visual or verbal cues influences consumer
expectations and response.
Thus, this study aims to assess how (1) material, (2) the way in which the prod-
uct is depicted and (3) conveying product attributes through visual or verbal
cues influence consumer sensory expectations, non-sensory expectations and
willingness to buy. Specifically, this study addresses the objectives 1.1. and 1.2. of this thesis.
Materials and methods
174 participants conducted a within-subjects online survey divided in two
parts in which they had to evaluate six crisps packages of olive oil fried crisps.
Stimuli were realistically designed according to the findings of a market study
conducted beforehand. Part I addressed the thesis objective 1.1. by assessing
how packaging material and the way in which the product is depicted influ-
ence sensory expectations (i.e. salty, intense flavour, crunchy), non-sensory
expectations (i.e. artisan, high quality) and willingness to buy. To that end, four
crisps packages were created in which only packaging material (metallized and
paper-like) and product image (an image depicting a small pile of loose crisps
ready for consumption and an image of the process of transforming uncooked
potatoes into crisps) were manipulated. The data corresponding to the attribute
expectations and the data corresponding to the willingness to buy were anal-
ysed by a 2 (material) x 2 (product image) repeated measures ANOVA and by a
multidimensional scaling.
On the other hand, part II addressed the thesis objective 1.2. by studying how
conveying product attributes through visual or verbal cues influences sensory
expectations (i.e. intense flavour, crunchy), non-sensory expectations (i.e. ar-
tisan, high quality, healthy) and willingness to buy. Thus, two additional crisps
packages were created in which only the way of conveying that the crisps had
been fried with olive oil (whether through an image or through a textual claim)
was manipulated. Participants’ evaluations of both the attribute expectations
and the willingness to buy were compared by means of a paired measures
t-test.
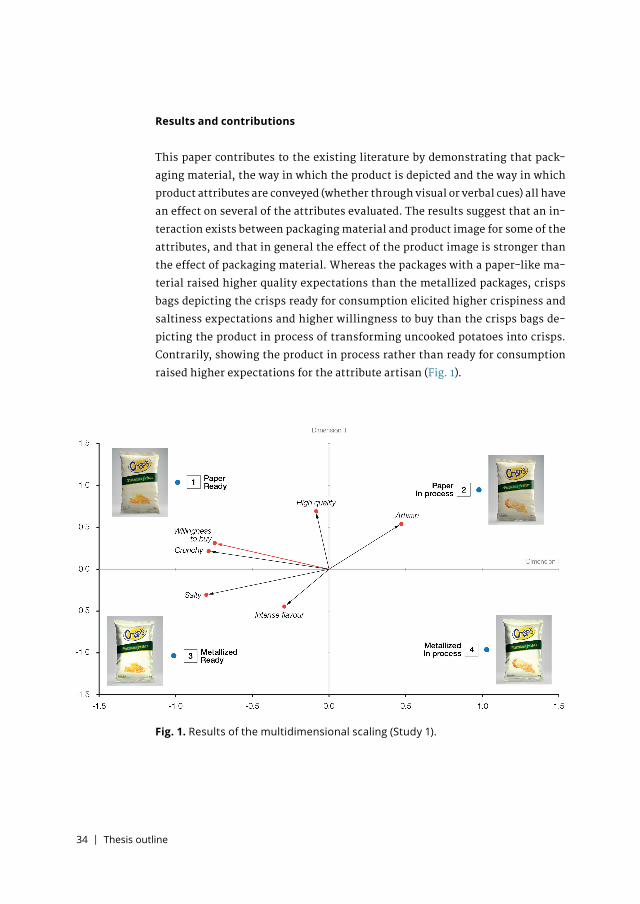
34 | Thesis outline
Results and contributions
This paper contributes to the existing literature by demonstrating that pack-
aging material, the way in which the product is depicted and the way in which
product attributes are conveyed (whether through visual or verbal cues) all have
an effect on several of the attributes evaluated. The results suggest that an in-
teraction exists between packaging material and product image for some of the
attributes, and that in general the effect of the product image is stronger than
the effect of packaging material. Whereas the packages with a paper-like ma-
terial raised higher quality expectations than the metallized packages, crisps
bags depicting the crisps ready for consumption elicited higher crispiness and
saltiness expectations and higher willingness to buy than the crisps bags de-
picting the product in process of transforming uncooked potatoes into crisps.
Contrarily, showing the product in process rather than ready for consumption
raised higher expectations for the attribute artisan (Fig. 1).
Fig. 1. Results of the multidimensional scaling (Study 1).
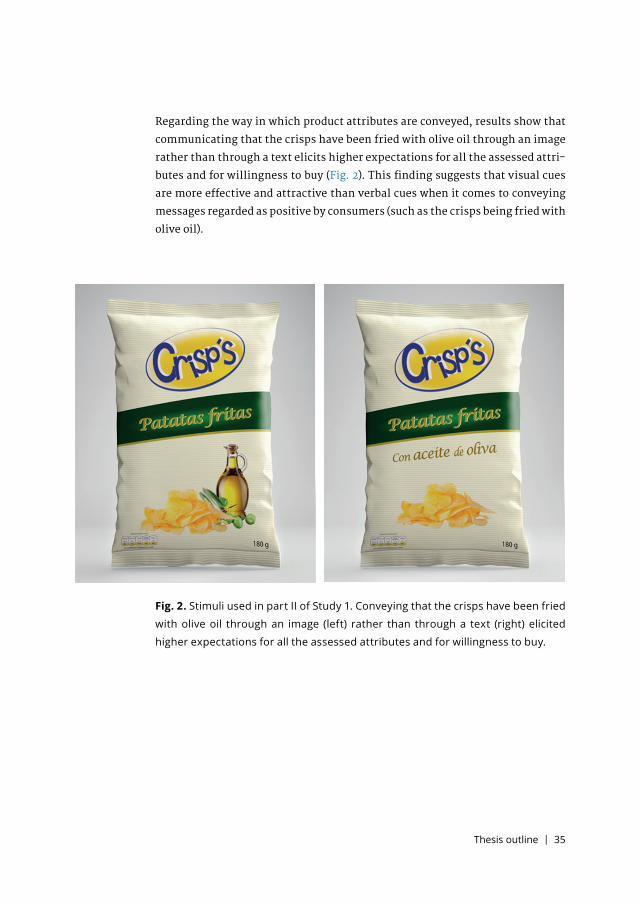
Thesis outline | 35
Regarding the way in which product attributes are conveyed, results show that
communicating that the crisps have been fried with olive oil through an image
rather than through a text elicits higher expectations for all the assessed attri-
butes and for willingness to buy (Fig. 2). This finding suggests that visual cues
are more effective and attractive than verbal cues when it comes to conveying
messages regarded as positive by consumers (such as the crisps being fried with
olive oil).
Fig. 2. Stimuli used in part II of Study 1. Conveying that the crisps have been fried
with olive oil through an image (left) rather than through a text (right) elicited
higher expectations for all the assessed attributes and for willingness to buy.
36 | Thesis outline
Study 2 p. 67
Rebollar, R., Lidón, I., Gil-Pérez, I., & Martín, J. (2018). Images used to convey
that a natural yogurt is sweetened influence consumer expectations and will-
ingness to buy. Manuscript submitted for publication to the Journal of Dairy Science.
Objectives
Given that packaging is a key communication tool, one of the main objectives of
packaging imagery is to convey messages to consumers. Typically, these mes-
sages aim to inform consumers about relevant product attributes such as its
ingredients, its flavour or its texture. In the previous study, we demonstrated
that conveying a given product attribute through an image rather than through
a text enhanced both expectations and willingness to buy, which highlights the
potential of images as communicative devices. However, there are many cases
in which the same message can be conveyed through different images, so that
designers have to decide which one will be more adequate in terms of both con-
sumer understanding and impact on consumer perception. Take for example
the case of sweetened yoghurt: It can be conveyed that the product has been
sweetened through images depicting sugar cubes, a spoon with sugar, a sugar
sack, and so on. Therefore, the question arises regarding what would be the
best one to be displayed on the packaging in terms of consumer comprehension
and consumer perception.
Thus, this study delves deeper on the findings of the previous study by ana-
lysing how the image shown on the package to communicate that a natural
yogurt has been sweetened affects both consumer expectations and will-
ingness to buy. Specifically, this study addresses the objective 1.1. of this
thesis.
Materials and methods
Four yoghurt packages were created for this experiment, in which the only ma-
nipulation was the image by which it was conveyed that the yogurt had been
sweetened. Following the conclusions of a market study conducted prior to
stimuli design, the images chosen to convey that the yogurt had been sweet-
2.2.2.
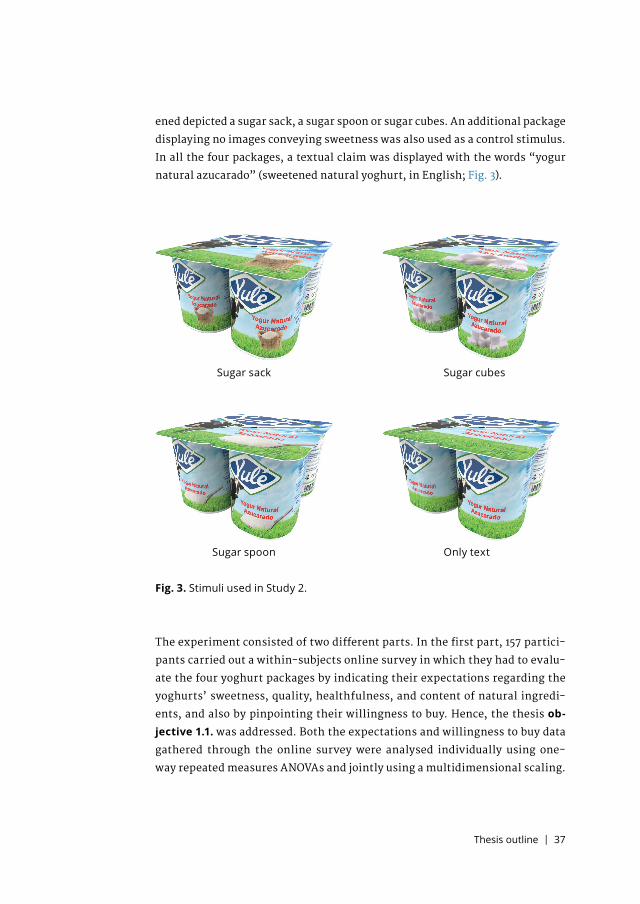
Thesis outline | 37
ened depicted a sugar sack, a sugar spoon or sugar cubes. An additional package
displaying no images conveying sweetness was also used as a control stimulus.
In all the four packages, a textual claim was displayed with the words “yogur
natural azucarado” (sweetened natural yoghurt, in English; Fig. 3).
Fig. 3. Stimuli used in Study 2.
Sugar sack Sugar cubes
Only textSugar spoon
The experiment consisted of two different parts. In the first part, 157 partici-
pants carried out a within-subjects online survey in which they had to evalu-
ate the four yoghurt packages by indicating their expectations regarding the
yoghurts’ sweetness, quality, healthfulness, and content of natural ingredi-
ents, and also by pinpointing their willingness to buy. Hence, the thesis ob-jective 1.1. was addressed. Both the expectations and willingness to buy data
gathered through the online survey were analysed individually using one-
way repeated measures ANOVAs and jointly using a multidimensional scaling.
38 | Thesis outline
In the second part, 112 participants (other than those who took part in the on-
line survey) conducted a between-subjects word association task in which they
were randomly divided in four groups of 28 people. They had to evaluate the
yoghurt packages by writing down the first three words, associations, thoughts
or feelings that came to their minds. Responses were analysed qualitatively and
by means of a HJ Biplot.
Results and contributions
Results show that the image chosen to convey the message that the yogurt is
sweetened influences both consumer sensory and non-sensory expectations
and that it also affects willingness to buy. Both online survey and word associ-
ation results demonstrate that the image depicting sugar cubes is more strong-
ly associated with the sugar concept than the other ones, thus making more
accessible the concept sweet in consumers’ minds and enhancing sweetness
expectations. Indeed, the yoghurt depicting sugar cubes also elicited the lower
willingness to buy, suggesting that both concepts (sweetness expectations and
willingness to buy) are somewhat negatively related (Fig. 4), whereas the yo-
ghurt depicting the sugar sack enhanced naturalness associations (and there-
by raised the higher willingness to buy). Interestingly, our findings also show
that not depicting an image may be preferable to depicting an inadequate one,
since the package conveying that the yoghurt has been sweetened only through
text (i.e. without conveying it through an image) elicited more willingness to
buy that the package depicting the sugar cubes. Thus, our findings suggest that
designers have to find a balance between clearly conveying that the yogurt is
sweetened without much emphasizing it due to the negative impact it may ex-
ert on willingness to buy.
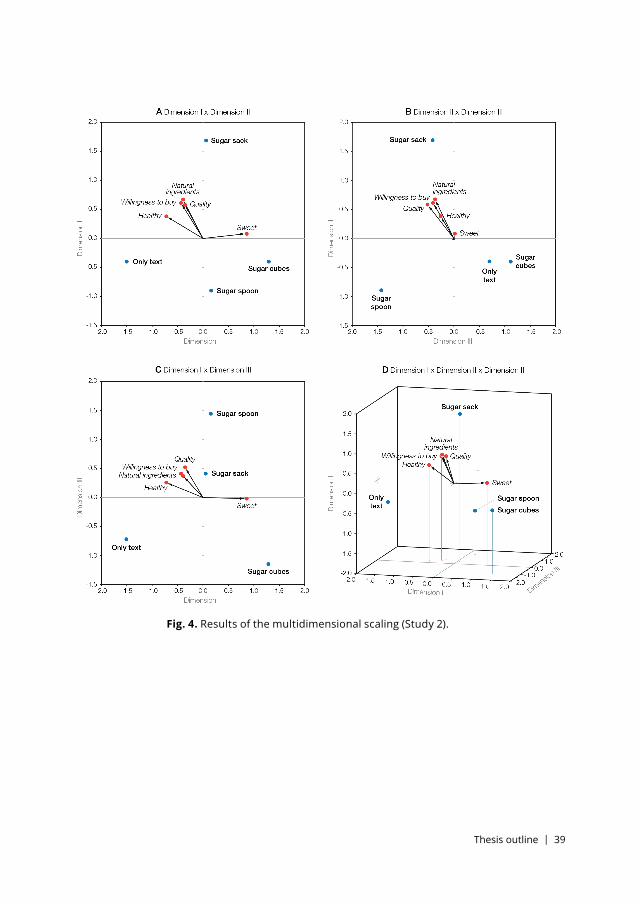
Thesis outline | 39
Fig. 4. Results of the multidimensional scaling (Study 2).
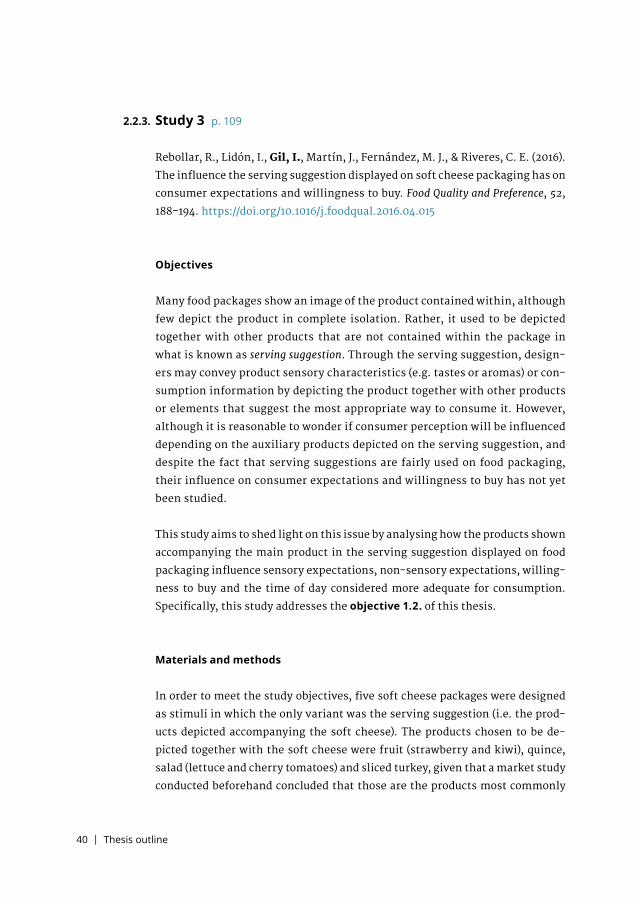
40 | Thesis outline
Study 3 p. 109
Rebollar, R., Lidón, I., Gil, I., Martín, J., Fernández, M. J., & Riveres, C. E. (2016).
The influence the serving suggestion displayed on soft cheese packaging has on
consumer expectations and willingness to buy. Food Quality and Preference, 52,
188–194. https://doi.org/10.1016/j.foodqual.2016.04.015
Objectives
Many food packages show an image of the product contained within, although
few depict the product in complete isolation. Rather, it used to be depicted
together with other products that are not contained within the package in
what is known as serving suggestion. Through the serving suggestion, design-
ers may convey product sensory characteristics (e.g. tastes or aromas) or con-
sumption information by depicting the product together with other products
or elements that suggest the most appropriate way to consume it. However,
although it is reasonable to wonder if consumer perception will be influenced
depending on the auxiliary products depicted on the serving suggestion, and
despite the fact that serving suggestions are fairly used on food packaging,
their influence on consumer expectations and willingness to buy has not yet
been studied.
This study aims to shed light on this issue by analysing how the products shown
accompanying the main product in the serving suggestion displayed on food
packaging influence sensory expectations, non-sensory expectations, willing-
ness to buy and the time of day considered more adequate for consumption.
Specifically, this study addresses the objective 1.2. of this thesis.
Materials and methods
In order to meet the study objectives, five soft cheese packages were designed
as stimuli in which the only variant was the serving suggestion (i.e. the prod-
ucts depicted accompanying the soft cheese). The products chosen to be de-
picted together with the soft cheese were fruit (strawberry and kiwi), quince,
salad (lettuce and cherry tomatoes) and sliced turkey, given that a market study
conducted beforehand concluded that those are the products most commonly
2.2.3.
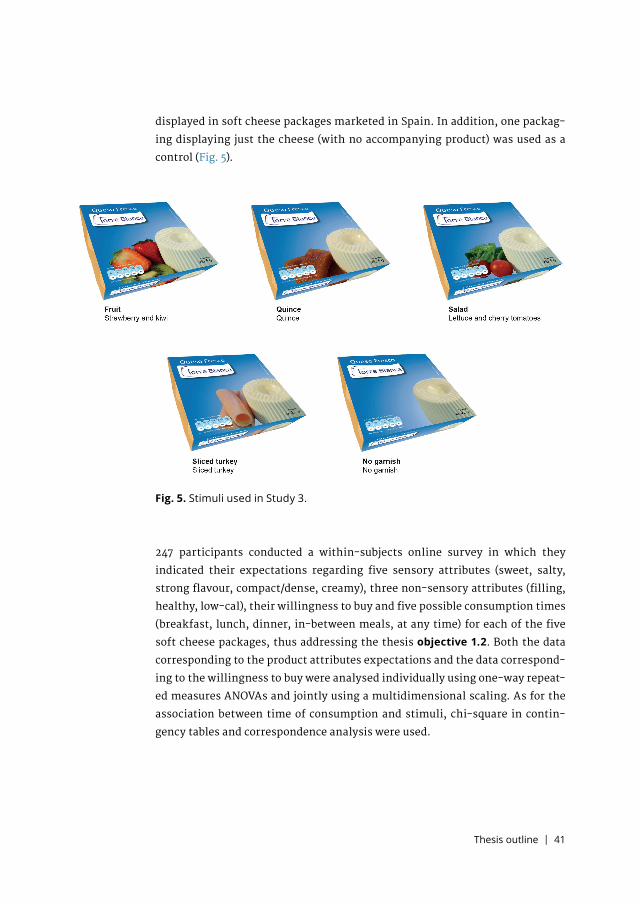
Thesis outline | 41
displayed in soft cheese packages marketed in Spain. In addition, one packag-
ing displaying just the cheese (with no accompanying product) was used as a
control (Fig. 5).
Fig. 5. Stimuli used in Study 3.
247 participants conducted a within-subjects online survey in which they
indicated their expectations regarding five sensory attributes (sweet, salty,
strong flavour, compact/dense, creamy), three non-sensory attributes (filling,
healthy, low-cal), their willingness to buy and five possible consumption times
(breakfast, lunch, dinner, in-between meals, at any time) for each of the five
soft cheese packages, thus addressing the thesis objective 1.2. Both the data
corresponding to the product attributes expectations and the data correspond-
ing to the willingness to buy were analysed individually using one-way repeat-
ed measures ANOVAs and jointly using a multidimensional scaling. As for the
association between time of consumption and stimuli, chi-square in contin-
gency tables and correspondence analysis were used.
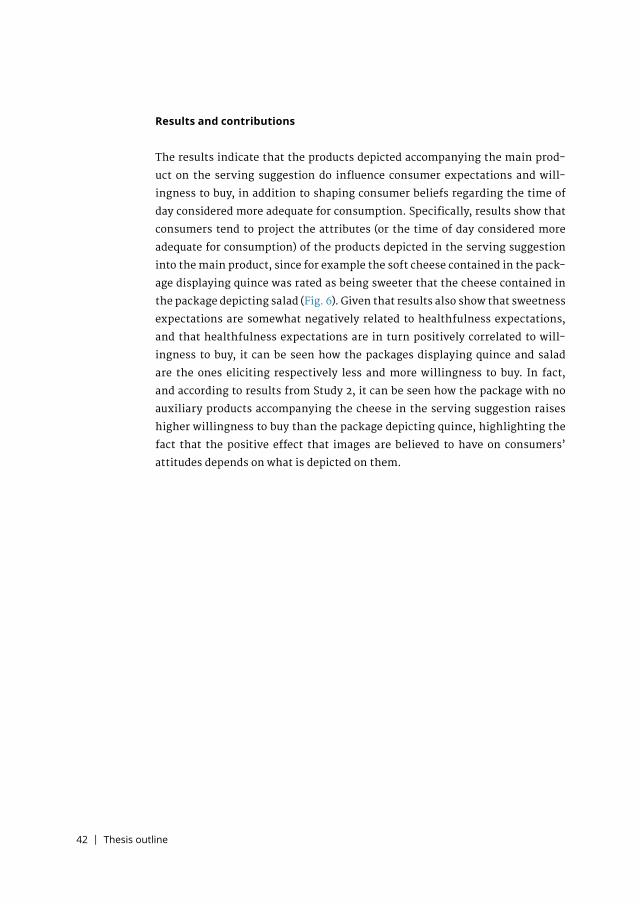
42 | Thesis outline
Results and contributions
The results indicate that the products depicted accompanying the main prod-
uct on the serving suggestion do influence consumer expectations and will-
ingness to buy, in addition to shaping consumer beliefs regarding the time of
day considered more adequate for consumption. Specifically, results show that
consumers tend to project the attributes (or the time of day considered more
adequate for consumption) of the products depicted in the serving suggestion
into the main product, since for example the soft cheese contained in the pack-
age displaying quince was rated as being sweeter that the cheese contained in
the package depicting salad (Fig. 6). Given that results also show that sweetness
expectations are somewhat negatively related to healthfulness expectations,
and that healthfulness expectations are in turn positively correlated to will-
ingness to buy, it can be seen how the packages displaying quince and salad
are the ones eliciting respectively less and more willingness to buy. In fact,
and according to results from Study 2, it can be seen how the package with no
auxiliary products accompanying the cheese in the serving suggestion raises
higher willingness to buy than the package depicting quince, highlighting the
fact that the positive effect that images are believed to have on consumers’
attitudes depends on what is depicted on them.
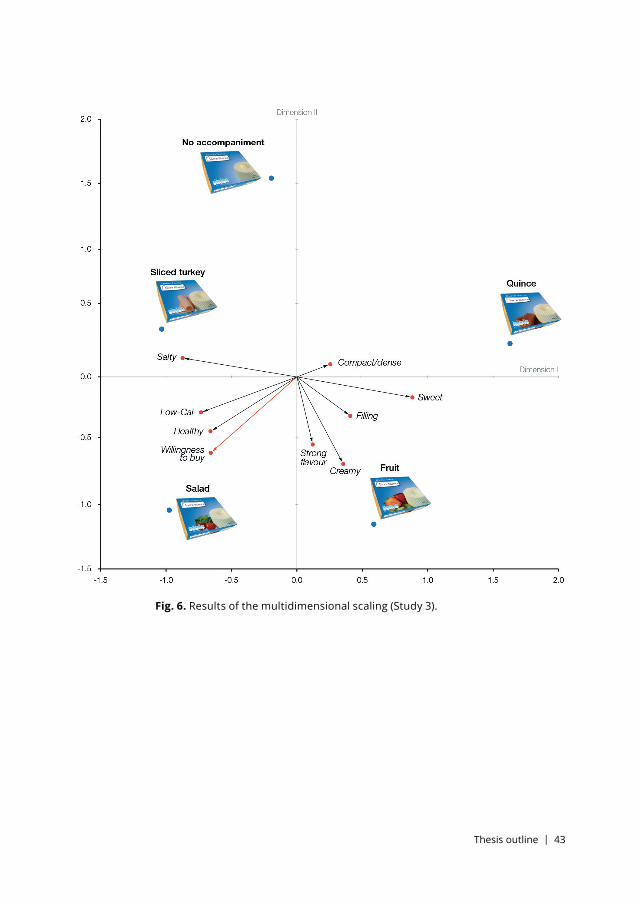
Thesis outline | 43
Fig. 6. Results of the multidimensional scaling (Study 3).
44 | Thesis outline
Study 4 p. 119
Lidón, I., Rebollar, R., Gil-Pérez, I., Martín, J., & Vicente-Villardón, J. L. (2018).
The influence the image of the product shown on food packaging labels has
on product perception during tasting: Effects and gender differences. Packaging
Technology and Science. https://doi.org/10.1002/pts.2407
Objectives
Literature shows that food packaging visual cues may influence not only the
expectations raised by the consumer regarding the attributes of the product
contained within, but also how the product is perceived during tasting. Visual
cues like packaging shape, background colours or even the typefaces used on
the label may influence consumer perception, which is relevant for both de-
signers and producers given that it has been suggested that up to a third of food
products are consumed directly from their packaging. Yet, and despite being a
key element of packaging visual appearance, the influence of packaging imag-
ery on tasting perception has barely been studied.
Studies conducted to date have assessed the effects of manipulating the im-
age’s symbolic meaning, congruence or valence, although designers use to rely
on congruent and positive-valenced images to design food packaging. There-
fore, the question arises regarding what would be the effect of manipulating
the visual appearance of the product on consumer perception during tasting.
Moreover, it is also reasonable to wonder if the effects would be the same for
all consumers, since literature shows that gender differences may exist due to
women’s greater sensibility both to visual and olfactory stimuli.
Thus, this study aims to assess the influence of manipulating the visual ap-
pearance of the product depicted on the package on consumer perception
during tasting and to explore if that influence is moderated by gender differ-
ences. Specifically, this study addresses the objective 1.2. of this thesis.
2.2.4.
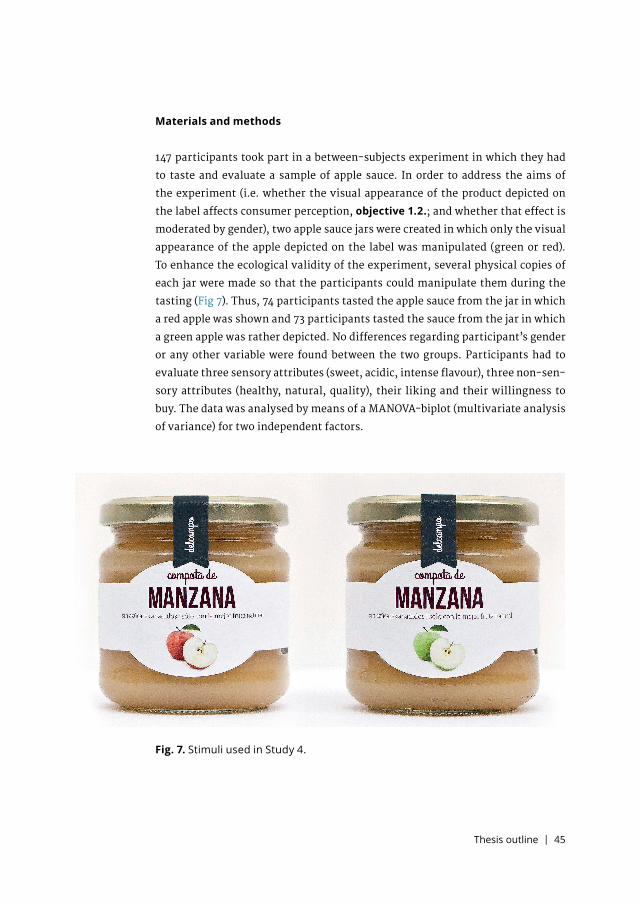
Thesis outline | 45
Materials and methods
147 participants took part in a between-subjects experiment in which they had
to taste and evaluate a sample of apple sauce. In order to address the aims of
the experiment (i.e. whether the visual appearance of the product depicted on
the label affects consumer perception, objective 1.2.; and whether that effect is
moderated by gender), two apple sauce jars were created in which only the visual
appearance of the apple depicted on the label was manipulated (green or red).
To enhance the ecological validity of the experiment, several physical copies of
each jar were made so that the participants could manipulate them during the
tasting (Fig 7). Thus, 74 participants tasted the apple sauce from the jar in which
a red apple was shown and 73 participants tasted the sauce from the jar in which
a green apple was rather depicted. No differences regarding participant’s gender
or any other variable were found between the two groups. Participants had to
evaluate three sensory attributes (sweet, acidic, intense flavour), three non-sen-
sory attributes (healthy, natural, quality), their liking and their willingness to
buy. The data was analysed by means of a MANOVA-biplot (multivariate analysis
of variance) for two independent factors.
Fig. 7. Stimuli used in Study 4.
46 | Thesis outline
Results and contributions
Results from the MANOVA-biplot show that the visual appearance of the prod-
uct depicted on the package affects liking, willingness to buy and some of the
assessed attributes (Fig. 8). Regarding sensory attributes, men perceived the
apple sauce from the jar depicting a red apple as being slightly sweeter than
the apple sauce from the jar depicting a green apple, while women evaluated
the apple sauce from the jar depicting a green apple as being more acidic than
the sauce coming from the jar displaying a red apple. This finding suggests that
consumers tend to enhance the perception of the salient attributes of the prod-
uct depicted on the label, since in Spain the red apple varieties are commonly
sweeter than the green ones and the green apple varieties tend to be more acid-
ic than the red ones. In addition, women perceived the apple sauce from the jar
depicting a red apple as being healthier and of higher quality than the sauce
coming from the green apple jar, in turn liking it more and claiming a higher
willingness to buy it. Thus, our findings indicate that gender differences exists
given that the reported effects were stronger for women than for men.
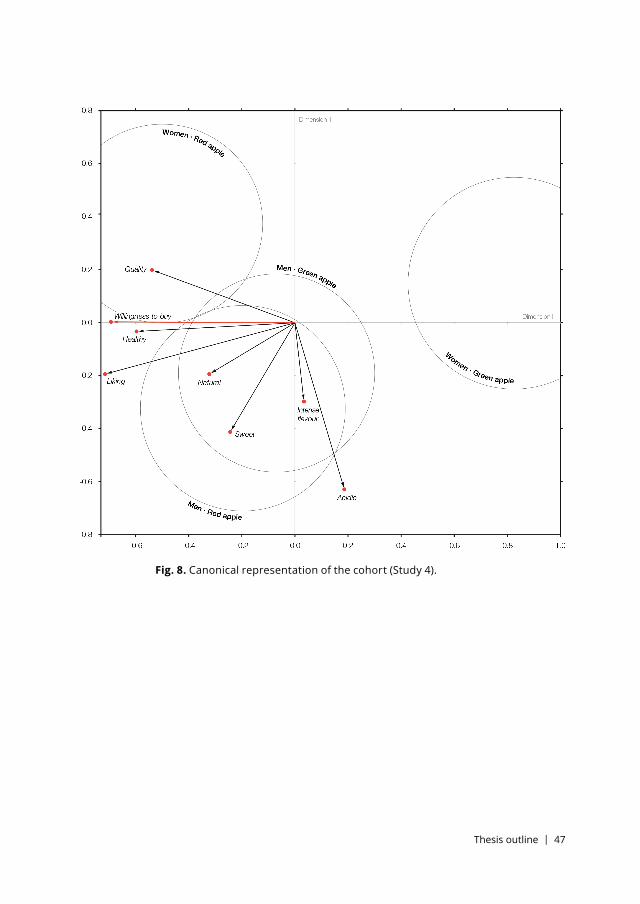
Thesis outline | 47
Fig. 8. Canonical representation of the cohort (Study 4).
48 | Thesis outline
Study 5 p. 131
Gil-Pérez, I., Rebollar, R., Lidón, I., Piqueras-Fiszman, B., & van Trijp, H. C. M.
(2019). What do you mean by hot? Assessing the associations raised by the vi-
sual depiction of an image of fire on food packaging. Food Quality and Preference,
71, 384–394. https://doi.org/10.1016/j.foodqual.2018.08.015
Objectives
Consumers rely on packaging imagery to identify and categorise products and
to set expectations about their properties. Thus, designers have to anticipate
the meaning that consumers will infer from images depicted on food packages
in order to convey the desired messages and to avoid confusion. However, it is
a challenging aim since images are inherently ambiguous due to their propo-
sitional indeterminacy, and therefore can be interpreted in different ways. For
example, consider the case of depicting fire on a food package. Although its
possible meanings are narrowed due to the context in which it is shown (food
packaging), it still remains as an ambiguous cue since it may be interpreted
literally (i.e. in the sense that the product has something to do with concepts
such as barbecue) or metaphorically (i.e. in the sense that the product is spicy).
This study seeks to understand the factors responsible for consumers inferring
a specific meaning from packaging imagery by following the previous example,
thus investigating the way an image of fire displayed on a food package influ-
ences the associations accessed by the consumer: Specifically, this study aims
to assess the effect of congruency between fire image meaning and product cat-
egory on classification easiness. In addition, it aims to assess how the rhetorical
style of the image (i.e. whether its interpretation is literal or metaphorical) af-
fects the cognitive effort necessary to process it. Thus, this study addresses the
objectives 1.1., 2.1. and 2.2. of this thesis.
Materials and methods
The study was composed of two pretests and a main experiment. Results from
the two pretests confirmed that the assumptions on which the main experiment
was based were correct, namely that a fire image depicted on a food package
2.2.5.
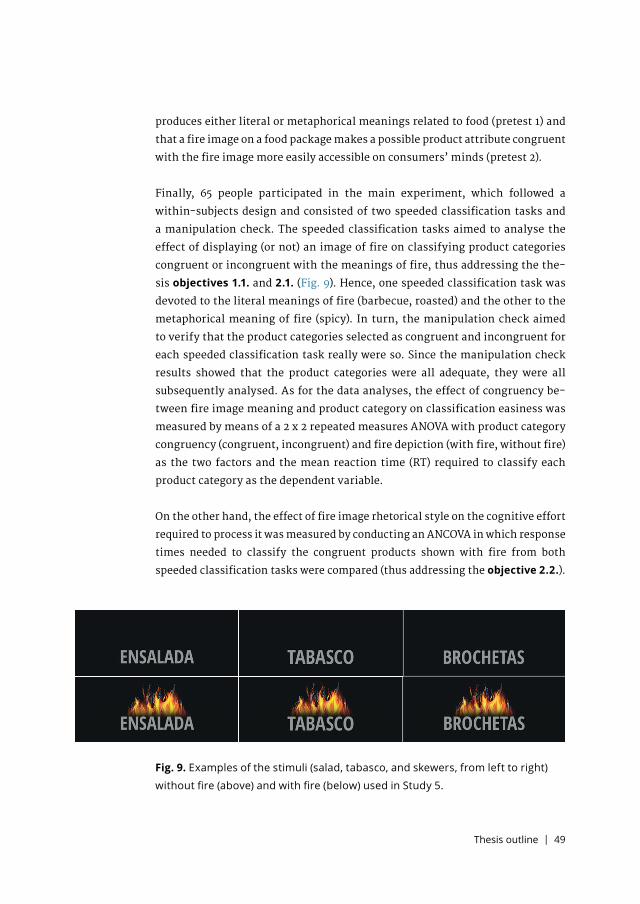
Thesis outline | 49
produces either literal or metaphorical meanings related to food (pretest 1) and
that a fire image on a food package makes a possible product attribute congruent
with the fire image more easily accessible on consumers’ minds (pretest 2).
Finally, 65 people participated in the main experiment, which followed a
within-subjects design and consisted of two speeded classification tasks and
a manipulation check. The speeded classification tasks aimed to analyse the
effect of displaying (or not) an image of fire on classifying product categories
congruent or incongruent with the meanings of fire, thus addressing the the-
sis objectives 1.1. and 2.1. (Fig. 9). Hence, one speeded classification task was
devoted to the literal meanings of fire (barbecue, roasted) and the other to the
metaphorical meaning of fire (spicy). In turn, the manipulation check aimed
to verify that the product categories selected as congruent and incongruent for
each speeded classification task really were so. Since the manipulation check
results showed that the product categories were all adequate, they were all
subsequently analysed. As for the data analyses, the effect of congruency be-
tween fire image meaning and product category on classification easiness was
measured by means of a 2 x 2 repeated measures ANOVA with product category
congruency (congruent, incongruent) and fire depiction (with fire, without fire)
as the two factors and the mean reaction time (RT) required to classify each
product category as the dependent variable.
On the other hand, the effect of fire image rhetorical style on the cognitive effort
required to process it was measured by conducting an ANCOVA in which response
times needed to classify the congruent products shown with fire from both
speeded classification tasks were compared (thus addressing the objective 2.2.).
Fig. 9. Examples of the stimuli (salad, tabasco, and skewers, from left to right)
without fire (above) and with fire (below) used in Study 5.
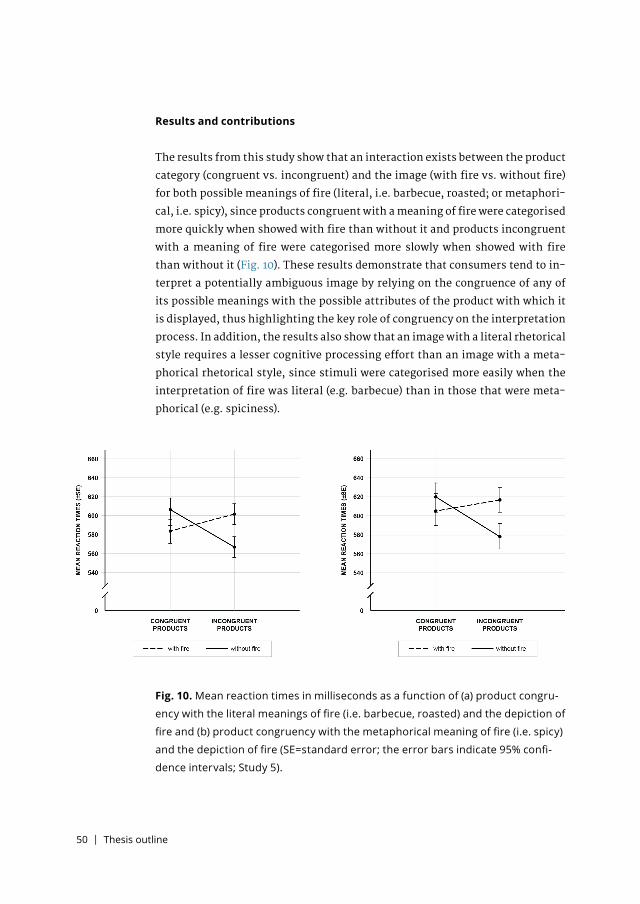
50 | Thesis outline
Results and contributions
The results from this study show that an interaction exists between the product
category (congruent vs. incongruent) and the image (with fire vs. without fire)
for both possible meanings of fire (literal, i.e. barbecue, roasted; or metaphori-
cal, i.e. spicy), since products congruent with a meaning of fire were categorised
more quickly when showed with fire than without it and products incongruent
with a meaning of fire were categorised more slowly when showed with fire
than without it (Fig. 10). These results demonstrate that consumers tend to in-
terpret a potentially ambiguous image by relying on the congruence of any of
its possible meanings with the possible attributes of the product with which it
is displayed, thus highlighting the key role of congruency on the interpretation
process. In addition, the results also show that an image with a literal rhetorical
style requires a lesser cognitive processing effort than an image with a meta-
phorical rhetorical style, since stimuli were categorised more easily when the
interpretation of fire was literal (e.g. barbecue) than in those that were meta-
phorical (e.g. spiciness).
Fig. 10. Mean reaction times in milliseconds as a function of (a) product congru-
ency with the literal meanings of fire (i.e. barbecue, roasted) and the depiction of
fire and (b) product congruency with the metaphorical meaning of fire (i.e. spicy)
and the depiction of fire (SE=standard error; the error bars indicate 95% confi-
dence intervals; Study 5).
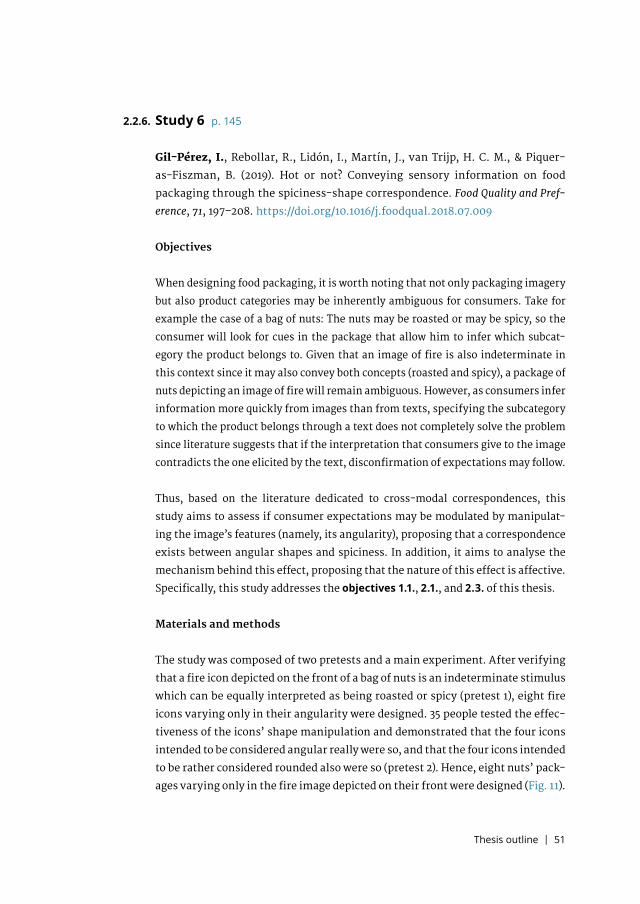
Thesis outline | 51
Study 6 p. 145
Gil-Pérez, I., Rebollar, R., Lidón, I., Martín, J., van Trijp, H. C. M., & Piquer-
as-Fiszman, B. (2019). Hot or not? Conveying sensory information on food
packaging through the spiciness-shape correspondence. Food Quality and Pref-
erence, 71, 197–208. https://doi.org/10.1016/j.foodqual.2018.07.009
Objectives
When designing food packaging, it is worth noting that not only packaging imagery
but also product categories may be inherently ambiguous for consumers. Take for
example the case of a bag of nuts: The nuts may be roasted or may be spicy, so the
consumer will look for cues in the package that allow him to infer which subcat-
egory the product belongs to. Given that an image of fire is also indeterminate in
this context since it may also convey both concepts (roasted and spicy), a package of
nuts depicting an image of fire will remain ambiguous. However, as consumers infer
information more quickly from images than from texts, specifying the subcategory
to which the product belongs through a text does not completely solve the problem
since literature suggests that if the interpretation that consumers give to the image
contradicts the one elicited by the text, disconfirmation of expectations may follow.
Thus, based on the literature dedicated to cross-modal correspondences, this
study aims to assess if consumer expectations may be modulated by manipulat-
ing the image’s features (namely, its angularity), proposing that a correspondence
exists between angular shapes and spiciness. In addition, it aims to analyse the
mechanism behind this effect, proposing that the nature of this effect is affective.
Specifically, this study addresses the objectives 1.1., 2.1., and 2.3. of this thesis.
Materials and methods
The study was composed of two pretests and a main experiment. After verifying
that a fire icon depicted on the front of a bag of nuts is an indeterminate stimulus
which can be equally interpreted as being roasted or spicy (pretest 1), eight fire
icons varying only in their angularity were designed. 35 people tested the effec-
tiveness of the icons’ shape manipulation and demonstrated that the four icons
intended to be considered angular really were so, and that the four icons intended
to be rather considered rounded also were so (pretest 2). Hence, eight nuts’ pack-
ages varying only in the fire image depicted on their front were designed (Fig. 11).
2.2.6.
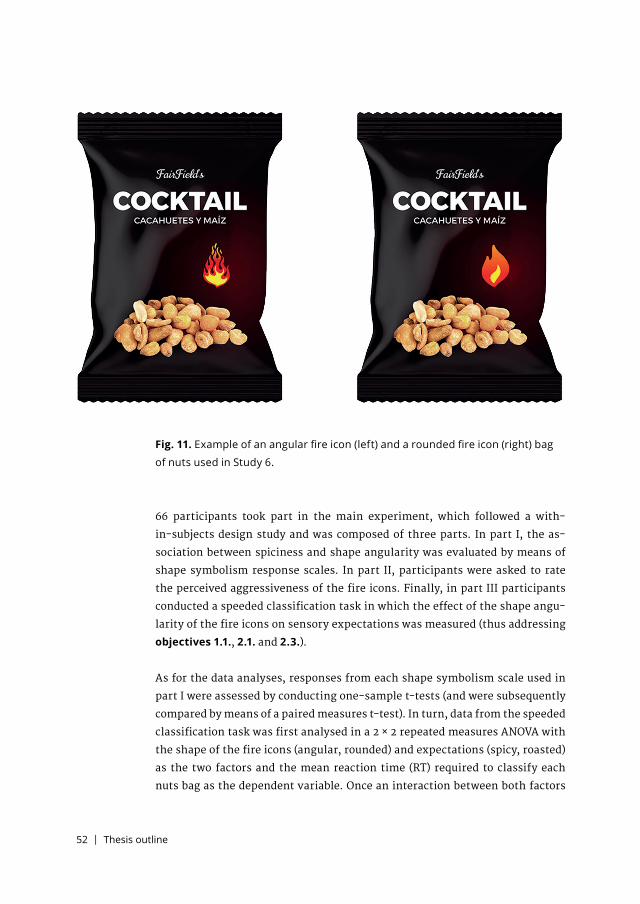
52 | Thesis outline
66 participants took part in the main experiment, which followed a with-
in-subjects design study and was composed of three parts. In part I, the as-
sociation between spiciness and shape angularity was evaluated by means of
shape symbolism response scales. In part II, participants were asked to rate
the perceived aggressiveness of the fire icons. Finally, in part III participants
conducted a speeded classification task in which the effect of the shape angu-
larity of the fire icons on sensory expectations was measured (thus addressing
objectives 1.1., 2.1. and 2.3.).
As for the data analyses, responses from each shape symbolism scale used in
part I were assessed by conducting one-sample t-tests (and were subsequently
compared by means of a paired measures t-test). In turn, data from the speeded
classification task was first analysed in a 2 × 2 repeated measures ANOVA with
the shape of the fire icons (angular, rounded) and expectations (spicy, roasted)
as the two factors and the mean reaction time (RT) required to classify each
nuts bag as the dependent variable. Once an interaction between both factors
Fig. 11. Example of an angular fire icon (left) and a rounded fire icon (right) bag
of nuts used in Study 6.
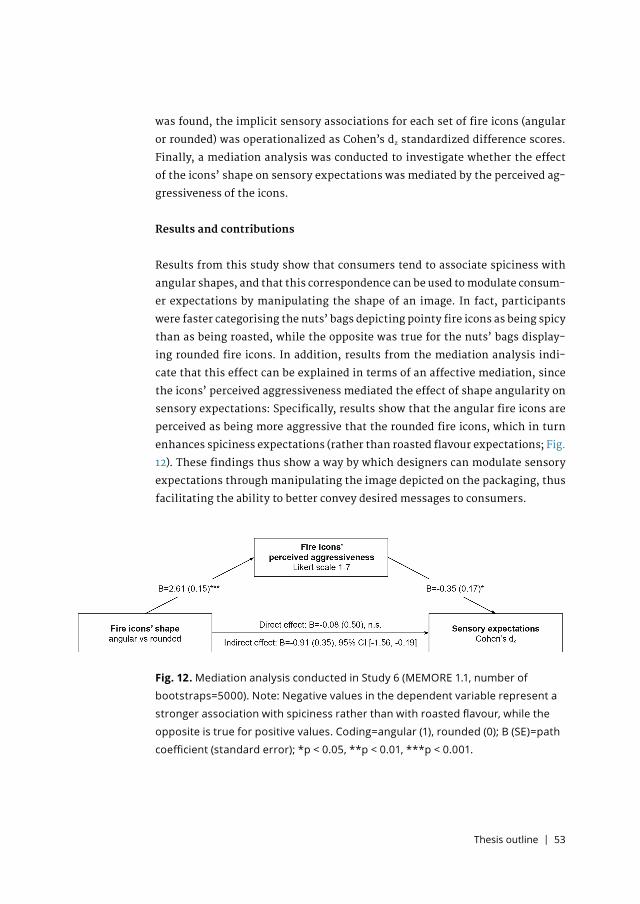
Thesis outline | 53
was found, the implicit sensory associations for each set of fire icons (angular
or rounded) was operationalized as Cohen’s dz standardized difference scores.
Finally, a mediation analysis was conducted to investigate whether the effect
of the icons’ shape on sensory expectations was mediated by the perceived ag-
gressiveness of the icons.
Results and contributions
Results from this study show that consumers tend to associate spiciness with
angular shapes, and that this correspondence can be used to modulate consum-
er expectations by manipulating the shape of an image. In fact, participants
were faster categorising the nuts’ bags depicting pointy fire icons as being spicy
than as being roasted, while the opposite was true for the nuts’ bags display-
ing rounded fire icons. In addition, results from the mediation analysis indi-
cate that this effect can be explained in terms of an affective mediation, since
the icons’ perceived aggressiveness mediated the effect of shape angularity on
sensory expectations: Specifically, results show that the angular fire icons are
perceived as being more aggressive that the rounded fire icons, which in turn
enhances spiciness expectations (rather than roasted flavour expectations; Fig.
12). These findings thus show a way by which designers can modulate sensory
expectations through manipulating the image depicted on the packaging, thus
facilitating the ability to better convey desired messages to consumers.
Fig. 12. Mediation analysis conducted in Study 6 (MEMORE 1.1, number of
bootstraps=5000). Note: Negative values in the dependent variable represent a
stronger association with spiciness rather than with roasted flavour, while the
opposite is true for positive values. Coding=angular (1), rounded (0); B (SE)=path
coefficient (standard error); *p < 0.05, **p < 0.01, ***p < 0.001.

54 | Thesis outline

Publications | 55
PUBLICATIONS3.

Publications · Study 1 | 57
Study 1
Rebollar, R., Gil, I., Lidón, I., Martín, J., Fernández, M. J., & Rivera, S. (2017).
How material, visual and verbal cues on packaging influence consumer expec-
tations and willingness to buy: The case of crisps (potato chips) in Spain. Food
Research International, 99, 239–246. https://doi.org/10.1016/j.foodres.2017.05.024
Food Research International’s JCR Journal Impact Factor in 2017 was 3.520,
placing it in position 14 of 133 (quartile Q1) of the Category Food Science &
Technology.
3.1.

58 | Publications · Study 1
Publications · Study 1 | 59
Contents lists available at ScienceDirect
Food Research International
journal homepage: www.elsevier.com/locate/foodres
How material, visual and verbal cues on packaging influence consumerexpectations and willingness to buy: The case of crisps (potato chips) inSpain
Rubén Rebollara,⁎, Ignacio Gila, Iván Lidóna, Javier Martínb,c, María J. Fernándezb,c,Sandra Riveraa
a Departamento de Ingeniería de Diseño y Fabricación, Escuela de Ingeniería y Arquitectura, Universidad de Zaragoza, c/María de Luna 3, C.P. 50018 Zaragoza, Spainb Departamento de Estadística, Universidad de Salamanca, c/Espejo 2, C.P. 37007 Salamanca, Spainc Bioestatistics Unit-IBSAL, Instituto de Investigación Biomédica de Salamanca, Paseo de San Vicente 58-182, 37007 Salamanca, Spain
A R T I C L E I N F O
Keywords:ExpectationsProduct imagePackaging communication
A B S T R A C T
This paper analyses the influence that certain aspects of packaging design have on the consumer expectations ofa series of sensory and non-sensory attributes and on willingness to buy for a bag of crisps in Spain. A two-partexperiment was conducted in which 174 people evaluated the attributes for different stimuli using an onlinesurvey. In the first part, four stimuli were created in which two factors were varied: the packaging material andthe image displayed. Interaction was identified between both factors for the attributes Crunchy, High quality andArtisan. For the attributes Salty, Crunchy andWillingness to buy, the image was the only significant factor, with theimage displaying crisps ready for consumption being the only one that obtained higher scores. For the attributeIntense flavour, no statistically significant differences were identified among the stimuli. In general terms, theimage displayed on the bag had a greater influence than the material from which the bag was made. In thesecond part, an analysis was made of the most effective way (visual cues versus verbal cues) to transmit theinformation that the crisps were fried in olive oil. To this end, two stimuli were designed: one displaying animage of an oil cruet and another with an allusive text. For all the attributes (Intense flavour, Crunchy, Artisan,High quality, Healthy and Willingness to buy), higher scores were obtained with the image than with the text.These results have important implications for crisps producers, marketers and packaging designers.
1. Introduction
During the process of designing a food package, the designer must makemany decisions about the package's visual appearance. Studies conducted inrecent years show that each of these decisions can influence the consumer'sexpectations of the product and their willingness to buy it, both individuallyand through interactions with other decisions made (Becker, vanRompay, Schifferstein, &Galetzka, 2011; Piqueras-Fiszman&Spence, 2011;Piqueras-Fiszman, Velasco, & Spence, 2012; Rebollar, Lidón, Serrano,Martín, & Fernández, 2012; Sundar&Noseworthy, 2014). Consumers' ex-pectations are generated from their beliefs and their prior experiences aswell as from a product's extrinsic aspects, such as the packaging'scharacteristics (see Deliza&MacFie, 1996; Piqueras-Fiszman&Spence,2015 for reviews). In this context, the visual appearance of a product'spackaging has an important role in generating consumer expectations andalso modulates willingness to buy (see Deliza &MacFie, 1996; Piqueras-Fiszman&Spence, 2015 for reviews). Designers now have a great deal of
useful information to consider when designing packaging; however, thisinformation is far from being complete and there are still some aspects ofthe visual appearance of packaging that remain largely unstudied. This istrue for packaging material, the product image displayed on the front of thepackage and the relationship between visual and verbal cues.
Material is considered to be one of the elements that forms a part ofthe visual appearance of a packaging (Magnier & Schoormans, 2015).Studies thus far have observed that, just as other visually processed designelements, material has a capacity to influence the way in which consumersperceive the product and the ideas that they generate about its character-istics (Mutsikiwa&Marumbwa, 2013). However, in the field of percep-tion, packaging material has been mainly studied from a perspective ofhaptic perception (i.e. information acquired through the hands) (Biggs,Juravle, & Spence, 2016; Chen, Barnes, Childs, Henson, & Shao, 2009;Krishna&Morrin, 2008; Piqueras-Fiszman& Spence, 2012; Schifferstein,Fenko, Desmet, Labbe, &Martin, 2013; Tu, Yang, &Ma, 2015), and thesensory transfer between touch and flavour (Spence, 2016). This body of
http://dx.doi.org/10.1016/j.foodres.2017.05.024Received 13 November 2016; Received in revised form 14 May 2017; Accepted 27 May 2017
⁎ Corresponding author.E-mail address: [email protected] (R. Rebollar).
Food Research International 99 (2017) 239–246
Available online 29 May 20170963-9969/ © 2017 Elsevier Ltd. All rights reserved.

60 | Publications · Study 1
knowledge suggests that packaging material may play a role in thegeneration of sensory expectations and willingness to buy, although thisrelationship has not been studied thus far. In this context, researchconducted so far has mainly focused on the concepts of sustainabilityand naturalness. Labbe, Pineau, and Martin (2013) observed that touchand sight are the predominant senses used to evaluate the naturalness of apackage of dehydrated soup, in a study that compared the use of differentkinds of materials in a packaging. Magnier and Schoormans (2015) foundthat using a sustainable material positively influences the perceivedethicality of the brand and increases willingness to buy, particularly whenthe sustainability is visibly showcased. In an earlier study, the sameresearchers found that consumers perceived a package of raisins madefrom recycled cardboard to be more sustainable than one made fromwhiteplastic (Magnier, Schoormans, &Mugge, 2016).
The product image displayed on the front of a large proportion offood packages is another key element in its visual appearance(Ampuero & Vila, 2006; Liao, Corsi, Chrysochou, & Lockshin, 2015;Rebollar, Lidón, Martín, & Puebla, 2015). It is also one of the graphicelements that gives graphic designers most possibilities in terms ofaesthetics as well as communication, and it tends to occupy animportant space in the composition. For consumers, it is particularlyimportant since it lets them know about the visual aspect of the productbefore buying it, making it a key element in the creation of expectations(Jaeger &MacFie, 2001; Underwood & Klein, 2002). The consumer'sresponse depends on the characteristics of the image as well as whetherit is an illustration or a photography (Deliza, Macfie, & Hedderley,2003; Smith, Barratt, & Selsøe Sørensen, 2015), its size (Neyens,Aerts, & Smits, 2015), the quantity of product units displayed(Madzharov & Block, 2010) and the product used as a serving sugges-tion (Rebollar et al., 2016). However, in practice the designer veryfrequently chooses from a selection of different images of the product inwhich the main variation is the way in which it is represented (e.g. cutor whole, raw or ready for consumption). Few studies have used theway in which the product is represented in the image as a designvariable (Kobayashi & de Benassi, 2015; Machiels & Karnal, 2016),although it seems reasonable to think that the different ways ofrepresenting the product will generate different responses in theconsumer in terms of their sensory and non-sensory expectations andwillingness to buy. However, this effect is yet to be further studied.
Moreover, while designing a packaging, the designer may use verbal orvisual cues to communicate a message or an idea (Kauppinen-Räisänen,Owusu,&Abeeku Bamfo, 2012; Machiels & Karnal, 2016). The benefits ofopting to use one over the other have been studied earlier in the fieldsof advertising and preventive medicine (Hammond et al., 2007;Jaeger &MacFie, 2001; Maynard, Munafò, & Leonards, 2013; Phillips,2000; Rayner, Rotello, Stewart, Keir, & Duffy, 2001; van Rompay-&Veltkamp, 2014). Visual and verbal cues produce different consumerresponses and require different levels of cognitive processing (Kauppinen-Räisänen et al., 2012). Studies conducted thus far demonstrate that visualcues produce a higher vividness effect and require a type of unconsciousand unintentional processing, while verbal cues require a higher level ofcognitive effort (Mueller, Lockshin, & Louviere, 2009; Underwood&Klein,2002). Visual cues attract the consumer's attention at point of sale(Honea&Horsky, 2012; Silayoi & Speece, 2007; Venter, van der Merwe,de Beer, Kempen, & Bosman, 2011) and their use enables consumers togenerate expectations more quickly than through reading a text(Underwood&Klein, 2002). Nevertheless, designers should not under-estimate the impact of transmitting information through verbal cues(Machiels & Karnal, 2016; Orth &Marchi, 2007). The influence of textand words on the way in which a food product is perceived andexperienced has attracted great interest (Okamoto et al., 2009;Spence& Piqueras-Fiszman, 2014; Yeomans, Chambers, Blumenthal,-& Blake, 2008), and it has been found that expectations generated by aproduct depend largely on the textual information displayed (Grabenhorst,Rolls, & Bilderbeck, 2008; Lähteenmäki et al., 2010; Liem, ToramanAydin, & Zandstra, 2012; Siret & Issanchou, 2000; Sütterlin & Siegrist,
2015). However, it is not easy for a designer to apply this knowledge.The real problems designers face are very complex: often they have tocommunicate several messages in different hierarchies through oneproduct packaging. In the case of a bag of crisps fried in olive oil, thedesigner must communicate the main message (crisps) and also asecondary one (with olive oil). Both messages can be communicatedthrough visual cues, verbal cues, or through a combination of both. Oncommercial packaging, in most cases the main message (crisps) iscommunicated through both visual cues (an image of crisps) as well asverbal cues (the word “crisps”). However, it is not clear which is the mosteffective way to communicate the secondary message (that they have beenprepared with olive oil). It is not easy to know the impact this decision willhave on consumer expectations and willingness to buy, and the simulta-neous nature of the stimuli means extracting valid conclusions from thestudies conducted thus far is a complex task.
Owing to all the above, we expect that the modification of any ofthese three factors (i.e. the packaging material, the product imagedisplayed or the use of visual or verbal cues to communicate additionalinformation) will produce an effect on the consumer's sensory and non-sensory expectations as well as on willingness to buy. In summary, thespecific aims of the present study were to analyse how the followingfactors of a bag of crisps: 1) the packaging material; 2) the way in whichthe product is represented in the image displayed on the packaging; and3) the use of visual or verbal cues to communicate additional productinformation; affect consumer expectation for certain sensory and non-sensory attributes and the willingness to buy the product.
2. Materials and methods
2.1. Participants
One hundred and eighty-two persons participated in this investiga-tion; eight of these were excluded because they did not complete thesurvey and were not included in the results. As such, one hundred andseventy four (approximately 51% female and 49% male, 18–61 yearsold, mean age of 27.6 (± 12.3) years) participants were considered.
With regard to their educational profile, approximately 64% ofparticipants stated they had university qualifications, 35% stated theyhad qualifications from non-university institutions, and 1% said theyhad no professional qualifications.
With respect to the consumption of crisps, 13.8% stated theyconsumed them frequently (at least once a week), 64.9% answeredfrom time to time (at least once a month), 20.1% said that they rarelyate them (less than once a month), and the remaining 1.1% admittednever having consumed crisps.
2.2. Procedure
The experiment was conducted via social media on a voluntary andanonymous basis, using an online survey tool to gather the data:SurveyMonkey®. Participants were not set a time limit to complete thesurvey or any particular section thereof. They were shown photorea-listic renderings of six (4 in the first part and 2 in the second one)different crisps packages created for this investigation and given asurvey to evaluate them. These stimuli were created using PhotoshopCS5 (Adobe Systems Inc., San Jose, CA, U.S.A.) and Keyshot 4 (LuxionInc., Tustin, CA, U.S.A.). All participants viewed the same packagesdisplayed sequentially in a random order, so a within-subject experi-mental design was used.
2.3. Stimuli
A market study was carried out prior to the design of the stimuli toknow the most frequent characteristics of the packages of potato chipssold in the Spanish market. The experiment was conducted in twoseparate parts.
R. Rebollar et al. Food Research International 99 (2017) 239–246
240
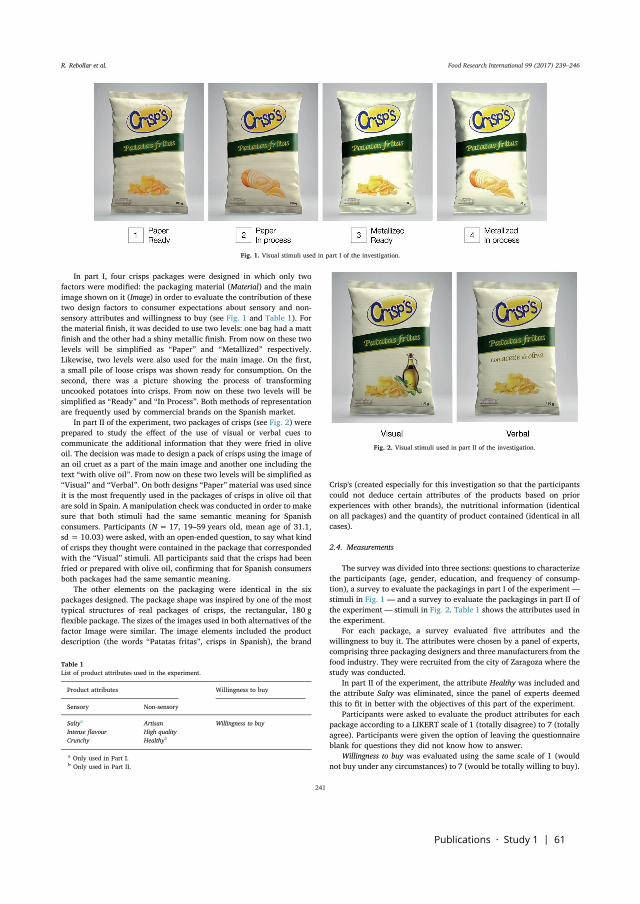
Publications · Study 1 | 61
In part I, four crisps packages were designed in which only twofactors were modified: the packaging material (Material) and the mainimage shown on it (Image) in order to evaluate the contribution of thesetwo design factors to consumer expectations about sensory and non-sensory attributes and willingness to buy (see Fig. 1 and Table 1). Forthe material finish, it was decided to use two levels: one bag had a mattfinish and the other had a shiny metallic finish. From now on these twolevels will be simplified as “Paper” and “Metallized” respectively.Likewise, two levels were also used for the main image. On the first,a small pile of loose crisps was shown ready for consumption. On thesecond, there was a picture showing the process of transforminguncooked potatoes into crisps. From now on these two levels will besimplified as “Ready” and “In Process”. Both methods of representationare frequently used by commercial brands on the Spanish market.
In part II of the experiment, two packages of crisps (see Fig. 2) wereprepared to study the effect of the use of visual or verbal cues tocommunicate the additional information that they were fried in oliveoil. The decision was made to design a pack of crisps using the image ofan oil cruet as a part of the main image and another one including thetext “with olive oil”. From now on these two levels will be simplified as“Visual” and “Verbal”. On both designs “Paper” material was used sinceit is the most frequently used in the packages of crisps in olive oil thatare sold in Spain. A manipulation check was conducted in order to makesure that both stimuli had the same semantic meaning for Spanishconsumers. Participants (N = 17, 19–59 years old, mean age of 31.1,sd = 10.03) were asked, with an open-ended question, to say what kindof crisps they thought were contained in the package that correspondedwith the “Visual” stimuli. All participants said that the crisps had beenfried or prepared with olive oil, confirming that for Spanish consumersboth packages had the same semantic meaning.
The other elements on the packaging were identical in the sixpackages designed. The package shape was inspired by one of the mosttypical structures of real packages of crisps, the rectangular, 180 gflexible package. The sizes of the images used in both alternatives of thefactor Image were similar. The image elements included the productdescription (the words “Patatas fritas”, crisps in Spanish), the brand
Crisp's (created especially for this investigation so that the participantscould not deduce certain attributes of the products based on priorexperiences with other brands), the nutritional information (identicalon all packages) and the quantity of product contained (identical in allcases).
2.4. Measurements
The survey was divided into three sections: questions to characterizethe participants (age, gender, education, and frequency of consump-tion), a survey to evaluate the packagings in part I of the experiment —stimuli in Fig. 1 — and a survey to evaluate the packagings in part II ofthe experiment — stimuli in Fig. 2. Table 1 shows the attributes used inthe experiment.
For each package, a survey evaluated five attributes and thewillingness to buy it. The attributes were chosen by a panel of experts,comprising three packaging designers and three manufacturers from thefood industry. They were recruited from the city of Zaragoza where thestudy was conducted.
In part II of the experiment, the attribute Healthy was included andthe attribute Salty was eliminated, since the panel of experts deemedthis to fit in better with the objectives of this part of the experiment.
Participants were asked to evaluate the product attributes for eachpackage according to a LIKERT scale of 1 (totally disagree) to 7 (totallyagree). Participants were given the option of leaving the questionnaireblank for questions they did not know how to answer.
Willingness to buy was evaluated using the same scale of 1 (wouldnot buy under any circumstances) to 7 (would be totally willing to buy).
Fig. 1. Visual stimuli used in part I of the investigation.
Table 1List of product attributes used in the experiment.
Product attributes Willingness to buy
Sensory Non-sensory
Saltya Artisan Willingness to buyIntense flavour High qualityCrunchy Healthyb
a Only used in Part I.b Only used in Part II.
Fig. 2. Visual stimuli used in part II of the investigation.
R. Rebollar et al. Food Research International 99 (2017) 239–246
241
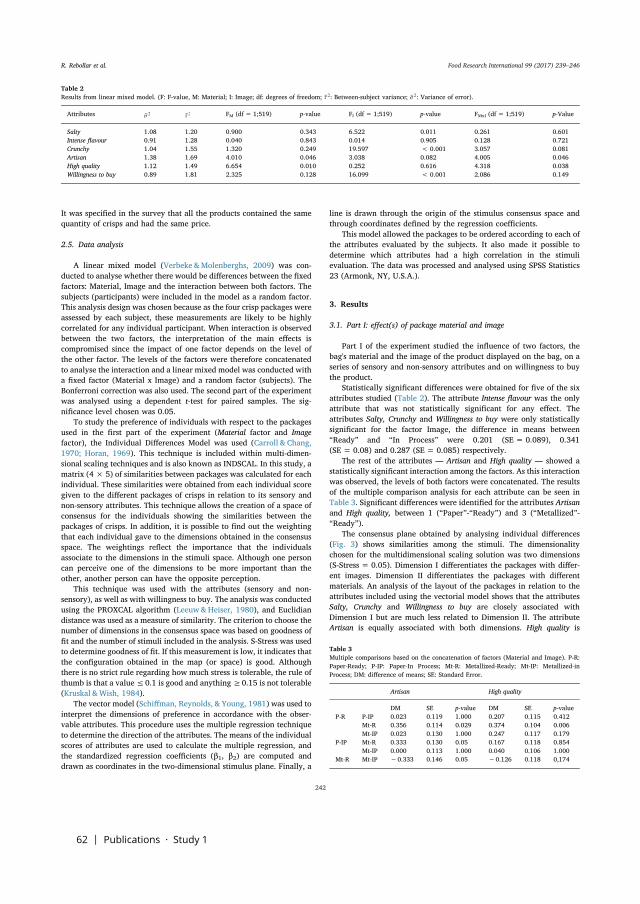
62 | Publications · Study 1
It was specified in the survey that all the products contained the samequantity of crisps and had the same price.
2.5. Data analysis
A linear mixed model (Verbeke &Molenberghs, 2009) was con-ducted to analyse whether there would be differences between the fixedfactors: Material, Image and the interaction between both factors. Thesubjects (participants) were included in the model as a random factor.This analysis design was chosen because as the four crisp packages wereassessed by each subject, these measurements are likely to be highlycorrelated for any individual participant. When interaction is observedbetween the two factors, the interpretation of the main effects iscompromised since the impact of one factor depends on the level ofthe other factor. The levels of the factors were therefore concatenatedto analyse the interaction and a linear mixed model was conducted witha fixed factor (Material x Image) and a random factor (subjects). TheBonferroni correction was also used. The second part of the experimentwas analysed using a dependent t-test for paired samples. The sig-nificance level chosen was 0.05.
To study the preference of individuals with respect to the packagesused in the first part of the experiment (Material factor and Imagefactor), the Individual Differences Model was used (Carroll & Chang,1970; Horan, 1969). This technique is included within multi-dimen-sional scaling techniques and is also known as INDSCAL. In this study, amatrix (4 × 5) of similarities between packages was calculated for eachindividual. These similarities were obtained from each individual scoregiven to the different packages of crisps in relation to its sensory andnon-sensory attributes. This technique allows the creation of a space ofconsensus for the individuals showing the similarities between thepackages of crisps. In addition, it is possible to find out the weightingthat each individual gave to the dimensions obtained in the consensusspace. The weightings reflect the importance that the individualsassociate to the dimensions in the stimuli space. Although one personcan perceive one of the dimensions to be more important than theother, another person can have the opposite perception.
This technique was used with the attributes (sensory and non-sensory), as well as with willingness to buy. The analysis was conductedusing the PROXCAL algorithm (Leeuw&Heiser, 1980), and Euclidiandistance was used as a measure of similarity. The criterion to choose thenumber of dimensions in the consensus space was based on goodness offit and the number of stimuli included in the analysis. S-Stress was usedto determine goodness of fit. If this measurement is low, it indicates thatthe configuration obtained in the map (or space) is good. Althoughthere is no strict rule regarding how much stress is tolerable, the rule ofthumb is that a value≤0.1 is good and anything ≥0.15 is not tolerable(Kruskal &Wish, 1984).
The vector model (Schiffman, Reynolds, & Young, 1981) was used tointerpret the dimensions of preference in accordance with the obser-vable attributes. This procedure uses the multiple regression techniqueto determine the direction of the attributes. The means of the individualscores of attributes are used to calculate the multiple regression, andthe standardized regression coefficients (β1, β2) are computed anddrawn as coordinates in the two-dimensional stimulus plane. Finally, a
line is drawn through the origin of the stimulus consensus space andthrough coordinates defined by the regression coefficients.
This model allowed the packages to be ordered according to each ofthe attributes evaluated by the subjects. It also made it possible todetermine which attributes had a high correlation in the stimulievaluation. The data was processed and analysed using SPSS Statistics23 (Armonk, NY, U.S.A.).
3. Results
3.1. Part I: effect(s) of package material and image
Part I of the experiment studied the influence of two factors, thebag's material and the image of the product displayed on the bag, on aseries of sensory and non-sensory attributes and on willingness to buythe product.
Statistically significant differences were obtained for five of the sixattributes studied (Table 2). The attribute Intense flavour was the onlyattribute that was not statistically significant for any effect. Theattributes Salty, Crunchy and Willingness to buy were only statisticallysignificant for the factor Image, the difference in means between“Ready” and “In Process” were 0.201 (SE = 0.089), 0.341(SE = 0.08) and 0.287 (SE = 0.085) respectively.
The rest of the attributes — Artisan and High quality — showed astatistically significant interaction among the factors. As this interactionwas observed, the levels of both factors were concatenated. The resultsof the multiple comparison analysis for each attribute can be seen inTable 3. Significant differences were identified for the attributes Artisanand High quality, between 1 (“Paper”-“Ready”) and 3 (“Metallized”-“Ready”).
The consensus plane obtained by analysing individual differences(Fig. 3) shows similarities among the stimuli. The dimensionalitychosen for the multidimensional scaling solution was two dimensions(S-Stress = 0.05). Dimension I differentiates the packages with differ-ent images. Dimension II differentiates the packages with differentmaterials. An analysis of the layout of the packages in relation to theattributes included using the vectorial model shows that the attributesSalty, Crunchy and Willingness to buy are closely associated withDimension I but are much less related to Dimension II. The attributeArtisan is equally associated with both dimensions. High quality is
Table 2Results from linear mixed model. (F: F-value, M: Material; I: Image; df: degrees of freedom; τ 2̂: Between-subject variance; σ 2: Variance of error).
Attributes σ 2 τ 2̂ FM (df = 1;519) p-value FI (df = 1;519) p-value FMxI (df = 1;519) p-Value
Salty 1.08 1.20 0.900 0.343 6.522 0.011 0.261 0.601Intense flavour 0.91 1.28 0.040 0.843 0.014 0.905 0.128 0.721Crunchy 1.04 1.55 1.320 0.249 19.597 < 0.001 3.057 0.081Artisan 1.38 1.69 4.010 0.046 3.038 0.082 4.005 0.046High quality 1.12 1.49 6.654 0.010 0.252 0.616 4.318 0.038Willingness to buy 0.89 1.81 2.325 0.128 16.099 < 0.001 2.086 0.149
Table 3Multiple comparisons based on the concatenation of factors (Material and Image). P-R:Paper-Ready; P-IP: Paper-In Process; Mt-R: Metallized-Ready; Mt-IP: Metallized-inProcess; DM: difference of means; SE: Standard Error.
Artisan High quality
DM SE p-value DM SE p-valueP-R P-IP 0.023 0.119 1.000 0.207 0.115 0.412
Mt-R 0.356 0.114 0.029 0.374 0.104 0.006Mt-IP 0.023 0.130 1.000 0.247 0.117 0.179
P-IP Mt-R 0.333 0.130 0.05 0.167 0.118 0.854Mt-IP 0.000 0.113 1.000 0.040 0.106 1.000
Mt-R Mt-IP −0.333 0.146 0.05 −0.126 0.118 0,174
R. Rebollar et al. Food Research International 99 (2017) 239–246
242
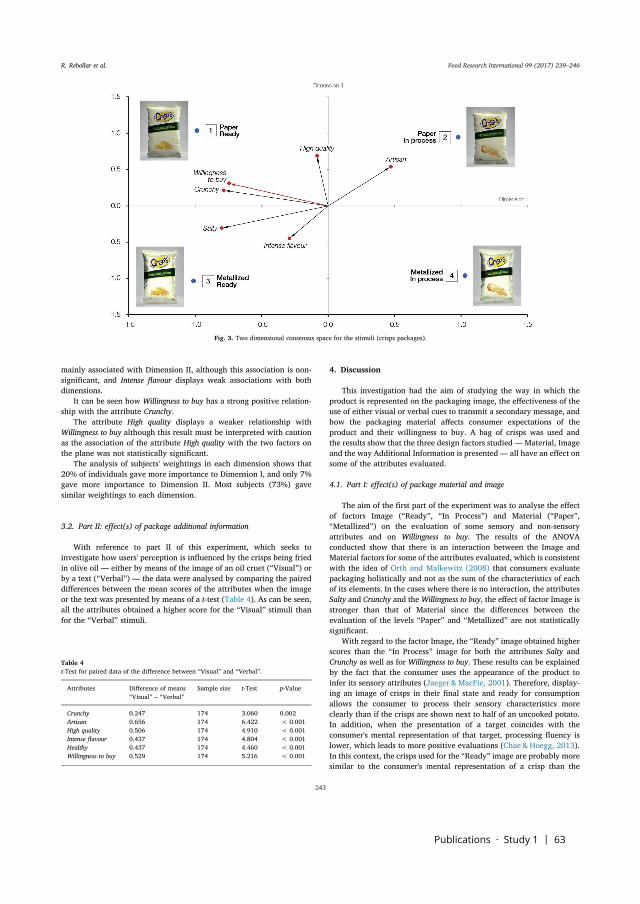
Publications · Study 1 | 63
mainly associated with Dimension II, although this association is non-significant, and Intense flavour displays weak associations with bothdimensions.
It can be seen how Willingness to buy has a strong positive relation-ship with the attribute Crunchy.
The attribute High quality displays a weaker relationship withWillingness to buy although this result must be interpreted with cautionas the association of the attribute High quality with the two factors onthe plane was not statistically significant.
The analysis of subjects' weightings in each dimension shows that20% of individuals gave more importance to Dimension I, and only 7%gave more importance to Dimension II. Most subjects (73%) gavesimilar weightings to each dimension.
3.2. Part II: effect(s) of package additional information
With reference to part II of this experiment, which seeks toinvestigate how users' perception is influenced by the crisps being friedin olive oil — either by means of the image of an oil cruet (“Visual”) orby a text (“Verbal”) — the data were analysed by comparing the paireddifferences between the mean scores of the attributes when the imageor the text was presented by means of a t-test (Table 4). As can be seen,all the attributes obtained a higher score for the “Visual” stimuli thanfor the “Verbal” stimuli.
4. Discussion
This investigation had the aim of studying the way in which theproduct is represented on the packaging image, the effectiveness of theuse of either visual or verbal cues to transmit a secondary message, andhow the packaging material affects consumer expectations of theproduct and their willingness to buy. A bag of crisps was used andthe results show that the three design factors studied —Material, Imageand the way Additional Information is presented— all have an effect onsome of the attributes evaluated.
4.1. Part I: effect(s) of package material and image
The aim of the first part of the experiment was to analyse the effectof factors Image (“Ready”, “In Process”) and Material (“Paper”,“Metallized”) on the evaluation of some sensory and non-sensoryattributes and on Willingness to buy. The results of the ANOVAconducted show that there is an interaction between the Image andMaterial factors for some of the attributes evaluated, which is consistentwith the idea of Orth and Malkewitz (2008) that consumers evaluatepackaging holistically and not as the sum of the characteristics of eachof its elements. In the cases where there is no interaction, the attributesSalty and Crunchy and the Willingness to buy, the effect of factor Image isstronger than that of Material since the differences between theevaluation of the levels “Paper” and “Metallized” are not statisticallysignificant.
With regard to the factor Image, the “Ready” image obtained higherscores than the “In Process” image for both the attributes Salty andCrunchy as well as for Willingness to buy. These results can be explainedby the fact that the consumer uses the appearance of the product toinfer its sensory attributes (Jaeger &MacFie, 2001). Therefore, display-ing an image of crisps in their final state and ready for consumptionallows the consumer to process their sensory characteristics moreclearly than if the crisps are shown next to half of an uncooked potato.In addition, when the presentation of a target coincides with theconsumer's mental representation of that target, processing fluency islower, which leads to more positive evaluations (Chae &Hoegg, 2013).In this context, the crisps used for the “Ready” image are probably moresimilar to the consumer's mental representation of a crisp than the
Fig. 3. Two dimensional consensus space for the stimuli (crisps packages).
Table 4t-Test for paired data of the difference between “Visual” and “Verbal”.
Attributes Difference of means“Visual” – “Verbal”
Sample size t-Test p-Value
Crunchy 0.247 174 3.060 0.002Artisan 0.656 174 6.422 < 0.001High quality 0.506 174 4.910 < 0.001Intense flavour 0.437 174 4.804 < 0.001Healthy 0.437 174 4.460 < 0.001Willingness to buy 0.529 174 5.216 < 0.001
R. Rebollar et al. Food Research International 99 (2017) 239–246
243
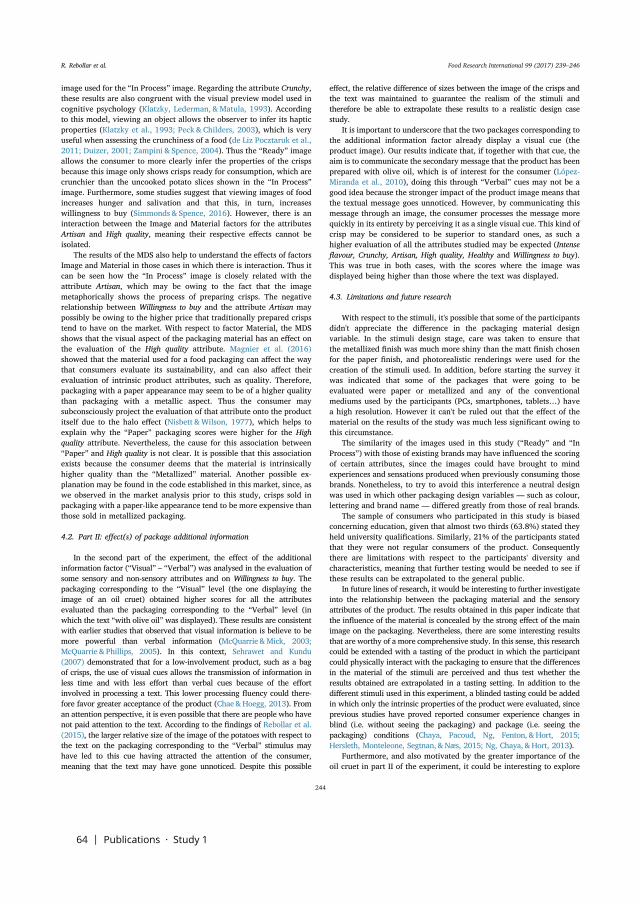
64 | Publications · Study 1
image used for the “In Process” image. Regarding the attribute Crunchy,these results are also congruent with the visual preview model used incognitive psychology (Klatzky, Lederman, &Matula, 1993). Accordingto this model, viewing an object allows the observer to infer its hapticproperties (Klatzky et al., 1993; Peck & Childers, 2003), which is veryuseful when assessing the crunchiness of a food (de Liz Pocztaruk et al.,2011; Duizer, 2001; Zampini & Spence, 2004). Thus the “Ready” imageallows the consumer to more clearly infer the properties of the crispsbecause this image only shows crisps ready for consumption, which arecrunchier than the uncooked potato slices shown in the “In Process”image. Furthermore, some studies suggest that viewing images of foodincreases hunger and salivation and that this, in turn, increaseswillingness to buy (Simmonds & Spence, 2016). However, there is aninteraction between the Image and Material factors for the attributesArtisan and High quality, meaning their respective effects cannot beisolated.
The results of the MDS also help to understand the effects of factorsImage and Material in those cases in which there is interaction. Thus itcan be seen how the “In Process” image is closely related with theattribute Artisan, which may be owing to the fact that the imagemetaphorically shows the process of preparing crisps. The negativerelationship between Willingness to buy and the attribute Artisan maypossibly be owing to the higher price that traditionally prepared crispstend to have on the market. With respect to factor Material, the MDSshows that the visual aspect of the packaging material has an effect onthe evaluation of the High quality attribute. Magnier et al. (2016)showed that the material used for a food packaging can affect the waythat consumers evaluate its sustainability, and can also affect theirevaluation of intrinsic product attributes, such as quality. Therefore,packaging with a paper appearance may seem to be of a higher qualitythan packaging with a metallic aspect. Thus the consumer maysubconsciously project the evaluation of that attribute onto the productitself due to the halo effect (Nisbett &Wilson, 1977), which helps toexplain why the “Paper” packaging scores were higher for the Highquality attribute. Nevertheless, the cause for this association between“Paper” and High quality is not clear. It is possible that this associationexists because the consumer deems that the material is intrinsicallyhigher quality than the “Metallized” material. Another possible ex-planation may be found in the code established in this market, since, aswe observed in the market analysis prior to this study, crisps sold inpackaging with a paper-like appearance tend to be more expensive thanthose sold in metallized packaging.
4.2. Part II: effect(s) of package additional information
In the second part of the experiment, the effect of the additionalinformation factor (“Visual” – “Verbal”) was analysed in the evaluation ofsome sensory and non-sensory attributes and on Willingness to buy. Thepackaging corresponding to the “Visual” level (the one displaying theimage of an oil cruet) obtained higher scores for all the attributesevaluated than the packaging corresponding to the “Verbal” level (inwhich the text “with olive oil” was displayed). These results are consistentwith earlier studies that observed that visual information is believe to bemore powerful than verbal information (McQuarrie &Mick, 2003;McQuarrie & Phillips, 2005). In this context, Sehrawet and Kundu(2007) demonstrated that for a low-involvement product, such as a bagof crisps, the use of visual cues allows the transmission of information inless time and with less effort than verbal cues because of the effortinvolved in processing a text. This lower processing fluency could there-fore favor greater acceptance of the product (Chae&Hoegg, 2013). Froman attention perspective, it is even possible that there are people who havenot paid attention to the text. According to the findings of Rebollar et al.(2015), the larger relative size of the image of the potatoes with respect tothe text on the packaging corresponding to the “Verbal” stimulus mayhave led to this cue having attracted the attention of the consumer,meaning that the text may have gone unnoticed. Despite this possible
effect, the relative difference of sizes between the image of the crisps andthe text was maintained to guarantee the realism of the stimuli andtherefore be able to extrapolate these results to a realistic design casestudy.
It is important to underscore that the two packages corresponding tothe additional information factor already display a visual cue (theproduct image). Our results indicate that, if together with that cue, theaim is to communicate the secondary message that the product has beenprepared with olive oil, which is of interest for the consumer (López-Miranda et al., 2010), doing this through “Verbal” cues may not be agood idea because the stronger impact of the product image means thatthe textual message goes unnoticed. However, by communicating thismessage through an image, the consumer processes the message morequickly in its entirety by perceiving it as a single visual cue. This kind ofcrisp may be considered to be superior to standard ones, as such ahigher evaluation of all the attributes studied may be expected (Intenseflavour, Crunchy, Artisan, High quality, Healthy and Willingness to buy).This was true in both cases, with the scores where the image wasdisplayed being higher than those where the text was displayed.
4.3. Limitations and future research
With respect to the stimuli, it's possible that some of the participantsdidn't appreciate the difference in the packaging material designvariable. In the stimuli design stage, care was taken to ensure thatthe metallized finish was much more shiny than the matt finish chosenfor the paper finish, and photorealistic renderings were used for thecreation of the stimuli used. In addition, before starting the survey itwas indicated that some of the packages that were going to beevaluated were paper or metallized and any of the conventionalmediums used by the participants (PCs, smartphones, tablets…) havea high resolution. However it can't be ruled out that the effect of thematerial on the results of the study was much less significant owing tothis circumstance.
The similarity of the images used in this study (“Ready” and “InProcess”) with those of existing brands may have influenced the scoringof certain attributes, since the images could have brought to mindexperiences and sensations produced when previously consuming thosebrands. Nonetheless, to try to avoid this interference a neutral designwas used in which other packaging design variables — such as colour,lettering and brand name — differed greatly from those of real brands.
The sample of consumers who participated in this study is biasedconcerning education, given that almost two thirds (63.8%) stated theyheld university qualifications. Similarly, 21% of the participants statedthat they were not regular consumers of the product. Consequentlythere are limitations with respect to the participants' diversity andcharacteristics, meaning that further testing would be needed to see ifthese results can be extrapolated to the general public.
In future lines of research, it would be interesting to further investigateinto the relationship between the packaging material and the sensoryattributes of the product. The results obtained in this paper indicate thatthe influence of the material is concealed by the strong effect of the mainimage on the packaging. Nevertheless, there are some interesting resultsthat are worthy of a more comprehensive study. In this sense, this researchcould be extended with a tasting of the product in which the participantcould physically interact with the packaging to ensure that the differencesin the material of the stimuli are perceived and thus test whether theresults obtained are extrapolated in a tasting setting. In addition to thedifferent stimuli used in this experiment, a blinded tasting could be addedin which only the intrinsic properties of the product were evaluated, sinceprevious studies have proved reported consumer experience changes inblind (i.e. without seeing the packaging) and package (i.e. seeing thepackaging) conditions (Chaya, Pacoud, Ng, Fenton, &Hort, 2015;Hersleth, Monteleone, Segtnan, &Næs, 2015; Ng, Chaya, &Hort, 2013).
Furthermore, and also motivated by the greater importance of theoil cruet in part II of the experiment, it could be interesting to explore
R. Rebollar et al. Food Research International 99 (2017) 239–246
244
Publications · Study 1 | 65
the option of using visual or verbal cues to transmit secondary messagesin contexts in which there is no main image, or when the secondarymessage to be transmitted does not have a mainly positive implicationfor the consumer (e.g. to communicate sensory properties like flavourand aroma).
Moreover, although this paper has not identified differences be-tween the results obtained in terms of gender, age or level of educationof the participants, it would be interesting to explore other associations,such as whether or not there are intercultural differences whenassessing the design variables and attributes that have been analysedin this paper, in line with papers such as that of Piqueras-Fiszman et al.(2012).
5. Conclusion
This research show that some design decisions can influenceconsumer expectations about the product even before purchasing it.Therefore the way in which the product is represented in the imagedisplayed on a bag of crisps influences consumer perception. Ofparticular interest is the fact that when the image shows crisps thatare ready for consumption, willingness to buy is higher than when theimage shows the process of transforming uncooked potatoes to crisps.The material used for the bag of crisps also influences consumerperception, although less so than the product image. One of the mainfindings was that a bag with a paper surface finish obtained higherscores in relation to the attribute High quality. This experiment hasdemonstrated that, the fact that the crisps are fried in olive oil istransmitted better through visual cues (displaying the image of an oilcruet) than via verbal cues (displaying the text “with olive oil”). Theresults presented in this paper highlight the importance of packaging oncustomer expectations and willingness to buy. These results are ofinterest to packaging designers and to manufacturers, marketers andprofessionals in the sector to provide information on the way in whichthe aspects related with the packaging influence the way in whichconsumers evaluate the product.
References
Ampuero, O., & Vila, N. (2006). Consumer perceptions of product packaging. Journal ofConsumer Marketing, 23(2), 100–112. http://dx.doi.org/10.1108/07363760610655032.
Becker, L., van Rompay, T. J. L., Schifferstein, H. N. J., & Galetzka, M. (2011). Toughpackage, strong taste: The influence of packaging design on taste impressions andproduct evaluations. Food Quality and Preference, 22(1), 17–23. http://dx.doi.org/10.1016/j.foodqual.2010.06.007.
Biggs, L., Juravle, G., & Spence, C. (2016). Haptic exploration of plateware alters theperceived texture and taste of food. Food Quality and Preference, 50, 129–134. http://dx.doi.org/10.1016/j.foodqual.2016.02.007.
Carroll, J. D., & Chang, J.-J. (1970). Analysis of individual differences inmultidimensional scaling via an n-way generalization of “Eckart-Young”decomposition. Psychometrika, 35(3), 283–319. http://dx.doi.org/10.1007/BF02310791.
Chae, B., & Hoegg, J. (2013). The future looks “right”: Effects of the horizontal location ofadvertising images on product attitude. Journal of Consumer Research, 40(2).
Chaya, C., Pacoud, J., Ng, M. L., Fenton, A., & Hort, J. (2015). Measuring the emotionalresponse to beer and the relative impact of sensory and packaging cues. Journal of theAmerican Society of Brewing Chemists. http://dx.doi.org/10.1094/ASBCJ-2015-0114-01.
Chen, X., Barnes, C. J., Childs, T. H. C., Henson, B., & Shao, F. (2009). Materials' tactiletesting and characterisation for consumer products' affective packaging design.Materials & Design, 30(10), 4299–4310. http://dx.doi.org/10.1016/j.matdes.2009.04.021.
Deliza, R., Macfie, H., & Hedderley, D. (2003). Use of computer-generated images andconjoint analysis to investigate sensory expectations. Journal of Sensory Studies, 18(6),465–486. http://dx.doi.org/10.1111/j.1745-459X.2003.tb00401.x.
Deliza, R., & MacFie, H. J. H. (1996). The generation of sensory expectation by externalcues and its effect on sensory perception and hedonic ratings: A review. Journal ofSensory Studies, 11(2), 103–128. http://dx.doi.org/10.1111/j.1745-459X.1996.tb00036.x.
Duizer, L. (2001). A review of acoustic research for studying the sensory perception ofcrisp, crunchy and crackly textures. Trends in Food Science & Technology, 12(1), 17–24.http://dx.doi.org/10.1016/S0924-2244(01)00050-4.
Grabenhorst, F., Rolls, E. T., & Bilderbeck, A. (2008). How cognition modulates affectiveresponses to taste and flavor: Top-down influences on the orbitofrontal and pregenual
cingulate cortices. Cerebral Cortex, 18(7), 1549–1559. http://dx.doi.org/10.1093/cercor/bhm185.
Hammond, D., Fong, G. T., Borland, R., Cummings, K. M., McNeill, A., & Driezen, P.(2007). Text and graphic warnings on cigarette packages: Findings from theInternational Tobacco Control Four Country Study. American Journal of PreventiveMedicine, 32(3), 202–209. http://dx.doi.org/10.1016/j.amepre.2006.11.011.
Hersleth, M., Monteleone, E., Segtnan, A., & Næs, T. (2015). Effects of evoked mealcontexts on consumers' responses to intrinsic and extrinsic product attributes in dry-cured ham. Food Quality and Preference, 40, 191–198. http://dx.doi.org/10.1016/j.foodqual.2014.10.002.
Honea, H., & Horsky, S. (2012). The power of plain: Intensifying product experience withneutral aesthetic context. Marketing Letters, 23(1), 223–235. http://dx.doi.org/10.1007/s11002-011-9149-y.
Horan, C. B. (1969). Multidimensional scaling: Combining observations when individualshave different perceptual structures. Psychometrika, 34(2), 139–165. http://dx.doi.org/10.1007/BF02289341.
Jaeger, S. R., & MacFie, H. J. H. (2001). The effect of advertising format and means-endinformation on consumer expectations for apples. Food Quality and Preference, 12(3),189–205. http://dx.doi.org/10.1016/S0950-3293(00)00044-6.
Kauppinen-Räisänen, H., Owusu, R. A., & Abeeku Bamfo, B. (2012). Brand salience ofOTC pharmaceuticals through package appearance. International Journal ofPharmaceutical and Healthcare Marketing, 6(3), 230–249. http://dx.doi.org/10.1108/17506121211259403.
Klatzky, R. L., Lederman, S. J., & Matula, D. E. (1993). Haptic exploration in the presenceof vision. Journal of Experimental Psychology. Human Perception and Performance,19(4), 726–743. http://dx.doi.org/10.1037/0096-1523.19.4.726.
Kobayashi, M. L., & de Benassi, M. T. (2015). Impact of packaging characteristics onconsumer purchase intention: Instant coffee in refill packs and glass jars. Journal ofSensory Studies, 1–12. http://dx.doi.org/10.1111/joss.12142.
Krishna, A., & Morrin, M. (2008). Does touch affect taste? The perceptual transfer ofproduct container haptic cues. Journal of Consumer Research, 34(6), 807–818. http://dx.doi.org/10.1086/523286.
Kruskal, J. B., & Wish, M. (1984). Multidimensional scaling. Beverly Hills and London: SagePublications.
Labbe, D., Pineau, N., & Martin, N. (2013). Food expected naturalness: Impact of visual,tactile and auditory packaging material properties and role of perceptualinteractions. Food Quality and Preference, 27(2), 170–178. http://dx.doi.org/10.1016/j.foodqual.2012.06.009.
Lähteenmäki, L., Lampila, P., Grunert, K., Boztug, Y., Ueland, Ø., Åström, A., &Martinsdóttir, E. (2010). Impact of health-related claims on the perception of otherproduct attributes. Food Policy, 35(3), 230–239. http://dx.doi.org/10.1016/j.foodpol.2009.12.007.
Leeuw, J., & Heiser, W. J. (1980). Multidimensional scaling with restrictions on theconfiguration. In P. R. Krishnaiah (Ed.), Multivariate analysis (pp. 501–522).(Amsterdam, the Netherlands: North-Holland).
Liao, L. X., Corsi, A. M., Chrysochou, P., & Lockshin, L. (2015). Emotional responsestowards food packaging: A joint application of self-report and physiological measuresof emotion. Food Quality and Preference, 42, 48–55. http://dx.doi.org/10.1016/j.foodqual.2015.01.009.
Liem, D. G., Toraman Aydin, N., & Zandstra, E. H. (2012). Effects of health labels onexpected and actual taste perception of soup. Food Quality and Preference, 25(2),192–197. http://dx.doi.org/10.1016/j.foodqual.2012.02.015.
de Liz Pocztaruk, R., Abbink, J. H., de Wijk, R. A., da Fontoura Frasca, L. C., Gavião, M. B.D., & van der Bilt, A. (2011). The influence of auditory and visual information on theperception of crispy food. Food Quality and Preference, 22(5), 404–411. http://dx.doi.org/10.1016/j.foodqual.2010.11.008.
López-Miranda, J., Pérez-Jiménez, F., Ros, E., De Caterina, R., Badimón, L., Covas, M. I.,... Yiannakouris, N. (2010). Olive oil and health: Summary of the II internationalconference on olive oil and health consensus report, Jaén and Córdoba (Spain) 2008.Nutrition, Metabolism, and Cardiovascular Diseases, 20(4), 284–294. http://dx.doi.org/10.1016/j.numecd.2009.12.007.
Machiels, C. J. A., & Karnal, N. (2016). See how tasty it is? Effects of symbolic cues onproduct evaluation and taste. Food Quality and Preference, 52, 195–202. http://dx.doi.org/10.1016/j.foodqual.2016.04.014.
Madzharov, A. V., & Block, L. G. (2010). Effects of product unit image on consumption ofsnack foods. Journal of Consumer Psychology, 20(4), 398–409. http://dx.doi.org/10.1016/j.jcps.2010.06.007.
Magnier, L., & Schoormans, J. (2015). Consumer reactions to sustainable packaging: Theinterplay of visual appearance, verbal claim and environmental concern. Journal ofEnvironmental Psychology, 44, 53–62. http://dx.doi.org/10.1016/j.jenvp.2015.09.005.
Magnier, L., Schoormans, J., & Mugge, R. (2016). Judging a product by its cover:Packaging sustainability and perceptions of quality in food products. Food Quality andPreference, 53, 132–142. http://dx.doi.org/10.1016/j.foodqual.2016.06.006.
Maynard, O. M., Munafò, M. R., & Leonards, U. (2013). Visual attention to healthwarnings on plain tobacco packaging in adolescent smokers and non-smokers.Addiction, 108(2), 413–419. http://dx.doi.org/10.1111/j.1360-0443.2012.04028.x.
McQuarrie, E. F., & Mick, D. G. (2003). Visual and verbal rhetorical figures under directedprocessing versus incidental exposure to advertising. Journal of Consumer Research,29(4), 579–587. http://dx.doi.org/10.1086/346252.
McQuarrie, E. F., & Phillips, B. J. (2005). Indirect persuasion in advertising: Howconsumers process metaphors presented in pictures and words. Journal of Advertising,34(2), 7–20. http://dx.doi.org/10.1080/00913367.2005.10639188.
Mueller, S., Lockshin, L., & Louviere, J. J. (2009). What you see may not be what you get:Asking consumers what matters may not reflect what they choose. Marketing Letters,21(4), 335–350. http://dx.doi.org/10.1007/s11002-009-9098-x.
R. Rebollar et al. Food Research International 99 (2017) 239–246
245
66 | Publications · Study 1
Mutsikiwa, M., & Marumbwa, J. (2013). The impact of aesthetics package designelements on consumer purchase decisions: A case of locally produced dairy products.Journal of Business and Management, 8(5), 64–71.
Neyens, E., Aerts, G., & Smits, T. (2015). The impact of image-size manipulation andsugar content on children's cereal consumption. Appetite, 95, 152–157. http://dx.doi.org/10.1016/j.appet.2015.07.003.
Ng, M., Chaya, C., & Hort, J. (2013). The influence of sensory and packaging cues on bothliking and emotional, abstract and functional conceptualisations. Food Quality andPreference, 29(2), 146–156. http://dx.doi.org/10.1016/j.foodqual.2013.03.006.
Nisbett, R. E., & Wilson, T. D. (1977). The halo effect: Evidence for unconscious alterationof judgments. Journal of Personality and Social Psychology, 35(4), 250–256. http://dx.doi.org/10.1037/0022-3514.35.4.250.
Okamoto, M., Wada, Y., Yamaguchi, Y., Kimur, A., Dan, H., Masuda, T., ... Dan, I. (2009).Influences of food-name labels on perceived tastes. Chemical Senses, 34(3), 187–194.http://dx.doi.org/10.1093/chemse/bjn075.
Orth, U. R., & Malkewitz, K. (2008). Holistic package design and consumer brandimpressions. Journal of Marketing, 72(3), 64–81. http://dx.doi.org/10.1509/jmkg.72.3.64.
Orth, U. R., & Marchi, R. D. (2007). Understanding the relationships between functional,symbolic, and experiential brand beliefs, product experiential attributes, and productschema: Advertising-trial interactions revisited. Journal of Marketing Theory andPractice, 15(3), 219–233.
Peck, J., & Childers, T. L. (2003). To have and to hold: The influence of haptic informationon product judgments. Journal of Marketing, 67(2), 35–48. http://dx.doi.org/10.1509/jmkg.67.2.35.18612.
Phillips, B. J. (2000). The impact of verbal anchoring on consumer response to image ads.Journal of Advertising, 29(1), 15–24. http://dx.doi.org/10.1080/00913367.2000.10673600.
Piqueras-Fiszman, B., & Spence, C. (2011). Crossmodal correspondences in productpackaging. Assessing color-flavor correspondences for potato chips (crisps). Appetite,57(3), 753–757. http://dx.doi.org/10.1016/j.appet.2011.07.012.
Piqueras-Fiszman, B., & Spence, C. (2012). The influence of the feel of product packagingon the perception of the oral-somatosensory texture of food. Food Quality andPreference, 26(1), 67–73. http://dx.doi.org/10.1016/j.foodqual.2012.04.002.
Piqueras-Fiszman, B., & Spence, C. (2015). Sensory expectations based on product-extrinsic food cues: An interdisciplinary review of the empirical evidence andtheoretical accounts. Food Quality and Preference, 40(PA), 165–179. http://dx.doi.org/10.1016/j.foodqual.2014.09.013.
Piqueras-Fiszman, B., Velasco, C., & Spence, C. (2012). Exploring implicit and explicitcrossmodal colour-flavour correspondences in product packaging. Food Quality andPreference, 25(2), 148–155. http://dx.doi.org/10.1016/j.foodqual.2012.02.010.
Rayner, K., Rotello, C. M., Stewart, A. J., Keir, J., & Duffy, S. A. (2001). Integrating textand pictorial information: Eye movements when looking at print advertisements.Journal of Experimental Psychology: Applied, 7(3), 219–226. http://dx.doi.org/10.1037/1076-898X.7.3.219.
Rebollar, R., Lidón, I., Gil, I., Martín, J., Fernández, M. J., & Riveres, C. E. (2016). Theinfluence the serving suggestion displayed on soft cheese packaging has on consumerexpectations and willingness to buy. Food Quality and Preference, 52, 188–194. http://dx.doi.org/10.1016/j.foodqual.2016.04.015.
Rebollar, R., Lidón, I., Martín, J., & Puebla, M. (2015). The identification of viewingpatterns of chocolate snack packages using eye-tracking techniques. Food Quality andPreference, 39, 251–258. http://dx.doi.org/10.1016/j.foodqual.2014.08.002.
Rebollar, R., Lidón, I., Serrano, A., Martín, J., & Fernández, M. J. (2012). Influence ofchewing gum packaging design on consumer expectation and willingness to buy. Ananalysis of functional, sensory and experience attributes. Food Quality and Preference,24, 162–170. http://dx.doi.org/10.1016/j.foodqual.2011.10.011.
van Rompay, T. J. L., & Veltkamp, M. (2014). Product packaging metaphors: Effects ofambiguity and explanatory information on consumer appreciation and brand
perception. Psychology and Marketing, 31(6), 404–415. http://dx.doi.org/10.1002/mar.20703.
Schifferstein, H. N. J., Fenko, A., Desmet, P. M. A., Labbe, D., & Martin, N. (2013).Influence of package design on the dynamics of multisensory and emotional foodexperience. Food Quality and Preference, 27(1), 18–25. http://dx.doi.org/10.1016/j.foodqual.2012.06.003.
Schiffman, S. S., Reynolds, M. L., & Young, F. W. (1981). Introduction tomultidimensional scaling. Theory, methods and applications. New York: AcademicPress.
Sehrawet, M., & Kundu, S. C. (2007). Buying behaviour of rural and urban consumers inIndia: The impact of packaging. International Journal of Consumer Studies, 31(6),630–638. http://dx.doi.org/10.1111/j.1470-6431.2007.00629.x.
Silayoi, P., & Speece, M. (2007). The importance of packaging attributes: A conjointanalysis approach. European Journal of Marketing, 41(11/12), 1495–1517. http://dx.doi.org/10.1108/03090560710821279.
Simmonds, G., & Spence, C. (2016). Thinking inside the box: How seeing products on, orthrough, the packaging influences consumer perceptions and purchase behaviour.Food Quality and Preference, 1–12. http://dx.doi.org/10.1016/j.foodqual.2016.11.010.
Siret, F., & Issanchou, S. (2000). Traditional process: Influence on sensory properties andon consumers' expectation and liking application to “pâté de campagne.”. FoodQuality and Preference, 11(3), 217–228. http://dx.doi.org/10.1016/S0950-3293(99)00058-0.
Smith, V., Barratt, D., & Selsøe Sørensen, H. (2015). Do natural pictures mean naturaltastes? Assessing visual semantics experimentally. Cognitive Semiotics, 8(1), 53–86.http://dx.doi.org/10.1515/cogsem-2015-0001.
Spence, C. (2016). Multisensory packaging design: Color, shape, texture, sound, andsmell. Integrating the packaging and product experience in food and beverages (pp. 1–22).. http://dx.doi.org/10.1016/B978-0-08-100356-5.00001-2.
Spence, C., & Piqueras-Fiszman, B. (2014). Tastes great, but what do we call it? The artand Science of food description. The perfect meal (pp. 71–107). Chichester, UK: JohnWiley & Sons, Ltd. http://dx.doi.org/10.1002/9781118491003.ch3.
Sundar, A., & Noseworthy, T. J. (2014). Place the logo high or low? Using conceptualmetaphors of power in packaging design. Journal of Marketing, 78(5), 138–151.http://dx.doi.org/10.1509/jm.13.0253.
Sütterlin, B., & Siegrist, M. (2015). Simply adding the word “fruit” makes sugar healthier:The misleading effect of symbolic information on the perceived healthiness of food.Appetite, 95, 252–261. http://dx.doi.org/10.1016/j.appet.2015.07.011.
Tu, Y., Yang, Z., & Ma, C. (2015). Touching tastes: The haptic perception transfer of liquidfood packaging materials. Food Quality and Preference, 39, 124–130. http://dx.doi.org/10.1016/j.foodqual.2014.07.001.
Underwood, R. L., & Klein, N. M. (2002). Packaging as brand communication: Effects ofproduct pictures on consumer responses to the package and brand. Journal ofMarketing Theory and Practice, 10(4), 58–68.
Venter, K., van der Merwe, D., de Beer, H., Kempen, E., & Bosman, M. (2011). Consumers'perceptions of food packaging: An exploratory investigation in Potchefstroom, SouthAfrica. International Journal of Consumer Studies, 35(3), 273–281. http://dx.doi.org/10.1111/j.1470-6431.2010.00936.x.
Verbeke, G., & Molenberghs, G. (2009). Linear mixed models for longitudinal data. NewYork: Springer Science & Business Media.
Yeomans, M. R., Chambers, L., Blumenthal, H., & Blake, A. (2008). The role of expectancyin sensory and hedonic evaluation: The case of smoked salmon ice-cream. FoodQuality and Preference, 19(6), 565–573. http://dx.doi.org/10.1016/j.foodqual.2008.02.009.
Zampini, M., & Spence, C. (2004). The role of auditory cues in modulating the perceivedcrispness and staleness of potato chips. Journal of Sensory Studies, 19(5), 347–363.http://dx.doi.org/10.1111/j.1745-459x.2004.080403.x.
R. Rebollar et al. Food Research International 99 (2017) 239–246
246
Publications · Study 2 | 67
Study 2
Rebollar, R., Lidón, I., Gil-Pérez, I., & Martín, J. (2018). Images used to convey
that a natural yogurt is sweetened influence consumer expectations and will-
ingness to buy. Manuscript submitted for publication to the Journal of Dairy Science.
Journal of Diary Science’s JCR Journal Impact Factor in 2017 (the latest avail-
able data) was 2.749, placing it in position 4 of 60 (quartile Q1) of the Category
Agriculture, Dairy and Animal Science.
3.2.

68 | Publications · Study 2
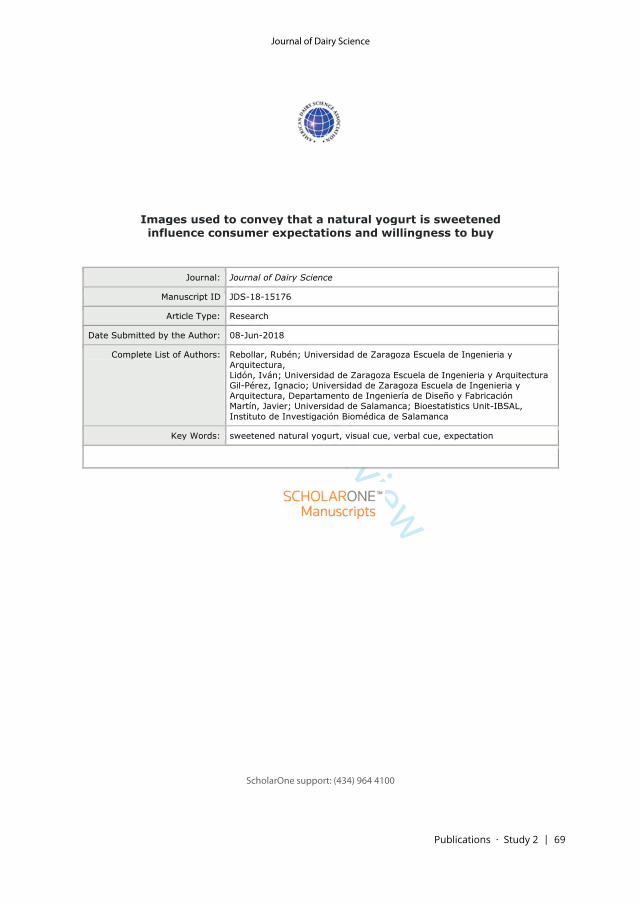
Publications · Study 2 | 69
For Peer Review
ScholarOne support: (434) 964 4100
Journal of Dairy Science
70 | Publications · Study 2
For Peer Review
1
Images used to convey that a natural yogurt is sweetened influence consumer 2
expectations and willingness to buy. Rebollar. We studied how the image depicted on 3
the packaging to convey that a natural yogurt is sweetened influences consumer 4
expectations and willingness to buy, for which we conducted an online survey and a 5
Word Association task. Our results show that the effect the images exert on consumer 6
expectations and response depends on what is depicted on them and that willingness to 7
buy is positively associated with healthiness, naturalness and quality perception. This 8
results are discussed and prove that dairy companies can improve the marketing 9
performance of their products by manipulating the image showed on their packages. 10
CONVEYING YOGURT SWEETNESS THROUGH IMAGES 11
12
13
14
* Departamento de Ingeniería de Diseño y Fabricación, Escuela de Ingeniería y 15
Arquitectura, Universidad de Zaragoza, c/María de Luna 3, C.P. 50018 Zaragoza, Spain 16
† Departamento de Estadística, Universidad de Salamanca, c/Espejo 2, C.P. 37007 17
Salamanca, Spain 18
‡ Bioestatistics UnitIBSAL, Instituto de Investigación Biomédica de Salamanca, Paseo 19
de San Vicente 58182, C.P. 37007 Salamanca, Spain 20
1Corresponding author: [email protected] 21
22
Page 1 of 43
ScholarOne support: (434) 964 4100
Journal of Dairy Science
Publications · Study 2 | 71
For Peer Review
23
Literature shows that packaging appearance has an important effect on shaping 24
consumer expectations and behavior towards the product. However, little is known 25
about how conveying relevant information about the product through an image depicted 26
on the packaging influences consumer perception and response. The objective of this 27
study was to assess how the image depicted on the packaging to convey that a natural 28
yogurt is sweetened influences consumer expectations and willingness to buy. Four 29
packages of natural yogurt were designed, in which the message that they were 30
sweetened was conveyed through three different images (some sugar cubes, a spoon of 31
sugar and a sack of sugar) and through only text. The results obtained by means of 32
conducting an online survey and a Word Association task show that yogurts whose front 33
label indicates it is a sweetened product using an image and not only text are perceived 34
as sweeter although some differences can be appreciated depending on the way sugar is 35
depicted. Willingness to buy is positively associated with such attributes as Healthy, 36
Quality and Natural Ingredients and in a slightly negative way with the attribute Sweet. 37
Overall, the results suggest that when designing packaging for natural sweetened 38
yogurts, producers and designers face a challenge of clearly communicating that the 39
yogurt is sweetened without it having a negative impact on willingness to buy. These 40
findings can help dairy companies and packaging designers to better communicate the 41
desired message to consumers and to improve the marketing performance of their 42
products. 43
44
sweetened natural yogurt; visual cue; verbal cue; expectation; willingness to buy45
Page 2 of 43
ScholarOne support: (434) 964 4100
Journal of Dairy Science
72 | Publications · Study 2
For Peer Review
46
Spanish households spend 8.59% of their food budget on dairy products. The fermented 47
milk category is the one that has greater presence in households, accounting for 38.7% 48
of the sales and 15.34 liters per person per year consumption. Within this category, 49
yogurt plays a key role and accounts for 65.2% of sales in the category of fermented 50
milk (MAPAMA, 2017). Consumption of yogurt and fermented milk is associated with 51
numerous health benefits and both products are among the most common fresh dairy 52
products consumed around the world (Donovan and Shamir, 2014). 53
In Spain, different types of yogurts are classified as follows: natural yogurts, natural 54
sugarsweetened yogurts, sweetened yogurts, fruit yogurts, juices and/or other foods, 55
flavored yogurts and yogurts pasteurized after fermentation (BOE, 2014). Natural 56
sweetened yogurts are those natural yogurts in which edible sugar or sugars were added. 57
As far as the energy level is concerned, it means that the average of 64 kcal in natural 58
yogurts can reach up to 100 kcal in natural sweetened yogurts (BEDCA, 2018). The 59
advantage of natural sweetened yogurts is that consumers do not need any additional 60
products (sugar) to eat it with. Roughly 50% of people add sugar to natural yogurts 61
before eating them and some studies have shown that the average amount of sugar 62
added to natural yogurts is above the average amount of sugar that natural sweetened 63
yogurts contain (SaintEve et al., 2016). 64
Due to its intrinsic characteristics, such as its creamy texture and its rapid degradation, 65
sweetened yogurt is always marketed packed. Yet, research has shown that the functions 66
of food packaging go well beyond the protection and handling of the product given that 67
packaging has the ability to grab consumer attention and to influence consumer 68
expectations and response (Rundh, 2005, 2009, 2013). Indeed, literature shows that 69
Page 3 of 43
ScholarOne support: (434) 964 4100
Journal of Dairy Science
Publications · Study 2 | 73
For Peer Review
consumer perception and attitude may be affected by physical packaging cues such as 70
its shape (Becker et al., 2011; Rebollar et al., 2012; Velasco et al., 2016) or its weight 71
(PiquerasFiszman and Spence, 2012), and by visual cues such as its material (Magnier 72
and Schoormans, 2017; Rebollar et al., 2017), its color (PiquerasFiszman and Spence, 73
2015; Spence, 2018) or even the typography used in the label texts (Velasco et al., 74
2014; Celhay et al., 2015). 75
However, despite being one of the most common food packaging design elements and a 76
prominent visual cue (Underwood and Klein, 2002), not so many studies have 77
addressed thus far the effect that the image depicted on food packaging has on consumer 78
expectations and response. To date, studies conducted with this aim have focused on 79
assessing the effect of the image on consumer sensory perception (Mizutani et al., 2010; 80
Machiels and Karnal, 2016), on consumer emotional response (Liao et al., 2015), or on 81
its influence in different aspects of consumer behavior such as consumption amount 82
(Madzharov and Block, 2010; Neyens et al., 2015) or consumer willingness to buy 83
(Bone and France, 2001). More recently, Rebollar et al. (2016) showed that the product 84
that appears with fresh cheese in the image on the package influences the expectations 85
that consumers have about characteristics of that fresh cheese. 86
Given that packaging is a key communication tool between producers and consumers 87
(Nancarrow et al., 1998; Celhay and Remaud, 2018), one of the main objectives of the 88
images shown on food packaging is to convey messages to the consumer (Underwood 89
and Klein, 2002; Ares et al., 2011). Consumers infer meaning from the images that 90
appear on packages and consequently use them to identify and categorize products, as 91
well as to generate expectations regarding their attributes (Loken, 2006; Piqueras92
Fiszman and Spence, 2015). Thus, images are commonly used by packaging designers 93
Page 4 of 43
ScholarOne support: (434) 964 4100
Journal of Dairy Science
74 | Publications · Study 2
For Peer Review
in order to convey messages or ideas to the consumer, and they are, together with verbal 94
cues, the most frequently used cues for this purpose (Piquerasfiszman et al., 2011; 95
KauppinenRäisänen et al., 2012; Machiels and Karnal, 2016). However, compared to 96
verbal cues images more easily attract consumer attention at the point of sale (Venter et 97
al., 2011; Honea and Horsky, 2012) and require a lower level of cognitive effort, as they 98
are processed in a more unintentional and unconscious way (Underwood and Klein, 99
2002; Mueller et al., 2009). As a consequence, consumers generate expectations more 100
quickly by looking at an image than by reading a text (Underwood and Klein, 2002). 101
It should be noted that this communication process can be very complex as designers 102
often have to convey several messages to consumers, for which they can rely on 103
different packaging cues (Ares et al., 2011; Laing and Masoodian, 2016). Among all the 104
possible cues, the most appropriate will be those that correctly transmit the desired 105
message and at the same time have a more positive impact on consumer's response. For 106
example, in the case of a sweetened natural yogurt the designer must clearly 107
communicate a main message (i.e. the product category, ) and a 108
secondary message (i.e. the product subcategory, ): in this case, it is 109
reasonable to wonder what kind of cue will be the most adequate for each message. 110
Whereas previous studies analyzed the consequences of using one or another kind of 111
cue in order to convey the main message (e.g. the product category, Bone and France, 112
2001; Underwood and Klein, 2002) and even suggested that the packaging shape can be 113
used for that purpose (Arboleda and ArceLopera, 2015; Velasco et al., 2016), it is not 114
clear which kind of cue (i.e. whether visual or verbal) is the most adequate to 115
communicate a secondary message (e.g. that a natural yogurt is sweetened) and how this 116
decision may influence consumer expectations and willingness to buy. 117
Page 5 of 43
ScholarOne support: (434) 964 4100
Journal of Dairy Science
Publications · Study 2 | 75
For Peer Review
According to previous findings, one may think that conveying that the yogurt is 118
sweetened through an image rather than through a text is preferable in order to improve 119
consumer attitude towards the product (Underwood and Klein, 2002; Rebollar et al., 120
2016). For example, Rebollar et al. (2017) showed that indicating that the chips 121
contained in a bag of chips had been fried in olive oil by using a visual cue rather than a 122
verbal cue enhanced willingness to buy and consumer expectations for all the assessed 123
attributes. However, the question arises of what the differences would be depending on 124
the specific image selected as visual cue. Findings of previous investigations on the 125
manipulation of the main image that is shown on the package suggest that what is 126
depicted makes an impact on consumer expectations and response (Mizutani et al., 127
2010; Machiels and Karnal, 2016), which proves it is necessary to verify whether if it 128
can also be the case of conveying a secondary message like that a natural yogurt is 129
sweetened. In addition, Rebollar et al. (2017) explained their results arguing that using a 130
visual cue instead of a verbal cue had improved the expectations and willingness to buy 131
because by doing so the secondary message conveyed on their package (i.e. that the 132
chips were fried in olive oil), which in that case was perceived as positive by consumers 133
(LópezMiranda et al., 2010), gained more prominence. However, in the case of natural 134
sweetened yogurts the secondary message does not have a clearly positive connotation 135
due to the fact that many consumers associate sugar consumption and sweet products 136
with various illnesses (Lustig et al., 2012; Sütterlin and Siegrist, 2015). Hence, it is 137
worth considering if in this case giving more prominence to the message that the yogurt 138
is sweetened by means of the image shall have a positive effect. 139
To summarize, the specific aim of the present study was to analyze how the image 140
shown on the package to communicate that a natural yogurt has been sweetened affects 141
both consumer expectations for certain sensory and nonsensory attributes and the 142
Page 6 of 43
ScholarOne support: (434) 964 4100
Journal of Dairy Science
76 | Publications · Study 2
For Peer Review
willingness to buy the product. To that end, an online survey and a Word Association 143
task were conducted. 144
145
146
The experiment performed consisted of two parts. In the first one, an online survey was 147
carried out. In it, the participants were asked to evaluate their expectations of four 148
sensory and nonsensory attributes marked as relevant for this product by a panel of 149
experts (Sweet, Healthy, Quality and Natural Ingredients) as well as their willingness to 150
buy in relation to different packages of natural sweetened yogurt. In the second part of 151
the experiment, a Word Association task was done using the same packages as in the 152
earlier online survey. 153
154
A market study was carried out prior to the design of the stimuli to know the most 155
frequent characteristics of the packages of sweetened natural yogurt sold in the Spanish 156
market. According to its findings, four kinds of stimuli were designed in a way they 157
would resemble the appearance any of these products might have on the market. Each 158
package included the same elements: the words ‘‘Yogur Natural Azucarado” 159
(sweetened natural yoghurt, in English), an image of a cow, the brand (Yulé – created 160
specifically for this investigation so that the participants could not deduce certain 161
attributes of the products based on their prior experiences with other brands), the 162
nutrition information and other symbols (barcode, recycled package…). The only 163
difference between packages was the image shown to indicate that yogurt was 164
sweetened. The images used were the ones more commonly seen in these kinds of 165
Page 7 of 43
ScholarOne support: (434) 964 4100
Journal of Dairy Science
Publications · Study 2 | 77
For Peer Review
yogurt packages: sugar cubes, a spoon of sugar, a sack of sugar and no image. These 166
stimuli will be hereafter referred to, respectively, as , , 167
and . 168
The visual stimuli used in the experiments were photorealistic renderings created using 169
Photoshop CS5 (Adobe Systems Inc., San Jose, CA, U.S.A.) and Keyshot 4 (Luxion 170
Inc., Tustin, CA, U.S.A.). The packages can be seen in Fig. 1. 171
172
The online survey was conducted via social media on a voluntary and anonymous basis, 173
using an online survey data collection tool: SurveyMonkey™. Participants were not 174
given a time limit to complete the survey or any particular section thereof. They were 175
shown photorealistic renderings (Figure 1) and given a questionnaire to evaluate them. 176
A withinsubject experimental design was used, so all survey participants saw the same 177
packages randomly displayed. 178
157 people participated in this investigation—60.5% females (95) and 39.5% (62) 179
males—all residing in Spain. Their mean age was 29.1 years with a standard deviation 180
of 10.1 years. 181
The survey was divided into two sections: control questions to identify the participants 182
(age and gender) and the presentation of the packages to analyze—the visual stimuli in 183
Figure 1. For each package, the survey evaluated a total of four product attributes 184
identified and chosen by a panel of experts, selected for being seen as particularly 185
relevant in case of natural sweetened yogurts: one sensory attribute (Sweet) and three 186
nonsensory attributes (Quality, Healthy, and Natural Ingredients). 187
Page 8 of 43
ScholarOne support: (434) 964 4100
Journal of Dairy Science
78 | Publications · Study 2
For Peer Review
Participants were asked to evaluate the four product attributes for each of the four 188
packages according to a LIKERT scale of 1 (strongly disagree) to 7 (strongly agree). 189
Willingness to buy was evaluated using the same LIKERT scale of 1 (would not buy 190
under any circumstances) to 7 (would be definitely willing to buy). It was specified that 191
all the products contained the same quantity of yogurt and had the same cost, though the 192
price was not specified. 193
194
Word Association is a qualitative research technique usually used in sociology and 195
psychology (Schmitt, 1998). This technique is based on free answers given by the 196
participant as a response to a stimulus; these answers provide a better understanding of 197
the mental representation that consumers have of the stimulus in question. When this 198
technique is applied to food, the answers given make it possible to identify the most 199
relevant concepts for consumer’s buying decisions (Roininen et al., 2006). 200
112 people participated in this investigation, other than those who took part in the 201
online survey—55.4% females (62) and 44.6% (50) males—all residing in Spain. Their 202
mean age was 33.5 years with a standard deviation of 13.5 years. The participants were 203
randomly divided into 4 groups of 28 people. No statistically relevant difference was 204
found in the composition of groups regarding age and gender. 205
Each group of participants performed a task with one of the four stimuli shown in the 206
Figure 1. Participants were asked to evaluate the stimuli and to write down the first 207
three words, associations, thoughts or feelings that came to their minds. The stimuli 208
were shown on a 23" LED monitor with a resolution of 1920 x 1080px and a refresh 209
Page 9 of 43
ScholarOne support: (434) 964 4100
Journal of Dairy Science
Publications · Study 2 | 79
For Peer Review
rate of 60Hz and was of a similar size to the reallife package. There was no time 210
limitation to perform the task and participants could write one, two or three ideas. 211
212
In the online survey, each attribute was individually analyzed using oneway repeated 213
measures analysis of variance (withinsubjects ANOVA). For the comparisons of pairs 214
following the analysis of variance, the Bonferroni correction was used. 215
To study the preference of individuals for different packages, the Individual Differences 216
Model was used (Horan, 1969; Carroll and Chang, 1970). This technique is included 217
within multidimensional scaling techniques and has been used primarily to characterize 218
variation in judged stimulus structure across individuals. 219
This method is also known as INDSCAL. In this study, a matrix (4X4) of similarities 220
between packages was calculated for each individual. These similarities were obtained 221
from each individual score given to the different packages of yogurts in relation to their 222
attributes. This technique allows the creation of a space of consensus for the individuals 223
showing the similarities between the packages of yogurts. In addition, it is possible to 224
find out the weights that each individual gave to the dimensions obtained in the 225
consensus space. The weights reflect the importance that the individuals associate to the 226
dimensions in the stimuli space. Although one person can perceive one of the 227
dimensions to be more important than the other, another person can have the opposite 228
perception. 229
This technique was used to evaluate the attributes, as well as willingness to buy. The 230
analysis was conducted using the PROXCAL algorithm (Leeuw and Heiser, 1980), and 231
Euclidian distance was used as a measure of similarity. The criterion to choose the 232
Page 10 of 43
ScholarOne support: (434) 964 4100
Journal of Dairy Science

80 | Publications · Study 2
For Peer Review
number of dimensions in the consensus space was based on goodness of fit and the 233
number of stimuli included in the analysis. SStress was used to determine goodness of 234
fit. If this measurement is low, it indicates that the configuration obtained in the map (or 235
space) is good. Kruskal and Wish (1984) deem the solution to be acceptable when the 236
SStress values are less than 0.1. 237
The vector model (Schiffman et al., 1981) was used to interpret the dimensions of 238
preference in accordance with the observable attributes. This procedure uses the 239
multipleregression technique to determine the direction of the attributes. The means of 240
the individual scores of attributes are used to calculate the multiple regression, and the 241
standardized regression coefficients (^β1; ^β2; ^β3) are computed and drawn as 242
coordinates in the threedimensional stimulus space. Finally, a line is drawn through the 243
origin of the stimulus consensus space and through coordinates defined by the 244
regression coefficients. This model helps to interpret the dimensions of the space of 245
similarities using the attributes forming the similarities between the stimuli. Moreover, 246
the attributevector is shown as a line in the space representing packages of yogurts in 247
which the projection of each stimulus corresponds to the level of attributes possessed by 248
that stimulus. If the attribute in question is strongly related with the stimuli space, then 249
the projections of the stimuli will coincide very closely with the value of the attribute 250
and the correlation between the projection and the attribute will be quite high. When 251
two attributes are facing in the same direction, this also indicates a high correlation. 252
When the points that represent the vector are close to a dimension and far from the 253
center, it means they are relevant for explaining that dimension. If an attribute is in a 254
position halfway between two dimensions, it indicates that the attribute is explained in 255
both dimensions. If a vectorattribute is close to the center of the stimuli space, it means 256
that it is insignificant in the explanation of the dimensions of that space. This model 257
Page 11 of 43
ScholarOne support: (434) 964 4100
Journal of Dairy Science
Publications · Study 2 | 81
For Peer Review
allowed the packages to be ordered according to each of the attributes evaluated by the 258
subjects. It also made it possible to determine which attributes had a high correlation in 259
the stimuli evaluation. Subjects’ willingness to buy was included as an external value to 260
explore the dimension with the highest correlation. 261
In the word association task, all associations made by the participant were analysed 262
qualitatively. The terms with similar meaning were grouped together using interrater 263
consensus technique (Glaser and Strauss, 1967; Armstrong et al., 1997). Each member 264
individually evaluated the results and, consequently, the classification of the final 265
categories was agreed on by three raters. This triangulation technique has been used by 266
other authors dealing with qualitative techniques (Guerrero et al., 2010). Only those 267
categories that were mentioned by at least 5 people were taken into consideration 268
(PiquerasFiszman et al., 2013). 269
HJ biplot (Galindo, 1986) was used to analyze the word association task. This 270
exploratory technique is a variant of the Biplot methods proposed by Gabriel (1971). 271
The Biplot methods make it possible to plot the rows (stimuli) and columns (words) of 272
the data matrix as points on a low dimension vector space. The interpretation of this 273
method is similar to other multivariate techniques. The distances between row makers 274
are interpreted as an inverse function of similarities, so closer makers (stimuli) are more 275
similar. The cosines of the angles between the column vectors (words) approximate the 276
correlation between variables in such a way that small acute angles are associated with 277
high positive correlations, obtuse angles are associated with negative correlations and 278
right angles are associated with uncorrelated variables. In the same way, the cosines of 279
angles between the column makers (words) and the axes approximate the correlations 280
between them. Besides, the order of the orthogonal projections of the row makers 281
Page 12 of 43
ScholarOne support: (434) 964 4100
Journal of Dairy Science
82 | Publications · Study 2
For Peer Review
(stimuli) onto column makers (words) approximates the order of the row values in that 282
column of the data matrix. 283
SPSS Statistics 23 (Armonk, NY, U.S.A.) and MULTBIPLOT (VicenteVillardón, 284
2015) were used for data processing. 285
286
287
All the results obtained using the variance technique analysis gave statistically 288
significant values regarding both the four attributes tested and the willingness to buy the 289
product. The results of the five analyses can be seen in Fig. 2. 290
Packages displaying the greatest difference in the results were those with the attribute 291
Sweet. There is a marked difference between the package in relation to the 292
others, with the package obtaining the highest mean value (5.47), and the 293
package obtaining the lowest mean value (4.48). After applying the 294
Bonferroni correction stimulus is found to have statistically relevant 295
differences with the rest of stimuli and the same happens with stimulus. The 296
results relating to the three nonsensory attributes, Healthy, Quality and Natural 297
Ingredients, also have a marked difference between their extreme values. All the 298
attributes obtain structurally similar results, with the package obtaining the 299
lowest results and the stimulus obtaining the highest results. The results for 300
Willingness to buy show that the package obtaining the highest value was the one 301
depicting a , and the one with the lowest value was the one depicting 302
. 303
Page 13 of 43
ScholarOne support: (434) 964 4100
Journal of Dairy Science
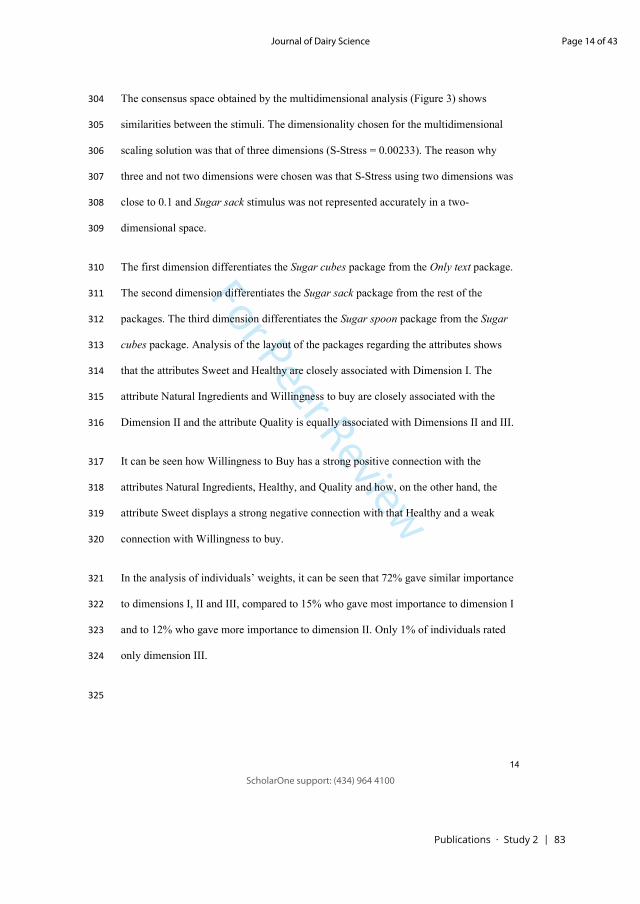
Publications · Study 2 | 83
For Peer Review
The consensus space obtained by the multidimensional analysis (Figure 3) shows 304
similarities between the stimuli. The dimensionality chosen for the multidimensional 305
scaling solution was that of three dimensions (SStress = 0.00233). The reason why 306
three and not two dimensions were chosen was that SStress using two dimensions was 307
close to 0.1 and stimulus was not represented accurately in a two308
dimensional space. 309
The first dimension differentiates the package from the package. 310
The second dimension differentiates the package from the rest of the 311
packages. The third dimension differentiates the package from the 312
package. Analysis of the layout of the packages regarding the attributes shows 313
that the attributes Sweet and Healthy are closely associated with Dimension I. The 314
attribute Natural Ingredients and Willingness to buy are closely associated with the 315
Dimension II and the attribute Quality is equally associated with Dimensions II and III. 316
It can be seen how Willingness to Buy has a strong positive connection with the 317
attributes Natural Ingredients, Healthy, and Quality and how, on the other hand, the 318
attribute Sweet displays a strong negative connection with that Healthy and a weak 319
connection with Willingness to buy. 320
In the analysis of individuals’ weights, it can be seen that 72% gave similar importance 321
to dimensions I, II and III, compared to 15% who gave most importance to dimension I 322
and to 12% who gave more importance to dimension II. Only 1% of individuals rated 323
only dimension III. 324
325
Page 14 of 43
ScholarOne support: (434) 964 4100
Journal of Dairy Science
84 | Publications · Study 2
For Peer Review
326
The elicited words were clustered into 9 categories, corresponding to those mentioned 327
by more than five participants (PiquerasFiszman et al., 2013). Table 1 shows how often 328
each category was mentioned for each package (frequency). As shown in Table 1, the 329
most mentioned associations were ‘Natural yogurt’, ‘Nature’ and ‘Sugar’. 330
Figure 4 is obtained by depicting Table 1 through a biplot graph. The first two axes of 331
the HJBiplot analysis explained 89.59% of the data variability. Axis 1 is mainly 332
defined by the term ‘Healthy’ against ‘Sugar’ and ‘Sweet’. This axis separates 333
and stimuli (more frequently associated with ‘Sugar’ and ‘Sweet’) 334
from and stimuli (more frequently associated with ‘Healthy’). 335
Axis 2 is defined by the terms ‘Yogurt’ and ‘Nature’ against the term ‘Fresh’. This axis 336
separates stimulus against and with 337
stimulus occupying the intermediate position. 338
339
The main objective of this research was to analyze whether the images used on 340
packages to convey the message that a yogurt package is sweetened make an impact on 341
consumer expectations and on willingness to buy. The results of the current research 342
enrich the literature on how the product extrinsic cues influence consumer expectations 343
and response by showing that the image chosen to convey the message that the yogurt is 344
sweetened influences both consumer sensory and nonsensory expectations and that it 345
also affects willingness to buy. These findings enhance our understanding of the effects 346
of conveying a secondary message on food packaging (in this case, indicating that 347
Page 15 of 43
ScholarOne support: (434) 964 4100
Journal of Dairy Science
Publications · Study 2 | 85
For Peer Review
yogurt is sweetened) through different cues, thus helping both designers and producers 348
to design clearer and more effective packages for their products. 349
The results of this study show that using an image or another does make an impact on 350
consumer’s sensory expectations, since packages with an image of sugar cubes 351
generated higher sweetness expectations than packages that had an image of a spoon of 352
sugar or that of a sack of sugar; the latter ones, in turn, were considered sweeter than 353
packages with no image whatsoever (i.e. that had only text informing the yogurt was 354
sweetened). This was reinforced by the findings obtained from the Word Association 355
task, in which the association to the stimuli regarding the terms ‘Sugar’ and ‘Sweet’ 356
proves to be the same. Indeed, the package that has only text and no images has the 357
lowest expectations of consumers regarding sweetness. This result supports previous 358
research which suggest that visual information is more powerful than verbal information 359
(McQuarrie and Mick, 2003; McQuarrie and Phillips, 2005), and is in accordance with 360
the findings by Rebollar et al. (2017) that suggested that conveying a secondary 361
message by means of a visual cue enhanced consumer expectations. Indeed, Sehrawet 362
and Kundu (2007) showed that, in the context of lowinvolvement products (such as 363
yogurt), visual cues are more easily processed and allow to transmit information more 364
quickly than verbal cues because of the higher level of effort involved in processing the 365
text. In addition, in the other stimuli there is also a reinforcement of the sweetness 366
concept when using a text along with images compared to using only text. This also 367
seems to be reinforced by the findings of the Word Association task, since in the case of 368
the stimulus showing only text the terms ‘Sugar’ and ‘Sweet’ are elicited less frequently 369
than in any other stimuli. 370
Page 16 of 43
ScholarOne support: (434) 964 4100
Journal of Dairy Science
86 | Publications · Study 2
For Peer Review
Nevertheless, it is necessary to understand why some images raise higher sweetness 371
expectations than others. We propose that the reason for this is twofold: on the one 372
hand, it may be due to the amount of sugar that appears depicted on the image; on the 373
other, because of the easy association between some of the images and the everyday 374
action of adding sugar. As for the amount of sugar depicted on the image, both the 375
package showing a sack of sugar and the package showing sugar cubes depict an 376
amount of sugar that could be used to sweeten many yogurts, whereas a spoon of sugar 377
is associated with the sugar used to sweeten one yogurt only. The higher sweetness 378
expectations raised by the packages in which a sack of sugar and sugar cubes were 379
shown compared with those generated by the sugar spoon package suggest that people 380
infer that the amount of sugar depicted in the image is related to the amount of sugar 381
present in the yogurt. This supports the results of Madzharov and Block (2010), who 382
showed that the number of product units (e.g., number of cookies) displayed on the 383
package influences consumers' perceptions of the quantity of product (the more cookies 384
are depicted on the package, the more cookies consumers think there are contained 385
within). As for the associations with actions of adding sugar, when consumers’ mental 386
representation of a target matches the way the target is presented, this fit increases 387
processing fluency (Chae and Hoegg, 2013) and increases the accessibility of the 388
depicted concept (González et al., 2006). Thus, sugar cubes and a spoon of sugar are 389
easily associated with the action of adding sugar to products, since they accurately 390
represent the way in which consumers are used to adding sugar to the yogurt: from a 391
semiotic point of view, the sign is congruent with the product in which it is applied and 392
it thus allows to easily access the concept of sweet in the consumer’s mind (Lynott and 393
Connell, 2010; Ares et al., 2011; Smith et al., 2015). However, a sack of sugar is an 394
element that consumers do not associate with the action of adding sugar to products 395
Page 17 of 43
ScholarOne support: (434) 964 4100
Journal of Dairy Science
Publications · Study 2 | 87
For Peer Review
since it does not fit into their everyday experience. Hence, according to this reasoning it 396
is easy to understand why a package depicting sugar cubes is the one that raises the 397
highest sweetness expectations (it both depicts a large amount of sugar and also fosters 398
the cognitive access to the concept of ‘Sweet’ by presenting it in an everyday and 399
coherent format within this context) and why the other two images raise similar 400
expectations, both of them lower than that of the sugar cubes image, since each image 401
relates to only one of these reasons (the package with the image of a sack shows a big 402
amount of sugar but does not fit with the mental representation of adding sugar to the 403
product, and the opposite is true for the package with the image of a spoon of sugar). 404
Regarding the nonsensory attributes, the results show that the image of a sack of sugar 405
is more easily associated with the attribute Natural Ingredients than the rest of the 406
images. The consumer associates a sack of sugar with the concept of natural ingredients 407
since it activates associations with concepts like farm, field or nature, which are not 408
closely connected with the mental representation of the industrial process (Chae and 409
Hoegg, 2013). This assumption lines up with other earlier studies which suggest that 410
stereotypical information associated with food shapes perception (Brierley and Elliott, 411
2015) and is endorsed by the findings obtained from the Word Association task in 412
which the packaging depicting a sugar sack is the one that is more frequently associated 413
with the term ‘Nature’. In contrast, consumers do not associate nor the image of the 414
sugar cubes nor the image of the sugar spoon with the concept of natural ingredients 415
because neither of the two images is easily associated with concepts related to nature, 416
since in both cases the sugar is represented fully processed and ready for consumption. 417
Additionally, the attributes Quality and Healthy have a positive correlation with the 418
attribute Natural Ingredients, which coincides with the studies interrelated in this 419
respect where it is suggested that consumers see products as healthier and of a higher 420
Page 18 of 43
ScholarOne support: (434) 964 4100
Journal of Dairy Science
88 | Publications · Study 2
For Peer Review
quality in case they have a high proportion of natural ingredients (Sütterlin and Siegrist, 421
2015; Machiels and Karnal, 2016; Román et al., 2017). 422
Finally, as for willingness to buy the results also confirm the earlier findings in the 423
literature and show that there is a strong positive association link between willingness to 424
buy and such attributes as Natural Ingredients, Healthy, and Quality (Fernqvist and 425
Ekelund, 2014; Román et al., 2017). This implies that the higher consumer expectations 426
are of whether the product is natural, of high quality and is made with natural 427
ingredients, the higher their willingness to buy is (Machiels and Karnal, 2016; Román et 428
al., 2017). However, it is worth noting that despite previous works argue that showing 429
an image have a positive effect in consumers’ attitude towards the product (Underwood 430
and Klein, 2002) the results of this study suggest that it depends on what is depicted on 431
the image: the participants showed less willingness to buy the package that showed 432
sugar cubes than the one that only had text. As it has been argued, this may be explained 433
by the fact that the sugar cubes image depicts a large amount of sugar and favors an 434
easy accessibility to the ‘Sugar’ concept, thus giving much prominence to the concept 435
‘Sweet’. Interestingly, the results of the multidimensional scaling show that willingness 436
to buy does not have a strong association with the expectations of sweetness, although it 437
does show a certain negative trend. In addition, the Word Association results show that 438
there is a strong negative association between sweet and healthy, which seems to 439
indicate that consumers do not relate expectations of the sweetness of the yogurt to their 440
willingness to buy directly, yet indirectly they do through the attribute Healthy. In other 441
words, consumers seem to quickly associate the concepts of sweetness with 442
unhealthiness and consequently unhealthiness with low willingness to buy (Lustig et al., 443
2012). 444
Page 19 of 43
ScholarOne support: (434) 964 4100
Journal of Dairy Science
Publications · Study 2 | 89
For Peer Review
Taken together, these results broaden and add more nuances to those of Rebollar et al. 445
(2017) since they show that conveying a secondary message (in this case, that yogurt is 446
sweetened) using a visual or verbal cue affects the consumer in a more complex way 447
than it used to be believed. Whereas their findings show that using an image enhances 448
expectations and willingness to buy, this research suggests that it depends on, firstly, the 449
concrete image chosen to be shown on the package and, secondly, on the type of 450
message to be conveyed. Conveying a message by means of an image provides it with 451
more relevance than doing so through a text because it captures attention more quickly 452
and is processed sooner (Underwood and Klein, 2002; Venter et al., 2011; Honea and 453
Horsky, 2012) Therefore, if the message to be conveyed is not clearly positive (like in 454
this case, since many consumers associate sweetness with diseases like obesity, Lustig 455
et al., 2012), providing too much relevance to it by means of a visual cue may end up 456
being counterproductive and detrimental to consumer expectations and willingness to 457
buy. This posits a challenge for designers and producers since they have to come up 458
with an engaging and effective way to convey the message that the product is sweetened 459
and yet not to give it too much relevance in order to not to prejudice willingness to buy. 460
Regarding the limitations of this research, it should be noted that the results obtained 461
may have been influenced by visual factors that have not been taken into account, such 462
as the size of the image or the aesthetics of the composition. As for the visual design, 463
the use of graphic elements such as images of the cow or a natural environment may 464
have biased the results increasing the accessibility to some concepts over others, but 465
since they were shown in all the stimuli, their possible effects were thus canceled. 466
Moreover, part of this study was conducted using an online survey on social media 467
meaning that the participants therein came only from that environment. Consequently, 468
there are limitations regarding the participants’ diversity and characteristics. It would be 469
Page 20 of 43
ScholarOne support: (434) 964 4100
Journal of Dairy Science
90 | Publications · Study 2
For Peer Review
interesting to carry out further testing to see if the obtained results can be extrapolated 470
to other countries, since all the participants were Spanish. 471
As an idea for a future research, it might be interesting to conduct a tasting in order to 472
investigate what minimum amount of added sugar shall be considered by the 473
participants to be excessively sweet and to assess if these effects also influence taste 474
perception and willingness to buy. It would also be relevant to analyze in depth the 475
possible existence of mediation (indirect effect) of the attribute Sweet with willingness 476
to buy through the attribute Healthy, as the findings of this study seem to show. We 477
believe that another interesting line of investigation should be directed at studying how 478
the results obtained might be affected by the individual differences of the participants 479
regarding health consciousness, since earlier studies suggest that the knowledge and 480
beliefs of the consumer influence food acceptance (Verbeke, 2005; Karnal et al., 2016). 481
482
The results of this research suggest that the image shown on the package to convey that 483
a yogurt is sweetened makes an impact on consumer sensory and nonsensory 484
expectations and willingness to buy. Specifically, the results show that conveying that 485
the yogurt is sweetened through both visual and verbal cues (i.e. both images and text) 486
increases consumer expectations of sweetness and also that what is depicted on the 487
image also has an effect on consumer perception and behavior. The package depicting 488
sugar cubes raises the highest sweetness expectations, partly due to the amount of sugar 489
depicted and partly because of how easily it is associated with the everyday action of 490
adding sugar to the product, thus raising the accessibility to the sweet concept in 491
consumers’ mind. In addition, the attributes Healthy, Quality and Natural Ingredients 492
have a strong positive association with willingness to buy and the attribute Sweet has a 493
Page 21 of 43
ScholarOne support: (434) 964 4100
Journal of Dairy Science
Publications · Study 2 | 91
For Peer Review
strong negative association with the attribute Healthy, which indirectly seems to create a 494
negative association with willingness to buy. The image of a sugar sack makes the 495
expectations of the attribute Natural Ingredients be the highest of all the images, which 496
implies that it also has higher willingness to buy. Despite the notion that defend that 497
showing images in packaging improves the willingness to buy and the attitude of the 498
consumer towards the product, the results of this study show that a poor image selection 499
may be worse than showing not image at all, given that willingness to buy is not always 500
improved if an image is shown. On the contrary, an adequate image choice may favor 501
willingness to buy the product. This therefore implies that yogurt producers and 502
packaging designers must find a balance in which they communicate that the natural 503
yogurt is sweetened without giving too much prominence to that idea. In this regard, the 504
image of a sack of sugar has proven to be the best one to achieve this twin objective. 505
506
Arboleda, A.M., and C. ArceLopera. 2015. Quantitative analysis of product 507
categorization in soft drinks using bottle silhouettes. Food Qual. Prefer. 45:1–10. 508
doi:10.1016/j.foodqual.2015.04.006. 509
Ares, G., B. PiquerasFiszman, P. Varela, R.M. Marco, A.M. López, and S. Fiszman. 510
2011. Food labels: Do consumers perceive what semiotics want to convey?. Food 511
Qual. Prefer. 22:689–698. doi:10.1016/j.foodqual.2011.05.006. 512
Armstrong, D., A. Gosling, J. Weinman, and T. Martaeu. 1997. The place of interrater 513
reliability in qualitative research: An empirical study. Sociology 31:1–6. 514
Becker, L., T.J.L. van Rompay, H.N.J. Schifferstein, and M. Galetzka. 2011. Tough 515
package, strong taste: The influence of packaging design on taste impressions and 516
product evaluations. Food Qual. Prefer. 22:17–23. 517
Page 22 of 43
ScholarOne support: (434) 964 4100
Journal of Dairy Science
92 | Publications · Study 2
For Peer Review
doi:10.1016/j.foodqual.2010.06.007. 518
BEDCA. 2018. Base de Datos Española de Composición de Alimentos. Accessed May 519
14, 2018. http://www.bedca.net/. 520
BOE. 2014. Real Decreto 271/2014, de 11 de abril, por el que se aprueba la Norma de 521
Calidad para el yogur o yoghourt 33154–33157. 522
Bone, P.F., and K.R. France. 2001. Package graphics and consumer product beliefs. J. 523
Bus. Psychol. 15:467–489. doi:10.1023/A:1007826818206. 524
Brierley, M., and C. Elliott. 2015. Nutritional components and children’s interpretations 525
of packaged food. Int. J. Heal. Promot. Educ. 53:230–243. 526
doi:10.1080/14635240.2015.1010654. 527
Carroll, J.D., and J.J. Chang. 1970. Analysis of individual differences in 528
multidimensional scaling via an nway generalization of “EckartYoung” 529
decomposition. Psychometrika 35:283–319. doi:10.1007/BF02310791. 530
Celhay, F., J. Boysselle, and J. Cohen. 2015. Food packages and communication 531
through typeface design: The exoticism of exotypes. Food Qual. Prefer. 39:167–532
175. doi:10.1016/j.foodqual.2014.07.009. 533
Celhay, F., and H. Remaud. 2018. What does your wine label mean to consumers? A 534
semiotic investigation of Bordeaux wine visual codes. Food Qual. Prefer. 65:129–535
145. doi:10.1016/j.foodqual.2017.10.020. 536
Chae, B., and J. Hoegg. 2013. The Future Looks “Right”: Effects of the Horizontal 537
Location of Advertising Images on Product Attitude. J. Consum. Res. 40. 538
Donovan, S.M., and R. Shamir. 2014. Introduction to the yogurt in nutrition initiative 539
and the first global summit on the health effects of yogurt. Am. J. Clin. Nutr. 540
99:1209–1211. doi:10.3945/ajcn.113.073429. 541
Page 23 of 43
ScholarOne support: (434) 964 4100
Journal of Dairy Science
Publications · Study 2 | 93
For Peer Review
Fernqvist, F., and L. Ekelund. 2014. Credence and the effect on consumer liking of food 542
A review. Food Qual. Prefer. 32:340–353. doi:10.1016/j.foodqual.2013.10.005. 543
Gabriel, R.K. 1971. The biplot graphic display of matrices with application to principal 544
component analysis. Biometrika 58:453–467. doi:10.1093/biomet/58.3.453. 545
Galindo, P. 1986. An alternative for simultaneous representation: HJBiplot. Questiió 546
Quad. d’Estadística, Sist. Inform. i Investig. Oper. 10:13–23. 547
Glaser, B.G., and A.L. Strauss. 1967. The Discovery of Grounded Theory: Strategies 548
for Qualitative Research. Aldine, Chicago. 549
González, J., A. BarrosLoscertales, F. Pulvermüller, V. Meseguer, A. Sanjuán, V. 550
Belloch, and C. Ávila. 2006. Reading cinnamon activates olfactory brain regions. 551
Neuroimage 32:906–912. doi:10.1016/j.neuroimage.2006.03.037. 552
Guerrero, L., A. Claret, W. Verbeke, G. Enderli, S. ZakowskaBiemans, F. 553
Vanhonacker, S. Issanchou, M. Sajdakowska, B.S. Granli, L. Scalvedi, M. Contel, 554
and M. Hersleth. 2010. Perception of traditional food products in six European 555
regions using free word association. Food Qual. Prefer. 21:225–233. 556
doi:10.1016/j.foodqual.2009.06.003. 557
Honea, H., and S. Horsky. 2012. The power of plain: Intensifying product experience 558
with neutral aesthetic context. Mark. Lett. 23:223–235. doi:10.1007/s11002011559
9149y. 560
Horan, C.B. 1969. Multidimensional scaling: Combining observations when individuals 561
have different perceptual structures. Psychometrika 34:139–165. 562
doi:10.1007/BF02289341. 563
Karnal, N., C.J.A. Machiels, U.R. Orth, and R. Mai. 2016. Healthy by design, but only 564
when in focus: Communicating nonverbal health cues through symbolic meaning 565
Page 24 of 43
ScholarOne support: (434) 964 4100
Journal of Dairy Science
94 | Publications · Study 2
For Peer Review
in packaging. Food Qual. Prefer. 52:106–119. doi:10.1016/j.foodqual.2016.04.004. 566
KauppinenRäisänen, H., R.A. Owusu, and B. Abeeku Bamfo. 2012. Brand salience of 567
OTC pharmaceuticals through package appearance. Int. J. Pharm. Healthc. Mark. 568
6:230–249. doi:10.1108/17506121211259403. 569
Kruskal, J.B., and M. Wish. 1984. Multidimensional Scaling. Sage Publications, 570
Beverly Hills and London. 571
Laing, S., and M. Masoodian. 2016. A study of the influence of visual imagery on 572
graphic design ideation. Des. Stud. 45:187–209. doi:10.1016/j.destud.2016.04.002. 573
Leeuw, J., and W.J. Heiser. 1980. Multidimensional scaling with restrictions on the 574
configuration. P.R. Krishnaiah, ed. NorthHolland, Amsterdam, the Netherlands. 575
Liao, L.X., A.M. Corsi, P. Chrysochou, and L. Lockshin. 2015. Emotional responses 576
towards food packaging: A joint application of selfreport and physiological 577
measures of emotion. Food Qual. Prefer. 42:48–55. 578
doi:10.1016/j.foodqual.2015.01.009. 579
Loken, B. 2006. Consumer Psychology: Categorization, Inferences, Affect, and 580
Persuasion. Annu. Rev. Psychol. 57:453–485. 581
doi:10.1146/annurev.psych.57.102904.190136. 582
LópezMiranda, J., F. PérezJiménez, E. Ros, R. De Caterina, L. Badimón, M.I. Covas, 583
E. Escrich, J.M. Ordovás, F. Soriguer, R. Abiá, C. Alarcón de la Lastra, M. 584
Battino, D. Corella, J. ChamorroQuirós, J. DelgadoLista, D. Giugliano, K. 585
Esposito, R. Estruch, J.M. FernandezReal, J.J. Gaforio, C. La Vecchia, D. Lairon, 586
F. LópezSegura, P. Mata, J.A. Menéndez, F.J. Muriana, J. Osada, D.B. 587
Panagiotakos, J.A. Paniagua, P. PérezMartinez, J. Perona, M.A. Peinado, M. 588
PinedaPriego, H.E. Poulsen, J.L. Quiles, M.C. RamírezTortosa, J. Ruano, L. 589
Page 25 of 43
ScholarOne support: (434) 964 4100
Journal of Dairy Science
Publications · Study 2 | 95
For Peer Review
SerraMajem, R. Solá, M. Solanas, V. Solfrizzi, R. de la TorreFornell, A. 590
Trichopoulou, M. Uceda, J.M. VillalbaMontoro, J.R. VillarOrtiz, F. Visioli, and 591
N. Yiannakouris. 2010. Olive oil and health: Summary of the II international 592
conference on olive oil and health consensus report, Jaén and Córdoba (Spain) 593
2008. Nutr. Metab. Cardiovasc. Dis. 20:284–294. 594
doi:10.1016/j.numecd.2009.12.007. 595
Lustig, R.H., L.A. Schmidt, and C.D. Brindis. 2012. Public health: The toxic truth about 596
sugar. Nature 482:27–29. doi:10.1038/482027a. 597
Lynott, D., and L. Connell. 2010. Embodied conceptual combination. Front. Psychol. 598
1:1–14. doi:10.3389/fpsyg.2010.00212. 599
Machiels, C.J.A., and N. Karnal. 2016. See How Tasty it is? Effects of Symbolic Cues 600
on Product Evaluation and Taste. Food Qual. Prefer. 52:195–202. 601
doi:10.1016/j.foodqual.2016.04.014. 602
Madzharov, A. V., and L.G. Block. 2010. Effects of product unit image on consumption 603
of snack foods. J. Consum. Psychol. 20:398–409. doi:10.1016/j.jcps.2010.06.007. 604
Magnier, L., and J. Schoormans. 2017. How Do Packaging Material, Colour and 605
Environmental Claim Influence Package, Brand and Product Evaluations?. Packag. 606
Technol. Sci.. doi:10.1002/pts.2318. 607
MAPAMA. 2017. Informe del consumo de alimentación en España 2016. Madrid. 608
McQuarrie, E.F., and D.G. Mick. 2003. Visual and Verbal Rhetorical Figures under 609
Directed Processing versus Incidental Exposure to Advertising. J. Consum. Res. 610
29:579–587. doi:10.1086/346252. 611
McQuarrie, E.F., and B.J. Phillips. 2005. Indirect persuasion in advertising: How 612
consumers process metaphors presented in pictures and words. J. Advert. 34:7–20. 613
Page 26 of 43
ScholarOne support: (434) 964 4100
Journal of Dairy Science
96 | Publications · Study 2
For Peer Review
doi:10.1080/00913367.2005.10639188. 614
Mizutani, N., M. Okamoto, Y. Yamaguchi, Y. Kusakabe, I. Dan, and T. Yamanaka. 615
2010. Package images modulate flavor perception for orange juice. Food Qual. 616
Prefer. 21:867–872. doi:10.1016/j.foodqual.2010.05.010. 617
Mueller, S., L. Lockshin, and J.J. Louviere. 2009. What you see may not be what you 618
get: Asking consumers what matters may not reflect what they choose. Mark. Lett. 619
21:335–350. doi:10.1007/s110020099098x. 620
Nancarrow, C., L.T. Wright, and I. Brace. 1998. Gaining competitive advantage from 621
packaging and labelling in marketing communications. Br. Food J. 100:110–118. 622
doi:10.1108/00070709810204101. 623
Neyens, E., G. Aerts, and T. Smits. 2015. The impact of imagesize manipulation and 624
sugar content on children’s cereal consumption. Appetite 95:152–157. 625
doi:10.1016/j.appet.2015.07.003. 626
Piquerasfiszman, B., G. Ares, and P. Varela. 2011. Semiotics and Perception : Do 627
Labels Convey the Same Messages To Older and Younger Consumers?. J. Sens. 628
Stud. 26:197–208. doi:10.1111/j.1745459X.2011.00336.x. 629
PiquerasFiszman, B., and C. Spence. 2012. The weight of the bottle as a possible 630
extrinsic cue with which to estimate the price (and quality) of the wine? Observed 631
correlations. Food Qual. Prefer. 25:41–45. doi:10.1016/j.foodqual.2012.01.001. 632
PiquerasFiszman, B., and C. Spence. 2015. Sensory expectations based on product633
extrinsic food cues: An interdisciplinary review of the empirical evidence and 634
theoretical accounts. Food Qual. Prefer. 40:165–179. 635
doi:10.1016/j.foodqual.2014.09.013. 636
PiquerasFiszman, B., C. Velasco, A. SalgadoMontejo, and C. Spence. 2013. Using 637
Page 27 of 43
ScholarOne support: (434) 964 4100
Journal of Dairy Science
Publications · Study 2 | 97
For Peer Review
combined eye tracking and word association in order to assess novel packaging 638
solutions: A case study involving jam jars. Food Qual. Prefer. 28:328–338. 639
doi:10.1016/j.foodqual.2012.10.006. 640
Rebollar, R., I. Gil, I. Lidón, J. Martín, M.J. Fernández, and S. Rivera. 2017. How 641
material, visual and verbal cues on packaging influence consumer expectations and 642
willingness to buy: The case of crisps (potato chips) in Spain. Food Res. Int. 643
99:239–246. doi:10.1016/j.foodres.2017.05.024. 644
Rebollar, R., I. Lidón, I. Gil, J. Martín, M.J. Fernández, and C.E. Riveres. 2016. The 645
influence the serving suggestion displayed on soft chee[1] R. Rebollar, I. Lidón, I. 646
Gil, J. Martín, M. J. Fernández, and C. E. Riveres, “The influence the serving 647
suggestion displayed on soft cheese packaging has on consumer expectations and 648
willingn. Food Qual. Prefer. 52:188–194. doi:10.1016/j.foodqual.2016.04.015. 649
Rebollar, R., I. Lidón, A. Serrano, J. Martín, and M.J. Fernández. 2012. Influence of 650
chewing gum packaging design on consumer expectation and willingness to buy. 651
An analysis of functional, sensory and experience attributes. Food Qual. Prefer. 652
24:162–170. doi:10.1016/j.foodqual.2011.10.011. 653
Roininen, K., A. Arvola, and L. Lähteenmäki. 2006. Exploring consumers’ perceptions 654
of local food with two different qualitative techniques: Laddering and word 655
association. Food Qual. Prefer. 17:20–30. doi:10.1016/j.foodqual.2005.04.012. 656
Román, S., L.M. SánchezSiles, and M. Siegrist. 2017. The importance of food 657
naturalness for consumers: Results of a systematic review. Trends Food Sci. 658
Technol. 67:44–57. doi:10.1016/j.tifs.2017.06.010. 659
Rundh, B. 2005. The multi‐faceted dimension of packaging. Marketing logistic or 660
marketing tool?. Br. Food J. 107:670–684. doi:10.1108/00070700510615053. 661
Page 28 of 43
ScholarOne support: (434) 964 4100
Journal of Dairy Science
98 | Publications · Study 2
For Peer Review
Rundh, B. 2009. Packaging design: creating competitive advantage with product 662
packaging. Br. Food J. 111:988–1002. doi:10.1108/00070700910992880. 663
Rundh, B. 2013. Linking packaging to marketing: how packaging is influencing the 664
marketing strategy. Br. Food J. 115:1547–1563. doi:10.1108/BFJ1220110297. 665
SaintEve, A., H. Leclercq, S. Berthelo, B. Saulnier, W. Oettgen, and J. Delarue. 2016. 666
How much sugar do consumers add to plain yogurts? Insights from a study 667
examining French consumer behavior and selfreported habits. Appetite 99:277–668
284. doi:10.1016/j.appet.2016.01.032. 669
Schiffman, S.S., M.L. Reynolds, and F.W. Young. 1981. Introduction to 670
Multidimensional Scaling. Academic Press, New York. 671
Schmitt, N. 1998. Quantifying word association responses: what is nativelike?. System 672
26:389–401. doi:http://dx.doi.org/10.1016/S0346251X(98)000190. 673
Sehrawet, M., and S.C. Kundu. 2007. Buying behaviour of rural and urban consumers 674
in India: the impact of packaging. Int. J. Consum. Stud. 31:630–638. 675
doi:10.1111/j.14706431.2007.00629.x. 676
Smith, V., D. Barratt, and H. Selsøe Sørensen. 2015. Do natural pictures mean natural 677
tastes? Assessing visual semantics experimentally. Cogn. Semiot. 8:53–86. 678
doi:10.1515/cogsem20150001. 679
Spence, C. 2018. Background colour & its impact on food perception & behaviour. 680
Food Qual. Prefer. 68:156–166. doi:10.1016/j.foodqual.2018.02.012. 681
Sütterlin, B., and M. Siegrist. 2015. Simply adding the word “fruit” makes sugar 682
healthier: The misleading effect of symbolic information on the perceived 683
healthiness of food. Appetite 95:252–261. doi:10.1016/j.appet.2015.07.011. 684
Underwood, R.L., and N.M. Klein. 2002. Packaging as brand communication: Effects 685
Page 29 of 43
ScholarOne support: (434) 964 4100
Journal of Dairy Science
Publications · Study 2 | 99
For Peer Review
of product pictures on consumer responses to the package and brand. J. Mark. 686
Theory Pract. 10:58–68. 687
Velasco, C., A. SalgadoMontejo, F. MarmolejoRamos, and C. Spence. 2014. 688
Predictive packaging design: Tasting shapes, typefaces, names, and sounds. Food 689
Qual. Prefer. 34:88–95. doi:10.1016/j.foodqual.2013.12.005. 690
Velasco, C., A.T. Woods, O. Petit, A.D. Cheok, and C. Spence. 2016. Crossmodal 691
correspondences between taste and shape, and their implications for product 692
packaging: A review. Food Qual. Prefer. 52:17–26. 693
doi:http://dx.doi.org/10.1016/j.foodqual.2016.03.005. 694
Venter, K., D. van der Merwe, H. de Beer, E. Kempen, and M. Bosman. 2011. 695
Consumers’ perceptions of food packaging: an exploratory investigation in 696
Potchefstroom, South Africa. Int. J. Consum. Stud. 35:273–281. 697
doi:10.1111/j.14706431.2010.00936.x. 698
Verbeke, W. 2005. Consumer acceptance of functional foods: Sociodemographic, 699
cognitive and attitudinal determinants. Food Qual. Prefer. 16:45–57. 700
doi:10.1016/j.foodqual.2004.01.001. 701
VicenteVillardón, J.L. 2015. MULTBIPLOT: A Package for Multivariate Analysis 702
Using Biplots. Accessed July 8, 2016. 703
http://biplot.usal.es/ClassicalBiplot/index.html. 704
705
Page 30 of 43
ScholarOne support: (434) 964 4100
Journal of Dairy Science
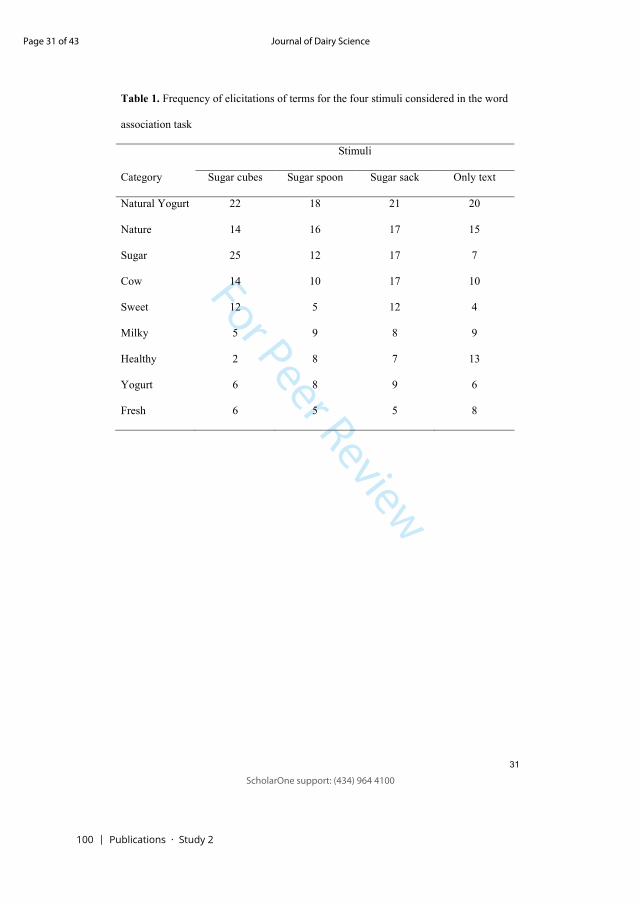
100 | Publications · Study 2
For Peer Review
Frequency of elicitations of terms for the four stimuli considered in the word
association task
Stimuli
Category Sugar cubes Sugar spoon Sugar sack Only text
Natural Yogurt 22 18 21 20
Nature 14 16 17 15
Sugar 25 12 17 7
Cow 14 10 17 10
Sweet 12 5 12 4
Milky 5 9 8 9
Healthy 2 8 7 13
Yogurt 6 8 9 6
Fresh 6 5 5 8
Page 31 of 43
ScholarOne support: (434) 964 4100
Journal of Dairy Science

Publications · Study 2 | 101
For Peer Review
706
Rebollar Figure 1. 707
Page 32 of 43
ScholarOne support: (434) 964 4100
Journal of Dairy Science
For Peer Review
Visual stimuli used in the investigation.708
Page 33 of 43
ScholarOne support: (434) 964 4100
Journal of Dairy Science
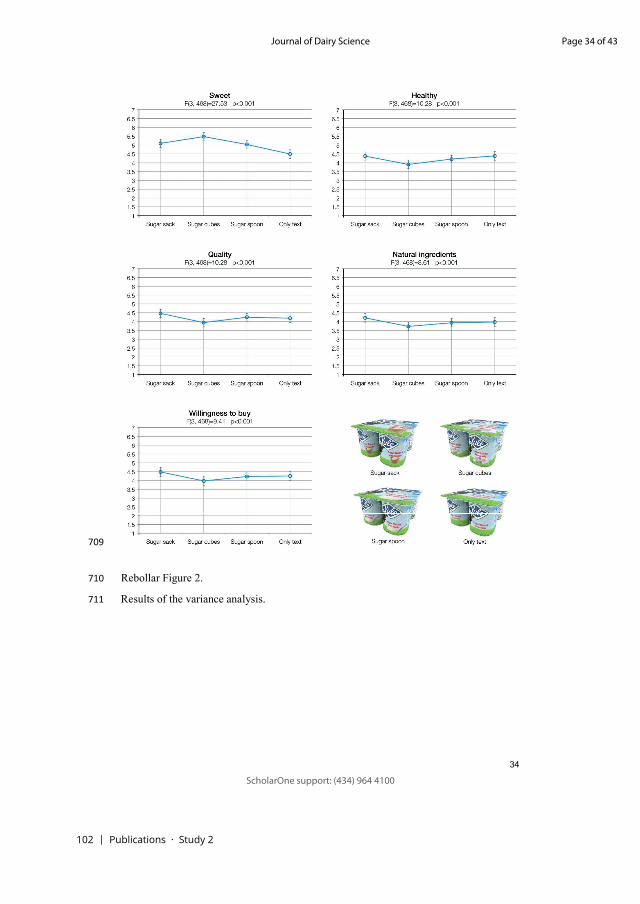
102 | Publications · Study 2
For Peer Review
709
Rebollar Figure 2. 710
Page 34 of 43
ScholarOne support: (434) 964 4100
Journal of Dairy Science
For Peer Review
Results of the variance analysis. 711
Page 35 of 43
ScholarOne support: (434) 964 4100
Journal of Dairy Science
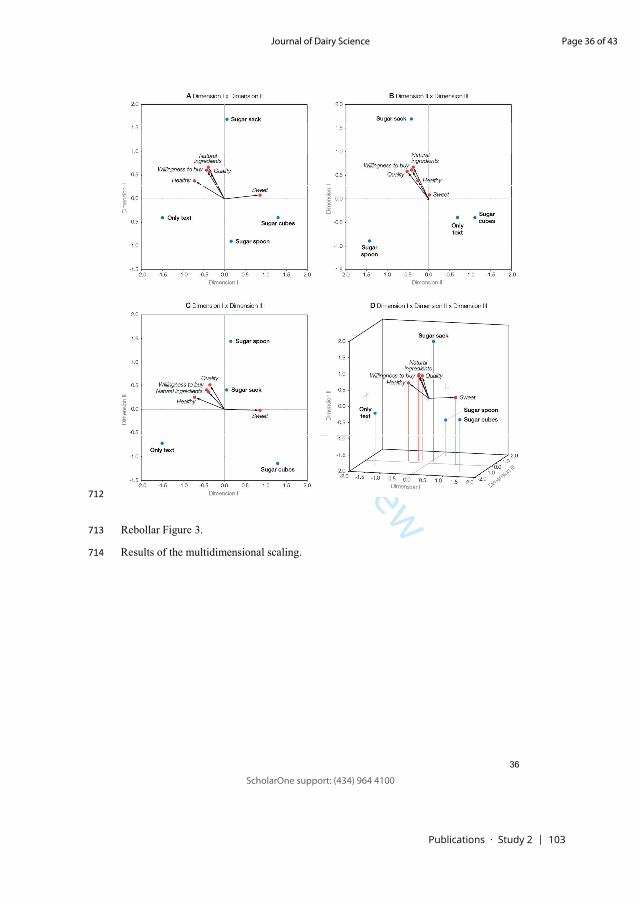
Publications · Study 2 | 103
For Peer Review
712
Rebollar Figure 3. 713
Page 36 of 43
ScholarOne support: (434) 964 4100
Journal of Dairy Science
For Peer Review
Results of the multidimensional scaling.714
Page 37 of 43
ScholarOne support: (434) 964 4100
Journal of Dairy Science
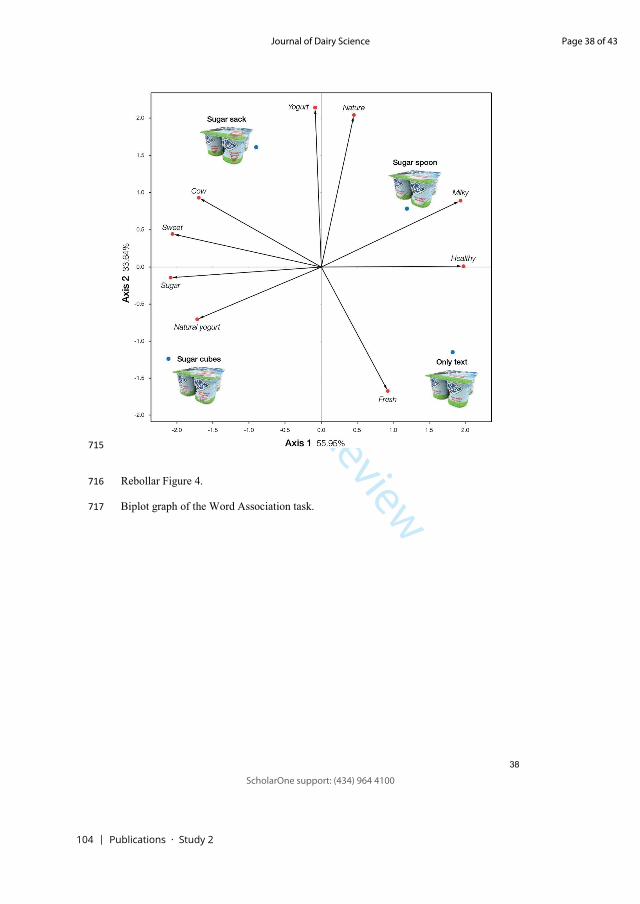
104 | Publications · Study 2
For Peer Review
715
Rebollar Figure 4. 716
Page 38 of 43
ScholarOne support: (434) 964 4100
Journal of Dairy Science
For Peer Review
Biplot graph of the Word Association task. 717
Page 39 of 43
ScholarOne support: (434) 964 4100
Journal of Dairy Science
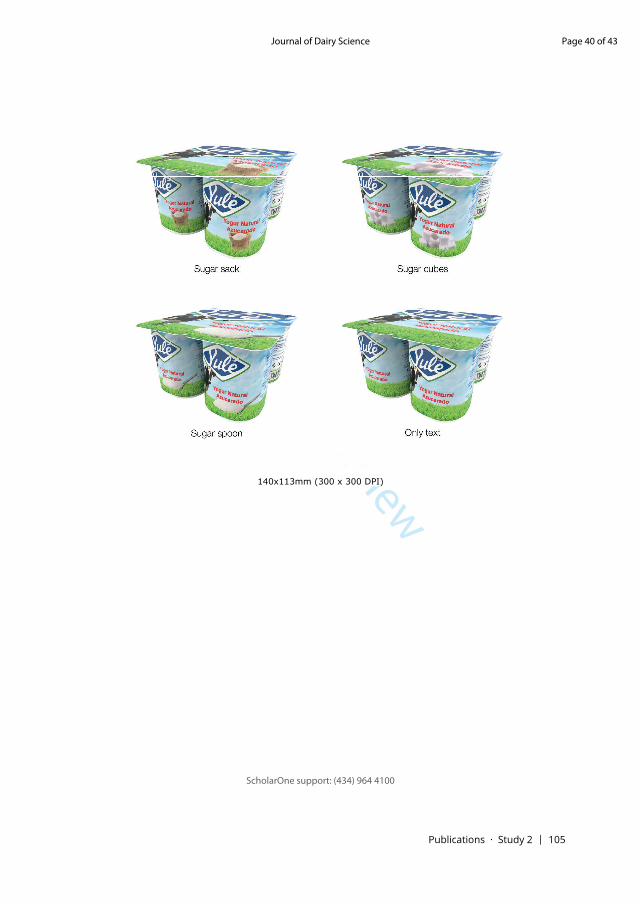
Publications · Study 2 | 105
For Peer Review
Page 40 of 43
ScholarOne support: (434) 964 4100
Journal of Dairy Science
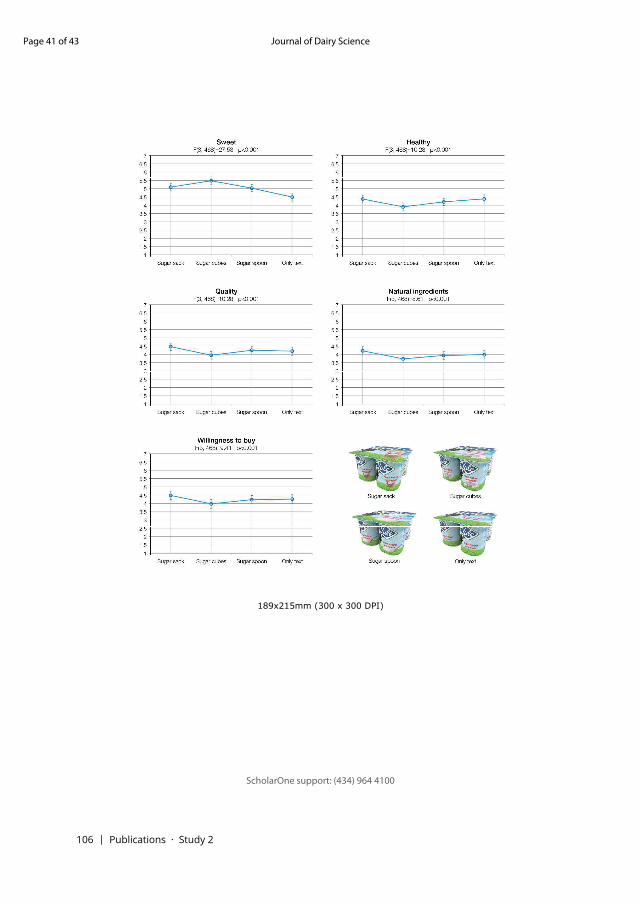
106 | Publications · Study 2
For Peer Review
Page 41 of 43
ScholarOne support: (434) 964 4100
Journal of Dairy Science
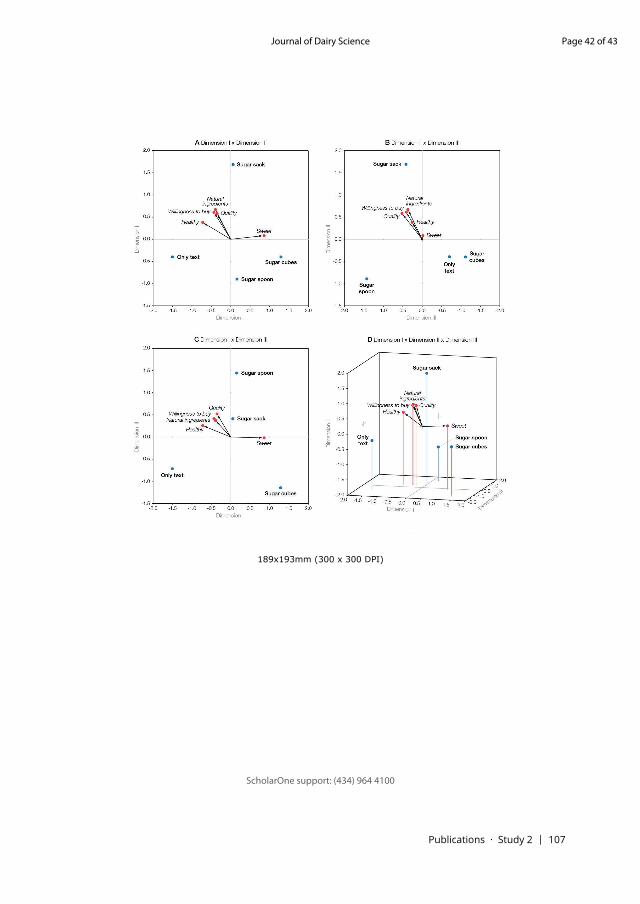
Publications · Study 2 | 107
For Peer Review
Page 42 of 43
ScholarOne support: (434) 964 4100
Journal of Dairy Science
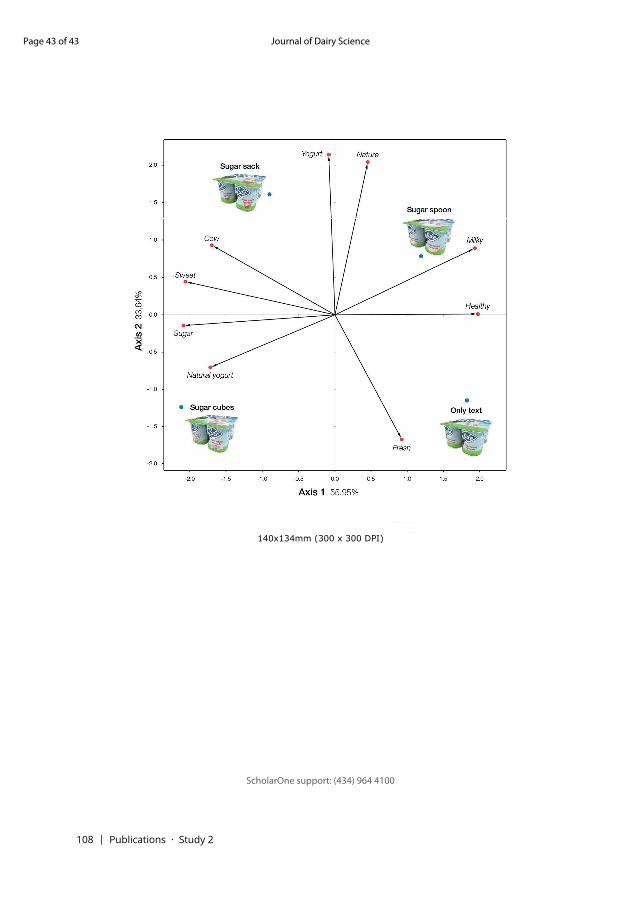
108 | Publications · Study 2
For Peer Review
Page 43 of 43
ScholarOne support: (434) 964 4100
Journal of Dairy Science
Publications · Study 3 | 109
Study 3
Rebollar, R., Lidón, I., Gil, I., Martín, J., Fernández, M. J., & Riveres, C. E. (2016).
The influence the serving suggestion displayed on soft cheese packaging has on
consumer expectations and willingness to buy. Food Quality and Preference, 52,
188–194. https://doi.org/10.1016/j.foodqual.2016.04.015
Food Quality and Preference’s JCR Journal Impact Factor in 2016 was 3.199,
placing it in position 16 of 130 (quartile Q1) of the Category Food Science &
Technology.
3.3.

110 | Publications · Study 3
Publications · Study 3 | 111
The influence the serving suggestion displayed on soft cheese packaginghas on consumer expectations and willingness to buy
Rubén Rebollar a,⇑, Iván Lidón a, Ignacio Gil a, Javier Martín b, Maria J. Fernández b, Celia E. Riveres a
aDepartamento de Ingeniería de Diseño y Fabricación, Escuela de Ingeniería y Arquitectura, Universidad de Zaragoza, c/ María de Luna 3, C.P. 50018 Zaragoza, SpainbDepartamento de Estadística, Universidad de Salamanca, c/ Espejo 2, C.P. 37007 Salamanca, Spain
a r t i c l e i n f o
Article history:Received 3 December 2015Received in revised form 27 March 2016Accepted 29 April 2016Available online 30 April 2016
Keywords:Serving suggestionPackagingConsumer expectationWillingness to buyCheese
a b s t r a c t
This paper studies the influence that serving suggestions on a popular Spanish soft cheese – known as‘‘queso fresco”—packaging have on consumer expectations regarding certain attributes of the product,its ideal consumption time during the day and the consumer’s willingness to buy. Some 247 people par-ticipated in this investigation, evaluating 8 attributes and 5 possible consumption times of 5 different softcheese packages with different accompaniments displayed on the serving suggestions. The results showthat the consumer perceives the soft cheese to have the qualities and ideal consumption time based onthe accompaniments shown in the serving suggestion. The study also shows that serving suggestioninfluences willingness to buy since there is a strong positive relationship between willingness to buyand accompaniments that are healthy and for special diets. These results have important implicationsfor soft cheese producers, marketers, and packaging designers.
� 2016 Elsevier Ltd. All rights reserved.
1. Introduction
Product packaging, in addition to protecting contents andenabling transport, handling and storage, serves to attract theattention of potential consumers, influencing their willingness tobuy and even increasing product acceptance once purchased(Rundh, 2005). As Kauppinen-Räisänen (2014) state, packagingnot only has the aim of containing the product, but also of promot-ing it, an idea that is supported by the fact that 70% of all buyingdecisions are made at the point of sale, even in the case of plannedpurchases (Inman, Winer, & Ferraro, 2013).
Food product packaging is therefore a priority sales tool formanufacturers; this is reflected in the fact that packaging designis the most important marketing task in the case of many products(Dickson, 1994). This is because outward appearance is a key forcapturing the potential consumer’s attention (Silayoi & Speece,2007) and thus encouraging product purchase (Bloch, 1995;Fenko, Schifferstein, & Hekkert, 2010; Tuorila & Pangborn, 1988),since it has been proven to act as both a psychological and physicalstimulus. (Reimann, Zaichkowsky, Neuhaus, Bender, & Weber,2010).
Today many studies underscore the influence elements on foodpackaging have on potential buyers. It is known, for instance, thatconsumers are affected by product packaging shape (Becker, van
Rompay, Schifferstein, & Galetzka, 2011; Rebollar, Lidón, Serrano,Martín, & Fernández, 2012), material (Mutsikiwa & Marumbwa,2013), colour (Ares & Deliza, 2010; Mohebbi, 2014), labelling(Charters, Lockshin, & Unwin, 1999), labelling fonts (Orth,Campana, & Malkewitz, 2010) and even weight (Piqueras-Fiszman & Spence, 2012). However, the relationship between pack-aging and a potential consumer is not fully understood. This studytherefore aims to go one step further by exploring how one of themost common food packaging design elements – the image onpackaged product (especially when displayed as a serving sugges-tion) – influences consumer perception and expectations.
It is very common for food packaging to show the productinside through the use of transparent material or by placing oneor more images on it. The influence this has on the consumer hasalready been studied. In this line, Deng and Srinivasan (2013) anal-ysed how directly viewing the product inside the package viatransparent materials affects the frequency of product consump-tion. Likewise, Underwood and Klein (2002) proved that includingproduct images on packaging encourages consumers to view theproducts more positively.
Other studies go deeper into understanding this relationship byanalysing the influence packaging images have on the consumer.Liao, Corsi, Chrysochou, and Lockshin (2015) studied the impactof images on packaging (regardless of whether these were of theproduct inside) on consumer emotional response; Bone andFrance (2001) observed the way these images affect willingnessto buy and Mizutani et al. (2010) explored how they alter sensory
http://dx.doi.org/10.1016/j.foodqual.2016.04.0150950-3293/� 2016 Elsevier Ltd. All rights reserved.
⇑ Corresponding author.E-mail address: [email protected] (R. Rebollar).
Food Quality and Preference 52 (2016) 188–194
Contents lists available at ScienceDirect
Food Quality and Preference
journal homepage: www.elsevier .com/locate / foodqual
112 | Publications · Study 3
perception of the product. Meanwhile, Madzharov and Block(2010) and Neyens, Aerts, and Smits (2015) demonstrated thatthe size of the image on the packaging affects the rate at whichthe product will be consumed once purchased.
Thus far, the researched conducted on images displayed on foodpackaging has tended to view them as a single element, focusingon their emotional character (Bone & France, 2001; Liao et al.,2015; Mizutani et al., 2010) or communicative character(Miraballes, Fiszman, Gámbaro, & Varela, 2014; Underwood &Klein, 2002; Underwood, Klein, & Burke, 2001). However, in prac-tice, images on food packaging are often complex compositionsin which several elements—other foods, people or props—are dis-played. To date we have no evidence on research into how theother foods—those displayed as an accompaniment alongside thefood product being sold—influence the consumer.
Manufacturers use other foods to accompany the main producton the package for several reasons. In some cases as a sensorymetaphor – informing consumers about certain product character-istics, such as taste or smell – while others seeks to inform the con-sumer of the ingredients used to make the main product.
Likewise, by using packages displaying serving suggestions, themanufacturer displays the product ready for consumption, accom-panied by other foods or props (usually dishes and/or cutlery),seeking to make the product more appetising and/or informingconsumers about how and when can it be consumed.
Serving suggestions are a design tool widely used in food pack-aging. However there is little scientific literature on this topic.Some investigations have not included it within their study vari-ables at all, considering packaging to be viewed as a given unit—meaning it is impossible to draw conclusions on the influence ofits individual elements—(Grunert & Valli, 2001; Neyens et al.,2015) or because they did not consider its importance relative toothers factors since it was not the aim of their research to studyit (Mueller, Peschel, & Grebitus, 2013).
This paper seeks to fill the gap in this field detected by studyingthe influence of the elements on the serving suggestions—theaccompaniments—not the product contents. The product studiedwas a Spanish soft cheese, since according to the Spanish Ministryof Agriculture, Food and Environment (MAGRAMA, 2015) this isthe type of cheese with the highest consumption in Spanish house-holds (29.9% of the total in 2013) and is purchased mainly in super-markets and hypermarkets (for which the consumer is used toacquire the product ready packaged). This cheese is known as‘‘queso fresco”.
From among all the categories of soft cheese on the Spanishmarket, this study focuses on those obtained from pasteurized milk(sheep, goat, or cow): a soft white cheese, cylindrical conical orprismatic, without crust and with a soft texture. It is very commonfor this cheese packaging to show a serving suggestion withaccompaniments.
In summary, this article aims to analyse the influence the foodsused to accompany the cheese on the serving suggestion have on:
� Consumer expectations with respect to the attributes of the softcheese,
� Consumer willingness to buy.� The time of day consumers believe most suitable for itsconsumption.
2. Materials and methods
2.1. Participants
Some 247 people participated in this investigation—64%females (158) and 36% (89) males—all residing in Spain between
October and November 2014. Their mean age was 27.7 years witha standard deviation of 10.4 years.
With regard to their educational profile, 80.16% of participantsstated they had university qualifications, 18.62% stated they hadqualifications from non-university institutions, and 1.21% said theyhad no professional qualifications.
With respect to the consumption of soft cheese, 21% stated theyconsumed it frequently, 45% answered from time to time, 24% saidthat they rarely ate it, and the remaining 10% admitted never hav-ing consumed soft cheese.
2.2. Procedure
The experiment was conducted via social media on a voluntaryand anonymous basis, using an online survey tool to gather thedata: SurveyMonkey�. Participants were not set a time limit tocomplete the survey or any particular section thereof. They wereshown photorealistic renderings of five different soft cheese pack-ages created for this investigation and given a questionnaire toevaluate them. All survey participants viewed the same packagesdisplayed in a random order.
2.3. Stimuli
This experiment was designed with a total of five differentpackages in which the only variant was the foods shown in theserving suggestion, imitating the foods most commonly consumedwith soft cheese: fruit (strawberry and kiwi), quince, salad (lettuceand cherry tomatoes) and sliced turkey, as well as one package dis-playing just the cheese. The packages used can be seen in Fig. 1.
The cheese was the central item in the composition on eachpackage with an identical position and size, with the accompani-ment to the left. The other variables were identical. The differentpackages were designed so that the space given to the accompani-ment was similar on all the packages thus creating consistency inthe relationship between both elements in all cases.
The package shape was inspired by the typical structure of areal package of four packs in a cardboard cover (the secondarypackage), since this is a typical format for this product. The graphicdesign of the secondary package mirrored the location and size ofthe different elements to make it as similar as possible to commer-cial packages. The image elements included the product descrip-tion (the words ‘‘Queso fresco”), the brand (Torre Blanca – WhiteTower, in English – created especially for this investigation so thatthe participants could deduce certain attributes of the productsbased on prior experiences with other brands), the nutritionalinformation (identical on all packages), the quantity of productcontained (identical in all cases) and the serving suggestion. Thefive secondary packages were designed with a blue backgroundcolour since this is a neutral colour frequently used for this typeof package.
The visual stimuli used in the survey were photorealistic ren-ders created using Photoshop CS5 and Keyshot 4. The product pho-tographs used on the package designs came from a set of ad hocphotographs taken of natural products.
2.4. Measurements
The survey was divided into three sections: control questions toidentify the participants (age, gender, and education), the presen-tation of the packages to analyse—the visual stimuli in Fig. 1—and a survey relating to the study variable.
For each package, the survey evaluated a total of eight productattributes identified and chosen by a panel of experts, five possibleconsumption times during the day and willingness to buy. The listof attributes can be seen in Table 1.
R. Rebollar et al. / Food Quality and Preference 52 (2016) 188–194 189

Publications · Study 3 | 113
Participants were asked to evaluate the eight product attributesfor each of the five packages according to a LIKERT scale of 1(totally disagree) to 7 (totally agree), and to choose what time ofday (from the five proposals) they deemed most suitable to con-sume each soft cheese. In both cases, participants were given theoption of leaving the questionnaire blank for questions they didnot know how to answer.
Willingness to buy was evaluated using the same scale of 1(would not buy under any circumstances) to 7 (would be totallywilling to buy). It was specified that all the products containedthe same quantity of cheese and had the same cost, though theprice wasn’t specified.
2.5. Data analysis
Each attribute was individually analysed using one-wayrepeated measures analysis of variance (within-subjects ANOVA).For the comparisons of pairs following the analysis of variance,the Bonferroni penalty was used.
To study the preference of individuals with respect to the differ-ent packages, the Individual Differences Model was used (Carrol &Chang, 1970; Horan, 1969). This technique is included withinmulti-dimensional scaling techniques and has been used primarilyto characterise variation in judged stimulus structure across indi-viduals. This method is also known as INDSCAL. In this study, amatrix (5 � 5) of similarities between packages was calculated
for each individual. These similarities were obtained from eachindividual score given to the different packages of soft cheese inrelation to its sensory and non-sensory attributes. This techniqueallows the creation of a space of consensus for the individualsshowing the similarities between the packages of soft cheese. Inaddition, it is possible to find out the weighting that each individ-ual gave to the dimensions obtained in the consensus space. Theweightings reflect the importance that the individuals associateto the dimensions in the stimuli space. Although one person canperceive one of the dimensions to be more important than theother, another person can have the opposite perception.
This technique was used with the attributes (sensory and non-sensory), as well as with willingness to buy. The analysis was con-ducted using the PROXCAL algorithm (Leeuw & Heiser, 1980), andEuclidian distance was used as a measure of similarity. The crite-rion to choose the number of dimensions in the consensus spacewas based on goodness of fit and the number of stimuli includedin the analysis. S-Stress was used to determine goodness of fit. Ifthis measurement is low, it indicates that the configurationobtained in the map (or space) is good. Kruskal and Wish (1984)deem the solution to be acceptable when the S-Stress values areless than 0.1. For this technique, these authors suggest the relation-ship between the number of stimuli and the number of dimen-sions, stating that up to 12 stimuli can be represented in twodimensions.
The vector model (Schiffman, Reynolds, & Young, 1981) wasused to interpret the dimensions of preference in accordance withthe observable attributes. This procedure uses the multiple regres-sion technique to determine the direction of the attributes. Themeans of the individual scores of attributes are used to calculatethe multiple regression, and the standardized regression coeffi-cients (b1, b2) are computed and drawn as coordinates in thetwo-dimensional stimulus plane. Finally, a line is drawn throughthe origin of the stimulus consensus space and through coordi-nates defined by the regression coefficients. This model helps tointerpret the dimensions of the space of similarities using the attri-butes forming the similarities among the stimuli. Moreover, theattribute-vector is shown as a line in the space representing the
Fig. 1. Visual stimuli used in the investigation.
Table 1List of product attributes used in the investigation.
Product attributes Willingness tobuy
Ideal time ofconsumption
Sensory Non-sensory
Sweet Filling Willingness to buy BreakfastSalty Healthy LunchStrong flavour Low-Cal DinnerCompact/dense In-between mealsCreamy At any time
190 R. Rebollar et al. / Food Quality and Preference 52 (2016) 188–194
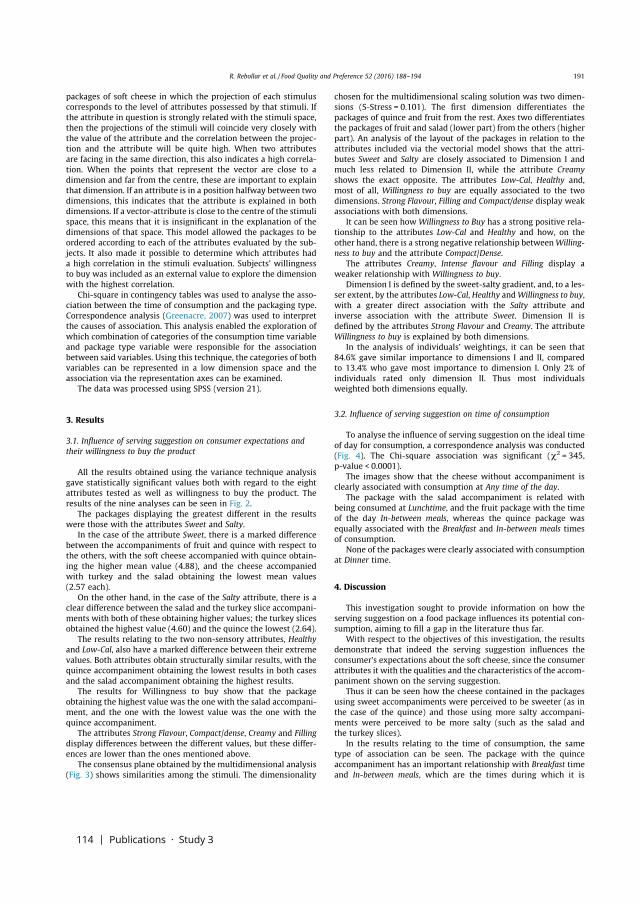
114 | Publications · Study 3
packages of soft cheese in which the projection of each stimuluscorresponds to the level of attributes possessed by that stimuli. Ifthe attribute in question is strongly related with the stimuli space,then the projections of the stimuli will coincide very closely withthe value of the attribute and the correlation between the projec-tion and the attribute will be quite high. When two attributesare facing in the same direction, this also indicates a high correla-tion. When the points that represent the vector are close to adimension and far from the centre, these are important to explainthat dimension. If an attribute is in a position halfway between twodimensions, this indicates that the attribute is explained in bothdimensions. If a vector-attribute is close to the centre of the stimulispace, this means that it is insignificant in the explanation of thedimensions of that space. This model allowed the packages to beordered according to each of the attributes evaluated by the sub-jects. It also made it possible to determine which attributes hada high correlation in the stimuli evaluation. Subjects’ willingnessto buy was included as an external value to explore the dimensionwith the highest correlation.
Chi-square in contingency tables was used to analyse the asso-ciation between the time of consumption and the packaging type.Correspondence analysis (Greenacre, 2007) was used to interpretthe causes of association. This analysis enabled the exploration ofwhich combination of categories of the consumption time variableand package type variable were responsible for the associationbetween said variables. Using this technique, the categories of bothvariables can be represented in a low dimension space and theassociation via the representation axes can be examined.
The data was processed using SPSS (version 21).
3. Results
3.1. Influence of serving suggestion on consumer expectations andtheir willingness to buy the product
All the results obtained using the variance technique analysisgave statistically significant values both with regard to the eightattributes tested as well as willingness to buy the product. Theresults of the nine analyses can be seen in Fig. 2.
The packages displaying the greatest different in the resultswere those with the attributes Sweet and Salty.
In the case of the attribute Sweet, there is a marked differencebetween the accompaniments of fruit and quince with respect tothe others, with the soft cheese accompanied with quince obtain-ing the higher mean value (4.88), and the cheese accompaniedwith turkey and the salad obtaining the lowest mean values(2.57 each).
On the other hand, in the case of the Salty attribute, there is aclear difference between the salad and the turkey slice accompani-ments with both of these obtaining higher values; the turkey slicesobtained the highest value (4.60) and the quince the lowest (2.64).
The results relating to the two non-sensory attributes, Healthyand Low-Cal, also have a marked difference between their extremevalues. Both attributes obtain structurally similar results, with thequince accompaniment obtaining the lowest results in both casesand the salad accompaniment obtaining the highest results.
The results for Willingness to buy show that the packageobtaining the highest value was the one with the salad accompani-ment, and the one with the lowest value was the one with thequince accompaniment.
The attributes Strong Flavour, Compact/dense, Creamy and Fillingdisplay differences between the different values, but these differ-ences are lower than the ones mentioned above.
The consensus plane obtained by the multidimensional analysis(Fig. 3) shows similarities among the stimuli. The dimensionality
chosen for the multidimensional scaling solution was two dimen-sions (S-Stress = 0.101). The first dimension differentiates thepackages of quince and fruit from the rest. Axes two differentiatesthe packages of fruit and salad (lower part) from the others (higherpart). An analysis of the layout of the packages in relation to theattributes included via the vectorial model shows that the attri-butes Sweet and Salty are closely associated to Dimension I andmuch less related to Dimension II, while the attribute Creamyshows the exact opposite. The attributes Low-Cal, Healthy and,most of all, Willingness to buy are equally associated to the twodimensions. Strong Flavour, Filling and Compact/dense display weakassociations with both dimensions.
It can be seen how Willingness to Buy has a strong positive rela-tionship to the attributes Low-Cal and Healthy and how, on theother hand, there is a strong negative relationship betweenWilling-ness to buy and the attribute Compact/Dense.
The attributes Creamy, Intense flavour and Filling display aweaker relationship with Willingness to buy.
Dimension I is defined by the sweet-salty gradient, and, to a les-ser extent, by the attributes Low-Cal, Healthy andWillingness to buy,with a greater direct association with the Salty attribute andinverse association with the attribute Sweet. Dimension II isdefined by the attributes Strong Flavour and Creamy. The attributeWillingness to buy is explained by both dimensions.
In the analysis of individuals’ weightings, it can be seen that84.6% gave similar importance to dimensions I and II, comparedto 13.4% who gave most importance to dimension I. Only 2% ofindividuals rated only dimension II. Thus most individualsweighted both dimensions equally.
3.2. Influence of serving suggestion on time of consumption
To analyse the influence of serving suggestion on the ideal timeof day for consumption, a correspondence analysis was conducted(Fig. 4). The Chi-square association was significant (v2 = 345,p-value < 0.0001).
The images show that the cheese without accompaniment isclearly associated with consumption at Any time of the day.
The package with the salad accompaniment is related withbeing consumed at Lunchtime, and the fruit package with the timeof the day In-between meals, whereas the quince package wasequally associated with the Breakfast and In-between meals timesof consumption.
None of the packages were clearly associated with consumptionat Dinner time.
4. Discussion
This investigation sought to provide information on how theserving suggestion on a food package influences its potential con-sumption, aiming to fill a gap in the literature thus far.
With respect to the objectives of this investigation, the resultsdemonstrate that indeed the serving suggestion influences theconsumer’s expectations about the soft cheese, since the consumerattributes it with the qualities and the characteristics of the accom-paniment shown on the serving suggestion.
Thus it can be seen how the cheese contained in the packagesusing sweet accompaniments were perceived to be sweeter (as inthe case of the quince) and those using more salty accompani-ments were perceived to be more salty (such as the salad andthe turkey slices).
In the results relating to the time of consumption, the sametype of association can be seen. The package with the quinceaccompaniment has an important relationship with Breakfast timeand In-between meals, which are the times during which it is
R. Rebollar et al. / Food Quality and Preference 52 (2016) 188–194 191
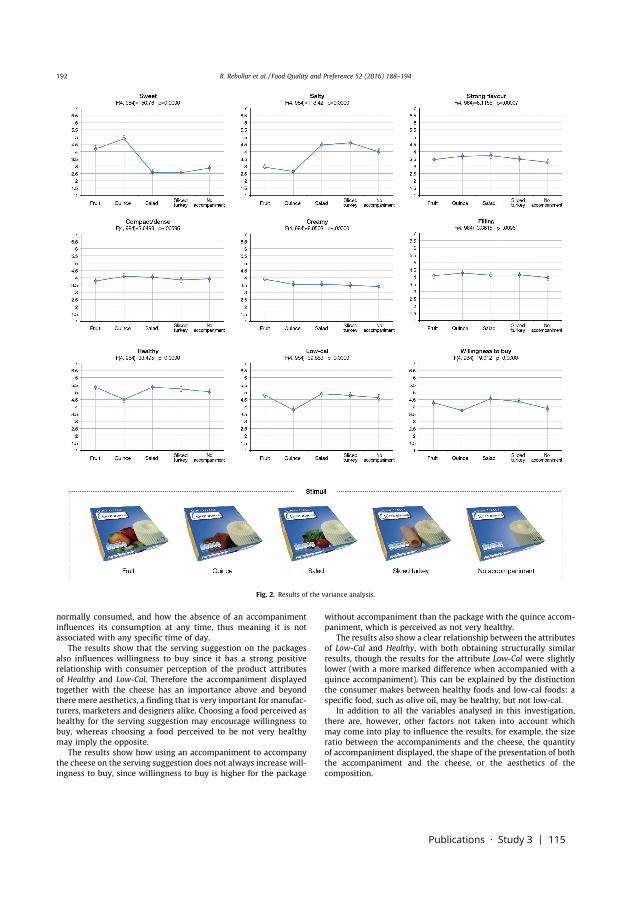
Publications · Study 3 | 115
normally consumed, and how the absence of an accompanimentinfluences its consumption at any time, thus meaning it is notassociated with any specific time of day.
The results show that the serving suggestion on the packagesalso influences willingness to buy since it has a strong positiverelationship with consumer perception of the product attributesof Healthy and Low-Cal. Therefore the accompaniment displayedtogether with the cheese has an importance above and beyondthere mere aesthetics, a finding that is very important for manufac-turers, marketers and designers alike. Choosing a food perceived ashealthy for the serving suggestion may encourage willingness tobuy, whereas choosing a food perceived to be not very healthymay imply the opposite.
The results show how using an accompaniment to accompanythe cheese on the serving suggestion does not always increase will-ingness to buy, since willingness to buy is higher for the package
without accompaniment than the package with the quince accom-paniment, which is perceived as not very healthy.
The results also show a clear relationship between the attributesof Low-Cal and Healthy, with both obtaining structurally similarresults, though the results for the attribute Low-Cal were slightlylower (with a more marked difference when accompanied with aquince accompaniment). This can be explained by the distinctionthe consumer makes between healthy foods and low-cal foods: aspecific food, such as olive oil, may be healthy, but not low-cal.
In addition to all the variables analysed in this investigation,there are, however, other factors not taken into account whichmay come into play to influence the results, for example, the sizeratio between the accompaniments and the cheese, the quantityof accompaniment displayed, the shape of the presentation of boththe accompaniment and the cheese, or the aesthetics of thecomposition.
Fig. 2. Results of the variance analysis.
192 R. Rebollar et al. / Food Quality and Preference 52 (2016) 188–194
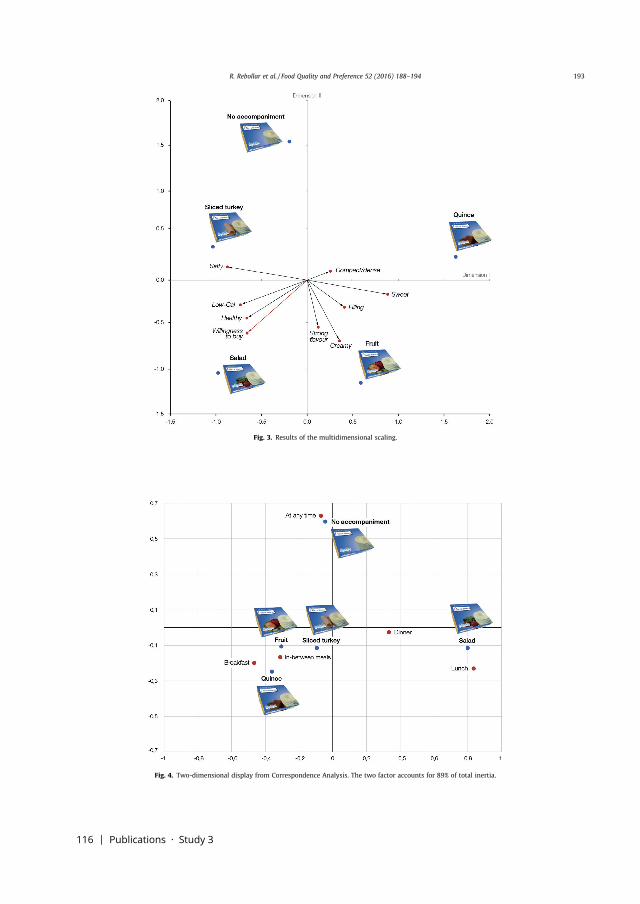
116 | Publications · Study 3
Fig. 3. Results of the multidimensional scaling.
Fig. 4. Two-dimensional display from Correspondence Analysis. The two factor accounts for 89% of total inertia.
R. Rebollar et al. / Food Quality and Preference 52 (2016) 188–194 193
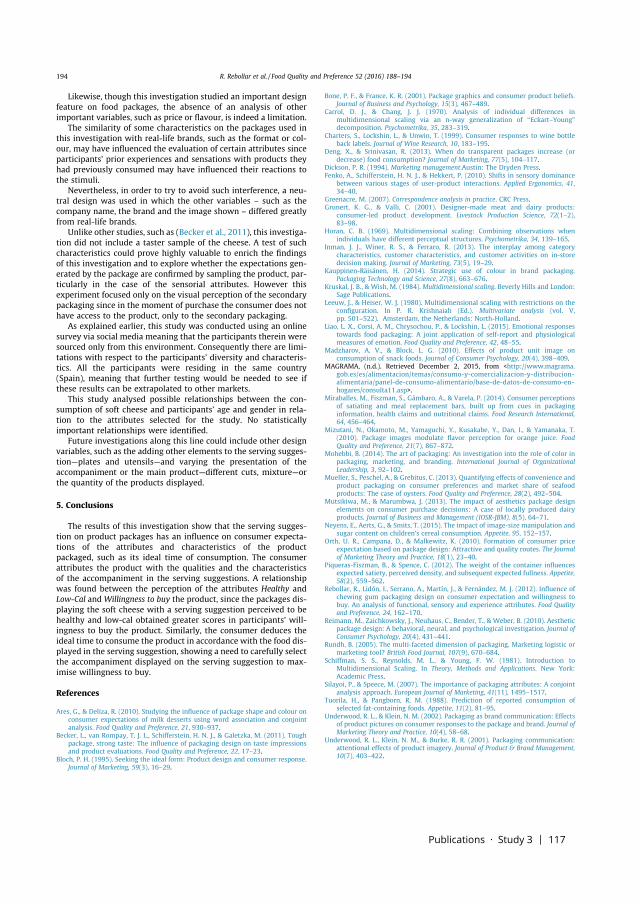
Publications · Study 3 | 117
Likewise, though this investigation studied an important designfeature on food packages, the absence of an analysis of otherimportant variables, such as price or flavour, is indeed a limitation.
The similarity of some characteristics on the packages used inthis investigation with real-life brands, such as the format or col-our, may have influenced the evaluation of certain attributes sinceparticipants’ prior experiences and sensations with products theyhad previously consumed may have influenced their reactions tothe stimuli.
Nevertheless, in order to try to avoid such interference, a neu-tral design was used in which the other variables – such as thecompany name, the brand and the image shown – differed greatlyfrom real-life brands.
Unlike other studies, such as (Becker et al., 2011), this investiga-tion did not include a taster sample of the cheese. A test of suchcharacteristics could prove highly valuable to enrich the findingsof this investigation and to explore whether the expectations gen-erated by the package are confirmed by sampling the product, par-ticularly in the case of the sensorial attributes. However thisexperiment focused only on the visual perception of the secondarypackaging since in the moment of purchase the consumer does nothave access to the product, only to the secondary packaging.
As explained earlier, this study was conducted using an onlinesurvey via social media meaning that the participants therein weresourced only from this environment. Consequently there are limi-tations with respect to the participants’ diversity and characteris-tics. All the participants were residing in the same country(Spain), meaning that further testing would be needed to see ifthese results can be extrapolated to other markets.
This study analysed possible relationships between the con-sumption of soft cheese and participants’ age and gender in rela-tion to the attributes selected for the study. No statisticallyimportant relationships were identified.
Future investigations along this line could include other designvariables, such as the adding other elements to the serving sugges-tion—plates and utensils—and varying the presentation of theaccompaniment or the main product—different cuts, mixture—orthe quantity of the products displayed.
5. Conclusions
The results of this investigation show that the serving sugges-tion on product packages has an influence on consumer expecta-tions of the attributes and characteristics of the productpackaged, such as its ideal time of consumption. The consumerattributes the product with the qualities and the characteristicsof the accompaniment in the serving suggestions. A relationshipwas found between the perception of the attributes Healthy andLow-Cal and Willingness to buy the product, since the packages dis-playing the soft cheese with a serving suggestion perceived to behealthy and low-cal obtained greater scores in participants’ will-ingness to buy the product. Similarly, the consumer deduces theideal time to consume the product in accordance with the food dis-played in the serving suggestion, showing a need to carefully selectthe accompaniment displayed on the serving suggestion to max-imise willingness to buy.
References
Ares, G., & Deliza, R. (2010). Studying the influence of package shape and colour onconsumer expectations of milk desserts using word association and conjointanalysis. Food Quality and Preference, 21, 930–937.
Becker, L., van Rompay, T. J. L., Schifferstein, H. N. J., & Galetzka, M. (2011). Toughpackage, strong taste: The influence of packaging design on taste impressionsand product evaluations. Food Quality and Preference, 22, 17–23.
Bloch, P. H. (1995). Seeking the ideal form: Product design and consumer response.Journal of Marketing, 59(3), 16–29.
Bone, P. F., & France, K. R. (2001). Package graphics and consumer product beliefs.Journal of Business and Psychology, 15(3), 467–489.
Carrol, D. J., & Chang, J. J. (1970). Analysis of individual differences inmultidimensional scaling via an n-way generalization of ‘‘Eckart–Young”decomposition. Psychometrika, 35, 283–319.
Charters, S., Lockshin, L., & Unwin, T. (1999). Consumer responses to wine bottleback labels. Journal of Wine Research, 10, 183–195.
Deng, X., & Srinivasan, R. (2013). When do transparent packages increase (ordecrease) food consumption? Journal of Marketing, 77(5), 104–117.
Dickson, P. R. (1994). Marketing management.Austin: The Dryden Press.Fenko, A., Schifferstein, H. N. J., & Hekkert, P. (2010). Shifts in sensory dominance
between various stages of user-product interactions. Applied Ergonomics, 41,34–40.
Greenacre, M. (2007). Correspondence analysis in practice. CRC Press.Grunert, K. G., & Valli, C. (2001). Designer-made meat and dairy products:
consumer-led product development. Livestock Production Science, 72(1–2),83–98.
Horan, C. B. (1969). Multidimensional scaling: Combining observations whenindividuals have different perceptual structures. Psychometrika, 34, 139–165.
Inman, J. J., Winer, R. S., & Ferraro, R. (2013). The interplay among categorycharacteristics, customer characteristics, and customer activities on in-storedecision making. Journal of Marketing, 73(5), 19–29.
Kauppinen-Räisänen, H. (2014). Strategic use of colour in brand packaging.Packaging Technology and Science, 27(8), 663–676.
Kruskal, J. B., & Wish, M. (1984). Multidimensional scaling. Beverly Hills and London:Sage Publications.
Leeuw, J., & Heiser, W. J. (1980). Multidimensional scaling with restrictions on theconfiguration. In P. R. Krishnaiah (Ed.). Multivariate analysis (vol. V,pp. 501–522). Amsterdam, the Netherlands: North-Holland.
Liao, L. X., Corsi, A. M., Chrysochou, P., & Lockshin, L. (2015). Emotional responsestowards food packaging: A joint application of self-report and physiologicalmeasures of emotion. Food Quality and Preference, 42, 48–55.
Madzharov, A. V., & Block, L. G. (2010). Effects of product unit image onconsumption of snack foods. Journal of Consumer Psychology, 20(4), 398–409.
MAGRAMA, (n.d.). Retrieved December 2, 2015, from <http://www.magrama.gob.es/es/alimentacion/temas/consumo-y-comercializacion-y-distribucion-alimentaria/panel-de-consumo-alimentario/base-de-datos-de-consumo-en-hogares/consulta11.asp>.
Miraballes, M., Fiszman, S., Gámbaro, A., & Varela, P. (2014). Consumer perceptionsof satiating and meal replacement bars, built up from cues in packaginginformation, health claims and nutritional claims. Food Research International,64, 456–464.
Mizutani, N., Okamoto, M., Yamaguchi, Y., Kusakabe, Y., Dan, I., & Yamanaka, T.(2010). Package images modulate flavor perception for orange juice. FoodQuality and Preference, 21(7), 867–872.
Mohebbi, B. (2014). The art of packaging: An investigation into the role of color inpackaging, marketing, and branding. International Journal of OrganizationalLeadership, 3, 92–102.
Mueller, S., Peschel, A., & Grebitus, C. (2013). Quantifying effects of convenience andproduct packaging on consumer preferences and market share of seafoodproducts: The case of oysters. Food Quality and Preference, 28(2), 492–504.
Mutsikiwa, M., & Marumbwa, J. (2013). The impact of aesthetics package designelements on consumer purchase decisions: A case of locally produced dairyproducts. Journal of Business and Management (IOSR-JBM), 8(5), 64–71.
Neyens, E., Aerts, G., & Smits, T. (2015). The impact of image-size manipulation andsugar content on children’s cereal consumption. Appetite, 95, 152–157.
Orth, U. R., Campana, D., & Malkewitz, K. (2010). Formation of consumer priceexpectation based on package design: Attractive and quality routes. The Journalof Marketing Theory and Practice, 18(1), 23–40.
Piqueras-Fiszman, B., & Spence, C. (2012). The weight of the container influencesexpected satiety, perceived density, and subsequent expected fullness. Appetite,58(2), 559–562.
Rebollar, R., Lidón, I., Serrano, A., Martín, J., & Fernández, M. J. (2012). Influence ofchewing gum packaging design on consumer expectation and willingness tobuy. An analysis of functional, sensory and experience attributes. Food Qualityand Preference, 24, 162–170.
Reimann, M., Zaichkowsky, J., Neuhaus, C., Bender, T., & Weber, B. (2010). Aestheticpackage design: A behavioral, neural, and psychological investigation. Journal ofConsumer Psychology, 20(4), 431–441.
Rundh, B. (2005). The multi-faceted dimension of packaging. Marketing logistic ormarketing tool? British Food Journal, 107(9), 670–684.
Schiffman, S. S., Reynolds, M. L., & Young, F. W. (1981). Introduction toMultidimensional Scaling. In Theory, Methods and Applications. New York:Academic Press.
Silayoi, P., & Speece, M. (2007). The importance of packaging attributes: A conjointanalysis approach. European Journal of Marketing, 41(11), 1495–1517.
Tuorila, H., & Pangborn, R. M. (1988). Prediction of reported consumption ofselected fat-containing foods. Appetite, 11(2), 81–95.
Underwood, R. L., & Klein, N. M. (2002). Packaging as brand communication: Effectsof product pictures on consumer responses to the package and brand. Journal ofMarketing Theory and Practice, 10(4), 58–68.
Underwood, R. L., Klein, N. M., & Burke, R. R. (2001). Packaging communication:attentional effects of product imagery. Journal of Product & Brand Management,10(7), 403–422.
194 R. Rebollar et al. / Food Quality and Preference 52 (2016) 188–194

Publications · Study 4 | 119
Study 4
Lidón, I., Rebollar, R., Gil-Pérez, I., Martín, J., & Vicente-Villardón, J. L. (in
press). The influence the image of the product shown on food packaging labels
has on product perception during tasting: Effects and gender differences. Pack-
aging Technology and Science. https://doi.org/10.1002/pts.2407
Packaging Technology and Science’s JCR Journal Impact Factor in 2017 (the
latest available data) was 1.808, placing it in position 65 of 133 (quartile Q2) of
the Category Food Science & Technology.
3.4.

120 | Publications · Study 4
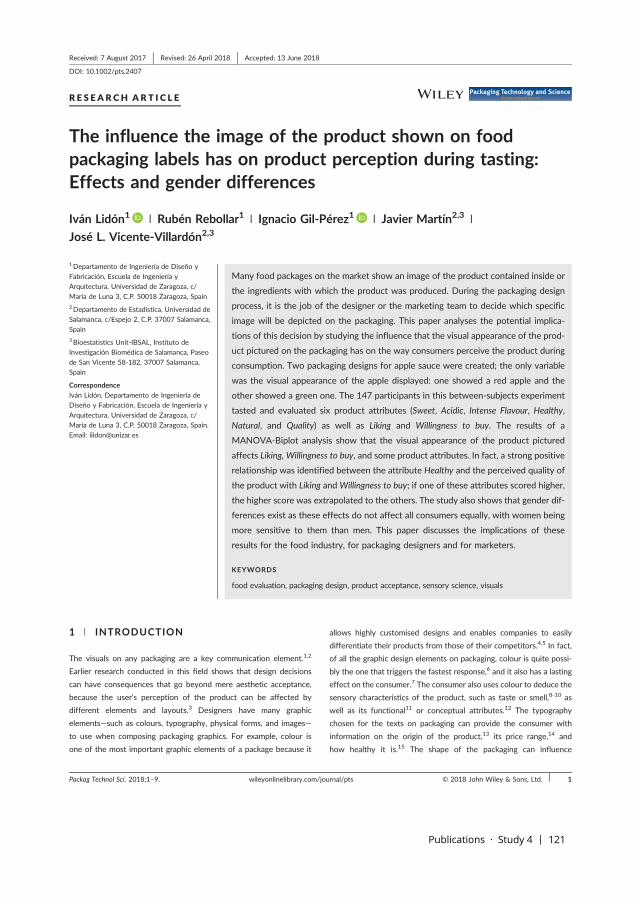
Publications · Study 4 | 121
R E S E A R CH AR T I C L E
The influence the image of the product shown on foodpackaging labels has on product perception during tasting:Effects and gender differences
Iván Lidón1 | Rubén Rebollar1 | Ignacio Gil‐Pérez1 | Javier Martín2,3 |
José L. Vicente‐Villardón2,3
1Departamento de Ingeniería de Diseño y
Fabricación, Escuela de Ingeniería y
Arquitectura, Universidad de Zaragoza, c/
María de Luna 3, C.P. 50018 Zaragoza, Spain
2Departamento de Estadística, Universidad de
Salamanca, c/Espejo 2, C.P. 37007 Salamanca,
Spain
3Bioestatistics Unit‐IBSAL, Instituto de
Investigación Biomédica de Salamanca, Paseo
de San Vicente 58‐182, 37007 Salamanca,
Spain
Correspondence
Iván Lidón, Departamento de Ingeniería de
Diseño y Fabricación, Escuela de Ingeniería y
Arquitectura, Universidad de Zaragoza, c/
María de Luna 3, C.P. 50018 Zaragoza, Spain.
Email: [email protected]
Many food packages on the market show an image of the product contained inside or
the ingredients with which the product was produced. During the packaging design
process, it is the job of the designer or the marketing team to decide which specific
image will be depicted on the packaging. This paper analyses the potential implica-
tions of this decision by studying the influence that the visual appearance of the prod-
uct pictured on the packaging has on the way consumers perceive the product during
consumption. Two packaging designs for apple sauce were created; the only variable
was the visual appearance of the apple displayed: one showed a red apple and the
other showed a green one. The 147 participants in this between‐subjects experiment
tasted and evaluated six product attributes (Sweet, Acidic, Intense Flavour, Healthy,
Natural, and Quality) as well as Liking and Willingness to buy. The results of a
MANOVA‐Biplot analysis show that the visual appearance of the product pictured
affects Liking, Willingness to buy, and some product attributes. In fact, a strong positive
relationship was identified between the attribute Healthy and the perceived quality of
the product with Liking and Willingness to buy; if one of these attributes scored higher,
the higher score was extrapolated to the others. The study also shows that gender dif-
ferences exist as these effects do not affect all consumers equally, with women being
more sensitive to them than men. This paper discusses the implications of these
results for the food industry, for packaging designers and for marketers.
KEYWORDS
food evaluation, packaging design, product acceptance, sensory science, visuals
1 | INTRODUCTION
The visuals on any packaging are a key communication element.1,2
Earlier research conducted in this field shows that design decisions
can have consequences that go beyond mere aesthetic acceptance,
because the user's perception of the product can be affected by
different elements and layouts.3 Designers have many graphic
elements—such as colours, typography, physical forms, and images—
to use when composing packaging graphics. For example, colour is
one of the most important graphic elements of a package because it
allows highly customised designs and enables companies to easily
differentiate their products from those of their competitors.4,5 In fact,
of all the graphic design elements on packaging, colour is quite possi-
bly the one that triggers the fastest response,6 and it also has a lasting
effect on the consumer.7 The consumer also uses colour to deduce the
sensory characteristics of the product, such as taste or smell,8-10 as
well as its functional11 or conceptual attributes.12 The typography
chosen for the texts on packaging can provide the consumer with
information on the origin of the product,13 its price range,14 and
how healthy it is.15 The shape of the packaging can influence
Received: 7 August 2017 Revised: 26 April 2018 Accepted: 13 June 2018
DOI: 10.1002/pts.2407
Packag Technol Sci. 2018;1–9. © 2018 John Wiley & Sons, Ltd.wileyonlinelibrary.com/journal/pts 1
122 | Publications · Study 4
consumers' sensory expectations of the product,4 flavour perceived
during tasting,16 and even experiential expectations.9
However, of all the visual elements present on a product's
packaging, the image depicted on the packaging is one of the features
most frequently used by both designers and marketers. In fact, it is an
element that is usually given a preferential space in the composition of
the package or label for most of the products on the market.17 The
image pictured on a food package is an element of particular interest
and importance within the visual elements.18-20 The image displayed
on a product's packaging also influences consumer beliefs about the
brand21 and helps to catch the attention of consumers.22 Previous
research has even studied its effect on the emotional response of
consumers.20 Moreover, it is an element with great scope for
designers. A visit to any supermarket demonstrates that there are
few products with no images on their packaging.17 The motifs used
vary greatly depending on the kind of product and the criteria used
by the designer or marketing team. As such, a package may display a
picture of the product contained inside, a picture of something more
vaguely related to the product (eg, places, animals or people) or a
combination of the two.
Showing the product contained in the packaging is particularly
important because it allows the consumer to see the product's
appearance. A product's appearance is a visual cue which consumers
use to infer it with certain quality attributes.17,23-25 Thus, seeing a
food product allows consumers to more easily imagine its sensory
attributes.23 One of the first studies conducted in this field evaluated
24 alternative passion fruit juice packages that had been generated
digitally.4 One of the variables in the experiment was the image shown
on the package; other variables were the background colour and the
language used in the text. This study evaluated expectations regarding
both sensory attributes (sweet, pure, intense, fresh) as well as non‐
sensory attributes (freshness, natural and acceptance). The study
concluded that the image was an influential and significant variable
in almost all the case studies and was particularly important for
participants with low need for cognition, ie, those who tended to
pay attention to the details.
In recent years, several studies have assessed the influence that
the image displayed on a food product's packaging has on the
generation of expectations3,26,27 and on willingness to buy.28
Rebollar et al29 proved that the serving suggestion displayed on
the package affects expectations and willingness to buy and that
the consumer perceives the main product to have the qualities
based on the accompaniments shown in the serving suggestion.
Madzharov and Block30 and Neyens, Aerts and Smits31 demon-
strated that certain image characteristics even influence how much
of the product is consumed. These studies show that consumption
may be higher when the number of product units displayed on the
image is higher30 and when the image occupies a larger portion of
the label.31 In a more recent paper, Rebollar et al32 showed that
the way in which crisps are depicted in the image on the package
has an effect on consumer sensory expectations, which is reflected
in their willingness to buy. The depiction of ready‐to‐eat crisps,
when compared with a composition in which a raw potato is
depicted, increased expectations of salty and crunchy attributes
and predisposition to buy.
In contrast to the growing body of knowledge we have about how
the image displayed on a package influences the generation of expec-
tations, research on how that image influences consumer perception
during tasting is scarce. This is particularly important for designers or
producers of products which are intended to be consumed directly
from their packages or with the package in sight (eg, soft drinks, jams,
or crisps). Until now, research has mainly focused on how factors such
as congruence,33,34 valence (ie, pleasantness),34 and the symbolic
meaning of the image shown on the package2 influence consumer
perception during tasting. In one of the few studies conducted in this
vein—published in its entirety only in Japanese, but summarized by
Mizutani et al,—34 Sakai33 studied the effect of viewing an image of
fruit while drinking fruit juice. This study analysed the influence of
congruent combinations—eg, the effect of displaying an image of an
orange when drinking orange juice—as well as incongruent combina-
tions—eg, the effect of displaying an image of an apple when drinking
orange juice—on consumers' sensory and hedonic evaluations. The
findings showed that sensory attributes and palatability were higher
for congruent combinations. Mizutani et al34 undertook a more
complex study in which participants drank orange juice from glasses
on which an image had been placed. The images were designed to
combine congruence factors (ie, orange or non‐food images) and
valence factors (ie, pleasant or unpleasant images). The results demon-
strated that valence had a significant effect on palatability and the
perceived freshness of juice, with higher scores for pleasant images.
The study also found that congruence was significant for aroma, with
the congruent images scoring higher in this variable. Interestingly, the
study found that flavour intensity was unaffected by image
congruence or valence. More recently, in a study conducted by
Machiels and Karnal,2 participants drank a glass of orange juice while
viewing an advert showing its commercial packaging. The stimuli
were designed to vary either the level of food processing in the image
(a whole orange versus a glass of juice) or the text shown (processed
versus unprocessed). The results show that displaying an image of a
glass of juice during tasting leads to purer taste evaluations, while
showing an image of a whole orange encourages certain consumers
to score it higher for purity of taste and be more willing to buy it.
Nevertheless, despite the progress made in this field thus far,
certain aspects of how the image of the product displayed on a pack-
age affects consumer perception during tasting are yet poorly under-
stood. From the designer's and producer's perspective, it is quite
reasonable to question whether or not the specific image chosen to
be depicted on the label will affect consumer perception during
tasting, even when all the options being considered are congruent,
pleasant, and have a similar symbolic meaning. In this context, the
choice of one particular image may influence the expectations of the
consumer,32 but it is not clear if it may also influence consumer
perception of sensory and non‐sensory attributes, product liking, or
the willingness to buy the product again.
In addition, there is reason to believe that the image seen on the
package during tasting does not affect all consumers equally. The
response of consumers to a product's extrinsic cues may be influenced
by individual characteristics like the capacity to understand and
interpret visual cues or to understand context‐related constructs.2 In
fact, according to previous research, the gender of the consumer
2 LIDÓN ET AL.
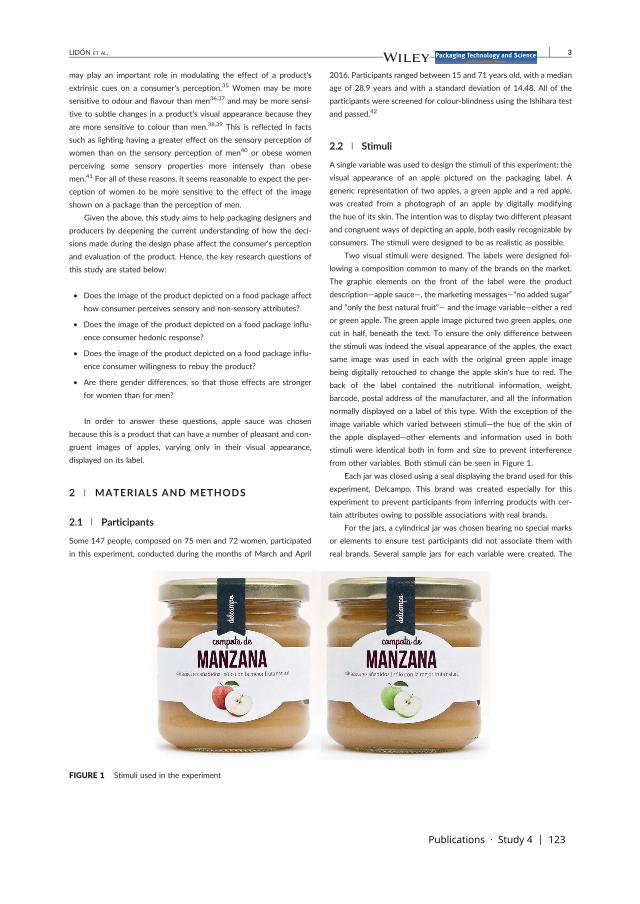
Publications · Study 4 | 123
may play an important role in modulating the effect of a product's
extrinsic cues on a consumer's perception.35 Women may be more
sensitive to odour and flavour than men36,37 and may be more sensi-
tive to subtle changes in a product's visual appearance because they
are more sensitive to colour than men.38,39 This is reflected in facts
such as lighting having a greater effect on the sensory perception of
women than on the sensory perception of men40 or obese women
perceiving some sensory properties more intensely than obese
men.41 For all of these reasons, it seems reasonable to expect the per-
ception of women to be more sensitive to the effect of the image
shown on a package than the perception of men.
Given the above, this study aims to help packaging designers and
producers by deepening the current understanding of how the deci-
sions made during the design phase affect the consumer's perception
and evaluation of the product. Hence, the key research questions of
this study are stated below:
• Does the image of the product depicted on a food package affect
how consumer perceives sensory and non‐sensory attributes?
• Does the image of the product depicted on a food package influ-
ence consumer hedonic response?
• Does the image of the product depicted on a food package influ-
ence consumer willingness to rebuy the product?
• Are there gender differences, so that those effects are stronger
for women than for men?
In order to answer these questions, apple sauce was chosen
because this is a product that can have a number of pleasant and con-
gruent images of apples, varying only in their visual appearance,
displayed on its label.
2 | MATERIALS AND METHODS
2.1 | Participants
Some 147 people, composed on 75 men and 72 women, participated
in this experiment, conducted during the months of March and April
2016. Participants ranged between 15 and 71 years old, with a median
age of 28.9 years and with a standard deviation of 14.48. All of the
participants were screened for colour‐blindness using the Ishihara test
and passed.42
2.2 | Stimuli
A single variable was used to design the stimuli of this experiment: the
visual appearance of an apple pictured on the packaging label. A
generic representation of two apples, a green apple and a red apple,
was created from a photograph of an apple by digitally modifying
the hue of its skin. The intention was to display two different pleasant
and congruent ways of depicting an apple, both easily recognizable by
consumers. The stimuli were designed to be as realistic as possible.
Two visual stimuli were designed. The labels were designed fol-
lowing a composition common to many of the brands on the market.
The graphic elements on the front of the label were the product
description—apple sauce—, the marketing messages—“no added sugar”
and “only the best natural fruit”— and the image variable—either a red
or green apple. The green apple image pictured two green apples, one
cut in half, beneath the text. To ensure the only difference between
the stimuli was indeed the visual appearance of the apples, the exact
same image was used in each with the original green apple image
being digitally retouched to change the apple skin's hue to red. The
back of the label contained the nutritional information, weight,
barcode, postal address of the manufacturer, and all the information
normally displayed on a label of this type. With the exception of the
image variable which varied between stimuli—the hue of the skin of
the apple displayed—other elements and information used in both
stimuli were identical both in form and size to prevent interference
from other variables. Both stimuli can be seen in Figure 1.
Each jar was closed using a seal displaying the brand used for this
experiment, Delcampo. This brand was created especially for this
experiment to prevent participants from inferring products with cer-
tain attributes owing to possible associations with real brands.
For the jars, a cylindrical jar was chosen bearing no special marks
or elements to ensure test participants did not associate them with
real brands. Several sample jars for each variable were created. The
FIGURE 1 Stimuli used in the experiment
LIDÓN ET AL. 3
124 | Publications · Study 4
jars were then filled with a brand of apple sauce that is rarely found on
the Spanish market and were then finally labelled for testing.
The labels were designed using software Illustrator CC and
Photoshop CC. The photo of the green apples was purchased with a
standard license from the iStockphoto online stock photo library.
2.3 | Procedure
The product tasting was conducted in a room with stable lighting con-
ditions and temperature. All participants took the test voluntarily and
anonymously. To ensure evaluations were unbiased by others' opin-
ions, each participant performed the test alone. Participants were
not aware of the true aim of the experiment.
A between‐subjects experimental design procedure was used. The
experimental procedure followed an alternate order, that is, the jar
was changed to ensure the variable was not the same as the previous
participant's. Thus, 74 participants tested the Red apple variable and
73 tested the Green apple variable. The Red apple cohort was com-
posed of 36 men (48.6%) and 38 women (51.4%) with a mean age of
29.1 years and a standard deviation of 14.18. The Green apple cohort
was composed of 39 men (53.4%) and 34 women (46.6%) with a mean
age of 28.8 years and a standard deviation of 14.87. Checks were car-
ried out to ensure there were no differences in age and gender vari-
ables between the two groups.
The tasting procedure went as follows. Once the participant had
entered the room, it was explained to them that they would be evalu-
ating a new line of apple sauce that the Delcampo Company had just
launched on the market. They were asked to test a small sample of the
product and answer a short survey. They were then seated at the
table, where there was a sealed apple sauce jar with which they could
interact freely and were handed a cup with a sample of sauce and a
teaspoon. They were told they could pick up and look at the jar for
as long as they wanted and were asked to try the sample in order to
fill out the survey. The sample was prepared whilst the participants
were in the room using a labelled jar identical to the one on the table.
The apple sauce that participants tasted was the same commercial
apple sauce with which the jars were filled. Each sample contained
15 g of apple sauce. The serving temperature was 5°C. To ensure this
temperature was maintained, the apple sauce was kept in a refrigera-
tor for at least 24 hours. Once the participants had tasted the apple
sauce and answered the survey, they were thanked and debriefed.
2.4 | Measurements
The survey was structured in two sections: one containing control
questions (age and gender) and the other asking participants to evalu-
ate a series of attributes of the sample of apple sauce they had just
tasted. The list of attributes evaluated is shown in Table 1.
Sweet and Acidic attributes were measured in order to analyse if
the sensory properties of the depiction of each apple influenced
consumer perception. The rest of the sensory and non‐sensory
attributes, as well as Liking and Willingness to buy, were measured with
an exploratory aim as they were identified as relevant attributes for
this product by a panel of experts made up of design professionals
and marketers.
Participants were asked to evaluate each of the sensory and non‐
sensory attributes of the product following a Likert‐7 scale, where 1
represented “strongly disagree” and 7 was “completely agree”.
Participants were asked not to leave any questions blank.
To allow participants to indicate how much they had liked the
product, a Likert‐7 scale was used, where 1 represented “did not like
it at all” and 7, “liked it a lot”. To end the survey, participants were
asked whether or not they would be willing to buy the product on a
Likert‐7 scale, where 1 indicated “would not buy under any circum-
stances” and 7, “would be totally willing to buy it”.
2.5 | Data analysis
The mean and standard deviation for the descriptive study of the
variables were calculated. In order to analyse the differences
between gender and stimuli for the group of all the attributes, the
MANOVA‐Biplot (multivariate analysis of variance) technique for
two independent factors was used.43 The main limitation of this
technique is the complexity of the presentation of the results and
their interpretation, particularly when there are many variables
owing to the interrelationships among them. This has led many
researchers to perform univariate analyses of each variable sepa-
rately resulting in errors or omissions when interpreting the results.
Biplot methods have been used to help the interpretation of the
MANOVA results. Thus, the MANOVA‐Biplot technique44 and the
canonical biplot technique45,46 were created, allowing a weighted
representation of the matrix of means, calculating the matrix posi-
tions with a maximum potential to discriminate among groups. This
technique enables a graphical representation to be created to iden-
tify the main differences among groups, the variables responsible
for the differences and inferences to be determined about the
canonical and original variables through confidence circles placed
over the points that represent the groups. In the MANOVA‐Biplot
for two independent factors, an image can be created to represent
each of the factors as well as their interaction. If the interaction is
significant, as is the case for univariate ANOVAS, analysing the
two factors separately is irrelevant because it is necessary to analyse
the causes of the differences taking into account the interaction.
This is done by using the total biplot technique to find out the posi-
tions that most separate the means of the set total of groups
defined by the combination of the levels of both factors. In the
representation of the total biplot, univariate trust circles are
displayed with the Bonferroni correction. If the trust circles are
projected over the attributes or the canonical axes, an estimation
of intervals of trust for each attribute or canonical axis can be
obtained. If the projections of the trust circles do not overlap, this
TABLE 1 List of product attributes used in the research
Product Attributes
Liking WillingnessSensory Non‐sensory
Sweet Healthy Liking To buy
Acidic Natural
Intense flavour Quality
4 LIDÓN ET AL.
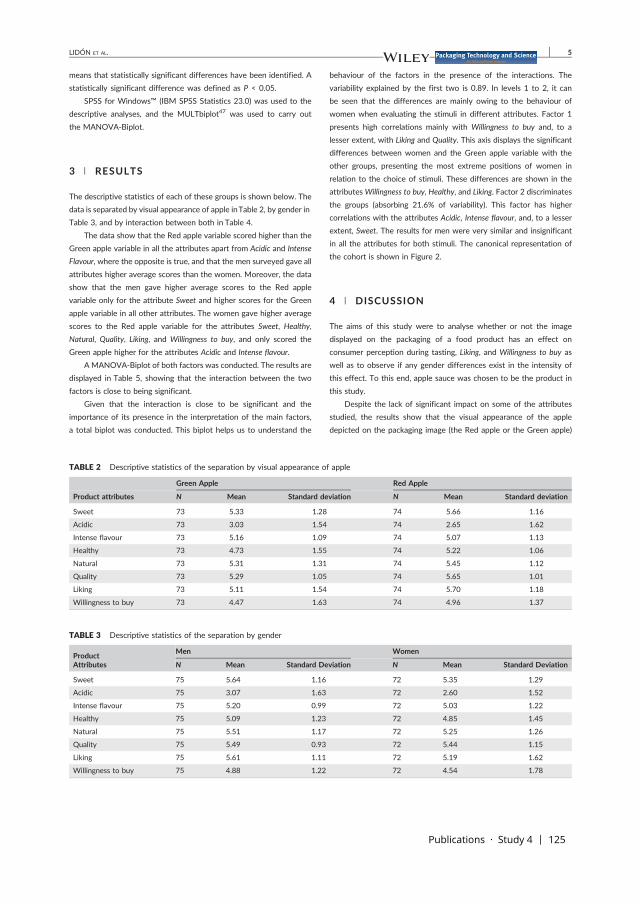
Publications · Study 4 | 125
means that statistically significant differences have been identified. A
statistically significant difference was defined as P < 0.05.
SPSS for Windows™ (IBM SPSS Statistics 23.0) was used to the
descriptive analyses, and the MULTbiplot47 was used to carry out
the MANOVA‐Biplot.
3 | RESULTS
The descriptive statistics of each of these groups is shown below. The
data is separated by visual appearance of apple inTable 2, by gender in
Table 3, and by interaction between both in Table 4.
The data show that the Red apple variable scored higher than the
Green apple variable in all the attributes apart from Acidic and Intense
Flavour, where the opposite is true, and that the men surveyed gave all
attributes higher average scores than the women. Moreover, the data
show that the men gave higher average scores to the Red apple
variable only for the attribute Sweet and higher scores for the Green
apple variable in all other attributes. The women gave higher average
scores to the Red apple variable for the attributes Sweet, Healthy,
Natural, Quality, Liking, and Willingness to buy, and only scored the
Green apple higher for the attributes Acidic and Intense flavour.
A MANOVA‐Biplot of both factors was conducted. The results are
displayed in Table 5, showing that the interaction between the two
factors is close to being significant.
Given that the interaction is close to be significant and the
importance of its presence in the interpretation of the main factors,
a total biplot was conducted. This biplot helps us to understand the
behaviour of the factors in the presence of the interactions. The
variability explained by the first two is 0.89. In levels 1 to 2, it can
be seen that the differences are mainly owing to the behaviour of
women when evaluating the stimuli in different attributes. Factor 1
presents high correlations mainly with Willingness to buy and, to a
lesser extent, with Liking and Quality. This axis displays the significant
differences between women and the Green apple variable with the
other groups, presenting the most extreme positions of women in
relation to the choice of stimuli. These differences are shown in the
attributes Willingness to buy, Healthy, and Liking. Factor 2 discriminates
the groups (absorbing 21.6% of variability). This factor has higher
correlations with the attributes Acidic, Intense flavour, and, to a lesser
extent, Sweet. The results for men were very similar and insignificant
in all the attributes for both stimuli. The canonical representation of
the cohort is shown in Figure 2.
4 | DISCUSSION
The aims of this study were to analyse whether or not the image
displayed on the packaging of a food product has an effect on
consumer perception during tasting, Liking, and Willingness to buy as
well as to observe if any gender differences exist in the intensity of
this effect. To this end, apple sauce was chosen to be the product in
this study.
Despite the lack of significant impact on some of the attributes
studied, the results show that the visual appearance of the apple
depicted on the packaging image (the Red apple or the Green apple)
TABLE 2 Descriptive statistics of the separation by visual appearance of apple
Green Apple Red Apple
Product attributes N Mean Standard deviation N Mean Standard deviation
Sweet 73 5.33 1.28 74 5.66 1.16
Acidic 73 3.03 1.54 74 2.65 1.62
Intense flavour 73 5.16 1.09 74 5.07 1.13
Healthy 73 4.73 1.55 74 5.22 1.06
Natural 73 5.31 1.31 74 5.45 1.12
Quality 73 5.29 1.05 74 5.65 1.01
Liking 73 5.11 1.54 74 5.70 1.18
Willingness to buy 73 4.47 1.63 74 4.96 1.37
TABLE 3 Descriptive statistics of the separation by gender
ProductAttributes
Men Women
N Mean Standard Deviation N Mean Standard Deviation
Sweet 75 5.64 1.16 72 5.35 1.29
Acidic 75 3.07 1.63 72 2.60 1.52
Intense flavour 75 5.20 0.99 72 5.03 1.22
Healthy 75 5.09 1.23 72 4.85 1.45
Natural 75 5.51 1.17 72 5.25 1.26
Quality 75 5.49 0.93 72 5.44 1.15
Liking 75 5.61 1.11 72 5.19 1.62
Willingness to buy 75 4.88 1.22 72 4.54 1.78
LIDÓN ET AL. 5
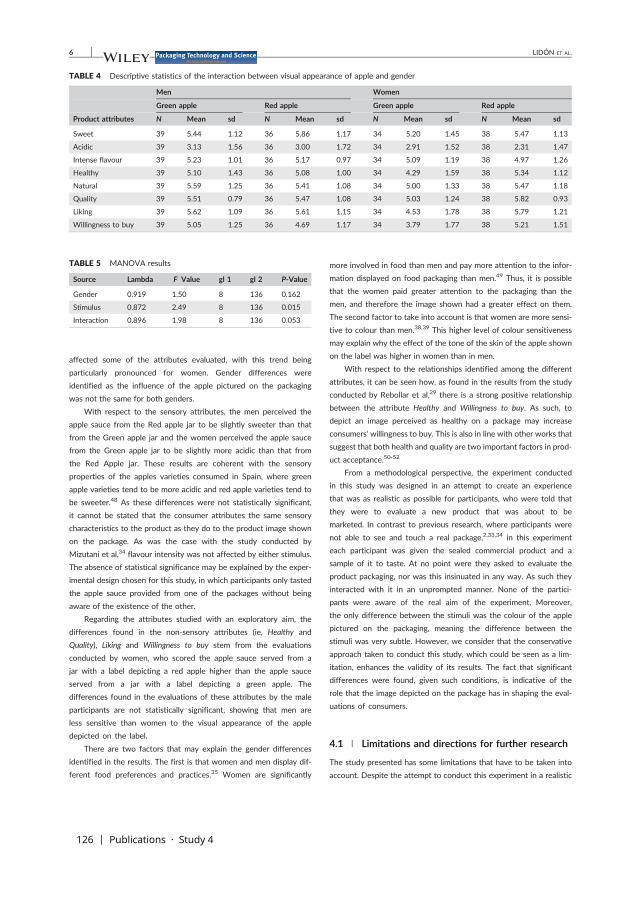
126 | Publications · Study 4
affected some of the attributes evaluated, with this trend being
particularly pronounced for women. Gender differences were
identified as the influence of the apple pictured on the packaging
was not the same for both genders.
With respect to the sensory attributes, the men perceived the
apple sauce from the Red apple jar to be slightly sweeter than that
from the Green apple jar and the women perceived the apple sauce
from the Green apple jar to be slightly more acidic than that from
the Red Apple jar. These results are coherent with the sensory
properties of the apples varieties consumed in Spain, where green
apple varieties tend to be more acidic and red apple varieties tend to
be sweeter.48 As these differences were not statistically significant,
it cannot be stated that the consumer attributes the same sensory
characteristics to the product as they do to the product image shown
on the package. As was the case with the study conducted by
Mizutani et al,34 flavour intensity was not affected by either stimulus.
The absence of statistical significance may be explained by the exper-
imental design chosen for this study, in which participants only tasted
the apple sauce provided from one of the packages without being
aware of the existence of the other.
Regarding the attributes studied with an exploratory aim, the
differences found in the non‐sensory attributes (ie, Healthy and
Quality), Liking and Willingness to buy stem from the evaluations
conducted by women, who scored the apple sauce served from a
jar with a label depicting a red apple higher than the apple sauce
served from a jar with a label depicting a green apple. The
differences found in the evaluations of these attributes by the male
participants are not statistically significant, showing that men are
less sensitive than women to the visual appearance of the apple
depicted on the label.
There are two factors that may explain the gender differences
identified in the results. The first is that women and men display dif-
ferent food preferences and practices.35 Women are significantly
more involved in food than men and pay more attention to the infor-
mation displayed on food packaging than men.49 Thus, it is possible
that the women paid greater attention to the packaging than the
men, and therefore the image shown had a greater effect on them.
The second factor to take into account is that women are more sensi-
tive to colour than men.38,39 This higher level of colour sensitiveness
may explain why the effect of the tone of the skin of the apple shown
on the label was higher in women than in men.
With respect to the relationships identified among the different
attributes, it can be seen how, as found in the results from the study
conducted by Rebollar et al,29 there is a strong positive relationship
between the attribute Healthy and Willingness to buy. As such, to
depict an image perceived as healthy on a package may increase
consumers' willingness to buy. This is also in line with other works that
suggest that both health and quality are two important factors in prod-
uct acceptance.50-52
From a methodological perspective, the experiment conducted
in this study was designed in an attempt to create an experience
that was as realistic as possible for participants, who were told that
they were to evaluate a new product that was about to be
marketed. In contrast to previous research, where participants were
not able to see and touch a real package,2,33,34 in this experiment
each participant was given the sealed commercial product and a
sample of it to taste. At no point were they asked to evaluate the
product packaging, nor was this insinuated in any way. As such they
interacted with it in an unprompted manner. None of the partici-
pants were aware of the real aim of the experiment. Moreover,
the only difference between the stimuli was the colour of the apple
pictured on the packaging, meaning the difference between the
stimuli was very subtle. However, we consider that the conservative
approach taken to conduct this study, which could be seen as a lim-
itation, enhances the validity of its results. The fact that significant
differences were found, given such conditions, is indicative of the
role that the image depicted on the package has in shaping the eval-
uations of consumers.
4.1 | Limitations and directions for further research
The study presented has some limitations that have to be taken into
account. Despite the attempt to conduct this experiment in a realistic
TABLE 4 Descriptive statistics of the interaction between visual appearance of apple and gender
Men Women
Green apple Red apple Green apple Red apple
Product attributes N Mean sd N Mean sd N Mean sd N Mean sd
Sweet 39 5.44 1.12 36 5.86 1.17 34 5.20 1.45 38 5.47 1.13
Acidic 39 3.13 1.56 36 3.00 1.72 34 2.91 1.52 38 2.31 1.47
Intense flavour 39 5.23 1.01 36 5.17 0.97 34 5.09 1.19 38 4.97 1.26
Healthy 39 5.10 1.43 36 5.08 1.00 34 4.29 1.59 38 5.34 1.12
Natural 39 5.59 1.25 36 5.41 1.08 34 5.00 1.33 38 5.47 1.18
Quality 39 5.51 0.79 36 5.47 1.08 34 5.03 1.24 38 5.82 0.93
Liking 39 5.62 1.09 36 5.61 1.15 34 4.53 1.78 38 5.79 1.21
Willingness to buy 39 5.05 1.25 36 4.69 1.17 34 3.79 1.77 38 5.21 1.51
TABLE 5 MANOVA results
Source Lambda F Value gl 1 gl 2 P‐Value
Gender 0.919 1.50 8 136 0.162
Stimulus 0.872 2.49 8 136 0.015
Interaction 0.896 1.98 8 136 0.053
6 LIDÓN ET AL.
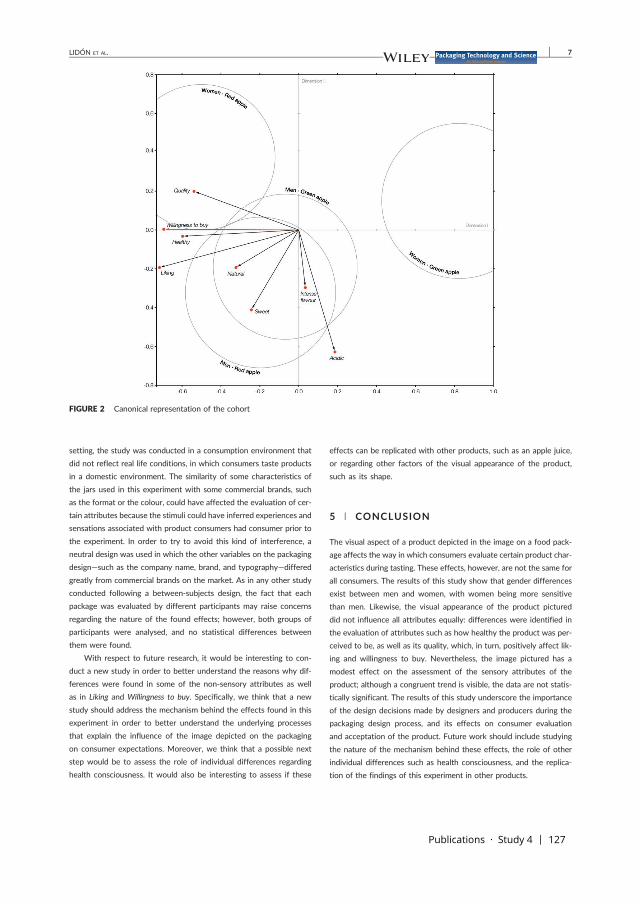
Publications · Study 4 | 127
setting, the study was conducted in a consumption environment that
did not reflect real life conditions, in which consumers taste products
in a domestic environment. The similarity of some characteristics of
the jars used in this experiment with some commercial brands, such
as the format or the colour, could have affected the evaluation of cer-
tain attributes because the stimuli could have inferred experiences and
sensations associated with product consumers had consumer prior to
the experiment. In order to try to avoid this kind of interference, a
neutral design was used in which the other variables on the packaging
design—such as the company name, brand, and typography—differed
greatly from commercial brands on the market. As in any other study
conducted following a between‐subjects design, the fact that each
package was evaluated by different participants may raise concerns
regarding the nature of the found effects; however, both groups of
participants were analysed, and no statistical differences between
them were found.
With respect to future research, it would be interesting to con-
duct a new study in order to better understand the reasons why dif-
ferences were found in some of the non‐sensory attributes as well
as in Liking and Willingness to buy. Specifically, we think that a new
study should address the mechanism behind the effects found in this
experiment in order to better understand the underlying processes
that explain the influence of the image depicted on the packaging
on consumer expectations. Moreover, we think that a possible next
step would be to assess the role of individual differences regarding
health consciousness. It would also be interesting to assess if these
effects can be replicated with other products, such as an apple juice,
or regarding other factors of the visual appearance of the product,
such as its shape.
5 | CONCLUSION
The visual aspect of a product depicted in the image on a food pack-
age affects the way in which consumers evaluate certain product char-
acteristics during tasting. These effects, however, are not the same for
all consumers. The results of this study show that gender differences
exist between men and women, with women being more sensitive
than men. Likewise, the visual appearance of the product pictured
did not influence all attributes equally: differences were identified in
the evaluation of attributes such as how healthy the product was per-
ceived to be, as well as its quality, which, in turn, positively affect lik-
ing and willingness to buy. Nevertheless, the image pictured has a
modest effect on the assessment of the sensory attributes of the
product; although a congruent trend is visible, the data are not statis-
tically significant. The results of this study underscore the importance
of the design decisions made by designers and producers during the
packaging design process, and its effects on consumer evaluation
and acceptation of the product. Future work should include studying
the nature of the mechanism behind these effects, the role of other
individual differences such as health consciousness, and the replica-
tion of the findings of this experiment in other products.
FIGURE 2 Canonical representation of the cohort
LIDÓN ET AL. 7
128 | Publications · Study 4
ORCID
Iván Lidón http://orcid.org/0000-0003-2558-982X
Ignacio Gil‐Pérez http://orcid.org/0000-0002-0181-2639
REFERENCES
1. Clement J. Visual influence on in‐store buying decisions: an eye‐trackexperiment on the visual influence of packaging design. J Mark Manag.2007;23(9–10):917‐928. https://doi.org/10.1362/026725707X250395
2. Machiels CJA, Karnal N. See how tasty it is? Effects of symbolic cueson product evaluation and taste. Food Qual Prefer. 2016;52:195‐202.https://doi.org/10.1016/j.foodqual.2016.04.014
3. Piqueras‐Fiszman B, Spence C. Sensory expectations based on prod-uct‐extrinsic food cues: an interdisciplinary review of the empiricalevidence and theoretical accounts. Food Qual Prefer 2015;40(PA):165–179. https://doi.org/10.1016/j.foodqual.2014.09.013.
4. Deliza R, Macfie H, Hedderley D. Use of computer‐generatedimages and conjoint analysis to investigate sensory expectations. JSens Stud. 2003;18(6):465‐486. https://doi.org/10.1111/j.1745‐459X.2003.tb00401.x
5. Hutchings JB. Expectations and the Food Industry: The Impact of Colorand Appearance. New York: Kluwer Academic/Plenum Publishers;2003.
6. Swientek B. Uncanny developments. Beverage Ind. 2001;92(12):38‐39.
7. Kauppinen‐Räisänen H. Strategic use of colour in brand packaging.Packag Technol Sci. 2014;27(8):663‐676. https://doi.org/10.1002/pts. 2061
8. Piqueras‐Fiszman B, Spence C. Crossmodal correspondences in prod-uct packaging. Assessing color‐flavor correspondences for potatochips (crisps). Appetite. 2011;57(3):753‐757. https://doi.org/10.1016/j.appet. 2011.07.012
9. Rebollar R, Lidón I, Serrano A, Martín J, Fernández MJ. Influence ofchewing gum packaging design on consumer expectation and willing-ness to buy. An analysis of functional, sensory and experienceattributes. Food Qual Prefer. 2012;24(1):162‐170. https://doi.org/10.1016/j.foodqual. 2011.10.011
10. Smets GJF, Overbeeke CJ. Expressing tastes in packages. Des Stud.1995;16(3):349‐365. https://doi.org/10.1016/0142‐694X (94)00003‐V
11. Bone PF, France KR. Package graphics and consumer product beliefs. J BusPsychol. 2001;15(3):467‐489. https://doi.org/10.1023/A:1007826818206
12. Magnier L, Schoormans J. How do packaging material, colour and envi-ronmental claim influence package, brand and product evaluations?Packag Technol Sci. May 2017;30(11):735‐751. https://doi.org/10.1002/pts. 2318
13. Celhay F, Boysselle J, Cohen J. Food packages and communicationthrough typeface design: the exoticism of exotypes. Food Qual Prefer.2015;39:167‐175. https://doi.org/10.1016/j.foodqual.%202014.07.009
14. Orth UR, Campana D, Malkewitz K. Formation of consumer priceexpectation based on package design: attractive and quality routes. JMark Theory Pract. 2010;18(1):23‐40. https://doi.org/10.2753/MTP1069‐6679180102
15. Karnal N, Machiels CJA, Orth UR, Mai R. Healthy by design, but onlywhen in focus: communicating non‐verbal health cues through sym-bolic meaning in packaging. Food Qual Prefer. 2016;52:106‐119.https://doi.org/10.1016/j.foodqual. 2016.04.004
16. Becker L, van Rompay TJL, Schifferstein HNJ, Galetzka M. Tough pack-age, strong taste: the influence of packaging design on tasteimpressions and product evaluations. Food Qual Prefer. 2011;22(1):17‐23. https://doi.org/10.1016/j.foodqual. 2010.06.007
17. Simmonds G, Spence C. Thinking inside the box: how seeing productson, or through, the packaging influences consumer perceptions andpurchase behaviour. Food Qual Prefer. 2016;1‐12. https://doi.org/10.1016/j.foodqual. 2016.11.010
18. Ampuero O, Vila N. Consumer perceptions of product packaging. JConsum Mark. 2006;23(2):100‐112. https://doi.org/10.1108/07363760610655032
19. Rebollar R, Lidón I, Martín J, Puebla M. The identification of viewingpatterns of chocolate snack packages using eye‐tracking techniques.Food Qual Prefer. 2015;39:251‐258. https://doi.org/10.1016/j.foodqual. 2014.08.002
20. Liao LX, Corsi AM, Chrysochou P, Lockshin L. Emotional responsestowards food packaging: a joint application of self‐report and physio-logical measures of emotion. Food Qual Prefer. 2015;42:48‐55.https://doi.org/10.1016/j.foodqual. 2015.01.009
21. Underwood RL, Klein NM. Packaging as brand communication: effectsof product pictures on consumer responses to the package and brand.J Mark Theory Pract. 2002;10(4):58‐68. http://linksource.ebsco.com.roble.unizar.es%3A9090%2FFullText.aspx%3Flinkout%3Dhttp%3A%2F%2Froble.unizar.es%3A9090%2Flogin%3Furl%3Dhttp%3A%2F%2Fgateway.proquest.com%2Fopenurl%3Furl_ver%3DZ39.88%25E2%2580%2593-2004%26amp%3Bres_dat%3Dxri%3Apqm%26amp%3Brft_val_fmt%3Dinfo%3Aofi%2Ffmt%3Akev%3Am
22. Underwood RL, Klein NM, Burke RR. Packaging communication: atten-tional effects of product imagery. J Prod Brand Manag. 2001;10(7):403‐422. https://doi.org/10.1108/10610420110410531
23. Jaeger SR, MacFie HJH. The effect of advertising format and means‐endinformation on consumer expectations for apples. Food Qual Prefer.2001;12(3):189‐205. https://doi.org/10.1016/S0950‐3293 (00)00044‐6
24. Zeithaml VA. Consumer perceptions of price, quality, and value: ameans‐end model and synthesis of evidence. J Mark. 1988;52(3):2‐22.
25. J‐BEM S. Conceptual model of the quality perception process. J Bus Res.1990;21(4):309‐333. https://doi.org/10.1016/0148‐2963 (90)90019‐A
26. Cardello AV. Measuring consumer expectations to improve food prod-uct development. In: MacFie HJH, ed. Consumer‐Led Food ProductDevelopment. Cambridge: Elsevier; 2007:223–261. https://doi.org/10.1533/9781845693381.2.223
27. Spence C, Piqueras‐Fiszman B. The multisensory packaging ofbeverages. In: Kontominas MG, ed. Food Packaging: Procedures, Man-agement and Trends. Hauppauge: Nova Publishers; 2012:187‐234http://www.scopus.com/inward/record.url?%20eid=2-s2.0%E2%80%93-84883720504&partnerID=tZOtx3y1.
28. Kobayashi ML, Benassi M de T. Impact of packaging characteristics onconsumer purchase intention: instant coffee in refill packs and glassjars. J Sens Stud. 2015;1‐12. https://doi.org/10.1111/joss. 12142
29. Rebollar R, Lidón I, Gil I, Martín J, Fernández MJ, Riveres CE. The influ-ence the serving suggestion displayed on soft cheese packaging has onconsumer expectations and willingness to buy. Food Qual Prefer.2016;52:188‐194. https://doi.org/10.1016/j.foodqual. 2016.04.015
30. Madzharov AV, Block LG. Effects of product unit image on consump-tion of snack foods. J Consum Psychol. 2010;20(4):398‐409. https://doi.org/10.1016/j.jcps. 2010.06.007
31. Neyens E, Aerts G, Smits T. The impact of image‐size manipulation andsugar content on children's cereal consumption. Appetite.2015;95:152‐157. https://doi.org/10.1016/j.appet. 2015.07.003
32. Rebollar R, Gil I, Lidón I, Martín J, Fernández MJ, Rivera S. How mate-rial, visual and verbal cues on packaging influence consumerexpectations and willingness to buy: the case of crisps (potato chips)in Spain. Food Res Int. 2017;99(Pt 1):239‐246. https://doi.org/10.1016/j.foodres. 2017.05.024
33. Sakai N, Morikawa S. The pictures of fruits juices affect flavor percep-tion of fruit juices. Japanese Assoc Study Tast Smell. 2006;13(3):463‐466.
34. Mizutani N, Okamoto M, Yamaguchi Y, KusakabeY, Dan I, YamanakaT.Package images modulate flavor perception for orange juice. Food QualPrefer. 2010;21(7):867‐872. https://doi.org/10.1016/j.foodqual.2010.05.010
35. Beardsworth A, Bryman A, Keil T, Goode J, Haslam C, Lancashire E.Women, men and food: the significance of gender for nutritional
8 LIDÓN ET AL.
Publications · Study 4 | 129
attitudes and choices. Br Food J. 2002;104(7):470‐491. https://doi.org/10.1108/00070700210418767
36. Bartoshuk LM, Duffy VB, Miller IJ. PTC/PROP tasting: anatomy, psy-chophysics, and sex effects. Physiol Behav. 1994;56(6):1165‐1171.http://www.ncbi.nlm.nih.gov/pubmed/7878086 Accessed November16, 2016
37. Oliveira‐Pinto AV, Santos RM, Coutinho RA, et al. Sexual dimorphismin the human olfactory bulb: females have more neurons and glial cellsthan males. Ravel N, Ed PLoS One. 2014;9(11):e111733. https://doi.org/10.1371/journal.%20pone.%200111733
38. Bimler DL, Kirkland J, K a J. Quantifying variations in personal colorspaces: are there sex differences in color vision? Color Res Appl.2004;29(2):128‐134. https://doi.org/10.1002/col. 10232
39. Rodríguez‐Carmona M, Sharpe LT, J a H, Barbur JL. Sex‐related differ-ences in chromatic sensitivity. Vis Neurosci. 2008;25(03):433‐440.https://doi.org/10.1017/S095252380808019X
40. Rebollar R, Lidón I, Guzmán R, Gil I, Martín J. The influence of illumi-nance level on perception and willingness to buy during the tastingof sweetened natural yoghurt. Food Qual Prefer. 2017;62:270‐274.https://doi.org/10.1016/j.foodqual.%202017.05.007
41. Proserpio C, Laureati M, Invitti C, Cattaneo C, Pagliarini E. BMI andgender related differences in cross‐modal interaction and liking of sen-sory stimuli. Food Qual Prefer. 2016. https://doi.org/10.1016/j.foodqual.%202016.09.011
42. Ishihara S. Ishihara's Tests for Colour Deficiency (38 Plates Edition).Kanehara Trading: Tokyo; 2003.
43. Amaro IR, Vicente‐Villardón JL, Galindo‐Villardón MP. Manova Biplotpara arreglos de tratamientos con dos factores basado en modeloslineales generales multivariantes. Interciencia. 2004;29(1):26‐32.
44. Gabriel KR. MANOVA Biplots for twoway contingency tables. In:Krzanowski W, ed. Recent Advances in Descriptive Multivariate Analysis.Oxford, UK: Clarendon Press; 1995:227‐268.
45. Gower JC, Hand DJ. Biplots. London: Chapman & Hall; 1995.
46. Vicente‐Villardón JL. Una alternativa a los métodos factoriales clásicosbasada en una generalización de los métodos biplot. 1992.
47. Vicente‐Villardón JL. MULTBIPLOT: a package for multivariate analysisusing biplots. Departamento de Estadística. Universidad de Salamanca.http://biplot.usal.es/ClassicalBiplot/index.html.Published2015.Accessed July 8, 2016.
48. Illescas JL, Bacho O, Ferrer S. Guía Práctica de Frutas Y Hortalizas.Madrid: Mercasa; 2008.
49. Vila‐López N, Kuster‐Boluda I. Adolescents' food packaging percep-tions. Does gender matter when weight control and healthmotivations are considered? Food Qual Prefer. 2016;52:179‐187.https://doi.org/10.1016/j.foodqual. 2016.04.012
50. Pravst I, Kušar A, Žmitek K, et al. Recommendations for successful sub-stantiation of new health claims in the European Union. Trends Food SciTechnol. August 2017;2018(71):259‐263. https://doi.org/10.1016/j.tifs.%202017.10.015
51. Chrysochou P, Krystallis A, Giraud G. Quality assurance labels asdrivers of customer loyalty in the case of traditional food products.Food Qual Prefer. 2012;25(2):156‐162. https://doi.org/10.1016/j.foodqual.2012.02.013
52. Walters A, Long M. The effect of food label cues on perceptions ofquality and purchase intentions among high‐involvement consumerswith varying levels of nutrition knowledge. J Nutr Educ Behav.2012;44(4):350‐354. https://doi.org/10.1016/j.jneb.2011.08.008
How to cite this article: Lidón I, Rebollar R, Gil‐Pérez I, Martín
J, Vicente‐Villardón JL. The influence the image of the product
shown on food packaging labels has on product perception
during tasting: Effects and gender differences. Packag Technol
Sci. 2018;1–9. https://doi.org/10.1002/pts.2407
LIDÓN ET AL. 9


Publications · Study 5 | 131
Study 5
Gil-Pérez, I., Rebollar, R., Lidón, I., Piqueras-Fiszman, B., & van Trijp, H. C. M.
(2019). What do you mean by hot? Assessing the associations raised by the vi-
sual depiction of an image of fire on food packaging. Food Quality and Preference,
71, 384–394. https://doi.org/10.1016/j.foodqual.2018.08.015
Food Quality and Preference’s JCR Journal Impact Factor in 2017 (the latest
available data) was 3.652, placing it in position 13 of 133 (quartile Q1) of the
Category Food Science & Technology.
3.5.

132 | Publications · Study 5
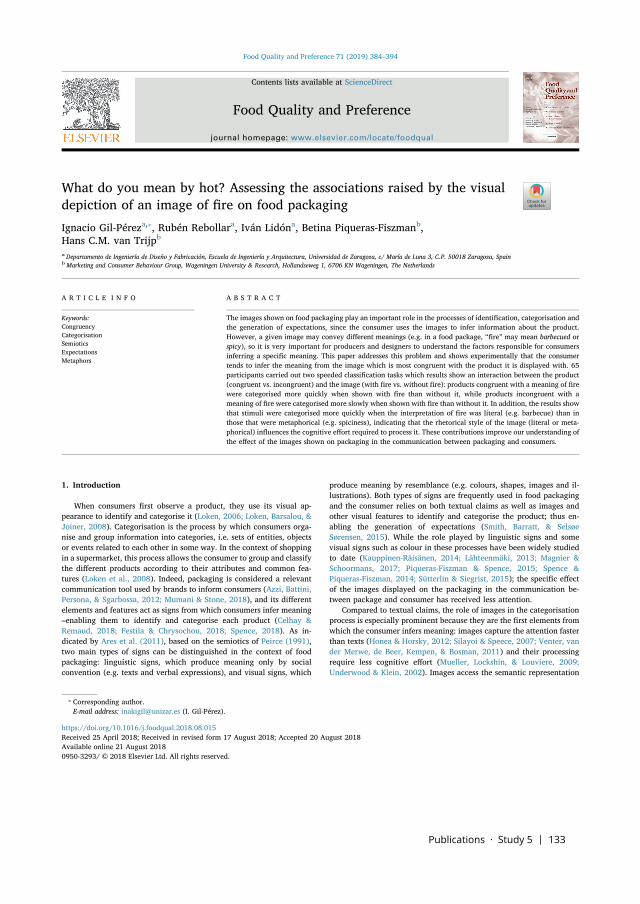
Publications · Study 5 | 133
Contents lists available at ScienceDirect
Food Quality and Preference
journal homepage: www.elsevier.com/locate/foodqual
What do you mean by hot? Assessing the associations raised by the visualdepiction of an image of fire on food packaging
Ignacio Gil-Péreza,⁎, Rubén Rebollara, Iván Lidóna, Betina Piqueras-Fiszmanb,Hans C.M. van Trijpb
a Departamento de Ingeniería de Diseño y Fabricación, Escuela de Ingeniería y Arquitectura, Universidad de Zaragoza, c/ María de Luna 3, C.P. 50018 Zaragoza, SpainbMarketing and Consumer Behaviour Group, Wageningen University & Research, Hollandseweg 1, 6706 KN Wageningen, The Netherlands
A R T I C L E I N F O
Keywords:CongruencyCategorisationSemioticsExpectationsMetaphors
A B S T R A C T
The images shown on food packaging play an important role in the processes of identification, categorisation andthe generation of expectations, since the consumer uses the images to infer information about the product.However, a given image may convey different meanings (e.g. in a food package, “fire” may mean barbecued orspicy), so it is very important for producers and designers to understand the factors responsible for consumersinferring a specific meaning. This paper addresses this problem and shows experimentally that the consumertends to infer the meaning from the image which is most congruent with the product it is displayed with. 65participants carried out two speeded classification tasks which results show an interaction between the product(congruent vs. incongruent) and the image (with fire vs. without fire): products congruent with a meaning of firewere categorised more quickly when shown with fire than without it, while products incongruent with ameaning of fire were categorised more slowly when shown with fire than without it. In addition, the results showthat stimuli were categorised more quickly when the interpretation of fire was literal (e.g. barbecue) than inthose that were metaphorical (e.g. spiciness), indicating that the rhetorical style of the image (literal or meta-phorical) influences the cognitive effort required to process it. These contributions improve our understanding ofthe effect of the images shown on packaging in the communication between packaging and consumers.
1. Introduction
When consumers first observe a product, they use its visual ap-pearance to identify and categorise it (Loken, 2006; Loken, Barsalou, &Joiner, 2008). Categorisation is the process by which consumers orga-nise and group information into categories, i.e. sets of entities, objectsor events related to each other in some way. In the context of shoppingin a supermarket, this process allows the consumer to group and classifythe different products according to their attributes and common fea-tures (Loken et al., 2008). Indeed, packaging is considered a relevantcommunication tool used by brands to inform consumers (Azzi, Battini,Persona, & Sgarbossa, 2012; Mumani & Stone, 2018), and its differentelements and features act as signs from which consumers infer meaning–enabling them to identify and categorise each product (Celhay &Remaud, 2018; Festila & Chrysochou, 2018; Spence, 2018). As in-dicated by Ares et al. (2011), based on the semiotics of Peirce (1991),two main types of signs can be distinguished in the context of foodpackaging: linguistic signs, which produce meaning only by socialconvention (e.g. texts and verbal expressions), and visual signs, which
produce meaning by resemblance (e.g. colours, shapes, images and il-lustrations). Both types of signs are frequently used in food packagingand the consumer relies on both textual claims as well as images andother visual features to identify and categorise the product; thus en-abling the generation of expectations (Smith, Barratt, & SelsøeSørensen, 2015). While the role played by linguistic signs and somevisual signs such as colour in these processes have been widely studiedto date (Kauppinen-Räisänen, 2014; Lähteenmäki, 2013; Magnier &Schoormans, 2017; Piqueras-Fiszman & Spence, 2015; Spence &Piqueras-Fiszman, 2014; Sütterlin & Siegrist, 2015); the specific effectof the images displayed on the packaging in the communication be-tween package and consumer has received less attention.
Compared to textual claims, the role of images in the categorisationprocess is especially prominent because they are the first elements fromwhich the consumer infers meaning: images capture the attention fasterthan texts (Honea & Horsky, 2012; Silayoi & Speece, 2007; Venter, vander Merwe, de Beer, Kempen, & Bosman, 2011) and their processingrequire less cognitive effort (Mueller, Lockshin, & Louviere, 2009;Underwood & Klein, 2002). Images access the semantic representation
https://doi.org/10.1016/j.foodqual.2018.08.015Received 25 April 2018; Received in revised form 17 August 2018; Accepted 20 August 2018
⁎ Corresponding author.E-mail address: [email protected] (I. Gil-Pérez).
Food Quality and Preference 71 (2019) 384–394
Available online 21 August 20180950-3293/ © 2018 Elsevier Ltd. All rights reserved.
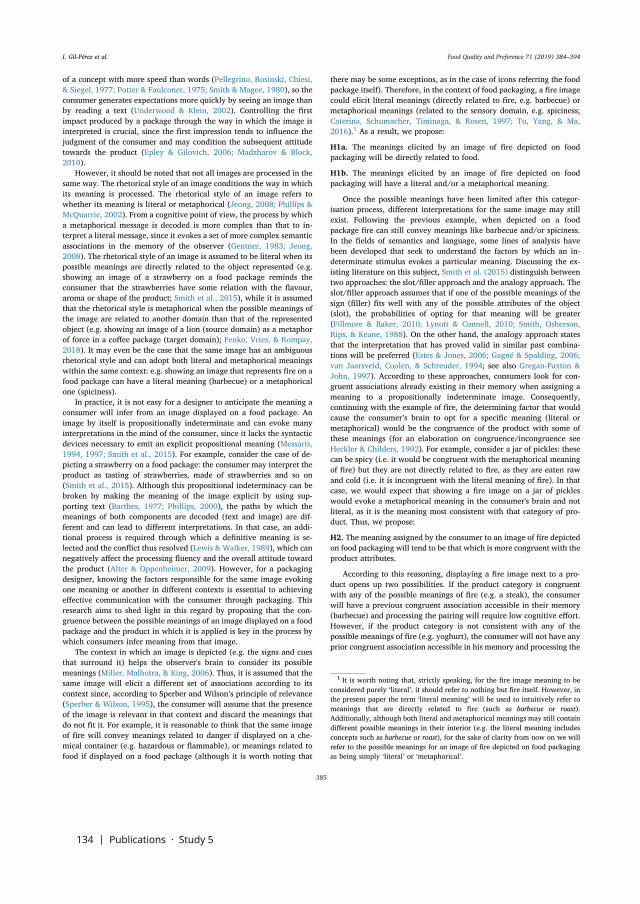
134 | Publications · Study 5
of a concept with more speed than words (Pellegrino, Rosinski, Chiesi,& Siegel, 1977; Potter & Faulconer, 1975; Smith & Magee, 1980), so theconsumer generates expectations more quickly by seeing an image thanby reading a text (Underwood & Klein, 2002). Controlling the firstimpact produced by a package through the way in which the image isinterpreted is crucial, since the first impression tends to influence thejudgment of the consumer and may condition the subsequent attitudetowards the product (Epley & Gilovich, 2006; Madzharov & Block,2010).
However, it should be noted that not all images are processed in thesame way. The rhetorical style of an image conditions the way in whichits meaning is processed. The rhetorical style of an image refers towhether its meaning is literal or metaphorical (Jeong, 2008; Phillips &McQuarrie, 2002). From a cognitive point of view, the process by whicha metaphorical message is decoded is more complex than that to in-terpret a literal message, since it evokes a set of more complex semanticassociations in the memory of the observer (Gentner, 1983; Jeong,2008). The rhetorical style of an image is assumed to be literal when itspossible meanings are directly related to the object represented (e.g.showing an image of a strawberry on a food package reminds theconsumer that the strawberries have some relation with the flavour,aroma or shape of the product; Smith et al., 2015), while it is assumedthat the rhetorical style is metaphorical when the possible meanings ofthe image are related to another domain than that of the representedobject (e.g. showing an image of a lion (source domain) as a metaphorof force in a coffee package (target domain); Fenko, Vries, & Rompay,2018). It may even be the case that the same image has an ambiguousrhetorical style and can adopt both literal and metaphorical meaningswithin the same context: e.g. showing an image that represents fire on afood package can have a literal meaning (barbecue) or a metaphoricalone (spiciness).
In practice, it is not easy for a designer to anticipate the meaning aconsumer will infer from an image displayed on a food package. Animage by itself is propositionally indeterminate and can evoke manyinterpretations in the mind of the consumer, since it lacks the syntacticdevices necessary to emit an explicit propositional meaning (Messaris,1994, 1997; Smith et al., 2015). For example, consider the case of de-picting a strawberry on a food package: the consumer may interpret theproduct as tasting of strawberries, made of strawberries and so on(Smith et al., 2015). Although this propositional indeterminacy can bebroken by making the meaning of the image explicit by using sup-porting text (Barthes, 1977; Phillips, 2000), the paths by which themeanings of both components are decoded (text and image) are dif-ferent and can lead to different interpretations. In that case, an addi-tional process is required through which a definitive meaning is se-lected and the conflict thus resolved (Lewis & Walker, 1989), which cannegatively affect the processing fluency and the overall attitude towardthe product (Alter & Oppenheimer, 2009). However, for a packagingdesigner, knowing the factors responsible for the same image evokingone meaning or another in different contexts is essential to achievingeffective communication with the consumer through packaging. Thisresearch aims to shed light in this regard by proposing that the con-gruence between the possible meanings of an image displayed on a foodpackage and the product in which it is applied is key in the process bywhich consumers infer meaning from that image.
The context in which an image is depicted (e.g. the signs and cuesthat surround it) helps the observer's brain to consider its possiblemeanings (Miller, Malhotra, & King, 2006). Thus, it is assumed that thesame image will elicit a different set of associations according to itscontext since, according to Sperber and Wilson’s principle of relevance(Sperber & Wilson, 1995), the consumer will assume that the presenceof the image is relevant in that context and discard the meanings thatdo not fit it. For example, it is reasonable to think that the same imageof fire will convey meanings related to danger if displayed on a che-mical container (e.g. hazardous or flammable), or meanings related tofood if displayed on a food package (although it is worth noting that
there may be some exceptions, as in the case of icons referring the foodpackage itself). Therefore, in the context of food packaging, a fire imagecould elicit literal meanings (directly related to fire, e.g. barbecue) ormetaphorical meanings (related to the sensory domain, e.g. spiciness;Caterina, Schumacher, Timinaga, & Rosen, 1997; Tu, Yang, & Ma,2016).1 As a result, we propose:
H1a. The meanings elicited by an image of fire depicted on foodpackaging will be directly related to food.
H1b. The meanings elicited by an image of fire depicted on foodpackaging will have a literal and/or a metaphorical meaning.
Once the possible meanings have been limited after this categor-isation process, different interpretations for the same image may stillexist. Following the previous example, when depicted on a foodpackage fire can still convey meanings like barbecue and/or spiciness.In the fields of semantics and language, some lines of analysis havebeen developed that seek to understand the factors by which an in-determinate stimulus evokes a particular meaning. Discussing the ex-isting literature on this subject, Smith et al. (2015) distinguish betweentwo approaches: the slot/filler approach and the analogy approach. Theslot/filler approach assumes that if one of the possible meanings of thesign (filler) fits well with any of the possible attributes of the object(slot), the probabilities of opting for that meaning will be greater(Fillmore & Baker, 2010; Lynott & Connell, 2010; Smith, Osherson,Rips, & Keane, 1988). On the other hand, the analogy approach statesthat the interpretation that has proved valid in similar past combina-tions will be preferred (Estes & Jones, 2006; Gagné & Spalding, 2006;van Jaarsveld, Coolen, & Schreuder, 1994; see also Gregan-Paxton &John, 1997). According to these approaches, consumers look for con-gruent associations already existing in their memory when assigning ameaning to a propositionally indeterminate image. Consequently,continuing with the example of fire, the determining factor that wouldcause the consumer’s brain to opt for a specific meaning (literal ormetaphorical) would be the congruence of the product with some ofthese meanings (for an elaboration on congruence/incongruence seeHeckler & Childers, 1992). For example, consider a jar of pickles: thesecan be spicy (i.e. it would be congruent with the metaphorical meaningof fire) but they are not directly related to fire, as they are eaten rawand cold (i.e. it is incongruent with the literal meaning of fire). In thatcase, we would expect that showing a fire image on a jar of pickleswould evoke a metaphorical meaning in the consumer's brain and notliteral, as it is the meaning most consistent with that category of pro-duct. Thus, we propose:
H2. The meaning assigned by the consumer to an image of fire depictedon food packaging will tend to be that which is more congruent with theproduct attributes.
According to this reasoning, displaying a fire image next to a pro-duct opens up two possibilities. If the product category is congruentwith any of the possible meanings of fire (e.g. a steak), the consumerwill have a previous congruent association accessible in their memory(barbecue) and processing the pairing will require low cognitive effort.However, if the product category is not consistent with any of thepossible meanings of fire (e.g. yoghurt), the consumer will not have anyprior congruent association accessible in his memory and processing the
1 It is worth noting that, strictly speaking, for the fire image meaning to beconsidered purely ‘literal’, it should refer to nothing but fire itself. However, inthe present paper the term ‘literal meaning’ will be used to intuitively refer tomeanings that are directly related to fire (such as barbecue or roast).Additionally, although both literal and metaphorical meanings may still containdifferent possible meanings in their interior (e.g. the literal meaning includesconcepts such as barbecue or roast), for the sake of clarity from now on we willrefer to the possible meanings for an image of fire depicted on food packagingas being simply ‘literal’ or ‘metaphorical’.
I. Gil-Pérez et al. Food Quality and Preference 71 (2019) 384–394
385
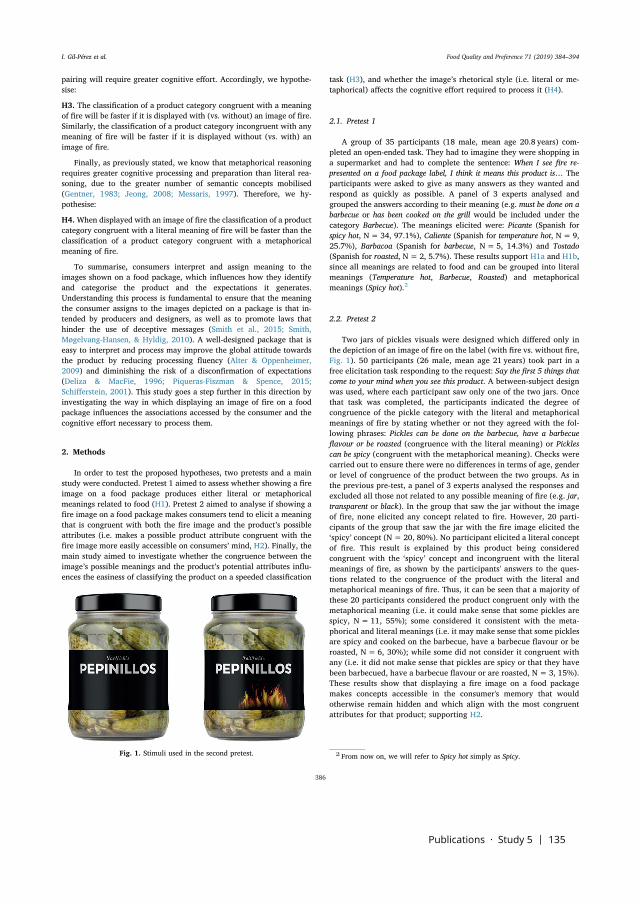
Publications · Study 5 | 135
pairing will require greater cognitive effort. Accordingly, we hypothe-sise:
H3. The classification of a product category congruent with a meaningof fire will be faster if it is displayed with (vs. without) an image of fire.Similarly, the classification of a product category incongruent with anymeaning of fire will be faster if it is displayed without (vs. with) animage of fire.
Finally, as previously stated, we know that metaphorical reasoningrequires greater cognitive processing and preparation than literal rea-soning, due to the greater number of semantic concepts mobilised(Gentner, 1983; Jeong, 2008; Messaris, 1997). Therefore, we hy-pothesise:
H4. When displayed with an image of fire the classification of a productcategory congruent with a literal meaning of fire will be faster than theclassification of a product category congruent with a metaphoricalmeaning of fire.
To summarise, consumers interpret and assign meaning to theimages shown on a food package, which influences how they identifyand categorise the product and the expectations it generates.Understanding this process is fundamental to ensure that the meaningthe consumer assigns to the images depicted on a package is that in-tended by producers and designers, as well as to promote laws thathinder the use of deceptive messages (Smith et al., 2015; Smith,Møgelvang-Hansen, & Hyldig, 2010). A well-designed package that iseasy to interpret and process may improve the global attitude towardsthe product by reducing processing fluency (Alter & Oppenheimer,2009) and diminishing the risk of a disconfirmation of expectations(Deliza & MacFie, 1996; Piqueras-Fiszman & Spence, 2015;Schifferstein, 2001). This study goes a step further in this direction byinvestigating the way in which displaying an image of fire on a foodpackage influences the associations accessed by the consumer and thecognitive effort necessary to process them.
2. Methods
In order to test the proposed hypotheses, two pretests and a mainstudy were conducted. Pretest 1 aimed to assess whether showing a fireimage on a food package produces either literal or metaphoricalmeanings related to food (H1). Pretest 2 aimed to analyse if showing afire image on a food package makes consumers tend to elicit a meaningthat is congruent with both the fire image and the product’s possibleattributes (i.e. makes a possible product attribute congruent with thefire image more easily accessible on consumers’ mind, H2). Finally, themain study aimed to investigate whether the congruence between theimage’s possible meanings and the product’s potential attributes influ-ences the easiness of classifying the product on a speeded classification
task (H3), and whether the image’s rhetorical style (i.e. literal or me-taphorical) affects the cognitive effort required to process it (H4).
2.1. Pretest 1
A group of 35 participants (18 male, mean age 20.8 years) com-pleted an open-ended task. They had to imagine they were shopping ina supermarket and had to complete the sentence: When I see fire re-presented on a food package label, I think it means this product is… Theparticipants were asked to give as many answers as they wanted andrespond as quickly as possible. A panel of 3 experts analysed andgrouped the answers according to their meaning (e.g. must be done on abarbecue or has been cooked on the grill would be included under thecategory Barbecue). The meanings elicited were: Picante (Spanish forspicy hot, N= 34, 97.1%), Caliente (Spanish for temperature hot, N=9,25.7%), Barbacoa (Spanish for barbecue, N=5, 14.3%) and Tostado(Spanish for roasted, N= 2, 5.7%). These results support H1a and H1b,since all meanings are related to food and can be grouped into literalmeanings (Temperature hot, Barbecue, Roasted) and metaphoricalmeanings (Spicy hot).2
2.2. Pretest 2
Two jars of pickles visuals were designed which differed only inthe depiction of an image of fire on the label (with fire vs. without fire,Fig. 1). 50 participants (26 male, mean age 21 years) took part in afree elicitation task responding to the request: Say the first 5 things thatcome to your mind when you see this product. A between-subject designwas used, where each participant saw only one of the two jars. Oncethat task was completed, the participants indicated the degree ofcongruence of the pickle category with the literal and metaphoricalmeanings of fire by stating whether or not they agreed with the fol-lowing phrases: Pickles can be done on the barbecue, have a barbecueflavour or be roasted (congruence with the literal meaning) or Picklescan be spicy (congruent with the metaphorical meaning). Checks werecarried out to ensure there were no differences in terms of age, genderor level of congruence of the product between the two groups. As inthe previous pre-test, a panel of 3 experts analysed the responses andexcluded all those not related to any possible meaning of fire (e.g. jar,transparent or black). In the group that saw the jar without the imageof fire, none elicited any concept related to fire. However, 20 parti-cipants of the group that saw the jar with the fire image elicited the‘spicy’ concept (N= 20, 80%). No participant elicited a literal conceptof fire. This result is explained by this product being consideredcongruent with the ‘spicy’ concept and incongruent with the literalmeanings of fire, as shown by the participants' answers to the ques-tions related to the congruence of the product with the literal andmetaphorical meanings of fire. Thus, it can be seen that a majority ofthese 20 participants considered the product congruent only with themetaphorical meaning (i.e. it could make sense that some pickles arespicy, N= 11, 55%); some considered it consistent with the meta-phorical and literal meanings (i.e. it may make sense that some picklesare spicy and cooked on the barbecue, have a barbecue flavour or beroasted, N= 6, 30%); while some did not consider it congruent withany (i.e. it did not make sense that pickles are spicy or that they havebeen barbecued, have a barbecue flavour or are roasted, N= 3, 15%).These results show that displaying a fire image on a food packagemakes concepts accessible in the consumer's memory that wouldotherwise remain hidden and which align with the most congruentattributes for that product; supporting H2.
Fig. 1. Stimuli used in the second pretest. 2 From now on, we will refer to Spicy hot simply as Spicy.
I. Gil-Pérez et al. Food Quality and Preference 71 (2019) 384–394
386
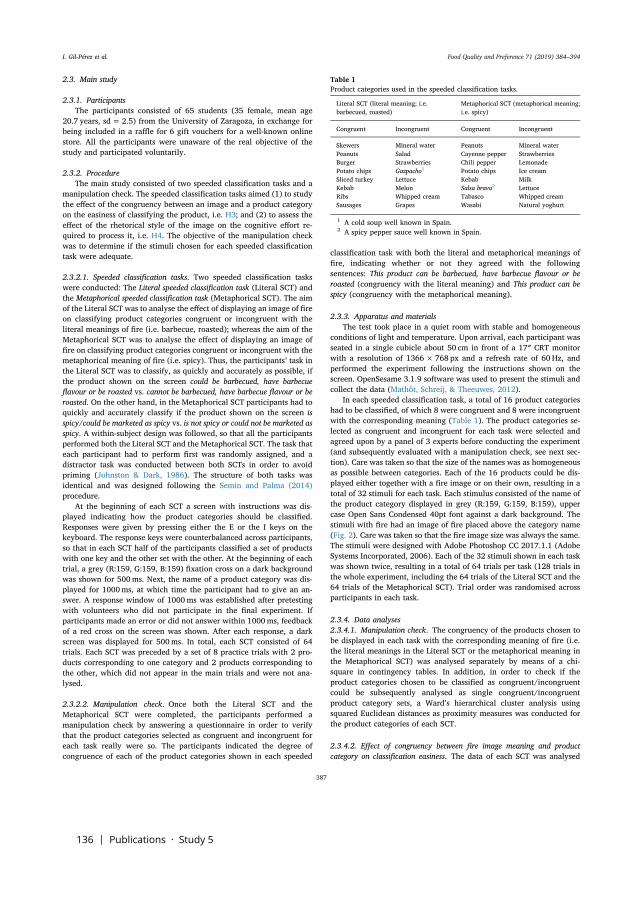
136 | Publications · Study 5
2.3. Main study
2.3.1. ParticipantsThe participants consisted of 65 students (35 female, mean age
20.7 years, sd= 2.5) from the University of Zaragoza, in exchange forbeing included in a raffle for 6 gift vouchers for a well-known onlinestore. All the participants were unaware of the real objective of thestudy and participated voluntarily.
2.3.2. ProcedureThe main study consisted of two speeded classification tasks and a
manipulation check. The speeded classification tasks aimed (1) to studythe effect of the congruency between an image and a product categoryon the easiness of classifying the product, i.e. H3; and (2) to assess theeffect of the rhetorical style of the image on the cognitive effort re-quired to process it, i.e. H4. The objective of the manipulation checkwas to determine if the stimuli chosen for each speeded classificationtask were adequate.
2.3.2.1. Speeded classification tasks. Two speeded classification taskswere conducted: The Literal speeded classification task (Literal SCT) andthe Metaphorical speeded classification task (Metaphorical SCT). The aimof the Literal SCT was to analyse the effect of displaying an image of fireon classifying product categories congruent or incongruent with theliteral meanings of fire (i.e. barbecue, roasted); whereas the aim of theMetaphorical SCT was to analyse the effect of displaying an image offire on classifying product categories congruent or incongruent with themetaphorical meaning of fire (i.e. spicy). Thus, the participants’ task inthe Literal SCT was to classify, as quickly and accurately as possible, ifthe product shown on the screen could be barbecued, have barbecueflavour or be roasted vs. cannot be barbecued, have barbecue flavour or beroasted. On the other hand, in the Metaphorical SCT participants had toquickly and accurately classify if the product shown on the screen isspicy/could be marketed as spicy vs. is not spicy or could not be marketed asspicy. A within-subject design was followed, so that all the participantsperformed both the Literal SCT and the Metaphorical SCT. The task thateach participant had to perform first was randomly assigned, and adistractor task was conducted between both SCTs in order to avoidpriming (Johnston & Dark, 1986). The structure of both tasks wasidentical and was designed following the Semin and Palma (2014)procedure.
At the beginning of each SCT a screen with instructions was dis-played indicating how the product categories should be classified.Responses were given by pressing either the E or the I keys on thekeyboard. The response keys were counterbalanced across participants,so that in each SCT half of the participants classified a set of productswith one key and the other set with the other. At the beginning of eachtrial, a grey (R:159, G:159, B:159) fixation cross on a dark backgroundwas shown for 500ms. Next, the name of a product category was dis-played for 1000ms, at which time the participant had to give an an-swer. A response window of 1000ms was established after pretestingwith volunteers who did not participate in the final experiment. Ifparticipants made an error or did not answer within 1000ms, feedbackof a red cross on the screen was shown. After each response, a darkscreen was displayed for 500ms. In total, each SCT consisted of 64trials. Each SCT was preceded by a set of 8 practice trials with 2 pro-ducts corresponding to one category and 2 products corresponding tothe other, which did not appear in the main trials and were not ana-lysed.
2.3.2.2. Manipulation check. Once both the Literal SCT and theMetaphorical SCT were completed, the participants performed amanipulation check by answering a questionnaire in order to verifythat the product categories selected as congruent and incongruent foreach task really were so. The participants indicated the degree ofcongruence of each of the product categories shown in each speeded
classification task with both the literal and metaphorical meanings offire, indicating whether or not they agreed with the followingsentences: This product can be barbecued, have barbecue flavour or beroasted (congruency with the literal meaning) and This product can bespicy (congruency with the metaphorical meaning).
2.3.3. Apparatus and materialsThe test took place in a quiet room with stable and homogeneous
conditions of light and temperature. Upon arrival, each participant wasseated in a single cubicle about 50 cm in front of a 17″ CRT monitorwith a resolution of 1366× 768 px and a refresh rate of 60 Hz, andperformed the experiment following the instructions shown on thescreen. OpenSesame 3.1.9 software was used to present the stimuli andcollect the data (Mathôt, Schreij, & Theeuwes, 2012).
In each speeded classification task, a total of 16 product categorieshad to be classified, of which 8 were congruent and 8 were incongruentwith the corresponding meaning (Table 1). The product categories se-lected as congruent and incongruent for each task were selected andagreed upon by a panel of 3 experts before conducting the experiment(and subsequently evaluated with a manipulation check, see next sec-tion). Care was taken so that the size of the names was as homogeneousas possible between categories. Each of the 16 products could be dis-played either together with a fire image or on their own, resulting in atotal of 32 stimuli for each task. Each stimulus consisted of the name ofthe product category displayed in grey (R:159, G:159, B:159), uppercase Open Sans Condensed 40pt font against a dark background. Thestimuli with fire had an image of fire placed above the category name(Fig. 2). Care was taken so that the fire image size was always the same.The stimuli were designed with Adobe Photoshop CC 2017.1.1 (AdobeSystems Incorporated, 2006). Each of the 32 stimuli shown in each taskwas shown twice, resulting in a total of 64 trials per task (128 trials inthe whole experiment, including the 64 trials of the Literal SCT and the64 trials of the Metaphorical SCT). Trial order was randomised acrossparticipants in each task.
2.3.4. Data analyses2.3.4.1. Manipulation check. The congruency of the products chosen tobe displayed in each task with the corresponding meaning of fire (i.e.the literal meanings in the Literal SCT or the metaphorical meaning inthe Metaphorical SCT) was analysed separately by means of a chi-square in contingency tables. In addition, in order to check if theproduct categories chosen to be classified as congruent/incongruentcould be subsequently analysed as single congruent/incongruentproduct category sets, a Ward’s hierarchical cluster analysis usingsquared Euclidean distances as proximity measures was conducted forthe product categories of each SCT.
2.3.4.2. Effect of congruency between fire image meaning and productcategory on classification easiness. The data of each SCT was analysed
Table 1Product categories used in the speeded classification tasks.
Literal SCT (literal meaning; i.e.barbecued, roasted)
Metaphorical SCT (metaphorical meaning;i.e. spicy)
Congruent Incongruent Congruent Incongruent
Skewers Mineral water Peanuts Mineral waterPeanuts Salad Cayenne pepper StrawberriesBurger Strawberries Chili pepper LemonadePotato chips Gazpacho1 Potato chips Ice creamSliced turkey Lettuce Kebab MilkKebab Melon Salsa brava2 LettuceRibs Whipped cream Tabasco Whipped creamSausages Grapes Wasabi Natural yoghurt
1 A cold soup well known in Spain.2 A spicy pepper sauce well known in Spain.
I. Gil-Pérez et al. Food Quality and Preference 71 (2019) 384–394
387

Publications · Study 5 | 137
separately in a 2× 2 repeated measures ANOVA with product categorycongruency (congruent, incongruent) and fire depiction (with fire,without fire) as the two factors and the mean reaction time (RT)required to classify each product category as the dependent variable(measured in ms). The RTs of the incorrect trials (i.e. wrong answersand participants who did not respond within 1000ms, 12.62% in theLiteral SCT and 11.85% in the Metaphorical SCT) or who deviated bymore than 3 standard deviations from the participants' conditionalmean (0.79% of the correct answers in the Literal SCT and 0.65% of thecorrect answers in the Metaphorical SCT) were excluded from theanalyses (Semin & Palma, 2014).
2.3.4.3. Effect of fire image rhetorical style on the cognitive effort requiredto process it. A one-way repeated measures ANCOVA was conducted inorder to verify if the mean RTs needed to classify the congruentproducts shown with fire in the Literal SCT was lower than the meanRTs needed to classify the congruent products shown with fire in theMetaphorical SCT. As the congruent products classified in each SCTwere not the same, there is a risk that the products used in one taskwere easier to classify than those used in the other task. To eliminatethis possible effect, the difference between the RTs of the congruentproducts shown without fire in both SCTs was included as a covariate(Δ=RTcongruent without fire (Literal SCT)− RTcongruent without fire (Metaphorical
SCT)).In all cases, effects were considered statistically significant when
p < 0.05. The data was processed and analysed by using SPSSStatistics 23 (Armonk, NY, USA).
3. Results
3.1. Manipulation check
3.1.1. Literal SCT stimuliA chi-square test was done to analyse the congruence of the pro-
ducts chosen to be classified as congruent or incongruent with the lit-eral meanings of fire (i.e. barbecue, roasted) in the Literal SCT. The chi-square association was statistically significant (χ2= 922, p < 0.001;Table 2), indicating that the selection of products was adequate. Thus,
the response latencies for all products were analysed.The results of the cluster analysis revealed that the eight product
categories chosen to be classified as congruent with the literal meaningsof fire made up a single congruent cluster, and that the eight productcategories chosen to be classified as incongruent with the literalmeanings of fire made up a single incongruent cluster (Table 3; see alsoDendrogram in Fig. 3a). Thus, the eight congruent product categorieswere subsequently analysed as a single congruent product category set,whereas the eight incongruent product categories were analysed as asingle incongruent product category set.
3.1.2. Metaphorical SCT stimuliAs in the previous case, a chi-square test was done to analyse the
congruence of the products chosen to be classified as congruent or in-congruent with the metaphorical meanings of fire (i.e. spicy) in theMetaphorical SCT. The chi-square association was statistically sig-nificant (χ2= 859, p < 0.001; Table 4), indicating that the selection ofproducts was also adequate. The response latencies for all productswere thus analysed.
The results of the cluster analysis showed that the eight productcategories chosen to be classified as congruent with the metaphoricalmeanings of fire made up a single congruent cluster, and that the eightproduct categories chosen to be classified as incongruent with themetaphorical meanings of fire made up a single incongruent cluster(Table 5; see also Dendrogram in Fig. 3b). Thus, the eight congruentproduct categories were subsequently analysed as a single congruentproduct category set, whereas the eight incongruent product categorieswere analysed as a single incongruent product category set.
3.2. Effect of congruency between fire image meaning and product categoryon classification easiness
3.2.1. Literal SCTFor the literal meanings of fire (i.e. barbecue, roasted; assessed in
the Literal SCT) the predicted interaction between product categorycongruency and fire depiction was significant, F(1,64)= 51.59,p < 0.001, η2p= 0.45, supporting H3 (Fig. 4a). Participants classifiedthe congruent product categories significantly faster when they were
Fig. 2. Examples of the stimuli (salad, tabasco, and skewers, from left to right) without fire (above) and with fire (below) used in the speeded classification tasks.
Table 2Evaluation of the participants regarding the congruence of each product displayed in the Literal SCT with the literal meanings of fire. Note: Figures denote number ofsubjects. Not all products add up to 65 responses, as some participants left some questions unanswered.
Products proposed as congruent Products proposed as incongruent
Product Congruent Incongruent Product Congruent Incongruent
Skewers 62 (100%) 0 (0%) Mineral water 1 (1.6%) 61 (98.4%)Peanuts 61 (98.4%) 1 (1.6%) Salad 2 (3.1%) 63 (96.9%)Burger 65 (100%) 0 (0%) Strawberries 0 (0%) 65 (100%)Potato chips 56 (88.9%) 7 (11.1%) Gazpacho 7 (10.8%) 58 (89.2%)Sliced turkey 62 (96.9%) 2 (3.1%) Lettuce 1 (1.6%) 63 (98.4%)Kebab 64 (100%) 0 (0%) Melon 2 (3.1%) 62 (96.9%)Ribs 64 (98.5%) 1 (1.5%) Whipped cream 0 (0%) 64 (100%)Sausages 65 (100%) 0 (0%) Grapes 3 (4.7%) 61 (95.3%)
I. Gil-Pérez et al. Food Quality and Preference 71 (2019) 384–394
388
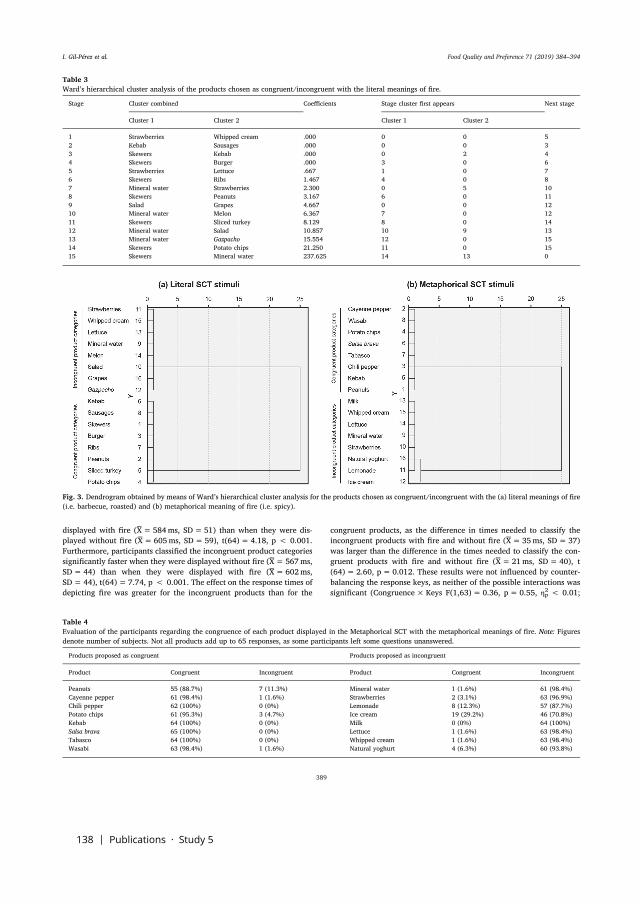
138 | Publications · Study 5
displayed with fire (X̅= 584ms, SD=51) than when they were dis-played without fire (X̅= 605ms, SD=59), t(64)= 4.18, p < 0.001.Furthermore, participants classified the incongruent product categoriessignificantly faster when they were displayed without fire (X̅= 567ms,SD=44) than when they were displayed with fire (X̅= 602ms,SD=44), t(64)= 7.74, p < 0.001. The effect on the response times ofdepicting fire was greater for the incongruent products than for the
congruent products, as the difference in times needed to classify theincongruent products with fire and without fire (X̅= 35ms, SD=37)was larger than the difference in the times needed to classify the con-gruent products with fire and without fire (X̅= 21ms, SD=40), t(64)= 2.60, p= 0.012. These results were not influenced by counter-balancing the response keys, as neither of the possible interactions wassignificant (Congruence×Keys F(1,63)= 0.36, p= 0.55, η2p < 0.01;
Table 3Ward’s hierarchical cluster analysis of the products chosen as congruent/incongruent with the literal meanings of fire.
Stage Cluster combined Coefficients Stage cluster first appears Next stage
Cluster 1 Cluster 2 Cluster 1 Cluster 2
1 Strawberries Whipped cream .000 0 0 52 Kebab Sausages .000 0 0 33 Skewers Kebab .000 0 2 44 Skewers Burger .000 3 0 65 Strawberries Lettuce .667 1 0 76 Skewers Ribs 1.467 4 0 87 Mineral water Strawberries 2.300 0 5 108 Skewers Peanuts 3.167 6 0 119 Salad Grapes 4.667 0 0 1210 Mineral water Melon 6.367 7 0 1211 Skewers Sliced turkey 8.129 8 0 1412 Mineral water Salad 10.857 10 9 1313 Mineral water Gazpacho 15.554 12 0 1514 Skewers Potato chips 21.250 11 0 1515 Skewers Mineral water 237.625 14 13 0
Fig. 3. Dendrogram obtained by means of Ward’s hierarchical cluster analysis for the products chosen as congruent/incongruent with the (a) literal meanings of fire(i.e. barbecue, roasted) and (b) metaphorical meaning of fire (i.e. spicy).
Table 4Evaluation of the participants regarding the congruence of each product displayed in the Metaphorical SCT with the metaphorical meanings of fire. Note: Figuresdenote number of subjects. Not all products add up to 65 responses, as some participants left some questions unanswered.
Products proposed as congruent Products proposed as incongruent
Product Congruent Incongruent Product Congruent Incongruent
Peanuts 55 (88.7%) 7 (11.3%) Mineral water 1 (1.6%) 61 (98.4%)Cayenne pepper 61 (98.4%) 1 (1.6%) Strawberries 2 (3.1%) 63 (96.9%)Chili pepper 62 (100%) 0 (0%) Lemonade 8 (12.3%) 57 (87.7%)Potato chips 61 (95.3%) 3 (4.7%) Ice cream 19 (29.2%) 46 (70.8%)Kebab 64 (100%) 0 (0%) Milk 0 (0%) 64 (100%)Salsa brava 65 (100%) 0 (0%) Lettuce 1 (1.6%) 63 (98.4%)Tabasco 64 (100%) 0 (0%) Whipped cream 1 (1.6%) 63 (98.4%)Wasabi 63 (98.4%) 1 (1.6%) Natural yoghurt 4 (6.3%) 60 (93.8%)
I. Gil-Pérez et al. Food Quality and Preference 71 (2019) 384–394
389
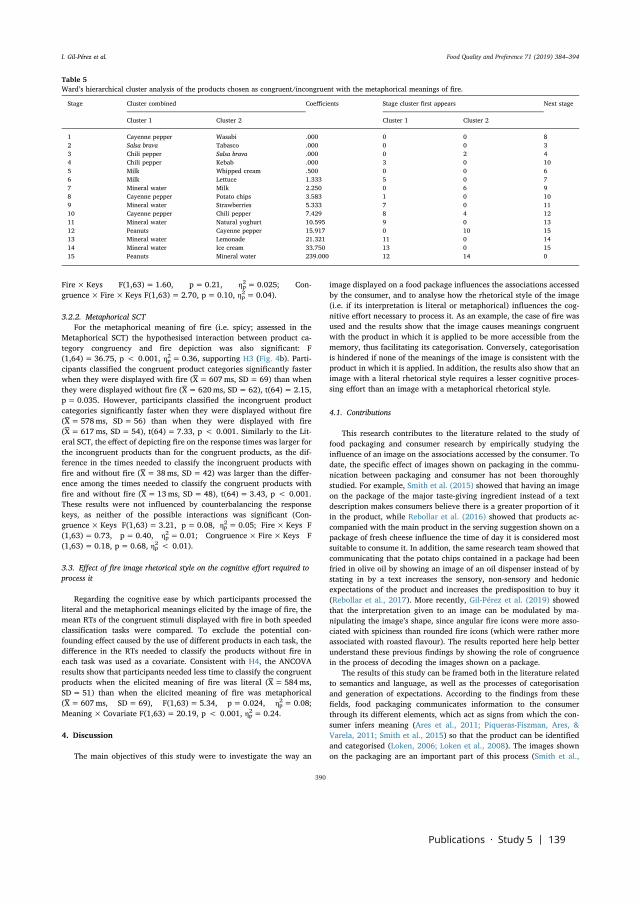
Publications · Study 5 | 139
Fire×Keys F(1,63)= 1.60, p=0.21, η2p= 0.025; Con-gruence× Fire×Keys F(1,63)= 2.70, p= 0.10, η2p= 0.04).
3.2.2. Metaphorical SCTFor the metaphorical meaning of fire (i.e. spicy; assessed in the
Metaphorical SCT) the hypothesised interaction between product ca-tegory congruency and fire depiction was also significant: F(1,64)= 36.75, p < 0.001, η2p= 0.36, supporting H3 (Fig. 4b). Parti-cipants classified the congruent product categories significantly fasterwhen they were displayed with fire (X̅= 607ms, SD=69) than whenthey were displayed without fire (X̅= 620ms, SD=62), t(64)= 2.15,p=0.035. However, participants classified the incongruent productcategories significantly faster when they were displayed without fire(X̅= 578ms, SD=56) than when they were displayed with fire(X̅= 617ms, SD=54), t(64)= 7.33, p < 0.001. Similarly to the Lit-eral SCT, the effect of depicting fire on the response times was larger forthe incongruent products than for the congruent products, as the dif-ference in the times needed to classify the incongruent products withfire and without fire (X̅= 38ms, SD=42) was larger than the differ-ence among the times needed to classify the congruent products withfire and without fire (X̅= 13ms, SD=48), t(64)= 3.43, p < 0.001.These results were not influenced by counterbalancing the responsekeys, as neither of the possible interactions was significant (Con-gruence×Keys F(1,63)= 3.21, p=0.08, η2p= 0.05; Fire×Keys F(1,63)= 0.73, p= 0.40, η2p= 0.01; Congruence× Fire×Keys F(1,63)= 0.18, p=0.68, η2p < 0.01).
3.3. Effect of fire image rhetorical style on the cognitive effort required toprocess it
Regarding the cognitive ease by which participants processed theliteral and the metaphorical meanings elicited by the image of fire, themean RTs of the congruent stimuli displayed with fire in both speededclassification tasks were compared. To exclude the potential con-founding effect caused by the use of different products in each task, thedifference in the RTs needed to classify the products without fire ineach task was used as a covariate. Consistent with H4, the ANCOVAresults show that participants needed less time to classify the congruentproducts when the elicited meaning of fire was literal (X̅ = 584ms,SD=51) than when the elicited meaning of fire was metaphorical(X̅= 607ms, SD=69), F(1,63)= 5.34, p= 0.024, η2p= 0.08;Meaning×Covariate F(1,63)= 20.19, p < 0.001, η2p= 0.24.
4. Discussion
The main objectives of this study were to investigate the way an
image displayed on a food package influences the associations accessedby the consumer, and to analyse how the rhetorical style of the image(i.e. if its interpretation is literal or metaphorical) influences the cog-nitive effort necessary to process it. As an example, the case of fire wasused and the results show that the image causes meanings congruentwith the product in which it is applied to be more accessible from thememory, thus facilitating its categorisation. Conversely, categorisationis hindered if none of the meanings of the image is consistent with theproduct in which it is applied. In addition, the results also show that animage with a literal rhetorical style requires a lesser cognitive proces-sing effort than an image with a metaphorical rhetorical style.
4.1. Contributions
This research contributes to the literature related to the study offood packaging and consumer research by empirically studying theinfluence of an image on the associations accessed by the consumer. Todate, the specific effect of images shown on packaging in the commu-nication between packaging and consumer has not been thoroughlystudied. For example, Smith et al. (2015) showed that having an imageon the package of the major taste-giving ingredient instead of a textdescription makes consumers believe there is a greater proportion of itin the product, while Rebollar et al. (2016) showed that products ac-companied with the main product in the serving suggestion shown on apackage of fresh cheese influence the time of day it is considered mostsuitable to consume it. In addition, the same research team showed thatcommunicating that the potato chips contained in a package had beenfried in olive oil by showing an image of an oil dispenser instead of bystating in by a text increases the sensory, non-sensory and hedonicexpectations of the product and increases the predisposition to buy it(Rebollar et al., 2017). More recently, Gil-Pérez et al. (2019) showedthat the interpretation given to an image can be modulated by ma-nipulating the image’s shape, since angular fire icons were more asso-ciated with spiciness than rounded fire icons (which were rather moreassociated with roasted flavour). The results reported here help betterunderstand these previous findings by showing the role of congruencein the process of decoding the images shown on a package.
The results of this study can be framed both in the literature relatedto semantics and language, as well as the processes of categorisationand generation of expectations. According to the findings from thesefields, food packaging communicates information to the consumerthrough its different elements, which act as signs from which the con-sumer infers meaning (Ares et al., 2011; Piqueras-Fiszman, Ares, &Varela, 2011; Smith et al., 2015) so that the product can be identifiedand categorised (Loken, 2006; Loken et al., 2008). The images shownon the packaging are an important part of this process (Smith et al.,
Table 5Ward’s hierarchical cluster analysis of the products chosen as congruent/incongruent with the metaphorical meanings of fire.
Stage Cluster combined Coefficients Stage cluster first appears Next stage
Cluster 1 Cluster 2 Cluster 1 Cluster 2
1 Cayenne pepper Wasabi .000 0 0 82 Salsa brava Tabasco .000 0 0 33 Chili pepper Salsa brava .000 0 2 44 Chili pepper Kebab .000 3 0 105 Milk Whipped cream .500 0 0 66 Milk Lettuce 1.333 5 0 77 Mineral water Milk 2.250 0 6 98 Cayenne pepper Potato chips 3.583 1 0 109 Mineral water Strawberries 5.333 7 0 1110 Cayenne pepper Chili pepper 7.429 8 4 1211 Mineral water Natural yoghurt 10.595 9 0 1312 Peanuts Cayenne pepper 15.917 0 10 1513 Mineral water Lemonade 21.321 11 0 1414 Mineral water Ice cream 33.750 13 0 1515 Peanuts Mineral water 239.000 12 14 0
I. Gil-Pérez et al. Food Quality and Preference 71 (2019) 384–394
390
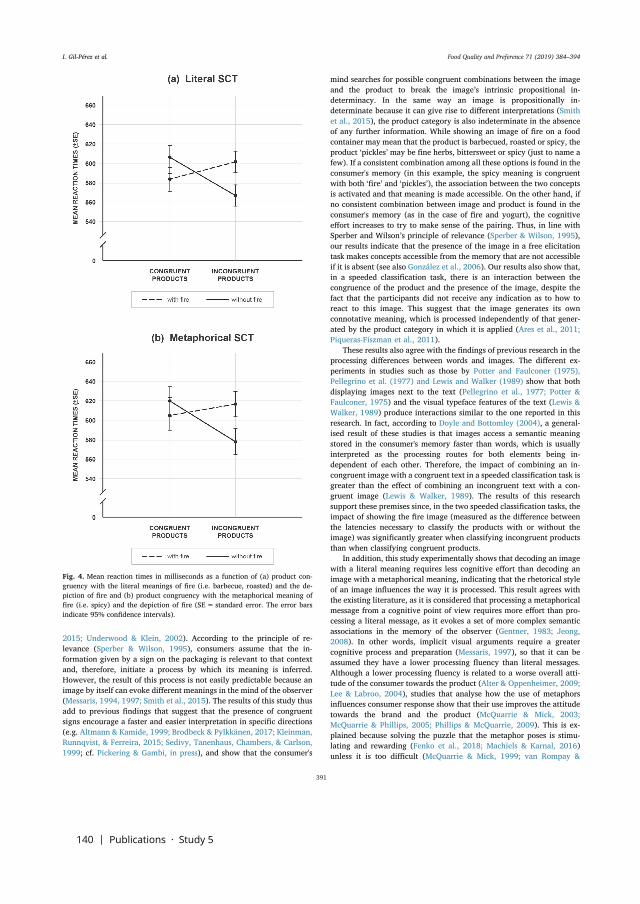
140 | Publications · Study 5
2015; Underwood & Klein, 2002). According to the principle of re-levance (Sperber & Wilson, 1995), consumers assume that the in-formation given by a sign on the packaging is relevant to that contextand, therefore, initiate a process by which its meaning is inferred.However, the result of this process is not easily predictable because animage by itself can evoke different meanings in the mind of the observer(Messaris, 1994, 1997; Smith et al., 2015). The results of this study thusadd to previous findings that suggest that the presence of congruentsigns encourage a faster and easier interpretation in specific directions(e.g. Altmann & Kamide, 1999; Brodbeck & Pylkkänen, 2017; Kleinman,Runnqvist, & Ferreira, 2015; Sedivy, Tanenhaus, Chambers, & Carlson,1999; cf. Pickering & Gambi, in press), and show that the consumer's
mind searches for possible congruent combinations between the imageand the product to break the image’s intrinsic propositional in-determinacy. In the same way an image is propositionally in-determinate because it can give rise to different interpretations (Smithet al., 2015), the product category is also indeterminate in the absenceof any further information. While showing an image of fire on a foodcontainer may mean that the product is barbecued, roasted or spicy, theproduct ‘pickles’ may be fine herbs, bittersweet or spicy (just to name afew). If a consistent combination among all these options is found in theconsumer's memory (in this example, the spicy meaning is congruentwith both ‘fire’ and ‘pickles’), the association between the two conceptsis activated and that meaning is made accessible. On the other hand, ifno consistent combination between image and product is found in theconsumer's memory (as in the case of fire and yogurt), the cognitiveeffort increases to try to make sense of the pairing. Thus, in line withSperber and Wilson’s principle of relevance (Sperber & Wilson, 1995),our results indicate that the presence of the image in a free elicitationtask makes concepts accessible from the memory that are not accessibleif it is absent (see also González et al., 2006). Our results also show that,in a speeded classification task, there is an interaction between thecongruence of the product and the presence of the image, despite thefact that the participants did not receive any indication as to how toreact to this image. This suggest that the image generates its ownconnotative meaning, which is processed independently of that gener-ated by the product category in which it is applied (Ares et al., 2011;Piqueras-Fiszman et al., 2011).
These results also agree with the findings of previous research in theprocessing differences between words and images. The different ex-periments in studies such as those by Potter and Faulconer (1975),Pellegrino et al. (1977) and Lewis and Walker (1989) show that bothdisplaying images next to the text (Pellegrino et al., 1977; Potter &Faulconer, 1975) and the visual typeface features of the text (Lewis &Walker, 1989) produce interactions similar to the one reported in thisresearch. In fact, according to Doyle and Bottomley (2004), a general-ised result of these studies is that images access a semantic meaningstored in the consumer's memory faster than words, which is usuallyinterpreted as the processing routes for both elements being in-dependent of each other. Therefore, the impact of combining an in-congruent image with a congruent text in a speeded classification task isgreater than the effect of combining an incongruent text with a con-gruent image (Lewis & Walker, 1989). The results of this researchsupport these premises since, in the two speeded classification tasks, theimpact of showing the fire image (measured as the difference betweenthe latencies necessary to classify the products with or without theimage) was significantly greater when classifying incongruent productsthan when classifying congruent products.
In addition, this study experimentally shows that decoding an imagewith a literal meaning requires less cognitive effort than decoding animage with a metaphorical meaning, indicating that the rhetorical styleof an image influences the way it is processed. This result agrees withthe existing literature, as it is considered that processing a metaphoricalmessage from a cognitive point of view requires more effort than pro-cessing a literal message, as it evokes a set of more complex semanticassociations in the memory of the observer (Gentner, 1983; Jeong,2008). In other words, implicit visual arguments require a greatercognitive process and preparation (Messaris, 1997), so that it can beassumed they have a lower processing fluency than literal messages.Although a lower processing fluency is related to a worse overall atti-tude of the consumer towards the product (Alter & Oppenheimer, 2009;Lee & Labroo, 2004), studies that analyse how the use of metaphorsinfluences consumer response show that their use improves the attitudetowards the brand and the product (McQuarrie & Mick, 2003;McQuarrie & Phillips, 2005; Phillips & McQuarrie, 2009). This is ex-plained because solving the puzzle that the metaphor poses is stimu-lating and rewarding (Fenko et al., 2018; Machiels & Karnal, 2016)unless it is too difficult (McQuarrie & Mick, 1999; van Rompay &
Fig. 4. Mean reaction times in milliseconds as a function of (a) product con-gruency with the literal meanings of fire (i.e. barbecue, roasted) and the de-piction of fire and (b) product congruency with the metaphorical meaning offire (i.e. spicy) and the depiction of fire (SE= standard error. The error barsindicate 95% confidence intervals).
I. Gil-Pérez et al. Food Quality and Preference 71 (2019) 384–394
391
Publications · Study 5 | 141
Veltkamp, 2014). In the case of this experiment, the metaphor ‘spicinessis fire’ is successful due to the perception of the increased temperaturethat occurs in the mouth when eating spicy foods (Caterina et al., 1997;Tu et al., 2016), and this is well known and recognisable to observersfor it to be considered a cognitive challenge to them (which explainswhy the difference in processing found between the literal and meta-phorical meanings of fire is modest).
4.2. Limitations and future research
Beyond its contributions, this study has some limitations that mustbe taken into account. For example, there may be a bias in the mainstudy regarding the diversity and features of the participants. All par-ticipants were university students living in the same country (Spain). Asa result, further testing would be needed to see if these results could beextrapolated to other markets and other cohorts of consumers and tocheck if individual differences exist (Lidón et al., in press; Piqueras-Fiszman et al., 2011). In addition, while we believe that the results ofthe second pretest suggest that the presence of the image in a free eli-citation task makes concepts accessible from the memory that are notaccessible if it is absent, it may be argued that in the case of pickles the‘spicy’ concept is not accessible without the image of fire because theyare interpreted as “normal” pickles (which are usually not spicy). It maybe worth to do further research in this regard studying how a givenimage favours the elicitation of an attribute shared by all the stimulistudied (e.g. vinegar flavour, which is usually shared by all pickles).Moreover, it should be highlighted that although the term ‘literal’ isused throughout this paper to refer to meanings directly related to fire(such as barbecue or roast), it would be more correct to refer to it as acase of metonymy, where the cause stands for the effect (i.e. the imageof fire is used to mean an effect of it). However, the term ‘literal’ wasused in order to intuitively distinguish the meanings directly related tofire from the metaphorical ones (such as spicy).
It is worth noting that several products used as being congruentwith the meaning assessed in one of the speeded classification tasksmay also be congruent with the meaning assessed in the other one (e.g.skewers, peanuts or burgers may be considered as being congruent bothwith the literal and with the metaphorical meanings of fire), which mayraise some concern about the validity of these results. It could be arguedthat one product being congruent with other meanings that the onesbeing assessed in a given task may lead to confusion or a higher cog-nitive load, which in turn may tarnish response times. However, itshould be noted that the order of the speeded classification tasks wasrandomised and that when participants performed the first speededclassification task they did not know that there was going to be anotherone (and therefore, another meaning to assess), so the chance of beinginfluenced by it (or by any other alternative concept to the one beingassessed in the first one) is modest. For example, in the Metaphoricalspeeded classification task participants just had to classify products asbeing spicy or not, and no reference was made to concepts like barbecueor roast (which were assessed in the Literal speeded classification task).
On the other hand, different products were used in each speededclassification task to ensure that the products chosen for each one re-presented unequivocally congruent and incongruent choices with theassessed meaning (literal or metaphorical), which implied that therecould be internal differences within each group of products in terms ofease or difficulty of processing, understanding or readability. Althoughit can be argued that this makes it difficult to analyse data as sets ofcongruent/incongruent product categories as it has been done in thisstudy, a panel of 3 experts agreed on the product categories beforeconducting the speeded classification tasks and a manipulation checkwas carried out in order to verify that this could be done. Indeed, theresults of the manipulation check reveal that the product categoriesconsidered as being congruent or incongruent with each meaning of firemade up robust clusters, making it possible to analyse them jointlyrather than by individual product categories.
Finally, it could also be argued that the fact that different productcategories were displayed in each speeded classification task makesimpossible to compare the response times of the products displayedwith fire on each, so that it would not be possible to assess if, as hy-pothesised, the metaphorical rhetorical style takes more time to processthat the literal rhetorical style. To solve this problem, an ANCOVA wascarried out in which the difference between the time needed to classifythe products displayed without fire in each speeded classification taskwas included as a covariate. However, despite all the precautions taken,we believe it is necessary to consider all these aspects as limitations ofthis study.
Moreover, it is important to emphasise that one must be cautiousabout drawing conclusions from the study results related to the hedonicand affective response of the consumer to the product. The processingfluency literature suggests that a lower cognitive effort is related togreater fluency and a better consumer attitude (Alter & Oppenheimer,2009), although it is not clear that the latencies of a speeded classifi-cation task, such as the one used in this experiment, really representprocessing fluency (Graf, Mayer, & Landwehr, 2017). On the otherhand, while several studies suggest that displaying an incongruent as-sociation on the package may improve the consumer's attitude towardthe product, due to the surprise or interest it may generate (Heckler &Childers, 1992; Van Rompay & Pruyn, 2011; van Rompay, Pruyn, &Tieke, 2009), others warn that showing information considered irrele-vant can negatively influence consumer expectations (Meyvis &Janiszewski, 2002). Further research is needed from these results inorder to better understand the relationship between the response la-tencies of a speeded classification task and the hedonic and affectiveresponses of the consumer.
This study leaves some unanswered questions that open the door tofuture lines of research. For example, this research shows that theconsumer relies on the congruence of possible meanings for the imagewith possible features of the image by studying when a fire imageevokes literal meanings (barbecue, roast) and when it evokes a meta-phorical one (spiciness). However, it does not address how the con-sumer decides which of the literal meanings is appropriate for a givenproduct. Although it can be assumed that the process will be the sameand will be based on the congruence of each of them with the product(e.g., we may expect that while displaying a fire image on a breadpackage transmits roasted, showing a fire image on a veal fillet wouldsuggest barbecue), experimental analysis would be needed to verify ifthis is the case. Moving forward in this direction would allow for abetter understanding of the factors responsible for the consumer as-signing meanings to images displayed on food packaging.
5. Conclusion
An image shown on a food package label helps the consumer cate-gorise the product and contribute to the process of generating ex-pectations, as the consumer’s brain tries to assign meaning to it. Thisinvestigation shows that, when a possible meaning of the image isconsistent with the product to which it is applied, the association be-tween the two is strengthened and the consumer finds it easier to ca-tegorise the product. However, showing an incongruent image with theproduct confuses the consumer and makes it difficult to understand,thus increasing the time needed to categorise it. The research resultsalso show that the rhetorical style of an image influences the cognitiveeffort needed to process it, since a literal interpretation of an imageallows for access to its meaning more quickly than a metaphorical one.
These results are of interest to producers, designers and legislators,since help to improve our understanding of the process by which con-sumers interpret messages elicited by food packaging and enable thedesign of packages which are more understandable and easy to inter-pret.
I. Gil-Pérez et al. Food Quality and Preference 71 (2019) 384–394
392

142 | Publications · Study 5
References
Alter, A. L., & Oppenheimer, D. M. (2009). Uniting the tribes of fluency to form a me-tacognitive nation. Personality and Social Psychology Review, 13(3), 219–235. https://doi.org/10.1177/1088868309341564.
Altmann, G. T. M., & Kamide, Y. (1999). Incremental interpretation at verbs: Restrictingthe domain of subsequent reference. Cognition, 73(3), 247–264. https://doi.org/10.1016/S0010-0277(99)00059-1.
Ares, G., Piqueras-Fiszman, B., Varela, P., Marco, R. M., López, A. M., & Fiszman, S.(2011). Food labels: Do consumers perceive what semiotics want to convey? FoodQuality and Preference, 22(7), 689–698. https://doi.org/10.1016/j.foodqual.2011.05.006.
Azzi, A., Battini, D., Persona, A., & Sgarbossa, F. (2012). Packaging design: General fra-mework and research agenda. Packaging Technology and Science, 25, 435–456.https://doi.org/10.1002/pts.993.
Barthes, R. (1977). Image music text. New York: Hill and Wang.Brodbeck, C., & Pylkkänen, L. (2017). Language in context: Characterizing the compre-
hension of referential expressions with MEG. NeuroImage, 147(September 2016),447–460. https://doi.org/10.1016/j.neuroimage.2016.12.006.
Caterina, M., Schumacher, M., Timinaga, M., & Rosen, T. (1997). The capsaicin receptor:A heat-activited ion channel in the pathway. Nature, 389(October), 816–824. https://doi.org/10.1038/39807.
Celhay, F., & Remaud, H. (2018). What does your wine label mean to consumers? Asemiotic investigation of Bordeaux wine visual codes. Food Quality and Preference,65(November 2017), 129–145. https://doi.org/10.1016/j.foodqual.2017.10.020.
Deliza, R., & MacFie, H. J. H. (1996). The generation of sensory expectation by externalcues and its effect on sensory perception and hedonic ratings: A review. Journal ofSensory Studies, 11(2), 103–128. https://doi.org/10.1111/j.1745-459X.1996.tb00036.x.
Doyle, J. R., & Bottomley, P. A. (2004). Font appropriateness and brand choice. Journal ofBusiness Research, 57(8), 873–880. https://doi.org/10.1016/S0148-2963(02)00487-3.
Epley, N., & Gilovich, T. (2006). The anchoring-and-adjustment heuristic why the ad-justments are insufficient. Psychological Science, 17(4), 311–319.
Estes, Z., & Jones, L. L. (2006). Priming via relational similarity: A copper horse is fasterwhen seen through a glass eye. Journal of Memory and Language, 55(1), 89–101.https://doi.org/10.1016/j.jml.2006.01.004.
Fenko, A., Vries, R. De, & Rompay, T. Van (2018). How strong is your coffee? The in-fluence of visual metaphors and textual claims on consumers’ flavor perception andproduct evaluation. Frontiers in Psychology, 9(February), 1–12. https://doi.org/10.3389/fpsyg.2018.00053.
Festila, A., & Chrysochou, P. (2018). Implicit communication of food product healthful-ness through package design: A content analysis. Journal of Consumer Behaviour,(February 2017), 1–16. https://doi.org/10.1002/cb.1732.
Fillmore, C. J., & Baker, C. (2010). A frames approach to semantic analysis. In B. Heine, &H. Narrog (Eds.). The Oxford Handbook of Linguistic Analysis (pp. 313–340). Oxford:Oxford University Press.
Gagné, C. L., & Spalding, T. L. (2006). Using conceptual combination research to betterunderstand novel compound words. SKASE Journal of Theoretical Linguistics, 3(2),9–16.
Gentner, D. (1983). Structure mapping: A theoretical framework for analogy. CognitiveScience, 7(2), 155–170. https://doi.org/10.1016/S0364-0213(83)80009-3.
Gil-Pérez, I., Rebollar, R., Lidón, I., Martín, J., van Trijp, H. C. M., & Piqueras-Fiszman, B.(2019). Hot or not? Conveying sensory information on food packaging through thespiciness-shape correspondence. Food Quality and Preference, 71(July 2018),197–208. https://doi.org/10.1016/j.foodqual.2018.07.009.
González, J., Barros-Loscertales, A., Pulvermüller, F., Meseguer, V., Sanjuán, A., Belloch,V., & Ávila, C. (2006). Reading cinnamon activates olfactory brain regions.NeuroImage, 32(2), 906–912. https://doi.org/10.1016/j.neuroimage.2006.03.037.
Graf, L. K. M., Mayer, S., & Landwehr, J. R. (2017). Measuring processing fluency: Oneversus five items. Journal of Consumer Psychology. https://doi.org/10.1002/jcpy.1021.
Gregan-Paxton, J., & John, D. R. (1997). Consumer learning by analogy: A model ofinternal knowledge transfer. Journal of Consumer Research, 24(3), 266–284. https://doi.org/10.1086/209509.
Heckler, S. E., & Childers, T. L. (1992). The role of expectancy and relevancy in memoryfor verbal and visual information: What is incongruency? Journal of ConsumerResearch, 18(4), 475. https://doi.org/10.1086/209275.
Honea, H., & Horsky, S. (2012). The power of plain: Intensifying product experience withneutral aesthetic context. Marketing Letters, 23(1), 223–235. https://doi.org/10.1007/s11002-011-9149-y.
Jeong, S. H. (2008). Visual metaphor in advertising: Is the persuasive effect attributableto visual argumentation or metaphorical rhetoric? Journal of MarketingCommunications, 14(1), 59–73. https://doi.org/10.1080/14697010701717488.
Johnston, W. A., & Dark, V. J. (1986). Selective attention. Annual Review of Psychology,37(1), 43–75. https://doi.org/10.1146/annurev.ps.37.020186.000355.
Kauppinen-Räisänen, H. (2014). Strategic use of colour in brand packaging. PackagingTechnology and Science, 27(8), 663–676. https://doi.org/10.1002/pts.2061.
Kleinman, D., Runnqvist, E., & Ferreira, V. S. (2015). Single-word predictions of up-coming language during comprehension: Evidence from the cumulative semanticinterference task. Cognitive Psychology, 79, 68–101. https://doi.org/10.1016/j.cogpsych.2015.04.001.
Lähteenmäki, L. (2013). Claiming health in food products. Food Quality and Preference,27(2), 196–201. https://doi.org/10.1016/j.foodqual.2012.03.006.
Lee, A. Y., & Labroo, A. A. (2004). The effect of conceptual and perceptual fluency on
brand evaluation. Journal of Marketing Research, 41(2), 151–165. https://doi.org/10.1509/jmkr.41.2.151.28665.
Lewis, C., & Walker, P. (1989). Typographic influences on reading. British Journal ofPsychology, 80(2), 241–257. https://doi.org/10.1111/j.2044-8295.1989.tb02317.x.
Lidón, I., Rebollar, R., Gil-Pérez, I., Martín, J., & Vicente-Villardón, J. L. (in press). Theinfluence the image of the product shown on food packaging labels has on productperception during tasting: Effects and gender differences. Packaging Technology andScience. https://doi.org/10.1002/pts.2407.
Loken, B. (2006). Consumer psychology: Categorization, inferences, affect, and persua-sion. Annual Review of Psychology, 57(1), 453–485. https://doi.org/10.1146/annurev.psych.57.102904.190136.
Loken, B., Barsalou, L. W., & Joiner, C. (2008). Categorzation theory and research inconsumer psychology: Category representation and category-based inference.Handbook of Consumer Psychology, 133–163.
Lynott, D., & Connell, L. (2010). Embodied conceptual combination. Frontiers inPsychology, 1(NOV), 1–14. https://doi.org/10.3389/fpsyg.2010.00212.
Machiels, C. J. A., & Karnal, N. (2016). See how tasty it is? Effects of symbolic cues onproduct evaluation and taste. Food Quality and Preference, 52, 195–202. https://doi.org/10.1016/j.foodqual.2016.04.014.
Madzharov, A. V., & Block, L. G. (2010). Effects of product unit image on consumption ofsnack foods. Journal of Consumer Psychology, 20(4), 398–409. https://doi.org/10.1016/j.jcps.2010.06.007.
Magnier, L., & Schoormans, J. (2017). How do packaging material, colour and environ-mental claim influence package, brand and product evaluations? PackagingTechnology and Science. https://doi.org/10.1002/pts.2318.
Mathôt, S., Schreij, D., & Theeuwes, J. (2012). OpenSesame: An open-source, graphicalexperiment builder for the social sciences. Behavior Research Methods, 44(2),314–324. https://doi.org/10.3758/s13428-011-0168-7.
McQuarrie, E. F., & Mick, D. G. (1999). Visual Rhetoric in advertising: Text-interpretive,experimental, and reader-response analyses. Journal of Consumer Research, 26(1),37–54. https://doi.org/10.1086/209549.
McQuarrie, E. F., & Mick, D. G. (2003). Visual and verbal rhetorical figures under directedprocessing versus incidental exposure to advertising. Journal of Consumer Research,29(4), 579–587. https://doi.org/10.1086/346252.
McQuarrie, E. F., & Phillips, B. J. (2005). Indirect persuasion in advertising: How con-sumers process metaphors presented in pictures and words. Journal of Advertising,34(2), 7–20. https://doi.org/10.1080/00913367.2005.10639188.
Messaris, P. (1994). Visual literacy: Image, mind, and reality. Boulder: Westview Press.Messaris, P. (1997). Visual persuasion: The role of images in advertising. Thousand Oaks, CA:
Sage Publications.Meyvis, T., & Janiszewski, C. (2002). Consumers’ beliefs about product benefits: The
effect of obviously irrelevant product information. Journal of Consumer Research,28(4), 618–635. https://doi.org/10.1086/338205.
Miller, G. L., Malhotra, N. K., & King, T. M. (2006). Categorization. In N. K. Malhotra(Ed.). Review of Marketing Research (Review of Marketing Research, Volume 2) (pp.109–150). Emerald Group Publishing Limited.
Mueller, S., Lockshin, L., & Louviere, J. J. (2009). What you see may not be what you get:Asking consumers what matters may not reflect what they choose. Marketing Letters,21(4), 335–350. https://doi.org/10.1007/s11002-009-9098-x.
Mumani, A., & Stone, R. (2018). State of the art of user packaging interaction (UPI).Packaging Technology and Science, (November 2017), 1–19. https://doi.org/10.1002/pts.2363.
Peirce, C. S. (1991). Peirce on signs: Writings on semiotic. Chapel Hill: University of NorthCarolina Press.
Pellegrino, J. W., Rosinski, R. R., Chiesi, H. L., & Siegel, A. (1977). Picture-word differ-ences in decision latency: An analysis of single and dual memory models. Memory &Cognition, 5(4), 383–396. https://doi.org/10.3758/BF03197377.
Phillips, B. J. (2000). The impact of verbal anchoring on consumer response to image ads.Journal of Advertising, 29(1), 15–24. https://doi.org/10.1080/00913367.2000.10673600.
Phillips, B., & McQuarrie, E. F. (2002). The development, change and transformation ofrhetorical style in magazine advertisements, 1994–1999. Journal of Advertising, 31(4),1–13.
Phillips, B. J., & McQuarrie, E. F. (2009). Impact of advertising metaphor on consumerbelief. Journal of Advertising, 38(1), 49–61.
Pickering, M. J., & Gambi, C. (in press). Predicting While Comprehending Language: ATheory and Review. Psychological Bulletin. https://doi.org/10.1037/bul0000158.
Piqueras-Fiszman, B., Ares, G., & Varela, P. (2011). Semiotics and perception: Do labelsconvey the same messages to older and younger consumers? Journal of SensoryStudies, 26(3), 197–208. https://doi.org/10.1111/j.1745-459X.2011.00336.x.
Piqueras-Fiszman, B., & Spence, C. (2015). Sensory expectations based on product-ex-trinsic food cues: An interdisciplinary review of the empirical evidence and theore-tical accounts. Food Quality and Preference, 40(PA), 165–179. https://doi.org/10.1016/j.foodqual.2014.09.013.
Potter, M., & Faulconer, B. (1975). Time to understand picture and words. Nature,253(1972), 437–438.
Rebollar, R., Gil, I., Lidón, I., Martín, J., Fernández, M. J., & Rivera, S. (2017). Howmaterial, visual and verbal cues on packaging influence consumer expectations andwillingness to buy: The case of crisps (potato chips) in Spain. Food ResearchInternational, 99, 239–246. https://doi.org/10.1016/j.foodres.2017.05.024.
Rebollar, R., Lidón, I., Gil, I., Martín, J., Fernández, M. J., & Riveres, C. E. (2016). Theinfluence the serving suggestion displayed on soft cheese packaging has on consumerexpectations and willingness to buy. Food Quality and Preference, 52, 188–194.https://doi.org/10.1016/j.foodqual.2016.04.015.
Schifferstein, H. N. J. (2001). Effects of product beliefs on product perception and liking.In L. Frewer, E. Risvik, & H. Schifferstein (Eds.). Food, people and society: A European
I. Gil-Pérez et al. Food Quality and Preference 71 (2019) 384–394
393
Publications · Study 5 | 143
perspective of consumers’ food choices (pp. 73–96). Berlin: Springer Verlag.Sedivy, J. C., Tanenhaus, M. K., Chambers, C. G., & Carlson, G. N. (1999). Achieving
incremental semantic interpretation through contextual representation. Cognition,71(2), 109–147. https://doi.org/10.1016/S0010-0277(99)00025-6.
Semin, G. R., & Palma, T. A. (2014). Why the bride wears white: Grounding gender withbrightness. Journal of Consumer Psychology, 24(2), 217–225. https://doi.org/10.1016/j.jcps.2013.09.003.
Silayoi, P., & Speece, M. (2007). The importance of packaging attributes: A conjointanalysis approach. European Journal of Marketing, 41(11/12), 1495–1517. https://doi.org/10.1108/03090560710821279.
Smith, V., Barratt, D., & Selsøe Sørensen, H. (2015). Do natural pictures mean naturaltastes? Assessing visual semantics experimentally. Cognitive Semiotics, 8(1), 53–86.https://doi.org/10.1515/cogsem-2015-0001.
Smith, M. C., & Magee, L. E. (1980). Tracing the time course of picture-word processing.Journal of Experimental Psychology: General, 109(4), 373–392. https://doi.org/10.1037/0096-3445.109.4.373.
Smith, V., Møgelvang-Hansen, P., & Hyldig, G. (2010). Spin versus fair speak in foodlabelling: A matter of taste? Food Quality and Preference, 21(8), 1016–1025. https://doi.org/10.1016/j.foodqual.2010.05.016.
Smith, E. E., Osherson, D. N., Rips, L. J., & Keane, M. (1988). Combining prototypes: Aselective modification model. Cognitive Science, 12(4), 485–527. https://doi.org/10.1016/0364-0213(88)90011-0.
Spence, C. (2018). Background colour & its impact on food perception & behaviour. FoodQuality and Preference, 68(December 2017), 156–166. https://doi.org/10.1016/j.foodqual.2018.02.012.
Spence, C., & Piqueras-Fiszman, B. (2014). The perfect meal: The multisensory science offood and dining. Chichester, UK: John Wiley & Sons, Ltd.
Sperber, D., & Wilson, D. (1995). Relevance: Communication and cognition. Malden:Blackwell Publishing.
Sütterlin, B., & Siegrist, M. (2015). Simply adding the word “fruit” makes sugar healthier:The misleading effect of symbolic information on the perceived healthiness of food.Appetite, 95, 252–261. https://doi.org/10.1016/j.appet.2015.07.011.
Tu, Y., Yang, Z., & Ma, C. (2016). The taste of plate: How the spiciness of food is affectedby the color of the plate used to serve it. Journal of Sensory Studies, 31(1), 50–60.https://doi.org/10.1111/joss.12190.
Underwood, R. L., & Klein, N. M. (2002). Packaging as brand communication: Effects ofproduct pictures on consumer responses to the package and brand. Journal ofMarketing Theory and Practice, 10(4), 58–68. https://doi.org/10.1080/10696679.2002.11501926.
van Jaarsveld, H. J., Coolen, R., & Schreuder, R. (1994). The role of analogy in the in-terpretation of novel compounds. Journal of Psycholinguistic Research, 23(2), 111–137.https://doi.org/10.1007/BF02143919.
Van Rompay, T. J. L., & Pruyn, A. T. H. (2011). When visual product features speak thesame language: Effects of shape-typeface congruence on brand perception and priceexpectations. Journal of Product Innovation Management, 28(4), 599–610. https://doi.org/10.1111/j.1540-5885.2011.00828.x.
van Rompay, T. J. L., Pruyn, A. T. H., & Tieke, P. (2009). Symbolic meaning integration indesign and its influence on product and brand evaluation. International Journal ofDesign, 3(2), 19–26.
van Rompay, T. J. L., & Veltkamp, M. (2014). Product packaging metaphors: Effects ofambiguity and explanatory information on consumer appreciation and brand per-ception. Psychology & Marketing, 31(6), 404–415. https://doi.org/10.1002/mar.20703.
Venter, K., van der Merwe, D., de Beer, H., Kempen, E., & Bosman, M. (2011). Consumers’perceptions of food packaging: An exploratory investigation in Potchefstroom, SouthAfrica. International Journal of Consumer Studies, 35(3), 273–281. https://doi.org/10.1111/j.1470-6431.2010.00936.x.
I. Gil-Pérez et al. Food Quality and Preference 71 (2019) 384–394
394

Publications · Study 6 | 145
Study 6
Gil-Pérez, I., Rebollar, R., Lidón, I., Martín, J., van Trijp, H. C. M., & Piquer-
as-Fiszman, B. (2019). Hot or not? Conveying sensory information on food
packaging through the spiciness-shape correspondence. Food Quality and Pref-
erence, 71, 197–208. https://doi.org/10.1016/j.foodqual.2018.07.009
Food Quality and Preference’s JCR Journal Impact Factor in 2017 (the latest
available data) was 3.652, placing it in position 13 of 133 (quartile Q1) of the Cat-
egory Food Science & Technology.
3.6.

146 | Publications · Study 6
Publications · Study 6 | 147
Contents lists available at ScienceDirect
Food Quality and Preference
journal homepage: www.elsevier.com/locate/foodqual
Hot or not? Conveying sensory information on food packaging through thespiciness-shape correspondence
Ignacio Gil-Péreza,⁎, Rubén Rebollara, Iván Lidóna, Javier Martínb,c, Hans C.M. van Trijpd,Betina Piqueras-Fiszmand
a Departamento de Ingeniería de Diseño y Fabricación, Escuela de Ingeniería y Arquitectura, Universidad de Zaragoza, c/ María de Luna 3, C.P. 50018 Zaragoza, SpainbDepartamento de Estadística, Universidad de Salamanca, c/ Espejo 2, C.P. 37007 Salamanca, Spainc Bioestatistics Unit-IBSAL, Instituto de Investigación Biomédica de Salamanca, Paseo de San Vicente 58-182, 37007 Salamanca, SpaindMarketing and Consumer Behaviour Group, Wageningen University & Research, Hollandseweg 1, 6706 KN Wageningen, The Netherlands
A R T I C L E I N F O
Keywords:SemioticsExpectationsCategorisationPackaging designImplicit measures
A B S T R A C T
The packaging of a product is a key element in the communication between producers and consumers, so gettingthe consumer to interpret the packaging visual signs in the desired way is crucial to be successful in the mar-ketplace. However, this is not easy as images can be ambiguous and may be interpreted in different ways. Forexample, depicting an icon of fire on the front of a bag of nuts may lead the consumer to interpret either that thenuts are spicy or that the nuts have been roasted. This paper addresses this problem and, using this case as anexample, assesses if the interpretation of a fire icon (spicy vs roasted) can be modulated by manipulating itsshape (angular vs rounded). 66 participants carried out an experiment which results show that there is acrossmodal correspondence between spiciness and pointy shapes and that this association can be used tomodulate sensory expectations: in a speeded classification task, the bags of nuts depicting pointy fire icons werecategorised more quickly as being spicy than as being roasted, while the opposite was true for the bags of nutsdisplaying rounded fire icons. In addition, the results of a mediation analysis suggest that this effect occursindirectly through affective appraisal: the pointy fire icons were judged as being more aggressive than therounded fire icons, which in turn raised spiciness expectations. These findings contribute to the research oncrossmodal correspondences and semiotics by showing that the association between spiciness and abstractshapes can be used to modulate how people interpret an ambiguous image.
1. Introduction
One of the main tasks of a packaging designer is to effectivelycommunicate the characteristics of the product contained within, aspackaging is an important communication tool between producers andconsumers (Nancarrow, Wright, & Brace, 1998). To that end, the de-signer must understand and untangle the codes and language used byconsumers (Frascara, 1988; Laing & Masoodian, 2016) and, in addition,reproduce them clearly in an appealing design (Silayoi & Speece, 2007).Images allow the designer to both communicate messages and gainaesthetic quality, which is why they are frequently used in foodpackaging (Underwood & Klein, 2002). Images are a key element in thepackaging visual appearance as they allow the consumer to quicklyidentify and categorize the product (Loken, 2006) and to generate ex-pectations about it (see Deliza & MacFie, 1996; Piqueras-Fiszman &Spence, 2015, for reviews). However, for the designer it is not easy to
anticipate the meaning that a consumer will assign to an image since ina given context an image can evoke different concepts (Smith, Barratt,& Selsøe Sørensen, 2015): for example, when viewing an icon depictingfire on a bag of nuts the consumer may interpret that the nuts are spicyor that the nuts have been roasted. For both designers and producers itis key to know what does the elicitation of one meaning or anotherdepend on, as previous works suggest that for a product to succeed inthe market it should satisfy consumer expectations (Piqueras-Fiszman &Spence, 2015). The investigation reported here addresses this problemby studying if it is possible to use the crossmodal correspondence be-tween spiciness and shapes to favour one of the possible interpretationsof the same image, which would allow the designer to gain control overthe communication process. Specifically, we argue that the meaningimplicitly assigned to an icon of fire depicted on a bag of nuts (i.e. spicyor roasted) depends on the angularity of the icon, and propose that thenature of this effect is affective.
https://doi.org/10.1016/j.foodqual.2018.07.009Received 3 May 2018; Received in revised form 9 July 2018; Accepted 11 July 2018
⁎ Corresponding author.E-mail address: [email protected] (I. Gil-Pérez).
Food Quality and Preference 71 (2019) 197–208
0950-3293/ © 2018 Published by Elsevier Ltd.
148 | Publications · Study 6
2. Background
2.1. The image displayed in the package as a propositionally indeterminatesemantic sign
The visual appearance of a package plays a key role during thecategorisation process and the generation of expectations, since con-sumers use the different elements of the package as signs from which toinfer information (Loken, 2006; Loken, Barsalou, & Joiner, 2008).Based on Peirce (1991), Ares et al. (2011) distinguish two kinds of signsin the context of food packaging: linguistic signs (i.e. signs that producemeaning by social convention, like texts or words) and visual signs (i.e.signs that produce meaning by resemblance, like colours or images).Today we have abundant information regarding the way in which lin-guistic signs or some visual signs such as colour influence these pro-cesses (Kauppinen-Räisänen & Luomala, 2010; Lähteenmäki, 2013;Piqueras-Fiszman & Spence, 2015; Spence & Piqueras-Fiszman, 2014;Sütterlin & Siegrist, 2015). On the contrary, the specific effect of theimages in the communication between packaging and consumer hasbeen less studied. For example, Smith et al. (2015) showed that havingan image on the package of the major taste-giving ingredient instead ofa text description makes consumers believe there is a greater proportionof it in the product, while Rebollar et al. (2016) showed that productsaccompanied with the main product in the serving suggestion depictedon a package of fresh cheese influence the time of the day it is con-sidered most suitable to consume it. More recent work from the sameteam suggest that communicating that the potato chips contained in apackage had been fried in olive oil by showing an image of an oil dis-penser instead of by stating it by a text increases the sensory, non-sensory and hedonic expectations of the product and increases thewillingness to buy it (Rebollar et al., 2017).
However, despite the importance of transmitting a clear and un-ambiguous message to the consumer, the designer cannot easily an-ticipate the meaning that will be inferred from an image displayed on afood package. An image by itself is propositionally indeterminate andmay evoke many interpretations in the mind of the consumer, since itlacks the syntactic devices necessary to emit an explicit propositionalmeaning (Messaris, 1994, 1997; Smith et al., 2015). For example,consider the case of depicting an image of fire on a bag of nuts: theconsumer may interpret that the product is spicy or that the product hasbeen roasted (Smith et al., 2015), as in this context fire may be con-gruently understood in either way. Although this propositional in-determinacy can be broken by making the meaning of the image ex-plicit by using supporting text (Barthes, 1977; Phillips, 2000), the pathsby which the meanings of text and image are decoded are different andcan lead to different interpretations. In that case, an additional processis required to resolve the conflict and select a definitive meaning (Lewis& Walker, 1989), which may negatively affect the processing fluencyand the overall attitude toward the product (Alter & Oppenheimer,2009). In addition, it is also worth noting that the image captures at-tention faster than the text (Honea & Horsky, 2012; Silayoi & Speece,2007; Venter, van der Merwe, de Beer, Kempen, & Bosman, 2011), isprocessed more quickly (Mueller, Lockshin, & Louviere, 2009;Underwood & Klein, 2002), and that the first impression may conditionthe response to subsequent stimuli (Epley & Gilovich, 2006; Madzharov& Block, 2010). Thus, effectively controlling the expectations evoked bythe image is thus crucial for the designer in order to ensure that themessage conveyed by all the signs displayed on the package is con-gruent.
2.2. Conveying spiciness through the shape of an image
The literature dedicated to crossmodal correspondences gives a hintabout why it can be expected that the shape of an image depicted on afood package may influence the sensory expectations of the productcontained within. Crossmodal correspondences are the often surprising
associations that the majority of people seems to share across stimulifrom different sensory modalities (Spence, 2011). Although many of thestudies that initially analysed these effects focused on the corre-spondences between audition and vision (Parise & Spence, 2013;Spence, 2011), crossmodal correspondences have been documentedamong all sensory modalities (Spence, 2011). Specially regarding thegustatory sense, it has been shown that expected and perceived flavourmay be influenced by audition (see Spence, 2015a for a review), touch(Barnett-Cowan, 2010; Piqueras-Fiszman, Harrar, Alcaide, & Spence,2011) or vision. In this particular case, associations have been foundbetween both flavour and taste and cues as colour (Piqueras-Fiszman &Spence, 2011; Piqueras-Fiszman, Velasco, & Spence, 2012), packagingshape (Becker, van Rompay, Schifferstein, & Galetzka, 2011; Velasco,Salgado-Montejo, Marmolejo-Ramos, & Spence, 2014) or abstractshapes (Liang, Roy, Chen, & Zhang, 2013; Velasco, Woods, Petit, Cheok,& Spence, 2016). However, the majority of the research conducted todate has focused in basic tastes and other components of flavour like theburning sensation of spiciness/piquancy1 have been barely studied(Wang, Keller, & Spence, 2017).
Literature makes a clear distinction between the concepts of tasteand flavour (Spence, Smith, & Auvray, 2014). While the basic tastesinclude bitter, sweet, salty, sour and umami, and are understood as thespecific gustatory sensations that occur with the stimulation of re-ceptors located in the tongue (Delwiche, 1996), flavour is a morecomplex multisensory perception that is processed from gustatory, ol-factory (mainly retronasal) and trigeminal inputs (Spence et al., 2014;Spence, 2015a, 2015b). The trigeminal system is the chemosensorysystem responsible of mediating sensations as the cool feeling caused bypeppermint chewing gum, the tingling produced on the tongue bycarbonated drinks or the burning sensation while eating chili peppers(Lundström, Boesveldt, & Albrecht, 2011). The spiciness/piquant sen-sation that arises when you eat chili peppers or other pungent productsis therefore produced by the activation of the trigeminal system re-ceptors located in the mouth when the irritants contained in theseproducts, such as capsaicin, are released. These receptors are the sameones that are responsible for processing temperature, pain and chemicalirritation, so the sensation produced by capsaicin is processed by thebrain in similar terms to those of an increase in temperature (Caterina,Schumacher, Timinaga, & Rosen, 1997). The intensity of the perceivedheat depends on factors such as the concentration of capsaicin presentin the food (Baron & Penfield, 1996), time elapsed between intakes(Carstens et al., 2002) or serving temperature (Reinbach, Toft, &Møller, 2009), and usually takes a few tenths of a second to reach itsmaximum level (Prescott & Stevenson, 1995). Although the spiciness/burning sensation produced by capsaicin is not considered a basic taste,it is described as a significant contributor to flavour perception and haseven been described as “the forgotten flavour sense” (Lawless, 1989;Spence, 2015b; Tu, Yang, & Ma, 2016; Viana, 2011). As is the case withother flavour components, people seem to match spiciness with stimulifrom other sensory domains such as audition and vision. Thus, bothexpected and perceived spiciness can be enhanced with specific soundattributes (high pitch, fast tempo or high levels of distortion; Wanget al., 2017), by manipulating the intensity of red colouring of a salsa(the more intense the red, more spicy the salsa; Levitan & Shermer,2014) or with the colour of the plate on which a food is served (beingred the spiciest; Tu et al., 2016).
In recent years there has been a growing interest in understandingshape symbolism within the framework of flavour-vision corre-spondences (Becker et al., 2011; Velasco et al., 2014; Velasco, Woods,Petit, et al., 2016). However, despite the burning sensation caused bypungent food being considered a significant contributor to flavour
1 Although the terms spiciness or spicy may also refer to the aroma of a givenfood (Spence et al., 2014), in the present paper they are used to describe theburning sensation caused by capsaicin (Caterina et al., 1997).
I. Gil-Pérez et al. Food Quality and Preference 71 (2019) 197–208
198
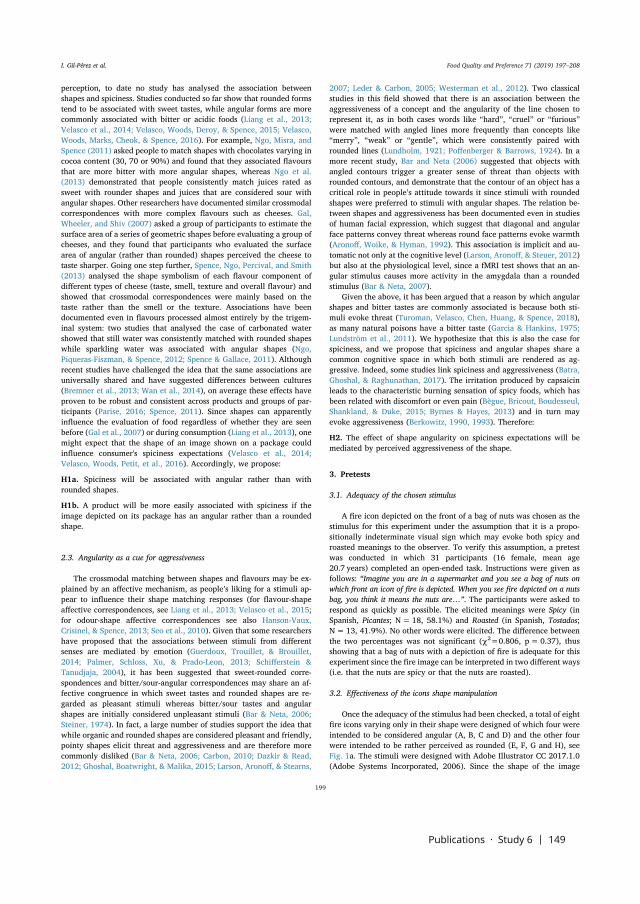
Publications · Study 6 | 149
perception, to date no study has analysed the association betweenshapes and spiciness. Studies conducted so far show that rounded formstend to be associated with sweet tastes, while angular forms are morecommonly associated with bitter or acidic foods (Liang et al., 2013;Velasco et al., 2014; Velasco, Woods, Deroy, & Spence, 2015; Velasco,Woods, Marks, Cheok, & Spence, 2016). For example, Ngo, Misra, andSpence (2011) asked people to match shapes with chocolates varying incocoa content (30, 70 or 90%) and found that they associated flavoursthat are more bitter with more angular shapes, whereas Ngo et al.(2013) demonstrated that people consistently match juices rated assweet with rounder shapes and juices that are considered sour withangular shapes. Other researchers have documented similar crossmodalcorrespondences with more complex flavours such as cheeses. Gal,Wheeler, and Shiv (2007) asked a group of participants to estimate thesurface area of a series of geometric shapes before evaluating a group ofcheeses, and they found that participants who evaluated the surfacearea of angular (rather than rounded) shapes perceived the cheese totaste sharper. Going one step further, Spence, Ngo, Percival, and Smith(2013) analysed the shape symbolism of each flavour component ofdifferent types of cheese (taste, smell, texture and overall flavour) andshowed that crossmodal correspondences were mainly based on thetaste rather than the smell or the texture. Associations have beendocumented even in flavours processed almost entirely by the trigem-inal system: two studies that analysed the case of carbonated watershowed that still water was consistently matched with rounded shapeswhile sparkling water was associated with angular shapes (Ngo,Piqueras-Fiszman, & Spence, 2012; Spence & Gallace, 2011). Althoughrecent studies have challenged the idea that the same associations areuniversally shared and have suggested differences between cultures(Bremner et al., 2013; Wan et al., 2014), on average these effects haveproven to be robust and consistent across products and groups of par-ticipants (Parise, 2016; Spence, 2011). Since shapes can apparentlyinfluence the evaluation of food regardless of whether they are seenbefore (Gal et al., 2007) or during consumption (Liang et al., 2013), onemight expect that the shape of an image shown on a package couldinfluence consumer's spiciness expectations (Velasco et al., 2014;Velasco, Woods, Petit, et al., 2016). Accordingly, we propose:
H1a. Spiciness will be associated with angular rather than withrounded shapes.
H1b. A product will be more easily associated with spiciness if theimage depicted on its package has an angular rather than a roundedshape.
2.3. Angularity as a cue for aggressiveness
The crossmodal matching between shapes and flavours may be ex-plained by an affective mechanism, as people’s liking for a stimuli ap-pear to influence their shape matching responses (for flavour-shapeaffective correspondences, see Liang et al., 2013; Velasco et al., 2015;for odour-shape affective correspondences see also Hanson-Vaux,Crisinel, & Spence, 2013; Seo et al., 2010). Given that some researchershave proposed that the associations between stimuli from differentsenses are mediated by emotion (Guerdoux, Trouillet, & Brouillet,2014; Palmer, Schloss, Xu, & Prado-Leon, 2013; Schifferstein &Tanudjaja, 2004), it has been suggested that sweet-rounded corre-spondences and bitter/sour-angular correspondences may share an af-fective congruence in which sweet tastes and rounded shapes are re-garded as pleasant stimuli whereas bitter/sour tastes and angularshapes are initially considered unpleasant stimuli (Bar & Neta, 2006;Steiner, 1974). In fact, a large number of studies support the idea thatwhile organic and rounded shapes are considered pleasant and friendly,pointy shapes elicit threat and aggressiveness and are therefore morecommonly disliked (Bar & Neta, 2006; Carbon, 2010; Dazkir & Read,2012; Ghoshal, Boatwright, & Malika, 2015; Larson, Aronoff, & Stearns,
2007; Leder & Carbon, 2005; Westerman et al., 2012). Two classicalstudies in this field showed that there is an association between theaggressiveness of a concept and the angularity of the line chosen torepresent it, as in both cases words like “hard”, “cruel” or “furious”were matched with angled lines more frequently than concepts like“merry”, “weak” or “gentle”, which were consistently paired withrounded lines (Lundholm, 1921; Poffenberger & Barrows, 1924). In amore recent study, Bar and Neta (2006) suggested that objects withangled contours trigger a greater sense of threat than objects withrounded contours, and demonstrate that the contour of an object has acritical role in people’s attitude towards it since stimuli with roundedshapes were preferred to stimuli with angular shapes. The relation be-tween shapes and aggressiveness has been documented even in studiesof human facial expression, which suggest that diagonal and angularface patterns convey threat whereas round face patterns evoke warmth(Aronoff, Woike, & Hyman, 1992). This association is implicit and au-tomatic not only at the cognitive level (Larson, Aronoff, & Steuer, 2012)but also at the physiological level, since a fMRI test shows that an an-gular stimulus causes more activity in the amygdala than a roundedstimulus (Bar & Neta, 2007).
Given the above, it has been argued that a reason by which angularshapes and bitter tastes are commonly associated is because both sti-muli evoke threat (Turoman, Velasco, Chen, Huang, & Spence, 2018),as many natural poisons have a bitter taste (Garcia & Hankins, 1975;Lundström et al., 2011). We hypothesize that this is also the case forspiciness, and we propose that spiciness and angular shapes share acommon cognitive space in which both stimuli are rendered as ag-gressive. Indeed, some studies link spiciness and aggressiveness (Batra,Ghoshal, & Raghunathan, 2017). The irritation produced by capsaicinleads to the characteristic burning sensation of spicy foods, which hasbeen related with discomfort or even pain (Bègue, Bricout, Boudesseul,Shankland, & Duke, 2015; Byrnes & Hayes, 2013) and in turn mayevoke aggressiveness (Berkowitz, 1990, 1993). Therefore:
H2. The effect of shape angularity on spiciness expectations will bemediated by perceived aggressiveness of the shape.
3. Pretests
3.1. Adequacy of the chosen stimulus
A fire icon depicted on the front of a bag of nuts was chosen as thestimulus for this experiment under the assumption that it is a propo-sitionally indeterminate visual sign which may evoke both spicy androasted meanings to the observer. To verify this assumption, a pretestwas conducted in which 31 participants (16 female, mean age20.7 years) completed an open-ended task. Instructions were given asfollows: “Imagine you are in a supermarket and you see a bag of nuts onwhich front an icon of fire is depicted. When you see fire depicted on a nutsbag, you think it means the nuts are…”. The participants were asked torespond as quickly as possible. The elicited meanings were Spicy (inSpanish, Picantes; N= 18, 58.1%) and Roasted (in Spanish, Tostados;N= 13, 41.9%). No other words were elicited. The difference betweenthe two percentages was not significant (χ2=0.806, p=0.37), thusshowing that a bag of nuts with a depiction of fire is adequate for thisexperiment since the fire image can be interpreted in two different ways(i.e. that the nuts are spicy or that the nuts are roasted).
3.2. Effectiveness of the icons shape manipulation
Once the adequacy of the stimulus had been checked, a total of eightfire icons varying only in their shape were designed of which four wereintended to be considered angular (A, B, C and D) and the other fourwere intended to be rather perceived as rounded (E, F, G and H), seeFig. 1a. The stimuli were designed with Adobe Illustrator CC 2017.1.0(Adobe Systems Incorporated, 2006). Since the shape of the image
I. Gil-Pérez et al. Food Quality and Preference 71 (2019) 197–208
199
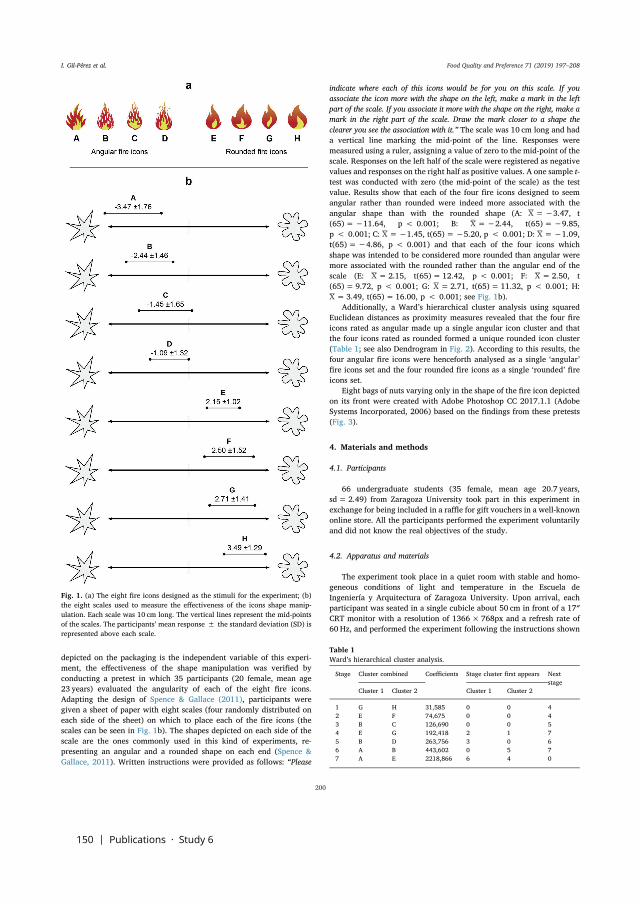
150 | Publications · Study 6
depicted on the packaging is the independent variable of this experi-ment, the effectiveness of the shape manipulation was verified byconducting a pretest in which 35 participants (20 female, mean age23 years) evaluated the angularity of each of the eight fire icons.Adapting the design of Spence & Gallace (2011), participants weregiven a sheet of paper with eight scales (four randomly distributed oneach side of the sheet) on which to place each of the fire icons (thescales can be seen in Fig. 1b). The shapes depicted on each side of thescale are the ones commonly used in this kind of experiments, re-presenting an angular and a rounded shape on each end (Spence &Gallace, 2011). Written instructions were provided as follows: “Please
indicate where each of this icons would be for you on this scale. If youassociate the icon more with the shape on the left, make a mark in the leftpart of the scale. If you associate it more with the shape on the right, make amark in the right part of the scale. Draw the mark closer to a shape theclearer you see the association with it.” The scale was 10 cm long and hada vertical line marking the mid-point of the line. Responses weremeasured using a ruler, assigning a value of zero to the mid-point of thescale. Responses on the left half of the scale were registered as negativevalues and responses on the right half as positive values. A one sample t-test was conducted with zero (the mid-point of the scale) as the testvalue. Results show that each of the four fire icons designed to seemangular rather than rounded were indeed more associated with theangular shape than with the rounded shape (A: X=−3.47, t(65)=−11.64, p < 0.001; B: X=−2.44, t(65)=−9.85,p < 0.001; C: X=−1.45, t(65)=−5.20, p < 0.001; D: X=−1.09,t(65)=−4.86, p < 0.001) and that each of the four icons whichshape was intended to be considered more rounded than angular weremore associated with the rounded rather than the angular end of thescale (E: X=2.15, t(65)= 12.42, p < 0.001; F: X=2.50, t(65)= 9.72, p < 0.001; G: X=2.71, t(65)= 11.32, p < 0.001; H:X=3.49, t(65)= 16.00, p < 0.001; see Fig. 1b).
Additionally, a Ward’s hierarchical cluster analysis using squaredEuclidean distances as proximity measures revealed that the four fireicons rated as angular made up a single angular icon cluster and thatthe four icons rated as rounded formed a unique rounded icon cluster(Table 1; see also Dendrogram in Fig. 2). According to this results, thefour angular fire icons were henceforth analysed as a single ‘angular’fire icons set and the four rounded fire icons as a single ‘rounded’ fireicons set.
Eight bags of nuts varying only in the shape of the fire icon depictedon its front were created with Adobe Photoshop CC 2017.1.1 (AdobeSystems Incorporated, 2006) based on the findings from these pretests(Fig. 3).
4. Materials and methods
4.1. Participants
66 undergraduate students (35 female, mean age 20.7 years,sd= 2.49) from Zaragoza University took part in this experiment inexchange for being included in a raffle for gift vouchers in a well-knownonline store. All the participants performed the experiment voluntarilyand did not know the real objectives of the study.
4.2. Apparatus and materials
The experiment took place in a quiet room with stable and homo-geneous conditions of light and temperature in the Escuela deIngeniería y Arquitectura of Zaragoza University. Upon arrival, eachparticipant was seated in a single cubicle about 50 cm in front of a 17″CRT monitor with a resolution of 1366×768px and a refresh rate of60 Hz, and performed the experiment following the instructions shown
Fig. 1. (a) The eight fire icons designed as the stimuli for the experiment; (b)the eight scales used to measure the effectiveness of the icons shape manip-ulation. Each scale was 10 cm long. The vertical lines represent the mid-pointsof the scales. The participants’ mean response ± the standard deviation (SD) isrepresented above each scale.
Table 1Ward’s hierarchical cluster analysis.
Stage Cluster combined Coefficients Stage cluster first appears Nextstage
Cluster 1 Cluster 2 Cluster 1 Cluster 2
1 G H 31,585 0 0 42 E F 74,675 0 0 43 B C 126,690 0 0 54 E G 192,418 2 1 75 B D 263,756 3 0 66 A B 443,602 0 5 77 A E 2218,866 6 4 0
I. Gil-Pérez et al. Food Quality and Preference 71 (2019) 197–208
200
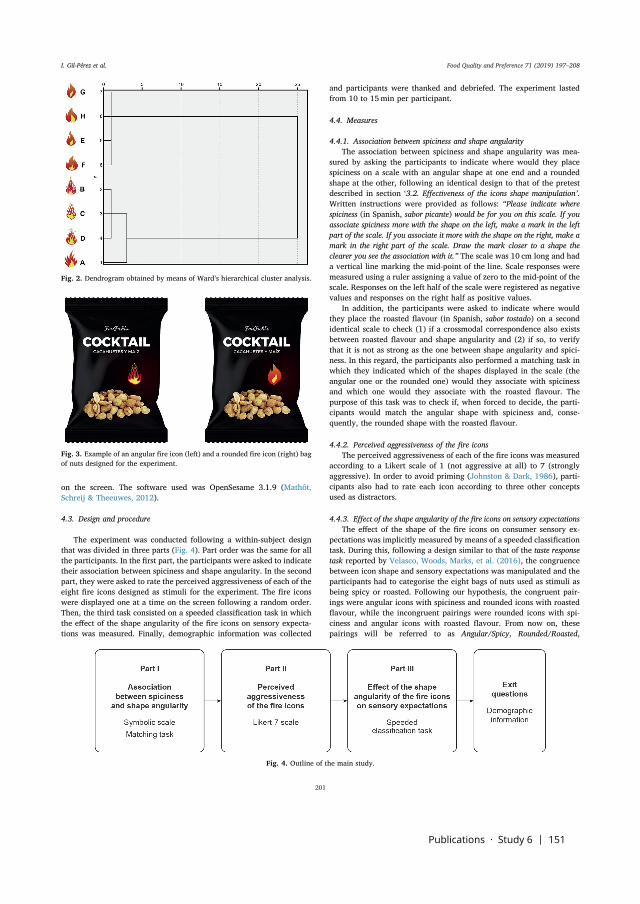
Publications · Study 6 | 151
on the screen. The software used was OpenSesame 3.1.9 (Mathôt,Schreij & Theeuwes, 2012).
4.3. Design and procedure
The experiment was conducted following a within-subject designthat was divided in three parts (Fig. 4). Part order was the same for allthe participants. In the first part, the participants were asked to indicatetheir association between spiciness and shape angularity. In the secondpart, they were asked to rate the perceived aggressiveness of each of theeight fire icons designed as stimuli for the experiment. The fire iconswere displayed one at a time on the screen following a random order.Then, the third task consisted on a speeded classification task in whichthe effect of the shape angularity of the fire icons on sensory expecta-tions was measured. Finally, demographic information was collected
and participants were thanked and debriefed. The experiment lastedfrom 10 to 15min per participant.
4.4. Measures
4.4.1. Association between spiciness and shape angularityThe association between spiciness and shape angularity was mea-
sured by asking the participants to indicate where would they placespiciness on a scale with an angular shape at one end and a roundedshape at the other, following an identical design to that of the pretestdescribed in section ‘3.2. Effectiveness of the icons shape manipulation’.Written instructions were provided as follows: “Please indicate wherespiciness (in Spanish, sabor picante) would be for you on this scale. If youassociate spiciness more with the shape on the left, make a mark in the leftpart of the scale. If you associate it more with the shape on the right, make amark in the right part of the scale. Draw the mark closer to a shape theclearer you see the association with it.” The scale was 10 cm long and hada vertical line marking the mid-point of the line. Scale responses weremeasured using a ruler assigning a value of zero to the mid-point of thescale. Responses on the left half of the scale were registered as negativevalues and responses on the right half as positive values.
In addition, the participants were asked to indicate where wouldthey place the roasted flavour (in Spanish, sabor tostado) on a secondidentical scale to check (1) if a crossmodal correspondence also existsbetween roasted flavour and shape angularity and (2) if so, to verifythat it is not as strong as the one between shape angularity and spici-ness. In this regard, the participants also performed a matching task inwhich they indicated which of the shapes displayed in the scale (theangular one or the rounded one) would they associate with spicinessand which one would they associate with the roasted flavour. Thepurpose of this task was to check if, when forced to decide, the parti-cipants would match the angular shape with spiciness and, conse-quently, the rounded shape with the roasted flavour.
4.4.2. Perceived aggressiveness of the fire iconsThe perceived aggressiveness of each of the fire icons was measured
according to a Likert scale of 1 (not aggressive at all) to 7 (stronglyaggressive). In order to avoid priming (Johnston & Dark, 1986), parti-cipants also had to rate each icon according to three other conceptsused as distractors.
4.4.3. Effect of the shape angularity of the fire icons on sensory expectationsThe effect of the shape of the fire icons on consumer sensory ex-
pectations was implicitly measured by means of a speeded classificationtask. During this, following a design similar to that of the taste responsetask reported by Velasco, Woods, Marks, et al. (2016), the congruencebetween icon shape and sensory expectations was manipulated and theparticipants had to categorise the eight bags of nuts used as stimuli asbeing spicy or roasted. Following our hypothesis, the congruent pair-ings were angular icons with spiciness and rounded icons with roastedflavour, while the incongruent pairings were rounded icons with spi-ciness and angular icons with roasted flavour. From now on, thesepairings will be referred to as Angular/Spicy, Rounded/Roasted,
Fig. 2. Dendrogram obtained by means of Ward’s hierarchical cluster analysis.
Fig. 3. Example of an angular fire icon (left) and a rounded fire icon (right) bagof nuts designed for the experiment.
Fig. 4. Outline of the main study.
I. Gil-Pérez et al. Food Quality and Preference 71 (2019) 197–208
201
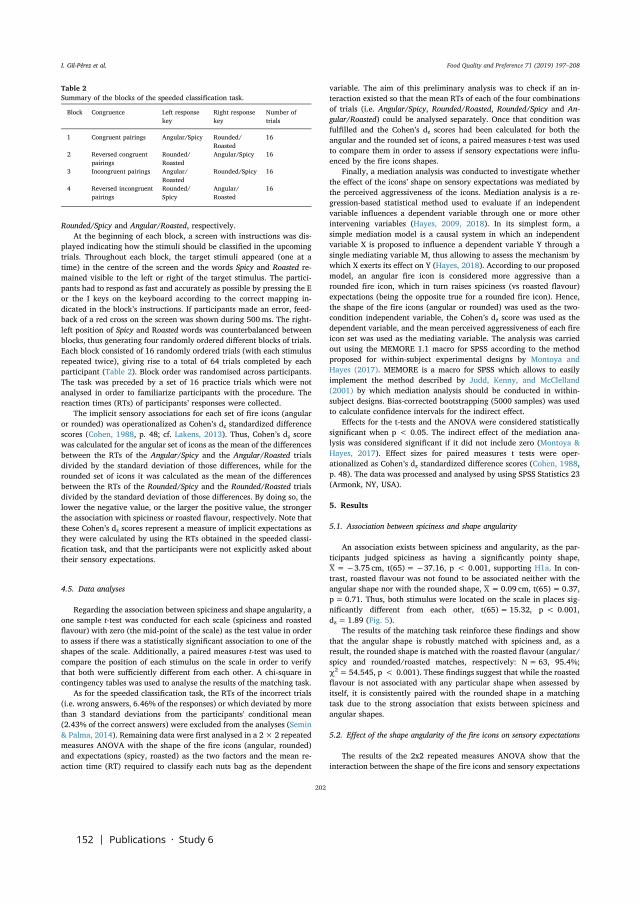
152 | Publications · Study 6
Rounded/Spicy and Angular/Roasted, respectively.At the beginning of each block, a screen with instructions was dis-
played indicating how the stimuli should be classified in the upcomingtrials. Throughout each block, the target stimuli appeared (one at atime) in the centre of the screen and the words Spicy and Roasted re-mained visible to the left or right of the target stimulus. The partici-pants had to respond as fast and accurately as possible by pressing the Eor the I keys on the keyboard according to the correct mapping in-dicated in the block’s instructions. If participants made an error, feed-back of a red cross on the screen was shown during 500ms. The right-left position of Spicy and Roasted words was counterbalanced betweenblocks, thus generating four randomly ordered different blocks of trials.Each block consisted of 16 randomly ordered trials (with each stimulusrepeated twice), giving rise to a total of 64 trials completed by eachparticipant (Table 2). Block order was randomised across participants.The task was preceded by a set of 16 practice trials which were notanalysed in order to familiarize participants with the procedure. Thereaction times (RTs) of participants’ responses were collected.
The implicit sensory associations for each set of fire icons (angularor rounded) was operationalized as Cohen’s dz standardized differencescores (Cohen, 1988, p. 48; cf. Lakens, 2013). Thus, Cohen’s dz scorewas calculated for the angular set of icons as the mean of the differencesbetween the RTs of the Angular/Spicy and the Angular/Roasted trialsdivided by the standard deviation of those differences, while for therounded set of icons it was calculated as the mean of the differencesbetween the RTs of the Rounded/Spicy and the Rounded/Roasted trialsdivided by the standard deviation of those differences. By doing so, thelower the negative value, or the larger the positive value, the strongerthe association with spiciness or roasted flavour, respectively. Note thatthese Cohen’s dz scores represent a measure of implicit expectations asthey were calculated by using the RTs obtained in the speeded classi-fication task, and that the participants were not explicitly asked abouttheir sensory expectations.
4.5. Data analyses
Regarding the association between spiciness and shape angularity, aone sample t-test was conducted for each scale (spiciness and roastedflavour) with zero (the mid-point of the scale) as the test value in orderto assess if there was a statistically significant association to one of theshapes of the scale. Additionally, a paired measures t-test was used tocompare the position of each stimulus on the scale in order to verifythat both were sufficiently different from each other. A chi-square incontingency tables was used to analyse the results of the matching task.
As for the speeded classification task, the RTs of the incorrect trials(i.e. wrong answers, 6.46% of the responses) or which deviated by morethan 3 standard deviations from the participants' conditional mean(2.43% of the correct answers) were excluded from the analyses (Semin& Palma, 2014). Remaining data were first analysed in a 2× 2 repeatedmeasures ANOVA with the shape of the fire icons (angular, rounded)and expectations (spicy, roasted) as the two factors and the mean re-action time (RT) required to classify each nuts bag as the dependent
variable. The aim of this preliminary analysis was to check if an in-teraction existed so that the mean RTs of each of the four combinationsof trials (i.e. Angular/Spicy, Rounded/Roasted, Rounded/Spicy and An-gular/Roasted) could be analysed separately. Once that condition wasfulfilled and the Cohen’s dz scores had been calculated for both theangular and the rounded set of icons, a paired measures t-test was usedto compare them in order to assess if sensory expectations were influ-enced by the fire icons shapes.
Finally, a mediation analysis was conducted to investigate whetherthe effect of the icons’ shape on sensory expectations was mediated bythe perceived aggressiveness of the icons. Mediation analysis is a re-gression-based statistical method used to evaluate if an independentvariable influences a dependent variable through one or more otherintervening variables (Hayes, 2009, 2018). In its simplest form, asimple mediation model is a causal system in which an independentvariable X is proposed to influence a dependent variable Y through asingle mediating variable M, thus allowing to assess the mechanism bywhich X exerts its effect on Y (Hayes, 2018). According to our proposedmodel, an angular fire icon is considered more aggressive than arounded fire icon, which in turn raises spiciness (vs roasted flavour)expectations (being the opposite true for a rounded fire icon). Hence,the shape of the fire icons (angular or rounded) was used as the two-condition independent variable, the Cohen’s dz score was used as thedependent variable, and the mean perceived aggressiveness of each fireicon set was used as the mediating variable. The analysis was carriedout using the MEMORE 1.1 macro for SPSS according to the methodproposed for within-subject experimental designs by Montoya andHayes (2017). MEMORE is a macro for SPSS which allows to easilyimplement the method described by Judd, Kenny, and McClelland(2001) by which mediation analysis should be conducted in within-subject designs. Bias-corrected bootstrapping (5000 samples) was usedto calculate confidence intervals for the indirect effect.
Effects for the t-tests and the ANOVA were considered statisticallysignificant when p < 0.05. The indirect effect of the mediation ana-lysis was considered significant if it did not include zero (Montoya &Hayes, 2017). Effect sizes for paired measures t tests were oper-ationalized as Cohen’s dz standardized difference scores (Cohen, 1988,p. 48). The data was processed and analysed by using SPSS Statistics 23(Armonk, NY, USA).
5. Results
5.1. Association between spiciness and shape angularity
An association exists between spiciness and angularity, as the par-ticipants judged spiciness as having a significantly pointy shape,X=−3.75 cm, t(65)=−37.16, p < 0.001, supporting H1a. In con-trast, roasted flavour was not found to be associated neither with theangular shape nor with the rounded shape, X=0.09 cm, t(65)= 0.37,p=0.71. Thus, both stimulus were located on the scale in places sig-nificantly different from each other, t(65)= 15.32, p < 0.001,dz= 1.89 (Fig. 5).
The results of the matching task reinforce these findings and showthat the angular shape is robustly matched with spiciness and, as aresult, the rounded shape is matched with the roasted flavour (angular/spicy and rounded/roasted matches, respectively: N=63, 95.4%;χ2= 54.545, p < 0.001). These findings suggest that while the roastedflavour is not associated with any particular shape when assessed byitself, it is consistently paired with the rounded shape in a matchingtask due to the strong association that exists between spiciness andangular shapes.
5.2. Effect of the shape angularity of the fire icons on sensory expectations
The results of the 2x2 repeated measures ANOVA show that theinteraction between the shape of the fire icons and sensory expectations
Table 2Summary of the blocks of the speeded classification task.
Block Congruence Left responsekey
Right responsekey
Number oftrials
1 Congruent pairings Angular/Spicy Rounded/Roasted
16
2 Reversed congruentpairings
Rounded/Roasted
Angular/Spicy 16
3 Incongruent pairings Angular/Roasted
Rounded/Spicy 16
4 Reversed incongruentpairings
Rounded/Spicy
Angular/Roasted
16
I. Gil-Pérez et al. Food Quality and Preference 71 (2019) 197–208
202
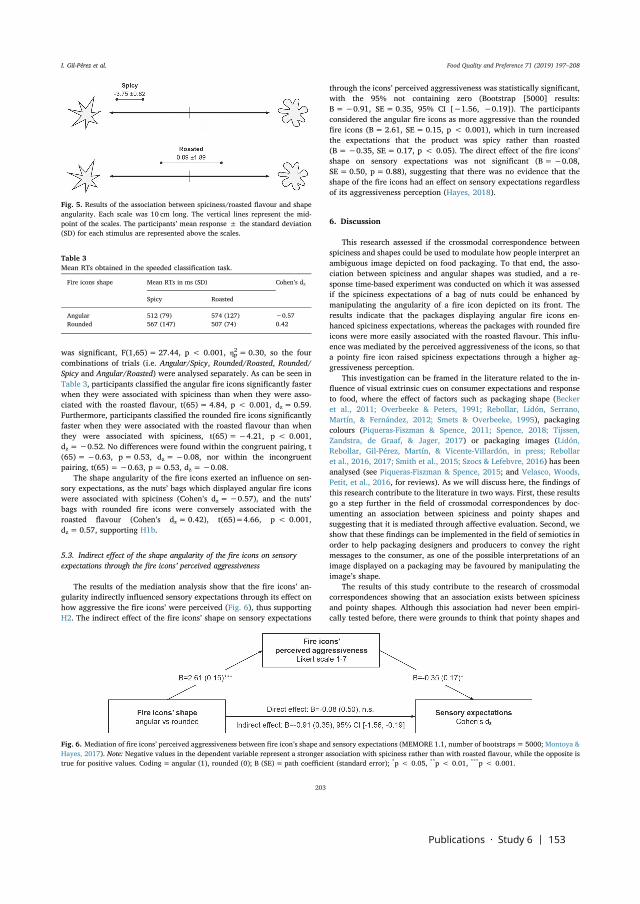
Publications · Study 6 | 153
was significant, F(1,65)= 27.44, p < 0.001, η2p= 0.30, so the fourcombinations of trials (i.e. Angular/Spicy, Rounded/Roasted, Rounded/Spicy and Angular/Roasted) were analysed separately. As can be seen inTable 3, participants classified the angular fire icons significantly fasterwhen they were associated with spiciness than when they were asso-ciated with the roasted flavour, t(65)= 4.84, p < 0.001, dz= 0.59.Furthermore, participants classified the rounded fire icons significantlyfaster when they were associated with the roasted flavour than whenthey were associated with spiciness, t(65)=−4.21, p < 0.001,dz=−0.52. No differences were found within the congruent pairing, t(65)=−0.63, p= 0.53, dz=−0.08, nor within the incongruentpairing, t(65)=−0.63, p= 0.53, dz=−0.08.
The shape angularity of the fire icons exerted an influence on sen-sory expectations, as the nuts’ bags which displayed angular fire iconswere associated with spiciness (Cohen’s dz=−0.57), and the nuts’bags with rounded fire icons were conversely associated with theroasted flavour (Cohen’s dz= 0.42), t(65)=4.66, p < 0.001,dz= 0.57, supporting H1b.
5.3. Indirect effect of the shape angularity of the fire icons on sensoryexpectations through the fire icons’ perceived aggressiveness
The results of the mediation analysis show that the fire icons’ an-gularity indirectly influenced sensory expectations through its effect onhow aggressive the fire icons’ were perceived (Fig. 6), thus supportingH2. The indirect effect of the fire icons’ shape on sensory expectations
through the icons’ perceived aggressiveness was statistically significant,with the 95% not containing zero (Bootstrap [5000] results:B=−0.91, SE= 0.35, 95% CI [−1.56, −0.19]). The participantsconsidered the angular fire icons as more aggressive than the roundedfire icons (B= 2.61, SE=0.15, p < 0.001), which in turn increasedthe expectations that the product was spicy rather than roasted(B=−0.35, SE=0.17, p < 0.05). The direct effect of the fire icons’shape on sensory expectations was not significant (B=−0.08,SE= 0.50, p=0.88), suggesting that there was no evidence that theshape of the fire icons had an effect on sensory expectations regardlessof its aggressiveness perception (Hayes, 2018).
6. Discussion
This research assessed if the crossmodal correspondence betweenspiciness and shapes could be used to modulate how people interpret anambiguous image depicted on food packaging. To that end, the asso-ciation between spiciness and angular shapes was studied, and a re-sponse time-based experiment was conducted on which it was assessedif the spiciness expectations of a bag of nuts could be enhanced bymanipulating the angularity of a fire icon depicted on its front. Theresults indicate that the packages displaying angular fire icons en-hanced spiciness expectations, whereas the packages with rounded fireicons were more easily associated with the roasted flavour. This influ-ence was mediated by the perceived aggressiveness of the icons, so thata pointy fire icon raised spiciness expectations through a higher ag-gressiveness perception.
This investigation can be framed in the literature related to the in-fluence of visual extrinsic cues on consumer expectations and responseto food, where the effect of factors such as packaging shape (Beckeret al., 2011; Overbeeke & Peters, 1991; Rebollar, Lidón, Serrano,Martín, & Fernández, 2012; Smets & Overbeeke, 1995), packagingcolours (Piqueras-Fiszman & Spence, 2011; Spence, 2018; Tijssen,Zandstra, de Graaf, & Jager, 2017) or packaging images (Lidón,Rebollar, Gil-Pérez, Martín, & Vicente-Villardón, in press; Rebollaret al., 2016, 2017; Smith et al., 2015; Szocs & Lefebvre, 2016) has beenanalysed (see Piqueras-Fiszman & Spence, 2015; and Velasco, Woods,Petit, et al., 2016, for reviews). As we will discuss here, the findings ofthis research contribute to the literature in two ways. First, these resultsgo a step further in the field of crossmodal correspondences by doc-umenting an association between spiciness and pointy shapes andsuggesting that it is mediated through affective evaluation. Second, weshow that these findings can be implemented in the field of semiotics inorder to help packaging designers and producers to convey the rightmessages to the consumer, as one of the possible interpretations of animage displayed on a packaging may be favoured by manipulating theimage’s shape.
The results of this study contribute to the research of crossmodalcorrespondences showing that an association exists between spicinessand pointy shapes. Although this association had never been empiri-cally tested before, there were grounds to think that pointy shapes and
Fig. 5. Results of the association between spiciness/roasted flavour and shapeangularity. Each scale was 10 cm long. The vertical lines represent the mid-point of the scales. The participants’ mean response ± the standard deviation(SD) for each stimulus are represented above the scales.
Table 3Mean RTs obtained in the speeded classification task.
Fire icons shape Mean RTs in ms (SD) Cohen’s dz
Spicy Roasted
Angular 512 (79) 574 (127) −0.57Rounded 567 (147) 507 (74) 0.42
Fig. 6. Mediation of fire icons’ perceived aggressiveness between fire icon’s shape and sensory expectations (MEMORE 1.1, number of bootstraps= 5000; Montoya &Hayes, 2017). Note: Negative values in the dependent variable represent a stronger association with spiciness rather than with roasted flavour, while the opposite istrue for positive values. Coding= angular (1), rounded (0); B (SE)= path coefficient (standard error); *p < 0.05, **p < 0.01, ***p < 0.001.
I. Gil-Pérez et al. Food Quality and Preference 71 (2019) 197–208
203

154 | Publications · Study 6
spiciness may be matched in consumers’ mind (Blazhenkova & Kumar,2018; Wang et al., 2017). Indeed, this result is in line with previousstudies that have documented associations between spiciness and cuesfrom other sensory domains such as audition (Wang et al., 2017) orsight (Levitan & Shermer, 2014; Tu et al., 2016). For example, Seo et al.(2010) demonstrated that the smell of pepper (which, according toWang et al, (2017), is an approximate olfactory counterpart to the tri-geminal spicy sensation) is more associated with angular shapes ratherthan with rounded shapes. Given that olfaction plays a key role in theperception of flavour (Spence et al., 2014; Spence, 2015a, 2015b), it isnot surprising that this association also occurs when thinking aboutother flavour contributors such as the burning sensation caused bycapsaicin (Lawless, 1989; Spence, 2015b). In this regard, it may beargued that this association could have been driven based either ontrigeminal cues or aromas, as the term spiciness may refer to both.Spiciness is a sensation that can contribute to flavour perception(Lawless, 1989; Spence, 2015b). Spicymay be sometimes, and for some,equivalent to painful, warm, irritating, burning (Bègue et al., 2015;Caterina et al., 1997). One may think that since in our main study therewere two types of shapes and two sensory descriptors, the correspon-dence could have been driven based either on trigeminal cues or ar-omas. However, we propose that the correspondence is more trigem-inal-based since spiciness was highly associated with the angular shape,but the roasted flavour (when assessed by itself) was not particularlyassociated to a shape. In addition, the fact that the effect was mediatedby aggressiveness supports the notion that the difference is more basedon trigeminal associations, since the concept of “roasted aroma” in thisfood context cannot be painful (nor linked to aggressiveness).
Furthermore, our results indicate that the association between spi-ciness and pointy shapes is affectively mediated, since perceived ag-gressiveness of the icons designed to convey sensory information in-creased spiciness expectations. This supports the notion that crossmodalcorrespondences between flavours and shapes may be, at least to someextent, explained in terms of affective mediation (Guerdoux et al.,2014; Palmer et al., 2013; Schifferstein & Tanudjaja, 2004), and is inline with previous findings that suggest that both pointy shapes andspiciness share a common affective space in which both stimuli arerendered as unpleasant or aggressive: while pointy shapes are generallyassociated with dangerous objects (Ghoshal et al., 2015) or even angryfaces (Aronoff et al., 1992) and therefore are initially disliked in com-parison with rounded shapes (Bar & Neta, 2006), the burning trigem-inal sensation produced by the capsaicin of spicy food has been relatedto discomfort, unpleasantness or pain (Bègue et al., 2015; Byrnes &Hayes, 2013; Caterina et al., 1997). Thus, the results of this researchadd to those of other studies which suggest that the mechanism behindthe crossmodal correspondence between flavour and shapes is of anaffective nature and do not fit satisfactorily into any of the three kindsof crossmodal correspondences previously proposed in the literature(i.e. statistical, structural or semantic; Spence, 2011). Indeed, the stu-dies that have assessed separately the association between abstractshapes and each of the sensory components of flavour perception (i.e.taste, smell or trigeminal; Spence et al., 2014) appear to be in the sameline, as is the case with taste-shape correspondences (Liang et al., 2013;Velasco et al., 2015), odour-shape correspondences (Hanson-Vauxet al., 2013; Seo et al., 2010) or trigeminal-shape correspondences(Spence et al., 2014): the mechanism behind these correspondencesseems to work indirectly through emotion rather than through en-vironmental or language inferences (cf. Turoman et al., 2018). How-ever, note that it seems unlikely that the association between spicinessand pointy shapes is exclusively mediated by an affective evaluation:although the evidence suggesting that affective judgements play animportant role in the matching between different stimuli across thesenses related to flavour perception is strong, other still unknown me-chanisms may also be at play (Turoman et al., 2018). In this regard,both the literature on shapes and motivation (Velasco, Salgado-Montejo, et al., 2016) and the literature on embodiment and grounded
cognition (Salgado-Montejo, Tapia Leon, Elliot, Salgado, & Spence,2015; Te Vaarwerk, van Rompay, & Okken, 2015) may offer alternativeexplanations for the findings reported here. While the shapes and mo-tivation approach argues that people tend to avoid negatively-valencedstimuli and to approach positively-valenced stimuli (Krieglmeyer,Deutsch, de Houwer, & de Raedt, 2010; although the association be-tween angular shapes and approach/avoidance motivation is yet notcompletely understood, e.g. Palumbo, Ruta, & Bertamini, 2015;Velasco, Salgado-Montejo, et al., 2016), embodiment assumes thatpeople interpret abstract concepts in terms of everyday physical inter-actions (Lakoff & Johnson, 1999). As stated by Fenko & van Rompay(2018), embodied cognition commonly assumes that the representationof symbolic concepts is grounded in direct bodily experience with thephysical world. For example, abstract concepts like importance anddominance are processed in terms of physical properties such as weightand height, as people tend to relate the heaviness of an object and itsperceived importance (Jostmann, Lakens, & Schubert, 2009) or therelative height of a product and its perceived dominance (van Rompay,Hekkert, Saakes, & Russo, 2005). Thus, according to this approach theassociation between spiciness and pointy shapes could also be ex-plained because both concepts are structured under a similar under-lying schema (van Rompay, Hekkert, & Muller, 2005): Since earlychildhood we learn that physical and tactile interactions with angularobjects may produce harm or pain on our skin, in the same way as spicyfood may produce a similar sensation inside the mouth (Bègue et al.,2015; Caterina et al., 1997). Furthermore, it is worth mentioning thatwhile aggressiveness is commonly related to threat and is thus initiallydisliked (Berkowitz, 1990; Liu, 2004), that does not necessarily meanthat it will be always processed as a negative input (Landwehr, McGill,& Herrmann, 2011). As is the case with other initially disliked stimuli asangular shapes or bitter flavours, in some contexts the concept of ag-gressiveness may be linked to positive judgements and therefore may berendered as positive (Ghoshal et al., 2015; Landwehr et al., 2011).
From a semiotic point of view, the main contribution of this paper isthat it shows that when it comes to convey sensory information about aproduct though an image depicted on its packaging, the reportedcrossmodal correspondence between spiciness and shapes can be usedto favour one of the image’s possible interpretations. Although thispossibility has been somewhat suggested by previous researchers (Ngoet al., 2012; Velasco, Woods, Petit, et al., 2016), this is the first studythat specifically addresses it experimentally by manipulating the shapeof an image depicted on a package. This finding can be framed on boththe two lines of analysis proposed in the literature that seek to under-stand the factors by which an indeterminate stimulus evokes a parti-cular meaning: the slot/filler approach and the analogy approach(Smith et al., 2015). The slot/filler approach assumes that the prob-abilities of opting for one of the possible meanings of the sign (filler)will be greater the better it fits with any of the possible attributes of theobject (slot) (Fillmore & Baker, 2010; Lynott & Connell, 2010; Smith,Osherson, Rips, & Keane, 1988), while the analogy approach states thatthe interpretation that has proved valid in similar past combinationswill be preferred (Estes & Jones, 2006; Gagné & Spalding, 2006; vanJaarsveld, Coolen, & Schreuder, 1994; see also Gregan-Paxton & John,1997). The results of this investigation show that the shape of the imageplays a role in these mechanisms, as it helps to evoke meaning bymaking a certain association more accessible in the mind of the con-sumer. Thus, according to the slot/filler approach, the results of thisexperiment can be explained as that an angular fire icon is associatedwith spiciness through an affective mechanism, so the concept spicybecomes more accessible to the consumer and therefore the chances ofchoosing it are increased. In addition, the existence of a crossmodalcorrespondence between spiciness and angular shapes implies thatthese results can also be explained under the analogy approach, sinceboth spicy and pointy stimulus are consistently paired in consumers’mind as a congruent match. Overall, these findings show that when itcomes to convey spiciness information about a product, images’ shape
I. Gil-Pérez et al. Food Quality and Preference 71 (2019) 197–208
204
Publications · Study 6 | 155
angularity may be used besides other well-known signs such as textualclaims or graphical scales (like the chillies scales commonly used infood packaging, where the higher the number of chillies shown, thespicier the food is supposed to be). Indeed, given the influence of signcongruency on consumer attitude (Becker et al., 2011), designersshould be careful to ensure that all signs on the packaging send aconsistent message.
However, as is the case in other works related to the study ofcrossmodal correspondences, the question arises as to what extent it isan association produced automatically in the mind of the consumer or,on the contrary, it rather emanates from a strategic process (Spence &Deroy, 2013). Some authors warn of the need to quantify the degree ofautomatism of the correspondences instead of adopting a two-prongedapproach between bottom-up and top-down processes (Getz & Kubovy,2018), and highlight the lack of consensus regarding what character-istics a process should have in order to be considered automatic (Spence& Deroy, 2013). Although conducting a speeded classification task al-lows to minimize the degree of reasoned processing (De Houwer, Teige-Mocigemba, Spruyt, & Moors, 2009), it is important to be cautiouswhen drawing conclusions about the true nature of this correspondencesince it has been shown that a lot of processes occur in the millisecondsin which the participant takes time to respond (Fiebelkorn, Foxe, &Molholm, 2010; Horowitz, Wolfe, Alvarez, Cohen, & Kuzmova, 2009;Spence & Deroy, 2013) and recent research has suggested that cross-modal correspondences may not be absolute in nature and may ratherbe subjected to the specific configuration of the task (Brunetti,Indraccolo, Gatto, & Spence, 2017).
Beyond its contributions, this study has some limitations that mustbe taken into account. For example, there may be a bias regarding thediversity and features of the participants. Sample size was modest andall participants were university students living in the same country(Spain); as a result, further testing would be needed to see if these re-sults could be extrapolated to other markets and other cohorts of con-sumers. In this regard, note that although some studies have founddifferences among populations (Bremner et al., 2013), crossmodalcorrespondences are shared by a large number of people (Spence,2011). Indeed, few studies have been conducted to date studying in-dividual differences (Parise, 2016). However, one may wonder if thesemantic interpretation of the symbols displayed on product packagingwould be different regarding consumer’s culture and language, giventhat some studies suggest that structural differences between languagesbased on ideographic writing systems (e.g. Chinese) and western lan-guages may influence packaging perception (Hoon Ang, 1997; Schmitt,Pan, & Tavassoli, 1994). A similar question arises regarding not onlyhow people interpret symbols according to the structure of their lan-guage, but also according to their culture. Whereas for the participantsin this study the depiction of an icon of fire in the context of food eli-cited the meaning of spiciness, this may not be the case across differentcultures or consumer cohorts. Although the metaphor spicy food is firerelays on a sensation emerging directly from the sensory domain(Caterina et al., 1997; Tu et al., 2016), and may therefore be consideredmore stable across cultures than other kind of metaphors (e.g. linguisticmetaphors, Landau, Meier, & Keefer, 2010), previous studies havesuggested that the existence of individual differences should not bedisregarded even within the same cultural group (Piqueras-fiszman,Ares, & Varela, 2011).
Moreover, although in this type of study it is very difficult tocompletely isolate the study variable and there is a risk that part of theeffects reported here are not exclusively due to the angularity of theicons but to another factor, the icons were designed as similar as pos-sible in terms of size, symmetry and colour (Parise, 2016). Despite this,it could be argued that they are not only differentiated by angularitybut also by other factors such as complexity, symmetry or colour, whichin turn could have influenced the results (Turoman et al., 2018).Therefore, it cannot be ruled out that other factors besides angularitymay have had an effect on the findings reported in this study, which
leaves the door open to further research. On the other hand, despite thefact that participants did not know the true aim of the study, it shouldbe noted that the order of the different experiment parts may haveprimed the responses for the subsequent tasks by making some concepts(namely, aggressiveness) more accessible in participants’ minds.Priming is said to occur when one stimulus affects how a subsequentstimulus is processed (Johnston & Dark, 1986), so asking the partici-pants to rate the perceived aggressiveness of each of the fire icons usedas stimuli in the speeded classification task may have biased their re-sponses. To prevent this, the participants had also to evaluate each fireicon with respect to three other concepts not related to the objectives ofthe study (which were used as distractors). However, despite this pre-caution, the presence of a priming effect cannot be completely ruledout. Furthermore, the crossmodal association between spiciness andangular shapes was studied by using the spicy word and not by tastingspicy samples of food. Further research is thus needed in order to assessif this correspondence also occurs with tastants and not only with words(Velasco, Woods, Marks, et al., 2016).
The work presented in this paper can be further developed throughfuture lines of research. For example, this study did not analyse theeffect of the fire icons shape on consumer affective response. It wouldbe reasonable to expect that a higher perceived aggressiveness wouldlead to a positive attitude towards the product for consumers who likespicy food, while the opposite would be expected for people who doesnot like the burning sensation produced by pungent food. It would alsobe interesting to assess how the findings reported here relate to othersigns commonly used to indicate the degree of spiciness of a food, suchas chillies scales: according to our findings, one might think that themanipulation of the chillies’ shape may be used to modulate spicinessexpectations conveyed by the scale. In addition, the scope of this re-search was limited to studying the effect of manipulating the shape ofan icon of fire depicted on a package on consumer expectations. Thenext logical step would be to assess if the shape manipulation also hasan effect on sensory perception and on the hedonic response to theproduct, as other studies in this field suggest (Becker et al., 2011;Velasco et al., 2015). Moreover, it should be taken into account thatwhile in this paper spiciness has been treated as if it was a single sti-mulus, in reality there are many kinds of spiciness differentiated in theirintensity, their duration, and in the location of the trigeminal systemreceptors that react in contact with capsaicin (Baron & Penfield, 1996;Caterina et al., 1997; Prescott & Stevenson, 1995). Therefore, a nextstudy should consider these differences by analysing their effect on thecrossmodal correspondence between spiciness and abstract shapes.
7. Conclusion
For the consumer, correctly interpreting the visual signs depicted onfood packaging is key to set the right sensory expectations. However,since an image can evoke different meanings in a given context, it is noteasy for the designer to anticipate how the consumer will interpret it.The results of this investigation shed light in this subject showing thatdesigners can communicate sensory information about the product justby manipulating the shape of the images depicted on the packaging.Specifically, it shows that while it is possible to communicate that a bagof nuts is spicy through a pointy fire icon (since the consumer implicitlyassociates spiciness and pointy shapes because both stimuli are ren-dered as aggressive), if the same bag of nuts displays a rounded fire iconthe consumer rather interprets that the product have been roasted.Overall, these findings suggest that if a designer has to convey that theproduct contained in a package is spicy, it may be a good idea to do soby depicting angular images or pointy shapes rather than by depictingrounded shapes. This paper thus shows a useful way to implement thetheoretical advances made to date regarding the crossmodal corre-spondence between spiciness and abstract shapes. This is of great in-terest to producers and food packaging designers as it can help them tobetter communicate the desired message to consumers.
I. Gil-Pérez et al. Food Quality and Preference 71 (2019) 197–208
205
156 | Publications · Study 6
References
Alter, A. L., & Oppenheimer, D. M. (2009). Uniting the tribes of fluency to form a me-tacognitive nation. Personality and Social Psychology Review, 13(3), 219–235. https://doi.org/10.1177/1088868309341564.
Ares, G., Piqueras-Fiszman, B., Varela, P., Marco, R. M., López, A. M., & Fiszman, S.(2011). Food labels: Do consumers perceive what semiotics want to convey? FoodQuality and Preference, 22(7), 689–698. https://doi.org/10.1016/j.foodqual.2011.05.006.
Aronoff, J., Woike, B. A., & Hyman, L. M. (1992). Which are the stimuli in facial displaysof anger and happiness: Configurational bases of emotion recognition. Journal ofPersonality and Social Psychology, 62(6), 1050. https://doi.org/10.1037/0022-3514.62.6.1050.
Bar, M., & Neta, M. (2006). Humans prefer curved visual objects. Psychological Science,17(2001), 645–648. https://doi.org/10.1111/j.1467-9280.2006.01759.x.
Bar, M., & Neta, M. (2007). Visual elements of subjective preference modulate amygdalaactivation. Neuropsychologia, 45(10), 2191–2200. https://doi.org/10.1016/j.neuropsychologia.2007.03.008.
Barnett-Cowan, M. (2010). An illusion you can sink your teeth into: Haptic cues modulatethe perceived freshness and crispness of pretzels. Perception, 39(12), 1684–1686.https://doi.org/10.1068/p6784.
Baron, R. F., & Penfield, M. P. (1996). Capsaicin heat intensity – Concentration, carrier,fat level, and serving temperature effects. Journal of Sensory Studies, 11(4), 295–316.https://doi.org/10.1111/j.1745-459X.1996.tb00046.x.
Barthes, R. (1977). Image music text. New York: Hill and Wang.Batra, R. K., Ghoshal, T., & Raghunathan, R. (2017). You are what you eat: An empirical
investigation of the relationship between spicy food and aggressive cognition. Journalof Experimental Social Psychology, 71, 42–48. https://doi.org/10.1016/j.jesp.2017.01.007.
Becker, L., van Rompay, T. J. L., Schifferstein, H. N. J., & Galetzka, M. (2011). Toughpackage, strong taste: The influence of packaging design on taste impressions andproduct evaluations. Food Quality and Preference, 22(1), 17–23. https://doi.org/10.1016/j.foodqual.2010.06.007.
Bègue, L., Bricout, V., Boudesseul, J., Shankland, R., & Duke, A. A. (2015). Some like ithot: Testosterone predicts laboratory eating behavior of spicy food. Physiology andBehavior, 139, 375–377. https://doi.org/10.1016/j.physbeh.2014.11.061.
Berkowitz, L. (1990). On the formation and regulation of anger and aggression: A cog-nitive-neoassiationistic analysis. American Psychologist, 45(4), 494–503.
Berkowitz, L. (1993). Pain and aggression: Some findings and implications.Motivation andEmotion, 17(3), 277–293. https://doi.org/10.1007/BF00992223.
Blazhenkova, O., & Kumar, M. M. (2018). Angular versus curved shapes: correspondencesand emotional processing. Perception, 47(1), 67–89. https://doi.org/10.1177/0301006617731048.
Bremner, A. J., Caparos, S., Davidoff, J., de Fockert, J., Linnell, K. J., & Spence, C. (2013).“ Bouba” and “ Kiki” in Namibia? A remote culture make similar shape-sound mat-ches, but different shape-taste matches to Westerners. Cognition, 126(2), 165–172.https://doi.org/10.1016/j.cognition.2012.09.007.
Brunetti, R., Indraccolo, A., Del Gatto, C., & Spence, C. (2017). Are crossmodal corre-spondences relative or absolute? Sequential effects on speeded classification.Attention, Perception, & Psychophysics, 1–8. https://doi.org/10.3758/s13414-017-1445-z.
Byrnes, N. K., & Hayes, J. E. (2013). Personality factors predict spicy food liking andintake. Food Quality and Preference, 28(1), 213–221. https://doi.org/10.1016/j.foodqual.2012.09.008.
Carbon, C. C. (2010). The cycle of preference: Long-term dynamics of aesthetic appre-ciation. Acta Psychologica, 134(2), 233–244. https://doi.org/10.1016/j.actpsy.2010.02.004.
Carstens, E., Iodi Carstens, M., Dessirier, J. M., O’Mahony, M., Simons, C. T., Sudo, M., &Sudo, S. (2002). It hurts so good: Oral irritation by spices and carbonated drinks andthe underlying neural mechanisms. Food Quality and Preference, 13(7–8), 431–443.https://doi.org/10.1016/S0950-3293(01)00067-2.
Caterina, M., Schumacher, M., Timinaga, M., & Rosen, T. (1997). The capsaicin receptor:A heat-activited ion channel in the pathway. Nature, 389(October), 816–824.
Cohen, J. (1988). Statistical power analysis for the behavioral sciences (2nd ed). New York,USA: Psychology Press.
Dazkir, S. S., & Read, M. A. (2012). Furniture forms and their influence on our emotionalresponses toward interior environments. Environment and Behavior, 44(5), 722–734.https://doi.org/10.1177/0013916511402063.
De Houwer, J., Teige-Mocigemba, S., Spruyt, A., & Moors, A. (2009). Implicit measures: Anormative analysis and review. Psychological Bulletin, 135(3), 347–368. https://doi.org/10.1037/a0014211.
Deliza, R., & MacFie, H. J. H. (1996). The generation of sensory expectation by externalcues and its effect on sensory perception and hedonic ratings: A review. Journal ofSensory Studies, 11(2), 103–128. https://doi.org/10.1111/j.1745-459X.1996.tb00036.x.
Delwiche, J. (1996). Are there “basic” tastes? Trends in Food Science and Technology,7(12), 411–415. https://doi.org/10.1016/S0924-2244(96)20010-X.
Epley, N., & Gilovich, T. (2006). The anchoring-and-adjustment heuristic why the ad-justments are insufficient. Psychological Science, 17(4), 311–319.
Estes, Z., & Jones, L. L. (2006). Priming via relational similarity: A copper horse is fasterwhen seen through a glass eye. Journal of Memory and Language, 55(1), 89–101.https://doi.org/10.1016/j.jml.2006.01.004.
Fenko, A., & van Rompay, T. J. L. (2018). Consumer-driven product design. In G. Ares, &P. Varela (Eds.). Methods in consumer research, volume 2: Alternative approaches andspecial applications (pp. 427–462). Elsevier.
Fiebelkorn, I. C., Foxe, J. J., & Molholm, S. (2010). Dual mechanisms for the cross-sensoryspread of attention: How much do learned associations matter? Cerebral Cortex,20(1), 109–120. https://doi.org/10.1093/cercor/bhp083.
Fillmore, C. J., & Baker, C. (2010). A frames approach to semantic analysis. In B. Heine, &H. Narrog (Eds.). The oxford handbook of linguistic analysis (pp. 313–340). Oxford:Oxford University Press. https://doi.org/10.1093/oxfordhb/9780199544004.013.0013.
Frascara, J. (1988). Graphic design: Fine art or social science? Design Issues, 5(1), 18.https://doi.org/10.2307/1511556.
Gagné, C. L., & Spalding, T. L. (2006). Using conceptual combination research to betterunderstand novel compound words. Retrieved from SKASE Journal of TheoreticalLinguistics, 3(2), 9–16. http://citeseerx.ist.psu.edu/viewdoc/download?doi=10.1.1.163.5240&rep=rep1&type=pdf.
Gal, D., Wheeler, S. C., & Shiv, B. (2007). Cross - Modal Influences on GustatoryPerception. Available at SSRN 1030197. Retrieved from http://papers.ssrn.com/sol3/papers.cfm?abstract_id=1030197.
Garcia, J., & Hankins, W. G. (1975). The evolution of bitter and the acquisition of tox-iphobia. Olfaction and Taste. V, Proceedings of the 5th International Symposium (pp. 39–45). Melbourne, Australia: Academic Press. https://doi.org/10.1016/B978-0-12-209750-8.50014-7.
Getz, L. M., & Kubovy, M. (2018). Questioning the automaticity of audiovisual corre-spondences. Cognition, 175(August 2017), 101–108. https://doi.org/10.1016/j.cognition.2018.02.015.
Ghoshal, T., Boatwright, P., & Malika, M. (2015). Curvature from all angles: An in-tegrative review and implications for product design. In R. Batra, C. Seifert, & D. Brei(Eds.). The psychology of design: Creating consumer appeal (pp. 91–105). New York:Routledge.
Gregan-Paxton, J., & John, D. R. (1997). Consumer learning by analogy: A model ofinternal knowledge transfer. Journal of Consumer Research, 24(3).
Guerdoux, E., Trouillet, R., & Brouillet, D. (2014). Olfactory-visual congruence effectsstable across ages: yellow is warmer when it is pleasantly lemony. Attention,Perception, and Psychophysics, 76(5), 1280–1286. https://doi.org/10.3758/s13414-014-0703-6.
Hanson-Vaux, G., Crisinel, A. S., & Spence, C. (2013). Smelling shapes: Crossmodal cor-respondences between odors and shapes. Chemical Senses, 38(2), 161–166. https://doi.org/10.1093/chemse/bjs087.
Hayes, A. F. (2009). Beyond Baron and Kenny: Statistical mediation analysis in the newmillennium. Communication Monographs, 76(4), 408–420. https://doi.org/10.1080/03637750903310360.
Hayes, A. F. (2018). Introduction to Mediation, Moderation, and Conditional Process Analysis:A Regression-Based Approach (Second edition). New York, NY: Guilford Press.
Honea, H., & Horsky, S. (2012). The power of plain: Intensifying product experience withneutral aesthetic context. Marketing Letters, 23(1), 223–235. https://doi.org/10.1007/s11002-011-9149-y.
Hoon Ang, S. (1997). Chinese consumers’ perception of alpha-numeric brand names.Journal of Consumer Marketing, 14(3), 220–233. https://doi.org/10.1108/07363769710166800.
Horowitz, T. S., Wolfe, J. M., Alvarez, G. A., Cohen, M. A., & Kuzmova, Y. I. (2009). Thespeed of free will. Quarterly Journal of Experimental Psychology, 62(11), 2262–2288.https://doi.org/10.1080/17470210902732155.
Johnston, W. A., & Dark, V. J. (1986). Selective Attention. Annual Review of Psychology,37(1), 43–75. https://doi.org/10.1146/annurev.ps.37.020186.000355.
Jostmann, N. B., Lakens, D., & Schubert, T. W. (2009). Weight as an emodiment of im-portance. Psychological Science, 20(9), 1169–1174.
Judd, C. M., Kenny, D. A., & McClelland, G. H. (2001). Estimating and testing mediationand moderation in within-subject designs. Psychological Methods, 6(2), 115–134.https://doi.org/10.1037//1082-989X.6.2.115.
Kauppinen-Räisänen, H., & Luomala, H. T. (2010). Exploring consumers’ product-specificcolour meanings. Qualitative Market Research: An International Journal, 13(3),287–308. https://doi.org/10.1108/13522751011053644.
Krieglmeyer, R., Deutsch, R., de Houwer, J., & de Raedt, R. (2010). Being moved: Valenceactivates approach-avoidance behavior independently of evaluation and approach-avoidance intentions. Psychological Science, 21(4), 607–613. https://doi.org/10.1177/0956797610365131.
Lähteenmäki, L. (2013). Claiming health in food products. Food Quality and Preference,27(2), 196–201. https://doi.org/10.1016/j.foodqual.2012.03.006.
Laing, S., & Masoodian, M. (2016). A study of the influence of visual imagery on graphicdesign ideation. Design Studies, 45, 187–209. https://doi.org/10.1016/j.destud.2016.04.002.
Lakens, D. (2013). Calculating and reporting effect sizes to facilitate cumulative science:A practical primer for t-tests and ANOVAs. Frontiers in Psychology, 4(NOV), 1–12.https://doi.org/10.3389/fpsyg.2013.00863.
Lakoff, G., & Johnson, M. (1999). Philosophy in the flesh. New York, NY: Basic Books.Landau, M. J., Meier, B. P., & Keefer, L. A. (2010). A metaphor-enriched social cognition.
Psychological Bulletin, 136(6), 1045–1067. https://doi.org/10.1037/a0020970.Landwehr, J. R., McGill, A. L., & Herrmann, A. (2011). It’s got the look: The effect of
friendly and aggressive “facial” expressions on product liking and sales. Journal ofMarketing, 75(3), 132–146. https://doi.org/10.1509/jmkg.75.3.132.
Larson, C. L., Aronoff, J., & Stearns, J. J. (2007). The shape of threat: simple geometricforms evoke rapid and sustained capture of attention. Emotion, 7(3), 526–534.https://doi.org/10.1037/1528-3542.7.3.526.
Larson, C. L., Aronoff, J., & Steuer, E. L. (2012). Simple geometric shapes are implicitlyassociated with affective value. Motivation and Emotion, 36(3), 404–413. https://doi.org/10.1007/s11031-011-9249-2.
Lawless, H. T. (1989). Pepper potency and the forgotten flavor sense. Food Technology,52–58 (November).
I. Gil-Pérez et al. Food Quality and Preference 71 (2019) 197–208
206
Publications · Study 6 | 157
Leder, H., & Carbon, C. C. (2005). Dimensions in appreciation of car interior design.Applied Cognitive Psychology, 19(5), 603–618. https://doi.org/10.1002/acp.1088.
Levitan, C. A., & Shermer, D. Z. (2014). Red hot: The crossmodal effect of color intensityon perceived piquancy. Multisensory Research, 27(3–4), 207–223. https://doi.org/10.1163/22134808-00002457.
Lewis, C., & Walker, P. (1989). Typographic influences on reading. British Journal ofPsychology, 80(2), 241–257. https://doi.org/10.1111/j.2044-8295.1989.tb02317.x.
Liang, P., Roy, S., Chen, M. L., & Zhang, G. H. (2013). Visual influence of shapes andsemantic familiarity on human sweet sensitivity. Behavioural Brain Research, 253,42–47. https://doi.org/10.1016/j.bbr.2013.07.001.
Lidón, I., Rebollar, R., Gil-Pérez, I., Martín, J., & Vicente-Villardón, J. L. (in press). Theinfluence the image of the product shown on food packaging labels has on productperception during tasting: effects and gender differences. Packaging Technology andScience. https://doi.org/10.1002/pts.2407.
Liu, J. (2004). Concept analysis: Aggression. Issues in Mental Health Nursing, 25(7),693–714. https://doi.org/10.1080/01612840490486755.
Loken, B. (2006). Consumer psychology: Categorization, inferences, affect, and persua-sion. Annual Review of Psychology, 57(1), 453–485. https://doi.org/10.1146/annurev.psych.57.102904.190136.
Loken, B., Barsalou, L. W., & Joiner, C. (2008). Categorzation theory and research inconsumer psychology: Category representation and category-based inference.Handbook of Consumer Psychology (pp. 133–163). .
Lundholm, H. (1921). The affective tone of lines: Experimental researches. PsychologicalReview, 28(1), 43–60. https://doi.org/10.1037/h0072647.
Lundström, J. N., Boesveldt, S., & Albrecht, J. (2011). Central processing of the chemicalsenses: An overview. ACS Chemical Neuroscience, 2(1), 5–16. https://doi.org/10.1021/cn1000843.
Lynott, D., & Connell, L. (2010). Embodied conceptual combination. Frontiers inPsychology, 1(NOV), 1–14. https://doi.org/10.3389/fpsyg.2010.00212.
Madzharov, A. V., & Block, L. G. (2010). Effects of product unit image on consumption ofsnack foods. Journal of Consumer Psychology, 20(4), 398–409. https://doi.org/10.1016/j.jcps.2010.06.007.
Mathôt, S., Schreij, D., & Theeuwes, J. (2012). OpenSesame: An open-source, graphicalexperiment builder for the social sciences. Behavior Research Methods, 44(2),314–324. https://doi.org/10.3758/s13428-011-0168-7.
Messaris, P. (1994). Visual literacy: Image, mind, and reality. Boulder: Westview Press.Messaris, P. (1997). Visual persuasion: The role of images in advertising. Thousand Oaks, CA:
Sage Publications.Montoya, A. K., & Hayes, A. F. (2017). Two-condition within-participant statistical
mediation analysis: A path-analytic framework. Psychological Methods, 22(1), 6–27.https://doi.org/10.1037/met0000086.
Mueller, S., Lockshin, L., & Louviere, J. J. (2009). What you see may not be what you get:Asking consumers what matters may not reflect what they choose. Marketing Letters,21(4), 335–350. https://doi.org/10.1007/s11002-009-9098-x.
Nancarrow, C., Wright, L. T., & Brace, I. (1998). Gaining competitive advantage frompackaging and labelling in marketing communications. British Food Journal, 100(2),110–118. https://doi.org/10.1108/00070709810204101.
Ngo, M. K., Misra, R., & Spence, C. (2011). Assessing the shapes and speech sounds thatpeople associate with chocolate samples varying in cocoa content. Food Quality andPreference, 22(6), 567–572. https://doi.org/10.1016/j.foodqual.2011.03.009.
Ngo, M. K., Piqueras-Fiszman, B., & Spence, C. (2012). On the colour and shape of stilland sparkling water: Insights from online and laboratory-based testing. Food Qualityand Preference, 24(2), 260–268. https://doi.org/10.1016/j.foodqual.2011.11.004.
Ngo, M. K., Velasco, C., Salgado, A., Boehm, E., O’Neill, D., & Spence, C. (2013). Assessingcrossmodal correspondences in exotic fruit juices: The case of shape and soundsymbolism. Food Quality and Preference, 28(1), 361–369. https://doi.org/10.1016/j.foodqual.2012.10.004.
Overbeeke, C. J., & Peters, M. E. (1991). The taste of desserts’ packages. Perceptual andMotor Skills, 73(2), 575–580. https://doi.org/10.2466/pms.1991.73.2.575.
Palmer, S. E., Schloss, K. B., Xu, Z., & Prado-Leon, L. R. (2013). Music-color associationsare mediated by emotion. Proceedings of the National Academy of Sciences, 110(22),8836–8841. https://doi.org/10.1073/pnas.1212562110.
Palumbo, L., Ruta, N., & Bertamini, M. (2015). Comparing angular and curved shapes interms of implicit associations and approach/avoidance responses. PLoS ONE, 10(10),1–16. https://doi.org/10.1371/journal.pone.0140043.
Parise, C., & Spence, C. (2013). Audiovisual cross - modal corresp ondences in the generalp opul ation. The Oxfod Handbook of Synesthesia, 790–815.
Parise, C. V. (2016). Crossmodal correspondences: Standing issues and experimentalguidelines. Multisensory Research, 29(1–3), 7–28. https://doi.org/10.1163/22134808-00002502.
Peirce, C. S. (1991). In J. Hoopes (Ed.). Peirce on Signs: Writings on Semiotic. Chapel Hill:University of North Carolina Press.
Phillips, B. J. (2000). The impact of verbal anchoring on consumer response to image ads.Journal of Advertising, 29(1), 15–24. https://doi.org/10.1080/00913367.2000.10673600.
Piqueras-fiszman, B., Ares, G., & Varela, P. (2011). Semiotics and perception: Do labelsconvey the same messages to older and younger consumers? Journal of SensoryStudies, 26(3), 197–208. https://doi.org/10.1111/j.1745-459X.2011.00336.x.
Piqueras-Fiszman, B., Harrar, V., Alcaide, J., & Spence, C. (2011). Does the weight of thedish influence our perception of food? Food Quality and Preference, 22(8), 753–756.https://doi.org/10.1016/j.foodqual.2011.05.009.
Piqueras-Fiszman, B., & Spence, C. (2011). Crossmodal correspondences in productpackaging. Assessing color-flavor correspondences for potato chips (crisps). Appetite,57(3), 753–757. https://doi.org/10.1016/j.appet.2011.07.012.
Piqueras-Fiszman, B., & Spence, C. (2015). Sensory expectations based on product-ex-trinsic food cues: An interdisciplinary review of the empirical evidence and
theoretical accounts. Food Quality and Preference, 40(PA), 165–179. https://doi.org/10.1016/j.foodqual.2014.09.013.
Piqueras-Fiszman, B., Velasco, C., & Spence, C. (2012). Exploring implicit and explicitcrossmodal colour-flavour correspondences in product packaging. Food Quality andPreference, 25(2), 148–155. https://doi.org/10.1016/j.foodqual.2012.02.010.
Poffenberger, A. T., & Barrows, B. E. (1924). The feeling value of lines. Journal of AppliedPsychology, 8, 187–205.
Prescott, J., & Stevenson, R. J. (1995). Pungency in food perception and preference. FoodReviews International, 11(4), 665–698. https://doi.org/10.1080/87559129509541064.
Rebollar, R., Gil, I., Lidón, I., Martín, J., Fernández, M. J., & Rivera, S. (2017). Howmaterial, visual and verbal cues on packaging influence consumer expectations andwillingness to buy: The case of crisps (potato chips) in Spain. Food ResearchInternational, 99, 239–246. https://doi.org/10.1016/j.foodres.2017.05.024.
Rebollar, R., Lidón, I., Gil, I., Martín, J., Fernández, M. J., & Riveres, C. E. (2016). Theinfluence the serving suggestion displayed on soft cheese packaging has on consumerexpectations and willingness to buy. Food Quality and Preference, 52, 188–194.https://doi.org/10.1016/j.foodqual.2016.04.015.
Rebollar, R., Lidón, I., Serrano, A., Martín, J., & Fernández, M. J. (2012). Influence ofchewing gum packaging design on consumer expectation and willingness to buy. Ananalysis of functional, sensory and experience attributes. Food Quality and Preference,24, 162–170. https://doi.org/10.1016/j.foodqual.2011.10.011.
Reinbach, H. C., Toft, M., & Møller, P. (2009). Relationship between oral burn andtemperature in chili spiced pork patties evaluated by time-intensity. Food Quality andPreference, 20(1), 42–49. https://doi.org/10.1016/j.foodqual.2008.07.003.
Salgado-Montejo, A., Tapia Leon, I., Elliot, A. J., Salgado, C. J., & Spence, C. (2015).Smiles over frowns: When curved lines influence product preference. Psychology &Marketing, 32(7), 771–781. https://doi.org/10.1002/mar.20817.
Schifferstein, H. N. J., & Tanudjaja, I. (2004). Visualising fragrances through colours: Themediating role of emotions. Perception, 33(10), 1249–1266. https://doi.org/10.1068/p5132.
Schmitt, B. H., Pan, Y., & Tavassoli, N. T. (1994). Language and consumer memory: Theimpact of linguistic differences between Chinese and English. Journal of ConsumerResearch, 21(3), 419–431. https://doi.org/10.1086/209408.
Semin, G. R., & Palma, T. A. (2014). Why the bride wears white: Grounding gender withbrightness. Journal of Consumer Psychology, 24(2), 217–225. https://doi.org/10.1016/j.jcps.2013.09.003.
Seo, H. S., Arshamian, A., Schemmer, K., Scheer, I., Sander, T., Ritter, G., & Hummel, T.(2010). Cross-modal integration between odors and abstract symbols. NeuroscienceLetters, 478(3), 175–178. https://doi.org/10.1016/j.neulet.2010.05.011.
Silayoi, P., & Speece, M. (2007). The importance of packaging attributes: A conjointanalysis approach. European Journal of Marketing, 41(11/12), 1495–1517. https://doi.org/10.1108/03090560710821279.
Smets, G. J. F., & Overbeeke, C. J. (1995). Expressing tastes in packages. Design Studies,16(3), 349–365. https://doi.org/10.1016/0142-694X(94)00003-V.
Smith, E. E., Osherson, D. N., Rips, L. J., & Keane, M. (1988). Combining prototypes: Aselective modification model. Cognitive Science, 12(4), 485–527. https://doi.org/10.1016/0364-0213(88)90011-0.
Smith, V., Barratt, D., & Selsøe Sørensen, H. (2015). Do natural pictures mean naturaltastes? Assessing visual semantics experimentally. Cognitive Semiotics, 8(1), 53–86.https://doi.org/10.1515/cogsem-2015-0001.
Spence, C. (2011). Crossmodal correspondences: A tutorial review. Attention, Perception &Psychophysics, 73(January), 971–995. https://doi.org/10.3758/s13414-010-0073-7.
Spence, C. (2015a). Eating with our ears: Assessing the importance of the sounds ofconsumption on our perception and enjoyment of multisensory flavour experiences.Flavour, 4(1), 3. https://doi.org/10.1186/2044-7248-4-3.
Spence, C. (2015b). Multisensory flavor perception. Cell, 161(1), 24–35. https://doi.org/10.1016/j.cell.2015.03.007.
Spence, C. (2018). Background colour & its impact on food perception & behaviour. FoodQuality and Preference, 68, 156–166. https://doi.org/10.1016/j.foodqual.2018.02.012.
Spence, C., & Deroy, O. (2013). How automatic are crossmodal correspondences?Consciousness and Cognition, 22(1), 245–260. https://doi.org/10.1016/j.concog.2012.12.006.
Spence, C., & Gallace, A. (2011). Tasting shapes and words. Food Quality and Preference,22(3), 290–295. https://doi.org/10.1016/j.foodqual.2010.11.005.
Spence, C., Ngo, M. K., Percival, B., & Smith, B. (2013). Crossmodal correspondences:Assessing shape symbolism for cheese. Food Quality and Preference, 28(1), 206–212.https://doi.org/10.1016/j.foodqual.2012.08.002.
Spence, C., & Piqueras-Fiszman, B. (2014). The perfect meal: The multisensory science offood and dining. Chichester, UK: John Wiley & Sons Ltd 10.1002/9781118491003.
Spence, C., Smith, B., & Auvray, M. (2014). Confusing tastes with flavours. In D. Stokes,M. Matthen, & S. Biggs (Eds.). Perception and its modalities (pp. 247–276). Oxford, UK:Oxford University Press. https://doi.org/10.1093/acprof: oso/9780199832798.003.0011.
Steiner, J. E. (1974). Innate human facial expressions to taste and smell stimulation.Annals of the New York Academy of Sciences, 237, 229–233. https://doi.org/10.1111/j.1749-6632.1974.tb49858.x.
Sütterlin, B., & Siegrist, M. (2015). Simply adding the word “fruit” makes sugar healthier:The misleading effect of symbolic information on the perceived healthiness of food.Appetite, 95, 252–261. https://doi.org/10.1016/j.appet.2015.07.011.
Szocs, C., & Lefebvre, S. (2016). The blender effect: Physical state of food influenceshealthiness perceptions and consumption decisions. Food Quality and Preference, 54,152–159. https://doi.org/10.1016/j.foodqual.2016.07.009.
Te Vaarwerk, M. C., van Rompay, T. J. L., & Okken, V. S. (2015). Under cover and close athand: Embodied metaphor in packaging design. International Journal of Design, 9(1),
I. Gil-Pérez et al. Food Quality and Preference 71 (2019) 197–208
207
158 | Publications · Study 6
29–37.Tijssen, I., Zandstra, E. H., de Graaf, C., & Jager, G. (2017). Why a ‘light’ product package
should not be light blue: Effects of package colour on perceived healthiness and at-tractiveness of sugar- and fat-reduced products. Food Quality and Preference, 59,46–58. https://doi.org/10.1016/j.foodqual.2017.01.019.
Tu, Y., Yang, Z., & Ma, C. (2016). The taste of plate: How the spiciness of food is affectedby the color of the plate used to serve it. Journal of Sensory Studies, 31(1), 50–60.https://doi.org/10.1111/joss.12190.
Turoman, N., Velasco, C., Chen, Y. C., Huang, P. C., & Spence, C. (2018). Symmetry andits role in the crossmodal correspondence between shape and taste. Attention,Perception, and Psychophysics, 80(3), 738–751. https://doi.org/10.3758/s13414-017-1463-x.
Underwood, R. L., & Klein, N. M. (2002). Packaging as brand communication: Effects ofproduct pictures on consumer responses to the package and brand. Retrieved fromJournal of Marketing Theory and Practice, 10(4), 58–68. http://search.proquest.com.ezproxy.uned.es/.
van Jaarsveld, H. J., Coolen, R., & Schreuder, R. (1994). The role of analogy in the in-terpretation of novel compounds. Journal of Psycholinguistic Research, 23(2), 111–137.https://doi.org/10.1007/BF02143919.
Van Rompay, T., Hekkert, P., & Muller, W. (2005). The bodily basis of product experi-ence. Design Studies, 26(4), 359–377. https://doi.org/10.1016/j.destud.2004.08.001.
van Rompay, T., Hekkert, P., Saakes, D., & Russo, B. (2005). Grounding abstract objectcharacteristics in embodied interactions. Acta Psychologica, 119(3), 315–351. https://doi.org/10.1016/j.actpsy.2005.02.001.
Velasco, C., Salgado-Montejo, A., Elliot, A. J., Woods, A. T., Alvarado, J., & Spence, C.(2016). The shapes associated with approach/avoidance words. Motivation andEmotion, 40(5), 689–702. https://doi.org/10.1007/s11031-016-9559-5.
Velasco, C., Salgado-Montejo, A., Marmolejo-Ramos, F., & Spence, C. (2014). Predictivepackaging design: Tasting shapes, typefaces, names, and sounds. Food Quality and
Preference, 34, 88–95. https://doi.org/10.1016/j.foodqual.2013.12.005.Velasco, C., Woods, A. T., Deroy, O., & Spence, C. (2015). Hedonic mediation of the
crossmodal correspondence between taste and shape. Food Quality and Preference, 41,151–158. https://doi.org/10.1016/j.foodqual.2014.11.010.
Velasco, C., Woods, A. T., Marks, L. E., Cheok, A. D., & Spence, C. (2016). The semanticbasis of taste-shape associations. Peerj, 1–20. https://doi.org/10.7287/peerj.preprints.1366v1.
Velasco, C., Woods, A. T., Petit, O., Cheok, A. D., & Spence, C. (2016). Crossmodal cor-respondences between taste and shape, and their implications for product packaging:A review. Food Quality and Preference, 52(4), 17–26. https://doi.org/10.1016/j.foodqual.2016.03.005.
Venter, K., van der Merwe, D., de Beer, H., Kempen, E., & Bosman, M. (2011). Consumers’perceptions of food packaging: An exploratory investigation in Potchefstroom, SouthAfrica. International Journal of Consumer Studies, 35(3), 273–281. https://doi.org/10.1111/j.1470-6431.2010.00936.x.
Viana, F. (2011). Chemosensory properties of the trigeminal system. ACS ChemicalNeuroscience, 2(1), 38–50. https://doi.org/10.1021/cn100102c.
Wan, X., Woods, A. T., Van Den Bosch, J. J. F., McKenzie, K. J., Velasco, C., & Spence, C.(2014). Cross-cultural differences in crossmodal correspondences between basictastes and visual features. Frontiers in Psychology, 5(DEC), 1–13. https://doi.org/10.3389/fpsyg.2014.01365.
Wang, Q., (Janice), Keller, S., & Spence, C. (2017). Sounds spicy: Enhancing the eva-luation of piquancy by means of a customised crossmodally congruent soundtrack.Food Quality and Preference, 58, 1–9. https://doi.org/10.1016/j.foodqual.2016.12.014.
Westerman, S. J., Gardner, P. H., Sutherland, E. J., White, T., Jordan, K., Watts, D., &Wells, S. (2012). Product Design: Preference for Rounded versus Angular DesignElements. Psychology and Marketing, 29(8), 595–605. https://doi.org/10.1002/mar.20546.
I. Gil-Pérez et al. Food Quality and Preference 71 (2019) 197–208
208

General discussion | 159
GENERAL DISCUSSION4.

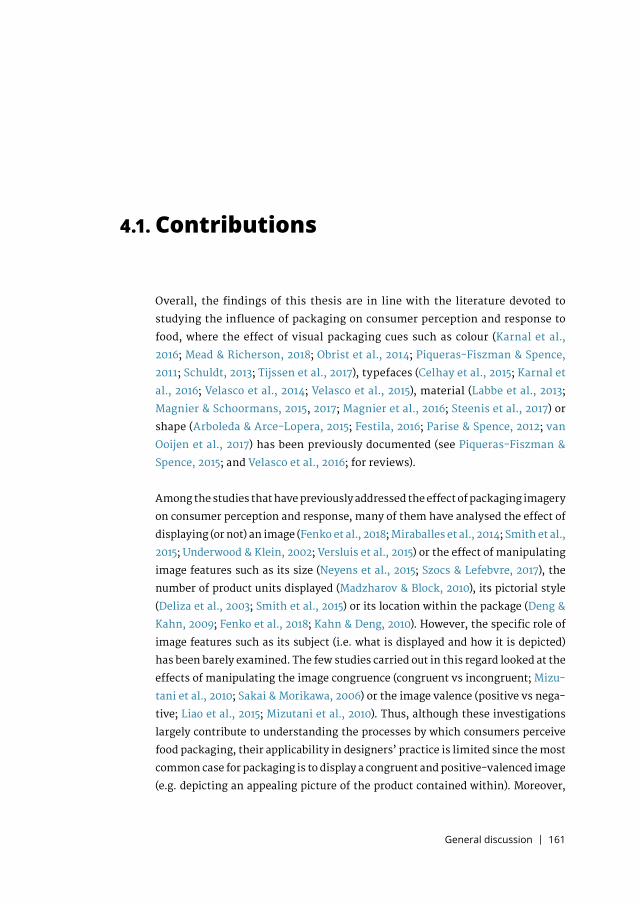
General discussion | 161
Contributions
Overall, the findings of this thesis are in line with the literature devoted to
studying the influence of packaging on consumer perception and response to
food, where the effect of visual packaging cues such as colour (Karnal et al.,
2016; Mead & Richerson, 2018; Obrist et al., 2014; Piqueras-Fiszman & Spence,
2011; Schuldt, 2013; Tijssen et al., 2017), typefaces (Celhay et al., 2015; Karnal et
al., 2016; Velasco et al., 2014; Velasco et al., 2015), material (Labbe et al., 2013;
Magnier & Schoormans, 2015, 2017; Magnier et al., 2016; Steenis et al., 2017) or
shape (Arboleda & Arce-Lopera, 2015; Festila, 2016; Parise & Spence, 2012; van
Ooijen et al., 2017) has been previously documented (see Piqueras-Fiszman &
Spence, 2015; and Velasco et al., 2016; for reviews).
Among the studies that have previously addressed the effect of packaging imagery
on consumer perception and response, many of them have analysed the effect of
displaying (or not) an image (Fenko et al., 2018; Miraballes et al., 2014; Smith et al.,
2015; Underwood & Klein, 2002; Versluis et al., 2015) or the effect of manipulating
image features such as its size (Neyens et al., 2015; Szocs & Lefebvre, 2017), the
number of product units displayed (Madzharov & Block, 2010), its pictorial style
(Deliza et al., 2003; Smith et al., 2015) or its location within the package (Deng &
Kahn, 2009; Fenko et al., 2018; Kahn & Deng, 2010). However, the specific role of
image features such as its subject (i.e. what is displayed and how it is depicted)
has been barely examined. The few studies carried out in this regard looked at the
effects of manipulating the image congruence (congruent vs incongruent; Mizu-
tani et al., 2010; Sakai & Morikawa, 2006) or the image valence (positive vs nega-
tive; Liao et al., 2015; Mizutani et al., 2010). Thus, although these investigations
largely contribute to understanding the processes by which consumers perceive
food packaging, their applicability in designers’ practice is limited since the most
common case for packaging is to display a congruent and positive-valenced image
(e.g. depicting an appealing picture of the product contained within). Moreover,
4.1.
162 | General discussion
research devoted to understanding how consumers interpret packaging imagery
has been scarce (for an elaboration on the different approaches adopted in this
regard in the fields of semantics and language, see Smith et al., 2015). Yet images
are intrinsically ambiguous and can elicit different meanings, so it is key for the
designer to anticipate how consumers will interpret packaging images given its
relevance in the inference process (Smith et al., 2015). Thus, both the specific role
of the subject of packaging images on consumer perception and the mechanis-
ms by which those images are interpreted have often been overlooked. By taking
an interdisciplinary approach, the work compiled in this thesis addressed these
issues by studying how manipulating the image subject influences consumer ex-
pectations, perception and response towards the product and investigating the
mechanisms by which consumers interpret those images.
Throughout six research studies, the work reported here shows that the properties
of the products depicted on the packaging tend to influence the evaluation of the
product contained within, since both perception and response depend on what is
depicted on the image (although the effects are stronger in expectations than in
perception during tasting). In addition, our findings show that the congruence be-
tween the image’s possible meanings and the product potential attributes plays a
key role in how the image is interpreted, and that the mechanism underlying this
interpretation may be in part explained through affective mediation. A general
discussion of these findings is outlined below in relation to the thesis objectives.
Objective 1: How manipulating the subject shown on packa-ging imagery influences consumer expectations, perception and response towards the product
The six research studies compiled in this dissertation aimed to investigate,
through slightly different approaches, whether manipulating the subject of
packaging imagery (i.e. what is displayed and how it is depicted) affects consu-
mer perception and response (objective 1). In this regard, our findings contri-
bute to the literature by showing that consumer perception and response de-
pend on the way in which the product is depicted (studies 1, p. 57; 4, p. 119), the
images chosen to convey a product attribute (studies 2, p. 67; 5, p. 131; 6, p. 145)
or the products shown accompanying the main product in the serving sugges-
tion (Study 3, p. 109). Specifically, we demonstrate that what is depicted on the
image biases how the product is perceived, since consumers tend to project the
4.1.1.
General discussion | 163
attributes of the image subject into the product. Thus, consumers tend to expect
that crisps will be crunchier if depicted ready for consumption rather than du-
ring the elaboration process (Study 1, p. 57), or that soft cheese will be sweeter
if shown together with a sweet product in the serving suggestion than if shown
together with a salty product (Study 3, p. 109).
These findings are in line with prior research where a similar heuristic judge-
ment has been reported, both regarding food extrinsic cues (e.g. Bell, Meisel-
man, Pierson, & Reeve, 1994; Celhay et al., 2015; North, Hargreaves, & McKen-
drick, 1997, 1999; Spence, 2018a) and the specific case of packaging imagery (e.g.
Bone & France, 2001; Gvili et al., 2015; Gvili et al., 2017; Machiels & Karnal, 2016;
Madzharov & Block, 2010; Smith et al., 2015; Szocs & Lefebvre, 2017). Indeed,
during the development of this thesis, studies on the effects of manipulating
the subject of the image have been published with results that support those
presented here. Thus, Machiels & Karnal (2016) showed that consumers rely on
the image to infer product naturalness, as depicting the food unprocessed (a
raw orange) rather than processed (a glass of orange juice) enhances percei-
ved taste pureness, which in turn increases purchase intentions (although the
effect was only significant for consumers who are health-conscious and search
for symbolic meaning). Moreover, Szocs & Lefebvre (2016) demonstrated that
altering the physical state in which the product is depicted (e.g. solid, liquid)
influences healthfulness perception and thereby product consumption.
Overall, these effects can be explained in terms of dual-process theories and heu-
ristic judgement (Gawronski & Creighton, 2013; Madzharov & Block, 2010; Nicker-
son, 1998). Food shopping has been shown to be a low-involvement process, since
consumers spend limited amounts of time and cognitive resources evaluating
products and deciding which to choose (Park et al., 1989). Thus, people uncons-
ciously use heuristics to make judgements regarding the attributes and benefits
of a food product, relying on the information available at the time (such as the
product’s package; Lee et al., 2013). Previous research has shown that packaging
imagery quickly draws consumer attention (Honea & Horsky, 2012; Rebollar et al.,
2015; Venter, van der Merwe, de Beer, Kempen, & Bosman, 2011), and that consu-
mers rely on the images depicted on food packaging to infer product information
(Schifferstein et al., 2013). Since judgements tend to be influenced by first impres-
sions (Epley & Gilovich, 2006; Lindgaard, Fernandes, Dudek, & Brown, 2006; see
also Smith et al., 2015), it is reasonable to think that expectations elicited by ima-
gery may anchor subsequent product evaluations, so that confirmation bias will
164 | General discussion
make the overall product evaluation to be consonant with the first impression
raised by the images (Nickerson, 1998; Westerman et al., 2013). This is in line with
the study conducted by Madzharov & Block (2010), which demonstrated that a si-
milar anchoring effect occurs regarding the number of product units depicted on
the package as consumers tend to estimate the number of product units contai-
ned within a package depending on the number of units depicted on it. Similarly,
several studies have addressed the presence of a halo effect by which consumers
tend to correlate the assessments of different product attributes (Lee et al., 2013;
Leuthesser, Kohli, & Harich, 1995; Westerman et al., 2013), making consumers
prone to make erroneous inferences (e.g. as with the health halo effect, Schuldt et
al., 2012; Schuldt & Schwarz, 2010; Skaczkowski, Durkin, Kashima, & Wakefield,
2016; Sütterlin & Siegrist, 2015). Our results contribute to this body of literature
by showing that packaging imagery anchors consumer perception and response
towards the product.
However, it should be noted that the effect of packaging imagery on expecta-
tions is stronger than in perception during tasting, as demonstrated by results
from Study 4 (p. 119). This is in line with findings from other studies conducted
in this vein (Levitan & Shermer, 2014; Wang, Keller, & Spence, 2017; Woods et
al., 2011; Woods, Poliakoff, Lloyd, Dijksterhuis, & Thomas, 2010). For example,
results from three experiments carried out by Tu et al. (2016) show that the co-
lour of the plate influences both spiciness expectations and perception, yet the
effect is stronger for the former. Indeed, although expectations largely influen-
ce consumption during tasting, it is worth noting that they are not the only fac-
tor contributing to the overall product experience (Piqueras-Fiszman & Spence,
2015; Spence, 2015a, 2018b). As results from Study 4 (p. 119) also show, individual
differences are another factor to be considered as contributing to perception,
since women were more sensitive than men to the manipulation of the image
depicted on the package. This is in line with prior research like that of Rebollar
et al. (2017), the results of which indicate that women are more sensitive to the
effect of illuminance than men, as women perceived a sample of natural yo-
ghurt as being sweeter under high (vs low) illuminance (cf. Running & Hayes,
2016). Although other individual differences such as need for cognition (Deliza
et al., 2003), design sensitivity (Becker et al., 2011; Celhay & Trinquecoste, 2014),
health consciousness (Machiels & Karnal, 2016) or metaphor processing (Ma-
chiels & Karnal, 2016) had been previously addressed regarding packaging per-
ception, our findings contribute to the literature by showing that gender also
moderates consumer response to packaging imagery manipulations.
General discussion | 165
Objective 2: How consumers infer meaning from an ambi-guous image
On the other hand, studies 5 (p. 131) and 6 (p. 145) aimed to investigate the pro-
cesses by which consumers infer meaning from an ambiguous image (objective
2). Images are known to be propositionally indeterminate, which implies that
they can be interpreted in different ways (e.g. according to the case analysed in
Study 6 (p. 145), an image of fire depicted on a nuts package may be interpreted
as being roasted or as being spicy). This poses a challenge to designers, as they
need to anticipate how the images will be decoded in order to make sure that pac-
kaging imagery elicits the intended message. In this regard, results from these
studies contribute to the literature demonstrating that the interpretation given to
an image depicted on a package depends on the congruence between the image’s
possible meanings and the product potential attributes (Study 5, p. 131), on the
image shape (Study 6, p. 145) and on the affective response raised by the image
(Study 6, p. 145). In addition, results from Study 5 (p. 131) show that the cognitive
effort needed to interpret an image with a metaphorical rhetorical style is higher
than the cognitive effort required to interpret an image with a literal rhetorical
style. These findings emphasize the complexity of the process by which consu-
mers interpret packaging imagery, since they reveal that several processes inte-
ract to set the definitive meaning of an ambiguous image.
Although the underlying mechanisms explaining these findings are discussed in
detail in each study, it is worth noting that overall these results support prior re-
search that suggest that packaging conveys meaning through each of its different
cues (Ares et al., 2011; Celhay & Remaud, 2018; Piqueras-Fiszman et al., 2011; Smi-
th et al., 2015; Smith et al., 2010), since our findings indicate that consumer inter-
pretation may be shaped by manipulating the image depicted on the package. This
is in line with approaches that propose that communication is a key part of de-
sign (Crilly, Good, Matravers, & Clarkson, 2008; Crilly, Moultrie, & Clarkson, 2004;
Frascara, 1988; Munari, 1973/2016), and highlights the importance of designing
each packaging cue considering what will be its role in the communication pro-
cess. Indeed, literature shows that cue congruence facilitates stimulus processing,
thereby positively influencing attitudes and beliefs towards the product (Spence,
2018a; Van Rompay & Pruyn, 2011). In contrast, cue incongruence may draw con-
fusion or deception, which in turn may lead to a disconfirmation of expectations
(Deliza & MacFie, 1996; Piqueras-Fiszman & Spence, 2015) or to suboptimal food
choices (Smith et al., 2015, 2010). It should be noted that cue incongruence may
4.1.2.
166 | General discussion
happen even when explicit verbal information is provided, as it often interacts
with other package cues in order to create meaning (Orth & Malkewitz, 2008). In
this line, studies 1 (p. 57), 2 (p. 67), 3 (p. 109) and 4 (p. 119) support prior research
and demonstrate that consumer perception may be affected by packaging visual
cues even when verbal information remains the same (e.g. Bone & France, 2001;
Schuldt, 2013). According to the literature, this implies that textual claims per se
are not enough to avoid confusing and deceptive interpretations of a package, sin-
ce the paths by which the meanings of texts and images are decoded are different
and thus can lead to different interpretations (Lewis & Walker, 1989). In that case,
an additional process is required in order to select a definitive meaning, which can
negatively affect the processing fluency and the overall attitude toward the pro-
duct, even if the elicited meaning is correct (Alter & Oppenheimer, 2009).
Thus, designers have to understand and disentangle the communication codes
by which consumers operate in order to foresee how images will be interpreted,
so as to achieve the congruence of all packaging cues and stimulate the desired
response (Ares et al., 2011; Orth & Malkewitz, 2008; Piqueras-Fiszman et al.,
2011). Many studies have addressed this issues by taking a semiotic approach
(Ares et al., 2011; Celhay et al., 2015; Celhay & Remaud, 2018; Mick, Burroughs,
Hetzel, & Brannen, 2004; Opperud, 2004; Oswald, 2015; Piqueras-Fiszman et
al., 2011; Smith et al., 2015), since semiotics provides a theoretical framework
by which to understand how packaging visual cues generate meaning to con-
sumers (Celhay & Remaud, 2018). The results reported in this dissertation take
a step forward by specifically examining the mechanisms by which consumers
interpret packaging imagery, and by doing so, experimentally assessing the
implicit associations generated by the images.
Practical implications
Taken together, these findings offer interesting insights into how consumers
process and interpret packaging imagery. Our results seem to show that the at-
tributes of what is depicted on packaging anchor consumers’ judgements, affec-
ting how the product within is evaluated and perceived. These are empirical re-
sults that need to be further tested to yield a comprehensive process model, and
therefore caution is needed before drawing definite conclusions from the fin-
dings reported here. Nevertheless, a number of design tips can be derived from
the observations of this thesis.
4.1.3.
General discussion | 167
Deciding whether to use visual or verbal cues in order to convey product in-
formation
First, our results suggest that when it comes to conveying product information
through packaging, it may be a good idea to decide which kind of cue (visual or
verbal) is more appropriate depending on the perceived valence of the attribu-
tes to be conveyed (i.e. whether those attributes are regarded by consumers as
positive or negative). Images are considered to be more vivid and salient that
texts, and therefore are commonly processed prior to textual claims (Kisielius
& Sternthal, 1984; Rebollar et al., 2015; Underwood & Klein, 2002). In this way,
they may anchor subsequent consumer judgements. Thus, if the product infor-
mation to be conveyed is perceived as positive (as tested in Study 1, p. 57), using
images rather than texts may enhance consumer expectations and response.
Conversely, relying on packaging imagery to communicate product attributes
that are not unequivocally positive, such as sweetness (which may be appealing
from a sensory point of view, but ambivalent about whether the product is heal-
thy) may negatively affect consumer attitude (as is suggested in Study 2, p. 67).
Further studies should address issues such as the validity of these conclusions,
or the moderating role of individual differences (where, for example, we would
expect a bigger effect for consumers with a strong focus on health promotion).
Conveying information through packaging imagery
The results from all six studies support the notion that packaging imagery plays a
key role in setting consumer expectations. They show that this effect can be used
by designers to convey product information, and also by consumers to infer the
product attributes (regardless of whether it was intended). This implies that de-
signers should be cautious when choosing what images to depict, since consumers
may use them to form expectations and, therefore, images may influence consu-
mers’ attitudes and responses. Specifically, results from the six studies indicate
that consumers tend to apply to the product the more prominent attributes of the
images depicted on its packaging. This can be seen when the appearance of the
main product is manipulated (studies 1, p. 57, and 4, p. 119), or when other pro-
ducts are shown (Study 3, p. 109), or when the image is used to convey a specific
product attribute (studies 2, p. 67; 5, p. 131; and 6, p. 145). For example, according
to our results, a designer could convey product healthfulness by depicting healthy
products on the packaging; and convey its sweetness either by displaying sweet
products or by manipulating its appearance (as is elaborated in Study 4, p. 119). In
168 | General discussion
addition, the features of the image can also be used to favour a preferred interpre-
tation, as can be seen in Study 6 (p. 145). Hence, for example, the designer could
convey product spiciness by displaying spicy products in the package’s serving
suggestion, by means of a metaphorical image (such as fire; studies 5, p. 131, and
6, p. 145) or by using angular and pointed shapes rather than rounded ones.
Favouring the image’s desired interpretation
Finally, our results give some insights that allow designers to modulate consumer
interpretation and to favour the desired meaning. As has already been discussed,
whereas the results of Study 5 (p. 131) highlight the key role that the congruence
between the image’s possible meanings and the product’s potential attributes has
on driving consumer interpretation, the findings from Study 6 (p. 145) show that
that interpretation may be modulated by manipulating the image’s shape. Thus,
it may be reasonable to expect that consumer confusion will be maximised if an
image whose shape has been manipulated to be strongly associated with a given
meaning is displayed together with a product whose potential attributes are in-
congruent with that meaning (e.g. depicting an angular fire image on a yoghurt
package). Accordingly, the contrary should occur and confusion may be minimi-
sed if such an image is displayed together with a product whose potential attri-
butes are congruent with that meaning (e.g. depicting an angular fire image on a
chili package). Indeed, there are grounds to expect that this latter combination
would help to reduce consumers’ cognitive effort even in the case of images with a
metaphorical rhetorical style (although this should be tested explicitly in further
research).
General discussion | 169
Methods used
Regarding the methods followed in this thesis, it is worth noting that several
measurement techniques have been used according to the objectives of each
study. Thus, whereas explicit self-assessment methods have been used in all
the six studies (mainly, Likert-7 scales) due to their reliability and their ea-
siness (Ares & Varela, 2018a; Asioli et al., 2016; Hendrick et al., 2013; Petty &
Cacioppo, 1996; Thomas & Chambault, 2016), other techniques such as word
association (Study 2, p. 67) or speeded classification tasks (studies 5, p. 131,
and 6, p. 145) have also been conducted. Specifically, word association allowed
us to qualitatively examine the associations raised by each of the images used
to convey sweetness in Study 2 (p. 67). It is a projective technique common-
ly used in the fields of psychology and sociology (Schmitt, 1998) which has
also been increasingly used to study the effects of consumer perception of
food (Esmerino et al., 2017; Guerrero et al., 2010; Roininen, Arvola, & Läh-
teenmäki, 2006). Our results support previous research, as it has proven to
be useful in order to investigate how packaging cues affect consumer per-
ception (Ares & Deliza, 2010; Carrillo, Fiszman, Lähteenmäki, & Varela, 2014;
Piqueras-Fiszman et al., 2013). As for the speeded classification tasks, both
Study 5 (p. 131) and Study 6 (p. 145) followed the procedure used by Semin &
Palma (2014). This kind of technique allows reducing the level of reasoning of
the participants (De Houwer et al., 2009), thus giving access to more implicit
associations than those accessed through explicit tasks (Bar-Anan & Nosek,
2014; Kraus & Piqueras-Fiszman, 2018; Nosek et al., 2011). Commonly used in
psychology (Bar-Anan & Nosek, 2014; Goodall, 2011), our results add to the
literature showing that speeded classification tasks can also be used to assess
semiotic meanings generated by packaging imagery (for similar uses regar-
ding other packaging cues, see e.g. Karnal et al., 2016; Mai et al., 2016; Parise
& Spence, 2012; Piqueras-Fiszman & Spence, 2011; Piqueras-Fiszman et al.,
2012). Given that some researchers have suggested that this type of task can
4.2.
170 | General discussion
also be conducted online without compromising its reliability (Chetverikov &
Upravitelev, 2016), it is expected that the number of studies using these tech-
niques will continue to increase in the future.
As for the ecological validity of the experiments, stimuli designed for all studies
were created following the findings of market studies conducted beforehand.
This allowed us to (1) identify the visual codes of the chosen product categories,
which in turn allowed us to design realistic packages with which to make the
experience more immersive for the participants; and (2) enhance the interest
and applicability of our findings by selecting realistic case studies which re-
present common design concerns. Moreover, Study 4 (p. 119) was conducted by
using tangible mock-up packages, so that participants could manipulate them
during the tasting. This contributes to boosting both the realism of the setting
and participant engagement, since participants are less prone to be aware of
the true aim of the experiment (Bangcuyo et al., 2015).
General discussion | 171
4.3. Limitations and future work
Beyond its contributions, the work reported in this thesis has some limitations
that should be taken into account. Regarding the participants who took part in
the six studies compiled in this dissertation, it should be noted that they were
mostly recruited in a Spanish university context, so a bias regarding their di-
versity and features should not be ruled out. Although our findings are in line
with previous research conducted in other contexts, further testing would be
needed in order to see if these results could be extrapolated to other markets
and other cohorts of consumers. In addition, it is worth noting that some of the
studies have modest sample sizes (such as the word association conducted in
Study 2, p. 67), so further work is advised in order to test the validity of their
results. Moreover, some studies followed a within participants design (studies 1, p. 57; 2, p. 67; 3, p. 109; 5, p. 131; and 6, p. 145) whereas others followed a be-
tween participants design (studies 2, p. 67; 4, p. 119; and 5, p. 131), so it is not
easy to compare their conclusions due to the practical effects that each kind of
study may carry for the marketplace (e.g. Keren, 1993). Furthermore, all stu-
dies were conducted in a laboratory setting, so it is reasonable to think that the
effects reported here may be modulated in a real consumption context (Lawless
& Heimann, 2010).
As has been previously discussed, the main experiments reported in studies 5 (p. 131) and 6 (p. 145) were conducted by means of speeded classification tas-
ks with the intention of accessing the implicit associations of the consumers
(De Houwer et al., 2009). However, some researchers have questioned whether
the documented associations are automatically produced in the mind (Spence &
Deroy, 2013) and whether this kind of task is able to really access purely impli-
cit associations (De Houwer et al., 2007). In addition, while literature suggests
that a lower cognitive effort is related to a better consumer attitude (Alter &
Oppenheimer, 2009), it is not clear whether latencies of a speeded classification
172 | General discussion
task really represent processing fluency (Graf, Mayer, & Landwehr, 2017). Thus,
since consumer hedonic response was not measured in those experiments, one
should be cautious regarding the implicit nature of the results and their effect
on consumer attitude.
The underlying mechanisms explaining the effects reported in studies 1 (p. 57),
2 (p. 67), 3 (p. 109) and 4 (p. 119) have been mainly discussed in terms of a confir-
mation bias (Nickerson, 1998), since we argue that consumers tend to assign the
attributes of what is depicted on the image into the product contained within
the package (although note that in the case of Study 4, p. 119, it can be argued
that it is not clear whether the effects obtained are driven by just colour or the
image as a whole; see e.g. Spence et al., 2015). Yet this effect has not been expli-
citly addressed in the work reported here. Indeed, it is not easy to disentangle
how much of the effect of a visual cue can be explained through semiotic/sym-
bolic associations and how much is rather attributed to its truly implicit impact
on perception and response (Spence, 2018a). Explicitly studying the difference
between how packaging imagery is perceived and how the overall product is
perceived could be a step forward in this direction, as it would allow assessing
the actual contribution of the images to the overall perception. In addition, our
results are in line with the literature suggesting that the perception of certain
product attributes (such as healthfulness, naturalness or quality) are positively
correlated with the willingness to buy (e.g. Annett et al., 2008; Ares et al., 2008;
Bower et al., 2003; Fernqvist & Ekelund, 2014; Lee et al., 2013; Machiels & Kar-
nal, 2016; Román et al., 2017), whereas other product attributes (such as sweet-
ness) seem to be somewhat negatively correlated through indirect means due to
their association with low health benefits (e.g. Lustig, Schmidt, & Brindis, 2012;
Rebollar et al., 2017). However, this causal relationship has not been addressed
in this thesis, so no robust conclusions can be drawn in this regard. Although
not directly related to the scope of the present dissertation, we believe that del-
ving deeper in these mechanisms would help designers and producers to better
understand the drivers of consumer behaviour.
Overall, it is worth noting that this dissertation is but a modest approach to
the challenge of understanding the effect of packaging imagery on consumer
perception and response, and it is by no means exhaustive. Much work re-
mains to be done in order to broaden our comprehension of these processes.
Given the interdisciplinary nature of the research conducted in this thesis,
that relies on conceptual frameworks from fields such as semiotics, psycho-
General discussion | 173
logy, consumer behavior or design, next steps should be aimed to develop a
cohesive conceptual and theoretical framework in which to include and dis-
cuss how each theory contributes in disentangling the processes by which
packaging imagery affects consumer perception. In fact, although our fin-
dings represent a small step forward in the direction of understanding the
mechanisms by which consumers interpret imagery, many questions remain
unanswered. For example, it remains unknown how consumers discriminate
meaning when there is more than one image on the package, or how a mea-
ning is selected when the image has more than two possible interpretations.
In addition, digging more into the literature about image rhetoric would be
interesting to investigate tropes other than metaphors (Scott, 1994). Thus,
further research is needed in order to address these and other questions ai-
med at better understanding interpretation processes. Indeed, there is more
and more research devoted to investigating how certain meanings can be
conveyed through packaging cues, so new lines of research should be aimed
to investigate how packaging imagery can be used to convey concepts such
as healthiness, naturalness or sustainability. Moreover, although previous
research has shown the moderating role of consumer individual differences
on the perceptual processes (Celhay & Remaud, 2018; Deliza et al., 2003; Ma-
chiels & Karnal, 2016; Running & Hayes, 2016), this issue has not been ex-
plored in depth in this thesis as just the effect of gender has been addressed
(Study 4, p. 119). Specifically, design sensitivity is particularly relevant from
a design point of view (Bloch, Brunel, & Arnold, 2003), so future lines of re-
search should investigate its possible moderating role in the effects exerted
by packaging imagery.

174 | General discussion

Conclusions | 175
CONCLUSIONS5.

Conclusions | 177
Conclusions
The findings reported in this dissertation highlight the key role that packaging
imagery plays on consumer perception and response. Throughout six research
studies, the objectives of this thesis have been fulfilled, as it has been demons-
trated that the images depicted on food packaging (1) may affect perception and
response towards the product contained within, and (2) can be used to modula-
te consumer interpretation. This has potential implications for both designers
and policy makers, since it is shown that the way in which consumers perceive
and consume a product may be modulated by manipulating the images depicted
on its packaging.
During the design process, designers have to make many decisions regarding
the visual appearance of the packaging and, specifically, the imagery depicted
on it. Although there is a rich body of research devoted to studying consumer
psychology and how the design outcomes affect perception and response, it is
not easy for designers to apply the findings of the scientific literature in their
everyday work. Thus, design is commonly based on designers’ practical expe-
rience and common sense rather than on empirical evidence from semiotics,
cognition or other related fields. This thesis contributes in this regard by ad-
dressing common concerns of packaging designers, and albeit its results have
to be further tested in order to check their validity, they seem to offer some
insights that can be useful during the design process. For example, these fin-
dings suggest that if a positive product attribute has to be conveyed through the
package, it may be a good idea to do so by depicting an image as it may enhance
consumer expectations and willingness to buy. Yet, these results also show that
it matters what (and how) is depicted on the image, since a poor image choice
can have a more negative effect than not displaying an image at all (even in the
case of congruent and positive-valenced imagery).
5.1.
178 | Conclusions
Finally, from a public policy point of view, this thesis adds to the growing
evidence that highlights the key role that packaging cues other than textual
claims play on food choice and consumer behaviour. Specifically, the work re-
ported here pinpoints that the perception of certain product attributes and be-
nefits may be enhanced through packaging imagery, so it could also be used to
mislead consumers by making unhealthful products look more healthful and
thereby favouring suboptimal product choices. It is a risk that should not be
overlooked, and thus these insights are also of interest to policy makers who
watch over consumer rights and health promotion.
Conclusiones | 179
Conclusiones
Los resultados de la presente tesis subrayan el papel clave que juegan las imá-
genes mostradas en los envases en los procesos de percepción y respuesta del
consumidor. Los objetivos de la tesis se han cumplido a lo largo de seis estudios
de investigación, en los que se ha demostrado que las imágenes mostradas en
los envases alimentarios (1) pueden influir en la percepción y respuesta hacia
el producto contenido en su interior, y (2) pueden emplearse para modular la
interpretación del consumidor. Esto tiene implicaciones potenciales tanto para
diseñadores como para agentes políticos, puesto que se muestra que el modo
en que los consumidores perciben y consumen un producto puede modularse
manipulando las imágenes mostradas en su envase.
Durante el proceso de diseño, los diseñadores tienen que tomar muchas deci-
siones relativas a la apariencia visual del envase y, específicamente, las imáge-
nes mostradas en él. Aunque hay gran cantidad de trabajos dedicados a estudiar
la psicología del consumidor y cómo las decisiones de diseño afectan su per-
cepción y respuesta, para los diseñadores no es fácil aplicar las conclusiones de
la literatura científica en su trabajo cotidiano. Así, la experiencia práctica y el
sentido común de los diseñadores influye más en el resultado de sus diseños que
la evidencia empírica hallada en campos como la semiótica, la cognición u otras
áreas relacionadas. Esta tesis contribuye en este aspecto abordando situaciones
y dilemas cotidianos a los que se efrentan los diseñadores en su día a día, y aun-
que sus resultados deben ser refrendados por futuras investigaciones que per-
mitan asegurar su validez, parecen ofrecer pistas que pueden ser útiles durante
el proceso de diseño. Por ejemplo, estos resultados sugieren que si se quiere co-
municar un atributo positivo del producto a través del envase, puede ser buena
idea hacerlo usando una imagen puesto que ello potencia las expectativas y la
predisposición a la compra del consumidor. Sin embargo, estos resultados tam-
bién muestran que importa qué (y cómo) es representado en la imagen, puesto
5.2.
180 | Conclusiones
que mostrar una imagen inadecuada puede tener un efecto más negativo que
no mostrar ninguna (incluso en el caso de imágenes congruentes y positivas).
Por último, desde el punto de vista de las políticas públicas, esta tesis se suma
a la creciente evidencia que destaca el papel fundamental que los elementos del
envase, más allá de los textuales, juegan sobre la elección de los alimentos y el
comportamiento del consumidor. Específicamente, la presente tesis demues-
tra que las imágenes mostradas en el envase pueden mejorar la percepción de
ciertos atributos y beneficios del producto, lo que también puede utilizarse para
inducir a error a los consumidores haciendo que productos no saludables sean
percibidos como saludables, favoreciendo así la elección de productos indesea-
dos. Este es un riesgo que no debe pasarse por alto y, por lo tanto, estos hallaz-
gos también son de interés para los agentes políticos encargados de velar por los
derechos del consumidor y la promoción de la salud.

References | 181
REFERENCES6.

References | 183
Alter, A. L., & Oppenheimer, D. M. (2009). Uniting the Tribes of Fluency to Form a Me-
tacognitive Nation. Personality and Social Psychology Review, 13(3), 219–235. https://
doi.org/10.1177/1088868309341564
Ampuero, O., & Vila, N. (2006). Consumer perceptions of product packaging. Journal of
Consumer Marketing, 23(2), 100–112. https://doi.org/10.1108/07363760610655032
Andersen, B. V., Brockhoff, P. B., & Hyldig, G. (2018). The importance of liking of appea-
rance, -odour, -taste and -texture in the evaluation of overall liking. A comparison
with the evaluation of sensory satisfaction. Food Quality and Preference. https://doi.
org/10.1016/j.foodqual.2018.07.005
Annett, L. E., Muralidharan, V., Boxall, P. C., Cash, S. B., & Wismer, W. V. (2008). In-
fluence of health and environmental information on hedonic evaluation of organic
and conventional bread. Journal of Food Science, 73(4). https://doi.org/10.1111/j.1750-
3841.2008.00723.x
Arboleda, A. M., & Arce-Lopera, C. (2015). Quantitative analysis of product categorization
in soft drinks using bottle silhouettes. Food Quality and Preference, 45, 1–10. https://
doi.org/10.1016/j.foodqual.2015.04.006
Ares, G., & Deliza, R. (2010). Studying the influence of package shape and colour on con-
sumer expectations of milk desserts using word association and conjoint analy-
sis. Food Quality and Preference, 21(8), 930–937. https://doi.org/10.1016/j.food-
qual.2010.03.006
Ares, G., Giménez, A., & Gámbaro, A. (2008). Does information about the source of functio-
nal ingredients influence consumer perception of functional milk desserts? Journal of
the Science of Food and Agriculture, 88(12), 2061–2068. https://doi.org/10.1002/jsfa.3313
Ares, G., Piqueras-Fiszman, B., Varela, P., Marco, R. M., López, A. M., & Fiszman, S. (2011).
Food labels: Do consumers perceive what semiotics want to convey? Food Quality
and Preference, 22(7), 689–698. https://doi.org/10.1016/j.foodqual.2011.05.006
Ares, G., & Varela, P. (Eds.). (2018a). Methods in Consumer Research, Volume 1: New Approa-
ches to Classic Methods. Cambridge, MA: Woodhead Publishing.
184 | References
Ares, G., & Varela, P. (Eds.). (2018b). Methods in Consumer Research, Volume 2: Alternative
Approaches and Special Applications. Cambridge, MA: Woodhead Publishing.
Asioli, D., Varela, P., Hersleth, M., Almli, V. L., Olsen, N. V., & Næs, T. (2016). A dis-
cussion of recent methodologies for combining sensory and extrinsic product pro-
perties in consumer studies. Food Quality and Preference. https://doi.org/10.1016/j.
foodqual.2016.03.015
Aslam, M. M. (2006). Are you selling the right colour? A cross-cultural review of colour
as a marketing cue. Journal of Marketing Communications, 12(1), 15–30. https://doi.
org/10.1080/13527260500247827
Azzi, A., Battini, D., Persona, A., & Sgarbossa, F. (2012). Packaging Design: General Fra-
mework and Research Agenda. Packaging Technology and Science, 25, 435–456. ht-
tps://doi.org/10.1002/pts.993
Bangcuyo, R. G., Smith, K. J., Zumach, J. L., Pierce, A. M., Guttman, G. A., & Simons, C. T.
(2015). The use of immersive technologies to improve consumer testing: The role of
ecological validity, context and engagement in evaluating coffee. Food Quality and
Preference, 41, 84–95. https://doi.org/10.1016/j.foodqual.2014.11.017
Bar-Anan, Y., & Nosek, B. A. (2014). A comparative investigation of seven indirect atti-
tude measures. Behavior Research Methods, 46(3), 668–688. https://doi.org/10.3758/
s13428-013-0410-6
Barthes, R. (1977). Rhetoric of the Image. In S. Heath (Ed.), Image-Music-Text (pp. 32–51).
New York: Hill and Wang.
Becker, L., van Rompay, T. J. L., Schifferstein, H. N. J., & Galetzka, M. (2011). Tough pac-
kage, strong taste: The influence of packaging design on taste impressions and pro-
duct evaluations. Food Quality and Preference, 22(1), 17–23. https://doi.org/10.1016/j.
foodqual.2010.06.007
Bell, R., Meiselman, H. L., Pierson, B. J., & Reeve, W. G. (1994). Effects of Adding an Ita-
lian Theme to a Restaurant on the Perceived Ethnicity, Acceptability, and Selection
of Foods. Appetite, 22(1), 11–24. https://doi.org/10.1006/appe.1994.1002
Biggs, L., Juravle, G., & Spence, C. (2016). Haptic exploration of plateware alters the per-
ceived texture and taste of food. Food Quality and Preference, 50, 129–134. https://doi.
org/10.1016/j.foodqual.2016.02.007
Bloch, P. H. (1995). Seeking the Ideal Form: Product Design and Consumer Response.
Journal of Marketing, 59(3), 16–29. https://doi.org/10.2307/1252116
Bloch, P. H., Brunel, F. F., & Arnold, T. J. (2003). Individual Differences in the Centrality
of Visual Product Aesthetics: Concept and Measurement. Journal of Consumer Re-
search, 29(4), 551–565. https://doi.org/10.1086/346250
Bone, P. F., & France, K. R. (2001). Package graphics and consumer product beliefs. Journal
of Business and Psychology, 15(3), 467–489. https://doi.org/10.1023/A:1007826818206
References | 185
Bottomley, D. A., Doyle, J. R., & Bottomley, P. A. (2002). Dressed for the Occasion:
Font-Product Congruity in the Perception of Logotype. McCarThy & Mothersbaugh,
16(2), 112–123.
Bower, J. A., Saadat, M. A., & Whitten, C. (2003). Effect of liking, information and con-
sumer characteristics on purchase intention and willingness to pay more for a fat
spread with a proven health benefit. Food Quality and Preference, 14(1), 65–74. ht-
tps://doi.org/10.1016/S0950-3293(02)00019-8
Bringhurst, R. (2004). The Elements of Typographic Style. Point Roberts, WA: Hartley & Marks.
Byrne, K. (1990). A “semantics” of visual design: the care and feeding of studio projects
within a communication-theory context. Design Studies, 11(3), 141–163. https://doi.
org/10.1016/0142-694X(90)90003-U
Caporale, G., Policastro, S., Carlucci, A., & Monteleone, E. (2006). Consumer expectations
for sensory properties in virgin olive oils. Food Quality and Preference, 17(1), 116–125.
https://doi.org/10.1016/j.foodqual.2005.07.011
Cardello, A. V. (2007). Measuring consumer expectations to improve food product de-
velopment. In H. J. H. MacFie (Ed.), Consumer-Led Food Product Development (pp.
223–261). Cambridge: Elsevier. https://doi.org/10.1533/9781845693381.2.223
Carrillo, E., Fiszman, S., Lähteenmäki, L., & Varela, P. (2014). Consumers’ perception
of symbols and health claims as health-related label messages. A cross-cultu-
ral study. Food Research International, 62, 653–661. https://doi.org/10.1016/j.foo-
dres.2014.04.028
Carter, R., Meggs, P. B., Day, B., Maxa, S., & Sanders, M. (2015). Typographic Design: Form
and Communication (6th ed.). Hoboken, NJ: John Wiley & Sons, Inc.
Castonguay, J., Kunkel, D., Wright, P., & Duff, C. (2013). Healthy characters? An inves-
tigation of marketing practices in children’s food advertising. Journal of Nutrition
Education and Behavior, 45(6), 571–577. https://doi.org/10.1016/j.jneb.2013.03.007
Cavanagh, K. V., Kruja, B., & Forestell, C. a. (2014). The effect of brand and caloric infor-
mation on flavor perception and food consumption in restrained and unrestrained
eaters. Appetite, 82, 1–7. https://doi.org/10.1016/j.appet.2014.06.100
Celhay, F., Boysselle, J., & Cohen, J. (2015). Food packages and communication through
typeface design: The exoticism of exotypes. Food Quality and Preference, 39, 167–175.
https://doi.org/10.1016/j.foodqual.2014.07.009
Celhay, F., & Remaud, H. (2018). What does your wine label mean to consumers? A semio-
tic investigation of Bordeaux wine visual codes. Food Quality and Preference, 65(No-
vember 2017), 129–145. https://doi.org/10.1016/j.foodqual.2017.10.020
Celhay, F., & Trinquecoste, J. F. (2014). Package Graphic Design: Investigating the Va-
riables that Moderate Consumer Response to Atypical Designs. Journal of Product
Innovation Management, 32(6), 1014–1032. https://doi.org/10.1111/jpim.12212
186 | References
Chetverikov, A., & Upravitelev, P. (2016). Online versus offline: The Web as a medium for
response time data collection. Behavior Research Methods, 48(3), 1086–1099. https://
doi.org/10.3758/s13428-015-0632-x
Childers, T. L., & Jass, J. (2002). All Dressed Up With Something to Say: Effects of Type-
face Semantic Associations on Brand Perceptions and Consumer Memory. Jour-
nal of Consumer Psychology, 12(2), 93–106. https://doi.org/10.1207/S15327663J-
CP1202_03
Chitturi, R., Raghunathan, R., & Mahajan, V. (2008). Delight by Design: The Role of He-
donic Versus Utilitarian Benefits. Journal of Marketing, 72(3), 48–63. https://doi.
org/10.1509/jmkg.72.3.48
Chrysochou, P., & Grunert, K. G. (2014). Health-related ad information and health moti-
vation effects on product evaluations. Journal of Business Research, 67(6), 1209–1217.
https://doi.org/10.1016/j.jbusres.2013.05.001
Clement, J. (2007). Visual influence on in-store buying decisions: an eye-track experi-
ment on the visual influence of packaging design. Journal of Marketing Management,
23(9–10), 917–928. https://doi.org/10.1362/026725707X250395
Clement, J., Kristensen, T., & Grønhaug, K. (2013). Understanding consumers’ in-sto-
re visual perception: The influence of package design features on visual attention.
Journal of Retailing and Consumer Services, 20(2), 234–239. https://doi.org/10.1016/j.
jretconser.2013.01.003
Creusen, M. E. H., & Schoormans, J. P. L. (2005). The different roles of product appearan-
ce in consumer choice. Journal of Product Innovation Management, 22, 63–81. https://
doi.org/10.1111/j.0737-6782.2005.00103.x
Crilly, N., Good, D., Matravers, D., & Clarkson, P. J. (2008). Design as communication: ex-
ploring the validity and utility of relating intention to interpretation. Design Studies,
29(5), 425–457. https://doi.org/10.1016/j.destud.2008.05.002
Crilly, N., Moultrie, J., & Clarkson, P. J. (2004). Seeing things: Consumer response to
the visual domain in product design. Design Studies, 25(6), 547–577. https://doi.or-
g/10.1016/j.destud.2004.03.001
De Houwer, J., Beckers, T., & Moors, A. (2007). Novel attitudes can be faked on the Im-
plicit Association Test. Journal of Experimental Social Psychology, 43(6), 972–978. ht-
tps://doi.org/10.1016/j.jesp.2006.10.007
De Houwer, J., Teige-Mocigemba, S., Spruyt, A., & Moors, A. (2009). Implicit measures:
A normative analysis and review. Psychological Bulletin, 135(3), 347–368. https://doi.
org/10.1037/a0014211
Deliza, R., MacFie, H., & Hedderley, D. (2003). Use of Computer-Generated Images and
Conjoint Analysis To Investigate Sensory Expectations. Journal of Sensory Studies,
18(6), 465–486. https://doi.org/10.1111/j.1745-459X.2003.tb00401.x
References | 187
Deliza, R., & MacFie, H. J. H. (1996). The Generation of Sensory Expectation by External
Cues and its Effect on Sensory Perception and Hedonic Ratings: a Review. Journal of
Sensory Studies, 11(2), 103–128. https://doi.org/10.1111/j.1745-459X.1996.tb00036.x
Deng, X., Hui, S. K., & Hutchinson, J. W. (2010). Consumer preferences for color com-
binations: An empirical analysis of similarity-based color relationships. Journal of
Consumer Psychology, 20(4), 476–484. https://doi.org/10.1016/j.jcps.2010.07.005
Deng, X., & Kahn, B. E. (2009). Is Your Product on the Right Side? The “Location Effect”
on Perceived Product Heaviness and Package Evaluation. Journal of Marketing Re-
search, 46, 725–738. https://doi.org/10.1509/jmkr.46.6.725
Deng, X., & Srinivasan, R. (2013). When Do Transparent Packages Increase (or Decrease) Food
Consumption? Journal of Marketing, 77(5), 104–117. https://doi.org/10.1509/jm.11.0610
di Pellegrino, G., Magarelli, S., & Mengarelli, F. (2011). Food pleasantness affects visual
selective attention. Quarterly Journal of Experimental Psychology, 64(3), 560–571. ht-
tps://doi.org/10.1080/17470218.2010.504031
Dijksterhuis, A. (2013). Automaticity. In D. E. Carlston (Ed.), The Oxford handbook of
social cognition (pp. 239–256). Oxford, UK: Oxford University Press. https://doi.
org/10.1093/oxfordhb/9780199730018.013.0012
Dixon, H., Scully, M., Niven, P., Kelly, B., Chapman, K., Donovan, R., … Wakefield, M.
(2014). Effects of nutrient content claims, sports celebrity endorsements and pre-
mium offers on pre-adolescent children’s food preferences: Experimental research.
Pediatric Obesity, 9(2), e47–e57. https://doi.org/10.1111/j.2047-6310.2013.00169.x
Doyle, J. R., & Bottomley, P. A. (2004). Font appropriateness and brand choice. Journal of
Business Research, 57(8), 873–880. https://doi.org/10.1016/S0148-2963(02)00487-3
Doyle, J. R., & Bottomley, P. A. (2009). The massage in the medium: Transfer of conno-
tative meaning from typeface to names and products. Applied Cognitive Psychology,
23(3), 396–409. https://doi.org/10.1002/acp.1468
Epley, N., & Gilovich, T. (2006). The Anchoring-and-Adjustment Heuristic Why the Ad-
justments Are Insufficient. Psychological Science, 17(4), 311–319.
Esmerino, E. A., Ferraz, J. P., Filho, E. R. T., Pinto, L. P. F., Freitas, M. Q., Cruz, A. G., &
Bolini, H. M. A. (2017). Consumers’ perceptions toward 3 different fermented dairy
products: Insights from focus groups, word association, and projective mapping.
Journal of Dairy Science, 100(11), 8849–8860. https://doi.org/10.3168/jds.2016-12533
Estes, Z., & Jones, L. L. (2006). Priming via relational similarity: A copper horse is faster
when seen through a glass eye. Journal of Memory and Language, 55(1), 89–101. ht-
tps://doi.org/10.1016/j.jml.2006.01.004
Fenko, A., Vries, R. De, & Rompay, T. Van. (2018). How Strong Is Your Coffee? The Influence of
Visual Metaphors and Textual Claims on Consumers’ Flavor Perception and Product Eva-
luation. Frontiers in Psychology, 9(Feb), 1–12. https://doi.org/10.3389/fpsyg.2018.00053
188 | References
Fernqvist, F., & Ekelund, L. (2014). Credence and the effect on consumer liking of food
- A review. Food Quality and Preference, 32(PC), 340–353. https://doi.org/10.1016/j.
foodqual.2013.10.005
Fernqvist, F., Olsson, A., & Spendrup, S. (2015). What’s in it for me? Food packaging and
consumer responses, a focus group study. British Food Journal, 117(3), 1122–1135. ht-
tps://doi.org/10.1108/BFJ-08-2013-0224
Festila, A. (2016). Health Metaphors of Package Design (Doctoral dissertation, Aarhus Uni-
versity, Aarhus, Denmark). Retrieved from https://bit.ly/2mXM8Ix
Festila, A., & Chrysochou, P. (2018). Implicit communication of food product healthful-
ness through package design: A content analysis. Journal of Consumer Behaviour,
(February 2017), 1–16. https://doi.org/10.1002/cb.1732
Fillmore, C. J., & Baker, C. (2010). A frames approach to semantic analysis. In B. Heine & H.
Narrog (Eds.), The Oxford Handbook of Linguistic Analysis (pp. 313–340). Oxford: Oxford
University Press. https://doi.org/10.1093/oxfordhb/9780199544004.013.0013
Frascara, J. (1988). Graphic Design: Fine Art or Social Science? Design Issues, 5(1), 18. ht-
tps://doi.org/10.2307/1511556
Fulcher, E., Dean, A., & Trufil, G. (2016). Neurosense and Packaging: Understanding Con-
sumer Evaluations Using Implicit Technology. In P. Burgess (Ed.), Integrating the
Packaging and Product Experience in Food and Beverages (pp. 121–138). Woodhead Pu-
blishing. https://doi.org/10.1016/B978-0-08-100356-5.00006-1
Gagné, C. L., & Spalding, T. L. (2006). Using conceptual combination research to bet-
ter understand novel compound words. SKASE Journal of Theoretical Linguistics,
3(2), 9–16. Retrieved from http://citeseerx.ist.psu.edu/viewdoc/download?-
doi=10.1.1.163.5240&rep=rep1&type=pdf
Gawronski, B., & Creighton, L. A. (2013). Dual-process theories. In D. E. Carlston (Ed.),
The Oxford handbook of social cognition (pp. 282–312). Oxford, UK: Oxford University
Press. https://doi.org/10.1017/S0140525X03340130
Gawronski, B., & De Houwer, J. (2014). Implicit measures in social and personality psycho-
logy. In H. T. Reis & C. M. Judd (Eds.), Handbook of research methods in social and per-
sonality psychology (pp. 283–310). New York, NY, USA: Cambridge University Press.
Getz, L. M., & Kubovy, M. (2018). Questioning the automaticity of audiovisual correspondences.
Cognition, 175(August 2017), 101–108. https://doi.org/10.1016/j.cognition.2018.02.015
Gilbride, T. J., Inman, J. J., & Stilley, K. M. (2015). The Role of Within-Trip Dynamics in
Unplanned Versus Planned Purchase Behavior. Journal of Marketing, 79(3), 57–73.
https://doi.org/10.1509/jm.13.0286
Goodall, C. E. (2011). An Overview of Implicit Measures of Attitudes: Methods, Mecha-
nisms, Strengths, and Limitations. Communication Methods and Measures, 5(3), 203–
222. https://doi.org/10.1080/19312458.2011.596992
References | 189
Graf, L. K. M., Mayer, S., & Landwehr, J. R. (2017). Measuring Processing Fluency: One
versus Five Items. Journal of Consumer Psychology, Advance online publication. ht-
tps://doi.org/10.1002/jcpy.1021
Greenwald, A. G., & Banaji, M. R. (1995). Implicit social cognition: Attitudes, self-es-
teem, and stereotypes. Psychological Review, 102(1), 4–27. https://doi.or-
g/10.1037/0033-295X.102.1.4
Greenwald, A. G., McGhee, D. E., & Schwartz, J. L. K. (1998). Measuring individual diffe-
rences in implicit cognition: the implicit association test. Journal of Personality and
Social Psychology, 74(6), 1464–1480. https://doi.org/10.1037/0022-3514.74.6.1464
Greenwald, A. G., Nosek, B. A., & Banaji, M. R. (2003). Understanding and using the Im-
plicit Association Test: An improved scoring algorithm. Journal Pers Soc Psychol.,
85(2), 197–216. https://doi.org/10.1037/0022-3514.85.2.197
Gregan-Paxton, J., & John, D. R. (1997). Consumer Learning by Analogy: A Model of In-
ternal Knowledge Transfer. Journal of Consumer Research, 24(3), 266–284. https://
doi.org/10.1086/209509
Guerrero, L., Claret, A., Verbeke, W., Enderli, G., Zakowska-Biemans, S., Vanhonacker,
F., … Hersleth, M. (2010). Perception of traditional food products in six European
regions using free word association. Food Quality and Preference, 21(2), 225–233. ht-
tps://doi.org/10.1016/j.foodqual.2009.06.003
Gvili, Y., Tal, A., Amar, M., Hallak, Y., Wansink, B., Giblin, M., & Bommelaer, C. (2015).
Fresh from the tree: Implied motion improves food evaluation. Food Quality and
Preference, 46, 160–165. https://doi.org/10.1016/j.foodqual.2015.07.015
Gvili, Y., Tal, A., Amar, M., & Wansink, B. (2017). Moving up in taste: Enhanced projec-
ted taste and freshness of moving food products. Psychology and Marketing, 34(7),
671–683. https://doi.org/10.1002/mar.21014
Hagtvedt, H., & Patrick, V. M. (2014). Consumer Response to Overstyling: Balancing Aes-
thetics and Functionality in Product Design. Psychology & Marketing, 31(7), 518–525.
https://doi.org/10.1002/mar.20713
Hembree, R. (2008). The Complete Graphic Designer: A Guide to Understanding Graphics and
Visual Communication. Beverly: Rockport Publishers.
Hendrick, T. A. M., Fischer, A. R. H., Tobi, H., & Frewer, L. J. (2013). Self-reported attitude sca-
les: Current practice in adequate assessment of reliability, validity, and dimensionality.
Journal of Applied Social Psychology, 43(7), 1538–1552. https://doi.org/10.1111/jasp.12147
Hine, T. (1995). The total package: The secret history and hidden meanings of boxes, bottles,
cans, and other persuasive containers. New York, NY: Little Brown.
Hoegg, J., & Alba, J. W. (2008). A Role for Aesthetics in Consumer Psychology. In C. P.
Haugtvedt, P. M. Herr, & F. R. Kardes (Eds.), Handbook of consumer psychology (pp.
733–754). New York: Taylor & Francis Group.
190 | References
Hoegg, J., Alba, J. W., & Dahl, D. W. (2010). The good, the bad, and the ugly: Influence
of aesthetics on product feature judgments. Journal of Consumer Psychology, 20(4),
419–430. https://doi.org/10.1016/j.jcps.2010.07.002
Honea, H., & Horsky, S. (2012). The power of plain: Intensifying product experience with
neutral aesthetic context. Marketing Letters, 23(1), 223–235. https://doi.org/10.1007/
s11002-011-9149-y
Jaeger, S. R., & MacFie, H. J. H. (2001). The effect of advertising format and means-end
information on consumer expectations for apples. Food Quality and Preference, 12(3),
189–205. https://doi.org/10.1016/S0950-3293(00)00044-6
Kahn, B. E., & Deng, X. (2010). Effects on visual weight perceptions of product image
locations on packaging. In A. Krishna (Ed.), Sensory Marketing: Research on the Sen-
suality of Products (pp. 259–278). New York: Routledge.
Karmarkar, U. R., & Plassmann, H. (2015). Consumer neuroscience. Revealing meaningful
relationships between brain and consumer behavior. In M. I. Norton, D. D. Rucker, &
C. Lamberton (Eds.), The Cambridge Handbook of Consumer Psychology (pp. 152–179).
Cambridge: Cambridge University Press. https://doi.org/10.1177/1094428117730598
Karnal, N., Machiels, C. J. A., Orth, U. R., & Mai, R. (2016). Healthy by design, but only
when in focus: Communicating non-verbal health cues through symbolic meaning
in packaging. Food Quality and Preference, 52, 106–119. https://doi.org/10.1016/j.
foodqual.2016.04.004
Kauppinen-Räisänen, H. (2014). Strategic Use of Colour in Brand Packaging. Packaging
Technology and Science, 27(8), 663–676. https://doi.org/10.1002/pts.2061
Kauppinen-Räisänen, H., Owusu, R. A., & Abeeku Bamfo, B. (2012). Brand salience of OTC
pharmaceuticals through package appearance. International Journal of Pharmaceutical
and Healthcare Marketing, 6(3), 230–249. https://doi.org/10.1108/17506121211259403
Keren, G. (1993). Between- or within-subjects design: A methodological dilemma. In G.
Keren & C. Lewis (Eds.), A handbook for data analyses in the behavioural sciences: Me-
thodological issues (pp. 257–272). Hillsdale, NJ: Lawrence Erlbaum Associates.
Kim, M. K., Lopetcharat, K., & Drake, M. A. (2013). Influence of packaging information
on consumer liking of chocolate milk. Journal of Dairy Science, 96(8), 4843–4856. ht-
tps://doi.org/10.3168/jds.2012-6399
Kisielius, J., & Sternthal, B. (1984). Detecting and Explaining Vividness Effects in Attitudinal
Judgments. Journal of Marketing Research, 21(1), 54–64. https://doi.org/10.2307/3151792
Klimchuk, M. R., & Krasovec, S. A. (2012). Packaging Design: Successful Product Branding
from Concept to Shelf. New Jersey: John Wiley & Sons.
Knez, I., & Kers, C. (2000). Effects of Indoor Lighting, Gender, and Age on Mood and
Cognitive Performance. Environment and Behavior, 32(6), 817–831. https://doi.
org/10.1177/0013916500326005
References | 191
Kobayashi, M. L., & Benassi, M. de T. (2015). Impact of Packaging Characteristics on Con-
sumer Purchase Intention: Instant Coffee in Refill Packs and Glass Jars. Journal of
Sensory Studies, 1–12. https://doi.org/10.1111/joss.12142
Kraus, A., & Piqueras-Fiszman, B. (2018). Measuring Implicit Associations in Food-Rela-
ted Consumer Research. In G. Ares & P. Varela (Eds.), Methods in Consumer Research,
Volume 2: Alternative Approaches and Special Applications (pp. 203–230). Cambridge,
MA: Woodhead Publishing.
Krishna, A., Cian, L., & Aydınoğlu, N. Z. (2017). Sensory Aspects of Package Design. Journal
of Retailing, 93(1), 43–54. https://doi.org/10.1016/j.jretai.2016.12.002
Labbe, D., Pineau, N., & Martin, N. (2013). Food expected naturalness: Impact of visual,
tactile and auditory packaging material properties and role of perceptual interac-
tions. Food Quality and Preference, 27(2), 170–178. https://doi.org/10.1016/j.food-
qual.2012.06.009
Labrecque, L. I., & Milne, G. R. (2012). Exciting red and competent blue: The importance
of color in marketing. Journal of the Academy of Marketing Science, 40, 711–727. ht-
tps://doi.org/10.1007/s11747-010-0245-y
Labrecque, L. I., Patrick, V. M., & Milne, G. R. (2013). The Marketers’ Prismatic Palette:
A Review of Color Research and Future Directions. Psychology and Marketing, 30(2),
187–202. https://doi.org/10.1002/mar.20597
Lagerkvist, C. J., Okello, J., Muoki, P., Heck, S., & Prain, G. (2016). Nutrition promotion
messages: The effect of information on consumer sensory expectations, experien-
ces and emotions of vitamin A-biofortified sweet potato. Food Quality and Preferen-
ce, 52, 143–152. https://doi.org/10.1016/j.foodqual.2016.04.009
Lähteenmäki, L. (2013). Claiming health in food products. Food Quality and Preference,
27(2), 196–201. https://doi.org/10.1016/j.foodqual.2012.03.006
Laing, S., & Masoodian, M. (2016). A study of the influence of visual imagery on graphic design
ideation. Design Studies, 45, 187–209. https://doi.org/10.1016/j.destud.2016.04.002
Lane, K. a., Banaji, M. R., Nosek, B. a., & Greenwald, A. G. (2007). Understanding and
Using the Implicit Association Test: IV What We Know (So Far) about the Method.
Implicit Measures of Attitudes, 59–102.
Lawless, H. T., & Heimann, H. (2010). Sensory Evaluation of Food: Principles and Practices.
New York: Springer. https://doi.org/10.1007/978-1-4419-6488-5
Lee, W. J., Shimizu, M., Kniffin, K. M., & Wansink, B. (2013). You taste what you see: Do
organic labels bias taste perceptions? Food Quality and Preference, 29(1), 33–39. ht-
tps://doi.org/10.1016/j.foodqual.2013.01.010
Lefebvre, S., & Orlowski, M. (2018). Can, cup, or bottle? The influence of beverage ves-
sel on taste and willingness to pay. International Journal of Hospitality Management,
(September 2017), 1–11. https://doi.org/10.1016/j.ijhm.2018.05.009
192 | References
Leuthesser, L., Kohli, C. S., & Harich, K. R. (1995). Brand equity: the halo
effect measure. European Journal of Marketing, 29(4), 57–66. https://doi.
org/10.1108/03090569510086657
Levitan, C. A., & Shermer, D. Z. (2014). Red Hot: The Crossmodal Effect of Color Inten-
sity on Perceived Piquancy. Multisensory Research, 27(3–4), 207–223. https://doi.
org/10.1163/22134808-00002457
Lewis, C., & Walker, P. (1989). Typographic influences on reading. British Journal of Psy-
chology, 80(2), 241–257. https://doi.org/10.1111/j.2044-8295.1989.tb02317.x
Liao, L. X., Corsi, A. M., Chrysochou, P., & Lockshin, L. (2015). Emotional responses
towards food packaging: A joint application of self-report and physiological me-
asures of emotion. Food Quality and Preference, 42, 48–55. https://doi.org/10.1016/j.
foodqual.2015.01.009
Lindgaard, G., Fernandes, G., Dudek, C., & Brown, J. (2006). Attention web designers:
You have 50 milliseconds to make a good first impression! Behaviour & Information
Technology, 25(2), 115–126. https://doi.org/10.1080/01449290500330448
Lockhart, H. E. (1997). A paradigm for packaging. Packaging Technology and Science, 10(5),
237–252. https://doi.org/10.1002/(SICI)1099-1522(199709/10)
Loken, B. (2006). Consumer Psychology: Categorization, Inferences, Affect, and Persua-
sion. Annual Review of Psychology, 57(1), 453–485. https://doi.org/10.1146/annurev.
psych.57.102904.190136
Loken, B., Barsalou, L. W., & Joiner, C. (2008). Categorzation Theory and Research in
Consumer Psychology: Category Representation and Category-Based Inference.
Handbook of Consumer Psychology, 133–163.
Lupton, E. (2010). Thinking with type. A critical guide for designers, writers, editors & students.
New York: Princeton Architectural Press.
Lustig, R. H., Schmidt, L. A., & Brindis, C. D. (2012). Public health: The toxic truth about
sugar. Nature, 482(7383), 27–29. https://doi.org/10.1038/482027a
Lynott, D., & Connell, L. (2010). Embodied conceptual combination. Frontiers in Psycholo-
gy, 1(NOV), 1–14. https://doi.org/10.3389/fpsyg.2010.00212
Machiels, C. J. A., & Karnal, N. (2016). See How Tasty it is? Effects of Symbolic Cues on
Product Evaluation and Taste. Food Quality and Preference, 52, 195–202. https://doi.
org/10.1016/j.foodqual.2016.04.014
Madden, T. J., Hewett, K., & Roth, M. S. (2000). Managing Images in Different Cultures:
A Cross-National Study of Color Meanings and Preferences. Journal of International
Marketing, 8(4), 90–107. https://doi.org/10.1509/jimk.8.4.90.19795
Madzharov, A. V., & Block, L. G. (2010). Effects of product unit image on consumption
of snack foods. Journal of Consumer Psychology, 20(4), 398–409. https://doi.or-
g/10.1016/j.jcps.2010.06.007

References | 193
Magnier, L., & Schoormans, J. (2015). Consumer reactions to sustainable packaging: The
interplay of visual appearance, verbal claim and environmental concern. Journal of
Environmental Psychology, 44, 53–62. https://doi.org/10.1016/j.jenvp.2015.09.005
Magnier, L., & Schoormans, J. (2017). How Do Packaging Material, Colour and Environ-
mental Claim Influence Package, Brand and Product Evaluations? Packaging Techno-
logy and Science. https://doi.org/10.1002/pts.2318
Magnier, L., Schoormans, J., & Mugge, R. (2016). Judging a product by its cover: Packaging
sustainability and perceptions of quality in food products. Food Quality and Preferen-
ce, 53, 132–142. https://doi.org/10.1016/j.foodqual.2016.06.006
Mai, R., Symmank, C., & Seeberg-Elverfeldt, B. (2016). Light and Pale Colors in Food
Packaging: When Does This Package Cue Signal Superior Healthiness or Infe-
rior Tastiness? Journal of Retailing, 92(4), 426–444. https://doi.org/10.1016/j.jre-
tai.2016.08.002
Maynard, O. M., Munafò, M. R., & Leonards, U. (2013). Visual attention to health warnings
on plain tobacco packaging in adolescent smokers and non-smokers. Addiction,
108(2), 413–419. https://doi.org/10.1111/j.1360-0443.2012.04028.x
Mead, J. A., & Richerson, R. (2018). Package color saturation and food healthfulness per-
ceptions. Journal of Business Research, 82(2), 10–18. https://doi.org/10.1016/j.jbus-
res.2017.08.015
Messaris, P. (1994). Visual literacy: Image, mind, and reality. Boulder: Westview Press.
Messaris, P. (1997). Visual persuasion: The role of images in advertising. Thousand Oaks, CA:
Sage Publications.
Mick, D. G., Burroughs, J. E., Hetzel, P., & Brannen, M. Y. (2004). Pursuing the mea-
ning of meaning in the commercial world: An international review of marketing
and consumer research founded on semiotics. Semiotica, 152(c), 1–74. https://doi.
org/10.1515/semi.2004.2004.152-1-4.1
Miraballes, M., Fiszman, S., Gámbaro, A., & Varela, P. (2014). Consumer perceptions of
satiating and meal replacement bars, built up from cues in packaging information,
health claims and nutritional claims. Food Research International, 64, 456–464. ht-
tps://doi.org/10.1016/j.foodres.2014.07.028
Mizutani, N., Okamoto, M., Yamaguchi, Y., Kusakabe, Y., Dan, I., & Yamanaka, T. (2010).
Package images modulate flavor perception for orange juice. Food Quality and Prefe-
rence, 21(7), 867–872. https://doi.org/10.1016/j.foodqual.2010.05.010
Mueller, S., Lockshin, L., & Louviere, J. J. (2009). What you see may not be what you get:
Asking consumers what matters may not reflect what they choose. Marketing Let-
ters, 21(4), 335–350. https://doi.org/10.1007/s11002-009-9098-x
Mumani, A., & Stone, R. (2018). State of the art of user packaging interaction (UPI). Packa-
ging Technology and Science, (November 2017), 1–19. https://doi.org/10.1002/pts.2363
194 | References
Munari, B. (1973/2016). Diseño y comunicación visual: Contribución a una metodología didác-
tica. Barcelona: Gustavo Gili.
Nancarrow, C., Wright, L. T., & Brace, I. (1998). Gaining competitive advantage from
packaging and labelling in marketing communications. British Food Journal, 100(2),
110–118. https://doi.org/10.1108/00070709810204101
Neyens, E., Aerts, G., & Smits, T. (2015). The impact of image-size manipulation and
sugar content on children’s cereal consumption. Appetite, 95, 152–157. https://doi.
org/10.1016/j.appet.2015.07.003
Nickerson, R. S. (1998). Confirmation bias: A ubiquitous phenomenon in many gui-
ses. Review of General Psychology, 2(2), 175–220. https://doi.org/10.1037/1089-
2680.2.2.175
Nijs, I. M. T., Muris, P., Euser, A. S., & Franken, I. H. A. (2010). Differences in attention to
food and food intake between overweight/obese and normal-weight females under
conditions of hunger and satiety. Appetite, 54(2), 243–254. https://doi.org/10.1016/j.
appet.2009.11.004
Nisbett, R. E., & Wilson, T. D. (1977). The halo effect: Evidence for unconscious alteration
of judgments. Journal of Personality and Social Psychology, 35(4), 250–256. https://doi.
org/10.1037/0022-3514.35.4.250
North, A. C., Hargreaves, D. J., & McKendrick, J. (1997). In-store music affects product
choice. Nature, 390(6656), 132–132. https://doi.org/10.1038/36484
North, A. C., Hargreaves, D. J., & McKendrick, J. (1999). The influence of in-store mu-
sic on wine selections. Journal of Applied Psychology, 84(2), 271–276. https://doi.
org/10.1037/0021-9010.84.2.271
Nosek, B. A., Hawkins, C. B., & Frazier, R. S. (2011). Implicit social cognition: from me-
asures to mechanisms. Trends in Cognitive Sciences, 15(4), 152–159. https://doi.or-
g/10.1016/j.tics.2011.01.005
Oberfeld, D., Hecht, H., Allendorf, U., & Wickelmaier, F. (2009). Ambient lighting mo-
difies the flavor of wine. Journal of Sensory Studies, 24(6), 797–832. https://doi.or-
g/10.1111/j.1745-459X.2009.00239.x
Oliveira-Pinto, A. V., Santos, R. M., Coutinho, R. A., Oliveira, L. M., Santos, G. B., Alho, A.
T. L., … Klein, R. (2014). Sexual Dimorphism in the Human Olfactory Bulb: Females
Have More Neurons and Glial Cells than Males. PLoS ONE, 9(11), e111733. https://doi.
org/10.1371/journal.pone.0111733
Obrist, M., Comber, R., Subramanian, S., Piqueras-Fiszman, B., Velasco, C., & Spence,
C. (2014). Temporal, affective, and embodied characteristics of taste experiences.
In Proceedings of the 32nd annual ACM conference on Human factors in computing sys-
tems - CHI ’14 (pp. 2853–2862). New York, New York, USA: ACM Press. https://doi.
org/10.1145/2556288.2557007

References | 195
Olson, J. C., & Jacoby, J. (1972). Cue utilization in the quality perception process. In M.
Venkatesan (Ed.), SV – proceedings of the third annual conference of the association for
consumer research (pp. 169–179). Chicago, IL: Association for Consumer Research.
Retrieved from http://www.acrwebsite.org/volumes/11997/volumes/sv02/SV-02
Opperud, A. (2004). Semiotic Product Analysis. In D. McDonagh, P. Hekkert, J. van Erp, &
D. Gyi (Eds.), Design and Emotion (pp. 137–141). London: Taylor and Francis.
Orth, U. R., & Malkewitz, K. (2008). Holistic Package Design and Consumer Brand Im-
pressions. Journal of Marketing, 72(3), 64–81. https://doi.org/10.1509/jmkg.72.3.64
Oswald, L. R. (2015). Creating Value: The Theory and Practice of Marketing Semiotics Research.
New York: Oxford University Press.
Parise, C. V., & Spence, C. (2012). Assessing the associations between brand packaging
and brand attributes using an indirect performance measure. Food Quality and Pre-
ference, 24(1), 17–23. https://doi.org/10.1016/j.foodqual.2011.08.004
Park, C. W., Iyer, E. S., & Smith, D. C. (1989). The Effects of Situational Factors on In-Store
Grocery Shopping Behavior: The Role of Store Environment and Time Available for
Shopping. Journal of Consumer Research, 15(4), 422. https://doi.org/10.1086/209182
Peirce, C. S. (1867-1893/1992). The essential Peirce: Selected philosophical writings, volume 1
(1867-1893). (P. E. Project, Ed.). Bloomington: Indiana University Press.
Perugini, M. (2005). Predictive models of implicit and explicit attitudes. British Journal of
Social Psychology, 44(1), 29–45. https://doi.org/10.1348/014466604X23491
Petty, R. E., & Cacioppo, J. T. (1996). Attitudes and persuasion: Classic and contempo-
rary approaches. Westview Press. Retrieved from http://psycnet.apa.org/psycin-
fo/1996-97904-000
Piqueras-Fiszman, B., Ares, G., & Varela, P. (2011). Semiotics and Perception : Do Labels
Convey the Same Messages To Older and Younger Consumers? Journal of Sensory
Studies, 26(3), 197–208. https://doi.org/10.1111/j.1745-459X.2011.00336.x
Piqueras-Fiszman, B., Harrar, V., Alcaide, J., & Spence, C. (2011). Does the weight of the
dish influence our perception of food? Food Quality and Preference, 22(8), 753–756.
https://doi.org/10.1016/j.foodqual.2011.05.009
Piqueras-Fiszman, B., Laughlin, Z., Miodownik, M., & Spence, C. (2012). Tasting spoons:
Assessing how the material of a spoon affects the taste of the food. Food Quality and
Preference, 24(1), 24–29. https://doi.org/10.1016/j.foodqual.2011.08.005
Piqueras-Fiszman, B., & Spence, C. (2011). Crossmodal correspondences in product pac-
kaging. Assessing color-flavor correspondences for potato chips (crisps). Appetite,
57(3), 753–7. https://doi.org/10.1016/j.appet.2011.07.012
Piqueras-Fiszman, B., & Spence, C. (2012). The weight of the container influences expec-
ted satiety, perceived density, and subsequent expected fullness. Appetite, 58(2),
559–562. https://doi.org/10.1016/j.appet.2011.12.021
196 | References
Piqueras-Fiszman, B., & Spence, C. (2015). Sensory expectations based on product-ex-
trinsic food cues: An interdisciplinary review of the empirical evidence and
theoretical accounts. Food Quality and Preference, 40(PA), 165–179. https://doi.or-
g/10.1016/j.foodqual.2014.09.013
Piqueras-Fiszman, B., Velasco, C., Salgado-Montejo, A., & Spence, C. (2013). Using com-
bined eye tracking and word association in order to assess novel packaging solu-
tions: A case study involving jam jars. Food Quality and Preference, 28(1), 328–338.
https://doi.org/10.1016/j.foodqual.2012.10.006
Piqueras-Fiszman, B., Velasco, C., & Spence, C. (2012). Exploring implicit and explicit
crossmodal colour-flavour correspondences in product packaging. Food Quality and
Preference, 25(2), 148–155. https://doi.org/10.1016/j.foodqual.2012.02.010
Ploydanai, K., van den Puttelaar, J., van Herpen, E., & van Trijp, H. (2017). Using a Virtual
Store As a Research Tool to Investigate Consumer In-store Behavior. Journal of Vi-
sualized Experiments, (125), 1–15. https://doi.org/10.3791/55719
Puyares, V., Ares, G., & Carrau, F. (2010). Searching a specific bottle for Tannat wine using
a check-all-that apply question and conjoint analysis. Food Quality and Preference,
21(7), 684–691. https://doi.org/10.1016/j.foodqual.2010.05.008
Rebollar, R., Lidón, I., Guzmán, R., Gil, I., & Martín, J. (2017). The influence of illumi-
nance level on perception and willingness to buy during the tasting of sweetened
natural yoghurt. Food Quality and Preference, 62, 270–274. https://doi.org/10.1016/j.
foodqual.2017.05.007
Rebollar, R., Lidón, I., Martín, J., & Puebla, M. (2015). The identification of viewing pat-
terns of chocolate snack packages using eye-tracking techniques. Food Quality and
Preference, 39, 251–258. https://doi.org/10.1016/j.foodqual.2014.08.002
Reimann, M., Zaichkowsky, J., Neuhaus, C., Bender, T., & Weber, B. (2010). Aesthetic
package design: A behavioral, neural, and psychological investigation. Journal of
Consumer Psychology, 20(4), 431–441. https://doi.org/10.1016/j.jcps.2010.06.009
Roe, B., Levy, A., & Derby, B. M. (1999). The impact of health claims on consumer search
and product evaluation outcomes: Results from FDA experimental data. Journal of
Public Policy & Marketing, 18(1), 89–105. Retrieved from http://www.jstor.org/sta-
ble/30000511
Roininen, K., Arvola, A., & Lähteenmäki, L. (2006). Exploring consumers’ perceptions
of local food with two different qualitative techniques: Laddering and word asso-
ciation. Food Quality and Preference, 17(1–2), 20–30. https://doi.org/10.1016/j.food-
qual.2005.04.012
Román, S., Sánchez-Siles, L. M., & Siegrist, M. (2017). The importance of food natural-
ness for consumers: Results of a systematic review. Trends in Food Science and Tech-
nology, 67, 44–57. https://doi.org/10.1016/j.tifs.2017.06.010
References | 197
Running, C. A., & Hayes, J. E. (2016). Individual Differences in Multisensory Flavor Per-
ception. In B. Piqueras-Fiszman & C. Spence (Eds.), Multisensory Flavor Perception
(pp. 185–210). Woodhead Publishing. https://doi.org/10.1016/B978-0-08-100350-
3.00010-9
Saito, M. (1996). Comparative studies on color preference in Japan and other asian re-
gions, with special emphasis on the preference for white. Color Research and Appli-
cation, 21(1), 35–49. https://doi.org/10.1002/(SICI)1520-6378(199602)21:1<35::AID-
COL4>3.0.CO;2-6
Sakai, N., & Morikawa, S. (2006). The pictures of fruits juices affect flavor perception of
fruit juices. The Japanese Association for the Study of Taste and Smell, 13(3), 463–466.
Schifferstein, H. N. J., Fenko, A., Desmet, P. M. A., Labbe, D., & Martin, N. (2013). In-
fluence of package design on the dynamics of multisensory and emotional food
experience. Food Quality and Preference, 27(1), 18–25. https://doi.org/10.1016/j.food-
qual.2012.06.003
Schifferstein, H. N. J., Howell, B. F., & Pont, S. C. (2017). Colored backgrounds affect the
attractiveness of fresh produce, but not it’s perceived color. Food Quality and Prefe-
rence, 56, 173–180. https://doi.org/10.1016/j.foodqual.2016.10.011
Schiffman, L. G., Hansen, H., & Kanuk, L. (2012). Consumer behaviour: A European Outlook.
Harlow: Prentice Hall.
Schmitt, N. (1998). Quantifying word association responses: what is native-like? System,
26(3), 389–401. http://dx.doi.org/10.1016/S0346-251X(98)00019-0
Schuldt, J. P. (2013). Does Green Mean Healthy? Nutrition Label Color Affects Perceptions
of Healthfulness. Health Communication, 28(8), 814–821. https://doi.org/10.1080/10
410236.2012.725270
Schuldt, J. P., Muller, D., & Schwarz, N. (2012). The “Fair Trade” Effect: Health Halos
From Social Ethics Claims. Social Psychological and Personality Science, 3(5), 581–589.
https://doi.org/10.1177/1948550611431643
Schuldt, J. P., & Schwarz, N. (2010). The “organic” path to obesity? Organic claims in-
fluence calorie judgments and exercise recommendations. Judgment and Decision
Making, 5(3), 144–150.
Scott, L. (1994). Images in Advertising - the Need for a Theory of Visual Rhetoric. Journal
of Consumer Research, 21(2), 252–273. https://doi.org/10.1086/209396
Semin, G. R., & Palma, T. A. (2014). Why the bride wears white: Grounding gender with
brightness. Journal of Consumer Psychology, 24(2), 217–225. https://doi.org/10.1016/j.
jcps.2013.09.003
Silayoi, P., & Speece, M. (2007). The importance of packaging attributes: a conjoint
analysis approach. European Journal of Marketing, 41(11/12), 1495–1517. https://doi.
org/10.1108/03090560710821279

198 | References
Simmonds, G., & Spence, C. (2017). Thinking inside the box: How seeing products on,
or through, the packaging influences consumer perceptions and purchase be-
haviour. Food Quality and Preference, 62, 340–351. https://doi.org/10.1016/j.food-
qual.2016.11.010
Simmonds, G., Woods, A. T., & Spence, C. (2017). ‘Show me the Goods’: Assessing the
Effectiveness of Transparent Packaging vs. Product Imagery on Product Eva-
luation. Food Quality and Preference, (In press). https://doi.org/10.1016/j.food-
qual.2017.07.015
Singh, & Satyendra. (2006). Impact of color on marketing. Management Decision, 44, 783–
789. https://doi.org/10.1108/00251740610673332
Skaczkowski, G., Durkin, S., Kashima, Y., & Wakefield, M. (2016). The effect of packaging,
branding and labeling on the experience of unhealthy food and drink: A review.
Appetite. https://doi.org/10.1016/j.appet.2016.01.022
Smith, E. E., Osherson, D. N., Rips, L. J., & Keane, M. (1988). Combining prototypes:
A selective modification model. Cognitive Science, 12(4), 485–527. https://doi.
org/10.1016/0364-0213(88)90011-0
Smith, V., Barratt, D., & Selsøe Sørensen, H. (2015). Do natural pictures mean natural
tastes? Assessing visual semantics experimentally. Cognitive Semiotics, 8(1), 53–86.
https://doi.org/10.1515/cogsem-2015-0001
Smith, V., Møgelvang-Hansen, P., & Hyldig, G. (2010). Spin versus fair speak in food la-
belling: A matter of taste? Food Quality and Preference, 21(8), 1016–1025. https://doi.
org/10.1016/j.foodqual.2010.05.016
Solomon, M., Bamossy, G., Askegaard, S., & Hogg, M. K. (2008). Consumer Behaviour: A
European Perspective. Harlow: Prentice Hall.
Spence, C. (2011). Mouth-Watering: The Influence Of Environmental And Cognitive Fac-
tors On Salivation And Gustatory/Flavor Perception. Journal of Texture Studies, 42(2),
157–171. https://doi.org/10.1111/j.1745-4603.2011.00299.x
Spence, C. (2015a). Multisensory Flavor Perception. Cell, 161(1), 24–35. https://doi.or-
g/10.1016/j.cell.2015.03.007
Spence, C. (2015b). On the psychological impact of food colour. Flavour, 4(1), 21. https://
doi.org/10.1186/s13411-015-0031-3
Spence, C. (2015c). Visual contributions to taste and flavour perception. In M. J. Scotter
(Ed.), Colour Additives for Foods and Beverages (pp. 189–210). Cambridge: Woodhead
Publishing. https://doi.org/10.1016/B978-1-78242-011-8.00007-6
Spence, C. (2016). Multisensory Packaging Design: Color, Shape, Texture, Sound, and
Smell. In Integrating the Packaging and Product Experience in Food and Beverages (pp.
1–22). https://doi.org/10.1016/B978-0-08-100356-5.00001-2
Spence, C. (2017). Gastrophysics: The new science of eating. London, UK: Penguin.
References | 199
Spence, C. (2018a). Background colour & its impact on food perception & behaviour. Food
Quality and Preference, 68(December 2017), 156–166. https://doi.org/10.1016/j.food-
qual.2018.02.012
Spence, C. (2018b). Multisensory Perception. In Stevens’ Handbook of Experimental Psy-
chology and Cognitive Neuroscience (pp. 1–56). Hoboken, NJ: John Wiley & Sons, Inc.
https://doi.org/10.1002/9781119170174.epcn214
Spence, C., & Deroy, O. (2013). How automatic are crossmodal correspondences? Cons-
ciousness and Cognition, 22(1), 245–260. https://doi.org/10.1016/j.concog.2012.12.006
Spence, C., Okajima, K., Cheok, A. D., Petit, O., & Michel, C. (2015). Eating with our
eyes: From visual hunger to digital satiation. Brain and Cognition. https://doi.or-
g/10.1016/j.bandc.2015.08.006
Spence, C., & Piqueras-Fiszman, B. (2014a). Tastes Great, But What do We Call It? The Art
and Science of Food Description. In The Perfect Meal (pp. 71–107). Chichester, UK:
John Wiley & Sons, Ltd. https://doi.org/10.1002/9781118491003.ch3
Spence, C., & Piqueras-Fiszman, B. (2014b). The Perfect Meal: The Multisensory Scien-
ce of Food and Dining. Chichester, UK: John Wiley & Sons, Ltd. https://doi.
org/10.1002/9781118491003
Spence, C., & Piqueras-Fiszman, B. (2016). Food Color and Its Impact on Taste/Flavor Percep-
tion. In B. Piqueras-Fiszman & C. Spence (Eds.), Multisensory Flavor Perception (pp. 107–
132). Woodhead Publishing. https://doi.org/10.1016/B978-0-08-100350-3.00006-7
Spence, C., Smith, B., & Auvray, M. (2014). Confusing Tastes with Flavours. In D.
Stokes, M. Matthen, & S. Biggs (Eds.), Perception and Its Modalities (pp. 247–
276). Oxford, UK: Oxford University Press. https://doi.org/10.1093/acprof:o-
so/9780199832798.003.0011
Spence, C., Wan, X., Woods, A., Velasco, C., Deng, J., Youssef, J., & Deroy, O. (2015). On
tasty colours and colourful tastes? Assessing, explaining, and utilizing crossmo-
dal correspondences between colours and basic tastes. Flavour, 4(1), 23. https://doi.
org/10.1186/s13411-015-0033-1
Sperber, D., & Wilson, D. (1995). Relevance: Communication and cognition. Malden: Blac-
kwell Publishing.
Spillmann, L., & Ehrenstein, W. H. (1996). From neuron to Gestalt: mechanisms of visual
perception. In R. Greger & U. Windhorst (Eds.), Comprehensive Human Physiology:
From Cellular Mechanisms to Integration (Vol. 1, pp. 861–893). Berlin, Heidelberg:
Springer-Verlag.
Spinelli, S., & Niedziela, M. (2016). Emotion Measurements and Application to Product
and Packaging Development. In P. Burguess (Ed.), Integrating the Packaging and Pro-
duct Experience in Food and Beverages: A Road-Map to Consumer Satisfaction (pp. 77–
119). Woodhead Publishing. https://doi.org/10.1016/B978-0-08-100356-5.00005-X
200 | References
Stacy, A. W., Ames, S. L., & Grenard, J. L. (2006). Word Association Tests of Associa-
tive Memory and Implicit Processes: Theoretical and Assessment Issues. In
Handbook of Implicit Cognition and Addiction (pp. 75–90). 2455 Teller Road, Thou-
sand Oaks California 91320 United States: SAGE Publications, Inc. https://doi.
org/10.4135/9781412976237.n6
Stasi, A., Songa, G., Mauri, M., Ciceri, A., Diotallevi, F., Nardone, G., & Russo, V. (2018).
Neuromarketing empirical approaches and food choice: A systematic review. Food
Research International, 108(November), 650–664. https://doi.org/10.1016/j.foo-
dres.2017.11.049
Steenis, N. D., van Herpen, E., van der Lans, I. A., Ligthart, T. N., & van Trijp, H. C. M.
(2017). Consumer response to packaging design: The role of packaging materials
and graphics in sustainability perceptions and product evaluations. Journal of Clea-
ner Production, 162, 286–298. https://doi.org/10.1016/j.jclepro.2017.06.036
Sütterlin, B., & Siegrist, M. (2015). Simply adding the word “fruit” makes sugar heal-
thier: The misleading effect of symbolic information on the perceived healthiness
of food. Appetite, 95, 252–261. https://doi.org/10.1016/j.appet.2015.07.011
Swientek, B. (2001). Uncanny Developments. Beverage Industry, 92(12), 38–39.
Szocs, C., & Lefebvre, S. (2016). The blender effect: Physical state of food influences heal-
thiness perceptions and consumption decisions. Food Quality and Preference, 54,
152–159. https://doi.org/10.1016/j.foodqual.2016.07.009
Szocs, C., & Lefebvre, S. (2017). Spread or stacked? Vertical versus horizontal food pre-
sentation, portion size perceptions, and consumption. Journal of Business Research,
75, 249–257. https://doi.org/10.1016/j.jbusres.2016.07.022
Tannenbaum, P. H., Jacobson, H. K., & Norris, E. L. (1964). An Experimental Investi-
gation of Typeface Connotations. Journalism Quarterly, 41(1), 65–73. https://doi.
org/10.1177/107769906404100108
Te Vaarwerk, M. C., van Rompay, T. J. L., & Okken, V. S. (2015). Under cover and close at
hand: Embodied metaphor in packaging design. International Journal of Design, 9(1),
29–37.
Teige-Mocigemba, S., Klauer, K. C., & Sherman, J. W. (2010). A Practical Guide to Implicit
Association Tests and Related Tasks. In B. Gawronski & B. K. Payne (Eds.), Handbook
of Implicit Social Cognition Measurement, Theory, and Applications (pp. 117–139). New
York: Guilford Press.
Tempesta, T., Giancristofaro, R. A., Corain, L., Salmaso, L., Tomasi, D., & Boatto, V.
(2010). The importance of landscape in wine quality perception: An integrated
approach using choice-based conjoint analysis and combination-based permu-
tation tests. Food Quality and Preference, 21(7), 827–836. https://doi.org/10.1016/j.
foodqual.2010.04.007

References | 201
Thomas, S., & Chambault, M. (2016). Explicit Methods to Capture Consumers’ Respon-
ses to Packaging. In P. Burgess (Ed.), Integrating the Packaging and Product Experience
in Food and Beverages (pp. 139–159). Woodhead Publishing. https://doi.org/10.1016/
B978-0-08-100356-5.00007-3
Thomson, D. M. H. (2016). Sensory Branding: Using Brand, Pack, and Product Sensory
Characteristics to Deliver a Compelling Brand Message. In B. Piqueras-Fiszman &
C. Spence (Eds.), Multisensory Flavor Perception (pp. 313–336). Woodhead Publishing.
https://doi.org/10.1016/B978-0-08-100350-3.00016-X
Tijssen, I., Zandstra, E. H., de Graaf, C., & Jager, G. (2017). Why a ‘light’ product package
should not be light blue: Effects of package colour on perceived healthiness and
attractiveness of sugar- and fat-reduced products. Food Quality and Preference, 59,
46–58. https://doi.org/10.1016/j.foodqual.2017.01.019
Tu, Y., Yang, Z., & Ma, C. (2016). The Taste of Plate: How the Spiciness of Food is Affected
by the Color of the Plate Used to Serve It. Journal of Sensory Studies, 31(1), 50–60.
https://doi.org/10.1111/joss.12190
Underwood, R. L. (2003). The Communicative Power of Product Packaging: Creating
Brand Identity via Lived and Mediated Experience. Journal of Marketing Theory and
Practice, 11(1), 62–76. https://doi.org/10.1080/10696679.2003.11501933
Underwood, R. L., & Klein, N. M. (2002). Packaging as brand communication: Effects of
product pictures on consumer responses to the package and brand. Journal of Mar-
keting Theory and Practice, 10(4), 58–68. https://doi.org/10.1080/10696679.2002.11501926
Underwood, R. L., & Ozanne, J. L. (1998). Is your package an effective communica-
tor? A normative framework for increasing the communicative competen-
ce of packaging. Journal of Marketing Communications, 4, 207–220. https://doi.
org/10.1080/135272698345762
van Herpen, E., Immink, V., & van den Puttelaar, J. (2016). Organics unpacked: The in-
fluence of packaging on the choice for organic fruits and vegetables. Food Quality
and Preference, 53, 90–96. https://doi.org/10.1016/j.foodqual.2016.05.011
van Herpen, E., & Trijp, H. C. M. va. (2011). Front-of-pack nutrition labels. Their effect
on attention and choices when consumers have varying goals and time constraints.
Appetite, 57(1), 148–160. https://doi.org/10.1016/j.appet.2011.04.011
van Jaarsveld, H. J., Coolen, R., & Schreuder, R. (1994). The role of analogy in the in-
terpretation of novel compounds. Journal of Psycholinguistic Research, 23(2), 111–137.
https://doi.org/10.1007/BF02143919
van Ooijen, I., Fransen, M. L., Verlegh, P. W. J., & Smit, E. G. (2017). Signalling product
healthiness through symbolic package cues: Effects of package shape and goal
congruence on consumer behaviour. Appetite, 109, 73–82. https://doi.org/10.1016/j.
appet.2016.11.021
202 | References
Van Rompay, T. J. L., & Pruyn, A. T. H. (2011). When visual product features speak the
same language: Effects of shape-typeface congruence on brand perception and pri-
ce expectations. Journal of Product Innovation Management, 28(4), 599–610. https://
doi.org/10.1111/j.1540-5885.2011.00828.x
Velasco, C., Salgado-Montejo, A., Marmolejo-Ramos, F., & Spence, C. (2014). Predictive
packaging design: Tasting shapes, typefaces, names, and sounds. Food Quality and
Preference, 34, 88–95. https://doi.org/10.1016/j.foodqual.2013.12.005
Velasco, C., Woods, A. T., & Hyndman, S. (2015). The Taste of Typeface. I-Perception, 6(4),
1–11. https://doi.org/10.1177/2041669515593040
Velasco, C., Woods, A. T., Petit, O., Cheok, A. D., & Spence, C. (2016). Crossmodal correspon-
dences between taste and shape, and their implications for product packaging: A review.
Food Quality and Preference, 52(4), 17–26. https://doi.org/10.1016/j.foodqual.2016.03.005
Velasco, C., Woods, A. T., & Spence, C. (2015). Evaluating the orientation of design ele-
ments in product packaging using an online orientation task. Food Quality and Pre-
ference, 46, 151–159. https://doi.org/10.1016/j.foodqual.2015.07.018
Venter, K., van der Merwe, D., de Beer, H., Kempen, E., & Bosman, M. (2011). Consumers’
perceptions of food packaging: an exploratory investigation in Potchefstroom,
South Africa. International Journal of Consumer Studies, 35(3), 273–281. https://doi.
org/10.1111/j.1470-6431.2010.00936.x
Versluis, I., Papies, E. K., & Marchiori, D. (2015). Preventing the pack size effect: explo-
ring the effectiveness of pictorial and non-pictorial serving size recommendations.
Appetite, 87, 116–26. https://doi.org/10.1016/j.appet.2014.12.097
Walters, A., & Long, M. (2012). The effect of food label cues on perceptions of quality
and purchase intentions among high-involvement consumers with varying levels
of nutrition knowledge. Journal of Nutrition Education and Behavior, 44(4), 350–4. ht-
tps://doi.org/10.1016/j.jneb.2011.08.008
Wang, Q. (Janice), Keller, S., & Spence, C. (2017). Sounds spicy: Enhancing the evaluation
of piquancy by means of a customised crossmodally congruent soundtrack. Food
Quality and Preference, 58, 1–9. https://doi.org/10.1016/j.foodqual.2016.12.014
Wansink, B. (2004). Environmental Factors That Increase the Food Intake and Consump-
tion Volume of Unknowing Consumers. Annual Review of Nutrition, 24(1), 455–479.
https://doi.org/10.1146/annurev.nutr.24.012003.132140
Wei, S. T., Ou, L. C., Luo, M. R., & Hutchings, J. B. (2014). Package design: Colour harmony
and consumer expectations. International Journal of Design, 8(1), 109–126.
Wentura, D., & Degner, J. (2010). A practical guide to sequential priming and related tas-
ks. In B. Gawronski & B. K. Payne (Eds.), Handbook of implicit social cognition: mea-
surement, theory and applications (p. 594). New York: Guilford Press. Retrieved from
http://dare.uva.nl/search?metis.record.id=333027
References | 203
Westerman, S. J., Sutherland, E. J., Gardner, P. H., Baig, N., Critchley, C., Hickey, C.,
… Zervos, Z. (2013). The design of consumer packaging: Effects of manipulations
of shape, orientation, and alignment of graphical forms on consumers’ assess-
ments. Food Quality and Preference, 27(1), 8–17. https://doi.org/10.1016/j.food-
qual.2012.05.007
Wilcock, A., Pun, M., Khanona, J., & Aung, M. (2004). Consumer attitudes, knowledge
and behaviour: A review of food safety issues. Trends in Food Science and Technology,
15(2), 56–66. https://doi.org/10.1016/j.tifs.2003.08.004
Woods, A. T., Lloyd, D. M., Kuenzel, J., Poliakoff, E., Dijksterhuis, G. B., & Thomas, A.
(2011). Expected taste intensity affects response to sweet drinks in primary taste cor-
tex. NeuroReport, 22(8), 365–369. https://doi.org/10.1097/WNR.0b013e3283469581
Woods, A. T., Poliakoff, E., Lloyd, D. M., Dijksterhuis, G. B., & Thomas, A. (2010). Flavor
expectation: The effect of assuming homogeneity on drink perception. Chemosen-
sory Perception, 3(3–4), 174–181. https://doi.org/10.1007/s12078-010-9080-2
Woods, A. T., Velasco, C., Levitan, C. A., Wan, X., & Spence, C. (2015). Conducting per-
ception research over the internet: a tutorial review. PeerJ, 3, e1058. https://doi.
org/10.7717/peerj.1058
Yang, C.-M., & Hsu, T.-F. (2015). Applying Semiotic Theories to Graphic Design Educa-
tion: An Empirical Study on Poster Design Teaching. International Education Studies,
8(12), 117. https://doi.org/10.5539/ies.v8n12p117
Yang, F. L., Cho, S., & Seo, H. S. (2016). Effects of Light Color on Consumers’ Acceptability
and Willingness to Eat Apples and Bell Peppers. Journal of Sensory Studies, 31(1), 3–11.
https://doi.org/10.1111/joss.12183
Yeomans, M. R., Chambers, L., Blumenthal, H., & Blake, A. (2008). The role of expectancy
in sensory and hedonic evaluation: The case of smoked salmon ice-cream. Food Qua-
lity and Preference, 19(6), 565–573. https://doi.org/10.1016/j.foodqual.2008.02.009
Zampini, M., & Spence, C. (2004). The Role of Auditory Cues in Modulating the Perceived
Crispness and Staleness of Potato Chips. Journal of Sensory Studies, 19(5), 347–363.
https://doi.org/10.1111/j.1745-459x.2004.080403.x

204 | References

Appendices | 205
APPENDICES7.


Appendices | 207
Publications’ impact factors
• Study 1 p. 57
The paper “How material, visual and verbal cues on packaging in-
fluence consumer expectations and willingness to buy: The case of
crisps (potato chips) in Spain” was published in the journal Food
Research International, 99, 239–246 (2017). https://doi.org/10.1016/j.
foodres.2017.05.024
Food Research International’s JCR Journal Impact Factor in 2017 was
3.520, placing it in position 14 of 133 (quartile Q1) of the Category Food
Science & Technology.
• Study 2 p. 67
The paper “Images used to convey that a natural yogurt is sweetened
influence consumer expectations and willingness to buy” was submit-
ted for publication to the Journal of Dairy Science in 2018.
Journal of Diary Science’s JCR Journal Impact Factor in 2017 (the lat-
est available data) was 2.749, placing it in position 4 of 60 (quartile Q1)
of the Category Agriculture, Dairy and Animal Science.
• Study 3 p. 109
The paper “The influence the serving suggestion displayed on soft
cheese packaging has on consumer expectations and willingness to
buy” was published in the journal Food Quality and Preference, 52, 188–
194 (2016). https://doi.org/10.1016/j.foodqual.2016.04.015
Food Quality and Preference’s JCR Journal Impact Factor in 2016 was
3.199, placing it in position 16 of 130 (quartile Q1) of the Category Food
Science & Technology.
7.1.
208 | Appendices
• Study 4 p. 119
The paper “The influence the image of the product shown on food
packaging labels has on product perception during tasting: Effects and
gender differences” was accepted for publication in the journal Pack-
aging Technology and Science in 2018 and is currently in press. https://
doi.org/10.1002/pts.2407
Packaging Technology and Science’s JCR Journal Impact Factor in
2017 (the latest available data) was 1.808, placing it in position 65 of
133 (quartile Q2) of the Category Food Science & Technology.
• Study 5 p. 131
The paper “What do you mean by hot? Assessing the associations
raised by the visual depiction of an image of fire on food packaging”
was published in the journal Food Quality and Preference, 71, 384–394
(2019). https://doi.org/10.1016/j.foodqual.2018.08.015
Food Quality and Preference’s JCR Journal Impact Factor in 2017 (the
latest available data) was 3.652, placing it in position 13 of 133 (quartile
Q1) of the Category Food Science & Technology.
• Study 6 p. 145
The paper “Hot or not? Conveying sensory information on food pack-
aging through the spiciness-shape correspondence” was published in
the journal Food Quality and Preference, 71, 197–208 (2019). https://doi.
org/10.1016/j.foodqual.2018.07.009
Food Quality and Preference’s JCR Journal Impact Factor in 2017 (the
latest available data) was 3.652, placing it in position 13 of 133 (quartile
Q1) of the Category Food Science & Technology.
Appendices | 209
Co-authorship contribution
• Study 1 p. 57
Rebollar, R., Gil, I., Lidón, I., Martín, J., Fernández, M. J., & Rivera, S.
(2017). How material, visual and verbal cues on packaging influence
consumer expectations and willingness to buy: The case of crisps (po-
tato chips) in Spain. Food Research International, 99, 239–246. https://
doi.org/10.1016/j.foodres.2017.05.024
− Literature review and stablishment of a theoretical framework.
− Statistical analysis of the data.
− Discussion of the results and framing on the existant literature.
− Writing of the paper.
− Re-writing and improving the paper following reviewers’ com-
ments.
• Study 2 p. 67
Rebollar, R., Lidón, I., Gil-Pérez, I., & Martín, J. (2018). Images used to
convey that a natural yogurt is sweetened influence consumer expec-
tations and willingness to buy. Manuscript submitted for publication to
the Journal of Dairy Science.
− Literature review and stablishment of a theoretical framework.
− Discussion of the results and framing on the existant literature.
− Writing of the paper together with other co-authors.
7.2.
210 | Appendices
• Study 3 p. 109
Rebollar, R., Lidón, I., Gil, I., Martín, J., Fernández, M. J., & Riveres,
C. E. (2016). The influence the serving suggestion displayed on soft
cheese packaging has on consumer expectations and willingness to
buy. Food Quality and Preference, 52, 188–194. https://doi.org/10.1016/j.
foodqual.2016.04.015
− Literature review and stablishment of a theoretical framework.
− Statistical analysis of the data.
− Discussion of the results and framing on the existant literature.
− Writing of the paper.
− Re-writing and improving the paper following reviewers’ com-
ments.
• Study 4 p. 119
Lidón, I., Rebollar, R., Gil-Pérez, I., Martín, J., & Vicente-Villardón,
J. L. (in press). The influence the image of the product shown on food
packaging labels has on product perception during tasting: Effects
and gender differences. Packaging Technology and Science. https://doi.
org/10.1002/pts.2407
− Ideation of the study.
− Literature review and stablishment of a theoretical framework.
− Design of the stimuli.
− Design of the experimental procedure.
− Conduction of the experiment and gathering of the data.
− Statistical analysis of the data.
− Discussion of the results and framing on the existant literature.
− Writing of the paper.
− Re-writing and improving the paper following reviewers’ com-
ments.
Appendices | 211
• Study 5 p. 131
Gil-Pérez, I., Rebollar, R., Lidón, I., Piqueras-Fiszman, B., & van Trijp,
H. C. M. (2019). What do you mean by hot? Assessing the associations
raised by the visual depiction of an image of fire on food packaging.
Food Quality and Preference, 71, 384–394. https://doi.org/10.1016/j.food-
qual.2018.08.015
− Ideation of the study.
− Literature review and stablishment of a theoretical framework.
− Design of the stimuli.
− Design of the experimental procedure.
− Conduction of the experiment and gathering of the data.
− Statistical analysis of the data.
− Discussion of the results and framing on the existant literature.
− Writing of the paper.
− Re-writing and improving the paper following reviewers’ com-
ments.
• Study 6 p. 145
Gil-Pérez, I., Rebollar, R., Lidón, I., Martín, J., van Trijp, H. C. M., &
Piqueras-Fiszman, B. (2019). Hot or not? Conveying sensory informa-
tion on food packaging through the spiciness-shape correspondence.
Food Quality and Preference, 71, 197–208. https://doi.org/10.1016/j.food-
qual.2018.07.009
− Ideation of the study.
− Literature review and stablishment of a theoretical framework.
− Design of the stimuli.
− Design of the experimental procedure.
− Conduction of the experiment and gathering of the data.
− Statistical analysis of the data.
− Discussion of the results and framing on the existant literature.
− Writing of the paper.
− Re-writing and improving the paper following reviewers’ com-
ments.
212 | Appendices
Related research activities
Other research articles
• Rebollar, R., Lidón, I., Guzmán, R., Gil, I., & Martín, J. (2017). The in-
fluence of illuminance level on perception and willingness to buy du-
ring the tasting of sweetened natural yoghurt. Food Quality and Preferen-
ce, 62, 270–274. https://doi.org/10.1016/j.foodqual.2017.05.007
Food Quality and Preference’s JCR Journal Impact Factor in 2017 was
3.652, placing it in position 13 of 133 (quartile Q1) of the Category Food
Science & Technology.
Book chapters
• Gil, I., Rebollar, R., Lidón, I., & Martín, J. (2017). Study on the Influence
of Fresh White Cheese Packaging Design Variables on Users’ Percep-
tion. In J. Ayuso Muñoz, J. Yagüe Blanco, & S. Capuz-Rizo (Eds.), Pro-
ject Management and Engineering Research. Lecture Notes in Management
and Industrial Engineering (pp. 37–49). Cham: Springer. https://doi.
org/10.1007/978-3-319-51859-6_3
7.3.
Appendices | 213
Conference proceedings
• Gil-Pérez, I., Lidón, I., Rebollar, R., & Martín, J. (2015). Study of the
Influence of White Cheese Packaging Design Variables in User’s Per-
ception. In 19th International Congress on Project Management and Engi-
neering. Granada (Spain).
• Gil-Pérez, I., Lidón, I., Rebollar, R., & Martín, J. (2016). Influence of the
Images Displayed in the Packaging in Consumers’ Sensory Perception.
In 20th International Congress on Project Management and Engineering.
Cartagena (Spain).
• Gil-Pérez, I., Lidón, I., Rebollar, R., Minguez, J., & Horna, E. (2017). The
explicit and implicit response of the consumer to the images displayed
in a food packaging: an exploratory study. In 21th International Congress
on Project Management and Engineering. Cádiz (Spain).
• Fernández-Gómez, M. J., Martín-Vallejo, J., Rebollar, R., Lidón, I.,
Gil, I., & Vicente-Villardón, J. L. (2017). The MANOVA BIPLOT as tool
to analyze the influence of the variety of Apple pictured on the label of
a jar of Apple sauce and the gender of consumers on perception during
tasting. In XVI Spanish Biometric Conference - CEB 2017. Sevilla (Spain).
• Gil-Pérez, I., Rebollar, R., & Lidón, I. (2018). Effects of the use of pic-
torial elements in a food packaging in the process of categorization and
generation of expectations. In 22th International Congress on Project Ma-
nagement and Engineering. Madrid (Spain).
• Gil-Pérez, I., Lidón, I., Rebollar, R., & Piqueras-Fiszman, B. (2018).
Crossmodal associations between flavours and shapes can be used to
set up consumer expectations. Poster presented in Eurosense 2018 - Ei-
ght European Conference on Sensory and Consumer Research. Verona (Italy).
• Gil-Pérez, I., Rebollar, R., & Lidón, I. (2018). Implying motion in a food
package influences perception of level of processing and hedonic res-
ponse during tasting. Poster presented in Eurosense 2018 - Eight Euro-
pean Conference on Sensory and Consumer Research. Verona (Italy).

214 | Appendices

Across six research studies, this thesis studies how manipulating the
subject shown on packaging imagery influences consumer expecta-
tions, perception, and response towards the product, and investigates
how consumers infer meaning from ambiguous images depicted on
food packaging.
The results show that both manipulating what is depicted on the image
and the way it is depicted influence consumer expectations and respon-
se, since the attributes of the products displayed on the packaging tend
to influence the evaluation of the product contained within. In
addition, the results demonstrate that the congruence between the
image’s possible meanings and the product’s potential attributes plays
a key role in how the image is interpreted, and that that interpretation
can be modulated by manipulating the image’s shape.
Overall, these findings contribute to research on design, semiotics,
sensory science, and consumer psychology, and thus are discussed
under an interdisciplinary approach.