food packaging process material's effect on environment and
TRANSCRIPT
Quang Truong
Food packaging process material’s effect on environment and their control measures.
Subtitle
Metropolia University of Applied Sciences
Degree Bachelor
Degree Programme Environmental Engineering
Thesis
Date 5 Feb 2019
Author(s)
Title
Number of Pages
Date
QUANG TRUONG
Food packaging process material’s effect on environment
and their control measures.
24 pages + 1 page appendices
5 Feb 2019
Degree Bachelor
Degree Programme Environmental Engineering
Specialisation option Waste management
Instructor(s)
Kaj Lindedahl, Senior Lecturer
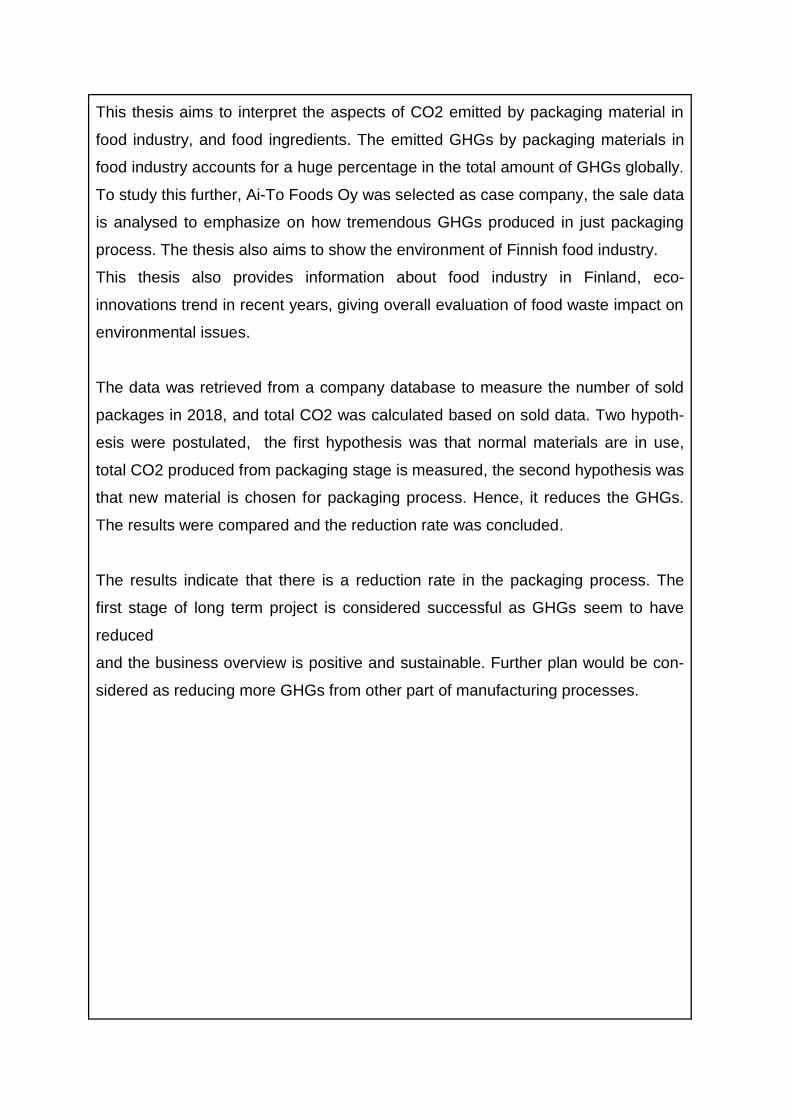
This thesis aims to interpret the aspects of CO2 emitted by packaging material in
food industry, and food ingredients. The emitted GHGs by packaging materials in
food industry accounts for a huge percentage in the total amount of GHGs globally.
To study this further, Ai-To Foods Oy was selected as case company, the sale data
is analysed to emphasize on how tremendous GHGs produced in just packaging
process. The thesis also aims to show the environment of Finnish food industry.
This thesis also provides information about food industry in Finland, eco-
innovations trend in recent years, giving overall evaluation of food waste impact on
environmental issues.
The data was retrieved from a company database to measure the number of sold
packages in 2018, and total CO2 was calculated based on sold data. Two hypoth-
esis were postulated, the first hypothesis was that normal materials are in use,
total CO2 produced from packaging stage is measured, the second hypothesis was
that new material is chosen for packaging process. Hence, it reduces the GHGs.
The results were compared and the reduction rate was concluded.
The results indicate that there is a reduction rate in the packaging process. The
first stage of long term project is considered successful as GHGs seem to have
reduced
and the business overview is positive and sustainable. Further plan would be con-
sidered as reducing more GHGs from other part of manufacturing processes.
Keywords packaging, material, management, carbon footprint
Contents 0
Introduction 1
2 Literature review 2
2.1 Carbon footprint 2
2.2 Food packaging 3
2.3 Packaging material 4
3 Food industry and carbon footprint 4
3.1 Food ingredients factor 4
3.2 Packaging materials factor 5
4 Food business and environment in Finland 7
5 Ai-to foods OY roadmap to sustainable development 10
6 Database and measure methods 11
6.1 Packaging materials information 12
6.2 GHGs statistical data 13
6.3 Meat factor GHGs 15
6.4 GHGs reduction by Ai-To Foods OY 17
6.5 Green logistics 18
7 Discussion 19
8 Conclusion 20
9 REFERENCE 21

Acknowledgement
Special thanks are reserved for my mentor, Senior lecturer of Metropolia UAS, Kaj
Lindedahl for supporting and guiding in order to complete this thesis. I would also
like to thank Ai-To Foods OY for providing data and co-operating in this thesis.
This was great opportunity to study food packaging waste, and it has been a pleas-
ure to get to know all department members of Metropolia UAS, Environmental Engi-
neering section.
1
1 Introduction
It is estimated that world population is rising with approximately 80 million
(80,700,291) [1] every year, hence the global food demand is moving in tandem
with growth rate, as are the environmental impacts of agricultural expansion. It
was studied that the crops demand per capita measure as caloric or protein
content of all crops combined, has significantly increased similarly, the real in-
come per capita has risen since 1960. As a consequences, this forecasts the
higher rise between 2005 to 2050, with approximate rate of 100%. (Global food
demand and sustainable intensification of agriculture- PNAS 2011) [2]. Fur-
thermore, if the current trends of greater agricultural intensification in richer na-
tions and greater land extensification in 3rd nations continues, global land loss
would be up to 1 billion hectares. Moreover, agriculture already has major im-
pacts on global environment, for instance, the threat to biodiversity from land
extensification activities, fertilization and fertilizer cause negative effects on ma-
rine, fresh water and terrestrial ecosystems.
It is statistically observed and reported that CO2 food emission equivalent
greenhouse gas is estimated at 3 gigatons, while the Nitrogen emission would
be up to 250 megatons by 2050 according to Food Waste within Food Supply
Chains: Quantification and Potential for Change to 2050 [3]. Food waste in 3rd
countries is unintentional due to lack of awareness, low management of food
flow (logistic, packaging, preservation factors), whereas in developed countries
food waste is intentional but also due to the lack of awareness, excessive food
purchasing factors.
Along with food ingredient emissions , municipal solid waste (MSW) includes
thrown away items such as packages, food scraps, and food bags , which form
in general, the food packages class in massive production chain. In fact, food is
a product class typically consumed regularly by every person, three times every
day. Therefore, food packaging accounts for almost two-thirds of total packag-
2
ing waste by volume, holding up to approximately 50% by weight of total pack-
aging sales, according to Journal of Food Science, April 2007 [4].
Therefore, some actions are needed to preserve environments while the food
demands for people should still be well met. Food packaging process, therefore,
is a major concern for wholesale selling food corporations around the globe. In
Finland, in 2018 report has shown that almost 45.8% and 27.1% percent of
wholesale food product is in a safe level of inspection-specific results, about
25% need more complied improvement with the minor 2.5% shortcomings de-
tected. (Evira publication, 1/2018) [5]. As the sustainable developing food busi-
ness, more corporations have an eco-friendly strategy. The general situation in
food industry in Finland will be shown in this thesis work.
2 Literature review
2.1 Carbon footprint
“A carbon footprint is the total greenhouse gas (GHS) emission caused by
measured subject, the emission can be caused directly and indirectly”. The sub-
jects can be individual, organization, products, food products or an event. The
carbon footprint is calculated based on the life cycle of the subject, different
greenhouse gases (GHGs) may be emitted such as methane and nitrous oxide,
which traps heat in the atmosphere.
3
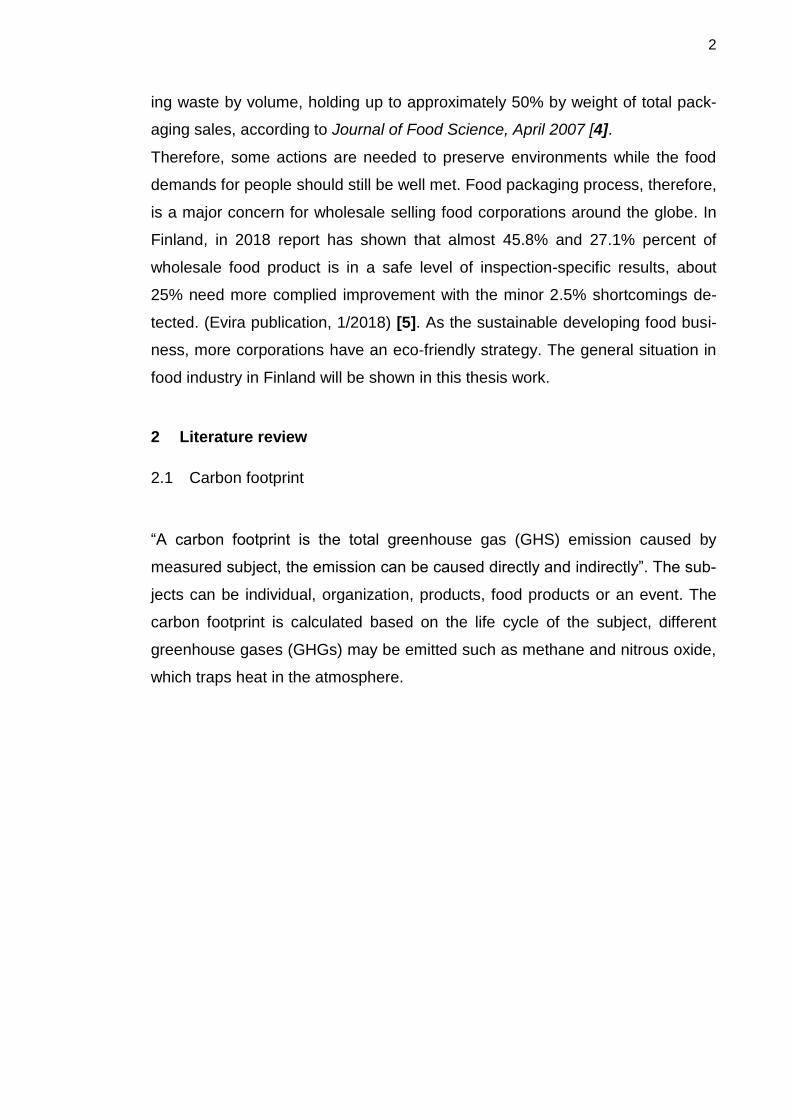
Figure 1. Food carbon footprint data-calculated in U.S 2018.
Facts: Average household in U.S food consumption emits 8.1 metric tons of
CO2e each year, with 84% production of food and 16% consists of food trans-
portation eg packaging, logistics.
Meat products have higher carbon footprints, not only in US but also in the
globe, compared to grain or vegetables due to inefficient transformation of plant
energy to animal energy.
Organic food has higher price, whereas it requires 30 up to 50% less energy
consumption but demand one-third more hours of human labour. [6]
2.2 Food packaging
The main principle role of food packaging are to protect food products from out-
side influences and damage, in order to preserve food in great quality to deliv-
ery to customers with nutrition information [7]. The process is capable of slow-
ing down product deterioration and retain the beneficial effects of processing,
maintain or increase quality and safety of food products.
4
Food packaging is the face of a product, and not only does give an impression
to new buyers, but it also is the only product that customers are exposed to ex-
perience prior to purchase. Consequently, distinctive or innovative packaging
can boost product selling in competitive environment.
2.3 Packaging material
Package design and construction plays significant role in determining the shelf
life of a product. The ideal selection of design’s material and technologies
should be able maintain product quality and freshness during distribution and
storage. Common chosen materials are glass, metal, paper, porous kraft paper
and wide variety of plastics. In order to cope with environmental issues, food
package materials are utilized for their functional or aesthetic properties, and to
ensure package quality.
3 Food industry and carbon footprint
3.1 Food ingredients factor
Food industry is believed to be one of the largest contributors to climate
change, as GHS emission from food preparing procedures (grow, harvest,
transport and store, and possibly process) before it reaches retailer’s shelves.
Furthermore, due to a growing population, the climate impact is undoubtedly on
the rise. In general, the estimated value of carbon emission is based on sources
that assess the greenhouse gas emission of food.
5
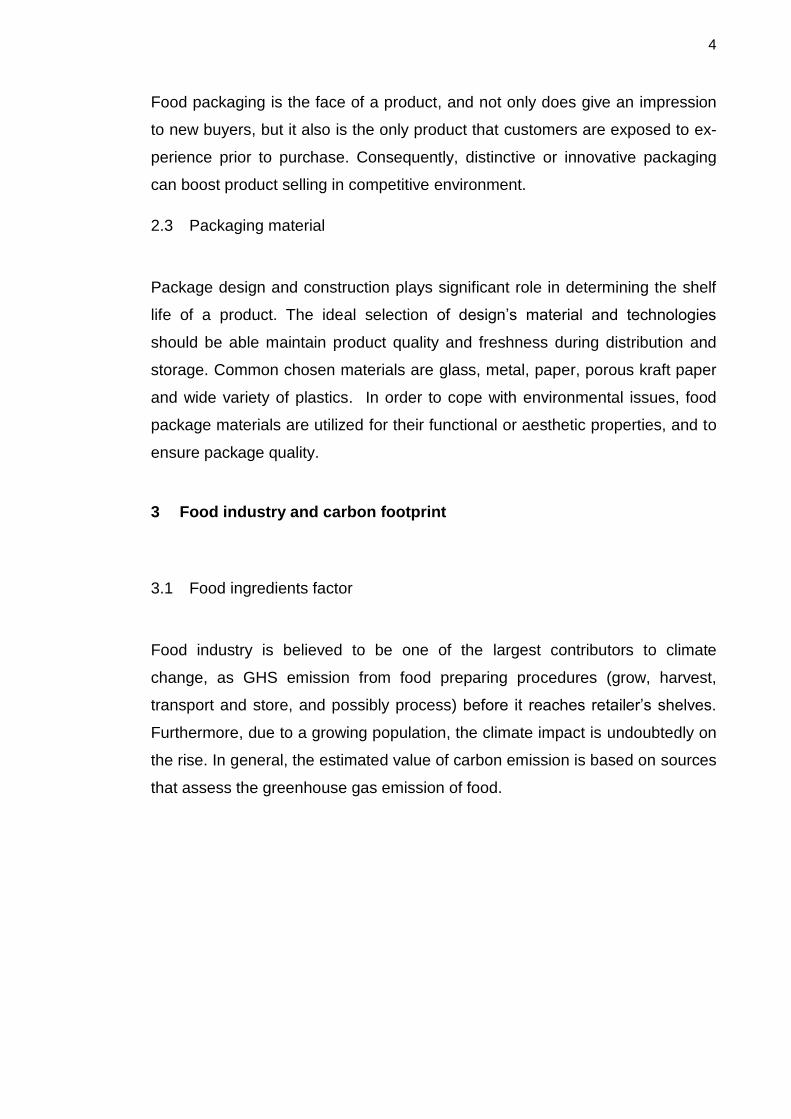
Figure 2. GHG emissions from different food types.
Figure 2 illustrates the carbon footprint on each type of food
sources in worldwide, the measure unit is kg CO2eq/kg.
Beef meat has a significant dominate value compared to other type of food with
a value of over 25 kg CO2eq/kg, vegetables have a very low CO2 emission val-
ue with mostly less than 5 kg CO2eq/kg. The data is calculated and reported
based on Lifecycle assessment, which follow the whole process of producing
the food source.
The European Commission has specifically planned to reduce in specific have
planned to cut down GHG at least by 20% by 2020 in order to reduce overall
emission.
3.2 Packaging materials factor
The second factor that significantly contributes to greenhouse gas (GHS) and
food waste is the manufacture process of the raw materials, fabrication of the
6
packaging system, transport and storage procedure and the use phase, includ-
ing refurbishment and reuse or end of life disposal.
The materials for food packaging business are mainly paper, stainless steel,
high-density polystyrene plastic, non-woven polypropylene plastic due to the
price element and endurable quality.
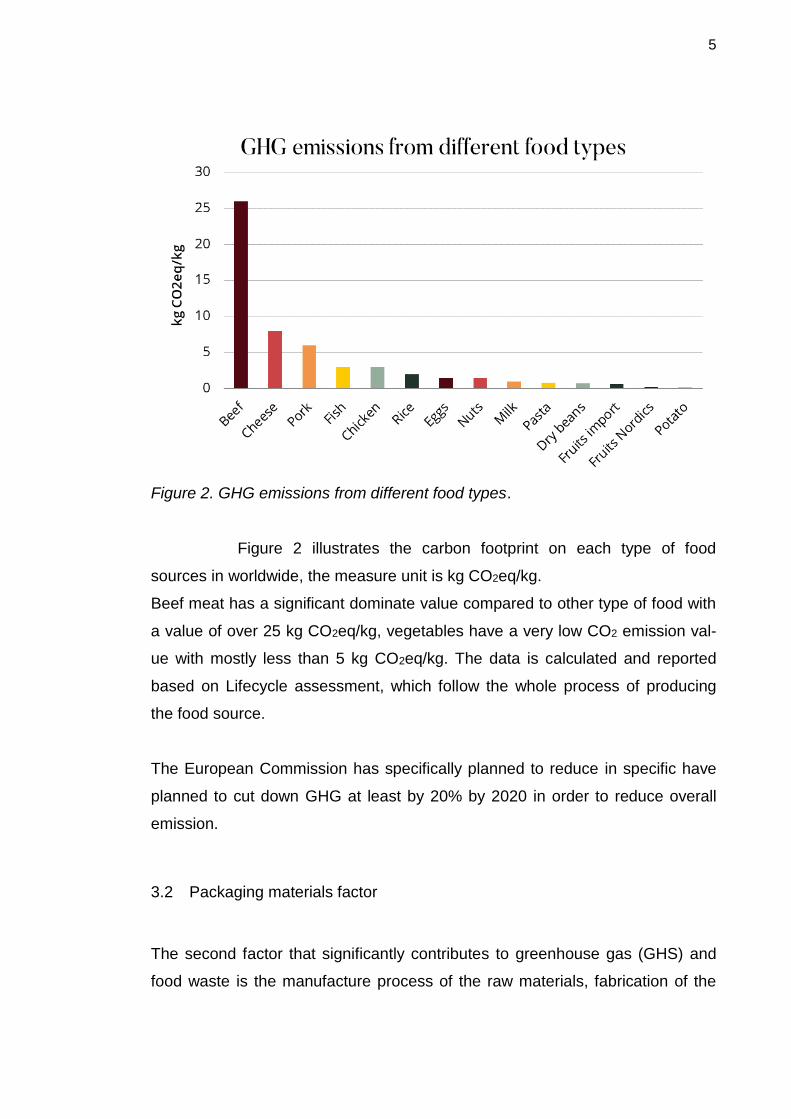
Figure 3. Development of all packaging waste generated, recovered and recy-
cled, EU, 2006-2015
Figure 3 from ec.europa.eu [8] shows the statistical data of waste generated
from food packaging. It is apparent that there is a huge gap between the recy-
cled, recovered waste compared to average 160 kg per inhabitant of generated
waste. On the other hands, packaging waste recycling rate rose steadily
throughout every year, showing that Europe is the following Directive 94/62/EC.
The Directive was amended to provide criteria clarifying the defini-
tion of the term 'packaging' and increase the targets for recovery
and recycling of packaging waste. In 2005, the Directive was re-
vised again to grant new Member States transitional periods for at-
taining the recovery and recycling targets.
In 2013 Annex I of the Directive containing the list of illustrative ex-
amples of items that are or are not to be considered as packaging
7
was revised in order to provide more clarity by adding a number of
examples to the list. The latest revision of the Packaging and Pack-
aging Waste Directive occurred on 29 April 2015 with the adoption
of Directive (EU) 2015/720 of the European Parliament and of the
Council amending Directive 94/62/EC as regards the consumption
of lightweight plastic carrier bags.
Sources of packaging wastes are mainly from households with approximately
64% and the rest from industrial and trading level. The recycling rate from
households segment obtained around 37,8%, which indicates positive trend in
protecting environment.
4 Food business and environment in Finland
Finland has been in advance position in eco-innovation projects in Europe, even
though the economy was relatively weak and recovering from an economy col-
lapse in 2008. Food industry also takes part in the eco-innovation trend in Fin-
land.
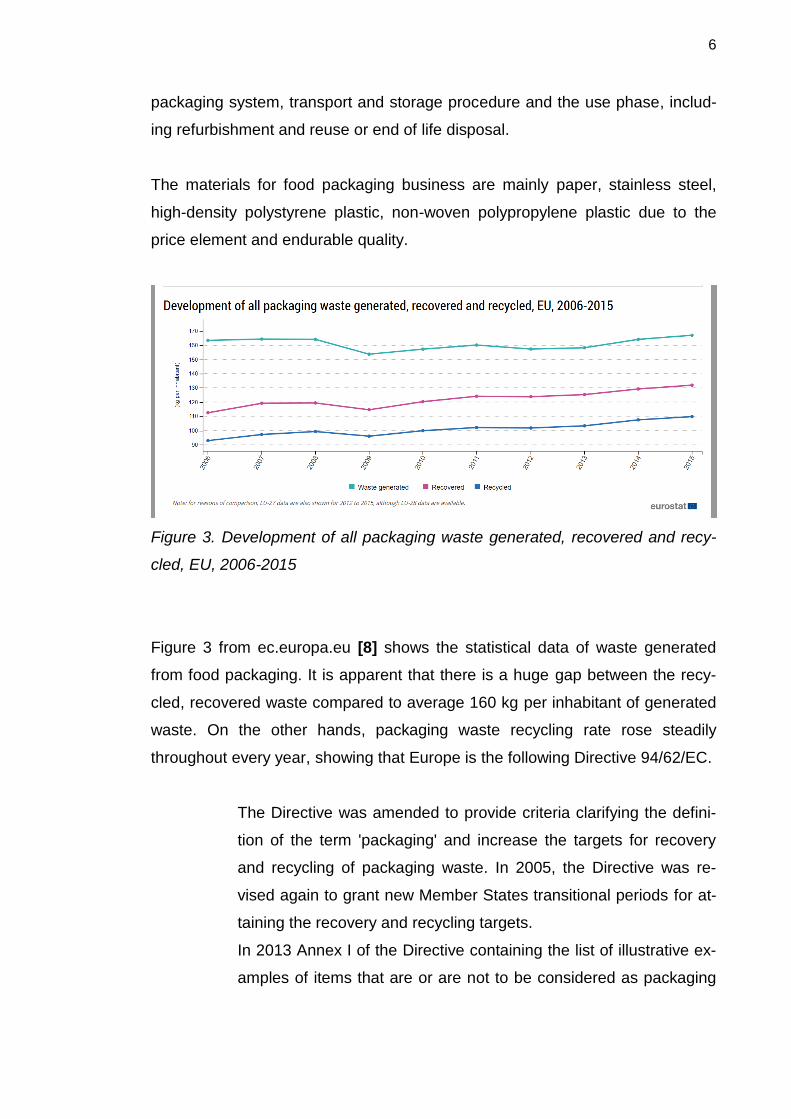
Figure 4. The eco-innovations factors between Finland and Europe.
8
The figure 4 above indicates component of Finland’s eco-innovation compared
to Europe [9]. In general, the resource efficiency component of the eco-
innovation score is around 20% lower than the EU average. The main challeng-
es are in material productivity (57% lower than the average) and energy produc-
tivity (41% lower). Interestingly, the share of renewable energy in total energy
consumption in Finland is relatively large. Finland also emits around 14% more
greenhouse gases than an average EU country, corrected for GDP, although
the gap has narrowed slightly from 2013. Despite the challenges in resource
efficiency and GHG emissions, overall Finland remains a forerunner in eco-
innovation performance, and an example of smart planning and organisation of
the national eco-innovation system.
A wide variety of restaurants and corporations have joined hands in the effort to
reduce the carbon emission from their business. The statistic data have proved
that about 70000kg waste is generated from restaurant business every year. In
Finland, fortunately with well educated programme, their citizens have strong
awareness in protecting environment from basic household level to large scale
business, the government has also boosted the warning about climate change
and effort in preserving environment. The pioneer in this campaign is Nolla res-
taurant [10] in Helsinki region. The idea of zero-waste restaurant was born out
of frustration in the wastefulness of the restaurant industry, “we strongly believe
that the contemporary waste management practices of the industry are outdat-
ed, and we want to do something about it”-Nolla restaurant stated. The busi-
ness model is working directly with local and international producers of organic
ingredients in order to reinvent, reject and control packaging, which reduces
storing and packaging materials. Hence carbon footprint is believed to be de-
creased.
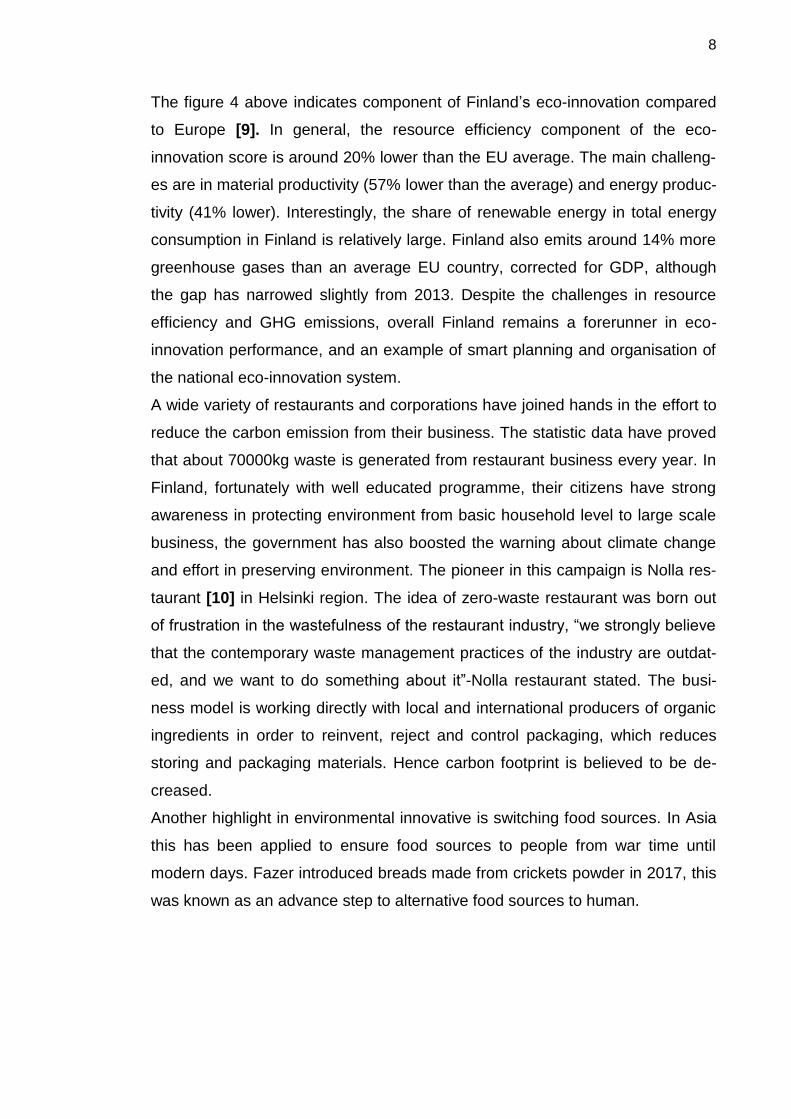
Another highlight in environmental innovative is switching food sources. In Asia
this has been applied to ensure food sources to people from war time until
modern days. Fazer introduced breads made from crickets powder in 2017, this
was known as an advance step to alternative food sources to human.
9
Figure 5. Global warming potential of selected animal source foods
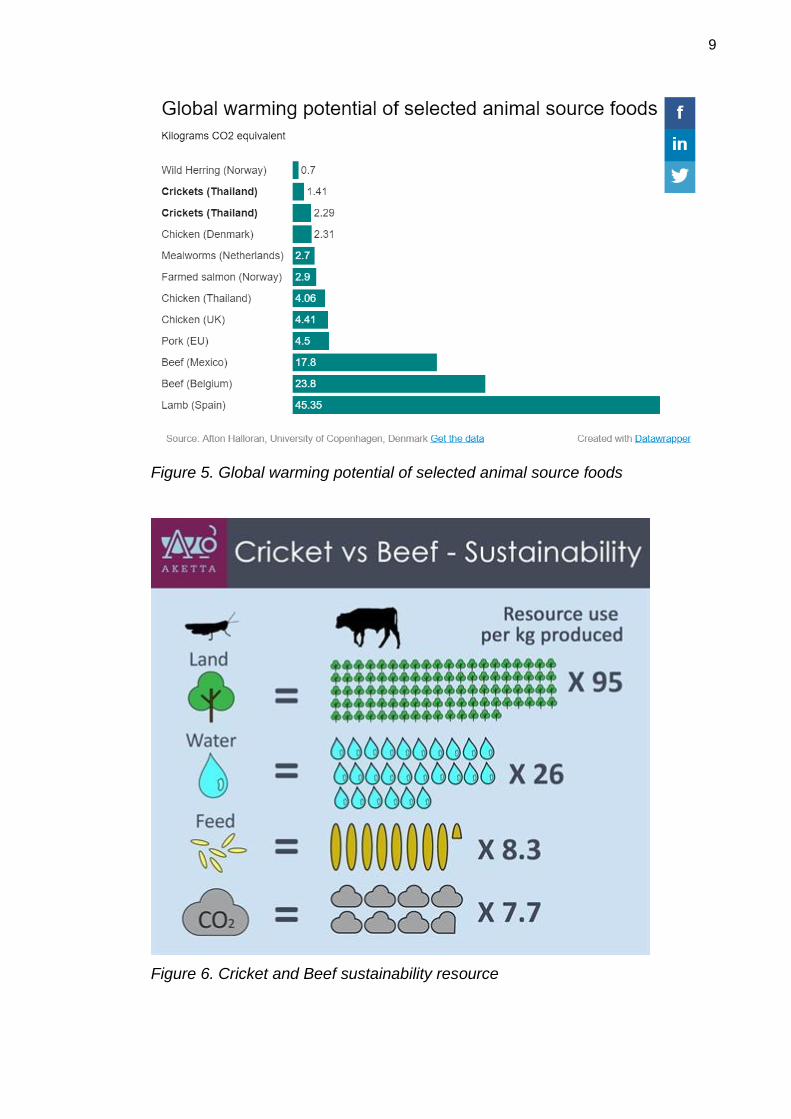
Figure 6. Cricket and Beef sustainability resource
10
Figure 5 and 6 above show relative comparison between cricket and beef car-
bon emission, with 7.7 time less CO2 produced and approximately 1.41 kg CO2
equivalents, changing food sources is the key leading to sustainable develop-
ment for the world. [11]
5 Ai-to foods OY roadmap to sustainable development
Ai-To Foods OY is a growing retail food company founded in 2013 by Tuukka
Saimen, with net profit calculated up to 2.2 million euros in previous year, 2017.
The sale of the company has been strongly increased from 2016 with approxi-
mately 31% growth rate to 2015. Company’s vision will be concentrating on
innovative and international business scale, with high-quality products to cus-
tomers and also support environment. Ai-To Foods Oy operates on an order-
production basic model, which means products are made after retailers have
placed their orders to ensure products at its finest quality.
The company has provision in manufacturing green products in period from
2019 to 2025 to satisfy the customer’s demand. The roadmap of company aims
to follow Directive 2004/12/EC of the European Parliament and of the Council of
11th February, 2004 on packaging and packaging waste [12] and local diet
trend nowadays, less red meat, more white meat and 0 waste achievement.
The revised legislative proposal on waste sets clear targets for
reduction of waste and establishes an ambitious and credible long-
term path for waste management and recycling. To ensure effective
implementation, the waste reduction targets in the new proposal
are accompanied by concrete measures to address obstacles on
the ground and the different situations across EU Member States.
Key elements of the revised waste proposal include:
A common EU target for recycling 65% of municipal waste by
2030;
11
A common EU target for recycling 75% of packaging waste by
2030;
A binding landfill target to reduce landfill to maximum of 10% of
municipal waste by 2030;
A ban on landfilling of separately collected waste;
Promotion of economic instruments to discourage landfilling ;
Simplified and improved definitions and harmonised calculation
methods for recycling rates throughout the EU;
Concrete measures to promote re-use and stimulate industrial
symbiosis –turning one industry's by-product into another indus-
try's raw material;
Economic incentives for producers to put greener products on the
market and support recovery and recycling schemes (eg for
packaging, batteries, electric and electronic equipment, vehicles).”
[13]
Once company reaches the goal, expanding business to neighbour area such
as Sweden, Estonia, or wider area like Asia is highly considered.
In order to study about food and food packaging emission, this company was
chosen to be study case, where data were collected and calculated and sum-
marised the change in reducing carbon footprint cooking procedure and pack-
aging procedure by decreasing high-produced carbon footprint ingredients and
switching to eco-friendly packaging materials. The carbon footprint was meas-
ured and calculated based on company’s library database, which focus on food
ingredients carbon emission and packaging materials to conclude the impact on
environment.
Sale profits were also taken into account and see how customers react to new
friendly environmental products. Fortunately, in Finland with high awareness for
environment, the new changes are accepted by customers and the sale rate is
stable and steadily higher than previous year.
6 Database and measure methods
12
The calculations are based on Ai-To Foods 12 months sale data in 2018. The
plan was applied from beginning of January, which lasted for a year until begin-
ning of 2019. The second hypothesis where no applied eco-friendly plan was
calculated based on real sale data, then the comparison was made in order to
emphasize the amount of CO2 reduced from eco plan. There were two ap-
proaches in our plan in reducing GHGs in food ingredients and packaging box
materials which are separated in 4 phases. In phase one the list of packaging
materials were listed out and carbon footprint were calculated from these mate-
rials, in order to explain the details of manufacturing in Ai-To Foods. The overall
measurement and calculations was done without carbon footprints from manu-
facturing processing by packaging machines, cooking batches or employees as
the plan would be executed after the eco-friendly products stage was done.
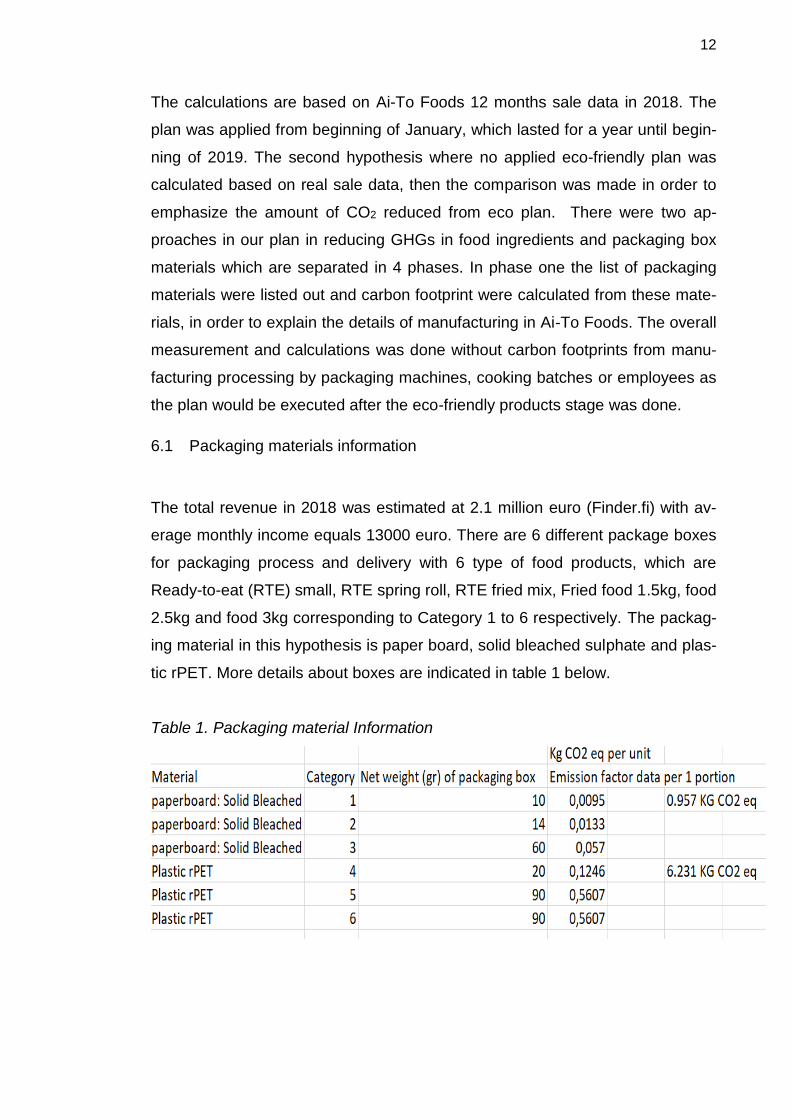
6.1 Packaging materials information
The total revenue in 2018 was estimated at 2.1 million euro (Finder.fi) with av-
erage monthly income equals 13000 euro. There are 6 different package boxes
for packaging process and delivery with 6 type of food products, which are
Ready-to-eat (RTE) small, RTE spring roll, RTE fried mix, Fried food 1.5kg, food
2.5kg and food 3kg corresponding to Category 1 to 6 respectively. The packag-
ing material in this hypothesis is paper board, solid bleached sulphate and plas-
tic rPET. More details about boxes are indicated in table 1 below.
Table 1. Packaging material Information
13
According to given access data, net weight of package box in categories is
weighted with scale, emission data was calculated in kg CO2eq per 1 product
portions. Emission factor formula is based on
Ef (emission factor) = x material’s emission factor [14] . Overall, one
package portion produces the highest CO2 with up to 5.6 kilograms CO2eq,
lowest CO2 produced by category 1. Material emission factors were taken from
environmental paper database https://c.environmentalpaper.org/individual.html
[15] .The material emission factor can be called M.e, which stands for Material
Emission.
The amount of each category products were concluded according to Ai-To
foods data on amount of sales for each delivered product to customers each
month, in quantity unit (pieces/kpl in Finnish). The monthly sales each month
was described in table 2. Each column represented the sold level of each cate-
gories. The pieces of delivered products were multiplied by emission factors of
materials to give emission factors of each categories products. Total annual
emission value is retrieved from SUM() equation from Excel, which is emission
factor of packaging material produced during packaging process. Calculated
units are in kg CO2.
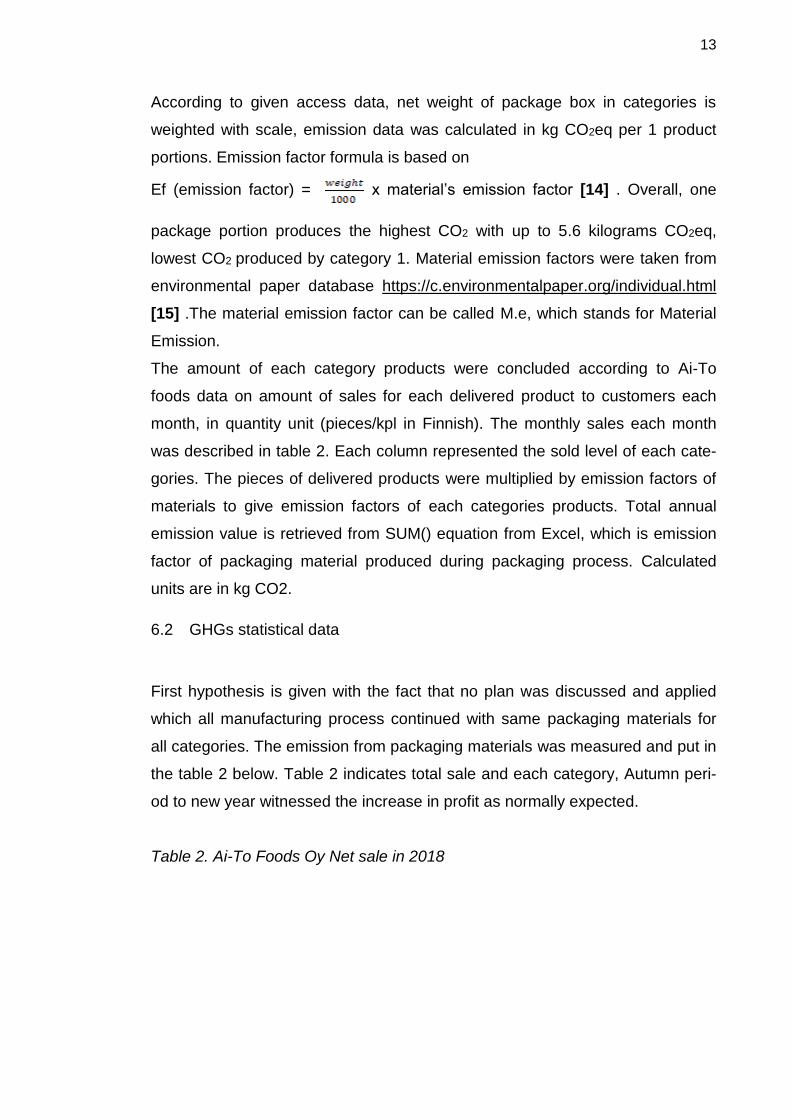
6.2 GHGs statistical data
First hypothesis is given with the fact that no plan was discussed and applied
which all manufacturing process continued with same packaging materials for
all categories. The emission from packaging materials was measured and put in
the table 2 below. Table 2 indicates total sale and each category, Autumn peri-
od to new year witnessed the increase in profit as normally expected.
Table 2. Ai-To Foods Oy Net sale in 2018
14
Table 3. Number of food portions sold in 2018
For each sale number in every category, the value is divided with price infor-
mation in order to receive the amount of sold portion during each month.
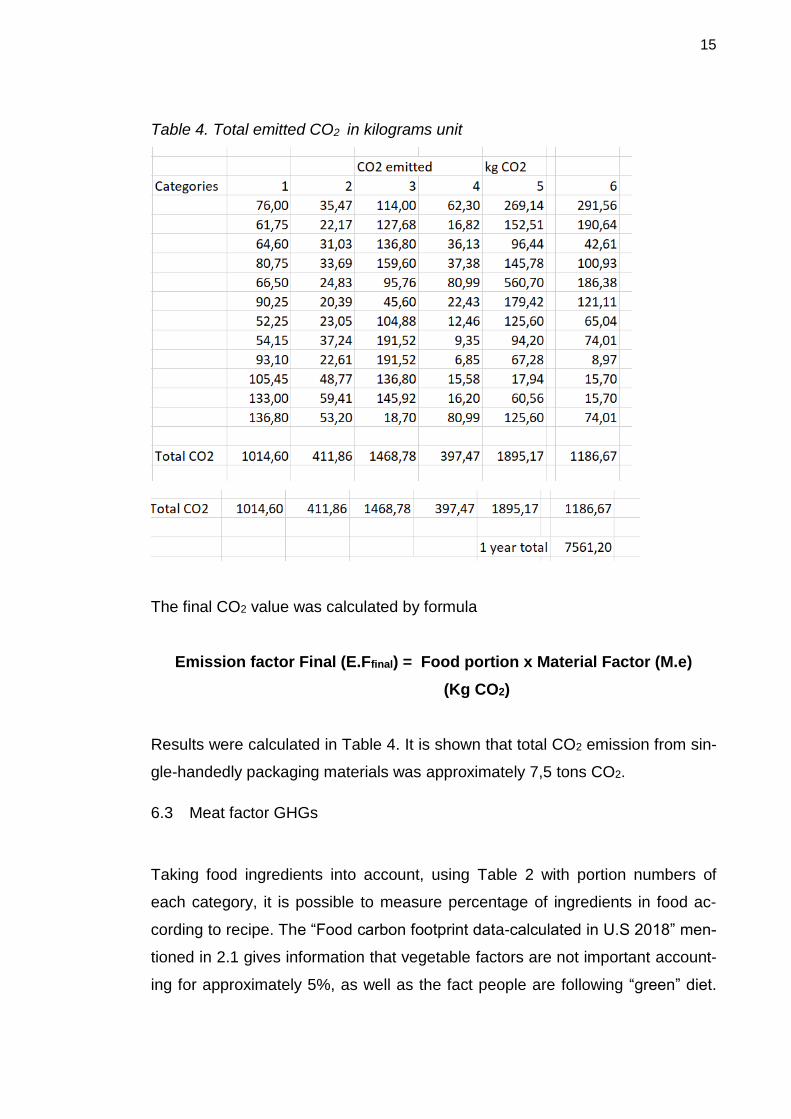
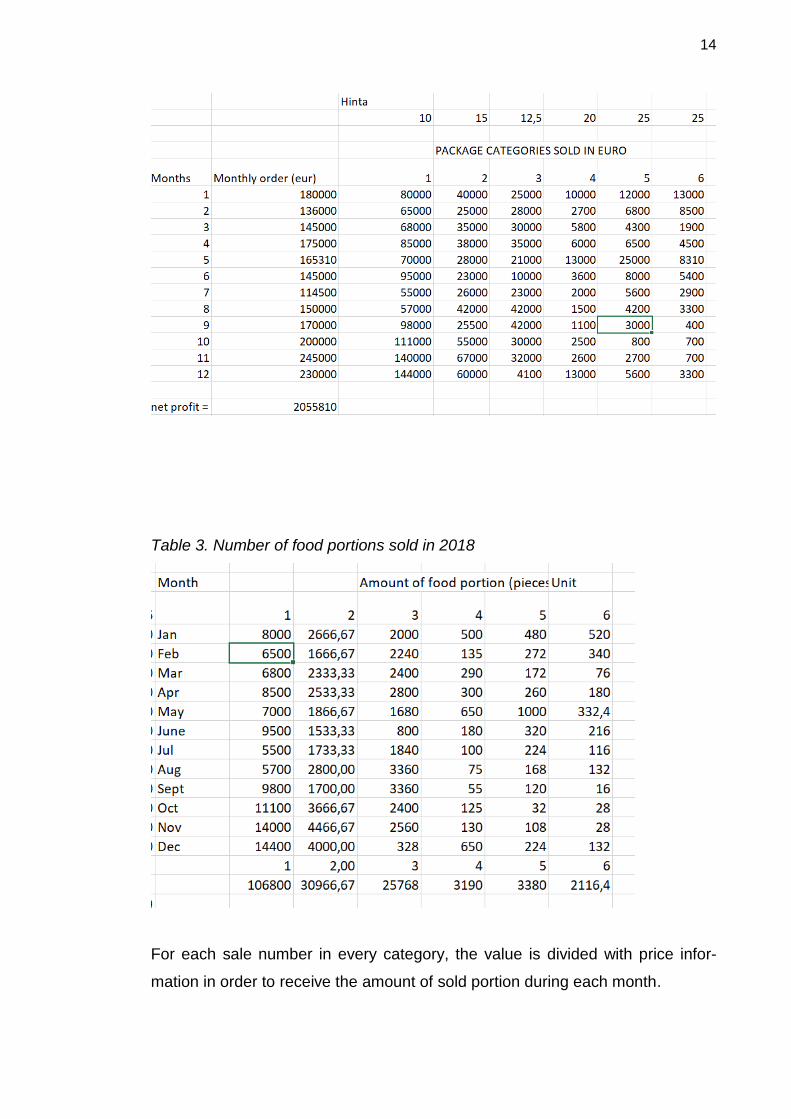
15
Table 4. Total emitted CO2 in kilograms unit
The final CO2 value was calculated by formula
Emission factor Final (E.Ffinal) = Food portion x Material Factor (M.e)
(Kg CO2)
Results were calculated in Table 4. It is shown that total CO2 emission from sin-
gle-handedly packaging materials was approximately 7,5 tons CO2.
6.3 Meat factor GHGs
Taking food ingredients into account, using Table 2 with portion numbers of
each category, it is possible to measure percentage of ingredients in food ac-
cording to recipe. The “Food carbon footprint data-calculated in U.S 2018” men-
tioned in 2.1 gives information that vegetable factors are not important account-
ing for approximately 5%, as well as the fact people are following “green” diet.
16
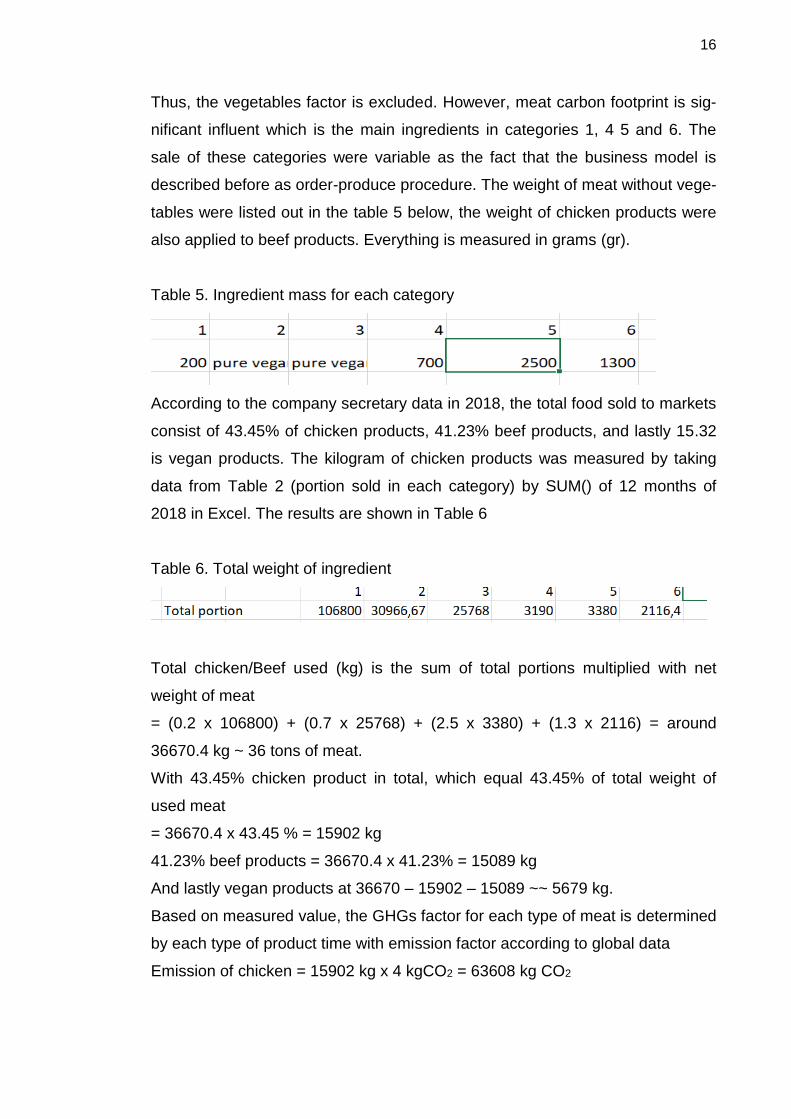
Thus, the vegetables factor is excluded. However, meat carbon footprint is sig-
nificant influent which is the main ingredients in categories 1, 4 5 and 6. The
sale of these categories were variable as the fact that the business model is
described before as order-produce procedure. The weight of meat without vege-
tables were listed out in the table 5 below, the weight of chicken products were
also applied to beef products. Everything is measured in grams (gr).
Table 5. Ingredient mass for each category
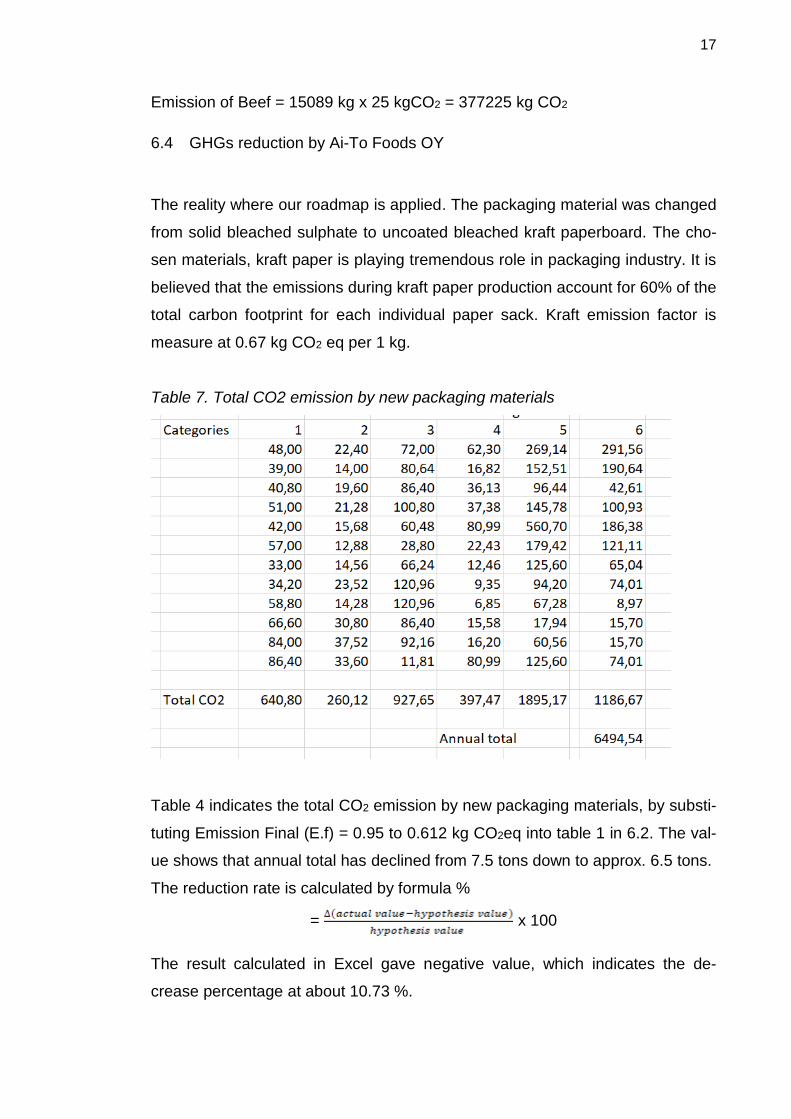
According to the company secretary data in 2018, the total food sold to markets
consist of 43.45% of chicken products, 41.23% beef products, and lastly 15.32
is vegan products. The kilogram of chicken products was measured by taking
data from Table 2 (portion sold in each category) by SUM() of 12 months of
2018 in Excel. The results are shown in Table 6
Table 6. Total weight of ingredient
Total chicken/Beef used (kg) is the sum of total portions multiplied with net
weight of meat
= (0.2 x 106800) + (0.7 x 25768) + (2.5 x 3380) + (1.3 x 2116) = around
36670.4 kg ~ 36 tons of meat.
With 43.45% chicken product in total, which equal 43.45% of total weight of
used meat
= 36670.4 x 43.45 % = 15902 kg
41.23% beef products = 36670.4 x 41.23% = 15089 kg
And lastly vegan products at 36670 – 15902 – 15089 ~~ 5679 kg.
Based on measured value, the GHGs factor for each type of meat is determined
by each type of product time with emission factor according to global data
Emission of chicken = 15902 kg x 4 kgCO2 = 63608 kg CO2
17
Emission of Beef = 15089 kg x 25 kgCO2 = 377225 kg CO2
6.4 GHGs reduction by Ai-To Foods OY
The reality where our roadmap is applied. The packaging material was changed
from solid bleached sulphate to uncoated bleached kraft paperboard. The cho-
sen materials, kraft paper is playing tremendous role in packaging industry. It is
believed that the emissions during kraft paper production account for 60% of the
total carbon footprint for each individual paper sack. Kraft emission factor is
measure at 0.67 kg CO2 eq per 1 kg.
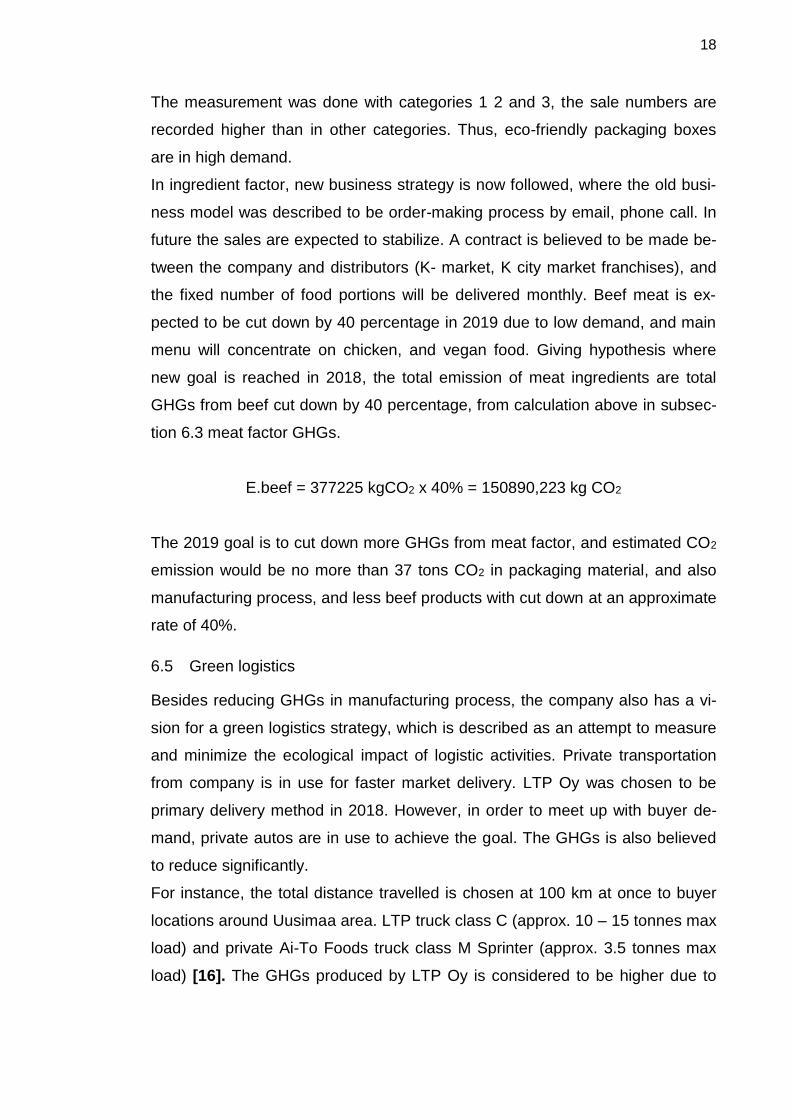
Table 7. Total CO2 emission by new packaging materials
Table 4 indicates the total CO2 emission by new packaging materials, by substi-
tuting Emission Final (E.f) = 0.95 to 0.612 kg CO2eq into table 1 in 6.2. The val-
ue shows that annual total has declined from 7.5 tons down to approx. 6.5 tons.
The reduction rate is calculated by formula %
= x 100
The result calculated in Excel gave negative value, which indicates the de-
crease percentage at about 10.73 %.
18
The measurement was done with categories 1 2 and 3, the sale numbers are
recorded higher than in other categories. Thus, eco-friendly packaging boxes
are in high demand.
In ingredient factor, new business strategy is now followed, where the old busi-
ness model was described to be order-making process by email, phone call. In
future the sales are expected to stabilize. A contract is believed to be made be-
tween the company and distributors (K- market, K city market franchises), and
the fixed number of food portions will be delivered monthly. Beef meat is ex-
pected to be cut down by 40 percentage in 2019 due to low demand, and main
menu will concentrate on chicken, and vegan food. Giving hypothesis where
new goal is reached in 2018, the total emission of meat ingredients are total
GHGs from beef cut down by 40 percentage, from calculation above in subsec-
tion 6.3 meat factor GHGs.
E.beef = 377225 kgCO2 x 40% = 150890,223 kg CO2
The 2019 goal is to cut down more GHGs from meat factor, and estimated CO2
emission would be no more than 37 tons CO2 in packaging material, and also
manufacturing process, and less beef products with cut down at an approximate
rate of 40%.
6.5 Green logistics
Besides reducing GHGs in manufacturing process, the company also has a vi-
sion for a green logistics strategy, which is described as an attempt to measure
and minimize the ecological impact of logistic activities. Private transportation
from company is in use for faster market delivery. LTP Oy was chosen to be
primary delivery method in 2018. However, in order to meet up with buyer de-
mand, private autos are in use to achieve the goal. The GHGs is also believed
to reduce significantly.
For instance, the total distance travelled is chosen at 100 km at once to buyer
locations around Uusimaa area. LTP truck class C (approx. 10 – 15 tonnes max
load) and private Ai-To Foods truck class M Sprinter (approx. 3.5 tonnes max
load) [16]. The GHGs produced by LTP Oy is considered to be higher due to
19
transportation weight compared to private company transportation. The invest-
ment on logistics is believed to be a cost-effective way to distribute products,
and there is also a smaller less carbon footprint from logistics process.
7 Discussion
The thesis emphasizes the packaging importance to environment and food
business. Following the fact that packaging products implies creator/seller strat-
egy to impress customers, the packaging box should also be considered to
have less negative impact on the environment. Packaging products along with
food industry contribute most to human’s emission factor, and these can be cat-
egorized under food waste. The awareness on environmental issue is on the
rise, providers have been turning to use more recycling packaging material, or
disposal packaging material to reduce less waste as much as possible.
Food industry is innovating rapidly to grow business sustainably. The manufac-
turing process can reduce GHGs, some possible methods are applying modern
machines in packaging process. GHGs measurement will be kept up to date for
GHGs controlling purposes in further time.
From 2019 to 2025, the company is striving to reduce GHGs at greater rate
(10% in packaging process), including other processes such as machinery op-
erating process, food storage and logistics, to make business model to be more
completed. Further plan can be putting more investment on private transporta-
tion, in order to make independent and active logistics. On the rapid business
growth, company tries its best to keep product distribution on stable cycle. It is
believed to save time and reduce GHGs significantly.
For applying a new plan in packaging material, the company has received great
achievement, proving it was a worthy investment. The sales peaked since 2013,
and were slightly higher than 2017. Finnish customers reacts positively toward
eco-friendly materials.
For the future, more solutions are considered to be applied to the facility; anoth-
er bright idea can be eco-box supply making. This idea arose from an increase
in the importing fee from food box suppliers; main suppliers at the moment in
20
the Netherlands. The company has a deal to obtain manufacturing process with
suppliers, in order to become fully-closed food producing process. It may help
business to be less independent on many suppliers, reduce the risk aspect in
the lack of production, for instance.
8 Conclusion
In conclusion, Food packaging is also categorised as food waste, which account
for a huge percentage in waste management. According to FAO (Food and Ag-
riculture Organization of United Nations), up to one third of total food intended
for human consumption is wasted or become a loss throughout its LCA cycle
from the farm to consumer circuit. The high level of inefficiency generates both
economic costs, which amount to around US $ 1 trillion per year, whereas envi-
ronmental resource loss is worth around US $ 700 billion per year. It is estimat-
ed that approximately 5600 metric tons of greenhouse gas from food loss and
food waste in 2009. [18], food packaging materials held up to 34 percentage in
overall. In Finland, reducing GHGs, food waste and food loss are on the rise, in
order to cope with environmental issues, global warming.
Ai-To Foods Oy was taken as a case company to indicate statistical data in an
attempt to reduce GHGs from manufacturing product stage by switching to eco-
friendly packaging materials. Calculations were done with a database, concen-
trating on used packaging materials. The results showed that with scale of busi-
ness at the time being which is less than 5 million euros profit, 7.5 tonnes CO2
are emitted in 2018 from packaging boxes factor itself. By switching to more
environmental friendly approach, the GHGs were cut down by 10 %. The first
stage of the project is believed to be successful when initial purpose had been
achieved. Plus, the eco-friendly is welcomingly feedbacked from buyers and
customers, which means no negative impact on The business model.
In further timeline, roadmap related to storage and logistics are discussed to
find out a cost-effective method to distribute products and to expand its goal in
attempt of reducing GHGs.
21
9 REFERENCE
[1] Bailey L, Bliese C, Carlson L, Grover D, Wasserman P, World Population
Map Activity [Internet], 2014 Sept available from http://populationeducation.org
[2] Tilman D, Balzer C, Hill J and L.Belfort B, Global food demand and the sus-
tainable intensification of agriculture, PNAS 13, 2011 Dec.
[3] Parfitt J, Barthel M, Macnaughton S, Food Waste within Food Supply
Chains: Quantification and Potential for Change to 2050, 2011 Sept 10th.
[4] Marsh K, Bugusu B, Journal of Food Science, Food Packaging—Roles, Ma-
terials, and Environmental Issues [Internet], page 1 – 3, 2007 April, availa-
ble from https://onlinelibrary.wiley.com
[5] ] Marsh K, Bugusu B, Journal of Food Science, Food Packaging—Roles,
Materials, and Environmental Issues [Internet], page 6 – 7, 2007 April, Available
from https://onlinelibrary.wiley.com
22
[6] ] Marsh K, Bugusu B, Journal of Food Science, Food Packaging—Roles,
Materials, and Environmental Issues [Internet], page 4 – 5, 2007 April, Available
from https://onlinelibrary.wiley.com
[7] ] Marsh K, Bugusu B, Journal of Food Science, Food Packaging—Roles,
Materials, and Environmental Issues [Internet], page 10 – 13, 2007 April, Avail-
able from https://onlinelibrary.wiley.com
[8] European Comission, European food Safety Authority, Development of food
waste and food recycle [Internet], 2015 May.
[9] Lastunen J, Eco-Innovations in Finland – Eio country Files 2014-2015 [In-
ternet] Available from https://ec.europa.eu/
[10] Nolla Ravintola, Nolla restaurant [Internet] Abertinkatu 3 Helsinki, 2015
July. Available from: https://www.restaurantnolla.com/contact
[11] Singh Y, Journal of Applied Animal Research, Potential of field crickets
meal (Gryllus bimaculatus) in the diet of African catfish (Clarias gariepinus) [In-
ternet], 2017 July. Available from https://umexpert.um.edu.my
[12] Official Journal of the European Union, Directive 2004/12/EC of the Euro-
pean Parliament and of the Council of 11 February 2004 amending Directive
94/62/EC on packaging and packaging waste - Statement by the Council, the
Commission and the European Parliament [Internet], page 3, 2004 Feb 18th
Available from https://eur-lex.europa.eu/
[13] Official Journal of the European Union, Directive 2004/12/EC of the Euro-
pean Parliament and of the Council of 11 February 2004 amending Directive
94/62/EC on packaging and packaging waste - Statement by the Council, the
Commission and the European Parliament [Internet], page 5, 2004 Feb 18th .
Available from https://eur-lex.europa.eu/
23
[14] Kalfas J, Air quality workshop, Emision factor calculator [Internet], page 5 – 10 2016 Feb 11th . Available form http://www.deq.state.ok.us
[15] ENVIRON International Corporation Denver, Carbon Calculator Version 3 ,
Production Carbon Calculator Emission Calculation Methodology guide [Inter-
net], page 3 – 5, 2013 Dec. Available from
http://www.greenproductionguide.com
[16] Wang Y, Huang Z, Liu Y, Yu Q and Ma W, Back-Calculation of Traffic-
Related PM10 Emission Factors Based on Roadside Concentration Measure-
ments [Internet], Methodologies, page 3 – 4, 2017 May 24th . Available from
https://pdfs.semanticscholar.org
[17] Borma A, Faculty, Practical Application of Science Volume V, Food
waste-A global problem [Internet], case study 3 page 10 – 12, 2013 Dec 12th.
Available from http://seaopenresearch.eu