the effect of strategic industry factor innovation on incumbent
TRANSCRIPT

The Effect of Strategic Industry Factor Innovation on
Incumbent Reaction, Survival, and Performance
Bart Devoldere
2013
Advisor:
Prof. Dr. Ir. Marion Debruyne, Vlerick Business School
Co-advisors:
Prof. Dr. Ruud Frambach, VU Amsterdam
Prof. Dr. Bert Weijters, Ghent University
Dissertation submitted to the Faculty of Economics and Business Administration, Ghent
University, in fulfillment of the requirements for the degree of Doctor in Applied Economic Sciences.
This doctoral research was funded by the Belgian Intercollegiate Center for Management Science
(I.C.M.), and the Vlerick Academic Research Fund (A.R.F., subsidized by the Flemish Government).

2
Acknowledgements
The long, lonely, and uncertain road to pursue a PhD and write a dissertation are close to
impossible without the support, coaching, and guidance of a number of people and organizations.
For the purpose of intellectual and emotional honesty, and sincere gratefulness, I would like to
thank everybody involved in this process in one way or another. Some deserve a special mention
though.
First, I am very grateful to have received proactive, insightful, and supportive guidance by my
advisor Prof. Dr. Ir. Marion Debruyne and my co-advisors Prof. Dr. Ruud Frambach and Prof. Dr. Bert
Weijters. Thanks to many meetings in person, over the phone, through Skype, over lunch, and on the
road they triggered and structured my thinking and motivated me to go the extra mile.
Second, I would like to thank ‘my’ schools, i.e., Vlerick Business School, Ghent University, and
Texas A&M University, for allowing me to conduct research, supporting me throughout both
logistically and financially, and making me feel part of the community. A special thanks to the staff,
PhD students, and faculty of Texas A&M University for making my stay in College Station enjoyable
and bearable without my family being there. Thank you Alina, Rajan, Venky, and Ram for your
generous support.
Third, a number of funding organizations supported me financially to conduct and complete the
PhD process. Thank you Flanders District of Creativity and Vlerick Academic Research Fund, both
partially subsidized by the Flemish Government, for the financial support making it possible to
collect precious data, freeing up time to analyze those data thoroughly, and to write up my research
projects. Also, thank you Belgian Intercollegiate Centre for Management Science (I.C.M.) for
providing me a living for three years and supporting me to experience PhD life at a top U.S. business
school.
And last but not least, my family and especially my wife and best friend Sofie who supported me
throughout, even when letting her on her own for a year while enjoying Texas. Also thank you Wout
for making it your mother not too hard (I hope) while I was gone and not being angry with me on my
return. Also thank you Stan for always smiling and making me enjoy my nights more consciously the
last couple of months. A final thanks to my parents and parents in law to not only support me, but
always being there for my loved ones when I was not.
Bart Devoldere - July 19, 2013
3
Summary
An industry is constantly in evolution. Competitors, innovators, or other industry stakeholders
can introduce new, ‘unknown’ resources or capabilities that increase the basis of competition in an
industry. Resources and capabilities that form the basis of industry competition and that drive firm
performance are called ‘strategic industry factors’ (Amit and Schoemaker 1993). I define the
introduction of new strategic industry factors as ‘strategic industry factor innovation’. Examples
include Pfizer introducing new patents and technological knowhow, or Intel building strong brand
equity while standing on the shoulders of giant computer manufacturers. However, there are also
strategic industry factor innovations associated with ‘known’ resources and capabilities. When
considering new business models like Netflix, Zara, Dell, iPod/iTunes, amongst many others, the
innovation is not always bringing ‘new’ resources or capabilities to the industry. Instead, these
examples show that new combinations of existing, ‘known’ resources and capabilities can also be
difficult for incumbents to react against or for new entrants to successfully launch.
In this dissertation I bundle three studies that relate to the concepts of strategic industry factors
and strategic industry factor innovation. Theory states that firm performance is determined from the
overlap between a firm’s resource bundle and what resources are needed to compete in its product
market(s). It reflects the close interconnection between a firm’s resources and its products (Penrose
1959; Wernerfelt 1984). The concept of a firm’s dynamic capability builds further on the idea of
developing an appropriate resource bundle to be competitive with respect to an industry’s strategic
factors (e.g., Helfat et al. 2007; Teece, Pisano, and Shuen 1997). In a first study, entitled “Growth
Implications of Within-Industry Diversification: a Paradox between Resource Creation and
Leverage”, I use these ideas to theorize and model how diversification across product markets in a
single industry relates to firm growth. Thereby I link diversification closely to the underlying resource
mechanisms that are initiated by deploying a dynamic capability while entering new product
markets. I show that within-industry diversification leads to firm growth, based on underlying
resource mechanisms such as resource creation, leverage, and configuration. Another key
contribution is that I empirically show a simultaneous, negative reciprocity between resource
creation and leverage which constitutes a core paradox when deploying a dynamic capability.
In a second part of this dissertation, I focus on a particular type of strategic industry factor
innovation, i.e., new business models. Despite a surge in research on new business models in both
popular press and academia, it is still surrounded with a high level of uncertainty because of its often
disruptive character towards both the demand and supply side in an incumbent industry. I target
two main areas of uncertainty related to new business models. First, there is a lack of knowledge on
how to successfully launch a business model. For every innovator with a new business model, there
are numerous copycats launching the same business model in a particular geographic market.
However, there are large differences in success across market launches of the same business model.
The second study, entitled “Success Drivers of Launching a Business Model”, addresses the lack of
empirical and theoretical guidance on how ventures can succeed when launching a business model. I
focus on four market entry decisions, i.e., entry timing, product adaptation, scale of entry, and
strategic control, that influence the business model’s value drivers and ability to create and capture
value. I find important main and interaction effects on how these entry decisions impact the survival
chances of the launched business model. Thereby I argue it is important to treat the business model

4
as a separate unit of analysis, different from industry, firm, product, or technology. Moreover, I
theoretically and empirically show that there are not only differences but also an interplay between
the business model and a product market strategy, which holds important consequences for the
market entry literature.
Second, there is lack of knowledge on how firms can reduce their uncertainty with respect to
launching a business model. Especially for incumbents, it is difficult deciding when to enter the new
market niche related to a business model innovation. Incumbents face severe financial and
managerial risks related to a lack of information on the new market niche. I focus on entry timing
because of its important short- and long-term performance implications (Gielens and Dekimpe 2001;
Green, Barclay, and Ryans 1995), and because the second study reveals important main and
interaction effects of entry timing on newly launched business model’s survival chances. In the third
study, entitled “Learning and Signals Across Firms and Markets: Identifying Entry Spillover Types
and Moderators”, I study what information signals actually influence an incumbent’s entry timing
decision and how these signals influence that decision. I focus on information signals related to
previous market niche entries. I model different types and moderators of entry spillover, i.e.,
previous market niche entries that influence a focal market niche entry decision. I make a strong
contribution to the market entry and scanning literature by taking into account signals from both
served and non-served geographic environments and by modelling the actual instead of potential
influence of signals on firm decision-making. I find that incumbents’ entry timing is influenced by
three different types of entry spillover. I show the existence of a type of entry spillover that is
neglected in the literature, i.e., across firm across market entry spillover, that embodies an indirect
effect among non-directly competing firms across different geographic markets. Also, I model and
find particular firm and market characteristics that moderate entry spillover across firms respectively
markets. It implies that entry spillover is non-linear, heterogeneous, and asymmetric.
For each study I develop a unique, longitudinal data set based on secondary data sources. I
collect data across various countries in two different industries. For studies 1 and 2, I model the
collected data using the ‘classical’ maximum likelihood estimation method, and use a three-stage
least squares growth model (study 1), and a Cox Proportional Hazards survival model (study 2). For
study 3, I use a simulated maximum likelihood estimation based on Metropolis-Hastings algorithms,
i.e., a Markov Chain Monte Carlo method, for a Bayesian hazard entry timing model. Another
important methodological contribution includes the development of a time-varying, continuous, and
indirect measure of product market relatedness to closely link diversification decisions with
underlying resource mechanisms in study 1 which can be easily applied in different industry
contexts. Also, I develop in study 3 a realistic and flexible entry timing model that accounts for a
possibly non-monotonic event rate, a permanent survivor fraction, and potentially asymmetric
spillover effects.
With this dissertation, I make some important theoretical and managerial contributions. Study 1
provides theoretical and empirical argumentation for a link between within-industry diversification
and growth performance. Also, study 1 contributes to the dynamic capability literature by
empirically identifying a core paradox that is taking place when deploying a dynamic capability.
Moreover, I contribute to the resource-based theory by further exploring and developing the link
between a firm’s resources and products. Managerial practice benefits through the insights on how

5
firms can grow by diversification while being aware of negative, internal frictions that form
constraints at different levels in the organization. Study 2 adds to the literature on business models,
innovation, and market entry by focusing on how ventures can successfully launch a business model
in an existing industry and by acknowledging that business models are a different unit of analysis,
distinct from the product, technology, firm, or industry. It spurs further research on how business
model innovation is different from other types of innovation. Moreover, study 2 enables managers,
entrepreneurs, and public authorities to better foresee and predict success and failure in new,
disruptive market niches following business model innovation. Study 3 contributes to the market
entry, scanning, and signaling literature by showing which information signals actually (instead of
potentially) influence a firm’s market entry decision while taking into account signals from both
served and non-served geographic environments. Also, I identify the co-existence of both direct and
indirect signals related to market entry. Moreover, I detect firm and market characteristics that
increase signal strength and I model the influence of signals on firm behavior more realistically
taking into account characteristics of signal senders and receivers. My research informs managers to
develop a better scanning system to capture all relevant information signals, both strong and weak,
without creating data overload.
After this summary (and the summary in Dutch hereafter), I first proceed with an introduction in
which I specify previous research findings across the relevant research domains, existing literature
gaps, and how I address these gaps in the three studies in this dissertation. Second, I explain the
research design and methodology I applied to conduct the different studies. Third, I include study 1,
2, and 3 in paper format. Fourth, I give an overview of the main findings and contributions. Fifth, I
conclude with some future research opportunities.

6
Samenvatting
Een industrie is voortdurend in beweging. Concurrenten, innovators, of andere stakeholders
introduceren nieuwe, ‘onbekende’ productiefactoren of competenties die het concurrentieniveau in
een industrie verhogen. Productiefactoren en competenties die de concurrentiebasis uitmaken in
een industrie en bedrijfsprestaties bepalen worden ‘strategische industriefactoren’ genoemd (Amit
and Schoemaker 1993). Ik definieer de introductie van nieuwe strategische industriefactoren als
'strategische industriefactor innovatie'. Voorbeelden hiervan zijn o.a. Pfizer die nieuwe patenten en
technologische knowhow introduceert, of Intel die een sterk merk opbouwt dankzij samenwerking
met computergiganten. Er zijn echter ook strategische industriefactor innovaties die gebruik maken
van 'bekende' productiefactoren en competenties. Bij nieuwe bedrijfsmodellen zoals die van Netflix,
Zara, Dell, iPod / iTunes, e.a., is de innovatie niet altijd het brengen van 'nieuwe' productiefactoren
of competenties in de industrie. In plaats daarvan laten deze voorbeelden zien dat nieuwe
combinaties van bestaande, 'bekende' productiefactoren en competenties ook moeilijk kunnen zijn
voor bestaande bedrijven om op te reageren of voor nieuwkomers om succesvol te lanceren.
In dit proefschrift bundel ik drie studies die betrekking hebben op de concepten van strategische
industriefactoren en strategische industriefactor innovatie. De theorie zegt dat bedrijfsprestaties
worden bepaald op basis van de overlap tussen de verzameling productiefactoren van een bedrijf
(cf., hieronder worden zowel productiefactoren als competenties begrepen) en de middelen nodig
om te concurreren in de productmarkt (en). Het weerspiegelt de nauwe koppeling tussen de
productiefactoren van een bedrijf en haar producten (Penrose 1959; Wernerfelt 1984). Het concept
‘dynamische competentie’ van een bedrijf bouwt verder op het idee dat bedrijven, om succesvol te
zijn, een gepaste bundel productiefactoren moeten ontwikkelen op basis van de strategische
factoren van een industrie (bvb. Helfat et al. 2007; Teece, Pisano en Shuen 1997). In een eerste
studie met als titel "Diversificatie Binnen een Industrie en Bedrijfsgroei: Een Paradox Tussen de
Creatie en het Opnieuw Aanwenden van Productiefactoren”, gebruik ik deze ideeën om een
theorie en model te ontwikkelen met betrekking tot hoe diversificatie in productmarkten binnen een
industrie kan leiden tot bedrijfsgroei. Daarbij link ik diversificatie nauw met de onderliggende
processen die worden gebruikt bij het aanwenden van een dynamische competentie om de gepaste
productiefactoren te hebben bij het binnentreden van nieuwe productmarkten. Ik toon aan dat
diversificatie binnen een industrie leidt tot bedrijfsgroei waarbij de groei gebaseerd is op de
onderliggende processen van een dynamische competentie, zijnde de creatie, het opnieuw
aanwenden, en de configuratie van productiefactoren. Een andere belangrijke bijdrage is dat ik
empirisch aantoon dat er een simultane, negatieve wederkerigheid bestaat tussen het creëren en
opnieuw aanwenden van productiefactoren wat een belangrijke paradox vormt bij de inzet van een
dynamische competentie.
In het tweede deel van dit proefschrift richt ik me op een bepaald type van strategische
industriefactor innovatie, met name innovatie van bedrijfsmodellen. Ondanks de sterke aandacht
voor onderzoek naar nieuwe bedrijfsmodellen in zowel de populair-wetenschappelijke als
academische wereld, heerst er nog altijd grote onzekerheid wanneer een nieuw bedrijfsmodel
geïntroduceerd wordt en dit vanwege het vaak ontwrichtende karakter van het nieuwe
bedrijfsmodel aan zowel vraag-als aanbodzijde van de gevestigde industrie. Ik richt me op twee
belangrijke deelgebieden met betrekking tot nieuwe bedrijfsmodellen. Ten eerste is er een gebrek

7
aan kennis over hoe je een bedrijfsmodel succesvol kunt lanceren. Voor elke innovator met een
nieuw bedrijfsmodel zijn er meerdere copycats die hetzelfde bedrijfsmodel in een bepaalde
geografische markt lanceren. Er zijn echter grote verschillen qua succes overheen introducties van
hetzelfde bedrijfsmodel. De tweede studie met als titel "Succes Drivers bij het Lanceren van een
Bedrijfsmodel”, onderzoekt empirisch en theoretisch hoe ventures kunnen slagen bij lanceren van
een bedrijfsmodel. Ik focus op vier belangrijke introductiebeslissingen bij het binnentreden op een
markt, met name introductietiming, productaanpassing, productieschaal, en strategische controle.
Deze beslissingen hebben een belangrijke invloed op de onderliggende waardedimensies van een
bedrijfsmodel, en de mogelijkheid van een bedrijfsmodel om waarde te creëren en capteren. Ik vind
belangrijke lineaire en niet-lineaire effecten van deze introductiebeslissingen op de
overlevingskansen van een bedrijfsmodel. Een belangrijk punt hierbij is dat het bedrijfsmodel als een
afzonderlijke eenheid van analyse moet worden behandeld, verschillend van industrie, bedrijf,
product, of technologie. Bovendien maak ik theoretisch en empirisch de suggestie dat er niet alleen
verschillen zijn, maar ook een wisselwerking is tussen het bedrijfsmodel en een productmarkt
strategie, wat belangrijke gevolgen heeft voor de literatuur rond marktintroducties.
Ten tweede is er een gebrek aan kennis over hoe bedrijven hun onzekerheid kunnen
verminderen met betrekking tot het lanceren van een bedrijfsmodel. Vooral voor gevestigde
bedrijven is het moeilijk om te beslissen wanneer een nieuwe marktniche, gerelateerd aan een
bedrijfsmodelinnovatie, binnen te treden. Voor bestaande bedrijven zijn er ernstige financiële -en
managementrisico's verbonden aan een gebrek aan informatie over de nieuwe marktniche. Ik focus
op introductietiming vanwege de belangrijke korte-en lange-termijn implicaties op bedrijfsprestaties
(Gielens en Dekimpe 2001; Green, Barclay, en Ryans 1995), en omdat de tweede studie belangrijke
effecten van introductietiming op de overlevingskansen van een bedrijfsmodel blootlegt. In de derde
studie met als titel "Kennis en Signalen Overheen Bedrijven en Markten: Het Identificeren van
Marktintroductie Spillover Types en Moderators”, bestudeer ik welke informatiesignalen
daadwerkelijk de introductietiming van een bestaand bedrijf in de nieuwe marktniche beïnvloeden
en hoe deze signalen die beslissing beïnvloeden. Ik focus op de informatiesignalen die slaan op
eerdere introducties in de marktniche. Ik giet verschillende types en moderators van
marktintroductie spillover, dat wil zeggen vorige introducties in de marktniche die invloed
uitoefenen op een huidige introductie in de marktniche, in een model. Ik maak een sterke bijdrage
tot de marktintroductie literatuur en de literatuur met betrekking tot het scannen van de markt door
rekening te houden met signalen van markten waarin een bedrijf zowel aanwezig als niet aanwezig
is, en door het modelleren van de werkelijke in plaats van de potentiële invloed van signalen op
bedrijfsbeslissingen. De derde studie onderzoekt of de introductietiming van bedrijven wordt
beïnvloed door drie verschillende types van marktintroductie spillover. Ik ontdek zowel conceptueel
als empirisch het bestaan van een nieuw type marktintroductie spillover, namelijk marktintroductie
spillover overheen bedrijven en overheen markten wat impliceert dat er een indirect effect is onder
niet-rechtstreeks concurrerende bedrijven overheen verschillende geografische markten. Ook vind ik
bedrijfs-en marktkenmerken die marktintroductie spillover overheen bedrijven respectievelijk
markten versterken of afzwakken. Het impliceert dat marktintroductie spillover niet-lineair,
heterogeen, en asymmetrisch is.
Voor elke studie ontwikkel ik een unieke, longitudinale dataset op basis van secundaire
gegevensbronnen. Ik verzamel gegevens overheen verschillende landen in twee verschillende

8
industrieën. Voor studies 1 en 2 modelleer ik de gegevens met behulp van de 'klassieke' maximum
likelihood schattingsmethode, en gebruik ik een three-stage least squares (3SLS) groeimodel (studie
1), en een Cox proportional hazards overlevingsmodel (studie 2). Voor studie 3 gebruik ik een
gesimuleerde maximum likelihood schatting op basis van Metropolis-Hastings algoritmes, dat zijn
Markov Chain Monte Carlo methodes, om een Bayesiaans hazard model te schatten. Een andere
belangrijke methodologische bijdrage omvat de ontwikkeling van een tijdsafhankelijk, continu, en
indirect meetinstrument in studie 1 om de verwantschap tussen productmarkten te meten wat kan
dienen om diversificatiebeslissingen nauwer in verband te brengen met onderliggende processen
van productiefactoren binnen een dynamische competentie. Ook ontwikkel ik in studie 3 een
realistisch en flexibel hazard model dat rekening houdt met een eventueel niet-monotone event
rate, een mogelijk permanente fractie van de populatie dat overleeft, en potentieel asymmetrische
spillover effecten.
Met dit proefschrift maak ik een aantal belangrijke theoretische en praktische management
bijdragen. Studie 1 geeft een theoretische en empirische onderbouwing voor een verband tussen
diversificatie binnen een industrie en bedrijfsgroei. Ook draagt studie 1 bij tot de dynamische
competentie literatuur door het empirisch identificeren van een paradox die plaatsvindt bij het
uitoefenen van een dynamische competentie. Bovendien draagt dit proefschrift bij tot de resource-
based theorie door het verder verkennen en ontwikkelen van het verband tussen productiefactoren
en producten van een bedrijf. De managementpraktijk kan gebruik maken van de inzichten over hoe
bedrijven kunnen groeien door diversificatie en het op de hoogte zijn van de negatieve, interne
wrijvingen op verschillende niveaus in de organisatie bij het uitoefenen van een dynamische
competentie. Studie 2 draagt bij tot de literatuur over bedrijfsmodellen, bedrijfsmodelinnovatie, en
introducties op de markt door te focussen op hoe ventures met succes een bedrijfsmodel kunnen
lanceren in een bestaande industrie en door te erkennen dat een bedrijfsmodel een andere eenheid
van analyse is dat verschilt van product, technologie, bedrijf of industrie. Het spoort aan tot verder
onderzoek over de manier waarop bedrijfsmodelinnovatie anders is dan andere vormen van
innovatie. Bovendien stelt studie 2 managers, ondernemers, en overheden beter in staat succes en
falen bij nieuwe, ‘verstorende’ marktniches gerelateerd aan bedrijfsmodelinnovatie, te voorspellen.
Studie 3 draagt bij tot de literatuur van marktintroducties, marktscanning en- signalering door te
laten zien welke informatie effectief (in plaats van potentieel) de beslissing tot marktintroductie bij
een bedrijf kan beïnvloeden, rekening houdend met signalen van geografische omgevingen waarin
het bedrijf zowel actief als niet actief is. Bovendien ontdek ik bedrijfs- en marktkenmerken die de
signaalsterkte beïnvloeden en ik modelleer ook de invloed van signalen op bedrijfsgedrag meer
realistisch, rekening houdend met de kenmerken van signaalzenders en- ontvangers. Mijn onderzoek
informeert managers omtrent een beter scanningssysteem om alle relevante informatiesignalen,
zowel sterke als zwakke, vast te leggen zonder een overdaad aan data nodig te hebben.

9
Table of content
Acknowledgements...................................................................................................................... 2
Summary ..................................................................................................................................... 3
Samenvatting .............................................................................................................................. 6
Table of content ........................................................................................................................... 9
List of tables .............................................................................................................................. 13
Study 1 .............................................................................................................................................. 13
Study 2 .............................................................................................................................................. 13
Study 3 .............................................................................................................................................. 13
List of figures ............................................................................................................................. 14
Study 1 .............................................................................................................................................. 14
Study 2 .............................................................................................................................................. 14
Study 3 .............................................................................................................................................. 14
Introduction .............................................................................................................................. 15
Strategic industry factors and diversification ................................................................................... 15
How can firms deploy dynamic capability to grow when diversifying? ............................................ 16
Strategic industry factor innovation ................................................................................................. 17
How to successfully launch a business model? ................................................................................ 17
Drivers of incumbent launch timing ................................................................................................. 18
Types of entry spillover ..................................................................................................................... 19
Moderators of entry spillover ........................................................................................................... 20
Research design and methodology ................................................................................................... 21
Reference list .................................................................................................................................... 22
Study 1 Growth Implications of Within-Industry Diversification: A Paradox between Resource
Creation and Leverage ............................................................................................................... 28
1.1 Abstract ................................................................................................................................. 28
1.2 Introduction .......................................................................................................................... 29
1.3 Conceptual background and hypothesis development ........................................................ 33
1.3.1 Within-industry diversification ................................................................................. 33
1.3.2 Dynamic capability and growth ................................................................................ 34
1.3.3 Resource creation and resource leverage: a paradox .............................................. 38
1.3.4 Controls ..................................................................................................................... 40
1.4 Data and variable operationalization .................................................................................... 41
1.4.1 Data ........................................................................................................................... 41

10
1.4.2 Variable operationalization ....................................................................................... 42
1.5 Model estimation and specification ..................................................................................... 45
1.6 Results and discussion .......................................................................................................... 46
1.6.1 Results ....................................................................................................................... 46
1.6.2 Robustness checks .................................................................................................... 48
1.6.3 Theoretical and methodological contributions ......................................................... 48
1.6.4 Managerial contributions .......................................................................................... 50
1.7 Limitations and conclusion ................................................................................................... 51
1.8 Reference list ........................................................................................................................ 52
1.9 Tables .................................................................................................................................... 60
Table 1: descriptives ..................................................................................................................... 60
Table 2: Pearson correlations ....................................................................................................... 61
Table 3: Model estimates (3SLS) ................................................................................................... 62
Table 4: Model estimate heterogeneity in terms of focus on being a generalist versus product
market scope (3SLS) ...................................................................................................................... 63
Table 5: Model estimate heterogeneity in terms of age and product market scope (3SLS) ........ 65
1.10 Figures ................................................................................................................................... 67
Figure 1: model specification ........................................................................................................ 67
Study 2 Success Drivers of Launching a Business Model ........................................................ 68
2.1 Abstract ................................................................................................................................. 68
2.2 Introduction .......................................................................................................................... 69
2.3 Conceptual background ........................................................................................................ 71
2.3.1 Business model ......................................................................................................... 71
2.3.2 Business model innovation and copycats ................................................................. 74
2.3.3 Launch decisions’ influence on business model success .......................................... 78
2.3.3.1 Entry timing ............................................................................................................... 78
2.3.3.2 Product adaptation ................................................................................................... 80
2.3.3.3 Entry scale ................................................................................................................. 82
2.3.3.4 Strategic control ........................................................................................................ 84
2.4 Context and Methodology .................................................................................................... 86
2.4.1 Context ...................................................................................................................... 86
2.4.2 Sample ....................................................................................................................... 87
2.4.3 Model ........................................................................................................................ 88
2.4.4 Measures ................................................................................................................... 88

11
2.5 Results and Discussion .......................................................................................................... 89
2.5.1 Descriptives ............................................................................................................... 89
2.5.2 Results ....................................................................................................................... 90
2.5.3 Robustness checks .................................................................................................... 91
2.5.4 Discussion .................................................................................................................. 92
2.6 Conclusion and Limitations ................................................................................................... 96
2.7 Reference list ........................................................................................................................ 97
2.8 Tables .................................................................................................................................. 106
Table 1: launch decisions’ effect on business models’ value drivers .......................................... 106
Table 2: free daily newspapers across Europe and Canada ........................................................ 107
Table 3: descriptives ................................................................................................................... 108
Table 4: frequency tables ............................................................................................................ 109
Table 5: results Cox PH models ................................................................................................... 110
2.9 Figures ................................................................................................................................. 111
Figure 1: Free daily newspapers across Europe and Canada ...................................................... 111
Study 3 Learning and Signals Across Firms and Markets: Identifying Entry Spillover Types and
Moderators ............................................................................................................................. 112
3.1 Abstract ............................................................................................................................... 112
3.2 Introduction ........................................................................................................................ 113
3.3 Conceptual development .................................................................................................... 116
3.3.1 Scanning and entry spillover ................................................................................... 116
3.3.2 Moderators of entry spillover ................................................................................. 119
3.3.3 Control variables ..................................................................................................... 122
3.4 Context ................................................................................................................................ 123
3.5 Methodology ....................................................................................................................... 124
3.5.1 Model specification ................................................................................................. 124
3.5.2 Estimation ............................................................................................................... 126
3.6 Data and measures ............................................................................................................. 128
3.6.1 Data collection ........................................................................................................ 128
3.6.2 Measures ................................................................................................................. 128
3.7 Results ................................................................................................................................. 130
3.7.1 Descriptives ............................................................................................................. 130
3.7.2 Model fit .................................................................................................................. 130
3.7.3 Parameter estimates ............................................................................................... 132

12
3.8 Discussion ............................................................................................................................ 133
3.8.1 Implications for marketing theory .......................................................................... 134
3.8.2 Implications for marketing practice ........................................................................ 134
3.9 Conclusion and future research .......................................................................................... 135
3.10 References .......................................................................................................................... 136
3.11 Tables .................................................................................................................................. 144
Table 1: overview of measures ................................................................................................... 144
Table 2: free newspapers in Europe ........................................................................................... 146
Table 3: correlation table control variables ................................................................................ 147
Table 4: correlation table firm-related moderators of entry spillover ....................................... 147
Table 5: correlation table market-related moderators of entry spillover .................................. 147
Table 6: convergence and model fit ........................................................................................... 148
Table 7: trace plots full model .................................................................................................... 149
Table 8: autocorrelation functions full model ............................................................................ 151
Table 9: parameter estimates Bayesian hazard MCMC approach .............................................. 153
Table 10: parameter estimates Cox PH closed estimation check ............................................... 154
3.12 Figures ................................................................................................................................. 155
Figure 1: conceptual framework ................................................................................................. 155
Conclusion ............................................................................................................................... 156
Main findings .................................................................................................................................. 156
Theoretical and methodological contributions .............................................................................. 157
Contributions to managerial practice ............................................................................................. 161
Limitations and future research opportunities ............................................................................... 162
References ...................................................................................................................................... 165
Glossary................................................................................................................................... 167

13
List of tables
Study 1
Table 1: descriptives ..................................................................................................................... 60
Table 2: Pearson correlations ....................................................................................................... 61
Table 3: Model estimates (3SLS) ................................................................................................... 62
Table 4: Model estimate heterogeneity in terms of focus on being a generalist versus product
market scope (3SLS) ...................................................................................................................... 63
Table 5: Model estimate heterogeneity in terms of age and product market scope (3SLS) ........ 65
Study 2
Table 1: launch decisions’ effect on business models’ value drivers .......................................... 106
Table 2: free daily newspapers across Europe and Canada ........................................................ 107
Table 3: descriptives ................................................................................................................... 108
Table 4: frequency tables ............................................................................................................ 109
Table 5: results Cox PH models ................................................................................................... 110
Study 3
Table 1: overview of measures ................................................................................................... 144
Table 2: free newspapers in Europe ........................................................................................... 146
Table 3: correlation table control variables ................................................................................ 147
Table 4: correlation table firm-related moderators of entry spillover ....................................... 147
Table 5: correlation table market-related moderators of entry spillover .................................. 147
Table 6: convergence and model fit ........................................................................................... 148
Table 7: trace plots full model .................................................................................................... 149
Table 8: autocorrelation functions full model ............................................................................ 151
Table 9: parameter estimates Bayesian hazard MCMC approach .............................................. 153
Table 10: parameter estimates Cox PH closed estimation check ............................................... 154

14
List of figures
Introduction
Figure 1: research design ................................................................................................................ 21
Study 1
Figure 1: model specification ........................................................................................................ 67
Study 2
Figure 1: Free daily newspapers across Europe and Canada ...................................................... 111
Study 3
Figure 1: conceptual framework ................................................................................................. 155

15
Introduction
Strategic industry factors and diversification
Strategic industry factors are a set of resources and capabilities that have become the prime
determinants of firm performance in an industry. They are industry-specific, subject to ex-ante
uncertainty, and developed at industry level through complex interactions among various
stakeholders (e.g., competitors, suppliers, and customers) and environmental factors (e.g.,
technology and regulation). Strategic industry factors can be referred to as factors driving
competition in an industry (Ghemawat 1991). Examples of strategic industry factors could include
brand equity, technological capability, control of distribution channels, buyer-seller relationships,
etc. Strategic industry factors are also the prime determinants of firm performance. Firm
performance is determined by the overlap between a firm’s resources and capabilities, and the
strategic industry factors (Amit and Schoemaker 1993). Thereby, it is important to not only
appreciate the value of possessing a particular resource or capability (Barney 1991), but also the
value of complementarities among resources and capabilities when configuring a bundle of
resources and capabilities at the firm level (Milgrom and Roberts 1990; 1995; Rumelt 1984).
Determining firm performance based on the overlap between a firm’s resource bundle1 and
what is needed to compete in its product market(s) draws back to the close interconnectedness
between resources and products. When offering a product, a firm makes use of the services of
particular resources in its resource bundle. To realize economic value, resources need to be
productively linked with particular products that are sold in the market. The correspondence
between a firm’s resource bundle and its product market(s) implies that, given a product that a firm
offers, one can infer the existence of the corresponding resources within the firm needed to offer
that product (Lee 2008). It is said that a firm’s resource bundle and product market portfolio are two
sides of the same coin (Wernerfelt 1984). However, there is a distinction between resources and the
services they can provide (Penrose 1959). Resources are not product-specific which means that they
can be relevant for various product markets (Danneels 2007; Penrose 1959; Prahalad and Hamel
1990; Teece 1982). Therefore, if two product markets are related, the underlying resources are likely
to overlap, even though one may not pinpoint exactly what the overlapping resources are (Lee
2008). Based on this close link between products and resources, I use product market relatedness to
identify resource-based view (RBV)-related arguments on how product market diversification
influences firm growth.
Previous research shows that dynamic capabilities are relevant in explaining product market
diversification (e.g., Danneels 2007; 2011). When entering a product market, a firm needs to
underpin its offering in that market with a reconfigured resource bundle consisting of both newly
created resources that are specialized towards that product market and existing resources that are
leveraged across different product markets (Helfat and Lieberman 2002). The concept of a firm’s
dynamic capability helps translating the idea of developing an appropriate resource bundle to be
competitive with respect to an industry’s strategic factors to the firm level. It is in line with the RBV
1 For ease of expression I consider in what follows a firm’s resource bundle as all assets, resources, and
capabilities that firm owns or has access to.

16
that relates a firm’s competitive advantage primarily to its resources and capabilities it possesses
(e.g., Barney 1991; Peteraf 1993). However, a dynamic capability stresses the importance of
changing a firm’s resource bundle to build a competitive advantage and especially sustain it over the
long term. A resource bundle consists of assets, resources, and capabilities that a firm can deploy to
offer products in its product market(s). A dynamic capability is a firm’s capability to change its
resource bundle purposefully (Helfat et al. 2007). Like other capabilities, a dynamic capability is a
complex bundle of skills and accumulated knowledge, exercised through organizational processes
that enables a firm to coordinate activities and make use of its assets (Day 1994). Unlike other
capabilities, its purpose is to actually alter a firm’s resource bundle (e.g., Danneels 2011; Eisenhardt
and Martin 2000; Helfat et al. 2007; Teece 2007). For example, a dynamic capability can be deployed
to create new resources, leverage existing resources, and (re)configure them in the firm’s resource
bundle. Possessing a dynamic capability does not necessarily imply enhanced performance
(Eisenhardt and Martin 2000; Helfat et al. 2007; Zahra, Sapienza, and Davidsson 2006). A dynamic
capability only implies that the firm is intentionally doing something differently, but not necessarily
better, than before. For example, the use of a dynamic capability when based on incorrect cause-
effect assumptions may harm rather than help performance outcomes (Zahra et al. 2006).
How can firms deploy dynamic capability to grow when diversifying?
Although there is a large number of studies on firms’ dynamic capability and the link between
the RBV and diversification, I target some important gaps that limit our understanding of how firms
can actually deploy dynamic capability to grow when diversifying. First, there is a large body of
literature on diversification, but it mainly focuses on diversification across industries and it has
difficulties showing a clear link between diversification and performance (For a review, see, e.g.,
Hoskisson and Hitt 1990; Palich, Cardinal, and Miller 2000). Second, the RBV is prominently used to
explain diversification, its antecedents and its outcomes (Lockett and Thompson 2001; Wan et al.
2011). However, fine-grained measures of relatedness that closely link diversification with
underlying arguments of the RBV are missing in the literature. Moreover, previous work lacks an
adequate approach to deal with the endogeneity between resources and relatedness in the
relationship between diversification and performance. Also, resources are bundled within firms.
Linking resources with firm performance without taking into account the bundled nature of
resources at firm level leads to potentially biased results. Third, the theory on dynamic capability
suggests an influence of dynamic capability on firm performance, but a widespread call for empirical
research whether and how dynamic capability is related to firm performance is still open (Barreto
2010; Helfat et al. 2007; Hoopes and Madsen 2008). Fourth, despite increasing attention for the
internal processes related to deploying a dynamic capability, i.e., its so-called microfoundations
(Eisenhardt, Furr, and Bingham 2010; Teece 2007), there is little empirical research to date on the
internal processes of dynamic capability that goes beyond case studies (Danneels 2011).
Study 1, “Growth Implications of Within-Industry Diversification: A Paradox Between Resource
Creation and Leverage”, is an empirical study of the growth implications of dynamic capability
deployment in the context of within-industry diversification. I closely link and explain diversification
with concepts from both the RBV and the dynamic capability literature. To adequately link within-
industry diversification to firm growth, I focus on both diversification level and diversification
activity. Diversification level relates more to a ‘static’ condition. Therefore, I link it with a ‘static’ RBV

17
concept, i.e., resource fit. Diversification activity relates more to a ‘dynamic’ process. Therefore, I
link it with ‘dynamic’ concepts related to a dynamic capability, i.e., resource creation and resource
leverage. I posit that a firm’s dynamic capability can positively influence growth by creating new
resources and configuring a firm’s resource bundle to have resource fit, but that there is a paradox
at the core of a firm’s dynamic capability. Striving for both resource creation and resource leverage
is needed for growth, but I argue they also have a negative reciprocity between each other, which
has negative, indirect growth effects. This negative reciprocity stems from the contradicting focus
and effect of resource creation and resource leverage. On the one hand, resource leverage focuses
on exploiting existing resources, creating efficiencies among existing resources, and building more
co-specialization and linkages among resources. That stimulates structure and inertia among
resources which hurts a firm’s ability to create new resources. On the other hand, resource creation
focuses on exploring new resources that also need integration with other, existing resources. That
demands flexibility among resources to (temporarily) de-link existing, co-specialized resources which
hurts a firm’s ability to leverage resources. Also, I try to empirically identify an important, new
dimension of diversification beyond a firm’s control that can increase growth, i.e., market
structuration. In study 1, I measure the relative importance of resource creation, resource leverage,
resource fit, and market structuration on growth performance together with a simultaneous
reciprocity between resource creation and leverage.
Strategic industry factor innovation
Industry stakeholders, environmental factors, and a firm’s own resources and capabilities can
change over time (e.g., Porter 1991; Teece, Pisano, and Shuen 1997). So can strategic industry
factors. I define ‘strategic industry factor innovation’ as an innovation introducing one or more new
strategic industry factors, or a new combination of strategic industry factors. A new strategic
industry factor can be a ‘known’ or an ‘unknown’ resource or capability. The distinctive character of
a strategic industry factor innovation is the change in the set of prime determinants of firm
performance and not the ‘novelty’ character of the resources or capabilities introduced. Business
model innovation is an example of strategic industry factor innovation that stresses the innovative
character of a new combination of often existing resources and capabilities, rather than coming up
with completely new resources and capabilities as such.
How to successfully launch a business model?
A business model defines how a focal firm creates value for customers and how that value is
appropriated across itself and its partners (Day 2011; Sorescu et al. 2011; Teece 2010). A business
model can be represented by a system of interconnected and interdependent activities that
transcends the focal firm (Zott and Amit 2010). Business models can be a potential source of
competitive advantage (Casadesus-Masanell and Ricart 2010; Markides and Charitou 2004; Zott and
Amit 2007; 2008). The business model is a major focal point of innovation (e.g., Casadesus-Masanell
and Zhu 2013; Economist Intelligence Unit 2005; Hamel 2000; IBM Global Business Services 2012;
Kim and Mauborgne 1997; Markides 1997; Mitchell and Coles 2003; Slywotzky 1996; Teece 2010).
One can innovate the existing business model by adding novel or deleting standard activities, by
linking or sequencing activities in novel ways, or by changing one or more parties that perform any
of the activities (Amit and Zott 2012). To qualify as a business model innovation, the new business
model should materially alter the value creation and appropriation logic, and it should be a new-to-
18
the-world business model that is reflected in new content, structure, governance, and/or value
driver combinations of the activity system (Sorescu et al. 2011).
Despite its prevalence in both popular press and academia, there is a very important gap in the
literature on business models that I want to address in this dissertation, i.e., that there is no
empirical or theoretical guidance in the literature on how ventures can successfully launch a
business model. Business models and their innovation are on top of the executive priority list as they
hold great promise for differentiation and performance benefits. Many business model innovations,
e.g., Netflix, Zara, and Southwest Airlines amongst others, are featured and praised for their success.
Also, for every innovator with a new business model, there are often copycats launching the same
business model in a particular geographic market. However, there are often large differences in
success across market launches of the same business model. In study 2,” Success Drivers of
Launching a Business Model “, I identify four market entry decisions, i.e., entry timing, product
adaptation, scale of entry, and strategic control, that may influence the business model’s value
drivers and ability to create and capture value. I hypothesize main and interaction effects on how
these entry decisions impact the survival of the launched business model. Thereby I argue it is
important to treat the business model as a separate unit of analysis, different from industry, firm,
product, or technology. Moreover, I posit there are not only differences but also an interplay
between the business model and a product market strategy, which can hold important
consequences for the market entry literature.
Drivers of incumbent launch timing
Innovative business models creating new market niches in an industry pose significant threats
for incumbents. Deciding when to enter such a new market niche is far from easy for incumbents.
Entry timing can have important short- and long-term performance implications (Gielens and
Dekimpe 2001; Green, Barclay, and Ryans 1995). Moreover, in study 2 of my dissertation I argue
there are important main and interaction effects of entry timing on a business model’s launch
success. However, incumbents face severe financial and managerial risks related to a lack of
information on the new market niche. Therefore, firms need to adequately scan their environment
to actively search and especially structure information to prepare, guide and defend their decisions.
Environmental scanning is the means through which managers perceive external events and trends
(Culnan 1983; Hambrick 1982). It has the task of reducing perceived strategic uncertainty (Daft,
Sormunen, and Parks 1988). Various literature streams suggest that environmental scanning is
important for firms to create and sustain a competitive advantage. Previous research on market
orientation (e.g., Hult, Ketchen, and Slater 2005; Kohli and Jaworski 1990), absorptive capacity
(Cohen and Levinthal 1990), dynamic capabilities (Teece 2007), and organizational vigilance (Day and
Schoemaker 2006; Fiol and O'Connor 2003; Levinthal and Rerup 2006) all suggest that firms should
actively scan their environment to identify, anticipate, and respond adequately to market
opportunities or threats. Also, scanning can provide a firm with an information advantage based on
the firm’s ability to perceive important signals in its environment before competitors do so (Dutton
and Freedman 1984). Moreover, scanning is also gaining importance because there are more and
more situations where there are problems of data overload and accelerated market complexity (Day
2011).

19
Previous research on scanning focuses on developing and managing an adequate scanning
system, describing scanning activities based on scanning mode, frequency, scope, and top
management involvement, and studying the alignment between environmental characteristics and a
firm’s scanning system design (e.g., Aaker 1983; Aguilar 1967; Culnan 1983; Daft, Sormunen, and
Parks 1988; Elenkov 1997; Hambrick 1982; Hambrick and Mason 1984; Yasai-Ardekani and Nystrom
1996). However, there are two important remaining gaps in the literature that make it difficult for
firms to adequately scan their environment, especially when the information is geographically
dispersed and firms lack time and money to conduct extensive scanning activities. First, previous
research on scanning seems to assume that the relevant environmental boundaries coincide with
the product-geographic scope of the firm (Yasai-Ardekani and Nystrom 1996) or with the perceived
impact of events on a firm’s own performance (Aaker 1983; Daft, Sormunen, and Parks 1988; Pfeffer
and Salancik 1978). However, with increasingly global competition and blurring industry boundaries,
the relevant geographic environment to scan might be much broader than what initially is expected.
Second, whereas previous research focuses on listing all possible information sources and stressing
the importance of applying a broad scanning scope with high frequency when uncertainty is high,
little is known on what information sources are actually influencing firms’ decisions. Consequently,
previous research provides little help for firms how to grasp what information signals in its
environment are most relevant, especially when these firms have limited resources but ever
increasing data dispersion and complexity.
In study 3, “Learning and Signals Across Firms and Markets: Identifying Entry Spillover Types
and Moderators”, I study what information signals actually influence a focal industry incumbent’s
decision when to enter a new market niche and how these signals influence that decision, while
taking into account signals from both served and non-served geographic environments. I focus on
information signals related to previous market niche entries. I define entry spillover as signals
related to a previous market niche entry by a particular firm in a particular market that influence the
focal firm’s entry decision for that market niche in a focal market. Scanning here involves gathering
and monitoring information on previous market niche entries. A market niche entry is done by a
particular firm in a particular market. Therefore, I can relate information signals from previous
market niche entries to both firms and markets, and their respective characteristics.
Types of entry spillover
I suggest there are three different types of entry spillover based on the two main information
dimensions firms relate to a market niche entry, i.e., information tied to the entering firm and
information tied to the market. Previous research suggests there are entry spillovers that take place
within firms across markets, and entry spillovers that take place across firms within markets. Firms
can search within their firm boundaries for information and own experiences with the new market
niche in other markets (e.g., Mitra and Golder 2002). The theory on multinational enterprises
specifically states that firms active in multiple markets build one organization in order to transfer
knowledge more efficiently across markets (Kogut and Zander 1993; 2003). Also, firms look at
competitors’ entries as signals of market attractiveness to guide a focal market entry decision
(Bowman and Gatignon 1995; Gielens and Dekimpe 2007; King and Tucci 2002). It appears there is
social pressure for a firm’s decision-makers to conform to imitation behavior (Abrahamson 1991;
Aldrich and Fiol 1994; Fiol and O'Connor 2003).

20
However, based on theoretical and empirical observations, I argue there is also a third type of
entry spillover, i.e., across firms across markets. First, organizational theory establishes that firms
learn from own experiences and other firms’ experiences (Levitt and March 1988). It has been
suggested that the ability of firms to learn from each other is not noticeably restricted by national
markets (Baldwin and Krugman 1988), i.e., that international inter-organizational learning networks
might exist (Tregaskis 2003). Second, firms become increasingly internationally active in multiple
markets. Therefore, incumbents should anticipate market entries by firms that are yet unknown, and
start monitoring them. Also, higher international presence implies that competitors are finding
themselves more and more in overlapping markets (Gielens, Helsen, and Dekimpe 2012). The higher
the number of overlapping markets between competitors, the more multimarket competition and
the more competitive effects across markets can occur. Whether multimarket contact leads to more
(Porter 1980), less (Bernheim and Whinston 1990; Feinberg 1985), or more strategic competition
(Kang, Bayus, and Balasubramanian 2010), all outcomes imply that firms monitor multimarket
competitors more than other competitors.
Moderators of entry spillover
When firms scan previous market niche entries, they need to structure all these information
signals to capture the essence. I argue that firms focus on information signals from particular firms in
particular markets more than from other firms or markets. It implies that entry spillover is
heterogeneously distributed across firms and markets. Previous research indicates that entry
spillover can differ in strength. For example, firms can transfer knowledge more easily across similar
markets (e.g., Gielens and Dekimpe 2007; Mitra and Golder 2002) and firms are more inclined to
imitate similar firms (e.g., Debruyne and Reibstein 2005). However, I argue there can be other
dimensions than similarity that moderate entry spillover. Based on signaling theory, spillover
strength could differ also depending on characteristics of the sender and the receiver of the
information signal. It implies that other firm and market characteristics could simultaneously
influence entry spillover and that entry spillover is asymmetric. Asymmetric spillover means that
entries by firm F1 (in market M1) can have more or less influence on entries by firm F2 (in market
M2), than that entries by firm F2 (in market M2) have on entries by firm F1 (in market M1).
To structure entry spillover’s heterogeneity and asymmetry, I split a spillover process in three
main dimensions. For every spillover, there is a source, a receiver, and a distance to overcome. The
source firm is the firm that enters the new market niche previous to a focal firm’s decision and the
source market is the market in which that source firm enters that new market niche. The receiver
firm is the focal firm and the receiver market is the market in which the focal firm might enter the
new market niche. The distance to overcome is the physical or ‘mental’ distance between source
and receiver firm, or between source and receiver market. The spillover dimension related to the
source is ‘sphere of influence’ of the source towards potential receivers. Sphere of influence
embodies how well senders of information are able to capture the attention of potential receivers
with respect to the information that is conveyed. The spillover dimension related to the receiver is
‘receptivity’ of the receiver towards external information. Receptivity embodies how well potential
receivers of information are able or open to capturing information. The spillover dimension related
to distance to overcome is the ‘proximity’ between senders and receivers. I posit that sphere of
influence, proximity and receptivity amplify the entry spillover effect of previous entries on a focal
21
incumbent’s time to enter the new market niche. I identify several firm characteristics that influence
firms’ proximity, sphere of influence, or receptivity. Similarly, I identify several market characteristics
that influence markets’ proximity, sphere of influence, and receptivity.
Research design and methodology
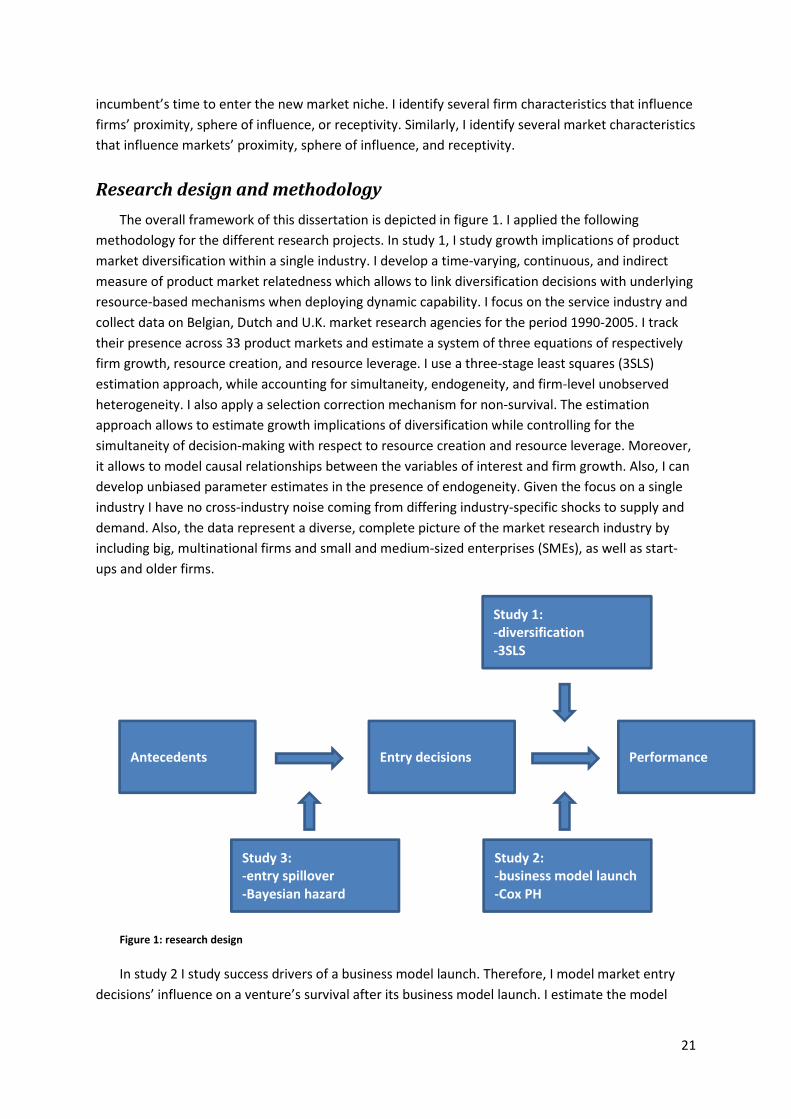
The overall framework of this dissertation is depicted in figure 1. I applied the following
methodology for the different research projects. In study 1, I study growth implications of product
market diversification within a single industry. I develop a time-varying, continuous, and indirect
measure of product market relatedness which allows to link diversification decisions with underlying
resource-based mechanisms when deploying dynamic capability. I focus on the service industry and
collect data on Belgian, Dutch and U.K. market research agencies for the period 1990-2005. I track
their presence across 33 product markets and estimate a system of three equations of respectively
firm growth, resource creation, and resource leverage. I use a three-stage least squares (3SLS)
estimation approach, while accounting for simultaneity, endogeneity, and firm-level unobserved
heterogeneity. I also apply a selection correction mechanism for non-survival. The estimation
approach allows to estimate growth implications of diversification while controlling for the
simultaneity of decision-making with respect to resource creation and resource leverage. Moreover,
it allows to model causal relationships between the variables of interest and firm growth. Also, I can
develop unbiased parameter estimates in the presence of endogeneity. Given the focus on a single
industry I have no cross-industry noise coming from differing industry-specific shocks to supply and
demand. Also, the data represent a diverse, complete picture of the market research industry by
including big, multinational firms and small and medium-sized enterprises (SMEs), as well as start-
ups and older firms.
Figure 1: research design
In study 2 I study success drivers of a business model launch. Therefore, I model market entry
decisions’ influence on a venture’s survival after its business model launch. I estimate the model
Antecedents
Study 3:
-entry spillover
-Bayesian hazard
Study 2:
-business model launch
-Cox PH
Entry decisions Performance
Study 1:
-diversification
-3SLS
22
using the Cox Proportional Hazards method. The context involves the free daily newspaper business
model innovation that appeared in the existing paid daily newspaper industry. This new business
model allows customers to take the daily newspaper for free instead of paying a subscription or per-
issue fee. Ad revenues are the only revenue stream for the publisher. The free daily newspaper is
mainly distributed in high-traffic commuter zones and in public transportation systems, e.g., through
self-service racks or by hand distributors in railway, subway and bus stations. Its target customers
are daily commuters using public transportation. I sampled 29 countries across Europe and Canada
where free daily newspapers have been introduced between 1995 and 2010. Across these countries,
I identified a census of 155 free daily newspaper ventures. I collected and analysed longitudinal data
on these free daily newspaper ventures’ launch and survival, market entry decisions, and venture
and market characteristics. Data sources include websites, newspaper articles, industry organization
secondary databases, and industry expert interviews.
In study 3, I model market entry spillover types and moderators that influence an incumbent’s
entry timing in a new market niche created by business model innovation. I model when incumbents
enter a new market niche based on previous market niche entries, i.e., market entry spillover. Also, I
include firm and market characteristics as moderators of entry spillover across firms respectively
markets. I develop a Bayesian hazard model that accounts for a possibly non-monotonic event rate,
a permanent survivor fraction, and potentially asymmetric spillover effects. I estimate the model
using a flexible Markov Chain Monte Carlo (MCMC) method known as the Metropolis-Hastings (MH)
algorithm. This algorithm allows to generate samples from the posterior distribution without the
form of the posterior density being known analytically. The context is similar to study 2, but the
sample now involves incumbent publishers of paid daily newspapers that are confronted with the
new market niche, i.e., the free daily commuter newspaper market (e.g., Metro, 20 Minutes). I
collected data on 163 incumbent newspaper publishers in 14 European markets for the period 1995-
2010. The unit of analysis is the incumbent publisher-market combination.
Reference list
Aaker, David A. (1983), "Organizing a Strategic Information Scanning System," California
Management Review, 25(2), 76-83.
Abrahamson, Eric (1991), "Managerial Fads and Fashions: The Diffusion and Refection of
Innovations," Academy of Management Review, 16(3), 586-612.
Aguilar, Francis J. (1967), Scanning the Business Environment. New York: MacMillan.
Aldrich, Howard E. and C. Marlene Fiol (1994), "Fools Rush In? The Institutional Context of Industry
Creation," Academy of Management Review, 19(4), 645-70.
Amit, Raphael and Paul J. H. Schoemaker (1993), "Strategic Assets and Organizational Rent,"
Strategic Management Journal, 14(1), 33-46.
Amit, Raphael and Christoph Zott (2012), "Creating Value Through Business Model Innovation," MIT
Sloan Management Review, 53(3), 41-9.

23
Baldwin, Richard E. and Paul R. Krugman (1988), "Market Access and International Competition: A
Simulation Study of 16K Random Access Memories," in Empirical Methods for International
Trade, Robert C. Feenstra, ed. Cambridge, MA: MIT Press.
Barney, Jay (1991), "Firm Resources and Sustained Competitive Advantage," Journal of
Management, 17(1), 99-120.
Barreto, llidio (2010), "Dynamic Capabilities: A Review of Past Research and an Agenda for the
Future," Journal of Management, 36(1), 256-80.
Bernheim, B. D. and Michael D. Whinston (1990), "Multimarket Contact and Collusive Behavior,"
RAND Journal of Economics, 21(1), 1-26.
Bowman, Douglas and Hubert Gatignon (1995), "Determinants of Competitor Response Time to a
New Product Introduction," Journal of Marketing Research, 32(1), 42-53.
Casadesus-Masanell, Ramon and Joan E. Ricart (2010), "From Strategy to Business Models and onto
Tactics," Long Range Planning, 43(2/3), 195-215.
Casadesus-Masanell, Ramon and Feng Zhu (2013), "Business Model Innovation and Competitive
Imitation: The Case of Sponsor-Based Business Models," Strategic Management Journal,
34(4), 464-82.
Cohen, Wesley M. and Daniel A. Levinthal (1990), "Absorptive Capacity: A New Perspective on
Learning and Innovation," Administrative Science Quarterly, 35(1), 128-52.
Culnan, Mary J. (1983), "Environmental Scanning: The Effects of Task Complexity and Source
Accessibility on Information Gathering Behavior," Decision Sciences, 14(2), 194-206.
Daft, Richard L., Juhani Sormunen, and Don Parks (1988), "Chief Executive Scanning, Environmental
Characteristics, and Company Performance: An Empirical Study," Strategic Management
Journal, 9(2), 123-39.
Danneels, Erwin (2007), "The Process of Technological Competence Leveraging," Strategic
Management Journal, 28(5), 511-33.
Danneels, Erwin (2011), "Trying to Become a Different Type of Company: Dynamic Capability at
Smith Corona," Strategic Management Journal, 32(1), 1-31.
Day, George S. (1994), "The Capabilities of Market-driven Organizations," Journal of Marketing,
58(4), 37-52.
Day, George S. (2011), "Closing the Marketing Capabilities Gap," Journal of Marketing, 75(4), 183-95.
Day, George S. and Paul J. H. Schoemaker (2006), Peripheral Vision: Detecting the Weak Signals that
Will Make or Break Your Company. Cambridge: Harvard Business School Press.
Debruyne, Marion and David J. Reibstein (2005), "Competitor See, Competitor Do: Incumbent Entry
in New Market Niches," Marketing Science, 24(1), 55-66.
Dutton, John M. and Richard D. Freedman (1984), "Uncertainty and Firm's Strategic Behaviors,"
Working papers - New York University.

24
Economist Intelligence Unit (2005), "Business 2010: Embracing the Challenge of Change," The
Economist Intelligence Unit.
Eisenhardt, Kathleen M., Nathan R. Furr, and Christopher B. Bingham (2010), "Microfoundations of
Performance: Balancing Efficiency and Flexibility in Dynamic Environments," Organization
Science, 21(6), 1263-73.
Eisenhardt, Kathleen M. and Jeffrey A. Martin (2000), "Dynamic Capabilities: What Are They?,"
Strategic Management Journal, 21(10-11), 1105-21.
Elenkov, Detelin S. (1997), "Strategic Uncertainty and Environmental Scanning: The Case for
Institutional Influences on Scanning Behavior," Strategic Management Journal, 18(4), 287-
302.
Feinberg, Robert M. (1985), ""Sales-at-Risk": A Test of the Mutual Forbearance Theory of
Conglomerate Behavior," Journal of Business, 58(2), 225-41.
Fiol, C. Marlene and Edward J. O'Connor (2003), "Waking Up! Mindfulness in the Face of
Bandwagons," The Academy of Management Review, 28(1), 54-70.
Ghemawat, Pankaj (1991), Commitment: The Dynamics of Strategy. New York: The Free Press.
Gielens, Katrijn and Marnik G. Dekimpe (2001), "Do International Entry Decisions of Retail Chains
Matter in the Long Run?," International Journal of Research in Marketing, 18(3), 235-59.
Gielens, Katrijn and Marnik G. Dekimpe (2007), "The Entry Strategy of Retail Firms into Transition
Economies," Journal of Marketing, 71(2), 196-212.
Gielens, Katrijn, Kristiaan Helsen, and Marnik G. Dekimpe (2012), "International Entry Strategies," in
Handbook of Marketing Strategy, Venkatesh Shankar and Gregory S. Carpenter, eds.
Cheltenham, UK: Edward Elgar Publishing Limited, 391-411.
Green, Donna H., Donald W. Barclay, and Adrian B. Ryans (1995), "Entry Strategy and Long-Term
Performance: Conceptualization and Empirical Examination," Journal of Marketing, 59(4), 1-
16.
Hambrick, Donald C. (1982), "Environmental Scanning and Organizational Strategy," Strategic
Management Journal, 3(2), 159-74.
Hambrick, Donald C. and Phyllis A. Mason (1984), "Upper Echelons: The Organization as a Reflection
of Its Top Managers," Academy of Management Review, 9(2), 193-206.
Hamel, Gary (2000), Leading the Revolution. Boston: Harvard Business School Press.
Helfat, Constance E., Sydney Finkelstein, Will. Mitchell, Margaret A. Peteraf, Harbir Singh, David J.
Teece, and Sidney G. Winter (2007), Dynamic Capabilities: Understanding Strategic Change
In Organizations. Blackwell Publishing.
Helfat, Constance E. and Marvin B. Lieberman (2002), "The Birth of Capabilities: Market Entry and
the Importance of Pre−History," Industrial & Corporate Change, 11(4), 725-60.
Hoopes, David G. and Tammy L. Madsen (2008), "A Capability-Based View of Competitive
Heterogeneity," Industrial & Corporate Change, 17(3), 393-426.

25
Hoskisson, Robert E. and Michael A. Hitt (1990), "Antecedents and Performance Outcomes of
Diversification: A Review and Critique of Theoretical Perspectives," Journal of Management,
16(2), 461-509.
Hult, G. Tomas, David J. Ketchen Jr, and Stanley F. Slater (2005), "Market Orientation and
Performance: an Integration of Disparate Approaches," Strategic Management Journal,
26(12), 1173-81.
IBM Global Business Services (2012), "Leading through Connections: Insights from the Global CEO
Study 2012".
Kang, Wooseong, Barry L. Bayus, and Sridhar Balasubramanian (2010), "The Strategic Effects of
Multimarket Contact: Mutual Forbearance and Competitive Response in the Personal
Computer Industry," Journal of Marketing Research, 47(3), 415-27.
Kim, W. Chan and Renée Mauborgne (1997), "Value Innovation: The Strategic Logic of High Growth,"
Harvard Business Review, 75(1), 103-12.
King, Andrew A. and Christopher L. Tucci (2002), "Incumbent Entry into New Market Niches: The
Role of Experience and Managerial Choice in the Creation of Dynamic Capabilities,"
Management Science, 48(2), 171-86.
Kogut, Bruce and Udo Zander (1993), "Knowledge of the Firm and the Evolutionary Theory of the
Multinational Corporation," Journal of International Business Studies, 24(4), 625-45.
Kogut, Bruce and Udo Zander (2003), "A Memoir and Reflection: Knowledge and an Evolutionary
Theory of the Multinational Firm 10 Years Later," Journal of International Business Studies,
34(6), 505-15.
Kohli, Ajay K. and Bernhard J. Jaworski (1990), "Market Orientation: The Construct, Research
Propositions, and Managerial Implications," Journal of Marketing, 54(2), 1-18.
Lee, Gwendolyn K. (2008), "Relevance of Organizational Capabilities and its Dynamics: What to Learn
from Entrants' Product Portfolios about the Determinants of Entry Timing," Strategic
Management Journal, 29(12), 1257-80.
Levinthal, Daniel and Claus Rerup (2006), "Crossing an Apparent Chasm: Bridging Mindful and Less-
Mindful Perspectives on Organizational Learning," Organization Science, 17(4), 502-13.
Levitt, Barbara and James G. March (1988), "Organizational Learning," Annual Review of Sociology,
14, 319-40.
Lockett, Andy and Steve Thompson (2001), “The Resource-Based View and Economics,” Journal of
Management, 27(6), 723-54.
Markides, Constantinos (1997), "Strategic Innovation," Sloan Management Review, 38(3), 9-23.
Markides, Constantinos and Constantinos D. Charitou (2004), "Competing With Dual Business
Models: A Contingency Approach," Academy of Management Executive, 18(3), 22-36.
Milgrom, Paul and John Roberts (1990), "The Economics of Modern Manufacturing: Technology,
Strategy, and Organization," American Economic Review, 80(3), 511-28.

26
Milgrom, Paul and John Roberts (1995), "Complementarities and Fit: Strategy, Structure, and
Organizational Change in Manufacturing," Journal of Accounting and Economics, 19(2-3),
179-208.
Mitchell, Donald and Carol Coles (2003), "The Ultimate Competitive Advantage of Continuing
Business Model Innovation," Journal of Business Strategy, 24(5), 15-21.
Mitra, Debanjan and Peter N. Golder (2002), "Whose Culture Matters? Near-Market Knowledge and
Its Impact on Foreign Market Entry Timing," Journal of Marketing Research, 39(3), 350-65.
Palich, Leslie E., Laura B. Cardinal, and C. Chet Miller (2000), "Curvilinearity in the Diversification-
Performance Linkage: An Examination of over Three Decades," Strategic Management
Journal, 21(2), 155-74.
Penrose, Edith T. (1959), The Theory of the Growth of the Firm. New York: Wiley.
Peteraf, Margaret A. (1993), "The Cornerstones of Competitive Advantage: A Resource-Based View,"
Strategic Management Journal, 14(3), 179-91.
Pfeffer, Jeffrey and Gerald R. Salancik (1978), The External Control of Organizations. New York:
Harper and Row.
Porter, Michael E. (1980), Competitive strategy: Techniques for analyzing industries and competitors.
New York, NY: Free Press.
Porter, Michael E. (1991), "Towards a Dynamic Theory of Strategy," Strategic Management Journal,
12(S2), 95-117.
Prahalad, C. K. and Gary Hamel (1990), "The Core Competence of the Corporation," Harvard Business
Review, 68(3), 79-92.
Rumelt, Richard (1984), "Towards a Strategic Theory of the Firm," in Competitive Strategic
Management, Robert Boyden Lamb, ed. Englewood-Cliffs, NJ: Prentice-Hall, 556-70.
Slywotzky, Adrian J. (1996), Value Migration: How to Think Several Moves Ahead of the Competition.
Boston: Harvard Business School Press.
Sorescu, Alina, Ruud T. Frambach, Jagdip Singh, Arvind Rangaswamy, and Cheryl Bridges (2011),
"Innovations in Retail Business Models," Journal of Retailing, 87(S1), 3-16.
Teece, David J. (1982), "Towards an Economic Theory of the Multiproduct Firm," Journal of Economic
Behavior and Organization, 3(1), 39-63.
Teece, David J. (2007), "Explicating Dynamic Capabilities: The Nature and Microfoundations of
(Sustainable) Enterprise Performance," Strategic Management Journal, 28(13), 1319-50.
Teece, David J. (2010), "Business Models, Business Strategy and Innovation," Long Range Planning,
43(2/3), 172-94.
Teece, David J., Gary Pisano, and Amy Shuen (1997), "Dynamic Capabilities and Strategic
Management," Strategic Management Journal, 18(7), 509-33.

27
Tregaskis, Olga (2003), "Learning Networks, Power and Legitimacy in Multinational Subsidiaries,"
International Journal of Human Resource Management, 14(3), 431-47.
Wan, William P., Robert E. Hoskisson, Jeremy C. Short, and Daphne W. Yiu (2011), “Resource-Based
Theory and Corporate Diversification: Accomplishments and Opportunities,” Journal of
Management, 37(5), 1335-68.
Wernerfelt, Birger (1984), "A Resource-Based View of the Firm," Strategic Management Journal,
5(2), 171-81.
Yasai-Ardekani, Masoud and Paul C. Nystrom (1996), "Designs for Environmental Scanning Systems:
Tests of a Contingency Theory," Management Science, 42(2), 187-204.
Zahra, Shaker A., Harry J. Sapienza, and Per Davidsson (2006), "Entrepreneurship and Dynamic
Capabilities: A Review, Model and Research Agenda," Journal of Management Studies, 43(4),
917-55.
Zott, Christoph and Raphael Amit (2007), "Business Model Design and the Performance of
Entrepreneurial Firms," Organization Science, 18(2), 181-99.
Zott, Christoph and Raphael Amit (2008), "The Fit between Product Market Strategy and Business
Model: Implications for Firm Performance," Strategic Management Journal, 29(1), 1-26.
Zott, Christoph and Raphael Amit (2010), "Business Model Design: An Activity System Perspective,"
Long Range Planning, 43(2/3), 216-26.

28
Study 1 Growth Implications of Within-Industry
Diversification: A Paradox between Resource Creation and
Leverage
Bart Devoldere*, Vlerick Business School
Marion Debruyne, Vlerick Business School
1.1 Abstract
Firm growth is a key concern of managers and investors. We investigate the growth implications
of a firm’s within-industry product diversification level and activity. Therefore, we closely link
diversification with concepts from both the resource-based view and the dynamic capability
literature. We argue and show that a firm’s dynamic capability can positively influence growth by
creating new resources and configuring a firm’s resource bundle to have resource fit. However, we
find a paradox that is at the core of a firm’s dynamic capability. Striving for both resource creation
and resource leverage is needed for growth, but they also have a negative reciprocity between each
other, which has negative, indirect growth effects. Also, we empirically identify an important, new
dimension of diversification beyond a firm’s control that increases growth, i.e., market structuration.
We measure the relative importance of resource creation, resource leverage, resource fit, and
market structuration for growth performance together with a simultaneous reciprocity between
resource creation and leverage. We analyse longitudinal data on the presence of market research
firms in various product markets in three countries and use three-stage least squares estimation
while accounting for endogeneity, simultaneity and selection bias. We discuss important theoretical,
methodological and managerial contributions.
Key words: 3SLS, within-industry diversification, dynamic capabilities, growth, RBV
Bart Devoldere acknowledges financial support from the Belgian Intercollegiate Centre for
Management Science (ICM). We are grateful to the Flanders District of Creativity (FDC), subsidized
by the Flemish government, for the financial support to execute this research project. We also thank
Rajan Varadarajan, Ruud Frambach, Anne Marie Knott and participants of the Strategic Management
Society International Conferences in Rome and Miami for valuable feedback on earlier versions of
this work. The usual disclaimer applies.
*Corresponding author: Bart Devoldere, Vlerick Business School, Reep 1, B-9000, Ghent,
Belgium, email: [email protected], phone: +32 9 210 9874.

29
1.2 Introduction
Firm growth is a central topic in strategy research and a key managerial concern. Companies that
grow slower than GDP are five times less likely to survive the next business cycle compared to firms
that grow faster than GDP (Baghai, Smit, and Viguerie 2007). Also, investors pay premiums for high-
growth firms. However, achieving consistent growth is extremely hard. For example, recent research
indicates that among big firms, only 4% out of nearly 5,000 achieve a net income growth of at least
5% for five consecutive years (McGrath 2012).
An important growth strategy for firms is to diversify across product markets. However, we
identify some important theoretical and methodological gaps in the literature that lead to
potentially biased results when estimating growth implications of diversification. First, there is a
large body of literature on diversification, but it mainly focuses on diversification across industries
and it has difficulties showing a clear link between diversification and performance (For a review,
see, e.g., Hoskisson and Hitt 1990; Palich, Cardinal, and Miller 2000). Because industry relatedness is
based on SIC categories that are sometimes randomly delineated and industrial conglomerates often
operate through holding structures with separate entities per industry, studies taking a cross-
industry approach often fail to capture the true resource drivers of relatedness and diversification.
Also, although any growth measure is based on both the level and change in the growth subject,
studies on diversification’s growth implications often fail to include both diversification level and
diversification activity to explain growth performance. Second, the resource-based theory is
prominently used to explain diversification, its antecedents and its outcomes (Lockett and
Thompson 2001; Wan et al. 2011). However, fine-grained measures of relatedness that closely link
diversification with underlying arguments of the resource-based view (RBV) are missing in the
literature. Moreover, previous work lacks an adequate approach to deal with the endogeneity
between resources and relatedness in the relationship between diversification and performance.
Also, resources are bundled within firms. Linking resources with firm performance without taking
into account the bundled nature of resources at firm level leads to potentially biased results.
The following research questions are remaining. First, does within-industry product
diversification lead to growth? Second, what is the relative influence of diversification activity
compared to level of diversification on firm growth? Third, what are the underlying resource
mechanisms of diversification that lead to growth? To address these gaps and subsequent research
questions, we explain growth implications of product market diversification by focusing on a single
industry, by relating both diversification level and diversification activity to growth while applying
underlying theoretical arguments of the RBV and dynamic capabilities literature, and by developing a
fine-grained relatedness measure in line with the close relationship between resources and product
market relatedness.
First, we focus on within-industry product diversification. Recently, there is more attention for
within-industry diversification in which firms enter different market niches within a single industry
(e.g., Stern and Henderson 2004; Tanriverdi and Lee 2008). In this study, we define a market niche as
a product market. Although there can be important differences between within-and across-industry
diversification (Li and Greenwood 2004), staying within the boundaries of one industry can alleviate
some of the previously mentioned problems when studying performance implications of
diversification. Compared to defining industry boundaries based on SIC categories, focusing on a

30
single industry enables us to define market niche boundaries more appropriately based on business
activities and industry-driven market structuration. This leads to a relatedness measure that can
capture underlying resource logic better. Also, when diversifying across industries, a prevalent
organizational structure is the holding unit with a set of -- often loosely -- coupled firms that are
active each in a different industry. In such a structure, it is hard to imagine having one, well-
integrated resource bundle shared across industries. A single industry is a more meaningful context
in which one, well-integrated resource bundle can reside in a single firm. Therefore, a single industry
is better able to take a holistic approach focused on resource bundles instead of individual
resources.
Second, we relate diversification level and diversification activity to growth with the help of
underlying theoretical arguments of the RBV respectively dynamic capabilities literature. Whereas
the RBV literature is more static and thus more suitable to explain growth implications of a firm’s
level of diversification, we argue it is key to understand how dynamic capabilities work to
understand how a firm’s diversification activity can lead to growth. A dynamic capability is a firm’s
capability to create, leverage, and configure elements of its resource bundle purposefully without
necessarily implying enhanced performance (Helfat et al. 2007). A firm’s resource bundle consists of
its assets, resources, and capabilities. Previous research shows that dynamic capabilities are relevant
in explaining product diversification (e.g., Danneels 2007; 2011). When entering a product market, a
firm needs to underpin its offering in that market with a reconfigured resource bundle consisting of
both newly created resources that are specialized towards that product market and existing
resources that are leveraged across different product markets (Helfat and Lieberman 2002).
We posit that both resource creation and resource leverage can lead to growth. However, the
key to understanding the role of a dynamic capability towards growth is that there lies a paradox in
striving for both resource creation and resource leverage. This paradox stems from the contradicting
focus and effect of resource creation and resource leverage. On the one hand, resource leverage
focuses on exploiting existing resources, creating efficiencies among existing resources, and building
more co-specialization and linkages among resources. That stimulates structure and inertia among
resources which hurts a firm’s ability to create new resources. On the other hand, resource creation
focuses on exploring new resources that also need integration with other, existing resources. That
demands flexibility among resources to (temporarily) de-link existing, co-specialized resources which
hurts a firm’s ability to leverage resources. More resource creation is likely to hurt resource
leverage and vice versa. But firms seem to need both and have to decide on both simultaneously
when diversifying.
In a similar vein, previous research states that firms need to balance exploitation of existing
resources and continuous development of new resource positions in order to obtain optimal growth
(Pettus 2001; Teece et al. 1997). But in diverse literature streams, it is suggested that creation
decreases leverage and leverage makes creation more difficult. See for example previously studied
tensions between efficiency and flexibility (Adler, Goldoftas, and Levine 1999; Mckee, Varadarajan,
and Pride 1989), organizational change and activity system fit (Siggelkow 2001), architectural
innovation and product component fit (Henderson and Clark 1990), and firm adaptation and
organizational element fit (Levinthal 1997).

31
Third, we develop a fine-grained relatedness measure in line with the close relationship between
resources and product market relatedness. We build a time-varying, continuous, and indirect
measure of product market relatedness. A time-varying relatedness measure is important to capture
the dynamics of an industry (Tanriverdi and Lee 2008) and changes in diversification over time
(Ramanujam and Varadarajan 1989). Also, within-industry diversification is assumed to be related,
so within-industry relatedness embodies the degree of relatedness which is best measured
continuously (Li and Greenwood 2004). Moreover, an indirect measure has the advantage it
increases external validity (Bryce and Winter 2009).
A key feature of our product market relatedness measure is that it is based on the joint
occurrences of different product markets in firms’ product market portfolios. Aggregating joint
occurrences of product markets across firms within an industry indicates how related those product
markets are. It also corresponds to how similar those product markets are in their need for
particular resources and how relevant a firm’s resource bundle is to underpin those product markets
(Lee 2008). When offering a product, a firm makes use of the services of particular resources in its
resource bundle. To realize economic value, resources need to be productively linked with particular
products that are sold in the market. The correspondence between a firm’s resource bundle and its
product markets implies that, given a product that a firm offers, one can infer the existence of the
corresponding resources within the firm needed to offer that product. It is said that a firm’s resource
bundle and product market portfolio are two sides of the same coin (Wernerfelt 1984). However,
there is a distinction between resources and the services they can provide (Penrose 1959).
Resources are not product-specific which means that they can be relevant for various product
markets (Danneels 2007; Penrose 1959; Prahalad and Hamel 1990; Teece 1982). Therefore, if two
product markets are related, the underlying resources are likely to overlap, even though one may
not pinpoint exactly what the overlapping resources are (Lee 2008). Based on this close link between
products and resources, we use product market relatedness to identify RBV-related arguments on
how product market diversification influences firm growth.
We apply the following methodology. We estimate a system of three equations of respectively
firm growth, resource creation, and resource leverage. We use a three-stage least squares (3SLS)
estimation approach. We account for simultaneity, endogeneity, and firm-level unobserved
heterogeneity. We also apply a selection correction mechanism for non-survival. Our estimation
approach has several advantages. It allows us to estimate growth implications of diversification
while controlling for the simultaneity of decision-making with respect to resource creation and
resource leverage. Moreover, it lets us model causal relationships between our variables of interest
and firm growth. Also, we can develop unbiased parameter estimates in the presence of
endogeneity.
We collect data on Belgian, Dutch and U.K. market research agencies for the period 1990-2005.
We track their presence across 33 product markets. Our sample and industry context are
appropriate for several reasons. First, the data stem from a mature service industry for which we
capture a large number of product market entries. Given our focus on a single industry we have no
cross-industry noise coming from differing industry-specific shocks to supply and demand. Second,
our data set spans 16 years of data in which there are both turbulent and stable periods.
Environmental changes include the introduction of internet research and online research methods

32
around 1995, and the start of a global recession and a wave of mergers and acquisitions in the
industry around 2000. We control for these changes by introducing fixed time effects and a dummy
indicating whether a firm is involved in a merger or acquisition. Third, our data set is a mix of big,
multinational firms and SMEs as well as start-ups and older firms. That way our data set presents a
diverse, complete picture of the market research industry. We control for firm size and age.
With this study, we offer important theoretical and methodological contributions. First, we
contribute to the diversification literature. We provide theoretical and empirical argumentation for a
link between within-industry diversification and growth performance. Also, we show the importance
of an adequate relatedness measure that needs to link aspects of diversification with underlying
theoretical logic to explain the outcomes of diversification. We show how an indirect method based
on a firm’s product market portfolio can be applied to measure product market relatedness that
reveals information on a firm’s resource bundle. Moreover, we not only include firms’ diversification
level, but also firms’ diversification activity. Prior research on diversification focuses on firms’
presence across markets, i.e., diversification level, based on decisions taken before the period in
which growth performance is appraised. Our study incorporates both static and dynamic aspects of
diversification and is therefore better suited to link diversification to growth performance. Second,
we contribute to the dynamic capabilities literature. We identify a core paradox that is taking place
when deploying a dynamic capability, i.e., a paradox between creating and leveraging resources.
Previous research suggests a dynamic capability involves finding a balance between two opposing
forces (Eisenhardt, Furr, and Bingham 2010; Helfat et al. 2007). We build further on that by
explaining a paradox between two resource altering activities that form the core of a dynamic
capability. We explain the paradox in terms of processes and in terms of managerial mental activity.
Also, we contribute by making decisions with an impact on resources and dynamic capabilities more
tangible and measurable. Moreover, our main findings help identify how a dynamic capability can
lead to growth and what the possible pitfalls are. Third, we contribute to the resource-based theory.
In line with previous work by Wernerfelt (1984) and Lee (2008), we further explore and develop the
link between a firm’s resources and products. We add to the relevance of the resource-based theory
for explaining diversification and firm growth. We also make measuring a firm’s resource bundle
more tangible.
This study also offers managerial contributions. First, we provide insights on how to grow in a
relatively ‘safe’ within-industry environment. Thereby, we focus on the importance of dynamic
capabilities and describe the resource trade-offs firms have to make. We show that managers can
capture growth opportunities through diversification and a dynamic capability, but that managers
should be aware of the dynamic capability’s negative internal effects. Our study helps managers
identifying possible causes for these negative effects in the form of different constraints at different
levels within the organization. Second, this study and its outcomes are informative for multiple
organizational functions, i.e., functions related to product portfolio management, resource and
process management, and top management decision-making. Third, our methodology used is easily
replicable, also across industries. It provides firms with an actionable method to benefit from
diversification. Also, we provide a convenient method for managers to build active knowledge on
how their product market portfolio is in congruence with their available resource bundle.

33
The paper is organized as follows. First, we focus on the conceptual background and develop
appropriate hypotheses. Second, we describe our data set and variable operationalization. Third, we
specify our model and estimation method. Fourth, we present our results, check for their
robustness, and discuss our contributions. We conclude with some limitations and areas for further
research.
1.3 Conceptual background and hypothesis development
1.3.1 Within-industry diversification
Within-industry diversification deals with firms entering different market niches within a single
industry. Previous research considers market niches that refer to product lines (Stern and Henderson
2004) or product lines within particular geographic areas (Li and Greenwood 2004). In this study, we
focus on diversification across product markets in a single industry within country borders. Previous
research observes that within-industry diversification can contribute to performance in terms of
product and organizational survival (Cottrell and Nault 2004; Stern and Henderson 2004),
profitability (Li and Greenwood 2004), and sales growth and market share (Tanriverdi and Lee 2008).
However, diversification per se does not lead to higher performance (Li and Greenwood 2004;
Tanriverdi and Lee 2008).
Reasons for possible performance contributions of within-industry diversification mentioned are
exploiting excess productive resource capacity, resource synergy creation in the form of economies
of scope, mutual forbearance, and market structuration (Cottrell and Nault 2004; Davis and Thomas
1993; Farjoun 1994; Li and Greenwood 2004; Markides and Williamson 1994; Robins and Wiersema
1995; Stern and Henderson 2004; Tanriverdi and Lee 2008). The RBV is prominently used to explain
diversification, its antecedents and its outcomes (Lockett and Thompson 2001; Wan et al. 2011).
However, fine-grained measures of relatedness that closely link diversification with underlying
arguments of the RBV are missing. Also, previous work lacks an adequate approach to deal with the
endogeneity between resources and relatedness in the relationship between diversification and
performance. Moreover, linking resources with firm performance without taking into account the
bundled nature of resources at firm level leads to potentially biased results. There is increased
attention to seeing resources in relation to other resources within configurations, instead of focusing
on individual resources. This is in line with a general RBV idea of resource bundles (Rumelt 1984),
and with concepts such as resource complementarities and co-specialization (Dierickx and Cool
1989; Teece 1986; Teece et al. 1997). More generally, it is in line with a renewed appeal of research
on fit (Peteraf and Reed 2008; Porter and Siggelkow 2008; Zajac, Kraatz, and Bresser 2000).
Instead of focusing merely on the RBV, which is often denoted as ‘static’ (Priem and Butler
2001a; Priem and Butler 2001b), we also relate diversification with the literature on dynamic
capabilities. There are two important reasons. First, to adequately link within-industry diversification
to firm growth, we need to focus on both diversification level and diversification activity. On the one
hand, diversification level relates more to a ‘static’ condition. Therefore, we link it with a ‘static’ RBV
concept, i.e., resource fit. On the other hand, diversification activity relates more to a ‘dynamic’

34
process. Therefore, we link it with ‘dynamic’ concepts related to a dynamic capability, i.e., resource
creation and resource leverage. Second, to capture empirically the underlying resource-based
arguments of diversification, we need to identify what happens when changes occur in a firm’s
resource bundle when diversifying. Spurred by the dynamic capabilities literature, there is increasing
attention for the internal dimensions of a firm’s resource bundle and how it works. Previous
research tries to disentangle dynamic capability and identifies different internal dimensions that
might have different performance implications (Danneels 2011; Helfat et al. 2007; Sirmon et al.
2011; Teece 2007). Also, it has been suggested that possible tensions among internal dimensions are
at the core of dynamic capability’s performance potential (Eisenhardt et al. 2010). In our study we
identify resource creation and resource leverage as two important dimensions of a dynamic
capability, and argue we need to study their growth implications separately. However, we also
suggest there is an internal paradox between resource creation and leverage based on constraints
that have been studied in various domains such as learning, managerial capacity, and organizational
structure.
1.3.2 Dynamic capability and growth
A dynamic capability is a firm’s capability to change its resource bundle purposefully (Helfat et
al. 2007). A firm’s resource bundle is its set of assets, resources, and capabilities. Like other
capabilities, a dynamic capability is a complex bundle of skills and accumulated knowledge, exercised
through organizational processes that enables a firm to coordinate activities and make use of its
assets (Day 1994). Unlike other capabilities, its purpose is to actually alter a firm’s resource bundle
(e.g., Danneels 2011; Eisenhardt and Martin 2000; Helfat et al. 2007; Teece 2007). For example, a
dynamic capability can be deployed to create new resources, leverage existing resources, and
(re)configure them in the firm’s resource bundle. Possessing a dynamic capability does not
necessarily imply enhanced performance (Eisenhardt and Martin 2000; Helfat et al. 2007; Zahra,
Sapienza, and Davidsson 2006). A dynamic capability only implies that the firm is intentionally doing
something differently, but not necessarily better, than before. For example, the use of a dynamic
capability when based on incorrect cause-effect assumptions may harm rather than help
performance outcomes (Zahra et al. 2006).
When diversifying across product markets, firms deploy a dynamic capability for two main
purposes: resource creation and resource leverage. Resource creation allows firms to sense, seize or
even shape opportunities, and to align with their external environment (Teece 2007). In line with
evolutionary thinking, dynamic capability deals with creating appropriate resources to fully capture
market opportunities in possibly changing environments. Performance then indicates how well a
firm adapts to its environment by possessing resources that are valuable, rare, non-inimitable, non-
substitutable, and appropriable (Barney 1991; Teece, Pisano, and Shuen 1997). Resources have been
categorized into two types: market-related and technology-related (Mitchell 1992). When entering a
product market, resource creation can refer to creating new technology-related resources and/or
market-specific resources to underpin the firm’s offering in that market and to enable the firm to
capture the growth potential of the market (Danneels 2002; Teece 1986; Tripsas 1997). Examples of
technology-related new-to-create resources include new production processes and new patents.
Examples of market-related new-to-create resources include new customer relationships, brand-
specific reputation, and knowledge of customer needs and preferences. When entering a market, a
firm always has to create new resources, be it technology-related, or market-specific, or both. Two

35
product markets with exactly the same technology-related and market-specific characteristics would
be the same product markets per definition.
We argue that creating resources increases firm growth in two ways. First, creating new
resources when entering product markets increases a firm’s potential and ability to capture
previously untapped market opportunities. Also, growing a firm’s resource bundle enhances its
value, ambiguity, in-imitability, and appropriability which should lead to better performance (Barney
1991). When creating market-specific resources such as customer relationships, goodwill, and brand
reputation, firms can access new customers with new or existing technology which increases firm
growth (Danneels 2002; 2007). Similarly, when creating technology-related resources such as
knowhow, patents, and production facilities, firms can build new products to offer to new or existing
customers which increases firm growth. Second, creating new resources for newly entered product
markets can increase firm value in important ways. It acts as important learning opportunity for
firms because it increases flexibility through exploring new things and decreases the probability for
competency traps (March 1991). Also, it creates valuable firm options for future deployment in
newly entered product markets. It is said that a firm’s value lies in its combinative potential of
deploying new and existing resources in its resource bundle for innovation in existing markets or for
addressing new markets (Kogut and Kulatilaka 2001). Therefore, we hypothesize the following.
H1a: Resource creation increases firm growth.
Next to creating new resources, a dynamic capability can also be deployed to leverage existing
resources for new product markets. Leveraging existing resources when entering product markets
means that firms can share and redeploy existing resources to offer and compete in both existing
and newly entered product markets. For example, firms can sometimes redeploy marketing
expertise, brands, and sales forces in multiple product markets (Capron and Hulland 1999). Also,
customer knowledge can be shared and redeployed when understanding and serving multiple
product needs of the same customer base (Farjoun 1998). It is said that resources that can be shared
across different product markets are fungible (Danneels 2007; Mahoney and Pandian 1992; Penrose
1959; Teece 1982). When trying to leverage resources across different product markets, firms are
focused on creating fit or alignment among technology-related and market-specific resources in
their resource bundle. Firms also (re)configure their resource bundle to achieve (higher) fit among
their resources which is expected to positively influence firm performance (Helfat et al. 2007;
Sirmon, Hitt, Ireland, and Gilbert 2011; Teece 2007).
We argue that both resource leverage related to a firm’s diversification activity in the focal time
period, and the level of resource fit related to the level of a firm’s diversification across product
markets can enhance firm growth. Resource fit signifies the relevance of a firm’s resource bundle to
target and compete in the various product markets in its product market portfolio. Higher resource
fit means a higher overlap among the resources needed for a firm’s various product markets and
thus refers to a higher relatedness among product markets in a firm’s product market portfolio.
Higher overlap indicates a firm possesses more of the resources that are important to offering
particular products, and lacks less of the resources that are vital to offering its products. That
increases its resource bundle’s overall effectiveness. Higher overlap also indicates that a firm’s
resource bundle is more relevant for competing in its product markets. It means a firm’s resources

36
are more helpful in underpinning its products and can be leveraged more often, and that the firm is
less over-resourced with irrelevant resources.
We discuss three main advantages of higher resource fit that can add to firm growth. First, there
is a learning advantage. Higher resource fit implies that firms can use similar or related technical,
managerial or customer knowledge when targeting and competing in their markets. Building upon
relevant and complete market knowledge, firms have to learn less and can learn faster when
entering a new market. This learning advantage can lead firms to capture the growth potential
associated with the new market faster and more effectively. For example, research on industry
diversification shows resource and knowledge similarities between diversifiers’ original and target
industries (Farjoun 1994; Montgomery and Hariharan 1991). Diversifying entry is influenced by
resource relatedness (Chatterjee and Wernerfelt 1991). Also, there is a positive relationship
between resource relatedness and diversification performance (Kor and Leblebici 2005; Levinthal
and Wu 2010). For example, research on international market entry suggests that the expected and
actual performance of a firm in a new market can depend on learning advantages in the form of
near-market knowledge and managerial experience in similar countries (Barkema, Bell, and Pennings
1996; Gielens and Dekimpe 2001; Gielens and Dekimpe 2007; Johnson and Tellis 2008; Mitra and
Golder 2002). Another example is that when redeploying technological knowledge in new markets,
serving customers in the newly entered markets is often different from serving existing customers
(Danneels 2007). However, when the newly entered market is very similar to a firm’s existing
markets, customers can be similar to existing customers or existing customers can even be present
in both new and existing markets. Firms are then able to redeploy existing customer relationships
and customer knowledge.
Second, there is an efficiency advantage. Previous research shows that striving for fit can have
measurable efficiency consequences (Peteraf and Reed 2007). We discuss two efficiency advantages
from resource fit that can have implications for firm growth. First, possessing only relevant resources
means that a firm is not over-resourced with irrelevant ones. Over-resourcing is unproductive and
can even be counter-productive when resources hinder each other. Irrelevant resources decrease a
firm’s ability to capture growth opportunities fast. Irrelevant resources do not help firms competing
in their markets. However, they add to a firm’s cost base, and slow down identification and
development of relevant resources, because they also demand time and efforts for development,
maintenance, and/or divestment. Second, fungible resources that are relevant across several
product markets can add to a firm’s efficiency. Firms can often leverage existing, fungible resources
across different markets. Resource leverage has been linked to growth (Helfat and Raubitschek
2000). Fully exploiting available resources’ fungibility means that firms can capture growth
opportunities faster because they do not have to create all resources needed to compete in a
particular product market. Firms often diversify to utilize excess resource capacity and to benefit
from economies of scope when the demand for the services from these input factors is limited and
an efficient factor market is absent (Kor and Leblebici 2005; Penrose 1959; Rumelt 1982; Teece
1982). That way, firms capture efficiencies through exploiting available resources over a larger
product market portfolio. It implies that firms capture all possible growth potential related to their
existing resource bundle.

37
Third, there is a complementarity advantage. High resource fit implies having more
complementary resources. If two resources are aligned and relevant to each other, they strengthen
each other and are said to be complementary. The value of two complementary resources combined
is more than the sum of their individual values (Milgrom and Roberts 1990; Milgrom and Roberts
1995). A higher combined value of a firm’s resources refers to a higher effectiveness of the firm’s
resources in underpinning its market offering. A higher value of its resources can enlarge the size of
the potential market and subsequently the firm’s potential growth. Moreover, if a firm has a more
complete set of complementary resources, especially market-related complementary resources, it is
better equipped to appropriate the value it created (Teece 1986). Also, including more
complementarities among resources increases the difficulty for competitors to imitate (Rivkin 2000).
Resources’ value, appropriability and in-imitability contribute to the firm’s ability to capture growth
opportunities.
We argued that both resource leverage which is related to diversification activity, and the level
of resource fit which is related to diversification level can enhance firm growth. Therefore, we
hypothesize the following.
H1b: Resource leverage increases firm growth.
H1c: Resource fit increases firm growth.
However, complementarities and fit can change over time. Previous research indicates that
complementary relationships among a firm’s resources or activities can change due to industry
evolutions such as radical technological innovations, changing consumer trends, and shocks across
distribution channels (Lee et al. 2010; Porter and Siggelkow 2008; Rothaermel and Hill 2005;
Siggelkow 2001; Tripsas 1997). Research on fit has long held a static orientation applying a cross-
sectional approach. However, there is increasing demand for more dynamics (Miles and Snow 1994;
Venkatraman 1989; Zajac et al. 2000). Recent empirical studies on fit taking dynamics into account
include Lee et al. (2010) and Peteraf and Reed (2007; 2008), amongst others.
Within a single industry, market structuration leads to changes in complementary relations (Li
and Greenwood 2004). Market structuration is the process whereby initially separate market niches
mature into ‘related’ market niches with supporting institutional infrastructures. The relatedness of
market niches is a function of social processes and beyond the control of individual firms. The social
processes involved are inter-firm learning (e.g., through competitive imitation, personnel flows,
trade associations, etc.), creation of support structures (e.g., lawyers, suppliers of raw material,
venture capitalists, etc.), and legitimization (e.g., through market analyst publications). The benefits
of market structuration are collective, but firms obviously need to be present in market niches to
profit from their relatedness. Li and Greenwood (2004) state that the greater the number of firms
concurrently operating in the same market niches, the more related that set of market niches
becomes due to an increased efficiency and legitimacy of that particular market niche portfolio. It is
based on the notion that markets are not ‘out there’, but are cognitively constructed by the
interactive behaviours of producers (Harrison 1981). In this study, we take product markets as
market niches. Because market structuration increases product market relatedness and thus a firm’s
resource bundle relevance for underpinning its product market portfolio, we hypothesize that
market structuration positively influences firm growth.

38
H1d: Market structuration increases firm growth.
1.3.3 Resource creation and resource leverage: a paradox
There seems to be a paradox though in simultaneously attempting to accomplish resource
creation and resource leverage. On the one hand, resource leverage focuses on exploiting existing
resources, creating efficiencies among existing resources, and building more co-specialization,
linkages, and fit among resources. Focusing on resource fit stimulates structure and inertia among
resources which hurts a firm’s ability to create new resources. On the other hand, resource creation
focuses on exploring new resources that also need integration with other, existing resources. That
demands flexibility among resources to (temporarily) de-link existing, co-specialized resources which
hurts a firm’s resource fit. We posit there is a paradox such that both resource creation and resource
leverage can add to growth, but also hurt each other. Not acknowledging this paradox can confound
performance outcomes in two important ways. First, adding resources can have a positive, direct
growth effect, but can negatively influence resource fit which results in a negative, indirect growth
effect. For example, even given the large number of customers who are familiar with buying their
computer over the internet after the arrival of Dell in the PC industry, adding a direct sales channel
over the internet presented challenges for HP because it was incompatible with its extensive
network of distributors. A direct internet channel would bring additional sales, but would at the
same time demotivate and upset its distribution network and thereby have a negative impact on
HP’s performance. Second, leveraging resources and increasing resource fit can have a positive,
direct growth effect, but could restrict resource creation which can have a negative, indirect growth
effect. For example, an airline buying and operating only one type of aircraft benefits from
standardizing training and maintenance needs. However, it also limits the airline’s ability to adjust to
changing customer demands in terms of in-flight accommodation and long- versus short-haul flights.
To describe and understand why this paradox between resource creation and resource leverage
emerges, we look at different constraints within firms.
Organizational learning constraints
Organizational learning is constrained. Organizations learn by focusing on either exploration or
exploitation (March 1991). Exploitation involves using the resources a firm already has and
exploration leads to adding new resources (Sitkin and Sutcliffe 1994). However, applying both
learning modes simultaneously is extremely hard to do for at least two reasons. First, exploration
and exploitation have contradicting implications with regard to breaking and creating linkages
among resources (Danneels 2002). For example, when entering new markets, firms are focused on
exploring and creating new market-related resources which involves de-linking existing market-
related resources from existing complementary, technology-related resources. De-linking
complementary resources harms resources’ fit and implies moving away from a focus on resource
configuration. When exploiting existing markets, firms are focused on integrating existing resources
and coordinating co-specialization by (re-)linking resources to create fit which implies moving away
from creating resources.
Second, exploration and exploitation are nested learning experiences that can substitute each
other (Levinthal and March 1993). Being nested means that learning occurs at different but

39
interrelated levels simultaneously. For example, a business firm learns both which markets to enter
and how to effectively compete in these markets. But increasingly learning how to compete
effectively in existing markets decreases the need to explore new markets, and vice versa. Because
of their nested relationship, exploration and exploitation can substitute each other. For example,
refining an existing technology substitutes for identifying a better one. And creating close ties with
existing customers substitutes for exploring new customer relationships. Therefore, increasing
resource fit substitutes for finding new, better resources. Similarly, finding new, better resources
substitutes for the need to increase resource fit.
Managerial capacity constraints
Managerial capacity is constrained in several ways. First, managers have only a limited amount
of time to divide between resource creation and resource configuration (amongst other things).
Focusing on both can thus be difficult. Limited managerial capacity with respect to time is identified
as a limitation to firm growth (Penrose 1959).
Second, a manager’s resource cognition can be a limitation to growth. Resource cognition
involves identifying resources and assessing their fungibility potential (Danneels 2011). Managerial
beliefs and mental models underpin a manager’s cognition and decision-making (Adner and Helfat
2003). But managers’ mental models and beliefs often fall victim to inertia (Hambrick and Mason
1984). Because managers have an important role to play in organizational learning (Mom, Van Den
Bosch, and Volberda 2007), their mental inertia might also not be beneficial to balancing exploration
and exploitation activities. Previous research shows that firms focusing on internal fit and existing
mental models have difficulties creating and configuring new resources, especially when their
internal fit relationships are stable (Siggelkow 2001). Also, focusing on tight fit among resources can
hold firms captive in a reinforcing feedback loop between their actions and cognition without
enough attention for resource creation (Danneels 2003).
Third, high resource fit implies more complementarities among resources in a firm’s resource
bundle that can render managers unwilling to change for at least three reasons. First, highly
complementary systems are well-oiled, efficient systems in which change seems unnecessary. When
changing one or more elements, one can not only loose more than the individual value of that
element (Milgrom and Roberts 1995), but it is also difficult to assess upfront the impact on other
complementary relationships in the system (Porter and Siggelkow 2008). Also, previous simulation
work shows that changing complementary systems in search for a higher fit implies a performance
drop at least in the short-term which is not appealing to managers, even when ultimately resulting
perhaps in higher performance (Levinthal 1997). The more complementarities present in a firm’s
current system, the higher and steeper the short term drop in performance. Second, highly fitted
systems have many ambiguities making it difficult to distinguish among different elements. That
makes it hard to adapt or replicate that system (Hoopes and Madsen 2008; Rivkin 2000; Teece
2007). The more complementary relationships in a firm’s resource bundle, the more difficult to
disentangle which resources are affected by what change. Also, the more complementarities among
resources in a resource bundle, the more value can be attributed to their combination relative to
their individual contribution. That makes it harder for managers to make a calculated guess on what
resources are driving performance in what manner which results in higher fear to make wrong
decisions. Third, highly fitted systems consist of complementary relationships that cannot be

40
changed easily. For example, in service firms, partners’ knowledge of particular clients is used in
combination with the firm’s specialized knowledge to perform services for its clients (Helfat 1997;
Hitt et al. 2001). Client-specific knowledge and firm’s specialized knowledge are said to be co-
specialized (Teece 1986). Building these types of client relationships is based on experience and
accumulated efforts, and demands time and commitment. Also, client-specific information is often
not easily transferred to other relationships. Moreover, partners are human resources that are
constrained by time and space. Therefore, opportunity costs and co-specialization of complementary
resources constrain firms in their ability to change.
Structural constraints
Organizational structures are constrained. Rigidity within organizational structures arises when
firms try to accommodate competing goals of organizational efficiency and flexibility (Thompson
1967). Striving for both efficiency and flexibility within organizations creates negative tensions that
can hurt performance (Brown and Eisenhardt 1998; Brown and Eisenhardt 1997; Eisenhardt et al.
2010; Tushman and O'Reilly III 1996; Uzzi 1997). Fit among resources bears upon stability and
continuity to create and maintain the appropriate linkages that bind them together. For example,
one is cautious changing cross-departmental task forces and middle managers linking R&D and
marketing too suddenly and too heavily given a potential loss of precious knowledge on
complementary resources such as valuable market knowledge or distribution channel relationships.
Also, such organizational knowledge is typically not built overnight but requires some time
investment. However, changing the linkages is needed when integrating new resources (Taylor and
Helfat 2009). Resource creation involves temporarily delinking and re-linking resources (Danneels
2007). Delinking and re-linking implies a temporal misfit, i.e., a decrease in fit. Although stability and
change might be complementary in the long run, they are likely to be conflicting in the short-run
(Farjoun 2010). The more a firm is focused on resource creation, the more it breaks up valuable
linkages, the less time it has to develop appropriate linkages and the less it can develop
complementarities. The more a firm is focused on resource fit, the less it wants to break up valuable
linkages and the more it wants to develop and maintain appropriate linkages and resulting
complementarities. Based on previous discussion we hypothesize the following.
H2: Resource leverage decreases resource creation.
H3: Resource creation decreases resource leverage.
1.3.4 Controls
We control for the following firm level variables. First, we control for firm age and firm size
which can influence growth (Delmar, Davidsson, and Gartner 2003). Young and small firms are
expected to grow faster than more mature, larger firms (Bahadir, Bharadwaj, and Parzen 2009). Also,
firm size can influence both the relatedness and performance of firms (Tanriverdi and Lee 2008).
Large firms offer more extensive product lines (Sorenson 2000), have more synergy exploitation
opportunities, and suffer more from managerial diseconomies (Nayyar 1993). Firm age is associated
with within-industry diversification strategies and firms’ performance (Stern and Henderson 2004).
The effect of firm size and age on resource creation and resource leverage is less predictable, but we
expect an effect because older and bigger firms tend to have higher inertia.
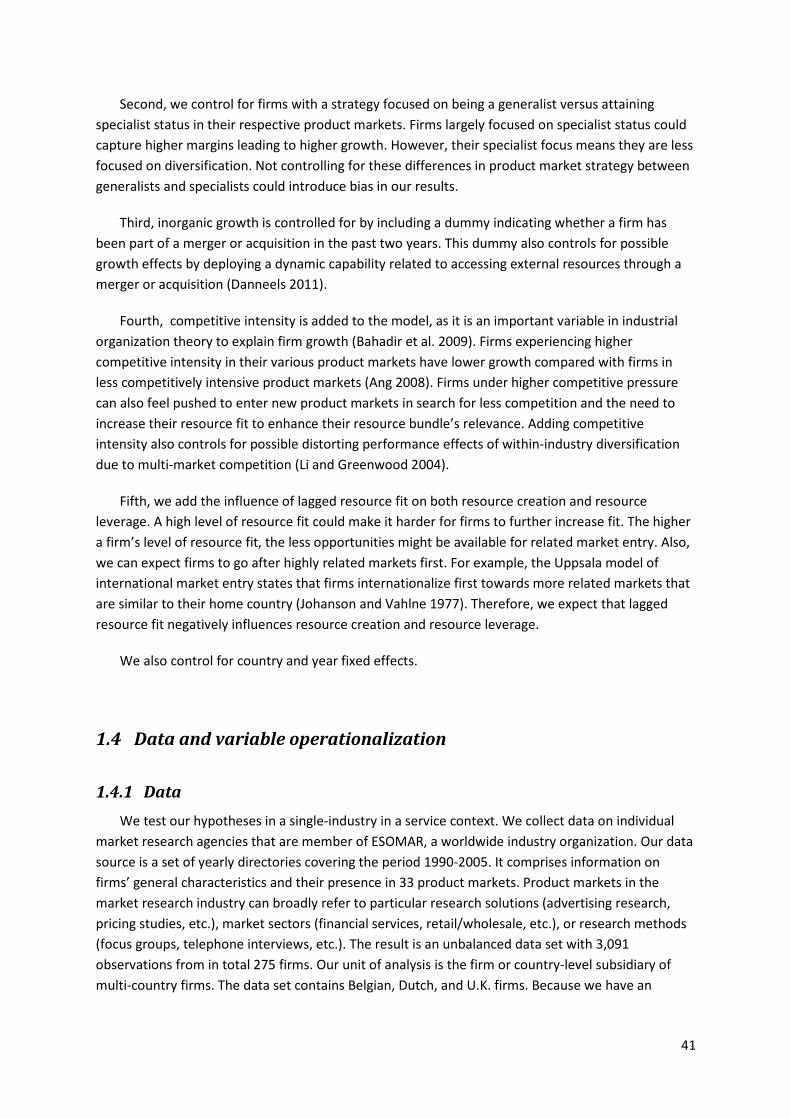
41
Second, we control for firms with a strategy focused on being a generalist versus attaining
specialist status in their respective product markets. Firms largely focused on specialist status could
capture higher margins leading to higher growth. However, their specialist focus means they are less
focused on diversification. Not controlling for these differences in product market strategy between
generalists and specialists could introduce bias in our results.
Third, inorganic growth is controlled for by including a dummy indicating whether a firm has
been part of a merger or acquisition in the past two years. This dummy also controls for possible
growth effects by deploying a dynamic capability related to accessing external resources through a
merger or acquisition (Danneels 2011).
Fourth, competitive intensity is added to the model, as it is an important variable in industrial
organization theory to explain firm growth (Bahadir et al. 2009). Firms experiencing higher
competitive intensity in their various product markets have lower growth compared with firms in
less competitively intensive product markets (Ang 2008). Firms under higher competitive pressure
can also feel pushed to enter new product markets in search for less competition and the need to
increase their resource fit to enhance their resource bundle’s relevance. Adding competitive
intensity also controls for possible distorting performance effects of within-industry diversification
due to multi-market competition (Li and Greenwood 2004).
Fifth, we add the influence of lagged resource fit on both resource creation and resource
leverage. A high level of resource fit could make it harder for firms to further increase fit. The higher
a firm’s level of resource fit, the less opportunities might be available for related market entry. Also,
we can expect firms to go after highly related markets first. For example, the Uppsala model of
international market entry states that firms internationalize first towards more related markets that
are similar to their home country (Johanson and Vahlne 1977). Therefore, we expect that lagged
resource fit negatively influences resource creation and resource leverage.
We also control for country and year fixed effects.
1.4 Data and variable operationalization
1.4.1 Data
We test our hypotheses in a single-industry in a service context. We collect data on individual
market research agencies that are member of ESOMAR, a worldwide industry organization. Our data
source is a set of yearly directories covering the period 1990-2005. It comprises information on
firms’ general characteristics and their presence in 33 product markets. Product markets in the
market research industry can broadly refer to particular research solutions (advertising research,
pricing studies, etc.), market sectors (financial services, retail/wholesale, etc.), or research methods
(focus groups, telephone interviews, etc.). The result is an unbalanced data set with 3,091
observations from in total 275 firms. Our unit of analysis is the firm or country-level subsidiary of
multi-country firms. The data set contains Belgian, Dutch, and U.K. firms. Because we have an

42
unbalanced data set based on a near-census sample from a major industry organization, chances for
sample selection bias are low.
1.4.2 Variable operationalization
Firm growth is measured as the two-year rate of firm size growth in terms of number of
employees (See equation 1). We take the natural log of number of employees. We focus on two-year
growth to reflect the long-term character of entering product markets. We focus on growth in
number of employees instead of sales or assets for the following reasons. First, in professional
service firms such as in consulting, law, or accounting, human capital is the most important form of
capital (Kor and Leblebici 2005; Malos and Campion 1995). Firm growth is then most essentially
captured by the growth in number of employees (Weinzimmer, Nystrom, and Freeman 1998).
Second, deployment of resources and exploiting market opportunities is primarily embedded in the
skills and tacit knowledge of a firm’s employees (Sirmon and Hitt 2003). Third, different growth
indicators based on for example employees versus sales, are attributes of the same underlying
theoretical concepts of growth and therefore tend to be correlated (Weinzimmer et al. 1998).
GROWTH�,, = ��(�����������)�,�,����(�����������)�,�,�����(�����������)�,�,��� (1)
Resource creation is measured as the number of actual product market entries that a firm
undertakes over a period of two years. With every product market entry, a firm needs to build
certain market-related resources (e.g., knowledge of customer needs and preferences, purchasing
procedures, sales access to customers, and customer goodwill), or technology-related resources
(e.g., knowledge of new product technology, appropriate production processes), or both (Danneels
2002; 2007). The more markets a firm enters, the more such resources that need to be created.
However, there will also be some existing resources that a firm can leverage when entering new
product markets (Penrose 1959). For example, a firm can offer new products to existing customers
while leveraging existing customer-related resources, a firm can offer existing products to new
customers while leveraging existing technology-related resources, and a firm can always leverage
existing supporting resources such as financial resources and organizational culture when offering
new products to new customers. We outline in the next section how we measure resource leverage
by making use of the relatedness among various product markets and a firm’s specific choices what
markets to enter. Notwithstanding that resource creation and resource leverage might overlap
partly due to the way we try to measure them, from our Pearson correlations table (See table 2) we
see that our measures for resource creation and resource leverage measure separate things and are
different enough to make inference on their effects.
We measure resource leverage, average level of resource fit, and market structuration based on
a fine-grained measure of product market relatedness in combination with a firm’s product market
presence and entry choices. We measure product market relatedness as follows. Inspired by
previous work by Lee (2008) and Bryce and Winter (2009), we develop a product market relatedness
index based on product markets’ joint occurrence within the industry. The product market
relatedness index for the combination of product markets x and z is given in Equation 2. The
relatedness between product markets’ x and z is based on their joint occurrence in the product
market portfolios of all firms in all countries in year t (See equation 2). P�,�,, is a dummy indicating

43
firm i’s presence in product market x in country j in year t. In our data set a market research agency
can be present in at least 1 and maximum 33 product markets. From the industry-level product
market relatedness index we calculate a firm-specific product market portfolio relatedness as the
sum of the relatedness among all product markets present in a firm’s product market portfolio,
which signifies the fit of the resources in its resource bundle that underpins its product market
portfolio. Equation 3 shows the calculation of a firm’s resource fit based on product market portfolio
relatedness where !"#,$,%& represents the product market portfolio of firm i in country j in year t.
R�,', = ∑ ∑ *+,�,�,�*,,�,�,�∑ *+,�,�,�-./0 1�/02�/03∑ ∑ �+,�,�,��1�/02�/0 3∑ ∑ �,,�,�,��1�/02�/0
with i,j = 1,2,…,33 (2)
FIT�,, =∑ ∑ R�,',�6'789�: ;<.,=,>&': ;<.,=,>& (3)
From the relatedness among product markets and a firm’s product market choices, we
operationalize our key variables. We measure resource leverage as the change in a firm’s product
market portfolio relatedness induced by that firm’s diversification activity in the period we assess its
growth performance (See equation 4). The relatedness among product markets in a firm’s product
market portfolio reflects the relevance of the firm’s resource bundle to underpin that product
market portfolio. When entering product markets, i.e., diversification activity, a firm that increases
its product market portfolio relatedness also increases its resource bundle relevance and resource fit
which means the firm can leverage existing resources for the new markets entered. Because we only
want to include effects on resource leverage by the focal firm’s decisions, we exclude possible
market structuration effects on a firm’s overall product market portfolio relatedness and use the
lagged level of product markets’ relatedness.
We measure a firm’s average level of resource fit as the two-year average level of its total
product market relatedness captured by its product market portfolio choices (See equation 5). We
use total product market relatedness instead of number of product markets in which the firm is
present (although they are highly related) as our measure for level of resource fit, because the
former is more closely related to a firm’s resource bundle and the fit among the resources in the
bundle.
We measure market structuration as a firm’s change in total relatedness driven by changes at
aggregated industry level (cf. R�,', is measured at industry level) (See equation 6). Our measure for
market structuration reflects the change in a firm’s total product market relatedness that is driven
beyond a firm’s own control, i.e., it is driven by all firms in the industry and their choices with
respect to their product market portfolio.
LEVERAGE�,, =
∑ ∑ R�,',�C�6'789�: ;<.,=,>&D: ;<.,=,>& − ∑ ∑ R�,',�C�6'789�: ;<.,=,>��&': ;<.,=,>��& (4)
AVGFIT�,, =∑ ∑ F+,,,�+G,HIJ+KLMN.,=,>O,KLMN.,=,>O �∑ ∑ F+,,,��0+G,HIJ+KLMN.,=,>�0O,KLMN.,=,>�0OC (5)

44
STRUCTURATION�,, = ∑ ∑ R�,',�6'789�: ;<.,=,>&': ;<.,=,>& − ∑ ∑ R�,',�C�6'789�: ;<.,=,>&': ;<.,=,>& (6)
Our approach for inferring resource bundle relevance and resource fit based on a firm’s product
market portfolio choices aggregated at industry level has several advantages. First, we develop a
time-varying, dynamic approach. Having a dynamic, time-varying relatedness measure is important
as relatedness and industries can change over time (e.g., Lee et al. 2010; Li and Greenwood 2004;
Tanriverdi and Lee 2008). Also, research on fit increasingly demands longitudinal approaches for
measuring fit (e.g., Peteraf and Reed 2007; 2008). Moreover, following the large literature stream on
dynamic capabilities, it has become imperative to consider a firm’s resource bundle dynamic (e.g.,
Helfat et al. 2007; Teece 2007; Teece et al. 1997). Not only resources can change, but also a resource
bundle’s configuration can be altered (e.g., Danneels 2011; Eisenhardt and Martin 2000). Second, we
build continuous measures. Within-industry diversification is assumed to be related, so within-
industry relatedness embodies degree of relatedness which is best measured continuously (Li and
Greenwood 2004). Third, we infer resource bundle relevance and resource fit indirectly from a firm’s
product market portfolio. Indirect measures have important advantages that increase external
validity (Bryce and Winter 2009). We don’t have to exhaustively list all individual resources possibly
relevant because we infer a firm’s resource bundle’s aggregated relevance based on product market
presence. Product market presence is much more visible than individual resources. There is a much
lower chance of neglecting relevant product markets instead of neglecting relevant individual
resources. Also, we don’t have to make any assumptions regarding the form of fit relationships
among resources because we infer fit merely from the joint occurrence of product markets across
firms. Moreover, we avoid a tautological approach when measuring relatedness as it is not based on
performance. Previous research uses product adoption patterns to measure fit (Arora 1996; Athey
and Stern 1998). In a similar vein, we use product market entry patterns. Measuring relatedness
based on joint occurrence of product market presence across firms is also consistent with the
conceptualization of intra-firm business activity coherence, such as Teece’s (1994) ‘survivor
principle’, which dictates that economic competition will lead to the disappearance of relatively
inefficient organizational forms. The survivor principle states that if corporations engage in activity A
almost always engage in activity B, that these activities are highly related. Also, it is in line with prior
research stating that whether relatedness actually occurs depends upon the density of firms
involved (Li and Greenwood 2004).
Firm level control variables are measured as follows. Firm age is the natural log of years since
firm foundation. Firm size is the two-year lagged natural log of number of employees. A firm’s
generalist focus is the two-year average of 1 minus the number of self-claimed product market
specializations relative to the number of product markets in which the firm is present. We include a
dummy indicating whether a firm has been part of a merger or acquisition in the last two years.
Competitive intensity is measured as the two-year average of the Hirsch-Herfindahl Index of all the
product markets in which the firm is present in a particular year and country based on number of
employees. We also include dummies to control for country and year fixed effects.

45
1.5 Model estimation and specification
We estimate a system of three equations specifying respectively firm growth, resource creation
and resource leverage as dependent variables. Resource creation and resource leverage also occur
as endogenous, independent variables. Because we have a system of equations including
endogenous variables we use a three-stage least squares (3SLS) estimation procedure (Greene 2003;
Hayashi 2000). Ordinary least squares (OLS) would produce inconsistent parameter estimates
because of the endogeneity among variables. Error terms across equations are also correlated, thus
a 3SLS approach is more efficient than a two-stage least squares approach.
A 3SLS approach consists of three stages. First, we regress our endogenous variables resource
creation and resource leverage on a set of exogenous instrumental variables being their own lags
and the lagged scope of the firm. We use appropriate instrumental variables that are correlated with
their endogenous variables, much less correlated with other endogenous variables and the
dependent variable firm growth, and not included in the main equation. We use fixed-effects
regression to account for firm-specific unobserved heterogeneity and within-firm correlation across
observations over time. Second, we replace our endogenous variables with their predicted values
from the first stage and estimate our three equations separately. We calculate cross-equation
correlation among errors. Third, we estimate our system of equations simultaneously while
accounting for the cross-equation error correlation.
We include a sample selection correction in our growth equation for two reasons. First, we want
to control for non-survival. Second, we control for the fact that failure of firms precludes their ability
to grow whatever decisions they might take. A selection correction variable eliminates an important
form of omitted variable bias that can create inconsistent estimates (Greene 2003). We model the
probability that a firm does not survive till next year by estimating a logistic regression that accounts
for repeated firm observations. We regress the odds of firm failure on resource creation and
resource leverage. When correcting for selection bias it is also recommended to include an
instrumental variable that is not present in the main equation (Puhani 2000). As instrumental
variable we use a dummy indicating whether the firm is active in multiple countries. We include the
predicted odds of non-survival from our logistic regression in our system’s growth equation.
The three equations below together with Figure 1 detail our model specification. The unit of
analysis is firm-country level. Subscripts refer to firm i, country j, and year t. We use lagged resource
fit as control variable in our resource creation and resource leverage equations. Reasons include the
following. First, an already high level of fit could make it harder for firms to increase it. Second, when
regressing a change variable it is normal practice to include the base level as control variable. Third,
we can expect firms to go after highly related markets first. Fourth, the higher a firm’s product
market portfolio relatedness, the less opportunities might be available for future, related market
entry. We also include lagged market structuration as control variable in our resource creation
equation. It is possible that an aggregated industry-level confirmation of previous managerial
judgment gives managers more confidence for new research creation.

46
Growth equation:
GROWTH�,, = α0+ α1 CREATIONT �,, + α2 LEVERAGET �,,+ α3 AVGFIT�,, + α4 STRUCTURATION�,, + α5 SURVT �,, + α6 AGE�,,+ α7 SIZE�,,�C+ α8 GENERALIST�,, + α9 MA�,,+ α10 CI�,, + ∑ W$COUNTRY$$:{Z[\]#^_,`[%a[b\cdef} + ∑ W% YEAR%Chhi%j�kki + ε�,#,$,%
Resource creation equation:
CREATION�,, = β0 + β1 LEVERAGET �,, + β2 FIT�,,�C + β3 STRUCTURATION�,,�C+ β4 AGE�,, +
β5 SIZE�,,�C+ β6 GENERALIST�,,+ β7 MA�,,+ β8 CI�,,+ εC,#,$,% Resource leverage equation:
LEVERAGE�,, = γ0+ γ1 CREATIONT m,, + γ2 FITm,,�C + γ3 AGEm,, + γ4 SIZEm,,�C+ γ5 GENERALISTm,,+ γ6 MAm,,+ γ7 CIm,,+ εn,#,$,%
GROWTH�,,= firm growth; CREATION�,, = resource creation; LEVERAGE�,, = resource
leverage; AVGFIT�,,= average level of resource fit; STRUCTURATION�,, = market
structuration; SURVT �,, = predicted odds of firm failure; FIT�,,�C = two-year lagged resource
fit; AGE�,, = Firm age; SIZE�,,�C= two-year lagged firm size; GENERALIST�,,= focus on
being a generalist versus specialist; MA�,,= Merger & Acquisition dummy; CI�,,=
Competitive Intensity; COUNTRY$ = Country dummies; YEAR%= Year dummies
‘Please insert figure 1 about here’
1.6 Results and discussion
1.6.1 Results
Tables 1 and 2 show the main descriptive statistics and Pearson correlations for all dependent,
independent, control and instrumental variables. There is no sign of multicollinearity issues.
‘Insert table 1 and 2 about here’
Table 3 shows the standardized coefficient estimates, standard errors and p-values for all three
equations. We also report the importance of each estimate based on its relative squared
standardized coefficient in percentages (RSSCP). We observe the following.
First, results from the growth equation support hypotheses H1a, H1c, and H1d that resource
creation, level of resource fit, and market structuration positively influence firm growth. Our results
do not indicate a significant growth effect of resource leverage, i.e., no support for H1b. Variables
related to resource bundle relevance and resource fit have an accumulated RSSCP value of more

47
than 20%, whereas resource creation has 8% RSSCP. A higher RSSCP refers to a higher relative
impact of the respective variables. Control variables are in line with expectations. There are negative
growth influences from the odds of non-survival, firm age and firm size. Conducting a merger or
acquisition positively influences firm growth. Firm size is an important determinant of firm size
growth (RSSCP: 42%).
Second, results from the resource creation equation support hypothesis H2. Resource leverage
has a negative influence on resource creation. Its RSSCP value is more than 20%. Also, we see
significant control variables. A firm’s lagged resource fit negatively influences resource creation
whereas a lagged market structuration positively influences resource creation. We note that firm
age, firm size and a focus on being a generalist positively influence resource creation.
Third, results from the resource leverage equation show that resource creation negatively
influences resource leverage which supports hypothesis H3. All control variables also show
significant results. The control variable lagged level of resource fit negatively influences resource
leverage with an RSSCP value of more than 78%. Firm age, firm size, focus on being a generalist, and
a merger or acquisition dummy positively influence resource leverage. Competitive intensity has a
negative influence.
In sum, our results support almost all our hypotheses. There are positive growth consequences
of resource creation, level of resource fit, and market structuration. We also observe the negative
reciprocity between resource creation and resource leverage which, in combination with direct
growth effects of resource creation and level of resource fit, constitutes a paradox when deploying a
dynamic capability.
‘Insert table 3 about here’
However, different firms might cope differently with the observed paradox when deploying their
dynamic capability. Table 4 and 5 show model results when investigating firms’ dynamic capability
heterogeneity along different contingencies. We focus on important contingencies such as a firm’s
product market scope, age and focus on being a generalist versus specialist. We choose scope
because experience in exercising a dynamic capability might add to a firm’s knowledge on how to
effectively and efficiently exercise that capability. Previous research indicates for example that more
frequent deployment of dynamic capability can add to their learning (Zott 2003) and that underlying
routines and processes of capabilities work better the more they have been exercised (Helfat et al.
2007). We choose age and generalist focus because both can have important but different effects on
firm inertia. For example, routines become more entrenched as an organization ages which can
increase inertia (Hannan 1998; Hannan, Polos, and Carroll 2004; Nelson and Winter 1982). Also, age
and generalist focus are significant in both our resource creation and resource leverage equations.
For each contingency we categorize firms in a low versus high category based on the sample
median for specific country-year combinations. We further estimate in all equations the effects of
our main variables for each category. Split-sample estimation was not preferred because of the high
loss of information due to small samples and the inability to estimate control variables across
categories. We prefer categories instead of continuous measures for our contingencies because of
the lower complexity and lower multicollinearity when not having to include three-way interactions.

48
Table 4 shows the standardized estimates, standard errors and p-values when estimating our
three equations while categorizing firms based on a high versus low generalist focus and a narrow
versus broad market scope. We observe the following. First, resource creation is significantly adding
to growth only when the firm has a narrow product market scope. Second, we see that firms with a
broader scope and thus higher experience in terms of deploying their dynamic capability deal better
with the observed reciprocity in the sense that they have a significantly positive influence of
resource creation on resource leverage and a significantly negative but low effect of resource
leverage on resource creation. Third, results show a significantly negative effect of lagged resource
fit on both resource creation and resource leverage across all categories. Fourth, having a high focus
on being a generalist together with a narrow scope is a firm’s worst position with low growth and a
significantly and highly negative reciprocity between resource creation and resource leverage.
Table 5 shows the standardized estimates, standard errors and p-values when estimating our
three equations while categorizing firms based on a high versus low age and a narrow versus broad
market scope. We observe the following. First, resource creation is again only directly adding to
growth when the firm has a narrow product market scope. Second, firms with a broader scope have
again a significantly positive influence of resource creation on resource leverage and a significantly
but low negative effect of resource leverage on resource creation. Third, results show a significantly
negative effect of lagged resource fit on both resource creation and resource fit across all categories.
Fourth, having a high age together with a narrow scope is a firm’s worst position with low growth
and a significantly and highly negative reciprocity between resource creation and resource leverage.
‘Insert table 4 and 5 about here’
1.6.2 Robustness checks
We conducted two important robustness checks. First, it is essential to check results for
different growth specifications. We check for other growth measures such as absolute change in firm
size, mean-centred firm size growth, market share growth in terms of firm size and absolute level of
firm size, but there are no meaningful differences with results from our main model. Second, growth
implications of resource creation and level of diversification are robust when leaving out
methodological adaptations for endogeneity, simultaneity and selection correction. However, the
negative reciprocity between resource creation and resource leverage disappears. That is obvious
because these decisions are taken simultaneously when deciding which new markets to enter. Only
leaving out the selection correction control variable does not change our reciprocity results
meaningfully.
1.6.3 Theoretical and methodological contributions
Our most important theoretical and methodological contributions are related to the
diversification literature and the literature on dynamic capabilities. First, we contribute to the
diversification literature. We provide theoretical and empirical underpinnings for a link between
within-industry diversification and growth performance by including arguments and measures from
the RBV and dynamic capabilities literature. For example, important arguments include the close link
between resources and products, resource fungibility, and the paradox between resource creation
and resource leverage when deploying a dynamic capability. Also, we develop an adequate

49
relatedness measure that links diversification with underlying resource logic to explain the outcomes
of diversification. We show how an indirect method based on a firm’s product market portfolio can
be applied to measure product market relatedness that reveals information on a firm’s resource
bundle relevance and fit. Besides being indirect, other important characteristics of our relatedness
measure are that it is time-varying, continuous, and non-tautological. Moreover, we not only include
firms’ diversification level, but also firms’ diversification activity. Resource creation and resource
leverage are related to a firm’s own diversification activity and resource fit is related to a firm’s level
of diversification. Our study thus incorporates both static and dynamic aspects of diversification and
is therefore better suited to link diversification to growth performance. Also, we empirically identify
market structuration as an important new growth dimension of diversification. Market structuration
is related to the industry’s overall diversification activity. Although market structuration is beyond a
firm’s control, it has implications for a firm’s growth when diversifying. The main findings are that
resource creation, resource fit, and market structuration are important determinants of firm growth
when diversifying across product markets within an industry. However, to understand growth
performance of firms, it is key to acknowledge the negative reciprocity between resource creation
and resource leverage which we identify as a core tension when deploying a dynamic capability.
Second, we contribute to the dynamic capabilities literature. We contribute to the theoretical
and empirical questions whether and how dynamic capabilities influence firm growth. Some have
argued that growth happens to firms randomly instead of being related to intended strategic
actions, which questions central concepts in the literature such as core competencies, managerial
capacity constraints, and dynamic capabilities (Geroski 2000; Geroski 2005). The theory on dynamic
capabilities suggests an influence of dynamic capability on firm growth but a widespread call for
empirical research whether and how dynamic capability is related to firm growth is still open (Helfat
et al. 2007). With this study, we help filling this gap in the literature and provide a common strategic
decision context in which dynamic capability can offer guidance to growth aspirations. We show that
firms can grow non-randomly through deploying their dynamic capability. Dynamic capability
deployment involves resource creation to add new resources to a firm’s resource bundle, resource
leverage to share existing resources across product markets, and resource configuration to create fit
among a firm’s resources. Our results show that both resource creation and resource fit have a
direct, positive influence on firm growth.
However, our key finding here is that we identify a core paradox that is taking place when
deploying a dynamic capability, i.e., a paradox between creating and leveraging resources. Previous
research suggests a dynamic capability involves finding a balance between two opposing forces
(Eisenhardt et al. 2010; Helfat et al. 2007). We build further on that by explaining and empirically
assessing a paradox between two core processes when deploying a dynamic capability. We
empirically show a simultaneous, negative reciprocity between resource creation and resource
leverage which has an indirect, negative impact on firm growth. This negative reciprocity denotes a
paradox at the heart of the dynamic capability concept. When deploying a dynamic capability, firms
create new resources, leverage existing ones, and configure their resources to achieve fit, which
creates positive performance consequences. However, resource creation and leverage also hurt
each other which creates indirect, negative performance consequences. We suggest that learning,
managerial and organizational constraints form the basis for this negative reciprocity. A firm is
constrained by its limited learning ability to simultaneously exploit existing and explore new

50
resources. A firm’s managers are constrained by their limited time availability, and their limited and
inert resource cognition. An organization is constrained in its limited ability to simultaneously focus
on both flexibility and efficiency.
However, firms that can cope with this paradox find a way for growth through a dynamic
capability. Indeed, some firms are affected more by this paradox than others. A firm’s dynamic
capability seems to be heterogeneous. Our results on three firm contingencies, i.e., product market
scope, age and focus on being a generalist versus a specialist, show that firms more experienced in
deploying their dynamic capability are less affected by the reciprocity between resource creation
and resource leverage. But that comes only at a time when deploying that dynamic capability, i.e.,
entering a new product market, is less of an option for those firms to grow because they have
already entered many markets. Results also show that firms should avoid a narrow product market
scope while not being specialized in its product markets, or a narrow product market scope at a
relatively high age.
Our empirical results on firms’ dynamic capability heterogeneity are only a start for discussion.
We suggest that herein lies an important and fruitful research avenue for more empirical work on
dynamic capabilities. Previous research on microfoundations of dynamic capability can help the
discussion. Teece (2007) identifies various routines and processes undergirding dynamic capability,
i.e., so-called microfoundations. These microfoundations relate to resource cognition and underlying
processes to sense and seize market opportunities and to (re)configure complete resource bundles.
His listing of several important microfoundations can help identifying appropriate sources of a firm’s
dynamic capability heterogeneity in function of the type of dynamic capability and the empirical
context. Eisenhardt et al. (2010) focus on microfoundations dealing with a firm’s trade-off between
efficiency and flexibility. They pay significant attention on how to bridge the cognitive and structural
contradiction when simultaneously striving for efficiency and flexibility. Their listing of several ways
how managers can deal with that contradiction can spur further empirical research on how to
achieve performance-enhancing dynamic capability heterogeneity.
Also, we contribute by making decisions with an impact on resources and dynamic capability
more tangible and measurable. We show how an indirect method based on a firm’s product market
portfolio can be applied to study a firm’s dynamic capability and measure resource fit non-
tautologically. The idea of using a firm’s product market portfolio to infer characteristics of its
resource base is not new. Our empirical, indirect approach for measuring resource bundle relevance
and resource fit is attractive for several reasons. First, we have a lower chance of neglecting relevant
resources, their complementarities, and changes in their complementarities. Second, we avoid a
tautological approach for measuring fit because we do not measure fit based on increased
performance. Third, our indirect approach is easily applied in various contexts, across time periods
and across firms. However, we acknowledge that our indirect approach should be complemented
with more research trying to measure the dynamics of resources and their complementarities more
directly. We are convinced both direct and indirect approaches are needed.
1.6.4 Managerial contributions
This study also offers at least two important managerial contributions. First, we provide insights
on how to grow in a relatively ‘safe’ within-industry environment. Our results show that if managers
51
want to capture growth opportunities associated with new product market entry, they need to focus
on three important aspects of a dynamic capability, i.e., resource creation, resource leverage, and
the negative reciprocity between the two. New market-related or technology-specific resources
have to be created in order to successfully target and compete in a product market. At the same
time, managers should try to make use of fungible resources that can be shared across different
product markets to benefit from existing knowledge, increased efficiencies and valuable
complementarities. However, we identify and describe a core paradox when deploying a dynamic
capability. We show that both resource creation and resource fit lead to growth, but that managers
should be aware of the negative reciprocity between creating and leveraging resources. Our study
helps managers identifying possible causes for these negative effects in the form of different
constraints at different levels within the organization. We discuss constraints with respect to
organizational learning, managerial capacity, and organizational structure. That way, our study and
its outcomes are informative for multiple organizational functions, i.e., functions related to product
portfolio management, resource and process management, and top management decision-making.
Second, our methodology used is easily replicable across business units, industries, or
environmental contexts. It provides firms with an actionable method to benefit from diversification.
Also, we provide an easy approach for managers to build active knowledge on how their product
market portfolio is in congruence with their available resource bundle. Our results on the influence
of resource fit on firm growth suggests that active knowledge and management of product market
complementarities together with benchmarking your own product market portfolio versus
competitors’ are worthwhile things to do.
1.7 Limitations and conclusion
We conclude with our main findings. First, we show that within-industry diversification leads to
firm growth. Second, we find that both a firm’s diversification activity and level of diversification add
to growth, with the relative influence of level of diversification being highest. Also, we empirically
identify an important, new dimension of diversification that increases growth, i.e., market
structuration, being the aggregated diversification activity of all firms at industry level that has an
influence on product market relatedness. Third, based on the RBV and dynamic capabilities
literature, we theoretically and empirically identify underlying resource mechanisms of within-
industry diversification that lead to growth. We find that, when deploying a dynamic capability to
diversify across product markets, resource creation and resource fit add to firm growth with
resource fit relatively seen more influential. However, we detect and discuss a paradox when
deploying such a dynamic capability. We observe a negative and simultaneous reciprocity between
resource creation and resource leverage which hurts firm growth indirectly. There is firm
heterogeneity with respect to dynamic capability’s growth consequences and internal reciprocity.
We investigate firm heterogeneity based on three important firm contingencies. Finally, this study
has important contributions for theory, methodology, and managerial practice.
However, there are some limitations that deserve further attention. First, we restrict our sample
to one particular industry and focus on within-industry diversification. It would add to the
generalizability of our study’s results when the hypotheses are tested in other types of industries

52
and also in a cross-industry diversification context. Our measures and methodology can be easily
applied in other industries without loss of conceptual meaning. Our choice for a single industry is
appropriate though, because our measures for resource leverage, level of resource fit, and market
structuration are based on product market relatedness, industry evolutions, and social processes
which are industry-specific. Second, our focus on a firm’s product market portfolio additions to
measure resource creation and leverage might neglect other forms of change in a firm’s resource
bundle such as deleting resources and accessing external resources that can have an impact on firm
growth. Integrating simultaneous firm decisions on product market exits and resource deletions
leaves ample room for further research but is beyond the scope of this study. Accessing external
resources through for example mergers or acquisitions is controlled for in our estimations. Third,
previous work considers many different dimensions of a firm’s environment, such as its velocity,
complexity, ambiguity, and unpredictability, when modelling a firm’s trade-off between efficiency
and flexibility (Davis, Eisenhardt, and Bingham 2009). Also, the effect of within-industry
diversification on firm performance is contingent upon environmental change induced by
competitive activity (Stern and Henderson 2004). Notwithstanding we include market structuration
that is a reflection of industry evolutions, and our country and time fixed effects are not significantly
related to growth, further exploring the role of different dimensions of a firm’s context on the
appropriateness of deploying a dynamic capability seems interesting. Our empirical identification
and growth consequences of market structuration imply that market structuration is also an
appropriate environmental dimension that needs to be taken into account in future studies.
1.8 Reference list
Adler, Paul S., Barbara Goldoftas, and David I. Levine (1999), "Flexibility versus Efficiency? A Case
Study of Model Changeovers in the Toyota Production System," Organization Science, 10(1),
43-68.
Adner, Ron and Constance E. Helfat (2003), "Corporate Effects and Dynamic Managerial
Capabilities," Strategic Management Journal, 24(10), 1011-25.
Ang, Siah H. (2008), "Competitive Intensity and Collaboration: Impact on Firm Growth Across
Technological Environments," Strategic Management Journal, 29(10), 1057-75.
Arora, Ashish (1996), "Testing for Complementarities in Reduced-form Regressions: a Note,"
Economic Letters, 50(1), 51-5.
Athey, Susan and Scott Stern (1998), "An Empirical Framework for Testing Theories about
Complementarity in Organizational Design," Working papers - National Bureau of Economic
Research.
Baghai, Mehrdad, Sven Smit, and S. Patrick Viguerie (2007), "The Granularity of Growth," McKinsey
Quarterly, 43(2), 40-51.
Bahadir, S. Cem, Sundar Bharadwaj, and Michael Parzen (2009), "A Meta-Analysis of the
Determinants of Organic Sales Growth," International Journal of Research in Marketing,
26(4), 263-75.

53
Barkema, Harry G., John H. J. Bell, and Johannes M. Pennings (1996), "Foreign Entry, Cultural
Barriers, and Learning," Strategic Management Journal, 17(2), 151-66.
Barney, Jay (1991), "Firm Resources and Sustained Competitive Advantage," Journal of
Management, 17(1), 99-120.
Brown, Shona L. and Kathleen M. Eisenhardt (1998), Competing on the Edge: Strategy as Structured
Chaos. Boston: Harvard Business School Press.
Brown, Shona L. and Kathleen M. Eisenhardt (1997), "The Art of Continuous Change: Linking
Complexity Theory and Time-paced Evolution in Relentlessly Shifting Organizations,"
Administrative Science Quarterly, 42(1), 1-34.
Bryce, David J. and Sidney G. Winter (2009), "A General Interindustry Relatedness Index,"
Management Science, 55(9), 1570-85.
Capron, Laurence and John Hulland (1999), "Redeployment of Brands, Sales Forces, and General
Marketing Management Expertise Following Horizontal Acquisitions: A Resource-Based
View," Journal of Marketing, 63(2), 41-54.
Chatterjee, Savan and Birger Wernerfelt (1991), "The Link between Resources and Type of
Diversification: Theory and Evidence," Strategic Management Journal, 12(1), 33-48.
Cottrell, Tom and Barrie A. Nault (2004), "Product Variety and Firm Survival in the Microcomputer
Software Industry," Strategic Management Journal, 25(10), 1005-25.
Danneels, Erwin (2002), "The Dynamics of Product Innovation and Firm Competences," Strategic
Management Journal, 23(12), 1095-121.
Danneels, Erwin (2003), "Tight-Loose Coupling with Customers: The Enactment of Customer
Orientation," Strategic Management Journal, 24(6), 559-76.
Danneels, Erwin (2007), "The Process of Technological Competence Leveraging," Strategic
Management Journal, 28(5), 511-33.
Danneels, Erwin (2011), "Trying to Become a Different Type of Company: Dynamic Capability at
Smith Corona," Strategic Management Journal, 32(1), 1-31.
Davis, Jason P., Kathleen M. Eisenhardt, and Christopher B. Bingham (2009), "Optimal Structure,
Market Dynamism, and the Strategy of Simple Rules," Administrative Science Quarterly,
54(3), 413-52.
Davis, Rachel and L. G. Thomas (1993), "Direct Estimation of Synergy: A New Approach to the
Diversity-Performance Debate," Management Science, 39(11), 1334-46.
Day, George S. (1994), "The Capabilities of Market-driven Organizations," Journal of Marketing,
58(4), 37-52.
Delmar, Frédéric, Per Davidsson, and William B. Gartner (2003), "Arriving at the High-Growth Firm,"
Journal of Business Venturing, 18(2), 189-216.
Dierickx, Ingemar and Karel Cool (1989), "Asset Stock Accumulation and Sustainability of Competitive
Advantage," Management Science, 35(12), 1504-11.

54
Eisenhardt, Kathleen M., Nathan R. Furr, and Christopher B. Bingham (2010), "Microfoundations of
Performance: Balancing Efficiency and Flexibility in Dynamic Environments," Organization
Science, 21(6), 1263-73.
Eisenhardt, Kathleen M. and Jeffrey A. Martin (2000), "Dynamic Capabilities: What Are They?,"
Strategic Management Journal, 21(10-11), 1105-21.
Farjoun, Moshe (1994), "Beyond Industry Boundaries: Human Expertise, Diversification and
Resource-related Industry Groups," Organization Science, 5(2), 185-99.
Farjoun, Moshe (1998), "The Independent and Joint Effects of the Skill and Physical Bases of
Relatedness in Diversification," Strategic Management Journal, 19(7), 611-30.
Farjoun, Moshe (2010), "Beyond Dualism: Stability and Change as a Duality," Academy of
Management Review, 35(2), 202-25.
Geroski, Paul A. (2000), "The Growth of Firms in Theory and Practice," in Competence, Governance,
and Entrepreneurship, Nicolai Foss and Volker Mahnke, eds. Oxford, UK: Oxford University
Press, 168-86.
Geroski, Paul A. (2005), "Understanding the Implications of Empirical Work on Corporate Growth
Rates," Managerial and Decision Economics, 26(2), 129-38.
Gielens, Katrijn and Marnik G. Dekimpe (2001), "Do International Entry Decisions of Retail Chains
Matter in the Long Run?," International Journal of Research in Marketing, 18(3), 235-59.
Gielens, Katrijn and Marnik G. Dekimpe (2007), "The Entry Strategy of Retail Firms into Transition
Economies," Journal of Marketing, 71(2), 196-212.
Greene, William H. (2003), Econometric Analysis. Upper Saddle River, NJ: Prentice-Hall.
Hambrick, Donald C. and Phyllis A. Mason (1984), "Upper Echelons: The Organization as a Reflection
of Its Top Managers," Academy of Management Review, 9(2), 193-206.
Hannan, Michael T. (1998), "Rethinking Age Dependence in Organizational Mortality: Logical
Formalizations," American Journal of Sociology, 104(1), 126-64.
Hannan, Michael T., Laszlo Polos, and Glenn R. Carroll (2004), "The Evolution of Inertia," Industrial &
Corporate Change, 13(1), 213-42.
Harrison, C. White (1981), "Where Do Markets Come From?," American Journal of Sociology, 87(3),
517-47.
Hayashi, Fumio (2000), Econometrics. Princeton, NJ: Princeton University Press.
Helfat, Constance E. (1997), "Know-how and Asset Complementarity and Dynamic Capability
Accumulation: The Case of R&D," Strategic Management Journal, 18(5), 339-60.
Helfat, Constance E., Sydney Finkelstein, Will. Mitchell, Margaret A. Peteraf, Harbir Singh, David J.
Teece, and Sidney G. Winter (2007), Dynamic Capabilities: Understanding Strategic Change
In Organizations. Blackwell Publishing.

55
Helfat, Constance E. and Marvin B. Lieberman (2002), "The Birth of Capabilities: Market Entry and
the Importance of Pre−History," Industrial & Corporate Change, 11(4), 725-60.
Helfat, Constance E. and Ruth S. Raubitschek (2000), "Product Sequencing: Co-evolution of
Knowledge, Capabilities and Products," Strategic Management Journal, 21(10/11), 961-79.
Henderson, Rebecca M. and Kim B. Clark (1990), "Architectural Innovation: The Reconfiguration of
Existing Product Technologies and the Failure of Established Firms," Administrative Science
Quarterly, 35(1), 9-30.
Hitt, Michael A., Leonard Biermant, Katsuhiko Shimizu, and Rahul Kochhar (2001), "Direct and
Moderating Effects of Human Capital on Strategy and Performance in Professional Service
Firms: A Resource-Based Perspective," Academy of Management Journal, 44(1), 13-28.
Hoopes, David G. and Tammy L. Madsen (2008), "A Capability-Based View of Competitive
Heterogeneity," Industrial & Corporate Change, 17(3), 393-426.
Hoskisson, Robert E. and Michael A. Hitt (1990), "Antecedents and Performance Outcomes of
Diversification: A Review and Critique of Theoretical Perspectives," Journal of Management,
16(2), 461-509.
Johanson, Jan and Jan-Erik Vahlne (1977), "The Internationalization Process of the Firm: A Model of
Knowledge Development and Increasing Foreign Markets Commitments," Journal of
International Business, 8(1), 23-32.
Johnson, Joseph and Gerard J. Tellis (2008), "Drivers of Success for Market Entry into China and
India," Journal of Marketing, 72(3), 1-13.
Kogut, Bruce and Nalin Kulatilaka (2001), "Capabilities as Real Options," Organization Science, 12(6),
744-58.
Kor, Yasemin Y. and Huseyin Leblebici (2005), "How do Interdepencies among Human-Capital
Deployment, Development, and Diversification Strategies Affect Firms' Financial
Performance?," Strategic Management Journal, 26(10), 967-85.
Lee, Chi-Hyon, N. Venkatraman, Hüseyin Tanriverdi, and Bala Iyer (2010), "Complementarity-Based
Hypercompetition in the Software Industry: Theory and Empirical Test, 1990-2002,"
Strategic Management Journal, 31(13), 1431-56.
Lee, Gwendolyn K. (2008), "Relevance of Organizational Capabilities and its Dynamics: What to Learn
from Entrants' Product Portfolios about the Determinants of Entry Timing," Strategic
Management Journal, 29(12), 1257-80.
Levinthal, Daniel A. (1997), "Adaptation on Rugged Landscapes," Management Science, 43(7), 934-
50.
Levinthal, Daniel A. and James G. March (1993), "The Myopia of Learning," Strategic Management
Journal, 14(S2), 95-112.
Levinthal, Daniel A. and Brian Wu (2010), "Opportunity Costs and Non-Scale Free Capabilities: Profit
Maximization, Corporate Scope, and Profit Margins," Strategic Management Journal, 31(7),
780-801.

56
Li, Stan X. and Royston Greenwood (2004), "The Effect of Within-Industry Diversification on Firm
Performance: Synergy Creation, Multi-Market Contact, and Market Structuration," Strategic
Management Journal, 25(12), 1131-53.
Mahoney, Joseph T. and J. Rajendran Pandian (1992), "The Resource-Based View Within the
Conversation of Strategic Management," Strategic Management Journal, 13(5), 363-80.
Malos, Stanley B. and Michael A. Campion (1995), "An Options-Based Model of Career Mobility in
Professional Service Firms," Academy of Management Review, 20(3), 611-44.
March, James G. (1991), "Exploration and Exploitation in Organizational Learning," Organization
Science, 2(1), 71-87.
Markides, Constantinos C. and Peter J. Williamson (1994), "Related Diversification, Core
Competences, and Corporate Performance," Strategic Management Journal, 15(S2), 149-65.
McGrath, Rita G. (2012), "How the Growth Outliers Do It," Harvard Business Review, 90(1/2), 110-6.
Mckee, Daryl O., Rajan P. Varadarajan, and William M. Pride (1989), "Strategic Adaptability and Firm
Performance: A Market-Contingent Perspective," Journal of Marketing, 53(3), 21-35.
Miles, Raymond E. and Charles C. Snow (1994), Fit, Failure and the Hall of Fame. New York:
Macmillan.
Milgrom, Paul and John Roberts (1990), "The Economics of Modern Manufacturing: Technology,
Strategy, and Organization," American Economic Review, 80(3), 511-28.
Milgrom, Paul and John Roberts (1995), "Complementarities and Fit: Strategy, Structure, and
Organizational Change in Manufacturing," Journal of Accounting and Economics, 19(2-3),
179-208.
Mitchell, Will (1992), "Are More Good Things Better, or Will Technical and Market Capabilities
Conflict When a Firm Expands?," Industrial & Corporate Change, 1(2), 327-46.
Mitra, Debanjan and Peter N. Golder (2002), "Whose Culture Matters? Near-Market Knowledge and
Its Impact on Foreign Market Entry Timing," Journal of Marketing Research, 39(3), 350-65.
Mom, Tom J. M., Frans A. J. Van Den Bosch, and Henk W. Volberda (2007), "Investigating Managers'
Exploration and Exploitation Activities: The Influence of Top-Down, Bottom-Up, and
Horizontal Knowledge Inflows," Journal of Management Studies, 44(6), 910-31.
Montgomery, Cynthia A. and S. Hariharan (1991), "Diversified Expansion by Large Established Firms,"
Journal of Economic Behavior and Organization, 15(1), 71-89.
Nayyar, Praveen R. (1993), "Performance Effects of Information Asymmetry and Economies of Scope
in Diversified Service Firms," Academy of Management Journal, 36(1), 28-57.
Nelson, Richard R. and Sidney G. Winter (1982), An Evolutionary Theory of Economic Change.
Cambridge, MA: Harvard University Press.
Palich, Leslie E., Laura B. Cardinal, and C. Chet Miller (2000), "Curvilinearity in the Diversification-
Performance Linkage: An Examination of over Three Decades," Strategic Management
Journal, 21(2), 155-74.

57
Penrose, Edith T. (1959), The Theory of the Growth of the Firm. New York: Wiley.
Peteraf, Margaret and Randal Reed (2007), "Managerial Discretion and Internal Alignment Under
Regulatory Constraints and Change," Strategic Management Journal, 28(11), 1089-112.
Peteraf, Margaret and Randal Reed (2008), "Regulatory Reform and Managerial Choice: An Analysis
of the Cost Savings from Airline Deregulation," Managerial & Decision Economics, 29(2/3),
99-116.
Pettus, Michael L. (2001), "The Resource-Based View as a Developmental Growth Process: Evidence
from the Deregulated Trucking Industry," Academy of Management Journal, 44(4), 878-96.
Porter, Michael and Nicolaj Siggelkow (2008), "Contextuality Within Activity Systems and
Sustainability of Competitive Advantage," Academy of Management Perspectives, 22(2), 34-
56.
Prahalad, C. K. and Gary Hamel (1990), "The Core Competence of the Corporation," Harvard Business
Review, 68(3), 79-92.
Priem, Richard L. and John E. Butler (2001a), "Is the Resource-Based "View" a Useful Perspective for
Strategic Management Research?," Academy of Management Review, 26(1), 22-40.
Priem, Richard L. and John E. Butler (2001b), "Tautology in the Resource-Based View and the
Implications of Externally Determined Resource Value: Further Comments," Academy of
Management Review, 26(1), 57-66.
Puhani, Patrick A. (2000), "The Heckman Correction for Sample Selection and Its Critique," Journal of
Economic Surveys, 14(1), 53-68.
Ramanujam, Vasudevan and P. Varadarajan (1989), "Research on Corporate Diversification: a
Synthesis," Strategic Management Journal, 10(6), 523-51.
Rivkin, Jan W. (2000), "Imitation of Complex Strategies," Management Science, 46(6), 824-44.
Robins, James and Margarethe F. Wiersema (1995), "A Resource-Based Approach to the
Multibusiness Firm: Empirical Analysis of Portfolio Interrelationships and Corporate Financial
Performance," Strategic Management Journal, 16(4), 277-99.
Rothaermel, Frank T. and Charles W. L. Hill (2005), "Technological Discontinuities and
Complementary Assets: A Longitudinal Study of Industry and Firm Performance,"
Organization Science, 16(1), 52-70.
Rumelt, Richard (1982), "Diversification Strategy and Profitability," Strategic Management Journal,
3(4), 359-69.
Rumelt, Richard (1984), "Towards a Strategic Theory of the Firm," in Competitive Strategic
Management, Robert Boyden Lamb, ed. Englewood-Cliffs, NJ: Prentice-Hall, 556-70.
Siggelkow, Nicolaj (2001), "Change in the Presence of Fit: the Rise, the Fall, and the Renaissance of
Liz Claiborne," Academy of Management, 44(4), 838-57.

58
Sirmon, David G. and Michael A. Hitt (2003), "Managing Resources: Linking Unique Resources,
Management, and Wealth Creation in Family Firms," Entrepreneurship: Theory & Practice,
27(4), 339-58.
Sirmon, David G., Michael A. Hitt, R. Duane Ireland, and Brett A. Gilbert (2011), "Resource
Orchestration to Create Competitive Advantage: Breadth, Depth, and Life Cycle Effects,"
Journal of Management, 37(5), 1390-412.
Sitkin, Sim B. and Kathleen M. Sutcliffe (1994), "Distinguishing Control from Learning in Total Quality
Management: A Contingency Perspective," Academy of Management Review, 19(3), 537-64.
Sorenson, Olav (2000), "Letting the Market Work for You: An Evolutionary Perspective on Product
Strategy," Strategic Management Journal, 21(5), 577-92.
Stern, Ithai and Andrew D. Henderson (2004), "Within-Business Diversification in Technology-
Intensive Industries," Strategic Management Journal, 25(5), 487-505.
Tanriverdi, Hüseyin and Chi-Hyon Lee (2008), "Within-Industry Diversification and Firm Performance
in the Presence of Network Externalities: Evidence From the Software Industry," Academy of
Management Journal, 51(2), 381-97.
Taylor, Alva and Constance E. Helfat (2009), "Organizational Linkages for Surviving Technological
Change: Complementary Assets, Middle Management, and Ambidexterity," Organization
Science, 20(4), 718-39.
Teece, David J. (1982), "Towards an Economic Theory of the Multiproduct Firm," Journal of Economic
Behavior and Organization, 3(1), 39-63.
Teece, David J. (1986), "Profiting from Technological Innovation: Implications for Integration,
Collaboration, Licensing and Public Policy," Research Policy, 15(6), 285-305.
Teece, David J. (1994), "Understanding Corporate Coherence: Theory and Evidence," Journal of
Economic Behavior and Organization, 23(1), 1-30.
Teece, David J. (2007), "Explicating Dynamic Capabilities: The Nature and Microfoundations of
(Sustainable) Enterprise Performance," Strategic Management Journal, 28(13), 1319-50.
Teece, David J., Gary Pisano, and Amy Shuen (1997), "Dynamic Capabilities and Strategic
Management," Strategic Management Journal, 18(7), 509-33.
Thompson, James D. (1967), Organizations in Action. New York: McGraw-Hill.
Tripsas, Mary (1997), "Unraveling the Process of Creative Destruction: Complementary Assets and
Incumbent Survival in the Typesetter Industry," Strategic Management Journal, 18(S1), 119-
42.
Tushman, Micheal L. and Charles A. O'Reilly III (1996), "Ambidextrous Organizations: Managing
Evolutionary and Revolutionary Change," California Management Review, 38(4), 8-30.
Uzzi, Brian (1997), "Social Structure and Competition in Interfirm Networks: The Paradox of
Embeddedness," in The Sociology of Economic Life, M. Granovetter and R. Swedberg, eds.
Boulder, CO: Westview Press, 207-38.

59
Venkatraman, N. (1989), "The Concept of Fit in Strategy Research: Toward Verbal and Statistical
Correspondence," Academy of Management Review, 14(3), 423-44.
Weinzimmer, Laurence G., Paul C. Nystrom, and Sarah J. Freeman (1998), "Measuring Organizational
Growth: Issues, Consequences and Guidelines," Journal of Management, 24(2), 235-62.
Wernerfelt, Birger (1984), "A Resource-Based View of the Firm," Strategic Management Journal,
5(2), 171-81.
Zahra, Shaker A., Harry J. Sapienza, and Per Davidsson (2006), "Entrepreneurship and Dynamic
Capabilities: A Review, Model and Research Agenda," Journal of Management Studies, 43(4),
917-55.
Zajac, Edward, Matthew S. Kraatz, and Rudi K. F. Bresser (2000), "Modeling the Dynamics of Strategic
Fit: a Normative Approach to Strategic Change," Strategic Management Journal, 21(4), 429-
53.
Zott, Christoph (2003), "Dynamic Capabilities and the Emergence of Intraindustry Differential Firm
Performance: Insights from a Simulation Study," Strategic Management Journal, 24(2), 97-
125.
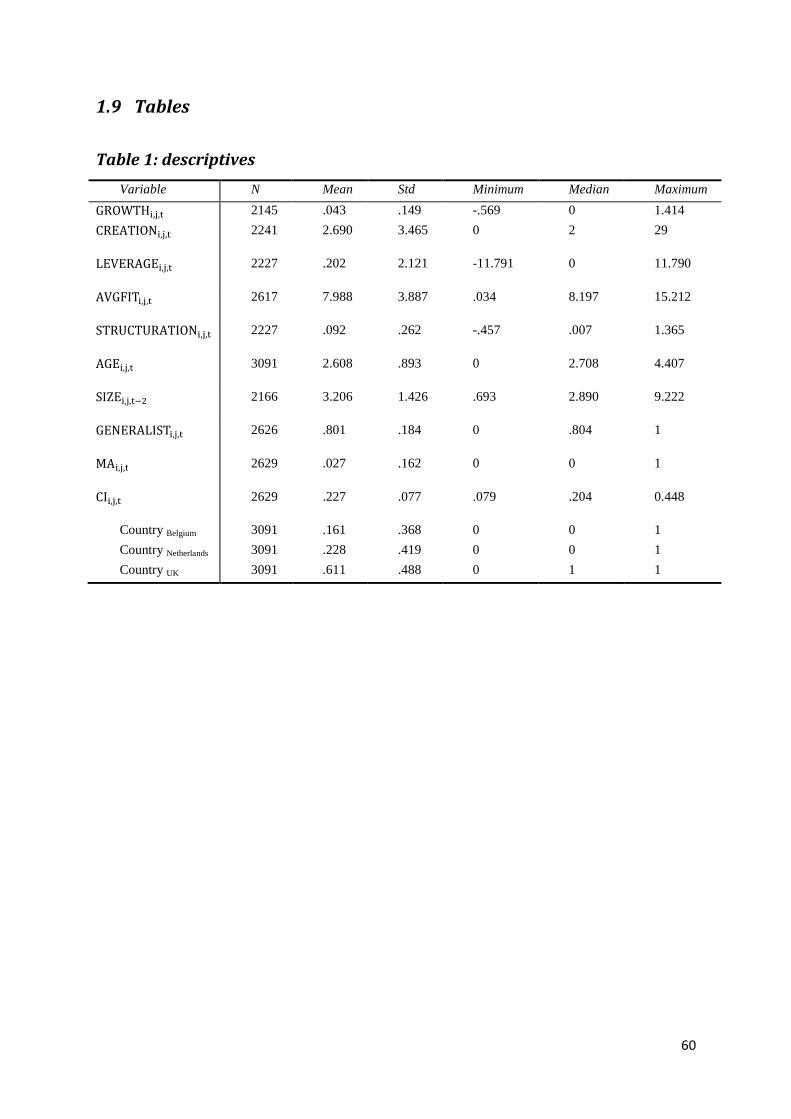
60
1.9 Tables
Table 1: descriptives
Variable N Mean Std Minimum Median Maximum
GROWTH�,, 2145 .043 .149 -.569 0 1.414
CREATION�,, 2241 2.690 3.465 0 2 29
LEVERAGE�,, 2227 .202 2.121 -11.791 0 11.790
AVGFIT�,, 2617 7.988 3.887 .034 8.197 15.212
STRUCTURATION�,, 2227 .092 .262 -.457 .007 1.365
AGE�,, 3091 2.608 .893 0 2.708 4.407
SIZE�,,�C 2166 3.206 1.426 .693 2.890 9.222
GENERALIST�,, 2626 .801 .184 0 .804 1
MA�,, 2629 .027 .162 0 0 1
CI�,, 2629 .227 .077 .079 .204 0.448
Country Belgium 3091 .161 .368 0 0 1
Country Netherlands 3091 .228 .419 0 0 1
Country UK 3091 .611 .488 0 1 1
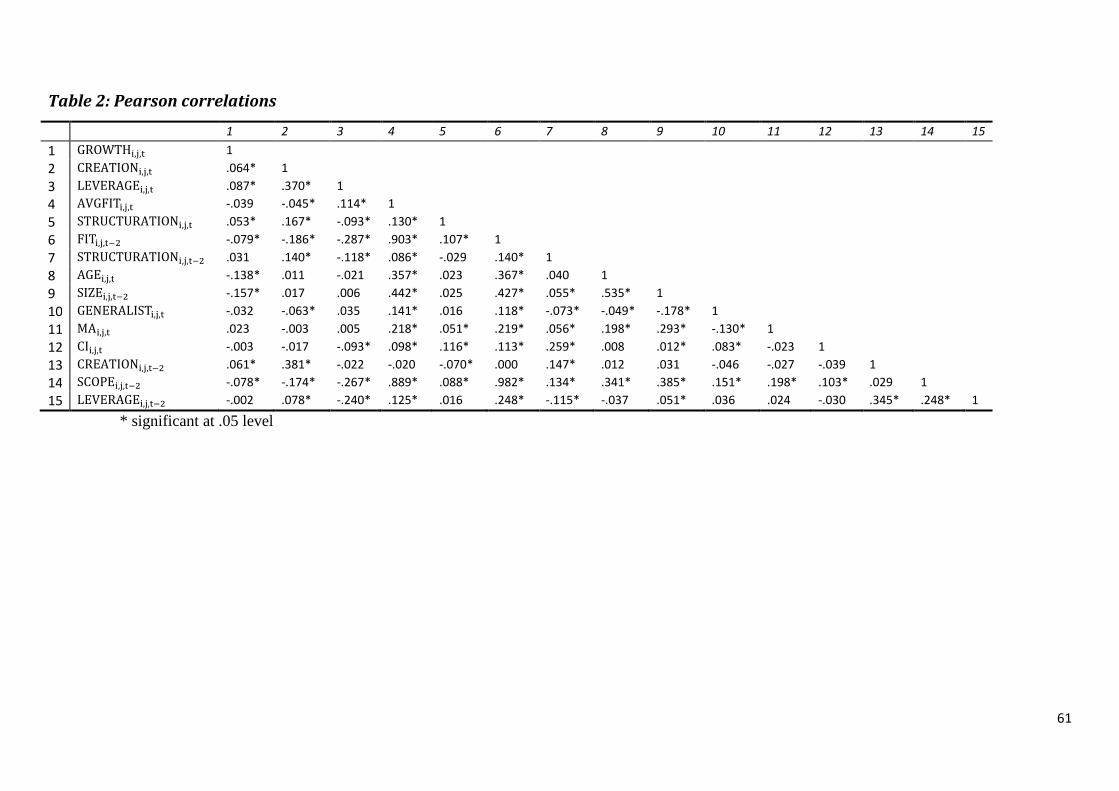
61
Table 2: Pearson correlations
1 2 3 4 5 6 7 8 9 10 11 12 13 14 15
1 GROWTH�,, 1
2 CREATION�,, .064* 1
3 LEVERAGE�,, .087* .370* 1
4 AVGFIT�,, -.039 -.045* .114* 1
5 STRUCTURATION�,, .053* .167* -.093* .130* 1
6 FIT�,,�C -.079* -.186* -.287* .903* .107* 1
7 STRUCTURATION�,,�C .031 .140* -.118* .086* -.029 .140* 1
8 AGE�,, -.138* .011 -.021 .357* .023 .367* .040 1
9 SIZE�,,�C -.157* .017 .006 .442* .025 .427* .055* .535* 1
10 GENERALIST�,, -.032 -.063* .035 .141* .016 .118* -.073* -.049* -.178* 1
11 MA�,, .023 -.003 .005 .218* .051* .219* .056* .198* .293* -.130* 1
12 CI�,, -.003 -.017 -.093* .098* .116* .113* .259* .008 .012* .083* -.023 1
13 CREATION�,,�C .061* .381* -.022 -.020 -.070* .000 .147* .012 .031 -.046 -.027 -.039 1
14 SCOPE�,,�C -.078* -.174* -.267* .889* .088* .982* .134* .341* .385* .151* .198* .103* .029 1
15 LEVERAGE�,,�C -.002 .078* -.240* .125* .016 .248* -.115* -.037 .051* .036 .024 -.030 .345* .248* 1
* significant at .05 level
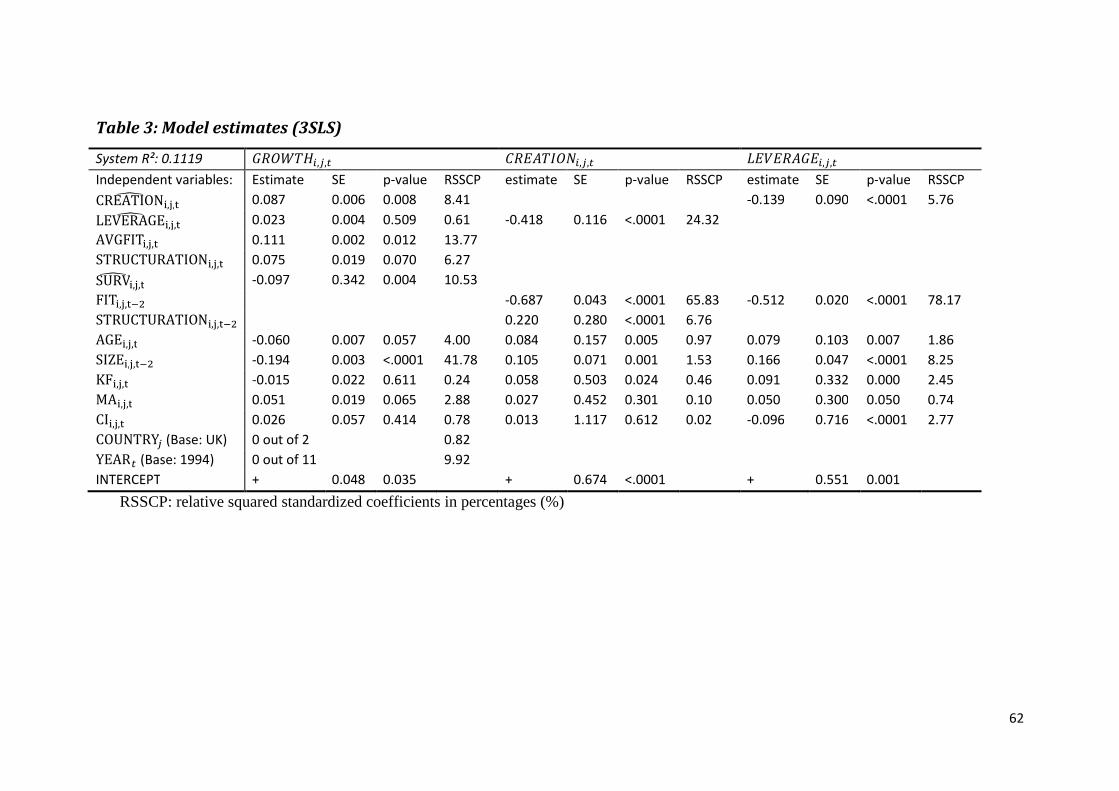
62
Table 3: Model estimates (3SLS)
System R²: 0.1119 opqrst#,$,% upvwsxqy#,$,% zv{vpwov#,$,%
Independent variables: Estimate SE p-value RSSCP estimate SE p-value RSSCP estimate SE p-value RSSCP CREATIONT �,, 0.087 0.006 0.008 8.41 -0.139 0.090 <.0001 5.76 LEVERAGET �,, 0.023 0.004 0.509 0.61 -0.418 0.116 <.0001 24.32 AVGFIT�,, 0.111 0.002 0.012 13.77 STRUCTURATION�,, 0.075 0.019 0.070 6.27 SURVT �,, -0.097 0.342 0.004 10.53 FIT�,,�C -0.687 0.043 <.0001 65.83 -0.512 0.020 <.0001 78.17 STRUCTURATION�,,�C 0.220 0.280 <.0001 6.76 AGE�,, -0.060 0.007 0.057 4.00 0.084 0.157 0.005 0.97 0.079 0.103 0.007 1.86 SIZE�,,�C -0.194 0.003 <.0001 41.78 0.105 0.071 0.001 1.53 0.166 0.047 <.0001 8.25 KF�,, -0.015 0.022 0.611 0.24 0.058 0.503 0.024 0.46 0.091 0.332 0.000 2.45 MA�,, 0.051 0.019 0.065 2.88 0.027 0.452 0.301 0.10 0.050 0.300 0.050 0.74 CI�,, 0.026 0.057 0.414 0.78 0.013 1.117 0.612 0.02 -0.096 0.716 <.0001 2.77 COUNTRY$ (Base: UK) 0 out of 2 0.82 YEAR% (Base: 1994) 0 out of 11 9.92
INTERCEPT + 0.048 0.035 + 0.674 <.0001 + 0.551 0.001
RSSCP: relative squared standardized coefficients in percentages (%)
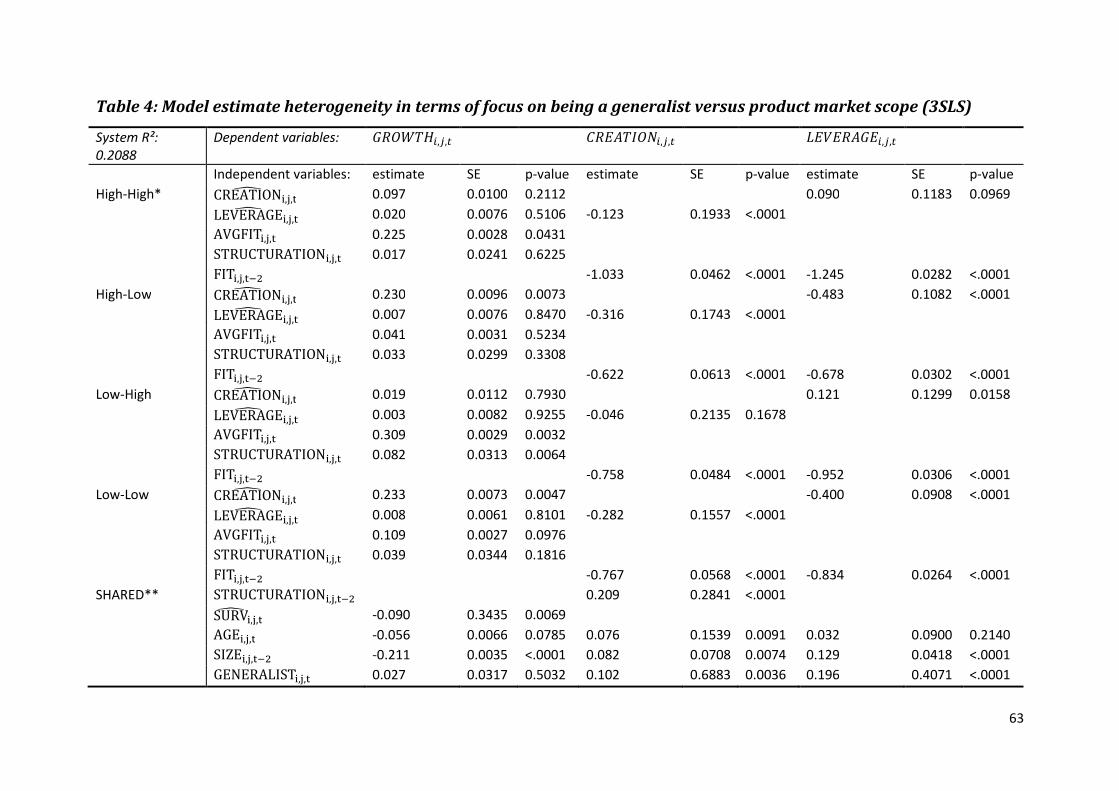
63
Table 4: Model estimate heterogeneity in terms of focus on being a generalist versus product market scope (3SLS)
System R²:
0.2088
Dependent variables: opqrst#,$,% upvwsxqy#,$,% zv{vpwov#,$,%
Independent variables: estimate SE p-value estimate SE p-value estimate SE p-value
High-High* CREATIONT �,, 0.097 0.0100 0.2112 0.090 0.1183 0.0969
LEVERAGET �,, 0.020 0.0076 0.5106 -0.123 0.1933 <.0001
AVGFIT�,, 0.225 0.0028 0.0431
STRUCTURATION�,, 0.017 0.0241 0.6225
FIT�,,�C -1.033 0.0462 <.0001 -1.245 0.0282 <.0001
High-Low CREATIONT �,, 0.230 0.0096 0.0073 -0.483 0.1082 <.0001
LEVERAGET �,, 0.007 0.0076 0.8470 -0.316 0.1743 <.0001
AVGFIT�,, 0.041 0.0031 0.5234
STRUCTURATION�,, 0.033 0.0299 0.3308
FIT�,,�C -0.622 0.0613 <.0001 -0.678 0.0302 <.0001
Low-High CREATIONT �,, 0.019 0.0112 0.7930 0.121 0.1299 0.0158
LEVERAGET �,, 0.003 0.0082 0.9255 -0.046 0.2135 0.1678
AVGFIT�,, 0.309 0.0029 0.0032
STRUCTURATION�,, 0.082 0.0313 0.0064
FIT�,,�C -0.758 0.0484 <.0001 -0.952 0.0306 <.0001
Low-Low CREATIONT �,, 0.233 0.0073 0.0047 -0.400 0.0908 <.0001
LEVERAGET �,, 0.008 0.0061 0.8101 -0.282 0.1557 <.0001
AVGFIT�,, 0.109 0.0027 0.0976
STRUCTURATION�,, 0.039 0.0344 0.1816
FIT�,,�C -0.767 0.0568 <.0001 -0.834 0.0264 <.0001
SHARED** STRUCTURATION�,,�C 0.209 0.2841 <.0001
SURVT �,, -0.090 0.3435 0.0069
AGE�,, -0.056 0.0066 0.0785 0.076 0.1539 0.0091 0.032 0.0900 0.2140
SIZE�,,�C -0.211 0.0035 <.0001 0.082 0.0708 0.0074 0.129 0.0418 <.0001
GENERALIST�,, 0.027 0.0317 0.5032 0.102 0.6883 0.0036 0.196 0.4071 <.0001

64
MA�,, 0.029 0.0198 0.3000 0.019 0.4525 0.4554 0.029 0.2670 0.1963
CI�,, 0.033 0.0579 0.3180 0.008 1.0964 0.7368 -0.094 0.6196 <.0001
COUNTRY$ (Base: UK) 0 out of 2
YEAR% (Base: 1994) 0 out of 11
INTERCEPT + 0.0526 0.2854 + 0.7886 <.0001 + 0.5295 <.0001
*‘High-high’ block indicates the estimates for the category with a high focus on being a generalist and high scope.
**‘Shared’ indicates the estimates for control variables across categories.
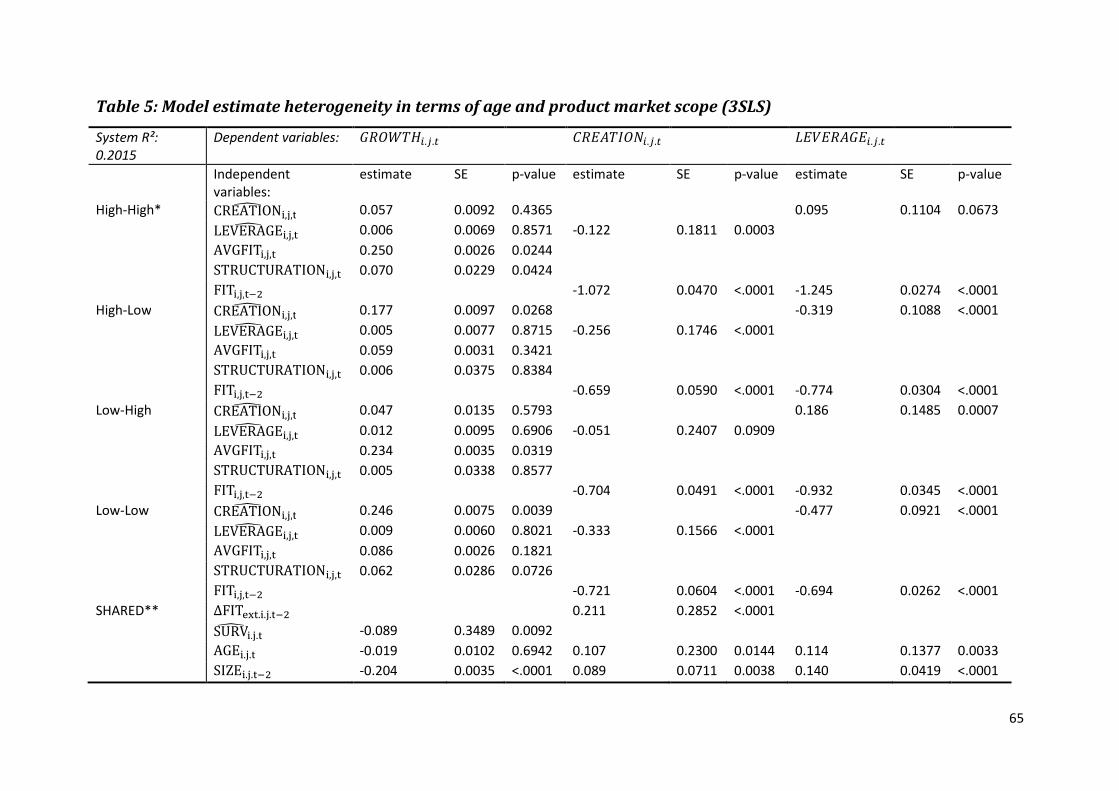
65
Table 5: Model estimate heterogeneity in terms of age and product market scope (3SLS)
System R²:
0.2015
Dependent variables: opqrst#.$.% upvwsxqy#.$.% zv{vpwov#.$.%
Independent
variables:
estimate SE p-value estimate SE p-value estimate SE p-value
High-High* CREATIONT �,, 0.057 0.0092 0.4365 0.095 0.1104 0.0673
LEVERAGET �,, 0.006 0.0069 0.8571 -0.122 0.1811 0.0003
AVGFIT�,, 0.250 0.0026 0.0244
STRUCTURATION�,, 0.070 0.0229 0.0424
FIT�,,�C -1.072 0.0470 <.0001 -1.245 0.0274 <.0001
High-Low CREATIONT �,, 0.177 0.0097 0.0268 -0.319 0.1088 <.0001
LEVERAGET �,, 0.005 0.0077 0.8715 -0.256 0.1746 <.0001
AVGFIT�,, 0.059 0.0031 0.3421
STRUCTURATION�,, 0.006 0.0375 0.8384
FIT�,,�C -0.659 0.0590 <.0001 -0.774 0.0304 <.0001
Low-High CREATIONT �,, 0.047 0.0135 0.5793 0.186 0.1485 0.0007
LEVERAGET �,, 0.012 0.0095 0.6906 -0.051 0.2407 0.0909
AVGFIT�,, 0.234 0.0035 0.0319
STRUCTURATION�,, 0.005 0.0338 0.8577
FIT�,,�C -0.704 0.0491 <.0001 -0.932 0.0345 <.0001
Low-Low CREATIONT �,, 0.246 0.0075 0.0039 -0.477 0.0921 <.0001
LEVERAGET �,, 0.009 0.0060 0.8021 -0.333 0.1566 <.0001
AVGFIT�,, 0.086 0.0026 0.1821
STRUCTURATION�,, 0.062 0.0286 0.0726
FIT�,,�C -0.721 0.0604 <.0001 -0.694 0.0262 <.0001
SHARED** ΔFIT��.�..�C 0.211 0.2852 <.0001
SURVT �.. -0.089 0.3489 0.0092
AGE�.. -0.019 0.0102 0.6942 0.107 0.2300 0.0144 0.114 0.1377 0.0033
SIZE�..�C -0.204 0.0035 <.0001 0.089 0.0711 0.0038 0.140 0.0419 <.0001

66
KF�.. -0.008 0.0229 0.7858 0.043 0.4973 0.0907 0.057 0.2913 0.0092
MA�.. 0.050 0.0195 0.0762 0.031 0.4497 0.2251 0.038 0.2641 0.0886
CI�.. 0.030 0.0577 0.3584 0.016 1.1061 0.5224 -0.088 0.6248 <.0001
COUNTRY$ (Base: UK) 0 out of 2
YEAR% (Base: 1994) 0 out of 11
INTERCEPT + 0.0562 0.2944 + 0.8886 <.0001 + 0.5784 <.0001
*‘High-high’ block indicates the estimates for the category with a high age and high scope.
**‘Shared’ indicates the estimates for control variables across categories.
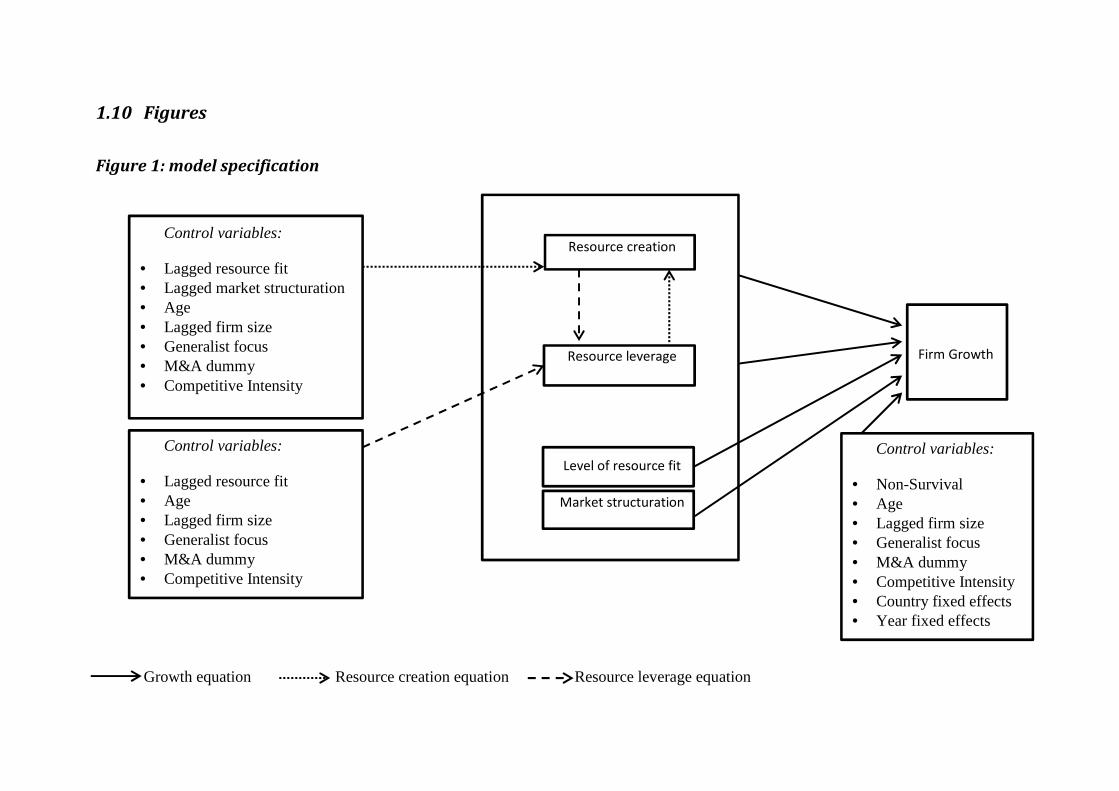
1.10 Figures
Figure 1: model specification
Growth equation Resource creation equation Resource leverage equation
Control variables:
• Non-Survival • Age • Lagged firm size • Generalist focus • M&A dummy • Competitive Intensity • Country fixed effects • Year fixed effects
Firm Growth
Control variables:
• Lagged resource fit • Age • Lagged firm size • Generalist focus • M&A dummy • Competitive Intensity
Control variables:
• Lagged resource fit • Lagged market structuration • Age • Lagged firm size • Generalist focus • M&A dummy • Competitive Intensity
Resource creation
Resource leverage
Level of resource fit
Market structuration

68
Study 2 Success Drivers of Launching a Business Model
Bart Devoldere*, Vlerick Business School
Marion Debruyne, Vlerick Business School
Ruud Frambach, VU Amsterdam
2.1 Abstract
Business models and their innovation are on top of the executive priority list as they hold great
promise for differentiation and performance benefits. Many business model innovations are
featured and praised for their success. Also, for every innovator with a new business model, there
are often numerous copycats launching the same business model in a particular geographic market.
However, we observe large differences in success across market launches of the same business
model. This study addresses the lack of empirical and theoretical guidance on how ventures can
succeed when launching a business model. We focus on four market entry decisions, i.e., entry
timing, product adaptation, scale of entry, and strategic control, that influence the business model’s
value drivers and ability to create and capture value, and find important main and interaction effects
on how they impact survival of the launched business model. Thereby we argue it is important to
treat the business model as a separate unit of analysis, different from industry, firm, product, or
technology. Moreover, we theoretically and empirically indicate that there are not only differences
but also an interplay between the business model and a product market strategy, which holds
important consequences for the market entry literature. The context of this study involves the free
daily newspaper business model introduced by Metro International early 1995, which disrupted the
paid daily newspaper business model in many countries worldwide. We collect and analyse data on
free daily newspaper ventures’ launch and survival, market entry decisions, and venture and market
characteristics. We observe important first-mover advantages associated with launching the
business model, while it is recommended to stay close to the product(s) as introduced by the
business model innovator. Moreover, we observe that first-mover advantages are increased when
launching big, and that late-mover disadvantages are exacerbated when launching with
differentiated products. This study offers several contributions for theory, managerial practice, and
policy makers.
Key words: business model innovation, market entry, first-mover advantage, survival, newspaper
Bart Devoldere acknowledges financial support from the Belgian Intercollegiate Centre for
Management Science (ICM). We are grateful to the Vlerick Academic Research Fund and the
Flanders District of Creativity (FDC), both partially subsidized by the Flemish government, for their
financial support to execute this research project. We also thank participants of the Strategic
Management Society Special Conference Lake Geneva for valuable feedback on earlier versions of
this work. The usual disclaimer applies.
*Corresponding author: Bart Devoldere, Vlerick Business School, Reep 1, B-9000, Ghent,
Belgium, email: [email protected], phone: +32 9 210 9874.

69
2.2 Introduction Business models take centre stage in many managerial and academic discussions. Many believe
that a business model holds greater promise for differentiation and performance benefits compared
to a product or technology. Across industries, business model innovation consistently scores very
high on the CEO’s agenda (IBM Global Business Services 2006; 2012). Many business model
innovations are featured and praised for their apparent success. Well-known examples include
Netflix, Zara, Dell, iPod/iTunes, Southwest Airlines, ING Direct, etc. Previous research helps
explaining how to define a business model (e.g., Baden-Fuller and Morgan 2010; Zott, Amit, and
Massa 2011), and possible ways to innovate and build business models (e.g., Amit and Zott 2012;
McGrath 2010).
Just like product and process innovations, a business model innovation triggers copycats
(Casadesus-Masanell and Zhu 2013; Teece 2010). For each innovator with a new business model,
there are often numerous copycats trying to launch the same business model in their own
geographic markets. A copycat business model refers to the same business model as the innovation
at hand, but introduced by competitors in a particular geographic market or by the innovator itself in
other geographic markets, after the original business model innovation was first launched. However,
we see large differences in success across market launches of the same business model. This study
addresses the lack of empirical and theoretical guidance on how ventures can succeed when
launching a business model. Do you need to be a first mover in your market (e.g., Nespresso) or can
you afford moving at a later stage (e.g., Amazon.com)? Do you need to launch an exact copy of the
innovator’s business model (e.g., Microsoft’s Xbox) or should you try to innovate your business
model as well (e.g., Nintendo’s Wii)? Is it better to reduce your commitment by sharing the risk (and
control) with others (e.g., Next Issue Media) and/or should you make early, large-scale investment in
the business model (e.g., Schibsted)?
We focus on four market entry decisions, i.e., entry timing, product adaptation, scale of entry,
and strategic control, that may impact the outcome of launching the business model and that are
not pre-defined by the underlying business model. Based on these decisions’ influence on the
business model’s value drivers and ability to create and capture value, we develop hypotheses on
how they impact survival of the launched business model. We use numerous business examples of
possible effects these entry decisions can have on the business model’s performance potential,
while integrating theoretical reasoning from mainly the resource-based view, transaction cost
economics, systems theory perspective, signalling theory, and market entry literature. We argue that
the business model constitutes a separate unit of analysis, different from industry, firm, product, or
technology. Moreover, we posit there are not only differences but also an interplay between the
business model and a product market strategy. When launching a business model, the outcome
effects of particular launch decisions can thus not be copy-pasted from the product entry literature.
Our context involves the advent of free daily newspapers, i.e., a business model innovation
disrupting the paid daily newspaper industry. In February 1995, Metro International introduces the
first free daily newspaper Metro in Stockholm, Sweden. We collect data from 29 countries across
Europe and Canada where free daily newspaper ventures have been launched between 1995 and
2010. For a census of 155 free daily newspaper ventures across these countries, we collect and

70
analyse data on free daily newspaper ventures’ survival, market entry decisions, and venture and
market characteristics.
This study offers several contributions. First, this study helps to fill the void of theoretical and
managerial guidance on how to launch a business model. By focusing on the commercialization stage
of a business model instead of the invention stage, we make an important shift towards better
understanding how business models can provide (sustainable) competitive advantage in markets not
immune for competitive dynamics.
Second, we show that copycatting a business model is an important and viable innovation
strategy. There can only be one business model innovator, and we show that it is not always the
innovator who benefits the most from its innovation. Our results tell that business models should be
launched with the appropriate launch decisions to be viable. We detect four key launch decisions,
together with important interactions, that impact the survival of a business model. It should help
both incumbents and new entrants that are confronted with new, disruptive markets and business
models or designing them themselves, to be better able to foresee and predict success and failure in
those new market niches.
Third, we provide more information on the conceptual and empirical underpinnings of how to
better delineate the differences (but also the interplay) between both the business model and a
product market strategy. Business model innovation has an influence on the product market
strategy, but product market strategy decision variables also have an influence on the (sustainable)
competitive advantage associated with a business model. Therefore, this study shows that the
market entry literature is also important at the level of the business model. We indicate that market
entry decisions do not only play a role when launching new products or entering new geographic
markets, but also when launching a business model. This can offer a new perspective on market
entry decisions, also when applied to entering new product or geographic markets. Because market
entry decisions also have an influence on the underlying business model’s performance potential,
the underlying business model can influence what the outcome will be of particular market entry
decisions taken for new product or geographic market entry. Therefore, trying to explain winning
versus failing product introductions or new market entries might be put in a different perspective,
when also incorporating the underlying business model in the analysis and taking into account the
influence of entry decisions (or product and technology characteristics) on that same business
model.
Fourth, policy makers and wider society can benefit from this study. Policy makers benefit from
a better understanding of how new markets and disruptive business model innovations operate,
spread out and survive, in order to make more informed decisions whether it is appropriate to
protect incumbent markets or not in the case of business model innovation. Also, we add to the
discussion whether it would be suitable to provide possibilities to protect intellectual property
derived from the business model. Moreover, the specific context of our study, the media industry, is
a very important industry from a policy perspective because of its democratizing character and
powerful public information channel.
This paper proceeds as follows. First, we provide the conceptual background of a business
model, business model innovation, and how various launch decisions can influence a business
71
model’s success. Second, we describe the context and methodology we applied in this study. Third,
we discuss our empirical results and findings. Fourth, we conclude by listing some limitations that
offer future research opportunities.
2.3 Conceptual background
2.3.1 Business model
Previous research offers a plethora of possible business model definitions. For examples, see the
special issue of Long Range Planning in 2010 on business models and a recent literature review by
Zott et al. (2011). Most definitions contain the following elements: a customer value proposition, a
profit model articulating revenue sources and cost constraints, key resources and processes, and the
governance mechanism linking all stakeholders involved. Thereby, it is emphasized that these
elements are not stand-alone but interdependent, i.e., they should create an integrated business
model system in which the whole is more valuable than the sum of its parts (e.g., Johnson,
Christensen, and Kagermann 2008; Magretta 2002; Morris, Schindehutte, and Allen 2005; Zott and
Amit 2010). These interdependent elements together with the received literature point towards two
key dimensions of a business model, i.e., defining the value creation for customers (that implicitly
also incorporates the ability to deliver that value to customers) and the value appropriation for the
focal firm and its partners (Day 2011; Sorescu et al. 2011; Teece 2010). A business model can be
represented by a system of interconnected and interdependent activities that transcends the focal
firm (Zott and Amit 2010). A business model as activity system articulates what activities are
performed, how they are linked with each other, and how they are governed across different
partners such as the focal firm, customers, suppliers, etc.
Business models can be a potential source of competitive advantage (Casadesus-Masanell and
Ricart 2010; Markides and Charitou 2004; Zott and Amit 2007; 2008). Previous research links a firm’s
business model with financial performance measures such as revenue growth, profitability, market
capitalisation, and equity growth (DeYoung 2005; Fisken and Rutherford 2002; Glick 2008; Zott and
Amit 2007; 2008), and non-financial measures such as the ability to provide social value to
stakeholders (Dahan et al. 2010; Yunus, Moingeon, and Lehmann-Ortega 2010). The activities that
form the basis of a business model can enable value creation and appropriation by emphasizing one
or multiple value drivers (Zott and Amit 2010). A firm can choose to focus on one particular value
driver, but value drivers can also be mutually reinforcing, i.e., the presence of each value driver can
enhance the effectiveness of any other value driver. In this study, we focus on the four value drivers
as identified by Zott and Amit (2010). However, as previous research shows, it might well be that this
list of value drivers is not exhaustive (Sorescu et al. 2011).
A first value driver is novelty. Novelty-centered activity systems focus on new activities, new
ways of linking activities, and/or new ways of governing activities. The activity system’s novelty
captures the degree of innovation embodied in the business model (Amit and Zott 2012). For
example, with the introduction of iPod/iTunes, Apple was the first electronics company that included
music distribution as an activity (iTunes), linking it to the development of a listening device’s
hardware and software (iPod), and digitizing it and thereby pushing many sub-activities of legal

72
music downloads to its customers (iTunes store). A second value driver is lock-in. Activity systems
can be designed for lock-in, i.e., their power to keep third parties attracted as business model
participants by creating switching costs or enhancing network externalities. For example, eBay’s
activity system shows very strong positive network externalities. Because of the huge number of
potential buyers (sellers), sellers (buyers) know that the odds to perform a trade at a convenient
price on eBay are higher than anywhere else, so they keep coming back. In a similar vein, social
networking sites such as Facebook and LinkedIn demand considerable time and effort from their
members to personalize their web profile and build their networks. These investments form strong
impediments to switching to other providers. A third value driver consists of emphasizing
complementarities among activities. Complementarities are present whenever bundling activities
within a system creates more value than running activities separately (Milgrom and Roberts 1995;
Porter 1996). For example, commercial banks proved to be stronger in the recent financial crisis
when they complemented deposit activities as a source of funding with lending activities. In the
diamond business, polishing and distribution activities within a single business model creates value,
because it enables the focal firm to produce tailor-made stones for each market segment’s specific
demand. Complementarities not only create value, they also enhance an activity system’s value
appropriation by increasing the difficulty for its imitation (Rivkin 2000). For example, whereas the
activity system of Southwest Airlines is very visible and widely known, the many complementarities
among its activities make that imitators are still struggling to reach similar success. A fourth value
driver can be efficiency. Business models emphasizing efficiency are focused on achieving greater
efficiency through reducing transaction costs. For example, third-party companies in the business
process outsourcing industry, e.g., TCS, Wipro, Infosys, Satyam, and WNS, can flourish because firms
want to standardize the interfaces between activities and lower transaction costs by outsourcing
some activities to these third parties. Also, greater efficiency can be achieved when including specific
activities, e.g., cross-docking and real-time point-of-sale information gathering at Wal-Mart, or
deleting specific activities, e.g., on-board catering or seat assignment at Ryanair.
A business model reflects transactions that connect activities both within and across firms. The
business model concept includes network partners, other allies and the customer, making the
business model particularly useful as a new unit of analysis in which the success of the organization
is closely tied to the relationships the entity has with others in the network. The locus of value
creation and appropriation, and thus the appropriate unit of analysis, spans firms’ and industries’
boundaries (Amit and Zott 2001). It implies that a business model transcends the focal firm, and that
the business model is a different unit of analysis than the firm or industry. For some business
models, focusing on boundary-spanning activities, such as customer -or supplier co-creation, that
link different partners with the focal firm is even the key value creator. For example, Deutsche
Telekom makes partnering and co-creation with both start-ups and large, established players a
cornerstone of its business model.
Although a business model creates and delivers value for customers in the form of products and
the associated product market strategies, a business model is different from a product (Markides
2006) and a product market strategy (Zott and Amit 2008). A product is anything that can be offered
to a market that might satisfy a want or need (Kotler et al. 2009). A single business model can offer
several products (e.g., internet banks offer various savings and investment products) and one
product can be sold through different business models (e.g., both Amazon and Barnes & Noble sell

73
books). A product market includes the set of products judged to be substitutes and customers who
seek similar patterns of product-related benefits. A product market strategy is the choices a firm
makes on how to compete in a particular product market. Previous research considers different
generic product market strategies. For example, there are product market strategies based on
whether firms create value by emphasizing a low-cost versus a differentiated offering (Porter 1980),
whether a firm’s scope is more geared towards generalism rather than specialism (Lambkin and Day
1989), or whether a firm can be type-casted as a so-called prospector, defender, or analyser (Miles
and Snow 1978). Typical elements of a product market strategy are decisions related to scope, cost-
to-deliver, and differentiation (Yarbrough, Morgan, and Vorhies 2011; Vorhies, Morgan, and Autry
2009). However, a business model not only articulates how to create value which is similar to a
product market strategy, but also how to appropriate that value offered to customers. A business
model thus not only focuses on how to compete on the targeted product market(s), but also on how
to compete on the associated factor market(s), and how both interconnect with each other. For
example, a key characteristic of Google’s Android operating system is that it is open source. It
attracts app developers and enables them to enhance and customize the app experience for
customers. However, it can make the appropriation of value more difficult for Google, e.g., in the
case of Facebook Home where Facebook develops a user interface and replaces the existing home
screen on select smartphones.
In standard economic and competitive market theory there is a lack of theoretical grounding for
the concept of the business model and its place as unit of analysis (Teece 2010). Economic theory
assumes away, both implicitly and explicitly, many real-life economic artefacts that occur in
(imperfect) markets and that form the basis for the need to design a business model to create and
capture value. For example, standard economic approaches assume zero transaction costs,
homogeneous products, strong property rights, costless information transfer, perfect arbitrage,
market existence for all products and inventions, and no innovation. One assumes that if value is
delivered, customers will pay for it. That makes business models redundant because producers and
suppliers can create and capture value simply through disposing their output at competitive market
prices. Customers will buy if the price is less than the utility yielded and producers will supply if price
is at or above all costs including an acceptable return to their capital. The price system resolves
everything and business design issues don’t arise. However, perfect competition is not realistic.
Products are not completely homogeneous, market entry and exit barriers do exist, innovation
occurs, and there are transaction costs involved in performing activities across parties. Also, markets
may not even exist or ready for particular activities or transactions, so entrepreneurs may have to
build organizations and design business models in order to be able to perform them.
The preceding discussion on the definition and the conceptual foundations of the business
model, and its characteristics as a separate unit of analysis different from the firm, industry, and
product, helps us appreciating the relevance to study this concept for both theory and managerial
practice. Also, it enables us in the next section to explaining the conceptualization of business model
innovation, the identification of important decisions when launching a business model in the market,
and why these business model launch decisions are worth investigating given existing research on
new product launches.
74
2.3.2 Business model innovation and copycats
The business model is a major focal point of innovation (e.g., Casadesus-Masanell and Zhu 2013;
Economist Intelligence Unit 2005; Hamel 2000; IBM Global Business Services 2012; Kim and
Mauborgne 1997; Markides 1997; Mitchell and Coles 2003; Slywotzky 1996; Teece 2010). We define
a business model innovation as a new-to-the-world business model with -- relative to the closest
existing business model -- one or more changes in one or more ways in the activity system. One can
innovate the existing business model by adding novel or deleting standard activities, by linking or
sequencing activities in novel ways, or by changing one or more parties that perform any of the
activities (Amit and Zott 2012). The more changes a new business model undergoes relative to the
closest existing business model, the more innovative a new business model is. However, to qualify as
a business model innovation, the new business model should materially alter the value creation and
appropriation logic, and it should be a new-to-the-world business model that is reflected in new
content, structure, governance, and/or value driver combinations of the activity system (Sorescu et
al. 2011).
Although a business model and a product are two different units of analysis, a business model
innovation changes the value creation logic of the product offer, i.e., it changes the way product
value is traditionally perceived in the market. A business model innovation emphasizes different
product attributes to those emphasized by the traditional business model (Markides 2006). For
example, whereas traditional brokers sell their services on the basis of their research and advice to
customers, online brokers sell by promoting their price and speed of execution. Similarly, whereas
the traditional car rental business model emphasizes locations nearby airports and car quality, new
business models emphasize downtown locations, price, or environmental sustainability. Business
model innovation is different from technological innovation and also different from radical product
innovation. The business model complements technology, and technology can be an enabler of the
business model, rather than that technology is part of the business model concept per se (Zott et al.
2011). A radical product innovation is defined as a new product that incorporates substantially
different technology from existing products, and can fulfill key customer needs better than existing
products (Chandy and Tellis 1998). However, a business model innovation may or may not be linked
to a technological innovation (Teece 2010), and emphasizes different key customer needs while
offering new or existing products, rather than performing better on currently stressed key customer
needs from existing products.
There is a growing consensus that business model innovation is key to firm performance (Zott et
al. 2011). Business model innovation may seem less heroic than technological innovation, but
without the former there may be no reward for technologically pioneering individuals, enterprises,
industries, and nations (e.g., Chesbrough and Rosenbloom 2002; Doganova and Eyquem-Renault
2009; Gambardella and McGahan 2010; Teece 2010). History shows that, without an adequate
business model, technological innovators will fail, even if the innovation is remarkable and later on
widely adopted by society. Examples include EMI with the CAT scanner, Xerox with the personal
computer, and Thomas Edison who failed commercially on many fronts. Also, business model
innovations can establish a competitive advantage without an accompanying technological
innovation, e.g., Dell in the personal computer industry or Southwest Airlines in the airline industry.
The business model itself can represent a potential source of competitive advantage (Markides and
Charitou 2004). Zott and Amit (2008) find that business models emphasizing novelty, i.e., business

75
model innovations, and that are coupled with either differentiation or cost leadership can have a
positive impact on a firm’s performance.
However, just like product and process innovations, a business model innovation attracts
copycats (Casadesus-Masanell and Zhu 2013; Teece 2010). A business model is often copied by
competitors. Empirical observations show that business model imitation by competitors may be
successful but it can also lead to failure. For example, in 1998, British Airways launched Go, a
copycat of Ryanair’s no-frills model, to compete against European low-cost airlines. Also, Ryanair
started in 1985 with a traditional business model, but changed in 1990 towards a no-frills business
model, imitated from Southwest Airlines. Moreover, Southwest Airlines, commonly referred to as
the no-frills business model innovator in the airline industry, even imitated its business model which
was pioneered by Freddie Laker in the U.K. The innovator Laker Airways eventually failed. Also
copycats like e.g. People’s Express (U.S.), Continental Lite (U.S.), and Buzz (U.K.) failed. Another
example involves the online brokerage business model innovation. The innovators of the online
brokerage business model are not Charles Schwab or E*Trade. They are successful copycats of the
innovative business model introduced by a joint venture called Net Investor in lanuary 1995 to offer
Internet-based stock trading. Six years later, the venture was dwarfed by the success of Charles
Schwab (Charitou and Markides 2003). As of January 2000, more than 150 companies entered the
online brokerage area, involving retail brokerage incumbents, start-ups, banks and technology
providers. However, after the dot-com bust, the declining number of retail investors and the
lowering trading margins fuelled consolidation in the online brokerage industry in the U.S. Year 2005
and 2006 has seen some major deals, such as E-Trade taking over Harrisdirect, and the merger of TD
Waterhouse and Ameritrade to form TD Ameritrade. In 2008, the leading online brokers are Fidelity,
E*Trade, TD Ameritrade, Charles Schwab and Scottrade. It is remarkable that these are all copycats
and representing both early incumbent movers and dominant new entrants. A business model is also
copied by the innovator itself in different geographical markets. Sustained performance often
requires from an innovative firm not just initial innovations, but also exploitation in the form of
replication in order to maximize value (Szulanski and Jensen 2008; Winter and Szulanski 2001).
Replication is applied in many industries across many geographic markets. Well-known examples of
a replication strategy are Intel, McDonald’s, and Starbucks, amongst many others. However,
replication may also be less successful (Szulanski and Winter 2002). Examples include failed
replications from free, daily newspaper publisher Metro International in Spain and Croatia, and
failed attempts by Wal-Mart to replicate its successful business model in Germany and South Korea.
We define a copycat business model as a business model that is imitated by a competitor or
replicated by the innovator. Although a copycat business model can be new-to-the-market in which
it is launched, it is not new-to-the-world and thus not a business model innovation as it copies an
already existing business model. Empirical observations in the previous paragraph indicate that
there are wide differences between similar business models in terms of being successful or not.
Because these business models (cf., the innovator as well as the copycats) are applying the same
business model with the same business model characteristics in terms of value creation and
appropriation logic, and the same content, structure, governance, and value driver emphasis of the
associated activity system, performance differences cannot be linked to these business model
characteristics. Instead, we argue that the performance differences among similar business models
depend on decisions taken when launching a particular instance of that business model. Decisions

76
taken at time of market launch are typically referred to as market entry decisions and can have a
long-lasting effect on performance (Gielens and Dekimpe 2001; Green, Barclay, and Ryans 1995).
The most important entry decisions identified in the literature that are not defined by the business
model are market selection, entry timing, scale of entry, strategic control, product adaptation versus
standardization, and what products to sell (Gielens and Dekimpe 2001; Gielens, Helsen, and
Dekimpe 2012; Varadarajan 2010; Zott and Amit 2008). From these entry decisions we focus on
entry timing, scale of entry, product adaptation, and strategic control as these seem to have an
important impact on the performance potential of the business model and are not already defined
by the business model. We control for market selection by taking into account characteristics such as
the market’s attractiveness and its competitive dynamics. Also, at the time of launching a business
model, the venture’s product offering is often small and focused. Therefore, we focus on product
adaptation rather than product portfolio characteristics.
To further defend our choice for these four important market entry decisions ventures have to
take when launching a business model, we show, based on some empirical observations, how these
decisions may influence the performance potential of a business model, i.e., how they may influence
the value drivers of the business model. In table (1) we relate our four market entry decisions to the
value drivers of the business model, i.e., novelty, lock-in, complementarities, and efficiencies. In the
next section, where we develop our hypotheses related to these four market entry decisions, we go
deeper in the theoretical and conceptual underpinnings. First, we argue that entry timing, i.e.,
whether to be a first mover or not, is an important decision when launching a business model. Being
first is per definition focused on novelty. Besides, it may also enable --albeit sometimes limited--
intellectual property protection. Examples of business models with (partial) patent protection
include Netflix and Nespresso. Also, being first provides a head-start in creating possible network
effects (e.g., like Amazon did in book-selling), building switching costs (e.g., like Apple did for media
sales in their iTunes Store), and pre-empting competitors (e.g., like The Warehouse did in New
Zealand keeping Wal-Mart out). Moreover, entering first in a market gives a venture first access to
complementary resources such as suppliers and customers that may co-create value together with
the focal firm. For example, Insites Consulting, an online market research agency, was the first to set
up an online panel of consumers in Belgium, i.e., supplier co-creation, to provide market insights to
firms ordering market research studies. Another example includes Chemstation that offers
customers to customize cleaning solutions. Being first to link to suppliers or customers to co-create
gives an edge by having access to the most motivated ones and creating switching costs. Being a first
mover can also add value to a business model focused on efficiencies, because it enables a venture
to increase learning effects, fine-tune operations, and profit from time compression diseconomies.
‘Insert table (1) about here’
Second, we argue that product adaptation, i.e., whether to enter with differentiated product(s)
or not, is also a key decision at launch. Product adaptations, offered through the same underlying
business model, can help adapting to markets (e.g., McDonald’s menu adaptations in India),
differentiating from competitors (e.g., Apple versus Samsung tablets and smartphones), or
generating new revenue by diversifying the product portfolio (e.g., McDonald’s Arch Deluxe).
Particular product features or components can also create value through lock-in (e.g., car radios that
are linked with airbag warning system or vacuum cleaners that come with specific bags) or switching
77
costs (e.g., Apple and Google apps are very similar but demand for some learning). However,
product adaptations can also hurt a business model’s value by having or introducing a misfit with the
associated business model. For example, Ryanair’s changes to its in-flight merchandise resulted in a
drop in in-flight sales, reducing the commission earned by the airline's flight attendants. As a result
Ryanair pledged to increase pay levels to offset this fall, but that increased overall costs which is not
compatible with the business model’s overall goal. Another example includes McDonald’s Arch
Deluxe that was targeted towards adults with more sophisticated taste, but which was a total misfit
with the business model that focuses on classics and convenience. Also, product adaptation is seen
as less efficient compared to product standardization.
Third, we argue that scale of entry is a key consideration when launching a business model. A
large scale can enable particular novel activities (e.g., Wal-Mart introducing real-time POS
information gathering, linking it to inventory, distribution, and marketing activities through its own
satellite). Also, a larger scale captures network externalities better (e.g., Facebook), creates
customer and supplier switching costs (e.g., Apple’s App Store), and pre-empts competition. For
example, Wal-Mart’s U.S. expansion in little one-horse towns excluded competition because the local
geographic market was too small to support a similarly-sized competitor. Another example is
McDonald’s that, due to its overall presence, excludes many locations from competitors. Moreover,
complementarities may occur only when having a certain scale, which was felt by Wal-Mart that
failed to replicate its low-cost strategy in Germany and South Korea particularly due to the low-scale
operations they set up there. For example, small scale operations do not lend themselves to install a
sufficient power base to force suppliers to create more value through lower prices and more
innovation efforts. Scale of entry can also influence the value of business models focused on
efficiency. Scale economies are typically translated in efficiencies in business functions such as
operations (e.g., discounters, no-frills airlines), marketing (e.g., franchising), customer activities (e.g.,
store within store format), etc.
Fourth, we argue that the level of strategic control, i.e., whether to share control over
operations across different venture partners or not, is also a key decision at launch. This decision is
close to what is defined by the business model in terms of governance structure. However, we do
not focus on what partners are involved in the business model. Rather, we focus on the level of
strategic control the focal firm can apply across the business model. The level of strategic control
may influence the business model value drivers as follows. Strong control can avoid leakage of
unique resources (e.g., Apple’s ability to keep secrecies in-house). Whereas shared control does not
seem to have an influence on network effects, shared control can create switching costs for both
parties and pre-empts attracting better partners (e.g., Nokia and Windows’ strategic partnership).
Also, although partners give access to complementary resources, strong control may still be needed
to enforce rigid execution to capture the complementarities. For example, Ryanair partners with
many stakeholders and suppliers, but maintains strong control to enforce a business model totally
devoted to low-cost operations and to maintain the flexibility to change partners that may be more
complementary. In a similar vein, Wal-Mart needs strong control to enforce its rigid execution of
low-cost activities focused on achieving efficiencies.
78
In the next section, we link business model success with the survival of the venture launching the
business model in a particular geographic area, and develop hypotheses on how the four launch
decisions can influence survival.
2.3.3 Launch decisions’ influence on business model success
When launching a business model, we argue that survival is an essential measure of success.
There are at least three reasons for this. First, launching a business model embodies a high level of
uncertainty, fuelled by its often disruptive effects on both demand and supply, and its potential for
industry upheaval. Notwithstanding that the uncertainty may be highest for the business model
innovator, launching a copycat business model can still be disruptive for many customers as well as
for firms’ traditional way of doing business in an industry or geographical market. It means that
several stakeholders have to change behavior before it can be successful which increases
uncertainty when launching a business model. The more uncertainty and ambiguity there is, the
more survival is of major concern to firms. For example, when new industries or new technologies
emerge, uncertainty is high and survival is considered a key performance measure (e.g., Bayus and
Agarwal 2007; Christensen, Suarez, and Utterback 1998; Dowell and Swaminathan 2006). Second,
business models are launched through a new venture that is confined within, across or outside firm
boundaries. Similar to Zimmerman and Zeitz (2002), we consider a new venture as an organization in
its early years of existence, whether initiated by an independent organization or emerged from an
established organization. For new ventures, survival is a standard performance measure. Financial
measures of realized performance are less suitable for assessing new ventures’ performance as
these ventures often have negative earnings, few tangible assets, and low or even negative book
values (Zott and Amit 2007). Third, survival is a necessary condition towards competitive advantage,
growth, and financial performance. That is also the reason why studies explaining firm performance
other than survival check for survival bias.
In the previous section, we identified four key decisions, taken at the time when launching a
business model, that are potential drivers of business model success. We discussed table (1) that
shows some empirical examples suggesting the influence of important launch decisions such as entry
timing, offer adaptation, entry scale, and shared control on a business model’s value drivers, i.e.,
novelty, lock-in, complementarities, and efficiencies. In what follows, we hypothesize to what extent
these launch decisions may influence the survival of a particular instance of the business model.
2.3.3.1 Entry timing
The timing to enter a particular geographic market with a business model, i.e., being first mover
or not, is crucial in terms of survival. Previous research identifies various first-mover advantages and
disadvantages, and late-mover advantages and disadvantages (For an overview, see, e.g., Kerin,
Varadarajan, and Peterson 1992; Lieberman and Montgomery 2012; Shankar and Carpenter 2012).
Most of the empirical support for first-mover advantages is found for market share and to a lesser
extent for profit. With respect to survival rates empirical findings are mixed, with some reporting
first-mover survival disadvantages (Golder and Tellis 1993), others identifying first-mover survival
advantages in terms of reducing operational risk (Yadong and Peng 1998) or tapping into network
effects (Wang, Chen, and Xie 2010), and various studies showing pioneer survival (dis)advantage
79
under different condition (e.g., Lilien and Yoon 1990; Min, Kalwani, and Robinson 2006; Robinson
and Min 2002; Srinivasan, Lilien, and Rangaswamy 2004).
We hypothesize that, when launching a business model, being the first in a particular geographic
market has important advantages, or similarly, that being a follower has important disadvantages.
The resource-based view is an appropriate theoretical framework to explain mechanisms by which
these first-mover advantages can be obtained (Lieberman and Montgomery 1998). First, being first
puts a venture in the best position to pre-empt important assets such as geographic and perceptual
space, or build unique resources such as patents or trademarks (Carpenter and Nakamoto 1989;
Lieberman and Montgomery 1988; Teece 2010). The importance of taking geographic space as a
business model first mover is illustrated not only by McDonald’s (and many other franchisors) in
many locations worldwide, but also by e.g., The Warehouse in New Zealand that pre-empted Wal-
Mart. Because a new business model is often disruptive for customers, being the first enables a
venture to imprint its business model characteristics and its brand in the customer’s mind as
prototypical (e.g., Nespresso). Also, being first may offer a venture the ability to obtain unique
resources such as patents or trademarks. Although it is rather exceptional, one can try to protect its
business model’s intellectual property by patents, e.g., like Netflix and Nespresso did, albeit only
partial patents on particular aspects of the business model.
Second, a first mover is first to develop sometimes vital political connections (Frynas, Mellahi,
and Pigman 2006). Because launching a business model is often disruptive for vested, incumbent
businesses, political connections can be important for success when trying to launch. Large
incumbent firms together with their industry organizations often put pressure on legislative
authorities to put business practices of ventures with unfamiliar and disruptive business models
under scrutiny. Although a first mover has to invest in developing these political connections or
fighting incumbent industry allegations, it is sometimes very useful to be offered a broad, public
forum to repeatedly state your value proposition and business model design. For example, Ryanair
very much liked being put aside by incumbent airlines and considered a complete industry outsider.
Third, being first in the market to launch a business model enables a venture to impose
switching costs on its partners and customers to lock them in, and the first opportunity to create
possible network effects (e.g., Amazon). Previous research identifies possible network effects as an
important first-mover advantage (e.g., Lieberman and Montgomery 2012; Wang, Chen, and Xie
2010). Buyer switching costs can include initial time and financial investments made by the buyer,
product learning efforts, and contractual switching costs imposed on the buyer. An example of buyer
switching costs is the advantage Apple’s iTunes Store holds over Google’s Play Store. Also, switching
costs for customers or suppliers can occur when the business model is focused on customer
respectively supplier co-creation. For example, online consumer panels developed by market
research agencies such as Insites Consulting focus on supplier co-creation, i.e., consumers providing
market insights, to create value for buyers of market research studies. Being first to set up such
consumer panel gives not only access to consumers that are most motivated to participate (cf., a
complementary resource), but it also creates switching costs for those consumers to participate in
other panels.
Fourth, a lot of ventures that are the first to launch a business model in a particular geographic
market are not the business model innovator. These first movers may benefit also from particular
80
late-mover advantages such as learning effects and potential spillovers from the original business
model innovator operating in another geographic market, while enjoying free-rider effects on some
of the innovator’s investments such as buyer education and new business model development.
Learning effects could consist of knowledge on how the new business model works, how it can be
executed successfully, and how customers react and behave. For example, Ryanair’s Michael O’Leary
went to Southwest Airlines to learn how to copy the business model as detailed as possible. Because
a business model innovation is sometimes widely covered in both popular and specialized media,
learning effects are even more likely to occur. It follows that first movers enjoy reduced uncertainty
among its stakeholders with respect to the viability of the business model that is launched. Also,
customers could already be acquainted with the new business model so that they barely need to be
educated. Also, a positive spillover effect may be that customers who already have experience with
the new business model start asking for the launch of that business model in other geographic
markets (e.g., Starbucks in Belgium). Based on previous discussion, we hypothesize the following.
H1: Being the first to launch a business model in a geographic market increases survival chances.
2.3.3.2 Product adaptation
When launching a business model, a venture has to decide what product(s) to offer. On the one
hand, one can exactly copy the product(s) of the business model innovator to make sure that all
elements of the business model are well aligned with each other and with the product(s) in place.
On the other hand, product adaptation can create a meaningful differentiation between the
innovator and copycat without materially altering the business model. Product adaptation can be
applied to adapt to specific market conditions (e.g., McDonald’s introducing vegetarian burgers in
India or Best Buy creating more experiential stores in China compared to transactional stores in
U.S.), to differentiate from competitors in the same geographic market (e.g., Samsung versus Apple
tablets and smartphones), to extend the current product portfolio (e.g., McDonald’s Arch Deluxe), or
to create lock-in (e.g., vacuum cleaners that come with particular bags) or switching costs (e.g.,
Google apps that are very similar to Apple apps). However, even small product adaptations can
create performance difficulties for the business model. For example, Ryanair replaced duty free with
other merchandise during flights and has seen a drop in in-flight sales, which reduced the
commission earned by the airline's flight attendants. As a result Ryanair pledged to increase pay
levels to offset this fall, but that increased overall costs which is not compatible with the business
model’s overall goal. Another example is McDonald’s Arch Deluxe that was targeted towards adults
with more sophisticated palates, but was a total misfit with the business model of McDonald’s
focusing on anything but customer sophistication and inconvenience.
We hypothesize that product adaptation relative to the original product(s) of the business model
innovator harms survival chances. Although similar business models can have different products,
products still need to be aligned with the underlying business model. Indeed, the business model
also defines how one creates value for the customer which has to be translated in appropriate
products. As shown in some examples above from McDonald’s and Ryanair, products can be ill-
aligned to the underlying business model or even introduce inconsistencies in the business model. In
line with a systems theory perspective on business models (Zott et al. 2011) and advice on
replicating best-practices (Szulanski and Winter 2002), it is common thinking to try to stay as close to
the original innovator’s business model as possible. Research in the airline industry supports this
81
view by finding that low-cost firms that stick to the original low-cost model seem to be more
successful (Alamdari and Fagan 2005). Indeed, because of activity interdependencies and
complementarities, imitating activity systems should not be done piece-wise (Porter 1996b; Rivkin
2000). Business model innovation involves a departure from industry practice, represented in not
just the adoption of a single new practice but by overhauling an entire system. Imitating this
innovation entails imitation of a complex system, with interdependencies between components.
Rivkin (2000) conceptualizes a strategy as a set of choices, whose outcome is dependent on each
other. For example, investments in machines for a complex product line are more valuable if the
sales force is trained to present these types of products to customers. Thus, the value of each
individual part of a business model is dependent on the choices made on other parts. This means
that one should aim at optimizing the combined choice set, not the individual components. In a
similar vein, Siggelkow (2002) claims that changing just one element in an organizational system is
not effective because it creates an organization that is not consistent, i.e., there is no fit between
individual elements. Other elements need to be adapted at the same time. This view of strategy as a
set of decisions whose usefulness is interdependent shows that it cannot be imitated by changing
single components. The same result cannot be attained without adopting the whole system. Also,
launching an already ‘proven’ business model signals better performance prospects and lower
strategic and operational risk, which attracts both customers and investors. When only including or
excluding a limited set of activities that does not materially alter the business model, it is difficult to
assess upfront how coherent the different activities will be and whether there will be significant
complementarities among activities or not (Porter and Siggelkow 2008). Based on legitimacy theory,
strategic group research has shown that the performance of solitary firms is lower than the
performance of companies that conform more to an existing group (McNamara, Deephouse, and
Luce 2003; Deephouse 1999). Therefore, we expect a negative survival impact from product
adaptation.
H2a: Adapting the original product(s) decreases survival chances.
However, product adaptations can be done specifically to differentiate from competition when
entering late (Shankar and Carpenter 2012). When being a first mover in a particular geographic
market, entering with the same underlying business model but a different product compared to the
original business model innovator operating in another geographic market, cannot be done for
differentiation purposes as there is no competition yet. When firms are not the first mover in a
particular geographic market, they may try to differentiate themselves from competition in their
market by introducing an adapted product. However, as we have already mentioned, product
adaptations can easily lead to inconsistencies or ill-aligned underlying business models, which
creates serious difficulties harming survival prospects. These difficulties can arise from causal
ambiguity with respect to a business model’s actual value drivers, distorted interdependencies and
complementarities among business model elements, and bad signals when deviating from a strategic
group that conforms to a particular business model.
Product adaptation by later entrants not only has the same drawbacks as anyone trying to
differentiate through product adaptation with the same underlying business model, but it also
exacerbates some first-mover advantages (or late-mover disadvantages). The research stream on
customer preference formation initiated by Carpenter and Nakamoto (1988; 1989) suggests that too

82
much differentiation might not be a good idea for later entrants. Because customers have a specific
process of forming their preferences, being a first mover can install an important competitive
advantage. More specifically, initial product experiences will define the relationship of the product
category to related ones, will define the product attributes that are relevant for decision-making,
and will define the attribute configuration that is prototypical of the category. That might be
especially the case for demand-disruptive business model innovation. A first mover thus benefits
because later entrants have difficulties to differentiate properly. If the product by later entrants is
too different, it falls outside the category, and, if inside the category, the later entrant faces the
entrenched customer category perceptions and preferences. Also, trying to adapt the product
without altering the underlying business model, may result in difficulties to attract the appropriate
partners that might already be locked-in by the first mover. Moreover, adapting the product without
changing the value created by the business model may make it difficult to attract customers in case
of important network effects or buyer switching costs. For example, if there is only a difference in
value based on the ‘differences’ in apps from Google’s Play Store versus Apple’s App Store,
customers would not be inclined to make the switch to Google. Also, when adapting the product(s)
as a later mover, it is more difficult to benefit from late-mover advantages based on learning effects
and potential spillovers, because that learning and spillover would be based on different products.
For example, customers would still need to be educated somehow, and could react and behave
differently towards different products. It follows that product adaptation increases uncertainty
among stakeholders with respect to the viability of the product(s) introduced. Therefore, we
hypothesize the following.
H2b: Product adaptation amplifies the negative impact on survival chances of being a late
mover.
2.3.3.3 Entry scale
We hypothesize that a larger scale of entry can increase the odds of survival for several reasons.
First, a larger scale of entry creates volume-driven cost advantages (Biggadike 1979). These cost
advantages through scale can be attributed to learning effects, increased market power, managerial
specialization, etc. A larger scale can create efficiencies in various business functions, e.g.,
purchasing, finance, marketing, operations, amongst others, that help business models create and
capture value. There are also business models especially focused on efficiencies. Examples include
business models focused on efficiencies in operations (e.g., discounters and no-frills airlines),
efficiencies in marketing expenditures (e.g., franchise chains), efficiencies in customer time spending
(e.g., store within a store format like Sephora within JC Penney), etc. Moreover, some efficiency-
focused complementarities come only together with a large scale. For example, Wal-Mart needs a
high number of stores with a high volume sold to support its purchasing power, its distribution
system through large distribution centers, and its lowest price commitment. In Germany and South
Korea, Wal-Mart could not replicate its low-cost strategy because it lacked considerable scale
(Gielens, Helsen, and Dekimpe 2012).
Second, scale can provide access to and the ability to develop unique assets and resources. A
larger scale can pre-empt more attractive locations in geographic and perceptual space. For
example, Wal-Mart pre-empted competition in its U.S. expansion by focusing on geographic
locations that were just big enough to support only one discounter, i.e., so-called little one-horse

83
towns. Another example is McDonald’s that not only pre-empts geographic locations from its
competitors by its huge number of locations, but also perceptual space as it is considered to be
everywhere and ‘always’ (compared to ‘sometimes’ for competitors) an option if need for a fast-
food hamburger option. Also, scale can make it possible to develop unique resources. An example is
Wal-Mart that was, mainly thanks to its scale, was able to build and efficiently incorporate an own
satellite system in its activities. Moreover, with a larger scale one is better able to develop and
capture network externalities, and customer or supplier switching costs. Examples include Facebook
and eBay that make heavily use of their scale to increase the associated network externalities, and
Apple’s App store that uses its scale to increase both customer and supplier switching costs.
Third, a large scale signals irreversibility and managerial commitment deterring competitive
reactions (Chen and MacMillan 1992; Ghemawat 1991; Sharma and Kesner 1996). It also signals
managerial belief in the attractiveness of the business model and the willingness for risk-taking
which decreases the uncertainty surrounding launching the business model. Indeed, entrants
holding more positive expectations are likely to make larger initial commitments (Caves 1998). Next
to managerial belief, it also signals the ability to attract enough financial support, which is a proxy
for future growth potential (Audretsch 1995). Taken together, larger scale of entry creates more
legitimacy and signals the business model’s value and a venture’s commitment towards important
stakeholders such as customers and investors, as well as to competitors, which positively adds to its
survival chances. Previous research defines legitimacy as a “a generalized perception or assumption
that the actions of an entity are desirable” (Suchman 1995, p. 574; Higgins and Gulati 2006).
Increased legitimacy gives access to important resources such as customers, high-quality employees,
partners, investors, and financial capital (Zimmerman and Zeitz 2002). These resources are vital for a
venture’s survival. Previous research indicates how legitimacy is important for new ventures in
emerging industries (e.g., Ashforth and Gibbs 1990; Rao, Chandy, and Prabhu 2008; Suchman 1995;
Van de Ven, Hudson, and Schroeder 1984; Zajac and Westphal 2004). The more uncertainty and
ambiguity there is, the more important legitimacy becomes for organizational survival (Dacin 1997;
Deephouse 1996; Meyer and Rowan 1977; Scott 1987; Singh, Tucker, and House 1986; Westphal,
Gulati, and Shortell 1997). A venture’s actions and decisions can signal legitimacy, quality, and
managerial commitment towards important stakeholders such as customers, employees, partners,
competitors, etc. (Spence 1973; Stiglitz 2000). For example, previous research shows that strategic
decisions can signal the value of a firm’s offering towards potential customers (Shane, Shankar, and
Aravindakshan 2006), that particular information signals can help building a venture’s underlying
credibility (e.g., Balboa and Marti 2007; Davila, Foster, and Gupta 2003; Janney and Folta 2003; Rao,
Chandy, and Prabhu 2008) or perceived product quality (e.g., Kirmani and Rao 2000; Milgrom and
Roberts 1986; Rao, Lu, and Robert 1999), and that ventures take actions that can signal their
intentions and commitment (e.g., Heil and Robertson 1991; Prabhu and Stewart 2001).
H3a: The larger a venture’s business model entry scale, the higher its survival chances.
We argue there is a reinforcing effect between scale of entry and being a first mover. Scale
effects can enhance first-mover advantages (Kerin, Varadarajan, and Peterson 1992). Combining a
high scale of entry with being a first mover, increases the entry barriers a first mover can raise and
increases the effect of scale-related entry barriers and signals because of a less competitive
environment. A first mover entering large is more effective in terms of pre-empting geographic and

84
perceptual space, reaching minimum efficient scale without over-production, signalling managerial
commitment and possible growth potential, and raising entry barriers for competition. Moreover,
being a first mover while having enough scale at entry can both be necessary conditions for
performing well post entry due to a combination of learning effects, time compression
diseconomies, and asset mass efficiencies (Nehrt 1996). Being a first mover can provide entering
ventures with beneficial learning effects (Lieberman 1989; Porter 1980; Spence 1977), while not
having the disadvantage of potential time compression diseconomies (Dierickx and Cool 1989). Time
compression diseconomies mean that particular tasks simply take some time to accomplish, and that
diseconomies to the firm result because it spends more resources to accelerate their completion.
Having a high scale of entry provides entering ventures with asset mass efficiencies (Dierickx and
Cool 1989). Asset mass efficiencies mean that firms sometimes need a minimum level of investment
to fully understand the technology, or by extension the business model, and gain from it. Previous
research suggests there is an interaction effect between scale of entry and order of entry, but
empirical confirmation is lacking (Gielens and Dekimpe 2001; Gielens, Helsen, and Dekimpe 2012;
Nehrt 1996; Szymanski, Troy, and Bharadwaj 1995). Based on previous discussion and focusing on
being a first mover instead of ventures’ order of entry, we expect that a larger scale of entry
increases the positive survival effect of being a first mover.
H3b: Being a first mover amplifies the positive impact of a higher scale of entry of the venture’s
business model on its survival chances.
2.3.3.4 Strategic control
The level of strategic control a venture has on its operations when entering a market is an
important launch decision. Previous research in international market entry indicates that a higher
level of control by the entering firm on its operations abroad has positive performance implications
(e.g., Gielens and Dekimpe 2001; Johnson and Tellis 2008). Also, based on two major theoretical
frameworks, i.e., the resource-based view and transaction cost economics, we can expect positive
performance implications of higher strategic control in the context of a business model launch. The
resource-based view argues that as the level of control increases, the firm can deploy key resources
that are essential to succeed (Gatignon and Anderson 1988; Isobe, Makino, and Montgomery 2000).
Control over key resources gives a firm the freedom to deploy them flexibly. Also, control safeguards
key resources such as patents from leakage. Moreover, control over key resources allows for internal
operational control over the execution of the business model in which key resources are often
interdependent with other business model elements such as the value proposition, the profit model,
and important activities. Not fully controlling how activities are performed is from an activity system
perspective dangerous, because even small changes to an activity system with many
complementarities can have important negative performance effects (Porter 1996; Porter and
Siggelkow 2008; Rivkin 2000).
Transaction cost economics views firms and markets as alternative governance structures that
differ in their transaction costs (Kim and Hwang 1992; Williamson 1975; Williamson 1981). The level
of transaction costs depends on the interplay of bounded rationality, opportunistic behavior by the
partners in the transaction, asset specificity of the assets involved in the transaction, and uncertainty
surrounding the transaction. Transaction cost analysis suggests that the governance structure and
performance of an exchange are influenced by the level of the exchange partners’ specific

85
investments and opportunistic behaviors (Palmatier, Dant, and Grewal 2007). A firm’s ability to
control and monitor their partners’ behavior and output is considered key in successful transactions
(Rindfleisch and Heide 1997). The transaction cost economics view holds that costs increase with
increasing control , and that control and commitment are inextricably linked (Luo 2001). High control
in entry strategies entails high commitment, and the higher the resource commitment and desired
control, the higher is the cost. In the previous section, we already highlighted the expected positive
survival implications of higher commitment. Also, when markets would be efficient and competitive,
market pressure would minimize the need for control. However, in the context of business models, it
has been argued that business models specifically exist because of market failure and that business
model launch is embedded in uncertainty and ambiguity. Therefore, when launching a business
model, we expect that high control becomes more desirable.
Strategic control is exercised by a single entity or is shared across several partnering entities that
jointly steer a venture. We focus on survival differences between a venture that consists of only one
entity with full strategic control versus a venture consisting of several entities with shared strategic
control over its operations when launching a business model. The latter relates for example to
shared ownership, joint ventures, or franchises. We argue that shared strategic control decreases
survival chances when launching a business model. First, in line with our reasoning on the level of
strategic control above, based on previous findings and both the resource-based view and
transaction cost economics, we expect that a lower level of strategic control, i.e., shared strategic
control, negatively impacts survival. Second, although collaboration gives a venture the potential to
leverage partners’ specific knowledge or other resources (Combs and Ketchen 1999), shared
strategic control reduces flexibility in resource deployment and in decision-making. Indeed, although
extensive collaboration is considered the key for successful business model innovation (IBM Global
Business Services 2012), it does not imply that control should be shared among collaborating
partners. Moreover, shared control might increase stakeholders’ uncertainty because of the
negative signals that may occur following low perceived commitment when resources and risk are
shared among partners. Indeed, sharing resources and risk among partners can be interpreted as a
low or limited belief in the market’s attractiveness. Third, the overall influence of shared strategic
control is expected to negatively influence a business model’s value drivers novelty, lock-in,
complementarities, and efficiencies. Not shared, strong control may avoid leakage of unique
resources based on for example intellectual property. Shared control creates switching costs for
both parties and can thus act both positively (cf., when the partner is good) and negatively (cf., when
there are better partners available) for the focal firm. Network effects substitute shared control to
lock in partners in the business model. Also, whereas partners can provide access to complementary
resources, shared control may be less able to enforce rigid execution of the business model and its
complementarities, leading to lower performance. Similarly, business models focused on efficiencies
are often strict to execute, which may be difficult to enforce with weaker or shared control.
H4a: Shared strategic control decreases survival chances.
However, we expect that shared strategic control decreases survival chances even more for later
entrants. Previous research indicates that the performance effect of the level of strategic control
may depend on entry timing (Gielens, Helsen, and Dekimpe 2012). When entering later, it is more
difficult to reap potential benefits from shared strategic control. A venture entering first can select
86
the best partners available (Szymanski, Troy, and Bharadwaj 1995). Therefore, a later entrant incurs
higher search costs related to finding appropriate partners to share strategic control while
potentially ending up with less knowledgeable partners. Also, a first entrant has the opportunity to
capture a larger market share compared with later entrants in a more competitive environment,
while a later entrant sharing its strategic control of a venture even has to share the performance
outcomes of its venture with its partners.
H4b: Shared strategic control amplifies the negative impact on survival chances of being a late
mover.
2.4 Context and Methodology
2.4.1 Context
Our context involves the newspaper industry in which the free daily newspaper business model
represents a business model innovation. The main characteristics of the free daily newspaper
business model are the following. First, customers can take the daily newspaper for free instead of
paying a subscription or per-issue fee. Ad revenues are the only revenue stream for the publisher.
Ad agencies are thus a very important (and the only paying) customer for these publishers. Second,
the free newspaper appears daily, i.e., at least four times a week, and is considered a newspaper,
i.e., it contains considerably more information content than advertising content. Third, the free daily
newspaper is mainly distributed in high-traffic commuter zones and in public transportation systems,
e.g., through self-service racks or by hand distributors in railway, subway and bus stations. Its target
customers are daily commuters using public transportation.
To qualify as a business model innovation, the new business model should materially alter the
existing value creation and appropriation logic, which should be reflected in new activity content,
structure, governance, and/or value driver combinations of the activity system. First, the value
creation logic is different. The free daily newspaper business model emphasizes different product
attributes compared to the existing paid daily newspaper business model, that in se offers the same
product (cf., a daily newspaper). The free daily newspaper business model emphasizes price (cf., it’s
free) and convenience (cf., it’s conveniently brought to you through the public transport system)
towards readers, and a new, younger reader audience towards advertisers. The traditional, paid
daily newspaper business model emphasizes quality (cf., editorial content) towards readers and an
older and wealthier audience towards advertisers. To support this new value creation logic, the free
daily newspaper business model introduces new activities such as distribution through public
transport or public places, and innovative marketing (e.g., new ways of advertising within the
newspaper, and campaigns and promotions linked to the newspaper’s distribution), while deleting
other activities such as subscription-based sales and administration, sales and distribution through
retail shops and kiosks, and marketing communication campaigns on television and radio. Also,
partnerships are different in the free daily newspaper business model. For example, printing is often
outsourced to specific printing facilities, retail shops and kiosks are excluded from the network,
public transportation authorities are becoming an important partner for distribution purposes, and
advertising partnerships focus on targeting younger audiences while excluding classified ads.

87
Second, the value appropriation logic is different. The free daily newspaper business model is a
sponsor-based business model innovation in which a focal firm monetizes its products through
sponsors rather than by setting prices directly to its customer base. Several reasons make this class
of business model innovation appealing to study. First, such innovations appear to be increasingly
prevalent in today’s economy. Second, sponsor-based business model innovations seem particularly
easy to imitate. Since the purpose of our study is to analyse the competitive effects among business
model copycats, the case of sponsor-based business models is most relevant. Third, sponsor-based
business models will become feasible in an ever-increasing number of industries. Also, in terms of
value appropriation, the public transport authorities take an important place. Whereas the retail and
kiosks in the traditional paid daily newspaper business model are numerous and less powerful to
appropriate much of the value created (and making their money mainly on complementary products
like candy, cigarettes, and drinks), the public transport authorities have a high degree of power
whether to allow publishers to distribute their free daily newspaper in the public transport system.
Public transport authorities can appropriate a large part of the value created, by organizing bids
among free daily newspaper publishers for exclusive distribution through their network.
Since the first introduction of a free daily newspaper, Metro by Metro International in February,
1995, both paid newspaper incumbents and new entrants across many countries worldwide entered
the new market opportunity with the free daily newspaper business model. In the year 2000 there
were 29 free daily newspapers in 14 European countries with an estimated circulation of 5.5 million
copies, and in 2005 there existed already 81 free daily newspapers in 24 European countries with an
estimated circulation of 15.4 million (Bakker 2008). By the end of 2010, free daily newspapers had
been introduced in 32 European countries. The Metro phenomenon is not restricted to Europe
though. There were 247 free daily newspapers in 56 countries worldwide with a daily circulation of
44 million copies at the end of 2007.
2.4.2 Sample
We sampled 29 countries across Europe and Canada where free daily newspapers have been
introduced between 1995 and 2010. For these countries we identified a census of 155 free daily
newspaper ventures. We collected and analysed longitudinal data on these free daily newspaper
ventures’ launch and survival, market entry decisions, and venture and market characteristics. Data
sources include websites, newspaper articles, industry organization secondary databases (e.g., from
WAN-IFRA), and industry expert interviews. Given the public character of the newspaper industry,
our data set does not suffer from obscured and biased introduction and exit data for this business
model innovation. Table (3) shows some important descriptive statistics for our sample. To make
sure our sample uniformly identifies success with survival, we exclude 19 so-called spoiler
newspapers that are solely intended to make the free daily newspaper market less attractive. We
identify spoiler newspapers through their own communication of their intentions, or as those
newspapers that are introduced by paid daily newspaper incumbents to compete head-on with
existing free daily newspapers and exit the market from the moment competition has exited.

88
2.4.3 Model
Survival is a key performance measure when launching a business model. We model individual
ventures’ survival when they launch the free daily newspaper business model in a particular country.
Therefore, we estimate the individual ventures’ time-to-exit using the Cox Proportional Hazards (PH)
method. Our unit of analysis is the newspaper-country combination and failure time is measured in
months from entry till exit or censoring. The Cox PH model is appropriate for studying survival data
that are right censored, i.e., unobserved failure or non-failure after the sampling end-date. The Cox
model is a semi-parametric model in which the hazard function of the survival time, i.e., the
instantaneous risk for failure, is given by the following equation (1), with �h(�) an unspecified
baseline hazard function, X our vector of covariates, and B the corresponding parameter vector.
�(�|�) = �h(�)exp(�′�) (1)
2.4.4 Measures
Important independent variables are measures as follows. First, we include a dummy (i.e., FIRST)
with ‘1’ indicating that the free daily newspaper is that market’s first free daily newspaper. Entry
timing is captured monthly in our data set. Second, product adaptation (i.e., ADAPT) is a dummy
with ‘1’ indicating that the focal newspaper deviates from the original Metro newspaper in terms of
consumption time, distribution model, or content coverage. The original Metro newspaper is a free
daily newspaper with general information content, distributed in the morning among commuters in
a subway system. With the entry of several other free daily newspapers, some entrants made
important changes to this original product. With respect to consumption time, most free daily
newspapers are distributed in the morning, but some are distributed in the afternoon or in the
evening to avoid competition with existing free and paid newspapers. Another consumption time
can have repercussions on content coverage and the distribution model. For example, more
breaking news can be included and one could still distribute through an underground system, while
the morning shift might be already allocated to a competitor. With respect to the distribution model,
most free daily newspapers distribute their papers through a public transport system (in racks or by
hand), while others try to differentiate by distributing the newspapers from door to door. With
respect to content coverage, most free daily newspapers spread general news information on a
variety of topics, while others focus on particular interest domains such as economic news or sports
coverage. We consider these differences as adaptations at the product level that are not critical
enough to materially alter the business model of the free daily newspaper to consider it as another
business model innovation. Third, scale of entry (i.e., SCALE) is measured as the free daily
newspaper’s circulation at time of entry relative to the total paid circulation in that market. Fourth,
we include a dummy (i.e., SHARED CONTROL) with ‘1’ showing whether more than one firm has a
stake of 10% or more in the free daily newspaper.
We control for important venture and market characteristics. We measure a venture’s lack of
incumbent industry knowledge and contacts with a dummy (i.e., STARTUP) showing ‘1’ when the
owner of the free daily newspaper is a start-up company. Incumbents may have different survival
chances compared to new entrants. Incumbents already have a business model in place which may
benefit their survival chances (e.g., Tripsas 1997; King and Tucci 2002), or downgrade them (e.g.,
Henderson and Clark 1990; Markides 2006; Teece, Pisano, and Shuen 1997). We could not include

89
venture size separately from scale of entry and incumbency status. However, as most ventures are
newly founded they tend to have a similar size; they differ especially in terms of access to knowledge
and ability for scale which we both include in our estimations. Competitive effects are represented
by two dummies, i.e., SPOILER and DIRECT. SPOILER indicates with value ‘1’ whether there is a
spoiler free daily newspaper in the market at time of entry by the focal venture. A spoiler free daily
newspaper is a free daily newspaper introduced in the market with the sole intention to make the
market unattractive. We identified spoiler newspapers by their own communication of being a
spoiler and compared our set of spoiler newspapers with the ones identified by a leading industry
expert, i.e., professor Piet Bakker. DIRECT measures with value ‘1’ whether the free daily newspaper
competes in the same cities with already existing free daily newspapers at time of entry by the focal
venture. It thus measures whether there is direct competition for the focal launch. Finally, market
attractiveness represents the ability of the country’s advertising market to support a free daily
newspaper business model. It is measured with the one-year lagged real growth percentage for the
country’s GDP per capita (i.e., GDP GROWTH), and the percentage of GDP spent on advertising (i.e.,
AD SPEND). Multilingualism or regionalism is not likely to be an issue, because newspaper editions in
different languages for the same country are often published by one venture (and thus treated as
one venture as we model at the venture level) and we incorporate possible (non)competition effects
by our control variable DIRECT.
2.5 Results and Discussion
2.5.1 Descriptives
Table (2) gives an overview of the free daily newspaper phenomenon for our sample of 29
countries across Europe and Canada. The table shows per country the first free daily newspapers
and their time of entry, the number of free daily newspapers introduced from 1995 till 2010, the
number of failures in that period, and the number of spoiler newspapers in that market. We make
the following observations. First, Sweden, Germany, Finland and the Czech Republic are the first
countries where free daily newspapers were introduced, whereas Slovenia, Luxembourg, Turkey,
and Bulgaria are late adopters. Second, in a number of countries, i.e., Canada, Denmark, France,
Ireland, and Turkey, competition is tough and rapid as there is more than one free daily newspaper
introduced at the start of that country’s free daily newspaper market. Also, we identified 19 free
daily newspapers, i.e., more than 10 per cent of total number of introductions, as trying to spoil the
market. Third, overall there were many introductions of free daily newspapers. Not only large
countries like the UK and Spain had many introductions of free daily newspapers, but also smaller
countries like Denmark and the Netherlands showed high entrepreneurial activity in this case.
However, there were also a lot of failures. From the 155 introductions, there were 81 that failed in
or before end of 2010.
Figure (1) shows the number of free daily newspapers in a selection of countries throughout the
observation period. After the start in 1995, we see that the concept of free daily newspapers starts
picking up in more and more countries as from 1998 with a yearly, gradual growth of new
introductions from 1998 till 2004. The market is booming between 2004 and 2006, but as from 2007

90
and following years the market is in serious decline till 2009 when the decrease seems to be
stabilizing. At the end of 2010 there are still 74 free daily newspapers present across Canada and 28
European countries.
‘Insert table (2) and figure (1) about here’
Table (3) gives an overview of our dependent, independent and control variables’ key descriptive
statistics and correlations. Multicollinearity seems not to be an issue, because most correlations
among our covariates are not significant at a level .05 and almost all are well below a correlation
level of .3.
Table (4) shows the frequencies of our dummy interactions between FIRST and ADAPT, and
FIRST and PARTNER. Every combination has observations. We take the combination with the highest
frequency to be the base level which is also the base level of the main effects of the dummies
involved. Also, due to identification difficulties when including all interactions in one model because
of linear dependency and lack of observations, some categories of the interaction between FIRST
and PARTNER are not included and become base level.
‘Insert tables (3) and (4) about here’
2.5.2 Results
Table (5) shows the results from our Cox PH regression estimations that measure the effect of
our covariates on a venture’s instantaneous probability of failure. We report parameter estimates,
significance levels, standard errors, and model fit for several models. Together with every covariate
and interaction of interest, we also state the associated hypothesis in bold. Model 1 serves as base
model and only incorporates our control variables, i.e., STARTUP, SPOILER, DIRECT, GDP GROWTH,
and AD SPEND. Model 2 includes our control variables together with the main effects of our
variables of interest, i.e., FIRST, ADAPT, SCALE, and SHARED CONTROL. Models 3 to 5 each report
one hypothesized interaction in addition to the other variables’ main effects. Model 3 includes the
interaction between entry timing and product adaptation. Model 4 includes the interaction between
entry timing and scale of entry. Model 5 includes the interaction between entry timing and shared
control.
‘Insert table (5) about here’
We find the following. First, from model 2, we observe that the hypothesized main effects of
being a first mover (H1: -) respectively adapting the product (H2a: +) are significant (at a .05 level). It
means that being a first mover increases your survival chances, whereas adapting the original
product decreases them. The hypothesized main effects of scale (H3a: -) and shared control (H4a: +)
are not confirmed by the results.
Second, model 3 shows that entering with an adapted product increases the negative survival
impact of being a late mover, which is in line with hypothesis H2b. Both combinations of being a late
mover while adapting or being a late mover while not adapting the product are significantly
decreasing survival chances (at .001 respectively .05 level). However, the parameter estimate of the
former is significantly higher than the parameter estimate of the latter. When taking into account

91
variables’ standard deviations, the same applies. It implies that a potential differentiation advantage
is less important than possible product-related changes to a proven business model.
Third, our results confirm our hypothesis that the positive effects of being a first mover are
increased by the scale of entry (H3b: -). Indeed, from model 4 we observe that the interaction
between FIRST and SCALE decreases the likelihood of venture failure significantly (at level .10). It is
important to take the interaction into account, as the AIC value of model 4 with the interaction is
lower than the AIC of model 2 with only the main effects. When including the interaction, however,
the main effect of being a first mover disappears and the main effect of scale of entry is still not
present compared to model 2 with only main effects. These results indicate that scale of entry
reinforces the positive survival effect of being a first mover, while scale of entry has no effect when
used by later entrants. Scale of entry is a pure moderator with no direct effect on venture survival,
but with an influence on survival when used by a first mover. Being a first mover or not is more
important in influencing survival compared with scale of entry. However, including scale of entry as a
pure moderator increases the explanatory power of the model. Also, model 4 shows again support
for the hypothesized main effect of product adaptation and has the best fit across all models.
Fourth, although model 5 shows that sharing control with partnering firms when entering the
market increases the negative survival impact of being a late mover, the result does not hold when
taking into account variables’ standard deviation. Also, although the combinations of being a late
mover while sharing control or being a late mover while not sharing control are significantly
decreasing survival chances (both at .05 level), the parameter estimate of the former is not
significantly different from the parameter estimate of the latter. It means our results do not confirm
hypothesis H4b. Also, model 5 shows again support for the hypothesized main effect of product
adaptation.
Finally, our control variables consistently show that market attractiveness measures such as
lagged GDP growth and the importance of advertising expenditures in a country’s GDP, increase the
likelihood of failure. It seems that firms entering in tougher macro-economic times, i.e., lower
advertising spend and lower economic growth, are more competitive and therefore live longer.
2.5.3 Robustness checks
We perform extra analyses to check our results for robustness. First, we measured scale of entry
as the free daily newspaper’s circulation at time of entry relative to the total paid circulation in that
market. However, scale can also be expressed in terms of number of newspaper editions that are
adapted to the regional or even local context. We check our results’ robustness for measuring scale
of entry as a dummy with value ‘1’ if the number of editions set up when introducing the free daily
newspaper is small (i.e., less than three editions). We find that our results are robust for this
alternative measure.
Second, in our estimations we exclude 19 spoiler newspapers that are solely intended to making
the free daily newspaper market unattractive. We verify whether including spoiler newspapers does
change our results meaningfully. We find that our results are robust with respect to excluding spoiler
newspapers.
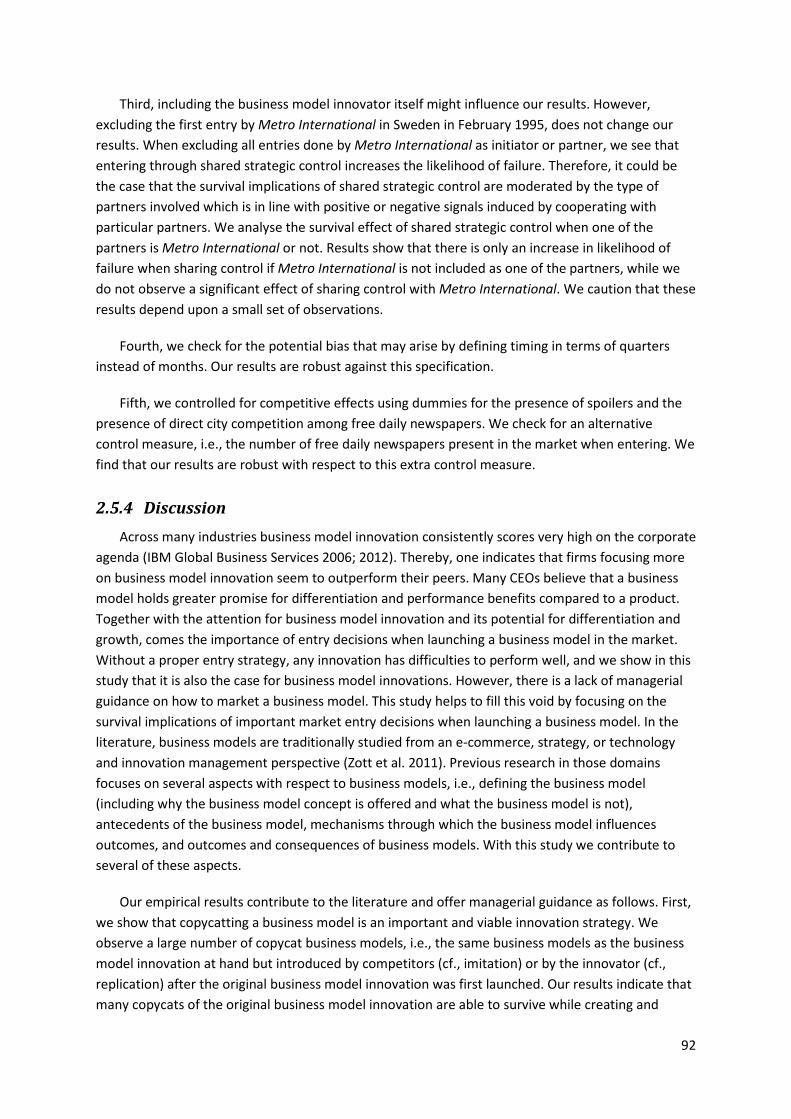
92
Third, including the business model innovator itself might influence our results. However,
excluding the first entry by Metro International in Sweden in February 1995, does not change our
results. When excluding all entries done by Metro International as initiator or partner, we see that
entering through shared strategic control increases the likelihood of failure. Therefore, it could be
the case that the survival implications of shared strategic control are moderated by the type of
partners involved which is in line with positive or negative signals induced by cooperating with
particular partners. We analyse the survival effect of shared strategic control when one of the
partners is Metro International or not. Results show that there is only an increase in likelihood of
failure when sharing control if Metro International is not included as one of the partners, while we
do not observe a significant effect of sharing control with Metro International. We caution that these
results depend upon a small set of observations.
Fourth, we check for the potential bias that may arise by defining timing in terms of quarters
instead of months. Our results are robust against this specification.
Fifth, we controlled for competitive effects using dummies for the presence of spoilers and the
presence of direct city competition among free daily newspapers. We check for an alternative
control measure, i.e., the number of free daily newspapers present in the market when entering. We
find that our results are robust with respect to this extra control measure.
2.5.4 Discussion
Across many industries business model innovation consistently scores very high on the corporate
agenda (IBM Global Business Services 2006; 2012). Thereby, one indicates that firms focusing more
on business model innovation seem to outperform their peers. Many CEOs believe that a business
model holds greater promise for differentiation and performance benefits compared to a product.
Together with the attention for business model innovation and its potential for differentiation and
growth, comes the importance of entry decisions when launching a business model in the market.
Without a proper entry strategy, any innovation has difficulties to perform well, and we show in this
study that it is also the case for business model innovations. However, there is a lack of managerial
guidance on how to market a business model. This study helps to fill this void by focusing on the
survival implications of important market entry decisions when launching a business model. In the
literature, business models are traditionally studied from an e-commerce, strategy, or technology
and innovation management perspective (Zott et al. 2011). Previous research in those domains
focuses on several aspects with respect to business models, i.e., defining the business model
(including why the business model concept is offered and what the business model is not),
antecedents of the business model, mechanisms through which the business model influences
outcomes, and outcomes and consequences of business models. With this study we contribute to
several of these aspects.
Our empirical results contribute to the literature and offer managerial guidance as follows. First,
we show that copycatting a business model is an important and viable innovation strategy. We
observe a large number of copycat business models, i.e., the same business models as the business
model innovation at hand but introduced by competitors (cf., imitation) or by the innovator (cf.,
replication) after the original business model innovation was first launched. Our results indicate that
many copycats of the original business model innovation are able to survive while creating and

93
capturing value to their customers, themselves, and their partners. There can indeed only be one
innovator and we show that it are not always the innovators who benefit the most from their
innovation. We show it is all right to copycat. Imitation and replication are much-executed practices
and can provide (sustainable) competitive advantage. Although it is important --like previous
research did-- to focus on how to arrive at business model innovation while featuring examples of
inspiring business model innovators, the focus might shift too much towards the importance of
business model design features for its performance potential. With our novel approach to focus on
how to commercialize business models instead of inventing them, we make an important shift
towards better understanding how business models can provide (sustainable) competitive
advantage in markets not immune from competitive dynamics. For one innovator with a new
business model there are hundreds of copycats trying to launch that business model in their own
geographic market. Therefore, knowing how to sustain your advantage as an innovator is key. It also
shows that ‘good’ business model innovations travel fast. Therefore, business model innovators
should be aware of the danger of imitation, not only in geographic markets in which they are
present, but also in unfamiliar territories, because imitation can pre-empt a potential replication
strategy. Our focus on the importance of copycats also shows that intellectual property protection
with respect to business model innovation is often lacking. The question whether and how business
models can be protected by intellectual property right is an important question for policy makers.
Second, our results show that copycats should be launched with the appropriate launch
decisions to be viable. We detect four key launch decisions, i.e., entry timing, product adaptation,
scale of entry, and level of strategic control. We observe important first-mover advantages
associated with launching a business model, while it is recommended to stay close to the product(s)
as introduced by the business model innovator. Moreover, we observe that first-mover advantages
are increased when launching big, i.e., with a large entry scale. Also, results indicate that late-mover
disadvantages are exacerbated when launching with differentiated products or by sharing control
among key partners. It is important to note that the influence of the launch decisions on the
business model’s (sustainable) competitive advantage should be assessed with respect to the launch
decisions’ impact on the business model’s characteristics such as its logic to create and capture
value, and its value drivers, while taking into account potential competitive dynamics among
business models in the appropriate (geographic) market. In this study, we give numerous business
examples of how particular launch decisions can influence particular business models’ value drivers,
and consequently, business models’ performance potential. Complementary with previous research
highlighting design characteristics of successful business models, we thus show the importance of
entry decisions when launching a business model. Therefore, firms confronted with new, disruptive
markets and business models or designing them themselves, will be better able to foresee and
predict success and failure in those new market niches. That can be important for both innovators
and incumbent firms in order to proactively assess success of entrepreneurial decisions.
Our conceptual development adds to the literature as well. First, we clearly define the concepts
of business model and business model innovation, while embedding them in previous contributions
of the field. We further build on the conceptualization of the business model as a definition of how
value is created (and delivered) for customers and how value is appropriated for the focal firm and
its partners. We concur that it is important to keep a system perspective towards the business
model, i.e., that it consists of interdependent and complementary decisions that need a holistic

94
approach. We show that by modelling and theorizing about the main and interaction effects of
launch decisions on the business model’s value drivers’ potential to create and appropriate value,
and the apparent interdependencies among those value drivers themselves. We also devote special
attention to the important notion that the business model constitutes a separate unit of analysis,
different from industry, firm, product, or technology. Discussing the definition and the conceptual
foundations of the business model, and its characteristics as a separate unit of analysis, helps us
appreciating the relevance to study this concept for both theory and managerial practice. With
respect to business model innovation, we posit that to qualify as an innovation, a new business
model should materially alter the value creation and appropriation logic of its closest related
business model, which is reflected in new content, structure, governance, and/or value driver
combinations of the associated activity system. In our conceptualization of business model
innovation, we make the case to clearly distinguish between innovations at the product, technology,
or business model level. Although they can be linked, they are separate things.
Second, although we follow previous research stating that a business model is different from a
product market strategy (Zott and Amit 2008), we provide more information on the conceptual and
empirical underpinnings of how to better delineate the differences (but also the interplay) between
both the business model and a product market strategy. Business model innovation has an influence
on the product market strategy, but product market strategy decision variables also have an
influence on the (sustainable) competitive advantage associated with a business model. It implies
that the difference between so-called tactical product market strategy decisions and strategic
business model decisions is superfluous. What matters is the empirical and theorized impact of a
decision on the performance potential of the underlying concept at hand, albeit a product or a
business model. If product market strategy decisions impact (sustainable) competitive advantage of
a business model, then they are a relevant part of the business model. We show that decisions such
as entry timing, product adaptation, scale of entry, and level of strategic control, that are
traditionally only deemed relevant for a product market strategy, have a theorized influence on a
business model’s value creation, value capture, and combination of value drivers, and an empirically
validated influence on a business model’s (sustainable) competitive advantage in the form of
survival. Our results indicate that the business model, apart from the industry, firm, product, or
technology, can provide value and (sustainable) competitive advantage, thereby claiming once more
its place in the literature as a separate unit of analysis. Also, with these results and associated
theorizing we provide more information on how business model mechanisms work to provide value
and influence outcomes.
We suggest that the marketing literature could also benefit greatly from taking the business
model as unit of analysis and complementing it with a more traditional focus on products,
technologies, firms, or industries. The concept of the business model is in line with the conceptual
foundations of marketing. The business model defines how and by whom value is created and
captured in exchanges among the focal firm and its factor providers, customers, and other network
partners. Exchange is at the foundation of marketing (Bagozzi 1975; Hunt 1983). Also, marketing
strategy and various strategic marketing issues are focused on both value creation and value
appropriation (Varadarajan 2010). Apart from the contributions already been mentioned above that
are also relevant to marketing, this study has another important contribution to the marketing field.
We add to the literature by studying market entry in the context of launching a business model

95
instead of a traditional focus on new products or new markets. Business models are a new unit of
analysis, distinct from the product, technology, firm, or industry. Business model innovation is also
different from other types of innovation. It is often disruptive for both demand and supply side, and
it borrows characteristics from different types of innovations such as radical product innovation,
disruptive technological innovation, and architectural innovation. This study shows that the market
entry literature is also important at the level of the business model. We indicate that market entry
decisions such as timing, scale, adaptation, and control, do not only play a role when launching new
products or entering new geographic markets, but also when launching a business model. This can
offer a new perspective on market entry decisions, also when applied to entering new product or
geographic markets. Because market entry decisions also have an influence on the underlying
business model’s performance potential, the underlying business model can influence what the
outcome will be of particular market entry decisions taken for new product or geographic market
entry. Therefore, trying to explain winning versus failing product introductions or new market
entries might be put in a different perspective, when also incorporating the underlying business
model in the analysis instead of only focusing on product or technology characteristics while not
taking into account the influence of entry decisions (or product and technology characteristics) on
that same business model.
Policy makers and wider society benefit from this study and its subject for several reasons. First,
policy makers benefit from a better understanding of how new markets and disruptive business
model innovations operate, spread out and survive. Moreover, with a better understanding of how
business models create and capture value, policy makers can make more informed decisions
whether it is appropriate to protect incumbent markets or not in the case of business model
innovation. For example, considering the case of the free daily newspapers’ competitive animosity in
the U.K. and Germany, is it acceptable from a society’s point of view to allow incumbents use
competitive strategies such as introducing spoiler newspapers to derail the market mechanism, or to
allow incumbents to abuse the legal system to fight competitors? Another example is whether policy
makers with a complete understanding of how value is created and appropriated in a business
model like for example that of Amazon and Ryanair, would still focus on the business model’s
disruptive aspects towards incumbents or on the internal operations of those business models?
Second, with our focus on the widespread practice of imitating business model innovations, we can
add to the discussion whether to provide possibilities to protect intellectual property derived from
the business model. Some firms like Netflix and Nespresso benefit(ed) from partly protection of their
business model. No protection might add to examples of business model concealment (Casadesus-
Masanell and Zhu 2013) or more ventures applying a strategy of imitation rather than invention,
while some form of protection could encourage the emergence of more new business models. Also,
at a basic level, partial protection could already foresee in trying to exclude aforementioned
strategies of market distortion (cf., the so-called spoiler strategy or abuse of the legal system).
However, full protection might be impossible, because sometimes parts of a business model
innovation are imitated across industries by non-competing firms with different products or
different target customers. For example, the ‘razor-razor blade model’, i.e., pricing razors
inexpensively while aggressively charging for the consumables (razor blades), is also applied as part
of the business model of firms like GE and Rolls Royce with respect to jet engines for commercial
aircraft that are sold relatively inexpensively while maintenance and parts are the main income
sources. Another example is the ‘freemium model’, i.e., a proprietary product or service provided for

96
free, while charging for advanced features, functionality, or virtual goods. The freemium model is
being applied by Adobe, Skype, LinkedIn, MySpace, amongst many others. Third, given our study’s
specific context in the media industry which is a very important industry from a policy perspective
because of its democratizing character and powerful public information channel, more intelligence
on disruptive forces within the media industry are of key informative value to public policy bodies
and the general public. The media industry already suffered from several radical changes in recent
history, including the advent of online --often free-- content provision, free classified ad websites
(e.g., Craigslist), and convergence of various media, internet and telecom players. However, the
industry still struggles how to respond adequately to these threats to their existing business.
2.6 Conclusion and Limitations
We conclude by identifying some limitations of our study that offer future research
opportunities. First, although the focus of our research required in-depth study of entry and exit
dynamics within a particular industry and the free newspaper market is a major industry as
evidenced by its rapid international growth, its ability to attract high entrepreneurial activity, and its
power to address a large and very different newspaper readership audience, such a focus comes at
the cost of loss of generalizability. Future research should therefore replicate the current study in
other industries. Also, because we focus on the entry decisions related to a single business model,
we could not theorize about possible entry timing effects from business model characteristics like
level of appropriability, customer lock-in, and network effects that might be important influencers of
post-entry performance. However, we win in terms of limiting across-industry biases. We stimulate
further research across industries on this topic to verify whether our main and interaction effects
among strategic market entry decisions are applicable across different business models and sectors.
Second, although crucial, survival is only one aspect of firm performance. Moreover, there might
be a potential trade-off between legitimacy and performance (Barreto and Baden-Fuller 2006). On
the one hand, legitimacy-seeking activities, e.g., peer imitation, can increase an organization’s
survival probability (DiMaggio and Powell 1983; Meyer and Rowan 1977), while, on the other hand,
the likelihood of survival can be obtained at the expense of performance (Henderson 1999).
Therefore, it would be great to have trustworthy information on other performance criteria such as
circulation throughout time, and advertising revenues and profit from individual newspaper titles.
However, these data are very hard to get and difficult to break down at business model level.
Overall, survival is seen as a good performance indicator for new ventures. If the new venture is not
profitable within a relevant time period (often three years), one will let the venture go, i.e., non-
survival. A situation where the venture is not profitable, but one is determined to go through only to
hurt competition, is taken into account and controlled for by means of a spoiler dummy. Future
research can also further explore whether spoiler tactics are a widespread competitive weapon.
Third, although it has been acknowledged that market entry decisions can have long-lasting
performance implications, future research focus might shift towards dynamic managerial decision-
making during a launch process, i.e., whether and how managers update their decisions over time
after the launch. For example, how can entrepreneurial firms dynamically adapt their strategic
decisions such as business model design, scale and strategic control, to improve the odds for success

97
instead of only focusing on decisions at time of entry. In addition, to get a full grasp of its
performance impact, it makes sense to split the effect of market attractiveness across decisions
related to market entry, market exit, and the exact timing of these decisions as it could well be that
market entry decisions are taken for example three years before actual market entry.
Finally, by focusing on launching strategies, we can stimulate another underexplored aspect of
business model innovation, i.e., its diffusion among consumers and across countries, and the
potential drivers of that diffusion. Examples include research whether business model innovation
differs from other types of innovation in its diffusion characteristics and drivers. Also, are there are
financial and/or media bubbles associated with business model innovations and their diffusion. The
general enthusiasm on this type of innovation and many market entries (and exits in for example the
free newspaper market) suggest there might be some kind of irrational enthusiasm surrounding
certain business model innovations.
2.7 Reference list
Alamdari, Fariba and Simon Fagan (2005), "Impact of the Adherence to the Original Low-cost Model
on the Profitability of Low-cost Airlines," Transport Reviews, 25(3), 377-92.
Amit, Raphael and Christoph Zott (2001), "Value Creation in e-Business," Strategic Management
Journal, 22(6/7), 493-520.
Amit, Raphael and Christoph Zott (2012), "Creating Value Through Business Model Innovation," MIT
Sloan Management Review, 53(3), 41-9.
Ashforth, Blake E. and Barrie W. Gibbs (1990), "The Double-edge of Organizational Legitimation,"
Organization Science, 1(2), 177-94.
Audretsch, David B. (1995), "Innovation, Growth and Survival," International Journal of Industrial
Organization, 13(4), 441-57.
Baden-Fuller, Charles and Mary S. Morgan (2010), "Business Models as Models," Long Range
Planning, 43(2/3), 156-71.
Bagozzi, Richard P. (1975), "Marketing as Exchange," Journal of Marketing, 39(4), 32-9.
Bakker, Piet (2008), "The Simultaneous Rise and Fall of Free and Paid Newspapers in Europe,"
Journalism Practice, 2(3), 427-43.
Balboa, Marina and José Marti (2007), "Factors that Determine the Reputation of Private Equity
Managers in Developing Markets," Journal of Business Venturing, 22(4), 453-80.
Barreto, llidio and Charles Baden-Fuller (2006), "To Conform or To Perform? Mimetic Behaviour,
Legitimacy-Based Groups and Performance Consequences," Journal of Management Studies,
43(7), 1559-81.
Bayus, Barry L. and Rajshree Agarwal (2007), "The Role of Pre-Entry Experience, Entry Timing, and
Product Technology Strategies in Explaining Firm Survival," Management Science, 53(12),
1887-902.

98
Biggadike, R. E. (1979), Corporate Diversification: Entry Strategy and Performance. Cambridge, MA:
Harvard University Press.
Carpenter, Gregory S. and Kent Nakamoto (1988), "Market Pioneering, Learning, and Preference,"
Advances in Consumer Research, 15(1), 275-9.
Carpenter, Gregory S. and Kent Nakamoto (1989), "Consumer Preference Formation and Pioneering
Advantage," Journal of Marketing Research, 26(3), 285-98.
Casadesus-Masanell, Ramon and Joan E. Ricart (2010), "From Strategy to Business Models and onto
Tactics," Long Range Planning, 43(2/3), 195-215.
Casadesus-Masanell, Ramon and Feng Zhu (2013), "Business Model Innovation and Competitive
Imitation: The Case of Sponsor-based Business Models," Strategic Management Journal,
34(4), 464-82.
Caves, Richard E. (1998), "Industrial Organization and New Findings on the Turnover and Mobility of
Firms," Journal of Economic Literature, 36(4), 1947-82.
Chandy, Rajesh K. and Gerard J. Tellis (1998), "Organizing for Radical Product Innovation: The
Overlooked Role of Willingness to Cannibalize," Journal of Marketing Research, 35(4), 474-
87.
Charitou, Constantinos D. and Constantinos C. Markides (2003), "Responses to Disruptive Strategic
Innovation," MIT Sloan Management Review, 44(2), 55-63.
Chen, Ming J. and Ian C. MacMillan (1992), "Nonresponse and Delayed Response to Competitive
Moves: The Roles of Competitor Dependence and Action Irreversibility," Academy of
Management Journal, 35(3), 539-70.
Chesbrough, Henry W. and Richard S. Rosenbloom (2002), "The Role of the Business Model in
Capturing Value from Innovation: Evidence from Xerox Corporation's Technology Spinoff
Companies," Industrial and Corporate Change, 11(3), 529-55.
Christensen, Clayton M., Fernando F. Suarez, and James M. Utterback (1998), "Strategies for Survival
in Fast-Changing Industries," Management Science, 44(12), 207-220.
Combs, James G. and David J. Ketchen Jr. (1999), "Explaining Interfirm Cooperation and
Performance: Toward a Reconciliation of Predictions," Strategic Management Journal, 20(9),
867-88.
Dacin, M. Tina (1997), "Isomorphism in Context: The Power and Prescription of Institutional Norms,"
The Academy of Management Journal, 40(1), 46-81.
Dahan, Nicolas M., Jonathan P. Doh, Jennifer Oetzel, and Michael Yaziji (2010), "Corporate-NGO
Collaboration: Co-creating New Business Models for Developing Markets," Long Range
Planning, 43(2/3), 326-42.
Davila, Antonio, George Foster, and Mahendra Gupta (2003), "Venture Capital Financing and the
Growth of Startup Firms," Journal of Business Venturing, 18(6), 689-708.
Day, George S. (2011), "Closing the Marketing Capabilities Gap," Journal of Marketing, 75(4), 183-95.

99
Deephouse, David L. (1996), "Does Isomorphism Legitimate?," The Academy of Management
Journal, 39(4), 1024-39.
Deephouse, David L. (1999), "To Be Different, or to Be the Same? It's a Question (and Theory) of
Strategic Balance," Strategic Management Journal, 20(2), 147-66.
DeYoung, Robert (2005), "The Performance of Internet-Based Business Models: Evidence from the
Banking Industry," Journal of Business, 78(3), 893-947.
Dierickx, Ingemar and Karel Cool (1989), "Asset Stock Accumulation and Sustainability of Competitive
Advantage," Management Science, 35(12), 1504-11.
DiMaggio, Paul J. and Walter W. Powell (1983), "The Iron Cage Revisited: Institutional Isomorphism
and Collective Rationality in Organizational Fields," American Sociological Review, 48(2), 147-
60.
Doganova, Liliana and Marie Eyquem-Renault (2009), "What Do Business Models Do? Innovation
Devices in Technology Entrepreneurship," Research Policy, 38(10), 1559-70.
Dowell, Glen and Anand Swaminathan (2006), "Entry Timing, Exploration, and Firm Survival in the
Early U.S. Bicycle Industry," Strategic Management Journal, 27(12), 1159-82.
Economist Intelligence Unit (2005), "Business 2010: Embracing the Challenge of Change," The
Economist Intelligence Unit.
Fisken, Jane and Jan Rutherford (2002), "Business Models and Investment Trends in the
Biotechnology Industry in Europe," Journal of Commercial Biotechnology, 8(3), 191-99.
Frynas, Jędrzej G., Kamel Mellahi, and Geoffrey A. Pigman (2006), "First Mover Advantages in
International Business and Firm-specific Political Resources," Strategic Management Journal,
27(4), 321-45.
Gambardella, Alfonso and Anita M. McGahan (2010), "Business Model Innovation: General Purpose
Technologies and their Implications for Industry Structure," Long Range Planning, 43(2/3),
262-71.
Gatignon, Hubert and Erin Anderson (1988), "The Multinational Corporation's Degree of Control over
Foreign Subsidiaries: An Empirical Test of a Transaction Cost Explanation," Journal of Law,
Economics, and Organization, 4(2), 305-36.
Ghemawat, Pankaj (1991), Commitment: The Dynamics of Strategy. New York: The Free Press.
Gielens, Katrijn and Marnik G. Dekimpe (2001), "Do International Entry Decisions of Retail Chains
Matter in the Long Run?," International Journal of Research in Marketing, 18(3), 235-59.
Gielens, Katrijn, Kristiaan Helsen, and Marnik G. Dekimpe (2012), "International Entry Strategies," in
Handbook of Marketing Strategy, Venkatesh Shankar and Gregory S. Carpenter, eds.
Cheltenham, UK: Edward Elgar Publishing Limited, 391-411.
Glick, J. Leslie (2008), "Biotechnology Business Models Work: Evidence from the Pharmaceutical
Marketplace," Journal of Commercial Biotechnology, 14(2), 106-17.

100
Golder, Peter N. and Gerard J. Tellis (1993), "Pioneer Advantage: Marketing Logic or Marketing
Legend?," Journal of Marketing Research, 30(2), 158-70.
Green, Donna H., Donald W. Barclay, and Adrian B. Ryans (1995), "Entry Strategy and Long-Term
Performance: Conceptualization and Empirical Examination," Journal of Marketing, 59(4), 1-
16.
Hamel, Gary (2000), Leading the Revolution. Boston: Harvard Business School Press.
Heil, Oliver and Thomas S. Robertson (1991), "Toward a Theory of Competitive Market Signaling: A
Research Agenda," Strategic Management Journal, 12(6), 403-18.
Henderson, Andrew D. (1999), "Firm Strategy and Age Dependence: A Contingent View of the
Liabilities of Newness, Adolescence, and Obsolescence," Administrative Science Quarterly,
44(2), 281-314.
Henderson, Rebecca M. and Kim B. Clark (1990), "Architectural Innovation: The Reconfiguration of
Existing Product Technologies and the Failure of Established Firms," Administrative Science
Quarterly, 35(1), 9-30.
Higgins, Monica C. and Ranjay Gulati (2006), "Stacking the Deck: The Effect of Upper Echelon
Affiliations for Entrepreneurial Firms," Strategic Management Journal, 27(13), 1-26.
Hunt, Shelby D. (1983), "General Theories and the Fundamental Explananda of Marketing," Journal
of Marketing, 47(4), 9-17.
IBM Global Business Services (2006), "Expanding the Innovation Horizon: The Global CEO Study
2006".
IBM Global Business Services (2012), "Leading through Connections: Insights from the Global CEO
Study 2012".
Isobe, Takehiko, Shige Makino, and David B. Montgomery (2000), "Resource Commitment, Entry
Timing, and Market Performance of Foreign Direct Investments in Emerging Economies: The
Case of Japanese International Joint Ventures in China," Academy of Management Journal,
43(3), 468-84.
Janney, Jay and Timothy B. Folta (2003), "Signaling through Private Equity Placements and its Impact
on the Valuation of Biotechnology Firms," Journal of Business Venturing, 18(3), 361-80.
Johnson, Joseph and Gerard J. Tellis (2008), "Drivers of Success for Market Entry into China and
India," Journal of Marketing, 72(3), 1-13.
Johnson, Mark W., Clayton M. Christensen, and Henning Kagermann (2008), "Reinventing Your
Business Model," Harvard Business Review, 86(12), 50-9.
Kerin, Roger A., P. R. Varadarajan, and Robert A. Peterson (1992), "First-mover advantage: A
synthesis, conceptual framework, and research propositions," Journal of Marketing, 56(4),
33-53.
Kim, Chan W. and Peter Hwang (1992), "Global Strategy and Multinational's Entry Mode Choice,"
Journal of International Business Studies, 23(1), 29-53.

101
Kim, W. Chan and Renée Mauborgne (1997), "Value Innovation: The Strategic Logic of High Growth,"
Harvard Business Review, 75(1), 103-12.
King, Andrew A. and Christopher L. Tucci (2002), "Incumbent Entry into New Market Niches: The
Role of Experience and Managerial Choice in the Creation of Dynamic Capabilities,"
Management Science, 48(2), 171-86.
Kirmani, Amna and Akshay R. Rao (2000), "No Pain, No Gain: A Critical Review of the Literature on
Signaling Unobservable Product Quality," Journal of Marketing, 64(2), 66-79.
Kotler, Philip, Kevin L. Keller, Mairead Brady, Malcolm Goodman, and Torben Hansen (2009),
Marketing Management. Pearson Eduction Unlimited.
Lambkin, Mary and George S. Day (1989), "Evolutionary Processes in Competitive Markets: Beyond
the Product Life Cycle," Journal of Marketing, 53(3), 4-21.
Lieberman, Marvin B. (1989), "The Learning Curve, Technology Barriers to Entry, and Competitive
Survival in the Chemical Processing Industries," Strategic Management Journal, 10(5), 431-
47.
Lieberman, Marvin B. and David B. Montgomery (1988), "First-mover Advantages," Strategic
Management Journal, 9(S1), 41-58.
Lieberman, Marvin B. and David B. Montgomery (1998), "First-mover (Dis)advantages: Retrospective
and Link with the Resource-based View," Strategic Management Journal, 19(12), 1111-25.
Lieberman, Marvin B. and David B. Montgomery (2012), "First-mover/Pioneer Strategies," in
Handbook of Marketing Strategy, Venkatesh Shankar and Gregory S. Carpenter, eds.
Norhampton, MA: Edward Elgar Publishing, Inc., 339-61.
Lilien, Gary L. and Eunsang Yoon (1990), "The Timing of Competitive Market Entry: An Exploratory
Study of New Industrial Products," Management Science, 36(5), 568-85.
Luo, Yadong (2001), "Determinants of Entry in an Emerging Economy: A Multilevel Approach,"
Journal of Management Studies, 38(3), 443-72.
Magretta, Joan (2002), "Why Business Models Matter," Harvard Business Review, 80(5), 86-92.
Markides, Constantinos (1997), "Strategic Innovation," Sloan Management Review, 38(3), 9-23.
Markides, Constantinos (2006), "Disruptive Innovation: In Need of Better Theory," Journal of Product
Innovation Management, 23(1), 19-25.
Markides, Constantinos and Constantinos D. Charitou (2004), "Competing with Dual Business
Models: A Contingency Approach," Academy of Management Executive, 18(3), 22-36.
McGrath, Rita G. (2010), "Business Models: A Discovery Driven Approach," Long Range Planning,
43(2/3), 247-61.
McNamara, Gerry, David L. Deephouse, and Rebecca A. Luce (2003), "Competitive Positioning Within
and Across a Strategic Group Structure: The Performance of Core, Secondary, and Solitary
Firms," Strategic Management Journal, 24(2), 161-81.

102
Meyer, John W. and Brian Rowan (1977), "Institutional Organizations: Formal Structure as Myth and
Ceremony," American Journal of Sociology, 83(2), 340-63.
Miles, Raymond E. and Charles C. Snow (1978), Organizational Strategy, Structure, and Process. New
York: McGraw-Hill.
Milgrom, Paul and John Roberts (1986), "Price and Advertising Signals of Product Quality," Journal of
Political Economy, 94(4), 796-821.
Milgrom, Paul and John Roberts (1995), "Complementarities and Fit: Strategy, Structure, and
Organizational Change in Manufacturing," Journal of Accounting and Economics, 19(2-3),
179-208.
Min, Sungwook, Manohar U. Kalwani, and William T. Robinson (2006), "Market Pioneer and Early
Follower Survival Risks: A Contingency Analysis of Really New versus Incrementally New
Product-Markets," Journal of Marketing, 70(1) 15-33.
Mitchell, Donald and Carol Coles (2003), "The Ultimate Competitive Advantage of Continuing
Business Model Innovation," Journal of Business Strategy, 24(5), 15-21.
Morris, Michael, Minet Schindehutte, and Jeffrey Allen (2005), "The Entrepreneur's Business Model:
Toward a Unified Perspective," Journal of Business Research, 58(6), 726-35.
Nehrt, Chad (1996), "Timing and Intensity Effects of Environmental Investments," Strategic
Management Journal, 17(7), 535-47.
Palmatier, Robert W., Rajiv P. Dant, and Dhruv Grewal (2007), "A Comparative Longitudinal Analysis
of Theoretical Perspectives of Interorganizational Relationship Performance," Journal of
Marketing, 71(4), 172-94.
Porter, Michael E. (1980), Competitive strategy: Techniques for analyzing industries and competitors.
New York, NY: Free Press.
Porter, Michael E. (1996), "What is Strategy?," Harvard Business Review, 74(6), 61-78.
Porter, Michael and Nicolaj Siggelkow (2008), "Contextuality Within Activity Systems and
Sustainability of Competitive Advantage," Academy of Management Perspectives, 22(2), 34-
56.
Prabhu, Jaideep and David W. Stewart (2001), "Signaling Strategies in Competitive Interaction:
Building Reputations and Hiding the Truth," Journal of Marketing Research, 38(1), 62-72.
Rao, Akshay R., Qu Lu, and W. R. Robert (1999), "Signalling Unobservable Product Quality through a
Brand Ally," Journal of Marketing Research, 36(2), 258-68.
Rao, Raghunath S., Rajesh K. Chandy, and Jaideep C. Prabhu (2008), "The Fruits of Legitimacy:Why
Some New Ventures Gain More from Innovation Than Others," Journal of Marketing, 72(4),
58-75.
Rindfleisch, Aric and Jan B. Heide (1997), "Transaction Cost Analysis: Past, Present, and Future
Applications," Journal of Marketing, 61(4), 30-54.
Rivkin, Jan W. (2000), "Imitation of Complex Strategies," Management Science, 46(6), 824-44.

103
Robinson, William T. and Sungwook Min (2002), "Is the First to Market the First to Fail? Empirical
Evidence for Industrial Goods Businesses," Journal of Marketing Research, 39(1),120-8.
Scott, W. Richard (1987), "The Adolescence of Institutional Theory," Administrative Science
Quarterly, 32(4), 493-511.
Shane, Scott, Venkatesh Shankar, and Ashwin Aravindakshan (2006), "The Effects of New Franchisor
Partnering Strategies on Franchise System Size," Management Science, 52(5), 773-87.
Shankar, Venkatesh and Gregory S. Carpenter (2012), "Late-mover Strategies," in Handbook of
Marketing Strategy, Venkatesh Shankar and Gregory S. Carpenter, eds. Northampton, MA:
Edward Elgar Publishing, Inc., 362-75.
Sharma, Anurag and Idalene F. Kesner (1996), "Diversifying Entry: Some Ex Ante Explanations for
Postentry Survival and Growth," Academy of Management Journal, 39(3), 635-77.
Siggelkow, Nicolaj (2002), "Evolution toward Fit," Administrative Science Quarterly, 47(1), 125-59.
Singh, Jitendra V., David J. Tucker, and Robert J. House (1986), "Organizational Legitimacy and the
Liability of Newness," Administrative Science Quarterly, 31(2), 171-93.
Slywotzky, Adrian J. (1996), Value Migration: How to Think Several Moves Ahead of the Competition.
Boston: Harvard Business School Press.
Sorescu, Alina, Ruud T. Frambach, Jagdip Singh, Arvind Rangaswamy, and Cheryl Bridges (2011),
"Innovations in Retail Business Models," Journal of Retailing, 87(S1), 3-16.
Spence, A. Michael (1977), "Entry, Capacity, Investment and Oligopolistic Pricing," The Bell Journal of
Economics, 8(2), 534-44.
Spence, A. Michael (1973), "Job Market Signaling," Quarterly Journal of Economics, 87(3), 355-74.
Srinivasan, Raji, Gary L. Lilien, and Arvind Rangaswamy (2004), "First in, First out? The Effects of
Network Externalities on Pioneer Survival," Journal of Marketing, 68(1), 41-58.
Stiglitz, Joseph (2000), "The Contributions of the Economics of Information to Twentieth Century
Economies," The Quarterly Journal of Economics, 115(4), 1441-78.
Suchman, Mark C. (1995), "Managing Legitimacy: Strategic and Institutional Approaches," The
Academy of Management Review, 20(3), 571-610.
Szulanski, Gabriel and Robert J. Jensen (2008), "Growing through Copying: The Negative
Consequences of Innovation on Franchise Network Growth," Research Policy, 37(10), 1732-
41.
Szulanski, Gabriel and Sidney Winter (2002), "Getting It Right the Second Time," Harvard Business
Review, 80(1), 62-9.
Szymanski, David M., Lisa C. Troy, and Sundar G. Bharadwaj (1995), "Order of Entry and Business
Performance: An Empirical Synthesis and Reexamination," Journal of Marketing, 59(4), 17-
33.

104
Teece, David J. (2010), "Business Models, Business Strategy and Innovation," Long Range Planning,
43(2/3), 172-94.
Teece, David J., Gary Pisano, and Amy Shuen (1997), "Dynamic Capabilities and Strategic
Management," Strategic Management Journal, 18(7), 509-33.
Tripsas, Mary (1997), "Unraveling the Process of Creative Destruction: Complementary Assets and
Incumbent Survival in the Typesetter Industry," Strategic Management Journal, 18(S1), 119-
42.
Van de Ven, Andrew H., Roger Hudson, and Dean M. Schroeder (1984), "Designing New Business
Startups: Entrepreneurial, Organizational and Ecological Considerations," Journal of
Management, 10(1), 87-108.
Varadarajan, Rajan (2010), "Strategic Marketing and Marketing Strategy: Domain, Definition,
Fundamental Issues and Foundational Premises," Journal of the Academy of Marketing
Science, 38(2), 119-40.
Vorhies, Douglas W., Robert E. Morgan, and Chad W. Autry (2009), "Product-market Strategy and
the Marketing Capabilities of the Firm: Impact on Market Effectiveness and Cash Flow
Performance," Strategic Management Journal, 30(12), 1310-34.
Wang, Qi, Yubo Chen, and JinHong Xie (2010), "Survival in Markets with Network Effects: Product
Compatibility and Order-of-Entry Effects," Journal of Marketing, 74(4), 1-14.
Westphal, James D., Ranjay Gulati, and Stephen M. Shortell (1997), "Customization or Conformity:
An Institutional and Network Perspective on the Content and Consequences of TQM
Adoption," Administrative Science Quarterly, 42(2), 366-394.
Williamson, Oliver E. (1975), Markets and Hierarchies. New York: The Free Press.
Williamson, Oliver E. (1981), "The Economics of Organization: The Transaction Cost Approach,"
American Journal of Sociology, 87(3), 548-77.
Winter, Sidney G. and Gabriel Szulanski (2001), "Replication as Strategy," Organization Science,
12(6), 730-43.
Yadong, Luo and Mike W. Peng (1998), "First Mover Advantages in Investing in Transitional
Economies," Thunderbird International Business Review, 40(2), 141-63.
Yarbrough, Larry, Neil Morgan, and Douglas Vorhies (2011), "The Impact of Product Market Strategy-
Organizational Culture Fit on Business Performance," Journal of the Academy of Marketing
Science, 39(4), 555-73.
Yunus, Muhammad, Bertrand Moingeon, and Laurence Lehmann-Ortega (2010), "Building Social
Business Models: Lessons from the Grameen Experience," Long Range Planning, 43(2/3),
308-25.
Zajac, Edward J. and James D. Westphal (2004), "The Social Construction of Market Value:
Institutionalization and Learning Perspectives on Stock Market Reactions," American
Sociological Review, 69(3), 433-57.

105
Zimmerman, Monica A. and Gerald J. Zeitz (2002), "Beyond Survival: Achieving New Venture Growth
by Building Legitimacy," Academy of Management Review, 27(3), 414-31.
Zott, Christoph and Raphael Amit (2007), "Business Model Design and the Performance of
Entrepreneurial Firms," Organization Science, 18(2), 181-99.
Zott, Christoph and Raphael Amit (2008), "The Fit between Product Market Strategy and Business
Model: Implications for Firm Performance," Strategic Management Journal, 29(1), 1-26.
Zott, Christoph and Raphael Amit (2010), "Business Model Design: An Activity System Perspective,"
Long Range Planning, 43(2/3), 216-26.
Zott, Christoph, Raphael Amit, and Lorenzo Massa (2011), "The Business Model: Recent
Developments and Future Research," Journal of Management, 37(4), 1019-42.
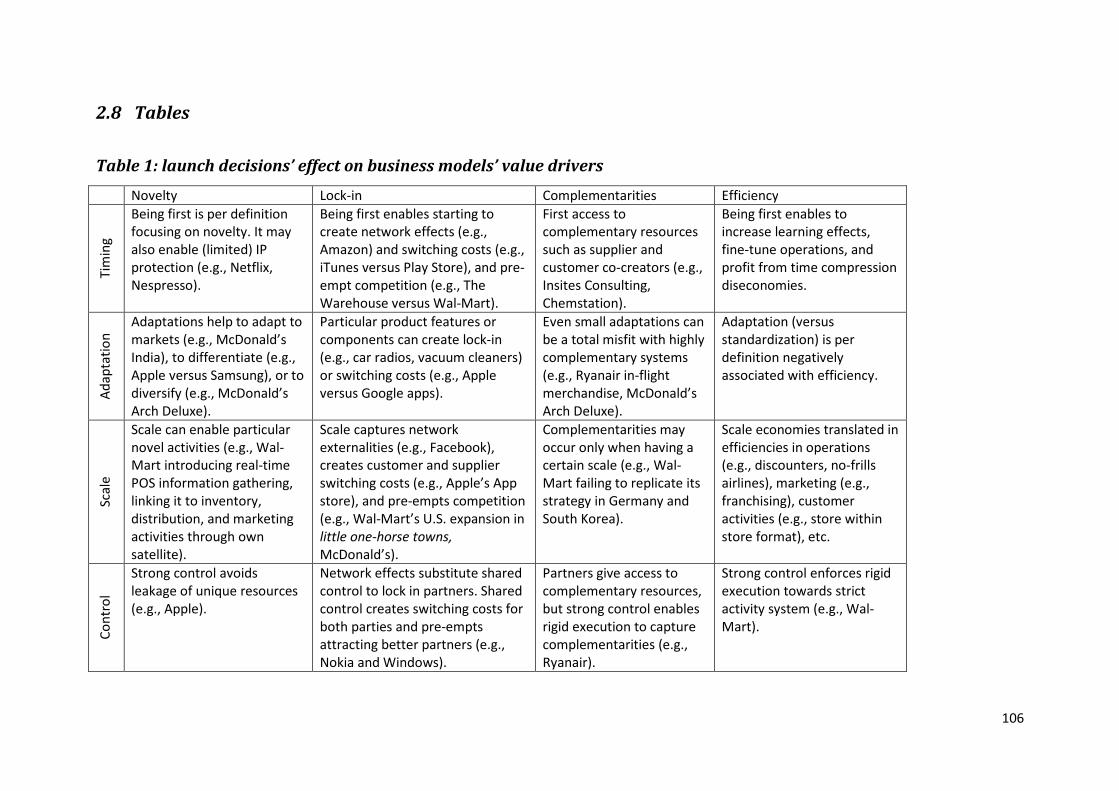
106
2.8 Tables
Table 1: launch decisions’ effect on business models’ value drivers
Novelty Lock-in Complementarities Efficiency
Tim
ing
Being first is per definition
focusing on novelty. It may
also enable (limited) IP
protection (e.g., Netflix,
Nespresso).
Being first enables starting to
create network effects (e.g.,
Amazon) and switching costs (e.g.,
iTunes versus Play Store), and pre-
empt competition (e.g., The
Warehouse versus Wal-Mart).
First access to
complementary resources
such as supplier and
customer co-creators (e.g.,
Insites Consulting,
Chemstation).
Being first enables to
increase learning effects,
fine-tune operations, and
profit from time compression
diseconomies.
Ad
ap
tati
on
Adaptations help to adapt to
markets (e.g., McDonald’s
India), to differentiate (e.g.,
Apple versus Samsung), or to
diversify (e.g., McDonald’s
Arch Deluxe).
Particular product features or
components can create lock-in
(e.g., car radios, vacuum cleaners)
or switching costs (e.g., Apple
versus Google apps).
Even small adaptations can
be a total misfit with highly
complementary systems
(e.g., Ryanair in-flight
merchandise, McDonald’s
Arch Deluxe).
Adaptation (versus
standardization) is per
definition negatively
associated with efficiency.
Sca
le
Scale can enable particular
novel activities (e.g., Wal-
Mart introducing real-time
POS information gathering,
linking it to inventory,
distribution, and marketing
activities through own
satellite).
Scale captures network
externalities (e.g., Facebook),
creates customer and supplier
switching costs (e.g., Apple’s App
store), and pre-empts competition
(e.g., Wal-Mart’s U.S. expansion in
little one-horse towns,
McDonald’s).
Complementarities may
occur only when having a
certain scale (e.g., Wal-
Mart failing to replicate its
strategy in Germany and
South Korea).
Scale economies translated in
efficiencies in operations
(e.g., discounters, no-frills
airlines), marketing (e.g.,
franchising), customer
activities (e.g., store within
store format), etc.
Co
ntr
ol
Strong control avoids
leakage of unique resources
(e.g., Apple).
Network effects substitute shared
control to lock in partners. Shared
control creates switching costs for
both parties and pre-empts
attracting better partners (e.g.,
Nokia and Windows).
Partners give access to
complementary resources,
but strong control enables
rigid execution to capture
complementarities (e.g.,
Ryanair).
Strong control enforces rigid
execution towards strict
activity system (e.g., Wal-
Mart).

107
Table 2: free daily newspapers across Europe and Canada
Country Timing
first title(s)
First title(s) Total entries
by end 2010
Total exits
by end 2010
Spoilers
Austria Mar-01 U-Express 8 4 2
Belgium Oct-00 Metro 1 0 0
Bulgaria Sep-08 19' 3 2 0
Canada Jun-00 Metro; FYI
Toronto; GTA
Today
11 5 0
Croatia Apr-06 24 sata 2 1 0
Czech
Republic
Jul-97 Metro 5 3 0
Denmark Sep-01 MetroXpress;
Urban
11 8 5
Finland Apr-97 Uutislehti 100 2 1 0
France Feb-02 Metro; Plus 5 0 2
Germany Oct-95 Handelsblatt News
am Abend
10 9 2
Greece Nov-00 Metro 4 0 0
Hungary Sep-98 Metro 2 1 0
Iceland Apr-01 Frettabladid 3 2 0
Ireland Oct-05 Herald AM; Metro 3 2 0
Italy Jul-00 Metro 10 2 1
Latvia Aug-05 5min 1 0 0
Lithuania Sep-05 15min 1 1 0
Luxembourg Oct-07 L'essentiel 2 0 0
Macedonia May-06 Sphic 1 0 0
Netherlands Jun-99 Sp!ts 7 3 0
Poland Nov-00 Metropol 2 1 0
Portugal Nov-04 Destak 7 3 0
Romania Jun-05 Expres 5 2 1
Serbia Sep-06 24 sata 1 0 0
Slovenia Sep-07 Zurnal24 1 0 0
Spain Feb-00 Madrid y Mas 13 7 0
Sweden Feb-95 Metro 6 3 0
Switzerland Dec-99 20
Minuten/Minutes
9 6 1
Turkey Feb-08 Gaste; 20dk 2 2 1
UK Mar-99 Metro 13 9 4
Ukraine Jun-06 15min 4 4 0

Table 3: descriptives
Variables: 1 2 3 4 5 6 7 8 9 10 11
1 TIME TO EXIT 1
2 CENSORING DUMMY .567* 1
3 FIRST .467* .202* 1
4 ADAPT -.263* -.193* -.262* 1
5 SCALE -.009 -.003 .077 .109 1
6 SHARED CONTROL .071 .102 .098 -.080 .051 1
7 STARTUP .156 .161 .158 -.066 .021 -.014 1
8 SPOILER -.249* -.094 -.189* .260* -.105 -.147 .032 1
9 DIRECT -.243* -.162 -.432* .221* -.018 .052 -.060 .228* 1
10 GDP GROWTH .006 -.117 .271* -.211* .140 -.203* .062 -.157 -.018 1
11 AD SPEND -.065 -.131 .067 -.004 .183 -.025 .048 -.066 -.034 .362* 1
Key statistics:
N 136 136 136 136 136 136 136 136 136 136 134
MEAN 52.441 .485 .257 .287 .097 .118 .331 .140 .684 2.820 .874
STD 42.283 .502 .439 .454 .171 .323 .472 .348 .467 2.417 .334
MIN 3 0 0 0 .000 0 0 0 0 -6.062 .310
MAX 190 1 1 1 1.250 1 1 1 1 9.252 2.160
Significance level: *.05

109
Table 4: frequency tables
FIRST ADAPT Frequency Percent
0 0 65 47.79
0 1 36 26.47
1 0 32 23.53
1 1 3 2.21
136 100
FIRST SHARED CONTROL Frequency Percent
0 0 91 66.91
0 1 10 7.35
1 0 29 21.32
1 1 6 4.41
136 100

110
Table 5: results Cox PH models
Model 1 Model 2 Model 3 Model 4 Model 5
Variables: PE SE PE SE PE SE PE SE PE SE
FIRST (H1: -) -1.047** .011 -.098 .587
ADAPT (H2a: +) .564** .047 .515* .287 .590** .283
SCALE (H3a: -) -.305 .646 -.297 .657 -.035 .644 -.339 .674
SHARED CONTROL (H4a: +) .133 .772 .133 .455 .095 .465
LATE&ADAPT (H2b) 1.656**** .493
LATE&NOT ADAPT (H2b) .968** .412
FIRST*SCALE (H3b: -) -13.597* 7.545
LATE&SHARED CONTROL (H4b) 1.408** .625
LATE&NO SHARED CONTROL (H4b) 1.010** .410
STARTUP -.532* .278 -.390 .165 -.377 .281 -.306 .281 -.372 .283
SPOILER .653* .340 .342 .340 .295 .360 .397 .361 .358 .359
DIRECT .638** .296 .127 .712 .064 .347 .033 .336 .113 .341
GDP GROWTH .081 .065 .131** .045 .127* .065 .134** .067 .135** .065
AD SPEND .781** .398 .764* .059 .803** .409 .827** .416 .739* .404
Fit statistics:
AIC 608.143 604.508 603.294 601.712 604.000
Likelihood ratio 18.407*** 30.042**** 31.2561**** 34.8377**** 30.5500****
PE: parameter estimate; SE: standard error; Significance level (two-sided tests): *.10 ; **.05; ***.01; ****<.001
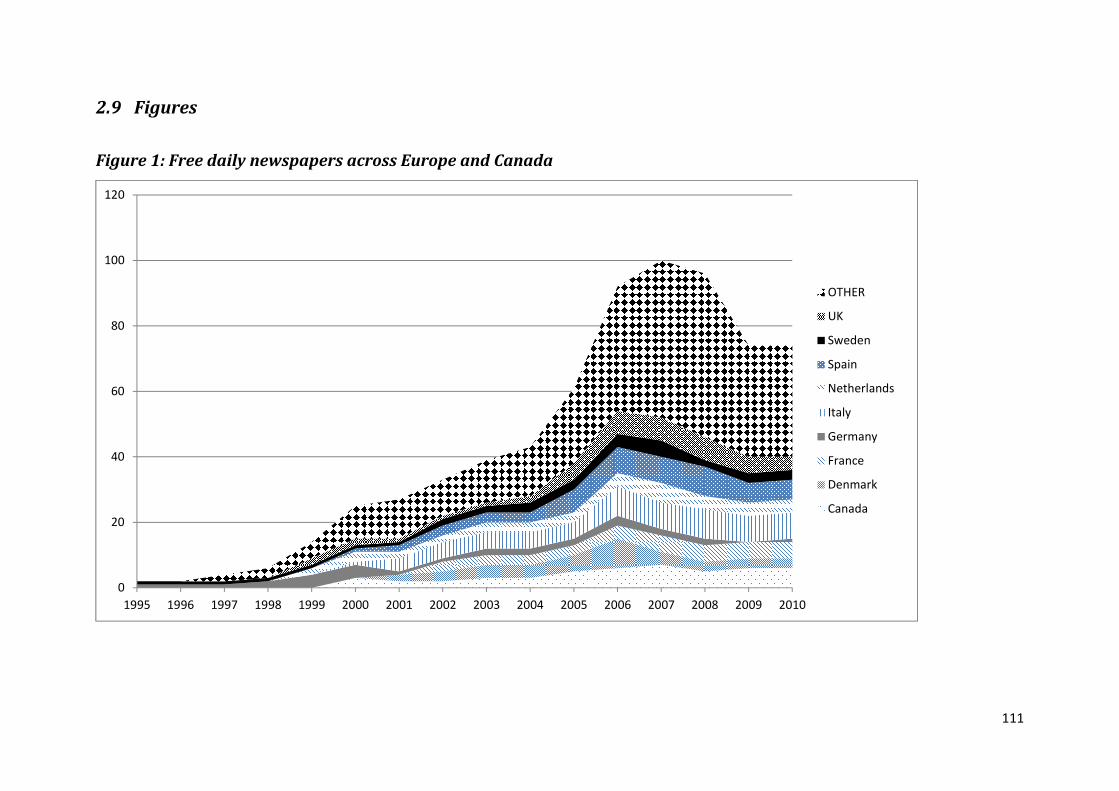
111
2.9 Figures
Figure 1: Free daily newspapers across Europe and Canada
0
20
40
60
80
100
120
1995 1996 1997 1998 1999 2000 2001 2002 2003 2004 2005 2006 2007 2008 2009 2010
OTHER
UK
Sweden
Spain
Netherlands
Italy
Germany
France
Denmark
Canada
112
Study 3 Learning and Signals Across Firms and Markets:
Identifying Entry Spillover Types and Moderators
Bart Devoldere*, Vlerick Business School
Marion Debruyne, Vlerick Business School
Ruud Frambach, VU Amsterdam
3.1 Abstract
Marketers have to anticipate and respond adequately and timely in increasingly complex and
fast-paced markets. Therefore, they need to scan their environment for market and competitive
information. However, relevant information can be very scarce and often not readily available,
especially in times of market upheaval. In such situations of high uncertainty, firms can only learn
from own, previous experiences or rely on information signals from other firms’ behavior. We study
learning and signals across firms and markets in a context of high uncertainty for incumbents. In our
study’s context, the incumbents are paid daily newspaper publishers across 14 European countries
who need to decide when to enter a new market niche, i.e., the free daily newspaper market niche.
We model entry spillover, i.e., previous market niche entries that influence a focal market niche
entry decision. We identify different types and moderators of entry spillover. We model incumbents’
time to enter the new market niche using a Bayesian hazard model that accounts for non-monotonic
event rates, non-linear, heterogeneous, and asymmetric spillover effects, and a permanent survival
fraction. We estimate our model through a Markov-Chain Monte-Carlo procedure using Metropolis-
Hastings algorithms. We find that incumbents’ entry timing is not only influenced by entry spillover
across competing firms, but also by entry spillover across non-competing firms in different markets.
Also, we show that entry spillover is non-linear, heterogeneous, and asymmetric while being
moderated by important firm and market characteristics. We discuss important contributions for
both managerial theory and practice.
Key words: Bayesian, hazard, niche entry, scanning, spillover
Acknowledgement: Bart Devoldere acknowledges financial support from the Belgian
Intercollegiate Centre for Management Science (ICM). We are grateful to the Vlerick Academic
Research Fund and the Flanders District of Creativity (FDC), both partially subsidized by the Flemish
government, for their financial support to execute this research project. We also thank participants
of the Boston 2012 INFORMS Marketing Science Conference for their useful comments.
*Corresponding author: Bart Devoldere, Vlerick Business School, Reep 1, B-9000, Ghent,
Belgium, email: [email protected], phone: +32 9 210 9874.

113
3.2 Introduction
Innovative business ideas and technologies creating new market niches in an industry are
increasingly occurring. These market niches can pose significant threats for complacent and passive
incumbents. Random examples include mobile payment solutions by Simple and Google Wallet
competing with traditional banking payment systems, and call services over the Internet by Skype
and Google Voice threatening traditional telecom fixed-line carriers. Deciding when to enter such a
new market niche is far from easy for incumbents. Entry timing can have important short- and long-
term performance implications (Gielens and Dekimpe 2001; Green, Barclay, and Ryans 1995).
However, incumbents face severe financial and managerial risks related to a lack of information on
the new market niche. Often, there is a lack of information with respect to the rewards of the new
market niche, its potential cannibalization of existing revenue streams and disruption of the existing
customer base, retaliations from incumbent competitors when entering the new market niche, etc.
However, with the Internet, smartphone, and social media use everywhere, geographically dispersed
information is increasingly and instantly available. On the one hand, it can help managers finding the
appropriate information in a timely manner to take good decisions. On the other hand, it creates an
instant and uncontrollable wealth of information signals that might be appropriate, but also
inappropriate, for the decision at hand. Managers need to structure all possible information signals
to capture the essence.
Therefore, firms --now, more than ever -- need to adequately scan their environment to actively
search and especially structure information to prepare, guide and defend their decisions.
Environmental scanning is the means through which managers perceive external events and trends
(Culnan 1983; Hambrick 1982). It has the task of reducing perceived strategic uncertainty (Daft,
Sormunen, and Parks 1988). Various literature streams suggest that environmental scanning is
important for firms to create and sustain a competitive advantage. Previous research on market
orientation (Hult, Ketchen, and Slater 2005; Kohli and Jaworski 1990), absorptive capacity (Cohen
and Levinthal 1990), dynamic capabilities (Teece 2007), and organizational vigilance (Day and
Schoemaker 2006; Fiol and O'Connor 2003; Levinthal and Rerup 2006) all suggest that firms should
actively scan their environment to identify, anticipate, and respond adequately to market
opportunities or threats. Also, scanning can provide a firm with an information advantage based on
the firm’s ability to perceive important signals in its environment before competitors do (Dutton and
Freedman 1984). Moreover, scanning is also gaining importance because there are more and more
situations where there are problems of data overload and accelerated market complexity (Day
2011).
Previous research on scanning focuses on developing and managing an adequate scanning
system, describing scanning activities based on scanning mode, frequency, scope, and top
management involvement, and studying the alignment between environmental characteristics and a
firm’s scanning system design (e.g., Aaker 1983; Aguilar 1967; Culnan 1983; Daft et al.1988; Elenkov
1997; Hambrick 1982; Hambrick and Mason 1984; Yasai-Ardekani and Nystrom 1996). However,
there are two important remaining gaps in the literature that make it difficult for firms to adequately
scan their environment, especially when the information is geographically dispersed and firms lack
time and money to conduct extensive scanning activities. First, previous research on scanning seems
to assume that the relevant environmental boundaries coincide with the product-geographic scope
of the firm (Yasai-Ardekani and Nystrom 1996) or with the perceived impact of events on a firm’s

114
own performance (Aaker 1983; Daft et al. 1988; Pfeffer 1978). However, with increasingly global
competition and blurring industry boundaries, a firm’s relevant threats and opportunities also come
from outside its current product-geographic scope. It implies that the relevant geographic
environment to scan might be much broader than what initially is expected. Second, whereas
previous research focuses on listing all possible information sources and stressing the importance of
applying a broad scanning scope with high frequency when uncertainty is high, little is known on
what information sources are actually influencing firms’ decisions. Consequently, previous research
provides little help for firms how to grasp what information signals in its environment are most
relevant, especially when these firms have limited resources but ever increasing data dispersion and
complexity.
Therefore, instead of merely focusing on a firm’s currently served product-geographic
environment and on signals’ potential influence on firm decisions, we study what information signals
actually influence a focal industry incumbent’s decision when to enter a new market niche and how
these signals influence that decision, while taking into account signals from both served and non-
served geographic environments. We focus on information signals related to previous market niche
entries. We define entry spillover as signals related to a previous market niche entry by a particular
firm in a particular market that influence the focal firm’s decision on when to enter that market
niche in a focal market. Scanning here involves gathering and monitoring information on previous
market niche entries. A market niche entry is done by a particular firm in a particular market.
Therefore, we can relate information signals from previous market niche entries to both firms and
markets, and their respective characteristics.
Previous research suggests there is entry spillover that takes place within firms across markets,
and entry spillover that takes place across firms within markets. Firms can search within their firm
boundaries for information and own experiences with the new market niche in other markets. For
example, firms use entry experiences in similar markets to guide focal entry decisions (Mitra and
Golder 2002). The theory on multinational enterprises specifically states that firms active in multiple
markets build one organization in order to transfer knowledge more efficiently across markets
(Kogut and Zander 1993; 2003). However, it can be hard to transfer knowledge internally (Aaker
2008; Szulanski 1996). Also, previous experience is often not available in case of early-stage market
niche development and only focusing on internal knowledge can seriously bias a firm’s market
assessment. However, firms can also look outside their firm boundaries for information related to
market niche entries. Previous research suggests that firms look at competitors’ entries as signals of
market attractiveness to guide a focal market entry decision (Bowman and Gatignon 1995; Gielens
and Dekimpe 2007; King and Tucci 2002). Also, so-called fad theorists claim that information about
how many adopters there are and who specifically has adopted the innovation, rather than
information about the innovation itself, generates social pressure for a firm’s decision-makers to
conform to imitation behavior (Abrahamson 1991; Aldrich and Fiol 1994; Fiol and O’Connor 2003).
However, there are at least two important research gaps remaining which impedes a more
elaborate understanding of entry spillover. First, previous research only identifies entry spillover
within firms across markets (cf., internal knowledge transfer of own, previous niche entries in other
markets) and entry spillover across firms within markets (cf., competitive imitation behavior).
However, why would there not be a third type of entry spillover that takes place across firms across

115
markets? Neglecting information signals from other firms in other-than-focal markets might harm
and slow down a firm’s entry decision, because it leaves out potentially important and early
information while also focusing too much on knowledge about current markets and competition.
Also, previous research does not study different types of entry spillover together. That can introduce
a bias in terms of the importance and effect of the different types of entry spillover on the focal
entry decision. Second, previous research indicates that entry spillover can differ in strength. For
example, firms can transfer knowledge more easily across similar markets (Gielens and Dekimpe
2007; Mitra and Golder 2002) and firms are more inclined to imitate similar firms (Debruyne and
Reibstein 2005). However, there can be other dimensions than similarity that moderate entry
spillover. For example, spillover strength could differ also depending on characteristics of the sender
and the receiver of the information signal, which is a common assumption in the signaling literature.
It implies that other firm and market characteristics could simultaneously influence entry spillover.
Also, it implies that entry spillover might not be -- as often assumed -- symmetric, i.e., that the
influence of firm A on firm B is not equal to the influence of firm B on firm A. Neglecting other
spillover dimensions, possible asymmetry of spillover effects, and not simultaneously taking into
account different firm and market characteristics that could moderate entry spillover, can introduce
a bias when modelling entry spillover.
In sum, the following research questions are remaining. First, what are the different types of
entry spillover and do they influence entry timing differently? Second, how do different types of
entry spillover influence entry timing? Third, what firm and market characteristics moderate entry
spillover across firms respectively markets? We address these literature gaps and research questions
as follows. Based on theoretical and practical observations, we present a conceptual and empirical
model to identify different types of entry spillover and different market and firm characteristics that
moderate entry spillover. We model when incumbents enter a new market niche based on previous
market niche entries. Our Bayesian hazard model accounts for a possibly non-monotonic event rate,
a permanent survivor fraction, and potentially asymmetric spillover effects. We estimate the model
using a flexible Markov Chain Monte Carlo (MCMC) method known as the Metropolis-Hastings (MH)
algorithm. This algorithm allows us to generate samples from the posterior distribution without the
form of the posterior density being known analytically. The context involves incumbent publishers of
paid daily newspapers that are confronted with a new market niche, i.e., the free daily commuter
newspaper market (e.g., Metro, 20 Minutes). We collected data on 163 incumbent newspaper
publishers in 14 European markets for the period 1995-2010. The unit of analysis is the incumbent
publisher-market combination.
Our study contributes to managerial theory and practice. We add to various literature streams.
First, we contribute to the literature on scanning by showing which information signals actually
(instead of potentially) influence a firm’s decision while taking into account signals from both served
and non-served geographic environments. Thereby, we shift the attention from the scanning system,
its characteristics, and its usage, towards the possible impact of a scanning system in firms’ decision-
making. Second, we extend signaling theory by identifying the co-existence of both direct and
indirect signals related to market entry. Direct signals are tied to the market of interest or direct
competitors, whereas indirect signals are tied to non-focal markets or non-competing firms. Prior
research on signaling focuses on direct signals. Market entry spillover across firms across markets
suggests that indirect signals can still be meaningful, i.e., that these indirect signals can still influence

116
firm decision-making. Moreover, we detect firm and market characteristics that increase signal
strength and we model the influence of signals on firm behavior more realistically taking into
account characteristics of signal senders and receivers. Third, our hazard model has several
characteristics to create more realistic models for empirical research on market entry timing. We
allow for non-monotonic event rates to allow for models closer to empirical settings, asymmetric
effects to include more realistic spillover models, and permanent survivor fractions that follow
common sense that not all incumbents always enter new market niches. Moreover, our model is
highly flexible and uses publicly accessible data.
We add to managerial practice by identifying relevant dimensions of firm scanning activities and
how these can influence firm decisions in a complex and uncertain market context. Thereby, we
develop a framework helping firms to detect not only strong signals from close competitors, but also
relevant, weak signals on the periphery of a firm’s scanning activities. It implies that firms
confronted with new market niches will be better able to foresee and predict whether, when and
where incumbents will react. That can be important for both innovators and incumbent firms in
order to proactively assess competitive behavior and evolutions in the industry. Also, our results on
what firm and market characteristics are driving entry spillover, will benefit managers through
knowing better how to organize scanning activities and gather industry intelligence in terms of what
markets and firms to watch for competitive and industry-specific information, without creating data
overload.
Our paper proceeds as follows. First, we develop our conceptual framework and hypotheses.
Second, we specify our study context. Third, we clarify our model specification and estimation
procedure. Fourth, we show our data collection and variable operationalization. Fifth, we report
results and discuss our findings. We conclude with some limitations of this study and opportunities
for future research.
3.3 Conceptual development
3.3.1 Scanning and entry spillover
Firms need to identify, anticipate and respond to market opportunities and threats to build and
sustain a competitive advantage. Environmental scanning is used by managers to identify and
capture information on external events and trends that can lead to a market opportunity or threat
for a firm (Culnan 1983; Hambrick 1982). Scanning has the task of reducing perceived strategic
uncertainty with respect to these external events and trends (Daft et al. 1988). Also, scanning can
provide a firm with an information advantage when it lets a firm perceive important information
signals in its environment before competitors do (Dutton and Freedman 1984). Moreover, with
accelerated market complexity in many industries and problems of data overload, scanning can
serve a firm by enabling it to cope with uncertainty and change (Day 2011). Scanning activities
underlie particular firm capabilities that are considered key for long-term organizational
performance and survival. For example, scanning is an essential part of a firm’s market orientation
(Hult et al. 2005; Kohli and Jaworski 1990), absorptive capacity (Cohen and Levinthal 1990), and

117
dynamic capability (Teece 2007). Market-oriented firms are expected to have increased short-and
long-term performance (e.g., Kumar et al. 2011). Increased absorptive capacity enhances a firm’s
capability to identify and appreciate market opportunities. It enhances a firm’s capability to enter
new markets (Danneels 2008) and its profitability (Narasimhan, Rajiv, and Dutta 2006). A firm’s
dynamic capability has been related to a firm’s long-term performance and survival, especially when
a firm’s environment is in serious upheaval (e.g., Helfat et al. 2007; Teece 2007; Teece, Pisano, and
Shuen 1997).
Firms build a scanning system to adequately identify and capture information signals related to
external events or trends (e.g., Aaker 1983). Important decisions firms need to take are how they
build and manage their scanning system. For example, firms differ with respect to scanning mode or
information sources, scanning frequency and scope, and top management involvement (e.g., Aaker
1983; Aguilar 1967; Culnan 1983; Daft et al. 1988; Elenkov 1997; Hambrick 1982; Hambrick and
Mason 1984; Yasai-Ardekani and Nystrom 1996). Firms focus in their scanning activities on
environmental events or trends that have an impact on their own performance (Aaker 1983; Daft et
al. 1988; Pfeffer and Salancik 1978). Otherwise, scanning activities could become far too expensive
and difficult to manage. However, because of this focus on events or trends with an impact on the
own performance, firms could define their relevant environment, in which they scan for information
signals, narrowly, i.e., coinciding with the product-geographic scope of the firm (Yasai-Ardekani and
Nystrom 1996). However, when a new market niche in an industry has been created, such a
narrowly defined environment could be harmful. With the advent of a new market niche,
incumbents’ uncertainty is high. There is high uncertainty with respect to the new market niche’s
revenue potential, possible cannibalization, disruption likelihood of the existing customer base,
retaliations from incumbent competitors towards firms entering the new market niche, etc.
However, a new market niche can originate from anywhere so that information on the new market
niche is often not readily and easily available within a firm’s product-geographic scope. Waiting for
information signals within its environment that can have a performance impact can be harmful. For
example, when there are important first-mover advantages related to the new market niche. Also,
indirect competitors outside a firm’s current product-geographic market scope can turn into direct
competitors in the future, especially with increasing globalization.
Therefore, we argue that firms broaden the scope of their scanning activities when there is a
new market niche in the industry. Scanning then involves gathering and monitoring information
related to all previous entries in the new market niche, both in- and outside the firm’s current
product-geographic market scope. Entry spillover occurs when signals from a previous market niche
entry by a particular firm in a particular market influence the focal firm’s market niche entry decision
in a focal market. Such spillover effect takes place because firms use information on previous market
niche entries to reduce the uncertainty and risk involved with their own possible market niche entry.
Whereas scanning refers to information gathering and monitoring with a potential effect on firm
decision-making, spillover refers to actual effects of information signals on firm decisions.
We suggest there are three different types of entry spillover based on the two main information
dimensions firms relate to a market niche entry, i.e., information tied to the entering firm and
information tied to the market. First, there can be entry spillover within firms across markets. Firms
can search within their organization for information and experiences related to own, previous

118
entries in that market niche in other markets. Previous market niche entries by the firm add to its
learning and knowledge about that specific market niche and how to enter market niches in general.
A firm’s capabilities, also market entry capabilities, are built through learning by doing (Helfat and
Lieberman 2002; Levitt and March 1988; Zollo and Winter 2002). Also, once a firm built valuable
resources to adequately perform a capability (e.g., technological and customer knowhow to be used
in a market entry capability), a firm can re-use these resources when redeploying that capability in a
related situation (e.g., Danneels 2007; Penrose 1959). It implies that firms actively apply knowledge
on previous market niche entries for subsequent entries. For example, entry experiences in markets
culturally, economically and geographically close to a focal market can speed up entry in that focal
market (e.g., Gielens and Dekimpe 2007; Mitra and Golder 2002). Also, once incumbents are
convinced to enter a new market niche in one market, they need less time to decide on a
subsequent market niche entry in another market, because they have more information and
knowledge on potential financial and managerial risks involved. Moreover, a firm organizes itself
across market borders in one enterprise to transfer knowledge more efficiently across markets
(Kogut and Zander 1993; 2003). It implies that there are knowledge streams within firms across
markets that can influence subsequent firm decisions. This learning behavior within firms across
markets related to market niche entry decisions reflects a first type of market entry spillover.
Second, there can be entry spillover across firms within markets. Firms look outside their firm
boundaries for information, because it can be hard to transfer knowledge internally (Aaker 2008;
Szulanski 1996), and because own previous experience is often not yet available in case of early-
stage market development. Under uncertainty, decision makers may turn to others’ behavior as a
signal of the value of an action (Gilbert and Lieberman 1987). Market entries by competitors signal
market attractiveness which can lead to contagion or imitation behavior among firms (Kennedy
2002). Also, market niche entries by competitors create social pressure among managers to also
enter. In a similar vein, information about how many adopters there are and who specifically has
adopted the innovation, rather than information about the innovation itself, generates social
pressure for a firm’s decision-makers to conform to imitation behavior (Abrahamson 1991; Aldrich
and Fiol 1994; Fiol and O’Connor 2003). In the process of contagion, each adoption of a new practice
or product makes the subsequent adoption from a potential adopter more likely (Burt 1987). At an
aggregate market level, population growth models claim that increased entry into a new market
attracts new entry in turn (Gort and Konakayama 1982; Hannan and Freeman 1977; Lambkin and
Day 1989). Besides contagion of managerial decisions across firms, contagion has also been
documented extensively as a dynamic behind the diffusion of new products (Bass 1969; Rogers
1995). It suggests that firms tend to look at competitors’ entries to guide a focal entry decision
(Bowman and Gatignon 1995; King and Tucci 2002). Such entry imitation behavior among firms
reflects entry spillover across firms within markets. Prior empirical research shows the existence of
such entry spillover with respect to entry timing (e.g., Debruyne and Reibstein 2005; Gielens and
Dekimpe 2007).
Third, whereas previous research focuses on direct entry spillover, i.e., spillover within firms
across markets or spillover across firms within markets, we argue there can also be indirect entry
spillover across firms across markets. Both empirical and theoretical observations suggest the
existence of such indirect entry spillover across firms across markets. Organizational theory
establishes that firms learn from own experiences and other firms’ experiences (Levitt and March

119
1988). It has been suggested that the ability of firms to learn from each other is not noticeably
restricted by national markets (Baldwin and Krugman 1988), i.e., that international inter-
organizational learning networks might exist (Tregaskis 2003). Indeed, if knowledge transfers exists
across firms within markets, it is hard to imagine there can be no such transfers across firms across
markets. Especially, when there are more and more cultural exchanges, and increasing trade and
better communication across markets. For example, prior research at aggregate market level shows
contagion effects across different markets with respect to the adoption of organizational practices
such as ISO certifications (Albuquerque, Bronnenberg, and Corbett 2007). Research in the
semiconductor industry even indicates that learning spills over just as much between firms in
different markets as between firms in a given market (Irwin and Klenow 1994). Although ‘local’
spillover still seems more important than ‘distant’ spillover, previous empirical studies in economics
show a substantial amount of evidence of knowledge spillover across markets (Keller 2002).
Also, increasingly, firms become internationally active in multiple markets. Not only firms from
developed economies, but also distant firms born in emerging economies enter different markets
worldwide. For example, over the past decade, the number of parent companies from emerging
economies, such as Brazil, China, and India, increased from less than 3,000 to more than 13,000
(UNCTAD 2006). Therefore, incumbents should anticipate market entries by firms that are yet
unknown because operating in different markets, and start monitoring them. Also, higher
international presence implies that competitors are finding themselves more and more in
overlapping markets (Gielens, Helsen, and Dekimpe 2012). The higher the number of overlapping
markets between competitors, the more multimarket competition and the more competitive effects
across markets can occur. Multimarket competition refers to situations in which the same firms
compete against each other in multiple markets (Jayachandran, Gimeno, and Varadarajan 1999).
Moreover, increased multimarket contact between two firms implies that these firms become more
interdependent, which means that the outcome of one firm’s actions becomes more contingent
upon competitive actions and reactions of the other firm. Also, when firms collect information on
competitors, competitors encountered in multiple markets are likely to receive more attention than
those encountered in fewer markets, even for information from those markets that are not yet
overlapping. Whether multimarket contact leads to more (Porter 1980), less (Bernheim and
Whinston 1990; Feinberg 1985), or more strategic competition (Kang, Bayus, and Balasubramanian
2010), all outcomes imply that firms monitor multimarket competitors more than other competitors.
We hypothesize the following.
H1a: Entry spillover within firms across markets decreases entry timing.
H1b: Entry spillover across firms within markets decreases entry timing.
H1c: Entry spillover across firms across markets decreases entry timing.
3.3.2 Moderators of entry spillover
When firms scan previous market niche entries, they need to structure all these information
signals to capture the essence. We argue that firms focus on information signals from particular
firms in particular markets more than from other firms or markets. We suggest that entry spillover is
heterogeneously distributed across firms and markets. Heterogeneous entry spillover means that
entries by firm F1 (in market M1) have more or less influence on subsequent entries by other firms

120
(in other markets), than entries by firm F2 (in market M2). Also, we suggest that entry spillover is
asymmetric. Asymmetric spillover means that entries by firm F1 (in market M1) can have more or
less influence on entries by firm F2 (in market M2), than that entries by firm F2 (in market M2) have
on entries by firm F1 (in market M1).
There are several theoretical and empirical arguments to suggest heterogeneous and
asymmetric entry spillover. First, heterogeneous and asymmetric entry spillover is in line with
signaling theory. It states that signals can have different strength (Lampel and Shamsie 2000;
Sorescu, Shankar, and Kushwaha 2007). Signal strength depends on the signaling environment
(Janney and Folta 2006; Park and Mezias 2005) and on sender characteristics such as being
observable and credible (Busenitz, Fiet, and Moesel 2005; Certo 2003; Lampel and Shamsie 2000;
Ramaswami et al. 2010; Warner, Fairbank, and Steensma 2006). Moreover, different receivers
process signals differently (Fischer and Reuber 2007; Gulati and Higgins 2003). Second, research in
competitive strategy suggests that spillover effects across firms are not homogeneously distributed.
A firm’s decision makers construct mental models of their industry in which they categorize
competitors in different groups (Porac and Thomas 1990). Firms in the same competitive group as
the focal firm get more attention and are more subject to imitation from the focal firm’s decision
makers than firms outside that group. Moreover, the more uncertainty surrounds a decision, the
more peer comparison becomes a guide (Haunschild and Miner 1997). For example, research in the
U.S. online brokerage industry shows that firms are more inclined to imitate market niche entries by
competitors that are similar in size and resources (Debruyne and Reibstein 2005). Also, firms seem
more likely to imitate competitors that are successful in terms of profits or size (Haveman 1993).
Moreover, previous research shows that competitive rivalry is asymmetric, i.e., a given pair of firms
may not pose an equal threat to each other (e.g., Chen 1996; Gielens et al. 2008). Third, spillover
effects across markets seem heterogeneously and asymmetrically distributed for at least two
reasons. First, a firm’s local knowledge is said to be sticky, i.e., difficult to transfer within the firm
across markets (Jensen and Szulanski 2004; Szulanski 1996). However, local knowledge and
experiences are easier to transfer to markets close in terms of culture, demography, economy and
geography (e.g., Gielens and Dekimpie 2007; Mitra and Golder 2002). Second, innovations diffuse
not homogeneously across markets (Dekimpe, Parker, and Sarvary 2000; Ganesh and Kumar 1996).
For example, spillover effects across markets with respect to the probability for new product takeoff,
suggests that these spillover effects are heterogeneous and asymmetric based on markets’
demographic, economic and geographic characteristics (van Everdingen, Fok, and Stremersch 2009).
To structure entry spillover’s heterogeneity and asymmetry, we split a spillover process in three
main dimensions. For every spillover, there is a source, a receiver, and a distance to overcome. The
source firm is the firm that enters the new market niche previous to a focal firm’s decision and the
source market is the market in which that source firm enters that new market niche. The receiver
firm is the focal firm and the receiver market is the market in which the focal firm might enter the
new market niche. The distance to overcome is the physical or mental distance between source and
receiver firm, or between source and receiver market. The spillover dimension related to the source
is ‘sphere of influence’ of the source towards potential receivers. Sphere of influence embodies how
well senders of information are able to capture the attention of potential receivers with respect to
the information that is conveyed. The spillover dimension related to the receiver is ‘receptivity’ of
the receiver towards external information. Receptivity embodies how well potential receivers of

121
information are able or open to capturing information. The spillover dimension related to distance
to overcome is the ‘proximity’ between senders and receivers. We argue that sphere of influence,
proximity and receptivity enhance entry spillover and decrease a focal incumbent’s time to enter the
new market niche.
We identify several firm characteristics that can influence firms’ proximity, sphere of influence,
or receptivity. First, we argue that familiarity and similarity between a pair of firms increase their
proximity. We relate market contact and resource similarity to firms’ familiarity respectively
similarity. Firms are familiar with each other through market contact in one or more markets. Firms
watch familiar firms’ actions more closely than those of less familiar firms. For example, firms with
heavily overlapping market presence are often found in situations with increased imitation of
product introductions (Kang et al. 2010; Young et al. 2000). Also, in case of multimarket contact,
foreign competitors can influence local firms’ entry behavior (Kang et al. 2010). With respect to
similarity, firms can be similar through their resource bundles in terms of both size and type (Chen
1996). Firms are likely to watch actions of firms with similar resources more closely (Porac and
Thomas 1990). Previous research indeed shows that firms are more likely to imitate competitors
with similar resources when entering new market niches (Debruyne and Reibstein 2005). Also, fellow
incumbents are more likely to watch other incumbents not only due to similar resource bundles, but
also because of shared history and possible competitive interactions. Moreover, previous research
indicates that incumbents’ performance in a new market niche is more related to other incumbents’
entry order, rather than to the overall entry order (Mitchell 1991; Narasimhan and Zhang 2000).
Second, market leaders have a higher sphere of influence towards other firms. Market leaders are
more easily observable and socially prominent which makes their market entries more likely to be
watched and hence imitated (Greve 2000). Also, market leaders have the power to signal what the
direction of the industry should be and what behavior of other industry participants is expected
(D'Aveni 1999). Moreover, established firms and especially market leaders who enter a particular
new market create substantial legitimacy for that new market (Navis and Glynn 2010; Rao, Chandy,
and Prabhu 2008). Third, a firm’s receptivity to being influenced by other firms’ actions depends on
its ability to capture signals and its ability to respond. We relate firm size to a firm’s ability to capture
signals and its ability to respond. Receivers’ attention is linked to the intensity of their scanning
activities (Connelly et al. 2011; Gulati and Higgins 2003; Janney and Folta 2006). Firm size has a
positive influence on the frequency of scanning activities (Yasai-Ardekani and Nystrom 1996). A
higher frequency of scanning the environment increases a firm’s ability to capture signals and
develop more knowledge. A firm’s ability to respond refers to the capacity of its available resource
bundle to react appropriately. Larger firms typically have more resources to react. Previous research
shows that in a context of destabilization of current business, a larger size of the incumbent firm
results in a higher ability to react (Aboulnasr et al. 2008). However, larger firms might also take their
time to react because of structural inertia (Hannan and Freeman 1984; Kuester, Homburg, and
Robertson 1999) or because they have a higher capacity to withstand a threat (Gielens et al. 2008).
Therefore, we hypothesize the following.
H2a: Firms’ proximity amplifies market entry spillover across firms.
H2b: A firm’s sphere of influence amplifies market entry spillover across firms.
H2c: A firm’s receptivity amplifies market entry spillover across firms.

122
We identify several market characteristics that can influence markets’ proximity, sphere of
influence, and receptivity. We focus on economic, demographic, cultural and geographic market
characteristics. First, we expect that cultural similarity, language similarity, geographic proximity,
and economic similarity increase the proximity between a pair of markets. Previous research shows
that influences across markets can be moderated by market similarity and economic relations
(Albuquerque, Bronnenberg, and Corbett 2007). Also, people with similar cultural values and a
similar language will be more inclined to speak to each other, read about the other and exchange
information. People communicate more easily when they share a common cultural background
(Ganesh, Kumar, and Subramaniam 1997; Kumar and Krishnan 2002; Rogers 1995; Takada and Jain
1991). Moreover, we expect that the more geographically distant markets are, the weaker the
international spillover is between them. Geographical proximity of rivals facilitates transfer of ideas
and imitation (Albuquerque et al. 2007), and is shown to be linked to knowledge spillover, innovative
activity, and firm development (Audretsch and Feldman 1996). There are also stronger networking
possibilities between firms within geographic clusters. For example, previous research finds so-
called neighborhood effects (Mahajan et al. 1979) and spatial clusters in adoption phenomena
(Garber et al. 2004). Second, we expect that the larger a market’s GDP, export size, and population
size are, the larger the market’s sphere of influence is. Markets with a lot of inhabitants, large GDP
or important export activities such as the U.S.A. and China, have a high visibility and economic
power towards other markets in the world. Trends and evolutions in these important markets are
being watched and followed more closely from abroad. Also, people in more open, export- or
import-oriented economies, are better able to share information with foreigners relative to people
from more closed economies, thanks to more relationship heuristics they developed (Wuyts et al.
2004), e.g., the way to conduct business with a market (Beise 2004). Third, we expect a larger
market susceptibility when a market has a smaller GDP, larger import activities, and higher
population density. Economic smaller markets and open, import-oriented markets are less self-
centered, and more depending upon (and thus more inclined to watch) what happens in other
markets. Foreign information can more easily penetrate the social system in densely populated
markets (Lemmens, Croux, and Dekimpe 2007; Mitra and Golder 2002). Also, people in dense
markets are close to each other physically, which may stimulate them to communicate. Therefore,
we hypothesize the following.
H3a: Markets’ proximity amplifies market entry spillover across markets.
H3b: A market’s sphere of influence amplifies market entry spillover across markets.
H3c: A market’s receptivity amplifies market entry spillover across markets.
3.3.3 Control variables
We control for several other factors that can explain entry timing. First, we control for firm size.
Firm size is often treated both as a proxy for market power and structural inertia. Firm size has been
associated with market power in both domestic and international contexts (Vibha, Yigang, and
Gerardo 2002). Large firms may be less financially restricted and more influential towards local
authorities for obtaining access to unique distribution facilities (e.g., subway stations). Also, more
financial resources provide a buffer against the risk of entering a new market niche. However,
bureaucratic tendencies from greater structural complexity and formalization can lead to increased
inertia which negatively affects a firm’s ability to react swiftly to new opportunities. Therefore,

123
although it is important to control for firm size, it is difficult to predict its impact on market entry
timing (Gielens and Dekimpe 2007).
Second, we control for previous failures in the new market niche. The perception of risk to enter
a market niche is closely related to previous failures in that market niche. The underlying reasons of
those failures (e.g., competitive rivalry, inefficient operations, etc.) are often unknown to other than
the failed firm itself and are thus hard to disentangle. We consider previous failures in the new
market niche as flow signals at aggregate market level that are important to signal the quality of a
possible entry. In a similar vein, Dekinder and Kohli (2008) showed that flow signals at firm level, i.e.,
a pattern of signals over multiple periods, can be important signals for the quality of start-up firms.
The more market niche entries that failed to survive, the riskier a market niche entry seems, and the
longer an incumbent will want to wait before entering.
Third, we control for a focal market’s attractiveness that is expected to increase the incumbent’s
time till entering the market niche. Market attractiveness is related to various economic and
demographic characteristics such as economic wealth and growth, and market potential. It seems
counterintuitive to expect a positive effect between market attractiveness and entry timing.
However, given that market attractiveness is positive for both the incumbent market and the new
market niche, and the complex and potentially grave effects of market niche entry on the incumbent
business, incumbents are expected to adopt a wait-and-see approach when market attractiveness is
high.
Figure 1 summarizes our conceptual framework. We model how previous market niche entries
influence a focal market niche entry by a particular firm in a particular market. Thereby, we
distinguish between different types of entry spillover and include different moderators of entry
spillover.
3.4 Context
The context of our study is the advent of a new market niche in the incumbent daily newspaper
industry. An innovative business idea by Metro International in Stockholm (Sweden) leads in
February 1995 to a new type of daily newspaper which is the start of a new market niche in the daily
newspaper industry. The main characteristics of the innovative newspaper are the following. First,
consumers can take the daily newspaper for free instead of paying a subscription or per-issue fee.
The newspaper is ad-sponsored which means that ad revenues are the only revenue stream for the
publisher. Second, the free newspaper appears daily, i.e., at least four times a week. It is also
considered a newspaper, i.e., it contains considerably more information content than advertising
content. Third, the free newspaper is mainly distributed in high-traffic commuter zones and in public
transportation systems, e.g., through self-service racks or by hand distributors in railway, subway,
and bus stations. Its target consumers are daily commuters using public transportation.
We study whether and how entries in the new market niche by both paid newspaper
incumbents and new entrants in the industry influence the entry timing of incumbent publishers of
paid newspapers in the new market niche of free daily newspapers. In many European countries

124
both paid newspaper incumbents and new entrants enter this new market niche opportunity. In
2000, there are 29 free daily newspapers in 14 European countries with an estimated circulation of
5.5 million copies, and in 2005, there are already 81 free daily newspapers in 24 European countries
with an estimated circulation of 15.4 million (Bakker 2008). The Metro phenomenon is not restricted
to Europe though. Since January 2000, Metro is also distributed in Philadelphia, Boston and New
York, and since June 2000, Metro appears in Canada. Moreover, free daily newspapers are present in
Latin America, Asia, Australia and Africa. Bakker (Bakker 2008) counts 247 free daily newspapers in
56 countries worldwide with a daily circulation of 44 million copies at the end of 2007.
This context is interesting and appropriate for several reasons. First, ad-sponsored market niches
like the free daily newspaper market niche are highly visible, relatively easy to imitate, and with low
entry barriers. Therefore, incumbents’ entry is based on strategic considerations rather than tied to
technological capabilities. Second, the free daily newspaper idea creates much fear and uncertainty
among incumbent paid daily newspaper publishers about its impact on incumbent revenue streams
and about its own viability for long-term survival. It also contains important first-mover advantages
in distribution. First-movers can use the railway system to display their free daily newspapers in
racks in stations thanks to often exclusive agreements with public transportation authorities,
whereas late-movers need to use people who hand out the free daily newspapers in the street, are
forced to distribute in alternative locations with less traffic (e.g., racks in office or apartment
buildings), or have to deliver the newspaper to people’s homes. Moreover, the idea of free daily
newspapers expands internationally in a relatively short period of time. Third, low-cost formats have
important social, competitive, and economic impacts (Gatignon and Anderson 2001; Singh, Hansen,
and Blattberg 2006). The advent of free daily newspapers concerns many different stakeholders.
There are the media companies that already suffered from several radical changes in recent history,
including the advent of online -- often free -- content provision, free classified ad websites (e.g.,
Craigslist), and convergence of various media, internet, and telecom players. There are also powerful
industry organizations like WAN-IFRA, and policy makers monitoring the media industry because of
its democratizing character and important public information channel.
3.5 Methodology
3.5.1 Model specification
Our model specification is based on our conceptual framework in figure 1 and follows Congdon
(2008). We develop a hazard model specifying the influence of all previous market niche entries by
any firm in any market, on a focal incumbent’s time to enter the new market niche in a focal market.
We model previous market niche entries by both industry new entrants and industry incumbents.
Time-to-entry is denoted by variable T. Our unit of analysis is the incumbent firm-market
combination. In our context, market borders are coinciding with country borders.
Our hazard model accounts for a permanent survivor fraction, a possibly non-monotonic event
rate, and non-linear and asymmetric spillover effects. Traditional survival models assume a survivor
function tending to be zero in the limit, i.e., that all incumbents would enter the new market niche in

125
the end. However, in line with previous research on split-hazard models (e.g., Sinha and
Chandrashekaran 1992; Dekimpe et al. 1998), it is more realistic to include a permanent survivor
fraction which assumes that not all incumbents will enter the new market niche. It is highly unlikely
that all incumbents will be convinced to pursue a purely ad-sponsored business concept which
would easily turn into an unwanted Bertrand competition (Casadesus-Masanell and Feng 2011).
Also, it is unlikely that the free daily newspaper market will totally overtake the paid daily
newspaper market. Comparable free or low-cost initiatives in other industries such as the airline and
banking industry, are also not completely overtaking, but rather living next to, paid businesses,
serving different customer segments. Also, we assume (and test) that the event-rate will be non-
monotonic. It means that the rate first increases but after reaching a peak it tails off again. It follows
from our assumption of a permanent survivor fraction and our hypotheses on important first-mover
advantages. A non-linear event rate is also in line with previous research stating that two opposing
forces, i.e., legitimization and deterrence effects, can shape the entry rate in a given market such
that there would be an inverted U-form relationship between entry rate and a market’s competitive
density (Carroll and Hannan 2000). Rival entry initially facilitates a process of legitimization attracting
other players to enter the market. However, as competitive investments increase in certain markets,
the best market space becomes pre-empted creating a deterrence effect that eventually can
dominate the legitimization effect (Hannan and Freeman 1977). A log-logistic distribution is a
parametric model accommodating for such a non-monotonic event rate.
Let v� be a partially unobservable binary indicator and n be an observation from an incumbent
firm i in a particular market c in which the incumbent firm i publishes a paid daily newspaper in
February 1995 (n = 1,2,…,N; i = 1,2,…,I; c=1,2,…C). An incumbent firm thus refers to a newspaper
publisher who is publishing a paid daily newspaper at the time the free daily newspaper market
niche started in February 1995. An incumbent firm can either enter the free daily newspaper market
in the market where it already offers a paid newspaper (with v�=1 and Pr(v�=1)=�d), or not (with
v�=0 and Pr(v�=0)=1-�d). Observing whether a firm enters or not depends on the censoring time.
For firms observed to enter (denoted by a binary, censoring indicator �d=1), v�=1 and their
likelihood contribution is Pr(v�=1) f(��) =�df(��) with f(��) the time-to-entry density function.
Censored firms (with �d=0) either enter never (i.e., permanent survivor) or enter after our
observation period that runs from February 1995 till December 2010. Censored firms’ likelihood
contribution is then Pr(v�=0) + Pr(v�=1) f(T>��) = (1-�d) + �dS(��) with S(��) the time-to-entry
survival function. Following a log-logistic distribution for T, the hazard function f(t) and survival
function S(t) have the following form with α, λ and t >0 (See equations 1 and 2). If 0<a<=1, we have a
unimodal distribution. If, as we would expect, a>1, then there is non-monotonicity. The overall
likelihood of all N observations is specified in equation 3.
(1) f(t) = W�W�W−1
(1+(��)W)2
(2) S(t) = (1 + (��)W)−1
(3) L(��,�d) = ∏ ���� α����W−1�1+(����)W�2�
�� �(1 − ��) + ��1+(����)W�1−��
�y�=1
�� shows the probability to enter which we assume to be .27 based on a maximum likelihood
grid search. We are interested in �� which models the timing of an incumbent’s market niche entry

126
(See equation 4). Important parts of equation 4 are the following. First, we model the different types
of entry spillover that can influence entry timing. Therefore, we include vectors �"�′� and �u�′� that
consist of two dummy variables each (�"�′� = ��"�′��; �"�′�′��; �u�′� = ��u��′�; �u�′�′��). �"�′�� indicates with a value ‘1’ an entry by firm f’ in market c by time t, i.e., entry spillover across firms
within market on focal firm i in focal market c. �u�′�′� indicates with a value ‘1’ an entry by firm f’ in
market c’ by time t, i.e., entry spillover across firm across market on focal firm i in focal market c.
The other dummies have similar interpretations. The corresponding parameter vectors related to
the cumulative sum of �"�′� and �u�′� entry spillover dummies are �1 = ��1,���ℎ���, �1, �¡¢££�� respectively �2 = ��2,���ℎ���, �2, �¡¢££��. Second, we include firm and country characteristics that
could moderate entry spillover through proximity, sphere of influence, and receptivity. Therefore,
we use FPROX, FSPHERE, and FRECEPT to model moderation of spillover across firms and CPROX,
CSPHERE, and CRECEPT to model moderation of spillover across markets. Corresponding parameter
vectors related to spillover moderators are then Κ[1x3] and Ξ[1x3]. Third, we include an intercept
and control variables (cf., CONTROL) with the corresponding parameter vector Γ�1¥4�. By modeling spillover like this, we account for different types of entry spillover, and also for
possible non-linear and asymmetric spillover effects. The extent to which spillover occurs depends
on the specific pair of firms respectively markets studied and their characteristics. Table 1 gives an
overview of all concepts, variables and corresponding parameters that are used in our model.
(4) �� =exp §Γuqyspqz��� +�1 ∑ § exp¨©1"!pq���′�ª∑ exp(©1"!pq��«�)"«=1;«≠� exp ®2"¯!tvpv�′�° exp(®3"pvuv!s��) �"�′�²"�′=1�′≠� +�2 ∑ � exp³1u!pq���′�°∑ exp´³1u!pq��µ�¶uµ=1;µ≠� exp´³2u¯!tvpv�′�¶ exp´³3upvuv!s��¶ �u�′��u�′=1�′≠� ²
3.5.2 Estimation
We estimate our model using a combination of Metropolis-Hastings (MH) updating algorithms
that are a family of Markov Chain Monte Carlo (MCMC) simulation methods. Direct, closed
estimation of our non-linear model is also possible, but is less preferred as we want to maintain
maximum model flexibility, e.g., when trying to include heterogeneity through random effects in
future applications. MH algorithms are useful for drawing samples from Bayesian posterior
distributions when not knowing exactly the functional form of those posterior distributions.
Therefore, we use an MH algorithm for every parameter of interest to approach its posterior
distribution. Our estimation procedure is in line with prescriptions by Gelman et al. (2004) and Hoff
(2009).
The MH algorithm is an adaptation of a random walk using an acceptance/rejection rule to
converge to a specified target distribution, i.e., a posterior distribution for a parameter of interest.

127
We run an MH algorithm for each parameter of interest. For example, the MH algorithm works as
follows for parameter ·1.
• Step 0: We start from an informed prior. Our start value for parameter ·1 is based on
the highest likelihood density in parameter space for ·1. For every parameter, including
the probability to enter ��, we include a prior value through a grid search based on the
highest likelihood density in parameter space.
• For sequence s (with s=1,2,…,S), we update ·1£−1 to ·1£ as follows:
o Step 1: we sample a proposal ·1∗ from a proposal distribution ¹£(·1∗|·1£−1). We
allow our proposal distribution to be asymmetric, i.e., there is no requirement that
¹£(º |º») ≡ ¹£(º»|º ). An asymmetric proposal distribution can increase the
speed of convergence of the simulation.
o Step 2: we calculate the ratio of densities r =
½´·1∗|¾¶¹£(·1∗|·1£−1)½´·1£−1|¾¶
¹£(·1£−1|·1∗) , with y our data set.
o Step 3: we update our parameter value for ·1as follows. We set ·1£ to ·1∗ with
probability min(r,1); we set ·1£ to ·1£−1 otherwise.
It is important to note that we have a MH algorithm for every parameter of interest we want to
have a posterior distribution from. For example, for a simulation in which we would only include the
4 control variables (including intercept), every sequence s in our simulation shows the following set
of updates.
• For sequence s (with s=1,2,…,S):
o Update ·1£−1 to ·1£ based on ·2£−1, ·3£−1, and ·4£−1
o Update ·2£−1 to ·2£ based on ·1£, ·3£−1, and ·4£−1
o Update ·3£−1 to ·3£ based on ·1£, ·2£, and ·4£−1
o Update ·4£−1 to ·4£ based on ·1£, ·2£, and ·3£
Our estimation procedure has also other important characteristics. First, we conduct three main
simulations in a hierarchical set-up. The first simulation only includes control variables. The second
simulation includes both control variables and types of entry spillover. The third simulation includes
all variables, i.e., control variables, entry spillover types, and entry spillover moderators. Second,
each simulation with in total 60,000 iterations starts with adaptive updating (for s from 1 to 10,000)
to find the most appropriate updating step for each MH algorithm which renders an acceptance
ratio between 0.2 and 0.5. The acceptance ratio is the number of accepted proposals relative to the
number of proposals made in a number of simulation iterations. Adaptive updating means that,
based on the acceptance ratio, we change the jump with which a proposal distribution proposes a
new parameter value based on the last updated value of that parameter. We assess the acceptance
ratio every 500 sequences so that we have a maximum of 20 adaptations to the updating step. Third,
after the initial adaptive updating sequences, each simulation sequence runs for another 50,000
iterations with a fixed jump (being the final jump obtained after adaptive updating). We use the

128
adaptive updating sequence as burn-in, i.e., disregard it in our final results, and a thinning of 250 to
decrease autocorrelation in our fixed jump sequences. Thinning by 250 means that we only keep
every 250th iteration. It follows that, from our total simulation of 60,000 iterations, we base our
posterior analyses on a simulation sample size of 201 observations.
3.6 Data and measures
3.6.1 Data collection
We collect data on both paid and free daily newspaper publishers for 14 European markets in
the period 1995-2010. We collect firm level data such as market niche entry decisions for the free
daily newspaper market niche and firm resource characteristics. Our information sources include
industry organization reports and databases, industry expert websites and interviews, company
reports, and newspaper articles. We also collect information on markets’ economic, demographic,
geographic and cultural characteristics through various public data sets such as CEPII on geographic
distances, the CIA World Fact Book, the Economist Intelligence Unit, the International Monetary
Fund, Hofstede’s website on cultural dimensions, and the World Bank.
Our data set is appropriate for several reasons. First, our sample is representative for the paid
daily newspaper incumbent industry. We identify paid daily newspaper incumbents through the
WAN-IFRA World Press Trends yearbooks and the United Nations’ 1995 World Media Handbook.
Using these reference information sources makes us confident to have sampled all relevant paid
daily newspapers that were in business in 1995. Second, our sample is representative for the free
daily newspaper market niche. Our data set includes 95 free daily newspapers in 14 European
countries on a total number of 134 across the continent and Canada that are introduced in or before
2010. Also, our sample covers both early adopting countries of free daily newspapers like Sweden,
Finland and the Czech Republic, and late adopters like Austria, Denmark, and France. Third, our
sample is representative for the economic, demographic, geographic, and cultural diversity in
Europe. We sample across important economic and demographic countries like Germany and
France, but also smaller countries like Belgium and Denmark. Our sample includes Nordic countries
like Sweden and Finland, middle countries like the Netherlands and Switzerland, Southern countries
like France, and Eastern countries like Austria, Bulgaria, the Czech Republic and Croatia. Fourth, our
data set does not suffer from an inherent survivor bias and fuzzy identification of adoption timing
which sometimes hinders research on entry timing. Introduction dates for free daily newspapers are
not that difficult to obtain and not biased. On the contrary, there are often difficulties in identifying
the exact year of introduction of new products in a particular market and most databases include a
product only when it has achieved non-trivial sales creating an inherent survivor bias
(Chandrasekaran and Tellis 2008).
3.6.2 Measures
Our dependent variable is the incumbent’s time to enter the free daily newspaper market niche
in its incumbent market where it publishes a paid daily newspaper. A paid daily newspaper publisher
is considered an incumbent when offering a paid daily newspaper in the focal market in February

129
1995. We measure time-to-entry as the number of months between the entry of the focal
incumbent in the focal market and February 1995, i.e., the moment when Metro International
introduced the free newspaper niche in Sweden.
The previous entries in the free daily newspaper market niche are measured using dummy
variables and split in the model based on their possible spillover across firms or markets. Previous
entries that create possible spillover across firms are captured by �"�′� = ��"�′��; �"�′�′��. Previous
entries that create possible spillover across markets are captured by �u�′� = ��u��′�; �u�′�′��. Different firm characteristics are measured as follows. First, with respect to firms’ proximity, we
measure market contact, that represents firm familiarity, as a dummy with value ‘1’ if two firms
have one or more overlapping markets. We measure a pair of firms’ resource similarity as the firms’
absolute difference of the log of their total paid daily newspaper circulation across all markets.
Second, with respect to a firm’s sphere of influence, we measure market leadership with a dummy
having value ‘1’ if the firm has the highest paid daily circulation in its market. Third, with respect to a
firm’s receptivity, we measure firm size as the log of the incumbent’s total paid daily newspaper
circulation across all markets.
Different market characteristics are measured as follows. First, with respect to markets’
proximity, we build a compound, standardized measure including cultural distance (Kogut and Singh
1988), a dummy with value ‘1’ if two markets have an official language in common, the geographic
distance between two markets’ capitals, and the one-year lagged absolute difference of the log of
the markets’ GDP. Second, with respect to a market’s sphere of influence, we construct a compound,
standardized measure including the one-year lagged log of GDP, the one-year lagged percentage of
total export in a market’s GDP (both logged), and a market’s population in millions. Third, with
respect to a market’s receptivity, we develop a compound, standardized measure including the one-
year lagged log of GDP, the one-year lagged percentage of total import in a market’s GDP (both
logged), and the market’s population density.
We include various control variables. First, we control for an incumbent’s baseline size, i.e., the
incumbent’s log of total paid daily newspaper circulation across all markets in the year 1995. Second,
we measure risk as the number of free daily newspapers that previously existed but already exited
from the focal market. Because of the inherent time lag in the way we measure risk, we exclude
endogeneity concerns for that measure. Also, because it is hard to get to know the underlying
reasons for these entry failures without respondent bias, we use this relatively straightforward count
measure for measuring risk. Third, we use a compound, standardized measure for focal market
attractiveness consisting of the one-year lagged total ad expenditures as percentage of a market’s
GDP, the one-year lagged log of a market’s GDP per capita, the log of total number of inhabitants
older than 14 years, and the urbanization percentage.
The time dependency of our variables is not likely to introduce a bias in our results for at least
two reasons. First, there is no danger of reverse causation because of the time lag we applied in our
measures and the interpretation of our variables. There would be reverse causation when the time-
dependent variable is effected by the likelihood of an event, instead of the other way around.
Second, our data changes over time and it is important our measures take that into account.
Moreover, key data like the number of cumulative entries in the new market niche, are simply not

130
present at baseline which makes it better to include them as time-dependent measures. Table 1
gives an overview of all measures used for the different variables included in our model.
3.7 Results
3.7.1 Descriptives
From table 2 we see that our sample covers 95 free daily newspapers introduced across 14
European markets in the period 1995-2010. Sweden and Germany were the first markets to find free
daily newspapers (both in 1995), whereas Bulgaria (2008) and Croatia (2006) were late adopters.
However, markets with a rather late first introduction of free daily newspapers, could still see a lot
of free daily newspapers entering the market. For example, France (2002) and Denmark (2001) had
their first free daily newspaper rather late, i.e., in 2002 respectively 2001, but at the end of 2010
already 9 respectively 11 free daily newspapers were introduced. In total, there were 99 free daily
newspaper niche entries by firms: 55 by new entrants and 44 by paid daily newspaper incumbents.
We collected data on 163 incumbents. The smallest incumbent had a total paid daily newspaper
circulation in 1995 of 24,000 and the largest incumbent a total paid daily newspaper circulation of
5,712,370. The number of free daily newspapers introduced in this 16-year period differs per
market, ranging from only 1 free daily newspaper introduction in Belgium to 12 free daily
newspapers introduced in Spain. We observe that smaller markets like Switzerland and Denmark can
also have a high number of free daily newspapers introduced, i.e., 10 respectively 11. However,
there were also a high number of failures in the free daily newspaper market niche. In total, there
were at the end of 2010 56 failures across all 14 markets ranging from zero failures in Belgium to 9
failures in Denmark and Germany, and on average of almost 4 failures per market.
Tables 3, 4, and 5 show the correlation tables for our control variables, and the firm and market
characteristics that moderate entry spillover. There is a high correlation of firm similarity with
market leadership (.48) and ability to respond (.98) which is driven because we develop all these
measures on the basis of firm size. Because of this high correlation and the fact that we still have
firm familiarity to relate with firms’ proximity dimension, we leave out firm similarity from our
estimations. The high correlation between firm leadership and ability to respond (.51) is less of a
problem, because both measures cannot occur together when relating to the same firm (cf., �′ ≠ � in equation 4). The high correlation between country proximity and country receptivity (.56) is
driven by a shared variable, i.e., GDP. When leaving out GDP from country proximity, correlation
between country proximity and receptivity decreases to .20, but the correlation between proximity
and sphere of influence increases to .54 (although there is not a particular reason for this). We check
for our results’ robustness when leaving out GDP from country proximity.
3.7.2 Model fit
There are two important steps to assess our model fit. In a first step we need to identify whether
our MCMC simulation results are likely to have reached convergence. To assess the convergence of
our sequences for each parameter of interest, we look at both the adaptive and fixed jump part of

131
our simulation. Iterations 1 to 10,000 run with an adaptive algorithm in which the jump with which a
new parameter value is proposed can change every 500 iterations based on the parameter
proposal’s acceptance ratio. A proposal acceptance ratio, ideally between .2 and .5, is calculated to
have an idea on how well the MCMC sequence of iterations is mixing. With a sequence length of
10,000 iterations and a possible change every 500th iteration, there can be maximum 20 changes. A
first step towards convergence is when the number of changes is well below 20 for a particular
parameter simulation, which means the updating step provides good mixing. From table 6 in
columns ‘Adapt CD’ we can observe that the number of proposal step changes is for every
parameter lower than 16 (and for most it is lower than 6) on a maximum of 20, which means that
the proposal step jump quickly converges to a particular value that is good enough for mixing
purposes. Iterations 10,001 to 60,000 run with a fixed jump algorithm, with the proposal step jump
being the final proposal step jump from the adaptive part. Table 6 shows the final proposal step
jump under columns ‘Adapt D’. For example, for the parameter of firm proximity we have a final
proposal step of 2.563. It means that for iteration s, our proposal ³1∗ is generated from a proposal
distribution ¹£(³1∗|³1£−1) with ¹£~y(³1£−1; 2.563).
For our fixed jump algorithm, we assess convergence through statistical diagnostic tests such as
the effective sample size (Kass et al. 1998) and the Geweke diagnostic (Geweke 1992). We also use
trace plots as visual tests of convergence. Although trace plots are not recommended as sole tool to
assess convergence, they are still useful to assess mixing and identify the trends in the simulated
data (Gelman et al. 2004). To reach acceptable convergence, we should have limited autocorrelation
and good mixing in our simulated parameter sequences. A large discrepancy between the effective
sample size and the simulation sample size indicates poor mixing and high autocorrelation. Our
simulation sample size is 201, given we have 50,000 iterations in our fixed jump algorithm (cf.,
adaptive part serves as burn-in) and a thinning by 250. The Geweke diagnostic compares values in
the early part of the Markov chain (first 10%) to those in the latter part of the chain (last 50%) in
order to detect failure of convergence. It tests whether the mean estimates of those two parts in the
chain have converged by comparing means from the early and latter part of the Markov chain. It is a
two-sided test based on a z-score statistic. Large absolute z values (>1.96) indicate rejection of
convergence.
In table 6 we can observe the effective sample sizes and Geweke diagnostic test values for the
different models we estimate. We see that all sequences in step 3 (cf., the full model) seem to
converge with an absolute Geweke test value well below 1.96 and effective sample sizes that are
often close to the simulation sample size of 201. Closer inspection of autocorrelation functions and
trace plots (in tables 7 and 8) of the sequences in step 3 that have lower effective sample sizes than
201 indicates that all sequences are well-mixed and indeed seem to converge around a particular
value, and that autocorrelation is acceptable. Moreover, the overall model converges based on the
Geweke diagnostic of the log likelihood value and its effective sample size. Also for our step 1 and
step 2 models, we see in table 6 overall model convergence based on the Geweke test value and the
effective sample size of the log likelihood. Nevertheless, there are two variables in step 1 (cf.,
intercept and firm base size) and one variable in step 2 (cf., market attractiveness) that seem not to
converge based on their Geweke test value. However, their non-convergence does not affect overall
model convergence. Moreover, these control variables’ parameter values (in table 9) are in line with

132
the output of the model in step 3 that does converge. Also, we test the robustness of the models in
step 1 and 2 using a closed estimation procedure.
In a second step we assess model fit by looking at the log-likelihood and Bayesian information
criterion (BIC) of our different models (Dixit and Chintagunta 2007). Models with lower values of BIC
are preferred. Table 9 shows the log-likelihood and BIC values of our models per estimation step.
Our step 1 model only includes control variables. Our step 2 model includes both control variables
and types of entry spillover. The step 3 model includes all variables, i.e., control variables, entry
spillover types, and entry spillover moderators. We observe that our model in step 3, including all
variables, is preferred over the other models in step 1 and 2. Our model in step 3 has the lowest BIC
value (-326.226), compared to our model in step 1 (-311.314) and step 2 (-303.769). Also, we see
that when taking market niche entry spillover into account, we also need to consider that there can
be firm and market characteristics that moderate entry spillover. Indeed, modeling market niche
entry spillover types without its moderators (step 2) gives lower model fit than including both entry
spillover types and moderators (step 3).
3.7.3 Parameter estimates
Table 9 shows the mean, the 95% confidence interval, and the standard error of the posterior
distribution of our parameter values per different model step. From table 9 we observe the
following. First, we see that there are two different types of entry spillover influencing incumbents’
entry timing, i.e., entry spillover across firms within markets (H1b: �1,���ℎ���), and entry spillover
across firms across markets (H1c: �1, �¡¢££�, �2, �¡¢££�). We thus confirm previous research on
imitation behavior of firms within the same market and we identify a previously unknown entry
spillover type across firms that are not directly competing in different markets. Due to a limited
number of firms that are active in different markets in the context of newspaper publishing, our
results do not reflect that entry timing may be influenced by entry spillover within firms across
markets (H1a: �2,���ℎ���). In line with our hypotheses H1b and H1c, both the entry spillover types
across firms within markets and across firms across markets have a negative influence on entry
timing, i.e., the more previous market niche entries there are the faster incumbents want to enter
the new market niche. It shows that incumbents use the information signals from previous market
niche entries to inform and speed up their own market niche entry decision. From table 9 we see
that these results are consistent across estimation steps 2 and 3.
Second, our results show that a firm’s sphere of influence related to incumbent market
leadership (H2b: ®2) is the only moderator having an impact on market niche entry spillover across
firms. However, instead of the expected amplified effect on spillover, market leadership rather
decreases the spillover effect across firms. It implies that, when a particular incumbent market
leader enters the new market niche, other incumbents, in whatever market they are, reduce their
time to enter less than when a non-market leader would have entered. It suggests that the deterring
effect of a market leader entering the new market niche is stronger than the legitimizing effect.
Other hypothesized firm-related moderators, i.e., firms’ proximity in terms of market familiarity
(H2a: ®1) and firm’s receptivity on market niche entry spillover (H2c: ®3), have no effects that are
meaningfully different from zero.

133
Third, we observe that markets’ proximity amplifies market niche entry spillover across markets
as hypothesized by H3a (³1). Our compounded measure for market proximity based on markets’
cultural, demographic, and economic proximity converges around a strongly positive value (cf.,
mean of 100). It implies that whenever a firm in a market different from the focal market, enters the
new market niche, incumbents in the focal market reduce their time to enter more the closer the
market in which that entry was, is. It suggests that the deterring effect of a ‘close’ market niche
entry is weaker than the legitimizing effect. We do not find support that a market’s sphere of
influence (H3a: ³2) or a market’s receptivity (H3a: ³3) may influence market niche entry spillover
across markets.
Fourth, we expected our log-logistic parameter α to be >1 which would indicate we have non-
monotonicity in our event rates. Consistent across all simulation steps and the associated models,
our results strongly support that α >1.
Fifth, with respect to our control variables we see consistently across all simulation steps, that
there is a negative intercept (·1<0) and a negative effect of market risk (·3<0) on an incumbent’s
market niche entry timing. It implies that the risk of entering the new market niche in the focal
market, which incumbents can observe through previous failures in that new market niche in the
focal market, has a decreasing effect on incumbents’ entry timing. We see no effects of a firm’s base
size (·2) nor a market’s attractiveness (·4), that are meaningfully different from zero.
We conduct two robustness checks. First, we check for a closed estimation approach in step 1
and 2 reaching convergence (because some variables did not converge in our MCMC estimation
approach). From table 10 we see that the closed Cox Proportional Hazards estimation gives similar
results as what is reported in table 9 for steps 1 and 2. Second, we checked our MCMC results’
robustness when leaving out GDP from market proximity and it gave no meaningfully different
results.
3.8 Discussion
The main findings of our results are the following. We identify different types and moderators of
market niche entry spillover that influence an incumbent’s entry timing decision into a new market
niche. We find that incumbents’ entry timing is influenced by two main types of entry spillover. First,
in line with previous research on contagion, we observe entry spillover across firms within markets,
i.e., imitation behavior among direct competitors. Second, we identify a previously unknown type of
entry spillover across firms across markets, i.e., indirect learning across markets in which a focal
incumbent is not active and imitation across firms that are not directly competing in the same
market. Also, we show that market niche entry spillover is non-linear, heterogeneous, and
asymmetric while being moderated by important firm and market characteristics. More specifically,
we detect markets’ proximity in terms of culture, geography, and economy, as an amplifier of
market niche entry spillover across markets, whereas the entry of an incumbent market leader in a
new market niche delays other incumbents’ market niche entry.
134
3.8.1 Implications for marketing theory
Our findings hold important implications for marketing theory. First, we contribute to the
literature on scanning by showing which information signals actually (instead of potentially)
influence a firm’s decision while taking into account signals from both served and non-served
geographic environments. Thereby, we shift the attention from the scanning system, its
characteristics, and its usage, towards the possible impact of a scanning system in firms’ decision-
making. By linking scanning activities more closely to firm decision-making, we also add to previous
research’ claims that environmental scanning is important for long-term performance enhancing
capabilities such as market orientation, absorptive capacity, dynamic capability, and organizational
vigilance. Second, we extend signaling theory by identifying the co-existence of both direct and
indirect signals related to market entry. Direct signals are tied to the market of interest or direct
competitors, whereas indirect signals are tied to non-focal markets or indirectly competing firms.
Prior research on signaling focuses on direct signals. Market entry spillover across firms across
markets suggests that indirect signals can still be meaningful, i.e., that these indirect signals can still
influence firm decision-making. Moreover, we detect firm and market characteristics that increase
signal strength and we model the influence of signals on firm behavior more realistically taking into
account characteristics of signal senders and receivers. Third, our hazard model has several
characteristics to create more realistic models for empirical research on market entry timing. We
allow for non-monotonic event rates to allow for models closer to empirical settings, asymmetric
effects to include more realistic spillover models, and permanent survivor fractions that follow
common sense that not all incumbents always enter new market niches. Moreover, our model is
highly flexible and uses publicly accessible data.
3.8.2 Implications for marketing practice
Our findings also hold some important implications for marketing practice. We identify relevant
dimensions of firm scanning activities and how these can influence a firm’s market niche entry
timing decision in a complex and uncertain market context. Business environments are becoming
increasingly fast-paced and complex. New business ideas and technological evolutions creating new
market opportunities, but also threats, are in many industries the only constant. Incumbent firms
struggle how to deal appropriately with these market opportunities and threats. They face severe
financial and managerial risks related to a lack of information on the new market niche. Therefore,
firms scan their environment searching for information related to a new market niche. Although
scanning activities are considered very important in underlying a firm’s capabilities on how to deal
with change, previous research on scanning focused merely on its potential -- and not actual --
impact on firm decisions. The scanning literature offers insights in how firms can develop and use a
scanning system focusing on system features such as scope and frequency, and top management
support. However, with respect to sensing and capturing weak information signals, structuring
instant and geographically dispersed information, and identifying the relevant information signals
for fast and effective decision-making, previous scanning research falls short.
Our study helps managers to structure their scanning process by identifying potentially relevant
sources of information signals that occur simultaneously in an incumbent’s close but also distant
environment. We do not only identify internal organizational learning and direct competitive
imitation as relevant influencers of incumbents’ entry timing decision. Also, weak signals outside a

135
firm’s geographic environment have an influence on their decision making. Moreover, we indicate to
managers that being influenced by particular information signals depends on the sender of that
signal (e.g., a market leader) and the distance the signal has to overcome (e.g., signals across similar
markets). Our results on what firm and market characteristics are moderating entry spillover, will
benefit managers through knowing better how to organize scanning activities and gather industry
intelligence in terms of what markets and firms to watch for competitive and industry-specific
information, without creating data overload. With this study, firms confronted with new market
niches will be better able to foresee and predict whether, when and where incumbents will react.
That can be important for both innovators and incumbent firms in order to proactively assess
competitive behavior and evolutions in the industry.
3.9 Conclusion and future research
In this study, we discuss how firms learn and capture information signals across firms and
markets. We do that in a context of high uncertainty for incumbents who need to decide when to
enter a new market niche. We model entry spillover, i.e., previous market niche entries that
influence a focal niche entry decision. We identify different types and moderators of market niche
entry spillover that influence an incumbent’s market niche entry timing. We find that incumbents’
entry timing is influenced by both direct and indirect entry spillover. Also, entry spillover is non-
linear, heterogeneous, and asymmetric while being moderated by important firm and market
characteristics. We model incumbents’ time to enter the new market niche using a Bayesian hazard
model that accounts for non-monotonic event rates, non-linear, heterogeneous, and asymmetric
spillover effects, and a permanent survival fraction. We estimate our model through a Markov-Chain
Monte-Carlo procedure using Metropolis-Hastings algorithms. Our study has important
contributions for conceptual theory, methodology, and managerial practice.
However, our work also has limitations that offer future research opportunities. First, our unit of
analysis is the incumbent-market combination with the market defined on country level. On the one
hand, our market could be defined too narrowly. However, the newspaper market is not a European
market, but is competed for at country level. For example, only 7 out of 149 of our paid daily
newspaper incumbents has paid daily newspaper operations in more than one country. On the other
hand, our market definition could be too wide. Country-level data instead of regional or city-level
data loses some potential for more fine-grained analysis. However, our results can be seen as
conservative, i.e., showing less easily significant results, relative to analyses with regional or city-
level data. Also, competition within countries often takes place in the country’s capital or in a limited
set of large cities which implies that competition within a country resembles head-on competition.
Finally, regional or city-level data for all variables concerned is not available for such an extensive
time period in all countries. Second, we studied the relationship from market insights (cf.,
information signals related to previous market niche entries) towards marketing capabilities (cf.,
capturing and interpreting information signals to enter a new market niche). However, some
suggest this relationship is reciprocal, i.e., that there is also an influence from marketing capabilities
on market insights (Day 2011). We partly covered this limitation by including free failures as control
variable market risk, without making our dependent variable endogenous. However, future research

136
could further explore the reciprocity between market insights and marketing capabilities by
estimating them simultaneously. Third, the context of our study is a single industry. It implies there
is less room for missing important variables or having to include too many. Country and firm
characteristics that moderate market niche entry spillover can also be industry-specific which would
make it very difficult to have the same depth and complexity in an multi-industry analysis with
enough appropriate data. However, further research across industries is needed to appraise our
findings’ relevance in different settings.
3.10 References
Aaker, David A. (1983), "Organizing a Strategic Information Scanning System," California
Management Review, 25(2), 76-83.
Aaker, David A. (2008), "Marketing in a Silo World: The New CMO Challenge," California
Management Review, 51(1), 144-56.
Aboulnasr, Khaled, Om Narasimhan, Edward Blair, and Rajesh Chandy (2008), "Competitive
Response to Radical Product Innovations," Journal of Marketing, 72(3), 94-110.
Abrahamson, Eric (1991), "Managerial Fads and Fashions: The Diffusion and Refection of
Innovations," Academy of Management Review, 16(3), 586-612.
Aguilar, Francis J. (1967), Scanning the Business Environment. New York: MacMillan.
Albuquerque, Paulo, Bart J. Bronnenberg, and Charles J. Corbett (2007), "A Spatiotemporal Analysis
of the Global Diffusion of ISO 9000 and ISO 14000 Certification," Management Science,
53(3), 451-68.
Aldrich, Howard E. and C. M. Fiol (1994), "Fools Rush In? The Institutional Context of Industry
Creation," Academy of Management Review, 19(4), 645-70.
Audretsch, David B. and Maryann P. Feldman (1996), "R&D Spillovers and the Geography of
Innovation and Production," The American Economic Review, 86(3), 630-40.
Bakker, Piet (2008), "The Simultaneous Rise and Fall of Free and Paid Newspapers in Europe,"
Journalism Practice, 2(3), 427-43.
Baldwin, Richard E. and Paul R. Krugman (1988), "Market Access and International Competition: A
Simulation Study of 16K Random Access Memories," in Empirical Methods for International
Trade, Robert C. Feenstra, ed. Cambridge, MA: MIT Press.
Bass, Frank M. (1969), "A New Product Growth for Model Consumer Durables," Management
Science, 15(5), 215-27.
Beise, Marian (2004), "Lead Markets: Country-specific Drivers of the Global Diffusion of
Innovations," Research Policy, 33(6-7), 997-1018.
Bernheim, B. D. and Michael D. Whinston (1990), "Multimarket Contact and Collusive Behavior,"
RAND Journal of Economics, 21(1), 1-26.

137
Bowman, Douglas and Hubert Gatignon (1995), "Determinants of Competitor Response Time to a
New Product Introduction," Journal of Marketing Research, 32(1), 42-53.
Burt, Ronald S. (1987), "Social Contagion and Innovation: Cohesion Versus Structural Equivalence,"
American Journal of Sociology, 92(6), 1287-335.
Busenitz, Lowell W., James O. Fiet, and Douglas D. Moesel (2005), "Signaling in Venture
Capitalist−New Venture Team Funding Decisions: Does It Indicate Long-Term Venture
Outcomes?," Entrepreneurship: Theory & Practice, 29(1), 1-12.
Carroll, Glenn R. and Michael T. Hannan (2000), The Demography of Corporations and Industries.
Princeton, NJ: Princeton University Press.
Casadesus-Masanell, Ramon and Zhu Feng (2011), "Business Model Innovation and Competitive
Imitation: The Case of Sponsor-Based Business Models," Working Papers -- Harvard Business
School Division of Research, 1-xvii.
Certo, S. Trevis (2003), "Influencing Initial Public Offering Investors with prestige: Signaling with
Board Structures," Academy of Management Review, 28(3), 432-46.
Chandrasekaran, Deepa and Gerard J. Tellis (2008), "Global Takeoff of New Products: Culture,
Wealth, or Vanishing Differences?," Marketing Science, 27(5), 844-60.
Chen, Ming J. (1996), "Competitor Analysis and Interfirm Rivalry: Toward a Theoretical Integration,"
Academy of Management Review, 21(1), 100-34.
Cohen, Wesley M. and Daniel A. Levinthal (1990), "Absorptive Capacity: A New Perspective on
Learning and Innovation," Administrative Science Quarterly, 35(1), 128-52.
Congdon, Peter (2008), "A Bivariate Frailty Model for Events with a Permanent Survivor Fraction and
Non-monotonic Hazard; with an Application to Age at First Maternity," Computational
Statistics and Data Analysis, 52(9), 4346-56.
Connelly, Brian L., S. Trevis Certo, R. Duane Ireland, and Christopher R. Reutzel (2011), "Signaling
Theory: A Review and Assessment," Journal of Management, 37(1), 39-67.
Culnan, Mary J. (1983), "Environmental Scanning: The Effects of Task Complexity and Source
Accessibility on Information Gathering Behavior," Decision Sciences, 14(2), 194-206.
D'Aveni, Richard A. (1999), "Strategic Supremacy through Disruption and Dominance," Sloan
Management Review, 40(3), 127-35.
Daft, Richard L., Juhani Sormunen, and Don Parks (1988), "Chief Executive Scanning, Environmental
Characteristics, and Company Performance: an Empirical Study," Strategic Management
Journal, 9(2), 123-39.
Danneels, Erwin (2007), "The Process of Technological Competence Leveraging," Strategic
Management Journal, 28(5), 511-33.
Danneels, Erwin (2008), "Organizational Antecedents of Second-Order Competences," Strategic
Management Journal, 29(5), 519.
Day, George S. (2011), "Closing the Marketing Capabilities Gap," Journal of Marketing, 75(4), 183-95.

138
Day, George S. and Paul J. H. Schoemaker (2006), Peripheral Vision: Detecting the Weak Signals that
Will Make or Break Your Company. Cambridge: Harvard Business School Press.
Debruyne, Marion and David J. Reibstein (2005), "Competitor See, Competitor Do: Incumbent Entry
in New Market Niches," Marketing Science, 24(1), 55-66.
Dekimpe, Marnik G., Philip M. Parker, and Miklos Sarvary (2000), "Global Diffusion of Technological
Innovations: A Coupled-Hazard Approach," Journal of Marketing Research, 37(1), 47-59.
Dekimpe, Marnik G., Linda M. Van de Gucht, Dominique M. Hanssens, and Keiko I. Powers (1998),
“Long-Run Abstinence After Narcotics Abuse: What Are the Odds?,” Management Science,
44(11), 1478-92.
DeKinder, Jade S. and Ajay K. Kohli (2008), "Flow Signals: How Patterns over Time Affect the
Acceptance of Start-Up Firms," Journal of Marketing, 72(5), 84-97.
Dixit, Ashutosh and Pradeep K. Chintagunta (2007), "Learning and Exit Behavior of New Entrant
Discount Airlines from City-Pair Markets," Journal of Marketing, 71(2), 150-68.
Dutton, John M. and Richard D. Freedman (1984), "Uncertainty and Firm's Strategic Behaviors,"
Working papers - New York University.
Elenkov, Detelin S. (1997), "Strategic Uncertainty and Environmental Scanning: The Case for
Institutional Influences on Scanning Behavior," Strategic Management Journal, 18(4), 287-
302.
Feinberg, Robert M. (1985), ""Sales-at-Risk": A Test of the Mutual Forbearance Theory of
Conglomerate Behavior," Journal of Business, 58(2), 225-41.
Fiol, C. Marlene and Edward J. O'Connor (2003), "Waking Up! Mindfulness in the Face of
Bandwagons," The Academy of Management Review, 28(1), 54-70.
Fischer, Eileen and Rebecca Reuber (2007), "The Good, the Bad, and the Unfamiliar: The Challenges
of Reputation Formation Facing New Firms," Entrepreneurship: Theory & Practice, 31(1), 53-
75.
Ganesh, Jaishankar and V. Kumar (1996), "Capturing the Cross-National Learning Effect: An Analysis
of an Industrial Technology Diffusion," Journal of the Academy of Marketing Science, 24(4),
328-37.
Ganesh, Jaishankar, V. Kumar, and Velavan Subramaniam (1997), "Learning Effect in Multinational
Diffusion of Consumer Durables: An Exploratory Investigation," Journal of the Academy of
Marketing Science, 25(3), 214-28.
Garber, Tal, Jacob Goldenberg, Barak Libai, and Eitan Muller (2004), "From Density to Destiny: Using
Spatial Dimension of Sales Data for Early Prediction of New Product Success," Marketing
Science, 23(3), 419-28.
Gatignon, Hubert and Erin Anderson (2001), "Inter Channel Competition and New Product Diffusion:
Market Making, Market Taking and Competitive Effects in Several European Countries,"
Working papers - INSEAD.

139
Gelman, Andrew, John B. Carlin, Hal S. Stern, and Donald B. Rubin (2004), Bayesian Data Analysis.
Chapman & Hall / CRC Press LLC.
Geweke, John (1992), "Evaluating the Accuracy of Sampling-Based Approaches to Calculating
Posterior Moments," in Bayesian Statistics, Oxford, UK: Clarendon Press, 169-93.
Gielens, Katrijn and Marnik G. Dekimpe (2001), "Do International Entry Decisions of Retail Chains
Matter in the Long Run?," International Journal of Research in Marketing, 18(3), 235-59.
Gielens, Katrijn and Marnik G. Dekimpe (2007), "The Entry Strategy of Retail Firms into Transition
Economies," Journal of Marketing, 71(2), 196-212.
Gielens, Katrijn, Kristiaan Helsen, and Marnik G. Dekimpe (2012), "International Entry Strategies," in
Handbook of Marketing Strategy, Venkatesh Shankar and Gregory S. Carpenter, eds.
Cheltenham, UK: Edward Elgar Publishing Limited, 391-411.
Gielens, Katrijn, Linda M. Van de Gucht, Jan B. Steenkamp, and Marnik G. Dekimpe (2008), "Dancing
with a Giant: The Effect of Wal-Mart's Entry into the United Kingdom on the Performance of
European Retailers," Journal of Marketing Research, 45(5), 519-34.
Gilbert, Richard J. and Marvin Lieberman (1987), "Investment and Coordination in Oligopolistic
Industries," RAND Journal of Economics, 18(1), 17-33.
Gort, Michael and Akira Konakayama (1982), "A Model of Diffusion in the Production of an
Innovation," The American Economic Review, 72(5), 1111-20.
Green, Donna H., Donald W. Barclay, and Adrian B. Ryans (1995), "Entry Strategy and Long-Term
Performance: Conceptualization and Empirical Examination," Journal of Marketing, 59(4), 1-
16.
Greve, Henrich R. (2000), "Marketing Niche Entry Decisions: Competition, Learning, and Strategy in
Tokyo Banking, 1894-1936," Academy of Management Journal, 43(5), 816-36.
Gulati, Ranjay and Monica C. Higgins (2003), "Which Ties Matter When? The Contingent Effects of
Interorganizational Partnerships on IPO Success," Strategic Management Journal, 24(2), 127-
44.
Hambrick, Donald C. (1982), "Environmental Scanning and Organizational Strategy," Strategic
Management Journal, 3(2), 159-74.
Hambrick, Donald C. and Phyllis A. Mason (1984), "Upper Echelons: The Organization as a Reflection
of Its Top Managers," Academy of Management Review, 9(2), 193-206.
Hannan, Michael T. and John Freeman (1977), "The Population Ecology of Organizations," American
Journal of Sociology, 82(5), 929-64.
Hannan, Michael T. and John Freeman (1984), "Structural Inertia and Organizational Change,"
American Sociological Review, 49(2), 149-64.
Haunschild, Pamela R. and Anne S. Miner (1997), "Modes of Interorganizational Imitation: The
Effects of Outcome Salience and Uncertainty," Administrative Science Quarterly, 42(3), 472-
500.

140
Haveman, Heather A. (1993), "Follow the Leader: Mimetic Isomorphism and Entry into New
Markets," Administrative Science Quarterly, 38(4), 593-627.
Helfat, Constance E., Sydney Finkelstein, Will. Mitchell, Margaret A. Peteraf, Harbir Singh, David J.
Teece, and Sidney G. Winter (2007), Dynamic Capabilities: Understanding Strategic Change
In Organizations. Blackwell Publishing.
Helfat, Constance E. and Marvin B. Lieberman (2002), "The Birth of Capabilities: Market Entry and
the Importance of Pre−History," Industrial & Corporate Change, 11(4), 725-60.
Hoff, Peter (2009), A First Course in Bayesian Statistical Methods. Springer.
Hult, G. Tomas, David J. Ketchen Jr, and Stanley F. Slater (2005), "Market Orientation and
Performance: an Integration of Disparate Approaches," Strategic Management Journal,
26(12), 1173-81.
Irwin, Douglas A. and Peter J. Klenow (1994), "Learning-by-Doing Spillovers in the Semiconductor
Industry," Journal of Political Economy, 102(6), 1200-27.
Janney, Jay J. and Timothy B. Folta (2006), "Moderating Effects of Investor Experience on the
Signaling Value of Private Equity Placements," Journal of Business Venturing, 21(1), 27-44.
Jayachandran, Satish, Javier Gimeno, and P. Rajan Varadarajan (1999), "The Theory of Multimarket
Competition: A Synthesis and Implications for Marketing Strategy," Journal of Marketing,
63(3), 49-66.
Jensen, Robert and Gabriel Szulanski (2004), "Stickiness and the Adaptation of Organizational
Practices in Cross-Border Knowledge Transfers," Journal of International Business Studies,
35(6), 508-23.
Kang, Wooseong, Barry L. Bayus, and Sridhar Balasubramanian (2010), "The Strategic Effects of
Multimarket Contact: Mutual Forbearance and Competitive Response in the Personal
Computer Industry," Journal of Marketing Research, 47(3), 415-27.
Kass, Robert E., Bradley P. Carlin, Andrew Gelman, and Radford M. Neal (1998), "Markov Chain
Monte Carlo in Practice: A Roundtable Discussion," The American Statistician, 52(2), 93-100.
Keller, Wolfgang (2002), "Geographic Localization of International Technology Diffusion," American
Economic Review, 92(1), 120-42.
Kennedy, Robert E. (2002), "Strategy Fads and Competitive Convergence: An Empirical Test for Herd
Behavior in Prime-Time Television Programming," Journal of Industrial Economics, 50(1), 57-
84.
King, Andrew A. and Christopher L. Tucci (2002), "Incumbent Entry into New Market Niches: The
Role of Experience and Managerial Choice in the Creation of Dynamic Capabilities,"
Management Science, 48(2), 171-86.
Kogut, Bruce and Udo Zander (2003), "A Memoir and Reflection: Knowledge and an Evolutionary
Theory of the Multinational Firm 10 Years Later," Journal of International Business Studies,
34(6), 505-15.

141
Kogut, Bruce and Harbir Singh (1988), "The Effect of National Culture on the Choice of Entry Mode,"
Journal of International Business Studies, 19(3), 411-32.
Kogut, Bruce and Udo Zander (1993), "Knowledge of the Firm and the Evolutionary Theory of the
Multinational Corporation," Journal of International Business Studies, 24(4), 625-45.
Kohli, Ajay K. and Bernhard J. Jaworski (1990), "Market Orientation: The Construct, Research
Propositions, and Managerial Implications," Journal of Marketing, 54(2), 1-18.
Kuester, Sabine, Christian Homburg, and Thomas S. Robertson (1999), "Retaliatory Behavior to New
Product Entry," Journal of Marketing, 63(4), 90-106.
Kumar, V., Eli Jones, Rajkumar Venkatesan, and Robert P. Leone (2011), "Is Market Orientation a
Source of Sustainable Competitive Advantage or Simply the Cost of Competing?," Journal of
Marketing, 75(1), 16-30.
Kumar, V. and Trichy V. Krishnan (2002), "Multinational Diffusion Models: An Alternative
Framework," Marketing Science, 21(3), 318-30.
Lambkin, Mary and George S. Day (1989), "Evolutionary Processes in Competitive Markets: Beyond
the Product Life Cycle," Journal of Marketing, 53(3), 4-21.
Lampel, Joseph and Jamal Shamsie (2000), "Critical Push: Strategies for Creating Momentum in the
Motion Picture Industry," Journal of Management, 26(2), 233-57.
Lemmens, Aurélie, Christophe Croux, and Marnik G. Dekimpe (2007), "Consumer Confidence in
Europe: United in Diversity?," International Journal of Research in Marketing, 24(2), 113-27.
Levinthal, Daniel and Claus Rerup (2006), "Crossing an Apparent Chasm: Bridging Mindful and Less-
Mindful Perspectives on Organizational Learning," Organization Science, 17(4), 502-13.
Levitt, Barbara and James G. March (1988), "Organizational Learning," Annual Review of Sociology,
14, 319-40.
Mahajan, Vijay, Robert A. Peterson, Arun K. Jain, and Naresh Malhotra (1979), "A New Product
Growth Model with a Dynamic Market Potential," Long Range Planning, 12(4), 51-8.
Mitchell, Will (1991), "Dual Clocks: Entry Order Influences on Incumbent and Newcomer Market
Share and Survival When Specialized Assets Retain Their Value," Strategic Management
Journal, 12(2), 85-100.
Mitra, Debanjan and Peter N. Golder (2002), "Whose Culture Matters? Near-Market Knowledge and
Its Impact on Foreign Market Entry Timing," Journal of Marketing Research, 39(3), 350-65.
Narasimhan, Chakravarthi and Z. John Zhang (2000), "Market Entry Strategy Under Firm
Heterogeneity and Asymmetric Payoffs," Marketing Science, 19(4), 313-27.
Narasimhan, Om, Surendra Rajiv, and Shantanu Dutta (2006), "Absorptive Capacity in High-
Technology Markets: The Competitive Advantage of the Haves," Marketing Science, 25(5),
510-24.

142
Navis, Chad and Mary A. Glynn (2010), "How New Market Categories Emerge: Temporal Dynamics of
Legitimacy, Identity, and Entrepreneurship in Satellite Radio, 1990-2005," Administrative
Science Quarterly, 55(3), 439-71.
Park, Namgyoo K. and John M. Mezias (2005), "Before and After the Technology Sector Crash: The
Effect of Environmental Munificence on Stock Market Response to Alliances to E-Commerce
Firms," Strategic Management Journal, 26(11), 987-1007.
Penrose, Edith T. (1959), The Theory of the Growth of the Firm. New York: Wiley.
Pfeffer, Jeffrey and Gerald R. Salancik (1978), The External Control of Organizations. New York:
Harper and Row.
Porac, Joseph F. and Howard Thomas (1990), "Taxonomic Mental Models in Competitor Definition,"
Academy of Management Review, 15(2), 224-40.
Porter, Michael E. (1980), Competitive strategy: Techniques for Analyzing Industries and Competitors
New York, NY: Free Press.
Ramaswami, Aarti, George F. Dreher, Robert Bretz, and Carolyn Wiethoff (2010), "Gender,
Mentoring, and Career Success: The Importance of Organizational Context," Personnel
Psychology, 63(2), 385-405.
Rao, Raghunath S., Rajesh K. Chandy, and Jaideep C. Prabhu (2008), "The Fruits of Legitimacy:Why
Some New Ventures Gain More from Innovation Than Others," Journal of Marketing, 72(4),
58-75.
Rogers, Everett M. (1995), Diffusion of Innovations. New York: The Free Press.
Singh, Vishal P., Karsten T. Hansen, and Robert C. Blattberg (2006), "Market Entry and Consumer
Behavior: An Investigation of a Wal-Mart Supercenter," Marketing Science, 25(5), 457-76.
Sinha, Rajiv K. and Murali Chandrashekaran (1992), “A Split Hazard Model for Analyzing the Diffusion
of Innovations,” Journal of Marketing Research, 29(2), 116-27.
Sorescu, Alina, Venkatesh Shankar, and Tarun Kushwaha (2007), "New Product Preannouncements
and Shareholder Value: Don't Make Promises You Can't Keep," Journal of Marketing
Research, 44(3), 468-89.
Szulanski, Gabriel (1996), "Exploring Internal Stickiness: Impediments to the Transfer of Best Practice
Within the Firm," Strategic Management Journal, 17(S2), 27-43.
Takada, Hirokazu and Dipak Jain (1991), "Cross-National Analysis of Diffusion of Consumer Durable
Goods in Pacific Rim Countries," Journal of Marketing, 55(2), 48-54.
Teece, David J. (2007), "Explicating Dynamic Capabilities: The Nature and Microfoundations of
(Sustainable) Enterprise Performance," Strategic Management Journal, 28(13), 1319-50.
Teece, David J., Gary Pisano, and Amy Shuen (1997), "Dynamic Capabilities and Strategic
Management," Strategic Management Journal, 18(7), 509-33.
Tregaskis, Olga (2003), "Learning Networks, Power and Legitimacy in Multinational Subsidiaries,"
International Journal of Human Resource Management, 14(3), 431-47.

143
UNCTAD (2006), "World Investment Report," New York and Geneva: United Nations.
van Everdingen, Yvonne, Dennis Fok, and Stefan Stremersch (2009), "Modeling Global Spillover of
New Product Takeoff," Journal of Marketing Research, 46(5), 637-52.
Vibha, Gaba, Pan Yigang, and R. U. Gerardo (2002), "Timing of Entry in International Market: An
Empirical Study of U.S. Fortune 500 Firms in China," Journal of International Business Studies,
33(1), 39-55.
Warner, Alfred G., James F. Fairbank, and H. K. Steensma (2006), "Managing Uncertainty in a Formal
Standards-Based Industry: A Real Options Perspective on Acquisition Timing," Journal of
Management, 32(2), 279-98.
Wuyts, Stefan, Stefan Stremersch, Christophe Van den Bulte, and Philip H. Franses (2004), "Vertical
Marketing Systems for Complex Products: A Triadic Perspective," Journal of Marketing
Research, 41(4), 479-87.
Yasai-Ardekani, Masoud and Paul C. Nystrom (1996), "Designs for Environmental Scanning Systems:
Tests of a Contingency Theory," Management Science, 42(2), 187-204.
Young, Greg, Ken G. Smith, Curtis M. Grimm, and Daniel Simon (2000), "Multimarket Contact and
Resource Dissimilarity: A Competitive Dynamics Perspective," Journal of Management, 26(6),
1217-36.
Zollo, Maurizio and Sidney G. Winter (2002), "Deliberate Learning and the Evolution of Dynamic
Capabilities," Organization Science, 13(3), 339-51.

144
3.11 Tables
Table 1: overview of measures
Concept Variable Measure Data source Parameters
Types of entry
spillover Types of entry
spillover Count measures based on summation of dummies
indicating entries in the free newspaper niche.
Different dummies indicate different types of
spillover across firms or markets.
Desk research �1, �2
Firm proximity Market
familiarity 1 if two firms are both present in one or more
markets; else 0 Desk research ®1
Firm sphere of
influence Market
leadership 1 if highest paid circulation in a market; else 0 WPT/desk research ®2
Firm receptivity Firm size Standardized total paid daily newspaper circulation
across all markets WPT/desk research ®3
Market
proximity Cultural,
geographic, and
economic
proximity
Compound measure (standardized measures
transformed towards proximity), based on:
• Cultural distance based on Kogut and Singh
(1988)
• 1 if overlap among official languages; 0 else
• Distance between two markets’ capitals
• One-year lagged absolute difference of log of
GDP between two markets
Hofstede values
CIA
CEPII
Worldbank
³1
Market sphere
of influence GDP
Export
Population
Compound measure (standardized measures):
• Log of GDP (one-year lagged)
• Lag 1 of Log of total export / log of total GDP
• Population in million
Worldbank
EIU ³2
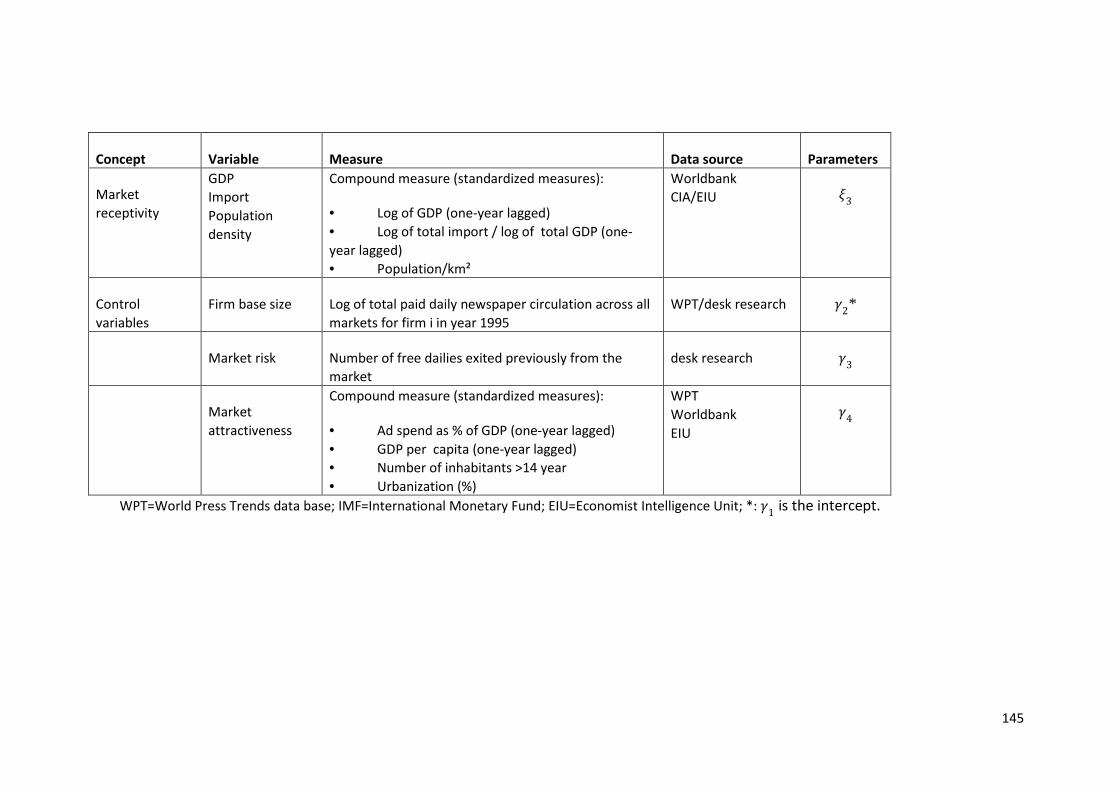
145
Concept Variable Measure Data source Parameters
Market
receptivity
GDP
Import
Population
density
Compound measure (standardized measures):
• Log of GDP (one-year lagged)
• Log of total import / log of total GDP (one-
year lagged)
• Population/km²
Worldbank
CIA/EIU ³3
Control
variables Firm base size Log of total paid daily newspaper circulation across all
markets for firm i in year 1995 WPT/desk research ·2*
Market risk Number of free dailies exited previously from the
market desk research ·3
Market
attractiveness
Compound measure (standardized measures):
• Ad spend as % of GDP (one-year lagged)
• GDP per capita (one-year lagged)
• Number of inhabitants >14 year
• Urbanization (%)
WPT
Worldbank
EIU
·4
WPT=World Press Trends data base; IMF=International Monetary Fund; EIU=Economist Intelligence Unit; *: ·1 is the intercept.
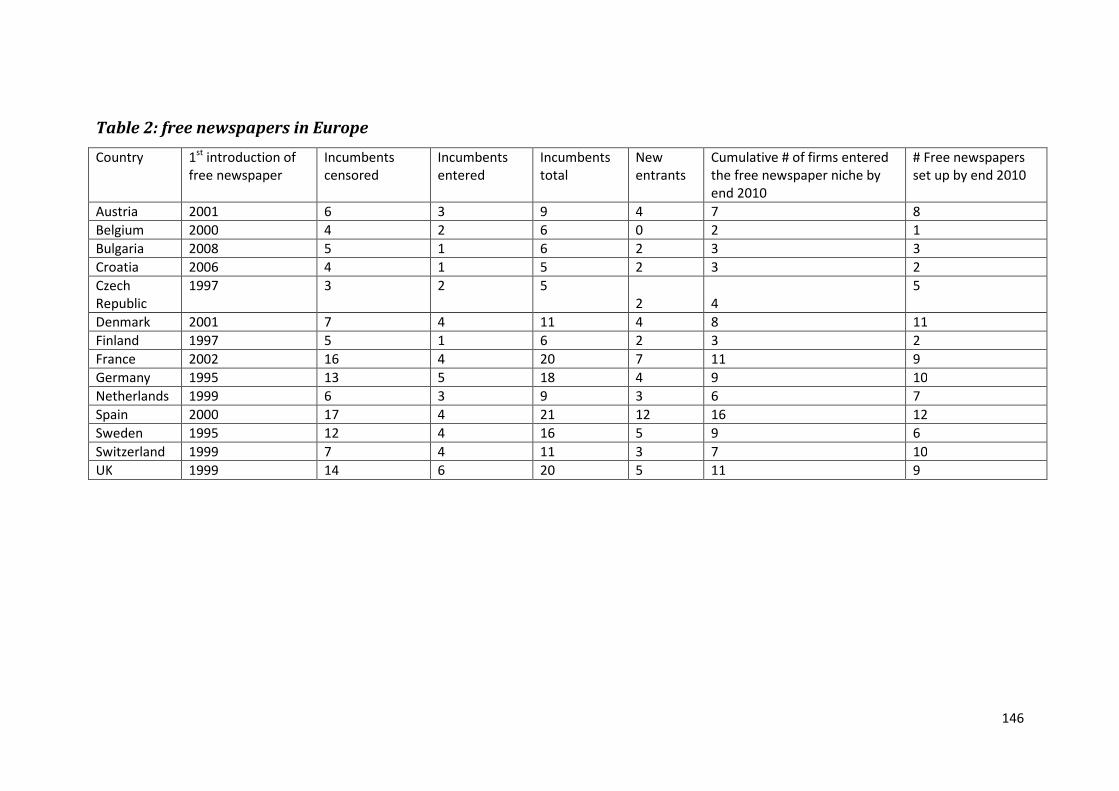
146
Table 2: free newspapers in Europe
Country 1st introduction of
free newspaper Incumbents
censored Incumbents
entered Incumbents
total New
entrants Cumulative # of firms entered
the free newspaper niche by
end 2010
# Free newspapers
set up by end 2010
Austria 2001 6 3 9 4 7 8 Belgium 2000 4 2 6 0 2 1 Bulgaria 2008 5 1 6 2 3 3 Croatia 2006 4 1 5 2 3 2 Czech
Republic 1997 3 2 5
2 4 5
Denmark 2001 7 4 11 4 8 11 Finland 1997 5 1 6 2 3 2 France 2002 16 4 20 7 11 9 Germany 1995 13 5 18 4 9 10 Netherlands 1999 6 3 9 3 6 7 Spain 2000 17 4 21 12 16 12 Sweden 1995 12 4 16 5 9 6 Switzerland 1999 7 4 11 3 7 10 UK 1999 14 6 20 5 11 9

147
Table 3: correlation table control variables
Firm base size Market risk Market attractiveness
Firm base size 1
Market risk -0.1120254 1
Market attractiveness 0.3258719 0.3128484 1
Table 4: correlation table firm-related moderators of entry spillover
Familiarity Similarity Leadership Ability to respond
Familiarity 1
Similarity 0.1140169 1
Leadership 0.2845392 0.4781161 1
Ability to respond 0.1595235 0.9848833 0.5151123 1
Table 5: correlation table market-related moderators of entry spillover
Proximity Sphere of influence Receptivity
Proximity 1
Sphere of influence 0.004464288 1
Receptivity 0.558912719 -0.186863037 1

148
Table 6: convergence and model fit
Variables Parameters Step 1 Step 2 Step 3 Adapt Adapt Fix Fix Adapt Adapt Fix Fix Adapt Adapt Fix Fix CD D ESS |G| CD D ESS |G| CD D ESS |G| Log Likelihood 201 1.011 136 .123 122 .641
Log-logistic
parameter α 15 1.460 201 .546 13 1.946 201 .153 13 1.946 139 .297
Intercept ·1 3 .338 31 3.073 4 .169 24 .643 4 .169 24 .812
Firm base size ·2 4 .019 30 2.794 4 .019 35 .700 4 .019 35 .549
Market risk ·3 4 .169 201 1.122 4 .056 151 .446 3 .113 101 .773
Market
attractiveness ·4 4 .506 201 1.352 4 .506 201 3.191 4 .506 201 .470
Across F within M* �1,���ℎ��� 4 .169 201 .287 3 .338 201 .055
Within F across M* �2,���ℎ��� 5 .759 201 1.236 5 .759 201 1.028
Across F across M* �1, �¡¢££� 4 .169 59 .013 5 .253 31 1.299
Across F across M* �2, �¡¢££� 4 .169 121 1.340
Firm proximity ®1 8 2.563 104 1.49
Firm sphere of
influence ®2 8 2.563 201 .945
Firm receptivity ®3 2 .075 92 .696
Market proximity ³1 8 2.563 201 1.447
Market sphere of
Influence ³2 12 1.442 235 1.349
Market receptivity ³3 7 .570 201 .694
Adapt=adaptive algorithm (N=10,000); Fix=fixed-step algorithm (N=50,000); CD = # changes in proposal step (with a potential maximum of 20); D=final
proposal step also used in fixed algorithm; ESS: effective sample size gives a MCMC’s sample size adjusted for autocorrelation, i.e., the number of
statistically independent observations in a MCMC (of 201 observations in our case); G=Geweke test statistic: standard normal test statistic testing for
convergence (H0: convergence). Significance at level .05 is indicated in bold format.

149
Table 7: trace plots full model
Log-logistic
parameter
α
Across F within
M*
�1,���ℎ���
Intercept
·1
Within F across
M*
�2,���ℎ���
Firm base size
·2
Across F across
M*
�1, �¡¢££�
Market risk
·3
Across F across
M*
�2, �¡¢££�
Market
attractiveness
·4
Firm familiarity
®1
Market leadership
®2
Ability to respond
®3

150
Market proximity
³1
Market sphere of
Influence
³2
Market receptivity
³3
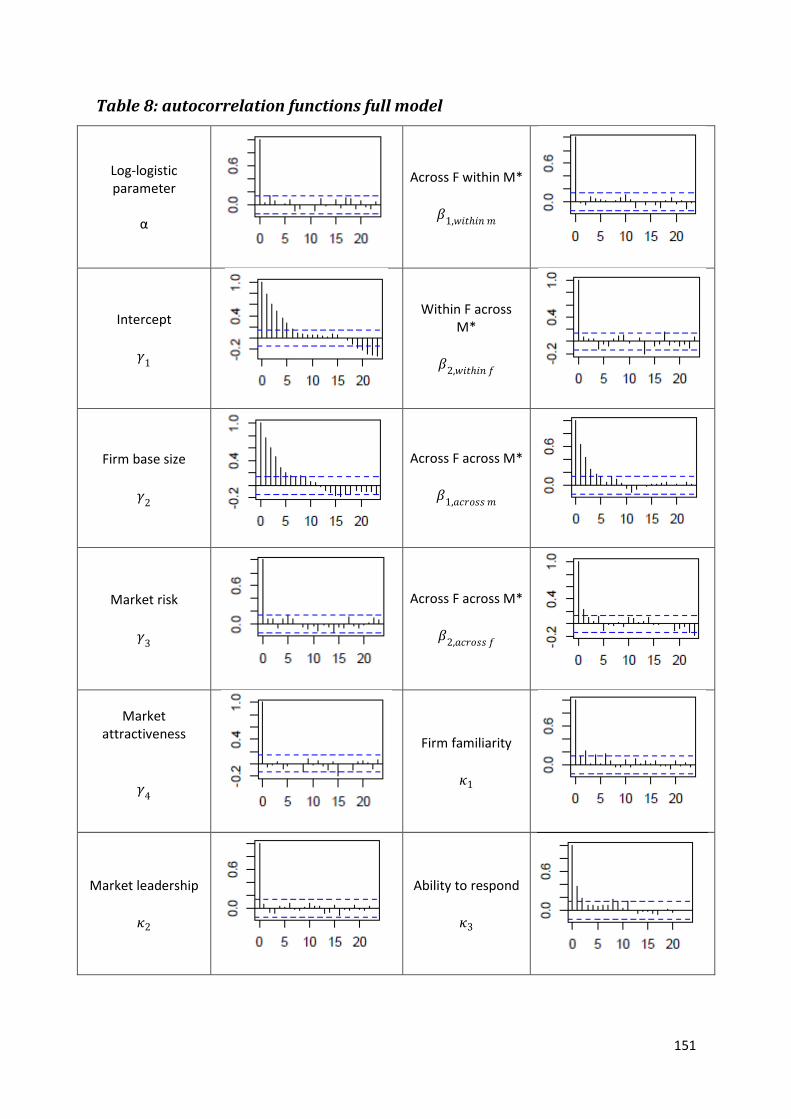
151
Table 8: autocorrelation functions full model
Log-logistic
parameter
α
Across F within M*
�1,���ℎ���
Intercept
·1
Within F across
M*
�2,���ℎ���
Firm base size
·2
Across F across M*
�1, �¡¢££�
Market risk
·3
Across F across M*
�2, �¡¢££�
Market
attractiveness
·4
Firm familiarity
®1
Market leadership
®2
Ability to respond
®3

152
Market proximity
³1
Market sphere of
Influence
³2
Market receptivity
³3

Table 9: parameter estimates Bayesian hazard MCMC approach
Variables Parameters Step 1: controls only Step 2: controls and types of
spillover Step 3: all
Mean CI (.025;.975) SE Mean CI (.025;.975) SE Mean CI (.025;.975) SE
Log-logistic parameter α 4.923 3.676; 6.167 .046 6.431 4.887; 8.123 .066 5.875 3.988; 7.458 .079
Intercept ·1 -5.251 -6.376; -4.227 .101 -2.701 -3.923; -1.576 .123 -2.913 -4.346; -1.650 .140
Firm base size ·2 .048 -.039; .139 .008 .096 .0326; .166 .006 .046 -.049; .155 .009
Market risk ·3 -.202 -.277; -.136 .003 -.090 -.146; -.047 .002 -.121 -.184; -.076 .003
Market attractiveness ·4 .386 .162; .637 .010 .168 -.031; .392 .008 .071 -.272; .399 .012
Across F within M* �1,���ℎ��� -.650 -.942; -.384 .010 -.594 -.984; -.302 .012
Within F across M* �2,���ℎ��� -.095 -.497; .263 .014 -.128 -.610; .204 .015
Across F across M* �1, �¡¢££� -3.154 -4.153; -1.983 .073 -2.497 -3.531; -.669 .116
Across F across M* �2, �¡¢££� -.055 -.617; .303 .018
Firm proximity ®1 -.157 -2.603; 1.243 .106
Firm sphere of influence ®2 -5.992 -7.794; -4.173 .065
Firm receptivity ®3 -.027 -.131; .014 .005
Market proximity ³1 100.041 98.322;
101.937
.069
Market sphere of Influence ³2 -.347 -1.853; .860 .045
Market receptivity ³3 .356 -1.123; 1.690 .051
Model fit: log likelihood -298.056 -300.798;
-294.230
1.615 -282.556 -287.467;
-277.737
.798 -289.103 -297.082;
-280.269
.988
Model fit: BIC -311.314 -303.769 -326.226
*F: firms; M: markets; SE: standard error is calculated as the standard deviation of the posterior sample divided by √v¯¯ . The Bayesian information
criterion (BIC) is given as LL – .5 × k × ln(n), where LL is the log-likelihood of the model, k the number of parameters, and n the number of observations.
Models with lower values of BIC are preferred.
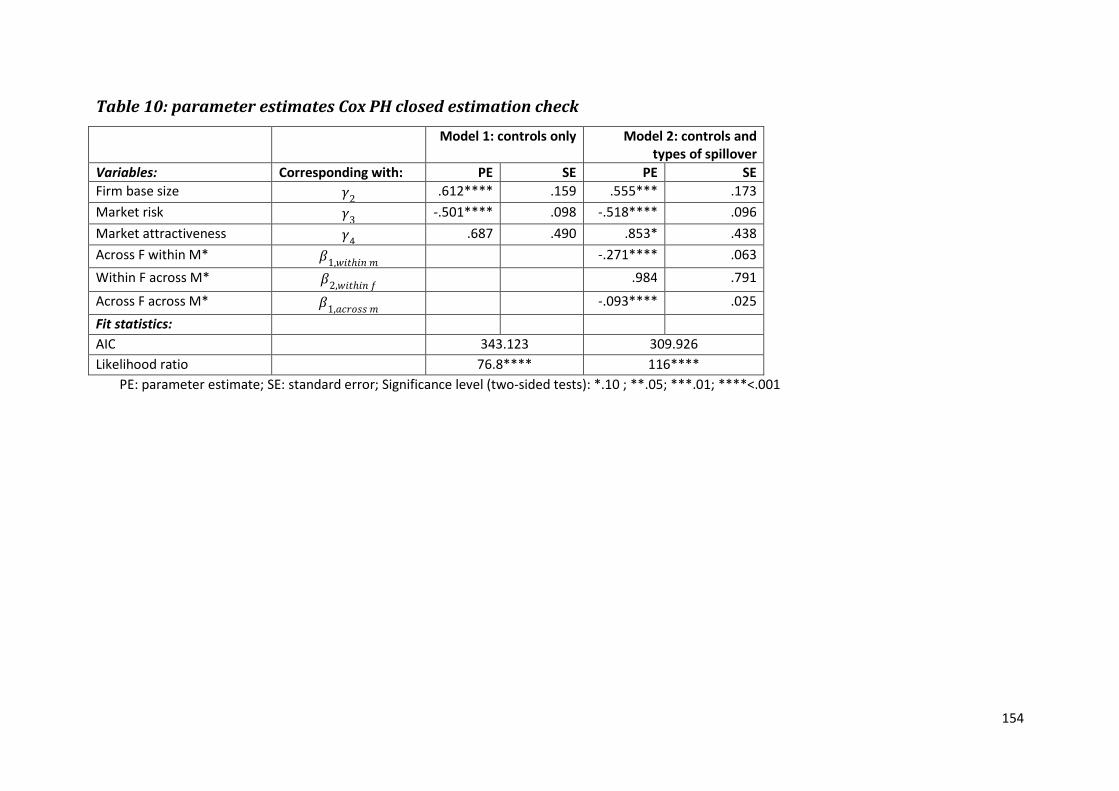
154
Table 10: parameter estimates Cox PH closed estimation check
Model 1: controls only Model 2: controls and
types of spillover
Variables: Corresponding with: PE SE PE SE
Firm base size ·2 .612**** .159 .555*** .173
Market risk ·3 -.501**** .098 -.518**** .096
Market attractiveness ·4 .687 .490 .853* .438
Across F within M* �1,���ℎ��� -.271**** .063
Within F across M* �2,���ℎ��� .984 .791
Across F across M* �1, �¡¢££� -.093**** .025
Fit statistics:
AIC 343.123 309.926
Likelihood ratio 76.8**** 116****
PE: parameter estimate; SE: standard error; Significance level (two-sided tests): *.10 ; **.05; ***.01; ****<.001
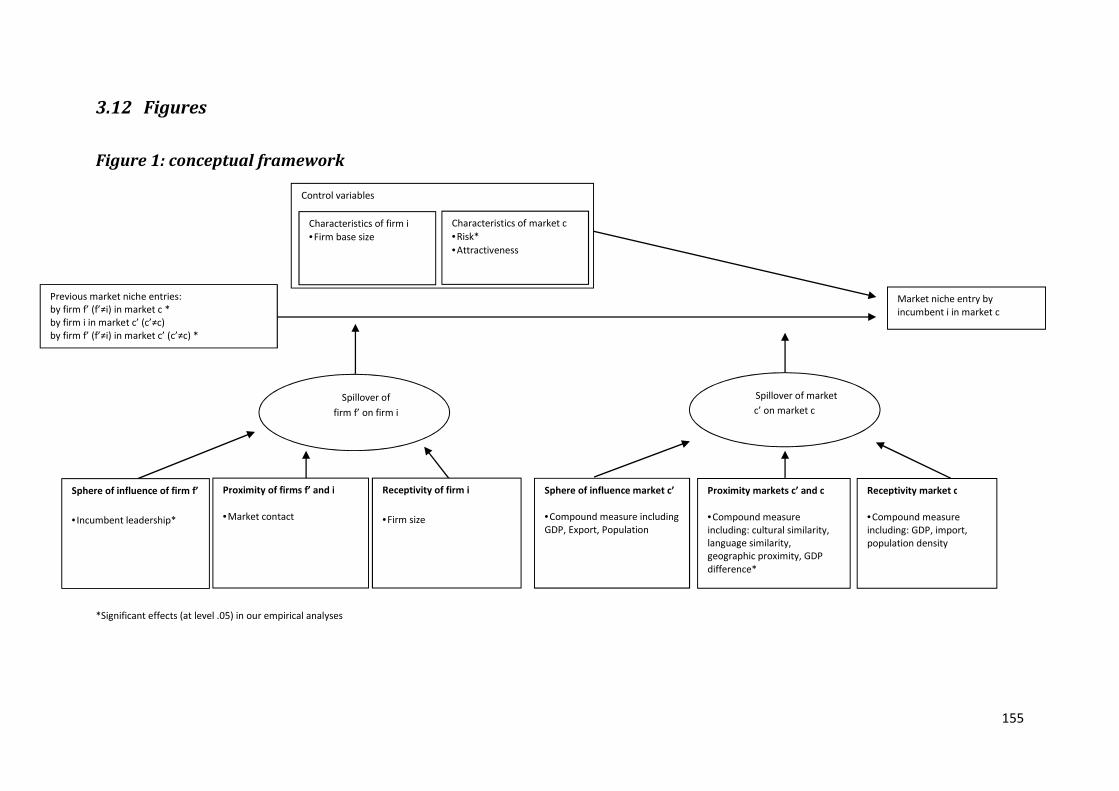
155
3.12 Figures
Figure 1: conceptual framework
*Significant effects (at level .05) in our empirical analyses
Market niche entry by
incumbent i in market c
Previous market niche entries:
by firm f’ (f’≠i) in market c *
by firm i in market c’ (c’≠c)
by firm f’ (f’≠i) in market c’ (c’≠c) *
Spillover of
firm f’ on firm i
Sphere of influence of firm f’
•Incumbent leadership*
Proximity of firms f’ and i
•Market contact
Receptivity of firm i
•Firm size
Spillover of market
c’ on market c
Sphere of influence market c’
•Compound measure including
GDP, Export, Population
Proximity markets c’ and c
•Compound measure
including: cultural similarity,
language similarity,
geographic proximity, GDP
difference*
Receptivity market c
•Compound measure
including: GDP, import,
population density
Control variables
Characteristics of market c
•Risk*
•Attractiveness
Characteristics of firm i
•Firm base size

Conclusion
This dissertation bundles three different studies related to strategic industry factors and
strategic industry factor innovation. In the first study I theorize and empirically model how the
overlap between a firm’s resource bundle and the industry’s strategic factors related to product
markets drives a firm’s growth performance in the context of within-industry product market
diversification. Thereby I pay special attention to the effects and internal workings of deploying a
dynamic capability to create and leverage resources when diversifying. In the second part of this
dissertation, I focus on a particular type of strategic industry factor innovation, i.e., new business
models. In the second study I offer empirical and theoretical guidance on how ventures can survive
when launching a business model. I focus on four market entry decisions, i.e., entry timing, product
adaptation, scale of entry, and strategic control, and how they can influence the business model’s
value drivers and ability to create and capture value. In the third study I empirically model how
different firms imitate each other in terms of entering a new market niche related to a new business
model. I empirically model what type of information signals related to previous market entries
influence an incumbent’s entry timing decision and how these signals influence that decision.
In what follows I discuss the main findings for each study, their theoretical and methodological
contributions, and their implications for managerial practice. Also, I elaborate on future research
opportunities based on this dissertation’s main findings and limitations.
Main findings
Study 1 argues that firms can grow through within-industry diversification across product
markets, while deploying their dynamic capability to create resources to add to the firm’s resource
bundle, leverage resources to share existing resources across product markets, and configure
resources to create fit among the firm’s resources. Results indicate that both resource creation and
resource fit have a direct, positive influence on firm growth. It empirically confirms theory on
strategic industry factors stating that firm performance is derived from the overlap between an
industry’s strategic factors and a firm’s individual resource bundle. Moreover, the study’s outcomes
identify a core paradox that is taking place when deploying a dynamic capability, i.e., a paradox
between creating and leveraging resources. I empirically show a simultaneous, negative reciprocity
between resource creation and resource leverage which has an indirect, negative impact on firm
growth. This negative reciprocity denotes a paradox at the heart of the dynamic capability concept. I
suggest and discuss learning, managerial and organizational constraints in a firm as the basis for this
negative reciprocity. Firms that can cope with this paradox find a way for growth through a dynamic
capability. Some firms are affected more by this paradox than others. It implies that a firm’s dynamic
capability is heterogeneous.
Study 2 addresses the lack of empirical and theoretical guidance on how ventures can succeed
when launching a business model. I focus on four market entry decisions, i.e., entry timing, product
adaptation, scale of entry, and strategic control, that can influence the business model’s value
drivers and ability to create and capture value. I find important main and interaction effects on the

157
survival of the launched business model of a venture’s entry timing, product adaptation, and scale of
entry. Study 2 empirically describes how a business model innovation, i.e., the free daily newspaper
business model, is launched across many countries by different ventures with different entry
strategies leading to different survival outcomes. It provides a new viewpoint of looking at business
model innovation, i.e., one that is not focused on the innovator and the business model
development process, but one that is focused on the innovation and how it is adopted by different
ventures. Also, study 2 shows an interesting type of competitive behavior, i.e., a strategy of ‘spoiling’
the market for everyone with the intention of keeping an innovation out. I conceptualize the
business model as a separate unit of analysis, different from industry, firm, product, or technology.
Moreover, I theoretically and empirically show that there are not only differences but also an
interplay between the business model and a product market strategy, which holds important
consequences for the market entry and strategy literature.
In study 3, I model how market entries spill over across firms and markets in a context of high
uncertainty for incumbents who need to decide when to enter a new market niche that results from
a business model innovation. Entry spillover is previous market niche entries influencing a focal
market niche entry decision. I argue that incumbents’ entry timing can be influenced by three
different types of entry spillover. Results confirm the existence of entry spillover across firms within
markets, and show the existence of a neglected type of entry spillover across firms across markets.
Spillover across firms across markets embodies an indirect effect among non-directly competing
firms across different markets. Also, I model and find particular firm and market characteristics that
moderate entry spillover across firms respectively markets. Results imply that entry spillover is non-
linear, heterogeneous, and asymmetric. Moreover, study 3 finds a flexible approach to estimate an
entry timing hazard model based on Bayesian statistics and Markov-Chain Monte-Carlo simulation
techniques which can complement existing closed-form estimation techniques.
Theoretical and methodological contributions
This dissertation makes some important theoretical and methodological contributions. Study 1
contributes to different literature streams. First, there are contributions to the diversification
literature. Study 1 adds theoretical and empirical arguments for a link between within-industry
diversification and growth performance. Study 1 contributes by distinguishing between both static
and dynamic aspects of diversification, i.e., diversification level and activity, and linking them to
underlying resource mechanisms such as resource creation, leverage, and configuration to explain
firm growth. Although there is already an intensive body of research on the link between
diversification and performance based on RBV arguments, study 1 specifically contributes by
pointing towards the importance of the bundled nature of resources, the endogeneity between
resources and relatedness, an inherent tension between different resource mechanisms, and a
relatedness measure making it possible to take these considerations into account. Study 1 not only
offers theoretical arguments, but also empirical tests by developing a fine-grained relatedness
measure that can link the different aspects of diversification with the underlying theoretical resource
logic to explain the outcomes of diversification. Thereby, I take into account business activities and
social processes to delineate market boundaries and their relatedness in a less artificial manner than
it is often the case in research on diversification across industries. Moreover, the theoretical and
empirical arguments of study 1 might also be translated and applied in a cross-industry

158
diversification context. For example, an indirect relatedness measure has been applied across
industries (Bryce and Winter 2009), and RBV arguments related to diversification based on the link
between products and resources, resource fungibility, and resource bundle characteristics such as its
relevance seem not bounded by industry borders. Also, study 1 adds to the diversification literature
by empirically confirming the presence of market structuration and theoretically clarifying its role
with respect to a firm’s resource bundle. Results show that market structuration has not only an
effect on firm profitability as in Li and Greenwood (2004), but also on firm growth. Moreover, study
1 elaborates on how market structuration has important implications for complementarities in a
firm’s resource bundle. Confirming the presence of market structuration implies that resource
complementarities are not only formed internally through for example process or organizational
linkages and efforts by middle managers (Taylor and Helfat 2009), but also externally through
evolutions in aggregated firm behavior and support structures (Li and Greenwood 2004). Moreover,
instead of focusing on the disruptive effects of environmental shocks or events on resource
complementarities (e.g., Lee et al. 2010; Siggelkow 2001), the results on market structuration
indicate that external evolutions can also bring a supportive contribution to resource
complementarities.
Second, study 1 contributes to the dynamic capability literature, more specifically that research
domain’s call for more empirical work and its link with growth performance (Barreto 2010; Helfat et
al. 2007). Study 1 offers a way to empirically grasp dynamic capability deployment by
operationalizing resource mechanisms such as resource creation, leverage, and configuration
without relying too heavily on the context or individual resources, which contributes to making
dynamic capability decisions more tangible, measurable, and applicable. The main findings of study 1
help identifying how a dynamic capability can lead to growth and what the possible pitfalls are.
Results indicate that resource creation and resource fit can help firms grow, but that firms should be
aware of a tradeoff between creating new resources and leveraging existing ones. A key contribution
of study 1 is that it theoretically argues and empirically identifies a core paradox that is taking place
when deploying a dynamic capability, i.e., a paradox between creating and leveraging resources.
Therefore, study 1 complements and adds to recent research efforts that try to clarify the internal
workings of dynamic capability by focusing on the different resource mechanisms (Danneels 2011;
Sirmon et al. 2011) and the internal processes (Eisenhardt, Furr, and Bingham 2010; Teece 2007)
taking place when deploying a dynamic capability. The results from study 1 show that a key aspect of
deploying a dynamic capability is to manage an inherent tension between creating something new
and leveraging what already exists. It means that a comprehensive list of underlying
microfoundations of a dynamic capability should consist of both processes related to individual
resource mechanisms (Teece 2007) and processes related to managing tensions across different
resource mechanisms (Eisenhardt et al. 2010; Helfat et al. 2007).
Third, study 1 contributes to the RBV literature. Study 1 further develops both conceptually and
methodologically the close link between a firm’s resources and products; a link that has been
acknowledged since the origins of the RBV, especially by Wernerfelt (1984), but has been treated
limitedly in the literature later on. Extending the work by Lee (2008), study 1 shows how a firm’s
product market choices can help to reveal information on its resource bundle and resource
mechanisms related to diversification, and link it with firm growth. An indirect method based on a
firm’s product market portfolio and the aggregated product market presence of all firms in the

159
industry, is applied to measure product market relatedness and reveal information on an individual
firm’s resource bundle. It makes measuring a firm’s resource bundle more tangible while
acknowledging the bundled nature of a firm’s resources. Also, it draws the attention to possibilities
for studying the performance potential of a firm based on resource bundle characteristics such as
relevance (Lee 2008) in addition to traditional individual resource characteristics such as value,
rareness, in-imitability, non-substitutability, and appropriability (Barney 1991). Therefore, study 1
sheds a new light on the potential to study the RBV based on Rumelt’s (1984) resource bundle
perspective. Study 1 not only indicates that it is possible to empirically study resource bundles and
their performance effects, but also that a firm’s decisions at the level of the resource bundle, besides
decisions at the level of individual resources, can have important implications for both performance
and decisions related to developing the resource bundle. Also, the main findings of study 1 are in
line with the theory on strategic industry factors (Amit and Schoemaker 1993) implying that a firm
needs both an outward focus (towards strategic industry factors) and an inward focus (towards the
individual resource bundle) to build and sustain a competitive advantage. Study 1 adds to the
literature not only an empirical translation of this theory, but also an integration with the theory on
dynamic capability that focuses on purposefully adapting a firm’s resource bundle to stay aligned
with a possibly changing external environment, while maintaining resource fit within the firm’s
individual resource bundle.
Studies 2 and 3 add to the literature as follows. First, study 2 contributes to the literature on
business models. Study 2 sets clear definitions of the concepts ‘business model’ and ‘business model
innovation’, while embedding them in previous contributions of the field in order to contribute to a
convergence in conceptual language which is in line with and extends earlier efforts by Zott, Amit,
and Massa (2011). More conceptual clarity gives current and future research also more background
with respect to the added value and usefulness of studying and applying the concepts ‘business
model’ or ‘business model innovation’ in a particular study. Thereby, study 2 devotes special
attention to further elaborate on the important notion that the business model constitutes a
separate unit of analysis, different from a firm, product, technology, or industry, that can provide
value and a (sustainable) competitive advantage. However, in line with previous research by Zott
and Amit (2008), results from study 2 indicate that the potential of a business model to create and
capture value also depends on a firm’s product market strategy. Study 2 extends Zott and Amit
(2008) not only by providing more information on the conceptual and empirical underpinnings of
how to better delineate the differences between a business model and a product market strategy,
but also by indicating there is an interplay between both such that a business model influences a
product market strategy and vice versa which influences survival.
Second, studies 2 and 3 add to the literature on market entry. An important contribution of
study 2 is showing that market entry decisions such as entry timing, product adaptation, and entry
scale, impact the survival chances of a newly launched business model. It implies that a business
model is not always able to create and appropriate value in and out of itself, but should be
accompanied by an appropriate market entry strategy. Also, study 2 makes an important
contribution by indicating that the influence of the launch decisions on the business model’s
(sustainable) competitive advantage should be assessed with respect to the launch decisions’ impact
on the business model’s characteristics such as its logic to create and capture value, and its value
drivers, while taking into account potential competitive dynamics among business models in the

160
appropriate (geographic) market. Moreover, study 2 indicates that market entry decisions do not
only play a role when launching new products or entering new geographic markets, but also when
launching a business model. This offers a new perspective on market entry decisions and their
outcome, also when applied to entering new product or geographic markets. Because market entry
decisions also have an influence on the underlying business model’s performance potential, the
underlying business model can influence what the outcome will be of particular market entry
decisions taken for new product or geographic market entry. Therefore, trying to explain winning
versus failing product introductions or new geographic market entries might be put in a different
perspective, when also incorporating in the analysis the underlying business model and the influence
of entry decisions (or product and technology characteristics) on that same business model instead
of only focusing on product or technology characteristics. Study 3 contributes to the market entry
literature by conceptualizing and empirically identifying a new type of market entry imitation
behavior, i.e., imitation of market entries among non-competing firms in different geographic
markets. It adds a third market entry spillover type besides the two already identified in previous
research, i.e., cross firm within market and within firm cross market entry spillover. It implies that
firms scanning the environment for interesting ideas are not restricted by national borders nor the
current competitive landscape. Study 3 shows the co-existence of both direct and indirect signals
related to market entry. Another contribution of study 3 is that if offers a hazard model with several
characteristics to create more realistic models for empirical research on market entry timing. The
model allows for non-monotonic event rates to enable models to connect more closely with
empirical settings, asymmetric effects to include more realistic spillover models, and permanent
survivor fractions that follow common sense that not all incumbents always enter new market
niches. Moreover, the model could easily be extended with various random and non-linear effects.
Third, studies 2 and 3 add to the innovation literature. They show that copycatting, i.e., imitation
or replication of an innovation, is a much-executed practice when a business model innovation
occurs. Study 2 shows that copycatting is a viable innovation strategy. Results indicate that many
copycats of the original business model innovation are able to survive while creating and capturing
value to their customers, themselves, and their partners. Although business model design is
important, the approach of study 2 to focus on how to commercialize business models instead of
inventing them, makes an important contribution towards better understanding how business
models can provide (sustainable) competitive advantage in markets not immune from competitive
dynamics. Knowing as a business model innovator that to build and sustain your advantage you also
need an appropriate launching strategy is important. Moreover, from an industry perspective, it is
also important knowing that one can successfully copycat a business model innovation so that
copycats can help fuelling an emerging business. Also, study 3 shows that business model innovation
ideas travel fast in both known and unknown territories. Business model innovators should be aware
of the danger of imitation, not only in geographic markets in which they are present, but also in
unfamiliar territories, because imitation can pre-empt a potential replication strategy. Moreover,
results indicate that business model ideas seem to travel more often across firm rather than within
firm boundaries, which seems to imply that firms are not always making appropriate use of own
data already available to them. Another contribution to the innovation literature is that the high
incidence of copycat business models (and their success) shows that intellectual property protection
with respect to business model innovation is lacking. However, empirical results show that being a
first mover has important survival advantages and being a first mover in all relevant territories

161
seems to be an even more difficult strategy when launching a business model compared to
launching a new product. Therefore, the question whether and how business models can be
protected by intellectual property right is an important question for policy makers, innovators, and
copycats.
Contributions to managerial practice
This dissertation holds some important managerial contributions. Study 1 provides insights on
how to grow in a relatively ‘safe’ within-industry environment. Managers benefit from more
conceptual and empirical knowledge on how dynamic capability and particular resource mechanisms
such as resource creation, leverage, and configuration can be deployed to grow when entering new
product markets. Especially valuable to practitioners is the finding that managers can capture
growth opportunities through diversification and dynamic capability deployment, but that they
should be aware of frictions between dynamic capability’s different resource mechanisms when
developing the resource bundle. Study 1 helps managers identifying possible causes for these
tensions in the form of different constraints at different levels within the organization, related to
organizational learning, managerial capacity, and organizational structure. Also, the indirect method
to gain insights in a firm’s product market relatedness and associated resource bundle
characteristics such as fit and relevance, are valuable to managerial practice because the
methodology is convenient and easily replicable across firms, countries, or industries. To replicate
this method, a firm only needs information on competitors’ presence in particular product markets
which is often considerably easy to obtain from websites or brochures, industry organization
databases, or trade journals, at least when focusing on cross-sectional data analyses. Moreover, the
methodology makes discussions and decisions with respect to a firm’s resource bundle more
tangible, transparent, and controllable, whereas previous discussions on a firm’s resources and its
dynamic capability were considered a black box.
Studies 2 and 3 show that copycatting a business model is a much-practiced and viable strategy
that is not restricted by geographic borders. It offers ventures the possibility to grow with a new
business model without necessarily being the innovator inventing the new business model.
However, it also warns business model innovators that their innovation is difficult to protect, that
many other ventures are likely to copy their invention, and that copy behavior is not restricted by
geographic borders. The results from study 2 also indicate that business models should be launched
with the appropriate market entry decisions to be viable. There are three key launch decisions, i.e.,
entry timing, product adaptation, and entry scale, that impact the survival of a business model. It
should help both incumbents and new entrants that are confronted with new, disruptive markets
and business models or designing them themselves, to be better able to foresee and predict success
and failure in those new market niches. Policy makers benefit from a better understanding of how
new markets and disruptive business model innovations operate, spread out and survive, in order to
make more informed decisions whether it is appropriate to protect incumbent markets or not in the
case of business model innovation. Also, studies 2 and 3 add to the discussion whether it would be
suitable to provide possibilities to protect intellectual property derived from the business model.
Moreover, the specific context of our studies, the media industry, is a very important industry from a
policy perspective because of its democratizing character and powerful public information channel.
Another contribution of study 3 to managerial practice is that it identifies relevant dimensions of
162
firm scanning activities and how these can influence firm decisions in a complex and uncertain
market context. It helps firms to detect not only strong signals from close competitors, but also weak
signals on the periphery. It implies that firms confronted with new market niches will be better able
to foresee and predict whether, when and where incumbents will react. Also, the results on what
firm and market characteristics are moderating entry spillover, will benefit managers through
knowing better how to organize scanning activities and gather industry intelligence in terms of what
markets and firms to watch for competitive and industry-specific information, without creating data
overload.
Limitations and future research opportunities
Based on this dissertation’s limitations and main findings, there are some compelling future
research opportunities. First, study 1 is limited to market entries, i.e., product market portfolio
additions and the associated portfolio breadth, to study resource creation, leverage, and fit, and
their impact on firm growth. That neglects other decisions with respect to a firm’s product market
portfolio that might be considered simultaneously with market entries, e.g., market exits or a focus
on portfolio depth instead of breadth, which could impact firm growth. It also neglects other types
of resource mechanisms such as deleting resources or accessing external resources, that can change
a resource bundle with a possible impact on firm growth. Integrating simultaneous firm decisions on
product market entries, exits, and depth, and the associated resource bundle decisions such as
resource creation, leverage, deletion, and fit leaves ample room for further research to enhance our
understanding of the close interconnectedness between resources and products, and the
mechanisms with which firms can change their resource bundles. Also, it is interesting for future
research to both conceptually and empirically study whether dynamic capability deployment differs
substantially when focusing on market entry, exit, or specialization, i.e., changing a firm’s product
market portfolio breadth or depth. Thereby not only the type of deployed resource mechanisms can
differ, but also the type of ‘frictions’ arising between resource mechanisms might change. For
example, just like particular combinations of breadth and depth of innovation and customer assets
can be complementary or detrimental (Fang, Palmatier, and Grewal 2011), future research on
dynamic capability deployment can investigate whether particular combinations of resource
mechanisms are more likely to create complementarities or frictions.
Second, study 1 is focused on further developing and using an indirect method for measuring a
firm’s resource bundle based on information from the firm’s product market portfolio. However, an
indirect method cannot measure individual resources and their characteristics, and has the
disadvantage of not being able to exactly pinpointing what it measures. Future research combining
both an indirect and direct method for measuring a firm’s resource bundle could add significantly to
advancing both the indirect and direct methodologies (e.g., insights in each method’s blindspots and
how both methods converge or diverge in their measurements), and to increasing our understanding
of the internal workings, characteristics, and management of a firm’s resource bundle. Moreover, it
could clarify the heterogeneity of firms with respect to their dynamic capability. In line with Zott’s
(2003) simulation of dynamic capability heterogeneity linked with cost, learning, and timing of
deployment, study 1 tries to uncover some of dynamic capability’s heterogeneity related to firm
scope, age, and specialist focus. However, more work is needed on dynamic capability’s
heterogeneity to get a better picture of its contribution to firm performance. Also, combining an

163
indirect and direct measurement method would help capturing more fully the performance
implications of a resource bundle by distinguishing between the performance impact of
characteristics of individual resources such as value and rareness amongst others, i.e., the
‘traditional’ viewpoint propagated in the RBV (e.g., Barney 1991; Peteraf 1993), and characteristics
of the resource bundle such as relevance and fit, i.e., a viewpoint initiated by Rumelt (1984), further
developed by research on dynamic capability (e.g., Helfat et al. 2007), and advanced by Lee (2008)
using the indirect method.
Third, in study 1, controls for environmental fixed effects related to time and place only have a
limited impact on firm growth. Moreover, decisions such as resource creation and leverage that are
not related to the environment and under control of an individual firm have important growth
implications. These results broaden the application domain of the dynamic capability concept by
questioning the traditionally accepted statement that dynamic capability is only relevant in a
dynamic environment. Studying dynamic capability in a dynamic environment is at the foundational
core of dynamic capability (e.g., Helfat et al. 2007; Teece, Pisano, and Shuen 1997). Previous
research identifies different environmental dimensions such as velocity, complexity, ambiguity, and
unpredictability (Davis, Eisenhardt, and Bingham 2009). However, the empirical identification and
large growth consequences of market structuration in study 1 imply that market structuration is an
environmental dimension that also needs to be taken into account when assessing performance
implications of dynamic capability and make that market structuration deserves further attention in
future studies. In its naming, market structuration seems to imply more structure and thus a less
dynamic environment. However, market structuration relates also to changes in the environment
and seems to impact other dimensions of the environment such as complexity, ambiguity, and
unpredictability. It would add to the literature to assess how market structuration can be clearly
conceptualized and how market structuration relates to and differs from other environmental
dimensions. Moreover, given market structuration’s importance for growth, future research should
extend Li and Greenwood (2004) by focusing on the underlying drivers of market structuration (e.g.,
type of drivers, empirical identification of drivers, relative importance of drivers). Also, dynamic
capability literature would benefit when assessing dynamic capability deployment and performance
implications in various environments that differ along the previously mentioned dimensions.
Fourth, study 2 is limited towards decisions at the time of market launch of the business model
and does not consider changes over time of important decisions such as scale, product adaptation,
and strategic control. Therefore, future research might shift the focus towards dynamic managerial
decision-making during a launch process. For example, how can entrepreneurial firms dynamically
adapt their market entry decisions such as product characteristics, scale and strategic control, to
improve the odds for success? Also, how do business model and market entry decisions at time of
entry influence business model and market entry decisions in a later stage, and are there any path
dependencies to observe? And similarly, are there performance feedback loops to observe, i.e., an
impact of incurred performance on business model and market entry decisions in later stages, after
the time of entry? Moreover, to get a full grasp of its performance impact, it makes sense to split the
effect of market attractiveness across decisions related to market entry, market exit, and the exact
timing of these decisions. Also, study 2 operationalizes many variables using a dummy approach.
Although a dummy approach is defensible given the hypotheses and data at hand, e.g., we are
interested in identifying first-mover advantages or not rather than entry order effects, a search for a

164
more continuous operationalization might create insights through more fine-grained main and non-
linear effects. Moreover, a continuous multi-dimensional measure for product adaptation along
several key aspects of a product (e.g., consumption experience in terms of place, time, content) can
also give more insights in how ventures can create differentiation with or without influencing the
underlying business model.
Fifth, considering a business model as a separate unit of analysis creates a number of interesting
future research opportunities. To have a better idea on the relative importance of different units of
analysis such as the firm, industry, business model, and even product and technology, future
research can try to decompose different dimensions of (sustainable) performance into parts
influenced by a particular unit of analysis. Previous research trying to decompose inter-firm
performance differences focuses on the firm, the industry, and sometimes strategic groups as main
units of analysis (e.g., McGahan and Porter 1997; Rumelt 1991; Short et al. 2007). More information
on the units of analysis’ relative importance not only gives an indication of the value of research
done on these units of analysis, but also informs future research to focus on research topics with
more impact. Another interesting research opportunity is conducting more research on business
model innovation and its importance (e.g., resources devoted to business model innovation),
innovation process (e.g., similarities, differences, and interactions with new product development
process), performance impact (e.g., impact on innovating firm, existing firms and business models),
characteristics (e.g., its similarities and differences with radical, disruptive, and architectural
innovation), and diffusion (e.g., diffusion process characteristics and possible differences across
adopting populations such as entrepreneurs, consumers, and countries; innovation and imitation
drivers and inhibitors; differences with diffusion of other innovation types). Also, are there financial
and/or media bubbles associated with business model innovations and their diffusion? The general
enthusiasm on this type of innovation together with many entries (and exits in for example the free
daily newspaper market) suggest there might be some kind of irrational enthusiasm.
Sixth, study 3 studies the relationship from market insights (cf., information signals related to
previous market niche entries) towards marketing capabilities (cf., capturing and interpreting
information signals to enter a new market niche). Therefore, study 3 seems to relate to a dynamic
capability in the sense that the dynamic capability is undergirded by systematic sensing and scanning
processes leading to market entry and associated resource bundle adaptations to enter the market
niche appropriately (Day 2011; Teece 2007). However, the main finding in study 3 that there is a
market entry spillover across firms across markets suggests that firms may possess a capability that
enables for anticipation and appropriate response. Therefore, study 3 seems also in line with what
some suggest as being the reciprocal relationship between market insights and marketing
capabilities, i.e., that there is also an influence from marketing capabilities on market insights,
leading to so-called adaptive marketing capabilities (Day 2011). Future research could further
explore the reciprocity between market insights and marketing capabilities by estimating them
simultaneously. Moreover, future research could further clarify how dynamic capability and adaptive
capability are similar and/or different, especially in an empirical setting. Another limitation of study
3 is the limited use of the flexibility the mathematical model offers. Future research can make more
use of that flexibility by e.g., introducing random firm and market effects and modeling the
probability of entry in line with a split hazard approach.

165
References
Amit, Raphael and Paul J. H. Schoemaker (1993), "Strategic Assets and Organizational Rent,"
Strategic Management Journal, 14(1), 33-46.
Barney, Jay (1991), "Firm Resources and Sustained Competitive Advantage," Journal of
Management, 17(1), 99-120.
Barreto, Ilidio (2010), “Dynamic Capabilities: A Review of Past Research and an Agenda for the
Future,” Journal of Management, 36(1), 256-80.
Bryce, David J. and Sidney G. Winter (2009), "A General Interindustry Relatedness Index,"
Management Science, 55(9), 1570-85.
Danneels, Erwin (2011), "Trying to Become a Different Type of Company: Dynamic Capability at
Smith Corona," Strategic Management Journal, 32(1), 1-31.
Davis, Jason P., Kathleen M. Eisenhardt, and Christopher B. Bingham (2009), "Optimal Structure,
Market Dynamism, and the Strategy of Simple Rules," Administrative Science Quarterly,
54(3), 413-52.
Day, George S. (2011), "Closing the Marketing Capabilities Gap," Journal of Marketing, 75(4), 183-95.
Eisenhardt, Kathleen M., Nathan R. Furr, and Christopher B. Bingham (2010), "Microfoundations of
Performance: Balancing Efficiency and Flexibility in Dynamic Environments," Organization
Science, 21(6), 1263-73.
Fang, Eric, Robert W. Palmatier, and Rajdeep Grewal (2011), “Effects of Customer and Innovation
Asset Configuration Strategies on Firm Performance,” Journal of Marketing Research, 48(3),
587-602.
Helfat, Constance E., Sydney Finkelstein, Will. Mitchell, Margaret A. Peteraf, Harbir Singh, David J.
Teece, and Sidney G. Winter (2007), Dynamic Capabilities: Understanding Strategic Change
In Organizations. Blackwell Publishing.
Lee, Gwendolyn K. (2008), "Relevance of Organizational Capabilities and its Dynamics: What to Learn
from Entrants' Product Portfolios about the Determinants of Entry Timing," Strategic
Management Journal, 29(12), 1257-80.
Li, Stan X. and Royston Greenwood (2004), "The Effect of Within-Industry Diversification on Firm
Performance: Synergy Creation, Multi-Market Contact, and Market Structuration," Strategic
Management Journal, 25(12), 1131-53.
McGahan, Anita M. and Michael E. Porter (1997), “How Much Does Industry Matter, Really?,”
Strategic Management Journal, 18(S1), 15-30.
Peteraf, Margaret A. (1993), “The Cornerstones of Competitive Advantage: A Resource-Based View,”
Strategic Management Journal, 14(3), 179-91.
Rumelt, Richard (1991), “How Much Does Industry Matter?,” Strategic Management Journal, 18(S1),
15-30.

166
Rumelt, Richard (1984), "Towards a Strategic Theory of the Firm," in Competitive Strategic
Management, Robert Boyden Lamb, ed. Englewood-Cliffs, NJ: Prentice-Hall, 556-70.
Short, Jeremy C., David J. Ketchen Jr., Timothy B. Palmer, and G. Tomas M. Hult (2007). “Firm,
Strategic Group, and Industry Influences on Performance,” Strategic Management Journal,
28(2), 147-167.
Sirmon, David G., Michael A. Hitt, R. Duane Ireland, and Brett A. Gilbert (2011), "Resource
Orchestration to Create Competitive Advantage: Breadth, Depth, and Life Cycle Effects,"
Journal of Management, 37(5), 1390-412.
Taylor, Alva and Constance E. Helfat (2009), "Organizational Linkages for Surviving Technological
Change: Complementary Assets, Middle Management, and Ambidexterity," Organization
Science, 20(4), 718-39.
Teece, David J. (2007), "Explicating Dynamic Capabilities: The Nature and Microfoundations of
(Sustainable) Enterprise Performance," Strategic Management Journal, 28(13), 1319-50.
Teece, David J., Gary Pisano, and Amy Shuen (1997), "Dynamic Capabilities and Strategic
Management," Strategic Management Journal, 18(7), 509-33.
Zott, Christoph (2003), "Dynamic Capabilities and the Emergence of Intraindustry Differential Firm
Performance: Insights from a Simulation Study," Strategic Management Journal, 24(2), 97-
125.
Zott, Christoph and Raphael Amit (2008), "The Fit between Product Market Strategy and Business
Model: Implications for Firm Performance," Strategic Management Journal, 29(1), 1-26.
Zott, Christoph, Raphael Amit, and Lorenzo Massa (2011), "The Business Model: Recent
Developments and Future Research," Journal of Management, 37(4), 1019-42.

167
Glossary
Asset: a useful or valuable thing, person, or quality
Business model: defines how a focal firm creates value for customers and how that value is
appropriated across itself and its partners. A business model can be represented by a system of
interconnected and interdependent activities that transcends the focal firm.
Business model innovation: a new-to-the-world business model with -- relative to the closest existing
business model -- one or more changes in one or more ways in the activity system so that the
existing business model’s value creation and appropriation logic is materially altered
Capability: a complex bundle of skills and accumulated knowledge, exercised through organizational
processes that enables a firm to coordinate activities and make use of its assets
Dynamic capability: a firm’s capability to change its resource bundle purposefully
Entry spillover: the influence of a previous market niche entry by a particular firm in a particular
market on a focal firm’s market niche entry in a focal market
MCMC: Markov-Chain Monte-Carlo
MH: Metropolis-Hastings
RBV: resource-based view
Resource bundle: a firm’s set of assets, resources, and capabilities
Resources: stocks of available assets that are owned or controlled by the firm
Strategic industry factors: a set of resources and capabilities that have become the prime
determinants of firm performance in an industry
Strategic industry factor innovation: introduction of new resources and capabilities or a new
combination of existing resources and capabilities that become the prime determinants of firm
performance in an industry