the effect of solidification thermal variables on surface quality of al–cu ingots
TRANSCRIPT
A
ttrdt©
K
1
iTihttdacs
tbimbm
0d
Journal of Alloys and Compounds 428 (2007) 130–138
The effect of solidification thermal variables onsurface quality of Al–Cu ingots
Jose M.V. Quaresma a, Noe Cheung b, Amauri Garcia b,∗a Federal University of Para, UFPA, Belem, PA, Brazil
b Department of Materials Engineering, State University of Campinas UNICAMP, PO Box 6122, 13083-970 Campinas, SP, Brazil
Received 1 March 2006; received in revised form 17 March 2006; accepted 20 March 2006Available online 27 April 2006
bstract
A combined theoretical and experimental approach was undertaken to quantitatively determine thermal variables during solidification, i.e.,ransient metal/mold heat transfer coefficients, cooling rates and a driving force factor for the solidified shell distortion, given by the gradient ofhe cooling rate. Such thermal variables were correlated with the geometric features of the observed surface marks of Al–Cu alloys ingots in the
ange of pure Al and the eutectic composition. It was shown that the thermal distortion factor increases with alloy Cu content, and it is stronglyependent on the initial values of the metal/mold heat transfer coefficient. A correlation with the resulting experimental surface marks has indicatedhat larger depth and pitch are associated with higher thermal distortion driving forces.2006 Elsevier B.V. All rights reserved.
tal/mo
afimbgiAah
filtmAc
eywords: Surface quality; Al–Cu alloys; Solidification thermal variables; Me
. Introduction
Addition of copper to Al decreases significantly the melt-ng point of the alloys formed and also increases treatability.he first and widely used aluminum alloys were those contain-
ng 4–10 wt.% Cu. Even though additions of copper can reduceot tear resistance and decrease castability and corrosion resis-ance, copper substantially improves strength and hardness inhe as-cast and heat-treated conditions [1]. When casting con-itions induce smaller dendritic array spacings in aluminumlloys, intermetallic compounds such as CuAl2 and second phaseonstituents are dispersed more finely and evenly leading to sub-tantial improvement in mechanical properties [2–4].
Ingot casting and continuous casting of metals are consideredo a large extent as heat transfer problems, with the freezing rateeing controlled by thermal resistances across the liquid/solidnterface, the solidifying shell, the metal mold interface and the
old itself. In particular the thermal conditions at the earlyeginning of solidification are of utmost importance in deter-ining the surface quality of a casting [5]. When a liquid is cast
∗ Corresponding author. Fax: +55 19 32893722.E-mail address: [email protected] (A. Garcia).
fii
trH
925-8388/$ – see front matter © 2006 Elsevier B.V. All rights reserved.oi:10.1016/j.jallcom.2006.03.054
ld heat transfer coefficient
gainst a mold wall the general expectation is that the ingot sur-ace will assume the microgeometry of the mold wall. However,n the case of chilled castings, the cast surface will exhibit geo-
etric features which are consequence of the thermomechanicalehavior of the solidifying shell and have little to do with theeometry of the mold wall [6]. The surface quality of ingots ismportant since the presence of defects leads to a loss in yield.
particular group of surface defects characterized by ripplesnd laps in ingots and reciprocation marks in continuous castingave been previously studied [5–12].
Thornton [5] proposed a model involving meniscus solidi-cation during casting to explain the formation of ripples and
aps. Fig. 1 shows a schematic representation of such proposi-ion. The mechanism is controlled by the surface tension of the
etal, which determines the shape and height of the meniscus.fter a short period of time the solid has grown over the menis-
us preventing the metal, which is restrained by surface tension,rom contacting the mold, as shown in Fig. 1. Eventually thenternal pressure is sufficient to deform the solid meniscus caus-ng the metal to recontact the mold, provoking ripple formation.
The presence and distribution of surface ripples is dependento a great extent on the rate of chilling of the meniscus as itises up the mold wall and on metal thermophysical properties.owever, the influence of solidification thermal variables on the

J.M.V. Quaresma et al. / Journal of Alloys and Compounds 428 (2007) 130–138 131
]. (das
gatAavcdmo
2
at
h
wTitctcscahb
h
ws
mdmii
wcfioflcc
dimhbtt[tlatmr
Fig. 1. Mechanism of surface mark formation in ingots [5
eometry of the cast surfaces has not been fully explored. Theim of the present study is to analyze the effect of metal/moldhermal variables on the surface mark formation in hypoeutecticl–Cu alloys castings. A combined theoretical and experimental
pproach was undertaken to quantitatively determine the thermalariables, i.e., transient metal/mold heat transfer coefficients,ooling rates and a driving force factor for the solidified shellistortion, given by the gradient of the cooling rate. Such ther-al variables were correlated with the geometric features of the
bserved surface marks.
. Solidification thermal variables
Heat flow across the metal casting/mold interface can be char-cterized by a macroscopic average metal/mold interfacial heatransfer coefficient (h), given by:
= q
A(TIC − TIM)(1)
here q [W] is the average heat flux, A [m2] is the area andIC and TIM are metal and mold surface temperatures [K] at the
nterface. It is well known that during the solidification process,he mold gradually expands due to heat absorption, and the metalasting is subjected to shrinkage. As a result, a gap develops dueo insufficient contact between metal and mold, and as a directonsequence, h decreases rapidly. In previous articles, the tran-ient interfacial heat transfer coefficient has been successfullyharacterized by using an approach based on measured temper-tures along the casting and numerical simulations provided byeat transfer solidification models [13–16]. This coefficient haseen expressed as a power function of time, given by:
= Ci(t)−n (2)
here h [W m−2 K−1], t is the time [s] and Ci and n are con-tants which depend on alloy composition, chill material and
fctf
hed line indicates remelting of the solid shell) t1 < t2 <t3.
elt superheat. In cooled molds, the overall heat flow can beefined by a series of thermal resistances. The interfacial ther-al resistance between the casting and the cooled mold (1/hm/m)
s generally the largest and the overall thermal resistance (1/hi)s given by [15]:
1
hi= 1
hm/m+ es
ks+ ec
kc+ 1
hw(3)
here hi is the overall heat transfer coefficient between theasting surface and the cooling fluid, hm/m the heat transfer coef-cient between the casting surface and the mold, es the thicknessf the mold sheet which separates the metal from the coolinguid, ks its thermal conductivity, ec the thickness of the moldoating, kc the coating thermal conductivity, and hw is the mold-oolant heat transfer coefficient.
Solidification processing variables can be analyticallyescribed as a function of metal/mold parameters and cast-ng operational conditions and consequently, as a function of
etal/mold interfacial heat transfer coefficient (h). An analyticaleat transfer model, which describes the temperature distri-ution and the position of solidus and liquidus isotherms inhe unidirectional solidification of binary alloys, can be usedo determine thermal variables during transient solidification2,17,18]. The model employs the mathematically expedientechnique of replacing the interfacial resistance by equivalentayers of material, and the latent heat of fusion is taken intoccount by adjusting the specific heat over the solidificationemperature range. The ingot is treated as a one-dimensional
oving boundary problem with boundaries at the tips andoots of the dendrites. It is assumed that the Newtonian inter-
ace resistance is represented by a metal/mold heat transferoefficient (h). The other thermophysical properties describinghe system are treated as averages within the same phase, asollows:
1 lloys a
e[h
citd
wmtSta
P
wicTd
T
wmr(ii
T
T
s
T
wmttft
ft
fr
S
32 J.M.V. Quaresma et al. / Journal of A
where TLiq is the liquidus temperature [K], TSol the non-quilibrium solidus temperature, k the thermal conductivityW m−1 K−1], c the specific heat [J kg−1 K−1],�H is the latenteat of fusion [J kg−1].
The one-dimensional Fourier field equation is exactly appli-able to the virtual metal/mold system, and the solution obtainedn the system can be related to the real system by simple rela-ionships. Under these assumptions the model is completelyescribed by the following equations:
Positionofsolidusisotherm :
t = S2S
4αS(φ1)2 + L0 SS
2αS(φ1)2 + L20 − S2
0
4αS(φ1)2 (9)
here t is time, SS the position of solidus isotherm frometal/mold interface, αS the solid diffusivity, φ1 is a solidifica-
ion constant associated to the displacement of solidus isotherm,0 is the thickness of solid pre-existing adjunct to the metal inhe virtual system, and L0 is the thickness of total pre-existingdjunct to metal in the virtual system (solid and mushy).
ositionofliquidusisotherm : t = S2L
4αSL (φ2)2 + L0SL
2αSL (φ2)2
(10)
here SL is the position of liquidus isotherm from metal/moldnterface, αSL is mushy zone diffusivity and φ2 is a solidificationonstant associated to the displacement of liquidus isotherm.he growth rates or velocities at the roots (VS) or tips (VL) ofendrites can be derived from Eqs. (9) and (10), respectively.
Temperature distribution in the mold (TM):
M = T0 + M (TSol − T0)
M + erf(φ1)
[1 + erf
(N φ1
x− E0
SS + L0
)](11)
here M is the ratio of heat diffusivities of solid and mold
aterial, (kScMρM/kMcSρS)1/2, N is the square root of theatio of thermal diffusivities of solid metal and mold material,αS/αM)1/2, E0 is the thickness of pre-existing adjunct to moldn the virtual system, T0 is the environment temperature and xs the position from metal/mold interface.
Temperature distribution in the solid (TS):
S = T0 + TSol − T0
M + erf(φ1)
[M + erf
(φ1x+ L0
SS + L0
)](12)
L
E
tS
nd Compounds 428 (2007) 130–138
Temperature distribution in the mushy zone (TSL):
SL = TLiq − TLiq − TSol
erf(φ2) − erf(nφ1)
[erf(φ2) − erf
(φ2x+ L0
SL + L0
)](13)
where n is the square root of the ratio of thermal diffusivities ofolid metal and mushy zone, (αS/αSL)1/2.
Temperature distribution in the liquid (TL):
L = TP − TP − TLiq
1 − erf(mφ2)
[1 − erf
(mφ2
x+ L0
SL + L0
)](14)
here m is the square root of ratio of thermal diffusivities ofushy zone and liquid, (αSL/αL)1/2 and TP is the initial melt
emperature. Temperature gradients immediately at the left ofhe dendrite tips and at the right of tip interface can be derivedrom Eqs. (13) and (14), respectively. Thermal gradients alonghe solid may be determined from Eq. (12).
Heat balances performed at solid/mush and mush/liquid inter-aces permit constants φ1 and φ2 to be determined by the simul-aneous solution of the resulting equations:
TLiq − TSol
erf(φ2) − erf(nφ1)= kS exp[(n2 − 1)φ2
1]
kSLn[M + erf(φ1)](TSol − T0) (15)
TLiq − TSol
erf(φ2) − erf(nφ1)= kLm exp[(1 −m2)φ2
2]
kSL[1 − erf(mφ2)](TP − TLiq)
(16)
The virtual adjuncts S0, L0 and E0 can be expressed as aunction of the metal/mold heat transfer coefficient, and areespectively given by:
0 = 2kSφ1(TSol − T0)√π(TLiq − T0) exp(φ2
1)[M + erf(φ1)]h(17)
0 = φ2
nφ1S0 (18)
0 = S0
N(19)
The model has been previously validated against experimen-al data describing the unidirectional solidification of Al–Cu,n–Pb and Zn–Al alloys [2,17–19].
loys a
m
T
iatshitth
Ψ
d
Ψ
w
hmtg
J.M.V. Quaresma et al. / Journal of Al
The cooling rate at any point of the solid shell can be deter-ined from Eq. (12) and is given by:
˙S = dTS
dt
= 2(TSol − T0)√π[M + erf(φ1)]
×[−(
x+ S0
4√αS(t + t0)3
)exp
(− (x+ S0)2
4αS(t + t0)
)](20)
The initial metal/mold heat transfer coefficient, h, stronglynfluences the temperature gradient near the casting surface ingiven solidification system, and the time-dependent tempera-
ure profile determines the stress and strain distributions in theolidifying shell. The strain development, initially affected by, when enough to cause distortion of the solidifying shell willn turn affect the heat transfer coefficient. The driving force forhe shell distortion, ψ, is the absolute value of the gradient ofhe cooling rate in a solidifying alloy, and for unidimensional
eat flow conditions is given by [20]:=∣∣∣∣∂T∂x
∣∣∣∣ (21) wo
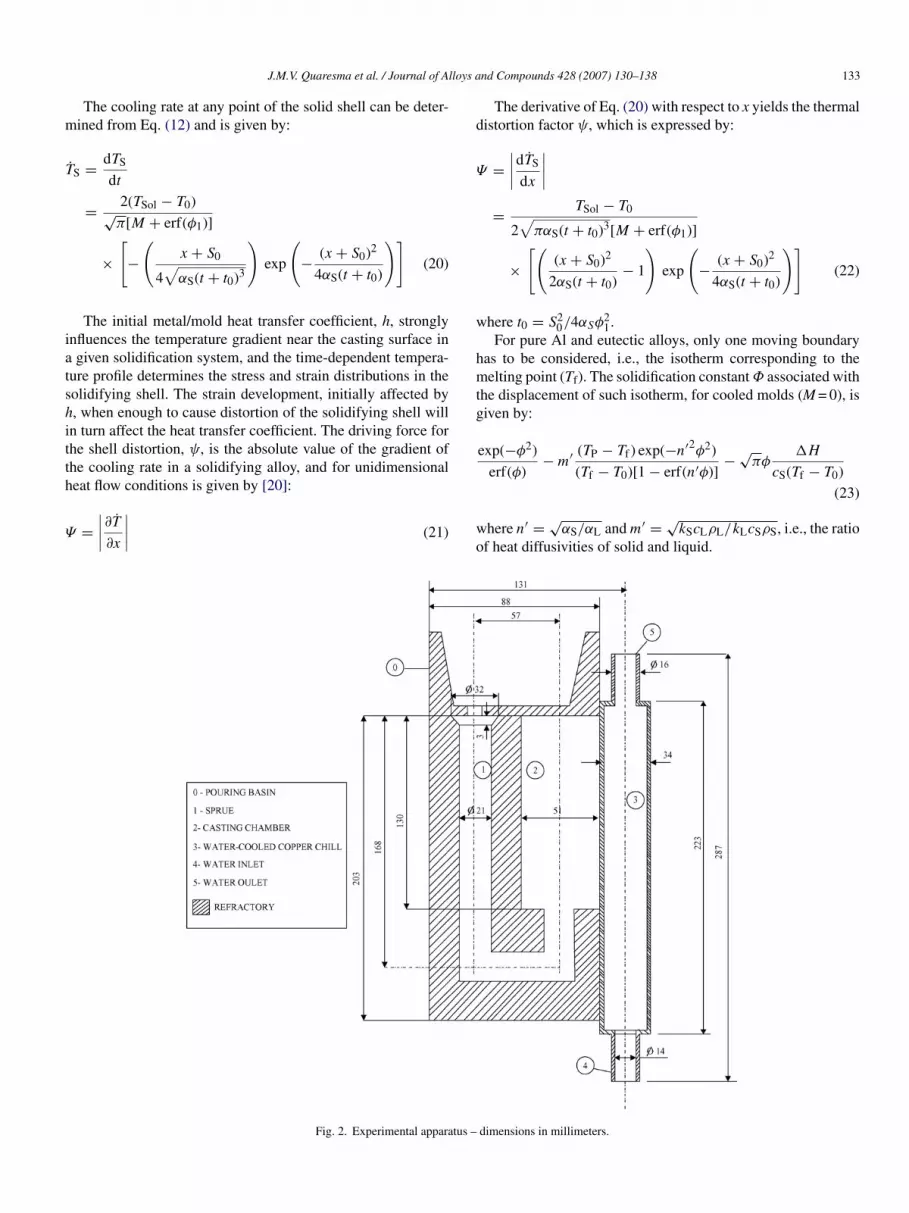
Fig. 2. Experimental apparatus –
nd Compounds 428 (2007) 130–138 133
The derivative of Eq. (20) with respect to x yields the thermalistortion factor ψ, which is expressed by:
=∣∣∣∣dTS
dx
∣∣∣∣= TSol − T0
2√παS(t + t0)3[M + erf(φ1)]
×[(
(x+ S0)2
2αS(t + t0)− 1
)exp
(− (x+ S0)2
4αS(t + t0)
)](22)
here t0 = S20/4αSφ
21.
For pure Al and eutectic alloys, only one moving boundaryas to be considered, i.e., the isotherm corresponding to theelting point (Tf). The solidification constantΦ associated with
he displacement of such isotherm, for cooled molds (M = 0), isiven by:
exp(−φ2)
erf(φ)−m′ (TP − Tf ) exp(−n′2φ2)
(Tf − T0)[1 − erf(n′φ)]− √
πφ�H
cS(Tf − T0)
(23)here n′ = √αS/αL andm′ = √
kScLρL/kLcSρS, i.e., the ratiof heat diffusivities of solid and liquid.
dimensions in millimeters.
1 lloys a
i[
3
ccFbtar
ctott
ataaawmttmicF
Fa
4
tAd
P
A
A
A
A
wataapEinfiri
34 J.M.V. Quaresma et al. / Journal of A
Eq. (22) can be applied for pure metals or eutectics by replac-ng TSol by Tf, Φ1 by Φ (calculated by Eq. (23)), and adopting(TSol − T0)/(TLiq − T0)] = 1 in Eq. (17) when calculating S0.
. Experimental procedure
The castings were made in the apparatus sketched in Fig. 2. A refractoryhamber was prepared having a copper water-cooled face on one side. Theopper face in contact with the melt was previously machined and polished.or some of the casts Helium (a neutral gas of high thermal conductivity) haseen injected into the casting cavity in order to enhance the melt/copper heatransfer efficiency. An alumina-based mold dressing of about 100 �m thick haslso been used in some experiments in order to increase the metal/copper thermalesistance (the term ec/kc in Eq. (3)).
In the uphill teeming technique used, the teeming speed was controlled by aombination of nozzle diameter and liquid depth in the pouring basin. The meltemperature was controlled immediately before pouring. The water inlet andutlet temperatures and the casting surface temperature were monitored alonghe experiments by types J and K thermocouples, respectively, at a frequency ofwo measurements per second.
A series of castings were made with Al, Al–4.5 wt.%Cu, Al–15 wt.%Cund Al–33 wt.%Cu (eutectic composition) in order to investigate the effect ofhe solute content on the geometric surface features. Pouring temperatures ofbout 5 ◦C above the liquidus temperature of Al–5Cu and Al–15Cu alloys,nd above the melting temperatures of pure Al and the eutectic alloy weredopted. Each alloy was melted in an electric resistance-type furnace, whichas simultaneously used to preheat the refractory chamber. When the moltenetal reached a predetermined temperature, it was stirred until the tempera-
ure was brought to a temperature of about 5 ◦C above the liquidus/meltingemperatures and poured into the pouring basin. Since the volume of liquid
etal necessary for each experiment was relatively small, stirring was effective
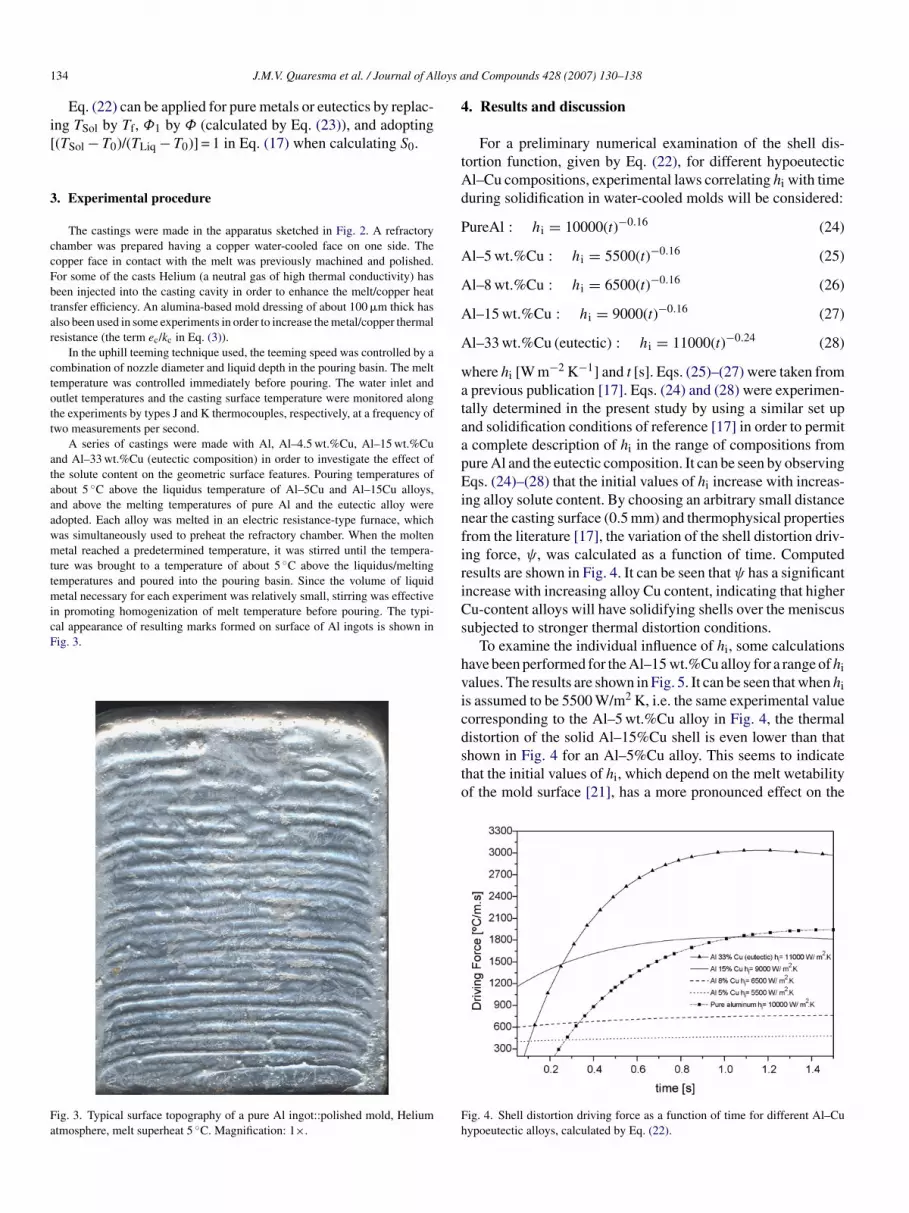
n promoting homogenization of melt temperature before pouring. The typi-al appearance of resulting marks formed on surface of Al ingots is shown inig. 3.ig. 3. Typical surface topography of a pure Al ingot::polished mold, Heliumtmosphere, melt superheat 5 ◦C. Magnification: 1×.
Cs
hvicdsto
Fh
nd Compounds 428 (2007) 130–138
. Results and discussion
For a preliminary numerical examination of the shell dis-ortion function, given by Eq. (22), for different hypoeutecticl–Cu compositions, experimental laws correlating hi with timeuring solidification in water-cooled molds will be considered:
ureAl : hi = 10000(t)−0.16 (24)
l–5 wt.%Cu : hi = 5500(t)−0.16 (25)
l–8 wt.%Cu : hi = 6500(t)−0.16 (26)
l–15 wt.%Cu : hi = 9000(t)−0.16 (27)
l–33 wt.%Cu (eutectic) : hi = 11000(t)−0.24 (28)
here hi [W m−2 K−1] and t [s]. Eqs. (25)–(27) were taken fromprevious publication [17]. Eqs. (24) and (28) were experimen-
ally determined in the present study by using a similar set upnd solidification conditions of reference [17] in order to permitcomplete description of hi in the range of compositions fromure Al and the eutectic composition. It can be seen by observingqs. (24)–(28) that the initial values of hi increase with increas-
ng alloy solute content. By choosing an arbitrary small distanceear the casting surface (0.5 mm) and thermophysical propertiesrom the literature [17], the variation of the shell distortion driv-ng force, ψ, was calculated as a function of time. Computedesults are shown in Fig. 4. It can be seen thatψ has a significantncrease with increasing alloy Cu content, indicating that higheru-content alloys will have solidifying shells over the meniscus
ubjected to stronger thermal distortion conditions.To examine the individual influence of hi, some calculations
ave been performed for the Al–15 wt.%Cu alloy for a range of hialues. The results are shown in Fig. 5. It can be seen that when his assumed to be 5500 W/m2 K, i.e. the same experimental valueorresponding to the Al–5 wt.%Cu alloy in Fig. 4, the thermal
istortion of the solid Al–15%Cu shell is even lower than thathown in Fig. 4 for an Al–5%Cu alloy. This seems to indicatehat the initial values of hi, which depend on the melt wetabilityf the mold surface [21], has a more pronounced effect on theig. 4. Shell distortion driving force as a function of time for different Al–Cuypoeutectic alloys, calculated by Eq. (22).

J.M.V. Quaresma et al. / Journal of Alloys and Compounds 428 (2007) 130–138 135
Fa
tc
sole
y
wm(ccmruiFpsa
Ff
Fa
ifima
cctfTmtitfatt
ig. 5. Influence of hi on shell distortion driving force for an Al–15 wt.%Culloy.
hermal distortion than specific values of other thermophysicalharacteristics exhibited by each Al–Cu alloy.
The shape of the meniscus can be also very influent on theeverity of surface mark formation. It is a complex functionf several parameters and can be assumed as the profile of aiquid cylinder in mechanical equilibrium with the surroundingnvironment, which can be theoretically determined by [8]:
− y0 = −(2γ − ε2)1/2 + γ√
2ln
[γ√
2 + (2γ2 − ε2)1/2
ε
]
(29)
here γ = (2σ/gρL)1/2 is the capillarity constant, σ the liquidetal surface tension, and ρL is the density of molten metal. Eq.
29) is compared in Fig. 6 with the experimental solid menis-us profile, which was obtained for a pure Al ingot cast underonditions of polished mold and air as atmosphere. The agree-ent between the calculated and the experimental profiles is
easonable despite the theoretical one being based on the liq-id meniscus profile. Eq. (29) can also be used to examine thenfluence of different atmospheres between metal and mold wall.
ig. 7 shows a comparison of calculated meniscus profiles forure Al castings under air and Helium atmospheres. It can beeen that the observed profile under Helium atmosphere formsdeeper valley at the vicinity of the mold wall. By consider-ig. 6. Calculated liquid meniscus and experimentally observed solid meniscusor pure Al castings.
ccfteaimcAh
iwicAT
ig. 7. Calculated liquid meniscus for pure Al castings under Helium and airtmospheres.
ng solidification over the meniscus as the mechanism of markormation, the observed differences on meniscus profiles shownn Fig. 7 will be related to differences in pitch and depth of
arks, i.e., more severe marks are expected to occur when antmosphere of high thermal conductivity is used during casting.
In order to experimentally investigate the influence of alloyomposition on the surface quality of Al–Cu alloys, a range ofompositions from dilute alloys (commercial purity aluminum)o the eutectic composition was chosen. This has permitted thereezing range and the metal/mold wetability to be analyzed.he results in terms of mean values of depth and pitch of thearks are shown in Fig. 8(a) and (b). It can be seen that under
he experimental conditions examined, the best surface qualitys associated with Cu content close to the maximum solidifica-ion range (at about 5 wt.% Cu). The surface quality increasesrom a pure aluminum casting up to castings of composition ofbout 5 wt.%Cu, decreasing again up to the eutectic composi-ion. These results contradict a report by Collins [7], which stateshat the only ingots of aluminum alloys that can be cast with aompletely smooth surface are those of dilute alloys which areharacterized by a small freezing range. As shown in Fig. 4,or Cu contents higher than 5 wt% the thermal distortion fac-or increases with alloy Cu content, and a correlation with thexperimental surface marks of Fig. 8 indicates that larger depthnd pitch are associated with higher thermal distortion driv-ng forces. As discussed previously, this seems to be associated
ainly to the differences in hi in the early beginning of solidifi-ation, which increases with increasing Cu content in the alloy.
higher heat transfer coefficient enhances shell distortion andence surface non-uniformity.
In order to investigate the influence of different chilling sever-ties on mark formation for an alloy in the range of compositionhich exhibited the best surface quality in Fig. 8, some exper-
ments where carried out with an Al–4.5 wt.%Cu alloy underonditions of polished mold and atmospheres of Helium andir and with the mold coated with an insulating alumina layer.he temperatures acquired during the present experiments were

136 J.M.V. Quaresma et al. / Journal of Alloys and Compounds 428 (2007) 130–138
F Castins
usca
h
wattt
(csta
F4
aftiadFoiwocr
ig. 8. Influence of alloy solute content on the surface quality of Al–Cu alloys.peed of 20 mm/s. (a) Depth and (b) pitch.
sed for estimating the transient hi profiles, by using an expres-ion which results from a heat balance based on the heat fluxoming from the metal and entering the metal/mold interfacend that is being absorbed by the cooling fluid, given by [11]:
iA(Ti − Tw) = mc(Twin − Twout) (30)
here, A is the cooled surface, Ti the casting surface temper-ture, Tw is a mean water temperature between the inlet wateremperature, Twin, and the outlet water temperature, Twout, m ishe water flow rate and c the water specific heat. The experimen-ally determined hi profiles are shown in Fig. 9.
The experimental results shown in Fig. 9 were used in Eq.22) to calculate the thermal distortion driving force (ψ). The
alculated values of ψ are shown in Fig. 10 compared to theurface quality obtained in each case. It can be observed thathe higher values of thermal distortion driving force are againssociated with a worst surface quality.ig. 9. Influence of different chilling severities on hi profiles for an Al–.5 wt.%Cu alloy.
csdf
Fa
g conditions: polished mold, helium atmosphere, 5 ◦C melt superheat, teeming
From these results, it seems that when a long freezing rangelloy solidifies over the meniscus, the shell distortion drivingorce at the early stage is minimal and do not affect significantlyhe solid shell, which is not sufficiently thick to withstand thenternal pressure and the meniscus bends back to the mold wall,s indicated in Fig. 11b. Ideally this situation should be con-ucive to a smooth surface where ripple formation is inhibited.or a short freezing range alloy, a thicker solid shell is formedver the meniscus at the early stage and the shell distortion driv-ng force becomes stronger with time. The thermal distortionill contribute with the metalostatic pressure in such a way thatnly the thinner solid shell region, with inherent less mechani-al strength, will be bent back to the mold wall, thus promotingipple formation, as shown in Fig. 11a. Care should be exer-ised when generalizing such explanation to other binary alloy
ystem, since the thermal distortion driving force, as previouslyiscussed, is strongly dependent on the metal/mold heat trans-er coefficient. For hypoeutectic Al–Cu alloys it was shown thatig. 10. Thermal distortion driving force and surface quality for an Al–4.5Culloy.

J.M.V. Quaresma et al. / Journal of Alloys and Compounds 428 (2007) 130–138 137
; (b) l
ht
biocamt
5
wmiittifnw
A
FS
R
Fig. 11. Ingot surface quality: (a) short freezing range alloy
i increases with alloy solute content, but this is not a generalrend, as shown recently for hypoeutectic Al–Si alloys [22].
The present study has been centered mainly on the thermalehavior of solidifying alloys and their effects on surface qual-ty of Al–Cu ingots, by assuming progressing of solidificationver the meniscus. However, it must be emphasized that for aomplete analysis of shell distortion a combination of thermalnd mechanical analysis should be considered. It is known thatechanical properties of a solidifying alloy are complex func-
ions mainly of temperature and alloy composition [20].
. Conclusions
The present theoretical/experimental analysis has shown thathen a long freezing range Al–Cu alloy solidifies over theeniscus, the shell distortion driving force at the early stage
s minimal and do not affect significantly the solid shell, whichs not sufficiently thick to withstand the internal pressure andhe meniscus bends back to the mold wall, and ripple forma-ion is minimized or inhibited. As the Cu content is increased,
.e., with decreasing freezing range, the shell distortion drivingorce becomes stronger with time, and associated with the inter-al metalostatic pressure will increase severity of surface markshich attains a maximum at the eutectic composition.[
[[
ong freezing range alloy. S: Solid; S + L: mushy; L: liquid.
cknowledgements
The authors acknowledge financial support provided byAPESP (The Scientific Research Foundation of the State ofao Paulo, Brazil) and CNPq (The Brazilian Research Council).
eferences
[1] E.L. Rooy, Metals Handbook, vol. 15, ASM International, Materials Park,Ohio, 1988, pp. 743–770.
[2] J.M.V. Quaresma, C.A. Santos, A. Garcia, Metall. Mater. Trans. A 31(2000) 3167–3178.
[3] S.G. Shabestari, H. Moemeni, J. Mater. Proc. Technol. 153/154 (2004)193–198.
[4] P.R. Goulart, J.E. Spinelli, W.R. Osorio, A. Garcia, Mater. Sci. Eng. A 421(2006) 245–253.
[5] D.R. Thornton, J. Iron Steel Inst. 183 (1956) 300–315.[6] P.J. Wray, Metall. Trans. B 12 (1981) 167–176.[7] D.L.W. Collins, Metallurgia 76 (1967) 137–144.[8] H. Tomono, W. Kurz, W. Heinemann, Metall. Trans. B 12 (1981) 409–
412.
[9] I. Saucedo, J. Beech, G.J. Davies, Metals Technol. 9 (1982) 282–291.10] J.L. Brendzy, I.A. Bakshi, I.V. Samarasekera, J.K. Brimacombe, Ironmak.Steelmak. 20 (1993) 63–74.11] H. Jacobi, Stahl Eisen 96 (1976) 964–968.12] P. Berthod, G. Lesoult, La Revue de Metallurgie 97 (2000) 1441–1453.

1 lloys a
[[
[
[
[
[
[[
38 J.M.V. Quaresma et al. / Journal of A
13] E.N. Souza, N. Cheung, A. Garcia, J. Alloys Compd. 399 (2005) 110–117.14] D.M. Rosa, J.E. Spinelli, I.L. Ferreira, A. Garcia, J. Alloys Compd. 422
(2006) 227–238.15] I.L. Ferreira, J.E. Spinelli, J.C. Pires, A. Garcia, Mater. Sci. Eng. A 366
(2005) 74–86.16] I.L. Ferreira, C.A. Santos, V.R. Voller, A. Garcia, Metall. Mater. Trans. B
35 (2004) 285–297.17] O.L. Rocha, C.A. Siqueira, A. Garcia, Metall. Mater. Trans. A 34 (2003)
995–1006.
[
[
nd Compounds 428 (2007) 130–138
18] F. Sa, O.L. Rocha, C.A. Siqueira, A. Garcia, Mater. Sci. Eng. A 373 (2004)131–138.
19] W.R. Osorio, A. Garcia, Mater. Sci. Eng. A 325 (2002) 102–111.20] I. Jin, J.G. Sutherland, Solidification and Casting of Metals, The Metals
Society, London, 1979, pp. 256–259.21] C.A. Santos, C.A. Siqueira, A. Garcia, J.M.V. Quaresma, J.A. Spim, Inverse
Probl. Sci. Eng. 12 (2004) 279–296.22] M.D. Peres, C.A. Siqueira, A. Garcia, J. Alloys Compd. 381 (2004)
168–181.