the effect of mother’s age and other related factors on neonatal survival associated with first...
TRANSCRIPT
Selemani et al. BMC Pregnancy and Childbirth 2014, 14:240http://www.biomedcentral.com/1471-2393/14/240
RESEARCH ARTICLE Open Access
The effect of mother’s age and other relatedfactors on neonatal survival associated with firstand second birth in rural, Tanzania: evidencefrom Ifakara health and demographic surveillancesystem in rural TanzaniaMajige Selemani1,4*, Mathew A Mwanyangala1, Sigilbert Mrema1, Amri Shamte1, Dan Kajungu1,2,3, Abdallah Mkopi1,Michael Johnson Mahande5 and Rose Nathan1
Abstract
Background: With a view to improve neonatal survival, data on birth outcomes are critical for planning maternaland child health care services. We present information on neonatal survival from Ifakara Health and DemographicSurveillance System (HDSS) in Tanzania, regarding the influence of mother’s age and other related factors onneonatal survival of first and second births.
Methods: The study conducted analysis using longitudinal health and demographic data collected from IfakaraHDSS in parts of Kilombero and Ulanga districts in Morogoro region. The analysis included first and second livebirths that occurred within six years (2004–2009) and the unit of observation was a live birth. A logistic regressionmodel was used to assess the influence of socio-demographic factors on neonates’ survival.
Results: A total of 18,139 first and second live births were analyzed. We found neonatal mortality rate of 32 per1000 live births (95% CI: 29/1000-34/1000). Results from logistic regression model indicated increase in risk ofneonatal mortality among neonates those born to young mothers aged 13–19 years compared with those whosemother‘s aged 20–34 years (aOR = 1.64, 95% CI = 1.34-2.02). We also found that neonates in second birth order weremore likely to die than those in first birth order (aOR = 1.85: 95% CI = 1.52-2.26). The risk of neonatal mortalityamong offspring of women who had a partner co-resident was 18% times lower as compared with offspring ofmothers without a partner co-resident in the household (aOR = 0.82: 95% CI = 0.66-0.98). Short birth interval(<33 months) was associated with increased risk of neonatal mortality (aOR = 1.50, 95% CI =1.16-1.96) comparedwith long birth interval (> = 33 months). Male born neonates were found to have an increased risk (aOR = 1.34, 95%CI =1.13- 1.58) of neonatal mortality as compared to their female counterparts.
Conclusions: Delaying the age at first birth may be a valuable strategy to promote and improve neonatal healthand survival. Moreover, birth order, birth interval, mother’s partner co-residence and sex of the neonate appeared asimportant markers for neonatal survival.
Keywords: Neonates, Neonatal mortality, Teenagers, Birth order, Birth interval
* Correspondence: [email protected] Health Institute, (IHI), Plot 463, Kiko Avenue, off Old Bagamoyo Road,Mikocheni P.O Box 78373, Dar es Salaam, Tanzania4Department of Statistics, University of Dar es Salaam, P.O. Box 35091, Dar esSalaam, TanzaniaFull list of author information is available at the end of the article
© 2014 Selemani et al.; licensee BioMed CentrCommons Attribution License (http://creativecreproduction in any medium, provided the or
al Ltd. This is an Open Access article distributed under the terms of the Creativeommons.org/licenses/by/2.0), which permits unrestricted use, distribution, andiginal work is properly credited.
Selemani et al. BMC Pregnancy and Childbirth 2014, 14:240 Page 2 of 9http://www.biomedcentral.com/1471-2393/14/240
BackgroundIt is estimated that about 2.96 million infants worldwide dieeach year during first four weeks of life (neonatal period)[1]. About 98% of these deaths occur in low- and middle-income countries; with the highest proportion in sub-Saharan Africa and south-east Asia [1]. In 2012, neonatalmortality accounted for 43% of the under five deaths in de-veloping countries [1,2]. A recent Tanzania Demographicand Health Survey report showed a decline in under-fivemortality rate from 112 per 1000 live births in 2004/05 to81 per 1000 live births in 2010 [3]. Similarly, the infantmortality rate has dropped from 68 to 45 per 1000 livebirths during the same period. However, the share of neo-natal death has slowly dropped from 32 to 25 per 1000 livebirths during the survey period 2004/05 to 2010. Reductionin neonatal deaths is an essential step towards effort toaccelerate progress towards achievement of MDG 4 forchild survival. However, this requires better understandingof major causes and risk factors for neonatal deaths.Several risk factors have been suggested to influence
neonatal mortality including maternal age, parity, race,smoking birth weight, gestational age, labour compli-cations, number of antenatal care visits, previous un-favourable outcomes (stillbirth and neonatal death)and various socio-economic factors [4,5].Pregnancy during teenage is a significant problem glo-
bally, with the highest incidence rates occurring in develo-ping nations [6]. Tanzania is among the countries withhighest teenage pregnancy (44%) and birth rates in theworld [7]. National survey reports indicate that about 25%of girls begun child-bearing at 17 years; this figure increasesto almost 40 per cent by age 18 [3,7]. While early childbear-ing has often been regarded as a social issue, there is evi-dence that young maternal age may be linked to adversepregnancy outcomes including low birth weight (LBW),preterm birth, intrauterine growth restriction, stillbirth,neonatal mortality [5]. Other studies have shown relation-ship between birth orders, birth interval, maternal age andneonatal mortality [8-10]. Previous studies in Tanzania thatconcentrated on effect of maternal age on neonatal out-come had small sample sizes which are difficult to make in-ference. Yet, there is scant information about the influenceof mothers’ age, birth order, and birth interval on neonatalmortality for the first and second births in Tanzania.In view of the importance of neonatal survival, epi-
demiological data regarding the influence of mother’sage on neonatal mortality provide important information topolicy makers and program managers when designing in-terventions to reduce neonatal mortality [1,7]. Therefore,this paper used longitudinal data generated in Health andDemographic Surveillance Systems to study the influenceof mother’s age and other factors on neonatal survival offirst and second births in the rural part of south-easternTanzania.
MethodsStudy design and settingThe analysis used data from Ifakara Health and Demo-graphic Surveillance Site (HDSS) situated in Kilombero andUlanga districts in Morogoro region. In 2011, the totalpopulation under surveillance was over 100,000 living in16,000 households [11]. The Ifakara HDSS has consistentlybeen recording pregnancies, pregnancy outcomes, deathsand migrations by visiting households once every fourmonths since 1997 after completion of the baseline censuscarried out in 1996. Since then every household in the sur-veillance area has been visited by a trained interviewerevery 4 months to record pregnancies, pregnancy out-comes, deaths and migrations that have happened since theprevious visit. Household registers are used to record eachof those events. All registered deaths are followed up with averbal Autopsy (VA) by well trained field staff. Date of birthof each individual is included in the household registersand each event is recorded along with specific date it hap-pened. Place of delivery and place of death are recorded ashealth facility, home or elsewhere.The population is predominantly rural and ethnically
heterogeneous. Majority of the households earn their liv-ing from subsistence farming, few are engaged in fishingand small-scale trading. The population of the study areais served by a network of health facilities, at the time ofthe study there were two hospitals, four health centresand twenty one dispensaries in Kilombero district; twohospitals, three health centres and twenty dispensaries inUlanga district.Overall, the total fertility rate in the study area is four
children per women in their lifetime. Within the studypopulation, about 60% of all deliveries occur in healthfacilities mainly in dispensaries. In the study area, most(96%) of pregnant women attend at least one antenatalcare (ANC) visit from the skilled birth attendants. How-ever, only 43% of pregnant women are recorded with atleast four visits. At the time of study, continuum of carewas not fully introduced in the study area.Data credibility was ensured at all stages of collection
and processing to enhance quality. Up to 5% of ran-domly selected households were visited by field supervi-sors for repeated interviews. Other strategies includedaccompanied interviews as well as surprise field visits byfield supervisor. Data management is done using thehousehold-registration system (HRS 2) with built inconsistency and range checks. Detailed description ofthe study area is presented elsewhere [12].
Data processing and analysisThis paper reports analysis using longitudinal data col-lected in the Ifakara Health and Demographic Surveil-lance Site (IHDSS) for children born between 2004 and2009. First and second birth order of neonates were
Selemani et al. BMC Pregnancy and Childbirth 2014, 14:240 Page 3 of 9http://www.biomedcentral.com/1471-2393/14/240
extracted from the database including their survival statuswithin the first 28 days of life. All women who had firstand second live births that occurred between 2004 and2009 were included in the analysis. We used live births asthe unit of observation. Explanatory variables include: ageof mother, sex, birth order, birth interval, place of delivery,social economic status (SES), education of the mother,mother having partner co-resident, and season of the year.The outcome variable was neonatal death.Birth order was classified into two groups - first birth
order and second birth order. Birth interval among sec-ond birth was classified as long birth interval (greaterthan 33 months after the previous birth) and short birthinterval (less than 33 months after the previous birth), asper WHO recommendation [13]. The age of mother atdelivery was categorized into three groups teenage (lessthan 20 years), (20 to 34 years) and (35 to 49 years) [14].The place of delivery was classified into two groups:health facility and outside health facility. All deliveriesthat occurred on the way to a health facility, home orelsewhere outside health facilities were all classified asoutside health facility deliveries. Seasons of delivery wereclassified into two groups: dry (June-October) and wet(November-May) according to the dates of birth thatcorrespond to the seasons of the year in the study area.Other variables were maternal educational level whichwas classified into two groups, “primary level or below”and “above primary education”, sex of neonate andmother’s partner co-resident.Household wealth status was constructed using Princi-
pal Component Analysis (PCA) [15]. Items included inthe PCA are household assets; animals, TV, bicycle andradio. Also type of toilet, source of drinking water, houseroofing material, wall material, and floor material wereincluded in PCA. Finally, all households were groupedinto five categories: Poorest, Poorer, Poor, Less Poor orLeast Poor according to their household wealth score.The outcome variable was defined by assigning the neo-natal death into one of the two categories: “1” if a newborndie within the first 28 days of life and “0” if a newborn hadnot die within the first 28 days of the life.
Statistical methodsThe analysis used both descriptive and analytical statistics.Neonatal death rates by each variable were calculated andpresented. Pearson’s Chi-Square test was used to deter-mine the association between a set of explanatory vari-ables and neonatal death for categorical variables. Furtheranalysis was performed in multivariable logistic regressionmodel to assess relative effect of the variables hypothe-sized to influence neonatal death. The Cox proportionalhazard regression model could not be used because thenumber of neonatal deaths were less than four percent,thus more than 96% would not observe the event in the
pre-designated time interval and would be treated as cen-sored (or missing).Explanatory variables were selected for inclusion in
the multivariate logistic regression if the p value was lessthan 0.1 p-values in the univariate analysis and improvedthe overall model [16]. The model was checked for sta-tistical interactions and adequacy before being approvedas final. An alpha level of 0.05 was used for all tests ofstatistical significance.Statistical analyses were performed using STATA ver-
sion 11.0 [17]. Odd ratios (OR) with 95% confidence in-tervals (CI) were used as measures of strength ofassociation. Given the low prevalence of neonatal mor-tality, the odds ratios are close approximation of relativerisks. The neonatal mortality rate was calculated as thenumber of neonatal deaths divided by number of livebirths in a given year and expressed per 1000 live births.
Ethical approvalIfakara Health and Demographic Surveillance Systemwere established with an initial aim of evaluating the effectof a large-scale social marketing of insecticide-treated netson child survival in rural Tanzania. The Ethical clearancewas granted by the Medical Research Coordinating Com-mittee (MRCC) of the National Institute for Medical Re-search (NIMR) in Tanzania. For each household visit,verbal consent was sought from the respondent.
ResultsDemographic characteristics of live birthThe analysis was based on 16,000 households registeredin the Health and Demographic Surveillance System. Atotal of 11, 562 that had at least one live birth duringthe study period were included in the analysis, there wasno refusal.A total of 18,139 first and second live births were re-
corded in the Ifakara Health and Demographic Surveil-lance Area for the period from January 2004 to December,2009. Of these, more than half 9,172 (51%) were males. Atotal of 576 neonatal deaths occurred during the studyperiod, this translates into a neonatal mortality rate of 32per 1000 live births (95% CI: 29/1000-34/1000).
Neonatal mortality rateThe risk of neonatal mortality rate among all live birthsreached its peak of 35 per 1000 live births in the year2005, it then decreased to a lowest mortality level of 29per 1000 live births in 2009. We observed a marked de-cline in neonatal mortality rates for the period from2006 to 2009 (Table 1).In this study, new-borns for teenage mothers (13–19
years) had higher neonatal mortality rate as comparedwith those born to older mothers (20 to 34 years) and(35 to 49 years), (46 per 1,000 live births, 28 and 31 per

Table 1 Estimates of neonatal mortality for the year of 2004-2009 (N = 18,139)
Live birth Neonatal Mortality
Year No. live births Deaths Percent Rate per 1000 live births 95% CI P-value
2004-09 18,139 576 3.18 31.8 29.3-34.4 0.640
2004 2,734 87 3.08 30.8 24.5-37.2
2005 2,831 105 3.58 35.8 29.0-42.5
2006 2,869 102 3.43 34.3 27.8-40.9
2007 2,877 92 3.10 31.0 24.8-37.2
2008 3,232 99 2.97 29.7 24.0-35.5
2009 3,020 91 2.93 29.3 23.3-35.2
Selemani et al. BMC Pregnancy and Childbirth 2014, 14:240 Page 4 of 9http://www.biomedcentral.com/1471-2393/14/240
1,000 live births respectively) (Table 2). In regards tobirth order, we found higher neonatal mortality ratesamong second birth order as compared with first birthorder (38 vs 28 per 1000 live births, respectively). Ourresults also showed that short birth intervals comparedwith long birth intervals were associated with an in-creased neonatal mortality rate in second births (47 and29 per 1000 live birth respectively). Neonates born tomothers who had their partners co-resident had a lowermortality compared with those whose mothers had nopartners (30 vs 38 per 1000 live births). Our data sug-gests that teenager mothers’ with a short birth intervalafter the previous birth have excess neonatal deaths (90per 1000 live births) as compared with their counter-parts with long birth interval (Table 3). Of the 576 livebirths that resulted in neonatal deaths, 45% happenedon the same day of birth and 84% occurred during thefirst week of life (Figure 1).
Factors associated with the risk for neonatal deathOdds and adjusted odds ratios (aORs) for neonatal deathare presented in Table 4. Findings from univariate ana-lysis revealed association between neonatal death andnumerous factors (maternal age at delivery, mother’spartner, sex of newborn, birth order and birth interval).These factors remained statistically significant evenafter entered in the multivariate model. As shown inTable 4, neonates of the teenage mothers (13–19 years)had 64% (aOR 1.64, 95% CI: 1.34-2.02) increased riskof dying during the neonatal period than those of oldermothers (20–34 years). In addition, neonates in thesecond birth order had nearly 2 fold (aOR 1.85, 95% CI:1.52-2.26) increased risk of dying than those in the firstbirth order. Furthermore, mothers with short birth intervalswere 1.5 times (aOR = 1.5, 95% CI: 1.16-1.96) more likely tolose their child during the neonatal period than motherswho had long birth interval after the previous pregnancy.The risk of neonatal death was higher among male new-born than female counterpart (aOR = 1.34, 95% CI:1.13- 1.58). We also found that presence of mother’spartner conferred protection against neonatal death,
where mothers with partner present had 18% reducedrisk of losing their child during neonatal period (aOR =0.82 95% CI: 0.62-0.98).
DiscussionIn Tanzania, the most recent Demographic and HealthSurvey conducted in 2010 indicated that neonatal mor-tality estimates declined from 32 deaths per 1000 in2001–2005, to 26 deaths per 1000 in 2006–2010 [3,18].This indicates 19% improvement in neonatal survival forthe period from 2001 to 2010 [3]. Our findings indicatesthat the neonatal mortality rate was 32 per 1000 livebirth during the period of 2004 to 2009 and declinedfrom 36 per 1,000 live births in 2005 to 29 per 1,000 livebirths in 2009. The possible explanation for this declinecould be attributed to different interventions related tomaternal and newborns such as Integrated Managementof Childhood Illness (IMCI) [19], and increased malariacontrol efforts, which lead to the decline of malaria mor-bidity in Kilombero and Ulanga [20].The higher neonatal mortality rate among infants born
to teenage mothers in our study corresponds with previ-ous studies [21-23]. Usually adolescent mothers face fi-nancial and social problems that lead to less provision ofchild care [23]. Also, physiological immaturity of teenagemothers such as small uterus or narrow bony pelvisand lack of social experience on caring newborn canlead to more neonatal deaths [24]. Some scholars haveargued that the neonatal deaths observed in teenagepregnancies might have been attributable to socio-demographic factors [25].The association between birth order and increased neo-
natal death might be an artefact of overrepresentation ofmothers with poor outcomes in their previous birth asreported by previous authors [26]. Previous studiesalso have shown that women who experience preg-nancy loss or poor pregnancy outcome tends to go fornext pregnancy after a short time to replace the previouspregnancy loss in order to achieve the desired family size,i.e. selective fertility or reproductive compensation[27-29]. This is an important challenge in reproductive
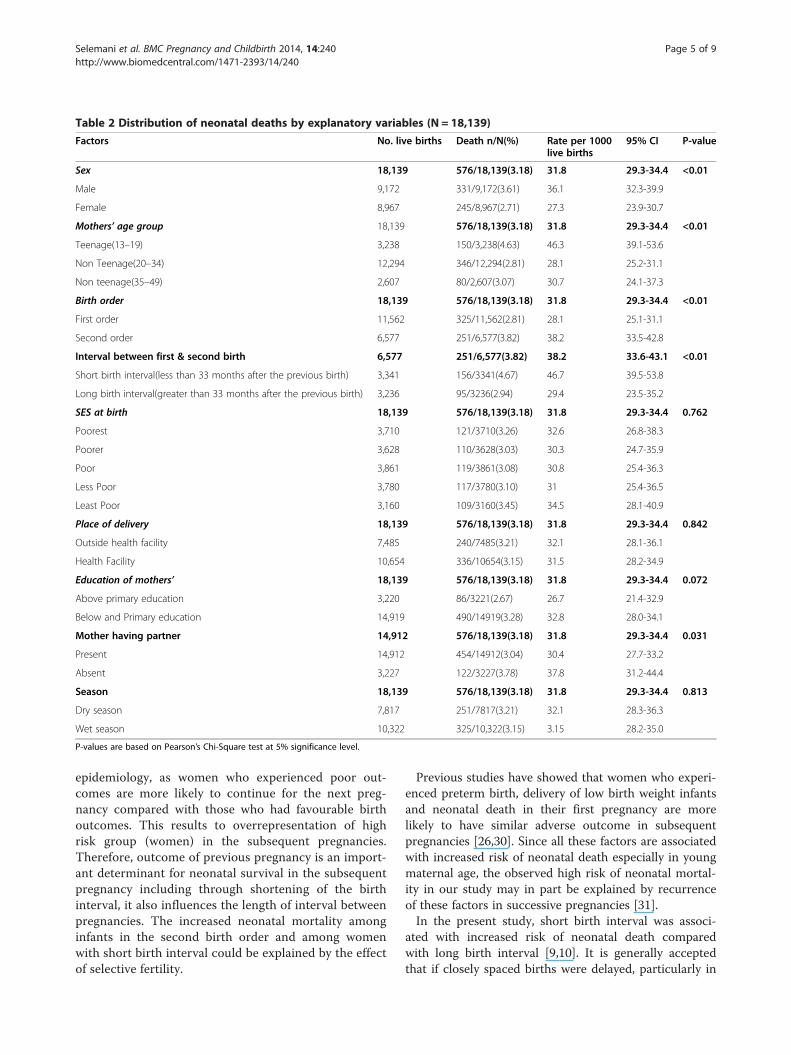
Table 2 Distribution of neonatal deaths by explanatory variables (N = 18,139)
Factors No. live births Death n/N(%) Rate per 1000live births
95% CI P-value
Sex 18,139 576/18,139(3.18) 31.8 29.3-34.4 <0.01
Male 9,172 331/9,172(3.61) 36.1 32.3-39.9
Female 8,967 245/8,967(2.71) 27.3 23.9-30.7
Mothers’ age group 18,139 576/18,139(3.18) 31.8 29.3-34.4 <0.01
Teenage(13–19) 3,238 150/3,238(4.63) 46.3 39.1-53.6
Non Teenage(20–34) 12,294 346/12,294(2.81) 28.1 25.2-31.1
Non teenage(35–49) 2,607 80/2,607(3.07) 30.7 24.1-37.3
Birth order 18,139 576/18,139(3.18) 31.8 29.3-34.4 <0.01
First order 11,562 325/11,562(2.81) 28.1 25.1-31.1
Second order 6,577 251/6,577(3.82) 38.2 33.5-42.8
Interval between first & second birth 6,577 251/6,577(3.82) 38.2 33.6-43.1 <0.01
Short birth interval(less than 33 months after the previous birth) 3,341 156/3341(4.67) 46.7 39.5-53.8
Long birth interval(greater than 33 months after the previous birth) 3,236 95/3236(2.94) 29.4 23.5-35.2
SES at birth 18,139 576/18,139(3.18) 31.8 29.3-34.4 0.762
Poorest 3,710 121/3710(3.26) 32.6 26.8-38.3
Poorer 3,628 110/3628(3.03) 30.3 24.7-35.9
Poor 3,861 119/3861(3.08) 30.8 25.4-36.3
Less Poor 3,780 117/3780(3.10) 31 25.4-36.5
Least Poor 3,160 109/3160(3.45) 34.5 28.1-40.9
Place of delivery 18,139 576/18,139(3.18) 31.8 29.3-34.4 0.842
Outside health facility 7,485 240/7485(3.21) 32.1 28.1-36.1
Health Facility 10,654 336/10654(3.15) 31.5 28.2-34.9
Education of mothers’ 18,139 576/18,139(3.18) 31.8 29.3-34.4 0.072
Above primary education 3,220 86/3221(2.67) 26.7 21.4-32.9
Below and Primary education 14,919 490/14919(3.28) 32.8 28.0-34.1
Mother having partner 14,912 576/18,139(3.18) 31.8 29.3-34.4 0.031
Present 14,912 454/14912(3.04) 30.4 27.7-33.2
Absent 3,227 122/3227(3.78) 37.8 31.2-44.4
Season 18,139 576/18,139(3.18) 31.8 29.3-34.4 0.813
Dry season 7,817 251/7817(3.21) 32.1 28.3-36.3
Wet season 10,322 325/10,322(3.15) 3.15 28.2-35.0
P-values are based on Pearson’s Chi-Square test at 5% significance level.
Selemani et al. BMC Pregnancy and Childbirth 2014, 14:240 Page 5 of 9http://www.biomedcentral.com/1471-2393/14/240
epidemiology, as women who experienced poor out-comes are more likely to continue for the next preg-nancy compared with those who had favourable birthoutcomes. This results to overrepresentation of highrisk group (women) in the subsequent pregnancies.Therefore, outcome of previous pregnancy is an import-ant determinant for neonatal survival in the subsequentpregnancy including through shortening of the birthinterval, it also influences the length of interval betweenpregnancies. The increased neonatal mortality amonginfants in the second birth order and among womenwith short birth interval could be explained by the effectof selective fertility.
Previous studies have showed that women who experi-enced preterm birth, delivery of low birth weight infantsand neonatal death in their first pregnancy are morelikely to have similar adverse outcome in subsequentpregnancies [26,30]. Since all these factors are associatedwith increased risk of neonatal death especially in youngmaternal age, the observed high risk of neonatal mortal-ity in our study may in part be explained by recurrenceof these factors in successive pregnancies [31].In the present study, short birth interval was associ-
ated with increased risk of neonatal death comparedwith long birth interval [9,10]. It is generally acceptedthat if closely spaced births were delayed, particularly in
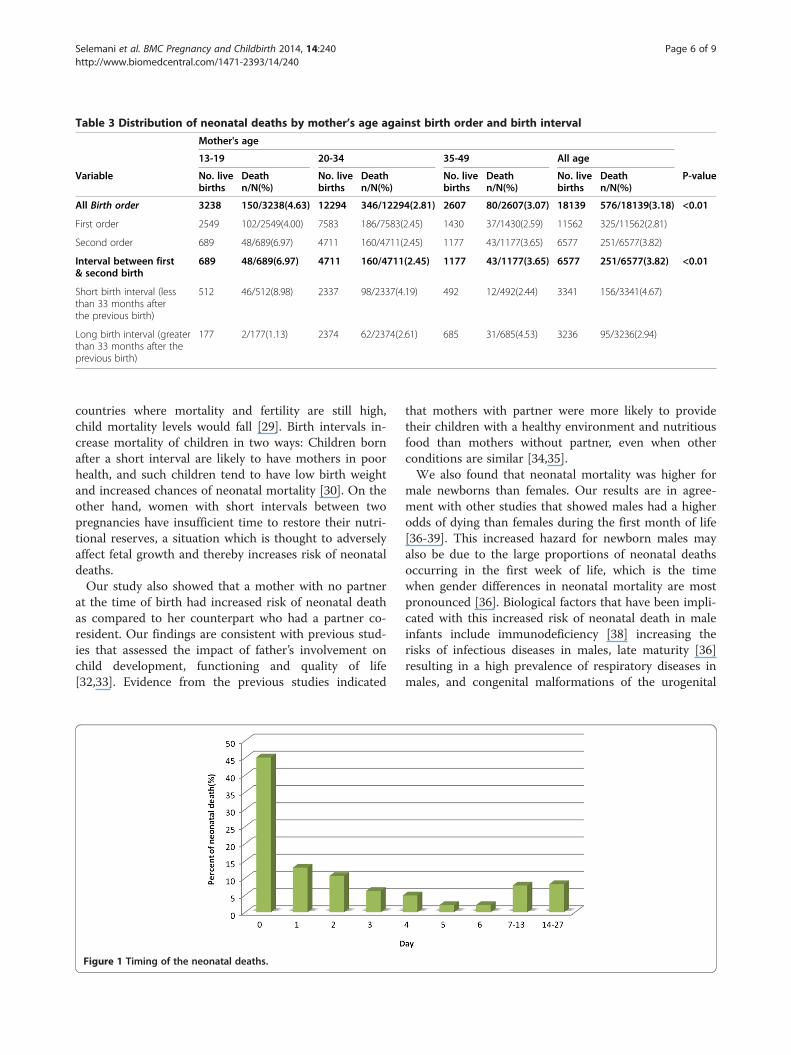
Table 3 Distribution of neonatal deaths by mother’s age against birth order and birth interval
Mother's age
13-19 20-34 35-49 All age
Variable No. livebirths
Deathn/N(%)
No. livebirths
Deathn/N(%)
No. livebirths
Deathn/N(%)
No. livebirths
Deathn/N(%)
P-value
All Birth order 3238 150/3238(4.63) 12294 346/12294(2.81) 2607 80/2607(3.07) 18139 576/18139(3.18) <0.01
First order 2549 102/2549(4.00) 7583 186/7583(2.45) 1430 37/1430(2.59) 11562 325/11562(2.81)
Second order 689 48/689(6.97) 4711 160/4711(2.45) 1177 43/1177(3.65) 6577 251/6577(3.82)
Interval between first& second birth
689 48/689(6.97) 4711 160/4711(2.45) 1177 43/1177(3.65) 6577 251/6577(3.82) <0.01
Short birth interval (lessthan 33 months afterthe previous birth)
512 46/512(8.98) 2337 98/2337(4.19) 492 12/492(2.44) 3341 156/3341(4.67)
Long birth interval (greaterthan 33 months after theprevious birth)
177 2/177(1.13) 2374 62/2374(2.61) 685 31/685(4.53) 3236 95/3236(2.94)
Selemani et al. BMC Pregnancy and Childbirth 2014, 14:240 Page 6 of 9http://www.biomedcentral.com/1471-2393/14/240
countries where mortality and fertility are still high,child mortality levels would fall [29]. Birth intervals in-crease mortality of children in two ways: Children bornafter a short interval are likely to have mothers in poorhealth, and such children tend to have low birth weightand increased chances of neonatal mortality [30]. On theother hand, women with short intervals between twopregnancies have insufficient time to restore their nutri-tional reserves, a situation which is thought to adverselyaffect fetal growth and thereby increases risk of neonataldeaths.Our study also showed that a mother with no partner
at the time of birth had increased risk of neonatal deathas compared to her counterpart who had a partner co-resident. Our findings are consistent with previous stud-ies that assessed the impact of father’s involvement onchild development, functioning and quality of life[32,33]. Evidence from the previous studies indicated
Figure 1 Timing of the neonatal deaths.
that mothers with partner were more likely to providetheir children with a healthy environment and nutritiousfood than mothers without partner, even when otherconditions are similar [34,35].We also found that neonatal mortality was higher for
male newborns than females. Our results are in agree-ment with other studies that showed males had a higherodds of dying than females during the first month of life[36-39]. This increased hazard for newborn males mayalso be due to the large proportions of neonatal deathsoccurring in the first week of life, which is the timewhen gender differences in neonatal mortality are mostpronounced [36]. Biological factors that have been impli-cated with this increased risk of neonatal death in maleinfants include immunodeficiency [38] increasing therisks of infectious diseases in males, late maturity [36]resulting in a high prevalence of respiratory diseases inmales, and congenital malformations of the urogenital
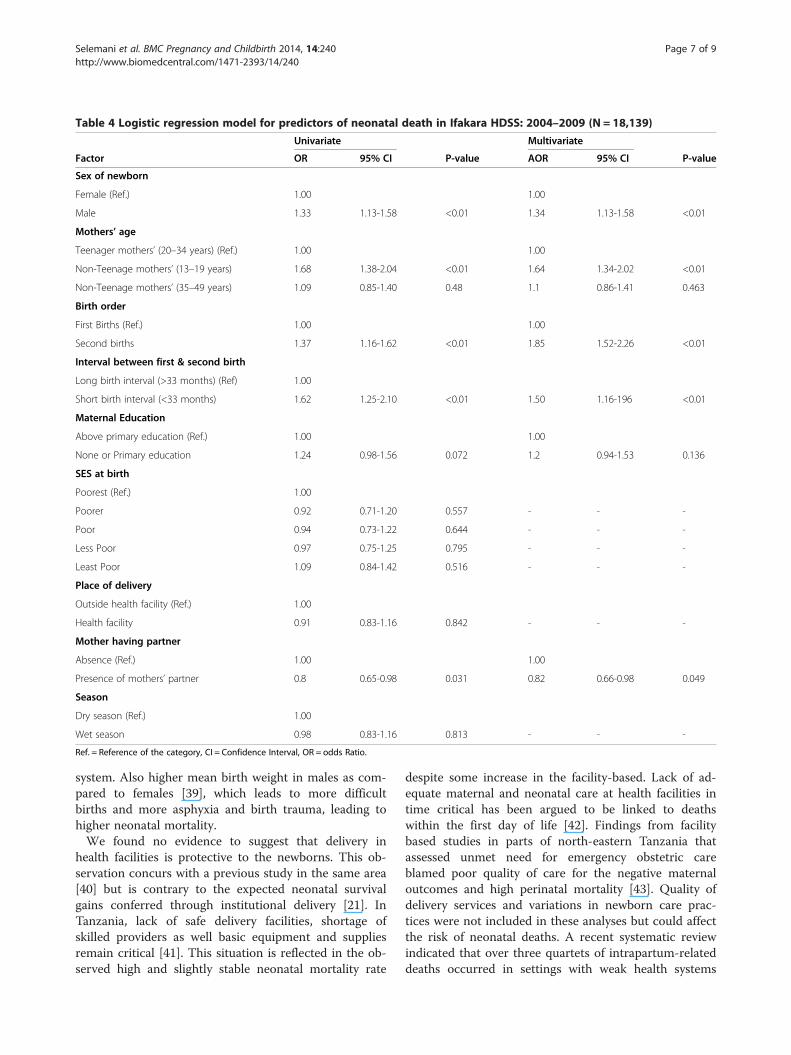
Table 4 Logistic regression model for predictors of neonatal death in Ifakara HDSS: 2004–2009 (N = 18,139)
Univariate Multivariate
Factor OR 95% CI P-value AOR 95% CI P-value
Sex of newborn
Female (Ref.) 1.00 1.00
Male 1.33 1.13-1.58 <0.01 1.34 1.13-1.58 <0.01
Mothers’ age
Teenager mothers’ (20–34 years) (Ref.) 1.00 1.00
Non-Teenage mothers’ (13–19 years) 1.68 1.38-2.04 <0.01 1.64 1.34-2.02 <0.01
Non-Teenage mothers’ (35–49 years) 1.09 0.85-1.40 0.48 1.1 0.86-1.41 0.463
Birth order
First Births (Ref.) 1.00 1.00
Second births 1.37 1.16-1.62 <0.01 1.85 1.52-2.26 <0.01
Interval between first & second birth
Long birth interval (>33 months) (Ref) 1.00
Short birth interval (<33 months) 1.62 1.25-2.10 <0.01 1.50 1.16-196 <0.01
Maternal Education
Above primary education (Ref.) 1.00 1.00
None or Primary education 1.24 0.98-1.56 0.072 1.2 0.94-1.53 0.136
SES at birth
Poorest (Ref.) 1.00
Poorer 0.92 0.71-1.20 0.557 - - -
Poor 0.94 0.73-1.22 0.644 - - -
Less Poor 0.97 0.75-1.25 0.795 - - -
Least Poor 1.09 0.84-1.42 0.516 - - -
Place of delivery
Outside health facility (Ref.) 1.00
Health facility 0.91 0.83-1.16 0.842 - - -
Mother having partner
Absence (Ref.) 1.00 1.00
Presence of mothers’ partner 0.8 0.65-0.98 0.031 0.82 0.66-0.98 0.049
Season
Dry season (Ref.) 1.00
Wet season 0.98 0.83-1.16 0.813 - - -
Ref. = Reference of the category, CI = Confidence Interval, OR = odds Ratio.
Selemani et al. BMC Pregnancy and Childbirth 2014, 14:240 Page 7 of 9http://www.biomedcentral.com/1471-2393/14/240
system. Also higher mean birth weight in males as com-pared to females [39], which leads to more difficultbirths and more asphyxia and birth trauma, leading tohigher neonatal mortality.We found no evidence to suggest that delivery in
health facilities is protective to the newborns. This ob-servation concurs with a previous study in the same area[40] but is contrary to the expected neonatal survivalgains conferred through institutional delivery [21]. InTanzania, lack of safe delivery facilities, shortage ofskilled providers as well basic equipment and suppliesremain critical [41]. This situation is reflected in the ob-served high and slightly stable neonatal mortality rate
despite some increase in the facility-based. Lack of ad-equate maternal and neonatal care at health facilities intime critical has been argued to be linked to deathswithin the first day of life [42]. Findings from facilitybased studies in parts of north-eastern Tanzania thatassessed unmet need for emergency obstetric careblamed poor quality of care for the negative maternaloutcomes and high perinatal mortality [43]. Quality ofdelivery services and variations in newborn care prac-tices were not included in these analyses but could affectthe risk of neonatal deaths. A recent systematic reviewindicated that over three quartets of intrapartum-relateddeaths occurred in settings with weak health systems

Selemani et al. BMC Pregnancy and Childbirth 2014, 14:240 Page 8 of 9http://www.biomedcentral.com/1471-2393/14/240
[44]. Scarcity of skilled providers, poor infrastructureand substandard quality of care are some of the criticalcomponents of such health systems that constrain pro-gress in maternal and newborn survival [45].
Strengths and limitationsThis study utilized huge datasets from Health andDemographic Surveillance System which are continuouslyregistered vital demographic events in a geographicaldefined area. Large sample size provided our study witha sufficient power to provide accurate statistical analysisacross sub groups in the study population. On the otherhand, findings from Health and Demographic SurveillanceSystems data provides information to policy makers andprogram manager which can be translated into policy andpractice.This study has some limitations that need to be consid-
ered in interpreting the findings. First, self-reporting ofneonatal deaths may result to under estimation of trueneonatal mortality due to underreporting particularly fordeaths that happened within the first day of life. Secondly,misclassification of stillbirth and early neonatal death, thedemarcation between intrapartum stillbirth and early neo-natal death is problematic, this leads to potential overesti-mation of early neonatal death as some stillbirths areregarded as early neonatal. Third, there are other possiblefactors associated with neonatal survival that were notavailable in the HDSS dataset, such as environmental, gen-etic factors, gestational age and birth weight.
ConclusionThis study revealed that delayed maternal age at birth, pres-ence of mother’s partner, birth order and birth interval areimportant factors which have an impact on neonatal mor-tality. These factors are amenable for strategy to promoteand improve neonatal health and survival. Teenagersshould access reproductive health information and servicesalong with appropriate support to avoid early pregnancies.Women at high risk during first or second pregnanciesneed specialized care to reduce avoidable neonatal deaths.Sexual and reproductive health education programs shouldalso promote use of family planning methods to enablewomen adhere to recommended birth interval and avoidunwanted pregnancies, increased age at marriage; andwomen empowerment in order to have control overtheir health. On the other hand, public health interven-tions directed at reducing neonatal death should addresscommunity, household and individual level factors suchas birth interval, birth order and mother’s age that sig-nificantly influence neonatal mortality in Tanzania.
Competing interestsThe authors declare that they have no competing interests.
Authors’ contributionsMS conceived the study idea, designed the study, carried out the statisticalanalyses, interpretation of the results, and drafted the manuscript. MA, SM,AS, DK, AM and RN participated in the design of the study, reviewed themanuscript. MJM provided technical support for interpreting results andreviewed it for intellectual content. MA was a coordinator of IfakaraDemographic Surveillance system during the study period. All authors readand approved the final manuscript.
AcknowledgementsWe are thankful to the members of staff at the Ifakara HDSS and to all fieldenumerators who collected data for the HDSS. We are grateful to theINDEPTH-Network for its continued support to the Ifakara HDSS.
Author details1Ifakara Health Institute, (IHI), Plot 463, Kiko Avenue, off Old Bagamoyo Road,Mikocheni P.O Box 78373, Dar es Salaam, Tanzania. 2INDEPTH Network, P.OBox KD 213, Kanda, Accra, Ghana. 3Santé Stat Analytical Research Institute(SSARI), P.O Box 37193, Kampala, Uganda. 4Department of Statistics,University of Dar es Salaam, P.O. Box 35091, Dar es Salaam, Tanzania.5Department of Epidemiology & Applied Biostatistics, Kilimanjaro ChristianMedical University College, Moshi, Tanzania.
Received: 11 March 2013 Accepted: 15 July 2014Published: 22 July 2014
References1. UNICEF: Levels and trends in child mortality report. New York: United Nations
Children’s Fund; 2012.2. UN Inter-agency Group for Child Mortality Estimation: Levels and trends in
child mortality. 2013, 1–30. http://www.childinfo.org/files/Child_Mortality_Report_2013.pdf.
3. National Bureau of Statistics (NBS) and Macro International Inc: Tanzaniademographic and health Survey 2010. Dar es Salaam, Tanzania: NBS and ICFMacro; 2011.
4. Hinderraker SG, Olsen BE, Bergsjo PB, Gasheka P, Lie RT, Kvale G: Perinatalmortality in northern rural Tanzania. Health Population Nutrition J 2003,21:8–17.
5. Chen X, Wen SW, Fleming N, Demissie K, Rhoads GC, Walker M: Teenagepregnancy and adverse birth outcomes: a large population based retrospectivecohort study. Epidemiology: International Journal; 2007.
6. World Health Organization: Issues in adolescent health and development.Geneva: WHO; 2004.
7. UNICEF: Adolescence in Tanzania. Dar es Salaam, Tanzania: United NationsChildren’s Fund; 2011.
8. Marchant T, Schellenberg JA, Nathan R, Abdulla S, Mukasa O, Mshinda H,Lengeler C: Anaemia in pregnancy and infant mortality in Tanzania. TropMed Int Health 2004, 9(2):262–266.
9. DaVanzo J, Hale L, Razzaque A, Rahman M: Effects of interpregnancyinterval and outcome of the preceding pregnancy on pregnancyoutcomes in Matlab, Bangladesh. BJOG: An International Journal ofObstetrics and Gynaecology 2007, 114(9):1079–1087.
10. Stephansson O, Dickman PW, Cnattingius S: The influence ofinterpregnancy interval on the subsequent risk of stillbirth and earlyneonatal death. An International Journal of Obstetrics and Gynaecology 2003,102(1):101–108.
11. Ifakara DSS: Tanzania. 2011. access at http://www.indepthnetwork.org/dss_site_profiles/Ifakaraprofile.pdf on 24th May.2011.
12. Schellenberg JA, Mukasa O, Abdulla S, Marchant T, Lengeler C, Kikumbih N,Mshinda HNR: Ifakara Demographic Surveillance System, Tanzania. In Inpopulation and Health in developing countries: Volume 1 population, Healthand Survival at INDEPTH sites. Edited by Sankon OA, Kahn K, Mwageni E,Ngom PNP. Ottawa, Canada: International Development Research centre;2002:159–164.
13. WHO: Report of a WHO Technical Consultation on Birth Spacing. Geneva,Switzerland: WHO; 2007.
14. Ministry of Planning Economy and Empowerment: National PopulationPolicy. Dar es Saaam, Tanzania: United Republic of Tanzania; 2006.
15. Vyas S, Kumaranayake L: Constructing socio-economic status indices: howto use principal components analysis. Health Policy and Planning 2006,21:459–468.

Selemani et al. BMC Pregnancy and Childbirth 2014, 14:240 Page 9 of 9http://www.biomedcentral.com/1471-2393/14/240
16. Bursac Z, Gauss CH, Williams DK, Hosmer DW: Purposeful Selection ofVariables in logistic regression. BioMedical Central Source Code for Biologyand Medicine 2008, 3:17.
17. Corp S: Stata: Release 11. Statistical Software College station TX: StataCorporation; 2009.
18. National Bureau of Statistics (NBS) and Macro Internation Inc: TanzaniaDemographic and Health Survey 2004–05. Dar es Salaam, Tanzania: NBS andICF Macro; 2005.
19. Sangber-Dery MD: The role of birth order in infant mortality in Ifakara DSSarea in rural Tanzania. Johannesburg, South Afica: University ofWitwatersrand; 2009.
20. Alba S: An Evaluation of Integrated Interventions to Improve Access to Malariatreatment in Tanzania (Access programme). University of Basel: PhD Thesis; 2010.
21. Lawn JE, Cousens S, Zupan J: 4 million neonatal deaths: when? Where?Why? Lancet 2005, 365(9462):891–900.
22. Vandana S, Joanne K, Luke CM, Subarna KK, Steven CL, Sharada RS, Gary L,Darmstadt JMT: Young maternal age and the risk of neonatal mortality inRural Nepal. Arch Pediatr Adolesc Med 2008, 162:828–835.
23. Markovitz BP, Cook R, Flick LHLT: Socioeconomic factors and adolescentpregnancy outcomes: distinctions between neonatal and post-neonataldeaths? BioMedical Central J Public Health 2005, 5:79.
24. Wang CS, Chou P: Characteristics of males who father babies born toadolescents versus older adult women in Taiwan. J Adolesc Health 2001,28(6):509–512.
25. Coall DA, Chisholm JS: Evolutionary perspectives on pregnancy: maternalage at menarche and infant birth weight. Soc Sci Med 2003, 57:1771–1781.
26. Hamisu M, Salihu HM, Salinas A, August EM, Mogos MF, Weldeselasse H,Whiteman VE: Small Size for Gestational Age and the Risk for InfantMortality in the Subsequent Pregnancy. Ann Epidemiol 2012, 22(11):764–771.
27. Quamrul HC, Rafiqul I, Karmal H: Effects of Demographic Characteristicson Neonatal, Post neonatal, Infant and Child Mortality. Curr Res J Biol Sci2010, 2(2):132–138.
28. Rahman MM, Abidin S: Factors Affecting Neonatal Mortality inBangladesh. J Health Manag 2010, 12(2):137–152.
29. Conde-Agudelo A, Rosas-Bermudez A, Kafury-Goeta AC: Effects of birthspacing on maternal health: A systematic review. Am J Obstet Gynecol2007, 196(4):297–308.
30. Rutstein S: Effects of preceding birth intervals on neonatal, infant, andunder-five years mortality and nutritional status in developing countries:evidence from the demographic and health surveys. Int J Gynaecol Obstet2005, 89(suppl 1):S7–S24.
31. Mahande MJ, Daltveit AK, Obure J, Mmbaga BT, Masenga G, Manongi R, LieRT: Recurrence of preterm birth and perinatal mortality in northernTanzania: registry-based cohort study. Trop Med Int Health 2013.doi:10.1111/tmi.121111.
32. Horn WF, Sylvester T: Father Facts. 4th edition. National FatherhoodInitiative; 2002. http://ncfy.acf.hhs.gov/library/2002/father-facts-fourth-edition.
33. Sartorius B, Kahn K, Collinson MA, Vounatsou PTS: Survived infancy but stillvulnerable: spatial-temporal trends and risk factors for child mortality inthe Agincourt rural sub-district, South Africa, 1992–2007. Geospat Health2011, 5(2):285–295.
34. Hani KA: Parents’ death and its implication for child survival. Rev Brasileirade Crescimento Desenvolvimento Humano 2011, 21(3):769–770.
35. Alonso V, Fuster VLF: Causes of neonatal mortality in Spain (1975–98):influence of sex, rural–urban residence and age at death. J Biosoc Sci2006, 38(4):537–551.
36. Shakya K, McMurray C: Neonatal mortality and maternal health care inNepal: searching for patterns of association. J Biosoc Sci 2001, 33(1):187–105.
37. Eshima N, Tokumaru O, Hara S, Bacal KKS: Age-Specific Sex-RelatedDifferences in Infections: A Statistical Analysis of National SurveillanceData in Japan. PLoS One 2012, 7(7):e42261.
38. Adolfo MR, Maria JG, de Marillia Carvalho L, Silvia W, Savinho SBC: Riskfactors for neonatal mortality among children with low birth weight.Rev Saude Publica 2009, 43(2):1–9.
39. Mmbaga BT, Lie RT, Olomi R, Mahande MJ, Kvåle G, Daltveit AK: Cause-specificneonatal mortality in a neonatal care unit in Northern Tanzania: a registrybased cohort study. BioMedical Central Pediatrics; 2012, 12(1):116.
40. Nathan R, Mwanyangala MA: Survival of neonates in rural southernTanzania: does place of delivery or continuum of care matter? BioMedicalCentral Pregnancy and childbirth 2012, 12:18.
41. Schellenberg JAR, Mrisho M, Manzi F, Shirima K, Mbuya C, Mushi AK,Katende SC, Alonso PL, Mshinda H, Tanner M, Schellenberg D: Health andsurvival of young children in southern Tanzania. BioMedical Central PublicHealth 2008, 8(194):1–17.
42. Lawn J, Kerber K, Enweronu-laryea C, Batwman M: Newborn survival in lowresource settings: are we delivering? BJOG: An International Journal ofObstetrics and Gynaecology 2009, 116(suppl 1):S49–S59.
43. Olsen OE, Ndeki S, Norheim OF: Availability, distribution and use ofemergency obstetric care in northern Tanzania. Health Policy Plan 2005,20(3):167–175.
44. Lawn JE, Kinney M, Lee AC, Chopra M, Donnay F, Paul VK, Bhutta ZA,Bateman M, Darmstadt GL: Reducing intrapartum-related deaths anddisability: can the health system deliver? International Journal of Obstetricsand Gynaecology 2009, 107(Suppl 1):S123-140–S140-122.
45. Koblinsky M, Matthews Z, Hussein J, Mavalankar D, Mridha MK, Anwar I,Achadi E, Adjei S, Padmanabhan P, Marchal B, De Brouwere V, vanLerberghe W:Going to scale with professional skilled care. Lancet 2006,368(9544):1377–1386.
doi:10.1186/1471-2393-14-240Cite this article as: Selemani et al.: The effect of mother’s age and otherrelated factors on neonatal survival associated with first and secondbirth in rural, Tanzania: evidence from Ifakara health and demographicsurveillance system in rural Tanzania. BMC Pregnancy and Childbirth2014 14:240.
Submit your next manuscript to BioMed Centraland take full advantage of:
• Convenient online submission
• Thorough peer review
• No space constraints or color figure charges
• Immediate publication on acceptance
• Inclusion in PubMed, CAS, Scopus and Google Scholar
• Research which is freely available for redistribution
Submit your manuscript at www.biomedcentral.com/submit