the economic impact of private equity and venture capital in
TRANSCRIPT
The economic impact of Private Equity and Venture Capital in Italy
pwc.com/it

2 | The economic impact of Private Equity and Venture Capital in Italy
1. Private Equity backed companies vs the Italian market
1. Private Equity backed companies vs the Italian market
Private Equity backed companiesvs the Italian market
2 | The economic impact of Private Equity and Venture Capital in Italy
3 | The economic impact of Private Equity and Venture Capital in Italy
1. Private Equity backed companies vs the Italian market
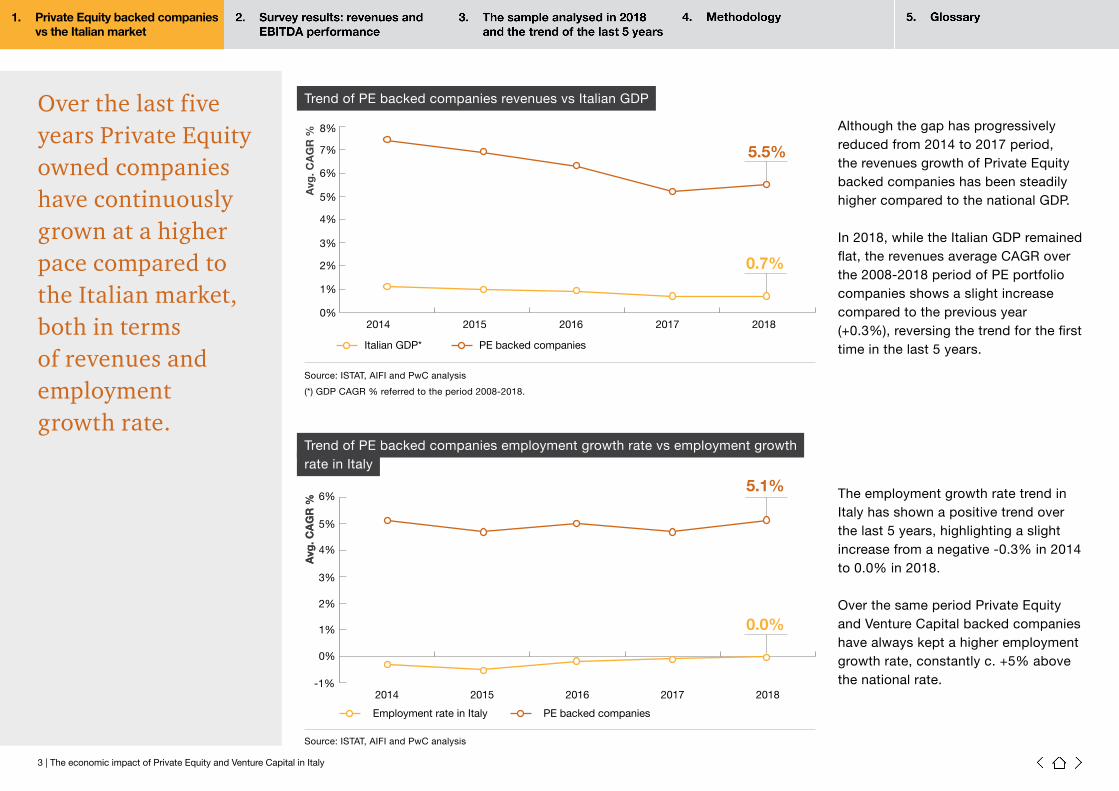
Over the last five years Private Equity owned companies have continuously grown at a higher pace compared to the Italian market, both in terms of revenues and employment growth rate.
(*) GDP CAGR % referred to the period 2008-2018.
Source: ISTAT, AIFI and PwC analysis
Source: ISTAT, AIFI and PwC analysis
Trend of PE backed companies revenues vs Italian GDP
Trend of PE backed companies employment growth rate vs employment growthrate in Italy
The employment growth rate trend in Italy has shown a positive trend over the last 5 years, highlighting a slight increase from a negative -0.3% in 2014 to 0.0% in 2018.
Over the same period Private Equity and Venture Capital backed companies have always kept a higher employment growth rate, constantly c. +5% above the national rate.
Although the gap has progressively reduced from 2014 to 2017 period, the revenues growth of Private Equity backed companies has been steadily higher compared to the national GDP.
In 2018, while the Italian GDP remained flat, the revenues average CAGR over the 2008-2018 period of PE portfolio companies shows a slight increase compared to the previous year (+0.3%), reversing the trend for the first time in the last 5 years.
2014 2015 2016 2017 2018
Italian GDP* PE backed companies
5.5%
0.7%
Avg
. CA
GR
%0%
1%
2%
3%
4%
5%
6%
7%
8%
Employment rate in Italy PE backed companies
5.1%
0.0%
2014 2015 2016 2017 2018
Avg
. CA
GR
%
-1%
0%
1%
2%
3%
4%
5%
6%
Avg
. CA
GR
%

4 | The economic impact of Private Equity and Venture Capital in Italy
2. Survey results: revenues and EBITDA performance
Survey results: revenuesand EBITDA performance
4 | The economic impact of Private Equity and Venture Capital in Italy
2. Survey results: revenues and EBITDA performance
5 | The economic impact of Private Equity and Venture Capital in Italy
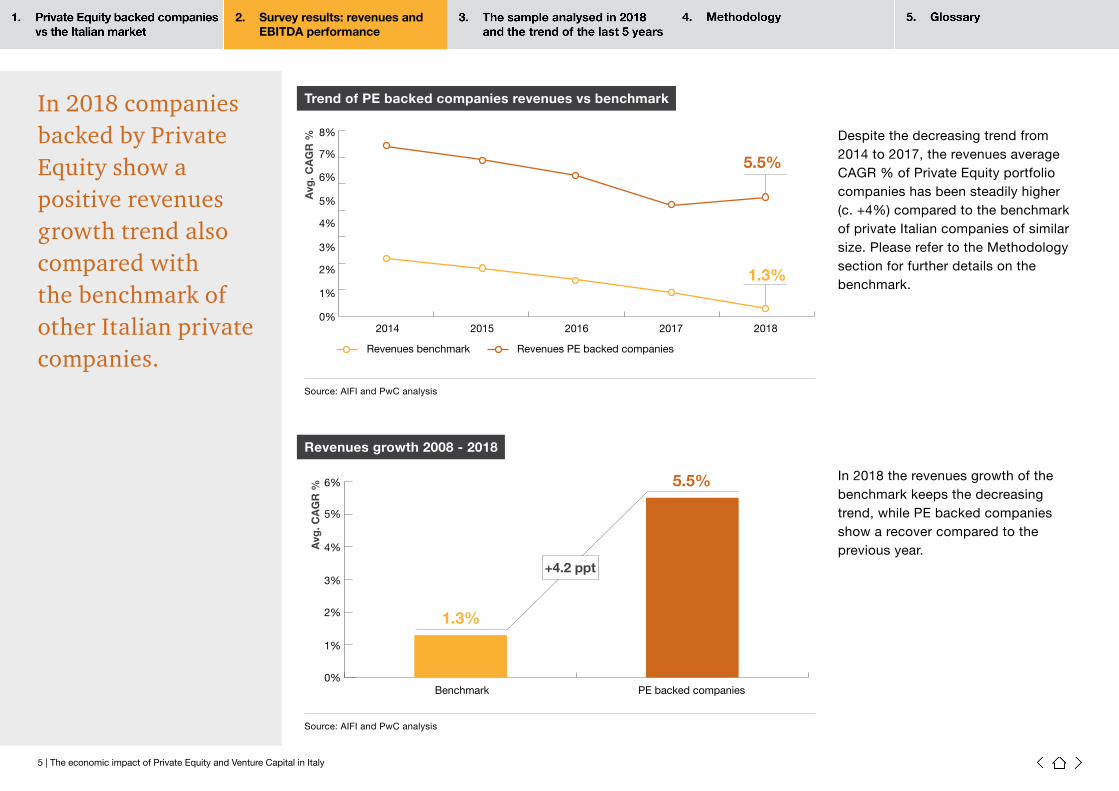
In 2018 companies backed by Private Equity show apositive revenues growth trend also compared withthe benchmark of other Italian private companies.
Source: AIFI and PwC analysis
Source: AIFI and PwC analysis
Trend of PE backed companies revenues vs benchmark
Revenues growth 2008 - 2018
Despite the decreasing trend from 2014 to 2017, the revenues average CAGR % of Private Equity portfolio companies has been steadily higher (c. +4%) compared to the benchmark of private Italian companies of similar size. Please refer to the Methodology section for further details on the benchmark.
In 2018 the revenues growth of the benchmark keeps the decreasing trend, while PE backed companies show a recover compared to the previous year.
Revenues PE backed companies Revenues benchmark
5.5%
1.3%
2014 2015 2016 2017 2018
Avg
. CA
GR
%0%
1%
2%
3%
4%
5%
6%
7%
8%
Benchmark PE backed companies
5.5%
1.3%
+4.2 ppt
Avg
. CA
GR
%
0%
1%
2%
3%
4%
5%
6%
2. Survey results: revenues and EBITDA performance
6 | The economic impact of Private Equity and Venture Capital in Italy
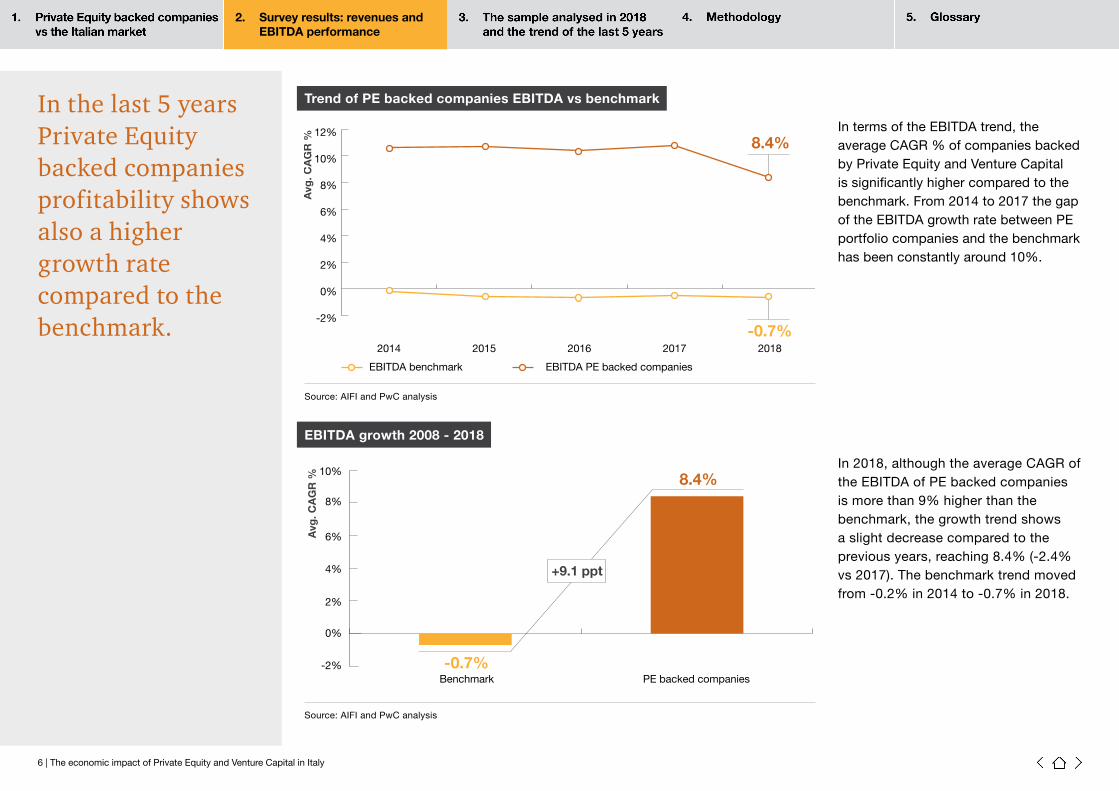
EBITDA growth 2008 - 2018
In terms of the EBITDA trend, the average CAGR % of companies backed by Private Equity and Venture Capital is significantly higher compared to the benchmark. From 2014 to 2017 the gap of the EBITDA growth rate between PE portfolio companies and the benchmark has been constantly around 10%.
In 2018, although the average CAGR of the EBITDA of PE backed companies is more than 9% higher than the benchmark, the growth trend shows a slight decrease compared to the previous years, reaching 8.4% (-2.4% vs 2017). The benchmark trend moved from -0.2% in 2014 to -0.7% in 2018.
Source: AIFI and PwC analysis
Source: AIFI and PwC analysis
Trend of PE backed companies EBITDA vs benchmarkIn the last 5 years Private Equity backed companies profitability shows also a higher growth rate compared to the benchmark.
EBITDA PE backed companies EBITDA benchmark
8.4%
-0.7%
Avg
. CA
GR
%
2014 2015 2016 2017 2018
-2%
0%
2%
4%
6%
8%
10%
12%
8.4%
-0.7%Benchmark PE backed companies
+9.1 ppt
-2%
0%
2%
4%
6%
8%
10%
Avg
. CA
GR
%
2. Survey results: revenues and EBITDA performance
7 | The economic impact of Private Equity and Venture Capital in Italy
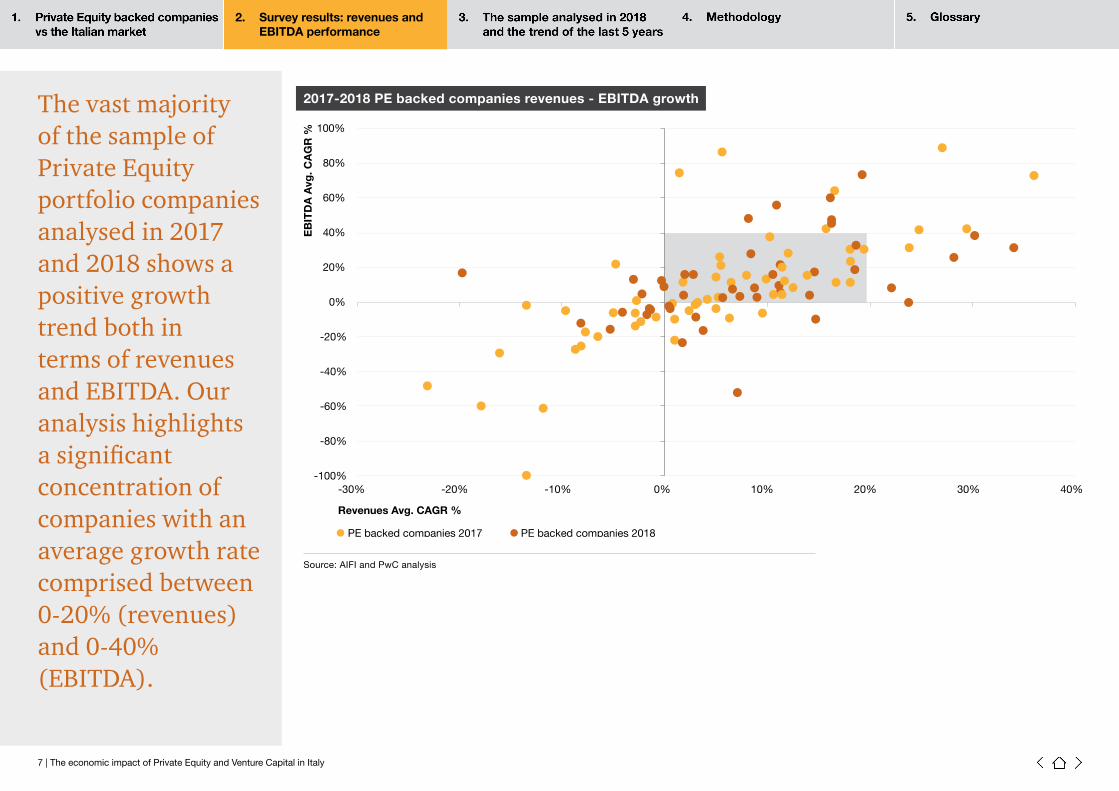
2017-2018 PE backed companies revenues - EBITDA growth
Source: AIFI and PwC analysis
The vast majority of the sample of Private Equity portfolio companies analysed in 2017 and 2018 shows a positive growth trend both in terms of revenues and EBITDA. Our analysis highlights a significant concentration of companies with an average growth rate comprised between 0-20% (revenues) and 0-40% (EBITDA).
-100%
-80%
-60%
-40%
-20%
0%
20%
40%
60%
80%
100%
-30% -20% -10% 0% 10% 20% 30% 40%
PE backed companies 2018
EB
ITD
A A
vg. C
AG
R %
Revenues Avg. CAGR %
PE backed companies 2017
2. Survey results: revenues and EBITDA performance
8 | The economic impact of Private Equity and Venture Capital in Italy
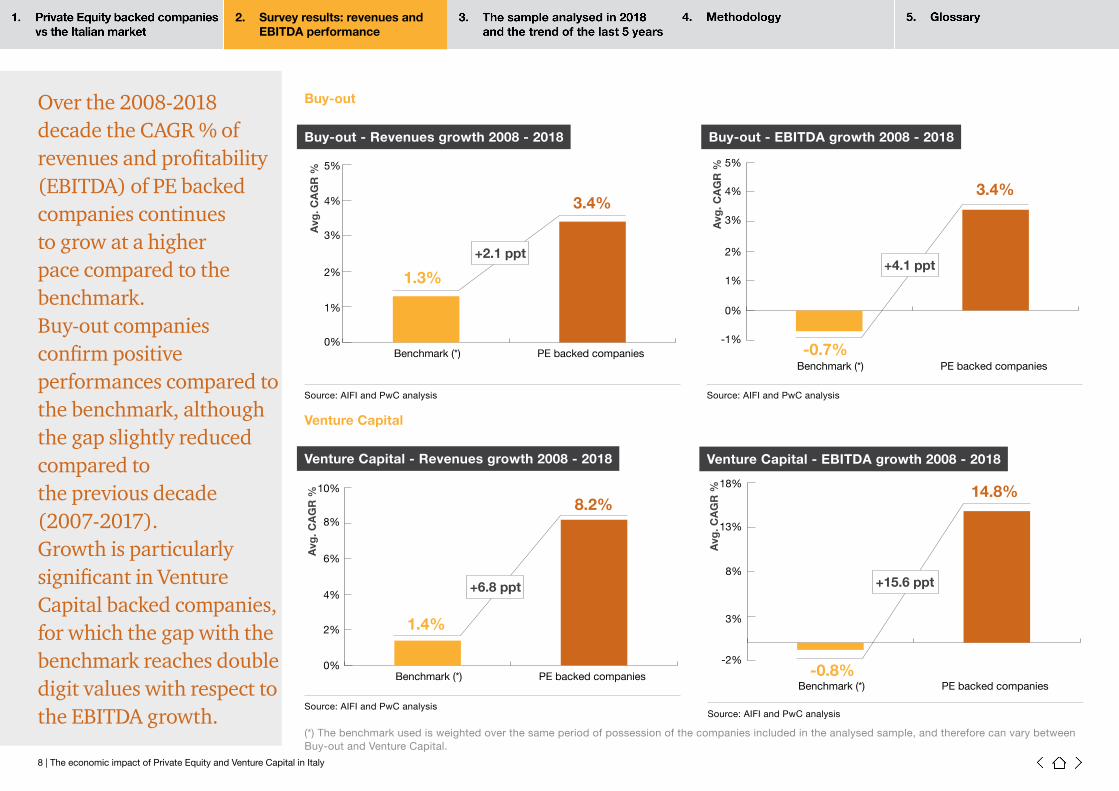
Over the 2008-2018 decade the CAGR % of revenues and profitability (EBITDA) of PE backed companies continues to grow at a higher pace compared to the benchmark. Buy-out companies confirm positive performances compared to the benchmark, although the gap slightly reduced compared to the previous decade (2007-2017).Growth is particularly significant in Venture Capital backed companies, for which the gap with the benchmark reaches double digit values with respect to the EBITDA growth.
Buy-out
Buy-out - Revenues growth 2008 - 2018 Buy-out - EBITDA growth 2008 - 2018
1.3%
3.4%
+2.1 ppt
Avg
. CA
GR
%
0%
1%
2%
3%
4%
5%
Benchmark (*) PE backed companies
Venture Capital
Venture Capital - Revenues growth 2008 - 2018 Venture Capital - EBITDA growth 2008 - 2018
1.4%
8.2%
Benchmark (*) PE backed companies
+6.8 ppt
Avg
. CA
GR
%
0%
2%
4%
6%
8%
10%
Source: AIFI and PwC analysisSource: AIFI and PwC analysis
Source: AIFI and PwC analysisSource: AIFI and PwC analysis
-0.7%
3.4%
+4.1 ppt
Benchmark (*) PE backed companies
-1%
0%
1%
2%
3%
4%
5%
Avg
. CA
GR
%
-0.8%
14.8%
Benchmark (*) PE backed companies
+15.6 ppt
Avg
. CA
GR
%
-2%
3%
8%
13%
18%
(*) The benchmark used is weighted over the same period of possession of the companies included in the analysed sample, and therefore can vary between Buy-out and Venture Capital.

9 | The economic impact of Private Equity and Venture Capital in Italy
3. The sample analysed in 2018 and the trend of the last 5 years
The sample analysed in 2018 and the trend of the last 5 years
9 | The economic impact of Private Equity and Venture Capital in Italy
3. The sample analysed in 2018 and the trend of the last 5 years
10 | The economic impact of Private Equity and Venture Capital in Italy
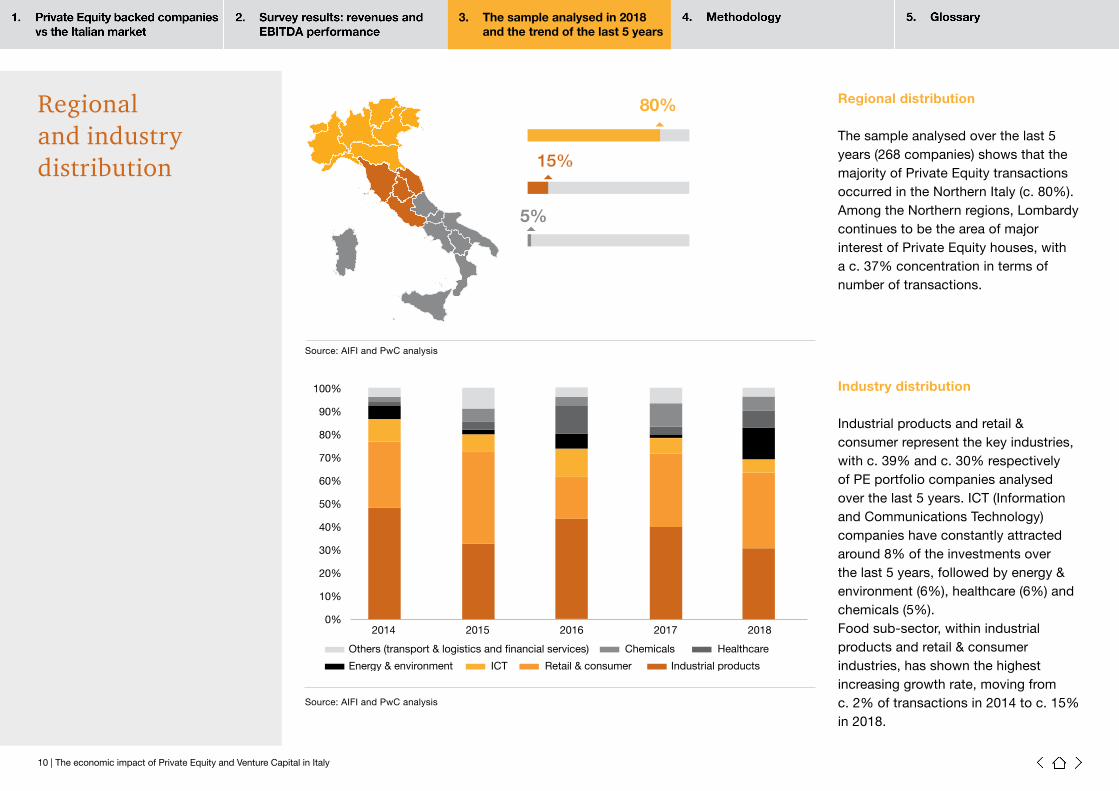
Regional distribution
The sample analysed over the last 5 years (268 companies) shows that the majority of Private Equity transactions occurred in the Northern Italy (c. 80%). Among the Northern regions, Lombardy continues to be the area of major interest of Private Equity houses, with a c. 37% concentration in terms of number of transactions.
Industry distribution
Industrial products and retail & consumer represent the key industries, with c. 39% and c. 30% respectively of PE portfolio companies analysed over the last 5 years. ICT (Information and Communications Technology)companies have constantly attracted around 8% of the investments over the last 5 years, followed by energy & environment (6%), healthcare (6%) and chemicals (5%).Food sub-sector, within industrial products and retail & consumer industries, has shown the highest increasing growth rate, moving from c. 2% of transactions in 2014 to c. 15% in 2018.
80%
15%
5%
80%
15%
5%
Source: AIFI and PwC analysis
Source: AIFI and PwC analysis
Retail & consumer Industrial productsEnergy & environment
Healthcare
ICT
ChemicalsOthers (transport & logistics and financial services)
0%2014 2015 2016 2017 2018
10%
20%
60%
70%
80%
90%
100%
30%
40%
50%
Regional and industry distribution
3. The sample analysed in 2018 and the trend of the last 5 years
11 | The economic impact of Private Equity and Venture Capital in Italy
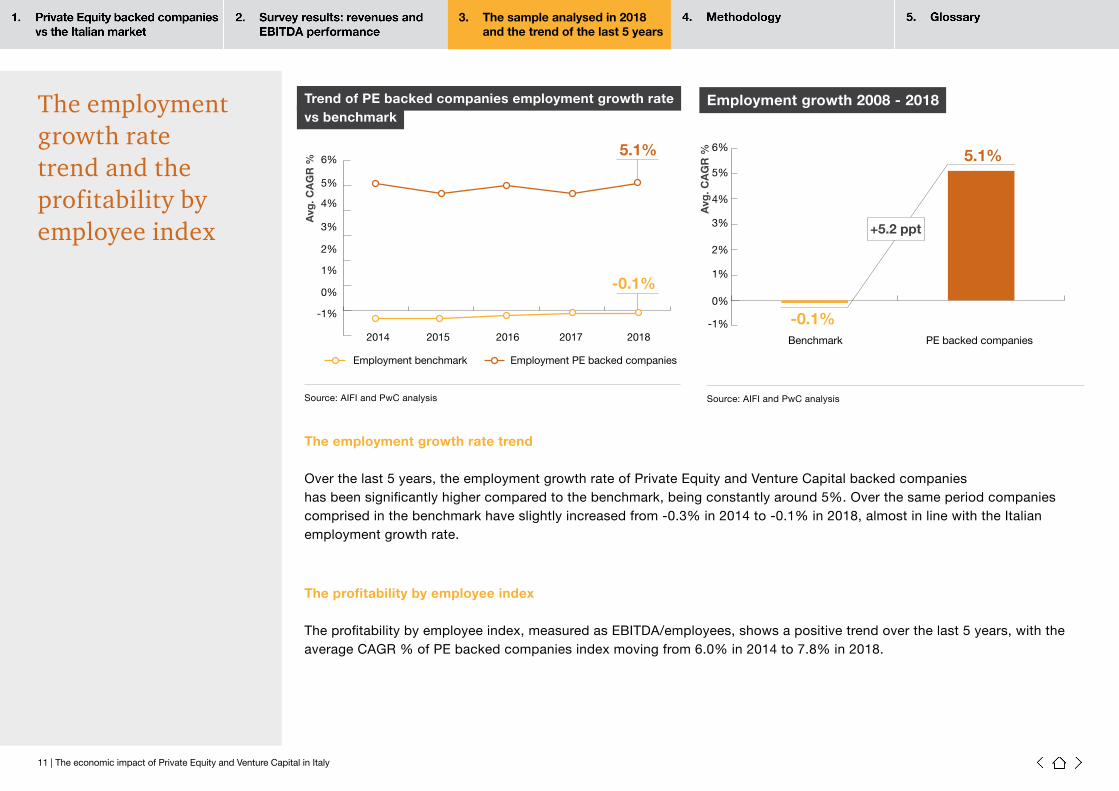
The employment growth rate trend
Over the last 5 years, the employment growth rate of Private Equity and Venture Capital backed companies has been significantly higher compared to the benchmark, being constantly around 5%. Over the same period companies comprised in the benchmark have slightly increased from -0.3% in 2014 to -0.1% in 2018, almost in line with the Italian employment growth rate.
The profitability by employee index
The profitability by employee index, measured as EBITDA/employees, shows a positive trend over the last 5 years, with the average CAGR % of PE backed companies index moving from 6.0% in 2014 to 7.8% in 2018.
Trend of PE backed companies employment growth ratevs benchmark
Employment growth 2008 - 2018The employment growth rate trend and the profitability by employee index
Source: AIFI and PwC analysis Source: AIFI and PwC analysis
5.1%
-0.1%Benchmark PE backed companies
-1%
0%
1%
2%
3%
4%
5%
6%
Avg
. CA
GR
%
+5.2 ppt
5.1%
-0.1%
Employment PE backed companiesEmployment benchmark
2014 2015 2016 2017 2018
Avg
. CA
GR
%-1%
0%
1%
2%
3%
4%
5%
6%
3. The sample analysed in 2018 and the trend of the last 5 years
12 | The economic impact of Private Equity and Venture Capital in Italy
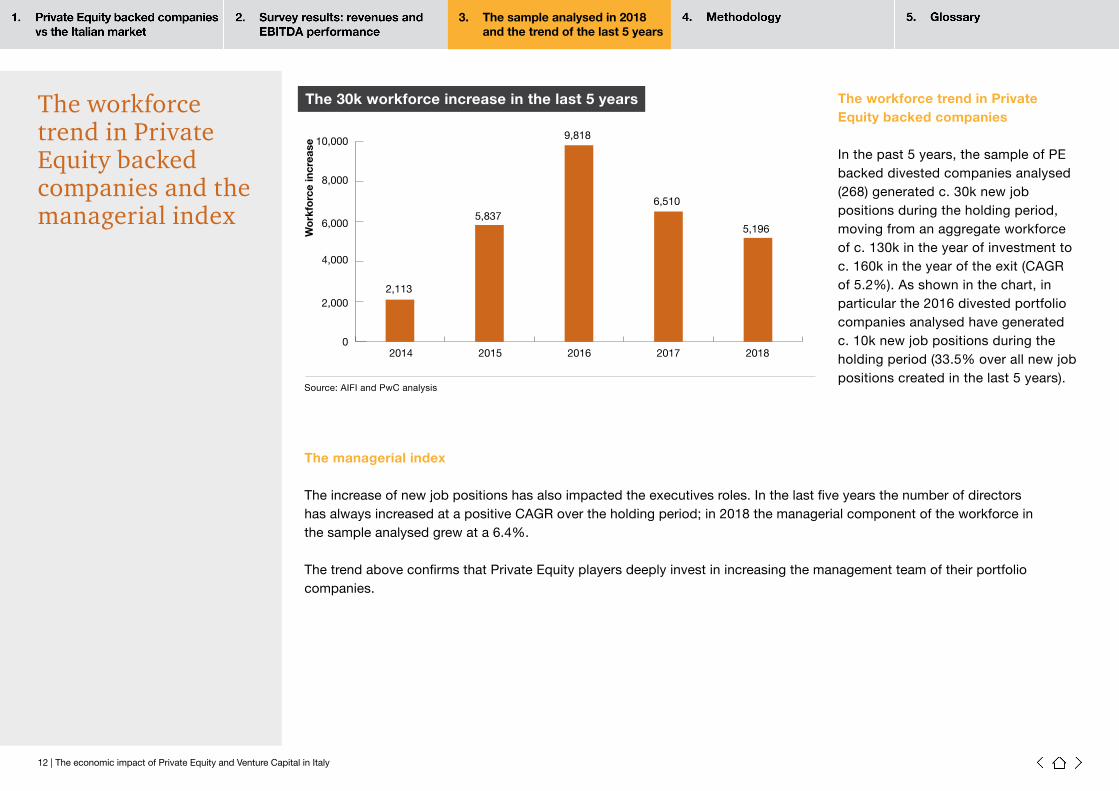
The workforce trend in Private Equity backed companies
In the past 5 years, the sample of PE backed divested companies analysed (268) generated c. 30k new job positions during the holding period, moving from an aggregate workforce of c. 130k in the year of investment to c. 160k in the year of the exit (CAGR of 5.2%). As shown in the chart, in particular the 2016 divested portfolio companies analysed have generated c. 10k new job positions during the holding period (33.5% over all new job positions created in the last 5 years).
Source: AIFI and PwC analysis
The 30k workforce increase in the last 5 yearsThe workforce trend in Private Equity backed companies and the managerial index
The managerial index
The increase of new job positions has also impacted the executives roles. In the last five years the number of directors has always increased at a positive CAGR over the holding period; in 2018 the managerial component of the workforce in the sample analysed grew at a 6.4%.
The trend above confirms that Private Equity players deeply invest in increasing the management team of their portfolio companies.
2,113
5,837
9,818
Wo
rkfo
rce
incr
ease
6,510
5,196
2014 2015 2016 2017 20180
2,000
4,000
6,000
8,000
10,000
3. The sample analysed in 2018 and the trend of the last 5 years
13 | The economic impact of Private Equity and Venture Capital in Italy
3.02014
PE backed companiesA
vg. y
ears
Buy-out
2015 2016 2017 2018
3.5
4.0
5.0
6.0
5.5
6.5
7.0
4.5
Venture Capital
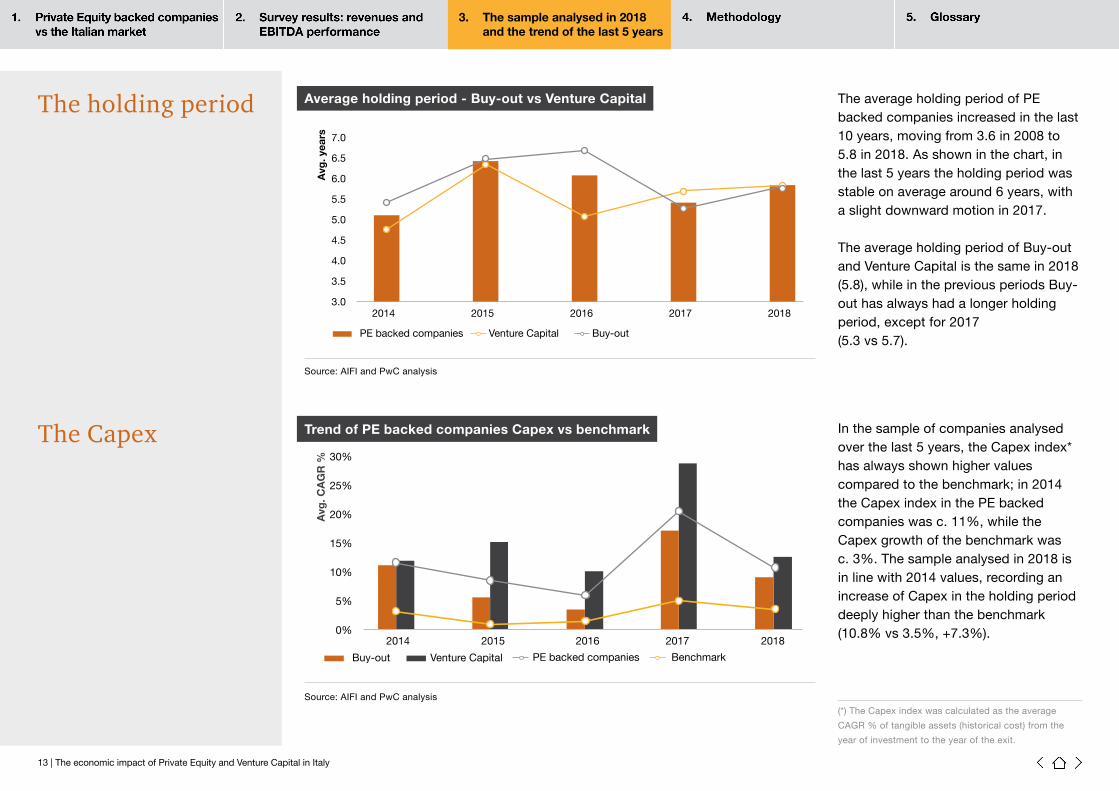
The average holding period of PE backed companies increased in the last 10 years, moving from 3.6 in 2008 to 5.8 in 2018. As shown in the chart, in the last 5 years the holding period was stable on average around 6 years, with a slight downward motion in 2017.
The average holding period of Buy-out and Venture Capital is the same in 2018 (5.8), while in the previous periods Buy-out has always had a longer holding period, except for 2017 (5.3 vs 5.7).
Source: AIFI and PwC analysis
Average holding period - Buy-out vs Venture CapitalThe holding period
The Capex
0%2014
Buy-out Venture Capital Benchmark
2015 2016 2017 2018
5%
10%
20%
30%
25%
15%
PE backed companies
Avg
. CA
GR
%
Source: AIFI and PwC analysis
Trend of PE backed companies Capex vs benchmark In the sample of companies analysed over the last 5 years, the Capex index* has always shown higher values compared to the benchmark; in 2014 the Capex index in the PE backed companies was c. 11%, while the Capex growth of the benchmark was c. 3%. The sample analysed in 2018 is in line with 2014 values, recording an increase of Capex in the holding period deeply higher than the benchmark (10.8% vs 3.5%, +7.3%).
(*) The Capex index was calculated as the average
CAGR % of tangible assets (historical cost) from the
year of investment to the year of the exit.
3. The sample analysed in 2018 and the trend of the last 5 years
14 | The economic impact of Private Equity and Venture Capital in Italy
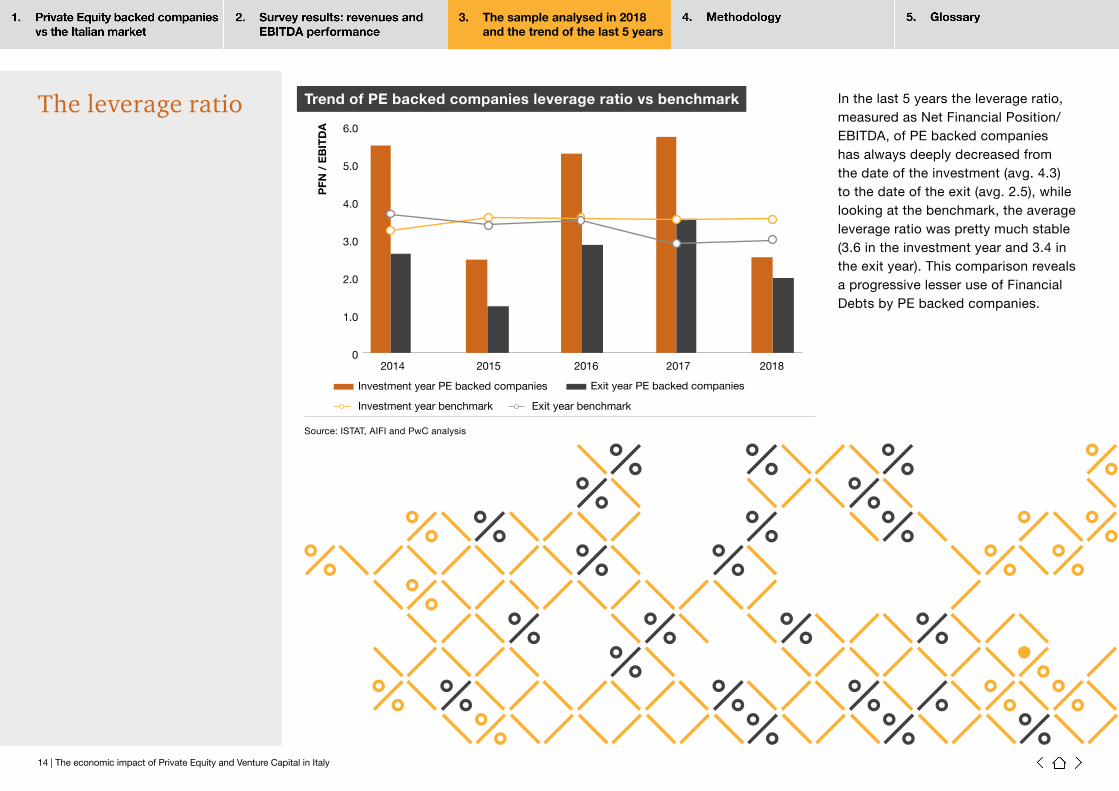
In the last 5 years the leverage ratio, measured as Net Financial Position/EBITDA, of PE backed companies has always deeply decreased from the date of the investment (avg. 4.3) to the date of the exit (avg. 2.5), while looking at the benchmark, the average leverage ratio was pretty much stable (3.6 in the investment year and 3.4 in the exit year). This comparison reveals a progressive lesser use of Financial Debts by PE backed companies.
Source: ISTAT, AIFI and PwC analysis
Trend of PE backed companies leverage ratio vs benchmarkThe leverage ratio
0
PFN
/ E
BIT
DA
2014
Investment year PE backed companies Exit year PE backed companies
Exit year benchmark
2015 2016 2017 2018
1.0
2.0
4.0
6.0
5.0
3.0
Investment year benchmark
15 | The economic impact of Private Equity and Venture Capital in Italy
3. The sample analysed in 2018 and the trend of the last 5 years
Over the last 5 years the sample analysed shows that the main divestment method is trade sales (c. 67%). Buy-back of the shares by the original owners is c. 14% and IPO/post IPO operations account for the remaining 7%.
Out of the 67% of the analysed divestments over 2014-2018, the percentage of sales to corporate is 32%, while the remaining 35% is represented by sales to other Private Equity or Venture Capital houses (Secondary Buy-out).
A specific focus on Secondary Buy-out shows that revenues, EBITDA and employees CAGR % continue to grow even during the further management of other Private Equity funds. Over the 2014-2018 period Secondary Buy-out revenues, EBITDA and workforce respectively grown by 7.4%, 6.5% and 7.0%.
Performance of Secondary Buy-outs

16 | The economic impact of Private Equity and Venture Capital in Italy
4. Methodology
Methodology
16 | The economic impact of Private Equity and Venture Capital in Italy
4. Methodology
17 | The economic impact of Private Equity and Venture Capital in Italy
Methodology
This study is designed to investigate the performance of the Target companies during the holding period (2008-2018) with a breakdown between Buy-out and Venture Capital.
Sample and holding period
This study has been prepared on a sample basis of 499 divestments (218 Venture Capital and 281 Buy-out related) undertaken in Italy by Private Equity investors in the period 2008-2018. The sample is representative of divestments over the 2008-2018 period. Further information on how the sample has been extracted is presented on the following paragraphs. Holding period: from the years subsequent to the acquisition to the years of divestment (2008-2018). In the last years, the average holding period has extended to approximately 5/6 years.
Performance indicators
The economic impact of PE players on Target companies was measured through a set of indicators based on Consolidated Financial Data, or on Parent (Operating) Company Financial Statements, where such Consolidated Financial Statements were not available. Measured indicators are as follows:• Revenues: amount included in the caption A1 “Ricavi delle vendite e delle prestazioni” of the Statutory Financial
Statements (for banks and financial institutions, revenues have been calculated as the sum of interests, commissions and other profits from financial operations);
• EBITDA (Earnings before Interest, Tax, Depreciation and Amortization) consists of the net earnings calculated before, and without giving effect to (i) interest expenses/income; (ii) income taxes; (iii) depreciation and amortization of balance sheet assets; and (iv) exceptional and non-recurring/operating items;
• Employees: headcount consists of the average number of employees per year or the actual headcount at the end of each year where the average information was not available.
Growth rate (CAGR)
CAGR presented in this study for each of the performance indicators (revenue, EBITDA, employment growth rate) is the average CAGR of each company included in the sample.
The sample This study is designed to investigate the performance of the target companies over the holding period. It should be highlighted that in certain cases a shift in the holding period was required in order to make certain figures comparable over the period itself.The sample was created based on total divestments occurred over the 2008-2018 period, excluding the targets: (i) whose name was undisclosed or not identifiable; (ii) represented by non-operating holding companies, small co-operative and state companies; (iii) whose most current financial data were not available; (iv) not representing a true divestment but a mere transfer of shares between shareholders belonging to the same syndicate.Due to the lack of specific information, it has not been possible to analyse separately the Organic vs. the Inorganic growth (i.e. impact of add-on). However, it should be noted that the sample analysed is fully comparable with the selected benchmark, which also includes the impact of acquisitions.
The benchmark
To measure if the sample performed under or over the market, the results of the research have been compared to the performance of medium and large sized Italian private companies. As previously mentioned, the selected benchmark for comparison was extrapolated from the information included in “Dati Cumulativi di 2,095 società italiane”, a survey compiled by Mediobanca’s Research Department, from which we have extracted information related to private entities only. It should be noted that for comparability reasons the benchmark information was weighted to consider the same holding period of the companies included in the sample analysed.

5. Glossary
18 | The economic impact of Private Equity and Venture Capital in Italy
Glossary
18 | The economic impact of Private Equity and Venture Capital in Italy
5. Glossary
19 | The economic impact of Private Equity and Venture Capital in Italy
Term Definition
Backed Companies
Companies included in a Private Equity portfolio of investment.
Buy-out (BO)Buying a company using own financial resources or borrowed money to pay most of the purchase price. The debt is secured against the assets of the company being acquired. The interest will be paid out of the company’s future cash flow.
CAGR
Compounded Annual Growth Rate. The year-over-year growth rate of an investment over a specified period of time. The CAGR is a mathematical formula that provides a “smoothed” rate of return. It is really a pro forma number that provides (i) what an investment yields on an annually compounded basis and (ii) an indication to investors what they really have at the end of the investment period. The compounded annual growth rate is calculated by taking the “nth” root of the total percentage growth rate, where “n” is the number of years in the period being considered.
EBITDA Earnings before Interest, Income taxes, Depreciation and Amortization.
Gross Domestic Product (GDP)
Gross domestic product is a measure of economic activity in a country. It is calculated as the sum of the total value of a country’s annual output of goods and services. GDP = private consumption + investments + public spending + the change in inventories + (exports - imports). It is usually valued at market price and by subtracting indirect tax and adding any government subsidy, however, GDP can be calculated at factor costs. The latter measure is more accurate and reveals the income paid to factors of production. In our analysis we have utilized the real GDP which takes into account the effects of inflation.
InflationRaising prices across the board. Inflation erodes the purchasing power of a unit of currency. Inflation usually refers to consumer prices, but it can also be applied to other prices (wholesale goods, wages, assets, and so on). It is usually expressed as an annual percentage rate of change on an index number.
Private Equity (PE)
When a firm’s shares are held privately and are not traded in the public markets. Private Equity includes shares in both mature private companies and, as Venture Capital, in newly started businesses. As it is less liquid than publicly traded equity, investors in Private Equity expect on average to earn a higher equity risk premium from it.
Venture Capital (VC)
Private Equity to help new companies to grow. A valuable alternative source of financing for entrepreneurs. For the purpose of this survey, start-up and development financing have been considered as Venture Capital activities.
Glossary
Contacts
Francesco GiordanoPartner | Deals+39 02 [email protected]
Daniela MentesanaDirector | Deals+39 02 [email protected]
pwc.com/it
© 2020 PricewaterhouseCoopers Advisory SpA. All rights reserved. PwC refers to PricewaterhouseCoopers Advisory SpA and maysometimes refer to the PwC network. Each member firm is a separate legal en tity. Please see www.pwc.com/structure for further details.This content is for general information purposes only, and should not be used as a substitute for consultation with professional advisors.