the digital transformation of smes - apcict
TRANSCRIPT
OECD Studies on SMEs and Entrepreneurship
The Digital Transformation of SMEs
Th
e Dig
ital Transfo
rmatio
n of S
ME
sO
EC
D S
tud
ies on S
ME
s and
Entrep
reneu
rship

OECD Studies on SMEs and Entrepreneurship
The Digital Transformation of SMEs
This document, as well as any data and map included herein, are without prejudice to the status of or sovereignty overany territory, to the delimitation of international frontiers and boundaries and to the name of any territory, city or area.
The statistical data for Israel are supplied by and under the responsibility of the relevant Israeli authorities. The use ofsuch data by the OECD is without prejudice to the status of the Golan Heights, East Jerusalem and Israeli settlements inthe West Bank under the terms of international law.
Note by TurkeyThe information in this document with reference to “Cyprus” relates to the southern part of the Island. There is no singleauthority representing both Turkish and Greek Cypriot people on the Island. Turkey recognises the Turkish Republic ofNorthern Cyprus (TRNC). Until a lasting and equitable solution is found within the context of the United Nations, Turkeyshall preserve its position concerning the “Cyprus issue”.
Note by all the European Union Member States of the OECD and the European UnionThe Republic of Cyprus is recognised by all members of the United Nations with the exception of Turkey. Theinformation in this document relates to the area under the effective control of the Government of the Republic of Cyprus.
Please cite this publication as:OECD (2021), The Digital Transformation of SMEs, OECD Studies on SMEs and Entrepreneurship, OECD Publishing, Paris, https://doi.org/10.1787/bdb9256a-en.
ISBN 978-92-64-39245-8 (print)ISBN 978-92-64-36760-9 (pdf)
OECD Studies on SMEs and EntrepreneurshipISSN 2078-0982 (print)ISSN 2078-0990 (online)
Photo credits: Cover © Chan2545.
Corrigenda to publications may be found on line at: www.oecd.org/about/publishing/corrigenda.htm.
© OECD 2021
The use of this work, whether digital or print, is governed by the Terms and Conditions to be found at http://www.oecd.org/termsandconditions.
3
THE DIGITAL TRANSFORMATION OF SMES © OECD 2021
Foreword
Digitalisation offers a range of opportunities for small and medium-sized enterprises (SMEs) to improve
performance, spur innovation, enhance productivity and compete, on a more even footing, with larger firms,
reflecting: economies of scale; lower operation and transaction costs; reduced information asymmetries;
greater capacity for product differentiation, business intelligence or automation; increased customer and
market outreach; network effects, etc.
However, despite the significant benefits on offer, smaller size often acts as a barrier to adoption and, as
such, smaller businesses continue to lag in the digital transformation, in particular dragged back by a lack
of internal resources and awareness, skills gaps or financing issues. These gaps in digital uptake weigh
down on productivity and in turn contribute to inequalities among people, places and, of course, firms,
where there are additional concerns that the benefits of digitalisation could accrue mainly to early adopters.
Overcoming these barriers, and allowing SMEs to fully embrace the benefits of the digital transformation,
cannot be met by SMEs alone. Policy makers have a strong role to play.
This report articulates that role, and in doing so acts as a cornerstone for current and future SME digital
policy development. It looks at SME digitalisation across all angles. It analyses recent trends in their uptake
of digital technologies, including in the context of the COVID-19 crisis. It focuses on digital security issues,
the opportunities and challenges raised by online platforms for small actors, the emergence of blockchain
ecosystems serving SME needs, and the changes in SME business environments and business models
due to recent developments in artificial intelligence. The report identifies the opportunities for small
businesses in digitalising their different business functions, and how they manage their transition. It
identifies the risks of not going digital, or going digital ill-prepared, as well as the barriers that prevent SME
adoption.
The report looks in particular into the policy actions undertaken by governments across OECD countries
and beyond, in order to support and accelerate the SME transformation. It identifies areas of policy
intervention, as well as convergences and differences in national strategies, instruments and governance
structures. Looking across a number of policy domains, it also aims to lay out the foundations for, and
advance, future research in the SME digital policy agenda.
This report is part of the OECD Studies on SMEs and Entrepreneurship and builds on the work carried out
in 2019-20 by the OECD Working Party on SMEs and Entrepreneurship (WPSMEE) on “Enabling SMEs
to Benefit from Digitalisation”. The report contributes to the OECD horizontal project on “Going Digital.
Making the transformation work for growth and wellbeing” which aims to help policy makers better
understand the drivers of digital transformation and develop coherent policies to shape a positive and
inclusive digital future.
4
THE DIGITAL TRANSFORMATION OF SMES © OECD 2021
Acknowledgements
This report was produced by the OECD Centre for Entrepreneurship, SMEs, Regions and Cities (CFE) led
by Lamia Kamal-Chaoui and as part of the programme of work of the OECD Working Party on SMEs and
Entrepreneurship (WPSMEE).
The report was co-ordinated and co-authored by Sandrine Kergroach (Head of SME and Entrepreneurship
Performance, Policies and Mainstreaming Unit) under the supervision of Céline Kauffmann and Lucia
Cusmano, respectively Head and Deputy Head of the SME and Entrepreneurship Division.
Chapter 1, “Digital access and uptake by SMEs”, received input and research support from Julien Salin (CFE).
Chapter 2, “Digital security in SMEs” was prepared by Benjamin Dean (Catastrophe Research Lead,
Hiscox). Key findings were discussed at an expert webinar organised on 29 October 2020 in the framework
of the OECD-Business at OECD Global “Digital for SMEs” initiative (D4SME), and by the OECD Working
Party on Security in the Digital Economy. Thanks to Laurent Bernat of the OECD Directorate for Science,
Technology and Innovation (STI) for his comments.
Chapter 3, “Digital platforms for SMEs” was prepared by Marco Bianchini (CFE). Thanks to Jeremy West
(STI) and Mauro Pisu of the OECD Economics Department (ECO) for their comments.
Chapter 4, “Blockchain ecosystems for SMEs” was prepared by Marco Bianchini and Insung Kwon with
guidance from Lucia Cusmano (CFE). Key findings and case studies were discussed with national authorities
in Israel (June 2019) and Italy (December 2019). Thanks to Caroline Malcom, Head of the OECD Blockchain
Centre, Directorate for Financial and Enterprise Affairs (DAF), for her feedback along the project.
Chapter 5, “Artificial intelligence: changing landscape for SMEs”, was prepared by Insung Kwon (CFE).
Thanks to Laura Galindo, Nobuhisa Nishigata, Alistair Nolan and Karine Perset of the OECD AI.Policy
Observatory (STI) and Mattia Corbetta (CFE) for their comments.
Chapter 6, “National AI Policies: what about diffusion?” was prepared by Jules Beley with research input
from Thanh Tran (CFE). Key findings were discussed with the Working Group on National AI Policies (PAI)
of the OECD Network of Experts on AI. Thanks to Andres Barreneche and Michael Keenan (STI) for their
comments on the use of the EC/OECD STI Policy Compass. Thanks to Laura Galindo, Nobuhisa Nishigata,
Alistair Nolan and Karine Perset of the OECD AI.Policy Observatory (STI), and Mattia Corbetta (CFE) for
their comments on the chapter. Thanks to Samuel Pinto-Ribeiro of the OECD Statistics and Data
Directorate (SDD) for his guidance on data engineering.
Marco Bianchini (CFE) co-ordinated the D4SME network and related events in support of international
policy dialogue and knowledge sharing. Thanks to Madison Lucas (CFE) for animating the D4SME
network, developing the D4SME databank of SMEs, and providing research assistance to the whole report.
Colleagues from the CFE also provided valuable input and feedback to the various chapters. Thanks go
to Lucia Cusmano and Stephan Raes.
Finally, François Iglesias designed the cover and, Pilar Philip served as co-ordinator of the publication
process. Heather Mortimer-Charoy provided project and secretariat assistance (all CFE).
5
THE DIGITAL TRANSFORMATION OF SMES © OECD 2021
Table of contents
Foreword 3
Acknowledgements 4
Abbreviations and acronyms 9
Executive summary 13
1 Digital tools and practices: SME access and uptake 15
In Brief 16
Introduction 17
Digital technology diffusion prior to COVID-19 19
COVID-19: The big push forward 33
Policy considerations 38
Conclusion 50
References 52
Notes 56
2 Digital security in SMEs 59
In Brief 60
Introduction 61
Digital security: Challenges for SMEs 62
SMEs and digital risk management 82
Public policies for strengthening digital risk management among SMEs 90
Conclusion 99
References 101
Notes 108
3 SMEs in the online platform economy 111
In Brief 112
Introduction 113
Online platforms: Features, benefits and challenges for SMEs 114
How do SME use online platforms? Prevalence, impact, barriers and enablers 128
National policies for SME use of online platforms 134
Conclusion 142
References 143
Notes 149
6
THE DIGITAL TRANSFORMATION OF SMES © OECD 2021
4 How can Blockchain ecosystems serve SMEs? 153
In Brief 154
Introduction 155
Blockchain use by SMEs: Features and challenges 155
Blockchain for SMEs and entrepreneurs: The cases of Israel and Italy 165
Policy approaches to foster blockchain for SMEs 178
Conclusion 183
References 184
Notes 188
5 Artificial intelligence: Changing landscape for SMEs 191
In Brief 192
Artificial Intelligence in a nutshell 194
Implications of AI on SME business environment and practices 201
AI diffusion, barriers and modalities 208
Conclusion 216
References 219
Notes 227
6 National policies for Artificial Intelligence: What about diffusion? 229
In Brief 230
Introduction 231
Data sources and methodology 234
Conclusion 262
Annex 6.A. Country coverage of the Compass 265
References 268
Notes 272
FIGURES
Figure 1.1. The 6+1 pillars of SME performance 18 Figure 1.2. Employees have increasing access to devices with online connection 21 Figure 1.3. SME gap in adoption is lower in relation to general administration and marketing functions 24 Figure 1.4. Large firms are consolidating their IT systems through cloud computing services more proactively 25 Figure 1.5. Weight of micro-firms in the business population and employment 26 Figure 1.6. Digital technology supports further digital technology adoption 27 Figure 1.7. Cross-country and cross-firm differences in accessing digital infrastructure are striking 29 Figure 1.8. Digital technologies diffuse differently across sectors 30 Figure 1.9. The most affected sectors by COVID-19 containment measures 36 Figure 2.1. Prevalence of security breaches in enterprises, 2019 66 Figure 2.2. Annual breach likelihood, by firm revenue, United States, 2009-19 70 Figure 2.3. Average breach losses by firm revenues, United States, 2009-19 73 Figure 2.4. Hyper-connectivity and codification increase the vulnerability of firms, 2019 76 Figure 2.5. COVID-19 containment measures gave a push to the adoption of smart working tools, United
States, first months of 2020 79 Figure 2.6. Digital attacks have continued during lockdowns, targeting sensitive sectors 79 Figure 2.7. Firms implement more digital security measures as they get larger, national statistics, United
Kingdom, 2019 82 Figure 2.8. Firms implement more digital security measures as they get larger, national statistics, Denmark,
2018 83 Figure 2.9. Firms implement more digital security measures as they get larger, national statistics, Australia,
2009 83
7
THE DIGITAL TRANSFORMATION OF SMES © OECD 2021
Figure 2.10. Firms implement more digital security measures as they get larger, national statistics, UK
Government’s “10 Steps Guidance”, 2019 84 Figure 2.11. SME digital practices increasingly differ from those of large firms as they become more
sophisticated or comprehensive, EU28, 2019 85 Figure 2.12. Smaller firms rely less on their own employees for cybersecurity purposes, EU28, 2019 86 Figure 2.13. Smaller firms tend to update their ICT policy less often, EU28, 2019 87 Figure 2.14. SMEs tend to be less well covered in case of incidents, 2019 88 Figure 2.15. There are large variations across countries on business adoption of ICT security measures,
EU28, 2019 90 Figure 3.1. Impact of platform development on the productivity of incumbent service providers 125 Figure 3.2. Business participation in e-commerce has increased since 2008, although smaller firms are
lagging 129 Figure 3.3. SMEs are more likely to sell online through their own website/apps than online marketplaces 130 Figure 3.4. SMEs selling online can make a substantial share of their sales on online platforms 131 Figure 3.5. Almost half of SMEs selling through e-commerce sell abroad 132 Figure 3.6. While broadly mainstreamed among large firms, the use of social media remains very unequal
among SMEs and across countries 133 Figure 3.7. SMEs that train their employees are more likely to engage in social media, especially the smaller
ones 134 Figure 4.1. Blockchain projects at the international level 159 Figure 4.2. Businesses sharing electronically SCM information with suppliers and customers 162 Figure 4.3. Blockchain companies by type of service offered 166 Figure 4.4. Blockchain companies by type of business operation within country 168 Figure 4.5. Size and age of blockchain companies 169 Figure 4.6. Blockchain entrepreneurs’ survey: Primary market target 171 Figure 4.7. Blockchain entrepreneurs’ survey: Development stage of the solution 172 Figure 4.8. Blockchain entrepreneurs’ survey: Blockchain architecture 173 Figure 4.9. Blockchain entrepreneurs’ survey: Principal source of finance 174 Figure 4.10. Blockchain entrepreneurs’ survey: Main actors of co-operation 175 Figure 4.11. Blockchain entrepreneurs’ survey: Business barriers 176 Figure 5.1. Conceptual view of an AI system 196 Figure 5.2. Global Internet Protocol Traffic, 1984-2017 197 Figure 5.3. Methods of machine learning 198 Figure 5.4. Examples of supervised learning and unsupervised learning 199 Figure 5.5. The 6+1 pillars of SME performance 207 Figure 5.6. Businesses having performed big data analysis 209 Figure 5.7. Diffusion of data analytics in manufacturing and SME-dominated sectors: A stylised approach 210 Figure 5.8. Businesses purchasing cloud CRM software 214 Figure 6.1. Subsets of Compass initiatives 235 Figure 6.2. Number of initiatives by subgroup, based on STIP Compass taxonomies 236 Figure 6.3. Number of initiatives by subgroup, using a keywords approach 239 Figure 6.4. Technology convergence and digital transformation in the industrial sector 246 Figure 6.5. Network of organisations responsible for innovation and AI policy in Australia 257 Figure 6.6. Network of organisations responsible for innovation and AI policy in France 258 Figure 6.7. Network of organisations responsible for innovation and AI policy in Germany 259 Figure 6.8. Network of organisations responsible for innovation and AI policy in Korea 260 Figure 6.9. Network of organisations responsible for innovation and AI policy in the Netherlands 261 Figure 6.10. Network of organisations responsible for innovation and AI policy in the United States 262
TABLES
Table 1.1. The digitalisation of SME business functions and relevant ICT business use indicators 23 Table 1.2. Statistical analysis of ICT use by businesses, methodological steps 31 Table 1.3. Correlations between the most explicative variables of digital gaps and value-added rate across
sectors 32 Table 1.4. Technology support and assistance programmes: Country examples 39 Table 1.5. Skills development programmes: Country examples 42 Table 1.6. Data governance and protection in SMEs: Country examples 45
8
THE DIGITAL TRANSFORMATION OF SMES © OECD 2021
Table 1.7. SME digital security policies: Country examples 46 Table 1.8. E-government and e-services for SMEs: Country examples 47 Table 1.9. Infrastructural policies, platforms and networking facilities: Country examples 49 Table 2.1. Data sources on digital security incidents and breaches 64 Table 2.2. Prevalence and type of digital security incidents by industry, 2019 67 Table 2.3. Largest proportions of personal data breaches by sector, Australia, February 2018 – June 2019 68 Table 2.4. Prevalence of digital security incidents by firm size, national statistics, United Kingdom, 2019 69 Table 2.5. Prevalence of digital security incidents by firm size, national statistics, United States, 2005 69 Table 2.6. Costs of digital security incidents, national statistics, United States, 2014-18 72 Table 2.7. Costs of digital security incidents, national statistics, Italy, 2016 72 Table 2.8. Costs of digital security incidents, national statistics, United Kingdom, 2017 73 Table 2.9. Early evidence of the impact of the COVID-19 on business digital adoption and risk 78 Table 2.10. Small firms tend to spend less on digital security, national statistics, United Kingdom, 2019 88 Table 2.11. Small firms tend to spend less on digital security, national statistics, Italy, 2016 88 Table 2.12. Mainstreaming of SME policy considerations in national digital security strategies 92 Table 2.13. Selected examples of policy initiatives aiming to raise digital security in the SME sector 92 Table 3.1. SME- business functions performed through online platforms 116 Table 3.2. Examples of policy initiatives to support SME uptake of online platforms 135 Table 5.1. Examples of business applications of AI in SME-dominated sectors 205 Table 5.2. Examples of AI applications in SME functions 206 Table 6.1. List of AI and SME&E keywords 237 Table 6.2. Policy instruments in use for STI policies, AI policies and AI/SMEE policies 247 Table 6.3. Types of collaborative infrastructure for AI innovation and diffusion 251 Table 6.4. Types of organisations in charge of AI policy initiatives 254 Table 6.5. Types of ministries in charge of AI policy initiatives 255 Table 6.6. Examples of agencies in charge of AI/SMEE policy initiatives 255 Table 6.7. Main characteristics of national AI/SMEE policy mix 263
Annex Table 6.A.1. Policy instrument types used in the Compass, with categories 265 Annex Table 6.A.2. STIP Compass: Basic descriptive statistics by country 266 Annex Table 6.A.3. Distribution of AI/SMEE policy initiatives by geographical entity 267
Look for the StatLinks2at the bottom of the tables or graphs in this book.To download the matching Excel® spreadsheet, just type the link into your Internetbrowser, starting with the https://doi.org prefix, or click on the link from the e-bookedition.
This book has...A service that delivers Excel® files fromthe printedpage!
Follow OECD Publications on:
http://twitter.com/OECD_Pubs
http://www.facebook.com/OECDPublications
http://www.linkedin.com/groups/OECD-Publications-4645871
http://www.youtube.com/oecdilibrary
http://www.oecd.org/oecddirect/Alerts
9
THE DIGITAL TRANSFORMATION OF SMES © OECD 2021
Abbreviations and acronyms
5G Fifth generation of mobile networks
AI Artificial intelligence
AGI Artificial General Intelligence
AML Anti-money laundering
ANI Artificial Narrow Intelligence
API Application Programme Interface
B2B Business-to-business
B2C Business-to-consumer
B2G Business-to-government
BaaS Blockchain-as-a-Service
CC Cloud computing
CFT Combating the financing of terrorism
CRM Consumer relationship management
dApp Decentralised application
DLT Distributed Ledger Technology
DoS Denial of service
EC European Commission
ERP Enterprise resource planning
EU European Union
GDP Gross domestic product
GDPR General Data Protection Regulation
GPT General purpose technology
GVC Global value chain
ICO Initial Coin Offering
ICT Information and communication technology
IIoT Industrial Internet of Things
IoT Internet of Things
10
THE DIGITAL TRANSFORMATION OF SMES © OECD 2021
IP Intellectual property
IPR Intellectual property rights
IT Information technology
KBC Knowledge-based capital
KYC Know Your Customer
M2M Machine-to-Machine
MLaaS Machine Learning as a Service
MNE Multinational enterprise
OGD Open Government Data
OI Open innovation
P2P Peer-to-peer
PoC Proof of Concept
PPP Public-private partnership
R&D Research and Development
RFID Radio frequency identification
RoI Return on Investment
SaaS Software as a Service
SCM Supply chain management
SME Small and medium-sized enterprise
SME&E Small and medium-sized enterprises and entrepreneurship
SNG Subnational government
STI Science, technology and innovation
USD United States dollar
VAT Value added tax
VC Venture capital
VET Vocational education and training
Country abbreviations and ISO codes
ARG Argentina
AUS Australia
AUT Austria
BEL Belgium
BRA Brazil
CAN Canada
CHE Switzerland
CHL Chile
CHN People’s Republic of China
CIR Costa Rica
11
THE DIGITAL TRANSFORMATION OF SMES © OECD 2021
COL Colombia
CYP Cyprus
CZE Czech Republic
DEU Germany
DNK Denmark
ESP Spain
EST Estonia
EU European Union
FIN Finland
FRA France
GBR United Kingdom
GRC Greece
HUN Hungary
IDN Indonesia
IRL Ireland
ISL Iceland
ISR Israel
ITA Italy
JPN Japan
KOR Korea
LTU Lithuania
LUX Luxembourg
LVA Latvia
MEX Mexico
NLD Netherlands
NOR Norway
NZL New Zealand
POL Poland
PRT Portugal
ROU Romania
RUS Russian Federation
SVK Slovak Republic
SVN Slovenia
SWE Sweden
TUR Turkey
USA United States
ZAF South Africa
Country groupings
EU27 European Union (Austria, Belgium, Bulgaria, Croatia, Cyprus, Czech Republic, Denmark, Estonia,
Finland, France, Germany, Greece, Hungary, Ireland, Italy, Latvia, Lithuania, Luxembourg, Malta,
Netherlands, Poland, Portugal, Romania, Slovak Republic, Slovenia, Spain, Sweden).
OECD Total OECD 37 (Australia, Austria, Belgium, Canada, Chile, Colombia, Czech Republic, Denmark,
Estonia, Finland, France, Germany, Greece, Hungary, Iceland, Ireland, Israel, Italy, Japan, Korea, Latvia,
Lithuania, Luxembourg, Mexico, Netherlands, New Zealand, Norway, Poland, Portugal, Slovak Republic,
Slovenia, Spain, Sweden, Switzerland, Turkey, United Kingdom, United States).

13
THE DIGITAL TRANSFORMATION OF SMES © OECD 2021
Executive summary
The digitalisation of businesses has continued apace in recent years. Across sectors, firms of all sizes are
increasingly equipping their staff with digital tools, although smaller firms do so more slowly, and some
sectors do so more quickly. Digitalisation is multi-faceted as it involves the use of different technologies,
serving different purposes, and requires a recombination of different strategic assets. Not all SMEs have
the capacity to undertake this transformation. The smaller the firms, the less likely they are to adopt new
digital practices, and the more likely they are to limit uptake to basic services. Overall, SME digitalisation
is strongly related to the way value is created within the firm and the sector in which it operates.
SMEs tend to digitalise general administration or marketing functions first. Business surveys on ICT use
show that the digital gap is smaller between SMEs and large firms in their online interactions with the
government, in electronic invoicing or in using social media or selling online. SME gaps in adoption
increase, however, when technologies become more sophisticated (e.g. data analytics) or mass matters
for implementation (e.g. enterprise resource planning for process integration). There are also striking
differences across firms in their use of cloud computing (CC), despite the potential of “pay-as-you-go” CC
services to raise IT capacity.
Cross-industry differences in digitalisation are significant. In knowledge-intensive sectors, firms make a
more intensive use of all types of technologies and some aspects of the digital transformation are almost
fully completed, e.g. the OECD median share of employees with access to connected devices is around
90%, compared to 50% across all sectors. Diffusion rates in other sectors are much lower. The uptake of
a couple of key technologies, which mix differs across industries, can explain the gaps. For example, in
the accommodation and food services, high-speed broadband connection, a website and CC to store files
are the main technologies associated with higher gaps in uptake and higher sectoral value added. In the
wholesale sector, there are e-sales, CC to host databases and the training of ICT specialists; in retail trade,
e-sales and CC to manage customer relationships.
When SMEs digitalise their business functions, they tend to outsource solutions, partly to compensate for
weak internal capabilities but also on cost-grounds. For example, digital platforms (e.g. social networks, e-
commerce marketplaces, etc.) serve for optimising certain functions at very low cost (e.g. business
intelligence and data analytics services). Similarly, for managing digital security risks, SMEs tend to rely
on external consultants or the security-by-design features of the products and services they use. They also
source artificial intelligence (AI) solutions from knowledge markets, and leapfrog to new AI systems with
CC-based Software as a Service.
The COVID-19 crisis has heightened the importance of SME digitalisation, and served as an accelerator.
Firms have moved operations online and implemented smart working solutions to remain in business
during lockdowns and overcome disruptions in supply chains, with online platforms playing an instrumental
role in connecting users to new markets, suppliers or resources. Early evidence from business surveys
worldwide point to up to 70% of SMEs having intensified their use of digital technologies due to COVID-
19. Most of these changes are poised to last since some investments are irreversible and the efficiency
gains have now been demonstrated.
14
THE DIGITAL TRANSFORMATION OF SMES © OECD 2021
However, the COVID-19 context has also provided an opportunity for hackers to intensify attacks,
exploiting SME lack of preparedness and ability to face increasingly sophisticated threats. Indeed, SMEs
have lower investment in digital security, and, often, a limited understanding of the consequences of those
threats. In fact, SMEs have smaller ‘attack surfaces’, due to lower digital intensities (exposure) and smaller
volumes (and value) of data or intellectual property to hack. When they are affected though, costs can be
disproportionate, amounting to months of revenue, well beyond their average available cash reserves. As
they go digital, their degree of exposure is likely to increase dramatically. And the impacts of attacks may
permeate beyond targeted SMEs, either because of potential supply-chain disruption costs or because
hackers use these SME as a back-door entry point to the larger firm.
Pre-COVID risks related to digital (non) adoption remain. At the firm level, digital gaps are strongly
associated with gaps in productivity, scaling up, innovation and growth. At the market level, concerns
remain about technology lock-ins, SME data protection, or distortions in competition. At the aggregate
level, the SME digital gap contributes to increased inequalities among people, places and firms. First-
mover advantage on digital markets, strong network effects and complementarities in digital diffusion,
especially as the firm grows in size and scale, could exacerbate digital divides. The COVID-19 crisis has
already exacerbated the impact of existing divides.
Pre-COVID barriers to SME digital adoption remain too: access to infrastructure; low interoperability of
systems; a lack of data culture and digital awareness; internal skills gaps; financing gaps for covering high
sunk costs to transform; uncertainty about liabilities and responsibilities when engaging in new digital
activities; risks of reputation damage, etc.
Policy makers have a key role to play in helping SMEs adapt their culture and processes to the digital
world. SME digitalisation is high on the policy agenda across OECD countries and beyond, but there is a
large mix of approaches and, in some areas, diverging viewpoints on how to do so. The heterogeneity of
the SME population and the diversity of their business ecosystems add to the complexity in designing
effective policy. Some countries seek to mainstream SME policy considerations in other policy agendas,
others target SMEs, with often instruments tailored to specific places or sectors.
Policy intervention spans across a broad range of areas, including: awareness campaigns; training and
technology assistance; access to finance; support for the development of SME-tailored digital solutions;
data centres, experimentation platforms and networking programmes; regulatory reforms (e.g. data
protection); e-government and one-stop-shops; and investment in infrastructure.
These findings raise several policy considerations and point to a number of future research avenues. First
is the role of governments in removing regulatory barriers and market distortions, and enabling greater
SME uptake, e.g. through the digitalisation of public services. Second is how policies should be adapted
to the specific industries SMEs operate in, as well as the business functions that are subject to
transformation, as challenges and changes vary by sector/function. Third, are more evidence, comparable
data, sectoral studies and business cases (successful or not) to inform all relevant actors, i.e. SMEs
themselves of course (those that are lagging and those at the frontier), investors, insurers, service
providers, business associations, business partners, such as large firms, and last but not least, online
platforms, which are major enablers of digitalisation and potentially key source of data and evidence on
the SME digital transformation.
15
THE DIGITAL TRANSFORMATION OF SMES © OECD 2021
The digitalisation of businesses has continued apace in recent years, but
SMEs lag in thetransition, despite potentially tremendous benefits. The stake
are high because the SME digital gap has proved to weigh down on
productivity and to increase inequalities among people, firms and places.
This chapter explores trends and patterns in SME digital uptake, and policies
in place to support SMEs in adapting business practices. A first section
analyses trends in diffusion across OECD countries prior to the COVID-19
crisis. A second section looks at the impact of the COVID-19 crisis on SME
digital transformation, with early evidence and business cases. The last
section considers how governments have intended, before and during the
COVID-19 crisis, to support SMEs in going digital.
1 Digital tools and practices: SME
access and uptake
16
THE DIGITAL TRANSFORMATION OF SMES © OECD 2021
In Brief Highlights
The digitalisation of businesses has continued apace in recent years. All sectors and firms
of all sizes are increasingly equipping their staff with computer and Internet access, although
smaller firms do so more slowly, and some sectors do so more quickly (e.g. construction,
logistics or retail trade).
Digitalisation is multi-faceted, and involves the use and applications of a broad range of
technologies, for different purposes.
In addition, there are complementarities in digital diffusion: The adoption of a technology A
rises with the adoption of a technology B. This complementarity increases as firms grow in size
and scale (increased elasticity), which can contribute to further enlarge digital divides, and
exacerbate the risks of seeing the benefits of the digital transformation accruing to early
adopters.
SMEs lag in digital adoption, in all technology areas, but tend to digitalise some business
functions first: general administration and marketing operations. The digital gap is smaller
between SMEs and large firms in their business-to-government interactions, in using electronic
invoicing or social media, or in selling online.
SME gap in adoption increases when technologies become more sophisticated or mass
matters for implementation. For instance, for enterprise resource planning software, a critical
size is required to deal with the complexity and the significant amount of resources needed.
Micro-firms go under the radar, i.e. about 90% of the business population in OECD countries
are not covered by international statistics on digital uptake by businesses.
Cross-industry differences in diffusion are marked. Some technologies are more relevant to
digitalisation in some sectors, and more closely related to value creation in these sectors. For
instance, high-speed broadband connection in accommodation and food services, or e-sales in
the wholesale and retail trade. This advocates for adopting a differentiated policy approach
towards SME digitalisation by industry but also business functions.
There has been a sharp increase in the digital uptake and online sales by SMEs since the
beginning of the COVID-19 pandemic. As the crisis continues, those changes are poised to
last, some investments being irreversible and the demonstration made.
There is a broad-based focus among OECD countries on accelerating digital innovation
diffusion to SMEs. However, there is a large mix of approaches and, in some areas, diverging
viewpoints on how to do so, considering the heterogeneity of the SME population and the
diversity of their business ecosystems. While some countries seek to mainstream SME policy
considerations in other policy agendas, others target SMEs with tailor-made instruments, often
combined with place-based or sector-wide policy mixes.
Governments implement a mix of policy approaches: from technology support programmes,
to skills development, to alternative sources of finance and Fintech, to improving SME capacity
to manage and protect their data, or to adopt sound digital security practices, to promoting e-
government as a lever of business adoption, to deploying high-quality infrastructure, and
networking platforms and facilities, etc.
17
THE DIGITAL TRANSFORMATION OF SMES © OECD 2021
Introduction
SMEs lag in the digital transition, despite potentially tremendous benefits to be reaped from new
digital-enhanced tools, services and practices (OECD, 2019[1]). Digitalisation creates unprecedented
opportunities for smaller businesses to overcome the size-related barriers they typically face in innovating,
going global and growing (Box 1.1). As their size limits the scope for generating economies of scale, SMEs
tend to rely on product differentiation and network and agglomeration effects to compete (OECD, 2019[1]).
Combined together, the Internet of Things (IoT), data analytics and cloud computing are likely to
increase firms’ capacity for simulation, prototyping, decision making and automation (OECD,
2017[2]). IoT supports machine-to-machine communication and enables the generation of an
unprecedented volume of data through the hyper-connectivity of devices, sensors and systems. Data
analytics leverages machine learning and new algorithms for data exploration and market intelligence.
Cloud computing allows storing and processing more information, at a more affordable cost. Emerging
digital technologies can help reduce operation costs along the internal value chain of the firm and generate
productivity gains, without additional mass (Chapter 5 on AI). Digital technologies can help increase SME
capacity for product differentiation and market segmentation (ibid). They can also increase SME customer
base and the firm’s regional and global reach through network effects (Chapter 3 on SMEs and digital
platforms), or help reduce information asymmetry on markets (Chapter 4 on Blockchain ecosystems for
SMEs).
Yet, SMEs lag the capacity to undertake this digital transformation. The smaller, the less likely a
company is to adopt new digital business practices. The digital uptake is to a large extent still confined to
basic services, and adoption gaps compared to large firms increase as technologies become more
sophisticated (OECD, 2019[1]). Although the majority of businesses are connected, information and
communication technologies (ICT) are still primarily seen as a communication tool. Having a website has
become a common practice and using social media for business purposes is frequent. Firms performing
data analytics are conversely less widespread.
SMEs must be better prepared for the digital transition. (Brynjolfsson and McElheran, 2016[3]) estimate
that timing is essential as leading adopters of data analytics are receiving the biggest gains, while laggards
that reach the frontier later tend to have lower net benefits, or not at all. Back in the early 1960s, the
diffusion theory already introduced the idea of a threshold beyond which late adopters of an innovation
might capture decreasing returns (in terms of market shares) as compared to earlier adopters (Rogers,
1962[4]). Business strategies that aim to move faster to commercialisation, through sometimes beta
versions of products, also illustrate the existence of a first-mover (or second-mover) advantage. This is
particularly true in sectors where network effects are important, and where early innovators can raise
visibility, set industry standards, and increase user costs of switching to alternative models or branding
(OECD, 2019[1]). The acceleration of technological change and innovation also contributes to widen gaps.
Digital technologies in particular allow small differences in skill, effort or quality to yield large differences in
returns, in part by increasing the size of the market that can be served by a single person or firm (OECD,
2015[5]).
The stakes are high, not only because SMEs make the most of the business and industrial fabric in most
countries and regions, but also because they are strategic actors in large firms’ supply chains and play a
key role in building inclusive and resilient societies. At an aggregate level, the SME digital gap has proved
to weigh down on a country’s productivity performance and to contribute to increasing inequalities among
individuals, firms, communities and places.
The COVID-19 outbreak is providing a striking example of the role SMEs play in ensuring resilience
and sustainability, and how digitalisation can help them improve business processes and offer.
Many SMEs have been experimenting with innovative forms of production and sales, often leveraging
digitalisation to develop working methods that could help them cope with containment and social distancing
18
THE DIGITAL TRANSFORMATION OF SMES © OECD 2021
measures (OECD, 2020[6]). Business surveys conducted worldwide since the beginning of the COVID-19
pandemic converge in highlighting a rapid uptake of teleworking and digital sales channels among SMEs,
also signalling an acceleration in their digital transformation.
This chapter explores trends and patterns in SME digital uptake and policies in place to support
SMEs in the transition. A first section analyses patterns and trends in digital technology diffusion across
OECD countries prior to the COVID-19 crisis, with a focus on cross-country, cross-industry and cross-
technology differences in diffusion, based on internationally comparable data and statistical analysis. A
second section looks at the impact of the health and economic crisis on SME digital uptake and transition,
with early evidence and business cases. The last section considers how governments have intended,
before and during the COVID-19 crisis, to support SMEs in going digital.
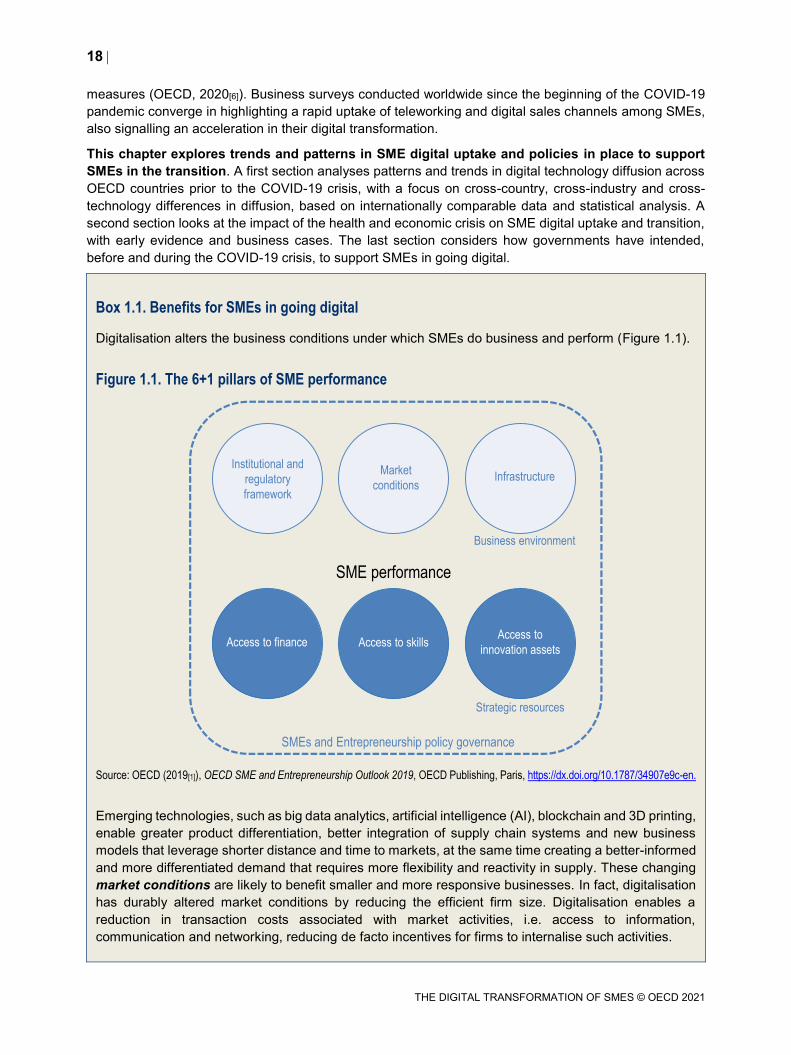
Box 1.1. Benefits for SMEs in going digital
Digitalisation alters the business conditions under which SMEs do business and perform (Figure 1.1).
Figure 1.1. The 6+1 pillars of SME performance
Source: OECD (2019[1]), OECD SME and Entrepreneurship Outlook 2019, OECD Publishing, Paris, https://dx.doi.org/10.1787/34907e9c-en.
Emerging technologies, such as big data analytics, artificial intelligence (AI), blockchain and 3D printing,
enable greater product differentiation, better integration of supply chain systems and new business
models that leverage shorter distance and time to markets, at the same time creating a better-informed
and more differentiated demand that requires more flexibility and reactivity in supply. These changing
market conditions are likely to benefit smaller and more responsive businesses. In fact, digitalisation
has durably altered market conditions by reducing the efficient firm size. Digitalisation enables a
reduction in transaction costs associated with market activities, i.e. access to information,
communication and networking, reducing de facto incentives for firms to internalise such activities.
Market
conditions
Institutional and
regulatory
framework
Infrastructure
Access to finance Access to skillsAccess to
innovation assets
Strategic resources
Business environment
SME performance
SMEs and Entrepreneurship policy governance
19
THE DIGITAL TRANSFORMATION OF SMES © OECD 2021
Digitalisation can also help SMEs integrate to global markets, as it reduces the costs associated with
transport and border operations, increases the tradability of many services (where SMEs are majority),
and reduces some hidden costs that fragmented global value chains (GVCs) raise (additional
management, logistics and operations) (Contractor et al., 2010[7]).
Digitalisation changes conditions under which SMEs access strategic resources. It creates a range of
innovative financial services for businesses that traditionally face greater difficulties in accessing
finance. From peer-to-peer lending, to alternative risk assessment tools, to Initial Coin Offerings (ICOs)
issuing crypto-assets, blended financing models are on the rise, Fintech becoming increasingly central
in the SME finance landscape and established market players increasingly adopting Fintech
instruments. Digitalisation also eases SME access to skills through job recruitment platforms,
outsourcing and online task hiring, or by connecting them with knowledge partners.
Digitalisation supports open sourcing and open innovation, and greater access to innovation
assets, such as technology itself, data or knowledge networks. For instance, multinational enterprises
(MNEs), through their international production networks, have long served as “internalised” cross-
border transmission channels for goods and services, financial flows, and intellectual property. They
increasingly serve as vehicles for the diffusion of digital technologies globally (Gestrin and Staudt,
2018[8]). Several factors mediate the extent to which SMEs can translate collaboration with MNEs into
productivity gains (OECD, 2016[9]), physical distance being one. Knowledge spill overs from MNEs are
the strongest up to 10 km from the lead firm, and progressively decay, partly reflecting production
linkages. Increased digitalisation may reduce the importance of distance.
Digitalisation is also transforming the institutional framework. E-government and online platforms are
facilitating consultations and public service delivery to SMEs. Digital applications are already spreading
across a broad range of areas, from business development services, to license systems, to tax
compliance, to courts.
In parallel, greater data availability, combined with behavioural insights, is enabling governments to
better adapt their services to user preferences, and creates room for policy experimentation (e.g. tax
compliance by design), overall improving SME policy efficiency.
Source: OECD (2019[1]), OECD SME and Entrepreneurship Outlook 2019, OECD Publishing, Paris, https://dx.doi.org/10.1787/34907e9c-en.
Digital technology diffusion prior to COVID-19
Digital technologies diffuse quickly but differently across firms, countries and industries. This
chapter explores patterns and trends in diffusion across OECD countries. It aims to identify SME gaps as
compared to large firms, and better understand cross-country, cross-industry and cross-technology
differences in diffusion. It intends to seize the connectivity gap and explore issues such as the degree of
sophistication of digital technologies, industrial structure, or the co-diffusion of technologies.
The analysis is mainly data-driven and based on the most recent data on business use of ICT, drawn
from the OECD ICT Access and Usage by Businesses Database and Eurostat database on the Digital
Economy and Society (Eurostat, 2020[10]) (OECD, 2020[11]). These databases are the largest repositories
of internationally comparable indicators on firms’ connectivity, uptake of digital technologies, and
integration of ICT specialists. The dataset covers 45 European and OECD countries (plus Brazil), and data
are available back to the early 2000s, depending on the indicators. However, the dataset presents some
limitations that are specific to survey data, i.e. issue of comparability and coverage across countries with
different surveys or collection systems, or the level of stratification that could be reached; for instance, data
cannot be disaggregated at both firm-size and industry levels, or break in series, etc. (Box 1.2).
20
THE DIGITAL TRANSFORMATION OF SMES © OECD 2021
Trends and patterns as described in this section are anterior to the COVID-19 crisis.
Box 1.2. OECD ICT Access and Usage by Businesses Database
Characteristics
The ICT Access and Usage by Businesses database provides access to a selection of 51 indicators,
based on the second revision of the OECD Model Survey on ICT Access and Usage by Businesses.
The survey was first launched in 2001 with a view to creating international standard metrics that capture
digital uptake, and trends in digital tool adoption, from businesses of all sizes across OECD countries
and sectors.
Core indicators are organised in nine categories: connectivity (A); websites (B); information
management tools (C); e-commerce (D); digital security (E); e-government (F); use of cloud computing
(G); ICT skills (H); and use of social media (I).
The indicators originate from two sources: 1) an OECD data collection (Australia, Brazil, Canada,
Colombia, Japan, Korea, Mexico, New Zealand, Switzerland and the United States); and 2) Eurostat
Statistics on Businesses for the OECD countries that are part of the European Statistical system. Survey
data are collected through different means across countries. Most OECD countries (e.g. those abiding
by the regulation of the European Statistical System) undertake the survey on annual basis, while a few
do it on multi-annual or occasional basis, or collect essential data (e.g. e-commerce in the United
States) by means of other surveys.
Statistics are computed as percentage values. Data are disaggregated by firm size or industry level.
The stratification by firm size is based on the number of persons employed, in general using the
following thresholds: 10 to 49 (small), 50 to 249 (medium), 250 and over (large). The stratification by
industry is based on the International Standard Industrial Classification of All Economic Activities (ISIC
Rev.4) at one digit.
Limitations in coverage and interpretation
Micro-enterprises (0-9) are not covered, since historically not included in the European regulation.
International practice also tends to exclude agriculture (notable exceptions are Australia, Chile and New
Zealand) and, in some cases, construction and personal services. Always excluded are the economic
activities of households and the whole of the public administration, for which other types of survey are
better suited. The European Statistical System (ESS) also excludes enterprises in the financial sector
and in the past network industries (e.g. Electricity, Telecommunications).
Diffusion rates may vary substantially for one single country and one single technology, from one year
to another, making comparisons over time difficult.
Data cannot support a cross-analysis of firm size and industry together.
Source: OECD (2020[11]), OECD ICT Access and Usage by Businesses Database, www.oecd.org/sti/ieconomy/ICT-Model-Survey-Usage-
Businesses.pdf (accessed on 25 November 2020).
The digitalisation of businesses has continued apace
The digitalisation of businesses has continued apace in recent years, with wide country disparities
(OECD, 2020[12]). A first exploration of ICT use data, drawing on the percentage of persons employed
using a computer with an Internet connection, gives some insights on the extent -and speed - at which
ICTs have been embedded throughout business activities (OECD, 2020[12]). The share of employees using
computers with Internet access has significantly increased across OECD countries during the last decade
21
THE DIGITAL TRANSFORMATION OF SMES © OECD 2021
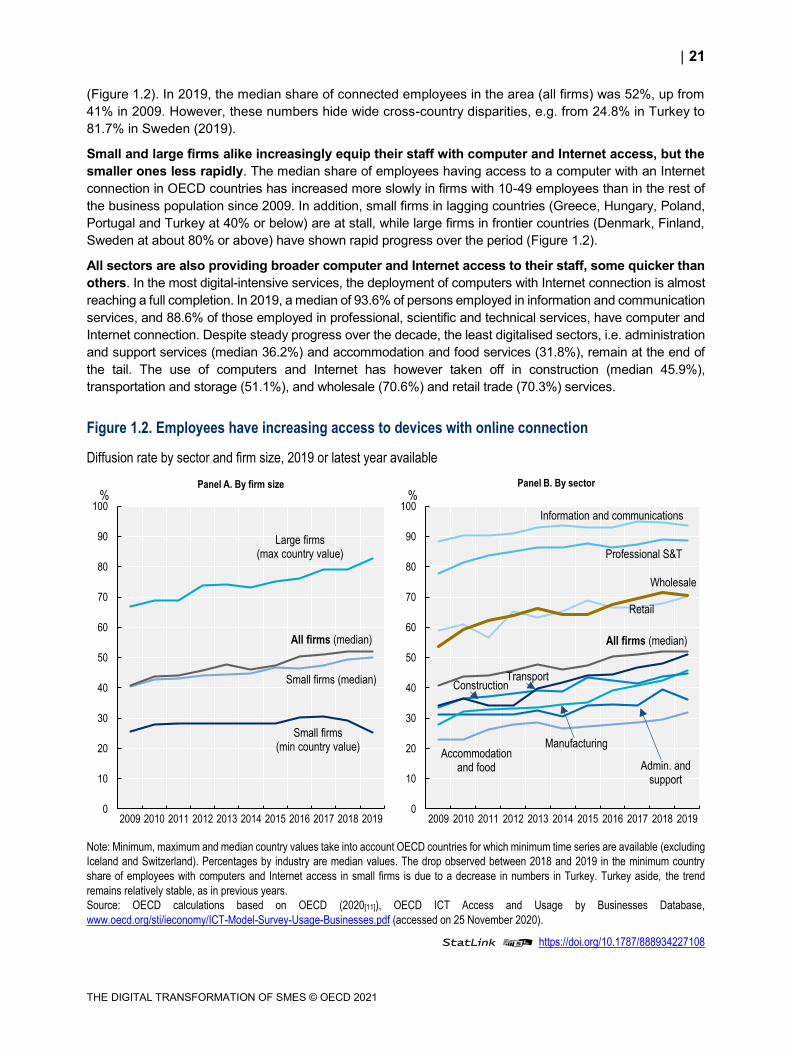
(Figure 1.2). In 2019, the median share of connected employees in the area (all firms) was 52%, up from
41% in 2009. However, these numbers hide wide cross-country disparities, e.g. from 24.8% in Turkey to
81.7% in Sweden (2019).
Small and large firms alike increasingly equip their staff with computer and Internet access, but the
smaller ones less rapidly. The median share of employees having access to a computer with an Internet
connection in OECD countries has increased more slowly in firms with 10-49 employees than in the rest of
the business population since 2009. In addition, small firms in lagging countries (Greece, Hungary, Poland,
Portugal and Turkey at 40% or below) are at stall, while large firms in frontier countries (Denmark, Finland,
Sweden at about 80% or above) have shown rapid progress over the period (Figure 1.2).
All sectors are also providing broader computer and Internet access to their staff, some quicker than
others. In the most digital-intensive services, the deployment of computers with Internet connection is almost
reaching a full completion. In 2019, a median of 93.6% of persons employed in information and communication
services, and 88.6% of those employed in professional, scientific and technical services, have computer and
Internet connection. Despite steady progress over the decade, the least digitalised sectors, i.e. administration
and support services (median 36.2%) and accommodation and food services (31.8%), remain at the end of
the tail. The use of computers and Internet has however taken off in construction (median 45.9%),
transportation and storage (51.1%), and wholesale (70.6%) and retail trade (70.3%) services.
Figure 1.2. Employees have increasing access to devices with online connection
Diffusion rate by sector and firm size, 2019 or latest year available
Note: Minimum, maximum and median country values take into account OECD countries for which minimum time series are available (excluding
Iceland and Switzerland). Percentages by industry are median values. The drop observed between 2018 and 2019 in the minimum country
share of employees with computers and Internet access in small firms is due to a decrease in numbers in Turkey. Turkey aside, the trend
remains relatively stable, as in previous years.
Source: OECD calculations based on OECD (2020[11]), OECD ICT Access and Usage by Businesses Database,
www.oecd.org/sti/ieconomy/ICT-Model-Survey-Usage-Businesses.pdf (accessed on 25 November 2020).
StatLink 2 https://doi.org/10.1787/888934227108
Small firms (min country value)
Small firms (median)
Large firms (max country value)
All firms (median)
0
10
20
30
40
50
60
70
80
90
100
2009 2010 2011 2012 2013 2014 2015 2016 2017 2018 2019
%Panel A. By firm size
All firms (median)
Accommodation and food Admin. and
support
Construction
Information and communications
Manufacturing
Professional S&T
Retail
Transport
Wholesale
0
10
20
30
40
50
60
70
80
90
100
2009 2010 2011 2012 2013 2014 2015 2016 2017 2018 2019
%Panel B. By sector
22
THE DIGITAL TRANSFORMATION OF SMES © OECD 2021
Digitalisation is multi-faceted
Digitalisation is multi-faceted. It involves the use and applications of a broad range of technologies, for
different purposes, e.g. from enabling greater access to markets and end-users, to achieving greater
integration of business processes, or to scaling up corporate IT capacity, etc. (OECD, 2014[13]) (OECD,
2019[1]) (Eurostat, 2020[14]).
Enterprise resource planning (ERP) systems enhance back-office efficiency and strategic planning.
ERP systems are software-based tools for managing and integrating internal and external information
flows, from material and human resources to finance, accounting and sales, and automates planning,
inventory, purchasing and other business functions (OECD, 2014[13]) (OECD, 2017[15]; Andrews, Nicoletti
and Timiliotis, 2018[16]).
Radio Frequency Identification (RFID) technologies help enhance efficiency in production and
logistics. RFID technologies allow near-field communication and are used for product identification,
person identification or access control, for monitoring and control of industrial production, supply chain and
inventory tracking and tracing, for service and maintenance information management or for payment
applications (e.g. highway tolls, passenger transport) (Eurostat, 2020[17]).
Customer Relationship Management (CRM) and Supply-Chain Management (SCM) software help
enhance front-office integration and supply chain operations. CRM and SCM software are used for
managing a company’s interactions with its customers, clients, prospects, employees and suppliers
(OECD, 2014[13]) (Andrews, Nicoletti and Timiliotis, 2018[16]).
Cloud computing help enhance IT systems and capacity. Cloud computing (CC) refers to ICT services
accessed over the Internet, including servers, storage, network components and software applications
(OECD, 2014[13]). CC offers opportunities for SMEs to access online extra processing power or storage
capacity, as well as databases and software, in quantities that suit and follow their needs. In addition to its
flexibility and scalability, CC reduces costs of technology upgrading by exempting firms of upfront
investments in hardware and regular expenses on maintenance, IT team and certification. In fact, higher
adoption rates of cloud computing are associated with lower intensities of ICT investment in equipment,
firms moving towards an ICT management model that is more based on software acquisition and digital
connectivity (OECD, 2019[1]).
Big data analytics could find a broad range of applications within the firm, supporting efficiency
gains in decision making and strategic planning, general administration, production, pre-production and
logistics, or marketing, advertising and commercialisation (Chapter 5 on AI: Changing landscape for
SMEs). Data analytics refers to the use of techniques, technologies and software tools for the analysis of
vast amounts of data generated by activities carried out electronically and through machine-to-machine
communications (OECD, 2014[13]; OECD, 2020[12]).
Social media help increase SME customer base, business visibility and outreach. Social media are
primarily used for external interactions including developing the enterprises’ image and marketing
products, as well as to obtain or respond to customers' opinions, reviews and questions (OECD, 2020[12]).
Social media are also used to collaborate with business partners or to recruit employees.
E-commerce help SMEs increase customer and supplier base, and reach markets beyond
traditional boundaries, in regions or abroad. E-commerce describes the sale or purchase of goods or
services conducted over computer networks by methods designed specifically for the purpose of receiving
or placing orders (i.e. webpages, extranet or electronic data interchange) (OECD, 2011[18]). E-booking and
orders are more advanced forms of e-sales. E-commerce takes place through a range of different
commercial relationships, involving any possible pairing of consumers (C), businesses (B) or governments
(G) (OECD, 2019[19]). These include classical B2B transactions, which still account for the lion’s share of
turnover resulting from private sector e-commerce, as well as business-to-government (B2G) transactions
(e.g. government procurement). E-commerce transactions increasingly involve consumers directly, most
23
THE DIGITAL TRANSFORMATION OF SMES © OECD 2021
notably business-to-consumer (B2C) transactions. Additionally, emerging business models involve
consumer-to-business (C2B) and peer-to-peer relationships, which take place between two or more
individuals.
B2G applications help cut the red tape and level the playing field in government-SME interactions,
while providing SMEs with incentives for further technology adoption (see Section 3 on policy
considerations).
Electronic invoicing supports compliance-by-design approaches and helps reinforce the
integration of accounting systems and tax rules, ultimately alleviating administrative burden on
SMEs. Electronic invoicing supports more secure chains of information between businesses and the public
administration, and the deployment of pay-as-you-earn arrangements for business withholding and
reporting to tax authorities (OECD, 2019[20]). E-invoicing systems allow for instance tax administrations to
go beyond personal income tax returns and (fully) pre-fill corporate income tax and value-added tax
returns.
High-speed broadband is a prerequisite for SME digital transformation. High-speed fixed broadband
is defined herein as having download speed of at least 100Mbit/s (i.e. fibre). Adequate network access
speed is essential to fully exploit existing services over the Internet and to foster the diffusion of new ones
(OECD, 2017[21]). Differences in speed levels are important for customers. For example, high-speed
broadband subscribers can download a high-quality movie (1.5 GB) in less than 22 minutes, while the
same process takes at least 52 minutes for low-speed subscribers.
Some indicators of business ICT use can therefore be used to monitor more specifically the digitalisation
of some SME business functions (Table 1.1).
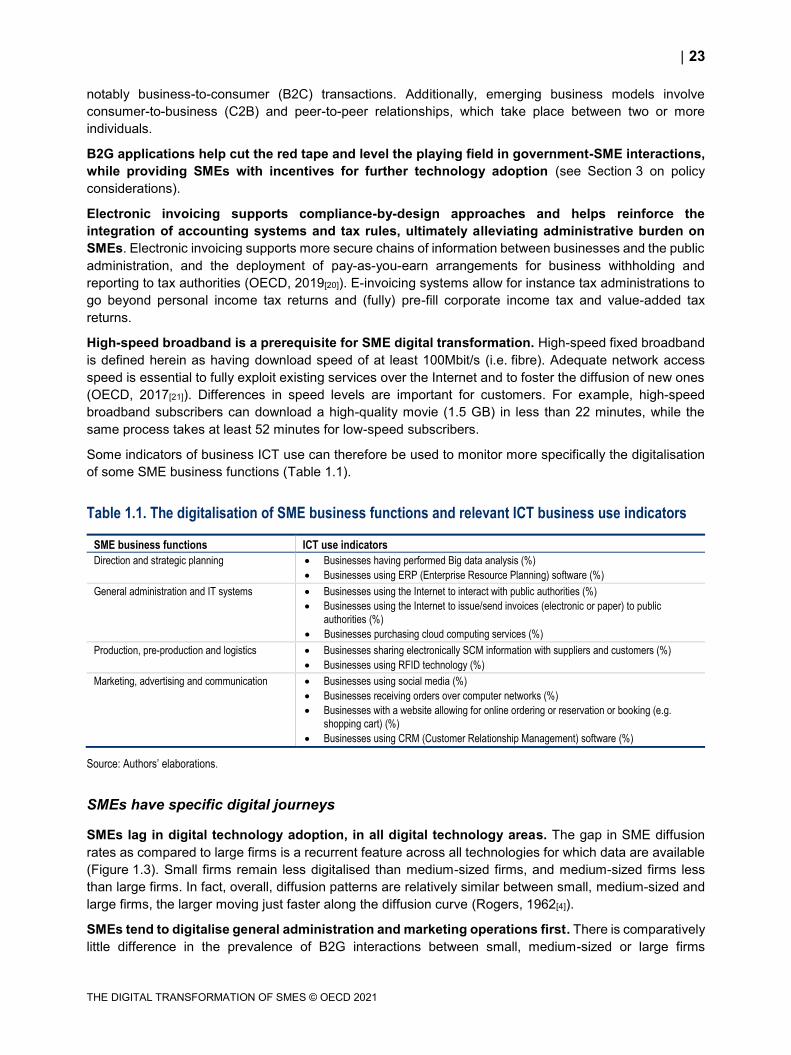
Table 1.1. The digitalisation of SME business functions and relevant ICT business use indicators
SME business functions ICT use indicators
Direction and strategic planning Businesses having performed Big data analysis (%)
Businesses using ERP (Enterprise Resource Planning) software (%)
General administration and IT systems Businesses using the Internet to interact with public authorities (%)
Businesses using the Internet to issue/send invoices (electronic or paper) to public
authorities (%)
Businesses purchasing cloud computing services (%)
Production, pre-production and logistics Businesses sharing electronically SCM information with suppliers and customers (%)
Businesses using RFID technology (%)
Marketing, advertising and communication Businesses using social media (%)
Businesses receiving orders over computer networks (%)
Businesses with a website allowing for online ordering or reservation or booking (e.g.
shopping cart) (%)
Businesses using CRM (Customer Relationship Management) software (%)
Source: Authors’ elaborations.
SMEs have specific digital journeys
SMEs lag in digital technology adoption, in all digital technology areas. The gap in SME diffusion
rates as compared to large firms is a recurrent feature across all technologies for which data are available
(Figure 1.3). Small firms remain less digitalised than medium-sized firms, and medium-sized firms less
than large firms. In fact, overall, diffusion patterns are relatively similar between small, medium-sized and
large firms, the larger moving just faster along the diffusion curve (Rogers, 1962[4]).
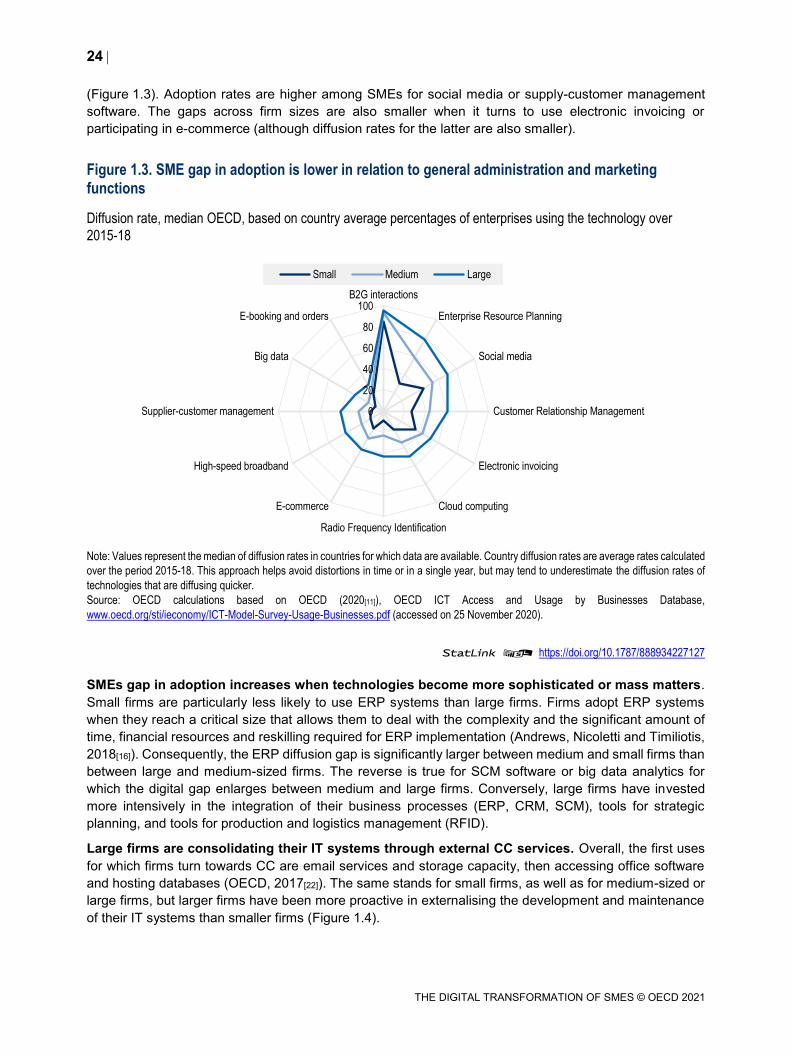
SMEs tend to digitalise general administration and marketing operations first. There is comparatively
little difference in the prevalence of B2G interactions between small, medium-sized or large firms
24
THE DIGITAL TRANSFORMATION OF SMES © OECD 2021
(Figure 1.3). Adoption rates are higher among SMEs for social media or supply-customer management
software. The gaps across firm sizes are also smaller when it turns to use electronic invoicing or
participating in e-commerce (although diffusion rates for the latter are also smaller).
Figure 1.3. SME gap in adoption is lower in relation to general administration and marketing functions
Diffusion rate, median OECD, based on country average percentages of enterprises using the technology over
2015-18
Note: Values represent the median of diffusion rates in countries for which data are available. Country diffusion rates are average rates calculated
over the period 2015-18. This approach helps avoid distortions in time or in a single year, but may tend to underestimate the diffusion rates of
technologies that are diffusing quicker.
Source: OECD calculations based on OECD (2020[11]), OECD ICT Access and Usage by Businesses Database,
www.oecd.org/sti/ieconomy/ICT-Model-Survey-Usage-Businesses.pdf (accessed on 25 November 2020).
StatLink 2 https://doi.org/10.1787/888934227127
SMEs gap in adoption increases when technologies become more sophisticated or mass matters.
Small firms are particularly less likely to use ERP systems than large firms. Firms adopt ERP systems
when they reach a critical size that allows them to deal with the complexity and the significant amount of
time, financial resources and reskilling required for ERP implementation (Andrews, Nicoletti and Timiliotis,
2018[16]). Consequently, the ERP diffusion gap is significantly larger between medium and small firms than
between large and medium-sized firms. The reverse is true for SCM software or big data analytics for
which the digital gap enlarges between medium and large firms. Conversely, large firms have invested
more intensively in the integration of their business processes (ERP, CRM, SCM), tools for strategic
planning, and tools for production and logistics management (RFID).
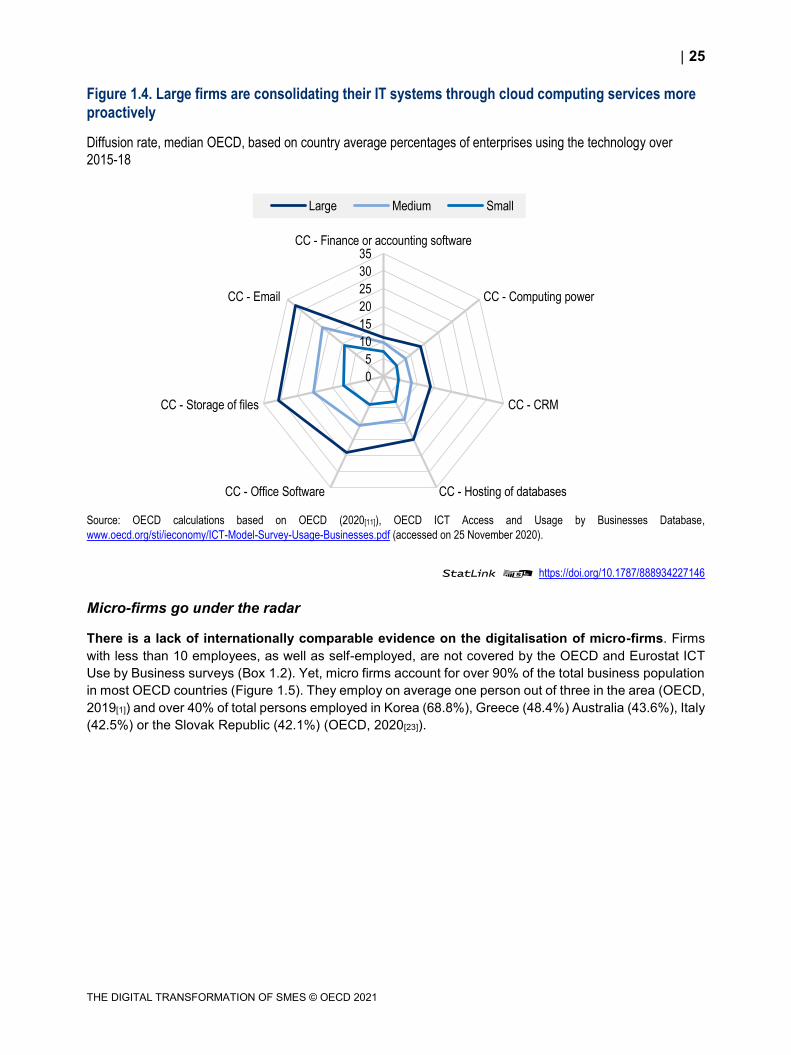
Large firms are consolidating their IT systems through external CC services. Overall, the first uses
for which firms turn towards CC are email services and storage capacity, then accessing office software
and hosting databases (OECD, 2017[22]). The same stands for small firms, as well as for medium-sized or
large firms, but larger firms have been more proactive in externalising the development and maintenance
of their IT systems than smaller firms (Figure 1.4).
0
20
40
60
80
100B2G interactions
Enterprise Resource Planning
Social media
Customer Relationship Management
Electronic invoicing
Cloud computing
Radio Frequency Identification
E-commerce
High-speed broadband
Supplier-customer management
Big data
E-booking and orders
Small Medium Large
25
THE DIGITAL TRANSFORMATION OF SMES © OECD 2021
Figure 1.4. Large firms are consolidating their IT systems through cloud computing services more proactively
Diffusion rate, median OECD, based on country average percentages of enterprises using the technology over
2015-18
Source: OECD calculations based on OECD (2020[11]), OECD ICT Access and Usage by Businesses Database,
www.oecd.org/sti/ieconomy/ICT-Model-Survey-Usage-Businesses.pdf (accessed on 25 November 2020).
StatLink 2 https://doi.org/10.1787/888934227146
Micro-firms go under the radar
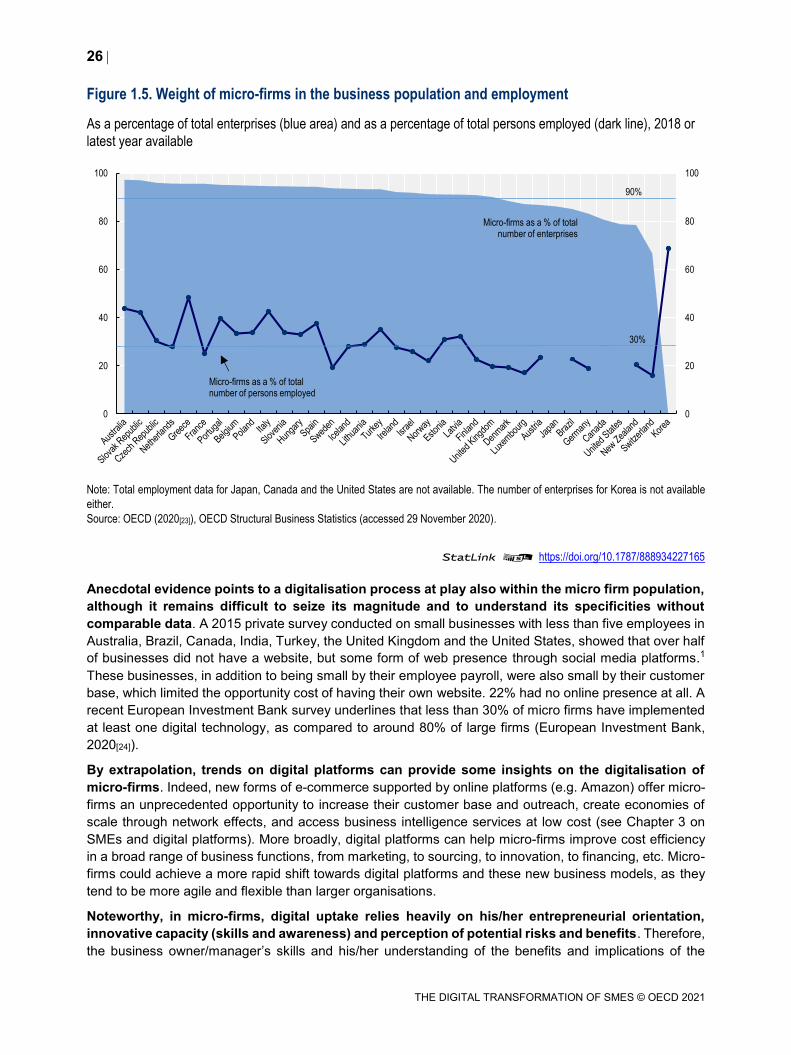
There is a lack of internationally comparable evidence on the digitalisation of micro-firms. Firms
with less than 10 employees, as well as self-employed, are not covered by the OECD and Eurostat ICT
Use by Business surveys (Box 1.2). Yet, micro firms account for over 90% of the total business population
in most OECD countries (Figure 1.5). They employ on average one person out of three in the area (OECD,
2019[1]) and over 40% of total persons employed in Korea (68.8%), Greece (48.4%) Australia (43.6%), Italy
(42.5%) or the Slovak Republic (42.1%) (OECD, 2020[23]).
0
5
10
15
20
25
30
35CC - Finance or accounting software
CC - Computing power
CC - CRM
CC - Hosting of databasesCC - Office Software
CC - Storage of files
CC - Email
Large Medium Small
26
THE DIGITAL TRANSFORMATION OF SMES © OECD 2021
Figure 1.5. Weight of micro-firms in the business population and employment
As a percentage of total enterprises (blue area) and as a percentage of total persons employed (dark line), 2018 or
latest year available
Note: Total employment data for Japan, Canada and the United States are not available. The number of enterprises for Korea is not available
either.
Source: OECD (2020[23]), OECD Structural Business Statistics (accessed 29 November 2020).
StatLink 2 https://doi.org/10.1787/888934227165
Anecdotal evidence points to a digitalisation process at play also within the micro firm population,
although it remains difficult to seize its magnitude and to understand its specificities without
comparable data. A 2015 private survey conducted on small businesses with less than five employees in
Australia, Brazil, Canada, India, Turkey, the United Kingdom and the United States, showed that over half
of businesses did not have a website, but some form of web presence through social media platforms.1
These businesses, in addition to being small by their employee payroll, were also small by their customer
base, which limited the opportunity cost of having their own website. 22% had no online presence at all. A
recent European Investment Bank survey underlines that less than 30% of micro firms have implemented
at least one digital technology, as compared to around 80% of large firms (European Investment Bank,
2020[24]).
By extrapolation, trends on digital platforms can provide some insights on the digitalisation of
micro-firms. Indeed, new forms of e-commerce supported by online platforms (e.g. Amazon) offer micro-
firms an unprecedented opportunity to increase their customer base and outreach, create economies of
scale through network effects, and access business intelligence services at low cost (see Chapter 3 on
SMEs and digital platforms). More broadly, digital platforms can help micro-firms improve cost efficiency
in a broad range of business functions, from marketing, to sourcing, to innovation, to financing, etc. Micro-
firms could achieve a more rapid shift towards digital platforms and these new business models, as they
tend to be more agile and flexible than larger organisations.
Noteworthy, in micro-firms, digital uptake relies heavily on his/her entrepreneurial orientation,
innovative capacity (skills and awareness) and perception of potential risks and benefits. Therefore,
the business owner/manager’s skills and his/her understanding of the benefits and implications of the
0
20
40
60
80
100
0
20
40
60
80
100
Micro-firms as a % of total number of enterprises
Micro-firms as a % of total number of persons employed
90%
30%
27
THE DIGITAL TRANSFORMATION OF SMES © OECD 2021
digitalisation process could positively leverage digital uptake among micro-firms (Al-Awlaqi, Aamer and
Habtoor, 2018[25]).
Technology supports further technology adoption
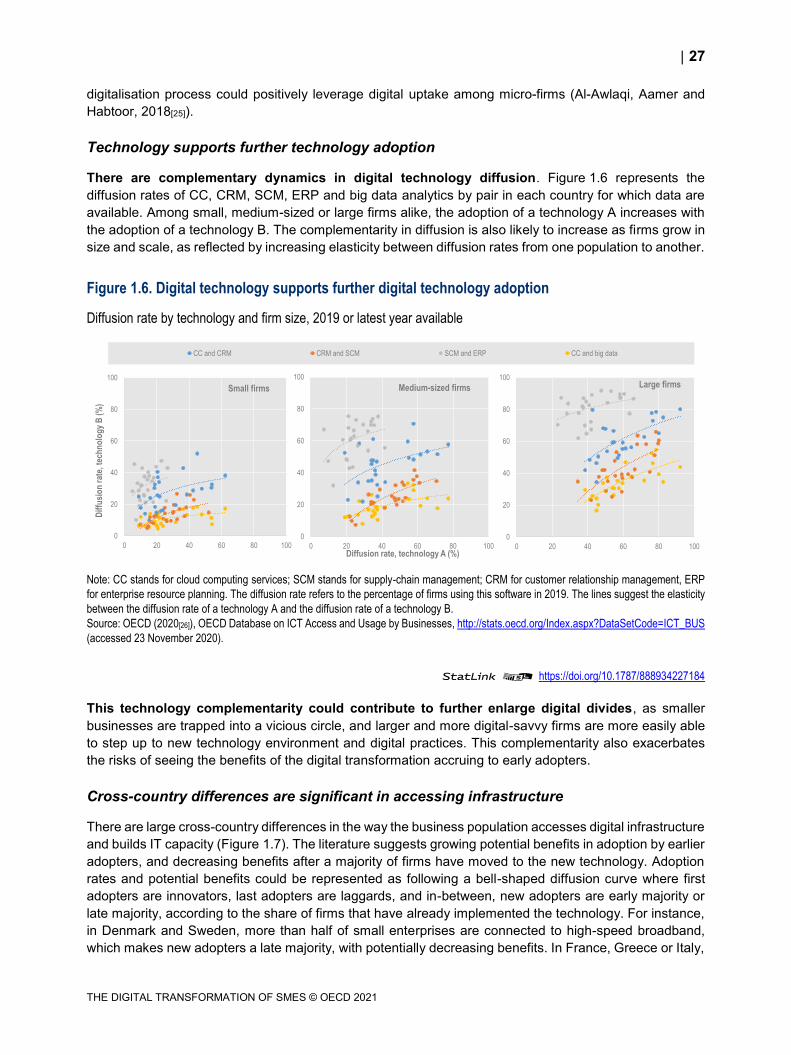
There are complementary dynamics in digital technology diffusion. Figure 1.6 represents the
diffusion rates of CC, CRM, SCM, ERP and big data analytics by pair in each country for which data are
available. Among small, medium-sized or large firms alike, the adoption of a technology A increases with
the adoption of a technology B. The complementarity in diffusion is also likely to increase as firms grow in
size and scale, as reflected by increasing elasticity between diffusion rates from one population to another.
Figure 1.6. Digital technology supports further digital technology adoption
Diffusion rate by technology and firm size, 2019 or latest year available
Note: CC stands for cloud computing services; SCM stands for supply-chain management; CRM for customer relationship management, ERP
for enterprise resource planning. The diffusion rate refers to the percentage of firms using this software in 2019. The lines suggest the elasticity
between the diffusion rate of a technology A and the diffusion rate of a technology B.
Source: OECD (2020[26]), OECD Database on ICT Access and Usage by Businesses, http://stats.oecd.org/Index.aspx?DataSetCode=ICT_BUS
(accessed 23 November 2020).
StatLink 2 https://doi.org/10.1787/888934227184
This technology complementarity could contribute to further enlarge digital divides, as smaller
businesses are trapped into a vicious circle, and larger and more digital-savvy firms are more easily able
to step up to new technology environment and digital practices. This complementarity also exacerbates
the risks of seeing the benefits of the digital transformation accruing to early adopters.
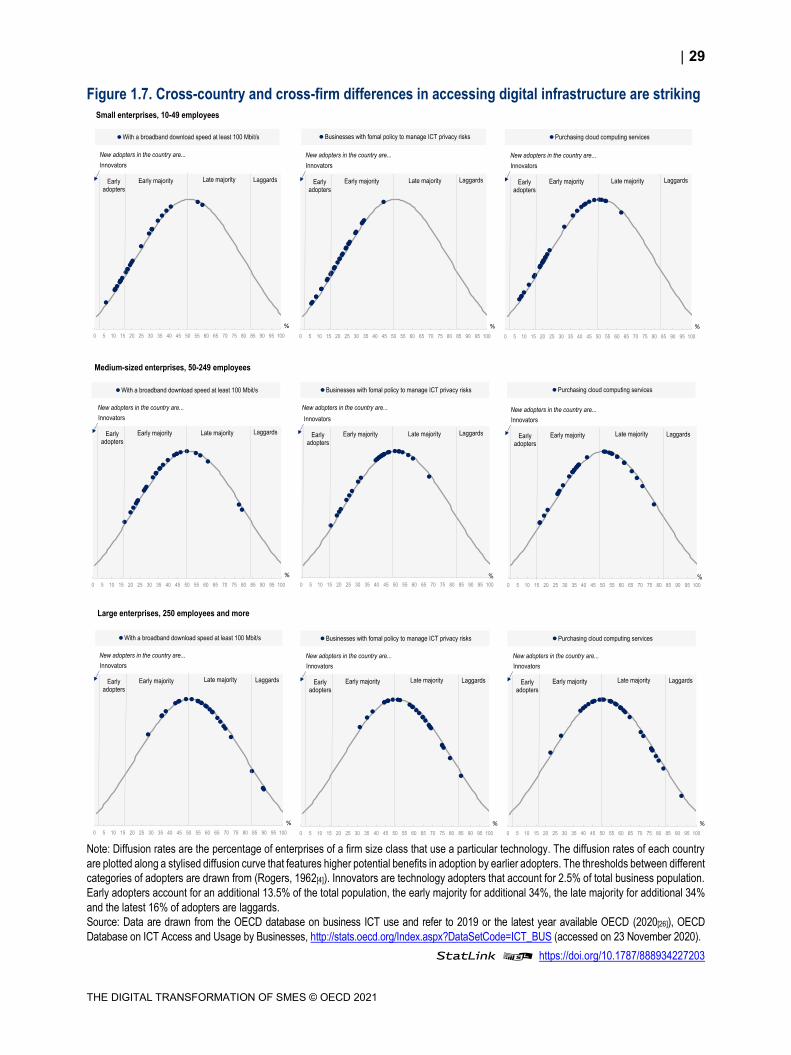
Cross-country differences are significant in accessing infrastructure
There are large cross-country differences in the way the business population accesses digital infrastructure
and builds IT capacity (Figure 1.7). The literature suggests growing potential benefits in adoption by earlier
adopters, and decreasing benefits after a majority of firms have moved to the new technology. Adoption
rates and potential benefits could be represented as following a bell-shaped diffusion curve where first
adopters are innovators, last adopters are laggards, and in-between, new adopters are early majority or
late majority, according to the share of firms that have already implemented the technology. For instance,
in Denmark and Sweden, more than half of small enterprises are connected to high-speed broadband,
which makes new adopters a late majority, with potentially decreasing benefits. In France, Greece or Italy,
0
20
40
60
80
100
0 20 40 60 80 100
Dif
fusi
on
rat
e, t
ech
no
log
y B
(%
)
Small firms
0
20
40
60
80
100
0 20 40 60 80 100Diffusion rate, technology A (%)
Medium-sized firms
0
20
40
60
80
100
0 20 40 60 80 100
Large firms
020406080100
0 10 20 30 40 50 60 70 80 90 100CC and CRM CRM and SCM SCM and ERP CC and big data
28
THE DIGITAL TRANSFORMATION OF SMES © OECD 2021
they are hardly 10%, or even less, in this case, which makes them early adopters. Likewise, in Denmark
and Sweden, new adopters among large firms are laggards, with almost 90% of large firms already
connected in these two countries. As a comparison, in Greece, the Slovak Republic and Turkey, new
adopters among large firms are early majority, with 35% or less of large firms connected. Overall, there
are more small firms connected to high-speed broadband in Denmark and Sweden than large firms
connected in Greece, the Slovak Republic and Turkey. The same stand where looking at digital security
practices or the purchase of cloud computing services.
Cross-country differences in digital infrastructure have inevitably an impact on SME digital adoption,
increasingly as emerging cloud-based solutions require quality digital network to transfer data and robust
digital security practices to protect codes and systems (see Chapter 2 on SMEs and digital security)
(Box 1.3).
Box 1.3. SME use case: The Building Blocks (United Kingdom)
The Building Workshop is an architecture and design firm located in Angus in the North Eastern part of
Scotland. The Building Workshop is a family business, founded in 2009. Digital technology has been
instrumental to business development since its inception. The use of building information modelling
(BIM) software and a 3D model approach, as well as social media, cloud storage and video
conferencing have been key to overcome the challenges related to the firm’s rural location. The Building
Workshop now works on projects and services clients based in different areas across the United
Kingdom, widening its potential customer base and allowing the firm to grow.
Limitations to doing and growing business were related to weak broadband connectivity in the area,
sometimes requiring owners to physically relocate to a family home in the neighbourhood during
working hours for accessing more reliable and stable broadband connection in order to back up data to
the cloud.
Source: OECD Global Digital for SMEs Initiative (D4SME), Databank.
29
THE DIGITAL TRANSFORMATION OF SMES © OECD 2021
Figure 1.7. Cross-country and cross-firm differences in accessing digital infrastructure are striking
Note: Diffusion rates are the percentage of enterprises of a firm size class that use a particular technology. The diffusion rates of each country
are plotted along a stylised diffusion curve that features higher potential benefits in adoption by earlier adopters. The thresholds between different
categories of adopters are drawn from (Rogers, 1962[4]). Innovators are technology adopters that account for 2.5% of total business population.
Early adopters account for an additional 13.5% of the total population, the early majority for additional 34%, the late majority for additional 34%
and the latest 16% of adopters are laggards.
Source: Data are drawn from the OECD database on business ICT use and refer to 2019 or the latest year available OECD (2020[26]), OECD
Database on ICT Access and Usage by Businesses, http://stats.oecd.org/Index.aspx?DataSetCode=ICT_BUS (accessed on 23 November 2020).
StatLink 2 https://doi.org/10.1787/888934227203
0 5 10 15 20 25 30 35 40 45 50 55 60 65 70 75 80 85 90 95 100
With a broadband download speed at least 100 Mbit/s
LaggardsLate majorityEarly majority
Innovators
Early adopters
%
New adopters in the country are...
0 5 10 15 20 25 30 35 40 45 50 55 60 65 70 75 80 85 90 95 100
Businesses with fomal policy to manage ICT privacy risks
LaggardsLate majorityEarly majority
Innovators
Early adopters
%
New adopters in the country are...
0 5 10 15 20 25 30 35 40 45 50 55 60 65 70 75 80 85 90 95 100
Purchasing cloud computing services
LaggardsLate majorityEarly majority
Innovators
Early adopters
%
New adopters in the country are...
0 5 10 15 20 25 30 35 40 45 50 55 60 65 70 75 80 85 90 95 100
With a broadband download speed at least 100 Mbit/s
LaggardsLate majorityEarly majority
Innovators
Early adopters
%
New adopters in the country are...
0 5 10 15 20 25 30 35 40 45 50 55 60 65 70 75 80 85 90 95 100
Businesses with fomal policy to manage ICT privacy risks
LaggardsLate majorityEarly majority
Innovators
Early adopters
%
New adopters in the country are...
0 5 10 15 20 25 30 35 40 45 50 55 60 65 70 75 80 85 90 95 100
Purchasing cloud computing services
LaggardsLate majorityEarly majority
Innovators
Early adopters
%
New adopters in the country are...
Small enterprises, 10-49 employees
Medium-sized enterprises, 50-249 employees
Large enterprises, 250 employees and more
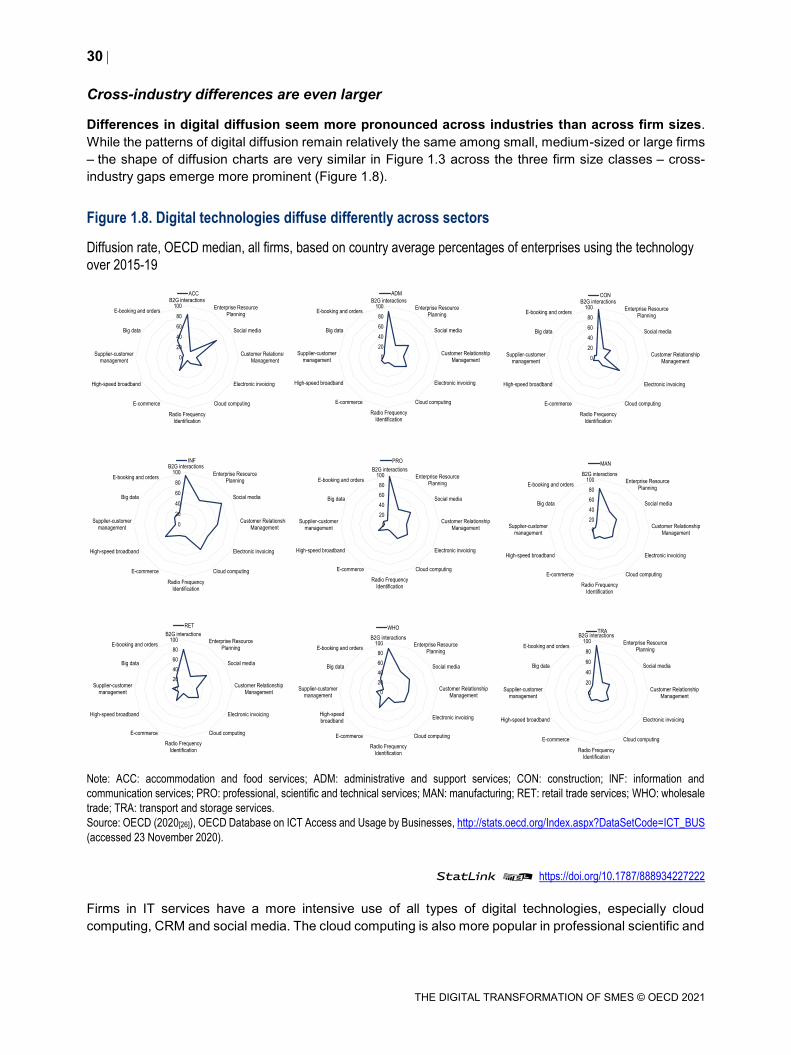
30
THE DIGITAL TRANSFORMATION OF SMES © OECD 2021
Cross-industry differences are even larger
Differences in digital diffusion seem more pronounced across industries than across firm sizes.
While the patterns of digital diffusion remain relatively the same among small, medium-sized or large firms
– the shape of diffusion charts are very similar in Figure 1.3 across the three firm size classes – cross-
industry gaps emerge more prominent (Figure 1.8).
Figure 1.8. Digital technologies diffuse differently across sectors
Diffusion rate, OECD median, all firms, based on country average percentages of enterprises using the technology
over 2015-19
Note: ACC: accommodation and food services; ADM: administrative and support services; CON: construction; lNF: information and
communication services; PRO: professional, scientific and technical services; MAN: manufacturing; RET: retail trade services; WHO: wholesale
trade; TRA: transport and storage services.
Source: OECD (2020[26]), OECD Database on ICT Access and Usage by Businesses, http://stats.oecd.org/Index.aspx?DataSetCode=ICT_BUS
(accessed 23 November 2020).
StatLink 2 https://doi.org/10.1787/888934227222
Firms in IT services have a more intensive use of all types of digital technologies, especially cloud
computing, CRM and social media. The cloud computing is also more popular in professional scientific and
0
20
40
60
80
100B2G interactions
Enterprise ResourcePlanning
Social media
Customer RelationshipManagement
Electronic invoicing
Cloud computing
Radio FrequencyIdentification
E-commerce
High-speed broadband
Supplier-customermanagement
Big data
E-booking and orders
ACC
0
20
40
60
80
100B2G interactions
Enterprise ResourcePlanning
Social media
Customer RelationshipManagement
Electronic invoicing
Cloud computing
Radio FrequencyIdentification
E-commerce
High-speed broadband
Supplier-customermanagement
Big data
E-booking and orders
ADM
0
20
40
60
80
100B2G interactions
Enterprise ResourcePlanning
Social media
Customer RelationshipManagement
Electronic invoicing
Cloud computing
Radio FrequencyIdentification
E-commerce
High-speed broadband
Supplier-customermanagement
Big data
E-booking and orders
CON
0
20
40
60
80
100B2G interactions
Enterprise ResourcePlanning
Social media
Customer RelationshipManagement
Electronic invoicing
Cloud computing
Radio FrequencyIdentification
E-commerce
High-speed broadband
Supplier-customermanagement
Big data
E-booking and orders
INF
0
20
40
60
80
100B2G interactions
Enterprise ResourcePlanning
Social media
Customer RelationshipManagement
Electronic invoicing
Cloud computing
Radio FrequencyIdentification
E-commerce
High-speed broadband
Supplier-customermanagement
Big data
E-booking and orders
MAN
0
20
40
60
80
100B2G interactions
Enterprise ResourcePlanning
Social media
Customer RelationshipManagement
Electronic invoicing
Cloud computing
Radio FrequencyIdentification
E-commerce
High-speed broadband
Supplier-customermanagement
Big data
E-booking and orders
PRO
0
20
40
60
80
100B2G interactions
Enterprise ResourcePlanning
Social media
Customer RelationshipManagement
Electronic invoicing
Cloud computing
Radio FrequencyIdentification
E-commerce
High-speed broadband
Supplier-customermanagement
Big data
E-booking and orders
RET
0
20
40
60
80
100B2G interactions
Enterprise ResourcePlanning
Social media
Customer RelationshipManagement
Electronic invoicing
Cloud computing
Radio FrequencyIdentification
E-commerce
High-speed broadband
Supplier-customermanagement
Big data
E-booking and orders
TRA
0
20
40
60
80
100B2G interactions
Enterprise ResourcePlanning
Social media
Customer RelationshipManagement
Electronic invoicing
Cloud computing
Radio FrequencyIdentification
E-commerce
High-speedbroadband
Supplier-customermanagement
Big data
E-booking and orders
WHO
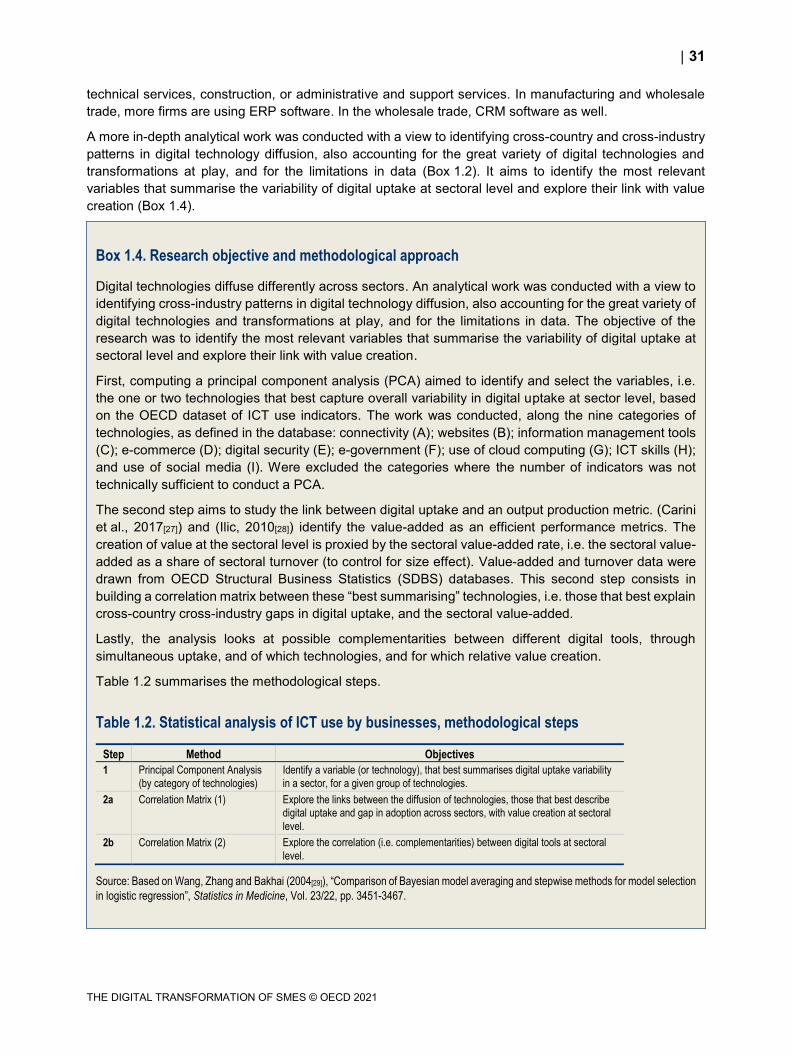
31
THE DIGITAL TRANSFORMATION OF SMES © OECD 2021
technical services, construction, or administrative and support services. In manufacturing and wholesale
trade, more firms are using ERP software. In the wholesale trade, CRM software as well.
A more in-depth analytical work was conducted with a view to identifying cross-country and cross-industry
patterns in digital technology diffusion, also accounting for the great variety of digital technologies and
transformations at play, and for the limitations in data (Box 1.2). It aims to identify the most relevant
variables that summarise the variability of digital uptake at sectoral level and explore their link with value
creation (Box 1.4).
Box 1.4. Research objective and methodological approach
Digital technologies diffuse differently across sectors. An analytical work was conducted with a view to
identifying cross-industry patterns in digital technology diffusion, also accounting for the great variety of
digital technologies and transformations at play, and for the limitations in data. The objective of the
research was to identify the most relevant variables that summarise the variability of digital uptake at
sectoral level and explore their link with value creation.
First, computing a principal component analysis (PCA) aimed to identify and select the variables, i.e.
the one or two technologies that best capture overall variability in digital uptake at sector level, based
on the OECD dataset of ICT use indicators. The work was conducted, along the nine categories of
technologies, as defined in the database: connectivity (A); websites (B); information management tools
(C); e-commerce (D); digital security (E); e-government (F); use of cloud computing (G); ICT skills (H);
and use of social media (I). Were excluded the categories where the number of indicators was not
technically sufficient to conduct a PCA.
The second step aims to study the link between digital uptake and an output production metric. (Carini
et al., 2017[27]) and (Ilic, 2010[28]) identify the value-added as an efficient performance metrics. The
creation of value at the sectoral level is proxied by the sectoral value-added rate, i.e. the sectoral value-
added as a share of sectoral turnover (to control for size effect). Value-added and turnover data were
drawn from OECD Structural Business Statistics (SDBS) databases. This second step consists in
building a correlation matrix between these “best summarising” technologies, i.e. those that best explain
cross-country cross-industry gaps in digital uptake, and the sectoral value-added.
Lastly, the analysis looks at possible complementarities between different digital tools, through
simultaneous uptake, and of which technologies, and for which relative value creation.
Table 1.2 summarises the methodological steps.
Table 1.2. Statistical analysis of ICT use by businesses, methodological steps
Step Method Objectives
1 Principal Component Analysis
(by category of technologies)
Identify a variable (or technology), that best summarises digital uptake variability
in a sector, for a given group of technologies.
2a Correlation Matrix (1) Explore the links between the diffusion of technologies, those that best describe digital uptake and gap in adoption across sectors, with value creation at sectoral
level.
2b Correlation Matrix (2) Explore the correlation (i.e. complementarities) between digital tools at sectoral
level.
Source: Based on Wang, Zhang and Bakhai (2004[29]), “Comparison of Bayesian model averaging and stepwise methods for model selection
in logistic regression”, Statistics in Medicine, Vol. 23/22, pp. 3451-3467.
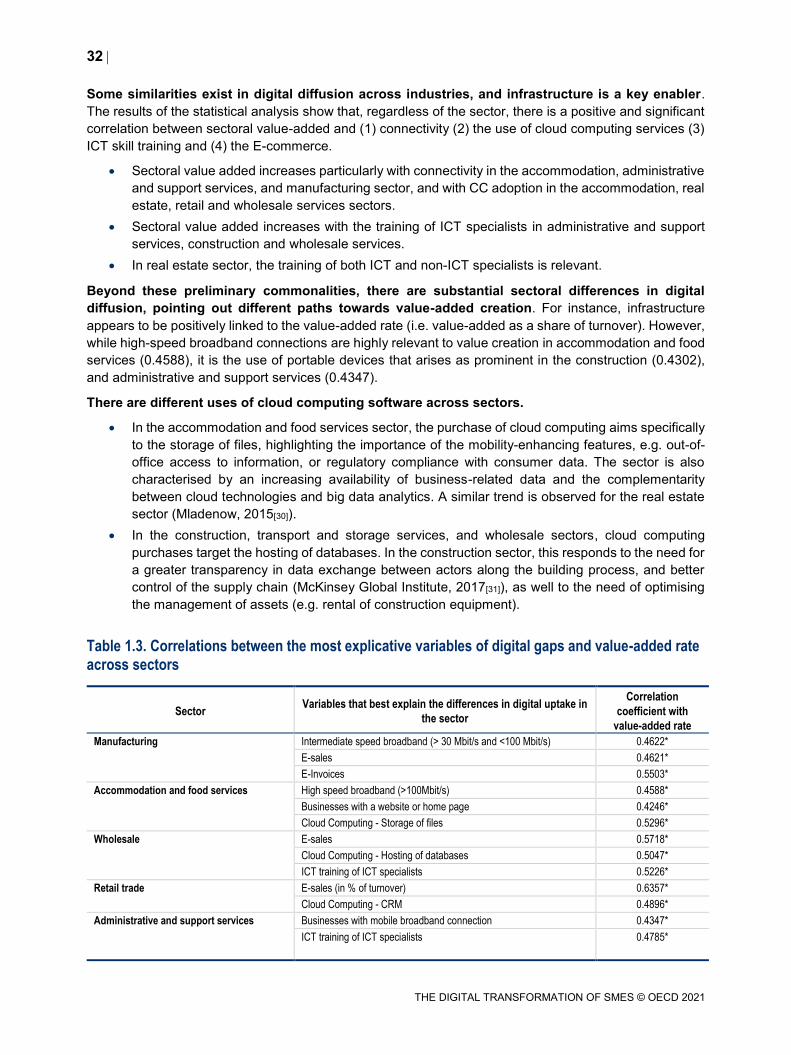
32
THE DIGITAL TRANSFORMATION OF SMES © OECD 2021
Some similarities exist in digital diffusion across industries, and infrastructure is a key enabler.
The results of the statistical analysis show that, regardless of the sector, there is a positive and significant
correlation between sectoral value-added and (1) connectivity (2) the use of cloud computing services (3)
ICT skill training and (4) the E-commerce.
Sectoral value added increases particularly with connectivity in the accommodation, administrative
and support services, and manufacturing sector, and with CC adoption in the accommodation, real
estate, retail and wholesale services sectors.
Sectoral value added increases with the training of ICT specialists in administrative and support
services, construction and wholesale services.
In real estate sector, the training of both ICT and non-ICT specialists is relevant.
Beyond these preliminary commonalities, there are substantial sectoral differences in digital
diffusion, pointing out different paths towards value-added creation. For instance, infrastructure
appears to be positively linked to the value-added rate (i.e. value-added as a share of turnover). However,
while high-speed broadband connections are highly relevant to value creation in accommodation and food
services (0.4588), it is the use of portable devices that arises as prominent in the construction (0.4302),
and administrative and support services (0.4347).
There are different uses of cloud computing software across sectors.
In the accommodation and food services sector, the purchase of cloud computing aims specifically
to the storage of files, highlighting the importance of the mobility-enhancing features, e.g. out-of-
office access to information, or regulatory compliance with consumer data. The sector is also
characterised by an increasing availability of business-related data and the complementarity
between cloud technologies and big data analytics. A similar trend is observed for the real estate
sector (Mladenow, 2015[30]).
In the construction, transport and storage services, and wholesale sectors, cloud computing
purchases target the hosting of databases. In the construction sector, this responds to the need for
a greater transparency in data exchange between actors along the building process, and better
control of the supply chain (McKinsey Global Institute, 2017[31]), as well to the need of optimising
the management of assets (e.g. rental of construction equipment).
Table 1.3. Correlations between the most explicative variables of digital gaps and value-added rate across sectors
Sector Variables that best explain the differences in digital uptake in
the sector
Correlation
coefficient with
value-added rate
Manufacturing Intermediate speed broadband (> 30 Mbit/s and <100 Mbit/s) 0.4622*
E-sales 0.4621*
E-Invoices 0.5503*
Accommodation and food services High speed broadband (>100Mbit/s) 0.4588*
Businesses with a website or home page 0.4246*
Cloud Computing - Storage of files 0.5296*
Wholesale E-sales 0.5718*
Cloud Computing - Hosting of databases 0.5047*
ICT training of ICT specialists 0.5226*
Retail trade E-sales (in % of turnover) 0.6357*
Cloud Computing - CRM 0.4896*
Administrative and support services Businesses with mobile broadband connection 0.4347*
ICT training of ICT specialists
0.4785*
33
THE DIGITAL TRANSFORMATION OF SMES © OECD 2021
Sector Variables that best explain the differences in digital uptake in
the sector
Correlation
coefficient with
value-added rate
Construction Persons employed provided with Internet-enabled portable devices 0.4302*
Businesses with a website or home page 0.5659*
ICT training of ICT specialists 0.4719*
Professional and scientific activities Cloud computing 0.4516*
Real estate activities Cloud Computing - Storage of files 0.5005*
ICT Training 0.4542*
Note: The table presents statistically significant results of the correlation matrix (1) that aims to explore the relation between digital tools and the
creation of value at sectoral level (as proxied by sectoral value-added rate, i.e. sectoral value-added as a share of sectoral turnover).
COVID-19: The big push forward
This section looks at the impact of the COVID-19 crisis on SME digital uptake, and exemplifies the
speed of transformation with some SME business cases drawn from the databank of the OECD Global
Digital for SMEs (D4SME) Initiative (OECD, 2020[32]) (Box 1.5).
Box 1.5. OECD Digital for SMEs Global Initiative (D4SME)
Co-organised by the OECD and by Business at OECD, the OECD Digital for SMEs Global Initiative
(D4SME) intends to promote knowledge sharing and learnings on how different types of SMEs can
seize the benefits of digitalisation, and on the role of government, regulators, business sectors and
other institutions in supporting SME digitalisation. The Initiative aims to promote knowledge sharing and
learning on how to enable all SMEs to make the most of the digital shift, placing specific emphasis on
the diverse opportunities and needs of the large “missing middle” of SMEs and entrepreneurs and on
their role for an effective, inclusive and sustainable digital transition
The D4SME Initiative is a response to a call from Ministers and high-level representatives from over 50
countries and 12 international organisations at the OECD Ministerial Conference on Strengthening
SMEs and Entrepreneurship for Productivity and Inclusive Growth (Mexico City, 22-23 February 2018).
At the Conference, Ministers stressed the importance of “fostering conditions for SME adoption and
diffusion of innovative and digital technologies, investment in complementary knowledge-based assets
and digital security.” In particular, they asked the OECD to strengthen multi-stakeholder dialogue to
inform policies that shape conducive framework conditions and remove obstacles to SME digitalisation.
Source: OECD (2020[32]), OECD Digital for SMEs Global Initiative, www.oecd.org/going-digital/sme/ (accessed on 29 November 2020).
The OECD Centre for Entrepreneurship, SMEs, Regions and Cities has monitored since February 2020
over 100 surveys conducted on SMEs in 31 countries.2 The surveys give insight into SME perspectives on
the impact of the COVID-19 pandemic, their efforts to cope with that and their expectations for the future.
Survey results differ across countries, reflecting the timing and severity of the COVID-19 pandemic and
containment measures, but follow a comparable pattern. Insights on SME digitalisation from this work are
provided below (OECD, Forthcoming[33]).
34
THE DIGITAL TRANSFORMATION OF SMES © OECD 2021
Up to 70% of SMEs are making more use of digital technologies due to COVID-19
The business surveys conducted in the course of 2020 worldwide document the increase in the
uptake of digital technologies and online sales by SMEs from May 2020 onwards. Surveys show that
since the start of the COVID-19 pandemic, up to 70% of SMEs are making more use of digital technologies,
although substantial differences exist between countries. However, the difference between SMEs – and in
particular small firms – and large firms continues to be significant, with the uptake of digital technologies
by SMEs being only half of that by larger firms.
As the crisis continues, those changes are poised to become structural and last. Most investments
will be irreversible. The crisis may have also served for demonstration effect.
A survey by the United States Chamber of Commerce (5 May) shows an acceleration in
digitalisation trends. Over April-May, the share of small businesses transitioning some or all of their
employees to teleworking increased from 12% to 20%, and small businesses that had begun
moving the retail aspect of their business to digital means increased from 10% to 17%.3
A survey carried among 1 128 SMEs in Brazil (June) finds that almost 50% of them were more
digitally enabled in June than before the COVID-19 pandemic. Improvements in customer
relationships, as well as process agility and customer acquisition were cited as key benefits of
digitisation by 55% of the SMEs surveyed, followed by the ability to operate remotely, cited by
53.5% of those polled.4
A study by CISCO (June) among SMEs in eight countries shows that 70% of SMEs are accelerating
their digitalisation efforts because of COVID-19.5
A study by the Business Development Bank of Canada among 1 000 SMEs in the country (June)
shows that 21% of small SMEs did not intend to make any change to their business practice, as
compared to 4% of larger SMEs. 60% of SMEs would make telework a business practice, whereas
40% intended to consolidate their financial position and increase their investment in technology.6
A survey held in the United Kingdom by CEP/CBI on technology adoption in response to COVID-
19 (July) shows that 75% of respondents had moved to remote working. In the period from late
March to late July 2020, over 60% of firms adopted new digital technologies and management
practices; and around a third invested in new digital capabilities. Nearly half of the respondents
have introduced new products or services.7
Research by Sage on placing SMEs at the heart of the UK recovery (mid-July) indicates that 80%
of SMEs think digital adoption will be critical for an enterprise-led recovery and job creation, but
only a small proportion (33%) have the bandwidth to invest in technology across key business
processes.8
A survey by Visa among SMEs in 8 countries (early August) indicates 67% have undertaken steps
towards digitalisation. More than a quarter of SMEs have tried targeted advertising on social media
or sold products or services online. Another 20% have adopted contactless payments and a third
say they have accepted less, or stopped accepting, cash.9
A survey by GoDaddy among 5 265 small business owners in Australia, Canada, Germany, India,
Mexico, Philippines, Spain, Turkey, the United Kingdom, and the US (19 August) highlights that
40% of respondents have a business website. Among owners that did have a website, more than
half increased their online presence during the COVID-19 pandemic by adding content, creating
an online store, and increasing digital marketing. American companies were most likely to handle
their own tech needs at 66% compared to 54% globally. Only 19% of businesses report budgeting
more money on building an online presence with 53% reporting that their online budget stayed the
same.10
A survey by Allianz in Australia (27 August) reports that 20% of small businesses changed their
policy completely during the COVID-19 pandemic, with 18% focusing on digitalisation.11
35
THE DIGITAL TRANSFORMATION OF SMES © OECD 2021
An American Express Small Business research survey (late August) shows that for 24% of
surveyed businesses, online sales will account for at least half of their sales within the next year
while 18 % say they already do. 39% of the businesses surveyed say the most helpful type of
assistance they could receive to help run their businesses while COVID-19 is digital training.12
A survey by Hewlett Packard in several Asian-Pacific countries (early September) shows that
where SMEs know digital adoption is very important to their recovery, they are currently focused
on managing their cash flow (Hewlett Packard, 2020[34]).
According to a report on small business digitalisation by the Connected Commerce Council
(10 September), 72% of small businesses have increased the use of digital tools during the
COVID-19 pandemic. The report distinguishes between different types of SMEs. Digital Drivers
(35%) consider digital tools essential and used these already before COVID-19. Digital Adopters
use some digital tools but are not fully committed to digital. And Digital Maintainers are generally
sceptical about the use of digital tools.13
A Salesforce survey in Spain (29 October) shows that, during the COVID-19 pandemic, SMEs have
opted for digital marketing strategies that allow them to reach their customers through these new
channels, despite the mobility restrictions. 7 out of 10 businesses in Spain have been digitised in
response to COVID-19 pandemic, and digital marketing spending relative to total company budgets
increased to 12.6% of company budgets on average from May, the highest recorded in the report,
up from 11.3% in February).14
A study by Paypall among small businesses in Canada about how dramatically the COVID-19
pandemic has accelerated digital commerce for them (November) reports that 67% of small
businesses accept now payments online and 47% of them only started doing so this year. Of all
small businesses selling online, 34% turned to digital payments only after COVID-19 was declared
a global pandemic in March. The majority of online small business owners (72%) believe e-
commerce is now necessary in order to have a successful business. In fact, 69% of online small
business owners said selling online has made them more successful, and without this possibility,
58% of small business owners said their business would not survive the COVID-19.15
A survey by Hewlett Packard to 1 600 businesses in Viet Nam and seven neighbour countries,
Australia, India, Indonesia, Japan, Singapore, South Korea, and Thailand (16 November) shows
that Vietnamese SMEs are the most optimistic in the Asia-Pacific region about the post-COVID-19
scenario. In Viet Nam, 41% of firms surveyed expect to see growth next year, against the regional
ratio of only 16%, with 47% of them believing digital adoption held the key to post-pandemic
growth.16
A survey by KOSGEB, the Turkish Small and Medium Enterprises Development Organisation, to
SMEs (December) showed that 32.6% of respondents had already moved their business to the
digital environment with the pandemic, and 21.8% of those which have not yet, plan to do so.
SMEs have transformed business operations in the most affected sectors
Most affected sectors by the COVID-19 pandemic are those where constraints regarding physical and
social distancing, disruptions in supply chains, and interruptions of activities have been the hardest. These
are also sectors where teleworking and smart working arrangements or digital solutions were less easy to
implement. Overall, they account for 35-45% of total employment in OECD countries (Figure 1.9).
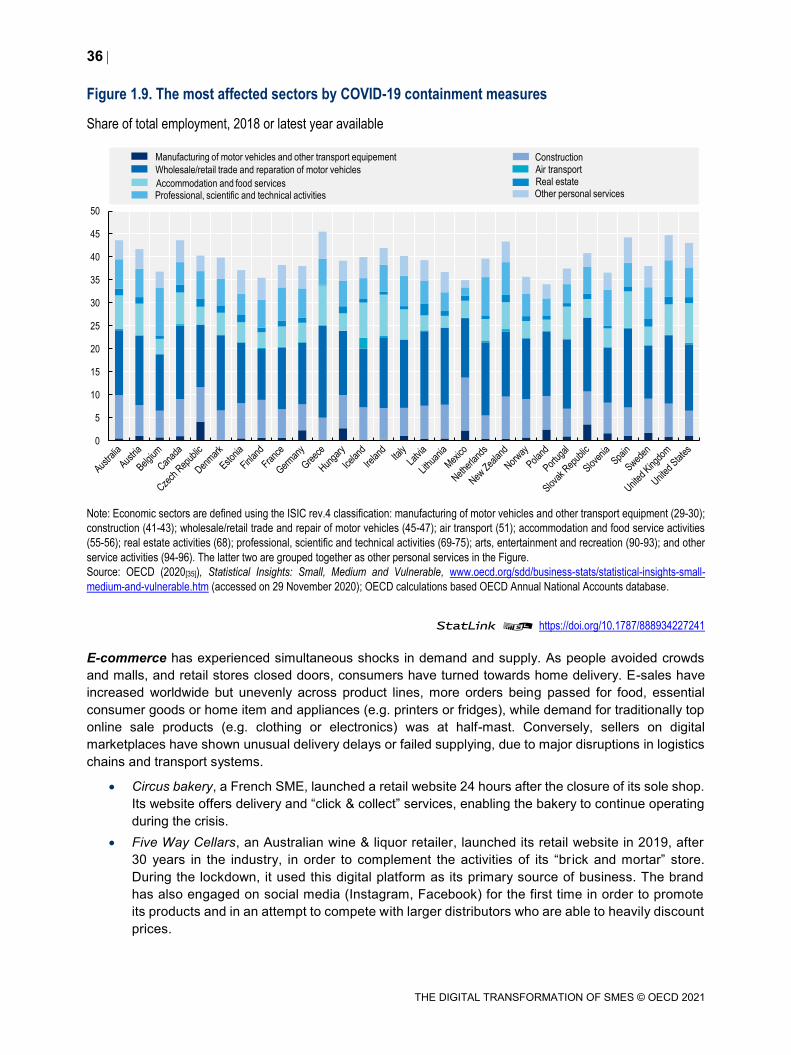
36
THE DIGITAL TRANSFORMATION OF SMES © OECD 2021
Figure 1.9. The most affected sectors by COVID-19 containment measures
Share of total employment, 2018 or latest year available
Note: Economic sectors are defined using the ISIC rev.4 classification: manufacturing of motor vehicles and other transport equipment (29-30);
construction (41-43); wholesale/retail trade and repair of motor vehicles (45-47); air transport (51); accommodation and food service activities
(55-56); real estate activities (68); professional, scientific and technical activities (69-75); arts, entertainment and recreation (90-93); and other
service activities (94-96). The latter two are grouped together as other personal services in the Figure.
Source: OECD (2020[35]), Statistical Insights: Small, Medium and Vulnerable, www.oecd.org/sdd/business-stats/statistical-insights-small-
medium-and-vulnerable.htm (accessed on 29 November 2020); OECD calculations based OECD Annual National Accounts database.
StatLink 2 https://doi.org/10.1787/888934227241
E-commerce has experienced simultaneous shocks in demand and supply. As people avoided crowds
and malls, and retail stores closed doors, consumers have turned towards home delivery. E-sales have
increased worldwide but unevenly across product lines, more orders being passed for food, essential
consumer goods or home item and appliances (e.g. printers or fridges), while demand for traditionally top
online sale products (e.g. clothing or electronics) was at half-mast. Conversely, sellers on digital
marketplaces have shown unusual delivery delays or failed supplying, due to major disruptions in logistics
chains and transport systems.
Circus bakery, a French SME, launched a retail website 24 hours after the closure of its sole shop.
Its website offers delivery and “click & collect” services, enabling the bakery to continue operating
during the crisis.
Five Way Cellars, an Australian wine & liquor retailer, launched its retail website in 2019, after
30 years in the industry, in order to complement the activities of its “br ick and mortar” store.
During the lockdown, it used this digital platform as its primary source of business. The brand
has also engaged on social media (Instagram, Facebook) for the first time in order to promote
its products and in an attempt to compete with larger distributors who are able to heavily discount
prices.
0
5
10
15
20
25
30
35
40
45
50
Manufacturing of motor vehicles and other transport equipement Construction
Wholesale/retail trade and reparation of motor vehicles Air transport
Accommodation and food services Real estate
Professional, scientific and technical activities Other personal services
37
THE DIGITAL TRANSFORMATION OF SMES © OECD 2021
Natoora, a UK wholesaler of fresh produce, has radically changed its business model from
business-to-business (B2B) to business-to-consumer (B2C), because it could no longer sustain
activities as a wholesaler to restaurants and businesses, many of which had to shut down due to
containment restrictions. Using a newly launched website, the company has delivered its product
to households and individual customers.
The leisure and entertainment industry has developed new markets in response to social distancing.
Dancing, relaxation or cooking classes are moving online. Museums are putting forward their virtual reality
tours (OECD, 2020[36]). Providers of video streaming services and Internet access have been boosting
their subscriptions, proposing free access to on-demand TV or complimentary online services.
SkyTing Yoga is a New York based yoga studio. Earlier in 2020, the studio launched its digital
platform, “SkyTing TV” as a complementary service. This has become its main source of revenue
along with a new offering in which the firm streams classes via Instagram for a donation using the
payment platform Venmo.
Boiler Room, the music production and events company, instead of cancelling 40 upcoming
concerts have lived streaming the events via their internet platform from the artists’ homes and
private spaces.
The e-banking and mobile payment industries have adapted to new market conditions, whereas
businesses were forced to go online for selling, consumers and businesses looked for solutions to avoid
contact with banknotes (some stores limiting payments to credit cards only), and the banking system
intended to maintain cash access. Commercial banks have encouraged customers to use online and app-
based banking services, eventually closing proximity agencies, while central banks in Korea, China
(People’s Republic of) and the United States, quarantined physical bills.
E-learning services have spread widely. Education systems have massively moved to e-learning, as more
than 900 million children and youth in more than 102 countries were locked down at home due to school
closures (OECD, 2020[37]). Large universities cancelled in-person classes for shifting towards virtual
training. In a very short time, digital-enabled approaches to learning have become a temporary alternative
to traditional face-to-face methods. The digital turnaround has also affected business education services.
Smart working solutions have bloomed to tackle the almost-total disappearance of face-to-face and on-
site business activities. The cancellation of trade shows, exhibitions and conferences has raised a major
challenge for firms that use these B2B channels for building professional networks and getting new clients.
This is especially true for smaller businesses that count more on word-of-mouth and reputation for
networking, or in professional and consulting services, where on-site visits could be an essential part of
the job. Some large digital firms, and SMEs as well, have been able to deploy a range of digital solutions.
From voice and video calling, to teleconferencing to live-streaming webinars, to teleworking, examples
include:
IBM hold its “Think 2020” client and developer conference and its “PartnerWorld” partnering
conference as global digital events by combining live-streamed content, interactive sessions,
certification, and locally hosted events.
Google changed its Cloud Next event to a digital-only conference this year.
Wolf PR, an Israeli media & advertising SME, has implemented a work-from-home policy for its
team of 20 people. Whilst staff work remotely, employees use the teleconferencing platform Zoom
to stay connected and the Microsoft Office cloud platform to share information.
Hylton and Company Realty, is a real-estate SME in the US. Much of the business was already
digital, through a website that was the main point of contact for customers. To respond to the
challenge of working from home, ‘open houses’ have been showcased online using cameras,
virtual tours and drone videos to display properties.
38
THE DIGITAL TRANSFORMATION OF SMES © OECD 2021
At the extreme, some firms have radically changed their business models with the help of digital tools.
Older, an Italian textile SME producing uniforms for the hospitality industry, has responded to the
decrease in demand by changing its business model in order to produce face masks. The company
has been using its website and Instagram for processing orders.
Peppe’s Sydney, an Australian restaurant, has responded to the COVID-19 restrictions by
changing its business model, from a fine dining restaurant, to a take-away service, using delivery
platforms such as Uber Eats for the first time.
Policy considerations
The SME digital lag arises from a range of factors and barriers, including SME lack of information and
awareness, skills gaps, insufficient capital or missing complementary assets such as technology itself or
organisational practices (OECD, 2019[1]). Smaller businesses often face more difficulties in adapting to
changing regulatory frameworks, dealing with digital security and privacy issues or simply accessing quality
digital infrastructure.
There is a broad-based focus among OECD countries on accelerating digital innovation diffusion to SMEs
and ensuring they keep pace with the digital transformation (OECD, 2019[1]) (OECD, 2020[6]). However,
there is a large mix of approaches and, in some areas, diverging viewpoints on how to unleash SME and
entrepreneurs’ digital potential, and account for the great heterogeneity of the SME population and the
diversity of their business ecosystems. While some countries have sought to mainstream SME policy
considerations in other policy agendas, others specifically target SMEs with tailor-made instruments, often
combined with place-based or sector-wide policy mixes.
Providing SMEs with technology support and assistance
Small enterprise owners are often unaware of the potential new digital tools could offer for improving their
business or they consider the upfront costs of upgrading towards more sophisticated digital technologies
as too high (OECD, 2017[38]).
Policy makers have been active in providing SMEs targeted financial support and technical assistance in
conducting technology and problem-solving diagnosis, or implementing new e-business solutions, often in
the form of small-scale and place-based initiatives. In some cases, financial and technical support is
supplemented with training and guidance on the skillset and organisational changes that are required to
support technological change (Table 1.4).
Government-funded technology extension programmes seek to expand the absorption and adaptation of
existing technologies (e.g. equipment, new managerial skills) in firms, and to increase their absorptive
capacity (Box 1.6). While this type of support is not new, the use of technology extension programmes that
are targeted at SMEs has expanded over the last decades (Shapira, Youtie and Kay, 2011[39]).
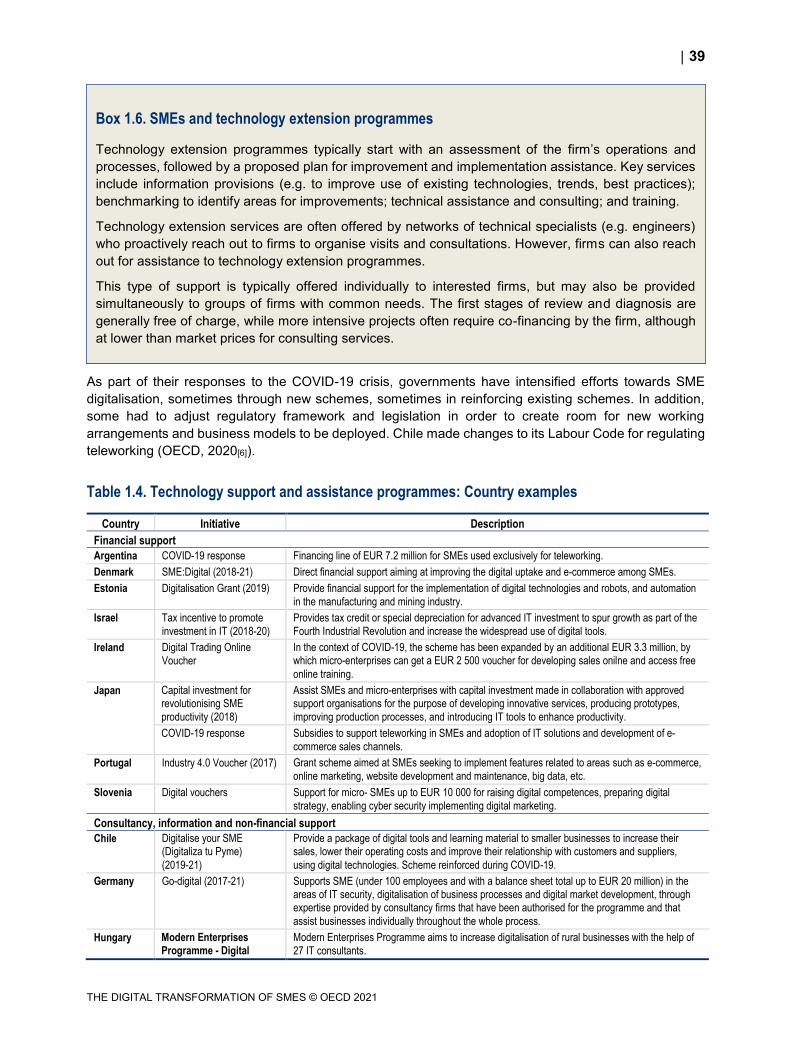
39
THE DIGITAL TRANSFORMATION OF SMES © OECD 2021
Box 1.6. SMEs and technology extension programmes
Technology extension programmes typically start with an assessment of the firm’s operations and
processes, followed by a proposed plan for improvement and implementation assistance. Key services
include information provisions (e.g. to improve use of existing technologies, trends, best practices);
benchmarking to identify areas for improvements; technical assistance and consulting; and training.
Technology extension services are often offered by networks of technical specialists (e.g. engineers)
who proactively reach out to firms to organise visits and consultations. However, firms can also reach
out for assistance to technology extension programmes.
This type of support is typically offered individually to interested firms, but may also be provided
simultaneously to groups of firms with common needs. The first stages of review and diagnosis are
generally free of charge, while more intensive projects often require co-financing by the firm, although
at lower than market prices for consulting services.
As part of their responses to the COVID-19 crisis, governments have intensified efforts towards SME
digitalisation, sometimes through new schemes, sometimes in reinforcing existing schemes. In addition,
some had to adjust regulatory framework and legislation in order to create room for new working
arrangements and business models to be deployed. Chile made changes to its Labour Code for regulating
teleworking (OECD, 2020[6]).
Table 1.4. Technology support and assistance programmes: Country examples
Country Initiative Description
Financial support
Argentina COVID-19 response Financing line of EUR 7.2 million for SMEs used exclusively for teleworking.
Denmark SME:Digital (2018-21) Direct financial support aiming at improving the digital uptake and e-commerce among SMEs.
Estonia Digitalisation Grant (2019) Provide financial support for the implementation of digital technologies and robots, and automation
in the manufacturing and mining industry.
Israel Tax incentive to promote
investment in IT (2018-20)
Provides tax credit or special depreciation for advanced IT investment to spur growth as part of the
Fourth Industrial Revolution and increase the widespread use of digital tools.
Ireland Digital Trading Online
Voucher
In the context of COVID-19, the scheme has been expanded by an additional EUR 3.3 million, by which micro-enterprises can get a EUR 2 500 voucher for developing sales onilne and access free
online training.
Japan Capital investment for revolutionising SME
productivity (2018)
Assist SMEs and micro-enterprises with capital investment made in collaboration with approved support organisations for the purpose of developing innovative services, producing prototypes,
improving production processes, and introducing IT tools to enhance productivity.
COVID-19 response Subsidies to support teleworking in SMEs and adoption of IT solutions and development of e-
commerce sales channels.
Portugal Industry 4.0 Voucher (2017) Grant scheme aimed at SMEs seeking to implement features related to areas such as e-commerce,
online marketing, website development and maintenance, big data, etc.
Slovenia Digital vouchers Support for micro- SMEs up to EUR 10 000 for raising digital competences, preparing digital
strategy, enabling cyber security implementing digital marketing.
Consultancy, information and non-financial support
Chile Digitalise your SME (Digitaliza tu Pyme)
(2019-21)
Provide a package of digital tools and learning material to smaller businesses to increase their sales, lower their operating costs and improve their relationship with customers and suppliers,
using digital technologies. Scheme reinforced during COVID-19.
Germany Go-digital (2017-21) Supports SME (under 100 employees and with a balance sheet total up to EUR 20 million) in the areas of IT security, digitalisation of business processes and digital market development, through expertise provided by consultancy firms that have been authorised for the programme and that
assist businesses individually throughout the whole process.
Hungary Modern Enterprises Programme - Digital
Modern Enterprises Programme aims to increase digitalisation of rural businesses with the help of
27 IT consultants.

40
THE DIGITAL TRANSFORMATION OF SMES © OECD 2021
Country Initiative Description
Entrepreneurship
(2015-21)
Lithuania Business Consultant LT
(2014-23)
The goal is to provide high-level specific business development consultations for Lithuanian
businesses.
Malaysia Digital Economy
Corporation
Set-up by the government as part of the country’s digital strategy, and mobilised during the COVID-19 crisis to offer an extensive list of digital solutions for SMEs by Malaysian tech
companies.
Portugal Opendays i4.0 (2018
onwards)
Awareness campaign to promote the need of digital transformation among SMEs.
Mix of support measures (financial and non-financial)
Australia Australian Small Business Advisory Service (ASBAS)
(2018-21)
Provides direct (grants) and non-financial support (advisory and mentoring services) to Australian small businesses. From November 2020, new businesses accessing this service will be offered an
initial review of their needs and given access to webinars, workshops and one-to-one mentoring.
Small business digital
champions (2019-21)
With a budget of AUD 8.9 million the programme aims at promoting the interaction between small digital businesses and high profile Australian innovators or leaders through direct funding (grants
additionned to private corporate funds from partners) and monitoring services (mentoring).
Colombia Boosting digital transformation of Colombian
enterprises(2019-22)
Increase the degree of adoption of mature and emerging technologies: (i) transform the mentality and business culture; (ii) provide support in the transformation of business processes; and (iii)
promote the development and implementation of technology for business digital transformation.
Digital Economy Policy
(2015) Creating accelerated economic growth through support for businesses and adoption of ICT.
Russia Programme of digitalisation and digital transformation of
SMEs
Encompasses different complementary measures including digital vouchers, advice mentoring and
upskilling services to improve access and use of digital tools.
Sweden Robo-Lift (2019-21) The Robo-Lift supports the automation in SMEs in Sweden. Through Robo-Lift a small or medium-sized business can receive financial support, get access to training and take part in networking
exercises related to automation issues.
With a sectoral approach or technology focus
Colombia Digital Sector Laboratories and E-commerce more
competitive (2019-22)
Promote the adoption and implementation of technologies in the productive sectors and in
companies that are part of the e-commerce value chain.
Estonia Digital solutions for industries seminars (2017
onwards)
The initiative includes seminars and networking sessions.
Japan Apply cloud service to
SMEs (2015 onwards)
The main goal of the initiative is to expand the cloud service market
Netherlands Dutch digitalisation strategy
(2018 onwards)
Promote digital transition in selected sectors (healthcare, mobility, education, energy and the agri-
food sector).
Portugal Portugal i4.0, National Strategy for the Digitalisation of the
Economy (2017)
Portugal i4.0 Initiative is the governmental strategy to digitalise industry.
Sweden Digi-lift (2016-19) Digi-Lift stimulates digital transformation in businesses, with a focus on the industrial sector. Digi-Lift is part of Smart Industry - Sweden's industrial strategy. Digi-Lift gives businesses the possibility
to interact with stakeholders of the digital transition, to get advice and coaching services.
Source: Country responses to the OECD Digital Economy Outlook survey on digital uptake by businesses, 2019; and OECD (2020[6]),
“Coronavirus (COVID-19): SME policy responses”, OECD Policy Responses to Coronavirus (COVID-19), www.oecd.org/coronavirus/policy-
responses/coronavirus-covid-19-sme-policy-responses-04440101/.
Encouraging SME training and upskilling
SMEs typically have greater difficulty in attracting and retaining skilled employees than large firms because
they tend to lack capacity and networks to identify and access talent, but more importantly, they tend to
offer less attractive remuneration and working conditions (Eurofound, 2016[40]). SMEs also offer fewer
training and development opportunities (OECD, 2013[41]), often due to the lack of internal training or Human
Resources departments to organise and co-ordinate training, and lower levels of management skills to
41
THE DIGITAL TRANSFORMATION OF SMES © OECD 2021
anticipate needs (OECD, 2015[42]). In addition, financial costs of tailored training are relatively higher for
SMEs because they have less employees to distribute the fixed training costs over, and less scope to
release people from revenue-generating activities for training. Furthermore, SMEs tend to experience
higher job turnover, which constrains their capacity and willingness to invest in skills development when
there is a risk that an upskilled employee will leave shortly after training (OECD, Forthcoming[43]).
Engaging SMEs in training and education
There are several types of policy initiatives that can be deployed to support the development of workforce
skills in SMEs (OECD, 2012[44]), mainly focusing on reducing training costs for firms and promoting the
benefits of workplace training.
Many OECD countries offer tax incentives to reduce the cost firms incur for training their employees.
Training costs can be, partially or fully, deductible from annual corporate profits in the form of tax
exemptions. Such schemes may specifically target smaller firms by offering them enhanced deductions.
Smaller firms are also frequently targeted by direct training subsidies schemes. Training vouchers, for
example, help SMEs purchase training hours from accredited individuals or institutions.
Countries aim to raise awareness of the importance of training and skills development in SMEs through
various channels, including public and stakeholder organisations. An option is to leverage local employer
networks to promote skills upgrading in the workplace. Employer networks and associations can foster
trust-based relationships between firms that support knowledge-sharing and pooled investments in
training. Collaborations across firms can also foster innovative diffusion within regional supply chains,
potentially integrating firms into GVCs, which also reduces regional vulnerability to automation (OECD,
2018[45]).
Countries are also investing more in “brokers” or intermediator bodies such as group or collective training
offices to organise training for groups of SMEs to shift the burden away from individual employers. These
organisations often sign apprenticeship contracts with government while also providing pastoral care and
practical assistance to individual apprentices (Box 1.7). They are particularly useful for SMEs who would
not otherwise be able to meet the national minimum standards for training apprentices and upholding
apprenticeship training quality standards.
Finally, regulation can encourage skills development. Some countries have introduced statutory rights for
employees for training leave. However, their take-up is generally not high (less than 2% of employees
benefitting from the measure).
Box 1.7. SMEs and apprenticeship
Many OECD countries are examining the role of apprenticeship programmes as a means of better
linking the education system to the world of work. Apprenticeship programmes combine both school-
based education and the on-the job training and result in a formal qualification or certificate (OECD/ILO,
2017[46]) ]. Many SMEs use apprenticeship programmes because of their benefit in stimulating company
productivity and profitability. In countries for which data are available, more than 50% of all apprentices
work in companies with 50 employees or fewer (OECD, 2016[9]). Apprenticeships are more common in
manufacturing, construction and engineering sectors, where employers (and often unions) are well
represented and organised (Kuczera, 2017[47]).
Source: OECD/ILO (2017[46]), Engaging Employers in Apprenticeship Opportunities: Making It Happen Locally, OECD Publishing, Paris,
http://dx.doi.org/10.1787/9789264266681-en; OECD (2016[9]), Increasing Productivity in Small Traditional Enterprises: Programmes for
Upgrading Managerial Skills and Practice; Kuczera (2017[47]), “Striking the right balance: Costs and benefits of apprenticeship”, OECD
Education Working Papers, No. 153, OECD Publishing, Paris, http://dx.doi.org/10.1787/995fff01-en.
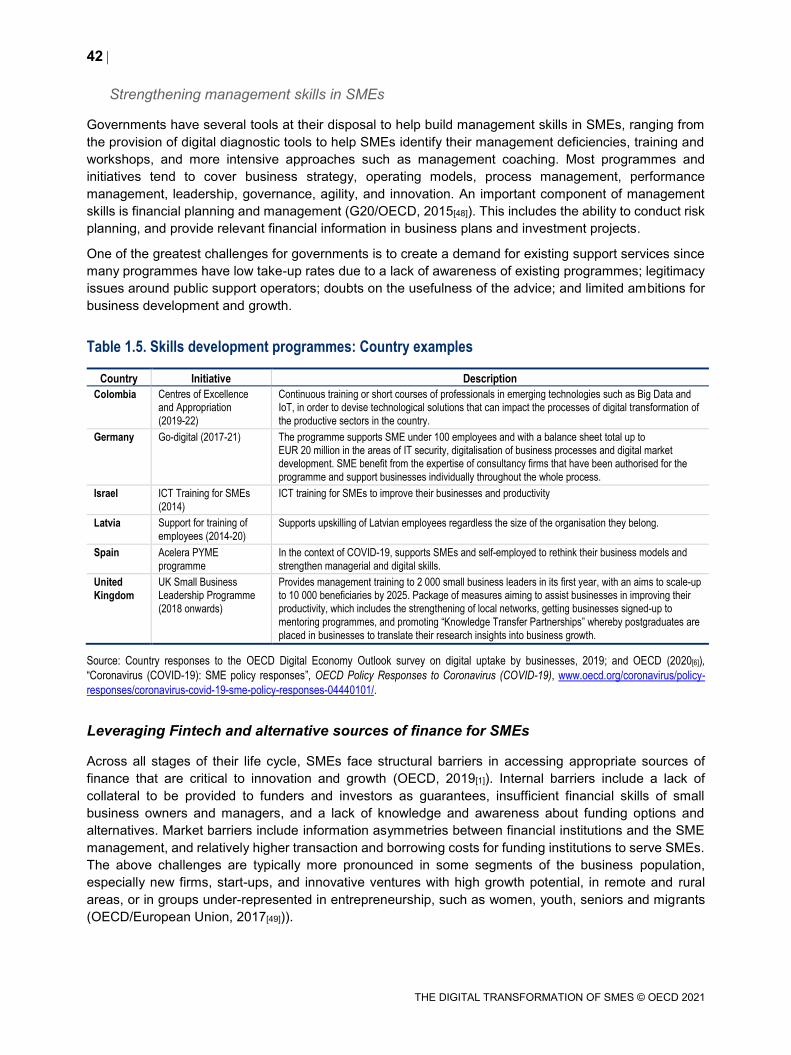
42
THE DIGITAL TRANSFORMATION OF SMES © OECD 2021
Strengthening management skills in SMEs
Governments have several tools at their disposal to help build management skills in SMEs, ranging from
the provision of digital diagnostic tools to help SMEs identify their management deficiencies, training and
workshops, and more intensive approaches such as management coaching. Most programmes and
initiatives tend to cover business strategy, operating models, process management, performance
management, leadership, governance, agility, and innovation. An important component of management
skills is financial planning and management (G20/OECD, 2015[48]). This includes the ability to conduct risk
planning, and provide relevant financial information in business plans and investment projects.
One of the greatest challenges for governments is to create a demand for existing support services since
many programmes have low take-up rates due to a lack of awareness of existing programmes; legitimacy
issues around public support operators; doubts on the usefulness of the advice; and limited ambitions for
business development and growth.
Table 1.5. Skills development programmes: Country examples
Country Initiative Description
Colombia Centres of Excellence and Appropriation
(2019-22)
Continuous training or short courses of professionals in emerging technologies such as Big Data and IoT, in order to devise technological solutions that can impact the processes of digital transformation of
the productive sectors in the country.
Germany Go-digital (2017-21) The programme supports SME under 100 employees and with a balance sheet total up to EUR 20 million in the areas of IT security, digitalisation of business processes and digital market development. SME benefit from the expertise of consultancy firms that have been authorised for the
programme and support businesses individually throughout the whole process.
Israel ICT Training for SMEs
(2014)
ICT training for SMEs to improve their businesses and productivity
Latvia Support for training of
employees (2014-20) Supports upskilling of Latvian employees regardless the size of the organisation they belong.
Spain Acelera PYME
programme
In the context of COVID-19, supports SMEs and self-employed to rethink their business models and
strengthen managerial and digital skills.
United
Kingdom
UK Small Business Leadership Programme
(2018 onwards)
Provides management training to 2 000 small business leaders in its first year, with an aims to scale-up to 10 000 beneficiaries by 2025. Package of measures aiming to assist businesses in improving their productivity, which includes the strengthening of local networks, getting businesses signed-up to
mentoring programmes, and promoting “Knowledge Transfer Partnerships” whereby postgraduates are
placed in businesses to translate their research insights into business growth.
Source: Country responses to the OECD Digital Economy Outlook survey on digital uptake by businesses, 2019; and OECD (2020[6]),
“Coronavirus (COVID-19): SME policy responses”, OECD Policy Responses to Coronavirus (COVID-19), www.oecd.org/coronavirus/policy-
responses/coronavirus-covid-19-sme-policy-responses-04440101/.
Leveraging Fintech and alternative sources of finance for SMEs
Across all stages of their life cycle, SMEs face structural barriers in accessing appropriate sources of
finance that are critical to innovation and growth (OECD, 2019[1]). Internal barriers include a lack of
collateral to be provided to funders and investors as guarantees, insufficient financial skills of small
business owners and managers, and a lack of knowledge and awareness about funding options and
alternatives. Market barriers include information asymmetries between financial institutions and the SME
management, and relatively higher transaction and borrowing costs for funding institutions to serve SMEs.
The above challenges are typically more pronounced in some segments of the business population,
especially new firms, start-ups, and innovative ventures with high growth potential, in remote and rural
areas, or in groups under-represented in entrepreneurship, such as women, youth, seniors and migrants
(OECD/European Union, 2017[49])).
43
THE DIGITAL TRANSFORMATION OF SMES © OECD 2021
Online alternative finance activity has been increasingly included in SME finance policies (OECD, 2020[50]).
Using technologies such as digital ID verification, distributed ledger technologies (DLT), big data and
marketplace lending, finance suppliers are offering an array of innovative services with the potential to
revolutionise SME finance markets. Mobile banking, (international) mobile payments and the use of
alternative data for credit risk assessment can significantly reduce information asymmetries and
transaction costs, tackling SME structural barriers in accessing finance.
Fintech, defined as technology-enabled innovation in financial services, is becoming more and more
important in offering more convenient and accessible services, more effective credit risk assessments and
lower transaction costs. These instruments can be a unique opportunity for projects that are too small, too
risky, or have a social purpose (OECD, 2018[51]), and their strong expansion in particular in the early 2010s
has prompted regulators to intervene.
In the context of the exercise to identify Effective Approaches for implementing the G20/OECD High Level
Principles on SME Financing, a large majority of countries reported supporting the development of Fintech
solutions (27 out of 38). Regulatory initiatives comprised 19 out of these 27 measures. In addition,
platforms to inform and connect SMEs to Fintech companies, workshops and the creation of Fintech
association were also mentioned (Koreen, Laboul and Smaini, 2018[52]).
The COVID-19 pandemic has provided further incentive to develop alternative sources of finance for SMEs
and entrepreneurs. In Latvia and Mexico, Fintech initiatives are being implemented to support SME finance
in the context of the crisis (OECD, 2020[6]).
Improving SME capacity to manage and protect their data and IPRs
SMEs tend to privilege trade secrecy as their default mode of data protection. Past surveys have showed
that small firms consider trade secrecy as an important means for protecting innovation (Cohen, Nelson
and Walsh, 2000[53]; Jankowski, 2012[54]; Hall et al., 2014[55]), with the lead time advantage -that is a primary
mechanism of IP appropriation in some industries- and on-purpose complex product design -that aims to
discourage competitors from engaging in counterfeiting (Rujan and Dussaux, 2017[56]; Hughes and Mina,
2011[57]). However, the protection of trade secrets is becoming increasingly difficult. Digitalisation and the
revolution in data codification, storage and exchange (i.e. cloud computing, emails, USB drives) are prime
drivers of a rise in trade secret infringements. Increasing value given to IP (and de facto its
misappropriation), staff mobility and changing work culture and relationships (e.g. temporary contracts,
outplacement, teleworking) or the fragmentation of global value chains (with more foreign parties involved
within more diverse legal frameworks and uneven enforcement conditions) also contribute to increase
exposure and risk of disclosure (Almeling, 2012[58]).
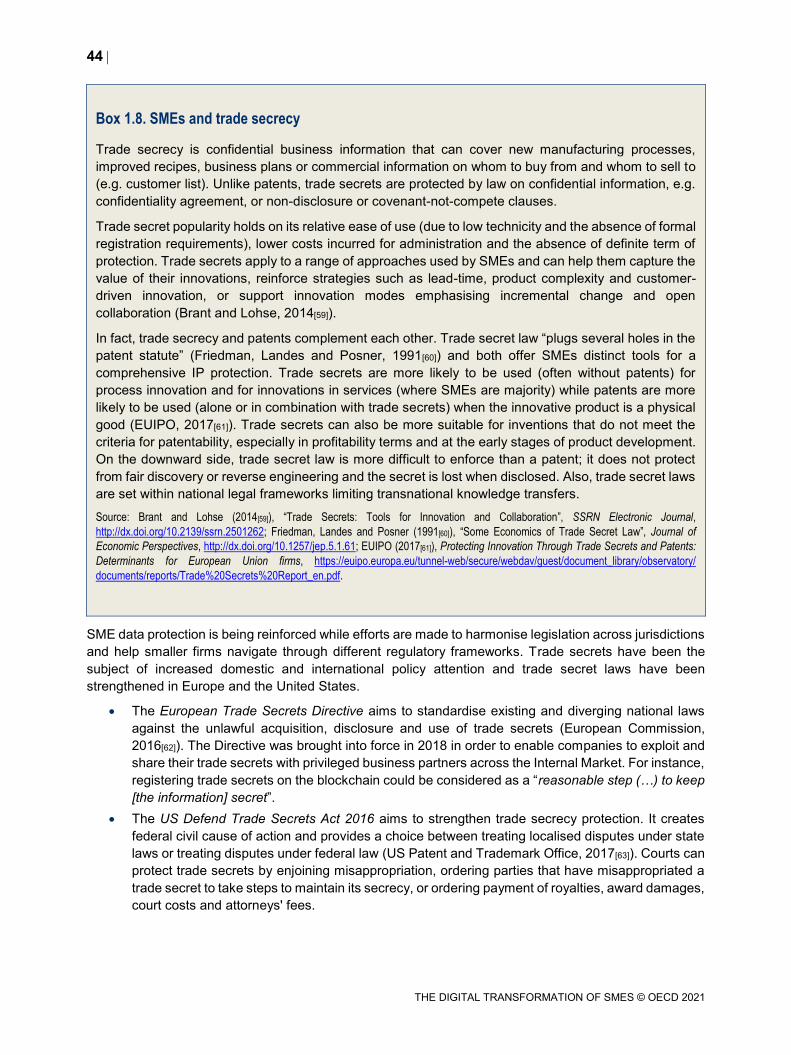
44
THE DIGITAL TRANSFORMATION OF SMES © OECD 2021
Box 1.8. SMEs and trade secrecy
Trade secrecy is confidential business information that can cover new manufacturing processes,
improved recipes, business plans or commercial information on whom to buy from and whom to sell to
(e.g. customer list). Unlike patents, trade secrets are protected by law on confidential information, e.g.
confidentiality agreement, or non-disclosure or covenant-not-compete clauses.
Trade secret popularity holds on its relative ease of use (due to low technicity and the absence of formal
registration requirements), lower costs incurred for administration and the absence of definite term of
protection. Trade secrets apply to a range of approaches used by SMEs and can help them capture the
value of their innovations, reinforce strategies such as lead-time, product complexity and customer-
driven innovation, or support innovation modes emphasising incremental change and open
collaboration (Brant and Lohse, 2014[59]).
In fact, trade secrecy and patents complement each other. Trade secret law “plugs several holes in the
patent statute” (Friedman, Landes and Posner, 1991[60]) and both offer SMEs distinct tools for a
comprehensive IP protection. Trade secrets are more likely to be used (often without patents) for
process innovation and for innovations in services (where SMEs are majority) while patents are more
likely to be used (alone or in combination with trade secrets) when the innovative product is a physical
good (EUIPO, 2017[61]). Trade secrets can also be more suitable for inventions that do not meet the
criteria for patentability, especially in profitability terms and at the early stages of product development.
On the downward side, trade secret law is more difficult to enforce than a patent; it does not protect
from fair discovery or reverse engineering and the secret is lost when disclosed. Also, trade secret laws
are set within national legal frameworks limiting transnational knowledge transfers.
Source: Brant and Lohse (2014[59]), “Trade Secrets: Tools for Innovation and Collaboration”, SSRN Electronic Journal,
http://dx.doi.org/10.2139/ssrn.2501262; Friedman, Landes and Posner (1991[60]), “Some Economics of Trade Secret Law”, Journal of
Economic Perspectives, http://dx.doi.org/10.1257/jep.5.1.61; EUIPO (2017[61]), Protecting Innovation Through Trade Secrets and Patents:
Determinants for European Union firms, https://euipo.europa.eu/tunnel-web/secure/webdav/guest/document_library/observatory/
documents/reports/Trade%20Secrets%20Report_en.pdf.
SME data protection is being reinforced while efforts are made to harmonise legislation across jurisdictions
and help smaller firms navigate through different regulatory frameworks. Trade secrets have been the
subject of increased domestic and international policy attention and trade secret laws have been
strengthened in Europe and the United States.
The European Trade Secrets Directive aims to standardise existing and diverging national laws
against the unlawful acquisition, disclosure and use of trade secrets (European Commission,
2016[62]). The Directive was brought into force in 2018 in order to enable companies to exploit and
share their trade secrets with privileged business partners across the Internal Market. For instance,
registering trade secrets on the blockchain could be considered as a “reasonable step (…) to keep
[the information] secret”.
The US Defend Trade Secrets Act 2016 aims to strengthen trade secrecy protection. It creates
federal civil cause of action and provides a choice between treating localised disputes under state
laws or treating disputes under federal law (US Patent and Trademark Office, 2017[63]). Courts can
protect trade secrets by enjoining misappropriation, ordering parties that have misappropriated a
trade secret to take steps to maintain its secrecy, or ordering payment of royalties, award damages,
court costs and attorneys' fees.
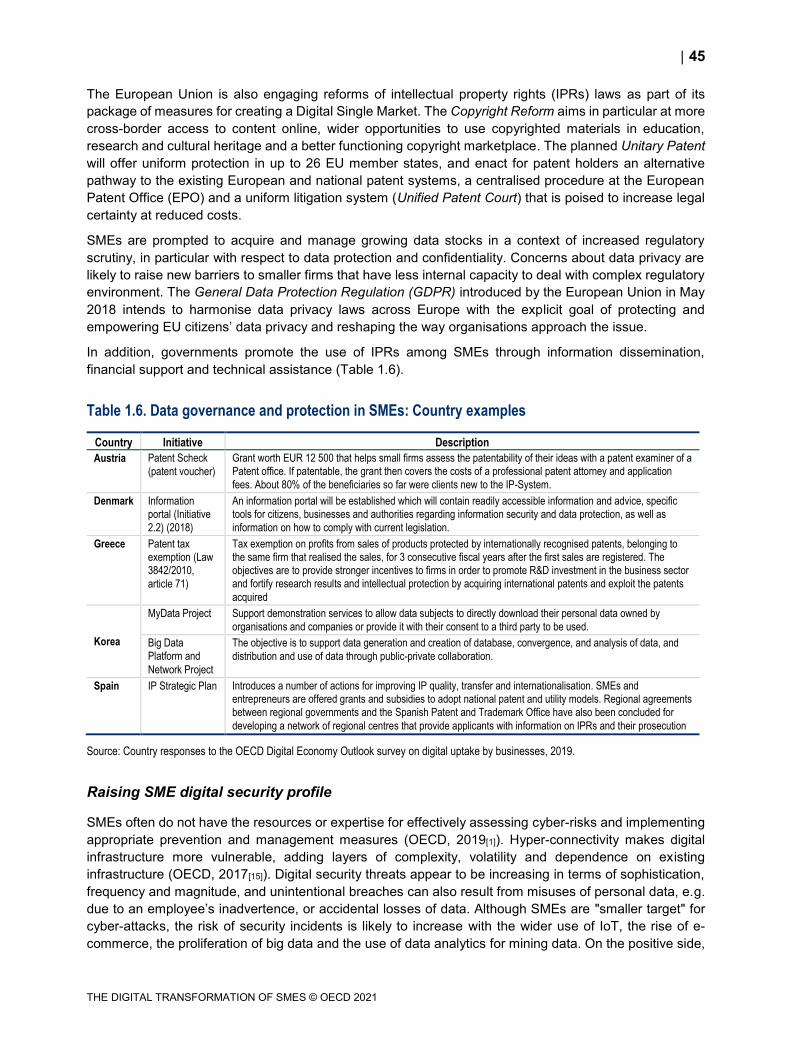
45
THE DIGITAL TRANSFORMATION OF SMES © OECD 2021
The European Union is also engaging reforms of intellectual property rights (IPRs) laws as part of its
package of measures for creating a Digital Single Market. The Copyright Reform aims in particular at more
cross-border access to content online, wider opportunities to use copyrighted materials in education,
research and cultural heritage and a better functioning copyright marketplace. The planned Unitary Patent
will offer uniform protection in up to 26 EU member states, and enact for patent holders an alternative
pathway to the existing European and national patent systems, a centralised procedure at the European
Patent Office (EPO) and a uniform litigation system (Unified Patent Court) that is poised to increase legal
certainty at reduced costs.
SMEs are prompted to acquire and manage growing data stocks in a context of increased regulatory
scrutiny, in particular with respect to data protection and confidentiality. Concerns about data privacy are
likely to raise new barriers to smaller firms that have less internal capacity to deal with complex regulatory
environment. The General Data Protection Regulation (GDPR) introduced by the European Union in May
2018 intends to harmonise data privacy laws across Europe with the explicit goal of protecting and
empowering EU citizens’ data privacy and reshaping the way organisations approach the issue.
In addition, governments promote the use of IPRs among SMEs through information dissemination,
financial support and technical assistance (Table 1.6).
Table 1.6. Data governance and protection in SMEs: Country examples
Country Initiative Description
Austria Patent Scheck
(patent voucher)
Grant worth EUR 12 500 that helps small firms assess the patentability of their ideas with a patent examiner of a Patent office. If patentable, the grant then covers the costs of a professional patent attorney and application
fees. About 80% of the beneficiaries so far were clients new to the IP-System.
Denmark Information portal (Initiative
2.2) (2018)
An information portal will be established which will contain readily accessible information and advice, specific tools for citizens, businesses and authorities regarding information security and data protection, as well as
information on how to comply with current legislation.
Greece Patent tax exemption (Law 3842/2010,
article 71)
Tax exemption on profits from sales of products protected by internationally recognised patents, belonging to the same firm that realised the sales, for 3 consecutive fiscal years after the first sales are registered. The objectives are to provide stronger incentives to firms in order to promote R&D investment in the business sector and fortify research results and intellectual protection by acquiring international patents and exploit the patents
acquired
Korea
MyData Project Support demonstration services to allow data subjects to directly download their personal data owned by
organisations and companies or provide it with their consent to a third party to be used.
Big Data Platform and
Network Project
The objective is to support data generation and creation of database, convergence, and analysis of data, and
distribution and use of data through public-private collaboration.
Spain IP Strategic Plan Introduces a number of actions for improving IP quality, transfer and internationalisation. SMEs and entrepreneurs are offered grants and subsidies to adopt national patent and utility models. Regional agreements between regional governments and the Spanish Patent and Trademark Office have also been concluded for
developing a network of regional centres that provide applicants with information on IPRs and their prosecution
Source: Country responses to the OECD Digital Economy Outlook survey on digital uptake by businesses, 2019.
Raising SME digital security profile
SMEs often do not have the resources or expertise for effectively assessing cyber-risks and implementing
appropriate prevention and management measures (OECD, 2019[1]). Hyper-connectivity makes digital
infrastructure more vulnerable, adding layers of complexity, volatility and dependence on existing
infrastructure (OECD, 2017[15]). Digital security threats appear to be increasing in terms of sophistication,
frequency and magnitude, and unintentional breaches can also result from misuses of personal data, e.g.
due to an employee’s inadvertence, or accidental losses of data. Although SMEs are "smaller target" for
cyber-attacks, the risk of security incidents is likely to increase with the wider use of IoT, the rise of e-
commerce, the proliferation of big data and the use of data analytics for mining data. On the positive side,
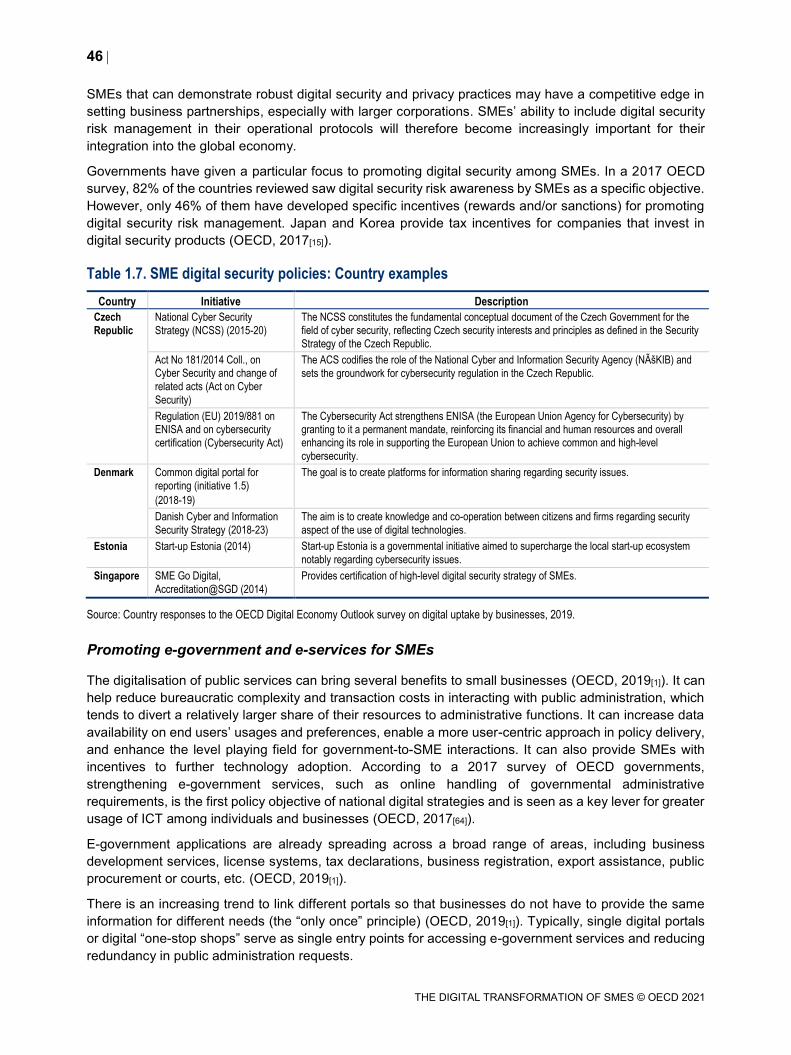
46
THE DIGITAL TRANSFORMATION OF SMES © OECD 2021
SMEs that can demonstrate robust digital security and privacy practices may have a competitive edge in
setting business partnerships, especially with larger corporations. SMEs’ ability to include digital security
risk management in their operational protocols will therefore become increasingly important for their
integration into the global economy.
Governments have given a particular focus to promoting digital security among SMEs. In a 2017 OECD
survey, 82% of the countries reviewed saw digital security risk awareness by SMEs as a specific objective.
However, only 46% of them have developed specific incentives (rewards and/or sanctions) for promoting
digital security risk management. Japan and Korea provide tax incentives for companies that invest in
digital security products (OECD, 2017[15]).
Table 1.7. SME digital security policies: Country examples
Country Initiative Description
Czech
Republic
National Cyber Security
Strategy (NCSS) (2015-20)
The NCSS constitutes the fundamental conceptual document of the Czech Government for the field of cyber security, reflecting Czech security interests and principles as defined in the Security
Strategy of the Czech Republic.
Act No 181/2014 Coll., on Cyber Security and change of
related acts (Act on Cyber
Security)
The ACS codifies the role of the National Cyber and Information Security Agency (NÚKIB) and
sets the groundwork for cybersecurity regulation in the Czech Republic.
Regulation (EU) 2019/881 on ENISA and on cybersecurity
certification (Cybersecurity Act)
The Cybersecurity Act strengthens ENISA (the European Union Agency for Cybersecurity) by granting to it a permanent mandate, reinforcing its financial and human resources and overall enhancing its role in supporting the European Union to achieve common and high-level
cybersecurity.
Denmark Common digital portal for
reporting (initiative 1.5)
(2018-19)
The goal is to create platforms for information sharing regarding security issues.
Danish Cyber and Information
Security Strategy (2018-23)
The aim is to create knowledge and co-operation between citizens and firms regarding security
aspect of the use of digital technologies.
Estonia Start-up Estonia (2014) Start-up Estonia is a governmental initiative aimed to supercharge the local start-up ecosystem
notably regarding cybersecurity issues.
Singapore SME Go Digital,
Accreditation@SGD (2014)
Provides certification of high-level digital security strategy of SMEs.
Source: Country responses to the OECD Digital Economy Outlook survey on digital uptake by businesses, 2019.
Promoting e-government and e-services for SMEs
The digitalisation of public services can bring several benefits to small businesses (OECD, 2019[1]). It can
help reduce bureaucratic complexity and transaction costs in interacting with public administration, which
tends to divert a relatively larger share of their resources to administrative functions. It can increase data
availability on end users’ usages and preferences, enable a more user-centric approach in policy delivery,
and enhance the level playing field for government-to-SME interactions. It can also provide SMEs with
incentives to further technology adoption. According to a 2017 survey of OECD governments,
strengthening e-government services, such as online handling of governmental administrative
requirements, is the first policy objective of national digital strategies and is seen as a key lever for greater
usage of ICT among individuals and businesses (OECD, 2017[64]).
E-government applications are already spreading across a broad range of areas, including business
development services, license systems, tax declarations, business registration, export assistance, public
procurement or courts, etc. (OECD, 2019[1]).
There is an increasing trend to link different portals so that businesses do not have to provide the same
information for different needs (the “only once” principle) (OECD, 2019[1]). Typically, single digital portals
or digital “one-stop shops” serve as single entry points for accessing e-government services and reducing
redundancy in public administration requests.
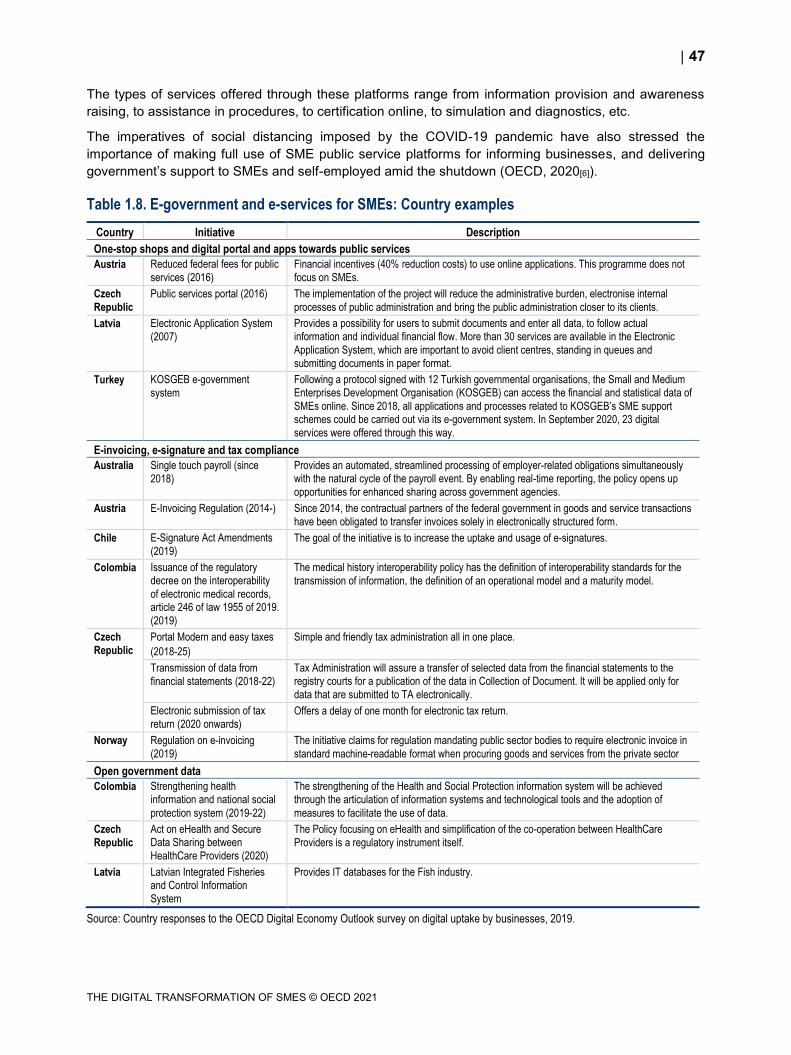
47
THE DIGITAL TRANSFORMATION OF SMES © OECD 2021
The types of services offered through these platforms range from information provision and awareness
raising, to assistance in procedures, to certification online, to simulation and diagnostics, etc.
The imperatives of social distancing imposed by the COVID-19 pandemic have also stressed the
importance of making full use of SME public service platforms for informing businesses, and delivering
government’s support to SMEs and self-employed amid the shutdown (OECD, 2020[6]).
Table 1.8. E-government and e-services for SMEs: Country examples
Country Initiative Description
One-stop shops and digital portal and apps towards public services
Austria Reduced federal fees for public
services (2016)
Financial incentives (40% reduction costs) to use online applications. This programme does not
focus on SMEs.
Czech
Republic
Public services portal (2016) The implementation of the project will reduce the administrative burden, electronise internal
processes of public administration and bring the public administration closer to its clients.
Latvia Electronic Application System
(2007)
Provides a possibility for users to submit documents and enter all data, to follow actual information and individual financial flow. More than 30 services are available in the Electronic
Application System, which are important to avoid client centres, standing in queues and
submitting documents in paper format.
Turkey KOSGEB e-government
system
Following a protocol signed with 12 Turkish governmental organisations, the Small and Medium Enterprises Development Organisation (KOSGEB) can access the financial and statistical data of
SMEs online. Since 2018, all applications and processes related to KOSGEB’s SME support schemes could be carried out via its e-government system. In September 2020, 23 digital
services were offered through this way.
E-invoicing, e-signature and tax compliance
Australia Single touch payroll (since
2018)
Provides an automated, streamlined processing of employer-related obligations simultaneously with the natural cycle of the payroll event. By enabling real-time reporting, the policy opens up
opportunities for enhanced sharing across government agencies.
Austria E-Invoicing Regulation (2014-) Since 2014, the contractual partners of the federal government in goods and service transactions
have been obligated to transfer invoices solely in electronically structured form.
Chile E-Signature Act Amendments
(2019) The goal of the initiative is to increase the uptake and usage of e-signatures.
Colombia Issuance of the regulatory decree on the interoperability
of electronic medical records, article 246 of law 1955 of 2019.
(2019)
The medical history interoperability policy has the definition of interoperability standards for the
transmission of information, the definition of an operational model and a maturity model.
Czech
Republic
Portal Modern and easy taxes
(2018-25)
Simple and friendly tax administration all in one place.
Transmission of data from
financial statements (2018-22)
Tax Administration will assure a transfer of selected data from the financial statements to the registry courts for a publication of the data in Collection of Document. It will be applied only for
data that are submitted to TA electronically.
Electronic submission of tax
return (2020 onwards) Offers a delay of one month for electronic tax return.
Norway Regulation on e-invoicing
(2019)
The initiative claims for regulation mandating public sector bodies to require electronic invoice in
standard machine-readable format when procuring goods and services from the private sector
Open government data
Colombia Strengthening health information and national social
protection system (2019-22)
The strengthening of the Health and Social Protection information system will be achieved through the articulation of information systems and technological tools and the adoption of
measures to facilitate the use of data.
Czech
Republic
Act on eHealth and Secure Data Sharing between
HealthCare Providers (2020)
The Policy focusing on eHealth and simplification of the co-operation between HealthCare
Providers is a regulatory instrument itself.
Latvia Latvian Integrated Fisheries and Control Information
System
Provides IT databases for the Fish industry.
Source: Country responses to the OECD Digital Economy Outlook survey on digital uptake by businesses, 2019.
48
THE DIGITAL TRANSFORMATION OF SMES © OECD 2021
Deploying high-quality digital infrastructure and platforms
ICT infrastructure is critical for sustaining digital diffusion among SMEs. Studies on German and Irish firms
pointed out that the use of broadband connections has a positive and significant impact on their innovation
activity (Bertschek, Cerquera and Klein, 2013[65]; Haller and Lyons, 2015[66]). Accessing high-speed
networks allows SMEs and entrepreneurs in connecting to suppliers and customers, obtaining real-time
information and providing real-time responses to fast-evolving markets and supply chains. High-speed
digital networks also enable smaller-scale businesses to build digital capacity, e.g. through cloud
computing services (Box 1.9). Although firms are increasingly moving towards high-speed fixed
broadband, stimulated by more affordable access prices and the market prospects of a vibrant Apps
economy, there are wide and enlarging cross-country and cross-firm divides in connection, with smaller
firms losing ground in the transition (OECD, 2019[1]).
Box 1.9. SMEs and barriers to cloud computing uptake
Firms have increasingly turned towards the cloud for accessing emails, storage or data management
capacity (OECD, 2019[1]). Cloud computing (CC) allows SMEs to access extra processing or storage
capacity, as well as databases and software, in quantities that suit and follow their needs. In addition to
its flexibility and scalability, CC reduces costs of technology upgrading by exempting firms of upfront
investments in hardware and regular expenses on maintenance, IT team and certification. In addition,
CC serves the dissemination of other technologies and enable technological catch-up. New mobile
forms of work have contributed to increasing its popularity as firms were able to adopt platform-
independent technologies that could be accessed anywhere and from any device (e.g. smartphones,
desktops, laptops, etc.).
SME use of cloud computing services is likely to expand in a near future, as SME owners get
increasingly aware of CC potential for gaining flexibility and reducing costs, general diffusion increases
pressure from competitors and business partners to follow the trend, and barriers to adoption are
progressively overcome.
In that respect, trust issues remain a major obstacle. It has become apparent that the preservation of
data sovereignty is a key reason for SMEs not to abandon on-premise IT and data solutions. The loss
of data control is indeed closely associated with the uncertainty of data location that raises uncertainty
around the data protection regulation that applies, and the jurisdictions under which it is enforced.
Likewise, the lack of open standards within the cloud providers’ community increases the difficulty for
CC users to switch between providers and the risk of technological lock-ins. As a consequence, users
can become extremely vulnerable to providers’ price policy, especially as new development in data
analytics will allow them to profile their users and discriminating prices. Fears are further exacerbated
by the current high market concentration of the cloud industry (Kushida, Murray and Zysman, 2011[67]).
Source: OECD (2019[1]), OECD SME and Entrepreneurship Outlook 2019, OECD Publishing, Paris, https://dx.doi.org/10.1787/34907e9c-
en; Kushida, Murray and Zysman (2011[67]), Diffusing the Cloud: Cloud Computing and Implications for Public Policy,
http://dx.doi.org/10.1007/s10842-011-0106-5.
Many countries have engaged in comprehensive strategy exercises, with a strong focus on strengthening
public-private dialogue and private sector participation in infrastructure development (OECD, 2017[64]; ITF,
2017[68]). In addition, subnational governments play a vital role in the infrastructure landscape, and regional
and municipal infrastructural policies are likely to grow in relevance, as cities and regions are increasingly
responsible for policy design and implementation in key areas for SMEs, such as broadband. In such a
vast and complex space, a whole-of-government approach including ministries, departments and agencies
across different levels of jurisdiction, becomes necessary in order to take account of interrelated effects
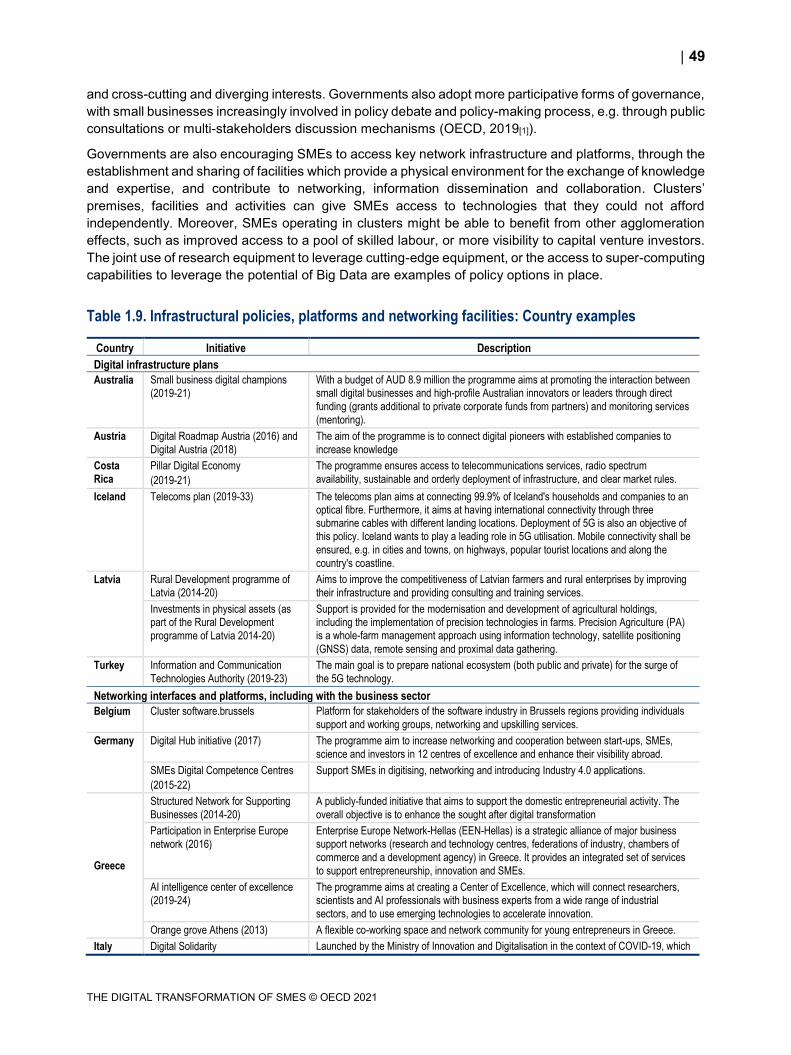
49
THE DIGITAL TRANSFORMATION OF SMES © OECD 2021
and cross-cutting and diverging interests. Governments also adopt more participative forms of governance,
with small businesses increasingly involved in policy debate and policy-making process, e.g. through public
consultations or multi-stakeholders discussion mechanisms (OECD, 2019[1]).
Governments are also encouraging SMEs to access key network infrastructure and platforms, through the
establishment and sharing of facilities which provide a physical environment for the exchange of knowledge
and expertise, and contribute to networking, information dissemination and collaboration. Clusters’
premises, facilities and activities can give SMEs access to technologies that they could not afford
independently. Moreover, SMEs operating in clusters might be able to benefit from other agglomeration
effects, such as improved access to a pool of skilled labour, or more visibility to capital venture investors.
The joint use of research equipment to leverage cutting-edge equipment, or the access to super-computing
capabilities to leverage the potential of Big Data are examples of policy options in place.
Table 1.9. Infrastructural policies, platforms and networking facilities: Country examples
Country Initiative Description
Digital infrastructure plans
Australia Small business digital champions
(2019-21)
With a budget of AUD 8.9 million the programme aims at promoting the interaction between small digital businesses and high-profile Australian innovators or leaders through direct
funding (grants additional to private corporate funds from partners) and monitoring services
(mentoring).
Austria Digital Roadmap Austria (2016) and
Digital Austria (2018)
The aim of the programme is to connect digital pioneers with established companies to
increase knowledge
Costa
Rica
Pillar Digital Economy
(2019-21)
The programme ensures access to telecommunications services, radio spectrum
availability, sustainable and orderly deployment of infrastructure, and clear market rules.
Iceland Telecoms plan (2019-33) The telecoms plan aims at connecting 99.9% of Iceland's households and companies to an optical fibre. Furthermore, it aims at having international connectivity through three submarine cables with different landing locations. Deployment of 5G is also an objective of this policy. Iceland wants to play a leading role in 5G utilisation. Mobile connectivity shall be
ensured, e.g. in cities and towns, on highways, popular tourist locations and along the
country's coastline.
Latvia Rural Development programme of
Latvia (2014-20)
Aims to improve the competitiveness of Latvian farmers and rural enterprises by improving
their infrastructure and providing consulting and training services.
Investments in physical assets (as part of the Rural Development
programme of Latvia 2014-20)
Support is provided for the modernisation and development of agricultural holdings, including the implementation of precision technologies in farms. Precision Agriculture (PA) is a whole-farm management approach using information technology, satellite positioning
(GNSS) data, remote sensing and proximal data gathering.
Turkey Information and Communication
Technologies Authority (2019-23)
The main goal is to prepare national ecosystem (both public and private) for the surge of
the 5G technology.
Networking interfaces and platforms, including with the business sector
Belgium Cluster software.brussels Platform for stakeholders of the software industry in Brussels regions providing individuals
support and working groups, networking and upskilling services.
Germany Digital Hub initiative (2017) The programme aim to increase networking and cooperation between start-ups, SMEs,
science and investors in 12 centres of excellence and enhance their visibility abroad.
SMEs Digital Competence Centres
(2015-22)
Support SMEs in digitising, networking and introducing Industry 4.0 applications.
Greece
Structured Network for Supporting
Businesses (2014-20)
A publicly-funded initiative that aims to support the domestic entrepreneurial activity. The
overall objective is to enhance the sought after digital transformation
Participation in Enterprise Europe
network (2016)
Enterprise Europe Network-Hellas (EEN-Hellas) is a strategic alliance of major business support networks (research and technology centres, federations of industry, chambers of
commerce and a development agency) in Greece. It provides an integrated set of services
to support entrepreneurship, innovation and SMEs.
AI intelligence center of excellence
(2019-24)
The programme aims at creating a Center of Excellence, which will connect researchers, scientists and AI professionals with business experts from a wide range of industrial
sectors, and to use emerging technologies to accelerate innovation.
Orange grove Athens (2013) A flexible co-working space and network community for young entrepreneurs in Greece.
Italy Digital Solidarity Launched by the Ministry of Innovation and Digitalisation in the context of COVID-19, which
50
THE DIGITAL TRANSFORMATION OF SMES © OECD 2021
Country Initiative Description
includes a portal where companies (in particular SMEs and self-employed) can register to access without costs digital services from large private sector companies regarding smart/teleworking, video conferencing, access to mobile data, cloud computing, etc., to
cope with restrictions to movement and work.
Slovenia Digital innovation Hub Slovenia
(2019-23)
DIH Slovenia provides, connects and supports knowledge, business expertise, technologies, and exchanges best practices with the aim to fully enable Slovene Industry in
building digital competencies, innovation models and processes, support their digital
transformation and raise companies’ competitive advantages.
Source: Country responses to the OECD Digital Economy Outlook survey on digital uptake by businesses, 2019.
Conclusion
SMEs lag in the digital transition, despite potentially tremendous benefits. SMEs must be better prepared
for adapting their operations and stakes are high. Not only because SMEs are the main form of business
in most countries and regions, and play a key role in building inclusive and resilient societies, but also
because digital gaps have proved to weigh down on a country’s productivity and to contribute to increasing
inequalities among people, communities and places. The COVID-19 crisis has exemplified how differences
in digital maturity and preparedness could undermine business resilience and their chances of faster
recovery (OECD, 2020[6]).
The digitalisation of businesses has continued apace in recent years, across all sectors and firms of all
sizes, but at different speeds. SMEs have specific digital journeys. They lag in all digital technology areas,
and small firms are less digitalised than medium-sized firms, which are less digitalised than large firms.
However, overall, diffusion patterns are relatively similar across firm sizes, the larger moving just faster
along the diffusion curve (Rogers, 1962[4]).
But digitalisation is multi-faceted. It involves the use and applications of a broad range of different
technologies, for different purposes, e.g. from enabling greater access to markets and end-users, to
achieving greater integration of internal business processes, or to scaling up corporate IT capacity, etc.
SMEs tend to digitalise general administration and marketing operations first, with a level of business-to-
government interactions, or an intensity of use of electronic invoicing, more similar to large firms. Likewise,
the digital gaps are smaller when it turns to using social media or participating in e-commerce. On the
contrary, SME gaps in adoption increase when technologies become more sophisticated or mass matters
for implementation, e.g. for ERP systems.
Technology supports further technology diffusion as complementarities take place in diffusion. This
however raises an issue as this complementarity could contribute to enlarge digital divides further, and
exacerbate the risks of seeing the benefits of the digital transformation accruing to early adopters.
Cross-industry differences in digital adoption also emerge more markedly, which advocates for considering
a differentiated policy approach towards SME digitalisation by industry and business functions. Firms in IT
services have a more intensive use of all types of digital technologies. Cloud computing is more popular
in professional scientific and technical services, construction, or administrative and support services. In
manufacturing and wholesale trade, more firms are using ERP software. In the wholesale, CRM software
as well.
In addition, some technologies are more determinant to explain variability in digital uptake across sectors
and more closely related to value creation in these sectors. For instance, high-speed broadband
connection is highly relevant to digitalisation and value creation in accommodation and food services, but
51
THE DIGITAL TRANSFORMATION OF SMES © OECD 2021
the use of portable devices is more so in the construction, and administrative and support services. In the
wholesale and retail trade, it is e-sales that correlate the most with value-added rate.
The COVID-19 crisis gave a big push to further digitalisation, SMEs aiming to move operations online in
order to survive lockdowns and the disruptions of supply chains, and to find new working arrangements in
order to accommodate constraints of social and physical distancing at work (OECD, 2020[6]).
Governments are proactive in addressing the various barriers SMEs face in going digital, including lack of
information and awareness, skills gaps, insufficient capital, missing complementary assets such as
technology itself or organisational practices, or difficulties in adapting to changing regulatory frameworks,
dealing with digital security and data protection issues, or simply accessing quality digital infrastructure
(OECD, 2019[1]).
There is a large mix of policy approaches in the area and diverging viewpoints on how to unleash SME
and entrepreneurs’ digital potential, and account for the great heterogeneity of the SME population, the
diversity of their business ecosystems and the diversity of their business needs. While some countries
have sought to mainstream SME policy considerations in other policy agendas, others specifically target
SMEs with tailor-made instruments, often combined with place-based or sector-wide policy mixes.
Further analysis and exploration would require additional evidence. First, international comparable data on
the digitalisation of micro firms are missing, despite those enterprises account on average for 90% of
business population in OECD countries. Second, considering the industrial dimension, but also the
business function(s) where the different digital tools are implemented, could provide more granularity in
the understanding of SME digital journey, its barriers and enablers. Statistical approaches could be
complemented with business use cases. Considering using other indicators of interest, e.g. investments
or spending on ICT services, could also be investigated further, especially since SMEs tend to externalise
their digitalisation instead of engaging heavy internal investments, and spending is accounted differently
in national accounts.
52
THE DIGITAL TRANSFORMATION OF SMES © OECD 2021
References
Al-Awlaqi, M., A. Aamer and N. Habtoor (2018), “The effect of entrepreneurship training on
entrepreneurial orientation: Evidence from a regression discontinuity design on micro-sized
businesses.”, International Journal of Management Education November,
http://dx.doi.org/10.1016/j.ijme.2018.11.003.
[25]
Almeling, D. (2012), “Seven Reasons Why Trade Secrets Are Increasingly Important”, Berkeley
Technology Law Journal, http://dx.doi.org/10.15779/Z38SM4F.
[58]
Andrews, D., G. Nicoletti and C. Timiliotis (2018), “Going digital: What determines technology
diffusion among firms?”, https://one.oecd.org/document/ECO/CPE/WP1(2018)8/en/pdf
(accessed on 16 July 2018).
[16]
Bertschek, I., D. Cerquera and G. Klein (2013), “More Bits - More Bucks? Measuring the Impact
of Broadband Internet on Firm Performance”, Dusseldorf Institute for Competition Economics
- Discussion Paper,
http://www.dice.hhu.de/fileadmin/redaktion/Fakultaeten/Wirtschaftswissenschaftliche_Fakulta
et/DICE/Discussion_Paper/086_Bertschek_Cerquera_Klein.pdf.
[65]
Brant, J. and S. Lohse (2014), “Trade Secrets: Tools for Innovation and Collaboration”, SSRN
Electronic Journal, http://dx.doi.org/10.2139/ssrn.2501262.
[59]
Brynjolfsson, E. and K. McElheran (2016), “The Rapid Adoption of Data-Driven Decision-
Making”, American Economic Review, Vol. 106/5, pp. 133-139,
http://dx.doi.org/10.1257/aer.p20161016.
[3]
Carini, C. et al. (2017), “Measure the Performance with the Market Value Added: Evidence from
CSR Companies”, Sustainability, Vol. 9/12, p. 2171, http://dx.doi.org/10.3390/su9122171.
[27]
Cohen, W., R. Nelson and J. Walsh (2000), Protecting Their Intellectual Assets: Appropriability
Conditions and Why U.S. Manufacturing Firms Patent (or Not), National Bureau of Economic
Research, Cambridge, MA, http://dx.doi.org/10.3386/w7552.
[53]
Contractor, F. et al. (2010), “Reconceptualizing the Firm in a World of Outsourcing and
Offshoring: The Organizational and Geographical Relocation of High-Value Company
Functions”, Journal of Management Studies, Vol. 47/8, pp. 1417-1433,
http://dx.doi.org/10.1111/j.1467-6486.2010.00945.x.
[7]
EUIPO (2017), Protecting Innovation Through Trade Secrets and Patents: Determinants for
European Union firms, https://euipo.europa.eu/tunnel-
web/secure/webdav/guest/document_library/observatory/documents/reports/Trade%20Secret
s%20Report_en.pdf.
[61]
Eurofound (2016), Sixth European Working Conditions Survey – Overview report,
http://eurofound.link/ef1634.
[40]
European Commission (2016), Trade Secrets Directives,
http://ec.europa.eu/growth/industry/intellectual-property/trade-secrets_en, accessed 15 June
2018. (accessed on 15 June 2018).
[62]
European Investment Bank (2020), Who is prepared for the new digital age? Evidence from the
EIB Investment Survey, http://www.eib.org/eibis.
[24]
53
THE DIGITAL TRANSFORMATION OF SMES © OECD 2021
Eurostat (2020), Community survey on ICT usage and e-commerce in enterprises,
https://ec.europa.eu/eurostat/web/digital-economy-and-society/data/database.
[10]
Eurostat (2020), Digital Economy and Society Indicators (DESI),
https://ec.europa.eu/eurostat/data/database (accessed on 29 November 2020).
[17]
Eurostat (2020), The Digital Economy and Society Index (DESI), https://ec.europa.eu/digital-
single-market/en/digital-economy-and-society-index-desi (accessed on 29 November 2020).
[14]
Friedman, D., W. Landes and R. Posner (1991), “Some Economics of Trade Secret Law”,
Journal of Economic Perspectives, http://dx.doi.org/10.1257/jep.5.1.61.
[60]
G20/OECD (2015), High-Level Principles on SME Financing, http://www.oecd.org/finance/G20-
OECD-High-Level-%20Principles-on-SME-Financing.pdf.
[48]
Gestrin, M. and J. Staudt (2018), The Digital Economy, Multinational Enterprises and
International Investment Policy, http://www.oecd.org/investment/investment-policy/The-digital-
economy-multinational-enterprises-and-international-investment-policy.pdf.
[8]
Hall, B. et al. (2014), “The Choice between Formal and Informal Intellectual Property: A Review”,
Journal of Economic Literature, http://dx.doi.org/10.1257/jel.52.2.1.
[55]
Haller, S. and S. Lyons (2015), “Broadband adoption and firm productivity: Evidence from Irish
manufacturing firms”, Telecommunications Policy, Vol. 39/1, pp. 1-13,
http://dx.doi.org/10.1016/j.telpol.2014.10.003.
[66]
Hewlett Packard (2020), The HP Asia SMB Report 2020. From Survival to Revival. How Asia’s
SMBs can find their way back to growth.
[34]
Hughes, A. and A. Mina (2011), The Impact of the Patent System on SMEs A Report to the
Strategic Advisory Board for Intellectual Property (SABIP), USPTO,
https://www.uspto.gov/sites/default/files/aia_implementation/ipp-2011nov08-ukipo-1.pdf
(accessed on 16 September 2018).
[57]
Ilic, M. (2010), “Economic value added as a modern performance indicator”, Perspectives of
Innovations, Economics and Business, Vol. 6/3, pp. 94-97,
http://dx.doi.org/10.15208/pieb.2010.90.
[28]
ITF (2017), ITF Transport Outlook 2017, OECD Publishing, Paris,
http://dx.doi.org/10.1787/9789282108000-en.
[68]
Jankowski, J. (2012), “Business Use of Intellectual Property Protection Documented in NSF
Survey”, https://www.nsf.gov/statistics/infbrief/nsf12307/nsf12307.pdf (accessed on
6 June 2018).
[54]
Koreen, M., A. Laboul and N. Smaini (2018), G20/OECD Effective Approaches for Implementing
the G20/OECD High-Level Principles on SME financing, OECD Publishing, Paris,
https://dx.doi.org/10.1787/329168b6-en.
[52]
Kuczera, M. (2017), “Striking the right balance: Costs and benefits of apprenticeship”, OECD
Education Working Papers, No. 153, OECD Publishing, Paris,
http://dx.doi.org/10.1787/995fff01-en.
[47]
54
THE DIGITAL TRANSFORMATION OF SMES © OECD 2021
Kushida, K., J. Murray and J. Zysman (2011), Diffusing the Cloud: Cloud Computing and
Implications for Public Policy, http://dx.doi.org/10.1007/s10842-011-0106-5.
[67]
McKinsey Global Institute (2017), “Reinventing construction: A route to higher productivity”,
https://www.mckinsey.com/business-functions/operations/our-insights/reinventing-
construction-through-a-productivity-revolution.
[31]
Mladenow, A. (2015), “Mobility for ‘Immovables’–clouds supporting the business with real
estates”, Procedia Computer Science, Vol. 63, pp. 120-127,
https://doi.org/10.1016/j.procs.2015.08.320.
[30]
OECD (2020), “Coronavirus (COVID-19): SME policy responses”, OECD Policy Responses to
Coronavirus (COVID-19), http://www.oecd.org/coronavirus/policy-responses/coronavirus-
covid-19-sme-policy-responses-04440101/.
[6]
OECD (2020), COVID-19: Tourism Policy Responses, https://www.oecd.org/coronavirus
(accessed on 29 March 2020).
[36]
OECD (2020), Financing SMEs and entrepreneurs 2020: an OECD scoreboard, OECD
Publishing, Paris, https://doi.org/10.1787/061fe03d-en.
[50]
OECD (2020), OECD Database on ICT Access and Usage by Businesses,
http://stats.oecd.org/Index.aspx?DataSetCode=ICT_BUS (accessed on 23 November 2020).
[26]
OECD (2020), OECD Digital Economy Outlook 2020, OECD Publishing, Paris,
https://dx.doi.org/10.1787/bb167041-en.
[12]
OECD (2020), OECD Digital for SMEs Global Initiative, https://www.oecd.org/going-digital/sme/
(accessed on 29 November 2020).
[32]
OECD (2020), OECD hub on policy responses to the coronavirus COVID-19,
http://www.oecd.org/coronavirus/en/ (accessed on 27 March 2020).
[37]
OECD (2020), OECD ICT Access and Usage by Businesses Database,
https://stats.oecd.org/Index.aspx?DataSetCode=ICT_BUS (accessed on 25 November 2020).
[11]
OECD (2020), OECD SDBS Structural Business Statistics Database,
https://stats.oecd.org/Index.aspx?DataSetCode=SSIS_BSC_ISIC4 (accessed on
29 November 2020).
[23]
OECD (2020), Statistical Insights: Small, Medium and Vulnerable,
https://www.oecd.org/sdd/business-stats/statistical-insights-small-medium-and-vulnerable.htm
(accessed on 29 November 2020).
[35]
OECD (2019), OECD SME and Entrepreneurship Outlook 2019, OECD Publishing, Paris,
https://dx.doi.org/10.1787/34907e9c-en.
[1]
OECD (2019), Tax Administration 2019: Comparative Information on OECD and other Advanced
and Emerging Economies, OECD Publishing, Paris, https://dx.doi.org/10.1787/74d162b6-en.
[20]
OECD (2019), Unpacking E-commerce: Business Models, Trends and Policies, OECD
Publishing, Paris, https://dx.doi.org/10.1787/23561431-en.
[19]
OECD (2018), OECD SME Ministerial Conference. Enhancing SME access to diversified
financing instruments: Plenary session 2, OECD.
[51]
55
THE DIGITAL TRANSFORMATION OF SMES © OECD 2021
OECD (2018), Productivity and Jobs in a Globalised World: (How) Can All Regions Benefit?,
OECD Publishing, Paris, http://dx.doi.org/10.1787/9789264293137-en.
[45]
OECD (2017), Key Issues for Digital Transformation in the G20, https://www.oecd.org/g20/key-
issues-for-digital-transformation-in-the-g20.pdf (accessed on 16 July 2018).
[38]
OECD (2017), OECD Digital Economy Outlook 2017, OECD Publishing, Paris,
http://dx.doi.org/10.1787/9789264276284-en.
[15]
OECD (2017), OECD ICT Access and Usage by Businesses Database,
https://stats.oecd.org/Index.aspx?DataSetCode=ICT_BUS (accessed on 18 July 2018).
[22]
OECD (2017), OECD Science, Technology and Industry Scoreboard 2017: The digital
transformation, OECD Publishing, Paris, https://dx.doi.org/10.1787/9789264268821-en.
[21]
OECD (2017), Small, Medium, Strong. Trends in SME Performance and Business Conditions,
OECD Publishing, Paris, https://dx.doi.org/10.1787/9789264275683-en.
[64]
OECD (2017), The Next Production Revolution: Implications for Governments and Business,
http://dx.doi.org/10.1787/9789264271036-en.
[2]
OECD (2016), Increasing Productivity in Small Traditional Enterprises: Programmes for
Upgrading Managerial Skills and Practice, OECD, Paris,
http://www.sela.org/media/3211842/increasing-productivity-in-small-traditional-enterprises-
oecd.pdf.
[9]
OECD (2015), “Skills and Learning Strategies for Innovation in SMEs”, Internal document -
Working Party on SMEs and Entrepreneurship,
https://one.oecd.org/document/CFE/SME(2014)3/REV2/en/pdf (accessed on 31 May 2018).
[42]
OECD (2015), The Innovation Imperative: Contributing to Productivity, Growth and Well-Being,
OECD Publishing, Paris, https://dx.doi.org/10.1787/9789264239814-en.
[5]
OECD (2014), Measuring the Digital Economy: A New Perspective, OECD Publishing, Paris,
https://doi.org/10.1787/9789264221796-en.
[13]
OECD (2013), Skills Development and Training in SMEs, OECD Skills Studies, OECD
Publishing, Paris, http://dx.doi.org/10.1787/9789264169425-en.
[41]
OECD (2012), Upgrading Workforce Skills in Small Businesses: International Review of Policy
and Experience, Report for Workshop on ‘Skills Development for SMEs and
Entrepreneurship’, OECD LEED programme,
https://www.oecd.org/cfe/leed/Skills%20Workshop%20Background%20report_Stone.pdf.
[44]
OECD (2011), OECD Guide to Measuring the Information Society 2011, OECD Publishing,
Paris, https://dx.doi.org/10.1787/9789264113541-en.
[18]
OECD (Forthcoming), Enhancing Productivity in SMEs. [43]
OECD (Forthcoming), Tackling the coronavirus: SME policy responses. [33]
OECD/European Union (2017), The Missing Entrepreneurs: Policies for Inclusive
Entrepreneurship, OECD Publishing, Paris, https://doi.org/10.1787/9789264283602-en.
[49]
56
THE DIGITAL TRANSFORMATION OF SMES © OECD 2021
OECD/ILO (2017), Engaging Employers in Apprenticeship Opportunities: Making It Happen
Locally, OECD Publishing, Paris, http://dx.doi.org/10.1787/9789264266681-en.
[46]
Rogers, E. (1962), Diffusion of Innovations, Free Press, New York. [4]
Rujan, C. and D. Dussaux (2017), Patents, trade and foreign direct investment in the European
Union, European Patent Office,
http://documents.epo.org/projects/babylon/eponet.nsf/0/AD3C8DB869617089C12581D70055
FF25/$File/patents_trade_fdi_en.pdf (accessed on 16 September 2018).
[56]
Shapira, P., J. Youtie and L. Kay (2011), “Building capabilities for innovation in SMEs: A cross-
country comparison of technology extension policies and programmes”, International Journal
of Innovation and Regional Development, Vol. 3, pp. 254-272,
http://dx.doi.org/10.1504/ijird.2011.040526.
[39]
US Patent and Trademark Office (2017), Trade Secret Policy, https://www.uspto.gov/patents-
getting-started/international-protection/trade-secret-policy (accessed on 12 June 2018).
[63]
Wang, D., W. Zhang and A. Bakhai (2004), “Comparison of Bayesian model averaging and
stepwise methods for model selection in logistic regression”, Statistics in Medicine,
Vol. 23/22, pp. 3451-3467, http://dx.doi.org/10.1002/sim.1930.
[29]
Notes
1 https://www.godaddy.com/garage/wp-content/uploads/2015/09/GoDaddy-Global-Small-Business-
Report-2015.pdf (accessed 29 November 2020).
2 China (People’s Republic of), Italy, Germany, Finland, Japan, Korea, United States, United Kingdom,
Poland, Canada, Belgium, Israel, Greece, Hungary, Netherlands, France, Australia, Portugal, Thailand,
Brazil, New Zealand, Ireland, Austria, South Africa, Philippines, Spain, India, Slovenia, Viet Nam, Mexico.
3 https://www.uschamber.com/report/small-business-coronavirus-impact-poll.
4 https://www.zdnet.com/article/brazilian-smbs-accelerate-tech-adoption-amid-pandemic/.
5 https://newsroom.cisco.com/press-release-content?type=webcontent&articleId=2095136.
6 https://www.bdc.ca/en/about/sme_research/pages/the-response-how-entrepreneurs-are-adapting-to-
pandemic.aspx.
7 http://cep.lse.ac.uk/pubs/download/cepcovid-19-009.pdf.
8 https://www.sage.com/en-gb/blog/survival-resilience-growth-report/.
9 https://usa.visa.com/dam/VCOM/global/run-your-business/documents/visa-back-to-business-study.pdf.
57
THE DIGITAL TRANSFORMATION OF SMES © OECD 2021
10 https://www.techrepublic.com/article/feeling-optimistic-71-of-microbusiness-owners-expect-to-recover-
from-covid-19-financial-hit-within-a-year/.
11 https://en.yna.co.kr/view/AEN20200827005400320.
12 https://www.afr.com/companies/financial-services/no-one-size-fits-all-for-digital-small-business-
recovery-20200827-p55pun.
13 https://connectedcouncil.org/digital-safety-net-helps-small-businesses-survive-during-covid-19/.
14 https://bcfocus.com/70-of-businesses-in-spain-have-been-digitized-during-the-pandemic/.
15 https://www.newswire.ca/news-releases/pandemic-fast-tracked-digital-transformation-for-canadian-
small-businesses-paypal-canada-survey-finds-847168737.html.
16 https://e.vnexpress.net/news/business/companies/vietnam-small-businesses-most-optimistic-in-asia-
pacific-about-post-covid-recovery-4192990.html.

59
THE DIGITAL TRANSFORMATION OF SMES © OECD 2021
This chapter covers the key issues surrounding digital security in small and
medium enterprises (SMEs). It discusses the challenges raised by the
changing nature of incidents, the prevalence and costs of cyberattacks and
human errors, and their incidence on SMEs. It highlights the growing
exposure of SMEs as digitalisation increases the economic value of data,
and their reliance on software code and connectivity. It identifies how the
COVID-19 pandemic gave opportunities for hackers to intensify attacks. It
looks into SME practices in terms of securing systems and data, and gaps
vis-à-vis large firms. Finally, this chapter presents the rationale for better
digital security policies, and how governments have attempted to improve
risk management amongst SMEs. Initiatives include legislation; certification
schemes and education and awareness campaigns to encourage uptake;
incentives to develop business solutions and “security by design”; and the
mainstreaming of SME policy considerations in national digital security
strategies.
2 Digital security in SMEs
60
THE DIGITAL TRANSFORMATION OF SMES © OECD 2021
In Brief Highlights
Cyber-attacks are a constant threat to enterprises, with criminal organisations likely to be
responsible for over half of the incidents reported in 2020. Financial profitability is the main
motive for these criminals.
Most products or services that contain software code contain vulnerabilities. Nowadays,
all enterprises, regardless of size or sector, can be exposed to malicious attacks that seek to
exploit these vulnerabilities in web applications, devices or servers.
The ideal target is a vulnerable organisation with valuable data (e.g. credentials or personal
data). Some sectors tend to be more exposed and are more targeted than others, i.e. those that
are digitally intensive, process sensitive or large volumes of data and have large cash reserves.
SMEs tend to be less digitally intensive (and possibly have lesser ability to detect security
incidents) but some factors increase their probability of suffering an incident, e.g. the nature of
their business, their sector of activity or immaturity in their digital security practices.
The digital transformation increases SME exposure to digital security risks and likelihood
to be victims of cybercrime by making them more exposed to digital security incidents and
making them more reliant on digital technology. The Internet of Things increases digital
connectivity, the number of vulnerabilities to exploit and the potential frequency or probability of
attacks. Cloud computing is resulting in increased migration of sensitive data to external parties
to the enterprise in question, which means that security and protection of that data are technically
managed by an external party. Artificial intelligence can enhance the capacity of digital security
teams but also be undermined by data poisoning and leveraged by cybercriminal organisations.
The COVID-19 crisis has made more businesses reliant on digital technology than before.
This is an opportunity for malicious actors to intensify cyber-attacks e.g. phishing then fraud.
Some of these attacks targeted sectors where social distancing and disruptions in supply chains
imposed a rapid shift towards digitalisation and working from home, e.g. retail trade, professional
services. This increased reliance also makes the potential impact of disruptions more serious
(i.e. business interruption).
Threat actors increase their sophistication over time as detection and mitigation
measures improve. Malicious techniques therefore evolve continuously requiring more
advanced risk management capacities that smaller firms are less likely to have first. Phishing,
ransomware, and denial of service attacks continue to be the most prevalent methods.
Economic damages from malicious and non-malicious incidents add up to large amounts
and can include hidden costs or under-stated losses. Absolute costs increase with firm size and
a small proportion of enterprises incur the lion’s share of total economy-wide incidents and
losses. When affected by rare but very costly incidents, SMEs can incur costs that add up to
several months of revenues. In addition, weak digital security practices may become a barrier
to them to building networks with larger enterprises, multinationals and business partners.
However, measuring the prevalence and costs of digital incidents remains a challenge
due to a lack of international standards and comparable data. Therefore, the data available
need to be interpreted with caution.
61
THE DIGITAL TRANSFORMATION OF SMES © OECD 2021
SMEs tend to have less comprehensive and sophisticated digital security risk
management practices. They often do not have a dedicated person in-house, they tend to seek
less information from external sources and do not tend to have formal procedures in place to
detect intrusions. They also tend to invest less in digital security, due partly to their lower relative
size by revenue, although this varies between sectors and countries.
SMEs tend to delegate responsibility for their digital security either explicitly to implicitly to
external third parties. In the former case, this might involve hiring external security consultants.
The latter case involves purchasing digital products or services where the security design
choices are made by the designer. This limits the control that SMEs have over the security of
their products and services and makes them reliant on the choices made by other stakeholders.
SMEs have to integrate digital security risk management into their business decisions
and processes in order to sufficiently reduce the risk they incur and the risk they may pose to
others. They also have to see digital security as an investment rather than a cost centre. As
SMEs go digital, an early change in culture and practices is increasingly critical.
Governments increasingly aim to encourage the adoption of better digital security
practices in SMEs through certification schemes, security standards, or by enforcing personal
data protection regulation, or raising awareness and building business competences on digital
security. Governments’ initiatives are often not specific to SMEs, or not specifically designed
towards this segment of the business population.
Governments also support the supply-side, through incentives for developing business
solutions that could help SMEs improve digital security risk management, or for producing more
secure digital products (“security by design”).
The mainstreaming of SME policy considerations in national digital security strategies is
emerging as a key topic. The OECD Recommendation in the area insists on considering SMEs
in strategy design and implementation, especially because of governance failures between
digital security agencies and SME policy instances.
The challenges at stake call for enhanced co-operation and knowledge exchange
between stakeholders. Within industries where actors share similar business models; between
SMEs and large firms that share similar threats with different and potentially complementary
response capacity; across jurisdictions that face no-border attacks; etc.
Introduction
We are at dawn of a new industrial era. Emerging digital technologies, such as artificial intelligence (AI),
5G or The Internet of Things (IoT), are opening tremendous market opportunities and creating entirely new
industries, but, in turn, raise new - or amplify existing - digital security risk. As small and medium-sized
enterprises connect to the digital world and move towards new digital practices, they will need to effectively
manage digital security risk so as to be able to reap the benefits of the digital transition.
Yet, some SMEs do not have the awareness, resources or expertise to effectively assess their digital risk
exposure and to implement appropriate prevention and remediation measures. Relatively poor or
inadequate digital security risk management practices could have far-reaching consequences since
smaller firms may not have the capacity to weather – even temporary - losses of reputation, consumer
trust or revenues following serious incidents. The risk is particularly pronounced in sectors where SMEs
tend to rely on sensitive or valuable data, or process significant volumes of data, such as professional
services, healthcare and retail trade.
62
THE DIGITAL TRANSFORMATION OF SMES © OECD 2021
This document discusses the challenges raised by digital (in)security, the changing nature of incidents, the
prevalence and costs of attacks and human errors, and their incidence on SMEs. It highlights the growing
exposure of SMEs as digitalisation increases the economic value of data, and their reliance on software
code, data and connectivity. It identifies some of the ways that the COVID-19 pandemic gave opportunities
for malicious actors to intensify attacks. It also looks into SME practices in terms of securing systems and
data and gaps vis-à-vis large firms. Finally, it presents the rationale for digital security and data protection
policies towards SMEs and provides examples of such government policies across the OECD area.
Digital security: Challenges for SMEs
Nature and evolution of digital security risk
Digital security incidents harm businesses, governments and individuals by undermining the availability,
integrity and/or confidentiality (the so-called “AIC triad”) of their data, information systems and networks.
A data breach is a specific sub-class of incident affecting the confidentiality of data that results in the
disclosure of data to an unauthorised party. As a consequence of digital security incidents, victims can
face tangible and intangible damages, ranging from monetary losses, reduced competitiveness,
reputational damages, interruption of operations, privacy breaches, etc. (OECD, 2020[1]).
Digital security risk results from incidents caused by threats exploiting vulnerabilities. Threat sources
include governments, groups and individuals with malicious or ill-intentioned and/or criminal purposes.
Their motivations vary, but typically include geopolitical goals for governments, profit making for criminals,
ideology for hacktivists, violence for terrorists, personal aims for thrill seekers, and discontent for insider
threats.
Incidents can also result from unintentional events such as human error, system bugs or external non-
malicious causes (e.g. power outage, lightning strikes, solar flares). These events might however be
initiated by an external malicious actor through social engineering methods, like phishing (Box 2.1).
However, due to the way in which digital systems and software are designed, users of these technologies
might make mistakes and cause financial costs or losses. The systems themselves might fail due to a bug
or other fault. Finally, non-malicious external forces might cause system failure e.g. power outage, lightning
strikes, solar flares.
Box 2.1. Digital security threats: Typology and trends
Distributed Denial of Service (DDoS) attacks are still common, but large-scale ones are rarer,
signalling a reluctance of attackers to attract attention from law enforcement for attacks that are
disproportionate in light of their benefits. DDoS attacks are a common type of incident that disrupts the
availability of an online service by flooding it with illegitimate requests, most often to extort money from
victims. To launch these attacks, malicious actors often leverage botnets, i.e. large networks of
compromised devices called drones or zombies.
Phishing remains high and is increasingly difficult to detect by humans. Phishing is a method whereby
an attacker disguises oneself as a trustworthy entity in an online communication to obtain sensitive
information, e.g. usernames and passwords, or to deliver malicious code, i.e. “malware”. There are
different types of phishing attacks, from broad untargeted campaigns aiming to collect credentials by
directing users to fake e-commerce or financial web sites, to more sophisticated spear-phishing emails
targeting specific individuals to plant malware in their organisation’s information system. Spear-phishing
remained the most popular avenue for targeted attacks in 2018 and was used by 65% of all known
cybercrime and State-sponsored groups ( (Symantec, 2019[2]). Phishing was present in 78% of digital
63
THE DIGITAL TRANSFORMATION OF SMES © OECD 2021
security espionage incidents (Verizon, 2019[3]). Yet, the frequency of phishing attacks is unclear, due
to the absence of common definitions and measurement techniques. In addition, phishing has become
increasingly sophisticated. Messages can include links to malicious sites that are difficult for end users
to detect without some automated protection. The presence of a Secure Sockets Layer padlock
pictogram, a standard security technology for establishing an encrypted link between a server and a
client, is no longer sufficient to trust a hyperlink, since an increasing number of phishing sites are hosted
on sites using technically valid digital certificates (OECD, 2020[4]).
Ransomware attacks become more targeted. Ransomware is a type of malicious software that limits
or disables the accessibility of data and demands a ransom for recovery. Ransomware can be delivered
through a phishing attack. Ransomware attacks are a form of digital extortion (ANSSI and BSI, 2018[5]).
In 2017, the Wannacry and NotPetya attacks hit media headline, as they caused billions of dollars of
damage to large businesses such as Boeing, Beiersdorf (Nivea), Deutsche Bahn, DHL, FedEx (USD
400 million), Honda, Renault, Merck (USD 870 million), Mondelez, Petrobras, PetroChina, Saint Gobain
(USD 384 million), and AP Moller Maersk (USD 300 million) (Greenberg, 2018[6]). In both cases, the
malware was designed to rapidly spread inside and outside victims’ networks, to encrypt files and to
ask for a ransom in exchange for a decryption key. Public sector organisations such as the National
Health Service in the United Kingdom and the Russian Interior Ministry were also affected (RT World
News, 2017[7]). The impact on SMEs is unknown. To increase the likelihood of a ransom being paid,
cybercriminals have been more and more choosing their victims among organisations that rely on ICTs
and are known to pay less attention to digital security. As a result, ransomware attacks evolved to
become more targeted. In 2018 and 2019, ports, airports, hospitals, healthcare organisations, and local
governments were targeted with ransom claims ranging from USD 5 000 to USD 5 million, and around
USD 1 million on average, depending on the size of the city (Kaspersky, 2019[8]). Plants and
manufacturing installations can also be paralysed if attackers get access to the IT system and
operational infrastructure that pilot physical installations.
Malware is malicious code that is always evolving to evade detection techniques and adapt to new
targets and technologies. Techniques have considerably improved, from encrypted to polymorphic and
metamorphic. Encrypted malware is the first step to evade signature-based detection. At each infection,
the malware is encrypted with a different key, making each file unique. However, security tools can still
detect the decryptor included in the code that remains the same across infections. Polymorphic malware
can create a countless number of decryptors using a mutation engine. As more sophisticated anti-
malware software can still detect polymorphic malware, attackers have developed metamorphic
malware that can completely rewrite its code so that each new version of itself propagated elsewhere
no longer matches its previous iteration without using encryption (You and Yim, 2010[9]). In 2017 and
2018, according to Webroot (2019[10]), 93% of malware were polymorphic, i.e. impossible to be detected
by simple signature-based security tools.
Source: Abridged from OECD (2020[1]), OECD Digital Economy Outlook 2020, OECD Publishing, Paris, https://doi.org/10.1787/bb167041-en.
Cyber-attacks often involve human error
Measuring the prevalence and costs of digital incidents remains a challenge due to a lack of international
standards and comparable data (Box 2.2). The data available need to be carefully interpreted because
enterprises either do not understand their real risk exposure; or do not detect incidents; or do not measure
their impact in a standard way; and might not report them at all. Nevertheless, when carefully interpreted,
some trends do emerge from the evidence.
Verizon, a large US telecommunications enterprise, recently released its Data Breach Incident Report for
2020 (Verizon, 2020[11]). Data come from a broad spectrum of government and non-government
representatives across 81 countries. Keeping in mind the methodological issues related to measuring
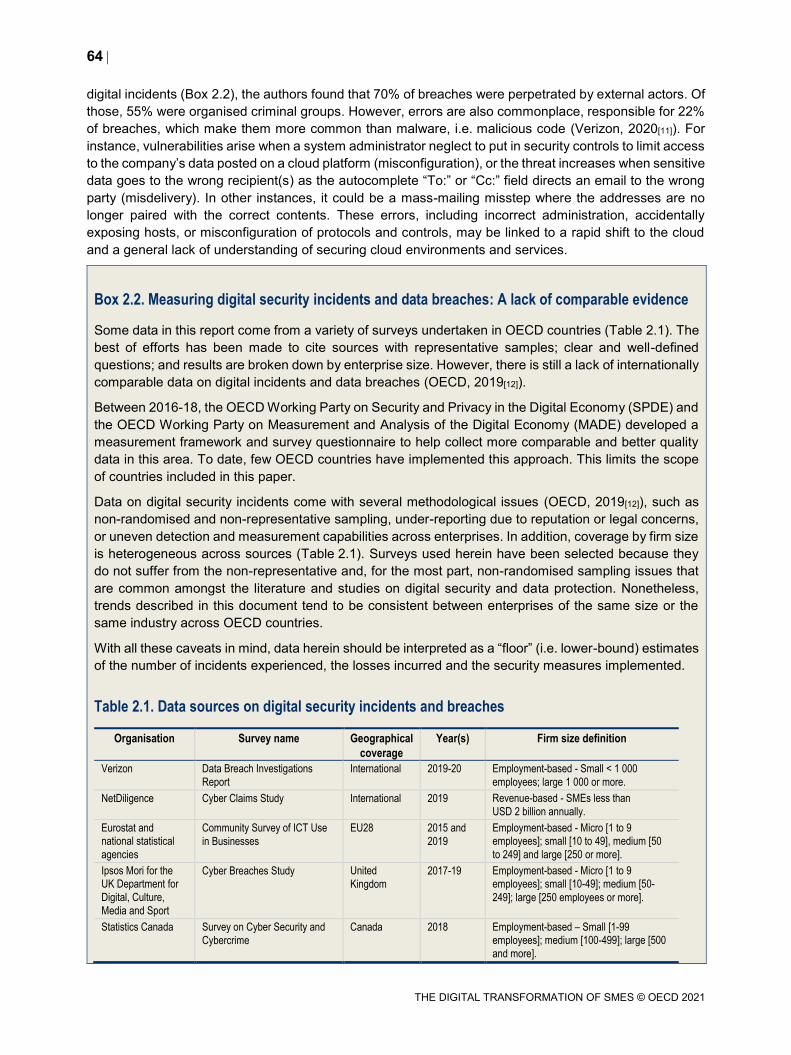
64
THE DIGITAL TRANSFORMATION OF SMES © OECD 2021
digital incidents (Box 2.2), the authors found that 70% of breaches were perpetrated by external actors. Of
those, 55% were organised criminal groups. However, errors are also commonplace, responsible for 22%
of breaches, which make them more common than malware, i.e. malicious code (Verizon, 2020[11]). For
instance, vulnerabilities arise when a system administrator neglect to put in security controls to limit access
to the company’s data posted on a cloud platform (misconfiguration), or the threat increases when sensitive
data goes to the wrong recipient(s) as the autocomplete “To:” or “Cc:” field directs an email to the wrong
party (misdelivery). In other instances, it could be a mass-mailing misstep where the addresses are no
longer paired with the correct contents. These errors, including incorrect administration, accidentally
exposing hosts, or misconfiguration of protocols and controls, may be linked to a rapid shift to the cloud
and a general lack of understanding of securing cloud environments and services.
Box 2.2. Measuring digital security incidents and data breaches: A lack of comparable evidence
Some data in this report come from a variety of surveys undertaken in OECD countries (Table 2.1). The
best of efforts has been made to cite sources with representative samples; clear and well-defined
questions; and results are broken down by enterprise size. However, there is still a lack of internationally
comparable data on digital incidents and data breaches (OECD, 2019[12]).
Between 2016-18, the OECD Working Party on Security and Privacy in the Digital Economy (SPDE) and
the OECD Working Party on Measurement and Analysis of the Digital Economy (MADE) developed a
measurement framework and survey questionnaire to help collect more comparable and better quality
data in this area. To date, few OECD countries have implemented this approach. This limits the scope
of countries included in this paper.
Data on digital security incidents come with several methodological issues (OECD, 2019[12]), such as
non-randomised and non-representative sampling, under-reporting due to reputation or legal concerns,
or uneven detection and measurement capabilities across enterprises. In addition, coverage by firm size
is heterogeneous across sources (Table 2.1). Surveys used herein have been selected because they
do not suffer from the non-representative and, for the most part, non-randomised sampling issues that
are common amongst the literature and studies on digital security and data protection. Nonetheless,
trends described in this document tend to be consistent between enterprises of the same size or the
same industry across OECD countries.
With all these caveats in mind, data herein should be interpreted as a “floor” (i.e. lower-bound) estimates
of the number of incidents experienced, the losses incurred and the security measures implemented.
Table 2.1. Data sources on digital security incidents and breaches
Organisation Survey name Geographical
coverage
Year(s) Firm size definition
Verizon Data Breach Investigations
Report
International 2019-20 Employment-based - Small < 1 000
employees; large 1 000 or more.
NetDiligence Cyber Claims Study International 2019 Revenue-based - SMEs less than
USD 2 billion annually.
Eurostat and national statistical
agencies
Community Survey of ICT Use
in Businesses
EU28 2015 and
2019
Employment-based - Micro [1 to 9 employees]; small [10 to 49], medium [50
to 249] and large [250 or more].
Ipsos Mori for the UK Department for
Digital, Culture,
Media and Sport
Cyber Breaches Study United
Kingdom 2017-19 Employment-based - Micro [1 to 9
employees]; small [10-49]; medium [50-
249]; large [250 employees or more].
Statistics Canada Survey on Cyber Security and
Cybercrime
Canada 2018 Employment-based – Small [1-99 employees]; medium [100-499]; large [500
and more].
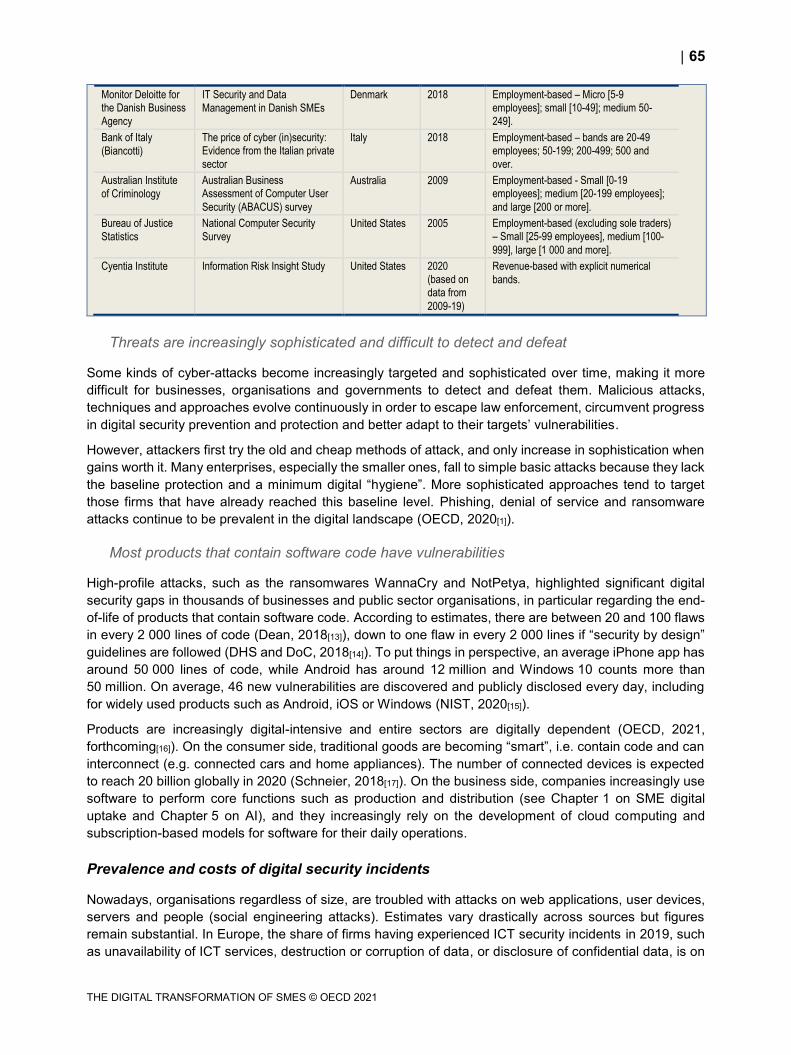
65
THE DIGITAL TRANSFORMATION OF SMES © OECD 2021
Monitor Deloitte for the Danish Business
Agency
IT Security and Data
Management in Danish SMEs
Denmark 2018 Employment-based – Micro [5-9 employees]; small [10-49]; medium 50-
249].
Bank of Italy
(Biancotti)
The price of cyber (in)security: Evidence from the Italian private
sector
Italy 2018 Employment-based – bands are 20-49 employees; 50-199; 200-499; 500 and
over.
Australian Institute
of Criminology
Australian Business Assessment of Computer User
Security (ABACUS) survey
Australia 2009 Employment-based - Small [0-19 employees]; medium [20-199 employees];
and large [200 or more].
Bureau of Justice
Statistics
National Computer Security
Survey United States 2005 Employment-based (excluding sole traders)
– Small [25-99 employees], medium [100-
999], large [1 000 and more].
Cyentia Institute Information Risk Insight Study United States 2020 (based on data from
2009-19)
Revenue-based with explicit numerical
bands.
Threats are increasingly sophisticated and difficult to detect and defeat
Some kinds of cyber-attacks become increasingly targeted and sophisticated over time, making it more
difficult for businesses, organisations and governments to detect and defeat them. Malicious attacks,
techniques and approaches evolve continuously in order to escape law enforcement, circumvent progress
in digital security prevention and protection and better adapt to their targets’ vulnerabilities.
However, attackers first try the old and cheap methods of attack, and only increase in sophistication when
gains worth it. Many enterprises, especially the smaller ones, fall to simple basic attacks because they lack
the baseline protection and a minimum digital “hygiene”. More sophisticated approaches tend to target
those firms that have already reached this baseline level. Phishing, denial of service and ransomware
attacks continue to be prevalent in the digital landscape (OECD, 2020[1]).
Most products that contain software code have vulnerabilities
High-profile attacks, such as the ransomwares WannaCry and NotPetya, highlighted significant digital
security gaps in thousands of businesses and public sector organisations, in particular regarding the end-
of-life of products that contain software code. According to estimates, there are between 20 and 100 flaws
in every 2 000 lines of code (Dean, 2018[13]), down to one flaw in every 2 000 lines if “security by design”
guidelines are followed (DHS and DoC, 2018[14]). To put things in perspective, an average iPhone app has
around 50 000 lines of code, while Android has around 12 million and Windows 10 counts more than
50 million. On average, 46 new vulnerabilities are discovered and publicly disclosed every day, including
for widely used products such as Android, iOS or Windows (NIST, 2020[15]).
Products are increasingly digital-intensive and entire sectors are digitally dependent (OECD, 2021,
forthcoming[16]). On the consumer side, traditional goods are becoming “smart”, i.e. contain code and can
interconnect (e.g. connected cars and home appliances). The number of connected devices is expected
to reach 20 billion globally in 2020 (Schneier, 2018[17]). On the business side, companies increasingly use
software to perform core functions such as production and distribution (see Chapter 1 on SME digital
uptake and Chapter 5 on AI), and they increasingly rely on the development of cloud computing and
subscription-based models for software for their daily operations.
Prevalence and costs of digital security incidents
Nowadays, organisations regardless of size, are troubled with attacks on web applications, user devices,
servers and people (social engineering attacks). Estimates vary drastically across sources but figures
remain substantial. In Europe, the share of firms having experienced ICT security incidents in 2019, such
as unavailability of ICT services, destruction or corruption of data, or disclosure of confidential data, is on
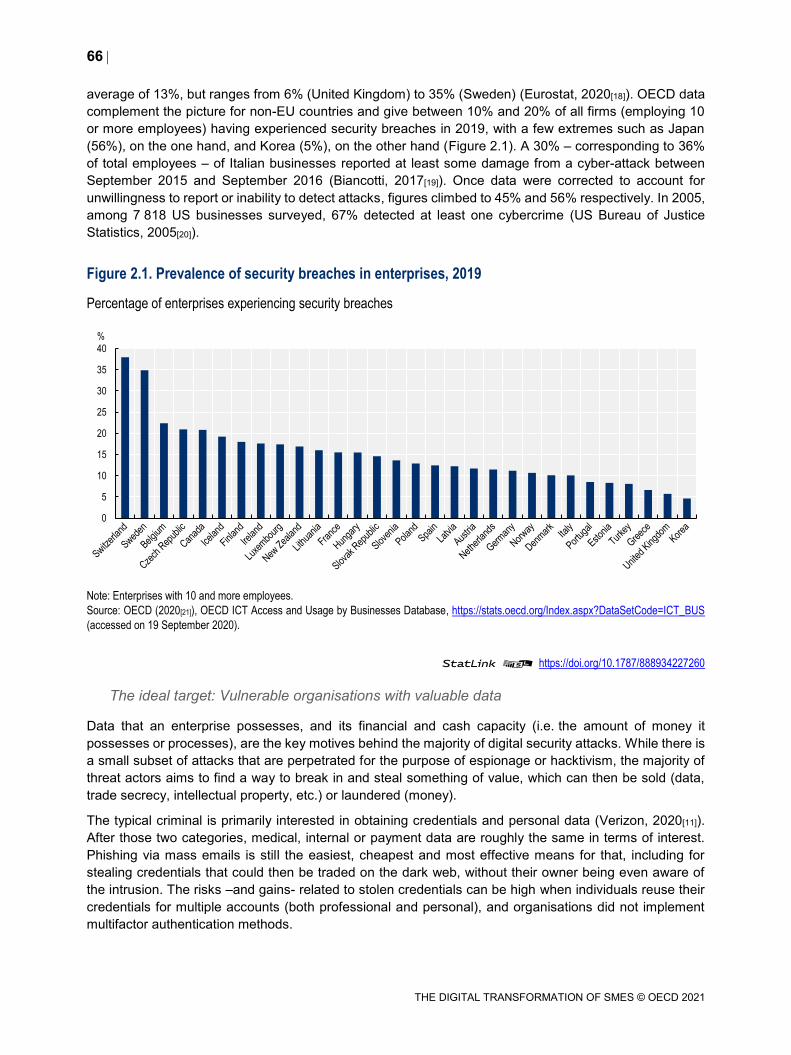
66
THE DIGITAL TRANSFORMATION OF SMES © OECD 2021
average of 13%, but ranges from 6% (United Kingdom) to 35% (Sweden) (Eurostat, 2020[18]). OECD data
complement the picture for non-EU countries and give between 10% and 20% of all firms (employing 10
or more employees) having experienced security breaches in 2019, with a few extremes such as Japan
(56%), on the one hand, and Korea (5%), on the other hand (Figure 2.1). A 30% – corresponding to 36%
of total employees – of Italian businesses reported at least some damage from a cyber-attack between
September 2015 and September 2016 (Biancotti, 2017[19]). Once data were corrected to account for
unwillingness to report or inability to detect attacks, figures climbed to 45% and 56% respectively. In 2005,
among 7 818 US businesses surveyed, 67% detected at least one cybercrime (US Bureau of Justice
Statistics, 2005[20]).
Figure 2.1. Prevalence of security breaches in enterprises, 2019
Percentage of enterprises experiencing security breaches
Note: Enterprises with 10 and more employees.
Source: OECD (2020[21]), OECD ICT Access and Usage by Businesses Database, https://stats.oecd.org/Index.aspx?DataSetCode=ICT_BUS
(accessed on 19 September 2020).
StatLink 2 https://doi.org/10.1787/888934227260
The ideal target: Vulnerable organisations with valuable data
Data that an enterprise possesses, and its financial and cash capacity (i.e. the amount of money it
possesses or processes), are the key motives behind the majority of digital security attacks. While there is
a small subset of attacks that are perpetrated for the purpose of espionage or hacktivism, the majority of
threat actors aims to find a way to break in and steal something of value, which can then be sold (data,
trade secrecy, intellectual property, etc.) or laundered (money).
The typical criminal is primarily interested in obtaining credentials and personal data (Verizon, 2020[11]).
After those two categories, medical, internal or payment data are roughly the same in terms of interest.
Phishing via mass emails is still the easiest, cheapest and most effective means for that, including for
stealing credentials that could then be traded on the dark web, without their owner being even aware of
the intrusion. The risks –and gains- related to stolen credentials can be high when individuals reuse their
credentials for multiple accounts (both professional and personal), and organisations did not implement
multifactor authentication methods.
0
5
10
15
20
25
30
35
40
%
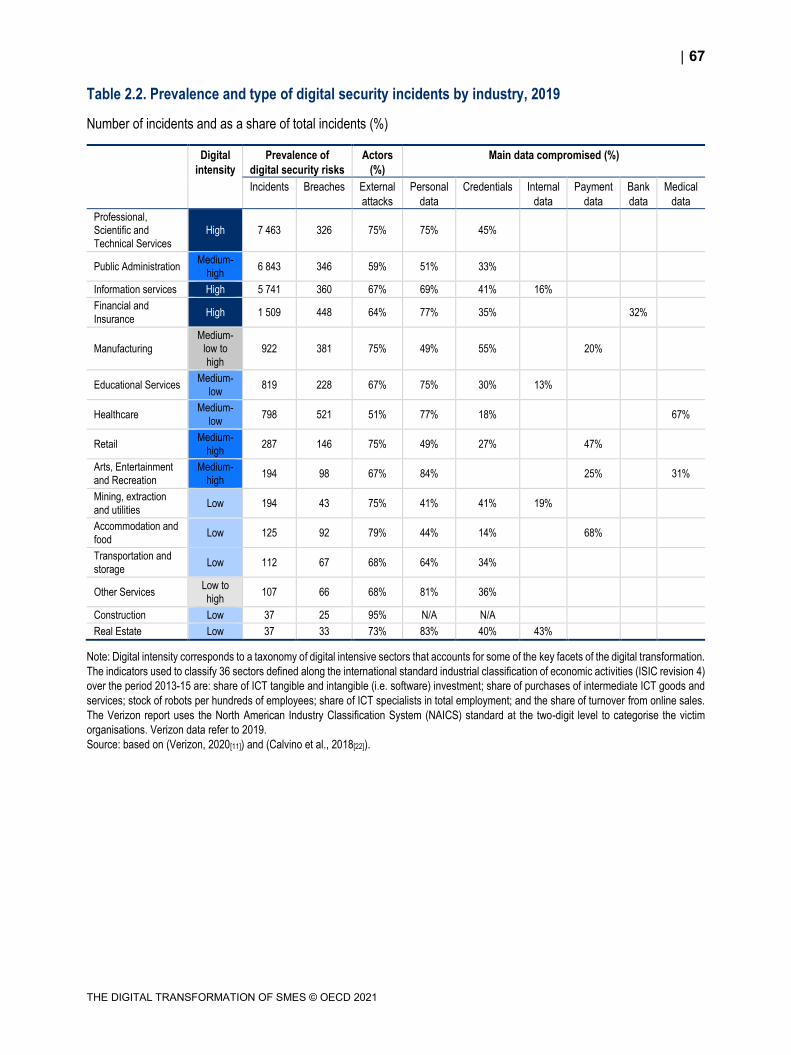
67
THE DIGITAL TRANSFORMATION OF SMES © OECD 2021
Table 2.2. Prevalence and type of digital security incidents by industry, 2019
Number of incidents and as a share of total incidents (%)
Digital
intensity
Prevalence of
digital security risks
Actors
(%)
Main data compromised (%)
Incidents Breaches External
attacks
Personal
data
Credentials Internal
data
Payment
data
Bank
data
Medical
data
Professional, Scientific and
Technical Services
High 7 463 326 75% 75% 45%
Public Administration Medium-
high 6 843 346 59% 51% 33%
Information services High 5 741 360 67% 69% 41% 16%
Financial and
Insurance High 1 509 448 64% 77% 35% 32%
Manufacturing
Medium-low to
high
922 381 75% 49% 55% 20%
Educational Services Medium-
low 819 228 67% 75% 30% 13%
Healthcare Medium-
low 798 521 51% 77% 18% 67%
Retail Medium-
high 287 146 75% 49% 27% 47%
Arts, Entertainment
and Recreation
Medium-
high 194 98 67% 84% 25% 31%
Mining, extraction
and utilities Low 194 43 75% 41% 41% 19%
Accommodation and
food Low 125 92 79% 44% 14% 68%
Transportation and
storage Low 112 67 68% 64% 34%
Other Services Low to
high 107 66 68% 81% 36%
Construction Low 37 25 95% N/A N/A
Real Estate Low 37 33 73% 83% 40% 43%
Note: Digital intensity corresponds to a taxonomy of digital intensive sectors that accounts for some of the key facets of the digital transformation.
The indicators used to classify 36 sectors defined along the international standard industrial classification of economic activities (ISIC revision 4)
over the period 2013-15 are: share of ICT tangible and intangible (i.e. software) investment; share of purchases of intermediate ICT goods and
services; stock of robots per hundreds of employees; share of ICT specialists in total employment; and the share of turnover from online sales.
The Verizon report uses the North American Industry Classification System (NAICS) standard at the two-digit level to categorise the victim
organisations. Verizon data refer to 2019.
Source: based on (Verizon, 2020[11]) and (Calvino et al., 2018[22]).
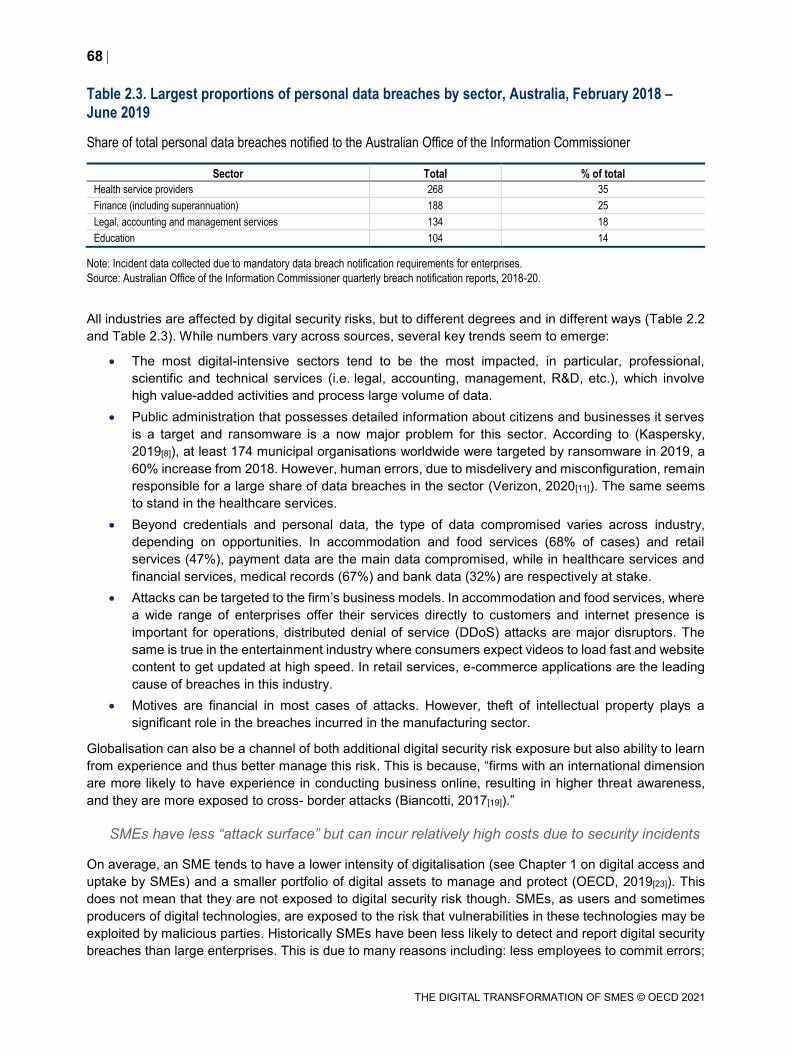
68
THE DIGITAL TRANSFORMATION OF SMES © OECD 2021
Table 2.3. Largest proportions of personal data breaches by sector, Australia, February 2018 – June 2019
Share of total personal data breaches notified to the Australian Office of the Information Commissioner
Sector Total % of total
Health service providers 268 35
Finance (including superannuation) 188 25
Legal, accounting and management services 134 18
Education 104 14
Note: Incident data collected due to mandatory data breach notification requirements for enterprises.
Source: Australian Office of the Information Commissioner quarterly breach notification reports, 2018-20.
All industries are affected by digital security risks, but to different degrees and in different ways (Table 2.2
and Table 2.3). While numbers vary across sources, several key trends seem to emerge:
The most digital-intensive sectors tend to be the most impacted, in particular, professional,
scientific and technical services (i.e. legal, accounting, management, R&D, etc.), which involve
high value-added activities and process large volume of data.
Public administration that possesses detailed information about citizens and businesses it serves
is a target and ransomware is a now major problem for this sector. According to (Kaspersky,
2019[8]), at least 174 municipal organisations worldwide were targeted by ransomware in 2019, a
60% increase from 2018. However, human errors, due to misdelivery and misconfiguration, remain
responsible for a large share of data breaches in the sector (Verizon, 2020[11]). The same seems
to stand in the healthcare services.
Beyond credentials and personal data, the type of data compromised varies across industry,
depending on opportunities. In accommodation and food services (68% of cases) and retail
services (47%), payment data are the main data compromised, while in healthcare services and
financial services, medical records (67%) and bank data (32%) are respectively at stake.
Attacks can be targeted to the firm’s business models. In accommodation and food services, where
a wide range of enterprises offer their services directly to customers and internet presence is
important for operations, distributed denial of service (DDoS) attacks are major disruptors. The
same is true in the entertainment industry where consumers expect videos to load fast and website
content to get updated at high speed. In retail services, e-commerce applications are the leading
cause of breaches in this industry.
Motives are financial in most cases of attacks. However, theft of intellectual property plays a
significant role in the breaches incurred in the manufacturing sector.
Globalisation can also be a channel of both additional digital security risk exposure but also ability to learn
from experience and thus better manage this risk. This is because, “firms with an international dimension
are more likely to have experience in conducting business online, resulting in higher threat awareness,
and they are more exposed to cross- border attacks (Biancotti, 2017[19]).”
SMEs have less “attack surface” but can incur relatively high costs due to security incidents
On average, an SME tends to have a lower intensity of digitalisation (see Chapter 1 on digital access and
uptake by SMEs) and a smaller portfolio of digital assets to manage and protect (OECD, 2019[23]). This
does not mean that they are not exposed to digital security risk though. SMEs, as users and sometimes
producers of digital technologies, are exposed to the risk that vulnerabilities in these technologies may be
exploited by malicious parties. Historically SMEs have been less likely to detect and report digital security
breaches than large enterprises. This is due to many reasons including: less employees to commit errors;
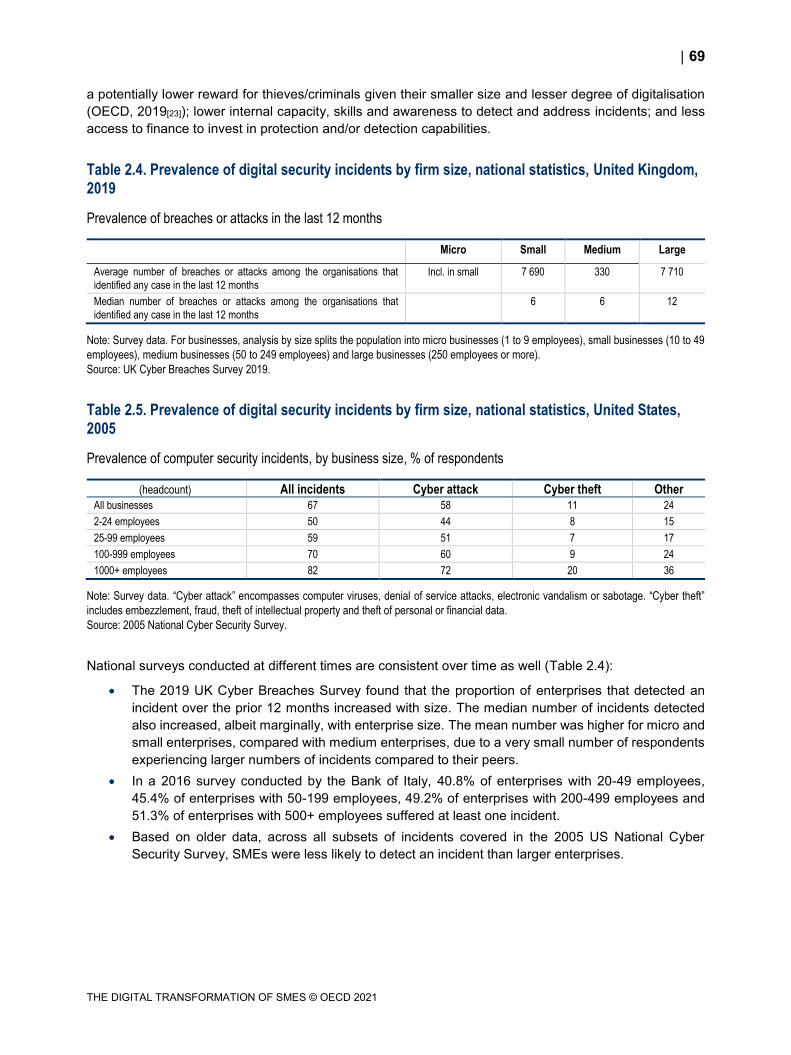
69
THE DIGITAL TRANSFORMATION OF SMES © OECD 2021
a potentially lower reward for thieves/criminals given their smaller size and lesser degree of digitalisation
(OECD, 2019[23]); lower internal capacity, skills and awareness to detect and address incidents; and less
access to finance to invest in protection and/or detection capabilities.
Table 2.4. Prevalence of digital security incidents by firm size, national statistics, United Kingdom, 2019
Prevalence of breaches or attacks in the last 12 months
Micro Small Medium Large
Average number of breaches or attacks among the organisations that
identified any case in the last 12 months Incl. in small 7 690 330 7 710
Median number of breaches or attacks among the organisations that
identified any case in the last 12 months
6 6 12
Note: Survey data. For businesses, analysis by size splits the population into micro businesses (1 to 9 employees), small businesses (10 to 49
employees), medium businesses (50 to 249 employees) and large businesses (250 employees or more).
Source: UK Cyber Breaches Survey 2019.
Table 2.5. Prevalence of digital security incidents by firm size, national statistics, United States, 2005
Prevalence of computer security incidents, by business size, % of respondents
(headcount) All incidents Cyber attack Cyber theft Other All businesses 67 58 11 24
2-24 employees 50 44 8 15
25-99 employees 59 51 7 17
100-999 employees 70 60 9 24
1000+ employees 82 72 20 36
Note: Survey data. “Cyber attack” encompasses computer viruses, denial of service attacks, electronic vandalism or sabotage. “Cyber theft”
includes embezzlement, fraud, theft of intellectual property and theft of personal or financial data.
Source: 2005 National Cyber Security Survey.
National surveys conducted at different times are consistent over time as well (Table 2.4):
The 2019 UK Cyber Breaches Survey found that the proportion of enterprises that detected an
incident over the prior 12 months increased with size. The median number of incidents detected
also increased, albeit marginally, with enterprise size. The mean number was higher for micro and
small enterprises, compared with medium enterprises, due to a very small number of respondents
experiencing larger numbers of incidents compared to their peers.
In a 2016 survey conducted by the Bank of Italy, 40.8% of enterprises with 20-49 employees,
45.4% of enterprises with 50-199 employees, 49.2% of enterprises with 200-499 employees and
51.3% of enterprises with 500+ employees suffered at least one incident.
Based on older data, across all subsets of incidents covered in the 2005 US National Cyber
Security Survey, SMEs were less likely to detect an incident than larger enterprises.
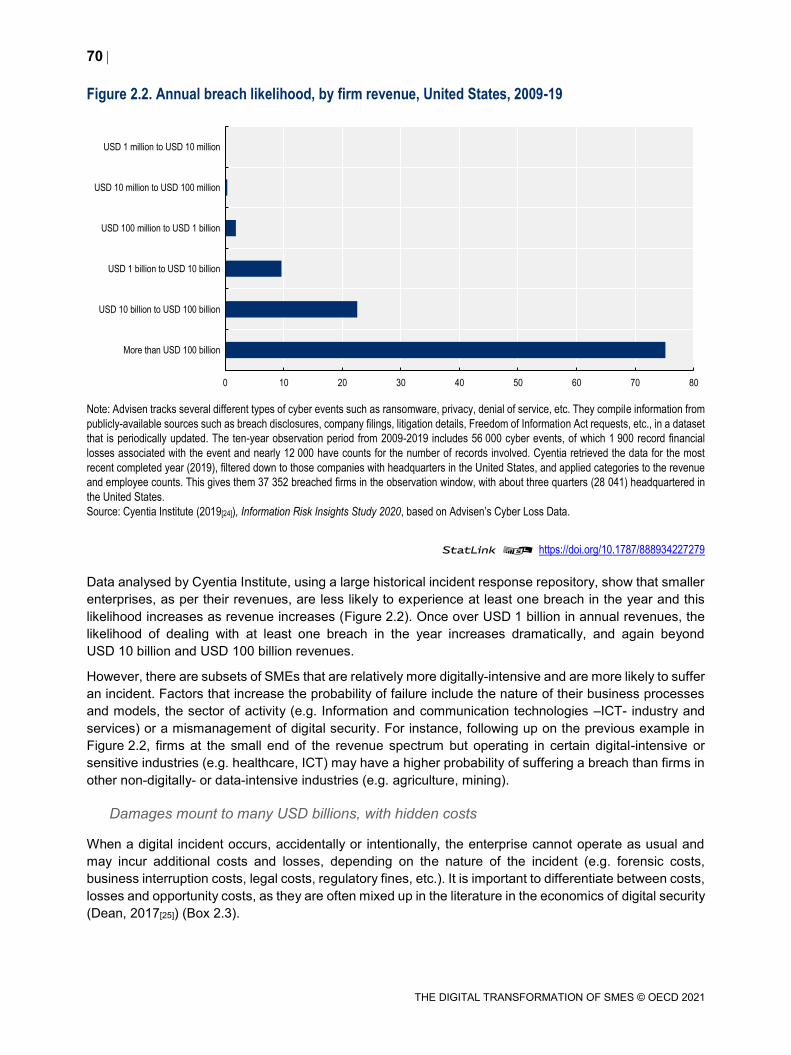
70
THE DIGITAL TRANSFORMATION OF SMES © OECD 2021
Figure 2.2. Annual breach likelihood, by firm revenue, United States, 2009-19
Note: Advisen tracks several different types of cyber events such as ransomware, privacy, denial of service, etc. They compile information from
publicly-available sources such as breach disclosures, company filings, litigation details, Freedom of Information Act requests, etc., in a dataset
that is periodically updated. The ten-year observation period from 2009-2019 includes 56 000 cyber events, of which 1 900 record financial
losses associated with the event and nearly 12 000 have counts for the number of records involved. Cyentia retrieved the data for the most
recent completed year (2019), filtered down to those companies with headquarters in the United States, and applied categories to the revenue
and employee counts. This gives them 37 352 breached firms in the observation window, with about three quarters (28 041) headquartered in
the United States.
Source: Cyentia Institute (2019[24]), Information Risk Insights Study 2020, based on Advisen’s Cyber Loss Data.
StatLink 2 https://doi.org/10.1787/888934227279
Data analysed by Cyentia Institute, using a large historical incident response repository, show that smaller
enterprises, as per their revenues, are less likely to experience at least one breach in the year and this
likelihood increases as revenue increases (Figure 2.2). Once over USD 1 billion in annual revenues, the
likelihood of dealing with at least one breach in the year increases dramatically, and again beyond
USD 10 billion and USD 100 billion revenues.
However, there are subsets of SMEs that are relatively more digitally-intensive and are more likely to suffer
an incident. Factors that increase the probability of failure include the nature of their business processes
and models, the sector of activity (e.g. Information and communication technologies –ICT- industry and
services) or a mismanagement of digital security. For instance, following up on the previous example in
Figure 2.2, firms at the small end of the revenue spectrum but operating in certain digital-intensive or
sensitive industries (e.g. healthcare, ICT) may have a higher probability of suffering a breach than firms in
other non-digitally- or data-intensive industries (e.g. agriculture, mining).
Damages mount to many USD billions, with hidden costs
When a digital incident occurs, accidentally or intentionally, the enterprise cannot operate as usual and
may incur additional costs and losses, depending on the nature of the incident (e.g. forensic costs,
business interruption costs, legal costs, regulatory fines, etc.). It is important to differentiate between costs,
losses and opportunity costs, as they are often mixed up in the literature in the economics of digital security
(Dean, 2017[25]) (Box 2.3).
0 10 20 30 40 50 60 70 80
More than USD 100 billion
USD 10 billion to USD 100 billion
USD 1 billion to USD 10 billion
USD 100 million to USD 1 billion
USD 10 million to USD 100 million
USD 1 million to USD 10 million
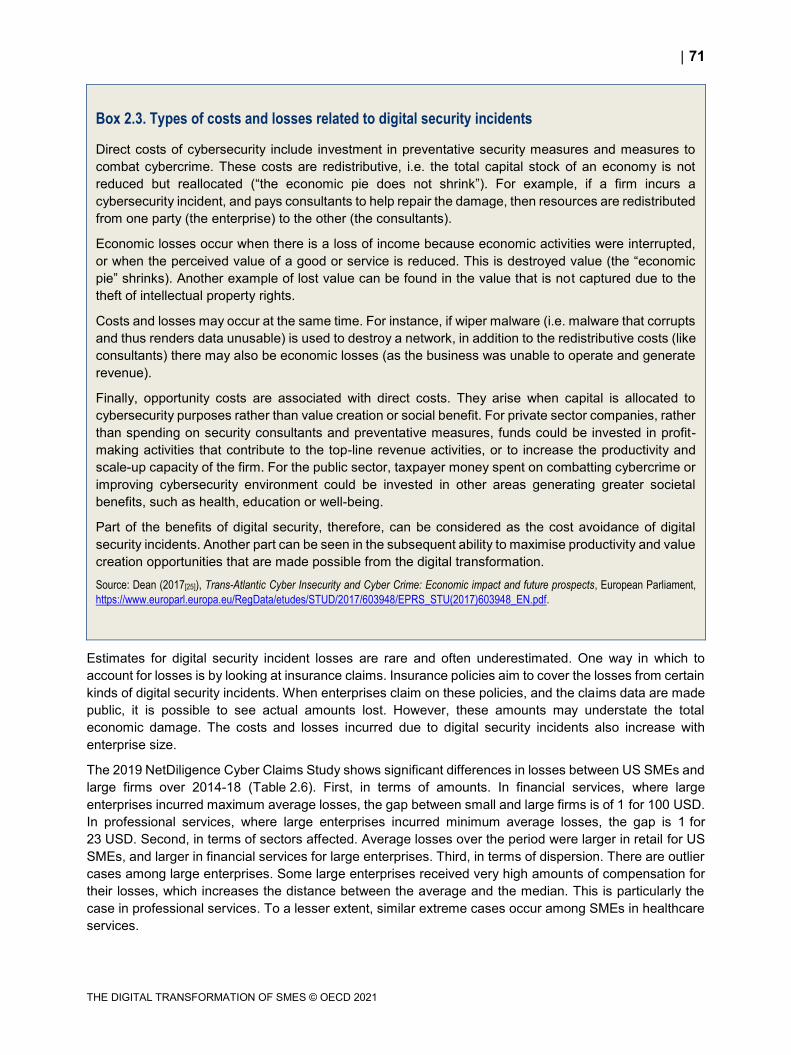
71
THE DIGITAL TRANSFORMATION OF SMES © OECD 2021
Box 2.3. Types of costs and losses related to digital security incidents
Direct costs of cybersecurity include investment in preventative security measures and measures to
combat cybercrime. These costs are redistributive, i.e. the total capital stock of an economy is not
reduced but reallocated (“the economic pie does not shrink”). For example, if a firm incurs a
cybersecurity incident, and pays consultants to help repair the damage, then resources are redistributed
from one party (the enterprise) to the other (the consultants).
Economic losses occur when there is a loss of income because economic activities were interrupted,
or when the perceived value of a good or service is reduced. This is destroyed value (the “economic
pie” shrinks). Another example of lost value can be found in the value that is not captured due to the
theft of intellectual property rights.
Costs and losses may occur at the same time. For instance, if wiper malware (i.e. malware that corrupts
and thus renders data unusable) is used to destroy a network, in addition to the redistributive costs (like
consultants) there may also be economic losses (as the business was unable to operate and generate
revenue).
Finally, opportunity costs are associated with direct costs. They arise when capital is allocated to
cybersecurity purposes rather than value creation or social benefit. For private sector companies, rather
than spending on security consultants and preventative measures, funds could be invested in profit-
making activities that contribute to the top-line revenue activities, or to increase the productivity and
scale-up capacity of the firm. For the public sector, taxpayer money spent on combatting cybercrime or
improving cybersecurity environment could be invested in other areas generating greater societal
benefits, such as health, education or well-being.
Part of the benefits of digital security, therefore, can be considered as the cost avoidance of digital
security incidents. Another part can be seen in the subsequent ability to maximise productivity and value
creation opportunities that are made possible from the digital transformation.
Source: Dean (2017[25]), Trans-Atlantic Cyber Insecurity and Cyber Crime: Economic impact and future prospects, European Parliament,
https://www.europarl.europa.eu/RegData/etudes/STUD/2017/603948/EPRS_STU(2017)603948_EN.pdf.
Estimates for digital security incident losses are rare and often underestimated. One way in which to
account for losses is by looking at insurance claims. Insurance policies aim to cover the losses from certain
kinds of digital security incidents. When enterprises claim on these policies, and the claims data are made
public, it is possible to see actual amounts lost. However, these amounts may understate the total
economic damage. The costs and losses incurred due to digital security incidents also increase with
enterprise size.
The 2019 NetDiligence Cyber Claims Study shows significant differences in losses between US SMEs and
large firms over 2014-18 (Table 2.6). First, in terms of amounts. In financial services, where large
enterprises incurred maximum average losses, the gap between small and large firms is of 1 for 100 USD.
In professional services, where large enterprises incurred minimum average losses, the gap is 1 for
23 USD. Second, in terms of sectors affected. Average losses over the period were larger in retail for US
SMEs, and larger in financial services for large enterprises. Third, in terms of dispersion. There are outlier
cases among large enterprises. Some large enterprises received very high amounts of compensation for
their losses, which increases the distance between the average and the median. This is particularly the
case in professional services. To a lesser extent, similar extreme cases occur among SMEs in healthcare
services.
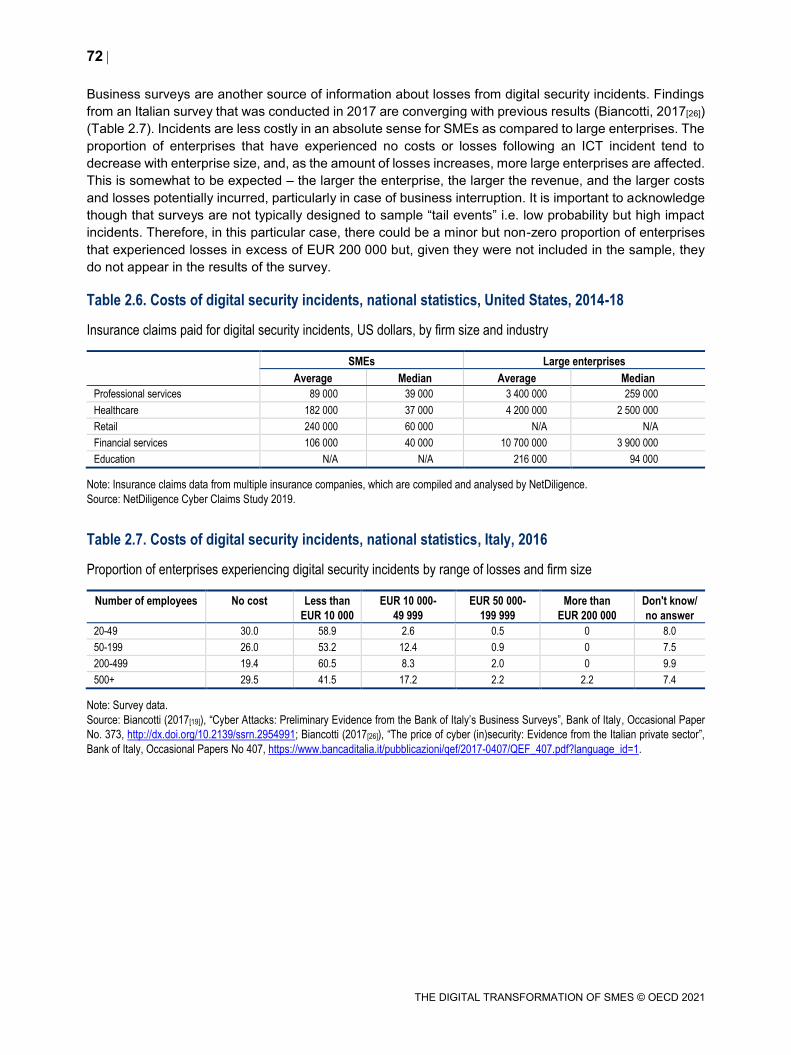
72
THE DIGITAL TRANSFORMATION OF SMES © OECD 2021
Business surveys are another source of information about losses from digital security incidents. Findings
from an Italian survey that was conducted in 2017 are converging with previous results (Biancotti, 2017[26])
(Table 2.7). Incidents are less costly in an absolute sense for SMEs as compared to large enterprises. The
proportion of enterprises that have experienced no costs or losses following an ICT incident tend to
decrease with enterprise size, and, as the amount of losses increases, more large enterprises are affected.
This is somewhat to be expected – the larger the enterprise, the larger the revenue, and the larger costs
and losses potentially incurred, particularly in case of business interruption. It is important to acknowledge
though that surveys are not typically designed to sample “tail events” i.e. low probability but high impact
incidents. Therefore, in this particular case, there could be a minor but non-zero proportion of enterprises
that experienced losses in excess of EUR 200 000 but, given they were not included in the sample, they
do not appear in the results of the survey.
Table 2.6. Costs of digital security incidents, national statistics, United States, 2014-18
Insurance claims paid for digital security incidents, US dollars, by firm size and industry
SMEs Large enterprises
Average Median Average Median
Professional services 89 000 39 000 3 400 000 259 000
Healthcare 182 000 37 000 4 200 000 2 500 000
Retail 240 000 60 000 N/A N/A
Financial services 106 000 40 000 10 700 000 3 900 000
Education N/A N/A 216 000 94 000
Note: Insurance claims data from multiple insurance companies, which are compiled and analysed by NetDiligence.
Source: NetDiligence Cyber Claims Study 2019.
Table 2.7. Costs of digital security incidents, national statistics, Italy, 2016
Proportion of enterprises experiencing digital security incidents by range of losses and firm size
Number of employees No cost Less than
EUR 10 000
EUR 10 000-
49 999
EUR 50 000-
199 999
More than
EUR 200 000
Don't know/
no answer
20-49 30.0 58.9 2.6 0.5 0 8.0
50-199 26.0 53.2 12.4 0.9 0 7.5
200-499 19.4 60.5 8.3 2.0 0 9.9
500+ 29.5 41.5 17.2 2.2 2.2 7.4
Note: Survey data.
Source: Biancotti (2017[19]), “Cyber Attacks: Preliminary Evidence from the Bank of Italy’s Business Surveys”, Bank of Italy, Occasional Paper
No. 373, http://dx.doi.org/10.2139/ssrn.2954991; Biancotti (2017[26]), “The price of cyber (in)security: Evidence from the Italian private sector”,
Bank of Italy, Occasional Papers No 407, https://www.bancaditalia.it/pubblicazioni/qef/2017-0407/QEF_407.pdf?language_id=1.
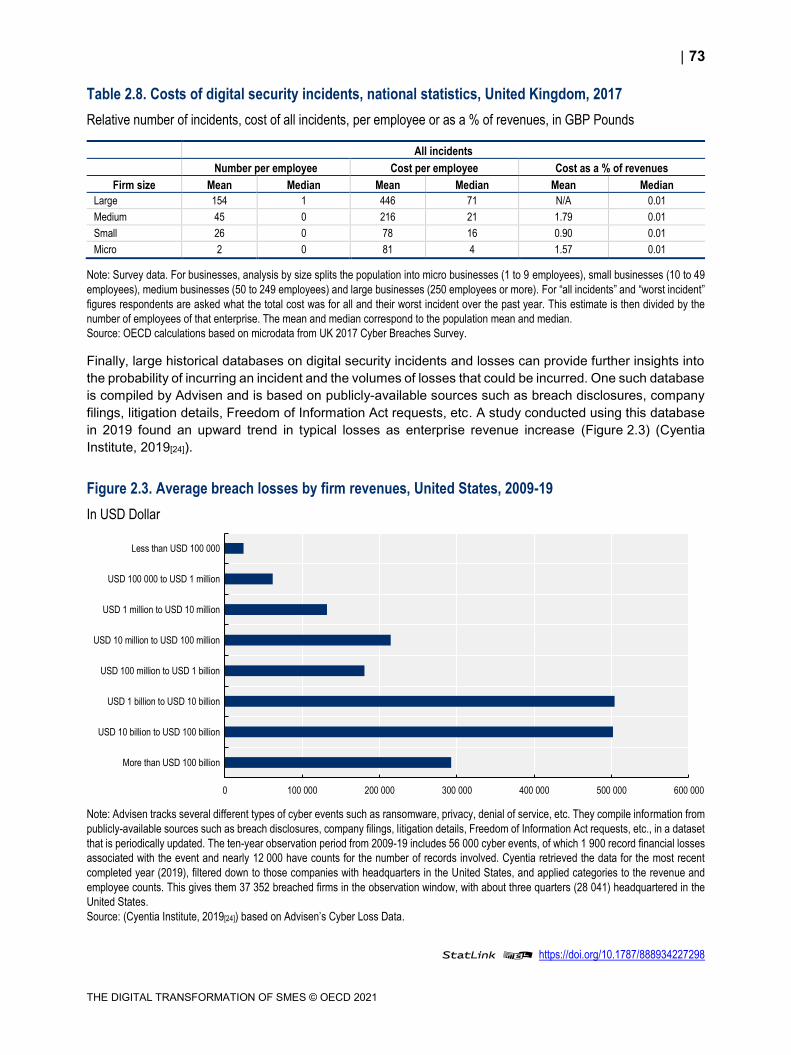
73
THE DIGITAL TRANSFORMATION OF SMES © OECD 2021
Table 2.8. Costs of digital security incidents, national statistics, United Kingdom, 2017
Relative number of incidents, cost of all incidents, per employee or as a % of revenues, in GBP Pounds
All incidents
Number per employee Cost per employee Cost as a % of revenues
Firm size Mean Median Mean Median Mean Median
Large 154 1 446 71 N/A 0.01
Medium 45 0 216 21 1.79 0.01
Small 26 0 78 16 0.90 0.01
Micro 2 0 81 4 1.57 0.01
Note: Survey data. For businesses, analysis by size splits the population into micro businesses (1 to 9 employees), small businesses (10 to 49
employees), medium businesses (50 to 249 employees) and large businesses (250 employees or more). For “all incidents” and “worst incident”
figures respondents are asked what the total cost was for all and their worst incident over the past year. This estimate is then divided by the
number of employees of that enterprise. The mean and median correspond to the population mean and median.
Source: OECD calculations based on microdata from UK 2017 Cyber Breaches Survey.
Finally, large historical databases on digital security incidents and losses can provide further insights into
the probability of incurring an incident and the volumes of losses that could be incurred. One such database
is compiled by Advisen and is based on publicly-available sources such as breach disclosures, company
filings, litigation details, Freedom of Information Act requests, etc. A study conducted using this database
in 2019 found an upward trend in typical losses as enterprise revenue increase (Figure 2.3) (Cyentia
Institute, 2019[24]).
Figure 2.3. Average breach losses by firm revenues, United States, 2009-19
In USD Dollar
Note: Advisen tracks several different types of cyber events such as ransomware, privacy, denial of service, etc. They compile information from
publicly-available sources such as breach disclosures, company filings, litigation details, Freedom of Information Act requests, etc., in a dataset
that is periodically updated. The ten-year observation period from 2009-19 includes 56 000 cyber events, of which 1 900 record financial losses
associated with the event and nearly 12 000 have counts for the number of records involved. Cyentia retrieved the data for the most recent
completed year (2019), filtered down to those companies with headquarters in the United States, and applied categories to the revenue and
employee counts. This gives them 37 352 breached firms in the observation window, with about three quarters (28 041) headquartered in the
United States.
Source: (Cyentia Institute, 2019[24]) based on Advisen’s Cyber Loss Data.
StatLink 2 https://doi.org/10.1787/888934227298
0 100 000 200 000 300 000 400 000 500 000 600 000
More than USD 100 billion
USD 10 billion to USD 100 billion
USD 1 billion to USD 10 billion
USD 100 million to USD 1 billion
USD 10 million to USD 100 million
USD 1 million to USD 10 million
USD 100 000 to USD 1 million
Less than USD 100 000
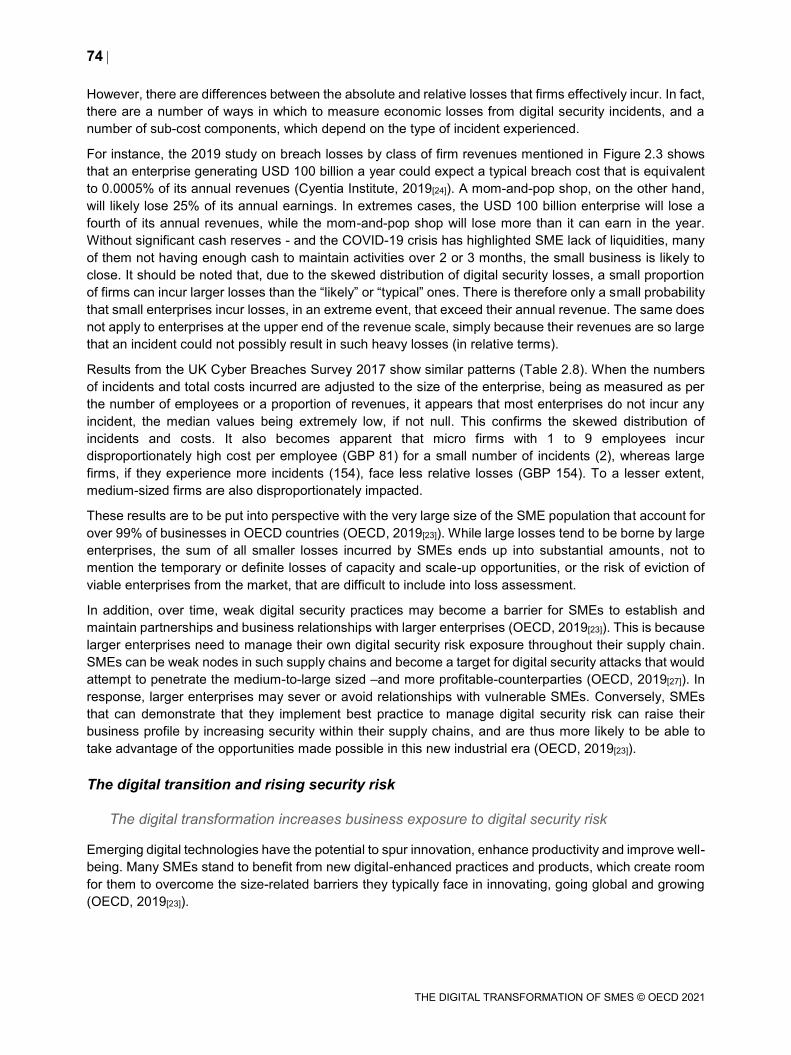
74
THE DIGITAL TRANSFORMATION OF SMES © OECD 2021
However, there are differences between the absolute and relative losses that firms effectively incur. In fact,
there are a number of ways in which to measure economic losses from digital security incidents, and a
number of sub-cost components, which depend on the type of incident experienced.
For instance, the 2019 study on breach losses by class of firm revenues mentioned in Figure 2.3 shows
that an enterprise generating USD 100 billion a year could expect a typical breach cost that is equivalent
to 0.0005% of its annual revenues (Cyentia Institute, 2019[24]). A mom-and-pop shop, on the other hand,
will likely lose 25% of its annual earnings. In extremes cases, the USD 100 billion enterprise will lose a
fourth of its annual revenues, while the mom-and-pop shop will lose more than it can earn in the year.
Without significant cash reserves - and the COVID-19 crisis has highlighted SME lack of liquidities, many
of them not having enough cash to maintain activities over 2 or 3 months, the small business is likely to
close. It should be noted that, due to the skewed distribution of digital security losses, a small proportion
of firms can incur larger losses than the “likely” or “typical” ones. There is therefore only a small probability
that small enterprises incur losses, in an extreme event, that exceed their annual revenue. The same does
not apply to enterprises at the upper end of the revenue scale, simply because their revenues are so large
that an incident could not possibly result in such heavy losses (in relative terms).
Results from the UK Cyber Breaches Survey 2017 show similar patterns (Table 2.8). When the numbers
of incidents and total costs incurred are adjusted to the size of the enterprise, being as measured as per
the number of employees or a proportion of revenues, it appears that most enterprises do not incur any
incident, the median values being extremely low, if not null. This confirms the skewed distribution of
incidents and costs. It also becomes apparent that micro firms with 1 to 9 employees incur
disproportionately high cost per employee (GBP 81) for a small number of incidents (2), whereas large
firms, if they experience more incidents (154), face less relative losses (GBP 154). To a lesser extent,
medium-sized firms are also disproportionately impacted.
These results are to be put into perspective with the very large size of the SME population that account for
over 99% of businesses in OECD countries (OECD, 2019[23]). While large losses tend to be borne by large
enterprises, the sum of all smaller losses incurred by SMEs ends up into substantial amounts, not to
mention the temporary or definite losses of capacity and scale-up opportunities, or the risk of eviction of
viable enterprises from the market, that are difficult to include into loss assessment.
In addition, over time, weak digital security practices may become a barrier for SMEs to establish and
maintain partnerships and business relationships with larger enterprises (OECD, 2019[23]). This is because
larger enterprises need to manage their own digital security risk exposure throughout their supply chain.
SMEs can be weak nodes in such supply chains and become a target for digital security attacks that would
attempt to penetrate the medium-to-large sized –and more profitable-counterparties (OECD, 2019[27]). In
response, larger enterprises may sever or avoid relationships with vulnerable SMEs. Conversely, SMEs
that can demonstrate that they implement best practice to manage digital security risk can raise their
business profile by increasing security within their supply chains, and are thus more likely to be able to
take advantage of the opportunities made possible in this new industrial era (OECD, 2019[23]).
The digital transition and rising security risk
The digital transformation increases business exposure to digital security risk
Emerging digital technologies have the potential to spur innovation, enhance productivity and improve well-
being. Many SMEs stand to benefit from new digital-enhanced practices and products, which create room
for them to overcome the size-related barriers they typically face in innovating, going global and growing
(OECD, 2019[23]).
75
THE DIGITAL TRANSFORMATION OF SMES © OECD 2021
Box 2.4. Artificial intelligence and digital security: The double-edged sword
An AI system enables making predictions, recommendations, or decisions that can influence real or
virtual worlds (OECD, 2019[28]). How AI will transform digital security is likely to be by both supporting
and challenging it.
AI techniques applied to digital security cover detection, repair and specification analysis. AI can help
improve digital security by enhancing the capability of digital security teams. Digital security systems
can be trained to identify the behaviour of malware and detect them before they enter IT systems or
create damages. Given the shortage of skilled digital security professionals and the increasing volume
of vulnerabilities, the automation of basic digital security tasks can help monitor higher volumes of
security data. The deployment of AI powered security applications can therefore contribute to reduce
time and costs of dealing with digital security threats. In addition, automation can reduce the likelihood
of human errors and negligence, and AI can help develop code with fewer vulnerabilities.
AI can however create new digital security challenges because AI security techniques are also
vulnerable to attacks. AI systems can be affected by new techniques that leverage their heavy
dependence on data to be trained. Data poisoning, adversarial input and model attack, for instance by
introducing bad data points, can disrupt the learning process of AI and make it inoperant.
AI is not yet widely used in cyber-attacks because cheaper techniques continue to be effective. As the
cost of AI decreases, malicious actors are likely to turn towards more sophisticated approaches and
leverage the AI potential for cybercrime, which will accelerate the digital security race between the
attackers and the defenders.
Source: OECD (2020[1]), OECD Digital Economy Outlook 2020, OECD Publishing, Paris, https://doi.org/10.1787/bb167041-en.
However, the digital transformation also increases business digital dependency and exposure to digital
security risk. The advancement of computing technology and storage capacities have encouraged the
widespread use of personal computing devices and the production of data. The Internet, smart apps and
big data increase the volume of data available. The 5G broadband increases the speed and volume of
data transfer. Artificial intelligence increases business capacity to make use and sense of it (OECD,
2017[29]). In addition, there is a non-negligible risk that AI creates new digital security challenges (Box 2.4).
In fact, digital security incidents can affect all information systems, including those that rely on AI.
The Internet of Things (IoT), i.e. hyper-connectivity of sensors, devices, and systems that support machine-
to-machine communication, will dramatically increase the volume of data available (and exploitable through
AI and machine learning). Yet, with the IoT, the likelihood of security incidents is likely to grow, the IoT
components becoming both targets of attacks and channels for disrupting physical systems (OECD,
2019[23]). As IoT can bridge the online and offline worlds, digital damages are likely to extend to the physical
environment. Cyberattacks could increasingly alter the functioning of control and monitoring systems (e.g.
self-driving cars, medical devices, etc.) or defense and security systems and disrupt the supply of essential
services (e.g. electricity, heating, water, finance, transport), with lethal consequences.
Cloud computing allows access to extra processing power or storage capacity online, as well as databases
and software, and supports the diffusion of other digital technologies, as well as innovative business
practices (OECD, 2019[23]). Due to its flexibility and scalability, cloud computing reduces the costs of
technology upgrading by exempting firms of upfront investments in hardware and regular expenses on
maintenance, IT team and certification, turning ICT management model into a model based on software
acquisition (codes) and digital (hyper)connectivity.
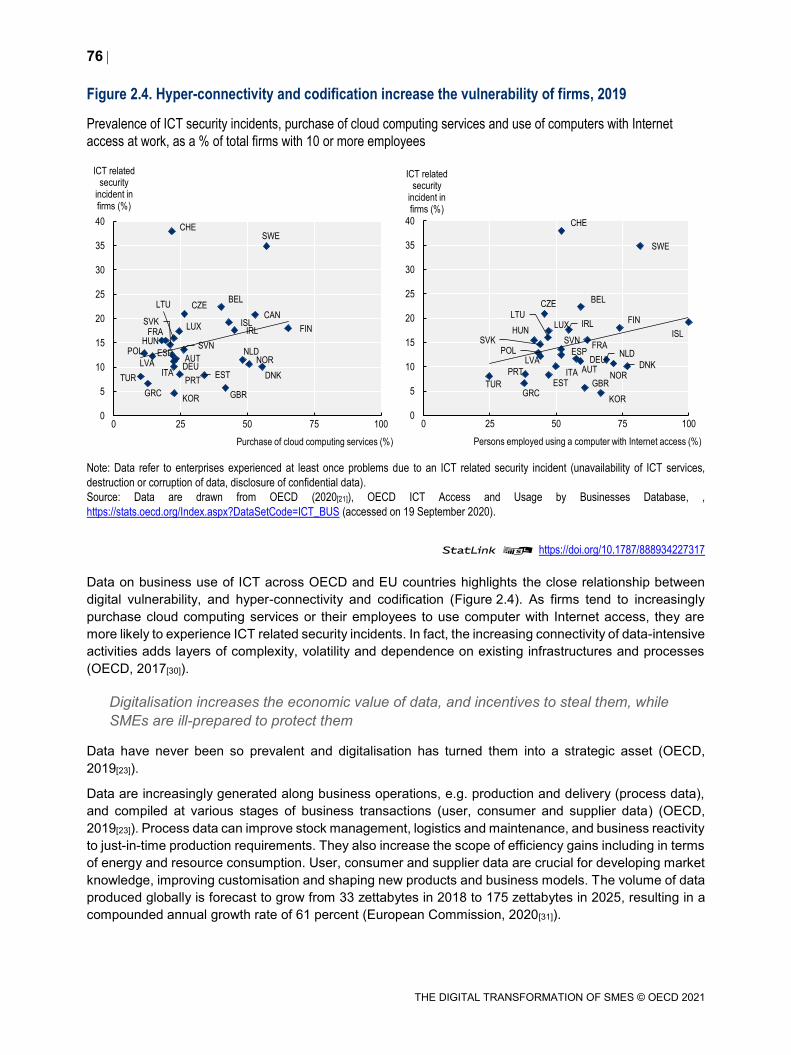
76
THE DIGITAL TRANSFORMATION OF SMES © OECD 2021
Figure 2.4. Hyper-connectivity and codification increase the vulnerability of firms, 2019
Prevalence of ICT security incidents, purchase of cloud computing services and use of computers with Internet
access at work, as a % of total firms with 10 or more employees
Note: Data refer to enterprises experienced at least once problems due to an ICT related security incident (unavailability of ICT services,
destruction or corruption of data, disclosure of confidential data).
Source: Data are drawn from OECD (2020[21]), OECD ICT Access and Usage by Businesses Database, ,
https://stats.oecd.org/Index.aspx?DataSetCode=ICT_BUS (accessed on 19 September 2020).
StatLink 2 https://doi.org/10.1787/888934227317
Data on business use of ICT across OECD and EU countries highlights the close relationship between
digital vulnerability, and hyper-connectivity and codification (Figure 2.4). As firms tend to increasingly
purchase cloud computing services or their employees to use computer with Internet access, they are
more likely to experience ICT related security incidents. In fact, the increasing connectivity of data-intensive
activities adds layers of complexity, volatility and dependence on existing infrastructures and processes
(OECD, 2017[30]).
Digitalisation increases the economic value of data, and incentives to steal them, while
SMEs are ill-prepared to protect them
Data have never been so prevalent and digitalisation has turned them into a strategic asset (OECD,
2019[23]).
Data are increasingly generated along business operations, e.g. production and delivery (process data),
and compiled at various stages of business transactions (user, consumer and supplier data) (OECD,
2019[23]). Process data can improve stock management, logistics and maintenance, and business reactivity
to just-in-time production requirements. They also increase the scope of efficiency gains including in terms
of energy and resource consumption. User, consumer and supplier data are crucial for developing market
knowledge, improving customisation and shaping new products and business models. The volume of data
produced globally is forecast to grow from 33 zettabytes in 2018 to 175 zettabytes in 2025, resulting in a
compounded annual growth rate of 61 percent (European Commission, 2020[31]).
KOR GBRGRC
TUR ESTPRT
ITA DNK
NORDEU
NLDAUT
LVAESPPOL
SVN
SVK
HUNFRA
LTU
LUX IRL FINISL
CZEBEL
SWECHE
CAN
0
5
10
15
20
25
30
35
40
0 25 50 75 100
ICT related security
incident in firms (%)
Purchase of cloud computing services (%)
KOR
GBRGRC
TUR EST
PRT ITADNK
NOR
DEUNLD
AUTLVA
ESPPOLSVNSVK
HUN
FRA
LTULUX IRL FIN
ISL
CZE BEL
SWE
CHE
0
5
10
15
20
25
30
35
40
0 25 50 75 100
ICT related security
incident in firms (%)
Persons employed using a computer with Internet access (%)
77
THE DIGITAL TRANSFORMATION OF SMES © OECD 2021
In this context, how SMEs protect their data is becoming more pertinent. SMEs tend to privilege trade
secrecy as their default mode of data protection (OECD, 2019[23]). Trade secrecy is confidential business
information that can cover new manufacturing processes, improved recipes, business plans or commercial
information on whom to buy from and whom to sell to (e.g. customer list). Unlike patents, trade secrets are
protected by law on confidential information, e.g. confidentiality agreement, or non-disclosure or covenant-
not-compete clauses. Trade secret popularity holds on its relative ease of use (due to low technicity and
the absence of formal registration requirements), lower costs incurred for administration and the absence
of definite term of protection (Brant and Lohse, 2014[32]).
Digitalisation has made the protection of trade secrets increasingly difficult. The revolution in data
codification, storage and exchange (i.e. cloud computing, emails, USB drives) are prime drivers of a rise
in trade secret infringements. Increasing value given to intellectual property (and de facto its
misappropriation), staff mobility and changing work culture and relationships (e.g. temporary contracts,
outplacement, teleworking) or the fragmentation of global value chains (with more foreign parties involved
within more diverse legal frameworks and uneven enforcement conditions) also contribute to increase
exposure and risk of disclosure (Almeling, 2012[33]).
The COVID-19 crisis has been an opportunity for malicious actors to intensify attacks
The COVID-19 pandemic of 2020 has imposed a radical rethinking of business models. Small businesses
in retail trade, manufacturing and a broad range of services, where physical presence and social contact
once were common practice, have been confronted with the need to deliver and do business in a
“contactless” way, or otherwise shut down non-mission critical, on-premise operations either periodically
or permanently (OECD, 2020[34]) (OECD, 2021 forthcoming[35]). Business opportunities also emerge in this
difficult context.
Some digital technologies and tools were sufficiently advanced and affordable to offer viable work-arounds
and solutions in this context. Existing businesses have re-engineered their organisational structure and
processes, adapting practices, proposing new products and/ or services (e.g. e-shops, home deliveries,
Click and Collect, etc.), and accelerating digital adoption, while customers and employees stay home.
SMEs have been at the forefront of these adjustments as the most affected by the crisis. The digital
transition took place, sometimes with no former digital experience or very low digital maturity or
preparedness (OECD, 2020[36]) (see Chapter 1 on digital access and uptake of SMEs).
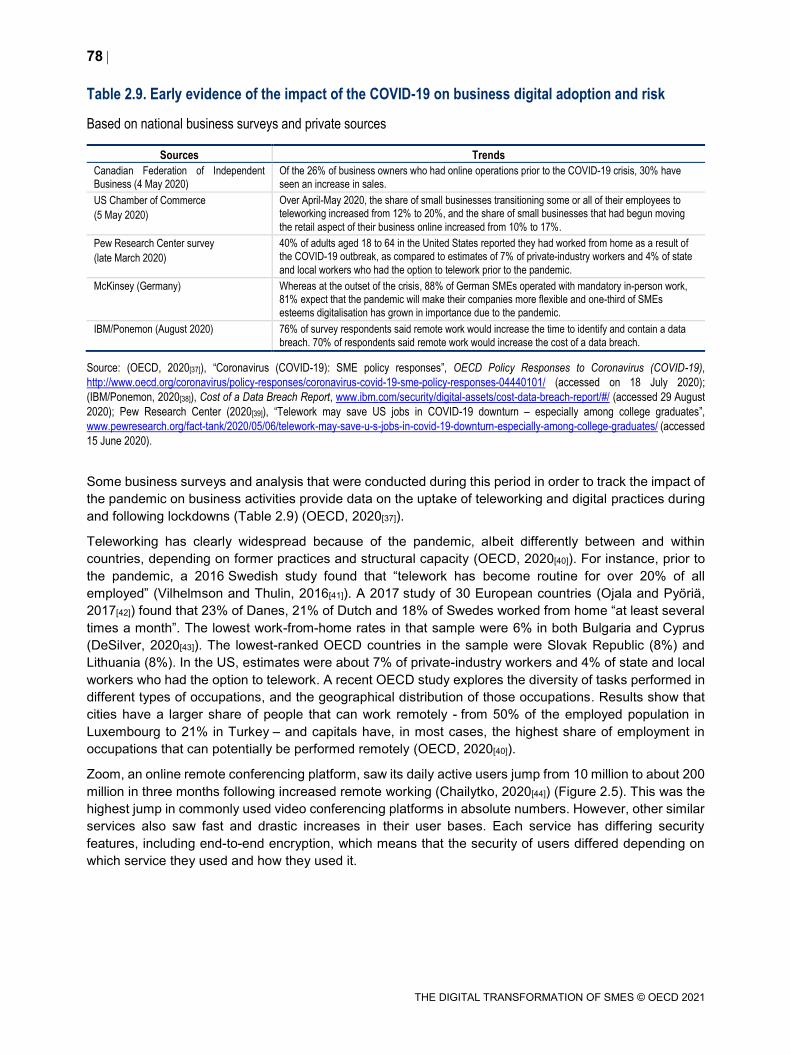
78
THE DIGITAL TRANSFORMATION OF SMES © OECD 2021
Table 2.9. Early evidence of the impact of the COVID-19 on business digital adoption and risk
Based on national business surveys and private sources
Sources Trends
Canadian Federation of Independent
Business (4 May 2020)
Of the 26% of business owners who had online operations prior to the COVID-19 crisis, 30% have
seen an increase in sales.
US Chamber of Commerce
(5 May 2020)
Over April-May 2020, the share of small businesses transitioning some or all of their employees to teleworking increased from 12% to 20%, and the share of small businesses that had begun moving
the retail aspect of their business online increased from 10% to 17%.
Pew Research Center survey
(late March 2020)
40% of adults aged 18 to 64 in the United States reported they had worked from home as a result of the COVID-19 outbreak, as compared to estimates of 7% of private-industry workers and 4% of state
and local workers who had the option to telework prior to the pandemic.
McKinsey (Germany) Whereas at the outset of the crisis, 88% of German SMEs operated with mandatory in-person work, 81% expect that the pandemic will make their companies more flexible and one-third of SMEs
esteems digitalisation has grown in importance due to the pandemic.
IBM/Ponemon (August 2020) 76% of survey respondents said remote work would increase the time to identify and contain a data
breach. 70% of respondents said remote work would increase the cost of a data breach.
Source: (OECD, 2020[37]), “Coronavirus (COVID-19): SME policy responses”, OECD Policy Responses to Coronavirus (COVID-19),
http://www.oecd.org/coronavirus/policy-responses/coronavirus-covid-19-sme-policy-responses-04440101/ (accessed on 18 July 2020);
(IBM/Ponemon, 2020[38]), Cost of a Data Breach Report, www.ibm.com/security/digital-assets/cost-data-breach-report/#/ (accessed 29 August
2020); Pew Research Center (2020[39]), “Telework may save US jobs in COVID-19 downturn – especially among college graduates”,
www.pewresearch.org/fact-tank/2020/05/06/telework-may-save-u-s-jobs-in-covid-19-downturn-especially-among-college-graduates/ (accessed
15 June 2020).
Some business surveys and analysis that were conducted during this period in order to track the impact of
the pandemic on business activities provide data on the uptake of teleworking and digital practices during
and following lockdowns (Table 2.9) (OECD, 2020[37]).
Teleworking has clearly widespread because of the pandemic, albeit differently between and within
countries, depending on former practices and structural capacity (OECD, 2020[40]). For instance, prior to
the pandemic, a 2016 Swedish study found that “telework has become routine for over 20% of all
employed” (Vilhelmson and Thulin, 2016[41]). A 2017 study of 30 European countries (Ojala and Pyöriä,
2017[42]) found that 23% of Danes, 21% of Dutch and 18% of Swedes worked from home “at least several
times a month”. The lowest work-from-home rates in that sample were 6% in both Bulgaria and Cyprus
(DeSilver, 2020[43]). The lowest-ranked OECD countries in the sample were Slovak Republic (8%) and
Lithuania (8%). In the US, estimates were about 7% of private-industry workers and 4% of state and local
workers who had the option to telework. A recent OECD study explores the diversity of tasks performed in
different types of occupations, and the geographical distribution of those occupations. Results show that
cities have a larger share of people that can work remotely - from 50% of the employed population in
Luxembourg to 21% in Turkey – and capitals have, in most cases, the highest share of employment in
occupations that can potentially be performed remotely (OECD, 2020[40]).
Zoom, an online remote conferencing platform, saw its daily active users jump from 10 million to about 200
million in three months following increased remote working (Chailytko, 2020[44]) (Figure 2.5). This was the
highest jump in commonly used video conferencing platforms in absolute numbers. However, other similar
services also saw fast and drastic increases in their user bases. Each service has differing security
features, including end-to-end encryption, which means that the security of users differed depending on
which service they used and how they used it.
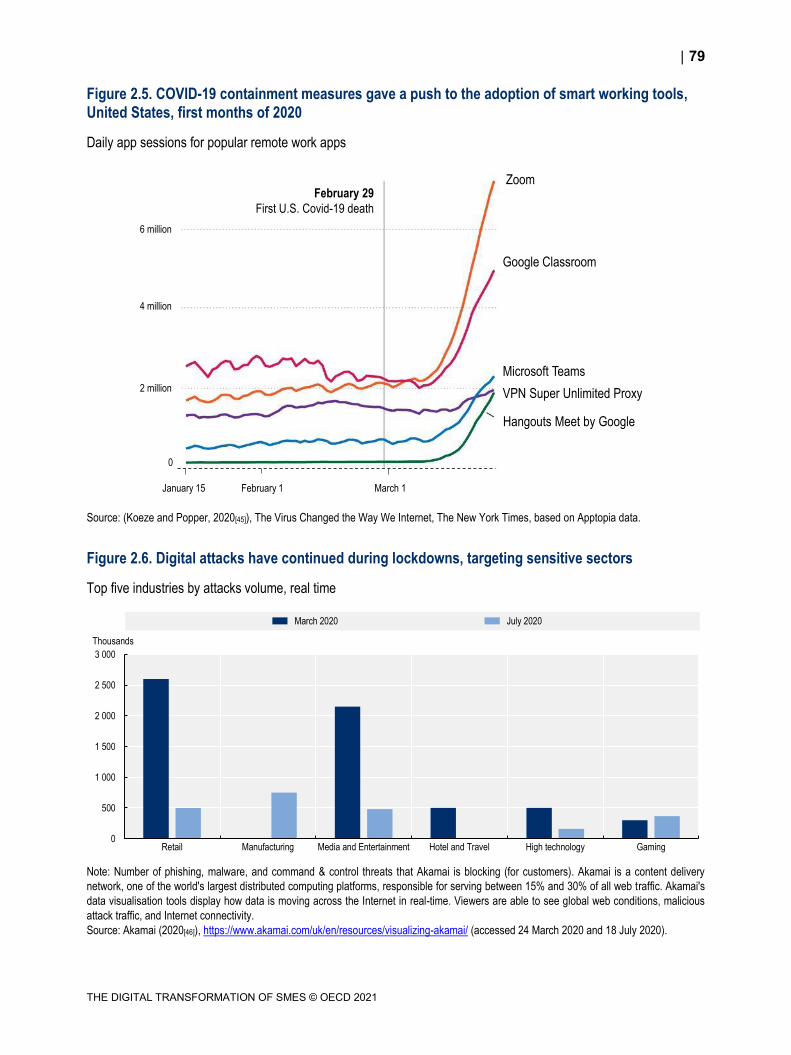
79
THE DIGITAL TRANSFORMATION OF SMES © OECD 2021
Figure 2.5. COVID-19 containment measures gave a push to the adoption of smart working tools, United States, first months of 2020
Daily app sessions for popular remote work apps
Source: (Koeze and Popper, 2020[45]), The Virus Changed the Way We Internet, The New York Times, based on Apptopia data.
Figure 2.6. Digital attacks have continued during lockdowns, targeting sensitive sectors
Top five industries by attacks volume, real time
Note: Number of phishing, malware, and command & control threats that Akamai is blocking (for customers). Akamai is a content delivery
network, one of the world's largest distributed computing platforms, responsible for serving between 15% and 30% of all web traffic. Akamai's
data visualisation tools display how data is moving across the Internet in real-time. Viewers are able to see global web conditions, malicious
attack traffic, and Internet connectivity.
Source: Akamai (2020[46]), https://www.akamai.com/uk/en/resources/visualizing-akamai/ (accessed 24 March 2020 and 18 July 2020).
January 15 February 1 March 1
6 million
4 million
2 million
0
February 29
First U.S. Covid-19 death
Zoom
Google Classroom
Microsoft Teams
VPN Super Unlimited Proxy
Hangouts Meet by Google
0
500
1 000
1 500
2 000
2 500
3 000
Retail Manufacturing Media and Entertainment Hotel and Travel High technology Gaming
Thousands
March 2020 July 2020
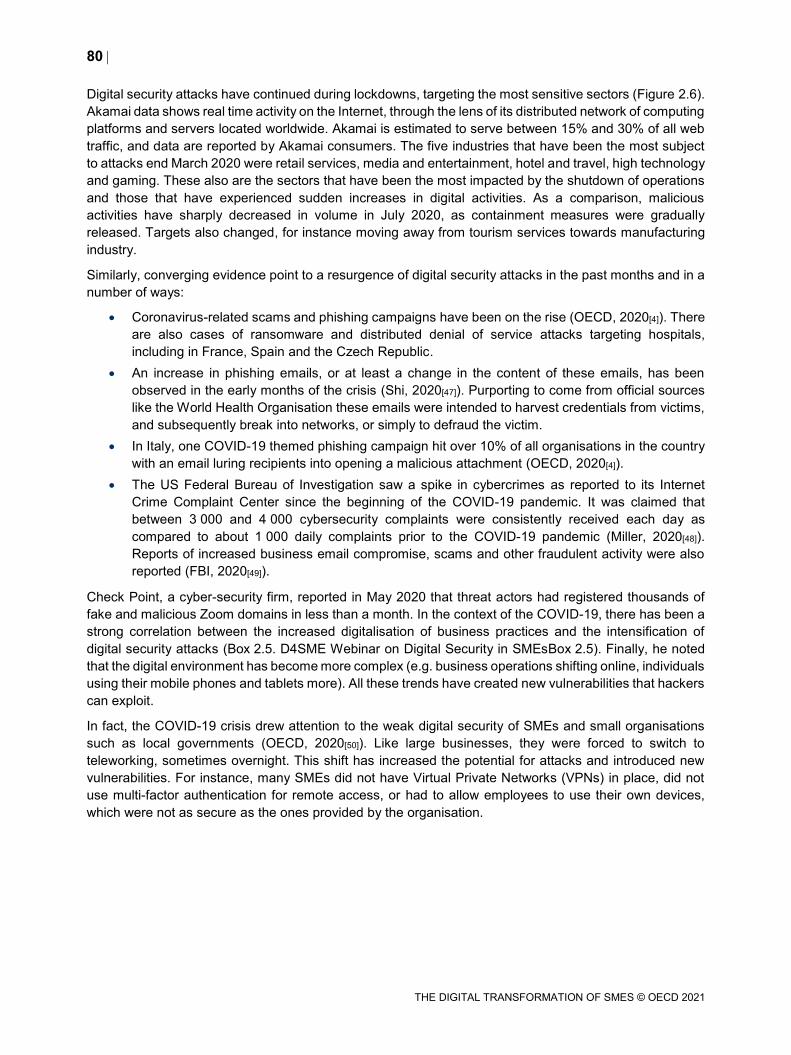
80
THE DIGITAL TRANSFORMATION OF SMES © OECD 2021
Digital security attacks have continued during lockdowns, targeting the most sensitive sectors (Figure 2.6).
Akamai data shows real time activity on the Internet, through the lens of its distributed network of computing
platforms and servers located worldwide. Akamai is estimated to serve between 15% and 30% of all web
traffic, and data are reported by Akamai consumers. The five industries that have been the most subject
to attacks end March 2020 were retail services, media and entertainment, hotel and travel, high technology
and gaming. These also are the sectors that have been the most impacted by the shutdown of operations
and those that have experienced sudden increases in digital activities. As a comparison, malicious
activities have sharply decreased in volume in July 2020, as containment measures were gradually
released. Targets also changed, for instance moving away from tourism services towards manufacturing
industry.
Similarly, converging evidence point to a resurgence of digital security attacks in the past months and in a
number of ways:
Coronavirus-related scams and phishing campaigns have been on the rise (OECD, 2020[4]). There
are also cases of ransomware and distributed denial of service attacks targeting hospitals,
including in France, Spain and the Czech Republic.
An increase in phishing emails, or at least a change in the content of these emails, has been
observed in the early months of the crisis (Shi, 2020[47]). Purporting to come from official sources
like the World Health Organisation these emails were intended to harvest credentials from victims,
and subsequently break into networks, or simply to defraud the victim.
In Italy, one COVID-19 themed phishing campaign hit over 10% of all organisations in the country
with an email luring recipients into opening a malicious attachment (OECD, 2020[4]).
The US Federal Bureau of Investigation saw a spike in cybercrimes as reported to its Internet
Crime Complaint Center since the beginning of the COVID-19 pandemic. It was claimed that
between 3 000 and 4 000 cybersecurity complaints were consistently received each day as
compared to about 1 000 daily complaints prior to the COVID-19 pandemic (Miller, 2020[48]).
Reports of increased business email compromise, scams and other fraudulent activity were also
reported (FBI, 2020[49]).
Check Point, a cyber-security firm, reported in May 2020 that threat actors had registered thousands of
fake and malicious Zoom domains in less than a month. In the context of the COVID-19, there has been a
strong correlation between the increased digitalisation of business practices and the intensification of
digital security attacks (Box 2.5. D4SME Webinar on Digital Security in SMEsBox 2.5). Finally, he noted
that the digital environment has become more complex (e.g. business operations shifting online, individuals
using their mobile phones and tablets more). All these trends have created new vulnerabilities that hackers
can exploit.
In fact, the COVID-19 crisis drew attention to the weak digital security of SMEs and small organisations
such as local governments (OECD, 2020[50]). Like large businesses, they were forced to switch to
teleworking, sometimes overnight. This shift has increased the potential for attacks and introduced new
vulnerabilities. For instance, many SMEs did not have Virtual Private Networks (VPNs) in place, did not
use multi-factor authentication for remote access, or had to allow employees to use their own devices,
which were not as secure as the ones provided by the organisation.
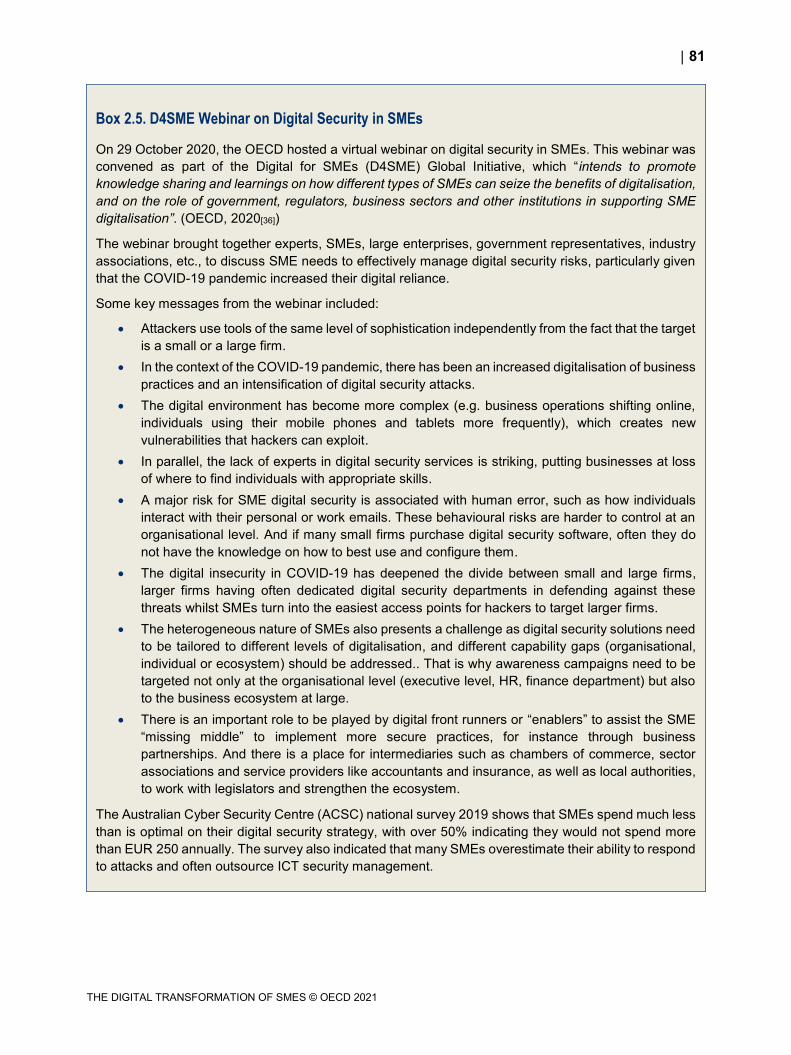
81
THE DIGITAL TRANSFORMATION OF SMES © OECD 2021
Box 2.5. D4SME Webinar on Digital Security in SMEs
On 29 October 2020, the OECD hosted a virtual webinar on digital security in SMEs. This webinar was
convened as part of the Digital for SMEs (D4SME) Global Initiative, which “intends to promote
knowledge sharing and learnings on how different types of SMEs can seize the benefits of digitalisation,
and on the role of government, regulators, business sectors and other institutions in supporting SME
digitalisation”. (OECD, 2020[36])
The webinar brought together experts, SMEs, large enterprises, government representatives, industry
associations, etc., to discuss SME needs to effectively manage digital security risks, particularly given
that the COVID-19 pandemic increased their digital reliance.
Some key messages from the webinar included:
Attackers use tools of the same level of sophistication independently from the fact that the target
is a small or a large firm.
In the context of the COVID-19 pandemic, there has been an increased digitalisation of business
practices and an intensification of digital security attacks.
The digital environment has become more complex (e.g. business operations shifting online,
individuals using their mobile phones and tablets more frequently), which creates new
vulnerabilities that hackers can exploit.
In parallel, the lack of experts in digital security services is striking, putting businesses at loss
of where to find individuals with appropriate skills.
A major risk for SME digital security is associated with human error, such as how individuals
interact with their personal or work emails. These behavioural risks are harder to control at an
organisational level. And if many small firms purchase digital security software, often they do
not have the knowledge on how to best use and configure them.
The digital insecurity in COVID-19 has deepened the divide between small and large firms,
larger firms having often dedicated digital security departments in defending against these
threats whilst SMEs turn into the easiest access points for hackers to target larger firms.
The heterogeneous nature of SMEs also presents a challenge as digital security solutions need
to be tailored to different levels of digitalisation, and different capability gaps (organisational,
individual or ecosystem) should be addressed.. That is why awareness campaigns need to be
targeted not only at the organisational level (executive level, HR, finance department) but also
to the business ecosystem at large.
There is an important role to be played by digital front runners or “enablers” to assist the SME
“missing middle” to implement more secure practices, for instance through business
partnerships. And there is a place for intermediaries such as chambers of commerce, sector
associations and service providers like accountants and insurance, as well as local authorities,
to work with legislators and strengthen the ecosystem.
The Australian Cyber Security Centre (ACSC) national survey 2019 shows that SMEs spend much less
than is optimal on their digital security strategy, with over 50% indicating they would not spend more
than EUR 250 annually. The survey also indicated that many SMEs overestimate their ability to respond
to attacks and often outsource ICT security management.
82
THE DIGITAL TRANSFORMATION OF SMES © OECD 2021
SMEs and digital risk management
The digital security toolkit of smaller firms is less comprehensive and sophisticated
Smaller firms implement less often digital security measures
There is a strong relationship between adoption of digital security measures and enterprise size. As
enterprises become larger, a higher proportion implement a greater number of and more advanced digital
security measures.
Figure 2.7. Firms implement more digital security measures as they get larger, national statistics, United Kingdom, 2019
Percentage of enterprises with a formal policy covering cyber security risks
Note: Survey data. Micro businesses (1 to 9 employees), small (10 to 49), medium (50 to 249) and large (250 or more).
Source: UK Cyber Breaches Survey 2019.
StatLink 2 https://doi.org/10.1787/888934227336
0 10 20 30 40 50 60 70 80
Overall
Micro
Small
Medium
Large
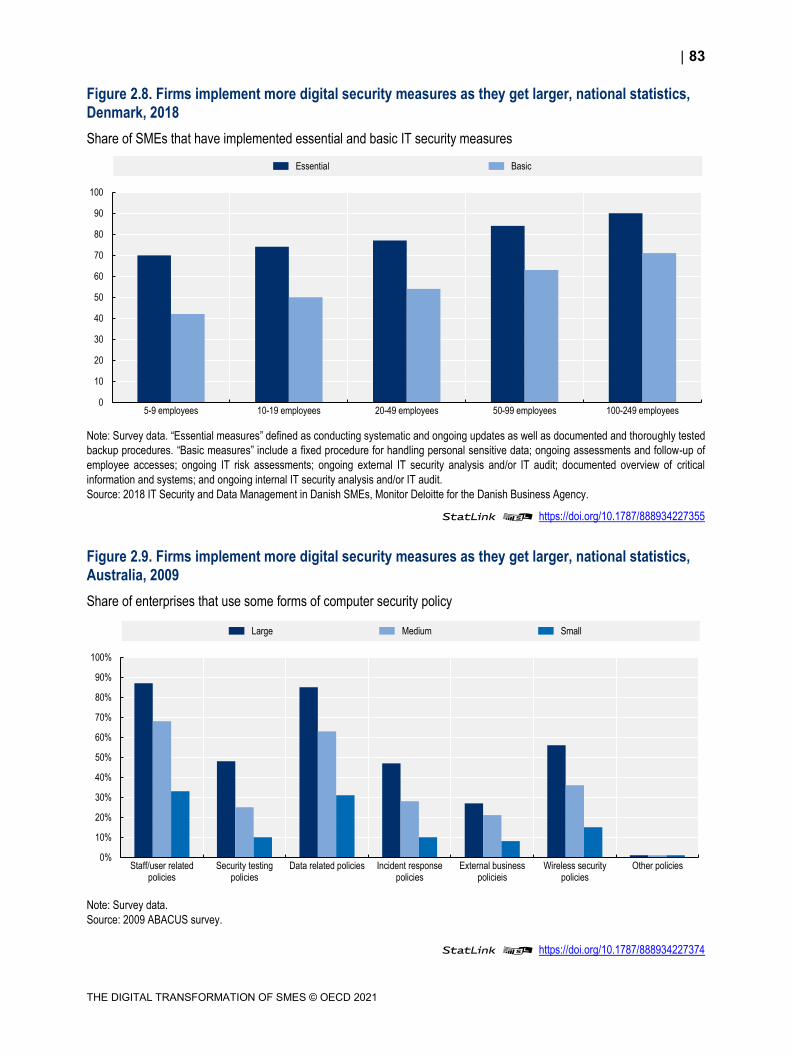
83
THE DIGITAL TRANSFORMATION OF SMES © OECD 2021
Figure 2.8. Firms implement more digital security measures as they get larger, national statistics, Denmark, 2018
Share of SMEs that have implemented essential and basic IT security measures
Note: Survey data. “Essential measures” defined as conducting systematic and ongoing updates as well as documented and thoroughly tested
backup procedures. “Basic measures” include a fixed procedure for handling personal sensitive data; ongoing assessments and follow-up of
employee accesses; ongoing IT risk assessments; ongoing external IT security analysis and/or IT audit; documented overview of critical
information and systems; and ongoing internal IT security analysis and/or IT audit.
Source: 2018 IT Security and Data Management in Danish SMEs, Monitor Deloitte for the Danish Business Agency.
StatLink 2 https://doi.org/10.1787/888934227355
Figure 2.9. Firms implement more digital security measures as they get larger, national statistics, Australia, 2009
Share of enterprises that use some forms of computer security policy
Note: Survey data.
Source: 2009 ABACUS survey.
StatLink 2 https://doi.org/10.1787/888934227374
0
10
20
30
40
50
60
70
80
90
100
5-9 employees 10-19 employees 20-49 employees 50-99 employees 100-249 employees
Essential Basic
0%
10%
20%
30%
40%
50%
60%
70%
80%
90%
100%
Staff/user relatedpolicies
Security testingpolicies
Data related policies Incident responsepolicies
External businesspolicieis
Wireless securitypolicies
Other policies
Large Medium Small
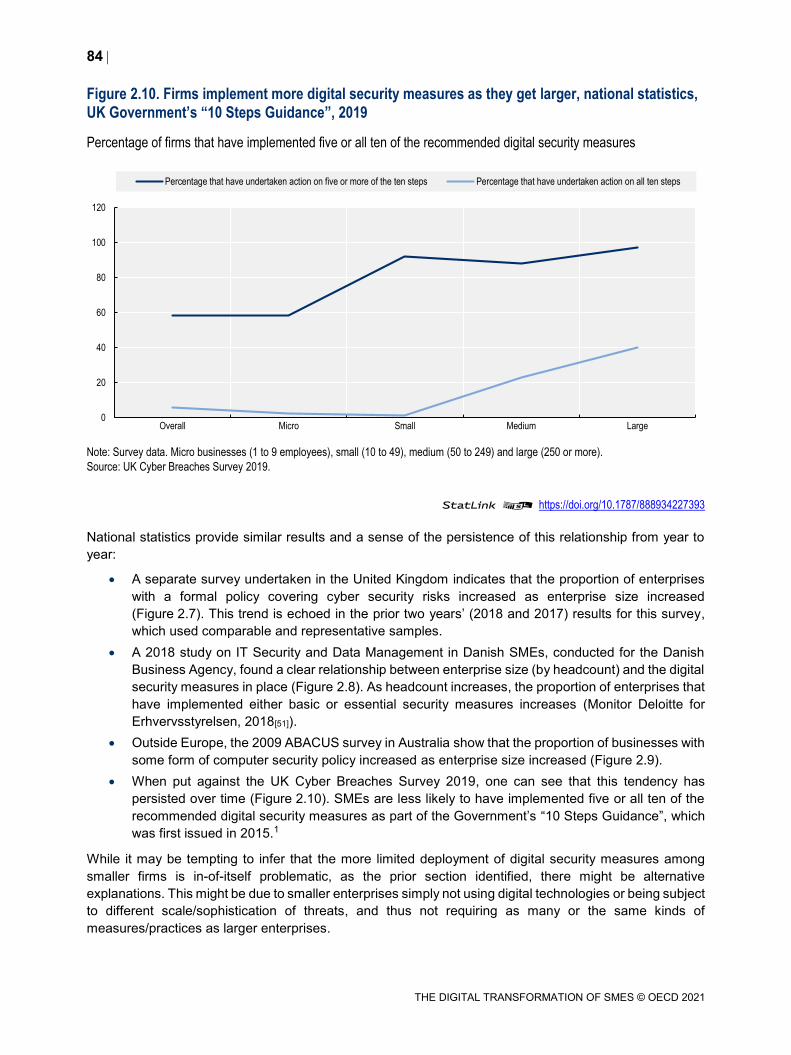
84
THE DIGITAL TRANSFORMATION OF SMES © OECD 2021
Figure 2.10. Firms implement more digital security measures as they get larger, national statistics, UK Government’s “10 Steps Guidance”, 2019
Percentage of firms that have implemented five or all ten of the recommended digital security measures
Note: Survey data. Micro businesses (1 to 9 employees), small (10 to 49), medium (50 to 249) and large (250 or more).
Source: UK Cyber Breaches Survey 2019.
StatLink 2 https://doi.org/10.1787/888934227393
National statistics provide similar results and a sense of the persistence of this relationship from year to
year:
A separate survey undertaken in the United Kingdom indicates that the proportion of enterprises
with a formal policy covering cyber security risks increased as enterprise size increased
(Figure 2.7). This trend is echoed in the prior two years’ (2018 and 2017) results for this survey,
which used comparable and representative samples.
A 2018 study on IT Security and Data Management in Danish SMEs, conducted for the Danish
Business Agency, found a clear relationship between enterprise size (by headcount) and the digital
security measures in place (Figure 2.8). As headcount increases, the proportion of enterprises that
have implemented either basic or essential security measures increases (Monitor Deloitte for
Erhvervsstyrelsen, 2018[51]).
Outside Europe, the 2009 ABACUS survey in Australia show that the proportion of businesses with
some form of computer security policy increased as enterprise size increased (Figure 2.9).
When put against the UK Cyber Breaches Survey 2019, one can see that this tendency has
persisted over time (Figure 2.10). SMEs are less likely to have implemented five or all ten of the
recommended digital security measures as part of the Government’s “10 Steps Guidance”, which
was first issued in 2015.1
While it may be tempting to infer that the more limited deployment of digital security measures among
smaller firms is in-of-itself problematic, as the prior section identified, there might be alternative
explanations. This might be due to smaller enterprises simply not using digital technologies or being subject
to different scale/sophistication of threats, and thus not requiring as many or the same kinds of
measures/practices as larger enterprises.
0
20
40
60
80
100
120
Overall Micro Small Medium Large
Percentage that have undertaken action on five or more of the ten steps Percentage that have undertaken action on all ten steps
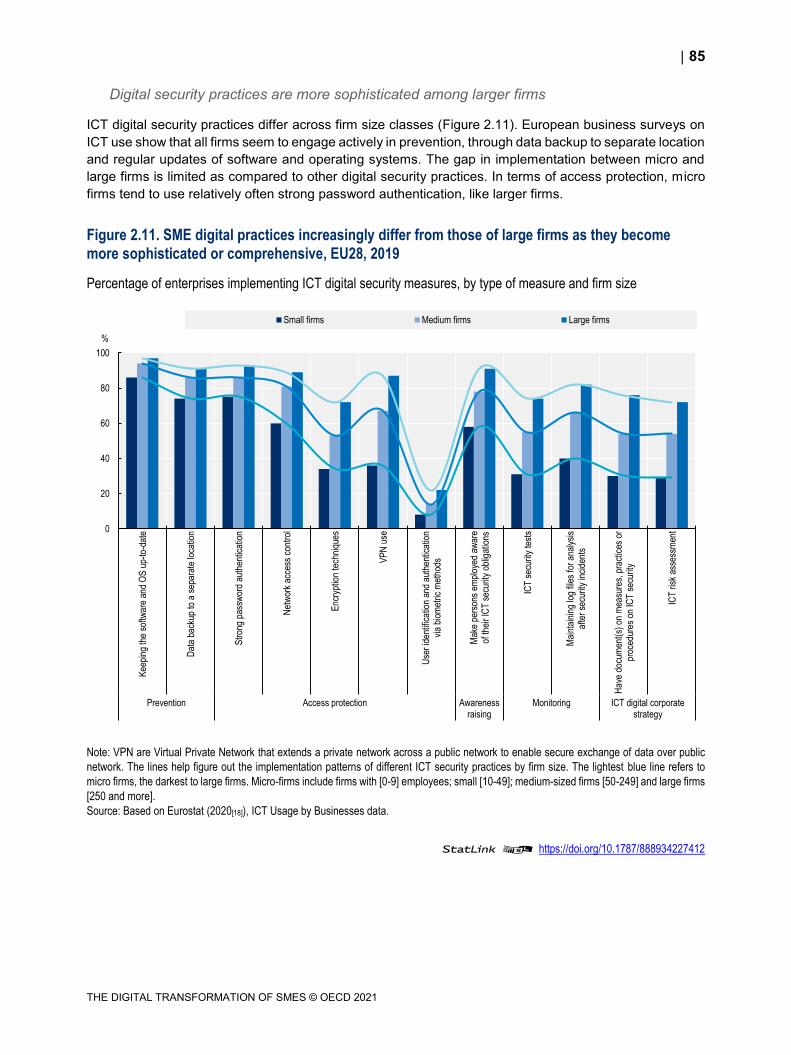
85
THE DIGITAL TRANSFORMATION OF SMES © OECD 2021
Digital security practices are more sophisticated among larger firms
ICT digital security practices differ across firm size classes (Figure 2.11). European business surveys on
ICT use show that all firms seem to engage actively in prevention, through data backup to separate location
and regular updates of software and operating systems. The gap in implementation between micro and
large firms is limited as compared to other digital security practices. In terms of access protection, micro
firms tend to use relatively often strong password authentication, like larger firms.
Figure 2.11. SME digital practices increasingly differ from those of large firms as they become more sophisticated or comprehensive, EU28, 2019
Percentage of enterprises implementing ICT digital security measures, by type of measure and firm size
Note: VPN are Virtual Private Network that extends a private network across a public network to enable secure exchange of data over public
network. The lines help figure out the implementation patterns of different ICT security practices by firm size. The lightest blue line refers to
micro firms, the darkest to large firms. Micro-firms include firms with [0-9] employees; small [10-49]; medium-sized firms [50-249] and large firms
[250 and more].
Source: Based on Eurostat (2020[18]), ICT Usage by Businesses data.
StatLink 2 https://doi.org/10.1787/888934227412
0
20
40
60
80
100
Kee
ping
the
softw
are
and
OS
up-
to-d
ate
Dat
a ba
ckup
to a
sep
arat
e lo
catio
n
Str
ong
pass
wor
d au
then
ticat
ion
Net
wor
k ac
cess
con
trol
Enc
rypt
ion
tech
niqu
es
VP
N u
se
Use
r id
entif
icat
ion
and
auth
entic
atio
nvi
a bi
omet
ric m
etho
ds
Mak
e pe
rson
s em
ploy
ed a
war
eof
thei
r IC
T s
ecur
ity o
blig
atio
ns
ICT
sec
urity
test
s
Mai
ntai
ning
log
files
for
anal
ysis
afte
r se
curit
y in
cide
nts
Hav
e do
cum
ent(
s) o
n m
easu
res,
pra
ctic
es o
rpr
oced
ures
on
ICT
sec
urity
ICT
ris
k as
sess
men
t
Prevention Access protection Awarenessraising
Monitoring ICT digital corporatestrategy
%
Small firms Medium firms Large firms
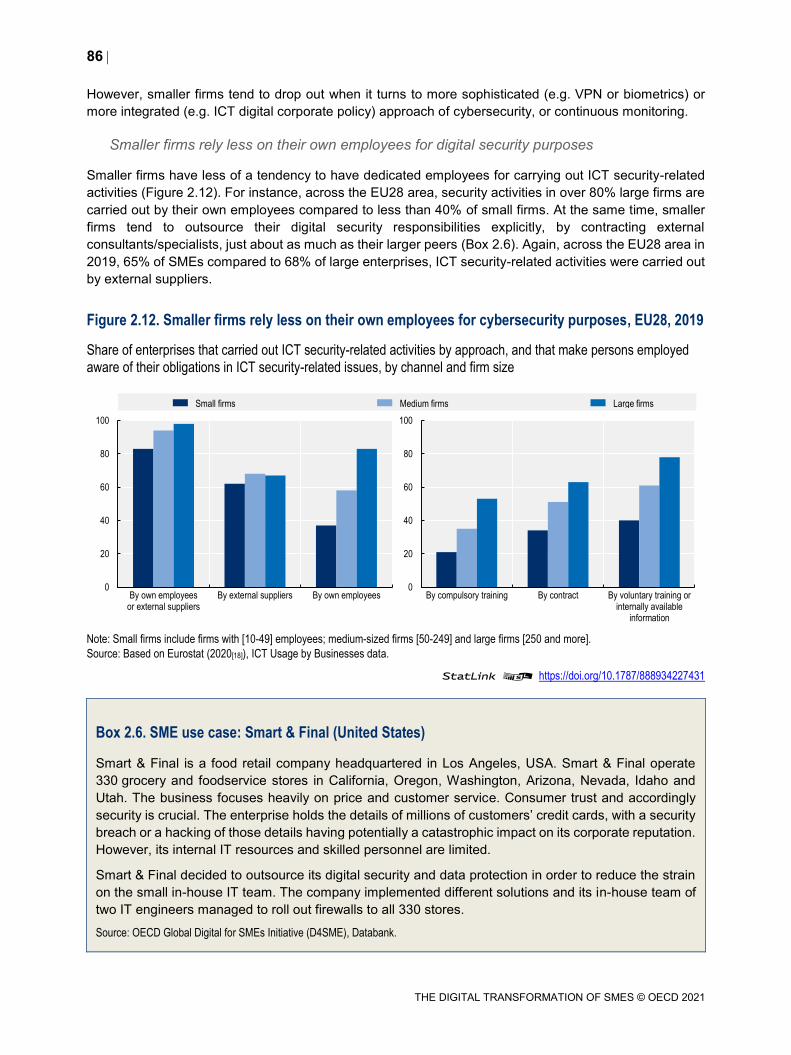
86
THE DIGITAL TRANSFORMATION OF SMES © OECD 2021
However, smaller firms tend to drop out when it turns to more sophisticated (e.g. VPN or biometrics) or
more integrated (e.g. ICT digital corporate policy) approach of cybersecurity, or continuous monitoring.
Smaller firms rely less on their own employees for digital security purposes
Smaller firms have less of a tendency to have dedicated employees for carrying out ICT security-related
activities (Figure 2.12). For instance, across the EU28 area, security activities in over 80% large firms are
carried out by their own employees compared to less than 40% of small firms. At the same time, smaller
firms tend to outsource their digital security responsibilities explicitly, by contracting external
consultants/specialists, just about as much as their larger peers (Box 2.6). Again, across the EU28 area in
2019, 65% of SMEs compared to 68% of large enterprises, ICT security-related activities were carried out
by external suppliers.
Figure 2.12. Smaller firms rely less on their own employees for cybersecurity purposes, EU28, 2019
Share of enterprises that carried out ICT security-related activities by approach, and that make persons employed
aware of their obligations in ICT security-related issues, by channel and firm size
Note: Small firms include firms with [10-49] employees; medium-sized firms [50-249] and large firms [250 and more].
Source: Based on Eurostat (2020[18]), ICT Usage by Businesses data.
StatLink 2 https://doi.org/10.1787/888934227431
Box 2.6. SME use case: Smart & Final (United States)
Smart & Final is a food retail company headquartered in Los Angeles, USA. Smart & Final operate
330 grocery and foodservice stores in California, Oregon, Washington, Arizona, Nevada, Idaho and
Utah. The business focuses heavily on price and customer service. Consumer trust and accordingly
security is crucial. The enterprise holds the details of millions of customers’ credit cards, with a security
breach or a hacking of those details having potentially a catastrophic impact on its corporate reputation.
However, its internal IT resources and skilled personnel are limited.
Smart & Final decided to outsource its digital security and data protection in order to reduce the strain
on the small in-house IT team. The company implemented different solutions and its in-house team of
two IT engineers managed to roll out firewalls to all 330 stores.
Source: OECD Global Digital for SMEs Initiative (D4SME), Databank.
0
20
40
60
80
100
By own employeesor external suppliers
By external suppliers By own employees0
20
40
60
80
100
By compulsory training By contract By voluntary training orinternally available
information
Small firms Medium firms Large firms
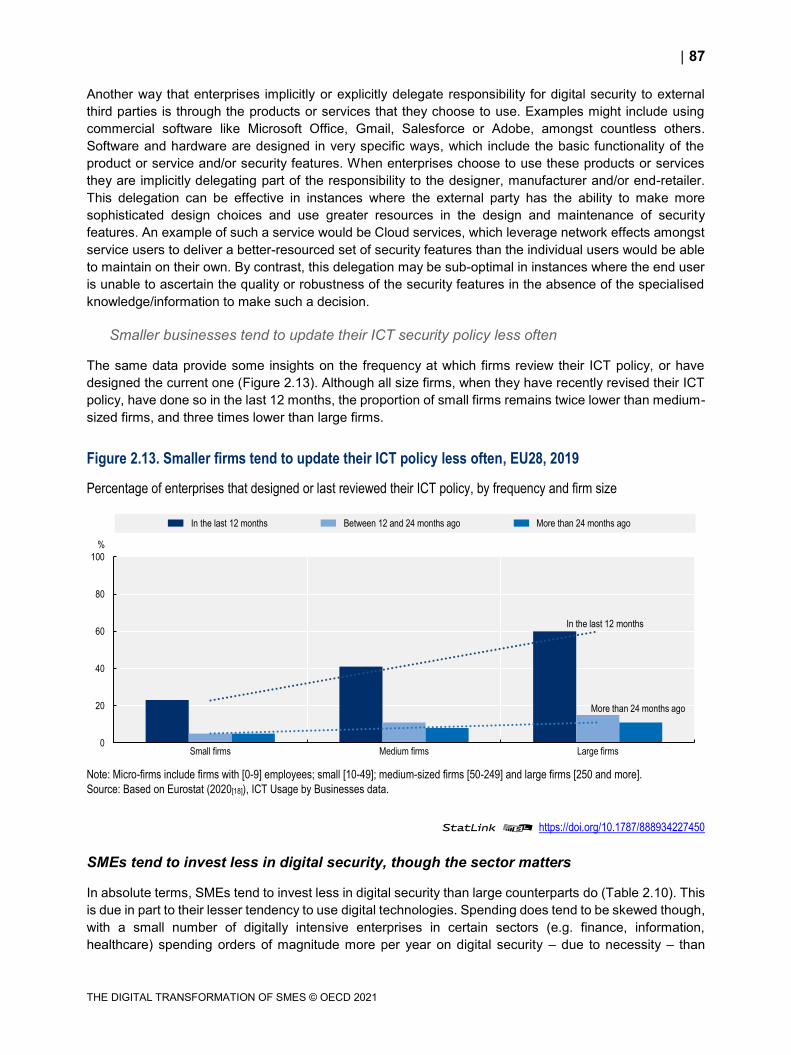
87
THE DIGITAL TRANSFORMATION OF SMES © OECD 2021
Another way that enterprises implicitly or explicitly delegate responsibility for digital security to external
third parties is through the products or services that they choose to use. Examples might include using
commercial software like Microsoft Office, Gmail, Salesforce or Adobe, amongst countless others.
Software and hardware are designed in very specific ways, which include the basic functionality of the
product or service and/or security features. When enterprises choose to use these products or services
they are implicitly delegating part of the responsibility to the designer, manufacturer and/or end-retailer.
This delegation can be effective in instances where the external party has the ability to make more
sophisticated design choices and use greater resources in the design and maintenance of security
features. An example of such a service would be Cloud services, which leverage network effects amongst
service users to deliver a better-resourced set of security features than the individual users would be able
to maintain on their own. By contrast, this delegation may be sub-optimal in instances where the end user
is unable to ascertain the quality or robustness of the security features in the absence of the specialised
knowledge/information to make such a decision.
Smaller businesses tend to update their ICT security policy less often
The same data provide some insights on the frequency at which firms review their ICT policy, or have
designed the current one (Figure 2.13). Although all size firms, when they have recently revised their ICT
policy, have done so in the last 12 months, the proportion of small firms remains twice lower than medium-
sized firms, and three times lower than large firms.
Figure 2.13. Smaller firms tend to update their ICT policy less often, EU28, 2019
Percentage of enterprises that designed or last reviewed their ICT policy, by frequency and firm size
Note: Micro-firms include firms with [0-9] employees; small [10-49]; medium-sized firms [50-249] and large firms [250 and more].
Source: Based on Eurostat (2020[18]), ICT Usage by Businesses data.
StatLink 2 https://doi.org/10.1787/888934227450
SMEs tend to invest less in digital security, though the sector matters
In absolute terms, SMEs tend to invest less in digital security than large counterparts do (Table 2.10). This
is due in part to their lesser tendency to use digital technologies. Spending does tend to be skewed though,
with a small number of digitally intensive enterprises in certain sectors (e.g. finance, information,
healthcare) spending orders of magnitude more per year on digital security – due to necessity – than
0
20
40
60
80
100
Small firms Medium firms Large firms
%
In the last 12 months Between 12 and 24 months ago More than 24 months ago
In the last 12 months
More than 24 months ago
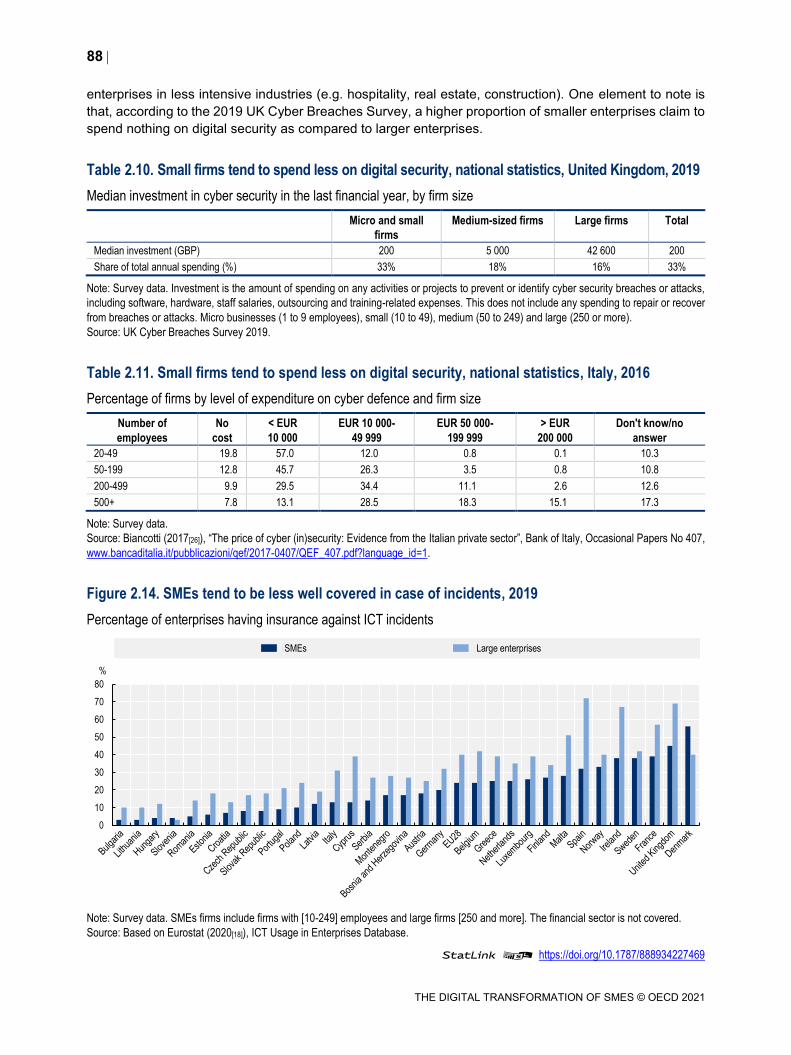
88
THE DIGITAL TRANSFORMATION OF SMES © OECD 2021
enterprises in less intensive industries (e.g. hospitality, real estate, construction). One element to note is
that, according to the 2019 UK Cyber Breaches Survey, a higher proportion of smaller enterprises claim to
spend nothing on digital security as compared to larger enterprises.
Table 2.10. Small firms tend to spend less on digital security, national statistics, United Kingdom, 2019
Median investment in cyber security in the last financial year, by firm size
Micro and small
firms
Medium-sized firms Large firms Total
Median investment (GBP) 200 5 000 42 600 200
Share of total annual spending (%) 33% 18% 16% 33%
Note: Survey data. Investment is the amount of spending on any activities or projects to prevent or identify cyber security breaches or attacks,
including software, hardware, staff salaries, outsourcing and training-related expenses. This does not include any spending to repair or recover
from breaches or attacks. Micro businesses (1 to 9 employees), small (10 to 49), medium (50 to 249) and large (250 or more).
Source: UK Cyber Breaches Survey 2019.
Table 2.11. Small firms tend to spend less on digital security, national statistics, Italy, 2016
Percentage of firms by level of expenditure on cyber defence and firm size
Number of
employees
No
cost
< EUR
10 000
EUR 10 000-
49 999
EUR 50 000-
199 999
> EUR
200 000
Don't know/no
answer
20-49 19.8 57.0 12.0 0.8 0.1 10.3
50-199 12.8 45.7 26.3 3.5 0.8 10.8
200-499 9.9 29.5 34.4 11.1 2.6 12.6
500+ 7.8 13.1 28.5 18.3 15.1 17.3
Note: Survey data.
Source: Biancotti (2017[26]), “The price of cyber (in)security: Evidence from the Italian private sector”, Bank of Italy, Occasional Papers No 407,
www.bancaditalia.it/pubblicazioni/qef/2017-0407/QEF_407.pdf?language_id=1.
Figure 2.14. SMEs tend to be less well covered in case of incidents, 2019
Percentage of enterprises having insurance against ICT incidents
Note: Survey data. SMEs firms include firms with [10-249] employees and large firms [250 and more]. The financial sector is not covered.
Source: Based on Eurostat (2020[18]), ICT Usage in Enterprises Database.
StatLink 2 https://doi.org/10.1787/888934227469
0
10
20
30
40
50
60
70
80
%
SMEs Large enterprises
89
THE DIGITAL TRANSFORMATION OF SMES © OECD 2021
There is a growing industry for insurance policies that aim to cover the costs and losses associated with
digital security incidents. According to Moody’s, based on US regulatory financial data, direct cyber
premiums written grew to USD 2 billion in 2018, or a cumulative annual growth rate of 26% since 2015
(Moody’s, 2019[52]). It was hoped that the European Union’s (EU) General Data Protection Regulation
(GDPR) would help spur faster growth in Europe following its implementation in 2018 (OECD, 2018[53]).
However, SMEs tend to purchase stand-alone digital security insurance policies less than larger
enterprises. This is a common feature in all countries covered by the European business survey on ICT
use, with the notable exception of Denmark (Figure 2.14). In the EU28, on average, about 40% of large
enterprises purchase ICT insurance as compared to about 20% of SMEs.
Setting aside that many non-stand-alone insurance policies could be triggered in the event of some digital
security incidents (e.g. property and casualty lines triggered due to ransomware), there are thought to be
a few reasons why SMEs tend to buy such insurance compared to larger enterprises. “The needs and
expectations of many businesses can diverge from the scope of coverage commonly provided by
insurance companies” (OECD, 2018[54]). “Buying the right policies can be challenging, particularly for
companies whose understanding of their own vulnerabilities may be sketchy” (OECD, 2018[55]). When
surveyed in 2019 on the reasons why they do not have “cyber insurance”, respondents in the United
Kingdom replied:
They are already being covered by an external cyber security provider (23% of businesses and
26% of charities).
They lack awareness of cyber insurance (23% of businesses and 15% of charities).
They consider themselves to have too low a risk (29% of charities and 22% of businesses).2
There are large variations across countries on how SMEs secure their systems and data.
There is substantial variation in the implementation of digital security practices and measures by country.
In almost all countries surveyed as part of the 2015 Community survey on ICT usage in enterprises, when
asked if the enterprise had a formally defined ICT policy3 in place the difference between SMEs and large
enterprises was approximately 30%. These results were reinforced in the most recent 2019 survey, though
the terminology used was slightly different4 (Figure 2.15).
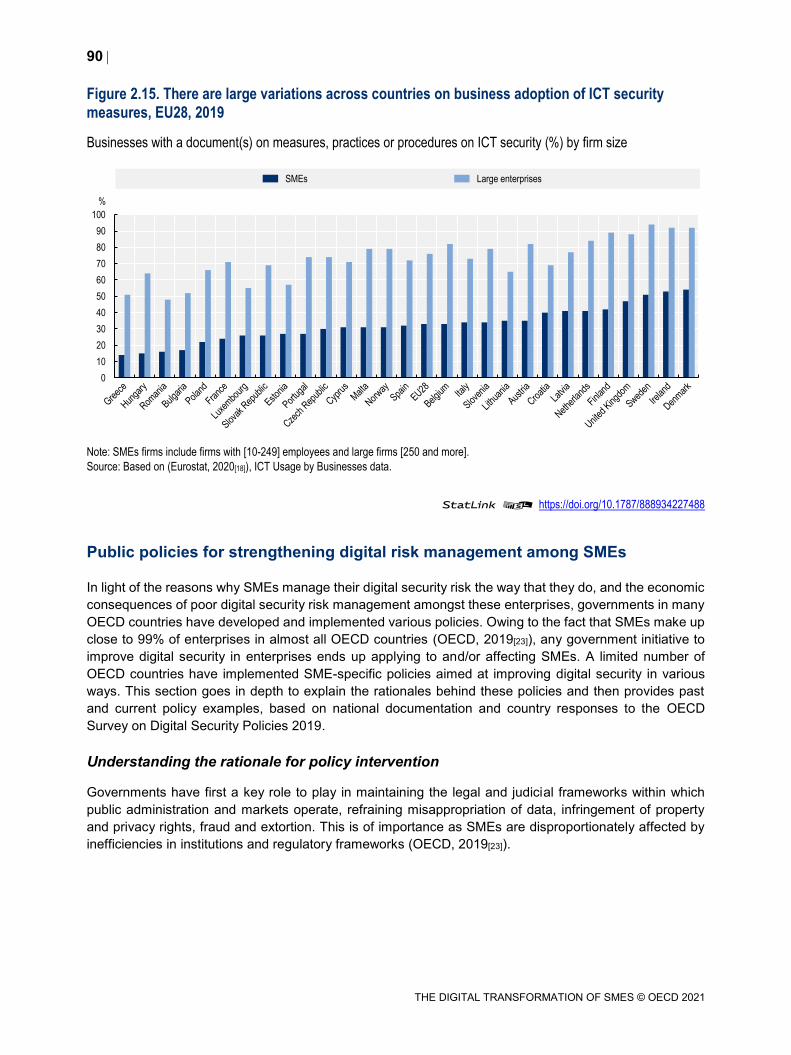
90
THE DIGITAL TRANSFORMATION OF SMES © OECD 2021
Figure 2.15. There are large variations across countries on business adoption of ICT security measures, EU28, 2019
Businesses with a document(s) on measures, practices or procedures on ICT security (%) by firm size
Note: SMEs firms include firms with [10-249] employees and large firms [250 and more].
Source: Based on (Eurostat, 2020[18]), ICT Usage by Businesses data.
StatLink 2 https://doi.org/10.1787/888934227488
Public policies for strengthening digital risk management among SMEs
In light of the reasons why SMEs manage their digital security risk the way that they do, and the economic
consequences of poor digital security risk management amongst these enterprises, governments in many
OECD countries have developed and implemented various policies. Owing to the fact that SMEs make up
close to 99% of enterprises in almost all OECD countries (OECD, 2019[23]), any government initiative to
improve digital security in enterprises ends up applying to and/or affecting SMEs. A limited number of
OECD countries have implemented SME-specific policies aimed at improving digital security in various
ways. This section goes in depth to explain the rationales behind these policies and then provides past
and current policy examples, based on national documentation and country responses to the OECD
Survey on Digital Security Policies 2019.
Understanding the rationale for policy intervention
Governments have first a key role to play in maintaining the legal and judicial frameworks within which
public administration and markets operate, refraining misappropriation of data, infringement of property
and privacy rights, fraud and extortion. This is of importance as SMEs are disproportionately affected by
inefficiencies in institutions and regulatory frameworks (OECD, 2019[23]).
0
10
20
30
40
50
60
70
80
90
100
%
SMEs Large enterprises
91
THE DIGITAL TRANSFORMATION OF SMES © OECD 2021
In addition, digital security risk is partly the consequence of a range of failures in digital technologies
markets (Dean, 2018[56]). In that sense, governments can provide the conditions for the market to reach a
socially optimal level of digital security, taking into account that cybersecurity presents the features of a
public good. Market failures include:
Information asymmetry among consumers: It can be difficult for consumers to evaluate the
security features of highly technical products. It can also be difficult for them to evaluate the relative
quality of software code, because of a lack of technical competences, and because many
producers use protection to prevent software inspection. When considering which products to
purchase, if given a choice, consumers are not always able to assess which is truly the more secure
option.
Distortion of market signals for producers: Compounding matters, the inability of consumers to
assess the relative security of a product means that producers who have invested in more secure
products cannot easily differentiate themselves in the market. This prevents them from passing the
additional cost of security development onto end users, e.g. in the form of price premium, also
resulting in a “market for lemons”, i.e. where “good” products are crowded out by the “bad” ones
(Akerlof, 1970[57]). As a result, private investment in digital security may be below the socially
desirable level if firms cannot fully appropriate the returns from their investments.
Negative externalities: The cost of digital security incidents are not always borne by the producer
of the technology in question. Moreover, some producers do not implement sufficient security
measures to reduce the probability of some classes of incidents, given that the costs of the
incidents are borne by others. Again, negative externalities may lead to an under-investment in
digital security.
Moral hazard: Moral hazard raises uncertainty as it involves that one party bears the costs and
losses due to the risky actions of others.
Recent government initiatives to improve SME digital security practices
To date, government efforts have aimed to incentivise the production of more secure digital products
(“security by design” or “privacy by design”), and to introduce penalties for actors whose products lead to
digital security incidents, or whose failure to properly manage digital security risk results in costs or losses
for others parties. Many of these initiatives have been implemented as part, or following, the adoption of
national cybersecurity strategies across OECD countries and they have increased in number and span
over time (OECD, 2017[30]). The following section provides a panorama of the major types of initiatives
typically undertaken to assist SMEs with digital security across OECD countries.
National digital security strategies serve as major container for related policies, and, according to the
OECD Recommendation (OECD, 2015[58]), should consider SMEs specifically in design and
implementation, especially because of possible governance failures between digital security agencies and
SME policy instances (Table 2.12).
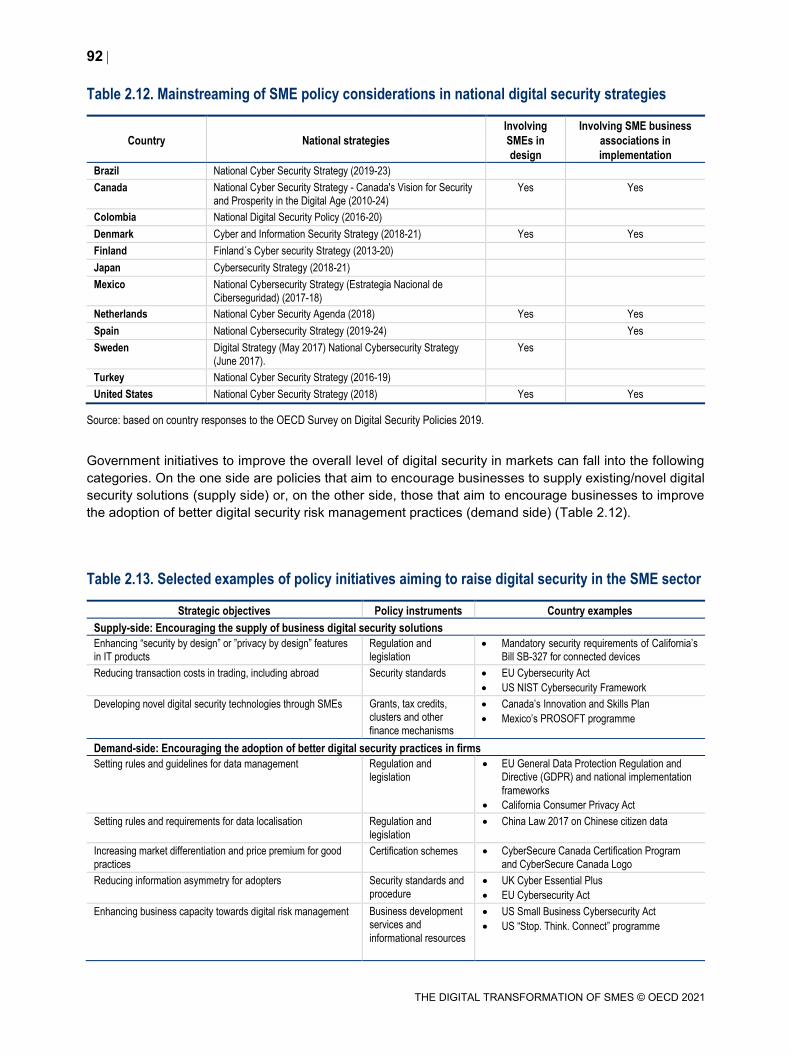
92
THE DIGITAL TRANSFORMATION OF SMES © OECD 2021
Table 2.12. Mainstreaming of SME policy considerations in national digital security strategies
Country National strategies
Involving
SMEs in
design
Involving SME business
associations in
implementation
Brazil National Cyber Security Strategy (2019-23)
Canada National Cyber Security Strategy - Canada's Vision for Security
and Prosperity in the Digital Age (2010-24) Yes Yes
Colombia National Digital Security Policy (2016-20)
Denmark Cyber and Information Security Strategy (2018-21) Yes Yes
Finland Finland´s Cyber security Strategy (2013-20)
Japan Cybersecurity Strategy (2018-21)
Mexico National Cybersecurity Strategy (Estrategia Nacional de
Ciberseguridad) (2017-18)
Netherlands National Cyber Security Agenda (2018) Yes Yes
Spain National Cybersecurity Strategy (2019-24) Yes
Sweden Digital Strategy (May 2017) National Cybersecurity Strategy
(June 2017).
Yes
Turkey National Cyber Security Strategy (2016-19)
United States National Cyber Security Strategy (2018) Yes Yes
Source: based on country responses to the OECD Survey on Digital Security Policies 2019.
Government initiatives to improve the overall level of digital security in markets can fall into the following
categories. On the one side are policies that aim to encourage businesses to supply existing/novel digital
security solutions (supply side) or, on the other side, those that aim to encourage businesses to improve
the adoption of better digital security risk management practices (demand side) (Table 2.12).
Table 2.13. Selected examples of policy initiatives aiming to raise digital security in the SME sector
Strategic objectives Policy instruments Country examples
Supply-side: Encouraging the supply of business digital security solutions
Enhancing “security by design” or ”privacy by design” features
in IT products
Regulation and
legislation
Mandatory security requirements of California’s
Bill SB-327 for connected devices
Reducing transaction costs in trading, including abroad Security standards EU Cybersecurity Act
US NIST Cybersecurity Framework
Developing novel digital security technologies through SMEs Grants, tax credits, clusters and other
finance mechanisms
Canada’s Innovation and Skills Plan
Mexico’s PROSOFT programme
Demand-side: Encouraging the adoption of better digital security practices in firms
Setting rules and guidelines for data management Regulation and
legislation
EU General Data Protection Regulation and Directive (GDPR) and national implementation
frameworks
California Consumer Privacy Act
Setting rules and requirements for data localisation Regulation and
legislation
China Law 2017 on Chinese citizen data
Increasing market differentiation and price premium for good
practices Certification schemes CyberSecure Canada Certification Program
and CyberSecure Canada Logo
Reducing information asymmetry for adopters Security standards and
procedure
UK Cyber Essential Plus
EU Cybersecurity Act
Enhancing business capacity towards digital risk management Business development services and
informational resources
US Small Business Cybersecurity Act
US “Stop. Think. Connect” programme
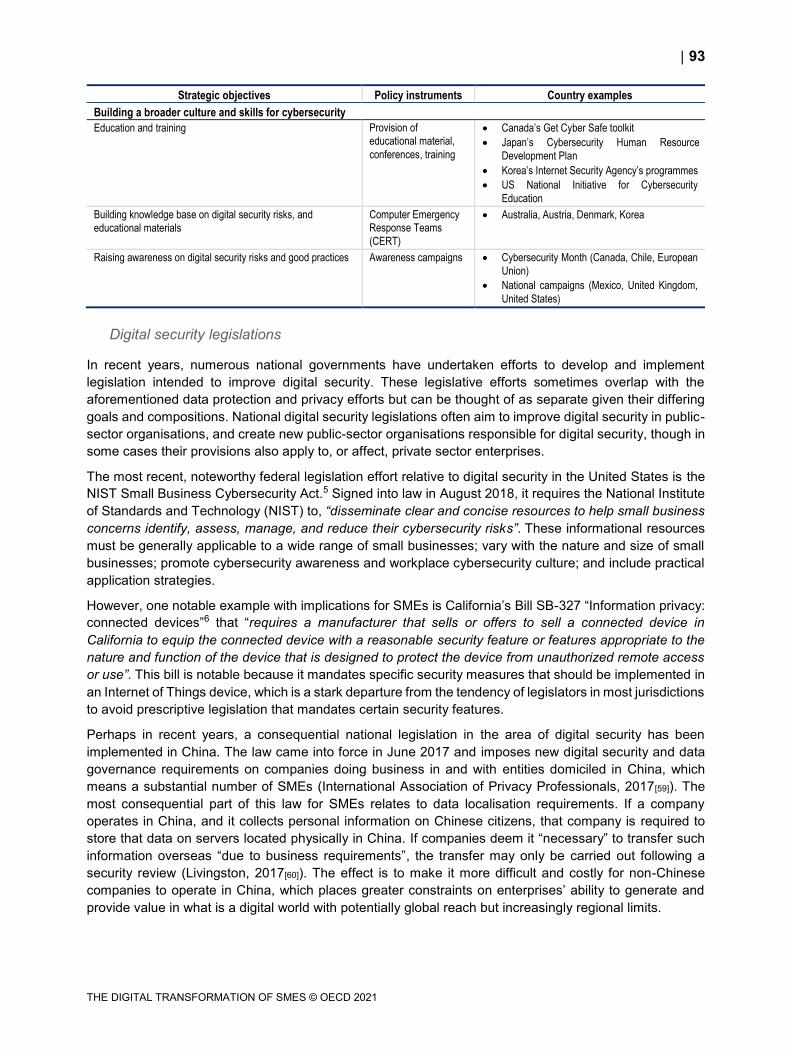
93
THE DIGITAL TRANSFORMATION OF SMES © OECD 2021
Strategic objectives Policy instruments Country examples
Building a broader culture and skills for cybersecurity
Education and training Provision of educational material,
conferences, training
Canada’s Get Cyber Safe toolkit
Japan’s Cybersecurity Human Resource
Development Plan
Korea’s Internet Security Agency’s programmes
US National Initiative for Cybersecurity
Education
Building knowledge base on digital security risks, and
educational materials
Computer Emergency Response Teams
(CERT)
Australia, Austria, Denmark, Korea
Raising awareness on digital security risks and good practices Awareness campaigns Cybersecurity Month (Canada, Chile, European
Union)
National campaigns (Mexico, United Kingdom,
United States)
Digital security legislations
In recent years, numerous national governments have undertaken efforts to develop and implement
legislation intended to improve digital security. These legislative efforts sometimes overlap with the
aforementioned data protection and privacy efforts but can be thought of as separate given their differing
goals and compositions. National digital security legislations often aim to improve digital security in public-
sector organisations, and create new public-sector organisations responsible for digital security, though in
some cases their provisions also apply to, or affect, private sector enterprises.
The most recent, noteworthy federal legislation effort relative to digital security in the United States is the
NIST Small Business Cybersecurity Act.5 Signed into law in August 2018, it requires the National Institute
of Standards and Technology (NIST) to, “disseminate clear and concise resources to help small business
concerns identify, assess, manage, and reduce their cybersecurity risks”. These informational resources
must be generally applicable to a wide range of small businesses; vary with the nature and size of small
businesses; promote cybersecurity awareness and workplace cybersecurity culture; and include practical
application strategies.
However, one notable example with implications for SMEs is California’s Bill SB-327 “Information privacy:
connected devices”6 that “requires a manufacturer that sells or offers to sell a connected device in
California to equip the connected device with a reasonable security feature or features appropriate to the
nature and function of the device that is designed to protect the device from unauthorized remote access
or use”. This bill is notable because it mandates specific security measures that should be implemented in
an Internet of Things device, which is a stark departure from the tendency of legislators in most jurisdictions
to avoid prescriptive legislation that mandates certain security features.
Perhaps in recent years, a consequential national legislation in the area of digital security has been
implemented in China. The law came into force in June 2017 and imposes new digital security and data
governance requirements on companies doing business in and with entities domiciled in China, which
means a substantial number of SMEs (International Association of Privacy Professionals, 2017[59]). The
most consequential part of this law for SMEs relates to data localisation requirements. If a company
operates in China, and it collects personal information on Chinese citizens, that company is required to
store that data on servers located physically in China. If companies deem it “necessary” to transfer such
information overseas “due to business requirements”, the transfer may only be carried out following a
security review (Livingston, 2017[60]). The effect is to make it more difficult and costly for non-Chinese
companies to operate in China, which places greater constraints on enterprises’ ability to generate and
provide value in what is a digital world with potentially global reach but increasingly regional limits.
94
THE DIGITAL TRANSFORMATION OF SMES © OECD 2021
This is part of a larger trend around data localisation, which is introducing similar additional costs to doing
business in a number of other countries. Other examples include Australia (Chander and Lê, 2015[61]),
Germany (Determann and Weigl, 2016[62]), Turkey (Yavuzdogan Okumus, 2020[63]), the Russian
Federation (Bowman, 2015[64]) and South Korea (Chander and Le, 2014[65]) among other countries. Data
localisation requirements’ potential impact on SMEs should be understood in light of the proliferation of
new services such as big data, cloud computing, and IoT. Many providers of these services have significant
international footprints; as such, data localisation requirements may raise barriers to entry and discourage
new market entrants. Local SMEs could thus face substantial increases in their computing costs, potentially
as high as 30-60% (Leviathan Security Group, 2015[66]).
Certification schemes and security standards
A number of countries have started to develop national certification schemes for digital security. These
initiatives involve the development of a series of “best practices” that enterprises can implement in their
own operations or in the design of their products and services. Upon completing the requisite steps,
enterprises receive a certification that can signal to consumers or business partners the level of digital
security of the enterprise or its products/services. These schemes aim to raise the firm’s profile and reduce
information asymmetry on the market. These schemes may also incentivise producers to design their
products/services in a way that is “secure by design” (OWASP, 2020[67]). In this way, labelling schemes
can help suppliers turn security into a competitive advantage and support market differentiation (OECD,
2019[27]).
The EU Cybersecurity Act creates, “an EU-wide cybersecurity certification framework for ICT products,
services and processes” (European Commission, n.d.[68]). Still in development, the framework is intended
to provide a comprehensive set of rules, technical requirements, standards and procedures for the
evaluation of the security properties of a specific ICT-based product or service. This is potentially of benefit
to SMEs in that it would provide a generally agreed upon standard and greater clarity for digital security in
products/services.
A consistent or common certification scheme across countries also comes with additional benefits:
consumers could refer to a trusted and recognisable standard, while producers could benefit from reduced
transaction and opportunity costs associated with operating across borders, which would also increase the
profitability of their products.
The United Kingdom, as part of its National Cyber Security Programme, has developed and implemented
the Cyber Essentials and Cyber Essentials Plus programmes (National Cyber Security Centre, n.d.[69]).
These programmes include an assurance framework and a simple set of security controls that enterprises
can implement to protect their data and systems from threats coming from the internet. Cyber Essentials
is a self-assessment tool, which is independently verified. Cyber Essentials Plus, by contrast, involves
independent testing. Divided up into five technical controls, an enterprise is encouraged to implement
boundary firewalls and internet gateways, secure configuration, access controls, malware protection and
patch management. The UK government worked with the Information Assurance for Small and Medium
Enterprises (IASME) consortium to develop Cyber Essentials and it is backed by the Federation of Small
Businesses (United Kingdom Government, 2019[70]). Any enterprise can apply for and receive these
certifications, but they may be particularly helpful to SMEs in that they provide succinct and clear guidance
on useful digital security measures. Moreover, they are required for government contracts where the
supplier is providing ICT services or handling personal information (Cyber Management Alliance, 2016[71]).
Having a clear set of minimum criteria may be helpful for SMEs in their efforts to win public contracts.
A similar initiative is Canada’s CyberSecure Canada Certification Program, which was announced in
August 2019. “SMEs that demonstrate compliance with specified baseline cybersecurity controls7, based
on an audit by an accredited certification body, will be granted a two-year certification and be entitled to
use the CyberSecure Canada logo” (Freedman, 2019[72]).
95
THE DIGITAL TRANSFORMATION OF SMES © OECD 2021
Innovation in digital security technologies
SMEs can be the source of new and improved digital security products, services or methods. A subset of
fast-growing SMEs are a particularly important source of such innovations in OECD countries (OECD,
2010[73]). There are a number of ways that governments can foster digital security innovation by
enterprises, including SMEs, such as tax incentives, acting as an early customer for innovative products,
using regulation to stimulate demand for such products, or through the creation of a digital security
innovation ecosystem (OECD, 2020[74]).
Canada’s Innovation and Skills plan seeks to encourage the growth of many innovative industries including
the “digital” industry, which includes digital security. While SMEs are not specifically mentioned as a target
for these initiatives, the plan will have implications for SMEs through the creation of superclusters,
attraction of new high-quality business investments (via the Strategic Innovation Fund), and the support
given to innovative businesses with venture capital (Government of Canada, 2017[75]).
Mexico, through its long-standing PROSOFT Program, promotes the creation of industrial Innovation
Centers (IIC) that are focused on providing trained and specialised human capital, as well as the adoption
of new technologies linked to “Industry 4.0”, such as digital security (Government of Mexico, 2016[76]).
Spain’s National Cyber Security Strategy aims to generate knowledge and develop research and
development activities in digital security. Line of Action 5 is specifically focused on, “strengthen[ing] the
Spanish cybersecurity industry and its capacity to nurture and retain talent, to bolster digital autonomy”
(Government of Spain, 2018[77]). Amongst the different measures proposed are: boosting R&D support
programmes in digital security in SMEs, businesses, universities and research centres; facilitating access
to national and international incentive programmes; and innovative public purchasing programmes.
The United Kingdom uses public procurement to encourage SMEs and supply chain actors to enhance
their digital security. Companies that wish to become government suppliers need to implement the Cyber
Essentials or Cyber Essentials Plus certification schemes. This approach promotes digital security without
creating rigid compliance regulation that is likely to become outdated quickly or create burdensome
requirements for business (OECD, 2020[74]).
The European Cyber Security Organisation (ECSO), is a public-private partnership that co-ordinates the
innovation roadmaps and investments in the EU. It brings together many stakeholders including SMEs and
industry more broadly, academia, regional representatives and Member States. ECSO helps prioritise
investments across many technical areas of which digital security. (OECD, 2020[74])
Education and awareness campaigns
Numerous countries have undertaken a variety of efforts to increase awareness of digital security amongst
the wider public, sometimes especially targeted to the business sector and SMEs. Those efforts aim to
provide quality advice/guidance, and relatively inexpensive solutions, that, if adopted, would reduce SME
digital security exposure and potential losses substantially. Indeed, the risk of exposure follows a Pareto
distribution, whereby a large proportion of possible losses can be avoided with small investments in and
implementation of certain protection measures.
As a part of its 2020 Cyber Security Strategy, Australia has implemented a number of SME-specific
initiatives including some related to education and awareness campaigns. The Australian Cyber Security
Centre (ACSC) chose to offer both guidance on what SMEs should be doing, but how they should
implement a digital security strategy. Policy examples include tailored toolkits (e.g. to assess maturity
levels).
The Belgian Federal Public Service for the Economy, SMEs, Middle Classes and Energy has an online set
of resources to inform and assist SMEs in digital security matters. The information kit includes documents
on undertaking risk assessments, key principles for ensuring digital security, what to do in the event of an
96
THE DIGITAL TRANSFORMATION OF SMES © OECD 2021
incident and a glossary of key technical terms (Belgian Federal Public Service for the Economy, SMEs,
Middle Classes and Energy, 2018[78]).
Brazil, amongst many activities proposed as part of its Cyber Security Strategy, aims to ‘create cyber
security awareness actions for SMEs’. This intends to raise the level of maturity in digital security across
society, and increase Brazil’s resilience to digital security threats (Government of Brazil, 2020[79]).
Canada’s Centre for Cyber Security provides people with a “Get Cyber Safe” toolkit during the
Cybersecurity Month in October. The structured curriculum covers topics like “How cyber threats work”,
“How cyber threats affect you”, and “How to protect your small business” (Government of Canada, 2020[80]).
Chile’s National Cybersecurity Policy includes the design of a large-scale cybersecurity campaign to
promote the implementation of awareness and dissemination programmes in partnership with the private
sector (Government of Chile, 2020[81]). The policy document also makes reference to October as the
Cybersecurity Month and a Safe Internet Day in February each year. More broadly, the Ministry of
Education administers the “Internet Segura” (Safe Internet) initiative, to help people use the internet in a
way that is “responsible, informed, safe, ethical, free and participatory” (Internet Segura y Ciudadanía
Digital, 2020[82]).
Denmark’s Cyber and Information Security Strategy focuses on strengthening the IT security knowhow of
SME primary advisors, so they can operate as “bridge-builders”. The aim is to make these advisors (e.g
accountants, lawyers, etc.) raise IT security issues in their dialogue with SME leadership (Government of
Denmark, 2018[83]).
France has a label SecNumedu for professional training courses targeting SMEs,8 a guide for developing
cyber hygiene within SMEs9 and a platform that reports on malicious activities and provides assistance to
professionals.10 Japan established the Cybersecurity Strategic Headquarters in 2014, with a number of
responsibilities of which implementing a “Cybersecurity Human Resource Development Plan” (National
center of Incident readiness and Strategy for Cybersecurity, 2020[84]). Its outreach functions include a
collaboration with Association of South East Asian Nations (ASEAN) members on “awareness raising,
capacity building and so on.11”
Korea’s Internet Security Agency (KISA) provides various educational and professional training
programmes in order to raise awareness with the general public, promoting cybersecurity courses in higher
education and promoting certification of professionals in both public and private sectors12.
Mexico has a National Cybersecurity Strategy and conducts awareness campaigns. The Federal Police
runs a National Prevention Campaign called Cybersecurity Mexico, which seeks to “raise awareness in
Mexican society about the responsible use of new technologies and the Internet to reduce the damage
caused by cybercrime” (Council of Europe, 2020[85]). Additionally, since 2015, National Cybersecurity
Weeks are organised in collaboration with the Organization of American States.
In 2018, Sweden assigned an authority to develop and implement a programme that aims to increase
digitalisation skills among the management and boards of small companies. It is a three-year venture,
whereby small businesses raise capacity to assess and manage digitalisation risks from an economic
perspective (Swedish Agency for Economic Growth and Regional Development, 2020[86]).
The UK Centre for the Protection of National Infrastructure has developed a series of security awareness
campaigns, designed to provide organisations with a complete range of materials they need. Some of the
topics covered in these materials include “Don’t take the bait”, which addresses the risk of spear-phishing,
“Identifying the right security behaviours” and “Think before you link” (Center for the Protection of National
Infrastructure, 2020[87]).
97
THE DIGITAL TRANSFORMATION OF SMES © OECD 2021
The US Department of Homeland Security (DHS) administers a National Initiative for Cybersecurity
Education. This comprises four key activities: 1) National Cybersecurity Awareness Campaign, 2) formal
cybersecurity education, 3) federal Cybersecurity Workforce Structure13 and 4) Cybersecurity Workforce
Training and Professional Development (McConnell, 2017[88]). The “Stop. Think. Connect” programme is
a national public awareness campaign aimed at increasing the understanding of cyber threats and
encouraging the public to be safer and more secure online (Cybersecurity and Infrastructure Agency,
2020[89]). A toolkit has been assembled for various groups, including the industry (Cybersecurity and
Infrastructure Agency, 2020[90]) and small businesses (Cybersecurity and Infrastructure Agency, 2020[91]).
October is National Cybersecurity Awareness Month (NCSAM) and DHS releases at this occasion a new
toolkit each year to make it easy for people and organisations, regardless of size or industry, to engage
and promote NCSAM (Cybersecurity and Infrastructure Agency, 2020[92]).
The European Cybersecurity Month (ECSM) is an awareness campaign in October of each year that:
“promotes cybersecurity among EU citizens and advocates seeking to change the perception of cyber-threats by promoting
education, sharing of good practices and competitions in data and information security” (ENISA, 2020[93])
In practice, this involves numerous activities including training, conferences, online quizzes and by
providing general presentations to end users (ENISA, 2019[94]).
The European Commission and EASME, the Executive Agency for SMEs, recently ran an initiative to
support specialised skills development related to Big Data, IoT and Cybersecurity for SMEs in Europe. The
initiative involved convening many stakeholders to discuss the issues, and resulted in a final report
containing an analysis of the potential benefits and barriers for technology adoption by SMEs. The work
presents a vision, roadmap and toolbox to increase the capacity of industry, social partners, education and
training organisations and policy makers at all levels to promote and support the acquisition of these skills
by SMEs in Europe (European Commission, 2020[95]).
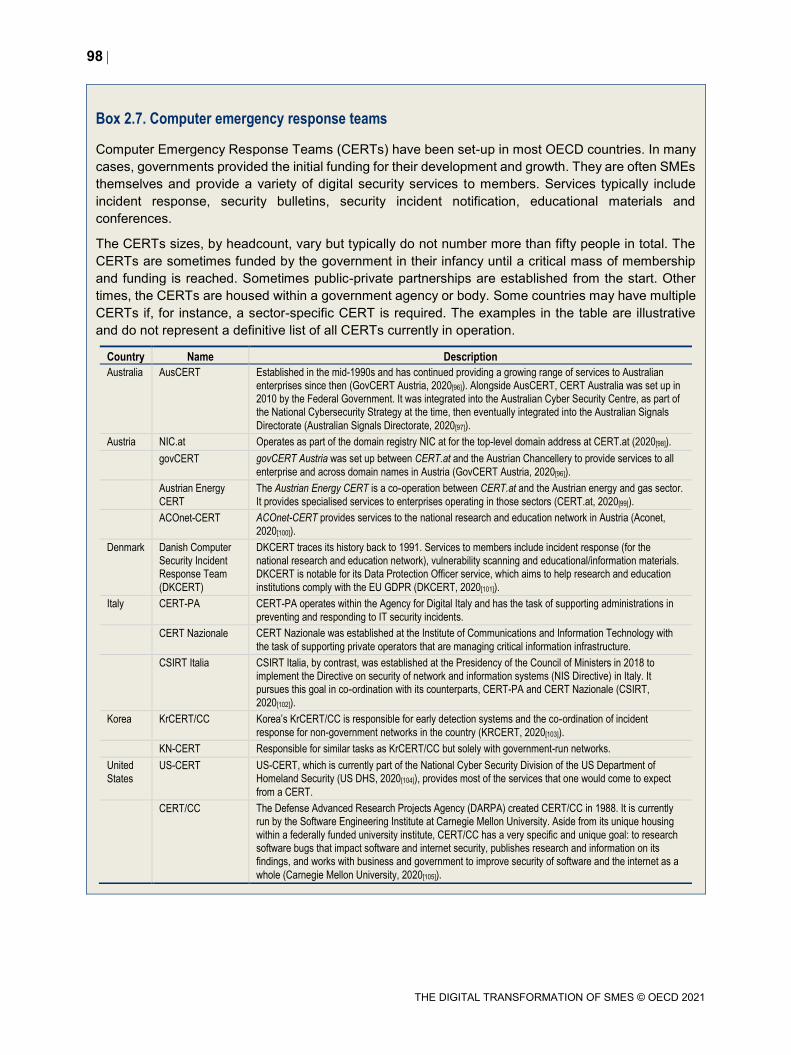
98
THE DIGITAL TRANSFORMATION OF SMES © OECD 2021
Box 2.7. Computer emergency response teams
Computer Emergency Response Teams (CERTs) have been set-up in most OECD countries. In many
cases, governments provided the initial funding for their development and growth. They are often SMEs
themselves and provide a variety of digital security services to members. Services typically include
incident response, security bulletins, security incident notification, educational materials and
conferences.
The CERTs sizes, by headcount, vary but typically do not number more than fifty people in total. The
CERTs are sometimes funded by the government in their infancy until a critical mass of membership
and funding is reached. Sometimes public-private partnerships are established from the start. Other
times, the CERTs are housed within a government agency or body. Some countries may have multiple
CERTs if, for instance, a sector-specific CERT is required. The examples in the table are illustrative
and do not represent a definitive list of all CERTs currently in operation.
Country Name Description
Australia AusCERT Established in the mid-1990s and has continued providing a growing range of services to Australian enterprises since then (GovCERT Austria, 2020[96]). Alongside AusCERT, CERT Australia was set up in 2010 by the Federal Government. It was integrated into the Australian Cyber Security Centre, as part of the National Cybersecurity Strategy at the time, then eventually integrated into the Australian Signals
Directorate (Australian Signals Directorate, 2020[97]).
Austria NIC.at Operates as part of the domain registry NIC at for the top-level domain address at CERT.at (2020[98]).
govCERT govCERT Austria was set up between CERT.at and the Austrian Chancellery to provide services to all
enterprise and across domain names in Austria (GovCERT Austria, 2020[96]).
Austrian Energy
CERT
The Austrian Energy CERT is a co-operation between CERT.at and the Austrian energy and gas sector.
It provides specialised services to enterprises operating in those sectors (CERT.at, 2020[99]).
ACOnet-CERT ACOnet-CERT provides services to the national research and education network in Austria (Aconet,
2020[100]).
Denmark Danish Computer Security Incident Response Team
(DKCERT)
DKCERT traces its history back to 1991. Services to members include incident response (for the national research and education network), vulnerability scanning and educational/information materials. DKCERT is notable for its Data Protection Officer service, which aims to help research and education
institutions comply with the EU GDPR (DKCERT, 2020[101]).
Italy CERT-PA CERT-PA operates within the Agency for Digital Italy and has the task of supporting administrations in
preventing and responding to IT security incidents.
CERT Nazionale CERT Nazionale was established at the Institute of Communications and Information Technology with
the task of supporting private operators that are managing critical information infrastructure.
CSIRT Italia CSIRT Italia, by contrast, was established at the Presidency of the Council of Ministers in 2018 to implement the Directive on security of network and information systems (NIS Directive) in Italy. It pursues this goal in co-ordination with its counterparts, CERT-PA and CERT Nazionale (CSIRT,
2020[102]).
Korea KrCERT/CC Korea’s KrCERT/CC is responsible for early detection systems and the co-ordination of incident
response for non-government networks in the country (KRCERT, 2020[103]).
KN-CERT Responsible for similar tasks as KrCERT/CC but solely with government-run networks.
United
States US-CERT US-CERT, which is currently part of the National Cyber Security Division of the US Department of
Homeland Security (US DHS, 2020[104]), provides most of the services that one would come to expect
from a CERT.
CERT/CC The Defense Advanced Research Projects Agency (DARPA) created CERT/CC in 1988. It is currently run by the Software Engineering Institute at Carnegie Mellon University. Aside from its unique housing
within a federally funded university institute, CERT/CC has a very specific and unique goal: to research software bugs that impact software and internet security, publishes research and information on its findings, and works with business and government to improve security of software and the internet as a
whole (Carnegie Mellon University, 2020[105]).
99
THE DIGITAL TRANSFORMATION OF SMES © OECD 2021
Conclusion
Although SMEs have a smaller “attack surface”, they are increasingly exposed to digital security threats
and digital security breaches. The digital transformation raises their level of exposure as it implies greater
connectivity and reliance on software, and make them more vulnerable if proper digital security risk
management practices are not in place. In addition, the COVID-19 crisis has made more businesses reliant
on digital technology than before, giving an opportunity for malicious actors to intensify attacks, e.g.
phishing then fraud, taking advantage of sudden and massive surge in teleworking arrangements and
online transactions. A combination of low digital security risk management experience/maturity coupled
with increased reliance also makes the potential impact of disruptions more serious (i.e. business
interruption).
Phishing, denial of service and ransomware attacks continue to be the most prevalent methods, and can
be often countered by implementing baseline security measures. But attacks have also become more
sophisticated over time, techniques evolving continuously and requiring more advanced risk management
capacities that smaller firms are less likely to have first.
Digital security incidents can result in sizeable costs and losses, and tend to increase with firm size. A
small proportion of enterprises incur the lion’s share of incidents and losses. However, when affected by
rare but very costly incidents, SMEs can incur costs that can add up to several months of revenues. In
addition, weak digital security practices may become a barrier for them to build business networks.
SMEs tend to have less comprehensive and sophisticated digital security risk management practices. They
often do not have a person dedicated to digital security internally. They tend to seek less information from
external sources on digital security and do not tend to have formal procedures in place to detect intrusions.
They also tend to update their procedures less often and invest less in digital security, although this varies
across sectors and countries.
Governments increasingly aim to encourage the adoption of better digital security practices in SMEs
through certification schemes, security standards, or by raising awareness and building business
competences on digital security. Policy initiatives are often not specific to SMEs, or not specifically
designed towards this segment of the business population, although recent policy trends show a shift
towards more targeted approaches (e.g. UK cyber essentials, France’s training label and reporting
platform, etc.).
Looking forward, SMEs need to be more aware of and effectively manage digital risk so as to make the
most of the opportunities afforded by the digital transformation. This message has been consistently
reinforced by the OECD, and the 2015 OECD Recommendation on Digital Security Risk Management for
Economic and Social Prosperity states that “digital risk should be approached as an economic risk; it
should therefore be an integral part of an organisation’s overall risk management and decision making
processes.” (OECD, 2019[27]; OECD, 2015[58]).
Unfortunately, there is no one-size-fits-all digital security governance, as methods and techniques vary,
depending on the risks incurred, the types of attacks suffered, the types of assets to protect, and in turn,
the business models prevailing in the sector. This makes managing digital security risk effectively
challenging. Various policies have attempted to assist SMEs to improve their digital security risk
management practices. The rapid intensification of digital uses in the context of COVID-19 has made the
need to manage this risk more urgent. If old trends hold, there is possibly a widening gap emerging
between the need and ability of SMEs to manage this risk.
The evidence base for digital security policies, and risk management, improve with each passing year. A
much more substantive research base is now available (and has been cited throughout this paper). There
is still much more work to be done though, so as to ensure that the best evidence and research is available
to guide decision making both within enterprises and government.
100
THE DIGITAL TRANSFORMATION OF SMES © OECD 2021
Further research would be useful to:
Better understand the correlation between firm-level vulnerability and investment in digital security,
and the various types and amounts of costs incurred due to different types of digital security
incidents. These incidents and their costs may differ across OECD countries depending on many
factors such as the composition of the enterprise population and their industrial structure.
The impact that age has on an enterprise’s likelihood to have mature digital security risk
management practices. Some evidence has pointed to younger enterprises being more likely to
use and be reliant upon digital technologies. This would imply that their digital security risk
management practices would need to be, and perhaps are more, sophisticated than older larger
enterprises. However, there is little in the way of evidence-based consensus in this area.
The link between the incidence of digital security attacks or failure and the policies implemented in
a country has not been clearly established. Anecdotally, ransomware incidents are not as severe
or frequent in Germany as in other OECD countries. This is because the government mandates
enterprises to have backups, which makes recovery from a ransomware attack much faster. An
evaluation of the impact of some policies, backed by methods involving natural experiments, might
shine more light on policies that work with the best return on investment by type of enterprises and
sector.
In addition, as digital services are increasingly connected and extending beyond the reach of a
single jurisdiction and control institution, the risks of systemic failures are likely to grow and new
governance challenges for businesses and governments to emerge. These single points of failure
aggregate systemic risk, which if disrupted could lead to cascading losses throughout economies.
Better understanding of where these single points of failure lie, and which enterprises are
connected to and reliant upon them, would help future efforts to manage this risk.
All this calls for enhanced co-operation and knowledge exchange: within industries where actors share
similar business models; between SMEs and large firms that share similar threats with different and
potentially complementary response capacity; across jurisdictions that face no-border attacks; or between
policy domains, for instance research and innovation policy and SME policy.
101
THE DIGITAL TRANSFORMATION OF SMES © OECD 2021
References
Aconet (2020), The ACOnet CERT, https://www.aco.net/cert.html?L=1. [100]
Akamai (2020), Visualizing Global Internet Performance,
https://www.akamai.com/uk/en/resources/visualizing-akamai/ (accessed on 18 July 2020).
[46]
Akerlof, G. (1970), “The Market for “Lemons”: Quality Uncertainty and the Market Mechanism”,
The Quarterly Journal of Economics, Vol. 84/3, p. 488, http://dx.doi.org/10.2307/1879431.
[57]
Almeling, D. (2012), “Seven Reasons Why Trade Secrets Are Increasingly Important”, Berkeley
Technology Law Journal, Vol. 27, p. 1091, http://dx.doi.org/10.15779/Z38SM4F.
[33]
ANSSI and BSI (2018), “ANSSI/BSI Common situational picture”,
https://www.ssi.gouv.fr/uploads/2018/07/bilateral-french-german-it-security-situation-
report.pdf (accessed on 30 March 2020).
[5]
Australian Signals Directorate (2020), About the ACSC, https://www.cyber.gov.au/about. [97]
Belgian Federal Public Service for the Economy, SMEs, Middle Classes and Energy (2018),
Cybersecurity – is your enterprise ready?,
https://economie.fgov.be/fr/publications/cybersecurite-votre-entreprise (accessed on
11 December 2020).
[78]
Biancotti, C. (2017), “Cyber Attacks: Preliminary Evidence from the Bank of Italy’s Business
Surveys”, Bank of Italy, Occasional Paper No. 373, http://dx.doi.org/10.2139/ssrn.2954991.
[19]
Biancotti, C. (2017), “The price of cyber (in)security: Evidence from the Italian private sector”,
Bank of Italy, Occasional Papers No 407, https://www.bancaditalia.it/pubblicazioni/qef/2017-
0407/QEF_407.pdf?language_id=1.
[26]
Bowman, C. (2015), “A Primer on Russia’s New Data Localization Law”, Privacy Law Blog,
https://privacylaw.proskauer.com/2015/08/articles/international/a-primer-on-russias-new-data-
localization-law/ (accessed on 4 March 2020).
[64]
Brant, J. and S. Lohse (2014), “Trade Secrets: Tools for Innovation and Collaboration in
Innovation”, Intellectual Property Series, International Chamber of Commerce,
https://cdn.iccwbo.org/content/uploads/sites/3/2017/02/ICC-Research-Trade-Secrets-
english.pdf (accessed on 18 July 2018).
[32]
Calvino, F. et al. (2018), “A taxonomy of digital intensive sectors”, OECD Science, Technology
and Industry Working Papers, No. 2018/14, OECD Publishing, Paris,
https://dx.doi.org/10.1787/f404736a-en.
[22]
Carnegie Mellon University (2020), “The CERT Division”, Software Engineering Institute,
http://sei.cmu.edu/about/divisions/cert/index.cfm.
[105]
Center for the Protection of National Infrastructure (2020), Security awareness campaigns,
https://www.cpni.gov.uk/security-awareness-campaigns (accessed on 11 December 2020).
[87]
CERT.at (2020), Australian energy CERT, https://cert.at/de/ueber-uns/austrian-energy-cert/
(accessed on 11 December 2020).
[99]
102
THE DIGITAL TRANSFORMATION OF SMES © OECD 2021
CERT.at (2020), Zuständigkeit, https://www.cert.at/about/scope/scope.html (accessed on
11 December 2020).
[98]
Chailytko, A. (2020), Zoom-zoom: we are watching you,
https://research.checkpoint.com/2020/zoom-zoom-we-are-watching-you/.
[44]
Chander, A. and U. Le (2014), “Breaking the Web: Data Localization vs. the Global Internet”,
Emory Law Journal, UC Davis Legal Studies Research Paper No. 378,
https://ssrn.com/abstract=2407858 (accessed on 15 January 2021).
[65]
Chander, A. and U. Lê (2015), “Data nationalism”, Emory Law Journal, Vol. 64/3,
https://scholarlycommons.law.emory.edu/elj/vol64/iss3/2 (accessed on 4 March 2020).
[61]
Council of Europe (2020), Mexico: National cybersecurity strategy and awareness campaign,
https://www.coe.int/en/web/cybercrime/-/mexico-national-cybersecurity-strategy-and-
awareness-campaign (accessed on 11 December 2020).
[85]
CSIRT (2020), CSIRT Italia, http://www.csirt-ita.it (accessed on 11 December 2020). [102]
Cyber Management Alliance (2016), “Cyber Essentials: The security standard for small to
medium companies”, https://www.cm-alliance.com/consultancy/compliance-gap-
analysis/cyber-essentials/ (accessed on 7 March 2020).
[71]
Cybersecurity and Infrastructure Agency (2020), Cybersecurity Awareness Month,
https://www.cisa.gov/national-cyber-security-awareness-month.
[92]
Cybersecurity and Infrastructure Agency (2020), Stop. Think. Connect.,
https://www.cisa.gov/stopthinkconnect (accessed on 11 December 2020).
[89]
Cybersecurity and Infrastructure Agency (2020), Stop. Think. Connect. Industry resources,
https://www.cisa.gov/publication/stopthinkconnect-industry-resources.
[90]
Cybersecurity and Infrastructure Agency (2020), Stop. Think. Connect. Small business
resources, https://www.cisa.gov/publication/stopthinkconnect-small-business-resources.
[91]
Cyentia Institute (2019), Information Risk Insights Study 2020, https://www.cyentia.com/iris/. [24]
Dean, B. (2018), “An exploration of strict products liability and the internet of things”, Center for
Democracy and Technology, https://dx.doi.org/10.2139/ssrn.3193049.
[56]
Dean, B. (2018), Strict Products Liability and the Internet of Things, Center for Democracy and
Technology, https://cdt.org/wp-content/uploads/2018/04/2018-04-16-IoT-Strict-Products-
Liability-FNL.pdf.
[13]
Dean, B. (2017), Trans-Atlantic Cyber Insecurity and Cyber Crime: Economic impact and future
prospects, European Parliament,
https://www.europarl.europa.eu/RegData/etudes/STUD/2017/603948/EPRS_STU(2017)6039
48_EN.pdf.
[25]
DeSilver, D. (2020), “Before the coronavirus, telework was an optional benefit – mostly for the
affluent few”, Pew Research Center, https://www.pewresearch.org/fact-
tank/2020/03/20/before-the-coronavirus-telework-was-an-optional-benefit-mostly-for-the-
affluent-few/ (accessed on 16 September 2020).
[43]
103
THE DIGITAL TRANSFORMATION OF SMES © OECD 2021
Determann, L. and M. Weigl (2016), “Data residency requirements creeping into German law”,
Bloomberg Law, https://web.archive.org/web/20171207221329/https://www.bna.com/data-
residency-requirements-n57982069680/ (accessed on 4 March 2020).
[62]
DHS and DoC (2018), Report on “Enhancing the Resilience of the Internet and Communications
Ecosystem Against Botnets”, https://www.commerce.gov/page/report-president-enhancing-
resilience-against-botnets.
[14]
DKCERT (2020), DKCERT homepage, https://www.cert.dk (accessed on 11 December 2020). [101]
ENISA (2020), European Cybersecurity Month,
https://www.enisa.europa.eu/topics/cybersecurity-education/european-cyber-security-month
(accessed on 11 December 2020).
[93]
ENISA (2019), ECSM Deployment Report 2019, https://www.enisa.europa.eu/publications/ecsm-
deployment-report-2019.
[94]
European Commission (2020), A European Strategy for Data, Communication from the
Commission to the European Parliament, the Council, the European Economic and Social
Committee and the Committee of the Regions - COM(2020) 66 final,
https://ec.europa.eu/info/sites/info/files/communication-european-strategy-data-
19feb2020_en.pdf.
[31]
European Commission (2020), Supporting Specialised Skill Development: Big Data, Internet of
Things and Cyber Security for SMEs – Final report, https://op.europa.eu/en/publication-
detail/-/publication/bb5c6c09-6285-11ea-b735-01aa75ed71a1/language-en.
[95]
European Commission (n.d.), “The EU cybersecurity certification framework”, Shaping Europe’s
digital future, https://ec.europa.eu/digital-single-market/en/eu-cybersecurity-certification-
framework (accessed on 4 March 2020).
[68]
Eurostat (2020), ICT Usage in Enterprises Database,
https://ec.europa.eu/eurostat/data/database (accessed on 18 July 2020).
[18]
FBI (2020), “FBI urge vigilance during Covid-19 pandemic”, https://www.fbi.gov/coronavirus
(accessed on 17 December 2020).
[49]
Freedman, B. (2019), Ready, set, certify – Canada’s new CyberSecurity Canada certification
program, https://cybersecuritylaw.ca/home/2019/8/16/ready-set-certify-canadas-new-
cybersecure-canada-certification-program (accessed on 4 March 2020).
[72]
GovCERT Austria (2020), GovCERT in Österreich, http://govcert.gv.at/ (accessed on
11 December 2020).
[96]
Government of Brazil (2020), National Strategy of Cyber Security,
https://www.in.gov.br/en/web/dou/-/decreto-n-10.222-de-5-de-fevereiro-de-2020-241828419
(accessed on 11 December 2020).
[79]
Government of Canada (2020), Cyber Security Awareness Month Toolkit,
https://www.getcybersafe.gc.ca/cnt/rsrcs/csam-tlkt-en.aspx (accessed on
11 December 2020).
[80]
104
THE DIGITAL TRANSFORMATION OF SMES © OECD 2021
Government of Canada (2017), “Chapter 1: Skills, Innovation and Middle Class Jobs”, Budget
2017, https://www.budget.gc.ca/2017/docs/plan/chap-01-en.html#archived (accessed on
11 December 2020).
[75]
Government of Chile (2020), National Cybersecurity Policy,
https://www.ciberseguridad.gob.cl/media/2017/05/NCSP-ENG.pdf.
[81]
Government of Denmark (2018), Danish Cyber and Information Security Strategy 2018-2021,
https://digst.dk/media/16943/danish_cyber_and_information_security_strategy_pdfa.pdf.
[83]
Government of Mexico (2016), “Programme for the development of the software industry
(PROSOFT) and innovation 2019”, https://www.gob.mx/se/acciones-y-programas/programa-
para-el-desarrollo-de-la-industria-de-software-prosoft-y-la-innovacion-2016.
[76]
Government of Spain (2018), “National security strategy”,
https://www.dsn.gob.es/documento/informe-anual-seguridad-nacional-2018 (accessed on
11 December 2020).
[77]
Greenberg, A. (2018), The Untold Story of NotPetya, the Most Devastating Cyberattack in
History, https://www.wired.com/story/notpetya-cyberattack-ukraine-russia-code-crashed-the-
world/ (accessed on 30 March 2020).
[6]
IBM/Ponemon (2020), Cost of a Data Breach Report, https://www.ibm.com/security/digital-
assets/cost-data-breach-report/#/ (accessed on 29 August 2020).
[38]
International Association of Privacy Professionals (2017), “China’s new cybersecurity law”,
https://iapp.org/resources/article/chinas-new-cybersecurity-law-2/ (accessed on
4 March 2020).
[59]
Internet Segura y Ciudadanía Digital (2020), Quiénes somos,
http://www.internetsegura.cl/quienes-somos/ (accessed on 11 December 2020).
[82]
Kaspersky (2019), Story of the year 2019: Cities under ransomware siege, Securelist,
https://securelist.com/story-of-the-year-2019-cities-under-ransomware-siege/95456/
(accessed on 31 March 2020).
[8]
Koeze, E. and N. Popper (2020), “The Virus Changed the Way We Internet”, The New York
Times, https://www.nytimes.com/interactive/2020/04/07/technology/coronavirus-internet-
use.html (accessed on 17 July 2020).
[45]
KRCERT (2020), KRCERT homepage, http://eng.krcert.or.kr. [103]
Leviathan Security Group (2015), Quantifying the Cost of Forced Localization,
https://static1.squarespace.com/static/556340ece4b0869396f21099/t/559dad76e4b0899d977
26a8b/1436396918881/Quantifying+the+Cost+of+Forced+Localization.pdf.
[66]
Livingston, S. (2017), “China set to expand data localization and security review requirements”,
International Association of Privacy Professionals, https://iapp.org/news/a/china-set-to-
expand-data-localization-and-security-review-requirements/ (accessed on 4 March 2020).
[60]
McConnell, B. (2017), National Cybersecurity Awareness Campaign,
https://www.nist.gov/system/files/documents/2017/01/25/bmcconnell_national-cybersec-
awareness.pdf.
[88]
105
THE DIGITAL TRANSFORMATION OF SMES © OECD 2021
Miller, M. (2020), “FBI sees spike in cyber crime reports during coronavirus pandemic”, The Hill,
https://thehill.com/policy/cybersecurity/493198-fbi-sees-spike-in-cyber-crime-reports-during-
coronavirus-pandemic (accessed on 17 December 2020).
[48]
Monitor Deloitte for Erhvervsstyrelsen (2018), IT security and data management in Danish
SMEs, https://erhvervsstyrelsen.dk/sites/default/files/2019-
11/Analyse%20af%20digital%20sikkerhed%20blandt%20SMV%27er%202019.pdf (accessed
on 9 September 2020).
[51]
Moody’s (2019), “Battling hidden cyber exposures, insurers position for growing opportunity”,
https://www.grupoaseguranza.com/adjuntos/fichero_32099_20190729.pdf (accessed on
9 September 2020).
[52]
National center of Incident readiness and Strategy for Cybersecurity (2020), About NISC,
https://www.nisc.go.jp/eng/.
[84]
National Cyber Security Centre (2018), “Executive Summary: the 10 Steps to Cyber Security”,
https://www.ncsc.gov.uk/collection/10-steps-to-cyber-security/introduction-to-cyber-
security/executive-summary.
[106]
National Cyber Security Centre (n.d.), “Information for Individuals and Families“,
https://www.cyberaware.gov.uk/cyberessentials/ (accessed on 4 March 2020).
[69]
NIST (2020), National Vulnerability Database,
https://nvd.nist.gov/vuln/search/statistics?form_type=Basic&results_type=statistics&search_ty
pe=last3years.
[15]
OECD (2020), “Capacity for remote working can affect lockdown costs differently across places”,
OECD Policy Responses to Coronavirus (COVID-19), http://www.oecd.org/coronavirus/policy-
responses/capacity-for-remote-working-can-affect-lockdown-costs-differently-across-places-
0e85740e/ (accessed on 18 July 2020).
[40]
OECD (2020), “Coronavirus (COVID-19): SME policy responses”, OECD Policy Responses to
Coronavirus (COVID-19), http://www.oecd.org/coronavirus/policy-responses/coronavirus-
covid-19-sme-policy-responses-04440101/ (accessed on 18 July 2020).
[37]
OECD (2020), “Dealing with digital security risk during the Coronavirus (COVID-19) crisis”,
OECD Policy Responses to Coronavirus (COVID-19), http://www.oecd.org/coronavirus/policy-
responses/dealing-with-digital-security-risk-during-the-coronavirus-covid-19-crisis-c9d3fe8e/
(accessed on 18 July 2020).
[4]
OECD (2020), Enabling SMEs to benefit from digitalisation: In progress report, Internal
document, CFE/SME(2020)3.
[34]
OECD (2020), “Encouraging digital security innovation”, OECD Working Party on Security in the
Digital Economy, DSTI/CDEP/SDE(2020)7/REV1.
[74]
OECD (2020), OECD Digital Economy Outlook 2020, OECD Publishing, Paris,
https://doi.org/10.1787/bb167041-en.
[1]
OECD (2020), OECD Digital for SMEs Global Initiative, https://www.oecd.org/going-digital/sme/
(accessed on 18 July 2020).
[36]
106
THE DIGITAL TRANSFORMATION OF SMES © OECD 2021
OECD (2020), OECD ICT Access and Usage by Businesses Database,
https://stats.oecd.org/Index.aspx?DataSetCode=ICT_BUS (accessed on
19 September 2020).
[21]
OECD (2020), “Seven lessons learned about digital security during the COVID-19 crisis”, OECD
Policy Responses to Coronavirus (COVID-19), https://www.oecd.org/coronavirus/policy-
responses/seven-lessons-learned-about-digital-security-during-the-covid-19-crisis-e55a6b9a/
(accessed on 10 December 2020).
[50]
OECD (2019), Artificial Intelligence in Society, OECD Publishing, Paris,
https://doi.org/10.1787/eedfee77-en.
[28]
OECD (2019), “Measuring digital security risk management practices in businesses”, OECD
Digital Economy Papers, No. 283, OECD Publishing, Paris,
https://dx.doi.org/10.1787/7b93c1f1-en.
[12]
OECD (2019), OECD SME and Entrepreneurship Outlook 2019, OECD Publishing, Paris,
https://dx.doi.org/10.1787/34907e9c-en.
[23]
OECD (2019), “Roles and responsibilities of actors for digital security”, OECD Digital Economy
Papers, No. 286, OECD Publishing, Paris, https://dx.doi.org/10.1787/3206c421-en.
[27]
OECD (2018), “Supporting an Effective Cyber Insurance Market: OECD report for the G7
Presidency”, http://www.oecd.org/daf/fin/insurance/Supporting-an-effective-cyber-insurance-
market.pdf (accessed on 9 September 2020).
[53]
OECD (2018), The Cyber Insurance Market: Responding to risk with few boundaries,
http://www.oecd.org/finance/insurance/The-cyber-insurance-market-responding-to-a-risk-with-
few-boundaries.pdf.
[55]
OECD (2018), Unleashing the Potential of the Cyber Insurance Market: Conference outcomes,
http://www.oecd.org/daf/fin/insurance/Unleashing-Potential-Cyber-Insurance-Market-
Summary.pdf.
[54]
OECD (2017), OECD Digital Economy Outlook 2017, OECD Publishing, Paris,
https://dx.doi.org/10.1787/9789264276284-en.
[30]
OECD (2017), The Next Production Revolution: Implications for Governments and Business,
OECD Publishing, Paris, https://dx.doi.org/10.1787/9789264271036-en.
[29]
OECD (2015), Digital Security Risk Management for Economic and Social Prosperity: OECD
Recommendation and Companion Document, OECD Publishing, Paris,
https://dx.doi.org/10.1787/9789264245471-en.
[58]
OECD (2010), SMEs, Entrepreneurship and Innovation, OECD Studies on SMEs and
Entrepreneurship, OECD Publishing, Paris, https://dx.doi.org/10.1787/9789264080355-en.
[73]
OECD (2021 forthcoming), OECD SME and Entrepreneurship Outlook 2021, OECD Publishing,
Paris.
[35]
OECD (2021, forthcoming), Understanding the Digital Security of Products: An in-depth analysis,
OECD Publishing, Paris.
[16]
107
THE DIGITAL TRANSFORMATION OF SMES © OECD 2021
Ojala, S. and P. Pyöriä (2017), “Mobile knowledge workers and traditional mobile workers”, Acta
Sociologica, Vol. 61/4, pp. 402-418, http://dx.doi.org/10.1177/0001699317722593.
[42]
OWASP (2020), “Security by design principles”, Open Web Application Security Project,
https://www.owasp.org/index.php/Security_by_Design_Principles (accessed on
11 December 2020).
[67]
Pew Research Center (2020), “Telework may save US jobs in COVID-19 downturn – especially
among college graduates”, http://www.pewresearch.org/fact-tank/2020/05/06/telework-may-
save-u-s-jobs-in-covid-19-downturn-especially-among-college-graduates/ (accessed on
15 June 2020).
[39]
RT World News (2017), Ransomware virus plagues 100k computers across 99 countries, RT,
https://www.rt.com/news/388153-thousands-ransomeware-attacks-worldwide/ (accessed on
30 March 2020).
[7]
Schneier, B. (2018), Click Here to Kill Everybody: Security and Survival in a Hyper-connected
World, Norton & Company.
[17]
Shi, F. (2020), “Threat spotlight: Coronavirus related phishing”, Barracuda Networks,
https://blog.barracuda.com/2020/03/26/threat-spotlight-coronavirus-related-phishing/
(accessed on 20 June 2020).
[47]
Swedish Agency for Economic Growth and Regional Development (2020), The Digilift is
renewing industry, https://tillvaxtverket.se/english/digitalization.html (accessed on
11 December 2020).
[86]
Symantec (2019), “ISTR Internet Security Threat Report”, https://docs.broadcom.com/doc/istr-
24-2019-en (accessed on 30 March 2020).
[2]
United Kingdom Government (2019), “Cyber Essentials Scheme: overview”,
https://www.gov.uk/government/publications/cyber-essentials-scheme-overview (accessed on
7 March 2020).
[70]
US Bureau of Justice Statistics (2005), National Computer Security Survey,
https://www.bjs.gov/index.cfm?ty=tp&tid=41.
[20]
US DHS (2020), “About CISA”, US Department of homeland Security CISA Cyber +
Infrastructure, https://www.us-cert.gov/about-us.
[104]
Verizon (2020), “2020 Data Breach Investigation Report”, https://agio.com/newsroom/key-
takeaways-from-verizons-2020-data-breach-investigation-report/ (accessed on
30 March 2020).
[11]
Verizon (2019), “2019 Data Breaches Investigations Report”,
http://veriscommunity.net/veris_webapp_min.html (accessed on 30 March 2020).
[3]
Vilhelmson, B. and E. Thulin (2016), “Who and where are the flexible workers? Exploring the
current diffusion of telework in Sweden”, New Technology, Work and Employment, Vol. 31/1,
pp. 77-96, http://dx.doi.org/10.1111/ntwe.12060.
[41]
Webroot (2019), 2019 Webroot Threat Report, Webroot, https://www-
cdn.webroot.com/9315/5113/6179/2019_Webroot_Threat_Report_US_Online.pdf (accessed
on 30 March 2020).
[10]
108
THE DIGITAL TRANSFORMATION OF SMES © OECD 2021
Yavuzdogan Okumus, B. (2020), “Latest development on data localization requirements in
Turkey”, International Association of Privacy Professionals, https://iapp.org/news/a/latest-
development-on-data-localization-requirements-in-turkey/ (accessed on 11 December 2020).
[63]
You, I. and K. Yim (2010), “Malware Obfuscation Techniques: A Brief Survey”, 2010 International
Conference on Broadband, Wireless Computing, Communication and Applications,
http://dx.doi.org/10.1109/BWCCA.2010.85.
[9]
Notes
1 Network security, user education and awareness, malware prevention, removable media controls, secure
configuration, managing user privileges, incident management, monitoring, home and mobile working.
See: National Cyber Security Centre (2018[106]), “Executive Summary: the 10 Steps to Cyber Security”,
available from: https://www.ncsc.gov.uk/collection/10-steps-to-cyber-security/introduction-to-cyber-
security/executive-summary
2 Department for Digital, Culture, Media and Sport (2019), Cyber Security Breaches Survey 2019:
Statistical Release
3 This is a set of security procedures, protocols and policies that are in a written form.
4 Instead of being asked if they had a “formally defined ICT security policy”, respondents were asked if
they had “document(s) on measures, practices or procedures on ICT security”.
5 Public Law 115-236, NIST Small Business Cybersecurity Act (August 18, 2018), available from:
https://www.govinfo.gov/content/pkg/PLAW-115publ236/pdf/PLAW-115publ236.pdf.
6 California Senate Bill 327, available from:
https://leginfo.legislature.ca.gov/faces/billNavClient.xhtml?bill_id=201720180SB327 (accessed 4 March
2020).
7 (1) develop an incident response plan; (2) automatically patch operating systems and applications; (3)
enable security software; (4) securely configure devices; (5) use strong user authentication; (6) provide
employee awareness training; (7) backup and encrypt data; (8) secure mobility; (9) establish basic
perimeter defences; (10) secure cloud and outsourced IT services; (11) secure websites; (12) implement
access control and authorisation; and (13) secure portable media.
Canadian Center for Cyber Security, “Baseline cyber security controls for small and medium
organizations”, available from: https://cyber.gc.ca/en/guidance/baseline-cyber-security-controls-small-
and-medium-organizations (accessed 4 March 2020).
109
THE DIGITAL TRANSFORMATION OF SMES © OECD 2021
8 www.ssi.gouv.fr/particulier/formations/secnumedu-fc-labellisation-de-formations-continues-en-
cybersecurite/; www.ssi.gouv.fr/particulier/formations/secnumedu-fc-labellisation-de-formations-
continues-en-cybersecurite/formations-continues-labellisees-secnumedu/cybersecurite-des-tpe-et-des-
pme-chef-dentreprise-face-aux-risques-cyber-etes-vous-pret/.
9 www.ssi.gouv.fr/actualite/petites-et-moyennes-entreprises-decouvrez-le-guide-des-bonnes-pratiques-
de-linformatique-adapte-a-vos-besoins/.
10 www.cybermalveillance.gouv.fr/.
11 For an example of such activities, see: https://www.nisc.go.jp/eng/pdf/Intl_Campaign_poster.pdf.
12 https://www.kisa.or.kr/eng/main.jsp.
13 Identify and code positions with information technology, cybersecurity, and other cyber-related functions
using the National Initiative for Cybersecurity Education (NICE) Framework.

111
THE DIGITAL TRANSFORMATION OF SMES © OECD 2021
This chapter looks at the ability of online platforms, which connect two or
more independent sets of users, and enable positive network effects,
increase their customer base, reach scale without mass, find innovation
opportunities and assets, and access digital solutions and business
intelligence services. However, online platforms can also raise risks related
to competition distortions, reputational damage, and digital security or lock-
ins, especially for SMEs. The chapter explores relatively scarce international
data and literature to analyse SME use of online platforms and economic
impact. Finally, the chapter highlights how policy action to support SME’s
access to, and ensure a level playing field on, digital platforms is currently
being mainstreamed by OECD governments, illustrated through six short
case studies (Australia, Denmark, France, Korea, New Zealand, United
Kingdom).
3 SMEs in the online platform
economy
112
THE DIGITAL TRANSFORMATION OF SMES © OECD 2021
In Brief Highlights
Online platforms are central in the digital transition of economies and societies, and the
pandemic has strengthened their role. They provide important channels for growth to SMEs
“going digital”.
At the time of COVID-19, online platforms have opened new sales and sourcing channels
for SMEs and facilitated their access to multiple types of digital networks which might be key for
the survival and expansion of both existing and nascent SMEs – by providing e-commerce sales,
teleworking capabilities and more.
SMEs uptake remains relatively limited and behind larger firms, despite the evidence
suggesting that by leveraging online platforms, SMEs can improve their productivity.
SMEs can lower operation costs, access business intelligence services, and generate
economies of scale (capitalising on network effects) as well as economies of scope, through
reduced information asymmetry, increased client/supplier base and greater market outreach,
outsourcing logistics, as well as many other factors. OECD studies highlight that the impact on
productivity is disproportionately larger the smaller the firm.
However, SMEs face challenges and risks in operating on online platforms. The lack of
digital skills and the need to adapt business models can be important barriers. Fee structures of
the platforms and the sharing of sensitive business data with implicit acceptance of matching
algorithms on which SMEs have no influence or even information also present challenges. There
are also risks related to digital security, competition distortion and possible lock-in effects.
Complementary investments to raise awareness and develop skills, especially of non-ICT
expert staff, could increase uptake. The higher the share of SMEs providing in-house ICT
training in a country, the higher the share using social media, with evidence of a stronger impact
on smaller firms.
Governments have a strong role to play in enabling greater uptake (and in turn fostering
resilient growth). Some OECD governments have introduced policies aimed at increasing SME
use of online platforms, through awareness campaigns, consultancy vouchers, self-assessment
tools or training. These initiatives typically target higher SME engagement in e-commerce,
greater online presence, and communication platforms that can facilitate remote working. Some
governments are also promoting programmes in co-operation with large online platforms. In the
context of COVID-19, policy actions have intensified, with more probably long-term effects.
113
THE DIGITAL TRANSFORMATION OF SMES © OECD 2021
Introduction
Online platforms are central in the development of digital economies and societies. In the last
decade, they have become ubiquitous, impacting most economic sectors and social dynamics in OECD
countries and beyond. Online platforms can be pure intermediaries, direct service providers, employers,
lenders, or, indeed, a combination of all the above. It is difficult to overstate their role in the rapid
development of the internet economy from a low starting point to the current relevant reach and influence.
For example, in the UnitedStates, e-commerce as a percent of total retail sales has grown from 0.6% in
1999 to 16.1% in the second quarter of 2020 (U.S. Census Bureau, 2020[1]). The global COVID-19
pandemic and the related requirements for social distancing has accelerated these trends.
Greater uptake of online platforms is especially important for SMEs. Unlike larger firms, the ability of
SMEs to develop internal digital infrastructures that can capitalise on the benefits of digitalisation, is limited
by a lack of financial resources and/or skills (OECD, 2019[2]).
Leveraging on online platforms provides scope to overcome size based challenges, and enable
SMEs to better benefit from digital transformation. Online platforms offer some obvious benefits to
SMEs. They provide a means to access new markets, sourcing channels and a multitude of digital
networks. They also provide scope for efficiencies that can drive economies of scale, leverage network
effects, and, in turn, boost competitiveness and productivity. Digital technologies can substantially lower
many types of cost: search costs, replication costs, distribution costs, tracking costs and verification costs,
(Goldfarb and Tucker, 2019[3]). A recent empirical study across 10 OECD countries in four industries in
which SMEs are the majority (hotels, restaurants, taxis and retail trade) found that platforms can improve
the productivity of incumbents and stimulate movement of workers to more productive firms (Bailin Rivares
et al., 2019[4]). Another recent study found that an increase in platform traffic has a stronger positive effect
on labour productivity growth for SMEs (Costa et al., 2020[5]).
At the same time, SMEs face challenges in adoption and adapting. Whilst online platforms can
circumvent the challenges and costs associated with developing their own internal digital infrastructures,
they do not amount to a free lunch. Capitalising on online platforms incurs direct and indirect costs: from
the fee structure proposed by platforms, to the need to share sensitive business data and the implicit
acceptance to be subjected to matching algorithms on which SMEs have little influence. Vertical integration
of platforms (e.g. combining production, advertising and distribution of goods) might also generate conflicts
of interest with SMEs which have low bargaining power. Moreover, many “offline” business models have
been disrupted by online platforms, creating the need for SMEs to adapt to the changing scenario. Possible
anti-competitive practices by online platforms could also threaten fair competition in an increasingly large
number of markets, and regulators in many OECD countries are looking closely at this phenomenon.
Many governments are supporting the transition of SMEs towards digital business practices,
especially in the context of the COVID-19 global pandemic. Many governments across the OECD have
shown an interest in helping SMEs and entrepreneurs to reap the benefits of online platforms. Some have
introduced policies that specifically target increasing SMEs’ skills and awareness, engagement in e-
commerce, online presence, or increasing capacities to leverage communication platforms for remote
working – policies that have become even more important in responding to the pandemic.
This chapter analyses how SMEs across OECD countries are capitalising on online platforms.
Using comparable international data the chapter analyses the benefits and the challenges, and provides
an overview of the main differences among countries in terms of uptake and usage. The chapter also
provides specific national examples of policies being adopted in OECD countries to support greater uptake
of online platforms by SMEs, both before and during the COVID-19 pandemic.
114
THE DIGITAL TRANSFORMATION OF SMES © OECD 2021
Online platforms: Features, benefits and challenges for SMEs
Features and definition
In this chapter, an online platform is defined as: “an online platform is a digital service that facilitates
interactions1 between two or more distinct but interdependent sets of users (whether firms or
individuals) who interact through the service via the internet” (OECD, 2019[6]; Rochet and Tirole,
2003[7]). The term “users” is considered here in its wider sense, and includes: not only individuals and firms
of all sizes, but also governments, non-profit organisations and other actors in the economy. In the
discussion that follows, we consider only those SMEs using non-proprietary platforms as opposed to SMEs
that develop their own platforms (Box 3.1).
A central feature of platforms relates to their ability to generate and deliver network effects. Direct
network externality can be defined as a change in the benefit that an agent derives from using a
good/service when the number of consumers or users of the same good/service increases – e.g. the value
for a user of a social network increases with the total number of other users of the same social network. In
the common economic literature, most markets with network externalities are two-sided, with particular
reference to online platforms and their ability to “get both sides of the market on board”. A more precise
definition of two-sided markets is “one in which the volume of transactions between end-users depends,
not only on the overall level of fees charged by the platforms, but on the structure of these fees”.
Two key notions derive from the theories of network externalities and of multi-product pricing. First
is the idea that end-users do not consider externalities and do not internalise them in their decisions to
interact through the platform. To clarify with an example: in his decision to purchase a good, a buyer on
an e-commerce website does not generally consider the welfare impact of his or her use of the platform
on other end-users (e.g. buying the product could drive the price up for other users if there is limited supply,
or drive it down by attracting new sellers). The second is the importance of price structure (e.g. product
pricing which defines various prices or discounts in relation to volumes, etc.). Two-sided and multi-sided
markets however can also be seen from a different angle, considering the existence of cross-group
externalities – the intuitive notion that the net utility of end users (for example, SMEs) on a platform is
affected by an increase of the number of members of the other group of end users (for example, customers)
in the platform (Rochet and Tirole, 2006[8]).
115
THE DIGITAL TRANSFORMATION OF SMES © OECD 2021
Box 3.1. The rise of SME platforms
The case of “SME platforms” is quite interesting as the specific features of their business model (i.e.
cascading network effects) has allowed them to become global players with millions (and sometimes
hundreds of millions) of users without the need to scale up in terms of size. This phenomenon that
became known in the literature as “Scale without mass” (Brynjolfsson et al., 2008[9]) is related to the
extremely low marginal cost of processing, storing, replicating and transmitting data for additional users
once the initial fixed costs incurred for hardware and software development have been covered/paid.
Whatsapp offers a telling example. The app was launched in 2009 and bought by Facebook in 2014 for
approximately USD 16 billion. The app had over 450 million monthly users, 70% of which were active
on any given day (SEC, 2014[10]). But the striking fact is that these volumes were reached by an SME
with only 55 employees. The possibility to scale up the business model rapidly and without the need to
grow the employee base is one of the core characteristics of the business and technology developments
underpinning it, involving network effects, vitality, behaviour design and data (Choudary, 2015[11]).
Another key aspect of these (typically disrupting) business models is that the network effects create
“winner-takes-all” markets, characterised by the fact that the player is able to reap all the benefits from
the market, leaving almost nothing for all other competitors (with similar albeit less extreme outcomes
in “winner-takes-most” markets). However, the winner-takes-all and winner-takes-most structure of
platform businesses can be offset in part by their property of scalability. New competitors can enter and
sweep the market rapidly if they are able to unlock the self-reinforcing network effects if users can
switch platforms easily and at low costs. The most recent example is in social media, where a seemingly
“closed” market dominated by few very large players saw the rapid growth of the new competitor Tik
Tok, especially among young users. The downloads of the platform’s app rapidly surged from 343
million in the first half of 2019 to 615 million in the first half of 2020 (Mediakix, 2020[12]). Fair competition
and low switching costs are a pre-requisite for markets to stay contestable (see the following sub-
section on “Risks of competition distortion”).
In OECD and G20 countries the COVID-19 pandemic has caused a surge in the use of online
platforms, but this surge has been very heterogeneous across sectors and countries. Online
platforms in areas where activities could be pursued without physical proximity (e.g. mobile payments,
online marketplaces, restaurant delivery) saw a rise in traffic above 20%. In other areas however where
physical proximity is needed to consume the service being provided (e.g. accommodation, restaurant
booking and transport) platform use declined sharply (-70%). Countries with more developed digital
infrastructure and higher digital literacy saw a steeper increase, suggesting that investing in these
capabilities could be a way to increase resilience to future shocks (OECD, 2020[13]). The uneven use of
online platforms across countries and regions is also a result of differences in access to digital
infrastructure (i.e. fixed or mobile high-speed broadband). This space-based disparity has also a more
general impact on digital adoption by SMEs (see sub-section on “Cross-country differences are significant
in accessing infrastructure” of Chapter 2).
SME business functions on online platforms
Online platforms are very heterogeneous in their functionalities, structures and in the services they
offer. The definition of “online platforms” considered (See sub-section on “Features and definition” of this
chapter) is very comprehensive. However, it makes it difficult to narrow the scope to the most important
cases in which platforms modify deeply market conditions (both as opportunities and challenges, see next
sections) specifically for SMEs. To give an idea of the wide variety of large active platforms offering their
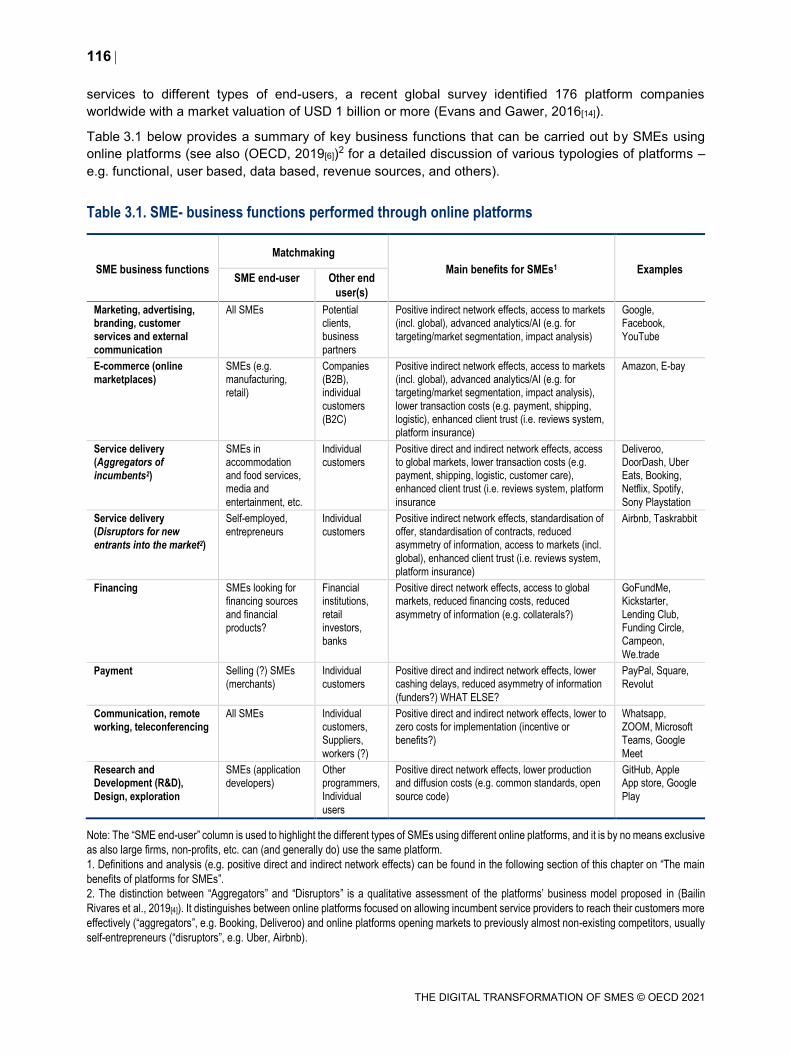
116
THE DIGITAL TRANSFORMATION OF SMES © OECD 2021
services to different types of end-users, a recent global survey identified 176 platform companies
worldwide with a market valuation of USD 1 billion or more (Evans and Gawer, 2016[14]).
Table 3.1 below provides a summary of key business functions that can be carried out by SMEs using
online platforms (see also (OECD, 2019[6])2 for a detailed discussion of various typologies of platforms –
e.g. functional, user based, data based, revenue sources, and others).
Table 3.1. SME- business functions performed through online platforms
SME business functions
Matchmaking
Main benefits for SMEs1 Examples SME end-user Other end
user(s)
Marketing, advertising, branding, customer services and external
communication
All SMEs Potential clients, business
partners
Positive indirect network effects, access to markets (incl. global), advanced analytics/AI (e.g. for
targeting/market segmentation, impact analysis)
Google, Facebook,
YouTube
E-commerce (online
marketplaces)
SMEs (e.g. manufacturing,
retail)
Companies (B2B), individual
customers
(B2C)
Positive indirect network effects, access to markets (incl. global), advanced analytics/AI (e.g. for targeting/market segmentation, impact analysis),
lower transaction costs (e.g. payment, shipping, logistic), enhanced client trust (i.e. reviews system,
platform insurance)
Amazon, E-bay
Service delivery (Aggregators of
incumbents2)
SMEs in accommodation and food services, media and
entertainment, etc.
Individual
customers
Positive direct and indirect network effects, access to global markets, lower transaction costs (e.g. payment, shipping, logistic, customer care), enhanced client trust (i.e. reviews system, platform
insurance
Deliveroo, DoorDash, Uber Eats, Booking, Netflix, Spotify,
Sony Playstation
Service delivery (Disruptors for new
entrants into the market2)
Self-employed,
entrepreneurs
Individual
customers
Positive indirect network effects, standardisation of offer, standardisation of contracts, reduced asymmetry of information, access to markets (incl.
global), enhanced client trust (i.e. reviews system,
platform insurance)
Airbnb, Taskrabbit
Financing SMEs looking for financing sources
and financial
products?
Financial institutions,
retail investors,
banks
Positive direct network effects, access to global markets, reduced financing costs, reduced
asymmetry of information (e.g. collaterals?)
GoFundMe, Kickstarter,
Lending Club, Funding Circle, Campeon,
We.trade
Payment Selling (?) SMEs
(merchants)
Individual
customers
Positive direct and indirect network effects, lower cashing delays, reduced asymmetry of information
(funders?) WHAT ELSE?
PayPal, Square,
Revolut
Communication, remote
working, teleconferencing
All SMEs Individual customers, Suppliers,
workers (?)
Positive direct and indirect network effects, lower to zero costs for implementation (incentive or
benefits?)
Whatsapp, ZOOM, Microsoft Teams, Google
Meet
Research and Development (R&D),
Design, exploration
SMEs (application
developers)
Other programmers, Individual
users
Positive direct network effects, lower production and diffusion costs (e.g. common standards, open
source code)
GitHub, Apple App store, Google
Play
Note: The “SME end-user” column is used to highlight the different types of SMEs using different online platforms, and it is by no means exclusive
as also large firms, non-profits, etc. can (and generally do) use the same platform.
1. Definitions and analysis (e.g. positive direct and indirect network effects) can be found in the following section of this chapter on “The main
benefits of platforms for SMEs”.
2. The distinction between “Aggregators” and “Disruptors” is a qualitative assessment of the platforms’ business model proposed in (Bailin
Rivares et al., 2019[4]). It distinguishes between online platforms focused on allowing incumbent service providers to reach their customers more
effectively (“aggregators”, e.g. Booking, Deliveroo) and online platforms opening markets to previously almost non-existing competitors, usually
self-entrepreneurs (“disruptors”, e.g. Uber, Airbnb).
117
THE DIGITAL TRANSFORMATION OF SMES © OECD 2021
Marketing, advertising, branding, customer services and external communication
Online advertising is now the dominant form of advertising in many OECD countries, and large
online platforms capture most of the market Industry estimates suggest that more than half of worldwide
revenues in online advertising in 2019 were attributable to Google (31%) and Facebook (20%), and around
77% if we consider all major online platforms (Alibaba, Amazon, Baidu, Tencent, Microsoft, Verizon,
Twitter, Sina) (eMarketer, 2020[15]).
Box 3.2. SME business case – Online marketing and e-commerce – Five Ways Cellars, Australia
Five Ways Cellars is an Australian independent wine retailer with one brick and mortar store. The
independent family-run small business has been in operation for over 30 years. Five Ways Cellars is
primarily a B2C retailer with a small B2B market, supplying imported European wine to a handful of
local restaurants. Despite the Australian wine and liquor retail industry being monopolised by large retail
conglomerates, Five Ways Cellars has experienced success and built up a loyal customer base. Its
owner and founder attributes this success to the personalised and unique in-shop customer experience.
Five Ways Cellars over the recent years has begun to engage with online platforms and digital tools as
a means to connect with existing customers and communicate offers. For most of its existence, Five
Ways Cellars used traditional channels (such as flyers dropped into mailboxes) to advertised its
products, but in recent years Five Ways Cellars created a Facebook page and started sending out a
newsletter to communicate new offers and wine catalogues. The small business also created a “landing
page” website, with basic information about the brick and mortar stores location and opening hours and
a digital catalogue of their retail contents. In 2018, the website was further developed with e-commerce
functionality, giving customers the opportunity to make orders online. Orders have traditionally been
done in-store or over the phone. This transition opened up new customer markets and lightened the
workload for the small team.
The COVID-19 crisis and the lockdown restrictions forced Five Ways Cellars to temporarily close its
brick and mortar store. The e-commerce website became the sole consumer channel. The crisis
accelerated Five Ways Cellars reliance on this medium and allowed the business to stay afloat during
the lockdown. With all Australian consumers ordering wine and liquor online, this was also an
opportunity for Five Ways Cellars to engage new customers and those in different markets, such as
interstate customers. To compete with the large wine and liquor conglomerates who were able to cut
prices and offer same-day delivery during this period, Five Ways Cellars increased social media
presence and online advertising. Through social media channels, particularly Instagram, Five Ways
Cellars could communicate its unique “boutique” offering. As lockdown regulations have eased in
Australia, Five Ways Cellars continues to rely heavily on e-commerce channels, particularly for
acquiring new customers.
Source: OECD “Digital for SMEs” Global Initiative Databank.
Online advertising offers sizeable opportunities to SMEs: from the global reach to the “targeting”
practices based on advanced analytics leveraging users’ information, on which online platforms excel.
However, this practice also raises various concerns related to consumer protection3 (OECD, 2019[16]).
The potential access of hundreds of millions/billions of users makes appearing on the search
algorithms of the larger search engines or social media platforms a crucial marketing tool for SMEs.
In 2019, an estimated 82% of European SMEs promoted their products and services on online search
engine platforms (European Commission, 2019[17]). In the United Kingdom, a recent survey showed that
60% of SMEs are currently using paid digital advertising, 67% are using free services, and half of them
118
THE DIGITAL TRANSFORMATION OF SMES © OECD 2021
declared that the current COVID-19 public health emergency has made it even more important for their
business. Moreover, 63% of the SMEs that do use these paid services are convinced that it has a good
return on investment in terms of generating sales. The same research suggests that up to 45% of all digital
advertising spending in the United Kingdom is accounted for by SMEs (IAB.uk, 2020[18]).
E-commerce and online marketplaces
Small firms selling online are more likely to sell on online platforms (35%) than medium-sized (29%)
and large firms (23%) in the EU28 (OECD, 2019[19]). SMEs deciding to outsource e-commerce functions,
can rely either on the few extremely large providers on which they can sell all kinds of products (e.g.
Amazon (eBay (183 million users) - or on smaller specialised online marketplaces focusing on specific
types of goods (e.g. Yoox or Zalando for fashion, BloomNation for flowers, GOAT for sneakers, Chrono24
for watches, etc.). The scale of a platform’s network plays a crucial role for both large and smaller
specialised platforms, as it enables the direct and indirect network effects creating value for SMEs joining
the network (Holland and Gutiérrez-Leefmans, 2018[20]). While the network of large players is obviously
bigger and more diversified in general, some specialised platforms can compete by offering access to a
deeper network of end-users in a specific industry/sector.
One key element for SMEs is that online marketplaces enable them to trade across regions and
countries and provide a wide range of complementary services (e.g. logistic, data analytics). This
happens in both developed and developing economies (OECD/WTO, 2017[21]; ITC, 2016[22]). It is estimated
that around 300 000 SMEs registered in Amazon’s “marketplace” in the United States were exporting to
other countries in 2017 (OECD, 2019[6]). Another important aspect is that they often offer a wide range of
complementary services that are particularly attractive for SMEs lacking resources: logistic, customer
services, SaaS, data analytics (OECD, 2019[19]). Data analytics offered to SMEs often rely on advanced
machine learning algorithms, creating an avenue for SMEs to access frontier knowledge and technology
that would have been out of reach if they had to conduct developments with their limited internal capacity
(see Chapter 6 on AI and SMEs).
Service delivery (Aggregators of incumbents)
“Aggregators” are platforms that allow incumbent service providers to reach their potential
customers more effectively (Bailin Rivares et al., 2019[4]). These platforms do not create a new market
but do make matchmaking in the existing market more efficient thanks to the network effects. This is
particularly relevant for SMEs as they have less resources to invest in traditional advertising and reach out
activities.
Two interesting examples come from the restaurant and hospitality industry:
In the first, online platforms (e.g. Deliveroo, Door Dash, Uber Eats) have provided scope for
restaurant owners to access many more clients than they were previously able to. By taking care
of advertising, software and mobile applications, customer care and the whole logistics of the
delivery service, they have transformed the food delivery industry. Market estimates suggest that
the global market reached USD 85 billion in 2018 and is set to double its value by 2025 (Forbes,
2019[23]). During the COVID-19 pandemic this industry has accelerated its expansion and offered
a lifeline to many restaurant owners who saw their conventional (non-delivery sales) disappear
during lockdowns.4
In the second, online platforms are able to offer a well-structured “catalogue” of hospitality service
businesses (e.g. hotels, Bed&Breakfasts) to potential customers. SMEs have a very strong
incentive in appearing on such platforms (e.g. Booking.com), as their global geographical reach,
standardised and intuitive reservation system and extensive “traveller reviews” repository makes
them very successful among travellers.
119
THE DIGITAL TRANSFORMATION OF SMES © OECD 2021
In creative industries, content delivery is increasingly shifting towards online platforms, matching
creators of content with consumers. For large and small producers of movies or TV series, it is now
very important to offer their products on online platforms that are coming to dominate the market (e.g.
Netflix, Hulu, YouTube, HBO, Amazon Prime Video, Disney+). An even more compelling case is the one
of game producers, as consumers access their products by design through platforms which might have a
physical terminal (e.g. consoles like Sony PlayStation, Microsoft Xbox), but not necessarily (e.g. games
for PC or Mac on Steam, Epic Games Store, Battle.net; e.g. mobile games on Apple Store or Play Store
on Android).
Service delivery (Market disruptors)
“Disruptors” platforms create new markets, by bringing in new service providers and increasing
competition for incumbents in the same industry. For example in the hospitality industry, the most
disrupting of such services has been Airbnb, which allows anyone who has a spare room/apartment/house
to rent it out directly on the platform. The growth of this online platform has allowed many new self-
entrepreneurs to enter the hospitality market, increasing competition but also allowing some existing SMEs
(e.g. B&Bs) to reach a much wider set of potential clients.
Financing
In recent years, a number of online platforms have entered the market to provide SMEs with easier
access to financial institutions and indeed finance from non-traditional sources. SMEs might decide
to use these types of platforms for their greater transparency, security and ability to lower information
asymmetry with finance providers. An example is Germany’s Campeon, a tech start-up connecting data
and financing requests from SMEs with large companies, banks, equity investors, guarantors, innovation
support agencies, and public and private databases (OECD, Upcoming[24]). A growing avenue of SME
financing is “Peer-to-peer lending” and “Crowdfunding”, with some online platforms connecting SMEs to
retail investors willing to finance directly their projects (e.g. Kickstarter, GoFundMe Lending Club, Funding
Circle). This way of soliciting funds from the public through an online platform is still relatively small: the
biggest market for “online alternative finance” is in the People’s Republic of China,5 and it accounts for
0.36% of GDP, followed by the United Kingdom (0.2%), Estonia (0.2%) and Israel (0.18%) (OECD,
2020[25]).
Some large online marketplace platforms have also started to offer financing solutions directly to
SMEs. Among the largest online marketplaces, Amazon, Alibaba, or MercadoLibre have developed a full
set of financial services for SMEs operating on their platform (e.g. working capital loans, payment services,
trade financing, and more). These players can leverage the large amount of data SMEs generate while
operating on their platform for credit risk assessment, and are able to provide them convenient financial
products without the need to partner with banks or traditional financial institutions.
Some platforms leverage distributed ledger technologies (blockchain) to provide decentralised
access to KYC6 information to financial institutions and trading companies (e.g. Komgo SA, using
the Ethereum chain). Other banks and financial institutions are testing the decentralised infrastructure of
R3’s Corda: the very innovative idea here is that clients (SMEs and private citizens) maintain self-
sovereignty over their data, managing their own identities and the amount of information shared with each
bank. Marco Polo is another platform based on Corda which specialises in trade finance and supply chain
financing. We.trade, another platform directed to SME buyers and sellers, is facilitated by 12 European
banks, and clears SMEs for KYC compliance (based on Hyperledger Fabric; (OECD, Upcoming[24])).
120
THE DIGITAL TRANSFORMATION OF SMES © OECD 2021
Payment
SMEs might decide to use online platforms to receive and make transfers for their products and
services. Incumbents as VISA or MasterCard offer this kind of service providing the platforms for their
network of merchants (including thousands of SMEs) to be paid by card-holders.
SMEs can also decide to open corporate accounts on new digital payment platforms that offer
online payment services. These platforms allow them to connect for instant-payments with their vast
network of users. Examples of such platforms are PayPal, Square or Revolut, which allow customers to
pay via extremely streamlined and user-friendly mobile applications on their phones.7
Communication, remote working, teleconferencing
SMEs also use online digital platforms for many of their communication needs, as the most
common ones offer attractive network effects with hundreds of millions of users and usually free
service. Instant messaging (e.g. Whatsapp, Telegram, Skype), web conferencing (e.g. ZOOM) and hybrid
services offering “workspaces” integrating both services (e.g. Slack, Microsoft Teams, Google Hangouts)
have become widely integrated in business practices worldwide.
When forced to avoid direct personal contact during the COVID-19 pandemic, SMEs have heavily
resorted to these online platforms to keep up their operations. Communication platforms have
become even more critical in maintaining relations between suppliers and clients across value chains, not
least because of their scope to enable teleworking. Obviously, the share of workers that can perform tasks
remotely varies widely across sectors, so the value of using such online platforms differs between SMEs.
For example, around 37% of EU-27 employees are in “teleworkable” occupations, but this share varies
from 10-15% in agriculture, forestry, fishing, and construction, to more than 90% in financial and insurance
activities (European Commission, 2020[26]).
Box 3.3. SME business case – Remote working – Chartwell Consulting, Germany/United Kingdom
Chartwell Consulting is a consulting firm that has offices in Berlin and London and is specialised in
advising businesses that operate in the manufacturing sector. Employees of Chartwell Consulting have
on average a high level of digital skills and have always used “work-flow” and time management
platforms to increase the efficiency of the day-to-day running of the business. Before the COVID-19
pandemic there was a company culture of occasional teleworking, mostly due to work-related travel.
However, with the crisis and lockdown restrictions, the entire firm was forced to work from home.
International travel restrictions made it impossible for employees to visit manufacturing sites in person.
These new business and market conditions accelerated the firm’s reliance on teleworking platforms and
accelerated its digital transition.
Chartwell Consulting in response to the crisis have used digital teleworking platforms and tools
throughout the period. For internal communication, employees use Microsoft Teams and for meetings
with external stakeholders they use Zoom. The firm has increased its reliance on cloud storage to adapt
to teleworking as well as ensure higher levels of digital security whilst operating on less secure personal
broadband connections. The practices put in place throughout this period has increased the teleworking
capabilities of the firm whilst also reducing costs related to international travel and will continue in a
post-COVID context.
Source: OECD “Digital for SMEs” Global Initiative Databank.
121
THE DIGITAL TRANSFORMATION OF SMES © OECD 2021
Research and Development (R&D), design, exploration
The importance of online digital platforms for innovation has been discussed in the literature of information
system (e.g. (Evans, Hagiu and Schmalensee, 2008[27])). One key point is that continuous innovation in
the internal structure and technical functioning of digital platforms has an effect on how businesses
leverage them for innovation, making the two concepts closely interconnected (Yoo, Henfridsson and
Lyytinen, 2010[28]). In other words, it is complicated to decouple the technical side of innovation on digital
platforms (analysed in Information System literature) and their economic effects on businesses, as one
cannot be understood without the other (De Reuver, Sørensen and Basole, 2017[29]).
One relevant case of innovation platforms is the digital applications marketplaces, or “App stores”,
on which SMEs (app developers) build and offer their products. These products are built from the beginning
respecting technical standards and leveraging the core functionality of the “app marketplace”,8 with a view
to being specifically commercialised in the marketplace and accessible to mobile users. The iOS and
Android ecosystems, integrating the App Store and Play Store platforms, are the two most important cases
in terms of number of mobile users globally and number of apps supported (respectively around 2 million
and around 3 million apps in Q3-2020): they offer application programming interfaces and software
development kits, alongside the access to their extremely large and ever-growing user-base.
Another important role of online platforms is that they allow for open innovation9 to blossom. The
openness of a digital platform architecture allows developers and programmers to access APIs, providing
an environment in which there are few barriers to the creation and development of innovative knowledge
products (Nambisan, Wright and Feldman, 2019[30]). As an example, GitHub has gathered 40 million
programmers and software entrepreneurs globally to interact with each other, creating over 44 million
repositories of code (GItHub, 2020[31]) to adapt existing products and develop new ones (e.g. business
applications, website functionalities, games). There are advanced technology applications applied to online
platforms that bring interesting results as well. For example, researchers have found that Artificial
Intelligence (machine learning algorithms) applied to machine translation on an online marketplace has
increased international trade (by users including both individuals and firms) on the platform by 10.9%
(Brynjolfsson, Hui and Liu, 2019[32]).
122
THE DIGITAL TRANSFORMATION OF SMES © OECD 2021
Box 3.4. Non-platform business digital applications
While the platforms of business applications are a very large and rapidly growing market at global level,
they do not fall into our definition of platforms (OECD, 2019[6]). Business applications such as Customer
Relations Management (CRM), Enterprise Resource Planning (ERP), Supply Chain Management
(SCM) provide business intelligence services to a single set of end-users (including millions of SMEs)
but are not “facilitating their interaction” with other sets of users. For example, if the “platform” provides
Customer Relationship Management services to an SME, it helps the SME to better manage its clients,
but these clients are not another “end-user” of the “platform” (or only indirectly). A similar consideration
might hold for cloud computing. It allows for a radical reduction in the cost of computing resources and
ICT tools, making them available at a relatively small operating expense rather than an important capital
expense, especially for SMEs (Kenney, 2016[33]), but it is a service offered directly from providers to
clients, without the involvement of other “end-users”. A few specific examples might help clarify further.
Some very renowned service providers which could be identified as a “platform” for the large variety of
different services they offer, ultimately serve only one set of end-users– even if most of these clients or
end-users are SMEs:
CRM, marketing (e.g. Salesforce).
Website building, sales solution (e.g. Shopify, Wix).
Cloud computing – storage, analytics, security (e.g. Amazon Web Services, Microsoft’s Azure,
Google Drive).
Source: OECD (2019[6]), An Introduction to Online Platforms and Their Role in the Digital Transformation, OECD Publishing, Paris,
https://dx.doi.org/10.1787/53e5f593-en; (Kenney, 2016[33]), The Rise of the Platform Economy, Issues in Science and Technology 32, No.
3, https://issues.org/the-rise-of-the-platform-economy/ (accessed on 16 July 2020).
The main benefits of platforms for SMEs
Network effects
Network externalities are among the most defining features that characterise online platforms
(OECD, 2019[6]). In economic theory, it is widely accepted that network externalities imply that the
usefulness of a platform is directly correlated to the size of its user-base. However, there is a distinction to
be made in discussing two-sided (or multi-sided) online platforms, as considered in this paper. As these
platforms serve different sets of end-users, network externalities can be either (Katz and Shapiro, 1985[34];
Shapiro and Varian, 1998[35]):
direct - if the value of accessing the platform for the user increases at the increase of the number
of users in the same set of users
indirect – if the value increases at the increase of the number of users in the other (different) set of
users.
For SMEs, the interplay between direct and indirect network effects depends on the type of platform
they choose. When an SME decides to join a platform, incentives differ in relation to the type of platform.
It can be argued, for example, that the most obvious incentive for an SME to sell products on an online
marketplace is to connect to a larger number of clients beyond its current physical and geographical reach
(positive indirect network effects). However, the presence of a large number of other SMEs selling on the
platform (direct network effects) can be both positive and negative. It can attract even more potential clients
(as it increases the positive indirect network effects for consumers who can access a broader and
123
THE DIGITAL TRANSFORMATION OF SMES © OECD 2021
potentially more diversified offer on the platform), thus increasing the positive indirect network effects for
the SME and starting a virtuous circle. The presence of more SMEs on the platform can also help improve
the offer of services to SMEs by the platform, as the higher their number, the more the platform will be able
to optimise and continuously improve its offer through client-feedback and demand-screening.10 However,
the presence of more SMEs on the platform also increases the level of competition from other SMEs, which
could reduce profit margins and ultimately make the presence on the platform unattractive.
Often platforms are willing to lose money (e.g. by keeping prices artificially low, by cross-subsidising
one set of end-users, by investing very heavily in advertising, etc.) in order to increase the overall
number of users and “ignite” the virtuous circle of direct and indirect network externalities. While
some platforms fail to achieve scale and disappear, in other cases this is a sound business strategy as it
allows the platform to become profitable at a later stage, once it achieves a dominant position in the market,
but profitability is not guaranteed (Cusumano, 2020[36]). An interesting and very well-known example is Uber.
Uber disrupted the taxi sector by proposing an efficient and secure platform to get alternative transportation
services at competitive and flexible rates, especially in large cities. Since its foundation in 2009, while its user
base and revenues have grown at a very fast pace, it has yet to generate a profit.
A large user base is key to unlocking the network effects that make platforms attractive for SMEs.
The larger the user base, the more likely for them to find a match (e.g. with service providers, suppliers,
clients) reducing transaction costs and information asymmetry. In some cases, platforms can leverage
their large user base to attract even more users by integrating additional separate functionalities. For
example, the review and rating systems in online marketplaces (which grows in effectiveness with the
growth of the user base) generates a positive direct network effect for customers, incentivising more to join
(Belleflamme and Peitz, 2018[37]). If we look at online marketplaces, ancillary services as review and rating
systems, platform insurance on purchases and refunds, as well as guarantees on delivery times and
logistic, greatly increase the trust of consumers, making it more likely for an SME to be able to sell to them
via the platform than through its own app/website.
Network effects permit online platforms to unlock access to digital services at very low costs for
SMEs. Platforms are able to scale and increase their user base at incredible speed as the marginal cost
of adding a new user becomes virtually zero after the initial sunk costs (hardware and software) are
undertaken (Brynjolfsson et al., 2008[9]). To use again the Whatsapp example, the platform passed from
50 employees serving 200 million users at the beginning of 2013, to 55 employees serving 420 million
users at the beginning of 2014 (Olson, 2015[38]). This consideration is very important in our perspective, as
the platform’s cost structure has an effect on its users as well. In most online platforms, the marginal cost
of adding a new user is close to zero, but it is fundamental to reach scale. Thus platforms have a strong
incentive at offering SMEs the opportunity to externalise business functions for a fraction of the cost they
would have incurred if they had to perform them on their own.
Increasing customer base and global and regional reach
Another core characteristic of online platforms is that they allow SMEs to interact with other end-users
across regional and national borders, and trade at a global level. SMEs are primarily local actors and
have usually more difficulties in participating and benefit from Global Value Chains (OECD, 2019[2]; López
González, 2017[39]). SME internationalisation has generated a very large and fragmented body of research
over the last 25 years, but digitalisation is seen as possibly the key strategic means for SMEs to reach
international markets by lowering trade costs and easing access to foreign markets (Morais and Ferreira,
2020[40]; OECD, 2018[41]). Online platforms are key for the digitalisation and internationalisation of SMEs, as
they provide the technological and logistical infrastructure to match buyers and sellers and deliver their
products and services, but also manage firm-consumers relationships and firm reputation (Nambisan, Wright
and Feldman, 2019[30]). Online platforms have also led to a rising number of small packages being sold across
international borders, by connecting SMEs and individual clients across borders (OECD, 2020[42]).
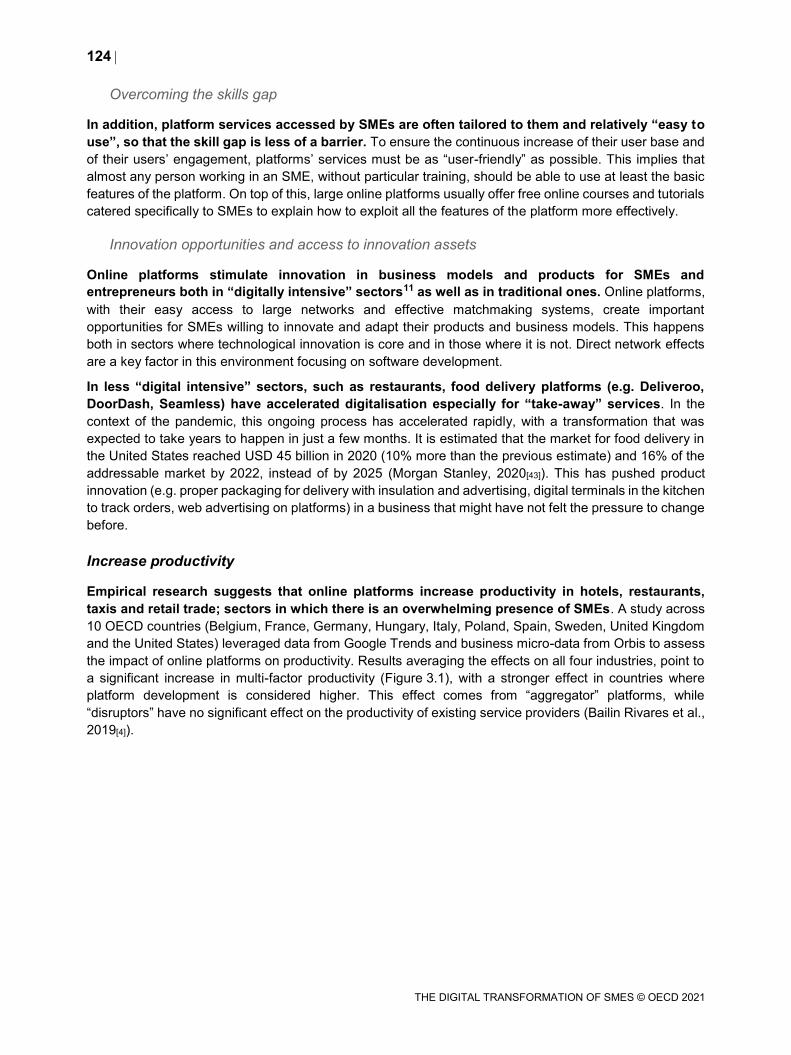
124
THE DIGITAL TRANSFORMATION OF SMES © OECD 2021
Overcoming the skills gap
In addition, platform services accessed by SMEs are often tailored to them and relatively “easy to
use”, so that the skill gap is less of a barrier. To ensure the continuous increase of their user base and
of their users’ engagement, platforms’ services must be as “user-friendly” as possible. This implies that
almost any person working in an SME, without particular training, should be able to use at least the basic
features of the platform. On top of this, large online platforms usually offer free online courses and tutorials
catered specifically to SMEs to explain how to exploit all the features of the platform more effectively.
Innovation opportunities and access to innovation assets
Online platforms stimulate innovation in business models and products for SMEs and
entrepreneurs both in “digitally intensive” sectors11 as well as in traditional ones. Online platforms,
with their easy access to large networks and effective matchmaking systems, create important
opportunities for SMEs willing to innovate and adapt their products and business models. This happens
both in sectors where technological innovation is core and in those where it is not. Direct network effects
are a key factor in this environment focusing on software development.
In less “digital intensive” sectors, such as restaurants, food delivery platforms (e.g. Deliveroo,
DoorDash, Seamless) have accelerated digitalisation especially for “take-away” services. In the
context of the pandemic, this ongoing process has accelerated rapidly, with a transformation that was
expected to take years to happen in just a few months. It is estimated that the market for food delivery in
the United States reached USD 45 billion in 2020 (10% more than the previous estimate) and 16% of the
addressable market by 2022, instead of by 2025 (Morgan Stanley, 2020[43]). This has pushed product
innovation (e.g. proper packaging for delivery with insulation and advertising, digital terminals in the kitchen
to track orders, web advertising on platforms) in a business that might have not felt the pressure to change
before.
Increase productivity
Empirical research suggests that online platforms increase productivity in hotels, restaurants,
taxis and retail trade; sectors in which there is an overwhelming presence of SMEs. A study across
10 OECD countries (Belgium, France, Germany, Hungary, Italy, Poland, Spain, Sweden, United Kingdom
and the United States) leveraged data from Google Trends and business micro-data from Orbis to assess
the impact of online platforms on productivity. Results averaging the effects on all four industries, point to
a significant increase in multi-factor productivity (Figure 3.1), with a stronger effect in countries where
platform development is considered higher. This effect comes from “aggregator” platforms, while
“disruptors” have no significant effect on the productivity of existing service providers (Bailin Rivares et al.,
2019[4]).
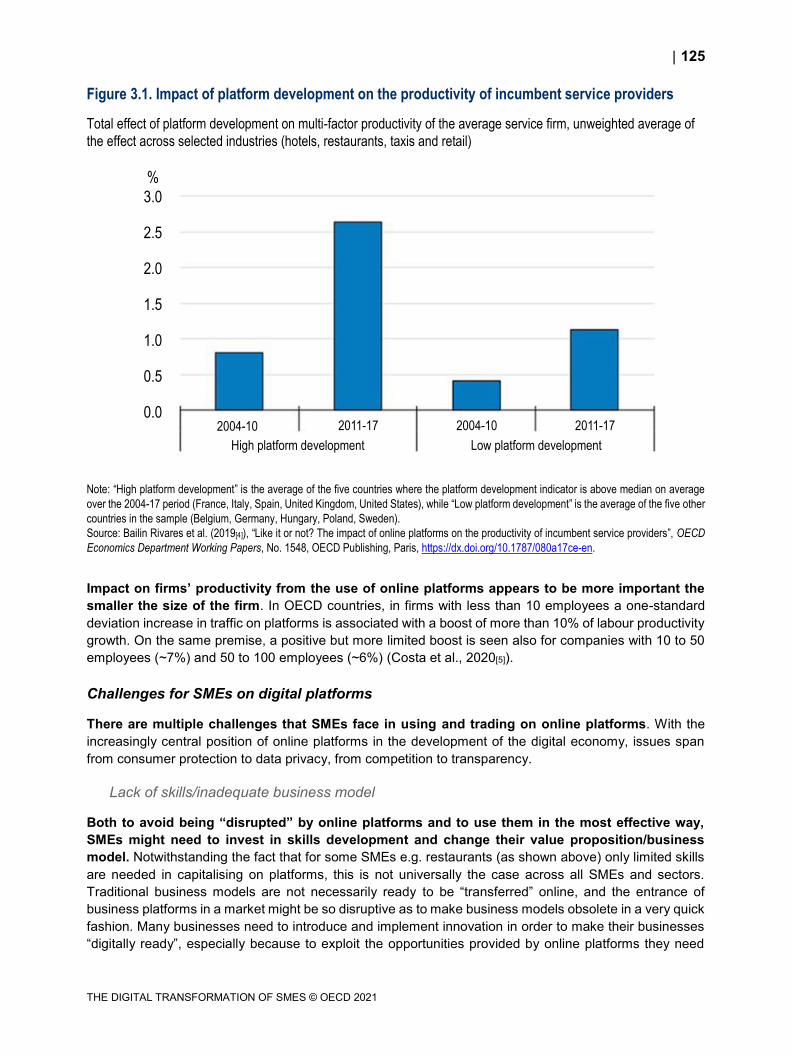
125
THE DIGITAL TRANSFORMATION OF SMES © OECD 2021
Figure 3.1. Impact of platform development on the productivity of incumbent service providers
Total effect of platform development on multi-factor productivity of the average service firm, unweighted average of
the effect across selected industries (hotels, restaurants, taxis and retail)
Note: “High platform development” is the average of the five countries where the platform development indicator is above median on average
over the 2004-17 period (France, Italy, Spain, United Kingdom, United States), while “Low platform development” is the average of the five other
countries in the sample (Belgium, Germany, Hungary, Poland, Sweden).
Source: Bailin Rivares et al. (2019[4]), “Like it or not? The impact of online platforms on the productivity of incumbent service providers”, OECD
Economics Department Working Papers, No. 1548, OECD Publishing, Paris, https://dx.doi.org/10.1787/080a17ce-en.
Impact on firms’ productivity from the use of online platforms appears to be more important the
smaller the size of the firm. In OECD countries, in firms with less than 10 employees a one-standard
deviation increase in traffic on platforms is associated with a boost of more than 10% of labour productivity
growth. On the same premise, a positive but more limited boost is seen also for companies with 10 to 50
employees (~7%) and 50 to 100 employees (~6%) (Costa et al., 2020[5]).
Challenges for SMEs on digital platforms
There are multiple challenges that SMEs face in using and trading on online platforms. With the
increasingly central position of online platforms in the development of the digital economy, issues span
from consumer protection to data privacy, from competition to transparency.
Lack of skills/inadequate business model
Both to avoid being “disrupted” by online platforms and to use them in the most effective way,
SMEs might need to invest in skills development and change their value proposition/business
model. Notwithstanding the fact that for some SMEs e.g. restaurants (as shown above) only limited skills
are needed in capitalising on platforms, this is not universally the case across all SMEs and sectors.
Traditional business models are not necessarily ready to be “transferred” online, and the entrance of
business platforms in a market might be so disruptive as to make business models obsolete in a very quick
fashion. Many businesses need to introduce and implement innovation in order to make their businesses
“digitally ready”, especially because to exploit the opportunities provided by online platforms they need
%
3.0
2.5
2.0
1.5
1.0
0.5
0.02004-10 2011-17 2004-10 2011-17
High platform development Low platform development
126
THE DIGITAL TRANSFORMATION OF SMES © OECD 2021
adequate internal digital processes. But this means dedicating the resources for complementary
investments, for example in skills development and organisational change. There are usually multiple
private (Amazon, 2020[44]) and public (European Commission, 2020[45]) programmes available for free, or
at a very low cost, for SMEs to embark on this transition. However, decision makers in the enterprise could
lack the motivation to dedicate resources and time to transform their business model.12
Risks of competition distortion
Competition authorities are looking at possible anti-competitive behaviours arising from platforms.
Online platforms maximise profits based on interlinked demand from the two (or multiple) sets of end-users
connected in the platform. The winner-takes-all and winner-takes-most effects Box 3.1, resulting from the
particularly strong network effects in this market introduce a risk that platform providers could wield their
market power and abuse their dominance status, thus distorting competition. (OECD, 2020[46]) presents
the main types of abuse of dominance that can be found in digital markets, which encompass digital
platforms (Box 3.5).
Box 3.5. Abuse of dominance in digital markets: Criteria and typology
Digital markets can be characterised by the dominance of particular service providers, multi-sided
markets connecting different groups of consumers, and the presence of network effects. Such
characteristics can result in more concentrated markets and consequently the emergence of dominant
player(s) in the market.
However, defining digital markets and assessing market dominance is challenging due to the unique
characteristics of these markets, such as the non-price dimensions of competition and the multiple markets
these multi-sided platforms operate in. Determining an abuse of dominance involves a case-by-case
assessment based on indicators such as substitutability, entry barriers, profitability and market shares.
Below are the main types of unilateral conduct that can constitute an abuse of dominance:
Refusal to deal: A dominant actor controls access to an important input, technology or
distribution network and refuses other players’ access to the resources, therefore foreclosing
competition.
Predatory pricing: A firm strategically sacrifices its profits in the short term to drive out its
competitors from the market, with the aim to recoup its losses at a later stage with higher prices.
Exclusive dealing and loyalty discounts: A dominant firm aims to obtain exclusivity in a market
through exclusive contracts with a supplier or a customer.
Tying and bundling: Exploiting linkages of a digital product with other products (e.g. hardware,
software, or web-based services) by tying or bundling products together.
Exploitative abuses: A firm uses its market power to impose unfair prices or other conditions on
consumers.
Source: OECD (2020[46]), Abuse of dominance in digital markets, http://www.oecd.org/daf/competition/abuse-of-dominance-in-digital-
markets-2020.pdf.
Anti-competitive behaviours by platform providers can harm SMEs using the platforms. 13 Distortion
in competition conditions does not allow SMEs to operate on a level playing field. Algorithmic price-
setting,14 results of search algorithms, and platforms competing with their own products against SMEs on
the same platform are all areas of scrutiny by public authorities (Khan, 2017[47]).
127
THE DIGITAL TRANSFORMATION OF SMES © OECD 2021
Consumer protection on platforms is relevant for SMEs as well, especially in e-commerce. In 2016
the OECD published the Recommendations of the Council on Consumer Protection in E-commerce
(OECD, 2016[48]) stating that some expansion of the traditional consumer protection principles (e.g. fair
business, advertising and marketing practices) should be applied when dealing with e-commerce
platforms. In particular, as many services are offered for free, non-monetary transactions should be
considered more carefully. For example, the trust-building system based on ratings, reviews and customer
services should be managed in full transparency to ensure that consumers as well as “sellers” operating
on such platforms are treated fairly.
On another side, platforms increase competition for SMEs that were previously exploiting small
“rents” based on the local networks. Allowing customers to access providers that can be based
anywhere makes many corner shops, restaurants, local entrepreneurs (painter, plumber, gardener) less
insulated from competition. While this might have a productivity-enhancing effect in aggregate, it might
also introduce an additional challenge for many SMEs. For example, a restaurant that was before serving
people leaving in its surroundings becomes less exclusive once food delivery apps become widely used.
In this sense, the lack of visibility on such apps might erode even local markets, “forcing” somehow SMEs
to establish an online presence on them.
Data protection risk
SMEs provide platforms with a large volume of sensitive business information, thus transparency
in the use of such data are essential. To operate on platforms, SMEs usually agree to contractual terms
and conditions that usually give online platforms the right to use the data they gather as they see fit, for
example by selling them to third parties that remain unidentified by SMEs. Often SMEs do not really have
a choice as some of the largest platforms are in dominant positions. Regulators around the world are
tackling the issue, trying to give more say to SMEs and consumers over the data they generate with their
commercial behaviour. In this sense, the General Data Protection Regulation (GDPR) in Europe is one of
the most advanced examples at the global level.
Digital security
As sensitive information is stored on online platforms, SMEs have an interest in their cybersecurity
standards. SMEs trust online platforms with business data (e.g. on sales, supply channels, client base)
that have crucial importance. There is a need for SMEs to fully understand the scale and scope of the data
they share, to better assess the inherent risks – but often SMEs lack the skills needed for this task
(Chapter 3).
Risks of lock-ins
Another critical aspect of the use of platforms by SMEs is the high switching costs and the difficulty
in multi-homing. As platforms profit from the size of their network and the volume of data gathered, stored
and managed, it is a clear business objective to retain client SMEs and avoid their passage to other
platforms. This is done by offering attractive conditions and constantly upgrading and enhancing the
services offered, but also by making it difficult to transfer data (e.g. transaction history, contacts, logistical
information) from one platform to another. So that the more a business uses a platform, the more it has to
lose if they decide to switch to a competitor. These barriers introduced by some platforms make data
transfer more costly, hindering multi-homing (i.e. the use by SMEs of multiple networks at the same time)
(Park, Seamans and Zhu, 2017[49]). A relevant example of lock-ins on both sides of the two-sided market
is in the gaming industry, where the high prices of consoles and subscription services, such as Xbox Live
and Playstation Plus reduce players’ incentive to multi-home – while exclusive contracts oblige content
developer to sell their product exclusively on one platform (Zhu and Iansiti, 2019[50]).
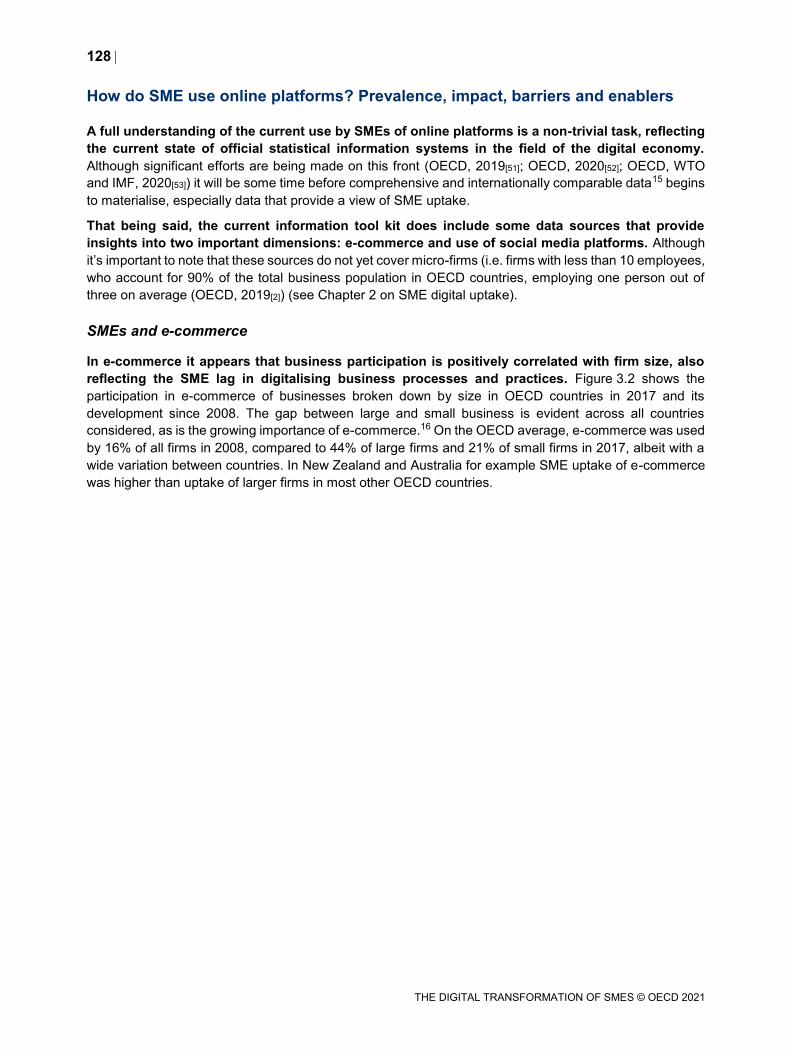
128
THE DIGITAL TRANSFORMATION OF SMES © OECD 2021
How do SME use online platforms? Prevalence, impact, barriers and enablers
A full understanding of the current use by SMEs of online platforms is a non-trivial task, reflecting
the current state of official statistical information systems in the field of the digital economy.
Although significant efforts are being made on this front (OECD, 2019[51]; OECD, 2020[52]; OECD, WTO
and IMF, 2020[53]) it will be some time before comprehensive and internationally comparable data15 begins
to materialise, especially data that provide a view of SME uptake.
That being said, the current information tool kit does include some data sources that provide
insights into two important dimensions: e-commerce and use of social media platforms. Although
it’s important to note that these sources do not yet cover micro-firms (i.e. firms with less than 10 employees,
who account for 90% of the total business population in OECD countries, employing one person out of
three on average (OECD, 2019[2]) (see Chapter 2 on SME digital uptake).
SMEs and e-commerce
In e-commerce it appears that business participation is positively correlated with firm size, also
reflecting the SME lag in digitalising business processes and practices. Figure 3.2 shows the
participation in e-commerce of businesses broken down by size in OECD countries in 2017 and its
development since 2008. The gap between large and small business is evident across all countries
considered, as is the growing importance of e-commerce.16 On the OECD average, e-commerce was used
by 16% of all firms in 2008, compared to 44% of large firms and 21% of small firms in 2017, albeit with a
wide variation between countries. In New Zealand and Australia for example SME uptake of e-commerce
was higher than uptake of larger firms in most other OECD countries.
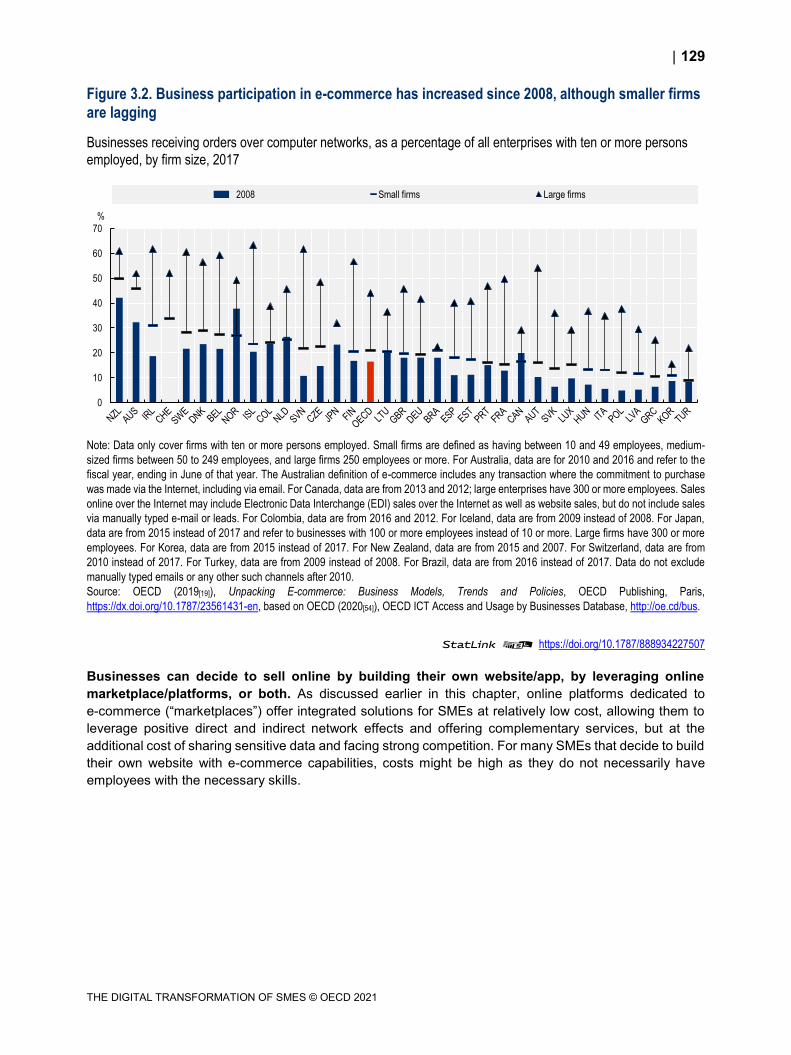
129
THE DIGITAL TRANSFORMATION OF SMES © OECD 2021
Figure 3.2. Business participation in e-commerce has increased since 2008, although smaller firms are lagging
Businesses receiving orders over computer networks, as a percentage of all enterprises with ten or more persons
employed, by firm size, 2017
Note: Data only cover firms with ten or more persons employed. Small firms are defined as having between 10 and 49 employees, medium-
sized firms between 50 to 249 employees, and large firms 250 employees or more. For Australia, data are for 2010 and 2016 and refer to the
fiscal year, ending in June of that year. The Australian definition of e-commerce includes any transaction where the commitment to purchase
was made via the Internet, including via email. For Canada, data are from 2013 and 2012; large enterprises have 300 or more employees. Sales
online over the Internet may include Electronic Data Interchange (EDI) sales over the Internet as well as website sales, but do not include sales
via manually typed e-mail or leads. For Colombia, data are from 2016 and 2012. For Iceland, data are from 2009 instead of 2008. For Japan,
data are from 2015 instead of 2017 and refer to businesses with 100 or more employees instead of 10 or more. Large firms have 300 or more
employees. For Korea, data are from 2015 instead of 2017. For New Zealand, data are from 2015 and 2007. For Switzerland, data are from
2010 instead of 2017. For Turkey, data are from 2009 instead of 2008. For Brazil, data are from 2016 instead of 2017. Data do not exclude
manually typed emails or any other such channels after 2010.
Source: OECD (2019[19]), Unpacking E-commerce: Business Models, Trends and Policies, OECD Publishing, Paris,
https://dx.doi.org/10.1787/23561431-en, based on OECD (2020[54]), OECD ICT Access and Usage by Businesses Database, http://oe.cd/bus.
StatLink 2 https://doi.org/10.1787/888934227507
Businesses can decide to sell online by building their own website/app, by leveraging online
marketplace/platforms, or both. As discussed earlier in this chapter, online platforms dedicated to
e-commerce (“marketplaces”) offer integrated solutions for SMEs at relatively low cost, allowing them to
leverage positive direct and indirect network effects and offering complementary services, but at the
additional cost of sharing sensitive data and facing strong competition. For many SMEs that decide to build
their own website with e-commerce capabilities, costs might be high as they do not necessarily have
employees with the necessary skills.
0
10
20
30
40
50
60
70
%
2008 Small firms Large firms
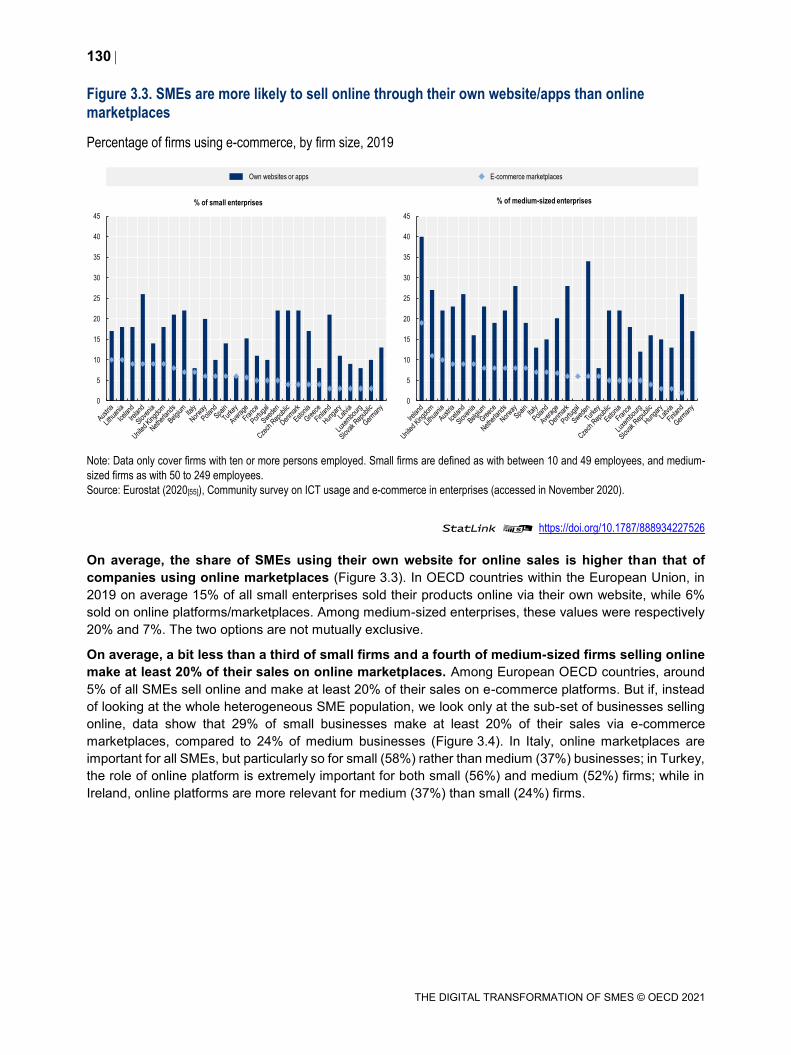
130
THE DIGITAL TRANSFORMATION OF SMES © OECD 2021
Figure 3.3. SMEs are more likely to sell online through their own website/apps than online marketplaces
Percentage of firms using e-commerce, by firm size, 2019
Note: Data only cover firms with ten or more persons employed. Small firms are defined as with between 10 and 49 employees, and medium-
sized firms as with 50 to 249 employees.
Source: Eurostat (2020[55]), Community survey on ICT usage and e-commerce in enterprises (accessed in November 2020).
StatLink 2 https://doi.org/10.1787/888934227526
On average, the share of SMEs using their own website for online sales is higher than that of
companies using online marketplaces (Figure 3.3). In OECD countries within the European Union, in
2019 on average 15% of all small enterprises sold their products online via their own website, while 6%
sold on online platforms/marketplaces. Among medium-sized enterprises, these values were respectively
20% and 7%. The two options are not mutually exclusive.
On average, a bit less than a third of small firms and a fourth of medium-sized firms selling online
make at least 20% of their sales on online marketplaces. Among European OECD countries, around
5% of all SMEs sell online and make at least 20% of their sales on e-commerce platforms. But if, instead
of looking at the whole heterogeneous SME population, we look only at the sub-set of businesses selling
online, data show that 29% of small businesses make at least 20% of their sales via e-commerce
marketplaces, compared to 24% of medium businesses (Figure 3.4). In Italy, online marketplaces are
important for all SMEs, but particularly so for small (58%) rather than medium (37%) businesses; in Turkey,
the role of online platform is extremely important for both small (56%) and medium (52%) firms; while in
Ireland, online platforms are more relevant for medium (37%) than small (24%) firms.
0
5
10
15
20
25
30
35
40
45
% of medium-sized enterprises
0
5
10
15
20
25
30
35
40
45
% of small enterprises
Own websites or apps E-commerce marketplaces
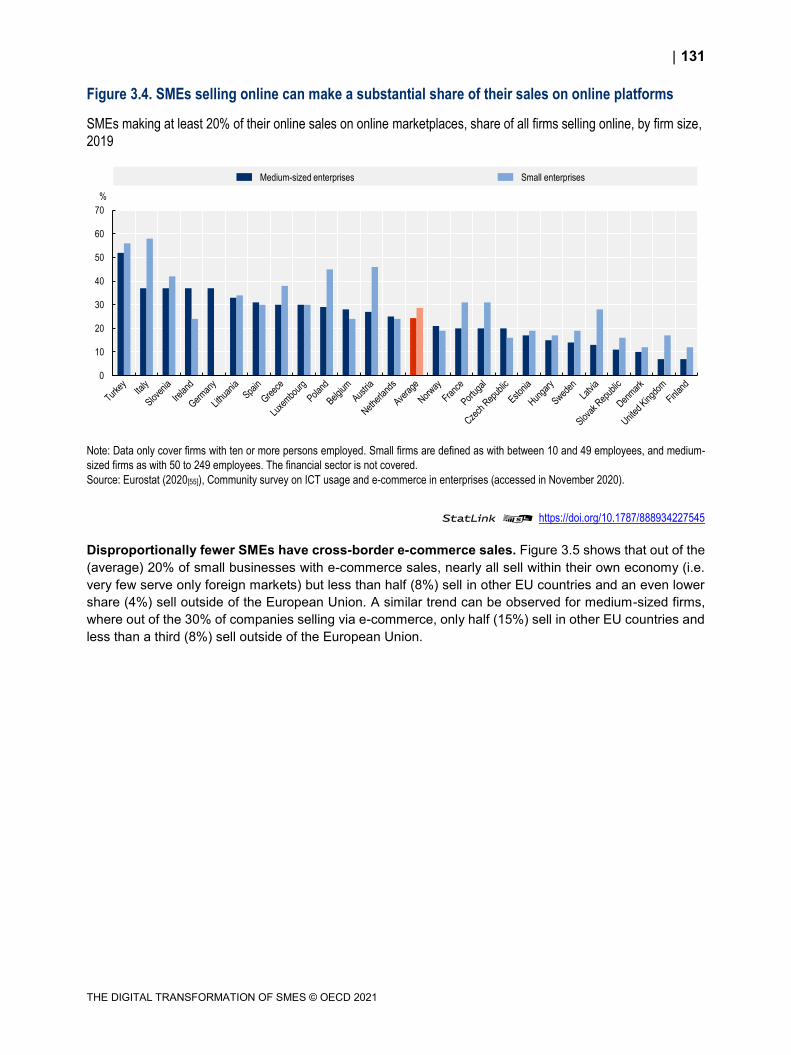
131
THE DIGITAL TRANSFORMATION OF SMES © OECD 2021
Figure 3.4. SMEs selling online can make a substantial share of their sales on online platforms
SMEs making at least 20% of their online sales on online marketplaces, share of all firms selling online, by firm size,
2019
Note: Data only cover firms with ten or more persons employed. Small firms are defined as with between 10 and 49 employees, and medium-
sized firms as with 50 to 249 employees. The financial sector is not covered.
Source: Eurostat (2020[55]), Community survey on ICT usage and e-commerce in enterprises (accessed in November 2020).
StatLink 2 https://doi.org/10.1787/888934227545
Disproportionally fewer SMEs have cross-border e-commerce sales. Figure 3.5 shows that out of the
(average) 20% of small businesses with e-commerce sales, nearly all sell within their own economy (i.e.
very few serve only foreign markets) but less than half (8%) sell in other EU countries and an even lower
share (4%) sell outside of the European Union. A similar trend can be observed for medium-sized firms,
where out of the 30% of companies selling via e-commerce, only half (15%) sell in other EU countries and
less than a third (8%) sell outside of the European Union.
0
10
20
30
40
50
60
70
%
Medium-sized enterprises Small enterprises
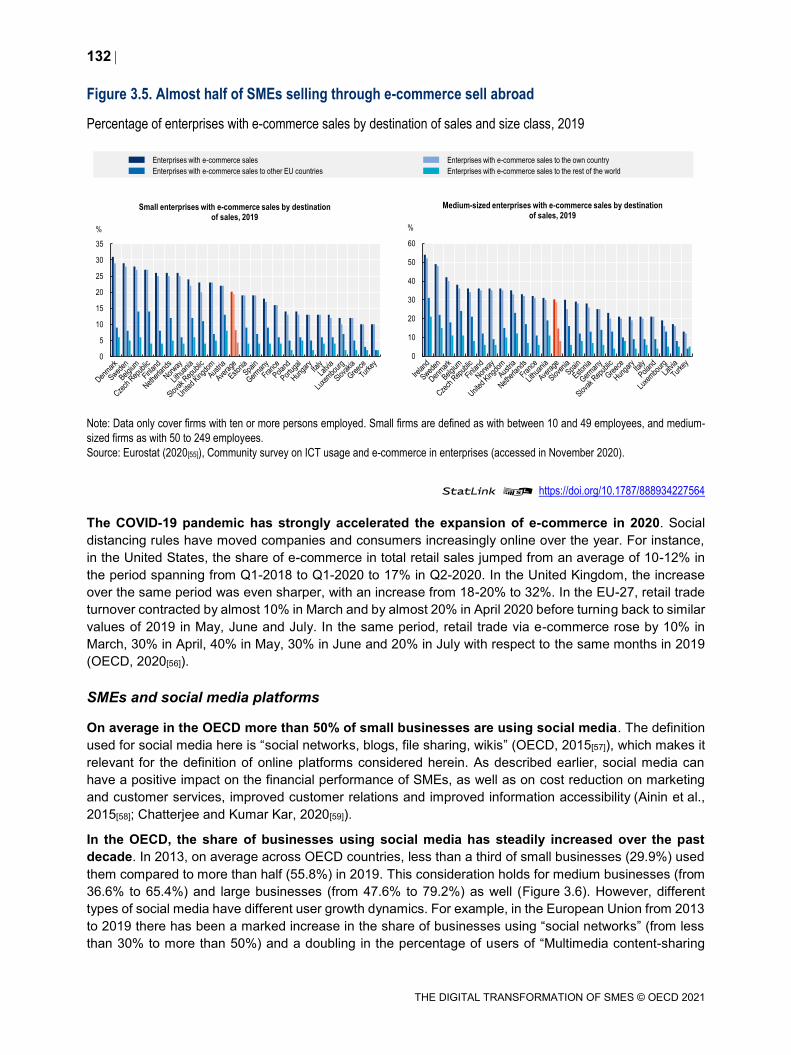
132
THE DIGITAL TRANSFORMATION OF SMES © OECD 2021
Figure 3.5. Almost half of SMEs selling through e-commerce sell abroad
Percentage of enterprises with e-commerce sales by destination of sales and size class, 2019
Note: Data only cover firms with ten or more persons employed. Small firms are defined as with between 10 and 49 employees, and medium-
sized firms as with 50 to 249 employees.
Source: Eurostat (2020[55]), Community survey on ICT usage and e-commerce in enterprises (accessed in November 2020).
StatLink 2 https://doi.org/10.1787/888934227564
The COVID-19 pandemic has strongly accelerated the expansion of e-commerce in 2020. Social
distancing rules have moved companies and consumers increasingly online over the year. For instance,
in the United States, the share of e-commerce in total retail sales jumped from an average of 10-12% in
the period spanning from Q1-2018 to Q1-2020 to 17% in Q2-2020. In the United Kingdom, the increase
over the same period was even sharper, with an increase from 18-20% to 32%. In the EU-27, retail trade
turnover contracted by almost 10% in March and by almost 20% in April 2020 before turning back to similar
values of 2019 in May, June and July. In the same period, retail trade via e-commerce rose by 10% in
March, 30% in April, 40% in May, 30% in June and 20% in July with respect to the same months in 2019
(OECD, 2020[56]).
SMEs and social media platforms
On average in the OECD more than 50% of small businesses are using social media. The definition
used for social media here is “social networks, blogs, file sharing, wikis” (OECD, 2015[57]), which makes it
relevant for the definition of online platforms considered herein. As described earlier, social media can
have a positive impact on the financial performance of SMEs, as well as on cost reduction on marketing
and customer services, improved customer relations and improved information accessibility (Ainin et al.,
2015[58]; Chatterjee and Kumar Kar, 2020[59]).
In the OECD, the share of businesses using social media has steadily increased over the past
decade. In 2013, on average across OECD countries, less than a third of small businesses (29.9%) used
them compared to more than half (55.8%) in 2019. This consideration holds for medium businesses (from
36.6% to 65.4%) and large businesses (from 47.6% to 79.2%) as well (Figure 3.6). However, different
types of social media have different user growth dynamics. For example, in the European Union from 2013
to 2019 there has been a marked increase in the share of businesses using “social networks” (from less
than 30% to more than 50%) and a doubling in the percentage of users of “Multimedia content-sharing
0
5
10
15
20
25
30
35
%
Small enterprises with e-commerce sales by destination of sales, 2019
0
10
20
30
40
50
60
%
Medium-sized enterprises with e-commerce sales by destination of sales, 2019
Enterprises with e-commerce sales Enterprises with e-commerce sales to the own country
Enterprises with e-commerce sales to other EU countries Enterprises with e-commerce sales to the rest of the world
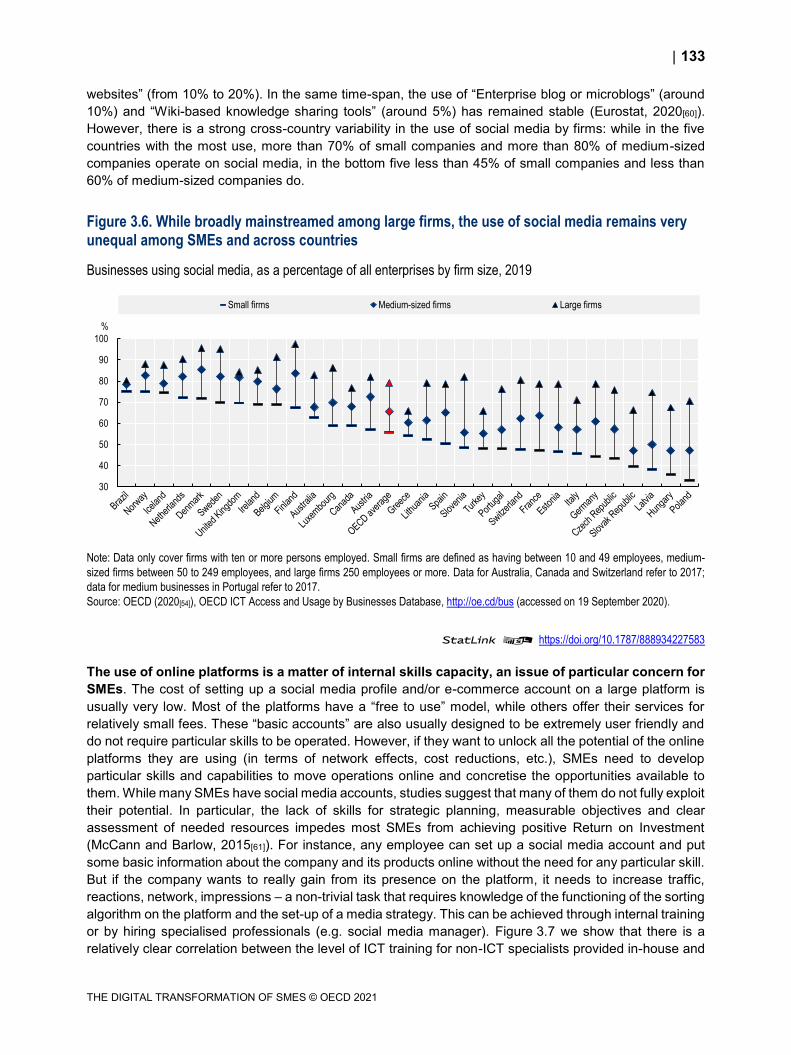
133
THE DIGITAL TRANSFORMATION OF SMES © OECD 2021
websites” (from 10% to 20%). In the same time-span, the use of “Enterprise blog or microblogs” (around
10%) and “Wiki-based knowledge sharing tools” (around 5%) has remained stable (Eurostat, 2020[60]).
However, there is a strong cross-country variability in the use of social media by firms: while in the five
countries with the most use, more than 70% of small companies and more than 80% of medium-sized
companies operate on social media, in the bottom five less than 45% of small companies and less than
60% of medium-sized companies do.
Figure 3.6. While broadly mainstreamed among large firms, the use of social media remains very unequal among SMEs and across countries
Businesses using social media, as a percentage of all enterprises by firm size, 2019
Note: Data only cover firms with ten or more persons employed. Small firms are defined as having between 10 and 49 employees, medium-
sized firms between 50 to 249 employees, and large firms 250 employees or more. Data for Australia, Canada and Switzerland refer to 2017;
data for medium businesses in Portugal refer to 2017.
Source: OECD (2020[54]), OECD ICT Access and Usage by Businesses Database, http://oe.cd/bus (accessed on 19 September 2020).
StatLink 2 https://doi.org/10.1787/888934227583
The use of online platforms is a matter of internal skills capacity, an issue of particular concern for
SMEs. The cost of setting up a social media profile and/or e-commerce account on a large platform is
usually very low. Most of the platforms have a “free to use” model, while others offer their services for
relatively small fees. These “basic accounts” are also usually designed to be extremely user friendly and
do not require particular skills to be operated. However, if they want to unlock all the potential of the online
platforms they are using (in terms of network effects, cost reductions, etc.), SMEs need to develop
particular skills and capabilities to move operations online and concretise the opportunities available to
them. While many SMEs have social media accounts, studies suggest that many of them do not fully exploit
their potential. In particular, the lack of skills for strategic planning, measurable objectives and clear
assessment of needed resources impedes most SMEs from achieving positive Return on Investment
(McCann and Barlow, 2015[61]). For instance, any employee can set up a social media account and put
some basic information about the company and its products online without the need for any particular skill.
But if the company wants to really gain from its presence on the platform, it needs to increase traffic,
reactions, network, impressions – a non-trivial task that requires knowledge of the functioning of the sorting
algorithm on the platform and the set-up of a media strategy. This can be achieved through internal training
or by hiring specialised professionals (e.g. social media manager). Figure 3.7 we show that there is a
relatively clear correlation between the level of ICT training for non-ICT specialists provided in-house and
30
40
50
60
70
80
90
100
%
Small firms Medium-sized firms Large firms
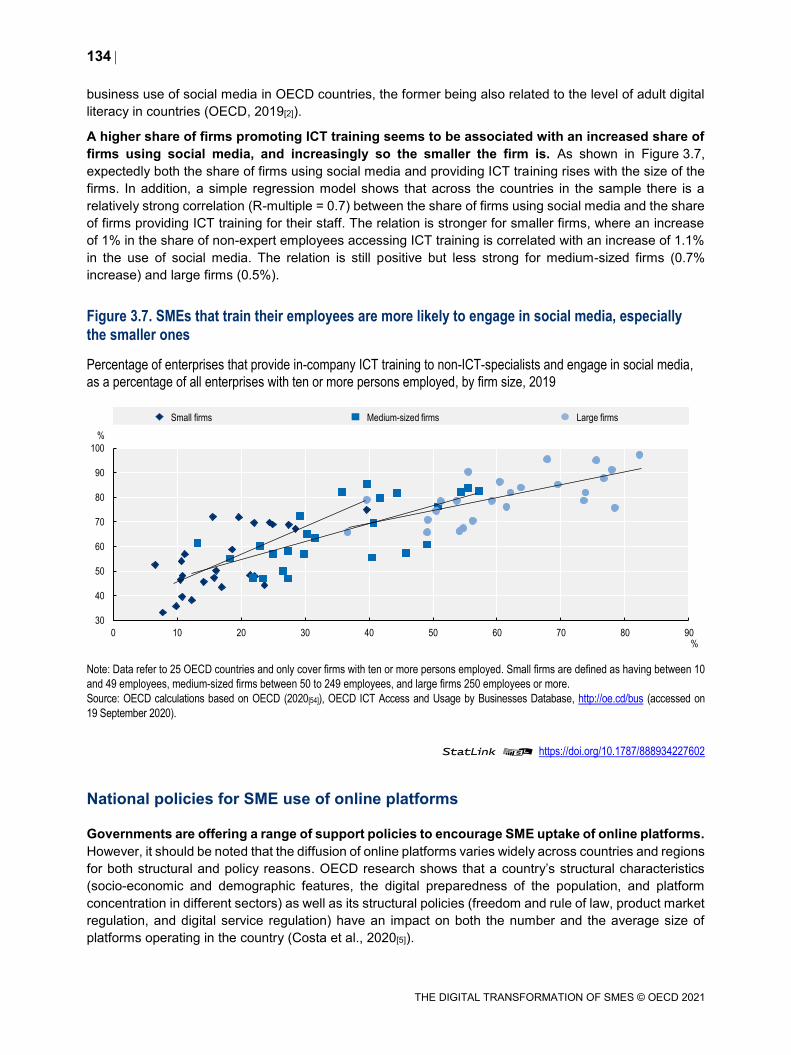
134
THE DIGITAL TRANSFORMATION OF SMES © OECD 2021
business use of social media in OECD countries, the former being also related to the level of adult digital
literacy in countries (OECD, 2019[2]).
A higher share of firms promoting ICT training seems to be associated with an increased share of
firms using social media, and increasingly so the smaller the firm is. As shown in Figure 3.7,
expectedly both the share of firms using social media and providing ICT training rises with the size of the
firms. In addition, a simple regression model shows that across the countries in the sample there is a
relatively strong correlation (R-multiple = 0.7) between the share of firms using social media and the share
of firms providing ICT training for their staff. The relation is stronger for smaller firms, where an increase
of 1% in the share of non-expert employees accessing ICT training is correlated with an increase of 1.1%
in the use of social media. The relation is still positive but less strong for medium-sized firms (0.7%
increase) and large firms (0.5%).
Figure 3.7. SMEs that train their employees are more likely to engage in social media, especially the smaller ones
Percentage of enterprises that provide in-company ICT training to non-ICT-specialists and engage in social media,
as a percentage of all enterprises with ten or more persons employed, by firm size, 2019
Note: Data refer to 25 OECD countries and only cover firms with ten or more persons employed. Small firms are defined as having between 10
and 49 employees, medium-sized firms between 50 to 249 employees, and large firms 250 employees or more.
Source: OECD calculations based on OECD (2020[54]), OECD ICT Access and Usage by Businesses Database, http://oe.cd/bus (accessed on
19 September 2020).
StatLink 2 https://doi.org/10.1787/888934227602
National policies for SME use of online platforms
Governments are offering a range of support policies to encourage SME uptake of online platforms.
However, it should be noted that the diffusion of online platforms varies widely across countries and regions
for both structural and policy reasons. OECD research shows that a country’s structural characteristics
(socio-economic and demographic features, the digital preparedness of the population, and platform
concentration in different sectors) as well as its structural policies (freedom and rule of law, product market
regulation, and digital service regulation) have an impact on both the number and the average size of
platforms operating in the country (Costa et al., 2020[5]).
30
40
50
60
70
80
90
100
0 10 20 30 40 50 60 70 80 90
%
%
Small firms Medium-sized firms Large firms
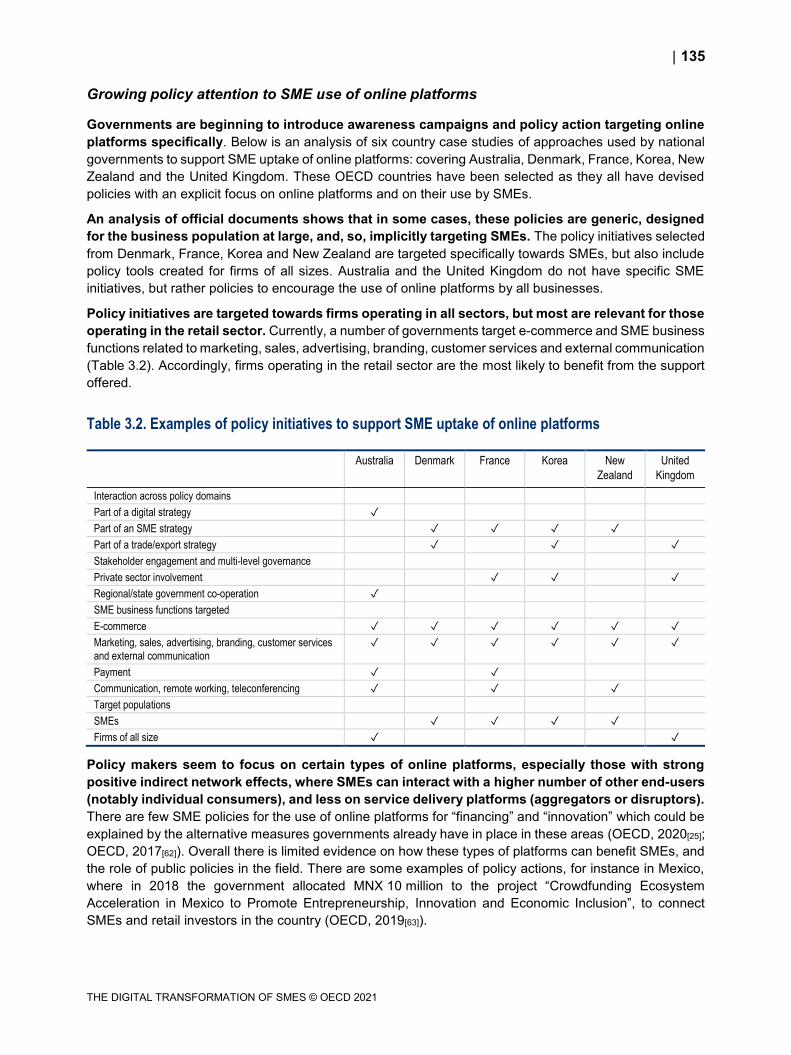
135
THE DIGITAL TRANSFORMATION OF SMES © OECD 2021
Growing policy attention to SME use of online platforms
Governments are beginning to introduce awareness campaigns and policy action targeting online
platforms specifically. Below is an analysis of six country case studies of approaches used by national
governments to support SME uptake of online platforms: covering Australia, Denmark, France, Korea, New
Zealand and the United Kingdom. These OECD countries have been selected as they all have devised
policies with an explicit focus on online platforms and on their use by SMEs.
An analysis of official documents shows that in some cases, these policies are generic, designed
for the business population at large, and, so, implicitly targeting SMEs. The policy initiatives selected
from Denmark, France, Korea and New Zealand are targeted specifically towards SMEs, but also include
policy tools created for firms of all sizes. Australia and the United Kingdom do not have specific SME
initiatives, but rather policies to encourage the use of online platforms by all businesses.
Policy initiatives are targeted towards firms operating in all sectors, but most are relevant for those
operating in the retail sector. Currently, a number of governments target e-commerce and SME business
functions related to marketing, sales, advertising, branding, customer services and external communication
(Table 3.2). Accordingly, firms operating in the retail sector are the most likely to benefit from the support
offered.
Table 3.2. Examples of policy initiatives to support SME uptake of online platforms
Policy makers seem to focus on certain types of online platforms, especially those with strong
positive indirect network effects, where SMEs can interact with a higher number of other end-users
(notably individual consumers), and less on service delivery platforms (aggregators or disruptors).
There are few SME policies for the use of online platforms for “financing” and “innovation” which could be
explained by the alternative measures governments already have in place in these areas (OECD, 2020[25];
OECD, 2017[62]). Overall there is limited evidence on how these types of platforms can benefit SMEs, and
the role of public policies in the field. There are some examples of policy actions, for instance in Mexico,
where in 2018 the government allocated MNX 10 million to the project “Crowdfunding Ecosystem
Acceleration in Mexico to Promote Entrepreneurship, Innovation and Economic Inclusion”, to connect
SMEs and retail investors in the country (OECD, 2019[63]).
Australia Denmark France Korea New
Zealand
United
Kingdom
Interaction across policy domains
Part of a digital strategy ✓
Part of an SME strategy
✓ ✓ ✓ ✓
Part of a trade/export strategy
✓ ✓ ✓
Stakeholder engagement and multi-level governance
Private sector involvement ✓ ✓ ✓
Regional/state government co-operation ✓
SME business functions targeted
E-commerce ✓ ✓ ✓ ✓ ✓ ✓
Marketing, sales, advertising, branding, customer services
and external communication
✓ ✓ ✓ ✓ ✓ ✓
Payment ✓ ✓
Communication, remote working, teleconferencing ✓ ✓ ✓
Target populations
SMEs ✓ ✓ ✓ ✓
Firms of all size ✓ ✓
136
THE DIGITAL TRANSFORMATION OF SMES © OECD 2021
Policy intervention is mainstreamed across different government ministries and agencies that have
responsibility in the field, with the modalities of policy implementation depending largely on the
goals pursued. For example, in the context of a national digital strategy, as seen in Australia, the Ministry
of Science, Technology and Innovation is often responsible. Similarly, if the initiatives are part of a business
community at large or small business specific policy, it will be the Ministry for Business or Ministry for Small
Business that is responsible. This is the case in Denmark, France and in Korea. Interestingly, as seen in
the United Kingdom, e-commerce policies are often created in the context of exports, which fall under the
responsibility of the Ministry for International Trade. Whilst, the aims and focuses of such policies are often
influenced by the body responsible for their execution, there is also room for shared responsibility, as seen
in Korea with the e-commerce export policy being a joint venture between the Ministry for SMEs and Start-
ups and the Ministry of Trade, Industry and Energy, and in Denmark where the Ministry of Industry,
Business and Financial Affairs jointly administrates with the Ministry for Foreign Affairs an export promotion
initiative for e-commerce.
Governments are promoting programmes in co-operation with some of the largest online
platforms. For many SMEs, to digitalise means to start using the services offered by the main global online
platforms. In France, Korea and the United Kingdom (Box 3.10), (Box 3.11) and (Box 3.13), co-operation
between government and the providers of such online platforms, specifically e-commerce and advertising
platforms, help support SME internationalisation, SME awareness of digital solutions, national brand
recognition, as well as SME resilience – particularly important in the current situation - through
diversification of revenue sources.
The push of the COVID-19 crisis
As part of the policy responses to the COVID-19 crisis, a number of government initiatives have
aimed to accelerate the digitalisation of SME operations, including on online platforms. For
example, Australia is providing businesses with information on how to make the best use of social media
platform (Box 3.8), while Korea is encouraging brick-and-mortar shops to open their business online
through a dedicated support programme, also to access foreign online platforms to sell their products
abroad (Box 3.11). Japan has offered subsidies to support firms to adopt IT solutions and develop e-
commerce sales channels. Broader support programmes for SMEs, such as the France Numérique
initiative also helped SMEs transition to an online business model (Box 3.6). Some countries, e.g. Mexico
and Turkey, also promoted solidarity campaigns to provide SMEs with essential cash flows during the
COVID-19 crisis and directly encouraged online sales on e-commerce platforms. Other countries helped
SMEs with access to essential services related to their online business model, e.g. e-customs processing
(Switzerland) and strategic consulting to strengthen SME’s online presence on international markets
(Spain) (OECD, 2020[64]; OECD, 2020[65]).
In the context of COVID-19, support has been targeted at increasing e-commerce and advertising
capabilities (including through online platforms), and enabling SME use of communication and
remote working platforms. For instance, the French government launched a call for large digital platforms
to provide small shops with access to free or discounted services in order to help them face the crisis.
Respondents included platforms active in e-commerce, e-payment, delivery/logistics, search
marketplaces, communication. In another example, the Chinese Ministry of Industry and Information
Technology introduced “online operations” programmes to help SMEs sell online through Alibaba and JD
(the two major Chinese e-commerce platforms), and to allow them to reduce costs, increase sales and
thus stabilise employment (OECD, 2020[65]).
National and sub-national governments are allocating further resources to encourage SME
activities on online platforms, particularly for teleworking and e-commerce. These policies tend to
be targeted at assisting SMEs in increasing their “work from home” capabilities or encouraging e-
commerce capabilities (including through the use of online platforms). For instance, the regions of
137
THE DIGITAL TRANSFORMATION OF SMES © OECD 2021
Lombardy and Friuli Venezia Giulia (Italy) have provided financial contributions to support companies and
self-employed workers to work remotely in response to the pandemic. The contribution can be requested
to cover both the training costs as well as the costs for the purchase of the digital tools/subscription to
digital platforms for teleworking (OECD, 2020[66]).
Public digital platforms
Some OECD governments have introduced freely accessible public online platforms to support the
digitalisation of SMEs. To facilitate the use of such portals, SMEs can directly select the business function
they want to “digitalise” to be directed to a consultant that might help them in the transition (Box 3.6). There
have also been more general reflections on how the government could itself become a “platform”, creating
and maintaining the infrastructure where businesses and citizens could match with public service providers
(Box 3.7).
Box 3.6. Public online platform to support SME digitalisation – FranceNum
In 2018 the French government launched an online platform to connect SMEs willing to digitalise with
a network of specialised consultants (both public and private) across the country. Small businesses
only need to connect to the online portal, indicate their size, location and sector of activity, and indicate
their digitalisation objective.
The objectives are related to different business functions: to create a digital strategy, to increase online
presence, to develop clientele, to sell online, to enhance internal processes, to train and recruit, to
protect the firm, to better use data, to integrate different work practices, and to innovate. Consultants
also offer information on the available financing options.
During the COVID-19 crisis, the website launched a rolling information feed to provide all SMEs with
live information on support initiatives from national and local governments, and from private sector
actors. To increase its reach, a daily radio show was launched to discuss upcoming digital trends.
Source: OECD (2020[65]), Policy Options to Support Digitalisation of Business Models during COVID-19: Annex,
https://www.oecd.org/sti/policy-options-to-support-digitalization-of-business-models-during-covid-19-annex.pdf; France Numérique official
website (www.francenum.gouv.fr).
Box 3.7. Government as a platform – G2B services
The idea of “government as a platform” h reflects the potential benefits that could arise from government
to be an online “Bazaar”, an open infrastructure to allow citizens and businesses to access services
from the public agencies. Central government would only provide the infrastructure and enforce
regulation, letting public and private stakeholders to then co-operate and exchange freely (O’Reilly,
2011[67]). However, this approach faces many difficulties in implementation, connected to the lack of
clear, quantifiable incentives for governments to restructure so deeply.
One option is that a “Government 2.0” could become a “marketplace for public services”. This would
require a strategic approach to data sharing, a trusted consent model for handling sensitive data, open
standards and interoperability of mechanisms for quality assurance. Such a foundational effort would
allow multiple public and private actors to concur in the provision of public services.
For businesses, relevant examples could be some “cross-governmental network for delivering services
that avoid silos of delivery (e.g. Service Communities, United Kingdom) or to offer standards for
138
THE DIGITAL TRANSFORMATION OF SMES © OECD 2021
technology (e.g. Secure Cloud Strategy, Australia; Open Source Contribution Policy, France; IT
architecture principles, Norway).
Source: OECD (2020[68]), “The OECD Digital Government Policy Framework: Six dimensions of a Digital Government”, OECD Public
Governance Policy Papers, No. 02, OECD Publishing, Paris, https://dx.doi.org/10.1787/f64fed2a-en.
Six country cases
The six OECD country cases below have in common the introduction of policies specifically aiming
to SMEs’ uptake of online platforms. Concrete measures spans from vouchers to hiring consultants to
help develop e-commerce capacity to how to guides on using social media for promotion and advertising,
from marketing training to business managers to target specific overseas market with e-commerce, to self-
assessment tools for businesses to track and monitor their ability to use online platforms. In the following
cases, the most common policy objective is to increase SMEs’ general digital skills, technology awareness
and adoption.
Box 3.8. Guide to digital transformation – Australia
The Australian government has published an online Guide to Digital Transformation to provide firms of
all sizes with accessible information on the benefits of going digital, including but not limited to the
uptake of online platforms, as well as step-by-step instructions on how to achieve their digital goals
(Australian Government, 2020[69]).
This initiative, co-ordinated by the Department of Industry, Science, Energy and Recourses (DISER) is
part of the greater business.gov.au whole-of-government website for the Australian business
community. The Guide to Digital Transformation includes links and resources that business owners can
turn to for help as well as a platform for “successful digitalisation stories” to be shared. The Guide to
Digital Transformation is accessible for SMEs. The Guide to Digital Transformation is not sector-
specific, with many of the more generic sub-sections (Is Your Business Digital Ready?, Know the Rules,
Move Your Operations Online, Build Your Team’s Digital Capability) being applicable to any business
interested in digitalising.
However, the initiatives focus on the uptake of online platforms is most relevant to SMEs operating in
the retail sector, mostly B2C but also for B2B, with the most substantial section being Get Your Products
or Services Online. This section provides firms with information on how to use social media platforms
to engage customers and advice on how to use online platforms for e-commerce.
The Guide to Digital Transformation collaborates with a sub-national initiative, the NSW state
government run Design System Guide which includes a catalogue of digital collaboration tools and
platforms that are relevant for virtual team management (NSW Government, 2019[70]). The Design
System Guide provides a summary of information on each tool, prompting businesses to engage with
online platforms for better internal communication. The co-operation with a state government on this
initiative aims to avoid overlap of resources.
The Guide to Digital Transformation along with other relevant guides related to e-commerce such as
the Guide to Exporting offers small firms a vast amount of information on digital engagement and
international trade, but are often overwhelming. According to the Growing the Digital Economy in
Australia and New Zealand: Maximising Opportunities for SMEs report, small firms have difficulties
finding the information they need (Australian Government Productivity Commission and New Zealand
Productivity Commission, 2019[71]).
139
THE DIGITAL TRANSFORMATION OF SMES © OECD 2021
Box 3.9. SMEs: Digital – Denmark
The Danish government’s programme SMEs: Digital, was established as a co-ordinated scheme and is
part of the national government’s Strategy for Denmark’s Digital Growth, to support the digital
transformation of Danish SMEs. SME: Digital features the “E-Commerce Centre”, an initiative designed
to assist SMEs with online sales (Danish Government, 2018[72]).
The E-Commerce Centre, like the strategy at large, aims to promote digitalisation and e-commerce
amongst SMEs from all sectors and Danish industry. The E-Commerce Centre is specifically targeted
towards SMEs. The Ministry of Industry, Business and Financial Affairs is responsible for the initiative
that was launched in 2018. The Ministry for Foreign Affairs’ has also contributed to the E-Commerce
Centre with their export promotion initiative for e-commerce, including work on reasonable competition
and framework conditions. DKK 10 million was allocated in 2018, along with DKK 20 million in 2019
and DKK 25 million in 2020-21.
The programme contains several different policy instruments such as grants for private consultancy in
order to clarify and develop a company’s e-commerce capacity, prepare business cases for converting
to advanced e-commerce solutions valued at up to DKK 100 000. SME business owners also have the
opportunity to receive a personalised strategy on how to strengthen their online sales. The E-Commerce
Centre also runs workshops that are accompanied by a grant of DKK 25 000 on a first come first served
basis, in which challenges associated with selling online are workshopped with industry experts.
The E-Commerce Centre offers information on regulation related to using online platform for sales
including guidance on EU regulations and Danish export policy, as well as assistance in dealing with
unfair competition. The E-Commerce Centre shares success stories of SMEs who have increased their
revenue and profits by engaging with online platforms as a key retail channel. There is also the
opportunity for referral for additional consultancy on e-commerce and e-exports in the Ministry of
Foreign Affairs, including promotion of specific international market opportunities via access to e-
commerce consultants in selected global markets.
SMEs: Digital as a portal also offers initiatives to improve the digital competence of managers. “Sprint:
Digital” is a policy instrument part of the greater strategy that measures the level of digitalisation of firms
and creates a tailored digital trajectory. These initiatives are more general and are not specifically
related to the uptake of online platforms.
Box 3.10. E-commerce Recovery Plan – France
The French Ministry of Economics, Finance and Recovery as part of its response to COVID-19 has
published an online guide to assist SMEs with their use of digital tools and e-commerce platforms to
reach customers (Ministère de l’économie des finances et de la relance, 2020[73]).
The French government put out a call to providers of online platforms for complimentary offers or to
offer their services at a preferential rate for French small businesses. The government then provided
an inventory of private sector companies and their preferential offers. The online platforms listed offer
solutions to assist SMEs develop commercial websites, navigate marketplaces and e-commerce sites,
use payment solutions, communication platforms and logistics and delivery solutions. This inventory is
targeted towards small businesses with a focus on the French market and the French consumer, rather
than exporting overseas.
140
THE DIGITAL TRANSFORMATION OF SMES © OECD 2021
The French government have complimented this inventory with an e-commerce digital guide. This guide
gives small business owners information on how to update their information online and on social media
platforms, how to best communicate with customers online and how to start or maintain a digital
business. The guide offers step-by-step solutions or instructions for businesses, as well as links to other
guides on specific topics available on www.francenum.gouv.fr. The guide also shares available case
studies on how existing businesses have been using digital technologies to better connect with their
customers remotely.
Box 3.11. Export policies – Korea
The Korean Ministry of SMEs and Start-ups (MSS) export policy has various programmes aimed at
helping SMEs gain entry into global value chains by offering e-commerce support and digital “Brank K”
marketing (Korean Government, 2020[74]).
The MSS operates online programmes to help SMEs sell their products through online marketplaces
such as Rakuten, Amazon and Taobao. MSS also promotes SME products on product-dedicated pages
that target overseas buyers as well as providing marketing training to business owners. This policy
initiative is targeted to SMEs operating in all sectors that are able to sell online.
The MSS in co-operation with the Ministry of Trade, Industry and Energy released plans in 2019 to
increase e-commerce exports by 2022 with additional infrastructure and financing (The Korea Herald,
2019[75]). The Korean government has plans to build an integrated logistics centre where storage,
clearance and delivery are handled in one place. The Korean government also plans to match Korean
SME exporters with global companies, foreign VCs and accelerators to attract investment funds.
As part of the Korean response to COVID-19 the Global Growth Policy Division in May 2020 announced
an initiative to hold online video conferences for export consultation for “BRAND K” products. The
purpose of the Brand K initiative is to strengthen brand recognition of Korean products, capitalising on
the “Korean Wave” in pop entertainment, cosmetics, fashion and food. The MSS as part of the initiative
are supporting the follow-up marketing of BRAND K company’s advancement into the global market by
assisting them on online platforms after the video consultations. The buyers at the video conference
included Suning.com, China’s largest online distribution company and HIT GLOBAL, Indonesia’s largest
home shopping vendor company. The co-operation with the private sector is a strength of the initiative.
This initiative is part of a greater MSS strategy for Korean SMEs to bounce back stronger in GVCs in
the aftermath of the COVID-19 crisis. This greater policy, co-ordinated by the MSS, is SME specific but
targeted to all sectors, as well as retail.
141
THE DIGITAL TRANSFORMATION OF SMES © OECD 2021
Box 3.12. Small business strategy – New Zealand
The New Zealand Minister for Small business, under the co-ordination of the Ministry of Business
Innovation and Employment, established the Small Business Council in 2018 to develop a Small
Business Strategy over a 12-month period (New Zealand Government, 2019[76]).
The Small Business Strategy, released in July 2019, had many recommendations including the update
of resources on business.govt.nz as part of an effort to build capabilities and skills amongst small
business owners to engage with online platforms. This initiative is targeted to firms operating in all
sectors.
The business.govt.nz resources were developed in partnership with technology leaders from Duke
University in the United States. The resource Business Strategy connects New Zealand SMEs with
global best-practice advice on engaging with e-commerce, online advertising and how to strategically
use social media.
In the context of COVID-19, business.govt.nz has launched a “revive & thrive” tool to give businesses
access to tailored support and information on how to do commerce digitally (New Zealand Government,
2020[77]). This resource provides case studies and information on the different options for e-commerce,
attracting online customers, customer engagement and improving customer experience. There is also
a self-assessment tool for businesses to track and monitor their ability to use online platforms
effectively. This tool is targeted to firms of all sizes and firms operating in all sectors.
Box 3.13. Selling online overseas with DIT’s E-exporting programme – United Kingdom
The United Kingdom as part of the great.gov.uk initiative has launched a platform Selling Online
Overseas with DIT’s E-Exporting Programme to provide tools and information to assist firms exporting
products to consumers through the use of online marketplaces (UK Government, 2018[78]).
The detailed guide is co-ordinated by the Department for International Trade and was started in
November 2016 and last updated September 2020. The service offers a tool to help UK businesses to
find online marketplaces and sell products on the platforms.
Business owners can select the category of export product (e.g. health and beauty, food and drink) and
the market they want to target, then a list of online platforms that fit their criteria are provided. The tool
also provides relevant information about the market place, such as registered users, markets they
operate in, commission for use. The initiative offers free support from UK-based E-Commerce advisors
and ongoing support on each firm's journey selling online overseas. The initiative also offers benefits to
firms that connect to international marketplaces through DIT’s website with reduced commission rates
and free trial periods. The programme’s website shares success stories on online exporting experience.
The information is for firms of all sizes operating in the retail sector. This e-commerce strategy is
specifically targeted towards exports and identifying online opportunities for UK businesses abroad.
Since November 2016, 1 236 UK companies have applied to sell on an online marketplace through the
Selling Online Overseas service, whilst 3 136 businesses have made an application to use the service.
Published in November 2018, the DIT released a specific guide titled E-commerce for UK small
businesses selling online to the USA. The guide offers general information about engaging in
e-commerce, as well as specific tips for the US market.
142
THE DIGITAL TRANSFORMATION OF SMES © OECD 2021
Conclusion
This chapter looks at the main characteristics of online multi-side platforms17 and their impact on SME
business. It explores the incentives, opportunities and challenges for SMEs to move operations onto these
often large and international digital platforms in order to understand implications for policy makers. In
particular, how SMEs leverage such platforms to perform specific business functions, such as: marketing,
communication, service delivery, financing, payment, remote working, teleconferencing, or innovation, etc.
To this end, the analysis takes into account the most recent academic literature, internationally comparable
data and policy experiences. It gives a particular focus to the effects of the COVID-19 pandemic on SME
uptake of digital platforms, and how governments are responding by leveraging the potential of platforms.
Online platforms allow SMEs to reduce transaction costs and information asymmetries, and enable
important direct and indirect network effects, increasing customer bases and global reach, overcoming
size-based skills gap, whilst also opening up innovation opportunities. Evidence shows higher productivity
levels in sectors with a high share of SMEs (e.g. hotels, restaurant, taxis, retail) and a presence of more
developed online platforms, as well as an association between higher labour productivity growth and more
SMEs engaging in online activities on platforms, the effect being stronger the smaller the firm.
However, there are considerable challenges and risks for SMEs in using online platforms. First of all the
lack of skills, understanding, or adequate business models to fully exploit the benefits of online operations.
But also important risks related to data protection, potential competition distortion, digital security, and lock-
in effects that might negatively and disproportionately impact SMEs.
While there is a significant effort at international level to provide comprehensive and internationally
comparable data on the digital economy, a full understanding of the use of online platforms by SMEs is
still non-trivial. Comparable international data on e-commerce show an increasing participation of firms of
all sizes, and a strong acceleration during the pandemic. Usually, SMEs are more likely to sell online
through their own website/apps than on e-commerce marketplaces, but smaller firms with an important
share of online sales make most of them via online platforms.
Data on social media platforms suggest a mainstreamed use among large firms (more than 80% of large
firms in the OECD area already use social media), less intensive use among SMEs (on average more than
50% of SMEs). But still wide differences in use across countries and firm-sizes, with social media use in
the top five countries above 70% for small companies and 80% for medium-sized companies, while in the
bottom five respectively less than 45% of small companies and less than 60% of medium-sized companies.
Skills matter in this case: while a basic use (e.g. creating a page, uploading some general information) do
not require any particular ability, effective more advanced use of these channels, e.g. for advertising,
marketing and managing customer relations, require training staff, e.g. on how to increase traffic, manage
reviews and reactions, build network, impressions). In fact, the provision of ICT training to non ICT staff
seems to be associated with a more intensive use of social media, the effect being stronger the smaller
the firm.
Governments are offering a range of support policies to encourage SME uptake of online platforms,
although the diffusion of online platforms varies widely across countries and regions for both structural and
policy reasons. A growing number of OECD government programmes aim to encourage the digitalisation
of SME operations through online platforms and sometimes in co-operation with them. The COVID-19
crisis reinforced policy efforts in that direction, with increased attention to strengthening e-commerce,
advertising, communication and remote working capabilities. Six country cases of Australia, Denmark,
France, Korea, New Zealand and the United Kingdom are explored in more detail to better understand the
design and governance of policies aiming to encourage SME operations on online platforms.
Further exploration of the topic would need a strengthened evidence base, for example by expanding the
collection of data on micro-firms (below 10 employees, currently missing in international statistics on ICT
business use), expanding the coverage of ICT data to other types of platforms, beyond e-commerce and
143
THE DIGITAL TRANSFORMATION OF SMES © OECD 2021
social media, getting a better understanding on the return on investments for micro and SMEs to move
part of their business functions on digital platforms, and which ones. Likewise, better understanding the
impact of digital platforms on market structures (OECD, 2019[2]), business and competition conditions, and
the internal processes of SMEs is critical to future policy making in the area.
Multi-stakeholder efforts including the private sector, large firms, digital platforms and SMEs themselves,
like the Digital for SMEs Global Initiative (D4SME) that is promoted by the OECD and Business at OECD,
might help OECD governments. For instance, by gathering relevant SMEs use cases for information and
awareness purposes (as the two integrated in Box 3.2 and Box 3.3), as well as by building research
co-operation with academia and large online platforms, in order to leverage original data, better understand
the evolution of the sector and the place of SMEs and micro-firms within, and ultimately better inform policy
makers.
References
Ainin, S. et al. (2015), “Factors influencing the use of social media by SMEs and its performance
outcomes”, Industrial Management and Data Systems, Vol. 115/3, pp. 570-588,
http://dx.doi.org/10.1108/IMDS-07-2014-0205.
[58]
Amazon (2020), Learn how to sell online, Amazon Seller University,
https://services.amazon.in/resources/seller-university.html (accessed on 8 September 2020).
[44]
Australian Government (2020), Get your products or services online, business.gov.au,
https://www.business.gov.au/Guide/Digital/Get-your-products-or-services-online (accessed on
16 July 2020).
[69]
Australian Government Productivity Commission and New Zealand Productivity Commission
(2019), Growing the digital economy in Australia and New Zealand: Maximising opportunities
for SMEs, https://www.productivity.govt.nz/assets/Research/b32acca009/Growing-the-digital-
economy-in-Australia-and-New-Zealand_Final-Report.pdf.
[71]
Bailin Rivares, A. et al. (2019), “Like it or not? The impact of online platforms on the productivity
of incumbent service providers”, OECD Economics Department Working Papers, No. 1548,
OECD Publishing, Paris, https://dx.doi.org/10.1787/080a17ce-en.
[4]
Belleflamme, P. and M. Peitz (2018), “Inside the Engine Room of Digital Platforms: Reviews,
Ratings, and Recommendations”, Working Papers, Aix-Marseille School of Economics 6,
http://dx.doi.org/10.2139/ssrn.3128141.
[37]
Brynjolfsson, E., X. Hui and M. Liu (2019), “Does machine translation affect international trade?
Evidence from a large digital platform”, Management Science, Vol. 65/12, pp. 5449-5460,
http://dx.doi.org/10.1287/mnsc.2019.3388.
[32]
Brynjolfsson, E. et al. (2008), “Scale Without Mass: Business Process Replication and Industry
Dynamics”, Harvard Business School Technology & Operations Mgt. Unit Research Paper
No. 07-016, http://dx.doi.org/10.2139/ssrn.980568.
[9]
144
THE DIGITAL TRANSFORMATION OF SMES © OECD 2021
Calvino, F. et al. (2018), “A taxonomy of digital intensive sectors”, OECD Science, Technology
and Industry Working Papers, No. 2018/14, OECD Publishing, Paris,
https://dx.doi.org/10.1787/f404736a-en.
[79]
Chatterjee, S. and A. Kumar Kar (2020), “Why do small and medium enterprises use social
media marketing and what is the impact: Empirical insights from India”, International Journal
of Information Management, Vol. 53, p. 102103,
http://dx.doi.org/10.1016/j.ijinfomgt.2020.102103.
[59]
Choudary, S. (2015), Platform Scale: How an emerging business model helps startups build
large empires with minimum investment, Platform Thinking Labs,
https://www.amazon.fr/Platform-Scale-emerging-business-
investment/dp/9810967586/ref=pd_lpo_14_t_1/261-7144033-
7648824?_encoding=UTF8&pd_rd_i=9810967586&pd_rd_r=74e77d48-6a57-400d-b039-
8d63ea9bf576&pd_rd_w=ERrks&pd_rd_wg=mkZ8B&pf_rd_p=a9e8383d-b25d-45ec-acc2-
a094dd781c31&pf_rd_r=WAKK5K58ZZ5VK3TNPEPX&psc=1&refRID=WAKK5K58ZZ5VK3T
NPEPX (accessed on 31 August 2020).
[11]
Costa, H. et al. (2020), Are online platforms killing the offline star? Platform diffusion and the
productivity of traditional firms, OECD Working Party No. 1 on Macroeconomic and Structural
Policy Analysis.
[5]
Cusumano, M. (2020), The bigger some platforms get, the more money they lose, MIT Sloan
Experts/Platform Strategy, https://mitsloan.mit.edu/experts/bigger-some-platforms-get-more-
money-they-lose (accessed on 1 September 2020).
[36]
Danish Government (2018), SMV: Digital, https://smvdigital.dk/e-handel/om-e-handelscenter
(accessed on 9 September 2020).
[72]
De Reuver, M., C. Sørensen and R. Basole (2017), “The digital platform: a research agenda”,
http://dx.doi.org/10.1057/s41265.
[29]
eMarketer (2020), Global Digital Ad Spending 2019 - Insider Intelligence Trends, Forecasts &
Statistics, https://www.emarketer.com/content/global-digital-ad-spending-2019 (accessed on
28 November 2020).
[15]
European Commission (2020), “Integration of Digital Technology by Enterprises”, Shaping
Europe’s digital future, https://ec.europa.eu/digital-single-market/en/integration-digital-
technology-enterprises (accessed on 30 November 2020).
[87]
European Commission (2020), Supporting digital skills development in European SMEs |
EASME, https://ec.europa.eu/easme/en/news/supporting-digital-skills-development-
european-smes (accessed on 8 September 2020).
[45]
European Commission (2020), Who can telework today? The teleworkability of occupations in
the EU, EU Commission, Science for Policy Briefs,
https://ec.europa.eu/jrc/sites/jrcsh/files/policy_brief_-_who_can_telework_today_-
_the_teleworkability_of_occupations_in_the_eu_final.pdf (accessed on 28 November 2020).
[26]
European Commission (2019), “How do online platforms shape our lives and businesses? -
Brochure”, Shaping Europe’s digital future, https://ec.europa.eu/digital-single-
market/en/news/how-do-online-platforms-shape-our-lives-and-businesses-brochure
(accessed on 30 November 2020).
[17]
145
THE DIGITAL TRANSFORMATION OF SMES © OECD 2021
Eurostat (2020), Community survey on ICT usage and e-commerce in enterprises. [55]
Eurostat (2020), Social media - statistics on the use by enterprises - Statistics Explained,
https://ec.europa.eu/eurostat/statistics-explained/index.php/Social_media_-
_statistics_on_the_use_by_enterprises#Types_of_social_media_used_over_time_.282013-
2019.29 (accessed on 16 September 2020).
[60]
Evans, D., A. Hagiu and R. Schmalensee (2008), Invisible Engines: How software platforms
drive innovation and transform industries, The MIT Press, Cambridge,
https://library.oapen.org/handle/20.500.12657/26084 (accessed on 28 August 2020).
[27]
Evans, P. and A. Gawer (2016), The Rise of the Platform Enterprise. A Global Survey, The
Centre for Global Enterprise.
[14]
Forbes (2019), The Soon To Be $200B Online Food Delivery Is Rapidly Changing The Global
Food Industry, https://www.forbes.com/sites/sarwantsingh/2019/09/09/the-soon-to-be-200b-
online-food-delivery-is-rapidly-changing-the-global-food-industry/?sh=7a6f2eeeb1bc
(accessed on 28 November 2020).
[23]
Gawer, A. and M. Cusumano (2013), “Industry Platforms and Ecosystem Innovation”, Journal of
Product Innovation Management, Vol. 31/3, http://dx.doi.org/10.1111/jpim.12105.
[83]
Ghazawneh, A. and O. Henfridsson (2015), “A Paradigmatic Analysis of Digital Application
Marketplaces”, Journal of Information Technology, Vol. 30/3, pp. 198-208,
http://dx.doi.org/10.1057/jit.2015.16.
[85]
GItHub (2020), The State of the Octoverse, https://octoverse.github.com/ (accessed on
7 September 2020).
[31]
Goldfarb, A. and C. Tucker (2019), “Digital Economics †”, Journal of Economic Literature 1,
pp. 3-43, http://dx.doi.org/10.1257/jel.20171452.
[3]
Holland, C. and M. Gutiérrez-Leefmans (2018), “A Taxonomy of SME E-Commerce Platforms
Derived from a Market-Level Analysis”, International Journal of Electronic Commerce,
Vol. 22/2, pp. 161-201, http://dx.doi.org/10.1080/10864415.2017.1364114.
[20]
IAB.uk (2020), Digital advertising crucial to SMEs’ recovery, https://www.iabuk.com/news-
article/digital-advertising-crucial-smes-recovery (accessed on 7 September 2020).
[18]
ITC (2016), Bringing SMEs onto the e-commerce highway, ITC, Geneva,
https://www.intracen.org/uploadedFiles/intracenorg/Content/Publications/Bringing%20SMEs%
20onto%20the%20e-Commerce%20Highway_final_250516_Low-res.pdf (accessed on
26 August 2020).
[22]
Katz, M. and C. Shapiro (1985), “Network externalities, competition, and compatibility”, American
Economic Review, Vol. 75/3, pp. 424-440, http://dx.doi.org/10.2307/1814809.
[34]
Kenney, M. (2016), The Rise of the Platform Economy, Issues in Science and Technology 32,
No. 3, https://issues.org/the-rise-of-the-platform-economy/ (accessed on 16 July 2020).
[33]
Khan, L. (2017), Amazon’s Antitrust Paradox, pp. 710-805,
https://digitalcommons.law.yale.edu/cgi/viewcontent.cgi?article=5785&context=ylj (accessed
on 26 November 2020).
[47]
146
THE DIGITAL TRANSFORMATION OF SMES © OECD 2021
Korean Government (2020), Ministry of SMEs and Startups: Exports,
https://www.mss.go.kr/site/eng/03/20301120000002019110758.jsp.
[74]
López González, J. (2017), “Mapping the participation of ASEAN small- and medium- sized
enterprises in global value chains”, OECD Trade Policy Papers, No. 203, OECD Publishing,
Paris, https://dx.doi.org/10.1787/2dc1751e-en.
[39]
McCann, M. and A. Barlow (2015), “Use and measurement of social media for SMEs”, Journal of
Small Business and Enterprise Development, Vol. 22/2, pp. 273-287,
http://dx.doi.org/10.1108/JSBED-08-2012-0096.
[61]
Mediakix (2020), TikTok User Growth Infographic, https://mediakix.com/blog/tik-tok-user-growth-
infographic/ (accessed on 4 December 2020).
[12]
Ministère de l’économie des finances et de la relance (2020), E-commerce : Des offres
préférentielles pour permettre aux commerçants de poursuivre une activité, economie.gouv.fr,
https://www.economie.gouv.fr/coronavirus-e-commerce-offres-preferentielles-commercants
(accessed on 16 July 2020).
[73]
Morais, F. and J. Ferreira (2020), “SME internationalisation process: Key issues and
contributions, existing gaps and the future research agenda”, European Management
Journal, Vol. 38/1, pp. 62-77, http://dx.doi.org/10.1016/j.emj.2019.08.001.
[40]
Morgan Stanley (2020), COVID-19 serves up big changes for U.S. restaurants,
https://www.morganstanley.com/ideas/coronavirus-restaurant-trends.
[43]
Nambisan, S., M. Wright and M. Feldman (2019), “The digital transformation of innovation and
entrepreneurship: Progress, challenges and key themes”, Research Policy, Vol. 48/8,
p. 103773, http://dx.doi.org/10.1016/j.respol.2019.03.018.
[30]
New Zealand Government (2020), business.govt.nz, https://www.business.govt.nz/. [77]
New Zealand Government (2019), Ministry of Business, Innovation & Employment: Small
Business Council, https://www.mbie.govt.nz/business-and-employment/business/support-for-
business/small-business/.
[76]
NSW Government (2019), Digital Collaboration Tools, http://dx.doi.org/08/09/2020. [70]
OECD (2020), Abuse of Dominance in Digital Markets,
http://www.oecd.org/daf/competition/abuse-of-dominance-in-digital-markets-2020.pdf.
[46]
OECD (2020), “Coronavirus (COVID-19): SME policy responses”, OECD Policy Responses to
Coronavirus (COVID-19), http://www.oecd.org/coronavirus/policy-responses/coronavirus-
covid-19-sme-policy-responses-04440101/.
[64]
OECD (2020), “E-commerce in the time of COVID-19”, OECD Policy Responses to Coronavirus
(COVID-19), http://www.oecd.org/coronavirus/policy-responses/e-commerce-in-the-time-of-
covid-19-3a2b78e8/ (accessed on 30 November 2020).
[56]
OECD (2020), Financing SMEs and Entrepreneurs 2020: An OECD Scoreboard, OECD
Publishing, Paris, https://dx.doi.org/10.1787/061fe03d-en.
[25]
147
THE DIGITAL TRANSFORMATION OF SMES © OECD 2021
OECD (2020), Guidelines for Supply-Use tables for the Digital Economy,
http://www.oecd.org/officialdocuments/publicdisplaydocumentpdf/?cote=SDD/CSSP/WPNA(2
019)1/REV1&docLanguage=En.
[52]
OECD (2020), “Italian regional SME policy responses”, OECD Policy responses to Coronavirus
(COVID-19), http://www.oecd.org/coronavirus/policy-responses/italian-regional-sme-policy-
responses-aa0eebbc/.
[66]
OECD (2020), OECD ICT Access and Usage by Businesses Database,
https://stats.oecd.org/Index.aspx?DataSetCode=ICT_BUS (accessed on 25 November 2020).
[54]
OECD (2020), Policy Options to Support Digitalisation of Business Models during COVID-19:
Annex, Report for the G20 Digital Economy Task Force, Saudi Arabia 2020,
https://www.oecd.org/sti/policy-options-to-support-digitalization-of-business-models-during-
covid-19-annex.pdf.
[65]
OECD (2020), The impact of digitalisation on trade, https://www.oecd.org/trade/topics/digital-
trade/ (accessed on 29 November 2020).
[42]
OECD (2020), “The OECD Digital Government Policy Framework: Six dimensions of a Digital
Government”, OECD Public Governance Policy Papers, No. 02, OECD Publishing, Paris,
https://dx.doi.org/10.1787/f64fed2a-en.
[68]
OECD (2020), The rle of online platforms in weathering the COVID-19 shock. [13]
OECD (2019), An Introduction to Online Platforms and Their Role in the Digital Transformation,
OECD Publishing, Paris, https://dx.doi.org/10.1787/53e5f593-en.
[6]
OECD (2019), Financing SMEs and Entrepreneurs 2019: An OECD Scoreboard, OECD
Publishing, Paris, https://dx.doi.org/10.1787/fin_sme_ent-2019-en.
[63]
OECD (2019), Measuring the Digital Transformation: A Roadmap for the Future, OECD
Publishing, Paris, https://dx.doi.org/10.1787/9789264311992-en.
[51]
OECD (2019), OECD SME and Entrepreneurship Outlook 2019, OECD Publishing, Paris,
https://dx.doi.org/10.1787/34907e9c-en.
[2]
OECD (2019), “Online advertising: Trends, benefits and risks for consumers”, OECD Digital
Economy Papers, No. 272, OECD Publishing, Paris, https://dx.doi.org/10.1787/1f42c85d-en.
[16]
OECD (2019), Unpacking E-commerce: Business Models, Trends and Policies, OECD
Publishing, Paris, https://dx.doi.org/10.1787/23561431-en.
[19]
OECD (2018), Fostering Greater SME participation in a globally integrated economy, SME
Ministerial Conference, Mexico City.
[41]
OECD (2018), Rethinking Antitrust Tools for Multi-Sided Platforms,
https://www.oecd.org/daf/competition/rethinking-antitrust-tools-for-multi-sided-platforms.htm
(accessed on 16 July 2020).
[80]
OECD (2017), Algorithms and Collusion: Competition Policy in the Digital Age, OECD, Paris,
http://www.oecd.org/competition/algorithms-collusion-competition-policy-in-the-digital-
age.htm.
[88]
148
THE DIGITAL TRANSFORMATION OF SMES © OECD 2021
OECD (2017), OECD Digital Economy Outlook 2017, OECD Publishing, Paris,
https://dx.doi.org/10.1787/9789264276284-en.
[62]
OECD (2016), OECD Recommendation of the Council on Consumer Protection in E-Commerce,
OECD Publishing, Paris, https://dx.doi.org/10.1787/9789264255258-en.
[48]
OECD (2015), Data-Driven Innovation: Big Data for Growth and Well-Being, OECD Publishing,
Paris, https://dx.doi.org/10.1787/9789264229358-en.
[81]
OECD (2015), The OECD Model Survey on ICT Usage by Businesses 2 nd Revision. [57]
OECD (2013), OECD Guidelines on the Protection of Privacy and Transborder Flows of
Personal Data,
https://www.oecd.org/internet/ieconomy/oecdguidelinesontheprotectionofprivacyandtransbord
erflowsofpersonaldata.htm (accessed on 27 August 2020).
[82]
OECD (Upcoming), Trade finance for SMEs in the Digital Era. [24]
OECD, WTO and IMF (2020), Handbook on Measuring Digital Trade,
https://www.oecd.org/sdd/its/handbook-on-measuring-digital-trade.htm.
[53]
OECD/European Union (2019), The Missing Entrepreneurs 2019: Policies for Inclusive
Entrepreneurship, OECD Publishing, Paris, https://dx.doi.org/10.1787/3ed84801-en.
[84]
OECD/WTO (2017), Aid for Trade at a Glance 2017: Promoting Trade, Inclusiveness and
Connectivity for Sustainable Development, World Trade Organization, Geneva/OECD
Publishing, Paris, https://dx.doi.org/10.1787/aid_glance-2017-en.
[21]
Olson, P. (2015), “Exclusive: The Rags-To-Riches Tale Of How Jan Koum Built WhatsApp Into
Facebook’s New $19 Billion Baby”, Forbes,
https://www.forbes.com/sites/parmyolson/2014/02/19/exclusive-inside-story-how-jan-koum-
built-whatsapp-into-facebooks-new-19-billion-baby/#70442bc82fa1 (accessed on
1 September 2020).
[38]
O’Reilly, T. (2011), “Government as a Platform”, Innovations: Technology, Governance,
Globalization, Vol. 6/1, pp. 13-40, http://dx.doi.org/10.1162/inov_a_00056.
[67]
Oxford Review (2020), Open innovation: Definition and explanation, https://www.oxford-
review.com/oxford-review-encyclopaedia-terms/encyclopaedia-open-innovation-definition-
explanation/.
[86]
Park, K., R. Seamans and F. Zhu (2017), “Multi-Homing and Platform Strategies: Historical
Evidence from the US Newspaper Industry”, Harvard Business Review, No. 18-032, Harvard
Business Review.
[49]
Rochet, J. and J. Tirole (2006), “Two-Sided Markets: A Progress Report”, RAND Journal of
Economics, Vol. 37/3, pp. 645-667.
[8]
Rochet, J. and J. Tirole (2003), “Platform Competition in Two-Sided Markets”, Journal of the
European Economic Association, Vol. 1/4, pp. 990-1029,
http://dx.doi.org/10.1162/154247603322493212.
[7]
149
THE DIGITAL TRANSFORMATION OF SMES © OECD 2021
SEC (2014), Facebook to Acquire WhatsApp,
https://www.sec.gov/Archives/edgar/data/1326801/000132680114000010/exhibit991_pressre
lease219.htm (accessed on 31 August 2020).
[10]
Shapiro, C. and H. Varian (1998), Information Rules: A Strategic Guide to the Network Economy,
Harvard Business Review Press, https://www.amazon.fr/Information-Rules-Strategic-
Network-Economy/dp/087584863X (accessed on 1 September 2020).
[35]
The Korea Herald (2019), South Korea to foster 15,000 e-commerce exporters by 2022,
http://www.koreaherald.com/view.php?ud=20190508000685 (accessed on 16 July 2020).
[75]
U.S. Census Bureau (2020), Census BUreau provides data on fast-growing retail e-commerce
sales, https://www.census.gov/library/stories/2020/11/share-of-online-retail-sales-
soaring.html#:~:text=On%20a%20seasonally%20adjusted%20basis,to%20the%20U.S.%20C
ensus%20Bureau.
[1]
UK Government (2018), E-commerce for UK small businesses selling online to the USA -
GOV.UK, https://www.gov.uk/government/publications/e-commerce-for-uk-small-businesses-
selling-online-to-the-usa/e-commerce-for-uk-small-businesses-selling-online-to-the-usa
(accessed on 16 July 2020).
[78]
Yoo, Y., O. Henfridsson and K. Lyytinen (2010), “The new organizing logic of digital innovation:
An agenda for information systems research”, Information Systems Research, Vol. 21/4,
pp. 724-735, http://dx.doi.org/10.1287/isre.1100.0322.
[28]
Zhu, F. and M. Iansiti (2019), “Why Some Platforms Thrive and Others Don’t”, Harvard Business
Review, https://hbr.org/2019/01/why-some-platforms-thrive-and-others-dont (accessed on
8 September 2020).
[50]
Notes
1 Some researchers defines platforms as business models that are rooted in the core interaction between
end-users, “followed by the design of an open infrastructure that will enable and govern this interaction”
(Choudary, 2015[11]).
2 These classifications include previous OECD work (OECD, 2015[81]; OECD, 2013[82]), as well as the
typologies proposed in (Gawer and Cusumano, 2013[83]).
3 For example: false or misleading advertising, “masked” advertising (not identifiable by consumers as
such), leveraging of consumer biases and vulnerabilities, “malvertising” (using online ads to infect devices
with malwares), misuse of personal data threatening consumer privacy and security.
4 These platforms have also another role as “employers” in “the Gig economy”. As multi-sided platforms,
they actually connect three types of end-users: restaurants, customers and couriers. In-depth discussion
on the conditions of “gig-economy” workers and their conditions as self-employed, while out of the scope
of this report, can be found in (OECD/European Union, 2019[84]).
150
THE DIGITAL TRANSFORMATION OF SMES © OECD 2021
5 63% of the global volumes are concentrated in the People’s Republic of China, followed by the United
States with 21% and by the United Kingdom with 8%.
6 Know Your Customer is a regulatory requirement that financial institution have to comply with, meaning
the mandatory process of identifying and verifying the identity of the client when opening an account and
periodically over time.
7 Digital payment platforms are extremely popular in the People’s Republic of China, with services as
AliPay and WeChat (platform integrating Social Media services) used by hundreds of millions of people.
While in this chapter we focus on services present in OECD countries, a more detailed discussion of the
innovative practices in China are discussed in (OECD, 2019[6]).
8 The definition advanced by (Ghazawneh and Henfridsson, 2015[85]) of “software-based external platforms
consisting of the extensible codebase of a software-based system that provides core functionality shared
by the modules that interoperate with it and the interfaces through which they interoperate”. These modules
are add-on software, usually in the form of the applications or “Apps” ultimately delivering services to the
end-users.
9 Open innovation indicates “a situation where an organisation doesn’t just rely on their own internal
knowledge, sources and resources (such as their own staff or R&D for example) for innovation (of products,
services, business models, processes, etc.) but also uses multiple external sources (such as customer
feedback, published patents, competitors, external agencies, the public, etc.) to drive innovation” (Oxford
Review, 2020[86]).
10 It is interesting to note that in “single end-user” services (as cloud-computing, business intelligence
software) there are inherently no indirect network effects, but this type of positive direct network effects
can be relevant.
11 “Digital intensive” refers to characteristics of the sectors as development and adoption of the most
advanced “digital” technologies, the human capital needed to embed them in production and the extent to
which digital tools are used to deal with clients and suppliers. The full taxonomy is proposed in (Calvino
et al., 2018[79]).
12 However, a recent trend is lowering these costs consistently. There are increasingly successful online
service providers (e.g. Shopify, Wix) offering tools to build a proprietary e-commerce website without the
need for any specific technical skill.
13 An overview of the main issues can be found in (OECD, 2019[6]), while a detailed analysis of Competition
issues can be found for example in the work of OECD’s Competition Division (OECD, 2017[88]) and (OECD,
2018[80]).
14 Algorithmic price setting is the practice of setting up algorithms that evaluate a number of factors (e.g.
probabilistic analysis of potential buyers behaviour, price of competing products, personal information on
the buyer) to set up a price that has the highest probability of making the trade happen while maximising
the value for the seller. However, there is the risk of anti-competitive practice, as firms can set up algorithm
to collude without the need of any human interaction (OECD, 2017[88]).
15 For instance in e-commerce, where multiple surveys allow to have some historical data, there are various
methodological problems (e.g. different practices for data collection and estimations, treatment of outliers,
accounting systems of businesses not differentiating between online and offline sales). On the other
typologies of online platforms relevant to SMEs, data are relatively scarce and scattered. Most information
151
THE DIGITAL TRANSFORMATION OF SMES © OECD 2021
on advertising, service delivery (disruptors and aggregators), communication, and innovation platforms are
provided by the private online platforms themselves.
16 Similarly, in the European Union 17.5% of SMEs sold online in 2019 (increasing by 1.4% from 2016),
while 39% of large firms did so (European Commission, 2020[87]).
17 See sub-section on “Online platforms: Features, benefits and challenges for SMEs”: “an online platform
is a digital service that facilitates interactions between two or more distinct but interdependent sets of users
(whether firms or individuals) who interact through the service via the internet”..

153
THE DIGITAL TRANSFORMATION OF SMES © OECD 2021
Blockchain applications for industrial use present distinct opportunities to
SMEs. The chapter aims to identify potential benefits blockchain uptake
could bring to SMEs as well as foreseeable challenges that could hinder
small businesses from reaping the benefits of blockchain adoption. Findings
from the OECD country cases studies on “Blockchain for SMEs and
Entrepreneurs” in Israel and Italy provide an in-depth analysis of the
characteristics and trends of country-specific blockchain ecosystems and
industrial use cases. The chapter also provides an overview of blockchain-
related policy and regulation trends as well as policy examples aimed at
increasing awareness and supporting blockchain innovation activities
beyond financial services.
4 How can Blockchain ecosystems
serve SMEs?
154
THE DIGITAL TRANSFORMATION OF SMES © OECD 2021
In Brief Highlights
Blockchain is at its core a secure decentralised database technology. As such, blockchain-
based products have the potential to become a widespread used tool to ensure protection of
sensitive data, as well as to enhance accountability and trust among parties.
Blockchain-based applications are being developed in many sectors beyond financial
services. Multiple distributed ledger technology (DLT) applications are being developed in
diverse sectors such as healthcare, business services, logistics and retail.
The majority of blockchain-related projects are still at an early or pre-commercialisation
phase of development. While the potential is high, no DLT-based application has had yet a
widespread diffusion among businesses, including SMEs.
Blockchain technologies present distinct opportunities for SMEs and start-ups. In
particular, by reducing information asymmetries and transaction costs, they can help new and
small businesses overcome long-standing challenges related to scale, opacity and lack of
business history, facilitating trade and access to finance. SMEs and new firms can also benefit
from greater efficiency and quality of products and services, enhanced supply chain
management and blockchain-driven innovation in business models.
Complementary digital infrastructure and capabilities are required for blockchain
adoption. Access to broadband connection (fixed or mobile) is a pre-requisite to use DLT-based
solutions. Uptake of complementary technologies might also be necessary, as for example
supply chain management software and/or Internet of Things (IoT) systems for tracking and
delivering.
There are significant challenges to the diffusion of technology among SMEs. These
include low awareness of salient features of blockchain, lack of interoperability across different
systems, limited access to digital infrastructure (mobile and fixed high-speed broadband
connection) and uncertainty over legal responsibilities.
Two country case studies, on Israel and Italy, were conducted with the aim to analyse the
characteristics and trends of country-specific blockchain environments. The studies
leveraged original survey-data to analyse and compare the characteristics of national blockchain
ecosystems. They show that, in both countries, SMEs and entrepreneurs are primary target
clients for new blockchain-based products, with solutions reflecting the underlying economic
structure and specialisation of the SME population.
While policy and regulatory attention first focused on digital assets, governments are
increasingly looking at how to promote industrial applications of DLTs. Policy measures
aim to address regulatory uncertainties, develop the technical infrastructure, increase
awareness among businesses and within government, adopt the technology to deliver public
services, and support private sector innovation. Whole-of-government approaches are also
emerging, through the design of national blockchain strategies.
155
THE DIGITAL TRANSFORMATION OF SMES © OECD 2021
Introduction
Distributed Ledger Technologies (DLTs1) and their financial applications have been at the centre
of international attention in recent years. The analysis and debate have focused mostly on renowned
crypto-currencies (e.g. Bitcoin, Ethereum) and on the role of inherently decentralised digital “currencies” in
global financial markets. Other financial applications are being discussed, especially in relation to the
possibility to “tokenise” financial (e.g. securities, commodities) and non-financial (e.g. real estate) assets.
This might positively impact access to finance for SMEs by enhancing inclusiveness in markets that were
previously restricted to larger or institutional investors (e.g. tokenisation of SMEs’ equity or debt (OECD,
2020[1])).
However, the development of DLTs applications in areas outside financial markets is growing
rapidly. Start-ups and innovative Small and Medium-sized Enterprises (SMEs) across the world are
working on DLT-based applications to support businesses, individuals and governments in areas spanning
from self-sovereign identity (SSI) to supply chain management and product tracing, from intellectual
property (IP) and copyright protection to procurement, and many more.
The present chapter focuses on the features and challenges of non-financial applications of DLTs
that are targeted to SMEs. The technology, which builds on decades of evolution of cryptographic
research, creates decentralised, distributed systems where stored information are immutable, secure and
transparent. This allows for disintermediation, enhancing trust between parties and unlocking efficiencies
and cost reductions. While there are multiple applications of the technology that are being tested and
commercialised, the market is still at the early stage of development, and relevant challenges exist that
might hinder further expansion. Some of the obstacles are technological, such as, for example, the lack of
interoperability between different blockchain infrastructures, which could lead to a fragmented ecosystem
with limited economies of scale for applications. Other challenges are more structural to the business
population, such as the lack of awareness and digital skills in SMEs, which may limit uptake of DLT-based
solutions, even when these reach a mature stage.
The chapter discusses the emergence of national blockchain ecosystems, their relevance for
SMEs, and policy approaches to ensure shared benefits, based on two case studies conducted in
Israel and Italy in 2019 and 2020 respectively. These studies reveal that the type of DLT-based services
being developed are largely tailored to the features of the countries’ industrial structures (e.g. IT
infrastructure and cybersecurity in Israel, supply chain and copyright protection in Italy). Original evidence
from online surveys of entrepreneurs, as well as in-person and phone interviews with the main stakeholders
in the countries, inform the analysis presented in this chapter.
The chapter illustrates policy experiences for the development of blockchain ecosystems and for
fostering SME uptake of DLT-based applications across OECD and non-OECD countries.
Approaches vary from structured national strategies to targeted programmes to enhance skills
development or to develop specific areas of applications (e.g. trade, IP protection). Some governments
are also looking at how DLTs can be leveraged to deliver public services and interact with SMEs more
effectively.
Blockchain use by SMEs: Features and challenges
Blockchain is a secure decentralised database technology. As such, blockchain-based products can
become a major tool to ensure protection of sensitive data, as well as enhance accountability and trust
among parties. To put it in simple terms, distributed ledger technologies offer a set of unique features that
are not available in any other type of existing computer networks. The most important example is the World
Wide Web, which is based on a network of servers managed by mostly private internet operators storing
data that can be copied and reproduced at will. Instead, data stored on the blockchain are not controlled
156
THE DIGITAL TRANSFORMATION OF SMES © OECD 2021
or managed by any single entity but are stored simultaneously in all nodes of the network (i.e.
decentralisation), are time-stamped, cannot be modified and can be transparently checked by any given
party (with some differences in permissioned and permissionless networks). This allows any data entry on
the blockchain to become truly unique and not duplicable, which makes it possible for the first time in
history to introduce the concept of “digital assets”. A more technical description is offered in Box 4.1.
Box 4.1. Blockchain and Distributed Ledger Technologies
In its simplest definition, blockchain is a database that is replicated over a peer-to-peer (P2P) network.
The technical structure of blockchain allows multiple parties (the "nodes" of the network) to continuously
achieve consensus over creating new "blocks" of information that are then added to the "chain" of data.
For the integrity of the “chain”, data is immutable, meaning that it cannot be altered but only appended.
The newly updated "chain" (i.e. database) is simultaneously stored in the nodes on the network, and
the process of finding consensus can start on the next "block" of information. In this sense, it is often
referred to as a distributed digital ledger, as it can be used to store any type of information (and so of
transactions and value) in an unalterable public record that is distributed among all the nodes. Key
technical components of the DLT have been developed in the areas of cryptographic research over the
past decades, (e.g. merkel trees, hash functions, public-key cryptography and digital signatures).
While traditional databases are managed and maintained by a central operator with the data stored in
its servers and data centres, blockchain-based databases distribute data among the nodes of a network.
This implies that the database is secure without requiring that no participant in the network trust another,
as each of them stores the complete history of transactions.
This implies that the database is secure without requiring any participant in the network to trust any
other, as each of them stores the whole history of transactions. Distributed storage thus ensures
disintermediation (as no third party external to the network is needed) and increased security.
Furthermore, the distributed nature of blockchain significantly reduces the problem of single point of
failure, as multiple nodes retain the identical data. Transactions recorded on blockchain can range from
simple (i.e. the transfer of the rights connected to digital assets from A to B) to more complex, as in the
case of smart contracts, in which terms of agreement between parties are inscribed in the unmodifiable
distributed ledger and are self-enforcing (i.e. with the automatic transfer of digital assets at the
satisfaction of agreed-upon conditions).
Some experts refer to blockchain as a nascent “internet of value” and of the “token economy”, as public
permissionless ledgers allow for Byzantine-Fault Tolerance and prevent the double-spending problem.
Different from traditional computer networks (including the global internet infrastructure), the
cryptographic systems underpinning public permissionless ledger are able to ensure the uniqueness of
digital items registered on the ledger, making double-spending impossible (i.e. transferring the same
asset A to two or more different accounts on the ledger). In addition, such networks are able to solve
the Byzantine General problem (known in cryptographic literature for decades (Lamport, Shostak and
Pease, 1982[2])). The so-called “consensus protocol” ensures the integrity of the information written to
the ledger at all times, regardless of the possibly malevolent motives of some of the actors in the
network. This means that they allow all nodes to read or write on the ledger, but the so-called
“consensus protocol” ensures the integrity of the information registered at all times, regardless of the
possibly malevolent motives of some of the actors in the network. This means that it is nearly
impossible2 to tamper with information registered on the public ledger. This has led many entrepreneurs
to look at how the creation of digital tokens representing any kind of asset might unlock a score of new
economic and financial opportunities (OECD, 2020[1]).
157
THE DIGITAL TRANSFORMATION OF SMES © OECD 2021
Blockchain was developed to underpin an innovation in finance and the first initiatives at the global
level were from this sector. The first and most renowned application of the technology was in the Bitcoin,
a peer-to-peer electronic cash system, which aspired (and aspires) to create a new global payment system
that would settle transactions while completely bypassing financial intermediaries (Nakamoto, 2008[3]). A
large number of alternative cryptocurrencies have been launched since.3 At a global scale, the subsequent
emergence of various form of “virtual assets”, whose property rights are cryptographically secured into the
chains and can be accessed, shared and leveraged by corporations and citizens across jurisdictions, is
opening the way for important innovations but also relevant risks. Regulators at the international level are
working on limiting such risks, in particular regarding Anti-Money Laundering (AML) and Combating the
Financing of Terrorism (CFT) practices (FATF, 2019[4]).
New trends in blockchain applications and uptake
The blockchain industry is developing rapidly in many sectors beyond financial services and
blockchain applications have the potential to spread across the economy. Start-ups are developing
Proof of Concepts (PoCs), Alpha and Beta version of blockchain solutions in multiple sectors, such as
healthcare, environment, cybersecurity, supply chain management, international trade, digital identity,
creative industry, voting and many more. These projects are B2C (Business to Consumer), B2B (Business
to Business) as well as B2G (Business to Government).
Multiple DLT applications are being developed, with many projects still in an experimental phase.
At the international level, there are projects to develop solutions in a multitude of functional areas from
supply chain management to privacy and security, from certification to identity management, from
intellectual property to human resources management. In turn, these applications target clients in sectors
spanning from healthcare to finance, from energy to education, from high-end manufacturing to public
administrations (Casino, Dasaklis and Patsakis, 2019[5]).
Start-ups are often key in the development of new solutions, both individually and in co-operation
with SMEs, large operators and public administrations. The new entrepreneurial scene opened up by
this technology brings together innovative entrepreneurs and experts from established companies and
institutions. The flexibility of start-ups allows them to explore a wide range of applications, and often to
provide innovative solutions to public administrations and large organisations lacking the skills internally.
The emergence of “Blockchain-as-a-Service” providers (BaaS), which offer third-party cloud-based
infrastructure and management for firms developing DLT applications, is enabling the development of new
technology-driven ecosystems. BaaS providers run the back-end operations of blockchain systems,
allowing entrepreneurs and start-ups to focus on the design and relevance of their applications. They also
enable SMEs to benefit from the unique features of the technology, without need for large own investments
in technology development, although awareness and understanding are pre-requisite for gaining trust and
adopting. Box 4.2 illustrates an example of an SME providing BaaS infrastructure. Start-ups offering
blockchain-based services are spurring across many diverse sectors. The cases of Israel and Italy,
presented in this report, are illustrative of the vital start-up ecosystems that are emerging around the
technology and its many possible market applications.
158
THE DIGITAL TRANSFORMATION OF SMES © OECD 2021
Box 4.2. Blocko, a case of blockchain-as-a-service (BaaS) for enterprise
Established in 2014, Blocko is a Korean blockchain enterprise servicing blockchain infrastructure. The
company provides a blockchain-as-a-service, which is a cloud-based blockchain development platform
that businesses can use to develop their own blockchain solutions. The platform was the first blockchain
solution to receive the Good Software (GS) certification, which is a series of quality tests based on
standards developed by the International Organisation for Standardisation (ISO) and the International
Electrotechnical Commission (IEC). GS is a nationally recognised certification often used in
procurement processes, including government purchases.
Blocko has worked with both the public and private sectors in developing blockchain-based services,
with more than 2.5 million users accessing their infrastructure. Use cases include detection of website
forgery, electronic document certification system and invoice issuing and tracking system. The company
also provides development tools, such as application programming interface (API) and software
development kit (SDK) for businesses that seek to build enterprise solutions on their open-sourced
blockchain infrastructure.
Source: Blocko website, https://www.blocko.io/ (accessed on 9 October 2020).
However, it would be difficult to point at a single DLT-based application that has already had a
widespread impact on business practices. This follows the early stage of development of the
technology, but also the fundamental architectural shift it implies in the storing, access and management
of core data for an organisation. This reflects a cautious approach by stakeholders in the private and public
sector before such solutions are adopted at scale. According to a 2019 survey of large firm executives
around the world, “Implementation (replacing or adapting existing legacy system)” (30%), “Regulatory
issues” (30%), and “Potential Security Threats” (29%) are the main barriers to adoption of blockchain
solutions. Interestingly, these percentages are lower than they were in 2018 (respectively 36%, 39% and
35%), pointing at an increased trust in the new technology (Delotte, 2019[6]).
Many companies around the world are now looking at concrete application of the technology to
their businesses. According to a recent global survey of 1 386 senior executives located in Brazil,
Canada, China (People’s Republic of), Germany, Hong Kong (China), Israel, Luxembourg, Singapore,
Switzerland, United Arab Emirates, United Kingdom and United States, more than half (53%) consider the
technology among the top-five strategic priorities for their firms, up from 43% in 2018. Importantly for SMEs,
most executives in large organisation (85%) also acknowledge the fact that their suppliers, customers
and/or competitors are working on blockchain solutions to challenges in the value chains that now serve
their organisation. As also illustrated in the studies conducted in Italy and Israel, presented in the following
section, a large number of projects are still at an early stage of development (alpha or beta versions).
However, a strong acceleration of blockchain projects brought into production by companies has taken
place in recent years, a jump from 23% in 2019 to 39% in 2020 (Deloitte, 2020[7]). Similarly, a research by
the Polytechnic University of Milan (2020[8]) shows steady increase of blockchain projects at the global
level since 2016: when considering both announced and implemented blockchain projects, the number
increased six folds between 2016 and 2019 (Figure 4.1).
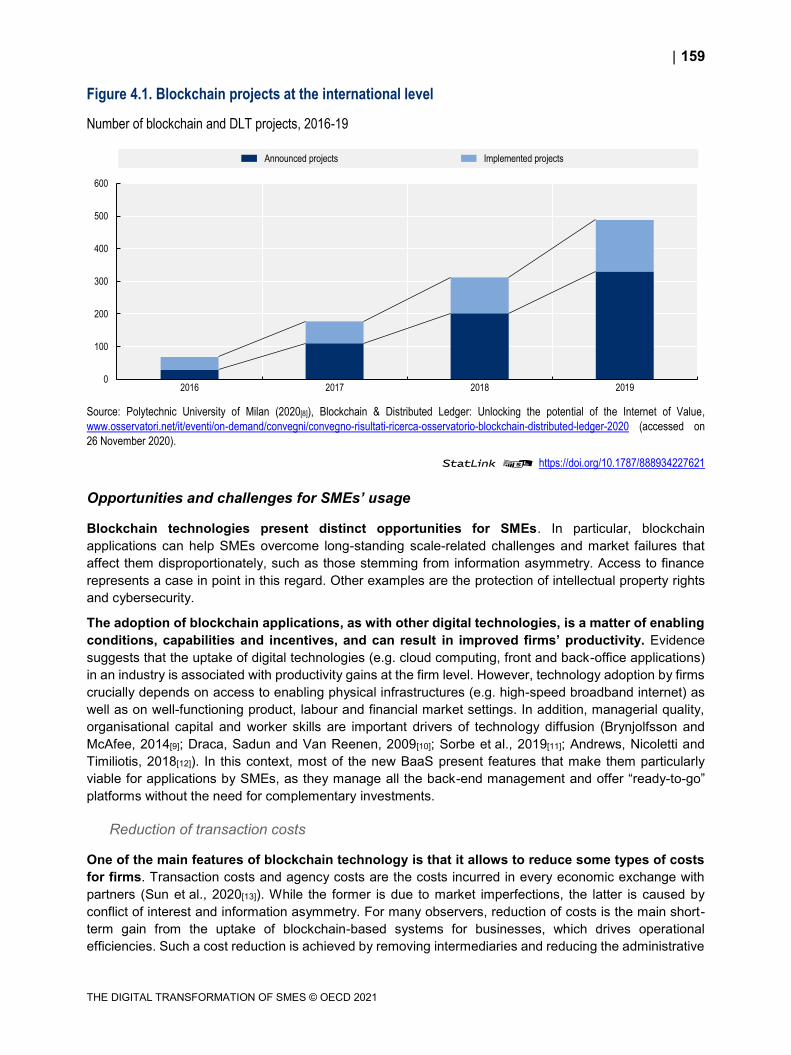
159
THE DIGITAL TRANSFORMATION OF SMES © OECD 2021
Figure 4.1. Blockchain projects at the international level
Number of blockchain and DLT projects, 2016-19
Source: Polytechnic University of Milan (2020[8]), Blockchain & Distributed Ledger: Unlocking the potential of the Internet of Value,
www.osservatori.net/it/eventi/on-demand/convegni/convegno-risultati-ricerca-osservatorio-blockchain-distributed-ledger-2020 (accessed on
26 November 2020).
StatLink 2 https://doi.org/10.1787/888934227621
Opportunities and challenges for SMEs’ usage
Blockchain technologies present distinct opportunities for SMEs. In particular, blockchain
applications can help SMEs overcome long-standing scale-related challenges and market failures that
affect them disproportionately, such as those stemming from information asymmetry. Access to finance
represents a case in point in this regard. Other examples are the protection of intellectual property rights
and cybersecurity.
The adoption of blockchain applications, as with other digital technologies, is a matter of enabling
conditions, capabilities and incentives, and can result in improved firms’ productivity. Evidence
suggests that the uptake of digital technologies (e.g. cloud computing, front and back-office applications)
in an industry is associated with productivity gains at the firm level. However, technology adoption by firms
crucially depends on access to enabling physical infrastructures (e.g. high-speed broadband internet) as
well as on well-functioning product, labour and financial market settings. In addition, managerial quality,
organisational capital and worker skills are important drivers of technology diffusion (Brynjolfsson and
McAfee, 2014[9]; Draca, Sadun and Van Reenen, 2009[10]; Sorbe et al., 2019[11]; Andrews, Nicoletti and
Timiliotis, 2018[12]). In this context, most of the new BaaS present features that make them particularly
viable for applications by SMEs, as they manage all the back-end management and offer “ready-to-go”
platforms without the need for complementary investments.
Reduction of transaction costs
One of the main features of blockchain technology is that it allows to reduce some types of costs
for firms. Transaction costs and agency costs are the costs incurred in every economic exchange with
partners (Sun et al., 2020[13]). While the former is due to market imperfections, the latter is caused by
conflict of interest and information asymmetry. For many observers, reduction of costs is the main short-
term gain from the uptake of blockchain-based systems for businesses, which drives operational
efficiencies. Such a cost reduction is achieved by removing intermediaries and reducing the administrative
0
100
200
300
400
500
600
2016 2017 2018 2019
Announced projects Implemented projects
160
THE DIGITAL TRANSFORMATION OF SMES © OECD 2021
efforts for record keeping and transaction reconciliation (Carson et al., 2018[14]). Researchers have also
identified other cost advantages from the technology: the reduced costs of verification (ability to verify the
state of a transaction/data/digital asset) and the lower cost of networking (ability to bootstrap and operate
a marketplace without assigning control to a centralised intermediary). These cost reductions allow for
more efficient practices, for example, in data ownership, privacy, licensing and monetisation of digital
content. In particular, the reduction in the cost of verification can have an immediate impact on SMEs’
business processes (Catalini and Gans, 2019[15]).
Improved security of data allowing for synergies with Internet of Things and machine learning
Security of sensitive business information is becoming increasingly important for SMEs, even
more so as the COVID-19 pandemic accelerates the digital transition for many firms. As discussed
in Chapter 2, this has created an opportunity for malicious actors to intensify cyber-attacks, an increasing
concern for entrepreneurs and policy makers alike. Blockchain applications provide for new methods to
secure data storage and transfer, as the decentralised, trustless, peer-to-peer structure makes them
inherently resilient to malevolent digital attacks. Blockchain technology also allows for the storage of time-
stamped data/transactions in chronological order in distributed networks that are tamperproof and not-
modifiable, as the information is stored/published separately in each single node of the network (Taylor
et al., 2020[16]).
This feature makes blockchain particularly interesting for the wide range of Internet of Things (IoT)
applications. In this regard, blockchain applications can become an important component in larger
systems leveraging also other technologies (Minoli and Occhiogrosso, 2018[17]). For instance, applications
to infrastructures (e.g. smart grid, intelligent transportation systems, and video-surveillance) or applications
to business processes (e.g. logistics, contract law and insurance). And this is also true for the use of
blockchain-secured data for analytical applications leveraging machine learning.
The secure and distributed storage of data is an attractive feature of blockchain that also has
implications for machine learning applications. Machine learning is a methodology used to train
Artificial Intelligence algorithm (for detailed information, see Chapter 5 on AI). The capability of the
blockchain can offer an interesting setting for the controlled access to data and the applications of
advanced AI for data analysis (Mamoshina et al., 2018[18]). Various attempts have been made at global
level to leverage the security, transparency and immutability of data stored on the blockchain to perform
advanced analysis through machine learning algorithms. For example, blockchain can be used to create
a mutual trust data sharing framework, breaking data barriers between diverse actors (Zhang et al.,
2018[19]). This structure has also been found to be effective also in dealing with privacy issues (Chen et al.,
2019[20]; Dillenberger et al., 2019[21]). Privacy is an important aspect for example in biomedical research,
where patients want to maintain a level of control on how their data are used in order to reap the benefits
of health monitoring without incurring the risk of misuse of such personal information.
Enhanced supply chain management
Application of blockchain solutions in connection with IoT opens up opportunities especially in
supply chain management. Documents and data stored in a blockchain are exchanged and tracked
without the need to make electronic duplicates between the sender and the receiver, while ensuring
immutability and transparency, hence trust. This makes the use of this technology in the supply chain
particularly appealing. Some of the enabling elements of the use of IoT in supply chain management are
RFID tags, Wireless Sensor Networks and data analysis platforms (Gubbi et al., 2013[22]). The high cost
and the need for robust security standards for such IoT networks imply this is a very promising case for
the application of decentralised peer-to-peer blockchain networks. Storing IoT devices’ configurations
through cryptographic hashes, avoiding the reliance and risk of bottleneck-effects on single servers and
the possibility to design Machine-to-Machine (M2M) communication messaging channels through
161
THE DIGITAL TRANSFORMATION OF SMES © OECD 2021
automatic smart contracts all constitute interesting rationale for blockchain-based applications in supply
chain management, which would also lower counterfeiting (Pournader et al., 2019[23]; Bahga and Madisetti,
2016[24]). One example is in the health sector, where the elimination of counterfeit medicine is a particularly
important issue (Mackey and Nayyar, 2017[25]). In the United States, an open and decentralised blockchain
network for the pharmaceutical supply chain is proposed by the MediLedger project, which was also
accepted as a pilot study for the Food and Drugs Administration (FDA) to meet the 2023 requirements of
the Drug Supply Chain Security Act (DSCSA) (Mediledger, 2020[26]).
The high-level of transparency of blockchain system can help meet stakeholders’ needs along the
supply chain. The use of systems based on this technology can include all stakeholders: suppliers and
other upstream partners; customers; governments, regulators and public agencies; non-governmental
organisations (NGOs); and trade associations. All participants have a clear and immediate understanding
of the state and “history” of products and components throughout the process. This helps firms also to
respond more effectively to public and political pressure and comply with regulations on environmental and
social impact of their operations, demonstrating integrity and improving customer confidence. Applications
have been tested in many industries with encouraging results (e.g. from mining to healthcare, from textile
to food and beverage).
The technology can also increment operational efficiencies for SMEs’ supply chains. The
technology can help error elimination and streamline processes by making them more transparent,
reducing physical documents and increasing consistency across information sources. Moreover,
transparent access to real-time tracking allows for a more effective monitoring of the lifetime of products
(Hastig and Sodhi, 2020[27]). The use of smart contracts to optimise order management, shipping and
delivery times, administrative procedures, as well as to limit delays in collection of account receivables
opens additional possibilities. Box 4.3 illustrates the case of an SME providing blockchain solution to
facilitate supply chain logistics. However, to fully benefit from the use of blockchain in managing IoT
devices, current limitations to blockchain, such as storage capacity and scalability need to be addressed
(Reyna et al., 2018[28]).
Box 4.3. Wave, a case of logistic management through blockchain
Wave is an Israeli enterprise providing blockchain-based digital document exchange platform. Founded
in 2015, the company operates a blockchain-based peer-to-peer network that connects various actors
along the logistics chain, including banks, carriers, traders and other trade-related parties, and is one
of the first companies to operationalise blockchain-based trade document exchange.
The company helps businesses digitalise their documents such as bills of lading, letters of guarantee and
commercial invoices. Documents stored on blockchain are exchanged and tracked digitally, which
increases process efficiency by reducing expenditures and workload related to handling paper
documents. In addition, disputes from inaccurate data and risk of fraud are significantly lowered when
compared with paper-based trade, as there is no redundancy, the need for manual data input in different
systems.
Source: OECD Phone interview, Wave website, https://wavebl.com/ (accessed 12 October 2020).
Automatic enforcement of contract obligations
The use of smart contracts can enable SMEs to ease the enforcement of contracts with third
parties. Smart contracts are software registered on the public blockchain ledgers (e.g. Ethereum) between
two or more parties, stating reciprocal obligations. As a computational system, the use of cryptographic
rules, mathematics and game-theoretical incentives of blockchain technology increase confidence in the
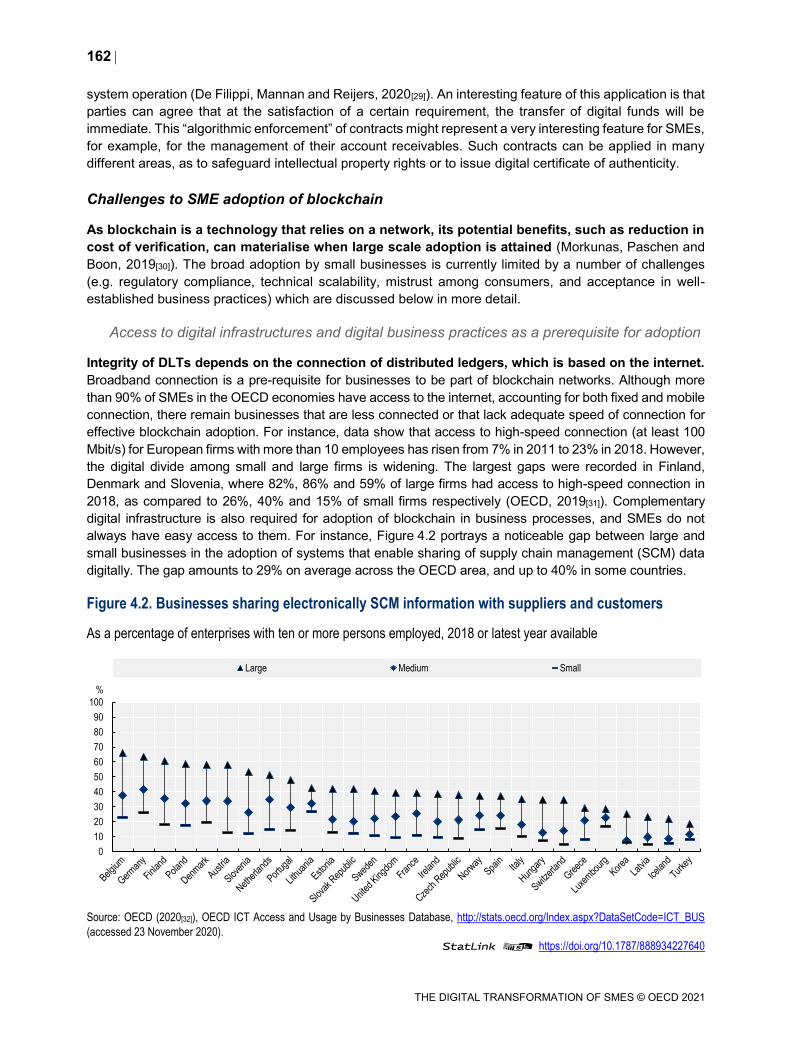
162
THE DIGITAL TRANSFORMATION OF SMES © OECD 2021
system operation (De Filippi, Mannan and Reijers, 2020[29]). An interesting feature of this application is that
parties can agree that at the satisfaction of a certain requirement, the transfer of digital funds will be
immediate. This “algorithmic enforcement” of contracts might represent a very interesting feature for SMEs,
for example, for the management of their account receivables. Such contracts can be applied in many
different areas, as to safeguard intellectual property rights or to issue digital certificate of authenticity.
Challenges to SME adoption of blockchain
As blockchain is a technology that relies on a network, its potential benefits, such as reduction in
cost of verification, can materialise when large scale adoption is attained (Morkunas, Paschen and
Boon, 2019[30]). The broad adoption by small businesses is currently limited by a number of challenges
(e.g. regulatory compliance, technical scalability, mistrust among consumers, and acceptance in well-
established business practices) which are discussed below in more detail.
Access to digital infrastructures and digital business practices as a prerequisite for adoption
Integrity of DLTs depends on the connection of distributed ledgers, which is based on the internet.
Broadband connection is a pre-requisite for businesses to be part of blockchain networks. Although more
than 90% of SMEs in the OECD economies have access to the internet, accounting for both fixed and mobile
connection, there remain businesses that are less connected or that lack adequate speed of connection for
effective blockchain adoption. For instance, data show that access to high-speed connection (at least 100
Mbit/s) for European firms with more than 10 employees has risen from 7% in 2011 to 23% in 2018. However,
the digital divide among small and large firms is widening. The largest gaps were recorded in Finland,
Denmark and Slovenia, where 82%, 86% and 59% of large firms had access to high-speed connection in
2018, as compared to 26%, 40% and 15% of small firms respectively (OECD, 2019[31]). Complementary
digital infrastructure is also required for adoption of blockchain in business processes, and SMEs do not
always have easy access to them. For instance, Figure 4.2 portrays a noticeable gap between large and
small businesses in the adoption of systems that enable sharing of supply chain management (SCM) data
digitally. The gap amounts to 29% on average across the OECD area, and up to 40% in some countries.
Figure 4.2. Businesses sharing electronically SCM information with suppliers and customers
As a percentage of enterprises with ten or more persons employed, 2018 or latest year available
Source: OECD (2020[32]), OECD ICT Access and Usage by Businesses Database, http://stats.oecd.org/Index.aspx?DataSetCode=ICT_BUS
(accessed 23 November 2020).
StatLink 2 https://doi.org/10.1787/888934227640
0
10
20
30
40
50
60
70
80
90
100
%
Large Medium Small
163
THE DIGITAL TRANSFORMATION OF SMES © OECD 2021
In addition, the application of blockchain in supply chains demands the investment in Industrial
Internet of Things (IIoT) and other digital technologies, to ensure the quality of data. Due to the
immutable nature of blockchain, robustness of blockchain network depends on the quality of the data
inputted on the ledger and thus on the generation of accurate data from the source. To reduce human
errors and increase precision of data, such as temperature, time and location, the data need to be
generated and inputted digitally, with the use of tamper-proof IIoT sensors. As blockchain-based supply
chain tracing becomes widespread, lack of readiness for IoT adoption could add to the difficulties of SMEs
in entering supply chains.
Lack of interoperability between systems might hinder scalability
As there is yet to be an industrial blockchain network that is adopted at a mass scale, the
ecosystem remains fragmented. Current blockchain projects tend to be limited in scale, involving a small
group of businesses and individuals. For example, supply chain tracking applications are often tailored for
a client business that produces finished products, such as packaged food and fashion items. The
applications track the supply chain of a product or products, while only covering actors that interact both
directly and indirectly with the client. The vertical focus of such projects indicate exclusive nature of the
applications, which can also be observed, for example, in projects in the agri-food sector. To illustrate, a
number of companies focusing on the tracing of wine products through the use of blockchain work
separately with a partnered wine brand, some with their own proprietary protocols.
Lack of interoperability between blockchain ecosystems can represent a heightened challenge for
SMEs. Each blockchain has its own distinctive characteristics, such as consensus mechanism and
governance mechanism, which restricts blockchain networks from “talking to each other” (Frezal and
Garsous, 2020[33]; Morkunas, Paschen and Boon, 2019[30]). Although interoperability could be attained by
utilising applications that make data readable in other networks, such as by using Application Programme
Interfaces (APIs), businesses would still need to rely on intermediary entities to obtain and exchange data
between networks. This is an important aspect influencing the creation of a true “internet of value”, and
research institutions are working with the industry to examine the impact of enhanced interoperability
across DLT applications and infrastructures (Polytechnic of Milan, 2020[34]). However, efforts are being
made to enhance interoperability between v arying blockchain networks (Box 4.4). With blockchain projects
conducted in siloes, it is possible that firms involved in different ecosystems would need to manage several
applications, increasing workload for the small businesses. In addition, low substitutability between
blockchain platforms could hinder businesses from switching to more attractive blockchain networks or
other alternative technologies (Pike and Capobianco, 2020[35]).
164
THE DIGITAL TRANSFORMATION OF SMES © OECD 2021
Box 4.4. Efforts for interoperable blockchain networks
Blockchain projects have been developed by various entities around the world during the last decade.
The lack of common standards has allowed innovation to spur in all directions, but has inevitably
brought the problem of interoperability among systems relying on different and often incompatible
blockchain platforms. This creates a challenge for SMEs and companies that might be interested in
using different DLT-based products as they would usually not be able to make them “communicate”
with each other, or with partners within or outside their supply chain using other DLT-products.
Non-governmental organisations (NGOs) and industry actors have been working to facilitate exchanges
across blockchain networks. Standard setting is one way to achieve compatibility among various
networks. At technical level, for instance, the International Standard Organisation (ISO), an international
NGO, established a Technical Committee on “Blockchain and distributed ledger technologies” to
provide technical standards of the technology, including security, smart contracts and identity. The
Committee operates a working group dedicated to Interoperability, while leveraging its previous work
on cloud interoperability standard. Similarly, GS1, an organisation that develops standards for business
communication including bar codes, seeks to enhance communication between blockchain networks
with the use of standardised identification data and data exchange protocols (e.g. Electronic Product
Code Information Services).
Devising a framework supportive of interoperability could also enable different ecosystems to exchange
data more easily. For example, the Responsible Minerals Initiative, an initiative focused on promoting
responsible mining and due diligence in the mining sector, published the “Responsible Minerals Initiative
Blockchain Guidelines”, industry-wide guidelines that layout detailed information related to treatment of
data to ensure integrity of mineral supply chain data between different blockchain platforms. The
Guidelines also require technology providers to develop interoperable blockchain-based solutions.
Source: ISO (2020[36]), ISO/TC 307 Blockchain and distributed ledger technologies, www.iso.org/committee/6266604.html ; GS1 (2019[37]),
Traceability and Blockchain, www.gs1.org/sites/default/files/gs1_traceability_and_blockchain_wp.pdf and Responsible Minerals Initiative
(2020[38]), Responsible Minerals Initiative Blockchain Guidelines: Second Edition, http://www.responsiblemineralsinitiative.org/media/docs/
RMI%20Blockchain%20Guidelines%20-%20Second%20Edition%20-%20March%202020%20FINAL.pdf.
Lack of awareness and skills
The lack of awareness about the possibilities offered by the technology might hinder its diffusion.
While the benefits of some blockchain applications to reduce transaction costs and increase accountability
can be relatively evident, it might be difficult to build trust among possible users. For example, for a
blockchain system to become the standard in a supply chain, it must be ingrained into business processes
by all stakeholders. In complex global value chains, this might mean dozens and dozens of entities,
including small companies that often do not have the resources and capabilities to fully understand the
system. This creates a strong barrier to unilateral adoption, and sometimes only the larger stakeholders
might decide for a shift towards this kind of system and then introduce it for all other participants in the
supply chain.
Uncertainty over legal responsibilities
DLTs make their security and transparency a clear strength, however, it is still possible that
complications and fraudulent behaviour might arise. The protection of intellectual property and of
sensitive data might become particularly challenging. The fact that blockchain relies on decentralised
ownership creates also an important complication in case of a dispute, as it is challenging to identify the
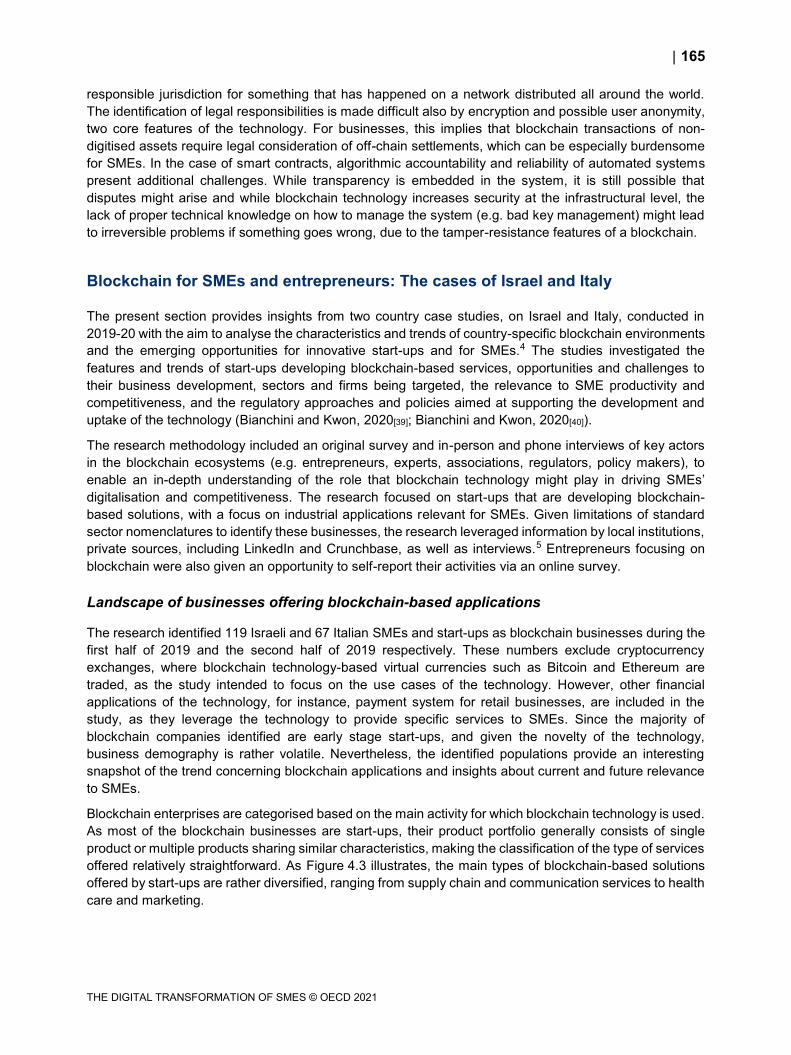
165
THE DIGITAL TRANSFORMATION OF SMES © OECD 2021
responsible jurisdiction for something that has happened on a network distributed all around the world.
The identification of legal responsibilities is made difficult also by encryption and possible user anonymity,
two core features of the technology. For businesses, this implies that blockchain transactions of non-
digitised assets require legal consideration of off-chain settlements, which can be especially burdensome
for SMEs. In the case of smart contracts, algorithmic accountability and reliability of automated systems
present additional challenges. While transparency is embedded in the system, it is still possible that
disputes might arise and while blockchain technology increases security at the infrastructural level, the
lack of proper technical knowledge on how to manage the system (e.g. bad key management) might lead
to irreversible problems if something goes wrong, due to the tamper-resistance features of a blockchain.
Blockchain for SMEs and entrepreneurs: The cases of Israel and Italy
The present section provides insights from two country case studies, on Israel and Italy, conducted in
2019-20 with the aim to analyse the characteristics and trends of country-specific blockchain environments
and the emerging opportunities for innovative start-ups and for SMEs.4 The studies investigated the
features and trends of start-ups developing blockchain-based services, opportunities and challenges to
their business development, sectors and firms being targeted, the relevance to SME productivity and
competitiveness, and the regulatory approaches and policies aimed at supporting the development and
uptake of the technology (Bianchini and Kwon, 2020[39]; Bianchini and Kwon, 2020[40]).
The research methodology included an original survey and in-person and phone interviews of key actors
in the blockchain ecosystems (e.g. entrepreneurs, experts, associations, regulators, policy makers), to
enable an in-depth understanding of the role that blockchain technology might play in driving SMEs’
digitalisation and competitiveness. The research focused on start-ups that are developing blockchain-
based solutions, with a focus on industrial applications relevant for SMEs. Given limitations of standard
sector nomenclatures to identify these businesses, the research leveraged information by local institutions,
private sources, including LinkedIn and Crunchbase, as well as interviews.5 Entrepreneurs focusing on
blockchain were also given an opportunity to self-report their activities via an online survey.
Landscape of businesses offering blockchain-based applications
The research identified 119 Israeli and 67 Italian SMEs and start-ups as blockchain businesses during the
first half of 2019 and the second half of 2019 respectively. These numbers exclude cryptocurrency
exchanges, where blockchain technology-based virtual currencies such as Bitcoin and Ethereum are
traded, as the study intended to focus on the use cases of the technology. However, other financial
applications of the technology, for instance, payment system for retail businesses, are included in the
study, as they leverage the technology to provide specific services to SMEs. Since the majority of
blockchain companies identified are early stage start-ups, and given the novelty of the technology,
business demography is rather volatile. Nevertheless, the identified populations provide an interesting
snapshot of the trend concerning blockchain applications and insights about current and future relevance
to SMEs.
Blockchain enterprises are categorised based on the main activity for which blockchain technology is used.
As most of the blockchain businesses are start-ups, their product portfolio generally consists of single
product or multiple products sharing similar characteristics, making the classification of the type of services
offered relatively straightforward. As Figure 4.3 illustrates, the main types of blockchain-based solutions
offered by start-ups are rather diversified, ranging from supply chain and communication services to health
care and marketing.
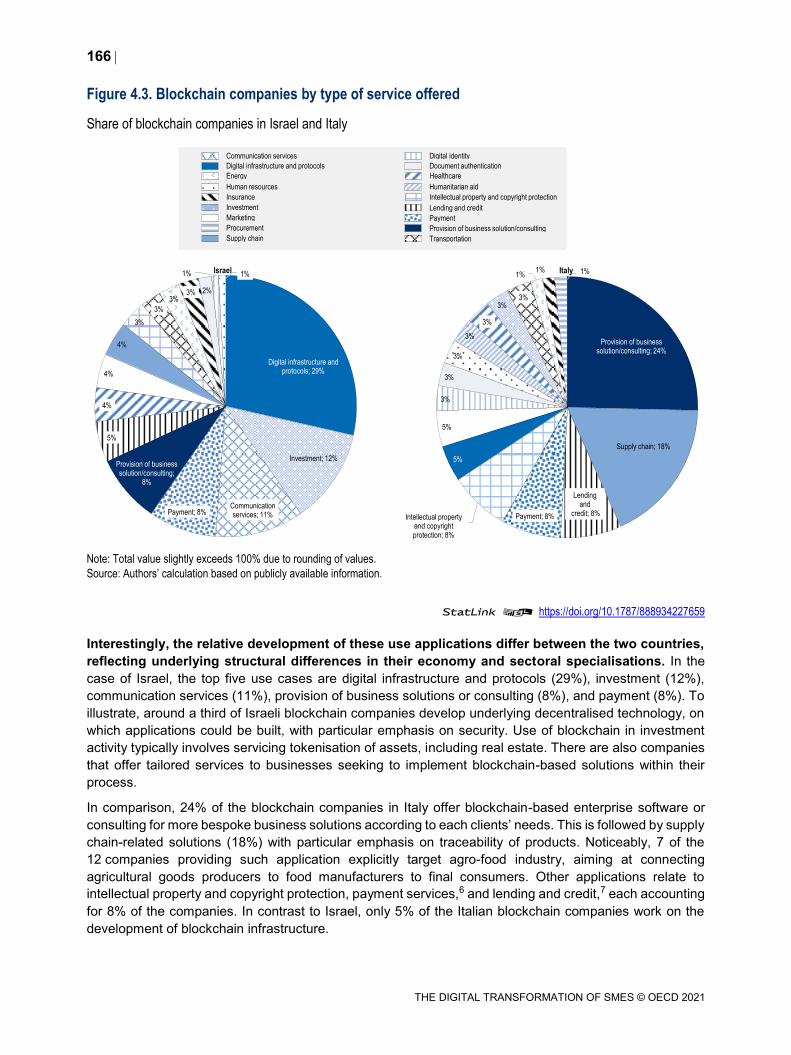
166
THE DIGITAL TRANSFORMATION OF SMES © OECD 2021
Figure 4.3. Blockchain companies by type of service offered
Share of blockchain companies in Israel and Italy
Note: Total value slightly exceeds 100% due to rounding of values.
Source: Authors’ calculation based on publicly available information.
StatLink 2 https://doi.org/10.1787/888934227659
Interestingly, the relative development of these use applications differ between the two countries,
reflecting underlying structural differences in their economy and sectoral specialisations. In the
case of Israel, the top five use cases are digital infrastructure and protocols (29%), investment (12%),
communication services (11%), provision of business solutions or consulting (8%), and payment (8%). To
illustrate, around a third of Israeli blockchain companies develop underlying decentralised technology, on
which applications could be built, with particular emphasis on security. Use of blockchain in investment
activity typically involves servicing tokenisation of assets, including real estate. There are also companies
that offer tailored services to businesses seeking to implement blockchain-based solutions within their
process.
In comparison, 24% of the blockchain companies in Italy offer blockchain-based enterprise software or
consulting for more bespoke business solutions according to each clients’ needs. This is followed by supply
chain-related solutions (18%) with particular emphasis on traceability of products. Noticeably, 7 of the
12 companies providing such application explicitly target agro-food industry, aiming at connecting
agricultural goods producers to food manufacturers to final consumers. Other applications relate to
intellectual property and copyright protection, payment services,6 and lending and credit,7 each accounting
for 8% of the companies. In contrast to Israel, only 5% of the Italian blockchain companies work on the
development of blockchain infrastructure.
Communication services Digital identity
Digital infrastructure and protocols Document authentication
Energy Healthcare
Human resources Humanitarian aid
Insurance Intellectual property and copyright protection
Investment Lending and credit
Marketing Payment
Procurement Provision of business solution/consulting
Supply chain Transportation
Digital infrastructure and protocols; 29%
Investment; 12%
Communication services; 11%Payment; 8%
Provision of business solution/consulting;
8%
5%
4%
4%
4%
3%
3%
3%3% 2%
1% 1%Israel
Provision of business solution/consulting; 24%
Supply chain; 18%
Lending and
credit; 8%Payment; 8%Intellectual property and copyright protection; 8%
5%
5%
3%
3%
3%
3%
3%
3%3%
1%1% 1%Italy
167
THE DIGITAL TRANSFORMATION OF SMES © OECD 2021
The use cases of blockchain companies seem to reflect the needs of domestic industries. The companies
are providing blockchain solutions aimed at solving challenges and supporting the country’s key strategic
industries. Interestingly, most of Israeli blockchain companies working to develop blockchain protocols
highlighted the enhanced digital security that blockchain adoption could bring. Israel is a prominent player
in the cybersecurity sector, where the country is responsible for 5% of the global market share in terms of
annual revenue, only second to the United States, and the start-ups in the sector attract 20% of the global
Venture Capital (VC) investments in cybersecurity (Start-up Nation Central, 2019[41]; The World Bank,
2016[42]).
On the other hand, in Italy, around a quarter of blockchain entrepreneurs are focusing on protecting Italian
goods and intellectual property rights, leveraging the immutable and traceable nature of blockchain. Italy
is the third most targeted country for IP rights infringement, after the United States and France
(OECD/EUIPO, 2019[43]). It is estimated that forgone sales of Italian businesses due to counterfeited goods
amounts to EUR 24 billion in 2016 alone (OECD, 2018[44]). Affected industries are characterised by a large
proportion of SMEs, which include the clothing/footwear sector and food and beverage sector.
Counterfeiting and piracy practices have significant impact beyond forgone revenue of the enterprises, as
this results in lost jobs and reduced tax revenue. Box 4.5 presents an Italian blockchain company that
works to tackle counterfeited goods.
Box 4.5. Certilogo, a case of blockchain-based product authentication
Certilogo, an Italian enterprise that began operation in 2006, uses blockchain and other complementary
technologies for its product authentication platform. Specialised in authentication of fashion and luxury
goods, the company partners with more than 100 brands globally. Originally focused on the use of
Artificial Intelligence for its authentication solution, the company acquired a blockchain IoT start-up in
2018 and incorporated the technology into its service.
The company offers brands various means of authentication, such as RFID tag, QR code and serial
number, with product information stored on blockchain. For authentication process, the company
provides mobile application that customers can use. Genuineness of a product can be verified multiple
times along the product’s life, including when a product changes hands, which also enables brands to
track distribution of their products. In addition, in the case of identification of a forged tag, Certilogo
provides complimentary report that customers could use to file complaints and seek refund of their
purchases.
Source: Certilogo website, https://discover.certilogo.com/en (accessed on 12 October 2020).
In both countries, most of the blockchain companies conduct their entire operation within the
country. Based on self-declared information, 63% of the Israeli blockchain companies have their company
located only in Israel, which is lower compared to that of Italian enterprises (Figure 4.4). Approximately a
third of Israeli companies have overseas operations while having their headquarter in Israel, with most of
the businesses located in the United States. On the other hand, 10% of Italian businesses have
international presence. The percentage of companies based abroad with regional teams in Israel and Italy
account for 5% and 3% respectively.
168
THE DIGITAL TRANSFORMATION OF SMES © OECD 2021
Figure 4.4. Blockchain companies by type of business operation within country
Share of blockchain companies in Israel and Italy
Source: Authors’ calculation based on publicly available information.
StatLink 2 https://doi.org/10.1787/888934227678
Box 4.6. Regional distribution of blockchain companies in Italy
In Italy, blockchain companies are largely concentrated in two regions. Out of the 67 companies
identified, 35 of the firms are headquartered in Lombardy, and 11 in Lazio. While 29 of the 35 blockchain
enterprises in Lombardy are situated in Milan, with the rest scattered in the neighbouring provinces,
including Como and Mantua, all of the firms in Lazio operate in Rome. Trentino-South Tyrol and Emilia-
Romagna regions host five companies each. As illustrated in the figure below, there are few number of
firms operating in the south of Italy.
Blockchain companies are mostly located in metropolitan regions: approximately three quarters of the
companies operate from areas defined as Nomenclature of Territorial Units for Statistics (NUTS) -
3 regions with at least 250 000 inhabitants.
A number of businesses are located close to universities, which presents advantages, particularly to
high-tech start-up firms, such as access to knowledge spillovers and to high-skilled human capital with
relatively low skill premium (Audretsch, Lehmann and Warning, 2005[45]; Feng and Valero, 2019[46]).
The survey of blockchain entrepreneurs (Figure 4.10) further highlights the links between blockchain
businesses and Higher Education Institutions. About one-fifth of Italian blockchain companies mention
co-operation with local universities, in the form of R&D collaboration or operation within university-
sponsored start-up incubators.
63%
32%
5%Israel
87%
10%
3%Italy
In the country only Headquartered in the country, with overseas operation
Regional team, headquartered abroad
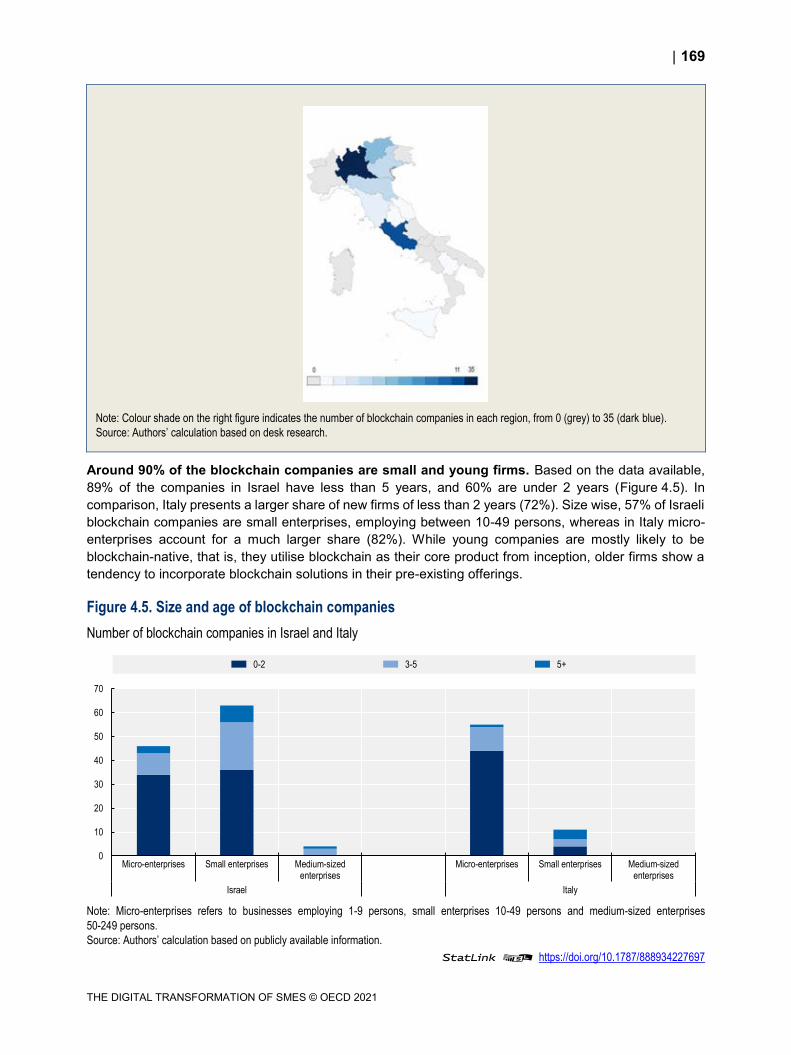
169
THE DIGITAL TRANSFORMATION OF SMES © OECD 2021
Note: Colour shade on the right figure indicates the number of blockchain companies in each region, from 0 (grey) to 35 (dark blue).
Source: Authors’ calculation based on desk research.
Around 90% of the blockchain companies are small and young firms. Based on the data available,
89% of the companies in Israel have less than 5 years, and 60% are under 2 years (Figure 4.5). In
comparison, Italy presents a larger share of new firms of less than 2 years (72%). Size wise, 57% of Israeli
blockchain companies are small enterprises, employing between 10-49 persons, whereas in Italy micro-
enterprises account for a much larger share (82%). While young companies are mostly likely to be
blockchain-native, that is, they utilise blockchain as their core product from inception, older firms show a
tendency to incorporate blockchain solutions in their pre-existing offerings.
Figure 4.5. Size and age of blockchain companies
Number of blockchain companies in Israel and Italy
Note: Micro-enterprises refers to businesses employing 1-9 persons, small enterprises 10-49 persons and medium-sized enterprises
50-249 persons.
Source: Authors’ calculation based on publicly available information.
StatLink 2 https://doi.org/10.1787/888934227697
0
10
20
30
40
50
60
70
Micro-enterprises Small enterprises Medium-sizedenterprises
Micro-enterprises Small enterprises Medium-sizedenterprises
Israel Italy
0-2 3-5 5+
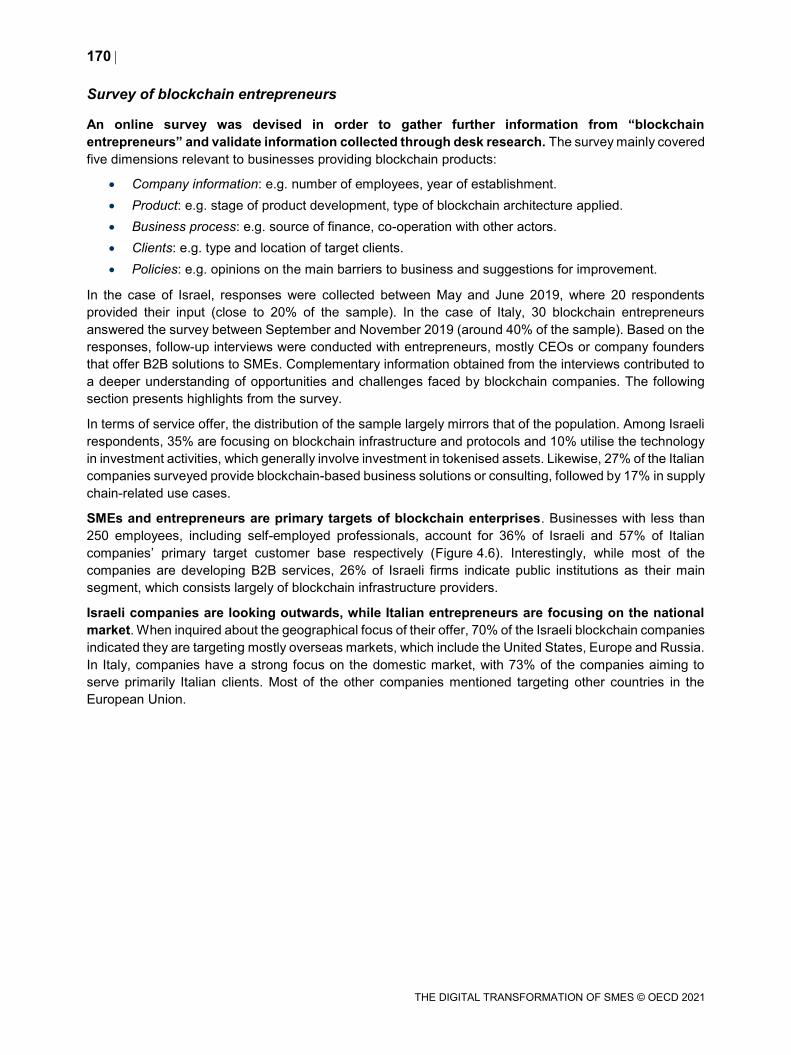
170
THE DIGITAL TRANSFORMATION OF SMES © OECD 2021
Survey of blockchain entrepreneurs
An online survey was devised in order to gather further information from “blockchain
entrepreneurs” and validate information collected through desk research. The survey mainly covered
five dimensions relevant to businesses providing blockchain products:
Company information: e.g. number of employees, year of establishment.
Product: e.g. stage of product development, type of blockchain architecture applied.
Business process: e.g. source of finance, co-operation with other actors.
Clients: e.g. type and location of target clients.
Policies: e.g. opinions on the main barriers to business and suggestions for improvement.
In the case of Israel, responses were collected between May and June 2019, where 20 respondents
provided their input (close to 20% of the sample). In the case of Italy, 30 blockchain entrepreneurs
answered the survey between September and November 2019 (around 40% of the sample). Based on the
responses, follow-up interviews were conducted with entrepreneurs, mostly CEOs or company founders
that offer B2B solutions to SMEs. Complementary information obtained from the interviews contributed to
a deeper understanding of opportunities and challenges faced by blockchain companies. The following
section presents highlights from the survey.
In terms of service offer, the distribution of the sample largely mirrors that of the population. Among Israeli
respondents, 35% are focusing on blockchain infrastructure and protocols and 10% utilise the technology
in investment activities, which generally involve investment in tokenised assets. Likewise, 27% of the Italian
companies surveyed provide blockchain-based business solutions or consulting, followed by 17% in supply
chain-related use cases.
SMEs and entrepreneurs are primary targets of blockchain enterprises. Businesses with less than
250 employees, including self-employed professionals, account for 36% of Israeli and 57% of Italian
companies’ primary target customer base respectively (Figure 4.6). Interestingly, while most of the
companies are developing B2B services, 26% of Israeli firms indicate public institutions as their main
segment, which consists largely of blockchain infrastructure providers.
Israeli companies are looking outwards, while Italian entrepreneurs are focusing on the national
market. When inquired about the geographical focus of their offer, 70% of the Israeli blockchain companies
indicated they are targeting mostly overseas markets, which include the United States, Europe and Russia.
In Italy, companies have a strong focus on the domestic market, with 73% of the companies aiming to
serve primarily Italian clients. Most of the other companies mentioned targeting other countries in the
European Union.
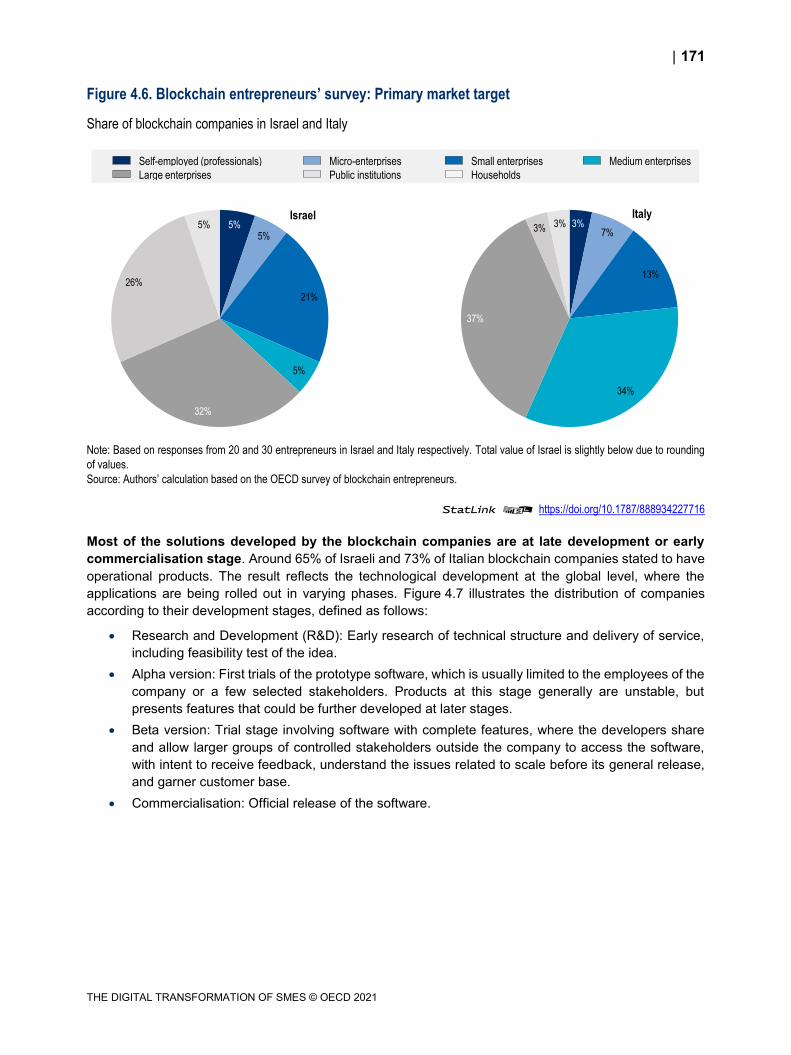
171
THE DIGITAL TRANSFORMATION OF SMES © OECD 2021
Figure 4.6. Blockchain entrepreneurs’ survey: Primary market target
Share of blockchain companies in Israel and Italy
Note: Based on responses from 20 and 30 entrepreneurs in Israel and Italy respectively. Total value of Israel is slightly below due to rounding
of values.
Source: Authors’ calculation based on the OECD survey of blockchain entrepreneurs.
StatLink 2 https://doi.org/10.1787/888934227716
Most of the solutions developed by the blockchain companies are at late development or early
commercialisation stage. Around 65% of Israeli and 73% of Italian blockchain companies stated to have
operational products. The result reflects the technological development at the global level, where the
applications are being rolled out in varying phases. Figure 4.7 illustrates the distribution of companies
according to their development stages, defined as follows:
Research and Development (R&D): Early research of technical structure and delivery of service,
including feasibility test of the idea.
Alpha version: First trials of the prototype software, which is usually limited to the employees of the
company or a few selected stakeholders. Products at this stage generally are unstable, but
presents features that could be further developed at later stages.
Beta version: Trial stage involving software with complete features, where the developers share
and allow larger groups of controlled stakeholders outside the company to access the software,
with intent to receive feedback, understand the issues related to scale before its general release,
and garner customer base.
Commercialisation: Official release of the software.
5%5%
21%
5%
32%
26%
5%Israel
3%7%
13%
34%
37%
3% 3%Italy
Self-employed (professionals) Micro-enterprises Small enterprises Medium enterprises
Large enterprises Public institutions Households
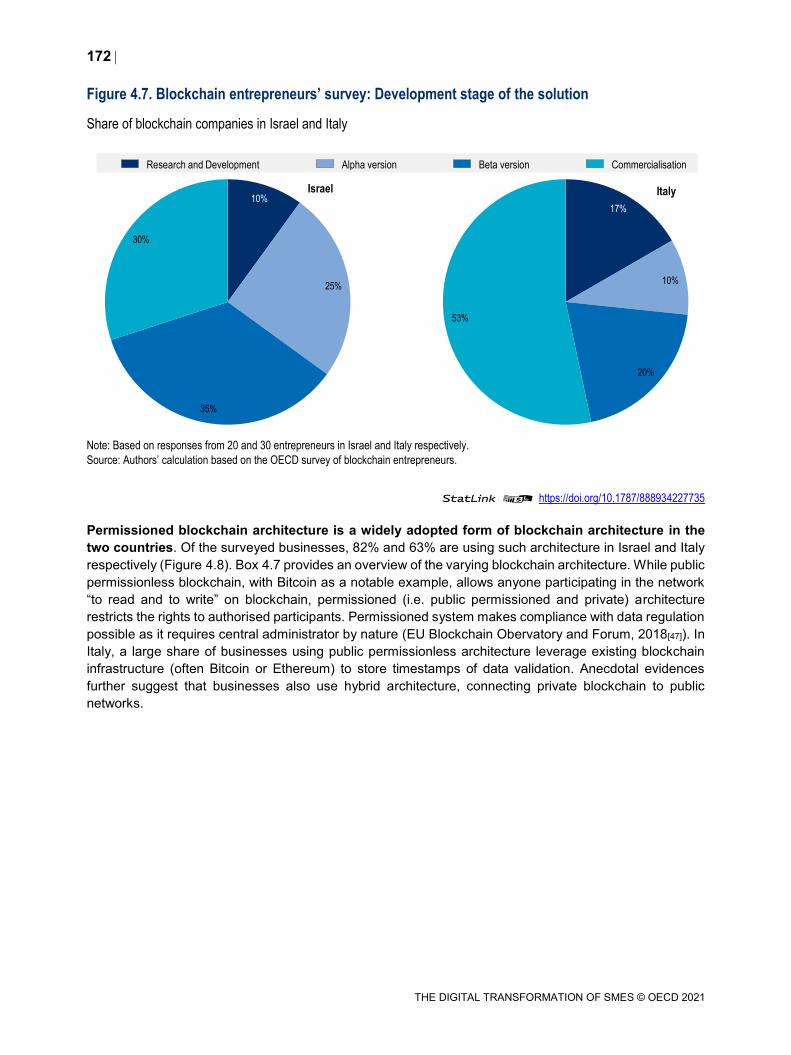
172
THE DIGITAL TRANSFORMATION OF SMES © OECD 2021
Figure 4.7. Blockchain entrepreneurs’ survey: Development stage of the solution
Share of blockchain companies in Israel and Italy
Note: Based on responses from 20 and 30 entrepreneurs in Israel and Italy respectively.
Source: Authors’ calculation based on the OECD survey of blockchain entrepreneurs.
StatLink 2 https://doi.org/10.1787/888934227735
Permissioned blockchain architecture is a widely adopted form of blockchain architecture in the
two countries. Of the surveyed businesses, 82% and 63% are using such architecture in Israel and Italy
respectively (Figure 4.8). Box 4.7 provides an overview of the varying blockchain architecture. While public
permissionless blockchain, with Bitcoin as a notable example, allows anyone participating in the network
“to read and to write” on blockchain, permissioned (i.e. public permissioned and private) architecture
restricts the rights to authorised participants. Permissioned system makes compliance with data regulation
possible as it requires central administrator by nature (EU Blockchain Obervatory and Forum, 2018[47]). In
Italy, a large share of businesses using public permissionless architecture leverage existing blockchain
infrastructure (often Bitcoin or Ethereum) to store timestamps of data validation. Anecdotal evidences
further suggest that businesses also use hybrid architecture, connecting private blockchain to public
networks.
10%
25%
35%
30%
Israel
17%
10%
20%
53%
Italy
Research and Development Alpha version Beta version Commercialisation
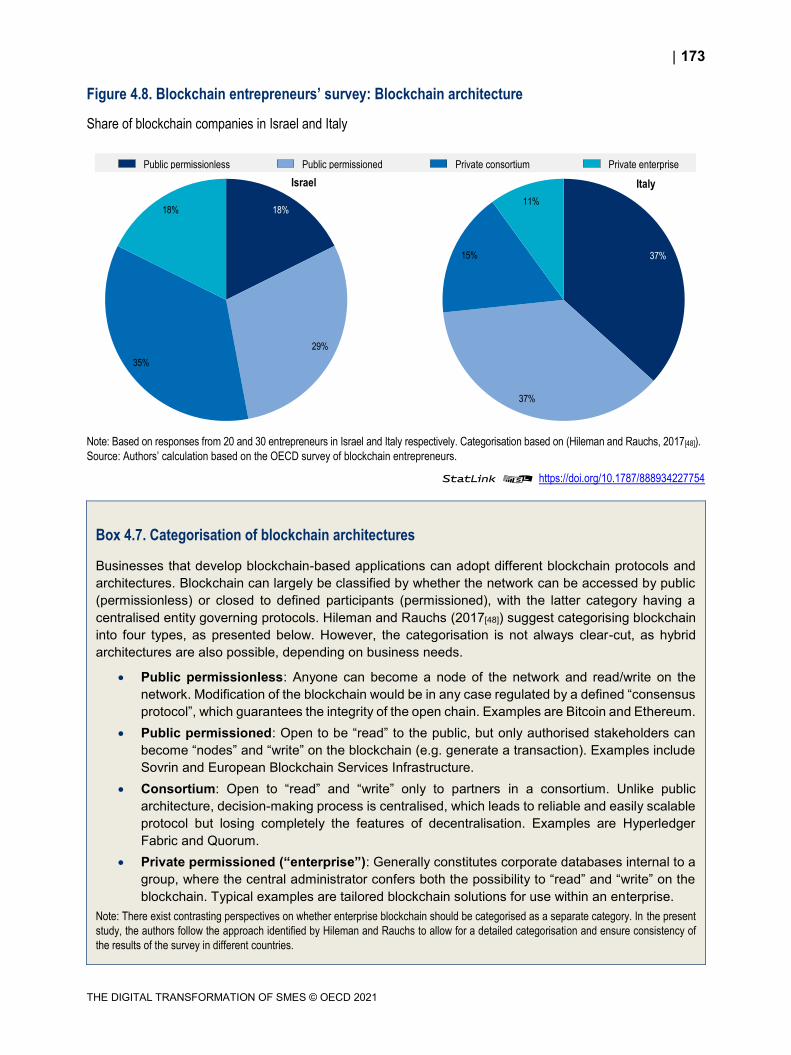
173
THE DIGITAL TRANSFORMATION OF SMES © OECD 2021
Figure 4.8. Blockchain entrepreneurs’ survey: Blockchain architecture
Share of blockchain companies in Israel and Italy
Note: Based on responses from 20 and 30 entrepreneurs in Israel and Italy respectively. Categorisation based on (Hileman and Rauchs, 2017[48]).
Source: Authors’ calculation based on the OECD survey of blockchain entrepreneurs.
StatLink 2 https://doi.org/10.1787/888934227754
Box 4.7. Categorisation of blockchain architectures
Businesses that develop blockchain-based applications can adopt different blockchain protocols and
architectures. Blockchain can largely be classified by whether the network can be accessed by public
(permissionless) or closed to defined participants (permissioned), with the latter category having a
centralised entity governing protocols. Hileman and Rauchs (2017[48]) suggest categorising blockchain
into four types, as presented below. However, the categorisation is not always clear-cut, as hybrid
architectures are also possible, depending on business needs.
Public permissionless: Anyone can become a node of the network and read/write on the
network. Modification of the blockchain would be in any case regulated by a defined “consensus
protocol”, which guarantees the integrity of the open chain. Examples are Bitcoin and Ethereum.
Public permissioned: Open to be “read” to the public, but only authorised stakeholders can
become “nodes” and “write” on the blockchain (e.g. generate a transaction). Examples include
Sovrin and European Blockchain Services Infrastructure.
Consortium: Open to “read” and “write” only to partners in a consortium. Unlike public
architecture, decision-making process is centralised, which leads to reliable and easily scalable
protocol but losing completely the features of decentralisation. Examples are Hyperledger
Fabric and Quorum.
Private permissioned (“enterprise”): Generally constitutes corporate databases internal to a
group, where the central administrator confers both the possibility to “read” and “write” on the
blockchain. Typical examples are tailored blockchain solutions for use within an enterprise.
Note: There exist contrasting perspectives on whether enterprise blockchain should be categorised as a separate category. In the present
study, the authors follow the approach identified by Hileman and Rauchs to allow for a detailed categorisation and ensure consistency of
the results of the survey in different countries.
18%
29%
35%
18%
Israel
37%
37%
15%
11%
Italy
Public permissionless Public permissioned Private consortium Private enterprise
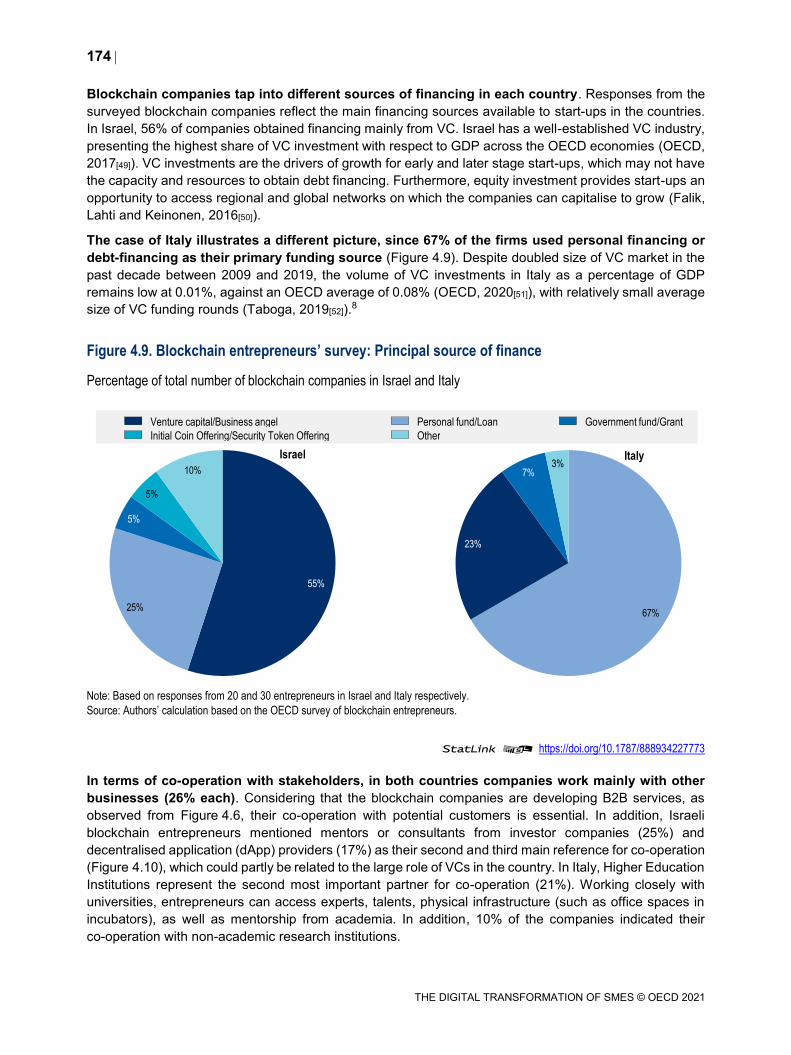
174
THE DIGITAL TRANSFORMATION OF SMES © OECD 2021
Blockchain companies tap into different sources of financing in each country. Responses from the
surveyed blockchain companies reflect the main financing sources available to start-ups in the countries.
In Israel, 56% of companies obtained financing mainly from VC. Israel has a well-established VC industry,
presenting the highest share of VC investment with respect to GDP across the OECD economies (OECD,
2017[49]). VC investments are the drivers of growth for early and later stage start-ups, which may not have
the capacity and resources to obtain debt financing. Furthermore, equity investment provides start-ups an
opportunity to access regional and global networks on which the companies can capitalise to grow (Falik,
Lahti and Keinonen, 2016[50]).
The case of Italy illustrates a different picture, since 67% of the firms used personal financing or
debt-financing as their primary funding source (Figure 4.9). Despite doubled size of VC market in the
past decade between 2009 and 2019, the volume of VC investments in Italy as a percentage of GDP
remains low at 0.01%, against an OECD average of 0.08% (OECD, 2020[51]), with relatively small average
size of VC funding rounds (Taboga, 2019[52]).8
Figure 4.9. Blockchain entrepreneurs’ survey: Principal source of finance
Percentage of total number of blockchain companies in Israel and Italy
Note: Based on responses from 20 and 30 entrepreneurs in Israel and Italy respectively.
Source: Authors’ calculation based on the OECD survey of blockchain entrepreneurs.
StatLink 2 https://doi.org/10.1787/888934227773
In terms of co-operation with stakeholders, in both countries companies work mainly with other
businesses (26% each). Considering that the blockchain companies are developing B2B services, as
observed from Figure 4.6, their co-operation with potential customers is essential. In addition, Israeli
blockchain entrepreneurs mentioned mentors or consultants from investor companies (25%) and
decentralised application (dApp) providers (17%) as their second and third main reference for co-operation
(Figure 4.10), which could partly be related to the large role of VCs in the country. In Italy, Higher Education
Institutions represent the second most important partner for co-operation (21%). Working closely with
universities, entrepreneurs can access experts, talents, physical infrastructure (such as office spaces in
incubators), as well as mentorship from academia. In addition, 10% of the companies indicated their
co-operation with non-academic research institutions.
55%
25%
5%
5%
10%
Israel
67%
23%
7%3%
Italy
Venture capital/Business angel Personal fund/Loan Government fund/Grant
Initial Coin Offering/Security Token Offering Other
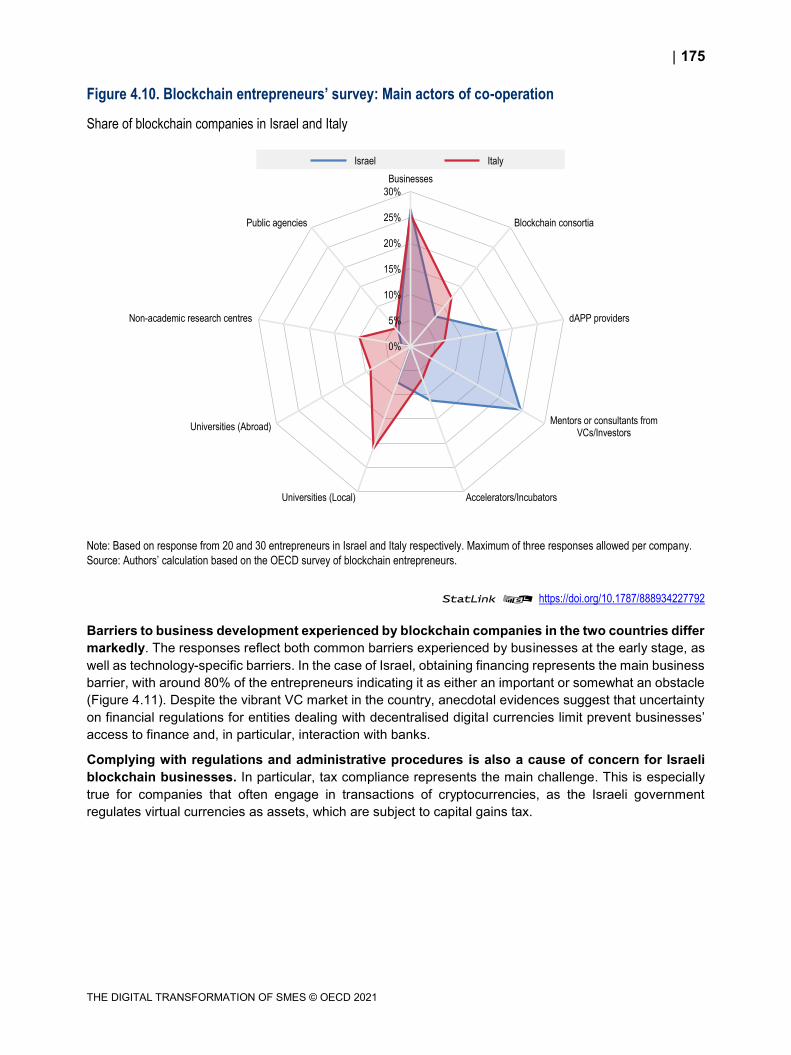
175
THE DIGITAL TRANSFORMATION OF SMES © OECD 2021
Figure 4.10. Blockchain entrepreneurs’ survey: Main actors of co-operation
Share of blockchain companies in Israel and Italy
Note: Based on response from 20 and 30 entrepreneurs in Israel and Italy respectively. Maximum of three responses allowed per company.
Source: Authors’ calculation based on the OECD survey of blockchain entrepreneurs.
StatLink 2 https://doi.org/10.1787/888934227792
Barriers to business development experienced by blockchain companies in the two countries differ
markedly. The responses reflect both common barriers experienced by businesses at the early stage, as
well as technology-specific barriers. In the case of Israel, obtaining financing represents the main business
barrier, with around 80% of the entrepreneurs indicating it as either an important or somewhat an obstacle
(Figure 4.11). Despite the vibrant VC market in the country, anecdotal evidences suggest that uncertainty
on financial regulations for entities dealing with decentralised digital currencies limit prevent businesses’
access to finance and, in particular, interaction with banks.
Complying with regulations and administrative procedures is also a cause of concern for Israeli
blockchain businesses. In particular, tax compliance represents the main challenge. This is especially
true for companies that often engage in transactions of cryptocurrencies, as the Israeli government
regulates virtual currencies as assets, which are subject to capital gains tax.
0%
5%
10%
15%
20%
25%
30%
Businesses
Blockchain consortia
dAPP providers
Mentors or consultants fromVCs/Investors
Accelerators/IncubatorsUniversities (Local)
Universities (Abroad)
Non-academic research centres
Public agencies
Israel Italy
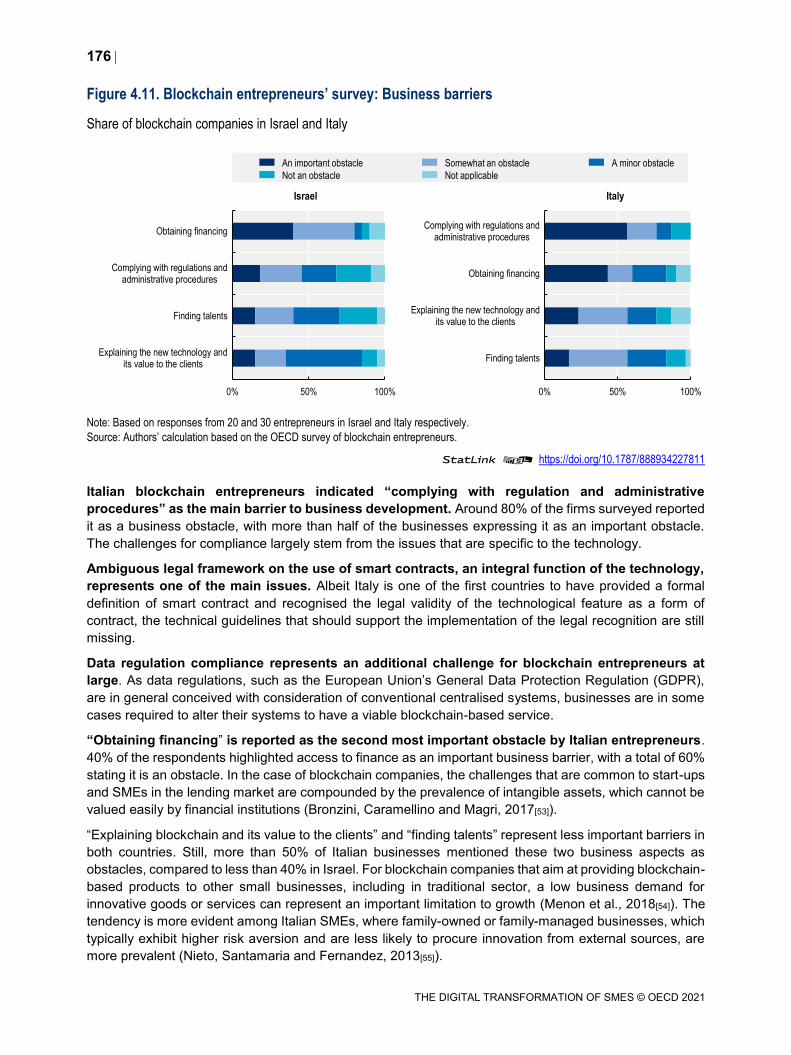
176
THE DIGITAL TRANSFORMATION OF SMES © OECD 2021
Figure 4.11. Blockchain entrepreneurs’ survey: Business barriers
Share of blockchain companies in Israel and Italy
Note: Based on responses from 20 and 30 entrepreneurs in Israel and Italy respectively.
Source: Authors’ calculation based on the OECD survey of blockchain entrepreneurs.
StatLink 2 https://doi.org/10.1787/888934227811
Italian blockchain entrepreneurs indicated “complying with regulation and administrative
procedures” as the main barrier to business development. Around 80% of the firms surveyed reported
it as a business obstacle, with more than half of the businesses expressing it as an important obstacle.
The challenges for compliance largely stem from the issues that are specific to the technology.
Ambiguous legal framework on the use of smart contracts, an integral function of the technology,
represents one of the main issues. Albeit Italy is one of the first countries to have provided a formal
definition of smart contract and recognised the legal validity of the technological feature as a form of
contract, the technical guidelines that should support the implementation of the legal recognition are still
missing.
Data regulation compliance represents an additional challenge for blockchain entrepreneurs at
large. As data regulations, such as the European Union’s General Data Protection Regulation (GDPR),
are in general conceived with consideration of conventional centralised systems, businesses are in some
cases required to alter their systems to have a viable blockchain-based service.
“Obtaining financing” is reported as the second most important obstacle by Italian entrepreneurs.
40% of the respondents highlighted access to finance as an important business barrier, with a total of 60%
stating it is an obstacle. In the case of blockchain companies, the challenges that are common to start-ups
and SMEs in the lending market are compounded by the prevalence of intangible assets, which cannot be
valued easily by financial institutions (Bronzini, Caramellino and Magri, 2017[53]).
“Explaining blockchain and its value to the clients” and “finding talents” represent less important barriers in
both countries. Still, more than 50% of Italian businesses mentioned these two business aspects as
obstacles, compared to less than 40% in Israel. For blockchain companies that aim at providing blockchain-
based products to other small businesses, including in traditional sector, a low business demand for
innovative goods or services can represent an important limitation to growth (Menon et al., 2018[54]). The
tendency is more evident among Italian SMEs, where family-owned or family-managed businesses, which
typically exhibit higher risk aversion and are less likely to procure innovation from external sources, are
more prevalent (Nieto, Santamaria and Fernandez, 2013[55]).
0% 50% 100%
Explaining the new technology andits value to the clients
Finding talents
Complying with regulations andadministrative procedures
Obtaining financing
Israel
0% 50% 100%
Finding talents
Explaining the new technology andits value to the clients
Obtaining financing
Complying with regulations andadministrative procedures
Italy
An important obstacle Somewhat an obstacle A minor obstacle
Not an obstacle Not applicable
177
THE DIGITAL TRANSFORMATION OF SMES © OECD 2021
Development of blockchain-related policies in Israel and Italy
As with other types of technological innovation, development of blockchain and its ecosystems have largely
been influenced by governments’ stance towards the technology and their subsequent policies. The
following section presents incremental development of blockchain-related policies from the case studies
on Israel and Italy.
Over the past decade, blockchain-related policies have initially focused on understanding and regulating
the exchange of crypto-assets, as the first widely used applications of blockchain technology were in the
financial sector. Hype-driven investments on blockchain-based virtual currencies exposed investors to
volatility risks and frauds related to the issuance as well as the exchange of coins and tokens. For example,
Israeli and Italian authorities issued statements on the development of the virtual currencies market in 2014
and 2015 respectively. Authorities underlined inherent risks that investors could be exposed to when
purchasing or selling so-called cryptocurrencies. Despite being called “currency”, most countries, including
Israel, have issued explicit guidance indicating that the crypto-assets do not constitute a fiat currency
(OECD, 2020[56]).
Financial regulators then aimed at defining their position towards crypto-currencies in relation to the
existing regulatory framework and sought to update or modify existing regulations to ensure compliance
with AML and know your customer (KYC) requirements for the new type of investment (FATF, 2019[4]).
In Israel, as the need for a co-ordinated approach in addressing cryptocurrencies was increasingly
perceived, the “Inter-Ministerial Committee for Regulatory Coordination of Virtual Assets” was established.
Led by the Bank of Israel and assembled relevant public authorities,9 representatives from the member
agencies convened regularly in the Committee to develop a whole-of-government strategy to gather
information on the barriers in dealing with virtual assets and respond to the increasing demand for
regulatory guidance from the industry (e.g. SMEs and start-ups working on blockchain technology).
In the case of Italy, the regulators made efforts to align their position with other institutions abroad. In
addition to making contributions in establishing regulatory guidance on crypto-assets, Italian government
bodies consulted decisions and legal framework provided by both European regulators, including
European Banking Authority (EBA) and European Securities and Markets Authority (ESMA), and
international authorities, such as Financial Action Task Force (FATF), in areas where there were no
comprehensive regulations.
In addition to the efforts to provide clear guidance on the crypto-asset-related activities, through reports
resolutions and circulars, financial regulators in both countries also explored the possibility of creating
additional systems to accommodate the new type of asset. Such examples include creating a dedicated
disclosure regime for entities issuing crypto-asset to enable compliant activities and relaxing restrictions
by establishing a framework for regulatory sandbox (Israel) and creating new public registries to ensure
AML/KYC compliant virtual currency-related activities (Italy).
However, in recent years, with the introduction of diverse DLT applications beyond the financial sector,
governments are increasingly taking nuanced policy approaches to promote innovative use cases in
industries. While acknowledging blockchain as a type of technological innovation, Israel has taken
technology-neutral approach for its innovation programmes. To illustrate, the Israel Innovation Authority
(IIA), a publicly funded agency, oversees innovation policy and provides grants to promote R&D activities
in the country. The Authority operates incentive programmes, conducting calls for proposals, across a
number of topics such as technological infrastructure and advancements in manufacturing. Between 2017
and mid-2019, the IIA has provided financial support to around 10-15 blockchain projects, with an
investment grant of around NIS 30 million (USD 8.5 million), which reflects growing interest in the
application of the technology.
Interestingly, Italy has taken a step further to recognise legal validity of blockchain. Italian parliament
approved a decree providing definition of DLT and recognising the legal validity of smart contracts.
178
THE DIGITAL TRANSFORMATION OF SMES © OECD 2021
Proposed by the Italian senate and adopted in February 2019, the amendment states that DLTs have the
legal effect of an “electronic time stamp”, while smart contracts satisfy the same requirement of the written
contract. With technical standards being laid out by a working group, the decision provides a groundwork
for creating an environment for blockchain innovation.
At various levels, the Italian government has made efforts to broaden the understanding of DLT and to
explore the use cases, and the benefits, beyond financial applications, from cloud computing to academic
credentials. Since 2018, the Ministry of Economic Development (MiSE) has undertaken actions to
participate in European Blockchain Partnership and created a high-level expert group to establish a
national blockchain strategy, with the aim to develop a comprehensive strategy to foster development and
uptake of blockchain in the Italian economy.
Policy approaches to foster blockchain for SMEs
As the hype on crypto-assets ease and financial regulators have begun clearing out uncertainties regarding
digital assets, governments are shifting focus on industrial applications of DLTs, and on strategies to
support firms in unlocking the benefits of the blockchain technology, while addressing possible risks. The
following section discusses key policy trends in this area, providing examples from both the OECD
members and non-member countries, with a specific focus on measures intended to foster industrial
applications of blockchain technology and on implications for SMEs and entrepreneurs.
Increasing awareness
Among businesses
Lack of awareness and understanding of blockchain technology and applications represent a key obstacle
to adoption, in particular by SMEs. Despite the introduction of use cases beyond cryptocurrencies, trust in
the technology is being affected by booms and bursts, as well as frauds associated with virtual assets.
Wider technology adoption crucially depends on entrepreneurs’ understanding of the potential benefits,
use cases, as well as challenges of blockchain applications. Australian Skills and Quality Authority
(ASQA), for example, accredits courses that aim to train entrepreneurs on blockchain and related business
models.10
In addition, governments can leverage digital innovation diffusion channels at hand to inform businesses
about the technology and provide assistance to businesses that have an interest in implementing
blockchain applications in their business process. This is the case, for instance, of the Digital Innovation
Hubs operated by the European Commission.11
Within governments
Policy makers also need to nurture basic knowledge of blockchain technology. By demystifying the
technology, the public sector would be able to compare blockchain with other technologies that are readily
available. Establishing expert groups and advisory boards can help government officials in broadening
their knowledge on the technical issues. In general, governments gather a group of experts knowledgeable
of the technology to learn from the field and to have a deeper understanding of the implications the
technology has on policy making before formulating national strategies.
International organisations can also play a role in facilitating understanding and fostering policy exchanges
regarding blockchain. For instance, the OECD Blockchain Policy Centre designs and provides tailored
blockchain trainings to policy makers from governments and public agencies across OECD countries. The
courses provide a general understanding of the technical characteristics of the technology, as well as an
overview of its main application and of the most relevant policy experiences around the world.
179
THE DIGITAL TRANSFORMATION OF SMES © OECD 2021
Promoting policy co-ordination and long-term vision
National strategies can reflect the interest and commitment in the development of a technology,
with the government setting high-level objectives and principles to provide guidance in a whole-
of-government approach. National blockchain strategies have emerged in recent years, which aim to
evaluate the specific opportunities of the technology in relation to countries’ specific economic structures.
Strategies also seek to leverage the use of other complementary technologies such as AI and 5G networks.
In February 2020, Australia’s Department of Industry, Science, Energy and Resources announced the
National Blockchain Roadmap, which is set to continue until 2025. The Roadmap states three main areas
for the country’s strategic focus, which are “regulation & standards”, “skills, capability & innovation” and
“international investment & collaboration”. The National Blockchain Roadmap Steering Committee, an
advisory group consisting of members from both the public and private sector and academia, has been
established to provide guidance on the advancement of the Roadmap. As a part of the effort to identify
possible use cases of the technology, the Roadmap highlights the country’s wine sector and suggests
potential adoption of blockchain solutions to track Australian wine exports.
In France, the Ministry of Economy and Finance published the country’s National Blockchain Strategy in
April 2019, based on a consultation with national experts, from entrepreneurs to non-profits, on non-
financial uses of the technology. The Strategy builds on the government’s previous efforts to regulate digital
assets within its financial framework, which included recognising Initial Coin Offerings (ICOs), issuance of
cryptographic tokens, as an alternative financing method for SMEs. The Strategy lays out four main areas
of work, which are “strengthening the excellence and structuring of the French industrial sectors in order
to initiate projects”, “fostering innovative projects”, “being on the cutting edge in tackling the major
technological challenges” and “assisting blockchain project initiators with their questions, especially legal
and regulatory issues”.
Led by the Federal Ministry of Economic Affairs and energy, Germany adopted Blockchain Strategy of the
German Federal Government in September 2019. The Strategy provides 10 principles for its
implementation, which includes guaranteeing stability, strengthening sustainability, and making
environment for fair competition among technologies, while creating a technology-neutral environment.
Following the Strategy, 44 measures are presented in five main areas of activity, which include: “Securing
stability and stimulating innovations: blockchain in the finance sector”, “Bringing innovations to maturity:
advancing projects and regulatory sandboxes”, “Making investments possible: clear, reliable framework
conditions”, “Applying technology: digitised public-administration services” and “Distributing information:
knowledge, networking and co-operation”. Measures examining potential industrial applications of the
technology are also provided, such as the use of technology in tracing product lifecycle with a case from
the aircraft industry and the development of effective maritime logistics governance structure.
Introducing technical infrastructure
Governments have also taken action to introduce blockchain-related infrastructure to facilitate
uptake of the technology, including by SMEs. Such infrastructure includes a public sector-backed
blockchain protocol that could be easily used by various actors, as well as technical foundation, e.g.
computing capacity and network connection, to make it easy for individuals and organisations to create
and use blockchain applications.
The European Blockchain Partnership (EBP) was established in April 2018 with the goal to foster
co-operation in realising the potential of blockchain applications that can bring value to citizens, society
and economy. As of mid-2020, 30 member states from both European Union (EU) and European Economic
Area (EEA) have joined the initiative. Under the Partnership, the member states are working towards
building the European Blockchain Services Infrastructure (EBSI), the EU-wide blockchain infrastructure
that will allow delivery of cross-border public services. Nodes are distributed across Europe and maintained
180
THE DIGITAL TRANSFORMATION OF SMES © OECD 2021
by the European Commission (EC), national governments, and knowledge institutions.12 Four use cases
have been tested in 2019, which are notarisation, education credentials, self-sovereign identity, and data-
sharing among customs and tax authorities in the European Union. It is also projected that private entities
will be able to leverage the infrastructure to create business applications.
In China, the government is fostering development of a technical infrastructure to facilitate blockchain
adoption. The State Information Centre (SIC), an e-government network advisory body operating within
the Ministry of Industry and Information Technology (MIIT), developed the Blockchain-based Service
Network (BSN) in co-operation with private sector entities including China Mobile and Union Pay. BSN was
inaugurated in April 2020 with global footprint, through 128 public nodes13 located in different cities, of
which eight are located outside of China. The network of public infrastructure hosts prefabricated code
mechanism, functioning as a one-stop blockchain environment that developers from the private sector can
leverage. The government projects that the Network will lower barrier to entry for developing blockchain
applications, and offer cost-efficient deployment of blockchain-based services, especially for SMEs.
Adopting blockchain to deliver public services
Blockchain adoption can be part of governments’ digital transformation efforts. Governments’
adoption of technology can provide use cases to businesses and further send signals to businesses
seeking blockchain adoption. For example, establishment of distributed ledgers by the government could
represent an alternative means to central databases, which would contribute to breaking data siloes
between government bodies. Such a system would streamline exchange of information between
government functions, reducing the time and burden businesses face regarding administrative procedures.
E-procurement is another area where the technology could be used to enhance transparency of the
government process and gain the public’s trust.
However, in order to have a solution that reflects implementation requirements, public organisations
embracing pilot projects need to have the capability to make detailed design decisions. A study from the
OECD Observatory of Public sector Innovation (OPSI) finds that the viability of government-driven
blockchain projects are influenced by some key success factors, such as having a clear value proposal
and identifying and managing relevant stakeholders, as well non-success factors, including disruptiveness
and limited scalability of the projects (Ubaldi et al., Forthcoming[57]).
Led by Singapore’s Infocomm Media Development Authority (IMDA), a statutory board under the Ministry
of Communications and Information (MCI), TradeTrust is a framework conceived to support exchange of
electronic trade documents. Use of blockchain to verify authenticity of trade documents facilitates
digitisation of document exchanges, reducing time and cost associated with document processing, as well
as risk of fraud. After a pilot project in 2019 involving Maritime Port Authority of Singapore, Singapore
Customs and the Singapore Shipping Association, the multilateral trading system expanded its reach, with
17 international corporations and International Chamber of Commerce (ICC) as members in the
consortium.
In Korea, the Ministry of Science and ICT (MSIT) and Korea Internet and Security Agency (KISA)
co-operates with actors from the public sector, from ministries to regional governments, to identify demand
as well as potential use cases of blockchain technology within government. Referred to as “public sector-
led blockchain pilot projects”, the process for public procurement of blockchain solutions began in 2018,
following the Blockchain Technology Development Strategy laid out in the same year. Pilot projects
generally last one year, testing prototypes to test wider adoption. Initially started with six projects proposed
by MSIT to ministries, the projects transitioned to demand-driven approach with request for proposal the
year later, presenting twelve pilot case studies in 2019 and 2020.
In addition, governments can adopt e-procurement practices that allow broadened participation,
especially by SMEs, thanks to lowered cost barriers (OECD, 2018[58]). Blockchain can enhance
181
THE DIGITAL TRANSFORMATION OF SMES © OECD 2021
transparency and thus trust in the procurement process from businesses. In 2020, the Office of the
Inspector General of Colombia partnered with the World Economic Forum and Inter-American
Development Bank (IDB) to examine the adoption of blockchain in the country’s public procurement
system. While implementation of blockchain-based public procurement systems is expected to enhance
fairness of the process, feasibility of implementation is to be tested on the country’s public school meal
programme.
Hosting hackathons can provide innovative solutions to the challenges that governments are
facing. Some countries have invited innovative minds to blockchain-focused hackathons, which offers
governments the chance to explore possibilities of the technology up close. For instance, in line with the
National Digital Strategy, Mexico’s Ministry of Public administration jointly hosted Blockchain HackMX with
Campus Talent Mexico, a training centre on digital skills. With the focus of the hackathon on creating
blockchain-based applications for the public sector, the winning team developed a public tender process
that incorporates evaluation of social benefits.
The Ministry of Economics of Latvia organised “.tax” hackathon in 2019, which called for ideas on
blockchain pilot project for the State Revenue Services (SRS). The event gathered over 100 experts
working on blockchain from more than 11 countries. Participants from large companies provided advice to
the participating teams. Proposal for tax fraud avoidance solution, which uses blockchain for storing
electronic signatures from traditional systems, such as Enterprise Resource Planning (ERP) and cash
register systems, was awarded the prize. The Ministry of Economics and the SRS have been co-operating
to scale up the prototype, which would include changing relevant regulatory requirements.
In Ireland, the Department of Public Expenditure and Reform and Department of Finance co-hosted
“Blockchathon”. The hackathon, which took place in 2019, was based on the work conducted by the
interdepartmental working group on blockchain and virtual currencies led by the Ministry for Finance. Ideas
presented included tracking State Aid payments for Enterprise Ireland, and were made public for other
developers.
Supporting private sector innovation through partnerships
As it is largely the private sector that provides applications for other businesses, support is being provided
in some countries to foster co-operation between businesses developing solutions, especially start-ups,
and various actors in the blockchain ecosystem, including universities and other public research centres.
In particular, efforts have been made to establish networks for public-private partnerships to steer
development of the blockchain industry. For instance, in the Netherlands, the Dutch Blockchain Coalition
(DBC) was created to bring together actors from government, knowledge institutions, and industry.
Founded in 2016 as a joint venture from the partners, the multiple stakeholder group aims at facilitating
exchange of knowledge and experience between the public and private actors and create synergies
between blockchain initiatives in the country. The DBC further engages with international stakeholders,
such as the EC and the ISO, for standardisation on the norms and governance of the technology. The DBC
identified six use cases for collaboration, which are self-sovereign identity, logistics, academic credentials,
pensions, government subsidies and mortgages.
Conducting pilot projects is another way for the governments to explore and test innovation from the private
sector. Pilot projects are small-scale projects conducted over a short period of time, usually with limited
investments, to test the functionalities and applicability of solutions based on DLTs. They offer a way to
experiment and identify issues prior to a full-scale adoption, which could minimise risks. By providing
testbeds, government bodies and application developers have the opportunity to work side-by-side, in a
co-operative environment in which all actors can widen their understanding of the capabilities, challenges,
and potential applications of the technology.
182
THE DIGITAL TRANSFORMATION OF SMES © OECD 2021
The Innovation, Science, and Economic Development Canada (ISED) is seeking to implement blockchain-
based supply chain tracing system for the steel industry. As the industry does not have a standardised
information-sharing mechanism, the goal of the project is to provide a solution that enables real-time
tracking of inputs and outputs along the steel supply chain, leveraging blockchain and AI. The ISED issued
a call for tender worth CAD 300 000 via Innovative Solutions Canada, which is a federal programme for
procuring innovative solutions from Canadian small businesses to solve government challenges.
The United States Food and Drug Administration (FDA) launched a pilot project to track and trace
medicines. Track-and-trace system to be implemented in 2023. The project has been carried out in
accordance with the Drug Supply Chain Security Act (DSCSA), which calls to build an interoperable
electronic system for the pharmaceutical distribution supply chain by 2023, which is also dubbed as the
DSCSA Pilot Project. The FDA expects that the new system would contribute to reducing diversion of
domestically distributed drugs, and detecting counterfeit drugs in the supply chain.
Addressing regulatory uncertainties
Regulatory incertitude always follows technologies in its early stage, which also applies to
blockchain. Before a common consensus is reached, interpretation on where the technology stands in
the existing framework may vary, which exposes both developers and users to regulatory uncertainties, as
observed in governments’ reactions to crypto-assets. Possibility of industrial mass adoption of blockchain
could also be affected by governments’ stance on the technology. A typical example is whether data stored
on blockchain could be recognised as a valid electronic time stamp, which is used to verify integrity of a
document. Recognising regulatory equivalence between the technological guarantees provided by
blockchain technology and current regulatory objectives could contribute to improving regulatory
compliance through technology, thereby reducing the uncertainty and the regulatory burden imposed on
these actors, and by doing so, encouraging regulatory-compliant innovation in the field. Here the concept
of “functional equivalence” and “regulatory equivalence”14 could be particularly relevant in the blockchain
context (Collomb, De Filippi and Sok, 2019[59]). As mentioned above, Italy has amended legislation to
acknowledge legal validity of blockchain-based timestamping. In addition, due to decentral nature of
blockchain, which is especially the case with permissionless networks, how disputes can be resolved
remains uncertain.
Regional and local-level policy initiatives
Regional and local-level governments can also play an active role in driving blockchain
development and promoting adoption of blockchain technology. In California, following the state
Assembly Bill, a Blockchain Working Group was established to identify potential use cases and their
benefits, as well as the risks of blockchain to the state government and businesses based in California.
The Working Group published a blockchain roadmap and proposed several pilot projects, which include
building a blockchain platform to tack a vehicle’s lifecycle and food supply tracking to allow rapid tracing of
the food-borne contamination source.
The government of British Columbia, in collaboration with government of Ontario and Canada initiated
an open-source project to create a blockchain-based network for self-sovereign identity Named Verifiable
Organisations Network (VON), the project aims at providing organisations, especially businesses, a
secured network on which they can, for example, store their credentials, or acquire licenses or permits
verified by government services. Servicing of the network would drastically shorten the time needed to
verify information and eliminate the need to type in information repeatedly for different government
services.
To address fragmented data ownership between different parts of government, Lombardy regional
government in Italy created a blockchain-based system that could store credentials of the citizens. The
183
THE DIGITAL TRANSFORMATION OF SMES © OECD 2021
pilot project “Nidi Gratis” focused on access to child care. Instead of developing a dedicated blockchain
infrastructure, the system uses existing blockchain network, which lowers system development and
maintenance costs. When individuals obtain certifications from government bodies, the proof of certification
is issued to the individuals’ account, which can be accessed by other government functions. With use of
the automated system, both citizens and businesses are freed from the burden of sending duplicate
documents to multiple public bodies. The regional government began using the system in 2019, where the
government benefited from reduction of thousands of hours’ worth of administrative work.
Conclusion
Blockchain has the potential to become an important tool to ensure integrity and security of data
while enhancing accountability and trust among stakeholders. Transaction history is distributed to the
participating nodes of a network, reducing the need to rely on intermediaries and other types of centralised
actors. Immutability of data contained in blockchain further increases transparency of the system. The DLT
industry is moving beyond financial services and many applications are being developed across multiple
sectors.
Blockchain-based software presents distinct opportunities to SMEs and start-ups, as its applications
can help new and small businesses overcome size-related challenges, such as those related to information
asymmetry and opacity, reduce transaction costs, improve efficiency in processes and quality in products,
enhance supply chain management, and spur innovation in business models. However, SMEs also face
challenges related to blockchain adoption: for example the need to invest in other complementary
technologies and the low interoperability of blockchain solutions sourced from different providers.
The OECD country case studies on “Blockchain for SMEs and Entrepreneurs”, conducted in Israel
and Italy, provide in-depth understanding of both the opportunities and challenges faced by
businesses working on blockchain innovation, and on the development of the blockchain
ecosystems at large. Interestingly, the products developed by “blockchain companies” reflect to a large
degree the economy’s structure and sectoral specialisation of the SME population, being largely targeted
at addressing the needs of domestic industries. Moreover, in both countries, the majority of enterprises
developing DLT-based services target SMEs as primary clients. The activities of “Blockchain businesses”
are influenced by the general domestic business environment, including regulation, access to finance and
to talents, but also by blockchain-specific issues, such as the legal validity (or lack of) of smart contracts.
Blockchain-related policies have initially focused on understanding and regulating the exchange
of crypto-assets, but, in recent years, governments have increasingly taken nuanced policy
approaches to promote innovative use cases in industries. The chapter provides examples of policies
aimed at, for example: increasing the awareness of DLT among businesses and within public
administration; introducing national strategies to pursue a whole-of-government approach; integrating
blockchain within public services; conducting pilot tests in co-operation with the private sector to support
DLT innovation; building public blockchain infrastructure; reducing regulatory uncertainty; and providing
services at regional and local level. These policy initiatives can provide use cases and send positive signals
to SMEs seeking or considering blockchain adoption, while addressing some of the main challenges for a
broader diffusion of the technology, such as lack of awareness and skills, lack of interoperability between
systems, and lack of access to digital infrastructure.
184
THE DIGITAL TRANSFORMATION OF SMES © OECD 2021
References
Andrews, D., G. Nicoletti and C. Timiliotis (2018), “Digital technology diffusion: A matter of
capabilities, incentives or both?”, OECD Economics Department Working Papers, No. 1476,
OECD Publishing, Paris, https://dx.doi.org/10.1787/7c542c16-en.
[12]
ASQA (2020), VET accredited courses target skills gaps and emerging industry needs,
https://www.asqa.gov.au/news-events/news/vet-accredited-courses-target-skills-gaps-and-
emerging-industry-needs (accessed on 8 December 2020).
[61]
Audretsch, D., E. Lehmann and S. Warning (2005), “University spillovers and new firm location”,
Research Policy, Vol. 34/7, pp. 1113-1122, http://dx.doi.org/10.1016/j.respol.2005.05.009.
[45]
Bahga, A. and V. Madisetti (2016), “Blockchain Platform for Industrial Internet of Things”, Journal
of Software Engineering and Applications, Vol. 09/10, pp. 533-546,
http://dx.doi.org/10.4236/jsea.2016.910036.
[24]
Bianchini, M. and I. Kwon (2020), “Blockchain for SMEs and entrepreneurs in Israel”, OECD
SME and Entrepreneurship Papers, No. 18, OECD Publishing, Paris,
https://dx.doi.org/10.1787/b6d380ed-en.
[39]
Bianchini, M. and I. Kwon (2020), “Blockchain for SMEs and entrepreneurs in Italy”, OECD SME
and Entrepreneurship Papers, No. 20, OECD Publishing, Paris,
https://dx.doi.org/10.1787/f241e9cc-en.
[40]
Blockchain Service Network Development Alliance (2020), Blockchain-based Service Network
Basic White Paper,
https://image.seohost.cn/storage/2718/file/20200427/1587959467867699.pdf (accessed on
5 August 2020).
[60]
Bronzini, R., G. Caramellino and S. Magri (2017), Venture capitalists at work: What are the
effects on the firms they finance?, Bank of Italy, https://www.bancaditalia.it/pubblicazioni/temi-
discussione/2017/2017-1131/en_tema_1131.pdf (accessed on 15 July 2020).
[53]
Brynjolfsson, E. and A. McAfee (2014), The second machine age: Work, progress, and
prosperity in a time of brilliant technologies.
[9]
Carson, B. et al. (2018), Blockchain beyond the hype: what is the strategic business value,
McKinsey&Company Digital, https://cybersolace.co.uk/CySol/wp-
content/uploads/2018/06/McKinsey-paper-about-Blockchain-Myths.pdf (accessed on
25 September 2020).
[14]
Casino, F., T. Dasaklis and C. Patsakis (2019), A systematic literature review of blockchain-
based applications: Current status, classification and open issues, Elsevier Ltd,
http://dx.doi.org/10.1016/j.tele.2018.11.006.
[5]
Catalini, C. and J. Gans (2019), “Some simple economics of the blockchain”, NBER Working
Paper Series, http://www.nber.org/papers/w22952 (accessed on 25 September 2020).
[15]
Chen, X. et al. (2019), When Machine Learning Meets Blockchain: A Decentralized, Privacy-
preserving and Secure Design, Institute of Electrical and Electronics Engineers Inc.,
http://dx.doi.org/10.1109/BigData.2018.8622598.
[20]
185
THE DIGITAL TRANSFORMATION OF SMES © OECD 2021
Collomb, A., P. De Filippi and K. Sok (2019), “Blockchain Technology and Financial Regulation:
A Risk-Based Approach to the Regulation of ICOs”, European Journal of Risk Regulation,
http://dx.doi.org/10.1017/err.2019.41ï.
[59]
De Filippi, P., M. Mannan and W. Reijers (2020), “Blockchain as a confidence machine: The
problem of trust & challenges of governance”, Technology in Society, Vol. 62, p. 101284,
http://dx.doi.org/10.1016/j.techsoc.2020.101284.
[29]
Deloitte (2020), 2020 Global Blockchain Survey,
https://www2.deloitte.com/content/dam/insights/us/articles/6608_2020-global-blockchain-
survey/DI_CIR%202020%20global%20blockchain%20survey.pdf (accessed on
9 October 2020).
[7]
Delotte (2019), Deloitte’s 2019 Global Blockchain Survey,
https://www2.deloitte.com/content/dam/Deloitte/se/Documents/risk/DI_2019-global-
blockchain-survey.pdf (accessed on 24 January 2020).
[6]
Dillenberger, D. et al. (2019), “Blockchain analytics and artificial intelligence”, IBM Journal of
Research and Development, Vol. 63/2, http://dx.doi.org/10.1147/JRD.2019.2900638.
[21]
Draca, M., R. Sadun and J. Van Reenen (2009), Productivity and ICTs: A review of the evidence,
Oxford University Press, http://dx.doi.org/10.1093/oxfordhb/9780199548798.003.0005.
[10]
EU Blockchain Obervatory and Forum (2018), Blockchain and the GDPR,
https://www.europarl.europa.eu/RegData/etudes/STUD/2019/634445/EPRS_STU(2019)6344
45_EN.pdf (accessed on 24 June 2020).
[47]
European Commission (2020), Smart Specialisation Platform,
https://s3platform.jrc.ec.europa.eu/digital-innovation-hubs-tool (accessed on
8 December 2020).
[62]
Falik, Y., T. Lahti and H. Keinonen (2016), “Does startup experience matter? Venture capital
selection criteria among Israeli entrepreneurs”, Venture Capital, Vol. 18/2, pp. 149-174,
http://dx.doi.org/10.1080/13691066.2016.1164109.
[50]
FATF (2019), Guidance for a Risk-Based Approach to Virtual Assets and Virtual Asset Service
Providers, FATF, https://www.fatf-gafi.org/media/fatf/documents/recommendations/RBA-VA-
VASPs.pdf (accessed on 13 August 2020).
[4]
Feng, A. and A. Valero (2019), Business benefits of local universities: More skills and better
management, Centre for Economic Performance, LSE,
http://cep.lse.ac.uk/pubs/download/cp564.pdf (accessed on 31 July 2020).
[46]
Frezal, C. and G. Garsous (2020), “New Digital Technologies to Tackle Trade in Illegal
Pesticides”, OECD Trade and Environment Working Papers, No. 2020/02, OECD Publishing,
Paris, https://dx.doi.org/10.1787/9383b310-en.
[33]
GS1 (2019), Traceability and Blockchain,
https://www.gs1.org/sites/default/files/gs1_traceability_and_blockchain_wp.pdf (accessed on
8 November 2020).
[37]
Gubbi, J. et al. (2013), “Internet of Things (IoT): A vision, architectural elements, and future
directions”, Future Generation Computer Systems, Vol. 29/7, pp. 1645-1660,
http://dx.doi.org/10.1016/j.future.2013.01.010.
[22]
186
THE DIGITAL TRANSFORMATION OF SMES © OECD 2021
Hastig, G. and M. Sodhi (2020), “Blockchain for Supply Chain Traceability: Business
Requirements and Critical Success Factors”, Production and Operations Management,
Vol. 29/4, pp. 935-954, http://dx.doi.org/10.1111/poms.13147.
[27]
Hileman, G. and M. Rauchs (2017), Global Blockchain Benchmarking Study, Cambridge Centre
for Alternative Finance, https://www.ey.com/Publication/vwLUAssets/ey-global-blockchain-
benchmarking-study-2017/$File/ey-global-blockchain-benchmarking-study-2017.pdf.
[48]
ISO (2020), ISO/TC 307 Blockchain and distributed ledger technologies,
https://www.iso.org/committee/6266604.html (accessed on 12 November 2020).
[36]
Lamport, L., R. Shostak and M. Pease (1982), “The Byzantine Generals Problem”, ACM
Transactions on Programming Languages and Systems (TOPLAS), Vol. 4/3, pp. 382-401,
http://dx.doi.org/10.1145/357172.357176.
[2]
Mackey, T. and G. Nayyar (2017), A review of existing and emerging digital technologies to
combat the global trade in fake medicines, Taylor and Francis Ltd,
http://dx.doi.org/10.1080/14740338.2017.1313227.
[25]
Mamoshina, P. et al. (2018), “Converging blockchain and next-generation artificial intelligence
technologies to decentralize and accelerate biomedical research and healthcare”, Oncotarget,
Vol. 9/5, pp. 5665-5690, http://dx.doi.org/10.18632/oncotarget.22345.
[18]
Mediledger (2020), Mediledger project, https://www.mediledger.com/fda-pilot-project. [26]
Menon, C. et al. (2018), “The evaluation of the Italian ’Start-up Act’”, OECD Science, Technology
and Industry Policy Papers, No. 54, OECD Publishing, Paris,
https://dx.doi.org/10.1787/02ab0eb7-en.
[54]
Minoli, D. and B. Occhiogrosso (2018), “Blockchain mechanisms for IoT security”, Internet of
Things, Vol. 1-2, pp. 1-13, http://dx.doi.org/10.1016/j.iot.2018.05.002.
[17]
Morkunas, V., J. Paschen and E. Boon (2019), “How blockchain technologies impact your
business model”, Business Horizons, Vol. 62/3, pp. 295-306,
http://dx.doi.org/10.1016/j.bushor.2019.01.009.
[30]
Nakamoto, S. (2008), Bitcoin: A Peer-to-Peer Electronic Cash System, http://www.bitcoin.org
(accessed on 21 June 2019).
[3]
Nieto, M., L. Santamaria and Z. Fernandez (2013), “Understanding the Innovation Behavior of
Family Firms”, Journal of Small Business Management, Vol. 53/2, pp. 382-399,
http://dx.doi.org/10.1111/jsbm.12075.
[55]
OECD (2020), OECD ICT Access and Usage by Businesses Database,
https://stats.oecd.org/Index.aspx?DataSetCode=ICT_BUS (accessed on 25 November 2020).
[32]
OECD (2020), Taxing Virtual Currencies: An Overview of Tax Treatments and Emerging Tax
Policy Issues, https://www.oecd.org/tax/tax-policy/taxing-virtual-currencies-an-overview-of-
tax-treatments-and-emerging-tax-policy-issues.htm (accessed on 12 November 2020).
[56]
OECD (2020), The Tokenisation of Assets and Potential Implications for Financial Markets,
OECD, Paris, https://www.oecd.org/finance/the-tokenisation-of-assets-and-potential-
implications-for-financial-markets.htm (accessed on 24 January 2020).
[1]
187
THE DIGITAL TRANSFORMATION OF SMES © OECD 2021
OECD (2020), “Venture capital investments”, Structural and Demographic Business Statistics
(database), https://dx.doi.org/10.1787/60395228-en (accessed on 3 September 2020).
[51]
OECD (2019), “ICT Access and Use by Businesses (Edition 2019)”, OECD Telecommunications
and Internet Statistics (database), https://dx.doi.org/10.1787/340cf74a-en (accessed on
14 September 2020).
[31]
OECD (2018), How to deal with Bitcoin and other cryptocurrencies in the System of National
Accounts?, OECD Directorate for Financial and Enterprise Affairs Statistics and Data
Directorate Working Party on Financial Statistics,
http://www.oecd.org/officialdocuments/publicdisplaydocumentpdf/?cote=COM/SDD/DAF(201
8)1&docLanguage=En (accessed on 11 July 2019).
[63]
OECD (2018), SMEs in Public Procurement: Practices and Strategies for Shared Benefits,
OECD Public Governance Reviews, OECD Publishing, Paris,
https://dx.doi.org/10.1787/9789264307476-en.
[58]
OECD (2018), Trade in Counterfeit Goods and the Italian Economy: Protecting Italy’s intellectual
property, Illicit Trade, OECD Publishing, Paris, https://dx.doi.org/10.1787/9789264302426-en.
[44]
OECD (2017), Entrepreneurship at a Glance 2017, OECD Publishing, Paris,
https://dx.doi.org/10.1787/entrepreneur_aag-2017-en.
[49]
OECD/EUIPO (2019), Trends in Trade in Counterfeit and Pirated Goods, Illicit Trade, OECD
Publishing, Paris/European Union Intellectual Property Office,
https://dx.doi.org/10.1787/g2g9f533-en.
[43]
Pike, C. and A. Capobianco (2020), Antitrust and the trust machine,
http://www.oecd.org/daf/competition/antitrust-and-the-trust-machine-2020.pdf (accessed on
16 November 2020).
[35]
Polytechnic of Milan (2020), Blockchain & Distributed Ledger Observatory - activities,
https://www.osservatori.net/it/ricerche/osservatori-attivi/blockchain-distributed-ledger
(accessed on 22 September 2020).
[34]
Polytechnic University of Milan (2020), Blockchain & Distributed Ledger: Unlocking the potential
of the Internet of Value, https://www.osservatori.net/it/eventi/on-demand/convegni/convegno-
risultati-ricerca-osservatorio-blockchain-distributed-ledger-2020 (accessed on
26 November 2020).
[8]
Pournader, M. et al. (2019), “Blockchain applications in supply chains, transport and logistics: A
systematic review of the literature”, International Journal of Production Research, pp. 1-19,
http://dx.doi.org/10.1080/00207543.2019.1650976.
[23]
Responsible Minerals Initiative (2020), Responsible Minerals Initiative Blockchain Guidelines:
Second Edition,
http://www.responsiblemineralsinitiative.org/media/docs/RMI%20Blockchain%20Guidelines%
20-%20Second%20Edition%20-%20March%202020%20FINAL.pdf (accessed on
9 November 2020).
[38]
Reyna, A. et al. (2018), “On blockchain and its integration with IoT. Challenges and
opportunities”, Future Generation Computer Systems, Vol. 88, pp. 173-190,
http://dx.doi.org/10.1016/j.future.2018.05.046.
[28]
188
THE DIGITAL TRANSFORMATION OF SMES © OECD 2021
Sorbe, S. et al. (2019), “Digital Dividend: Policies to Harness the Productivity Potential of Digital
Technologies”, OECD Economic Policy Papers, No. 26, OECD Publishing, Paris,
https://dx.doi.org/10.1787/273176bc-en.
[11]
Start-up Nation Central (2019), Israel’s Cybersecurity Industry in 2018,
http://mlp.startupnationcentral.org/rs/663-SRH-472/images/Start-
Up%20Nation%20Central%20Cybersecurity%20Report%202019.pdf.
[41]
Sun, R. et al. (2020), “Transformation of the Transaction Cost and the Agency Cost in an
Organization and the Applicability of Blockchain—A Case Study of Peer-to-Peer Insurance”,
Frontiers in Blockchain, Vol. 3, http://dx.doi.org/10.3389/fbloc.2020.00024.
[13]
Taboga, M. (2019), Cross-country differences in the size of venture capital financing rounds: a
machine learning approach, Bank of Italy, https://www.bancaditalia.it/pubblicazioni/temi-
discussione/2019/2019-1243/en_Tema_1243.pdf?language_id=1 (accessed on
20 July 2020).
[52]
Taylor, P. et al. (2020), “A systematic literature review of blockchain cyber security”, Digital
Communications and Networks, Vol. 6/2, pp. 147-156,
http://dx.doi.org/10.1016/j.dcan.2019.01.005.
[16]
The World Bank (2016), Israel shares cybersecurity expertise with World Bank client countries,
https://www.worldbank.org/en/news/feature/2016/06/22/israel-shares-cybersecurity-expertise-
with-world-bank-client-countries (accessed on 2020 October 12).
[42]
Ubaldi, B. et al. (Forthcoming), The Uncertain Promise of Blockchain for Government,
https://one.oecd.org/document/GOV/PGC/EGOV(2020)4/REV1/en/pdf (accessed on
12 November 2020).
[57]
Zhang, G. et al. (2018), “Blockchain-Based Data Sharing System for AI-Powered Network
Operations”, Journal of Communications and Information Networks, Vol. 3/3, pp. 1-8,
http://dx.doi.org/10.1007/s41650-018-0024-3.
[19]
Notes
1 For simplicity, in this chapter the terms “DLTs” and “Blockchain” will be used interchangeably, even if the
latter is actually a sub-set of the former.
2 A few types of attacks are still theoretically possible. For example, the “Proof-of-work” consensus protocol
used by the major cryptocurrencies (Bitcoin and Ethereum) could be the object of a “51% attack”, where
the new block of information is tampered with the malevolent consensus of at least 51% of the network.
However, this would require a malevolent actor to invest at least 51% of the computer power (“mining
power”) of the whole network, which in a large global networks would be nearly impossible to be done or
to go unnoticed.
3 The discussion on how such cryptocurrencies should be recorded in the System of National Accounts is
still open at international level (OECD, 2018[63]).
189
THE DIGITAL TRANSFORMATION OF SMES © OECD 2021
4 The two case studies on Israel and Italy were carried out in co-operation with, and at the request of, the
Small and Medium Business Agency of the Ministry of Economy and Industry and the Digital Israel National
Bureau of Israel and the Ministry of Economic Development of Italy, respectively.
5 Start-Up Nation Central, a non-profit organisation that keeps track of innovative businesses, and Israeli
Blockchain Association provided data on small businesses developing blockchain in Israel. In the case of
Italy , the research leveraged the “Startup and innovative SMEs” database, a special business register
created through co-operation between the Ministry of Economic Development (MiSE) and Italian Chamber
of Commerce, and the database of the Blockchain Observatory of Polytechnic University of Milan.
6 Payment service refers to offering businesses an option to accept cryptocurrencies as payment, notably
Bitcoin.
7 In relation to lending & credit, blockchain companies provide peer-to-peer (P2P) financing with
transactions recorded on blockchain.
8 In 2020, the Italian government has introduced a large public sector-backed fund of funds to sustain the
growth of equity financing in the country. The “Fund of Funds Private Equity Italia” is controlled by Italian
public bank “Cassa Depositi e Prestiti” (CDP) and has a target of EUR 600 million to support the
development of the Italian SME market through investments in private equity funds. CDP’s overall
commitment to the fund reached EUR 300 million in 2020.
9 The list of regulators is as follows; the Ministry of Finance, the Ministry of Justice, the National Economy
Council of Israel, the Israel Securities Authority (ISA), the Israel Tax Authority (ITA), the Capital Markets,
Insurance and Savings Authority (CMISA), the Israel Money Laundering and Terror Financing Prohibition
Authority (IMPA), the Israel National Cyber Bureau (INCB), and the Israel Innovation Authority (IIA).
10 “Diploma of Applied Blockchain” and “Advanced Diploma of Applied Blockchain” are the two accredited
courses on blockchain, which include modules on developing blockchain business model, and strategies
in developing blockchain projects (ASQA, 2020[61]).
11 At the time of writing, there are 32 Digital Innovation Hubs that focus on blockchain, such as Frankfurt
School Blockchain Center (FSBC) in Germany, and Future Position X in Sweden (European Commission,
2020[62]).
12 In Italy, for example, three nodes are located, which are managed by Infratel (an in-house company of the
Ministry of Economic Development), INPS (social security authority) and the Polytechnic University of Milan.
13 The official name is public city node. Although the term “node” is used, it is not to be confused with the
concept of node used to describe blockchain networks. The term used in the project refers to cloud-
computing data centres that provide storage and computing power. In other words, the public city node is
not a blockchain node, and the service network itself is not a blockchain infrastructure. (Blockchain Service
Network Development Alliance, 2020[60]).
14 Functional equivalence allows to establish equivalence between an object already within the realm of a
legal rule and another object not yet encompassed by it. Through functional equivalence the “means” by
which a regulated activity will be considered as compliant with the law can be broadened (e.g. an electronic
signature that complies with specific requirements is held to be functionally equivalent to a qualified
signature). Regulatory equivalence allows to establish equivalence between the function of a legal rule
and the function of a technology. Through regulatory equivalence the realm of “activities” for achieving a
policy objective of any given law can be broadened, as some technology can have features that
automatically comply with the policy objective (e.g. publicity of information, which in the case of open
blockchains is intrinsically achieved).

191
THE DIGITAL TRANSFORMATION OF SMES © OECD 2021
Artificial Intelligence (AI) could trigger a new production revolution, radically
transforming business practices and conditions. This chapter aims to provide
an understanding of what AI is, its potential impact on SME activities, and
barriers to adoption. The first section examines the rise of data-driven AI
systems. The second section looks at the implications of these technological
changes on SME practices and business environment. It looks at how AI can
drive greater efficiency in the SME sector, across different industries and
along SMEs’ internal value chain, as well as how AI can improve SME
business conditions. The third section discusses how AI diffuses differently
within the SME sector, and elaborates on the barriers and challenges smaller
businesses face when they consider AI adoption. Overall, this work intends
to stress some areas where policy intervention could be considered.
5 Artificial intelligence: Changing
landscape for SMEs
192
THE DIGITAL TRANSFORMATION OF SMES © OECD 2021
In Brief Highlights
Recent progress in the field of Artificial Intelligence (AI) is largely due to the wide
adoption of data-driven statistical methods and breakthroughs in machine learning,
supported by greater data availability, increased computing power and growing algorithmic
efficiency.
AI systems are built on sensors (to capture data), an operational logic (to analyse data and
infer decisions), and actuators (to intervene in the physical or virtual world). They are trained
with data, and machine learning algorithms can adjust constantly while processing information,
with little human supervision.
The self-improving nature of AI poses challenges, with a risk that AI systems could be
prejudicial to the real world (i.e. an over reliance on biased or poisoned data, and a lack of
explainability of algorithms). In addition, the scope for replicating and scaling up AI solutions
remains limited because their features are little transferable from one environment to another.
The main business applications of AI relate to automation, image/face recognition,
natural language processing, data analytics and predictive capacity.
New AI systems make possible to automate non-routine tasks. Automation could help SMEs
increase productivity, e.g. by refocusing activities on higher value-added functions, or by
reducing costs. Such systems could also help small businesses overcome administrative
bottlenecks and increase responsiveness.
AI allows a significant drop in prediction price and facilitates decision making. SMEs can
execute predictive analytics to lower their exposure to risks, automate business forecasts with
real-time data, or increase efficiency in asset management. Enhanced prediction capability also
allows for greater market segmentation and opens new opportunities for SMEs to innovate.
AI can be applied to most sectors, including services and low-tech sectors, as well as to all
business functions, from pre-production to post-production. Marketing and sales, supply chain
management and production are functions where AI could have great impact. Retail trade,
transport and logistics services, or automotive and assembly manufacturing are sectors where
AI could contribute to creating significant value.
AI can substantially affect SME business environment, by enhancing the efficiency of public
administration, courts and tax authorities, reducing red tape, securing digital infrastructure,
improving SMEs’ access to finance, easing skills management and job matching, or reducing
the costs of experimentation and innovation. At the same time, algorithms increase the risk of
tacit collusion on product and labour markets, and of (likely large) firms sustaining profits and
prices above a fair competitive level, at the detriment of smaller businesses.
Evidence suggests different degrees of AI diffusion across countries, sectors and firm
sizes. This is not without consequence on the capacity of governments to reduce inequalities
and achieve greater inclusiveness. There are concerns that most of the AI benefits could be
reaped by first adopters, while laggards have low or no benefits at all.
Businesses in most countries show low level of data analytics adoption with leading
countries tend to head the ranking in all sectors, while lagging countries tend to lag in all of
them. New AI practices are diffusing across all sectors, with services adapting faster than
193
THE DIGITAL TRANSFORMATION OF SMES © OECD 2021
manufacturing or construction. In information and communication services, there is already an
early majority of enterprises that are performing data analytics.
There is also evidence of an SME gap in using data analytics and/or implementing AI
solutions. SMEs face several barriers to adoption: a lack of data culture; a lack of awareness
about what AI could bring; a need for retraining managers and workers; high sunk costs for
internalising AI, plus a need for engaging complementary investments; few evidence and little
visibility on the returns on investment; and reputational and legal risks.
SMEs can source external AI expertise and solutions from knowledge markets that
typically compensate for a lack of internal capacity. Cloud computing-based Software as a
Services (SaaS) and Machine learning as a Service (MLaaS) offer advantages such as the
scalability of AI solutions and costs, no prerequisite of technical knowledge (for Saas), digital
security features directly embedded in the software.
However, SaaS and MLaaS raise additional challenges related to data ownership and
portability, and lock-ins effects. Moreover, since both are cloud-based, SMEs need an access
to a minimum speed and quality internet connection. Although digital network infrastructure has
gained in reach, speed and sophistication, smaller firms remain less connected.
Data is the key. Governments have a role to play in supporting SMEs in building a culture of
data and improving digital risk management practices.
The human factor is critical. Raising awareness among SME managers and workers on AI
benefits, and building the conditions of a trustworthy transition are required. National and local
governments should also co-ordinate actions for reskilling SME managers and workers, and
ensure a participatory approach in redesigning work processes and training AI models.
The issue of financing should be addressed, first by building more evidence on the return on
investment of AI business applications, in order to inform not only SME managers and business
owners, but also investors and financial institutions, and by identifying mechanisms for bridging
the financing gap until AI can deliver its full promises.
Regulators and policy makers should ensure the well-functioning of knowledge markets
that provide cloud solutions embedding AI technologies, as well as the transfer of knowledge
that could enable SMEs to scale up their capacity before being eventually able to develop their
own AI solutions.
Adopting a differentiated industrial approach on AI transition(s), through sectoral studies
and business use cases, could help inform relevant stakeholders and account for the low
transferability of AI knowledge across environments.
Supporting mutual learning, through platforms such as the OECD Digital for SMEs Initiative
and the OECD.AI Policy Observatory could help better understand the role large firms, business
associations, chambers of commerce, academia, national and local governments, international
organisations, and SMEs as well, could play to advance on these different agendas.
194
THE DIGITAL TRANSFORMATION OF SMES © OECD 2021
Artificial Intelligence in a nutshell
Artificial intelligence (AI) has regained attention in the last decade, after “winters” of general pessimism
regarding the promise of the technology. The capacity of computing systems has expanded with greater
data availability, increased computing power and storage capacity, and substantial improvements in
algorithmic efficiency. Continued improvements in hardware and software and the convergence of
complementary technologies, e.g. sensors, robotics, Internet of Things (IoT), have paved the way for a
new generation of more autonomous AI systems that require less human intervention (if at all), for adjusting
and upgrading.
AI is becoming increasingly prevalent across diverse spheres of the business and social life, given its ability
to enhance the automation and prediction capacity of firms and organisations, or to bring natural language
processing and image recognition to a new level. Applications are pervasive, embedded in software,
devices or platforms, foreshadowing far-reaching consequences on the functioning and performance of
firms, industries and places.
All firms are not placed on an equal footing in embracing the AI revolution (OECD, 2017[1]), and in
orchestrating the changes in mindsets, practices or processes that are yet required. Small and medium-
sized enterprises (SMEs) face greater disadvantages in the transformation, and the OECD recognises the
need to give them special attention when designing AI policies in order to ensure a fair transition (OECD,
2019[2]; Daor et al., 2020[3]).
This chapter aims to better understand what AI is, its business applications and their potential impact on
SME activities, and barriers to adoption. The first part examines the recent conceptual and technological
developments around AI and the shift in AI paradigm. The second part looks at the implications of these
technological shifts on SME practices and business environment. It looks at how AI can drive greater
efficiency in the SME sector, how AI applications can benefit SMEs across different industries and along
their internal value chain, as well as how AI can improve SME business conditions and help level the
playing field. The third part of this chapter discusses how AI diffuses differently within the SME sector, and
elaborates on the barriers and challenges smaller businesses face when they turn to AI adoption.
Main characteristics of AI
The idea of objects being capable of conducting formal reasoning has existed for long. The concept
became more concrete during the mid-20th century with the introduction of the term “Artificial Intelligence”.
Box 5.1 presents some insights on the early development of AI.
Box 5.1. A brief history of Artificial Intelligence over the 20th century
The confluence of disciplines, including computer science and neurology, in the early 20th century
supported concerted efforts to create machines with human-like cognitive capability. Such concepts
and systems were named in different ways, such as “electronic brain” (Walter, 1950[4]) and “learning
machine” (Turing, 1950[5]).
“The Dartmouth Summer Research Project on Artificial Intelligence” held in 1956 is widely considered
as the cornerstone of AI (Moor, 2006[6]; Negnevitsky, 2005[7]). A small group of researchers, gathered
to exchange their vision on self-improving intelligent machines, which paved the way for a new
academic discipline on AI. A computer programme named Logic Theorist was developed during the
conference, which later came to be known as the first AI programme.
Thereafter came a series of research and development (R&D) programmes of sophisticated computers
that aimed to further mimic human intelligence, from solving algebra word problems to having basic
conversation with humans. Early successes in the field of AI, followed by ambitious predictions of what
195
THE DIGITAL TRANSFORMATION OF SMES © OECD 2021
the future of the technology could be, garnered much attention from both the private and public sectors.
However, the enthusiasm of techno-optimists soon faded away, as progress in the field did not meet
the early expectations. The community expressed growing concerns about what results could be
effectively achieved. This time was referred to as “AI winter,” depicting general pessimism regarding
the promise of the technology, which lead to cut back in R&D funding and a downscale of the field
(Hendler, 2008[8]; Agrawal, Gans and Goldfarb, 2018[9]).
The AI winter began melting as from the mid-1990s. However, researchers on computer-engineering
methods, avoided labelling their work as such, in order to circumvent the negative perception of the
technology. Instead, they associated themselves with subfields of AI, e.g. computer vision or expert
system, without mentioning AI. The private sector was also reluctant in using the term AI to describe
their solutions. For example, when promoting Deep Blue, a chess-playing computer that won against
human chess champion in 1997, IBM explicitly stated that the computer did not use Artificial Intelligence,
although it integrated computing techniques that are considered today as AI along the current standard
(Korf, 1997[10]).
Since its early developments over the 20th century, the boundaries of AI research and applications
have been expanding, along with the development of new methodologies and the deployment of
complementary technologies. Although AI is often referred to as a single technological concept, it consists
of a variety of technology subfields that are often inter-related. Examples include natural language
processing, speech recognition, image processing and robotics. From the 1990s onwards, noticeable
advancements in AI have enabled systems to learn and adapt to changing environments and perform
increasingly sophisticated tasks.
Despite a broad use of the term, until recently, there was no internationally accepted definition of
AI. In 2018, the AI Group of Experts at the OECD (AIGO) came up with a description of AI that aimed to
be understandable, technology-neutral and encompass AI definitions commonly used by the scientific,
business and policy communities. The AIGO definition also aimed to inform the development of the OECD
Recommendation of the Council on Artificial Intelligence (OECD, 2019[2]). Therefore, the OECD defines an
AI system as “a machine-based systems that are able to infer models and formulate predictions,
recommendations, or draw decisions, that can in turn influence environment, whether real or virtual,
according to objectives defined by human” (OECD, 2019[2]).
An AI system is comprised of three key elements: sensors, operational logic and actuators
(Figure 5.1). Raw data from the environment is collected by sensors. Data is then processed according to
a given set of objectives that are encoded into an operational logic. An AI model constitutes an important
part of the operational logic as it reflects the environment and describes its structure and/or its internal
dynamics.
An AI model can be built based on knowledge and data generated by humans, automated tools, or
a combination of both. Model inference shapes the model outcomes in the form of prediction,
recommendations or decisions.
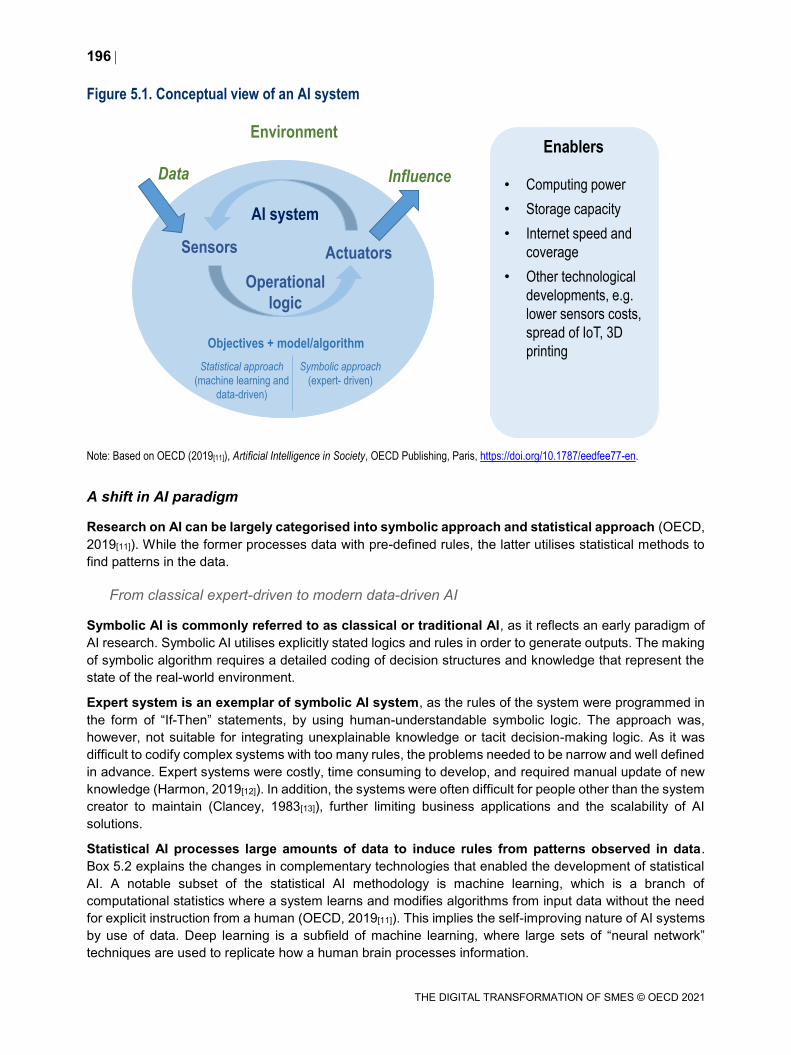
196
THE DIGITAL TRANSFORMATION OF SMES © OECD 2021
Figure 5.1. Conceptual view of an AI system
Note: Based on OECD (2019[11]), Artificial Intelligence in Society, OECD Publishing, Paris, https://doi.org/10.1787/eedfee77-en.
A shift in AI paradigm
Research on AI can be largely categorised into symbolic approach and statistical approach (OECD,
2019[11]). While the former processes data with pre-defined rules, the latter utilises statistical methods to
find patterns in the data.
From classical expert-driven to modern data-driven AI
Symbolic AI is commonly referred to as classical or traditional AI, as it reflects an early paradigm of
AI research. Symbolic AI utilises explicitly stated logics and rules in order to generate outputs. The making
of symbolic algorithm requires a detailed coding of decision structures and knowledge that represent the
state of the real-world environment.
Expert system is an exemplar of symbolic AI system, as the rules of the system were programmed in
the form of “If-Then” statements, by using human-understandable symbolic logic. The approach was,
however, not suitable for integrating unexplainable knowledge or tacit decision-making logic. As it was
difficult to codify complex systems with too many rules, the problems needed to be narrow and well defined
in advance. Expert systems were costly, time consuming to develop, and required manual update of new
knowledge (Harmon, 2019[12]). In addition, the systems were often difficult for people other than the system
creator to maintain (Clancey, 1983[13]), further limiting business applications and the scalability of AI
solutions.
Statistical AI processes large amounts of data to induce rules from patterns observed in data.
Box 5.2 explains the changes in complementary technologies that enabled the development of statistical
AI. A notable subset of the statistical AI methodology is machine learning, which is a branch of
computational statistics where a system learns and modifies algorithms from input data without the need
for explicit instruction from a human (OECD, 2019[11]). This implies the self-improving nature of AI systems
by use of data. Deep learning is a subfield of machine learning, where large sets of “neural network”
techniques are used to replicate how a human brain processes information.
AI system
Sensors Actuators
Environment
Objectives + model/algorithm
Enablers
• Computing power
• Storage capacity
• Internet speed and
coverage
• Other technological
developments, e.g.
lower sensors costs,
spread of IoT, 3D
printing
Data Influence
Operational
logic
Symbolic approach
(expert- driven)
Statistical approach
(machine learning and
data-driven)
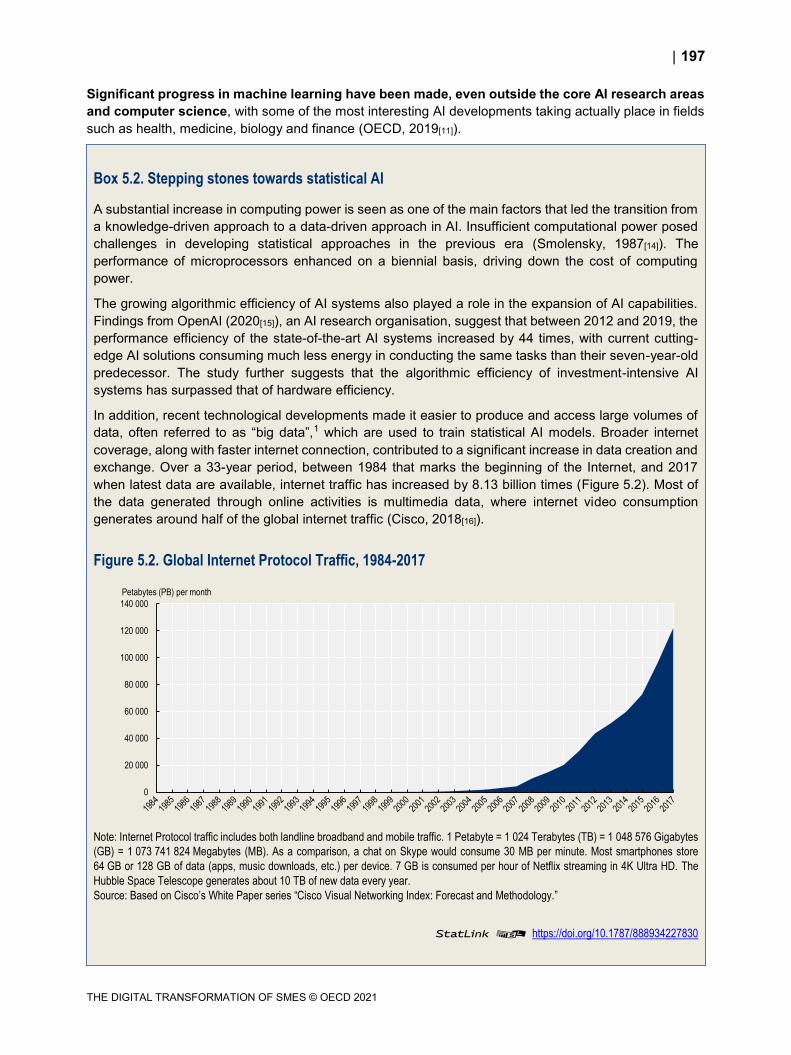
197
THE DIGITAL TRANSFORMATION OF SMES © OECD 2021
Significant progress in machine learning have been made, even outside the core AI research areas
and computer science, with some of the most interesting AI developments taking actually place in fields
such as health, medicine, biology and finance (OECD, 2019[11]).
Box 5.2. Stepping stones towards statistical AI
A substantial increase in computing power is seen as one of the main factors that led the transition from
a knowledge-driven approach to a data-driven approach in AI. Insufficient computational power posed
challenges in developing statistical approaches in the previous era (Smolensky, 1987[14]). The
performance of microprocessors enhanced on a biennial basis, driving down the cost of computing
power.
The growing algorithmic efficiency of AI systems also played a role in the expansion of AI capabilities.
Findings from OpenAI (2020[15]), an AI research organisation, suggest that between 2012 and 2019, the
performance efficiency of the state-of-the-art AI systems increased by 44 times, with current cutting-
edge AI solutions consuming much less energy in conducting the same tasks than their seven-year-old
predecessor. The study further suggests that the algorithmic efficiency of investment-intensive AI
systems has surpassed that of hardware efficiency.
In addition, recent technological developments made it easier to produce and access large volumes of
data, often referred to as “big data”,1 which are used to train statistical AI models. Broader internet
coverage, along with faster internet connection, contributed to a significant increase in data creation and
exchange. Over a 33-year period, between 1984 that marks the beginning of the Internet, and 2017
when latest data are available, internet traffic has increased by 8.13 billion times (Figure 5.2). Most of
the data generated through online activities is multimedia data, where internet video consumption
generates around half of the global internet traffic (Cisco, 2018[16]).
Figure 5.2. Global Internet Protocol Traffic, 1984-2017
Note: Internet Protocol traffic includes both landline broadband and mobile traffic. 1 Petabyte = 1 024 Terabytes (TB) = 1 048 576 Gigabytes
(GB) = 1 073 741 824 Megabytes (MB). As a comparison, a chat on Skype would consume 30 MB per minute. Most smartphones store
64 GB or 128 GB of data (apps, music downloads, etc.) per device. 7 GB is consumed per hour of Netflix streaming in 4K Ultra HD. The
Hubble Space Telescope generates about 10 TB of new data every year.
Source: Based on Cisco’s White Paper series “Cisco Visual Networking Index: Forecast and Methodology.”
StatLink 2 https://doi.org/10.1787/888934227830
0
20 000
40 000
60 000
80 000
100 000
120 000
140 000
Petabytes (PB) per month
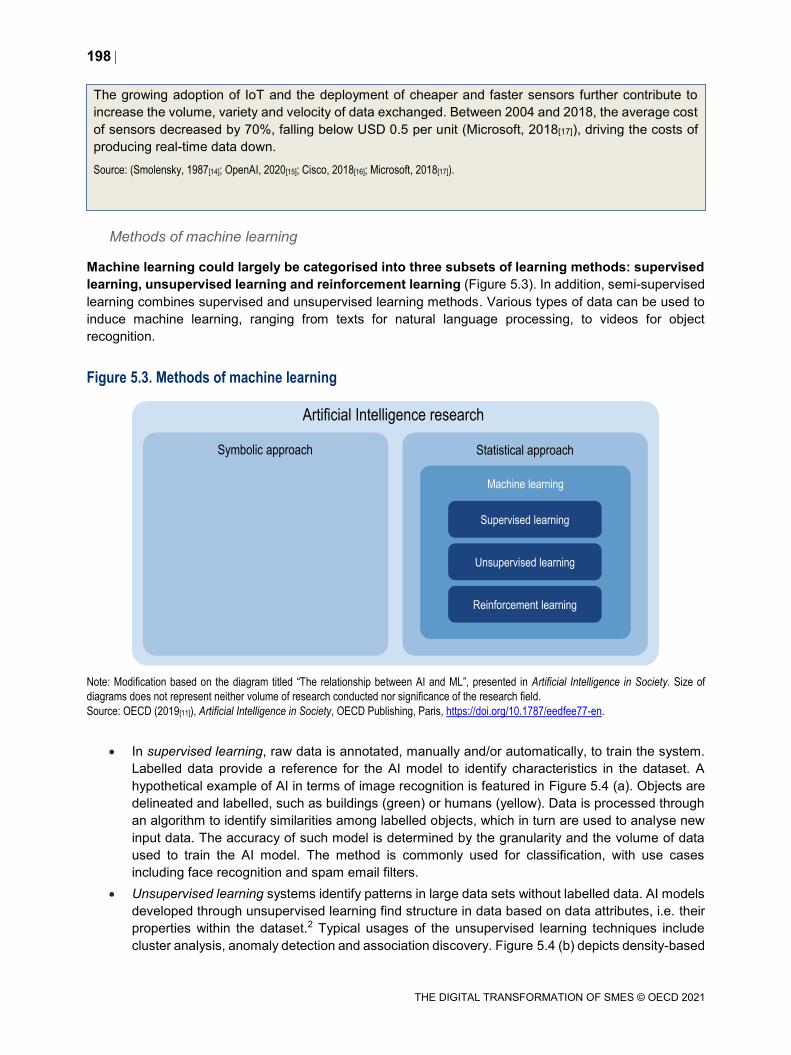
198
THE DIGITAL TRANSFORMATION OF SMES © OECD 2021
The growing adoption of IoT and the deployment of cheaper and faster sensors further contribute to
increase the volume, variety and velocity of data exchanged. Between 2004 and 2018, the average cost
of sensors decreased by 70%, falling below USD 0.5 per unit (Microsoft, 2018[17]), driving the costs of
producing real-time data down.
Source: (Smolensky, 1987[14]; OpenAI, 2020[15]; Cisco, 2018[16]; Microsoft, 2018[17]).
Methods of machine learning
Machine learning could largely be categorised into three subsets of learning methods: supervised
learning, unsupervised learning and reinforcement learning (Figure 5.3). In addition, semi-supervised
learning combines supervised and unsupervised learning methods. Various types of data can be used to
induce machine learning, ranging from texts for natural language processing, to videos for object
recognition.
Figure 5.3. Methods of machine learning
Note: Modification based on the diagram titled “The relationship between AI and ML”, presented in Artificial Intelligence in Society. Size of
diagrams does not represent neither volume of research conducted nor significance of the research field.
Source: OECD (2019[11]), Artificial Intelligence in Society, OECD Publishing, Paris, https://doi.org/10.1787/eedfee77-en.
In supervised learning, raw data is annotated, manually and/or automatically, to train the system.
Labelled data provide a reference for the AI model to identify characteristics in the dataset. A
hypothetical example of AI in terms of image recognition is featured in Figure 5.4 (a). Objects are
delineated and labelled, such as buildings (green) or humans (yellow). Data is processed through
an algorithm to identify similarities among labelled objects, which in turn are used to analyse new
input data. The accuracy of such model is determined by the granularity and the volume of data
used to train the AI model. The method is commonly used for classification, with use cases
including face recognition and spam email filters.
Unsupervised learning systems identify patterns in large data sets without labelled data. AI models
developed through unsupervised learning find structure in data based on data attributes, i.e. their
properties within the dataset.2 Typical usages of the unsupervised learning techniques include
cluster analysis, anomaly detection and association discovery. Figure 5.4 (b) depicts density-based
Artificial Intelligence research
Symbolic approach Statistical approach
Machine learning
Supervised learning
Unsupervised learning
Reinforcement learning
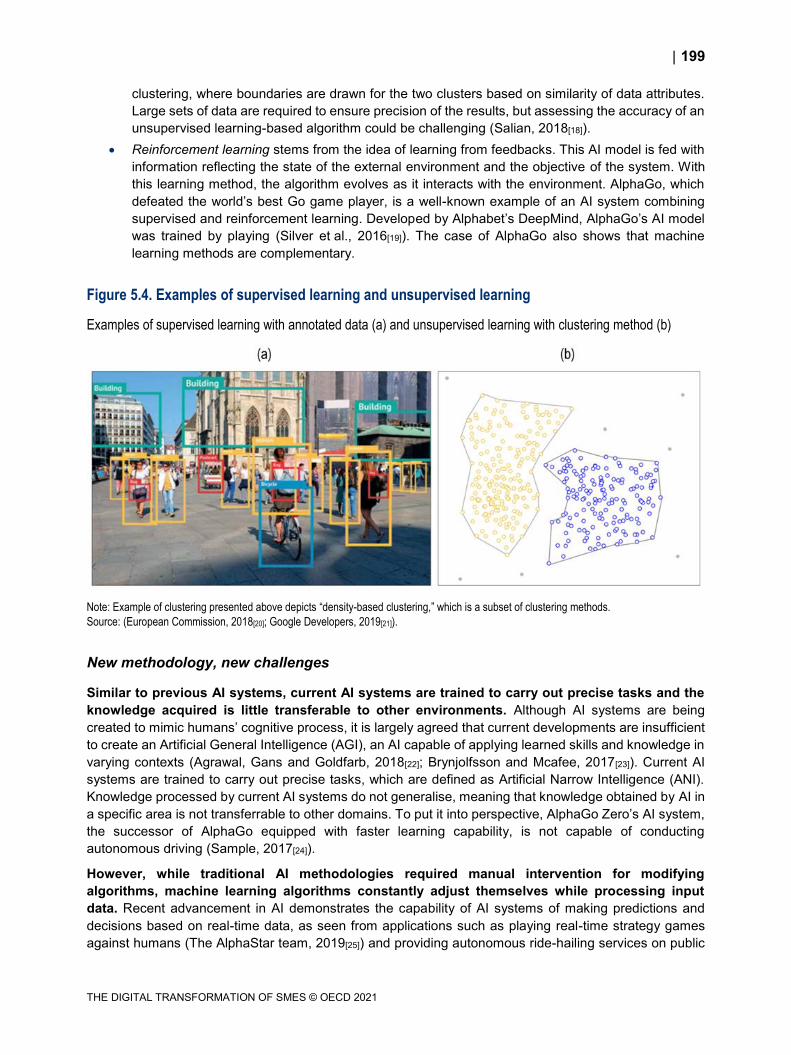
199
THE DIGITAL TRANSFORMATION OF SMES © OECD 2021
clustering, where boundaries are drawn for the two clusters based on similarity of data attributes.
Large sets of data are required to ensure precision of the results, but assessing the accuracy of an
unsupervised learning-based algorithm could be challenging (Salian, 2018[18]).
Reinforcement learning stems from the idea of learning from feedbacks. This AI model is fed with
information reflecting the state of the external environment and the objective of the system. With
this learning method, the algorithm evolves as it interacts with the environment. AlphaGo, which
defeated the world’s best Go game player, is a well-known example of an AI system combining
supervised and reinforcement learning. Developed by Alphabet’s DeepMind, AlphaGo’s AI model
was trained by playing (Silver et al., 2016[19]). The case of AlphaGo also shows that machine
learning methods are complementary.
Figure 5.4. Examples of supervised learning and unsupervised learning
Examples of supervised learning with annotated data (a) and unsupervised learning with clustering method (b)
Note: Example of clustering presented above depicts “density-based clustering,” which is a subset of clustering methods.
Source: (European Commission, 2018[20]; Google Developers, 2019[21]).
New methodology, new challenges
Similar to previous AI systems, current AI systems are trained to carry out precise tasks and the
knowledge acquired is little transferable to other environments. Although AI systems are being
created to mimic humans’ cognitive process, it is largely agreed that current developments are insufficient
to create an Artificial General Intelligence (AGI), an AI capable of applying learned skills and knowledge in
varying contexts (Agrawal, Gans and Goldfarb, 2018[22]; Brynjolfsson and Mcafee, 2017[23]). Current AI
systems are trained to carry out precise tasks, which are defined as Artificial Narrow Intelligence (ANI).
Knowledge processed by current AI systems do not generalise, meaning that knowledge obtained by AI in
a specific area is not transferrable to other domains. To put it into perspective, AlphaGo Zero’s AI system,
the successor of AlphaGo equipped with faster learning capability, is not capable of conducting
autonomous driving (Sample, 2017[24]).
However, while traditional AI methodologies required manual intervention for modifying
algorithms, machine learning algorithms constantly adjust themselves while processing input
data. Recent advancement in AI demonstrates the capability of AI systems of making predictions and
decisions based on real-time data, as seen from applications such as playing real-time strategy games
against humans (The AlphaStar team, 2019[25]) and providing autonomous ride-hailing services on public
200
THE DIGITAL TRANSFORMATION OF SMES © OECD 2021
roads (Chu, 2019[26]). However, despite AI systems’ ability to sift through vast amounts of data faster than
human beings, in various areas, from medicine (Wakefield, 2020[27]) to law (Thomas Suh, 2018[28]), the
self-improving nature of the current wave of AI poses challenges.
Examining the robustness of statistical AI systems poses challenge. Unlike symbolic AI systems that
are built with syntax that humans can understand and amend, statistical AI systems require uncommon
ability in comprehending the conclusion process of mathematical models. In contrast to conventional
software that are programmed manually, machine learning algorithms improve as they process more input
data, making it sometimes difficult for humans to understand the statistical logic behind the results (Garcez
et al., 2019[29]). AI algorithms are often dubbed as a black box (Castelvecchi, 2016[30]; H. James Wilson,
2018[31]) and their lack of explainability limits the scope for human intervention to correct unintended
results. In addition, an algorithm could yield different results after multiple runs, albeit being trained with
identical data sets (Rogel-Salazar, 2018[32]). The rules designed at the initial phase of the machine learning
process, and input data, may not be sufficient in explaining the output of the AI systems.
Data play a critical role in training statistical AI, and their characteristics influence the predictions
and decisions of AI systems. In other words, having adequate data is crucial in building viable AI
algorithms. AI systems that follow a statistical approach are based on a certain level of confidence that the
data used to train the model actually reflect the real-life environment, while this may not be the case
(Brynjolfsson and Mcafee, 2017[23]). When data fed into AI systems are biased or poisoned, AI systems’
outputs reflect these same biases and preferences. Therefore, the output could be skewed due to an over-
or under-representation of some sub-populations in the training data, or because of pre-existing reliability
issues in data, implying that AI systems could be partial and prejudicial to the real world. In addition, the
challenges of interpreting biased results are exacerbated because diagnosing and correcting errors in
algorithms is difficult. For example, AI-based hiring tools have been recognised to be based on unproven
metrics (Harwell, 2018[33]), discriminate female candidates (Dastin, 2018[34]) and are “far from perfect”
(Wright, 2019[35]). Therefore, the applications of AI should be guided in order to limit negative externalities.
Acknowledging the risk of unintended effects from AI systems, efforts have been made both at the
national and international levels to provide guidelines for ethical and trustworthy AI. For example,
the High-Level Expert Group on AI (AI HLEG) set up by the European Commission published “Ethics
Guidelines for Trustworthy AI” in 2019, which calls for lawful, ethical and robust AI (AI HLEG, 2019[36]).
International organisations, including the OECD (Box 5.3), as well as UNESCO, have published reports
and guidelines on AI ethics.
Box 5.3. The OECD Principles on AI call on governments to pay special attention to SMEs in their national policies
The OECD recognises AI as a general purpose technology that can have a profound impact on societies
and economies. They set standards for governments and other actors to promote use of AI that is
innovative and that respects human rights and democratic values. As an OECD legal instrument, the
Principles represent a common aspiration for its adhering countries to shape a human-centric approach
to trustworthy AI.
The Principles were adopted by the OECD Council at Ministerial level on 22 May 2019. In June 2019
the G20 adopted the same AI Principles, providing the beginning of a global policy and ethical
benchmark. As of March 2020, 44 countries, both member and non-member states, are adherents to
the Recommendation (OECD, 2019[2]).
The Recommendation is the first AI standard at the intergovernmental level. It provides five principles
for the responsible stewardship of trustworthy AI.
201
THE DIGITAL TRANSFORMATION OF SMES © OECD 2021
First, inclusive growth sustainable development and well-being. Stakeholders should engage in
creating trustworthy AI that can contribute to inducing outcomes that are beneficial for people,
as well as for the planet.
Second, human-centred values and fairness. The values of human rights, democracy, and rule
of law should be incorporated throughout the AI system’s lifecycle, while providing appropriate
mechanisms and safeguards such as human intervention.
Third, transparency and explainability. AI actors that develop or operate AI systems should
provide information to foster an overall understanding of the systems among stakeholders, in
which people affected by AI systems could comprehend the outcome and challenge the decision
when needed.
Fourth, robustness, security and safety. AI systems need to function appropriately while
ensuring traceability, while AI actors need to apply systematic risk management approach to
mitigate safety risks.
Fifth, accountability. AI actors should respect the principles and should be accountable for
proper operation of AI systems.
The Principle further calls for special attention to Small and Medium-sized Enterprises (SMEs) and
recommends the adherents to implement national policies and international co-operation while having
in mind SMEs.
The OECD (2019[2]) also provides five recommendations for national policies and international co-
operation in creating trustworthy AI. The recommendations include 1) investing in AI research and
development; 2) fostering a digital ecosystem for AI; 3) shaping an enabling policy environment for AI;
4) building human capacity and preparing for labour market transformation; and 5) international co-
operation for trustworthy AI.
To help implement the OECD AI Principles in policies and practices, the OECD launched the OECD AI
Policy Observatory in early 2020 and formed a multi-stakeholder and multi-disciplinary OECD Network
of Experts on Artificial Intelligence (ONE AI). ONE AI is developing practical guidance to assist countries
in developing and monitoring trustworthy AI systems through three working groups focusing on:
i) classifying AI systems; ii) implementing trustworthy AI; and iii) identifying good practices for national
AI policies as well as iv) a task force on AI compute.
Source: OECD (2019[2]), Recommendation of the Council on Artificial Intelligence, OECD Legal Instrument, OECD, Paris,
https://legalinstruments.oecd.org/en/instruments/OECD-LEGAL-0449 and OECD (2020[37]), OECD Policy Observatory: A platform to share
and shape AI policies, www.oecd.org/going-digital/ai/about-the-oecd-ai-policy-observatory.pdf (accessed on 27 February 2020).
Implications of AI on SME business environment and practices
AI can affect and benefit SMEs in two ways: by altering their business environment and easing the
conditions under which they do business, or by enabling them to change their business models and
practices, which could ultimately allow them to increase productivity and outreach, and scale-up.
Obviously, these two dynamics are closely interrelated, as SMEs adapt to changing business conditions
by transforming their processes and products, or alter market conditions by innovating.
How can AI drive a revolution in the SME sector?
With recent improvements in machine learning, AI creates the conditions for a fundamental change
in businesses from the prior wave of computerisation (Brynjolfsson, Rock and Syverson, 2017[38]).
Before the introduction of machine learning, the transfer of knowledge-intensive tasks and functions in the
business process to computer systems was limited to explicit knowledge. In addition, building classical AI
202
THE DIGITAL TRANSFORMATION OF SMES © OECD 2021
systems required extensive efforts of codification. Enhanced capability of sensors and advances in data
processing, such as computer vision, enable machines to learn tacit knowledge that would otherwise be
challenging for workers to fully explain. Based on the patterns identified in data sets, AI systems can learn
embodied expertise on their own, which is then utilised to provide recommendations or predictions.
AI presents the characteristics of a general purpose technology (GPT) in the sense that the
technology is generic, has a pervasive effect across industries and can spur the development of other
technologies or innovation, with high positive externalities. Box 5.4 provides further explanation of GPT.
Box 5.4. General purpose technology: The case of electric motor
A general purpose technology (GPT) is the kind of technology that could have long-term pervasive effects
on the economy by raising its productivity potential. Examples of GPTs include steam engine, electric
motor and semiconductor (Bresnahan and Trajtenberg, 1995[39]). GPT typically offers substantial room for
economic improvements compared to existing technologies. Due to its generic and pervasive nature, it
has the potential to be used across industries and be improved over time. It also spurs complementary
technologies or innovations that could further foster advancements in the GPT. GPT can transform
production systems, as well as organisations, industries and business models (OECD, 2010[40]).
However, a wide adoption of GPT requires time and effort. The case of integrating electricity in
production process illustrates the slow transition process. The electrification process in the US started
in the early 1880s. However, the diffusion of the technology has been slow, with more than half of the
manufacturing businesses not connected to the electricity grid 30 years after (David and Wright,
2006[41]). Atkeson and Kehoe (2007[42]) point to a manufacturers’ reluctance in adapting to new
knowledge as the main reason.
Companies that adopted electric motors in lieu of steam engine were replacing large steam engines
with equivalently large electric generators as a single power source. They often reverted to the old
production system, as businesses were not able to see noticeable increase in profit. This was because
the manufacturers failed to overcome their inertia, with insufficient understanding of the potential
benefits of electrification, and were unable to absorb innovation induced by the new technology
(Henderson, 2006[43]). The benefits of adoption came much later, when production systems were
reconceived. Rather than having a large electric motor to convey kinetic energy, a small electric motor
powered individual machine, which facilitated maintenance and increased the efficiency of the
production. The new system enhanced labour productivity and streamlined manufacturing process
(Brynjolfsson, Rock and Syverson, 2017[38]; Harford, 2017[44]).
The main business applications of AI relate to automation, image/face recognition, natural
language processing, data analytics and decision making, with the latter including enhanced
information management and predictive capacity. The following section discusses benefits for businesses
in using AI-based applications. The biggest benefits for enterprises could come from the ability of AI to
broaden the boundary of task automation and enhance prediction, which are closely interrelated.
Automation of a broader range of tasks
By identifying patterns in datasets and learning from tacit non-structured knowledge, new AI systems
make possible to automate non-routine tasks that previously required human intervention. Process
automation is not limited to manufacturing and could also be used in providing services (Huang and Rust,
2018[45]). With ability to learn from the environment, automated machines could perform more tasks that are
hard or dangerous humans, such as loading/unloading charges (e.g. from trucks) or precision tasks that
require an acute perception of the environment (e.g. precision welding) (Duobao, 2019[46]).
203
THE DIGITAL TRANSFORMATION OF SMES © OECD 2021
AI-enabled automation could free workers from repetitive low value-added tasks, provided their
jobs could be re-organised and their skillset upgraded (Box 5.5). For example, AI-integrated chatbots
and voicebots can perform pre-programmed contact centre tasks. While the former provide text-based
responses, the latter simulate conversation with customers. The AI call centre solutions can provide
standard responses to inquiries such as product stock availability, opening hours, and reservation
cancellation (Google, 2020[47]). Multiple requests could be addressed simultaneously, answering
customers’ inquiries without waiting time. In case of complex requests, the AI tools can analyse
conversations and reroute the calls to relevant human interlocutors while providing them with necessary
information from the previous conversation.
These new waves of automation, enabled by AI systems, could help SMEs increase productivity,
e.g. by refocusing business activities on higher value-added functions, by reducing human and economic
costs associated with accidents or injuries, or improving work environment and conditions (e.g. dirty tasks).
The implementation of such systems could also help small businesses overcome administrative
bottlenecks and increase their responsiveness at lower costs, for instance by responding to customers’
simple inquiries and enabling customer interaction 24/7.
Box 5.5. To which extent will AI replace jobs?
Empirical studies suggest that AI diffusion may not translate into a complete job replacement. Actual
work replacement by automated machines could be lower than past projections suggested (McKinsey
Global Institute, 2017[48]). Frey and Osborne (2017[49]) estimated that about 47% of US employment
was at high risk of automation. Nedelkoska and Quintini (2018[50]), with more granular occupational
data, found that 14% of all jobs across the OECD were at a high risk of automation, while another 32%
were likely to be significantly affected. Arntz et al. (2016[51]) even found, for a sample of 21 OECD
countries, a risk rate of 9%.
Current ANIs are capable of substituting specific tasks that consist in jobs and some occupations
actually face high risk of automation (e.g. food preparation assistants, drivers and mobile plant
operators, labourers in mining, construction, manufacturing and transport, stationary plant and machine
operators and refuse workers, etc.) (Nedelkoska and Quintini, 2018[50]). As the geographic distribution
of these jobs varies across OECD countries and regions, the risk of automation is also highly variable
from one place to another (OECD, 2018[52]). Regions with smaller risk of automation are characterised
by a larger proportion of workers with tertiary education and jobs in services, and are highly urbanised.
Some jobs are, however, considered safer from automation. These are those that imply performing:
i) tasks linked to perception and manipulation (e.g. dexterity), ii) tasks that require creativity, such as
artistic activities or coming up with original ideas, problem-solving or teaching abilities; iii) tasks that rely
on social intelligence, such as being persuasive, negotiating aspects of a project or caring for others
(Frey and Osborne, 2017[49]; Nedelkoska and Quintini, 2018[50]).
Early use cases show that AI also induces substitution and complementary effects, which modify
workers’ task composition and reinforce their skillset, rather than replacing them entirely (OECD,
2019[53]). Furthermore, whether an occupation might be replaced by automation would also depend on
technological factors such as the direction of the technological change, as well as firm-level factors,
such as the sector of activity (Ekkhehard, Merola and Samaan, 2018[54]).
Lastly, the application of AI is likely to induce a demand for new skills as observed during previous
waves of automation (Acemoglu and Restrepo, 2018[55]). It could also be expected an increase in
demand for the tasks that cannot be automated.
204
THE DIGITAL TRANSFORMATION OF SMES © OECD 2021
Increased efficiency in predictive analytics for decision making
AI systems are capable of making statistical predictions, which means inferring diagnosis and analysis
based on the information previously obtained, while sifting through big data and adjusting their algorithms.
The use of advanced statistical techniques for deriving prediction is commonly referred to as predictive
analytics, which is a subset area of data analytics.
The main difference from conventional predictive modelling is that AI allows a significant drop in
prediction price and facilitates data-driven decision making in the business context (Agrawal, Gans
and Goldfarb, 2018[22]), since lower prediction cost could ease access to a wider range of prediction
methods. SMEs can execute predictive analytics to map uncertainties and lower their exposure to risks,
while identifying possible opportunities. AI-based prediction tools could automate business projections
such as sales and budget forecasts and inventory management, making it easier for companies to forecast
their businesses with real-time data.
For instance, AI can increase efficiency in asset maintenance and management. Predictive
maintenance enables identification of when and where an asset is likely to malfunction, and repairing of its
parts before they break down. Information on the condition of assets is collected in real-time through IoT
sensors, which are combined with historical life cycle data to diagnose the status of assets and detect
anomalies. Compared to reactive maintenance, predictive maintenance presents substantial benefits by
reducing downtime (or risks of), and subsequently reducing cost of production or business interruption in
case of incident, while avoiding unnecessary routine maintenance.
Enhanced prediction capability allows for a greater market segmentation and price differentiation
and gives SMEs a possibility to innovate and adapt business processes, as they can better predict
individual customer behaviour and price sensitivity, and can anticipate shifts in demand (OECD, 2019[56]).
Based on German firm-level data, Niebel et al. (2018[57]) found that the use of data analytics increases the
likelihood of a firm becoming a product innovator and achieving market success through its innovation.
How can AI applications benefit SMEs?
AI can be applied to most industrial activities, from optimising multi-machine systems to enhancing
industrial research (OECD, 2019[11]). McKinsey Global Institute (2018[58]) identified retail, transport and
logistics, travel, automotive and assembly and consumer packaged goods as sectors that AI could
contribute substantially in creating value. Evidence from recent surveys suggest that transportation,
logistics, automotive and technology sectors already lead in terms of the share of early AI-adopting firms,
while process industries (such as chemicals) lag behind (Boston Consulting Group, 2018[59]). The 2019
OECD report on Artificial Intelligence also presents several sectors where AI technologies are seeing rapid
uptake: transport, finance, marketing and advertising, as well as science, healthcare, security or the public
sector. In these sectors, the report highlights that AI systems can detect patterns in enormous volumes of
data and model complex, interdependent systems to improve decision making and cost efficiency (OECD,
2019[11]).
Table 5.1 presents some examples of recent business applications of AI in sectors that are traditionally
dominated by SMEs (OECD, 2019[56]).
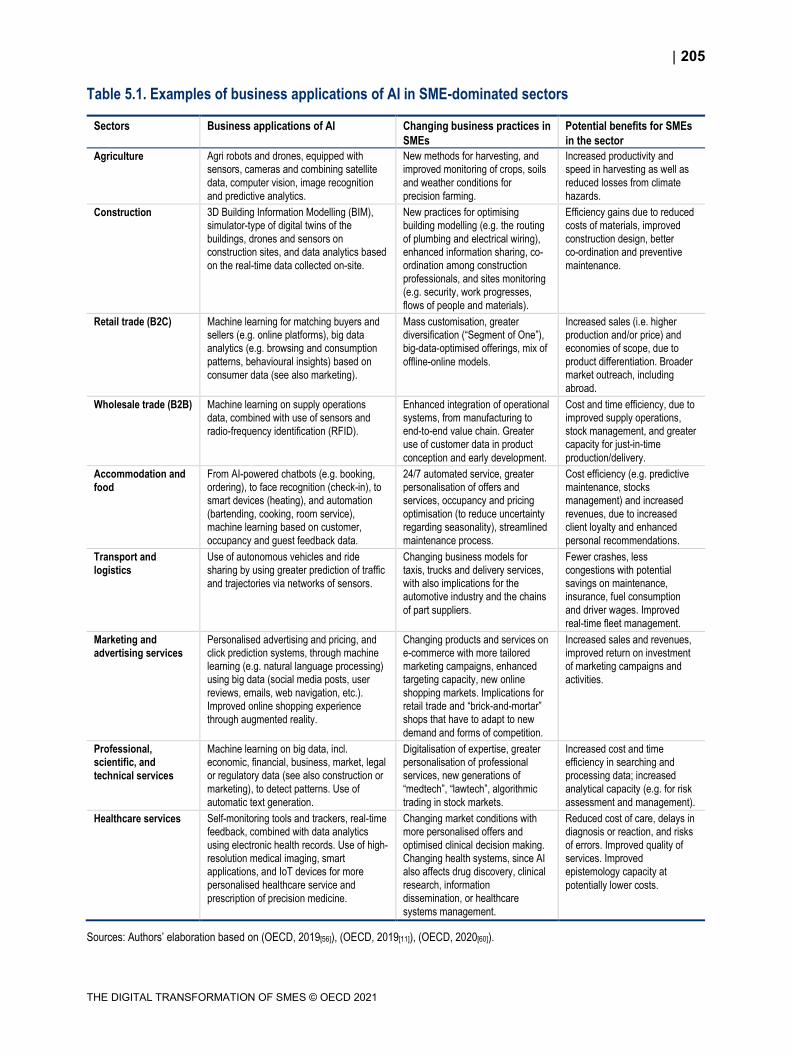
205
THE DIGITAL TRANSFORMATION OF SMES © OECD 2021
Table 5.1. Examples of business applications of AI in SME-dominated sectors
Sectors Business applications of AI Changing business practices in
SMEs
Potential benefits for SMEs
in the sector
Agriculture Agri robots and drones, equipped with sensors, cameras and combining satellite
data, computer vision, image recognition
and predictive analytics.
New methods for harvesting, and improved monitoring of crops, soils
and weather conditions for
precision farming.
Increased productivity and speed in harvesting as well as
reduced losses from climate
hazards.
Construction 3D Building Information Modelling (BIM), simulator-type of digital twins of the
buildings, drones and sensors on construction sites, and data analytics based
on the real-time data collected on-site.
New practices for optimising building modelling (e.g. the routing
of plumbing and electrical wiring), enhanced information sharing, co-ordination among construction
professionals, and sites monitoring (e.g. security, work progresses,
flows of people and materials).
Efficiency gains due to reduced costs of materials, improved
construction design, better co-ordination and preventive
maintenance.
Retail trade (B2C) Machine learning for matching buyers and sellers (e.g. online platforms), big data analytics (e.g. browsing and consumption
patterns, behavioural insights) based on
consumer data (see also marketing).
Mass customisation, greater diversification (“Segment of One”), big-data-optimised offerings, mix of
offline-online models.
Increased sales (i.e. higher production and/or price) and economies of scope, due to
product differentiation. Broader market outreach, including
abroad.
Wholesale trade (B2B) Machine learning on supply operations data, combined with use of sensors and
radio-frequency identification (RFID).
Enhanced integration of operational systems, from manufacturing to end-to-end value chain. Greater use of customer data in product
conception and early development.
Cost and time efficiency, due to improved supply operations, stock management, and greater capacity for just-in-time
production/delivery.
Accommodation and
food
From AI-powered chatbots (e.g. booking, ordering), to face recognition (check-in), to smart devices (heating), and automation
(bartending, cooking, room service), machine learning based on customer,
occupancy and guest feedback data.
24/7 automated service, greater personalisation of offers and services, occupancy and pricing
optimisation (to reduce uncertainty regarding seasonality), streamlined
maintenance process.
Cost efficiency (e.g. predictive maintenance, stocks management) and increased
revenues, due to increased client loyalty and enhanced
personal recommendations.
Transport and
logistics
Use of autonomous vehicles and ride sharing by using greater prediction of traffic
and trajectories via networks of sensors.
Changing business models for taxis, trucks and delivery services, with also implications for the automotive industry and the chains
of part suppliers.
Fewer crashes, less congestions with potential savings on maintenance, insurance, fuel consumption
and driver wages. Improved
real-time fleet management.
Marketing and
advertising services
Personalised advertising and pricing, and click prediction systems, through machine learning (e.g. natural language processing) using big data (social media posts, user
reviews, emails, web navigation, etc.). Improved online shopping experience
through augmented reality.
Changing products and services on e-commerce with more tailored marketing campaigns, enhanced targeting capacity, new online
shopping markets. Implications for retail trade and “brick-and-mortar” shops that have to adapt to new
demand and forms of competition.
Increased sales and revenues, improved return on investment of marketing campaigns and
activities.
Professional, scientific, and
technical services
Machine learning on big data, incl. economic, financial, business, market, legal or regulatory data (see also construction or
marketing), to detect patterns. Use of
automatic text generation.
Digitalisation of expertise, greater personalisation of professional services, new generations of
“medtech”, “lawtech”, algorithmic
trading in stock markets.
Increased cost and time efficiency in searching and processing data; increased
analytical capacity (e.g. for risk
assessment and management).
Healthcare services Self-monitoring tools and trackers, real-time feedback, combined with data analytics
using electronic health records. Use of high-resolution medical imaging, smart applications, and IoT devices for more
personalised healthcare service and
prescription of precision medicine.
Changing market conditions with more personalised offers and
optimised clinical decision making. Changing health systems, since AI also affects drug discovery, clinical
research, information dissemination, or healthcare
systems management.
Reduced cost of care, delays in diagnosis or reaction, and risks
of errors. Improved quality of services. Improved epistemology capacity at
potentially lower costs.
Sources: Authors’ elaboration based on (OECD, 2019[56]), (OECD, 2019[11]), (OECD, 2020[60]).
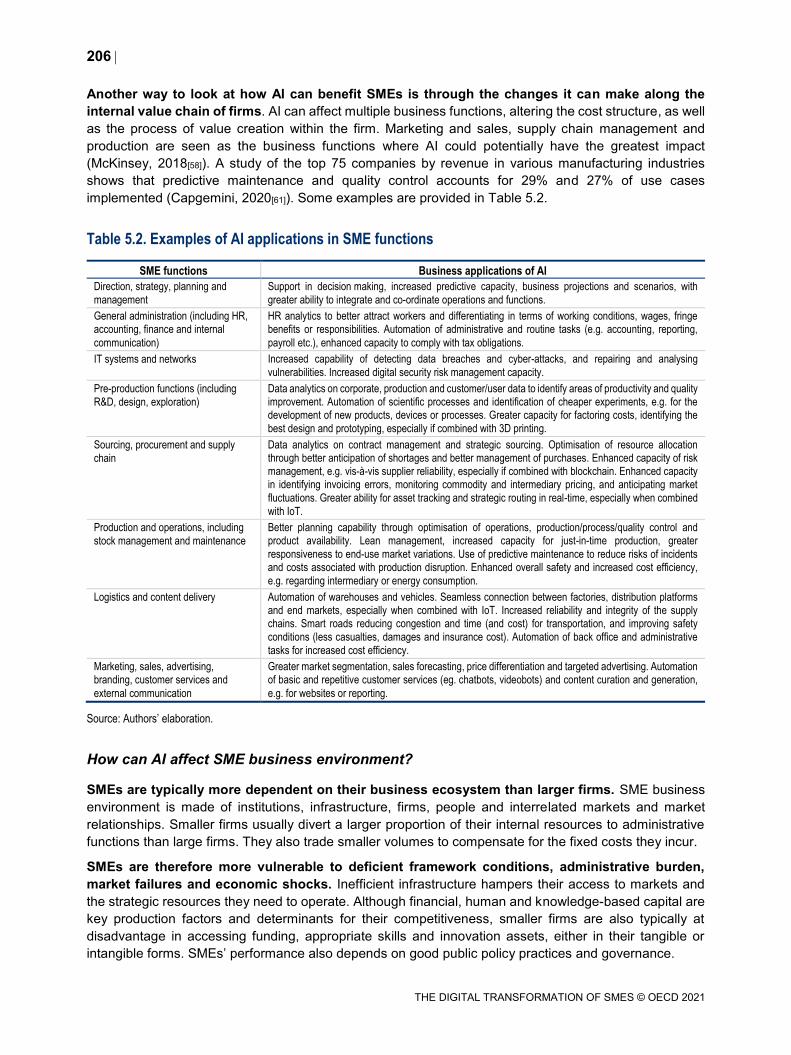
206
THE DIGITAL TRANSFORMATION OF SMES © OECD 2021
Another way to look at how AI can benefit SMEs is through the changes it can make along the
internal value chain of firms. AI can affect multiple business functions, altering the cost structure, as well
as the process of value creation within the firm. Marketing and sales, supply chain management and
production are seen as the business functions where AI could potentially have the greatest impact
(McKinsey, 2018[58]). A study of the top 75 companies by revenue in various manufacturing industries
shows that predictive maintenance and quality control accounts for 29% and 27% of use cases
implemented (Capgemini, 2020[61]). Some examples are provided in Table 5.2.
Table 5.2. Examples of AI applications in SME functions
SME functions Business applications of AI
Direction, strategy, planning and
management
Support in decision making, increased predictive capacity, business projections and scenarios, with
greater ability to integrate and co-ordinate operations and functions.
General administration (including HR, accounting, finance and internal
communication)
HR analytics to better attract workers and differentiating in terms of working conditions, wages, fringe benefits or responsibilities. Automation of administrative and routine tasks (e.g. accounting, reporting,
payroll etc.), enhanced capacity to comply with tax obligations.
IT systems and networks Increased capability of detecting data breaches and cyber-attacks, and repairing and analysing
vulnerabilities. Increased digital security risk management capacity.
Pre-production functions (including
R&D, design, exploration)
Data analytics on corporate, production and customer/user data to identify areas of productivity and quality improvement. Automation of scientific processes and identification of cheaper experiments, e.g. for the development of new products, devices or processes. Greater capacity for factoring costs, identifying the
best design and prototyping, especially if combined with 3D printing.
Sourcing, procurement and supply
chain
Data analytics on contract management and strategic sourcing. Optimisation of resource allocation through better anticipation of shortages and better management of purchases. Enhanced capacity of risk management, e.g. vis-à-vis supplier reliability, especially if combined with blockchain. Enhanced capacity in identifying invoicing errors, monitoring commodity and intermediary pricing, and anticipating market
fluctuations. Greater ability for asset tracking and strategic routing in real-time, especially when combined
with IoT.
Production and operations, including
stock management and maintenance
Better planning capability through optimisation of operations, production/process/quality control and product availability. Lean management, increased capacity for just-in-time production, greater
responsiveness to end-use market variations. Use of predictive maintenance to reduce risks of incidents and costs associated with production disruption. Enhanced overall safety and increased cost efficiency,
e.g. regarding intermediary or energy consumption.
Logistics and content delivery Automation of warehouses and vehicles. Seamless connection between factories, distribution platforms and end markets, especially when combined with IoT. Increased reliability and integrity of the supply chains. Smart roads reducing congestion and time (and cost) for transportation, and improving safety
conditions (less casualties, damages and insurance cost). Automation of back office and administrative
tasks for increased cost efficiency.
Marketing, sales, advertising, branding, customer services and
external communication
Greater market segmentation, sales forecasting, price differentiation and targeted advertising. Automation of basic and repetitive customer services (eg. chatbots, videobots) and content curation and generation,
e.g. for websites or reporting.
Source: Authors’ elaboration.
How can AI affect SME business environment?
SMEs are typically more dependent on their business ecosystem than larger firms. SME business
environment is made of institutions, infrastructure, firms, people and interrelated markets and market
relationships. Smaller firms usually divert a larger proportion of their internal resources to administrative
functions than large firms. They also trade smaller volumes to compensate for the fixed costs they incur.
SMEs are therefore more vulnerable to deficient framework conditions, administrative burden,
market failures and economic shocks. Inefficient infrastructure hampers their access to markets and
the strategic resources they need to operate. Although financial, human and knowledge-based capital are
key production factors and determinants for their competitiveness, smaller firms are also typically at
disadvantage in accessing funding, appropriate skills and innovation assets, either in their tangible or
intangible forms. SMEs’ performance also depends on good public policy practices and governance.
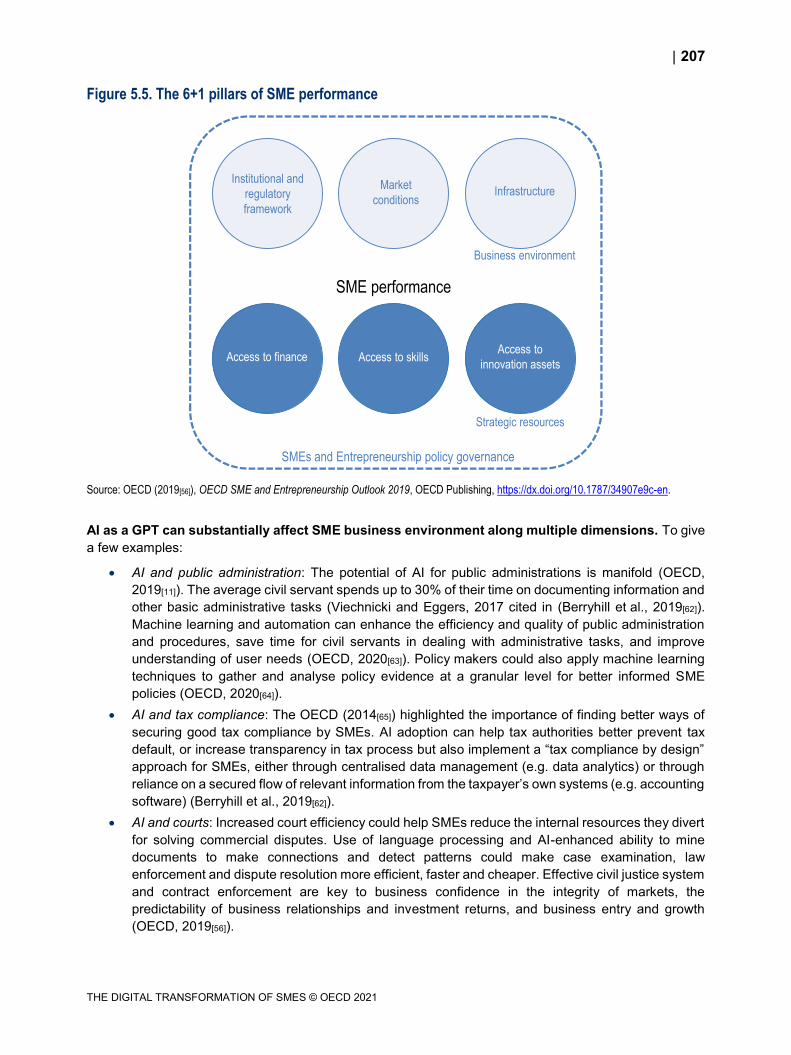
207
THE DIGITAL TRANSFORMATION OF SMES © OECD 2021
Figure 5.5. The 6+1 pillars of SME performance
Source: OECD (2019[56]), OECD SME and Entrepreneurship Outlook 2019, OECD Publishing, https://dx.doi.org/10.1787/34907e9c-en.
AI as a GPT can substantially affect SME business environment along multiple dimensions. To give
a few examples:
AI and public administration: The potential of AI for public administrations is manifold (OECD,
2019[11]). The average civil servant spends up to 30% of their time on documenting information and
other basic administrative tasks (Viechnicki and Eggers, 2017 cited in (Berryhill et al., 2019[62]).
Machine learning and automation can enhance the efficiency and quality of public administration
and procedures, save time for civil servants in dealing with administrative tasks, and improve
understanding of user needs (OECD, 2020[63]). Policy makers could also apply machine learning
techniques to gather and analyse policy evidence at a granular level for better informed SME
policies (OECD, 2020[64]).
AI and tax compliance: The OECD (2014[65]) highlighted the importance of finding better ways of
securing good tax compliance by SMEs. AI adoption can help tax authorities better prevent tax
default, or increase transparency in tax process but also implement a “tax compliance by design”
approach for SMEs, either through centralised data management (e.g. data analytics) or through
reliance on a secured flow of relevant information from the taxpayer’s own systems (e.g. accounting
software) (Berryhill et al., 2019[62]).
AI and courts: Increased court efficiency could help SMEs reduce the internal resources they divert
for solving commercial disputes. Use of language processing and AI-enhanced ability to mine
documents to make connections and detect patterns could make case examination, law
enforcement and dispute resolution more efficient, faster and cheaper. Effective civil justice system
and contract enforcement are key to business confidence in the integrity of markets, the
predictability of business relationships and investment returns, and business entry and growth
(OECD, 2019[56]).
Market
conditions
Institutional and
regulatory
framework
Infrastructure
Access to finance Access to skillsAccess to
innovation assets
Strategic resources
Business environment
SME performance
SMEs and Entrepreneurship policy governance
208
THE DIGITAL TRANSFORMATION OF SMES © OECD 2021
AI and market competition: Market structure and conditions are critical for SMEs to do business
and compete. Entry costs, factor endowment and sunk costs are important determinants of firm
size and its capacity to scale up (OECD, 2019[56]). Algorithms are fundamentally affecting market
conditions for competition (OECD, 2017[66]). By providing firms with powerful automated
mechanisms to monitor prices, implement common policies, send market signals or optimise joint
profits with deep learning techniques, algorithms could enable firms to achieve tacit collusion,
create cartels and sustain profits above a fair competitive level, without necessarily any agreement.
AI and infrastructure: AI systems are increasingly relevant for the digital security of information and
communication technology (ICT) infrastructure, and transport and energy infrastructure. Machine
learning can help address the rising number of cyber-attacks, the skills shortage in the digital
security industry and the growing sophistication of threats (see Chapter 3 on cybersecurity).
Conversely, AI can also make cyber-attacks even more damageable and difficult to defeat, placing
physical and virtual infrastructure at risk.
AI and access to finance: The bank and finance industry has long used statistical approaches for
credit scoring. Neural network techniques enable the analysis of vast amount of credit report data,
also lowering default risk and the cost of lending, and making it more profitable for credit institutions
to serve some segments of the SME population that were left aside (e.g. small informal businesses
or those operating in remote areas). In addition, AI can further facilitate SMEs’ access to credit,
especially to SMEs with no records and credit history, as alternative data sources (e.g. social media
activities, online shopping information, shipping data, insurance claims, etc.) allow Fintech actors
to better assess SMEs’ creditworthiness (OECD, 2020[67]).
AI and labour markets: AI is expected to change the world of work (OECD, 2019[53]). While
discussions often touch upon the issue of job replacement by automation, the use of AI and “people
analytics” in the workplace has far-reaching implications for occupational health and safety,
privacy, evaluation of work performance and hiring and firing decisions (OECD, 2019[68]). Collusion
on labour markets cannot be excluded either. However, AI creates enhanced possibilities in
matching skills needs and supply, or in creating new solutions for training workers on the job
through interactive augmented and virtual reality.
AI and access to knowledge and innovation assets: As scientists may have reached a “peak
reading”, the automation of science can accelerate scientific discovery, reduce the costs of
experimentation, ease (robot) training and improve data sharing and reproducibility (OECD,
2018[69]; OECD, 2019[11]), bringing frontier knowledge within the reach of a greater number.
Considering the wide range of issues at stake, the following part of this report focuses more specifically on
the potential of AI in steering SME transformation and on the barriers to AI adoption.
AI diffusion, barriers and modalities
AI diffusion and the SME gap
Evidence suggest different degrees of AI diffusion in the business sector across countries, sectors
and firm sizes. This is not without consequence on the capacity of governments to reduce the inequalities
that already exist across industries, firms and places, and that could further enlarge with the diffusion of
AI. Brynjolfsson and McElheran (2016[70]) estimate that the timing of diffusion is actually essential, in the
case of data analytics, as leading adopters are receiving the biggest gains, while laggards that reach the
frontier later tend to have lower net benefits, or not at all.
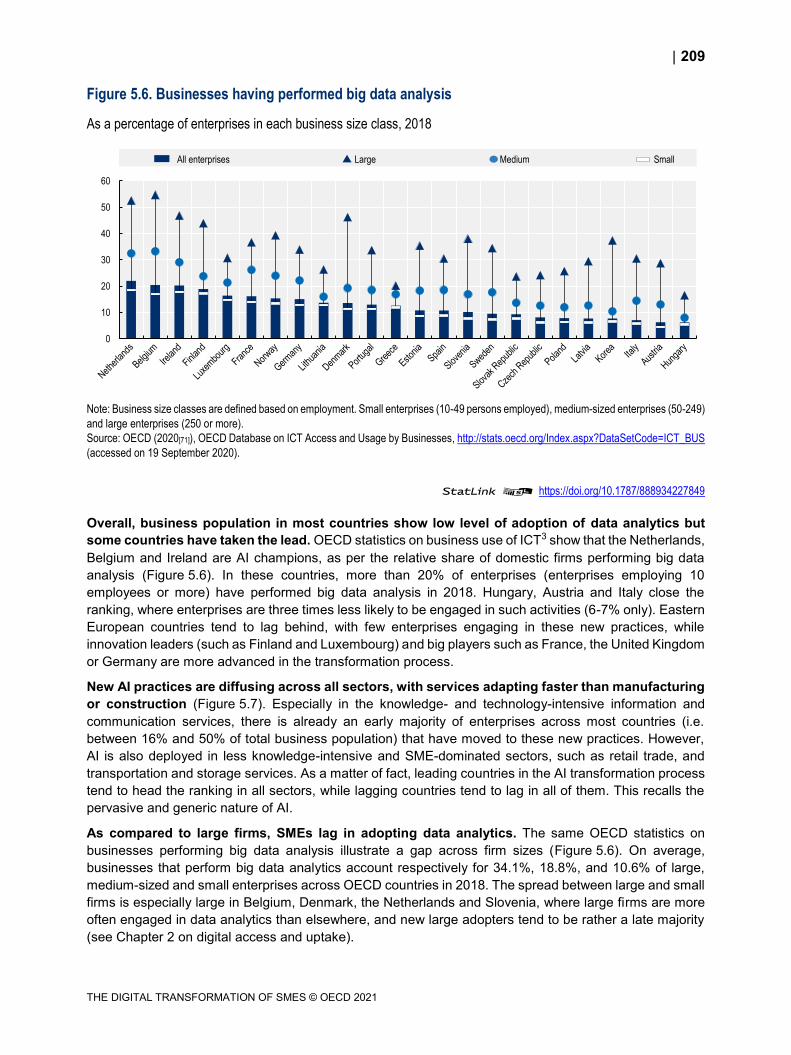
209
THE DIGITAL TRANSFORMATION OF SMES © OECD 2021
Figure 5.6. Businesses having performed big data analysis
As a percentage of enterprises in each business size class, 2018
Note: Business size classes are defined based on employment. Small enterprises (10-49 persons employed), medium-sized enterprises (50-249)
and large enterprises (250 or more).
Source: OECD (2020[71]), OECD Database on ICT Access and Usage by Businesses, http://stats.oecd.org/Index.aspx?DataSetCode=ICT_BUS
(accessed on 19 September 2020).
StatLink 2 https://doi.org/10.1787/888934227849
Overall, business population in most countries show low level of adoption of data analytics but
some countries have taken the lead. OECD statistics on business use of ICT3 show that the Netherlands,
Belgium and Ireland are AI champions, as per the relative share of domestic firms performing big data
analysis (Figure 5.6). In these countries, more than 20% of enterprises (enterprises employing 10
employees or more) have performed big data analysis in 2018. Hungary, Austria and Italy close the
ranking, where enterprises are three times less likely to be engaged in such activities (6-7% only). Eastern
European countries tend to lag behind, with few enterprises engaging in these new practices, while
innovation leaders (such as Finland and Luxembourg) and big players such as France, the United Kingdom
or Germany are more advanced in the transformation process.
New AI practices are diffusing across all sectors, with services adapting faster than manufacturing
or construction (Figure 5.7). Especially in the knowledge- and technology-intensive information and
communication services, there is already an early majority of enterprises across most countries (i.e.
between 16% and 50% of total business population) that have moved to these new practices. However,
AI is also deployed in less knowledge-intensive and SME-dominated sectors, such as retail trade, and
transportation and storage services. As a matter of fact, leading countries in the AI transformation process
tend to head the ranking in all sectors, while lagging countries tend to lag in all of them. This recalls the
pervasive and generic nature of AI.
As compared to large firms, SMEs lag in adopting data analytics. The same OECD statistics on
businesses performing big data analysis illustrate a gap across firm sizes (Figure 5.6). On average,
businesses that perform big data analytics account respectively for 34.1%, 18.8%, and 10.6% of large,
medium-sized and small enterprises across OECD countries in 2018. The spread between large and small
firms is especially large in Belgium, Denmark, the Netherlands and Slovenia, where large firms are more
often engaged in data analytics than elsewhere, and new large adopters tend to be rather a late majority
(see Chapter 2 on digital access and uptake).
0
10
20
30
40
50
60
All enterprises Large Medium Small
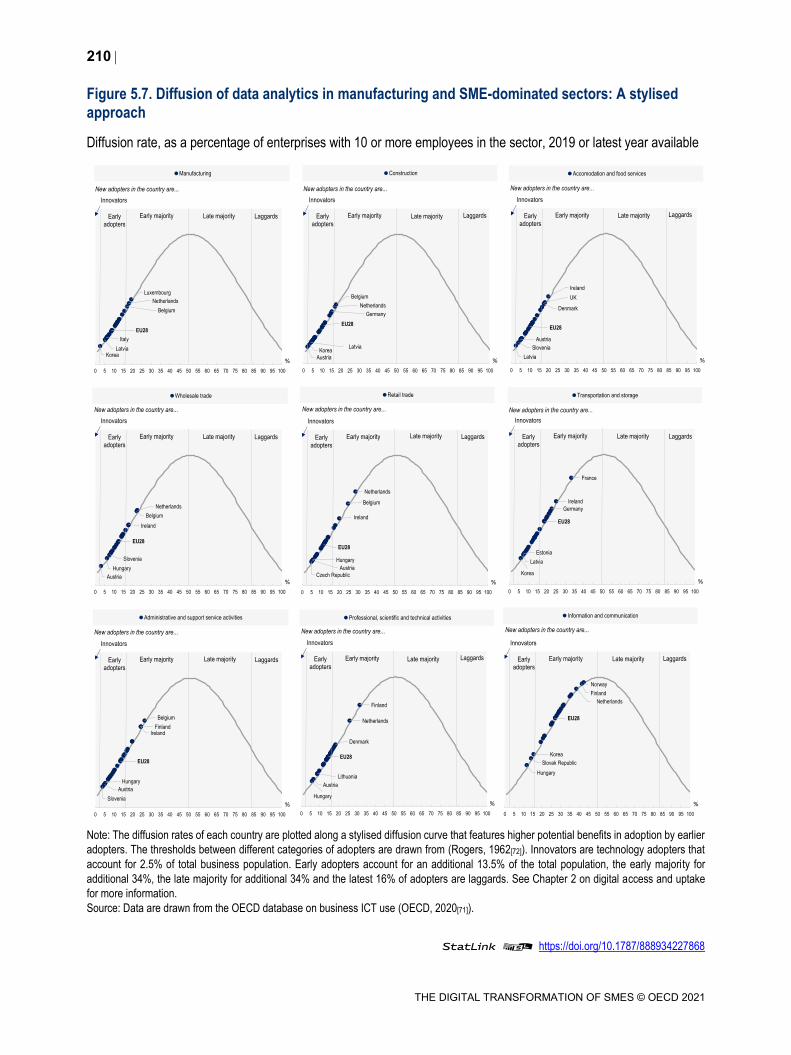
210
THE DIGITAL TRANSFORMATION OF SMES © OECD 2021
Figure 5.7. Diffusion of data analytics in manufacturing and SME-dominated sectors: A stylised approach
Diffusion rate, as a percentage of enterprises with 10 or more employees in the sector, 2019 or latest year available
Note: The diffusion rates of each country are plotted along a stylised diffusion curve that features higher potential benefits in adoption by earlier
adopters. The thresholds between different categories of adopters are drawn from (Rogers, 1962[72]). Innovators are technology adopters that
account for 2.5% of total business population. Early adopters account for an additional 13.5% of the total population, the early majority for
additional 34%, the late majority for additional 34% and the latest 16% of adopters are laggards. See Chapter 2 on digital access and uptake
for more information.
Source: Data are drawn from the OECD database on business ICT use (OECD, 2020[71]).
StatLink 2 https://doi.org/10.1787/888934227868
Hungary
Slovak Republic
Korea
EU28
Netherlands
Finland
Norway
0 5 10 15 20 25 30 35 40 45 50 55 60 65 70 75 80 85 90 95 100
Information and communication
LaggardsLate majorityEarly majority
Innovators
Early adopters
%
New adopters in the country are...
Hungary
Austria
Lithuania
EU28
Denmark
Netherlands
Finland
0 5 10 15 20 25 30 35 40 45 50 55 60 65 70 75 80 85 90 95 100
Professional, scientific and technical activities
LaggardsLate majorityEarly majority
Innovators
Early adopters
%
New adopters in the country are...
Slovenia
Austria
Hungary
EU28
FinlandIreland
Belgium
0 5 10 15 20 25 30 35 40 45 50 55 60 65 70 75 80 85 90 95 100
Administrative and support service activities
LaggardsLate majorityEarly majority
Innovators
Early adopters
%
New adopters in the country are...
Austria
Hungary
Slovenia
EU28
Ireland
Belgium
Netherlands
0 5 10 15 20 25 30 35 40 45 50 55 60 65 70 75 80 85 90 95 100
Wholesale trade
LaggardsLate majorityEarly majority
Innovators
Early adopters
%
New adopters in the country are...
Czech Republic
Austria
Hungary
EU28
Ireland
Belgium
Netherlands
0 5 10 15 20 25 30 35 40 45 50 55 60 65 70 75 80 85 90 95 100
Retail trade
LaggardsLate majorityEarly majority
Innovators
Early adopters
%
New adopters in the country are...
Korea
Latvia
Estonia
EU28
Germany
Ireland
France
0 5 10 15 20 25 30 35 40 45 50 55 60 65 70 75 80 85 90 95 100
Transportation and storage
LaggardsLate majorityEarly majority
Innovators
Early adopters
%
New adopters in the country are...
Austria
KoreaLatvia
EU28
Germany
Netherlands
Belgium
0 5 10 15 20 25 30 35 40 45 50 55 60 65 70 75 80 85 90 95 100
Construction
LaggardsLate majorityEarly majority
Innovators
Early adopters
%
New adopters in the country are...
Latvia
Slovenia
Austria
EU28
Denmark
UK
Ireland
0 5 10 15 20 25 30 35 40 45 50 55 60 65 70 75 80 85 90 95 100
Accomodation and food services
LaggardsLate majorityEarly majority
Innovators
Early adopters
%
New adopters in the country are...
KoreaLatvia
Italy
EU28
Belgium
Netherlands
Luxembourg
0 5 10 15 20 25 30 35 40 45 50 55 60 65 70 75 80 85 90 95 100
Manufacturing
LaggardsLate majorityEarly majority
Innovators
Early adopters
%
New adopters in the country are...
211
THE DIGITAL TRANSFORMATION OF SMES © OECD 2021
National studies and statistics also stress an SME gap in implementing AI solutions. In Korea,
around 50% of small enterprises surveyed in 2018 responded that they were not aware of work-related AI
application or services, which was higher than for large businesses (29%) (MSIT and NIA, 2020[73]).
According to Denmark’s ICT Use in Enterprises Survey, 24% of large enterprises used machine learning
or Artificial Intelligence in 2019, compared to 5% of small enterprises (Statistics Denmark, 2019[74]). In the
case of Canada, large companies are 7.5 times more likely to use automated systems for inspection (e.g.
vision- or sensor-based) than SMEs (Galindo-Rueda, Verger and Ouellet, 2020[75]). However, these
statistics do not allow for an international comparison because the definition of AI and its applications used
by national statistical institutions differ across countries.
Barriers and challenges for SMEs
SMEs face barriers in adopting AI, some of which are common to other digital technologies, such as lack
of awareness and readiness, and some that largely stem from the very characteristics of machine learning
techniques.
High costs and uncertainty about AI benefits
Building and maintaining an AI system remain a costly investment. Training AI systems requires large
amount of data, as well as human intervention to process the data and make them machine-readable. For
example, labelling an hour of video typically takes eight hours (Murgia, 2019[76]). Despite the availability of
open-source AI tools and declining training costs of AI algorithms (Coleman et al., 2020[77]), SMEs may
lack cash flow and finance to bear these capital expenses, especially since calculating the cost of
developing AI system and its benefits are often challenging (Accenture, 2019[78]). Furthermore, uncertainty
and the lack of clear evidence and business plans can raise the cost of accessing credit (OECD, 2019[56]).
An effective implementation of AI solutions requires developing and adopting complementary
technologies, whereas SMEs lag behind large firms in all technological areas (see Chapter 2 on
digital access and uptake). Investments in 5G and high-speed internet infrastructure are needed to
increase digital connectivity and to facilitate data transfer. Further diffusion of cloud computing services
could help increase data storage and computing power capacity, making AI applications more accessible
and affordable. Technologies closely related to generating and maintaining reliable data, e.g. IoT and
blockchain, or technologies enabling AI systems to interact with the real-world environment, such as 3D
printing, augmented reality and robotics, are few examples of complementary technologies that can
support AI deployment and enhance its transformative potential.
A broader AI diffusion requires investments in adapting the technology to business processes and
skills structure. Reconfiguring business practices means going beyond a simple replacement of current
systems with AI solutions in order to optimise the usage of AI systems. Adapting to AI-enhanced working
environment also calls for a retraining of the workforce, in order to provide workers with the skills for training
AI algorithms and interpreting predictions. In some sectors or business functions, the skills gap could be
substantial. In addition, reconfiguring business activities for accommodating AI solutions include
organisational changes and reskilling to integrate complementary technologies.
However, the AI transformation may not deliver immediate benefits and productivity gains, which
raises sunk costs for SMEs before a growth potential could be achieved. As observed with the
adoption of electric motors in production (Box 5.4), it is expected that it would take time to build a sufficient
stock of AI subfields before seeing effect (Brynjolfsson, Rock and Syverson, 2017[38]). Gartner (2019[79]), a
consultancy with a specialty in technology, anticipates that most advanced AI technologies will require at
least 2 years to become mainstream. In addition, how AI will be effectively applied in businesses will vary
and depend on the purpose of adoption and the combination of technologies (Table 5.1). In fact, apart from
innovative start-ups, firms in general, with SMEs in particular, may be reluctant to uptake innovations that
212
THE DIGITAL TRANSFORMATION OF SMES © OECD 2021
could result in losses on a short run due to their limited revenues and cash flow (Holmes, Levine and
Schmitz, 2012[80]).
Reputational and legal risks
The lack of explainability of AI systems that use machine learning has been one of the obstacles
to further adoption, and could raise a series of challenges for users and producers of AI solutions
(Michael Chui, 2018[81]). While this is also true for large tech firms (Vincent, 2018[82]), SMEs are particularly
more at disadvantage, even those that are using AI without knowing it. For instance, when an issue occurs
with an AI solution provided by a third party, it is highly likely that SMEs may not be able to react in a timely
manner, and may not have the authority or capacity to audit the algorithm. SMEs using AI-enhanced tools
to interact with customers could face reputation issues and legal liability especially if the AI model used is
perceived as unethical (Capgemini Research Institute, 2019[83]), and shows discriminative behaviour, such
as in product pricing and recruitment.
The human factor
Unclear understanding of potential and risks of using AI, from managers to workers
There is a need to raise awareness among SME owners, managers and entrepreneurs about what
AI could bring to their business, and to demystify the technology. Managers need to see AI as an option
in pursuing their digital journey. As an example, entrepreneurs could have misconceptions of AI, possibly
confounding current developments in AI with AGI (Roffel and Evans, 2018[84]). It is therefore important for
them to access information about AI solutions, their capabilities, as well as their constraints, with concrete
business use cases. Understanding how different subfields of AI could apply to different industries, different
business functions and different business models is critical for further diffusion (McKinsey, 2018[58]).
Likewise, greater clarity on the Return on Investment (RoI) that AI adoption could generate is needed
(Mannar, 2019[85]).
Awareness raising among the workforce, including better information about the complementary
role AI play with workers in new AI-enhanced systems, is key for effective implementation.
Concerns regarding AI, the risk of losing human knowledge and expertise at the expense of AI systems,
and the threat of job replacement by machines are key obstacles to the transformation of workplaces and
processes. These concerns should be addressed upstream in the transition. A clear communication on the
complementary aspect of AI systems with the workforce should be made, while leveraging insiders’ opinion
and knowledge on how best to manage the transition (Tabrizi et al., 2019[86]).
Raising the skillset for an effective implementation of AI solutions
The implementation of AI in the business process may require different skillsets from managers and
workers.
Decision makers and managers have to be trained in order to rethink their business processes and
to reconfigure tasks and organisational structures accordingly. Managers need to nurture
understanding of what AI systems can or cannot do, as well as what decisions can be automated by AI.
They need to learn how to create sound models and manage algorithms, by setting clear objectives and
stating soft goals in training and using AI (Luca, Kleinberg and Mullainathan, 2016[87]).
More workers will be called to exercise their judgement to guide algorithms. AI enables reducing the
cost of prediction while increasing its frequency (Agrawal, Gans and Goldfarb, 2019[88]), making it possible
to apply data-driven prediction methods more extensively. An increase in the number of predictions
produced requires in turn more decisions to be taken, which necessitates some human interpretation and
intervention. Early researches on workforce’s use of AI emphasise the importance of enabling employees
213
THE DIGITAL TRANSFORMATION OF SMES © OECD 2021
to learn from their own work (OECD, 2019[53]; Beane, 2019[89]). It further suggests that workers using AI
should be provided with incentives to experiment new ways of working with the technology and adjust their
work process, as well as opportunities to recover from mistakes, given that there is no playbook in using
AI.
In this new landscape, the value of human judgement is likely to increase with the availability of
predictions (McKinsey & Company, 2018[90]). Human intervention in decision making remains important
because all options cannot be fully codified in advance (Agrawal, Gans and Goldfarb, 2019[88]), the AI
systems can find patterns and correlation in existing data but cannot explain causality, and their forecasting
ability remains limited when circumstances change drastically, as observed during the COVID-19
pandemic (Heaven, 2020[91]). Furthermore, human judgement is needed to reassess the predictions in
different settings (Luca, Kleinberg and Mullainathan, 2016[87]).
Lack of data culture and weak data management practices
SMEs are less well prepared to valorise their data. Although SMEs produce and handle a great volume
and variety of data, from the back office to the front office, small businesses often lack the ability to collate,
manage and protect them. In addition to the data that are not captured, data collected and stored may not
be of adequate quantity or quality to derive meaningful insight (Bianchini and Michalkova, 2019[92]).
Inconsistencies in data format and collection method, data duplication, or incorrect manual input are some
of the examples undermining data integrity (see also Chapter 3 on cybersecurity).
SMEs need to raise data readiness with appropriate data management practices. As a start, SMEs
can aim to break data siloes between different business functions within the enterprise in order to form a
consolidated data pool. Small businesses can begin building structured and time-series datasets based on
their data, such as consumer, user, production, or administrative data, which could be used to derive value
with use of AI (McKinsey, 2018[58]). Enhancing SME data readiness today could allow them to anticipate
and prepare before deploying machine learning techniques in their workstreams when such techniques
become affordable.
The enhanced volume and granularity of data collected and managed can expose SMEs to more
data breaches. Data privacy issues concern personal, credentials, or financial data of SMEs’ customers
and workers, as well as internal data to the firm, and in some sectors medical records as well. Although
the providers of AI solutions offer in general applications that are compliant with privacy regulations such
as the EU’s General Data Protection Regulation (GDPR), SMEs could be deemed liable for the
consequences of data breaches if the process of data collection does not meet legal requirements.
AI solution markets for SMEs
SMEs can source external knowledge and technology solutions from knowledge markets (Hayek,
1945[93]). Knowledge-intensive business services (KIBS), including software, information and technology
(IT) services, are key enablers of knowledge diffusion (Den Hertog, 2000[94]; Muller and Zenker, 2001[95])
and their use is conducive to more business innovation, including radical innovation (Burger-Helmchen,
2012[96]; Cao, Shuo and Nagahiraagahira, 2010[97]; Doloreux and Shearmur, 2012[98]; OECD, 2017[66]).
Typically, KIBS compensate for a lack of internal capacities of a firm and complement the
knowledge transfer capacities of universities and public research institutes. KIBS have been more
and more in use in SMEs for overcoming size-related barriers in accessing strategic resources (OECD,
2019[56]), e.g. developing innovation-related skills (Zhou, Kautonen and Wei, 2015[99]), or outsourcing
knowledge and R&D (García-Quevedo, Mas-Verdú and Montolio, 2013[100]). KIBS have therefore emerged
as a dynamic industry, increasingly important for firms to adapt processes and commercialise new products
and services. New technologies have been instrumental in this expansion, reducing substantially the cost
of copying, storing and sharing data and information, and enabling new models of knowledge sourcing.
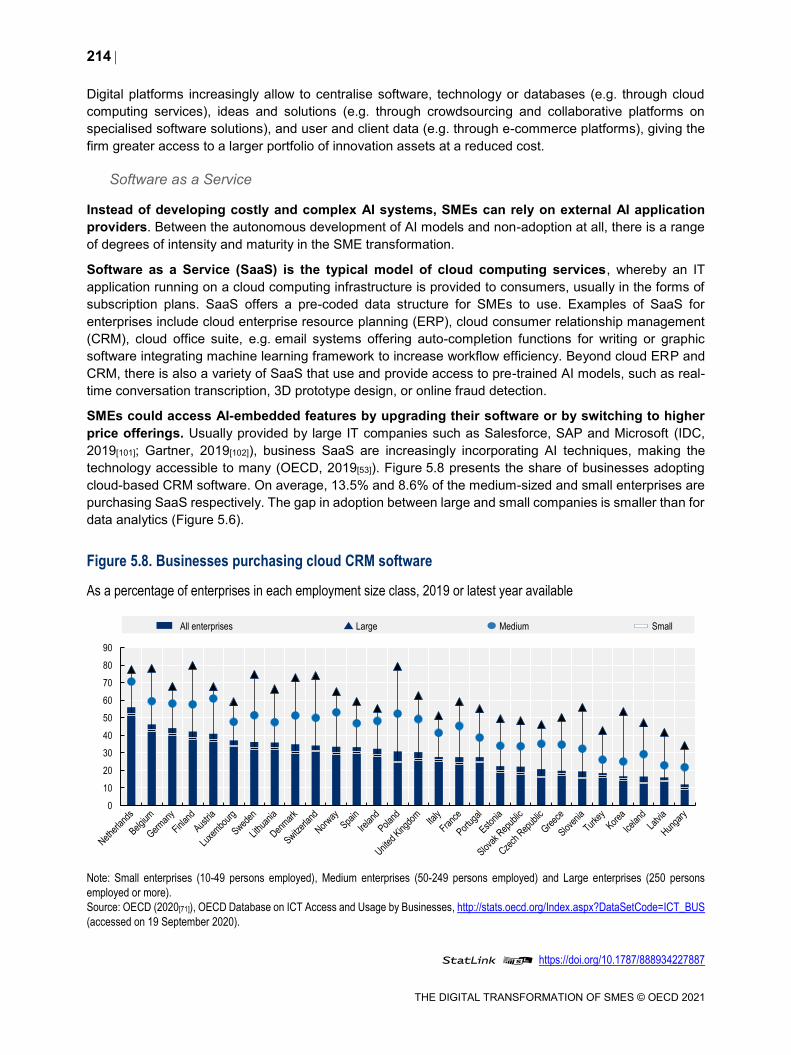
214
THE DIGITAL TRANSFORMATION OF SMES © OECD 2021
Digital platforms increasingly allow to centralise software, technology or databases (e.g. through cloud
computing services), ideas and solutions (e.g. through crowdsourcing and collaborative platforms on
specialised software solutions), and user and client data (e.g. through e-commerce platforms), giving the
firm greater access to a larger portfolio of innovation assets at a reduced cost.
Software as a Service
Instead of developing costly and complex AI systems, SMEs can rely on external AI application
providers. Between the autonomous development of AI models and non-adoption at all, there is a range
of degrees of intensity and maturity in the SME transformation.
Software as a Service (SaaS) is the typical model of cloud computing services, whereby an IT
application running on a cloud computing infrastructure is provided to consumers, usually in the forms of
subscription plans. SaaS offers a pre-coded data structure for SMEs to use. Examples of SaaS for
enterprises include cloud enterprise resource planning (ERP), cloud consumer relationship management
(CRM), cloud office suite, e.g. email systems offering auto-completion functions for writing or graphic
software integrating machine learning framework to increase workflow efficiency. Beyond cloud ERP and
CRM, there is also a variety of SaaS that use and provide access to pre-trained AI models, such as real-
time conversation transcription, 3D prototype design, or online fraud detection.
SMEs could access AI-embedded features by upgrading their software or by switching to higher
price offerings. Usually provided by large IT companies such as Salesforce, SAP and Microsoft (IDC,
2019[101]; Gartner, 2019[102]), business SaaS are increasingly incorporating AI techniques, making the
technology accessible to many (OECD, 2019[53]). Figure 5.8 presents the share of businesses adopting
cloud-based CRM software. On average, 13.5% and 8.6% of the medium-sized and small enterprises are
purchasing SaaS respectively. The gap in adoption between large and small companies is smaller than for
data analytics (Figure 5.6).
Figure 5.8. Businesses purchasing cloud CRM software
As a percentage of enterprises in each employment size class, 2019 or latest year available
Note: Small enterprises (10-49 persons employed), Medium enterprises (50-249 persons employed) and Large enterprises (250 persons
employed or more).
Source: OECD (2020[71]), OECD Database on ICT Access and Usage by Businesses, http://stats.oecd.org/Index.aspx?DataSetCode=ICT_BUS
(accessed on 19 September 2020).
StatLink 2 https://doi.org/10.1787/888934227887
0
10
20
30
40
50
60
70
80
90
All enterprises Large Medium Small
215
THE DIGITAL TRANSFORMATION OF SMES © OECD 2021
Compared to conventional software, SaaS offers a number of advantages to SMEs. First, SMEs can
receive constant upgrades and maintenance support without the need to internalise these functions and
related costs. The use of SaaS solutions does not require any technical knowledge on AI from end users,
which could help SMEs overcome the limitations of their skills in the first instance. Actually, users may not
even be aware of using AI, as they receive results from the data that the AI algorithm processed. For
example, the customer sentiment analysis that is embedded in CRM software uses natural language
processing techniques, to determine the tonality of customers, which is then labelled as positive, neutral
and negative. Finally, SMEs could also benefit from secured data storage, as SaaS are generally based
on cloud computing infrastructure, such as Amazon Web Services and Microsoft Azure that integrate data
security measures.
However, the use of AI-integrated SaaS could present some challenges for SMEs with regard to
data ownership and portability. Businesses using SaaS are mainly responsible for managing their
identity and access, as well as protecting the data they have stored off-line (McAfee, 2020[103]; AWS,
2020[104]). In the case of SaaS, issues can arise about data ownership and data control, as user data are
often hosted remotely for the purpose of training AI systems (Steenstrup and Foust, 2018[105]). There is
also an issue of data portability, when data generated from one SaaS provider are not transferable and
reusable by another provider of similar software.
In that vein, SaaS solutions could expose SMEs to lock-in effects, and make it difficult for them to
reconsider their subscription plans and switch to other (eventually more competitive or
appropriate) solutions and providers (Seethamraju, 2014[106]). As the performance of machine learning
algorithms improve with the volume of data processed, the lack of data portability could increase switching
cost further. Dependency on SaaS is also exposing SMEs to external risks, as their business activities rely
on the continuity of the software provision and they may not be able to access their data and software
anymore if their SaaS providers discontinue their services.
Machine Learning as a Service
SMEs have the possibilities to train AI models themselves, purchase algorithms or rent the
infrastructure needed to use AI systems. Commonly referred to as Machine Learning as a Service
(MLaaS), these platforms provide automated or semi-automated machine learning services using various
data sources, and allowing for greater customisation than SaaS can offer. MLaaS providers generally
adopt a “pay-as-you-go” model, whereby users are charged according to their usage. To illustrate, a
MLaaS for natural language processing charges USD 1.5 per 1 000 pages of document uploaded, USD 3
per hour for algorithm training and USD 0.05 per hour for deployment, along with USD 25 per prediction of
1 000 pages. MLaaS offers similar advantages as SaaS, in terms of flexibility and the scalability of
subscription plans with SMEs’ needs. It requires, however, a higher level of expert skills and digital
maturity.
The use of SaaS and MLaaS, since they are cloud based, require access to the Internet in order to
transfer data and run software applications. There is a minimum speed and quality connection needed
to support the exchange of large volumes of information, with low latency for ensuring real-time predictions.
Although digital network infrastructure has gained in reach, speed and sophistication in recent years,
smaller firms remain less likely connected (OECD, 2019[56]). The SMEs’ lag in connecting to high-speed
broadband has even increased across all OECD countries in recent years. In 2018, 23% of European firms
with 10 or more employees had high-speed connection, up from 7% in 2011, but smaller firms have lost
ground in the transition, with twice less connections than large firms on average. In addition, special
challenges affect the deployment of digital infrastructure that are often geographically distributed, and
administratively and financially decentralised. In that respect, subnational governments at regional and
municipal level play a vital role in the infrastructure landscape, and their infrastructural policies are likely
to grow further in relevance.
216
THE DIGITAL TRANSFORMATION OF SMES © OECD 2021
Conclusion
Recent developments in machine learning, greater data availability for training AI models, and increased
computing storage and processing capacity have created a new generation of AI statistical systems that
constantly adjust, while processing input data, with little (or no) human supervision.
The new generation of AI systems can affect and benefit SMEs in two ways: by altering their business
environment, or by enabling them to change their business practices, and increase productivity and
outreach. The main business applications of AI relate to automation, image/face recognition, natural
language processing, data analytics and decision making, the latter including enhanced information
management and predictive capacity.
By identifying patterns in datasets and learning from tacit knowledge, new AI systems make automating
non-routine tasks possible and free workers from repetitive lower value-added tasks, provided their jobs
could be re-organised and their skillset upgraded. These new waves of automation could help SMEs
increase productivity, e.g. by refocusing activities on higher value-added functions, by reducing human
and economic costs associated with accidents or injuries, or improving work environment. The
implementation of such systems could also help small businesses overcome administrative bottlenecks
and increase reactivity at lower costs, for instance by enabling customer interaction 24/7.
AI allows a significant drop in prediction price and facilitates decision making. SMEs can execute predictive
analytics to map uncertainties and lower their exposure to risks, automate business projections such as
sales and budget forecasts, or increase efficiency in asset maintenance and management. Enhanced
prediction capability allows for greater market segmentation and price differentiation and give SMEs a
possibility to innovate, as they can predict customer behaviour and price sensitivity better, and can
anticipate shifts in demand.
AI can be applied to most sectors, with a few number of sectors likely to see greater gains. AI can also
bring changes to the internal value chain of the firm and be applied to multiple business functions.
Marketing and sales, supply chain management and production are seen as the business functions where
AI could have the greatest impact.
Moreover, AI can substantially affect SME business environment, and in various ways. Machine learning
can enhance the efficiency of public administration, reducing red tape. AI adoption can help tax authorities
implement a “tax compliance by design” approach for SMEs. Language processing and AI ability to mine
documents could make case examination more efficient and cheaper, reducing the amount of internal
resources SMEs divert for solving commercial disputes. AI systems are also increasingly relevant for
securing the ICT infrastructure, and addressing the rising number of cyber-attacks and the skills shortage
in the digital security industry. Neural network techniques enable the analysis of credit report data, lowering
default risk and the cost of lending, and making it more profitable for credit institutions to serve some
segments of the SME population. The use of AI and “people analytics” in the workplace can support the
evaluation of work performance and hiring and firing decisions. The automation of science can reduce the
costs of experimentation and improve data sharing and reproducibility, putting scientific research at the
reach of more (and likely smaller) firms. At the same time, algorithms increase the risk of tacit collusion on
product and labour markets, and of sustaining profits and prices above a fair competitive level, at the
detriment of smaller businesses.
Evidence suggest different degrees of AI diffusion across countries, sectors and firms. Overall, business
population in most countries show low level of adoption of data analytics but some countries have taken
the lead. Among OECD countries, the Netherlands, Belgium or Ireland are AI champions in performing big
data analysis (20-22% of firms). Austria, Italy and Eastern European countries tend to lag behind.
217
THE DIGITAL TRANSFORMATION OF SMES © OECD 2021
New AI practices are diffusing across all sectors, with services adapting faster than manufacturing or
construction. Especially in information and communication services, there is already an early majority of
enterprises across most countries (up to 50% of total business population) that moved to data analytics.
There are also converging evidence of an SME gap in using data analytics or implementing AI solutions.
SMEs face a series of barriers in adopting AI. They incur high sunk costs for training and maintaining AI
systems. This combines with the need for investing in new business processes, skillset and complementary
technologies in order to implement AI, whereas the transformation may not deliver immediate benefits,
future productivity gains are difficult to anticipate, and the return on investment is difficult to assess, and
therefore the investments to finance.
There is a need to raise awareness among SME owners, managers and entrepreneurs about the
opportunities and challenges AI could bring to their business, and how different subfields of AI could apply
to different industries, business functions and business models. There is also a need to raise awareness
among SME workers on the real impact of AI on job replacement, and the complementarity of AI systems
with the workforce.
Training is required. The implementation of AI in business processes may imply different skillsets from
managers and workers. Decision makers have to train in order to rethink their processes and to reconfigure
tasks and organisational structures. More workers would need to exercise their judgement to guide and
interpret algorithms, and experiment new ways of working with the technology. In this new landscape, the
value of human judgement is likely to increase with the availability of predictions.
SMEs are less well prepared to valorise their data. Although they produce and handle a great volume and
variety of data, small businesses often lack ability to collate, manage and protect them, and those collected
may not be of adequate quality or inadequate quantity to derive pertinent analysis. In addition, the
increased volume and granularity of data can expose SMEs to more data breaches. Data privacy issues
concern personal, credentials, or financial data of SME customers and workers, as well as internal and
external data to the firm, for which SMEs could be deemed liable.
The lack of explainability of statistical algorithms also raises a series of challenges for SMEs using AI
solutions, if they are not able to react in a timely manner, cannot audit the algorithm, or incur reputational
risks, etc.
SMEs can source external AI expertise and technology solutions from knowledge markets that typically
compensate for a lack of internal capacity. Instead of developing costly and complex AI systems, SMEs
can rely on external providers of SaaS and MLaaS. SaaS offers access to pre-coded data structure and
pre-trained AI models for SMEs to use, such as cloud ERP, or cloud CRM. MLaaS platforms provide
automated or semi-automated machine learning services using various data sources, and allowing for
greater customisation than SaaS.
Compared to conventional software, SaaS offers a number of advantages to SMEs, e.g. scalability of AI
solutions and costs, no prior technical knowledge required, digital security features directly embedded in
the software, etc., but they also raise some challenges related to data ownership and portability, and lock-
ins effects. MLaaS offers similar advantages as SaaS, in terms of flexibility and the scalability of
subscription plans, but it requires a higher level of expert skills and digital maturity.
Last but not least, the use of SaaS and MLaaS, since they are cloud-based, require access to the Internet
in order to transfer data and run software applications. There is a minimum speed and quality connection
needed to support the exchange of large volumes of information, with low latency for ensuring real-time
predictions. Although digital network infrastructure has gained in reach, speed and sophistication in recent
years, smaller firms remain less likely and less well connected.
218
THE DIGITAL TRANSFORMATION OF SMES © OECD 2021
This range of issues calls for enhanced policy attention to be given to:
Supporting SMEs in building a culture of data, from collection, to management, to protection and
analysis, and ensuring the AI transition takes place with improved digital risk management
practices in SMEs.
Raising awareness among SME managers and workers on the benefits of AI, the conditions of a
transition and how the risks could be best managed.
Reskilling SME managers and workers and ensuring a participatory approach for redesigning work
processes and training AI models.
Collecting and building more evidence on the return on investment of moving to AI business models
and practices, in order to inform SME managers and business owners, as well as investors and
financial institutions.
Identifying mechanisms to bridge the financing gap until AI can deliver its full promises.
Enabling SMEs leapfrog to AI-enhanced models through cloud solutions by ensuring the well
functioning of knowledge markets that provide cloud solutions embedding AI technologies, and the
transfer of knowledge that could enable SMEs scale up their capacity before being eventually able
to develop their own AI solutions.
Building differentiated evidence about the industry-wide or function-wide specificities of the AI
transition(s), to account for the low transferability of AI knowledge across environments, including
analysing the sectoral impact of AI on SME business activities, with concrete business use cases,
and informing relevant stakeholders.
Better understanding the role large firms, business associations, chambers of commerce,
academia, national and local governments, international organisations, and SMEs as well, could
play to advance on these different dimensions, and supporting knowledge sharing and mutual
learning, through international platforms such as the OECD Digital for SMEs Initiative and the
OECD.AI Policy Observatory.
219
THE DIGITAL TRANSFORMATION OF SMES © OECD 2021
References
Accenture (2019), The ROI of AI, https://www.accenture.com/cn-en/insights/artificial-
intelligence/roi-artificial-intelligence (accessed on 20 February 2020).
[78]
Acemoglu, D. and P. Restrepo (2018), Artificial Intelligence, Automation and Work, National
Bureau of Economic Research, Cambridge, MA, http://dx.doi.org/10.3386/w24196.
[55]
Agrawal, A., J. Gans and A. Goldfarb (2019), “Exploring the impact of artificial Intelligence:
Prediction versus judgment”, Information Economics and Policy, Vol. 47, pp. 1-6,
http://dx.doi.org/10.1016/j.infoecopol.2019.05.001.
[88]
Agrawal, A., J. Gans and A. Goldfarb (2018), Economic Policy for Artificial Intelligence, National
Bureau of Economic Research, Cambridge, MA, http://dx.doi.org/10.3386/w24690.
[22]
Agrawal, A., J. Gans and A. Goldfarb (2018), Prediction, Judgment and Complexity: A Theory of
Decision Making and Artificial Intelligence, National Bureau of Economic Research,
Cambridge, MA, http://dx.doi.org/10.3386/w24243.
[9]
AI HLEG (2019), Ethics Guidelines for Trustworthy AI,
http://file:///C:/Users/Kwon_I/Downloads/AIHLEG_EthicsGuidelinesforTrustworthyAI-
ENpdf.pdf (accessed on 24 May 2020).
[36]
Arntz, M., T. Gregory and U. Zierahn (2016), “The Risk of Automation for Jobs in OECD
Countries: A Comparative Analysis”, OECD Social, Employment and Migration Working
Papers, No. 189, OECD Publishing, Paris, https://dx.doi.org/10.1787/5jlz9h56dvq7-en.
[51]
Atkeson, A. and P. Kehoe (2007), “Modeling the Transition to a New Economy: Lessons from
Two Technological Revolutions”, American Economic Review, Vol. 97/1, pp. 64-88,
http://dx.doi.org/10.1257/aer.97.1.64.
[42]
AWS (2020), “Shared Responsibility Model”, Amazon Web Services website,
https://aws.amazon.com/compliance/shared-responsibility-model/ (accessed on
5 March 2020).
[104]
Beane, M. (2019), Learning to Work with Intelligent Machines, Harvard Business Press,
https://hbr.org/2019/09/learning-to-work-with-intelligent-machines (accessed on
20 April 2020).
[89]
Berryhill, J. et al. (2019), “Hello, World: Artificial intelligence and its use in the public sector”,
OECD Observatory of Public Sector Innovation (OPSI), https://oecd-opsi.org/wp-
content/uploads/2019/11/AI-Report-Online.pdf.
[62]
Bianchini, M. and V. Michalkova (2019), “Data Analytics in SMEs: Trends and Policies”, OECD
SME and Entrepreneurship Papers, No. 15, OECD Publishing, Paris,
https://dx.doi.org/10.1787/1de6c6a7-en.
[92]
Boston Consulting Group (2018), AI in the factory of the future: The ghost in the machine,
Boston Consulting Group, https://www.bcg.com/publications/2018/artificial-intelligence-
factory-future.
[59]
Bresnahan, T. and M. Trajtenberg (1995), “General purpose technologies ‘Engines of growth’?”,
Journal of Econometrics, Vol. 65/1, pp. 83-108, http://dx.doi.org/10.1016/0304-
4076(94)01598-t.
[39]
220
THE DIGITAL TRANSFORMATION OF SMES © OECD 2021
Brynjolfsson, E. and A. Mcafee (2017), The Business of Artifical Intelligence: What it can-and
cannot-do for your organisation, https://hbr.org/cover-story/2017/07/the-business-of-artificial-
intelligence (accessed on 2020 February 26).
[23]
Brynjolfsson, E. and K. McElheran (2016), “The rapid adoption of data-driven decision-making”,
American Economic Review, Vol. 106/5, pp. 133-139,
http://dx.doi.org/10.1257/aer.p20161016.
[70]
Brynjolfsson, E., D. Rock and C. Syverson (2017), Artificial Intelligence and the Modern
Productivity Paradox: A Clash of Expectations and Statistics, National Bureau of Economic
Research, Cambridge, MA, http://dx.doi.org/10.3386/w24001.
[38]
Burger-Helmchen, T. (2012), “Innovation dans les services: Différences technologiques et
similarités organisationnelles dans les entreprises de mécanique françaises et allemandes”,
La Revue des Sciences de Gestion, Vol. 5/257, pp. 81-89,
https://doi.org/10.3917/rsg.257.0081.
[96]
Cao, Y., S. Shuo and A. Nagahiraagahira (2010), “The relationship between Japanese
manufacturing corporations and KIBS from the client-side point of view”, Proceedings of the
Second International Conference on InformationTechnology and Computer Science (ITCS)
2010.
[97]
Capgemini (2020), “Scaling AI in manufacutring operations: A Practitioners’ perspective”,
https://www.capgemini.com/wp-content/uploads/2019/12/Infographic-–-AI-in-MfG-Ops.pdf.
[61]
Capgemini Research Institute (2019), Why addressing ethical questions in AI will be benefit
organisations, https://www.capgemini.com/wp-content/uploads/2019/08/AI-in-Ethics_Web.pdf
(accessed on 22 January 2020).
[83]
Castelvecchi, D. (2016), “Can we open the black box of AI?”, Nature, Vol. 538/7623, pp. 20-23,
http://dx.doi.org/10.1038/538020a.
[30]
Chu, D. (2019), Waymo One: A year of firsts, https://blog.waymo.com/2019/12/waymo-one-year-
of-firsts.html?m=1 (accessed on 7 May 2020).
[26]
Cisco (2018), Cisco Visual Networking Index: Forecast and Trends, 2017-2022,
https://cyrekdigital.com/pl/blog/content-marketing-trendy-na-rok-2019/white-paper-c11-
741490.pdf (accessed on 3 February 2020).
[16]
Clancey, W. (1983), “The epistemology of a rule-based expert system —a framework for
explanation”, Artificial Intelligence, Vol. 20/3, pp. 215-251, http://dx.doi.org/10.1016/0004-
3702(83)90008-5.
[13]
Coleman, C. et al. (2020), DAWNBench: An End-to-End Deep Learning Benchmark and
Competition, https://dawn.cs.stanford.edu/benchmark/#imagenet-train-cost (accessed on
4 March 2020).
[77]
Daor, G. et al. (2020), Revised outline for practical guidance for the Recommendation of the
Council on Aritificial IntelligenceGallia Daor,
https://one.oecd.org/document/DSTI/CDEP(2019)4/REV3/en/pdf (accessed on
5 March 2020).
[3]
221
THE DIGITAL TRANSFORMATION OF SMES © OECD 2021
Dastin, J. (2018), Amazon scraps secret AI recruiting tool that showed bias against women,
https://www.reuters.com/article/us-amazon-com-jobs-automation-insight/amazon-scraps-
secret-ai-recruiting-tool-that-showed-bias-against-women-idUSKCN1MK08G (accessed on
7 May 2020).
[34]
David, P. and G. Wright (2006), “General Purpose Technologies and Surges in Productivity:
Historical Reflections on the Future of the ICT Revolution”, in The Economic Future in
Historical Perspective, British Academy,
http://dx.doi.org/10.5871/bacad/9780197263471.003.0005.
[41]
Den Hertog, P. (2000), “Knowledge-intensive business services as co-producers of innovation”,
International Journal of Innovation Management, Vol. 4/4, pp. 491-528,
https://doi.org/10.1142/S136391960000024X.
[94]
Doloreux, D. and R. Shearmur (2012), “How much does KIB contribute to R&D activities of
manufacturing firms?”, Economica Politica, Vol. 29/3, pp. 319-342,
https://doi.org/10.1428/38929.
[98]
Duobao, X. (2019), AI-equipped robots active in precision welding,
https://asia.nikkei.com/Business/Startups/AI-equipped-robots-active-in-precision-welding
(accessed on 14 May 2020).
[46]
Ekkhehard, E., R. Merola and D. Samaan (2018), The economics of artificial intelligence:
Implications of the future of work, International Labour Organisation,
https://www.ilo.org/wcmsp5/groups/public/---dgreports/---
cabinet/documents/publication/wcms_647306.pdf (accessed on 29 January 2020).
[54]
European Commission (2018), Artificial Intelligence: A European Perspective, European
Commission, http://dx.doi.org/10.2760/936974.
[20]
Frey, C. and M. Osborne (2017), “The future of employment: How susceptible are jobs to
computerisation?”, Technological Forecasting and Social Change, Vol. 114, pp. 254-280,
http://dx.doi.org/10.1016/j.techfore.2016.08.019.
[49]
Galindo-Rueda, F., F. Verger and S. Ouellet (2020), “Patterns of innovation, advanced
technology use and business practices in Canadian firms”, OECD Science, Technology and
Industry Working Papers, No. 2020/02, OECD Publishing, Paris,
https://dx.doi.org/10.1787/6856ab8c-en.
[75]
Garcez, A. et al. (2019), “Neural-Symbolic Computing: An Effective Methodology for Principled
Integration of Machine Learning and Reasoning”, IfCoLoG Journal of Logics and their
Applications, Vol. 6/4, pp. 611-631, http://arxiv.org/abs/1905.06088 (accessed on
4 March 2020).
[29]
García-Quevedo, J., F. Mas-Verdú and D. Montolio (2013), “What types of firms acquire
knowledge intensive services and from which suppliers?”, Technology Analysis & Strategic
Management, Vol. 25/4, pp. 473-486, https://doi.org/10.1080/09537325.2013.774348.
[100]
Gartner (2019), Market Share Analysis: ERP Software, Worldwide, 2018,
https://www.gartner.com/en/documents/3913449/market-share-analysis-erp-software-
worldwide-2018 (accessed on 3 March 2020).
[102]
222
THE DIGITAL TRANSFORMATION OF SMES © OECD 2021
Gartner (2019), Top Trends on the Gartner Hype Cycle for Artificial Intelligence, 2019,
https://www.gartner.com/smarterwithgartner/top-trends-on-the-gartner-hype-cycle-for-
artificial-intelligence-2019/ (accessed on 12 May 2020).
[79]
Gobble, M. (2013), “Big Data: The Next Big Thing in Innovation”, Research-Technology
Management, Vol. 56/1, pp. 64-67, http://dx.doi.org/10.5437/08956308X5601005.
[108]
Google (2020), Rapid Response Virtual Agent, https://cloud.google.com/solutions/contact-
center/covid19-rapid-response (accessed on 14 May 2020).
[47]
Google Developers (2019), Clustering Algorithms, https://developers.google.com/machine-
learning/clustering/clustering-algorithms (accessed on 14 February 2020).
[21]
H. James Wilson, P. (2018), Collaborative Intelligence: Humans and AI Are Joining Forces,
Harvard Business Publishing, https://hbr.org/2018/07/collaborative-intelligence-humans-and-
ai-are-joining-forces (accessed on 25 February 2020).
[31]
Harford, T. (2017), Why didn’t electricity immediately change manufacturing?,
https://www.bbc.com/news/business-40673694 (accessed on 25 February 2020).
[44]
Harmon, P. (2019), Business Process Change: A Business Process Management Guide for
Managers and Process Professionals, Elsevier, http://dx.doi.org/10.1016/c2017-0-02868-9.
[12]
Harwell, D. (2018), “Wanted: The ‘perfect babysitter.’ Must pass AI scan for respect and
attitude.”, The Washington Post,
https://www.washingtonpost.com/technology/2018/11/16/wanted-perfect-babysitter-must-
pass-ai-scan-respect-attitude/?noredirect=on (accessed on 7 May 2020).
[33]
Hayek, F. (1945), “The use of knowledge in society”, American Economic Review, Vol. 35/4,
pp. 519-530, https://ssrn.com/abstract=1505216.
[93]
Heaven, W. (2020), Our weird behavior during the pandemic is messing with AI models,
https://www.technologyreview.com/2020/05/11/1001563/covid-pandemic-broken-ai-machine-
learning-amazon-retail-fraud-humans-in-the-
loop/?truid=538165e6a853542703d07b8605ff2f0f&utm_source=the_algorithm&utm_medium
=email&utm_campaign=the_algorithm.unpaid.engage (accessed on 12 May 2020).
[91]
Henderson, R. (2006), “The Innovator’s Dilemma as a Problem of Organizational Competence”,
Journal of Product Innovation Management, Vol. 23/1, pp. 5-11,
http://dx.doi.org/10.1111/j.1540-5885.2005.00175.x.
[43]
Hendler, J. (2008), “Avoiding Another AI Winter”, IEEE Intelligent Systems, Vol. 23/2, pp. 2-4,
http://dx.doi.org/10.1109/mis.2008.20.
[8]
Holmes, T., D. Levine and J. Schmitz (2012), “Monopoly and the Incentive to Innovate When
Adoption Involves Switchover Disruptions”, American Economic Journal: Microeconomics,
Vol. 4/3, pp. 1-33, http://dx.doi.org/10.1257/mic.4.3.1.
[80]
Huang, M. and R. Rust (2018), “Artificial Intelligence in Service”, Journal of Service Research,
Vol. 21/2, pp. 155-172, http://dx.doi.org/10.1177/1094670517752459.
[45]
IDC (2019), Worldwide Semiannual Software Tracker,
https://www.idc.com/tracker/showproductinfo.jsp?prod_id=521 (accessed on 3 March 2020).
[101]
223
THE DIGITAL TRANSFORMATION OF SMES © OECD 2021
Kitchin, R. and G. McArdle (2016), “What makes Big Data, Big Data? Exploring the ontological
characteristics of 26 datasets”, Big Data & Society, Vol. 3/1, p. 205395171663113,
http://dx.doi.org/10.1177/2053951716631130.
[107]
Korf, R. (1997), Does Deep-Blue use AI?, Association for the Advancement of Artificial
Intelligence, http://www.aaai.org (accessed on 11 February 2020).
[10]
Luca, M., J. Kleinberg and S. Mullainathan (2016), Algorithms Need Managers, Too, Harvard
Business Publishing, pp. 96-101, https://hbr.org/2016/01/algorithms-need-managers-too
(accessed on 20 November 2019).
[87]
Mannar, K. (2019), The ROI of AI, https://www.accenture.com/us-en/insights/artificial-
intelligence/roi-artificial-intelligence (accessed on 2 February 2020).
[85]
McAfee (2020), Enterprise Supernova: The Data Dispersion Cloud Adoption and Risk Report,
https://www.mcafee.com/enterprise/en-us/assets/reports/restricted/rp-enterprise-supernova-
data-dispersion.pdf (accessed on 5 March 2020).
[103]
McKinsey (2018), Noted from the AI frontier: Insights from hundreds of use cases, McKinsey &
Company,
https://www.mckinsey.com/~/media/mckinsey/featured%20insights/artificial%20intelligence/n
otes%20from%20the%20ai%20frontier%20applications%20and%20value%20of%20deep%2
0learning/notes-from-the-ai-frontier-insights-from-hundreds-of-use-cases-discussion-paper.
(accessed on 16 December 2019).
[58]
McKinsey & Company (2019), Driving Impact at Scale from Automation and AI,
https://www.mckinsey.com/~/media/McKinsey/Business%20Functions/McKinsey%20Digital/O
ur%20Insights/Driving%20impact%20at%20scale%20from%20automation%20and%20AI/Driv
ing-impact-at-scale-from-automation-and-AI.ashx (accessed on 26 February 2020).
[110]
McKinsey & Company (2018), The Economics of Artificial Intelligence,
https://www.mckinsey.com/~/media/McKinsey/Business%20Functions/McKinsey%20Analytic
s/Our%20Insights/The%20economics%20of%20artificial%20intelligence/The-economics-of-
artificial-intelligence.ashx (accessed on 12 November 2019).
[90]
McKinsey Global Institute (2017), Jobs lost, jobs gained: Workforce transitions in a time of
automation,
https://www.mckinsey.com/~/media/mckinsey/featured%20insights/Future%20of%20Organiz
ations/What%20the%20future%20of%20work%20will%20mean%20for%20jobs%20skills%20
and%20wages/MGI-Jobs-Lost-Jobs-Gained-Report-December-6-2017.ashx (accessed on
2 February 2020).
[48]
Michael Chui, J. (2018), What AI can and can’t do (yet) for your business,
https://www.mckinsey.com/business-functions/mckinsey-analytics/our-insights/what-ai-can-
and-cant-do-yet-for-your-business (accessed on 12 May 2020).
[81]
Microsoft (2018), 2019 Manufacturing Trends Report, https://info.microsoft.com/rs/157-GQE-
382/images/EN-US-CNTNT-Report-2019-Manufacturing-Trends.pdf (accessed on
11 February 2020).
[17]
Moor, J. (2006), The Dartmouth College Artificial Intelligence Conference: The Next Fifty Years,
pp. 87-91, https://doi.org/10.1609/aimag.v27i4.1911 (accessed on 20 February 2020).
[6]
224
THE DIGITAL TRANSFORMATION OF SMES © OECD 2021
MSIT and NIA (2020), Information Society Statistics,
http://kosis.kr/statHtml/statHtml.do?orgId=127&tblId=DT_120008N_72&vw_cd=MT_ZTITLE&l
ist_id=110_12008_2015_B005&scrId=&seqNo=&lang_mode=ko&obj_var_id=&itm_id=&conn
_path=K1&path=%25EC%25A0%2595%25EB%25B3%25B4%25ED%2586%25B5%25EC%
258B%25A0%252F%25EA%25B3%25B (accessed on 7 April 2020).
[73]
Muller, E. and A. Zenker (2001), “Business services as actors of knowledge transformation: the
role of KIBS in regional and national innovation systems”, Research Policy, Vol. 30/9,
https://doi.org/10.1016/S0048-7333(01)00164-0.
[95]
Murgia, M. (2019), AI’s new workforce: The data-labelling industry spreads globally,
https://www.ft.com/content/56dde36c-aa40-11e9-984c-fac8325aaa04 (accessed on
5 May 2020).
[76]
Nedelkoska, L. and G. Quintini (2018), “Automation, skills use and training”, OECD Social,
Employment and Migration Working Papers, No. 202, OECD Publishing, Paris,
https://dx.doi.org/10.1787/2e2f4eea-en.
[50]
Negnevitsky, M. (2005), Artificial intelligence: A guide to intelligent systems, Pearson education,
http://dx.doi.org/978-1408225745 (accessed on 18 March 2020).
[7]
Niebel, T., F. Rasel and S. Viete (2018), “BIG data - BIG gains? Understanding the link between
big data analytics and innovation”, Economics of Innovation and New Technology, pp. 296-
316, https://doi.org/10.1080/10438599.2018.1493075.
[57]
OECD (2020), “An insight into the innovative start-up landscape of Friuli-Venezia Giulia: A tale of
two sub-regions?”, OECD Local Economic and Employment Development (LEED) Papers,
No. 2020/08, OECD Publishing, Paris, https://dx.doi.org/10.1787/2174a2fc-en.
[64]
OECD (2020), Financing SMEs and Entrepreneurs 2020: An OECD Scoreboard, OECD
Publishing, Paris, https://dx.doi.org/10.1787/061fe03d-en.
[67]
OECD (2020), OECD Database on ICT Access and Usage by Businesses,
http://stats.oecd.org/Index.aspx?DataSetCode=ICT_BUS (accessed on 19 September 2020).
[71]
OECD (2020), OECD Digital Economy Outlook 2020, OECD Publishing, Paris,
https://dx.doi.org/10.1787/bb167041-en.
[60]
OECD (2020), OECD Policy Observatory: A platform to share and shape AI policies,
https://www.oecd.org/going-digital/ai/about-the-oecd-ai-policy-observatory.pdf (accessed on
27 February 2020).
[37]
OECD (2020), OPSI (OECD Observatory of Public Sector Innovation), https://oecd-opsi.org
(accessed on 13 September 2020).
[63]
OECD (2019), Artificial Intelligence in Society, OECD Publishing, Paris,
https://dx.doi.org/10.1787/eedfee77-en.
[11]
OECD (2019), OECD Employment Outlook 2019: The Future of Work, OECD Publishing, Paris,
https://dx.doi.org/10.1787/9ee00155-en.
[68]
OECD (2019), OECD Skills Outlook 2019: Thriving in a Digital World, OECD Publishing, Paris,
https://dx.doi.org/10.1787/df80bc12-en.
[53]
225
THE DIGITAL TRANSFORMATION OF SMES © OECD 2021
OECD (2019), OECD SME and Entrepreneurship Outlook 2019, OECD Publishing, Paris,
https://dx.doi.org/10.1787/34907e9c-en.
[56]
OECD (2019), Recommendation of the Council on Artificial Intelligence, OECD Legal Instrument,
OECD, Paris, https://legalinstruments.oecd.org/en/instruments/OECD-LEGAL-0449.
[2]
OECD (2018), Job Creation and Local Economic Development 2018: Preparing for the Future of
Work, OECD Publishing, Paris, https://dx.doi.org/10.1787/9789264305342-en.
[52]
OECD (2018), OECD Science, Technology and Innovation Outlook 2018: Adapting to
Technological and Societal Disruption, OECD Publishing, Paris,
https://dx.doi.org/10.1787/sti_in_outlook-2018-en.
[69]
OECD (2017), Algorithms and Collusion: Competition Policy in the Digital Age, OECD, Paris,
http://www.oecd.org/competition/algorithms-collusion-competition-policy-in-the-digital-
age.htm.
[66]
OECD (2017), The Next Production Revolution: Implications for Governments and Business,
OECD Publishing, Paris, https://dx.doi.org/10.1787/9789264271036-en.
[1]
OECD (2014), Tax Compliance by Design: Achieving Improved SME Tax Compliance by
Adopting a System Perspective, OECD Publishing, Paris,
https://doi.org/10.1787/9789264223219-en.
[65]
OECD (2010), The Impacts of Nanotechnology on Companies: Policy Insights from Case
Studies, OECD Publishing, Paris, https://dx.doi.org/10.1787/9789264094635-en.
[40]
OpenAI (2020), AI and Efficiency, https://openai.com/blog/ai-and-efficiency/ (accessed on
11 May 2020).
[15]
Ransbotham, S. et al. (2019), Winning With AI: Pioneers Combine Strategy, Organizational
Behavior, and Technology, MIT Sloan Management Review and Boston Consulting Group,
https://sloanreview.mit.edu/projects/winning-with-ai/ (accessed on 5 November 2019).
[109]
Roffel, S. and I. Evans (2018), The biggest misconceptions about AI: The experts’ view,
https://www.elsevier.com/connect/the-biggest-misconceptions-about-ai-the-experts-view
(accessed on 4 March 2020).
[84]
Rogel-Salazar, J. (2018), Data Science and Analytics with Python, CRC Press. [32]
Rogers, E. (1962), Diffusion of innovations, New York, Free Press of Glencoe. [72]
Salian, I. (2018), SuperVize Me: What’s the Difference Between Supervised, Unsupervised,
Semi-Supervised and Reinforcement Learning?,
https://blogs.nvidia.com/blog/2018/08/02/supervised-unsupervised-learning/ (accessed on
3 December 2019).
[18]
Sample, I. (2017), ’It’s able to create knowledge itself’: Google unveils AI that learns on its own,
https://www.theguardian.com/science/2017/oct/18/its-able-to-create-knowledge-itself-google-
unveils-ai-learns-all-on-its-own (accessed on 26 February 2020).
[24]
Seethamraju, R. (2014), “Adoption of Software as a Service (SaaS) Enterprise Resource
Planning (ERP) Systems in Small and Medium Sized Enterprises (SMEs)”, Information
Systems Frontiers, Vol. 17/3, pp. 475-492, http://dx.doi.org/10.1007/s10796-014-9506-5.
[106]
226
THE DIGITAL TRANSFORMATION OF SMES © OECD 2021
Silver, D. et al. (2016), “Mastering the game of Go with deep neural networks and tree search”,
Nature, Vol. 529, pp. 484-489, http://dx.doi.org/10.1038/nature16961.
[19]
Smolensky, P. (1987), “Connectionist AI, symbolic AI, and the brain”, Artificial Intelligence
Review, Vol. 1/2, pp. 95-109, http://dx.doi.org/10.1007/BF00130011.
[14]
Statistics Denmark (2019), ICT use in enterprises, https://www.statbank.dk/ITAV7 (accessed on
7 April 2020).
[74]
Steenstrup, K. and N. Foust (2018), 6 Critical Changes That Affect the Future of Asset
Maintenance, Gartner, https://www.gartner.com/en/documents/3895579/6-critical-changes-
that-affect-the-future-of-asset-maint (accessed on 5 March 2020).
[105]
Tabrizi, B. et al. (2019), Digital Transformation is not about technology, Harvard Business
Publishing, https://bluecirclemarketing.com/wp-content/uploads/2019/07/Digital-
Transformation-Is-Not-About-Technology.pdf (accessed on 22 December 2019).
[86]
The AlphaStar team (2019), AlphaStar: Mastering the Real-Time Strategy Game StarCraft II,
https://deepmind.com/blog/article/alphastar-mastering-real-time-strategy-game-starcraft-ii
(accessed on 7 May 2020).
[25]
Thomas Suh, J. (2018), Save the Lawyer: AI technology accelerates and augments legal work,
https://www.ibm.com/blogs/client-voices/save-the-lawyer-ai-technology-accelerates-and-
augments-legal-work/ (accessed on 6 May 2020).
[28]
Turing, A. (1950), “I.—COMPUTING MACHINERY AND INTELLIGENCE”, Mind, Vol. LIX/236,
pp. 433-460, http://dx.doi.org/10.1093/mind/lix.236.433.
[5]
Vincent, J. (2018), Google ‘fixed’ its racist algorithm by removing gorillas from its image-labeling
tech, https://www.theverge.com/2018/1/12/16882408/google-racist-gorillas-photo-recognition-
algorithm-ai (accessed on 6 May 2020).
[82]
Wakefield, J. (2020), Coronavirus: AI steps up in battle against Covid-19,
https://www.bbc.com/news/technology-52120747 (accessed on 6 May 2020).
[27]
Walter, W. (1950), An Imitation of Life, Scientific American, a Division of Springer Nature
America, Inc., http://www.jstor.org/stable/24967456.
[4]
Wright, R. (2019), “‘Disease’ of recruitment bias: is technology a cure or a cause?”, Financial
Times, https://www.ft.com/content/4150aa8e-9cf8-11e9-9c06-a4640c9feebb (accessed on
7 May 2020).
[35]
Zhou, D., M. Kautonen and J. Wei (2015), “The effect of external KISA on innovation in
manufacturing firms”, Innovation, Vol. 17/4, pp. 508-523,
https://doi.org/10.1080/14479338.2016.1159919.
[99]
227
THE DIGITAL TRANSFORMATION OF SMES © OECD 2021
Notes
1 However, there is no universally accepted threshold as to when data can be considered “big”. It is
suggested that such data sets, whether structured or unstructured, require the capacity beyond
conventional tools and methods to process and analyse (Kitchin and McArdle, 2016[107]; Gobble, 2013[108]).
2 For example, attributes of a person could include name, age and nationality.
3 Other studies provide higher diffusion rates but also adopt a broader definition of what AI adoption could
embed and cover rather large corporations. For example, MIT Sloan School of Management, in
collaboration with BCG, suggests categorising businesses as pioneers, investigators, experimenters and
passives based on the degree of AI maturity in businesses, with 20% of the businesses surveyed as
“pioneers” that both understand and have implemented AI (Ransbotham et al., 2019[109]). Another similar
survey conducted by McKinsey & Company (2019[110]) presents comparable results where firms
representing 20% of the workforce have operationalised AI-related technology in their core business, and
9% having adopted machine learning approach.

229
THE DIGITAL TRANSFORMATION OF SMES © OECD 2021
Despite projected gains, the broad diffusion of artificial intelligence (AI) is not
automatic, particularly for small and medium-sized firms (SMEs) that face
barriers in adoption. This chapter looks at the attention policy makers have
been given to SMEs and entrepreneurs in their newly designed AI policy
agenda. It looks at the directionality and composition of national AI policy
mixes, and aims to identify patterns in public policies and instruments.
Through an exploratory text-as-data analysis, this chapter presents the
various characteristics of AI policies in place, in particular those targeted
towards SMEs and entrepreneurs. The report provides selected country
cases illustrating the networks and clusters of governance institutions
involved in national AI policies.
6 National policies for Artificial
Intelligence: What about diffusion?
230
THE DIGITAL TRANSFORMATION OF SMES © OECD 2021
In Brief Highlights
Artificial intelligence has emerged as a topic of policy interest, and most countries have
recently launched their national AI strategies in order to articulate public action in the area.
A stronger policy emphasis is generally placed on AI innovation development (supply-
side) than AI adoption (demand-side), e.g. increasing the number of AI researchers and
skilled graduates, increasing national AI research capacity, and fostering national
competitiveness in AI with global ambitions.
SMEs are rarely directly targeted by national AI strategies and policy initiatives. But when
targeted, measures aim at a mix of SMEs, start-ups, entrepreneurs, and research institutions,
with a focus on innovative firms, on the supply side, and a focus on the general SME population,
on the demand-side.
However, most national AI strategies place priority on addressing issues that SMEs face
in the AI transition, suggesting that the SME policy agenda is mainstreamed into the AI policy
agenda.
Policies aim to ensure that new AI technologies can be applied to industrial processes.
The manufacturing industry is seen as one of the sectors that could benefit the most of AI
solutions, automation and enhanced predictive capacity.
Cybersecurity is an important recurrent theme in AI policy initiatives.
In terms of instrumentalisation, the AI policy mix, i.e. the composition of the AI policy
portfolio, is dominated by governance arrangements, also reflecting the novelty of the area.
However, AI policies geared towards SMEs are more likely to be direct financial support
or collaborative infrastructure, platforms, and experimentation labs and testbeds. Indeed,
financing AI innovation is a major issue, as traditional obstacles to finance innovation and
obstacles faced by SMEs to access finance compound. Infrastructure particularly matters for
SMES to engage in co-operation and access networks, where knowledge transfer and
partnerships take place.
AI policy responsibilities tend to be distributed across multiple policy areas and levels of
governance, reflecting both the growing complexity and interweaving of innovation policy
arrangements and the pervasive nature of AI. This may exacerbate the issues of policy
co-ordination and coherence.
AI policies for SMEs often fall under the authority of institutions in charge of STI and
industry policy, less often under those in charge of economic development. Through a
selection of country cases and an exploratory text-as-data analysis of the EC/OECD STI Policy
Compass, the report highlights very large country differences in AI/SMEE governance settings.
Going forward, future policy mapping exercise of this kind should consider complementing
policy information with other sources, in order to bridge the knowledge gap across different policy
domains (e.g. broadband policies, data protection policies) and different levels of governance
(subnational programmes).
231
THE DIGITAL TRANSFORMATION OF SMES © OECD 2021
Introduction
Driven by the growth in computing power and greater data availability and algorithm efficiency,
“Artificial Intelligence” (AI) has gained prominence in recent years. In particular, “machine learning”
has seen spectacular progress since the early 2010s, following a paradigm shift in the discipline which has
enabled AI models to self-improve and has greatly broadened the scope of applications (OECD, 2019[1]).
The main business applications of new generation AI relate to automation, image/face recognition, natural
language processing, data analytics and predictive capacity.
AI adoption can have many benefits for small and medium-sized firms (SMEs), including increased
cost efficiency and productivity gains, increased ability to manage risks and address complex challenges,
increased prediction and decision-making capacity and increased innovation opportunities (Cockburn,
Henderson and Stern, 2018[2]) (see Chapter 5 for a detailed discussion on AI implications for SMEs and
barriers to adoption [CFE/SME(2020)5/CHAP7]) For example, SMEs involved in retail trade and e-
commerce can use AI to personalise offerings and suggestions to customers. Those that engage in
customer support can use AI-supported chatbots to interact with customers 24/7 with no human presence.
AI can also help business owners with forecasting their sales and market trends. A manufacturing SME
could use AI to improve production operations and maintenance, for instance by identifying the
combination of tools and robots that can assemble a device most efficiently, with real-time feedback about
performance, allowing for further optimisation (OECD, 2017[3]).
AI can also substantially improve SME business environment, by enhancing the efficiency of public
administration, courts and tax authorities, reducing red tape, securing digital infrastructure, improving SME
access to finance, easing skills management and job matching, or reducing the costs of experimentation
and innovation. At the same time, algorithms increase the risk of tacit collusion on product and labour
markets, and of (likely large) firms sustaining profits and prices above a fair competitive level, at the
detriment of smaller businesses.
Despite projected gains, the diffusion of AI innovation is not automatic. Evidence suggest different
degrees of AI diffusion across countries, sectors and firm sizes (see Chapter 5), with concerns that most
of the AI benefits could be reaped by first adopters, while laggards have low or no benefits at all
(Brynjolfsson and McElheran, 2016[4]). There are also converging evidence of an SME gap in using data
analytics or implementing AI solutions.
SMEs face a number of barriers in adoption. The AI transition requires them to engage in a process of
transformation that can be lengthy and costly, and for which most of them lack awareness, skills and the
culture of data required. A transformation that also depends both on their absorptive capacities of new
knowledge and on various market and policy incentives (Brynjolfsson, Rock and Syverson, 2017[5];
Berlingieri et al., 2020[6]; Andrews, Nicoletti and Timiliotis, 2018[7]) (Box 6.1). In addition, the deployment
of AI solutions will have a cost. Generally, effective use of AI depends on investments in data and skills
(OECD, 2019[1]; Berlingieri et al., 2020[6]; Andrews, Nicoletti and Timiliotis, 2018[7]), but also on the use of
complementary technologies, such as the Internet of Things (IoT), high-speed broadband, sensors, or
computing storage, etc. These complementary investments add to the high sunk costs SMEs would have
to incur for training AI models. The financial issue is not trivial as little evidence exists on what returns on
investment businesses could expect from AI, nor when they could expect reaping these benefits. It would
take time to build a sufficient stock of AI subfields before seeing effect (Brynjolfsson, Rock and Syverson,
2017[5]).
In fact, AI is unlikely to translate into aggregate productivity growth soon, until sufficient AI innovation
has been undertaken and until adoption has been mainstreamed, along with the spread of adequate
skillset, (Brynjolfsson, Rock and Syverson, 2017[5]), what has emerged as an “aggregate productivity
paradox”.
232
THE DIGITAL TRANSFORMATION OF SMES © OECD 2021
A literature review on barriers to AI adoption by SMEs has helped identify several areas where
policy attention could be given, if governments are to ensure SMEs can participate in the AI transition
(see Chapter 5).
Data is the key. Governments have a role to play in supporting SMEs in building a culture of data
and improving digital risk management practices.
The human factor is critical. Raising awareness among SME managers and workers on AI
benefits, and the conditions of a trustworthy transition, is required. National and local governments
should also co-ordinate action for reskilling SME managers and workers, and ensuring a
participatory approach in redesigning work processes and training AI models.
The issue of financing should be addressed, first by building more evidence on the return on
investment of AI business applications, in order to inform SME managers and business owners,
but also investors and financial institutions, and by identifying mechanisms for bridging the
financing gap until AI can deliver its full promises.
Regulators and policy makers should ensure the well functioning of knowledge markets that
provide cloud solutions embedding AI technologies, as well as the transfer of knowledge that could
enable SMEs scale up capacity before being eventually able to develop their own AI solutions.
Adopting a differentiated industrial approach of the AI transition(s), through sectoral studies
and business use cases, could help inform relevant stakeholders and account for the low
transferability of AI knowledge across environments.
Supporting mutual learning in terms of capacity building and knowledge sharing, through
platforms such as the OECD Digital for SMEs Initiative and the OECD.AI Policy Observatory, could
help better understand the role large firms, business associations, chambers of commerce,
academia, national and local governments, international organisations, and SMEs as well, could
play to advance on these different agenda.
What is the place of SMEs and entrepreneurs in AI ecosystems and what role can public policy
play to ensure SMEs are able to participate in the AI revolution? SMEs are actors of the digital
transformation in two ways, namely as producers and/or as adopters of AI tools (Box 6.1). This chapter
looks at the attention given to SMEs and entrepreneurs in national AI innovation policy mixes across
various countries. It looks at what major policy initiatives have been implemented to support AI
development and diffusion in the SME sector and aims to identify patterns in these public policies and
instruments. The report builds on information contained in the European Commission/OECD Science,
Technology and Innovation Policy (STIP) Compass (European Commission/OECD, 2020[8]) database
(henceforth the Compass), which is the largest international repository on national STI policies. The report
explores two methods for navigating the database, and presents various characteristics of AI policies in
place, in particular those that target SMEs and entrepreneurs. The analysis focuses on the following
questions:
How are national innovation policy mixes shaped for AI innovation and diffusion? What attention is
given to SMEs and entrepreneurs? Are national policy mixes targeted alongside other groups?
Do policy initiatives tend to support the development and diffusion of complementary technologies
besides AI? If so, which ones and how? Have some countries a sector-specific approach?
What policy instruments are used to support AI innovation and AI diffusion? To which extent do
these instruments address the specific barriers faced by smaller businesses?
What role do various public and private organisations play in AI governance? How are SMEs and
entrepreneurs engaged in AI policy governance?
233
THE DIGITAL TRANSFORMATION OF SMES © OECD 2021
Box 6.1. Innovation and innovation policies: Some theoretical insights
Innovation is a broad concept and encompasses a wide range of activities. Taking into account that it
is not specific to the business sector and could be undertaken in the public administration, the
OECD/Eurostat Oslo Manual defines innovation as: “a new or improved product or process (or
combination thereof) that differs significantly from the unit’s previous products or processes and that
has been made available to potential users (product) or brought into use by the unit (process)”
(OECD/Eurostat, 2018[9]).
By innovating, the firm seeks new opportunities and competitive advantage, and aims to generate more
profits, through increased sales, greater brand awareness, new customer base or higher market shares
(i.e. product innovation), or through greater cost efficiency and improved productivity (i.e. business
process innovation). (Schumpeter, 1934[10]) described the disruption of existing economic activities
brought by these innovations, and the subsequent re-organisation of markets, as “creative destruction”.
Innovations derive from an accumulation of knowledge and information that constitutes the firm’s
knowledge-based capital. R&D, for instance, is one of the activities that can generate innovations, or
through which useful knowledge for innovation can be acquired. Technology is a key innovation asset
and its deployment is a major driver of changes in business products and processes and the apparition
of new industries.
Innovation diffusion encompasses both the process by which ideas underpinning product and business
process innovations spread (innovation knowledge diffusion), and the adoption of such products or
processes by other firms (innovation output diffusion) (OECD/Eurostat, 2018[9]).
Firms can source knowledge within their organisational boundaries, as well as from outside, including
from their customers, investors, suppliers, etc. (Enkel, 2010[11]) or from knowledge markets (Hayek,
1945[12]). In fact, firms almost never innovate in isolation (DeBresson, 1996[13]), and networks of
innovation involving multiple actors are the rule rather than the exception.
The scope and nature of innovation diffusion remain deeply conditioned by the firm’s absorptive
capacity, and the incentives -and barriers – existing in its business environment. The firm’s absorptive
capacity depends on structural aspects, such as its size and its sector of activity, but also on its
(financial, human and knowledge-based) capital endowment and its ability to access strategic resources
(OECD, 2019[14]). The business environment is defined by institutional and regulatory settings,
competition and market conditions, and the available infrastructure. Agglomeration is also an important
enabling factor of innovation diffusion (Audretsch and Feldman, 1996[15]).
A range of market, system and government failures provide the rationale for governments to intervene
in support of innovation and technology diffusion (OECD, 2015[16]; OECD, 2016[17]). However, the
diversity of innovation actors, learning processes, linkages, knowledge bases, institutions and
organisations engaged in knowledge transfers increases the complexity of policy making. In fact,
intervention in the field can take many different forms, as it targets the various existing forms of
innovation, the various actors engaged in knowledge flows, the various diffusion channels and
mechanisms at play, or the various enabling conditions that help the firm scale up its capacity to
innovate or provide it the incentives to do so.
This complexity advocates for adopting a “policy mix” approach in the design and evaluation of
innovation diffusion policies, i.e. an approach that takes into account the composition and balance
between policies, and their complementarities or trade-offs.
Source: Abridged from Kergroach (2020[18]), “Benchmarking national innovation policy mixes for technology diffusion”.
234
THE DIGITAL TRANSFORMATION OF SMES © OECD 2021
Data sources and methodology
Data sources
This work builds on desk research and on text-as-data analysis of information contained in the
Compass (European Commission/OECD, 2020[8]). The Compass gathers government responses to a
biennial policy survey on national STI policies. Data from the Compass, edition 2020, was downloaded
using the dedicated query builder (https://stip.oecd.org/stip/query-builder) in March 2020 (see Box 6.2) for
more information).
Box 6.2. The EC/OECD STI Policy Compass
The Compass contains country responses to a biennial survey on major national science, technology
and innovation policy initiatives. The database was first published in 2017, with earlier pilot versions
back to 2012. Respondents are government representatives to the OECD Committee for Scientific and
Technological Policy and to the European Research and Innovation Committee (ERAC). The 2020
edition of the database allows for multiple respondents by country, via national contact points (NCPs)
– see (OECD, 2019[19]). Policy initiatives are reported at the country level, reflecting government views
on the major components of their policy mix for STI (Meissner and Kergroach, 2019[20]). The latest
edition of the database is structured as follows (OECD, 2019[19]):1
There are 5 685 observations (policy initiatives).
67 geographical entities are covered (see Annex 6.A).
Several fields are free text (name in English, background, objective(s), description, responsible
organisation(s)).
Other fields are multiple-choice and base themselves on pre-existing taxonomies (yearly budget
range, theme area(s), theme(s), policy instrument name, etc.).
The database also includes information about the start year and the end year of each initiative.
Two True/False fields indicate whether the initiative is a structural reform and whether it has
been or is currently evaluated.
The share of incomplete information (i.e. initiatives with at least one mandatory field2 left empty)
is 39% (OECD, 2020[21]).
Identifying national AI policies for SMEs
The Compass covers a broad range of STI policy initiatives and instruments. Some initiatives are
reported as “national AI policies”, some are specifically designed for targeting SMEs and entrepreneurs,
and some present both characteristics. Several methods can be used in order to identify the relevant
initiatives for this work in the Compass. The composition of the Compass is represented in stylised form
below, with the intersection between the two subsets, namely initiatives targeting SMEs and entrepreneurs
and initiatives focusing on AI (Figure 6.1).
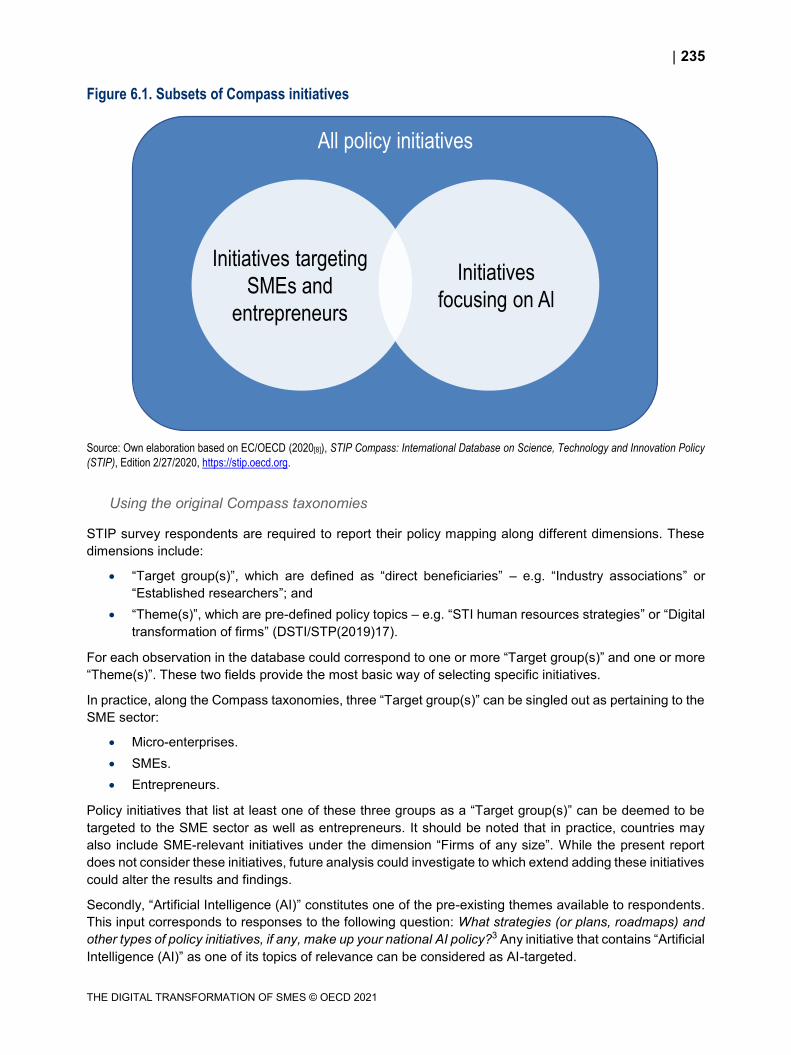
235
THE DIGITAL TRANSFORMATION OF SMES © OECD 2021
Figure 6.1. Subsets of Compass initiatives
Source: Own elaboration based on EC/OECD (2020[8]), STIP Compass: International Database on Science, Technology and Innovation Policy
(STIP), Edition 2/27/2020, https://stip.oecd.org.
Using the original Compass taxonomies
STIP survey respondents are required to report their policy mapping along different dimensions. These
dimensions include:
“Target group(s)”, which are defined as “direct beneficiaries” – e.g. “Industry associations” or
“Established researchers”; and
“Theme(s)”, which are pre-defined policy topics – e.g. “STI human resources strategies” or “Digital
transformation of firms” (DSTI/STP(2019)17).
For each observation in the database could correspond to one or more “Target group(s)” and one or more
“Theme(s)”. These two fields provide the most basic way of selecting specific initiatives.
In practice, along the Compass taxonomies, three “Target group(s)” can be singled out as pertaining to the
SME sector:
Micro-enterprises.
SMEs.
Entrepreneurs.
Policy initiatives that list at least one of these three groups as a “Target group(s)” can be deemed to be
targeted to the SME sector as well as entrepreneurs. It should be noted that in practice, countries may
also include SME-relevant initiatives under the dimension “Firms of any size”. While the present report
does not consider these initiatives, future analysis could investigate to which extend adding these initiatives
could alter the results and findings.
Secondly, “Artificial Intelligence (AI)” constitutes one of the pre-existing themes available to respondents.
This input corresponds to responses to the following question: What strategies (or plans, roadmaps) and
other types of policy initiatives, if any, make up your national AI policy?3 Any initiative that contains “Artificial
Intelligence (AI)” as one of its topics of relevance can be considered as AI-targeted.
All policy initiatives
Initiatives targeting
SMEs and
entrepreneurs
Initiatives
focusing on Al
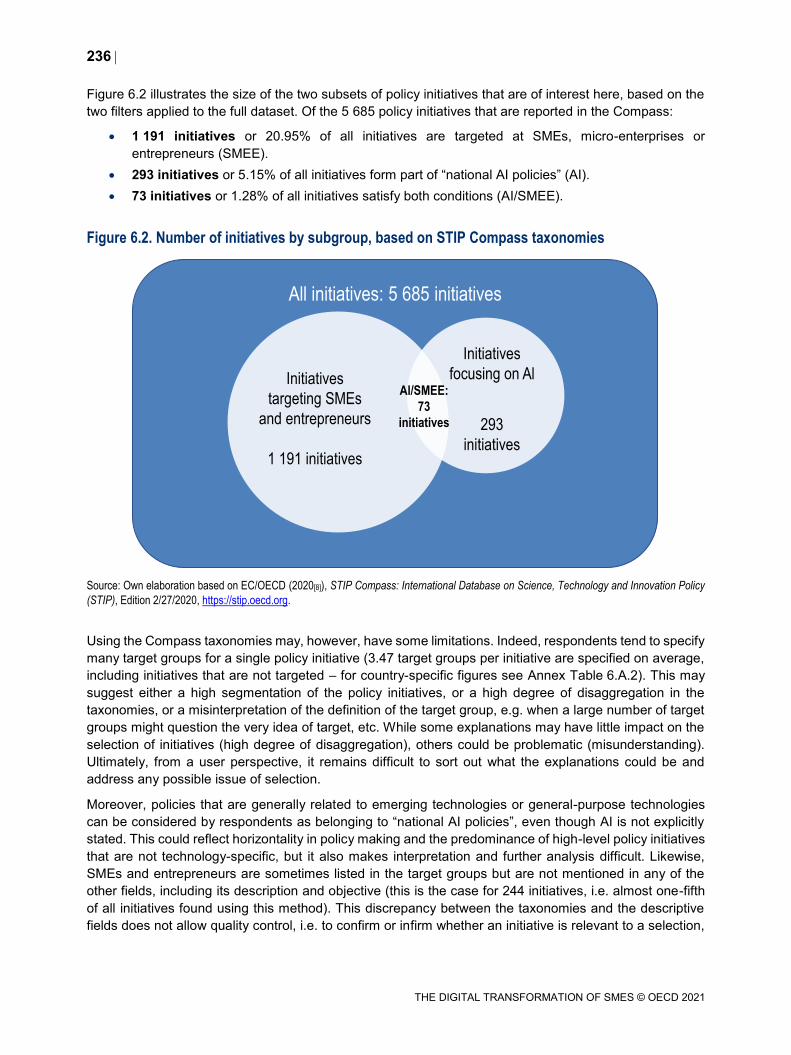
236
THE DIGITAL TRANSFORMATION OF SMES © OECD 2021
Figure 6.2 illustrates the size of the two subsets of policy initiatives that are of interest here, based on the
two filters applied to the full dataset. Of the 5 685 policy initiatives that are reported in the Compass:
1 191 initiatives or 20.95% of all initiatives are targeted at SMEs, micro-enterprises or
entrepreneurs (SMEE).
293 initiatives or 5.15% of all initiatives form part of “national AI policies” (AI).
73 initiatives or 1.28% of all initiatives satisfy both conditions (AI/SMEE).
Figure 6.2. Number of initiatives by subgroup, based on STIP Compass taxonomies
Source: Own elaboration based on EC/OECD (2020[8]), STIP Compass: International Database on Science, Technology and Innovation Policy
(STIP), Edition 2/27/2020, https://stip.oecd.org.
Using the Compass taxonomies may, however, have some limitations. Indeed, respondents tend to specify
many target groups for a single policy initiative (3.47 target groups per initiative are specified on average,
including initiatives that are not targeted – for country-specific figures see Annex Table 6.A.2). This may
suggest either a high segmentation of the policy initiatives, or a high degree of disaggregation in the
taxonomies, or a misinterpretation of the definition of the target group, e.g. when a large number of target
groups might question the very idea of target, etc. While some explanations may have little impact on the
selection of initiatives (high degree of disaggregation), others could be problematic (misunderstanding).
Ultimately, from a user perspective, it remains difficult to sort out what the explanations could be and
address any possible issue of selection.
Moreover, policies that are generally related to emerging technologies or general-purpose technologies
can be considered by respondents as belonging to “national AI policies”, even though AI is not explicitly
stated. This could reflect horizontality in policy making and the predominance of high-level policy initiatives
that are not technology-specific, but it also makes interpretation and further analysis difficult. Likewise,
SMEs and entrepreneurs are sometimes listed in the target groups but are not mentioned in any of the
other fields, including its description and objective (this is the case for 244 initiatives, i.e. almost one-fifth
of all initiatives found using this method). This discrepancy between the taxonomies and the descriptive
fields does not allow quality control, i.e. to confirm or infirm whether an initiative is relevant to a selection,
All initiatives: 5 685 initiatives
Initiatives
focusing on Al
293
initiatives
Al/SMEE:
73
initiatives
Initiatives
targeting SMEs
and entrepreneurs
1 191 initiatives
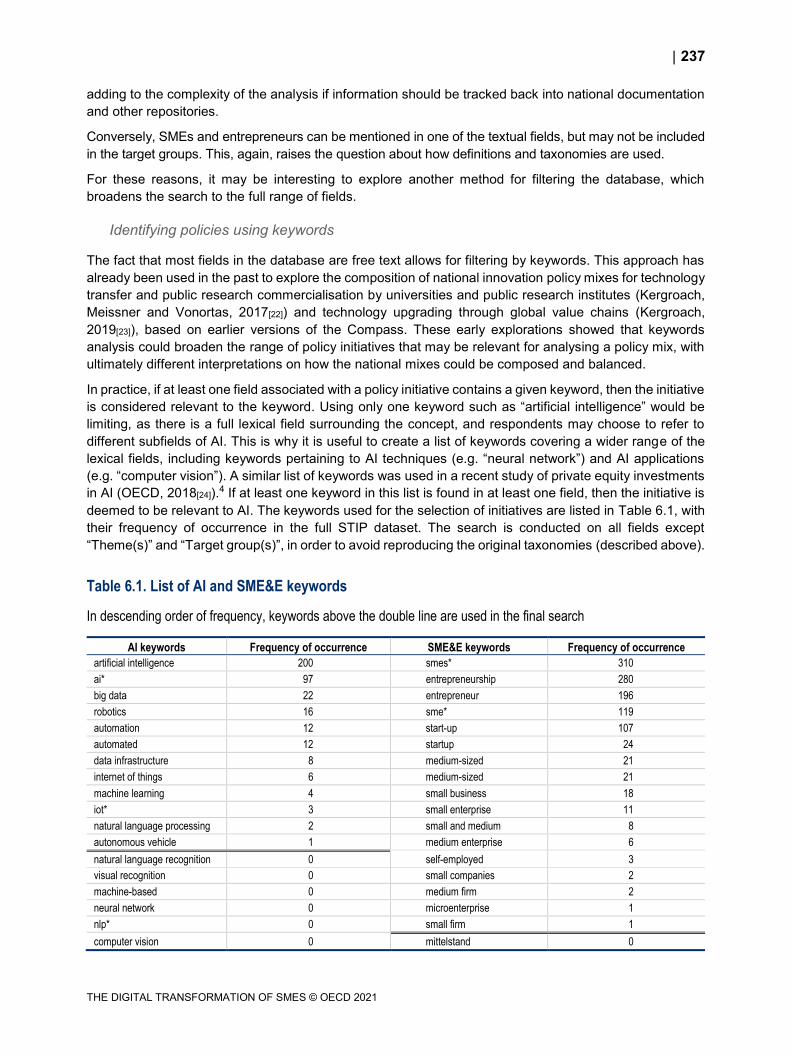
237
THE DIGITAL TRANSFORMATION OF SMES © OECD 2021
adding to the complexity of the analysis if information should be tracked back into national documentation
and other repositories.
Conversely, SMEs and entrepreneurs can be mentioned in one of the textual fields, but may not be included
in the target groups. This, again, raises the question about how definitions and taxonomies are used.
For these reasons, it may be interesting to explore another method for filtering the database, which
broadens the search to the full range of fields.
Identifying policies using keywords
The fact that most fields in the database are free text allows for filtering by keywords. This approach has
already been used in the past to explore the composition of national innovation policy mixes for technology
transfer and public research commercialisation by universities and public research institutes (Kergroach,
Meissner and Vonortas, 2017[22]) and technology upgrading through global value chains (Kergroach,
2019[23]), based on earlier versions of the Compass. These early explorations showed that keywords
analysis could broaden the range of policy initiatives that may be relevant for analysing a policy mix, with
ultimately different interpretations on how the national mixes could be composed and balanced.
In practice, if at least one field associated with a policy initiative contains a given keyword, then the initiative
is considered relevant to the keyword. Using only one keyword such as “artificial intelligence” would be
limiting, as there is a full lexical field surrounding the concept, and respondents may choose to refer to
different subfields of AI. This is why it is useful to create a list of keywords covering a wider range of the
lexical fields, including keywords pertaining to AI techniques (e.g. “neural network”) and AI applications
(e.g. “computer vision”). A similar list of keywords was used in a recent study of private equity investments
in AI (OECD, 2018[24]).4 If at least one keyword in this list is found in at least one field, then the initiative is
deemed to be relevant to AI. The keywords used for the selection of initiatives are listed in Table 6.1, with
their frequency of occurrence in the full STIP dataset. The search is conducted on all fields except
“Theme(s)” and “Target group(s)”, in order to avoid reproducing the original taxonomies (described above).
Table 6.1. List of AI and SME&E keywords
In descending order of frequency, keywords above the double line are used in the final search
AI keywords Frequency of occurrence SME&E keywords Frequency of occurrence
artificial intelligence 200 smes* 310
ai* 97 entrepreneurship 280
big data 22 entrepreneur 196
robotics 16 sme* 119
automation 12 start-up 107
automated 12 startup 24
data infrastructure 8 medium-sized 21
internet of things 6 medium-sized 21
machine learning 4 small business 18
iot* 3 small enterprise 11
natural language processing 2 small and medium 8
autonomous vehicle 1 medium enterprise 6
natural language recognition 0 self-employed 3
visual recognition 0 small companies 2
machine-based 0 medium firm 2
neural network 0 microenterprise 1
nlp* 0 small firm 1
computer vision 0 mittelstand 0
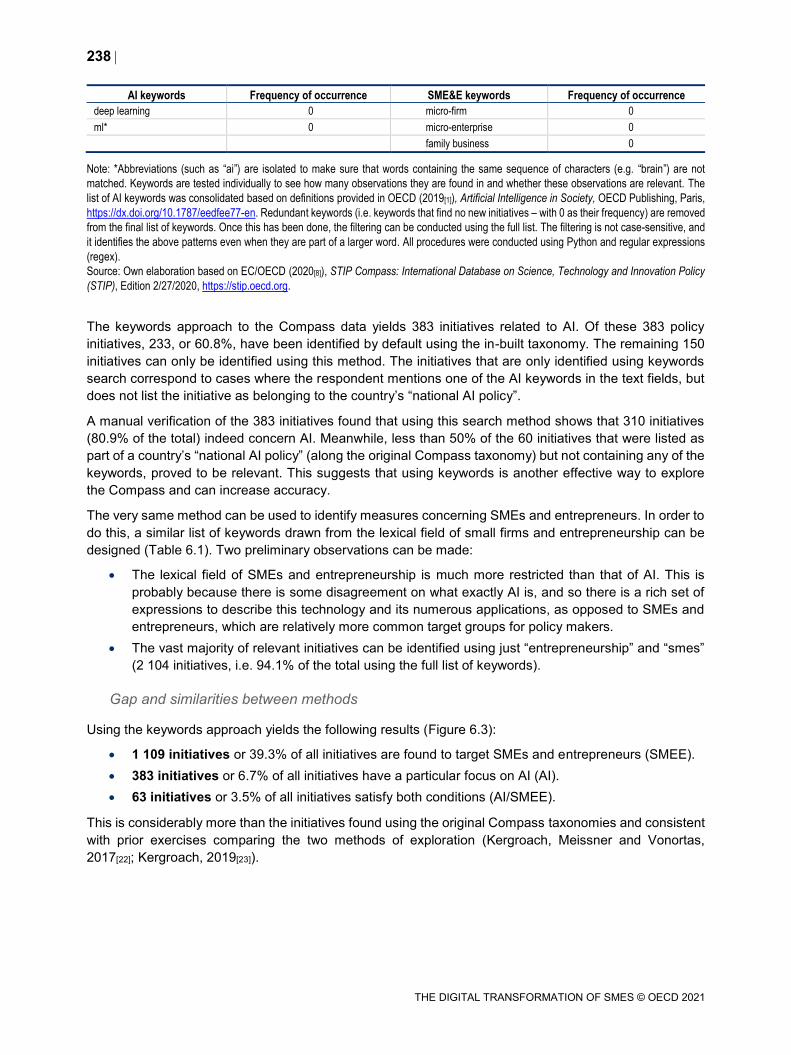
238
THE DIGITAL TRANSFORMATION OF SMES © OECD 2021
AI keywords Frequency of occurrence SME&E keywords Frequency of occurrence
deep learning 0 micro-firm 0
ml* 0 micro-enterprise 0
family business 0
Note: *Abbreviations (such as “ai”) are isolated to make sure that words containing the same sequence of characters (e.g. “brain”) are not
matched. Keywords are tested individually to see how many observations they are found in and whether these observations are relevant. The
list of AI keywords was consolidated based on definitions provided in OECD (2019[1]), Artificial Intelligence in Society, OECD Publishing, Paris,
https://dx.doi.org/10.1787/eedfee77-en. Redundant keywords (i.e. keywords that find no new initiatives – with 0 as their frequency) are removed
from the final list of keywords. Once this has been done, the filtering can be conducted using the full list. The filtering is not case-sensitive, and
it identifies the above patterns even when they are part of a larger word. All procedures were conducted using Python and regular expressions
(regex).
Source: Own elaboration based on EC/OECD (2020[8]), STIP Compass: International Database on Science, Technology and Innovation Policy
(STIP), Edition 2/27/2020, https://stip.oecd.org.
The keywords approach to the Compass data yields 383 initiatives related to AI. Of these 383 policy
initiatives, 233, or 60.8%, have been identified by default using the in-built taxonomy. The remaining 150
initiatives can only be identified using this method. The initiatives that are only identified using keywords
search correspond to cases where the respondent mentions one of the AI keywords in the text fields, but
does not list the initiative as belonging to the country’s “national AI policy”.
A manual verification of the 383 initiatives found that using this search method shows that 310 initiatives
(80.9% of the total) indeed concern AI. Meanwhile, less than 50% of the 60 initiatives that were listed as
part of a country’s “national AI policy” (along the original Compass taxonomy) but not containing any of the
keywords, proved to be relevant. This suggests that using keywords is another effective way to explore
the Compass and can increase accuracy.
The very same method can be used to identify measures concerning SMEs and entrepreneurs. In order to
do this, a similar list of keywords drawn from the lexical field of small firms and entrepreneurship can be
designed (Table 6.1). Two preliminary observations can be made:
The lexical field of SMEs and entrepreneurship is much more restricted than that of AI. This is
probably because there is some disagreement on what exactly AI is, and so there is a rich set of
expressions to describe this technology and its numerous applications, as opposed to SMEs and
entrepreneurs, which are relatively more common target groups for policy makers.
The vast majority of relevant initiatives can be identified using just “entrepreneurship” and “smes”
(2 104 initiatives, i.e. 94.1% of the total using the full list of keywords).
Gap and similarities between methods
Using the keywords approach yields the following results (Figure 6.3):
1 109 initiatives or 39.3% of all initiatives are found to target SMEs and entrepreneurs (SMEE).
383 initiatives or 6.7% of all initiatives have a particular focus on AI (AI).
63 initiatives or 3.5% of all initiatives satisfy both conditions (AI/SMEE).
This is considerably more than the initiatives found using the original Compass taxonomies and consistent
with prior exercises comparing the two methods of exploration (Kergroach, Meissner and Vonortas,
2017[22]; Kergroach, 2019[23]).
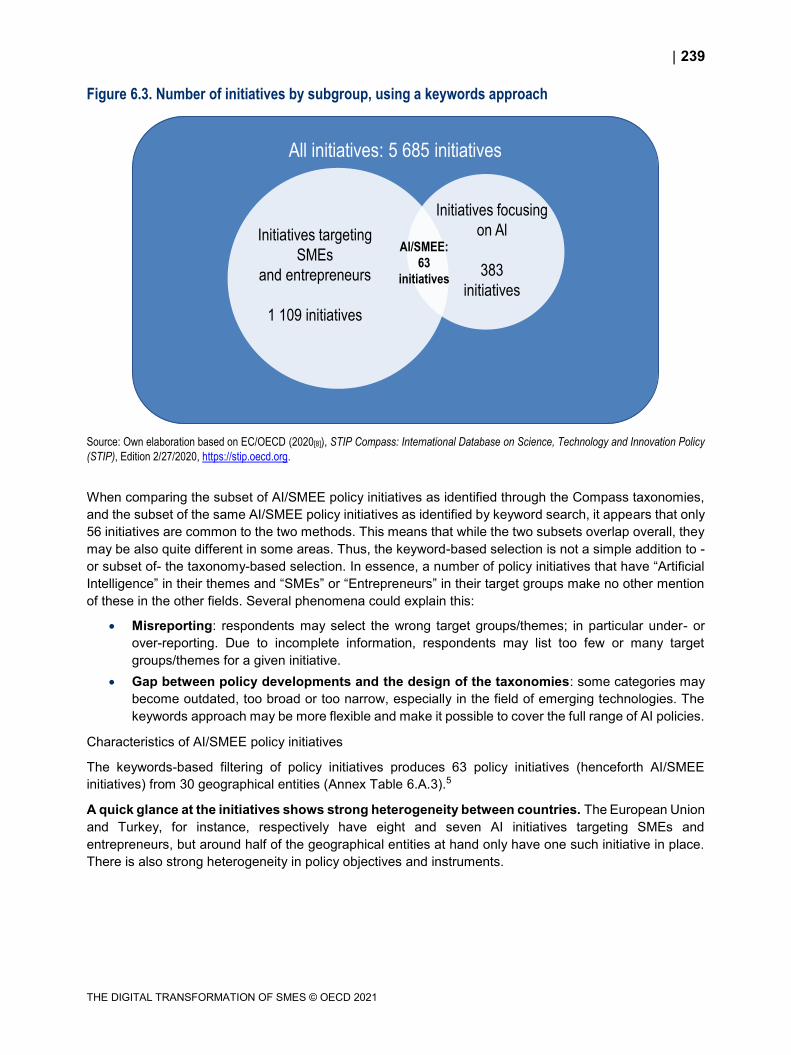
239
THE DIGITAL TRANSFORMATION OF SMES © OECD 2021
Figure 6.3. Number of initiatives by subgroup, using a keywords approach
Source: Own elaboration based on EC/OECD (2020[8]), STIP Compass: International Database on Science, Technology and Innovation Policy
(STIP), Edition 2/27/2020, https://stip.oecd.org.
When comparing the subset of AI/SMEE policy initiatives as identified through the Compass taxonomies,
and the subset of the same AI/SMEE policy initiatives as identified by keyword search, it appears that only
56 initiatives are common to the two methods. This means that while the two subsets overlap overall, they
may be also quite different in some areas. Thus, the keyword-based selection is not a simple addition to -
or subset of- the taxonomy-based selection. In essence, a number of policy initiatives that have “Artificial
Intelligence” in their themes and “SMEs” or “Entrepreneurs” in their target groups make no other mention
of these in the other fields. Several phenomena could explain this:
Misreporting: respondents may select the wrong target groups/themes; in particular under- or
over-reporting. Due to incomplete information, respondents may list too few or many target
groups/themes for a given initiative.
Gap between policy developments and the design of the taxonomies: some categories may
become outdated, too broad or too narrow, especially in the field of emerging technologies. The
keywords approach may be more flexible and make it possible to cover the full range of AI policies.
Characteristics of AI/SMEE policy initiatives
The keywords-based filtering of policy initiatives produces 63 policy initiatives (henceforth AI/SMEE
initiatives) from 30 geographical entities (Annex Table 6.A.3).5
A quick glance at the initiatives shows strong heterogeneity between countries. The European Union
and Turkey, for instance, respectively have eight and seven AI initiatives targeting SMEs and
entrepreneurs, but around half of the geographical entities at hand only have one such initiative in place.
There is also strong heterogeneity in policy objectives and instruments.
All initiatives: 5 685 initiatives
Initiatives focusing
on Al
383
initiatives
Al/SMEE:
63
initiatives
Initiatives targeting
SMEs
and entrepreneurs
1 109 initiatives
240
THE DIGITAL TRANSFORMATION OF SMES © OECD 2021
The subset of AI/SMEE policies includes:
High-level national strategies on AI (e.g. Malta’s National AI Strategy).
Large-scale AI research programmes (AI R&D Framework and Activities of the Israeli Innovation
Authority).
Platforms helping SMEs to reap the benefits of digitalisation, with a focus on AI and other
technologies (e.g. Digital Catapult – United Kingdom).
This section starts by introducing broad features of the national AI/SMEE policy initiatives in place, and
then analyses them more into details along several dimensions, trying to situate them within the broader
picture of national AI policy landscape:
Target groups: What is the place given to SMEs and entrepreneurs?
Technological focus: What complementary technologies, if any, appear alongside AI in these
initiatives?
Policy instruments: What tools do policy makers use?
Responsible organisations: What are the institutions in charge of AI policy implementation and
what do institutional arrangements say about national AI/SMEE policy?
General orientation and strategies
AI innovation and AI diffusion
Two policy approaches reflect the two faces of digital transformation, whereby SMEs participate in
digital innovation production on the one hand, and adopt and benefit from digital innovation diffusion on
the other hand (OECD, 2019[25]). The two approaches can be complementary as they both contribute to
foster the emergence of an AI ecosystem from which SMEs could benefit significantly as they gain
competitiveness and productivity.
These two main policy orientations shape AI/SMEE policy initiatives, when policy makers aim to:
Foster AI development. As part of this objective, measures often provide funding for research and
target innovative SMEs, start-ups, entrepreneurs, often alongside research institutions and other
innovation actors. These groups are targeted as producers of AI solutions, and initiatives are
research, S&T and innovation policies.
Promote technology diffusion and the adoption of AI solutions among SMEs. These initiatives focus
on increasing demand for AI services in the general SME population. In this case, SMEs and
entrepreneurs are targeted as potential adopters of AI, and initiatives fall within the policy area of
technology diffusion.
A stronger policy emphasis is generally placed on AI development (supply-side) than AI adoption
(demand-side) in national innovation policy mixes. A first observation is that, as per the number of
related measures in place, a larger number of countries are implementing supply-oriented initiatives in
order to support innovative and high-growth SMEs developing AI, as opposed to supporting the adoption
of AI tools among the general SME population. And it comes as no surprise that these two subsets of
initiatives have different target groups, rationales and strategic objectives, and use different policy
instruments.
The frame of national AI strategies
Artificial Intelligence for many governments is an emerging policy priority and national AI
strategies are being devised to articulate public action in the area. National Strategies or Agendas
serve as plans that develop the government’s vision regarding the (in this case) contribution of AI to the
241
THE DIGITAL TRANSFORMATION OF SMES © OECD 2021
nation’s social and economic development. National Strategies are a policy tool that sets priorities for
public investment and policy intervention, and identifies the focal points of government legislation. They
also provide a framework for co-ordinating policy action towards this shared vision. An increasing number
of countries are being implemented their national AI strategy across ministries and government agencies,
with different focuses on different opportunities and challenges.
Out of the forty OECD and non-OECD countries reviewed in the OECD AI Observatory, 26 countries have a
national strategy dedicated to AI in place. Of the remaining, eleven countries have plans to develop such a
strategy in the near future, including Austria, Hungary, Israel and Spain. Finally, three countries touch upon
AI policy challenges in their national digital strategy, i.e. Australia, the Slovak Republic and Switzerland.
There are cross-country commonalities on the policy areas of intervention and policy ambitions of
these strategies, e.g. the shared aim to increase the number of AI researchers and skilled graduates,
strengthening national AI research capacity, and translating AI research into public and private sector
applications. Countries also share a mutual goal of fostering national competitiveness in AI, with many of
them aiming to be a global leader in AI development and adoption. However, national agendas also reflect
differences in legal systems, economic capabilities, digital capabilities and cultures (OECD, 2019[25])
Most initiatives aim to embrace the horizontal and generic nature of AI, by actively involving multiple
stakeholders from public research, industry and government institutions, having mixed public-private
funding models and seeking international co-operation on AI.
The public budgetary investment on AI varies radically across countries, ranging from over
USD 500 million – Japan, Korea and the United Kingdom- to less than USD 1 million -Australia, Estonia,
Greece, Lithuania and Portugal-, also reflecting differences in financial capacity and size. Several states
have not disclosed the budget for their National Strategies.
Most National AI strategies were launched in 2019 or 2020 and are short term with an end date in the
next few years.
According to the OECD AI Observatory again, SMEs are rarely directly targeted by these strategies,
which rather aim at national governments, firms of any size and public research institutions. Whilst firms
of any size were identified to be the target group in 56 national AI strategies, SMEs were only an explicit
target for 18countries.
SMEs are featured in national AI strategies to a varying extent, depending on whether those are
focused on the supply-side and supporting AI invention and innovation, or the demand-side and
accelerating AI innovation diffusion. SMEs are referred to in Finland, in terms of their incorporation into
broader AI R&D plans.
Below are the countries where national strategies have underlined SME innovation diffusion as a
priority and that assist SMEs with AI and data-driven business development as a strategic focus:
Artificial Intelligence Mission Austria 2030 (Austria)
National Artificial Intelligence Strategy of the Czech Republic (Czech Republic)
Denmark’s National Strategy for Artificial Intelligence (Denmark)
Artifical Intelligence Strategy Germany (Germany)
National Artificial Intelligence Strategy (Italy)
Malta’s National AI Strategy (Malta)
National Strategy for Artificial Intelligence (Norway)
Strategic Action Plan on Artificial Intelligence (Netherlands)
National Strategy for Artificial Intelligence – AI Portugal 2030 (Portugal)
DigitalWallonia4AI (Belgium – Wallonia – regional government)
242
THE DIGITAL TRANSFORMATION OF SMES © OECD 2021
When the national AI strategy is managed by the Ministry of Economy, there tend to be a greater
policy focus on SME adoption. There is a difference among countries of what department or
governmental ministry is responsible for implementing the national AI strategy. Whilst policy
implementation falls under the Ministerial portfolios for science, technology and innovation in some
countries, it is under that of economy or education, or administrated by the Ministry in charge of the
digitalisation agenda in others. For instance, the Polish Artificial Intelligence Development Policy falls under
the responsibility of the Ministry of Digitalisation
However, most national AI strategies place priority on five main themes, which reflect the barriers
SMEs face in the AI transition, and suggest that the SME policy agenda is mainstreamed into the
AI policy agenda: i) creating the enabling conditions to AI innovation and diffusion, such as AI research
capabilities and skills development, ii) improving demand and diffusion conditions; iii) sector-approaches
in related and supporting industries; iv) firm strategy, structure and competition; and v) improving the
governance and co-ordination of national AI policy. Several AI strategies set specific actions to strengthen
AI research capabilities reflecting the centrality of AI R&D, but many also aim to support private sector
adoption of AI and develop standards for the ethical use of AI. Likewise, responsible data-access and
sharing regulations, infrastructure investments, and measures to ensure that AI contribute to sustainable
and inclusive growth are priorities. In fact, there is a growing focus given by governments on ethics and
human rights in the context of AI (OECD, 2019[25]).
In addition, some countries such as Luxembourg and Latvia are focusing on building the
framework conditions for AI diffusion among the SME sector, e.g by focusing on government adoption
of AI and how this can benefit SMEs through alleviated administrative burden or improved public service
delivery, or through larger plans to develop AI skills, such as Australia.
Targeted policy approaches6
Target populations
Similarly as for the national AI strategies, the majority of AI policy initiatives do not specifically
target SMEs and entrepreneurs. The keywords method used to identify policy initiatives in the Compass
database shows that of the 383 policy initiatives which mention AI and/or related keywords, only 63 (16.4%)
refer to SMEs and entrepreneurs. Other target groups for AI policies may include higher education
institutions, large firms, the public sector, or students, for example.
Within AI/SMEE policy, three types of policy initiatives can be distinguished: those that focus exclusively
on SMEs and entrepreneurs, those that target a wide range of actors with the aim to foster agglomeration
and collaboration (e.g. cluster policies), and finally those that target firms regardless of size, but have
preferential conditions for SMEs. This section looks at these aspects.
On the supply-side, AI innovation initiatives often target a mix of SMEs, start-ups, entrepreneurs,
and research institutions, with a focus on innovative firms and an aim to foster collaboration. Firms
never innovate in isolation, and innovative firms are embedded within knowledge networks and markets,
which comprise various organisations, institutions and intermediaries. Actors involved in these networks
include businesses of various sizes, universities, public research institutes , governments, public
administrations, individuals and non-governmental-organisations (OECD, 2013[26]). Moreover, actors of
innovation exhibit high geographic concentration and interconnectedness, often forming “clusters” (Porter,
1998[27]), being through market processes or being policy-led.
243
THE DIGITAL TRANSFORMATION OF SMES © OECD 2021
Target groups include:
All firms, but with a specific emphasis on SMEs and/or start-ups or with an aim of fostering
partnerships with large firms and research institutions. For example, under Australia’s
Cooperative Research Centers Program, research projects must involve at least two firms (of which
one must be an SME) as well as a research organisation. Canada’s Innovation Superclusters
Initiative, supports partnerships between large firms, SMEs and industry-relevant research
institutions. Both initiatives contain a specific round or focus on AI innovation. For its part, the High
Performance Computer RIVR-VEGA infrastructure, implemented in Slovenia, is accessible to
researchers and to all Slovenian firms, with emphasis on SMEs.
Start-ups exclusively, e.g. the Digital Tech Fund seed fund, launched by the Luxembourg’s
Ministry of the Economy and a group of private investors, supports innovative start-ups in the field
of ICT, including IoT and Big Data. To be eligible, start-ups must be less than seven years old, and
must preferably already have developed functional prototypes.
Entrepreneurs and firms regardless of size. These include the AI R&D Framework and Activities
of the Israeli Innovation Authority, International Partnerships in Sciences and Technology
(Portugal) and the Brussels Region Artificial Intelligence Policy (Belgium – Brussels – regional
government).
SMEs exclusively in a few countries, such as The SME Development Support Program
(KOBIGEL) - Digitalisation in Manufacturing Industry (Turkey).
Other less common target groups include students, spinoffs, and professionals. In general,
initiatives aiming to foster AI innovation have a tendency to support firms rather than individuals, especially
through . partnerships between public research institutions and privately-owned businesses.
By contrast, on the demand-side, AI adoption initiatives focus on the general SME population, with
attention to manufacturing SMEs in particular. Concerns have been raised about technology diffusion
initiatives that would target predictable early adopters, including multinationals, high-technology start-ups,
and firms involved in the development of technology (OECD, 2017[3]). Instead, policy makers should make
sure that these new technologies reach the SME population as whole (OECD, 2017[3]). In line with this
policy recommendation, measures targeting demand for AI solutions among SMEs and entrepreneurs do
tend to focus on the bulk of the SME population. Initiatives focusing on diffusion either target SMEs directly
or target the private sector as a whole, with preferential conditions for SMEs. In general, several trends
can be identified:
Programmes such as Finland Fit for Digital, Platform Industry 4.0 (Germany) and Italy’s Tax credit
on training 4.0 aim to support digital transformation in large and small firms alike, but have special
provisions or preferential conditions for SMEs. Finland Fit for Digital is a broad programme which
aims to accelerate the digital transformation of firms, and focuses inter alia on the digital readiness
of industrial SMEs. Platform Industry 4.0 encourages all firms in Germany to gain awareness of
Industry 4.0 tools, with specific emphasis on SMEs. Finally, all firms are eligible to the Italian Tax
credit on training 4.0, but SMEs benefit from preferential rates of 50% for micro-enterprises and
small firms and 40% for medium-sized firms, as opposed to 30% for large firms.
Secondly, there is a clear emphasis on enhancing AI diffusion to manufacturing SMEs. The Digital
Turkey Roadmap supports SMEs in the manufacturing industry, which face technical and financial
difficulties in engaging in digital transformation. The United Kingdom’s Digital Catapult has a
sectoral focus on manufacturing and the creative industries, with specific support to SMEs in these
sectors.
In addition, two initiatives foster, or plan to foster, adoption of AI tools within public sector
organisations and SMEs simultaneously. This is the case of the Support program for emerging
technologies based on 5G (Italy) and the Digital Innovation Hubs (European Union).
244
THE DIGITAL TRANSFORMATION OF SMES © OECD 2021
Focus on technology complementarity
There is often a focus given to technology complementarity in national AI policies alongside the AI
technology itself, whether on the AI innovation side or on the AI diffusion side. Innovation policy
often concentrates on several technologies simultaneously, recognising that transdisciplinary R&D can be
highly beneficial and that new technologies can converge, creating new uses and applications. On the
adoption side, different technologies often rely on the same infrastructure; for example, access to 5G
infrastructure can facilitate access to AI, IoT or blockchain, enabling better connectivity and faster data
transactions. For its part, blockchain can help to ensure data reliability and traceability. High-speed internet
and high-performance computing are also crucial, both for AI development and for AI adoption (e.g. through
cloud computing).
A striking feature of AI/SMEE policy initiatives is the emphasis given to fostering supply in a wide
array of technologies.Technology convergence between different fields requires R&D to overcome
traditionally mono-disciplinary arrangements (OECD, 2019[28]), and support innovation in software as well
as hardware and infrastructure. This is the case for very broad-based innovation frameworks such as
Luxembourg’s Digital Tech Fund, which provides co-investment in innovative ventures in areas such as
cybersecurity, FinTech, Big Data, Digital Health, media and the next-generation communication networks,
digital learning, IoT or satellite telecommunications and services. Some policy initiatives jointly target two
technologies at once, for instance Financing of Artificial Intelligence and Blockchain Technologies
(European Commission). Others are centred on the opportunities offered by new networks, such as Italy’s
Support Program for Emerging Technologies based on 5G, which supports the development of IoT
alongside AI and blockchain. Korea’s Smart Media Technology R&BD Support Program supports “digital
technologies including the Internet of Things (IoT), cloud technologies, big data, artificial intelligence,
augmented reality, and virtual reality.”
AI/SMEE diffusion policies exhibit similar characteristics, with a tendency to support the diffusion
of multiple technologies, rather than focusing just on AI. This includes IoT, 5G, blockchain, photonics,
synthetic biology, robotics, additive manufacturing (Finland Fit for Digital) immersive technologies (Digital
Catapult), and robotics (Digital Turkey Roadmap).
Most AI/SMEE innovation measures aim to spur the development of AI software, often through
investment in R&D. In this respect, France’s Ambition Seed Angels Fund is an exception in that it also
targets the production of (1) hardware (e.g. connected objects, robotics, etc.) and (2) new services/uses
(e.g. mobile applications, platforms, collaborative models).
In addition, some subfields of AI receive special attention from policy makers, such as language
technologies. Indeed, machine translation can bring significant gains to e-commerce, by reducing barriers
between national markets at a lower cost. This issue is particularly acute for SMEs, which have more
difficulty accessing translation services and engaging in e-commerce internationally. Language
technologies are also crucial for interactive dialogue systems and personal assistants (European
Commission, 2018[29]). In line with this, the AI R&D Framework and Activities of the Israel Innovation
Authority, specifically cites the absence of commercial Hebrew-language natural language processing
(NLP) tools as a reason to support the industry. Spain has a dedicated national plan (National Plan for the
Advancement of Language Technologies), while the Greek Artificial Intelligence Center of Excellence
supports research in AI, with an emphasis on document intelligence.
Cybersecurity emerges as an important related topic for AI policy makers. When adopting new
technologies, SMEs face a number challenges related to digital risk management. Generally, SMEs lack
the know-how that is necessary to ensure digital security and data protection (see Chapter 2) and AI may
bring risks of its own (see Chapter 5). In particular, SMEs which are users of AI software-as-a-service
(SaaS) may face issues maintaining ownership over their data and managing related digital risks. For
instance, businesses which use SaaS tend to be responsible for managing their identity and access, and
245
THE DIGITAL TRANSFORMATION OF SMES © OECD 2021
they must also protect data which is stored offline (McAfee, 2020[30]; AWS, 2020[31]). The frequent
references to cybersecurity in AI/SMEE initiatives show a policy concern for making sure SMEs engage in
technology adoption without becoming vulnerable to cyber-attacks or digital security risks:
The SME Development Support Program (KOBIGEL) - Digitalisation in Manufacturing Industry
(Turkey). Under this programme, SMEs can apply for support in the form of grants and subsidised
loans. Eligible projects include use of big data, internet of things, intelligent sensor technologies,
autonomous robot technologies, AI and cybersecurity.
Digital Innovation Hubs (European Union): As part of Digital Europe Programme, the European
Commission and member states plan to invest in European Digital Innovation Hubs. In particular,
emphasis will be placed on supporting uptake of cybersecurity among other themes.
Tax credit on training 4.0 (Italy): Firms whose staff receive training on selected themes are eligible
for subsidies on labour costs. Cybersecurity is one of the theme among others: co-operative robots,
additive manufacturing, augmented reality, simulation, digital integration, industrial internet, cloud,
and big data/analytics.
As part of Germany’s Platform Industry 4.0, implicated stakeholders aim to issue recommendations
of the “security of networked systems”. Generally, the platform aims to increase awareness of
Industry 4.0 themes among firms, with emphasis on SMEs.
Focus on the manufacturing sector and Industry 4.0
A particular field of interest for policy makers is ensuring that new AI technologies can be applied
to industrial processes. The term “Industry 4.0” refers to the application of transformative digital
technologies to industrial production, with a view to developing new processes or making existing
processes more efficient. A variety of technologies form part of this “fourth industrial revolution”, including
technologies which permit autonomous and intelligent systems (AI, and in particular machine learning and
data science), but also the sensors which IoT is built on and the tools related to new-age robotics (OECD,
2017[3]). AI is central to the functioning of other technologies such as additive manufacturing, autonomous
machines, and human-machine integration (Figure 6.4).
The manufacturing industry is seen as one of the sectors that could benefit the most of the
implementation of AI solutions, thanks to the automation of processes and enhanced predictive
capacity. AI tools can help optimise operations in smart factories, improving quality and safety control,
increasing capacity for just-in-time production with greater reactivity to end-use market variations and
better planning capability (e.g. peaks of demand), reducing costs, e.g. regarding intermediaries or energy
consumption, and reducing the delays of sourcing and delivering, improving stock and asset management
through predictive maintenance, and reducing the risks of incidents and costs associated with production
disruption and routine maintenance (European Commission, 2020[32]) (see Chapter 5 on AI implications on
business practices).
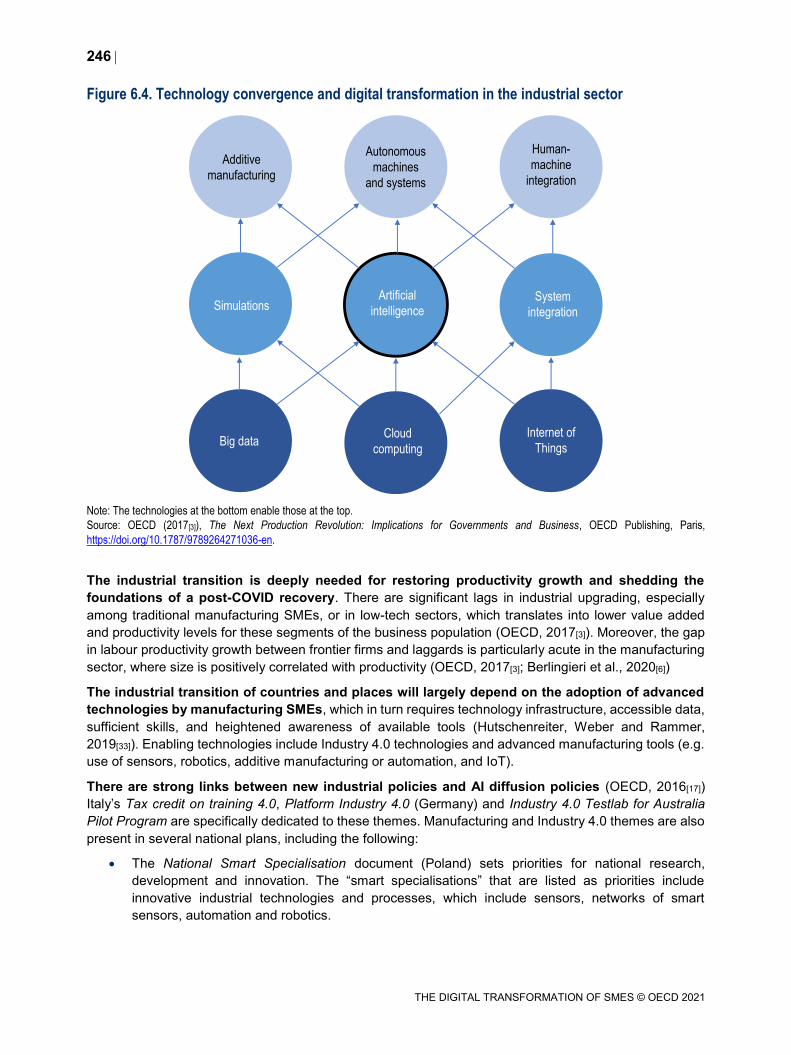
246
THE DIGITAL TRANSFORMATION OF SMES © OECD 2021
Figure 6.4. Technology convergence and digital transformation in the industrial sector
Note: The technologies at the bottom enable those at the top.
Source: OECD (2017[3]), The Next Production Revolution: Implications for Governments and Business, OECD Publishing, Paris,
https://doi.org/10.1787/9789264271036-en.
The industrial transition is deeply needed for restoring productivity growth and shedding the
foundations of a post-COVID recovery. There are significant lags in industrial upgrading, especially
among traditional manufacturing SMEs, or in low-tech sectors, which translates into lower value added
and productivity levels for these segments of the business population (OECD, 2017[3]). Moreover, the gap
in labour productivity growth between frontier firms and laggards is particularly acute in the manufacturing
sector, where size is positively correlated with productivity (OECD, 2017[3]; Berlingieri et al., 2020[6])
The industrial transition of countries and places will largely depend on the adoption of advanced
technologies by manufacturing SMEs, which in turn requires technology infrastructure, accessible data,
sufficient skills, and heightened awareness of available tools (Hutschenreiter, Weber and Rammer,
2019[33]). Enabling technologies include Industry 4.0 technologies and advanced manufacturing tools (e.g.
use of sensors, robotics, additive manufacturing or automation, and IoT).
There are strong links between new industrial policies and AI diffusion policies (OECD, 2016[17])
Italy’s Tax credit on training 4.0, Platform Industry 4.0 (Germany) and Industry 4.0 Testlab for Australia
Pilot Program are specifically dedicated to these themes. Manufacturing and Industry 4.0 themes are also
present in several national plans, including the following:
The National Smart Specialisation document (Poland) sets priorities for national research,
development and innovation. The “smart specialisations” that are listed as priorities include
innovative industrial technologies and processes, which include sensors, networks of smart
sensors, automation and robotics.
Additive
manufacturing
Autonomous
machines
and systems
Human-
machine
integration
SimulationsArtificial
intelligenceSystem
integration
Big dataCloud
computing
Internet of
Things
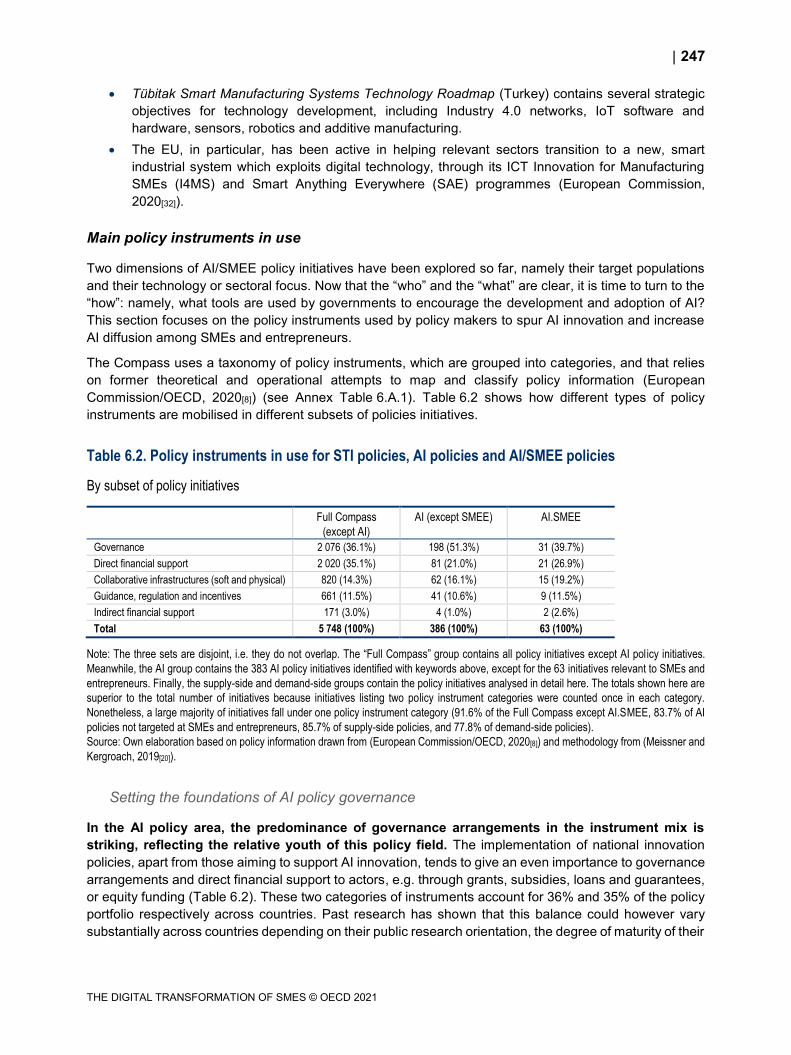
247
THE DIGITAL TRANSFORMATION OF SMES © OECD 2021
Tübitak Smart Manufacturing Systems Technology Roadmap (Turkey) contains several strategic
objectives for technology development, including Industry 4.0 networks, IoT software and
hardware, sensors, robotics and additive manufacturing.
The EU, in particular, has been active in helping relevant sectors transition to a new, smart
industrial system which exploits digital technology, through its ICT Innovation for Manufacturing
SMEs (I4MS) and Smart Anything Everywhere (SAE) programmes (European Commission,
2020[32]).
Main policy instruments in use
Two dimensions of AI/SMEE policy initiatives have been explored so far, namely their target populations
and their technology or sectoral focus. Now that the “who” and the “what” are clear, it is time to turn to the
“how”: namely, what tools are used by governments to encourage the development and adoption of AI?
This section focuses on the policy instruments used by policy makers to spur AI innovation and increase
AI diffusion among SMEs and entrepreneurs.
The Compass uses a taxonomy of policy instruments, which are grouped into categories, and that relies
on former theoretical and operational attempts to map and classify policy information (European
Commission/OECD, 2020[8]) (see Annex Table 6.A.1). Table 6.2 shows how different types of policy
instruments are mobilised in different subsets of policies initiatives.
Table 6.2. Policy instruments in use for STI policies, AI policies and AI/SMEE policies
By subset of policy initiatives
Full Compass
(except AI)
AI (except SMEE) AI.SMEE
Governance 2 076 (36.1%) 198 (51.3%) 31 (39.7%)
Direct financial support 2 020 (35.1%) 81 (21.0%) 21 (26.9%)
Collaborative infrastructures (soft and physical) 820 (14.3%) 62 (16.1%) 15 (19.2%)
Guidance, regulation and incentives 661 (11.5%) 41 (10.6%) 9 (11.5%)
Indirect financial support 171 (3.0%) 4 (1.0%) 2 (2.6%)
Total 5 748 (100%) 386 (100%) 63 (100%)
Note: The three sets are disjoint, i.e. they do not overlap. The “Full Compass” group contains all policy initiatives except AI pol icy initiatives.
Meanwhile, the AI group contains the 383 AI policy initiatives identified with keywords above, except for the 63 initiatives relevant to SMEs and
entrepreneurs. Finally, the supply-side and demand-side groups contain the policy initiatives analysed in detail here. The totals shown here are
superior to the total number of initiatives because initiatives listing two policy instrument categories were counted once in each category.
Nonetheless, a large majority of initiatives fall under one policy instrument category (91.6% of the Full Compass except AI.SMEE, 83.7% of AI
policies not targeted at SMEs and entrepreneurs, 85.7% of supply-side policies, and 77.8% of demand-side policies).
Source: Own elaboration based on policy information drawn from (European Commission/OECD, 2020[8]) and methodology from (Meissner and
Kergroach, 2019[20]).
Setting the foundations of AI policy governance
In the AI policy area, the predominance of governance arrangements in the instrument mix is
striking, reflecting the relative youth of this policy field. The implementation of national innovation
policies, apart from those aiming to support AI innovation, tends to give an even importance to governance
arrangements and direct financial support to actors, e.g. through grants, subsidies, loans and guarantees,
or equity funding (Table 6.2). These two categories of instruments account for 36% and 35% of the policy
portfolio respectively across countries. Past research has shown that this balance could however vary
substantially across countries depending on their public research orientation, the degree of maturity of their
248
THE DIGITAL TRANSFORMATION OF SMES © OECD 2021
STI systems, their comparative advantages on international markets, or business absorptive capacities,
(Kergroach, Meissner and Vonortas, 2017[22]; Kergroach, 2019[23]).
As it turns to absorptive capacity, SMEs crucially depend on accessing human capital and skills
(OECD, 2019[14]). Yet SMEs face specific size-related barriers in developing and/or accessing innovation-
related skills (OECD, 2019[14]; Zhou, Kautonen and Wei, 2015[34]). This is due to the fact that SMEs have
a harder time dealing with information asymmetry on labour markets and identifying talent, and attracting
and retaining skilled employees, partly because they often have less appealing remuneration and working
conditions (OECD, 2019[14]). They may also be reluctant to invest in reskilling if they cannot ensure they
can retain their employees once they have undergone training. AI is no different. While many SMEs may
access AI through cloud-based software, which means that technical in-house skills may play a smaller
role, efficiently using AI requires managers and day-to-day users to understand what the technology can
or cannot do and to assess potentials as well as risks. This has led experts to argue that using complex AI
algorithms requires non-technical skills (Luca, Kleinberg and Mullainat, 2016[35]; Beane, 2019[36]).
AI skills development is often addressed within the wider framework of the digital skills agenda,
whereas relatively few AI initiatives are specifically devoted to upgrading skills. One exception is Italy’s
Tax Credit on Training 4.0, which provides subsidies on labour costs for employees that receive training
on Industry 4.0 themes. In detail, 24 AI/SMEE initiatives put emphasis on skills and fall under the category
of “National strategies, agendas, and plans”. This includes several of the national strategies that were
analysed above. Apart from national strategies, these initiatives also frequently consist of high-level
digitalisation frameworks that have provisions on AI and the transformation of firms, in particular in the
manufacturing sector. As shown above, these initiatives are frequently non-population targeted but cover
a wide array of digital technologies. They also have a clear focus on enhancing skills, including through
training and other forms of non-financial support.
The Digital Turkey Roadmap aims to encourage the uptake of new technologies in the
manufacturing sector, with a specific focus on AI, sensors and robotics. The levers it will mobilise
to spur adoption are diverse, and include setting up data infrastructure and telecommunication
services for SMEs. The programme also has a focus on skills and finance, with technical and
financial aid to be offered to manufacturing SMEs that struggle with digital transformation. It also
aims to launch new programmes in technical colleges and universities in order to tackle the lack of
digital skills in the manufacturing sector.
Finland Fit for Digital Program is a wider digitalisation framework which is to be launched during
the current government’s term (2019-2023), with emphasis on sustainable manufacturing and the
digital readiness of industrial SMEs. It aims to modernise public support services and structures
for digital transformation, including through digital innovation hubs (DIH).
The European network of Digital Innovation Hubs is a network of one-stop-shops for SMEs
requiring support for digitalisation. The programme, which was announced in 2016 as part of the
Digitising European Industry initiative, places emphasis on specialisation of DIHs with respect to
local/territorial needs (Rissola and Sörvik, 2018[37]). DIHs can provide test beds for technologies,
advice on financing options, and networking and training opportunities. The EU’s role is to provide
funding and to encourage co-operation between DIHs in different regions so that beneficiaries are
informed about services not provided in their regional DIH. As part of the Digital Europe
Programme, an expansion of existing DIHs’ offer is foreseen to include AI and other technologies.
AI policies towards SMEs are more likely than other AI policy initiatives to be direct financial
support or collaborative infrastructure, and less likely to be governance mechanisms. Table 6.2
shows that AI policies are more often governance-oriented, e.g. including formal consultation of
stakeholders or experts, national strategies, agenda and plans, or governance/co-ordination bodies and
structures. Conversely, while governance arrangements remain important in the mix of AI policies towards
SMEs, direct financial support – more than one-quarter of all instruments – and collaborative infrastructures
249
THE DIGITAL TRANSFORMATION OF SMES © OECD 2021
– almost 20% of all policy instruments have gained prominence. Direct financial support includes in
particular grants for public research, equity financing for start-ups and innovative ventures, loans and
credits for innovation, or innovation vouchers for knowledge transfer, while collaborative infrastructures
include support to research infrastructure, networking and collaborative platforms, as well as information
services and providing access to datasets. These different categories of policy instruments are analysed
in more detail below.
More of direct financial support for SMEs
Innovation is an area where financing is potentially more difficult to find. High uncertainty about
outcome and high investment costs, on the one hand, and the indivisibility of research results and the
existence of externalities that increase the risk of misappropriation of innovation benefits, on the other
hand, may lead to an underinvestment in knowledge production (Arrow, 1962[38]). Back in the 1960s, this
market failure gave a strong rationale for public funding of R&D (Stoneman, 1987[39]). In addition to
suboptimal investments, external sources of debt and equity finance are relatively more expensive for R&D
and innovation than for ordinary investment (Hall, 2009[40]).
Moreover, SMEs and entrepreneurs face specific hurdles in accessing finance (OECD, 2020[41];
OECD, 2019[14]), as highlighted in the G20/OECD High-Level Principles on SME Financing (G20/OECD,
2015[42]). In particular, young firms and start-ups face strong barriers when it comes to financing
investments, partly because they have more difficulty signalling quality to investors (Hall, 2009[40]). The
fact that innovative and R&D-intensive SMEs rely extensively on intangible assets (e.g. software,
intellectual property) creates an additional barrier, because banks and their regulatory environments often
continue to require tangible assets as collateral (Brassell and Boschmans, 2019[43]). These constraints can
have a negative effect on SME investment and innovation capacity (OECD, 2019[14]). In fact, recent studies
have shown that there is a strong link between financial constraints and firm-level productivity, with stronger
impacts in R&D-intensive and innovative sectors – such as the technology industry (Ferrando and Ruggieri,
2015[44]; Altomonte et al., 2016[45]).
Financing AI innovation is no exception. SMEs incur high sunk costs for training and maintaining AI
systems. This combines with the need for investing in new business processes, skillset and complementary
technologies in order to implement AI, whereas the transformation may not deliver immediate benefits, future
productivity gains are difficult to anticipate, and the return on investment is difficult to assess, and
therefore the investments to finance (see Chapter 5).
A large number of AI policy initiatives aim to address the financing gap with direct financial support
of the supply side. Several initiatives involve or encourage private equity investments in AI start-ups.
Private equity volumes invested in AI have increased steadily in past years, showing mounting interest in
the technology and its commercial applications (OECD, 2018[24]). It has been estimated that AI start-ups
attracted around 12% of all worldwide private equity investments in the first half of 2018, up from just 3%
in 2011. However, venture capital investments in AI, as in other technological areas, are highly
concentrated in the United States and in China (People’s Republic of). In other countries, as the private
equity market remains small relative to GDP, many governments have deployed publicly-backed equity
support to innovative firms, often in the form of co-investment and funds of funds:
Financing of Artificial Intelligence and Blockchain Technologies (European Union) is a call for
tender aiming to develop and operate an investment support programme. This equity instrument is
due to complement the EU Artificial Intelligence and Blockchain Investment Fund, which aims to
provide equity financing to innovative SMEs, start-ups and small mid-caps in early and growth
stages that develop AI and blockchain-based services and products. The investment support
programme will foster investments at the national level by involving national development banks
(such as Bpifrance) and incentivising private sector investments.
250
THE DIGITAL TRANSFORMATION OF SMES © OECD 2021
Luxembourg’s Digital Tech Fund is jointly funded by the state and by private actors, with a total
budget of approximately EUR 20 million. The Fund focuses primarily on venture capital investments
in start-ups active in ICT and related fields, including cybersecurity, Fintech, Big Data, Digital
Health, media and the next-generation communication networks, digital learning, IoT or satellite
telecommunications and services.
Ambition Seed Angels Fund (France) is different in that it targets business angel investments. In
practice, the fund invests in firms at the start-up stage alongside business angels, pledging up to
100% of the amount invested by the business angel (match funding).
Though, financial support is also highly relevant to technology diffusion and adoption. Empirical
analysis suggests that more favourable financial conditions for SMEs is associated with higher catch-up
rates for laggards in digital and skill-intensive industries, which could mean that relaxing financial
constraints could increase technology adoption (OECD, 2020[41]; Berlingieri et al., 2020[6]). Direct financial
support in the form of public grants and loans has shown to play an important signalling role for private
investors, often facilitating recipients’ access to private financiers (European Commission, 2017[46]; Hall,
2009[40]) In addition, well-developed private equity markets are positively correlated to the speed of
technological diffusion (Andrews, Nicoletti and Timiliotis, 2018[7]).
Several AI diffusion initiatives offer financial support for AI adoption, in the form of indirect tax
incentives (Italy’s Tax Credit on Training 4.0) or direct subsidies :
The EU cascade funding, also known as Financial Support for Third Parties (FSTP), is a scheme
under which SMEs are eligible for funding as third parties of existing projects, for example (AI4EU).
It forms part of the wider Horizon 2020 framework. Open calls take place regularly, and support
can take the form of direct financial support, vouchers for support services or opportunities to use
testing facilities. In particular, emphasis is placed on enabling SMEs to test new technologies which
are Horizon 2020 priorities, such as robotics, Industry 4.0, next-generation Internet, or advanced
computing.
The Czech Republic is developing specific support grants and investment programmes for SMEs,
start-ups and spinoffs with innovative services and business models (OECD, 2020[47]).
More of collaborative infrastructure
Innovation and technology diffuse along and within a great variety of knowledge networks and
markets, the diffusion channels differing according to the type of knowledge transferred, and the actors
engaged in the transfer. Knowledge networks and markets encompass a set of systems, institutions,
infrastructure, agreements, organisations and intermediaries (see (OECD, 2013[26]) for more elaboration).
Market and system failures prevent the proper deployment of innovation networks, providing
rationale for public intervention. While a network tends to benefit all of its members, the cost of
constructing and running it traditionally falls on the organisations promoting it (OECD, 2001[48]). Private
benefits from running the network may not cover the private costs some members have to incur for this,
even though there are high social benefits (OECD, 2001[48]). In addition, systemic failures may arise from
mismatches between different actors in the system (OECD, 1999[49]), e.g. due to weak links or lack of
networking facilities. This is why knowledge networks which are essential for knowledge production are
partially based on formal policy-led, linkages (OECD, 2013[26])
Infrastructure, including soft infrastructure without physical premises, particularly matter for
co-operation and accessing these networks, and the knowledge and partners they gather. The
Compass groups under the category of “collaborative infrastructure” policy initiatives dedicated to support
research infrastructure, networking and collaborative platforms and the provision of information services
and access to datasets. Around 20% of AI/SMEE policy instruments fall under this category. Several types
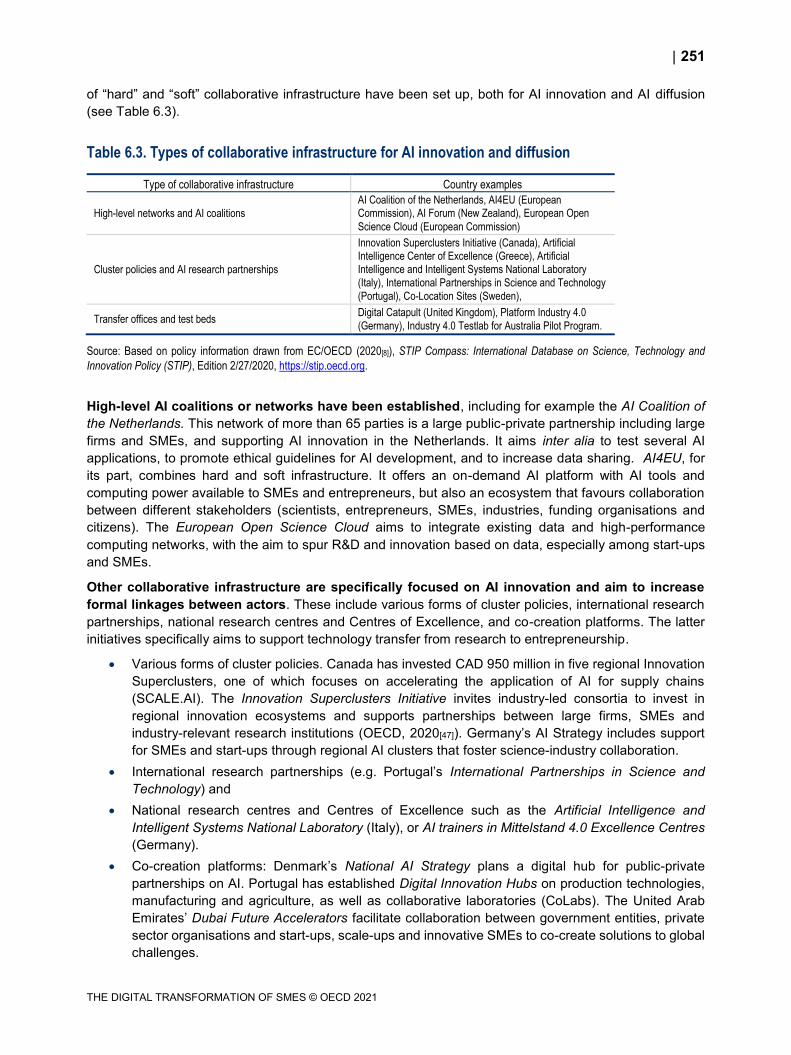
251
THE DIGITAL TRANSFORMATION OF SMES © OECD 2021
of “hard” and “soft” collaborative infrastructure have been set up, both for AI innovation and AI diffusion
(see Table 6.3).
Table 6.3. Types of collaborative infrastructure for AI innovation and diffusion
Type of collaborative infrastructure Country examples
High-level networks and AI coalitions
AI Coalition of the Netherlands, AI4EU (European Commission), AI Forum (New Zealand), European Open
Science Cloud (European Commission)
Cluster policies and AI research partnerships
Innovation Superclusters Initiative (Canada), Artificial Intelligence Center of Excellence (Greece), Artificial Intelligence and Intelligent Systems National Laboratory
(Italy), International Partnerships in Science and Technology
(Portugal), Co-Location Sites (Sweden),
Transfer offices and test beds Digital Catapult (United Kingdom), Platform Industry 4.0
(Germany), Industry 4.0 Testlab for Australia Pilot Program.
Source: Based on policy information drawn from EC/OECD (2020[8]), STIP Compass: International Database on Science, Technology and
Innovation Policy (STIP), Edition 2/27/2020, https://stip.oecd.org.
High-level AI coalitions or networks have been established, including for example the AI Coalition of
the Netherlands. This network of more than 65 parties is a large public-private partnership including large
firms and SMEs, and supporting AI innovation in the Netherlands. It aims inter alia to test several AI
applications, to promote ethical guidelines for AI development, and to increase data sharing. AI4EU, for
its part, combines hard and soft infrastructure. It offers an on-demand AI platform with AI tools and
computing power available to SMEs and entrepreneurs, but also an ecosystem that favours collaboration
between different stakeholders (scientists, entrepreneurs, SMEs, industries, funding organisations and
citizens). The European Open Science Cloud aims to integrate existing data and high-performance
computing networks, with the aim to spur R&D and innovation based on data, especially among start-ups
and SMEs.
Other collaborative infrastructure are specifically focused on AI innovation and aim to increase
formal linkages between actors. These include various forms of cluster policies, international research
partnerships, national research centres and Centres of Excellence, and co-creation platforms. The latter
initiatives specifically aims to support technology transfer from research to entrepreneurship.
Various forms of cluster policies. Canada has invested CAD 950 million in five regional Innovation
Superclusters, one of which focuses on accelerating the application of AI for supply chains
(SCALE.AI). The Innovation Superclusters Initiative invites industry-led consortia to invest in
regional innovation ecosystems and supports partnerships between large firms, SMEs and
industry-relevant research institutions (OECD, 2020[47]). Germany’s AI Strategy includes support
for SMEs and start-ups through regional AI clusters that foster science-industry collaboration.
International research partnerships (e.g. Portugal’s International Partnerships in Science and
Technology) and
National research centres and Centres of Excellence such as the Artificial Intelligence and
Intelligent Systems National Laboratory (Italy), or AI trainers in Mittelstand 4.0 Excellence Centres
(Germany).
Co-creation platforms: Denmark’s National AI Strategy plans a digital hub for public-private
partnerships on AI. Portugal has established Digital Innovation Hubs on production technologies,
manufacturing and agriculture, as well as collaborative laboratories (CoLabs). The United Arab
Emirates’ Dubai Future Accelerators facilitate collaboration between government entities, private
sector organisations and start-ups, scale-ups and innovative SMEs to co-create solutions to global
challenges.
252
THE DIGITAL TRANSFORMATION OF SMES © OECD 2021
Finally, some AI/SMEE initiatives offer places and resources to specifically increase awareness
and uptake among SMEs or provide controlled environments for the testing and experimentation
of AI systems by SMEs (Lithuania, New Zealand, United Arab Emirates, United Kingdom, United States)
(OECD, 2020[47]).
The Industry 4.0 Testlab for Australia Pilot Programme funds six testlabs in Australian universities.
The testlabs provide opportunities for SMEs to learn about Industry 4.0 applications and
digitalisation in the manufacturing sector and have been shaped by close collaboration between
Australia and Germany on Industry 4.0 issues (Prime Minister’s Industry 4.0 Taskforce, Swinburne
University of Technology, 2017[50]).
Finland’s AI accelerator, initiated by the Ministry of Economy and Employment with Finland’s
association of technology, aims to spur AI use in SMEs.
Germany’s Platform Industry 4.0 brings together different Industry 4.0 stakeholders, aims to
develop common recommendations and raise awareness of new tools among SMEs. A Transfer
Network was established in 2017 to help the diffusion of Industry 4.0 applications.
Hungary has established the AI in practice self-service online platform, where developers can
showcase technologies and local case studies to foster collaboration and awareness.
Korea’s AI Open Innovation Hub provides SMEs and start-ups with data, algorithms and high-
performance computing resources to allow them to innovate with AI.
The UK’s Digital Catapult, for instance, acts as an interface between the digital sector (producers)
and the wider UK economy (potential adopters).
The European Commission’s AI4EU project is an AI-on-demand platform that aims to help EU
SMEs adopt AI.
The United Arab Emirates’ Dubai AI lab, a partnership between different parts of government, IBM
and other partners, provides essential tools and go-to-market support to implement AI services and
applications in different areas.
Responsible institutions: networks and clusters of policy initiatives
Innovation policy arrangements have become increasingly complex, interweaving a growing
number of institutions across multiple policy domains, and raising the issue of co-ordination. Given
that innovation is a cross-cutting theme and that a wide array of actors are involved in knowledge transfers,
innovation policy competences tend to be distributed across a high number of organisations and policy
areas, including economic affairs, tax, science, education, immigration and enterprise (Edler and
Fagerberg, 2017[51]; OECD, 2015[16]). Innovation is also characterised by multiple levels of governance:
subnational and supranational levels of STI policy making have gained importance with globalisation on
the one hand, and with regionalisation and decentralisation on the other (OECD, 2015[16]). As public
intervention spreads across ministries, departments, agencies, dedicated organisations, regions and
international bodies, issues of co-ordination may arise (e.g. inconsistency or redundancies), creating the
potential for inefficient spending, lower quality of service, and contradictory objectives (OECD, 2015[16]).
While policy co-ordination and integration is one of the oldest challenges for governments, there is
evidence that the proliferation of independent or quasi-independent agencies may have exacerbated this
issue (Peters, 2018[52]). For instance, research in the field of AI has existed for several decades, but the
holistic focus on AI as a general-purpose technology is relatively recent, as shown by the proliferation of
national strategies on AI in recent years (see chapter 6 on AI and SMEs, and (Paunov, Planes-Satorra and
Ravelli, 2019[53])).
Several solutions to address a lack of policy co-ordination exist, including effective policy
monitoring and evaluation, ensuring policy co-ordination via the centre of government (CoG)
(OECD, 2019[54]), or setting up dedicated co-ordination mechanisms. Generally, different forms of
253
THE DIGITAL TRANSFORMATION OF SMES © OECD 2021
consultation and dialogue are often highly effective in ensuring policy coherence (OECD, 2015[16]). In
some cases, similar or identical instruments across different levels of governance (e.g. identical R&D
funding at federal and regional level) may actually not be redundant, as they may have different target
groups, territorial scopes, or approaches (OECD, 2015[16]). National strategies, plans and roadmaps also
play a role in co-ordinating policy action. In the field of AI, a number of overarching federal/national
instruments have been put in place, such as national strategies (e.g. Malta’s National AI Strategy) and “AI
coalitions” (e.g. the AI Coalition of the Netherlands).
The distribution of AI policy responsibilities and action across policy areas and levels of
governance is likely to be even higher than for innovation policy generally. Based on the policy
information provided in the Compass, on average, countries for which data is available have approximately
six AI policy initiatives in place, with five organisations steering AI policy in the country (European
Commission/OECD, 2020[8]). The following areas of co-ordination can be distinguished:
Co-ordination within the AI policy domain,
o Along the AI policy making process, from policy design, to implementation to monitoring and
evaluation.
o Between policy initiatives targeting SMEs and entrepreneurs (AI/SMEE), and generic AI
policies.
o Between innovation policies and technology diffusion policies.
Co-ordination across policy domains, between AI.SMEE policies and finance, tax, skills or even
other innovation policies.
Co-ordination at supranational level of AI/SMEE policies, where applicable (e.g. at EU level).
Co-ordination between subnational policy initiatives (e.g. regional industrial strategies) and national
policy initiatives.
Fine-grained evaluation of policy co-ordination would involve detailed policy mappings by country,
looking not only at institutional arrangements but also at co-ordination mechanisms and policy practices at
the micro-level. Given the recent implementation of most initiatives under study here and the information
contained in the Compass, this task is difficult to undertake. However, it is possible to analyse which
organisations are responsible for which initiatives, and how AI/SMEE policy initiatives are calibrated within
the broader AI policy mix. This is the objective of this section. Emphasis in this research work is placed on
co-ordination between AI/SMEE policy initiatives and generic AI policies. It should be stressed that
institutional arrangements for STI policy are highly idiosyncratic and context-specific, and that there is no
“one-size-fits-all” arrangement (OECD, 2010[55]).
The following research questions are treated in this section:
Which types of organisations are responsible for AI/SMEE policy initiatives?
Where applicable, which government portfolios are in charge of AI/SMEE policy initiatives?
How are AI/SMEE policy initiatives calibrated within broader AI policy mixes?
Are AI innovation initiatives implemented by the same organisations as AI diffusion initiatives?
Six country cases (see following sub-section) specifically focus on the institutional arrangements in
Australia, France, Germany, Korea, the Netherlands and the United States, in order to evaluate the
centrality of AI/SMEE policy initiatives in the national STI policy mixes.
General observations
A variety of organisations are traditionally responsible for administrating STI policy intervention,
sometimes jointly. The different types of organisations involved are listed in Table 6.4. This includes
ministries/departments, agencies, research centres or organisations and dedicated organisations.
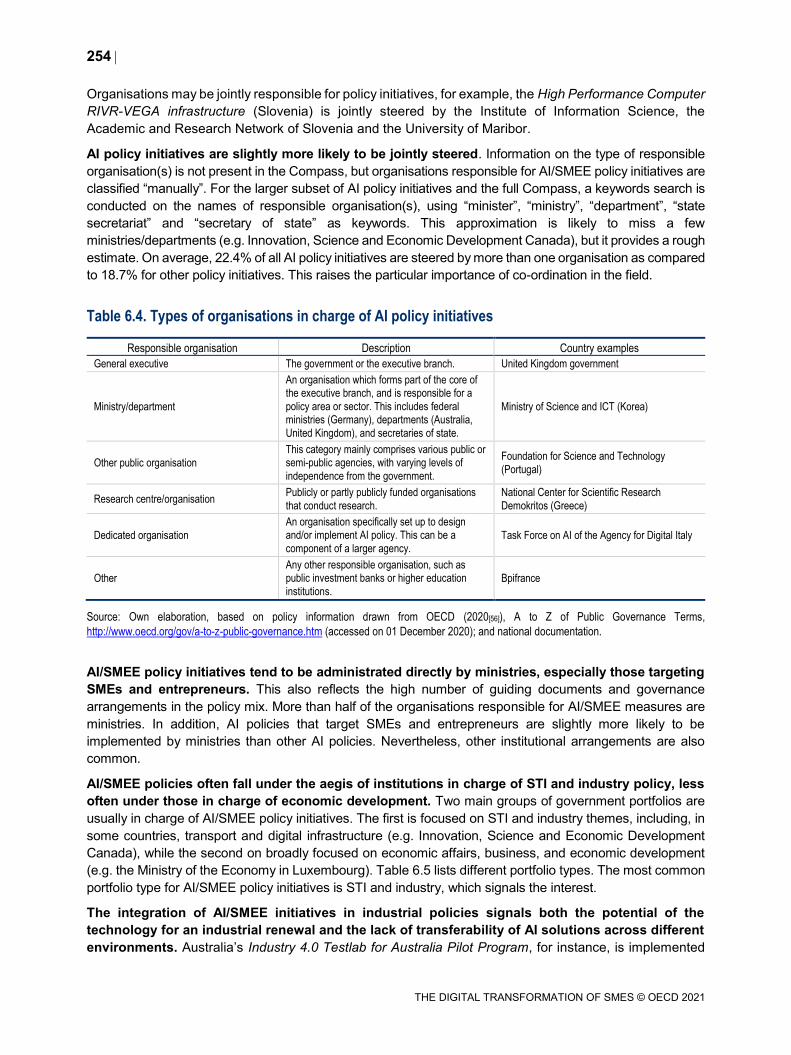
254
THE DIGITAL TRANSFORMATION OF SMES © OECD 2021
Organisations may be jointly responsible for policy initiatives, for example, the High Performance Computer
RIVR-VEGA infrastructure (Slovenia) is jointly steered by the Institute of Information Science, the
Academic and Research Network of Slovenia and the University of Maribor.
AI policy initiatives are slightly more likely to be jointly steered. Information on the type of responsible
organisation(s) is not present in the Compass, but organisations responsible for AI/SMEE policy initiatives are
classified “manually”. For the larger subset of AI policy initiatives and the full Compass, a keywords search is
conducted on the names of responsible organisation(s), using “minister”, “ministry”, “department”, “state
secretariat” and “secretary of state” as keywords. This approximation is likely to miss a few
ministries/departments (e.g. Innovation, Science and Economic Development Canada), but it provides a rough
estimate. On average, 22.4% of all AI policy initiatives are steered by more than one organisation as compared
to 18.7% for other policy initiatives. This raises the particular importance of co-ordination in the field.
Table 6.4. Types of organisations in charge of AI policy initiatives
Responsible organisation Description Country examples
General executive The government or the executive branch. United Kingdom government
Ministry/department
An organisation which forms part of the core of the executive branch, and is responsible for a
policy area or sector. This includes federal ministries (Germany), departments (Australia,
United Kingdom), and secretaries of state.
Ministry of Science and ICT (Korea)
Other public organisation
This category mainly comprises various public or semi-public agencies, with varying levels of
independence from the government.
Foundation for Science and Technology
(Portugal)
Research centre/organisation Publicly or partly publicly funded organisations
that conduct research.
National Center for Scientific Research
Demokritos (Greece)
Dedicated organisation
An organisation specifically set up to design and/or implement AI policy. This can be a
component of a larger agency. Task Force on AI of the Agency for Digital Italy
Other
Any other responsible organisation, such as public investment banks or higher education
institutions. Bpifrance
Source: Own elaboration, based on policy information drawn from OECD (2020[56]), A to Z of Public Governance Terms,
http://www.oecd.org/gov/a-to-z-public-governance.htm (accessed on 01 December 2020); and national documentation.
AI/SMEE policy initiatives tend to be administrated directly by ministries, especially those targeting
SMEs and entrepreneurs. This also reflects the high number of guiding documents and governance
arrangements in the policy mix. More than half of the organisations responsible for AI/SMEE measures are
ministries. In addition, AI policies that target SMEs and entrepreneurs are slightly more likely to be
implemented by ministries than other AI policies. Nevertheless, other institutional arrangements are also
common.
AI/SMEE policies often fall under the aegis of institutions in charge of STI and industry policy, less
often under those in charge of economic development. Two main groups of government portfolios are
usually in charge of AI/SMEE policy initiatives. The first is focused on STI and industry themes, including, in
some countries, transport and digital infrastructure (e.g. Innovation, Science and Economic Development
Canada), while the second on broadly focused on economic affairs, business, and economic development
(e.g. the Ministry of the Economy in Luxembourg). Table 6.5 lists different portfolio types. The most common
portfolio type for AI/SMEE policy initiatives is STI and industry, which signals the interest.
The integration of AI/SMEE initiatives in industrial policies signals both the potential of the
technology for an industrial renewal and the lack of transferability of AI solutions across different
environments. Australia’s Industry 4.0 Testlab for Australia Pilot Program, for instance, is implemented
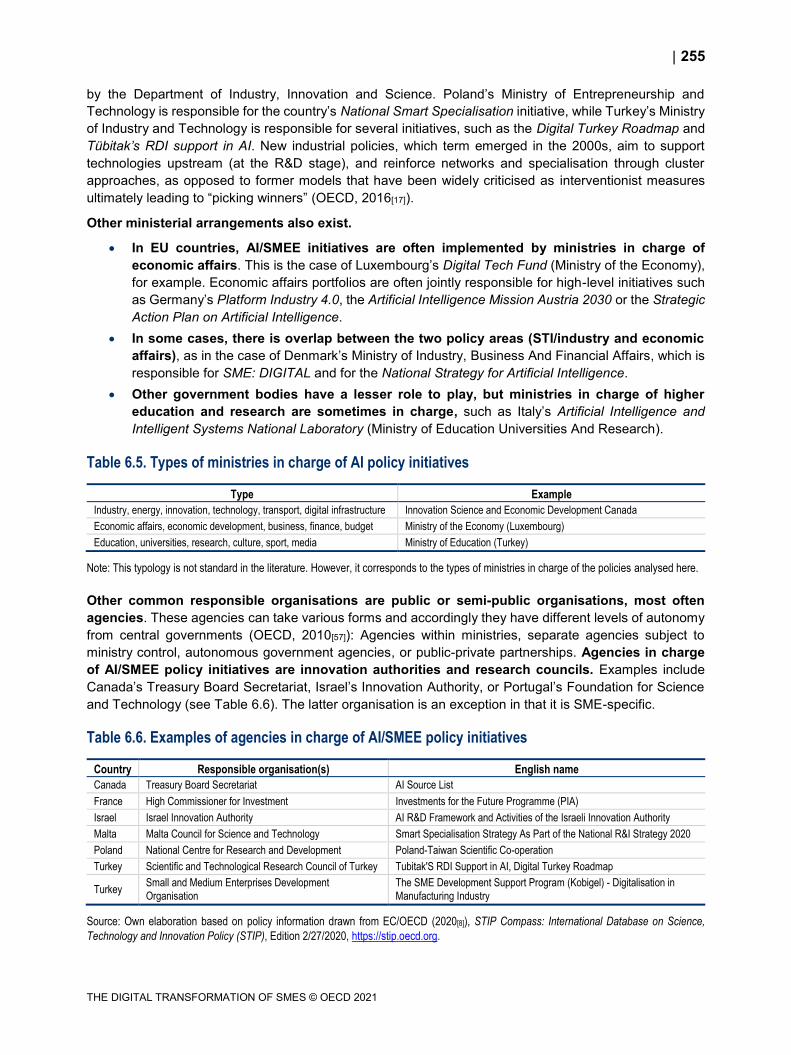
255
THE DIGITAL TRANSFORMATION OF SMES © OECD 2021
by the Department of Industry, Innovation and Science. Poland’s Ministry of Entrepreneurship and
Technology is responsible for the country’s National Smart Specialisation initiative, while Turkey’s Ministry
of Industry and Technology is responsible for several initiatives, such as the Digital Turkey Roadmap and
Tübitak’s RDI support in AI. New industrial policies, which term emerged in the 2000s, aim to support
technologies upstream (at the R&D stage), and reinforce networks and specialisation through cluster
approaches, as opposed to former models that have been widely criticised as interventionist measures
ultimately leading to “picking winners” (OECD, 2016[17]).
Other ministerial arrangements also exist.
In EU countries, AI/SMEE initiatives are often implemented by ministries in charge of
economic affairs. This is the case of Luxembourg’s Digital Tech Fund (Ministry of the Economy),
for example. Economic affairs portfolios are often jointly responsible for high-level initiatives such
as Germany’s Platform Industry 4.0, the Artificial Intelligence Mission Austria 2030 or the Strategic
Action Plan on Artificial Intelligence.
In some cases, there is overlap between the two policy areas (STI/industry and economic
affairs), as in the case of Denmark’s Ministry of Industry, Business And Financial Affairs, which is
responsible for SME: DIGITAL and for the National Strategy for Artificial Intelligence.
Other government bodies have a lesser role to play, but ministries in charge of higher
education and research are sometimes in charge, such as Italy’s Artificial Intelligence and
Intelligent Systems National Laboratory (Ministry of Education Universities And Research).
Table 6.5. Types of ministries in charge of AI policy initiatives
Type Example
Industry, energy, innovation, technology, transport, digital infrastructure Innovation Science and Economic Development Canada
Economic affairs, economic development, business, finance, budget Ministry of the Economy (Luxembourg)
Education, universities, research, culture, sport, media Ministry of Education (Turkey)
Note: This typology is not standard in the literature. However, it corresponds to the types of ministries in charge of the policies analysed here.
Other common responsible organisations are public or semi-public organisations, most often
agencies. These agencies can take various forms and accordingly they have different levels of autonomy
from central governments (OECD, 2010[57]): Agencies within ministries, separate agencies subject to
ministry control, autonomous government agencies, or public-private partnerships. Agencies in charge
of AI/SMEE policy initiatives are innovation authorities and research councils. Examples include
Canada’s Treasury Board Secretariat, Israel’s Innovation Authority, or Portugal’s Foundation for Science
and Technology (see Table 6.6). The latter organisation is an exception in that it is SME-specific.
Table 6.6. Examples of agencies in charge of AI/SMEE policy initiatives
Country Responsible organisation(s) English name
Canada Treasury Board Secretariat AI Source List
France High Commissioner for Investment Investments for the Future Programme (PIA)
Israel Israel Innovation Authority AI R&D Framework and Activities of the Israeli Innovation Authority
Malta Malta Council for Science and Technology Smart Specialisation Strategy As Part of the National R&I Strategy 2020
Poland National Centre for Research and Development Poland-Taiwan Scientific Co-operation
Turkey Scientific and Technological Research Council of Turkey Tubitak'S RDI Support in AI, Digital Turkey Roadmap
Turkey Small and Medium Enterprises Development
Organisation
The SME Development Support Program (Kobigel) - Digitalisation in
Manufacturing Industry
Source: Own elaboration based on policy information drawn from EC/OECD (2020[8]), STIP Compass: International Database on Science,
Technology and Innovation Policy (STIP), Edition 2/27/2020, https://stip.oecd.org.
256
THE DIGITAL TRANSFORMATION OF SMES © OECD 2021
A small minority of policy initiatives depend on AI dedicated organisations, like AI Innovation
Sweden (responsible for the Co-location Sites initiatives) or the Netherlands’ NL AI Coalition.
Finally, national digital transformation frameworks and national strategies are often steered by the
executive branch directly, unlike most AI/SMEE initiatives.
Agencies and ministries tend to be in charge of a comparable number of AI initiatives: ministries in charge
of AI/SMEE initiatives are in charge of two other AI initiatives on average, while agencies in charge of
AI/SMEE initiatives are in charge of 1.6 other AI initiatives on average.
Due to their recent implementation, few AI initiatives have been evaluated so far. 9.14% of all AI
initiatives as reported in the Compass are being or having been evaluated. By contrast, a slightly larger
proportion of all innovation initiatives are evaluated (16.45%). AI initiatives are more recent on average, with
a mean start year of 2016, as against a mean start year of 2010 for the full set of initiatives reported in the
Compass. However, the AI/SMEE initiatives are more likely to be evaluated than other AI initiatives (12.70%).
Policy evaluation can play a strong role in ensuring good co-ordination between various policy instruments.
National AI policy governance structure: Selected country cases
National innovation policy systems consist of institutions responsible for policy design and
implementation, forming networks of organisations collaborating on innovation and AI-specific
policy development. Different forms of co-ordination could exist between these institutions.
Due to the horizontal and generic nature of AI, policy developments in the area will imply enhanced
efforts to improve policy co-ordination and coherence across government levels and domain-
specific measures. Co-ordination relies upon a mix of hierarchical, market and network-based
interactions (OECD, 2012[58]). It has both vertical and horizontal aspects, the former referring to co-
ordination between a ministry and its delivery agencies, and the latter covering inter-ministry relations.
Instruments of co-ordination can be based on regulation, incentives, norms and information, with different
degrees of formalisation. They can be top-down and rely upon the authority of a lead actor, or bottom-up
and emergent. Governance arrangements contributing to the co-ordination of innovation policy include
roadmaps and guiding documents, inter-agency programming, policy evaluation, job circulation of civil
servants, inter-ministerial councils or even informal channels of communication, etc.
This exploratory work more specifically examines the existence of co-ordination mechanisms
through joint programming between agencies and ministries. From the Compass dataset, networks
of national innovation governance arrangements have been constructed for a selection of countries. The
visualised networks show how different types of organisations are linked to each other, and identify the
locus of the national innovation landscape. Each organisation responsible for STI policy is represented by
a node, while the edge connecting the two nodes reflect the collaboration between a pair of organisations
by the means of sharing the same policy initiative. The size of the nodes is proportional to the number of
policy initiatives for which it is responsible. The graphs are force-directed – an algorithm to define how the
nodes are laid out - to make it more legible (Kamada and Kawai, 1989[59]).
The result shows that countries usually have one or two clusters of organisations taking care of
national innovation policies. The majority of countries have centralised network around one large
organisation (usually at a ministerial level) such as France, Korea, Israel, while a number of countries have
two sizeable loci such as Austria, Germany, or the Netherlands, and some countries have decentralised,
distributed networks with each organisation linking directly to many different partners in the clusters such
as the Australia, Canada and the United States.
However, very large country differences emerge from this network analysis. Australia, France and
The United States lead as countries with the largest number of organisations issuing AI policies, while the
Netherlands have four ministries targeting SMEE as the centre of their innovation policies. The detailed
analyses of a sample of six countries’ innovation networks are presented below.
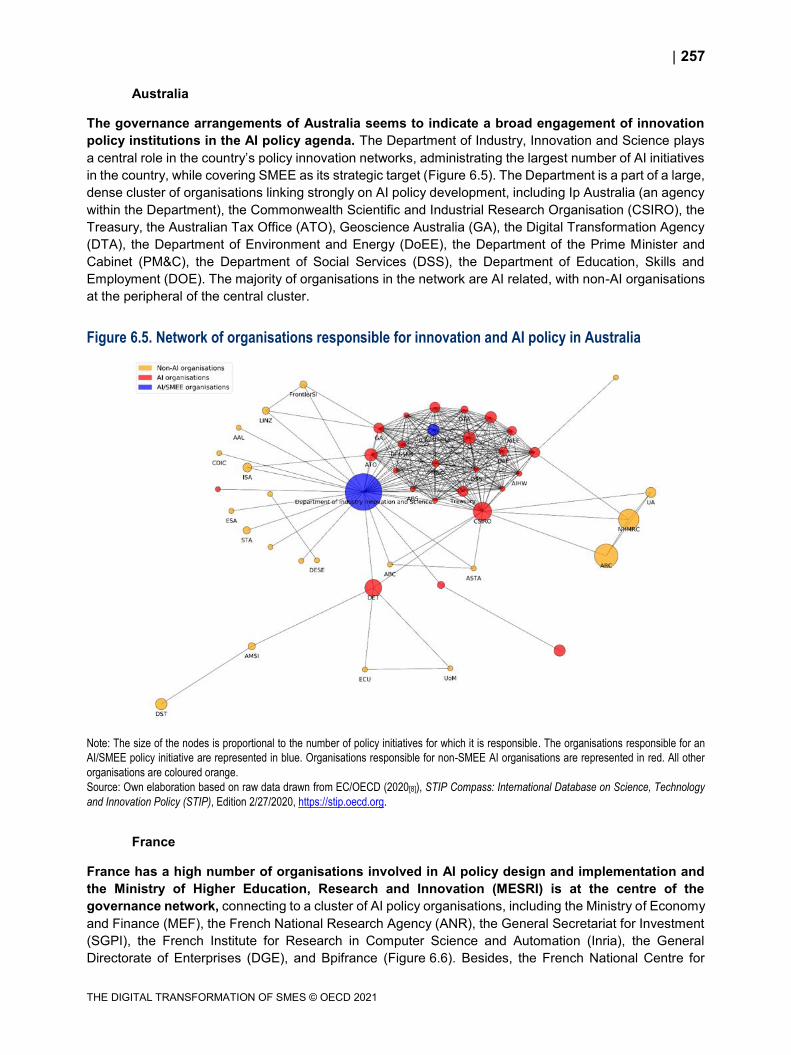
257
THE DIGITAL TRANSFORMATION OF SMES © OECD 2021
Australia
The governance arrangements of Australia seems to indicate a broad engagement of innovation
policy institutions in the AI policy agenda. The Department of Industry, Innovation and Science plays
a central role in the country’s policy innovation networks, administrating the largest number of AI initiatives
in the country, while covering SMEE as its strategic target (Figure 6.5). The Department is a part of a large,
dense cluster of organisations linking strongly on AI policy development, including Ip Australia (an agency
within the Department), the Commonwealth Scientific and Industrial Research Organisation (CSIRO), the
Treasury, the Australian Tax Office (ATO), Geoscience Australia (GA), the Digital Transformation Agency
(DTA), the Department of Environment and Energy (DoEE), the Department of the Prime Minister and
Cabinet (PM&C), the Department of Social Services (DSS), the Department of Education, Skills and
Employment (DOE). The majority of organisations in the network are AI related, with non-AI organisations
at the peripheral of the central cluster.
Figure 6.5. Network of organisations responsible for innovation and AI policy in Australia
Note: The size of the nodes is proportional to the number of policy initiatives for which it is responsible. The organisations responsible for an
AI/SMEE policy initiative are represented in blue. Organisations responsible for non-SMEE AI organisations are represented in red. All other
organisations are coloured orange.
Source: Own elaboration based on raw data drawn from EC/OECD (2020[8]), STIP Compass: International Database on Science, Technology
and Innovation Policy (STIP), Edition 2/27/2020, https://stip.oecd.org.
France
France has a high number of organisations involved in AI policy design and implementation and
the Ministry of Higher Education, Research and Innovation (MESRI) is at the centre of the
governance network, connecting to a cluster of AI policy organisations, including the Ministry of Economy
and Finance (MEF), the French National Research Agency (ANR), the General Secretariat for Investment
(SGPI), the French Institute for Research in Computer Science and Automation (Inria), the General
Directorate of Enterprises (DGE), and Bpifrance (Figure 6.6). Besides, the French National Centre for
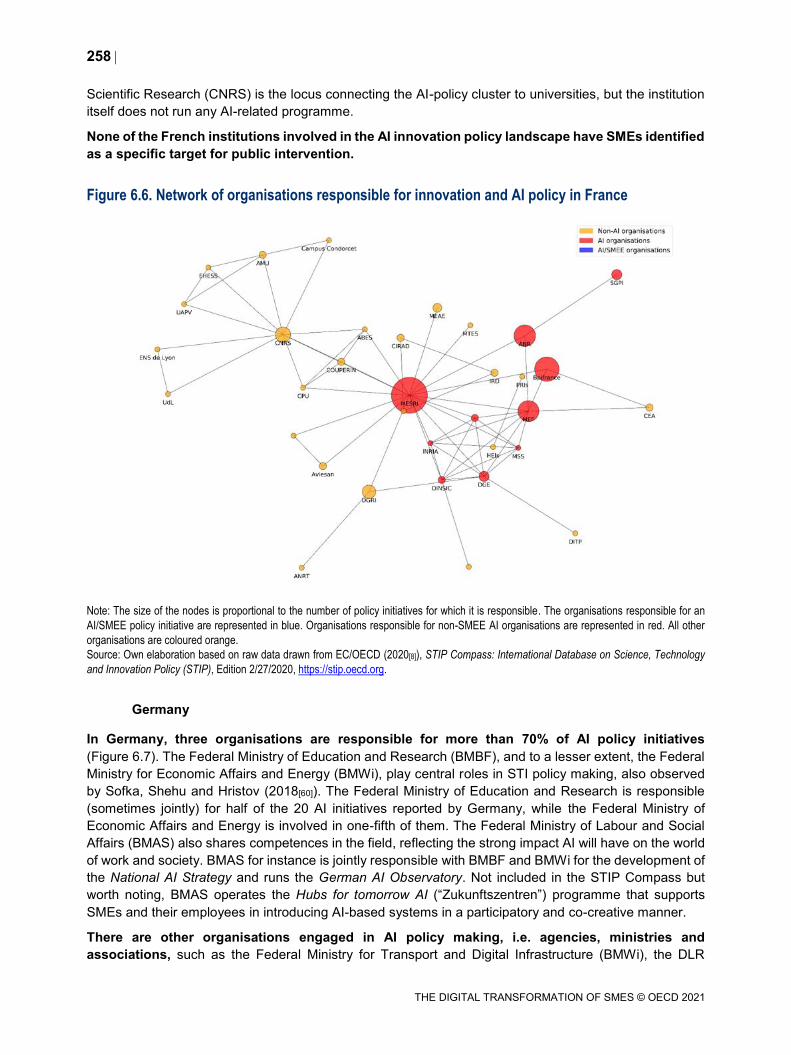
258
THE DIGITAL TRANSFORMATION OF SMES © OECD 2021
Scientific Research (CNRS) is the locus connecting the AI-policy cluster to universities, but the institution
itself does not run any AI-related programme.
None of the French institutions involved in the AI innovation policy landscape have SMEs identified
as a specific target for public intervention.
Figure 6.6. Network of organisations responsible for innovation and AI policy in France
Note: The size of the nodes is proportional to the number of policy initiatives for which it is responsible. The organisations responsible for an
AI/SMEE policy initiative are represented in blue. Organisations responsible for non-SMEE AI organisations are represented in red. All other
organisations are coloured orange.
Source: Own elaboration based on raw data drawn from EC/OECD (2020[8]), STIP Compass: International Database on Science, Technology
and Innovation Policy (STIP), Edition 2/27/2020, https://stip.oecd.org.
Germany
In Germany, three organisations are responsible for more than 70% of AI policy initiatives
(Figure 6.7). The Federal Ministry of Education and Research (BMBF), and to a lesser extent, the Federal
Ministry for Economic Affairs and Energy (BMWi), play central roles in STI policy making, also observed
by Sofka, Shehu and Hristov (2018[60]). The Federal Ministry of Education and Research is responsible
(sometimes jointly) for half of the 20 AI initiatives reported by Germany, while the Federal Ministry of
Economic Affairs and Energy is involved in one-fifth of them. The Federal Ministry of Labour and Social
Affairs (BMAS) also shares competences in the field, reflecting the strong impact AI will have on the world
of work and society. BMAS for instance is jointly responsible with BMBF and BMWi for the development of
the National AI Strategy and runs the German AI Observatory. Not included in the STIP Compass but
worth noting, BMAS operates the Hubs for tomorrow AI (“Zukunftszentren”) programme that supports
SMEs and their employees in introducing AI-based systems in a participatory and co-creative manner.
There are other organisations engaged in AI policy making, i.e. agencies, ministries and
associations, such as the Federal Ministry for Transport and Digital Infrastructure (BMWi), the DLR
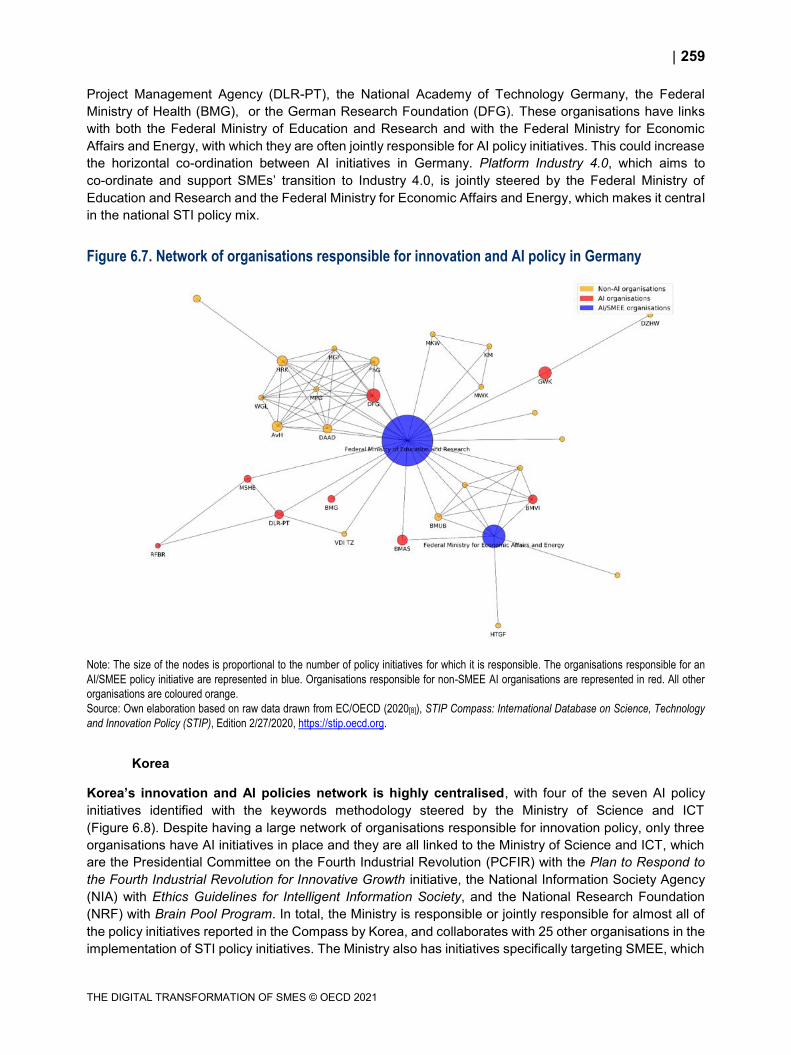
259
THE DIGITAL TRANSFORMATION OF SMES © OECD 2021
Project Management Agency (DLR-PT), the National Academy of Technology Germany, the Federal
Ministry of Health (BMG), or the German Research Foundation (DFG). These organisations have links
with both the Federal Ministry of Education and Research and with the Federal Ministry for Economic
Affairs and Energy, with which they are often jointly responsible for AI policy initiatives. This could increase
the horizontal co-ordination between AI initiatives in Germany. Platform Industry 4.0, which aims to
co-ordinate and support SMEs’ transition to Industry 4.0, is jointly steered by the Federal Ministry of
Education and Research and the Federal Ministry for Economic Affairs and Energy, which makes it central
in the national STI policy mix.
Figure 6.7. Network of organisations responsible for innovation and AI policy in Germany
Note: The size of the nodes is proportional to the number of policy initiatives for which it is responsible. The organisations responsible for an
AI/SMEE policy initiative are represented in blue. Organisations responsible for non-SMEE AI organisations are represented in red. All other
organisations are coloured orange.
Source: Own elaboration based on raw data drawn from EC/OECD (2020[8]), STIP Compass: International Database on Science, Technology
and Innovation Policy (STIP), Edition 2/27/2020, https://stip.oecd.org.
Korea
Korea’s innovation and AI policies network is highly centralised, with four of the seven AI policy
initiatives identified with the keywords methodology steered by the Ministry of Science and ICT
(Figure 6.8). Despite having a large network of organisations responsible for innovation policy, only three
organisations have AI initiatives in place and they are all linked to the Ministry of Science and ICT, which
are the Presidential Committee on the Fourth Industrial Revolution (PCFIR) with the Plan to Respond to
the Fourth Industrial Revolution for Innovative Growth initiative, the National Information Society Agency
(NIA) with Ethics Guidelines for Intelligent Information Society, and the National Research Foundation
(NRF) with Brain Pool Program. In total, the Ministry is responsible or jointly responsible for almost all of
the policy initiatives reported in the Compass by Korea, and collaborates with 25 other organisations in the
implementation of STI policy initiatives. The Ministry also has initiatives specifically targeting SMEE, which
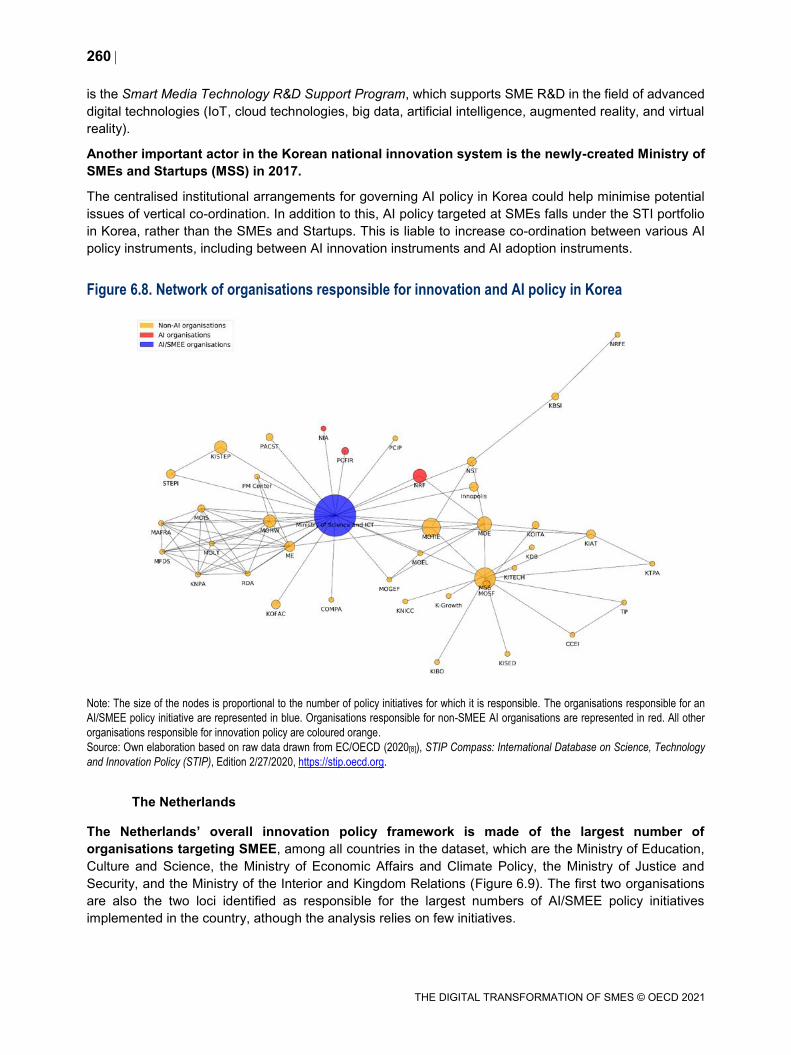
260
THE DIGITAL TRANSFORMATION OF SMES © OECD 2021
is the Smart Media Technology R&D Support Program, which supports SME R&D in the field of advanced
digital technologies (IoT, cloud technologies, big data, artificial intelligence, augmented reality, and virtual
reality).
Another important actor in the Korean national innovation system is the newly-created Ministry of
SMEs and Startups (MSS) in 2017.
The centralised institutional arrangements for governing AI policy in Korea could help minimise potential
issues of vertical co-ordination. In addition to this, AI policy targeted at SMEs falls under the STI portfolio
in Korea, rather than the SMEs and Startups. This is liable to increase co-ordination between various AI
policy instruments, including between AI innovation instruments and AI adoption instruments.
Figure 6.8. Network of organisations responsible for innovation and AI policy in Korea
Note: The size of the nodes is proportional to the number of policy initiatives for which it is responsible. The organisations responsible for an
AI/SMEE policy initiative are represented in blue. Organisations responsible for non-SMEE AI organisations are represented in red. All other
organisations responsible for innovation policy are coloured orange.
Source: Own elaboration based on raw data drawn from EC/OECD (2020[8]), STIP Compass: International Database on Science, Technology
and Innovation Policy (STIP), Edition 2/27/2020, https://stip.oecd.org.
The Netherlands
The Netherlands’ overall innovation policy framework is made of the largest number of
organisations targeting SMEE, among all countries in the dataset, which are the Ministry of Education,
Culture and Science, the Ministry of Economic Affairs and Climate Policy, the Ministry of Justice and
Security, and the Ministry of the Interior and Kingdom Relations (Figure 6.9). The first two organisations
are also the two loci identified as responsible for the largest numbers of AI/SMEE policy initiatives
implemented in the country, athough the analysis relies on few initiatives.
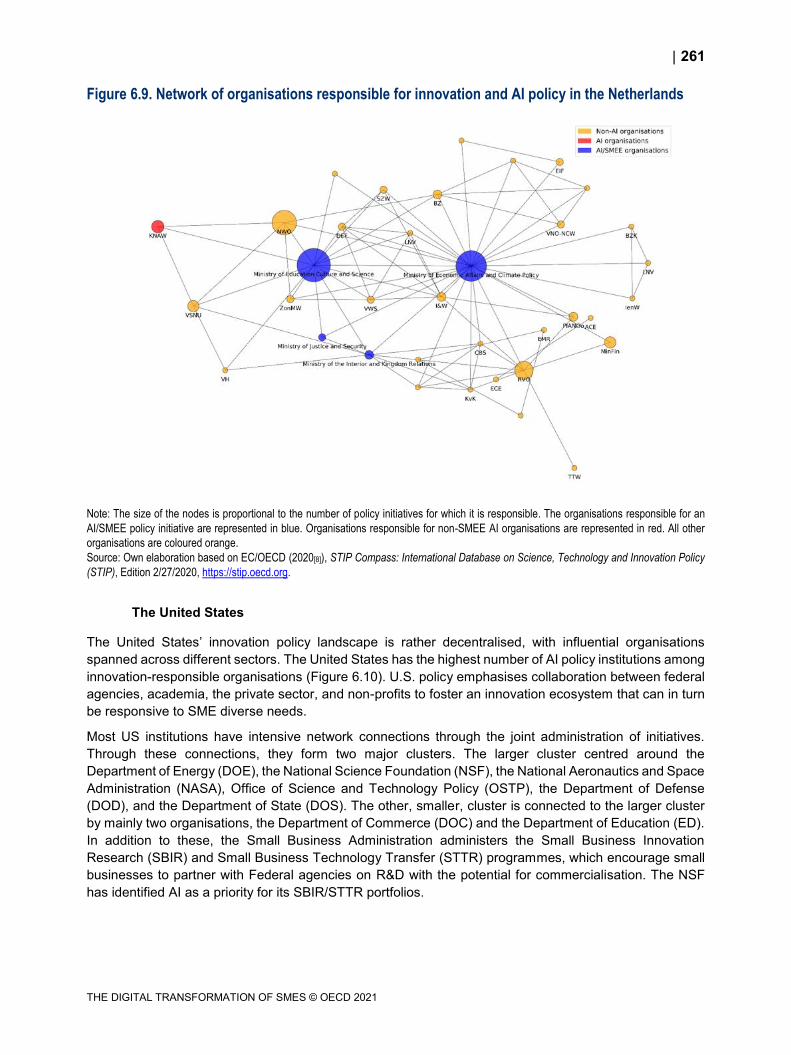
261
THE DIGITAL TRANSFORMATION OF SMES © OECD 2021
Figure 6.9. Network of organisations responsible for innovation and AI policy in the Netherlands
Note: The size of the nodes is proportional to the number of policy initiatives for which it is responsible. The organisations responsible for an
AI/SMEE policy initiative are represented in blue. Organisations responsible for non-SMEE AI organisations are represented in red. All other
organisations are coloured orange.
Source: Own elaboration based on EC/OECD (2020[8]), STIP Compass: International Database on Science, Technology and Innovation Policy
(STIP), Edition 2/27/2020, https://stip.oecd.org.
The United States
The United States’ innovation policy landscape is rather decentralised, with influential organisations
spanned across different sectors. The United States has the highest number of AI policy institutions among
innovation-responsible organisations (Figure 6.10). U.S. policy emphasises collaboration between federal
agencies, academia, the private sector, and non-profits to foster an innovation ecosystem that can in turn
be responsive to SME diverse needs.
Most US institutions have intensive network connections through the joint administration of initiatives.
Through these connections, they form two major clusters. The larger cluster centred around the
Department of Energy (DOE), the National Science Foundation (NSF), the National Aeronautics and Space
Administration (NASA), Office of Science and Technology Policy (OSTP), the Department of Defense
(DOD), and the Department of State (DOS). The other, smaller, cluster is connected to the larger cluster
by mainly two organisations, the Department of Commerce (DOC) and the Department of Education (ED).
In addition to these, the Small Business Administration administers the Small Business Innovation
Research (SBIR) and Small Business Technology Transfer (STTR) programmes, which encourage small
businesses to partner with Federal agencies on R&D with the potential for commercialisation. The NSF
has identified AI as a priority for its SBIR/STTR portfolios.
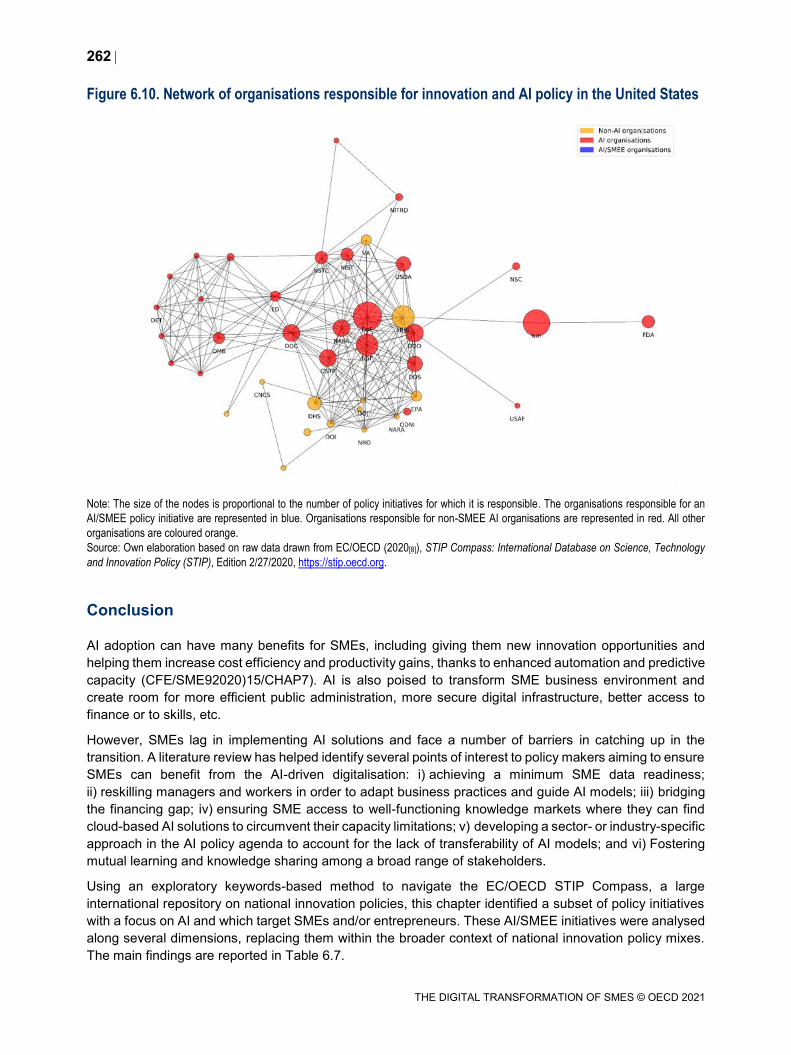
262
THE DIGITAL TRANSFORMATION OF SMES © OECD 2021
Figure 6.10. Network of organisations responsible for innovation and AI policy in the United States
Note: The size of the nodes is proportional to the number of policy initiatives for which it is responsible. The organisations responsible for an
AI/SMEE policy initiative are represented in blue. Organisations responsible for non-SMEE AI organisations are represented in red. All other
organisations are coloured orange.
Source: Own elaboration based on raw data drawn from EC/OECD (2020[8]), STIP Compass: International Database on Science, Technology
and Innovation Policy (STIP), Edition 2/27/2020, https://stip.oecd.org.
Conclusion
AI adoption can have many benefits for SMEs, including giving them new innovation opportunities and
helping them increase cost efficiency and productivity gains, thanks to enhanced automation and predictive
capacity (CFE/SME92020)15/CHAP7). AI is also poised to transform SME business environment and
create room for more efficient public administration, more secure digital infrastructure, better access to
finance or to skills, etc.
However, SMEs lag in implementing AI solutions and face a number of barriers in catching up in the
transition. A literature review has helped identify several points of interest to policy makers aiming to ensure
SMEs can benefit from the AI-driven digitalisation: i) achieving a minimum SME data readiness;
ii) reskilling managers and workers in order to adapt business practices and guide AI models; iii) bridging
the financing gap; iv) ensuring SME access to well-functioning knowledge markets where they can find
cloud-based AI solutions to circumvent their capacity limitations; v) developing a sector- or industry-specific
approach in the AI policy agenda to account for the lack of transferability of AI models; and vi) Fostering
mutual learning and knowledge sharing among a broad range of stakeholders.
Using an exploratory keywords-based method to navigate the EC/OECD STIP Compass, a large
international repository on national innovation policies, this chapter identified a subset of policy initiatives
with a focus on AI and which target SMEs and/or entrepreneurs. These AI/SMEE initiatives were analysed
along several dimensions, replacing them within the broader context of national innovation policy mixes.
The main findings are reported in Table 6.7.
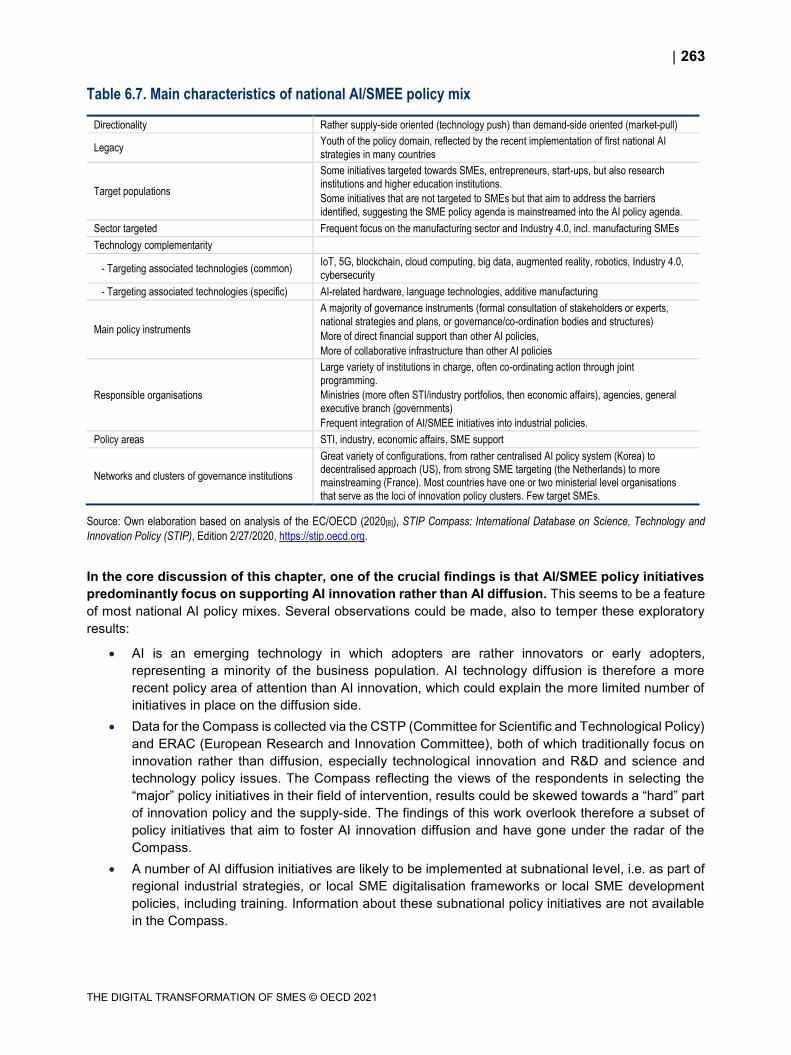
263
THE DIGITAL TRANSFORMATION OF SMES © OECD 2021
Table 6.7. Main characteristics of national AI/SMEE policy mix
Directionality Rather supply-side oriented (technology push) than demand-side oriented (market-pull)
Legacy Youth of the policy domain, reflected by the recent implementation of first national AI
strategies in many countries
Target populations
Some initiatives targeted towards SMEs, entrepreneurs, start-ups, but also research
institutions and higher education institutions.
Some initiatives that are not targeted to SMEs but that aim to address the barriers
identified, suggesting the SME policy agenda is mainstreamed into the AI policy agenda.
Sector targeted Frequent focus on the manufacturing sector and Industry 4.0, incl. manufacturing SMEs
Technology complementarity
- Targeting associated technologies (common) IoT, 5G, blockchain, cloud computing, big data, augmented reality, robotics, Industry 4.0,
cybersecurity
- Targeting associated technologies (specific) AI-related hardware, language technologies, additive manufacturing
Main policy instruments
A majority of governance instruments (formal consultation of stakeholders or experts,
national strategies and plans, or governance/co-ordination bodies and structures)
More of direct financial support than other AI policies,
More of collaborative infrastructure than other AI policies
Responsible organisations
Large variety of institutions in charge, often co-ordinating action through joint
programming.
Ministries (more often STI/industry portfolios, then economic affairs), agencies, general
executive branch (governments)
Frequent integration of AI/SMEE initiatives into industrial policies.
Policy areas STI, industry, economic affairs, SME support
Networks and clusters of governance institutions
Great variety of configurations, from rather centralised AI policy system (Korea) to decentralised approach (US), from strong SME targeting (the Netherlands) to more mainstreaming (France). Most countries have one or two ministerial level organisations
that serve as the loci of innovation policy clusters. Few target SMEs.
Source: Own elaboration based on analysis of the EC/OECD (2020[8]), STIP Compass: International Database on Science, Technology and
Innovation Policy (STIP), Edition 2/27/2020, https://stip.oecd.org.
In the core discussion of this chapter, one of the crucial findings is that AI/SMEE policy initiatives
predominantly focus on supporting AI innovation rather than AI diffusion. This seems to be a feature
of most national AI policy mixes. Several observations could be made, also to temper these exploratory
results:
AI is an emerging technology in which adopters are rather innovators or early adopters,
representing a minority of the business population. AI technology diffusion is therefore a more
recent policy area of attention than AI innovation, which could explain the more limited number of
initiatives in place on the diffusion side.
Data for the Compass is collected via the CSTP (Committee for Scientific and Technological Policy)
and ERAC (European Research and Innovation Committee), both of which traditionally focus on
innovation rather than diffusion, especially technological innovation and R&D and science and
technology policy issues. The Compass reflecting the views of the respondents in selecting the
“major” policy initiatives in their field of intervention, results could be skewed towards a “hard” part
of innovation policy and the supply-side. The findings of this work overlook therefore a subset of
policy initiatives that aim to foster AI innovation diffusion and have gone under the radar of the
Compass.
A number of AI diffusion initiatives are likely to be implemented at subnational level, i.e. as part of
regional industrial strategies, or local SME digitalisation frameworks or local SME development
policies, including training. Information about these subnational policy initiatives are not available
in the Compass.
264
THE DIGITAL TRANSFORMATION OF SMES © OECD 2021
Going forward, policy mapping exercise of this kind should consider using complementing policy
information, especially to bridge the knowledge gap in different policy domains and levels of governance.
For instance, countries may have in practice SME-relevant initiatives in their policy mix for “firms of any
size”. While the present report does not consider those, future analysis could investigate to which extend
adding these initiatives into the sample under review could alter the results and findings.
Likewise, access to co-operation infrastructure is often enabled by digital technologies and Internet
infrastructure (online access to data, cloud computing or online “networking” through platforms, for
example), showing that policy instruments to foster technology adoption are leveraging digital instruments
themselves (OECD, 2019[25]). The availability of digital infrastructure and quality broadband has been
shown to be a key enabler of technology adoption among firms (OECD, 2019[14]; Andrews, Nicoletti and
Timiliotis, 2018[7]).
Another area of interest that did not emerge from this analysis based on the Compass is the role regulators
and governments play in ensuring the well functioning of knowledge markets that provide cloud-based AI
solutions to SMEs, and how to address issues related to data ownership, data portability and locks-in
effects.
As the AI transition turns to the reskilling of managers, business owners and the workforce, a closer
attention will have to be paid to subnational policy arrangements in support of AI diffusion, the types of
initiatives put in place, and their relative balance both at local level and within national policy mixes. This
is a full stream of research work to be developed.
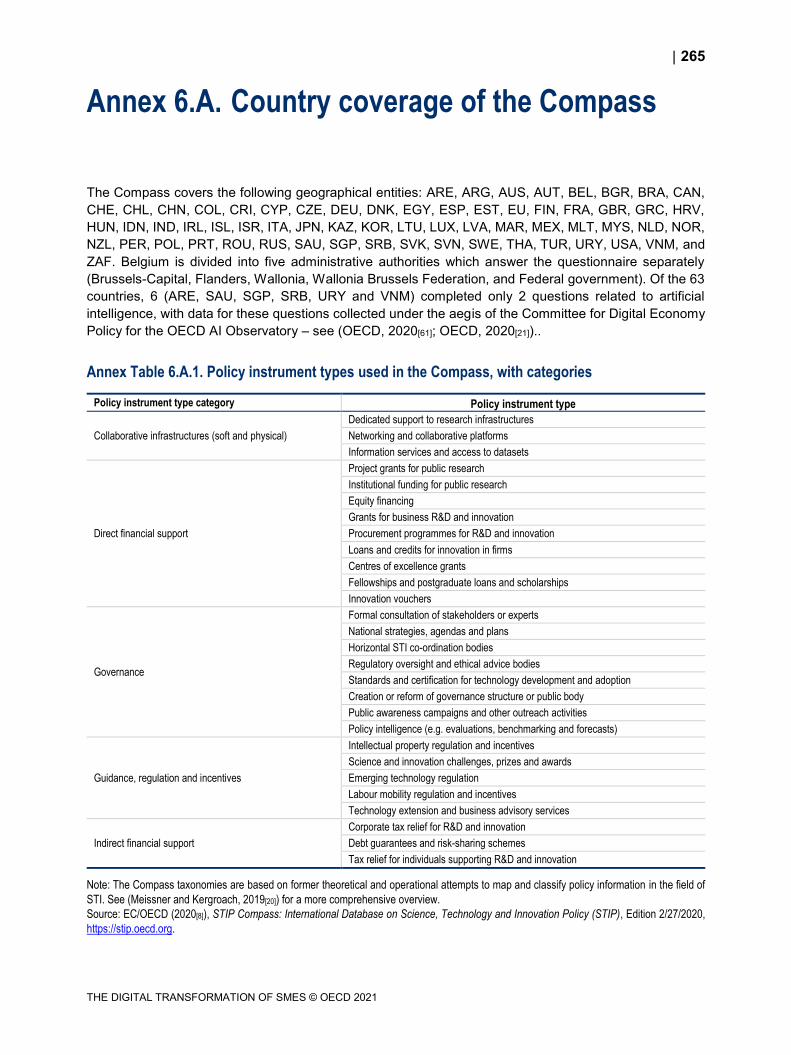
265
THE DIGITAL TRANSFORMATION OF SMES © OECD 2021
Annex 6.A. Country coverage of the Compass
The Compass covers the following geographical entities: ARE, ARG, AUS, AUT, BEL, BGR, BRA, CAN,
CHE, CHL, CHN, COL, CRI, CYP, CZE, DEU, DNK, EGY, ESP, EST, EU, FIN, FRA, GBR, GRC, HRV,
HUN, IDN, IND, IRL, ISL, ISR, ITA, JPN, KAZ, KOR, LTU, LUX, LVA, MAR, MEX, MLT, MYS, NLD, NOR,
NZL, PER, POL, PRT, ROU, RUS, SAU, SGP, SRB, SVK, SVN, SWE, THA, TUR, URY, USA, VNM, and
ZAF. Belgium is divided into five administrative authorities which answer the questionnaire separately
(Brussels-Capital, Flanders, Wallonia, Wallonia Brussels Federation, and Federal government). Of the 63
countries, 6 (ARE, SAU, SGP, SRB, URY and VNM) completed only 2 questions related to artificial
intelligence, with data for these questions collected under the aegis of the Committee for Digital Economy
Policy for the OECD AI Observatory – see (OECD, 2020[61]; OECD, 2020[21])..
Annex Table 6.A.1. Policy instrument types used in the Compass, with categories
Policy instrument type category Policy instrument type
Collaborative infrastructures (soft and physical)
Dedicated support to research infrastructures
Networking and collaborative platforms
Information services and access to datasets
Direct financial support
Project grants for public research
Institutional funding for public research
Equity financing
Grants for business R&D and innovation
Procurement programmes for R&D and innovation
Loans and credits for innovation in firms
Centres of excellence grants
Fellowships and postgraduate loans and scholarships
Innovation vouchers
Governance
Formal consultation of stakeholders or experts
National strategies, agendas and plans
Horizontal STI co-ordination bodies
Regulatory oversight and ethical advice bodies
Standards and certification for technology development and adoption
Creation or reform of governance structure or public body
Public awareness campaigns and other outreach activities
Policy intelligence (e.g. evaluations, benchmarking and forecasts)
Guidance, regulation and incentives
Intellectual property regulation and incentives
Science and innovation challenges, prizes and awards
Emerging technology regulation
Labour mobility regulation and incentives
Technology extension and business advisory services
Indirect financial support
Corporate tax relief for R&D and innovation
Debt guarantees and risk-sharing schemes
Tax relief for individuals supporting R&D and innovation
Note: The Compass taxonomies are based on former theoretical and operational attempts to map and classify policy information in the field of
STI. See (Meissner and Kergroach, 2019[20]) for a more comprehensive overview.
Source: EC/OECD (2020[8]), STIP Compass: International Database on Science, Technology and Innovation Policy (STIP), Edition 2/27/2020,
https://stip.oecd.org.
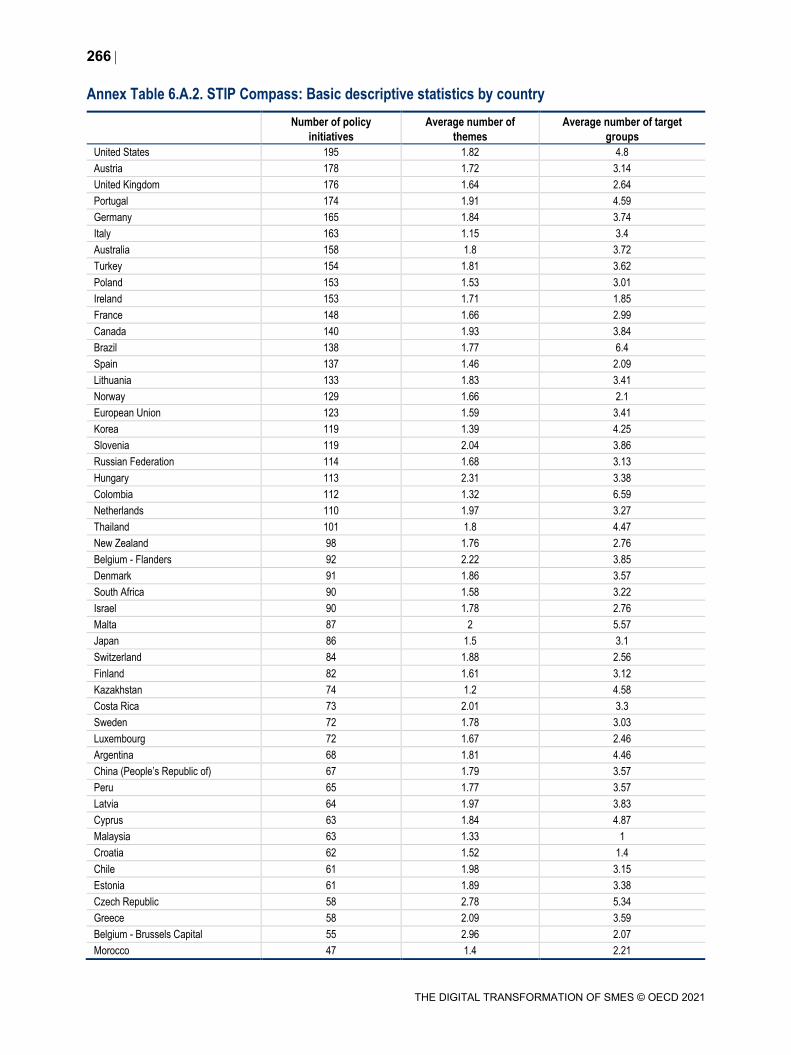
266
THE DIGITAL TRANSFORMATION OF SMES © OECD 2021
Annex Table 6.A.2. STIP Compass: Basic descriptive statistics by country
Number of policy
initiatives
Average number of
themes
Average number of target
groups
United States 195 1.82 4.8
Austria 178 1.72 3.14
United Kingdom 176 1.64 2.64
Portugal 174 1.91 4.59
Germany 165 1.84 3.74
Italy 163 1.15 3.4
Australia 158 1.8 3.72
Turkey 154 1.81 3.62
Poland 153 1.53 3.01
Ireland 153 1.71 1.85
France 148 1.66 2.99
Canada 140 1.93 3.84
Brazil 138 1.77 6.4
Spain 137 1.46 2.09
Lithuania 133 1.83 3.41
Norway 129 1.66 2.1
European Union 123 1.59 3.41
Korea 119 1.39 4.25
Slovenia 119 2.04 3.86
Russian Federation 114 1.68 3.13
Hungary 113 2.31 3.38
Colombia 112 1.32 6.59
Netherlands 110 1.97 3.27
Thailand 101 1.8 4.47
New Zealand 98 1.76 2.76
Belgium - Flanders 92 2.22 3.85
Denmark 91 1.86 3.57
South Africa 90 1.58 3.22
Israel 90 1.78 2.76
Malta 87 2 5.57
Japan 86 1.5 3.1
Switzerland 84 1.88 2.56
Finland 82 1.61 3.12
Kazakhstan 74 1.2 4.58
Costa Rica 73 2.01 3.3
Sweden 72 1.78 3.03
Luxembourg 72 1.67 2.46
Argentina 68 1.81 4.46
China (People’s Republic of) 67 1.79 3.57
Peru 65 1.77 3.57
Latvia 64 1.97 3.83
Cyprus 63 1.84 4.87
Malaysia 63 1.33 1
Croatia 62 1.52 1.4
Chile 61 1.98 3.15
Estonia 61 1.89 3.38
Czech Republic 58 2.78 5.34
Greece 58 2.09 3.59
Belgium - Brussels Capital 55 2.96 2.07
Morocco 47 1.4 2.21
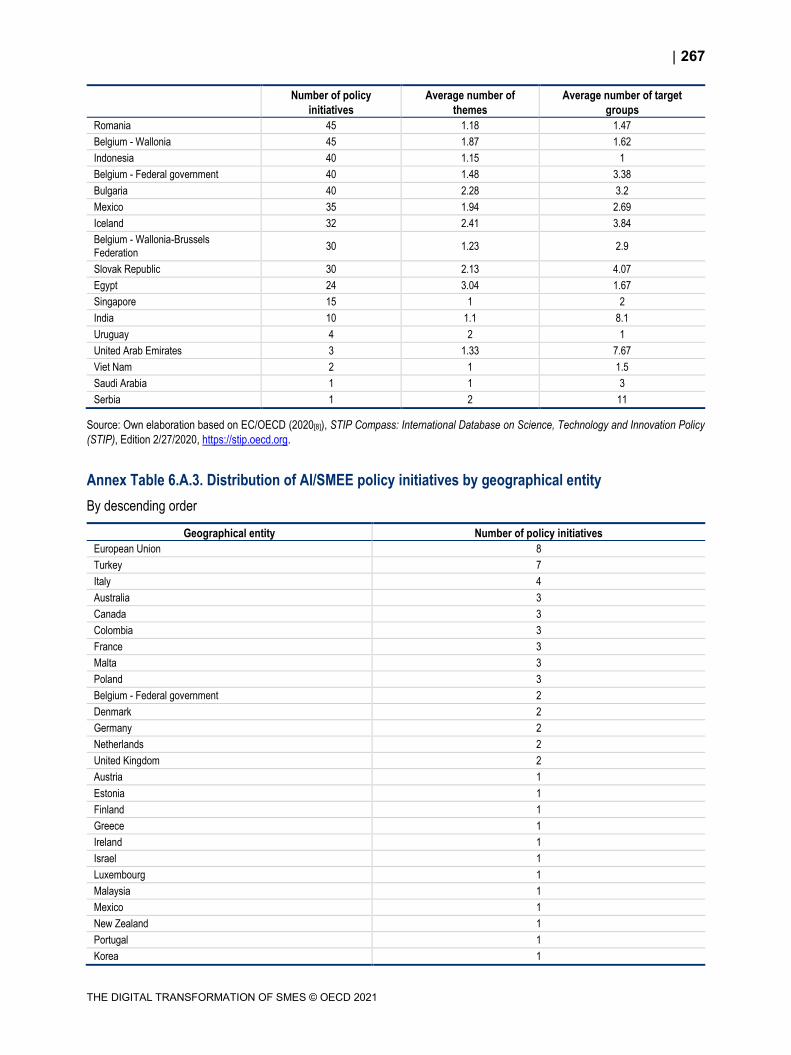
267
THE DIGITAL TRANSFORMATION OF SMES © OECD 2021
Number of policy
initiatives
Average number of
themes
Average number of target
groups
Romania 45 1.18 1.47
Belgium - Wallonia 45 1.87 1.62
Indonesia 40 1.15 1
Belgium - Federal government 40 1.48 3.38
Bulgaria 40 2.28 3.2
Mexico 35 1.94 2.69
Iceland 32 2.41 3.84
Belgium - Wallonia-Brussels
Federation 30 1.23 2.9
Slovak Republic 30 2.13 4.07
Egypt 24 3.04 1.67
Singapore 15 1 2
India 10 1.1 8.1
Uruguay 4 2 1
United Arab Emirates 3 1.33 7.67
Viet Nam 2 1 1.5
Saudi Arabia 1 1 3
Serbia 1 2 11
Source: Own elaboration based on EC/OECD (2020[8]), STIP Compass: International Database on Science, Technology and Innovation Policy
(STIP), Edition 2/27/2020, https://stip.oecd.org.
Annex Table 6.A.3. Distribution of AI/SMEE policy initiatives by geographical entity
By descending order
Geographical entity Number of policy initiatives
European Union 8
Turkey 7
Italy 4
Australia 3
Canada 3
Colombia 3
France 3
Malta 3
Poland 3
Belgium - Federal government 2
Denmark 2
Germany 2
Netherlands 2
United Kingdom 2
Austria 1
Estonia 1
Finland 1
Greece 1
Ireland 1
Israel 1
Luxembourg 1
Malaysia 1
Mexico 1
New Zealand 1
Portugal 1
Korea 1
268
THE DIGITAL TRANSFORMATION OF SMES © OECD 2021
Geographical entity Number of policy initiatives
Slovenia 1
Spain 1
Sweden 1
Viet Nam 1
Source: Own elaboration based on policy information drawn from EC/OECD (2020[8]), STIP Compass: International Database on Science,
Technology and Innovation Policy (STIP), Edition 2/27/2020, https://stip.oecd.org.
References
Altomonte, C. et al. (2016), “R&D investments, financing constraints, exporting and productivity”,
Economics of Innovation and New Technology, Vol. 25/3, pp. 283-303,
https://doi.org/10.1080/10438599.2015.1076203.
[45]
Andrews, D., G. Nicoletti and C. Timiliotis (2018), “Digital technology diffusion: A matter of
capabilities, incentives or both?”, OECD Economics Department Working Papers, No. 1476,
OECD Publishing, Paris, https://dx.doi.org/10.1787/7c542c16-en.
[7]
Audretsch, D. and M. Feldman (1996), “R&D Spillovers and the Geography of Innovation and
Production”, American Economic Review, Vol. 86/3, pp. 630-640.
[15]
AWS (2020), “Shared Responsibility Model”, Amazon Web Services website,
https://aws.amazon.com/compliance/shared-responsibility-model/ (accessed on
5 March 2020).
[31]
Beane, M. (2019), Learning to Work with Intelligent Machines, Harvard Business Press,
https://hbr.org/2019/09/learning-to-work-with-intelligent-machines (accessed on
20 April 2020).
[36]
Berlingieri, G. et al. (2020), “Laggard firms, technology diffusion and its structural and policy
determinants”, OECD Science, Technology and Industry Policy Papers, No. 86, OECD
Publishing, Paris, https://dx.doi.org/10.1787/281bd7a9-en.
[6]
Brassell, M. and K. Boschmans (2019), “Fostering the use of intangibles to strengthen SME
access to finance”, OECD SME and Entrepreneurship Papers, No. 12, OECD Publishing,
Paris, https://dx.doi.org/10.1787/729bf864-en.
[43]
Brynjolfsson, E. and K. McElheran (2016), “The rapid adoption of data-driven decision-making”,
American Economic Review, Vol. 106/5, pp. 133-139,
http://dx.doi.org/10.1257/aer.p20161016.
[4]
Brynjolfsson, E., D. Rock and C. Syverson (2017), “Artificial intelligence and the modern
productivity paradox: A clash of expectations and statistics”, NBER Working Papers,
No. 24001, https://www.nber.org/papers/w24001.
[5]
Cockburn, I., R. Henderson and S. Stern (2018), “The Impact of Artificial Intelligence on
Innovation”, NBER Working Papers, No. 24449, http://www.nber.org/papers/w24449.
[2]
DeBresson, C. (1996), Economic Interdependence and Innovative Activity: Economic
Interdependence and Innovative, Edward Elgar Publishing.
[13]
269
THE DIGITAL TRANSFORMATION OF SMES © OECD 2021
Edler, J. and J. Fagerberg (2017), “Innovation policy: what, why, and how”, Oxford Review of
Economic Policy, Vol. 33/11, pp. 2-23, https://doi.org/10.1093/oxrep/grx001.
[51]
Enkel, E. (2010), “Attributes required for profiting from open innovation in networks”, International
Journal of Technology Management, Vol. 52/3/4, pp. 344-371,
http://dx.doi.org/10.1504/ijtm.2010.035980.
[11]
European Commission (2020), Industrial applications of artificial intelligence and big data,
https://ec.europa.eu/growth/industry/policy/advanced-technologies/industrial-applications-
artificial-intelligence-and-big-data_en (accessed on 17 April 2020).
[32]
European Commission (2018), Language Technologies, https://ec.europa.eu/digital-single-
market/en/language-technologies (accessed on 29 May 2020).
[29]
European Commission (2017), “The economic rationale for public R&I funding and its impact”,
Policy Brief Series, http://dx.doi.org/10.2777/047015.
[46]
European Commission/OECD (2020), STIP Compass: International Database on Science,
Technology and Innovation Policy (STIP), Edition 2/27/2020, https://stip.oecd.org.
[8]
Ferrando, A. and A. Ruggieri (2015), “Financial constraints and productivity: Evidence from euro
area companies”, European Central Bank Working Paper Series, No. 1823,
https://www.ecb.europa.eu/pub/pdf/scpwps/ecbwp1823%20en.pdf.
[44]
G20/OECD (2015), High-level principles on SME Financing, OECD, Paris,
https://www.oecd.org/finance/G20-OECD-High-Level-Principles-on-SME-Financing.pdf.
[42]
Hall, B. (2009), “The financing of innovative firms”, EIB Papers, Vol. 14/2,
https://eml.berkeley.edu/~bhhall/papers/BHH09_EIB_Papers_14_Nr_2.pdf.
[40]
Hayek, F. (1945), “The use of knowledge in society”, American Economic Review, Vol. 35/4,
pp. 519-530, https://ssrn.com/abstract=1505216.
[12]
Hutschenreiter, G., J. Weber and C. Rammer (2019), “Innovation support in the enterprise sector
: Industry and SMEs”, OECD Science, Technology and Industry Policy Papers, No. 82, OECD
Publishing, Paris, Vol. N082, https://doi.org/10.1787/4ffb2cbc-en.
[33]
Kamada, T. and S. Kawai (1989), “An algorithm for drawing general undirected graphs”,
Information Processing Letters, Vol. 31/1, pp. 7-15, https://doi.org/10.1016/0020-
0190(89)90102-6.
[59]
Kergroach, S. (2020), “Benchmarking national innovation policy mixes for technology diffusion”. [18]
Kergroach, S. (2019), “National innovation policies for technology upgrading through GVCs: A
cross-country comparison”, Technological Forecasting and Social Change, Vol. 145, pp. 258-
272, https://doi.org/10.1016/j.techfore.2018.04.033.
[23]
Kergroach, S., D. Meissner and N. Vonortas (2017), “Technology transfer and commercialisation
by universities and PRIs: benchmarking OECD country policy approaches”, Economics of
Innovation and New Technology, Vol. 27/5-6, pp. 510-530,
http://dx.doi.org/10.1080/10438599.2017.1376167.
[22]
Luca, M., J. Kleinberg and S. Mullainat (2016), Algorithms Need Managers, Too,
https://hbr.org/2016/01/algorithms-need-managers-too (accessed on 8 June 2020).
[35]
270
THE DIGITAL TRANSFORMATION OF SMES © OECD 2021
McAfee (2020), Enterprise Supernova: The Data Dispersion: Cloud Adoption and Risk Report,
https://www.mcafee.com/enterprise/en-us/assets/reports/restricted/rp-enterprise-supernova-
data-dispersion.pdf.
[30]
Meissner, D. and S. Kergroach (2019), “Innovation policy mix: mapping and measurement”, The
Journal of Technology Transfer, pp. 1-26, https://doi.org/10.1007/s10961-019-09767-4.
[20]
Nelson, R. (ed.) (1962), “Economic Welfare and the Allocation of Resources for Innovation”,
Princeton University Press, Princeton (NJ.).
[38]
OECD (2020), A to Z of Public Governance Terms, http://www.oecd.org/gov/a-to-z-public-
governance.htm (accessed on 2020 December 01).
[56]
OECD (2020), Financing SMEs and Entrepreneurs 2020: An OECD Scoreboard, OECD
Publishing, Paris, https://dx.doi.org/10.1787/061fe03d-en.
[41]
OECD (2020), OECD AI Policy Observatory, https://oecd.ai (accessed on 20 March 2020). [61]
OECD (2020), OECD Digital Economy Outlook 2020, OECD Publishing, Paris,
https://dx.doi.org/10.1787/bb167041-en.
[47]
OECD (2020), STIP Compass 2020: An update on the latest data and features, Internal
document of the OECD Directorate for Science, Technology and Innovation
(DSTI/STP(2020)4).
[21]
OECD (2019), 2019 EC/OECD Science, Technology and Innovation Policy Survey,
http://dx.doi.org/internal document of the OECD Directorate for Science, Technology and
Innovation (DSTI/STP(2019)17).
[19]
OECD (2019), Artificial Intelligence in Society, OECD Publishing, Paris,
https://dx.doi.org/10.1787/eedfee77-en.
[1]
OECD (2019), Enhancing Access and Connectivity to Harness Digital Transformation, OECD
Publishing, Paris, http://www.oecd.org/going-digital/enhancing-access-digital-
transformation.pdf.
[28]
OECD (2019), Government at a Glance 2019, OECD Publishing, Paris,
https://dx.doi.org/10.1787/8ccf5c38-en.
[54]
OECD (2019), OECD SME and Entrepreneurship Outlook 2019, OECD Publishing, Paris,
https://dx.doi.org/10.1787/34907e9c-en.
[14]
OECD (2019), “Policies to stimulate digital innovation’s diffusion and collaboration”, in Digital
Innovation: Seizing Policy Opportunities, OECD Publishing, Paris,
https://dx.doi.org/10.1787/9b5b4958-en.
[25]
OECD (2018), “Private Equity Investment in Artificial Intelligence”, OECD Going Digital Policy
Note, http://www.oecd.org/going-digital/ai/private-equity-investment-in-artificial-
intelligence.pdf.
[24]
OECD (2017), The Next Production Revolution: Implications for Governments and Business,
OECD Publishing, Paris, https://dx.doi.org/10.1787/9789264271036-en.
[3]
OECD (2016), OECD Science, Technology and Innovation Outlook 2016, OECD Publishing,
Paris, https://dx.doi.org/10.1787/sti_in_outlook-2016-en.
[17]
271
THE DIGITAL TRANSFORMATION OF SMES © OECD 2021
OECD (2015), The Innovation Imperative: Contributing to Productivity, Growth and Well-Being,
OECD Publishing, Paris, https://dx.doi.org/10.1787/9789264239814-en.
[16]
OECD (2013), “Knowledge Networks and Markets”, OECD Science, Technology and Industry
Policy Papers, No. 7, OECD Publishing, Paris, https://dx.doi.org/10.1787/5k44wzw9q5zv-en.
[26]
OECD (2012), “STI governance structures and arrangements”, in OECD Science, Technology
and Industry Outlook 2012, OECD Publishing, Paris, https://dx.doi.org/10.1787/sti_outlook-
2012-9-en.
[58]
OECD (2010), OECD Science, Technology and Industry Outlook 2010, OECD Publishing, Paris,
https://dx.doi.org/10.1787/sti_outlook-2010-en.
[55]
OECD (2010), The OECD Innovation Strategy: Getting a Head Start on Tomorrow, OECD
Publishing, Paris, https://dx.doi.org/10.1787/9789264083479-en.
[57]
OECD (2001), Innovative Networks: Co-operation in National Innovation Systems, OECD
Publishing, Paris, https://dx.doi.org/10.1787/9789264195660-en.
[48]
OECD (1999), Managing National Innovation Systems, OECD Publishing, Paris,
https://dx.doi.org/10.1787/9789264189416-en.
[49]
OECD.AI (2020), OECD AI Policy Observatory, powered by EC/OECD (2020), STIP Compass
database, http:s://oecd.ai (accessed on 22 June 2020).
[62]
OECD/Eurostat (2018), Oslo Manual 2018: Guidelines for Collecting, Reporting and Using Data
on Innovation, 4th Edition, The Measurement of Scientific, Technological and Innovation
Activities, OECD Publishing, Paris/Eurostat, Luxembourg,
https://dx.doi.org/10.1787/9789264304604-en.
[9]
Paunov, C., S. Planes-Satorra and G. Ravelli (2019), “Review of national policy initiatives in
support of digital and AI-driven innovation”, OECD Science, Technology and Industry Policy
Papers, No. 79, OECD Publishing, Paris, https://dx.doi.org/10.1787/15491174-en.
[53]
Peters, B. (2018), “The challenge of policy coordination”, Policy Design and Practice, Vol. 1/1,
pp. 1–11, http://dx.doi.org/10.1080/25741292.2018.1437946.
[52]
Porter, M. (1998), On Competition, Harvard Business School Publishing, Boston,
Massachusetts.
[27]
Prime Minister’s Industry 4.0 Taskforce, Swinburne University of Technology (2017), Industry 4.0
Testlabs in Australia: Preparing for the Future, Swinburne Research, Swinburne University of
Technology,
https://www.industry.gov.au/sites/default/files/July%202018/document/pdf/industry-4.0-
testlabs-report.pdf?acsf_files_redirect.
[50]
Rissola, G. and J. Sörvik (2018), “Digital Innovation Hubs in Smart Specialisation Strategies”,
JRC Technical Reports, http://dx.doi.org/10.2760/475335.
[37]
Schumpeter, J. (1934), The Theory of Economic Development: An Inquiry into Profits, Capital,
Credit, Interest and the Business Cycle, Harvard University Press, Cambridge (MA).
[10]
Sofka, W., E. Shehu and H. Hristov (2018), RIO Country Report 2017: Germany, Publications
Office of the European Union, Luxembourg, http://dx.doi.org/10.2760/507952.
[60]
272
THE DIGITAL TRANSFORMATION OF SMES © OECD 2021
Stoneman, P. (1987), The Economic Analysis of Technology Policy, Clarendon Press, Oxford. [39]
Zhou, D., M. Kautonen and J. Wei (2015), “The effect of external KISA on innovation in
manufacturing firms”, Innovation, Vol. 17/4.
[34]
Notes
1 For basic descriptive statistics on the Compass, see Annex 6.A.
2 Mandatory fields are the following: name in English, description, objective(s), target group(s), name of
responsible organisation, policy instrument type and/or yearly budget range.
3 This question was broadened since the 2017 edition of the survey, where it used to read What policy
initiatives exist, if any, to support research on artificial intelligence? (European Commission/OECD,
2020[8]). The Compass contains data collected as part of an AI-specific survey using the same
infrastructure (OECD.AI, 2020[62]).
4 This study lists the following incomplete set of keywords: i) generic AI keywords (notably “artificial
intelligence”, “AI”, “machine learning” and “machine intelligence”); ii) keywords pertaining to AI
techniques (notably “neural network”, “deep learning”, and “reinforcement learning”); and iii) keywords
referring to AI applications (notably “computer vision”, “predictive analytics”, “natural language processing”,
“autonomous vehicles”, “intelligent systems” and “virtual assistant”) (OECD, 2018[24]).
5 For a full list of initiatives, see Annex 6.A. A few possible duplicated entries were found, but are left in the
subset of initiatives, because the fields are slightly different.
6 The original taxonomies specified by respondents in the “Target group(s)” field are not used here,
because they were not used to conduct the initial search. Generally, the fact that respondents tend to
specify a large number of target groups for a given initiative reduces the value of this field.
OECD Studies on SMEs and Entrepreneurship
The Digital Transformation of SMEsDespite potentially tremendous benefits, small and medium‑sized enterprises (SMEs) lag in the digital transformation. Emerging technologies, as diverse as they are, offer a range of applications for them to improve performance and overcome the size‑related limitations they face in doing business. However, SMEs must be better prepared, and stakes are high. SMEs make the most of the industrial fabric in many countries and regions, they create jobs (most jobs sometimes) and are the cement of inclusive and sustainable societies. The SME digital gap has increased inequalities among people, places and firms, and there are concerns that the benefits of the digital transformation could accrue to early adopters, further broadening these inequalities. Enabling SME digitalisation has become a top policy priority in OECD countries and beyond. The report looks at recent trends in SME digital uptake, including in the context of the COVID‑19 crisis. It focuses on issues related to digital security, online platforms, blockchain ecosystems, and artificial intelligence. The report identifies opportunities, risks of not going digital, and barriers to adoption. It looks to concrete policy action taken worldwide to speed the SME transformation and raises a series of considerations to advance the SME digital policy agenda.
9HSTCQE*djcefi+
PRINT ISBN 978-92-64-39245-8PDF ISBN 978-92-64-36760-9
Th
e Dig
ital Transfo
rmatio
n of S
ME
sO
EC
D S
tud
ies on S
ME
s and
Entrep
reneu
rship