the differnces between bond lengths in biogenic and geologocal calcite
TRANSCRIPT
pubs.acs.org/crystalPublished on Web 02/05/2010r 2010 American Chemical Society
DOI: 10.1021/cg901195t
2010, Vol. 101207–1214
Differences between Bond Lengths in Biogenic and Geological Calcite
E. Zolotoyabko,*,† E. N. Caspi,‡ J. S. Fieramosca,§ R. B. VonDreele,§ F.Marin,# G.Mor, )
L. Addadi, ) S. Weiner, ) and Y. Politi )
†Department of Materials Engineering, Technion-Israel Institute of Technology, Haifa 32000, Israel,‡Physics Department, Nuclear Research Centre, Negev, P.O. Box 9001, Beer-Sheva 84190, Israel,§Advanced Photon Source, Argonne National Laboratory, 9700 South Cass Avenue, Argonne,Illinois 60439, #Laboratoire de Biog�eosciences, UMR 5561, Universit�e de Bourgogne, 6 Bd. Gabriel,21000 Dijon, France, and )Department of Structural Biology, Weizmann Institute of Science,Rehovot 76100, Israel
Received September 29, 2009; Revised Manuscript Received January 19, 2010
ABSTRACT: We used high-resolution neutron powder diffraction to accurately measure the atomic positions and bondlengths in biogenic and geological calcite. A special procedure for data analysis was developed in order to take into account theconsiderable amounts ofmagnesiumpresent in all the investigated samples. As a result, in biogenic calcite we found some atomicbonds to have significantly different lengths as compared to those in geological calcite, after the contribution of magnesium isaccounted for. The maximum effect (elongation up to 0.7%) was found for the C-O bonds. We also analyzed changes infrequencies and spectral widths of normal vibrations of carbonate groups in biogenic calcite (as compared to geological calcite)measured by Raman and Fourier transform IR techniques. Surprisingly, the frequency shifts after subtracting the magnesiumcontribution are close to zero. At the same time, substantial spectral broadening (up to 1.2%) in biogenic calcite as compared togeological samples was detected. Possible explanations for the experimental findings are discussed.
1. Introduction
The formationmechanisms of mineralized composite materi-als produced by organisms are of great interest (see reviews1-3
and references therein). The processes developed in nature differdrastically from those used in industry for fabricating denseceramicmaterials.Organismsareable toproduce suchmaterials,often with superior mechanical, optical, and other physicalcharacteristics, at ambient temperatures and pressures. The“secrets” of nature presumably relate to the precise biologicalcontrol over every stageof themineralizationprocess.This startswith the preparation of the microenvironment, which oftenincludes preformation of an organic scaffold in which mineralsnucleate and grow.4 In many biomineralization processes, atransient amorphous precursor phase is first deposited thatsubsequently transforms into a crystalline polymorphof calciumcarbonate (see, for example, ref 5). The resultantmicrostructureof the crystalline phase has been studied extensively by differenttechniques including high resolution X-ray diffraction. It wasfound that the sizes of crystalline blocks, which coherentlyscatter X-rays, are precisely controlled and show anisotropywith respect to crystallographic directions that matches thebiomineral morphology.6-8 A comparison of the microstruc-tures inbiomineralswith synthetic crystals grown in the presenceof proteins, extracted from the biominerals, shows a correlationbetween the specific crystal planes onto which the macromole-cules are absorbed and the “coherence lengths”measured for therespective crystal orientations.8 Furthermore, anisotropic latticedistortions in biogenic crystals relative to their geological orsynthetic counterparts9 were discovered using high-resolutionX-ray powder and single-crystal diffraction techniques. Latticedistortions of up to about 0.2% were directly measured in avariety of biogenic aragonites10-14 and calcites.15,16 It was
suggested17 that these distortions result from the interaction ofthe organic macromolecules and the crystalline phase.
Examination of the microstructures of mature crystallinebiominerals by scanning electronmicroscopy (SEM) and ato-mic force microscopy (AFM) revealed a unique morphologyof packed globules, 20-100 nm in diameter.18-20 Althoughthe origin of these nanostructures is not well understood, it isbelieved that they reflect the manner in which themineral wasinitially deposited in the form of amorphous calcium carbo-nate (ACC) spherules.
Frequencies and spectral widths of molecular vibrationsmeasured by optical techniques, such as Raman spectroscopyor Fourier-transform infrared spectroscopy (FTIR), are alsopotentially affected by crystal disorder and interactions be-tweenorganicmacromolecules and crystallites. The frequenciesofmolecular vibrations aredirectly related to the characteristicsof the interatomic bonds. In biogenic aragonite, some of thesefrequencies can differ by about 1% as compared to geologicalsamples.21,22 It was shown11 that in biogenic aragonite thesedifferences correlate with certain structural modifications,mainly with the reduced aplanarity of carbonate groups.Calcite is more complicated since the changes in structuralparameters as well as frequency and spectral width changes arealso introducedby thepresenceof substantial concentrations ofMg.23 Nevertheless, the interrelations between local atomicdisorder and peculiarities in the infrared spectra in biogeniccalcite (with no relation to Mg) were noted.24
Herewe investigatepossible interrelationsbetween thechanges(with respect to geological calcite) in atomic bonds (measured byneutron diffraction) and optical characteristics in biogenic calcitecrystals, after subtracting the contribution of Mg.
2. Atomic Bonds in Calcite
Rhombohedral calcite belongs to point group 3hm and spacegroup R3hc (No. 167). In the hexagonal setting, calcite has six
*To whom correspondence should be addressed. E-mail: [email protected].
1208 Crystal Growth & Design, Vol. 10, No. 3, 2010 Zolotoyabko et al.
CaCO3 molecules per unit cell occupying partial atomicpositions given below. These are also duplicated by internaltranslations (2/3,
1/3,1/3) and (1/3,
2/3,2/3). Namely, Ca is
located in the 6b-positions: (0, 0, 0) and (0, 0, 1/2); C is locatedin the 6a-positions: (0, 0, 1/4) and (0, 0, 3/4), while O is locatedin the 18e-positions: (x, 0, 1/4); (0, x,
1/4); (-x,-x, 1/4); (-x, 0,3/4); (0, -x, 3/4); (x, x,
3/4).The atomic bond lengths in calcite are therefore deter-
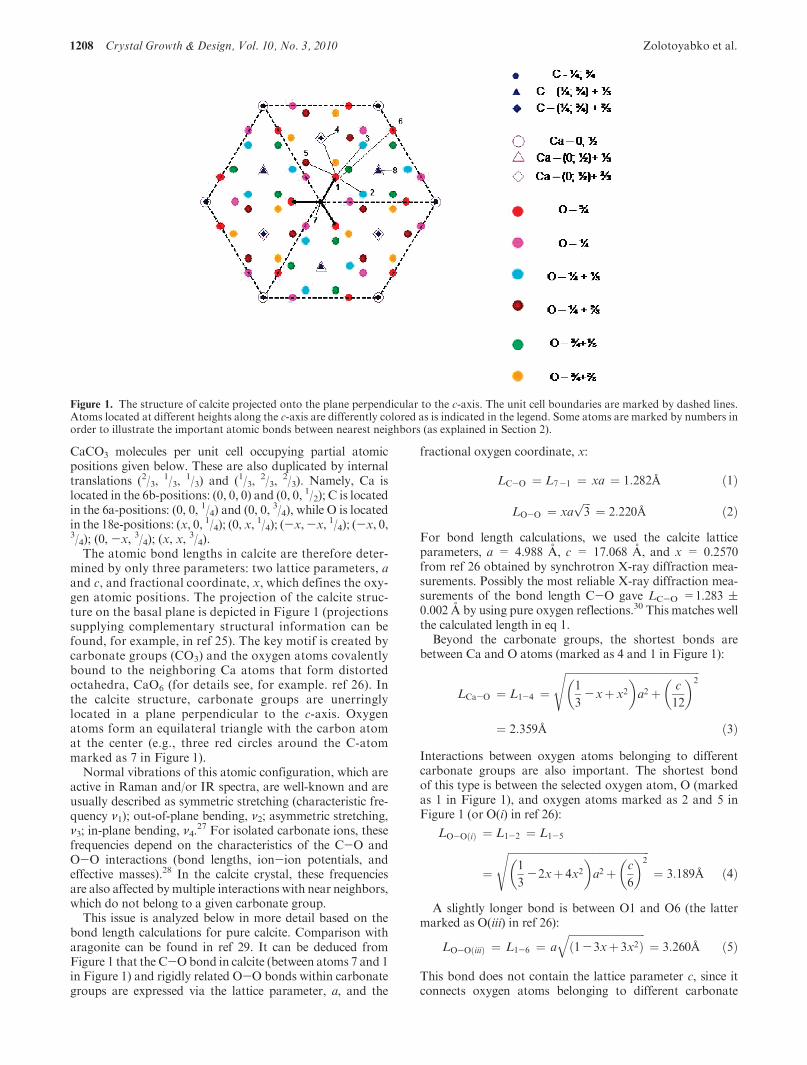
mined by only three parameters: two lattice parameters, aand c, and fractional coordinate, x, which defines the oxy-gen atomic positions. The projection of the calcite struc-ture on the basal plane is depicted in Figure 1 (projectionssupplying complementary structural information can befound, for example, in ref 25). The key motif is created bycarbonate groups (CO3) and the oxygen atoms covalentlybound to the neighboring Ca atoms that form distortedoctahedra, CaO6 (for details see, for example. ref 26). Inthe calcite structure, carbonate groups are unerringlylocated in a plane perpendicular to the c-axis. Oxygenatoms form an equilateral triangle with the carbon atomat the center (e.g., three red circles around the C-atommarked as 7 in Figure 1).
Normal vibrations of this atomic configuration, which areactive in Raman and/or IR spectra, are well-known and areusually described as symmetric stretching (characteristic fre-quency ν1); out-of-plane bending, ν2; asymmetric stretching,ν3; in-plane bending, ν4.
27 For isolated carbonate ions, thesefrequencies depend on the characteristics of the C-O andO-O interactions (bond lengths, ion-ion potentials, andeffective masses).28 In the calcite crystal, these frequenciesare also affected bymultiple interactions with near neighbors,which do not belong to a given carbonate group.
This issue is analyzed below in more detail based on thebond length calculations for pure calcite. Comparison witharagonite can be found in ref 29. It can be deduced fromFigure 1 that the C-Obond in calcite (between atoms 7 and 1in Figure 1) and rigidly related O-O bonds within carbonategroups are expressed via the lattice parameter, a, and the
fractional oxygen coordinate, x:
LC-O ¼ L7-1 ¼ xa ¼ 1:282Å ð1Þ
LO-O ¼ xaffiffiffi3
p¼ 2:220Å ð2Þ
For bond length calculations, we used the calcite latticeparameters, a = 4.988 A, c = 17.068 A, and x = 0.2570from ref 26 obtained by synchrotron X-ray diffraction mea-surements. Possibly the most reliable X-ray diffraction mea-surements of the bond length C-O gave LC-O =1.283 (0.002 A by using pure oxygen reflections.30 This matches wellthe calculated length in eq 1.
Beyond the carbonate groups, the shortest bonds arebetween Ca and O atoms (marked as 4 and 1 in Figure 1):
LCa-O ¼ L1-4 ¼ffiffiffiffiffiffiffiffiffiffiffiffiffiffiffiffiffiffiffiffiffiffiffiffiffiffiffiffiffiffiffiffiffiffiffiffiffiffiffiffiffiffiffiffiffiffiffiffiffiffiffi1
3-xþ x2
� �a2 þ c
12
� �2s
¼ 2:359Å ð3ÞInteractions between oxygen atoms belonging to differentcarbonate groups are also important. The shortest bondof this type is between the selected oxygen atom, O (markedas 1 in Figure 1), and oxygen atoms marked as 2 and 5 inFigure 1 (or O(i) in ref 26):
LO-OðiÞ ¼ L1-2 ¼ L1-5
¼ffiffiffiffiffiffiffiffiffiffiffiffiffiffiffiffiffiffiffiffiffiffiffiffiffiffiffiffiffiffiffiffiffiffiffiffiffiffiffiffiffiffiffiffiffiffiffiffiffiffiffiffiffiffi1
3-2xþ 4x2
� �a2 þ c
6
� �2s
¼ 3:189Å ð4Þ
A slightly longer bond is between O1 and O6 (the lattermarked as O(iii) in ref 26):
LO-OðiiiÞ ¼ L1-6 ¼ a
ffiffiffiffiffiffiffiffiffiffiffiffiffiffiffiffiffiffiffiffiffiffiffiffiffiffiffiffiffið1-3xþ 3x2Þ
q¼ 3:260Å ð5Þ
This bond does not contain the lattice parameter c, since itconnects oxygen atoms belonging to different carbonate
Figure 1. The structure of calcite projected onto the plane perpendicular to the c-axis. The unit cell boundaries are marked by dashed lines.Atoms located at different heights along the c-axis are differently colored as is indicated in the legend. Some atoms are marked by numbers inorder to illustrate the important atomic bonds between nearest neighbors (as explained in Section 2).
Article Crystal Growth & Design, Vol. 10, No. 3, 2010 1209
groups, but situated within the same plane perpendicular tothe c-axis. The last rather short O-Obond is between O1 andO3 (the latter marked as O(iv) in ref 26):
LO-OðivÞ ¼ L1-3 ¼ffiffiffiffiffiffiffiffiffiffiffiffiffiffiffiffiffiffiffiffiffiffiffiffiffiffiffiffiffiffiffiffiffiffiffiffiffiffiffiffiffiffiffiffiffiffiffiffiffi1
3-xþ x2
� �a2 þ c
6
� �2s
¼ 3:411Å ð6ÞThe bond length betweenCa andC (atomsmarked as 4 and
7 in Figure 1) is also in that range:
LCa-C ¼ L4-7 ¼ffiffiffiffiffiffiffiffiffiffiffiffiffiffiffiffiffiffiffiffiffiffiffiffia2
3þ c
12
� �2s
¼ 3:212Å ð7Þ
but it does not depend on the x-value and for this reason is lessimportant in further analysis. The same conclusion is drawnfor the shortest C-C bond between atoms marked as 7 and 8in Figure 1:
LC-C ¼ L7-8 ¼ffiffiffiffiffiffiffiffiffiffiffiffiffiffiffiffiffiffiffiffiffiffia2
3þ c
6
� �2s
¼ 4:048Å ð8Þ
This bond length is significantly larger than the Ca-C bondlength.
All these bondsmay have a potential effect on the vibrationfrequencies of carbonate groups in calcite crystals. Bearing inmind the case of aragonite,11 we can also expect some bondlength changes in biogenic calcite on the order of 1%,compared to a geological standard. Note that the measure-ment of bond length changes smaller than 1% by X-raydiffraction is not trivial. It is particularly difficult for calciumcarbonate as we are interested mainly in the positions of thelight atoms, C and O, whose atomic scattering factors aremuch smaller than those of heavier Ca atoms. In order toincrease the sensitivity of the structural refinement of atomicpositions, and hence bond lengths, we used high-resolutionpowder neutron diffraction. This technique does not sufferfrom the drawbacks mentioned above. For aragonite, theaccuracy of the bond lengthdeterminationby thismethodwasin the range 0.05-0.2%.11
3. Experimental Details
The biogenic calcites studied are the spines and the body skeleton(so-called test) of the sea urchin Paracentrotus lividus, and theprisms from the prismatic layers of the mollusk bivalves, Pinnanobilis and Atrina rigida.31 All samples diffract X-rays as singlecrystals. We separated the sea urchin spines into two groups:medium size spines (MS), ranging from 150 to 1000 μm, and largespines (LS) more than 1 mm in size. The size differences reflect theproportions of two types of mineralization processes in spinegrowth. In the initial mineralization stage, a spongy structure,called the stereom, is produced. The stereom calcite is producedvia an ACC precursor phase32 and contains relatively largeamounts of Mg (see Table 1) and up to 0.07 wt % proteins. Duringthe second stage of mineralization, the spongy structure is filled inwith calcite that contains lower Mg concentrations than thestereom and also lower amounts of proteins, around 0.02 wt %.33
The sea urchin skeleton is built of the so-called test-plates, each ofwhich is a single crystal of calcite with stereom morphology (testsample). The skeleton has a higher Mg concentration than thespines (see Table 1), but protein concentrations similar to the largespines (LS), namely, around 0.02 wt %.6
Atrina rigida and Pinna nobilis are two members of the Pinnidaefamily. Their shells are built of an inner aragonitic nacreous layer andanouter calcitic prismatic layer. The prisms are large single crystals of
calcite (up to hundreds of micrometers in width and millimeters inlength). The organic matrix within the prisms comprises a networkof chitin fibers and about 0.08 wt% proteins. Some of these proteinsare unusually acidic. For example, Asprich and Caspartin haveup to 60% aspartic acid in their sequences.34 Geological Calcitefrom Creel (Mexico) Was Used As Reference Sample forComparison.
Neutron diffraction measurements (in the time-of-flight mode)were performed at the intense pulsed neutron source (IPNS) of theArgonne National Laboratory (Argonne, IL) by using the specialenvironment powder diffractometer (SEPD).35 For diffraction mea-surements, the powdered specimens were bleachedwith a 5%sodiumhypochlorite solution for 24 h, washed and air-dried, followed bysieving through a 25 μm sieve. For extracting structural parameters,the measured neutron diffraction spectra were analyzed by means ofRietveld refinement36 using the GSAS program37 and the EXPGUIinterface.38 Rietveld refinements did not reveal the traces of dolomite((MgCa)(CO3)2), huntite ((CaMg3)(CO3)4), or magnesite (MgCO3).andmagnesia (MgO) phases. The absence of two latter phases provesthat there is no significant Mg segregation (in a form of oxides orcarbonates) at grain boundaries. This also fits the results of ref 39,which concludes (based on Mg K-edge X-ray absorption spectro-scopy) that even in the sea urchin test sample (having the highestMg-content, see Table 1) the majority of Mg atoms isomorphouslysubstitute Ca in lattice positions. This conclusion is fully supportedby our neutron diffraction data which show well-shaped nonsplitdiffraction peaks, which allow excellent refinements in terms of singlephase, MgyCa1-yCO3. The latter has smaller lattice parameters thancalcite (see next section) because of the difference between theMgandCa atomic radii.
ForRaman spectroscopy, finepowders of the investigated sampleswere pressed into pellets and measured with a Raman spectrophot-ometer (Renishawmicro-Raman imagingmicroscope) equippedwitha 780 nm excitation laser. The spectral resolution was 1.6 cm-1. Foreach pellet, we took eight Raman spectra at slightly different posi-tions, the averaged spectral characteristics being used for furtheranalysis.
For FTIR measurements, the KBr pellets were prepared andmeasured with an FTIR spectrophotometer (Nicolet 380), the stepof the wave vector change being 0.5 cm-1.
Special attention was paid to the precise determination of Mgconcentrations in the investigated specimens since it has a strongeffect on structural and optical characteristics in calcite. The Mgconcentrations in all investigated samples were measured byapplying EDS and WDS (Oxford Instruments INCA) in SEM(Supra 55 VP FEG LEO and FEI Quanta 200). Specimens forthese measurements were prepared using standard procedures, in-cluding polishing in diamond suspensions. TheMg contents for eachtype of calcite specimen were averaged over a large number ofsampling points. The results are presented in Table 1, in the formof the Mg/(CaþMg) molar fraction (%), η = 100y, in the solidsolution, MgyCa1-yCO3. The lowest Mg-concentration, less than 1mol %, was detected in geological specimens, while the highestconcentration, η = 11 mol %, was found in the sea urchin testspecimen. We note the rather large standard deviations (within10-30 relative percents) of the measured mean concentrations inTable 1, which reflect some inhomogenity in the distribution of Mgon a micrometer scale.
In addition, in biogenic calcite we found minute amounts of S,about 0.4 at % in mollusk shells and 0.15-0.25 at % in sea urchinparts. Besides the fact that these concentrations are much smallerthan the measured Mg-concentrations, it was recently establishedthat the major source of sulfur in biogenic calcite are organicmacromolecules.40,41 Inotherwords, sulfur atomsdonot enter calcite
Table 1. The Mg-Contents (η = Mg/(CaþMg) in mol %) Measured in
Different Calcite Specimens
specimen η (mol %)geological calcite 0.45 ( 0.1Atrina rigida 1.25 ( 0.3Pinna nobilis 2.65 ( 0.4large spines (LS) 3.8 ( 0.8medium spines (MS) 4.9 ( 1.7test 11.0 ( 1.2
1210 Crystal Growth & Design, Vol. 10, No. 3, 2010 Zolotoyabko et al.
lattice as point defects (interstitial or substitutional) and, hence, donot influence the calcite lattice parameters, as Mg does.
4. Experimental Results
4.1. Neutron Diffraction. The structural parameters determinedby neutron diffraction for the biogenic and geological calcite speci-mens are given in Table 2. In principle, by using eqs 1-8 fromSection 2, the atomic bond lengths in geological and biogenicsamples can be calculated. However, in order to properly comparebond lengths in different samples we need to subtract the contribu-tion due to the Ca/Mg substitutions. For this purpose, we usedpublished structural parameters, which have been measured withhigh enough accuracy in nonbiogenic calcite containing knownamounts of Mg atoms.15,26,30,42-52 Fitting the set of the parametersa, c, and x by parabolic functions (i.e., using the generalized Vegardlaw53), yields:
a ¼ 0:000007308η2 - 0:004287733ηþ 4:98964 ¼ að0Þþ faðηÞc ¼ - 0:0000022233η2 - 0:020291349η þ 17:06728 ¼ cð0Þþ fcðηÞx ¼ 0:000001054η2 þ 0:000102258ηþ 0:25717 ¼ xð0Þþ fxðηÞ
ð9ÞOn the basis of eqs 9, we assume that structural parameters, am, cm,and xm, measured by us using neutron diffraction in samples withdifferent η-values, can be expressed as
am ¼ a�þ faðηÞcm ¼ c�þ fcðηÞxm ¼ x�þ fxðηÞ
ð10Þ
The corrected structural parameters a*, c*, and x* (with subtractedMg-contribution) are calculated as
a� ¼ am - faðηÞc� ¼ cm - fcðηÞx� ¼ xm - fxðηÞ
ð11Þ
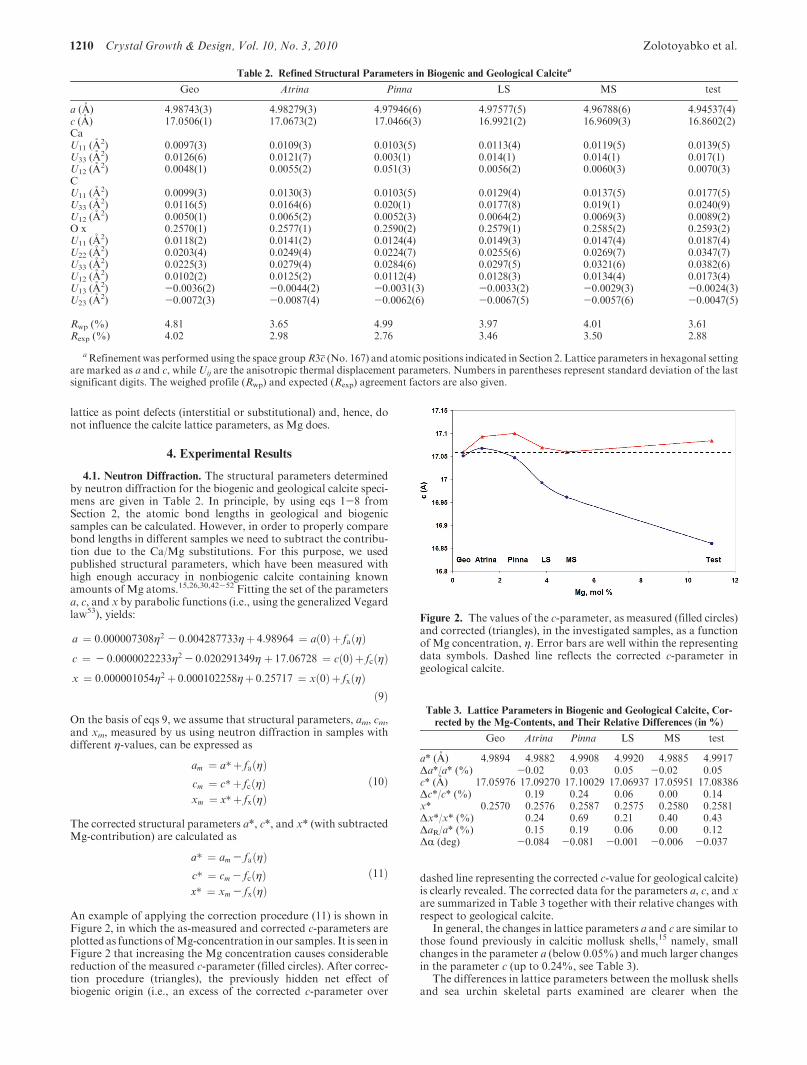
An example of applying the correction procedure (11) is shown inFigure 2, in which the as-measured and corrected c-parameters areplotted as functions ofMg-concentration in our samples. It is seen inFigure 2 that increasing the Mg concentration causes considerablereduction of the measured c-parameter (filled circles). After correc-tion procedure (triangles), the previously hidden net effect ofbiogenic origin (i.e., an excess of the corrected c-parameter over
dashed line representing the corrected c-value for geological calcite)is clearly revealed. The corrected data for the parameters a, c, and xare summarized in Table 3 together with their relative changes withrespect to geological calcite.
In general, the changes in lattice parameters a and c are similar tothose found previously in calcitic mollusk shells,15 namely, smallchanges in the parameter a (below 0.05%) andmuch larger changesin the parameter c (up to 0.24%, see Table 3).
The differences in lattice parameters between the mollusk shellsand sea urchin skeletal parts examined are clearer when the
Table 2. Refined Structural Parameters in Biogenic and Geological Calcitea
Geo Atrina Pinna LS MS test
a (A) 4.98743(3) 4.98279(3) 4.97946(6) 4.97577(5) 4.96788(6) 4.94537(4)c (A) 17.0506(1) 17.0673(2) 17.0466(3) 16.9921(2) 16.9609(3) 16.8602(2)CaU11 (A
2) 0.0097(3) 0.0109(3) 0.0103(5) 0.0113(4) 0.0119(5) 0.0139(5)U33 (A
2) 0.0126(6) 0.0121(7) 0.003(1) 0.014(1) 0.014(1) 0.017(1)U12 (A
2) 0.0048(1) 0.0055(2) 0.051(3) 0.0056(2) 0.0060(3) 0.0070(3)CU11 (A
2) 0.0099(3) 0.0130(3) 0.0103(5) 0.0129(4) 0.0137(5) 0.0177(5)U33 (A
2) 0.0116(5) 0.0164(6) 0.020(1) 0.0177(8) 0.019(1) 0.0240(9)U12 (A
2) 0.0050(1) 0.0065(2) 0.0052(3) 0.0064(2) 0.0069(3) 0.0089(2)O x 0.2570(1) 0.2577(1) 0.2590(2) 0.2579(1) 0.2585(2) 0.2593(2)U11 (A
2) 0.0118(2) 0.0141(2) 0.0124(4) 0.0149(3) 0.0147(4) 0.0187(4)U22 (A
2) 0.0203(4) 0.0249(4) 0.0224(7) 0.0255(6) 0.0269(7) 0.0347(7)U33 (A
2) 0.0225(3) 0.0279(4) 0.0284(6) 0.0297(5) 0.0321(6) 0.0382(6)U12 (A
2) 0.0102(2) 0.0125(2) 0.0112(4) 0.0128(3) 0.0134(4) 0.0173(4)U13 (A
2) -0.0036(2) -0.0044(2) -0.0031(3) -0.0033(2) -0.0029(3) -0.0024(3)U23 (A
2) -0.0072(3) -0.0087(4) -0.0062(6) -0.0067(5) -0.0057(6) -0.0047(5)
Rwp (%) 4.81 3.65 4.99 3.97 4.01 3.61Rexp (%) 4.02 2.98 2.76 3.46 3.50 2.88
aRefinementwas performed using the space groupR3c (No. 167) and atomic positions indicated in Section 2. Lattice parameters in hexagonal settingare marked as a and c, whileUij are the anisotropic thermal displacement parameters. Numbers in parentheses represent standard deviation of the lastsignificant digits. The weighed profile (Rwp) and expected (Rexp) agreement factors are also given.
Figure 2. The values of the c-parameter, as measured (filled circles)and corrected (triangles), in the investigated samples, as a functionof Mg concentration, η. Error bars are well within the representingdata symbols. Dashed line reflects the corrected c-parameter ingeological calcite.
Table 3. Lattice Parameters in Biogenic and Geological Calcite, Cor-
rected by the Mg-Contents, and Their Relative Differences (in %)
Geo Atrina Pinna LS MS test
a* (A) 4.9894 4.9882 4.9908 4.9920 4.9885 4.9917Δa*/a* (%) -0.02 0.03 0.05 -0.02 0.05c* (A) 17.05976 17.09270 17.10029 17.06937 17.05951 17.08386Δc*/c* (%) 0.19 0.24 0.06 0.00 0.14x* 0.2570 0.2576 0.2587 0.2575 0.2580 0.2581Δx*/x* (%) 0.24 0.69 0.21 0.40 0.43ΔaR/a* (%) 0.15 0.19 0.06 0.00 0.12ΔR (deg) -0.084 -0.081 -0.001 -0.006 -0.037
Article Crystal Growth & Design, Vol. 10, No. 3, 2010 1211
structural data are transformed into the rhombohedral symmetrysystem, which is defined by the length of translation vectors, aR,and the angle between translation vectors, R. Conversion fromhexagonal to rhombohedral setting is made by using the followingexpressions:
aR ¼ 1
3
ffiffiffiffiffiffiffiffiffiffiffiffiffiffiffiffiffi3a2 þ c2
p; sin
R2
¼ 3
2
ffiffiffiffiffiffiffiffiffiffiffiffiffiffiffiffiffiffiffiffiffi3þðc=aÞ2
q ð12Þ
By differentiating eq 12, we find that in rhombohedral setting, thechanges of the rhombohedron edge, aR, and angle, R, are related tothe change in the hexagonal lattice parameters Δa/a and Δc/c, as
ΔaRaR
¼ 1
3ð1þ p2Þ 4p2Δa
aþð3-p2ÞΔc
c
� �
ΔR ¼ 2
3
pð3-p2Þð1þ p2Þ
Δa
a-Δc
c
� �with p ¼ tanðR=2Þ
ð13Þ
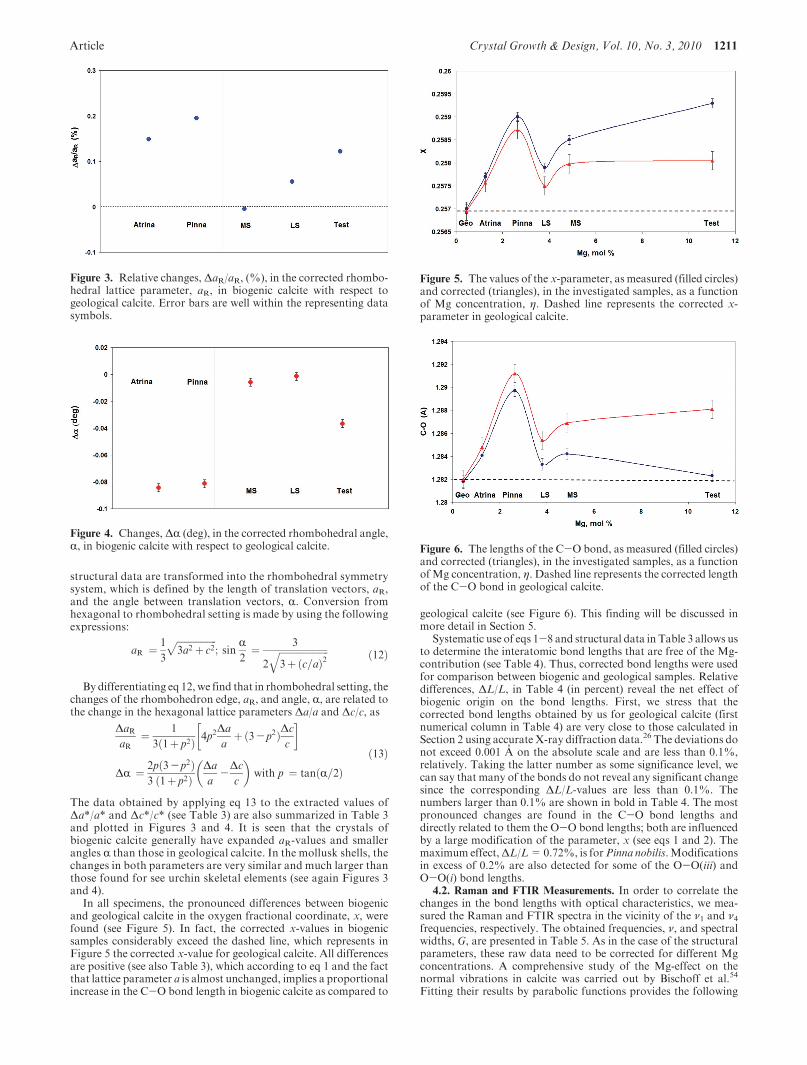
The data obtained by applying eq 13 to the extracted values ofΔa*/a* and Δc*/c* (see Table 3) are also summarized in Table 3and plotted in Figures 3 and 4. It is seen that the crystals ofbiogenic calcite generally have expanded aR-values and smallerangles R than those in geological calcite. In the mollusk shells, thechanges in both parameters are very similar and much larger thanthose found for see urchin skeletal elements (see again Figures 3and 4).
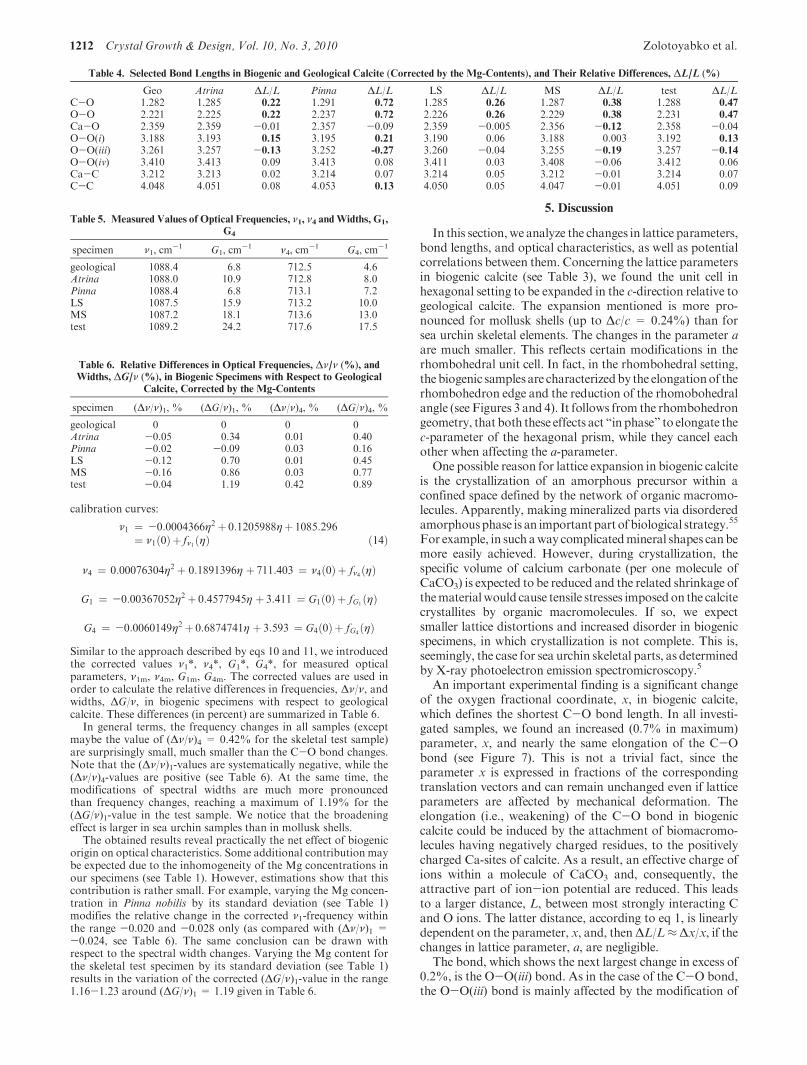
In all specimens, the pronounced differences between biogenicand geological calcite in the oxygen fractional coordinate, x, werefound (see Figure 5). In fact, the corrected x-values in biogenicsamples considerably exceed the dashed line, which represents inFigure 5 the corrected x-value for geological calcite. All differencesare positive (see also Table 3), which according to eq 1 and the factthat lattice parameter a is almost unchanged, implies a proportionalincrease in the C-O bond length in biogenic calcite as compared to
geological calcite (see Figure 6). This finding will be discussed inmore detail in Section 5.
Systematic use of eqs 1-8 and structural data in Table 3 allows usto determine the interatomic bond lengths that are free of the Mg-contribution (see Table 4). Thus, corrected bond lengths were usedfor comparison between biogenic and geological samples. Relativedifferences, ΔL/L, in Table 4 (in percent) reveal the net effect ofbiogenic origin on the bond lengths. First, we stress that thecorrected bond lengths obtained by us for geological calcite (firstnumerical column in Table 4) are very close to those calculated inSection 2 using accurate X-ray diffraction data.26 The deviations donot exceed 0.001 A on the absolute scale and are less than 0.1%,relatively. Taking the latter number as some significance level, wecan say that many of the bonds do not reveal any significant changesince the corresponding ΔL/L-values are less than 0.1%. Thenumbers larger than 0.1% are shown in bold in Table 4. The mostpronounced changes are found in the C-O bond lengths anddirectly related to them the O-O bond lengths; both are influencedby a large modification of the parameter, x (see eqs 1 and 2). Themaximum effect,ΔL/L=0.72%, is forPinna nobilis.Modificationsin excess of 0.2% are also detected for some of the O-O(iii) andO-O(i) bond lengths.
4.2. Raman and FTIR Measurements. In order to correlate thechanges in the bond lengths with optical characteristics, we mea-sured the Raman and FTIR spectra in the vicinity of the ν1 and ν4frequencies, respectively. The obtained frequencies, ν, and spectralwidths, G, are presented in Table 5. As in the case of the structuralparameters, these raw data need to be corrected for different Mgconcentrations. A comprehensive study of the Mg-effect on thenormal vibrations in calcite was carried out by Bischoff et al.54
Fitting their results by parabolic functions provides the following
Figure 3. Relative changes, ΔaR/aR, (%), in the corrected rhombo-hedral lattice parameter, aR, in biogenic calcite with respect togeological calcite. Error bars are well within the representing datasymbols.
Figure 4. Changes, ΔR (deg), in the corrected rhombohedral angle,R, in biogenic calcite with respect to geological calcite.
Figure 5. The values of the x-parameter, as measured (filled circles)and corrected (triangles), in the investigated samples, as a functionof Mg concentration, η. Dashed line represents the corrected x-parameter in geological calcite.
Figure 6. The lengths of the C-O bond, as measured (filled circles)and corrected (triangles), in the investigated samples, as a functionof Mg concentration, η. Dashed line represents the corrected lengthof the C-O bond in geological calcite.
1212 Crystal Growth & Design, Vol. 10, No. 3, 2010 Zolotoyabko et al.
calibration curves:
ν1 ¼ -0:0004366η2 þ 0:1205988ηþ 1085:296¼ ν1ð0Þþ fν1 ðηÞ ð14Þ
ν4 ¼ 0:00076304η2 þ 0:1891396η þ 711:403 ¼ ν4ð0Þþ fν4 ðηÞ
G1 ¼ -0:00367052η2 þ 0:4577945η þ 3:411 ¼ G1ð0Þþ fG1ðηÞ
G4 ¼ -0:0060149η2 þ 0:6874741η þ 3:593 ¼ G4ð0Þþ fG4ðηÞ
Similar to the approach described by eqs 10 and 11, we introducedthe corrected values ν1*, ν4*, G1*, G4*, for measured opticalparameters, ν1m, ν4m, G1m, G4m. The corrected values are used inorder to calculate the relative differences in frequencies, Δν/ν, andwidths, ΔG/ν, in biogenic specimens with respect to geologicalcalcite. These differences (in percent) are summarized in Table 6.
In general terms, the frequency changes in all samples (exceptmaybe the value of (Δν/ν)4 = 0.42% for the skeletal test sample)are surprisingly small, much smaller than the C-O bond changes.Note that the (Δν/ν)1-values are systematically negative, while the(Δν/ν)4-values are positive (see Table 6). At the same time, themodifications of spectral widths are much more pronouncedthan frequency changes, reaching a maximum of 1.19% for the(ΔG/ν)1-value in the test sample. We notice that the broadeningeffect is larger in sea urchin samples than in mollusk shells.
The obtained results reveal practically the net effect of biogenicorigin on optical characteristics. Some additional contribution maybe expected due to the inhomogeneity of the Mg concentrations inour specimens (see Table 1). However, estimations show that thiscontribution is rather small. For example, varying the Mg concen-tration in Pinna nobilis by its standard deviation (see Table 1)modifies the relative change in the corrected ν1-frequency withinthe range -0.020 and -0.028 only (as compared with (Δν/ν)1 =-0.024, see Table 6). The same conclusion can be drawn withrespect to the spectral width changes. Varying the Mg content forthe skeletal test specimen by its standard deviation (see Table 1)results in the variation of the corrected (ΔG/ν)1-value in the range1.16-1.23 around (ΔG/ν)1 = 1.19 given in Table 6.
5. Discussion
In this section,we analyze the changes in lattice parameters,bond lengths, and optical characteristics, as well as potentialcorrelations between them. Concerning the lattice parametersin biogenic calcite (see Table 3), we found the unit cell inhexagonal setting to be expanded in the c-direction relative togeological calcite. The expansion mentioned is more pro-nounced for mollusk shells (up to Δc/c = 0.24%) than forsea urchin skeletal elements. The changes in the parameter aare much smaller. This reflects certain modifications in therhombohedral unit cell. In fact, in the rhombohedral setting,the biogenic samples are characterizedby the elongationof therhombohedron edge and the reduction of the rhomobohedralangle (see Figures 3 and 4). It follows from the rhombohedrongeometry, that both these effects act “in phase” to elongate thec-parameter of the hexagonal prism, while they cancel eachother when affecting the a-parameter.
One possible reason for lattice expansion in biogenic calciteis the crystallization of an amorphous precursor within aconfined space defined by the network of organic macromo-lecules. Apparently, making mineralized parts via disorderedamorphousphase is an importantpart of biological strategy.55
For example, in such away complicatedmineral shapes canbemore easily achieved. However, during crystallization, thespecific volume of calcium carbonate (per one molecule ofCaCO3) is expected to be reduced and the related shrinkage ofthematerialwould cause tensile stresses imposedon the calcitecrystallites by organic macromolecules. If so, we expectsmaller lattice distortions and increased disorder in biogenicspecimens, in which crystallization is not complete. This is,seemingly, the case for sea urchin skeletal parts, as determinedby X-ray photoelectron emission spectromicroscopy.5
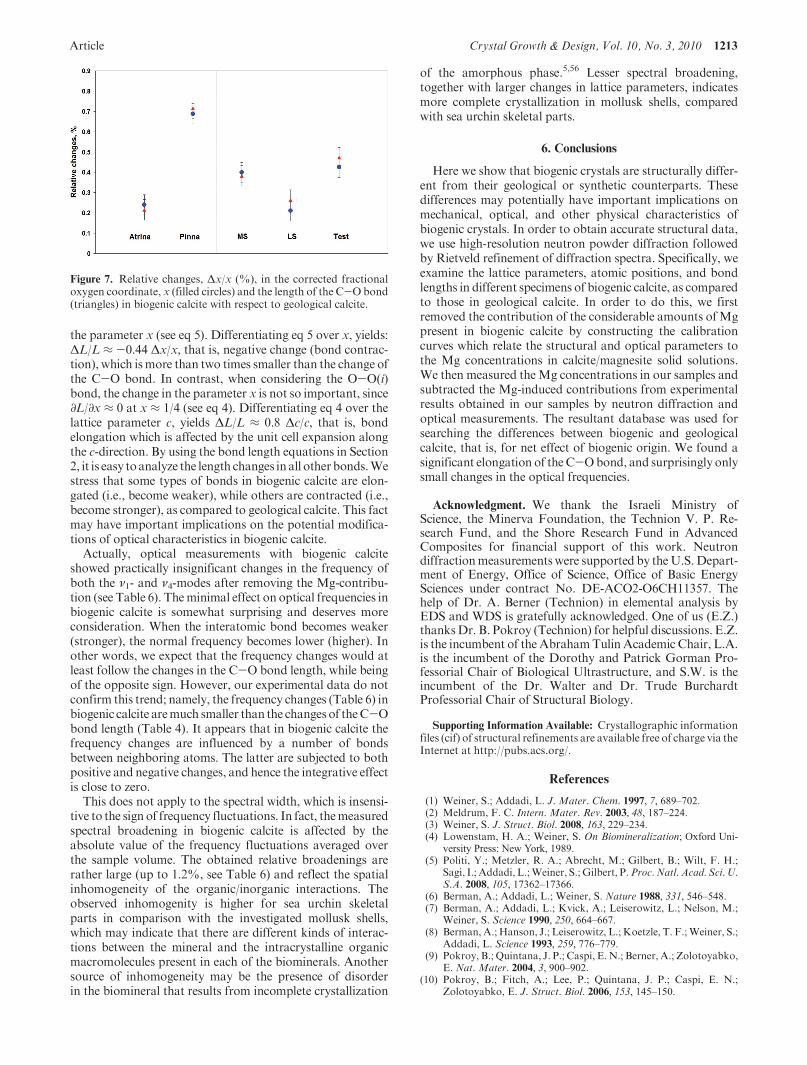
An important experimental finding is a significant changeof the oxygen fractional coordinate, x, in biogenic calcite,which defines the shortest C-O bond length. In all investi-gated samples, we found an increased (0.7% in maximum)parameter, x, and nearly the same elongation of the C-Obond (see Figure 7). This is not a trivial fact, since theparameter x is expressed in fractions of the correspondingtranslation vectors and can remain unchanged even if latticeparameters are affected by mechanical deformation. Theelongation (i.e., weakening) of the C-O bond in biogeniccalcite could be induced by the attachment of biomacromo-lecules having negatively charged residues, to the positivelycharged Ca-sites of calcite. As a result, an effective charge ofions within a molecule of CaCO3 and, consequently, theattractive part of ion-ion potential are reduced. This leadsto a larger distance, L, between most strongly interacting Cand O ions. The latter distance, according to eq 1, is linearlydependent on the parameter, x, and, thenΔL/L≈Δx/x, if thechanges in lattice parameter, a, are negligible.
The bond, which shows the next largest change in excess of0.2%, is the O-O(iii) bond. As in the case of the C-O bond,the O-O(iii) bond is mainly affected by the modification of
Table 4. Selected Bond Lengths in Biogenic and Geological Calcite (Corrected by the Mg-Contents), and Their Relative Differences, ΔL/L (%)
Geo Atrina ΔL/L Pinna ΔL/L LS ΔL/L MS ΔL/L test ΔL/LC-O 1.282 1.285 0.22 1.291 0.72 1.285 0.26 1.287 0.38 1.288 0.47
O-O 2.221 2.225 0.22 2.237 0.72 2.226 0.26 2.229 0.38 2.231 0.47
Ca-O 2.359 2.359 -0.01 2.357 -0.09 2.359 -0.005 2.356 -0.12 2.358 -0.04O-O(i) 3.188 3.193 0.15 3.195 0.21 3.190 0.06 3.188 0.003 3.192 0.13
O-O(iii) 3.261 3.257 -0.13 3.252 -0.27 3.260 -0.04 3.255 -0.19 3.257 -0.14
O-O(iv) 3.410 3.413 0.09 3.413 0.08 3.411 0.03 3.408 -0.06 3.412 0.06Ca-C 3.212 3.213 0.02 3.214 0.07 3.214 0.05 3.212 -0.01 3.214 0.07C-C 4.048 4.051 0.08 4.053 0.13 4.050 0.05 4.047 -0.01 4.051 0.09
Table 5. Measured Values of Optical Frequencies, ν1, ν4 andWidths, G1,
G4
specimen ν1, cm-1 G1, cm
-1 ν4, cm-1 G4, cm
-1
geological 1088.4 6.8 712.5 4.6Atrina 1088.0 10.9 712.8 8.0Pinna 1088.4 6.8 713.1 7.2LS 1087.5 15.9 713.2 10.0MS 1087.2 18.1 713.6 13.0test 1089.2 24.2 717.6 17.5
Table 6. Relative Differences in Optical Frequencies, Δν/ν (%), andWidths, ΔG/ν (%), in Biogenic Specimens with Respect to Geological
Calcite, Corrected by the Mg-Contents
specimen (Δν/ν)1, % (ΔG/ν)1, % (Δν/ν)4, % (ΔG/ν)4, %
geological 0 0 0 0Atrina -0.05 0.34 0.01 0.40Pinna -0.02 -0.09 0.03 0.16LS -0.12 0.70 0.01 0.45MS -0.16 0.86 0.03 0.77test -0.04 1.19 0.42 0.89
Article Crystal Growth & Design, Vol. 10, No. 3, 2010 1213
the parameter x (see eq 5). Differentiating eq 5 over x, yields:ΔL/L ≈ -0.44 Δx/x, that is, negative change (bond contrac-tion), which ismore than two times smaller than the change ofthe C-O bond. In contrast, when considering the O-O(i)bond, the change in the parameter x is not so important, since∂L/∂x ≈ 0 at x ≈ 1/4 (see eq 4). Differentiating eq 4 over thelattice parameter c, yields ΔL/L ≈ 0.8 Δc/c, that is, bondelongation which is affected by the unit cell expansion alongthe c-direction. By using the bond length equations in Section2, it is easy toanalyze the length changes inall otherbonds.Westress that some types of bonds in biogenic calcite are elon-gated (i.e., become weaker), while others are contracted (i.e.,become stronger), as compared to geological calcite. This factmay have important implications on the potential modifica-tions of optical characteristics in biogenic calcite.
Actually, optical measurements with biogenic calciteshowed practically insignificant changes in the frequency ofboth the ν1- and ν4-modes after removing the Mg-contribu-tion (see Table 6). Theminimal effect on optical frequencies inbiogenic calcite is somewhat surprising and deserves moreconsideration. When the interatomic bond becomes weaker(stronger), the normal frequency becomes lower (higher). Inother words, we expect that the frequency changes would atleast follow the changes in the C-O bond length, while beingof the opposite sign. However, our experimental data do notconfirm this trend; namely, the frequency changes (Table 6) inbiogenic calcite aremuch smaller than the changes of theC-Obond length (Table 4). It appears that in biogenic calcite thefrequency changes are influenced by a number of bondsbetween neighboring atoms. The latter are subjected to bothpositive and negative changes, and hence the integrative effectis close to zero.
This does not apply to the spectral width, which is insensi-tive to the sign of frequency fluctuations. In fact, themeasuredspectral broadening in biogenic calcite is affected by theabsolute value of the frequency fluctuations averaged overthe sample volume. The obtained relative broadenings arerather large (up to 1.2%, see Table 6) and reflect the spatialinhomogeneity of the organic/inorganic interactions. Theobserved inhomogenity is higher for sea urchin skeletalparts in comparison with the investigated mollusk shells,which may indicate that there are different kinds of interac-tions between the mineral and the intracrystalline organicmacromolecules present in each of the biominerals. Anothersource of inhomogeneity may be the presence of disorderin the biomineral that results from incomplete crystallization
of the amorphous phase.5,56 Lesser spectral broadening,together with larger changes in lattice parameters, indicatesmore complete crystallization in mollusk shells, comparedwith sea urchin skeletal parts.
6. Conclusions
Here we show that biogenic crystals are structurally differ-ent from their geological or synthetic counterparts. Thesedifferences may potentially have important implications onmechanical, optical, and other physical characteristics ofbiogenic crystals. In order to obtain accurate structural data,we use high-resolution neutron powder diffraction followedby Rietveld refinement of diffraction spectra. Specifically, weexamine the lattice parameters, atomic positions, and bondlengths in different specimens of biogenic calcite, as comparedto those in geological calcite. In order to do this, we firstremoved the contribution of the considerable amounts ofMgpresent in biogenic calcite by constructing the calibrationcurves which relate the structural and optical parameters tothe Mg concentrations in calcite/magnesite solid solutions.We then measured theMg concentrations in our samples andsubtracted the Mg-induced contributions from experimentalresults obtained in our samples by neutron diffraction andoptical measurements. The resultant database was used forsearching the differences between biogenic and geologicalcalcite, that is, for net effect of biogenic origin. We found asignificant elongation of theC-Obond, and surprisingly onlysmall changes in the optical frequencies.
Acknowledgment. We thank the Israeli Ministry ofScience, the Minerva Foundation, the Technion V. P. Re-search Fund, and the Shore Research Fund in AdvancedComposites for financial support of this work. Neutrondiffractionmeasurementswere supported by theU.S.Depart-ment of Energy, Office of Science, Office of Basic EnergySciences under contract No. DE-ACO2-O6CH11357. Thehelp of Dr. A. Berner (Technion) in elemental analysis byEDS and WDS is gratefully acknowledged. One of us (E.Z.)thanksDr. B. Pokroy (Technion) for helpful discussions. E.Z.is the incumbent of the AbrahamTulin Academic Chair, L.A.is the incumbent of the Dorothy and Patrick Gorman Pro-fessorial Chair of Biological Ultrastructure, and S.W. is theincumbent of the Dr. Walter and Dr. Trude BurchardtProfessorial Chair of Structural Biology.
Supporting Information Available: Crystallographic informationfiles (cif) of structural refinements are available free of charge via theInternet at http://pubs.acs.org/.
References
(1) Weiner, S.; Addadi, L. J. Mater. Chem. 1997, 7, 689–702.(2) Meldrum, F. C. Intern. Mater. Rev. 2003, 48, 187–224.(3) Weiner, S. J. Struct. Biol. 2008, 163, 229–234.(4) Lowenstam, H. A.; Weiner, S. On Biomineralization; Oxford Uni-
versity Press: New York, 1989.(5) Politi, Y.; Metzler, R. A.; Abrecht, M.; Gilbert, B.; Wilt, F. H.;
Sagi, I.; Addadi, L.;Weiner, S.; Gilbert, P.Proc.Natl. Acad. Sci. U.S.A. 2008, 105, 17362–17366.
(6) Berman, A.; Addadi, L.; Weiner, S. Nature 1988, 331, 546–548.(7) Berman, A.; Addadi, L.; Kvick, A.; Leiserowitz, L.; Nelson, M.;
Weiner, S. Science 1990, 250, 664–667.(8) Berman, A.; Hanson, J.; Leiserowitz, L.; Koetzle, T. F.;Weiner, S.;
Addadi, L. Science 1993, 259, 776–779.(9) Pokroy, B.; Quintana, J. P.; Caspi, E.N.; Berner, A.; Zolotoyabko,
E. Nat. Mater. 2004, 3, 900–902.(10) Pokroy, B.; Fitch, A.; Lee, P.; Quintana, J. P.; Caspi, E. N.;
Zolotoyabko, E. J. Struct. Biol. 2006, 153, 145–150.
Figure 7. Relative changes, Δx/x (%), in the corrected fractionaloxygen coordinate, x (filled circles) and the length of the C-Obond(triangles) in biogenic calcite with respect to geological calcite.
1214 Crystal Growth & Design, Vol. 10, No. 3, 2010 Zolotoyabko et al.
(11) Pokroy, B.; Zolotoyabko, E.; Fieramosca, J. S.; VonDreele, R. B.;Caspi, E. N.; Fitch, A. N. Chem. Mater. 2007, 19, 3244–3251.
(12) Stolarski, J.; Przenioslo, R.; Mazur, M.; Brunelli, M. J. Appl.Crystallogr. 2007, 40, 2–9.
(13) Ouhenia, S.; Chateigner, D.; Belkhir, M. A.; Guilmeau, E.J. Struct. Biol. 2008, 163, 175–184.
(14) Nemliher, J.; Tonsuaadu,K.; Kallaste, T. J. Therm. Anal. Calorim.2009, 97, 27–32.
(15) Pokroy, B.; Fitch,A.;Marin, F.;Kapon,M.;Adir,N.; Zolotoyabko,E. J. Struct. Biol. 2006, 155, 96–103.
(16) Pokroy, B.; Fitch, A. N.; Zolotoyabko, E. Adv. Mater. 2006, 18,2363–2368.
(17) Zolotoyabko, E.; Pokroy, B. CrystEngComm 2007, 9, 1156–1161.(18) Nudelman, F.; Chen, H. H.; Goldberg, H. A.; Weiner, S.; Addadi,
L. Faraday Discuss. 2007, 136, 9–25.(19) Dauphin, Y. Comp. Biochem. Physiol. A 2002, 132, 577–590.(20) Sethmann, I.; Worheide, G. Micron 2008, 39, 209–228.(21) Zhang, G. S.; Li, H. X. Kuangwu Yanshi 2006, 26, 1–4.(22) Verma, D.; Katti, K.; Katti, D. Spectrochem. Acta A 2006, 64,
1051–1057.(23) Bischoff, W. D.; Sharma, S. K.; Mackenzie, F. T. Am. Mineral.
1985, 70, 581–589.(24) Gueta, R.; Natan, A.; Addadi, L.; Weiner, S.; Refson, K.; Kronik,
L. Angew. Chem. In. Ed. 2007, 46, 291–294.(25) Pokroy,B.;Kapon,M.;Marin, F.;Adir,N.; Zolotoyabko, E.Proc.
Natl. Acad. Sci. U.S.A. 2007, 104, 7337–7341.(26) Maslen, E.N.; Streltsov,V.A.; Streltsova,N.R.; Ishizawa,N.Acta
Crystallogr. B 1995, 51, 929–939.(27) Adler, H. H.; Kerr, P. F. Am. Mineral. 1962, 47, 700–717.(28) Menzies, A. C. Proc. R. Soc. London A 1931, 134, 265–277.(29) Zolotoyabko, E.; Caspi, E.N.; Fieramosca, J. S.; VonDreele, R. B.
Mater. Sci. Eng., A 2009, 524, 77–81.(30) Chessin, H.; Hamilton, W. C.; Post, B. Acta Crystallogr. 1965, 18,
689–693.(31) Dauphin, Y. J. Bio. Chem. 2003, 278, 15168–15177.(32) Politi, Y.; Arad, T.; Klein, E.; Weiner, S.; Addadi, L. Science 2004,
306, 1161–1164.(33) Aizenberg, J.; Hanson, J.; Koetzle, T. F.; Weiner, S.; Addadi, L.
J. Am. Chem. Soc. 1997, 119, 881–886.
(34) Marin, F.; Luquet, G.; Marie, B. Curr. Top. Dev. Biol. 2008, 80,209–276.
(35) Jorgensen, J. D.; Faber, J.; Carpenter, J. M.; Crawford, R. K.;Haumann, J. R.; Hitterman, R. L.; Kleb, R.; Ostrowski, G. E.;Rotella, F. J.; Worlton, T. G. J. Appl. Crystallogr. 1989, 22,321–333.
(36) Rietveld, H. M. J. Appl. Crystallogr. 1969, 2, 65–71.(37) Larson, C.; Von Dreele, R. B. Report LAUR 86-748; Los Alamos
National Laboratory: New Mexico, USA, 1986.(38) Toby, B. J. Appl. Crystallogr. 2001, 34, 210–221.(39) Politi, Y.; Batchelor, D.; Zaslansky, P.; Chmelka, B.; Weaver, J.;
Sagi, I.; Weiner, S.; Addadi, L. Chem. Mater. 2010, 22, 161–166.(40) Dauphin, Y.; Cuif, J.; Doucet, J.; Salom�e, M.; Susini, J.; Willams,
C. J. Struct. Biol. 2003, 142, 272–280.(41) Dauphin, Y.; Cuif, J.; Salom�e,M.; Susini, J.Am.Mineral. 2005, 90,
1748–1758.(42) Erenburg, B. G. Zh. Strukt. Khim. 1961, 2, 178–182.(43) Graf, D. L. Am. Mineral. 1961, 46, 1283–1316.(44) Erenburg, B. G.; Samoilov, O. Ya. Zh. Strukt. Khim. 1963, 4, 868–
871.(45) Oh, K. D.; Moriakawa, H.; Iwai, S.; Aoki, H. Am. Mineral. 1973,
58, 1029–1033.(46) Althoff, P. I. Am. Mineral. 1977, 62, 772–783.(47) Bischoff, W. D.; Bishop, F. C.; Mackenzie, F. T. Am. Mineral.
1983, 68, 1183–1188.(48) Markgraf, S. A.; Reeder, R. J. Am. Mineral. 1985, 70, 590–600.(49) Maslen, E. N.; Streltsov, V. A.; Streltsova, N. R. Acta Crystallogr.
B 1993, 49, 636–641.(50) Ross, N. L. Am. Mineral. 1997, 82, 682–688.(51) Falini, G.; Fermani, S.; Gazzano, M.; Ripamonti, A. J. Mater.
Chem. 1998, 8, 1061–1065.(52) Bromiley, F. A.; Ballaran, T. B.; Langenhorst, F.; Seifert, F. Am.
Mineral. 2007, 92, 829–836.(53) Vegard, L. Z. Phys. 1921, 5, 17–26.(54) Bischoff, W. D.; Sharma, S. K.; Mackenzie, F. T. Am. Mineral.
1985, 70, 581–589.(55) Weiner, S.; Sagi, I.; Addadi, L. Science 2005, 309, 1027–1028.(56) Politi, Y.; Levi-Kalisman,Y.; Raz, S.;Wilt, F.; Addadi, L.;Weiner,
S.; Sagi, I. Adv. Funct. Mater. 2006, 16, 1289–1298.