the connection between galaxies and intergalactic absorption lines at redshift 2
TRANSCRIPT
arX
iv:a
stro
-ph/
0505
122v
1 6
May
200
5Received 2005 February 07; Accepted 2005 May 09Preprint typeset using LATEX style emulateapj v. 11/26/03
THE CONNECTION BETWEEN GALAXIES AND INTERGALACTIC ABSORPTION LINES AT REDSHIFT2 <∼ Z <
∼ 31
Kurt L. Adelberger2
Carnegie Observatories, 813 Santa Barbara St., Pasadena, CA, 91101
Alice E. Shapley3
University of California, Department of Astronomy, 601 Campbell Hall, Berkeley, CA 94720
Charles C. SteidelPalomar Observatory, Caltech 105–24, Pasadena, CA 91125
Max PettiniInstitute of Astronomy, Madingley Road, Cambridge CB3 0HA, UK
Dawn K. Erb & Naveen A. ReddyPalomar Observatory, Caltech 105–24, Pasadena, CA 91125
Draft version February 2, 2008
ABSTRACT
Absorption-line spectroscopy of 23 background QSOs and numerous background galaxies has let usmeasure the spatial distribution of metals and neutral hydrogen around 1044 UV-selected galaxies atredshifts 1.8 <
∼ z <∼ 3.3. The typical galaxy is surrounded to radii r ∼ 40 proper kpc by gas that has
a large velocity spread (∆v > 260 km s−1) and produces very strong absorption lines (NCIV ≫ 1014
cm−2) in the spectra of background objects. These absorption lines are almost as strong as thoseproduced by a typical galaxy’s own interstellar gas. Absorption with an average column density ofNCIV ≃ 1014 cm−2 extends to ∼ 80 kpc, a radius large enough to imply that most strong intergalacticCIV absorption is associated with star-forming galaxies like those in our sample. Our measurementof the galaxy/CIV spatial correlation function shows that even the weakest detectable CIV systemsare found in the same regions as galaxies; we find that the cross-correlation length increases with CIVcolumn density and is similar to the galaxy auto-correlation length (r0 ∼ 4h−1 Mpc) for NCIV
>∼ 1012.5
cm−2. Distortions in the redshift-space galaxy-CIV correlation function on small scales may implythat some of the CIV systems have large peculiar velocities. Four of the five detected OVI absorptionsystems in our sample lie within 400 proper kpc of a known galaxy. Strong Lyman-α absorption isproduced by the intergalactic gas within 1h−1 comoving Mpc of most galaxies, but for a significantminority (∼ 1/3) the absorption is weak or absent. This is not observed in SPH simulations that omitthe effects of “feedback” from galaxy formation. We were unable to identify any statistically significantdifferences in age, dust reddening, environment, or kinematics between galaxies with weak nearby HIabsorption and the rest, although galaxies with weak absorption may have higher star-formation rates.Galaxies near intergalactic CIV systems appear to reside in relatively dense environments and to havedistinctive spectral energy distributions that are characterized by blue colors and young ages.
Subject headings: galaxies: formation — galaxies: high-redshift — intergalactic medium — quasars:absorption lines
1. INTRODUCTION
A tremendous amount of gravitational energy is re-leased when a massive galaxy forms, roughly 1062 ergfrom its billion supernova explosions and another 1062
erg during the assembly of its central 108-M⊙ black hole.Although 99% of the supernova energy is carried away byneutrinos, and a similar fraction of the black hole radia-
1 Based, in part, on data obtained at the W.M. Keck Observa-tory, which is operated as a scientific partnership between the Cal-ifornia Institute of Technology, the University of California, andNASA, and was made possible by the generous financial supportof the W.M. Keck Foundation.
2 Carnegie Fellow3 Miller Fellow
tion escapes the galaxy, the remaining energy is enoughto unbind most of the galaxy’s gas. The fate of the galaxydepends on what happens to the energy. If it is absorbedby sufficiently dense gas, it will be converted into radi-ation by two-body processes and will stream harmlesslyaway; but otherwise it will set in motion an enormousblast-wave analogous to those produced by nuclear ex-plosions on earth. These blast-waves, tearing throughgalaxies, stripping away material, plowing outwards, andcoming finally to rest in distant intergalactic space, arebelieved to have significantly altered the evolution of thebaryonic universe.
Indirect evidence for their existence comes in twoforms. First, if the gas near galaxies had not been heated
2 K.L. Adelberger et al.
by some source, disk galaxies would be smaller than theyare (Weil, Eke, & Efstathiou 1998) and the correlationbetween galaxy clusters’ X-ray temperature and luminos-ity would have the wrong shape (Kaiser 1991; Ponman,Cannon, & Navarro 1999). Second, something quenchesmost galaxies’ star formation at some point in their his-tory, and blast-waves seem the best candidate. Withoutthem small galaxies would be too numerous (e.g., Coleet al. 1994), big galaxies would be too blue (Springel, DiMatteo, & Hernquist 2005) and too large a fraction ofbaryons would have been turned into stars (e.g., White& Rees 1978, Springel & Hernquist 2002).
Direct evidence remains elusive, however. Althoughlocal star-forming galaxies are surrounded by outflowinggas (e.g., Heckman et al. 1990; Martin 2005), typicallytheir observable outflows extend to only a few kpc, farsmaller than their virial radii. It is unclear how far theseflows will advance before they stall or how severely theywill affect the evolution of the galaxies and their sur-roundings. The presence of metals in the intergalacticmedium might be taken as proof that the blast-wavesspill out of some galaxies’ halos, but even that is con-troversial. Intergalactic metals could also have been pro-duced by the first generation of Population III stars orstripped from galaxies by other processes (e.g., Gnedin1998).
Five years ago, our group began to search for directevidence for large-scale outflows around galaxies at highredshift. High-redshift galaxies were attractive targetsbecause they have larger star-formation rates and (possi-bly) shallower potentials than their nearby counterparts.In addition, the higher density of the universe in the pastis a significant advantage, because it strengthens manyof the absorption lines that can be used to detect inter-galactic gas. We identified three observations that wouldqualify, in our view, as direct evidence for large-scale out-flows: gas at large galactocentric radii moving outwardsat greater than the escape velocity; a strong associationof intergalactic metals and galaxies; and disturbances,near galaxies, to the lattice-work of intergalactic HI thatpervades the high-redshift universe.
We searched for this evidence by systematically map-ping the relative spatial distributions of star-forminggalaxies and intergalactic gas. Early results were pre-sented in Adelberger et al. (2003). This paper is anupdate. After describing the current data in § 2, wereview the status of our search. Section 3 shows thatthe outflowing material responsible for the blue-shifted“interstellar” absorption lines in the galaxies’ spectra of-ten lies at a radius of ∼ 20–40h−1 proper kpc. Weakerabsorption lines extend out to radii approaching 200h−1
kpc. Section 4 describes the galaxy-CIV cross-correlationfunction and reinforces the idea that detectable inter-galactic metals tend to lie near actively star-forminggalaxies. Section 5 shows that most galaxies are sur-rounded by significant amounts of intergalactic HI butthat galaxies with little nearby HI are significantly morecommon than would be expected in the absence of winds.Section 6 discusses the characteristics of galaxies that ap-pear to be associated with unusually weak Ly-α or un-usually strong CIV absorption. As we discuss in § 7,these observations may be suggestive of galactic winds,but they do not rule out other alternatives. Our conclu-sions are summarized in § 8. Throughout the paper we
Table 1. Observed fields
Field ∆Ωa NLRISb NNIRSPEC
c
Q0000 3.4 × 4.5 18 1Q0201 6.8 × 7.4 25 3Q0256 7.3 × 6.6 47 1Q0302 6.5 × 6.9 44 1Q0933 8.1 × 8.0 64 0Q1305 11.8 × 11.0 80 1Q1422 7.2 × 14.2 113 1Q1623 16.1 × 11.6 213 31Q1700 11.5 × 11.0 89 16Q2233 8.2 × 8.6 46 1Q2343 22.5 × 8.5 194 19Q2346 10.9 × 11.0 50 7SSA22a 7.8 × 8.4 61 8
aArea imaged in UnGR and observed spectroscopically, arcmin2
bNumber of galaxies with LRIS redshift z > 1cNumber of galaxies with NIRSPEC redshift z > 1
assume a cosmology with ΩM = 0.3, ΩΛ = 0.7, h = 0.7.
2. DATA
The galaxies in our analysis were taken from the red-shift surveys of Steidel et al. (2003; 2004). These surveystargeted galaxies with magnitude R <
∼ 25.5 whose UnGRcolors suggested that they had redshift 2 <
∼ z <∼ 3 (Adel-
berger et al. 2004; Steidel et al. 2003). We restrictedour analysis to galaxies in the 13 survey fields that con-tained one or more background QSOs. Although thesefields include those previously analyzed by Adelberger etal. (2003), much of the present analysis relies on near-IRnebular redshifts (see below) that are only available inother fields. As a result, the overlap is small between thesamples analyzed here and in Adelberger et al. (2003).
Our 13 fields are scattered around the sky and havetypical area ∆Ω ∼ 100 arcmin2 (Table 1). Redshifts fora total of 1044 objects in these fields were measured fromlow-resolution (∼ 10A) multislit spectra taken between1995 and 2004 with LRIS (Oke et al. 1995; Steidel etal. 2004) on the Keck I and II 10m telescopes. Thetypical spectroscopic exposure time was 1.5 hours permultislit mask, although a subset of the objects was ob-served for more than ten times longer (Shapley et al.2005, in preparation). The redshifts obtained from thesespectra are imprecise, because they rely on features (Ly-α emission and various far-UV interstellar absorptionlines) that are redshifted or blueshifted relative to thegalaxy’s stars. Erb et al. (2005, in preparation) usedNIRSPEC (McLean et al. 2000) on the Keck II tele-scope to obtain more-precise redshifts from the nebularemission lines ([OII]λ3727, Hα, Hβ, [OIII]λλ4959, 5007)of 90 galaxies in this sample, many near the sightlinesto background QSOs, and we adopt their redshifts wher-ever possible. If nebular redshifts were unavailable, weestimated the stellar redshifts with the relationships de-fined in the following paragraph. Precise redshifts wererequired for much of the analysis, however, and in thesecases we ignored galaxies that had not been observedwith NIRSPEC.
We measured the relationship between redshifts fromLyman-α emission (zLyα), interstellar absorption (zISM),and near-IR nebular emission (zneb) for the full 138-
HIGH-REDSHIFT GALAXIES AND INTERGALACTIC ABSORPTION LINES 3
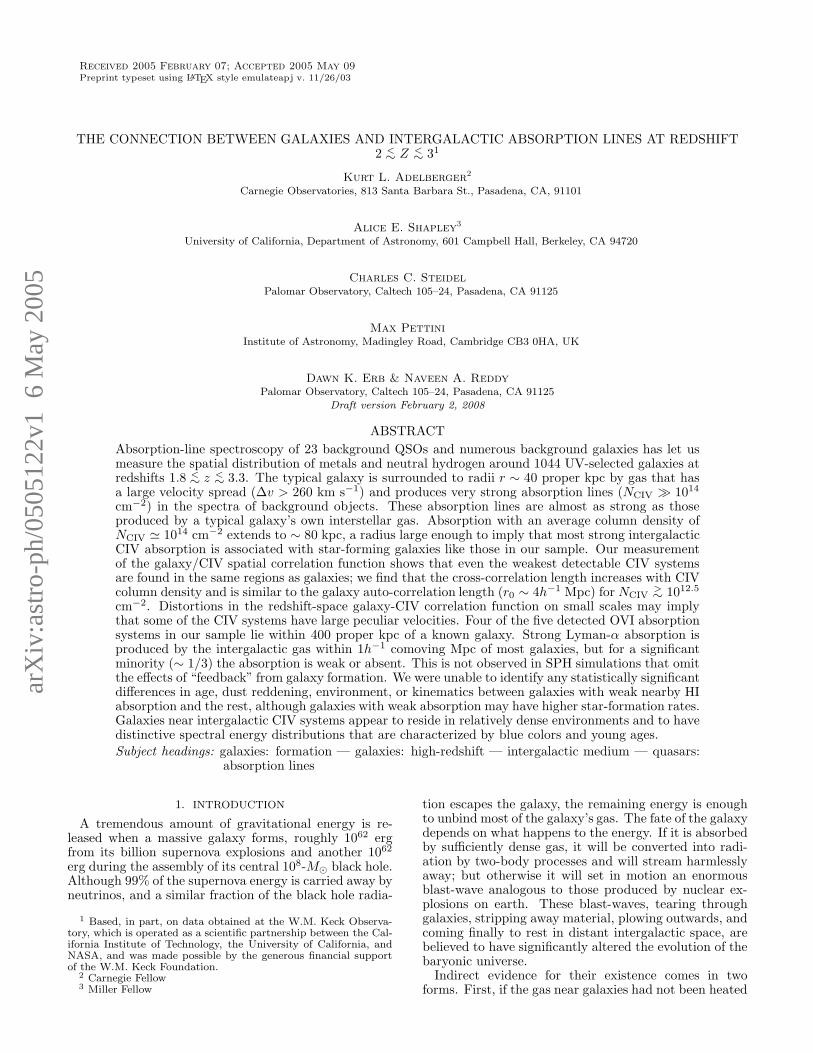
Fig. 1.— Velocity differences between the Lyman-α emis-sion line, interstellar absorption lines, and near-IR nebular linesfor galaxies in the NIRSPEC sample. Each point represents onegalaxy; shaded regions show the mean velocity difference ± stan-dard deviation of the mean for two redshift bins. The value ofSpearman’s rank correlation coefficient and its significance arers = 0.16, P = 0.19 and rs = −0.197, P = 0.03 for the datain the left and right panels, respectively. The weak apparent cor-relations of velocity offset with redshift are therefore significant atonly the 1–2σ level.
object NIRSPEC sample of Erb et al. (2005, in prepa-ration), and used the results to help assign systemic red-shifts to galaxies when NIRSPEC redshifts were unavail-able. Figure 1 shows the observed velocity offsets for thegalaxies in the full NIRSPEC sample. The least-squaresfirst-order fits to the data can be written
zneb = zLyα − 0.0033 − 0.0050(zLyα − 2.7) (1)
for galaxies with no detected interstellar absorption lines,
zneb = zISM + 0.0022 + 0.0015(zISM − 2.7) (2)
for galaxies with no detected Lyman-α emission, and
zneb = z + 0.070∆z − 0.0017− 0.0010(z − 2.7), (3)
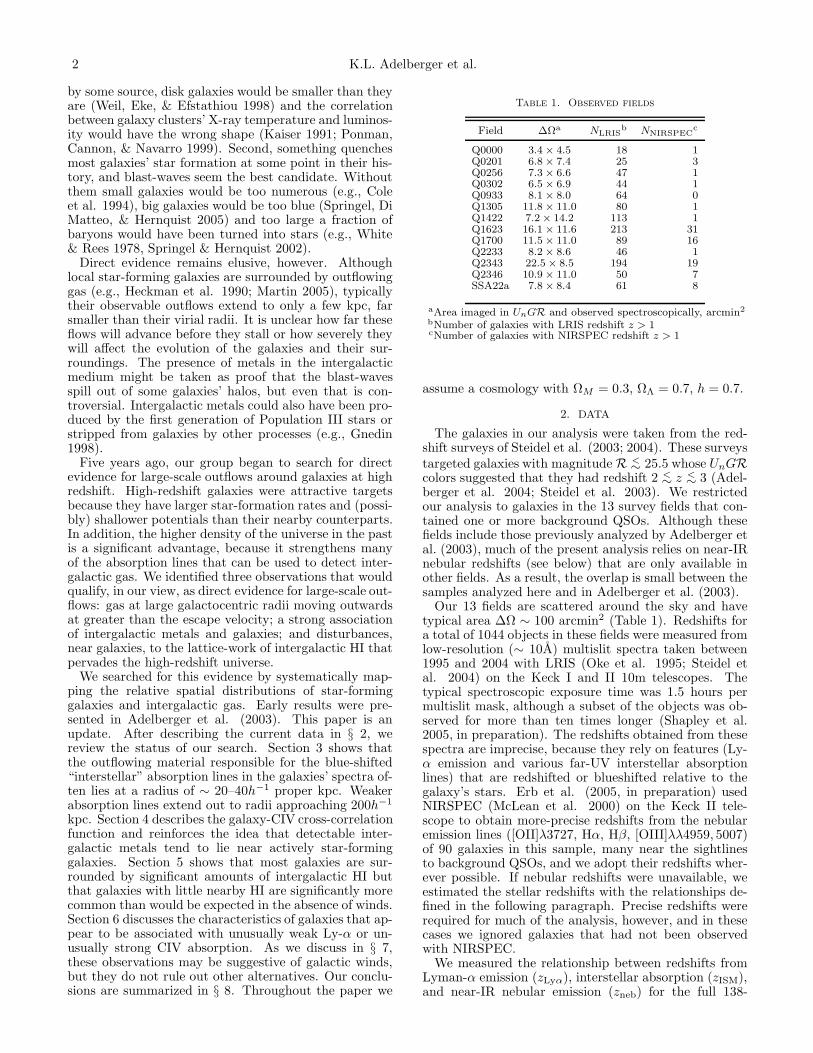
with z ≡ (zLyα +zISM)/2, ∆z ≡ zLyα−zISM, for galaxieswith detectable Lyman-α emission and interstellar ab-sorption. The rms scatter around the three relationshipsis σz = 0.0027, 0.0033, 0.0024, respectively. In each equa-tion the final term accounts for the weak apparent trendof smaller velocity offsets at lower redshifts. Figure 2shows the expected error distributions for the galaxiesthat lack near-IR nebular redshifts, calculated by com-bining the observed error distributions for equations 1, 2,and 3 after weighting by the number of galaxies in eachclass (233 with Lyman-α emission only, 425 with inter-stellar absorption only, 296 with both). For comparison,repeated observations of galaxies in the NIRSPEC sam-ple suggest that these galaxies’ redshifts have a randomuncertainty of 60 km s−1.
The criteria used to select galaxies for spectroscopywere irregular. We favored objects with 23 < R < 24.5and objects near any known QSOs, and strongly disfa-vored objects far from the field centers. Near QSOs weoften observed objects whose colors satisfied any of the
Fig. 2.— Estimated histogram of velocity errors ∆v ≡ vest−vtrue
for galaxies without near-IR nebular redshifts.
UnGR selection criteria of Steidel et al. (2003) or Adel-berger et al. (2004). Far from QSOs our spectroscopic se-lection tended to be prejudiced towards one or the othercolor-selection criterion, “BX/BM” or “LBG,” depend-ing on the field. This haphazard approach imposes acomplicated selection bias on our data. Rather than tryto correct it with elaborate simulations, we restrict ouranalysis to quantities that are not affected by irregularangular sampling or the assumed redshift selection func-tion. Further details of the galaxy observations can befound in Steidel et al. (2003; 2004) and Erb et al. (2005,in preparation).
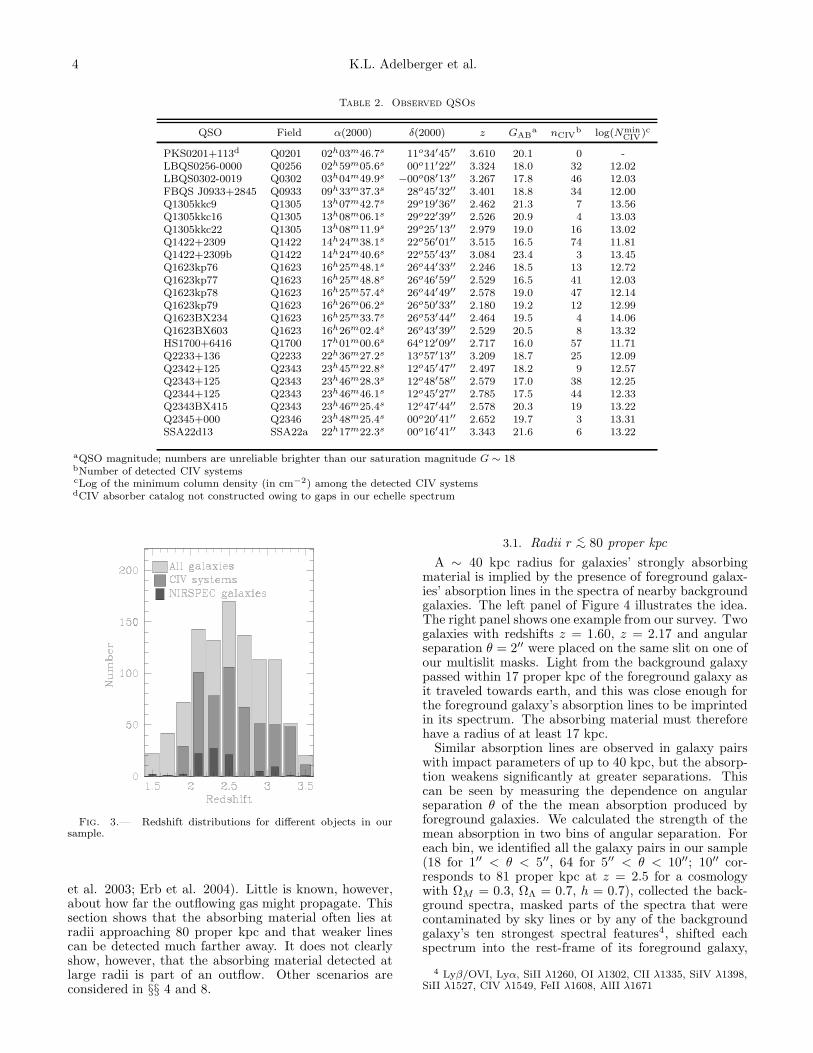
The QSO spectra we analyzed were obtained between1996 and 2003 with either the HIRES echelle spectro-graph (Vogt et al. 1994) or the ESI echellette (Sheinis etal. 2000) on the Keck I and II telescopes. The HIRESspectra were reduced using the standard procedures ofTom Barlow’s Makee package. The ESI spectra were re-duced with the “Dukee” suite of custom IRAF scriptsand C programs written by KLA and M. Hunt. Theshape of the continuum was removed from the QSO spec-tra interactively by fitting a high-order (∼ 30) b-splineto regions of the spectra that appeared to be free fromabsorption. CIV absorption systems in the QSO spec-tra were identified interactively by scanning for absorp-tion doublets with the right wavelength spacing. Col-umn densities were estimated by fitting each doublet’sabsorption profile with two Gaussians in optical depth.This is equivalent to Voigt-profile fitting at the low (i.e.,undamped) column-densities of interest to us. Occasion-ally the velocity profiles were unresolved in our spectra.If this happened and the doublet ratio suggested thatthe lines were saturated, we obtained a crude estimateof column density from the weaker line only. Otherwiseboth lines were used. See Adelberger et al. (2003) forfurther details. Our ability to detect CIV systems de-pended on the quality of the QSO spectrum. Table 2lists the minimum detected CIV column density in eachQSO’s spectrum. This should be roughly equal to thespectrum’s CIV detection limit.
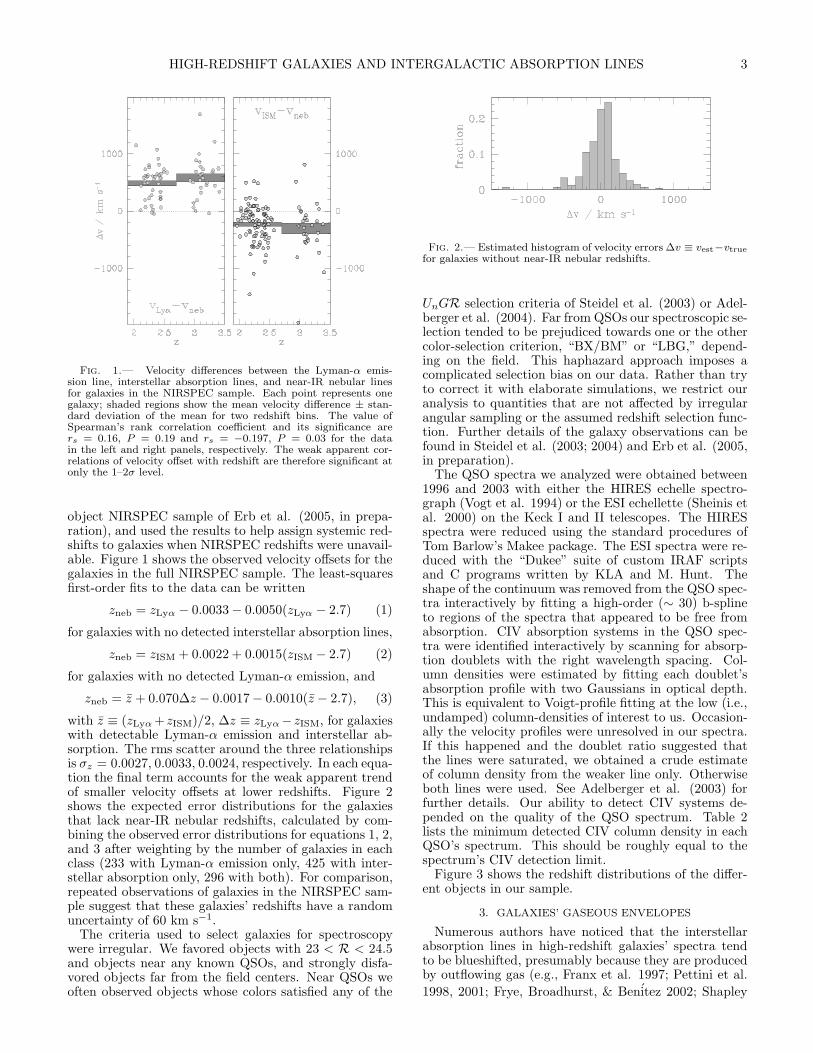
Figure 3 shows the redshift distributions of the differ-ent objects in our sample.
3. GALAXIES’ GASEOUS ENVELOPES
Numerous authors have noticed that the interstellarabsorption lines in high-redshift galaxies’ spectra tendto be blueshifted, presumably because they are producedby outflowing gas (e.g., Franx et al. 1997; Pettini et al.
1998, 2001; Frye, Broadhurst, & Benitez 2002; Shapley
4 K.L. Adelberger et al.
Table 2. Observed QSOs
QSO Field α(2000) δ(2000) z GABa nCIV
b log(NminCIV
)c
PKS0201+113d Q0201 02h03m46.7s 11o34′45′′ 3.610 20.1 0 -LBQS0256-0000 Q0256 02h59m05.6s 00o11′22′′ 3.324 18.0 32 12.02LBQS0302-0019 Q0302 03h04m49.9s −00o08′13′′ 3.267 17.8 46 12.03FBQS J0933+2845 Q0933 09h33m37.3s 28o45′32′′ 3.401 18.8 34 12.00Q1305kkc9 Q1305 13h07m42.7s 29o19′36′′ 2.462 21.3 7 13.56Q1305kkc16 Q1305 13h08m06.1s 29o22′39′′ 2.526 20.9 4 13.03Q1305kkc22 Q1305 13h08m11.9s 29o25′13′′ 2.979 19.0 16 13.02Q1422+2309 Q1422 14h24m38.1s 22o56′01′′ 3.515 16.5 74 11.81Q1422+2309b Q1422 14h24m40.6s 22o55′43′′ 3.084 23.4 3 13.45Q1623kp76 Q1623 16h25m48.1s 26o44′33′′ 2.246 18.5 13 12.72Q1623kp77 Q1623 16h25m48.8s 26o46′59′′ 2.529 16.5 41 12.03Q1623kp78 Q1623 16h25m57.4s 26o44′49′′ 2.578 19.0 47 12.14Q1623kp79 Q1623 16h26m06.2s 26o50′33′′ 2.180 19.2 12 12.99Q1623BX234 Q1623 16h25m33.7s 26o53′44′′ 2.464 19.5 4 14.06Q1623BX603 Q1623 16h26m02.4s 26o43′39′′ 2.529 20.5 8 13.32HS1700+6416 Q1700 17h01m00.6s 64o12′09′′ 2.717 16.0 57 11.71Q2233+136 Q2233 22h36m27.2s 13o57′13′′ 3.209 18.7 25 12.09Q2342+125 Q2343 23h45m22.8s 12o45′47′′ 2.497 18.2 9 12.57Q2343+125 Q2343 23h46m28.3s 12o48′58′′ 2.579 17.0 38 12.25Q2344+125 Q2343 23h46m46.1s 12o45′27′′ 2.785 17.5 44 12.33Q2343BX415 Q2343 23h46m25.4s 12o47′44′′ 2.578 20.3 19 13.22Q2345+000 Q2346 23h48m25.4s 00o20′41′′ 2.652 19.7 3 13.31SSA22d13 SSA22a 22h17m22.3s 00o16′41′′ 3.343 21.6 6 13.22
aQSO magnitude; numbers are unreliable brighter than our saturation magnitude G ∼ 18bNumber of detected CIV systemscLog of the minimum column density (in cm−2) among the detected CIV systemsdCIV absorber catalog not constructed owing to gaps in our echelle spectrum
Fig. 3.— Redshift distributions for different objects in oursample.
et al. 2003; Erb et al. 2004). Little is known, however,about how far the outflowing gas might propagate. Thissection shows that the absorbing material often lies atradii approaching 80 proper kpc and that weaker linescan be detected much farther away. It does not clearlyshow, however, that the absorbing material detected atlarge radii is part of an outflow. Other scenarios areconsidered in §§ 4 and 8.
3.1. Radii r <∼ 80 proper kpc
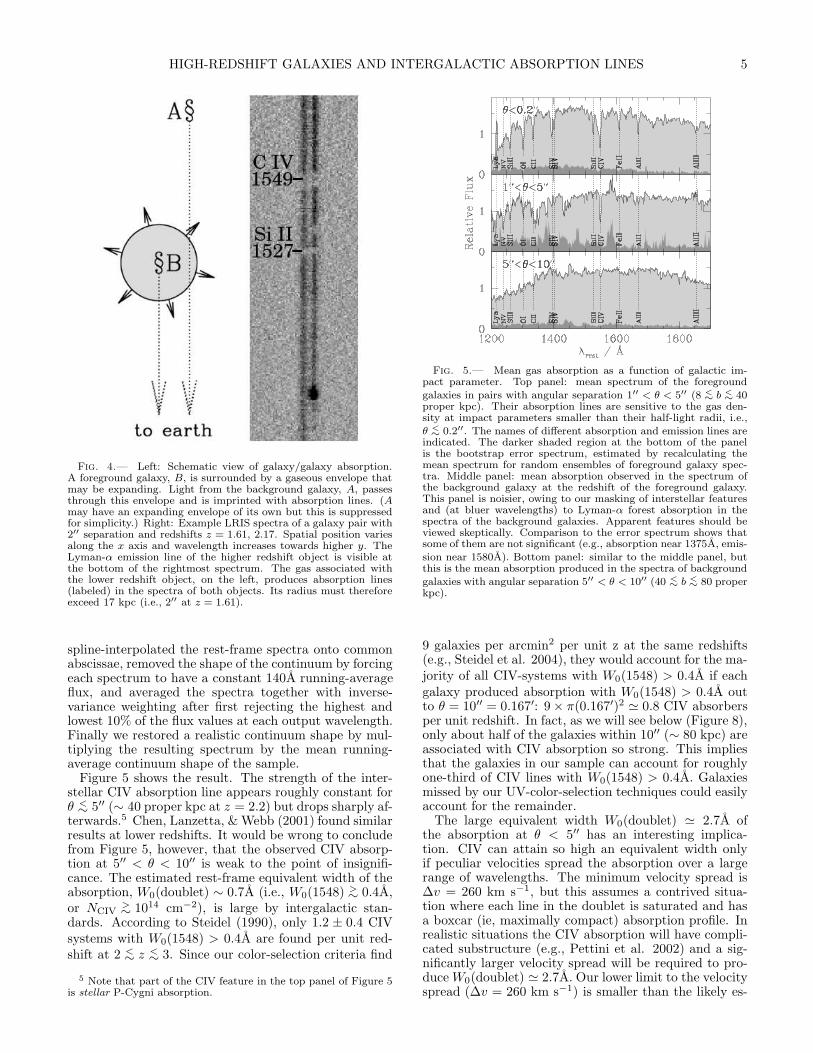
A ∼ 40 kpc radius for galaxies’ strongly absorbingmaterial is implied by the presence of foreground galax-ies’ absorption lines in the spectra of nearby backgroundgalaxies. The left panel of Figure 4 illustrates the idea.The right panel shows one example from our survey. Twogalaxies with redshifts z = 1.60, z = 2.17 and angularseparation θ = 2′′ were placed on the same slit on one ofour multislit masks. Light from the background galaxypassed within 17 proper kpc of the foreground galaxy asit traveled towards earth, and this was close enough forthe foreground galaxy’s absorption lines to be imprintedin its spectrum. The absorbing material must thereforehave a radius of at least 17 kpc.
Similar absorption lines are observed in galaxy pairswith impact parameters of up to 40 kpc, but the absorp-tion weakens significantly at greater separations. Thiscan be seen by measuring the dependence on angularseparation θ of the the mean absorption produced byforeground galaxies. We calculated the strength of themean absorption in two bins of angular separation. Foreach bin, we identified all the galaxy pairs in our sample(18 for 1′′ < θ < 5′′, 64 for 5′′ < θ < 10′′; 10′′ cor-responds to 81 proper kpc at z = 2.5 for a cosmologywith ΩM = 0.3, ΩΛ = 0.7, h = 0.7), collected the back-ground spectra, masked parts of the spectra that werecontaminated by sky lines or by any of the backgroundgalaxy’s ten strongest spectral features4, shifted eachspectrum into the rest-frame of its foreground galaxy,
4 Lyβ/OVI, Lyα, SiII λ1260, OI λ1302, CII λ1335, SiIV λ1398,SiII λ1527, CIV λ1549, FeII λ1608, AlII λ1671
HIGH-REDSHIFT GALAXIES AND INTERGALACTIC ABSORPTION LINES 5
Fig. 4.— Left: Schematic view of galaxy/galaxy absorption.A foreground galaxy, B, is surrounded by a gaseous envelope thatmay be expanding. Light from the background galaxy, A, passesthrough this envelope and is imprinted with absorption lines. (Amay have an expanding envelope of its own but this is suppressedfor simplicity.) Right: Example LRIS spectra of a galaxy pair with2′′ separation and redshifts z = 1.61, 2.17. Spatial position variesalong the x axis and wavelength increases towards higher y. TheLyman-α emission line of the higher redshift object is visible atthe bottom of the rightmost spectrum. The gas associated withthe lower redshift object, on the left, produces absorption lines(labeled) in the spectra of both objects. Its radius must thereforeexceed 17 kpc (i.e., 2′′ at z = 1.61).
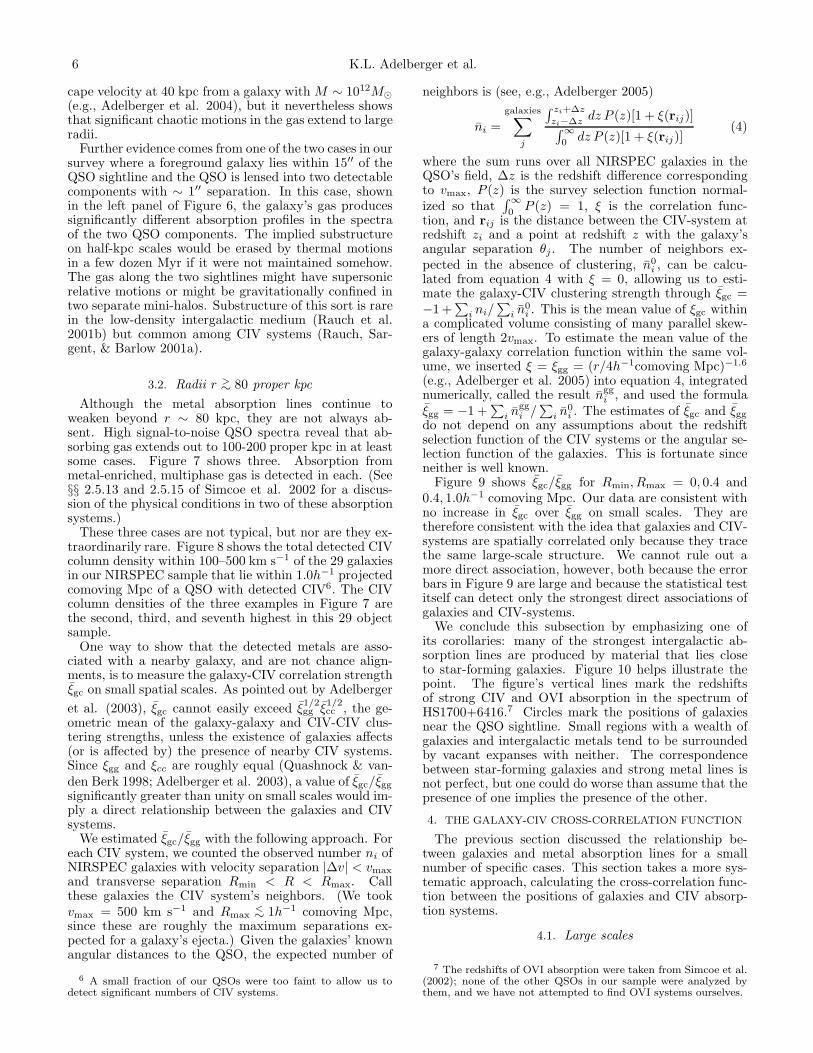
spline-interpolated the rest-frame spectra onto commonabscissae, removed the shape of the continuum by forcingeach spectrum to have a constant 140A running-averageflux, and averaged the spectra together with inverse-variance weighting after first rejecting the highest andlowest 10% of the flux values at each output wavelength.Finally we restored a realistic continuum shape by mul-tiplying the resulting spectrum by the mean running-average continuum shape of the sample.
Figure 5 shows the result. The strength of the inter-stellar CIV absorption line appears roughly constant forθ <∼ 5′′ (∼ 40 proper kpc at z = 2.2) but drops sharply af-
terwards.5 Chen, Lanzetta, & Webb (2001) found similarresults at lower redshifts. It would be wrong to concludefrom Figure 5, however, that the observed CIV absorp-tion at 5′′ < θ < 10′′ is weak to the point of insignifi-cance. The estimated rest-frame equivalent width of theabsorption, W0(doublet) ∼ 0.7A (i.e., W0(1548) >
∼ 0.4A,or NCIV
>∼ 1014 cm−2), is large by intergalactic stan-
dards. According to Steidel (1990), only 1.2 ± 0.4 CIVsystems with W0(1548) > 0.4A are found per unit red-shift at 2 <
∼ z <∼ 3. Since our color-selection criteria find
5 Note that part of the CIV feature in the top panel of Figure 5is stellar P-Cygni absorption.
Fig. 5.— Mean gas absorption as a function of galactic im-pact parameter. Top panel: mean spectrum of the foregroundgalaxies in pairs with angular separation 1′′ < θ < 5′′ (8 <
∼ b <∼ 40
proper kpc). Their absorption lines are sensitive to the gas den-sity at impact parameters smaller than their half-light radii, i.e.,θ <∼ 0.2′′. The names of different absorption and emission lines are
indicated. The darker shaded region at the bottom of the panelis the bootstrap error spectrum, estimated by recalculating themean spectrum for random ensembles of foreground galaxy spec-tra. Middle panel: mean absorption observed in the spectrum ofthe background galaxy at the redshift of the foreground galaxy.This panel is noisier, owing to our masking of interstellar featuresand (at bluer wavelengths) to Lyman-α forest absorption in thespectra of the background galaxies. Apparent features should beviewed skeptically. Comparison to the error spectrum shows thatsome of them are not significant (e.g., absorption near 1375A, emis-sion near 1580A). Bottom panel: similar to the middle panel, butthis is the mean absorption produced in the spectra of backgroundgalaxies with angular separation 5′′ < θ < 10′′ (40 <
∼ b <∼ 80 proper
kpc).
9 galaxies per arcmin2 per unit z at the same redshifts(e.g., Steidel et al. 2004), they would account for the ma-jority of all CIV-systems with W0(1548) > 0.4A if eachgalaxy produced absorption with W0(1548) > 0.4A outto θ = 10′′ = 0.167′: 9 × π(0.167′)2 ≃ 0.8 CIV absorbersper unit redshift. In fact, as we will see below (Figure 8),only about half of the galaxies within 10′′ (∼ 80 kpc) areassociated with CIV absorption so strong. This impliesthat the galaxies in our sample can account for roughlyone-third of CIV lines with W0(1548) > 0.4A. Galaxiesmissed by our UV-color-selection techniques could easilyaccount for the remainder.
The large equivalent width W0(doublet) ≃ 2.7A ofthe absorption at θ < 5′′ has an interesting implica-tion. CIV can attain so high an equivalent width onlyif peculiar velocities spread the absorption over a largerange of wavelengths. The minimum velocity spread is∆v = 260 km s−1, but this assumes a contrived situa-tion where each line in the doublet is saturated and hasa boxcar (ie, maximally compact) absorption profile. Inrealistic situations the CIV absorption will have compli-cated substructure (e.g., Pettini et al. 2002) and a sig-nificantly larger velocity spread will be required to pro-duce W0(doublet) ≃ 2.7A. Our lower limit to the velocityspread (∆v = 260 km s−1) is smaller than the likely es-
6 K.L. Adelberger et al.
cape velocity at 40 kpc from a galaxy with M ∼ 1012M⊙
(e.g., Adelberger et al. 2004), but it nevertheless showsthat significant chaotic motions in the gas extend to largeradii.
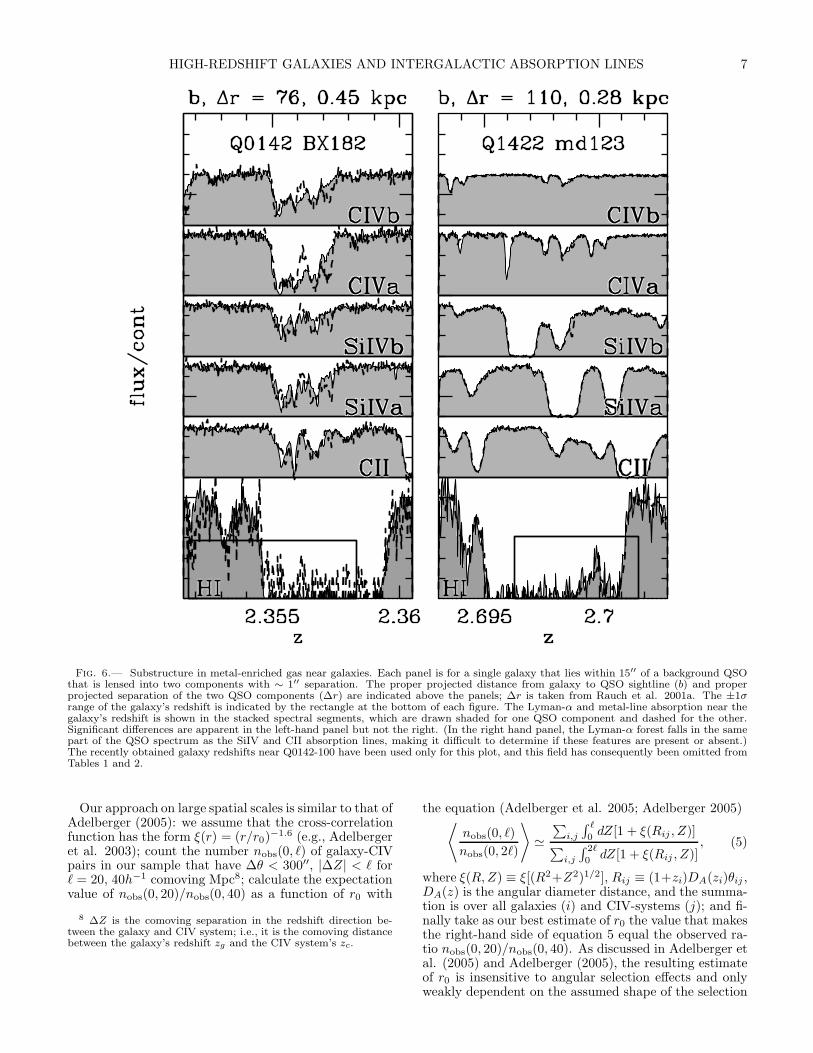
Further evidence comes from one of the two cases in oursurvey where a foreground galaxy lies within 15′′ of theQSO sightline and the QSO is lensed into two detectablecomponents with ∼ 1′′ separation. In this case, shownin the left panel of Figure 6, the galaxy’s gas producessignificantly different absorption profiles in the spectraof the two QSO components. The implied substructureon half-kpc scales would be erased by thermal motionsin a few dozen Myr if it were not maintained somehow.The gas along the two sightlines might have supersonicrelative motions or might be gravitationally confined intwo separate mini-halos. Substructure of this sort is rarein the low-density intergalactic medium (Rauch et al.2001b) but common among CIV systems (Rauch, Sar-gent, & Barlow 2001a).
3.2. Radii r >∼ 80 proper kpc
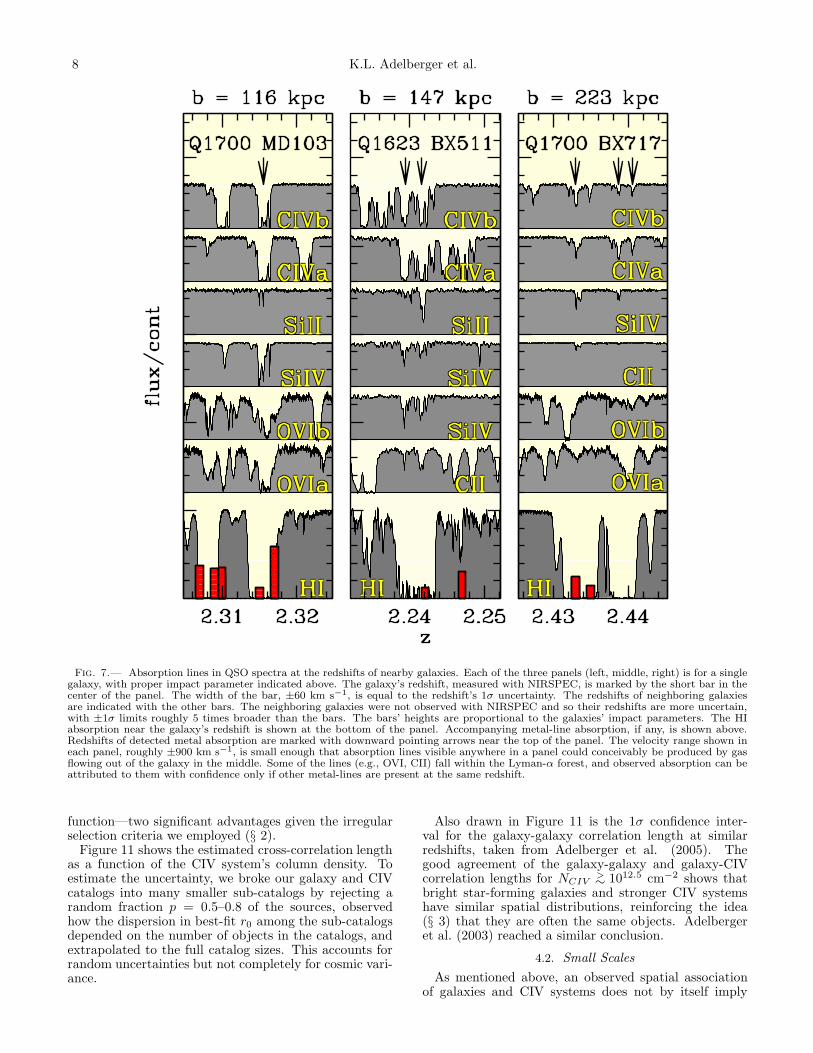
Although the metal absorption lines continue toweaken beyond r ∼ 80 kpc, they are not always ab-sent. High signal-to-noise QSO spectra reveal that ab-sorbing gas extends out to 100-200 proper kpc in at leastsome cases. Figure 7 shows three. Absorption frommetal-enriched, multiphase gas is detected in each. (See§§ 2.5.13 and 2.5.15 of Simcoe et al. 2002 for a discus-sion of the physical conditions in two of these absorptionsystems.)
These three cases are not typical, but nor are they ex-traordinarily rare. Figure 8 shows the total detected CIVcolumn density within 100–500 km s−1 of the 29 galaxiesin our NIRSPEC sample that lie within 1.0h−1 projectedcomoving Mpc of a QSO with detected CIV6. The CIVcolumn densities of the three examples in Figure 7 arethe second, third, and seventh highest in this 29 objectsample.
One way to show that the detected metals are asso-ciated with a nearby galaxy, and are not chance align-ments, is to measure the galaxy-CIV correlation strengthξgc on small spatial scales. As pointed out by Adelberger
et al. (2003), ξgc cannot easily exceed ξ1/2gg ξ
1/2cc , the ge-
ometric mean of the galaxy-galaxy and CIV-CIV clus-tering strengths, unless the existence of galaxies affects(or is affected by) the presence of nearby CIV systems.Since ξgg and ξcc are roughly equal (Quashnock & van-den Berk 1998; Adelberger et al. 2003), a value of ξgc/ξgg
significantly greater than unity on small scales would im-ply a direct relationship between the galaxies and CIVsystems.
We estimated ξgc/ξgg with the following approach. Foreach CIV system, we counted the observed number ni ofNIRSPEC galaxies with velocity separation |∆v| < vmax
and transverse separation Rmin < R < Rmax. Callthese galaxies the CIV system’s neighbors. (We tookvmax = 500 km s−1 and Rmax
<∼ 1h−1 comoving Mpc,
since these are roughly the maximum separations ex-pected for a galaxy’s ejecta.) Given the galaxies’ knownangular distances to the QSO, the expected number of
6 A small fraction of our QSOs were too faint to allow us todetect significant numbers of CIV systems.
neighbors is (see, e.g., Adelberger 2005)
ni =
galaxies∑
j
∫ zi+∆z
zi−∆z dz P (z)[1 + ξ(rij)]∫ ∞
0 dz P (z)[1 + ξ(rij)](4)
where the sum runs over all NIRSPEC galaxies in theQSO’s field, ∆z is the redshift difference correspondingto vmax, P (z) is the survey selection function normal-ized so that
∫ ∞
0P (z) = 1, ξ is the correlation func-
tion, and rij is the distance between the CIV-system atredshift zi and a point at redshift z with the galaxy’sangular separation θj . The number of neighbors ex-pected in the absence of clustering, n0
i , can be calcu-lated from equation 4 with ξ = 0, allowing us to esti-mate the galaxy-CIV clustering strength through ξgc =−1 +
∑
i ni/∑
i n0i . This is the mean value of ξgc within
a complicated volume consisting of many parallel skew-ers of length 2vmax. To estimate the mean value of thegalaxy-galaxy correlation function within the same vol-ume, we inserted ξ = ξgg = (r/4h−1comoving Mpc)−1.6
(e.g., Adelberger et al. 2005) into equation 4, integratednumerically, called the result ngg
i , and used the formulaξgg = −1 +
∑
i nggi /
∑
i n0i . The estimates of ξgc and ξgg
do not depend on any assumptions about the redshiftselection function of the CIV systems or the angular se-lection function of the galaxies. This is fortunate sinceneither is well known.
Figure 9 shows ξgc/ξgg for Rmin, Rmax = 0, 0.4 and0.4, 1.0h−1 comoving Mpc. Our data are consistent withno increase in ξgc over ξgg on small scales. They aretherefore consistent with the idea that galaxies and CIV-systems are spatially correlated only because they tracethe same large-scale structure. We cannot rule out amore direct association, however, both because the errorbars in Figure 9 are large and because the statistical testitself can detect only the strongest direct associations ofgalaxies and CIV-systems.
We conclude this subsection by emphasizing one ofits corollaries: many of the strongest intergalactic ab-sorption lines are produced by material that lies closeto star-forming galaxies. Figure 10 helps illustrate thepoint. The figure’s vertical lines mark the redshiftsof strong CIV and OVI absorption in the spectrum ofHS1700+6416.7 Circles mark the positions of galaxiesnear the QSO sightline. Small regions with a wealth ofgalaxies and intergalactic metals tend to be surroundedby vacant expanses with neither. The correspondencebetween star-forming galaxies and strong metal lines isnot perfect, but one could do worse than assume that thepresence of one implies the presence of the other.
4. THE GALAXY-CIV CROSS-CORRELATION FUNCTION
The previous section discussed the relationship be-tween galaxies and metal absorption lines for a smallnumber of specific cases. This section takes a more sys-tematic approach, calculating the cross-correlation func-tion between the positions of galaxies and CIV absorp-tion systems.
4.1. Large scales
7 The redshifts of OVI absorption were taken from Simcoe et al.(2002); none of the other QSOs in our sample were analyzed bythem, and we have not attempted to find OVI systems ourselves.
HIGH-REDSHIFT GALAXIES AND INTERGALACTIC ABSORPTION LINES 7
Fig. 6.— Substructure in metal-enriched gas near galaxies. Each panel is for a single galaxy that lies within 15′′ of a background QSOthat is lensed into two components with ∼ 1′′ separation. The proper projected distance from galaxy to QSO sightline (b) and properprojected separation of the two QSO components (∆r) are indicated above the panels; ∆r is taken from Rauch et al. 2001a. The ±1σrange of the galaxy’s redshift is indicated by the rectangle at the bottom of each figure. The Lyman-α and metal-line absorption near thegalaxy’s redshift is shown in the stacked spectral segments, which are drawn shaded for one QSO component and dashed for the other.Significant differences are apparent in the left-hand panel but not the right. (In the right hand panel, the Lyman-α forest falls in the samepart of the QSO spectrum as the SiIV and CII absorption lines, making it difficult to determine if these features are present or absent.)The recently obtained galaxy redshifts near Q0142-100 have been used only for this plot, and this field has consequently been omitted fromTables 1 and 2.
Our approach on large spatial scales is similar to that ofAdelberger (2005): we assume that the cross-correlationfunction has the form ξ(r) = (r/r0)
−1.6 (e.g., Adelbergeret al. 2003); count the number nobs(0, ℓ) of galaxy-CIVpairs in our sample that have ∆θ < 300′′, |∆Z| < ℓ forℓ = 20, 40h−1 comoving Mpc8; calculate the expectationvalue of nobs(0, 20)/nobs(0, 40) as a function of r0 with
8 ∆Z is the comoving separation in the redshift direction be-tween the galaxy and CIV system; i.e., it is the comoving distancebetween the galaxy’s redshift zg and the CIV system’s zc.
the equation (Adelberger et al. 2005; Adelberger 2005)⟨
nobs(0, ℓ)
nobs(0, 2ℓ)
⟩
≃
∑
i,j
∫ ℓ
0dZ[1 + ξ(Rij , Z)]
∑
i,j
∫ 2ℓ
0dZ[1 + ξ(Rij , Z)]
, (5)
where ξ(R, Z) ≡ ξ[(R2+Z2)1/2], Rij ≡ (1+zi)DA(zi)θij ,DA(z) is the angular diameter distance, and the summa-tion is over all galaxies (i) and CIV-systems (j); and fi-nally take as our best estimate of r0 the value that makesthe right-hand side of equation 5 equal the observed ra-tio nobs(0, 20)/nobs(0, 40). As discussed in Adelberger etal. (2005) and Adelberger (2005), the resulting estimateof r0 is insensitive to angular selection effects and onlyweakly dependent on the assumed shape of the selection
8 K.L. Adelberger et al.
Fig. 7.— Absorption lines in QSO spectra at the redshifts of nearby galaxies. Each of the three panels (left, middle, right) is for a singlegalaxy, with proper impact parameter indicated above. The galaxy’s redshift, measured with NIRSPEC, is marked by the short bar in thecenter of the panel. The width of the bar, ±60 km s−1, is equal to the redshift’s 1σ uncertainty. The redshifts of neighboring galaxiesare indicated with the other bars. The neighboring galaxies were not observed with NIRSPEC and so their redshifts are more uncertain,with ±1σ limits roughly 5 times broader than the bars. The bars’ heights are proportional to the galaxies’ impact parameters. The HIabsorption near the galaxy’s redshift is shown at the bottom of the panel. Accompanying metal-line absorption, if any, is shown above.Redshifts of detected metal absorption are marked with downward pointing arrows near the top of the panel. The velocity range shown ineach panel, roughly ±900 km s−1, is small enough that absorption lines visible anywhere in a panel could conceivably be produced by gasflowing out of the galaxy in the middle. Some of the lines (e.g., OVI, CII) fall within the Lyman-α forest, and observed absorption can beattributed to them with confidence only if other metal-lines are present at the same redshift.
function—two significant advantages given the irregularselection criteria we employed (§ 2).
Figure 11 shows the estimated cross-correlation lengthas a function of the CIV system’s column density. Toestimate the uncertainty, we broke our galaxy and CIVcatalogs into many smaller sub-catalogs by rejecting arandom fraction p = 0.5–0.8 of the sources, observedhow the dispersion in best-fit r0 among the sub-catalogsdepended on the number of objects in the catalogs, andextrapolated to the full catalog sizes. This accounts forrandom uncertainties but not completely for cosmic vari-ance.
Also drawn in Figure 11 is the 1σ confidence inter-val for the galaxy-galaxy correlation length at similarredshifts, taken from Adelberger et al. (2005). Thegood agreement of the galaxy-galaxy and galaxy-CIVcorrelation lengths for NCIV
>∼ 1012.5 cm−2 shows that
bright star-forming galaxies and stronger CIV systemshave similar spatial distributions, reinforcing the idea(§ 3) that they are often the same objects. Adelbergeret al. (2003) reached a similar conclusion.
4.2. Small Scales
As mentioned above, an observed spatial associationof galaxies and CIV systems does not by itself imply
HIGH-REDSHIFT GALAXIES AND INTERGALACTIC ABSORPTION LINES 9
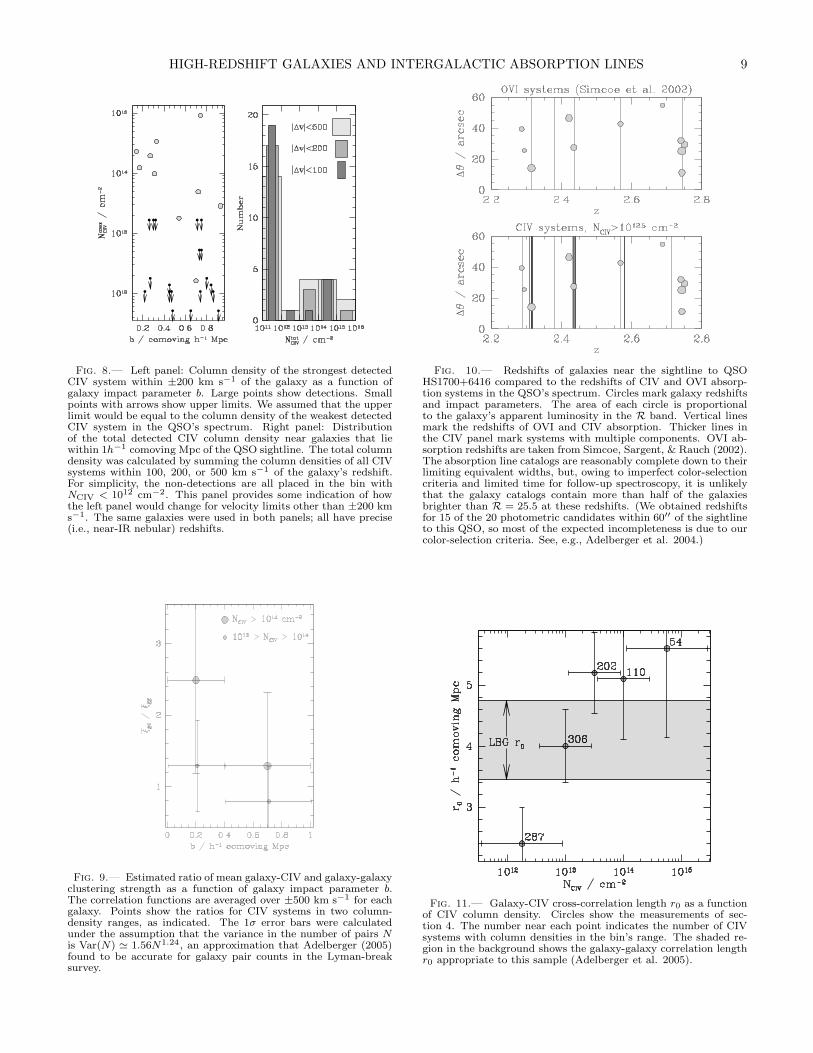
Fig. 8.— Left panel: Column density of the strongest detectedCIV system within ±200 km s−1 of the galaxy as a function ofgalaxy impact parameter b. Large points show detections. Smallpoints with arrows show upper limits. We assumed that the upperlimit would be equal to the column density of the weakest detectedCIV system in the QSO’s spectrum. Right panel: Distributionof the total detected CIV column density near galaxies that liewithin 1h−1 comoving Mpc of the QSO sightline. The total columndensity was calculated by summing the column densities of all CIVsystems within 100, 200, or 500 km s−1 of the galaxy’s redshift.For simplicity, the non-detections are all placed in the bin withNCIV < 1012 cm−2. This panel provides some indication of howthe left panel would change for velocity limits other than ±200 kms−1. The same galaxies were used in both panels; all have precise(i.e., near-IR nebular) redshifts.
Fig. 9.— Estimated ratio of mean galaxy-CIV and galaxy-galaxyclustering strength as a function of galaxy impact parameter b.The correlation functions are averaged over ±500 km s−1 for eachgalaxy. Points show the ratios for CIV systems in two column-density ranges, as indicated. The 1σ error bars were calculatedunder the assumption that the variance in the number of pairs Nis Var(N) ≃ 1.56N1.24, an approximation that Adelberger (2005)found to be accurate for galaxy pair counts in the Lyman-breaksurvey.
Fig. 10.— Redshifts of galaxies near the sightline to QSOHS1700+6416 compared to the redshifts of CIV and OVI absorp-tion systems in the QSO’s spectrum. Circles mark galaxy redshiftsand impact parameters. The area of each circle is proportionalto the galaxy’s apparent luminosity in the R band. Vertical linesmark the redshifts of OVI and CIV absorption. Thicker lines inthe CIV panel mark systems with multiple components. OVI ab-sorption redshifts are taken from Simcoe, Sargent, & Rauch (2002).The absorption line catalogs are reasonably complete down to theirlimiting equivalent widths, but, owing to imperfect color-selectioncriteria and limited time for follow-up spectroscopy, it is unlikelythat the galaxy catalogs contain more than half of the galaxiesbrighter than R = 25.5 at these redshifts. (We obtained redshiftsfor 15 of the 20 photometric candidates within 60′′ of the sightlineto this QSO, so most of the expected incompleteness is due to ourcolor-selection criteria. See, e.g., Adelberger et al. 2004.)
Fig. 11.— Galaxy-CIV cross-correlation length r0 as a functionof CIV column density. Circles show the measurements of sec-tion 4. The number near each point indicates the number of CIVsystems with column densities in the bin’s range. The shaded re-gion in the background shows the galaxy-galaxy correlation lengthr0 appropriate to this sample (Adelberger et al. 2005).
10 K.L. Adelberger et al.
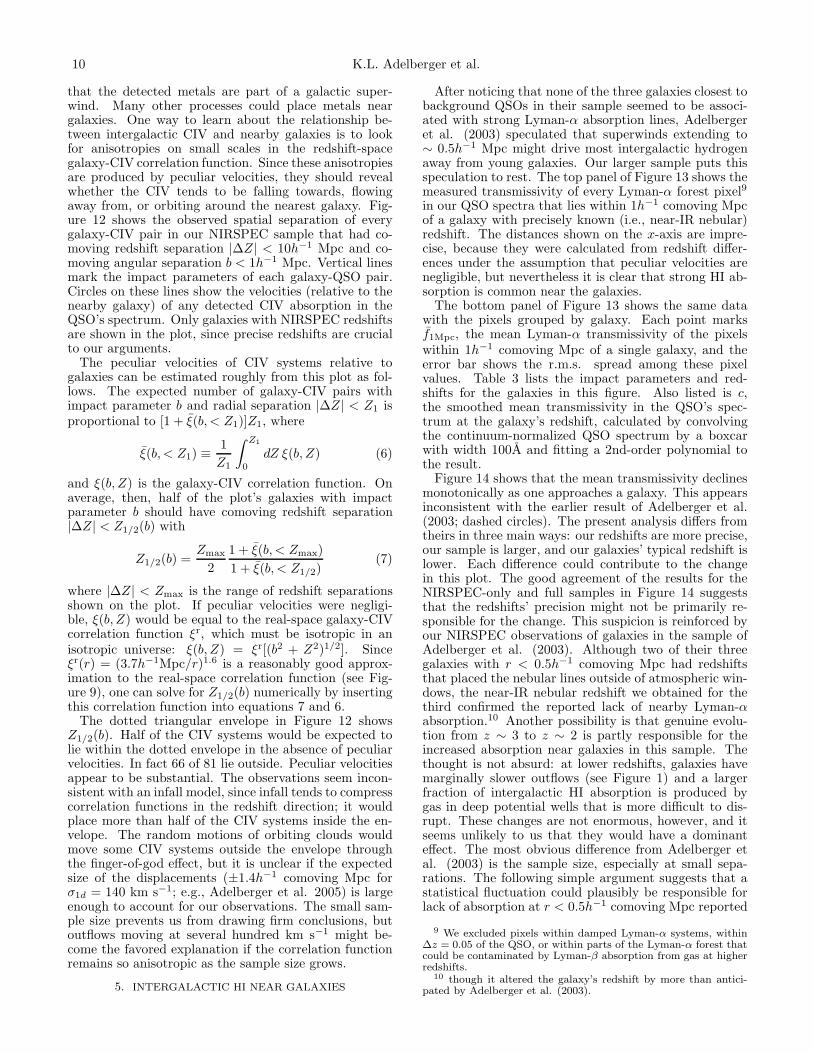
that the detected metals are part of a galactic super-wind. Many other processes could place metals neargalaxies. One way to learn about the relationship be-tween intergalactic CIV and nearby galaxies is to lookfor anisotropies on small scales in the redshift-spacegalaxy-CIV correlation function. Since these anisotropiesare produced by peculiar velocities, they should revealwhether the CIV tends to be falling towards, flowingaway from, or orbiting around the nearest galaxy. Fig-ure 12 shows the observed spatial separation of everygalaxy-CIV pair in our NIRSPEC sample that had co-moving redshift separation |∆Z| < 10h−1 Mpc and co-moving angular separation b < 1h−1 Mpc. Vertical linesmark the impact parameters of each galaxy-QSO pair.Circles on these lines show the velocities (relative to thenearby galaxy) of any detected CIV absorption in theQSO’s spectrum. Only galaxies with NIRSPEC redshiftsare shown in the plot, since precise redshifts are crucialto our arguments.
The peculiar velocities of CIV systems relative togalaxies can be estimated roughly from this plot as fol-lows. The expected number of galaxy-CIV pairs withimpact parameter b and radial separation |∆Z| < Z1 isproportional to [1 + ξ(b, < Z1)]Z1, where
ξ(b, < Z1) ≡1
Z1
∫ Z1
0
dZ ξ(b, Z) (6)
and ξ(b, Z) is the galaxy-CIV correlation function. Onaverage, then, half of the plot’s galaxies with impactparameter b should have comoving redshift separation|∆Z| < Z1/2(b) with
Z1/2(b) =Zmax
2
1 + ξ(b, < Zmax)
1 + ξ(b, < Z1/2)(7)
where |∆Z| < Zmax is the range of redshift separationsshown on the plot. If peculiar velocities were negligi-ble, ξ(b, Z) would be equal to the real-space galaxy-CIVcorrelation function ξr, which must be isotropic in anisotropic universe: ξ(b, Z) = ξr[(b2 + Z2)1/2]. Sinceξr(r) = (3.7h−1Mpc/r)1.6 is a reasonably good approx-imation to the real-space correlation function (see Fig-ure 9), one can solve for Z1/2(b) numerically by insertingthis correlation function into equations 7 and 6.
The dotted triangular envelope in Figure 12 showsZ1/2(b). Half of the CIV systems would be expected tolie within the dotted envelope in the absence of peculiarvelocities. In fact 66 of 81 lie outside. Peculiar velocitiesappear to be substantial. The observations seem incon-sistent with an infall model, since infall tends to compresscorrelation functions in the redshift direction; it wouldplace more than half of the CIV systems inside the en-velope. The random motions of orbiting clouds wouldmove some CIV systems outside the envelope throughthe finger-of-god effect, but it is unclear if the expectedsize of the displacements (±1.4h−1 comoving Mpc forσ1d = 140 km s−1; e.g., Adelberger et al. 2005) is largeenough to account for our observations. The small sam-ple size prevents us from drawing firm conclusions, butoutflows moving at several hundred km s−1 might be-come the favored explanation if the correlation functionremains so anisotropic as the sample size grows.
5. INTERGALACTIC HI NEAR GALAXIES
After noticing that none of the three galaxies closest tobackground QSOs in their sample seemed to be associ-ated with strong Lyman-α absorption lines, Adelbergeret al. (2003) speculated that superwinds extending to∼ 0.5h−1 Mpc might drive most intergalactic hydrogenaway from young galaxies. Our larger sample puts thisspeculation to rest. The top panel of Figure 13 shows themeasured transmissivity of every Lyman-α forest pixel9
in our QSO spectra that lies within 1h−1 comoving Mpcof a galaxy with precisely known (i.e., near-IR nebular)redshift. The distances shown on the x-axis are impre-cise, because they were calculated from redshift differ-ences under the assumption that peculiar velocities arenegligible, but nevertheless it is clear that strong HI ab-sorption is common near the galaxies.
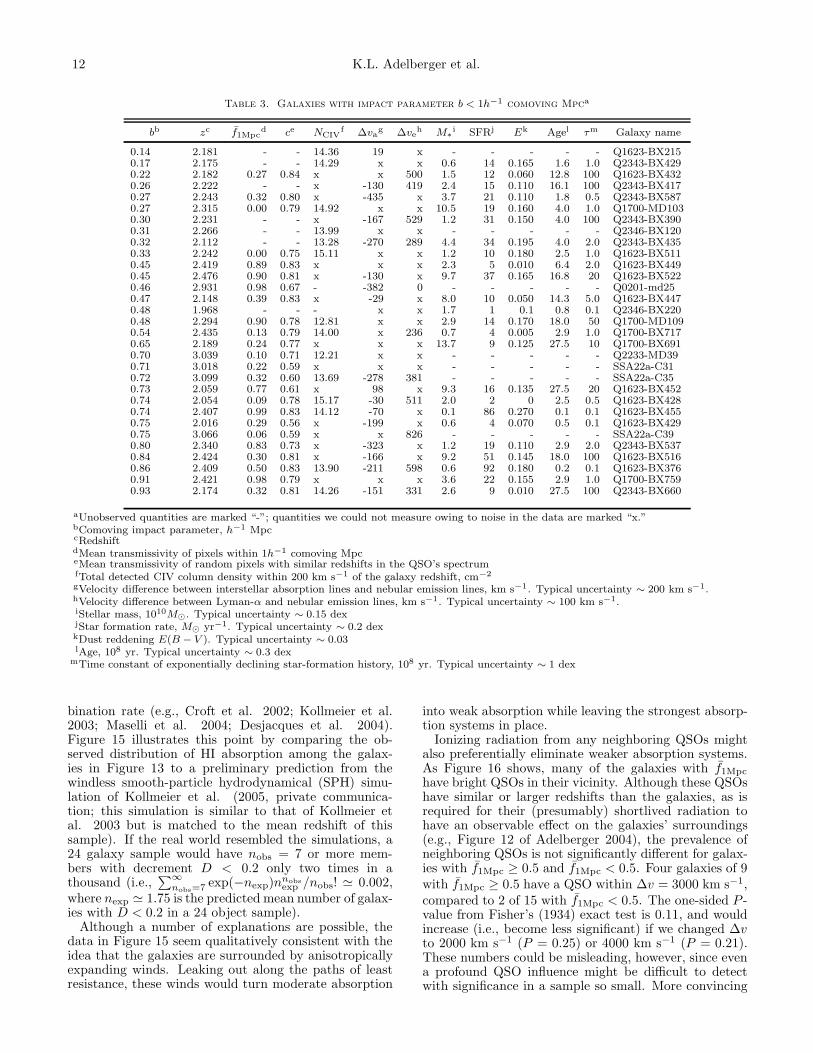
The bottom panel of Figure 13 shows the same datawith the pixels grouped by galaxy. Each point marksf1Mpc, the mean Lyman-α transmissivity of the pixelswithin 1h−1 comoving Mpc of a single galaxy, and theerror bar shows the r.m.s. spread among these pixelvalues. Table 3 lists the impact parameters and red-shifts for the galaxies in this figure. Also listed is c,the smoothed mean transmissivity in the QSO’s spec-trum at the galaxy’s redshift, calculated by convolvingthe continuum-normalized QSO spectrum by a boxcarwith width 100A and fitting a 2nd-order polynomial tothe result.
Figure 14 shows that the mean transmissivity declinesmonotonically as one approaches a galaxy. This appearsinconsistent with the earlier result of Adelberger et al.(2003; dashed circles). The present analysis differs fromtheirs in three main ways: our redshifts are more precise,our sample is larger, and our galaxies’ typical redshift islower. Each difference could contribute to the changein this plot. The good agreement of the results for theNIRSPEC-only and full samples in Figure 14 suggeststhat the redshifts’ precision might not be primarily re-sponsible for the change. This suspicion is reinforced byour NIRSPEC observations of galaxies in the sample ofAdelberger et al. (2003). Although two of their threegalaxies with r < 0.5h−1 comoving Mpc had redshiftsthat placed the nebular lines outside of atmospheric win-dows, the near-IR nebular redshift we obtained for thethird confirmed the reported lack of nearby Lyman-αabsorption.10 Another possibility is that genuine evolu-tion from z ∼ 3 to z ∼ 2 is partly responsible for theincreased absorption near galaxies in this sample. Thethought is not absurd: at lower redshifts, galaxies havemarginally slower outflows (see Figure 1) and a largerfraction of intergalactic HI absorption is produced bygas in deep potential wells that is more difficult to dis-rupt. These changes are not enormous, however, and itseems unlikely to us that they would have a dominanteffect. The most obvious difference from Adelberger etal. (2003) is the sample size, especially at small sepa-rations. The following simple argument suggests that astatistical fluctuation could plausibly be responsible forlack of absorption at r < 0.5h−1 comoving Mpc reported
9 We excluded pixels within damped Lyman-α systems, within∆z = 0.05 of the QSO, or within parts of the Lyman-α forest thatcould be contaminated by Lyman-β absorption from gas at higherredshifts.
10 though it altered the galaxy’s redshift by more than antici-pated by Adelberger et al. (2003).
HIGH-REDSHIFT GALAXIES AND INTERGALACTIC ABSORPTION LINES 11
Fig. 12.— Spatial separations of galaxy-CIV pairs in the angular (b) and redshift (∆Z) direction. Vertical lines show the projecteddistance between each galaxy in the NIRSPEC sample and its nearest QSO. The QSO spectra allow us to detect any CIV-absorbing gasalong these lines. Circles show the actual locations of detected CIV absorption, with one circle at the redshift of each resolved absorptioncomponent. In the absence of peculiar velocities, the distribution of CIV systems around galaxies would be spherically symmetric onaverage and (as a result) half of the circles would be expected to lie inside the dotted triangular envelope (see § 4). In fact 65 of 81 lieoutside. The uncertainty in each galaxy-CIV pair’s redshift separation (i.e., in each circle’s vertical position) is too small to account forthis (±1σ size indicated by two-headed arrow labeled ∆z). Peculiar velocities must therefore be substantial. If the CIV systems wereorbiting in the galaxy’s halo, their observed redshift separations would be displaced relative to their true separations by a random amountcomparable to their galaxy’s velocity dispersion σ1d. The approximate size of ±σ1d (140 km s−1) is indicated by the labeled double-headedarrow. If the CIV were infalling, the CIV systems’ observed (i.e., redshift space) positions would be artificially compressed towards the xaxis by an amount comparable to σ1d. If it were flowing outwards, the observed positions would be displaced away from the x axis by anamount that depends on the wind speed. The two-headed arrow labeled vwind shows the approximate size of ±500 km s−1.
by Adelberger et al. (2003). Suppose that half of thegalaxies with r < 0.5h−1 comoving Mpc are heavily ob-scured (f = 0) and half are unobscured (f = 1). This is arough approximation to the data in the bottom panel ofFigure 13. Then the mean and standard deviation of theaverage transmissivity for a three-object sample wouldbe f3 = 0.5 ± 0.29. Although an observation of f3 = 1superficially seems inconsistent with this scenario, differ-ing by almost 2σ from the expectation f3 = 0.5, in factit should occur one time out of eight. The real world isonly vaguely similar to our simple model, but the point
is that large fluctuations occur often in samples drawnfrom a bimodal underlying distribution. The results inthis paper and in Adelberger et al. (2003) are clearly notthe same, but they are less inconsistent than one mightnaively suppose.
In any case, although strong HI absorption is the normat small separations, we continue to find some galaxieswith little absorption. The existence of these galaxiesis surprising: one would expect all galaxies to reside indense regions with significant hydrogen and an elevatedneutral fraction from the ρ2 dependence of the recom-
12 K.L. Adelberger et al.
Table 3. Galaxies with impact parameter b < 1h−1 comoving Mpca
bb zc f1Mpcd ce NCIV
f ∆vag ∆ve
h M∗i SFRj Ek Agel τm Galaxy name
0.14 2.181 - - 14.36 19 x - - - - - Q1623-BX2150.17 2.175 - - 14.29 x x 0.6 14 0.165 1.6 1.0 Q2343-BX4290.22 2.182 0.27 0.84 x x 500 1.5 12 0.060 12.8 100 Q1623-BX4320.26 2.222 - - x -130 419 2.4 15 0.110 16.1 100 Q2343-BX4170.27 2.243 0.32 0.80 x -435 x 3.7 21 0.110 1.8 0.5 Q2343-BX5870.27 2.315 0.00 0.79 14.92 x x 10.5 19 0.160 4.0 1.0 Q1700-MD1030.30 2.231 - - x -167 529 1.2 31 0.150 4.0 100 Q2343-BX3900.31 2.266 - - 13.99 x x - - - - - Q2346-BX1200.32 2.112 - - 13.28 -270 289 4.4 34 0.195 4.0 2.0 Q2343-BX4350.33 2.242 0.00 0.75 15.11 x x 1.2 10 0.180 2.5 1.0 Q1623-BX5110.45 2.419 0.89 0.83 x x x 2.3 5 0.010 6.4 2.0 Q1623-BX4490.45 2.476 0.90 0.81 x -130 x 9.7 37 0.165 16.8 20 Q1623-BX5220.46 2.931 0.98 0.67 - -382 0 - - - - - Q0201-md250.47 2.148 0.39 0.83 x -29 x 8.0 10 0.050 14.3 5.0 Q1623-BX4470.48 1.968 - - - x x 1.7 1 0.1 0.8 0.1 Q2346-BX2200.48 2.294 0.90 0.78 12.81 x x 2.9 14 0.170 18.0 50 Q1700-MD1090.54 2.435 0.13 0.79 14.00 x 236 0.7 4 0.005 2.9 1.0 Q1700-BX7170.65 2.189 0.24 0.77 x x x 13.7 9 0.125 27.5 10 Q1700-BX6910.70 3.039 0.10 0.71 12.21 x x - - - - - Q2233-MD390.71 3.018 0.22 0.59 x x x - - - - - SSA22a-C310.72 3.099 0.32 0.60 13.69 -278 381 - - - - - SSA22a-C350.73 2.059 0.77 0.61 x 98 x 9.3 16 0.135 27.5 20 Q1623-BX4520.74 2.054 0.09 0.78 15.17 -30 511 2.0 2 0 2.5 0.5 Q1623-BX4280.74 2.407 0.99 0.83 14.12 -70 x 0.1 86 0.270 0.1 0.1 Q1623-BX4550.75 2.016 0.29 0.56 x -199 x 0.6 4 0.070 0.5 0.1 Q1623-BX4290.75 3.066 0.06 0.59 x x 826 - - - - - SSA22a-C390.80 2.340 0.83 0.73 x -323 x 1.2 19 0.110 2.9 2.0 Q2343-BX5370.84 2.424 0.30 0.81 x -166 x 9.2 51 0.145 18.0 100 Q1623-BX5160.86 2.409 0.50 0.83 13.90 -211 598 0.6 92 0.180 0.2 0.1 Q1623-BX3760.91 2.421 0.98 0.79 x x x 3.6 22 0.155 2.9 1.0 Q1700-BX7590.93 2.174 0.32 0.81 14.26 -151 331 2.6 9 0.010 27.5 100 Q2343-BX660
aUnobserved quantities are marked “-”; quantities we could not measure owing to noise in the data are marked “x.”bComoving impact parameter, h−1 MpccRedshiftdMean transmissivity of pixels within 1h−1 comoving MpceMean transmissivity of random pixels with similar redshifts in the QSO’s spectrumfTotal detected CIV column density within 200 km s−1 of the galaxy redshift, cm−2
gVelocity difference between interstellar absorption lines and nebular emission lines, km s−1. Typical uncertainty ∼ 200 km s−1.hVelocity difference between Lyman-α and nebular emission lines, km s−1. Typical uncertainty ∼ 100 km s−1.iStellar mass, 1010M⊙. Typical uncertainty ∼ 0.15 dexjStar formation rate, M⊙ yr−1. Typical uncertainty ∼ 0.2 dexkDust reddening E(B − V ). Typical uncertainty ∼ 0.03lAge, 108 yr. Typical uncertainty ∼ 0.3 dex
mTime constant of exponentially declining star-formation history, 108 yr. Typical uncertainty ∼ 1 dex
bination rate (e.g., Croft et al. 2002; Kollmeier et al.2003; Maselli et al. 2004; Desjacques et al. 2004).Figure 15 illustrates this point by comparing the ob-served distribution of HI absorption among the galax-ies in Figure 13 to a preliminary prediction from thewindless smooth-particle hydrodynamical (SPH) simu-lation of Kollmeier et al. (2005, private communica-tion; this simulation is similar to that of Kollmeier etal. 2003 but is matched to the mean redshift of thissample). If the real world resembled the simulations, a24 galaxy sample would have nobs = 7 or more mem-bers with decrement D < 0.2 only two times in athousand (i.e.,
∑∞
nobs=7 exp(−nexp)nnobs
exp /nobs! ≃ 0.002,where nexp ≃ 1.75 is the predicted mean number of galax-ies with D < 0.2 in a 24 object sample).
Although a number of explanations are possible, thedata in Figure 15 seem qualitatively consistent with theidea that the galaxies are surrounded by anisotropicallyexpanding winds. Leaking out along the paths of leastresistance, these winds would turn moderate absorption
into weak absorption while leaving the strongest absorp-tion systems in place.
Ionizing radiation from any neighboring QSOs mightalso preferentially eliminate weaker absorption systems.As Figure 16 shows, many of the galaxies with f1Mpc
have bright QSOs in their vicinity. Although these QSOshave similar or larger redshifts than the galaxies, as isrequired for their (presumably) shortlived radiation tohave an observable effect on the galaxies’ surroundings(e.g., Figure 12 of Adelberger 2004), the prevalence ofneighboring QSOs is not significantly different for galax-ies with f1Mpc ≥ 0.5 and f1Mpc < 0.5. Four galaxies of 9with f1Mpc ≥ 0.5 have a QSO within ∆v = 3000 km s−1,compared to 2 of 15 with f1Mpc < 0.5. The one-sided P -value from Fisher’s (1934) exact test is 0.11, and wouldincrease (i.e., become less significant) if we changed ∆vto 2000 km s−1 (P = 0.25) or 4000 km s−1 (P = 0.21).These numbers could be misleading, however, since evena profound QSO influence might be difficult to detectwith significance in a sample so small. More convincing
HIGH-REDSHIFT GALAXIES AND INTERGALACTIC ABSORPTION LINES 13
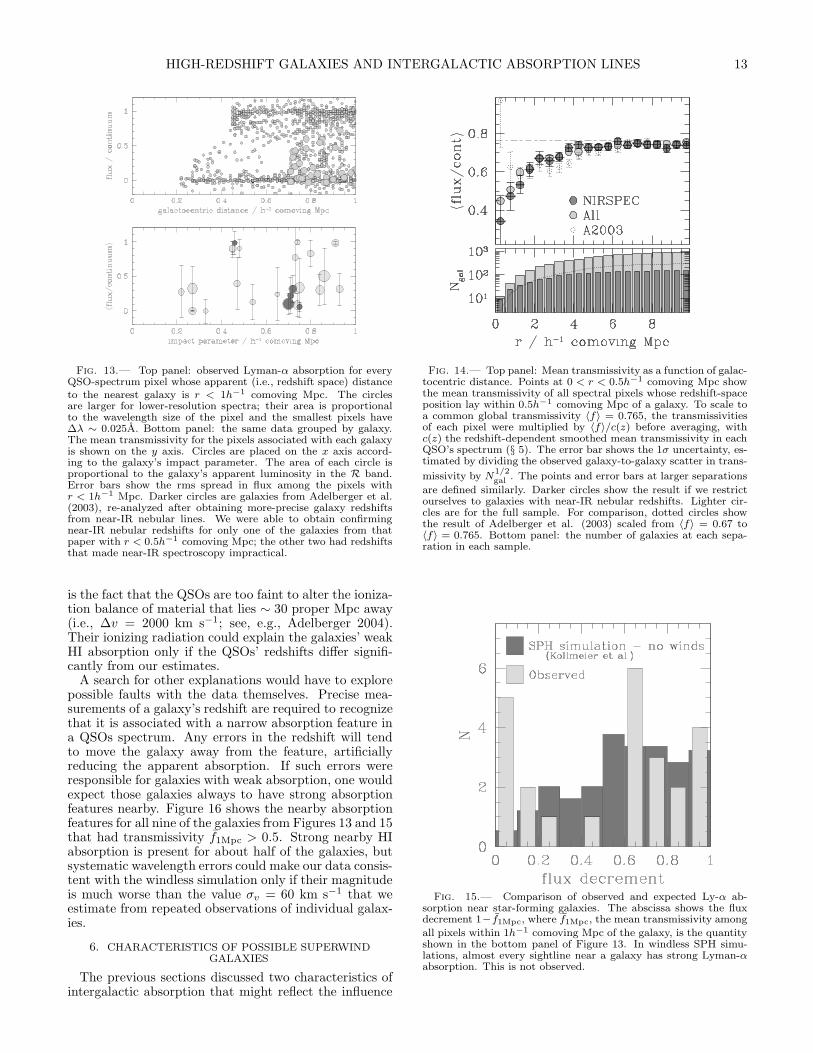
Fig. 13.— Top panel: observed Lyman-α absorption for everyQSO-spectrum pixel whose apparent (i.e., redshift space) distanceto the nearest galaxy is r < 1h−1 comoving Mpc. The circlesare larger for lower-resolution spectra; their area is proportionalto the wavelength size of the pixel and the smallest pixels have∆λ ∼ 0.025A. Bottom panel: the same data grouped by galaxy.The mean transmissivity for the pixels associated with each galaxyis shown on the y axis. Circles are placed on the x axis accord-ing to the galaxy’s impact parameter. The area of each circle isproportional to the galaxy’s apparent luminosity in the R band.Error bars show the rms spread in flux among the pixels withr < 1h−1 Mpc. Darker circles are galaxies from Adelberger et al.(2003), re-analyzed after obtaining more-precise galaxy redshiftsfrom near-IR nebular lines. We were able to obtain confirmingnear-IR nebular redshifts for only one of the galaxies from thatpaper with r < 0.5h−1 comoving Mpc; the other two had redshiftsthat made near-IR spectroscopy impractical.
is the fact that the QSOs are too faint to alter the ioniza-tion balance of material that lies ∼ 30 proper Mpc away(i.e., ∆v = 2000 km s−1; see, e.g., Adelberger 2004).Their ionizing radiation could explain the galaxies’ weakHI absorption only if the QSOs’ redshifts differ signifi-cantly from our estimates.
A search for other explanations would have to explorepossible faults with the data themselves. Precise mea-surements of a galaxy’s redshift are required to recognizethat it is associated with a narrow absorption feature ina QSOs spectrum. Any errors in the redshift will tendto move the galaxy away from the feature, artificiallyreducing the apparent absorption. If such errors wereresponsible for galaxies with weak absorption, one wouldexpect those galaxies always to have strong absorptionfeatures nearby. Figure 16 shows the nearby absorptionfeatures for all nine of the galaxies from Figures 13 and 15that had transmissivity f1Mpc > 0.5. Strong nearby HIabsorption is present for about half of the galaxies, butsystematic wavelength errors could make our data consis-tent with the windless simulation only if their magnitudeis much worse than the value σv = 60 km s−1 that weestimate from repeated observations of individual galax-ies.
6. CHARACTERISTICS OF POSSIBLE SUPERWINDGALAXIES
The previous sections discussed two characteristics ofintergalactic absorption that might reflect the influence
Fig. 14.— Top panel: Mean transmissivity as a function of galac-tocentric distance. Points at 0 < r < 0.5h−1 comoving Mpc showthe mean transmissivity of all spectral pixels whose redshift-spaceposition lay within 0.5h−1 comoving Mpc of a galaxy. To scale toa common global transmissivity 〈f〉 = 0.765, the transmissivitiesof each pixel were multiplied by 〈f〉/c(z) before averaging, withc(z) the redshift-dependent smoothed mean transmissivity in eachQSO’s spectrum (§ 5). The error bar shows the 1σ uncertainty, es-timated by dividing the observed galaxy-to-galaxy scatter in trans-
missivity by N1/2
gal. The points and error bars at larger separations
are defined similarly. Darker circles show the result if we restrictourselves to galaxies with near-IR nebular redshifts. Lighter cir-cles are for the full sample. For comparison, dotted circles showthe result of Adelberger et al. (2003) scaled from 〈f〉 = 0.67 to〈f〉 = 0.765. Bottom panel: the number of galaxies at each sepa-ration in each sample.
Fig. 15.— Comparison of observed and expected Ly-α ab-sorption near star-forming galaxies. The abscissa shows the fluxdecrement 1− f1Mpc, where f1Mpc, the mean transmissivity among
all pixels within 1h−1 comoving Mpc of the galaxy, is the quantityshown in the bottom panel of Figure 13. In windless SPH simu-lations, almost every sightline near a galaxy has strong Lyman-αabsorption. This is not observed.
14 K.L. Adelberger et al.
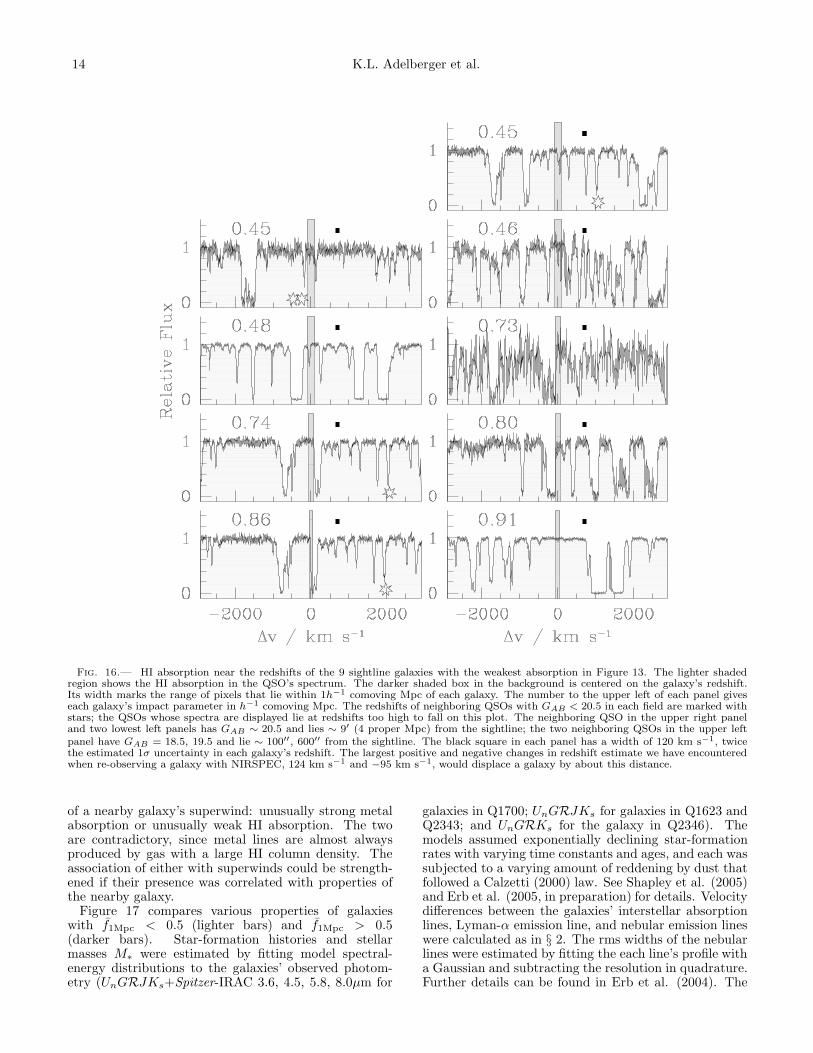
Fig. 16.— HI absorption near the redshifts of the 9 sightline galaxies with the weakest absorption in Figure 13. The lighter shadedregion shows the HI absorption in the QSO’s spectrum. The darker shaded box in the background is centered on the galaxy’s redshift.Its width marks the range of pixels that lie within 1h−1 comoving Mpc of each galaxy. The number to the upper left of each panel giveseach galaxy’s impact parameter in h−1 comoving Mpc. The redshifts of neighboring QSOs with GAB < 20.5 in each field are marked withstars; the QSOs whose spectra are displayed lie at redshifts too high to fall on this plot. The neighboring QSO in the upper right paneland two lowest left panels has GAB ∼ 20.5 and lies ∼ 9′ (4 proper Mpc) from the sightline; the two neighboring QSOs in the upper leftpanel have GAB = 18.5, 19.5 and lie ∼ 100′′, 600′′ from the sightline. The black square in each panel has a width of 120 km s−1, twicethe estimated 1σ uncertainty in each galaxy’s redshift. The largest positive and negative changes in redshift estimate we have encounteredwhen re-observing a galaxy with NIRSPEC, 124 km s−1 and −95 km s−1, would displace a galaxy by about this distance.
of a nearby galaxy’s superwind: unusually strong metalabsorption or unusually weak HI absorption. The twoare contradictory, since metal lines are almost alwaysproduced by gas with a large HI column density. Theassociation of either with superwinds could be strength-ened if their presence was correlated with properties ofthe nearby galaxy.
Figure 17 compares various properties of galaxieswith f1Mpc < 0.5 (lighter bars) and f1Mpc > 0.5(darker bars). Star-formation histories and stellarmasses M∗ were estimated by fitting model spectral-energy distributions to the galaxies’ observed photom-etry (UnGRJKs+Spitzer-IRAC 3.6, 4.5, 5.8, 8.0µm for
galaxies in Q1700; UnGRJKs for galaxies in Q1623 andQ2343; and UnGRKs for the galaxy in Q2346). Themodels assumed exponentially declining star-formationrates with varying time constants and ages, and each wassubjected to a varying amount of reddening by dust thatfollowed a Calzetti (2000) law. See Shapley et al. (2005)and Erb et al. (2005, in preparation) for details. Velocitydifferences between the galaxies’ interstellar absorptionlines, Lyman-α emission line, and nebular emission lineswere calculated as in § 2. The rms widths of the nebularlines were estimated by fitting the each line’s profile witha Gaussian and subtracting the resolution in quadrature.Further details can be found in Erb et al. (2004). The
HIGH-REDSHIFT GALAXIES AND INTERGALACTIC ABSORPTION LINES 15
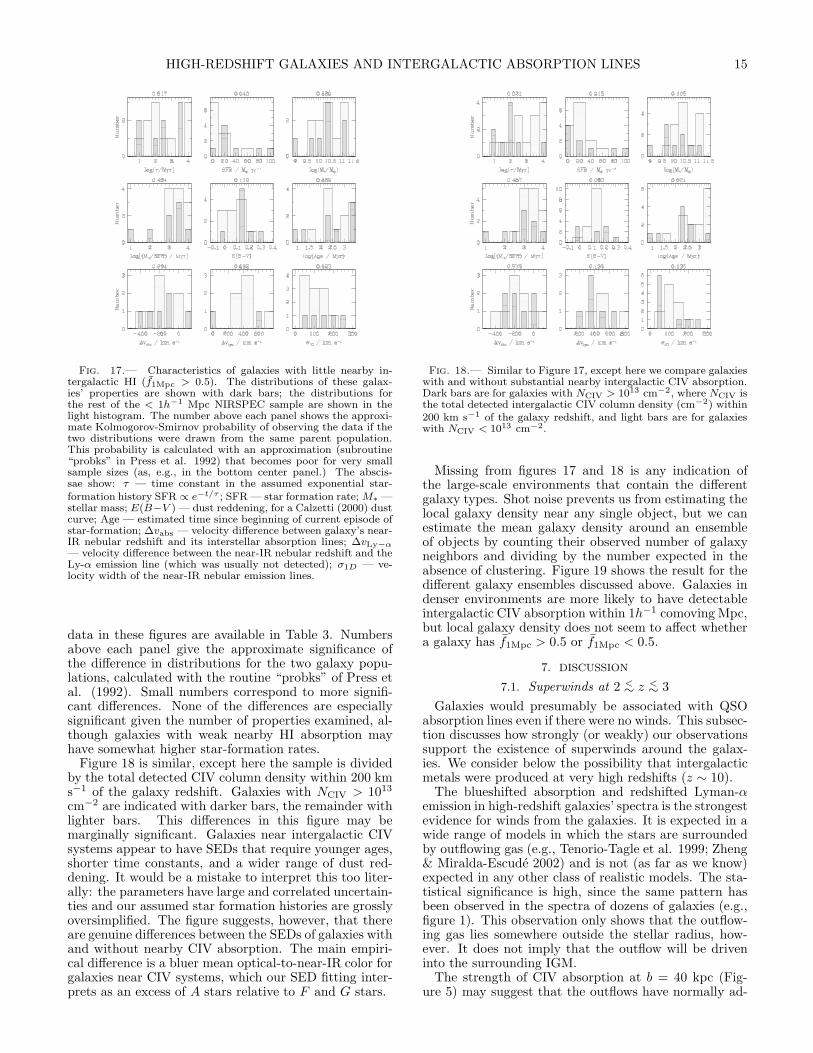
Fig. 17.— Characteristics of galaxies with little nearby in-tergalactic HI (f1Mpc > 0.5). The distributions of these galax-ies’ properties are shown with dark bars; the distributions forthe rest of the < 1h−1 Mpc NIRSPEC sample are shown in thelight histogram. The number above each panel shows the approxi-mate Kolmogorov-Smirnov probability of observing the data if thetwo distributions were drawn from the same parent population.This probability is calculated with an approximation (subroutine“probks” in Press et al. 1992) that becomes poor for very smallsample sizes (as, e.g., in the bottom center panel.) The abscis-sae show: τ — time constant in the assumed exponential star-formation history SFR ∝ e−t/τ ; SFR — star formation rate; M∗ —stellar mass; E(B−V ) — dust reddening, for a Calzetti (2000) dustcurve; Age — estimated time since beginning of current episode ofstar-formation; ∆vabs — velocity difference between galaxy’s near-IR nebular redshift and its interstellar absorption lines; ∆vLy−α— velocity difference between the near-IR nebular redshift and theLy-α emission line (which was usually not detected); σ1D — ve-locity width of the near-IR nebular emission lines.
data in these figures are available in Table 3. Numbersabove each panel give the approximate significance ofthe difference in distributions for the two galaxy popu-lations, calculated with the routine “probks” of Press etal. (1992). Small numbers correspond to more signifi-cant differences. None of the differences are especiallysignificant given the number of properties examined, al-though galaxies with weak nearby HI absorption mayhave somewhat higher star-formation rates.
Figure 18 is similar, except here the sample is dividedby the total detected CIV column density within 200 kms−1 of the galaxy redshift. Galaxies with NCIV > 1013
cm−2 are indicated with darker bars, the remainder withlighter bars. This differences in this figure may bemarginally significant. Galaxies near intergalactic CIVsystems appear to have SEDs that require younger ages,shorter time constants, and a wider range of dust red-dening. It would be a mistake to interpret this too liter-ally: the parameters have large and correlated uncertain-ties and our assumed star formation histories are grosslyoversimplified. The figure suggests, however, that thereare genuine differences between the SEDs of galaxies withand without nearby CIV absorption. The main empiri-cal difference is a bluer mean optical-to-near-IR color forgalaxies near CIV systems, which our SED fitting inter-prets as an excess of A stars relative to F and G stars.
Fig. 18.— Similar to Figure 17, except here we compare galaxieswith and without substantial nearby intergalactic CIV absorption.Dark bars are for galaxies with NCIV > 1013 cm−2, where NCIV isthe total detected intergalactic CIV column density (cm−2) within200 km s−1 of the galaxy redshift, and light bars are for galaxieswith NCIV < 1013 cm−2.
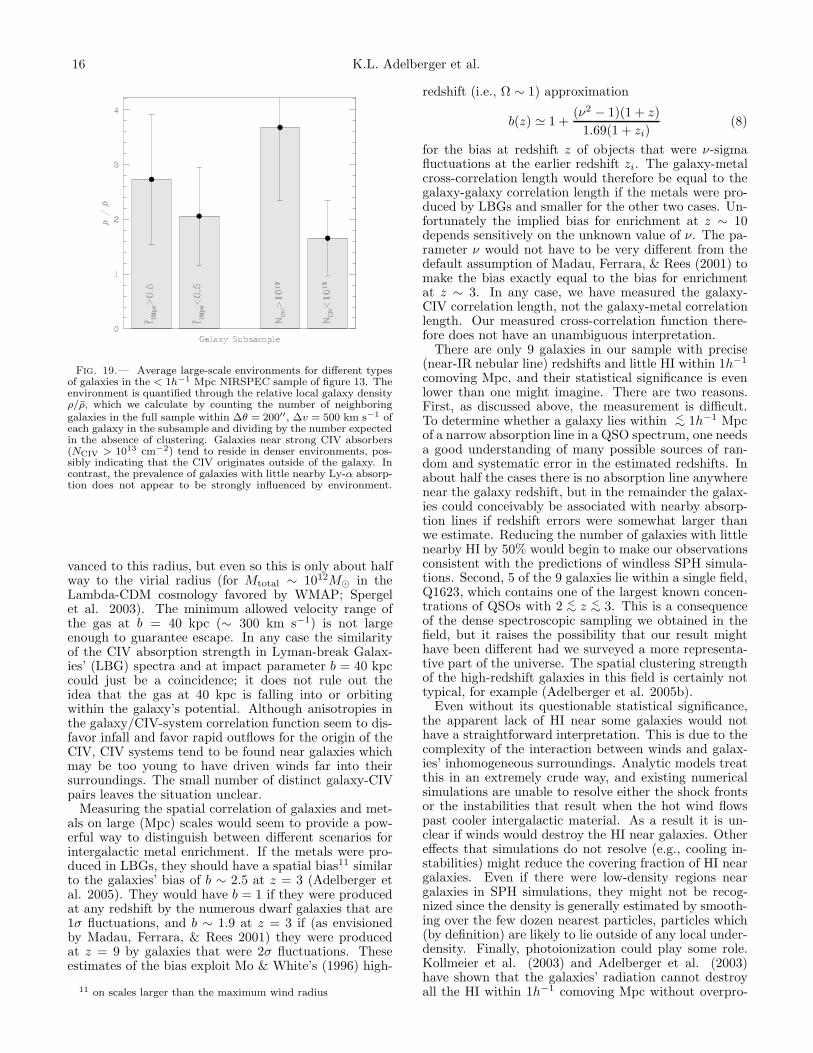
Missing from figures 17 and 18 is any indication ofthe large-scale environments that contain the differentgalaxy types. Shot noise prevents us from estimating thelocal galaxy density near any single object, but we canestimate the mean galaxy density around an ensembleof objects by counting their observed number of galaxyneighbors and dividing by the number expected in theabsence of clustering. Figure 19 shows the result for thedifferent galaxy ensembles discussed above. Galaxies indenser environments are more likely to have detectableintergalactic CIV absorption within 1h−1 comoving Mpc,but local galaxy density does not seem to affect whethera galaxy has f1Mpc > 0.5 or f1Mpc < 0.5.
7. DISCUSSION
7.1. Superwinds at 2 <∼ z <
∼ 3
Galaxies would presumably be associated with QSOabsorption lines even if there were no winds. This subsec-tion discusses how strongly (or weakly) our observationssupport the existence of superwinds around the galax-ies. We consider below the possibility that intergalacticmetals were produced at very high redshifts (z ∼ 10).
The blueshifted absorption and redshifted Lyman-αemission in high-redshift galaxies’ spectra is the strongestevidence for winds from the galaxies. It is expected in awide range of models in which the stars are surroundedby outflowing gas (e.g., Tenorio-Tagle et al. 1999; Zheng& Miralda-Escude 2002) and is not (as far as we know)expected in any other class of realistic models. The sta-tistical significance is high, since the same pattern hasbeen observed in the spectra of dozens of galaxies (e.g.,figure 1). This observation only shows that the outflow-ing gas lies somewhere outside the stellar radius, how-ever. It does not imply that the outflow will be driveninto the surrounding IGM.
The strength of CIV absorption at b = 40 kpc (Fig-ure 5) may suggest that the outflows have normally ad-
16 K.L. Adelberger et al.
Fig. 19.— Average large-scale environments for different typesof galaxies in the < 1h−1 Mpc NIRSPEC sample of figure 13. Theenvironment is quantified through the relative local galaxy densityρ/ρ, which we calculate by counting the number of neighboringgalaxies in the full sample within ∆θ = 200′′, ∆v = 500 km s−1 ofeach galaxy in the subsample and dividing by the number expectedin the absence of clustering. Galaxies near strong CIV absorbers(NCIV > 1013 cm−2) tend to reside in denser environments, pos-sibly indicating that the CIV originates outside of the galaxy. Incontrast, the prevalence of galaxies with little nearby Ly-α absorp-tion does not appear to be strongly influenced by environment.
vanced to this radius, but even so this is only about halfway to the virial radius (for Mtotal ∼ 1012M⊙ in theLambda-CDM cosmology favored by WMAP; Spergelet al. 2003). The minimum allowed velocity range ofthe gas at b = 40 kpc (∼ 300 km s−1) is not largeenough to guarantee escape. In any case the similarityof the CIV absorption strength in Lyman-break Galax-ies’ (LBG) spectra and at impact parameter b = 40 kpccould just be a coincidence; it does not rule out theidea that the gas at 40 kpc is falling into or orbitingwithin the galaxy’s potential. Although anisotropies inthe galaxy/CIV-system correlation function seem to dis-favor infall and favor rapid outflows for the origin of theCIV, CIV systems tend to be found near galaxies whichmay be too young to have driven winds far into theirsurroundings. The small number of distinct galaxy-CIVpairs leaves the situation unclear.
Measuring the spatial correlation of galaxies and met-als on large (Mpc) scales would seem to provide a pow-erful way to distinguish between different scenarios forintergalactic metal enrichment. If the metals were pro-duced in LBGs, they should have a spatial bias11 similarto the galaxies’ bias of b ∼ 2.5 at z = 3 (Adelberger etal. 2005). They would have b = 1 if they were producedat any redshift by the numerous dwarf galaxies that are1σ fluctuations, and b ∼ 1.9 at z = 3 if (as envisionedby Madau, Ferrara, & Rees 2001) they were producedat z = 9 by galaxies that were 2σ fluctuations. Theseestimates of the bias exploit Mo & White’s (1996) high-
11 on scales larger than the maximum wind radius
redshift (i.e., Ω ∼ 1) approximation
b(z) ≃ 1 +(ν2 − 1)(1 + z)
1.69(1 + zi)(8)
for the bias at redshift z of objects that were ν-sigmafluctuations at the earlier redshift zi. The galaxy-metalcross-correlation length would therefore be equal to thegalaxy-galaxy correlation length if the metals were pro-duced by LBGs and smaller for the other two cases. Un-fortunately the implied bias for enrichment at z ∼ 10depends sensitively on the unknown value of ν. The pa-rameter ν would not have to be very different from thedefault assumption of Madau, Ferrara, & Rees (2001) tomake the bias exactly equal to the bias for enrichmentat z ∼ 3. In any case, we have measured the galaxy-CIV correlation length, not the galaxy-metal correlationlength. Our measured cross-correlation function there-fore does not have an unambiguous interpretation.
There are only 9 galaxies in our sample with precise(near-IR nebular line) redshifts and little HI within 1h−1
comoving Mpc, and their statistical significance is evenlower than one might imagine. There are two reasons.First, as discussed above, the measurement is difficult.To determine whether a galaxy lies within <
∼ 1h−1 Mpcof a narrow absorption line in a QSO spectrum, one needsa good understanding of many possible sources of ran-dom and systematic error in the estimated redshifts. Inabout half the cases there is no absorption line anywherenear the galaxy redshift, but in the remainder the galax-ies could conceivably be associated with nearby absorp-tion lines if redshift errors were somewhat larger thanwe estimate. Reducing the number of galaxies with littlenearby HI by 50% would begin to make our observationsconsistent with the predictions of windless SPH simula-tions. Second, 5 of the 9 galaxies lie within a single field,Q1623, which contains one of the largest known concen-trations of QSOs with 2 <
∼ z <∼ 3. This is a consequence
of the dense spectroscopic sampling we obtained in thefield, but it raises the possibility that our result mighthave been different had we surveyed a more representa-tive part of the universe. The spatial clustering strengthof the high-redshift galaxies in this field is certainly nottypical, for example (Adelberger et al. 2005b).
Even without its questionable statistical significance,the apparent lack of HI near some galaxies would nothave a straightforward interpretation. This is due to thecomplexity of the interaction between winds and galax-ies’ inhomogeneous surroundings. Analytic models treatthis in an extremely crude way, and existing numericalsimulations are unable to resolve either the shock frontsor the instabilities that result when the hot wind flowspast cooler intergalactic material. As a result it is un-clear if winds would destroy the HI near galaxies. Othereffects that simulations do not resolve (e.g., cooling in-stabilities) might reduce the covering fraction of HI neargalaxies. Even if there were low-density regions neargalaxies in SPH simulations, they might not be recog-nized since the density is generally estimated by smooth-ing over the few dozen nearest particles, particles which(by definition) are likely to lie outside of any local under-density. Finally, photoionization could play some role.Kollmeier et al. (2003) and Adelberger et al. (2003)have shown that the galaxies’ radiation cannot destroyall the HI within 1h−1 comoving Mpc without overpro-
HIGH-REDSHIFT GALAXIES AND INTERGALACTIC ABSORPTION LINES 17
ducing the UV background, but photoionizing the weakerclouds around one third of the galaxies might be possi-ble. It therefore remains unclear if the lack of HI nearsome galaxies is a unique or even an expected signatureof superwinds. The weak correlations between galaxyproperties and the strength of nearby intergalactic HIabsorption may suggest that the HI absorption is unre-lated to winds.
7.2. Metal enrichment at z ∼ 10
Although our observations do not provide unequivo-cal evidence for superwinds at 2 <
∼ z <∼ 3, it would be a
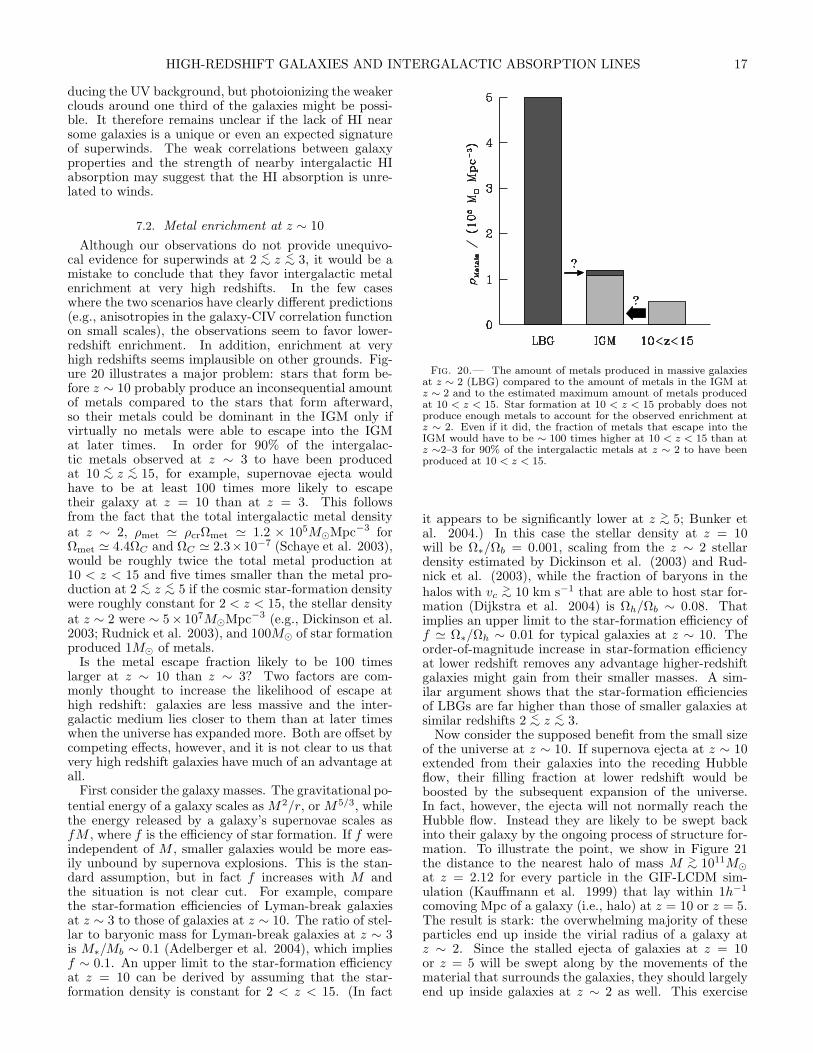
mistake to conclude that they favor intergalactic metalenrichment at very high redshifts. In the few caseswhere the two scenarios have clearly different predictions(e.g., anisotropies in the galaxy-CIV correlation functionon small scales), the observations seem to favor lower-redshift enrichment. In addition, enrichment at veryhigh redshifts seems implausible on other grounds. Fig-ure 20 illustrates a major problem: stars that form be-fore z ∼ 10 probably produce an inconsequential amountof metals compared to the stars that form afterward,so their metals could be dominant in the IGM only ifvirtually no metals were able to escape into the IGMat later times. In order for 90% of the intergalac-tic metals observed at z ∼ 3 to have been producedat 10 <
∼ z <∼ 15, for example, supernovae ejecta would
have to be at least 100 times more likely to escapetheir galaxy at z = 10 than at z = 3. This followsfrom the fact that the total intergalactic metal densityat z ∼ 2, ρmet ≃ ρcrΩmet ≃ 1.2 × 10⁵M⊙Mpc−3 forΩmet ≃ 4.4ΩC and ΩC ≃ 2.3×10⁻⁷ (Schaye et al. 2003),would be roughly twice the total metal production at10 < z < 15 and five times smaller than the metal pro-duction at 2 <
∼ z <∼ 5 if the cosmic star-formation density
were roughly constant for 2 < z < 15, the stellar densityat z ∼ 2 were ∼ 5× 10⁷M⊙Mpc−3 (e.g., Dickinson et al.2003; Rudnick et al. 2003), and 100M⊙ of star formationproduced 1M⊙ of metals.
Is the metal escape fraction likely to be 100 timeslarger at z ∼ 10 than z ∼ 3? Two factors are com-monly thought to increase the likelihood of escape athigh redshift: galaxies are less massive and the inter-galactic medium lies closer to them than at later timeswhen the universe has expanded more. Both are offset bycompeting effects, however, and it is not clear to us thatvery high redshift galaxies have much of an advantage atall.
First consider the galaxy masses. The gravitational po-tential energy of a galaxy scales as M2/r, or M5/3, whilethe energy released by a galaxy’s supernovae scales asfM , where f is the efficiency of star formation. If f wereindependent of M , smaller galaxies would be more eas-ily unbound by supernova explosions. This is the stan-dard assumption, but in fact f increases with M andthe situation is not clear cut. For example, comparethe star-formation efficiencies of Lyman-break galaxiesat z ∼ 3 to those of galaxies at z ∼ 10. The ratio of stel-lar to baryonic mass for Lyman-break galaxies at z ∼ 3is M∗/Mb ∼ 0.1 (Adelberger et al. 2004), which impliesf ∼ 0.1. An upper limit to the star-formation efficiencyat z = 10 can be derived by assuming that the star-formation density is constant for 2 < z < 15. (In fact
Fig. 20.— The amount of metals produced in massive galaxiesat z ∼ 2 (LBG) compared to the amount of metals in the IGM atz ∼ 2 and to the estimated maximum amount of metals producedat 10 < z < 15. Star formation at 10 < z < 15 probably does notproduce enough metals to account for the observed enrichment atz ∼ 2. Even if it did, the fraction of metals that escape into theIGM would have to be ∼ 100 times higher at 10 < z < 15 than atz ∼2–3 for 90% of the intergalactic metals at z ∼ 2 to have beenproduced at 10 < z < 15.
it appears to be significantly lower at z >∼ 5; Bunker et
al. 2004.) In this case the stellar density at z = 10will be Ω∗/Ωb = 0.001, scaling from the z ∼ 2 stellardensity estimated by Dickinson et al. (2003) and Rud-nick et al. (2003), while the fraction of baryons in thehalos with vc
>∼ 10 km s−1 that are able to host star for-
mation (Dijkstra et al. 2004) is Ωh/Ωb ∼ 0.08. Thatimplies an upper limit to the star-formation efficiency off ≃ Ω∗/Ωh ∼ 0.01 for typical galaxies at z ∼ 10. Theorder-of-magnitude increase in star-formation efficiencyat lower redshift removes any advantage higher-redshiftgalaxies might gain from their smaller masses. A sim-ilar argument shows that the star-formation efficienciesof LBGs are far higher than those of smaller galaxies atsimilar redshifts 2 <
∼ z <∼ 3.
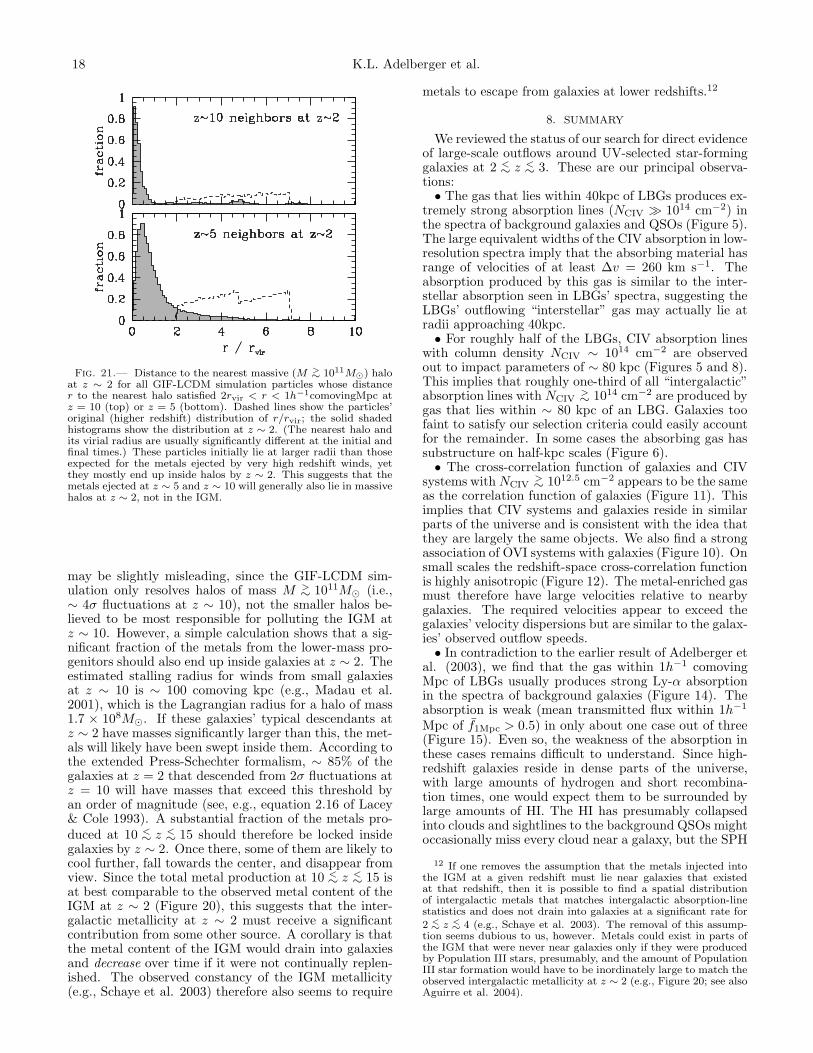
Now consider the supposed benefit from the small sizeof the universe at z ∼ 10. If supernova ejecta at z ∼ 10extended from their galaxies into the receding Hubbleflow, their filling fraction at lower redshift would beboosted by the subsequent expansion of the universe.In fact, however, the ejecta will not normally reach theHubble flow. Instead they are likely to be swept backinto their galaxy by the ongoing process of structure for-mation. To illustrate the point, we show in Figure 21the distance to the nearest halo of mass M >
∼ 1011M⊙
at z = 2.12 for every particle in the GIF-LCDM sim-ulation (Kauffmann et al. 1999) that lay within 1h−1
comoving Mpc of a galaxy (i.e., halo) at z = 10 or z = 5.The result is stark: the overwhelming majority of theseparticles end up inside the virial radius of a galaxy atz ∼ 2. Since the stalled ejecta of galaxies at z = 10or z = 5 will be swept along by the movements of thematerial that surrounds the galaxies, they should largelyend up inside galaxies at z ∼ 2 as well. This exercise
18 K.L. Adelberger et al.
Fig. 21.— Distance to the nearest massive (M >∼ 1011M⊙) halo
at z ∼ 2 for all GIF-LCDM simulation particles whose distancer to the nearest halo satisfied 2rvir < r < 1h−1comovingMpc atz = 10 (top) or z = 5 (bottom). Dashed lines show the particles’original (higher redshift) distribution of r/rvir; the solid shadedhistograms show the distribution at z ∼ 2. (The nearest halo andits virial radius are usually significantly different at the initial andfinal times.) These particles initially lie at larger radii than thoseexpected for the metals ejected by very high redshift winds, yetthey mostly end up inside halos by z ∼ 2. This suggests that themetals ejected at z ∼ 5 and z ∼ 10 will generally also lie in massivehalos at z ∼ 2, not in the IGM.
may be slightly misleading, since the GIF-LCDM sim-ulation only resolves halos of mass M >
∼ 1011M⊙ (i.e.,∼ 4σ fluctuations at z ∼ 10), not the smaller halos be-lieved to be most responsible for polluting the IGM atz ∼ 10. However, a simple calculation shows that a sig-nificant fraction of the metals from the lower-mass pro-genitors should also end up inside galaxies at z ∼ 2. Theestimated stalling radius for winds from small galaxiesat z ∼ 10 is ∼ 100 comoving kpc (e.g., Madau et al.2001), which is the Lagrangian radius for a halo of mass1.7 × 108M⊙. If these galaxies’ typical descendants atz ∼ 2 have masses significantly larger than this, the met-als will likely have been swept inside them. According tothe extended Press-Schechter formalism, ∼ 85% of thegalaxies at z = 2 that descended from 2σ fluctuations atz = 10 will have masses that exceed this threshold byan order of magnitude (see, e.g., equation 2.16 of Lacey& Cole 1993). A substantial fraction of the metals pro-duced at 10 <
∼ z <∼ 15 should therefore be locked inside
galaxies by z ∼ 2. Once there, some of them are likely tocool further, fall towards the center, and disappear fromview. Since the total metal production at 10 <
∼ z <∼ 15 is
at best comparable to the observed metal content of theIGM at z ∼ 2 (Figure 20), this suggests that the inter-galactic metallicity at z ∼ 2 must receive a significantcontribution from some other source. A corollary is thatthe metal content of the IGM would drain into galaxiesand decrease over time if it were not continually replen-ished. The observed constancy of the IGM metallicity(e.g., Schaye et al. 2003) therefore also seems to require
metals to escape from galaxies at lower redshifts.12
8. SUMMARY
We reviewed the status of our search for direct evidenceof large-scale outflows around UV-selected star-forminggalaxies at 2 <
∼ z <∼ 3. These are our principal observa-
tions:• The gas that lies within 40kpc of LBGs produces ex-
tremely strong absorption lines (NCIV ≫ 1014 cm−2) inthe spectra of background galaxies and QSOs (Figure 5).The large equivalent widths of the CIV absorption in low-resolution spectra imply that the absorbing material hasrange of velocities of at least ∆v = 260 km s−1. Theabsorption produced by this gas is similar to the inter-stellar absorption seen in LBGs’ spectra, suggesting theLBGs’ outflowing “interstellar” gas may actually lie atradii approaching 40kpc.• For roughly half of the LBGs, CIV absorption lines
with column density NCIV ∼ 1014 cm−2 are observedout to impact parameters of ∼ 80 kpc (Figures 5 and 8).This implies that roughly one-third of all “intergalactic”absorption lines with NCIV
>∼ 1014 cm−2 are produced by
gas that lies within ∼ 80 kpc of an LBG. Galaxies toofaint to satisfy our selection criteria could easily accountfor the remainder. In some cases the absorbing gas hassubstructure on half-kpc scales (Figure 6).• The cross-correlation function of galaxies and CIV
systems with NCIV>∼ 1012.5 cm−2 appears to be the same
as the correlation function of galaxies (Figure 11). Thisimplies that CIV systems and galaxies reside in similarparts of the universe and is consistent with the idea thatthey are largely the same objects. We also find a strongassociation of OVI systems with galaxies (Figure 10). Onsmall scales the redshift-space cross-correlation functionis highly anisotropic (Figure 12). The metal-enriched gasmust therefore have large velocities relative to nearbygalaxies. The required velocities appear to exceed thegalaxies’ velocity dispersions but are similar to the galax-ies’ observed outflow speeds.• In contradiction to the earlier result of Adelberger et
al. (2003), we find that the gas within 1h−1 comovingMpc of LBGs usually produces strong Ly-α absorptionin the spectra of background galaxies (Figure 14). Theabsorption is weak (mean transmitted flux within 1h−1
Mpc of f1Mpc > 0.5) in only about one case out of three(Figure 15). Even so, the weakness of the absorption inthese cases remains difficult to understand. Since high-redshift galaxies reside in dense parts of the universe,with large amounts of hydrogen and short recombina-tion times, one would expect them to be surrounded bylarge amounts of HI. The HI has presumably collapsedinto clouds and sightlines to the background QSOs mightoccasionally miss every cloud near a galaxy, but the SPH
12 If one removes the assumption that the metals injected intothe IGM at a given redshift must lie near galaxies that existedat that redshift, then it is possible to find a spatial distributionof intergalactic metals that matches intergalactic absorption-linestatistics and does not drain into galaxies at a significant rate for2 <∼ z <
∼ 4 (e.g., Schaye et al. 2003). The removal of this assump-tion seems dubious to us, however. Metals could exist in parts ofthe IGM that were never near galaxies only if they were producedby Population III stars, presumably, and the amount of PopulationIII star formation would have to be inordinately large to match theobserved intergalactic metallicity at z ∼ 2 (e.g., Figure 20; see alsoAguirre et al. 2004).
HIGH-REDSHIFT GALAXIES AND INTERGALACTIC ABSORPTION LINES 19
simulations of Kollmeier et al. (in preparation) suggestthat the chance of this is very low (Figure 15).• We were unable to identify any statistically signif-
icant differences in age, dust reddening, stellar mass,kinematics, or environment between galaxies with weaknearby HI absorption and the rest, although galaxieswith weak absorption may have higher star-formationrates (Figure 17). Galaxies near intergalactic CIV sys-tems appear to reside in relatively dense environments(Figure 19) and to have distinctive SEDs characterizedby blue colors and young ages (Figure 18).
As discussed in § 7, none of these observations provideunequivocal evidence for superwinds at z ∼ 2–3. Thisis mostly because it is unclear how superwinds wouldaffect the correlation between galaxies and intergalac-tic absorption lines. Metals and galaxies would lie neareach other at z ∼ 3 even if there were no active outflows,for example. We argued in § 7 that star-formation at10 < z < 15 may not produce enough metals to accountfor the intergalactic metallicity at z ∼ 2–3, and thatmany of these metals would be buried inside galaxies byz ∼ 2–3, but our simple arguments need to be checkedwith numerical simulations. The interpretation of ourdata will remain ambiguous until that time. The argu-ments presented in § 7 should make it clear that metalenrichment at 5 <
∼ z <∼ 15 will be much harder to rule out
than metal enrichment at 10 <∼ z <
∼ 15.There is only one case where the data seem easy to
interpret and we are limited by the small size of oursample. This is the redshift-space distribution of met-als within ∼ 200 comoving kpc of galaxies. Mapping thevelocity offsets between galaxies’ stars and their metals
as a function of impact parameter would help show if thedetected metals are flowing out of, falling into, or orbit-ing within the galaxies’ halos. The velocity offsets can bemapped by obtaining higher resolution spectra of moreclose pairs (e.g., the right panel of figure 4) or by obtain-ing more near-IR nebular redshifts for galaxies near theQSO sightline (e.g., Figure 12). That seems the sensibleway to proceed.
Trenchant criticism from P. Madau, P. Petitjean, M.Rauch, J. Schaye, and an anonymous referee improvedthis paper significantly. We benefited as well fromconversations with T. Abel, J. Kollmeier, J. Miralda-Escude, D. Weinberg and S. White. W. Sargent andM. Rauch gave us generous access to their QSO spec-tra. J. Kollmeier, D. Weinberg, N. Katz, and R. Daveallowed us to show some of their unpublished results.KLA and AES were supported by fellowships from theCarnegie Institute of Washington and the Miller Foun-dation. DKE, NAR, and CCS were supported by grantAST 03-07263 from the National Science Foundation andby a grant from the Packard Foundation. During thecourse of our observations we frequently consulted theNASA/IPAC Extragalactic Database (NED), which isoperated by the Jet Propulsion Laboratory, CaliforniaInstitute of Technology, under contract with the NationalAeronautics and Space Administration. We are gratefulthat the people of Hawaii allow astronomers to build andoperate telescopes on the summit of Mauna Kea.
REFERENCES
Adelberger, K.L., Steidel, C.C., Shapley, A.E., & Pettini, M. 2003,ApJ, 584, 45
Adelberger, K.L., Steidel, C.C., Shapley, A.E., Hunt, M.P., Erb,D.K., Reddy, N.A., & Pettini, M. 2004, ApJ, 607, 226
Adelberger, K.L. 2004, ApJ, 612, 706Adelberger, K.L. 2005, ApJ, 621, 574Adelberger, K.L., Steidel, C.C., Pettini, M., Shapley, A.E., Reddy,
N.A., & Erb, D.K. 2005, ApJ, 619, 697Adelberger, K.L., Steidel, C.C., Pettini, M., Shapley, A.E., Reddy,
N.A., & Erb, D.K. 2005, ApJL, 620, L75Aguirre, A., Schaye, J., Kim, T.-S., Theuns, T., Rauch, M., &
Sargent, W.L.W., 2004, ApJ, 602, 38Bunker, A.J., Stanway, E.R., Ellis, R.S., & McMahon, R.G. 2004,
MNRAS, 355, 374Calzetti, D., Armus, L., Bohlin, R.C., Kinney, A.C., Koornneef, J.,
& Storchi-Bergmann, T. 2000, ApJ, 533, 682Chen, H.-W., Lanzetta, K.M., & Webb, J.K. 2001, ApJ, 556, 158Croft, R.A.C., Hernquist, L., Springel, V., Westover, M., & White,
M. 2002, ApJ, 580, 634Desjacques, V., Nusser, A., Haehnelt, M.G., & Stoehr, F. 2004,
MNRAS, 350, 879Dickinson, M., Papovich, C., Ferguson, H.C., & Budavari, T., 2003,
ApJ, 587, 25Dijkstra, M., Haiman, Z., Rees, M.J., & Weinberg, D.H., 2004,
ApJ, 601, 666Erb, D.K., Steidel, C.C., Shapley, A.E., Pettini, M., & Adelberger,
K.L. 2004, ApJ, 612, 122Erb, D.K. et al., 2003, ApJ, 591, 101Fisher, R.A. 1934, “Statistical Methods for Research Workers”, 5th
Edition, (Edinburgh: Oliver & Boyd), §12Franx, M., Illingworth, G.D., Kelson, D.D., van Dokkum, P.G., &
Tran, K.-V. 1997, ApJ, 486, L75Frye, B.L., Broadhurst, T., & Benitez, N. 2002, ApJ, 568, 558Gnedin, N.Y. 1998, MNRAS, 294, 407Kaiser, N. 1991, ApJ, 383, 104Kauffmann, G., Colberg, J.M., Diaferio, A., & White, S.D.M., 1999,
MNRAS, 303, 188
Kollmeier, J.A., Weinberg, D.H., Dave, R., & Katz, N. 2003, ApJ,594, 75
Lacey, C. & Cole, S. 1993, MNRAS, 262, 627Madau, P., Ferrara, A., & Rees, M.J. 2001, ApJ, 555, 92Martin, C. 2005, ApJ, submitted astro-ph/0410247Maselli, A., Ferrara, A., Bruscoli, M., Marri, S., & Schneider, R.
2004, MNRAS, 350, 21McLean, I.S., Graham, J.R., Becklin, E.E., Figer, D.F., Larkin,
J.E., Levenson, N.A., & Teplitz, H.I. 2000, SPIE, 4008, 1048Mo, H.J. & White, S.D.M. 1996, MNRAS, 282, 347Oke, J.B. et al. 1995, PASP, 107, 3750Pettini, M., Kellogg, M., Steidel, C.C., Dickinson, M., Adelberger,
K.L., & Giavalisco, M. 1998, ApJ, 508, 539Pettini, M. et al. 2001, ApJ, 554, 981Pettini, M., Rix, S.A., Steidel, C.C., Adelberger, K.L., Hunt, M.P.,
& Shapley, A.E., 2002, ApJ, 569, 742Ponman, T.J., Cannon, D.B., & Navarro, J.F. 1999, Nature, 397,
135Press, W. H., Flannery, B. P., Teukolsky, S. A., & Vetterling, W.
T. 1992, “Numerical Recipes in C”, (Cambridge: CambridgeUniversity Press)
Quashnock, J.M. & Vanden Berk, D.E. 1998, ApJ, 500, 98Rauch, M., Sargent, W.L.W., & Barlow, T.A. 2001a, ApJ, 554, 823Rauch, M., Sargent, W.L.W., Barlow, T.A., & Carswell, R.F.
2001b, ApJ, 554, 823Rudnick, G. et al., 2003, ApJ, 599, 847Sargent, W.L.W., Steidel, C.C., & Boksenberg, A. 1988, ApJS, 68,
539Sheinis, A.I., Miller, J.S., Bolte, M., & Sutin, B.M. 2000, SPIE,
4008, 522Schaye, J., Aguirre, A., Kim, T., Theuns, T., Rauch, M., & Sargent,
W., 2003, ApJ, 596, 768Shapley, A.E. et al. 2005, ApJ, in pressShapley, A.E., Steidel, C.C., Pettini, M., & Adelberger, K.L. 2003,
ApJ, 588, 65Simcoe, R.A., Sargent, W.L.W., & Rauch, M. 2002, ApJ, 578, 737Spergel, D.N. et al. 2003, ApJS, 148, 175
20 K.L. Adelberger et al.
Springel, V. & Hernquist, L. 2003, MNRAS, 339, 289Springel, V., di Matteo, T. & Hernquist, L. 2004, astro-ph/0409436Steidel, C.C. 1990, ApJS, 72, 1Steidel, C.C., Adelberger, K.L., Shapley, A.E., Pettini, M.,
Dickinson, M., & Giavalisco, M. 2003, ApJ, 592, 728Steidel, C.C., Shapley, A.E., Pettini, M., Adelberger, K.L., Erb,
D.K., Reddy, N.A., & Hunt, M.P. 2004, ApJ, 604, 534
Tenorio-Tagle, G., Silich, S.A., Kunth, D., Terlevich, E., &
Terlevich, R. 1999, MNRAS, 309. 332
Vogt, S.S. et al. 1994, SPIE, 2198, 362
Weil, M. L., Eke, V. R., & Efstathiou, G. 1998, MNRAS, 300, 773
White, S.D.M. & Rees, M.J. 1978, MNRAS, 183, 341
Zheng, Z. & Miralda-Escude, J. 2002, ApJ, 578, 33