the california commission on health and safety and workers' compensation selected indicators in...
TRANSCRIPT
The California Commission on Health and Safety
and Workers’ Compensation
Selected Indicators in Workers’ Compensation:
A Report Card for Californians
CHSWC Members
John C. Wilson (2005 Chair) Allen Davenport
Leonard C. McLeod Alfonso Salazar
Kristen Schwenkmeyer Robert B. Steinberg
Darrel “Shorty” Thacker Angie Wei
Executive Officer
Christine Baker
State of California Labor and Workforce Development Agency
Department of Industrial Relations
December 2005
Selected Indicators in Workers’ Compensation: A Report Card for Californians
- i - December 14, 2005
Table of Contents
INTRODUCTION.........................................................................................................................................1
WORKERS’ COMPENSATION PREMIUMS.............................................................................................................2 PURE PREMIUM WC ADVISORY RATES..............................................................................................................................................2
Minimum Rate Law and Open Rating .......................................................................................................................................2 Graphic: Recommended v. Approved Advisory WC Rates.................................................................................6 Graphic: Recommended v. Approved v. SCIF v. All Insurers WC Rates............................................................7
CALIFORNIA WORKERS’ COMPENSATION RATE CHANGES..................................................................................................................7 Graphic: California Workers’ Compensation Insurance Carrier Rate Filing Changes in 2004 ...........................8
WORKERS’ COMPENSATION EARNED PREMIUM..................................................................................................................................9 Graphic: Workers’ Compensation Total Earned Premium ..................................................................................9
WORKERS’ COMPENSATION WRITTEN PREMIUM ..............................................................................................................................10 Workers’ Compensation Written Premium..............................................................................................................................10
Graphic: California WC Written Premium..........................................................................................................10 California WC Premium Deductibles .......................................................................................................................................11
Graphic: California WC Premium Deductibles...................................................................................................11 Graphic: California WC Deductibles as percent of Written Premium...............................................................11
CALIFORNIA WORKERS’ COMPENSATION INSURANCE INDUSTRY................................................................................12 Workers’ Compensation Insurer Expenses.............................................................................................................................12 Combined Loss and Expense Ratios......................................................................................................................................12
Graphic: Combined Loss and Expense Ratios ..................................................................................................12 Under-reserving.......................................................................................................................................................................13 Average Claim Costs...............................................................................................................................................................13
Graphic: Estimated Total Loss per Indemnity Claim 1993 - 2005 .....................................................................13 Current State of the Insurance Industry ..................................................................................................................................14
Market Share..................................................................................................................................................................... 14 Graphic: California WC Market Share by Type of Insurer .................................................................................14
September 11 Impact on Insurance Industry.................................................................................................................... 14 Insurance Market Insolvency ............................................................................................................................................ 15
Listing: Insurers Liquidated since 2000 .............................................................................................................15 WORKERS’ COMPENSATION COSTS................................................................................................................17
Average California Workers’ Compensation Premium Rate Per $100 of Payroll ............................................................ 17 Graphic: Average California Workers’ Compensation Premium Rate Per $100 of Payroll ...............................17
Workers Covered by Workers’ Compensation Insurance ................................................................................................ 18 Graphic: Workers Covered by WC Insurance....................................................................................................18
Average Earned Premium per Covered Worker .....................................................................................................................18 Graphic Average Earned Premium per Covered Worker ..................................................................................18
Workers’ Compensation Expenditures – Insured Employers .................................................................................................19 Indemnity Benefits ............................................................................................................................................................. 19
Table: System-wide Estimated Costs of Paid Indemnity Benefits .....................................................................19 Graphic: Indemnity Benefits Paid by Insured Employers - 2004 .......................................................................20 Graphic: Indemnity Benefits Paid by Insured Employers - 2003 .......................................................................20
Medical Benefits ................................................................................................................................................................ 21 Table: System-wide Costs – Medical Benefits ...................................................................................................21 Graphic: Medical Paid in 2003 - Insurers...........................................................................................................22 Graphic: Medical Paid in 2004 - Insurers...........................................................................................................22
Average Cost per Claim by Type of Injury........................................................................................................................ 23 Graphic: Average Cost per Claim by Type of Injury ..........................................................................................23
Workers’ Compensation Expenditures - Private Sector Self-insured Employers...................................................................24 Graphic: Employees of Private Sector Self-insured Employers ........................................................................24
Selected Indicators in Workers’ Compensation: A Report Card for Californians
- ii - December 14, 2005
Graphic: Indemnity Claims per 100 Employees of Self-Insured Employers......................................................25 Graphic: Incurred Cost per Indemnity Claim......................................................................................................26 Graphic: Incurred Cost per Claim – Indemnity and Medical ..............................................................................27
Public Self-Insured Employers.......................................................................................................................................... 28 Graphic: Number of Employees of Public Self Insured Employers (in Millions) ................................................28 Graphic: Indemnity Claims per 100 Employees of Public Self Insured Employers...........................................28 Graphic: Incurred Cost per Indemnity Claim of Public Self-Insured Employers................................................29 Graphic: Incurred Cost per Indemnity and Medical Claim - Public Self Insured Employers.............................29
Vocational Rehabilitation Costs ...............................................................................................................................................30 Graphic: Voc Rehab Costs compared with Total Incurred Losses...................................................................30 Graphic: Voc Rehab Costs as Percent of Total Incurred Losses .....................................................................31
INJURIES AND ILLNESSES...........................................................................................................................32 Non-fatal Injury and Illness Rates in California .......................................................................................................................32
Graphic: OSHA Injury and Illness Rates in California 1985-2003 .....................................................................32 Graphic: Occupational Injury and Illness Rates in California by Sector ............................................................33 Graphic: Lost Time Injury and Illness Rates in California by Sector .................................................................34
Non-fatal Occupational Injuries and Illness Days-away-from-work Rates by Industry...........................................................35 Graphic: Injury Rates by Industry 1996 v 2002 .................................................................................................35
Profile of Injury and Illness Statistics.......................................................................................................................................36 California and the Nation................................................................................................................................................... 36
Incidence Rates ............................................................................................................................................................36 Duration.........................................................................................................................................................................36
Industry Data ..................................................................................................................................................................... 36 Non-fatal and Fatal Occupational Injuries by Establishment Size and Type ................................................................... 37 Types of Injuries ................................................................................................................................................................ 38 Demographics................................................................................................................................................................... 38
WORKERS’ COMPENSATION SYSTEM PERFORMANCE ...............................................................................40 INTRODUCTION................................................................................................................................................................................40 ADMINISTRATIVE OPERATIONS........................................................................................................................................................41
Division of Workers’ Compensation Opening Documents ......................................................................................................41 Graphic: DWC Opening Documents ..................................................................................................................41
Mix of Opening Documents .....................................................................................................................................................42 Graphic: DWC Opening Documents as Percentage of Total ............................................................................42
Division of Workers’ Compensation Hearings.........................................................................................................................43 Number of Hearings.......................................................................................................................................................... 43
Graphic: DWC Hearings Held ............................................................................................................................43 DWC Expedited Hearings................................................................................................................................................. 44
Graphic: DWC Expedited Hearings ...................................................................................................................44 Timeliness of Hearings...................................................................................................................................................... 45
Graphic: Elapsed Time in Days from Request to DWC Hearing .......................................................................45 Division of Workers’ Compensation Decisions .......................................................................................................................46
Graphic: Division of Workers’ Compensation Case-closing Decisions .............................................................46 Mix of Division of Workers’ Compensation Decisions ...................................................................................................... 47
Graphic: DWC Decisions: Percentage Distribution by Type of Decision ..........................................................47 Division of Workers’ Compensation Lien Decisions ......................................................................................................... 48
Graphic: DWC Decisions on Liens.....................................................................................................................49 FRAUD................................................................................................................................................50
Suspected Fraudulent Claims .................................................................................................................................................50 Workers’ Compensation Fraud Suspect Arrests.....................................................................................................................50 Workers’ Compensation Fraud Suspect Convictions..............................................................................................................51 Workers’ Compensation Fraud Investigations ........................................................................................................................52
Types of WC Fraud Investigations.................................................................................................................................... 52 PERMANENT DISABILITY AND MEDICAL/LEGAL EXPENSES.......................................................................................53
Selected Indicators in Workers’ Compensation: A Report Card for Californians
- iii - December 14, 2005
Permanent Disability Claims ...................................................................................................................................................53 Graphic: PPD Claims at Insured Employers......................................................................................................53
Medical-legal Examinations per Claim....................................................................................................................................53 Graphic: Medical-Legal Exams per WC Claim..................................................................................................54 Graphic: Average Medical-legal Reports per Claim by Region .........................................................................55
Cost per Medical-legal Examination........................................................................................................................................55 Graphic: Average Cost of Medical-Legal Exam.................................................................................................56 Graphic: Average Cost of Medical-Legal Exam by Region ...............................................................................56 Graphic: Distribution of Medical-Legal Exam by Type (Southern California) ....................................................57 Graphic: Average Number of Psychiatric Exams per PPD Claim by Region ....................................................58
Medical-legal Cost Calculation ................................................................................................................................................59 Medical-legal Costs .................................................................................................................................................................59
Graphic: Medical-Legal Costs on PPD Claim at Insured Employers ................................................................60 Sources of Improvement in Medical- legal Costs .....................................................................................................................60
Graphic: Sources of Savings: Medical-Legal Costs on PPD Claims 1990-2002 ..............................................61 CARVE-OUTS - ALTERNATIVE WORKERS’ COMPENSATION SYSTEMS...........................................................................62
Carve-outs - Alternative Workers’ Compensation Systems....................................................................................................62 Carve-out Participants as of May 2005............................................................................................................................. 63
Table: Non-construction Industry Carve-out Participants ..................................................................................63
Selected Indicators in Workers’ Compensation: A Report Card for Californians
- 1 - December 14, 2005
INTRODUCTION
As part of its mandate to conduct a continuing examination of California’s health and safety and workers’ compensation systems, the California Commission on Health and Safety and Workers’ Compensation (CHSWC) is pleased to present an updated report summarizing key information. This “Selected indicators in Workers’ Compensation: A Report Card for Californians” is a compilation of data from and for the entire workers’ compensation community. It is intended to be a reference for monitoring the ongoing system and serve as an empirical basis for proposing improvements. The “Report Card” will be continually updated as needed. The online Report Card, available at the CHSWC website, www.dir.ca.gov/chswc, will reflect the latest available information. This information was compiled by CHSWC from data derived from many sources, including:
Ø Workers’ Compensation Insurance Rating Bureau of California (WCIRB)
Ø California Workers’ Compensation Institute (CWCI)
Ø National Association of Social Insurance (NASI)
Ø United States Bureau of Labor Statistics (BLS)
Ø California Department of Insurance Fraud Division (CDI)
Ø California Labor and Workforce Development Agency
o Department of Industrial Relations (DIR)
o Division of Workers’ Compensation (DWC)
o Division of Labor Statistics and Research (DLSR)
o DIR Self-Insurance Plans (DIR-SIP)
Ø CHSWC studies of Permanent Disability by RAND
Ø CHSWC studies by the University of California at Berkeley (UC Berkeley)
CHSWC would appreciate comments on this Report Card and suggestions for including other data. We wish to provide a useful tool for the community. CHSWC appreciates the gracious cooperation of the entire California workers' compensation community for their assistance in this and other endeavors.
Selected Indicators in Workers’ Compensation: A Report Card for Californians
- 2 - December 14, 2005
WORKERS’ COMPENSATION PREMIUMS
Pure WC Premium Advisory Rates
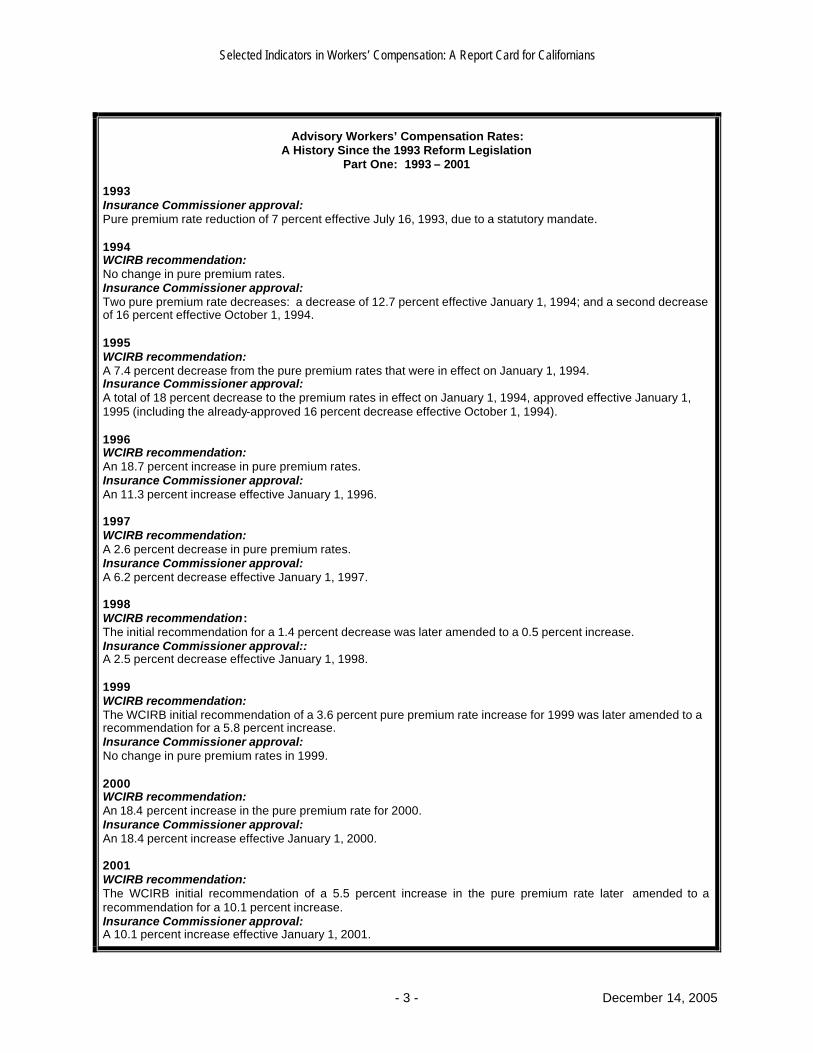
Minimum Rate Law and Open Rating In 1993, the workers’ compensation reform legislation repealed California’s 80-year-old minimum rate law and replaced it beginning in 1995 with an open-competition system of rate regulation in which insurers set their own rates based on “pure premium advisory rates” developed by the Workers’ Compensation Insurance Rating Bureau (WCIRB). These rates, approved by the Insurance Commissioner (IC) and subject to annual adjustment, are based on historical loss data for more than 500 job categories. Under this “open rating” system, these recommended, non-mandatory pure premium rates are intended to cover the average costs of benefits and loss-adjustment expenses for all employers in an occupational class and thus provide insurers with benchmarks for pricing their policies. Insurers typically file rates that are intended to cover other costs and expenses, including unallocated loss-adjustment expenses. The chart on the following pages shows the history of the workers’ compensation pure premium advisory rates since the 1993 reforms.
Selected Indicators in Workers’ Compensation: A Report Card for Californians
- 3 - December 14, 2005
Advisory Workers’ Compensation Rates: A History Since the 1993 Reform Legislation
Part One: 1993 – 2001 1993 Insurance Commissioner approval: Pure premium rate reduction of 7 percent effective July 16, 1993, due to a statutory mandate. 1994 WCIRB recommendation: No change in pure premium rates. Insurance Commissioner approval: Two pure premium rate decreases: a decrease of 12.7 percent effective January 1, 1994; and a second decrease of 16 percent effective October 1, 1994. 1995 WCIRB recommendation: A 7.4 percent decrease from the pure premium rates that were in effect on January 1, 1994. Insurance Commissioner approval: A total of 18 percent decrease to the premium rates in effect on January 1, 1994, approved effective January 1, 1995 (including the already-approved 16 percent decrease effective October 1, 1994). 1996 WCIRB recommendation: An 18.7 percent increase in pure premium rates. Insurance Commissioner approval: An 11.3 percent increase effective January 1, 1996. 1997 WCIRB recommendation: A 2.6 percent decrease in pure premium rates. Insurance Commissioner approval: A 6.2 percent decrease effective January 1, 1997. 1998 WCIRB recommendation: The initial recommendation for a 1.4 percent decrease was later amended to a 0.5 percent increase. Insurance Commissioner approval:: A 2.5 percent decrease effective January 1, 1998. 1999 WCIRB recommendation: The WCIRB initial recommendation of a 3.6 percent pure premium rate increase for 1999 was later amended to a recommendation for a 5.8 percent increase. Insurance Commissioner approval: No change in pure premium rates in 1999. 2000 WCIRB recommendation: An 18.4 percent increase in the pure premium rate for 2000. Insurance Commissioner approval: An 18.4 percent increase effective January 1, 2000. 2001 WCIRB recommendation: The WCIRB initial recommendation of a 5.5 percent increase in the pure premium rate later amended to a recommendation for a 10.1 percent increase. Insurance Commissioner approval: A 10.1 percent increase effective January 1, 2001.
Selected Indicators in Workers’ Compensation: A Report Card for Californians
- 4 - December 14, 2005
Advisory Workers’ Compensation Pure Premium Rates A History since the 1993 Reform Legislation
Part Two: 2002 - 2004
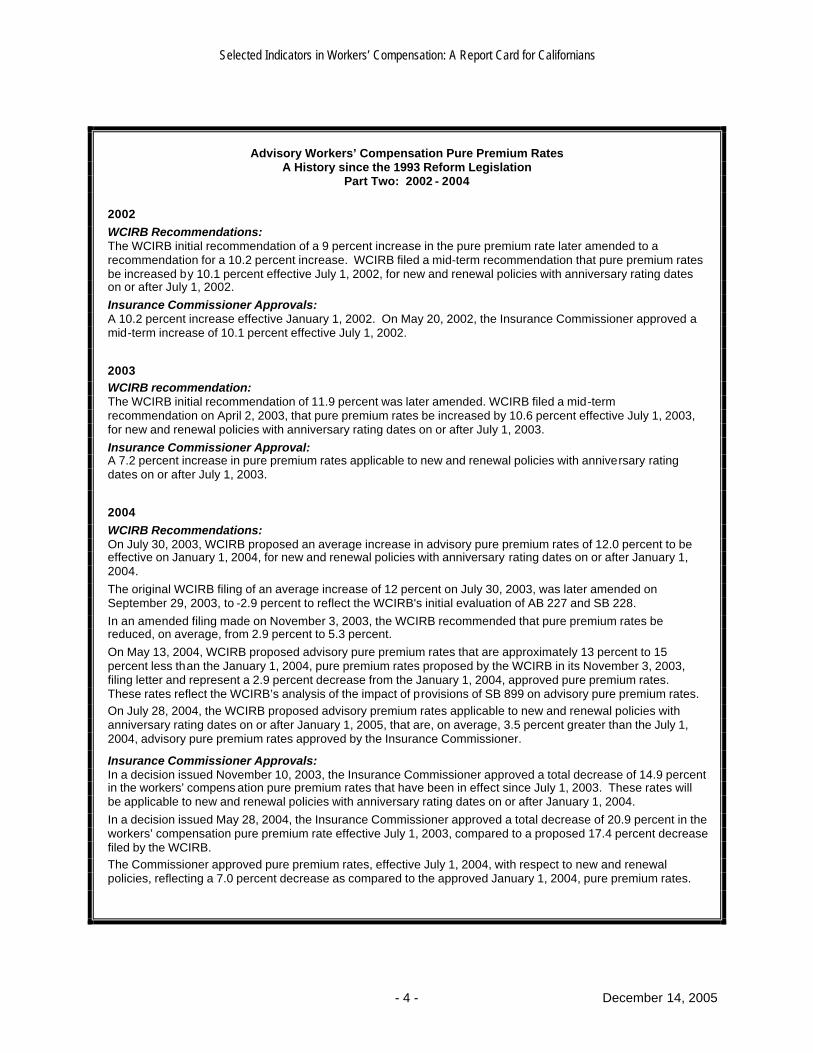
2002 WCIRB Recommendations: The WCIRB initial recommendation of a 9 percent increase in the pure premium rate later amended to a recommendation for a 10.2 percent increase. WCIRB filed a mid-term recommendation that pure premium rates be increased by 10.1 percent effective July 1, 2002, for new and renewal policies with anniversary rating dates on or after July 1, 2002. Insurance Commissioner Approvals: A 10.2 percent increase effective January 1, 2002. On May 20, 2002, the Insurance Commissioner approved a mid-term increase of 10.1 percent effective July 1, 2002.
2003 WCIRB recommendation: The WCIRB initial recommendation of 11.9 percent was later amended. WCIRB filed a mid-term recommendation on April 2, 2003, that pure premium rates be increased by 10.6 percent effective July 1, 2003, for new and renewal policies with anniversary rating dates on or after July 1, 2003. Insurance Commissioner Approval: A 7.2 percent increase in pure premium rates applicable to new and renewal policies with anniversary rating dates on or after July 1, 2003.
2004 WCIRB Recommendations: On July 30, 2003, WCIRB proposed an average increase in advisory pure premium rates of 12.0 percent to be effective on January 1, 2004, for new and renewal policies with anniversary rating dates on or after January 1, 2004. The original WCIRB filing of an average increase of 12 percent on July 30, 2003, was later amended on September 29, 2003, to -2.9 percent to reflect the WCIRB's initial evaluation of AB 227 and SB 228. In an amended filing made on November 3, 2003, the WCIRB recommended that pure premium rates be reduced, on average, from 2.9 percent to 5.3 percent. On May 13, 2004, WCIRB proposed advisory pure premium rates that are approximately 13 percent to 15 percent less than the January 1, 2004, pure premium rates proposed by the WCIRB in its November 3, 2003, filing letter and represent a 2.9 percent decrease from the January 1, 2004, approved pure premium rates. These rates reflect the WCIRB’s analysis of the impact of provisions of SB 899 on advisory pure premium rates. On July 28, 2004, the WCIRB proposed advisory premium rates applicable to new and renewal policies with anniversary rating dates on or after January 1, 2005, that are, on average, 3.5 percent greater than the July 1, 2004, advisory pure premium rates approved by the Insurance Commissioner.
Insurance Commissioner Approvals: In a decision issued November 10, 2003, the Insurance Commissioner approved a total decrease of 14.9 percent in the workers’ compens ation pure premium rates that have been in effect since July 1, 2003. These rates will be applicable to new and renewal policies with anniversary rating dates on or after January 1, 2004. In a decision issued May 28, 2004, the Insurance Commissioner approved a total decrease of 20.9 percent in the workers’ compensation pure premium rate effective July 1, 2003, compared to a proposed 17.4 percent decrease filed by the WCIRB. The Commissioner approved pure premium rates, effective July 1, 2004, with respect to new and renewal policies, reflecting a 7.0 percent decrease as compared to the approved January 1, 2004, pure premium rates.
Selected Indicators in Workers’ Compensation: A Report Card for Californians
- 5 - December 14, 2005
Advisory Workers’ Compensation Pure Premium Rates A History since the 1993 Reform Legislation
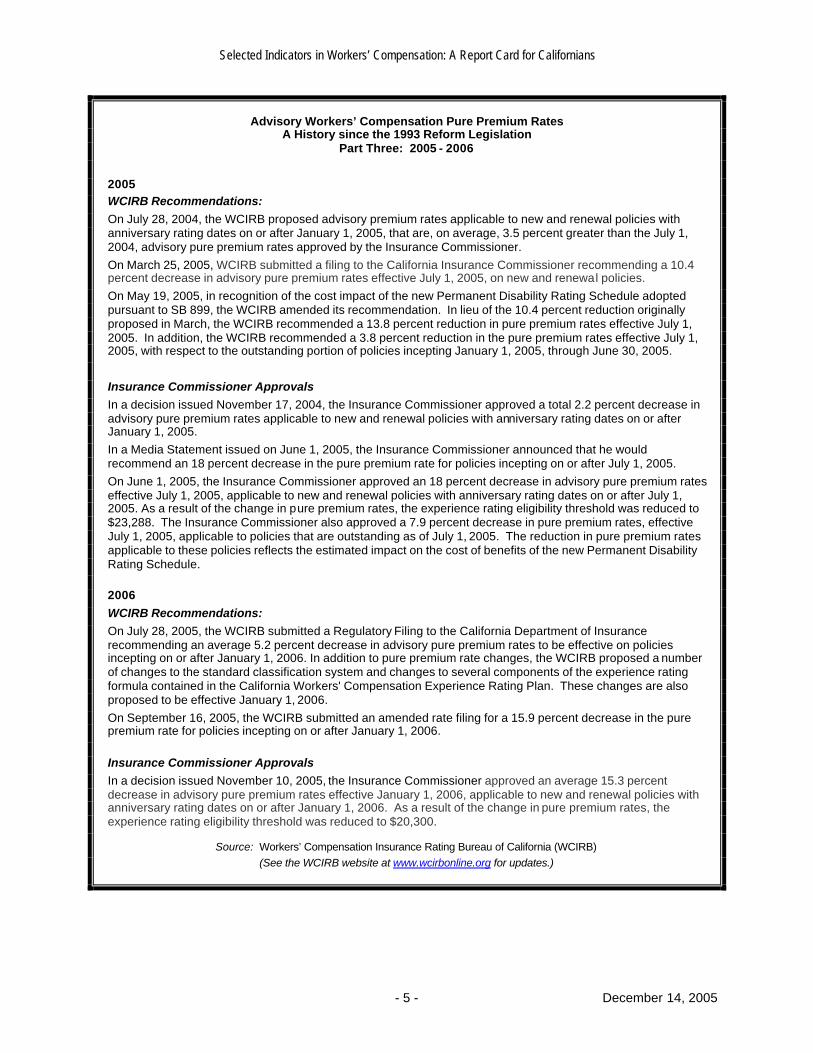
Part Three: 2005 - 2006 2005 WCIRB Recommendations: On July 28, 2004, the WCIRB proposed advisory premium rates applicable to new and renewal policies with anniversary rating dates on or after January 1, 2005, that are, on average, 3.5 percent greater than the July 1, 2004, advisory pure premium rates approved by the Insurance Commissioner. On March 25, 2005, WCIRB submitted a filing to the California Insurance Commissioner recommending a 10.4 percent decrease in advisory pure premium rates effective July 1, 2005, on new and renewal policies. On May 19, 2005, in recognition of the cost impact of the new Permanent Disability Rating Schedule adopted pursuant to SB 899, the WCIRB amended its recommendation. In lieu of the 10.4 percent reduction originally proposed in March, the WCIRB recommended a 13.8 percent reduction in pure premium rates effective July 1, 2005. In addition, the WCIRB recommended a 3.8 percent reduction in the pure premium rates effective July 1, 2005, with respect to the outstanding portion of policies incepting January 1, 2005, through June 30, 2005. Insurance Commissioner Approvals In a decision issued November 17, 2004, the Insurance Commissioner approved a total 2.2 percent decrease in advisory pure premium rates applicable to new and renewal policies with anniversary rating dates on or after January 1, 2005. In a Media Statement issued on June 1, 2005, the Insurance Commissioner announced that he would recommend an 18 percent decrease in the pure premium rate for policies incepting on or after July 1, 2005. On June 1, 2005, the Insurance Commissioner approved an 18 percent decrease in advisory pure premium rates effective July 1, 2005, applicable to new and renewal policies with anniversary rating dates on or after July 1, 2005. As a result of the change in pure premium rates, the experience rating eligibility threshold was reduced to $23,288. The Insurance Commissioner also approved a 7.9 percent decrease in pure premium rates, effective July 1, 2005, applicable to policies that are outstanding as of July 1, 2005. The reduction in pure premium rates applicable to these policies reflects the estimated impact on the cost of benefits of the new Permanent Disability Rating Schedule. 2006 WCIRB Recommendations: On July 28, 2005, the WCIRB submitted a Regulatory Filing to the California Department of Insurance recommending an average 5.2 percent decrease in advisory pure premium rates to be effective on policies incepting on or after January 1, 2006. In addition to pure premium rate changes, the WCIRB proposed a number of changes to the standard classification system and changes to several components of the experience rating formula contained in the California Workers' Compensation Experience Rating Plan. These changes are also proposed to be effective January 1, 2006. On September 16, 2005, the WCIRB submitted an amended rate filing for a 15.9 percent decrease in the pure premium rate for policies incepting on or after January 1, 2006. Insurance Commissioner Approvals In a decision issued November 10, 2005, the Insurance Commissioner approved an average 15.3 percent decrease in advisory pure premium rates effective January 1, 2006, applicable to new and renewal policies with anniversary rating dates on or after January 1, 2006. As a result of the change in pure premium rates, the experience rating eligibility threshold was reduced to $20,300.
Source: Workers’ Compensation Insurance Rating Bureau of California (WCIRB) (See the WCIRB website at www.wcirbonline.org for updates.)
Selected Indicators in Workers’ Compensation: A Report Card for Californians
- 6 - December 14, 2005
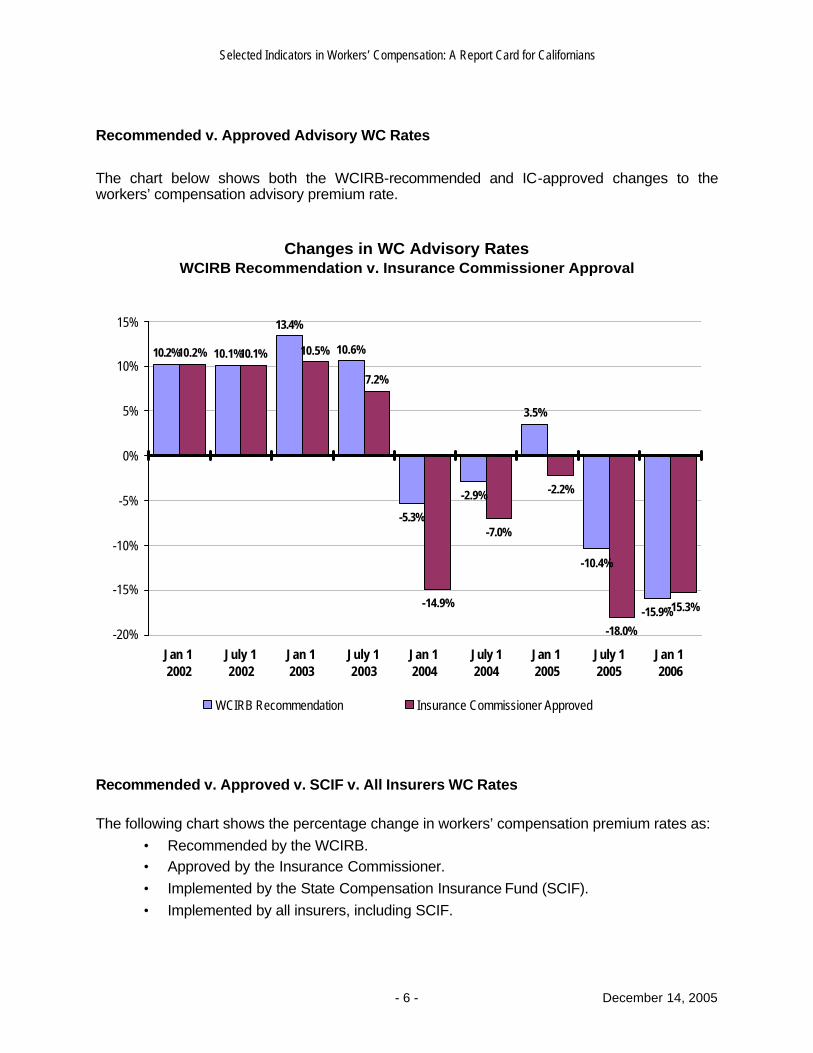
Recommended v. Approved Advisory WC Rates
The chart below shows both the WCIRB-recommended and IC-approved changes to the workers’ compensation advisory premium rate.
Changes in WC Advisory Rates WCIRB Recommendation v. Insurance Commissioner Approval
10.2% 10.1%
13.4%
10.6%
-5.3%
-2.9%
3.5%
-10.4%
-15.9%
10.2% 10.1% 10.5%
7.2%
-14.9%
-7.0%
-2.2%
-18.0%
-15.3%
-20%
-15%
-10%
-5%
0%
5%
10%
15%
Jan 1 2002
July 12002
Jan 1 2003
July 12003
Jan 1 2004
July 12004
Jan 1 2005
July 12005
Jan 1 2006
WCIRB Recommendation Insurance Commissioner Approved
Recommended v. Approved v. SCIF v. All Insurers WC Rates The following chart shows the percentage change in workers’ compensation premium rates as:
• Recommended by the WCIRB. • Approved by the Insurance Commissioner. • Implemented by the State Compensation Insurance Fund (SCIF). • Implemented by all insurers, including SCIF.
Selected Indicators in Workers’ Compensation: A Report Card for Californians
- 7 - December 14, 2005
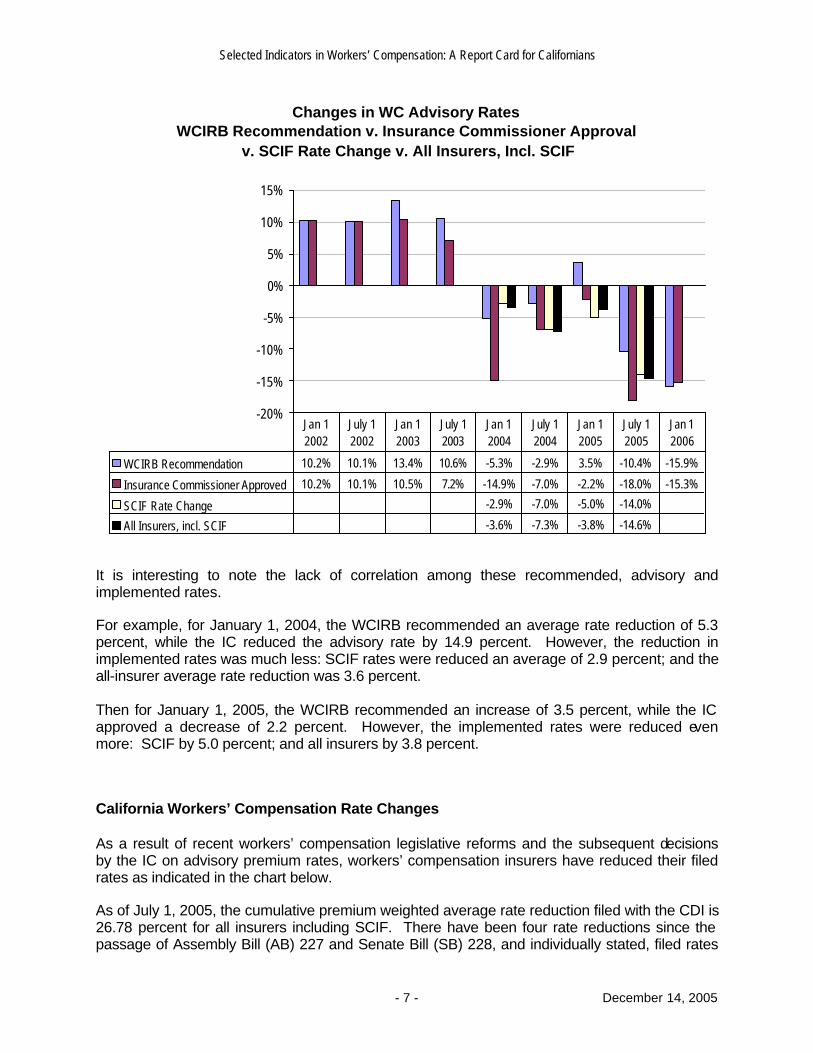
Changes in WC Advisory Rates WCIRB Recommendation v. Insurance Commissioner Approval
v. SCIF Rate Change v. All Insurers, Incl. SCIF
-20%
-15%
-10%
-5%
0%
5%
10%
15%
WCIRB Recommendation 10.2% 10.1% 13.4% 10.6% -5.3% -2.9% 3.5% -10.4% -15.9%
Insurance Commissioner Approved 10.2% 10.1% 10.5% 7.2% -14.9% -7.0% -2.2% -18.0% -15.3%
SCIF Rate Change -2.9% -7.0% -5.0% -14.0%
All Insurers, incl. SCIF -3.6% -7.3% -3.8% -14.6%
Jan 1 2002
July 1 2002
Jan 1 2003
July 1 2003
Jan 1 2004
July 1 2004
Jan 1 2005
July 1 2005
Jan 1 2006
It is interesting to note the lack of correlation among these recommended, advisory and implemented rates. For example, for January 1, 2004, the WCIRB recommended an average rate reduction of 5.3 percent, while the IC reduced the advisory rate by 14.9 percent. However, the reduction in implemented rates was much less: SCIF rates were reduced an average of 2.9 percent; and the all-insurer average rate reduction was 3.6 percent. Then for January 1, 2005, the WCIRB recommended an increase of 3.5 percent, while the IC approved a decrease of 2.2 percent. However, the implemented rates were reduced even more: SCIF by 5.0 percent; and all insurers by 3.8 percent.
California Workers’ Compensation Rate Changes As a result of recent workers’ compensation legislative reforms and the subsequent decisions by the IC on advisory premium rates, workers’ compensation insurers have reduced their filed rates as indicated in the chart below. As of July 1, 2005, the cumulative premium weighted average rate reduction filed with the CDI is 26.78 percent for all insurers including SCIF. There have been four rate reductions since the passage of Assembly Bill (AB) 227 and Senate Bill (SB) 228, and individually stated, filed rates
Selected Indicators in Workers’ Compensation: A Report Card for Californians
- 8 - December 14, 2005
were reduced 3.6 percent on January 1, 2004, 7.3 percent on July 1, 2004, 3.8 percent on January 1, 2005, and 14.6 percent on July 1, 2005.1 The WCIRB reports that actual rates charged in the marketplace, as of September 30, 2004, had fallen by 16 percent since the enactment of AB 227 and SB 228. The average rate per $100 of payroll fell from $6.35 in the second half of 2003 to $5.34 in the third quarter of 2004. When the WCIRB average rate data is updated through the third quarter of 2005, it is expected to mirror the 26.5 percent reduction in filed rates for the same period.
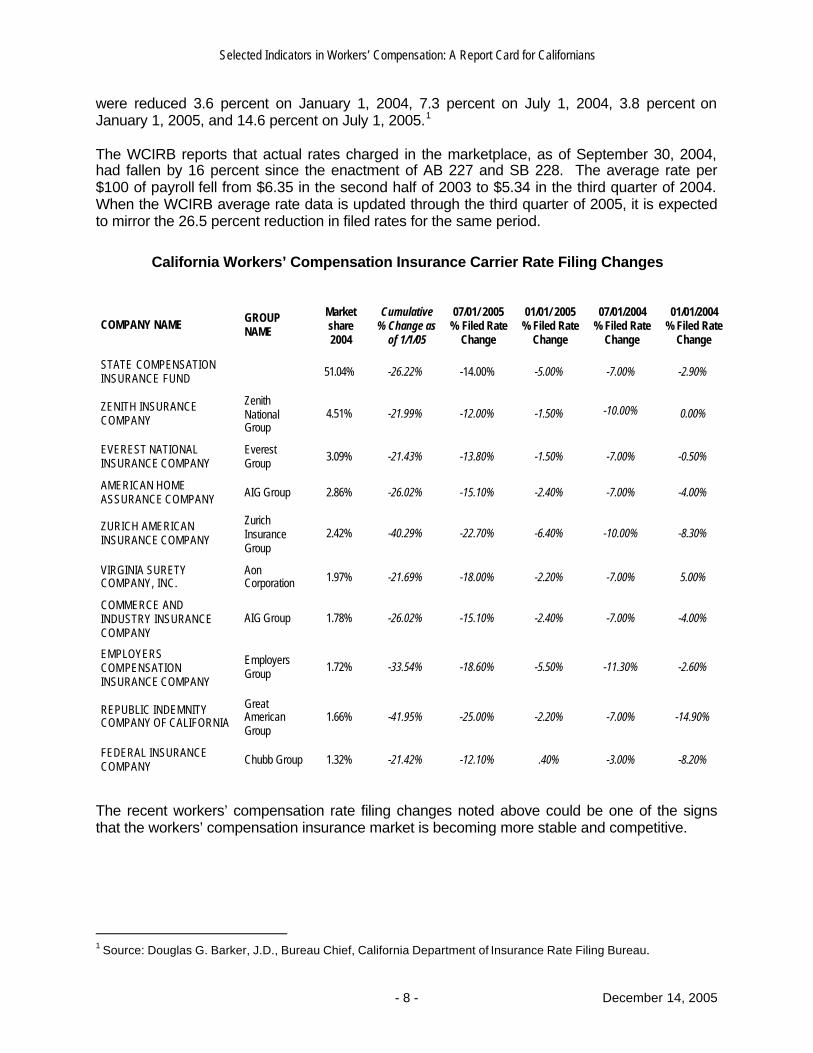
California Workers’ Compensation Insurance Carrier Rate Filing Changes
COMPANY NAME GROUP NAME
Market share 2004
Cumulative % Change as
of 1/1/05
07/01/ 2005 % Filed Rate
Change
01/01/ 2005 % Filed Rate
Change
07/01/2004 % Filed Rate
Change
01/01/2004 % Filed Rate
Change
STATE COMPENSATION INSURANCE FUND 51.04% -26.22% -14.00% -5.00% -7.00% -2.90%
ZENITH INSURANCE COMPANY
Zenith National Group
4.51% -21.99% -12.00% -1.50% -10.00% 0.00%
EVEREST NATIONAL INSURANCE COMPANY
Everest Group 3.09% -21.43% -13.80% -1.50% -7.00% -0.50%
AMERICAN HOME ASSURANCE COMPANY AIG Group 2.86% -26.02% -15.10% -2.40% -7.00% -4.00%
ZURICH AMERICAN INSURANCE COMPANY
Zurich Insurance Group
2.42% -40.29% -22.70% -6.40% -10.00% -8.30%
VIRGINIA SURETY COMPANY, INC.
Aon Corporation 1.97% -21.69% -18.00% -2.20% -7.00% 5.00%
COMMERCE AND INDUSTRY INSURANCE COMPANY
AIG Group 1.78% -26.02% -15.10% -2.40% -7.00% -4.00%
EMPLOYERS COMPENSATION INSURANCE COMPANY
Employers Group 1.72% -33.54% -18.60% -5.50% -11.30% -2.60%
REPUBLIC INDEMNITY COMPANY OF CALIFORNIA
Great American Group
1.66% -41.95% -25.00% -2.20% -7.00% -14.90%
FEDERAL INSURANCE COMPANY Chubb Group 1.32% -21.42% -12.10% .40% -3.00% -8.20%
The recent workers’ compensation rate filing changes noted above could be one of the signs that the workers’ compensation insurance market is becoming more stable and competitive.
1 Source: Douglas G. Barker, J.D., Bureau Chief, California Department of Insurance Rate Filing Bureau.
Selected Indicators in Workers’ Compensation: A Report Card for Californians
- 9 - December 14, 2005
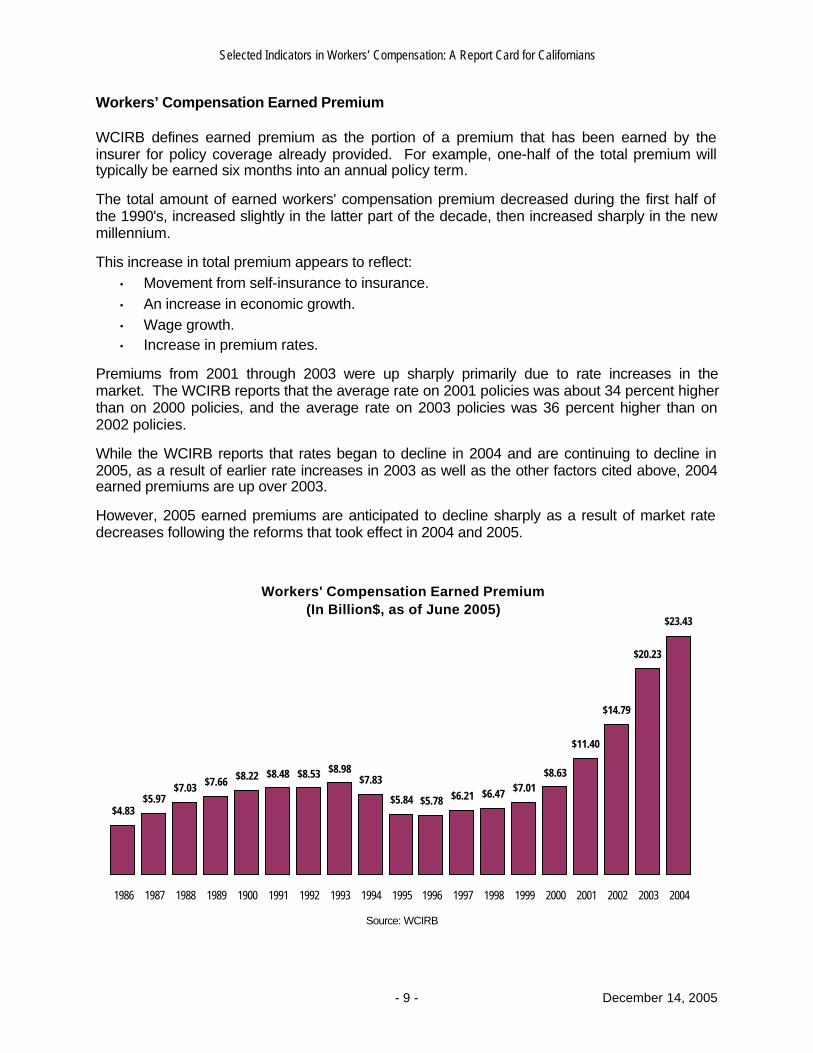
Workers’ Compensation Earned Premium WCIRB defines earned premium as the portion of a premium that has been earned by the insurer for policy coverage already provided. For example, one-half of the total premium will typically be earned six months into an annual policy term.
The total amount of earned workers' compensation premium decreased during the first half of the 1990's, increased slightly in the latter part of the decade, then increased sharply in the new millennium.
This increase in total premium appears to reflect: • Movement from self-insurance to insurance. • An increase in economic growth. • Wage growth. • Increase in premium rates.
Premiums from 2001 through 2003 were up sharply primarily due to rate increases in the market. The WCIRB reports that the average rate on 2001 policies was about 34 percent higher than on 2000 policies, and the average rate on 2003 policies was 36 percent higher than on 2002 policies.
While the WCIRB reports that rates began to decline in 2004 and are continuing to decline in 2005, as a result of earlier rate increases in 2003 as well as the other factors cited above, 2004 earned premiums are up over 2003.
However, 2005 earned premiums are anticipated to decline sharply as a result of market rate decreases following the reforms that took effect in 2004 and 2005.
Workers' Compensation Earned Premium (In Billion$, as of June 2005)
$4.83$5.97
$7.03 $7.66 $8.22 $8.48 $8.53 $8.98$7.83
$5.84 $5.78 $6.21 $6.47 $7.01$8.63
$11.40
$14.79
$20.23
$23.43
1986 1987 1988 1989 1900 1991 1992 1993 1994 1995 1996 1997 1998 1999 2000 2001 2002 2003 2004
Source: WCIRB
Selected Indicators in Workers’ Compensation: A Report Card for Californians
- 10 - December 14, 2005
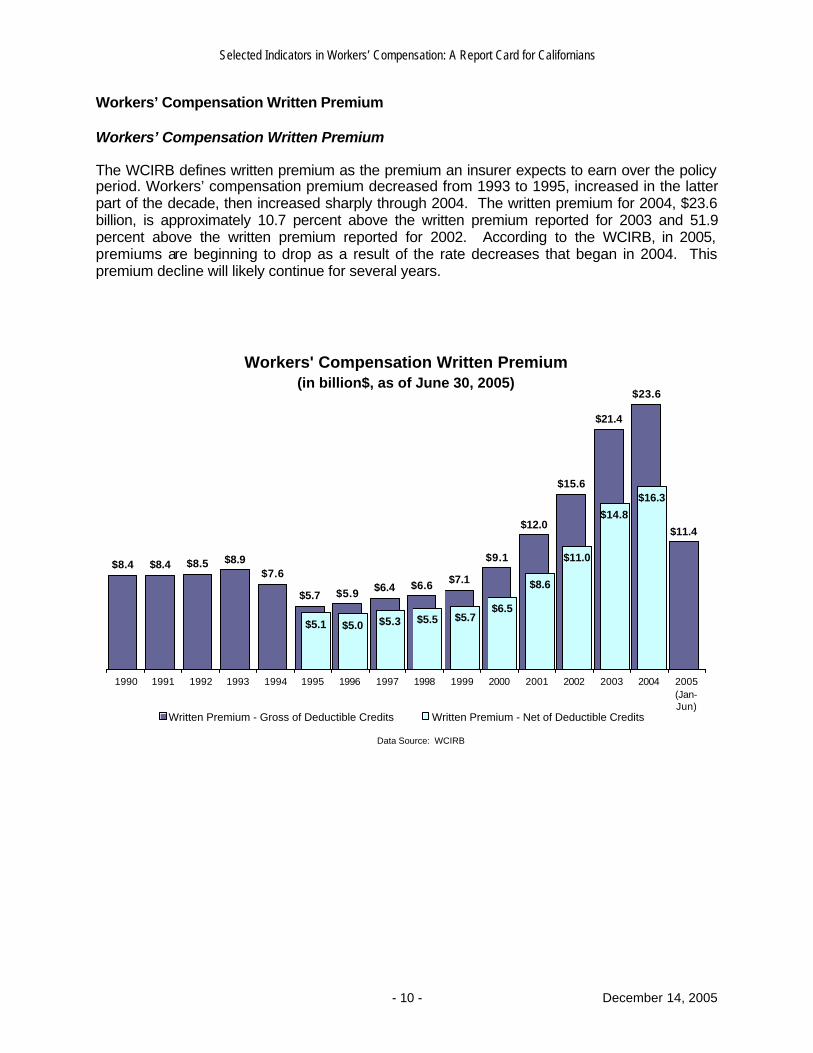
Workers’ Compensation Written Premium Workers’ Compensation Written Premium
The WCIRB defines written premium as the premium an insurer expects to earn over the policy period. Workers’ compensation premium decreased from 1993 to 1995, increased in the latter part of the decade, then increased sharply through 2004. The written premium for 2004, $23.6 billion, is approximately 10.7 percent above the written premium reported for 2003 and 51.9 percent above the written premium reported for 2002. According to the WCIRB, in 2005, premiums are beginning to drop as a result of the rate decreases that began in 2004. This premium decline will likely continue for several years.
Workers' Compensation Written Premium (in billion$, as of June 30, 2005)
$8.4 $8.4 $8.5 $8.9$7.6
$5.7 $5.9 $6.4 $6.6 $7.1
$9.1
$12.0
$15.6
$21.4
$23.6
$11.4
$5.1 $5.0 $5.3 $5.5 $5.7$6.5
$8.6
$11.0
$14.8
$16.3
1990 1991 1992 1993 1994 1995 1996 1997 1998 1999 2000 2001 2002 2003 2004 2005(Jan-Jun)
Written Premium - Gross of Deductible Credits Written Premium - Net of Deductible Credits
Data Source: WCIRB
Selected Indicators in Workers’ Compensation: A Report Card for Californians
- 11 - December 14, 2005
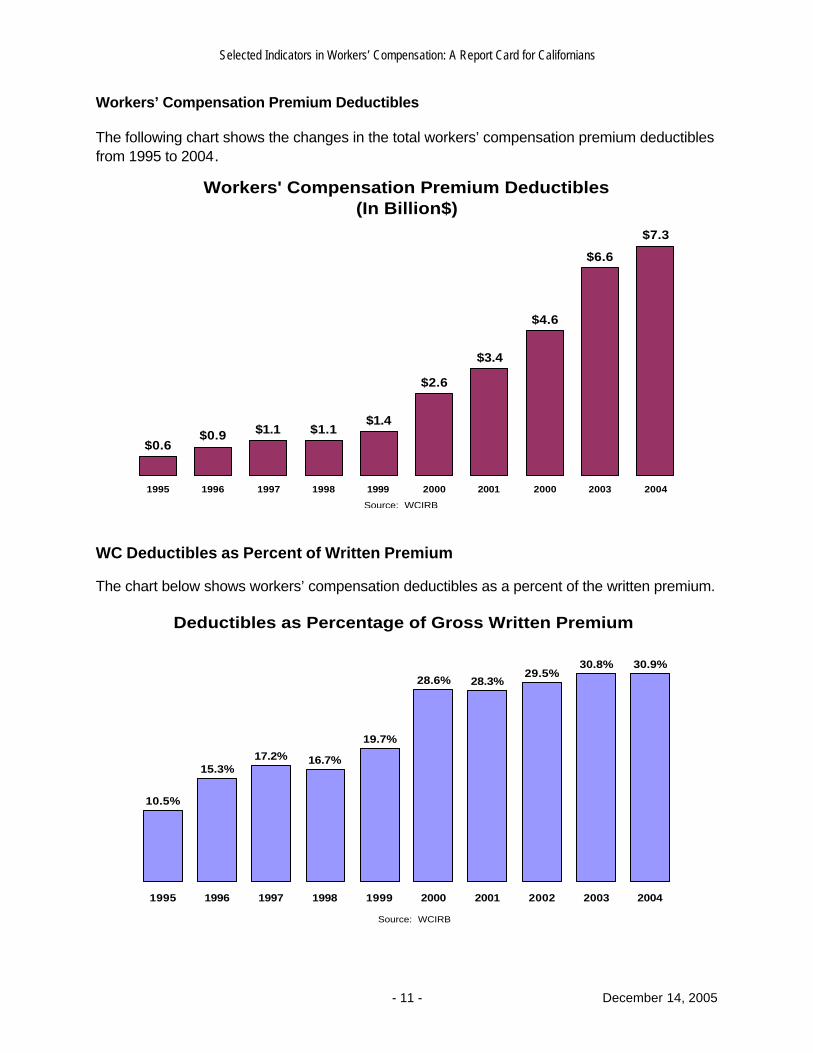
Workers’ Compensation Premium Deductibles The following chart shows the changes in the total workers’ compensation premium deductibles from 1995 to 2004.
Workers' Compensation Premium Deductibles (In Billion$)
$0.6$0.9 $1.1 $1.1
$1.4
$2.6
$3.4
$4.6
$6.6
$7.3
1995 1996 1997 1998 1999 2000 2001 2000 2003 2004
Source: WCIRB
WC Deductibles as Percent of Written Premium The chart below shows workers’ compensation deductibles as a percent of the written premium.
10.5%
15.3%17.2% 16.7%
19.7%
28.6% 28.3%29.5%
30.8% 30.9%
1995 1996 1997 1998 1999 2000 2001 2002 2003 2004
Source: WCIRB
Deductibles as Percentage of Gross Written Premium
Selected Indicators in Workers’ Compensation: A Report Card for Californians
- 12 - December 14, 2005
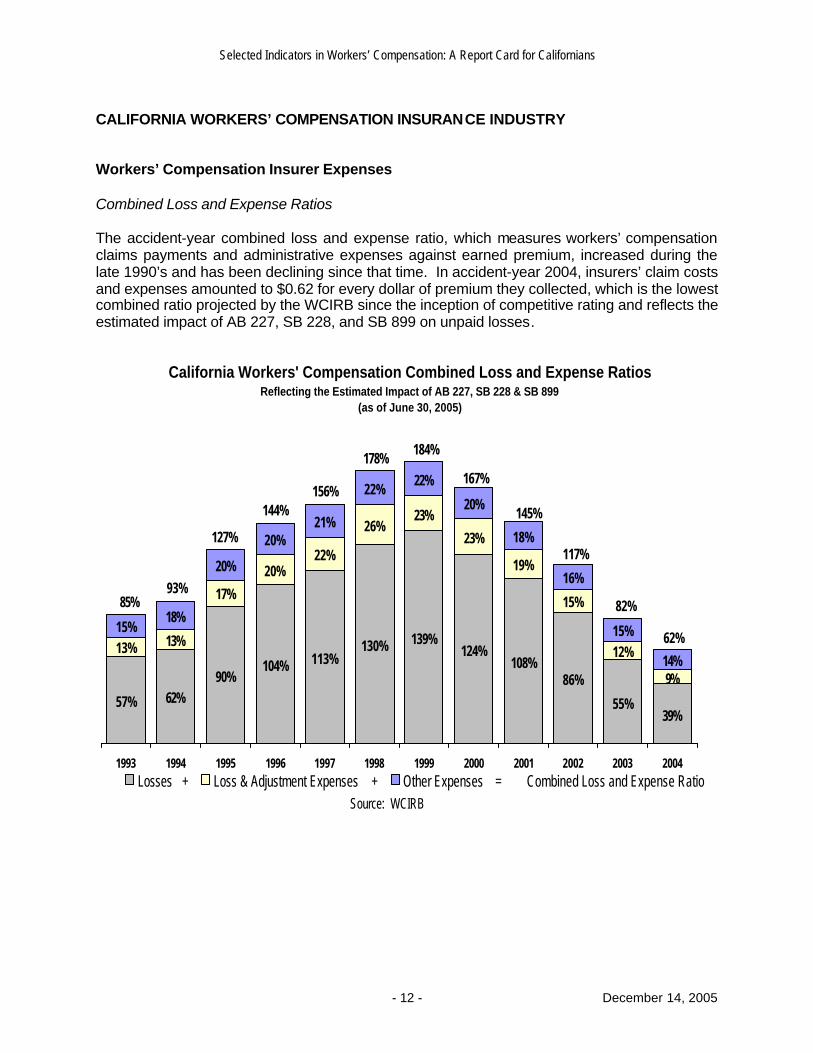
CALIFORNIA WORKERS’ COMPENSATION INSURANCE INDUSTRY Workers’ Compensation Insurer Expenses Combined Loss and Expense Ratios The accident-year combined loss and expense ratio, which measures workers’ compensation claims payments and administrative expenses against earned premium, increased during the late 1990’s and has been declining since that time. In accident-year 2004, insurers’ claim costs and expenses amounted to $0.62 for every dollar of premium they collected, which is the lowest combined ratio projected by the WCIRB since the inception of competitive rating and reflects the estimated impact of AB 227, SB 228, and SB 899 on unpaid losses.
California Workers' Compensation Combined Loss and Expense RatiosReflecting the Estimated Impact of AB 227, SB 228 & SB 899
(as of June 30, 2005)
130% 139%124%
55%39%
13% 13%
17%
20%22%
26%23%
23%
19%
15%
12%
9%
15%18%
20%
20%21%
22%22%
20%
18%
16%
15%
14%113%104%90% 86%
108%
62%57%
85%93%
127%
144%156%
178%184%
167%
145%
117%
82%
62%
1993 1994 1995 1996 1997 1998 1999 2000 2001 2002 2003 2004Losses + Loss & Adjustment Expenses + Other Expenses = Combined Loss and Expense Ratio
Source: WCIRB
Selected Indicators in Workers’ Compensation: A Report Card for Californians
- 13 - December 14, 2005
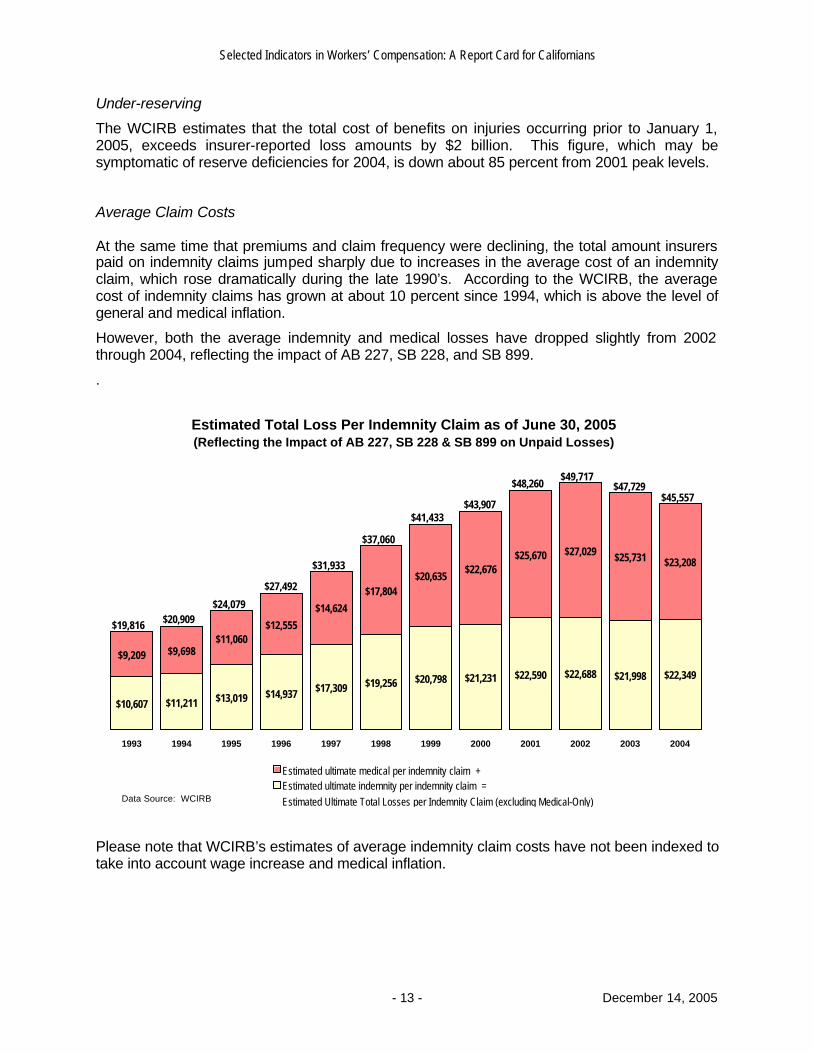
Under-reserving
The WCIRB estimates that the total cost of benefits on injuries occurring prior to January 1, 2005, exceeds insurer-reported loss amounts by $2 billion. This figure, which may be symptomatic of reserve deficiencies for 2004, is down about 85 percent from 2001 peak levels.
Average Claim Costs At the same time that premiums and claim frequency were declining, the total amount insurers paid on indemnity claims jumped sharply due to increases in the average cost of an indemnity claim, which rose dramatically during the late 1990’s. According to the WCIRB, the average cost of indemnity claims has grown at about 10 percent since 1994, which is above the level of general and medical inflation.
However, both the average indemnity and medical losses have dropped slightly from 2002 through 2004, reflecting the impact of AB 227, SB 228, and SB 899.
.
$10,607 $11,211 $13,019 $14,937 $17,309 $19,256 $20,798 $21,231 $22,590 $22,688 $21,998 $22,349
$9,209 $9,698$11,060
$12,555
$14,624
$17,804$20,635
$22,676$25,670 $27,029 $25,731 $23,208
$45,557$47,729
$49,717$48,260
$43,907$41,433
$37,060
$31,933
$27,492
$24,079$20,909$19,816
1993 1994 1995 1996 1997 1998 1999 2000 2001 2002 2003 2004
Estimated ultimate medical per indemnity claim +Estimated ultimate indemnity per indemnity claim =Estimated Ultimate Total Losses per Indemnity Claim (excluding Medical-Only)Data Source: WCIRB
Estimated Total Loss Per Indemnity Claim as of June 30, 2005(Reflecting the Impact of AB 227, SB 228 & SB 899 on Unpaid Losses)
Please note that WCIRB’s estimates of average indemnity claim costs have not been indexed to take into account wage increase and medical inflation.
Selected Indicators in Workers’ Compensation: A Report Card for Californians
- 14 - December 14, 2005
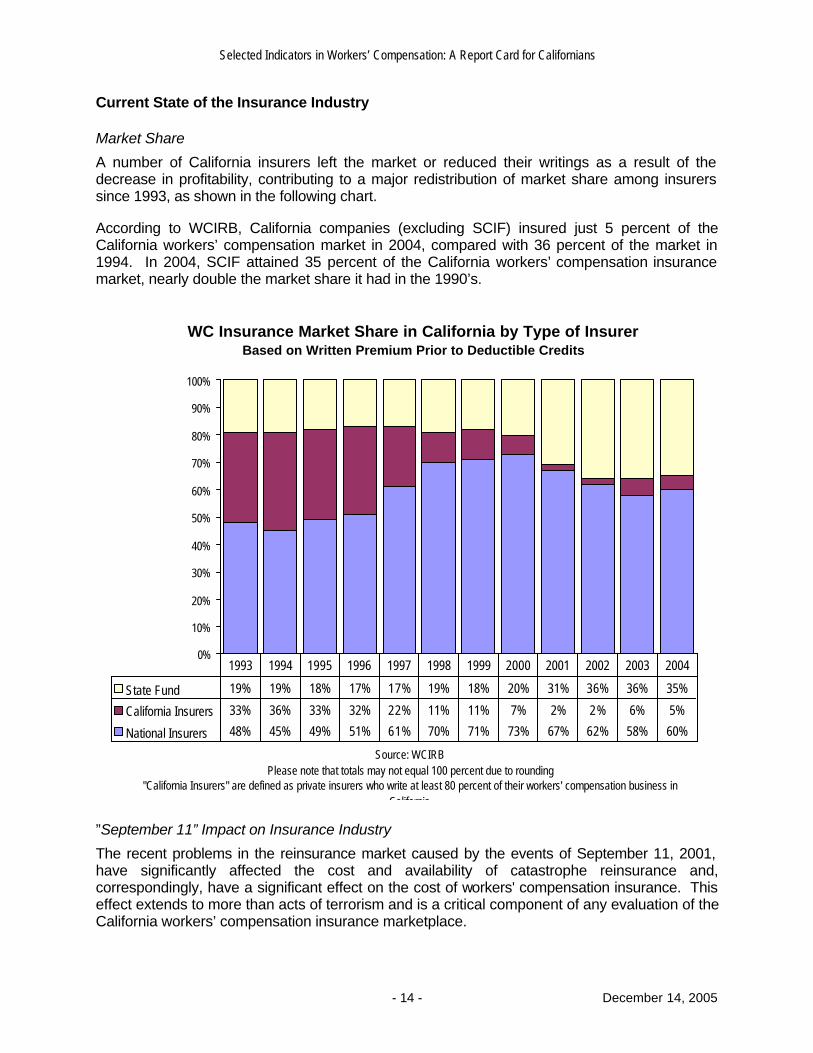
Current State of the Insurance Industry Market Share
A number of California insurers left the market or reduced their writings as a result of the decrease in profitability, contributing to a major redistribution of market share among insurers since 1993, as shown in the following chart. According to WCIRB, California companies (excluding SCIF) insured just 5 percent of the California workers’ compensation market in 2004, compared with 36 percent of the market in 1994. In 2004, SCIF attained 35 percent of the California workers’ compensation insurance market, nearly double the market share it had in the 1990’s.
WC Insurance Market Share in California by Type of InsurerBased on Written Premium Prior to Deductible Credits
0%
10%
20%
30%
40%
50%
60%
70%
80%
90%
100%
State Fund 19% 19% 18% 17% 17% 19% 18% 20% 31% 36% 36% 35%
California Insurers 33% 36% 33% 32% 22% 11% 11% 7% 2% 2% 6% 5%
National Insurers 48% 45% 49% 51% 61% 70% 71% 73% 67% 62% 58% 60%
1993 1994 1995 1996 1997 1998 1999 2000 2001 2002 2003 2004
Source: WCIRB Please note that totals may not equal 100 percent due to rounding
"California Insurers" are defined as private insurers who write at least 80 percent of their workers' compensation business in California
”September 11” Impact on Insurance Industry
The recent problems in the reinsurance market caused by the events of September 11, 2001, have significantly affected the cost and availability of catastrophe reinsurance and, correspondingly, have a significant effect on the cost of workers' compensation insurance. This effect extends to more than acts of terrorism and is a critical component of any evaluation of the California workers’ compensation insurance marketplace.
Selected Indicators in Workers’ Compensation: A Report Card for Californians
- 15 - December 14, 2005
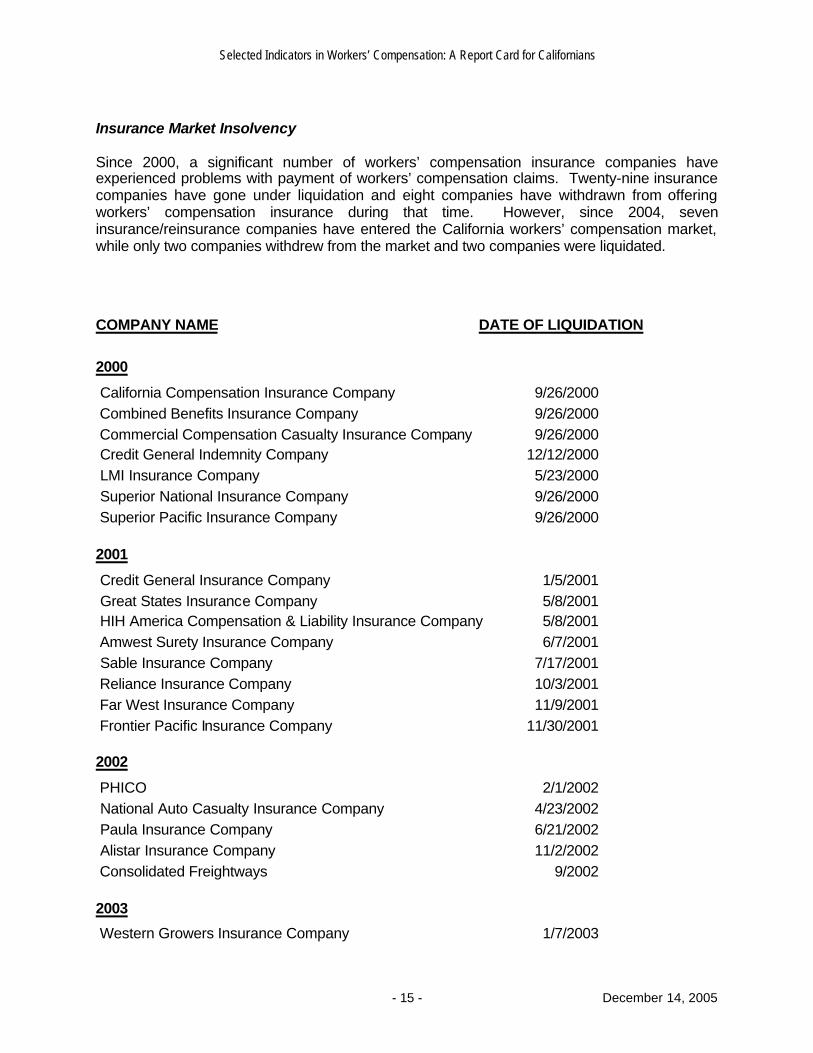
Insurance Market Insolvency Since 2000, a significant number of workers’ compensation insurance companies have experienced problems with payment of workers’ compensation claims. Twenty-nine insurance companies have gone under liquidation and eight companies have withdrawn from offering workers’ compensation insurance during that time. However, since 2004, seven insurance/reinsurance companies have entered the California workers’ compensation market, while only two companies withdrew from the market and two companies were liquidated.
COMPANY NAME DATE OF LIQUIDATION
2000
California Compensation Insurance Company 9/26/2000 Combined Benefits Insurance Company 9/26/2000 Commercial Compensation Casualty Insurance Company 9/26/2000 Credit General Indemnity Company 12/12/2000 LMI Insurance Company 5/23/2000 Superior National Insurance Company 9/26/2000 Superior Pacific Insurance Company 9/26/2000
2001
Credit General Insurance Company 1/5/2001 Great States Insurance Company 5/8/2001 HIH America Compensation & Liability Insurance Company 5/8/2001 Amwest Surety Insurance Company 6/7/2001 Sable Insurance Company 7/17/2001 Reliance Insurance Company 10/3/2001 Far West Insurance Company 11/9/2001 Frontier Pacific Insurance Company 11/30/2001
2002
PHICO 2/1/2002 National Auto Casualty Insurance Company 4/23/2002 Paula Insurance Company 6/21/2002 Alistar Insurance Company 11/2/2002 Consolidated Freightways 9/2002
2003
Western Growers Insurance Company 1/7/2003
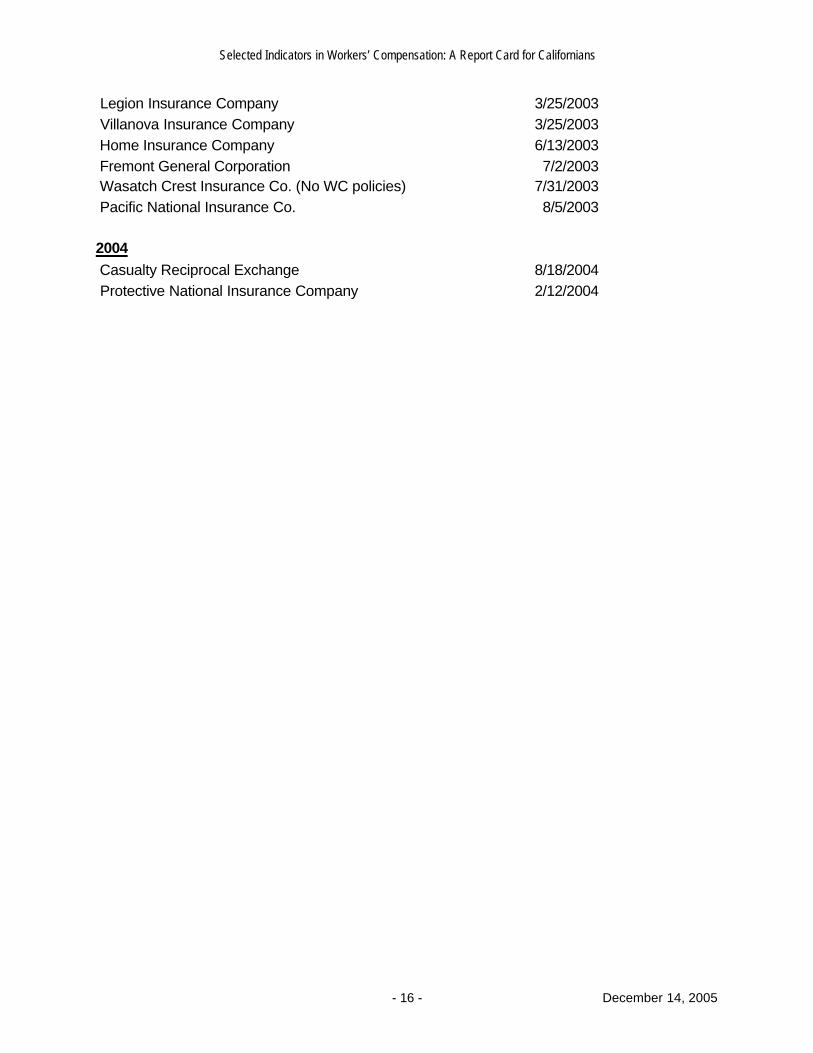
Selected Indicators in Workers’ Compensation: A Report Card for Californians
- 16 - December 14, 2005
Legion Insurance Company 3/25/2003 Villanova Insurance Company 3/25/2003 Home Insurance Company 6/13/2003 Fremont General Corporation 7/2/2003 Wasatch Crest Insurance Co. (No WC policies) 7/31/2003 Pacific National Insurance Co. 8/5/2003 2004 Casualty Reciprocal Exchange 8/18/2004 Protective National Insurance Company 2/12/2004
Selected Indicators in Workers’ Compensation: A Report Card for Californians
- 17 - December 14, 2005
WORKERS’ COMPENSATION COSTS
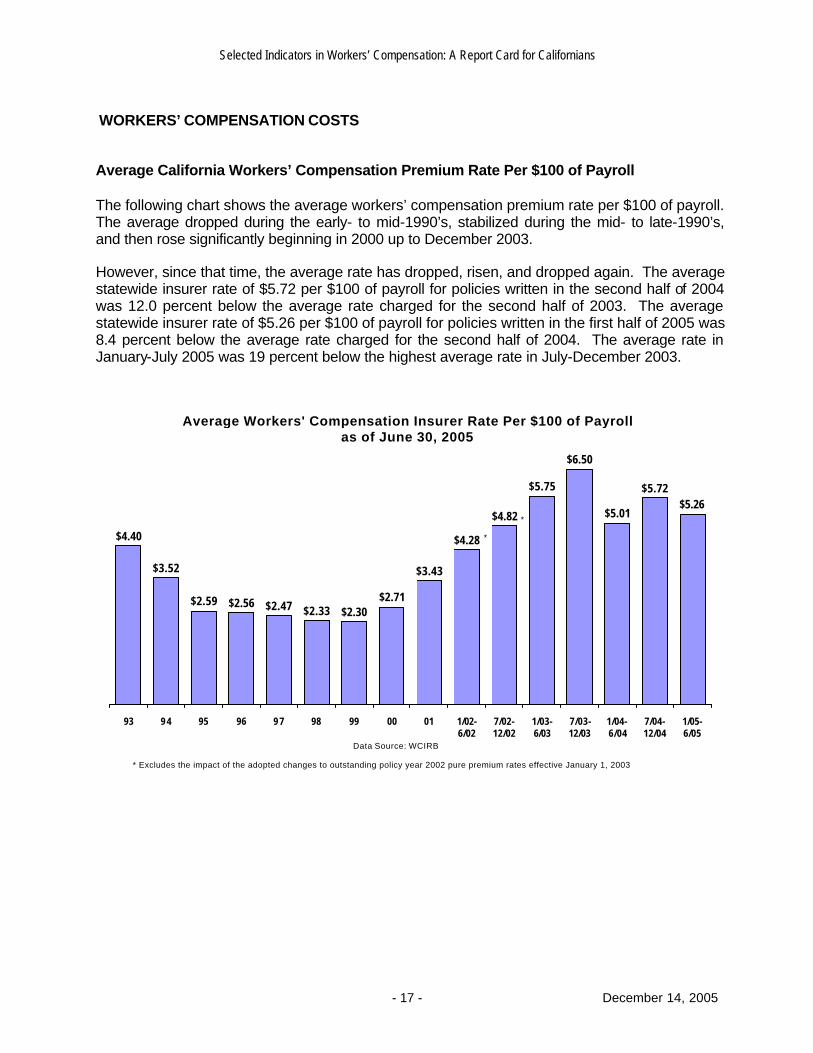
Average California Workers’ Compensation Premium Rate Per $100 of Payroll The following chart shows the average workers’ compensation premium rate per $100 of payroll. The average dropped during the early- to mid-1990’s, stabilized during the mid- to late-1990’s, and then rose significantly beginning in 2000 up to December 2003. However, since that time, the average rate has dropped, risen, and dropped again. The average statewide insurer rate of $5.72 per $100 of payroll for policies written in the second half of 2004 was 12.0 percent below the average rate charged for the second half of 2003. The average statewide insurer rate of $5.26 per $100 of payroll for policies written in the first half of 2005 was 8.4 percent below the average rate charged for the second half of 2004. The average rate in January-July 2005 was 19 percent below the highest average rate in July-December 2003.
Average Workers' Compensation Insurer Rate Per $100 of Payroll as of June 30, 2005
$4.40
$3.52
$2.59 $2.56 $2.47 $2.33 $2.30$2.71
$3.43
$5.75
$6.50
$5.01
$5.72$5.26
$4.82
$4.28
93 9 4 95 96 9 7 98 99 00 01 1/02-6/02
7/02-12/02
1/03-6/03
7/03-12/03
1/04-6/04
7/04-12/04
1/05-6/05
Data Source: WCIRB
* Excludes the impact of the adopted changes to outstanding policy year 2002 pure premium rates effective January 1, 2003
*
*
Selected Indicators in Workers’ Compensation: A Report Card for Californians
- 18 - December 14, 2005
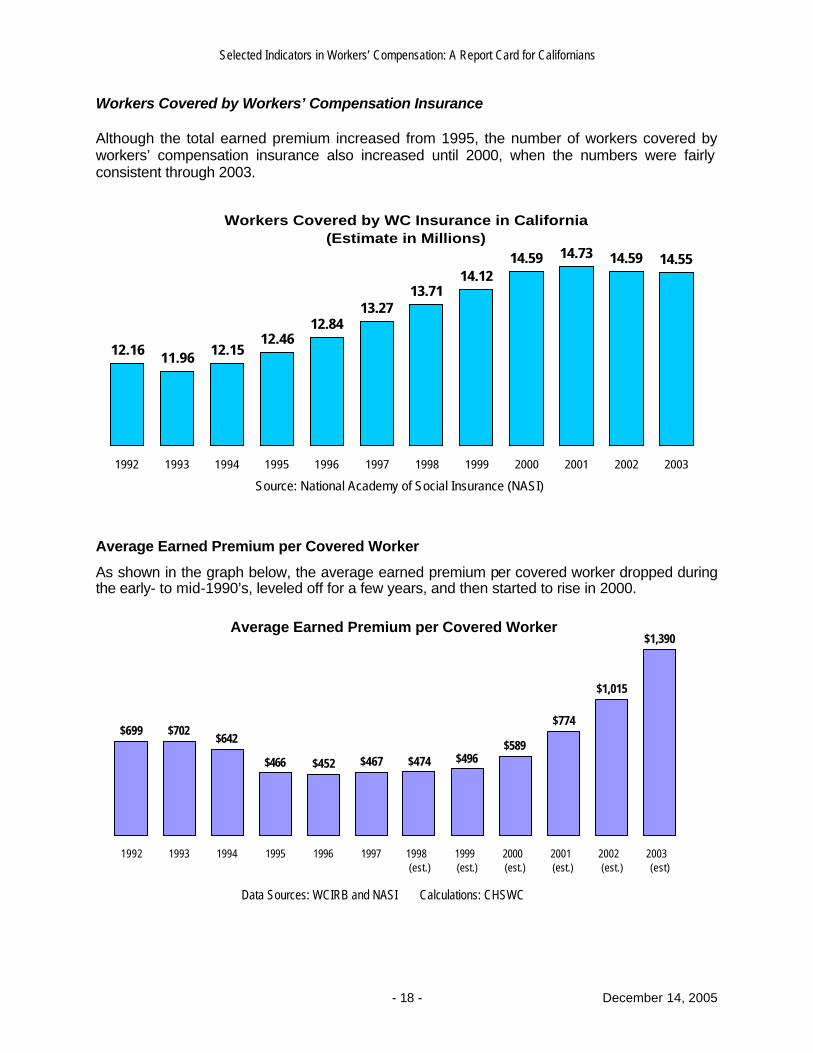
Workers Covered by Workers’ Compensation Insurance Although the total earned premium increased from 1995, the number of workers covered by workers’ compensation insurance also increased until 2000, when the numbers were fairly consistent through 2003.
Workers Covered by WC Insurance in California (Estimate in Millions)
12.16 11.96 12.1512.46
12.8413.27
13.7114.12
14.59 14.73 14.59 14.55
1992 1993 1994 1995 1996 1997 1998 1999 2000 2001 2002 2003
Source: National Academy of Social Insurance (NASI)
Average Earned Premium per Covered Worker
As shown in the graph below, the average earned premium per covered worker dropped during the early- to mid-1990’s, leveled off for a few years, and then started to rise in 2000.
Average Earned Premium per Covered Worker
$699 $702$642
$466 $452 $467 $474 $496$589
$774
$1,015
$1,390
1992 1993 1994 1995 1996 1997 1998 (est.)
1999 (est.)
2000 (est.)
2001 (est.)
2002 (est.)
2003 (est)
Data Sources: WCIRB and NASI Calculations: CHSWC
Selected Indicators in Workers’ Compensation: A Report Card for Californians
- 19 - December 14, 2005
Workers’ Compensation Expenditures – Insured Employers
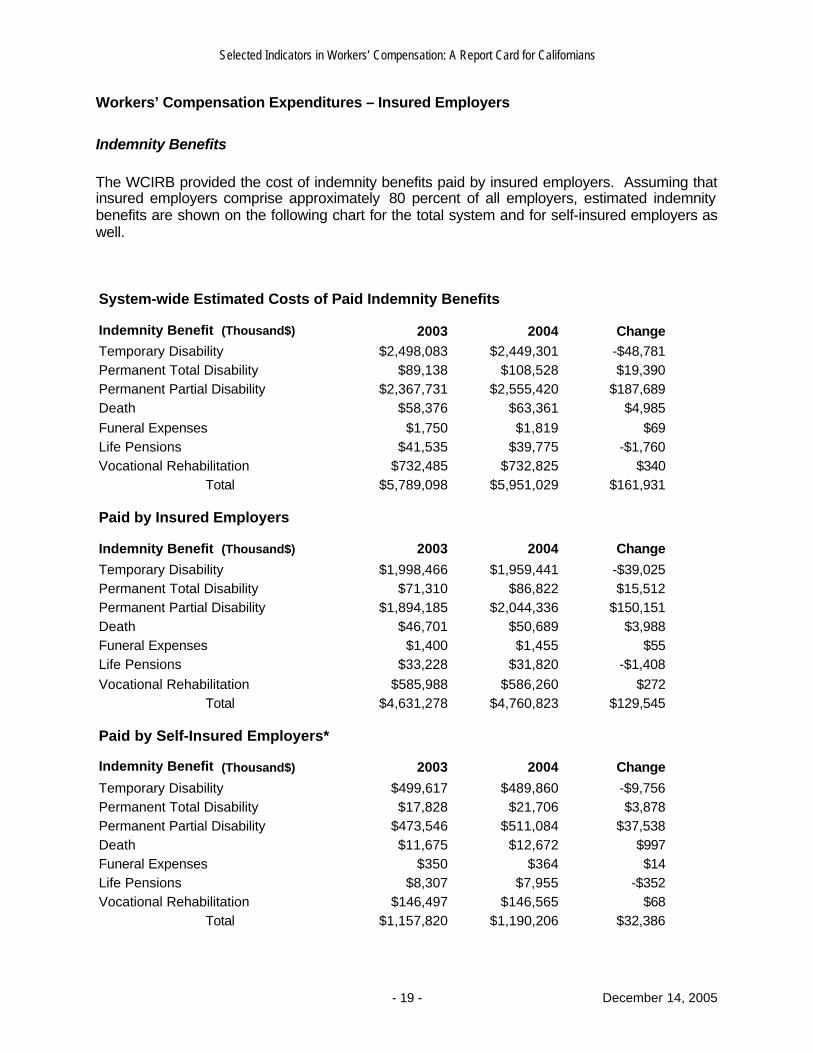
Indemnity Benefits The WCIRB provided the cost of indemnity benefits paid by insured employers. Assuming that insured employers comprise approximately 80 percent of all employers, estimated indemnity benefits are shown on the following chart for the total system and for self-insured employers as well.
System-wide Estimated Costs of Paid Indemnity Benefits
Indemnity Benefit (Thousand$) 2003 2004 ChangeTemporary Disability $2,498,083 $2,449,301 -$48,781Permanent Total Disability $89,138 $108,528 $19,390Permanent Partial Disability $2,367,731 $2,555,420 $187,689Death $58,376 $63,361 $4,985Funeral Expenses $1,750 $1,819 $69Life Pensions $41,535 $39,775 -$1,760Vocational Rehabilitation $732,485 $732,825 $340
Total $5,789,098 $5,951,029 $161,931
Paid by Insured Employers
Indemnity Benefit (Thousand$) 2003 2004 Change
Temporary Disability $1,998,466 $1,959,441 -$39,025Permanent Total Disability $71,310 $86,822 $15,512Permanent Partial Disability $1,894,185 $2,044,336 $150,151Death $46,701 $50,689 $3,988Funeral Expenses $1,400 $1,455 $55Life Pensions $33,228 $31,820 -$1,408Vocational Rehabilitation $585,988 $586,260 $272
Total $4,631,278 $4,760,823 $129,545
Paid by Self-Insured Employers*
Indemnity Benefit (Thousand$) 2003 2004 Change
Temporary Disability $499,617 $489,860 -$9,756Permanent Total Disability $17,828 $21,706 $3,878Permanent Partial Disability $473,546 $511,084 $37,538Death $11,675 $12,672 $997Funeral Expenses $350 $364 $14Life Pensions $8,307 $7,955 -$352Vocational Rehabilitation $146,497 $146,565 $68
Total $1,157,820 $1,190,206 $32,386
Selected Indicators in Workers’ Compensation: A Report Card for Californians
- 20 - December 14, 2005
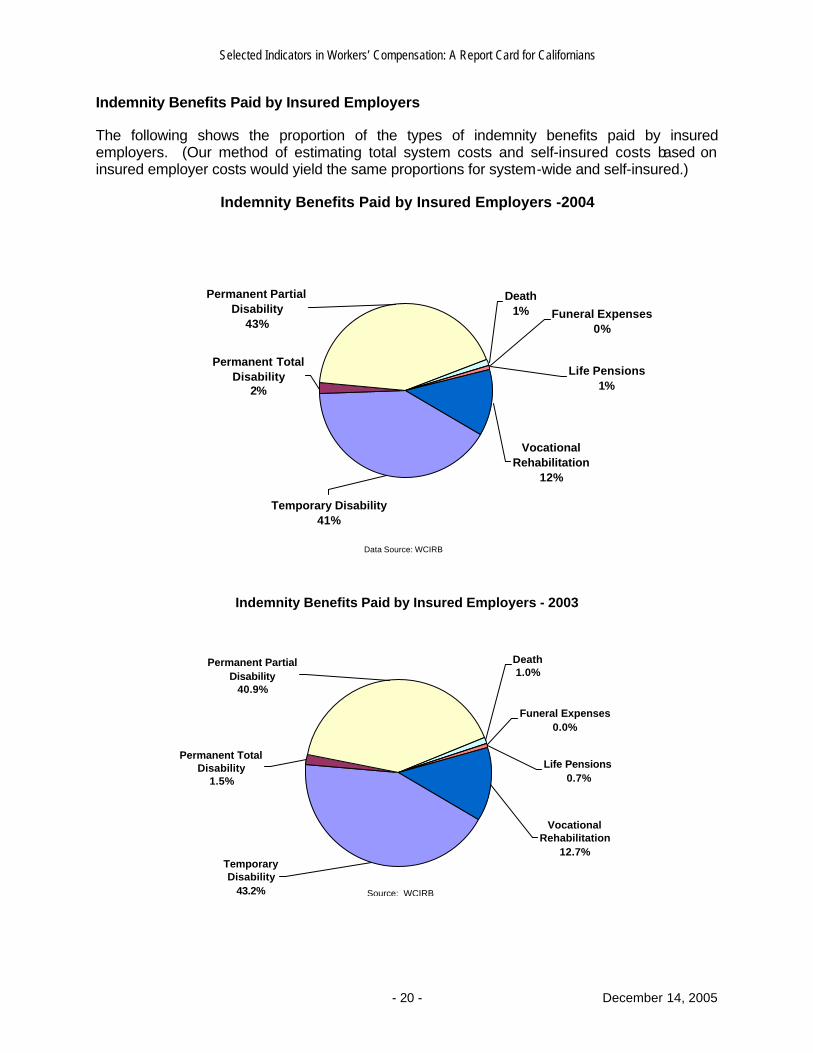
Indemnity Benefits Paid by Insured Employers The following shows the proportion of the types of indemnity benefits paid by insured employers. (Our method of estimating total system costs and self-insured costs based on insured employer costs would yield the same proportions for system-wide and self-insured.)
Indemnity Benefits Paid by Insured Employers -2004
Funeral Expenses0%
Death 1%
Life Pensions1%
Vocational Rehabilitation
12%
Permanent Partial Disability
43%
Permanent Total Disability
2%
Temporary Disability41%
Data Source: WCIRB
Indemnity Benefits Paid by Insured Employers - 2003
Vocational Rehabilitation
12.7%
Life Pensions0.7%
Funeral Expenses0.0%
Death 1.0%
Permanent Partial Disability
40.9%
Temporary Disability
43.2%
Permanent Total Disability
1.5%
Source: WCIRB
Selected Indicators in Workers’ Compensation: A Report Card for Californians
- 21 - December 14, 2005
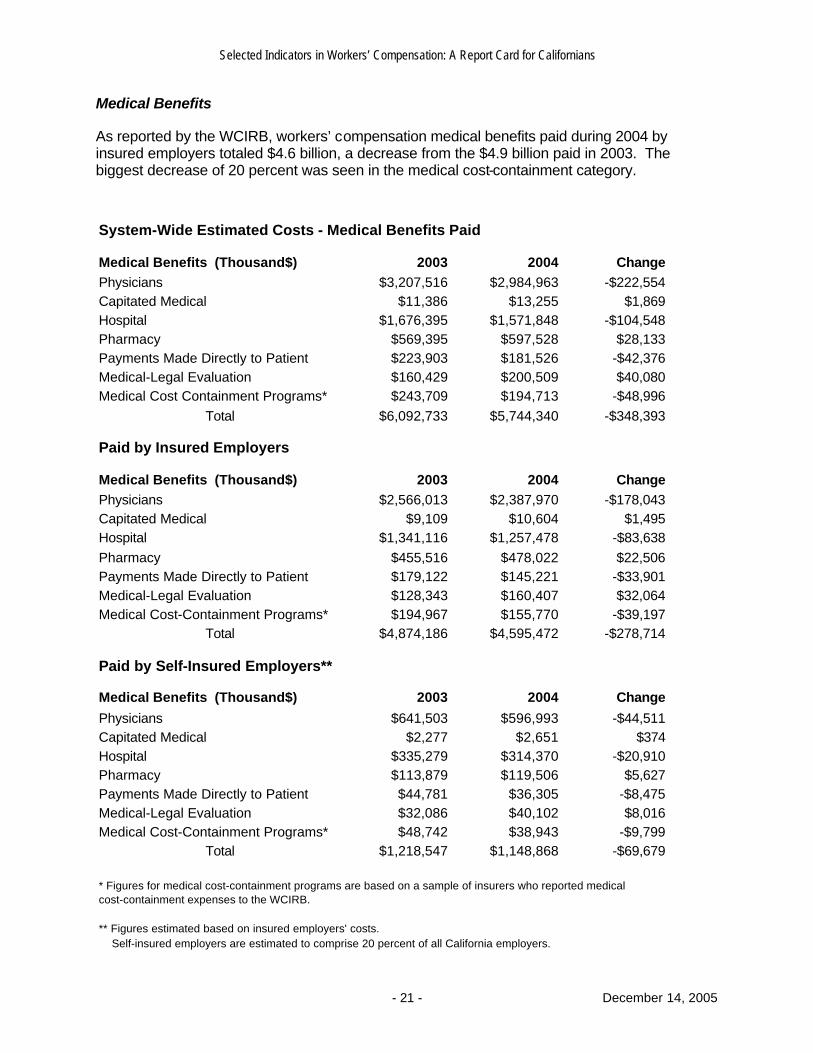
Medical Benefits
As reported by the WCIRB, workers’ compensation medical benefits paid during 2004 by insured employers totaled $4.6 billion, a decrease from the $4.9 billion paid in 2003. The biggest decrease of 20 percent was seen in the medical cost-containment category.
System-Wide Estimated Costs - Medical Benefits Paid
Medical Benefits (Thousand$) 2003 2004 ChangePhysicians $3,207,516 $2,984,963 -$222,554Capitated Medical $11,386 $13,255 $1,869Hospital $1,676,395 $1,571,848 -$104,548Pharmacy $569,395 $597,528 $28,133Payments Made Directly to Patient $223,903 $181,526 -$42,376Medical-Legal Evaluation $160,429 $200,509 $40,080Medical Cost Containment Programs* $243,709 $194,713 -$48,996
Total $6,092,733 $5,744,340 -$348,393
Paid by Insured Employers
Medical Benefits (Thousand$) 2003 2004 ChangePhysicians $2,566,013 $2,387,970 -$178,043Capitated Medical $9,109 $10,604 $1,495Hospital $1,341,116 $1,257,478 -$83,638Pharmacy $455,516 $478,022 $22,506Payments Made Directly to Patient $179,122 $145,221 -$33,901Medical-Legal Evaluation $128,343 $160,407 $32,064Medical Cost-Containment Programs* $194,967 $155,770 -$39,197
Total $4,874,186 $4,595,472 -$278,714
Paid by Self-Insured Employers**
Medical Benefits (Thousand$) 2003 2004 Change
Physicians $641,503 $596,993 -$44,511Capitated Medical $2,277 $2,651 $374Hospital $335,279 $314,370 -$20,910Pharmacy $113,879 $119,506 $5,627Payments Made Directly to Patient $44,781 $36,305 -$8,475Medical-Legal Evaluation $32,086 $40,102 $8,016Medical Cost-Containment Programs* $48,742 $38,943 -$9,799
Total $1,218,547 $1,148,868 -$69,679
* Figures for medical cost-containment programs are based on a sample of insurers who reported medical cost-containment expenses to the WCIRB.
** Figures estimated based on insured employers' costs. Self-insured employers are estimated to comprise 20 percent of all California employers.
Selected Indicators in Workers’ Compensation: A Report Card for Californians
- 22 - December 14, 2005
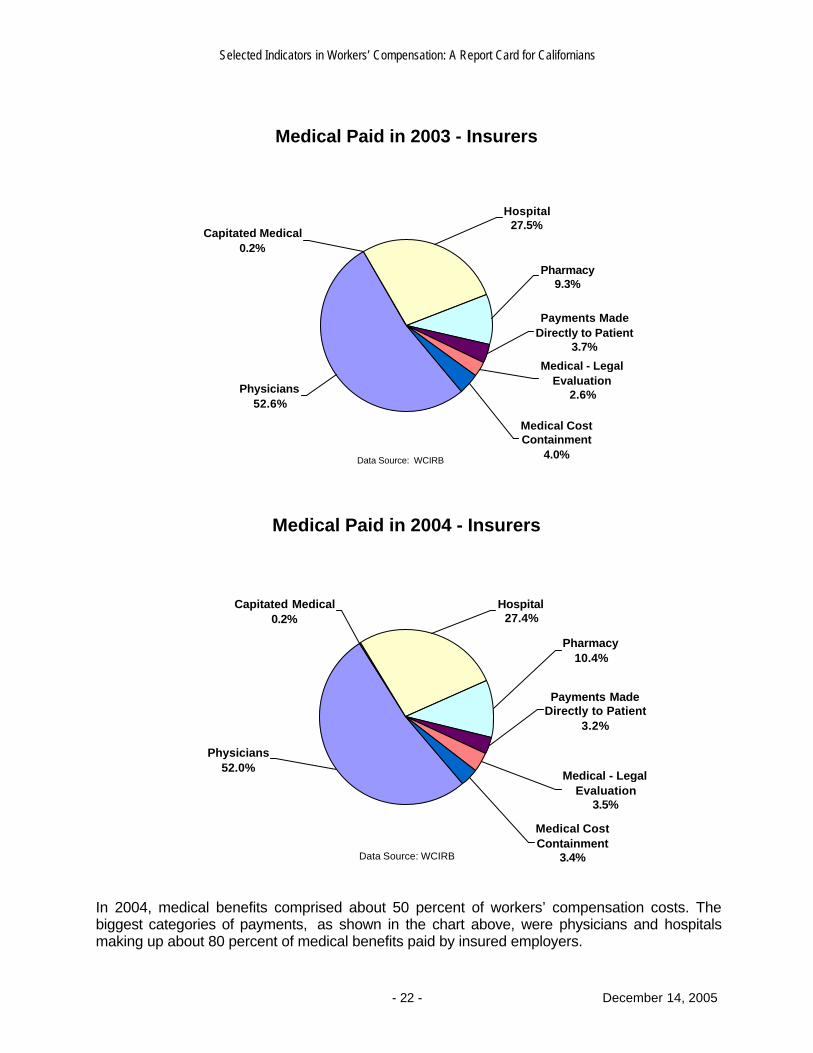
Medical Paid in 2003 - Insurers
Medical Cost Containment
4.0%
Medical - Legal Evaluation
2.6%
Payments Made Directly to Patient
3.7%
Pharmacy9.3%
Hospital27.5%
Physicians52.6%
Capitated Medical0.2%
Data Source: WCIRB
Medical Paid in 2004 - Insurers
Payments Made Directly to Patient
3.2%
Medical - Legal Evaluation
3.5%
Medical Cost Containment
3.4%
Pharmacy10.4%
Hospital27.4%
Capitated Medical0.2%
Physicians52.0%
Data Source: WCIRB
In 2004, medical benefits comprised about 50 percent of workers’ compensation costs. The biggest categories of payments, as shown in the chart above, were physicians and hospitals making up about 80 percent of medical benefits paid by insured employers.
Selected Indicators in Workers’ Compensation: A Report Card for Californians
- 23 - December 14, 2005
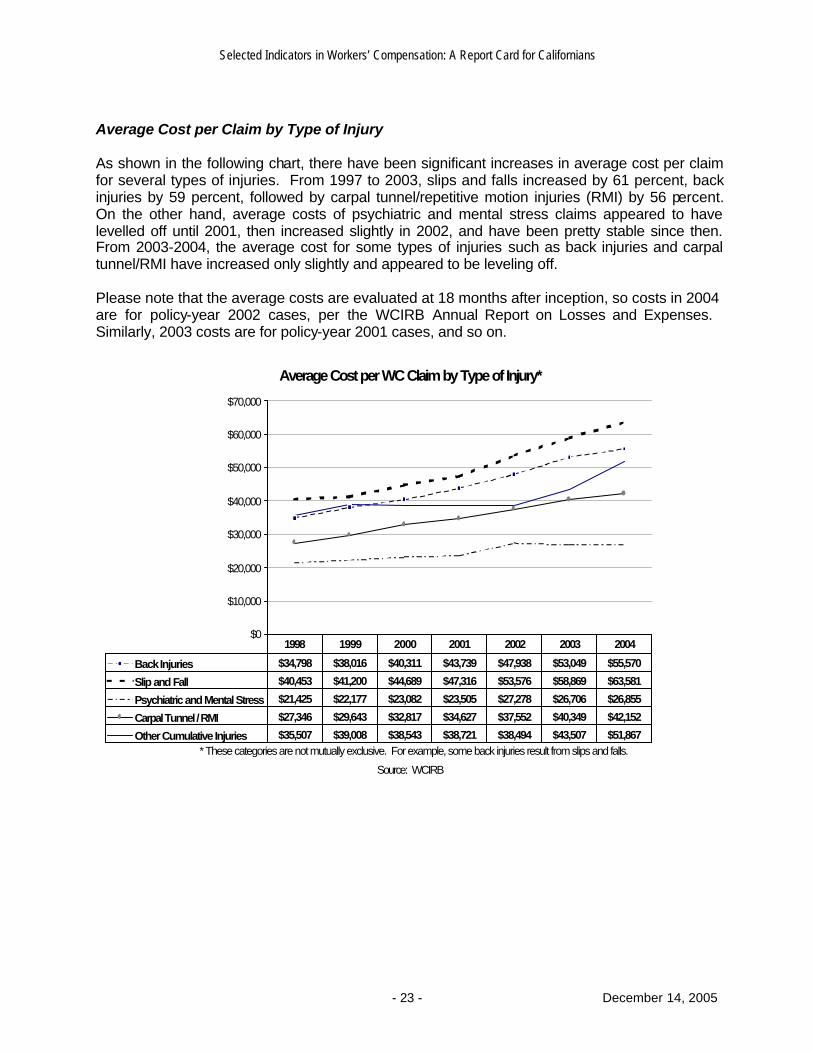
Average Cost per Claim by Type of Injury As shown in the following chart, there have been significant increases in average cost per claim for several types of injuries. From 1997 to 2003, slips and falls increased by 61 percent, back injuries by 59 percent, followed by carpal tunnel/repetitive motion injuries (RMI) by 56 percent. On the other hand, average costs of psychiatric and mental stress claims appeared to have levelled off until 2001, then increased slightly in 2002, and have been pretty stable since then. From 2003-2004, the average cost for some types of injuries such as back injuries and carpal tunnel/RMI have increased only slightly and appeared to be leveling off. Please note that the average costs are evaluated at 18 months after inception, so costs in 2004 are for policy-year 2002 cases, per the WCIRB Annual Report on Losses and Expenses. Similarly, 2003 costs are for policy-year 2001 cases, and so on.
Average Cost per WC Claim by Type of Injury*
$0
$10,000
$20,000
$30,000
$40,000
$50,000
$60,000
$70,000
Back Injuries $34,798 $38,016 $40,311 $43,739 $47,938 $53,049 $55,570
Slip and Fall $40,453 $41,200 $44,689 $47,316 $53,576 $58,869 $63,581
Psychiatric and Mental Stress $21,425 $22,177 $23,082 $23,505 $27,278 $26,706 $26,855
Carpal Tunnel / RMI $27,346 $29,643 $32,817 $34,627 $37,552 $40,349 $42,152
Other Cumulative Injuries $35,507 $39,008 $38,543 $38,721 $38,494 $43,507 $51,867
1998 1999 2000 2001 2002 2003 2004
Source: WCIRB
* These categories are not mutually exclusive. For example, some back injuries result from slips and falls.
Selected Indicators in Workers’ Compensation: A Report Card for Californians
- 24 - December 14, 2005
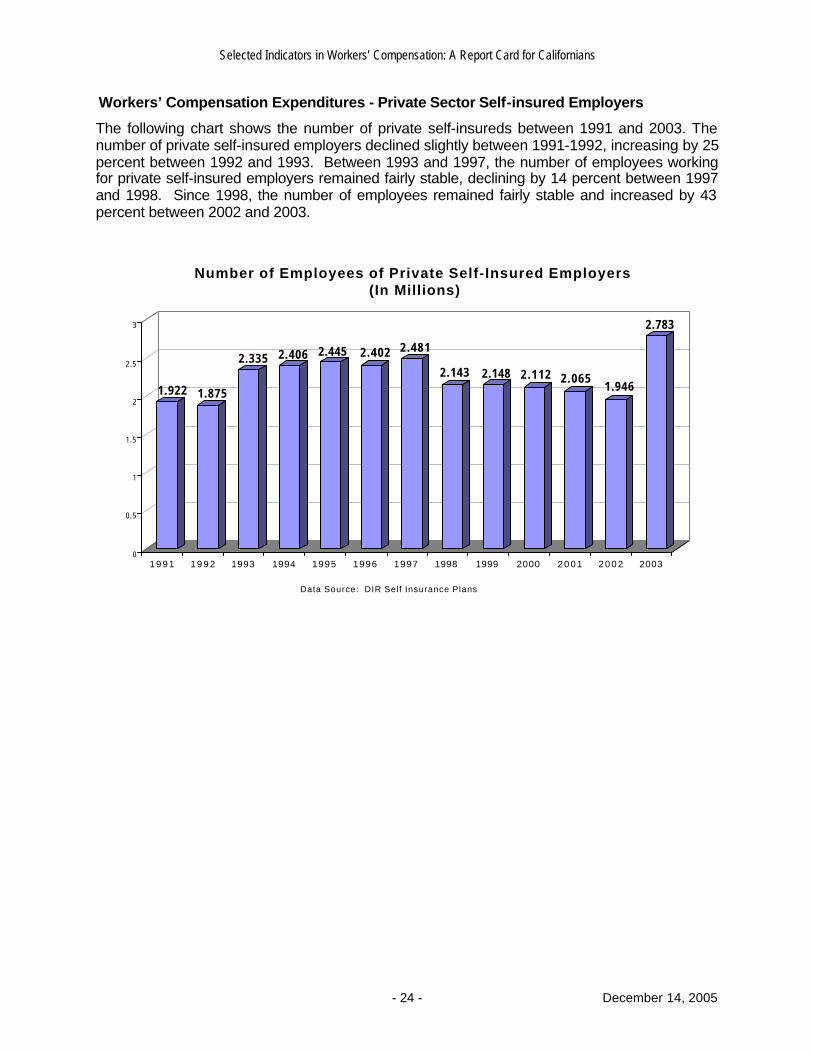
Workers’ Compensation Expenditures - Private Sector Self-insured Employers
The following chart shows the number of private self-insureds between 1991 and 2003. The number of private self-insured employers declined slightly between 1991-1992, increasing by 25 percent between 1992 and 1993. Between 1993 and 1997, the number of employees working for private self-insured employers remained fairly stable, declining by 14 percent between 1997 and 1998. Since 1998, the number of employees remained fairly stable and increased by 43 percent between 2002 and 2003.
1.922 1.875
2.335 2.406 2.445 2.402 2.481
2.143 2.148 2.112 2.0651.946
2.783
0
0.5
1
1.5
2
2.5
3
1 9 9 1 1 9 9 2 1993 1994 1995 1996 1997 1998 1999 2000 2 0 0 1 2 0 0 2 2003
Number of Employees of Private Self-Insured Employers(In Millions)
Data Source: DIR Self Insurance Plans
Selected Indicators in Workers’ Compensation: A Report Card for Californians
- 25 - December 14, 2005
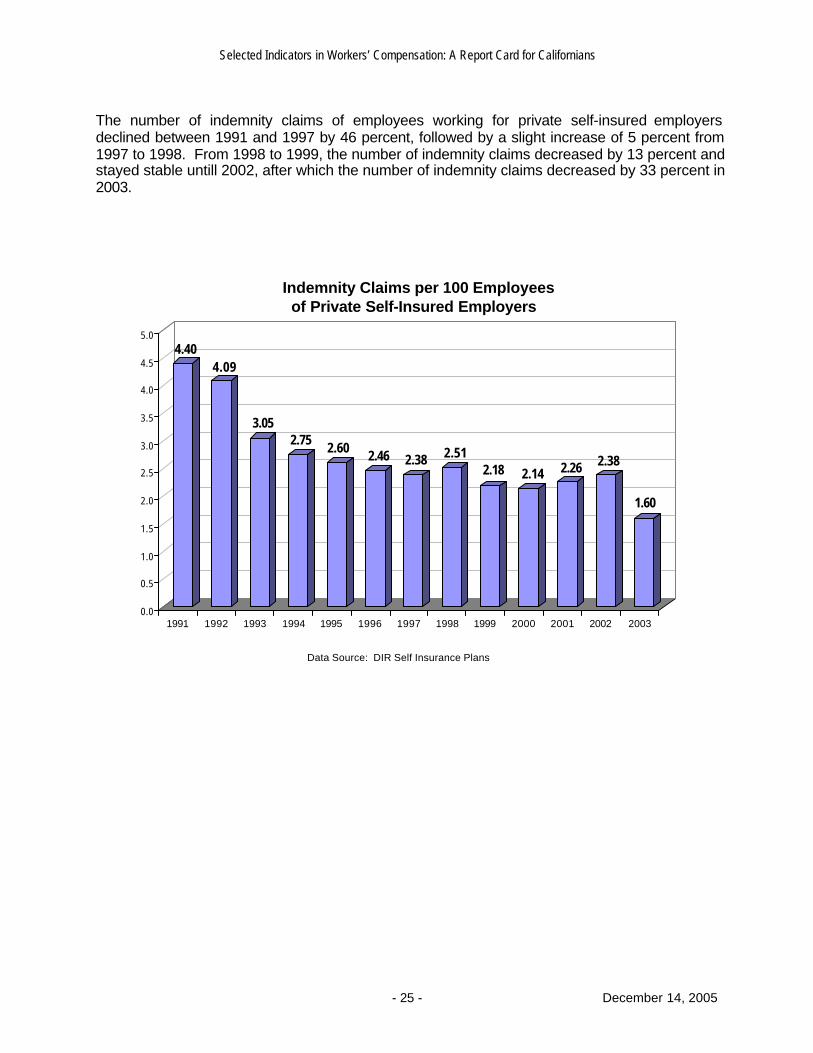
The number of indemnity claims of employees working for private self-insured employers declined between 1991 and 1997 by 46 percent, followed by a slight increase of 5 percent from 1997 to 1998. From 1998 to 1999, the number of indemnity claims decreased by 13 percent and stayed stable untill 2002, after which the number of indemnity claims decreased by 33 percent in 2003.
4.404.09
3.052.75 2.60 2.46 2.38 2.51
2.18 2.14 2.26 2.38
1.60
0.0
0.5
1.0
1.5
2.0
2.5
3.0
3.5
4.0
4.5
5.0
1991 1992 1993 1994 1995 1996 1997 1998 1999 2000 2001 2002 2003
Indemnity Claims per 100 Employees of Private Self-Insured Employers
Data Source: DIR Self Insurance Plans
Selected Indicators in Workers’ Compensation: A Report Card for Californians
- 26 - December 14, 2005
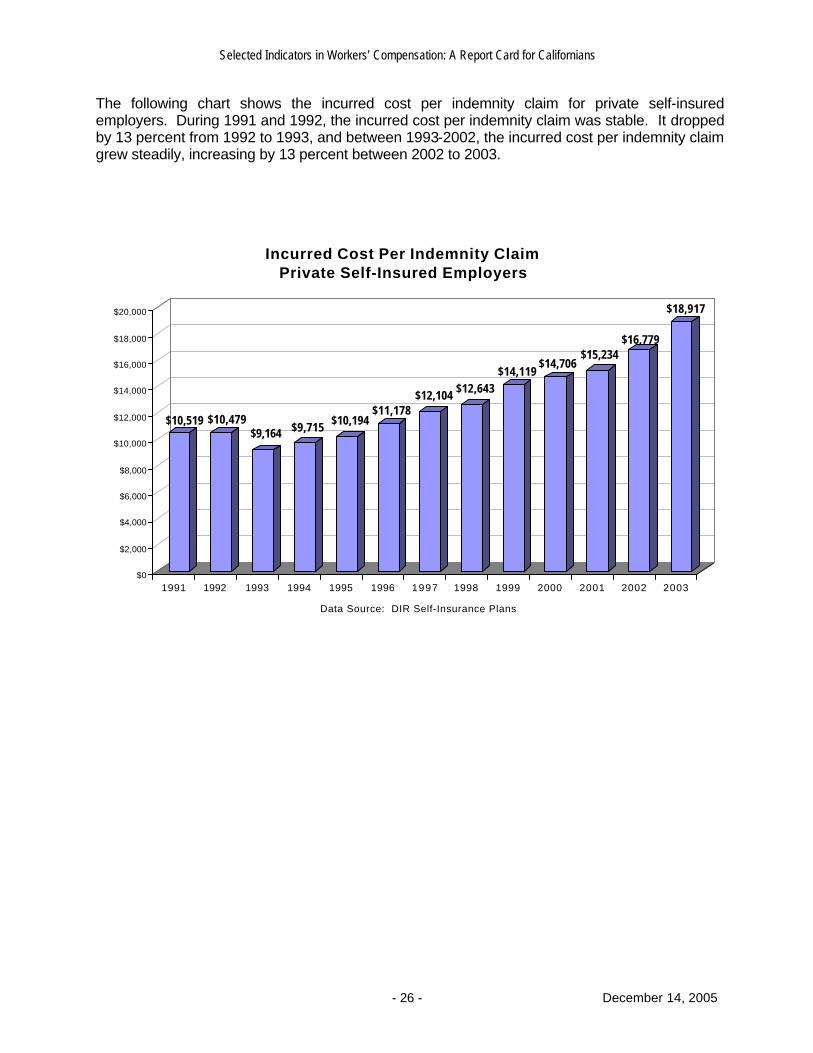
The following chart shows the incurred cost per indemnity claim for private self-insured employers. During 1991 and 1992, the incurred cost per indemnity claim was stable. It dropped by 13 percent from 1992 to 1993, and between 1993-2002, the incurred cost per indemnity claim grew steadily, increasing by 13 percent between 2002 to 2003.
$10,519 $10,479$9,164 $9,715 $10,194
$11,178$12,104 $12,643
$14,119$14,706
$15,234$16,779
$18,917
$0
$2,000
$4,000
$6,000
$8,000
$10,000
$12,000
$14,000
$16,000
$18,000
$20,000
1991 1992 1993 1994 1995 1996 1997 1998 1999 2000 2001 2002 2003
Incurred Cost Per Indemnity ClaimPrivate Self-Insured Employers
Data Source: DIR Self-Insurance Plans
Selected Indicators in Workers’ Compensation: A Report Card for Californians
- 27 - December 14, 2005
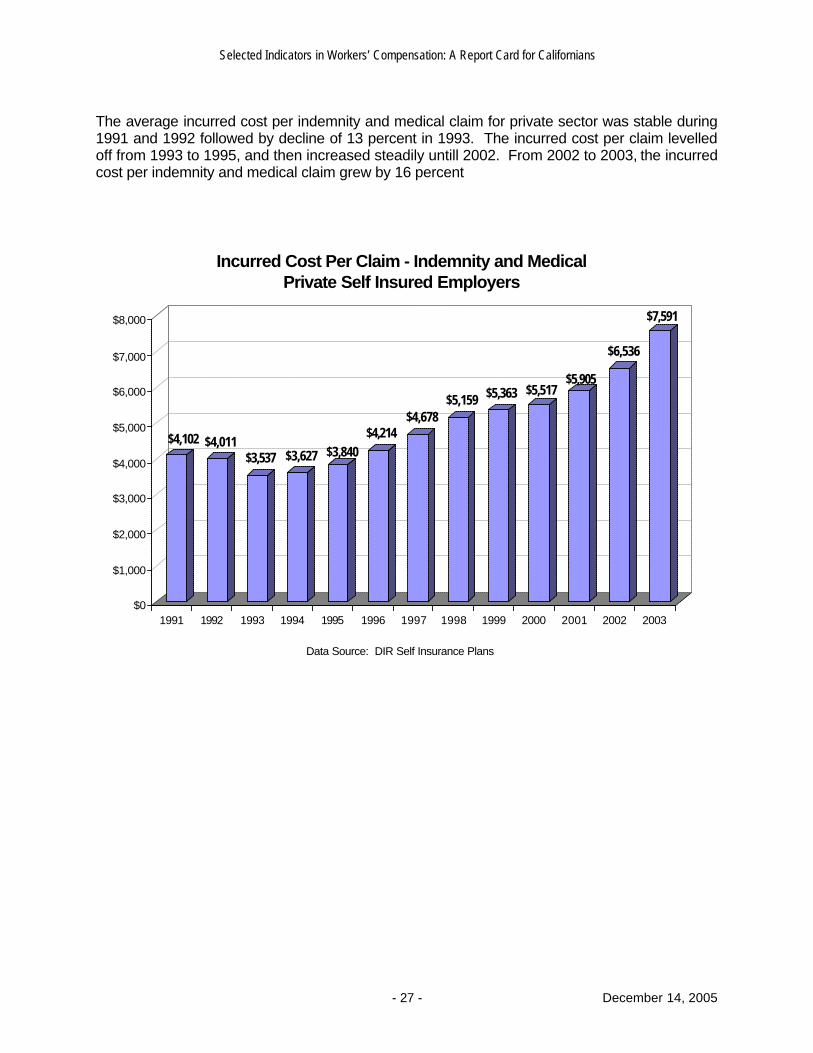
The average incurred cost per indemnity and medical claim for private sector was stable during 1991 and 1992 followed by decline of 13 percent in 1993. The incurred cost per claim levelled off from 1993 to 1995, and then increased steadily untill 2002. From 2002 to 2003, the incurred cost per indemnity and medical claim grew by 16 percent
$4,102 $4,011$3,537 $3,627 $3,840
$4,214$4,678
$5,159 $5,363 $5,517$5,905
$6,536
$7,591
$0
$1,000
$2,000
$3,000
$4,000
$5,000
$6,000
$7,000
$8,000
1991 1992 1993 1994 1995 1996 1997 1998 1999 2000 2001 2002 2003
Incurred Cost Per Claim - Indemnity and MedicalPrivate Self Insured Employers
Data Source: DIR Self Insurance Plans
Selected Indicators in Workers’ Compensation: A Report Card for Californians
- 28 - December 14, 2005
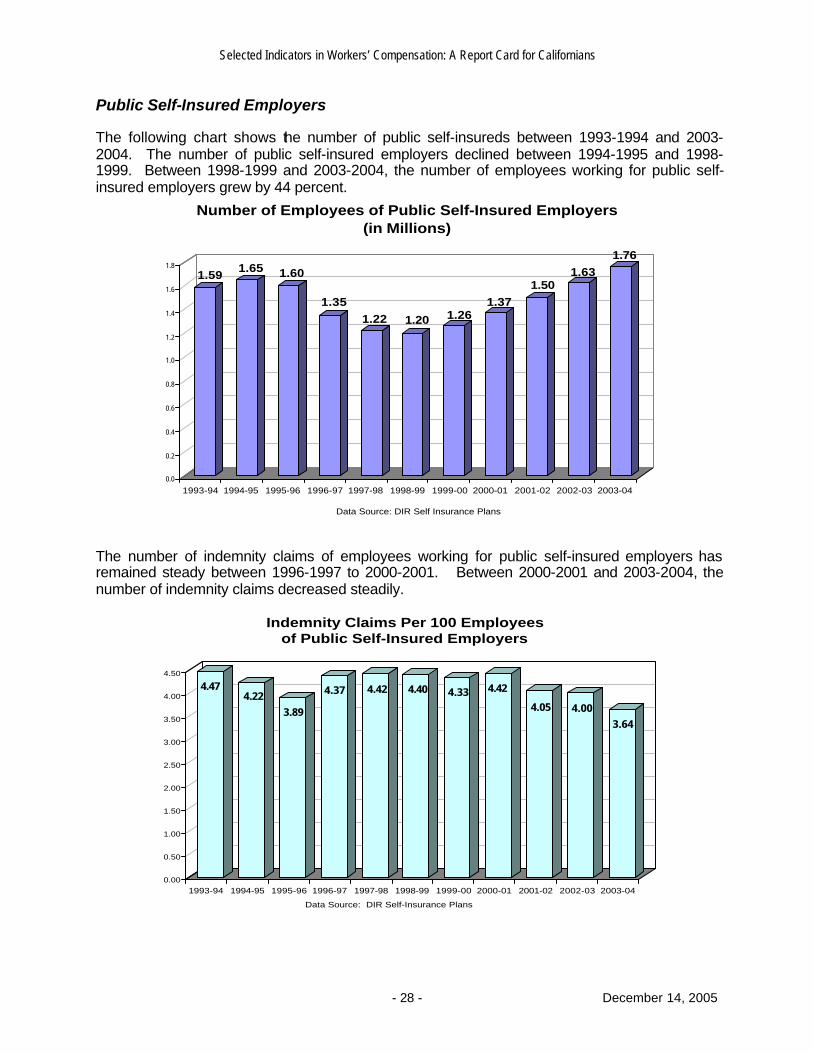
Public Self-Insured Employers The following chart shows the number of public self-insureds between 1993-1994 and 2003-2004. The number of public self-insured employers declined between 1994-1995 and 1998-1999. Between 1998-1999 and 2003-2004, the number of employees working for public self- insured employers grew by 44 percent.
1.591.65 1.60
1.351.22 1.20 1.26
1.371.50
1.631.76
0.0
0.2
0.4
0.6
0.8
1.0
1.2
1.4
1.6
1.8
1993-94 1994-95 1995-96 1996-97 1997-98 1998-99 1999-00 2000-01 2001-02 2002-03 2003-04
Number of Employees of Public Self-Insured Employers(in Millions)
Data Source: DIR Self Insurance Plans
The number of indemnity claims of employees working for public self-insured employers has remained steady between 1996-1997 to 2000-2001. Between 2000-2001 and 2003-2004, the number of indemnity claims decreased steadily.
4.474.22
3.89
4.37 4.42 4.40 4.33 4.42
4.05 4.003.64
0.00
0.50
1.00
1.50
2.00
2.50
3.00
3.50
4.00
4.50
1993-94 1994-95 1995-96 1996-97 1997-98 1998-99 1999-00 2000-01 2001-02 2002-03 2003-04
Indemnity Claims Per 100 Employeesof Public Self-Insured Employers
Data Source: DIR Self-Insurance Plans
Selected Indicators in Workers’ Compensation: A Report Card for Californians
- 29 - December 14, 2005
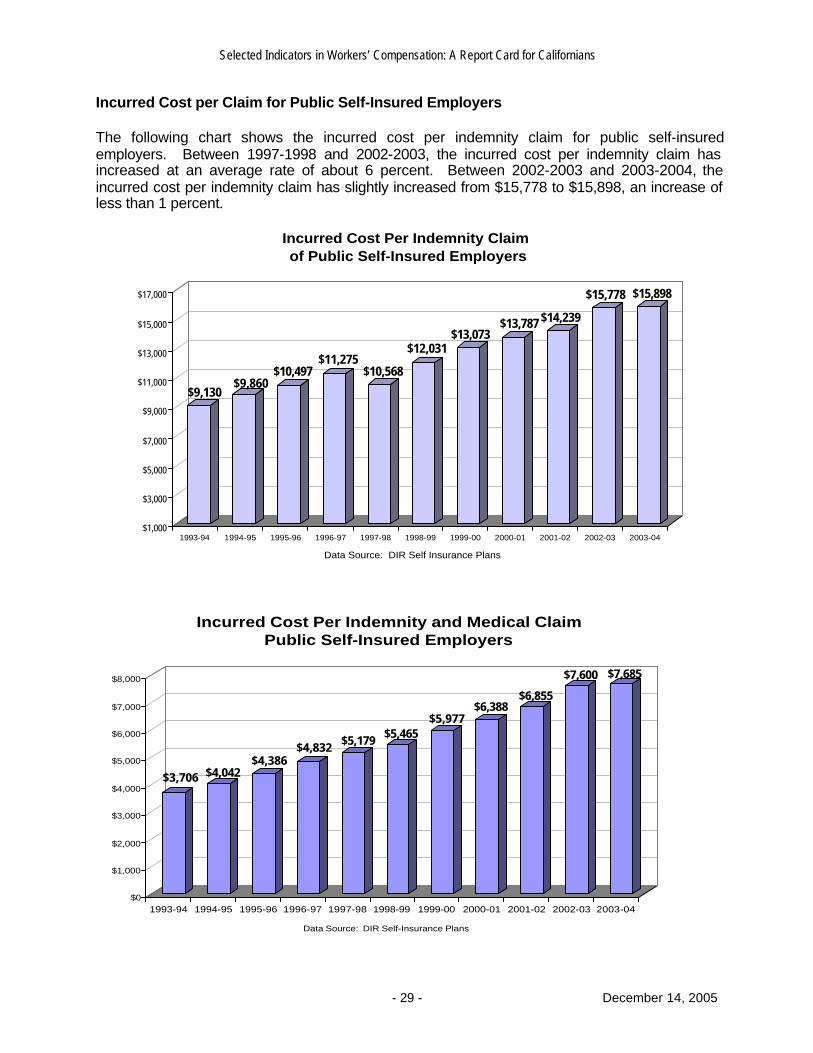
Incurred Cost per Claim for Public Self-Insured Employers The following chart shows the incurred cost per indemnity claim for public self-insured employers. Between 1997-1998 and 2002-2003, the incurred cost per indemnity claim has increased at an average rate of about 6 percent. Between 2002-2003 and 2003-2004, the incurred cost per indemnity claim has slightly increased from $15,778 to $15,898, an increase of less than 1 percent.
$9,130$9,860
$10,497$11,275
$10,568
$12,031$13,073
$13,787 $14,239
$15,778 $15,898
$1,000
$3,000
$5,000
$7,000
$9,000
$11,000
$13,000
$15,000
$17,000
1993-94 1994-95 1995-96 1996-97 1997-98 1998-99 1999-00 2000-01 2001-02 2002-03 2003-04
Incurred Cost Per Indemnity Claim of Public Self-Insured Employers
Data Source: DIR Self Insurance Plans
$3,706 $4,042$4,386
$4,832 $5,179 $5,465$5,977
$6,388$6,855
$7,600 $7,685
$0
$1,000
$2,000
$3,000
$4,000
$5,000
$6,000
$7,000
$8,000
1993-94 1994-95 1995-96 1996-97 1997-98 1998-99 1999-00 2000-01 2001-02 2002-03 2003-04
Incurred Cost Per Indemnity and Medical ClaimPublic Self-Insured Employers
Data Source: DIR Self-Insurance Plans
Selected Indicators in Workers’ Compensation: A Report Card for Californians
- 30 - December 14, 2005
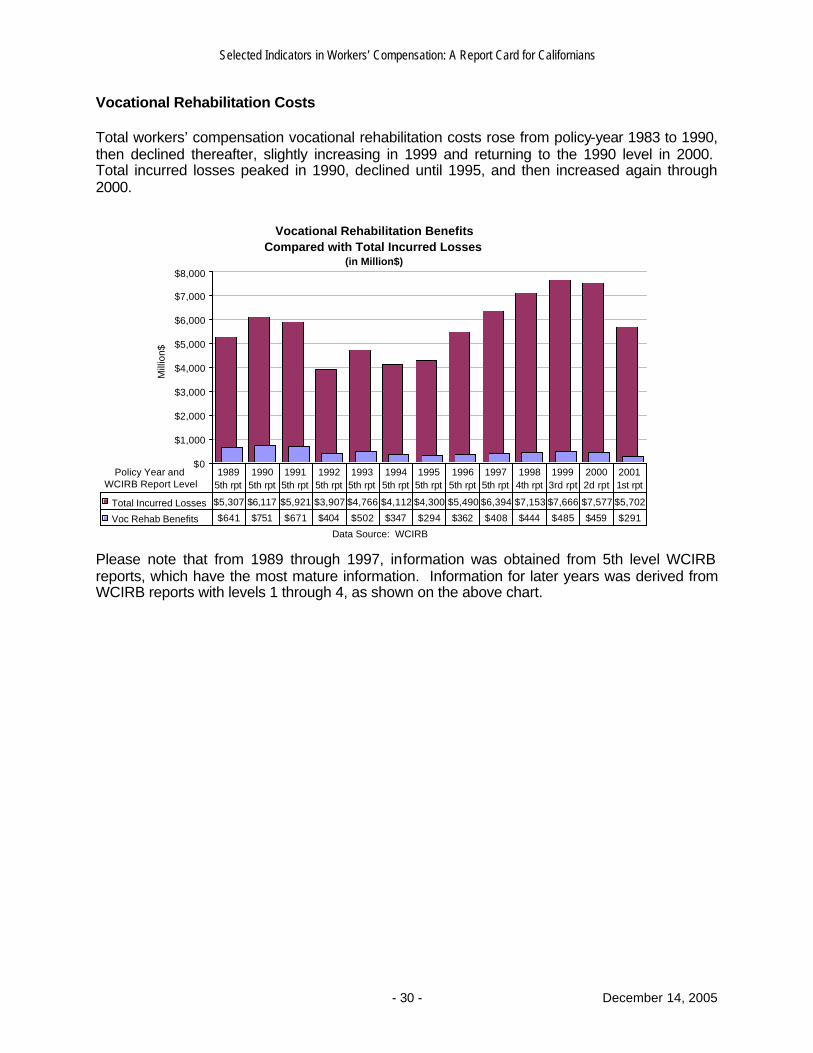
Vocational Rehabilitation Costs Total workers’ compensation vocational rehabilitation costs rose from policy-year 1983 to 1990, then declined thereafter, slightly increasing in 1999 and returning to the 1990 level in 2000. Total incurred losses peaked in 1990, declined until 1995, and then increased again through 2000.
Vocational Rehabilitation Benefits Compared with Total Incurred Losses
(in Million$)
$0
$1,000
$2,000
$3,000
$4,000
$5,000
$6,000
$7,000
$8,000
Policy Year and WCIRB Report Level
Mill
ion$
Total Incurred Losses $5,307 $6,117 $5,921 $3,907 $4,766 $4,112 $4,300 $5,490 $6,394 $7,153 $7,666 $7,577 $5,702
Voc Rehab Benefits $641 $751 $671 $404 $502 $347 $294 $362 $408 $444 $485 $459 $291
1989 5th rpt
1990 5th rpt
1991 5th rpt
1992 5th rpt
1993 5th rpt
1994 5th rpt
1995 5th rpt
1996 5th rpt
1997 5th rpt
1998 4th rpt
1999 3rd rpt
2000 2d rpt
2001 1st rpt
Data Source: WCIRB
Please note that from 1989 through 1997, information was obtained from 5th level WCIRB reports, which have the most mature information. Information for later years was derived from WCIRB reports with levels 1 through 4, as shown on the above chart.
Selected Indicators in Workers’ Compensation: A Report Card for Californians
- 31 - December 14, 2005
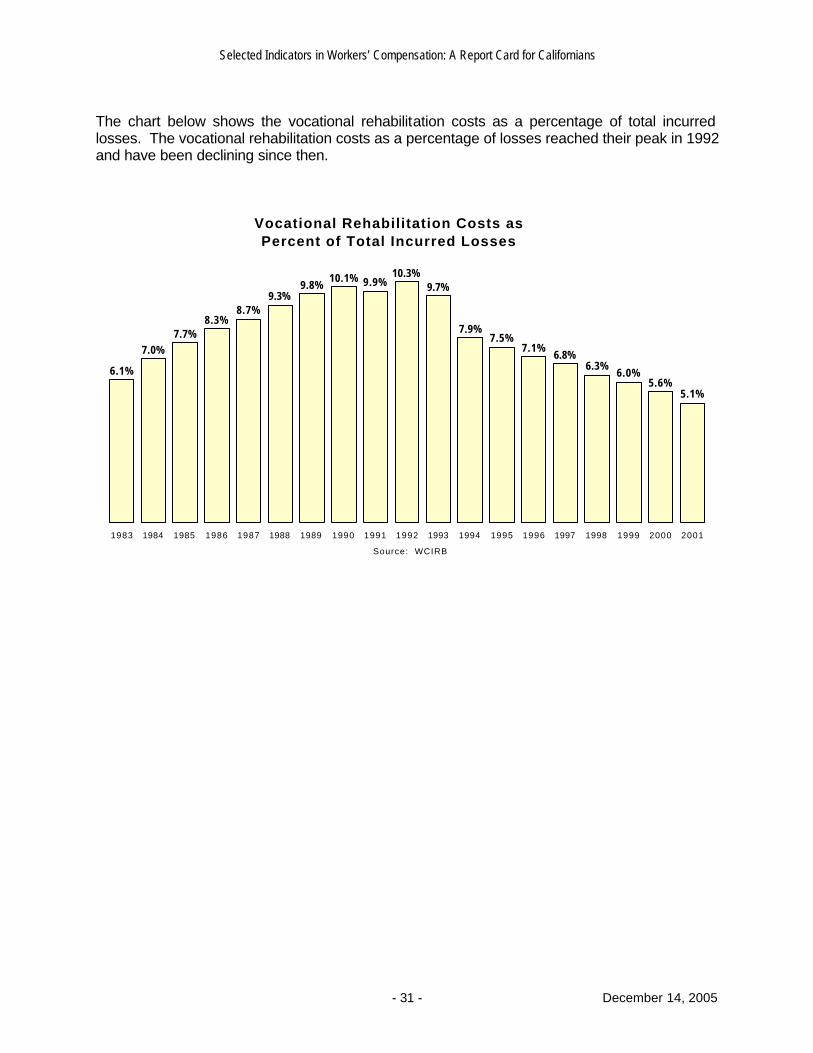
The chart below shows the vocational rehabilitation costs as a percentage of total incurred losses. The vocational rehabilitation costs as a percentage of losses reached their peak in 1992 and have been declining since then.
Vocational Rehabilitation Costs as Percent of Total Incurred Losses
6.1%
7.0%7.7%
8.3%8.7%
9.3%9.8%
10.1% 9.9%10.3%
9.7%
7.9%7.5%
7.1%6.8%
6.3%6.0%
5.6%5.1%
1983 1984 1985 1986 1987 1988 1989 1990 1991 1992 1993 1994 1995 1996 1997 1998 1999 2000 2001
Source: WCIRB
Selected Indicators in Workers’ Compensation: A Report Card for Californians
- 32 - December 14, 2005
INJURIES AND ILLNESSES
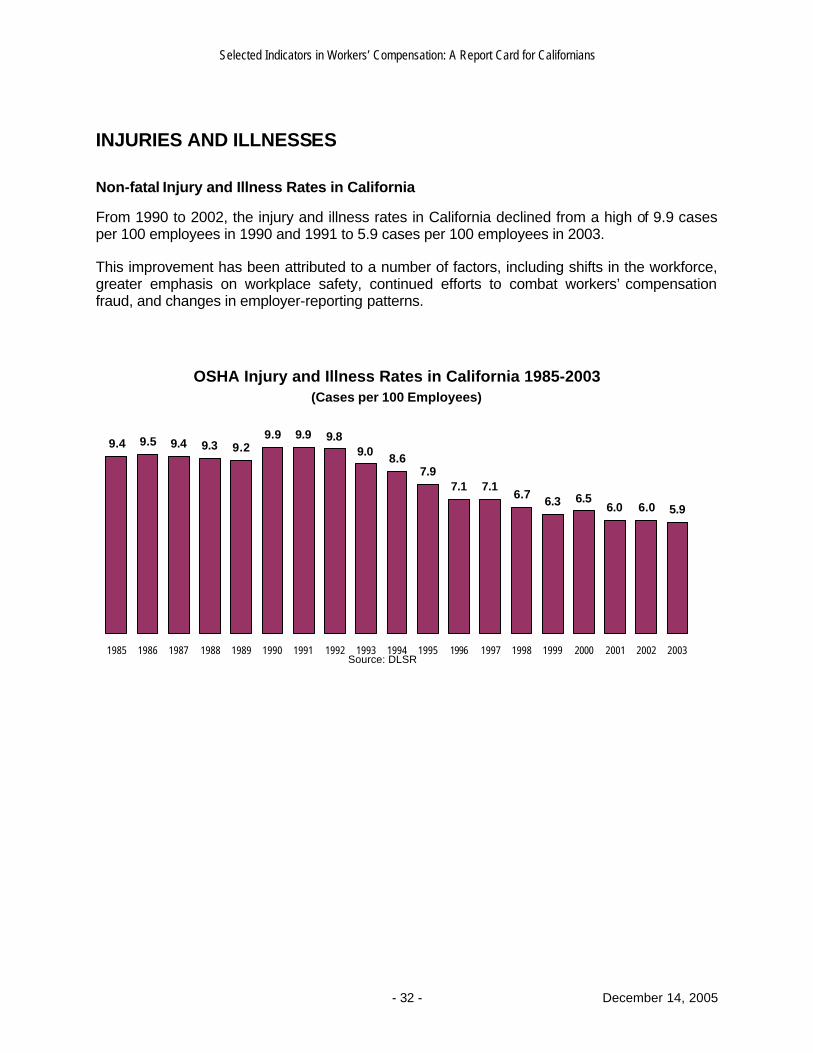
Non-fatal Injury and Illness Rates in California
From 1990 to 2002, the injury and illness rates in California declined from a high of 9.9 cases per 100 employees in 1990 and 1991 to 5.9 cases per 100 employees in 2003. This improvement has been attributed to a number of factors, including shifts in the workforce, greater emphasis on workplace safety, continued efforts to combat workers’ compensation fraud, and changes in employer-reporting patterns.
OSHA Injury and Illness Rates in California 1985-2003(Cases per 100 Employees)
9.4 9.5 9.4 9.3 9.29.9 9.9 9.8
9.0 8.67.9
7.1 7.16.7 6.3 6.5
6.0 6.0 5.9
1985 1986 1987 1988 1989 1990 1991 1992 1993 1994 1995 1996 1997 1998 1999 2000 2001 2002 2003Source: DLSR
Selected Indicators in Workers’ Compensation: A Report Card for Californians
- 33 - December 14, 2005
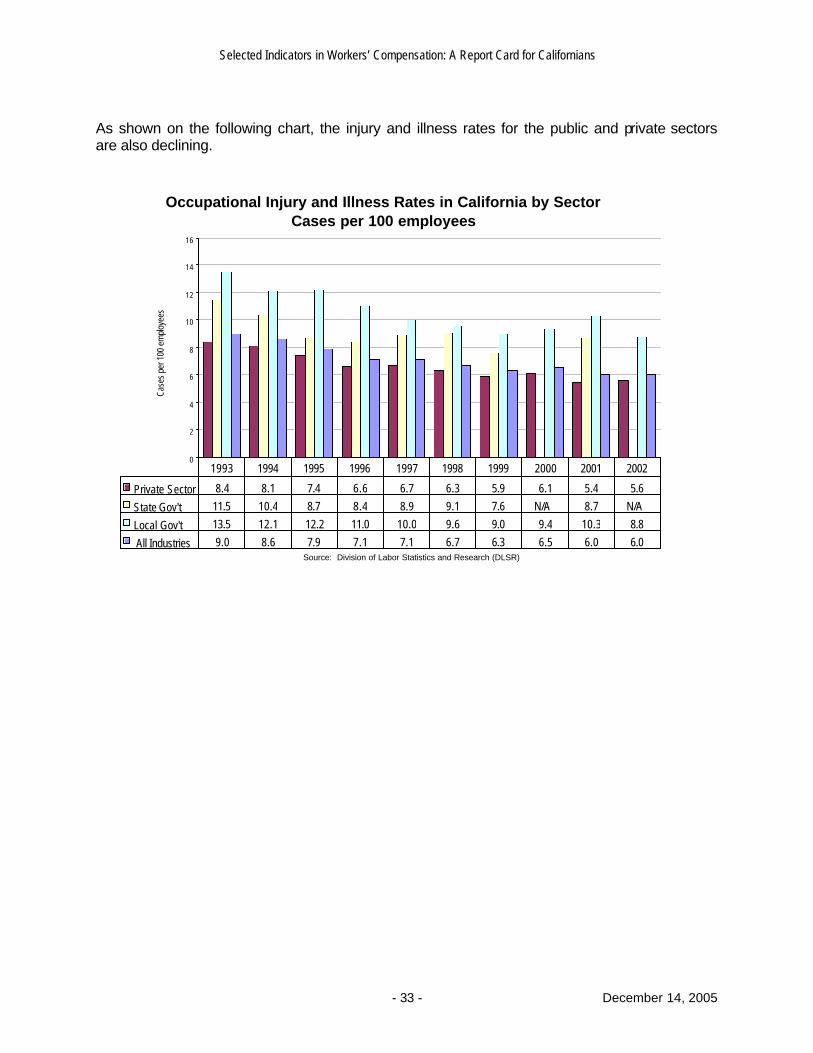
As shown on the following chart, the injury and illness rates for the public and private sectors are also declining.
Occupational Injury and Illness Rates in California by SectorCases per 100 employees
0
2
4
6
8
10
12
14
16
Case
s pe
r 100
em
ploy
ees
Private Sector 8.4 8.1 7.4 6.6 6.7 6.3 5.9 6.1 5.4 5.6
State Gov't 11.5 10.4 8.7 8.4 8.9 9.1 7.6 N/A 8.7 N/A
Local Gov't 13.5 12.1 12.2 11.0 10.0 9.6 9.0 9.4 10.3 8.8
All Industries 9.0 8.6 7.9 7.1 7.1 6.7 6.3 6.5 6.0 6.0
1993 1994 1995 1996 1997 1998 1999 2000 2001 2002
Source: Division of Labor Statistics and Research (DLSR)
Selected Indicators in Workers’ Compensation: A Report Card for Californians
- 34 - December 14, 2005
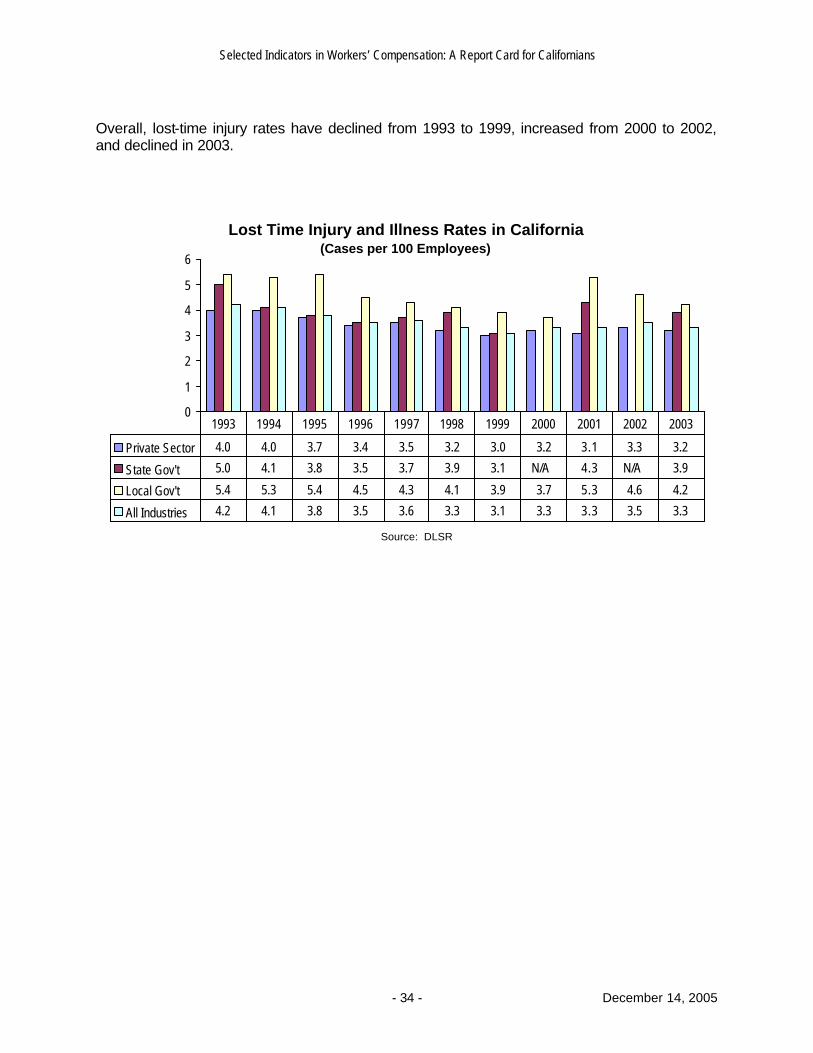
Overall, lost-time injury rates have declined from 1993 to 1999, increased from 2000 to 2002, and declined in 2003.
Lost Time Injury and Illness Rates in California (Cases per 100 Employees)
0
1
2
3
4
5
6
Private Sector 4.0 4.0 3.7 3.4 3.5 3.2 3.0 3.2 3.1 3.3 3.2
State Gov't 5.0 4.1 3.8 3.5 3.7 3.9 3.1 N/A 4.3 N/A 3.9
Local Gov't 5.4 5.3 5.4 4.5 4.3 4.1 3.9 3.7 5.3 4.6 4.2
All Industries 4.2 4.1 3.8 3.5 3.6 3.3 3.1 3.3 3.3 3.5 3.3
1993 1994 1995 1996 1997 1998 1999 2000 2001 2002 2003
Source: DLSR
Selected Indicators in Workers’ Compensation: A Report Card for Californians
- 35 - December 14, 2005
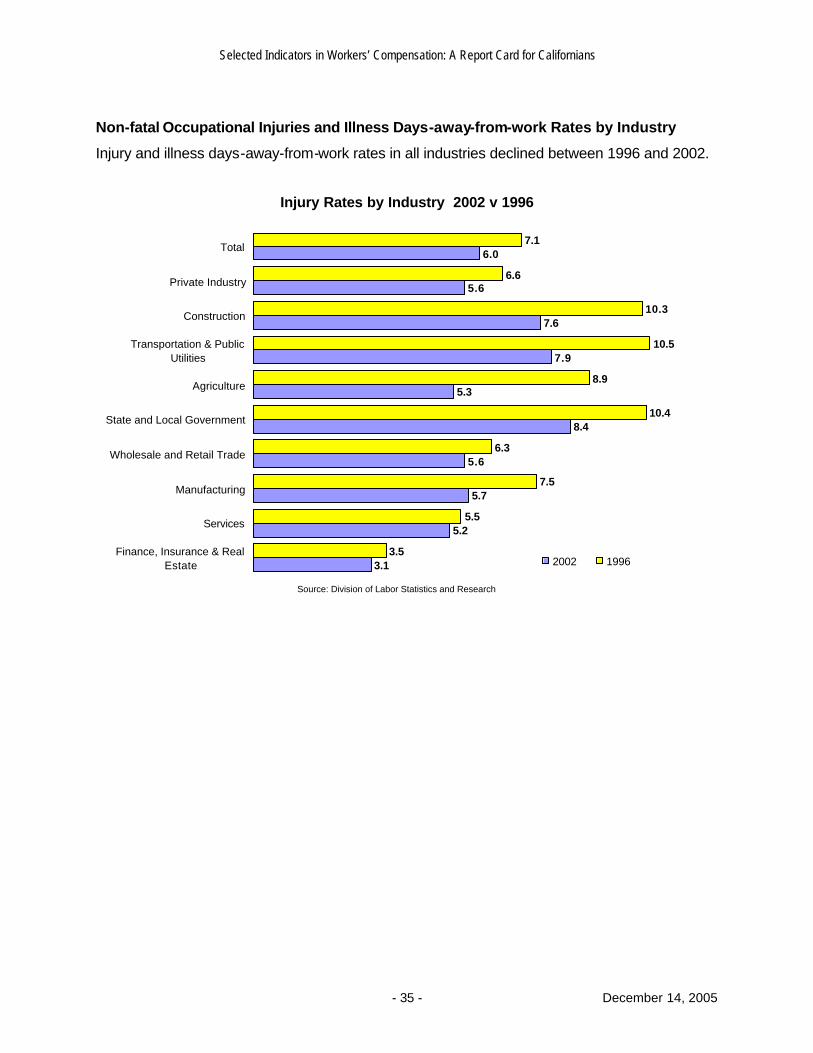
Non-fatal Occupational Injuries and Illness Days-away-from-work Rates by Industry
Injury and illness days-away-from-work rates in all industries declined between 1996 and 2002.
Injury Rates by Industry 2002 v 1996
3.1
5.2
5.7
5.6
8.4
5.3
7.9
7.6
5.6
6.0
3.5
5.5
7.5
6.3
10.4
8.9
10.5
10.3
6.6
7.1
Finance, Insurance & RealEstate
Services
Manufacturing
Wholesale and Retail Trade
State and Local Government
Agriculture
Transportation & PublicUtilities
Construction
Private Industry
Total
2002 1996
Source: Division of Labor Statistics and Research
Selected Indicators in Workers’ Compensation: A Report Card for Californians
- 36 - December 14, 2005
Profile of Injury and Illness Statistics Data for the following analyses, except where noted, were derived from the Department of Industrial Relations (DIR) Division of Labor Statistics and Research (DLSR), from the United States Department of Labor (DOL) Bureau of Labor Statistics (BLS), and from the California Workers’ Compensation Institute (CWCI).
California and the Nation
Incidence Rates
California’s most recent work injury and illness statistics (2003) indicate an injury and illness rate of 5.4 cases per 100 full-time employees in the private sector in 2003. This is a 43 percent decline from the 1990 peak level of 9.4 and an estimated 3.6 percent increase from the previous year’s figures.
The above trend in California mirrors a national trend. DOL figures for private employers show that from 1990 to 2003, the work injury and illness rate across the U.S. fell from 8.8 to 5.0 cases per 100 employees in the private sector. The reduction in the number of incidences of job injuries is likely due to various factors including a greater emphasis on job safety, the improving economy since the early 1990’s, and the shift from manufacturing toward service jobs.
Compared with the Western region states (Alaska, Arizona, California, Hawaii, Nevada, Oregon, Washington), California’s 2002 private-industry rate of 5.4 for non-occupational injuries and illnesses is the second lowest.2 The state with the lowest incidence rate of 4.6 in 2003 was Arizona. Hawaii had the second-lowest incidence rate.
Duration
Days-away-from-work cases, including those that result in days away from work with or without a job transfer or restriction, dropped from 2.1 to 1.7 cases per 100 full-time employees from 1996 to 2003 in the private sector. This also mirrors the national trend with the number of days-away-from-work cases falling from 2.2 to 1.5 cases in the national private sector with a similar decline as that of California.
In “State Report Cards for Workers’ Compensation,” published by the Work Loss Data Institute, the Institute reported that the median days away from work in California and New York is 8 days, compared with the national average of 6 days.3
Industry Data • In 2003, injury and illness incidence rates varied greatly between private industries ranging
from 2.8 injuries/illnesses per 100 full-time workers in the financial activities sector to 7.8 in construction. California’s private industry rates for total cases were higher than the national rates in every major industry division, except for manufacturing, and in natural resources and mining.
2 The comparisons of industry rates have not been adjusted for industry mix within each state. 3 http://www.odg-disability.com/pr_repsrc.htm
Selected Indicators in Workers’ Compensation: A Report Card for Californians
- 37 - December 14, 2005
• The private-industry total-case rate for non-fatal injuries decreased between 2002 and 2003 from 5.6 to 5.4, and the rate for the public sector (state and local government) did not change in 2003 from 8.4 in 2002.
• Over the past decade (1993-2003), the number of fatal injuries declined by about 31 percent, from 664 to 456. The number of fatal injuries declined by 30 percent since 1997 and continued to decrease in 2003 to 456 fatalities. From 2002 to 2003, the number of fatal injuries decreased by 4.6 percent. The highest number of fatal injuries was in trade, transportation and utilities, closely followed by construction.
• In private industry, the top ten occupations with the most non-fatal injuries and illnesses in descending order are: laborers and freight, stock, and material movers; retail sales persons, truck drivers, heavy and tractor-trailer; janitors and cleaners, except maids and house-keeping cleaners; construction laborers; carpenters; farmworkers and laborers, crop, nursery, and greenhouse; maintenance and repair workers, general; truck drivers, light or delivery services; nursing aides, orderlies, and attendants.
• In the state government, the top ten occupations with the most non-fatal injuries and illnesses are correctional officers and jailers; police and sheriff’s patrol officers; office clerks, general; psychiatric technicians, registered nurses; janitors and cleaners, except maids and housekeeping cleaners, medical assistants; first-line supervisors/managers of correctional officers, medical and health services managers; maintenance and repair workers, general.
• In the local government, the top ten occupations with the most non-fatal injuries and illnesses are police and sheriff’s patrol officers; janitors and cleaners except maids and house-keeping; elementary school teachers, except special education; teacher assistants, fire fighters; bus drivers, transit and intercity; maintenance and repair workers, general; landscaping and grounds keeping workers; food servers, non-restaurant; office clerks, general.
• Truck drivers, construction laborers, farm workers, ground maintenance workers and police officers were the occupations with the most number of fatal injuries in 2003. Transportation accidents were the number one cause of fatal injuries accounting for about 38 percent of fatal injuries in 2003.
• Assaults and violent acts accounted for about 18 percent of fatal injuries in 2003 and are a major cause of fatalities among sales and related occupations; transportation and material moving occupations; protective service occupations; installation, maintenance and repair.
• California agriculture has the fourth-highest incidence rate for fatal injuries. The major cause for fatalities in agriculture is motor vehicles, accounting for 47 percent of the total, while the major causes for non-fatal injuries in this industry are “struck by” and “overexertion,” which together account for over 50 percent.4
Non-fatal and Fatal Occupational Injuries by Establishment Size and Type • The lowest rate for the total recordable non-fatal cases in 2003 was experienced by the
smallest employers. Employers with 1 to 10 employees and 11 to 49 employees had incidence rates of 2.1 and 4.6 cases, respectively, per 100 full-time employees. There was no change in incidence rates for employers with 1 to 10 employees. For employers with 11
4 California Occupational and Environmental Health Division, UC Berkeley.
Selected Indicators in Workers’ Compensation: A Report Card for Californians
- 38 - December 14, 2005
to 49 employees, there was a slight 4 percent decrease in incidence rates compared to 2002.
• Establishments with 250 to 999 and 1000 or more employees reported the highest rate of 7.3 and 7.0 cases per 100 full-time employees. Establishments with 1000 or more employees are the only establishments that had an increase in incidence rates, 4.5 percent, compared to 2002.
• Establishments with 50 to 249 employees reported a rate of 6.8 per 100 full-time employees.
• Private-sector wage and salary workers accounted for 74 percent of fatal occupational injuries, followed by self-employed and government workers accounting for about 16 percent and 10 percent, respectively, of fatal injuries in 2003.
Types of Injuries
• Some types of work injuries have declined since 1997 in the private sector, while others have increased. The number of sprains and strains continued to decline from 1997, but these injuries remain by far the most common type of work injury accounting for about 41 percent of days-away-from-work cases in the private sector. Cuts, lacerations, heat burns, carpal tunnel syndrome, tendonitis, chemical burns, amputations, and multiple injuries have decreased from 1997-2003, with the biggest decrease, 60 percent, seen in tendonitis. From 1997 to 2003, the only injury categories that experienced an increase are bruises, contusions and fractures.
• In the private sector, contact with objects and equipment was the leading cause of days- away-from-work injuries, cited in about 23.6 percent of days-away-from-work cases. Overexertion was the second common cause of injury, accounting for about 22 percent of injuries.
• In the local and state government, the number one cause of injury was overexertion, accounting for about 20 percent and 16 percent, respectively, of days-away-from-work cases in 2003.
• The back is still the most frequently injured body part, accounting for about 16 percent of the cases in the state government and about 20 percent cases in the local government. In the private sector, back injuries account for 24 percent of non-fatal cases.
Demographics
• Over the period from 1997 to 2003 in California, the number of days-away-from-work cases for women decreased by about 3.5 percent percent. Days-away-from-work cases for men decreased by about 15 percent.
• Between 1997 and 2003 in California, the age groups (20 to 24, 25 to 34, 35 to 44 and 65 and over) experienced a decline. [The biggest decline (21 percent) occurred among 25 to 34 year-old workers]. All other age groups (16 to 19, 45 to 54, 55 to 64) experienced an increase in their days-away-from-work rates, with the biggest increase (18 percent) seen in the 55 to 64 and over age group.
• In 2003, out of 456 fatalities, approximately 92 percent were male and 8 percent were female. Some age group categories – 18 to 19 years, 35 to 44 years, 65 years and over – experienced a decline in fatal injuries between 2002 and 2003, while others – 20 to 24 years and 25 to 34 years – experienced an increase. The biggest decline (48 percent) was seen
Selected Indicators in Workers’ Compensation: A Report Card for Californians
- 39 - December 14, 2005
in the 65 years and over age group and the biggest increase (36 percent) in the 20 to 24-year age group. The 55 to 64 age group did not experience an increase or a decline.
• The highest number of fatalities in 2003 by race or ethnic origin categories was experienced by “White, non-Hispanic” followed by “Hispanic or Latino,” accounting for 52 percent and 35 percent of the fatalities respectively. From 2002 to 2003, fatal injuries declined by 31 percent for the “Black, non-Hispanic” and by 9 percent for the “Hispanic or Latino.” Fatal injuries for the “White, non-Hispanic” and “Asian” categories remained the same since 2002.
Selected Indicators in Workers’ Compensation: A Report Card for Californians
- 40 - December 14, 2005
WORKERS’ COMPENSATION SYSTEM PERFORMANCE
Introduction The Commission on Health and Safety and Workers’ Compensation (CHSWC) monitors the overall performance of the entire health and safety and workers’ compensation system to determine whether it meets the State’s Constitutional objective to “accomplish substantial justice in all cases expeditiously, inexpensively, and without encumbrance of any character.” In this section, CHSWC has attempted to provide performance measures to assist in evaluating the system impact on everyone, particularly workers and employers. Through studies and comments from the community, CHSWC has compiled the following information pertaining to the performance of California’s systems for health, safety and workers’ compensation. Brief interpretations are provided with the graphical representations. The first subsection deals with how well the system is operating in terms of the volume of workload and the timeliness of actions. These factors affect both employers and employees. The second subsection discusses the costs, which are of particular interest to employers. The impact on workers in terms of benefits and outcomes is the focus of the third subsection. Administrative Operations
Division of Workers’ Compensation Opening Documents Division of Workers’ Compensation Hearings Division of Workers’ Compensation Decisions Division of Workers’ Compensation Lien Decisions Vocational Rehabilitation Plan Approvals and Disapprovals Vocational Rehabilitation Decisions and Orders After Conference Vocational Rehabilitation Plan Outcomes Division of Workers’ Compensation Audits Disability Evaluation Unit Information and Assistance Unit Division of Worker’ Compensation Staffing
Adjudication Simplification Efforts Division of Workers’ Compensation Information System Carve-outs – Alternative Workers’ Compensation Systems
Costs Workers’ Compensation Premium Insured and Self-insured Employer Expenditures
Indemnity Medical Benefits Average Cost per Claim by Type of Injury
Private-sector Self-insured Employer Expenditures Vocational Rehabilitation Costs
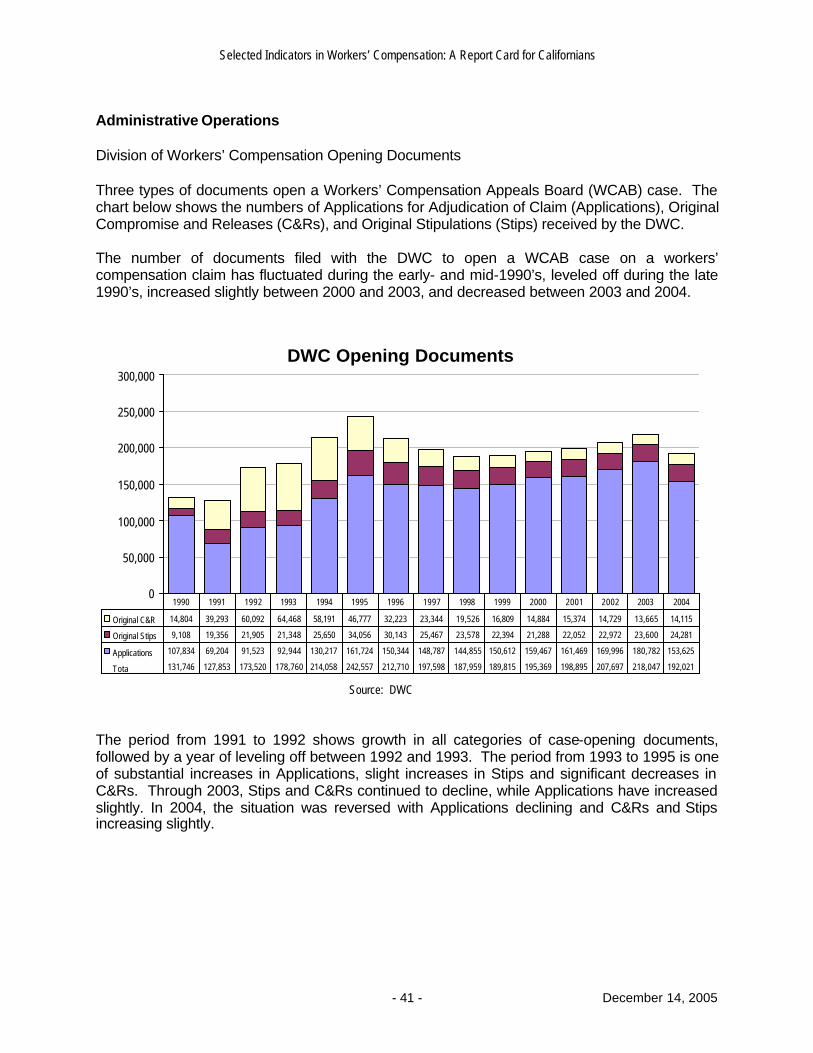
Selected Indicators in Workers’ Compensation: A Report Card for Californians
- 41 - December 14, 2005
Administrative Operations Division of Workers’ Compensation Opening Documents Three types of documents open a Workers’ Compensation Appeals Board (WCAB) case. The chart below shows the numbers of Applications for Adjudication of Claim (Applications), Original Compromise and Releases (C&Rs), and Original Stipulations (Stips) received by the DWC. The number of documents filed with the DWC to open a WCAB case on a workers’ compensation claim has fluctuated during the early- and mid-1990’s, leveled off during the late 1990’s, increased slightly between 2000 and 2003, and decreased between 2003 and 2004.
DWC Opening Documents
0
50,000
100,000
150,000
200,000
250,000
300,000
Original C&R 14,804 39,293 60,092 64,468 58,191 46,777 32,223 23,344 19,526 16,809 14,884 15,374 14,729 13,665 14,115
Original Stips 9,108 19,356 21,905 21,348 25,650 34,056 30,143 25,467 23,578 22,394 21,288 22,052 22,972 23,600 24,281
Applications 107,834 69,204 91,523 92,944 130,217 161,724 150,344 148,787 144,855 150,612 159,467 161,469 169,996 180,782 153,625
Total 131,746 127,853 173,520 178,760 214,058 242,557 212,710 197,598 187,959 189,815 195,369 198,895 207,697 218,047 192,021
1990 1991 1992 1993 1994 1995 1996 1997 1998 1999 2000 2001 2002 2003 2004
Source: DWC
The period from 1991 to 1992 shows growth in all categories of case-opening documents, followed by a year of leveling off between 1992 and 1993. The period from 1993 to 1995 is one of substantial increases in Applications, slight increases in Stips and significant decreases in C&Rs. Through 2003, Stips and C&Rs continued to decline, while Applications have increased slightly. In 2004, the situation was reversed with Applications declining and C&Rs and Stips increasing slightly.
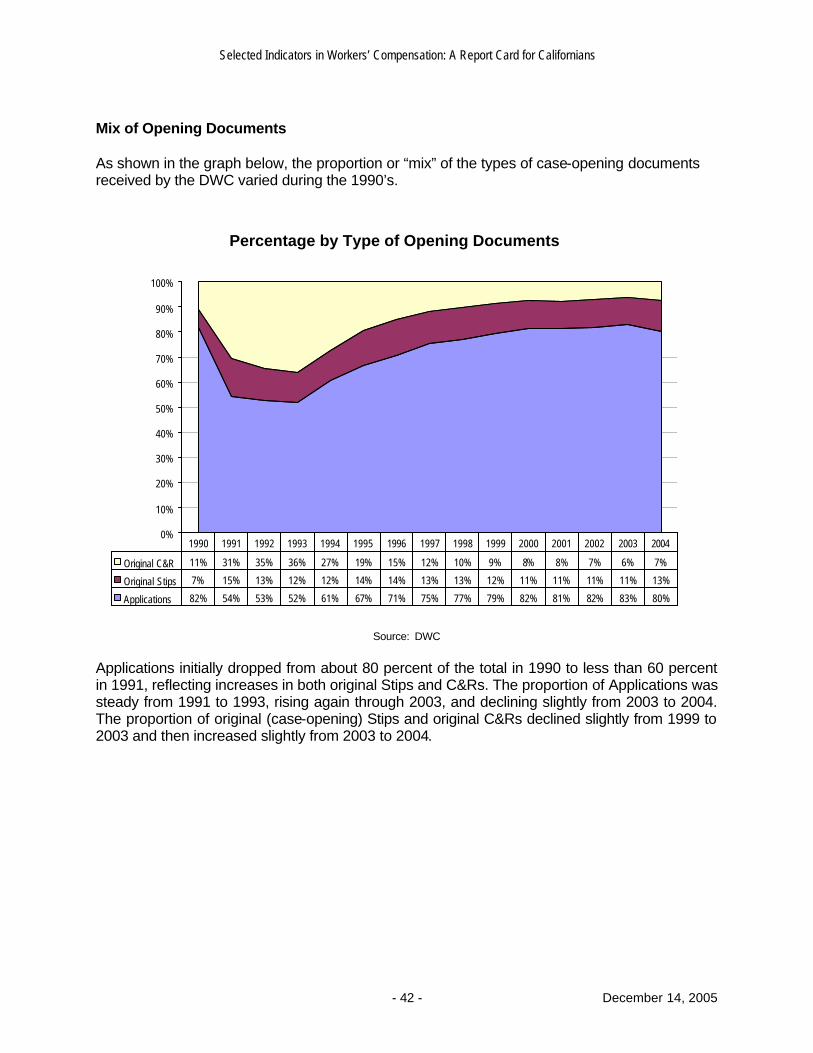
Selected Indicators in Workers’ Compensation: A Report Card for Californians
- 42 - December 14, 2005
Mix of Opening Documents As shown in the graph below, the proportion or “mix” of the types of case-opening documents received by the DWC varied during the 1990’s.
Percentage by Type of Opening Documents
0%
10%
20%
30%
40%
50%
60%
70%
80%
90%
100%
Original C&R 11% 31% 35% 36% 27% 19% 15% 12% 10% 9% 8% 8% 7% 6% 7%
Original Stips 7% 15% 13% 12% 12% 14% 14% 13% 13% 12% 11% 11% 11% 11% 13%
Applications 82% 54% 53% 52% 61% 67% 71% 75% 77% 79% 82% 81% 82% 83% 80%
1990 1991 1992 1993 1994 1995 1996 1997 1998 1999 2000 2001 2002 2003 2004
Source: DWC
Applications initially dropped from about 80 percent of the total in 1990 to less than 60 percent in 1991, reflecting increases in both original Stips and C&Rs. The proportion of Applications was steady from 1991 to 1993, rising again through 2003, and declining slightly from 2003 to 2004. The proportion of original (case-opening) Stips and original C&Rs declined slightly from 1999 to 2003 and then increased slightly from 2003 to 2004.
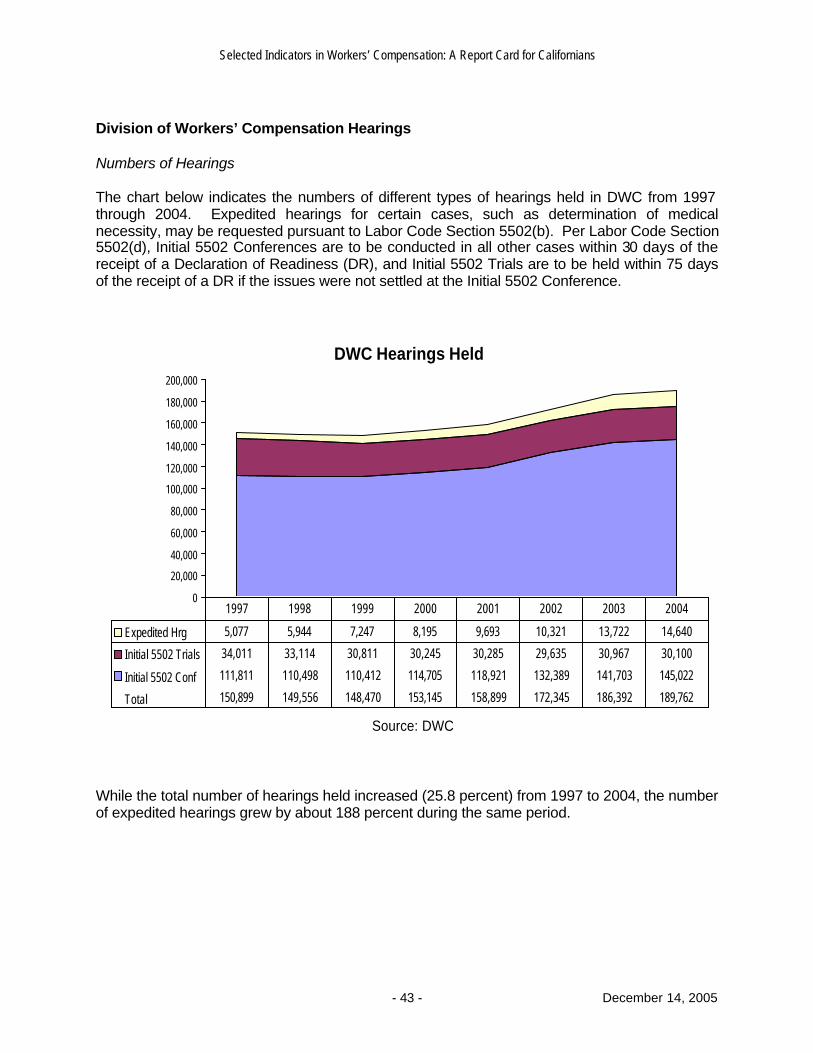
Selected Indicators in Workers’ Compensation: A Report Card for Californians
- 43 - December 14, 2005
Division of Workers’ Compensation Hearings Numbers of Hearings The chart below indicates the numbers of different types of hearings held in DWC from 1997 through 2004. Expedited hearings for certain cases, such as determination of medical necessity, may be requested pursuant to Labor Code Section 5502(b). Per Labor Code Section 5502(d), Initial 5502 Conferences are to be conducted in all other cases within 30 days of the receipt of a Declaration of Readiness (DR), and Initial 5502 Trials are to be held within 75 days of the receipt of a DR if the issues were not settled at the Initial 5502 Conference.
DWC Hearings Held
0
20,000
40,000
60,000
80,000
100,000
120,000
140,000
160,000
180,000
200,000
Expedited Hrg 5,077 5,944 7,247 8,195 9,693 10,321 13,722 14,640
Initial 5502 Trials 34,011 33,114 30,811 30,245 30,285 29,635 30,967 30,100
Initial 5502 Conf 111,811 110,498 110,412 114,705 118,921 132,389 141,703 145,022
Total 150,899 149,556 148,470 153,145 158,899 172,345 186,392 189,762
1997 1998 1999 2000 2001 2002 2003 2004
Source: DWC
While the total number of hearings held increased (25.8 percent) from 1997 to 2004, the number of expedited hearings grew by about 188 percent during the same period.
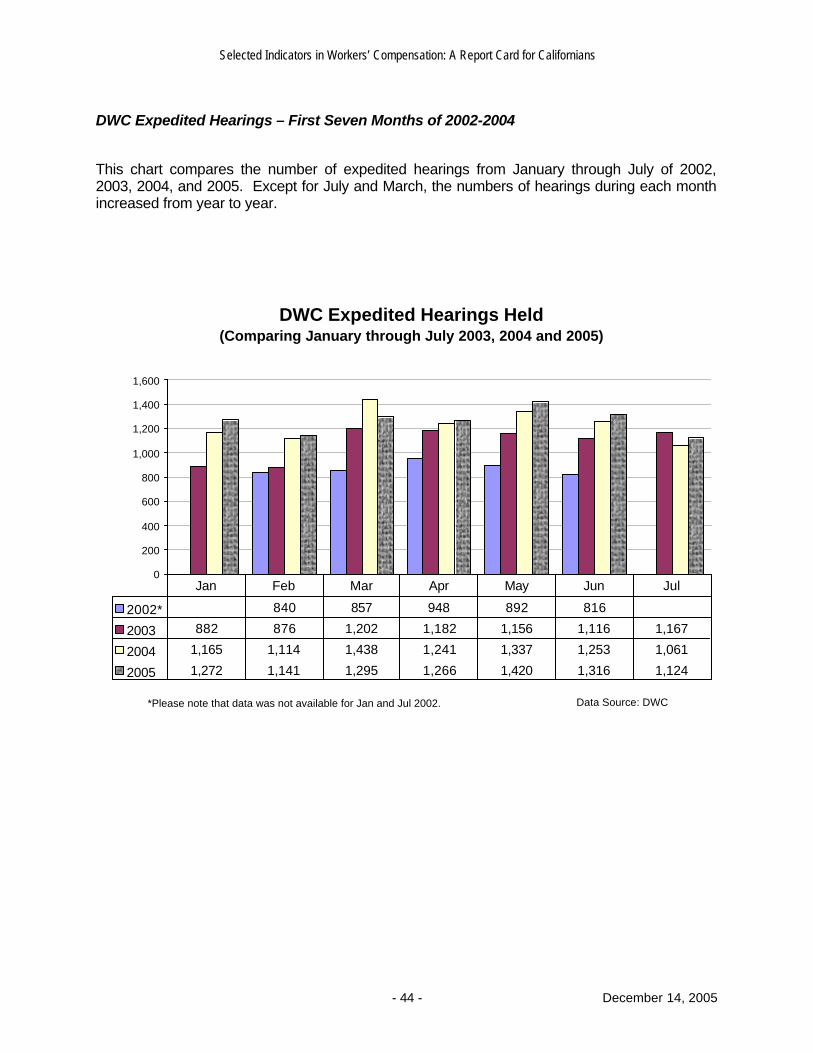
Selected Indicators in Workers’ Compensation: A Report Card for Californians
- 44 - December 14, 2005
DWC Expedited Hearings – First Seven Months of 2002-2004 This chart compares the number of expedited hearings from January through July of 2002, 2003, 2004, and 2005. Except for July and March, the numbers of hearings during each month increased from year to year.
DWC Expedited Hearings Held (Comparing January through July 2003, 2004 and 2005)
0
200
400
600
800
1,000
1,200
1,400
1,600
2002* 840 857 948 892 816
2003 882 876 1,202 1,182 1,156 1,116 1,167
2004 1,165 1,114 1,438 1,241 1,337 1,253 1,061
2005 1,272 1,141 1,295 1,266 1,420 1,316 1,124
Jan Feb Mar Apr May Jun Jul
Data Source: DWC*Please note that data was not available for Jan and Jul 2002.
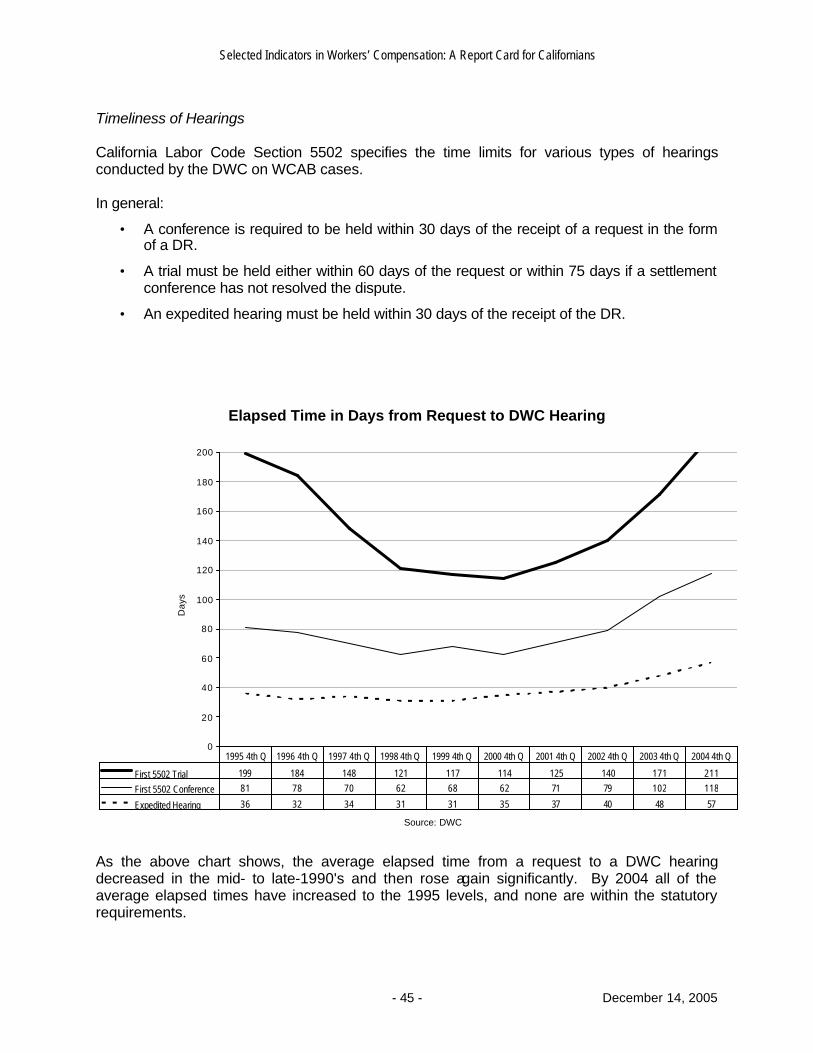
Selected Indicators in Workers’ Compensation: A Report Card for Californians
- 45 - December 14, 2005
Timeliness of Hearings California Labor Code Section 5502 specifies the time limits for various types of hearings conducted by the DWC on WCAB cases. In general:
• A conference is required to be held within 30 days of the receipt of a request in the form of a DR.
• A trial must be held either within 60 days of the request or within 75 days if a settlement conference has not resolved the dispute.
• An expedited hearing must be held within 30 days of the receipt of the DR.
Elapsed Time in Days from Request to DWC Hearing
0
20
40
60
80
100
120
140
160
180
200
Day
s
First 5502 Trial 199 184 148 121 117 114 125 140 171 211
First 5502 Conference 81 78 70 62 68 62 71 79 102 118
Expedited Hearing 36 32 34 31 31 35 37 40 48 57
1995 4th Q 1996 4th Q 1997 4th Q 1998 4th Q 1999 4th Q 2000 4th Q 2001 4th Q 2002 4th Q 2003 4th Q 2004 4th Q
Source: DWC
As the above chart shows, the average elapsed time from a request to a DWC hearing decreased in the mid- to late-1990's and then rose again significantly. By 2004 all of the average elapsed times have increased to the 1995 levels, and none are within the statutory requirements.
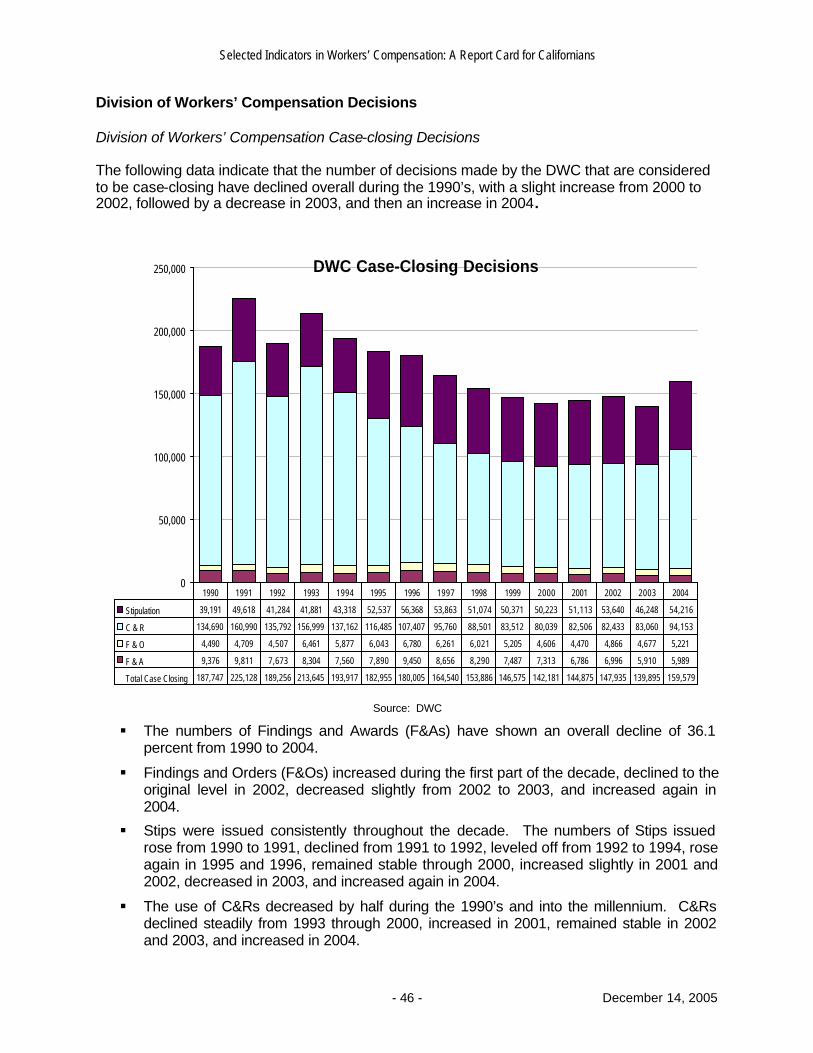
Selected Indicators in Workers’ Compensation: A Report Card for Californians
- 46 - December 14, 2005
Division of Workers’ Compensation Decisions Division of Workers’ Compensation Case-closing Decisions The following data indicate that the number of decisions made by the DWC that are considered to be case-closing have declined overall during the 1990’s, with a slight increase from 2000 to 2002, followed by a decrease in 2003, and then an increase in 2004.
DWC Case-Closing Decisions
0
50,000
100,000
150,000
200,000
250,000
Stipulation 39,191 49,618 41,284 41,881 43,318 52,537 56,368 53,863 51,074 50,371 50,223 51,113 53,640 46,248 54,216
C & R 134,690 160,990 135,792 156,999 137,162 116,485 107,407 95,760 88,501 83,512 80,039 82,506 82,433 83,060 94,153
F & O 4,490 4,709 4,507 6,461 5,877 6,043 6,780 6,261 6,021 5,205 4,606 4,470 4,866 4,677 5,221
F & A 9,376 9,811 7,673 8,304 7,560 7,890 9,450 8,656 8,290 7,487 7,313 6,786 6,996 5,910 5,989
Total Case Closing 187,747 225,128 189,256 213,645 193,917 182,955 180,005 164,540 153,886 146,575 142,181 144,875 147,935 139,895 159,579
1990 1991 1992 1993 1994 1995 1996 1997 1998 1999 2000 2001 2002 2003 2004
Source: DWC
§ The numbers of Findings and Awards (F&As) have shown an overall decline of 36.1 percent from 1990 to 2004.
§ Findings and Orders (F&Os) increased during the first part of the decade, declined to the original level in 2002, decreased slightly from 2002 to 2003, and increased again in 2004.
§ Stips were issued consistently throughout the decade. The numbers of Stips issued rose from 1990 to 1991, declined from 1991 to 1992, leveled off from 1992 to 1994, rose again in 1995 and 1996, remained stable through 2000, increased slightly in 2001 and 2002, decreased in 2003, and increased again in 2004.
§ The use of C&Rs decreased by half during the 1990’s and into the millennium. C&Rs declined steadily from 1993 through 2000, increased in 2001, remained stable in 2002 and 2003, and increased in 2004.
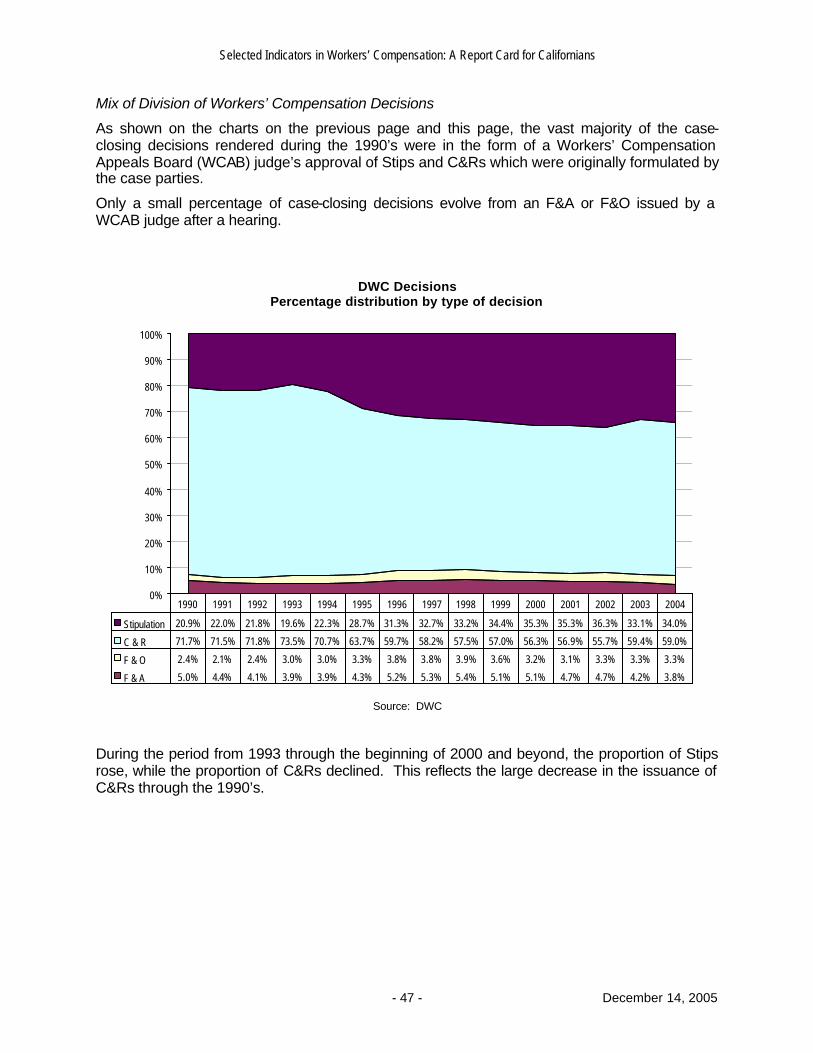
Selected Indicators in Workers’ Compensation: A Report Card for Californians
- 47 - December 14, 2005
Mix of Division of Workers’ Compensation Decisions
As shown on the charts on the previous page and this page, the vast majority of the case-closing decisions rendered during the 1990’s were in the form of a Workers’ Compensation Appeals Board (WCAB) judge’s approval of Stips and C&Rs which were originally formulated by the case parties.
Only a small percentage of case-closing decisions evolve from an F&A or F&O issued by a WCAB judge after a hearing.
DWC Decisions
Percentage distribution by type of decision
0%
10%
20%
30%
40%
50%
60%
70%
80%
90%
100%
Stipulation 20.9% 22.0% 21.8% 19.6% 22.3% 28.7% 31.3% 32.7% 33.2% 34.4% 35.3% 35.3% 36.3% 33.1% 34.0%
C & R 71.7% 71.5% 71.8% 73.5% 70.7% 63.7% 59.7% 58.2% 57.5% 57.0% 56.3% 56.9% 55.7% 59.4% 59.0%
F & O 2.4% 2.1% 2.4% 3.0% 3.0% 3.3% 3.8% 3.8% 3.9% 3.6% 3.2% 3.1% 3.3% 3.3% 3.3%
F & A 5.0% 4.4% 4.1% 3.9% 3.9% 4.3% 5.2% 5.3% 5.4% 5.1% 5.1% 4.7% 4.7% 4.2% 3.8%
1990 1991 1992 1993 1994 1995 1996 1997 1998 1999 2000 2001 2002 2003 2004
Source: DWC
During the period from 1993 through the beginning of 2000 and beyond, the proportion of Stips rose, while the proportion of C&Rs declined. This reflects the large decrease in the issuance of C&Rs through the 1990’s.
Selected Indicators in Workers’ Compensation: A Report Card for Californians
- 48 - December 14, 2005
Division of Workers’ Compensation Lien Decisions The DWC has been handling a large backlog of liens filed on WCAB cases. Many of the liens have been for medical treatment and medical-legal reports. However, liens are also filed to obtain reimbursement for other expenses:
• The Employment Development Department (EDD) files liens to recover disability insurance indemnity and unemployment benefits paid to industrially injured workers.
• Attorneys have an implied lien during representation of an injured worker. If an attorney is substituted out of a case and seeks a fee, the attorney has to file a lien.
• District Attorneys file liens to recover spousal and/or child support ordered in marital dissolution proceedings.
• A landlord or grocer will occasionally claim a lien for living expenses of the injured or his/her dependents.
• Although relatively rare now, a private disability insurance policy will occasionally file a lien on workers' compensation benefits on the theory that the proceeds from the benefits were used for living expenses of the injured worker.
• Some defendants will file liens in lieu of petitions for contribution where they have paid or are paying medical treatment costs to which another carrier's injury allegedly contributed.
• Liens are sometimes used to document recoverable (non-medical) costs, e.g., photocopying of medical records, interpreters’ services and travel expenses.
These data, as shown n the following graph, indicate a large growth in decisions regarding liens filed on WCAB cases and a concomitant expenditure of DWC staff resources on the resolution of those liens. Labor Code Section 4903.05, added by SB 228, requires that a filing fee of $100 be charged for each initial lien filed by a medical provider, excluding the Veterans Administration, the Medi-Cal program, or public hospitals. SB 899 amended Section 4903.05 to provide that persons filing liens on behalf of medical providers may also pay the $100 filing fee.
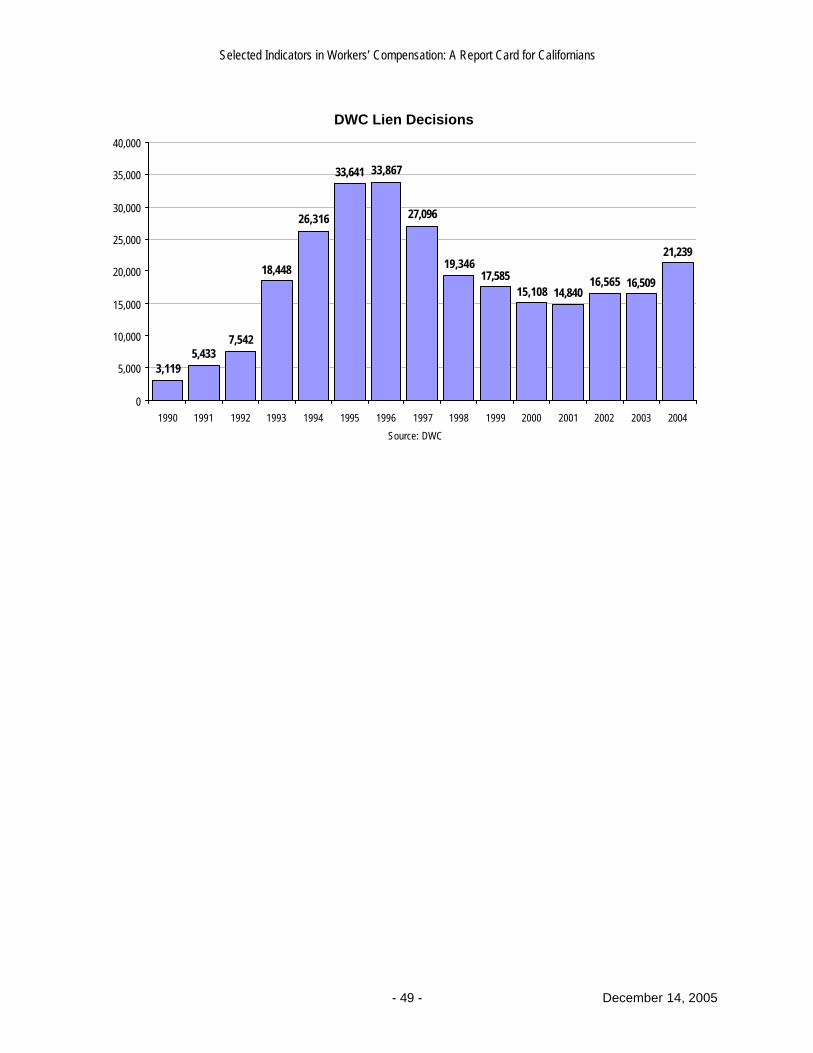
Selected Indicators in Workers’ Compensation: A Report Card for Californians
- 49 - December 14, 2005
DWC Lien Decisions
3,1195,433
7,542
18,448
26,316
33,641 33,867
27,096
19,34617,585
15,108 14,84016,565 16,509
21,239
0
5,000
10,000
15,000
20,000
25,000
30,000
35,000
40,000
1990 1991 1992 1993 1994 1995 1996 1997 1998 1999 2000 2001 2002 2003 2004
Source: DWC
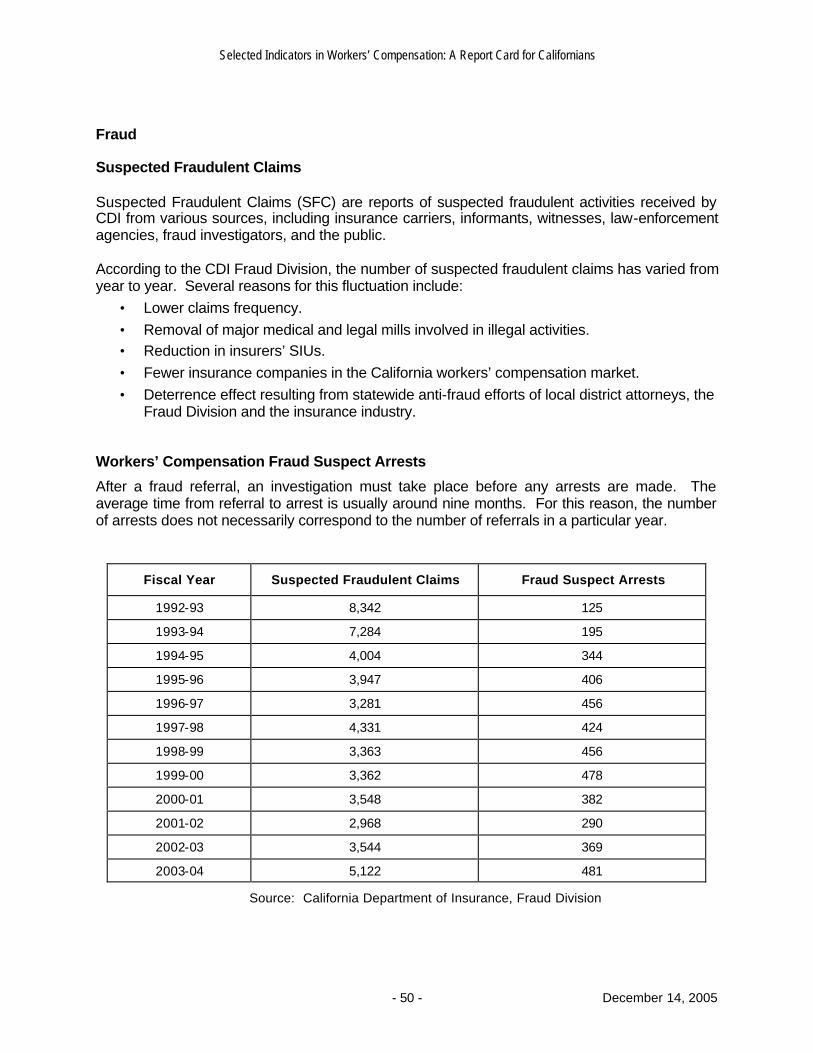
Selected Indicators in Workers’ Compensation: A Report Card for Californians
- 50 - December 14, 2005
Fraud
Suspected Fraudulent Claims Suspected Fraudulent Claims (SFC) are reports of suspected fraudulent activities received by CDI from various sources, including insurance carriers, informants, witnesses, law-enforcement agencies, fraud investigators, and the public. According to the CDI Fraud Division, the number of suspected fraudulent claims has varied from year to year. Several reasons for this fluctuation include:
• Lower claims frequency. • Removal of major medical and legal mills involved in illegal activities. • Reduction in insurers’ SIUs. • Fewer insurance companies in the California workers’ compensation market. • Deterrence effect resulting from statewide anti-fraud efforts of local district attorneys, the
Fraud Division and the insurance industry. Workers’ Compensation Fraud Suspect Arrests
After a fraud referral, an investigation must take place before any arrests are made. The average time from referral to arrest is usually around nine months. For this reason, the number of arrests does not necessarily correspond to the number of referrals in a particular year.
Fiscal Year Suspected Fraudulent Claims Fraud Suspect Arrests
1992-93 8,342 125
1993-94 7,284 195
1994-95 4,004 344
1995-96 3,947 406
1996-97 3,281 456
1997-98 4,331 424
1998-99 3,363 456
1999-00 3,362 478
2000-01 3,548 382
2001-02 2,968 290
2002-03 3,544 369
2003-04 5,122 481
Source: California Department of Insurance, Fraud Division
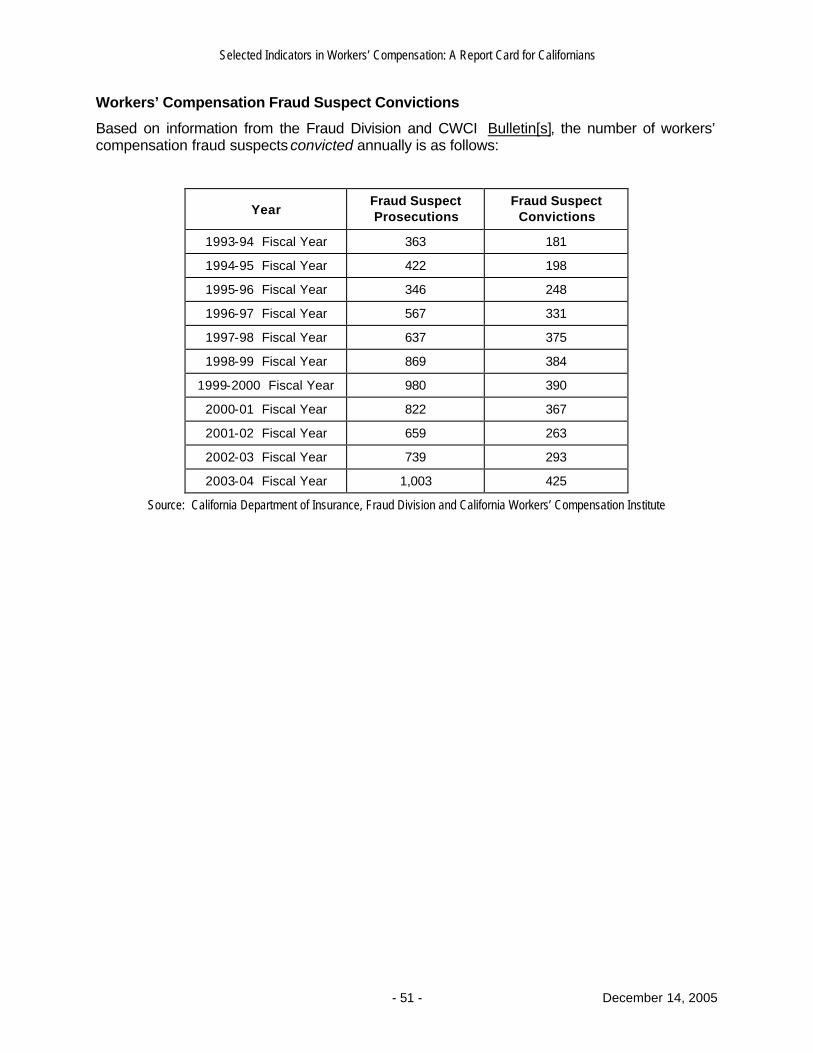
Selected Indicators in Workers’ Compensation: A Report Card for Californians
- 51 - December 14, 2005
Workers’ Compensation Fraud Suspect Convictions
Based on information from the Fraud Division and CWCI Bulletin[s], the number of workers’ compensation fraud suspects convicted annually is as follows:
Year Fraud Suspect Prosecutions
Fraud Suspect Convictions
1993-94 Fiscal Year 363 181
1994-95 Fiscal Year 422 198
1995-96 Fiscal Year 346 248
1996-97 Fiscal Year 567 331
1997-98 Fiscal Year 637 375
1998-99 Fiscal Year 869 384
1999-2000 Fiscal Year 980 390
2000-01 Fiscal Year 822 367
2001-02 Fiscal Year 659 263
2002-03 Fiscal Year 739 293
2003-04 Fiscal Year 1,003 425
Source: California Department of Insurance, Fraud Division and California Workers’ Compensation Institute
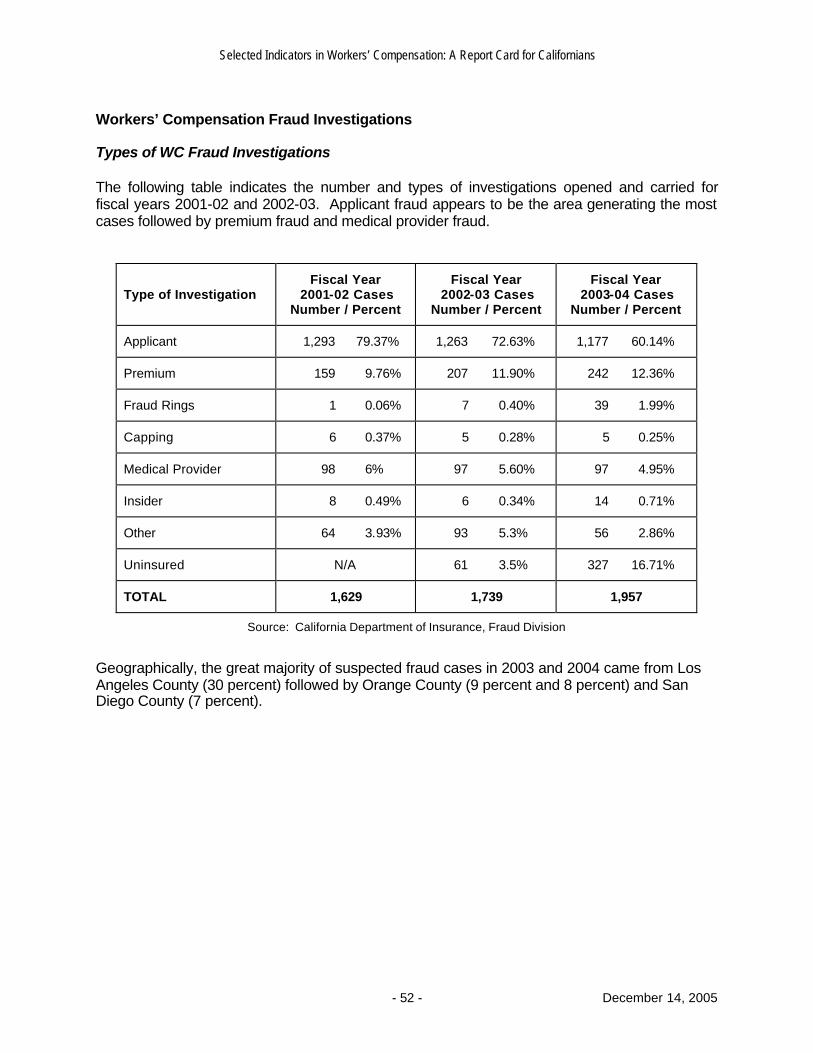
Selected Indicators in Workers’ Compensation: A Report Card for Californians
- 52 - December 14, 2005
Workers’ Compensation Fraud Investigations Types of WC Fraud Investigations The following table indicates the number and types of investigations opened and carried for fiscal years 2001-02 and 2002-03. Applicant fraud appears to be the area generating the most cases followed by premium fraud and medical provider fraud.
Type of Investigation Fiscal Year
2001-02 Cases Number / Percent
Fiscal Year 2002-03 Cases
Number / Percent
Fiscal Year 2003-04 Cases
Number / Percent
Applicant 1,293 79.37% 1,263 72.63% 1,177 60.14%
Premium 159 9.76% 207 11.90% 242 12.36%
Fraud Rings 1 0.06% 7 0.40% 39 1.99%
Capping 6 0.37% 5 0.28% 5 0.25%
Medical Provider 98 6% 97 5.60% 97 4.95%
Insider 8 0.49% 6 0.34% 14 0.71%
Other 64 3.93% 93 5.3% 56 2.86%
Uninsured N/A 61 3.5% 327 16.71%
TOTAL 1,629 1,739 1,957
Source: California Department of Insurance, Fraud Division
Geographically, the great majority of suspected fraud cases in 2003 and 2004 came from Los Angeles County (30 percent) followed by Orange County (9 percent and 8 percent) and San Diego County (7 percent).
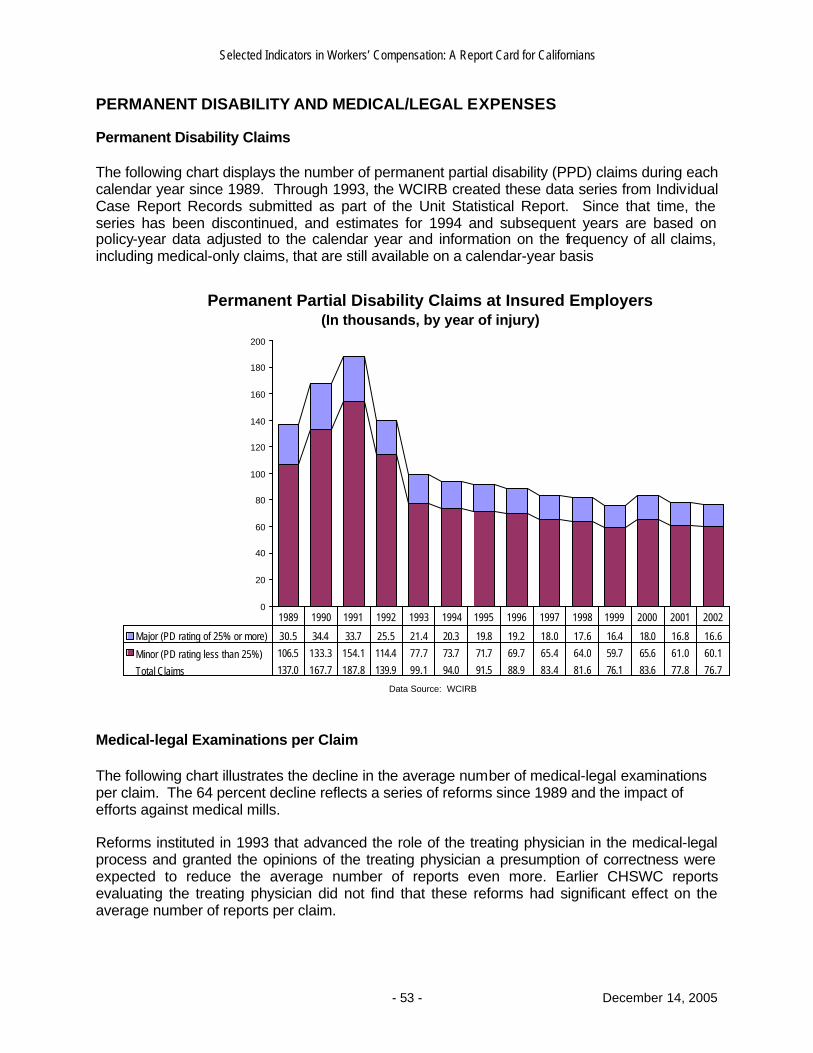
Selected Indicators in Workers’ Compensation: A Report Card for Californians
- 53 - December 14, 2005
PERMANENT DISABILITY AND MEDICAL/LEGAL EXPENSES Permanent Disability Claims The following chart displays the number of permanent partial disability (PPD) claims during each calendar year since 1989. Through 1993, the WCIRB created these data series from Individual Case Report Records submitted as part of the Unit Statistical Report. Since that time, the series has been discontinued, and estimates for 1994 and subsequent years are based on policy-year data adjusted to the calendar year and information on the frequency of all claims, including medical-only claims, that are still available on a calendar-year basis
Permanent Partial Disability Claims at Insured Employers (In thousands, by year of injury)
0
20
40
60
80
100
120
140
160
180
200
Major (PD rating of 25% or more) 30.5 34.4 33.7 25.5 21.4 20.3 19.8 19.2 18.0 17.6 16.4 18.0 16.8 16.6
Minor (PD rating less than 25%) 106.5 133.3 154.1 114.4 77.7 73.7 71.7 69.7 65.4 64.0 59.7 65.6 61.0 60.1
Total Claims 137.0 167.7 187.8 139.9 99.1 94.0 91.5 88.9 83.4 81.6 76.1 83.6 77.8 76.7
1989 1990 1991 1992 1993 1994 1995 1996 1997 1998 1999 2000 2001 2002
Data Source: WCIRB
Medical-legal Examinations per Claim The following chart illustrates the decline in the average number of medical-legal examinations per claim. The 64 percent decline reflects a series of reforms since 1989 and the impact of efforts against medical mills. Reforms instituted in 1993 that advanced the role of the treating physician in the medical-legal process and granted the opinions of the treating physician a presumption of correctness were expected to reduce the average number of reports even more. Earlier CHSWC reports evaluating the treating physician did not find that these reforms had significant effect on the average number of reports per claim.
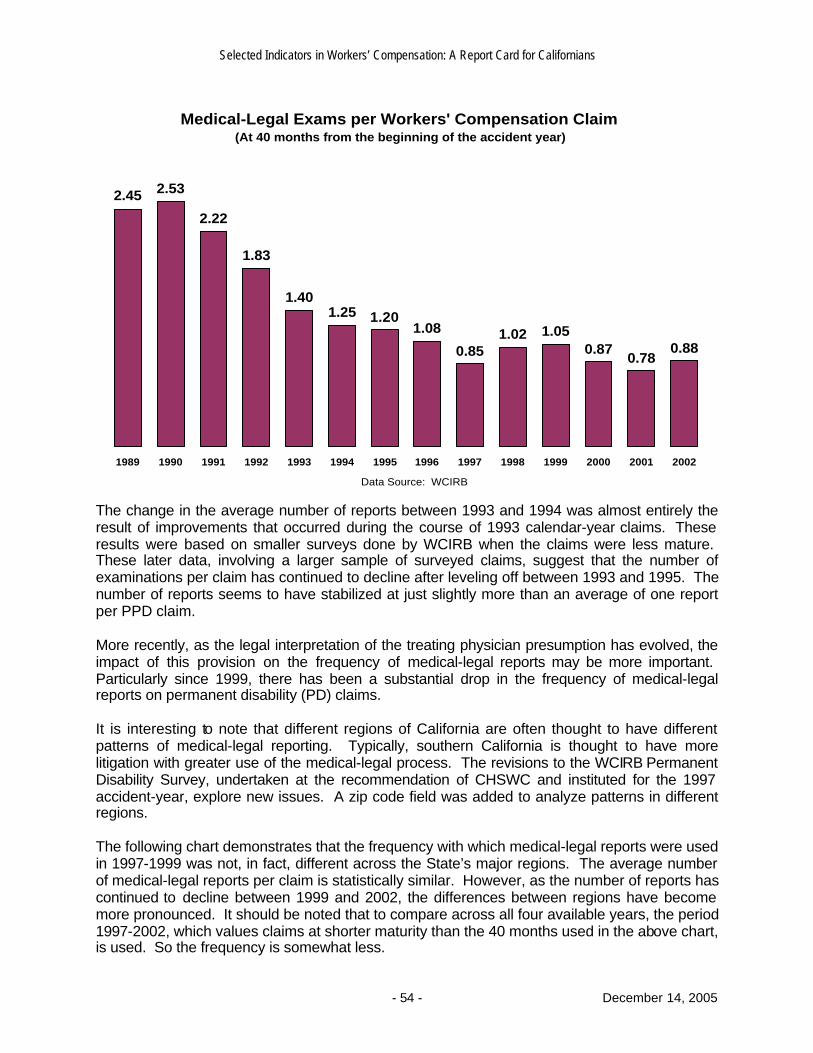
Selected Indicators in Workers’ Compensation: A Report Card for Californians
- 54 - December 14, 2005
Medical-Legal Exams per Workers' Compensation Claim (At 40 months from the beginning of the accident year)
2.45 2.53
2.22
1.83
1.401.25 1.20
1.08
0.851.02 1.05
0.870.78
0.88
1989 1990 1991 1992 1993 1994 1995 1996 1997 1998 1999 2000 2001 2002
Data Source: WCIRB
The change in the average number of reports between 1993 and 1994 was almost entirely the result of improvements that occurred during the course of 1993 calendar-year claims. These results were based on smaller surveys done by WCIRB when the claims were less mature. These later data, involving a larger sample of surveyed claims, suggest that the number of examinations per claim has continued to decline after leveling off between 1993 and 1995. The number of reports seems to have stabilized at just slightly more than an average of one report per PPD claim. More recently, as the legal interpretation of the treating physician presumption has evolved, the impact of this provision on the frequency of medical-legal reports may be more important. Particularly since 1999, there has been a substantial drop in the frequency of medical-legal reports on permanent disability (PD) claims. It is interesting to note that different regions of California are often thought to have different patterns of medical-legal reporting. Typically, southern California is thought to have more litigation with greater use of the medical-legal process. The revisions to the WCIRB Permanent Disability Survey, undertaken at the recommendation of CHSWC and instituted for the 1997 accident-year, explore new issues. A zip code field was added to analyze patterns in different regions. The following chart demonstrates that the frequency with which medical-legal reports were used in 1997-1999 was not, in fact, different across the State’s major regions. The average number of medical-legal reports per claim is statistically similar. However, as the number of reports has continued to decline between 1999 and 2002, the differences between regions have become more pronounced. It should be noted that to compare across all four available years, the period 1997-2002, which values claims at shorter maturity than the 40 months used in the above chart, is used. So the frequency is somewhat less.
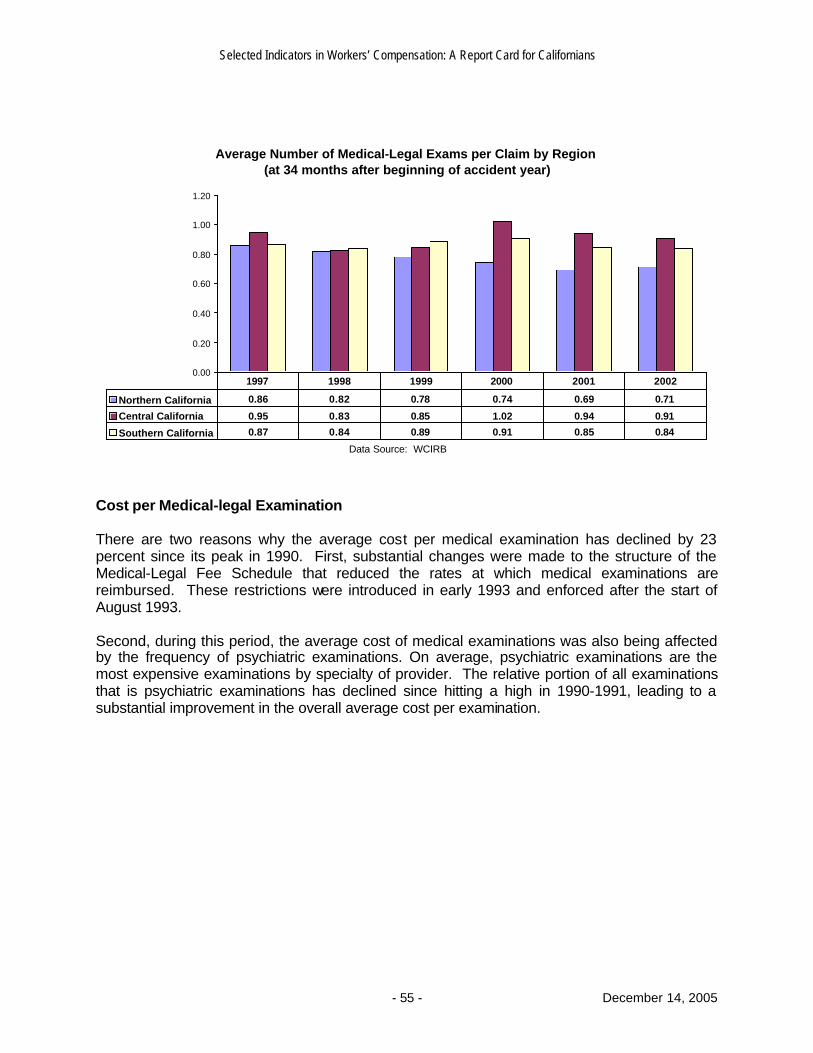
Selected Indicators in Workers’ Compensation: A Report Card for Californians
- 55 - December 14, 2005
Average Number of Medical-Legal Exams per Claim by Region (at 34 months after beginning of accident year)
0.00
0.20
0.40
0.60
0.80
1.00
1.20
Northern California 0.86 0.82 0.78 0.74 0.69 0.71
Central California 0.95 0.83 0.85 1.02 0.94 0.91
Southern California 0.87 0.84 0.89 0.91 0.85 0.84
1997 1998 1999 2000 2001 2002
Data Source: WCIRB Cost per Medical-legal Examination There are two reasons why the average cost per medical examination has declined by 23 percent since its peak in 1990. First, substantial changes were made to the structure of the Medical-Legal Fee Schedule that reduced the rates at which medical examinations are reimbursed. These restrictions were introduced in early 1993 and enforced after the start of August 1993. Second, during this period, the average cost of medical examinations was also being affected by the frequency of psychiatric examinations. On average, psychiatric examinations are the most expensive examinations by specialty of provider. The relative portion of all examinations that is psychiatric examinations has declined since hitting a high in 1990-1991, leading to a substantial improvement in the overall average cost per examination.
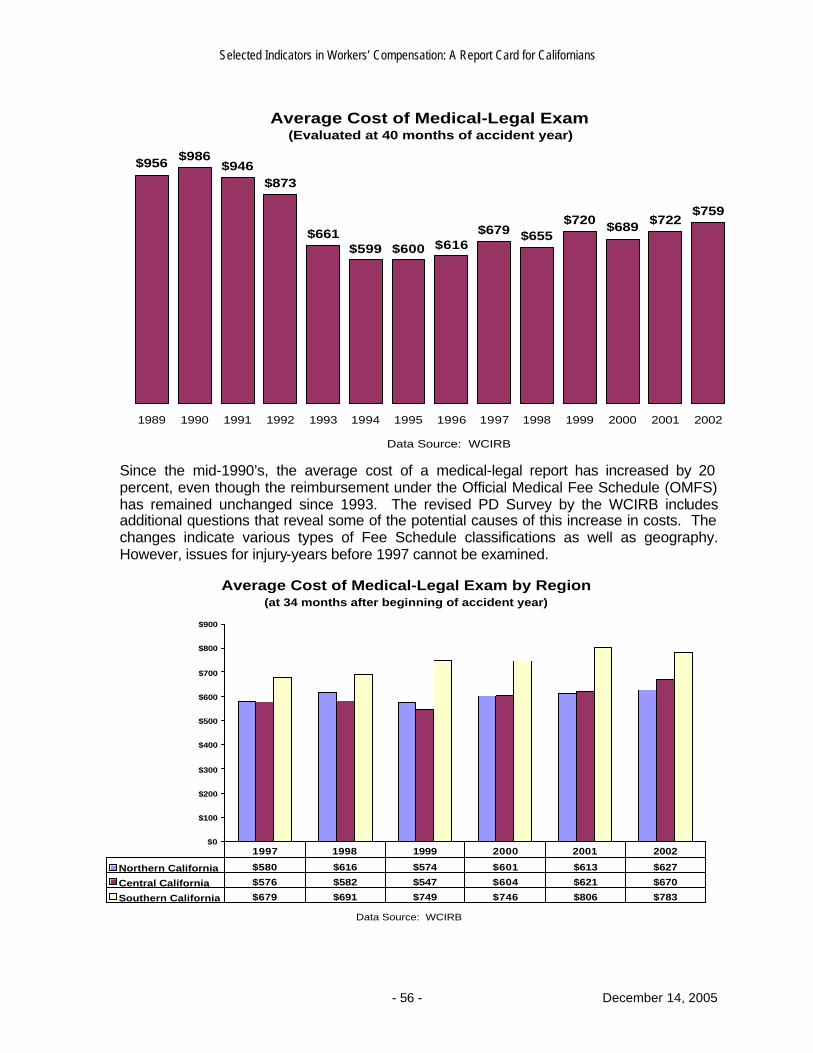
Selected Indicators in Workers’ Compensation: A Report Card for Californians
- 56 - December 14, 2005
Average Cost of Medical-Legal Exam (Evaluated at 40 months of accident year)
$956 $986$946
$873
$661$599 $600 $616
$679 $655$720 $689 $722
$759
1989 1990 1991 1992 1993 1994 1995 1996 1997 1998 1999 2000 2001 2002
Data Source: WCIRB
Since the mid-1990’s, the average cost of a medical-legal report has increased by 20 percent, even though the reimbursement under the Official Medical Fee Schedule (OMFS) has remained unchanged since 1993. The revised PD Survey by the WCIRB includes additional questions that reveal some of the potential causes of this increase in costs. The changes indicate various types of Fee Schedule classifications as well as geography. However, issues for injury-years before 1997 cannot be examined.
Average Cost of Medical-Legal Exam by Region (at 34 months after beginning of accident year)
$0
$100
$200
$300
$400
$500
$600
$700
$800
$900
Northern California $580 $616 $574 $601 $613 $627
Central California $576 $582 $547 $604 $621 $670
Southern California $679 $691 $749 $746 $806 $783
1997 1998 1999 2000 2001 2002
Data Source: WCIRB
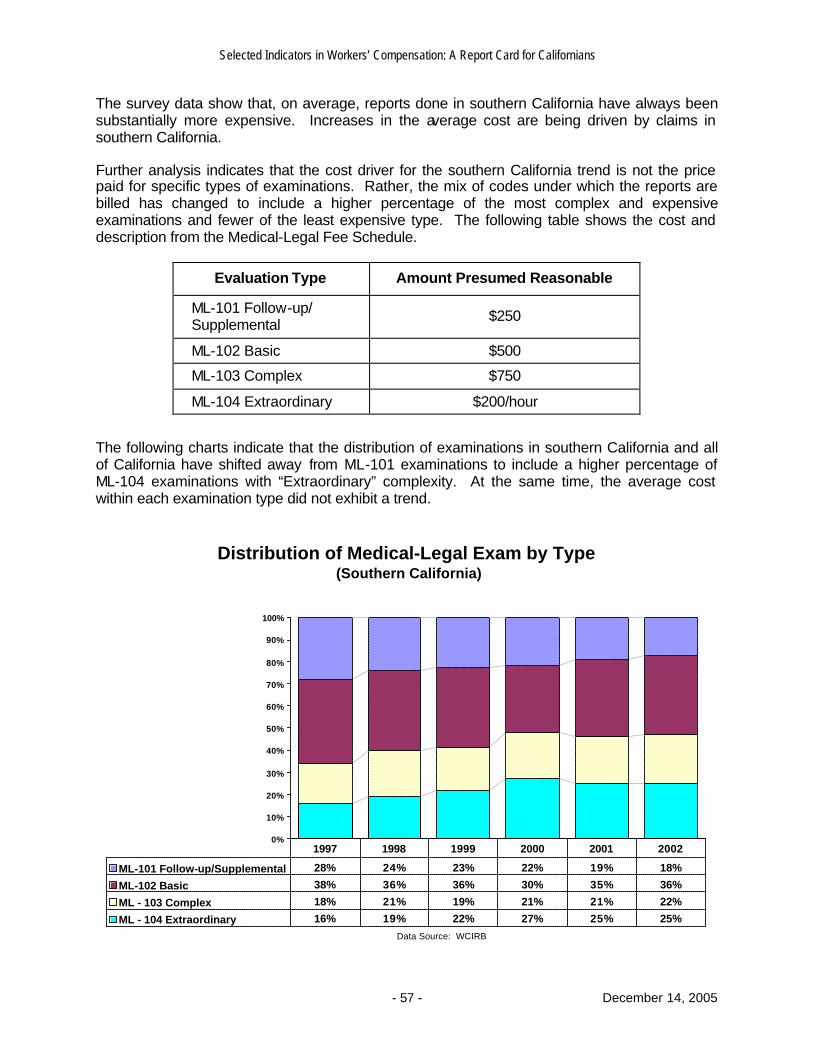
Selected Indicators in Workers’ Compensation: A Report Card for Californians
- 57 - December 14, 2005
The survey data show that, on average, reports done in southern California have always been substantially more expensive. Increases in the average cost are being driven by claims in southern California.
Further analysis indicates that the cost driver for the southern California trend is not the price paid for specific types of examinations. Rather, the mix of codes under which the reports are billed has changed to include a higher percentage of the most complex and expensive examinations and fewer of the least expensive type. The following table shows the cost and description from the Medical-Legal Fee Schedule.
Evaluation Type Amount Presumed Reasonable
ML-101 Follow-up/ Supplemental $250
ML-102 Basic $500
ML-103 Complex $750
ML-104 Extraordinary $200/hour
The following charts indicate that the distribution of examinations in southern California and all of California have shifted away from ML-101 examinations to include a higher percentage of ML-104 examinations with “Extraordinary” complexity. At the same time, the average cost within each examination type did not exhibit a trend.
Distribution of Medical-Legal Exam by Type (Southern California)
0%
10%
20%
30%
40%
50%
60%
70%
80%
90%
100%
ML-101 Follow-up/Supplemental 28% 24% 23% 22% 19% 18%
ML-102 Basic 38% 36% 36% 30% 35% 36%
ML - 103 Complex 18% 21% 19% 21% 21% 22%
ML - 104 Extraordinary 16% 19% 22% 27% 25% 25%
1997 1998 1999 2000 2001 2002
Data Source: WCIRB
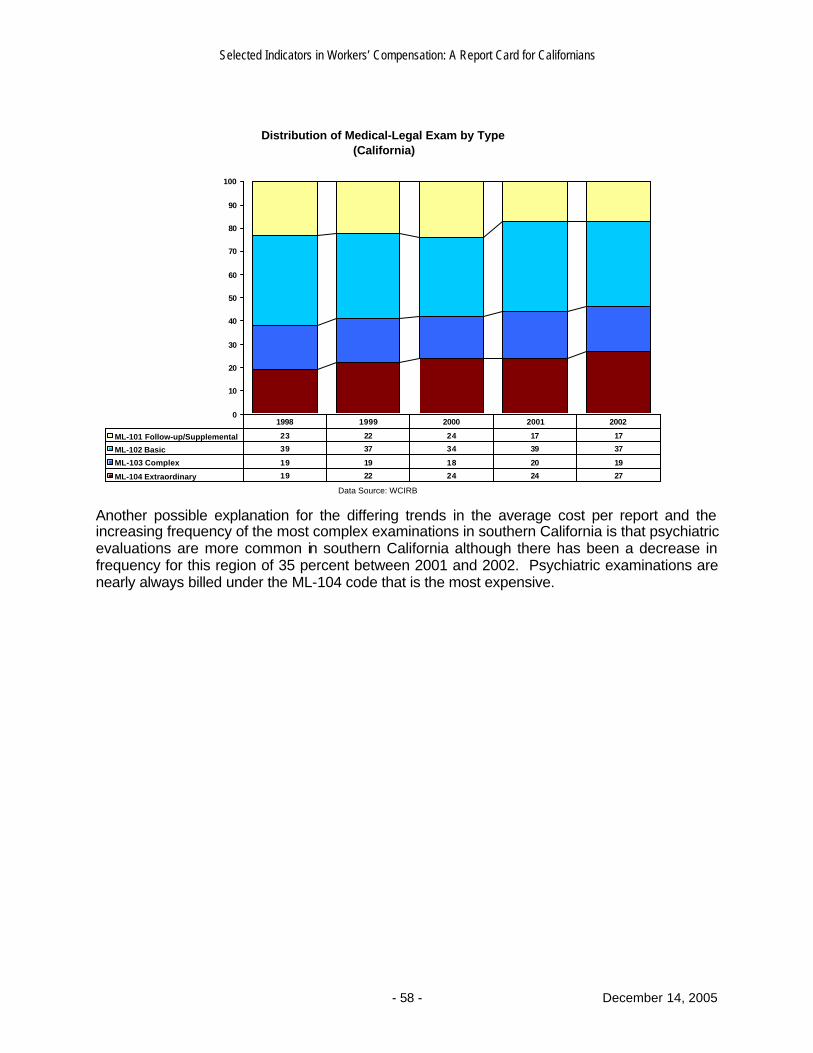
Selected Indicators in Workers’ Compensation: A Report Card for Californians
- 58 - December 14, 2005
Distribution of Medical-Legal Exam by Type (California)
0
10
20
30
40
50
60
70
80
90
100
ML-101 Follow-up/Supplemental 23 22 24 17 17
ML-102 Basic 39 37 34 39 37
ML-103 Complex 19 19 18 20 19
ML-104 Extraordinary 19 22 24 24 27
1998 1999 2000 2001 2002
Data Source: WCIRB
Another possible explanation for the differing trends in the average cost per report and the increasing frequency of the most complex examinations in southern California is that psychiatric evaluations are more common in southern California although there has been a decrease in frequency for this region of 35 percent between 2001 and 2002. Psychiatric examinations are nearly always billed under the ML-104 code that is the most expensive.
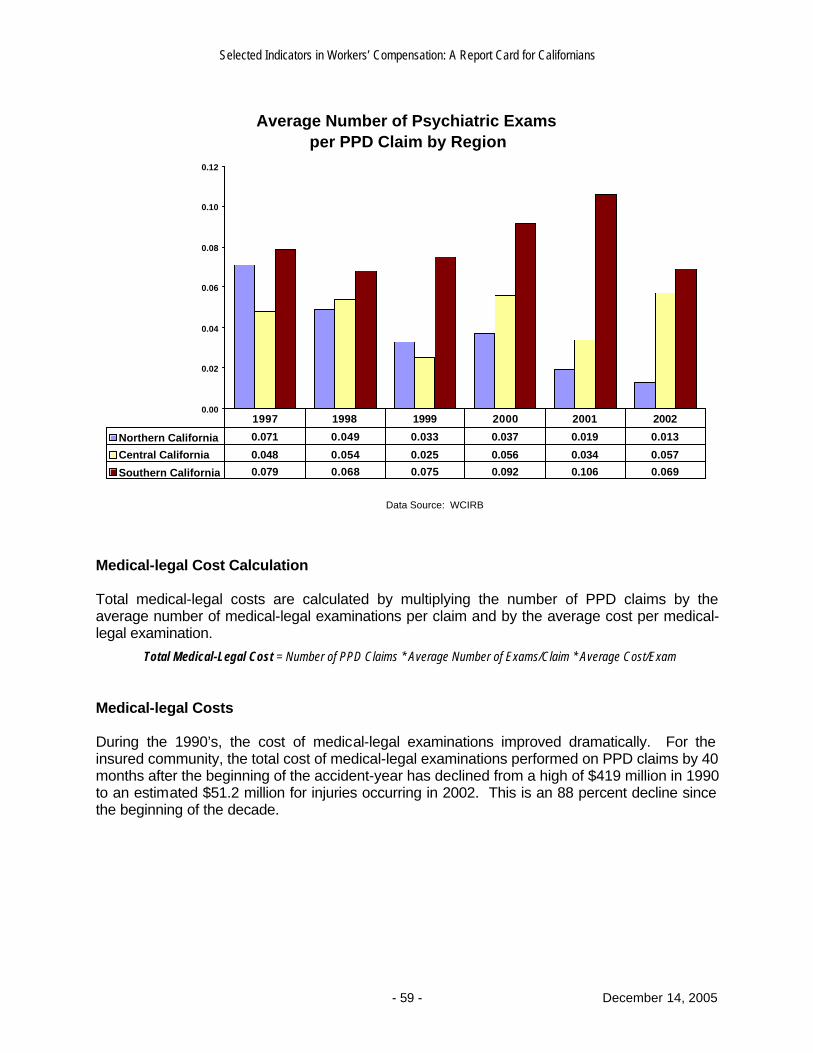
Selected Indicators in Workers’ Compensation: A Report Card for Californians
- 59 - December 14, 2005
Average Number of Psychiatric Exams per PPD Claim by Region
0.00
0.02
0.04
0.06
0.08
0.10
0.12
Northern California 0.071 0.049 0.033 0.037 0.019 0.013
Central California 0.048 0.054 0.025 0.056 0.034 0.057
Southern California 0.079 0.068 0.075 0.092 0.106 0.069
1997 1998 1999 2000 2001 2002
Data Source: WCIRB
Medical-legal Cost Calculation
Total medical-legal costs are calculated by multiplying the number of PPD claims by the average number of medical-legal examinations per claim and by the average cost per medical-legal examination.
Total Medical-Legal Cost = Number of PPD Claims * Average Number of Exams/Claim * Average Cost/Exam Medical-legal Costs
During the 1990’s, the cost of medical-legal examinations improved dramatically. For the insured community, the total cost of medical-legal examinations performed on PPD claims by 40 months after the beginning of the accident-year has declined from a high of $419 million in 1990 to an estimated $51.2 million for injuries occurring in 2002. This is an 88 percent decline since the beginning of the decade.
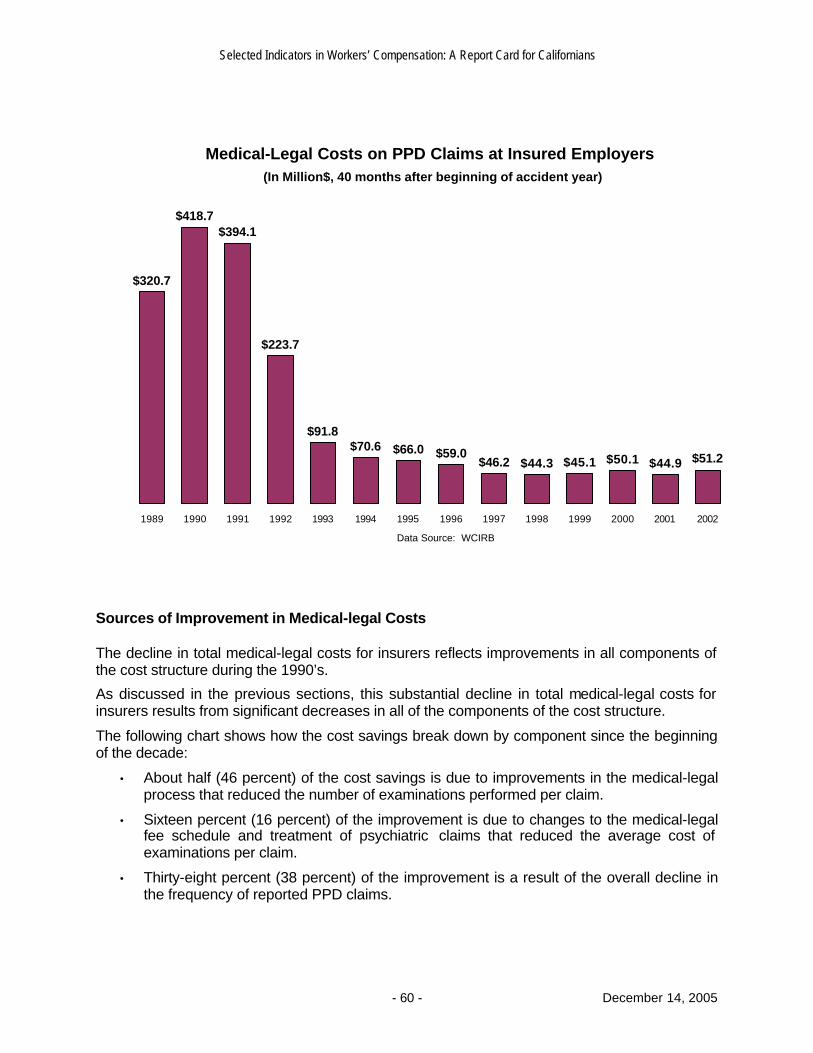
Selected Indicators in Workers’ Compensation: A Report Card for Californians
- 60 - December 14, 2005
Medical-Legal Costs on PPD Claims at Insured Employers (In Million$, 40 months after beginning of accident year)
$320.7
$418.7$394.1
$223.7
$91.8$70.6 $66.0 $59.0
$46.2 $44.3 $45.1 $50.1 $44.9 $51.2
1989 1990 1991 1992 1993 1994 1995 1996 1997 1998 1999 2000 2001 2002
Data Source: WCIRB
Sources of Improvement in Medical-legal Costs The decline in total medical-legal costs for insurers reflects improvements in all components of the cost structure during the 1990’s.
As discussed in the previous sections, this substantial decline in total medical-legal costs for insurers results from significant decreases in all of the components of the cost structure.
The following chart shows how the cost savings break down by component since the beginning of the decade:
• About half (46 percent) of the cost savings is due to improvements in the medical-legal process that reduced the number of examinations performed per claim.
• Sixteen percent (16 percent) of the improvement is due to changes to the medical-legal fee schedule and treatment of psychiatric claims that reduced the average cost of examinations per claim.
• Thirty-eight percent (38 percent) of the improvement is a result of the overall decline in the frequency of reported PPD claims.
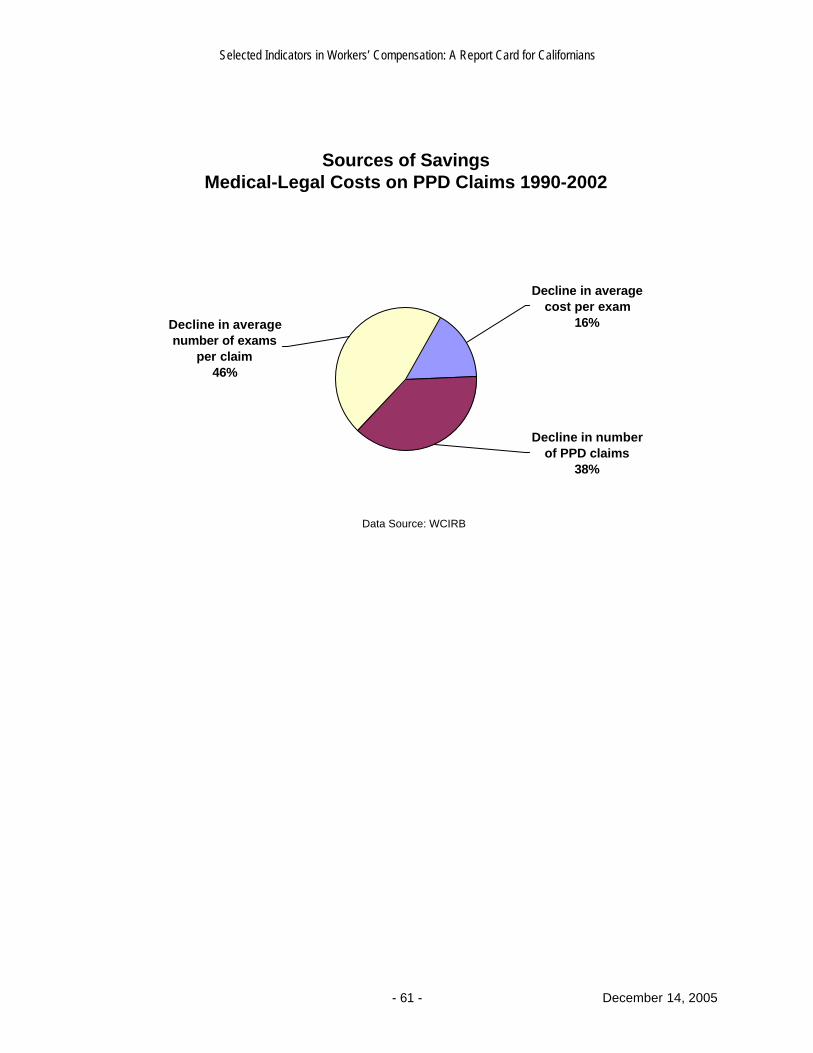
Selected Indicators in Workers’ Compensation: A Report Card for Californians
- 61 - December 14, 2005
Sources of SavingsMedical-Legal Costs on PPD Claims 1990-2002
Decline in average number of exams
per claim46%
Decline in average cost per exam
16%
Decline in number of PPD claims
38%
Data Source: WCIRB
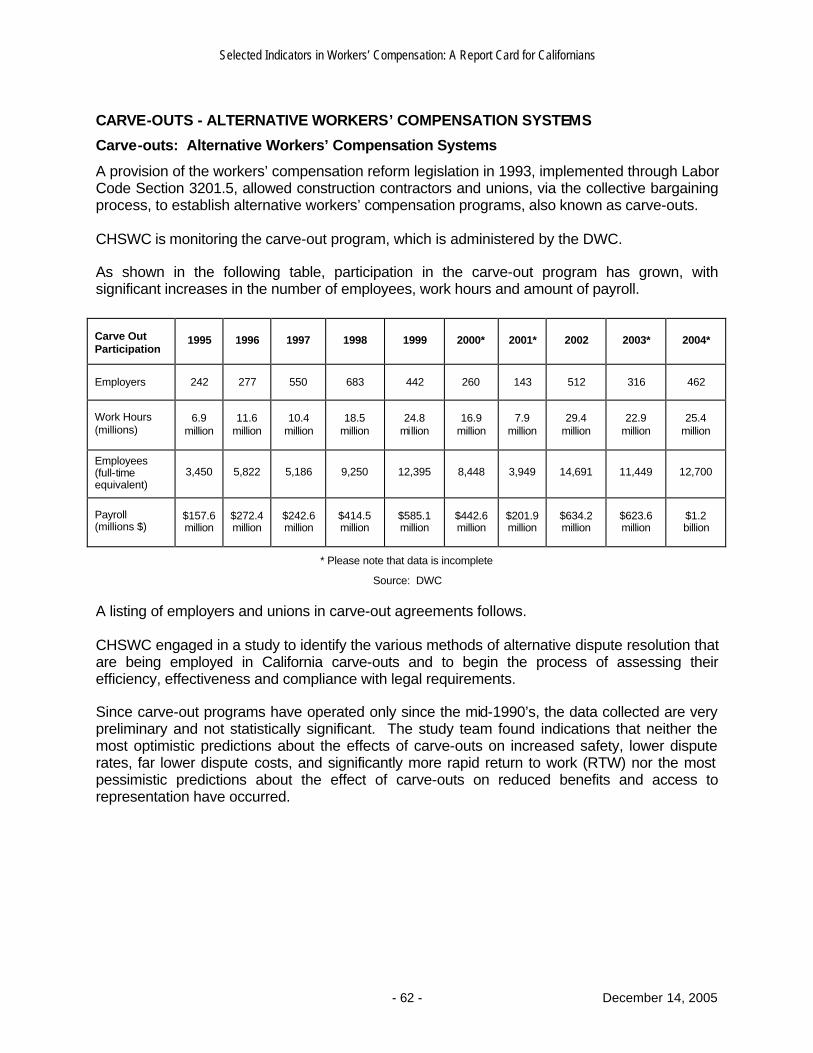
Selected Indicators in Workers’ Compensation: A Report Card for Californians
- 62 - December 14, 2005
CARVE-OUTS - ALTERNATIVE WORKERS’ COMPENSATION SYSTEMS
Carve-outs: Alternative Workers’ Compensation Systems
A provision of the workers’ compensation reform legislation in 1993, implemented through Labor Code Section 3201.5, allowed construction contractors and unions, via the collective bargaining process, to establish alternative workers’ compensation programs, also known as carve-outs. CHSWC is monitoring the carve-out program, which is administered by the DWC. As shown in the following table, participation in the carve-out program has grown, with significant increases in the number of employees, work hours and amount of payroll.
Carve Out Participation
1995 1996 1997 1998 1999 2000* 2001* 2002 2003* 2004*
Employers 242 277 550 683 442 260 143 512 316 462
Work Hours (millions)
6.9 million
11.6 million
10.4 million
18.5 million
24.8 million
16.9 million
7.9 million
29.4 million
22.9 million
25.4 million
Employees (full-time equivalent)
3,450 5,822 5,186 9,250 12,395 8,448 3,949 14,691 11,449 12,700
Payroll (millions $)
$157.6 million
$272.4 million
$242.6 million
$414.5 million
$585.1 million
$442.6 million
$201.9 million
$634.2 million
$623.6 million
$1.2 billion
* Please note that data is incomplete
Source: DWC
A listing of employers and unions in carve-out agreements follows. CHSWC engaged in a study to identify the various methods of alternative dispute resolution that are being employed in California carve-outs and to begin the process of assessing their efficiency, effectiveness and compliance with legal requirements. Since carve-out programs have operated only since the mid-1990’s, the data collected are very preliminary and not statistically significant. The study team found indications that neither the most optimistic predictions about the effects of carve-outs on increased safety, lower dispute rates, far lower dispute costs, and significantly more rapid return to work (RTW) nor the most pessimistic predictions about the effect of carve-outs on reduced benefits and access to representation have occurred.
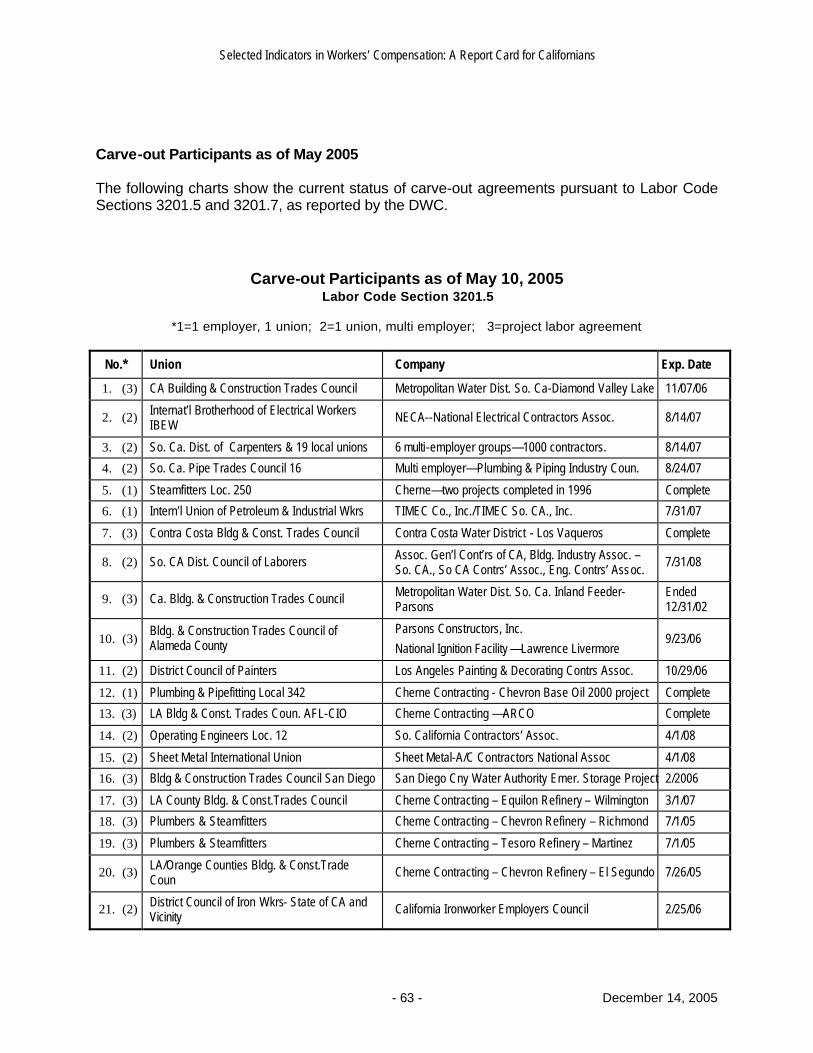
Selected Indicators in Workers’ Compensation: A Report Card for Californians
- 63 - December 14, 2005
Carve-out Participants as of May 2005
The following charts show the current status of carve-out agreements pursuant to Labor Code Sections 3201.5 and 3201.7, as reported by the DWC.
Carve-out Participants as of May 10, 2005
Labor Code Section 3201.5
*1=1 employer, 1 union; 2=1 union, multi employer; 3=project labor agreement
No.* Union Company Exp. Date
1. (3) CA Building & Construction Trades Council Metropolitan Water Dist. So. Ca-Diamond Valley Lake 11/07/06
2. (2) Internat’l Brotherhood of Electrical Workers IBEW
NECA--National Electrical Contractors Assoc. 8/14/07
3. (2) So. Ca. Dist. of Carpenters & 19 local unions 6 multi-employer groups—1000 contractors. 8/14/07
4. (2) So. Ca. Pipe Trades Council 16 Multi employer—Plumbing & Piping Industry Coun. 8/24/07
5. (1) Steamfitters Loc. 250 Cherne—two projects completed in 1996 Complete
6. (1) Intern’l Union of Petroleum & Industrial Wkrs TIMEC Co., Inc./TIMEC So. CA., Inc. 7/31/07
7. (3) Contra Costa Bldg & Const. Trades Council Contra Costa Water District - Los Vaqueros Complete
8. (2) So. CA Dist. Council of Laborers Assoc. Gen’l Cont’rs of CA, Bldg. Industry Assoc. –So. CA., So CA Contrs’ Assoc., Eng. Contrs’ Assoc.
7/31/08
9. (3) Ca. Bldg. & Construction Trades Council Metropolitan Water Dist. So. Ca. Inland Feeder-Parsons
Ended 12/31/02
10. (3) Bldg. & Construction Trades Council of Alameda County
Parsons Constructors, Inc.
National Ignition Facility —Lawrence Livermore 9/23/06
11. (2) District Council of Painters Los Angeles Painting & Decorating Contrs Assoc. 10/29/06
12. (1) Plumbing & Pipefitting Local 342 Cherne Contracting - Chevron Base Oil 2000 project Complete
13. (3) LA Bldg & Const. Trades Coun. AFL-CIO Cherne Contracting —ARCO Complete
14. (2) Operating Engineers Loc. 12 So. California Contractors’ Assoc. 4/1/08
15. (2) Sheet Metal International Union Sheet Metal-A/C Contractors National Assoc 4/1/08
16. (3) Bldg & Construction Trades Council San Diego San Diego Cny Water Authority Emer. Storage Project 2/2006
17. (3) LA County Bldg. & Const.Trades Council Cherne Contracting – Equilon Refinery – Wilmington 3/1/07
18. (3) Plumbers & Steamfitters Cherne Contracting – Chevron Refinery – Richmond 7/1/05
19. (3) Plumbers & Steamfitters Cherne Contracting – Tesoro Refinery – Martinez 7/1/05
20. (3) LA/Orange Counties Bldg. & Const.Trade Coun
Cherne Contracting – Chevron Refinery – El Segundo 7/26/05
21. (2) District Council of Iron Wkrs- State of CA and Vicinity
California Ironworker Employers Council 2/25/06
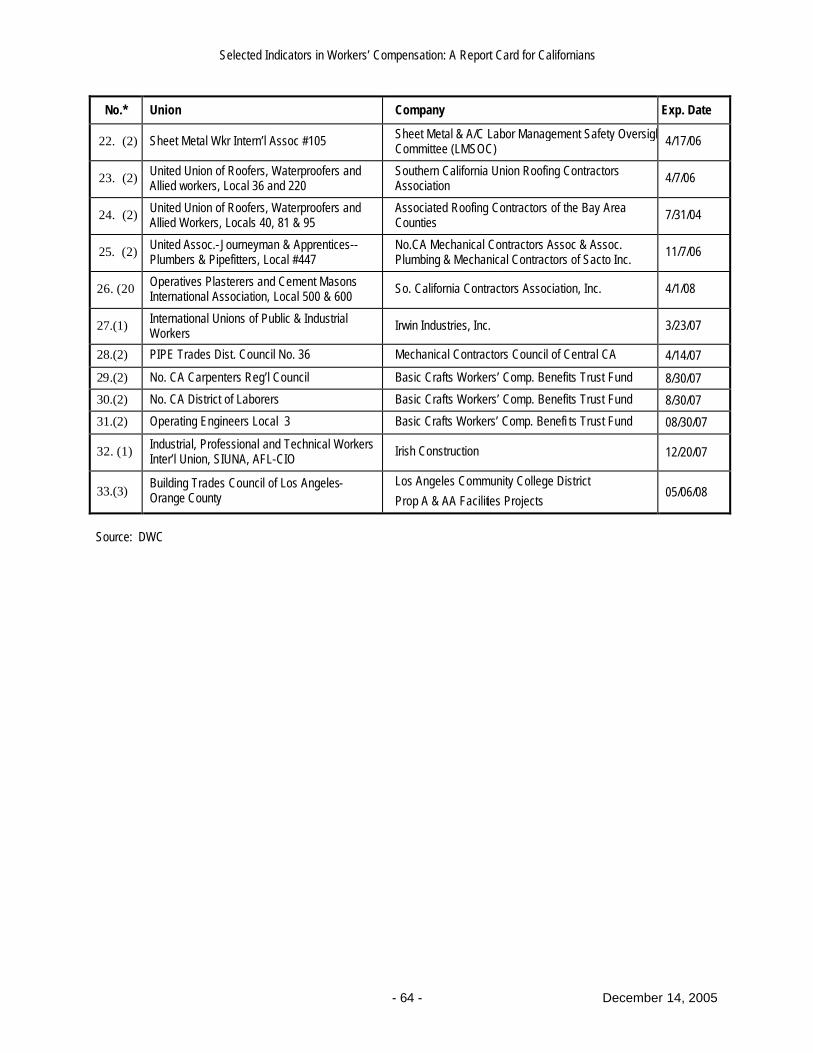
Selected Indicators in Workers’ Compensation: A Report Card for Californians
- 64 - December 14, 2005
No.* Union Company Exp. Date
22. (2) Sheet Metal Wkr Intern’l Assoc #105 Sheet Metal & A/C Labor Management Safety Oversight Committee (LMSOC)
4/17/06
23. (2) United Union of Roofers, Waterproofers and Allied workers, Local 36 and 220
Southern California Union Roofing Contractors Association
4/7/06
24. (2) United Union of Roofers, Waterproofers and Allied Workers, Locals 40, 81 & 95
Associated Roofing Contractors of the Bay Area Counties
7/31/04
25. (2) United Assoc.- Journeyman & Apprentices--Plumbers & Pipefitters, Local #447
No.CA Mechanical Contractors Assoc & Assoc. Plumbing & Mechanical Contractors of Sacto Inc.
11/7/06
26. (20 Operatives Plasterers and Cement Masons International Association, Local 500 & 600
So. California Contractors Association, Inc. 4/1/08
27.(1) International Unions of Public & Industrial Workers
Irwin Industries, Inc. 3/23/07
28.(2) PIPE Trades Dist. Council No. 36 Mechanical Contractors Council of Central CA 4/14/07
29.(2) No. CA Carpenters Reg’l Council Basic Crafts Workers’ Comp. Benefits Trust Fund 8/30/07
30.(2) No. CA District of Laborers Basic Crafts Workers’ Comp. Benefits Trust Fund 8/30/07
31.(2) Operating Engineers Local 3 Basic Crafts Workers’ Comp. Benefi ts Trust Fund 08/30/07
32. (1) Industrial, Professional and Technical Workers Inter’l Union, SIUNA, AFL-CIO
Irish Construction 12/20/07
33.(3) Building Trades Council of Los Angeles-Orange County
Los Angeles Community College District
Prop A & AA Facilities Projects 05/06/08
Source: DWC
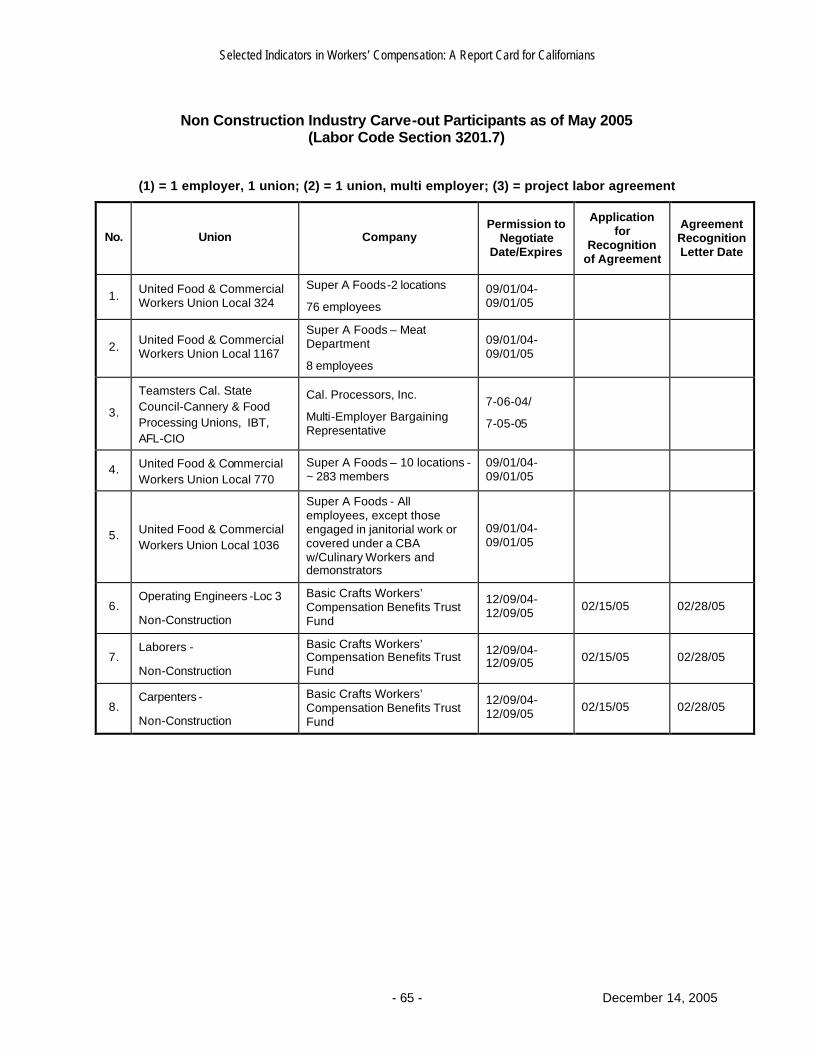
Selected Indicators in Workers’ Compensation: A Report Card for Californians
- 65 - December 14, 2005
Non Construction Industry Carve-out Participants as of May 2005
(Labor Code Section 3201.7)
(1) = 1 employer, 1 union; (2) = 1 union, multi employer; (3) = project labor agreement
No. Union Company Permission to
Negotiate Date/Expires
Application for
Recognition of Agreement
Agreement Recognition Letter Date
1. United Food & Commercial Workers Union Local 324
Super A Foods-2 locations
76 employees 09/01/04-09/01/05
2. United Food & Commercial Workers Union Local 1167
Super A Foods – Meat Department
8 employees
09/01/04-09/01/05
3.
Teamsters Cal. State Council-Cannery & Food Processing Unions, IBT, AFL-CIO
Cal. Processors, Inc.
Multi-Employer Bargaining Representative
7-06-04/
7-05-05
4. United Food & Commercial Workers Union Local 770
Super A Foods – 10 locations - ~ 283 members
09/01/04-09/01/05
5. United Food & Commercial Workers Union Local 1036
Super A Foods - All employees, except those engaged in janitorial work or covered under a CBA w/Culinary Workers and demonstrators
09/01/04-09/01/05
6. Operating Engineers -Loc 3
Non-Construction
Basic Crafts Workers’ Compensation Benefits Trust Fund
12/09/04-12/09/05 02/15/05 02/28/05
7. Laborers -
Non-Construction
Basic Crafts Workers’ Compensation Benefits Trust Fund
12/09/04-12/09/05 02/15/05 02/28/05
8. Carpenters -
Non-Construction
Basic Crafts Workers’ Compensation Benefits Trust Fund
12/09/04-12/09/05 02/15/05 02/28/05