the burden of headache disorders in nepal: estimates from a
TRANSCRIPT
RESEARCH ARTICLE Open Access
The burden of headache disorders inNepal: estimates from a population-basedsurveyKedar Manandhar1,2, Ajay Risal1,2, Mattias Linde1,3 and Timothy J. Steiner1,4*
Abstract
Background: Headache disorders, particularly migraine and tension-type headache (TTH), are among the mostprevalent global public-health problems. Medication-overuse headache (MOH) is a common sequela ofmismanagement of these. Migraine and MOH are highly disabling. Formulation of responsive health policy requiresreliable, locally-derived, population-based data describing both individual and societal impact of headachedisorders. South-East Asia is the only one of WHO’s six world regions in which no such national data have yet beengathered.
Methods: In a nationwide population-based cross-sectional study, a representative sample of Nepalese-speakingadults (18–65 years) were randomly selected by stratified multistage cluster sampling. Trained interviewers madeunannounced door-to-door visits and enquired into headache and its attributable burden using a culturally-adapted and validated Nepalese translation of the Headache-Attributed Restriction, Disability, Social Handicap andImpaired Participation (HARDSHIP) questionnaire.
Results: Among 2100 participants, 1794 (85.4 %) reported headache during the preceding year (male: 689 [38.4 %],female 1105 [61.6 %]; mean age 36.1 ± 12.6 years). Mean headache frequency was 3.8 ± 6.2 days/month, meanheadache intensity 2.1 ± 0.7 on a 0–3 scale, and mean attack duration 41.9 ± 108.5 h. All aspects of symptom burden(frequency, intensity and duration) were greater among females (p < 0.001). Participants with headache had poorerquality of life (QoL) than those without (p < 0.001); QoL was worst among those with probable MOH (pMOH).Mean proportions of total available time spent in the ictal state were 5.4 % among participants with migraine, 3.9 %among those with TTH and 44.7 % among those with pMOH, with headache-related disabilities of 2.4, 0.15 and 9.7 %respectively. At population level, these disorders were responsible for reduced functional capacities of 0.81, 0.06 and0.20 %. Total lost productive time due to headache was 6.8 % for the 85 % of the population with headache. Males lostmore paid worktime than females (p < 0.001); the reverse was so for household worktime (p < 0.001).
Conclusions: Headache disorders, very common in Nepal, are also highly burdensome at both individual andpopulation levels. There is a substantial penalty in lost production. The remedy lies in better health care for headache;structured headache-care services are urgently needed in the country, and likely to be cost-saving.
Keywords: Migraine, Tension-type headache, Medication-overuse headache, Public health, Population-based study,Burden of disease, Disability, Nepal, South-East Asia region, Global campaign against headache
* Correspondence: [email protected] of Neuroscience, Norwegian University of Science andTechnology, Edvard Griegs Gate, Trondheim, NO 7489, Norway4Division of Brain Sciences, Imperial College London, London, UKFull list of author information is available at the end of the article
© 2016 Manandhar et al. Open Access This article is distributed under the terms of the Creative Commons Attribution 4.0International License (http://creativecommons.org/licenses/by/4.0/), which permits unrestricted use, distribution, andreproduction in any medium, provided you give appropriate credit to the original author(s) and the source, provide a link tothe Creative Commons license, and indicate if changes were made.
Manandhar et al. The Journal of Headache and Pain (2016) 17:3 DOI 10.1186/s10194-016-0594-0

BackgroundPrimary headache disorders – migraine and tension-typeheadache (TTH) – are among the most prevalent diseasesin the world [1–3]. These disorders, together with theirmajor sequela, medication-overuse headache (MOH), areof substantial importance to public health nationally andglobally because they lead to widespread ill health andimpaired quality of life (QoL) and are disabling [4] TheGlobal Burden of Disease Study 2013 (GBD2013) foundmigraine to be the sixth highest cause of disability world-wide, and MOH the 18th, measured in years of life lost todisability (YLDs) [3]. Collectively, headache disorders arethe third highest cause of disability in the world [5]. Theeconomic consequences through productivity losses aresubstantial [6].Mitigating action is required, a message strongly en-
dorsed by the World Health Organization (WHO) [4, 7].But decisions about the allocation of national health-careresources are best informed by reliable, locally-derived,population-based data. This is especially important indeveloping countries such as Nepal, which have very con-strained health budgets and a clear imperative to maxi-mise health gain from them. In the case of headache care,this means data on the burden attributable to headachedisorders harvested from the population of Nepal as thebasis of needs assessment. Recent population-based stud-ies in other developing countries [8–10] have shown highheadache prevalences and heavy headache-attributableburden, but these factors remain poorly described in manylarge and populous areas of the world [2, 4] – nowheremore obviously than in the South-East Asia Region(SEAR). In fact, SEAR, in which Nepal lies, is the only oneof WHO’s six world regions for which no national data ofthis type have yet been gathered in any country [4].Nepal is one of the poorest countries within SEAR
[11], but with great geographic and cultural diversity. Itslocation in the Himalayas, and their foothills and plainsbeyond, includes eight of the world’s ten highest peaks,among them Mount Everest, the highest point on Earth[11]. Its population is approximately 30 million [12],with a rather unequal distribution of wealth so thatabout one quarter live below the international povertyline [11]. The majority of Nepalese engage in agriculture[13]. More than 70 ethnic groups maintain different cul-tures and spoken languages [13].We earlier reported headache prevalence data from
our adult population-based study in Nepal [14]. The 1-year prevalence of migraine in this country (34.1 %) wasuniquely high, while the point prevalence of probableMOH (pMOH) (2.1 %) was towards the upper end ofthe range for most countries studied [15]. The 1-yearprevalence of TTH (44.1 %) was in line with the globalaverage [2, 3]. Here, with the specific purpose of inform-ing health policy, and as a study conducted within the
Global Campaign against Headache, we report the esti-mates of burden attributable to these disorders in Nepal.
MethodsEthicsThe Nepal Health Research Council, the InstitutionalReview Committee of Kathmandu University School ofMedical Sciences, Dhulikhel Hospital, and the RegionalCommittee for Health and Research Ethics in CentralNorway all approved the study protocol.All participants were informed about the nature and
purpose of the study and this was documented in ac-cordance with requirements of the three committees.
Study design and samplingThe study design, sampling and data collection procedureshave been reported in detail previously [16]. In summary,this was a cross-sectional survey using structured inter-views administered by trained health workers making un-announced door-to-door visits during May, 2013. Toobtain a nationally representative sample, we used multi-stage stratified cluster sampling in all three physiographicdivisions of the country and, within each division, all fivedevelopment regions (Far-Western, Midwestern, Western,Central and Eastern). We randomly selected one eligibleadult (aged 18–65 years, Nepalese-speaking and living inNepal) from each household.
InstrumentsWe used the Headache-Attributed Restriction, Disability,Social Handicap and Impaired Participation (HARDSHIP)questionnaire developed by Lifting The Burden (LTB) forpopulation-based studies [17]. The original English-language version was translated into Nepalese accordingto LTB’s translation protocol for hybrid documents [18]and modified according to Nepalese culture [19]. Thequestionnaire consisted of four parts relevant to this re-port. For all participants there were (i) personal anddemographic enquiry and (ii) a neutral headache screen-ing question (“Have you had a headache during the last12 months?”). Those who answered “no” to the latter wereclassified as headache-free. Those who answered “yes”were asked whether their headaches were of one or moretypes and, if more than one, to focus only on the mostbothersome type. Only those who answered positively tothe screening question were also asked (iii) diagnosticquestions in line with the International Classification ofHeadache Disorders (ICHD-3 beta) [20], and (iv) ques-tions ascertaining various aspects of headache burden.We measured symptom burden in terms of frequency
(days/month), intensity (with response options “not bad”,“quite bad” and “very bad”, which we interpreted as mild,moderate and severe) and duration (hours).
Manandhar et al. The Journal of Headache and Pain (2016) 17:3 Page 2 of 10
We enquired into willingness to pay (WTP) as anoverall measure of burden [17] using a bidding gamemethod [21]. We asked how much participants would bewilling to pay per month for an effective treatment suchthat their headaches would no longer bother them. Bid-ding began at NPR 100/month (at the time of the survey,NPR 100 ≈USD 1): was the respondent willing to paythis amount? If “yes”, the interviewer incremented thebidding stepwise (NPR 200, 400, 1000 and 2000) untilthe answer was “no”, or it was clear that the participantwould pay > NPR 2000. If the opening bid of NPR 100was declined, the interviewer instead reduced stepwise(NPR 40 and 20) until the participant said “yes”, or it be-came clear that nothing would be paid. Finally, in everycase, an exact amount was agreed upon as the individ-ual’s WTP-value.We assessed QoL using the World Health Organization
Quality of Life-8 (WHOQOL-8) questionnaire [22]. Itseight items addressed subjective wellbeing and satisfactionin four domains (two in each): psychological, physical, so-cial and environmental [17]. Each item was graded on ascale of 1–5, with a higher score indicating better QoL.We estimated lost time due to headache during the pre-
ceding 3 months using the Headache-Attributed LostTime (HALT) questionnaire [23]. Its first two questionsasked for the numbers of days in that period (i) completelymissed from paid work and (ii) with <50 % productivitybecause of headache while at work; the next two asked fornumbers of days of household work (iii) completelymissed and (iv) with <50 % productivity; the last enquiredinto (v) the number of days on which family, social orleisure activities were missed because of headache.
Headache diagnosisThe diagnostic method has been described previously [14].Diagnoses were not made during the interviews but lateraccording to an algorithm. Participants reporting headacheon ≥15 days/month were first separated as a distinct groupbecause they cannot be fully diagnosed by questionnaire.Those who in addition were overusing acute medicationwere considered to have pMOH [24]; the remainder werecategorised as “other headache on ≥15 days/month”. To allothers, reporting headache on ≤14 days/month, the algo-rithm applied modified ICHD-3 beta criteria [20] in the fol-lowing order: definite migraine, definite TTH, probablemigraine and probable TTH. Definite and probable mi-graine were subsequently considered together, and likewisedefinite and probable TTH, for attribution of burden. Thefew remaining cases were unclassifiable.
StatisticsCategorical variables are presented as numbers and per-centages. Continuous variables are presented as means
with standard deviations (SDs) and/or medians withinterquartile ranges (IQRs).We transformed the categorical variable for headache
intensity (mild, moderate, and severe) into a numericalscale 0–3 (0 being no pain), and treated these results ascontinuous data.We summed responses to the first four items (i-iv) of
HALT to estimate total productivity loss. These scoreswere treated as continuous variables. We separatelysummed the first and second items (i, ii) to estimate lostpaid worktime, and the third and fourth (iii, iv) to esti-mate lost household worktime.We estimated individual and population-level disability
attributable to migraine, TTH and pMOH using the dis-ability weights (DWs) from GBD2013 [3] for the ictalstates of each. We calculated the mean absolute timespent in the ictal state (Tabs) as the product of mean at-tack frequency (AF) and mean attack duration (D). Formigraine, because headache frequency (HF) had been re-corded as days/month, we assumed participants with at-tacks lasting >24 h had counted days affected ratherthan number of attacks per month. Therefore, to calcu-late mean AF we made separate computations for thosewith attack durations of ≥24 h and <24 h, using the for-mula AF =HF/D in the former group. We then took theweighted mean of the two groups. We did not need toperform the same manipulation for TTH, because themean duration of headache was <24 h (Table 1). ForpMOH, we made separate calculations for those describ-ing durations of <24 h and those asserting pain “nevergoes away”, for whom we assumed AF = 30 and D = 24;there were no respondents in between. Again we tookthe weighted mean. From Tabs (in hours/year) we calcu-lated the proportion of total available time that wasspent in the ictal state (Tpro) by dividing by (24*365).We multiplied this proportion by the DW for thedisorder in question to calculate individual disability(DISper), and then by the prevalence of the disorder toarrive at population-level disability (DISpop).We used Student’s t-test for significance of differences
between means of two groups and one-way analysis ofvariance (ANOVA) for more than two groups. Sincemost of the continuous variables were skewed in distri-bution, we also used the non-parametric Mann–WhitneyU-test or Kruskal-Wallis test to examine differences be-tween groups. We considered p < 0.05 as statistically sig-nificant. All data were analysed with SPSS 21.0 software(SPSS Inc., Chicago, IL, USA).
ResultsWe interviewed 2100 participants aged 18–65 years(participation rate >99 % [16]), of whom 1794 (85.4 %) re-ported headache during the preceding year (male: 689[38.4 %], female 1105 [61.6 %]; mean age 36.1 ± 12.6 years;
Manandhar et al. The Journal of Headache and Pain (2016) 17:3 Page 3 of 10
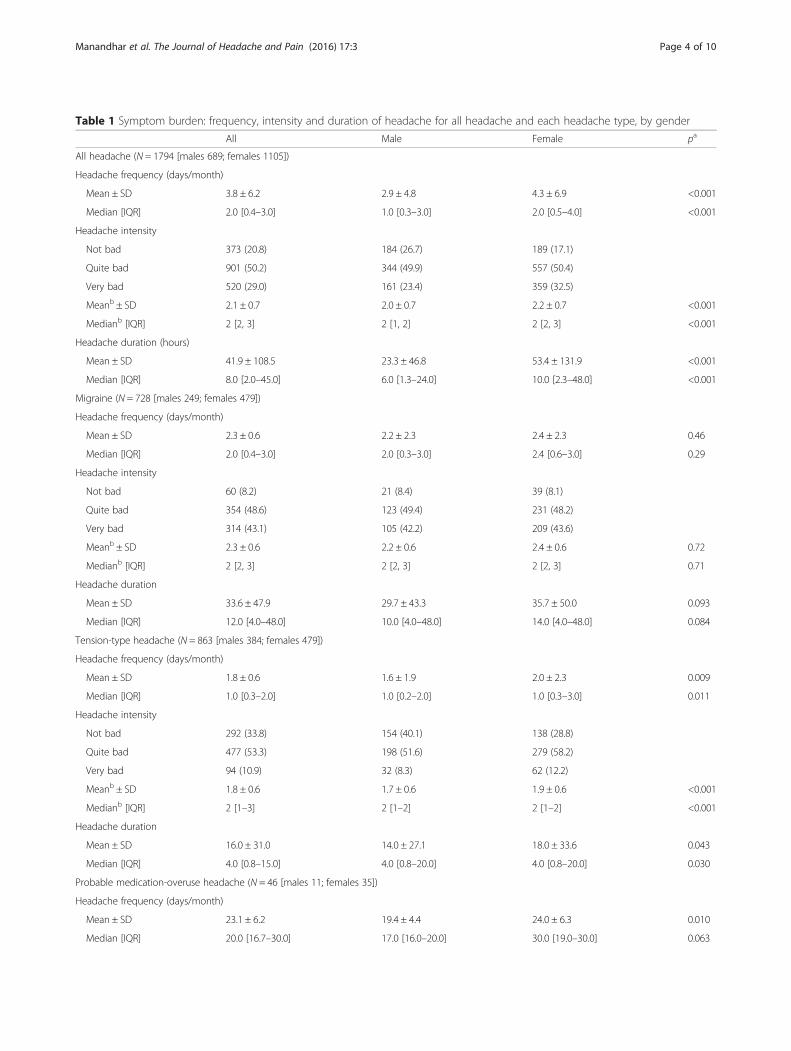
Table 1 Symptom burden: frequency, intensity and duration of headache for all headache and each headache type, by gender
All Male Female pa
All headache (N = 1794 [males 689; females 1105])
Headache frequency (days/month)
Mean ± SD 3.8 ± 6.2 2.9 ± 4.8 4.3 ± 6.9 <0.001
Median [IQR] 2.0 [0.4–3.0] 1.0 [0.3–3.0] 2.0 [0.5–4.0] <0.001
Headache intensity
Not bad 373 (20.8) 184 (26.7) 189 (17.1)
Quite bad 901 (50.2) 344 (49.9) 557 (50.4)
Very bad 520 (29.0) 161 (23.4) 359 (32.5)
Meanb ± SD 2.1 ± 0.7 2.0 ± 0.7 2.2 ± 0.7 <0.001
Medianb [IQR] 2 [2, 3] 2 [1, 2] 2 [2, 3] <0.001
Headache duration (hours)
Mean ± SD 41.9 ± 108.5 23.3 ± 46.8 53.4 ± 131.9 <0.001
Median [IQR] 8.0 [2.0–45.0] 6.0 [1.3–24.0] 10.0 [2.3–48.0] <0.001
Migraine (N = 728 [males 249; females 479])
Headache frequency (days/month)
Mean ± SD 2.3 ± 0.6 2.2 ± 2.3 2.4 ± 2.3 0.46
Median [IQR] 2.0 [0.4–3.0] 2.0 [0.3–3.0] 2.4 [0.6–3.0] 0.29
Headache intensity
Not bad 60 (8.2) 21 (8.4) 39 (8.1)
Quite bad 354 (48.6) 123 (49.4) 231 (48.2)
Very bad 314 (43.1) 105 (42.2) 209 (43.6)
Meanb ± SD 2.3 ± 0.6 2.2 ± 0.6 2.4 ± 0.6 0.72
Medianb [IQR] 2 [2, 3] 2 [2, 3] 2 [2, 3] 0.71
Headache duration
Mean ± SD 33.6 ± 47.9 29.7 ± 43.3 35.7 ± 50.0 0.093
Median [IQR] 12.0 [4.0–48.0] 10.0 [4.0–48.0] 14.0 [4.0–48.0] 0.084
Tension-type headache (N = 863 [males 384; females 479])
Headache frequency (days/month)
Mean ± SD 1.8 ± 0.6 1.6 ± 1.9 2.0 ± 2.3 0.009
Median [IQR] 1.0 [0.3–2.0] 1.0 [0.2–2.0] 1.0 [0.3–3.0] 0.011
Headache intensity
Not bad 292 (33.8) 154 (40.1) 138 (28.8)
Quite bad 477 (53.3) 198 (51.6) 279 (58.2)
Very bad 94 (10.9) 32 (8.3) 62 (12.2)
Meanb ± SD 1.8 ± 0.6 1.7 ± 0.6 1.9 ± 0.6 <0.001
Medianb [IQR] 2 [1–3] 2 [1–2] 2 [1–2] <0.001
Headache duration
Mean ± SD 16.0 ± 31.0 14.0 ± 27.1 18.0 ± 33.6 0.043
Median [IQR] 4.0 [0.8–15.0] 4.0 [0.8–20.0] 4.0 [0.8–20.0] 0.030
Probable medication-overuse headache (N = 46 [males 11; females 35])
Headache frequency (days/month)
Mean ± SD 23.1 ± 6.2 19.4 ± 4.4 24.0 ± 6.3 0.010
Median [IQR] 20.0 [16.7–30.0] 17.0 [16.0–20.0] 30.0 [19.0–30.0] 0.063
Manandhar et al. The Journal of Headache and Pain (2016) 17:3 Page 4 of 10
686 [38.2 %] rural; 949 [52.9 %] living at altitude ≥1000 m).These 1794 were included in the analysis of burden;728 [40.5 %] reported migraine, 863 [48.1 %] TTH,46 [2.6 %] pMOH and 115 [6.4 %] other headacheon ≥15 days/month.
Symptom burdenSymptom burden is presented in Table 1 by headachetype and gender. From a public-health perspective it wassubstantial: the mean overall reported headache fre-quency was 3.8 days/month – 1 day in every eight – andmean overall reported intensity was 2.1. Half of all par-ticipants with headache (901; 50.2 %) reported moderateheadache and another nearly one third (520; 29.0 %) re-ported severe headache. By headache type, pMOH wasof course the most frequent headache; it was followed bymigraine, then TTH. The same rank order was seen forboth headache intensity and duration. On every meas-ure, females were worse affected than males with regardto all headache and TTH, but not significantly so with
regard to migraine or (taking both means and mediansinto account) pMOH.
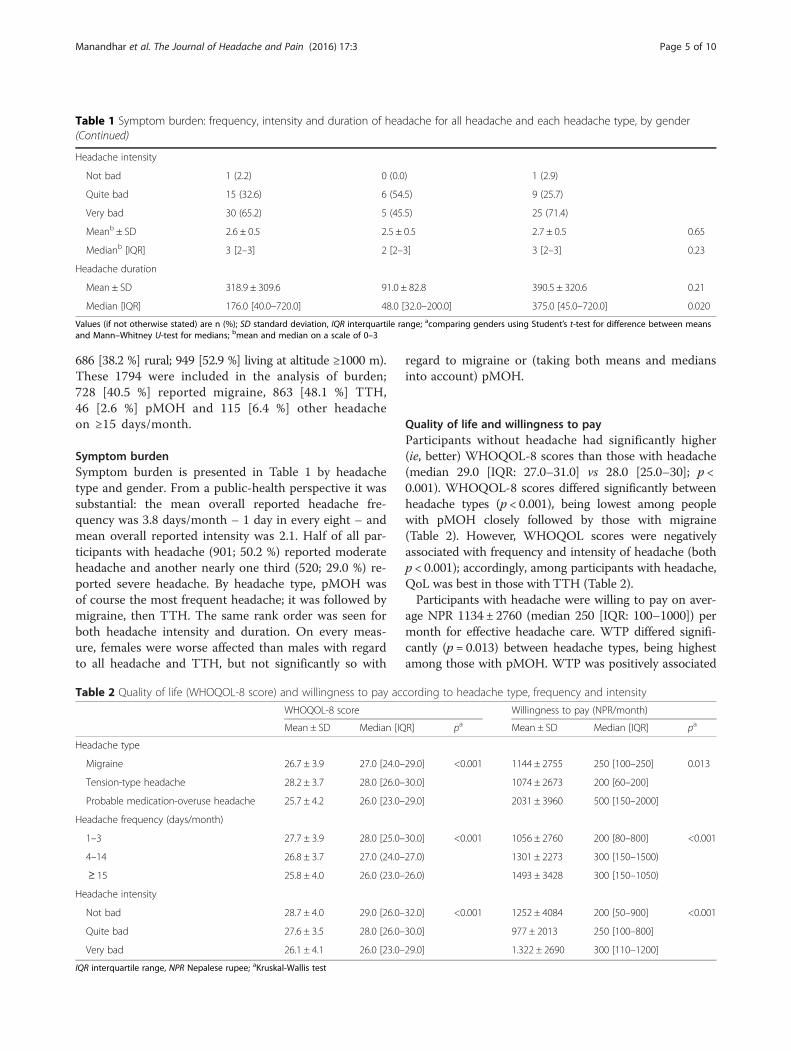
Quality of life and willingness to payParticipants without headache had significantly higher(ie, better) WHOQOL-8 scores than those with headache(median 29.0 [IQR: 27.0–31.0] vs 28.0 [25.0–30]; p <0.001). WHOQOL-8 scores differed significantly betweenheadache types (p < 0.001), being lowest among peoplewith pMOH closely followed by those with migraine(Table 2). However, WHOQOL scores were negativelyassociated with frequency and intensity of headache (bothp < 0.001); accordingly, among participants with headache,QoL was best in those with TTH (Table 2).Participants with headache were willing to pay on aver-
age NPR 1134 ± 2760 (median 250 [IQR: 100–1000]) permonth for effective headache care. WTP differed signifi-cantly (p = 0.013) between headache types, being highestamong those with pMOH. WTP was positively associated
Table 1 Symptom burden: frequency, intensity and duration of headache for all headache and each headache type, by gender(Continued)
Headache intensity
Not bad 1 (2.2) 0 (0.0) 1 (2.9)
Quite bad 15 (32.6) 6 (54.5) 9 (25.7)
Very bad 30 (65.2) 5 (45.5) 25 (71.4)
Meanb ± SD 2.6 ± 0.5 2.5 ± 0.5 2.7 ± 0.5 0.65
Medianb [IQR] 3 [2–3] 2 [2–3] 3 [2–3] 0.23
Headache duration
Mean ± SD 318.9 ± 309.6 91.0 ± 82.8 390.5 ± 320.6 0.21
Median [IQR] 176.0 [40.0–720.0] 48.0 [32.0–200.0] 375.0 [45.0–720.0] 0.020
Values (if not otherwise stated) are n (%); SD standard deviation, IQR interquartile range; acomparing genders using Student’s t-test for difference between meansand Mann–Whitney U-test for medians; bmean and median on a scale of 0–3
Table 2 Quality of life (WHOQOL-8 score) and willingness to pay according to headache type, frequency and intensity
WHOQOL-8 score Willingness to pay (NPR/month)
Mean ± SD Median [IQR] pa Mean ± SD Median [IQR] pa
Headache type
Migraine 26.7 ± 3.9 27.0 [24.0–29.0] <0.001 1144 ± 2755 250 [100–250] 0.013
Tension-type headache 28.2 ± 3.7 28.0 [26.0–30.0] 1074 ± 2673 200 [60–200]
Probable medication-overuse headache 25.7 ± 4.2 26.0 [23.0–29.0] 2031 ± 3960 500 [150–2000]
Headache frequency (days/month)
1–3 27.7 ± 3.9 28.0 [25.0–30.0] <0.001 1056 ± 2760 200 [80–800] <0.001
4–14 26.8 ± 3.7 27.0 (24.0–27.0) 1301 ± 2273 300 [150–1500)
≥ 15 25.8 ± 4.0 26.0 (23.0–26.0) 1493 ± 3428 300 [150–1050)
Headache intensity
Not bad 28.7 ± 4.0 29.0 [26.0–32.0] <0.001 1252 ± 4084 200 [50–900] <0.001
Quite bad 27.6 ± 3.5 28.0 [26.0–30.0] 977 ± 2013 250 [100–800]
Very bad 26.1 ± 4.1 26.0 [23.0–29.0] 1.322 ± 2690 300 [110–1200]
IQR interquartile range, NPR Nepalese rupee; aKruskal-Wallis test
Manandhar et al. The Journal of Headache and Pain (2016) 17:3 Page 5 of 10
with both frequency and intensity of headache (p < 0.001),and therefore least in TTH (Table 2).
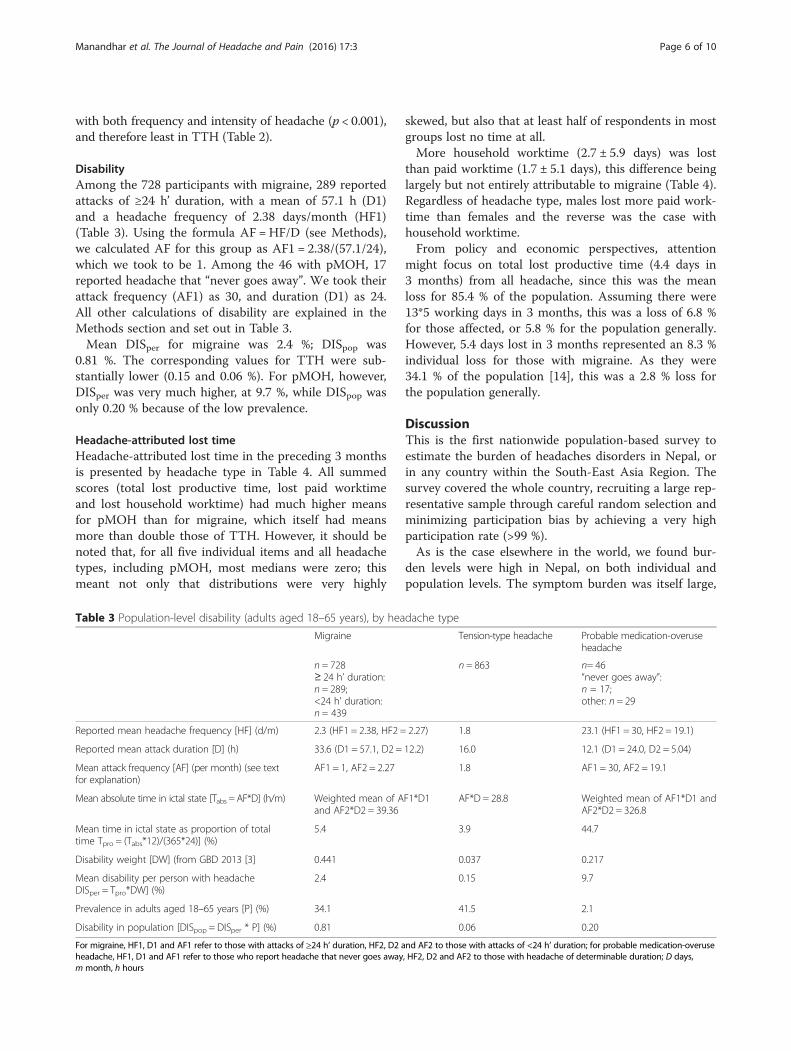
DisabilityAmong the 728 participants with migraine, 289 reportedattacks of ≥24 h’ duration, with a mean of 57.1 h (D1)and a headache frequency of 2.38 days/month (HF1)(Table 3). Using the formula AF =HF/D (see Methods),we calculated AF for this group as AF1 = 2.38/(57.1/24),which we took to be 1. Among the 46 with pMOH, 17reported headache that “never goes away”. We took theirattack frequency (AF1) as 30, and duration (D1) as 24.All other calculations of disability are explained in theMethods section and set out in Table 3.Mean DISper for migraine was 2.4 %; DISpop was
0.81 %. The corresponding values for TTH were sub-stantially lower (0.15 and 0.06 %). For pMOH, however,DISper was very much higher, at 9.7 %, while DISpop wasonly 0.20 % because of the low prevalence.
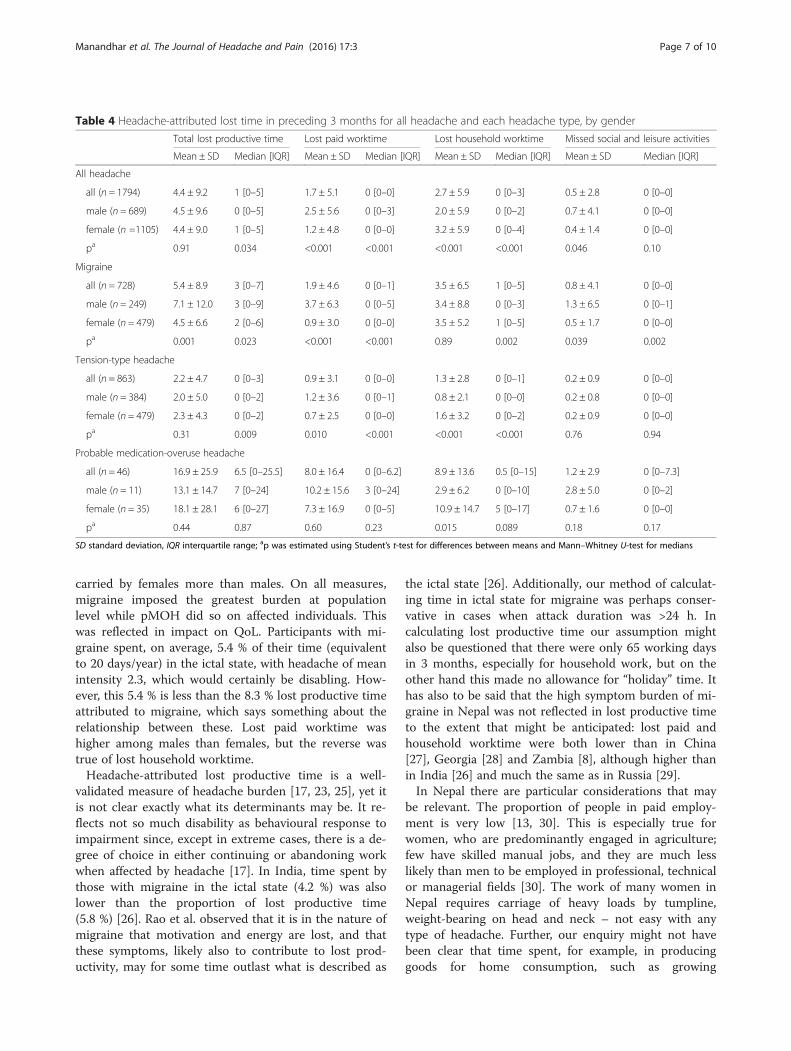
Headache-attributed lost timeHeadache-attributed lost time in the preceding 3 monthsis presented by headache type in Table 4. All summedscores (total lost productive time, lost paid worktimeand lost household worktime) had much higher meansfor pMOH than for migraine, which itself had meansmore than double those of TTH. However, it should benoted that, for all five individual items and all headachetypes, including pMOH, most medians were zero; thismeant not only that distributions were very highly
skewed, but also that at least half of respondents in mostgroups lost no time at all.More household worktime (2.7 ± 5.9 days) was lost
than paid worktime (1.7 ± 5.1 days), this difference beinglargely but not entirely attributable to migraine (Table 4).Regardless of headache type, males lost more paid work-time than females and the reverse was the case withhousehold worktime.From policy and economic perspectives, attention
might focus on total lost productive time (4.4 days in3 months) from all headache, since this was the meanloss for 85.4 % of the population. Assuming there were13*5 working days in 3 months, this was a loss of 6.8 %for those affected, or 5.8 % for the population generally.However, 5.4 days lost in 3 months represented an 8.3 %individual loss for those with migraine. As they were34.1 % of the population [14], this was a 2.8 % loss forthe population generally.
DiscussionThis is the first nationwide population-based survey toestimate the burden of headaches disorders in Nepal, orin any country within the South-East Asia Region. Thesurvey covered the whole country, recruiting a large rep-resentative sample through careful random selection andminimizing participation bias by achieving a very highparticipation rate (>99 %).As is the case elsewhere in the world, we found bur-
den levels were high in Nepal, on both individual andpopulation levels. The symptom burden was itself large,
Table 3 Population-level disability (adults aged 18–65 years), by headache type
Migraine Tension-type headache Probable medication-overuseheadache
n = 728≥ 24 h’ duration:n = 289;<24 h’ duration:n = 439
n = 863 n= 46“never goes away”:n = 17;other: n = 29
Reported mean headache frequency [HF] (d/m) 2.3 (HF1 = 2.38, HF2 = 2.27) 1.8 23.1 (HF1 = 30, HF2 = 19.1)
Reported mean attack duration [D] (h) 33.6 (D1 = 57.1, D2 = 12.2) 16.0 12.1 (D1 = 24.0, D2 = 5.04)
Mean attack frequency [AF] (per month) (see textfor explanation)
AF1 = 1, AF2 = 2.27 1.8 AF1 = 30, AF2 = 19.1
Mean absolute time in ictal state [Tabs = AF*D] (h/m) Weighted mean of AF1*D1and AF2*D2 = 39.36
AF*D = 28.8 Weighted mean of AF1*D1 andAF2*D2 = 326.8
Mean time in ictal state as proportion of totaltime Tpro = (Tabs*12)/(365*24)] (%)
5.4 3.9 44.7
Disability weight [DW] (from GBD 2013 [3] 0.441 0.037 0.217
Mean disability per person with headacheDISper = Tpro*DW] (%)
2.4 0.15 9.7
Prevalence in adults aged 18–65 years [P] (%) 34.1 41.5 2.1
Disability in population [DISpop = DISper * P] (%) 0.81 0.06 0.20
For migraine, HF1, D1 and AF1 refer to those with attacks of ≥24 h’ duration, HF2, D2 and AF2 to those with attacks of <24 h’ duration; for probable medication-overuseheadache, HF1, D1 and AF1 refer to those who report headache that never goes away, HF2, D2 and AF2 to those with headache of determinable duration; D days,m month, h hours
Manandhar et al. The Journal of Headache and Pain (2016) 17:3 Page 6 of 10
carried by females more than males. On all measures,migraine imposed the greatest burden at populationlevel while pMOH did so on affected individuals. Thiswas reflected in impact on QoL. Participants with mi-graine spent, on average, 5.4 % of their time (equivalentto 20 days/year) in the ictal state, with headache of meanintensity 2.3, which would certainly be disabling. How-ever, this 5.4 % is less than the 8.3 % lost productive timeattributed to migraine, which says something about therelationship between these. Lost paid worktime washigher among males than females, but the reverse wastrue of lost household worktime.Headache-attributed lost productive time is a well-
validated measure of headache burden [17, 23, 25], yet itis not clear exactly what its determinants may be. It re-flects not so much disability as behavioural response toimpairment since, except in extreme cases, there is a de-gree of choice in either continuing or abandoning workwhen affected by headache [17]. In India, time spent bythose with migraine in the ictal state (4.2 %) was alsolower than the proportion of lost productive time(5.8 %) [26]. Rao et al. observed that it is in the nature ofmigraine that motivation and energy are lost, and thatthese symptoms, likely also to contribute to lost prod-uctivity, may for some time outlast what is described as
the ictal state [26]. Additionally, our method of calculat-ing time in ictal state for migraine was perhaps conser-vative in cases when attack duration was >24 h. Incalculating lost productive time our assumption mightalso be questioned that there were only 65 working daysin 3 months, especially for household work, but on theother hand this made no allowance for “holiday” time. Ithas also to be said that the high symptom burden of mi-graine in Nepal was not reflected in lost productive timeto the extent that might be anticipated: lost paid andhousehold worktime were both lower than in China[27], Georgia [28] and Zambia [8], although higher thanin India [26] and much the same as in Russia [29].In Nepal there are particular considerations that may
be relevant. The proportion of people in paid employ-ment is very low [13, 30]. This is especially true forwomen, who are predominantly engaged in agriculture;few have skilled manual jobs, and they are much lesslikely than men to be employed in professional, technicalor managerial fields [30]. The work of many women inNepal requires carriage of heavy loads by tumpline,weight-bearing on head and neck – not easy with anytype of headache. Further, our enquiry might not havebeen clear that time spent, for example, in producinggoods for home consumption, such as growing
Table 4 Headache-attributed lost time in preceding 3 months for all headache and each headache type, by gender
Total lost productive time Lost paid worktime Lost household worktime Missed social and leisure activities
Mean ± SD Median [IQR] Mean ± SD Median [IQR] Mean ± SD Median [IQR] Mean ± SD Median [IQR]
All headache
all (n = 1794) 4.4 ± 9.2 1 [0–5] 1.7 ± 5.1 0 [0–0] 2.7 ± 5.9 0 [0–3] 0.5 ± 2.8 0 [0–0]
male (n = 689) 4.5 ± 9.6 0 [0–5] 2.5 ± 5.6 0 [0–3] 2.0 ± 5.9 0 [0–2] 0.7 ± 4.1 0 [0–0]
female (n =1105) 4.4 ± 9.0 1 [0–5] 1.2 ± 4.8 0 [0–0] 3.2 ± 5.9 0 [0–4] 0.4 ± 1.4 0 [0–0]
pa 0.91 0.034 <0.001 <0.001 <0.001 <0.001 0.046 0.10
Migraine
all (n = 728) 5.4 ± 8.9 3 [0–7] 1.9 ± 4.6 0 [0–1] 3.5 ± 6.5 1 [0–5] 0.8 ± 4.1 0 [0–0]
male (n = 249) 7.1 ± 12.0 3 [0–9] 3.7 ± 6.3 0 [0–5] 3.4 ± 8.8 0 [0–3] 1.3 ± 6.5 0 [0–1]
female (n = 479) 4.5 ± 6.6 2 [0–6] 0.9 ± 3.0 0 [0–0] 3.5 ± 5.2 1 [0–5] 0.5 ± 1.7 0 [0–0]
pa 0.001 0.023 <0.001 <0.001 0.89 0.002 0.039 0.002
Tension-type headache
all (n = 863) 2.2 ± 4.7 0 [0–3] 0.9 ± 3.1 0 [0–0] 1.3 ± 2.8 0 [0–1] 0.2 ± 0.9 0 [0–0]
male (n = 384) 2.0 ± 5.0 0 [0–2] 1.2 ± 3.6 0 [0–1] 0.8 ± 2.1 0 [0–0] 0.2 ± 0.8 0 [0–0]
female (n = 479) 2.3 ± 4.3 0 [0–2] 0.7 ± 2.5 0 [0–0] 1.6 ± 3.2 0 [0–2] 0.2 ± 0.9 0 [0–0]
pa 0.31 0.009 0.010 <0.001 <0.001 <0.001 0.76 0.94
Probable medication-overuse headache
all (n = 46) 16.9 ± 25.9 6.5 [0–25.5] 8.0 ± 16.4 0 [0–6.2] 8.9 ± 13.6 0.5 [0–15] 1.2 ± 2.9 0 [0–7.3]
male (n = 11) 13.1 ± 14.7 7 [0–24] 10.2 ± 15.6 3 [0–24] 2.9 ± 6.2 0 [0–10] 2.8 ± 5.0 0 [0–2]
female (n = 35) 18.1 ± 28.1 6 [0–27] 7.3 ± 16.9 0 [0–5] 10.9 ± 14.7 5 [0–17] 0.7 ± 1.6 0 [0–0]
pa 0.44 0.87 0.60 0.23 0.015 0.089 0.18 0.17
SD standard deviation, IQR interquartile range; ap was estimated using Student’s t-test for differences between means and Mann–Whitney U-test for medians
Manandhar et al. The Journal of Headache and Pain (2016) 17:3 Page 7 of 10
vegetables, should have counted in the context of theNepalese economy as paid (“income”-generating) ratherthan household work. Therefore it is likely that lost pro-ductive worktime was underestimated, especially amongwomen. The finding of greater lost productivity amongmales than females should be interpreted with cautionin view of this and since the symptom burden was actu-ally higher among females.At population level, migraine caused most disability
(0.81 %). We might compare this with 0.46 % in neigh-bouring India, where the survey used very similarmethods but was conducted only in the southern Stateof Karnataka [26]. The difference approximately reflectsthe lower prevalence of migraine in India (25.2 %) [9].The 0.81 % implies a reduction by this amount of popu-lation functional capacity. Whereas above we noted a1.5-fold discrepancy between time spent in the ictal stateof migraine and lost productive time, here there is muchgreater disparity: at population level, lost productivetime due to migraine was 2.8 %, or 3.5 times the disability.Very similar disparities were found in India (3.3 times)[26] and in Zambia (also 3.3 times, despite a higher dis-ability of 0.98 %) [8]. The determinants of lost productivetime due to migraine may be unclear and probably com-plex, but we see evidence here, nonetheless, of constancyin its relationship to disability, which survives the influ-ences of different behaviours among peoples from differ-ent cultures.Information on WTP can, in theory, be used to esti-
mate reasonable pricings and make economic forecastsbefore introducing new health-care services [31, 32]. Wedoubt its reliability for this purpose when gathered insurveys of this type, but see it more as a measure ofoverall burden [17]. As judged from the median WTP(in view of the skewed distribution), participants withheadache were willing to pay NPR 250 (USD 2.50) permonth for effective headache care, the amount correlat-ing with headache type (pMOH >migraine > TTH), fre-quency and intensity. The absolute monetary value ofthis might be lower than has been reported from other,even low-income countries [28] but, put into local con-text, it would be a day’s earnings for an average Nepalesecitizen [33]. As a measure of burden, this suggests heavyburden. As a reflection of what people with headachemight be willing to invest in headache services, it signalsneed but probably not sufficient willingness (or ability)to pay.Like all cross-sectional surveys, this study had limita-
tions. Most importantly it relied on retrospective en-quiry over 3 months, and therefore participants’ recall,to estimate impact of headache on work absence andproductivity. The effect of recall error is uncertain, butit is more likely to have introduced random degrees ofover- and underestimation than systematic error [24].
We focused on the most bothersome headache type inparticipants identifying more than one. In fact thisavoided double-counting: although it might be possiblein such a survey to diagnose multiple headache types,correctly attributing burden between them is not a realis-tic proposition. Among those with both migraine andTTH, the former would usually be the more bothersome[34]; this meant that some part of the burden of TTH wasinstead attributed to migraine, but from a public-healthperspective this would have little consequence.
Implications for NepalHeadache disorders are not only common in Nepal butalso highly burdensome: symptom burden is heavy, thereis much consequential disability and substantial lost prod-uctivity. The economic cost is certain to be high. The rem-edy lies in better health care for headache; structuredheadache-care services are urgently needed in the country.However, Nepal is among the least developed countries inthe world, with uneven distribution of its limited re-sources [11]. Government allocation to the health sectoris also scarce; gaps in specialized health care exist at alllevels [35]. Furthermore, Nepal’s rural hilly/mountainousgeography poses great challenges to community healthservices. Creating new headache-care services would cer-tainly demand investment of additional financial and hu-man resources in the health sector; on the other hand,refraining from doing so will leave undiminished the bur-den of these highly prevalent but cost-effectively treatablebrain disorders [36]. Structured headache services basedin primary care [37] would be an efficient, effective, af-fordable and equitable model for Nepal, likely to be cost-saving [4]. Such services, appropriately adapted, could beimplemented within the existing health-service structureof Nepal. This potential solution requires further researchin order to inform political decision-makers. Doing noth-ing is almost certainly a more costly option.
ConclusionsHeadache disorders, very common in Nepal, are alsohighly burdensome at both individual and populationlevels. They cause disability and reduced functional cap-acity, with a substantial penalty in lost production. Theremedy lies in better health care for headache; struc-tured headache-care services are urgently needed in thecountry, and likely to be cost-saving.
AbbreviationsANOVA: Analysis of variance; DW: Disability weight; GBD: Global burden ofdisease; HALT: Headache-attributed lost time; HARDSHIP: Headache-attributed restriction, disability, social handicap and impaired participation;ICHD: International classification of headache disorders; IQR: Interquartilerange; LTB: Lifting the burden; MOH: Medication-overuse headache;NPR: Nepalese rupee; pMOH: probable MOH; QoL: Quality of life;SD: Standard deviation; SEAR: South-East Asia Region; SPSS: Statisticalpackage for social sciences; TTH: Tension-type headache; USD: United States
Manandhar et al. The Journal of Headache and Pain (2016) 17:3 Page 8 of 10
dollar; WHOQOL-8: World Health Organization quality of life-8;WTP: Willingness to pay; YLD: Year of life lost to disability.
Competing interestsTJS is a Director and Trustee of Lifting The Burden.
Authors’ contributionsAll authors were involved in conception and design of the project. KM, AR,ML and TJS took part in acquisition, analysis and interpretation of the data.KM drafted the manuscript. All authors reviewed it critically for intellectualcontent and approved the final version of the manuscript.
AcknowledgementsThis project was funded by grants from Samarbeidsorganet, the LiaisonCommittee between the Central Norway Regional Health Authority and theNorwegian University of Science and Technology (NTNU). It was conductedwithin the Global Campaign against Headache, led by the nongovernmentalorganization Lifting The Burden in official relations with the World HealthOrganization, and with the support of Dhulikhel Hospital, KathmanduUniversity Hospital, Dhulikhel, Kavre, Nepal.We are grateful to Professor Grethe Albrektsen, Professor in Medical Statistics,Faculty of Medicine Department of Public Health and General Practice,NTNU, for advice in statistical analysis.
Author details1Department of Neuroscience, Norwegian University of Science andTechnology, Edvard Griegs Gate, Trondheim, NO 7489, Norway. 2DhulikhelHospital, Kathmandu University Hospital, Kavre, Dhulikhel, Nepal. 3NorwegianAdvisory Unit on Headache, St Olavs University Hospital, Trondheim, Norway.4Division of Brain Sciences, Imperial College London, London, UK.
Received: 15 December 2015 Accepted: 21 January 2016
References1. Jensen R, Stovner LJ (2008) Epidemiology and comorbidity of headache.
Lancet Neurol 7(4):354–361. doi:10.1016/s1474-4422(08)70062-02. Stovner L, Hagen K, Jensen R, Katsarava Z, Lipton R, Scher A, Steiner TJ,
Zwart JA (2007) The global burden of headache: a documentation ofheadache prevalence and disability worldwide. Cephalalgia 27(3):193–210.doi:10.1111/j.1468-2982.2007.01288.x
3. Vos T, Barber RM, Bell B, Bertozzi-Villa A, Biryukov S, Bolliger I, Charlson F,Davis A, Degenhardt L, Dicker D, Duan L, Erskine H, Feigin VL, Ferrari AJ,Fitzmaurice C, Fleming T, Graetz N, Guinovart C, Haagsma J, Hansen GM,Hanson SW, Heuton KR, Higashi H, Kassebaum N, Kyu H, Laurie E, Liang X,Lofgren K, Lozano R, MacIntyre MF et al (2015) Global, regional, andnational incidence, prevalence, and years lived with disability for 301 acuteand chronic diseases and injuries in 188 countries, 1990–2013: a systematicanalysis for the global burden of disease study 2013. Lancet 386:743–800.doi:10.1016/s0140-6736(15)60692-4
4. World Health Organization and Lifting The Burden (2011) Atlas of headachedisorders and resources in the world 2011. WHO, Geneva
5. Steiner TJ, Birbeck GL, Jensen RH, Katsarava Z, Stovner LJ, Martelletti P(2015) Headache disorders are third cause of disability worldwide.J Headache Pain 16:58. doi:10.1186/s10194-015-0544-2
6. Linde M, Gustavsson A, Stovner LJ, Steiner TJ, Barré J, Katsarava Z, Lainez JM,Lampl C, Lantéri-Minet M, Rastenyte D, Ruiz de la Torre E, Tassorelli C,Andrée C (2012) The cost of headache disorders in Europe: the eurolightproject. Eur J Neurol 19(5):703–711. doi:10.1111/j.1468-1331.2011.03612.x
7. Steiner TJ, Stovner LJ, Dua T, Birbeck GL, Jensen R, Katsarava Z, Martelletti P,Saxena S (2011) Time to act on headache disorders. J Headache Pain12(5):501–503. doi:10.1007/s10194-011-0368-7
8. Mbewe E, Zairemthiama P, Paul R, Birbeck GL, Steiner TJ (2015) The burdenof primary headache disorders in Zambia: national estimates from a population-based door-to-door survey. J Headache Pain 16:36. doi:10.1186/s10194-015-0513-9
9. Kulkarni GB, Rao GN, Gururaj G, Stovner LJ, Steiner TJ (2015) Headachedisorders and public ill-health in India: prevalence estimates in KarnatakaState. J Headache Pain 16:67. doi:10.1186/s10194-015-0549-x
10. Mbewe E, Zairemthiama P, Yeh HH, Paul R, Birbeck GL, Steiner TJ (2015) Theepidemiology of primary headache disorders in Zambia: a population-baseddoor-to-door survey. J Headache Pain 16:30. doi:10.1186/s10194-015-0515-7
11. United States Central Intelligence Agency, Office of Public Affairs. The WorldFactbook. https://www.cia.gov/library/publications/the-world-factbook/geos/np.html. Accessed 19 Sep 2015
12. Government of Nepal, National Planning Commission Secretariate (2012)Population and housing census 2011. Central Bureau of Statistics,Kathmandu, Nepal
13. Government of Nepal, National Planning Commission Secretariate (2014)Population monograph of Nepal, vol I. Central Bureau of Statistics,Kathmandu, Nepal
14. Manandhar K, Risal A, Steiner TJ, Holen A, Linde M (2015) The prevalence ofprimary headache disorders in Nepal: a nationwide population-based study.J Headache Pain 16:95. doi:10.1186/s10194-015-0580-y
15. Westergaard ML, Hansen EH, Glumer C, Olesen J, Jensen RH (2014)Definitions of medication-overuse headache in population-based studiesand their implications on prevalence estimates: a systematic review.Cephalalgia 34(6):409–425. doi:10.1177/0333102413512033
16. Manandhar K, Risal A, Steiner TJ, Holen A, Koju R, Linde M (2014) Estimatingthe prevalence and burden of major disorders of the brain in Nepal:methodology of a nationwide population-based study. J Headache Pain 15:52. doi:10.1186/1129-2377-15-52
17. Steiner TJ, Gururaj G, Andrée C, Katsarava Z, Ayzenberg I, Yu SY, Al JumahM, Tekle-Haimanot R, Birbeck GL, Herekar A, Linde M, Mbewe E, ManandharK, Risal A, Jensen R, Queiroz LP, Scher AI, Wang SJ, Stovner LJ (2014)Diagnosis, prevalence estimation and burden measurement in populationsurveys of headache: presenting the HARDSHIP questionnaire. J HeadachePain 15(1):3. doi:10.1186/1129-2377-15-3
18. Peters M, Bertolote JM, Houchin C, Kandoura T, Steiner TJ (2007) Translationprotocol for hybrid documents. J Headache Pain 8(Suppl 1):S40–S47
19. Risal A, Manandhar K, Steiner TJ, Holen A, Koju R, Linde M (2014) Estimatingprevalence and burden of major disorders of the brain in Nepal: cultural,geographic, logistic and philosophical issues of methodology. J HeadachePain 15:51. doi:10.1186/1129-2377-15-51
20. International Headache Society Classification Comittee (2013) Theinternational classification of headache disorders, 3rd edition (beta version).Cephalalgia 33(9):629–808. doi:10.1177/0333102413485658
21. Dong H, Kouyate B, Cairns J, Sauerborn R (2005) Inequality in willingness-to-pay for community-based health insurance. Health Policy 72(2):149–156.doi:10.1016/j.healthpol.2004.02.014
22. Schmidt S, Muhlan H, Power M (2006) The EUROHIS-QOL 8-item index:psychometric results of a cross-cultural field study. Eur J Public Health16(4):420–428. doi:10.1093/eurpub/cki155
23. Steiner TJ (2007) The HALT and HART indices. J Headache Pain 8(Suppl 1):S22–S2524. Stovner LJ, Al Jumah M, Birbeck GL, Gururaj G, Jensen R, Katsarava Z,
Queiroz LP, Scher AI, Tekle-Haimanot R, Wang SJ, Steiner TJ (2014) Themethodology of population surveys of headache prevalence, burden andcost: Principles and recommendations from the Global Campaign againstHeadache. J Headache Pain 15(1):5. doi:10.1186/1129-2377-15-5
25. Stewart WF, Lipton RB, Kolodner KB, Sawyer J, Lee C, Liberman JN (2000)Validity of the migraine disability assessment (MIDAS) score in comparisonto a diary-based measure in a population sample of migraine sufferers.Pain 88(1):41–52
26. Rao GN, Kulkarni GB, Gururaj G, Stovner LJ, Steiner TJ (2015) The burdenattributable to headache disorders in India: estimates from a community-basedstudy in Karnataka State. J Headache Pain 16(1):94. doi:10.1186/s10194-015-0574-9
27. Yu S, Liu R, Zhao G, Yang X, Qiao X, Feng J, Fang Y, Cao X, He M, Steiner T(2012) The prevalence and burden of primary headaches in China: apopulation-based door-to-door survey. Headache 52(4):582–591
28. Lampl C, Steiner TJ, Mueller T, Mirvelashvili E, Djibuti M, Kukava M,Dzagnidze A, Jensen R, Stovner LJ, Katsarava Z (2012) Will (or can) peoplepay for headache care in a poor country? J Headache Pain 13(1):67–74.doi:10.1007/s10194-011-0398-1
29. Ayzenberg I, Katsarava Z, Sborowski A, Chernysh M, Osipova V, Tabeeva G,Steiner TJ (2014) Headache-attributed burden and its impact onproductivity and quality of life in Russia: structured healthcare for headacheis urgently needed. Eur J Neurol 21(5):758–765. doi:10.1111/ene.12380
30. Ministry of Health and Population (MOHP) [Nepal], New ERA, and ICFInternational Inc (2012) Nepal demographic and health survey 2011.Ministry of health and population. New ERA, and ICF International,Kathmandu, Nepal
31. Shono A, Kondo M, Ohmae H, Okubo I (2014) Willingness to pay for publichealth services in rural central java, Indonesia: methodological
Manandhar et al. The Journal of Headache and Pain (2016) 17:3 Page 9 of 10
considerations when using the contingent valuation method. Soc Sci Med110:31–40. doi:10.1016/j.socscimed.2014.03.025
32. Yasunaga H, Ide H, Imamura T, Ohe K (2006) Willingness to pay for healthcare services in common cold, retinal detachment, and myocardiacinfarction: an internet survey in Japan. BMC Health Serv Res 6:12.doi:10.1186/1472-6963-6-12
33. Government of Nepal, National Planning Commission Secretariate (2011)Nepal living standards survey 2010/11, vol II. Central Bureau of Statistics,Kathmandu, Nepal
34. Krogh AB, Larsson B, Linde M (2015) Prevalence and disability of headacheamong Norwegian adolescents: a cross-sectional school-based study.Cephalalgia 35(13):1181–1191. doi:10.1177/0333102415573512
35. Karkee R, Jha N (2010) Primary health care development: where is Nepalafter 30 years of Alma Ata declaration? J Nepal Med Assoc 49(178):178–184
36. Linde M, Steiner TJ, Chisholm D (2015) Cost-effectiveness analysis ofinterventions for migraine in four low- and middle-income countries.J Headache Pain 16:15. doi:10.1186/s10194-015-0496-6
37. Steiner TJ, Antonaci F, Jensen R, Lainez MJ, Lantéri-Minet M, Valade D (2011)Recommendations for headache service organisation and delivery inEurope. J Headache Pain 12(4):419–426. doi:10.1007/s10194-011-0320-x
Submit your manuscript to a journal and benefi t from:
7 Convenient online submission
7 Rigorous peer review
7 Immediate publication on acceptance
7 Open access: articles freely available online
7 High visibility within the fi eld
7 Retaining the copyright to your article
Submit your next manuscript at 7 springeropen.com
Manandhar et al. The Journal of Headache and Pain (2016) 17:3 Page 10 of 10