the biodiversity of epiphytic lichens in pretoria (south africa
TRANSCRIPT

THE BIODIVERSITY OF EPIPHYTIC LICHENS
IN PRETORIA (SOUTH AFRICA) AND ITS VALUE FOR ECOLOGICAL INDICATION
by
KHUMBUDZO WALTER MAPHANGWA
submitted in accordance with the requirements for the degree of
DOCTOR OF PHILOSOPHY IN ENVIRONMENTAL SCIENCE
in the subject
COLLEGE OF AGRICULTURE AND ENVIRONMENTAL SCIENCES
DEPARTMENT OF ENVIRONMENTAL SCIENCES
at the
UNIVERSITY OF SOUTH AFRICA
SUPERVISOR: DR. L. ZEDDA
CO-SUPERVISOR: PROF. M. TEKERE
November 2019

i
DEDICATION
To my mother (Selinah Maphangwa), Azwifaneli, Mpho and Mashudu
who always believed in me.

ii
DECLARATION
Name: Khumbudzo Walter Maphangwa Student number: 55774830 Degree: Doctor of Philosophy in Environmental Science The biodiversity of epiphytic lichens in Pretoria (South Africa) and its value for ecological indication I declare that the above thesis is my own work and that all the sources that I have used or quoted have been indicated and acknowledged by means of complete references. I further declare that I submitted the thesis to originality checking software and that it falls within the accepted requirements for originality. I further declare that I have not previously submitted this work, or part of it, for examination at Unisa for another qualification or at any other higher education institution.
Signature: Date: 4 November 2019

iii
ACKNOWLEDGMENTS I would like to express my sincere gratitude to the following individuals and organisations for
their assistance and support:
• I would like to thank my supervisor, Dr Luciana Zedda for guiding me throughout this
study and for reviewing my chapters. Her encouragement, guidance during fieldwork,
lichen identification and support enabled me to develop an understanding of the
subject and to conduct this research.
• My co-supervisor, Prof Memory Tekere for her encouragement, support and reviewing
my chapters.
• The City of Tshwane Metropolitan Municipality, Groenkloof Nature Reserve, Pionier
Museum, Rietvlei Nature Reserve, South African National Biodiversity Institute
(SANBI) and Voortrekker Monument Nature Reserve are thanked for allowing research
to be carried out in their reverses and around the city.
• Dr André Aptroot and Dr Harrie J.M. Sipman are thanked for helping with lichen
identification.
• Dr Robert Lücking is thanked for providing lichen identification facilities and chemicals
at the Botanical Garden and Botanical Museum in Berlin (Germany).
• Dr Pablo Alvarado for helping with the sequencing of Culbersonia nubila.
• TerraData environmetrics is thanked for helping with the lichen monitoring analyses.
• Ms Kim Ward is thanked for editing and proofreading the thesis.
• The following people are thanked for helping with fieldwork: Ulrich Sukopp, Lufuno
Makwarela, Thambulo Nonyana, Litshani Nemakhavhani and Phumzile Mbonani.
• Dr Allan Barrett and Ms Selina Nkosi helped with the map of the study area.
• All colleagues in the Department of Environmental Sciences at UNISA are thanked for
their support and encouragement. In particular, I would like to thank Ntsako Baloyi,
Mogashoa Matlhalefi, Billy Malatji, Maarten Jordaan, Tsakani Tshimbana, Unine Van
den Berg, Boitumelo Mongale, Khomotso Semenya, Malebo Matlala, Estherlene Hart
and Prof. Kevin Mearns.
• Dr Ntakadzeni Madala and Lufuno Nemadodzi are thanked for their encouragement.
• Azwifaneli Makungo, Mpho and Mashudu Maphangwa are thanked for their love,
encouragement and support.
• I would also like to extend my heartfelt gratitude to the UNISA for funding this study,
providing vehicles and internet facilities.
• Last but not least, I would like to thank my mother, Mrs Selinah Maphangwa, and my
brothers and sisters for their love and care.

iv
ABSTRACT
The purpose of this study was to assess the diversity of epiphytic lichens growing on Acacia
karroo, A. caffra and Jacaranda mimosifolia trees in Pretoria, and to investigate the influence
of air pollution, land use, altitude and climate on lichen diversity. Lichen diversity was first
studied at 12 sampling sites under different land use types (high traffic areas, residential areas
and industrial areas) and in protected areas (open-air museums and nature reserves). The
“European guidelines for monitoring lichen diversity as an indicator of environmental stress”
were then tested in 29 sites using the same tree species and under two main land use types
(“Industrial areas and busy roads” and “Parks and nature reserves”). Lichen Diversity Values
(LDVs) were calculated for 164 trees. Correlations of LDVs and single lichen species with
environmental parameters were studied by descriptive statistics, univariate analysis, Principal
Component Analysis (PCA) and Generalized Linear Models (GLM). A naturality/alteration
interpretative scale based on the percentile deviation of LDVs from natural conditions was
developed for the first time in South Africa. Altogether 25 taxa, predominantly foliose and
subtropical to tropical species, were recorded and are reported with their ecology and
distribution. An identification key was developed for easy identification of species in the field.
The highest lichen diversity was found in protected areas. The LDVs of Jacaranda are lower
than values for both Acacia species. “Parks and nature reserves” have significantly higher
LDVs than “industrial areas and busy roads”, as demonstrated by the PCA. The GLM models
were significant for LDV and some lichen species. Sampling sites in industrial areas and the
proximity of busy roads are negatively related to LDV and with the frequency of many lichen
species. Higher atmospheric concentrations of NOx were negatively related to LDV and to the
frequency of the species Candelaria concolor, Lepraria spp. and Pyxine cocoes. Culbersonia
nubila and Lepraria spp. were respectively positively and negatively correlated with
atmospheric SO2. The intensity of land use appears to have a negative impact on lichen
diversity. In conclusion, lichens respond well to human disturbances in Pretoria and can be
used as bioindicators of naturality/alteration. The European standardised monitoring method
can be applied to estimate the degree of environmental alteration in South Africa, by adopting
a stratified random sampling and a more flexible strategy for tree selection.
Keywords: lichen, biodiversity, distribution, monitoring, disturbance, Pretoria, South Africa

v
TABLE OF CONTENTS
DEDICATION......................................................................................................................... i
DECLARATION .....................................................................................................................ii
ACKNOWLEDGMENTS ....................................................................................................... iii
ABSTRACT .......................................................................................................................... iv
LIST OF TABLES ............................................................................................................... viii
LIST OF FIGURES ............................................................................................................... ix
LIST OF APPENDICES ........................................................................................................ xi
CHAPTER 1: INTRODUCTION ............................................................................................ 1
1.1 Introduction and background ....................................................................................... 1
1.2 Problem statement ........................................................................................................ 3
1.3 The need for this research ........................................................................................... 5
1.4 Research questions ...................................................................................................... 6
1.5 Research objectives ..................................................................................................... 7
1.6 Ethical considerations .................................................................................................. 7
1.7 Study limitations ........................................................................................................... 7
1.8 Chapter breakdown ....................................................................................................... 8
CHAPTER 2: LITERATURE REVIEW ................................................................................ 10
2.1 Lichen morphology ..................................................................................................... 10
2.2 Lichen diversity and ecology in South Africa ........................................................... 12
2.3 Ecological roles of lichens ......................................................................................... 15
2.4 Lichen as a bioindicator of human disturbances ..................................................... 17
2.4.1 Air pollution ..................................................................................................................... 17
2.4.1.1 Pollution by sulphur dioxide (SO2) and lichen diversity .............................. 18
2.4.1.2 Pollution by nitrogen compounds and lichen diversity ............................... 19
2.4.1.3 Pollution by particulate matter (PM10, PM2.5) and lichen diversity ............... 20
2.4.1.4 Pollution by heavy metals and lichens as biomonitors ............................... 21
2.4.1.5 Methods used to detect and monitor air pollution ....................................... 23
2.5 Lichens’ response to global warming ....................................................................... 24
2.6 Other kinds of human-driven ecosystem disturbance on lichens ........................... 26
2.7 Economic importance of lichens ............................................................................... 27

vi
CHAPTER 3: MATERIALS AND METHODS...................................................................... 28
3.1 Study area.................................................................................................................... 28
3.2 Sampling sites ............................................................................................................. 30
3.2.1 (A) Waterkloof ................................................................................................................... 30
3.2.2 (B) Pretoria central business district ................................................................................. 30
3.2.3 (C) Groenkloof Nature Reserve ........................................................................................ 30
3.2.4 (D) Magalies ...................................................................................................................... 31
3.2.5 (E) Arcadia ........................................................................................................................ 31
3.2.6 (F and J) Pretoria West ..................................................................................................... 31
3.2.7 (G) Pionier Museum .......................................................................................................... 31
3.2.8 (H) Hercules ...................................................................................................................... 31
3.2.9 (I) Sunnyside ..................................................................................................................... 32
3.2.10 (K) Lotus Gardens .......................................................................................................... 32
3.2.11 (L) Rietvlei Nature Reserve ............................................................................................ 32
3.2.12 (M) SANBI ....................................................................................................................... 32
3.3 Phorophytes ................................................................................................................ 32
3.3.1 Jacaranda mimosifolia D.Don........................................................................................... 33
3.3.2 Acacia karroo Hayne (current name: Vachellia karroo (Hayne) Banfi and Glasso ......... 33
3.3.3 Acacia caffra (Thunb.) Willd. (current name: Senegalia caffra (Thunb.) P.J.H.Hurter and Mabb.) ........................................................................................................................................ 33
3.4 Floristic survey: Sampling of lichen species and identification methods .............. 34
3.5 Molecular analyses of specimens of the genus Culbersonia .................................. 36
3.6 Lichen monitoring: Sampling design ........................................................................ 37
3.7 Lichen monitoring: Monitored sites ........................................................................... 38
3.7.1 Muckleneuk ....................................................................................................................... 39
3.7.2 Queenswood ..................................................................................................................... 39
3.7.3 Akasia ............................................................................................................................... 39
3.7.4 Mayville ............................................................................................................................. 39
3.7.5 Hermanstad ...................................................................................................................... 39
3.7.6 Kameeldrift ........................................................................................................................ 40
3.7.7 Saulsville ........................................................................................................................... 40
3.7.8 Philip Nel Park................................................................................................................... 40
3.7.9 Brooklyn ............................................................................................................................ 40
3.7.10 Hatfield ............................................................................................................................ 40
3.7.11. Gezina ............................................................................................................................ 41
3.7.12 Voortrekker Monument Nature Reserve ........................................................................ 41

vii
3.7.13 Suiderberg....................................................................................................................... 41
3.7.14 The Willows 340-Jr ......................................................................................................... 41
3.7.15 Mamelodi ........................................................................................................................ 42
3.7.16 Koedoespoort 456-jr ....................................................................................................... 42
3.8 Lichen monitoring: Survey of Lichen Diversity ........................................................ 46
3.9 Calculation of the Lichen Diversity Value (LDV) for trees and sites and further data elaborations ...................................................................................................................... 47
CHAPTER 4: RESULTS ..................................................................................................... 49
4.1 List of recorded species ............................................................................................. 49
4.1.1 Additional species reported from Pretoria in the literature ....................................... 58
4.1.2 Frequency and phytogeography of the recorded lichens ......................................... 59
4.2 Simplified identification key to the most common species on trees ....................... 63
4.3 Phylogenetic position of Culbersonia nubila ............................................................ 66
4.4 Monitoring results ....................................................................................................... 66
4.4.1 Descriptive statistics ...................................................................................................... 66
4.4.1.1 Comparison of habitat and land use types................................................... 69
4.4.1.2 Comparison of phorophytes ......................................................................... 71
4.4.1.3 Comparison of sites ....................................................................................... 74
4.4.2 A naturality/alteration interpretative scale .................................................................. 75
4.4.3 Multivariate analysis ....................................................................................................... 80
4.4.4 Interpolation of air pollution and climate data ............................................................ 83
4.4.5 Multiple Factor Analysis (MFA) with interpolated environmental data .................... 86
4.4.6 Multivariate analysis (PCA) with interpolated environmental data .......................... 89
4.4.7 Generalised linear regression models (GLM) with interpolated environmental data ......................................................................................................................................... 100
CHAPTER 5: DISCUSSION, RECOMMENDATIONS AND CONCLUSIONS ................... 103
5.1 Discussion ................................................................................................................. 103
5.1.1 Lichen taxa on the investigated trees under different land use types ................... 103
5.1.2 The indicator value of lichen diversity ....................................................................... 105
5.2 Contribution of the study ......................................................................................... 110
5.3 Conclusion and recommendations .......................................................................... 111
REFERENCES ................................................................................................................. 113
APPENDICES................................................................................................................... 144

viii
LIST OF TABLES Table 4.1. Descriptive statistics for the average annual values of air pollution and climate variables ............................................................................................................................. 66
Table 4.2. Average monthly values of the selected variables in the five monitoring stations for the period 2010 to 2014 (5 years) ....................................................................................... 67
Table 4.3. Descriptive statistics of the variables related to site, tree level and to lichen diversity data ..................................................................................................................................... 69
Table 4.4. Descriptive statistics of the values of the variables in the two classes of land use (only species occurring at least more than 5% considered in the analysis) ......................... 70
Table 4.5. Descriptive statistics of the values of the variables for the different tree substrates ........................................................................................................................... 72
Table 4.6. Wilcoxon test between pairs of tree species ....................................................... 73
Table 4.7 Descriptive statistics of LDV at tree and site level................................................ 74
Table 4.8. A naturality/alteration interpretative scale based on the percentile deviation ...... 76
Table 4.9. Number of trees and Mean LDV under the 5 naturality/alteration classes and their distribution under the two land use categories..................................................................... 78
Table 4.10. Comparison of host tree species (phorophytes) with regard to their occurrence in the five naturality/alteration classes and within the two land use types ................................ 79
Table 4.11. Eigen values of the PCA solution ..................................................................... 80
Table 4.12. Significant correlation coefficients of the variables with Axis 1 and 2 (p<0.001) 81
Table 4.13. Interpolated values (IDW) of the air pollution, climate variables and LDV obtained for the 29 lichen sampling sites ........................................................................................... 84
Table 4.14. Correlation coefficients of the variables with the three dimensions of the Multiple Factor Analysis. The highest correlations (>0.2) with the 3 dimensions are highlighted. ..... 87
Table 4.15. Correlation coefficients of the variables with Axis 1 and 2. Values >0.2 are highlighted. ......................................................................................................................... 90
Table 4.16. Multiple Linear Regression Models describing the effects of the environmental variables on LDV and species frequencies. Estimated values are reported together with statistically significant p values (* p<0.05; ** p<0.01; *** p<0.001). Last column shows the summary statistics of each model (156 df), with Multiple R2 (Mult R2), Adjusted R2 (Adj R2), F-statistic (on 7 and 156 df), p value. ................................................................................ 102

ix
LIST OF FIGURES Figure 2.1. Crustose lichen: Caloplaca haematodes (A. Massal.) Zahlbr............................. 10
Figure 2.2. Foliose lichen: Parmotrema austrosinense (Zahlbr.) Hale ................................. 11
Figure 2.3. Fruticose lichen: Evernia prunastri (L.) Ach. ...................................................... 12
Figure 3.1A. Study area and sampling sites. Sampling sites are marked with alphabetical letters .................................................................................................................................. 29
Figure 3.1B. The town of Pretoria showing distribution of the lichen monitoring sites .......... 42
Figure 3.2. Groenkloof Nature Reserve with sampling points (Google Earth, 2019) ............ 43
Figure 3.3. Voortrekker Nature Reserve with sampling points (Google Earth, 2019) ........... 44
Figure 3.4. Monitoring grid attached to tree J. mimosifolia .................................................. 45
Figure 4.1. Frequency occurrence (%) of the different lichen species at the investigated sites (n=362; n= number of lichen specimen collected) ............................................................... 60
Figure 4.2. World distribution (phytogeography) of the collected lichen species in percentage occurrence (n=25; n = number of recorded species) ........................................................... 60
Figure 4.3. Differences in species distribution between the phorophytes and lichen diversity on each tree species ........................................................................................................... 61
Figure 4.4. Percentage occurrence of growth forms of the recorded species ...................... 62
Figure 4.5. Number of specimens collected at each site ..................................................... 62
Figure 4.6. Wilcoxon test of LDV values in the two land use classes ................................... 70
Figure 4.7. Distribution of LDV values for the three tree species ......................................... 73
Figure 4.8. LDV values measured at each site (n: 29) ......................................................... 75
Figure 4.9. Percentile distribution of the LDV values detected at site level .......................... 76
Figure 4.10. Distribution of LDV values at site level (n=29) categorised into five naturality/alteration classes ................................................................................................. 77
Figure 4.11. Interpolated LDV map of the study area with air monitoring stations, monitoring sites, main roads and five naturality/alteration classes ........................................................ 77
Figure 4.12. Loadings plot of the PCA ordination of lichen diversity parameters (LDV, N. of species, lichen taxa) ........................................................................................................... 81
Figure 4.13. Score plot of the PCA ordination of LDV and lichen species on sampled trees within different land use types: “Industrial areas and busy roads” and “Parks and natural reserves” ............................................................................................................................. 82
Figure 4.14. Score plot of the PCA ordination of LDV and lichen species on the selected tree substrates Acacia caffra, A. karroo and Jacaranda mimosifolia ........................................... 82
Figure 4.15. Loadings plot of the PCA ordination showing vectors with statistically significant relationship to the environmental variables “Distance from emission sources” and “Tree circumference” .................................................................................................................... 83
Figure 4.16. Interpolated map (IDW) of NOx (ppb) concentrations in the study area............ 85

x
Figure 4.17. Interpolated map (IDW) of SO2 (ppb) concentrations in the study area ............ 86
Figure 4.18. Loadings plot of the MFA ordination. Vectors show the axes of the single PCA performed on each of the three groups (climatic, pollutants and lichens) ............................ 88
Figure 4.19. Loadings plot of the MFA ordination. Vectors show the correlation of environmental variables separated in the main three factors (climatic, pollutants and lichens) with the three dimensions of the MFA. ................................................................................ 88
Figure 4.20. Score plot of the MFA ordination showing the distribution of the sampled trees and the partial contribution of the three environmental factors (climatic, pollutants and lichens) to the variance .................................................................................................................... 89
Figure 4.21. Score plot of the PCA ordination with tree substrates categorised by LDV classes ................................................................................................................................ 91
Figure 4.22. Score plot of the PCA ordination with sampled trees categorised by land use: industrial areas and busy roads, parks and natural reserves ............................................... 91
Figure 4.23. Score plot of the PCA ordination with tree substrates categorised by tree species (Acacia caffra, A. karroo and Jacaranda mimosifolia).......................................................... 92
Figure 4.24. Loadings plot of the PCA ordination. Vectors show the correlation of environmental variables with the two axes. ......................................................................... 93
Figure 4.25. Distribution of LDV values in the species substrates in relation to the two land use categories. Boxplot: median, interquartile range, 1.5 interquartile range, outliers. ........ 94
Figure 4.26. Jacaranda trees. Score plot of the PCA ordination with tree substrates categorised by LDV classes ................................................................................................ 95
Figure 4.27. Jacaranda trees. Score plot of the PCA ordination with sampled trees categorised by land use: industrial areas and busy roads, parks and natural reserves ........................... 95
Figure 4.28. Jacaranda trees. Loadings plot of the PCA ordination. Vectors show the correlation of environmental variables with the two axes. .................................................... 96
Figure 4.29. Acacia caffra. Score plot of the PCA ordination with tree substrates categorised by LDV classes ................................................................................................................... 97
Figure 4.30. Acacia caffra trees. Score plot of the PCA ordination with sampled trees categorised by land use: industrial areas and busy roads, parks and natural reserves ........ 97
Figure 4.31. Acacia caffra. Loadings plot of the PCA ordination. Vectors show the correlation of environmental variables with the two axes. ..................................................................... 98
Figure 4.32. Acacia karroo. Score plot of the PCA ordination with tree substrates categorised by LDV classes ................................................................................................................... 99
Figure 4.33. Acacia karroo. Score plot of the PCA ordination with sampled trees categorised by land use: industrial areas and busy roads, parks and natural reserves ........................... 99
Figure 4.34. Acacia karroo. Loadings plot of the PCA ordination. Vectors show the correlation of environmental variables with the two axes. ................................................................... 100

xi
LIST OF APPENDICES Appendix 1A: City of Tshwane ......................................................................................... 145
Appendix 1B: City of Tshwane ......................................................................................... 146
Appendix 2: Pionier Museum ............................................................................................ 147
Appendix 3: Voortrekker Monument Nature Reserve ........................................................ 148
Appendix 4: Ethical clearance ........................................................................................... 149
Appendix 5: Tree with termite mounds .............................................................................. 151
Appendix 6: Jacaranda tree with advertisement notice ...................................................... 152
Appendix 7: Protocol for lichen monitoring ........................................................................ 153
Appendix 8: Jacaranda trees ............................................................................................. 158
Appendix number 9A: TLC plate run with Solvent A (toluene-dioxan-acetic acid) .............. 159
Appendix number 9B: TLC plate run with Solvent B (hexane-diethyl ether-formic acid) .... 160
Appendix number 9C: TLC plate run with Solvent C (toluene-acetic acid) ......................... 161
Appendix 10: Survey form ................................................................................................. 162
Appendix 11A: Pictures of lichens ..................................................................................... 165
Appendix 11B: Pictures of lichens ..................................................................................... 166
Appendix 11C: Pictures of lichens ..................................................................................... 167
Appendix 11D: Pictures of lichens ..................................................................................... 168
Appendix 12: TLC Retention factors (Rf) and identities of detected secondary metabolites ...................................................................................................... 169
Appendix 13: Published paper .......................................................................................... 170
Appendix 14: Generalised linear regression models (GLM) with interpolated environmental data ........................................................................................................... 175
Appendix 15: Published paper .......................................................................................... 177
Appendix 16: Papers to be published ................................................................................ 193
Appendix 17: Conference attendance ............................................................................... 194

1
CHAPTER 1: INTRODUCTION
1.1 Introduction and background
Lichens are not single organisms but a symbiosis among fungal partners (mycobiont) and
photosynthetic partners (photobionts), which are green algae or cyanobacteria, with each
partner contributing in various ways to the symbiosis (Nash, 2008; Atala et al., 2015). Although
the symbiosis among mycobionts and phobionts is well acknowledged, it is less well known
that the lichens actually host other types of organisms such as yeasts and other fungi, virus,
bacteria as well as small animals, and can be therefore regarded as a sort of microhabitat
(Grube et al., 2015; Zedda and Rambold, 2015; Cernava et al., 2016; Spribille et al., 2016;
Muggia and Grube, 2018). Spribille et al. (2016) recently discovered that basidiomycete yeasts
growing in the cortex of ascomycete macrolichens can play an important function in the
symbiosis and may influence lichen traits.
The main advantage of the symbiosis for the photobionts is that the fungal hyphae protect
them from intense insolation and drying out, and absorb mineral nutrients from the substratum
and the atmosphere to share with the photobionts. The photobionts synthesise organic
compounds by photosynthesis and cyanobiontal photobionts are even able to fix nitrogen
compounds (Hale, 1983; Purvis, 2000; Nash, 2008).
Lichens are perennials and maintain a uniform morphology over time (Nash, 2008). They
develop gradually and rely heavily on the environment for long-term nutrition (Hale, 1983;
Asplund and Wardle, 2017).
Lichens are traditionally classified into three main growth forms, with many intermediate forms.
The main forms are the crustose, foliose and fruticose (Hale, 1983; Nash, 2008; Asplund and
Wardle, 2017). These forms, which are in no sense natural divisions, are at best points on a
scale of continuous differentiation from primitive to highly structured thalli. Each form has
different arrangements of cortical, algal and medullary tissues as well as different modes of
attachment to the substrate, and each form represents an ecological adaptation to
environmental conditions (Hale, 1983).
Lichens colonise tree bark, wood, rocks, man-made substrate and soil and are found in all
terrestrial ecosystems, where they cover between 6-8% of the earth’s land surface (Nimis et
al., 2002; Nash, 2008; Purvis and Pawlik-Skowrońska, 2008; Colesie et al., 2014; Bajpai
et al., 2016; Asplund and Wardle, 2017). Lichens can live in a variety of habitats and can

2
survive extreme environmental conditions (heat or cold), for instance deserts, cold regions,
tropical rain forests, natural and managed environments (Nimis et al., 2002; Purvis, 2014;
Zedda and Rambold, 2015; Bajpai et al., 2016).
Ecological factors such as climate, topography and geology as well as the prevailing land use,
the extent of pollution (Hauck et al., 2013), the age and type of trees, and bark pH influence
the occurrence of lichens (Nascimbene et al., 2013; Nelson et al., 2015). Other factors include
bark properties and light availability (Mulligan, 2009). James et al. (1977), as cited by Mulligan
(2009), noted humidity of the environment, age of the bark surface, inclination of tree, degree
of bark leaching by rain, degree of impregnation of bark with organic nutrients, air pollution,
soil pollution by agricultural chemicals, pH of the bark surface and basic nutrient status of bark
as factors that can affect lichen distribution.
The growth of lichen species on given tree species is dependent on bark, crown features and
tree structure (Cáceres et al., 2007; Frati et al., 2008; Mežaka et al., 2012; Ódor et al., 2013;
Frisch et al., 2015).
Lichens were perceived as potential indicators of air pollution as early as the 1860s in Europe
where a progressive loss of lichens in major cities was noticed (Hale, 1967). Since then,
lichens have played important roles as bioindicators of sulphur dioxide (SO2) air pollution
throughout the world (Nimis et al., 2002; Tiwari, 2008; Gibson et al., 2013; Tregidgo et al.,
2013). Furthermore, lichens accumulate large amounts of elements, especially heavy metals,
from wet and dry deposition sources (Nash, 1996; Hussan et al., 2013; Purvis, 2014).
Accumulation mostly exceeds their physiological requirements (Nash, 2008). The analysis of
elements in epiphytic lichens provides information on the possible sources of pollution (Budka
et al., 2002; Nash, 2008; Maphangwa et al., 2012a; Monaci et al., 2012; Loppi, 2014). For this
reason, lichens can be used as bioaccumulators of heavy metals such as mercury (Grangeon
et al., 2012) and lead (Sujetoviene and Sliumpaite, 2013) and for biomonitoring environmental
pollution (Puckett, 1988; Garty, 2001; Kularatne and de Freitas, 2013). Many species, such
as the epiphytic, foliose lichen Flavoparmelia caperata (L.) Hale have been widely utilised to
assess atmospheric depositions and air quality (Loppi et al., 1998).
Epiphytic lichen diversity has also been effectively used for evaluating other effects of
anthropogenic disturbances, not only atmospheric pollution. Changes in lichen diversity can,
for instance, indicate the intensity of land use and habitat fragmentation in urbanised and rural
environments, especially in woodlands (Budka et al., 2002; Nimis et al., 2002; Ohnuki et al.,
2002; Ng et al., 2005; Werth et al., 2006; Brunialti et al., 2012; Benítez et al., 2012; 2018;

3
Benítez, 2016). This is possible because many species of epiphytic lichens are very sensitive
to even minor environmental changes, while others are more resistant (Nimis et al., 2002;
Zedda, 2002; Brodekovà et al., 2006; Nash, 2008; Danesh et al., 2013).
Lichens are more sensitive to pollution than plants because they lack cuticles and stomata
and have no roots. For this reason, they absorb much of their raw materials and also pollutants
directly from the air and moisture around them without restrictions (Nash, 2008; Sett and
Kundu, 2016; Asplund and Wardle, 2017). Lichens are furthermore perennial and grow slowly
(Zvěřina et al., 2018). Pollutant uptake by lichens is considerably higher than by vascular
plants (Nash, 2008).
Lichen functional traits such as growth forms (foliose, fruticose and crustose), reproductive
strategy (sexual, asexual), photobiont type (green algal or cyanobacterial), production of
secondary metabolites such as photoprotective, antioxidant compounds, thickness of thallus
layers, substrate preference and geographical distribution are dependent on environmental
factors, especially air and substrate humidity, sun radiation, rainfall, temperature, light and
land use intensity. These ecological factors determine lichen distribution and can be detected
through analyses of functional types or morphotypes (Diaz and Cabido, 2001; Zedda et al.,
2011a; Benítez et al., 2012; Ellis, 2012; Giordani et al., 2012; Pinho et al., 2012; Gauslaa,
2014; Atala et al., 2015; Nelson et al., 2015; López et al., 2016; Rubio-Salcedo et al., 2017).
Since various lichen species have a wide scope of ideal conditions concerning humidity,
temperature, substrate quality and stability, and nutrients needs, certain traits such as the
ones listed above, are related to various environmental factors (Weber et al., 2010; Marini
et al., 2011).
1.2 Problem statement
South Africa is a well-known biodiversity hotspot for phanerogams (Myers et al., 2000;
Mittermeier et al., 2004). However, lichen diversity still remains relatively underexplored
(Crous et al., 2006, Maphangwa et al., 2012b, Mayrhofer et al., 2014). One problem is due to
the fact that herbarium vouchers of South African lichens are very scattered throughout
numerous herbaria in South Africa, Europe and North America and are therefore difficult to
check (Fryday, 2015). This hinders further floristic investigation of South Africa's lichen
diversity (Maphangwa et al., 2018).

4
As illustrated above, lichens are excellent bioindicators of environmental pollution. In
particular, epiphytic species growing on the bark of trees and bushes, are regularly utilised in
assessing air pollution in urbanised areas (Budka et al., 2002, 2004; Ohnuki et al., 2002) and
rural environments (Ng et al., 2005). As fruticose lichens are the most sensitive to air pollution,
they are the first group to vanish from polluted sites, followed by foliose lichens. In contrast,
crustose lichens are generally the most resistant to air pollution (Boonpragob, 2003; Díaz-
Escandón et al., 2016). One example is the lichen Lecanora conizaeoides Nyl. ex Cromb.,
which grows typically in SO2-polluted areas (Boonpragob, 2003).
Epiphytic lichens have been used as ecological indicators for several decades (Brunialti et al.,
2012). Most investigations have, however, been restricted to Europe and the US (Asta et al.,
2002a, 2002b; VDI-Richtlinien, 2005; Thormann, 2006; Geiser and Neitlich, 2007; Munzi et
al., 2007; Hauck et al., 2013). Some studies have been carried out in Asian countries, for
example, lichens were utilised as indicators of air quality in Northern Thailand (Budka et al.,
2002). Also Wolseley and Aguirre-Hudson (1997) have used epiphytic lichen communities as
bioindicators of environmental change in Thailand. Lichen communities were valuable
indicators of succession stages in tropical rainforests (Koch et al., 2013). In Venezuelan
tropical lowland rainforest, Komposch and Hafellner (2000) assessed the diversity and
distribution of lichen in relation to changing conditions.
The indicator value of lichen diversity in urban environments of South Africa has been poorly
investigated, with limited studies focusing on lichens as bioaccumulators of heavy metals in
the Pretoria area of Gauteng (Forbes et al., 2009; Olowoyo et al., 2010; Trüe et al., 2012;
Panichev et al., 2019). The diversity of epiphytic lichens and their ecology in relation to urban
pollution or to other types of human disturbances in the city of Pretoria has not been fully
explored, although lichens are important bioindicators of air quality and environmental
disturbance.
Only a few studies on epiphytic lichens or on lichens as bioindicators have been carried out in
Africa and in Southern Africa (Aptroot, 2001; Crous et al., 2006; Swinscow and Krog, 1988;
Schultz et al., 2009; Zedda and Rambold, 2004; Zedda et al., 2009, 2010a, 2010b;
Boamponsem et al., 2010). While other studies have been carried out in desert and semi-
desert habitats of South Africa (Zedda and Rambold, 2004, 2009; Zedda et al., 2010a, b), this
is the first study on the biodiversity of lichens and its value for ecological indication in a South
African urban environment.

5
The purpose of this study was to assess the diversity of epiphytic lichens on selected trees in
Pretoria, and to investigate to what extent lichen diversity is influenced by the phorophyte type
on which lichens are growing, by human activities, especially by air pollution and land use, or
by other environmental factors such as altitude and climate. The study aimed also to explore
the potential for using lichens as bioindicators of air pollution in the city.
1.3 The need for this research
Different authors have published numerous taxonomical revisions, ecological and floristic
studies on lichens from South Africa (for example, Almborn, 1966; Hale, 1984; Brusse, 1986;
Zedda and Rambold, 2009). These studies focused, however, mainly on saxicolous (i.e.
Kärnefelt, 1988; Matzer and Mayrhofer, 1996) and terricolous lichens (i.e. Zedda and
Rambold, 2004), and on given regions of South Africa, such as the Cape region, while
epiphytic lichens and the Pretoria area have been less explored (Maphangwa et al., 2018).
Lichen diversity and ecology studies in South Africa are detailed in section 2.2. In order to
improve knowledge on lichen diversity, especially on epiphytic lichens in different
environments of South Africa, floristic and ecological studies remain necessary.
Urbanisation has been attributed to rampant environmental pollution and urban transportation
is among the major cause of atmospheric pollution. The City of Tshwane (Pretoria) is affected
by different kinds of environmental pollutants. Among the air pollutants are particulates (ash
and aerosols), sulphur dioxide (SO2), sulphur oxides (SOx), oxides of nitrogen (NOx), carbon
monoxide (CO), carbon dioxide (CO2), volatile organic compounds (VOCs), semi-volatile
organic compounds (SVOCs), methane (CH4), ammonia (NH3), hydrogen chloride (HCI),
hydrogen sulphide (H2S), ozone (O3), lead (Pb) and other secondary pollutants and numerous
trace elements (Liebenberg-Enslin and Petzer, 2005). Organic compounds released into the
air include benzene, PCBs and dioxins and furans (Liebenberg-Enslin and Petzer, 2005;
Forbes et al., 2009; Olowoyo et al., 2011). The sources of these organic pollutants are power
generation (Rooiwal and Pretoria West power stations), industrial areas (ceramic, cement,
iron and steel), transport (diesel and petrol vehicle emissions) and household fuel combustion.
The City of Tshwane has seven air quality monitoring stations to check if the pollution is within
set standards (Liebenberg-Enslin and Petzer, 2005; Olowoyo et al., 2011, South African Air
Quality Information Systems (SAAQIS), 2018 http://www.saaqis.org.za/), but none of the
monitoring systems use bioindicators.
This study not only assesses lichen diversity, but also analyses lichen occurrence in
relationship to changing ecological conditions. Understanding the reaction of lichens to the

6
investigated environmental parameters and to air pollution would facilitate estimation of air
quality or of naturality/alteration conditions on a wider area so as to ascertain the possibility of
using lichens as bioindicators in environmental monitoring, thus limiting costs associated with
setting and sustaining monitoring stations. Biomonitoring also allows detecting the synergistic
effects of the different pollutants on living organisms, which cannot be detected by monitoring
stations.
The present study focused on the biodiversity of epiphytic lichens in Pretoria and its value for
ecological indication. It represents a first assessment of the biodiversity of epiphytic lichens in
an urban environment in South Africa. To allow the elaboration of a monitoring methodology,
the floristic evaluation was restricted to the three most widespread tree species: the native
Acacia caffra (Thunb.) Willd and A. karroo Hayne and the exotic Jacaranda mimosifolia D.Don.
The lichen biota of these phorophytes was investigated for the first time. Comparisons have
been made between the different trees. The research further provides new scientific
information on the diversity of epiphytic lichens occurring in Pretoria in relation to different
levels of environmental disturbance, due to air pollution (industry, traffic), plantations of exotic
plants and habitat fragmentation. This study is important for the town of Pretoria, as it develops
a methodology to estimate air quality and other disturbances (environmental
naturality/alteration) in a cheaper and more reliable way than by using monitoring stations. A
long-term monitoring approach using lichens as bioindicators could be established on the
basis of the present research work, and could be extended to other southern African towns as
well. This study adds information about the importance of lichens and their conservation, and
supports building expertise on these organisms in South Africa, where lichen experts are rare.
1.4 Research questions
• What is the richness, distribution and composition of lichen diversity in Pretoria on
selected tree species (Acacia caffra, Acacia karroo and Jacaranda mimosifolia)?
• How do lichen communities vary across the selected tree species, considering
taxonomy as well as native vs exotic species?
• How do lichen species respond to environmental pollution and disturbances?
• To what extent is lichen diversity related to air quality in the town?
• Which lichen species are more sensitive and related to the given environmental
conditions?
• What is the indicator value of the different species occurring on trees?
• Can lichens be used reliably for biomonitoring to estimate air quality and the level of
human disturbance (naturality/alteration) in Pretoria?

7
1.5 Research objectives
The objectives of the research were:
• To assess the diversity of lichens growing on selected trees (epiphytic) in the urban
environment of Pretoria.
• To analyse the ecological conditions under which given lichen species occur.
• To evaluate the diversity of lichens in relationship to tree species (two native Acacia
caffra, A. karroo and one exotic, Jacaranda mimosofolia) and human disturbance, with
special reference to air quality (comparison of areas with different degrees of pollution).
• To analyse lichen communities (spatial changes in species composition, diversity and
frequency) in relation to changing environmental factors (human disturbance).
• To identify the indicator value of lichen species growing on trees and develop a long-
term monitoring approach for detecting air quality changes and/or environmental
naturality/alteration using lichens as biodindicators.
1.6 Ethical considerations
The study required collection and monitoring of lichens in nature reserves, open-air museums
and public areas around the City of Tshwane. Ethical considerations to conduct research were
followed. Permission to conduct the study and to collect lichen samples from different trees
was obtained from the City of Tshwane, Voortrekker Monument and Pionier Museum through
an official letter before the study commenced (see Appendices 1, 2 and 3). The aim and
purpose of the study were included in the permission letter. Ethical clearance for this study
was obtained by the researcher from University of South Africa, College of Agriculture and
Environmental Science (Ref: 2014/CAES/157) (see Appendix 4).
1.7 Study limitations
This study focused on epiphytic lichens growing on only three different tree species. The
identification of lichens was difficult at the beginning of the research as identification keys and
reference material on epiphytic lichens is very limited for the region. This was also why the
study was limited to the three trees and did not consider the entire epiphytic diversity of the
investigated area.
Though the study intended to cover the wider Tshwane area, it was difficult to collect and
monitor lichens in more protected areas such as Onderstepoort Nature Reserve, Pretoria
Metal Pressing and Pretoria Zoological Gardens. The researcher tried several times
unsuccessfully to obtain permission to access and collect data. Some residential areas could
not be visited due to safety concerns. Some of the trees in the study were not suitable for

8
lichen monitoring as they did not meet the selection criteria of international guidelines. Certain
trees were not sufficiently straight or were affected by termite mounds (see Appendix 5). Some
trees were too thin (less than 60 cm trunk diameter) whereas other were too large (more than
1 m in diameter). In addition, people often pin advertisements and notices on Jacaranda trees,
which makes these not suitable for monitoring (see Appendix 6). This was observed mostly in
the city centre, Brooklyn and Hatfield. In the rural sites like Hermanstad, Saulsville and
Suiderberg, trees had been often cut down for firewood.
For this study, each site was only monitored once. Monitoring was only spatial and not
repeated in different years (long-term monitoring) for the following reasons. The first part of
the study was dedicated to the collection and identification of species (assessment of lichen
diversity in the study area), a work that had never been done before. This investigation took
more than one year of my PhD-period. During the second and third year the monitoring was
started and methodology from Europe tested, with a focus on spatial monitoring (investigation
of different sites and environments). However, the examined trunks were accurately and
durably marked for long-term monitoring purposes, so that this can be carried out in the future.
In protected areas like Rietvlei Nature Reserve and Voortrekker Monument Nature Reserve,
there were signs that certain wild animals were eating lichens. Some animals also use Acacias
to scratch their bodies as observed in the field. Often Acacias were multi-stemmed and not
wide enough for monitoring. All these factors made many trees unsuitable for monitoring in
the protected areas. In the Akasia site, vegetation had recently been burnt, so the trees here
were unsuitable for monitoring. The European guidelines for choosing plots and trees to
monitor lichen diversity, according to Asta et al. (2002a, 2002b) could therefore not always be
applied.
The pollution and climate data for this study was obtained from the South African Air Quality
Information System (SAAQIS). However, only data from five monitoring stations, relatively
close to the sampling areas, were used as the datasets for pollution and climate were not
complete for the other stations. Data for benzene and xylene could not be considered in the
elaborations because it was not complete.
1.8 Chapter breakdown
This thesis comprises five chapters. The first chapter includes an introduction, describes the
significance of the research as well as the study objectives, limitations of the study and
includes a chapter breakdown. The second chapter presents a literature review, while Chapter

9
Three contains a description of the study sites and the materials and methods of the research
(site selection, lichen collection, identification, and monitoring and data analysis). The fourth
chapter describes results and is split into two sections. The first section reports on the general
diversity of epiphytic lichens found in Pretoria and includes an annotated list of all species with
information on their distribution and ecology worldwide recorded at the study sites. The second
part of Chapter Four reports on monitoring and elaborates on statistics. The fifth chapter
presents a discussion, recommendations and conclusions. References and appendices are
included at the end of the thesis.

10
CHAPTER 2: LITERATURE REVIEW
2.1 Lichen morphology
The mycobiont is reponsible for the appearance of a lichen thallus. In a few cases, the
photobiont determines the pattern of the entire thallus (Nash, 2008). As reported in section
1.1, lichens generally have three principal growth habits: these are the crustose, foliose and
fruticose types, with several intermediate forms (Hale, 1983; Nash, 2008).
Crustose lichens expose a limited surface, are firmly attached to the substrate (often bark of
trees and shrubs, wood, rock, soil, and tree leaves in moist forests) with their lower surface
(Figure 2.1), and may not be detached from it without decimation (Nash, 2008; Asplund and
Wardle, 2017). Water uptake and loss is limited fundamentally to the upper, uncovered surface
(Nash, 2008). These features enable crustose lichens to tolerate the environmental conditions
of extreme habitats such as bare and exposed rock surfaces or soil in dry zones (Zedda and
Rambold, 2011). Sub-types of crustose lichens include: powdery, endolithic, endophloeodic,
squamulose, peltate, pulvinate, lobate, effigurate and subfruticose crusts. The thallus
association of crustose lichens is either homoiomerous or heteromerous (Nash, 2008). In the
homoiomerous thallus, the mycobionts and photobionts are evenly distributed, whereas in a
heteromerous thallus they are well structured and distributed in well-defined thallus layers
(Nash, 2008).
Figure 2.1. Crustose lichen: Caloplaca haematodes (A. Massal.) Zahlbr. (image by Felix Schumm, from http://dryades.units.it/italic, CC BY-SA4.0)

11
Foliose lichens are leaf-like horizontally and are only partly connected to the substrate (Figure
2.2). These thalli are either homoiomerous (i.e. gelatinous lichens) or heteromerous. Usually
they have a dorsiventral structure with different upper and lower surfaces (Nash, 2008).
Frequently, the thallus is partitioned into lobes, which show different degrees of expanding
branching. Occasionally the lobes overlap like tiles, and the lower side can frequently have
fixing rhizinae (Hale, 1983; Asplund and Wardle, 2017). Common foliose genera are
Anaptychia, Cetraria, Heterodermia, Parmelia s.l., Physcia and Xanthoria. This well-
established form has given rise to an extraordinary range of thallus sizes and diversity (Hale,
1983; Nash, 2008).
Figure 2.2. Foliose lichen: Parmotrema austrosinense (Zahlbr.) Hale (image by Felix Schumm,
from http://dryades.units.it/italic, CC BY-SA4.0)
Fruticose lichens stand out from the substrate and are attached to it with only a very small part
of the thallus (Figure 2.3). They may present hair-like, strap-shaped or shrubby ramifications,
and can be flat or cylindrical. They can have dorsiventrally arranged (e.g. Evernia prunastri
(L.) Ach.) or radial symmetric thalli (e.g. Usnea species). The branching pattern of lobes varies
considerably among different systematic groups and also within a single genus. There are
considerable variations in size with some Usnea species growing to a few metres while certain
minute species measure only 1 or 2 mm. Fruticose lichens are found in different climates,
ranging from desert to wet rainforest and on different kinds of substrates, but all require high
levels of air humidity or fog (Hale, 1983; Nash, 2008).

12
Figure 2.3. Fruticose lichen: Evernia prunastri (L.) Ach. (image by Simonetta Peruzzi, from
http://dryades.units.it/italic, CC BY-SA4.0)
2.2 Lichen diversity and ecology in South Africa
Most relevant among the existing taxonomic and floristic studies concerning South African
lichens are those of Massalongo (1861), Crombie (1876a; 1876b), Van der Byl (1931), Doidge
(1950), Almborn (1966, 1987, 1988), Hale (1971, 1984, 1990), Brusse (1984, 1985, 1986,
1988, 1994), Kärnefelt (1986, 1987, 1988), Thomas and Bhat (1994, 1995, 1996), Jürgens
and Niebel-Lohmann (1995), Elix (1999, 2002, 2003), Zedda and Rambold (2004, 2009),
Schultz et al. (2009), Wirth (2010), Zedda et al. (2009, 2010a, 2010b, 2011b, 2011c), Ahti et
al. (2016), Wirth and Sipman (2018), Wirth et al. (2018) and Maphangwa et al. (2018).
The first checklist of South African lichens was compiled by Doidge (1950) and supplemented
by Almborn (1988), Feuerer and Zedda (2001), Fryday (2015), Feuerer (2016) and Ahti et al.
(2016). Online versions of the checklists of Fryday (2015) and Feuerer (2016) are available
and updated periodically. However, checklists are still provisional and far from being complete
(Feuerer and Zedda, 2001; Maphangwa et al., 2018).
The preliminary version of a checklist of the lichens and lichenicolous fungi of South Africa
compiled by Feuerer (2016)1 lists 1 728 lichen taxa, which comprises 9.2% of the total global
1 The website http://www.lichens.uni-hamburg.de/lichens/africa/south-africa_checklists_switch.htm was last visited on 22 October 2018. At present (September 2019), it is not available and it is not clear when it will be online again.

13
list of 18 882 lichen species (Feuerer, 20092; Feuerer and Hawksworth, 2007). The Pretoria
Centralised Information System database (PRECIS) registers 1 460 quarter degree square
distribution records for 412 lichen species, comprising 105 genera in South Africa
(Maphangwa, 2010). Lichen species in South Africa are estimated to be about 2 000 (Crous
et al., 2006). The diversity of soil lichens in South Africa, covering different biomes of the
Western and Northern Cape, is of 73 taxa (Zedda et al., 2010a, 2010b), most of which are not
yet included in Feuerer’s checklist (2009).
Concerning ecology, physio-ecological works have been carried out in northern areas of South
Africa, the Karoo and other areas by Wessels and van Vuuren (1986), Wessels and Schoeman
(1988), Wessels and Wessels (1991), Wessels and Kappen (1994). Maphangwa et al. (2012b)
examined the effects on lichens of raised temperatures and reduced amounts of rainfall,
resembling impending climate scenarios that would harmfully influence the photosynthesis of
sensitive lichen species in the arid southern African Succulent Karoo Biome. These authors
concluded that climate change will cause lichen death. Maphangwa et al. (2012a) examined
the interception and evaporation of fog, dew and water vapour by soils and lichens in a coastal
desert of South Africa and investigated the chemical analysis. These authors found that
atmospheric water vapour and fog plays a crucial role in driving lichen photosynthesis and
distribution in a coastal desert. Maphangwa et al. (2014) tested the deadly photosynthetic
temperature edges of lichens in a southern African arid region. It was found that only atypical
conditions of lichen exposure in a hydrated state to extreme temperatures at midday with high
levels of solar irradiances during summer could affect photosynthetic thresholds in sensitive
lichen species (Maphangwa et al., 2014). Musil et al. (2010) examined the reaction of dwarf
succulent plants, lichens and soils to experimental climate warming in an arid South African
ecosystem and found that lichens are more sensitive indicators of climate change than other
plants. Mukherjee et al. (2010) investigated the potential importance of lichens in enriching
spider diversity and richness on Robben Island and reported that habitat structure and
epiphytic lichen abundance may be reasons for the greater number of spiders on the island.
Lalley and Viles (2005, 2006) assessed the diversity and the vehicle track disturbances of soil-
growing lichens in the fog of the Namib Desert (which extends from South Africa, Namibia,
and into Angola) and found that global climate change can cause significant changes in the
composition of lichen communities. Büdel et al. (2010) investigated the ecophysiology of
biological soil crusts including lichens from the arid and semi-arid regions of South Western
2 The website http://www.lichens.uni-hamburg.de/lichens/africa/south-africa_checklists_switch.htm was last visited on 22 October 2018. At present (September 2019), it is not available and it is not clear when it will be online again.

14
Africa. These authors found the biological soil crusts among the most diverse worldwide.
Weber et al. (2010) used remote sensing data to map the biological soil crust in the succulent
Karoo and found many biological soil crusts. Pfiz et al. (2010) assessed the fluctuating
patterns of lichen growth form distributions in central Namib within the lichen field and reported
wind erosion as an important functional parameter of the lichen species. Wirth et al. (2010)
investigated the distribution of lichens along an ocean-inland gradient in the fog zone of the
Central Namib, where 42 lichen species were reported.
Recently, lichen diversity and its changes due to land use and climate change have been
investigated at the South African BIOTA biodiversity observatories (www.biota-africa.org) and
lists of species together with ecological analyses, concerning mainly soil lichens and lichens
on pebbles, were reported by Zedda and Rambold (2004, 2009) and Zedda et al. (2010a,
2010b, 2011a, 2011b, 2011c). These authors reported lichens as a valuable bioindicator for
climate and soil change. Data on these collections (1 930 records) are now available through
the GBIF online database (http://data.gbif.org/datasets/resource/12005/). Descriptive data on
South African lichens were included within the BIOTA-projekt in the online LIAS light database,
from which identification keys can be automatically generated (Rambold et al., 2001 onwards;
2014).
Trüe et al. (2012) determined mercury levels in epiphytic lichens and tree bark in the cities of
Pretoria and Witbank. Tree bark had lower concentrations of mercury compared to lichens
from both cities. Monna et al. (2006) differentiated the various sources of lead from epiphytic
lichens in and around Johannesburg and it was found that leaded antiknock compounds added
to gasoline were the main source of lead around Johannesburg. Forbes et al. (2009) used the
lichen Parmotrema austrosinense (Zahlbr.) Hale as a bioindicator of air quality to determine
the effects of the phasing out of leaded petrol and the simultaneous introduction of manganese
anti-knock additives to fuel in South Africa. Specimens were collected from the Pretoria central
business district (CBD), as well as from three sites to the east of Pretoria: the National
Botanical Gardens, the CSIR campus and the suburb of Lynnwood. The highest
concentrations of lead were found in the CBD.
Panichev and McCrindle (2004) assessed the levels of metals in topsoil, dust, leaves, grass,
lichens and bark from the Kruger National Park utilising electro thermal atomic absorption
techniques. Lichens and bark were found to be more sensitive to air pollution than grasses
and trees leaves. Olowoyo et al. (2011) used Parmelia sulcata Taylor to evaluate the possible
sources of trace elements in the Tshwane metropolis, with the objective of assessing the
capacity of this lichen species to screen air contaminations in a polluted environment. It was

15
observed that P. sulcata can be used as bioindicator of air pollution because higher
concentrations were reported in the polluted sites. Panichev et al. (2019) used Parmelia
caperata (current name: Flavoparmelia caperata (L.) Hale) as bioindicators for mercury in
South African provinces. It was shown that P. caperata can be used to assess mercury and
the highest concentration was found in lichens from Secunda (Mpumalanga province).
Despite these previous works, many regions of southern Africa remain underexplored in terms
of lichens. Numerous taxa have not yet been described and taxonomical groups need to be
reviewed. Identification keys are missing for several families and genera. More floristic and
ecological investigations are necessary to better understand the influence of anthropogenic
impacts on these sensitive organisms, which could be used more often as bioindicators in
southern Africa (Crous et al., 2006; Maphangwa, 2010).
2.3 Ecological roles of lichens
Lichens support numerous ecosystem services, for example soil richness, nutrient cycling,
and soil development, nitrogen and carbon fixing (De Bello et al., 2010; Zedda and Rambold,
2015). Additionally, they bolster the diversity of various organisms through the provision of
nutrients, habitat, shelter, camouflage and nesting material, among others (Zedda and
Rambold, 2015). Lichens are principal colonisers and on rock surfaces and they are involved
in physical and chemical weathering of rocks, playing a leading role in soil formation and
nutrient enrichment in an ecosystem (Nash, 2008; Zedda and Rambold, 2015; Giordani et al.,
2016). The physical impacts are reflected by the mechanical disturbance of rocks brought
about by hyphal infiltration, development and compression of lichen thallus, swelling activity
of the natural and inorganic salts originating from lichen action (Chen et al., 2000). Chemical
breakdown occurs when oxalic acids are secreted and react with mineral components of rocks
to form various metal oxalates and acidic polysaccharides that dissolve the cementing material
in sandstones releasing the quartz crystals (Nash, 2008). Organic matter produced by lichen
thalli contributes to improving soil even in arid to semi-arid ecosystems (Chen et al., 2000;
Zedda and Rambold, 2009; Maphangwa, 2010; Jackson, 2015). Lichen also promotes
vegetation succession as the soil cover by terricolous lichens can influence vascular plant
germination (Zedda and Rambold, 2015; Gypser et al., 2016).
Lichens accumulate and store a pool of nutrients through wet and dry atmospheric deposition
(Pike, 1978; Loppi and Pirintsos, 2003; Nash, 2008; Maphangwa, 2010; Asplund and Wardle,
2017; Gupta et al., 2017). They do not have cuticles and stomata making them very effective
at absorbing nutrients (Nieboer et al., 1978; Asplund and Wardle, 2017). Fruticose lichens

16
such as Teloschistes capensis (L.f.) Müll. Arg. are particularly effective at capturing both dew
and fog, which often contain more nutrients than rain (Nash, 2008; Maphangwa et al., 2012a).
Some lichens play an important role in ecosystems by fixing atmospheric nitrogen
(cyanolichens) and other elements into nutrient poor soils and by contributing to nutrient
cycling (Nieboer et al., 1978; Knops and Nash, 1996; Longton, 1997; Asplund and Wardle,
2017). The fixed nitrogen by lichen even facilitates the colonisation and growth of vascular
plants (Asplund and Wardle, 2017). The captured nutrients reach other ecosystem
components through leaching, litter fall, decomposition and consumption by animals or by
bacterial incorporation (Pike, 1978; Asplund and Wardle, 2017). Lichens are also important
carbon sinks and therefore play a role in mitigating atmospheric greenhouse effects
(Maphangwa, 2010; Nash, 2008; Palmqvist et al., 2008; Ding et al., 2013; de Guevara et al.,
2014).
Lichens are an important source of food for animals worldwide (Zedda and Rambold, 2015).
Monkeys, snails, bacteria, protozoa, nematodes, reindeer, caribou and rodents consume
lichens as source of food (Pekkarinen et al., 2015; Zhao et al., 2015; Asplund and Wardle,
2017). Monkeys prefer fruticose lichens such as Usnea longissima Ach. (current name:
Dolichousnea longissima (Ach.) Articus) and Bryoria species (Grueter et al., 2012). In China,
some monkeys such as Rhinopithecus roxellana Milne-Edwards eat lichens as their
fundamental source of nourishment (Yiming, 2006; Liu et al., 2013). Sheep in Libyan deserts
graze extensively on the lichen Lecanora esculenta (Pall.) Eversm. (current name: Circinaria
esculenta (Pall.) Sohrabi) (Hale, 1983). Cladonia rangiferina (L.) Weber ex F.H. Wigg. are
significant winter forage for caribou and reindeer in northern ecosystems (Seaward, 2008;
Athukorala and Piercey-Normore, 2014).
Flying squirrels feed on fruticose lichens of the genus Bryoria. For example, Northern flying
squirrels consume Bryoria fremontii (Tuck.) Brodo and D. Hawksw. (Hayward and
Rosentreter, 1994; Seaward, 2008). Different groups of terrestrial invertebrates feed on
lichens, in particular arthropods such as mites and bark lice (Mukherjee et al., 2010; Asplund
and Wardle, 2017) and snails (Baur et al., 1995; Asplund and Wardle, 2017).
In addition, birds use lichen material to build their nests (Richardson and Young, 1977).
Ploceus olivaceiceps Reichenow and Carduelis spinus (Linnaeus) construct their nests fully
from Usnea species (Purvis, 2000). Hummingbirds in Colombia and in Arizona protect their
nests with the foliose Parmotrema reticulatum (Taylor) M. Choisy (Hale, 1983). Bowerbirds

17
use lichens for decorating their nests (Seaward, 2008). Rufous-bellied bush tyrant birds build
their nest using Unsea lichens in Peru and western Bolivia (Kingwell and Londoño, 2015).
Some spiders on Robben Island (South Africa) are reportedly dependent on lichens as their
primary habitat and the giant crab spider uses lichens of the genus Usnea (Mukherjee et al.,
2010) for their nests. Lichens also give shelter to other animals, such as water bears, mites
and lizards (Mukherjee et al., 2010). Some invertebrates (peppered moth) and vertebrates
(amphibians) animals are able to camouflage themselves using lichens (Purvis, 2000;
Sewards, 2008; Mukherjee et al., 2010).
Lichens are sensitive biological indicators of environmental change (details are provided in
section 2.4). Human beings are at present the biggest threats for lichen, devastating their
habitats worldwide through deforestation, agricultural practices, urbanisation, pollution and
habitat degradation, fragmentation and overuse of natural resources and biological invasion
(Gradstein, 2008; Hulme et al., 2008; Seaward, 2008; Ardelean et al., 2015; Zedda and
Rambold, 2015; Boch et al., 2016; Zarabska-Bożejewicz and Kujawa, 2018).
2.4 Lichen as a bioindicator of human disturbances
Lichens have been acknowledged as indicators of environmental quality, especially air quality,
since 1866 by Nylander (1866), as cited by Olowoyo et al. (2010), and have been used as
such worldwide (Aptroot and van Herk, 2007; Dyer and Letourneau, 2007; Pinho et al., 2012;
Li et al., 2013). The impact of different types of human disturbances on lichens and their role
as bioindicators is discussed below.
2.4.1 Air pollution Lichens are recognised as excellent indicators of environmental stress caused by various
pollutants (Lupšina, 1992; Budka et al., 2004; Lisowska, 2011; Sett and Kundu, 2016; Giordani
and Malaspina, 2017). Epiphytic lichens are, in particular, used for assessing air quality in
urbanised and industrial areas (Budka et al., 2004; Giordani, 2007). They show differing
sensitivities to air pollution (Branquinho et al., 1999), with sensitive species disappearing with
even low levels of pollution (Hawksworth and Rose, 1970; Nash, 1976; Eversman, 1978).
More tolerant species include Candelaria concolor (Dicks.) Arnold (tolerant to NOx),
Hypogymnia physodes (L.) Nyl. (fairly tolerant to SO2), Lecanora conizaeoides Nyl. ex Cromb.
(very tolerant to SO2) and Physcia tenella (Scop.) DC. (tolerant to NOx) (Conti and Cecchetti,
2001; Sujetovienė, 2010; Sett and Kundu, 2016; Manninen, 2018). Other species such as
Lobaria pulmonaria (L.) Hoffm. or Usnea spp. are very sensitive to SO2 (Conti and Cecchetti,

18
2001; Sett and Kundu, 2016). Isocrono et al. (2007) reported on changes in lichen diversity in
Italy between 1960 and 1996 due to changes in environmental conditions especially pollution.
Apart from SO2, a variety of other elements and chemical compounds in the atmosphere affect
lichen development and spreading. These comprise nitrous oxides, fluoride, and other
secondary pollutants formed through chemical reactions in the atmosphere, for example,
ozone, peroxy-acetyl nitrate, sulphuric and nitric acids (Tiwari, 2008). Thus lichens have been
used as indicators of a range of pollutants. The influence of different pollutants on lichens is
discussed below.
Information on air pollution and pollution sources in South Africa and in Pretoria are reported
in Chapter 1, section 1.3. Data on air pollutants and their concentration in Pretoria are reported
in Chapter 4, section 4.4.1.
2.4.1.1 Pollution by sulphur dioxide (SO2) and lichen diversity Sulphur oxides, especially sulphur dioxide (SO2), affect lichen communities (Hawksworth and
Rose, 1970; Aarrestad and Aamlid, 1999; Pescott et al., 2015). SO2 pollution is the primary
cause of death of lichens in most urban and industrial areas (Gilbert, 1970; Nimis et al., 2002;
Tiwari, 2008). The main human source of SO2 pollution is due to burning of fossil fuels such
as coal, oil and natural gas, i.e. from thermoelectric power plants, road traffic and heating
systems. Additionally, smaller sources of SO2 are released from industrial processes (Giordani
et al., 2002; Tiwari, 2008). This kind of pollution was most serious in Europe and in North
America until the nineties but has been declining in the last few decades. However, SO2
remains a significant pollutant in developing countries such as China and India. Lichens
respond to sulphur dioxide pollution with different sensitivities as confirmed by studies carried
out throughout the world (Beekley and Hoffman, 1981; Aarrestad and Aamlid, 1999; Giordani
et al., 2002; Wolseley, 2002; Nash, 2008). Nimis et al. (1996) and Giordani et al. (2002)
reported that SO2 was the main pollutant affecting lichen biodiversity in Italy for the period from
1996 to 1999. Pollution from vehicle exhausts and SO2 clearly damaged the lichen Ramalina
menziesii Taylor in Los Angeles (Riddell et al., 2008).
High levels of SO2 pollution causes lichen death in most urban and industrial areas and the
consequent reduction of lichen cover (“lichen deserts”). For instance, in England and Wales it
was observed that at SO2 levels of about 125 µg/m3 most lichens disappeared from trees and
only few very tolerant species such as Lecanora conizaeoides still occured (Aarrestad and
Aamlid, 1999; Gilbert, 1970; Nimis et al., 2002; Tiwari, 2008). In northeastern South Dakota

19
(United State) photosynthesis and respiration of the lichens Physconia grisea (Lam.) Poelt
and Physcia stellaris (L.) Nyl. decreased significantly after fumigation with 2.5 ppm of SO2
(Beekley and Hoffman, 1981). After the decline in SO2 since the beginning of this century, due
to changes in legislation regarding pollution (Larsen et al., 2007), lichens have been
recolonising urban and industrial areas across Europe (Kandler, 1987; Seaward and Letrouit-
Galinou, 1991).
In London, fruticose and foliose lichens such as E. prunastri, Ramalina farinacea (L.) Ach. and
Parmelia caperata, which are among the most sensitive to SO2 pollution, are now found in
central parks (Hawksworth and McManus, 1989). The reduction of SO2 pollution in London
has led in the last years to re-establishment of sensitive lichens such as Ramalina farinacea
and Parmelia caperata (Hawksworth and McManus, 1989). Lisowska (2011) has also reported
the same trend in Poland. In Finland, the reduction of SO2 levels led to the decline of SO2-
resistent lichen species L. conizaeoides (Manninen, 2018). This was also noticed in other
European countries and in North America (Beekley and Hoffman, 1981; Seaward and Letrouit-
Galinou, 1991; Aarrestad and Aamlid, 1999; Wolseley, 2002; Nash, 2008). In Seoul (Korea),
the SO2 concentration declined from 0.094 ppm in the 1980s to 0.04 ppm post-1992 leading
to the re-colonisation of lichens (Ahn et al., 2011). There is no longer a lichen desert in Rome
(Italy) as a result of CO, NOx and SO2 pollution reduction (Munzi et al., 2007). In Sudbury
(Canada), Evernia mesomorpha Nyl. and Usnea hirta (L.) Weber ex F.H. Wigg., known to be
very sensitive to pollution, are now found in areas where they were not previously found as a
result of the reduction in SO2 pollution (Gunn et al., 1995).
2.4.1.2 Pollution by nitrogen compounds and lichen diversity Nitrogen oxides (NOx, NO and NO2) are the main causes of atmospheric nitrogen deposition
(Truscott et al., 2005). NOx are among the most significant pollutants at present in urban areas
worldwide (Davies et al., 2007; Ahn et al., 2011). They are produced by coal burning and by
automobile emissions. NOx resulting from domestic heating and traffic emissions are also
responsible for changes in lichen diversity worldwide (Fuentes and Rowe, 1998; Purvis et al.,
2001; Loppi and Corsini, 2003). NOx have been reported to reduce chlorophyll concentrations
in lichens, even at a concentration of only 4 ppm NO2 (Nash, 1976; Davies et al., 2007; Tiwari,
2008). In the lichens Lecanora chrysoleuca (Sm.) Ach. (current name: Rhizoplaca chrysoleuca
(Sm.) Zopf), Usnea cavernosa Tuck. and Parmelia praesignis Nyl., 4 ppm nitrogen dioxide
resulted in significant chlorophyll reductions (Nash, 1976). NOx was considered as the factor
that prevented the growth of lichen Parmelia saxatilis (L.) Ach. next to busy roads (Batty et al.,
2003) and caused poor health of Parmelia sulcata Taylor in London (Purvis et al., 2003). Large

20
amounts of NOx hinder photosynthesis of Flavoparmelia caperata (Tretiach et al., 2007). In
the Netherlands and in other European countries, SO2 reduction led to an increased
abundance of nitrophilous lichens belonging to the Xanthorion association (van Dobben and
ter Braak, 1998), which are tolerant of nitrogen pollution. An example of a more tolerant
species is Phaeophyscia orbicularis (Neck.) Moberg recorded this species, for example, in an
area with high peaks of NOx in London (Larsen et al., 2007).
Lichens have been furthermore utilised to monitor ammonia deposition (NH3) in rural areas
(Fangmeier et al., 1994; van Dobben and ter Braak, 1998; Wolseley et al., 2006; Jovan and
Carlberg, 2007; Sparrius, 2007; Nash, 2008; Paoli et al., 2014; Paoli et al., 2015a). Paoli et al.
(2015a) used the lichens Flavoparmelia caperata and Xanthoria parietina (L.) Th. Fr., as
indicators of ammonia concentration in the environment. These lichens were exposed to NH3
for eight weeks and for F. caperata, both the photobiont and the mycobiont were affected,
while in X. parietina, only the photobiont was altered. In F. caperata there was decrease in
chlorophyll content, photosynthesis performance and alteration of the secondary metabolite
usnic acid, whereas in X. parietina there was only alteration of photosynthesis. In the
Netherlands, the decrease of ammonia in polluted areas was followed by a quick increase in
nitrogen-sensitive species such as Bryoria fuscescens (Gyeln.) Brodo and D. Hawksw. and
E. prunastri (Sparrius, 2007).
2.4.1.3 Pollution by particulate matter (PM10, PM2.5) and lichen diversity Particulate matter (PM) is a combination of dense particles suspended in the air, which differ
in size and originate from different anthropogenic sources (Degtjarenko, 2018). These
particles can be both fine and coarse. Coarse PM (PM10, particulate matter 10 micrometers or
less in diameter) is primary in nature and originates from point sources such as abrasion and
combustion and crushing processes, soil disturbances, desiccation of marine aerosol, rock
quarrying and limestone quarry road surfaces (Zaharopoulou et al., 1993; Grantz et al., 2003;
Degtjarenko, 2018). Fine PM (PM2.5, particulate matter 2.5 micrometers or less in diameter) is
secondary in nature and contains condensates of volatile organic compounds, volatilised
metals and products of incomplete combustion (Grantz et al., 2003). PM is one of the most
dangerous group of pollutants, exceeding the acceptable levels in many countries worldwide
(Degtjarenko, 2018; Varela et al., 2018; Rola and Osyczka, 2019). The PM2.5 concentration of
more than 60 μg.m-3 affect lichen abundance negatively in Chile (Varela et al., 2018).
Despite the increase in PMs in many urban areas worldwide, there are few studies
investigating their effects on lichens (Varela et al., 2018). In Thessaloniki (Greece), limestone

21
dust caused reduction in chlorophyll content of foliose lichen Physcia adscendens H. Olivier
(Zaharopoulou et al., 1993). Lichen growth forms and reproductive strategies, as well as
species richness and abundance have been used as bioindicators of PM in Chile and Estonia
(Degtjarenko, 2018; Varela et al., 2018). Crustose lichens with sexual reproduction can be
utilised as indicators of alkaline dust pollution, as they are more resistant to this kind of
pollution than foliose narrow-lobed and fruticose species, due to their smaller surface of thalli
exposed to the dust particles (Giordani et al., 2012; Degtjarenko, 2018; Varela et al., 2018).
Lichen abundance, not only lichen presence, can be used as an ecological indicator of PM2.5
concentrations in urban environments (Varela et al., 2018).
2.4.1.4 Pollution by heavy metals and lichens as biomonitors Lichens are also used as bioindicators of heavy metals (Agnan et al., 2017), for instance lead, in different countries including Italy, South Africa, Sri Lanka and in the Antarctica (Conti and
Cecchetti, 2001; Forbes et al., 2009; Gunathilaka et al., 2011; Zvěřina et al., 2018) and of
mercury (Bargagli, 2016; Vasilevich and Vasilevich, 2018; Zvěřina et al., 2018). In Pretoria,
the lead concentrations in lichen Parmotrema austrosinense (Zahlbr.) Hale found in the central
business district (CBD) (181.1 ± 98.0 μg.g-1) were significantly higher than in those growing
outside of the CBD area (41.5 ± 36.4 μg.g-1) (Forbes et al., 2009). There was a significant
difference in accumulation of mercury by lichens of different genera in northwest of Russia
(Vasilevich and Vasilevich, 2018). The average content was 113.4 ±22.6 μg/kg for the genus
Usnea and 192.0±40.0 μg/kg for Bryoria (Vasilevich and Vasilevich, 2018).
Hypogymnia physodes was utilised as a bioindicator of mercury and methyl mercury in
Slovenia (Lupšina et al., 1992) and Usnea antarctica Du Rietz in Antarctica (Zvěřina et al.,
2014; 2018). The highest concentration of mercury (115-188 μg.g-1) was found next to the
smelting house in H. physodes whereas the lowest concentration was found at the control site
in a mountain area (0.4 μg.g-1) (Lupšina et al., 1992). López Berdonces et al. (2017) used the
lichen genera Ramalina and Xanthoria as biomonitors of mercury in Spain. The highest
concentration was found next to the emitting source of mercury (110 ng.m-3) and the lowest
far away from sources (20-40 ng.m-3) (López Berdonces et al., 2017). Panichev et al. (2019)
used P. caperata as a bioindicator for mercury concentration in South African provinces. The
highest concentration was found in Secunda (Mpumalanga Province) which has many power
stations and the lowest was recorded in Limpopo Province, which has fewer power stations
(Panichev et al., 2019). This shows that lichens can be used as indicators of mercury.

22
Lichens were also used as indicators of nitrogen pollution and cadmium in California (Sierra
Nevada) and Antarctica (Jovan and Carlberg, 2007; Zvěřina et al., 2018). The concentration
of cadium was 0.04 mg.kg-1 for lichen Usnea antarctica Du Rietz in James Ross Island,
Antarctica (Zvěřina et al., 2018). The lichen Ramalina fastigiata (Pers.) Ach. was used as a
biomonitor of copper dust emissions from coal mines in Portugal and the highest concentration
was found next to the mine (Branquinho et al., 1999).
Lichens have furthermore been used as biomonitors of uranium in many countries (Beckett
et al., 1982; Garty, 2001; Di Lella et al., 2003; Loppi et al., 2003; Rosamilia et al., 2004;
Golubev et al., 2005; Boryło et al., 2017). They accumulate and retain uranium for numerous
decades even after the source is no longer in existence (Fahselt et al., 1995). Sources of
uranium includes milling of uranium, mining, ammunition repository and yellow cake
production (Beckett et al., 1982; Di Lella et al., 2003; Loppi et al., 2003; Jeran et al., 2005).
The elemental contents of lichens decrease with increasing distance from the emission source
as indicated by Beckett et al. (1982) in Ontario (Canada) for the lichen Cladonia rangiferina
(L.) Weber ex F.H. Wigg. Hypogymnia physodes was also used as biomonitor of uranium in
Russia by Golubev et al. (2005). These authors reported high concentrations of uranium (1.45
mg kg-1) next to the contaminated site and low concentrations (0.106 mg.kg-1) in the clean site.
Boryło et al. (2017) reported the highest concentration of uranium next to the Orle settlements
belonging to Sobieszewo Island in Poland. These authors reported the highest concentration
of uranium in the crustose lichen Lepraria incana (L.) Ach., followed by the fruticose lichen
Evernia prunastri, while the smallest concentration was observed in Platismatia glauca (L.)
W.L. Culb. and C.F. Culb. Jeran et al. (2005) also observed the highest concentration of
uranium of transplanted Hypogymnia physodes next to an emission source in Slovenia
compared to in areas far away from this source.
In Yugoslavia, Di Lella et al. (2003) found the highest concentration of uranium in lichen
Physcia adscendens (4.26 µg.g-1) and Phaeophyscia orbicularis (2.15 µg.g-1) followed by
Physcia biziana (A. Massal.) Zahlbr. (1.44 µg.g-1) and the lowest concentration in Xanthoria
parietina (0.11 µg.g-1). In the Balkan area, Loppi et al. (2003) evaluated the contribution of the
conflict of 1999 to the environmental levels of uranium by means of lichens, but they did not
find high concentrations related to depleted uranium. Lichen species such as P. sulcata and
P. saxatilis were also used as biomonitors of depleted uranium dusts in Bosnia-Herzegovina
(Rosamilia et al., 2004). Lichen are also used to monitor Perfluorinated contaminants (PFCs).
Lichen species Usnea aurantiaciparvula A. Gerlach and P. Clerc was used as indicator of
PFCs in Antarctic Peninsula – 60% of PFCs were detected in this lichen species (Alava et al.,
2015).

23
2.4.1.5 Methods used to detect and monitor air pollution Different methods are used to monitor pollution. Commonly used worldwide are scales and
maps of air quality. In the past, scales had been based on the calculation of an Index of
Atmospheric Purity (I.A.P.), which considered the number of lichen species and their
frequency-abundance, sometimes also their degree of toxiphoby (Nimis et al., 2002). They
evolved later in scales of air quality based on a calculation of Lichen Diversity Values (LDV)
(Asta et al., 2002a; VDI-Richtlinien, 2005). A different sampling design may be more or less
appropriate in different ecological situations (Leedy and Ormrod, 2016). The LDV of a sample
unit is a measurable estimator of the environmental conditions in that unit. The initial phase in
calculating the LDV of a sampling unit is to sum the frequencies of all lichen species found on
selected trees at different orientations (N, S, W and E). Since considerable variances in lichen
development might be normal on various sides of the trunks, the frequencies must be summed
independently for every aspect (Asta et al., 2002a, b). The sums of lichen frequencies at each
aspect of one tree were used to calculate mean values. Later, average values were calculated
for all the trees within a sampling unit (plot). The LDV of an area was obtained by adding the
average sum of LDVs resulting from all sampling units of that area (Asta et al., 2002a, b) (see
Appendix 7).
During recent years, these guidelines have been further modified in European countries by
considering the occurrence of eutrophic species as well as nitrogen-tolerant species which
have become more frequent in urban areas because of increasing nitrogen pollution
(Kirschbaum and Wirth, 2010). Different authors (i.e. Asta et al., 2002b) introduced scales of
“naturality/alteration” based on LDVs and this method is also applied in the present study.
There are several applications and further developments of such scales in Italy by Loppi et al.
(2002), Giordani et al. (2002), Brunialti et al. (2008), Cocozza et al. (2016), Cecconi et al.
(2019). The following publications were also consulted to design the monitoring approach for
the Pretoria area: Larsen et al., 2007; Jovan, 2008; Paoli et al., 2015b. These authors
indicated that all aspects of the trees must be monitored (N, S, E and W) and the trees must
be straight and not damaged. Lichen diversity values are generally lower in urban areas than
rural areas due to vehicular traffic (Loppi et al., 2002; Frati and Brunialti, 2006). For example,
Giordani et al. (2002) found very high alteration (low lichen diversity value) in areas
characterised by high pollution such as urban and industrial districts of the towns Genova and
Savona in Italy. Isocrono et al. (2007) reported highest lichen diversity value in the areas
characterised by lower vehicular traffic and industries in Turin (Italy). The lowest lichen
diversity value was limited to the area characterised by industries and municipal rubbish dump
(Isocrono et al., 2007) (see Appendix 7).

24
2.5 Lichens’ response to global warming
Lichens are among the most sensitive organisms to global warming (Insarov and Insarova,
2002; Aptroot and Van Herk, 2007; Giordani et al., 2014; Root et al., 2014; Aptroot et al., 2015;
Nascimbene and Marini, 2015; Zedda and Rambold, 2015; Allen and Lendemer, 2016; Bajpai
et al., 2016; Nascimbene et al., 2016) due to their particular physiological and ecological
characteristics (Matos et al., 2015). Specifically, epiphytic lichens are climate-sensitive and
may give early warning signs of climate change (Nash and Olafsen, 1995; Insarov and
Schroeter, 2002; Ellis et al., 2007; Nascimbene and Marini, 2015). Lichen thallus size and
growth-form, secondary metabolites and photobiont type are lichen characters known to be
related to climatic conditions and to respond to climate change. For instance, green-algae
lichens show less vulnerability to climate change than cyanolichens (Rubio-Salcedo et al.,
2017). Crustose lichens are more tolerant than foliose and fruticose species to increasing
temperature in arid regions of the world as well as in temperate and Mediterranean ones
(Maphangwa et al., 2014; Nascimbene and Marini, 2015).
Lichen growth is especially dependent on climate (temperature and precipitation), which
means that a minor change in the climate may change the lichen community structure of a
given site (Aptroot and Van Herk, 2007; Sancho et al., 2007). Global warming is the main
cause of fast changes in the epiphytic lichen flora in some parts of Europe (Van Herk et al.,
2002; Aptroot et al., 2015). Changes in temperature and humidity can severely affect the
structure of epiphytic communities and may cause local extinction of several species in Spain
(Aragón et al., 2012). Climate change poses a substantial risk especially to montane lichens
and in cold environments, where future decline of lichens is expected (Allen and Lendemer,
2016). For instance, Lobaria species, which require temperate-humid conditions, are facing a
high extinction risk in Italy because of climate change (Nascimbene et al., 2016). They are
among the most vulnerable lichens in Europe (Nascimbene et al., 2013; Otalora et al., 2015).
Søchting (2004) reported the first signs of global warming effects on lichen distribution in
Denmark. Soil lichens are threatened by global change in natural alpine environments,
especially on moss-dominated soils, where there is a decline of mosses and lichens and
replacement by vascular plants (Bueno de Mesquita et al., 2017).
Soil lichens have declined in response to climate warming in lower-altitude sub-arctic and mid-
arctic ecosystems as well (Cornelissen et al., 2001). Warming experiments resulted in the
decrease of lichen cover in the tundra biome (Walker et al., 2006).

25
Climate change effects could lead to the extinction of rare and endemic terricolous lichen
vegetation in the arid Succulent Karoo Biome and in the Desert Biome (Alexander Bay, Namib)
in southern Africa (Zedda and Rambold, 2009; Maphangwa et al., 2012b; 2014). This will have
possibly significant consequences for such biomes, which host a huge variety of lichen taxa
with high endemism (Zedda and Rambold, 2009; Zedda et al. 2011b, 2011c).
Increased temperatures influence lichens negatively in two ways: through direct effects on
metabolic rates, and by increasing evaporation in tropical lowlands (Zotz and Bader, 2009).
Slight increments in temperature might make tropical lowlands not habitable to lichens (Zotz
and Bader, 2009).
The diversity of epiphytic species is however increasing in other regions such as in the
Netherlands because of the colonisation of trees by Mediterranean lichen species as a result
of global warming in Western Europe (Aptroot and Van Herk, 2007). In Denmark and the
Netherlands, growth rates of F. caperata, a drought resistant, warm-temperate lichen, have
increased over the last 100 years (Van Herk and Aptroot, 1996, 2004; Van Herk et al., 2002).
This appears to be linked to the increase of temperatures during the last 20 years (Van Herk
and Aptroot, 1996, 2004; Søchting, 2004). Other warm-temperate species such as
Candelariella reflexa (Nyl.) Lettau, Lecidella flavosorediata (Vězda) Hertel and Leuckert,
Parmelia borreri Turner and P. soredians Nyl. have increased in frequency in the Netherlands
as well, while species characteristics of colder environments have either declined or become
extinct (Van Herk et al., 2002; Hauck, 2009). Species most rapidly increasing contain
Trentepohlia as phycobiont, which is often associated with warm-humid environmental
conditions (Aptroot and Van Herk, 2007) because of the increase of temperature.
P. borreri has also increased its frequency in the Netherlands (Spier and Van Herk, 1997) and
Physcia tribacioides Nyl. and Heterodermia japonica (M. Satô) Swinscow and Krog (current
name: Heterodermia obscurata (Nyl.) Trevis.) have been found here for the first time
(Wolfskeel and Van Herk, 2000 as cited by Aptroot and Van Herk, 2007).
Climate change might also have positive effects on some Mediterranean species such as
Buellia cedricola Werner (current name: Diplotomma cedricola (Werner) Etayo) and Cladonia
mediterranea P.A. Duvign. and Abbayes, as well as in Pyrrhospora lusitanica (Räsänen)
Hafellner, Solenopsora holophaea (Mont.) Samp. and Waynea adscendens V.J. Rico with a
Mediterranean Atlantic distribution and preferring higher temperature and low precipitation
(Rubio-Salcedo et al., 2017). This is because in the Mediterranean, temperature is expected
to increase and precipitation to decrease in future (Rubio-Salcedo et al., 2017).

26
2.6 Other kinds of human-driven ecosystem disturbance on lichens
Forest disturbances and deforestation are major human activities affecting lichen diversity
and composition on trees. This can lead to the disappearance of epiphytic lichens, especially
the most sensitive ones (Seaward, 2008; Boch et al., 2016), such as foliose and pendulous
forms as well as cyanolichens as their habitat is affected (Seaward, 2008). In the tropical
montane rainforests, deforestation causes significant loss in the species diversity of epiphytic
macrolichens and lichen total richness (Gradstein, 2008; Benítez et al., 2012, 2015). Lichens
are also used as indicators of forest disturbance in Ethiopia, Uganda and Kenya (Yeshitela,
2008).
When land use is intense due to agricultural practice or overgrazing, lichen diversity is
reportedly low as compared to areas with lower land use intensity (Gilbert, 1980; Ruoss, 1999;
Giordani et al., 2010; Boch et al., 2016). Overgrazing by small stock is likely to be the
responsible factor for the relative low species diversity in some rangeland areas of South
Africa, where climatic conditions are potentially feasible for lichen growth (Zedda and
Rambold, 2010a). Overgrazing by sheep and goats causes trampling impacts on lichen crusts
(Weber et al., 2010; Zedda and Rambold, 2010a; Zedda et al., 2011b). The future of soil-
inhabiting fruticose lichens, which are dominant in arctic and sub-arctic landscapes, is
uncertain due to commercial exploitation of oil, minerals and timber (Seaward, 2008).
Biological invasions by alien plant species are viewed as another main environmental
problem (Osyczka, 2010; Hulme et al., 2008; Zedda et al., 2010c; Cogoni et al., 2011). In USA,
invasive plants frequently occupied former biologically crusted interspaces (Belnap, 2001).
Under such conditions, biological soil crusts including lichens have lower diversity and cover.
In the Mediterranean areas, lichen and bryophyte covers on sand dunes along the coast
decrease significantly or these organisms tend to vanish by an increasing cover of alien plants
such as Carpobrotus spp. (Zedda et al., 2010c; Cogoni et al., 2011). The thick deposits of litter
produced by some exotic trees rot slowly and may promote acidic and dry top soil conditions,
which are not favourable for the growth of numerous bryophyte and lichen species (Babu and
Kandasamy 1997; Zedda et al., 2010c).
Lichen diversity is also affected by human trampling, off-road driving, fire and mining activities (Zedda et al., 2010c; Cogoni et al., 2011) in different parts of the world. In Northern
Sweden, it has been shown that trampling decreases species richness of lichens (Jägerbrand
and Alatalo, 2017). In Namibia, open cast mining and extensive off-road driving affect lichen
distribution (Lalley and Vleis, 2005). High fire intensities in savanna cause changes in woody

27
vegetation composition and structure (Trollope and Trollope, 1997; Smit et al., 2010). It led,
for instance, to the reduction of woody vegetation in Kruger National Park (Smit et al., 2010).
This may affect also the diversity of epiphytic lichens in affected areas as the trees will be
reduced or destroyed and lichens burnt. In the eastern Iberian Peninsula, fire was found to
affect the diversity of lichens on holm oak trees (Garrido-Benavent et al., 2015). Previous
lichen richness had still not recovered 20 years after fires (Garrido-Benavent et al., 2015). Fire
appears also to disturb lichen growth in the Cape region of South Africa (Zedda and Rambold,
2010b).
2.7 Economic importance of lichens
Lichens are important natural resources which have been utilised for various purposes for a
long time all over the world by people. They are used for medication, nourishment, grain,
aroma, fuel, flavours, dyes and other purposes (Llano, 1948; Malhotra et al., 2007; Nash,
2008; Basile et al., 2015; Crawford, 2015; Vitalini et al., 2015; Zedda and Rambold, 2015; Xu
et al., 2016; Devkota et al., 2017; Poulin, 2017).
In South Africa (Cape area), species of the family Parmeliaceae are used for the treatment of
back torment and kidney trouble and against other diseases (Van Wyk et al., 2008; De Beer
and Van Wyk, 2011). They are also used for anointing babies (Van Wyk et al., 2008; De Beer
and Van Wyk, 2011). The Khoisan utilised lichens for treating general torments, wounds and
bladder sicknesses (De Beer and Van Wyk, 2011). Additionally, they utilised them for sore
throats and oral thrush in new-born children, abdominal pain and kidney sicknesses (Van Wyk
and Gericke, 2000). The Xhosa people use the lichen Xanthoparmelia conspersa (Ehrh. ex
Ach.) Hale to treat syphilis eruptions, both known and suspected snakebites (Crawford, 2015).
The Xhosas in the Eastern Cape also used lichen Usnea filipendula Stirt. for the treatment of
mammary infections in cattle (Afolayan et al., 2002).
Considering the lack of comprehensive information on lichen diversity studies in urban
environments with a considerable number of anthropogenic activities, there is a need to
undertake studies on determining lichen diversity and their environmental relevance. As
evidenced from a plethora of evidence on the potential applications of lichens in
environmental/ air pollution bioindication, there is a need to explain the biodiversity of lichens
in Pretoria in relation to possible use as indicator of pollution and climate change.

28
CHAPTER 3: MATERIALS AND METHODS
3.1 Study area
This study was carried out in Pretoria and its metropolis (Figure 3.1A). Pretoria lies in the
northern part of Gauteng Province (25°44′46 S; 28°11′1 E) and is located around 55 km north-
northeast of Johannesburg in the north-east of South Africa. It is divided into three sections:
west, east and north, with respect to the central business district. Pretoria is located inside the
City of Tshwane Metropolitan Municipality. It is known as the ‘Jacaranda City’ (see Appendix
8) because of the large number of Jacaranda trees growing in its streets, parks and gardens
(Henderson, 1990; Joseph, 2006; Coetzee et al., 2015). Pretoria is located in a transitional
belt between the level of the Highveld towards the south and the lower-lying Bushveld towards
the north.
The town has a population of around 2.9 million (Statistics South Africa, 2011). It has a dry,
sunny climate, except for incidental late evening storms between October to April.
Temperatures are usually fairly mild because of the city's high elevation (1,271 m a.s.l.) with
the normal maximum daytime temperature of 21.5°C in January, dropping to a normal limit of
11°C in July (Olowoyo et al., 2010). Snow is very uncommon and the mean annual rainfall is
784 mm. June to August are the coldest months (Olowoyo et al., 2013).
All study sites fall within the Savannah biome with the exception of one located in the
Grassland biome (see section 3.2. below). The Savannah biome, the most far-reaching biome
in Africa, covers 32.8% of South Africa (399 600 km2). Savannah occupies northern Gauteng
with more isolated occurrences in the south of this province (Mucina and Rutherford, 2006).
Much of the Savannah prospered during early geographical periods under hot, wet climatic
conditions (Mucina and Rutherford, 2006). The Grassland biome covers a large part of central
South Africa and has a high frequency of lightning flashes making the incidence of fire
relatively high (Mucina and Rutherford, 2006).

29
Figure 3.1A. Study area and sampling sites. Sampling sites are marked with alphabetical letters

30
3.2 Sampling sites Sampling was carried out from 32 different sites. A first floristic survey was carried out at
twelve sampling sites. Further sites were later selected for monitoring according to a stratified
sampling method (see 3.7, 3.8). The first sites were identified with the help of a local map and
field surveys were carried out in July 2016 to March 2018. The sites were selected so as to
be representative of different kinds of land use activities in Pretoria, e.g. high traffic areas,
residential areas, industrial areas (metal pressings), open-air museums and nature reserves.
The study sites where lichens were collected for a first floristic survey are listed below and
their distribution is shown on the map in Figure 3.1A. Some were visited again for lichen
monitoring and further sites were identified for monitoring (see 3.7). Each visited site is defined
by a progressive code (e.g. S01). When the same locality was visited several times, different
codes were assigned to the different sampling/monitoring sites. Study sites are described in
the sections that follow and section 3.7 covers the monitoring sites (see also Figure 3.1B).
3.2.1 (A) Waterkloof This is a residential area situated in the East of Pretoria around 10 km from the city centre.
The site falls within the Savannah biome. Sampling was done at Rigel Avenue (around
25o47”44 S; 28o14’36 E, elevation 1546 m a.s.l.) from three trees. There are many Jacaranda
mimosifolia trees planted along the streets. Traffic is heavy only along the main avenues and
roads, but lower compared to the city centre. Visited on 18 July 2016. Code S07.
3.2.2 (B) Pretoria central business district This site is located in the city centre and falls within the Savannah biome. Collections were
done at Nana Sita Street (around 25o74’50'' S; 28o19’25'' E, elevation 1354 m a.s.l.) from one
tree. This is a high traffic area frequented by heavy trucks, buses, small cars and taxis. The
street is lined with J. mimosifolia trees. Visited on 19 July 2016. Code S016.
3.2.3 (C) Groenkloof Nature Reserve The nature reserve is located adjacent to Fountains Valley (Christina De Wit Ave), about 5 km
south of the city centre. The reserve is about 600 ha in size and falls within the Savannah
biome. In terms of vegetation, there is semi-open thicket but this is dominated by woody
species such as Acacia karroo, A. caffra, Commelina erecta L. and Drimia multisetosa (Baker)
Jessop (Marais, 2004). Collections were made in several spots (around 25o47’22'' S;
28o11’54'' E, elevation 1390 m a.s.l.) from seven trees. Visited on 19 July 2016. Code S05.

31
3.2.4 (D) Magalies This is a mountainous area approximately 15 km NW of the city centre. It falls within the
Savannah biome. The sampling site was situated along the Hornsnek Road (around 25°68’12''
S; 28°06’82'' E, elevation 1453 m a.s.l.) and collection was done from two trees. The area was
characterised by the presence of A. caffra and other Acacia species and grasses. Visited on
19 July 2016. Code S014.
3.2.5 (E) Arcadia This area is situated around the Union Buildings. It falls within the Savannah biome. The
collecting site was located at Stanza Bopape Street from one tree (around 25°44’41'' S;
28°12’30'' E, elevation 1332 m a.s.l.) next to the Union Buildings. Traffic is very heavy. The
street is lined up with many J. mimosifolia trees, on the bark of which citizens often pin notices
and advertisements. Visited on 20 July 2016. Code S010.
3.2.6 (F and J) Pretoria West This area is situated approximately 7-8 km west of the city centre and falls within the Savannah
biome. Two sites were investigated here. The first was along Quagga Road (F) (around
25°45’24'' S; 28°08’32'' E, elevation 1340 m a.s.l.), near a coal-fired power plant belonging to
the City of Tshwane, a road busy with cars and trucks and lined with old J. mimosifolia trees.
Collection was done from three trees. Visited on 13 September 2017. Code S030. The second site was in the Pretoria West industrial area at Staal Road (J) (around 25°45’50''
S; 28°07’52'' E, elevation 1360 m a.s.l.) from one tree, opposite the metal pressings. J.
mimosifolia trees are found along the street. There are also other small industries and traffic
is heavy. Visited on 04 February 2017. Code S02.
3.2.7 (G) Pionier Museum This area is approximately 10 km east of the city centre and falls within the Savannah biome.
The collecting site was situated at Keuning Drive (around 25°44’07'' S; 28°18’36'' E, elevation
1315 m a.s.l.) from seven trees. The vegetation here includes A. karroo, A. caffra and other
indigenous trees. Visited on 14 November 2016. Code S04.
3.2.8 (H) Hercules This is a residential area located north-west of the city centre. The site falls within the
Savannah biome. Collections were made at Van Der Hoff Road (25°43’03'' S; 28°08’25'' E,
elevation 1293 m a.s.l.), at a site dominated by A. karroo and J. mimosifolia trees. Car traffic

32
is very heavy. Collection was done from four trees. There is also coal burning by households
in winter. Visited on 18 November 2016. Code S03.
3.2.9 (I) Sunnyside This area is situated less than 3 km from the city centre and falls within the Savannah biome.
The collecting site was located in Jorissen Street (around 25°45’27'' S; 28°12’56'' E, elevation
1343 m a.s.l.). Collection was done from six trees. This is a busy street with heavy traffic, lined
with J. mimosifolia trees. Visited on 03 February 2017. Code S031.
3.2.10 (K) Lotus Gardens This residential area is situated approximately 10 km from the city centre and falls within the
Savannah biome. The collecting site was located at WF Nkomo Street (around 25°75’90'' S;
28°08’68'' E, elevation 1389 m a.s.l.). Collection was done from four trees. The area has heavy
traffic. Residents also burn coal for heating their homes during winter months. Vegetation
found in this site includes planted J. mimosifolia and other woody trees, as well as different
grasses. Visited on 04 February 2017. Code S032.
3.2.11 (L) Rietvlei Nature Reserve This reserve is located along the R21 highway, 18 km SSE of the centre of Pretoria and 38 km
north of OR Tambo International Airport. The area is approximately 3 800 ha and falls within
the Grassland biome. Tree vegetation includes Acacia caffra, A. decurrens Willd., A. karroo,
Euclea crispa (Thunb.) Gürke. Lichen collections were made at one site close to Rietvlei Dam
(around 25°53’47'' S; 28°15’50'' E, elevation 1529 m a.s.l.). Collection was done from five
trees. Visited on 23 July and 17 February 2017. Code S09.
3.2.12 (M) SANBI This is a Botanical Garden situated in the east of Pretoria around 10 km from the city centre
along Cussonia Avenue. It falls within the Savannah biome (around 25°44’12'' S; 28°16’17'' E,
elevation 1356 m a.s.l.). Collection was done from one tree. Car traffic is very low inside the
garden but high in the areas surrounding the garden. Visited 08 April 2018. Code S06.
3.3 Phorophytes
All available epiphytic lichen species were collected from selected native and exotic trees.
Sampling was focused on the following three tree species:

33
3.3.1 Jacaranda mimosifolia D.Don
This species is commonly known as jacaranda and belongs to the family Bignoniaceae
(Walker, 1986; Henderson, 1990). Jacaranda is a fast-growing tree, 15 to 22 m tall, with a
fairly dark green, rounded and spreading crown. The young bark is smooth and pale grey, but
with age it becomes rougher and darker brownish-grey (Henderson, 1990). Jacaranda is
indigenous to North-Western Argentina (Coetzee et al., 2015), where it is found mostly on river
banks in warm temperate sub-humid conditions. The species is cultivated for ornamental
reasons (particularly on streets which become carpeted with its purple flowers during October
and November), shade and timber (Van Wyk and Van Wyk, 1997; Henderson, 2007). This
beautiful tree, however, is invasive and presents potential risk for indigenous vegetation in the
subtropical regions of the country, and specifically in Mpumalanga and Lowveld (Henderson,
1990). According to Department of Agriculture (1985), Jacaranda is an invader plant (Category
3 of CARA List) which may no longer be propagated or sold, but its existing plants do not need
to be removed.
3.3.2 Acacia karroo Hayne (current name: Vachellia karroo (Hayne) Banfi and Glasso
This is a shrub to medium-sized tree, variable in shape but typically with a somewhat rounded
spreading crown (Van Wyk and Van Wyk, 1997; Boon, 2010) and is usually single stemmed
with pendulous branches. Its bark is dark, coarse, fissured, reddish in cracks when old, while
young stems are red-brown. A. karroo is a heterogeneous species best split into a number of
distinct entities (Van Wyk and Van Wyk, 1997; Boon, 2010). This is one of the most
widespread trees in Africa occurring in many different habitats (Palgrave, 1977; Boon, 2010),
in particular in bushveld, grassland and in coastal dune forest. It ranges from the South
Western Cape northwards into Angola, Botswana, Namibia, Swaziland, Zambia and
Zimbabwe (Pooley, 1993; O'Connor, 1995). The wood is used for building and furniture and
the tree is valued for shade, shelter and firewood. It has many medicinal uses from poultices
for wounds to gargles for sore throats (Palgrave, 1977; Pooley, 1993; Boon, 2010).
3.3.3 Acacia caffra (Thunb.) Willd. (current name: Senegalia caffra (Thunb.) P.J.H.Hurter
and Mabb.)
This is a shrub to medium-sized deciduous tree up to 12 m in height, often with a twisted trunk
and rather thin spreading somewhat rounded crown and drooping foliage. It is single or multi-
stemmed (Palgrave, 1977; Pooley, 1993; Boon, 2010). Its bark is dark brown to black and
rough, sometimes fissured and horizontally cracked forming squares. A. caffra is one of the
least thorny Acacia species (Palgrave, 1977; Boon, 2010). It occurs in bushveld, grassland
and coastal shrub, often also on rocky ridges up to 1700 m altitude. It is found in South Africa,
Botswana, south Mozambique and Zimbabwe (Boon, 2010). Bark, leaves and roots of the

34
plant are used for medicinal purposes (Palgrave, 1977; Van Wyk and Van Wyk, 1997). It can
be easily distinguished from A. karroo because of its narrow, straight, brown seed pods, which
are narrow, flat and crescent shaped in A. karroo.
These tree species were selected for the investigation as they are widespread across the
town. Jacaranda trees are planted and widely distributed in Pretoria along most roads and
avenues. Acacia karroo and A. caffra are part of the natural savannah vegetation and are
widespread in urbanised areas where they are able to survive (Alexander Heunis; personal
communication, 2016). These trees were simple to identify and were mostly easily accessible
for sampling (Walker, 1986).
3.4 Floristic survey: Sampling of lichen species and identification methods
Different epiphytic lichen species were collected mainly from tree trunks with the aid of a knife
as well as with a chisel and hammer for woodworking. The samples were placed in paper
bags, on which sampling information was indicated (locality, coordinates, tree species, land
use, date, and operators). Collected specimens were transported to the laboratory for
preparation and identification.
After identification, the specimens were sealed in paper envelopes and labels were prepared
with the taxon name, the collection site, elevation and coordinates, the collector’s name, the
date of collection, the date of identification, and the name of the identifying person.
Identification was made using the LIASLight online interactive identification keys
(http://www.lias.net) and the following publications: Swinscow and Krog (1988), Brodo et al.
(2001), Nash et al. (2002, 2004) and Sipman (2003). Further publications with identification
keys were used for given genera or families, i.e. for the family Physciaceae (Moberg, 2004),
for the genera Chrysothrix (Elix and Kantvilas, 2007; Elix 2009) and Rinodina (Matzer and
Mayrhofer, 1996; Mayrhofer et al., 2007, 2014).
Taxonomical nomenclature follows the databases:
• “LIASnames” (www.lias.net)
• “Index Fungorum” (www.indexfungorum.org/) and
• “Species Fungorum” (http://www.speciesfungorum.org/Names/Names.asp).
Identification was performed at the University of South Africa (UNISA), the Botanical Garden
and Botanical Museum Berlin and in Bonn (Germany) in 2016 and 2017. The identification of
some specimens of Culbersonia nubila was confirmed by DNA analsyis (Aptroot et al., 2019).

35
Some specimens were compared with herbarium specimens stored at the South African
National Biodiversity Institute (SANBI) in Pretoria (South Africa) (February 2017) and at the
Botanical Garden and Botanical Museum Berlin (Germany) (in March-April 2017).
Lichen traits were observed with a binocular microscope capable of magnification up to 40×.
Microscopic features (thallus, apothecia and asci anatomy or spores of some species) were
observed by cutting thin vertical slices of lichen thalli or of fruiting bodies with a razor blade.
Sections were placed in a drop of water or on potassium hydroxide on a microscope slide and
examined with a microscope having 10×, 40× and 100× objectives (the last one with oil
immersion), following the methodology described by Purvis et al. (1992) and Nash et al.
(2002).
Reagent tests of thalli were performed during microscopic examination to detect the presence
of lichen secondary metabolites through colour reaction of thalli or fruiting bodies. The
following reagents were used: pure bleach (sodium hypochlorite solution) (C), 10% potassium
hydroxide solution (K), paraphenylenediamine (Pd), and Lugol’s iodine solution for studying
asci. Pictures of some of the species were taken with an Olympus DP72 digital color camera
for microscopes, with 2×, 7× and 10× magnification. The Olympus SZX7 stereomicroscope
and an Olympus BX50 compound microscope with interference contrast, connected to a Nikon
Coolpix digital camera, were also used to identify some species.
Thin Layer Chromatography (TLC) was carried out on some of the collected lichens, following
the methodology described by Orange et al. (2001). TLC is important for the identification of
lichens. Thin vertical slices of dry lichen material were cut with a razor blade and placed in
numbered plastic phials into which cold acetone was added to extract lichen substances. A
glass capillary tube was used to transfer the acetone extracts from each phial to corresponding
numbered points on the TLC plates. Three applications per spot were used on three different
plates. Acetone extracts from voucher specimens of Evernia divaricata (L.) Ach. and Cladonia
impexa Harm. were used as references for usnic, divaricatic, perlatolic acids and other lichen
substances. The prepared plates from each application were placed into three developing
chambers each containing a different solvent (A, B and C). The solvents used were toluene-
dioxan-acetic acid (A), hexane-diethyl ether-formic acid (B) and toluene-acetic acid (C) (see
Appendix 9A, B and C). The plates were removed from the developing chambers when the
solvent reached the terminating front line and dried with a hairdryer.
Water from the tap was brushed over the three plates to mark fatty acids. A 10% solution of
sulphuric acid was also brushed over the three plates to mark more spots. All spots were

36
marked with a dotted outline. The plates were subsequently transferred to a pre-heated oven
at 110ºC for a few minutes for colour development. The plates were then allowed to cool before
being transferred to the lab to check the spots under UV light. The coloured spots on the dried
plates were examined under UV-B (254 nm) and UV-A (365 nm) light. All spots illuminated
under UV light were marked by circling spots with an unbroken outline and also with the first
letter of the name of the seen colour. The occurring secondary metabolites were finally
identified on the basis of their retention factor and colour of spots.
Voucher specimens have been deposited in the Horticulture Centre Herbarium of the
University of South Africa. Duplicates of the specimens will also be deposited in the Herbarium
of Pretoria (PRE) at the South African National Biodiversity Institute (SANBI). A list of the
identified species was reported in a Microsoft Excel table. Information on species (description,
ecology, distribution worldwide, in Africa and in Southern Africa, was gathered from the
literature and reported in the same table or in a text file. Graphs were elaborated using
Microsoft Excel for the frequency of occurrence of the different lichen species, world
distribution and diversity of species occurrence. An identification key, based on the collected
lichen descriptions, was prepared with the aim of facilitating monitoring and the identification
of species in the field for this study, but also for future investigations. Descriptions and the key
are going to be published in Bothalia (Maphangwa et al., in preparation).
3.5 Molecular analyses of specimens of the genus Culbersonia
To detect the phylogenetic position of Culbersonia nubila (Moberg) Essl., which had not been
studied before, molecular analyses were carried out. Analyses consisted of DNA extraction,
amplification and sequencing according to a methodology described in detail by Aptroot et al.
(2019). Total DNA was extracted from dry specimens employing a modified protocol based on
Murray and Thompson (1980). PCR amplification was performed with the primers ITS1F and
ITS4 (White et al., 1990; Gardes and Bruns, 1993) for the rDNA internal transcribed spacer 1,
5.8S and internal transcribed spacer 2 (collectively referred to as ITS), and LR0R and LR5
(Vilgalys and Hester, 1990; Cubeta et al., 1991) were used to amplify the 28S rDNA of the
nuclear ribosomal repeat. PCR reactions were performed with a programme consisting of a
hot start at 95°C for 5 min, followed by 35 cycles at 94°C, 54°C and 72°C (45, 30 and 45 s
respectively) with a final 72°C step for 10 minutes. PCR products were checked in 1% agarose
gels and positive reactions were sequenced with one of the PCR primers. BLAST (Altschul et
al., 1997) of 5.8S-ITS2 and 28S rDNA sequences was used to select the most closely related
taxa; 5.8S-ITS2 and 28S rDNA were the only regions amplified from the samples. Sequences
were first aligned in MEGA 5.0 (Tamura et al., 2011) with the ClustalW application and then

37
corrected manually. Ambiguous regions were not removed from the alignment. ITS1 was
excluded because insertions/deletions make alignment difficult.
3.6 Lichen monitoring: Sampling design
Lichen spatial monitoring was carried out following the European guidelines for mapping lichen
diversity as an indicator of environmental stress (Asta et al., 2002b; Van Haluwyn and Van
Herk, 2002; VDI-Richtlinien, 2005; EN 16413, 2014; Giordani and Brunialti, 2015) described
in Chapter Two, section 2.4.1.5. The following publications were also consulted to design the
monitoring approach for the Pretoria area: Saipunkaew et al., 2005, 2007; Geiser and Neitlich,
2007; Larsen et al., 2007; Jovan, 2008; Poličnik et al., 2008; Samsudi et al., 2012; Mulligan,
2009; Paoli et al., 2015b. The European sampling design recommends the use of a grid for
the selection of sampling units. Grid density and the number of sampling units can be variable
for different geographical scales and type of study. It depends also on the presence of
perturbation. Grid density can vary from 0.25 km x 0.25 km to 12 km x 12 km. Sampling tactics,
concerning the size of the sampling units, the quantity of trees to be sampled and their
selection within the sampling units, is also indicated in the European guidelines (Asta et al.,
2002a, b). The quantity of trees per sampling unit relies on its size, on the within-unit data
variability and on the accessibility of appropriate trees in small areas. The recommended
minimum number of trees to be investigated for sampling units of 0.25 km x 0.25 km is 3-4, in
larger units of 1 km x 1 km, 6-12 trees (EN 16413, 2014) (see Appendix 7).
This design of the present study had to be slightly modified and adapted to different South
African environmental conditions, especially concerning the selection of suitable trees at
monitored sites. For this investigation a “stratified random sampling” design was preferred to
a random/raster (grid) method for selecting of sampling units, as most sites were
heterogeneous and characterised by different land use types. This design consists of
separating habitats into non-overlapping strata and choosing independent simple random
sampling from each of these strata (Manly, 2001; Leedy and Ormrod, 2016). Moreover, some
parts of the town are not easily accessible (i.e. private areas, unsafe townships) to allow a
faster investigation.
Within this study, smaller sampling units were chosen (100 m × 100 m) and here at least two
trees were sampled. In each area with different ecological and land use conditions, 2 to 4
sampling units were selected, according to the area’s size. These are shown in Figures 3.2
and 3.3. At least two trees were chosen randomly and monitored per plot (or sampling unit).
In many cases, there were not enough trees or these where damaged, so only two trees could

38
be considered. The monitoring was exclusively spatial monitoring carried out in 2017 and
2018. It was not repeated during different periods at the same site. Surveys were carried out
as reported under Chapter 3.8.
3.7 Lichen monitoring: Monitored sites
Most of the sites where lichens had been collected for a floristic survey, were revisited for
carrying out monitoring of lichen diversity. All these sites are already described in section 3.2
and thus only information relative to monitoring is reported below. These areas were:
• Pretoria central business district. Monitoring was conducted on 20 May 2018 from six
trees. Code S016.
• SANBI. Monitoring was conducted on 8 April 2018 from five trees. Code S06.
• Pretoria West. Three sites were monitored here. The first site was situated around
industrial area at Staal Road. Monitoring was conducted on 26 August 2017 from two
trees. Code S02. Second site was at WF Nkomo Street (around 25°45’03'' S; 28°07’29''
E, elevation 1344 m a.s.l). There is heavy traffic throughout the area, which is situated
5 km west of the city centre. Monitoring was conducted on 26 August 2017 from seven
trees. Code S01. The third site was Es'kia Mphahlele Drive, which is 2 km from city
centre (around 25°45’03'' S; 28°07’29'' E, elevation 1344 m a.s.l). There is heavy traffic
all around the area. Trees were scattered and not straight. Citizens also pin notices
and advertisements on trees. Visited on 22 July 2018. Code S026. Monitoring was
conducted from five trees.
• Waterkloof. Monitoring was conducted on 24 April 2018 (around 25°48’24'' S;
28°14’53'' E, elevation 1535 m a.s.l.) from four trees. Code S07.
• Groenkloof Nature Reserve. Monitoring was conducted on 21 March 2018 from nine
trees. Code S05.
• Magalies. Monitoring was conducted on the 19 May 2018 from four trees. Code S014.
• Arcadia. Monitoring was conducted on (around 25°44’24'' S; 28°13’02'' E, elevation
1393 m a.s.l.) on 13 May 2018 from six trees. Code S010.
• Pionier Museum. Monitoring was conducted on 18 March 2018 from six trees. Code
S04.
• Hercules. Monitoring was conducted on 27 August 2017 from three trees. Code S03.
• Rietvlei Nature Reserve, Monitoring was conducted on 28 April 2018 from four trees.
Code S09.

39
The following sites were investigated additionally according to the monitoring approach
described in sections 3.6 and 3.8.
3.7.1 Muckleneuk This is a residential area situated about 3 km from the city centre. Monitoring was conducted
along Celliers Street (around 25°45’42'' S; 28°12’11'' E, elevation 1358 m a.s.l.) from four
trees. The area is lined with J. mimosifolia trees that are big and mostly not straight. Termite
mounds also disturb trees. Visited on 24 April 2018. Code S08.
3.7.2 Queenswood This is a residential area situated in the north-east of Pretoria around 9 km from the city centre.
Monitoring was done at CR Swart Drive (around 25°42’52'' S; 28°15’28'' E, elevation 1300 m
a.s.l.) from five trees. The area has many J. mimosifolia trees. Traffic volume is very high.
Some trees have termite mounds. Visited on 13 May 2018. Code S011.
3.7.3 Akasia This is a residential area situated in the north-west of Pretoria around 11 km from the city
centre. Monitoring was done at Brits Road (around 25°40’36'' S; 28°06’58'' E, elevation 1304
m a.s.l.) from nine trees. The area has high traffic and is characterised by the presence of
many Acacia trees, which are mostly multi-stemmed and not straight. Some have recently
been cut. Visited on 18 May 2018. Code S012.
3.7.4 Mayville This is a park situated in the north-east of Pretoria, 9 km from city centre along Es'kia
Mphahlele Drive (around 25°41’49'' S; 28°11’06'' E, elevation 1233 m a.s.l.) from five trees. It
has many very old and not straight Acacia trees, some of which have been recently cut. Traffic
by vehicles is very high. Visited on 18 May 2018. Code S013.
3.7.5 Hermanstad This is an industrial area (cement industry) situated around 7 km north-west from the city
centre. The survey of lichen diversity was done at Moot Street (around 25°42’59'' S; 28°09’58''
E, elevation 1262 m a.s.l.) from four trees. The area has several Acacia trees, but many are
either very small in diameter or have been damaged by termite mounds. Furthermore, people
often fell the trees. Traffic is very high. Visited on 20 May 2018. Code S015.

40
3.7.6 Kameeldrift This is an open area situated in the east of Pretoria around 20 km from the city centre.
Monitoring was done along Sefako Makgatho Drive (around 25°41’06'' S; 28°17’00'' E,
elevation 1262 m a.s.l.) from four trees. This is a rural area with high vehicle traffic. The area
has numerous Acacias and is used for church services. Not all trees are suitable for monitoring
as some are very young while others are not straight enough. Visited on 20 May 2018. Code
S017.
3.7.7 Saulsville This is a residential area situated in the west of Pretoria around 16 km from the city centre.
Monitoring was carried out along the Masopha Street (around 25°45’48'' S; 28°03’27'' E,
elevation 1389 m a.s.l.) from four trees. The area is rich in Acacia trees but some have termite
mounds and others are not straight. It is used by people for church services and meetings.
This is a rural area with high traffic. Visited on 10 June 2018. Code S018.
3.7.8 Philip Nel Park This site is in a residential area in the north-west of Pretoria around 6 km from the city centre.
Monitoring was carried out along the Transoranje Road (around 25°44’22'' S; 28°08’08'' E,
elevation 1329 m a.s.l.) from five trees. The road is lined with J. mimosifolia trees, most of
which have termite mounds and/or large trunks. People often damage tree trunks by pinning
notices and advertisements onto them. Traffic is very high. Visited on 10 June 2018. Code
S019.
3.7.9 Brooklyn This is a residential area situated in the east of Pretoria around 8 km from the city centre.
Monitoring was done along Roper Street (around 25°45’26'' S; 28°13’52'' E, elevation 1371 m
a.s.l.) from eleven trees. The area has both Jacaranda and Acacia trees, but they are often
disturbed by people pinning notices and advertisements onto their trunks which are also
affected by termite mounds. Some Acacia trees are not straight. Traffic levels are high. Visited
on 23 June 2018. Code S020.
3.7.10 Hatfield This area is next to a shopping centre situated east of Pretoria around 8 km from the city
centre. Monitoring was done at two sites. The first was along the Duxbury Road (around
25°45’21'' S; 28°14’23'' E, elevation 1369 m a.s.l.) from five trees. Visited on 23 June 2018.
Code S021.

41
The second site was along Pretorius Street (around 25°44’39'' S; 28°14’32'' E, elevation 1356
m a.s.l.) from four trees. Visited on 7 July 2018. Both areas have Jacaranda trees, on which
people often pin notices and advertisements. Some trees have large trunks; on others termite
mounds are evident. Traffic levels are very high. Visited on 23 June 2018. Code S022.
3.7.11. Gezina This is a residential area situated in the north-east of Pretoria around 6 km from the city centre.
Monitoring was carried out along Rose Street (around 25°43’53'' S; 28°12’24'' E, elevation
1309 m a.s.l.) from four trees. The area has many Jacaranda trees, but several were not
suitable for monitoring being too big, not straight or with termite mounds. Traffic levels are not
very high. Visited on 7 July 2018. Code S023.
3.7.12 Voortrekker Monument Nature Reserve This nature reserve is in the south of Pretoria around 7.8 km from city centre. The reserve is
located along Eeufees Road and there are numerous Acacia trees. Monitoring surveys were
carried out on sixteen trees (around 25°46’36'' S; 28°10’25'' E, elevation 1470 m a.s.l.)
although some were either not old enough (low trunk diameter) or not straight. Some lichens
had been eaten or damaged by wild animals that use acacias to scratch their bodies. Traffic
levels inside the reserve are low. Visited on 8 July 2018. Code S024.
3.7.13 Suiderberg This is a residential area situated in the north-east of Pretoria around 13 km from the city
centre. Monitoring was done along Sarel Avenue (around 25°42’03'' S; 28°08’39'' E, elevation
1256 m a.s.l.) from four trees. Different Acacias are evident though some had termite mounds
or were not straight. Traffic levels are not very high. The area is used to dump waste. Visited
on 21 July 2018. Code S025.
3.7.14 The Willows 340-Jr This is a residential area situated in the north-east of Pretoria around 23 km from the city
centre. Monitoring was done along Solomon Mahlangu Drive (around 25°45’22'' S; 28°21’53''
E, elevation 1317 m a.s.l.) from four trees. The area has some Acacias, most of which are too
old or not straight enough for monitoring. Traffic levels are very high. Visited on 18 August
2018. Code S027.

42
3.7.15 Mamelodi This is a residential area situated in the north-east of Pretoria around 30 km from the city
centre. Monitoring was done along Tsamaya Avenue (around 25°43’05'' S; 28°20’48'' E,
elevation 1302 m a.s.l.), using Jacaranda trees, many of which have termite mounds and/or
are damaged by pinned notices and advertisements. Traffic is very high. Visited on 18 July
2018. Monitoring was conducted from four trees. Code S028.
3.7.16 Koedoespoort 456-jr This is a park situated in the east of Pretoria around 10 km from the city centre. Monitoring
was done along the N4 Highway (around 25°44’34'' S; 28°14’59'' E, elevation 1335 m a.s.l.)
from twelve trees. The area has many different Acacias trees, which are mostly very old and
not straight or too small in diameter for monitoring. Traffic levels are very high. Visited on 19
August 2018. Code S029.
Figure 3.1B. The town of Pretoria showing distribution of the lichen monitoring sites

43
Figure 3.2. Groenkloof Nature Reserve with sampling points (Google Earth, 2019)

44
Figure 3.3. Voortrekker Nature Reserve with sampling points (Google Earth, 2019)

45
Figure 3.4. Monitoring grid attached to tree J. mimosifolia

46
3.8 Lichen monitoring: Survey of Lichen Diversity
The same tree species (Jacaranda mimosifolia, Acacia karroo and A. caffra) used for floristic
surveys were used for the monitoring survey as well within the sampling units. Trees of the
above mentioned species were selected according to the criteria suggested by the European
guidelines (Asta et al., 2002a, 2002b). These include: free-standing trees, whose trunks must
have an inclination lower than 10° from the vertical position, must receive direct solar radiation
for at least part of the day and have a trunk circumference not less than 40 cm and not larger
than 150 cm (Asta et al., 2002a, 2002b; Minganti et al., 2003; Brunialti et al., 2008). Trees of
the same size must be used within a survey for monitoring. Injured trees are not appropriate
for survey purposes and they were therefore not considered during this monitoring work. Trees
evidently affected by actions such as liming, removal of the bark or of the lichens by humans
or by grazing animals are additionally not appropriate and were excluded from survey as well
as trees with termite nests (Asta et al., 2002a,b; Minganti et al., 2003). If it was not possible to
place at least three ladders of the grid onto one tree, the tree was not surveyed. Parts of the
tree with greater than 25% cover of bryophytes were not used (Asta et al., 2002a, 2002b).
A sampling grid composed of four ladders each with five quadrats sized 10 cm × 10 cm (Figure
3.4), was appended vertically to the trunk so that the lower edge of the ladder was 1 m above
the highest point of the ground (Asta et al., 2002a, 2002b; Cristofolini et al., 2014). The four
ladders of the sampling grid were placed to correspond to the four aspects (NSEW) of the tree
trunk. The examined trunks were accurately and durably marked with numbers for long-term
monitoring purposes with permanent marker (Asta et al., 2002a,2002b; Cristofolini et al., 2014)
see Appendix 7.
All lichen species present within each quadrat portion were recorded using a survey form (see
Appendix 10) together with their frequency occurrence in the five quadrats of each ladder.
Even if more individuals of the same species occurred in one quadrat (10 cm × 10 cm square),
only the frequency value “1” was given to that species for each square. For this reason, the
value 5 can be the maximal value for each species in one 10 cm × 50 cm ladder. Lichens
within the quadrat segments were not collected, but identified in the field. If there was a new
species not previously collected during floristic investigation, a specimen was collected near
the sampling grid but not inside the quadrats. This was done to allow future monitoring on the
same plots. All the information regarding the areas where the trees were assessed was
recorded on the survey form and later collected in Excel tables (Asta et al., 2002a, 2002b).

47
3.9 Calculation of the Lichen Diversity Value (LDV) for trees and sites and further data elaborations For each tree, four totals of frequencies can be recorded at four different aspects (N, S, W and
E) (Asta et al., 2002a). The sums of lichen frequencies at each aspect of one tree were used
to calculate mean values. Later, average values were calculated for all the trees within a
sampling unit (plot). The Lichen Diversity Value (LDV) of an area was obtained by adding the
average sum of LDVs resulting from all sampling units of that area.
Lichen diversity values were related to the type of land use (categories), to tree species and
to climatic and pollution data. Land use was categorised into two main classes. The first is
“industrial areas and busy roads”, which includes industrial, urban and rural areas and roads
with high vehicle traffic, all characterised by higher levels of human disturbance. Here the
felling of trees is common. The second land use category was “parks and nature reserves”,
which includes savannahs with low disturbance located in nature reserves, private gardens
and more natural areas, with lower levels of car traffic, pollution levels and other kinds of man-
made disturbance.
Seven pollutants were considered for elaborations, namely CO (ppb) measured with Carbon
monoxide analyser, NO (ppb) measured with NOx analyser, NO2 (ppb) measured with NOx
analyser, NOx (ppb) measured with Nox analyser, O3 (µg/m3) measured with Ozone analyser,
PM10 measured with Particulate matter analysers and SO2 (ppb) was measured with Sulphur
dioxide analysers. Climatic variables considered were pressure PRES (kPa) measured with
Atmospheric pressure Sensor, RAIN (mm) measured with Rain gauge and solar radiation
(SOL) (W/m2) was measured with Solar radiation Sensor. These information was obtained
from the South African Air Quality Information System (SAAQIS). Correlation analyses with
these parameters were tested. A naturality/alteration interpretative scale was developed for
the first time for a town in South Africa. This was based on the percentile deviations from the
maximum lichen diversity observed in the study area.
The influence of land use and tree species on LDV and on lichen species was studied by
statistical analyses, carried out with the freeware software R (R Core Team 2017) and
Quantum GIS 2.18.22. The following analyses were applied:
• ANOVA and Kruskal Wallis test, Wilcoxon test for paired data.
• Principal Component Analysis (PCA), used as explorative unsupervised multivariate
analysis to study the relationships among the response variables (lichen diversity,
lichen species) and the predictive variables (i.e., climate, pollution, photophyte, land
use).

48
• A multiple factor analysis (MFA), on the whole dataset in order to test correlation
between the same variable mentioned above.
• Generalised Linear Models, applied to fit the relationship between the same set of
environmental predictors and the response variables.
This dataset was interpolated (Inverse Distance Weighting) to assign missing values to each
of the 29 lichen monitoring stations. Results are presented graphically and in table format in
the next chapter.

49
CHAPTER 4: RESULTS
4.1 List of recorded species
This study recorded 25 lichen taxa on the three selected trees. Altogether, 362 specimens of
these species were collected and identified. The recorded lichens are listed below with notes
on sampling sites, ecology and distribution of each species in the world and in Southern Africa.
The pictures of all the lichens are in Appendix 11A, B, C and D. The results of Thin Layer
Chromatography (TLC) are included for some species as the detection of given lichen
substances by TLC is important for the identification of lichens (see Appendix 12).
Amandinea natalensis (Vain.) Marbach – Magalies, Hornsnek Road, on A. caffra,
Maphangwa and Zedda KWM_0032 (PRE).
This subtropical crustose species has been reported only once in South Africa, in particular
from Howick in KwaZulu-Natal (Marbach, 2000). Marbach (2000) provided a detailed
description of this species, and Sipman (2003) included this in a global identification key of
the genus Amandinea. Fryday (2015) also included it in the checklist of South African lichens.
In Pretoria, it was found once during this study, in a mountain area, where traffic is very low.
Candelaria concolor (Dicks.) Arnold – Groenkloof Nature Reserve, Christina De Wit Ave, on
A. karroo and A. caffra, Maphangwa and Zedda KWM_0009; KWM_0012 (PRE). Magalies,
Hornsnek Road, on A. caffra, Maphangwa and Zedda KWM_0031 (PRE). Hercules, Van Der
Hoff Road, on A. karroo and J. mimosifolia, Maphangwa KWM_0039; KWM_0056 (PRE).
Pionier Museum, Keuning Dr, on A. karroo, Maphangwa KWM_0082 (PRE). Pretoria West,
Staal Road, on J. mimosifolia, Maphangwa KWM_0115 (PRE). Lotus Gardens, WF Nkomo
Street, on J. mimosifolia, Maphangwa KWM_0119 (PRE). Pretoria West, Quagga Road, on J.
mimosifolia, Maphangwa KWM_0140 (PRE). Sunnyside, Jorissen Street, on J. mimosifolia,
Maphangwa KWM_0148 (PRE). Rietvlei Nature Reserve, OR Tambo (R21), on A. karroo and
A. caffra, Maphangwa KWM_0182; KWM_0197 (PRE). Arcadia, Stanza Bopape Street, on J.
mimosifolia, Maphangwa and Zedda KWM_0207 (PRE). Central, Nana Sita Street, on J.
mimosifolia, Maphangwa and Zedda KWM_0210 (PRE). Waterkloof, Rigel Avenue, on J.
mimosifolia, Maphangwa and Zedda KWM_0218 (PRE).
This is a cosmopolitan species common on nutrient-rich substrates (Almborn, 1966; Brodo et
al., 2001). It is common in tropical and temperate regions of the world and in East Africa at an
altitude of 1000 to 2000 m a.s.l. (Swinscow and Krog, 1988). Almborn (1966) and Zedda et al.
(2009) reported it on different trees in Namibia and Almborn (1966, 1988) and Fryday (2015)
in South Africa as well. In Pretoria, it was widespread across all sampling sites.

50
Canoparmelia texana (Tuck.) Elix and Hale Waterkloof, Rigel Avenue, close to house
number 226, on J. mimosifolia, Maphangwa and Zedda KWM_0004 (PRE). Groenkloof Nature
Reserve, Christina De Wit Ave, on A. caffra and A. karroo, Maphangwa and Zedda
KWM_0014, KWM_0023 (PRE). Hercules, Van Der Hoff Road, on A. karroo, Maphangwa
KWM_0041 (PRE). Pionier Museum, Keuning Dr, on A. karroo, Maphangwa KWM_0086
(PRE). Lotus Gardens, WF Nkomo, on J. mimosifolia, Maphangwa KWM_0128 (PRE).
Sunnyside, Jorissen Street, on J. mimosifolia, Maphangwa KWM_0156 (PRE). Rietvlei Nature
Reserve, OR Tambo (R21), on A. karroo and A. caffra, Maphangwa KWM_0184 (PRE).
This species (pantropical world distribution) is found in in Southern and East Africa (Swinscow
and Krog, 1988) and in Madagascar (Aptroot, 2016), where it grows in dry, sun-exposed
habitats on lowlands and coastal hills at up to 1000 m a.s.l., and. It has been reported in South
Africa by Fryday (2015). In Pretoria, it is relatively common and was found in both human
disturbed and undisturbed areas. Atranorin and divaricatic acid were found in the specimens
examined by TLC in KWM_0041, KWM_0094, and KWM_0203.
Chrysothrix xanthina (Vain.) Kalb Groenkloof Nature Reserve, Christina De Wit Ave, on
A. caffra, Maphangwa KWM_0232 (PRE).
The species is known across Africa, Asia, Macaronesia, Madagascar, New Zealand, Norfolk
Island, North and South America (Laundon, 1981; Kalb, 2001; Elix and Kantvilas, 2007;
Fryday, 2015). In Pretoria, it was found only once during this study in a nature reserve.
Culbersonia nubila (Moberg) Essl. Groenkloof Nature Reserve, Christina De Wit Ave, on
A. karroo and A. caffra, Maphangwa and Zedda KWM_0011; KWM_0025 (PRE). Pionier
Museum, Keuning Dr, on A. caffra, Maphangwa KWM_0103 (PRE). Lotus Gardens, WF
Nkomo Street, on J. mimosifolia, Maphangwa KWM_0138 (PRE). Sunnyside, Jorissen Street,
on J. mimosifolia, Maphangwa KWM_0150 (PRE). Arcadia, Stanza Bopape Street, on J.
mimosifolia, Maphangwa and Zedda KWM_0205 (PRE). Waterkloof, Rigel Avenue, close to
house number 226, on J. mimosifolia, Maphangwa and Zedda KWM_0218 (PRE).
This species is also known as Pyxine nubila Morberg. It has a scattered distribution in dry,
subtropical areas of Africa, America, Australia and Eurasia, where it can occur on trees and
rocks (Swinscow and Krog, 1988; Moberg, 2004, Obermayer et al., 2009). In Southern Africa,
the species has been reported in South Africa (Eastern Cape, Free State, Mpumalanga and
KwaZulu-Natal provinces) and Lesotho (Moberg, 2004). It has also been reported in Gauteng
Province by Obermayer et al. (2009). In Pretoria, it is common and was found in the less
disturbed areas during this study. No recognisable substances were found by TLC in

51
KWM_0103, KWM_0138 and KWM_0204. The phylogenetic position of this monotypic genus
is explained under 4.2.
Dirinaria applanata (Fée) D.D. Awasthi Pionier Museum, Keuning Dr, on A. karroo,
Maphangwa KWM_0078 (PRE). D. applanata is a common corticolous and saxicolous lichen
widespread in all tropical regions worldwide (Nash et al., 2004). The species has been
reported in Tanzania, Kenya, South Africa, Ethiopia and Uganda, where it occurs in natural
woodlands, parks, avenues, and plantations, from sea level up to 2300 m a.s.l. (Swinscow
and Krog, 1988; Fryday, 2015; Aptroot, 2016). In Pretoria, it was recorded only once, in a
protected area.
Flavopunctelia flaventior (Stirt.) Hale Groenkloof Nature Reserve, Christina De Wit Ave,
on A. karroo and A. caffra, Maphangwa and Zedda KWM_0008; KWM_0016 (PRE). Hercules,
Van Der Hoff Road, on A. karroo and on J. mimosifolia, Maphangwa KWM_0044; KWM_0047
(PRE). Pionier Museum, Keuning Dr, on A. karroo, Maphangwa KWM_0069 (PRE). Lotus
Gardens, WF Nkomo Street, on J. mimosifolia, Maphangwa KWM_0117 (PRE). Sunnyside,
Jorissen Street, on J. mimosifolia, Maphangwa KWM_0155 (PRE). Rietvlei Nature Reserve,
OR Tambo (R21), on A. karroo and A. caffra, Maphangwa KWM_0179; KWM_0200 (PRE).
Waterkloof, Rigel Avenue, close to house number 226, on J. mimosifolia, Maphangwa and
Zedda KWM_0217 (PRE).
This species is widespread in temperate as well as tropical regions of Africa, Europe, India,
North and South America at moderate elevations (Swinscow and Krog, 1988; Nash et al.,
2004; Fryday, 2015). It is common in East Africa (Swinscow and Krog, 1988; Killmann and
Fischer, 2005) and Schultz et al. (2009) and Zedda et al. (2009) reported it in Namibia. In
Pretoria it has been previously collected by Degelius in the Fountains Valley (UPS:BOT:L-
053801). During this study, it was found at many of the research sites. The collected
specimens had usnic and lecanoric acids as detected by TLC in KWM_0099, KWM_0122, and
KWM_0186.
Flavopunctelia soredica (Nyl.) Hale Waterkloof, Rigel Avenue, close to house number 226,
on J. mimosifolia, Maphangwa and Zedda KWM_0002 (PRE). Groenkloof Nature Reserve,
Christina De Wit Ave, on A. caffra and A. karroo, Maphangwa and Zedda KWM_0007;
KWM_0224 (PRE). Hercules, Van Der Hoff Road, on A. karroo and on J. mimosifolia,
Maphangwa KWM_0048 (PRE). Pionier Museum, Keuning Dr, on A. karroo, Maphangwa
KWM_0095 (PRE). Lotus Gardens, WF Nkomo Street, on J. mimosifolia, Maphangwa
KWM_0130 (PRE). Sunnyside, Jorissen Street, on J. mimosifolia, Maphangwa KWM_0146

52
(PRE). Rietvlei Nature Reserve, OR Tambo (R21), on A. karroo, Maphangwa KWM_0179
(PRE).
This species is prevalent in temperate areas of Asia, North and South America where it grows
on bark and wood of different tree species (Nash et al., 2004). Fryday (2015) reported it in
South Africa, while Brusse (1988) recorded it on Jacaranda trees in Windhoek (Namibia) as
Parmelia soredica Nyl. Also Zedda et al. (2009) reported it as an epiphyte from Namibia. In
Pretoria, it has the same distribution as F. flaventior (Maphangwa et al., 2018). The specimens
investigated by TLC (KWM_0134, KWM_0189 and KWM_0224) were found to contain usnic
and lecanoric acids as secondary metabolites.
Heterodermia speciosa (Wulfen) Trevis. Groenkloof Nature Reserve, Christina De Wit Ave,
on A. karroo and A. caffra, Maphangwa and Zedda KWM_0008; KWM_0022 (PRE). Pionier
Museum, Keuning Dr, on A. karroo, Maphangwa KWM_0067 (PRE). Lotus Gardens, WF
Nkomo Street, on J. mimosifolia, Maphangwa KWM_0120 (PRE). Pretoria West, Quagga
Road, on J. mimosifolia, Maphangwa KWM_0140 (PRE). Sunnyside, Jorissen Street, on J.
mimosifolia, Maphangwa KWM_0157 (PRE). Rietvlei Nature Reserve, OR Tambo (R21), on
A. karroo and A. caffra, Maphangwa KWM_0175; KWM_0203 (PRE). Arcadia, Stanza Bopape
Street, on J. mimosifolia, Maphangwa and Zedda KWM_0206 (PRE). Waterkloof, Rigel
Avenue, close to house number 226, on J. mimosifolia, Maphangwa and Zedda KWM_0218
(PRE).
H. speciosa is widely distributed in subtropical to temperate areas of the world (Nash et al.,
2002). It is common on sheltered tree trunks in natural and artificial habitats at 1100 to 3600 m
altitude in East Africa (Swinscow and Krog, 1988), while in North America it grows on sunny,
but moist rocks or on tree trunks in humid conditions (Nash et al., 2002). The species has
been reported from East Africa, Madagascar and South Africa (Swinscow and Krog, 1988;
Killmann and Fischer, 2005; Fryday, 2015; Aptroot, 2016). In Pretoria, it is common as an
epiphyte and was found at several sites. TLC applied to specimens KWM_0079, KWM_0162,
and KWM_0204 revealed the presence of atranorin and zeorin.
Hyperphyscia adglutinata (Flörke) H. Mayrhofer and Poelt Hercules, Van Der Hoff Road,
on J. mimosifolia, Maphangwa KWM_0045 (PRE). Pionier Museum, Keuning Dr, on A. karroo,
Maphangwa KWM_0066 (PRE). Lotus Gardens, WF Nkomo Street, on J. mimosifolia,
Maphangwa KWM_0124 (PRE). Pretoria West, Quagga Road, on J. mimosifolia, Maphangwa
KWM_0139 (PRE). Sunnyside, Jorissen Street, on J. mimosifolia, Maphangwa KWM_0149
(PRE). Rietvlei Nature Reserve, OR Tambo (R21), on A. karroo, Maphangwa KWM_0198
(PRE). Arcadia, Stanza Bopape Street, on J. mimosifolia, Maphangwa and Zedda KWM_0209
(PRE). Waterkloof, Rigel Avenue, close to house number 226, on J. mimosifolia, Maphangwa

53
and Zedda KWM_0211 (PRE). Groenkloof Nature Reserve, Christina De Wit Ave, on A. caffra,
Maphangwa and Zedda KWM_0221 (PRE).
This species is widespread and common worldwide from tropical to temperate regions
(Swinscow and Krog, 1988; Purvis et al., 1992; Zedda et al., 2009). In South Africa, it has a
wide distribution and grows mainly on nutrient-rich or nutrient-enriched tree trunks, branches,
twigs and rocks in open or partly shaded habitats, even in polluted areas (Swinscow and Krog,
1988; Moberg, 2004, Fryday, 2015). It is frequent and widespread in Pretoria.
Hyperphyscia granulata (Poelt) Moberg Lotus Gardens, WF Nkomo Street, on J.
mimosifolia, Maphangwa KWM_119 (PRE). Waterkloof, Rigel Avenue, close to house number
226, on J. mimosifolia, Maphangwa and Zedda KWM_0214 (PRE).
H. granulata is widespread in tropical-subtropical regions of East Africa, Madagascar,
Southern Africa, South America and Asia (Swinscow and Krog, 1988; Moberg, 2004; Schultz
et al., 2009; Zedda et al., 2009; Fryday, 2015; Aptroot, 2016). In South Africa, it has been
collected in Gauteng, KwaZulu-Natal and Limpopo provinces (Moberg, 2004). It grows on
trunks, branches, and twigs mixed with other Hyperphyscia species at 850 to 2470 m a.s.l.
(Swinscow and Krog, 1988; Moberg, 2004). In Pretoria, it was only found in residential areas.
Hyperphyscia isidiata Moberg Hercules, Van Der Hoff Road, on A. karroo and J.
mimosifolia, Maphangwa KWM_0042; KWM_0051 (PRE).
The species is uncommon, but known worldwide from Angola, Australia, Costa Rica, South
Africa and a few localities in Kenya (Swinscow and Krog, 1988; Moberg, 2004; Fryday, 2015).
Moberg (2004) reported it from one locality in Pretoria (UPS:BOT:L-057759). It grows on tree
trunks in open conditions associated with other species of Hyperphyscia at 800 to 1600 m
a.s.l. (Swinscow and Krog, 1988; Moberg, 2004). In this study, it was found only once in a
residential area with high traffic.
Hyperphyscia pandani (H. Magn.) Moberg Hercules, Van Der Hoff Road, on J. mimosifolia,
Maphangwa KWM_0052 (PRE). Magalies, Hornsnek Road, on A. caffra, Maphangwa and
Zedda KWM_0062 (PRE). Lotus Gardens, WF Nkomo Street, on J. mimosifolia, Maphangwa
KWM_0119 (PRE). Pretoria West, Quagga Road, on J. mimosifolia, Maphangwa KWM_0144
(PRE). Sunnyside, Jorissen Street, on J. mimosifolia, Maphangwa KWM_0165 (PRE). Rietvlei
Nature Reserve, OR Tambo (R21), on A. caffra, Maphangwa KWM_0199 (PRE).
The species is found in tropical to subtropical areas of America, Australia, East Africa, the
Hawaiian Islands and South Africa (Swinscow and Krog, 1988; Moberg, 2004; Fryday, 2015).
It grows on trunks, branches, and twigs of different tree species, often with other species of
Hyperphyscia (Swinscow and Krog, 1988; Moberg, 2004). It appears to be widespread in

54
South Africa, where it occurs in the Eastern Cape, Gauteng, KwaZulu-Natal and Limpopo
Provinces (Moberg, 2004). In Pretoria, it is common and was found in disturbed and protected
areas.
Hyperphyscia pruinosa Moberg Magalies, Hornsnek Road, on A. caffra, Maphangwa and
Zedda KWM_0033 (PRE). Pionier Museum, Keuning Dr, on A. karroo, Maphangwa
KWM_00087 (PRE). Sunnyside, Jorissen Street, on J. mimosifolia, Maphangwa KWM_0160
(PRE). This species is found in Australia (Moberg, 1987), Lesotho, South Africa (Eastern and
Northern Cape) (Moberg, 2004; Fryday 2015), Namibia (Zedda et al., 2009) and East Africa
(Moberg, 2004; Swinscow and Krog, 1988). The species is uncommon and is found on old
decorticated wood and on bark of trees and shrubs at 1500 to 2900 m a.s.l. in East Africa
(Swinscow and Krog, 1988). In Pretoria, it was found in mountain, rural areas and once at
downtown Sunnyside.
Lepraria spp. Groenkloof Nature Reserve, Christina De Wit Ave, on A. caffra, Maphangwa
and Zedda KWM_0013 (PRE). Magalies, Hornsnek Road, on A. caffra, Maphangwa and
Zedda KWM_0063 (PRE). Pionier Museum, Keuning Dr, on A. karroo, Maphangwa
KWM_0104 (PRE). Sunnyside, Jorissen Street, on J. mimosifolia, Maphangwa KWM_0171
(PRE). Rietvlei Nature Reserve, OR Tambo (R21), on A. karroo, Maphangwa KWM_0188
(PRE). Waterkloof, Rigel Avenue, close to house number 226, on J. mimosifolia, Maphangwa
and Zedda KWM_0213 (PRE).
Lepraria species are widespread worldwide, however the highest number of species is found
in temperate areas (Saag et al., 2009). They look similar and are difficult to distinguish, without
TLC analyses. The only traits enabling identification are differences in colour, thallus
thickness, substrate and especially chemistry of secondary metabolites (Brodo et al., 2001).
Saag et al. (2009) have reported few taxa from Africa so far. These include Lepraria
nigrocincta Diedrich, Sérus and Aptroot, L. pallida Sipman, L. rigidula (de Lesd.) Tønsberg, L.
leuckertiana (Zedda) L. Saag, L. sipmaniana (Kümmerl. and Leuckert) Kukwa, L. umbricola
Tønsberg, L. usnica Sipman, L. glaucella Ach., L. incana (L.) Ach. and L. yunnaniana (Hue)
Zahlbr. Most have been found in Northern or East Africa. L. sipmaniana, L. usnica, L. glaucella
and L. incana have been recorded from Southern Africa as well (Fryday, 2015). The collected
specimens from Pretoria could not be identified to species level within this study. Either
important thallus traits or characteristic secondary metabolites could not be observed or
detected (Maphangwa et al., 2018). The genus as a whole is widespread in Pretoria but the
thalli are always poorly developed. TLC in KWM_0018, KWM_0061 and KWM_0104 detected
atranorin and unidentified traces of other compounds.

55
Parmotrema austrosinense (Zahlbr.) Hale Groenkloof Nature Reserve, Christina De Wit
Ave, on A. karroo and A. caffra, Maphangwa and Zedda KWM_0005; KWM_0019 (PRE).
Hercules, Van Der Hoff Road, on A. karroo and J. mimosifolia, Maphangwa KWM_0040;
KWM_0055 (PRE). Pionier Museum, Keuning Dr, on A. karroo, Maphangwa KWM_0072
(PRE). Lotus Gardens, WF Nkomo Street, on J. mimosifolia, Maphangwa KWM_0116 (PRE).
Pretoria West, Quagga Road, on J. mimosifolia, Maphangwa KWM_0143 (PRE). Sunnyside,
Jorissen Street, on J. mimosifolia, Maphangwa KWM_0152 (PRE). Rietvlei Nature Reserve,
OR Tambo (R21), on A. karroo, Maphangwa KWM_0177 (PRE). Arcadia, Stanza Bopape
Street, on J. mimosifolia, Maphangwa and Zedda KWM_0207 (PRE). Waterkloof, Rigel
Avenue, close to house number 226, on J. mimosifolia, Maphangwa and Zedda KWM_0216
(PRE).
This species is widespread in tropical and temperate regions (Swinscow and Krog, 1988;
Brodo et al., 2001). It is known from Africa, Australia, North and South America, and Oceania
(Nash et al., 2002; Kukwa et al., 2012). In Africa, it is relatively common and it has been
recorded in East Africa, Madagascar, Namibia, and South Africa (Almborn, 1988; Swinscow
and Krog, 1988; Thomas and Bhat, 1994; Killmann and Fischer, 2005; Forbes et al., 2009;
Schultz et al., 2009; Zedda et al., 2009; Trüe et al., 2012; Fryday, 2015; Aptroot, 2016). In
Pretoria, it was also very common at most sites. Atranorin and lecanoric acid were found by
TLC in KWM_0117, KWM_0188 and KWM_0216.
Parmotrema reticulatum (Taylor) M. Choisy Pionier Museum, Keuning Dr, on A. karroo,
Maphangwa KWM_0089 (PRE).
This species is widespread throughout the tropical and temperate regions of Africa,
Australasia, Europe, India, North and South America, Oceania and southern Asia (Swinscow
and Krog, 1988; Purvis et al., 1992; Nash et al., 2002; Aptroot and Feijen, 2002; Purvis et al.,
1992; Nash et al., 2002). In Africa, the species was found in East Africa (Swinscow and Krog,
1988), Madagascar (Aptroot, 2016) and Southern Africa (Doidge, 1950; Almborn, 1988;
Fryday, 2015). P. reticulatum is corticolous, saxicolous, and terricolous in a wide variety of
natural and artificial, and more or less open habitats. In East Africa, it is common and
widespread at 1000 to 3000 m a.s.l. (Swinscow and Krog, 1988). In Pretoria, it is infrequent
and was found only once, in a protected area. Atranorin and salazinic acid were detected by
TLC.
Physcia biziana (A. Massal.) Zahlbr. Lotus Gardens, WF Nkomo Street, on J. mimosifolia,
Maphangwa KWM_0126 (PRE). Pretoria West, Quagga Road, on J. mimosifolia, Maphangwa
KWM_0142 (PRE). Rietvlei Nature Reserve, OR Tambo (R21), on A. caffra, Maphangwa
KWM_0199 (PRE).

56
This is a Mediterranean to mild-temperate species (Nimis and Martellos, 2017), known from
Africa, Australia, Europe, North and South America (Swinscow and Krog, 1988; Moberg,
2004). The species has been previously reported in Africa from East Africa (Swinscow and
Krog, 1988), Namibia (Zedda et al., 2009), South Africa (Almborn, 1988; Moberg, 2004;
Fryday, 2015), and Tunisia (Guttová et al., 2015). In East Africa, it is found at 1500 to 2100 m
a.s.l. and is uncommon (Swinscow and Krog, 1988). In South Africa it is established in
Mpumalanga province so far, where it grows on tree trunks and branches in open conditions
(Moberg, 2004) and in the Botanical Garden of Pretoria (collected by Almborn, specimens in
B and UPS:BOT:L-012954). During this investigation, it was found on roadside trees in streets
with heavy traffic and once in a nature reserve in Pretoria.
Physcia erumpens Moberg Waterkloof, Rigel Avenue, close to house number 226, on
J. mimosifolia, Maphangwa and Zedda KWM_0003 (PRE). Groenkloof Nature Reserve,
Christina De Wit Ave, on A. caffra, Maphangwa and Zedda KWM_0021 (PRE).
This species is subtropical (Nimis and Martellos, 2017) and known from Europe, Asia, East
Africa, Madagascar, North America and South Africa (Moberg, 2004; Aptroot, 2016). In South
Africa, it has been reported in scattered localities in the Eastern and Western Cape, KwaZulu-
Natal and Mpumalanga provinces (Moberg, 2004; Fryday, 2015). It grows on trees and rocks
in more or less open conditions (Moberg, 2004). In Pretoria it was found only at two sites, on
roadside trees in a green residential area and in a nature reserve.
Physcia poncinsii Hue Pionier Museum, Keuning Dr, on A. karroo, Maphangwa
KWM_0104 (PRE).
P. poncinsii is found in tropical to subtropical regions of America, Australia, East Africa,
Madagascar and Southern Africa (Nash et al., 2002; Moberg, 2004; Fryday, 2015; Aptroot,
2016). It is known in South Africa (Eastern and Western Cape, Mpumalanga and KwaZulu-
Natal provinces) (Moberg, 2004) and Zedda et al., (2009) reported it on trees in Namibia. In
southern Africa, it grows on tree trunk, wood and rocks in open conditions (Moberg, 2004). In
Pretoria, it is uncommon and was found only once in a protected area.
Physcia tribacia (Ach.) Nyl. Groenkloof Nature Reserve, Christina De Wit Ave, on Acacia
caffra, Maphangwa and Zedda KWM_0016 (PRE). Hercules, Van Der Hoff Road, on A. karroo
and J. mimosifolia, Maphangwa KWM_0043; KWM_0043 (PRE). Pionier Museum, Keuning
Dr, on A. karroo, Maphangwa KWM_0113 (PRE). Rietvlei Nature Reserve, OR Tambo (R21),
on A. karroo and A. caffra, Maphangwa KWM_0188; KWM_0196 (PRE).
This species is widely distributed but not common in temperate regions (Swinscow and Krog
1988; Nash et al., 2002; Moberg, 2004). According to Nimis and Martellos (2017), it is a

57
Mediterranean to sub-tropical lichen, usually growing on rather exposed rocks and rarely on
bark (Swinscow and Krog, 1988; Moberg, 2004). In Africa P. tribacia is known from East Africa,
Lesotho and South Africa (Swinscow and Krog, 1988; Moberg, 2004; Fryday, 2015). In South
Africa, it is well-known in the Eastern and Northern Cape, Free State, KwaZulu-Natal and
Mpumalanga provinces (Moberg 2004). In Pretoria, it was found mainly in protected areas and
once in a street with heavy traffic.
Physcia undulata Moberg Groenkloof Nature Reserve, Christina De Wit Ave, on A. caffra,
Maphangwa and Zedda KWM_0027 (PRE).
It is known in Africa, Australia and South and Central America (Swinscow and Krog, 1988;
Moberg, 2004) and has probably a tropical-subtropical distribution. In Africa, it has been
reported in Kenya (Moberg, 1986), Namibia (Zedda et al., 2009), Lesotho and South Africa, in
particular in the Eastern and Northern Cape and KwaZulu-Natal provinces (Moberg, 2004;
Fryday, 2015). It grows on trunks and branches of solitary trees in open sites (Nash et al.,
2002) at 500 to 3000 m a.s.l. (Swinscow and Krog, 1988). In Pretoria, it was found once in a
protected area.
Pyxine cocoes (Sw.) Nyl. Groenkloof Nature Reserve, Christina De Wit Ave, on A. karroo
and A. caffra, Maphangwa and Zedda KWM_0008; KWM_0017 (PRE). Magalies, Hornsnek
Road, on A. caffra, Maphangwa and Zedda KWM_0030 (PRE). Hercules, Van Der Hoff Road,
on A. karroo and J. mimosifolia, Maphangwa KWM_0039; KWM_0058 (PRE). Pionier
Museum, Keuning Dr, on A. karroo, Maphangwa KWM_0068 (PRE). Lotus Gardens, Church
Street, on J. mimosifolia, Maphangwa KWM_0121 (PRE). Rietvlei Nature Reserve, OR Tambo
(R21), on A. karroo and A. caffra, Maphangwa KWM_0181; KWM_0196 (PRE). Waterkloof,
Rigel Avenue, close to house number 226, on J. mimosifolia, Maphangwa and Zedda
KWM_0220 (PRE).
This is a pantropical species with scattered records from the subtropics and Laurimacaronesia
(Nash et al., 2002). Swinscow and Krog (1988) reported it as widespread in the tropics and
sub-tropics. It is common and widespread in East Africa, where it occurs on bark and wood of
trees and shrubs, sometimes on rocks in sunny or partial shaded conditions, from sea level
up to about 2500 m a.s.l. It even thrives in artificial habitats (Swinscow and Krog, 1988). Zedda
et al. (2009) and Schultz et al. (2009) reported it in Namibia and Aptroot (2016) in Madagascar.
It seems to be rather common in South Africa, as it has been reported by Moberg (2004) and
Fryday (2015) from Eastern and Northern Cape and Mpumalanga provinces as corticolous
and saxicolous. In Pretoria, it was collected during the present study in nature reserves, rural
areas and on avenue trees in residential areas. Lichexanthone and terpenoids were detected
by TLC in KWM_0223.

58
Pyxine petricola Nyl. Pretoria Botanical Garden, Cussonia Avenue on Acacia caffra,
Maphangwa KWM_0233 (PRE). Pretoria Voortrekker Monument, on Acacia karroo,
Maphangwa KWM_0234 (PRE).
This is a pantropical to nearly cosmopolitan species (Zedda et al., 2009) reported from tropical
East Africa (Swinscow and Krog, 1988), Namibia (Schultz et al., 2009; Zedda et al., 2009) and
Zimbabwe (Becker, 2002). It has also formerly been reported from South Africa (Doidge, 1950;
Moberg, 2004; Fryday, 2015). In East Africa it is common on trees, shrubs, and rocks in
exposed or partly shaded places in artificial as well as natural habitats up to 2000 m altitude
(Swinscow and Krog, 1988). In Pretoria, it was only found in nature reserves.
Rinodina sp. Rietvlei Nature Reserve, OR Tambo (R21), on A. karroo, Maphangwa
KWM_0176 (PRE).
A recent revision of corticolous species of the genus Rinodina is available for Southern Africa
(Mayrhofer et al., 2014). Four species are reported: Rinodina albocincta Zahlbr., R.
australiensis Müll. Arg., R. capensis Hampe and R. ficta (Stizenb.) Zahlbr. R. ficta has been
previously reported from Pretoria (Zwartdam) on bark of Acacia, Transvaal and Namibia, while
the other listed species have been found mainly in the Cape regions and along the coast so
far (Mayrhofer et al., 2014). Fryday (2015) lists further Rinodina spp. The collected specimen
could not be identified to the species level due to a lack of well-developed ascospores, is most
likely R. ficta. In Pretoria, it was found once in a nature reserve.
4.1.1 Additional species reported from Pretoria in the literature The following specimens were reported from Pretoria by other authors but were not found
during the present study.
Parmelia sulcata Taylor, reported around Garankuwa in Pretoria and Johannesburg by
Olowoyo et al. (2011) and Monna et al. (2006). It is a cosmopolitan, pantemperate to southern
boreal species (CNALH, 2017; Swinscow and Krog, 1988). It is mainly saxicolous in the lower
alpine zone at 3500 to 4200 m a.s.l. and rare in East Africa (Swinscow and Krog, 1988).
Phaeophyscia adiastola (Essl.) Essl., reported in Fountains Valley in Pretoria on tree bark
by Moberg (2004). It is also known to exist in Ethiopia, Kenya, Lesotho, Tanzania, Uganda,
North America and Eastern Russia (Swinscow and Krog, 1988; Moberg, 2004). In South
Africa, it was found in the Eastern Cape, Gauteng and Western Cape provinces as well
(Moberg, 2004; Fryday, 2015). The species is corticolous, but occasionally also saxicolous, in
well-lit sites at 900 to 3600 m a.s.l. (Swinscow and Krog, 1988).

59
Phaeophyscia orbicularis (Neck.) Moberg, reported by Moberg (2004) from the zoological
garden of Pretoria. It is also known in the Eastern Cape, Gauteng, Lesotho and North West
provinces in South Africa (Moberg, 2004; Fryday, 2015). It occurs worldwide in temperate
regions of the northern hemisphere, where it is very common on tree trunks in open conditions
(Moberg, 2004).
Rinodina ficta (Stizenb.) Zahlbr. reported in Pretoria by Mayrhofer et al. (2014) (Zwartdam,
on bark of an Acacia tree) and in South Africa by Fryday (2015). It is also known in Namibia
(Zedda et al., 2009, reported as Rinodina aff. boleana; Mayrhofer et al., 2014), Italy, New
Zealand and USA (Giralt and Mayrhofer, 1995; Mayrhofer et al., 2007; Sheard et al., 2011). It
occurs in parkland and woodlands, where it grows on bark (Giralt and Mayrhofer, 1991;
Mayrhofer et al., 2014).
4.1.2 Frequency and phytogeography of the recorded lichens Of the 25 taxa of epiphytic lichens recorded during this study in Pretoria, the most frequent
species were Candelaria concolor (18.2% occurrence), Parmotrema austrosinense (12.2%),
Heterodermia speciosa (11.9%), Flavopunctelia flaventior (8.3%), Hyperphyscia adglutinata
(7.7%), Pyxine cocoes (7.2%), F. soredica and Lepraria spp. (6.4%), Canoparmelia texana
(6.1%) and Culbersonia nubila (3.3%) (Figure 4.1). The percentage occurrences of
Hyperphyscia pandani and Physcia tribacia were 3.0%. Physcia biziana occurrence was 1.4%,
whereas the rest of the species had less than 1% occurrence; this means they were found
only once. More than half of the species belong to the family Physciaceae.
As shown in Figure 4.2, the majority of the species recorded in this study are subtropical to
tropical (31%), tropical (17%) and tropical-temperate (17%), making a total of 65%. The
subtropical (9%) and subtropical-temperate (9%) taxa amount together to 18%. The
cosmopolitan species are 9%, while the Mediterranean-subtropical (4%) and Mediterranean-
mild temperate (4%) are 8% of the study samples.

60
Figure 4.1. Frequency occurrence (%) of the different lichen species at the investigated sites
(n=362; n= number of lichen specimen collected)
Figure 4.2. World distribution (phytogeography) of the collected lichen species in percentage
occurrence (n=25; n = number of recorded species)
The lichen diversity (in terms of number of species on the three different phorophytes,
Jacaranda mimosifolia, Acacia caffra and A. karroo) does not differ much (17, 18 and 19 taxa
respectively) (Figure 4.3). However, cosmopolitan and more disturbance-tolerant species

61
such as Candelaria concolor and Hyperphyscia adglutinata are more common on alien
Jacaranda (blue bars). Most of the rare species collected in Pretoria such as Chrysothrix
xanthina, Dirinaria applanata, Parmotrema reticulatum and Rinodina sp. were found growing
exclusively on native A. karroo. A. caffra usually hosts more common and widespread species.
Figure 4.3. Differences in species distribution between the phorophytes and lichen diversity
on each tree species
Most of the recorded species are foliose-narrow lobed (60%), followed by foliose-broad-lobed
species (24%), while leprose (8%) and crustose (8%) lichens are rare (Figure 4.4). No
fruticose lichens were found.
The greater diversity of specimens collected is found in protected sites such as Pionier
Museum, Rietvlei Nature Reserve and Groenkloof Nature Reserve (Figure 4.5). Followed by
Sunnyside (low traffic area), Lotus Gardens, Hercules, Waterkloof and Magalies. The sites
with lower diversity are Pretoria central and Pretoria West (industrial area, Staal Road),
hosting only the widespread Candelaria concolor. At SANBI and Voortrekker Monument
(protected areas) a higher diversity of lichens was observed, but only Pyxine petricola was
collected there, as no collecting permit was available during the first phase of the study.

62
Figure 4.4. Percentage occurrence of growth forms of the recorded species
Figure 4.5. Number of specimens collected at each site

63
4.2 Simplified identification key to the most common species on trees
A preliminary simplified identification key to the most common species found on trees in the
city was developed. This can be used in the field, e.g. during monitoring, or in the laboratory,
even without an optical microscope. But the use of a good magnifying glass, binocular
microscope and of a UV-lamp is recommended. The key and more detailed descriptions of
species are going to be published in Bothalia.
1a Thallus crustose (crust-like or whole surface granular)…..……………….………………… 2
2a Thallus leprose (surface entirely granular, without corticated thallus).……………….... 3 3a Thallus bright yellow to yellowish green …………………………Chrysothrix xanthina
3b Thallus whitish to blue-grey, rarely pale yellowish green, sterile ..……..….. Lepraria
2b Thallus not leprose (crust-like, ± corticated, at least in some parts) .…………………. 4
4a Thallus crustose, thin with small black, lecideine (without a corticated thalline
margin) apothecia, 0.2-0.6 mm diam., superficial ...….…………Amandinea natalensis
4b Thallus crustose, thick with lecanorine (with a corticated thalline margin)
…………………………………… …….. Rinodina sp.
1b Thallus foliose (leaf-like, with an upper and lower cortex ±easily separable from the
substratum of growth)………………………………………………………………….………….…5
5a Thallus small foliose (lobes less than 2 mm wide) ………………………………………. 6
6a Thallus yellow, lobes branched and up to 0.5 mm wide; minutely granular isidia and
soredia marginal and laminal present ..……………………………Candelaria concolor
6b Thallus white to pale grey, dark grey or brownish grey, with or without pruina…..…7
7a Tightly adnate, small foliose thalli, almost crustose in appearance, brownish grey
to grey, lower surface pale to black, without (or with few) rhizines; Cortex PD-, K-,
KC-, C-……………………………………………………………………………………...8
8a Thallus with soralia ……………………………………………………………….. 9
9a Thallus orbicular to irregular to 2 cm diameter, closely or loosely adnate;
soralia laminal, maniculiform or capitate, near lobe apices with marginal
granular soredia; medulla white …….……………….. Hyperphyscia adglutinata
9b Thallus orbicular up to 3 cm in diameter, firmly adnate to substrate, upper
surface usually paler at the lobe tips; soralia laminal, maculiform, capitate to
crateriform, occasionally confluent and covering central parts of the thallus,
often dark coloured or rusty red; medulla orange-red to red-brown (with
skyrin) … …. Hyperphyscia pandani
9c Thallus usually orbicular to 2 cm in diameter firmly adnate to substrate,
distinctly lobate at margins; thallus mostly with a white to blue-grey pruina;

64
soralia starting as marginal, delimited patches on inner lobes, developing into
more or less confluent soredia-covered areas with granular to almost isidiate
soredia, medulla white …………………………………... Hyperphyscia pruinosa
8b Thallus with isidia ………………………………………………………………. 10
10a Thallus without pruina; isidia globular; medulla orange to red (skyrin)
mainly in the lowest part ………………………...….. Hyperphyscia granulata
10b Thallus mostly with a whitish, thin pruina; isidia cylindrical, sometimes
coralloid to 0.5 mm high, often crowded; medulla white
…………………………………………………………..…Hyperphyscia isidiata
7b Lobes non-tightly adnate, and not crustose in appearance ……..……………. ..11 11a Thallus K+ yellow …………………..……….….………………………………. 12
12a with apothecia; rhizines scattered, white to dark grey; medulla K-
………………………………………………………………….…... Physcia biziana
12b without apothecia, with laminal soralia ………………………………...…. 13 13a Soralia crateriform to almost capitate; thallus to 5 cm in diameter;
lower surface white to weakly brownish grey, rhizines white to dark grey;
medulla K+ yellow ……………………………….………….. Physcia poncinsii
13b Soralia crateriform,± capitate; thallus to 3 cm diameter, lower surface
black except at tips, rhizines black; medulla K+ yellow
………………………………………………………….…..... Physcia erumpens
13c Soralia hemispherical, sometimes erose and crateriform; thallus to 6
cm diameter, white; lower surface dark grey to black without rhizines;
medulla K- ………………………………………….…Dirinaria applanata
12c mostly without apothecia, with marginal soralia .……..……..………...… 14 14a Upper surface grey to dark grey and frosted; lobes loosely adnate to
ascending to 2 mm wide, tips rounded ….……….………Physcia undulata
14b Upper surface whitish grey to dark-grey or cream coloured, glossy and
epruinose or rarely pruinose, with darker margins; lobes to 1 mm wide
…………………………………………………………..…... Physcia tribacia
14c Upper surface cream-colored or brownish to bluish gray, ± shiny, the
lobe-tips sometimes darkening, very rarely pruinose; lobes plane, not
ascending; soredia gray to bluish gray, in labiate soralia on lateral lobes
………………………………………………….………Heterodermia speciosa
11b Thallus K- ……………………………………………………………………….. 15
15a Thallus appressed but loosely adnate to 4 cm in diameter, lobes 1-3 mm
wide, rounded and overlapping; upper surface gray, usually with bluish tint,
evenly pruinose; soralia marginal first and then laminal; lower surface mostly

65
pale, moderately rhizinate, the rhizines simple to irregularly furcate, pale;
thallus UV- ……………………………………………………Culbersonia nubila
15b Thallus closely attached to 10 cm in diameter, lobes to 1 mm wide; upper
side white to yellowish grey with a distinct and patchy pruina; soralia marginal;
lower surface dark, with black rhizines. Apothecia common to 1.5 mm in
diameter without pruina; thallus UV+ yellow …………………. Pyxine cocoes
15c Thallus more or less closely appressed to 5 cm in diameter, lobes flat to
0.7-1 mm wide; upper side gray, greenish gray or whitish with pruina;
pseudocyphellae present sparse, laminal and marginal, usually restricted to
the peripheral parts of the lobes, sometimes reticulate; soralia absent; lower
surface black, paler towards lobe tips, with black rhizines. Apothecia common
to 1.5 mm in diameter without pruina; thallus UV+ yellow …. Pyxine petricola
5b Thallus broad foliose (lobes more than 2 mm wide) ………….……………………….. 16
16a Lobes usually more than 1 cm wide, with a distinct marginal zone without rhizines
on the underside; thallus pale grey to grey ……………………………………………… 17
17a Lobes 1-3 cm wide, rounded, without cilia; upper cortex weakly maculate;
thallus C+ yellow, P-; underside black; soralia marginal and sub marginal; medulla
K-, C+ red, P- …………………………………..……………Parmotrema austrosinense
17b Lobes 0.5-1.5(2) cm wide, rounded to deeply incised, ciliate; upper cortex
reticulately maculate and cracked; thallus C-, P+ yellow; soralia laminal or marginal,
linear to orbicular/subcapitate; medulla K+ yellow turning red, C-, P+ orange
…………………………………………………………………… Parmotrema reticulatum
16b Lobes usually less than 1 cm wide, without a distinct marginal zone without
rhizines on the underside; thallus pale grey or yellowish-green ………………………. 18 18a Thallus grey, closely adnate, lobes mostly 2-4 mm wide with a wrinkled surface
and course, granular, laminal soredia mainly along the crests of the wrinkles,
maniculae absent or very inconspicuous; lower surface dull reddish brown
darkening to almost black in the centre of the thallus. Photobiont green. Medulla
white. Chemistry: Soralia and medulla PD-, K-,C-, KC- or KC+ faint purple, UV+
bright blue-white (divaricatic acid)… …………….....Canoparmelia texana
18b Thallus greenish yellow to yellow-green; lobes sometimes with white maculae;
pseudocyphellae common; soredia in round, laminal soralia arising from
pseudocyphellae, sometimes coalescing; medulla K-, C+ red, P-
…………………………………………………………………… Flavopunctelia flaventior
18c Thallus pale green, greenish yellow to yellow-green; lobes frequently with white
maculae; pseudocyphellae absent or rare; soredia mostly in marginal soralia;
medulla K-, C+ red, P- ……….………………………….……. Flavopunctelia soredica

66
4.3 Phylogenetic position of Culbersonia nubila The genus Culbersonia was hitherto thought to belong to the family Physciaceae Zahlbr.
because its morphology resembles that of the genus Physconia Poelt (Esslinger, 2000).
During this study and according to phylogenetic analyses of collected specimens, it has been
demonstrated that it belongs to the family Caliciaceae (Aptroot et al., 2019). For more
information on methods and the sequencing results of Culbersonia nubila, see Appendix 13
(published paper).
4.4 Monitoring results
4.4.1 Descriptive statistics Table 4.1 below reports on the descriptive statistics regarding the air pollution and climate data available from five measuring stations (Booysens, Mamelodi, Pretoria West,
Oliovienhoutbosch and Rossylin Monitoring station) for eight years, from 2010 to 2017. These
stations were relatively close to the sampling areas. The annual average values of the different
parameters were used for elaboration.
Table 4.1. Descriptive statistics for the average annual values of air pollution and climate variables
Variables Mean SD Median Min Max CV National limit
CO (Carbon monoxide) 0.84 0.25 0.62 0.62 1.19 30.13 10
NO (Nitric oxide) 19.91 2.21 21.81 16.93 21.81 11.08 50
NO2 (Nitrogen dioxide) 17.02 7.74 11.65 11.65 28.96 45.46 40
NOx (Nitrogen oxide) 36.97 3.27 35.41 33.18 41.9 8.85 50
O3 (Ozone) 16.09 4.83 11.94 11.94 22.68 30.01 120
PM10 (Particulate matter) 82.28 35.19 64.78 43.6 135.62 42.76 40
SO2 (Sulphur dioxide) 4.85 0.5 5.3 4.29 5.3 10.3 50
PRES (Atmospheric pressure) 387.25 201.29 208.7 208.7 657.79 51.98
RAIN (Rainfall) 60.33 50.71 105.61 3.29 105.61 84.06
SOL (Solar radiation) 130.19 90.35 51.14 51.14 266.1 69.4
PM10 has a mean annual value of 82.28 µg/m3, which is higher in comparison to national limits
(40 µg/m3). NOx has mean annual value of 36.97 ppb and compared to national limits, it is low
(50 ppb). NO is lower than national limits (50 ppb) with a mean annual value of 19.91 ppb.
NO2 has a mean value of 17.02 ppb and is lower than the limits reported for RSA (40 ppb). O3
with mean 16.09 µg/m3 is low compared to national limits (120 µg/m3). SO2 with mean value
of 4.85 (ppb) is also low compared to national limits (50 ppb) as is CO (mean: 0.84 ppb) in

67
comparison to national limits (10 ppb). The national limits are reported in
https://www.gov.za/documents/national-environmental-management-air-quality-act-national-
ambient-air-quality-standards (accessed 30 September 2019).
PRES has mean values of 387.25 (kPa), with Standard Deviation (SD): 201.29, min and max:
208.7 and 657.79 respectively; Coefficient of Variation (CV): 51.98. The mean value of SOL
is 130.19 (W/m2); SD: 90.35; min and max: 51.14 and 266.1 respectively; CV: 69.4. RAIN
shows (mean values of 60.33 mm/year; SD: 50.71; min and max: 3.29 and 105.61
respectively; CV: 84.06).
Table 4.2. shows the average monthly values of air pollution and climate data from the five
monitoring stations. The variables RAIN and SOL were excluded from the subsequent
analyses because the data set was not complete nor therefore reliable.
Table 4.2. Average monthly values of the selected variables in the five monitoring stations for the period 2010 to 2014 (5 years)
Monitoring station CO (ppb)
NO (ppb)
NO2 (ppb)
NOx (ppb)
SO2 (ppb)
O3 (ppb)
PM10 (µg/m3)
HUM (%)
PRES (hPa)
TEMP (° C)
WIND DIR (°)
WIND SPEED (m/sec)
Booysens 1.113 7.364 7.739 16.48 3.249 16.8 37.08 60.47 834.4 19.45 153.7 1.311
Mamelodi 1.687 34.36 69.41 78.3 2.893 24.46 44.94 54.67 774.6 19.04 116.5 1.776
Oliovienhoutbosch 0.507 17.41 10.68 25.4 3.54 22.45 56.69 55.7 754.6 18.46 169.3 2.131
PTAWest 0.618 10.94 15.15 24.92 5.343 19.57 104.1 NA 781.6 17.28 183.5 2.414
Rosslyn 0.747 7.308 12.15 19.11 5.394 22.64 23.14 50.97 906.8 18.9 184.3 1.876
There is a difference in pollutant concentration between the monitoring stations. The highest
values for pollutants, exceeding national limits, were found for PM10 in Pretoria West (PTA),
Oliovienhoutbosch and Mamelodi. Booysens and Rosslyn have lower values than the national
limit of 40 µg/m3. For NO, the highest value was recorded at Mamelodi and Oliovienhoutbosch,
whereas PTA West, Booysens and Rosslyn have much lower values. For NO2 and NOx, the
highest value, exceeding national limits, was found at Mamelodi, while all other stations have
much lower values. In Oliovienhoutbosch, PTAWest, Rosslyn and Booysens, much lower
values were recorded for NO2 and NOx. In contrast to the concentration of the NO compounds,
the highest values of SO2 were recorded at Rosslyn and PTAWest; these are however below
the national limits. O3 has the highest value at Mamelodi similarly to NO-compounds, followed
by Rosslyn, Oliovienhoutbosch, PTA West and Booysens. But these values are below the
national limit of 120 µg/m3. The highest value of CO was also observed at Mamelodi (but it

68
does not exceed national limits) followed by Booysens, Rosslyn, PTAWest and
Oliovienhoutbosch, which show much lower values.
There is a climatic difference between the stations. Humidity ranges from 54.65 to 60.47
(higher value in Booysens). Pressure ranges from 754.6 µg/m3 to 906.8 µg/m3 (higher value in
Rosslyn). Temperature ranges from 17.28°C to 19.45°C (higher value in Booysens). Wind
direction ranges from 116.5° to 184.3° (higher value in Rosslyn) between stations whereas
wind speed ranges from 1.311 m/sec to 2.414 m/sec (higher value in PTAWest).
Descriptive statistics of the variables related to site and tree features (altitude, distance from
emission sources and tree circumference) and to lichen diversity data (Lichen Diversity
Value (LDV)), frequency occurrence of each lichen species) are reported in Table 4.3. One
hundred and sixty-four trees, belonging to the investigated species (A. caffra: 24, A. karroo:
70, J. mimosofolia: 70) were sampled from 29 sites (2-16 trees per site), according to the
methodology reported in Chapter 3.
Regarding lichen species, Candelaria concolor (mean: 16.51; SD: 5.45; median: 20; min and
max: 0 and 20 respectively), Hyperphyscia adglutinata (mean: 8.12; SD: 6.33; median: 8; min
and max: 0 and 20 respectively), Lepraria spp. (mean: 5.98; SD: 7.61; median: 1; min and
max: 0 and 20 respectively) and Parmotrema austrosinense (mean: 6.73; SD: 6.2; median: 5;
min and max: 0 and 20 respectively) have higher frequency occurrence as shown by mean
and median values in contrast to other species. However, SD, the range between minimum
and maximum values, is relatively high for some species as indicated in Table 4.2, this
showing high variability among trees. Species with the lowest frequency occurrence are
Hyperphyscia granulata (mean: 0.25; SD: 1.86; median: 0; min and max: 0 and 18
respectively), Hyperphyscia pandani (mean: 0.01; SD: 0.11; median: 0; min and max: 0 and 1
respectively), Physcia undulata (mean: 0.1; SD: 0.71; median: 0; min and max: 0 and 7
respectively) and Pyxine petricola (mean: 0.09; SD: 0.47; median: 0; min and max: 0 and 4
respectively). LDV is in average of 53.26 with an SD of 32.67 and CV of 61.35.
Concerning environmental and tree parameters, the mean altitude is 1357 m a.s.l. with an SD
of 70.2 and a low CV. The mean distance from emission sources is 0.4 km, with an SD of 1.28
and high CV. Tree circumference has mean value of 87.34 cm with an SD of 16.13 and CV of
18.47.

69
Table 4.3. Descriptive statistics of the variables related to site, tree level and to lichen diversity data
Variables Mean SD Median Min Max CV Si
te a
nd
tree
leve
l da
ta Altitude 1357 70.2 1343.5 1233 1536 5.17
Distance from emission sources 0.4 1.28 0.03 0 10.01 324.34
Tree circumference 87.34 16.13 86 56 142 18.47
Lich
en d
iver
sity
dat
a
LDV 53.26 32.67 49.5 3 140 61.35
Candelaria concolor 16.51 5.45 20 0 20 33.03
Canoparmelia texana 0.93 2.35 0 0 14 253.41
Culbersonia nubila 1.63 3.05 0 0 17 186.75
Flavopunctelia flaventior 1.8 3.46 0 0 15 192.6
Flavopunctelia soredica 3.71 6 0 0 20 161.65
Heterodermia speciosa 2.43 4.38 0 0 19 180.46
Hyperphyscia adglutinata 8.12 6.33 8 0 20 77.98
Hyperphyscia granulata 0.25 1.86 0 0 18 744.55
Hyperphyscia pandani 0.01 0.11 0 0 1 902.76
Lepraria spp. 5.98 7.61 1 0 20 127.18
Parmotrema austrosinense 6.73 6.2 5 0 20 92.15
Physcia tribacia 2.8 3.61 1 0 17 128.93
Physcia undulata 0.1 0.71 0 0 7 728.95
Pyxine cocoes 2.21 3.07 1 0 14 138.76
Pyxine petricola 0.09 0.47 0 0 4 511.16
4.4.1.1 Comparison of habitat and land use types Two classes of land use were distinguished for analysis: “Industrial areas and busy roads”,
which includes industrial, urban and rural areas with higher levels of human disturbance due
to traffic and pollution, and “Parks and nature reserves”, which includes savanna, private
gardens and more natural areas or with less human disturbance. Table 4.4. reports the
descriptive statistics of sites and of lichen variables under the two classes of land use. “Parks
and nature reserves” show significantly higher Lichen Diversity Values (LDV) than “Industrial
areas and busy roads”. This is also confirmed by the Wilcoxon test (p<0.001) as shown in
Figure 4.6. In particular, mean LDVs are 40.44±23.37 and median LDVs 38.5 in “Industrial
areas and busy roads”. In “Parks and nature reserves” mean LDVs are 88.2±28.77 and
median values 83.5. However, the variability of LDVs among sites is quite high as shown by
SD and Min-Max-values. In “Industrial areas and busy roads” LDVs range between 3 and 97,
and in “Parks and nature reserves” between 43 and 140. All species are more frequently found
in parks and reserves with the exception of Hyperphyscia granulata which is more frequently
found in industrial areas and along busy roads.

70
Table 4.4. Descriptive statistics of the values of the variables in the two classes of land use (only species occurring at least more than 5% considered in the analysis)
Variables Industrial areas and busy roads Parks and nature reserves
Mean±SD Median Min-Max CV Mean±SD Median Min-Max CV
Altitude 1333.46±56.06 1331 1233-1536 4.2 1421.2±64.97 1451 1305-1505 4.57 Distance.emission.sources 0.15±0.92 0.01 0-10.01 615.51 1.07±1.8 0.45 0.25-7.5 169.3
Tree.circumference 89.3±16.29 89.5 56-142 18.25 82±14.54 78 60-110 17.73 LDV 40.44±23.37 38.5 3-97 57.77 88.2±28.77 83.5 43-140 32.62
Candelaria.concolor 15.82±5.89 19 0-20 37.23 18.36±3.43 20 4-20 18.68 Canoparmelia.texana 0.25±0.76 0 0-5 303.48 2.77±3.81 1 0-14 137.58
Culbersonia.nubila 0.82±1.56 0 0-7 189.65 3.84±4.66 2 0-17 121.33 Flavopunctelia.flaventior 0.96±2.21 0 0-14 230.13 4.09±4.97 1.5 0-15 121.46 Flavopunctelia.soredica 1.57±3.21 0 0-17 205 9.57±7.75 9 0-20 81.03 Heterodermia.speciosa 0.77±1.81 0 0-10 235.97 6.95±5.91 6.5 0-19 85.04
Hyperphyscia.adglutinata 7.48±6.45 6.5 0-20 86.13 9.84±5.72 10.5 0-20 58.1 Hyperphyscia.granulata 0.34±2.17 0 0-18 635.48 0±0 0 0-0 NA Hyperphyscia.pandani 0±0 0 0-0 NA 0.05±0.21 0 0-1 463.56
Lepraria spp. 3.12±5.4 0 0-20 173.27 13.8±7.3 17.5 0-20 52.91 Parmotrema.austrosinense 5.68±5.9 4 0-20 103.78 9.59±6.18 10 0-20 64.4
Physcia.tribacia 1.96±2.59 1 0-12 132.13 5.09±4.85 6 0-17 95.18 Physcia.undulata 0.08±0.54 0 0-5 716.09 0.16±1.06 0 0-7 663.32
Pyxine.cocoes 1.55±2.66 0 0-14 171.15 4.05±3.4 3.5 0-11 84.12 Pyxine.petricola 0.08±0.4 0 0-3 481.59 0.11±0.62 0 0-4 543.99
Figure 4.6. Wilcoxon test of LDV values in the two land use classes

71
4.4.1.2 Comparison of phorophytes Table 4.5 reports the descriptive statistics of selected ecological variables concerning site and
tree features (Altitude, Distance from emission sources, Tree circumference) and the most
common lichen species for the three different phorophytes. Regarding species distribution on
the tree species, the species less frequently found on exotic Jacaranda and more common on
Acacias are: Canoparmelia texana, Flavopunctelia flaventior, F. soredica, Heterodermia
speciosa, Hyperphyscia adglutinata, Lepraria spp., Parmotrema austrosinense, Physcia
tribacia, P. undulata and Pyxine cocoes.
Candelaria concolor is only slightly more frequently found on Acacias than on Jacaranda. The
frequency of Hyperphyscia granulata and Pyxine petricola is higher on Jacaranda in contrast
to A. karroo and A. caffra. Between the two Acacias there are also some differences:
Culbersonia nubila, Flavopunctelia flaventior, F. soredica, Lepraria spp., Parmotrema
austrosinense and Pyxine cocoes more common on A. karroo. On the contrary, Heterodermia
speciosa, Hyperphyscia adglutinata, H. pandani, Physcia tribacia and P. undulata are slightly
more frequent on A. caffra.
The Jacarandas in this study were closer in distance from emission sources when compared
to both A. karroo and A. caffra. This is because these trees were found mostly downtown and
next to the industries. A. caffra and A. karroo have smaller average tree circumferences than
Jacarandas. Both Acacias are also found at slightly higher altitudes in comparison to
Jacarandas.
LDVs are significantly different on the three species as also confirmed by the Kruskal-Wallis
test (p<0.001, Figure 4.7), especially on Jacaranda in comparison to the two Acacias.
Jacaranda trees show the lowest average LDV (mean±SD: 34.39±19.85; median: 35.5)
compared with Acacia karroo (mean±SD: 68.34±35.48; median: 67.5) and A. caffra
(mean±SD: 64.29±26.52; median: 58). The Wilcoxon tests between plots with Jacaranda vs
A. karroo and of Jacaranda vs A. caffra are very significant (see Table 4.6). The two species
of Acacia show similar LDVs as confirmed also by the W and p-values of Wilcoxon test (see
also Table 4.7 that shows the number of investigated trees for the different species). A. karroo
has the highest average and median LDVs, but also the highest SD.

72
Table 4.5. Descriptive statistics of the values of the variables for the different tree substrates
Variables Acacia caffra
Acacia karroo
Jacaranda mimosifolis
MEAN± SD MEDIAN MIN- MAX CV MEAN± SD MEDIAN MIN- MAX CV MEAN± SD MEDIAN MIN- MAX CV
Altitude 1353.12±64.38 1346.5 1262-1456 4.76 1364.41±83.63 1342 1233-1505 6.13 1350.91±56.28 1344.5 1292-1536 4.17
Distance.emission.sources 0.63±0.28 0.6 0.3-1.2 43.88 0.56±1.53 0.1 0-7.5 274.19 0.15±1.2 0 0-10.01 777.29
Tree.circumference 80.21±15.94 76 56-107 19.87 82.87±14.81 79 60-130 17.87 94.26±14.97 92 60-142 15.88
LDV 64.29±26.52 58 8-131 41.25 68.34±35.48 67.5 5-140 51.92 34.39±19.85 35.5 3-87 57.72
Candelaria concolor 18.17±3.68 20 4-20 20.25 16.91±5.6 20 0-20 33.09 15.53±5.68 18 2-20 36.59
Canoparmelia texana 1.54±3.71 0 0-14 240.41 1.46±2.65 0 0-13 182.02 0.19±0.67 0 0-4 358.5
Culbersonia nubila 0.38±0.92 0 0-4 246.33 2.96±4.05 1 0-17 136.9 0.74±1.48 0 0-7 199.38
Flavopunctelia flaventior 1.42±3.61 0 0-15 254.86 3.16±4.04 2 0-15 127.91 0.57±2.06 0 0-14 360.71
Flavopunctelia soredica 3.17±4.04 1 0-12 127.57 6.5±7.37 2 0-20 113.35 1.11±3.25 0 0-17 291.72
Heterodermia speciosa 4.17±4.91 2.5 0-14 117.93 3.64±5.3 1 0-19 145.56 0.61±1.8 0 0-10 293.69
Hyperphyscia adglutinata 11.54±5.73 11.5 0-20 49.67 8.34±6.05 8 0-20 72.46 6.71±6.4 5 0-20 95.35
Hyperphyscia granulata 0±0 0 0-0 NA 0.27±2.15 0 0-18 793.21 0.31±1.88 0 0-15 597.21
Hyperphyscia pandani 0.04±0.2 0 0-1 489.9 0.01±0.12 0 0-1 836.66 0±0 0 0-0 NA
Lepraria spp. 7.17±7.53 5.5 0-20 105.12 9.9±8.6 11 0-20 86.84 1.66±2.97 0 0-13 179.39
Parmotrema austrosinense 6.29±6.36 5.5 0-20 101.12 9.23±5.97 10 0-19 64.73 4.39±5.45 2 0-20 124.36
Physcia tribacia 7±4.99 6.5 0-17 71.24 2.51±2.72 2 0-11 108.29 1.64±2.73 0 0-12 166.47
Physcia undulata 0.29±1.43 0 0-7 489.9 0.04±0.36 0 0-3 836.66 0.09±0.61 0 0-5 709.04
Pyxine cocoes 3.21±3.35 2.5 0-11 104.38 3.26±3.57 2 0-14 109.73 0.83±1.54 0 0-8 186.03
Pyxine petricola 0.04±0.2 0 0-1 489.9 0.09±0.5 0 0-4 587.31 0.11±0.5 0 0-3 435.41

73
Figure 4.7. Distribution of LDV values for the three tree species
Table 4.6. Wilcoxon test between pairs of tree species
Acacia caffra - Acacia karroo: Wilcoxon rank sum test with continuity correction data: LDV by Tree.species W = 779.5, p-value = 0.6028 alternative hypothesis: true location shift is not equal to 0 Acacia karroo - Jacaranda
Wilcoxon rank sum test with continuity correction data: LDV by Tree.species W = 3885, p-value = 2.242e-09 alternative hypothesis: true location shift is not equal to 0 Acacia caffra - Jacaranda
Wilcoxon rank sum test with continuity correction data: LDV by Tree.species W = 1398, p-value = 1.328e-06 alternative hypothesis: true location shift is not equal to 0 LDV sampled in the three tree species are significantly different (Kruskal-Wallis test, p<0.001). The main differences are drived by the Jacaranda trees. The two species of Acacia show similar LDV.

74
Table 4.7 Descriptive statistics of LDV at tree and site level
Spatial level N Mean ± SD Median Min-Max Tree total 164 53.3 ± 32.7 49 3-141
Acacia caffra 24 64.4 ± 26.5 58.5 8-132 Acacia karroo 70 68.3 ± 35.5 68.5 5-141
Jacaranda mimosifolia 70 34.5 ± 19.9 35 3-87 Site 29 46.7 ± 24.8 44.5 10.7-113.7
4.4.1.3 Comparison of sites LDV values measured at each site are reported in Figure 4.8. The highest LDV values were
observed in the protected areas such as Site 24 (Voortrekker Monument Nature Reserve),
Site 6 (SANBI Botanical Garden), Site 5 (Groenkloof Nature Reserve), Site 9 (Rietvlei Nature
Reserve) and Site 4 (Pionier Museum). Higher values were also found at site 25 (Suiderberg),
which is characterised by low traffic. On the contrary, the sites with lower lichen diversity were
Site 27 (The Willows 340-Jr,), Site 28 (Mamelodi), Site 22 (Hatfield) and Site 16 (Pretoria
Central Business District, Nana Sita Street), all characterised by high traffic and tree
disturbance.

75
Figure 4.8. LDV values measured at each site (n: 29)
4.4.2 A naturality/alteration interpretative scale A naturality/alteration interpretative scale was developed based on the percentile deviations
from the maximum lichen diversity observed in the study area (Figure 4.9, Table 4.8). All
examined sites were attributed to five naturality/alteration classes:
1) Lichen desert (LDV 0)
2) Alteration (LDV 1-35)
3) Semi-alteration (LDV 35-70)
4) Semi-naturality (LDV 70-100)
5) Naturality (LDV ˃ 100)

76
Table 4.8. A naturality/alteration interpretative scale based on the percentile deviations
min 3 10° percentile 13 20° percentile 23 30° percentile 35 40° percentile 43 50° percentile 49.5 60° percentile 55 70° percentile 67.1 80° percentile 79.2 90° percentile 96.1 95° percentile 124.1 98° percentile 134.7 max 140
Figure 4.9. Percentile distribution of the LDV values detected at site level
The number of sites (n=29) within the five selected naturality/alteration classes is reported
below in Figure 4.10. Most sites have LDVs between 1 and 70 (alteration and semialteration),
while conditions of seminaturality (LDV 70-100) and of naturality (LDV>100) are poorly
represented. A “lichen desert” condition was never found.

77
Figure 4.10. Distribution of LDV values at site level (n=29) categorised into five
naturality/alteration classes
Figure 4.11. Interpolated LDV map of the study area with air monitoring stations, monitoring
sites, main roads and five naturality/alteration classes
The alteration class (LDV 1-35) comprises industrial, urban and rural areas such as Mamelodi,
Pretoria central business district, Pretoria west (Staal road) and Philip Nel among others. The

78
semi-alteration class (LDV 35-70) comprises, for instance, the sites Magalies, Mayville,
Waterkloof and Pionier Museum. To the semi-naturality class (LDV 70-100) belong parks and
nature reserves, like Rietvlei Nature Reserve, Groenkloof Nature Reserve, SANBI and
Suiderberg. Voortrekker Monument Nature Reserve represents the only naturality class
(LDV > 100).
Most trees found in “Industrial areas and busy roads” belong to the class “semi-alteration” and
“alteration” (50+56), only 14 to the “semi-naturality” class, while no tree from sites with this
land use type occur under the class “naturality”. No trees belonging to the class “alteration”
are found in “Parks and natural reserves”. Thirteen trees from these sites are found in the
class “semi-alteration”, 16 in “semi-naturality and 15 in “naturality” (Table 4.9).
Table 4.9. Number of trees and Mean LDV under the 5 naturality/alteration classes and their distribution under the two land use categories
LDV Naturality/alteration classes
Mean LDV
N trees
Industrial areas and busy roads
(n=120)
Parks and natural reserves
(n=44)
0 lichen desert - 0 0 0
0-35 alteration 18.5 50 50 0
35-70 semi-alteration 50.8 69 56 13
70-100 semi-naturality 82.4 30 14 16
>100 naturality 122.6 15 0 15
As shown in Table 4.10, Jacaranda mimosifolia is exclusively found in “Industrial areas and
busy roads” and is most frequent in the class “alteration”, but also common in the “semi-
naturality” class. Acacia caffra trees are found both in “Industrial areas and busy roads“ and
in “Parks and nature reserves“, but this tree species is more frequent in the last land use type
and in the classes “semi-alteration” and “semi-naturality”. A. karroo also occurs under both
land use types, but is more common in “Industrial areas and busy roads” rather than in “Parks
and nature reserves”. It is also more common in the classes “semi-alteration” and “semi-
naturality”. Considering all tree species, trees belonging to “Industrial areas and busy roads”
occur more frequently in the classes “alteration” and “semi-alteration”, while the tree species
found in “Parks and nature reserves” follow within the categories “semi-alteration” to
“naturality”.

79
Table 4.10. Comparison of host tree species (phorophytes) with regard to their occurrence in the five naturality/alteration classes and within the two land use types
Total Land use Industrial areas
and busy roads Parks and
nature reserves Jacaranda mimosifolia
N of trees 70 70 0 Mean LDV 34.4 34.4 -
LDV, range min-max 3 - 87 3 - 87 - Naturality/alteration classes (n trees, %)
lichen desert 0 (0%) 0 (0%) - alteration 35 (50%) 35 (50%) -
semi-alteration 4 (6%) 4 (6%) - semi-naturality 31 (44%) 31 (44%) -
naturality 0 (0%) 0 (0%) - Acacia caffra
N of trees 24 4 20 Mean LDV 64,3 29,7 71,2
LDV, range min-max 8 - 131 8 - 43 43 - 131 Naturality/alteration classes (n trees, %)
lichen desert 0 (0%) 0 (0%) 0 (0%) alteration 3 (13%) 3 (75%) 0 (0%)
semi-alteration 12 (50%) 1 (25%) 11 (55%) semi-naturality 6 (25%) 0 (0%) 6 (30%)
naturality 3 (13%) 0 (0%) 3 (15%) Acacia karroo
N of trees 70 46 24 Mean LDV 68,3 50,6 102,4
LDV, range min-max 5 - 140 5 - 97 53 - 140 Naturality/alteration classes (n trees, %)
lichen desert 0 (0%) 0 (0%) 0 (0%) alteration 12 (17%) 12 (26%) 0 (0%)
semi-alteration 26 (37%) 24 (52%) 2 (8%) semi-naturality 20 (29%) 10 (22%) 10 (42%)
naturality 12 (17%) 0 (0%) 12 (50%) Total
N of trees 164 120 44 Mean LDV 53,3 40,4 88,2
LDV, range min-max 3 - 140 3 - 97 43 - 140 Naturality/alteration classes (n trees, %)
lichen desert 0 (0%) 0 (0%) 0 (0%) alteration 50 (30%) 50 (42%) 0 (0%)
semi-alteration 69 (42%) 56 (47%) 13 (30%) semi-naturality 30 (18%) 14 (12%) 16 (36%)
naturality 15 (9%) 0 (0%) 15 (34%)

80
4.4.3 Multivariate analysis The results of a multivariate analysis (Principal Component Analysis, PCA) performed at tree
level for different parameters are presented in Figures 4.12 to 4.15. Lichen species present
in less than 5% of trees were excluded from the analysis. Axis 1 explains 50.29%, while Axis
2 explains 11.7% (Table 4.11).
Concerning single variables (Table 4.12), lichen diversity (LDV) correlates positively and
significantly with Axis 1 (coefficient=0.992) but much less with Axis 2 (coefficient=0.083). The
parameter “Number of species” correlates positively with Axis 1 (coefficient=0.883) but less
with Axis 2 (coefficient=0.159). Also the occurrence of the following single species correlates
positively with Axis 1: Canoparmelia texana, Culbersonia nubila, Flavopunctelia flaventior, F.
soredica, Heterodermia speciosa, Lepraria spp., Parmotrema austrosinense, and Pyxine
cocoes. Canoparmelia texana, Culbersonia nubila, Flavopunctelia flaventior, F. soredica,
Heterodermia speciosa and Lepraria spp. are negatively related to Axis 2. Distance from
emission sources" is positively related to Axis 1, while "Tree circumference" is negatively
related. In contrast, Candelaria concolor, Hyperphyscia adglutinata and Physcia tribacia are
more positively related to Axis 2 than to Axis 1. These relationships are charted in Figure 4.12.
Table 4.11. Eigen values of the PCA solution
Dimensions
1 2 3 4 5 6 7 8 9 10 11 12 13
Variance 6.537
1.524 0.988 0.805 0.678 0.58 0.506 0.444 0.328 0.293 0.173 0.142 0.002
% of variance
50.285
11.721 7.597 6.193 5.218 4.458 3.891 3.412 2.524 2.256 1.332 1.095 0.018
Cumulative % of
variance
50.285
62.006
69.603
75.796
81.014
85.472
89.362
92.774
95.299
97.555
98.887
99.982 100

81
Table 4.12. Significant correlation coefficients of the variables with Axis 1 and 2 (p<0.001)
Variables Axis 1 Axis 2 LDV 0.992 0.083
N of species 0.883 0.159 Flavopunctelia soredica 0.851 -0.317
Lepraria spp. 0.823 -0.134 Flavopunctelia flaventior 0.778 -0.092
Culbersonia nubila 0.762 -0.306 Parmotrema austrosinense 0.736 0.109
Heterodermia speciosa 0.684 -0.206 Canoparmelia texana 0.674 -0.358
Pyxine cocoes 0.570 0.282 Candelaria concolor 0.478 0.617
Hyperphyscia adglutinata 0.375 0.607 Physcia tribacia 0.159 0.509
Distance from emission sources 0.072 ns Tree circumference -0.235 ns
Figure 4.12. Loadings plot of the PCA ordination of lichen diversity parameters (LDV, N. of
species, lichen taxa)
Figure 4.13. compares LDV and lichen species within the two land use types and shows
significant differences between “Parks and natural reserves” and “Industrial areas and busy
roads”. “Parks and natural reserves” are also far from emission sources and are therefore
distinct from “Industrial areas and busy roads”, which are more directly impacted by emissions.

82
Figure 4.13. Score plot of the PCA ordination of LDV and lichen species on sampled trees
within different land use types: “Industrial areas and busy roads” and “Parks and natural
reserves”
Figure 4.14 below shows differences in LDV and lichen species composition among the tree
species. In this aspect, Jacaranda trees are clearly distinguished from Acacias, with only some
overlap with A. karroo, with Jacaranda generally closer to emission sources in contrast to the
other two species.
Figure 4.14. Score plot of the PCA ordination of LDV and lichen species on the selected tree substrates Acacia caffra, A. karroo and Jacaranda mimosifolia

83
Figure 4.15 shows which environmental variables correlate significantly with the two axes.
Axis 1 has a positive relationship with the factor “Distance from emission sources” and a
negative relationship with the parameter “Tree circumference”.
Figure 4.15. Loadings plot of the PCA ordination showing vectors with statistically significant
relationship to the environmental variables “Distance from emission sources” and “Tree
circumference”
4.4.4 Interpolation of air pollution and climate data As air pollution and climate data were only available for five monitoring stations, an
interpolation was carried out to obtain data for all 29 lichen sampling sites to test correlations
with lichen diversity variables (see 4.4.5-4.4.7). Table 4.13 shows the interpolated values
(IDW) of the air pollution, climate variables obtained with the elaboration and LDV at each site.
“Industrial areas and busy roads” are coloured orange and sites from “Parks and nature
reserves” are coloured green.

84
Table 4.13. Interpolated values (IDW) of the air pollution, climate variables and LDV obtained for the 29 lichen sampling sites
Site ID CO NO NO2 NOX PRES SO2 TEMP WIND dir
WIND Speed PM10 O3 HUM LDV
1 Pretoria West - Nkomo Street 0.73 10.3 13.8 23.4 794 4.86 17.8 177 2.16 87.72 19.1 59.5 33.9
2 Pretoria West - Staal Road 0.72 10.7 14.3 23.9 793 4.89 17.8 177 2.19 88.06 19.3 58.7 15 3 Hercules - Van Der Hoff 1.09 7.6 8.2 17.0 832 3.36 19.3 155 1.37 40.29 17.0 60.4 33 7 Waterkloof - Rigel Avenue 1.00 17.2 27.7 37.5 796 4.04 18.4 158 1.95 63.22 20.9 56.2 61
8 Muckleneuk - Celliers Street 0.84 12.3 17.9 27.5 799 4.50 18.1 169 2.04 75.12 19.6 57.6 56.5
10 Arcadia - Government Avenue 0.93 13.6 21.0 30.3 803 4.27 18.4 164 1.94 67.41 19.9 57.3 62.8
11 Queenswood - CR Swart Drive 1.22 21.4 39.0 48.2 797 3.70 18.7 145 1.85 54.83 21.7 55.8 32.4
12 Akasia - Brits Road 0.96 8.6 11.0 19.6 840 4.01 19.0 164 1.61 43.80 18.7 57.8 53
13 Mayville - Es'kia Mphahlele Drive 0.94 10.5 14.5 23.5 819 4.09 18.7 164 1.76 57.69 18.9 58.4 59.2
15 Hermanstad - Moot Street 0.93 9.4 12.0 21.1 816 4.06 18.7 165 1.74 60.31 18.3 59.6 29.8
16 Pretoria Central Business District - Skinner Street 0.75 10.9 14.9 24.5 795 4.80 17.8 175 2.15 85.38 19.3 58.6 22
17 Kameeldrift - Sefako Makgatho Drive 1.41 26.6 51.3 60.3 790 3.38 18.9 134 1.81 49.63 22.9 55.2 44.5
18 Saulsville - Masopha Street 0.83 10.8 13.5 23.2 812 4.30 18.5 169 1.90 62.23 19.5 57.4 43
19 Philip Nel Park - Transoranje Road 0.79 9.9 12.9 22.3 801 4.61 18.1 173 2.03 79.65 18.7 59.9 27.8
20 Brooklyn - Roper Street 0.98 15.5 25.0 34.4 800 4.17 18.4 160 1.95 65.65 20.4 56.7 46.8 21 Hatfield - Duxbury Road 1.04 17.0 28.4 37.8 799 4.05 18.5 157 1.92 62.94 20.7 56.4 36.8 22 Hatfield - Pretorious Street 1.07 17.7 30.2 39.6 799 3.98 18.5 155 1.90 61.07 20.9 56.3 13.5 23 Gezina - Rose Street 0.90 12.3 18.2 27.6 806 4.32 18.3 166 1.94 68.25 19.5 57.8 28.2
26 Pretoria West - Es'kia Mphahlele Drive 0.75 10.7 14.5 24.1 795 4.82 17.8 176 2.15 85.87 19.2 58.9 26.8
27 The Willows - Solomon Mahlangu Drive 1.57 31.4 62.3 71.3 780 3.08 19.0 123 1.80 47.01 23.9 54.8 10.8
28 Mamelodi - Tsamaya Avenue 1.68 34.2 69.0 77.9 775 2.90 19.0 117 1.78 45.06 24.4 54.7 13
29 Koedoespoort - N4 Highway 1.12 19.0 33.3 42.6 798 3.89 18.6 152 1.89 59.30 21.2 56.1 46
25 Suiderberg - Sarel Avenue 1.06 7.9 9.0 17.8 831 3.49 19.2 157 1.43 42.96 17.3 60.1 80 14 Magalies - Hornsnek Road 0.87 9.0 12.5 20.8 853 4.50 18.8 171 1.77 42.62 20.1 55.3 58.2
4 Pionier Museum - Keuning Drive 1.60 32.0 63.7 72.7 779 3.04 19.0 122 1.79 46.71 24.0 54.8 68.5
5 Groenkloof Nature Reserve 0.84 13.1 18.8 28.5 797 4.46 18.1 168 2.05 74.18 19.9 57.1 80.3 6 SANBI - Cussonia Avenue 1.34 24.9 47.2 56.3 790 3.49 18.8 138 1.84 52.76 22.5 55.4 82.2
9 Rietvlein Nature reserve - R21 1.00 18.6 28.9 39.1 792 3.86 18.6 155 1.94 57.88 21.5 55.8 71.8
24 Voortrekker Monument - Eeufees Road 0.71 11.1 15.2 24.9 791 4.93 17.7 177 2.22 89.90 19.5 58.2 113.7
Some of the obtained values are questionable as many sites with high traffic have low values
of NO, NO2 and NOx. For example, Site 2 (Pretoria West - Staal Road) has lower values of
these pollutants, while site 24 (Voortrekker Monument - Eeufees Road), in a more protected
area with low traffic, has higher values for those pollutants. This is despite LDV being much
higher in Voortrekker Monument compared to Pretoria West. The same results were observed
at site 6 (SANBI), with levels of NO, NO2 and NOx very high compared to site 22 (Hatfield -
Pretorious Street) which is characterised by high traffic but low values of these pollutants. As
the table shows, the LDV was higher at SANBI compared to Hatfield. This shows that LDV is
a more reliable indicator of good air quality compared to interpolated pollution data which does

85
not give a true reflection of the degree of pollution in Pretoria, due to insufficient numbers of
monitoring stations. Other interpolated pollution parameters also proved unreliable: SO2, PM10 and O3 were lowest at site 28 (Mamelodi - Tsamaya Avenue) which is however characterised
by high traffic and low LDV, while the highest values were found at Voortrekker Monument,
an area with the highest LDV.
Figures 4.16 and 4.17 show the interpolated maps for NOx and SO2 in the study area. They
confirm that interpolated data does not give true reflections. NOx is mainly concentrated in the
eastern part of the study area according to the map, whereas SO2 is concentrated in the
western and northern sites of the study area. This is erroneous and can also be explained by
the low number of monitoring stations in the municipality, which do not provide representative
data for the entire area and all investigated sites.
Figure 4.16. Interpolated map (IDW) of NOx (ppb) concentrations in the study area

86
Figure 4.17. Interpolated map (IDW) of SO2 (ppb) concentrations in the study area
4.4.5 Multiple Factor Analysis (MFA) with interpolated environmental data A Multiple Factor Analysis (MFA) was carried out with the interpolated environmental data.
Table 4.14 shows the correlation coefficients of the three groups of variables with the
dimensions of the Multiple Factor Analysis (MFA). The first two dimensions explain
respectively only 34.2% (Dim.1) and 18.4% (Dim.2) of the variance (see Figures 4.18 and
4.20). The climatic variables PRES, WIND, WINDS and HUM correlate positively with Dim.1,
whereas TEMP correlates negatively. All variables, excepting WINDS, correlate negatively
with Dim.2. PRES and TEMP correlate positively with Dim.3, WINDS negatively. Pollutants
CO, NO, NO2, NOx and O3 are negatively correlated with Dim.1, while SO2 and PM10 are
positively correlated. NO, NO2, NOx, PM10 and O3 correlate positively with Dim. 2. Correlations
with Dim. 3 are weaker and in most cases negative.
Lichen diversity (LDV) and a large group of lichen species (Candelaria concolor, Canoparmelia
texana, Flavopunctelia flaventior, F. soredica, Heterodermia speciosa, Parmotrema
austrosinense and Lepraria spp. are positively correlated with all three Dim. Physcia tribacia
is negatively related to Dim.1, but positively to the other two Dim. Hyperphyscia adglutinata
and Pyxine cocoes are significantly and positively correlated only with Dim.2 and Dim.3.

87
Table 4.14. Correlation coefficients of the variables with the three dimensions of the Multiple Factor Analysis. The highest correlations (>0.2) with the 3 dimensions are highlighted.
Groups Variables Dim.1 Dim.2 Dim.3
Clim
atic
va
riabl
es PRES 0,205 -0,774 0,517
TEMP -0,789 -0,400 0,454 WIND 0,969 -0,189 -0,062
WINDS 0,600 0,583 -0,521 HUM 0,746 -0,429 -0,018
Pollu
tant
s
CO -0,972 0,149 0,084 NO -0,859 0,483 -0,152 NO2 -0,870 0,460 -0,140 NOX -0,862 0,474 -0,150 SO2 0,944 0,060 -0,234 PM10 0,795 0,376 -0,457 O3 -0,796 0,545 -0,177
Lich
en d
iver
sity
var
iabl
es
LDV 0,391 0,579 0,703 Candelaria concolor 0,284 0,103 0,518
Canoparmelia texana 0,220 0,544 0,332 Culbersonia nubila 0,459 0,502 0,269
Flavopunctelia flaventior 0,278 0,534 0,465 Flavopunctelia soredica 0,397 0,580 0,415 Heterodermia speciosa 0,261 0,560 0,332
Hyperphyscia adglutinata 0,062 0,202 0,335 Hyperphyscia granulata 0,022 -0,045 -0,037 Hyperphyscia pandani 0,119 0,095 -0,020
Lepraria spp. 0,420 0,331 0,595 Parmotrema
austrosinense 0,232 0,410 0,544
Physcia tribacia -0,209 0,245 0,321 Physcia undulata -0,031 0,139 0,069
Pyxine cocoes 0,104 0,213 0,576 Pyxine petricola 0,081 0,121 0,009
As shown in Figures 4.18 and 4.19, the increasing gradient of lichen diversity (LDV and a large
group of species) along positive values of Dim. 1 is positively related to climatic variables such
as wind direction and speed, and humidity, and pollutants PM10 and SO2. On the contrary,
most of the other pollutants (NO, NO2, NOx, CO and O3) show an increasing gradient for
negative values of Dim.1. Almost no lichens relate to temperature (Figures 4.18 to 4.20).

88
Figure 4.18. Loadings plot of the MFA ordination. Vectors show the axes of the single PCA
performed on each of the three groups (climatic, pollutants and lichens)
Figure 4.19. Loadings plot of the MFA ordination. Vectors show the correlation of
environmental variables separated in the main three factors (climatic, pollutants and lichens)
with the three dimensions of the MFA.

89
Figure 4.20. Score plot of the MFA ordination showing the distribution of the sampled trees
and the partial contribution of the three environmental factors (climatic, pollutants and lichens)
to the variance
4.4.6 Multivariate analysis (PCA) with interpolated environmental data Table 4.15 shows the correlation coefficients of the variables with Axis 1 and 2. Axis 1 of the
ordination explains 29.8% of variance and Axis 2 17.7%. Figures 4.21 to 4.25 report the PCA
ordination results. Regarding site and tree parameters, only “Altitude” correlates significantly
and positively with Axis 2. Other correlations were not significant. Pollutants CO, NO, NO2,
NOx and O3 are positively correlated with Axis 2, but in most cases correlations are not
significant (only for O3), while their negative relationships with Axis 1 are significant. SO2 and
PM10 are positively correlated with Axis 1. The negative correlations with Axis 2 are not
significant. Significant correlations of the climatic variables with both axes are: WIND and
HUM, which correlate positively with Axis 1 and negatively with Axis 2. TEMP correlates
negatively with Axis 1. WINDS correlate positively with Axis 1 (Table 4.15).
Lichen diversity (LDV) and a numerous group of lichen species (Canoparmelia texana,
Culbersonia nubila, Flavopunctelia flaventior, F. soredica, Heterodermia speciosa, Lepraria
spp., and Parmotrema austrosinense are positively related to Axis 2 (Table 4.15).

90
Table 4.15. Correlation coefficients of the variables with Axis 1 and 2. Values >0.2 are highlighted.
PC 1 (expl. var. 29.82%)
PC 2 (expl. var. 17.67%)
Altitude 0.158 0.211 Distance.emission.sources 0.011 0.088 Tree.circumference -0.022 -0.086 CO -0.311 0.116 NO -0.277 0.197 NO2 -0.281 0.190 NOX -0.278 0.194 PRES 0.075 -0.207 SO2 0.299 -0.064 TEMP -0.245 -0.031 WIND 0.310 -0.128 WINDS 0.185 0.099 PM10 0.245 0.018 O3 -0.254 0.217 HUM 0.227 -0.210 LDV 0.167 0.328 Candelaria concolor 0.114 0.111 Canoparmelia texana 0.096 0.260 Culbersonia nubila 0.171 0.215 Flavopunctelia flaventior 0.121 0.277 Flavopunctelia soredica 0.163 0.290 Heterodermia speciosa 0.111 0.264 Hyperphyscia adglutinata 0.034 0.124 Hyperphyscia granulata 0.002 -0.032 Hyperphyscia pandani 0.042 0.030 Lepraria spp. 0.171 0.220 Parmotrema austrosinense 0.103 0.238 Physcia tribacia -0.053 0.162 Physcia undulata -0.007 0.062 Pyxine cocoes 0.058 0.174 Pyxine petricola 0.028 0.042
Positive values of Axis 2 show therefore a clear increasing gradient of lichen diversity, from
alteration to naturality classes (Figure 4.21). An increasing gradient is also present in relation
to land use in “Parks and natural reserves” (Figure 4.22), where Acacia trees (both A. karroo
and A. caffra) are mainly distributed (Figure 4.23). Lichen diversity is lower in “Industrial areas
and busy roads’ and on Jacaranda trees, which are distributed in the lower parts of plots,
having low or negative correlations with Axes 1 and 2 (Figure 4.22 and 4.23).

91
Figure 4.21. Score plot of the PCA ordination with tree substrates categorised by LDV classes
Figure 4.22. Score plot of the PCA ordination with sampled trees categorised by land use:
industrial areas and busy roads, parks and natural reserves

92
Figure 4.23. Score plot of the PCA ordination with tree substrates categorised by tree species
(Acacia caffra, A. karroo and Jacaranda mimosifolia)
In addition, SO2, wind, pressure and humidity are negatively correlated with Axis 2, even if
with low correlation values (Figure 4.24). LDV and most of the lichen species such as
Candelaria concolor, Canoparmelia texana, Culbersonia nubila, Flavopunctelia flaventior, F.
soredica, Heterodermia speciosa, Hyperphyscia adglutinata and Lepraria spp. are distributed
in the positive values of Axis 1, with an opposite trend with respect to the main atmospheric
pollutants (O3, NO, NO2, NOx and CO). These are distributed in the positive values of Axis 2,
thus showing a clear negative influence of these variables on lichen diversity (Figure 4.24).

93
Figure 4.24. Loadings plot of the PCA ordination. Vectors show the correlation of
environmental variables with the two axes.
The distribution of LDV in relation to land use and tree species is shown in Figure 4.25 below.
Independently from the phorophyte, the lowest values were found in industrial areas and busy
roads, and this is particularly evident for Jacaranda trees, that are mostly found under these
conditions. The highest lichen diversity values where found in the parks and natural reserves
where Acacia caffra and A. karroo are most frequently found.

94
Figure 4.25. Distribution of LDV values in the species substrates in relation to the two land
use categories. Boxplot: median, interquartile range, 1.5 interquartile range, outliers.
In order to explore in more detail the multivariate relationship between environmental variables
and LDV of the tree species, and to discover any specific trends, PCA was also performed
separately for each tree species. Figures 4.26 to 4.28 reported the PCA ordinations for
Jacaranda trees, Figures 4.29 to 4.31 for Acacia caffra, and Figures 4.32 to 4.34 for Acacia
karroo.
A general trend of lichen diversity is evident in relation to land use, with “industrial areas and
busy roads” showing LDV values mainly included in the alteration classes, and, on the
contrary, “parks and natural reserves” within naturality classes (Figures 4.26 to 4.27, 4.29 to
4.30 and 4.32 to 4.33). This trend is clearly related to the distribution of the atmospheric
pollutants, which are negatively correlated with LDV values and with the frequency of lichen
species (Figures 4.28, 4.31 and 4.34).

95
Figure 4.26. Jacaranda trees. Score plot of the PCA ordination with tree substrates
categorised by LDV classes
Figure 4.27. Jacaranda trees. Score plot of the PCA ordination with sampled trees categorised
by land use: industrial areas and busy roads, parks and natural reserves

96
In terms of results for Jacaranda mimosifolia, pressure and altitude are negatively correlated
with Axis 2, but positively with Axis 1, together with LDV and Candelaria concolor,
Canoparmelia texana, Culbersonia nubila, Hyperphyscia adglutinata, Parmotrema
austrosinense, and Physcia tribacia. Other species are negatively related to both axes. These
are Flavopunctelia flaventior, F. soredica, Heterodermia speciosa, Hyperphyscia granulata, H.
pandani, Lepraria spp., Physcia undulata, Pyxine cocoes and P. petricola. In contrast, the
pollutants CO, NO, NO2 and NOx are negatively related to Axis 1 and slightly positively with
Axis 2. PM10, Humidity and SO2 are positively related to both axes and show no positive
correlations with lichen diversity (Figure 4.28).
Figure 4.28. Jacaranda trees. Loadings plot of the PCA ordination. Vectors show the
correlation of environmental variables with the two axes.

97
Figure 4.29. Acacia caffra. Score plot of the PCA ordination with tree substrates categorised
by LDV classes
Figure 4.30. Acacia caffra trees. Score plot of the PCA ordination with sampled trees
categorised by land use: industrial areas and busy roads, parks and natural reserves

98
In considering the dataset of Acacia caffra, LDV and the majority of lichens are positively
related to Axis 1 and negatively to Axis 2. These species include Canoparmelia taxana,
Flavopunctelia flaventior, Heterodermia speciosa and Pyxine petricola. SO2, PM10, Altitude,
Winds and a few species such as Candelaria concolor, Culbersonia nubila, Hyperphyscia
pandani and Lepraria spp. correlate negatively with Axis 1, whereas Humidity and Pressure
correlate positively with Axis 2. The Distance from emission sources and Temperature
positively correlated with both Axis (Figure 4.31).
Figure 4.31. Acacia caffra. Loadings plot of the PCA ordination. Vectors show the correlation
of environmental variables with the two axes.

99
Figure 4.32. Acacia karroo. Score plot of the PCA ordination with tree substrates categorised
by LDV classes
Figure 4.33. Acacia karroo. Score plot of the PCA ordination with sampled trees categorised
by land use: industrial areas and busy roads, parks and natural reserves

100
In considering the dataset of Acacia karroo, CO, NO, NO2 and NOx and O3 are positively
correlated with Axis 1 while PM10 and SO2 are negatively correlated with Axis 1 and Axis 2.
Humidity and Wind are also negatively correlated with Axis 1, but positively with Axis 2.
Pressure and Temperature are positively correlated with Axis 2. LDV and the majority of lichen
species such as Canoparmelia texana, Flavopunctelia flaventior and F. soredica as well as
the Distance from Emission sources and Altitude are negatively correlated with Axis 1 and
Axis 2. Other species, such as Pyxine cocoes, Lepraria spp., but as well as Humidity, are
negatively correlated with Axis 2 (Figure 4.34).
Figure 4.34. Acacia karroo. Loadings plot of the PCA ordination. Vectors show the correlation
of environmental variables with the two axes.
4.4.7 Generalised linear regression models (GLM) with interpolated environmental data Table 4.16 reports the results of the multiple linear regression models describing the effects
of the selected environmental variables on LDV and species frequency (also see Appendix
14). The models were significant (p<0.001) for LDV and for 10 of the 15 lichen species, thus
confirming the relationship with some variables as already shown with MFA and PCA.
Although the altitude range of the study area is rather small (min-max: 1233-1536 m), this
variable is positively correlated with the frequency of Flavopunctelia flaventior (p <0.05) and
F. soredica (p <0.001).

101
The circumference of tree trunks does not correlate significantly with lichen diversity,
despite the high range of this variable on the sampled trees (median: 86 cm; min-max: 56-142
cm) see appendix 14.
Higher land use impact in industrial areas and at the proximity of busy roads is clearly
negatively related to LDV and to the frequency of the following lichens: Canoparmelia texana,
Culbersonia nubila, Flavopunctelia flaventior and F. soredica, Heterodermia speciosa,
Lepraria spp. and Pyxine cocoes.
In terms of the tree species, Acacia karroo trees show a positive relationship with lichen
diversity and an abundance of some species, such as Culbersonia nubila, Pyxine cocoes,
Flavopunctelia. flaventior, F. soredica, Lepraria spp. and Parmotrema austrosinense.
Acacia caffra is not strongly related to the variable LDV, but it is positively related with an
abundance of H. adglutinata and P. tribacia. On the contrary, it has a negative relationship
with the frequency of C. nubila, F. soredica and Lepraria. Higher atmospheric concentrations
of NOx are negatively related to LDV and the frequency of Candelaria concolor, Lepraria spp.
and Pyxine cocoes. The frequencies of Culbersonia nubila and Lepraria spp. are positively
and negatively correlated with atmospheric SO2 respectively. This pollutant does not show
any significant effect on LDV. All other relationships are not significant.

102
Table 4.16. Multiple Linear Regression Models describing the effects of the environmental variables on LDV and species frequencies. Estimated values are reported together with statistically significant p values (* p<0.05; ** p<0.01; *** p<0.001). Last column shows the summary statistics of each model (156 df), with Multiple R2 (Mult R2), Adjusted R2 (Adj R2), F-statistic (on 7 and 156 df), p value.
Inte
rcep
t
Alti
tude
Land
use
In
dust
rial a
reas
an
d bu
sy ro
ads
Tree
spe
cies
A
caci
a ca
ffra
Tree
spe
cies
A
caci
a ka
rroo
Tree
circ
umfe
renc
e
NO
X
SO2 Summary statistics of each
model
LDV 37.4 0.06 -44.26*** -4.12 17.61*** 0.02 -0.48* -4.91 Mult R2: 0.565; Adj R2: 0.546 F: 29; p<0.001
Candelaria concolor
12.8 0.01 -1.39 2.52 0.82 0.02 -0.14** -1.68 Mult R2: 0.148; Adj R2: 0.109 F: 3.854; p<0.001
Canoparmelia texana
-1.86 0.002 -2.45*** -0.67 0.43 -0.001 0.01 0.33 Mult R2: 0.264; Adj R2: 0.231 F: 7.976; p<0.001
Culbersonia nubila
2.16 -0.004 -4.22*** -3.30*** 1.05* 0.003 0.01 1.65** Mult R2: 0.468; Adj R2: 0.444 F: 19.63; p<0.001
Flavopuntelia flaventior
-16.6* 0.015** -2.04* -0.85 1.73** 0.008 -0.007 -0.35 Mult R2: 0.318; Adj R2: 0.287 F: 10.38; p<0.001
Flavopuntelia soredica
-25.3* 0.03*** -6.87*** -3.81* 2.38** -0.01 -0.05 -1.00 Mult R2: 0.608; Adj R2: 0.591 F: 34.63; p<0.001
Heterodermia speciosa
9.70 -0.001 -7.12*** -2.40 0.50 -0.01 -0.006 0.16 Mult R2: 0.439; Adj R2: 0.414 F: 17.45; p<0.001
Hyperphyscia adglutinata
1.18 -0.002 0.65 5.79* 2.04 -0.003 0.02 1.66 Mult R2: 0.073; Adj R2: 0.0315 F: 1.758; p>0.05
Hyperphyscia granulata
1.52 -0.004 0.11 0.14 0.28 0.02 0.005 0.42 Mult R2: 0.0395; Adj R2: -0.0036 F: 0.916; p>0.05
Hyperphyscia pandani
-0.09 0.000 -0.025 0.025 0.004 0.000 0.000 0.021 Mult R2: 0.0464; Adj R2: 0.00358 F: 1.084; p>0.05
Lepraria spp. 33.7* 0.006 -13.1*** -4.94** 2.93** -0.019 -0.24*** -3.98** Mult R2: 0.650; Adj R2: 0.635 F: 41.42; p<0.001
Parmotrema austrosinense
-5.83 0.010 -2.64 0.10 3.96** 0.02 -0.034 -0.47 Mult R2: 0.190; Adj R2: 0.154 F: 5.225; p<0.001
Physcia tribacia
5.85 0.000 -1.70 3.49** 0.18 -0.001 0.01 -0.78 Mult R2: 0.282; Adj R2: 0.250 F: 8.766; p<0.001
Physcia undulata
-1.18 0.000 0.08 0.32 0.04 0.004 0.005 0.12 Mult R2: 0.0236; Adj R2: -0.0202 F: 0.539; p>0.05
Pyxine cocoes 15.6* -0.004 -3.08** -0.16 1.30* 0.001 -0.05* -1.13 Mult R2: 0.221; Adj R2: 0.186 F: 6.333; p<0.001
Pyxine petricola
-0.14 0.000 -0.07 -0.12 -0.04 0.000 0.002 0.07 Mult R2: 0.0112; Adj R2: -0.0332 F: 0.252; p>0.05

103
CHAPTER 5: DISCUSSION, RECOMMENDATIONS AND CONCLUSIONS
5.1 Discussion
5.1.1 Lichen taxa on the investigated trees under different land use types Twenty-five taxa of epiphytic lichens were recorded during this study. Lichens were
investigated only on three selected tree species and the trees provided comparison data for
lichens on native and exotic phorophytes and for different land use conditions. Furthermore,
an analysis of relationships among environmental factors, in particular land use, climate and
pollution and lichens, was another important goal of the work.
The diversity of epiphytic lichens from Pretoria is clearly considerable as observed especially
at the more natural sites (Botanical Garden, nature reserves) and further phorophytes and
sites still need to be investigated to assess the full diversity of epiphytic lichens in the city.
There are only very few studies concerning the diversity of epiphytic lichens in Africa and
Southern Africa with which to compare the diversity in Pretoria. A comparison with the study
carried out in Namibia by Zedda et al. (2009) shows that the recorded epiphytic lichen diversity
of Pretoria is lower as these authors reported 37 taxa. However, the observations in Namibia
were on different tree species, on a wider area and mainly outside towns. Aptroot (2001)
reported 27 epiphytic lichens from Gambia. Frisch et al. (2015) recorded 191 epiphytic lichen
species from 276 trees in Uganda (Bwindi National Park), but investigated different habitats
in other climatic conditions.
Interestingly, most of the recorded species are subtropical to tropical or subtropical-/ tropical-
temperate. A few are more widely spread and are present also in the Mediterranean area. An
initial floristic survey of the area at the beginning of the project revealed that the entire lichen
mycota collected from all tree parts (branches, twigs, trunks) across the city does not differ so
much in terms of number of species on the tree phorophytes (17 species on Jacaranda
mimosifolia, 18 on Acacia caffra and 19 on A. karroo). However, the composition of lichen
communities is different as the exotic Jacaranda hosts more widely-found and more
disturbance-tolerant species than the two Acacias.
A clear difference emerged moreover between the two identified land use types “Industrial
areas and busy roads” and “Parks and nature reserves”. More protected sites such as Pionier

104
Museum, Rietvlei Nature Reserve and Groenkloof Nature Reserve have the highest lichen
diversity (Maphangwa et al., 2018). Most of the rare species in this study such as Chrysothrix
xanthina, Dirinaria applanata, Parmotrema reticulatum, Physcia poncinsii, Pyxine petricola
and Rinodina sp. were found exclusively in protected areas. The sites with less human
disturbance are predominantly colonised by subtropical to tropical species, such as
Hyperphyscia granulata, H. isidiata, H. pandani, H. pruinosa, Pyxine cocoes, Physcia poncinsii
and P. undulata.
The most disturbed sites, Pretoria central and Pretoria West (Staal Road), show the lowest
diversity as only Candelaria concolor was observed there. The protected areas are
characterised by low traffic whereas Pretoria central and Pretoria West are characterised by
high traffic and the presence of industrial activities. Disturbed sites host more cosmopolitan
species such as Candelaria concolor and Hyperphyscia adglutinata, which were mostly found
on Jacaranda, as this is the dominant tree across the city, especially along avenues with high
car traffic, and under disturbed conditions. These lichen species prefer nutrient-enriched and
sun exposed barks (Almborn, 1966, Killmann and Fischer, 2005, Zedda et al., 2009). They
are usually found in areas with high man-made disturbance such as urban areas (Güvenç and
Öztürk, 2017).
Candelaria concolor appeared to be widespread in a study by Coffey and Fahrig (2012),
assessing the effects of vehicle pollution in Canada. C. concolor flourishes under high
nitrogen-contaminated air situations (Leith et al., 2005). Canoparmelia texana, Flavopunctelia
flaventior, F. soredica and Heterodermia speciosa prefer sites with nitrogen deposition, but
are sensitive to acid deposition, e.g. by SO2 (United States Forest Service, 2019). Also
Parmotrema austrosinense and P. reticulatum prefer sites with nitrogen deposition. The latter
is also tolerant to acid deposition (United States Forest Service, 2019). Pyxine cocoes is
tolerant to both nitrogen and SO2 pollution (Abas and Awang, 2017; Abas et al., 2018).
Chrysothrix xanthina prefers moderate pollution (Abas et al., 2018).
The results of this study show that many of the recorded species belong to the family
Physciaceae. In particular, the genus Hyperphyscia is very species-rich. This is in agreement
with the findings of Zedda et al. (2009), who found that the majority of epiphytic lichens in
Namibia also belong to this family. Several species of the Physciaceae are known from other
regions of the world to be tolerant to nitrogen pollution, while many crustose lichens are
relatively sensitive.

105
The findings that fruticose lichens were absent, is also in agreement with Zedda et al. (2009),
who did not record any fruticose lichens in the Savannah biome of Namibia, probably because
air humidity is low in savannas and/or disturbance factors, such as fire and grazing, frequent.
Foliose lichens were much more frequently found than crustose lichens both in Pretoria and
in Namibia. It remains unclear if the scarcity of crustose lichen is affected by human influences,
in particular by air pollution by nitrogen compounds, or only by, for example, the dry climate.
Certainly the checklist of South Africa (Fryday, 2015) contains numerous epiphytic crustose
lichens, which might potentially be present in Pretoria. This aspect needs to be better
investigated.
5.1.2 The indicator value of lichen diversity The results of the monitoring carried out using the grid on the tree trunk of 164 trees and at
29 sites also showed that the most frequent species are the cosmopolitans Candelaria
concolor and Hyperphyscia adglutinata. Also common are Parmotrema austrosinense and
Lepraria spp.
Descriptive statistics, univariate analysis as well as PCA confirmed that lichen diversity on tree
trunk differs according to area and anthropogenic activities. Sites under the category “Parks
and nature reserves” shows also in this case significantly higher LDVs than sites under the
land use category “Industrial areas and busy roads”. LDVs and species composition also vary
among the photophytes. Acacia karroo and A. caffra have higher values in contrast to
Jacaranda mimosifolia. Both are native species and more frequently found in the protected
areas compared to Jacaranda, which is only found at disturbed sites.
According to the monitoring results, some species are more frequently found on Jacaranda
like Hyperphyscia granulata and Pyxine petricola. Other lichens are more common or
restricted to Acacias such as Canoparmelia texana, Flavopunctelia flaventior, F. soredica,
Heterodermia speciosa, Hyperphyscia adglutinata, Lepraria spp., Parmotrema austrosinense,
Physcia tribacia, P. undulata and Pyxine cocoes. Between the two Acacias there are also
some differences, Culbersonia nubila, Flavopunctelia flaventior, F. soredica, Lepraria spp.,
Parmotrema austrosinense and Pyxine cocoes are more common on A. karroo. Heterodermia
speciosa, Hyperphyscia adglutinata, H. pandani, Physcia tribacia and P. undulata are slightly
more frequent on A. caffra.
Based on the results of the monitoring study, a naturality/alteration interpretative scale with
five classes could be developed and this was done for the first time for an African urban
environment. The scale was used to produce a map of naturality/alteration for the city.

106
Alteration classes have very low LDVs, such as in Mamelodi, Pretoria central business district
and Pretoria west (Staal Road), whereas more natural and less impacted sites, like the
Voortrekker Monument Nature Reserve, have higher levels of naturality and LDVs. Such
scales have been developed and used for several years by different researchers worldwide to
define the alteration degree of an environment (Giordani and Brunialti, 2015). Giordani et al.
(2002) defined, for instance, naturality/alteration classes for the region of Liguria in Italy. These
authors found very high alteration in areas characterised by high pollution such as urban and
industrial districts (towns of Genova and Savona), with frequent lichen desert conditions.
Isocrono et al. (2007) reported lichen desert in areas characterised by higher traffic and
industries in Italy in contrast to natural areas. Frati and Brunialti (2006) found alteration classes
near emission sources in Italy (Ancona), while naturality classes were found in areas
characterised by less anthropogenic impacts.
In other regions, like Slovakia, Svoboda et al. (2010) found higher LDV in semi natural and
natural sites characterised by low air pollution, and lowest values in areas with high pollution
from various sources. The naturality/alteration scale of this study differs only slightly from the
scale developed by Loppi et al. (2002) for Toscana and Liguria in Italy, wherein LDV = 0
represents a lichen desert condition and LDV ˃ 75 represents a natural class. In this study,
the lichen desert class was not found.
These scales can be useful to estimate the effects of air pollution on lichen diversity (Giordani
et al., 2002), but also of the impact of land use in general in a cheap and reliable way (Asta et
al., 2002b; Brunialti et al., 2008). They could be used in Southern Africa in areas where there
are no monitoring stations, like in remote rural areas. The public authorities of the City of
Tshwane and/or the governmental Department of Environmental Affairs, could apply these
scales to extend similar monitoring to other parts of Pretoria and/or to other towns of South
Africa. Practitioners and other stakeholders could also profit from using these scales for
identifying areas with higher impact by land use.
According to PCA (Figure 4.12), there is a significant relationship among LDV, the number of
species found on tree trunk, and species composition in Pretoria. The most important gradient
is related to the distance from emission source. This is in agreement with numerous studies
carried out worldwide on epiphytic lichens, for instance Li et al. (2013) found that
anthropogenic disturbances severely affect the diversity of epiphytes lichens in the subtropical
forests of southwest China, Käffer et al. (2011) in Brazil, Łubek et al. (2018) in Poland, Aragón
et al. (2010) in the Mediterranean and Hauck et al. (2012) in the Mongolian Altai. Other
examples have been reported in Chapter Two.

107
Although the parameter “land use type” showed a strong relationship with lichen diversity, the
tested relationships among LDVs, single species and measured ecological parameters
(climate, pollution) were not very strong in Pretoria. This is surely due to the fact that only
climate and pollution data from five monitoring stations were available, with many gaps in the
dataset. The data from these stations appears not to be representative for the entire town,
while lichen parameters (LDV, N. of species and lichen species composition) respond better
to changing environmental conditions, as demonstrated by the significant relationship with the
parameter “distance from emission source” which was measured within the monitoring survey
of the present study.
To fill the data gaps, an interpolation of air pollution and climate data was carried out for the
29 lichen sampling sites and these new datasets were then correlated with lichen parameters.
The results were, however, also in this case unsatisfactory and not realistic and reliable for all
sites. For instance, Pretoria West - Staal Road, characterised by higher traffic and industries,
showed lower (interpolated) values of NO, NO2 and NOx pollutants, while the Voortrekker
Monument Nature Reserve had higher values of these pollutants, although it was
characterised by low traffic and human impacts, and higher LDV compared to Pretoria West.
The same trend was also observed at Rietvlei Nature Reserve that has low traffic, but here
the same interpolated values of the same pollutants were high compared to Pretoria central
business district, which has higher traffic and much lower LVDs (Chapter 4.2, Table 4.13).
Despite the poor reliability of some of the interpolated data, the multivariate analyses and the
generalised linear regression models (GLM) give an indication of significant relationships
among some of the tested parameters, for instance the climatic parameters wind direction and
speed, and also air humidity positively relate to lichen diversity.
The relationship of lichen diversity to air humidity is well-known from many studies and in
agreement, for instance, with the findings of Nimis (1986), Loppi et al. (2002), Brunialti et al.
(2008) and Giordani and Brunialti (2015) for Italy. Concerning Southern Africa, air humidity is
considered one of the most important ecological factors influencing lichen diversity as
demonstrated in the studies of Zedda and Rambold (2009), Maphangwa et al. (2012a, 2014)
and Zedda et al. (2011a) for soil and stone lichens. In particular, the predominance of green
algal photobionts and the occurrence of foliose lichens are demonstrative of raised air humidity
in the desert biome, where green algal lichens can utilise tremendously small amounts of water
and water vapour for photosynthetic activity (Zedda et al., 2011b). Also in this study, only
green algal lichens were found and these were mostly foliose.

108
Altitude, which was measured in the field during monitoring work (not interpolated), was
positively related to the occurrence of some lichen species such as Flavopunctelia flaventior
and F. soredica. The finding that altitude has a positive influence on the frequency of epiphytic
lichens is in accordance with the results of numerous authors, who investigated diversity
changes along altitudinal gradients. For instance, Güvenç and Öztürk (2017) found altitude to
be the main factor influencing lichen distribution in Turkey. Also in Mediterranean forests,
altitude is one of the main factors affecting lichen distribution together with management
intensity (Aragón et al., 2010). In Kenya, Kirika et al. (2018) reported altitude as the main factor
influencing lichen assemblage, whereas Loppi et al. (1997) reported altitude as an important
parameter in Tuscany (Italy). According to Zedda et al. (2011b), altitude does not influence
soil lichen diversity directly in Namibia and in the western part of South Africa, but altitude may
have an indirect positive effect on the occurrence of dewfall events, because of lower
temperatures during the night. Dewfall is an important water source for lichens in semi-arid to
arid regions of the world (Maphangwa et al., 2012a).
The factors most strongly related to lichen diversity and composition on the investigated trees
and sites were, however, the “phorophyte” and “land use” type. Regarding the phorophyte, see what is reported on page 104. The dependence of lichen species on certain tree species
is well documented by numerous studies carried out worldwide. This is mainly due to bark and
crown features, as well as to ecological conditions of sites where trees grow (Cáceres et al.,
2007; Frati et al., 2008; Mežaka et al., 2012; Trüe et al., 2012; Ódor et al., 2013; Frisch et al.,
2015). The circumference of trees does not correlate significantly with lichen communities
in the present study, despite the high range of this variable on the sampled trees.
Concerning land use, the negative correlation of sites with high traffic, in the proximity of busy
roads and located in industrial areas with lichen parameters is clear, and confirmed by the
different elaborations. The finding that epiphytic lichen diversity is higher in protected areas
than in more disturbed urban areas is in agreement with the results of several authors, among
others, Nimis et al. (2002), Bergamini et al. (2005), Stofer et al. (2006) and Aragón et al.
(2010). The last authors found that when land use (forestry practice, agricultural and livestock
use) increases, lichen species richness and the richness of functional groups tend to decrease
in eight European countries (Switzerland, Ireland, United Kingdom, Finland, France, Portugal,
Spain and Hungary) and in six different biogeographic zones (Bergamini et al., 2005; Aragón
et al., 2010). Hauck et al. (2012) reported that epiphytic lichen diversity is affected by different
land use activities in Asia, such as grazing and fuelwood collection (Mongolian Altai). In the
Mediterranean area and in the USA, lichen diversity is also influenced by different land uses
such as traffic and air quality (Washburn and Culley, 2006; Llop et al., 2012; Giordani and

109
Brunialti, 2015). McCune et al. (1997) also reported a higher diversity of lichens in remote
areas and lower diversity in urban and industrial areas in the USA. Svoboda et al. (2010)
reported similar results for Slovakia. According to Ahn et al. (2011), the diversity of lichens
increases with increasing distance from the city centre in Seoul (Korea). In contrast with the
findings of this study and most findings worldwide, Perlmutter (2010) did not find any
correlation between LDV and traffic in North Carolina in the USA.
The correlations with interpolated data show that the pollutants NO, NO2, NOx, CO and O3 are
negatively related to lichen diversity and to a group of species. The finding that N-compounds
affect lichen diversity in this study is in agreement with the works of Giordani et al. (2002) and
Giordani et al. (2013) carried out in Italy. NO2 from traffic emissions affects lichen diversity in
Spain (Fuentes and Rowe, 1998; Purvis et al., 2001) and in Italy (Lorenzini et al., 2003).
Hawksworth and Rose (1970), Davies et al. (2007) and Larsen et al. (2007) reported that SO2
and NOx limit lichen diversity in England and Wales and in London, a large amounts of NOx
are found next to busy roads. Parmelia saxatilis (L.) Ach. is prevented from growing next to
busy roads in London because of NOx concentrations (Batty et al., 2003). NOx is also reported
to injure the lichens Parmelia sulcata Taylor and Hypogymnia physodes (L.) Nyl. in London
(Purvis et al., 2003). Ahn et al. (2011) reported NOx as the main pollutants affecting lichen
diversity in Seoul in Korea. NOx is one of the main pollutants in most urban areas today
worldwide (Davies et al., 2007; Ahn et al., 2011). Heterodermia speciosa was used as an
indicator of N-pollution in Sri Lanka and the highest pollution was found in the congested urban
area in Colombo with industries (Gunathilaka et al., 2011). The lowest pollution was reported
in Kurunegala city, which is less congested and has few industries (Gunathilaka et al., 2011).
The results of the present work in relation to pollution are in accordance with studies carried
out by Liebenberg-Enslin and Petzer (2005) in the City of Tshwane. These authors reported
that N-pollutants, which emanate from tyre burning, domestic burning and industries, are a
priority, and that Pretoria West is the most affected area. Also in the present study, the lowest
lichen diversity was observed in these areas, which have high concentrations of mercury as
indicated by Trüe et al. (2012), who analysed thalli of Parmotrema austrosinense. Mercury
concentrations were in contrast lower in Hatfield, which is a more natural area. The highest
annual concentration of SO2 was in Pretoria West (Wright et al., 2011), normally found in
winter, where coal domestic burning is high. This is also in agreement with the observations
of Forbes et al. (2009) and Olowoyo et al. (2010, 2011), who observed that sites situated away
from Pretoria central such as Pionier Museum are characterised by low pollution compared to
Pretoria central.

110
The coal-fired power stations of the energy sector are the biggest emission sources of NOx
and SO2 in South Africa (Wright et al., 2011; Pretorius et al., 2015; Girmay and Chikobvu,
2017; Muyemeki et al., 2017). The power stations that are mostly owned by Eskom contribute
enormously to energy supply in South Africa (Girmay and Chikobvu, 2017; Muyemeki et al.,
2017). Nitrogen dioxide concentration in South Africa is a big concern, especially in
Mpumalanga Province, which has many coal-fired power stations (Collett et al., 2010). Coal
and fuel burning in South African townships such as Garankuwa, Mamelodi and Soshanguve
are a main source of pollution as well (Wright et al., 2011). NOx concentrations are higher in
winter months (Broccardo et al., 2008; Collett et al., 2010; Naidoo et al., 2014). Pretorius et
al. (2015) also reported vehicle emissions and industries as other sources of pollution in South
Africa, where between 2006 and 2012, NOX emission increased by 10% and by 2030 is
projected to increase by 40%.
In this study, only the frequency of Culbersonia nubila was positively related to SO2, while SO2
was negatively related to Lepraria spp. There was no other significant relationship between
SO2 and further lichen species. SO2 is also often a main cause of lichen diversity decline in
both urban and industrial areas, although pollution by SO2 has become less severe during the
last decades in many countries (Gilbert, 1970; Nimis, 1986; Nimis and Purvis, 2002; Nimis et
al., 1996; Nimis et al., 2002; Giordani, 2007; Brunialti et al., 2008; Svoboda et al., 2010; Tiwari,
2008; Giordani and Brunialti, 2015).
Domestic coal burning, power stations, traffic emissions and industries are some of the main
causes of SO2 pollution in South Africa (Collett et al., 2010; Girmay and Chikobvu, 2017;
Muyemeki et al., 2017; Sangeetha and Sivakumar, 2019). SO2 is of great concern in South
Africa as it poses threats to different organisms (Muyemeki et al., 2017). In Pretoria West, the
main sources of pollution are industrial and residential areas (Sangeetha and Sivakumar,
2019) and SO2 pollution is high next to power stations (Muyemeki et al., 2017). The SO2
emission is projected to increase in South Africa, as coal is the main source of energy supply
(Henneman et al., 2016); for this reason the monitoring of environmental impacts is very
important. Pretorius et al. (2015) projected SO2 emissions to increase by 38% under worst-
case scenarios by the year 2030. The relationship between SO2 and lichens therefore needs
to be better analysed in future studies.
5.2 Contribution of the study This study adds to new knowledge on epiphytic lichens in Pretoria and in South Africa. Lichen
descriptions and information on species distribution and frequency in Pretoria, South Africa,
Africa and worldwide, as well as information on ecology of each species are provided in this
111
work and in the published papers (see Appendix 15) (Maphangwa et al., 2018). This study
has developed a lichen identification key that can be used in Pretoria and in other cities of
South Africa. This will encourage more lichen studies in urban areas of South Africa, which
still remain unexplored (Crous et al., 2006; Maphangwa et al., 2012b) as many people in South
Africa are not familiar with lichens and find their identification difficult (Mukherjee et al., 2010).
Identification keys are missing for many areas of South Africa and taxonomic lichen groups.
This is the first study investigating epiphytic lichens and their importance as bioindicators in
urban environments of Africa, and tests a methodology to monitor environmental impact and
air quality using lichens, which was developed for other regions of the world. Relationships
among lichen species and lichen diversity with the phorophyte type, the land use type and
some climatic and pollution parameters could be demonstrated. This study also developed a
naturality/alteration interpretative scale, which can be used to monitor environmental alteration
in Pretoria and similar areas in South Africa. The use of such scales is a cheaper way of
monitoring effects of land use and estimating air quality (Rindita et al., 2015) and could be
applied all over South Africa.
Three more papers will be published soon from this study (see Appendix 16) and results have
been presented at an international conference (see Appendix 17). The results will also be
presented at an international conference in 2020 (see Appendix 17).
The identified material is available for future studies at SANBI (National Herbarium) and
UNISA Horticulture Centre where the identified specimens will be stored. This contributes to
the availability of identified specimens for further lichenological surveys in the country.
This study also revealed that the phylogenetic position of Culbersonia is in the Caliciaceae (as
per paper published from this study in the Appendix, Aptroot et al., 2019). This has never been
studied before, according to Lücking et al. (2016) and Aptroot et al. (2019).
5.3 Conclusion and recommendations In conclusion, human disturbances and land-use in Pretoria appear to have a negative impact
on lichen diversity, reducing species number and changing species composition, and
influencing morphological and biogeographical groups. There is good evidence from the
present study that epiphytic lichens are, in South Africa, suitable indicators of given climatic
and air quality conditions as well as indicators of land use type, even if species composition is
different in comparison to European towns.

112
The European standardised monitoring method for mapping lichen diversity as an indicator of
environmental stress (Asta et al., 2002b; VDI-Richtlinien, 2005; EN 16413, 2014; Giordani and
Brunialti, 2015) needs, however, to be adapted to South African conditions. The methodology
can be more easily applied in South Africa, by adopting a stratified random sampling and a
more flexible spatial selection of suitable trees. It would be interesting to extend such studies
to more sites in Pretoria, also assessing the lichen diversity on other tree species. These sites
should include more mountainous and protected areas such as nature reserves that are
situated far from industries and pollution sources. Other cities could furthermore be assessed
for comparison, for instance Johannesburg, which has similar climatic and altitudinal
conditions as Pretoria. Future studies should use more sampling units so that more suitable
trees can be found.
In future studies, the bark properties of trees need to be investigated, so that trees with similar
bark properties such as structure, pH and nutrient content can be identified and used for
monitoring in the future. In order to better define the indicator value of given lichen species,
the different pollution and climate parameters should be measured at more sites and
relationships further tested.
More training, identification facilities and financial support are needed in South Africa to
facilitate further studies on the rich lichen diversity and for building new generations of lichen
experts, who are presently missing in the country.

113
REFERENCES
Aarrestad, P.A., Aamlid, D., 1999. Vegetation monitoring in South-Varanger, Norway –
species composition of ground vegetation and its relation to environmental variables
and pollution impact. Environmental Monitoring and Assessment 58, 1-21.
Abas, A., Awang, A., 2017. Air pollution assessments using lichen biodiversity index (LBI) in
Kuala Lumpur, Malaysia. Pollution Research 36(2), 242-249.
Abas, A., Awang, A., Aiyub, K., 2018. Lichen as bio-indicator for air pollution in Klang
Selangor. Pollution Research 37(4), 35-39.
Afolayan, A.J., Grierson, D.S., Kambizi, L., Madamombe, I., Masika, P.J., Jäger, A.K., 2002.
In vitro antifungal activity of some South African medicinal plants. South African
Journal of Botany 68, 72-76.
Agnan, Y., Probst, A., Séjalon-Delmas, N., 2017. Evaluation of lichen species resistance to
atmospheric metal pollution by coupling diversity and bioaccumulation approaches: A
new bioindication scale for French forested areas. Ecological Indicators 72, 99-110.
Ahn, C., Chang, E., Kang, H., 2011. Epiphytic macrolichens in Seoul: 35 years after the first
lichen study in Korea. Journal of Ecology and Field Biology 34(4), 381-391.
Ahti, T., Mayrhofer, H., Schultz, M., Tehler, A., Fryday, A.M., 2016. First supplement to the
lichen checklist of South Africa. Bothalia 46(1), 1-8.
Alava, J.J., McDougall, M.R.R., Borbor-Cordova, M.J., Calle, K.P., Riofrio, M., Calle, N.,
Ikonomou, M.G., Gobas, F.A.P.C., 2015. Perfluorinated chemicals in sediments,
lichens, and seabirds from the Antarctic Peninsula — Environmental assessment and
management perspectives. Emerging Pollutants in the Environment - Current and
Further Implications, 1-24.
Allen, J.L., Lendemer, J.C., 2016. Climate change impacts on endemic, high-elevation lichens
in a biodiversity hotspot. Biodiversity Conservation 25, 555-568.
Almborn, O., 1966. Revision of some lichen genera in southern Africa I. Botaniska Notiser
119, 70-112.
Almborn, O., 1987. Lichens at high altitudes in southern Africa. Bibliotheca Lichenologica 25,
401-417.
Almborn, O., 1988. Lichenes Africani. Fasc. V (Nos. 101–125). Lund, Botanical Museum of
the University, 1-9 (unnumbered).
Altschul, S.F., Gish, W., Miller, W., Myers, E.W., Lipman, D.J., 1997. Basic local alignment
search tool. Journal of Molecular Biology 215, 403-410.
Aptroot, A., 2001. Lichens from Gambia, with a new black-fruiting isidiate Caloplaca on
savannah trees. Cryptogamie, Mycologie 22, 265-270.

114
Aptroot, A., 2016. Preliminary checklist of the lichens of Madagascar, with two new
thelotremoid Graphidaceae and 131 new records. Willdenowia 46(3), 349-365.
Aptroot, A., Feijen, F.J., 2002. Annotated checklist of the lichens and lichenicolous fungi of
Bhutan. Fungal Diversity 11, 21-48.
Aptroot, A., Maphangwa, K.W., Zedda, L., Tekere, M., Alvarado, P, Sipman, H.J.M., 2019.
The phylogenetic position of Culbersonia is in the Caliciaceae (lichenized
ascomycetes). The Lichenologist 51(2), 1-5.
Aptroot, A., Stapper, N. J., Košuthová, A., Cáceres, M.E.S., 2015. Lichens. In: Letcher, T.M.
(ed.): Climate Change: Observed Impacts on Planet Earth. Amsterdam. Elsevier,
295-307.
Aptroot, A., Van Herk, C.M., 2007. Further evidence of the effects of global warming on
lichens, particularly those with Trentepohlia phycobionts. Environmental Pollututio 146,
293-298.
Aragón, G., Martínez, I., Izquierdo, P., Belinchón, I., Escudero, A., 2010. Effects of forest
management on epiphytic lichen diversity in Mediterranean forests. Applied Vegetation
Science 13(2), 183-194.
Aragón, G., Martínez, I., García, A., 2012. Loss of epiphytic diversity along a latitudinal
gradient in southern Europe. Science of the Total Environment 426, 188-195.
Ardelean, I.V., Keller, C., Scheidegger, C., 2015. Effects of management on lichen species
richness, ecological traits and community structure in the Rodnei Mountains National
Park (Romania). PLoS ONE 10(12), e0145808. doi:10.1371/journal
Asplund, J., Wardle, D.A., 2017. How lichens impact on terrestrial community and ecosystem
properties. Biological Reviews 92(3), 1720-1738.
Asta, J., Erhardt, W., Ferretti, M., Fornasier, F., Kirschbaum, U., Nimis, P.L., Purvis, O.W.,
Pirintsos, S., Scheidegger, C., Van Haluwyn, C., Wirth, V., 2002a. Mapping Lichen
Diversity as an Indicator of Environmental Quality. In: Nimis P.L., Scheidegger C.,
Wolseley P.A. (eds.): Monitoring with Lichens - Monitoring Lichens. Dordrecht. Kluwer
Academic Publishers, 273-279.
Asta, J., Erhardt, W., Ferretti, M., Fornasier, F., Kirschbaum, U., Nimis, P.L., Purvis, O.W.,
Pirintsos, S., Scheidegger, C., van Haluwyn, C., Wirth, V., 2002b. European guideline
for mapping lichen diversity as an indicator of environmental stress. London, the British
Lichen Society.
Atala, C., Schneider, C., Bravo, G., Quilodrán, M., Vargas, R., 2015. Anatomical, physiological
and chemical differences between populations of Pseudocyphellaria flavicans (Hook.
f. and Taylor) Vain. From Chile. Gayana Botanica 72(1), 21-26.

115
Athukorala, S.N.P., Piercey-Normore, M.D., 2014. Effect of temperature and pH on the early
stages of interaction of compatible partners of the lichen Cladonia rangiferina
(Cladoniaceae). Symbiosis 64, 87-93.
Babu, R.C., Kandasamy, O.S., 1997. Allelopathic Effect of Eucalyptus globulus Labill. on
Cyperus rotundus L. and Cynodon dactylon L. Pers. Journal of Agronomy and Crop
Science 179(2), 123-126.
Bajpai, R., Mishra, S., Dwivedi, S., Upreti, K.D., 2016. Change in atmospheric deposition
during last half century and its impact on lichen community structure in Eastern
Himalaya. Scientific Reports 6, 30838. doi: 10.1038/srep30838.
Bargagli, R., 2016. Moss and lichen biomonitoring of atmospheric mercury: A review. Science
of the Total Environment 572, 216-231.
Baur, B., Frӧberg, L., Baur, A., 1995. Species diversity and grazing damage in a calcicolous
lichen community on top stone walls in Ӧland, Sweden. Annales Botanici Fennici 32,
239-250.
Basile, A., Rigano, D., Loppi, S., Santi, A.D., Nebbioso, A., Sorbo, S., Conte, B., Paoli, L., De
Ruberto, F., Molinari, A.M., Altucci, A., Bontempo, P., 2015. Antiproliferative,
Antibacterial and Antifungal Activity of the Lichen Xanthoria parietina and Its
Secondary Metabolite Parietin. International Journal of Molecular Sciences 16,
7861-7875.
Batty, K., Bates, J.W., Bell, J.N.B., 2003. A transplant experiment on the factors preventing
lichen colonization of oak bark in southeast England under declining SO2 pollution.
Canadian Journal of Botany 81, 439-451.
Becker, U., 2002. Flechtenflora und Flechtenvegetation tropischer Inselberge am Beispiel
Zimbabwes. PhD thesis, University of Cologne, 342.
Beckett, P.J., Boileau, L.J.R., Padovan, D., Richardson, D.H.S., Nieboer, E., 1982. Lichens
and mosses as monitors of industrial activity associated with U mining in Northern
Ontario, Canada – Part 2: Distance dependent U and lead accumulation patterns.
Environmental Pollution Series B 4, 91-107.
Beekley, P.K., Hoffman, G.R., 1981. Effects of sulfur fumigations on photosynthesis,
respiration, and chlorophyll content of selected lichens. Bryologist 84, 379-390.
Belnap, J., Büdel, B., Lange, O.L., 2001. Biological soil crusts: Characteristics and distribution.
In: Belnap, J., Lange, O.L. (eds.): Biological soil crusts: Structure, function, and
management. Ecological Studies. Vol. 150. Berlin. Springer-Verlag, 3-30.
Benítez, A., 2016. Effects of tropical forests disturbance on epiphyte diversity (lichens and
bryophytes). Tesis Doctoral. Universidad Rey Juan Carlos. Departamento de Biología
y Geología, Física y Química Inorgánica.

116
Benítez, A., Aragón, G., González, Y., Prieto, M., 2018. Functional traits of epiphytic lichens
in response to forest disturbance and as predictors of total richness and diversity.
Ecological Indicators 86, 18-26.
Benítez, A., Prieto, M., Aragón, G., 2015. Large trees and dense canopies: Key factors for
maintaining high epiphytic diversity on trunk bases (bryophytes and lichens) in tropical
montane forests. Forestry 88, 521-527.
Benítez, A., Prieto, M., González, Y., Aragón, G., 2012. Effects of tropical montane forest
disturbance on epiphytic macrolichens. Science of the Total Environment 441,
169-175.
Bergamini, A., Scheidegger, C., Stofer, S., Carvalho, P., Davey, S., Dietrich, M., Dubs, F.,
Farkas, E., Groner, U., Kärkkiänen, K., Keller, C., Lӧkӧs, L., Lommi, S., Máguas, C.,
Mitchell, R., Pinho, P., Rico, V.J., Aragón, G., Truscott, A.M., Wolseley, P., Watt, A.,
2005. Performance of macrolichens and lichen genera as indicators of lichen species
richness and composition. Conservation Biology 19, 1051-1062.
Boamponsem, L.K, Adam, J.I., Dampare, S.B., Nyarko, B.J.B., Essumang, D.K., 2010.
Assessment of atmospheric heavy metal deposition in the Tarkwa gold mining area of
Ghana using epiphytic lichens. Nuclear Instruments and Methods in Physics Research
B 268, 1492-1501.
Boch, S., Prati, D., Schӧnin, I., Fischer, M., 2016. Lichen species richness is highest in non-
intensively used grasslands promoting suitable microhabitats and low vascular plant
competition. Biodiversity Conservation 25, 225-238.
Boon, R., 2010. Pooley’s trees of eastern South Africa - A complete guide. Durban: Flora and
Fauna PublicationTrust.
Boonpragob, K., 2003. Using lichen as bioindicator of air pollution. Acid deposition monitoring
and Assessment Third country Training.
Boryło, A., Romańczyk, G., Skwarzec, B., 2017. Lichens and mosses as polonium and
uranium biomonitors on Sobieszewo Island. Journal of Radioanalytical and Nuclear
Chemistry 311(1), 859-869.
Branquinho, C., Catarino, F., Brown, D.H., Pereira, M.J., Soares, A., 1999. Improving the use
of lichens as biomonitors of atmospheric metal pollution. The Science of the Total
Environment 232, 67-77.
Broccardo, S., Heue, K-P., Walter, D., Meyer, C., Kokhanovsky, A., van der A,R., Piketh, S.,
Langerman, K., Platt, U, 2018. Intra-pixel variability in satellite tropospheric NO2
column densities derived from simultaneous space-borne and airborne observations
over the South African Highveld, Atmospheric Measurement Techniques, 11,
2797-2819.

117
Brodekovà, L., Gilmer, A., Dowding, P., Fox, H., Guttova, A., 2006. An assessment of epiphytic
lichen diversity and environmental quality in Knocksink wood nature reserve, Ireland.
Biology and Environment: Proceedings of the Royal Irish academy 106B (3), 215-223.
Brodo, I.R., Sharnoff, S., Sharnoff, S.D., 2001. Lichens of North America. New Haven and
London Yale: University Press.
Brunialti, G., Frati, L., Cristofolini, F., Chiarucci, A., Giordanid, P., Loppi, S., Benesperi, R.,
Cristofori, A., Critelli, P., Capuag, E.D., Genovesi, V., Gottardini, E., Innocenti, G.,
Munzi, S., Paoli, L., Pisani, T., Ravera, S., Ferretti, M., 2012. Can we compare lichen
diversity data? A test with skilled teams. Ecological Indicators 23, 509-516.
Brunialti G., Frati, L., Incerti, G., Rizzi, G., Vinci, M., Giordani, P., 2008. Lichen biomonitoring
of air pollution: issues for applications in complex environments. In: Romano, G.C.,
Conti, A.G. (eds.): Air Quality in the 21st Century. New York. Nova Science Publishers,
211-259.
Brusse, F.A., 1984. New species and combinations in Parmelia (Lichenes) from southern
Africa. Bothalia 15, 315-321.
Brusse, F.A., 1985. Corynecystis, a new lichen genus from the Karoo, South Africa. Bothalia
15, 552-553.
Brusse, F.A., 1986. Porinaceae. A new species of Porina on limestone. Bothalia 16, 62-64.
Brusse, F.A., 1988. Five new species of Parmelia (Parmeliaceae, Lichenized Ascomycetes)
from southern Africa, with new combinations and notes, and new lichen records.
Mycotaxon 31, 533-555.
Brusse, F.A., 1994. A remarkable new lichen genus Catarrhospora (Ascomycotina,
Porpidiaceae), from Cape Floral Kingdom, South Africa. Mycotaxon 52, 501-512.
Budka, D., Mesjasz-Przybyłowicz, J., Przybyłowicz, W.J., 2004. Environmental pollution
monitoring using lichens as bioindicators: A micro-PIXE study. Radiation Physics and
Chemistry 71, 783-784.
Budka, D., Przybyłowicz, J.W., Mesjasz-Przybyłowicz, J., Sawicka-Kapusta, K., 2002.
Elemental distribution in lichens transplanted on polluted forest sites near Krakow
(Poland). Nuclear Instruments and Methods in Physics Research B 189, 499-505.
Büdel, B., Deutschewitz, K., Dojani, S., Friedl, T., Darienko, T., Mohr, K.I., Webber, B., 2010.
Biological soil crusts along the Biota Southern Africa transects. In: Schmiedel, U.,
Jürgens, N. (eds.): Biodiversity in southern Africa. Volume 2. Patterns and processes
at regional scale. Göttingen and Windhoek. Klaus Hess Publishers, 93-99.
Bueno de Mesquita, C.P., Knelman, J.E., King, J.E., Farrer, E.C., Porazinska, D.L., Schmidt,
S.K., Suding, K.N., 2017. Plant colonization of moss-dominated soils in the alpine:
Microbial and biogeochemical implications. Soil Biology and Biochemistry 111,
135-142.

118
Cáceres, M.E.S., Lücking, R., Rambold, G., 2007. Phorophyte specificity and environmental
parameters versus stochasticity as determinants for species composition of corticolous
crustose lichen communities in the Atlantic rain forest of northeastern Brazil.
Mycological Progress 6(3), 117-136 .
Cecconi, E., Fortuna, L., Benesperi, R., Bianchi, E., Brunialti, G., Contardo, T., Di Nuzzo, L.,
Frati, L., Monaci, F., Munzi, S., Nascimbene, J., Paoli, L., Ravera, S., Vannini, A.,
Giordani, P., Loppi, S., Tretiach, M., 2019. New Interpretative Scales for Lichen
Bioaccumulation Data: The Italian Proposal. Atmosphere 10, 136.
Cernava, T., Berg, B., Grube, M., 2016. High life expectancy of bacteria on lichens. Microbial
Ecology 72, 510-513.
Chen, J., Blume, H.P., Beyer, L., 2000. Weathering of rocks induced by lichen colonization –
A review. Catena 39, 121-146.
Cocozza, C., Ravera, S., Cherubini, P., Lombardi, F., Marchetti, M., Tognetti, R., 2016.
Integrated biomonitoring of airborne pollutants over space and time using tree rings,
bark, leaves and epiphytic lichens. Urban Forestry and Urban Greening 17, 177-191.
Coetzee, M.P.A., Marincowitz, S., Muthelo, V.G., Wingfield, M.J., 2015. Ganoderma species,
including new taxa associated with root rot of the iconic Jacaranda mimosifolia in
Pretoria, South Africa. IMA Fungus 6(1), 249-256.
Coffey, H.M.P., Fahrig, L., 2012. Relative effects of vehicle pollution, moisture and colonization
sources on urban lichens. Journal of Applied Ecology 49, 1467-1474.
Cogoni, A., Brundu, G., Zedda, L., 2011. Diversity and ecology of terricolous bryophyte and
lichen communities in coastal areas of Sardinia (Italy). Nova Hedwigia 92(1-2),
159-175.
Colesie, C., Green, T.G.A., Haferkamp, I., Büdel, B., 2014. Habitat stress initiates changes in
composition, CO2 gas exchange and C-allocation as life traits in biological soil crusts.
The International Society for Microbial Ecology 8, 2104-2115.
Collett, K.S., Piketh, S.J., Ross, K.E., 2010. An assessment of the atmospheric nitrogen
budget on the South African Highveld. South African Journal of Science 106(5/6), 1-9.
Consortium of North American Lichen Herbaria (CNALH), 2017.
http://lichenportal.org/portal/. Accessed on 07 October 2017.
Conti, M.E., Cecchetti, G., 2001. Biological monitoring: Lichens as bioindicators of air pollution
assessment – a review. Environmental Pollution 114, 471-492.
Cornelissen, J.H.C., Callaghan, T.V., Alatalo, J.M., Michelsen, A., Graglia, E., Hartley, A.E.,
Hik, D.S., Hobbie, S.E., Press, M.C., Robinson, C.H., Henry, G.H.R., Shaver, G.R.,
Phoneix, G.K., Gwynn, J.D., Jonasson, S., Chapin III, F.S., Molau, U., Neill, C., Lee,
J.A., Melillo, J.M., Sveinbjörnsson, B., Aerts, R., 2001. Global Change and Arctic

119
Ecosystems: Is lichen decline a function of increases in vascular plant biomass?
Journal of Ecology 89(6), 984-994.
Crawford, S.D., 2015. Lichens used in traditional medicine. In: Rankovie, B. (ed.): Lichen
secondary metabolites. Switzerland. Springer International Publishing, 27-80.
Cristofolini, F., Brunialti, G., Giordani, P., Nascimbene, J., Cristofori, A., Gottardini, E., Frati,
L., Matos, P., Batič, F., Caporale, S., Fornasier, M.F., Marmor, L., Merinero, S., Nuñez
Zapata, J., Tõrrai, T., Wolseley, P., Ferretti, M., 2014. Towards the adoption of an
international standard for biomonitoring with lichens. Consistency of assessment
performed by experts from six European countries. Ecological Indicators 45, 63-67.
Crombie, J.M., 1876a. Lichenes capenses, an enumeration of the lichens collected at the
Cape of Good Hope by A.E. Eaton during the Venus-Transit Expedition in 1874.
Journal of the Linnaean Society 15, 165-180.
Crombie, J.M., 1876b. New Lichens from the Cape of Good Hope. The Journal of Botany
14, 18.
Crous, P.W., Rong, I.H., Wood, A., Lee, S., Glen, H., Botha, W., Slippers, B., De Beer, W.Z.,
Wingfield, J., Hawksworth, D.L., 2006. How many species of fungi are there at the tip
of Africa. Studies in Mycology 55, 13-33.
Cubeta, M.A., Echandi, E., Abernethy, T., Vilgalys, R., 1991. Characterization of anastomosis
groups of binucleate Rhizoctonia species using restriction analysis of an amplified
ribosomal RNA gene. Phytopathology 81, 1395-1400.
Danesh, N., Puttaiah, E.T., Basavarajappa, B.E., 2013. Studies on diversity of lichen Pyxine
cocoes to air pollution in Bhadravathi town, Karnataka, India. Journal of Environmental
Biology 34, 579-584.
Davies, L., Bates, J.W., Bell, J.N.B., James, P.W., 2007. Diversity and sensitivity of epiphytes
to oxides of nitrogen in London. Environmental Pollution 146, 299-310.
De Beer, J.J.J., Van Wyk, B.E., 2011. An ethnobotanical survey of the Agter–Hantam,
Northern Cape Province, South Africa. South African Journal of Botany 77, 741-754.
De Bello, F., Lavorel, S., Díaz, S., Harrington, R., Cornelissen, J.H.C., Bardgett, R.D., Berg,
M.P., Cipriotti, P., Feld, C.K., Hering, D., Martins da Silva, P., Potts, S.G., Sandin, L.,
Sousa, J.P., Storkey, J., Wardle, D.A., Harrison, P.A., 2010. Towards an assessment
of multiple ecosystem processes and services via functional traits. Biodiversity
Conservation 19, 2873-2893.
Degtjarenko, P., Matos, P., Marmor, S., Branquinho, C., Randlane, T., 2018. Functional traits
of epiphytic lichens respond to alkaline dust pollution. Fungal Ecology 36, 81-88.
De Guevara, M.L., Lázaro, R., Quero, J.L., Ochoa, V., Gozalo, B., Berdugo, M., Uclés, O.,
Escolar, C., Maestre, F.T., 2014. Simulated climate change reduced the capacity of

120
lichen-dominated biocrusts to act as carbon sinks in two semi-arid Mediterranean
ecosystems. Biodiversity and Conservation 23(7), 1787-1807.
Department of Agriculture, 1985. Conservation of Agricultural Resources Act, 1983 (Act No.
43 of 1983) https://www.sanbi.org/documents/conservation-of-agricultural-resources-
act-43-of-1983-schedule-and-regulations-and-list/ Last accessed 21 February 2020.
Devkota, S., Chaudhary, R.P., Werth, S., Scheidegger, C., 2017. Indigenous knowledge and
use of lichens by the lichenophilic communities of the Nepal Himalaya. Journal of
Ethnobiology and Ethnomedicine 13(15), 1-10.
Diaz, S., Cabido, M., 2001. Vive la difference: Plant functional diversity matters to ecosystem
processes. Trends in Ecology and Evolution 16, 646-655.
Díaz-Escandón, D., Soto-medina, E., Lücking, R., Silverstone-Sopkin, P.A., 2016. Corticolous
lichens as environmental indicators of natural sulphur emissions near the sulphur mine
El Vinagre (Cauca, Colombia). The Lichenologist 48, 147-159.
Di Lella L.A., Frati, L., Loppi, S., Protano, G., Riccobono, F., 2003. Lichens as biomonitors of
uranium and other trace elements in an area of Kosovo heavily shelled with depleted
uranium rounds. Atmospheric Environment 37, 5445-5449.
Ding, L.P., Zhou, Q.M., Wei, J.C., 2013. Estimation of Endocarpon pusillum Hedwig carbon
budget in the Tengger Desert based on its photosynthetic rate. Science China Life
Science 56(9), 848-855.
Doidge, E.M., 1950. The South African fungi and lichens to the end of 1945. Bothalia 5,
1-1094.
Dyer, L.A., Letourneau, D.K., 2007. Determinants of Lichen Diversity in a Rain Forest
Understorey. Biotropica 9(4), 525-529.
Elix, J.A., 1999. New species of Xanthoparmelia (lichenized Ascomycotina, Parmeliaceae)
from South Africa. Mycotaxon 73, 51-61.
Elix, J.A., 2002. New species of Xanthoparmelia (lichenized Ascomycotina, Parmeliaceae)
from Africa. The Lichenologist 34(4), 283-291.
Elix, J.A., 2003. The lichen genus Paraparmelia, a synonym of Xanthoparmelia
(Ascomycotina, Parmeliaceae). Mycotaxon 87, 395-403.
Elix, J.A. 2009. Chrysotricaceae. In: Patrick M., McCarthy, P.M., (eds.): Flora of Australia.
Collingwood: CSIRO Publishing, Lichens, Volume 57(5) pp. 13-18.
Elix, J.A., Kantvilas, G., 2007. The genus Chrysothrix in Australia. The Lichenologist 39(4),
361-369.
Ellis, C.J., 2012. Lichen epiphyte diversity: A species, community and trait-based review.
Perspectives in Plant Ecology, Evolution and Systematics 14(2), 131-152.

121
Ellis, C.J., Coppins, B.J., Dawson, T.P., Seaward, M.R.D., 2007. Response of British lichens
to climate change scenarios: Trends and uncertainties in the projected impact for
contrasting biogeographic groups. Biological Conservation 140, 217-235.
EN 16413, 2014. Ambient air - Biomonitoring with lichens - Assessing epiphytic lichen
diversity. European Standard 16413. CEN, Brussels.
Esslinger, T.L., 2000. Culbersonia americana, a rare new lichen (Ascomycota) from western
America. Bryologist 103, 771-773.
Eversman, S., 1978. Effects of Low-Level SO2 on Usnea hirta and Parmelia chlorochroa.
Bryologist 81(3), 368-377.
Fahselt, D., Wu, T.W., Mott, B., 1995. Trace element patterns in lichens following uranium
mine closures. Bryologist 98, 228-234.
Fangmeier, A., Hadwiger-Fangmeier, A., Van der Eerden, L., Jäger, H.J., 1994. Effect of
atmospheric ammonia on vegetation – A review. Environmental Pollution 86, 43-82.
Feuerer, T., Hawksworth, D.L., 2007. Biodiversity of lichens, including a world-wide analysis
of checklist data based on Takhtajan’s floristic regions. Biodiversity Conservation 16,
85-98.
Feuerer, T., Zedda, L., 2001. Checklist of lichens and lichenicolous fungi of South Africa.
http://checklists.lias.net/. Last accessed on 22 September 2017.
Forbes, P.B.C., Thanjekwayo, M., Okonkwo, J.O., Sekhula, M., Zvinowanda, C., 2009.
Lichens as biomonitors for manganese and lead in Pretoria, South Africa. Fresenius
Environmental Bulletin 18(5), 609-614.
Frati, L., Brunialti, G., 2006. Long-term biomonitoring with lichens: Comparing data from
different sampling procedures. Environmental Monitoring and Assessment 119,
391-404.
Frati, L., Brunialti, G., Loppi, S., 2008. Effects of reduced nitrogen compounds on epiphytic
lichen communities in Mediterranean Italy. Science of The Total Environment 407(1),
630-637.
Frisch, A., Rudolphi, J., Sheil, D., Caruso, A., Thor, G., Gustafsson, L., 2015. Tree Species
Composition Predicts Epiphytic Lichen Communities in an African Montane Rain
Forest. Biotropica 47(5), 542-549.
Fryday, A.M., 2015. A new checklist of lichenised, lichenicolous and allied fungi reported from
South Africa. Bothalia 45(1), 1-4.
Fuentes, J.M.C., Rowe, J.G., 1998. The effect of air pollution from nitrogen dioxide (NO2) on
epiphytic lichens in Seville, Spain. Aerobiologia 14, 241-247.
Gardes, M., Bruns, T.D., 1993. ITS primers with enhanced specificity for basidiomycetes –
application to the identification of mycorrhizae and rusts. Molecular Ecology 2,
113-118.

122
Garrido-Benavent, I., Llop, E., Gómez-Bolea, A., 2015. The effect of agriculture management
and fire on epiphytic lichens on holm oak trees in the eastern Iberian Peninsula. The
Lichenologist 47(1), 59-68.
Garty, J., 2001. Biomonitoring atmospheric heavy metals with lichens: Theory and application.
Critical Review in Plant Sciences 20(4), 309-371.
Gauslaa, Y., 2014. Rain, dew, and humid air as drivers of morphology, function and spatial
distribution in epiphytic lichens. The Lichenologist 46(1), 1-16.
Geiser, L.H., Neitlich, P.N., 2007. Air pollution and climate gradients in western Oregon and
Washington indicated by epiphytic macrolichens. Environmental Pollution 145,
203-218.
Gibson, M.D., Heal, M.R., Li, Z., Kuchta, J., King, G.H., Hayes, A., Lambert, S., 2013. The
spatial and seasonal variation of nitrogen dioxide and sulfur dioxide in Cape Breton
Highlands National Park, Canada, and the association with lichen abundance.
Atmospheric Environment 64, 303-311.
Gilbert, O.L., 1970. Further studies on the effect of sulphur dioxide on lichens and bryophytes.
New Phytologist 69, 605-627.
Gilbert, O.L., 1980. Effect of land-use on terricolous lichens. Lichenologia 12(1), 117-124.
Giordani, P., 2007. Is the diversity of epiphytic lichens a reliable indicator of air pollution? A
case study from Italy. Environmental Pollution 146, 317-323.
Giordani, P., Brunialti, G., 2015. Sampling and interpreting lichen diversity data for
biomonitoring purposes. In: Upreti D.K., Divakar, P.K., Shukla, V., Bajpai, R. (eds.):
Recent advances in lichenology. New Delhi. Springer, 19-46.
Giordani, P., Malaspina, P., 2017. Do tree-related factors mediate the response of lichen
functional groups to eutrophication?. Plant Biosystems - An International Journal
Dealing with all Aspects of Plant Biology 151(6), 1062-1072.
Giordani, P., Brunialti, G., Alleteo, D., 2002. Effects of atmospheric pollution on lichen
biodiversity (LB) in a Mediterranean region (Liguria, NW Italy). Environmental Pollution
118, 53-64.
Giordani, P., Brunialti, G., Bacaro, G., Nascimbene, J., 2012. Functional traits of epiphytic
lichens as potential indicators of environmental conditions in forest ecosystems.
Ecological Indicators 18, 413-420.
Giordani, P., Brunialti, G., Frati, L., Incerti, G., Ianesch, L., Vallone, E., Bacaro, G., Maccherini,
S., 2013. Spatial scales of variation in lichens: implications for sampling design in
biomonitoring surveys. Environmental Monitoring and Assessment 185, 1567-1576.
Giordani, P., Incerti, G., Rizzi, G., Ginaldi, F., Viglione, S., Rellini, I., Brunialti, G., Malaspina,
P., Modenesi, P., 2010. Land use intensity drives the local variation of lichen diversity

123
in Mediterranean ecosystems sensitive to desertification. Bibliotheca Lichenologica
105, 139-148.
Giordani, P., Incerti, G., Rizzi, G., Rellini, I., Nimis, P.L., Modenesi, P., 2014. Functional traits
of cryptogams in Mediterranean ecosystems are driven by water, light and substrate
interactions. Journal of Vegetation Science 25, 778-792.
Giordani, P., Rizzi, G., Caselli, A., Modenesi, P., Malaspina, P., Mariotti, M.G., 2016. Fire
affects the functional diversity of epilithic lichen communities. Fungal Ecology 20,
49-55.
Giralt, M., Mayrhofer, H., 1991. Rinodina boleana spec. nova, a new lichen species from north-
eastern Spain. Mycotaxon 40, 435-439.
Giralt, M., Mayrhofer, H., 1995. Some corticolous and lignicolous species of the genus
Rinodina (lichenized Ascomycetes, Physciaceae) lacking secondary lichen
compounds and vegetative propagules in Southern Europe and adjacent regions.
Bibliotheca Lichenologica 57, 127-160.
Girmay, M.E., Chikobvu, D., 2017. Quantifying South Africa’s sulphur dioxide emission
efficiency in coal-powered electricity generation by fitting the three-parameter log-
logistic distribution. Journal of Energy in Southern Africa 28(1), 91-103.
Golubev, A.V., Golubeva, V.N., Krylov, N.G., Kuznetsova, V.F., Mavrin, S.V., Aleinikov, A.Y.,
Hoppes, W.G., Surano, K,A., 2005. On monitoring anthropogenic airborne uranium
concentrations and 235U/238U isotopic ratio by lichen bio-indicator technique. Journal
of Environmental Radioactivity 84, 333-342.
Gradstein, S.R., 2008. Epiphytes and deforestation in the tropics. Abhandlungen aus dem
Westfälischen Museum für Naturkunde 70, 41-424.
Grangeon, S., Guédron, S, Asta, J., Sarret, G., Charlet, L., 2012. Lichen and soil as indicators
of an atmospheric mercury contamination in the vicinity of a chlor-alkali plant
(Grenoble, France). Ecological Indicators 13(1), 178-183.
Grantz, D.A., Garner, J.H.B., Johnson, D.W., 2003. Ecological effects of particulate matter.
Environment International 29, 213-239.
Grube, M., Cernava, T., Soh, J., Fuchs, S., Aschenbrenner, I., Lassek, C., Wegner, U.,
Becher, D., Riedel, K., Sensen, C.W., Berg, G., 2015. Exploring functional contexts of
symbiotic sustain within lichen-associated bacteria by comparative omics. International
Society for Microbial Ecology Journal 9, 412-424.
Grueter, C.C., Li, D., Ren, B., Xiang, Z., Li, M., 2012. Food abundance is the main determinant
of high-altitude range use in snub-nosed monkeys. International Journal of Zoology.
doi:10.1155/2012/739419.
Gunathilaka, P.A.D.H.N., Ranundeniya, R.M.N.S., Najim, M.M.M., Seneviratne, S., 2011. A
determination of air pollution in Colombo and Kurunegala, Sri Lanka, using energy

124
dispersive X-ray fluorescence spectrometry on Heterodermia speciosa. Turkish
Journal of Botany 35, 439-446.
Gunn, J., Keller, W., Negusanti, J., Potvin, R., Beckett, P., Winterhalder, K., 1995. Ecosystem
recovery after emission reductions: Sudbury, Canada. Water, Air and Soil Pollution 85,
1783-1788.
Gupta, S., Rai, H., Upreti, D.K., Gupta, R.K., Sharma, P.K., 2017. Lichenized fungi
Phaeophyscia (Physciaceae, ascomycota) as indicator of ambient air heavy metal
deposition, along land use gradient in an Alpine habitat of Western Himalaya, India.
Pollution Research 36(1), 150-157.
Guttová, A., Vondrák, J., Schultz, M., Mokni, R.E.L., 2015. Lichens collected during the 12
“Iter Mediterraneum” in Tunisia, 24 March – 4 April 2014. Bocconea 27, 69-76.
Güvenç, S., Öztürk, S., 2017. Difference in epiphytic lichen communities on Quercus cerris
from urban and rural areas in Bursa (Turkey). Pakistan Journal of Botany 49(2),
631-637.
Gypser, S., Herppich, W.B., Fischer, T., Lange, P., Veste, M., 2016. Photosynthetic
characteristics and their spatial variance on biological soil crusts covering initial soils
of post-mining sites in Lower Lusatia,NE Germany. Flora 220, 103-116.
Hale, M.E., 1967. The Biology of Lichens. London. Edward Arnold.
Hale, M.E., 1971. Studies on Parmelia subgenus Xanthoparmelia (Lichenes) in South Africa.
Botaniska Notiser 124, 343-354.
Hale, M.E., 1983. The Biology of Lichens. Edward Arnold, London.
Hale, M.E., 1984. New species of Xanthoparmelia (Vain.) Hale (Ascomycotina:
Parmeliaceae). Mycotaxon 20, 73-79.
Hale, M.E., 1990. A synopsis of the lichen genus Xanthoparmelia (Vainio) Hale
(Ascomycotina: Parmeliaceae). Smithonian Contributions to Botany 74, 1-250.
Hauck, M., 2009. Global warming and alternative causes of decline in arctic-alpine and boreal-
montane lichens in the North-Western Central Europe. Global Change Biology 15,
2653-2661.
Hauck, M., Javkhlan, S., Lkhagvadorj, D., Bayartogtokh, B., Dulamsuren, C., Leuschner, C.,
2012. Edge and land-use effects on epiphytic lichen diversity in the forest-steppe
ecotone of the Mongolian Altai. Flora 207(6), 450-458.
Hauck, M., de Bruyn, U., Leuschner, C., 2013. Dramatic diversity losses in epiphytic lichens
in temperate broad-leaved forests during the last 150 years. Biological Conservation
157, 136-145.
Hawksworth, D.L., Rose, L., 1970. Qualitative scale for extimating sulphur dioxide air pollution
in England and Wales using epiphytic lichens. Nature 227, 145-148.

125
Hawksworth, D.L., McManus, P.M., 1989. Lichen recolonization in London under conditions
of rapidly falling sulphur dioxide levels, and the concept of zone skipping. Botanical
Journal of the Linnean Society 100, 99-109.
Hayward, G.D., Rosentreter, R., 1994. Lichens as nesting material for Northern Flying
Squirrels in the Northern Rocky Mountains. Journal of Mammalogy 75 (3), 663-673.
Henderson, L., 1990. Jacaranda. Farming in South Africa. Weeds A 30, 2132-2134.
Henderson, L., 2007. Invasive, naturalized and casual alien plants in southern Africa: a
summary based on the Southern African Plant Invaders Atlas (SAPIA). Bothalia 37(2),
215-248.
Henneman, L.R.F., Rafag, P., Annegarn, H.J., Klausbruckner, C., 2016. Assessing emissions
levels and costs associated with climate and air pollution policies in South Africa.
Energy Policy 89, 160-170.
Hulme, P.E., Brundu, G., Camarda, I., Dalias, P., Lambdon, P., Lloret, F., Medail, F.,
Moragues, E., Suehs, C.M., Traveset, A., Troumbis, A., Vilà, M., 2008. Assessing the
risks to Mediterranean islands ecosystems from alien plant introductions. In: Tokarska-
Guzik, B., Brock, J.H., Brundu, G., Child, I., Daehler, C.C., Pyšek, P. (eds.): Plant
Invasions: Human perception, ecological impacts and management. The Netherlands.
Backhuys Publishers, 39-56.
Hussan, A., Sheikh, M.A., Rahim, A., 2013. Effect of air pollution on diversity and distribution
of lichens in Pampore industrial area of Jammu and Kashmir. International Journal of
Current Trends in Research 2(1), 151-155.
Insarov, G., Insarov, I., 2002. Long term monitoring of the response of lichen communities to
climate change in the Central Negev Highlands (Israel). Bibliotheca Lichenologica 82,
209-220.
Insarov, G., Schroeter, B., 2002. Lichen monitoring and climate change. In: Nimis P.L.,
Scheidegger, C., Wolseley, P.A. (eds.): Monitoring with lichens, monitoring lichens.
Dordrecht. Kluwer Academic Publishers, 183-201.
Isocrono, D., Matteucci, E., Ferrarese, A., Pensi, E., Piervittori, R., 2007. Lichen colonization
in the city of Turin (N Italy) based on current and historical data. Environmental
Pollution 145, 258-265.
Jackson, T.A., 2015. Weathering, secondary mineral genesis, and soil formation caused by
lichens and mosses growing on granitic gneiss in a boreal forest environment.
Geoderma 252-252, 78-91.
Jägerbrand, A., Alatalo, J.M., 2017. Effects of human trampling on abundance and diversity
of vascular plants, bryophytes and lichens in alpine heath vegetation, Northern
Sweden. Springer Plus 4, 95

126
James, P.W, Hawksworth, D.L., Rose, F. 1977. Lichen communities in the British Isles: A
preliminary conspectus. In Seaward, M.R.D. (ed.): Lichen Ecology. London. Academic
Press.
Jeran, S., Byrne, A.R., Batic, F., 1995. Transplantedepiphytic lichens as biomonitors of air-
contamination by natural radionuclides around the Zirovski Vrh uranium mine,
Slovenia. The Lichenologist 27, 375-385.
Jovan, S., 2008. Lichen Bioindication of Biodiversity, Air Quality, and Climate: Baseline
Results From Monitoring in Washington, Oregon, and California. Report PNW-GTR-
737: General Technical.
Jovan, S., Carlberg, T., 2007. Nitrogen content of Letharia vulpina tissue from forests of the
Sierra Nevada, California: geographic patterns and relationships to ammonia
estimates and climate. Environmental Monitoring and Assessment, 129(1-3), 243-251.
Joseph, P., 2006. Assessment of lead pollution in Pretoria using Jacaranda Mimosifolia tree
bark. MSc thesis. Tshwane University of Technology: Faculty of Natural Sciences.
Jürgens, N., Niebel-Lohmann, A., 1995. Geobotanical observations on lichen fields of the
southern Namib Desert. Mitteilungen aus dem Institut für allgemeine Botanik in
Hamburg 25, 135-156.
Käffer, M.I., Martins, S.M.A., Alves, C., Pereira, V.C., Fachel, J., Vargas, V.M.F., 2011.
Corticolous lichens as environmental indicators in urban areas in southern Brazil.
Ecological Indicators 11, 1319-1332.
Kalb, K., 2001. New or otherwise interesting lichens I. Bibliotheca Lichenologica 78, 141-167.
Kandler, O., 1987. Lichen and conifer recolonization in Munich’s cleaner air. In Symposium of
the Commission of the European Communities on ‘‘Effects of Air Pollution on
Terrestrial and Aquatic Ecosystems’’ 18–22 May 1987. In: Mathy, P. (ed.): Brussels.
European Commission, 1-7.
Kärnefelt, I., 1986. The genera Bryocaulon, Coelocaulon and Cornicularia and formerly
associated taxa. Opera Botanica 86, 1-90.
Kärnefelt, I., 1987. A new species of Caloplaca from southern Africa. Bothalia 17, 41-43.
Kärnefelt, I., 1988. Morphology and biogeography of saxicolous Caloplaca in southern Africa.
Monographs in Systematic Botany from the Missouri Botanical Garden 25, 439-452.
Killmann, D., Fischer, E., 2005. New records for the lichen flora of Rwanda, East Africa.
Willdenowia 35, 193-204.
Kingwell, C.J., Londoño, G., 2015. Description of the nest, eggs, and nestling of Rufous-bellied
Bush-Tyrants (Myiotheretes fuscorufus). The Wilson Journal of Ornithology 127(1),
92-97.

127
Kirika, P.M., Ndiritu, G.G., Mugambi, G.K., Newton, L.E., Lumbsch, H.T., 2018. Diversity and
altitudinal distribution of understorey corticolous lichens in a tropical montane forest in
Kenya (East Africa). Cryptogam Biodiversity and Assessment (Special Volume) 47-70.
Kirschbaum, U., Wirth, V., 2010. Flechten erkennen - Umwelt bewerten. Hessisches
Landesamt für Umwelt und Geologie, 1-201.
Knops, J.M.H., Nash III, T.H., 1996. The influence of epiphytic lichens on the nutrient cycling
of an oak woodland. Ecological Monographs 66, 159-179.
Koch, N.M., Martins, S.M.A., Lucheta, F., Müller, S.C., 2013. Functional diversity and traits
assembly patterns of lichens as indicators of successional stages in a tropical
rainforest. Ecological Indicators 34, 22-30.
Komposch, H., Hafellner, J., 2000. Diversity and vertical distribution of lichens in a Venezuelan
tropical lowland rain forest. Selbyana 21, 11-24
Kuwka, M., Bach, K., Sipman, H.J.M., Flakus, A., 2012. Thirty-six species of the lichen genus
Parmotrema (Lecanorales, Ascomycota) new to Bolivia. Polish Botanical Journal
57(1), 243-257.
Kularatne, K.I.A., de Freitas C.R., 2013. Epiphytic lichens as biomonitors of airborne heavy
metal pollution. Environmental and Experimental Botany 88, 24-32.
Lalley, J.S., Viles, H.A., 2005. Terricolous lichens in the northern Namib Desert of Namibia:
distribution and community composition. The Lichenologist 37, 77-91.
Lalley, J.S., Viles, H.A., 2006. Do vehicle track disturbances affect the productivity of soil-
growing lichens in a fog desert? Functional Ecology 20, 548-556.
Larsen, R.S., Bell, J.N.B., Chimonides, P.J., Rumsey, F.J., Tremper, A., Purvis, O.W., 2007.
Lichen and bryophyte distribution on oak in London in relation to air pollution and bark
acidity. Environmental Pollution 146, 322-340.
Laundon, J.R., 1981. The species of Chrysothrix. The Lichenologist 13(2), 101-121.
Leedy, P.D., Ormrod, J.E., 2016. Practical Research: Planning and Design. (11th Edition).
Pearson, United States.
Leith, I.D., van Dijk, N., Pitcairn C.E.R., Wolseley, P.A., Whitfield, C.P., Sutton, M.A., 2005.
Biomonitoring methods for assessing impacts of nitrogen pollution: refinement and
testing. Joint Nature Conservation Committee (JNCC) Report 386, 1-290.
Li, S., Liu, W., Li, D., 2013. Bole epiphytic lichens as potential indicators of environmental
change in subtropical forest ecosystems in southwest China. Ecological Indicators 29,
93-104.
Liebenberg-Enslin, H., Petzer, G., 2005. Draft Air Quality Management Plan for the City of
Tshwane Metropolitan Municipality. Project done on behalf of City of Tshwane
Metropolitan Municipality. Pretoria: Department of Social Development. Report No:
APP/05/CTMM-02aRev 2.

128
Lisowska, M., 2011. Lichen recolonisation in an urban-industrial area of southern Poland as a
result of air quality improvement. Environmental Monitoring and Assessment 179,
177-190.
Liu, X., Stanford, C.B., Yang, J., Yao, H., Li, Y., 2013. Foods eaten by the Sichuan snub-nosed
Monkey (Rhinopithecus roxellana) in Shennongjia National Nature Reserve, China, in
relation to nutritional chemistry. American Journal of Primatology 75, 860-871.
Llano, G.A., 1948. Economic uses of lichens. Economic Botany 2, 5-45.
Llop, E., Pinho, P., Matos, P., Pereira, M.J., Branquinho, C., 2012. The use of lichen functional
groups as indicators of air quality in a Mediterranean urban environment. Ecological
Indicators 13, 215-221.
Longton, R.E., 1997. The role of bryophytes and lichens in polar ecosystems. In: Woodin, S.J.,
Marquiss, M., (eds.): Ecology of Arctic Environments. Blackwell Science. Oxford. UK,
69-96.
López, L.G.C., Medina, E.A.S., Peña, A.M., 2016. Effects of Microclimate on Species Diversity
and Functional Traits of Corticolous Lichens in the Popayan Botanical Garden (Cauca,
Colombia). Cryptogamie, Mycologie 37(2), 205-215.
López Berdonces, M.A., Higueras, P.L., Fernández-Pascual, M., Borreguero, A.M., Carmona
M., 2017. The role of native lichens in the biomonitoring of gaseous mercury at
contaminated sites. Journal of Environmental Management 186, 207-213.
Loppi, S., 2014. Lichens as sentinels for air pollution at remote alpine areas (Italy).
Environmental Science Pollution Research 21, 2563-2571.
Loppi, S., Corsini, A., 2003. Diversity of epiphytic lichens and metal contents of Parmelia
caperata thalli as monitors of air pollution in the town of Pistoia (C Italy). Environmental
Monitoring and Assessment 86, 289-301.
Loppi, S., Giordani, P., Brunialti, G., Isocrono, D., Piervittori, R., 2002. A new scale for the
interpretation of lichen biodiversity values in the Thyrrenian side of Italy. Bibliotheca
Lichenologica 82, 237-243.
Loppi, S, Pirintsos, S.A., 2003. Epiphytic lichens as sentinels for heavy metal pollution at forest
ecosystems (central Italy). Environmental Pollution 121, 327-332.
Loppi, S., Pirintsos, S.A., De Dominicis, V., 1997. Analysis of the distribution of epiphytic
lichens on Quercus pubescens along an altitudinal gradient in a Mediterranean area
(Tuscany, central Italy). Israel Journal of Plant Sciences 45, 53-58.
Loppi, S., Putortì, E., Signorini, C., Fommei, S., Pirintsos, S.A., De Dominicis, C., 1998. A
retrospective study using epiphytic lichens as biomonitors of air quality: 1980 and 1996
(Tuscany, central Italy). Acta Oecologica 19, 405-408.
Loppi, S., Riccobono, F., Zhang, Z.H., Savic, S., Ivanov, D., Pirintsos, S.A., 2003. Lichens as
biomonitors of uranium in the Balkan area. Environmental Pollution 125, 277-280.

129
Lorenzini, G., Landi, U., Loppi, S., Nali, C., 2003. Lichen distribution and bioindicator tobacco
plants give discordant response: A case study from Italy. Environmental Monitoring
and Assessment 82, 243-264.
Łubek, A., Kukwa, M., Jaroszewicz, B., Czortek, P., 2018. Changes in the epiphytic lichen
biota of Białowieża Primeval Forest are not explained by climate warming. Science of
the Total Environment 643, 468-478.
Lücking, R., Hodkinson, B.P., Leavitt, S.D., 2016. The 2016 classification of lichenized fungi
in the Ascomycota and Basidiomycota – approaching one thousand genera. Bryologist
119, 361-416.
Lupšina, V., Horvat, M., Jeran, Z., Stegnar, P., 1992. Investigation of mercury speciation in
lichens. Analyst 117, 673-675.
Malhotra, S., Subban, R., Singh, A., 2007. Lichens- Role in Traditional Medicine and Drug
Discovery. The Internet Journal of Alternative Medicine 5(2), 1-6.
Manly, B.F.J., 2001. Statistics for Environmental Science and Management, Second Edition.
Chapman and Hall/CRC, United States of America.
Manninen, S., 2018. Deriving nitrogen critical levels and loads based on the responses of
acidophytic lichen communities on boreal urban Pinus sylvestris trunks. Science of the
Total Environment (613-614), 751-762.
Maphangwa, K.W., 2010. Lichen thermal sensitivities, moisture interception and elemental
accumulation in an arid South African ecosystem. MSc Thesis. Department of
Biodiversity and Conservation Biology, University of the Western Cape.
Maphangwa, K.W., Musil, C., Raitt, L., Zedda, L., 2012a. Differential interception and
evaporation of fog, dew and water vapour and elemental accumulation by lichens
explain their relative abundance in a coastal desert. Journal of Arid Environments 82,
71-80.
Maphangwa, K.W., Musil, C., Raitt, L., Zedda, L., 2012b. Experimental climate warming
decreases photosynthetic efficiency of lichens in an arid South African ecosystem.
Oecologia 169, 25 -268.
Maphangwa, K.W., Musil, C., Raitt, L., Zedda, L., 2014. Will climate warming exceed lethal
photosynthetic temperature thresholds of lichens in a southern African arid region?
African Journal of Ecology 52(2), 228-236.
Maphangwa, K.W., Sipman, H.J.M., Tekere, M., Zedda, L., 2018. Epiphytic lichen diversity on
Jacaranda and Acacia trees in Pretoria (Tshwane, Republic of South Africa). Herzogia
31(2), 949-964.
Marais, R., 2004. A plant ecological study of the Rietvlei Nature Reserve, Gauteng Province.
Magister Agriculturae. Department of Animal, Wildlife and Grassland Sciences.
University of the Free State.

130
Marbach, B., 2000. Corticole und lignicole Arten der Flechtengattung Buellia sensu lato in den
Subtropen und Tropen. Bibliotheca Lichenologica 74, 1-384.
Marini, L., Nascimbene, J., Nimis, P.L., 2011. Large-scale patterns of epiphytic lichen species
richness: Photobiont-dependent response to climate and forest structure. Science of
the Total Environment 409, 4381-4386.
Massalongo, A., 1861. Lichenes Capenses quos colleg. in itinere 1853-1856 Dr. H. Wavra, a
Dott. A. Massalongo delineati ac descripti. − Memorie dell' Istituto Veneto di scienze,
lettere ed arti 10, 43-90.
Matos, P., Pinho, P., Aragón, G., Martínez, I., Nunes, I., Soares, A.M.V.M., Branquinho, C.,
2015. Lichen traits responding to aridity. Journal of Ecology 103, 451-458.
Matzer, M., Mayrhofer, H., 1996. Saxicolous species of the genus Rinodina (lichenized
Ascomycetes, Physciaceae) in southern Africa. Bothalia 26(1), 11-30.
Mayrhofer, H., Lambauer, M., Edler, C., 2007. Rinodina (Ach.) Gray, 1821. In: Galloway, D.J.
(ed.): Flora of New Zealand: Lichens, including lichen forming and lichenicolous fungi.
Revised 2nd edition. Landcare Research. Lincoln, NZ: Manaaki Whenua Press,
1563-1590.
Mayrhofer, H., Obermayer, W., Wetschnig, W., 2014. Corticolous species of the genus
Rinodina (lichenized Ascomycetes, Physciaceae) in southern Africa. Herzogia 27,
1-12.
McCune, B., Dey. J., Peck, J., Heiman, K., Will-Wolf, S., 1997. Regional Gradients in Lichen
Communities of the Southeast United States. The Bryologist 100(2), 145-158.
Mežaka, A., Brūmelis, G., Piterāns, A., 2012. Tree and stand-scale factors affecting richness
and composition of epiphytic bryophytes and lichens in deciduous woodland key
habitats. Biodiversity and Conservation 21, 3221-3241.
Minganti, V., Capelli, R., Drava, G., Pellegrini, R.D., Brunialti, G., Giordani, P., Modenesi., P.,
2003. Biomonitoring of Trace Metals by different species of Lichens (Parmelia) in
North-West Italy. Journal of Atmospheric Chemistry 45, 219-229.
Mittermeier, R.A., Robles-Gil, P., Hoffmann, M., Pilgrim, J., Brooks, T., Mittermeier, C.G.,
Lamoreux, J., Da Fonseca, G.A., 2004. Hotspots revisited: Earth’s biologically richest
and most endangered terrestrial ecoregions. Washington, DC: Conservation
International.
Moberg, R., 1986. The genus Physcia in East Africa. Nordic Journal of Botany 6, 843-864.
Moberg, R., 1987. The genera Hyperphyscia and Physconia in East Africa. Nordic Journal of
Botany 7(6), 719-728.
Moberg, R., 2004. Notes on foliose species of the lichen family Physciaceae in southern Africa.
Acta Universitatis Upsaliensis Symbolae Botanicae Upsalienses 34(1), 257-288.

131
Monaci, F., Fantozzi, F., Figueroa, R., Parra, O., 2012. Bargagli, R., Baseline element
composition of foliose and fruticose lichens along the steep climatic gradient of SW
Patagonia (Aisén Region, Chile). Journal of Environmental Monitoring 14, 2309-2316.
Monna, F., Poujo, M., Losno R., Dominik, J., Annegarn, H., Coetzee H., 2006. Origin of
atmospheric lead in Johannesburg, South Africa. Atmospheric Environment 40,
6554-6566.
Mucina, L., Rutherford M.C., 2006. The Vegetation of South Africa, Lesotho and Swaziland.
Strelitzia 19, South African National Biodiversity Institute, Pretoria.
Muggia, L., Grube, M., 2018. Fungal diversity in lichens: From extremotolerance to
Interactions with algae. Life 8(2), 1-14.
Mukherjee, A., Wilske, B., Navarro, R.A., Dippenaar-Schoeman, A., Underhill, L.G., 2010.
Association of spiders and lichen on Robben Island, South Africa: a case report.
Journal of Threatened Taxa 2(4), 815-819.
Mulligan, L., 2009. An Assessment of epiphytic lichens, lichen diversity and environmental
quality in the seminatural woodlands of Knocksink Wood nature reserve, Enniskerry,
County Wicklow. MPhil, Dublin Institute of Technology.
Munzi, S., Ravera, S., Caneva, G., 2007. Epiphytic lichens as indicators of environmental
quality in Rome. Environmental Pollution 146, 350-358.
Murray, M.G., Thompson, W.F., 1980. Rapid isolation of high molecular weight plant DNA.
Nucleic Acids Research 8, 4321-4325.
Musil, C., Nyaga, J., Maphangwa, K., Raitt, L., 2010. Responses of dwarf succulent plants,
lichens, and soils to experimental climate warming in an arid South African ecosystem.
In: Schmiedel, U., Jürgens, N. (eds.): Biodiversity in southern Africa. Volume 2.
Patterns and processes at regional scale. Göttingen and Windhoek. Klaus Hess
Publishers, 246-250.
Muyemeki, L., Burger, R., Piketh, S.J., Evans, S.W., 2017. Bird species richness and densities
in relation to sulphur dioxide gradients and environmental variables. Ostrich 88(3),
253-259.
Myers, N., Mittermeier, R.A., Mittermeier, C.G., Da Fonseca, G.A., Kent J., 2000. Biodiversity
hotspots for conservation priorities. Nature 403, 853-858.
Naidoo, S., Piketh, S.J., Curtis, C., 2014. Quantification of emissions generated from domestic
burning activities from townships in Johannesburg. Clean Air Journal (24)1, 34-41.
Nascimbene, J., Benesperi, R., Brunialti, G., Catalano, I., Dalle Vedove, M., Grillo, M.,
Isocrono, D., Matteucci, E., Potenza, G., Puntillo, D., Puntillo, M., Ravera, S., Rizzi,
G., Giordani, P., 2013. Patterns and drivers of β-diversity and similarity of Lobaria
pulmonaria communities in Italian forests. Journal of Ecology 101, 493-505.

132
Nascimbene, J., Marini, L., 2015. Epiphytic lichen diversity along elevational gradients:
biological traits reveal a complex response to water and energy. Journal of
Biogeography 42, 1222-1232.
Nascimbene, J., Casazza, G., Benesperi, R., Catalano, I., Cataldo, D., Grillo, M., Isocrono, D.,
Matteucci, E., Ongaro, S., Potenza, G., Puntillo, D., Ravera, S., Zedda, L., Giordani,
P., 2016. Climate change fosters the decline of epiphytic Lobaria species in Italy.
Biological Conservation 201, 377-384.
Nash III, T.H., 1976. Sensitivity of lichens to nitrogen dioxide fumigations. Bryologist 79,
103-106.
Nash III, T.H., 1996. Nutrients, elemental accumulation, and mineral cycling: In. Nash III, T.H.
(ed.): Lichen Biology. Cambridge. Cambridge University Press, 136-153.
Nash III, T.H. (ed.): 2008. Lichen Biology. USA. Cambridge University Press.
Nash III, T.H., Olafsen, A.G., 1995. Climate change and the ecophysiological response of
arctic lichens. The Lichenologist 21(6), 559-565.
Nash III, T.H., Ryan, B.D., Gries, C., Bungartz, F., 2002. Lichen Flora of the Greater Sonoran
Desert Region. Volume 1. Tempe. Arizona State University.
Nash III, T.H., Ryan, B.D., Gries, C., Bungartz, F., 2004. Lichen Flora of the Greater Sonoran
Desert Region. Volume 2. Tempe. Arizona State University.
Nelson, P.R., McCune, B., Swanson, D.K., 2015. Lichen traits and species as indicators of
vegetation and environment. The Bryologist 118(3), 252-263.
Ng, O.H., Tan, B.C., Obbard, J.P., 2005. Lichens as bioindicators of atmospheric heavy metal
pollution in Singapore. Environmental Monitoring Assessment 123, 63-74.
Nieboer, E., Richardson, D.H.S., Tomassini, F.D., 1978. Mineral uptake and release by
lichens: an overview. Bryologist 81, 226-246.
Nimis, P.L., 1986. Urban lichen studies in Italy II: The town of Udine. Gortania 7(85), 147-172.
Nimis, P.L., Lazzarin, G., Gasparo, D., 1996. Biomonitoring of SO2 and metal pollution with
lichens in the province of Treviso (NE Italy). In: Azzoni, R., De Marco, N., Sansoni G.
(eds): Dalla tossicologia alla ecotossicologia. Pordenone 16-17 September 1994,
9-28.
Nimis, P.L., Martellos, S., 2017. ITALIC – The Information System on Italian Lichens. Version
5.0. – University of Trieste. Department of Biology. http://dryades.units.it/italic. Last
visited 15 October 2017.
Nimis, P.L., Purvis, W.O., 2002. Monitoring lichens as indicators of pollution. An introduction.
In: Nimis, P.L., Scheidegger, C., Wolseley, P. (eds.): Monitoring with Lichens and
Monitoring Lichens. Dordrecht. Kluwer Academic Publishers, 39-64 7-10.

133
Nimis, P.L., Scheidegger, C., Wolseley, P.A., 2002. Monitoring With Lichens: Monitoring
Lichens. Kluwer Academic Published in Association with the NATO Scientific Affairs
London. Division, Dordrecht.
Nylander, W., 1866. Les lichens du Jardin de Luxembourg. Bulletin Society Botanique de
France 13, 364-372.
Obermayer, W., Kalb, K., Sipman, H.J.M., Nash III, T.H., 2009. New reports of Culbersonia
nubila (Moberg) Essl. from the Tibetan Region, Bolivia, Argentina, Lesotho and South
Africa. The Lichenologist 41(6), 683-687.
O'Connor, T.G., 1995. Acacia karroo invasion of grassland: environmental and biotic effects
influencing seedling emergence and establishment. Oecologia 103(2), 214-223.
Ódor, P., Király, I., Tinya, F., Bortignon, F., Nascimbene, J., 2013. Patterns and drivers of
species composition of epiphytic bryophytes and lichens in managed temperate
forests. Forest Ecology and Management 306, 256-265.
Ohnuki, T., Sakamoto, F., Kozai, N., Samadfam, M., Sakai, T., Kamiya, T., Satoh, T., Oikawa,
M., 2002. Application of the micro-PIXE technique for analyzing arsenic in biomat and
lower plants of lichen and mosses around an arsenic mine site, at Gunma, Japan.
Nuclear Instruments and Methods in Physics Research B 190, 477-481.
Olowoyo, J.O., van Heerden, E., Fischer, J.L., 2010. Investigating Jacaranda mimosifolia tree
as biomonitor of atmospheric trace metals. Environmental Monitoring and Assessment
164, 435-443.
Olowoyo, J.O., van Heerden, E., Fischer, J.L., 2011. Trace element concentrations from lichen
transplants in Pretoria, South Africa. Environmental Science and Pollution Research
18, 663-668.
Olowoyo, J.O., van Heerden, E., Fischer, J.L. 2013. Trace metals concentrations in soil from
different sites in Pretoria, South Africa. Sustainable Environment Research 23(2),
93-99.
Orange, A., James, P.W., White, F.J., 2001. Microchemical Methods for the Identification of
Lichens. British Lichen Society.
Osyczka, P., 2010. Alien lichens unintentionally transported to the ‘‘Arctowski’’ station (South
Shetlands, Antarctica). Polar Biology 33, 1067-1073.
Otalora, M., Belinchon, R., Prieto, M., Aragón, G., Izquiredo, P., Martínez, I., 2015. The
threatened epiphytic lichen Lobaria pulmonaria in the Iberian Peninsula: genetic
diversity and structure across a latitudinal gradient. Fungal Biology 119, 802-811.
Palgrave, K.C., 1977. Trees of Southern Africa. Struik Publishers, Cape Town.
Palmqvist, K., Dahlman, L., Jonsson, A., Nash III, T.H., 2008. The carbon economy of lichens.
In: Nash III, T.H. (ed): Lichen Biology. 2nd edition. Cambridge. Cambridge University
Press, 182-215.

134
Panichev, N., McCrindle, R.I., 2004. The application of bio-indicators for the assessment of
air pollution. Journal of Environmental Monitoring 6, 121-123.
Panichev, N., Mokgalaka, N., Panicheva, S., 2019. Assessment of air pollution by mercury in
South African provinces using lichens Parmelia caperata as bioindicators.
Environmental Geochemistry and Health doi: 10.1007/s10653-019-00283-w.
Paoli, L., Benesperi, R., Pannunzi, D.P., Corsini, A., Loppi, S., 2014. Biological effects of
ammonia released from a composting plant assessed with lichens. Environmental
Science and Pollution Research 21, 5861-5872.
Paoli, L., Grassi, A., Vannini, A., Maslaňáková,I., Bil’ová, I., Bačkor, M., Corsini, A., Loppi, S.,
2015b. Epiphytic lichens as indicators of environmental quality around a municipal
solid waste landfill (C Italy). Waste Management 42, 67-73.
Paoli, L., Maslaňáková, I., Grassi, A., Bačkor, M., Loppi, S., 2015a. Effects ofacuteNH3 air
pollution on N-sensitive and N-tolerant lichen species. Ecotoxicology and
Environmental Safety 122, 377-383.
Pekkarinen, A.J., Kumpula, J., Tahvonena, O., 2015. Reindeer management and winter
pastures in the presence of supplementary feeding and government subsidies.
Ecological Modelling 312, 256-271.
Perlmutter, G.B., 2010. Bioassessing air pollution effects with epiphytic lichens in Raleigh,
North Carolina, U.S.A. The Bryologist 113(1), 39-50.
Pescott, O.L., Simkin, J.M., August, T.A., Randle, Z., Dore, A.J., Botham, M.S., 2015. Air
pollution and its effects on lichens, bryophytes, and lichen-feeding Lepidoptera: review
and evidence from biological records. Biological Journal of the Linnean Society 115,
611-635.
Pfiz, M., Loris, K., Erb, E., Wirth, V., Küppers, M., 2010. Changing patterns of lichen growth
form distributions within the lichen fields of the Central Namib. In: Schmiedel, U.,
Jürgens, N. (eds.): Biodiversity in southern Africa. Volume 2. Patterns and processes
at regional scale. Göttingen and Windhoek. Klaus Hess Publishers, 107-111.
Pike, L.H., 1978. The importance of epiphytic lichens in mineral cycling. Bryologist 81,
247-257.
Pinho, P., Bergamini, A., Carvalho, P., Branquinho, C., Stofer, S., Scheidegger, C., Maguas,
C., 2012. Lichen functional groups as ecological indicators of the effects of land-use in
Mediterranean ecosystems. Ecological Indicators 15, 36-42.
Poličnik, H., Simončič, P., Batič, F., 2008. Monitoring air quality with lichens: A comparison
between mapping in forest sites and in open areas. Environmental Pollution 151(2),
395-400.
Pooley, S., 1993. The complete guide to trees of Natal, Zululand and Transkei. Durban, Natal
Flora Publication Trust.

135
Poulin, J., 2017. A new methodology for the characterisation of natural dyes on museum
objects using gas Chromatography–Mass Spectrometry. Studies in Conservation
63(1), 36-61.
Pretorius, I., Piketh, S., Burger, R., Neomagus, H., 2015. A perspective on South African coal
fired power station emissions. Journal of Energy in Southern Africa 26(3), 27-40.
Puckett, K.J., 1988. Bryophytes and lichens as monitors of metal deposition. Bibliotheca
Lichenologica 30, 231-267.
Purvis, O.W., 2000. Lichens. London. Natural History Museum.
Purvis, O.W., 2014. Adaptation and interaction of saxicolous crustose lichens with metals.
Botanical Studies 55 (23), 1-14.
Purvis, O.W., Bamber, R, Chimonides, Din, V., Erotokritou, L., Jeffries, T., Jones, G.C., 2001.
Burnham Beeches lichen monitoring: Phase 2. Year 2. Report to Corporation of
London.
Purvis, O.W., Chimonides, J., Din, V.K., Erotokritou, L., Jeffries, T., Jones, G.C., Louwoff, S.,
Read, H., Spiro, B., 2003. Which factors are responsible for the changing lichen floras
of London? Science of the Total Environment 310, 179-189.
Purvis, O. W., Coppins, B. J., Hawksworth, D. L., James, P.W., Moore, D.M. (Eds,), 1992. The
Lichen Flora of Great Britain and Ireland. London. Natural History Museum
Publications and British Lichen Society.
Purvis, O.W., Pawlik-Skowrońska, B., 2008. Lichens and Metals. The British Mycological
Society 176-191.
Rambold, G., Davydov E., Elix J.A., Nash III, T.H., Scheidegger C., Zedda L. (eds.): 2001
onwards). LIAS light – A database for rapid identification of lichens.
http://liaslight.lias.net/ last visited 26 August 2019.
Rambold, G., Elix J.A., Heindl-Tenhunen B., Köhler T., Nash III, T.H., Neubacher D., Reichert
W., Zedda L., Triebel, D., 2014. LIAS light – Towards the ten thousand species
milestone. MycoKeys 8, 11-16.
Richardson, D.H.S., Young, C.M., 1977. Lichens and vertebrates. In: Seaward, M.R.D. (ed.):
Lichen Ecology. London. Academic Press, 121-144.
Riddell, J., Nash III, T.H., Padgett, P., 2008. The effect of HNO3 gas on the lichen Ramalina
menziesii. Flora, 203, 47-54.
Rindita, Lisdar, I.S., Yoni, K., 2015. Air Quality Bioindicator Using the Population of Epiphytic
Macrolichens in Bogor City, West Java. Hayati Journal of Biosciences 22(2), 53-59.
Rola, K., Osyckzs, P., 2019. Temporal changes in accumulation of trace metals in vegetative
and generative parts of Xanthoria parietina lichen thalli and their implications for
biomonitoring studies. Ecological Indicators 96, 293-302.

136
Root, H.T., McCune, B., Jovan, S., 2014. Lichen communities and species indicate climate
thresholds in southeast and south-central Alaska, USA. The Bryologist 117(3), 241-
252.
Rosamilia, S., Gaudino, Sansone, S., Belli, M., Jeran, Z., Ruisi, S., Zucconi, L., 2004. Uranium
isotopes, metals and other elements in lichens and tree barks collected in Bosnia–
Herzegovina. Journal of Atmospheric Chemistry 49, 447-460.
Rubio-Salcedo, M., Psomas, A., Prieto, M., Zimmerman, N.E., Martínez, I., 2017. Case study
of the implications of climate change for lichen diversity and distributions. Biodiversity
Conservation 26, 1121-1141.
Ruoss, E., 1999. How agriculture affects lichen vegetation in central Switzerland. The
Lichenologist 31(1), 63-73.
Saag, L., Saag, A., Randlane, T., 2009. World survey of the genus Lepraria (Stereocaulaceae,
lichenized Ascomycota). The Lichenologist 41(1), 25-60.
Saipunkaew, W., Wolseley P., Chimonides, P.J., 2005. Epiphytic lichens as indicators of
environmental health in the vicinity of Chiang Mai city, Thailand. The Lichenologist 37
(4), 345-356.
Saipunkaew, W., Wolseley P.A., Chimonides, P.J., Boonpragob, K., 2007. Epiphytic
macrolichens as indicators of environmental alteration in northern Thailand.
Environmental Pollution 146, 366-374.
Samsudin, M.D., Din, L., Zakaria., Z, Latip, J, Lihan, T., Jemain, A.A., Samsudin, F., 2012.
Measuring air quality using lichen mapping at Universiti Kebangsaan Malaysia (UKM)
Campus. Procedia - Social and Behavioral Sciences 59, 635-643.
Sancho, L.G., Green, T.G.A., Pintado, A., 2007. Slowest to fastest: Extreme range in lichen
growth rates supports their use as an indicator of climate change in Antarctica. Flora
202, 667-673.
Sangeetha, S.K., Sivakumar, V., 2019. Long-term temporal and spatial analysis of SO2 over
Gauteng and Mpumalanga monitoring sites of South Africa. Journal of Atmospheric
and Solar-Terrestrial Physics 191, 105044.
Schultz, M., Zedda, L., Rambold, G., 2009. New records of lichen taxa from Namibia and
South Africa. Bibliotheca Lichenologica 99, 315-334.
Seaward, M.R.D., 2008. Environmental role of lichens. In: Nash III, T.H. (ed.): Lichen Biology.
2nd Edition. Cambridge. Cambridge University Press, 274-298.
Seaward, M.R.D., Letrouit-Galinou, M., 1991. Lichens return to the Jardin du Luxembourg
after an absence of almost a century. The Lichenologist 23, 181-186.
Sheard, J.W., Knudsen, K., Mayrhofer, H., Morse, C.A., 2011. Three new species of Rinodina
(Physciaceae) and a new record from North America. The Bryologist 114, 453-465.

137
Sett, R., Kundu, M., 2016. Epiphytic Lichens: Their Usefulness as Bio-indicators of Air
Pollution. Donnish Journal of Research in Environmental Studies 3(3), 017-024.
Sipman, 2003: Lichen determination keys.
http://www.bgbm.org/sipman/keys/Trobuellia.htm#127. Last accessed 6 March 2017.
Smit, I.P.J., Asner, G.P., Govender, N., Kennedy-Bowdoin, T., Knapp, D.E., Jacobson, J.,
2010. Effects of fire on woody vegetation structure in African savanna. Ecological
Applications 20(7), 1865-1875.
Søchting, U., 2004. Flavoparmelia caperata - a probable indicator of increased temperatures
in Denmark. Graphis Scripta 15, 53-56.
Sparrius L.B., 2007. Response of epiphytic lichen communities to decreasing ammonia air
concentrations in a moderately polluted area of The Netherlands. Environmental
Pollution 146, 375-379.
Spier, L.J., Van Herk, C.M., 1997. Recent increase of Parmelia borreri in The Netherlands.
The Lichenologist 29, 390-393.
Spribille, T., Tuovinen, V., ResI, P., Vanderpool, D., Wolinski, H., Aime, M.C., Schneider, K.,
Stabentheiner, E., Toome-Heller, M., Thor, G., Mayrhofer, H., Johannesson, H.,
McCutcheon, J.P., 2016. Basidiomycete yeasts in the cortex of ascomycete
macrolichens. Science 353(6298), 488-492.
South African Air Quality Information Systems (SAAQIS), 2018.
http://www.saaqis.org.za/Mashup.aspx. Last accessed 16 January 2018.
Statistics South Africa, 2011). http://www.statssa.gov.za/?page_id=993&id=city-of-tshwane-
municipality. Last accessed 2 March 2020.
Stofer, S., Bergamini, A., Aragón, G., Carvalho, P., Coppins, B.J., Davey, S., Dietrich, M.,
Farkas, E., Kärkkäinen, K., Keller, C., Lӧkӧs, L., Lommi, S., Maguas, C., Mitchell, R.,
Pinho, P., Rico, V.J., Truscott, A.-M., Wolseley, P.A., Watt, A., Scheidegger, C., 2006.
Species richness of lichen functional groups in relation to land use intensity. The
Lichenologist 38, 331-353.
Sujetovienė, G., 2010. Road traffic pollution effects on epiphytic lichens. Ekologija 56(1-2),
64-71.
Sujetoviene, G., Sliumpaite, I., 2013. Response of Evernia prunastri transplanted to an urban
area in central Lithuania. Atmospheric Pollution Research 4, 222-228.
Svoboda, D., Peksa, O., Veselá, J., 2010. Epiphytic lichen diversity in central European oak
forests: Assessment of the effects of natural environmental factors and human
influences. Environmental Pollution 158, 812-819.
Swinscow, T.D.V., Krog, H., 1988. Macrolichens of East Africa. London, British Museum
(Natural History).

138
Tamura, K., Peterson, D., Peterson, N., Stecher, G., Nei, M., Kumar, S., 2011. MEGA5:
molecular evolutionary genetics analysis using maximum likelihood, evolutionary
distance, and maximum parsimony methods. Molecular Biology and Evolution 28,
2731-2739.
Thomas, C.M., Bhat, R.B., 1994. Contribution to the lichen flora of Transkei. Mycotaxon 50,
9-18.
Thomas, C.M., Bhat, R.B., 1995. Some advances in lichenological exploration of southern
Africa since the time of Linnaeus-I. Biológia 50(1), 1-8.
Thomas, C.M., Bhat, R.B., 1996. New report of lichens from southern Africa. Mycotaxon 58, 375-385.
Thormann, M.N., 2006. Lichens as indicators of forest health in Canada. The Forestry
Chronicle 82, (3), 335-343.
Tiwari, P.K., 2008. Lichens as an indicator of air pollution: A review. Indian Journal of Air
Pollution Control 8, (1), 8-17.
Tregidgo, D.J., West, S.E., Mike R. Ashmore, M.R., 2013. Can citizen science produce good
science? Testing the OPAL Air Survey methodology, using lichens as indicators of
nitrogenous pollution. Environmental Pollution 182, 448-451.
Tretiach, M., Piccotto, M., Baruffo, L., 2007. Effects of ambient NOx on chlorophyll a
fluorescence in transplanted Flavoparmelia caperata (Lichen). Environmental Science
and Technology 41, 2978-2984.
Trollope, W.S.W., Trollope, L.A., 1997. Fire effects and management in African grasslands
and savannas. Range and Animal Science and Resource Management (Vol II).
Nelspruit, South Africa: Encyclopedia of Life Support Systems.
Trüe A., Panichev, N., Okonkwo, J., Forbes, P.B.C., 2012. Determination of the mercury
content of lichens and comparison to atmospheric mercury levels in the South African
Highveld Region. Clean Air Journal 2(1), 19-25.
Truscott, A.M., Palmer, S.C.F., McGowan, G.M., Cape, J.N., Smart, S., 2005. Vegetation
composition of roadside verges in Scotland: the effects of nitrogen deposition,
disturbance and management. Environmental Pollution 136, 109-118.
United States Forest Service, National Lichens and Air Quality Database and Clearinghouse,
http://gis.nacse.org/lichenair/index.php?page=e_sensitivity Last visited on 3
September 2019.
Van der Byl, P.A., 1931. In Lys van Korsmosse (Lichenes) versamel in die Unie van Suid-
Afrika en in Rhodesie gedurende die tydperk 1917-1929 (List of lichens collected in
the Union of South Africa and in Rhodesia from 1917-1929). Annale v.d. Univ.
Stellenbosch 9A, Afl. 3(1), 1-17.

139
Van Dobben, H.F., ter Braak, C.J.F., 1998. Effects of atmospheric NH3 on epiphytic lichens in
The Netherlands: The pitfalls of biological monitoring. Atmospheric Environment, 32,
551-557.
Van Haluwyn, C., Van Herk, K.C.M., 2002. Bioindication: the Community Approach. In: Nimis,
P.L., Scheidegger, C., Wolseley, P.A. (eds.): Monitoring with Lichens - Monitoring
Lichens. Dordrecht. Kluwer Academic Publishers, 39-64.
VDI-Richtlinien 3957, 2005. Biological measurement procedures for determining and
evaluating the effects of ambient air pollutions by means of lichens (bioindication)
Mapping the diversity of epiphytic lichens as an indicator of air quality. Beuth-Verlag,
Berlin.
Van Herk, C.M., Aptroot, A., 1996. Epifytische korstmossen komen ver terug. Nature 93,
130-133.
Van Herk, C.M., Aptroot, A., 2004. Veldgids korstmossen. Uitgeverij KNNV, Utrecht.
Van Herk, C.M., Aptroot, A., van Dobben, H.F., 2002. Long-term monitoring in the Netherlands
suggests that lichens respond to global warming. The Lichenologist 34(2), 141-154.
Van Wyk, B.E., Van Wyk, P., 1997. Field guide to trees of Southern Africa. Struik, Cape Town.
Van Wyk, B.E., Gericke, N., 2000. People’s plants: a guide to useful plants of Southern Africa.
Briza, Arcadia, South Africa.
Van Wyk, B.E., de Wet, H., Van Heerden, F.R., 2008. An ethnobotanical survey of medicinal
plants in the southeastern Karoo, South Africa. South African Journal of Botany 74,
696-704.
Varela, Z., López-Sánchez, G., Yáñez, M., Pérez, C., Fernández, J.A., Matos, P., Branquinho,
C., Aboalb, J.R., 2018. Changes in epiphytic lichen diversity are associated with air
particulate matter levels: The case study of urban areas in Chile. Ecological Indicators
91, 307-314.
Vasilevich, M.I., Vasilevich, R.S., 2018. Features of heavy metal accumulation by epiphytic
lichens in background areas of the Taiga Zone in the European Northwest of Russia.
Russian Journal of Ecology 49(1), 14-20.
Vilgalys, R., Hester, M., 1990. Rapid genetic identification and mapping of enzymatically
amplified ribosomal DNA from several Cryptococcus species. Journal of Bacteriology
172, 4238-4246.
Vitalini, S., Puricelli, C., Mikerezi, I., Iriti, M., 2015. Plants, people and traditions:
ethnobotanical survey in the Lombard Stelvio National Park and neighbouring areas
(Central Alps, Italy). Journal of Ethnopharmacology 173, 435-458.
Walker, N.P., 1986. The use of jacaranda leaves to determine the distribution of trace
elements in Pretoria. MSc Thesis. Department of Environmental and Geographical
Science, University of Cape Town.

140
Walker, M.D., Wahren, C.H., Hollister, R.D., Henry, G.H.R., Ahlquist, L.E., Alatalo, J.M., Bret-
Harte, M.S., Calef, M.P., Callaghan T.V., Carroll A.B., Epstein, H.E., Jónsdóttir, I.S.,
Klein, J.A., Magnússon, B., Molau, U., Oberbauer, S.F., Rewa, S.P., Robinson, C.H.,
Shaver, G.R., Suding, K.N., Thompson, C.C., Tolvanen, A., Totland, O., Turner, P.L.,
Tweedie, C.E., Webber, P.J., Wookey, P.A., 2006. Plant community responses to
experimental warming across the tundra biome. Proceedings of the National Academy
of Sciences of the United States of America 103, 1342-1436.
Washburn, S.J., Culley, T.M., 2006. Epiphytic macrolichens of the greater Cincinnati
metropolitan area – part II: distribution, diversity and urban ecology. The Bryologist,
109(4), 516-526.
Weber, B., Olehowski, C., Deutschewitz, K., Büdel, B., 2010. Responses of dwarf succulent
plants, lichens, and soils to experimental climate warming in an arid South African
ecosystem. In: Schmiedel, U., Jürgens, N. (eds.): Biodiversity in southern Africa.
Volume 2. Patterns and processes at regional scale. Göttingen and Windhoek. Klaus
Hess Publishers, 246-250.
Werth, S., Wagner, H.H., Gugerli, F., Holderegger, R., Csencsics, D., Kalwij, J.M.,
Scheidegger, C., 2006. Quantifying dispersal and establishment limitation in a
population of an epiphytic lichen. Ecology 87(8), 2037-2046.
Wessels, D.C.J., Kappen, L., 1994. Aspect, microclimate and photosynthetic activity of lichens
in the northern Transvaal and Karoo, South Africa. Cryptogamic Botany 4(2), 242-253.
Wessels, D.C.J., Schoeman, P., 1988. Mechanism and rate of weathering of Clarens
sandstone by an endolithic lichen. South African Journal of Science 84(4), 274-277.
Wessels, D.C.J., van Vuuren, D.R.J., 1986. Landsat imagery - its possible use in mapping the
distribution of major lichen communities in the Namib Desert, South West Africa.
Madoqua 14(4), 369-373.
Wessels, D.C.J., Wessels, L.A., 1991. Erosion of biogenically weathered Clarens sandstone
by lichenophagous bagworm larvae (Lepidoptera; Pyschidae). The Lichenologist
23(3), 283-291.
White, T.J., Bruns, T., Lee, S., Taylor, J.W., 1990. Amplification and direct sequencing of
fungal ribosomal RNA genes for phylogenetics. In PCR Protocols. In Innis, M.A.,
Gelfand, D.H., Sninsky, J.J., White, T.J. (eds.): A Guide to Methods and Applications
New York. Academic Press, 315-322.
Wirth, V., 2010. Lichens of the Namib Desert: A Guide to their identification. Göttingen and
Windhoek: Klaus Hess publishers.
Wirth, V., Müller, J., Pfiz, M., Loris, K., Küppers, M., 2010. Responses of dwarf succulent
plants, lichens, and soils to experimental climate warming in an arid South African
ecosystem. In: Schmiedel, U., Jürgens, N. (eds.): Biodiversity in southern Africa.

141
Volume 2: Patterns and processes at regional scale. Göttingen and Windhoek.Klaus
Hess Publishers, 246-250.
Wirth, V., Sipman, H.J.M., 2018. Xanthoparmelia krcmarii, a new species from South Africa
with haemathamnolic acid. Herzogia 31(1), 505-509.
Wirth, V., Sipman, H.J.M., Curtis-Scott, O., 2018. A sketch of the lichen biota in a Renosterveld
vegetation habitat. Carolinea 76, 35-55.
Wolfskeel, D.W., Van Herk, C.M., 2000. Heterodermia obscurata nieuw voor Nederland.
Buxbaumiella 52, 47-50.
Wolseley, P.A., 2002. Using corticolous lichens of tropical forests to assess environmental
changes. In Monitoring with Lichens – Monitoring Lichens. Nimis, P.L., Scheidegger,
C., Wolseley P.A., (eds.): Nato Science Series IV: Earth and Environmental Sciences.
Dordrecht. Kluwer Academic Publishers, 373-378.
Wolseley, P.A., Aguirre-Hudson, B., 1991. Lichens as Indicators of Environmental Change in
the Tropical Forests of Thailand. Global Ecology and Biogeography Letters 1(6),
170-175.
Wolseley, P.A., Aguirre-Hudson, B., 1997. The Ecology and Distribution of Lichens in Tropical
Deciduous and Evergreen Forests of Northern Thailand. Journal of Biogeography
24(3), 327-343.
Wolseley, P.A., James, P.W., Theobald, M.R., Sutton, M.A., 2006. Detecting changes in
epiphytic lichen communities at sites affected by atmospheric ammonia from
agricultural sources. Lichenologist 38, 161-176.
Wright, C., Oosthuizen, M.A., Mostert, J., Mostert, L., 2011. Investigating air quality and air-
related complaints in the City of Tshwane, South Africa. Clean Air Journal 20(2), 1-10.
Xu, M., Heidmarsson, S., Olafsdottir, E.S., Buonfiglio, R., Kogej, T., Omarsdottir, S., 2016.
Secondary metabolites from cetrarioid lichens: Chemotaxonomy, biological activities
and pharmaceutical potential. Phytomedicine 23, 441-459.
Yeshitela, K., 2008. Effects of anthropogenic disturbance on the diversity of foliicolous lichens
in tropical rainforests of east Africa: Godere (Ethiopia), Budongo (Uganda) and
Kakamega (Kenya). PhD Thesis. Universität Koblenz-Landau: Mathematik.
Yiming, L., 2006. Seasonal variation of diet and food availability in a group of Sichuan snub-
nosed monkeys in Shennongjia Nature Reserve, China. American Journal of
Primatology 68, 217-233.
Zaharopoulou, A., Lanaras, T., Arianoutsou, M., 1993. Influence of dust from a limestone
quarry on chlorophyll degradation of the lichen Physcia adscendens (Fr.) Oliv. Bulletin
of Environmental Contamination and Toxicology 50(6) 852-5.
Zarabska-Bożejewicz, D., Kujawa, K., 2018. The effect of land use on taxonomical and
functional diversity of lichens in an agricultural landscape. Fungal Ecology 33, 72-79.

142
Zedda, L., 2002. The epiphytic lichens on Quercus in Sardinia (Italy) and their value as
ecological indicators. Englera 24, 1-457.
Zedda, L., Cogoni, A., Flore, F., Brundu, G., 2010c. Impacts of alien plants and man-made
disturbance on soil-growing bryophyte and lichen diversity in coastal areas of Sardinia
(Italy). Plant Biosystems 144(3), 547-562.
Zedda, L., Kong, S-M., Rambold, G., 2011a. Morphological groups as a surrogate for soil
lichen biodiversity in Southern Africa. Bibliotheca Lichenologica 106, 384-401.
Zedda, L., Gröngröft, A., Schultz, M., Petersen, A., Mills, A., Rambold, G., 2011b. Patterns of
soil lichen diversity along the BIOTA transects in relation to climate and soil features.
In: Schmiedel, U., Jürgens, N. (eds.): Biodiversity in southern Africa. Volume 2.
Patterns and processes at regional scale. Göttingen and Windhoek. Klaus Hess
Publishers, 100-106.
Zedda, L., Gröngröft, A., Schultz, M., Petersen, A., Mills, A., Rambold, G., 2011c. Distribution
patterns of soil lichens across the principal biomes of southern Africa, Journal of Arid
Environment, 75, 215-220.Zedda, L., Rambold, G., 2004. Diversity change of soil-
growing lichens along a climate gradient in Southern Africa. Bibliotheca Lichenologica
88, 701-714.
Zedda, L., Rambold, G., 2004. Diversity change of soil-growing lichens along a climate
gradient in Southern Africa. Bibliotheca Lichenologica 88, 701-714.
Zedda, L., Rambold, G., 2009. Diversity and ecology of soil lichens in the Knersvlakte (South
Africa). The Bryologist 112(1), 19-29.
Zedda, L., Rambold, G., 2010a. The Lichen sections. In: Jürgens, N., Haarmeyer, D.H.,
Luther-Mosebach, J., Finckh, M., Schmiedel, U., (eds): Biodiversity in Southern Africa
1: Patterns at local scale – the BIOTA Observatories. Göttingen and Windhoek.Klaus
Hess Publishers.
Zedda, L., Rambold, G., 2010b. Lichen Diversity at the BIOTA Observatories. In: Schmiedel,
U., Jürgens, N., Hoffman, M.T. (eds.): Biodiversity in southern Africa. Volume 1.
Patterns at local scale – the BIOTA Observatories. Göttingen and Windhoek. Klaus
Hess Publishers, 66-790.
Zedda, L., Schultz, M., Rambold, G., 2009. Diversity of epiphytic lichens in the savannah
biome of Namibia. Herzogia 22, 153-164.
Zedda, L., Rambold, G., 2011 Lichens and their importance for the monitoring of
environmental changes in southern Africa. BIOTA Southern Africa, 1-18.
http://publikationen.ub.uni-frankfurt.de/frontdoor/index/index/docId/23334klopij
Zedda, L., Rambold, G., 2015. The Diversity of Lichenised Fungi: Ecosystem Functions and
Ecosystem Services. In: Upreti, D.K., Divakar, P.K., Shukla, V., Bajpa, R. (eds.): Recent
Advances in Lichenology. India. Springer, 121-145.

143
Zhao, H., Dang, D., Wang, C., Wang, X., Guo, D., Luo, X., Zhao, J., He, Z, Li, B., 2015. Diet
and seasonal changes in Sichuan snub-nosed monkeys (Rhinopithecus roxellana) in
the southern Qinling mountains in China. Acta Theriologica Sinica 35(2), 130-137.
Zotz, G., Bader, M.Y., 2009. Epiphytic Plants in a Changing World-Global: Change Effects on
Vascular and Non-Vascular Epiphytes. In: Lüttge, U., Beyschlag, W., Büdel, B.,
Francis, D. (eds.): Progress in Botany 70. Berlin Heidelberg. Springer-Verlag, 147-170.
Zvěřina, O., Coufalík, P., Barták, M., Petrov, M., Komárek, J., 2018. The contents and
distributions of cadmium, mercury, and lead in Usnea antarctica lichens from Solorina
Valley, James Ross Island (Antarctica). Environ Monit Assess 190(13), 1-9.
Zvěřina, O., Láska, K., Červenka, R., Kuta, J., Coufalík, P., Komárek, J., 2014. Analysis of
mercury and other heavy metals accumulated in lichen Usnea antarctica from James
Ross Island, Antarctica. Environmental Monitoring and Assessment 186(12),
9089-9100.

144
APPENDICES
The sequence of appendices is according to order of citation in the chapters.

145
Appendix 1A: City of Tshwane

146
Appendix 1B: City of Tshwane

147
Appendix 2: Pionier Museum

148
Appendix 3: Voortrekker Monument Nature Reserve

149
Appendix 4: Ethical clearance

150

151
Appendix 5: Tree with termite mounds

152
Appendix 6: Jacaranda tree with advertisement notice

153
Appendix 7: Protocol for lichen monitoring
Protocol for lichen monitoring from the “European guideline for mapping lichen diversity as an
indicator of environmental stress” (Asta et al. 2002) that this study tested in Pretoria. Also the
European standard protocol EN 16413 (2014) was consulted for applying the methodology in
South Africa.
The European procedure for monitoring environmental alteration using lichens is universally
applicable, but interpretation of the results has to be adapted to the regional characteristics of
the lichen flora and to the prevalent types of environmental stress.
The sampling design defines rules to objectively select monitoring sites (sampling units). If
the source of perturbation is not distinct in the monitored area, the sampling units are located
at the intersections of the gridlines within a grid covering the areas (case A). In case of distinct
perturbation, i.e. an emission source (case B), they are located around the emission source.
Sampling density (= number of sampling units) can be variable for different geographical
scales and type of study. This is calculated with a specific formula according to grid size.
The size of each sampling unit of a grid can vary from 0.25 km x 0.25 km to 12 km x 12 km,
considering the presence of perturbation, the type of study and the geographical scale.
Sampling tactic also defines the quantity of trees to be sampled and their selection within the
sampling units. The quantity of trees per sampling unit relies on its size, on the within-unit data
variability and on the accessibility of appropriate trees in small areas. The recommended
minimum number of trees to be investigated for sampling units of 0.25 km x 0.25 km is 3-4, in
larger units of 1 km x 1 km, 6-12 trees should be investigated (see also EN 16413, 2014). If
the minimal number of trees is not available, the sampling unit has to be shifted according to

154
given rules. When many suitable trees occur in a sampling unit, trees for monitoring are
selected according to a statistically valid method.
The sampling procedure indicates the investigation of free-standing trees, whose trunks
must have an inclination lower than 10° from the vertical position, must receive direct solar
radiation for at least part of the day and have a trunk circumference not less than 40 cm and
not larger than 150 cm. Trees of the same size must be used within a survey for monitoring.
Injured trees are not appropriate for survey purposes and they should not be considered for
monitoring work. Trees evidently affected by actions such as liming, removal of the bark or of
the lichens by humans or by grazing animals are additionally not appropriate and excluded
from survey. If it is not possible to place at least three ladders of the grid onto one tree, the
tree is not surveyed. Parts of the tree with greater than 25% cover of bryophytes are not used.
A sampling grid composed of four ladders each with five quadrats sized 10 cm × 10 cm is
appended vertically to the trunk so that the lower edge of the ladder is 1 m above the highest
point of the ground. The four ladders of the sampling grid are placed to correspond to the four
aspects (NSEW) of the tree trunk.
This sampling procedure in Pretoria is also explained in Chapter 3, section 3.8.
Data analysis consists in the calculating of the Lichen Diversity Values (LDV). The LDV
of a sample unit is a measurable estimator of the environmental conditions in that unit. Since
considerable variances in lichen development might be normal on various sides of the trunks,
the frequencies must be summed independently for every aspect. The initial phase in
calculating the LDV of a sampling unit (j) is to sum the frequencies of all lichen species found
on selected tree (i) at different orientations (N, S, W and E). For each tree, there are four Sums
of Frequencies (tree i: SFiN, SFiE, SFiS, SFiW). After that, the arithmetic mean of the Sums of
Frequencies (MSF) for sampling unit j are calculated using the following formula for each
aspect:
Wherein:
• MSF: Mean of the sums of frequencies of all the sampled trees of unit j
• SF: Sum of frequencies of all lichen species found at one aspect of tree i
• N, E, S, W: north, east, south, west
• n: number of trees sampled in unit j
The Lichen Diversity Value of a sampling unit j (LDVj) is the sum of the MSFs of each aspect

155
Example of calculating LDV
Lichen Diversity Classes (LDC) are then defined by grouping LDV into classes. Standard
errors of LDV can help to define the size of classes. If these are large, the classes will be
broad. If standard errors are small, a finer distinction of lichen diversity values will be possible
(smaller classes).

156
For data Interpretation LDV classes are assigned to an interpretation scale to detect
geographic patterns of LDV and relate these to environmental alteration (deviation from
background conditions). In the European guideline, lichen diversity is defined as “very high -
high - moderate - low - very low“. Examples for the scale of different geographical areas are
reported as follow.
The LDV classes are assigned to different colours in the interpretation scale.
If an interpretation scale is not available, interpretations can be based on the differences
between maximum and minimum LDV values within the survey area.
Further examples from other publications are reported below.
Naturality/alteration scale obtained from Loppi et al. (2002) for Tyrrhenian Italy
LB values % deviation from normal conditions
Interpretation
0 1-25 25-50 50-75
> 75
100 75-99 50-75 25-50 0-25
Lichen desert Alteration
Semi-alteration Semi-naturality Naturality

157
Naturality/alteration scale obtained by Frati and Brunialti (2006) for the town Ancona in Italy.
% Deviation from normal conditions
Classes
LB
LDV
0-25 26-50
1. Naturality 2. Semi-naturality
>70 41-70
>115 76-115
51-75 3. Semi-alteration 21-40 41-75 76-99 4. Alteration 1-20 1-40 100 5. Lichen desert 0 0

158
Appendix 8: Jacaranda trees

159
Appendix number 9A: TLC plate run with Solvent A (toluene-dioxan-acetic acid)

160
Appendix number 9B: TLC plate run with Solvent B (hexane-diethyl ether-formic acid)

161
Appendix number 9C: TLC plate run with Solvent C (toluene-acetic acid)

162
Appendix 10: Survey form

163

164

165
Appendix 11A: Pictures of lichens
A. Candelaria concolor, B. Parmotrema austrosinense, C. Flavopunctelia flaventior,
D. F. soredica, E. Heterodermia speciosa and F. Hyperphyscia adglutinata

166
Appendix 11B: Pictures of lichens
A. Pyxine cocoes, B. Lepraria spp., C. Canoparmelia texana, D. Culbersonia nubila,
E. Hyperphyscia pandani and F. Physcia tribacia

167
Appendix 11C: Pictures of lichens
A. Amandinea natalensis, B. Chrysothrix xanthina, C. Dirinaria applanata, D. Hyperphyscia
granulata, E. Hyperphyscia pruinosa and F. Hyperphyscia isidiata (H. isidiata picture
obtained from Nimis and Martellos, 2017: http://dryades.units.it/italic, CC BY-SA4.0)

168
Appendix 11D: Pictures of lichens
A. Physcia biziana, B. Physcia erumpens, C. Physcia poncinsii, D. Physcia undulata,
E. Parmotrema reticulatum, F. Pyxine petricola and G. Rinodina ficta. Picture D, E, F and G
are from Nimis and Martellos, 2017: http://dryades.units.it/italic, CC BY-SA4.0

169
Appendix 12: TLC Retention factors (Rf) and identities of detected secondary metabolites
TLC - Rf (retention factor) Comments
Secondary Compound
Solvent A Solvent A Solvent A
atranorin
75 73 79
divaricatic acid
39 68 51
lecanoric acid
28 44 22
lichexanthone
72 66 75
perlatolic acid
44 75 54
salazinic acid
10 7 4
terpenoids
“A pool of different compounds with different Rf not identifiable by TLC”.
usnic acid
70 66 71
zeorin
52 42 43
unidentified traces
Obtained from Lepraria spp.

170
Appendix 13: Published paper

171

172

173

174

175
Appendix 14: Generalised linear regression models (GLM) with interpolated environmental data

176

177
Appendix 15: Published paper

178

179

180

181

182

183

184

185

186
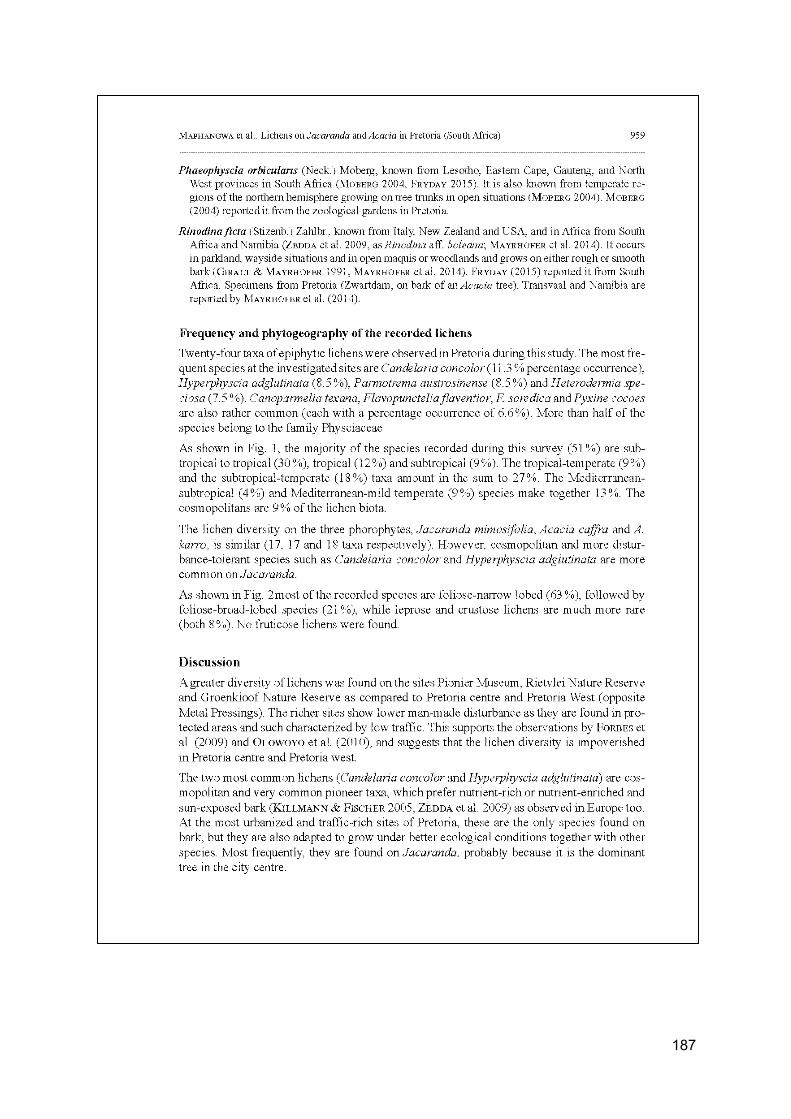
187

188

189

190

191

192

193
Appendix 16: Papers to be published
1. Most common epiphytic lichens in Pretoria: description and identification key. Bothalia
Journal
2. Feasibility study for the application of European guidelines for mapping lichen diversity
as environmental indicator in Pretoria (Republic of South Africa). Journal of
Environmental Monitoring and Assessment
3. Modelling lichen diversity in relation to environmental predictors. The case study of the
city of Pretoria (South Africa). Ecological Indicators Journal

194
Appendix 17: Conference attendance
1. XXXII Congress of the Italian Lichen Society (Bologna, Italy from 18th - 20th
September 2019).

195
Abstract A

196
Abstract B
2. IX International Lichenological Symposium (IAL9), in Bonito, Mato Grosso do Sul, Brazil from 2 - 7 August 2020.