the atomic structure of protein-protein recognition sites
TRANSCRIPT

The Atomic Structure of Protein-Protein
separately is central to
Article No. jmbi.1998.2439 available online at http://www.idealibrary.com on J. Mol. Biol. (1999) 285, 2177±2198
Recognition Sites
Loredana Lo Conte1, Cyrus Chothia1 and JoeÈ l Janin1,2*
1MRC Laboratory of Molecular The non-covalent assembly of proteins that fold
Biology, Hills Road, Cambridge many biological processes, and differs from the permanent macromolecu- CB1 1JX, England2Laboratoire d'Enzymologie etde Biochimie StructuralesCNRS UPR9063 91198Gif-sur-Yvette, France*Corresponding author
Introduction
Many biological processes a
E-mail address of the [email protected]
area; PDB, Protein Data Bank; PTI,inhibitor.
0022-2836/99/052177±22 $30.00/0
lar assembly of protein subunits in oligomeric proteins. We performed ananalysis of the atomic structure of the recognition sites seen in 75 pro-tein-protein complexes of known three-dimensional structure: 24 pro-tease-inhibitor, 19 antibody-antigen and 32 other complexes, includingnine enzyme-inhibitor and 11 that are involved in signal transduction.
The size of the recognition site is related to the conformational changesthat occur upon association. Of the 75 complexes, 52 have ``standard-size''interfaces in which the total area buried by the components in the recog-nition site is 1600 (�400) AÊ 2. In these complexes, association involves onlysmall changes of conformation. Twenty complexes have ``large'' interfacesburying 2000 to 4660 AÊ 2, and large conformational changes are seen tooccur in those cases where we can compare the structure of complexedand free components. The average interface has approximately the samenon-polar character as the protein surface as a whole, and carries some-what fewer charged groups. However, some interfaces are signi®cantlymore polar and others more non-polar than the average.
Of the atoms that lose accessibility upon association, half make contactsacross the interface and one-third become fully inaccessible to the solvent.In the latter case, the Voronoi volume was calculated and compared withthat of atoms buried inside proteins. The ratio of the two volumes was1.01 (�0.03) in all but 11 complexes, which shows that atoms buried atprotein-protein interfaces are close-packed like the protein interior. Thisconclusion could be extended to the majority of interface atoms by includ-ing solvent positions determined in high-resolution X-ray structures in thecalculation of Voronoi volumes. Thus, water molecules contribute to theclose-packing of atoms that insure complementarity between the two pro-tein surfaces, as well as providing polar interactions between the two pro-teins.
# 1999 Academic Press
Keywords: protein-protein complexes; interface area; polar interactions;packing density; conformation changes
re carried out, or
ognition sites seen in protein-protein complexes ofknown structure. The protein-protein complexes
regulated, through the interactions between pre-formed proteins. The importance of such inter-actions in biology has made the protein recognitionprocess an area of considerable interest. Here, wedescribe aspects of the atomic structure of the rec-
Abbreviations used: ASA, solvent-accessible surface
ing author:
pancreatic trypsin
whose structures we analyse here are non-covalentassemblies of proteins that fold separately to carryout independent functions before they associate, asopposed to permanent macromolecular assemblies,such as oligomeric proteins, virus capsids ormuscle ®bres. Though the two types of complexeshave features in common, they also have manythat differ, and are best treated separately.
General analyses of structural aspects of protein-protein interaction have been carried out (Chothia& Janin, 1975; Argos, 1988; Janin & Chothia, 1990;Janin, 1995, 1996; Jones & Thornton, 1995, 1996,
# 1999 Academic Press
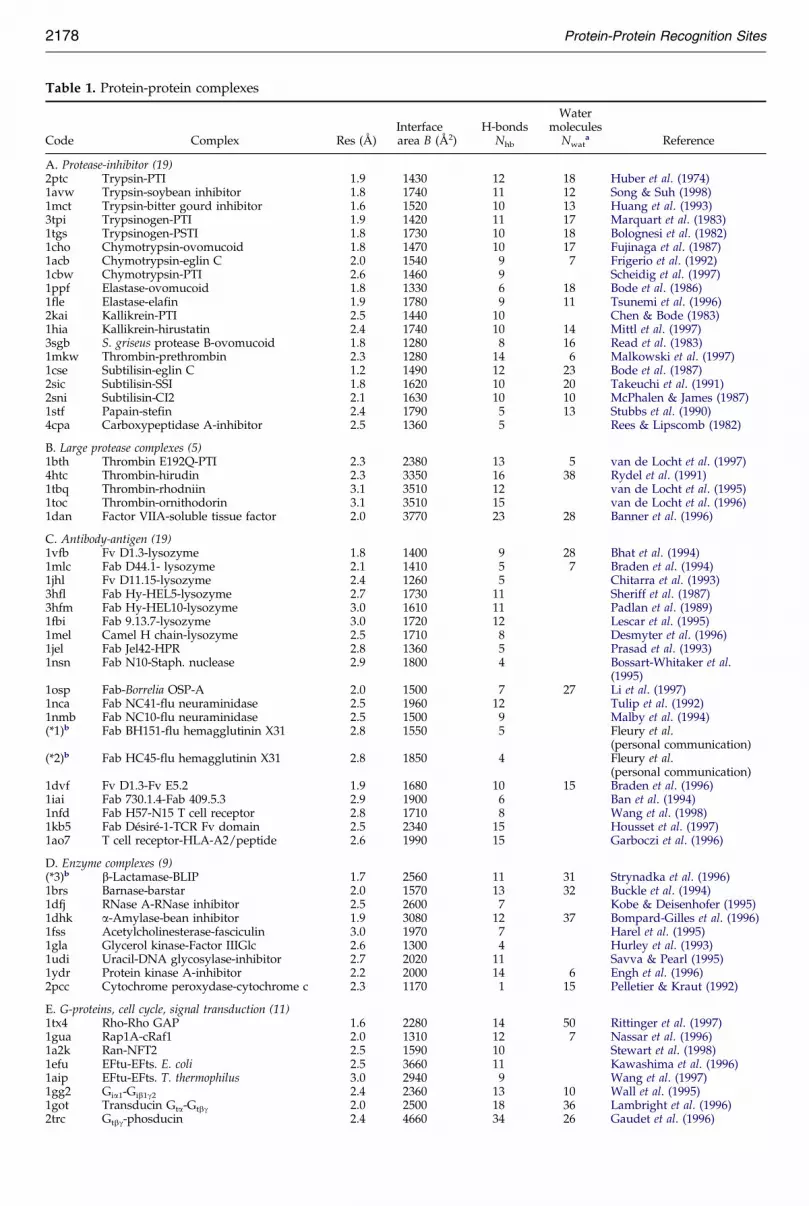
Table 1. Protein-protein complexes
Code Complex Res (AÊ )Interfacearea B (AÊ 2)
H-bondsNhb
Watermolecules
Nwata Reference
A. Protease-inhibitor (19)2ptc Trypsin-PTI 1.9 1430 12 18 Huber et al. (1974)1avw Trypsin-soybean inhibitor 1.8 1740 11 12 Song & Suh (1998)1mct Trypsin-bitter gourd inhibitor 1.6 1520 10 13 Huang et al. (1993)3tpi Trypsinogen-PTI 1.9 1420 11 17 Marquart et al. (1983)1tgs Trypsinogen-PSTI 1.8 1730 10 18 Bolognesi et al. (1982)1cho Chymotrypsin-ovomucoid 1.8 1470 10 17 Fujinaga et al. (1987)1acb Chymotrypsin-eglin C 2.0 1540 9 7 Frigerio et al. (1992)1cbw Chymotrypsin-PTI 2.6 1460 9 Scheidig et al. (1997)1ppf Elastase-ovomucoid 1.8 1330 6 18 Bode et al. (1986)1fle Elastase-elafin 1.9 1780 9 11 Tsunemi et al. (1996)2kai Kallikrein-PTI 2.5 1440 10 Chen & Bode (1983)1hia Kallikrein-hirustatin 2.4 1740 10 14 Mittl et al. (1997)3sgb S. griseus protease B-ovomucoid 1.8 1280 8 16 Read et al. (1983)1mkw Thrombin-prethrombin 2.3 1280 14 6 Malkowski et al. (1997)1cse Subtilisin-eglin C 1.2 1490 12 23 Bode et al. (1987)2sic Subtilisin-SSI 1.8 1620 10 20 Takeuchi et al. (1991)2sni Subtilisin-CI2 2.1 1630 10 10 McPhalen & James (1987)1stf Papain-stefin 2.4 1790 5 13 Stubbs et al. (1990)4cpa Carboxypeptidase A-inhibitor 2.5 1360 5 Rees & Lipscomb (1982)
B. Large protease complexes (5)1bth Thrombin E192Q-PTI 2.3 2380 13 5 van de Locht et al. (1997)4htc Thrombin-hirudin 2.3 3350 16 38 Rydel et al. (1991)1tbq Thrombin-rhodniin 3.1 3510 12 van de Locht et al. (1995)1toc Thrombin-ornithodorin 3.1 3510 15 van de Locht et al. (1996)1dan Factor VIIA-soluble tissue factor 2.0 3770 23 28 Banner et al. (1996)
C. Antibody-antigen (19)1vfb Fv D1.3-lysozyme 1.8 1400 9 28 Bhat et al. (1994)1mlc Fab D44.1- lysozyme 2.1 1410 5 7 Braden et al. (1994)1jhl Fv D11.15-lysozyme 2.4 1260 5 Chitarra et al. (1993)3hfl Fab Hy-HEL5-lysozyme 2.7 1730 11 Sheriff et al. (1987)3hfm Fab Hy-HEL10-lysozyme 3.0 1610 11 Padlan et al. (1989)1fbi Fab 9.13.7-lysozyme 3.0 1720 12 Lescar et al. (1995)1mel Camel H chain-lysozyme 2.5 1710 8 Desmyter et al. (1996)1jel Fab Jel42-HPR 2.8 1360 5 Prasad et al. (1993)1nsn Fab N10-Staph. nuclease 2.9 1800 4 Bossart-Whitaker et al.
(1995)1osp Fab-Borrelia OSP-A 2.0 1500 7 27 Li et al. (1997)1nca Fab NC41-flu neuraminidase 2.5 1960 12 Tulip et al. (1992)1nmb Fab NC10-flu neuraminidase 2.5 1500 9 Malby et al. (1994)(*1)b Fab BH151-flu hemagglutinin X31 2.8 1550 5 Fleury et al.
(personal communication)(*2)b Fab HC45-flu hemagglutinin X31 2.8 1850 4 Fleury et al.
(personal communication)1dvf Fv D1.3-Fv E5.2 1.9 1680 10 15 Braden et al. (1996)1iai Fab 730.1.4-Fab 409.5.3 2.9 1900 6 Ban et al. (1994)1nfd Fab H57-N15 T cell receptor 2.8 1710 8 Wang et al. (1998)1kb5 Fab DeÂsireÂ-1-TCR Fv domain 2.5 2340 15 Housset et al. (1997)1ao7 T cell receptor-HLA-A2/peptide 2.6 1990 15 Garboczi et al. (1996)
D. Enzyme complexes (9)(*3)b b-Lactamase-BLIP 1.7 2560 11 31 Strynadka et al. (1996)1brs Barnase-barstar 2.0 1570 13 32 Buckle et al. (1994)1dfj RNase A-RNase inhibitor 2.5 2600 7 Kobe & Deisenhofer (1995)1dhk a-Amylase-bean inhibitor 1.9 3080 12 37 Bompard-Gilles et al. (1996)1fss Acetylcholinesterase-fasciculin 3.0 1970 7 Harel et al. (1995)1gla Glycerol kinase-Factor IIIGlc 2.6 1300 4 Hurley et al. (1993)1udi Uracil-DNA glycosylase-inhibitor 2.7 2020 11 Savva & Pearl (1995)1ydr Protein kinase A-inhibitor 2.2 2000 14 6 Engh et al. (1996)2pcc Cytochrome peroxydase-cytochrome c 2.3 1170 1 15 Pelletier & Kraut (1992)
E. G-proteins, cell cycle, signal transduction (11)1tx4 Rho-Rho GAP 1.6 2280 14 50 Rittinger et al. (1997)1gua Rap1A-cRaf1 2.0 1310 12 7 Nassar et al. (1996)1a2k Ran-NFT2 2.5 1590 10 Stewart et al. (1998)1efu EFtu-EFts. E. coli 2.5 3660 11 Kawashima et al. (1996)1aip EFtu-EFts. T. thermophilus 3.0 2940 9 Wang et al. (1997)1gg2 Gia1-Gib1g2 2.4 2360 13 10 Wall et al. (1995)1got Transducin Gta-Gtbg 2.0 2500 18 36 Lambright et al. (1996)2trc Gtbg-phosducin 2.4 4660 34 26 Gaudet et al. (1996)
2178 Protein-Protein Recognition Sites
1997; Tsai et al., 1996; Chothia, 1997). Recently,however, there has been a large increase in the
ic co-ordinates of another three complexes weregiven to us by their authors.
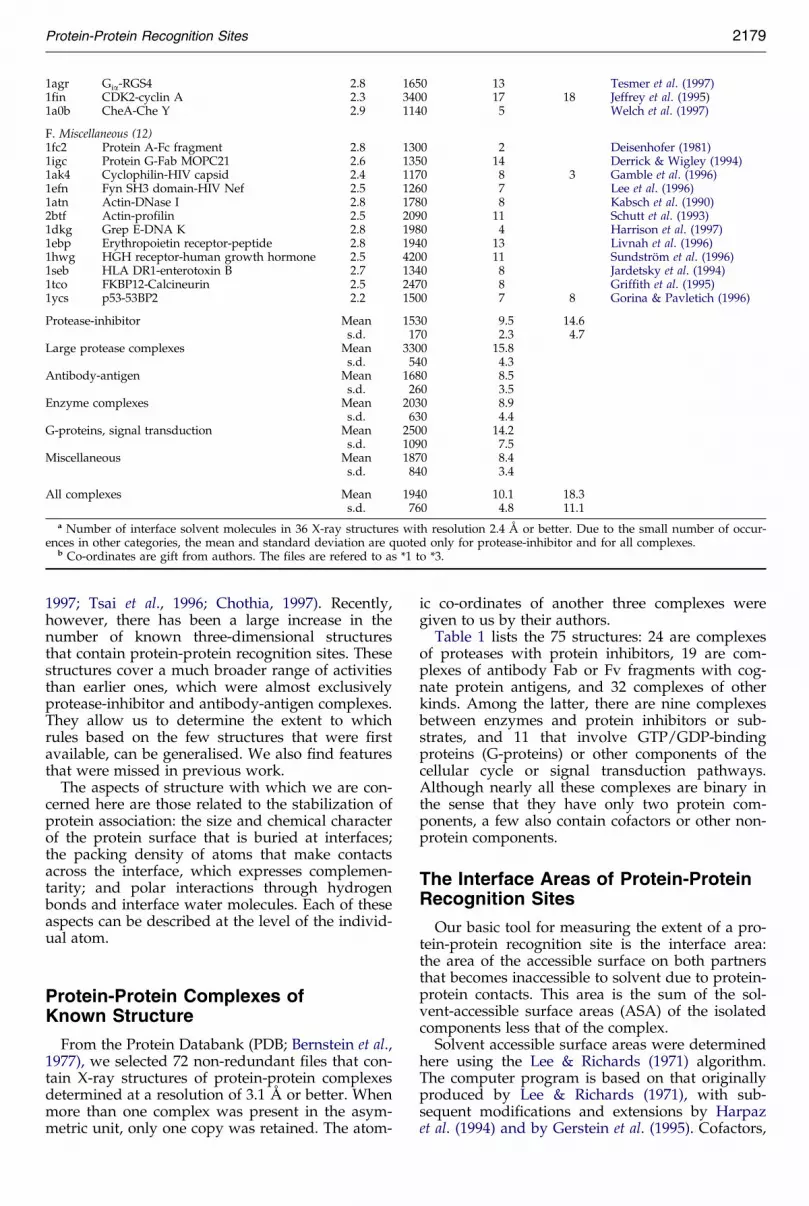
1agr Gia-RGS4 2.8 1650 13 Tesmer et al. (1997)1fin CDK2-cyclin A 2.3 3400 17 18 Jeffrey et al. (1995)1a0b CheA-Che Y 2.9 1140 5 Welch et al. (1997)
F. Miscellaneous (12)1fc2 Protein A-Fc fragment 2.8 1300 2 Deisenhofer (1981)1igc Protein G-Fab MOPC21 2.6 1350 14 Derrick & Wigley (1994)1ak4 Cyclophilin-HIV capsid 2.4 1170 8 3 Gamble et al. (1996)1efn Fyn SH3 domain-HIV Nef 2.5 1260 7 Lee et al. (1996)1atn Actin-DNase I 2.8 1780 8 Kabsch et al. (1990)2btf Actin-profilin 2.5 2090 11 Schutt et al. (1993)1dkg Grep E-DNA K 2.8 1980 4 Harrison et al. (1997)1ebp Erythropoietin receptor-peptide 2.8 1940 13 Livnah et al. (1996)1hwg HGH receptor-human growth hormone 2.5 4200 11 SundstroÈm et al. (1996)1seb HLA DR1-enterotoxin B 2.7 1340 8 Jardetsky et al. (1994)1tco FKBP12-Calcineurin 2.5 2470 8 Griffith et al. (1995)1ycs p53-53BP2 2.2 1500 7 8 Gorina & Pavletich (1996)
Protease-inhibitor Mean 1530 9.5 14.6s.d. 170 2.3 4.7
Large protease complexes Mean 3300 15.8s.d. 540 4.3
Antibody-antigen Mean 1680 8.5s.d. 260 3.5
Enzyme complexes Mean 2030 8.9s.d. 630 4.4
G-proteins, signal transduction Mean 2500 14.2s.d. 1090 7.5
Miscellaneous Mean 1870 8.4s.d. 840 3.4
All complexes Mean 1940 10.1 18.3s.d. 760 4.8 11.1
a Number of interface solvent molecules in 36 X-ray structures with resolution 2.4 AÊ or better. Due to the small number of occur-ences in other categories, the mean and standard deviation are quoted only for protease-inhibitor and for all complexes.
b Co-ordinates are gift from authors. The ®les are refered to as *1 to *3.
Protein-Protein Recognition Sites 2179
number of known three-dimensional structuresthat contain protein-protein recognition sites. Thesestructures cover a much broader range of activitiesthan earlier ones, which were almost exclusivelyprotease-inhibitor and antibody-antigen complexes.They allow us to determine the extent to whichrules based on the few structures that were ®rstavailable, can be generalised. We also ®nd featuresthat were missed in previous work.
The aspects of structure with which we are con-cerned here are those related to the stabilization ofprotein association: the size and chemical characterof the protein surface that is buried at interfaces;the packing density of atoms that make contactsacross the interface, which expresses complemen-tarity; and polar interactions through hydrogenbonds and interface water molecules. Each of theseaspects can be described at the level of the individ-ual atom.
Protein-Protein Complexes ofKnown Structure
From the Protein Databank (PDB; Bernstein et al.,1977), we selected 72 non-redundant ®les that con-tain X-ray structures of protein-protein complexesdetermined at a resolution of 3.1 AÊ or better. Whenmore than one complex was present in the asym-metric unit, only one copy was retained. The atom-
Table 1 lists the 75 structures: 24 are complexesof proteases with protein inhibitors, 19 are com-plexes of antibody Fab or Fv fragments with cog-nate protein antigens, and 32 complexes of otherkinds. Among the latter, there are nine complexesbetween enzymes and protein inhibitors or sub-strates, and 11 that involve GTP/GDP-bindingproteins (G-proteins) or other components of thecellular cycle or signal transduction pathways.Although nearly all these complexes are binary inthe sense that they have only two protein com-ponents, a few also contain cofactors or other non-protein components.
The Interface Areas of Protein-ProteinRecognition Sites
Our basic tool for measuring the extent of a pro-tein-protein recognition site is the interface area:the area of the accessible surface on both partnersthat becomes inaccessible to solvent due to protein-protein contacts. This area is the sum of the sol-vent-accessible surface areas (ASA) of the isolatedcomponents less that of the complex.
Solvent accessible surface areas were determinedhere using the Lee & Richards (1971) algorithm.The computer program is based on that originallyproduced by Lee & Richards (1971), with sub-sequent modi®cations and extensions by Harpazet al. (1994) and by Gerstein et al. (1995). Cofactors,
but not solvent molecules, were included in thecalculations. Group radii were taken from Chothia
Whereas the value of B quoted in Table 1 appliesto the two component proteins of a complex, inter-
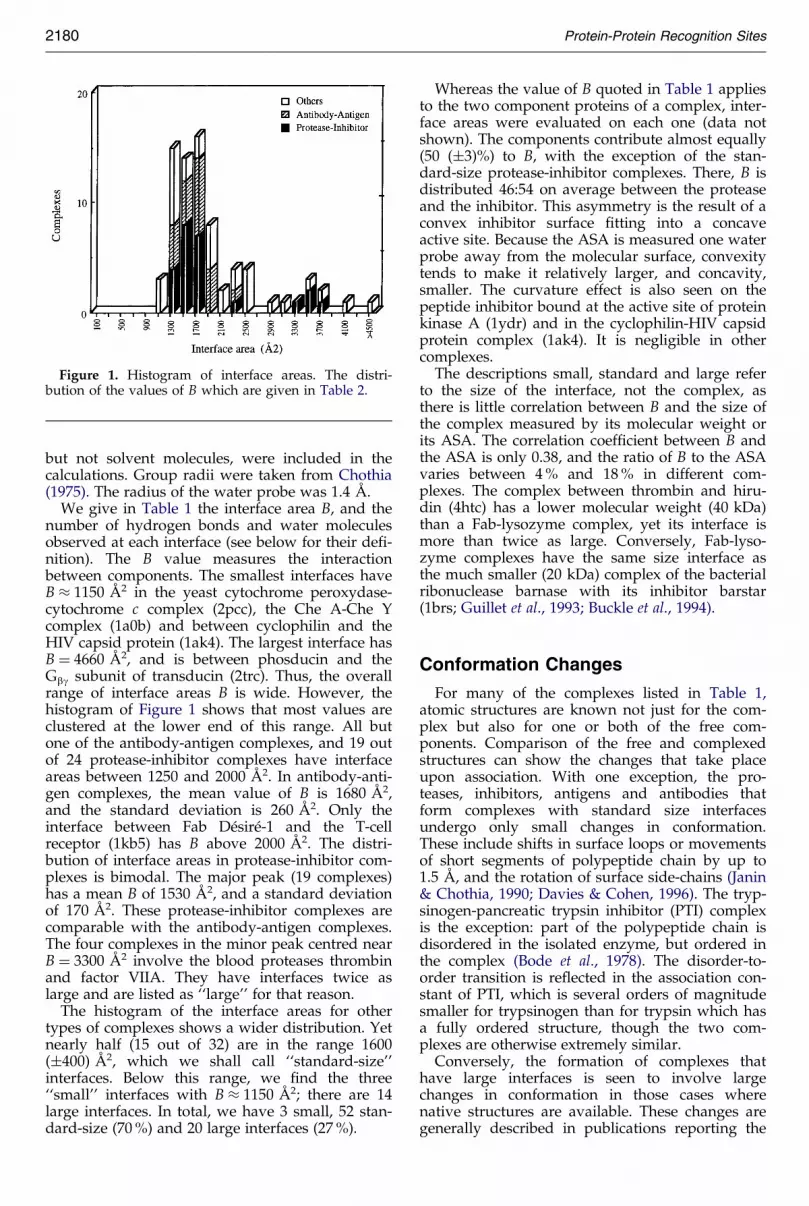
Figure 1. Histogram of interface areas. The distri-bution of the values of B which are given in Table 2.
2180 Protein-Protein Recognition Sites
(1975). The radius of the water probe was 1.4 AÊ .We give in Table 1 the interface area B, and the
number of hydrogen bonds and water moleculesobserved at each interface (see below for their de®-nition). The B value measures the interactionbetween components. The smallest interfaces haveB � 1150 AÊ 2 in the yeast cytochrome peroxydase-cytochrome c complex (2pcc), the Che A-Che Ycomplex (1a0b) and between cyclophilin and theHIV capsid protein (1ak4). The largest interface hasB � 4660 AÊ 2, and is between phosducin and theGbg subunit of transducin (2trc). Thus, the overallrange of interface areas B is wide. However, thehistogram of Figure 1 shows that most values areclustered at the lower end of this range. All butone of the antibody-antigen complexes, and 19 outof 24 protease-inhibitor complexes have interfaceareas between 1250 and 2000 AÊ 2. In antibody-anti-gen complexes, the mean value of B is 1680 AÊ 2,and the standard deviation is 260 AÊ 2. Only theinterface between Fab DeÂsireÂ-1 and the T-cellreceptor (1kb5) has B above 2000 AÊ 2. The distri-bution of interface areas in protease-inhibitor com-plexes is bimodal. The major peak (19 complexes)has a mean B of 1530 AÊ 2, and a standard deviationof 170 AÊ 2. These protease-inhibitor complexes arecomparable with the antibody-antigen complexes.The four complexes in the minor peak centred nearB � 3300 AÊ 2 involve the blood proteases thrombinand factor VIIA. They have interfaces twice aslarge and are listed as ``large'' for that reason.
The histogram of the interface areas for othertypes of complexes shows a wider distribution. Yetnearly half (15 out of 32) are in the range 1600(�400) AÊ 2, which we shall call ``standard-size''interfaces. Below this range, we ®nd the three``small'' interfaces with B � 1150 AÊ 2; there are 14large interfaces. In total, we have 3 small, 52 stan-dard-size (70 %) and 20 large interfaces (27 %).
face areas were evaluated on each one (data notshown). The components contribute almost equally(50 (�3)%) to B, with the exception of the stan-dard-size protease-inhibitor complexes. There, B isdistributed 46:54 on average between the proteaseand the inhibitor. This asymmetry is the result of aconvex inhibitor surface ®tting into a concaveactive site. Because the ASA is measured one waterprobe away from the molecular surface, convexitytends to make it relatively larger, and concavity,smaller. The curvature effect is also seen on thepeptide inhibitor bound at the active site of proteinkinase A (1ydr) and in the cyclophilin-HIV capsidprotein complex (1ak4). It is negligible in othercomplexes.
The descriptions small, standard and large referto the size of the interface, not the complex, asthere is little correlation between B and the size ofthe complex measured by its molecular weight orits ASA. The correlation coef®cient between B andthe ASA is only 0.38, and the ratio of B to the ASAvaries between 4 % and 18 % in different com-plexes. The complex between thrombin and hiru-din (4htc) has a lower molecular weight (40 kDa)than a Fab-lysozyme complex, yet its interface ismore than twice as large. Conversely, Fab-lyso-zyme complexes have the same size interface asthe much smaller (20 kDa) complex of the bacterialribonuclease barnase with its inhibitor barstar(1brs; Guillet et al., 1993; Buckle et al., 1994).
Conformation Changes
For many of the complexes listed in Table 1,atomic structures are known not just for the com-plex but also for one or both of the free com-ponents. Comparison of the free and complexedstructures can show the changes that take placeupon association. With one exception, the pro-teases, inhibitors, antigens and antibodies thatform complexes with standard size interfacesundergo only small changes in conformation.These include shifts in surface loops or movementsof short segments of polypeptide chain by up to1.5 AÊ , and the rotation of surface side-chains (Janin& Chothia, 1990; Davies & Cohen, 1996). The tryp-sinogen-pancreatic trypsin inhibitor (PTI) complexis the exception: part of the polypeptide chain isdisordered in the isolated enzyme, but ordered inthe complex (Bode et al., 1978). The disorder-to-order transition is re¯ected in the association con-stant of PTI, which is several orders of magnitudesmaller for trypsinogen than for trypsin which hasa fully ordered structure, though the two com-plexes are otherwise extremely similar.
Conversely, the formation of complexes thathave large interfaces is seen to involve largechanges in conformation in those cases wherenative structures are available. These changes aregenerally described in publications reporting the
X-ray structure of the complexes. They are sum-marised in Table 2 for the 20 complexes that have
Ê 2
N-terminal globular domain that binds at theactive site, the hirudin inhibitor has a C-terminal
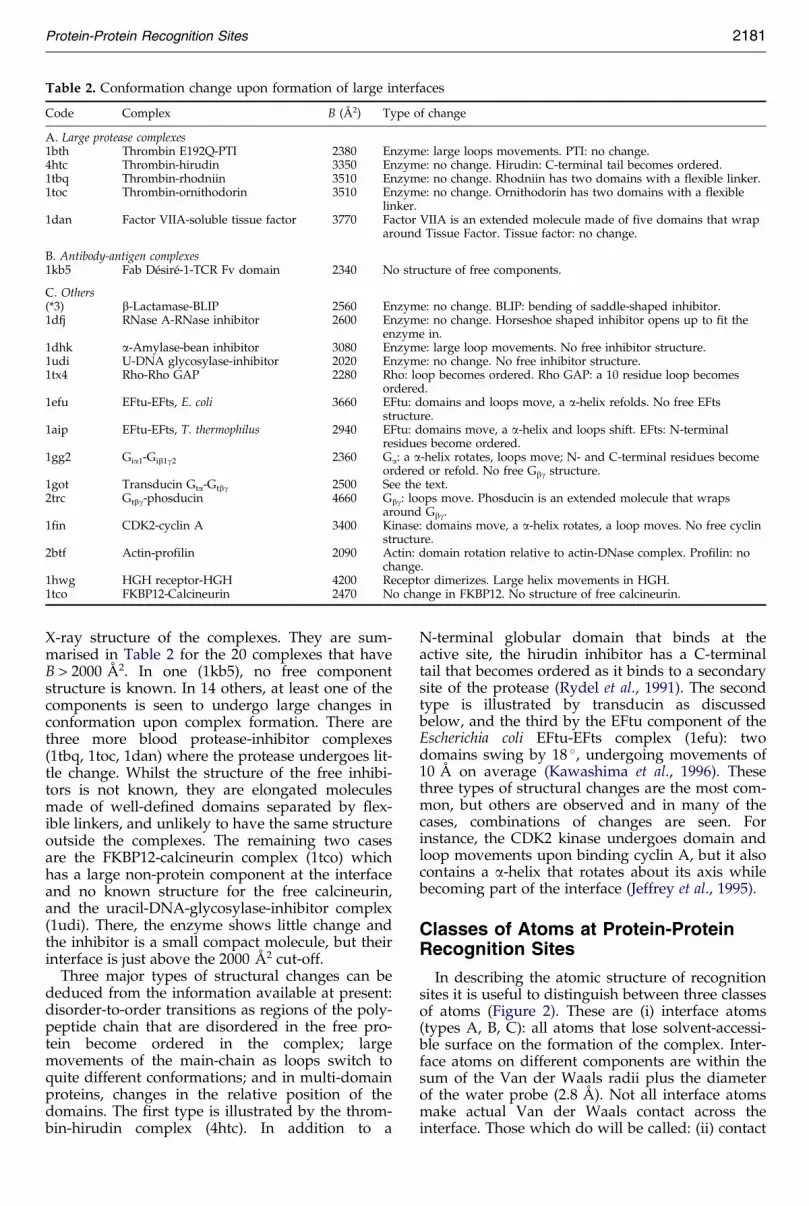
Table 2. Conformation change upon formation of large interfaces
Code Complex B (AÊ 2) Type of change
A. Large protease complexes1bth Thrombin E192Q-PTI 2380 Enzyme: large loops movements. PTI: no change.4htc Thrombin-hirudin 3350 Enzyme: no change. Hirudin: C-terminal tail becomes ordered.1tbq Thrombin-rhodniin 3510 Enzyme: no change. Rhodniin has two domains with a flexible linker.1toc Thrombin-ornithodorin 3510 Enzyme: no change. Ornithodorin has two domains with a flexible
linker.1dan Factor VIIA-soluble tissue factor 3770 Factor VIIA is an extended molecule made of five domains that wrap
around Tissue Factor. Tissue factor: no change.
B. Antibody-antigen complexes1kb5 Fab DeÂsireÂ-1-TCR Fv domain 2340 No structure of free components.
C. Others(*3) b-Lactamase-BLIP 2560 Enzyme: no change. BLIP: bending of saddle-shaped inhibitor.1dfj RNase A-RNase inhibitor 2600 Enzyme: no change. Horseshoe shaped inhibitor opens up to fit the
enzyme in.1dhk a-Amylase-bean inhibitor 3080 Enzyme: large loop movements. No free inhibitor structure.1udi U-DNA glycosylase-inhibitor 2020 Enzyme: no change. No free inhibitor structure.1tx4 Rho-Rho GAP 2280 Rho: loop becomes ordered. Rho GAP: a 10 residue loop becomes
ordered.1efu EFtu-EFts, E. coli 3660 EFtu: domains and loops move, a a-helix refolds. No free EFts
structure.1aip EFtu-EFts, T. thermophilus 2940 EFtu: domains move, a a-helix and loops shift. EFts: N-terminal
residues become ordered.1gg2 Gia1-Gib1g2 2360 Ga: a a-helix rotates, loops move; N- and C-terminal residues become
ordered or refold. No free Gbg structure.1got Transducin Gta-Gtbg 2500 See the text.2trc Gtbg-phosducin 4660 Gbg: loops move. Phosducin is an extended molecule that wraps
around Gbg.1fin CDK2-cyclin A 3400 Kinase: domains move, a a-helix rotates, a loop moves. No free cyclin
structure.2btf Actin-profilin 2090 Actin: domain rotation relative to actin-DNase complex. Profilin: no
change.1hwg HGH receptor-HGH 4200 Receptor dimerizes. Large helix movements in HGH.1tco FKBP12-Calcineurin 2470 No change in FKBP12. No structure of free calcineurin.
Protein-Protein Recognition Sites 2181
B > 2000 A . In one (1kb5), no free componentstructure is known. In 14 others, at least one of thecomponents is seen to undergo large changes inconformation upon complex formation. There arethree more blood protease-inhibitor complexes(1tbq, 1toc, 1dan) where the protease undergoes lit-tle change. Whilst the structure of the free inhibi-tors is not known, they are elongated moleculesmade of well-de®ned domains separated by ¯ex-ible linkers, and unlikely to have the same structureoutside the complexes. The remaining two casesare the FKBP12-calcineurin complex (1tco) whichhas a large non-protein component at the interfaceand no known structure for the free calcineurin,and the uracil-DNA-glycosylase-inhibitor complex(1udi). There, the enzyme shows little change andthe inhibitor is a small compact molecule, but theirinterface is just above the 2000 AÊ 2 cut-off.
Three major types of structural changes can bededuced from the information available at present:disorder-to-order transitions as regions of the poly-peptide chain that are disordered in the free pro-tein become ordered in the complex; largemovements of the main-chain as loops switch toquite different conformations; and in multi-domainproteins, changes in the relative position of thedomains. The ®rst type is illustrated by the throm-bin-hirudin complex (4htc). In addition to a
tail that becomes ordered as it binds to a secondarysite of the protease (Rydel et al., 1991). The secondtype is illustrated by transducin as discussedbelow, and the third by the EFtu component of theEscherichia coli EFtu-EFts complex (1efu): twodomains swing by 18 �, undergoing movements of10 AÊ on average (Kawashima et al., 1996). Thesethree types of structural changes are the most com-mon, but others are observed and in many of thecases, combinations of changes are seen. Forinstance, the CDK2 kinase undergoes domain andloop movements upon binding cyclin A, but it alsocontains a a-helix that rotates about its axis whilebecoming part of the interface (Jeffrey et al., 1995).
Classes of Atoms at Protein-ProteinRecognition Sites
In describing the atomic structure of recognitionsites it is useful to distinguish between three classesof atoms (Figure 2). These are (i) interface atoms(types A, B, C): all atoms that lose solvent-accessi-ble surface on the formation of the complex. Inter-face atoms on different components are within thesum of the Van der Waals radii plus the diameterof the water probe (2.8 AÊ ). Not all interface atomsmake actual Van der Waals contact across theinterface. Those which do will be called: (ii) contact
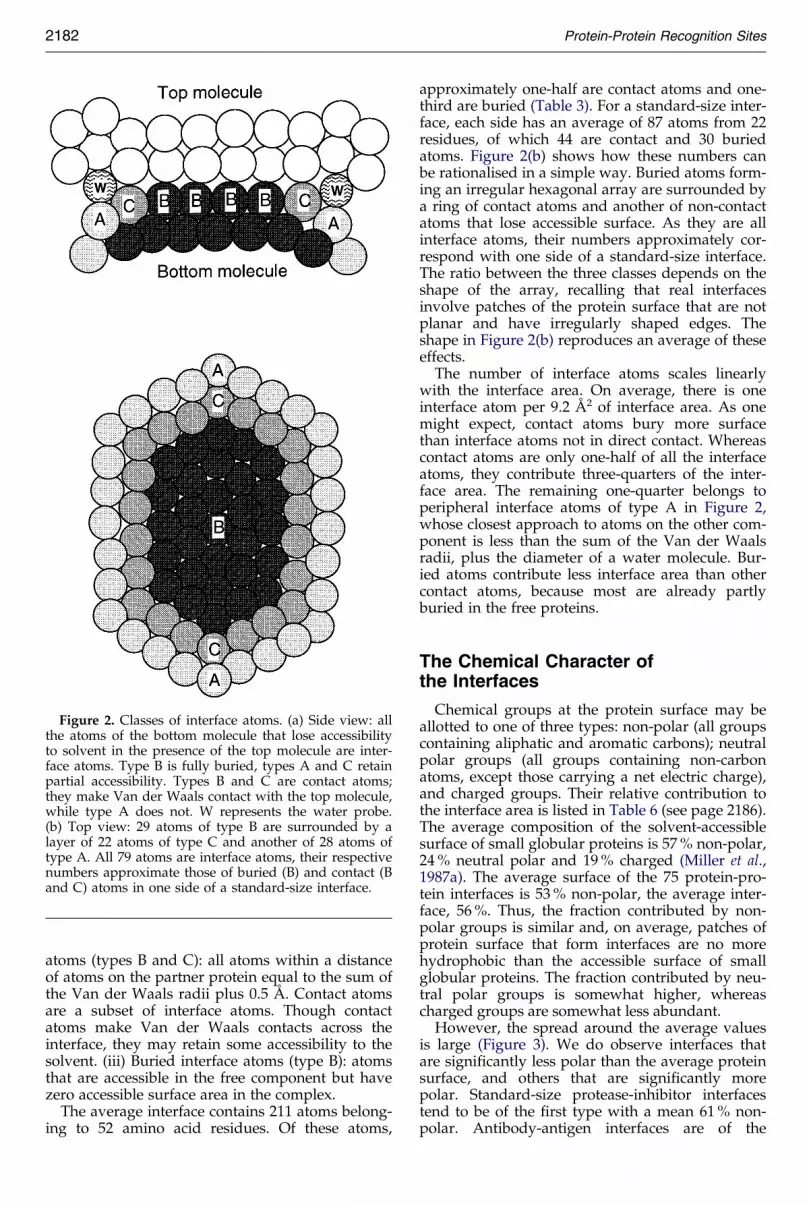
atoms (types B and C): all atoms within a distanceof atoms on the partner protein equal to the sum of
approximately one-half are contact atoms and one-third are buried (Table 3). For a standard-size inter-
Figure 2. Classes of interface atoms. (a) Side view: allthe atoms of the bottom molecule that lose accessibilityto solvent in the presence of the top molecule are inter-face atoms. Type B is fully buried, types A and C retainpartial accessibility. Types B and C are contact atoms;they make Van der Waals contact with the top molecule,while type A does not. W represents the water probe.(b) Top view: 29 atoms of type B are surrounded by alayer of 22 atoms of type C and another of 28 atoms oftype A. All 79 atoms are interface atoms, their respectivenumbers approximate those of buried (B) and contact (Band C) atoms in one side of a standard-size interface.
2182 Protein-Protein Recognition Sites
the Van der Waals radii plus 0.5 AÊ . Contact atomsare a subset of interface atoms. Though contactatoms make Van der Waals contacts across theinterface, they may retain some accessibility to thesolvent. (iii) Buried interface atoms (type B): atomsthat are accessible in the free component but havezero accessible surface area in the complex.
The average interface contains 211 atoms belong-ing to 52 amino acid residues. Of these atoms,
face, each side has an average of 87 atoms from 22residues, of which 44 are contact and 30 buriedatoms. Figure 2(b) shows how these numbers canbe rationalised in a simple way. Buried atoms form-ing an irregular hexagonal array are surrounded bya ring of contact atoms and another of non-contactatoms that lose accessible surface. As they are allinterface atoms, their numbers approximately cor-respond with one side of a standard-size interface.The ratio between the three classes depends on theshape of the array, recalling that real interfacesinvolve patches of the protein surface that are notplanar and have irregularly shaped edges. Theshape in Figure 2(b) reproduces an average of theseeffects.
The number of interface atoms scales linearlywith the interface area. On average, there is oneinterface atom per 9.2 AÊ 2 of interface area. As onemight expect, contact atoms bury more surfacethan interface atoms not in direct contact. Whereascontact atoms are only one-half of all the interfaceatoms, they contribute three-quarters of the inter-face area. The remaining one-quarter belongs toperipheral interface atoms of type A in Figure 2,whose closest approach to atoms on the other com-ponent is less than the sum of the Van der Waalsradii, plus the diameter of a water molecule. Bur-ied atoms contribute less interface area than othercontact atoms, because most are already partlyburied in the free proteins.
The Chemical Character ofthe Interfaces
Chemical groups at the protein surface may beallotted to one of three types: non-polar (all groupscontaining aliphatic and aromatic carbons); neutralpolar groups (all groups containing non-carbonatoms, except those carrying a net electric charge),and charged groups. Their relative contribution tothe interface area is listed in Table 6 (see page 2186).The average composition of the solvent-accessiblesurface of small globular proteins is 57 % non-polar,24 % neutral polar and 19 % charged (Miller et al.,1987a). The average surface of the 75 protein-pro-tein interfaces is 53 % non-polar, the average inter-face, 56 %. Thus, the fraction contributed by non-polar groups is similar and, on average, patches ofprotein surface that form interfaces are no morehydrophobic than the accessible surface of smallglobular proteins. The fraction contributed by neu-tral polar groups is somewhat higher, whereascharged groups are somewhat less abundant.
However, the spread around the average valuesis large (Figure 3). We do observe interfaces thatare signi®cantly less polar than the average proteinsurface, and others that are signi®cantly morepolar. Standard-size protease-inhibitor interfacestend to be of the ®rst type with a mean 61 % non-polar. Antibody-antigen interfaces are of the

second type with a mean 51 % non-polar. Theinterface between the two antibody Fv fragments
The polypeptide main-chain atoms contribute to19 % of the interface area of the average protein-
Table 3. Categories of interface atoms
All interfaces Protease-inhibitor Antigen-antibody Other interfaces Accessible surface
Averagenumber
211 207 185 229 -
A. Number fractionContact 0.51 0.56 0.48 0.49Burieda 0.35 0.40 0.31 0.32 -Buriedwith waterb
0.59 0.60 0.62 0.55 -
B. Area fractionc
Contact 0.76 0.79 0.73 0.75 -Burieda 0.26 0.32 0.22 0.24 -Buriedwith waterb
0.59 0.59 0.63 0.57 -
Main-chain 0.19 0.23 0.19 0.17 0.22Side-chain 0.80 0.76 0.81 0.82 0.77Non-protein groups 0.004 0 0 0.01 0.006
a Interface atoms with zero accessible-surface area.b Interface atoms with zero accessible-surface area when solvent is taken into account; the data set is restricted to 36 X-ray struc-
tures with resolution 2.4 AÊ or better.c The average interface area per interface atom is close to 9.2 AÊ 2 in all complexes.
Protein-Protein Recognition Sites 2183
D1.3 and E5.2 (1dvf) is the most hydrophilic in oursample (42 % non-polar). The most hydrophobic(�70 % non-polar) are in two protease-inhibitorcomplexes (1ppf,1acb) and in the erythropoietinreceptor-peptide complex (1ebp). The latter com-plex contains a peptide that has been selectedin vitro for high af®nity, but is unrelated to thenatural ligand hormone. The three most hydro-phobic interfaces are of standard-size and bury�1100 AÊ 2 of non-polar surface. No large interfaceis as non-polar as these three. Yet, the total amountof non-polar protein surface that is buried at alarge interface can be huge, over 2000 AÊ 2 in theE. coli EFtu-EFts complex (1efu) for instance.
The non-polar fraction is very similar for contactatoms (58 %) and for interface atoms in general(56 %). This might be expected because the fractionis calculated on interface areas, of which contactatoms contribute three-quarters. Buried atoms arede®nitely more non-polar, 63 % on average, thanother interface atoms, which remain partly accessi-ble to the solvent.
The polar surface includes neutral and chargedgroups. On average, neutral polar groups contrib-ute 29 % to the interface area. Charged side-chaingroups contribute 15 %, with a slight excess of thepositively charged surface over the negative one,whereas the accessible surface of the complexes is18 % charged and equally distributed betweenpositive and negative charges. We ®nd that inter-faces are somewhat depleted in negatively chargedgroups relative to the rest of the protein surface(6.7 % versus 9.1 %), but not in positively chargedgroups. Again, these numbers are averages and thecontribution of charged groups varies widely fromone complex to another, from zero at the erythro-poietin receptor-peptide interface (1ebp), to 27 % atthe Rap1A-Raf1 interface (1gua).
protein complex (Table 3). Side-chain atoms con-tribute 80 %, and non-protein groups 0.4 %. Again,these fractions are close to the average surface.They show that the main-chain contribution tointerfaces cannot be ignored, especially that of thecarbonyl oxygen which accounts for 11 % of theinterface area, more than any other type of atom.Non-protein groups (HETATM in PDB ®les) areunimportant, with the exception of the FK506immunosuppressant drug in the FKBP12 immuno-philin-calcineurin complex (1tco), which is a majorpart of the interface and accounts for 30 % of theaccessible surface area lost by the immunophilinwhen it binds to calcineurin. In a few other com-plexes, metal ions occur at the interface, but theirburied surface is small.
The Character of Amino Acidsat Interfaces
Table 4 describes the contribution of each of the20 amino acid types to the interfaces and to theprotein surface that remains accessible to solvent inthe complexes. The two surfaces have amino acidcompositions that are signi®cantly different. Inter-faces are much richer in aromatic residues His,Tyr, Phe and Trp than the average protein surface(21 % versus 8 %), and somewhat richer in aliphaticresidues Leu, Ile, Val and Met (17 % versus 11 %).They are depleted in the charged residues Asp,Glu and Lys, but not Arg, which is the residuetype that makes the largest overall contribution tointerfaces (10 %). Some variations are seen betweendifferent types of complexes, but the large contri-bution of Arg and depletion in Lys are general.Protease-inhibitor interfaces are particularly rich inCys (mostly from disulphide bridges), antigen-anti-

body interfaces in Tyr, which contributes one-sixthof their area.
area, not to the number of residues. For pairwisecomparison, a Euclidian distance �f can be com-
Figure 3. Histograms of thechemical character of protein-pro-tein interfaces. Distributions of thevalues for the non-polar (top), neu-tral polar (middle) and charged(bottom) fractions of the interfaceareas given in Table 6.
2184 Protein-Protein Recognition Sites
The amino acid composition of protein-proteininterfaces is compared in Table 4 and Figure 4 tothat of interfaces between subunits in 23 oligomericproteins, and also to their accessible surface and tothe protein surface buried upon subunit folding(Janin et al., 1988). These compositions refer to thecontribution of the residue types to the surface
puted in the 19-dimension space of amino acidcomposition, from:
��f �2 � 1=19�i�fi ÿ f 01�2
where fi and f0i are the percentage areas contributedby residue type i to the two surfaces. Distances
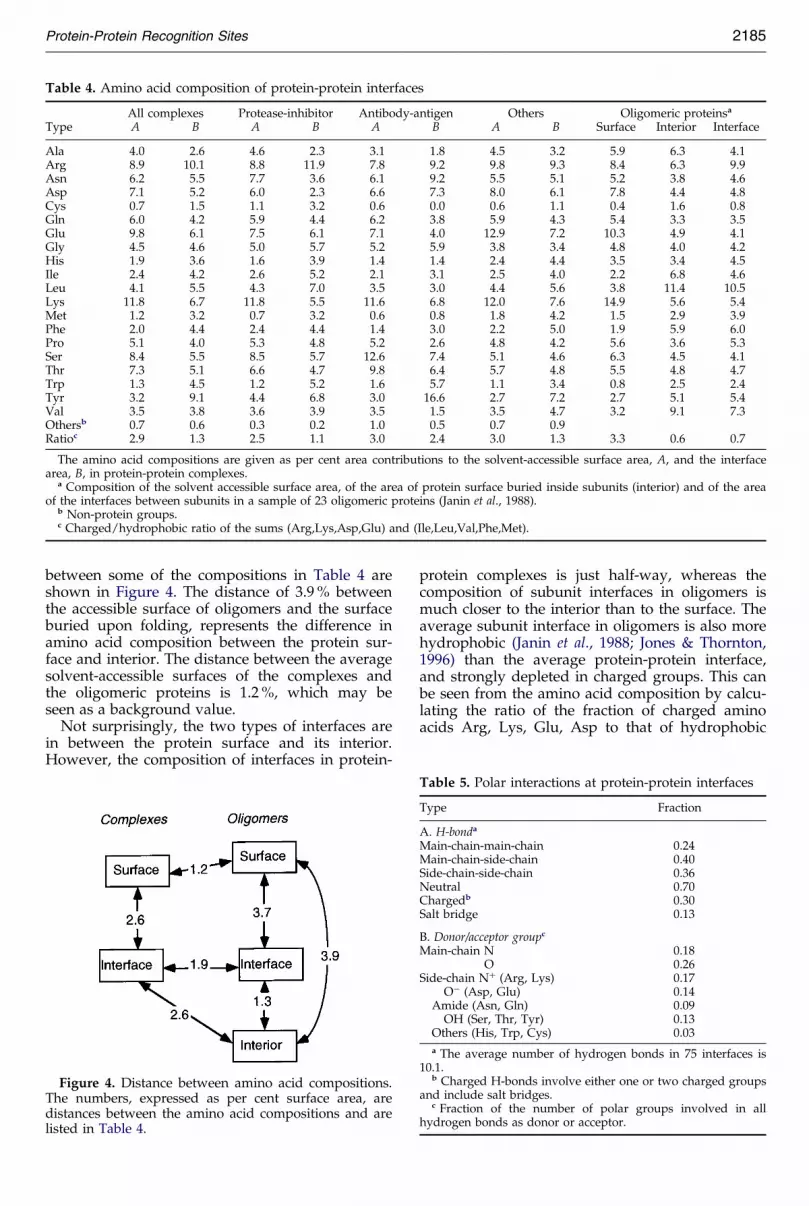
between some of the compositions in Table 4 areshown in Figure 4. The distance of 3.9 % between
protein complexes is just half-way, whereas thecomposition of subunit interfaces in oligomers is
Table 4. Amino acid composition of protein-protein interfaces
All complexes Protease-inhibitor Antibody-antigen Others Oligomeric proteinsa
Type A B A B A B A B Surface Interior Interface
Ala 4.0 2.6 4.6 2.3 3.1 1.8 4.5 3.2 5.9 6.3 4.1Arg 8.9 10.1 8.8 11.9 7.8 9.2 9.8 9.3 8.4 6.3 9.9Asn 6.2 5.5 7.7 3.6 6.1 9.2 5.5 5.1 5.2 3.8 4.6Asp 7.1 5.2 6.0 2.3 6.6 7.3 8.0 6.1 7.8 4.4 4.8Cys 0.7 1.5 1.1 3.2 0.6 0.0 0.6 1.1 0.4 1.6 0.8Gln 6.0 4.2 5.9 4.4 6.2 3.8 5.9 4.3 5.4 3.3 3.5Glu 9.8 6.1 7.5 6.1 7.1 4.0 12.9 7.2 10.3 4.9 4.1Gly 4.5 4.6 5.0 5.7 5.2 5.9 3.8 3.4 4.8 4.0 4.2His 1.9 3.6 1.6 3.9 1.4 1.4 2.4 4.4 3.5 3.4 4.5Ile 2.4 4.2 2.6 5.2 2.1 3.1 2.5 4.0 2.2 6.8 4.6Leu 4.1 5.5 4.3 7.0 3.5 3.0 4.4 5.6 3.8 11.4 10.5Lys 11.8 6.7 11.8 5.5 11.6 6.8 12.0 7.6 14.9 5.6 5.4Met 1.2 3.2 0.7 3.2 0.6 0.8 1.8 4.2 1.5 2.9 3.9Phe 2.0 4.4 2.4 4.4 1.4 3.0 2.2 5.0 1.9 5.9 6.0Pro 5.1 4.0 5.3 4.8 5.2 2.6 4.8 4.2 5.6 3.6 5.3Ser 8.4 5.5 8.5 5.7 12.6 7.4 5.1 4.6 6.3 4.5 4.1Thr 7.3 5.1 6.6 4.7 9.8 6.4 5.7 4.8 5.5 4.8 4.7Trp 1.3 4.5 1.2 5.2 1.6 5.7 1.1 3.4 0.8 2.5 2.4Tyr 3.2 9.1 4.4 6.8 3.0 16.6 2.7 7.2 2.7 5.1 5.4Val 3.5 3.8 3.6 3.9 3.5 1.5 3.5 4.7 3.2 9.1 7.3Othersb 0.7 0.6 0.3 0.2 1.0 0.5 0.7 0.9Ratioc 2.9 1.3 2.5 1.1 3.0 2.4 3.0 1.3 3.3 0.6 0.7
The amino acid compositions are given as per cent area contributions to the solvent-accessible surface area, A, and the interfacearea, B, in protein-protein complexes.
a Composition of the solvent accessible surface area, of the area of protein surface buried inside subunits (interior) and of the areaof the interfaces between subunits in a sample of 23 oligomeric proteins (Janin et al., 1988).
b Non-protein groups.c Charged/hydrophobic ratio of the sums (Arg,Lys,Asp,Glu) and (Ile,Leu,Val,Phe,Met).
Table 5. Polar interactions at protein-protein interfaces
Type Fraction
Protein-Protein Recognition Sites 2185
the accessible surface of oligomers and the surfaceburied upon folding, represents the difference inamino acid composition between the protein sur-face and interior. The distance between the averagesolvent-accessible surfaces of the complexes andthe oligomeric proteins is 1.2 %, which may beseen as a background value.
Not surprisingly, the two types of interfaces arein between the protein surface and its interior.However, the composition of interfaces in protein-
Figure 4. Distance between amino acid compositions.The numbers, expressed as per cent surface area, aredistances between the amino acid compositions and arelisted in Table 4.
much closer to the interior than to the surface. Theaverage subunit interface in oligomers is also morehydrophobic (Janin et al., 1988; Jones & Thornton,1996) than the average protein-protein interface,and strongly depleted in charged groups. This canbe seen from the amino acid composition by calcu-lating the ratio of the fraction of charged aminoacids Arg, Lys, Glu, Asp to that of hydrophobic
A. H-bonda
Main-chain-main-chain 0.24Main-chain-side-chain 0.40Side-chain-side-chain 0.36Neutral 0.70Chargedb 0.30Salt bridge 0.13
B. Donor/acceptor groupc
Main-chain N 0.18O 0.26
Side-chain N� (Arg, Lys) 0.17Oÿ (Asp, Glu) 0.14
Amide (Asn, Gln) 0.09OH (Ser, Thr, Tyr) 0.13
Others (His, Trp, Cys) 0.03
a The average number of hydrogen bonds in 75 interfaces is10.1.
b Charged H-bonds involve either one or two charged groupsand include salt bridges.
c Fraction of the number of polar groups involved in allhydrogen bonds as donor or acceptor.
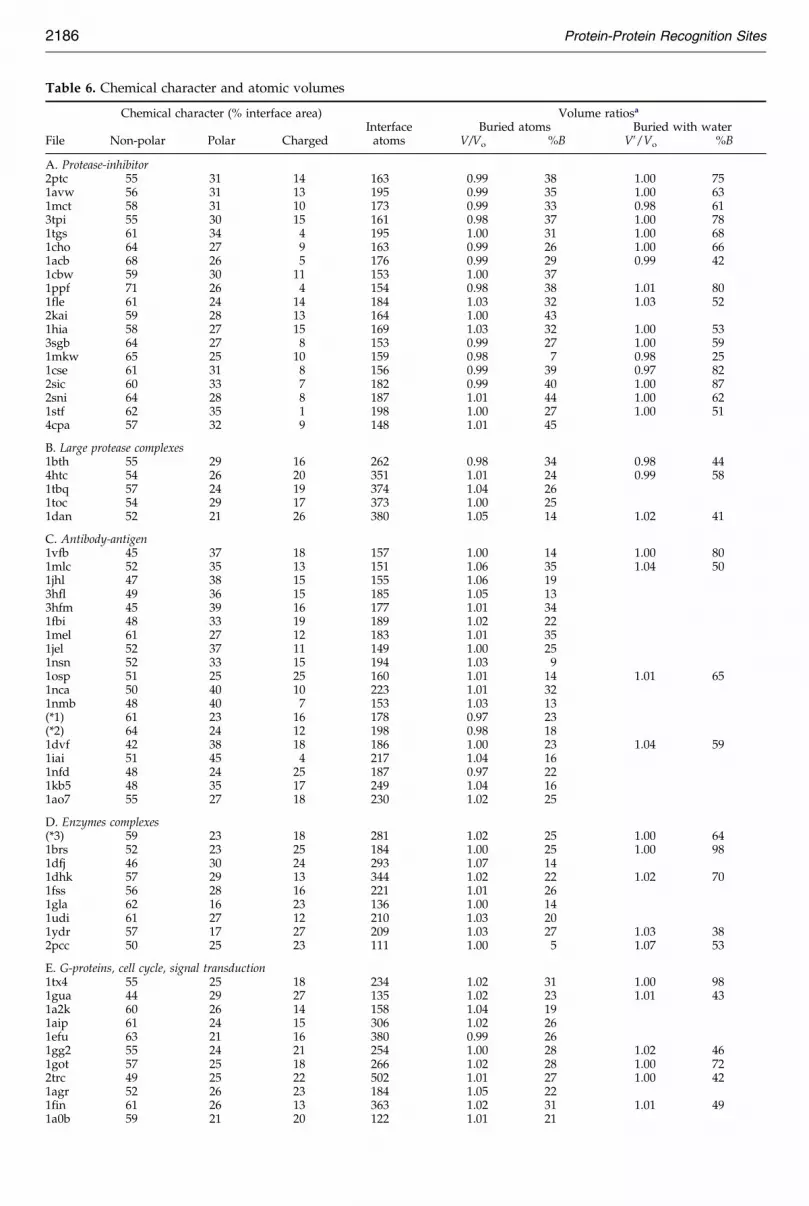
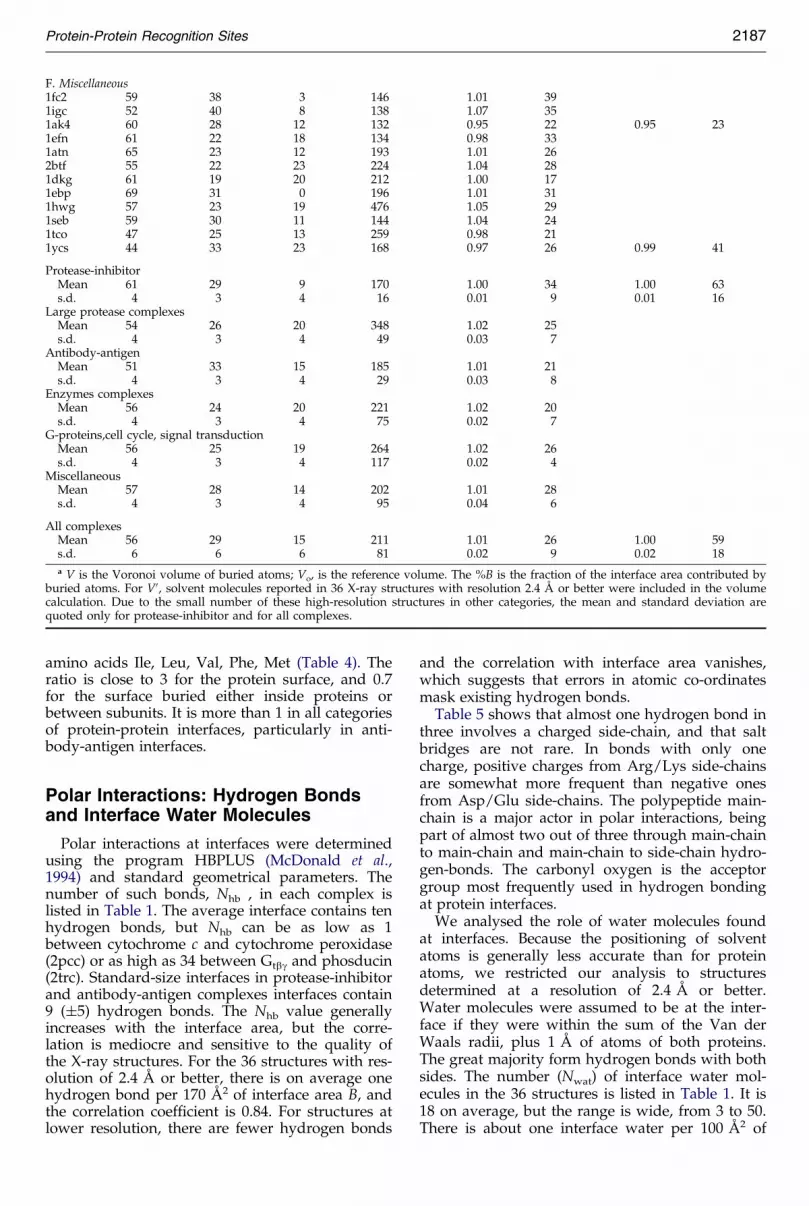
Table 6. Chemical character and atomic volumes
Chemical character (% interface area) Volume ratiosa
Interface Buried atoms Buried with waterFile Non-polar Polar Charged atoms V/Vo %B V0/Vo %B
A. Protease-inhibitor2ptc 55 31 14 163 0.99 38 1.00 751avw 56 31 13 195 0.99 35 1.00 631mct 58 31 10 173 0.99 33 0.98 613tpi 55 30 15 161 0.98 37 1.00 781tgs 61 34 4 195 1.00 31 1.00 681cho 64 27 9 163 0.99 26 1.00 661acb 68 26 5 176 0.99 29 0.99 421cbw 59 30 11 153 1.00 371ppf 71 26 4 154 0.98 38 1.01 801fle 61 24 14 184 1.03 32 1.03 522kai 59 28 13 164 1.00 431hia 58 27 15 169 1.03 32 1.00 533sgb 64 27 8 153 0.99 27 1.00 591mkw 65 25 10 159 0.98 7 0.98 251cse 61 31 8 156 0.99 39 0.97 822sic 60 33 7 182 0.99 40 1.00 872sni 64 28 8 187 1.01 44 1.00 621stf 62 35 1 198 1.00 27 1.00 514cpa 57 32 9 148 1.01 45
B. Large protease complexes1bth 55 29 16 262 0.98 34 0.98 444htc 54 26 20 351 1.01 24 0.99 581tbq 57 24 19 374 1.04 261toc 54 29 17 373 1.00 251dan 52 21 26 380 1.05 14 1.02 41
C. Antibody-antigen1vfb 45 37 18 157 1.00 14 1.00 801mlc 52 35 13 151 1.06 35 1.04 501jhl 47 38 15 155 1.06 193hfl 49 36 15 185 1.05 133hfm 45 39 16 177 1.01 341fbi 48 33 19 189 1.02 221mel 61 27 12 183 1.01 351jel 52 37 11 149 1.00 251nsn 52 33 15 194 1.03 91osp 51 25 25 160 1.01 14 1.01 651nca 50 40 10 223 1.01 321nmb 48 40 7 153 1.03 13(*1) 61 23 16 178 0.97 23(*2) 64 24 12 198 0.98 181dvf 42 38 18 186 1.00 23 1.04 591iai 51 45 4 217 1.04 161nfd 48 24 25 187 0.97 221kb5 48 35 17 249 1.04 161ao7 55 27 18 230 1.02 25
D. Enzymes complexes(*3) 59 23 18 281 1.02 25 1.00 641brs 52 23 25 184 1.00 25 1.00 981dfj 46 30 24 293 1.07 141dhk 57 29 13 344 1.02 22 1.02 701fss 56 28 16 221 1.01 261gla 62 16 23 136 1.00 141udi 61 27 12 210 1.03 201ydr 57 17 27 209 1.03 27 1.03 382pcc 50 25 23 111 1.00 5 1.07 53
E. G-proteins, cell cycle, signal transduction1tx4 55 25 18 234 1.02 31 1.00 981gua 44 29 27 135 1.02 23 1.01 431a2k 60 26 14 158 1.04 191aip 61 24 15 306 1.02 261efu 63 21 16 380 0.99 261gg2 55 24 21 254 1.00 28 1.02 461got 57 25 18 266 1.02 28 1.00 722trc 49 25 22 502 1.01 27 1.00 421agr 52 26 23 184 1.05 221fin 61 26 13 363 1.02 31 1.01 491a0b 59 21 20 122 1.01 21
2186 Protein-Protein Recognition Sites
amino acids Ile, Leu, Val, Phe, Met (Table 4). Theratio is close to 3 for the protein surface, and 0.7
and the correlation with interface area vanishes,which suggests that errors in atomic co-ordinatesmask existing hydrogen bonds.
F. Miscellaneous1fc2 59 38 3 146 1.01 391igc 52 40 8 138 1.07 351ak4 60 28 12 132 0.95 22 0.95 231efn 61 22 18 134 0.98 331atn 65 23 12 193 1.01 262btf 55 22 23 224 1.04 281dkg 61 19 20 212 1.00 171ebp 69 31 0 196 1.01 311hwg 57 23 19 476 1.05 291seb 59 30 11 144 1.04 241tco 47 25 13 259 0.98 211ycs 44 33 23 168 0.97 26 0.99 41
Protease-inhibitorMean 61 29 9 170 1.00 34 1.00 63s.d. 4 3 4 16 0.01 9 0.01 16
Large protease complexesMean 54 26 20 348 1.02 25s.d. 4 3 4 49 0.03 7
Antibody-antigenMean 51 33 15 185 1.01 21s.d. 4 3 4 29 0.03 8
Enzymes complexesMean 56 24 20 221 1.02 20s.d. 4 3 4 75 0.02 7
G-proteins,cell cycle, signal transductionMean 56 25 19 264 1.02 26s.d. 4 3 4 117 0.02 4
MiscellaneousMean 57 28 14 202 1.01 28s.d. 4 3 4 95 0.04 6
All complexesMean 56 29 15 211 1.01 26 1.00 59s.d. 6 6 6 81 0.02 9 0.02 18
a V is the Voronoi volume of buried atoms; Vo, is the reference volume. The %B is the fraction of the interface area contributed byburied atoms. For V0, solvent molecules reported in 36 X-ray structures with resolution 2.4 AÊ or better were included in the volumecalculation. Due to the small number of these high-resolution structures in other categories, the mean and standard deviation arequoted only for protease-inhibitor and for all complexes.
Protein-Protein Recognition Sites 2187
for the surface buried either inside proteins orbetween subunits. It is more than 1 in all categoriesof protein-protein interfaces, particularly in anti-body-antigen interfaces.
Polar Interactions: Hydrogen Bondsand Interface Water Molecules
Polar interactions at interfaces were determinedusing the program HBPLUS (McDonald et al.,1994) and standard geometrical parameters. Thenumber of such bonds, Nhb , in each complex islisted in Table 1. The average interface contains tenhydrogen bonds, but Nhb can be as low as 1between cytochrome c and cytochrome peroxidase(2pcc) or as high as 34 between Gtbg and phosducin(2trc). Standard-size interfaces in protease-inhibitorand antibody-antigen complexes interfaces contain9 (�5) hydrogen bonds. The Nhb value generallyincreases with the interface area, but the corre-lation is mediocre and sensitive to the quality ofthe X-ray structures. For the 36 structures with res-olution of 2.4 AÊ or better, there is on average onehydrogen bond per 170 AÊ 2 of interface area B, andthe correlation coef®cient is 0.84. For structures atlower resolution, there are fewer hydrogen bonds
Table 5 shows that almost one hydrogen bond inthree involves a charged side-chain, and that saltbridges are not rare. In bonds with only onecharge, positive charges from Arg/Lys side-chainsare somewhat more frequent than negative onesfrom Asp/Glu side-chains. The polypeptide main-chain is a major actor in polar interactions, beingpart of almost two out of three through main-chainto main-chain and main-chain to side-chain hydro-gen-bonds. The carbonyl oxygen is the acceptorgroup most frequently used in hydrogen bondingat protein interfaces.
We analysed the role of water molecules foundat interfaces. Because the positioning of solventatoms is generally less accurate than for proteinatoms, we restricted our analysis to structuresdetermined at a resolution of 2.4 AÊ or better.Water molecules were assumed to be at the inter-face if they were within the sum of the Van derWaals radii, plus 1 AÊ of atoms of both proteins.The great majority form hydrogen bonds with bothsides. The number (Nwat) of interface water mol-ecules in the 36 structures is listed in Table 1. It is18 on average, but the range is wide, from 3 to 50.There is about one interface water per 100 AÊ 2 of
interface area B, suggesting that water-mediatedpolar interactions are more numerous than directhydrogen bonds, but the correlation between Nwat
sity within protein-protein interfaces analysed hereis very similar to that within the protein interior.
2188 Protein-Protein Recognition Sites
and B is poor (0.5). The different practises of crys-tallographers in locating and listing solvent mol-ecules are responsible for at least some of thisvariation. Still, it is evident that there are interfacesfrom which water is excluded and where solventmolecules are distributed on the periphery of thecontact, and others where they occur in centralregions of the interface. This can be seen by exam-ining the complexes individually and will be dis-cussed below where it is illustrated in Figure 6.
Atomic packing at interfaces
The volumes occupied by atoms inside proteinsor buried in their interfaces can be determined byconstructing Voronoi polyhedra around theiratoms, and calculating their volume. The packingdensity at interfaces was determined by calculatingthe volume of the Voronoi polyhedron of eachatom buried in the interface, summing the valuesto give a total volume V, and comparing V to areference value Vo. To derive Vo, we used themean volumes that the atomic groups of residuesoccupy in protein interiors. A V/Vo ratio largerthan unity means the packing density at interfacesis lower than that in protein interiors, and a ratioless than unity means a higher packing density.
Volumes of atomic groups buried in the inter-faces were calculated using an implementation ofthe Voronoi procedure that is based on an originalprogram by Richards (1974), with its subsequentmodi®cations and extensions by Harpaz et al.(1994) and by Gerstein et al. (1995). The same pro-gram has been used to determine the referencevalues for the average volume of atoms buriedinside globular proteins (Harpaz et al., 1994; Tsaiet al., unpublished results). These volumes are, onaverage, 5 % smaller than the volumes of equival-ent groups in small molecule crystals, of aminoacids, indicating that the protein inside is betterpacked on average than small molecule crystals inspite of the occasional presence of internal cavitieswhich increase the average atomic volume. Assmall molecule crystals are usually considered tobe close-packed, volumes observed inside proteinsare a good reference for atomic packing.
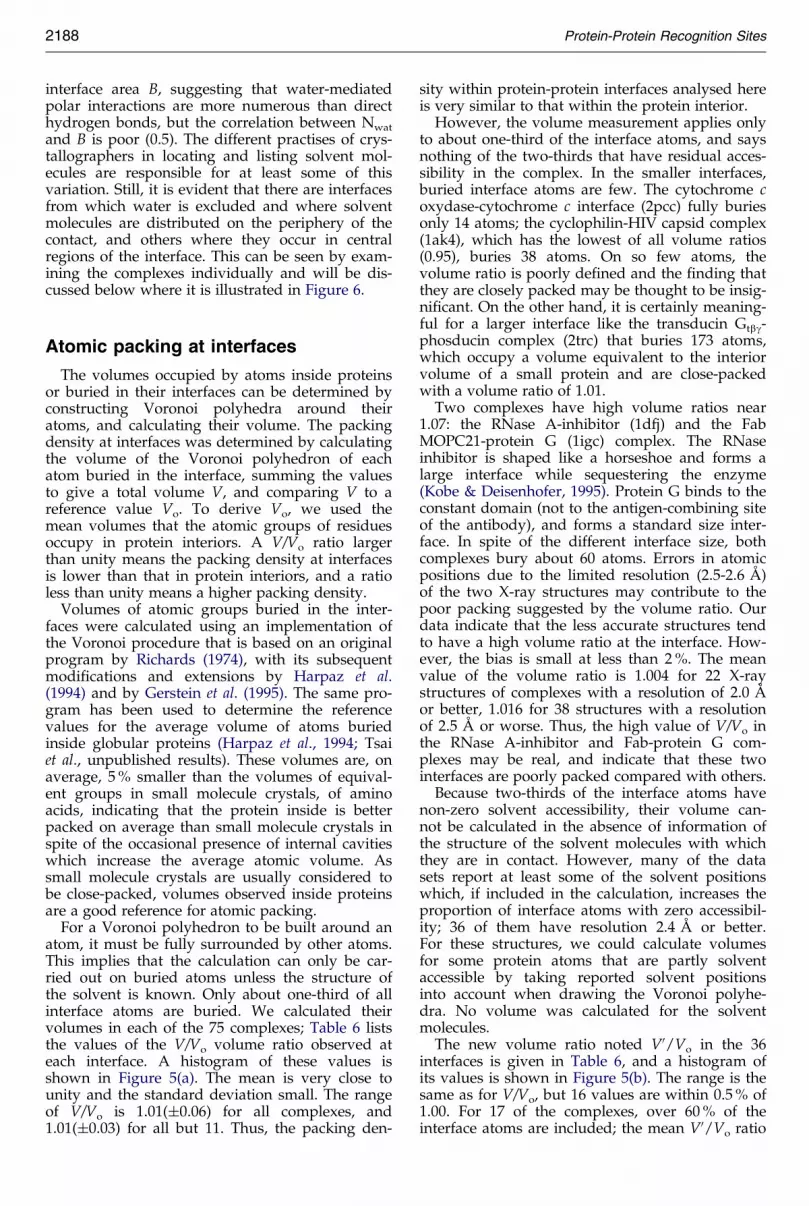
For a Voronoi polyhedron to be built around anatom, it must be fully surrounded by other atoms.This implies that the calculation can only be car-ried out on buried atoms unless the structure ofthe solvent is known. Only about one-third of allinterface atoms are buried. We calculated theirvolumes in each of the 75 complexes; Table 6 liststhe values of the V/Vo volume ratio observed ateach interface. A histogram of these values isshown in Figure 5(a). The mean is very close tounity and the standard deviation small. The rangeof V/Vo is 1.01(�0.06) for all complexes, and1.01(�0.03) for all but 11. Thus, the packing den-
However, the volume measurement applies onlyto about one-third of the interface atoms, and saysnothing of the two-thirds that have residual acces-sibility in the complex. In the smaller interfaces,buried interface atoms are few. The cytochrome coxydase-cytochrome c interface (2pcc) fully buriesonly 14 atoms; the cyclophilin-HIV capsid complex(1ak4), which has the lowest of all volume ratios(0.95), buries 38 atoms. On so few atoms, thevolume ratio is poorly de®ned and the ®nding thatthey are closely packed may be thought to be insig-ni®cant. On the other hand, it is certainly meaning-ful for a larger interface like the transducin Gtbg-phosducin complex (2trc) that buries 173 atoms,which occupy a volume equivalent to the interiorvolume of a small protein and are close-packedwith a volume ratio of 1.01.
Two complexes have high volume ratios near1.07: the RNase A-inhibitor (1dfj) and the FabMOPC21-protein G (1igc) complex. The RNaseinhibitor is shaped like a horseshoe and forms alarge interface while sequestering the enzyme(Kobe & Deisenhofer, 1995). Protein G binds to theconstant domain (not to the antigen-combining siteof the antibody), and forms a standard size inter-face. In spite of the different interface size, bothcomplexes bury about 60 atoms. Errors in atomicpositions due to the limited resolution (2.5-2.6 AÊ )of the two X-ray structures may contribute to thepoor packing suggested by the volume ratio. Ourdata indicate that the less accurate structures tendto have a high volume ratio at the interface. How-ever, the bias is small at less than 2 %. The meanvalue of the volume ratio is 1.004 for 22 X-raystructures of complexes with a resolution of 2.0 AÊ
or better, 1.016 for 38 structures with a resolutionof 2.5 AÊ or worse. Thus, the high value of V/Vo inthe RNase A-inhibitor and Fab-protein G com-plexes may be real, and indicate that these twointerfaces are poorly packed compared with others.
Because two-thirds of the interface atoms havenon-zero solvent accessibility, their volume can-not be calculated in the absence of information ofthe structure of the solvent molecules with whichthey are in contact. However, many of the datasets report at least some of the solvent positionswhich, if included in the calculation, increases theproportion of interface atoms with zero accessibil-ity; 36 of them have resolution 2.4 AÊ or better.For these structures, we could calculate volumesfor some protein atoms that are partly solventaccessible by taking reported solvent positionsinto account when drawing the Voronoi polyhe-dra. No volume was calculated for the solventmolecules.
The new volume ratio noted V0/Vo in the 36interfaces is given in Table 6, and a histogram ofits values is shown in Figure 5(b). The range is thesame as for V/Vo, but 16 values are within 0.5 % of1.00. For 17 of the complexes, over 60 % of theinterface atoms are included; the mean V0/Vo ratio

is 1.00, and the standard deviation 0.01. In the bar-nase-barstar (1brs) and the Rho-Rho GAP (1tx4)
packed over their entire extent on the conditionthat solvent molecules are taken into account. As
Figure 5. Histogram of packing densities for buried atoms. (a) Distribution of the values of the V/Vo ratio cited inTable 6 for atoms fully buried at the 75 protein-protein interfaces. V is the sum of their Voronoi volumes, Vo, is areference volume observed for atoms buried inside proteins. (b) Distribution of the values of the V0/Vo ratio in 36structures with resolution of 2.4 AÊ or better. The Voronoi volume V0 is calculated for interface atoms in the presenceof the solvent molecules reported in PDB ®les. This increases the fraction of interface atoms with zero accessibility. In17 complexes (black columns), these atoms account for more than 60 % of the interface area.
Protein-Protein Recognition Sites 2189
complexes, the calculation involved almost all theinterface atoms. Both have V0/Vo ratios of 1.00and, therefore, these two interfaces are close-
only 33-35 % of their interface atoms are actuallyburied, this shows how important water moleculesare in the packing of these two interfaces.

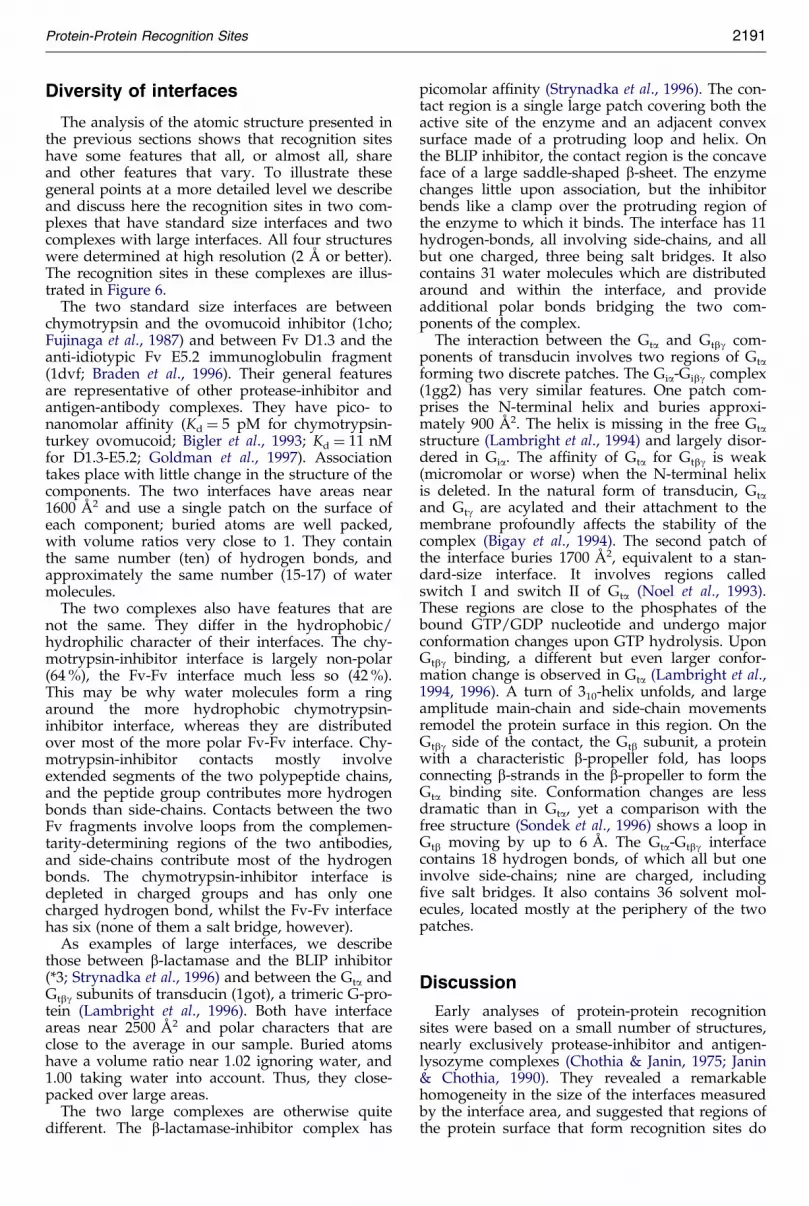
Figure 6. Interfaces in four protein-protein complexes. The backbone of the two components are coloured blue andgreen. The shaded surface belongs to the green component at the back, and is in contact with the blue component infront. Red spheres are interface water molecules. From left to right and top to bottom: 1cho, complex of chymotrypsinon the back with the turkey ovomucoid third domain inhibitor (Fujinaga et al., 1987); 1dvf, complex between two Fvfragments of antibody D1.3 and the anti-idiotypic antibody E5.2 (Braden et al., 1996); *3, complex of RTEM b-lacta-mase on the back with the BLIP inhibitor (Strynadka et al., 1996); 1got, the transducin Gta-Gtbg heterotrimer(Lambright et al., 1996); Gta is at the back. The Figure was drawn with GRASP (Nicholls et al., 1992).
2190 Protein-Protein Recognition Sites
Diversity of interfaces picomolar af®nity (Strynadka et al., 1996). The con-tact region is a single large patch covering both the
Protein-Protein Recognition Sites 2191
The analysis of the atomic structure presented inthe previous sections shows that recognition siteshave some features that all, or almost all, shareand other features that vary. To illustrate thesegeneral points at a more detailed level we describeand discuss here the recognition sites in two com-plexes that have standard size interfaces and twocomplexes with large interfaces. All four structureswere determined at high resolution (2 AÊ or better).The recognition sites in these complexes are illus-trated in Figure 6.
The two standard size interfaces are betweenchymotrypsin and the ovomucoid inhibitor (1cho;Fujinaga et al., 1987) and between Fv D1.3 and theanti-idiotypic Fv E5.2 immunoglobulin fragment(1dvf; Braden et al., 1996). Their general featuresare representative of other protease-inhibitor andantigen-antibody complexes. They have pico- tonanomolar af®nity (Kd � 5 pM for chymotrypsin-turkey ovomucoid; Bigler et al., 1993; Kd � 11 nMfor D1.3-E5.2; Goldman et al., 1997). Associationtakes place with little change in the structure of thecomponents. The two interfaces have areas near1600 AÊ 2 and use a single patch on the surface ofeach component; buried atoms are well packed,with volume ratios very close to 1. They containthe same number (ten) of hydrogen bonds, andapproximately the same number (15-17) of watermolecules.
The two complexes also have features that arenot the same. They differ in the hydrophobic/hydrophilic character of their interfaces. The chy-motrypsin-inhibitor interface is largely non-polar(64 %), the Fv-Fv interface much less so (42 %).This may be why water molecules form a ringaround the more hydrophobic chymotrypsin-inhibitor interface, whereas they are distributedover most of the more polar Fv-Fv interface. Chy-motrypsin-inhibitor contacts mostly involveextended segments of the two polypeptide chains,and the peptide group contributes more hydrogenbonds than side-chains. Contacts between the twoFv fragments involve loops from the complemen-tarity-determining regions of the two antibodies,and side-chains contribute most of the hydrogenbonds. The chymotrypsin-inhibitor interface isdepleted in charged groups and has only onecharged hydrogen bond, whilst the Fv-Fv interfacehas six (none of them a salt bridge, however).
As examples of large interfaces, we describethose between b-lactamase and the BLIP inhibitor(*3; Strynadka et al., 1996) and between the Gta andGtbg subunits of transducin (1got), a trimeric G-pro-tein (Lambright et al., 1996). Both have interfaceareas near 2500 AÊ 2 and polar characters that areclose to the average in our sample. Buried atomshave a volume ratio near 1.02 ignoring water, and1.00 taking water into account. Thus, they close-packed over large areas.
The two large complexes are otherwise quitedifferent. The b-lactamase-inhibitor complex has
active site of the enzyme and an adjacent convexsurface made of a protruding loop and helix. Onthe BLIP inhibitor, the contact region is the concaveface of a large saddle-shaped b-sheet. The enzymechanges little upon association, but the inhibitorbends like a clamp over the protruding region ofthe enzyme to which it binds. The interface has 11hydrogen-bonds, all involving side-chains, and allbut one charged, three being salt bridges. It alsocontains 31 water molecules which are distributedaround and within the interface, and provideadditional polar bonds bridging the two com-ponents of the complex.
The interaction between the Gta and Gtbg com-ponents of transducin involves two regions of Gtaforming two discrete patches. The Gia-Gibg complex(1gg2) has very similar features. One patch com-prises the N-terminal helix and buries approxi-mately 900 AÊ 2. The helix is missing in the free Gtastructure (Lambright et al., 1994) and largely disor-dered in Gia. The af®nity of Gta for Gtbg is weak(micromolar or worse) when the N-terminal helixis deleted. In the natural form of transducin, Gtaand Gtg are acylated and their attachment to themembrane profoundly affects the stability of thecomplex (Bigay et al., 1994). The second patch ofthe interface buries 1700 AÊ 2, equivalent to a stan-dard-size interface. It involves regions calledswitch I and switch II of Gta (Noel et al., 1993).These regions are close to the phosphates of thebound GTP/GDP nucleotide and undergo majorconformation changes upon GTP hydrolysis. UponGtbg binding, a different but even larger confor-mation change is observed in Gta (Lambright et al.,1994, 1996). A turn of 310-helix unfolds, and largeamplitude main-chain and side-chain movementsremodel the protein surface in this region. On theGtbg side of the contact, the Gtb subunit, a proteinwith a characteristic b-propeller fold, has loopsconnecting b-strands in the b-propeller to form theGta binding site. Conformation changes are lessdramatic than in Gta, yet a comparison with thefree structure (Sondek et al., 1996) shows a loop inGtb moving by up to 6 AÊ . The Gta-Gtbg interfacecontains 18 hydrogen bonds, of which all but oneinvolve side-chains; nine are charged, including®ve salt bridges. It also contains 36 solvent mol-ecules, located mostly at the periphery of the twopatches.
Discussion
Early analyses of protein-protein recognitionsites were based on a small number of structures,nearly exclusively protease-inhibitor and antigen-lysozyme complexes (Chothia & Janin, 1975; Janin& Chothia, 1990). They revealed a remarkablehomogeneity in the size of the interfaces measuredby the interface area, and suggested that regions ofthe protein surface that form recognition sites do

not differ greatly in their chemical character fromthe rest of the solvent-accessible surface. The inter-
This re¯ects the fact that the protein componentsof a complex must be stable and soluble in
2192 Protein-Protein Recognition Sites
faces have a large non-polar component which pro-vides hydrophobic free energy in favour ofassociation as it becomes buried in the complexes,and a polar component providing hydrogenbonds. Both are essential to recognition. Recog-nition was shown to occur between protein sur-faces of similar character having complementaryshapes and excluding water over at least 1200 AÊ 2
as the two partners come into contact. It washypothesised that this is the minimum size of aninterface yielding a stable structure. In most cases,the shapes were preformed and conformationchanges limited to local movements of small ampli-tude: complexes formed by rigid-body association.
Standard-size, small and large interfaces
The present study uses a much larger sample.Protease-inhibitor and antibody-lysozyme com-plexes are still in the majority, but there is a num-ber of examples of recognition sites involved invery different physiological processes. Their anal-ysis con®rms earlier conclusions and introducesnew ones, because the diversity of interfaces ismuch greater. Standard-size interfaces with B�1600 (�400) AÊ 2 correspond to the description ofprotein-protein recognition sites given by Janin &Chothia (1990). Here, we see that the range ofstructures in which they occur is extended. Inaddition to protease-inhibitor and antibody-antigencomplexes, they occur in about half of the othercomplexes. Below and above the limits of stan-dard-size interfaces, novel features are observed.The smallest interfaces have B � 1150 AÊ 2. Thoughthey are few at present, we suggest that they rep-resent a type of interaction in which proteins formshort-lived, low-stability complexes. The complexbetween cytochrome peroxydase and cytochrome c(2pcc) is an example. Cytochrome c is a substrateof the enzyme, and must not bind too tightly forturnover to take place. This type of interaction isessential in many cellular processes, but still poorlyrepresented in the PDB.
Large interfaces are better represented, as theyform 27 % of the present sample. They wereessentially absent in earlier studies. Interfaceswith B in the range 2000-4660 AÊ 2 occur mostlybetween proteases and a particular class ofinhibitors and between G-proteins and other com-ponents of the signal transduction system. Bytheir size, they resemble subunit interfaces in oli-gomeric proteins analysed by Miller et al. (1987b),Janin et al. (1988), Argos (1988), Jones &Thornton (1995, 1996) and Tsai & Nussinov(1997). However, they are less hydrophobic andcontain a larger proportion of charged groups.
{ �ASA values in Jones & Thornton (1996) are givenper subunit and differ by a factor of 2 from interface
areas quoted here.water, whereas isolated subunits of oligomericproteins are generally not stable and water sol-uble. Yet, we ®nd another point of similaritybetween large interfaces in complexes and in oli-gomeric proteins: their formation is generallyaccompanied by major conformation changes. Inmost oligomeric proteins, association is coupledwith subunit folding. The disorder-to-order tran-sition illustrated by the C-terminal tail of hirudin(4htc) and the N-terminal helix of transducin Gabelongs to that category. At many large inter-faces, the polypeptide chain partly refolds, loopsmove and the shape of the protein surfacechanges completely upon association. Thus, thecomplementary regions that form recognitionsites do not pre-exist association as they do instandard-size interfaces.
Close-packing of atoms at recognition sites
We reported here that the atoms buried in theinterfaces of trypsin-PTI and the Fab HyHEL-lysozyme complexes have packing densities likethose in organic solids (Janin & Chothia, 1976,1990). Here, we have extended this work in twodirections. First, we have carried out calculationsof Voronoi volumes on a large number of com-plexes. Second, in structures where the solventstructure at the interface is known, we can calcu-late densities for atoms that are not fully buried.For interface atoms that are buried in 75 com-plexes, which represents one-third of all interfaceatoms, the packing density derived from the Vor-onoi volume is within 7 % of that of the proteininterior. In most of the complexes, it is within4 %. Atoms in protein interiors have meanvolumes that are 5 % smaller than those found incrystals of amino acids (Harpaz et al., 1994; Tsaiet al., unpublished results). Thus, close-packing ofatoms buried at protein-protein interfaces is equalto or better than in organic solids. By taking intoaccount solvent molecules observed in high-resol-ution X-ray structures, we can extend this con-clusion to a larger fraction of interface atomswhich make up more than 60 % of the interfacein 17 complexes and almost 100 % in two com-plexes.
Comparison with other studies
Most surveys of protein-protein interaction(Miller et al., 1987b; Janin et al., 1988; Argos, 1988;Jones & Thornton, 1995, 1996, 1997; Tsai et al.,1996; Xu et al., 1997) deal principally with oligo-meric proteins, which we do not consider here.However, the study by Jones & Thornton (1996)has 19 structures in common with our study,mostly protease-inhibitor and antigen-antibodycomplexes. The statistics on interface areas{,hydrophobicity and hydrogen bonds agree withour study for these types of complexes. For other
types, the overlap of the structural samples is toosmall and heterogeneous in composition for a com-
A-inhibitor or the protein G complexes; there areno examples in antigen-antibody complexes.
Protein-Protein Recognition Sites 2193
parison to be meaningful. A common conclusion isthat, except perhaps in protease-inhibitor com-plexes, interfaces are no more hydrophobic thanthe rest of the protein surface. This ®nding is atvariance with the general description of recog-nition sites as hydrophobic clusters given byYoung et al. (1994), a description that applies onlyto protease-inhibitor complexes. The amino acidcomposition of interfaces reported here agrees withresidue propensities cited by Jones & Thornton(1996) for interfaces in heterocomplexes.
Geometric complementarity
Several methods have been proposed to estimategeometric complementarity. Lawrence & Colman(1993) calculated a shape correlation index basedon distance and the angle of the normal vectors tothe molecular surface. Jones & Thornton (1996)proposed a gap index which is the volume of cav-ities between the components of complexesdivided by the interface area. Values of the shapecorrelation and of the gap indices were taken toindicate that antigen-antibody interfaces are lesscomplementary than interfaces in oligomeric pro-teins and in protease-inhibitor complexes. Whereasneither quantity can be directly compared with theratio of Voronoi volumes we use, our data suggestthat the difference, if real, must be marginal. We®nd the average value of the volume ratio is 1.00in standard size protease-inhibitor interfaces(Table 6) and 1.01 at antigen-antibody interfaces. Inboth cases, buried atoms are better packed thansmall molecule crystals, and cavities are no moreabundant than inside monomeric proteins. Whenwater is included in the calculation, this conclusionapplies to nearly two-thirds of the interface area inboth types of complexes.
The apparent contradiction may originate fromthe presence of water at interfaces and its role inpacking. Solvent was present in only one of theantigen-antibody complexes analysed by Lawrence& Colman (1993), and not considered in the gapindex of Jones & Thornton (1996). We ®nd thatcrystallographic water molecules surround thecontact region and may also ®ll cavities within it.The number of water molecules is about the samein standard-size protease-inhibitor and antibody-antigen interfaces (Table 1) and their importance inrecognition has been emphasised in both types ofcomplexes (Huang et al., 1995; Bhat et al., 1994).Water molecules that surround an interface areillustrated in Figure 6 by the chymotrypsin-ovomu-coid protease-inhibitor complex; an example ofwater molecules within the interface is the D1.3-E5.2 antibody-antigen complex. Both have wellpacked interfaces, but water plays a greater part inthe packing of the second category. Poorly packedinterfaces may exist (Ysern et al., 1998), and if thereis an example in our sample, it is in the RNase
Structure of interfaces and the effectsof mutations
Atoms that form protein-protein recognitionsites can be put into one of three classes: atomsthat lose accessibility but do not make direct con-tacts across the interface; atoms that make directcontacts but remain partly accessible; and atomsthat become buried. This description of interfaces,sketched in Figure 2, should help in interpretingdata on the effect of site-directed mutagenesis onthe stability of protein-protein complexes. Systema-tic studies of this type have been performed onseveral of the complexes considered here: trypsinand chymotrypsin with PTI (Castro & Anderson,1996), antibody D1.3 with lysozyme or antibodyE5.2 (Dall'Acqua et al., 1996, 1998; Goldman et al.,1997), barnase and barstar (Schreiber & Fersht,1993, 1995), the human growth hormone and itsreceptor (Cunningham & Wells, 1993; de Vos et al.,1992; Clackson & Wells, 1995; Wells, 1996), factorVIIA and soluble tissue factor (Kelley et al., 1995).
Bogan & Thorn (1998) recently compiled data onaf®nity changes, expressed as changes in dis-sociation free enthalpies (��Gd), that occur whenalanine is substituted for individual contact resi-dues. They proposed a O-ring model of interfacessimilar to that illustrated in Figure 2(b), yet basedon a very different approach. They found thatalmost all residues that yield large ��Gd valueshave very little accessibility in the complex, andthat they tend to cluster at the centre of the inter-faces. This ®nding may help in solving an apparentcontradiction between the structural data and amajor conclusion of the mutagenesis studies: thatonly a small number of residues matter in terms ofaf®nity. In barnase-barstar, 43 residues lose accessi-ble surface, a typical value for a standard-sizeinterface. Yet, only 11 yield ��Gd > 1 kcal/molwhen mutated to alanine. In the hormone receptor-human growth hormone complex, the numbers are115 and 25. Thus, in these two systems, aboutthree-quarters of the interface residues can be sub-stituted with alanine with no or little effect on af®-nity. The difference is less (48 versus 22) in theantibody D1.3-antibody E5.2 system.
To understand why the ``functional epitope''de®ned by mutagenesis is much smaller than the``structural epitope'' seen in the three-dimensionalstructures (Cunningham & Wells, 1993), severalfeatures of interfaces should be taken into account.First, the polypeptide main-chain is inaccessible tosite-directed mutagenesis. However, it is animportant contributor to interfaces as it representsabout one-®fth of the interface area and contributesnearly two-thirds of the hydrogen bonds. Second,three-quarters of the interface area comes fromatoms that remain partly accessible to solvent.When these atoms are deleted in an alaninemutant, they can be replaced by water molecules
at much less cost than fully buried atoms. In con-trast, deleting buried atoms which we ®nd to be
References
2194 Protein-Protein Recognition Sites
close-packed optimising Van der Waals inter-actions, cannot be done without a cost.
Conclusion
The examples of antibody-antigen, protease-inhibitors and many other complexes show that astandard-size interface is suf®cient for both stab-ility and speci®city. These standard recognitionsites form stable protein-protein complexes irre-spective of the size of the proteins, and no largeconformational change is involved in their for-mation. On average, these interfaces bury 1600 AÊ 2,have a chemical character that is close to the aver-age protein surface, and involve nine hydrogenbonds and the same packing density as the proteininterior. Individual complexes have variationsaround these mean values, which are large in thecase of their chemical character but small in thecase of packing densities. These variations are notapparently correlated with each other, with thesize of the components or with af®nity constants.They balance each other in a manner not open tosimple structural analysis.
Large interfaces are not designed to improvestability. In transducin or in the bacterialelongation factors, stable association of the sub-units could presumably be achieved by forming astandard interface. However, it would serve nofunction: in the G-proteins, subunit assembly istightly coupled with the hydrolysis or the releaseof the bound nucleotide through large confor-mation changes. In transducin, the changes med-iate the visual signal; in elongation factors, theyallow aminoacyl-tRNA to bind. Compared withthose between trypsin and PTI or barnase and bar-star, the interfaces between the Gta and Gtbg sub-units of transducin or the Ts and Tu subunits ofthe elongation factors, have a similar atomic com-position and they are equally well-packed, butthey are much larger. This must be the source ofadditional free energy for the conformationchanges that enable these proteins to carry theirfunction.
Acknowledgements
L.L. thanks IBM for an IBM Cooperative Fellowshipand The Fondazione Cassa di Risparmio and theCompagnia di San Paolo of Torino for support. J.J.acknowledges ®nancial support from EMBL-EuropeanBioinformatics Institute (Hinxton, Cambridge, UK) andUniversite Paris-Sud (Orsay, France) during a sabbaticalleave. We thank Dr S. Wodak for discussion, Dr N. Stry-nadka, S. Smerdon, M. Knossow, D. Fleury, N. Chinar-det and H.K. Song for providing co-ordinates prior todeposition.
Argos, P. (1988). An investigation of protein subunitand domain interfaces. Protein Eng. 2, 101-113.
Ban, N., Escobar, C., Garcia, R., Hasel, K., Day, J.,Greenwood, A. & McPherson, A. (1994). Crystalstructure of an idiotype-anti-idiotype Fab complex.Proc. Natl Acad. Sci. USA, 91, 1604-1608.
Banner, D. W., d'Arcy, A., Chene, C., Winkler, F., Guha,A., Konigsberg, W. H., Nemerson, Y. & Kirschhofer,D. (1996). The crystal structure of the complex ofblood coagulation factor VIIA with soluble tissuefactor. Nature, 380, 41-46.
Bernstein, F. C., Koetzle, T. F., Williams, J. B., Meyer,E. F., Jr, Brice, M. D., Rodgers, J. R., Kennard, O.,Shimanouchi, T. & Tasumi, M. (1977). The ProteinData Bank. A computer-based archival ®le formacromolecular structures. J. Mol. Biol. 112, 535-542.
Bhat, T. N., Bentley, G. A., Boulot, G., Greene, M. I.,Tello, D., Dall'Acqua, W., Souchon, H., Schwarz,F. P., Mariuzza, R. A. & Poljak, R. J. (1994). Boundwater molecules and conformational stabilizationhelp mediate an antigen-antibody association. Proc.Natl Acad. Sci. USA, 91, 1089-1093.
Bigay, J., Faurobert, E., Franco, M. & Chabre, M. (1994).Roles of lipid modi®cations of transducin subunitsin their GDP-dependent association and membranebinding. Biochemistry, 33, 14081-14090.
Bigler, T. L., Lu, W., Park, S. J., Tashiro, M., Wieczorek,M., Wynn, R. & Laskowski, M., Jr (1993). Bindingof aminoacid side chains to preformed cavities:interaction of serine proteases with turkey ovomu-coid third domains with coded and noncoded P1residues. Protein Sci. 2, 786-799.
Bode, W., Schwager, P. & Huber, R. (1978). The tran-sition of bovine trypsinogen to a trypsin-like stateupon strong ligand binding. J. Mol. Biol. 118, 99-112.
Bode, W., Wei, A. Z., Huber, R., Meyer, E., Travis, J. &Neumann, S. (1986). X-ray crystal structure of thecomplex of human leukocyte (Pmn elastase) andthe third domain of the turkey ovomucoid inhibitor.EMBO J. 5, 2453-2458.
Bode, W., Papamokas, E. & Musil, D. (1987). The highresolution X-ray crystal structure of the complexformed between subtilsin Carlsberg and eglin C, anelastase inhibitor from the leech Hirudo medicinalis.Eur. J. Biochem. 166, 673-692.
Bogan, A. A. & Thorn, K. S. (1998). An analysis of hotspots in protein interfaces. J. Mol. Biol. 280, 1-9.
Bolognesi, M., Gatti, G., Menegatti, E., Guarneri, M.,Marquart, M., Papamokos, E. & Huber, R. (1982).Three-dimensional structure of the complexbetween pancreatic secretory inhibitor (Kazal type)and trypsinogen at 1.8 AÊ resolution. J. Mol. Biol.162, 839-868.
Bompard-Gilles, C., Rousseau, P., RougeÂ, P. & Payan, P.(1996). Substrate mimicry in the active center ofmammalian a-amylase: structural analysis of anenzyme-inhibitor complex. Structure, 4, 1441-1452.
Bossart-Whitaker, P., Chang, C. Y., Novotny, J.,Benjamin, D. C. & Sheriff, S. (1995). The crystalstructure of the antibody N10±Staphylococcalnuclease complex at 2.9 AÊ resolution. J. Mol. Biol.253, 559-575.
Braden, B. C., Souchon, H., EiseleÂ, J.-L., Bentley, G. A.,Bhat, T. N., Navaza, J. N. & Poljak, R. J. (1994).Three-dimensional structures of the free and anti-

gen-complexed Fab from monoclonal anti-lysozymeantibody D44.1. J. Mol. Biol. 242, 767-781.
Braden, B. C., Fields, B. A., Ysern, X., Dall'Acqua, W.,
subunit of cAMP-dependent protein kinase in com-plex with isoquinolinesulfonyl protein kinase inhibi-tor H7, H8 and H89. Structural implications for
Protein-Protein Recognition Sites 2195
Goldbaum, F. A., Poljak, R. J. & Mariuzza, R. A.(1996). Crystal structure of an Fv-Fv idiotope-anti-idiotope complex at 1.9 AÊ resolution. J. Mol. Biol.264, 137-151.
Buckle, A. M., Schreiber, G. & Fersht, A. R. (1994). Pro-tein-protein recognition: crystal structural analysisof a barnase-barstar complex at 2.0 AÊ resolution.Biochemistry, 33, 8878-8889.
Castro, M. J. & Anderson, S. (1996). Alanine point-mutations in the reactive region of bovine pancrea-tic trypsin inhibitor: effects on the kinetics andthermodynamics of binding to b-trypsin anda-chymotrypsin. Biochemistry, 35, 11435-11446.
Chen, Z. & Bode, W. (1983). Re®ned 2.5 AÊ X-ray crystalstructure of the complex formed by porcine kallik-rein A and the bovine pancreatic trypsin inhibitor.J. Mol. Biol. 164, 283-311.
Chitarra, V., Alzari, P. M., Bentley, G. A., Bhat, T. N.,Eisele, J. L., Houdusse, A., Lescar, J., Souchon, H. &Poljak, R. J. (1993). Three-dimensional structure of aheteroclitic antigen-antibody cross-reaction complex.Proc. Natl Acad. Sci. USA, 90, 7711-7715.
Chothia, C. (1975). Structural invariants in protein fold-ing. Nature, 254, 304-308.
Chothia, C. (1997). Protein-protein and protein-carbo-hydrate recognition. In Molecular Aspects of Host-Pathogen Interaction (McCrae, M. A., Saunders, J. R.,Smyth, C. J. & Stow, N. D., eds), CambridgeUniversity Press.
Chothia, C. & Janin, J. (1975). Principles of protein-pro-tein recognition. Nature, 256, 705-708.
Clackson, T. & Wells, J. A. (1995). A hot spot of bindingenergy in a hormone-receptor interface. Science, 267,383-386.
Cunningham, B. C. & Wells, J. A. (1993). Comparison ofa structural and functional epitope. J. Mol. Biol. 234,554-563.
Dall'Acqua, W., Goldman, E. R., Eisenstein, E. &Mariuzza, R. A. (1996). A mutational analysis ofbthe inding of two different proteins to the sameantibody. Biochemistry, 35, 9667-9676.
Dall'Acqua, W., Goldman, E. R., Lin, W., Teng, C.,Tsuchiya, D., Li, H., Ysern, X., Braden, B. C., Li, Y.,Smith-Gill, S. J. & Mariuzza, R. A. (1998). A muta-tional analysis of binding interactions in an antigen-antibody protein-protein complex. Biochemistry, 37,7981-7991.
Davies, D. R. & Cohen, G. H. (1996). Interactions of pro-tein antigens with antibodies. Proc. Natl Acad. Sci.USA, 93, 7-12.
Deisenhofer, J. (1981). Crystallographic re®nement andatonic models of a human Fc fragment and its com-plex with fragment B of protein A from Staphylococ-cus aureus at 2.9 and 2.8 AÊ resolution. Biochemistry,20, 2361-2370.
Derrick, J. P. & Wigley, D. B. (1994). The third IgG-bind-ing domain from streptococcal protein G. J. Mol.Biol. 243, 906-18.
Desmyter, A., Transue, T. R., Arbabi-Ghahroudi, M.,Dao-Thi, M., Poortmans, F., Hamers, R.,Muyldermans, S. & Wyns, L. (1996). Crystal struc-ture of a single-domain Vh antibody fragment incomplex with lysozyme. Nature Struct. Biol. 3, 803-811.
Engh, R. A., Girod, A., Kinzel, V., Huber, R. &Bossemeyer, D. (1996). Crystal structures of catalytic
selectivity. J. Biol. Chem. 271, 26157-26164.Frigerio, F., Coda, A., Puglise, L., Lionetti, C.,
Menegatti, E., Amiconi, G., Schnebli, H. P., Ascenzi,P. & Bolognesi, M. (1992). Crystal and molecularstructure of the bovine a-chymotrypsin-eglin Ccomplex at 2.0 AÊ resolution. J. Mol. Biol. 225, 107-123.
Fujinaga, M., Sielecki, R., Read, R. J., Ardelt, W.,Laskowski, M. & James, M. N. J. (1987). Crystal andmolecular structures of a-chymotrypsin with itsinhibitor turkey ovomucoid third domain at 1.8 AÊ
resolution. J. Mol. Biol. 195, 397-418.Gamble, T. R., Vajdos, F. F., Yoo, S., Worthylake, D. K.,
Houseweart, M., Sundquist, W. I. & Hill, C. P.(1996). Crystal structure of human cyclophilin Abound to the amino-terminal domain of HIV1 cap-sid. Cell, 87, 1285-1294.
Garboczi, D. N., Ghosh, P., Utz, U., Fan, Q. R.,Biddison, W. E. & Wiley, D. C. (1996). Structure ofthe complex between human T-cell receptor, viralpeptide and HLA-A2. Nature, 384, 134-141.
Gaudet, R., Bohm, A. & Sigler, P. B. (1996). Crystalstructure at 2.4 AÊ resolution of the complex oftransducin bg and its regulator, phosducin. Cell, 87,577-588.
Gerstein, M., Tsai, J. & Levitt, M. (1995). The volume ofatoms on the protein surface calculated from simu-lation using Voronoi polyhedra. J. Mol. Biol. 249, 955-966.
Goldman, E. R., Dall'Acqua, W., Braden, B. C. &Mariuzza, R. A. (1997). Analysis of binding inter-actions in an idiotope-antiidiotope protein-proteincomplex by double mutant cycles. Biochemistry, 36,49-56.
Gorina, S. & Pavletich, N. P. (1996). Structure of the p53tumor suppressor bound to the ankyrin and SH3domains of 53BP2. Science, 274, 1001-1005.
Grif®th, J. P., Kim, J. L., Kim, E. E., Sintchak, M. D.,Thomson, J. A., Fitzgibbon, M. J., Fleming, M. A.,Caron, P. R., Hsiao, K. & Navia, M. A. (1995). X-raystructure of calcineurin inhibited by the immuno-philin-immunosuppressant FKBP12-FK506 complex.Cell, 82, 507-522.
Guillet, V., Lapthorn, A., Hartley, R. W. & Mauguen, Y.(1993). Recognition between a bacterial ribonu-clease, barnase, and its natural inhibitor, barstar.Structure, 1, 165-177.
Harel, M., Kleywegt, G. J., Ravelli, R. B. G., Silman, I. &Sussman, J. L. (1995). Crystal structure of an acetyl-cholinesterase-fasciclin complex: interaction of athree-®ngered toxin from snake venom with its tar-get. Structure, 3, 1355-1366.
Harrison, C. J., Hayer-Hartl, M., Di Liberto, M., Hartl,F. U. & Kuriyan, J. (1997). Crystal structure of thenucleotide exchange factor GrpE bound to theATPase domain of the molecular chaperone DnaK.Science, 276, 431-435.
Harpaz, Y., Gerstein, M. & Chothia, C. (1994). Volumechanges on protein folding. Structure, 2, 641-649.
Housset, D., Mazza, G., GreÂgoire, C., Piras, C., Malissen,B. & Fontecilla-Camps, J. C. (1997). The three-dimensional structure of a T-cell antigen receptorVa-Vb heterodimer reveals a novel rearrangementof the Vb domain. EMBO J. 16, 4205-4216.
Huang, Q., Liu, S. & Tang, Y. (1993). The re®ned 1.6 AÊ
resolution crystal structure of the complex formed
between porcine b-trypsin and MCTI-A, a trypsininhibitor of the squash family. J. Mol. Biol. 229,1022-1036.
Lambright, D. G., Noel, J. P., Hamm, H. E. & Sigler, P. B.(1994). Structural determinants for activation of thea-subunit of a heterotrimeric G protein. Nature, 369,
2196 Protein-Protein Recognition Sites
Huang, K., Lu, W., Anderson, S., Laskowski, M., Jr &James, M. N. G. (1995). Water molecules participatein protease-inhibitor interactions: crystal structuresof Leu-18, Ala-18 and Gly-18 variants of turkeyovomucoid inhibitor third domain in complex withS. griseus proteinase B. Protein Sci, 4, 1985-1997.
Huber, R., Kukla, D., Bode, W., Schwager, P., Bartels,K., Deisenhofer, J. & Steigemann, W. (1974). Struc-ture of the complex formed by bovine trypsin andbovine pancreatic trypsin inhibitor. II Crystallo-graphic re®nement at 1.9 AÊ resolution. J. Mol. Biol.89, 73-101.
Hurley, J. H., Faber, H. R., Worthylake, D., Meadow,N. D., Roseman, S., Pettigrew, D. W. & Remington,S. J. (1993). Structure of the regulatory complex ofE. coli IIIGel with glycerol kinase. Science, 259, 673-677.
Janin, J. (1995). Principles of protein-protein recognitionfrom structure to thermodynamics. Biochimie, 77,497-505.
Janin, J. (1996). Protein-protein recognition. Prog. Bio-phys. Mol. Biol. 64, 145-165.
Janin, J. & Chothia, C. (1976). Stability and speci®city ofprotein-protein interactions: the case of the trypsin-trypsin inhibitor complexes. J. Mol. Biol. 100, 197-211.
Janin, J. & Chothia, C. (1990). The structure of protein-protein recognition sites. J. Biol. Chem. 265, 16027-16030.
Janin, J., Miller, S. & Chothia, C. (1988). Surface, subunitinterfaces and interior of oligomeric proteins. J. Mol.Biol. 204, 155-164.
Jardetzky, T. S., Brown, J. H., Gorga, J. C., Stern, L., J.,Urban, R. G., Chi, Y.-I., Stauffacher, C., Strominger,J., L. & Wiley, D. C. (1994). Three-dimensionalstructure of a human class II histocompatibilitymolecule complexed with superantigen. Nature, 368,711-718.
Jeffrey, P. D., Russo, A. A., Polyak, K., Gibbs, E.,Hurwitz, J., MassagueÂ, J. & Pavletich, (1995). Mech-anism of CDK activation revealed by the structureof a cyclin A-CDK2 complex. Nature, 376, 313-320.
Jones, S. & Thornton, J. M. (1995). Protein-protein inter-action: a review of protein dimer structures. Prog.Biophys. Mol. Biol. 63, 131-165.
Jones, S. & Thornton, J. M. (1996). Principles of protein-protein interactions. Proc. Natl Acad. Sci. USA, 93,13-20.
Jones, S. & Thornton, J. M. (1997). Analysis of protein-protein interaction sites using surface patches. J. Mol.Biol. 272, 121-132.
Kabsch, W., Mannherz, H. G., Suck, D., Pai, E. F. &Holmes, K. C. (1990). Atomic structure of theactin:DNAse I complex. Nature, 347, 37-44.
Kawashima, T., Berthet-Colominas, C., Wulff, M.,Cusack, S. & Leberman, R. (1996). The structure ofthe E. coli EF-Tu. EF-Ts complex at 2.5 AÊ resolution.Nature, 379, 511-518.
Kelley, R. F., Costas, K. E., O'Connell, M. P. & Lazarus,R. A. (1995). Analysis of the factor VIIa binding siteon human tissue factor: effects of tissue factormutations on the kinetics and thermodynamics ofbinding. Biochemistry, 34, 10383-10392.
Kobe, B. & Deisenhofer, J. (1995). A structural basis ofthe interactions between leucine rich repeats andprotein ligands. Nature, 374, 183-186.
621-628.Lambright, D. G., Sondek, J., Bohm, A., Skiba, N. P.,
Hamm, H. E. & Sigler, P. B. (1996). The 2.0 AÊ crys-tal structure of a heterotrimeric G-protein. Nature,379, 311-319.
Lawrence, M. C. & Colman, P. M. (1993). Shape comple-mentarity at protein/protein interfaces. J. Mol. Biol.234, 946-950.
Lee, B. & Richards, F. M. (1971). The interpretation ofprotein structures: estimation of static accessibility.J. Mol. Biol. 55, 379-400.
Lee, C.-H., Saksela, K., Mirza, U. A., Chait, B. T. &Kuriyan, J. (1996). Crystal structure of the con-served coreof HIV-1 nef complexed with a Srcfamily SH3 domain. Cell, 85, 831-942.
Lescar, J., Pellegrini, M., Souchon, H., Tello, D., Poljak,R. J., Peterson, N., Greene, M. & Alzari, P. M.(1995). Crystal Structure of a cross reaction complexbetween Fab F9.13.7 and guinea fowl lysozyme.J. Biol. Chem. 270, 18067-18076.
Li, H., Dunn, J. J., Luft, B. J. & Lawson, C. L. (1997).Crystal structure of Lyme disease antigen OspAcomplexed with a Fab. Proc. Natl Acad. Sci. USA,94, 3584-3589.
Livnah, O., Stura, E. A., Johnson, D. L., Middleton, S. A.,Mulcahy, L. S., Wrighton, N. C., Dower, W. J.,Jolliffe, L. K. & Wilson, I. A. (1996). Functionalmimicry of a protein hormone by a peptide agonist:the EPO receptor at 2.8 AÊ resolution. Science, 273,464-471.
Malby, R. L., Tulip, W. R., Harley, V. R., McKimm-Breschkin, J. L., Laver, W. G., Webster, R. G. &Colman, P. M. (1994). The structure of a complexbetween the NC10 antibody and in¯uenza virusneuraminidase and comparison with the overlap-ping site of the NC41 antibody. Structure, 2, 733-746.
Malkowski, M. G., Martin, P. D., Guzik, G. C. &Edwards, B. F. (1997). The co-crystal structure ofunliganded bovine a-thrombin and prethrombin-2:movement of the Tyr-Pro-Pro-Trp segment uponligand binding. Protein Sci. 6, 1438-1448.
Marquart, M., Walter, J., Deisenhofer, J., Bode, W. &Huber, R. (1983). The geometry of the reactive siteand of the peptide groups in trypsin, trypsinogenand its complexes with inhibitors. Acta Crystallog.sect. B, 39, 480-490.
McDonald, I. K. & Thornton, J. M. (1994). Satisfyinghydrogen bonding potential in proteins. J. Mol. Biol.238, 777-793.
McPhalen, C. A. & James, M. N. G. (1987). Structuralcomparison of two serine proteinase-protein inhibi-tor complexes. Eglin C-subtilisin Carlsberg and CI2±subtilisin novo. Biochemistry, 27, 6582-6598.
Miller, S., Janin, J., Lesk, A. M. & Chothia, C. (1987a).Interior and surface of monomeric proteins. J. Mol.Biol. 196, 641-656.
Miller, S., Lesk, A. M., Janin, J. & Chothia, C. (1987b).The accessible surface area and stability of oligo-meric proteins. Nature, 328, 834-836.
Mittl, P. R., Di Marco, S., Fendrich, G., Pohlig, G., Heim,J., Sommerhoff, C., Fritz, H., Priestle, J. P. &Grutter, M. G. (1997). A new structural class of ser-ine protease inhibitors revealed by the structure ofthe hirustatin-kallikrein complex. Structure, 5, 253-264.
Nassar, N., Horn, G., Herrmann, C., Scherer, A.,McCormick, F. & Wittinghofer, A. (1996). The 2.2 AÊ
Three-dimensional structure of an antibody-antigencomplex. Proc. Natl Acad. Sci. USA, 84, 8075-8079.
Protein-Protein Recognition Sites 2197
crystal structure of the ras-binding domain of theserine/threonine kinase c-Raf1 in a complex withRap1A and a GTP analogue. Nature, 375, 554-660.
Nicholls, A., Sharp, K. & Honig, B. (1992). Protein fold-ing and association: insights from the interfacialand thermodynamic properties of hydrocarbons.Proteins: Struct. Funct. Genet. 11, 281-296.
Noel, J. P., Hamm, H. E. & Sigler, P. B. (1993). The2.2 AÊ crystal structure of transducin complexes withGTPgS. Nature, 366, 654-662.
Padlan, E. A., Silverton, E. W., Sheriff, S., Cohen, G. H.,Smith-Gill, S. J. & Davis, D. R. (1989). Structure ofan antibody-antigen complex: crystal structure ofthe HyHEL-10 Fab-lysozyme Complex. Proc. NatlAcad. Sci. USA, 86, 5938-5952.
Pelletier, H. & Kraut, J. (1992). Crystal structure of acomplex between electron transfer partners, cyto-chrome c peroxidase and cytochrome c. Science, 258,1748-1755.
Prasad, L., Sharma, S., Vandonselaar, M., Quail, J. W.,Lee, J. S., Waygood, E. B., Wilson, K. S., Dauter, Z.& Delbaere, L. T. J. (1993). Evaluation of mutagen-esis for epitope mapping: structure of an antibody-protein antigen complex. J. Biol. Chem. 268, 10705-10708.
Read, R. J., Fujinaga, M., Sielecki, R. & James, M. N. G.(1983). Structure of the complex of Streptomyces gri-seus protease B and the third domain of the turkeyovomucoid inhibitor at 1.8 AÊ resolution. Biochemis-try, 22, 4420-4433.
Rees, D. C. & Lipscomb, W. N. (1982). Re®ned crystalstructure of potato inhibitor complex of carboxy-peptidase A at 2.5 AÊ resolution. J. Mol. Biol. 160,475-498.
Richards, F. M. (1974). The interpretation of proteinstructures: total volume, group volume distributionsand packing density. J. Mol. Biol. 82, 1-14.
Rittinger, K., Walker, P. A., Eccleston, J. F., Smerdon,S. J. & Gamblin, S. J. (1997). Structure at 1.65 AÊ ofRhoA and its GTPase -activating protein in complexwith a transition-state analogue. Nature, 389, 758-762.
Rydel, T. J., Tulinsky, A., Bode, W. & Huber, R. (1991).The re®ned crystal structure of the hirudin-throm-bin complex. J. Mol. Biol. 221, 583-601.
Savva, R. & Pearl, L. H. (1995). Nucleotide mimicry inthe crystal structure of the uracil-DNA glycosylase-uracil glycoslase inhibitor protein complex. NatureStruct. Biol. 2, 752-757.
Scheidig, A. J., Hynes, T. R., Pelleyier, L. A., Wells, J. A.& Kossiakoff, A. A. (1997). Crystal structures ofbovine chymotrypsin and trypsin complexed to theinhibitor domain of Alzheimer's amyloid b-proteinprecursor (APPI) and basic pancreatic trypsininhibitor (BPTI). Protein Sci. 6, 1806-1824.
Schreiber, G. & Fersht, A. R. (1993). Interaction of bar-nase with its polypeptide inhibitor barstat studiedby protein engineering. Biochemistry, 32, 5145-5150.
Schreiber, G. & Fersht, A. R. (1995). Energetics of pro-tein-protein interactions: analysis of the Barnase-Barstar interface by single mutations and doublemutant cycles. J. Mol. Biol. 248, 478-486.
Schutt, C. E., Myslik, J. C., Rozycki, M. D., Goonesekere,N. C. W. & Lindberg, U. (1993). The structure ofcrystalline pro®lin-b-actin. Nature, 365, 810-816.
Sheriff, S., Silverton, E. W., Padlan, E. A., Cohen, G. H.,Smith-Gill, S. J., Finzel, B. C. & Davies, D. R. (1987).
Sondek, J., Bohm, A., Lambright, D. G., Hamm, H. E. &Sigler, P. B. (1996). Crystal structure of a GA proteinbg dimer at 2. 1 AÊ resolution. Nature, 379, 369-374.
Song, H. K. & Suh, S. W. (1998). Kunitz-type soybeantrypsin inhibitor revisited: re®ned structure of itscomplex with porcine trypsin reveals an insight ofthe interaction between a homologous inhibitorfrom Erythrina caffra and tissue-type plasminogenactivator. J. Mol. Biol. 275, 347-363.
Stewart, M., Kent, H. M. & McCoy, A. J. (1998). Struc-tural basis for molecular recognition betweennuclear transport factor 2 (NTF2) and the GDP-bound form of the Ras-family GTPase Ran. J. Mol.Biol. 277, 635-646.
Strynadka, N. C. J., Jensen, S. E., Alzari, P. M. & James,M. N. G. (1996). A potent new mode of b-lactamaseinhibition revealed by the 1.7 AÊ X-ray crystallo-graphic structute of the TEM-1±BLIP complex.Nature Struct. Biol. 3, 290-297.
Stubbs, M. T., Laber, B., Bode, W., Huber, R., Jerala, R.,Lenarcic, B. & Turk, V. (1990). The re®ned 2.4 AÊ
X-ray crystal structure of recombinant human ste®nB in complex with the cysteine proteinease papain:a novel type of proteinase inhibitor interaction.EMBO J. 9, 1939-1947.
SundstroÈm, M., Lundqvist, T., RoÈdin, J., Giebel, L. B.,Milligan, D. & Norstedt, G. (1996). Crystal structureof an antagonist mutant of human growth hormonG120R in complex with its receptor at 2.9 AÊ resol-ution. J. Biol. Chem. 271, 32197-32203.
Takeuchi, Y., Satow, Y., Nakamura, K. T. & Mitsui, Y.(1991). Re®ned crystal structure of the complex sub-tilisin BPN and Streptomyces subtilisin inhibitor at1.8 AÊ resolution. J. Mol. Biol. 221, 309-325.
Tesmer, J. J. G., Berman, D. M., Gilman, A. G. &Sprang, S. R. (1997). Structure of RGS4 bound toAlF4ÿ activated Gia1: stabilisation of the transitionstate of GTP hydrolysis. Cell, 89, 251-261.
Tsai, C. J. & Nussinov, R. (1997). Hydrophobic foldingunits at protein-protein interfaces: implications toprotein folding and to protein-protein association.Protein Sci. 6, 1426-1437.
Tsai, J., Lin, S. L., Wolfson, H. & Nussinov, R. (1996). Adataset of protein-protein interfaces generated witha sequence order-independent comparison tech-nique. J. Mol. Biol., 260, 604-620.
Tsunemi, M., Matsuura, Y., Sakakibara, S. & Katsube, Y.(1996). Crystal structure of an elastase-speci®cinhibitor ela®n complexed with porcine pancreaticelastase. Biochemistry, 35, 11570-11576.
Tulip, W. R., Varghese, J. N., Laver, W. G., Webster,R. G. & Colman, P. M. (1992). Re®ned crystal struc-ture of the in¯uenza virus N9 neuraminidase-NC41Fab complex. J. Mol. Biol. 227, 122-148.
van de Locht, A., Lamba, D., Bauer, M., Huber, R.,Friedrich, T., KroÈger, B., HoÈ ffken, W. & Bode, W.(1995). Two heads are better than one: crystal struc-ture of the insect derived double domain Kazalinhibitor rhodnin in complex with thrombin. EMBOJ. 14, 5149-5157.
van de Locht, A., Stubbs, M. T., Bode, W., Friedrich, T.,Bollschweiler, C., Hoffken, W. & Huber, R. (1996).The ornithodorin-thrombin crystal structure, a keyto the TAP enigma? EMBO J. 15, 6011-6017.
van de Locht, A., Bode, W., Huber, R., Le, Bonniec B. F.,Stone, S. R., Esmon, C. T. & Stubbs, M. T. (1997).The thrombin E192Q-BPTI complex reveals gross
structural rearrangements: implications for the inter-action with antithrombin and thrombomodulin.EMBO J. 16, 2977-2984.
(1998). Atomic structure of an ab T-cell receptor(TCR) heterodimer in complex with an anti-TCR
2198 Protein-Protein Recognition Sites
Vos, A. M., de Ultsch, M. & Kossiakoff, A. A. (1992).Human growth hormone and extracellular domainof its receptor: crystal structure of thr complex.Science, 255, 306-312.
Wall, M. A., Coleman, D. E., Lee, E., Iniguez-Lluhi, J. A.,Posner, B. A., Gilman, A. G. & Sprang, S. R. (1995).The structure of the G protein heterotrimer Gia1b1g2.Cell, 83, 1047-1058.
Wang, Y., Jiang, Y., Meyering-Voss, M., Sprinzl, M. &Sigler, P. B. (1997). Crystal structure of the EF-Tu.EF-Ts complex from Thermus thermophilus. NatureStruct. Biol. 4, 650-656.
Wang, J. H., Lim, K., Smolyar, A., Teng, M. K., Liu, J. H.,Tse, A. G. D., Liu, J., Hussey, R. E., Chishti, Y.,Thomson, C. T., Sweet, R. M., Nathenson, S. G.,Chang, H. C., Sacchenetti, J. C. & Reinherz, E. L.
Fab fragment derived from a mitogenic antibody.EMBO J. 17, 10-26.
Welch, M., Chinardet, N., Mourey, L., Birck, C. &Samama, J. P. (1997). Structure of the CheY-bindingdomain of histidine kinase CheA in complex withCheY. Nature Struct. Biol, 5, 25-29.
Wells, J. A. (1996). Binding in the growth hormonereceptor complex. Proc. Natl Acad. Sci. USA, 93, 1-6.
Xu, D., Tsai, C. J. & Nussinov, R. (1997). Hydrogenbonds and salt bridges across protein-protein inter-faces. Protein Eng. 10, 999-1012.
Young, L., Jernigan, R. L. & Covell, D. G. (1994). A rolefor surface hydrophobicity in protein-protein recog-nition. Protein Sci. 3, 717-729.
Ysern, X., Li, H. & Mariuzza, R. A. (1998). Imperfectinterfaces. Nature Struct. Biol. 5, 412-414.
Edited by A. R. Fersht
(Received 1 October 1998; received in revised form 30 November 1998; accepted 30 November 1998)