the agile silicon tracker: testbeam results of the prototype silicon detector
TRANSCRIPT

Nuclear Instruments and Methods in Physics Research A 490 (2002) 146–158
The AGILE silicon tracker: testbeam results of the prototypesilicon detector
G. Barbiellinia, G. Fedela, F. Lielloa, F. Longob, C. Pontonic, M. Prestc,*,M. Tavanid, E. Vallazzae
aUniversit "a degli Studi di Trieste and INFN, sezione di Trieste, ItalybUniversit "a degli Studi di Ferrara and INFN, sezione di Ferrara, Italy
cCIFS - Consorzio Interuniversitario per la Fisica Spaziale and INFN, sezione di Trieste, Padriciano 99, 34012 Trieste, Italyd Istituto di Fisica Cosmica, CNR, Milano, Italy
e INFN, sezione di Trieste, Italy
Received 2 May 2001; received in revised form 7 November 2001; accepted 3 March 2002
Abstract
AGILE (Light Imager for Gamma-ray Astrophysics) is a small scientific satellite for the detection of cosmic g-raysources in the energy range 30 MeV–50 GeV with a very large field of view (1/4 of the sky). It is planned to be
operational in the years 2003–2006, a period in which no other g-ray mission in the same energy range is foreseen.
The heart of the AGILE scientific instrument is a silicon–tungsten tracker made of 14 planes of single sided silicon
detectors for a total of 43 000 readout channels. Each detector has a dimension of 9:5� 9:5 cm2 and a thickness of
410 mm:We present here a detailed description of the performance of the detector prototype during a testbeam period at the
CERN PS in May 2000. The Tracker performance is described in terms of position resolution and signal-to-noise ratio
for on and off-axis incident charged particles. The measured 40 mm resolution for a large range of incident angles will
provide an excellent angular resolution for cosmic g-ray imaging. r 2002 Elsevier Science B.V. All rights reserved.
PACS: 07.50.Qx; 29.30.Kv; 29.40.Wk; 95.55Ka
Keywords: Satellite; Silicon detector; Self triggering; Floating strip; g-ray detector
1. Introduction
The Astrorivelatore Gamma a ImmaginiLEggero—Light Imager for g-ray Astrophysics(AGILE) mission has been approved by the ItalianSpace Agency (ASI) in 1998 and has just entered
the construction phase. AGILE will provide apowerful observatory for g-ray astrophysics in theenergy range 30 MeV–50 GeV; during the years2003–2006. No other g-ray mission in this energyrange is planned in the same period.
The instrument is light ðE100 kgÞ and effectivein detecting and monitoring g-ray sources within alarge field of view ðE1=4 of the whole sky).The instrument consists of a silicon–tungstenTracker, a 1:5X0 deep CsI(Tl) minicalorimeter,
*Corresponding author. Tel.: +39-040-3756253; fax: +39-
040-3756258.
E-mail address: [email protected] (M. Prest).
0168-9002/02/$ - see front matter r 2002 Elsevier Science B.V. All rights reserved.
PII: S 0 1 6 8 - 9 0 0 2 ( 0 2 ) 0 1 0 6 2 - 8
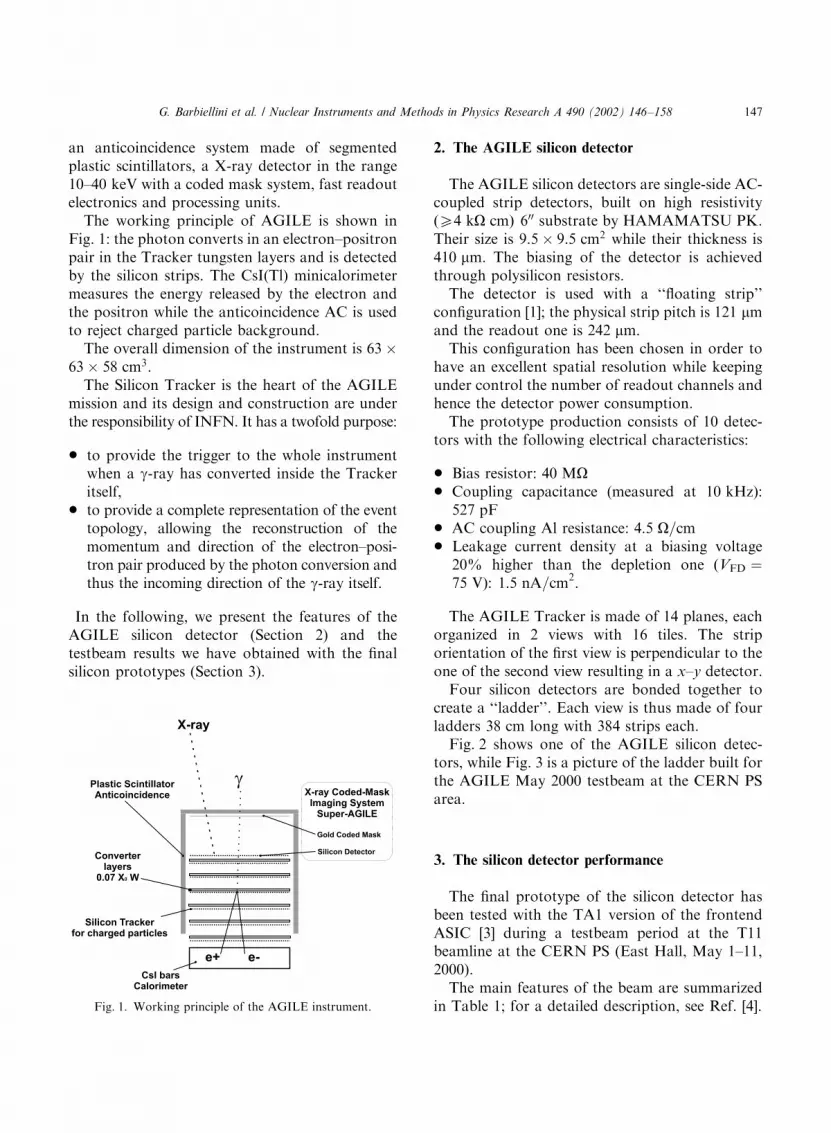
an anticoincidence system made of segmentedplastic scintillators, a X-ray detector in the range10–40 keV with a coded mask system, fast readoutelectronics and processing units.
The working principle of AGILE is shown inFig. 1: the photon converts in an electron–positronpair in the Tracker tungsten layers and is detectedby the silicon strips. The CsI(Tl) minicalorimetermeasures the energy released by the electron andthe positron while the anticoincidence AC is usedto reject charged particle background.
The overall dimension of the instrument is 63�63� 58 cm3:
The Silicon Tracker is the heart of the AGILEmission and its design and construction are underthe responsibility of INFN. It has a twofold purpose:
* to provide the trigger to the whole instrumentwhen a g-ray has converted inside the Trackeritself,
* to provide a complete representation of the eventtopology, allowing the reconstruction of themomentum and direction of the electron–posi-tron pair produced by the photon conversion andthus the incoming direction of the g-ray itself.
In the following, we present the features of theAGILE silicon detector (Section 2) and thetestbeam results we have obtained with the finalsilicon prototypes (Section 3).
2. The AGILE silicon detector
The AGILE silicon detectors are single-side AC-coupled strip detectors, built on high resistivityðX4 kO cmÞ 600 substrate by HAMAMATSU PK.Their size is 9:5� 9:5 cm2 while their thickness is410 mm: The biasing of the detector is achievedthrough polysilicon resistors.
The detector is used with a ‘‘floating strip’’configuration [1]; the physical strip pitch is 121 mmand the readout one is 242 mm:
This configuration has been chosen in order tohave an excellent spatial resolution while keepingunder control the number of readout channels andhence the detector power consumption.
The prototype production consists of 10 detec-tors with the following electrical characteristics:
* Bias resistor: 40 MO* Coupling capacitance (measured at 10 kHzÞ:
527 pF* AC coupling Al resistance: 4:5 O=cm* Leakage current density at a biasing voltage
20% higher than the depletion one ðVFD ¼75 VÞ: 1:5 nA=cm2:
The AGILE Tracker is made of 14 planes, eachorganized in 2 views with 16 tiles. The striporientation of the first view is perpendicular to theone of the second view resulting in a x–y detector.
Four silicon detectors are bonded together tocreate a ‘‘ladder’’. Each view is thus made of fourladders 38 cm long with 384 strips each.
Fig. 2 shows one of the AGILE silicon detec-tors, while Fig. 3 is a picture of the ladder built forthe AGILE May 2000 testbeam at the CERN PSarea.
3. The silicon detector performance
The final prototype of the silicon detector hasbeen tested with the TA1 version of the frontendASIC [3] during a testbeam period at the T11beamline at the CERN PS (East Hall, May 1–11,2000).
The main features of the beam are summarizedin Table 1; for a detailed description, see Ref. [4].Fig. 1. Working principle of the AGILE instrument.
G. Barbiellini et al. / Nuclear Instruments and Methods in Physics Research A 490 (2002) 146–158 147

As far as the beam particle composition isconcerned, the relative fraction of the differenttypes is shown in Fig. 4.
The main goal of the test was to study thedetector behaviour before starting the final pro-duction. In the following subsections, we describethe testbeam and the detector setup and the mainresults we have obtained.
3.1. Testbeam setup
Fig. 5 shows the testbeam setup, which consistsof:
* A Cherenkov counter for particle identification,which is part of the T11 beam instrumentation,
followed by the last magnet of the T11 beam-line;
* A system of two plastic scintillators (S1 and S2)of 3� 5 cm2 and 1 cm thick, for the trigger;
Table 1
Main features of the T11 beam ðh ¼ horizontal; v ¼ verticalÞ
Maximum design momentum 3:5 GeV=c
Theoretical momentum resolution 1.9%
Calculated beam cross-section 18ðhÞ � 10ðvÞ mm2
Production angle 149:2 mrad
Angular acceptance 76:2ðhÞ; 719:2ðvÞ mrad
Fig. 3. Prototype ladder tested during the May 2000 testbeam at the CERN PS area; the ladder has been assembled by Mipot [2].
e±
π± + p+
Momentum (GeV/c)
Par
ticl
e fr
acti
on
(%
)
1
10
10 2
0 0.5 1 1.5 2 2.5 3 3.5 4 4.5
Fig. 4. Particle composition of the T11 beam as a function of
the energy.
Fig. 2. The HAMAMATSU final prototype for the AGILE
silicon detector.
G. Barbiellini et al. / Nuclear Instruments and Methods in Physics Research A 490 (2002) 146–158148

* A couple of delay wire chambers [5] for thebeam characterization and monitoring;
* A system of 3 x–y silicon telescopes [6] for thetracking. Each telescope is made of two single-side AC-coupled silicon detectors of 3:2�3:2 cm2 with a readout pitch of 50 mm and afloating strip configuration; the detector read-out is based on VA2 ASICs [7];
* The detector under test (Fig. 3); it is an AGILEladder made of four HAMAMTSU prototypesconnected together with 17 mm wire bondingsand readout by TA1s;
* The AGILE top anticoincidence scintillator andtwo of the bars of the CsI (Tl) minicalorimeter.
Fig. 6 shows the testbeam data acquisitionsystem, which can be divided into three blocks:
* Trigger logic: The signals from the scintillatorsand the Cherenkov counter are discriminatedand sent to the trigger logic for the generationof the DAQ trigger needed by the mainacquisition board, the Viking Sequencer;1 thesame logic treats the TA1 trigger signals;
* Beam monitoring: The signals from the DWCsand the Cherenkov counter are readout by a setof TDCs (LeCroy 1176 and 2228 A) and used inthe offline analysis;
* Detector test: The silicon strip signals (the 1280strips of each of the three telescopes and the 384
ladder strips) are read by four 10 bit VMEADCs ðSirocco6Þ while the informationof the CsI bars is read by a 10 bit ADC CAENV550.
The anticoincidence had an independent dataacquisition system which is not shown in Fig. 6.
As far as the hardware is concerned, we adoptedthe VME standard while the CAMAC is accessedby means of a CES CBD8210 branch driver.
The DAQ system has to fulfil the followingtasks:
* Generate the timing sequence for the readoutwhen a trigger signal is present;
* Get the information from the detectors (theDWCs, the telescopes, the ladder and the CsIbars) and write it on disk;
* Check the run conditions and the workingparameters of the TA1s;
* Display the monitor histograms.
The DAQ system has been developed so thateach task is controlled by a separate process. Theinter-process communication is performed viaTCP/IP using the RPC protocol [8].
In the present setup, all the processes run on aPC with an Athlon 500 MHz processor with theLinux operating system. The access to the VME isdone through a Bit3 Mod. 617 controller [9].
The data acquisition frame relies on the Tcl/Tkpackage [10], which provides a flexible structure to
Fig. 5. Testbeam setup on the T11 beamline at the CERN PS for the May AGILE run.
1LEPSI, Strasbourg, France.
G. Barbiellini et al. / Nuclear Instruments and Methods in Physics Research A 490 (2002) 146–158 149

implement the different functions and to controlthem via a GUI.
The DAQ code is written in C and C++ whilethe histogramming part is built using HPLOT [11].
3.2. Testbeam results
More than 2.3 million events have been collectedin order to study:
* The ladder behaviour according to the regionhit by the beam (different silicon tile or differentregion inside the tile);
* The ladder behaviour as a function of the angleof incidence of the beam with respect to thesilicon strips, in terms of cluster pulse height,signal-to-noise ratio (SNR), number of stripsper cluster. The incidence angle is the anglebetween the beam and the plane of the siliconstrip tile. The range between 301 and 901 (that isthe interesting region for AGILE) has beenscanned in steps of 151: Fig. 7 defines theincidence angle of the beam: the tracks have
been chosen using the y telescope informationin order to guarantee that the beam is containedin a horizontal plane and the x information toselect tracks with the same angle.
* The trigger efficiency of the ladder as a functionof the incidence angle of the beam.
Pedestal data for all the strips are collected indedicated runs and then analyzed offline tocompute the pedestal value for each strip (meanvalue of the distribution of all the events) and thenoise rms before and after the subtraction of thecommon mode.
All the results presented in the followingsections have been obtained with a positivecharged particle beam (mostly pions) characterizedby a momentum of 2 GeV=c:
3.2.1. Noise
Given the characteristics of the detectors undertest, it is possible to compute the expected noisefor the AGILE ladder.
Fig. 6. Testbeam data acquisition system.
G. Barbiellini et al. / Nuclear Instruments and Methods in Physics Research A 490 (2002) 146–158150

From Ref. [12], the different noise contributionsare
* From the leakage current
ENCleak ¼e
q
ffiffiffiffiffiffiffiffiffiffiffiffiffiffiffiffiffiffiffiffiffiqIleakTp=4
q
where e is the natural logarithm base, q theelectron charge, Ileak the total strip leakagecurrent and Tp the shaper peaking time (in ourcase 5 msÞ;
* From the polarization resistors
ENCres ¼e
q
ffiffiffiffiffiffiffiffiffiffiffiffiffikT Tp
2Rp
s
where kT ¼ 0:025 eV at T ¼ 300 K and Rp thebiasing resistor;
* From the resistance of the metal strip
ENCms ¼Cte
q
ffiffiffiffiffiffiffiffiffiffiffiffiffiffiffikT Rms
6Tp
s
where Rms is the total resistance of the metal stripend to end and Ct the total strip capacitance;
* From the readout ASIC
ENCTA1 ¼ 165þ 6:1Ct
as given by IDE AS.
The total noise is the sum in quadrature of thedifferent components:
ENCtot ¼ ENCTA1"ENCms"ENCres"ENCleak:
The different noise contributions expressed inrms electrons for an AGILE Silicon Trackerladder are shown in Table 2.
The distribution of the rms noise of all theladder channels before (13 ADC) and after thecommon mode (CM) subtraction (5.9 ADC) isshown in Fig. 8. The common mode component isgiven by the fluctuation of all the channels at thesame time and is mainly due to pickup on thedetector bias voltage. A too high CM couldprevent the possibility of setting the triggerthreshold at 1/4 of a MIP thus reducing thesatellite trigger efficiency.
The CM component is computed offline foreach event as
CM ¼PN
i¼1ðrawi � pediÞN
where rawi is the raw content of the readoutchannel in ADC counts, pedi the channel pedestalas computed using the pedestal run and N thenumber of ‘‘good’’ strips of the detector; noisyand/or dead strips are discarded.
Fig. 7. Definition of the incidence angle of the beam with
respect to the detector plane.
Table 2
AGILE Silicon Tracker noise contributions for a ladder
expressed in rms electrons
Noise contribution Value (rms e-)
ENCleak 227
ENCres 508
ENCms 45.5
ENCTA1 490
ENCtot 743
G. Barbiellini et al. / Nuclear Instruments and Methods in Physics Research A 490 (2002) 146–158 151

3.2.2. Ladder behaviour
The silicon detector design has been optimizedin order to obtain a good position resolution.
The main features of the silicon detector such asimplant width and interstrip capacitance havebeen chosen in order to have more than one stripper cluster while at the same time maintaining thesignal high enough on the readout strips togenerate a trigger even when the particle crossesthe floating ones.
Fig. 9 shows the beam profile measured by theladder (upper plot) and the correlation betweenthe ladder and one of the x telescope position(lower plot).
The following method has been used to define acluster in each event:
* The pulse height of each strip PHi is defined as
PHi ¼ rawi � pedi � CM
where rawi is the raw content of the readoutchannel, pedi the channel pedestal and CM thecommon mode contribution for the event;
* the strip with the maximum signal is found; itssignal has to be greater than 5 times the noiserms of the strip itself ðsiÞ;
* the strips contiguous to the one with themaximum signal are considered when they arecharacterized by a ratio PHi=si > 3: This groupof strips is called a cluster.
The choice of the cuts for the strip with themaximum signal ð5sÞ and for the nearby ones ð3sÞis explained by Fig. 10, where the ‘‘pull’’ (definedas the ratio of the strip PH and its noise) for thestrip with the maximum signal (upper plot) and forthe noise (lower plot) is represented. In the upperplot, the peak on the left is the one due to the noisewhile the other two correspond to the case inwhich the particle crosses a readout strip (highersignal) or a floating one (lower signal).
The cluster pulse height (most probable value)as a function of the incidence angle of the beam isshown in Fig. 11. The fit with a 1=cos y function issuperimposed.
Fig. 12 shows the cluster pulse height in ADCcounts (upper plot) and the SNR (lower plot)defined as
SNR ¼P
i PHi
Nc¼
Pi PHiffiffiffiffiffiffiffiffiffiffiffiP
is2i
N
q
CM subtracted
Noise
Noise rms (ADC counts)
0
20
40
60
80
100
120
140
160
0 2 4 6 8 10 12 14 16 18 20
Fig. 8. Ladder noise rms before and after the CM subtraction.
0
1000
2000
3000
4000
5000
100 125 150 175 200 225 250 275 300
Strip number
Ladder strip numberX
2 st
rip
nu
mb
er
100
200
300
400
500
600
100 125 150 175 200 225 250 275 300
Fig. 9. Ladder beam profile (upper plot) and correlation
between the ladder and one of the x telescope position (lower
plot); two of the ladder strips have been excluded in the offline
analysis because of their high noise.
G. Barbiellini et al. / Nuclear Instruments and Methods in Physics Research A 490 (2002) 146–158152

where the sum is made over the strips of thecluster, PHi is the pulse height of the ith strip, Nc isthe cluster noise, si is the noise value of the ithstrip and N is the total number of strips in thecluster [13].
Both histograms have been obtained with abeam perpendicular to the detector and theyhave been fitted with a simplified Landaufunction [14]
F ðlÞ ¼1ffiffiffiffiffiffi2p
p exp�0:5ðlþexp�lÞ
where DEMP is the most probable value of thefunction, l ¼ ðDE � DEMPÞ=x and x ¼FWHM=4:02:
The number of strips per cluster as a function ofthe incidence angle of the beam is shown inFig. 13. Even for large angles with respect to thepointing direction of AGILE, the mean value isbelow 5. This means that all the relevant informa-tion on the cluster can be transmitted to ground,even with a limited telemetry bandwidth.
3.2.3. Position resolution
To evaluate the position resolution of theAGILE silicon detector, the track was recon-structed using the information of the silicontelescopes nearest to the ladder and the distribu-tion of the residuals, that is the distribution of thedifference of the extrapolated position on the
0200400600800
10001200140016001800
0 5 10 15 20 25 30 35 40
Pull - strip max
CUT
Pull - noise
0
200
400
600
800
1000
1200
x 102
0 1 2 3 4 5 6 7
Fig. 10. Upper plot: pull distribution for the strip with the
maximum signal. Lower plot: pull distribution for the noise.
Angle (degrees)
Clu
ster
Pu
lse
Hei
gh
t (A
DC
co
un
ts)
100
125
150
175
200
225
250
275
300
20 30 40 50 60 70 80 90 100 110 120
Fig. 11. Cluster pulse height as a function of the incidence
angle of the beam with respect to the strip plane. The fit has
been performed with a 1=cos y function.
0
500
1000
1500
2000
2500
3000
0 200 400 600 800 1000
Cluster PH (ADC counts)
Most probable = 130 ADC
SNR
Most probable = 22
0
500
1000
1500
2000
2500
0 20 40 60 80 100 120 140
Fig. 12. Cluster pulse height (upper plot) and SNR (lower plot)
for an incident beam perpendicular to the detector plane. The fit
has been done with a simplified Landau function described in
the text.
G. Barbiellini et al. / Nuclear Instruments and Methods in Physics Research A 490 (2002) 146–158 153

ladder and the one measured by the ladder itself,was plotted.
The ladder measured position is computed witha center of gravity method, weighting the positionof each cluster strip with the pulse height of thestrip itself.
Since the beam momentum is low ð2 GeV=cÞ;the multiple scattering due to the material betweenthe two telescopes has to be taken into account.The multiple scattering contribution to the tele-scope position resolution has been measuredreplacing the ladder with the third telescope. Theresult has been compared with the theoreticalcalculation and the simulation.
The residual distribution obtained with anormal incidence beam of 2 GeV=c is shown inFig. 14.
The position resolution can be derived from thesigma of the Gaussian fit sfit as
sres ¼ffiffiffiffiffiffiffiffiffiffiffiffiffiffiffiffiffiffiffiffis2fit � s2ext
q
0
2000
4000
6000
8000
2 4 6 8 100
2500
5000
7500
10000
2 4 6 8 10
02000400060008000
2 4 6 8 100
250050007500
10000
2 4 6 8 10
angle = 90angle = 75
angle = 60angle = 45
angle = 30
Strip per cluster
0250050007500
10000
2 4 6 8 10
Fig. 13. Number of strips per cluster as a function of the incidence angle of the beam.
Constant 4416.Mean 0.4731E-05Sigma 0.5459E-02
Residuals (cm)
Angle = 90o
0
1000
2000
3000
4000
5000
-0.1 -0.075 -0.05 -0.025 0 0.025 0.05 0.075 0.1
Fig. 14. Position resolution at normal incidence of the beam.
The value obtained with the fit is the convolution of the real
position resolution of the ladder and of the error introduced by
reconstructing the track with the telescopes.
G. Barbiellini et al. / Nuclear Instruments and Methods in Physics Research A 490 (2002) 146–158154

where sext is the uncertainty introduced by thetrack reconstruction of the silicon telescopes,which is due to the multiple scattering.
The position resolution of the AGILE detectoras a function of the incidence angle of the beam ispresented in Table 3.
Fig. 15 shows the advantage, in terms of spatialresolution, resulting from using the analog infor-mation on the charge collected by the siliconstrips. As far as the digital evaluation is concerned,the cluster is identified by applying a 3s cut to thestrips and the hit position is the center of gravity ofthe cluster (in this case, all the strips in the clusterhave the same weight).
3.2.4. Trigger efficiency
One of the most innovative features of theAGILE Tracker is represented by the autotriggercapability.
Dedicated runs have been performed in order tostudy the trigger efficiency of the silicon strips as afunction of the incident angle of the beam. Theefficiency is evaluated considering for each thresh-old the number of events with a high pulse heightin the strip with the maximum and no triggersignal. The presence of a trigger signal is measuredwith a multihit TDC that follows the timedevelopment of the trigger signal itself since itsamples up to 16 transitions.
Fig. 16 shows the time interval ðy-axis) in msbetween the particle crossing and the trigger signalgeneration as a function of the signal amplitude ðx-axis) in the strip with the maximum. The plot hasbeen obtained with a 2 GeV=c beam impingingorthogonally on the silicon detector. The TA1threshold has been set to 50 keV (0.5MIP).
The lower the pulse height, the higher the timeneeded to generate the trigger.
From the trigger efficiency point of view, theworst condition is represented by a particle cross-ing a floating strip, which corresponds to the
Table 3
Position resolution of the AGILE detector as a function of the
incidence angle of the beam
Angle ð1Þ sfit ðmmÞ sres ðmmÞ
90 55 47
75 47 37
60 51 41.3
45 67 59
30 116 110
Angle (deg)
Sp
atia
l res
olu
tio
n (
µm)
Analog
Digital
0
20
40
60
80
100
120
140
30 40 50 60 70 80 90
Fig. 15. Comparison between the digital and the analog
position resolution for the AGILE silicon detector.
PH_(strip max) (ADC counts)
Tim
e (µ
s)
0
0.5
1
1.5
2
2.5
100 200 300 400 500 600
Fig. 16. Time interval between the particle crossing and the
trigger signal generation as a function of the signal amplitude in
the strip with the maximum.
G. Barbiellini et al. / Nuclear Instruments and Methods in Physics Research A 490 (2002) 146–158 155

minimum signal seen by the nearby readout ones.Fig. 17 shows the signal amplitude of the strip withthe maximum as a function of the incidence angleof the beam for the two extreme cases of theparticle crossing the center of a readout strip or ofa floating strip. The line represents a threshold of1/4 of a MIP. The signal amplitude corresponds tothe most probable value of the Landau function(upper plot in Fig. 12).
For all the angles the signal is higher than thethreshold, ensuring the maximum trigger effi-ciency. If the detector noise increases, thusrequiring an increase in the threshold value, theefficiency will decrease for tracks impingingorthogonally. Fig. 18 shows the efficiency as afunction of the threshold value for two incidentangles of the beam. The measured efficiency valuesare written in Table 4.
3.3. Comparison between data and simulation
From the testbeam data, it is possible toevaluate a set of detector parameters which arefundamental for the simulation of the behaviour ofthe entire satellite.
The testbeam setup has been simulated usingGEANT 3.21 [15].
The silicon strips are implemented by dividingthe silicon itself in slices of 121 mm and the energyinformation of each of these sub-volumes is savedfor each event.
The capacitive coupling between the strips isimplemented as described in Fig. 19: the energyreleased in each strip is multiplied by a factor andassigned to the nearby readout strips. Thisprocedure is applied to each event and to all thestrips, and the signal obtained has to be comparedwith the measured one.
Angle (degrees)
Max
imu
m P
uls
e H
eig
ht
(AD
C c
ou
nts
)
Center in readout
Center in floating
Threshold40
60
80
100
120
140
160
30 40 50 60 70 80 90
Fig. 17. Signal amplitude of the strip with the maximum as a
function of the incidence angle of the beam for the two extreme
cases of a particle crossing the center of a readout strip or of a
floating one.
Threshold (keV)T
rig
ger
eff
icie
ncy
(%
)
90 deg
60 deg
AGILE ST
40
50
60
70
80
90
100
110
20 30 40 50 60 70 80 90 100 110
Fig. 18. Trigger efficiency as a function of the threshold value
for a 2 GeV=c beam impinging orthogonally and at 601 with
respect to the detector plane.
Table 4
Trigger efficiency as a function of the threshold value for an
incident angle of the beam of 601 and 901
Threshold (keV) e (%) at 901 e (%) at 601
25 99.46
38 99.4
51 99.13 99.25
64 98 99.57
76 85.1 99.55
89 68 98
102 58 91.4
G. Barbiellini et al. / Nuclear Instruments and Methods in Physics Research A 490 (2002) 146–158156

The comparison of the position resolution as afunction of the incidence angle for data andsimulation is shown in Fig. 20.
Fig. 21 shows the comparison data-simulationfor the function Z which represents the way thesignal is divided between adjacent strips
Z ¼PHmax � PHmax�1
PHmax þ PHmaxþ1if PHmax�1 > PHmaxþ1
¼PHmaxþ1 � PHmax
PHmaxþ1 þ PHmaxif PHmaxþ1 > PHmax�1
where PHmax is the signal of the strip with themaximum and PHmax71 is the signal of the nearbystrip with the higher signal.
4. Conclusions
The Silicon Tracker design has been proved tofully satisfy the scientific requirements set by theAGILE mission.
The testbeam analysis has demonstrated thevalidity of the analog readout and of the floatingstrip principle even with a large pitch detector asthis one. In this way, it is possible to maintainunder control the number of channels and thus thepower needed by the instrument while at the sametime obtaining a good spatial resolution.
No stability problems have arisen in the use ofthe ensemble detector-electronics, which is afundamental aspect for a satellite experiment.
The final production of the AGILE silicondetectors has been completed before the middleof the year 2001.
Around 43 000 silicon channels will be launchedin 2003 for a total of 4 m2 of silicon detectors,which is the largest number of silicon strips as faras satellites are concerned up to now.
F floating strip
0.38
0.095
0.035
0.115
0.045
RFRRR
1.
R readout strip
Fig. 19. Schematic representation of the implementation of the
capacitive coupling in the simulation. The symmetric couplings
on the right are not represented.
Angle (degrees)
Po
siti
on
Res
olu
tio
n (
µm)
Data
Simulation
0
20
40
60
80
100
120
20 30 40 50 60 70 80 90 100
Fig. 20. Comparison of the position resolution as a function of
the incidence angle for data and simulation.
Test beam data
Simulation
η
0
50
100
150
200
250
300
350
400
-1 -0.8 -0.6 -0.4 -0.2 0 0.2 0.4 0.6 0.8 1
Fig. 21. Z function: comparison between data and simulation.
G. Barbiellini et al. / Nuclear Instruments and Methods in Physics Research A 490 (2002) 146–158 157

Acknowledgements
This work has been done with the financialsupport of ASI and INFN. We would like to thankThomas Ruf and the CERN EP and PS divisionstaff for the support during the testbeam and PeterWeilhammer and Alan Rudge for the silicontelescopes.
References
[1] A. Peisert, Silicon microstrip detectors, in: F. Sauli (Ed.),
DELPHI 92-143 MVX 2, 1992, chapter of a volume on
Instrumentation on High energy Physics, World Scientific
Publishing Co., Singapore, 1992;
M. Krammer, H. Pernegger, Nucl. Instr. and Meth. A 397
(1997) 232.
[2] S.p.A. Mipot, Cormons, GO, Italy, http://www.mipot.-
com.
[3] IDE AS, Norway, http://www.ideas.no, http://
193.216.193.195/download/ASICdocuments/TA1.pdf.
[4] CERN PS East Hall, http://psschedule.web.cern.ch/
PSschedule/pindex.html.
[5] G. Vismara, A. Manarin, LEP/BI-TA/Note 85-3, CERN,
Geneva, 1985.
[6] A. Rudge, P. Weilhammer, CERN.
[7] O. Toker, et al., Nucl. Instr. and Meth. A 340 (1994) 572.
[8] Sun Microsystems, Inc., DARPA RFC 1050 Remote
Procedure Call Protocol Specification (1988).
[9] SBS Bit3 Operations, St. Paul, MN, USA. VME driver
provided by Nata Kruszynska (http://www.nikhef.nl/user/
natalia/projects/vmehb.html).
[10] J.K. Ousterhout, Tcl and the Tk Toolkit, Addison-Wesley
Publishing Company, Reading, MA, 1996.
[11] CN/ASD Group, HIGZ/HPLOT Users Guide, Program
Library Q120 and Y251, CERN (1993).
[12] G. Barichello, et al., Nucl. Instr. and Meth. A 413 (1998)
17.
[13] C. Eklund, et al., Nucl. Instr. and Meth. A 430 (1999) 321.
[14] J.E. Moyal, Philos. Mag. 46 (1955) 263.
[15] R. Brun, et al., GEANT detector description and
simulation tool, CERN Program Library, 1993.
G. Barbiellini et al. / Nuclear Instruments and Methods in Physics Research A 490 (2002) 146–158158