testing the waters in south korea internationalization of sea
TRANSCRIPT

A Work Project, presented as part of the requirements for the Award of a Master Degree in
Management from the NOVA – School of Business and Economics.
Testing the Waters in South Korea
Internationalization of Sea & Sun Electronics to the
South Korean Market
APPENDICES
Linda Joana Kovacevic
#3044
A Project carried out on the Master in Management Program, under the supervision of:
Professor Sara Alves
06 January 2017

2
TABLE OF CONTENTS
Appendix 1 – Characteristics of Entry Modes ................................................................................. 3
Appendix 2 – Product Portfolio ....................................................................................................... 3
Appendix 3 – Research Programs .................................................................................................... 7
Appendix 4 – Sales evolution and forecast ...................................................................................... 8
Appendix 5 – Quantitiy sold and forecast ........................................................................................ 8
Appendix 6 – Market volume and growth ....................................................................................... 9
Appendix 7 – Porter’s Five Forces Analysis .................................................................................... 9
Appendix 8 – Organizational Resource Platform .......................................................................... 12
Appendix 9 – Results CORETM tool .............................................................................................. 13
Appendix 10 – Detailed results: Preliminary elimination .............................................................. 14
Appendix 11 – Scoring model: Description and source of indicators............................................ 15
Appendix 12 – Scoring model: Standardized data for all countries ............................................... 15
Appendix 13 – Formula applied for standardization of country scores ......................................... 16
Appendix 14 – Correlation matrix for selected indicators ............................................................. 16
Appendix 15 – PESTLE Analysis for South Korea ....................................................................... 16

3
APPENDICES
Appendix 1 – Characteristics of Entry Modes
Appendix 2 – Product Portfolio
(i) Measuring probes
Sea & Sun’s product portfolio consists of two broad types of measuring probes: Multiparameter
and Microstructure probes, which vary in size, weight, types of sensors and application field.
Multiparameter probes can be ordered to have an internal flash memory of between 8 and 128
MB. They are resistant against nearly all chemical compounds and absolutely corrosion free. The
smaller probes are further suitable for portable application as they do not require winches to lower
them into water. Also, some of the probes are fitted with rechargeable batteries. Multiparameter
probes can be applied really flexible, due to the ability to configurate the probes individually and
equip them with several types of sensors.
Control available to the focal firm over foreign operations
Resource commitment
Flexibility
Risk*
Minimum
Limited
Maximum
Low
Maximum
Substantial
Minimum
High
*does not hold for all sorts of risk, e.g. currency risk
Source: Cavusgil et al. (2014)
Export-based entry modesNon-equity-based entry
modesEquity-based entry modes

4
Source: Sea & Sun Electronics
All Microstructure probes of the portfolio can be applied in marine and limnic waters. They have
a sampling rate of 1,024 samples generated per second. In addition, they can be connected to a
computer via USB 2.0, in order to transfer the data samples.
Multiparameter
probesCTD 48 CTD 60 CTD 75 CTD 90 CTD 115
No. of sensors 4 - 8 5 - 12 8 9 12
Type of sensors
Pressure,
Temperature,
pH, dissolved
oxygen, H2S
Pressure,
Temperature,
Conductivity,
pH, dissolved
oxygen, light
transmission,
light scattering
Pressure,
Temperature,
Conductivity,
Turbidity, pH,
Redox,
dissolved
oxygen,
Chlorophyll A
Pressure,
Temperature,
Conductivity,
pH, dissolved
oxygen, light
transmission,
light scattering
Pressure
(installed),
possibility to
connect external
units like
fluorometers,
currentmeters
etc.
Water depth up to 6,000 m up to 6,000 m up to 2,000 m 6,000 m 2,000 m
Length 400 mm 620 mm 654 mm 600 mm 600 mm
Weight 1 - 1.2 kg 3 kg 3.5 kg 6 kg 7 kg
Resolution 20 Bit 16 Bit 16 Bit 20 Bit 20 Bit

5
Source: Sea & Sun Electronics
(ii) Software
Sea & Sun develops the data acquisition software used to display and analyze the SDA data
collected by its probes itself. The software runs under both, Windows and Mac operating systems
and supports up to 8 probes at the time. It is important to the company, that the software is easily
to be used by customers.1
1 Standard Data Acquisition Software. 2016. Sea & Sun Electronics. http://www.sea-sun-tech.com/marine-
tech/oceanography/software.html.
Microstructure
probesMSS 60 MSS 90 MSS 90L MSS 90-D1 MSS 90-D2
No. of sensors 5 9 9 9 9
Type of sensors
Turbidty,
Oxygen
Turbidity,
Fluorescence,
Oxygen, pH
Turbidity,
Fluorescence,
Oxygen, pH
Turbidity,
Fluorescence,
Oxygen, pH
Turbidity,
Fluorescence,
pH
Water depth 200 m 500 m 500 m 1,000 m 2,000 m
Length 0.8 m 1.0 m 1.25 m 1.5 m 1.7 m
Weight 5 kg 12 kg 15 kg 25 kg 33 kg
Resolution 16 Bit 16 Bit 16 Bit 16 Bit 16 Bit

6
(iii) Equipment
Additional equipment provided by Sea & Sun comprises various types of cable drums, manual
and automatic winches as well as interfaces and remote displays to transfer and display data
collected by the probes. In the following one product per equipment type is exemplary examined
in more detail:
Bluetooth cable drum
Cable connected with measuring probe, but wireless
communication with data acquisition device
Cable length: 200m
Weight: 3.3 kg
Bluetooth reach: 10m in open field
Operating time per charge: 10h
Electrical winch (SMW 3000)
Electrical winch to automatically lower probes into
water and pull them out again
Cable length: 3,000m
Cable from winch to laboratory: 40m
Probe interface (STT)
Connects measuring devices (probes) without direct
connectivity with data displaying and analyzing
devices (generally computers)
Source: Sea & Sun Electronics

7
Appendix 3 – Research Programs
Sea & Sun is a partner and supplier of several environmental research and monitoring programs,
such as a project of the German Federal Ministry of Food and Agriculture regarding the German
fishing industry. Another collaboration with the Federal Ministry of Economic Affairs and
Technology and several other high-tech companies is in place. Under the project name BOSS
(stands for “Bionic Observation and Survey System”) the firms and researches develop an
autonomous data collection probe, which looks and moves like a ray. This animal-looking device
can maneuver through the ocean by itself and can be equipped with different sensors, cameras and
sonars to capture a holistic data picture of its environment.
A complete list of all research programs, which use Sea & Sun’s water measurement solutions, can
be found at Sea & Sun’s webpage2.
Source: Sea & Sun Electronics
2 Reference List for measurements and data processing. 2016. Sea & Sun Technologies. http://www.sea-sun-
tech.com/marine-tech/projects-references.html.
8
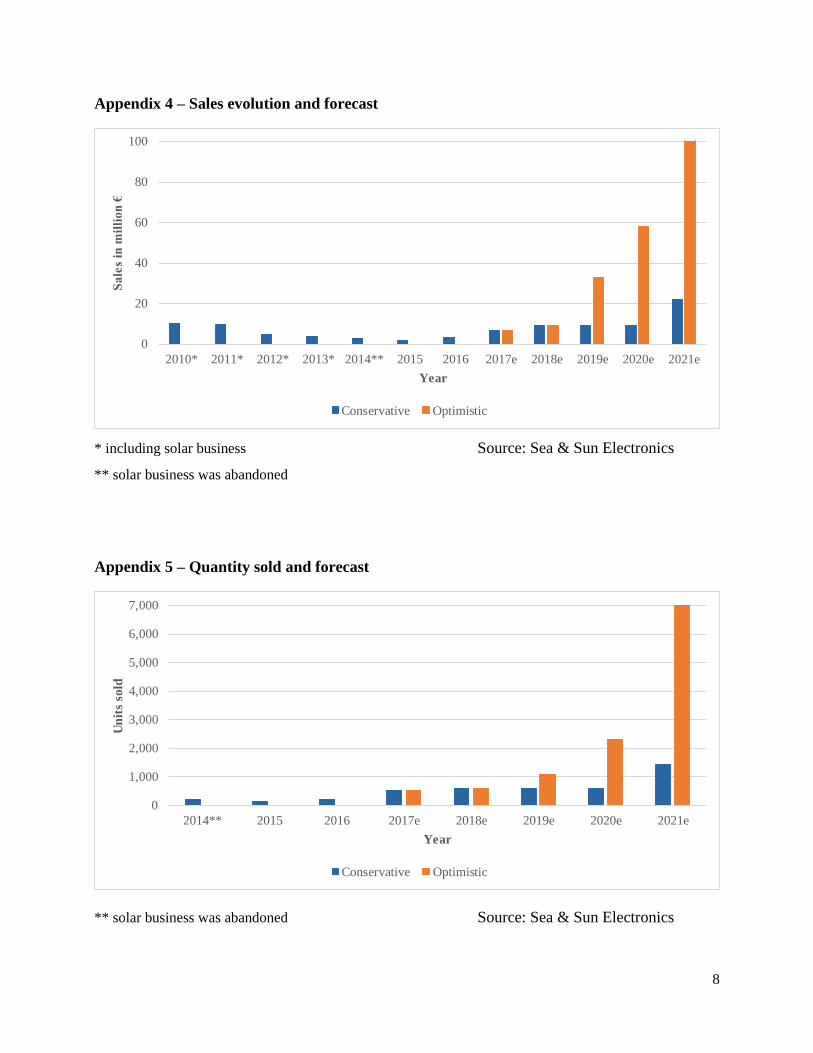
Appendix 4 – Sales evolution and forecast
* including solar business Source: Sea & Sun Electronics
** solar business was abandoned
Appendix 5 – Quantity sold and forecast
** solar business was abandoned Source: Sea & Sun Electronics
0
20
40
60
80
100
2010* 2011* 2012* 2013* 2014** 2015 2016 2017e 2018e 2019e 2020e 2021e
Sale
s in
mil
lion
€
Year
Conservative Optimistic
0
1,000
2,000
3,000
4,000
5,000
6,000
7,000
2014** 2015 2016 2017e 2018e 2019e 2020e 2021e
Un
its
sold
Year
Conservative Optimistic

9
Appendix 6 – Market volume and growth
Source: Water Analysis Instrumentation: A Global Strategic Business Report, Global Industry Analysts
Appendix 7 – Porter’s Five Forces Analysis
1 Internal Rivalry
With around 28 firms, there is a comparably small number of players in the market for water
measuring probes. Globally, there are only three companies operating internationally, with Sea-
Bird Electronics clearly dominating the market. RBR and Sea & Sun are the only firms whose
products are able to compete in terms of innovative technology, capabilities and quality. There is
a global trend towards extensively exploring the environment on more granular levels, in order to
understand environmental contexts and developments. This tendency will strongly increase the
overall market size of the industry. In turn, this will attract new market entrants who aim at
capturing abnormal returns. Thus, internal rivalry of the industry can overall be considered to be
low, but will most probably increase in the future.
2 Buyer Power
The major buyers within the water measurement instrumentation market are considered to be
research institutes and universities conducting water-related research. Another group of buyers in
1.47 1.571.86
2.22.8
3.6
6.80%
18.47% 18.28%
27.27% 28.57%
0
0.05
0.1
0.15
0.2
0.25
0.3
0
0.5
1
1.5
2
2.5
3
3.5
4
2015 2016 2017e 2018e 2019e 2020e
Ma
rke
t g
row
th i
n %
Ma
rket
size
in
$ b
illi
on
Year
Market size Market growth

10
the industry are navies and fisheries worldwide, using the products for environmental research on
fish and the aquatic environment in general. Thus, the great majority of buyers is funded by
governments and therefore dependent on national R&D spendings. As such, they have a research
budget at their disposal and are not very price-sensitive. It is most important for them that products
meet their requirements as these customers show high involvement with the products. In addition,
the number of manufacturers of water testing probes is very limited, therefore buyers cannot widely
chose whose products to purchase, especially with regards to individualized products. Thus, prices
for measuring probes are generally fixed. However, another (smaller) group of customers are
private enterprises that are engaged in offshore exploration and ocean resource utilization (e.g.
offshore wind parks, monitoring of underwater oil pipelines and searching for undiscovered oil
resources in the sea). Within this group of buyers, some firms place particular large orders at times
(e.g. 100 new probes) and do have some bargaining power due to their purchase volume.
Buyers cannot easily switch between products of different manufacturers as each player uses its
own software to display and process the data. Switching to the product of another player means the
use of another software which is not compatible with the software of other firms. Thus, data
collected by different devices cannot be analyzed and compared together.
Due to these reasons, buyer power is considered to be low to moderate. As worldwide market
demand is expected to strongly increase within the next years and as new manufacturers of probes
will not be able to appear as quickly, bargaining power of buyers will decrease even more.
3 Supplier Power
There are four major groups of suppliers in the industry: (i) titan parts are supplied by mechanical
engineering companies of which exist a very high number worldwide. Thus, these firms have
almost no bargaining power as the titan parts can be produced by any firm and switching to

11
competitors is very easy for manufacturers of measuring probes. (ii) sensors are very product-
specific and the most important part of the probes. As suppliers of sensors are monopolists in their
specific field, prices are static and bargaining power of sensor suppliers is very high. (iii)
electronics like circuits are also not a very specific product and can be purchased from a very large
number of producers. Consequently, their bargaining power is very low as switching costs are low
as well. (iv) software is bought from third parties by some players, others develop the software for
its products themselves. As there is a large number of software developers and switching between
different suppliers is very easy, their bargaining power is very low.
As demand for test probes is expected to increase over the next years, bargaining power of sensor
suppliers will increase even more, yet, power of titan, electrics, and software suppliers will
remain the same due to the large number of players in the markets.
4 Threat of New Entrants
Entering the water measurement instrumentation market requires substantial capital resources to
set up the technical facilities required to produce and service of such kinds of probes. However,
the greatest entry barriers represent the need of technology and highly specified know-how, which
are difficult to obtain and very costly, but necessary to be able to compete in this industry. Besides
these factors, the major incumbents already built up a well-known reputation for their products,
which a new entrant would have to attain in order to convince buyers of the quality of his probes.
Yet, strong global market growth will surely attract new competitors as main materials are
relatively easy to access and distribution is left to the firms’ personal sales forces and specialized
dealers or agents. Also, the fact that the majority of players in the industry focusses on sea water
as their major field of application of products, might draw firms to enter the field of testing probes
for fresh water. In summary, the threat of new entrants is moderate but likely to increase.

12
5 Threat of Substitutes
Currently, there is no other way of measuring water characteristics as there are no alternative
products that offer similar benefits and occasions for use to the customer. Technology will most
probably advance further in the years to come with more precise measuring probes being
developed. However, it is not expected that substitutes for water measurement probes will evolve
within the next 10 years. Thus, threat of substitute products is very low today, but might slightly
increase in the future.
Appendix 8 – Organizational Resource Platform
CompetenciesRelative
Strength
Strat.
ImportanceSpecialized Assets
Relative
Strength
Strat.
Importance
Architecture of
relationships
Relative
Strength
Strat.
Importance
C1 HR (Technical Know-How) S1 Reputation A1 National Governments
Employees have very specific and
extensive know-how and
capabilities that enables Sea & Sun
to develop high-quality products
Solid reputation in the water
measurement market worldwide
Close relationahips with German
and Chinese governmental
institutions. Thereby important
contracts for projects are generated.
In other countries no such
relationships exist.
C2 Customer Service S2 IP Protection A2 Strategic Partnerships
BEMÜHT do provide excellent
customer service, however due to
large distance to customers in
foreign markets and absence of
subsidiaries in these markets, service
cannot always be provided as
desired.
Sea & Sun used to hold patents on
past innovations, but does not apply
patents to its new technology
anymore as competition in low IP-
protection countries has shown to
examine the patent paper and copy
the technology
Sea & Sun conducts a number of
projects together with strategic
partners in order to combine know-
how and components. Through
these partnerships it is able to enter
new niche markets earlier than
competition.
C3 Financial Management S3 LocationA3 Universities and Other
Research Institutions
Due to the default of financial
resources as the major equity-holder
left the company on account of
death, Sea & Sun has faced serious
financing problems in the past two
years. Yet, due to consequent
financial resource management and
downsizing, the firm has survived
and is propsering again.
Location of production site and
calibration laboratories is very
advantageous in Germany (close to
suppliers and customers), but the
network of calibration laboratories
worldwide has to be expanded in
order to provide high-quality
customer service
Founder holds lectures and
presentations at universities and
research institutes, which leads to
close relationships with existing
customers, new customers, project-
collaborations and recruitment of
high-potential employees
C4 New Product Development A4 Network of Investors
Around 50 new products developed
during the last 10 years in
comparison to competition (e.g. Sea-
Bird: none) due to ability to develop
specific products for individual
customers on low-scale
Difficulties to attract new invesotrs
during crisis and restructuring. But
investment from Chinese
governmental company might
facilitate to build up larger network
of (potential) investors
C5 Marketing and Sales
Low number of intermediaries in the
sales process, very personal and
customer-specific. Marketing almost
does not exist and should be
improved.
Scale: 1 - Lowest, 10 - Highest
7 7
9
8
8
7
9 9
5
6 8
8
3
6
8
5
4
7 5
10
2
3
8 5

13
Source: Sea & Sun Electronics
Appendix 9 – Results CORETM tool
Source: Global EDGE – CORETM tool
Superfluous Strengths
Zone of Irrelevance
Key Strengths
Key Weaknesses
Rela
tiv
e S
tren
gth
Strategic Importance
C1
S1
A1
51
1
5
10
10 C4
C2
C3
S2
S3
A2
A4
A5 A3
Competencies Specialized Assets Architecture of Relationships
C5
Dimension Score Rating
Competitive Capabilities in Domestic Market 66 Moderate
Motivation for Going International 77 Moderate
Commitment of Owners and Top Management 81 High
Product Readiness for Foreign Markets 87 High
Skill, Knowledge and Resources 93 High
Experience and Training 70 Moderate
Overall 79 Moderate

14
Appendix 10 – Detailed results: Preliminary elimination
Country Index of Economic Freedom Country Risk Urban Population
1 Afghanistan N/A D 8,685,568
2 Armenia 67 D 1,891,291
3 Azerbaijan 60.2 C 5,271,567
4 Bahrain 74.3 B 1,222,642
5 Bangladesh 53.3 D 55,184,476
6 Bhutan 59.5 C 299,425
7 Brunei Darussalam 67.3 BB 326,710
8 Cambodia 57.9 D 3,228,208
9 Cyprus 68.7 B 779,830
10 Georgia 72.6 D 1,973,452
11 Iraq N/A D 25,303,697
12 Israel 70.7 BB 7,721,701
13 Jordan 68.3 B 6,355,041
14 Kazakhstan 63.6 D 9,341,721
15 Korea, North 2.3 D 15,313,299
16 Korea, South 71.7 BB 41,745,902
17 Kuwait 62.7 BB 3,827,584
18 Kyrgyzstan 59.6 D 2,127,066
19 Laos 49.8 D 2,626,533
20 Lebanon 59.5 D 5,136,484
21 Malaysia 71.5 BB 22,658,779
22 Maldives 53.9 D 186,316
23 Mongolia 59.4 D 2,131,760
24 Myanmar 48.7 D 18,377,852
25 Nepal 50.9 D 5,307,825
26 Oman 67.1 BB 3,486,501
27 Pakistan 55.9 D 73,223,503
28 Qatar 70.7 BB 2,218,456
29 Russia 50.6 C 106,643,169
30 Saudi Arabia 62.1 BB 26,219,511
31 Singapore 87.8 AA 5,535,002
32 Sri Lanka 59.9 C 3,848,519
33 Syria N/A D 10,667,751
34 Tajikistan 51.3 D 2,271,610
35 Thailand 63.9 B 34,233,848
36 Timor-Leste 45.8 D 407,991
37 Turkmenistan 41.9 D 2,688,739
38 United Arab Emirates 72.6 BB 7,832,958
39 Uzbekistan 46.0 D 11,382,063
40 Vietnam 54.0 C 30,806,058
41 Yemen N/A D 9,285,556
(grey marked countries are eliminated from the analysis)

15
Appendix 11 – Scoring model: Description and source of indicators
Appendix 12 – Scoring model: Standardized data for all countries
Indicator Description Unit Year Source
(1) ECON.FREED Index of Economic Freedom 2016 The Heritage Foundation
(2) TRD.FREED Index of Trade Freedom 2016 The Heritage Foundation
(3) CNTRY.RISK Country Risk Index 2016 Euler Hermes
(4) FEXCH.RISK Foreign Exchange Risk Index 2016 The Economist Intelligence Unit
(5) URBAN.POP Urban Population million ppl. 2016The World Bank
(World Development Indicators)
(6) CAGR.POP Population growth (CAGR) in % 1960 - 2015The World Bank
(World Development Indicators)
(7) IP.PROT Legal protection of property rights 2016 The Heritage Foundation
(8) R&D.EXP R&D expenditure million USD 2014The World Bank
(World Development Indicators)
(9) NO.RES Number of researchers people latest availableThe World Bank
(World Development Indicators)
(10) IMPR.WATER Population using improved drinking-water sources in % 2015The World Bank
(World Development Indicators)
(11) IMPR.SANIT Population using improved sanitation facilities in % 2015The World Bank
(World Development Indicators)
(12) TRIFFS.GER Tariffs on imports of measuring instruments from Germany in % 2016International Trade Centre (Trade
Map)
(13) TARIFFS.CHINA Tariffs on imports of measuring instruments from China in % 2016International Trade Centre (Trade
Map)
A
zerb
aij
an
Is
ra
el
J
ord
an
M
ala
ysi
a
R
uss
ia
S
au
di
Ara
bia
S
ing
ap
ore
S
ou
th K
orea
T
ha
ila
nd
U
nit
ed
Ara
b E
mir
ate
s
V
ietn
am
(1) Index of Economic Freedom 27 55 48 57 1 32 100 57 36 60 10
(2) Trade Freedom 20 90 7 52 1 31 100 13 30 60 61
(3) Country Risk 1 67 34 67 1 67 100 67 34 67 1
(4) Foreign Exchange Risk 1 100 1 67 34 34 100 100 67 34 34
(5) Urban Population 1 3 2 18 100 21 1 37 29 4 26
(6) CAGR Population (1960 - 2015) 17 27 44 26 1 42 23 12 17 100 18
(7) Legal protection of property rights 8 80 60 54 8 34 100 74 34 54 1
(8) R&D expenditure (in million USD) 1 15 1 13 56 2 13 100 7 6 2
(9) Number of researchers 3 15 3 14 100 1 9 78 15 3 3
(10) Population using improved drinking-water sources (in %) 100 1 25 16 25 24 1 1 18 4 16
(11) Population using improved sanitation facilities (in %) 46 1 7 18 100 1 1 1 30 11 93
(12) Tariffs on imports of measuring instruments from Germany 11 1 1 1 1 100 1 1 1 100 1
(13) Tariffs on imports of measuring instruments from China 7 1 1 1 1 63 1 100 1 63 1

16
Appendix 13 – Formula applied for standardization of country scores
𝑋′𝒊𝒋 = [𝑋𝒊𝒋 −𝑚𝑖𝑛𝒊
𝑚𝑎𝑥𝑖 −𝑚𝑖𝑛𝑖∗ 99] + 1
𝑋′𝒊𝒋 scaled final score of country j for indicator i
𝑋𝒊𝒋 score of country j for indicator i
𝑚𝑖𝑛𝒊 minimum value for indicator i
𝑚𝑎𝑥𝒊 maximum value for indicator i
Source: Cavusgil et al. (2004)
Appendix 14 – Correlation matrix for selected indicators
Appendix 15 – PESTLE Analysis for South Korea
Political
South Korea is a presidential republic, with its presidents obtaining the highest position in the
hierarchy. It is a democratic system with its citizens having substantial voting rights, freedom to
express their selves, freedom of association and a free media, which is reflected in the country’s
rank of #69 in Voice and Accountability in the Worldwide Governance Indicators. Further, the
political system is relatively stable with a ranking of #523. However, the critical political situation
3 Worldwide Governance Indicators. 2015. The World Bank.
http://info.worldbank.org/governance/wgi/index.aspx# reports.
ECON.FREED TRD.FREED CNTRY.RISK FEXCH.RISK URBAN.POP CAGR.POP R&D.EXP NO.RES IMPR.WATER IMPR.SANIT TARIFFS.GER TARIFFS.CHINA IP.PROT
ECON.FREED 1
TRD.FREED 0.599 1
CNTRY.RISK 0.886 0.576 1
FEXCH.RISK 0.586 0.560 0.675 1
URBAN.POP -0.607 -0.516 -0.437 -0.017 1
CAGR.POP 0.320 0.225 0.365 -0.239 -0.493 1
R&D.EXP -0.001 -0.353 0.082 0.450 0.571 -0.390 1
NO.RES -0.283 -0.471 -0.188 0.248 0.854 -0.491 0.885 1
IMPR.WATER -0.433 -0.431 -0.615 -0.667 -0.082 -0.216 -0.285 -0.168 1
IMPR.SANIT -0.796 -0.298 -0.841 -0.403 0.660 -0.429 0.034 0.357 0.306 1
TRIFFS:GER 0.017 0.032 0.276 -0.275 -0.183 0.766 -0.266 -0.311 -0.054 -0.287 1
TARIFFS.CHINA 0.150 -0.220 0.364 0.166 0.013 0.350 0.537 0.242 -0.236 -0.404 0.564 1
IP.PROT 0.926 0.518 0.890 0.690 -0.457 0.228 0.180 -0.087 -0.596 -0.818 -0.062 0.194 1

17
between North and South Korea, which deteriorated in the past few years as well as the tense
relationship with Japan caused by the two countries’ joint history, poses certain political risks on
South Korea4. In addition, a political corruption scandal around president Park Geun-Hye in 2016
has led to further political uncertainty5. This incidence might be reflected in the Corruption
Perceptions Index 2016, which is not published yet. Past perception has been very positive, with
South Korea ranking #37 in last year’s index6. Also, South Korea is a member of the OECD and
the United Nations which shows its participation and belonging in world politics.
Economical
South Korea is the fourth biggest economy in Asia7 with relatively strong economic growth
expected in the next year (forecasted GDP growth rate for 2017 of 2.6%8). It is a member of the
World Trade Organization and has a network of 19 pluliteral and bi-literal trade agreements with
58 countries and the EU in place9. This is favorable, as South Korea has a strong trade imbalance
and is highly dependent on exports (net income from trading activities 2015 of $90.4 billion with
exports accounting for 38.2% of GDP10). Further, household disposable income grew by 3.65% in
2014, yet, high household debt of 170% of net disposable income in 201511 has led to inhibited
4 The World Factbook. 2016. Central Intelligence Agency. https://www.cia.gov/library/publications/the-world-
factbook/geos/ks.html. 5 Wirtschaftsausblick Winter 2016/17 – Korea (Rep.). 2016. Germany Trade and Invest. http://www.gtai.de/
GTAI/Navigation/DE/Trade/Maerkte/Wirtschaftsklima/wirtschaftsentwicklung,t=wirtschaftsausblick-winter-
201617--korea-rep,did=1599140.html. 6 Corruption Perceptions Index 2015. 2015. Transparency International. http://www.transparency.org/cpi2015#
results-table. 7 SWOT-Analyse – Korea (Rep.). 2016. Germany Trade and Invest. http://www.gtai.de/GTAI/Navigation/
DE/Trade/Maerkte/suche,t=swotanalyse--korea-rep,did=1589556.html. 8 Real GDP forecast. 2016. OECD. https://data.oecd.org/gdp/real-gdp-forecast.htm. 9 Regional trade agreements – Korea, Republic of. 2016. World Trade Organization. http://rtais.wto.org/UI/Public
SearchByMemberResult.aspx?MemberCode=410&lang=1&redirect=1. 10 Wirtschaftsdaten Kompakt – Korea (Rep.). 2016. Germany Trade and Invest. http://www.gtai.de/GTAI/
Navigation/DE/Trade/Maerkte/Wirtschaftsklima/wirtschaftsdaten-kompakt,t=wirtschaftsdaten-kompakt--republik-
korea,did=1584982.html. 11 Household debt. 2016. OECD. https://data.oecd.org/hha/household-debt.html.

18
consumption. On the other hand, the construction industry has strongly increased due to an
increased demand for real estate. Experts consider this inequality in growth as a potential risk
factor12. However, South Korea offers overall a very favorable business environment, ranking #5
on the Ease of Doing Business Index13.
Social
South Korea has a population of 49.5 million people14. Low population growth (0.41% in 201415)
and the lowest fertility rate within the OECD countries (1.21 children/woman in 201416) have led
to an aging population. This in turn has increased the dependency ratio, with 17.9 elderly being
dependent on 100 citizens aged 15-64, which poses challenges on government and society. Further,
the country shows relatively low inequality regarding life expectancy, education and income as
well as a low unemployment rate of 3.2%17. Also, South Korea has a labor and welfare system
which meets international standards18. Further, the country shows strong affinity to education with
one of the highest adult education levels in the OECD, having 45.5% of adults with tertiary level
of education. Among the ages 25-34 the tertiary education share even reaches 69%, scoring first in
the OECD19.
12 Wirtschaftsausblick Winter 2016/17 – Korea (Rep.). 2016. Germany Trade and Invest. http://www.gtai.de/
GTAI/Navigation/DE/Trade/Maerkte/Wirtschaftsklima/wirtschaftsentwicklung,t=wirtschaftsausblick-winter-
201617--korea-rep,did=1599140.html. 13 Economy Rankings. 2016. The Wold Bank. http://www.doingbusiness.org/rankings. 14 Human Development Reports. 2016. United National Development Programme.
http://hdr.undp.org/en/countries/ profiles/KOR 15 Population. 2014. OECD. https://data.oecd.org/pop/population.htm. 16 Fertility rates. 2014. OECD. https://data.oecd.org/pop/fertility-rates.htm. 17 Human Development Reports. 2016. United National Development Programme.
http://hdr.undp.org/en/countries/ profiles/KOR 18 Labor and Social Welfare System. 2016. Korea.net. http://www.korea.net/AboutKorea/Society/Labor-Social-
Welfare-System 19 Population with tertiary education. 2015. OECD. https://data.oecd.org/eduatt/population-with-tertiary-
education. htm

19
Technological
South Korea is the leading country in the OECD with regards to R&D investments, amounting to
4.3% of GDP in 201420. In the information and communication technology sector, several South
Korean firms are market leaders, underlining the country’s innovative mindset. This can also be
seen in the population’s high receptiveness to new technologies, making the market to a testing
ground for new products and services21.
Legal
The legal system in South Korea is a combination of Anglo-American, civil law and Chinese
classical thoughts22. The system is moderately effective, which can be seen in a score of 70 for the
protection of property rights, which indicates, how well laws are safeguarded and enforced23. The
score indicates, that private property is guaranteed, however not all contracts are enforced
successfully and the system shows delays in operations. Similarly, the strength of the legal rights
index of 5 measures protection of rights of borrowers and lenders and indicates moderate
enforcement only24. However, setting up a business is highly convenient, comprising 2 procedures,
that are completed within 4 days on average25.
20 Gross domestic spending on R&D. 2014. OECD. https://data.oecd.org/rd/gross-domestic-spending-on-r-d.htm. 21 SWOT-Analyse – Korea (Rep.). 2016. Germany Trade and Invest. http://www.gtai.de/GTAI/Navigation/
DE/Trade/Maerkte/suche,t=swotanalyse--korea-rep,did=1589556.html. 22 The World Factbook. 2016. Central Intelligence Agency. https://www.cia.gov/library/publications/the-world-
factbook/geos/ks.html. 23 Index of Economic Freedom. 2016. The Heritage Foundation. http://www.heritage.org/index/country/southkorea. 24 Strength of legal rights index (0=weak to 12=strong). 2016. http://data.worldbank.org/indicator/IC.LGL.CRED.
XQ?locations=KR. 25 Starting a Business in Korea, Rep. 2016. The World Bank.
http://www.doingbusiness.org/data/exploreeconomies/ korea/starting-a-business.
20
Environmental
Regarding the environment, South Korea performs poorly, as seen in the Environmental
Performance Index 2016, ranking #80 of 180 countries. Especially in terms of air pollution the
country faces large issues, especially health risks, obtaining one of the lowest ranks with #17426.
To fight this, the government has established several environmental laws and activities to strongly
reduce emissions in the country. However, the main issue causing strong air pollution is dust and
polluted air being blown from China27. One of the measures to reduce emissions was the adoption
of nuclear power instead of power plants using fossil fuels. However, this has led to a substantial
nuclear waste storage problem, with around 70% of all nuclear waste being currently stored in
temporary depots only28. Besides this storage issue, South Korea’s environmental efforts and use
of clean technology seem to forecast an improved environmental situation in the country.
26 South Korea – Country Overview. 2016. Environmental Performance Index. http://epi.yale.edu/country/south-
korea. 27 South Korea: Environmental Issues, Policies and Clean Technology. 2015. AZO Cleantech. http://www.azo
cleantech.com/article.aspx?ArticleID=552. 28 As nuclear waste piles up, South Korea faces storage crisis. 2014. Reuters. http://uk.reuters.com/article/us-
southkorea-nuclear-storage-idUKKCN0I10WR20141012.