temperature variability since a.d. 1837 inferred from tree-ring maximum density of abies fabri on...
TRANSCRIPT
© Science China Press and Springer-Verlag Berlin Heidelberg 2010 csb.scichina.com www.springerlink.com
Article
SPECIAL TOPICS:
Geography September 2010 Vol.55 No.26: 3015–3022
doi: 10.1007/s11434-010-3182-8
Temperature variability since A.D. 1837 inferred from tree-ring maximum density of Abies fabri on Gongga Mountain, China
DUAN JianPing1,2, WANG Lily1*, LI Lun3 & CHEN KeLong4
1 Institute of Geographic Sciences and Natural Resources Research, Chinese Academy of Sciences, Beijing 100101, China;
2 Graduate University of the Chinese Academy of Sciences, Beijing 100049, China;
3 Institute of Atmospheric Physics, Chinese Academy of Sciences, Beijing 100029, China;
4 Department of Geography, Qinghai Normal University, Xining 810008, China
Received November 11, 2009; accepted December 31, 2009
Two tree-ring MXD (maximum latewood density) chronologies of Abies fabri were developed from the eastern slopes of Gongga Mountain, and a regional chronology (RC) was established based on the two MXD chronologies. There were significant positive correlations between the three MXD chronologies and August–September temperature, and the RC had the highest correlation (r=0.733, n=48, P<0.001) with mean August–September temperature. Based on growth-climate analyses, we reconstructed mean August–September temperature during the past 171 years for the study area. The reconstruction explained 53.5% of the instru-mental temperature variance during the period 1960–2007 (F=52.8, R2
adj =52.4%). In the past 171 years, there were 22 very warm years and 23 very cold years, four cold periods (1837–1842, 1884–1891, 1899–1905 and 1984–1989) and three warm periods (1966–1973, 1916–1924 and 1876–1881). Our reconstruction was validated by other tree ring-based temperature reconstructions from the surrounding area and documented climate disaster events.
Gongga Mountain, Abies fabri, tree-ring density, temperature reconstruction
Citation: Duan J P, Wang L, Li L, et al. Temperature variability since A.D. 1837 inferred from tree-ring maximum density of Abies fabri on Gongga Mountain, China. Chinese Sci Bull, 2010, 55: 3015−3022, doi: 10.1007/s11434-010-3182-8
Tree-ring data are a major proxy for paleoclimate research due to their accurate dating, high resolution, wide distribu-tion and good replication [1–4]. In China, climate recon-structions based on tree rings have been conducted in most cold or arid climate regions covered by original forest [4–9]. The Tibetan Plateau is a sensitive ecosystem and a driver of regional climate change; therefore, it is considered an important region for tree-ring research. However, avail-able tree-ring density data are still sparse over the Tibetan Plateau because most studies focused on tree-ring width [9–12]. In high-altitude, low-temperature regions, tree-ring density studies can shed more light on climate variability.
Tree-ring density is an important aspect of dendroclima-tology. Its response to climate variability occurs in the same *Corresponding author (email: [email protected])
year as the climatic event. Seven tree-ring variables (maxi-mum density, minimum density, mean early wood density, mean latewood density, earlywood width, latewood width and annual ring width) can be investigated by X-ray pho-tography. These variables reveal diverse climate informa-tion, and also can be validated and complemented by each other. Tree-ring density variables, especially for maximum latewood density from cold moist sites, have great potential for reconstructing summer or growing season temperature [13–18]. In this paper, we analyzed growth-climate re-sponse using the MXD series from the eastern slopes of Gongga Mountain on the eastern Tibetan Plateau. We re-constructed mean August-September temperature during the past 171 years in the study area. The reconstruction ad-dresses the paucity of long-term climatic records and pro-vides a basic reference for advance and retreat of the mon-
3016 DUAN JianPing, et al. Chinese Sci Bull September (2010) Vol.55 No.26
soonal temperate glaciers in China.
1 Materials and methods
1.1 Selection of tree-ring samples
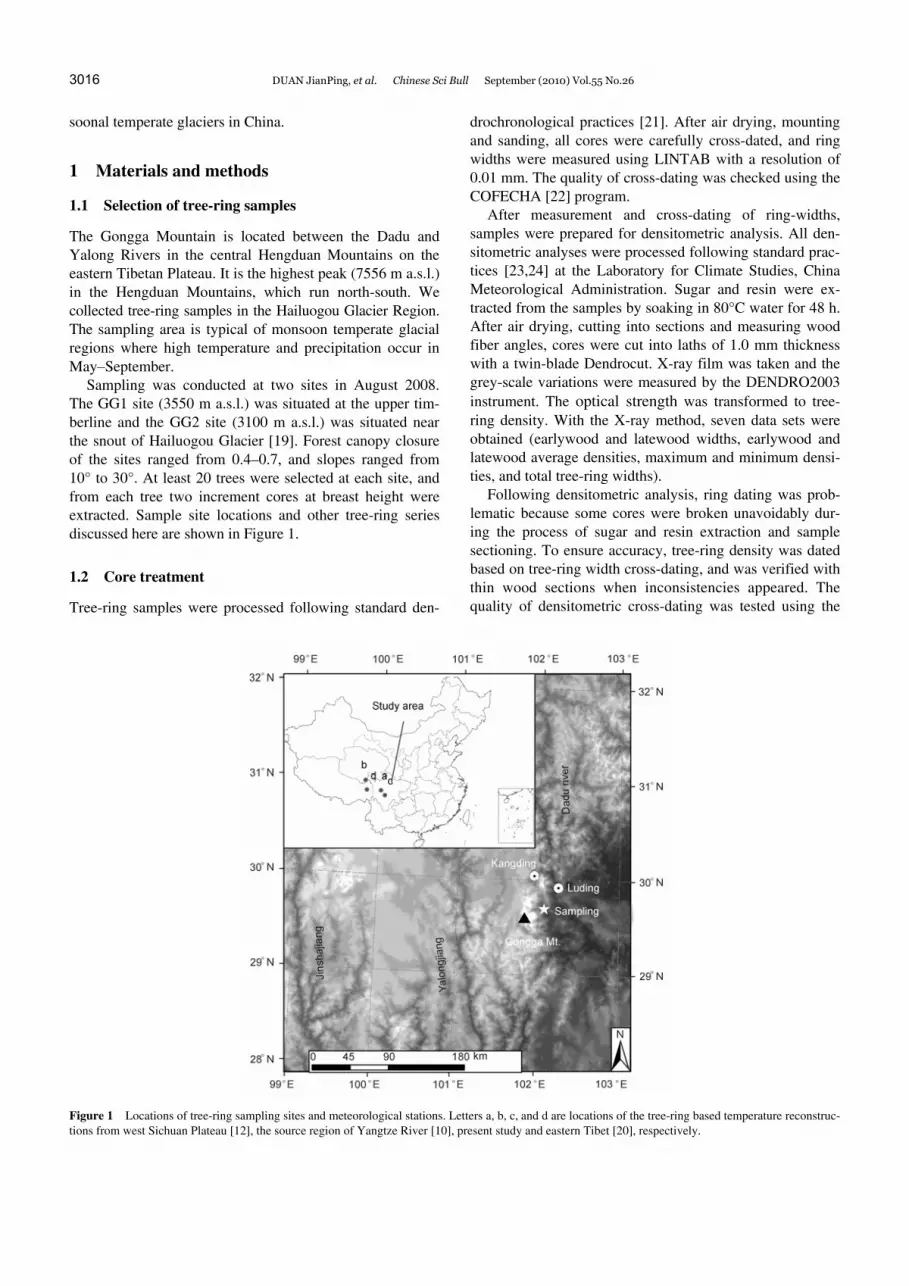
The Gongga Mountain is located between the Dadu and Yalong Rivers in the central Hengduan Mountains on the eastern Tibetan Plateau. It is the highest peak (7556 m a.s.l.) in the Hengduan Mountains, which run north-south. We collected tree-ring samples in the Hailuogou Glacier Region. The sampling area is typical of monsoon temperate glacial regions where high temperature and precipitation occur in May–September.
Sampling was conducted at two sites in August 2008. The GG1 site (3550 m a.s.l.) was situated at the upper tim-berline and the GG2 site (3100 m a.s.l.) was situated near the snout of Hailuogou Glacier [19]. Forest canopy closure of the sites ranged from 0.4–0.7, and slopes ranged from 10° to 30°. At least 20 trees were selected at each site, and from each tree two increment cores at breast height were extracted. Sample site locations and other tree-ring series discussed here are shown in Figure 1.
1.2 Core treatment
Tree-ring samples were processed following standard den-
drochronological practices [21]. After air drying, mounting and sanding, all cores were carefully cross-dated, and ring widths were measured using LINTAB with a resolution of 0.01 mm. The quality of cross-dating was checked using the COFECHA [22] program.
After measurement and cross-dating of ring-widths, samples were prepared for densitometric analysis. All den-sitometric analyses were processed following standard prac-tices [23,24] at the Laboratory for Climate Studies, China Meteorological Administration. Sugar and resin were ex-tracted from the samples by soaking in 80°C water for 48 h. After air drying, cutting into sections and measuring wood fiber angles, cores were cut into laths of 1.0 mm thickness with a twin-blade Dendrocut. X-ray film was taken and the grey-scale variations were measured by the DENDRO2003 instrument. The optical strength was transformed to tree- ring density. With the X-ray method, seven data sets were obtained (earlywood and latewood widths, earlywood and latewood average densities, maximum and minimum densi-ties, and total tree-ring widths).
Following densitometric analysis, ring dating was prob-lematic because some cores were broken unavoidably dur-ing the process of sugar and resin extraction and sample sectioning. To ensure accuracy, tree-ring density was dated based on tree-ring width cross-dating, and was verified with thin wood sections when inconsistencies appeared. The quality of densitometric cross-dating was tested using the
Figure 1 Locations of tree-ring sampling sites and meteorological stations. Letters a, b, c, and d are locations of the tree-ring based temperature reconstruc-tions from west Sichuan Plateau [12], the source region of Yangtze River [10], present study and eastern Tibet [20], respectively.

DUAN JianPing, et al. Chinese Sci Bull September (2010) Vol.55 No.26 3017
COFECHA program. The accuracy of tree-ring density dat-ing was ensured through the above procedure.
1.3 MXD chronology development
MXD chronologies were developed with the ARSTAN pro-gram [25]. After comparing the statistics of each raw MXD series and several detrending methods, we found that the smoothing spline with two thirds of the series length gave better results for removing or reducing the influence of dis-turbance and changes in tree growth with age. The MXD series were therefore detrended using the smoothing splines with two thirds of the series length, and standardized index series of the two sampling sites were established. The statis-tical characteristics of standard (STD) and residual chro-nologies (RES) for the two sampling sites were very similar or identical, which indicated that STD and RES contained common signals. We chose STD for correlation analysis and reconstruction in this study. The correlation efficient between the two MXD STD during 1858–2007 was 0.626 (P<0.001). To reduce possible site-specific effects on tree growth and emphasize regional-scale climate signals, all MXD tree-ring index series were combined to construct the regional chronology (Figure 2). The statistical characteris-tics of the three MXD chronologies are shown in Table 1.
2 Growth-climate responses of MXD series
2.1 Climate data
Continuous air temperatures in the sampling area have been recorded at an automated weather station at 3000 m a.s.l. since 1988. Because these records are too short to calibrate a long-term climate reconstruction, we used climate data (1960–2007) from the Luding County observation station as being representative of local climate conditions.
Even at different elevations, there were similar variations
Figure 2 MXD standard chronologies from the sites GG1 and GG2 and the regional chronology (RC). The year since SSS>0.85 is indicated by an arrow.
Table 1 Site characteristics and chronology statistics (common interval analysis for 1900–2000) a)
Site GG1 GG2 RC
Elevation (m a.s.l.) 3550 3100 –
Latitude 29°33′N 29°33′N –
Longitude 101°58′E 102°E –
Slope aspect SW NW –
Trees/cores 20/39 22/42 42/79
MS 0.05 0.042 0.046
SD 0.043 0.036 0.039
Rac –0.086 0.043 –0.129
SSS >85% 1842/11 1858/15 1837/17
Rar 0.211 0.166 0.179
Rbt 0.21 0.162 0.177
Rwt 0.33 0.268 0.290
SNR 7.5 6.36 13.1
EPS 0.88 0.864 0.929
PC1 24.7% 20.7% 20.2% a) MS, Mean sensitivity; SD, standard deviation; Rac, first-order auto-
correlation, year and minimum number of trees needed for SSS >0.85; Rar, mean inter-series correlation; Rbt, correlation between trees; Rwt, correla-tion within trees; SNR, signal to noise ratio; EPS, expressed population signal; PC1, variance in 1st eigenvector.
and significant correlations between the two stations (Figure 3). The correlation coefficients of the multi-year mean of monthly temperature and precipitation during 1988–2007 were 0.992 and 0.963 (P<0.0001), respectively. Most an-nual precipitation at the two stations occurred during May– September, and this period also had the highest annual temperatures (Figure 3). A homogeneity test of datasets from the two stations showed that temperature and precipi-tation data were all homogeneous, although temperature was better than precipitation. Because temperature was the reconstruction target here, we assumed that climate data from Luding County meteorological station represented the main climatic conditions in the study area. Figure 3 shows seasonal variability in mean monthly temperature and monthly precipitation at Luding County and Gongga Mountain.
2.2 Correlation analyses between MXD series and cli-mate data
We calculated correlation coefficients for the three MXD STDs and monthly temperature (maximum, mean and minimum) and precipitation from the previous September to the current October (Figure 4).
As Figure 4 shows, the pattern of correlation coefficients between individual MXD chronologies and monthly mean, maximum and minimum temperature were similar. At the 0.01 significance level, all three chronologies correlated sig-nificantly with temperature in August and September, and presented the highest correlation with mean August– Sep-tember temperature. However, the month of the highest correlation coefficient between individual MXD chronolo-gies and monthly temperature is August for GG1 and Sept-

3018 DUAN JianPing, et al. Chinese Sci Bull September (2010) Vol.55 No.26
Figure 3 Annual temperature (T) and precipitation (Pre) at the Luding County and Gongga Mountain meteorological stations.
ember for GG2. These results indicate which month tem-perature is the main limiting factor in formation of MXD may be related to altitude. There are few significant correlations between individual MXD chronologies and precipitation at the 0.01 significance level (Figure 4). The MXD of Abies fabri on Gongga Mountain is controlled mainly by Au-gust-September temperatures (Figure 5), indicating this is the important period for tracheid cell wall thickening. This result also is in agreement with studies from other regions [20,26]. Based on the growth-climate relationship, we reconstructed the August-September temperature for the study area.
3 Reconstruction and variation of mean Au-gust–September temperature
Based on growth-climate analyses, we calculated a transfer function by linear regression using August–September tem-perature as the dependent variable and the regional MXD STD as the independent variable. The transform function was derived as: T8–9=6.5039+14.54×RC, where T8–9 is re-constructed August–September temperature, and RC is re-gional MXD STD. The final calibration model accounts for 53.5% (r2
adj=52.4%) of total August–September temperature variance over the calibration period 1960–2007 (Table 2). During this period, the correlation coefficient between RC and mean August–September temperature was 0.73 (P<0.001). The comparison between actual and recon-structed mean August–September temperature is shown in Figure 5. In general, the temperature reconstruction derived from this model showed good agreement with actual re-gional temperature, but the increased disparity from 1986 to 1988 is evident. The disparity may be related to the highly favorable temperatures of May–June during 1986–1988, which encouraged tree-ring growth and increased carbohy-drate storage in the stem, so that growth of MXD was not affected significantly by lower temperatures in the later growing season [27].
We employed the leave-one-out cross-validation method to verify our reconstruction [28], the statistics of which are shown in Table 2. The model yielded significant verification
Figure 4 Pearson correlation coefficients between the three MXD chronologies and monthly mean, minimum and maximum temperature and precipitation from Luding County meteorological station from the previous September to the current October over the period 1960–2007. The horizontal dotted denotes the 0.01 level significance. AS is the average temperature for August and September.

DUAN JianPing, et al. Chinese Sci Bull September (2010) Vol.55 No.26 3019
Table 2 Calibration statistics and leave-one-out verification results for the analysis period 1960–2007a)
Period R2 R2a F ST1 ST Pmt RE R P
1960–2007 53.5% 52.4% 52.8 34+/13–* 37+/11–* 3.37 0.489 0.73 <0.001 a) R2 and R2
a are coefficients of determination, and adjusted coefficients of determination of regression analysis, respectively. F is the F statistic for re-gression model significance. ST and ST1 are sign test and sign test of the first differences, respectively, which counts the number of agreements and dis-agreements between reconstructed and instrumental climatic data; Pmt is product mean test. RE is the reduction of error; R is the correlation coefficient; P is the significance level of Pearson correlation.
statistics as measured by the sign test, sign test of the first differences and product mean test (P<0.01). The RE value was 0.489, indicating that some success in the reconstruc-tion. A statistically significant correlation coefficient (R=0.73) and F statistic (F=52.8) for statistical significance of the regression models additionally supported the recon-struction’s validity.
Based on the transfer function, we reconstructed mean August-September temperature during the past 171 years (1837–2007 A.D.) for the study area (Figure 6). Based on a 5-year moving average, seven remarkable cold periods oc-curred during 1837–1842, 1860–1864, 1884–1891, 1899– 1905, 1956–1966, 1976–1990 and 1997–2001. Conversely, six warm periods occurred in 1865–1883, 1892–1898, 1907–1922, 1967–1975, 1991–1996 and 2002–2007. Of these periods, four severe cold events lasted more than 5 years: 1837–1842, 1884–1891 (except 1888), 1899–1905 (except 1900) and 1984–1989. Three extreme warm events
Figure 5 Actual and estimated mean August–September temperature for the period 1960–2007.
lasting more than 5 years occurred: 1872–1883, 1916–1924 (except 1920) and 1966–1973.
To characterize interannual temperature fluctuations, we used the standard deviation (σ = ± 0.507°C) of the recon-struction. We define a very warm year as > mean + 1σ, and a very cold year as < mean –1σ. The full mean Au-gust–September temperature reconstruction showed strong interannual variability throughout the entire period from 1837 to 2007 (Figure 6). There were 22 very warm years and 23 very cold years in the reconstruction, accounting for 13.2% of the total. Over the past 171 years, the warmest and the coldest year of August–September temperature occurred in 1847 and 1965, respectively.
4 Discussion
Ring-density features of Abies fabri in the high forest on the eastern slopes of Gongga Mountain were similar to those at high-elevation and high-latitude areas, where maximum latewood density is limited by the temperature of the current August and September [20,27]. Analyses of tree-cambial activities show that the tree radial growth in the upper forest is affected mainly by mean minimum temperature of the previous November and current July [29,30]. This growth pattern occurs in the high-altitude forests from the arid re-gion in the northern to the humid region in the southeastern Tibetan Plateau [30]. July temperature is therefore a critical climate factor in the growing season that constrains tree radial growth in most regions of the Tibetan Plateau. This is
Figure 6 Mean August–September temperature reconstruction of Gongga Mountain derived from MXD. Thin line represents annual values; bold line shows smoothed 5-year moving average; dotted line indicates standard deviation.

3020 DUAN JianPing, et al. Chinese Sci Bull September (2010) Vol.55 No.26
the photosynthetic accumulation period for Abies fabri in August and September, manifested by thickening of the latewood cell walls [17]. Favorable temperatures in Au-gust–September are conducive to photosynthesis, and con-tribute to latewood cell wall thickening and production of higher latewood density. October temperature shows little effect on thickening of the latewood cell wall.
To verify our reconstruction, we compared it with the advance and retreat of the Hailuogou Glacier over the past 100 years [31] (Figure 7(e)), and other three tree-ring-based temperature reconstructions from near our sampling sites (Figure 1). Shao and Fan [12] reconstructed winter mean minimum temperature on the West Sichuan Plateau based on tree-ring width (Figure 1(a); 7(a)), Liang et al. [10] recon-structed mean summer minimum temperature in the re-source region of the Yangtze River on the Tibetan Plateau using tree-ring widths (Figure 1(b); 7(b)), and Wang et al. [20] reconstructed mean August–September temperature in the Changdu region of eastern Tibet using MXD (Figure 1(d); 7(d)). Our reconstruction shows similar warm/cold intervals to these other temperature reconstructions (Figure 7). Over the past 171 years, the warm 1930s–1950s, the cold 1900s–1910s and the warming trend since 1990 are consistent between the different records. The warm 1850s were occurred in three of the four temperature series (Figure 7(b), (c) and (d)). The high 1860s–1880s August–September temperatures identified here and in the reconstructions of Wang et al. [20] are consistent with warm summers in southern Tibet [32].
Although the distances between these comparison sites are relatively small, there were significant differences between reconstructions. There were two warm periods
(1907–1922 and 1967–1975) that occurred only in our re-construction. It was reported that summer temperature on the western Sichuan Plateau increased in the early 20th century, and reached a peak during the mid-1920s slightly ahead of the 1930s peak observed in other Chinese regions [33,34]. The warm period of 1910–1920 was also men-tioned in a calamity memorandum in Sichuan, China. There were abnormally severe droughts during 1910–1920 around our study area, especially in 1913 and 1919 [35]. These may have been related to the high temperature period of 1910–1920. The warm period of 1967–1975 was also indi-cated by August-September temperature variations in the Changdu region, eastern Tibet [20] and summer temperature variations on the Chengdu Plateau and Xiaojin region, Si-chuan [33,34]. The 1970s cooling phase and 1980s warming phase shown our reconstruction also occurred on Chengdu Plateau and in Xiaojin region, Sichuan. The warm periods 1907–1922 and 1967–1975 might be only local summer temperature changes that occurred on the West Sichuan Pla-teau, and which were absent in the reconstructions of Shao and Fan [12] and Liang et al. [10]. The discrepancies between different temperature reconstructions may be also caused by the different representative target season windows.
In our reconstruction, the 1960s cold period with 1965 as its coldest year was also recorded in the climatic calamity document. A memorandum from Sichuan, China, men-tioned abnormally heavy snow (~20 mm) in Xinduqiao of Kangding near our study area on June 20, 1965 [35]. Sev-eral severe frosts occurred in Aba Prefecture, Sichuan, from the end of July to August in the same year, which caused crop lodging, snapping and abnormal growth, leading to large reductions in crop yield [35].
Figure 7 Graphical comparison of the mean August–September temperature reconstruction in this study with other tree-ring series and Hailuogou Glacier variations records. (a) Winter season temperature reconstruction from west Sichuan Plateau [12] (Figure 1a); (b) mean summer minimum temperature recon-struction in the resource region of Yangtze River on the Tibetan Plateau [10] (Figure 1b); (c) mean August–September temperature reconstruction of the present study; (d) mean August–September temperature reconstruction in eastern Tibet [20] (Figure 1d); (e) the front variations of the Hailuogou Glacier during the past 100 years [31]. All series were smoothed with a 10-year moving average.
DUAN JianPing, et al. Chinese Sci Bull September (2010) Vol.55 No.26 3021
Our reconstructed temperature fluctuations coincide with the development of Hailuogou Glacier. The 1880–1930 cold period (except for 1910–1920) matched the advance or standstill of the Hailuogou Glacier from 1900 to 1930, while the warm periods 1930–1966 corresponded to the rapid glacier retreat. A slow retreat of the Hailuogou Glacier from 1966–2004 also coincided with a cold period in our reconstruction (except for 1967–1975), and warming after 2000 as shown in our reconstruction coincided with rapid glacier retreat. Because of the response lag of glacial ad-vance and retreat to climate change, the 1910–1920 warm period and 1950s–1960s cold period did not produce rapid glacier variations; the lag phase is about 10 years in China [36,37]. On the other hand, glacial advance and retreat is controlled largely by changes in summer temperature [10]. Our reconstruction of August–September temperature may not be a significant indicator of past fluctuations of the Hailuogou Glacier.
In summary, our reconstruction shows large-scale tem-perature variability on the Tibetan Plateau in some periods (after 1990, 1930–1950, the end of the 19th century and the beginning of the 20th century) as demonstrated by other re-cords, including winter minimum temperature variability, and regional climate characteristics in the periods 1910–1920 and 1967–1975. Our reconstruction paralleled fluctuations in the Hailuogou Glacier and was consistent with recorded climatic calamity years. In particular, it successfully represented two warm periods in 1910–1920 and 1967–1975, and the recent 10 years of warming on the western Sichuan Plateau.
5 Conclusions
The MXD of Abies fabri at the upper timberline of the Gongga Mountains region was controlled mainly by Au-gust–September temperature. This growth-response pattern was also shown in other high-altitude regions.
Our reconstruction revealed four cold periods and three warm periods for the study area in the past 171 years (1837– 2007). The numbers of very warm years and very cold years were almost same, accounting for ~13% of the total.
Statistical analysis indicated that our model was suc-cessful in tracking temperature variability, and the ex-plained variance is 53.5% for the period 1960–2007. Our reconstruction is supported by other proxy paleoclimatic records (historical calamity records, other temperature se-ries based on tree rings near our sampling sites, and Hailuogou Glacier variations). Such agreements demon-strate the reliability of our reconstruction.
Meteorological data from the Gongga Mountain and Luding County were provided by the Gongga Mountain Alpine Ecosystems Observation Station and Dr. Jiang X W, respectively. We thank the editors and reviewers for their comments and suggestions on our manuscript. This work was sup-ported by the Science and Technology Ministry Commonwealth Trade
(Meteorology) Scientific Research Specialized Project (GYHY200806011), the National Basic S&T Project of the Ministry of Science and Technology of China (2007FY220200), and the National Natural Science Foundation of China (40871058).
1 Fritts H C. Tree Rings and Climate. London: Academic Press, 1976 2 Timothy J O, Briffa K R.The spatial extent of 20th-century warmth in
the context of the past 1200 years. Science, 2006, 311: 841–844 3 Fidel A R, Carlos Le-Q, José A B, et al. Climate variability 50000
years ago in mid-latitude Chile as reconstructed from tree rings. Na-ture, 2001, 410: 567–570
4 Zhu H F, Zheng Y H, Shao X M, et al. Millennial temperature recon-struction based on tree-ring widths of Qilian juniper from Wulan, Qinghai Province, China. Chinese Sci Bull, 2008, 53: 3914–3920
5 Shao X M, Wu X D. Reconstruction of climate change on Changbai Mountain Northeast China using tree-ring data (in Chinese). Quat Sci, 1997, 1: 76–85
6 Liu Y, Shi J F, Shishov V, et al. Reconstruction of May-July precipi-tation in the north Helan Mountain, Inner Mongolia since A.D. 1726 from tree-ring late-wood widths (in Chinese). Chinese Sci Bull, 2004, 49: 265–269
7 Yuan Y J, Jin L Y, Shao X M, et al. Variations of the spring precipi-tation day numbers reconstructed from tree rings in the Urumqi River drainage, Tianshan Mts. Over the last 370 years. Chinese Sci Bull, 2003, 48: 1507–1510
8 Liang E Y, Shao X M, Liu H Y, et al. Tree-ring based PDSI reconstruc-tion since A. D. 1842 in the Ortindag Sand Land, east Inner Mongolia. Chinese Sci Bull, 2007, 52: 2715–2721
9 Zhang Q B, Cheng G D, Yao T D, et al. A 2326-year tree-ring record of climate variability on the northeastern Qinghai-Tibetan Plateau. Geophys Res Lett, 2003, 30, doi: 10.1029/2003GL017425
10 Liang E Y, Shao X M, Qin N S. Tree-ring based summer temperature reconstruction for the source region of the Yangtze River on the Ti-betan Plateau. Glob Planet Change, 2008, 61: 313–320
11 Gou X H, Chen F H, Yang M X, et al. A comparison of tree-ring re-cords and glacier variations over the past 700 years, northeastern Ti-betan Plateau. Ann Glaciol, 2006, 43: 86–90
12 Shao X M, Fan J M. Past climate on west Sichuan Plateau as recon-structed from ring-widths of dragon spruce (in Chinese). Quat Sci, 1999, 1: 81–89
13 Briffa K R, JonesP D, Schweingruber F H. Summer temperature pat-terns over Europe: A reconstruction from 1759A.D. based on muxi-mum latewood density indices of conifers. Quat Res, 1988, 30: 36–52
14 Schweingruber F H, Briffa K R, Jones P D. Yearly maps of summer temperatures in western Europe from A.D. 1750 to 1975 and western North America from 1600 to 1982: Results of a radiodensitometrical study on tree rings. Vegetatio, 1991, 92: 5–71
15 Luckman B H, Briffa K R, Jones P D, et al. Tree-ring based recon-struction of summer temperatures at the Columbia Icefield, Alberta, Canada, A. D. 1073–1983. Holocene 1997, 7: 375–389
16 Chen J, Wang L L, Zhu H F, et al. Reconstructing mean maximum temperature of growing season from the maximum density of the Schrenk Spruce in Yili, Xinjiang, China. Chinese Sci Bull, 2009, 54: 2300–2308
17 Wang L L, Shao X M, Huang L, et al. Tree-ring characteristics of Larix gmelinii and Pinus sylvestris var. mongolica and their response to cli-mate in Mohe, China (in Chinese). Acta Phyt Sin, 2005, 29: 380–385
18 Fan Z X, Bräuning A, Yang B, et al. Tree ring density-based summer temperature reconstruction for the central Hengduan Mountains in southern China. Glob Planet Change, 2009, 65: 1–11
19 He Y Q, Li Z X, Yang X M, et al. Changes of the Hailuogou glacier, Mt. Gongga, China, against the background of global warming in the Last several decades. J Chin Univ Geosci, 2008, 19: 271–281
20 Wang L, Duan J P, Chen J, et al. Temperature reconstruction from tree- ring maximum density of Balfour spruce in eastern Tibet, China. Int J Climatol, 2009 (www.interscience.wiley.com), doi:10.1002/joc.2000
21 Cook E R, Kairiukstis L A. Methods of Dendrochronology: Applica-tions in the Environmental Sciences. Dordrecht: Kluwer Academic

3022 DUAN JianPing, et al. Chinese Sci Bull September (2010) Vol.55 No.26
Publishers, 1990. 1–13 22 Cook E R, Buckley B M, D’Arrigo R D, et al. Warm-season tempera-
tures since 1600 BC reconstructed from Tasmanian tree rings and their relationship to large-scale sea surface temperature anomalies. Clim Dyn, 2000, 16: 79–91
23 Lenz O, Schaer E, Schweingruber F H. Methodological problems rela-tive to the measurement of the density and width of growth rings by X-ray densitograms of wood. Holzforschung, 1976, 30: 114–123
24 Schweingruber F H, Bartholin T, Schär E, et al. Radiodensitomet-ric-dendroclimatological conifer chronologies from Lapland (Scandina-vie) and the Alps (Switzerland). Boreas, 1988, 17: 559–566
25 Cook E R. A time series analysis approach to tree-ring standardization. Dissertation for the Doctoral Degree. Tucson: University of Arizona, 1985. 1–171
26 Bräuning A, Mantwill B. Increase of Indian Summer Monsoon rain-fall on the Tibetan plateau recorded by tree rings. Geophys Res Lett, 2004, 31, L24205, doi: 10.1029/2004GL020793
27 Wang L, Payette S, Begin Y. Relationships between anatomical and densitometric characteristics of black spruce and summer temperature at tree line in northern Quebec. Can J For Res, 2002, 32: 477–486
28 Mosteller F, Tukey J W. Data Analysis and Regression. Massachu-setts: Addison-Wesley Publishing Company, 1977. 1–588
29 Rossi S, Deslauriers A, Gricar J, et al. Critical temperatures for xy-logenesis in conifers of cold climates. Glob Ecol Biogeogr, 2008, 17:
696–707 30 Liang E Y, Eckstein D. Dendrochronological potential of the alpine
shrub Rhododendron nivale on the south-eastern Tibetan Plateau. Ann Bot, 2009, 104: 665–670
31 Li Z X, He Y Q, Jia W X, et al. Response of “glaciers-runoff” system in a typical temperate-glacier, Hailuogou Glacier in Gongga Mountain of China to global change (in Chinese). Sci Geogr Sin, 2008, 28: 229–234
32 Liang E Y, Shao X M, Xu Y. Tree-ring evidence of recent abnormal warming on the southeast Tibetan Plateau. Theor Appl Climatol, 2009, 98: 9–18
33 Wu P, Wang L L, Shao X M. Reconstruction of summer temperature variation from maximum density of alpine pine during 1917–2002 for west Sichuan Plateau, China. J Geogr Sci, 2008, 18: 201–210
34 Chen W X, Hao K J, Tian H. Multiple time scale analyses of surface temperature variations in Sichuan during the last 100 years (in Chi-nese). J Chengdu Inst Meteorol, 1999, 14: 78–82
35 Wen K G. China Meteorological Calamity Grand Ceremony: Sichuan (in Chinese). Beijing: Meteorological Press, 2005. 474–518
36 Duan J P, Wang L L, Ren J W, et al. Progress in glacier variations in China and its sensitivity to climatic change during the past century (in Chinese). Prog Geogr, 2009, 28: 231–237
37 Wang N L, Zhang X S. Mountain glacier fluctuations and climatic change during the last 100 years (in Chinese). J Glaciol Geocryol, 1992, 14: 242–250