technical and economic analysis of electricity generation from forest, fossil, and wood-waste fuels...
TRANSCRIPT
lable at ScienceDirect
Energy 36 (2011) 5579e5590
Contents lists avai
Energy
journal homepage: www.elsevier .com/locate/energy
Technical and economic analysis of electricity generation from forest, fossil,and wood-waste fuels in a Finnish heating plant
Teijo Palander*
University of Eastern Finland, School of Forest Sciences, P.O. Box 111, FI-80101 Joensuu, Finland
a r t i c l e i n f o
Article history:Received 10 May 2011Received in revised form4 July 2011Accepted 9 July 2011Available online 11 August 2011
Keywords:Dynamic multiple-objective linearprogrammingEnergy-flow modelForest energyEnergy efficiencyForest technology
* Tel.: þ358 504619988; fax: þ358 132511111.E-mail address: [email protected].
0360-5442/$ e see front matter � 2011 Elsevier Ltd.doi:10.1016/j.energy.2011.07.014
a b s t r a c t
The Finnish energy industry is subject to policy decisions regarding renewable energy production andenergy efficiency. Conventional electricity generation has environmental side-effects that may causeglobal warming. Renewable fuels are superior because they offer near-zero net emissions.
In this study, I investigated a heating mill’s ability to generate electricity from forest fuels in southernFinland on a 1-year strategic decision-making horizon. I solved the electricity generation problem usingoptimization of the energy products and fuel mixtures based on energy efficiency and forest technology.The decision environment was complicated by the sequence-dependent procurement chains for forestfuels. The optimal product and fuel mixtures were selected by minimizing procurement costs, maxi-mizing production revenues, and minimizing energy losses.
The combinatorial complexity of the problem required the use of adaptive techniques to solvea multiple-objective linear programming systemwith industrial relevance. I discuss the properties of thedecision-support system and methodology and illustrate pricing of electricity generation based on realindustrial data. The electricity-generation, -purchase, and -sales decisions are made based ona comprehensive technical and economic analysis that accounts for procurement of local forest fuels ina holistic supply chain model.
� 2011 Elsevier Ltd. All rights reserved.
1. Introduction
1.1. Renewable energy production
As part of the EU’s response to climate change [1], the Finnishgovernment has proposed that renewable energy productionshould account for 38% of the national total by 2020, and believesthat the utilization of forest fuels in energy production is a prom-ising approach to accomplish this goal [2]. In Finland, 3.4 millionsolid m3 of forest chips were used to generate 6.8 TWh of energy in2006 [3]. There are currently targets to increase the annual use offorest chips to between 8 and 12 million solid m3 per year(16e24 TWh) by 2015 [4,5]. These targets presuppose that thedelivery of forest fuels to the energy-production sector can betripled or even quadrupled compared with the current deliveryvolume. This will require significant changes in the logistics envi-ronment for fossil and wood-waste fuels, but the changes arecomplicated by the sequence-dependent procurement chainsinvolved in the production of forest fuels.
All rights reserved.
In this paper, I have defined combined heat and power (CHP) tomean heat produced by combustion of fuel to drive a steam-basedgenerator, and power in the form of electrical energy; both forms ofenergy can be used by the plant that produces them, or sold toother customers, including other units of the same company. This isalso referred to as cogeneration. According to a recent survey,managers of energy plants will aim to increase energy productionfrom renewable fuels at the expense of fossil fuels [6]. However, inlight of the country’s emission-reduction targets, it is interesting tonote that manager believes that peat will continue to be animportant fuel in Finnish CHP production in the future. A typicalFinnish plant that produces energy from peat fuel purchases lessthan 5% of its energy needs from the national electrical grid and cansell power about 40% to the grid [6]. Because of Finland’s large areasof water and wetlands, extensive areas of peat have developed. Theeasy availability of this biomass means that about 40% of the energygenerated by power plants is provided by burning peat. It is nota renewable fuel because it regenerates too slowly.
Finland expects to achieve its renewable energy target throughthe implementation of additional policy measures [2]. This targetwill require incentive-based policies, including the use of carbontaxes and fuel taxes that will increase the relative cost of non-renewable fuels [7e10], which will both decrease consumption of

Nomenclature
C number of customers (1, ., c, ., 4)Clos total lost revenues (V) due to energy losses during
production and sales during the decision-makinghorizon
Cmax total active procurement timeCtot total operating costs (V) of the supply chain during the
decision-making horizoncenckt the energy loss cost (VMWh�1) for product n
allocated to customer c at plant k during period tcelnckt lost revenues due to energy losses (VMWh�1) for
product n allocated to customer c at plant k duringperiod t
clijt purchase and logging costs (VMWh�1) for fuelmixture i from team j during period t
cmikt plant inventory cost (VMWh�1) for fuel mixture i atplant k during period t
cmcikt chipping cost (VMWh�1) for fuel mixture i at plant kduring period t
cpnckt the production cost (VMWh�1) of product n allocatedto customer c at plant k during period t
csnckt the sales cost (VMWh�1) of product n sold tocustomer c from plant k during period t
cyijkt transportation cost (VMWh�1) to transport fuelmixture i from team j to plant k during period t
cycijkt chipping and transportation cost (VMWh�1) totransport fuel mixture i from team j to plant k duringperiod t
Dg deviation (V) above and below the decision-makers’goals defined by the study problem
dn due date of task nEnckt energy loss (MWh) for product n allocated to customer
c at plant k during period tEmaxnckt maximum energy loss (MWh) of product n allocated
to customer c at plant k during period tEminnckt minimum energy loss (MWh) of product n allocated to
customer c at plant k during period tEBnck energy loss (MWh) of product n allocated to customer
c at plant k at the beginning of the decision-makinghorizon
EDmaxnkt the maximum energy content (MWh) of product nrequired by plant k during period t
EDminnkt the minimum energy content (MWh) of product nrequired by plant k during period t
EInck energy loss (MWh) of product n allocated to customerc at plant k at the beginning of the decision-makinghorizon
FDk total energy content (MWhm�3) required at plant kduring the decision-making horizon
FDmaxikt maximum energy content (MWhm�3) of fuel mixturei required by plant k during period t
FDminikt minimum energy content (MWhm�3) of fuel mixture irequired by plant k during period t
G number of deviations from the decision-maker’s goals(1, ., g, ., 6)
I number of energy-fuel mixtures (1, ., i, ., I)J number of teams (1, ., j, ., J)K number of plants (1, ., k, ., K)Lijt energy content (MWhm�3) of fuel mixture i
purchased from and logged by team j during period tLmaxijt maximum energy content (MWhm�3) of fuel mixture
i purchased from and logged by team j during period t
Lminijt minimum energy content (MWhm�3) of fuel mixture ipurchased from and logged by team j during period t
Mikt energy content (MWhm�3) of fuel mixture i held inthe plant inventory of plant k at the end of period t
Mmaxikt maximum energy content (MWhm�3) of fuel mixturei held in plant inventory k during period t
Mminikt minimum energy content (MWhm�3) of fuel mixture iheld in plant inventory k during period t
MBik energy content (MWhm�3) of fuel mixture i stored byteam k at the end of the decision-making horizon
MCikt energy content (MWhm�3) of fuel mixture i chippedand held in the plant inventory of plant k at the end ofperiod t
MIik energy content (MWhm�3) of fuel mixture i stored byplant k at the beginning of the decision-makinghorizon
N number of tasks (1, ., n, ., 2), each of whichrepresents the delivery of a given mixture of products
p annual interest rate (%)Pnckt energy content (MWh) of energy product n allocated to
customer c that was produced at plant k during period tpens1kt production efficiency of product ns 1 at plant k during
period tprnckt production revenues (VMWh�1) from product n sold
to customer c from plant k during period tpron pre-specified production time for task nR total revenues (V) from energy production from the
supply chain during the decision-making horizonrn release date (i.e., time when raw materials become
available) of procurement task nSnckt energy content (MWh) of product n sold to customer c
from plant k during period tsnl setup time between tasks n and lT number of periods (1, ., t, ., T)tn delivery time of task nTarn tardiness of task nURmaxk maximum conversion efficiency between fuels and
products recovered by plant k during decision-makinghorizon
URmink minimum conversion efficiency between fuels andproducts required by plant k during decision-makinghorizon
Wc time-based procurement costwg positive weight that reflect the decision-maker’s
preferences regarding the relative importance ofobjective g
wTn tardiness penalty for task nXijt energy content (MWhm�3) of fuel mixture i held in
the roadside inventory of team j at the end of period tXBif energy content (MWhm�3) of fuel mixture i stored by
team j at the end of the decision-making horizonXIij energy content (MWhm�3) of fuel mixture i stored by
team j at the beginning of the decision-making horizonYijkt the energy content (MWhm�3) of fuel mixture i
transported from team j to plant k during period tYmaxij maximum energy content (MWhm�3) of fuel mixture
i transported from team jYminij minimum energy content (MWhm�3) of fuel mixture i
transported from team jYCijkt energy content (MWhm�3) of fuel mixture i chipped
and transported from team j to plant k during period tZ is the optimum weighted sum of wgDg during the
decision-making horizon
T. Palander / Energy 36 (2011) 5579e55905580

Fig. 1. Dynamics of the energy-resource inventories for an energy (CHP) plant: Vertical arrows represent sequence-dependent effects for the system; horizontal arrows representtime-dependent effects for the system. Arrows labeled with a þ represent inputs to a component of the system; arrows labeled with a e represent withdrawals from a component.
T. Palander / Energy 36 (2011) 5579e5590 5581
fossil fuels and improve energy efficiency (20%) by 2020. TheFinnish government’s policy includes taxes for heating fuels thatwill increase the costs of fossil and peat fuels. For example, theenergy content tax for fuel peat will be 1.90 VMWh�1 from 1January 2011 to 31 December 2012 and will increase to2.90 VMWh�1 from 1 January 2013 to 31 December 2014. A tax onemissions would motivate plants to cut back on their emissions ifthe cost of doing so was less than the cost of paying the tax. The keyprinciple of the Finnish energy taxation legislation is that all fuelsconsumed in the production of electricity are exempt from the tax,whereas the fuels consumed in the production of heat are subject tothe tax.When the same plant can produce both electricity and heat,the fuels used by the plant for these two purposes are consideredseparately for calculating the taxes. Another price driver is a feed-intariff for renewable energy sources, which guarantees the price andsales of electricity so as to give producers more confidence in itsproduction. The Finnish forest fuel market therefore faces aninteresting opportunity, because the feed-in tariff is also used forforest fuel production. The size of this tariff is suggested to be6.9 VMWh�1.
1.2. Optimization methods for dynamic multiple-objective linearprogramming system
The efficient use of available raw materials is vitally importantto the energy-production industry. Procurement decisions for rawmaterials play a key role in achieving this goal, which can only bereached using accurate information provided by optimizationmethods. Therefore, for decision-support systems to be efficient,they must be based on the right methodology for solving theproblem at hand. Since the classical work of Dantzig [11], therehave been continuous efforts by operational researchers to developoptimization methodologies suitable for various types of problemsrelated to procurement operations [12,13]. In addition to mathe-matical formulations, various heuristic approaches suitable forcases with various sequence-dependent problems have beenprovided by Dykstra [14], among others. Two of the earliest
continuous-time formulations for solving the problem of sched-uling energy production from forest fuels were presented byEriksson and Björheden [15] and Björheden and Eriksson [16].Decision-making models and a recent review of the various tech-niques for scheduling wood procurement as a system or as anenergy flow have also been published [17e19].
In the present paper, I focus on an integrated forest fuelprocurement and energy-production process of a CHP plant, andthe resulting problem in multiple-objective decision-making:how it is possible to optimize a multiple-objective model withpossibly conflicting decision-making principles (e.g., reducingcosts, maximizing revenues). Available decision alternatives areassumed to be defined by means of a mathematical model[20e23]. The term “dynamic multiple-objective linear program-ming” is used to refer to this model. The linear optimizationmethods are very advanced today and very well established. Inaddition to studies related on scheduling CHP production fromforest fuels, there are also studies addressing the development oflinear optimization methods for scheduling of CHP productionusing other than forest fuels [24,25]. The results have providedinformation on the relationship between power generation costand CO2 emissions, and allowed sensitivity analyses of importanteconomical parameters like natural gas and electricity prices. Inthis study, parameters are used by an adaptive optimizationtechnique to solve a multiple-objective linear programmingsystem with industrial relevance [26].
1.3. Scheduling problems in energy-production system
In the procurement of forest fuels, as well as in many otherbranches of the procurement of fuels and even in general raw-materials markets, the procurement environment is complicatedby significant sequence dependencies within the supply chain forvarious raw materials. On the other hand, daily changes often takeplace in such systems; for example, new orders arrive at the woodprocurement organization, some old orders are completed, somemay be modified, fuel prices may vary, and deliveries of forest fuels
T. Palander / Energy 36 (2011) 5579e55905582
can be delayed. Managers should thus be able to rapidly account forthese changes because they must often update their procurementprogram in real-time. If the procurement problem is solved in thetraditional way (i.e., manually), it is often necessary to oversimplifythe decision-making process, since managers have neither the timenor the ability to consider the entire complexity of the procurementchain. This can easily produce suboptimal procurement schedules,particularly if the problem is formulated using only a short-term(e.g., daily schedule) model. In addition to daily decision-support,managers require a tool that they can use to develop an optimallong-term fuel mixture strategy as the logistics environmentchanges. Furthermore, the tool should permit the development ofmonthly rather than daily schedules, since setup times for productmixtures tend to be planned on a monthly schedule. Managerscannot resolve this kind of monthly schedule on a daily basis usingstandard computer programs. It is therefore necessary to usea more flexible programming technique and develop adaptivemodels that are capable of responding rapidly to changes in thedecision environment.
The problem studied in the present paper is based on long-termproduction scheduling at an energy plant in Finland, wheremixtures of energy are provided by CHP production (Fig. 1). Theelectricity production from CHP plants is expected to increase bymore than 25% by 2050 [27,28]. On the other hand, increases inindustrial energy efficiency are expected to increase electricityproduction by (8%) 2050 [6]. According to the World EnergyCouncil, energy efficiency refers to the ratio of energy outputs tothe inputs used to produce those outputs. In addition to generationof more electricity with heat, there aremany other ways to improveenergy efficiency, such as improvements in the transmission andstorage of primary fuels; in this sense, improvements result fromthe technologies used in CHP production.
Electricity market prices have increased rapidly in recent years,which makes important to produce and sell additional electricitybecause this is an important factor in determining a heating plant’sprofitability. Recently, Finland has decided to support the salesprice of electricity from CHP plants so that the market price willremain constant, thereby encouraging the production of electricityand its input into a district’s electrical network. In this study, Iassumed that a high energy efficiency for electricity production canbe achieved by using the right mixture of fuels and that problemsdelivering this mixture can be avoided by using an effectivedecision-support methodology. However, there has been littleresearch about the topic of electricity pricing and production fromrenewable forest fuels [2].
In this study, I will investigate a heating mill’s ability to generateelectricity from forest fuels in southern Finland. I will also discussthe various aspects of the fuel procurement problem from bothmethodological and practical points of view. I used a continuous-time dynamic multiple-objective programming formulation tomodel this scheduling problem on a large scale and over a long timeperiod by considering the release (harvesting) and due (delivery)dates as well as the sequence-dependent setup times. Finland hasthe problem with an inability to harvest many sites during thespring warming period, and it affects harvesting dates, roadsideand mill inventories, and thus, it affects storage costs and thelogistical aspects of the model. Instead of modeling only the energyflows of fuels, I have addressed the combinatorial complexity of theenergy-production problem by modeling the energy flowsembodied in the available mixtures of products, and have solvedthe model using adaptive techniques to provide an updated andintegrated schedule.
My main focus was on the solution methodology, not on opti-mizing the supply chains among multiple plants, therefore I haveonly considered the case for a single energy plant with restrictions
based on its forest technology rate of forest fuel procurement andenergy efficiency level of energy production. To calculate costs andprofits, I assumed three scenarios for the use of forest fuels basedon Finland’s plans to increase the use of these fuels: 100% torepresent the current baseline, 300% to represent an increase to 3�the baseline value, and 1000% to represent an increase to 10� thebaseline value. However, the overall method has been developed insuch a way that it could be easily expanded to include two or moreplants simply by modifying the value of K in the model (see Section2 for details). Because the planning horizon for such facilities istypically annual, with a monthly procurement schedule, I per-formed my analysis for a 12-month period, with iterations at 1-month intervals.
2. Mathematical formulation of the model and methodology
2.1. Optimization problem
Consider N different tasks (obtaining different mixtures ofenergy products), each of which must be completed for a given dayby a CHP plant (Fig. 1). For short-term planning, every task n hasa given release date rn, which describes a lower bound for thedelivery time tn to produce the products required by the task (mostoften due to other production operations before delivery of theenergy product), and a pre-specified production time, pron. Whentwo tasks, n and l, are performed immediately after each other,a setup time snl is required. The setup time is strongly sequence-dependent. It is required to adjust the energy plant’s infeedsystem to accept a different mixture of fuels or as a supply timerequired to obtain the new mixture of fuels defined by task l. Thesetup times can be derived from the parameters (e.g., the energycontent of fuels) for the tasks in question with acceptable accuracy.For short-term planning, each task n has a due date dn before whichthe task should be completed. If a task n is completed after dn, thetardiness of task n is defined as Tarn¼max{0, tnþpron� dn}. Pal-ander and Vesa [19] have described how procurement organiza-tions obtain mixtures of fuels and construct optimal procurementschedules in this context.
There are three main objectives in constructing the optimalshort-term production schedule. First, the natural goal is to fulfillthe customer’s orders; that is, the group of tasks should becompleted on time. Second, the monetary goal is to minimize theproduction cost. Third, the most important property of theschedule from a practical production perspective is that the setuptimes for the energy-product mixtures are minimized and anefficient delivery sequence is guaranteed. However, in most casesthese objectives are contradictory to some extent. For example, inorder to meet the confirmed due dates, it is often necessary tochange the quality of the fuel materials before the release dates(e.g., change the energy-product mixture) more than would berequired in the absence of a due date. In practice, schedulingwork involves a continuous balancing of the three goals. Forexample, quality changes can be compensated for by payingadditional production costs. To support short-term planning,a reasonable objective function could include the total weightedtardiness and the total active production time, Cmax. In mathe-matical terms:
Minimize wc � Cmax þXN
n¼1
ðwTn � TARnÞ (1)
wherewC is the time-based production cost andwTn is the tardinesspenalty for task n. The parameterwTn can be determined separatelyfor each task according to its level of priority. This approach couldbe applicable in some small-scale cases and it is simple enough that

T. Palander / Energy 36 (2011) 5579e5590 5583
it could be performed manually or by using a simulation. In a largescale and long-term case, the parameter wTn is assumed to equalzero because there is a sufficiently large supply area and a suffi-ciently long planning horizon that delivery deadlines are unlikely
PIi¼1
PJj¼1
PTt¼1
�clijtLijt�ðð1þpÞ=26Þt
�þ PI
i¼1
PJj¼1
PKk¼1
PTt¼1
�cyijktYijkt �ðð1þpÞ=26Þt
�þ PI
i¼1
PJj¼1
PKk¼1
PTt¼1
�cycijktYCijkt �ðð1þpÞ=26Þt
�
þXI
i¼1
XK
k¼1
XT
t¼1
�cmciktMCikt �ðð1þpÞ=26Þt
�þXN
n¼1
XC
c¼1
XK
k¼1
XT
t¼1
�cpncktPnckt �ðð1þpÞ=26Þt
�þXN
n¼1
XC
c¼1
XK
k¼1
XT
t¼1
�csncktSnckt �ðð1þpÞ=26Þt
�
þXI
i¼1
XJ
j¼1
XT
t¼1
�Xijt �ðð1þpÞ=26Þt
�þXN
n¼1
XC
c¼1
XK
k¼1
XT
t¼1
�cencktEnckt �ðð1þpÞ=26Þt
�þXI
i¼1
XK
k¼1
XT
t¼1
�cmiktMikt �ðð1þpÞ=26Þt
�
þD1�D2 ¼ Ctot (3)
to be missed and other, more important, properties must beincluded in the optimization methodology, such as certain energyflows, intermediate storage times, and transition times. These arecrucial components of the multiple objectives in an actual dynamicsupply chain, in which task n (obtaining a specific energy-productmixture) happens during period t.
In the production problem considered in the present study, Iassumed that the procurement of fuels was based on a monthlyorder-driven policy, since this is the planning horizon typically usedin the Finnish forest industry. To maintain an energy-efficientproduction mixture and to maximize revenues, orders fromenergy plants are directly transformed into procurement tasks,ideally without storing considerable volumes of materials asa buffer at the plant or as roadside inventories. (Any form of storageentails potentially significant costs for both the producer and theconsumer of these materials.) The challenge is to allocate the tasksin the procurement chains to supply sufficient materials for energyproduction so that the release periods (i.e., time when raw mate-rials become available to the customer) are obeyed, due dates aremet, energy loss costs (i.e., energy that could potentially be used togenerate heat or electricity, but that is lost before it can be used forthis purpose) are reduced, and total procurement and inventorycost are minimized. The materials must be harvested sufficientlyearly to be delivered on the required date. Because supplymanagement over a long period must account for many differentenergy-fuel sources, global fossil fuel delivery chains, national peatfuel procurement chains, and a company’s flows of renewableforest fuels, the scheduling is too difficult to handle manually.
2.2. Optimization model
The energy-flowmodel of Palander and Vesa [19] can be furtherdeveloped and converted into software to solve this problem task.In mathematical terms, the new model can be described using thefollowing equations:
MinimizeZ ¼ w1D1þw2D2þw3D3þw4D4þw5D5þw6D6 (2)
where Z is the optimumweighted sum of Dg, which represents thedeviations (V) above and below the decision-maker’s goals of theproblem, the parameter wg is a positive weight that reflects thedecision-maker’s preferences regarding to the relative importanceof each objective, and G is the number deviations of decision-makergoals (1, ., g, ., 6).
Eq. (2) is subject to the following restrictions:
Operating costs:
where Ctot is the total operating costs (V) of supply chain, Lijt is theenergy content (MWhm�3) of fuel mixture i purchased from andlogged by team j during period t, Yijkt is the energy content(MWhm�3) of fuel mixture i transported from team j to plant kduring period t, YCijkt is the energy content (MWhm�3) of fuelmixture i chipped and transported from team j to plant k duringperiod t, MCikt is the energy content (MWhm�3) of fuel mixture ichipped and held in the plant inventory of plant k at the end ofperiod t, Pnckt is the energy content (MWh) of energy product nallocated to customer c produced at plant k during period t, Snckt isthe energy content (MWh) of energy product n sold to customer cfromplant k during period t, Xijt is the energy content (MWhm�3) offuel mixture i held in the roadside inventory of team j at the end ofperiod t, Enckt is the energy loss (MWh) for product n allocated tocustomer c produced at plant k during period t, Mikt is the energycontent (MWhm�3) of fuel mixture i held in the plant inventory ofplant k at the end of period t, D1 and D2 are the deviation above orbelow the total costs (V) of supply chain during the decision-makinghorizon, clijt is the purchase and logging costs (VMWh�1) for fuelmixture i from team j during period t, cyijkt is the transportation cost(VMWh�1) to transport fuel mixture i from team j to plant k duringperiod t, cycijkt is the chipping and transportation cost (VMWh�1) totransport fuelmixture i from team j to plant kduringperiod t, cenckt isthe energy loss cost (VMWh�1) for product n allocated to customerc at plant kduringperiod t, cmcikt is the chipping cost (VMWh�1) forfuel mixture i at plant k during period t, cpnckt is the production cost(VMWh�1) of product n allocated to customer c at plant k duringperiod t, csnckt is the sales cost (VMWh�1) of product n sold tocustomer c from plant k during period t, and cmikt is the plantinventory cost (VMWh�1) for fuelmixture i at plant k during periodt. In addition,p is the annual interest rate (%), I thenumber of energy-fuel mixtures (1,., i,., 9), J is number of teams (1,., j,., 11), N isthe number of products (1,., n,., 2), C is the number of customers(1,., c,., 4), K is the number of plants (1, ., k, where k¼ 1 in thepresent paper), T is the number of periods (1, ., t, ., 12 in thepresentpaper), andG is thenumberof deviationvariables (1,., g,.,6, where g¼ 1 and g¼ 2 are used in the present constraint).
Fuel demands:
Yijkt þ YCijkt þMCikt þMikt�1 �Mikt � FDmaxikt (4)
Yijkt þ YCijkt þMCikt þMikt�1 �Mikt � FDminikt (5)

T. Palander / Energy 36 (2011) 5579e55905584
where FDmaxikt and FDminikt are the maximum and minimum(respectively) energy contents (MWhm�3) of fuel mixture irequired by plant k during period t.
Energy-production rate:
P1kt ¼ pens1ktPns1kt (6)
Where Pnkt is the energy content (MWh) of energy product n atplant k during period t and pens1kt is the production efficiency ofproduct ns 1 at plant k during period t.
Energy production:
Enckt�1 � Enckt þ Pnkt � EDmaxnkt (7)
Enckt�1 � Enckt þ Pnkt � EDminnkt (8)
where EDmaxnkt and EDminnkt and are the maximum andminimum (respectively) energy contents (MWh) of product nrequired by plant k during period t.
Conversion efficiency between fuels and products:
Mikt�1þYijktþYCijkt þMCikt �Mikt �Pnckt �Enckt�1þEnckt
�URmaxk (9)
Mikt�1þYijktþYCijkt þMCikt �Mikt �Pnckt �Enckt�1þEnckt
�URmink (10)
where URmaxk and URmink are the maximum and minimum(respectively) conversion efficiencies between fuels and productsrequired by plant k during the decision-making horizon.
Energy sales revenues:
prncktSnckt � ðð1þ pÞ=26ÞtþD3 � D4 ¼ R (11)
where R is the total revenue (V) from energy production from thesupply chain during the decision-making horizon, Snckt is theenergy content (MWh) of energy product n sold to customer c fromplant k during period t, prnckt is the production revenue fromproduct n (VMWh�1) sold to customer c from plant k duringperiod t, Dg are the deviations (V) above and below the totalrevenue from the supply chain during the decision-making horizonfor deviation g, and G is the number of deviation variables (1, ., g,., 6, where g¼ 3 and g¼ 4 in the present constraint).
Lost revenues for energy losses:
celncktEnckt � ðð1þ pÞ=26ÞtþD5 � D6 ¼ Clos (12)
where Clos is the total lost revenues (V) due to energy losses duringproduction and sales during the decision-making horizon, celnckt islost revenue due to energy losses (VMWh�1) for product n allo-cated to customer c at plant k during period t, Enckt is the energycontent (MWh) of the energy loss for product n allocated tocustomer c at plant k during period t, Dg are the deviations aboveand below the lost revenues (V) of production during the decision-making horizon for deviation g, and G is the number of deviationvariables (1, ., g, ., 6, where g¼ 5 and g¼ 6 in the presentconstraint).
Fuel procurement and production:
Yijkt þ YCijkt þMCikt þMikt�1 � FDk (13)
where FDk is the total energy content (MWhm�3) required at plantk during the decision-making horizon.
Dynamic equations:
Xijt�1 � Yijkt � YCijkt þ Lijt ¼ Xijt (14)
Mikt�1 þ Yijkt �MCikt ¼ Mikt (15)
Enckt�1 þ Pnckt � Snckt ¼ Enckt (16)
Production and sales:
Pnckt � Snckt (17)
Roadside chipping:
Yijt þ YCijktþ1 � 0 (18)
Purchase and logging:
Lijt � Lmaxijt (19)
Lijt � Lminijt (20)
where Lmaxijt and Lminijt are the maximum and minimum(respectively) energy contents (MWhm�3) of fuel mixture ipurchased from and logged by team j during period t.
Roadside inventories:
Xijt¼0 ¼ XIij (21)
Xijt¼12 ¼ XBij (22)
where XIij is the energy content (MWhm�3) of fuel mixture i storedby team j at the beginning of the decision-making horizon and XBij
is the energy content (MWhm�3) of fuel mixture i stored by team jat the end of the decision-making horizon.
Transportation:
Yijkt þ YCijkt � Ymaxij (23)
Yijkt þ YCijkt � Yminij (24)
where Ymaxij and Yminij are the maximum and minimum(respectively) energy contents (MWhm�3) of fuel mixture itransported from team j.
Plant inventories:
Mikt � Mmaxikt (25)

T. Palander / Energy 36 (2011) 5579e5590 5585
Mikt � Mminikt (26)
Mikt¼0 ¼ MIik (27)
Mikt¼12 ¼ MBik (28)
where Mmaxikt and Mminikt are the maximum and minimum(respectively) energy contents (MWhm�3) of fuel mixture i held inplant inventory k during period t, MIik is the energy content(MWhm�3) of fuel mixture i stored by plant k at the beginning ofthe decision-making horizon, and MBik is the energy content(MWhm�3) of fuel mixture i stored by team k at the end of thedecision-making horizon.
Energy losses:
Enckt � Emaxnckt (29)
Enckt � Eminnckt (30)
Enckt¼0 ¼ EInck (31)
Enckt¼12 ¼ EBnck (32)
where Emaxnckt and Eminnckt are the maximum and minimum(respectively) energy loss (MWh) of product n allocated tocustomer c at plant k during period t, and EInck and EBnck are theenergy losses (MWh) of product n allocated to customer c at plant kat the beginning and end (respectively) of the decision-makinghorizon.
Non-negativity:
Yijkt ; YCijkt ;MCikt ; Lijt ; Pnckt ; Snckt ;Xijt ; Enckt ;Mikt ;Dg �0 (33)
2.3. Solution methodology
The solution methodology involves general stages that areindependent of the particulars of the energy-production systemand can also be used in other similar scheduling problems. In thisstudy, the solution methodology was used to model and solve thescheduling problem focused on the Finnish reality. The schedulingproblem was formulated using an objective function subjectedto allocation, production, and technical constraints. Constraintswere formulated at the plant level. Traditional single-objectiveprogramming considers the problem as a cost-minimization orprofit-maximization problem. The other “requirements” are thentaken as constraints. In contrast, multiple-objective programmingtakes a “softer” perspective. Here, I have considered the system asa three-objective problem. The manager wants to earn as muchrevenue as possible, but simultaneously wants to use critical fuelsas little as possible and to minimize the loss of energy duringproduction and sales. During the search process for non-dominateddecision alternatives, the roles of these objectives may be changed,if necessary.
In terms of the allocation constraints, unit costs for purchases,logging, chipping, and transportation were determined from thematerialized average unit costs in 2006. The dynamics of the modelwere based on 12 monthly planning periods with no periodsduring which forest fuels are not procured and energy is notproduced. Data were provided by an energy plant in southernFinland that requested anonymity. For this plant, inventory costs
were calculated to be 1 VMWh�1. I used an assumed annualinterest rate of 8% based on my consideration of the unit capitalcosts that were used as coefficients in the model. The annualinterest rate was applied to the wood value to determine the unitcost for the roadside inventory. To simplify the calculations, and toclarify the use of the model, my analysis was confined to a singleplant (i.e., k¼ 1). However, the model could be easily expanded byusing a larger value of K.
The maximum procurement energy content (MWhm3) wascalculated for every harvesting team from the materialized procure-ment volumes for the subject plant in 2006. To permit a calculation ofprofitability, the energy equivalent provided by each volume of fuelwas calculated. In terms of production constraints, the profitability ofenergy production by a plant depends on three decision goals:maximizing the energy production (thus, the revenues) while mini-mizing the total operating costs and the energy loss costs. Themodeldetermined the operating costs according to the primary fuel energyrequired at the plant during the decision-making horizon andaccording to the type of energy (heat versus electricity) produced.Initial levels were determined for the roadside and plant inventoriesusing data from the same plant. Roadside inventory levelswere set tocorrespond a priori to the weekly energy-fuel requirement for theplant at the beginning of the planning horizon, and were changedlinearly to reflect a priori theweekly energy-fuel requirement for theplant at the end of the planning horizon. Roadside inventory levelswere scaled to reflect the proportion of the total harvest allocated toeach of the harvesting teams. The minimum plant inventory wasdefined as 50% of the a prioriweekly energy-fuel requirement for theplant; themaximum levelwas set to 60% of this weekly requirement.All plant inventorieswere set at theirminimumhistorical levels at thebeginning of the planning horizon. The technical constraints werebasedon theproved theoryare requiredwhenamodel is solvedusingthe simplex method of Dantzig [11].
Themain objectives were included in the solution methodology,which was encoded in computer software. The optimization runs ofthe model were performed using six scenarios on a standarddesktop computer (a 2393 MHz x86 processor) with 4 GB of RAMrunning the Windows XP Professional operating system. Thescheduling algorithm was implemented using the Microsoft VisualCþþ programming language and the user interface was createdusingMicrosoft Visual Basic fromversion 6.0 of theMicrosoft VisualStudio suite [19]. I used version 5.0 of the Lindo API software(http://www.lindo.com/), with its standard settings, as the linearprogramming solver. The model software’s user interface wasdesigned to make it easier for users to adapt the model to changingdecision environments simply by changing the parameter valuesfor each of the parameters described in previous sub-section [26].This makes the approach usable by managers without requiringthem to learn advanced programming skills. The software producesefficient and non-dominated decision alternatives. The model issolved using a pre-emptive method that finds a globally optimalsolution [29]. The most important objective was minimizing theprocurement and production costs. To compare trade-offs amongthe multiple objectives, any choice from among the set of efficientand non-dominated solutions was considered to be an acceptableand reasonable solution, because I had no additional informationabout the decision-maker’s preference structure [21].
2.4. Scenarios
In a perfectly competitive emissions-credit trading market, themarket-clearing price of the emissions allowance for the plantwould be equal to the marginal cost of its emissions [30,31]. In thescenarios that I analyzed, the peat fuel tax costs (þ1.9 VMWh�1)and the feed-in tariff revenue (þ6.9 VMWh�1) were based on
T. Palander / Energy 36 (2011) 5579e55905586
calculations for the renewable energy source incentives based onpolicy decisions by the Finnish government [8,9]. During a taxationperiod, the combined production of electricity and heat means thata power plant produces both electricity and heat for utilitypurposes either simultaneously or separately. Therefore, for taxa-tion purposes, the important factor is what the plant is producingduring a given tax period, not the plant’s technological type. Thefuels used to produce heat in a combined production plant aredefined based on the heat “transferred to consumption” byapplying effective heat values (i.e., the efficiency of conversion ofa given fuel into energy). Heat transferred to consumption refers tothe quantity of heat transmitted by the power plant to a districtheating and process steam network, and for other correspondingutility purposes. The taxes on the fuels used to produce heat ina combined production plant are assessed based on the heatquantity, which is obtained by multiplying the effective heatquantity transmitted to consumption by 0.9 to account for theinevitable thermodynamic energy losses [8,9]. The heat quantitythus obtained is divided onto the quantity of each of the fuels usedin proportion to their consumption.
To illustrate the solution methodology, six real-life scenarios ofthe model are presented here. Scenario A1 is based on the dataprovided by the plant simulated by the model, and follows an oldprocurement and production structure that does not account fora high forest technology rates and energy efficiency of electricityproduction. However, the plant’s actual energy efficiency varied somuch (3e22%, average was 13%) that I used an energy efficiency of19%, which represents the lowest possible rate found by the modelfor a globally optimal solution. Scenario B1 is similar, but assumesa higher energy efficiency (42%), which is the plant’s maximumefficiency for electricity production. Scenarios A2, B2, A3, and B3include higher forest technology rates (300% for A2 and B2 and1000% for A3 and B3, respectively, versus 100% in the baseline A1and B1 scenarios) that account for the additional forest fuelsprocured by the energy plant and that therefore may increase theunit revenues of the sales function used in the model. Apart fromthese differences, the scenarios used the same underlying data. Theenergy efficiency of electricity production for the energy plant wasbased on CHP production technology and calculations for thepotential electricity production capacity [6]. In these scenarios, Iassumed that the procurement organization was prepared to startits work before the scheduled beginning of the decision-makinghorizon and thus, that the first fuel mixture could be scheduledat time¼ 0, with no delay. The research area for the present studycomprised the operating areas of the Kymenlaakso and Etelä-Kar-jala provinces in southern Finland. These provinces are divided into11 procurement areas, which were used to represent the timberprocurement teams (i.e., J¼ 11) in the model.
3. Results and discussion
3.1. Evaluation of solution methodology
I used the model results to evaluate the quality of the model interms of its technical performance and its ability to reveal differ-ences in the scheduled decision alternatives. The differences werecalculated by analyzing the efficient and non-dominated solutionsfor each scenario during each time period. I assumed that thepresence of a clear technological difference indicated good modelquality. Furthermore, if the differences were reasonable andacceptable, they also revealed the importance of multiple-objectiveplanning for electricity generation by the energy plant from forest,fossil, and wood-waste fuels. Moreover, if the solutions are globallyoptimal, the methodology can be considered to have reacheda good-quality solution.
The design of the software ensured that the optimization modelcould be easily adapted to a changed decision environment withoutrequiring the users to learn sophisticated programming skills.Managers could use the software for their daily work, as well as tosolve larger procurement problems, because it is too complex andlaborious to formulate such models manually. The multiple-objective models proved to be more effective than the single-objective model developed by Palander and Vesa [19] because thenew model more efficiently accounted for both delivery of theforest fuels and energy production. The new model also accountedfor electricity generation using separate variables. The energy-flowmodel used in the previous research [19] did not account for theprofitability of the whole energy flow in the supply chain, fromstump to markets. In the present study, I calculated the revenuesfrom sales of energy produced by the CHP plant. The single-objective energy-flow model allocated only forest fuels to ensurethat the best possible alternative was selected by the model, but itdid not ensure that this solution was profitable. Therefore, some ofthe delivery alternatives would presumably have decreased ratherthan increased the ability of the procurement managers to achievea profitable mixture of fuels.
The scenarios achieved global optimality, with total processingtime increasing from 120 to 232 s as a result of adding the energy-efficiency constraint to the model. This increased the total numberof multiple-objective linear programming iterations from 256 to741. The resulting ranges of the decision objectives in the scenariosincreased from V0.1 thousand, at a high forest technology rate(1000%) and a low energy efficiency (19%), toV650.6 thousandwitha high forest technology rate (1000%) and a high energy efficiency(42%) (Table 1). The model was solved using a pre-emptive methodthat finds a globally optimal solution [29]. Furthermore, the processwas employed to extract one of the Pareto-optimal solutions as thebest compromise non-dominated solution.
The methodology guaranteed a globally optimal solution withina realistic range of values for the objectives and within a fewminutes of computational time using a standard desktop computer.The results are accordance with Pareto-optimality theory [21]. Theresults also indicate that the Pareto frontier is useful in simulationsof forest technology: by restricting attention to the set of choicesthat are Pareto-efficient, a manager can make trade-offs withina non-dominated objective set rather than considering the fullrange of every parameter. Results were compared with some of themost recently published research in the area which confirms thepotential and effectiveness of the proposed approach [24,25].Studies’ results show the influence of the configuration and tech-nical parameters on the electrical efficiencies of the Pareto-optimalplants and their sub-systems. The software clearly performed well,although the model could undoubtedly be improved by improvingthe parameterization of each of the underlying functions thatdescribes the supply chain and possibly by adding additionalparameters (such as a subsidy price parameter associatedwith eachtype of forest fuel).
The objective values were also reasonable based on the availabledata for energy production by the plant whose data was used asinputs for the model. Including the feed-in tariff revenues andeffects of increased energy efficiency increase the total revenuesfrom the energy products, while also decreasing the total loss costsof energy products during production and sales. For comparison,the increased energy efficiency that was reported as the best policyalternative in a recent Finnish energy-policy study [2] is presentednext to those values presented in Table 1. Bundling the energyefficiency and renewable fuels together seems to be an interestingopportunity for a CHP plant. Due to space limitations, I have pre-sented only a basic set of results, but a complete set of test results isavailable as Supplementary data.
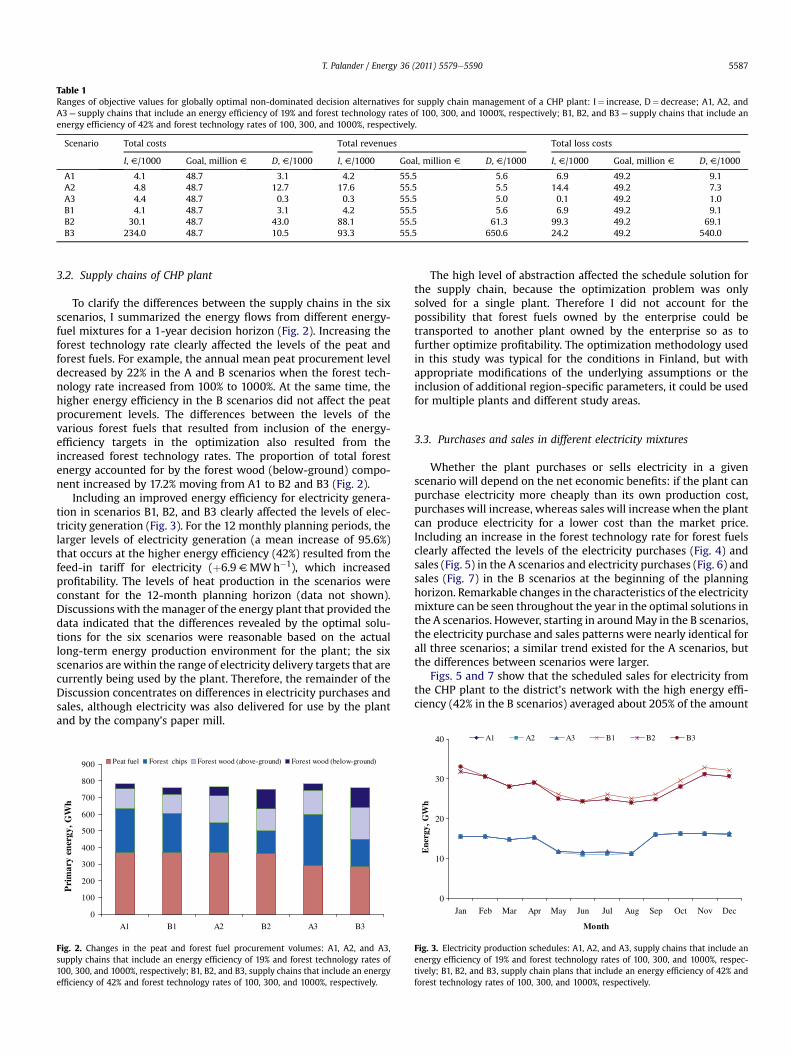
Table 1Ranges of objective values for globally optimal non-dominated decision alternatives for supply chain management of a CHP plant: I¼ increase, D¼ decrease; A1, A2, andA3¼ supply chains that include an energy efficiency of 19% and forest technology rates of 100, 300, and 1000%, respectively; B1, B2, and B3¼ supply chains that include anenergy efficiency of 42% and forest technology rates of 100, 300, and 1000%, respectively.
Scenario Total costs Total revenues Total loss costs
I, V/1000 Goal, million V D, V/1000 I, V/1000 Goal, million V D, V/1000 I, V/1000 Goal, million V D, V/1000
A1 4.1 48.7 3.1 4.2 55.5 5.6 6.9 49.2 9.1A2 4.8 48.7 12.7 17.6 55.5 5.5 14.4 49.2 7.3A3 4.4 48.7 0.3 0.3 55.5 5.0 0.1 49.2 1.0B1 4.1 48.7 3.1 4.2 55.5 5.6 6.9 49.2 9.1B2 30.1 48.7 43.0 88.1 55.5 61.3 99.3 49.2 69.1B3 234.0 48.7 10.5 93.3 55.5 650.6 24.2 49.2 540.0
T. Palander / Energy 36 (2011) 5579e5590 5587
3.2. Supply chains of CHP plant
To clarify the differences between the supply chains in the sixscenarios, I summarized the energy flows from different energy-fuel mixtures for a 1-year decision horizon (Fig. 2). Increasing theforest technology rate clearly affected the levels of the peat andforest fuels. For example, the annual mean peat procurement leveldecreased by 22% in the A and B scenarios when the forest tech-nology rate increased from 100% to 1000%. At the same time, thehigher energy efficiency in the B scenarios did not affect the peatprocurement levels. The differences between the levels of thevarious forest fuels that resulted from inclusion of the energy-efficiency targets in the optimization also resulted from theincreased forest technology rates. The proportion of total forestenergy accounted for by the forest wood (below-ground) compo-nent increased by 17.2% moving from A1 to B2 and B3 (Fig. 2).
Including an improved energy efficiency for electricity genera-tion in scenarios B1, B2, and B3 clearly affected the levels of elec-tricity generation (Fig. 3). For the 12 monthly planning periods, thelarger levels of electricity generation (a mean increase of 95.6%)that occurs at the higher energy efficiency (42%) resulted from thefeed-in tariff for electricity (þ6.9 VMWh�1), which increasedprofitability. The levels of heat production in the scenarios wereconstant for the 12-month planning horizon (data not shown).Discussions with the manager of the energy plant that provided thedata indicated that the differences revealed by the optimal solu-tions for the six scenarios were reasonable based on the actuallong-term energy production environment for the plant; the sixscenarios arewithin the range of electricity delivery targets that arecurrently being used by the plant. Therefore, the remainder of theDiscussion concentrates on differences in electricity purchases andsales, although electricity was also delivered for use by the plantand by the company’s paper mill.
0
100
200
300
400
500
600
700
800
900
A1 B1 A2 B2 A3 B3
Pri
mar
y en
ergy
, GW
h
Peat fuel Forest chips Forest wood (above-ground) Forest wood (below-ground)
Fig. 2. Changes in the peat and forest fuel procurement volumes: A1, A2, and A3,supply chains that include an energy efficiency of 19% and forest technology rates of100, 300, and 1000%, respectively; B1, B2, and B3, supply chains that include an energyefficiency of 42% and forest technology rates of 100, 300, and 1000%, respectively.
The high level of abstraction affected the schedule solution forthe supply chain, because the optimization problem was onlysolved for a single plant. Therefore I did not account for thepossibility that forest fuels owned by the enterprise could betransported to another plant owned by the enterprise so as tofurther optimize profitability. The optimization methodology usedin this study was typical for the conditions in Finland, but withappropriate modifications of the underlying assumptions or theinclusion of additional region-specific parameters, it could be usedfor multiple plants and different study areas.
3.3. Purchases and sales in different electricity mixtures
Whether the plant purchases or sells electricity in a givenscenario will depend on the net economic benefits: if the plant canpurchase electricity more cheaply than its own production cost,purchases will increase, whereas sales will increase when the plantcan produce electricity for a lower cost than the market price.Including an increase in the forest technology rate for forest fuelsclearly affected the levels of the electricity purchases (Fig. 4) andsales (Fig. 5) in the A scenarios and electricity purchases (Fig. 6) andsales (Fig. 7) in the B scenarios at the beginning of the planninghorizon. Remarkable changes in the characteristics of the electricitymixture can be seen throughout the year in the optimal solutions inthe A scenarios. However, starting in aroundMay in the B scenarios,the electricity purchase and sales patterns were nearly identical forall three scenarios; a similar trend existed for the A scenarios, butthe differences between scenarios were larger.
Figs. 5 and 7 show that the scheduled sales for electricity fromthe CHP plant to the district’s network with the high energy effi-ciency (42% in the B scenarios) averaged about 205% of the amount
0
10
20
30
40
Jan Feb Mar Apr May Jun Jul Aug Sep Oct Nov Dec
Month
Ene
rgy,
GW
h
A1 A2 A3 B1 B2 B3
Fig. 3. Electricity production schedules: A1, A2, and A3, supply chains that include anenergy efficiency of 19% and forest technology rates of 100, 300, and 1000%, respec-tively; B1, B2, and B3, supply chain plans that include an energy efficiency of 42% andforest technology rates of 100, 300, and 1000%, respectively.
0
10
20
30
40
Jan Feb Mar Apr May Jun Jul Aug Sep Oct Nov Dec
Month
Ene
rgy,
GW
h
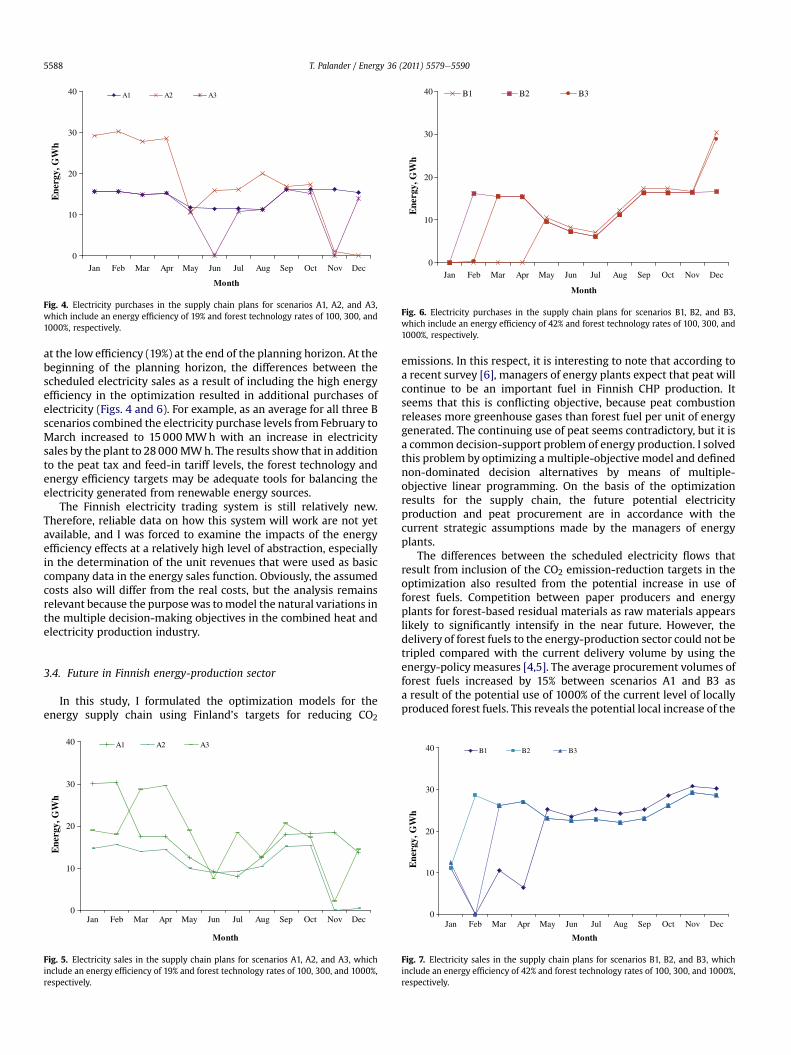
A1 A2 A3
Fig. 4. Electricity purchases in the supply chain plans for scenarios A1, A2, and A3,which include an energy efficiency of 19% and forest technology rates of 100, 300, and1000%, respectively.
0
10
20
30
40
Jan Feb Mar Apr May Jun Jul Aug Sep Oct Nov Dec
Month
Ene
rgy,
GW
h
B1 B2 B3
Fig. 6. Electricity purchases in the supply chain plans for scenarios B1, B2, and B3,which include an energy efficiency of 42% and forest technology rates of 100, 300, and1000%, respectively.
T. Palander / Energy 36 (2011) 5579e55905588
at the low efficiency (19%) at the end of the planning horizon. At thebeginning of the planning horizon, the differences between thescheduled electricity sales as a result of including the high energyefficiency in the optimization resulted in additional purchases ofelectricity (Figs. 4 and 6). For example, as an average for all three Bscenarios combined the electricity purchase levels from February toMarch increased to 15000 MWh with an increase in electricitysales by the plant to 28 000 MWh. The results show that in additionto the peat tax and feed-in tariff levels, the forest technology andenergy efficiency targets may be adequate tools for balancing theelectricity generated from renewable energy sources.
The Finnish electricity trading system is still relatively new.Therefore, reliable data on how this system will work are not yetavailable, and I was forced to examine the impacts of the energyefficiency effects at a relatively high level of abstraction, especiallyin the determination of the unit revenues that were used as basiccompany data in the energy sales function. Obviously, the assumedcosts also will differ from the real costs, but the analysis remainsrelevant because the purposewas tomodel the natural variations inthe multiple decision-making objectives in the combined heat andelectricity production industry.
3.4. Future in Finnish energy-production sector
In this study, I formulated the optimization models for theenergy supply chain using Finland’s targets for reducing CO2
0
10
20
30
40
Jan Feb Mar Apr May Jun Jul Aug Sep Oct Nov Dec
Month
Ene
rgy,
GW
h
A1 A2 A3
Fig. 5. Electricity sales in the supply chain plans for scenarios A1, A2, and A3, whichinclude an energy efficiency of 19% and forest technology rates of 100, 300, and 1000%,respectively.
emissions. In this respect, it is interesting to note that according toa recent survey [6], managers of energy plants expect that peat willcontinue to be an important fuel in Finnish CHP production. Itseems that this is conflicting objective, because peat combustionreleases more greenhouse gases than forest fuel per unit of energygenerated. The continuing use of peat seems contradictory, but it isa common decision-support problem of energy production. I solvedthis problem by optimizing a multiple-objective model and definednon-dominated decision alternatives by means of multiple-objective linear programming. On the basis of the optimizationresults for the supply chain, the future potential electricityproduction and peat procurement are in accordance with thecurrent strategic assumptions made by the managers of energyplants.
The differences between the scheduled electricity flows thatresult from inclusion of the CO2 emission-reduction targets in theoptimization also resulted from the potential increase in use offorest fuels. Competition between paper producers and energyplants for forest-based residual materials as raw materials appearslikely to significantly intensify in the near future. However, thedelivery of forest fuels to the energy-production sector could not betripled compared with the current delivery volume by using theenergy-policy measures [4,5]. The average procurement volumes offorest fuels increased by 15% between scenarios A1 and B3 asa result of the potential use of 1000% of the current level of locallyproduced forest fuels. This reveals the potential local increase of the
0
10
20
30
40
Jan Feb Mar Apr May Jun Jul Aug Sep Oct Nov Dec
Month
Ene
rgy,
GW
h
B1 B2 B3
Fig. 7. Electricity sales in the supply chain plans for scenarios B1, B2, and B3, whichinclude an energy efficiency of 42% and forest technology rates of 100, 300, and 1000%,respectively.

T. Palander / Energy 36 (2011) 5579e5590 5589
forest technology rate of human-machine systems (forest machinesand operators) during decision-making horizon. The results showthat meeting peat tax, feed-in tariff, forest technology, and energyefficiency targets may not be adequate for the future success ofrenewable energy production.
The proposed investments in energy production in Finlandusing renewable resources will further increase the demand forwoody biomass [6]. Therefore, an important future planningproblemwill be how to calculate the optimal procurement area foran energy plant. In this context, the present study provides a simpletool that plant managers can use to analyze the optimal fuel andproduct mixtures in response to changes in the available forestresources and the forest technology rates and in the prices of rawmaterials and feed-in tariffs. This strategic planning system couldalso help managers of wood procurement organizations makebetter procurement decisions, particularly since the model alsoaddresses vehicle fleet management problems by explicitlyaccounting for the transportation costs of each type of fuel [32].
Increases in the energy efficiency of electricity production bythe CHP plant are currently far from practice, but they are theo-retically possible and these improvements will become increas-ingly likely in the future [6]. However, applying the feed-in tariff tothe electricity is currently standard practice, and will motivateCHP plants to increase their electricity production from renewablefuels if the revenues from this production exceed the net revenuesfrom producing electricity from fossil fuels (after accounting fortaxes on these fuels). Previous studies have also indicated thatmore efficient low-emitting technologies are expected to becomecommercially viable and increase electricity production [33,34].Globally, by the end of 2006, the installed power capacity wasestimated at 4300 GW, and only 207 GW of this capacity(excluding large hydropower plants) was provided using renew-able fuels [33].
4. Conclusions
In this study, I developed a decision-support model for thegeneration of electricity and heat from renewable forest fuelsbased on dynamic multiple-objective programming. The formu-lation focused on the supply chain of a single CHP plant, suppliedat a large scale and over a long-term scheduling problem thatexplicitly accounted for energy flows from different types of fuelsand products. Because of the model’s structure, it could be easilyexpanded to account for multiple plants. Using the provenmultiple-objective linear programming methodology made itpossible to efficiently solve the problem, and given the efficiencyof the model (processing times in minutes, not hours), thesolution should scale well to larger industrial problems thataccount for precedence objective functions and additionalconstraints.
I examined six illustrative scenarios based on real-life data fromthe Finnish energy-production industry, allowing an assessment ofthe impacts for the industry of including the potential foresttechnology rates and energy efficiency. Themethodology generateda globally optimal solution with these costs and revenues amongmultiple non-dominated objectives (minimum fuel procurementcosts, maximum product sales revenues, minimum energy losscosts). Because the software’s operating parameters can be easilymodified by the user without requiring advanced programmingskills, the software lets users efficiently adapt the model inresponse to a changing decision environment. Further, the meth-odology can be used as a powerful core for future decision-supportsystems, and has high potential to significantly improve the infor-mation logistics related to the planning of a more renewable supplychain.
The energy industry as a whole is subject to policy decisionsregarding electricity trading and energy efficiency regulation.These decisions should be made on the basis of comprehensivetechnical and economic analyses of the driving forces for renewableenergy and options involving forest stakeholders and accountingfor the local forest energy procurement effects in a holistic model ofthe energy supply chain. The results illustrate the advantages oflocal planning of fuel procurement and the potential impacts oflocal electricity production for the Finnish industry. Further studieswill be needed to demonstrate the efficiency of the methodologyfor managers in various real-life environments.
Appendix. Supplementary data
Supplementary data associated with this article can be found inthe online version, at doi:10.1016/j.energy.2011.07.014.
References
[1] Directive of the European Parliament and of the Council on the Promotion ofthe Use of Energy from Renewable Sources. Brussel: Commission of EuropeanCommunities; 2010.
[2] Lund PD. The link between political decision-making and energy options:assessing future role of renewable energy and energy efficiency in Finland.Energy 2007;32:2271e81.
[3] Ylitalo E. Puun energiakäyttö 2006 [Use of wood for energy generation in2006]. Forest statistical bulletin 867. Finland: Finnish Forest Research Insti-tute; 2007 [in Finnish with English summary].
[4] Uusiutuvan energian edistämisohjelma 2003e2006. Työryhmän ehdotus[A programme to promote renewable energy 2003e2006. Proposal of workinggroup]. Working Group and Committee Papers 5. Helsinki: Finnish Ministry ofTrade and Industry; 2003 [in Finnish with English summary].
[5] Kansallinen metsäohjelma 2015. Lisää hyvinvointia monimuotoisista metsistä[National Forest Programme 2015. More welfare from multi-use forests]Helsinki: Finnish Ministry of Agriculture and Forestry; 2008 [in Finnish withEnglish summary].
[6] Vehviläinen I, Hiltunen J, Vanhanen J. Lämmön ja sähkön yhteistuotannonpotentiaali sekä kaukolämmityksen jadjäähdytyksen tulevaisuus Suomessa.Gaia Consulting Oy; 2007 [in Finnish with English summary].
[7] Energiatuotannon lämmön veromuutosten vaikutus maakaasun kilpailuky-kyyn ja päästöihin Case-kohteissa. Pöyry Management Consulting, http://www.poyry.com; 2010 [in Finnish with English summary].
[8] Uusiutuvien energiamuotojen edistäminen. Valtiontalouden tarkastusvirastontuloksellisuustarkastuskertomukset213;2010 [inFinnishwithEnglish summary].http://www.vtv.fi/files/2397/2132010_Uusiutuvien_energiamuotojen_edistaminen_netti.pdf;
[9] PienCHP-laitosten syöttötariffi ja eri energiatuet.MSO/PuuSuomiverkostohanke.Työdja elinkeinoministeriö. Helsinki; 2010 [in Finnish with English summary].
[10] Metsähakkeen käyttö nousi yli 6 miljoonan kuutiometrin. In: Metsätilasto-tiedote 16; 2010 [in Finnish].
[11] Dantzig GB. Application of the simplex method to a transportation problem.In: Koopmans TC, editor. Activity analysis of production and allocation.New York, NY: John Wiley & Sons; 1951. p. 359e73.
[12] Hadley G. Linear programming. Reading, MA: Addison-Wesley PublishingCompany Inc.; 1962.
[13] Bengston SJ. A mathematical model for optimum timber allocation. M.S.thesis. Corvallis, OR: Oregon State University; 1966.
[14] Dykstra DP. Timber harvest layout by mathematical and heuristic program-ming. Ph.D. dissertation. Corvallis, OR: Oregon State University; 1976.
[15] Eriksson LO, Björheden R. Optimal storing, transport, and processing fora forest-fuel supplier. European Journal of Operational Research 1989;4:26e33.
[16] Björheden R, Eriksson LO. The effects of operational planning of changes inenergy content of stored wood fuels. Scandinavian Journal of Forest Research1990;5:255e61.
[17] Palander T. Tactical models of wood-procurement teams for geographicallydecentralized group decision-making. D.Sc. (Agr. and For.) thesis. Joensuu,Finland: University of Joensuu, Faculty of Forest Sciences; 1998.
[18] Palander T, Toivonen M, Laukkanen S. Groupware and group decision supportsystems for wood procurement organisation. A review. Silva Fennica 2002;36(2):585e600.
[19] Palander T, Vesa L. Integrated procurement planning for supplying energyplant with forest, fossil, and wood waste fuels. Biosystems Engineering 2009;103(4):409e16.
[20] Zeleny M. Multiple criteria decision-making. New York, NY: McGraw Hill;1982.
[21] Dyer J, Fishburn P, Steuer R, Wallenius J, Zionts S. Multiple criteria decision-making, multiattribute utility theorydthe next ten years. ManagementScience 1992;38:645e54.

T. Palander / Energy 36 (2011) 5579e55905590
[22] Hämäläinen RP, Mäntysaari J. Dynamic multi-objective heating optimization.European Journal of Operational Research 2002;142:1e15.
[23] Hämäläinen RP, Mäntysaari J, Ruusunen J, Pineau P-O. Cooperative consumersin a deregulated electricity marketddynamic consumption strategies andprice coordination. Energy 2000;25:857e75.
[24] Hongtao L, Maréchal F, Burer M, Favrat D. Multi-objective optimization of anadvanced combined cycle power plant including CO2 separation options.Energy 2006;31:3117e34.
[25] Hongtao L, Maréchal F, Favrat D. Power and cogeneration technology envi-ronomic performance typification in the context of CO2 abatement part II:combined heat and power cogeneration. Energy 2010;35:3517e23.
[26] Palander T. Local factors and time-variable parameters in tactical planningmodels: a tool for adaptive timber procurement planning. ScandinavianJournal of Forest Research 1995;10:370e82.
[27] Ilmastonmuutoksen kansallinen sopeutumisstrategia. Helsinki: FinnishMinistry of Agriculture and Forestry; 2005.
[28] Kansallisen energia- ja ilmastostrategian laadinnassa käytetyt skenaariot.Helsinki: Finnish Ministry of Trade and Industry; 2005.
[29] Taha HA. Operations research: an introduction. 9th ed. Prentice Hall;2010.
[30] Lasky M. The economic costs of reducing emissions of greenhouse gases:a survey of economic models. In: U.S. Congress. CBO Technical Paper 3.Washington, D.C.: Congressional Budget Office; 2003.
[31] Policy options for reducing CO2 emissions. In: U.S. Congress, Publication No.2930, Washington, D.C.: Congressional Budget Office; 2008.
[32] Palander T, Väätäinen J, Laukkanen S, Malinen J. Modeling backhauling onFinnish energy-timber network using minimizing of empty routes. Interna-tional Journal of Forest Engineering 2004;2:79e85.
[33] Renewable Energy Policy Network for the 21st Century (REN21). Renewables.Global status report; 2007. http://www.asiaing.com/ren21-renewables-2007-global-status-report.html;
[34] Future Energy Solutions. Assessment of emerging innovative energy efficienttechnologies as part of the energy efficiency innovation review. InternationalAtomic Energy Agency Technology Report AEAT/ENV/R/2001. Harwell, UK;2005. http://www.decc.gov.uk/assets/decc/what%20we%20do/supporting%20consumers/saving_energy/analysis/fes-report.pdf;