teaching and learning the concept of area and perimeter of
TRANSCRIPT
California State University, San Bernardino California State University, San Bernardino
CSUSB ScholarWorks CSUSB ScholarWorks
Theses Digitization Project John M. Pfau Library
2007
Teaching and learning the concept of area and perimeter of Teaching and learning the concept of area and perimeter of
polygons without the use of formulas polygons without the use of formulas
Jamie Robin Anderson Mickens
Follow this and additional works at: https://scholarworks.lib.csusb.edu/etd-project
Part of the Science and Mathematics Education Commons
Recommended Citation Recommended Citation Mickens, Jamie Robin Anderson, "Teaching and learning the concept of area and perimeter of polygons without the use of formulas" (2007). Theses Digitization Project. 3290. https://scholarworks.lib.csusb.edu/etd-project/3290
This Project is brought to you for free and open access by the John M. Pfau Library at CSUSB ScholarWorks. It has been accepted for inclusion in Theses Digitization Project by an authorized administrator of CSUSB ScholarWorks. For more information, please contact [email protected].
TEACHING AND LEARNING THE CONCEPT OF AREA AND PERIMETER OF
POLYGONS WITHOUT THE USE OF FORMULAS
A Project
Presented to the
Faculty of
California State University,
San Bernardino
In Partial Fulfillment
of the Requirements for the Degree
Master of Arts
in
Teaching Mathematics
byJamie Robin Anderson Mickens
June 2007
TEACHING AND LEARNING THE CONCEPT OF AREA AND PERIMETER OF
POLYGONS WITHOUT THE USE OF FORMULAS
A Project
Presented to the
Faculty of
California State University,
San Bernardino
by
Jamie Robin Anderson Mickens
June 2007
Approved by:
Date
Peter Williams, Chair Department of Mathematics
Davida Fischman Graduate CoordinatorDepartment ofMathematics
ABSTRACT
This study examined teaching and learning the concept
of area and the concept of perimeter of polygons without
the use of numbers. The purpose of this study was to
increase the students' understanding of the measures of
area and perimeter of polygons. The goal of this project
was to create a supplemental geometry unit to develop the
concept of the area and perimeter of a polygon without the
use of formulas, and numbers and to measure the
effectiveness of this unit on student understanding.
■ Although this study was a small pilot study done with
a fairly small sample group (the two geometry classes
participating in the project had less than twenty-eight
students each) and even though the treatment group's
sample data only supported significant growth on two
problems, the project's impact on the students' assessment
results were noticeable. The treatment group showed
growth on twelve of the eighteen problems on the post
test .
iii
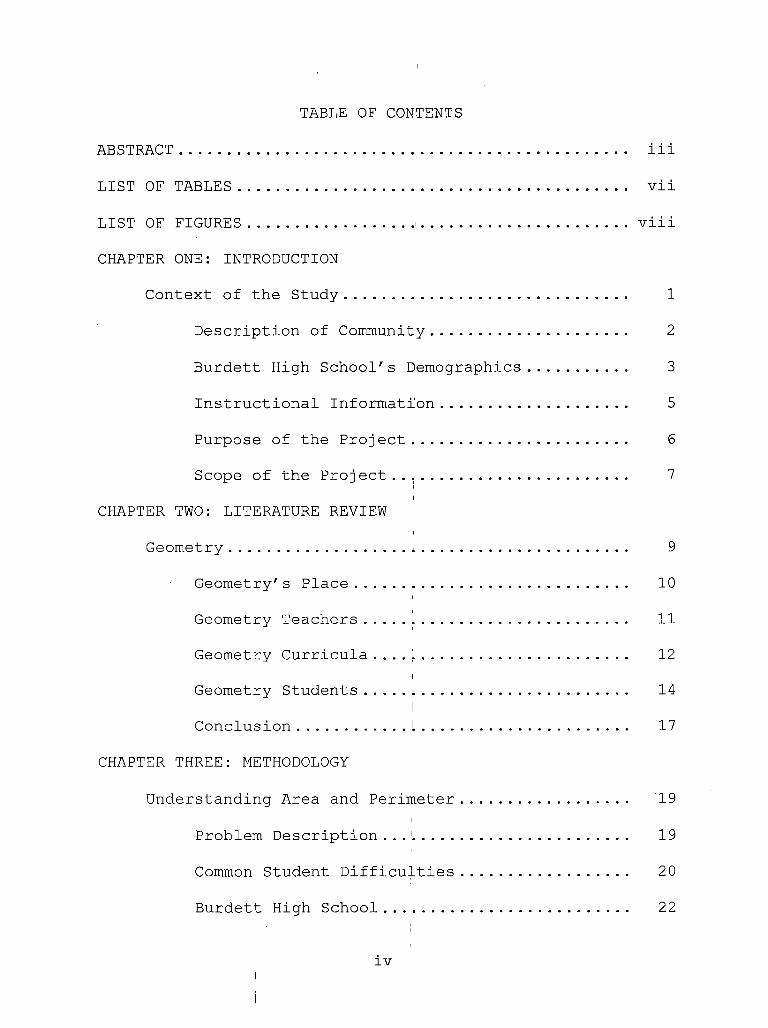
TABLE OF CONTENTS
ABSTRACT .............................................. iii
LIST OF TABLES.................. vii
LIST OF FIGURES.................>.......................viii
CHAPTER ONE: INTRODUCTION
Context of the Study ............................. 1
Description of Community .................... 2
Burdett High School's Demographics.......... 3
Instructional Information ................... 5
Purpose of the Project...................... 6
Scope of the Project ......................... 7
CHAPTER TWO: LITERATURE REVIEW
Geometry.................. ....................... 9
Geometry's Place ............................t
Geometry Teachers ...........................
Geometry Curricula .... 1.....................I
Geometry Students...........................I
Conclusion...........I......................
10
11
12
14
17
CHAPTER THREE: METHODOLOGY
Understanding Area and Perimeter................. 19
Problem Description...1...................... 19
Common Student Difficulties................. 20
Burdett High School......................... 22
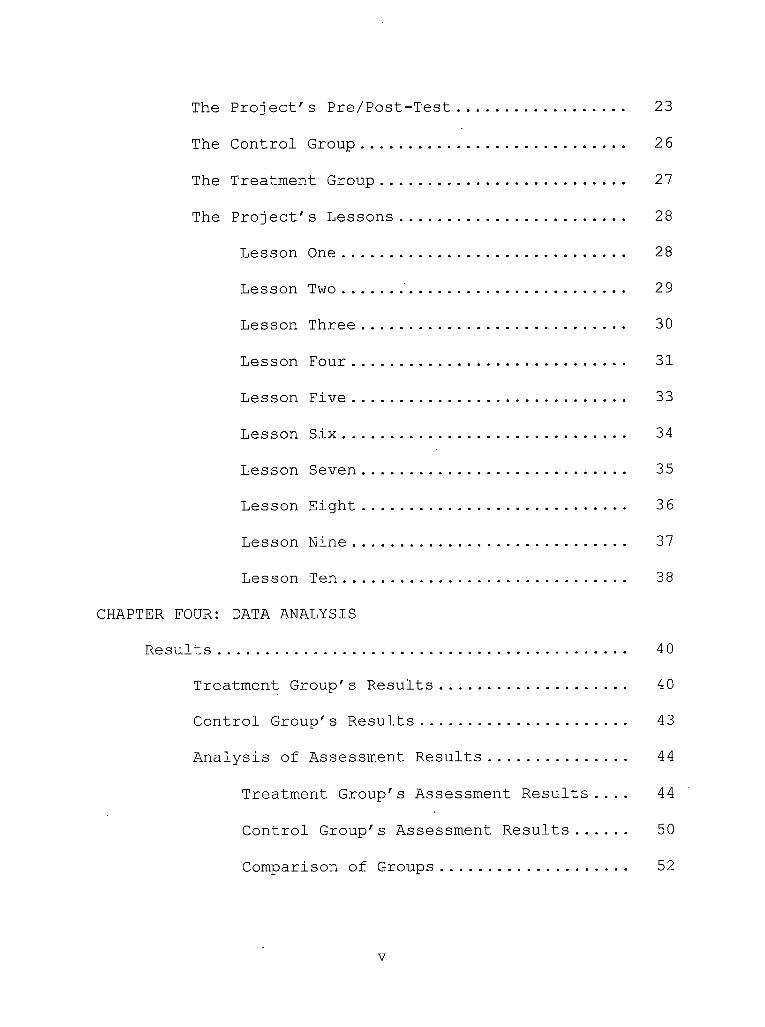
23The Project's Pre/Post-Test
The Control Group.......................... 2 6
The Treatment Group........................ 27
The Project's Lessons...................... 28
Lesson One............................. 28
Lesson Two......’...................... 29
Lesson Three........................... 30
Lesson Four............................ 31
Lesson Five............................ 33
Lesson Six............................. 34
Lesson Seven........................... 35
Lesson Eight........................... 36
Lesson Nine............................ 37
Lesson Ten............................. 38
CHAPTER FOUR: DATA ANALYSIS
Results.......................................... 40
Treatment Group's Results................... 40
Control Group's Results..................... 43
Analysis of Assessment Results.............. 44
Treatment Group's Assessment Results.... 44
Control Group's Assessment Results..... 50
Comparison of Groups................... 52
v
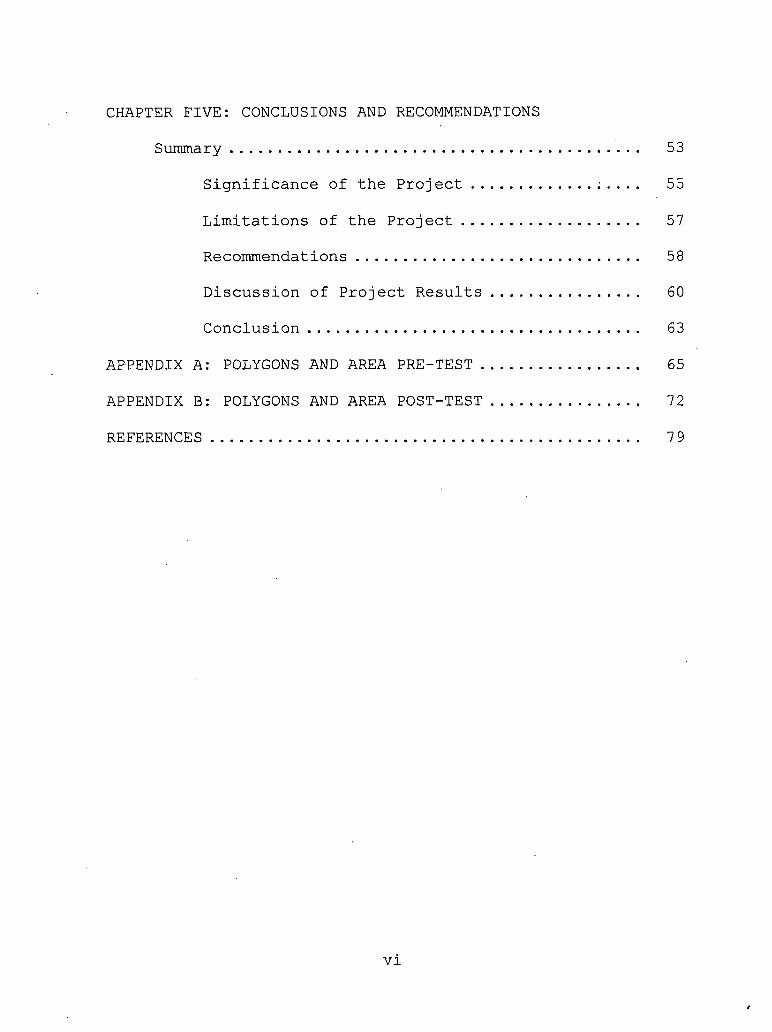
CHAPTER FIVE: CONCLUSIONS AND RECOMMENDATIONS
Summary.......................................... 53
Significance of the Project............ . 55
Limitations of the Project.................. 57
Recommendations ............................. 58
Discussion of Project Results ............... 60
Conclusion.................................. 63
APPENDIX A: POLYGONS AND AREA PRE-TEST................ 65
APPENDIX B: POLYGONS AND AREA POST-TEST............... 72
REFERENCES........................ .................... 7 9
vi
LIST OF TABLES
Table 1. Class Data: Proportion Correct.............. 41
vii
LIST OF FIGURES
Figure 1. Triangle to Parallelogram................... 45
Figure 2. Ruler....................................... 4 6
Figure 3. Inscribed Star.............................. 48
Figure 4. Geo-board Shapes............................ 48
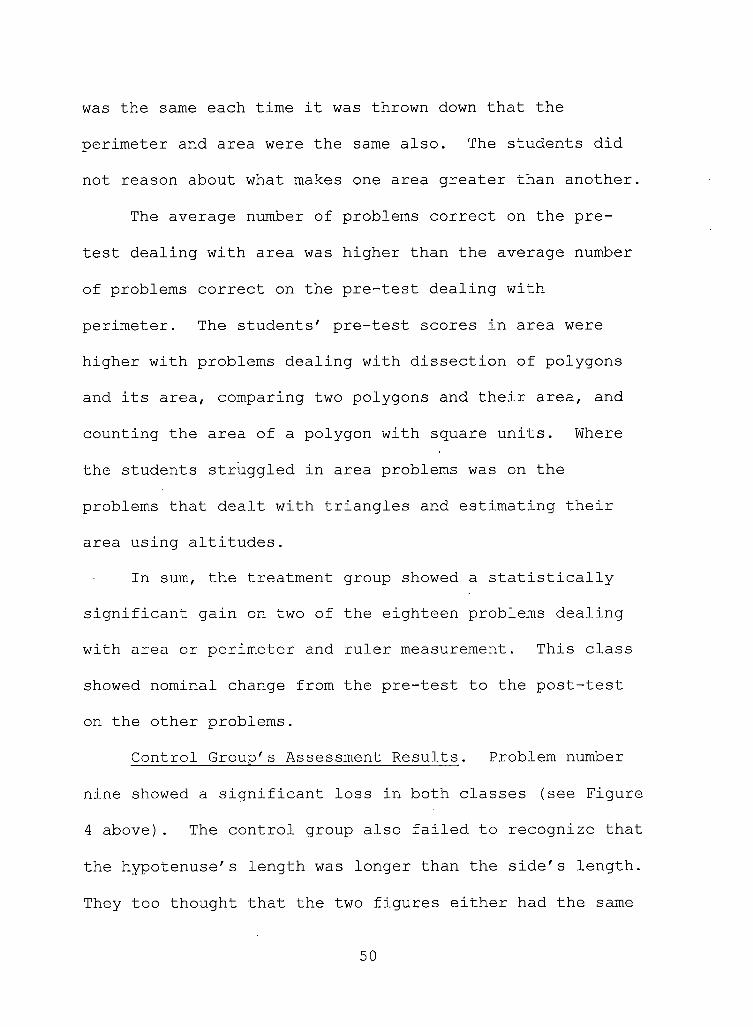
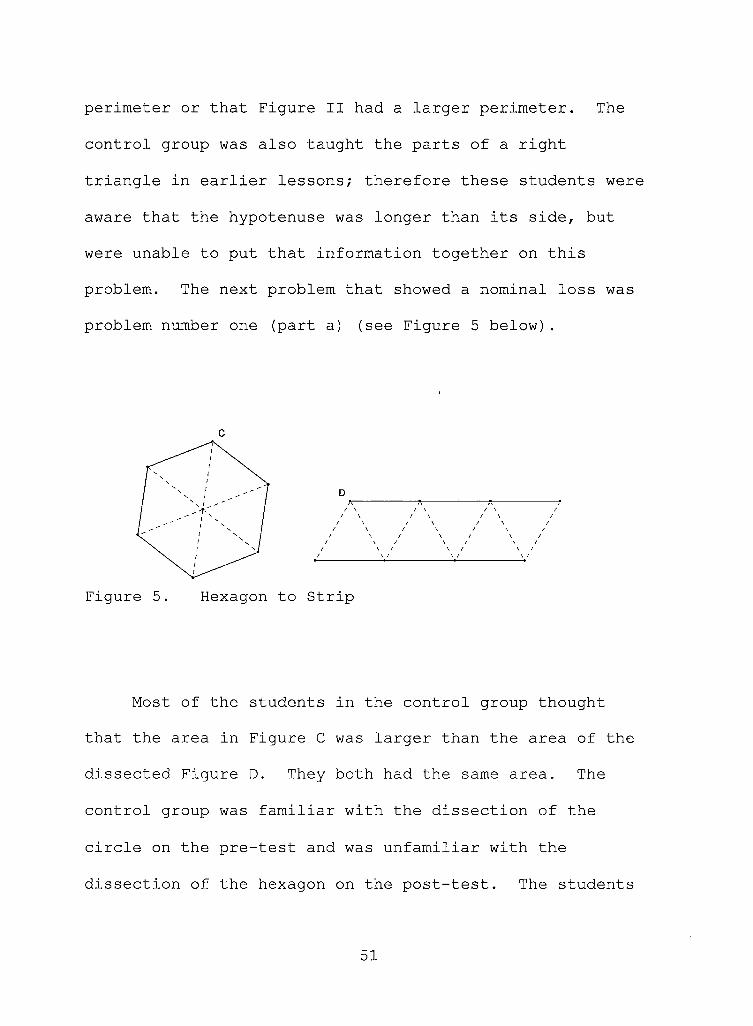
Figure 5. Hexagon to Strip............................ 51
viii
CHAPTER ONE
INTRODUCTION
Context of the Study1
1 To preserve anonymity, the websites and other material used to collect information about the city, school district, and schools are not cited.
The objective of this project was to establish a
supplemental geometry unit that develops the concept of
the area and the perimeter of a polygon without the use of
formulas. The purpose of this study was to improve the
students' understanding of the measure of area and
perimeter of polygons. A pre- and post-test was designed
to measure the effects of this project's unit on the
students' comprehension of the concept of area and
perimeter.
It is important for future references and comparisons
to know about the community in which the school is
situated in order to understand the context of teaching
and learning at that high school. Burdett High School
(pseudonym) is the sample high school for this project.
Description of Community
My master's degree project was implemented in a
school in a Southern California community within the
1
Inland Empire. The community in which the school is
situated is ethnically diverse, and is one of the fastest
growing areas in the state. According to the California
Department of Finance (2006), the approximate population
of the community is 99,200 residents as of January 2006. '
The ethnic makeup of the community breaks down as 51.2%
Hispanic or Latino (of any race), 39.4% White, 22.3% Black
or African American, and 12.9% are listed as "others"
reported by the U.S. Census Bureau (Census 2000) . The
median age of people living in the community is 26.4 years
old and nearly 60% of them speak English with another 40%
speaking Spanish.
Economically, of 24,659 total households, 83.2% were
family households with a median household income of
$41,254 (U.S. Census, 2000). The percent of owner-
occupied housing units from the above total households is
68.4%, leaving 31.6% as renter-occupied housing units.
The unemployment rate for those over 16 years old in this
community was just over 6%. The school districts, with
2,251 employees, and FedEx Ground Distribution and
Packages, with 1,750 employees were the two major
employers in this region. Most people traveled just over
30 minutes when going to their jobs.
2
Most of the people living in this community,
according to the U.S. Census, have had no college
education (U.S. Census, 2000). Only 2.3% were reported as
having received a graduate or professional degree and 6.4%
had received a bachelor's degree. Just over 6% of the
people were shown as receiving an associate's degree, and
23.6% had some college though they had not gone on to
receive degrees.
In 2000, nearly 28,000 students were enrolled in the
local K-12 school district (U.S. Census, 2000). The
district included 13 elementary schools, 5 middle schools,
and 5 high schools. A sizable number of students were
raised by their grandparents, as 38.7% of grandparents
living with children less than 18 years old were primary
caregivers.
Burdett High School's Demographics
As published by School Wise Press, in the school
accountability report card for 2004-2005, there were 2,245
students enrolled in the Burdett High School. The ethnic
makeup of the high school students mimicked that of the
community with 51% Latino/Hispanic and 34% African
American. However, there was a lower percentage of white
students attending the sample high school, 12% compared to
3
the nearly 40% White population in the community as a
whole. Ten percent.of these high school students were
English learners and primarily spoke Spanish at home.
Over 60% of the students came from households whose adults
have attended some college and another 28% came from homes
in which the caregivers had a college degree. Thirty
eight percent of these students were on free or reduced-
price meal, which was subsidized for low-income students
whose families earn less than $34,873 a year for a family
of four.
In 2006, the district employed eighty-three teachers
at Burdett High School. The average teaching experience
within the high school was ten years, with 25% of the
staff having less than two years experience. About half
of the teachers had only a bachelor's degree while
slightly more than half of the teachers also held a
graduate degree. While most of the teachers held single
subject credentials, some of the teachers who taught at
the Burdett High School held a multiple subject
credential. Only 87% of Burdett's teaching faculty held
the secondary (single-subject) credential, below the
statewide average of 90%. The math department had an even
lower percentage, with 70% of the faculty holding a
4
secondary (single-subject) credential with the remaining
math teachers holding a supplemental credential. Ninety
percent of the faculty held a full, clear authorization to
teach either at the elementary level with a supplemental
credential or the secondary level with a single subject
credential while 8% held an internship credential, and so
were still taking university courses to complete their
preliminary credential. Two percent of the high school
teachers held an emergency permit.
Instructional Information
Burdett High School was the newest school within the
district. In 2004, when the school opened, Burdett had
only a junior class. The school initially was on a
modified block schedule, meaning that on Monday and Friday
students would attend all their classes for fifty-five
minutes, and on Tuesday, Wednesday, and Thursday they
would attend four classes for eighty minutes. Each class
would meet four times per week, Monday and Friday, and
then twice during Tuesday, Wednesday, or Thursday. The
average class size was thirty students compared to
statewide average of twenty-nine students. The school was
staffed with a career counselor and two career
technicians. Students had an opportunity to be part of
5
Advancement via Individual Determination (AVID) Program to
prepare them for college. Some students were able to
enroll in courses that were more challenging than the
required courses such as honors, Advanced Placement (AP),
and International Baccalaureate (IB). In 2005, 13% of the
students took and passed Advanced Placement (AP) exams,
below the 15% county average recorded in the school
accountability report card.
Purpose of the Project
Burdett's geometry students encountered difficulties
in high school geometry. In 2005, according to the school
accountability report card, only 9% of the students scored
at the proficient or advanced levels on the State's
standardized testing program for geometry, which was far
below the average California high school at 24%. The
California Standards Test (CST) sub-score analysis in
geometry was broken up into four clusters, logic and
geometric proofs, volume and area formulas, trigonometry,
and angle relations, constructions, and lines. Students
at Burdett scored the least overall within the cluster of
volume and area formulas at 42% correct, which was below
70%, the cutoff score for minimal proficiency. Anecdotal
evidence gathered from student work and teacher comments
6
indicated that students struggled to memorize geometric
definitions, theorems, and formulas.
Scope of the Project
Throughout this project's unit students compared the
areas and lengths of polygons by using two-dimensional
constructions. The project addressed the definitions and
concepts of area and perimeter of polygonal regions and
challenged students to know, derive, and solve problems
involving perimeter and area without the use of formulas.
Two geometry classes participated in the project, one
using traditional instruction via the textbook and direct
instruction, and the other class using the project's unit.
Students in small groups from the class using the
project's curriculum unit were challenged to find the area
and perimeter of a polygon in as many ways as possible.
The length of the project's unit was ten days.
The participants in the project's new unit were from
a geometry class consisting of ninth, tenth, and eleventh
grade students. The project was to supplement Burdett's
geometry textbook, Glencoe's "Geometry: Concepts and
Applications" (Cummins, Kanold, Kenney, Malloy, & Mojica,
2001). The expected results of this project were that
students using the new unit that emphasized exploration
7
and discovery would gain a better grasp of the concepts of
area and perimeter and thus be able to accurately complete
test questions at a higher rate of success than the
students in the traditional geometry class. The study
shows that modifications in teaching curriculum can
improve student learning.
I
8
CHAPTER TWO
LITERATURE REVIEW
Geometry
When people look around in nature and their natural
environment they encounter geometric concepts: in
architecture, art, advertising, nature, neighborhoods,
their homes, landmarks, and the streets they travel.
Geometry is a natural place to develop students reasoning.
In most geometry classes in the United States, this is not
occurring. Geometry is the area of mathematics on which
most elementary and middle school teachers spent the least
time (Van de Walle, 2004). This lack of attention created
a ripple affect reaching the college level. Clements and
Stephan reported that several research reports revealed
that college-level students had difficulties with area
measurement (Clements & Stephan, 2003). It has been noted
that even though geometry is a natural place to develop
students' reasoning, it is the area of mathematics where
students perform poorly (Kenney & Silver, 1997; Beaton et
al., 1996).
9
Geometry's Place
"Geometry is a natural place for the development of
students' reasoning and justification skills, culminating
in work with proof in the secondary grades" (The National
Council of Teachers of Mathematics [NCTM], 2000, p. 41).
Geometric ideas and spatial reasoning are useful tools in
sblving problems. The National Council of Teachers of
Mathematics (NCTM) (2000) reminds teachers that through
geometric ideas, students are provided with important
tools to describe and interpret their physical environment
and to solve real-world situations. The state of
California echoes the NCTM's statement about the need for
students to develop good reasoning skills through the
venue of geometry. The Mathematics Framework for
California Public Schools standards states: "The main
purpose of the geometry curriculum is to develop geometric
skills and concepts and the ability to construct formal
logical arguments and proofs in a geometric setting"
(Curriculum Development and Supplemental Materials
Commission [CDE], 2000, p. 162). Developing informal to
more formal thinking in geometry across the grades is
consistent with the thinking of theorists and researchers
(Fuys, Geddes, & Tischler, 1988; NCTM, 2000; van Hiele, .
10
1999). "The Geometry Standard includes a strong focus on
the development of careful reasoning and proof, using
definitions and established facts" (NCTM, 2000, p. 41) .
Despite the benefits for understanding geometry and
spatial sense, research suggests "many teachers do not
consider geometry and spatial relations to be an important
topic, which gives rise to feelings that geometry lacks
firm direction and purpose" (Pegg & Davey, 1998, p. 109).
Dina van Hiele and Pierre van Hiele are credited with
"improving teaching geometry by organizing instruction to
take into account students' thinking" (Pegg & Davey, 1998,
p. 110). A closer examination of the van Hiele framework
is discussed later in this paper.
Geometry Teachers
Since mathematics educators, such as Van de Walle (as
cited in Menon, 1998), have called for teaching
mathematics with understanding, researchers' attention
have focused not only on the mathematical competency of
the students, but have also on "how much mathematics the
pre-service teachers themselves understand" (Menon, 1998,
p. 361). Menon states that there are very few studies on
pre-service elementary teachers' understanding of
perimeter and area (1998). Menon (1998) conducted a
11
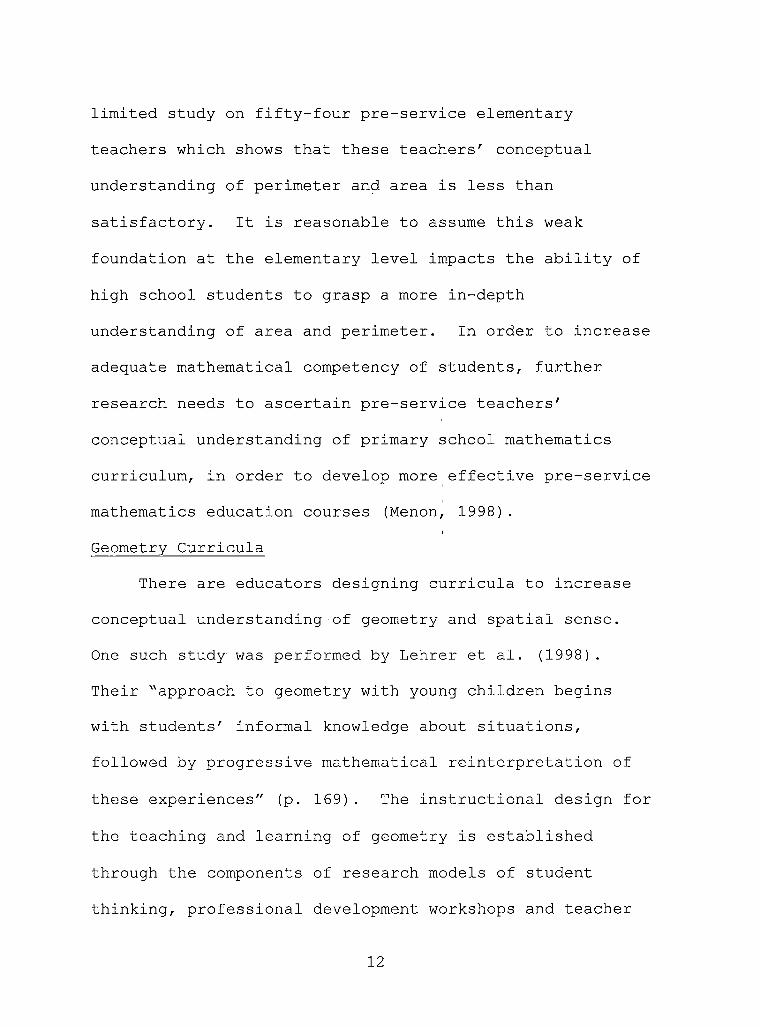
limited study on fifty-four pre-service elementary
teachers which shows that these teachers' conceptual
understanding of perimeter and area is less than
satisfactory. It is reasonable to assume this weak
foundation at the elementary level impacts the ability of
high school students to grasp a more in-depth
understanding of area and perimeter. In order to increase
adequate mathematical competency of students, further
research needs to ascertain pre-service teachers'
conceptual understanding of primary school mathematics
curriculum, in order to develop more effective pre-service
mathematics education courses (Menon, 1998).
Geometry Curricula
There are educators designing curricula to increase
conceptual understanding of geometry and spatial sense.
One such study was performed by Lehrer et al. (1998).
Their "approach to geometry with young children begins
with students' informal knowledge about situations,
followed by progressive mathematical reinterpretation of
these experiences" (p. 169). The instructional design for
the teaching and learning of geometry is established
through the components of research models of student
thinking, professional development workshops and teacher
12
authoring, parents as partners, and classroom-based
collaborative research.
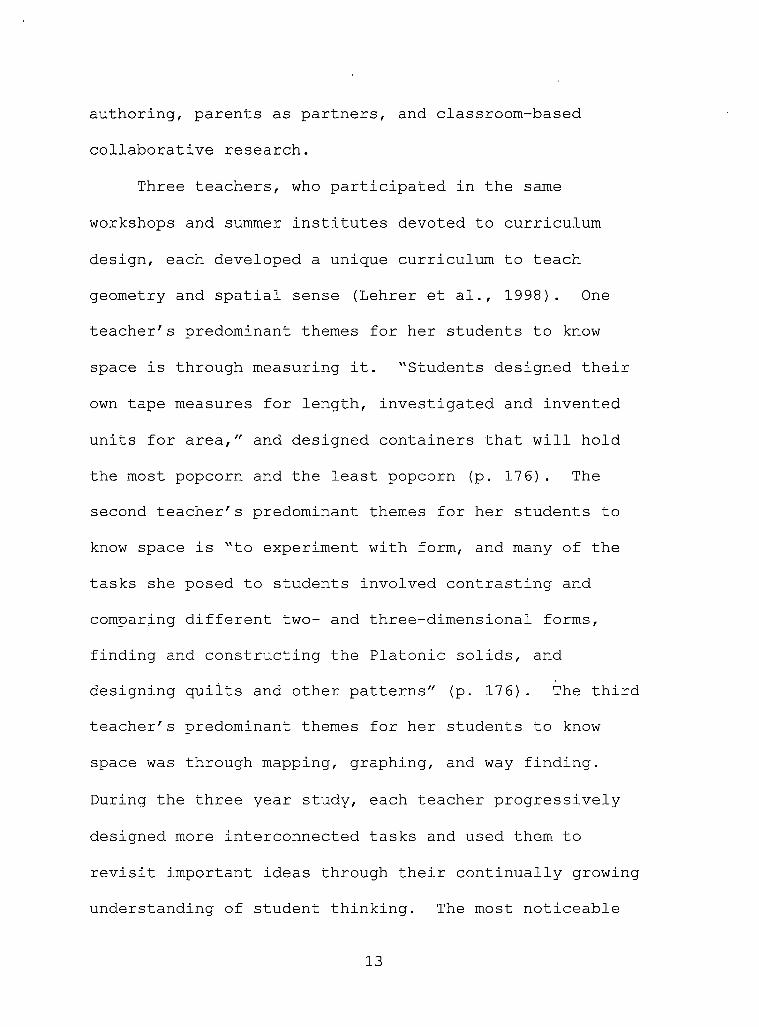
Three teachers, who participated in the same
workshops and summer institutes devoted to curriculum
design, each developed a unique curriculum to teach
geometry and spatial sense (Lehrer et al., 1998). One
teacher's predominant themes for her students to know
space is through measuring it. "Students designed their
own tape measures for length, investigated and invented
units for area," and designed containers that will hold
the most popcorn and the least popcorn (p. 176). The
second teacher's predominant themes for her students to
know space is "to experiment with form, and many of the
tasks she posed to students involved contrasting and
comparing different two- and three-dimensional forms,
finding and constructing the Platonic solids, and
designing quilts and other patterns" (p. 176). The third
teacher's predominant themes for her students to know
space was through mapping, graphing, and way finding.
During the three year study, each teacher progressively
designed more interconnected tasks and used them to
revisit important ideas through their continually growing
understanding of student thinking. The most noticeable
13
change is in the class' communication about space. When
students spoke about space, they usually talked about
drawing or building a measuring tool. In each year of the
three year study they noted significant transitions in
student thinking in all classrooms, and significant growth
in children's number sense as well as their spatial sense.
Geometry Students
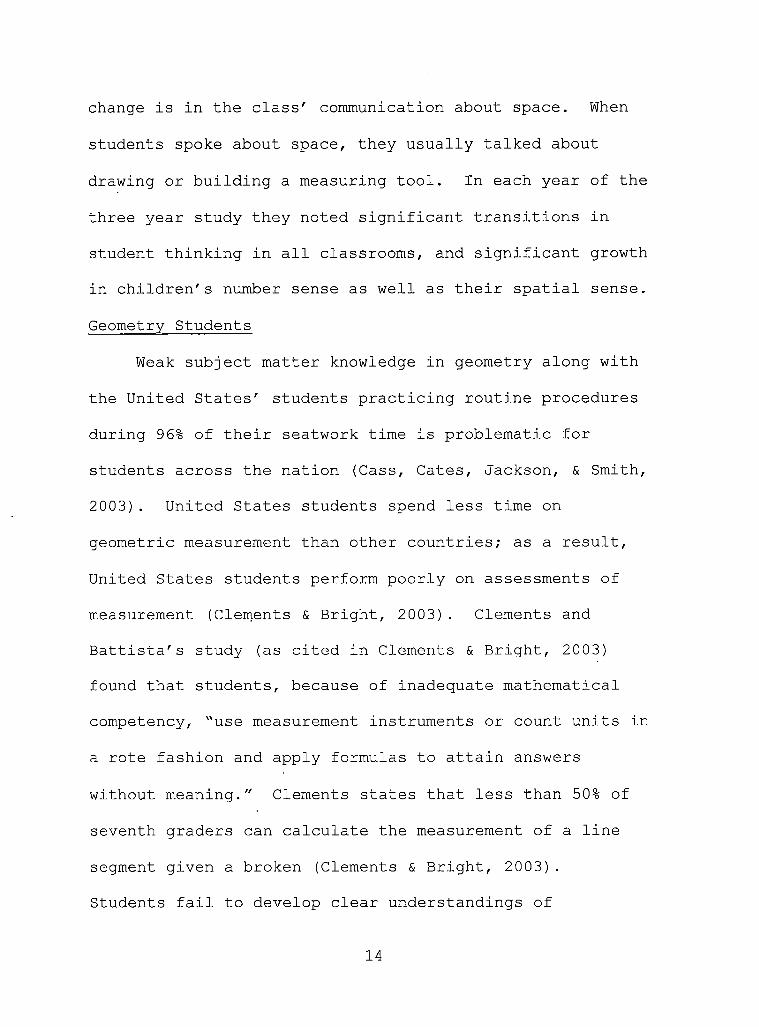
Weak subject matter knowledge in geometry along with
the United States' students practicing routine procedures
during 96% of their seatwork time is problematic for
students across the nation (Cass, Cates, Jackson, & Smith,
2003). United States students spend less time on
geometric measurement than other countries; as a result,
United States students perform poorly on assessments of
measurement (Clements & Bright, 2003). Clements and
Battista's study (as cited in Clements & Bright, 2003)
found that students, because of inadequate mathematical
competency, "use measurement instruments or count units in
a rote fashion and apply formulas to attain answers
without meaning." Clements states that less than 50% of
seventh graders can calculate the measurement of a line
segment given a broken (Clements & Bright, 2003).
Students fail to develop clear understandings of
14
measurement because they lack the ability to partition
space into equal linear units or arrays of two dimensional
units (Clements & Stephen, 2003). To counteract this,
they suggest that teachers should encourage students to
measure items with standard and nonstandard units.
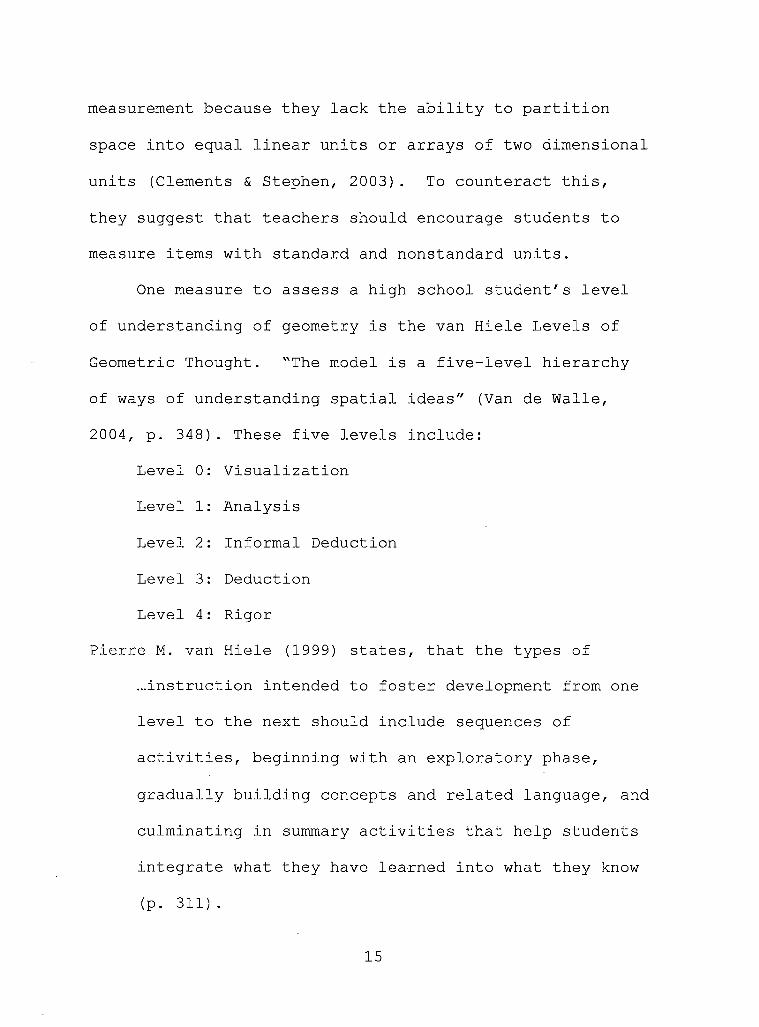
One measure to assess a high school student's level
of understanding of geometry is the van Hiele Levels of
Geometric Thought. "The model is a five-level hierarchy
of ways of understanding spatial ideas" (Van de Walle,
2004, p. 348). These five levels include:
Level 0: Visualization
Level 1: Analysis
Level 2: Informal Deduction
Level 3: Deduction
Level 4: Rigor
Pierre M. van Hiele (1999) states, that the types of
...instruction intended to foster development from one
level to the next should include sequences of
activities, beginning with an exploratory phase,
gradually building concepts and related language, and
culminating in summary activities that help students
integrate what they have learned into what they know
(p. 311).
15
This concept of developing students' thinking from one
level to the next is the impetus for the present project.
Evidence shows that across the nation students lack
the understanding of geometry concepts. The Third
International Mathematics and Science Study (TIMSS)
revealed the fact that the United States' eighth grade
students' geometry achievement is below average among the
forty-five countries involved in the study (Beaton et al.,
1996). The report covered more than thirty languages at
five grade levels, and revealed that'eighth grade students
from the United States showed little understanding of the
properties of perimeter and area (Beaton et al., 1996).
The TIMSS report asked the students this question for
perimeter: "What is the ratio of the length of a side of a
square to its perimeter? A. 1/1 B. 1/2 C. 1/3 D. 1/4 (p.
78)." The correct answer is D. Fifty-five percent of
eighth grade students from the United States answered this
question correctly which is far below the 80% successful
answers from eighth grade students living in Japan and
Singapore, and just below the forty-five countries'
average of 56%. To test students understanding of area,
they are given a rectangle and asked a two part question.
The first task asked students to draw a rectangle "whose
16
length is one and one-half times the length of the given
rectangle and whose width is half the width of the
rectangle (p. 95)." The next part of the question asked
the students to state "the ratio of the area of the new
rectangle to the area of the first one" and they are asked
to show their work (p. 95). The level of difficulty of
this problem proved to be far above the seventh and eighth
grade students participating in this study. On average,
31% of the eighth grade students in the forty-five
countries drew the correct rectangle compared to 16% in
the United States. The second part of the question proved
to be even more difficult. On average, in the forty-five
countries the number of students answering that part of
the guestion correctly is just 6%, while the United States
did better with 10%.
Conclusion
Geometry is important in terms of developing
students' mathematical reasoning skills (NCTM, 2000). The
literature shows there is a need to meet the students at
their knowledge and develop their knowledge through
everyday experiences (Fuys et al., 1988; Lehrer et al.,
1998; van Hiele, 1999). There is a need to develop
curricula to increase the students' spatial awareness and
17
understanding (Lehrer et al., 1998; Menon, 1998). The
development of pre-service elementary teachers will assist
in developing students' conceptual understanding instead
of computational knowledge without understanding (Menon,
1998). Rote memorization of formulas has proven
ineffective (Cass et al., 2003; Clements & Stephan, 2004;
de Villiers, 1998; Malloy, 1999; Ridgway & Healy, 1997).
American students and teachers are not proficient in their
understanding of area and perimeter (Addington, 2006;
Malloy, 1999; Menon, 1998; TIMSS, 1996). Area and
perimeter is one field in geometry that needs more
attention. The goal of this project was to create a
supplemental geometry unit to develop the concept of the
area and perimeter of a polygon without the use of
formulas and numbers, thereby increasing students'
understanding of these concepts.
18
CHAPTER THREE
METHODOLOGY
Understanding Area and Perimeter
The purpose of this study was to test whether hands-
on activities can increase the student's understanding of
the measures of area and perimeter of polygons. The goal
of this project was to create a supplemental geometry unit
to develop the concept of the area and perimeter of a
polygon without the use of formulas and numbers, and test
its effect on student understanding of these concepts.
Michael de Villiers argues "that students should be
actively engaged in the defining of geometric concepts"
while actively participating in the construction and the
development of the content (1998, p. 248). Studying area
and perimeter through two dimensional constructions gives
the students a visual meaning of the definition of area
and perimeter, which increases their interest while
helping them with their understanding (Murrey & Newton,
2007) .
Problem Description
According to the California mathematics standards,
students begin learning about area and perimeter in
19
elementary school (CDE, 2000) . Malloy (1999) states that
by the time students enter the middle grades they should
have a concept of what area and perimeter are. She argues
that, although many students may be able to compute the
area and perimeter of given figures, few have fully
conceptualized the meaning of area and perimeter.
Perimeter and area are concepts that are usually
learned by formulas. Students often become "confused by
the formula and find area when they are asked for
perimeter and perimeter when they are asked for area"
(Malloy, 1999, p. 87). Other research shows that students
and some teachers try to compare perimeter and area even
though these quantities have different units (Addington,
2006). However, if meaning is attached to perimeter and
area, then "confusion can be eliminated because the
measures are obviously different: one is the number of
length units that fits around the figure, and the other is
the number of square units enclosed by the figure" (Moyer,
2001, p. 52).
Common Student Difficulties
This project addresses several areas highlighted by
research as problematic for geometry students. Research
conducted by Fuys, Geddes, and Tischler (1998) found,
20
"Experiences of secondary school mathematics teachers
indicate that many students encounter difficulties in high
school geometry" (p. 4). One of the causes for these
difficulties was traditional instruction in which students
were taught rote memorization of formulas (Cass et al.,
2003; Clements & Stephan, 2004; de Villiers, 1998; Malloy,
1999; Ridgway & Healy, 1997). Another cause for these
difficulties was that traditional instruction needs to
account for the different phases of the learning process:
the instruction must foster development from one level of
understanding to the next (Fuys et al., 1988; Lehrer et
al., 1998; van Hiele, 1999). Students may also encounter
difficulties in high school geometry through their
textbook's inability to account for the various phases of
the learning process (Fuys et al., 1998).
Pierre M. van Hiele believed that secondary school
geometry requires a high level of thinking while many
secondary geometry students did not have sufficient
experience in thinking at lower levels. A gap exists
between students' level of thinking and the required level
of thinking necessary for geometry success (van Hiele,
1999). Dina van Hiele and Pierre van Hiele "observed that
teachers often talked about geometry using language that
21
students could not understand," placing the teacher and
students at different levels of thought about geometry
(Malloy, 1999, p. 1). This lack of communication between
teachers and students is an added obstacle to the
students' understanding of secondary school geometry.
Burdett High School
Can a student gain a solid understanding of area and
perimeter of polygons without the use of numbers and
formulas? The project's unit was taught to a geometry
class at Burdett High School, supplementing the textbook's
chapter ten, while another geometry teacher taught the
traditional geometry class. Both classes were given a
pre-test prior to the start of chapter ten, and both
teachers gave a post-test following the conclusion of the
chapter or the project's unit.
The first goal of the project was to deepen the
student's understanding of the concept of area of a
polygon. Students were challenged to find the area of a
polygon in as many ways as they could. Within small
groups and with the class, students shared and discussed
their results and strategies. The second goal of the
project was to define and estimate the perimeter of
polygons. Working in small groups, students were
22
challenged to find two figures with the same area and
different perimeters (Addington, 2005). In small groups
the students discussed and shared their results with the
class.
The following sections will detail the project's
scope and sequence.
The Project's Pre/Post-Test
The project's pre- and post-test were broken up into
two types of problems. The first area of the test dealt
with the concept of geometric area of polygons. The
second area of the test dealt with the concept of length
measurement with units and perimeter, mostly without
units. Both the pre- and post-test consisted of twelve
problems, with four of the problems having two parts.
Five of the remaining twelve problems dealt with two
different figures, with one of the figures having two
guestions, and the other figure having three questions.
The first question of the pre- and post-test dealt
with the concept of dissection: taking a polygon and
separating it into pieces, and then comparing the original
polygon's area and perimeter to the new figure created.
The students were required to recognize that the two
figures were constructed with congruent pieces, and then
23
analyze whether the figures' area, then perimeter, were
the same, less than, or greater than. Then the students
were to explain their reasoning.
Problem number two and three had the same concept.
In problem two there was a story and a picture about a
rope tied to make a loop; it was thrown on the ground
twice making two different figures. The students were
required to recognize that the rope was the same each time
creating two different figures. Students were to analyze
whether the figures' area, then perimeter, were the same,
less than, or greater than. Then the students were asked
to explain their reasoning. In problem number three the
students were given a triangle with the side lengths
marked. Two parallelograms were created with two copies
of the triangle. Students were to find the perimeter and
the area of each parallelogram, and if they could not find
the area, then they were to compare the areas of the two
parallelograms.
Problem number four was a labeled triangle with three
line segments drawn in the interior from two vertices.
The students were to recognize and list the triangle's
altitudes.
24
Problem number five simulated a bricklayer building a
patio. The outline of the patio was given, and one of the
brick units was labeled. The students were to find the
area and perimeter of the finished patio.
Problem number six and seven pertained to a figure
that was inscribed in another figure. The inside figure's
interior was shaded. Problem six asked the students to
determine which figure had the greater perimeter and why.
Problem seven asked the students to determine which figure
had the greater area and why.
Problems eight, nine, and ten pertained to two
figures on a square grid. The figure created had a side
labeled and a hypotenuse labeled with letters. Students
were asked to compare the two figures' area and perimeter.
Problem ten asked students to write an expression for the
perimeter by using the labeling of the side and the
hypotenuse.
Problem eleven asked students to interpret the length
of a line drawn under a partial ruler that started at zero
and ended at one, and was marked with binary fraction
subdivisions. The unit was nonstandard, and the students
were told that the basic unit was called an elbo. The
25
students were asked how long (in elbos) the heavy line
segment beneath the ruler was.
Problem twelve was a labeled parallelogram. The
students were asked if the height of the parallelogram was
greater than, less than, or equal to the side.
The Control Group
The control group had a class of less than thirty
students, but only twenty students were in attendance for
both pre- and post-test. The control group used Burdett
High School's textbook, "Geometry: Concepts and
Applications," and direct instruction (Cummins et al.,
2001). This group covered all seven sections of chapter
10, "Polygons and Area," in the textbook. The class took
one day for the pre-test, ten days to cover the material,
and one day for the post-test. Burdett High School was on
a modified block schedule meaning that on Monday and
Friday students would attend all their classes for fifty-
five minutes, and on Tuesday, Wednesday, and Thursday they
would attend four classes for eighty minutes. Each week
each class would meet four times per week, Monday and
Friday, and then twice during Tuesday, Wednesday, or
Thursday.
26
The Treatment Group
The treatment group had a class of less than thirty
students with twenty-four students in attendance to take
both the pre- and post-test. The treatment group was on
the same modified block schedule as the control group
which met four times a week, two days for fifty-five
minutes and two days for eighty minutes. This class took
one day for the pre-test, ten days for the project's unit,
and one day for the post-test. The treatment group also
used Burdett High School's textbook, but, covered only
three sections of chapter ten: 1) Naming Polygons, 2) Area
of Polygons, and 3) Areas of Triangles and Trapezoids.
These sections were sprinkled throughout the project's
unit. The four sections of chapter ten of Burdett High
School's textbook that was not covered were Diagonals and
Angle Measure, Areas of Regular Polygons, Symmetry, and
Tessellations. The other lessons in the project's unit
took material from the textbook "Geometry: Seeing, Doing,
Understanding (Jacobs, 2003), and the textbook
"Discovering Geometry: An Investigative Approach" (Serra,
2003) .
27
The Project's Lessons
The routine each day in which the project was
implemented was to discuss the previous day's concepts and
assignment. I checked for understanding and assisted with
clarity as needed. Concepts that were unclear were re
visited. Concepts that led into the day's topic were
reviewed.
Lesson One. In the first lesson of the project,
students were asked to compare the area of polygons
without the use of formulas. Students were asked to state
the definition of the "area of a polygon." Students were
given a laminated map of the United States to compare the
areas of different states on the map (Jacobs, 2003).
Normally, to compare sizes, we usually use numbers.
Without numbers such comparisons are not always as easy.
There was class discussion of how to approach this without
numbers. Numbers were usually used as a measuring tool to
compare sizes. We discussed other possible measuring
tools that could be used to compare sizes. Then students
were challenged to use.the map and pick a measuring tool
like rice, white beans, "CHEEZ-IT", or any tool which they
chose to calculate the next three largest states following
Texas. Students were to state their measuring tool; they
28
were to explain why they chose that particular measuring
tool; and they were to explain why their tool was
accurate. The students were asked to name the next three
largest states following Texas and state how they arrived
at that result. Students were asked what would be the
unit of measurement, and why? Then for homework the
students were asked to use two other measuring tools to
calculate the area without formulas and record what they
used and their results. Next, students were to discuss
which measuring tool they preferred and explain why.
Finally, the students discussed the fact that if someone
else were to use their measuring tool would they arrive at
the same result, and briefly explain why they would or
would not.
Lesson Two. In the second lesson students discussed
what measuring tools they used during class and why?
Students were asked about the measuring tools used when
they were at home and were the results the same? Students
were asked what would be the unit of measurement, and why?
Finally, each group was asked to state in their own words
the definition of the area of a polygon which prompted the
lesson's discussion on polygonal regions. Students were
asked to define a polygonal region (Jacobs, 2003). I
29
presented several copies of the same polygonal region. I
took one copy of the polygonal region and cut it up into
several pieces. I reassembled the pieces with overlapping
pieces, and discussed whether or not it had the same area
as the original polygonal region. A complete definition
of the area of a polygonal region was established and
discussed. The class practiced estimating the area of
polygonal regions (Jacobs, 2003). Students were asked to
compare areas of polygonal regions for homework and
justify their answers (Jacobs, 2003) .'
Lesson Three. In the third lesson I expanded their
homework problem with the flags of Thailand and Panama.
Each flag had three colors. The areas of the flags were
described by a variable or variables,- and the students
were asked to write an expression for the area of a
particular part or parts of the flag. I used these flags
to introduce perimeter to the class. We discussed what
the definition of perimeter was and how it differed from
area. Students were challenged to come up with a variable
expression for the perimeter of the flags if given
variables for the sides. Because of the different color
strips on the flag of Thailand, we were able to vary the
variables for the side of this flag creating different
30
scenarios leading to different expressions for the same
perimeter. While in their small groups, students were
asked to compare and contrast the meaning of the area of
the flags with the perimeter of the flags. Then we used
Burdett High School's textbook, chapter ten section one,
to define a regular polygon, a convex polygon, and a
concave polygon (Cummins et al., 1998). Through guided
practice we determined if figures were polygons or not,
and if the figure was a polygon, then it was determined if
it was concave or convex. Polygons were classified by the
number of sides by using prefixes. Homework was assigned
where students were asked to identify each polygon by its
sides, to classify each polygon as convex or concave, and
then find the perimeter of each regular polygon with the
given side lengths (Cummins et al., 1998).
Lesson Four. In the fourth lesson we reviewed the
definition of polygonal region and the area of a polygon.
We discussed how area can be used to describe, compare,
and contrast polygons.
as having equal areas.
postulate which states,
We classified congruent polygons
We discussed the area addition
"The area of a given polygon
equals the sum of the areas of the non-overlapping
polygons that form the given polygon" (Cummins et al.,
31
1998). We looked at similar polygons and determined
whether or not they were congruent. In small groups the
students investigated the relationship between the areas
of a polygon drawn on rectangular dot paper and the number
of dots on the figure (Cummins et al., 1998). These
figures were drawn with no dots in the interior of the
polygons. On the overhead projector I drew a polygon with
a dot in its interior so students could see how not to
draw their polygons. The students were asked to draw
polygons that go through three dots, 'four dots, five dots,
and 6 dots, having no dots in the interior, and they were
given examples. Next, they were asked to copy a table
which had a row for the number of dots on the figure and a
row for the corresponding area in square units of that
polygon which was created by that number of dots. Given
the number of dots on the figure, the students were
required to fill in the area in square units of the
corresponding polygon. Students were asked to predict the
area of a figure whose sides go through twenty dots and
verify it. Finally, students were asked to choose the
correct relationship that exists between the number of
dots on the figure and the area of the figure. Homework
was given which mimic this hands-on geometry activity
32
using rectangular dot paper with polygons having no dots
in the interior to polygons having one dot in the interior
(Cummins et al., 1998).
Lesson Five. In the fifth lesson we discussed the
homework and compared the polygon area patterns found in
the hands-on geometry activity when polygons had no dots
in the interior to polygons having one dot in the
interior. We discussed whether or not we could use these
patterns in the future, and under what circumstances will
they work. Caution was given to the students not to apply
these patterns to any polygon drawn on rectangular dot
paper, but only to those polygons with no dots or one dot
in the interior. I provided guided practice on estimating
areas of polygons. Students were reminded of the area
addition postulate, and shown that one way to find the
area of a polygon was to divide it into shapes such as
squares, rectangles, and triangles. Students were asked
to use rectangular dot paper to draw a polygon with the
same area as a given polygon, but not congruent to that
polygon. We also discussed how to sketch two polygons
that both had the same perimeter, but had different areas.
One of their homework problems required them to do this.
Homework from Burdett's textbook, chapter 10 section
33
three, was given that allowed students to practice
estimating the area of given polygons on grid paper and
rectangular dot paper (Cummins et al., 1998).
Lesson Six. In lesson six we began by discussing the
previous lesson's homework problem which asked the
students to sketch two polygons that both had a perimeter
of twelve units, but that-had different areas. I had
several students present their results to this problem on
the board, and as a class, we discussed their results.
After that discussion, I had students draw a rectangle ten
units by four units on grid paper. I asked them to find
the area of the rectangle. Then I directed the students
to draw a diagonal to divide the rectangle into two
congruent triangles. I then asked the students to find
the area of one of those triangles. We discussed the
relationship of the area of the rectangle to the area of
the triangle. After they found the area of one of those
triangles, I drew three more triangles on grid paper on
the overhead. One of the triangles had the altitude in
the interior of the triangle, another one of the triangles
had the altitude outside the triangle, and the last
triangle had one of the sides of the triangle as the
altitude. The students were instructed to copy these
34
triangles on their grid paper and to find each triangle's
altitude. As a class we discussed the definition of
altitude and its attributes. Then we discussed the
definition of height, and whether or not it meant the same
as the altitude. For homework the students were given
three different triangles drawn on dot paper with equal
areas. The students were asked to explain why the
triangles had equal areas.
Lesson Seven. In lesson seven the students were
asked to draw two unequal parallel line segments on their
grid paper, and they were to draw a line segment
connecting the left endpoints together, and then a line
segment connecting the right endpoints together. The
students were asked if they knew the name of this shape.
We discussed the features of the trapezoid, and the
students were challenged to find the area of the trapezoid
that they had drawn. They were reminded of the Area
Addition Postulate, and we discussed how the trapezoid
could be separated into pieces to estimate the area. For
homework Burdett High School's textbook, chapter 10
section four, asked the students to make a conjecture
about how the area of a trapezoid changes if the lengths
of its bases and altitude are doubled (Cummins et al.,
35
1996). I encouraged the students to draw both trapezoids
on rectangular dot paper, and estimate both areas before
they make their conjectures. Finally in the students'
homework they were given an isosceles trapezoid separated
into four right triangles. On rectangular dot paper, the
students were to draw three isosceles trapezoids. The
students were to separate one of the isosceles trapezoids
into three isosceles triangles, another one into two
congruent trapezoids, and the last one into five polygonal
regions (name the regions) (Cummins et al., 2001). I
asked the students to estimate the area of those three
isosceles trapezoids, the area of the interior regions
that they created, and show that all the parts are equal
to the whole.
Lesson Eight. In lesson eight we reviewed the
definition of an altitude. In small groups each student
was given heavy grid paper to construct a parallelogram
(Serra, 2003). From the vertex of the obtuse angle
adjacent to the base, the students were to draw an
altitude to the side opposite the base. The students were
shown how to label their parallelogram. Next, students
were to cut out the parallelogram and then cut along the
altitude leaving them with two pieces, a triangle and a
36
trapezoid. They were challenged to try to arrange the two
pieces into other shapes without overlapping them. The
students were asked whether or not the areas of each of
the new shapes are the same as the area of the original
parallelogram (Serra, 2003). First in small groups, and
then as a class, we discussed why. Next we discovered
whether or not anyone created a rectangle as their new
shape and how it compared to the original parallelogram.
Students were asked how the parallelogram and the
rectangle were the same, and how they were different
(Serra, 2003). We discussed as a class what the students
knew about area. We discussed the idea that area often
means a number associated with the region enclosed by the
shape. Then the students were asked to state a conjecture
for the area of a parallelogram (Serra, 2003) .
Lesson Nine. Students were taught how to read a
ruler. I drew a line on the board and randomly asked
students to measure it with a ruler in centimeters,
millimeters, and inches while noting each time the unit of
measurement. I then showed how an inch could be broken
down into fourths, eighths, and sixteenths. As a class we
practiced measuring different lengths of lines using
different scales of rulers. I drew a line on each
37
student's paper and asked them to measure it in inches and
centimeters. Next students were asked to create a
triangle with sides of four centimeters, seven
centimeters, and nine centimeters (Addington, 2005). The
students were asked to draw the altitude in the interior
from the vertex created by the four centimeter and the
seven centimeter sides of the triangle, and then measure
and label the altitude. Students were to label the sides
of the triangle in the interior, so that the triangle
could be cut out. With two copies of this cut-out
triangle, students were to construct three parallelograms
with different side lengths. They were to calculate the
area and perimeter of each parallelogram, and state their
findings. We discussed the students' findings as a class
and shared why their results were attained.
Lesson Ten. In lesson ten students were posed with
the question, "Do all rectangles with the same perimeter■
have the same area" (Serra, 2003)? Students were given
rectangle dot paper, geoboards, and strings to assist in
their investigation. Students were asked to document
their examples along with their conclusion, and discuss
their findings. Then students were asked to investigate
and document their findings concerning these questions:
38
Is it possible to have two plane figures with the
same area and different perimeter? Is it possible to
have two plane figures with the same perimeter and
different area? Find two shapes that are not
congruent but have the same area and perimeter
(Addington, 2005).
Students were asked to document their examples along with
their findings, and conclusions.
39
CHAPTER FOUR
DATA ANALYSIS
Results
The following sections analyze the pre- and post
tests for both the treatment group and the control group
students. In each group, problems which showed
statistically significant growth were analyzed along with
problems which showed decline.
Treatment Group's Results
When comparing pre- and post- tests, I found that the
students involved in the research project showed nominal
growth in some areas and declines in others. Perimeter
was a challenging concept for most of the students. The
intention of this project was to engage the students while
deepening their knowledge of area and perimeter.
Table 1 (see Table 1 below) shows that out of the
nine problems dealing with perimeter and ruler
measurement, students showed growth on six of the nine
problems, and declines in three problems. Two of the six
problems that showed growth had a significant gain while
another problem just missed showing a significant growth
from the pre-test to the post-test.
40
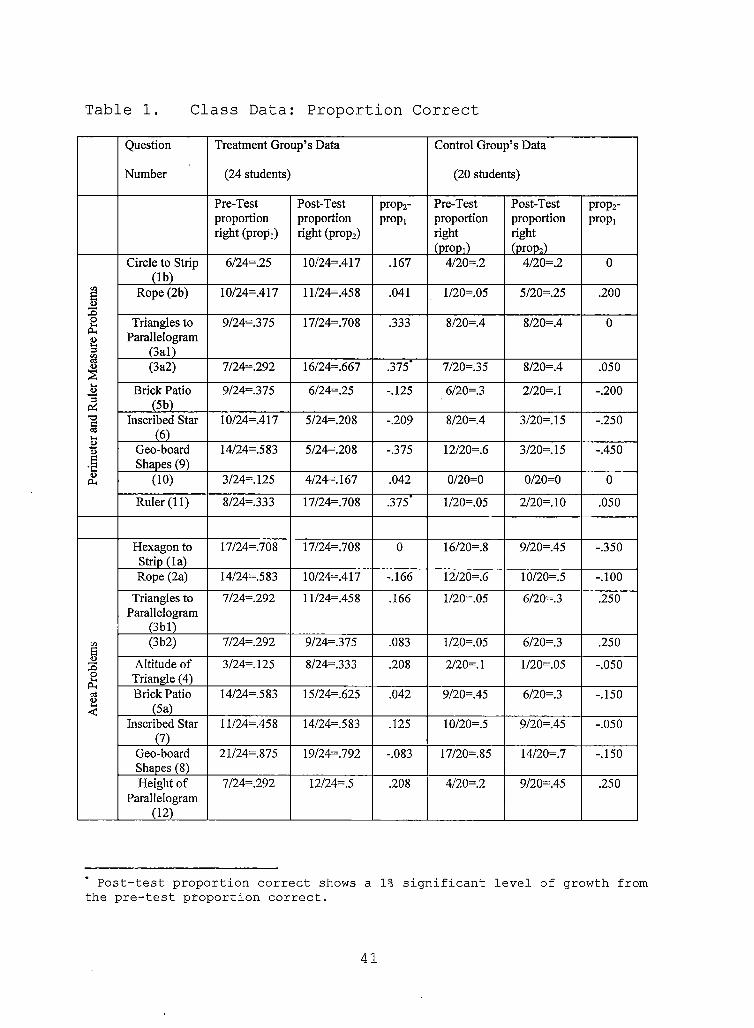
Table 1 Class Data: Proportion Correct
Question
Number
Treatment Group’s Data
(24 students)
Control Group’s Data
(20 students)
Pre-Test proportion right (prop,)
Post-Test proportion right (prop2)
prop2- propi
Pre-Test proportion right (propO
Post-Test proportion right (prop2)
prop2- propi
Perim
eter
and
Rul
er M
easu
re P
robl
ems
Circle to Strip (lb)
6/24=.25 10/24=.417 .167 4/20=.2 4/20=2 0
Rope (2b) 10/24=417 ll/24=.458 .041 l/20=.05 5/20=25 .200
Triangles to Parallelogram
(3al)
9/24=375 17/24=.708 .333 8/20=.4 8/20=4 0
(3a2) 7/24=.292 16/24=.667 .375’ 7/20=35 8/20=4 .050
Brick Patio (5b)
9/24=375 6/24=25 -.125 6/20=3 2/20=. 1 -.200
Inscribed Star(6)
10/24=417 5/24=208 -.209 8/20=4 3/20=. 15 -.250
Geo-board Shapes (9)
14/24=583 5/24=.208 -.375 12/20=6 3/20=15 -.450
(10) 3/24=. 125 4/24=167 .042 0/20=0 0/20=0 0
Ruler (11) 8/24=.333 17/24=.7O8 .375’ l/20=.05 2/20=. 10 .050
Are
a Pro
blem
s
Hexagon to Strip (la)
17/24=708 17/24=708 0 16/20=8 9/20=.45 -.350
Rope (2a) 14/24=.583 10/24=417 -.166 12/20=.6 10/20=5 -.100
Triangles to Parallelogram
(3bl)
7/24=292 ll/24=.458 .166 l/20=.05 6/20=3 .250
(3b2) 7/24=.292 9/24=375 .083 1/20=05 6/20=3 .250
Altitude ofTriangle (4)
3/24=. 125 8/24=333 .208 2/20=. 1 1/20=05 -.050
Brick Patio (5a)
14/24=.583 15/24=,625 .042 9/20=45 6/20=3 -.150
Inscribed Star(7)
11/24= 458 14/24=.583 .125 10/20=5 9/20=45 -.050
Geo-boardShapes (8)
21/24=875 19/24=792 -.083 17/20=85 14/20=.7 -.150
Height of Parallelogram
(12)
7/24=292 12/24= 5 .208 4/20=.2 9/20=.45 .250
Post-test proportion correct shows a 1% significant level of growth from the pre-test proportion correct.
41
The sample data supports the claim that problem three
(Part a, parallelogram 2)and problem eleven's post-test
shows significant growth from the pre-test. Problem three
(Part a, parallelogram 2) asked the students to find the
perimeter of the parallelogram made with two copies of the
given triangle. The lengths of all sides of the triangle
were given. The next problem that showed a significant
gain was problem eleven. Problem eleven asked students to
measure the length of a line drawn under a partial ruler
that started at zero and ended at one. The unit was
nonstandard, and the students were told that the basic
unit was called an elbo. The students were asked how long
(in elbos) the heavy line segment beneath the ruler was.
The problem that just missed showing a significant gain
was problem number three (part a, parallelogram 1).
Problem number nine showed a significant loss among
the three problems that showed declines within the
problems dealing with perimeter and ruler measurement. In
problem number nine the students were asked to find the
perimeter of the two figures drawn on a square grid with
one side and one hypotenuse labeled. Another problem that
showed a nominal decline was problem six. In problem six
one figure was inscribed in another figure. The inside
42
figure's interior was shaded. Problem six asked the
students to determine which figure had the greater
perimeter.
In the nine problems dealing with area, students
showed nominal growth on six of the nine problems, no
change in one problem, and declines in two problems. No
sample data showed any significant growth from the pre
test to the post-test. The problem that dealt with the
tied rope created a slight problem when it came to area,
but they showed growth when it came to perimeter.
Control Group's Results
In the nine problems on perimeter and ruler
measurement, the control group showed nominal increase in
three problems, no change in three problems, and declines
in three problems. In the nine problems on area, the
control group showed nominal increase in three problems,
and declines in six problems. There was no significant
growth in both perimeter and ruler measurement or area
problems. Problem nine, like the treatment group, showed
a significant loss from the pre-test to the post-test.
The students were asked to find the perimeter of the two
figures drawn on a square grid with one side and one
hypotenuse labeled. The control group also was unable to
43
compare the lengths of the perimeter when there were
unequal number of sides and hypotenuses. The next problem
that showed a nominal decline was problem one (part a)
which asked students to compare the area of two figures
whose pieces were rearranged into a different figure.
Analysis of Assessment Results
The following sections analyzed the problems that
showed statistically significant growth. Problems that
showed significant decline were also analyzed along with
problems that just missed showing significant growth.
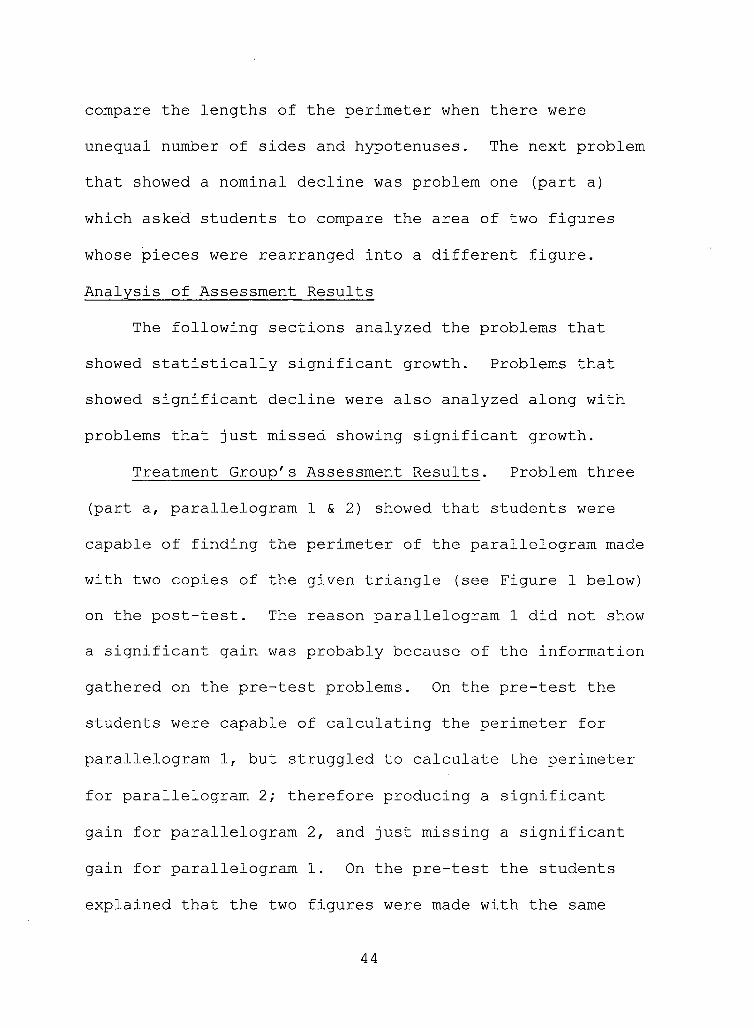
Treatment Group's Assessment Results. Problem three
(part a, parallelogram 1 & 2) showed that students were
capable of finding the perimeter of the parallelogram made
with two copies of the given triangle (see Figure 1 below)
on the post-test. The reason parallelogram 1 did not show
a significant gain was probably because of the information
gathered on the pre-test problems. On the pre-test the
students were capable of calculating the perimeter for
parallelogram 1, but struggled to calculate the perimeter
for parallelogram 2; therefore producing a significant
gain for parallelogram 2, and just missing a significant
gain for parallelogram 1. On the pre-test the students
explained that the two figures were made with the same
44
sides, but turned in different directions. The students
may not have checked to see that the length of the sides
for parallelogram 1 were different than parallelogram 2.
Therefore, more students missed the perimeter for
parallelogram 2 on the pre-test.
Figure 1. Triangle to Parallelogram
45
In the treatment group's lesson the students were
asked to use two copies of the same triangle cut out, and
arrange the two triangles' creating two different
polygons. The two triangles sides were labeled in the
interior. When the polygons were formed with the two
triangles the students labeled the polygons. The students
were asked to find the perimeter and area of the polygons
created by the triangles. This activity seemed to have
increased the treatment group's understanding of how two
polygons can be made with different sides of two copies of
the same triangle, thereby creating different perimeters.
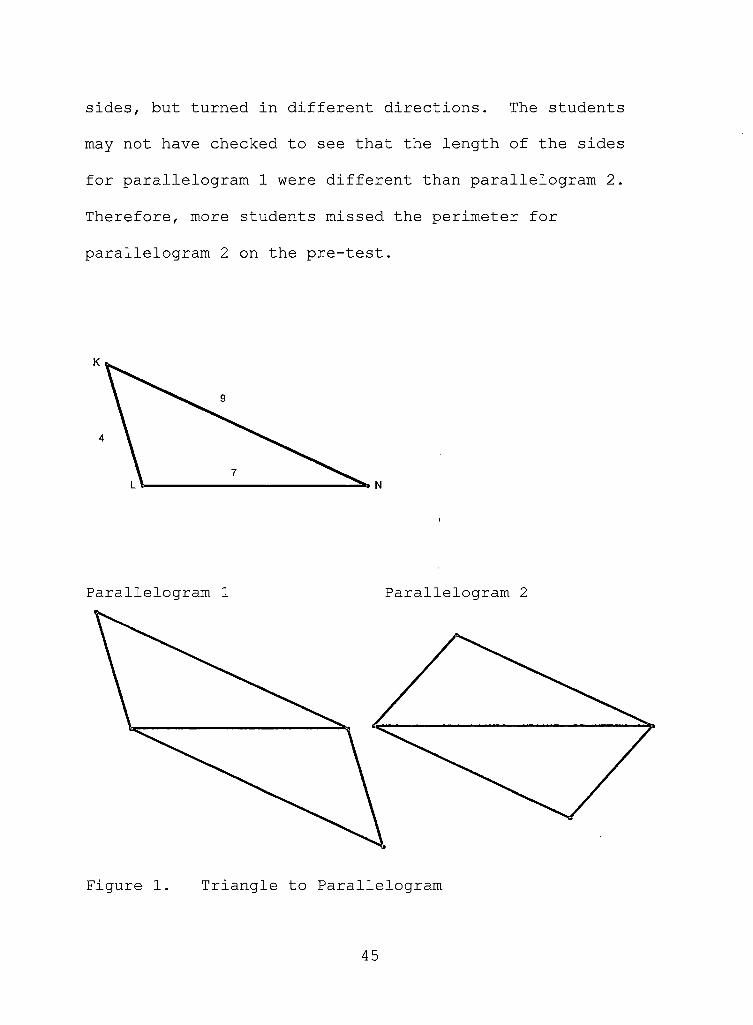
In problem eleven (see Figure 2 below) the students
were asked to measure how long (in elbos) the length of
the heavy line beneath the ruler was.
0 1
Figure 2. Ruler
46
Within the project's unit lesson the students were
asked to measure a line using different units consisting
of standard units (inches and centimeter) and nonstandard
units (a created basic unit of length). The students were
asked to measure the line using a ruler in inches by using
fourths, eighths, and sixteenths, and then in centimeters.
Once the students grasped the fact that the same line
could be measured by using different units they seemed to
have less challenges with the use of rulers. This
activity seemed to have increased the treatment group's
understanding of ruler measurement.
In problem number six the students were asked to
determine which figure had the greater perimeter. One
figure was inscribed in the other figure. The inside
figure's interior was shaded (see Figure 3).
Students' written explanations made it clear that the
treatment group could not see that the inside figure were
created by curving the arc of the circle inside, therefore
giving the same perimeter. No lesson within the project's
unit seemed to have addressed this concept.
47
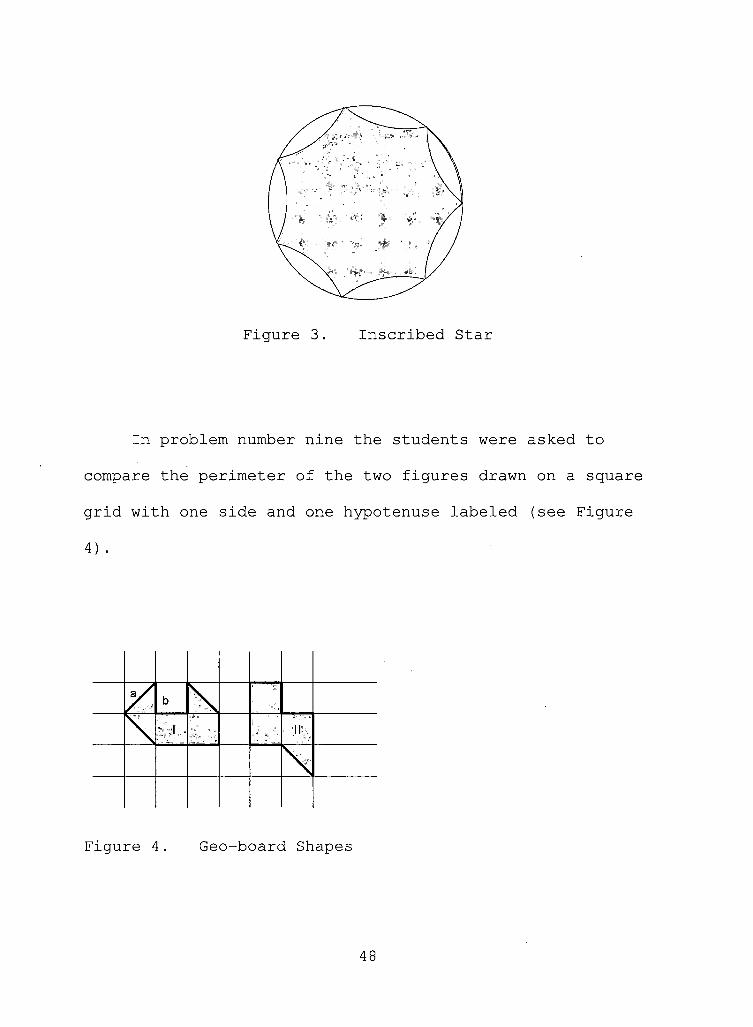
Figure 3. Inscribed Star
In problem number nine the students were asked to
compare the perimeter of the two figures drawn on a square
grid with one side and one hypotenuse labeled (see Figure
4) .
Figure 4. Geo-board Shapes
48
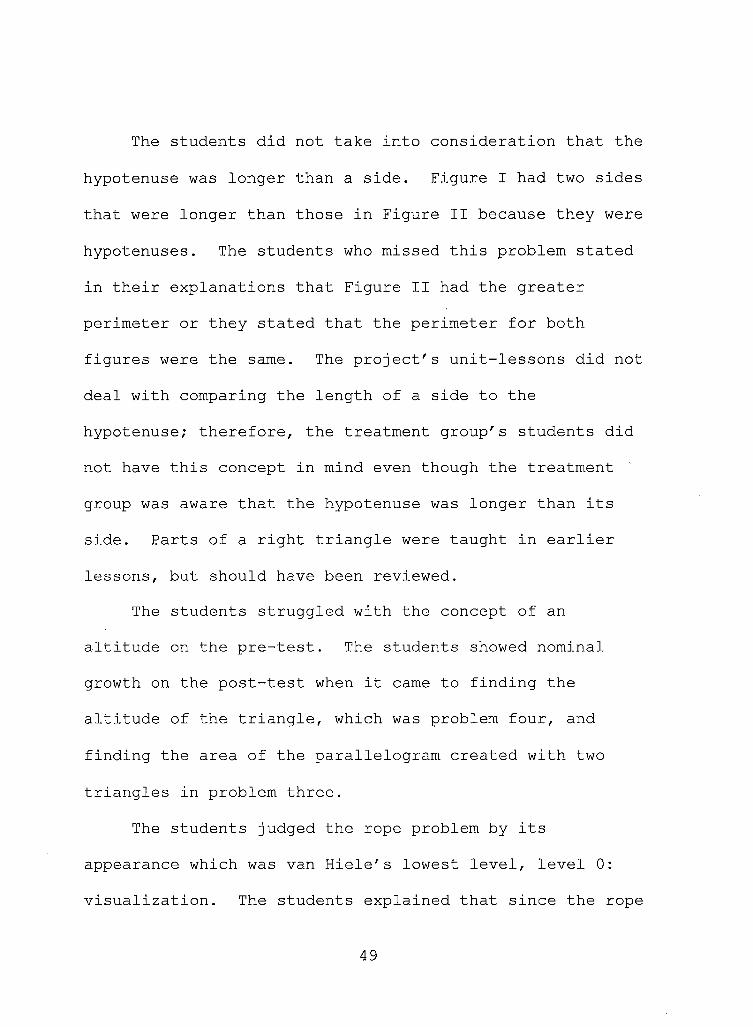
The students did not take into consideration that the
hypotenuse was longer than a side. Figure I had two sides
that were longer than those in Figure II because they were
hypotenuses. The students who missed this problem stated
in their explanations that Figure II had the greater
perimeter or they stated that the perimeter for both
figures were the same. The project's unit-lessons did not
deal with comparing the length of a side to the
hypotenuse; therefore, the treatment group's students did
not have this concept in mind even though the treatment
group was aware that the hypotenuse was longer than its
side. Parts of a right triangle were taught in earlier
lessons, but should have been reviewed.
The students struggled with the concept of an
altitude on the pre-test. The students showed nominal
growth on the post-test when it came to finding the
altitude of the triangle, which was problem four, and
finding the area of the parallelogram created with two
triangles in problem three.
The students judged the rope problem by its
appearance which was van Hiele's lowest level, level 0:
visualization. The students explained that since the rope
49
was the same each time it was thrown down that the
perimeter and area were the same also. The students did
not reason about what makes one area greater than another.
The average number of problems correct on the pre
test dealing with area was higher than the average number
of problems correct on the pre-test dealing with
perimeter. The students' pre-test scores in area were
higher with problems dealing with dissection of polygons
and its area, comparing two polygons and their area, and
counting the area of a polygon with square units. Where
the students struggled in area problems was on the
problems that dealt with triangles and estimating their
area using altitudes.
In sum, the treatment group showed a statistically
significant gain on two of the eighteen problems dealing
with area or perimeter and ruler measurement. This class
showed nominal change from the pre-test to the post-test
on the other problems.
Control Group's Assessment Results. Problem number
nine showed a significant loss in both classes (see Figure
4 above). The control group also failed to recognize that
the hypotenuse's length was longer than the side's length.
They too thought that the two figures either had the same
50
perimeter or that Figure II had a larger perimeter. The
control group was also taught the parts of a right
triangle in earlier lessons; therefore these students were
aware that the hypotenuse was longer than its side, but
were unable to put that information together on this
problem. The next problem that showed a nominal loss was
problem number one (part a) (see Figure 5 below).
Figure 5. Hexagon to Strip
Most of the students in the control group thought
that the area in Figure C was larger than the area of the
dissected Figure D. They both had the same area. The
control group was familiar with the dissection of the
circle on the pre-test and was unfamiliar with the
dissection of the hexagon on the post-test. The students
51
in the control group were thinking on van Hiele's level 0:
visualization. The students did not analyze the pieces
that made up both figures; the students explained that
they thought that Figure C looked larger. Lastly, the
control group also struggled with problem number six (see
Figure 3). The students were asked to determine which
figure had the greater perimeter. One figure was
inscribed in the other figure. The inside figure's
interior was shaded. The students could not see that the
inside figure was created by curving the arch of the
circle inward, therefore having the same perimeter.
The control group did not show a statistically
significant gain on any of the eighteen problems dealing
with area or perimeter and ruler measurement.
Statistically, the control group showed a significant loss
on one of the eighteen problems.
Comparison of Groups. There was not significant data
to support the claim that the project's unit increased the
conceptual understanding of area and perimeter in the
treatment group compared to the control group. The
treatment group did show growth on eleven of the eighteen
parts of the test where the control group showed growth on
six of the eighteen parts.
52
CHAPTER FIVE
CONCLUSIONS AND RECOMMENDATIONS
Summary
Analysis of Burdett's textbook showed an inability to
account for various phases of the learning process.
Burdett's textbook did not challenge students to analyze
figures in terms of their components or have the students
prove or establish the definitions of area and perimeter.
The textbook, "Geometry Concepts and Applications," spread
out the concept of area and perimeter throughout the book
(Cummins et al., 2001). There was no concentration of
area and perimeter within the textbook to analyze, compare
and contrast those concepts. Students were not given an
opportunity to investigate and develop the formulas
presented. Burdett's textbook did not challenge the
students to analyze the differences between the units of
perimeter and area.
Area and perimeter were introduced in chapter one
under the section titled "A Plan for Problem Solving"
(Cummins et al., 2001). In that chapter the textbook
defined and provided the formulas and definitions for the
perimeter P of a rectangle as P = 21 + 2w where the length
53
is 1 and width is w, area A of a rectangle as A = 1 w, and
area A of a parallelogram as A = b h where base is b and
height is h. Twenty-two of the thirty-two problems for
that section had problems which only required the students
to find the area or perimeter of polygons by substituting
numbers for variables given in the appropriate formulas.
The difficulty with these problems was that teaching
computational and procedural skills may create an absence
of understanding mathematics content standards (CDE,
2000). Anecdotal evidence suggested that most students
did not learn the concepts of area and perimeter, but
instead memorized and used formulas. Murrey and Newton
(2007) state, "Students may have a difficult time
remembering and applying formulas because they have not
had the opportunity to investigate and develop these
formulas" (p. 36).
After presenting the two ideas in chapter one, the
text used at Burdett High School then reviewed area and
perimeter by including one problem per chapter that dealt
with the topic until chapter ten, "Polygons and Area,"
which this project supplements (Cummins et al., 2001).
The textbook used by Burdett's geometry classes assumed
that the students would memorize the definitions, theorems
54
and formulas in order to apply them to problems. The
application of the formulas within the area and perimeter
unit was the primary means for students to gain an
understanding of the concept of area and perimeter, which
was to know the meaning of area and perimeter and how
those mathematical ideas could be used in the real world.
The National Council of Teachers of Mathematics noted
that many students had difficulty understanding how the
formulas for perimeter and area related to the attributes
being measured and the measuring unit to use (NCTM, 2000).
The purpose for this project was to investigate teaching
and learning mathematics, specifically with the concept of
area and perimeter, without memorizing formulas.
Significance of the Project
Many students struggle to make the meaningful
connections necessary for understanding the concept of
area and perimeter (Murrey & Newton, 2007). They search
their memory bank for the right key, a formula, to open
the door. Rarely do the students look at a polygon and
have a mental reference as to what the area or perimeter
might be. Often students try to memorize formulas without
an understanding of the concept. "Vinner and many others
have presented arguments and empirical data that just
55
knowing the definition of a concept does not at all
guarantee understanding of the concepts" (de Villiers,
1998, p.249). The present project attempted to develop
geometric thinking by providing the students an
opportunity to explore and discover mathematical formulas
for area and perimeter.
"The need to understand and be able to use
mathematics in everyday life and in the workplace has
never been greater and will continue to increase" (NCTM,
2000, p.4). Greater opportunities are afforded to
students who comprehend and perform well in mathematical
computations because we live in a dynamic world. Evidence
has made it clear that many students are not learning the
mathematics necessary to reshape their future (Kenney &
Silver, 1997; NCTM, 2000). Low performing students in
mathematics tend to have a strong dislike toward
mathematics where as high achieving students in
mathematics tend to have a strong liking of mathematics
(Beaton et al., 1996). The confidence level of high
school students toward their mathematics ability tends to
have a direct relationship between their mathematics
achievements in college (House, 2001). "It is crucial for
students to realize that math is an integral part of
56
everyday life rather than just a series of problems to be
solved in a textbook (Cass et al., 2003, p. 112).
Unfortunately, many students struggle in their
mathematical studies, producing low mathematical
achievements.
This project attempted to develop geometric thinking
by providing the students an opportunity to make the
learning experience more personal by requiring the
students to take more responsibility for their own
learning. Students developed and constructed the area and
perimeter so that it was more comprehensible to them. The
project provided students with the knowledge of area and
perimeter without the use of formulas and numbers. The
purpose for not using formulas and numbers was to create a
deep understanding along with a visual picture of what was
meant by area and perimeter. This project was to mitigate
the difficulties of memorizing and understanding the usage
of definitions, theorems, and formulas.
Limitations of the Project
One limitation with this project was class time. To
develop the deep understanding of area and perimeter
required the students to develop and construct their
meaning in as many ways as they can. Students were asked
57
to explain and compare what they had developed about area
and perimeter. The students were then asked to share
their findings with the class. Fifty minutes of class
time only permitted a limited amount of this work to be
completed during a class period, requiring the class to
finish the next day. This break in time limited the flow
of an idea, making it difficult to pick up where we left
off. Another limitation with this project was the
extended time it took to finish that particular chapter.
This meant we were behind the district's timeline;
therefore the students struggled on the benchmark test
from the district because of the information not provided
to them due to the time spent on the project. The final
limitation with this project was that it was a small pilot
study done with a fairly small sample group. The two
geometry clas'ses participating in the project had less
than twenty-eight students each.
Recommendations
The students in the treatment group struggled with
the concept that the perimeter of shapes on a geo-board
has to take into consideration both the number of
horizontal and vertical sides and the number of
hypotenuses when comparing with other shapes.
58
Modification to lesson five of the project's unit, which
asked students to use rectangular dot paper to draw a
polygon with the same area as a given polygon, but which
is not congruent, may clarify this concept. The teacher
should then have the students analyze the perimeters of
both polygons. In analyzing both perimeters the students
should first label a side and a hypotenuse with a
variable. Next, the students should write an expression
in terms of the variables (without numbers for length) for
each perimeter. Then the students should compare the two
perimeters to determine which one was greater, and explain
why it is greater by using what they knew about sides and
hypotenuses. To assist students with comparing
perimeters, add activities that require the students to
compare the distance around their head to the length of
their forearm, or compare the length of their waist to the
length of their leg, or the length of their hand spread
out to the length around their foot.
To assist the students with finding the altitude of a
triangle, in lesson six of the project's unit, the teacher
should have the students construct the altitudes of a
triangle from each vertex by using the corner of a three
by five card and a straightedge. Then the students should
59
label the triangle and its bases. Following this, have
the students name the altitude and its corresponding base.
Finally, the students should explain how many altitudes a
triangle has and why it is important to have the correct
altitude with the correct base.
To get the students to understand that the perimeter
of the inscribed star was created by the arc of the circle
turned inward, the teacher should create an activity that
uses the geo-board and a loop of string. Have the
students create a shape on the geo-board with the loop of
string. Next, have the students move only pieces of the
string to create another shape. Ask the student to
compare the original shape, area and perimeter, with the
new shape created. The students are to draw each shape
and document their findings.
Discussion of Project Results
Area and perimeter are difficult concepts for
students to conceptually understand. Burdett High School
students are introduced to the concepts of area and
perimeter in elementary school. In the third grade the
students are introduced to area and perimeter of a square
and a rectangle by looking at pictures in the textbook
with formulas. In the fourth and fifth grade the students
60
continue with area and perimeter of a square and a
rectangle. By seventh grade they have a chapter dedicated
to area of parallelograms, triangles, and trapezoids.
However, the concept of perimeter is embedded throughout
the chapters in a few problems. The seventh grade's pre
algebra textbook treats perimeter as if the students have
mastered this concept and only need a few problems for
review. The perimeter problems that are given throughout
the seventh grade pre-algebra textbook were used to have
the students practice writing and solving equations. In
the eighth grade, the algebra I textbook assumes that the
students have mastered both area and perimeter. In the
algebra I textbook, the concept of area and perimeter is
sprinkled through out the chapters in different sections.
In the ninth grade the students are taking geometry.
Burdett High School's textbook refreshes the concept of
area and perimeter in chapter one in a section titled "A
Plan for Problem Solving," but does not spend much time on
these concepts (Cummins et al., 2001). In this section
the textbook reviewed the definition and formula for the
area and perimeter of a rectangle and parallelogram. The
difficulties with the problems in this section are that
these problems only require the students to find the area
61
or perimeter of polygons by substituting numbers for
variables into the appropriate formulas. Rote
memorization of formulas has proven ineffective /Cass et
al., 2003; Clements & Stephen, 2004; de Villiers, 1998;
Malloy, 1999; Ridgway & Healy, 1997).
The honors geometry class at Burdett High School uses
"Discovering Geometry: An Investigative Approach" as their
textbook (Serra, 2003). The honors geometry teacher
stated that even though Serra covers geometry in a
discovery fashion, he is unable to use it for the whole
year because some required topics are missing from this
book. He mixes discovery with direct teaching to get
through the material. He uses two textbooks for his
honors students. This project's supplemental unit used
Serra's textbook for a couple of the lessons. The
approach used in Serra's textbook provided the students
with a discovery approach to understanding the concepts
taught. The disadvantage to Serra's approach to teaching
geometry, as stated by the honors geometry teacher, is the
time needed to cover the material and trying to complete
the schedule set by the district.
During Math 632, "Geometry from a Teaching and
Problem Solving Perspective," at California State
62
University, San Bernardino, the participants in the class
brought their districts' geometry textbooks to class one
night to analyze them. Comparing Burdett High School's
textbook to other district's textbook revealed a few
interesting facts. First, the students at Burdett are
using a textbook that avoids two-column proofs until
chapter 15, which is rarely reached during the year.
Secondly, the textbook is written on a lower level to meet
the students' abilities, but does a poor job at developing
the knowledge learned. Finally, the textbook fails to
stretch the students or challenge them to develop and
apply conceptual understanding of topics learned.
Conclusion
This project's unit attempted to stretch the
students' understanding of the concept of area and
perimeter while supplementing Burdett High School's
textbook. This study is done with a fairly small sample
group. The treatment group's results showed gain in the
students' understanding of twelve of the nineteen problems
on the post-test. Even though the sample data only
supported statistically significant growth on two
problems, the project's unit impact on the students'
result is noticeable. Developing a project's unit to
63
increase students' conceptual understanding of area and
perimeter must be a learning process. Implementing the
recommendations suggested by this paper along with this
unit will develop curricula closer to establishing an
understanding of area and perimeter. Maybe these topics,
area and perimeter, were harder than I thought, and a two
week lesson is not enough time to accomplish statistical
success. More time should be given to these topics at the
beginning of the school year with two dimensional
constructions. Then when this project supplements the
textbook's chapter ten it will provide reinforcement andI
continual conceptual understanding of area and perimeter.
This project is designed to develop a high school unit in
mathematics that will provide the students with an
opportunity to construct understanding of area and
perimeter. I look forward to doing more research in this
area.
64
APPENDIX A
POLYGONS AND AREA PRE-TEST
65
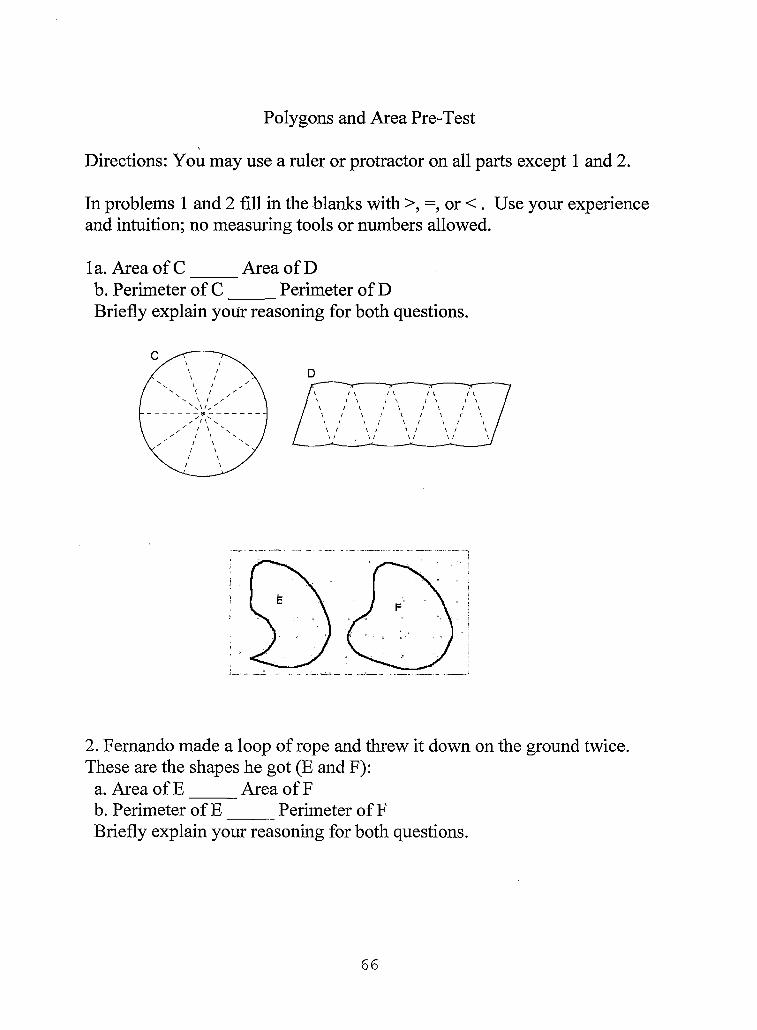
Polygons and Area Pre-Test
Directions: You may use a ruler or protractor on all parts except 1 and 2.
In problems 1 and 2 fill in the blanks with >, = or < . Use your experience and intuition; no measuring tools or numbers allowed.
1 a. Area of C_____ Area of Db. Perimeter of C_____ Perimeter of DBriefly explain your reasoning for both questions.
2. Fernando made a loop of rope and threw it down on the ground twice.These are the shapes he got (E and F):
a. Area of E_____ Area of Fb. Perimeter of E_____Perimeter of FBriefly explain your reasoning for both questions.
66
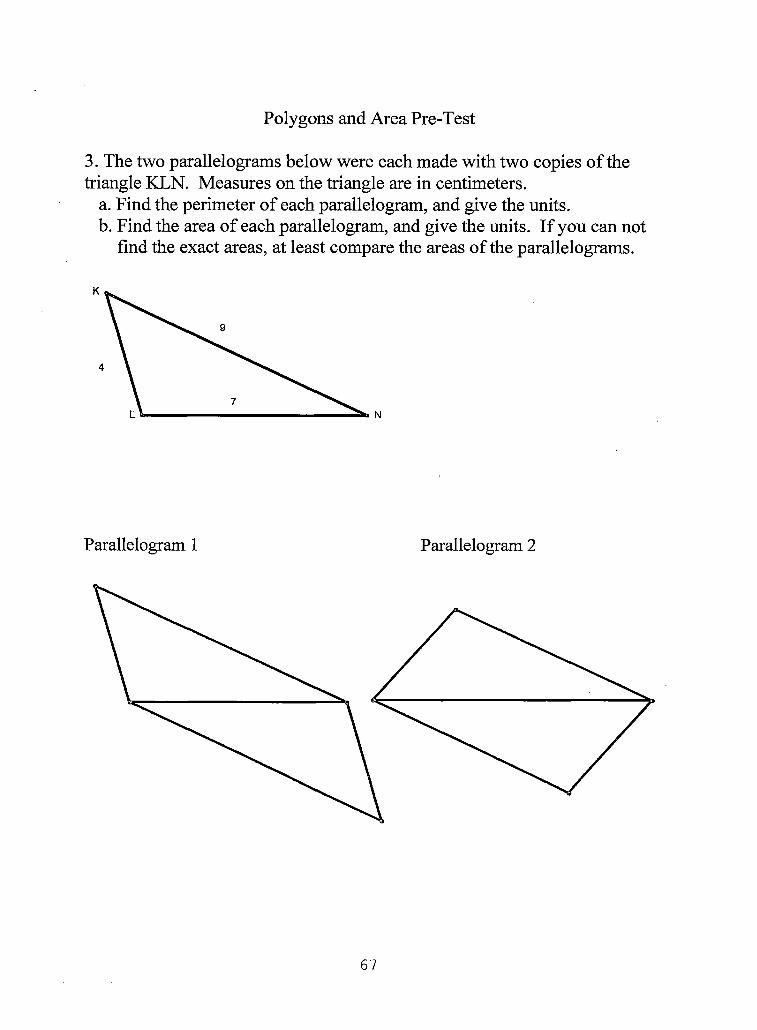
Polygons and Area Pre-Test
3. The two parallelograms below were each made with two copies of the triangle KLN. Measures on the triangle are in centimeters.
a. Find the perimeter of each parallelogram, and give the units.b. Find the area of each parallelogram, and give the units. If you can not
find the exact areas, at least compare the areas of the parallelograms.
67
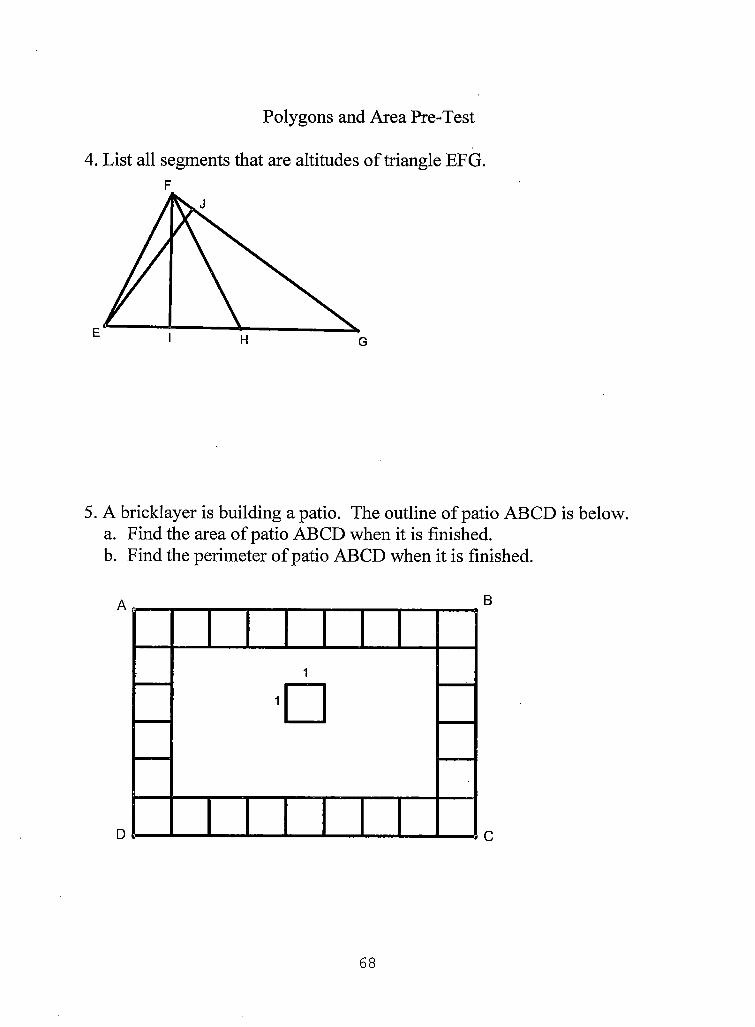
Polygons and Area Pre-Test
4. List all segments that are altitudes of triangle EFG.
5. A bricklayer is building a patio. The outline of patio ABCD is below.a. Find the area of patio ABCD when it is finished.b. Find the perimeter of patio ABCD when it is finished.
Illi1
’□
68
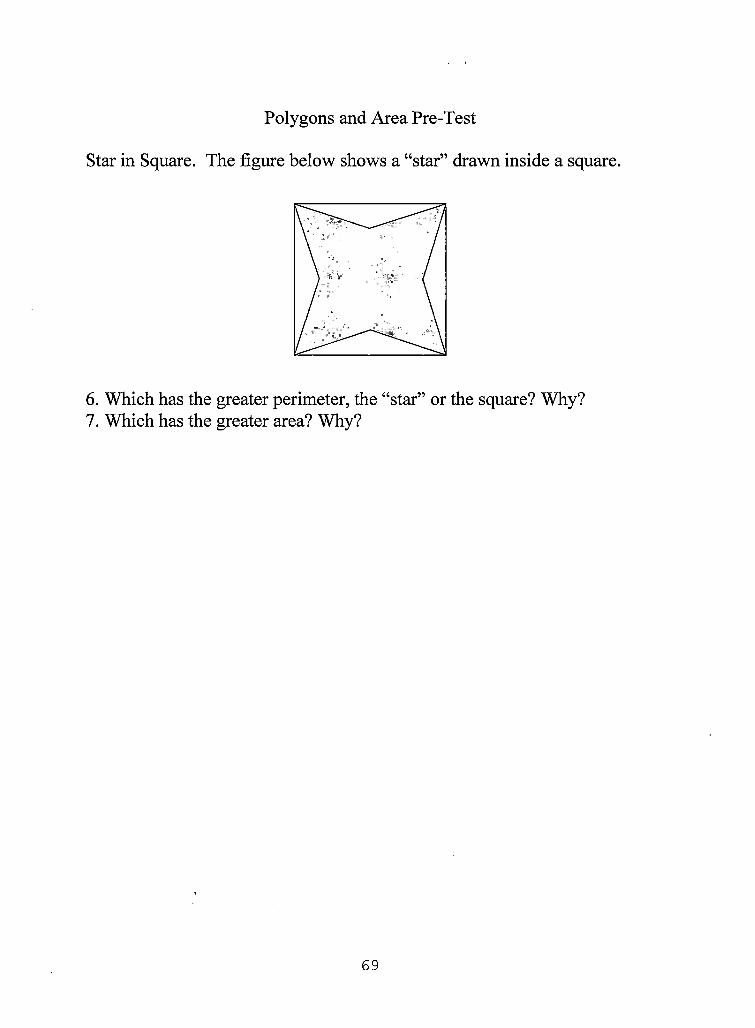
Polygons and Area Pre-Test
Star in Square. The figure below shows a “star” drawn inside a square.
6. Which has the greater perimeter, the “star” or the square? Why?7. Which has the greater area? Why?
69
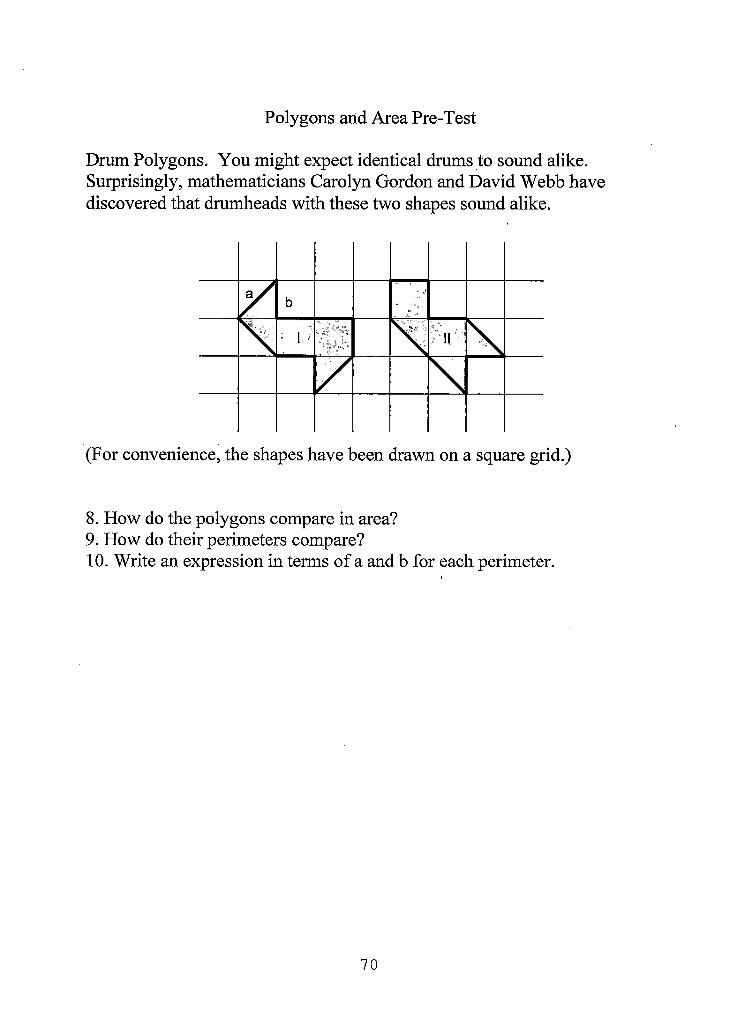
Polygons arid Area Pre-Test
Drum Polygons. You might expect identical drums to sound alike. Surprisingly, mathematicians Carolyn Gordon and David Webb have discovered that drumheads with these two shapes sound alike.
(For convenience, the shapes have been drawn on a square grid.)
8. How do the polygons compare in area?9. How do their perimeters compare?10. Write an expression in terms of a and b for each perimeter.
70
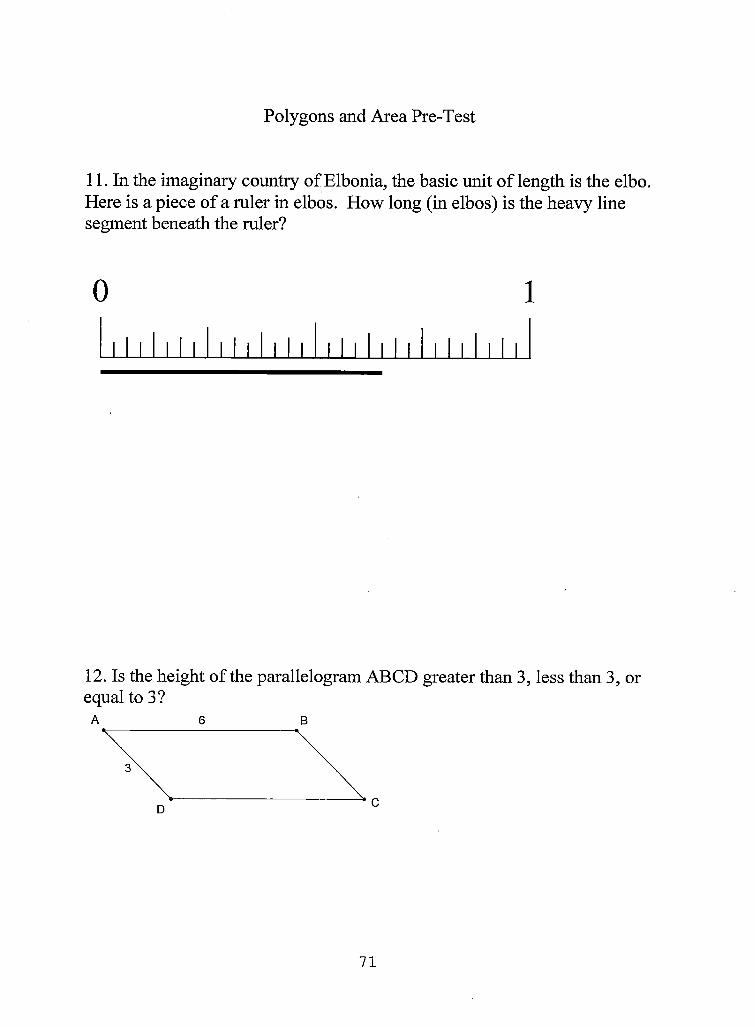
Polygons and Area Pre-Test
11. In the imaginary country of Elbonia, the basic unit of length is the elbo. Here is a piece of a ruler in elbos. How long (in elbos) is the heavy line segment beneath the ruler?
12. Is the height of the parallelogram ABCD greater than 3, less than 3, or equal to 3?
71

APPENDIX B
POLYGONS AND AREA POST-TEST
72
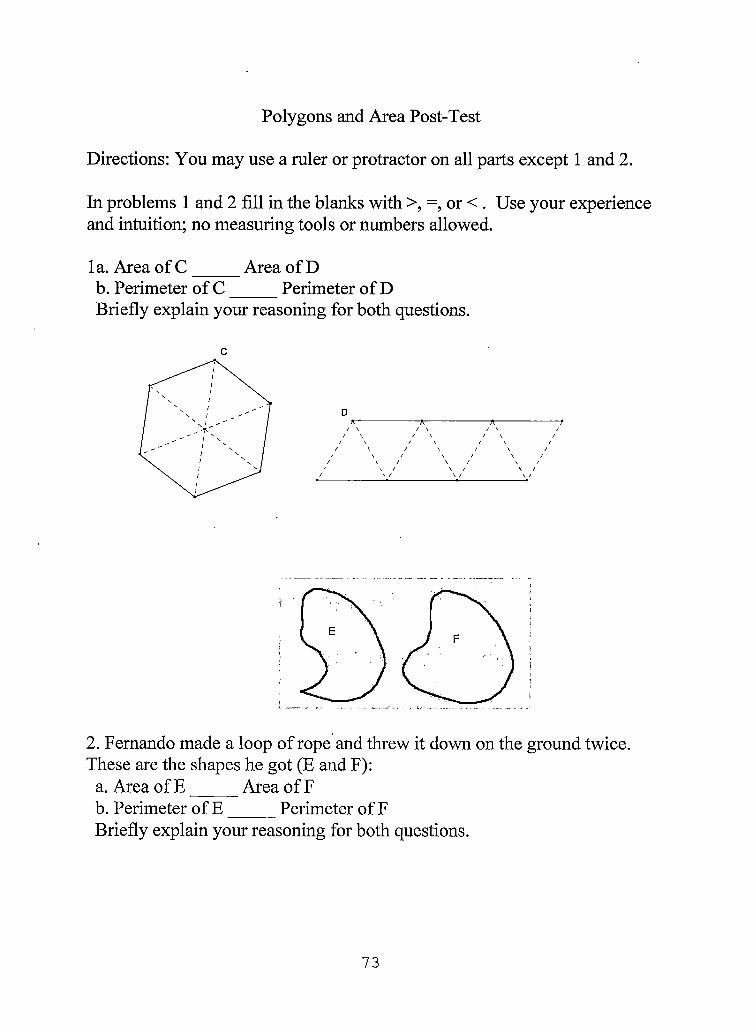
Polygons and Area Post-Test
Directions: You may use a ruler or protractor on all parts except 1 and 2.
In problems 1 and 2 fill in the blanks with >, = or < . Use your experience and intuition; no measuring tools or numbers allowed.
la. Area of C_____ Area of Db. Perimeter of C_____ Perimeter of DBriefly explain your reasoning for both questions.
2. Fernando made a loop of rope and threw it down on the ground twice.These are the shapes he got (E and F):
a. Area of E_____ Area of Fb. Perimeter of E_____ Perimeter of FBriefly explain your reasoning for both questions.
73
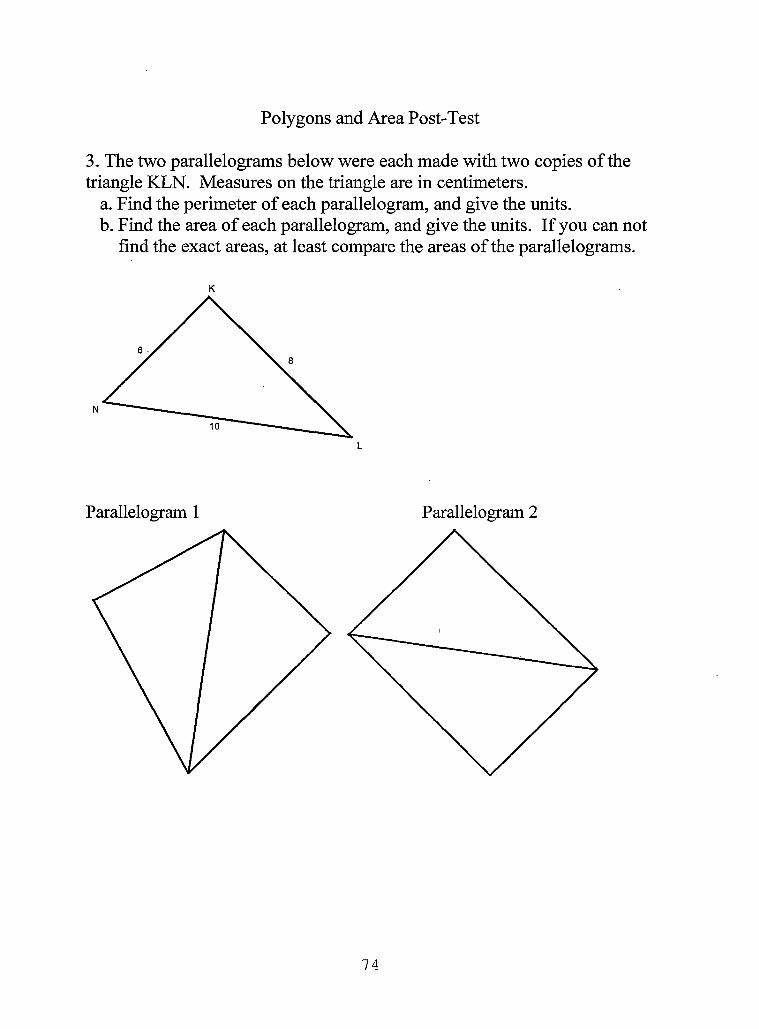
Polygons and Area Post-Test
3. The two parallelograms below were each made with two copies of the triangle KLN. Measures on the triangle are in centimeters.
a. Find the perimeter of each parallelogram, and give the units.b. Find the area of each parallelogram, and give the units. If you can not
find the exact areas, at least compare the areas of the parallelograms.
74
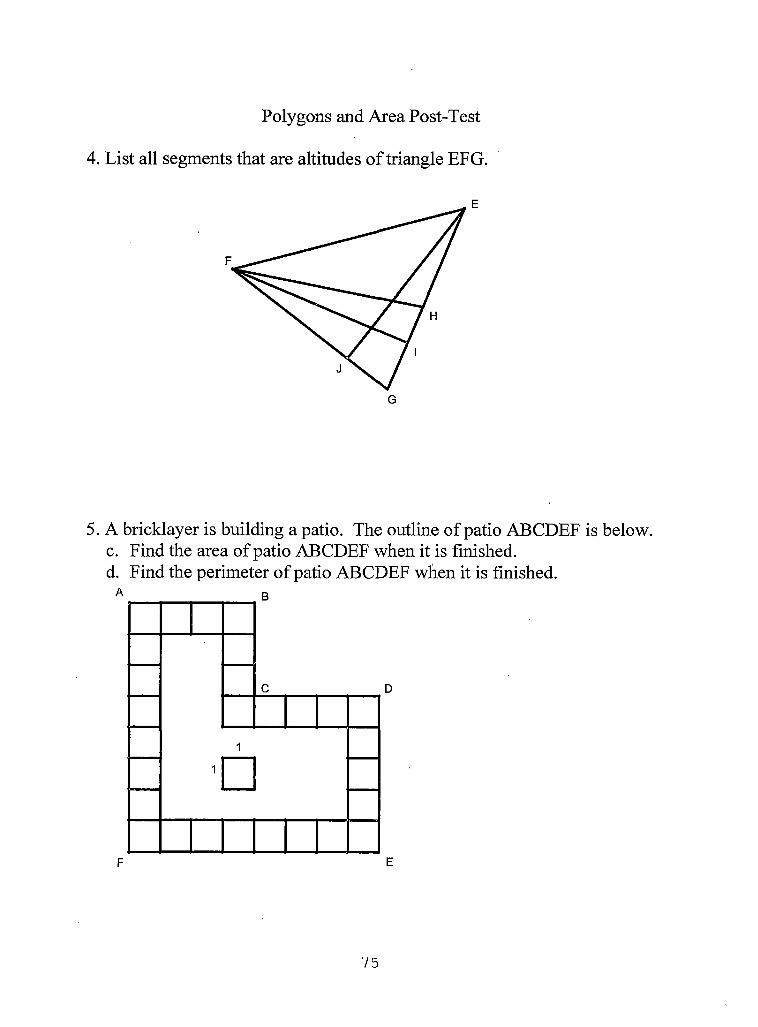
Polygons and Area Post-Test
4. List all segments that are altitudes of triangle EFG.
E
5. A bricklayer is building a patio. The outline of patio ABCDEF is below.c. Find the area of patio ABCDEF when it is finished.d. Find the perimeter of patio ABCDEF when it is finished.
75
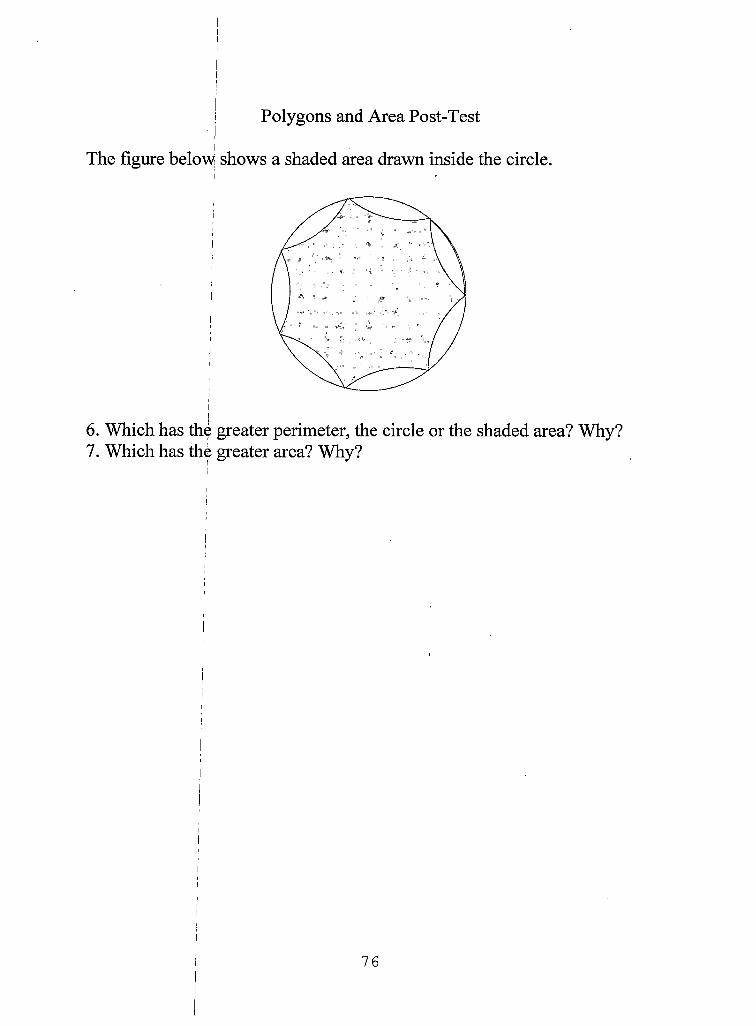
Polygons and Area Post-Test
I
The figure below shows a shaded area drawn inside the circle.I
6. Which has the greater perimeter, the circle or the shaded area? Why?7. Which has the greater area? Why?
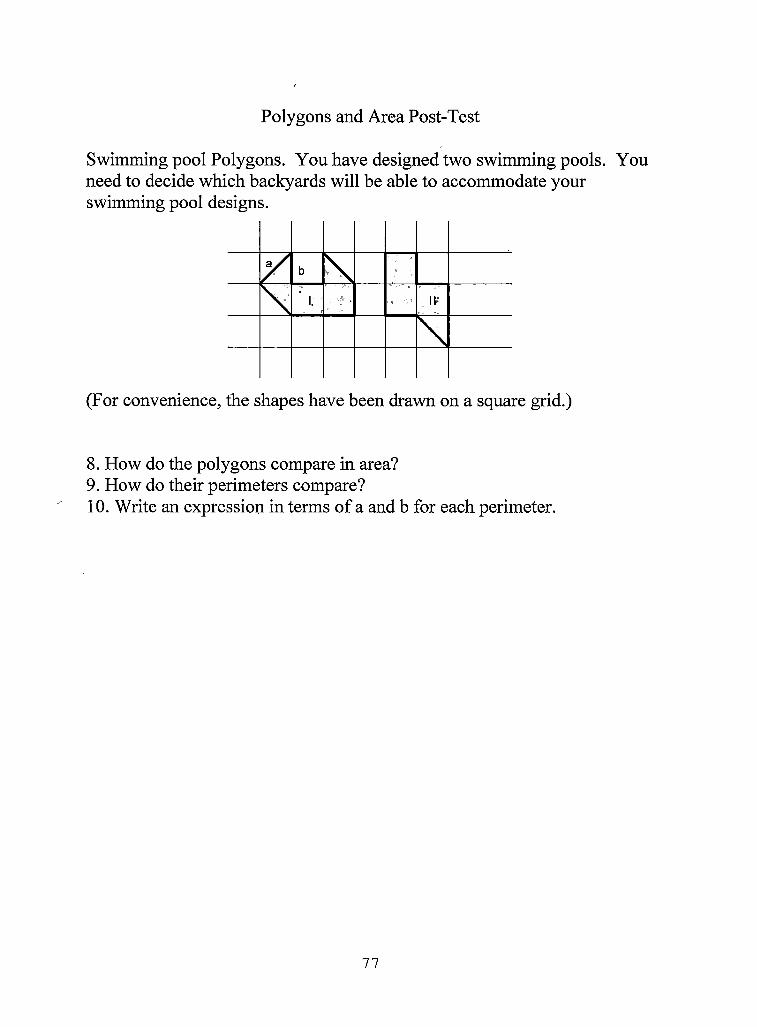
Polygons and Area Post-Test
Swimming pool Polygons. You have designed two swimming pools. You need to decide which backyards will be able to accommodate your swimming pool designs.
(For convenience, the shapes have been drawn on a square grid.)
8. How do the polygons compare in area?9. How do their perimeters compare?10. Write an expression in terms of a and b for each perimeter.
77
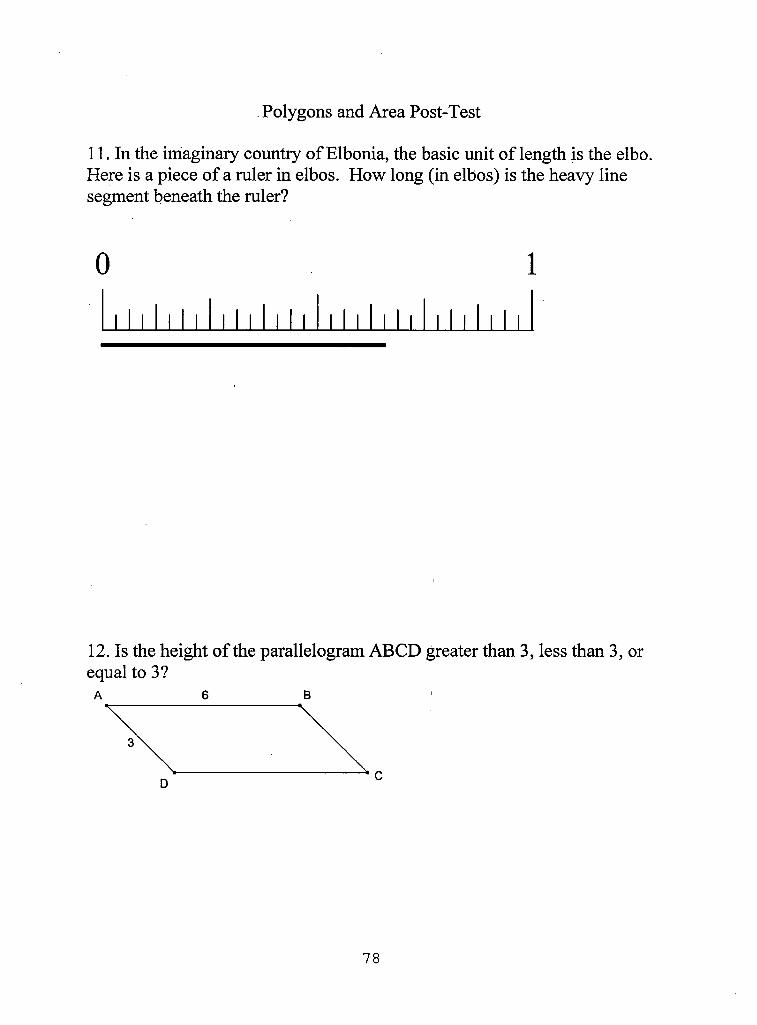
Polygons and Area Post-Test
11. In the imaginary country of Elbonia, the basic unit of length is the elbo. Here is a piece of a ruler in elbos. How long (in elbos) is the heavy line segment beneath the ruler?
12. Is the height of the parallelogram ABCD greater than 3, less than 3, or equal to 3?
78
REFERENCES
Addington, S. (2005). Measuring the world. Unpublished manuscript, California State University, San Bernardino.
Addington, S. (2006). Etty Wanda and the Have a Heart Problem. Teaching Children Mathematics 13(3)., 148- 453.
Beaton, A., Mullis, I., Martin, M., Gonzalez, E., Kelley, D., Smith, T. (1996). Mathematics Achievement in the Middle School Years. TEA's Third International Mathematics and Science Study (TIMSS). Chestnut Hill, MA: Boston College.
Cass, M., Cates, D., Jackson, C., & Smith, M. (2003). Effects of Manipulative Instruction on Solving Area and Perimeter Problems by Students with Learning Disabilities. Learning Disabilities Research & Practices, 18(2), 112-120.
Clements, D., & Bright, G. (2003). Learning and Teaching Measurement, 2003 Yearbook, xi-xiii. Reston, VA: The National Council of Teachers of Mathematics.
Clements, D., & Stephan, M. (2003). .Linear and Area Measurement in Prekindergarten to Grade 2. In D. Clements & G. Bright (Eds.), Learning and Teaching Measurement, 2003 Yearbook (pp. 3-16). Reston, VA: The National Council of Teachers of Mathematics.
Clements, D., & Stephan, M. (2004) . Measurement in Pre-K to Grade 2 Mathematics. In D. Clements, J. Sarama, & A. DiBiase (Eds.), Engaging Young Children in Mathematics, Standards for Early Childhood Mathematics Education (pp. 299-317). Mahwah, NJ: Lawrence Erlbaum Associates.
Cummins, J., Kanold, T., Kenney, M., Malloy, C. & Mojica, Y. (2001). Geometry: Concepts and Applications. Columbus, OH: Glencoe/McGraw-Hill.
Curriculum Development and Supplemental Materials Commission. (2000). Mathematics Framework for
79
California Public Schools, Kindergarten Through Grade Twelve. Sacramento, CA: California Department of Education.
De Villiers, M. (1998) . To Teach Definitions in Geometry or Teach to Define? Psychology of Mathematics Education PME, 2, 2 4 8-255.
Fuys, D., Geddes, D., & Tischler, R. (1988). The Van Hiele Model of Thinking in Geometry Among Adolescents [Monograph]. Journal for Research in Mathematics Education, 3, 4-191.
House, D. J. (2001). The Predictive Relationship Between Academic Self-Concept, Achievement Expectancies, and Grade Performance in College Calculus. The Journal of Social Psychology, 135 (1), 111-112.
Jacobs, H. R. (2003). Geometry: Seeing, Doing, Understanding. New York, NY: W.H Freeman and Company.
Kenney, P. A., & Silver, E. A. (1997). Results from the Sixth Mathematics Assessment of the National Assessment of Educational Progress. Reston, VA: National Council of Teachers of Mathematics.
Lehrer, R. , Jacobson, C., Thoyre, G., Kemeny, V., Storm, D., Horvath, J., Gance, S., & Koehler, M. (1998). Developing Understanding of Geometry and Space in the Primary Grades. In R. Lehrer & D. Chazan (Eds.), Designing Learning Environments for Developing Understanding of Geometry and Space (pp. 169-200). Mahwah, NJ: Lawrence Erlbaum Associates, Inc.
Malloy, C. (1999). Perimeter and Area through the van Hiele Model. Mathematics Teaching in the Middle School 5 (2), 87-90.
Menon, R. (1998). Preservice Teachers' Understanding of Perimeter and Area. School Science and Mathematics 98(7), 361-368.
Moyer, P. (2001). Using Representations to Explore Perimeter and Area. Teaching Children Mathematics 8(1), 52-59.
80
Murrey, D., & Newton, J. (2007). Constructing Understanding to Motivate Underachievers: Investigating Perimeter and Area Formulas. The California Mathematics Council Communicator, 31 (3), 36-38.
Pegg, J., & Davey, G. (1998) Interpreting Student Understanding in Geometry: A Synthesis of Two Models. In R. Lehrer & D. Chazan (Eds.), Designing Learning Environments for Developing Understanding of Geometry and Space (pp. 109-135). Mahwah, NJ: Lawrence Erlbaum Associates, Inc.
Ridgway, C. & Healy, C. (1997). Evaluation of Empowerment in a High School Geometry Class. Mathematics Teacher, 90, 738-741.
Serra, M. (2003). Discovering Geometry: An Investigative Approach. Emeryville, CA: Key Curriculum Press.
The National Council of Teachers of Mathematics. (2000). Principles and Standards for School Mathematics. Reston, VA.
Van de Walle, J. (2004). Elementary and Middle School Mathematics, 346-348. New York: Allyn and Bacon.
Van Hiele, P. M. (1999). Developing Geometric Thinking through Activities that Begin wgth Play. Teaching Children Mathematics, 310-316.
81