tcmp social economic rep.#5006
TRANSCRIPT
Tanzania Coastal Management Partnership i
TTTanzaniaCCCoastal
MMManagementPPPartnership
A joint initiative between the National Environment Management Council,the University of Rhode Island/Coastal Resources Center and the
United States Agency for International Development
SOCIOECONOMIC ASSESSMENT OF
TANZANIA'S COASTAL REGIONS
A Background Study prepared for the Tanzania Coastal Management Partnership
BACKGROUND DOCUMENT
October, 1998Prepared by:
Susan Wagner, University of Dar Salaam and Ignace Mchallo,National Environment Management Council
With James Tobey, University of Rhode Island
Working Document: 5006 TCMP
Tanzania Coastal Management Partnership i
PREFACE
This study reviews socioeconomic conditions and trends in the five coastal regions of mainlandTanzania— Lindi, Tanga, Mtwara, Coast and Dar es Salaam. Regional statistics do notnecessarily give an accurate picture of life in coastal communities. Nevertheless, since mostinformation is collected on a regional basis, regional information was used as a starting pointfor this assessment of socioeconomics and coastal management. The study was prepared as abackground report for the Tanzania Coastal Management Partnership (TCMP). It was writtenby Susan Wagner, University of Dar es Salaam, and Ignace Mchallo, National EnvironmentManagement Council (NEMC), with the supervision of James Tobey, University of RhodeIsland Coastal Resources Center (CRC).
This is a preliminary, fact-finding study and does not pretend to be a comprehensive treatmentof socioeconomic issues. The objective was to become familiar with existing socioeconomicinformation specific to the coastal regions, to identify key issues, and to help identify selectedtopics for further and more focused research. The draft is being made available to elicitreviewer comments. Field visits to selected coastal communities to observe, interview andcollect baseline information would be an important part of follow-up activities to improveunderstanding of key socioeconomic issues.
The limitations of data need to be noted from the outset. Data availability, reliability andconsistency across different regions are problematic. Socioeconomic data are scattered andoften do not exist or are outdated, and then extrapolated into the future. The last populationcensus in Tanzania was in 1988. The capacity of the government to collect and processinformation is lagging behind the changes taking place in the economy. In particular, theBureau of Statistics does not have the financial resources to adequately undertake all the datacollection activities under its mandate. Data are scattered and inconsistent. Normally, regionalauthorities produce annual “Socioeconomic Profiles” that contain essential information on thesocioeconomic status of the region. However, these reports are not comprehensive, nor is thedata they present consistent across regions. Price information is typically missing. Anadditional problem is that the employment and products of the informal sector— a criticalcomponent of Tanzania’s coastal regions— are not counted in official statistics.
Information was gathered from primary and secondary sources. Most information wasobtained from national government agencies such as the Planning Commission, Dar es SalaamCity Commission, Bureau of Statistics, National Environmental Management Council (NEMC)and various libraries and information centers in the capital. Time and resources allowed foronly one field trip to Tanga. During the field visit, consultations were held with the TangaCoastal Zone Conservation Development Programme and various regional authorities.Interviews were also held with the district authorities of Pangani and Muheza.
Seaweed farming and other mariculture activities are not covered in this study. Mariculture, aswell as coastal salt and lime production, is addressed in the reports of the TCMP Core PolicyWorking Group and Mariculture Working Group prepared in parallel with this study.
Section one summarizes population dynamics in the five coastal regions. Section two reviewseconomic activities including agriculture and livestock, forestry, fishing, mining, tourism, andmanufacturing and other industry. Sections three and four briefly note the importance of theinformal sector and women’s development groups in coastal regions. Section five highlightsthe links among economic growth and the environment, and emphasizes the importance ofmaintaining a balance to ensure sustainable growth. Section six surveys the status of health

Tanzania Coastal Management Partnership ii
and social services in Tanzania’s coastal regions. Section seven assesses transportation andcommunication infrastructure— a key consideration and constraint to alleviating poverty andinequality in rural Tanzania, and as opportunities for growth in all economic sectors.
Tanzania Coastal Management Partnership iii
TABLE OF CONTENTS
PREFACE ...............................................................................................i
LIST OF TABLES................................................................................ iv
EXECUTIVE SUMMARY....................................................................1
1.0 POPULATION DYNAMICS .........................................................3
2.0 THE CONTRIBUTION OF COASTAL REGIONS TO THEECONOMY OF TANZANIA ........................................................4
2.1 AGRICULTURE.................................................................................................................... 52.2 LIVESTOCK....................................................................................................................... 102.3 FORESTRY ........................................................................................................................ 102.4 FISHERIES......................................................................................................................... 122.5 MINING ............................................................................................................................ 142.6 TOURISM .......................................................................................................................... 152.7 MANUFACTURING AND INDUSTRY ..................................................................................... 16
3.0 THE INFORMAL SECTOR........................................................ 17
4.0 WOMEN’S DEVELOPMENT GROUPS IN COASTALREGIONS ..................................................................................... 17
5.0 BALANCING DEVELOPMENT AND ENVIRONMENTALSUSTAINABILITY...................................................................... 18
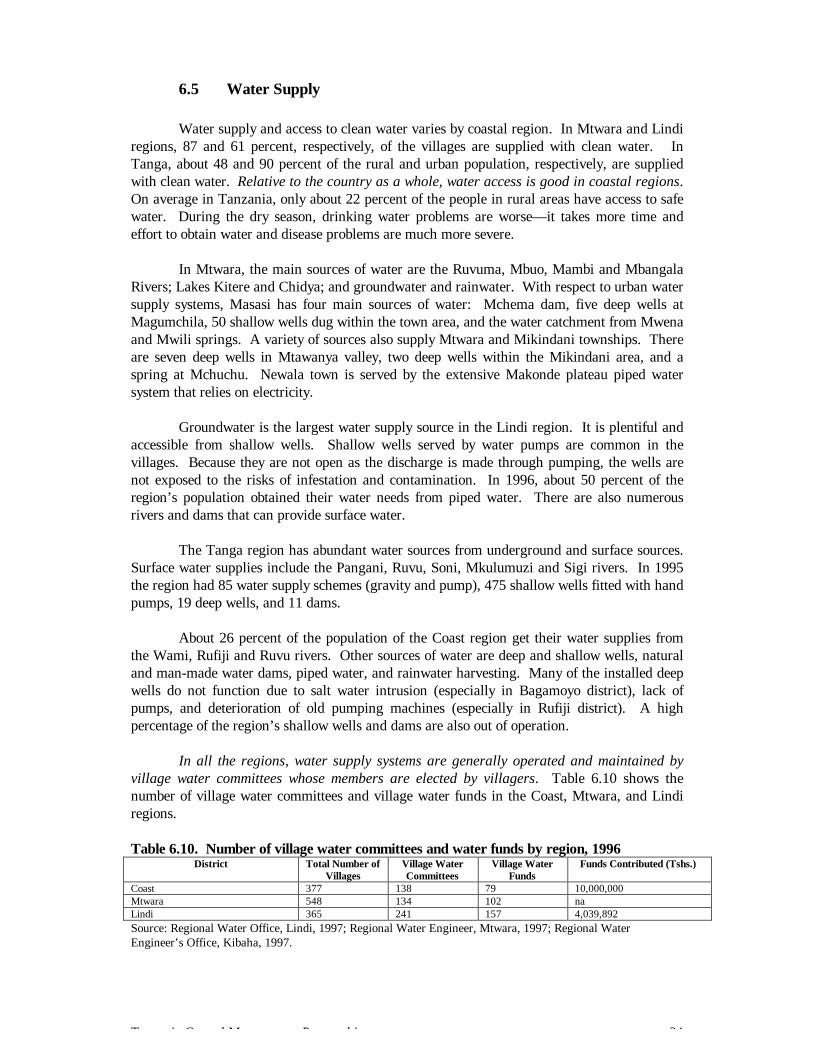
6.0 HEALTH AND SOCIAL SERVICES......................................... 196.1 HEALTH............................................................................................................................ 206.2 SANITATION...................................................................................................................... 226.3 NUTRITION ....................................................................................................................... 226.4 EDUCATION ...................................................................................................................... 236.5 WATER SUPPLY ................................................................................................................ 24
7.0 COMMUNICATION AND TRANSPORTATIONINFRASTRUCTURE................................................................... 25
7.1 ROADS .............................................................................................................................. 257.2 PORTS AND HARBORS ....................................................................................................... 267.3 AIR SERVICES................................................................................................................... 277.4 RAILWAYS ........................................................................................................................ 277.5 TELECOMMUNICATIONS ................................................................................................... 277.6 ELECTRICAL POWER ........................................................................................................ 28
REFERENCES .................................................................................... 29
Tanzania Coastal Management Partnership iv
LIST OF TABLES
1.1 Population density and annual population growth rate by region1.2 Lifetime migration by region2.1 Regional contribution to national GDP2.2 GDP per capita, 19942.3 Food crop production, coastal regions, 1991 (tons)2.4 Food and cash crop production, Mtwara region (tons)2.5 Cashewnut production by major producing regions (tons)2.6 Agricultural production, Dar es Salaam region2.7 Contribution of agriculture to total income, Coast region, 1991 and 19962.8 Hectares of major food crops under production, Lindi region2.9 Production of major food crops, Lindi region (tons)2.10 Simsim production in major producing regions (tons)2.11 Production of food and cash crops, Tanga region (tons)2.12 Livestock population by region2.13 Forest product imports, Dar es Salaam, 19912.14 Forest product revenues, Mtwara region2.15 Forest product revenues, Dar es Salaam region, 19912.16 Forest product revenues, Coast region (Tshs.)2.17 Marine and freshwater fishery resources2.18 Marine fishery resources by region, 19932.19 Mineral deposits by district, Tanga region2.20 Mineral deposits, Mtwara region6.1 Top ten diseases by number of cases, Coast region6.2 Number of health facilities by region, 19966.3 Hospitals and dispensaries per capita by region, 19966.4 Life expectancy at birth by region, 1978 and 1988 census6.5 Infant mortality rate and under five mortality rate by region (per 1,000)6.6 Urban and rural infant mortality rate and under five mortality rate by coastal region,
19886.7 Type of toilet facility by region (percentage of households, 1988 census)6.8 Nutrition status of children by region, 19956.9 Number of secondary schools by region6.10 Number of village water committees and water funds by region, 19967.1 Kilometers of roads, Coast region, 19967.2 Road density, Coast region, 19967.3 Cargo movement in major ports (tons)7.4 Communication services, Coast region, 1996
Tanzania Coastal Management Partnership 1
EXECUTIVE SUMMARY
The coastal regions of Tanzania are critical to its future social and economicdevelopment. They are rich in natural resources and currently contribute a more thanproportionate share of national income (32 percent). There is substantial potential foragriculture, mariculture and fisheries, tourism, small-scale mining, and manufacturing. Thecountry’s principal urban area— Dar es Salaam— and 75 percent of the country’s industry arelocated in coastal regions.
One of the challenges for coastal management is to harness the potential of the coastalregions’ natural and human resources in a way that is environmentally, socially, andeconomically sustainable. Promoting sustainable development in coastal regions is importantbecause of the growing human pressures on the resource base.
Promoting and managing balanced growth in coastal regions will mean addressingissues of rural poverty, equity, resource use, and underlying development constraints. Thisstudy shows that a large percentage of the coastal population lives at very low levels ofwelfare. The level of per capita income, health and educational standards, and basicinfrastructure is very low, especially in rural areas. Some coastal regions are ranked amongthe poorest in the nation. This is the context in which national and local coastal managementefforts must operate. A conclusion that can be drawn is that sustainable coastal managementstrategies and activities should maintain a focus on promoting social and economicdevelopment.
The main findings of the study are listed below.
1. There is a significant pattern of rural-urban migration, particularly to the city of Dar esSalaam. It is anticipated that over 33 percent of the country’s population will live in urbanareas by the turn of the century, compared to 18 percent in 1988 (World Bank, 1996).Major reasons are the lack of communication and transportation infrastructure in ruralcoastal areas, especially in southern regions, lack of livelihood opportunities and socialservices, and poor performance of agriculture and fishing.
2. In the coastal regions overall, agriculture is the most important sector in terms ofemployment and income. Most men and women are farmers. The agricultural potentialremains to be harnessed as productivity is low. The main constraints relate to the need toaccess more productive, appropriate technology, including reliable low-cost implements,extension service support, supply of inputs (including fertilizers, fuel and seeds), andprovision of rural infrastructure (including transport and water resources). Rural farmersneed advice on sound farming practices. Improved rural infrastructure, particularly ruralroads and low-cost public transport, is essential to the effective functioning of markets.Other than the Postal Banks, rural financial institutions are lacking.
3. Fishing is the major livelihood activity and source of income for inhabitants of coastalvillages. A large percentage of the male population in coastal villages or towns iscomposed of artisanal fishermen using traditional, labor intensive techniques. Artisanalfisheries contribute more than 96 percent of total marine fish landings. Fish and mollusksare the main source of protein for coastal people. Fishing is also an important activity andsource of income not only for the fishermen but also for many others engaged in theprocessing, frying and trading of fish. Aside from seaweed farming, the potential ofmariculture is largely untapped.
Tanzania Coastal Management Partnership 2
4. The demand for forestry products in coastal regions is growing rapidly, especially due topopulation increases and growing demand of the city of Dar es Salaam. Timber cuttingand sale of wood is an important economic activity for villagers. The revenues from timberproduct licenses are also important source of district revenue. Forests in coastal regionsare cut for household cooking; for fuelwood in the production of lime, salt, and charcoal;construction; boat building; crafts; and to clear land for low input, extensive agriculture.Wood and charcoal are the source of energy for most residents of coastal regions inTanzania in both urban and rural areas. Hardwood species are exploited for woodcarvingsand woodwork.
5. In coastal regions, particularly in urban areas, the informal sector is becoming a moresignificant component of the economy. The number of people in the informal sector hasgrown as the economic situation has worsened and real wages have declined. The informalsector has an important role to play because it provides income-earning opportunities forlarge numbers of unskilled and otherwise jobless people.
6. Health, nutrition, sanitation, safe water access, and educational standards are low,especially in rural areas. It is increasingly difficult to finance basic public services fromdomestic revenues.
7. There is great potential to empower and increase the role of women in the economy andsocial development of coastal communities. Credit schemes in coastal regions are havingan impact on the establishment and strengthening of women’s groups, providing them withcredit and technology, improving their marketing skills, and thus helping to improve theirincome earning potential.
8. Problems with infrastructure, including roads and other transport, port facilities, electricalpower, and telecommunications, are fundamental and underlying issues in almost allaspects of development in coastal regions. They have a major impact on economic growth,decisions to migrate, health, education, and sanitation.
Finally, there are a number of complex and multi-dimensional issues that thispreliminary study does not address, but that have direct relevance for coastal resourcestewardship, and should be priorities for further socioeconomic research. They include:
• How the rural poor make decisions on resource use, strategies for coping with poverty, andthe essential factors that determine the prosperity or poverty of a community.
• Gender, inequality, and the quantity and quality of associational life and related norms incoastal communities.
• The impact of the land tenure system on equity, migration, and flexibility and adaptation inthe economy. There is currently a shift to a private, market-based economy, yet there is nomarket-based system for land purchase and sale.
• Assessment of the market and non-market value of coastal resources, resource carryingcapacity, and natural resource accounting.
Tanzania Coastal Management Partnership 3
1.0 POPULATION DYNAMICS
Tanzania’s coastal zone stretches 800 kilometers from North to South along theWestern Indian Ocean. The five coastal regions encompass about 15 percent of the country’sland area and are home to approximately 25 percent of the country’s population. Most of thecountry’s major urban areas and industrial activities are located in coastal regions,including Dar es Salaam, the national capital.
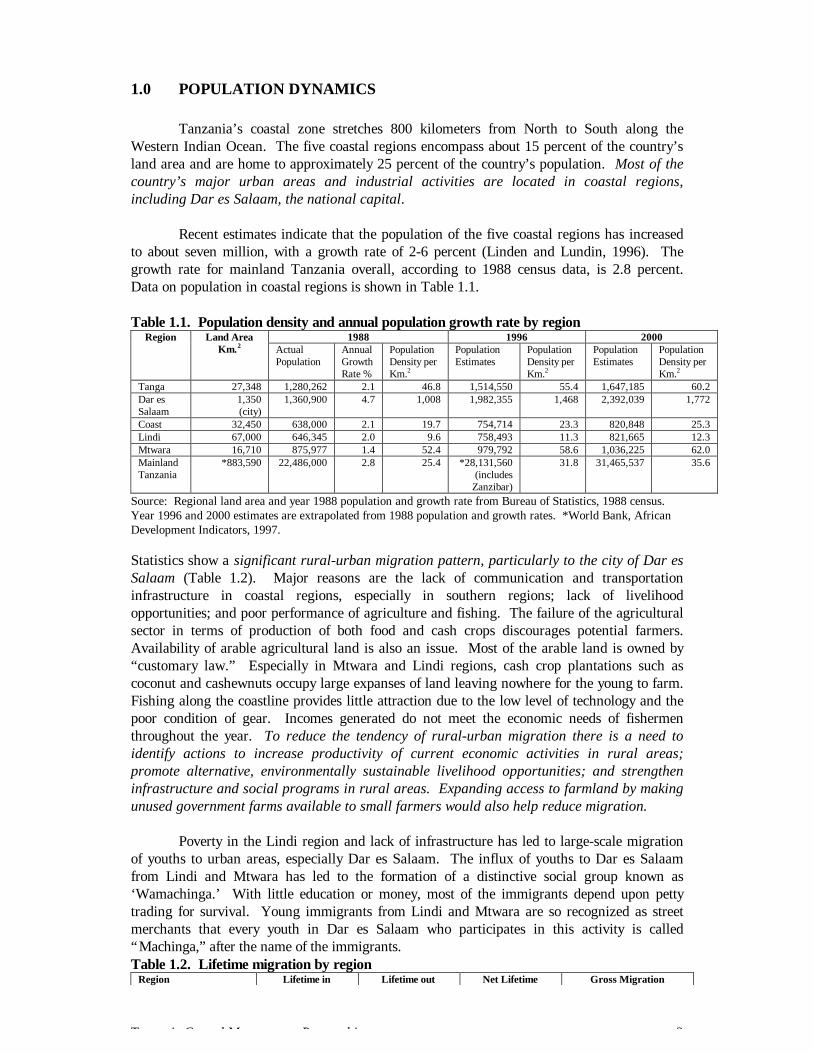
Recent estimates indicate that the population of the five coastal regions has increasedto about seven million, with a growth rate of 2-6 percent (Linden and Lundin, 1996). Thegrowth rate for mainland Tanzania overall, according to 1988 census data, is 2.8 percent.Data on population in coastal regions is shown in Table 1.1.
Table 1.1. Population density and annual population growth rate by region1988 1996 2000Region Land Area
Km.2 ActualPopulation
AnnualGrowthRate %
PopulationDensity perKm.2
PopulationEstimates
PopulationDensity perKm.2
PopulationEstimates
PopulationDensity perKm.2
Tanga 27,348 1,280,262 2.1 46.8 1,514,550 55.4 1,647,185 60.2Dar esSalaam
1,350(city)
1,360,900 4.7 1,008 1,982,355 1,468 2,392,039 1,772
Coast 32,450 638,000 2.1 19.7 754,714 23.3 820,848 25.3Lindi 67,000 646,345 2.0 9.6 758,493 11.3 821,665 12.3Mtwara 16,710 875,977 1.4 52.4 979,792 58.6 1,036,225 62.0MainlandTanzania
*883,590 22,486,000 2.8 25.4 *28,131,560(includes
Zanzibar)
31.8 31,465,537 35.6
Source: Regional land area and year 1988 population and growth rate from Bureau of Statistics, 1988 census.Year 1996 and 2000 estimates are extrapolated from 1988 population and growth rates. *World Bank, AfricanDevelopment Indicators, 1997.
Statistics show a significant rural-urban migration pattern, particularly to the city of Dar esSalaam (Table 1.2). Major reasons are the lack of communication and transportationinfrastructure in coastal regions, especially in southern regions; lack of livelihoodopportunities; and poor performance of agriculture and fishing. The failure of the agriculturalsector in terms of production of both food and cash crops discourages potential farmers.Availability of arable agricultural land is also an issue. Most of the arable land is owned by“customary law.” Especially in Mtwara and Lindi regions, cash crop plantations such ascoconut and cashewnuts occupy large expanses of land leaving nowhere for the young to farm.Fishing along the coastline provides little attraction due to the low level of technology and thepoor condition of gear. Incomes generated do not meet the economic needs of fishermenthroughout the year. To reduce the tendency of rural-urban migration there is a need toidentify actions to increase productivity of current economic activities in rural areas;promote alternative, environmentally sustainable livelihood opportunities; and strengtheninfrastructure and social programs in rural areas. Expanding access to farmland by makingunused government farms available to small farmers would also help reduce migration.
Poverty in the Lindi region and lack of infrastructure has led to large-scale migrationof youths to urban areas, especially Dar es Salaam. The influx of youths to Dar es Salaamfrom Lindi and Mtwara has led to the formation of a distinctive social group known as‘Wamachinga.’ With little education or money, most of the immigrants depend upon pettytrading for survival. Young immigrants from Lindi and Mtwara are so recognized as streetmerchants that every youth in Dar es Salaam who participates in this activity is called“Machinga,” after the name of the immigrants.Table 1.2. Lifetime migration by region
Region Lifetime in Lifetime out Net Lifetime Gross Migration
Tanzania Coastal Management Partnership 4
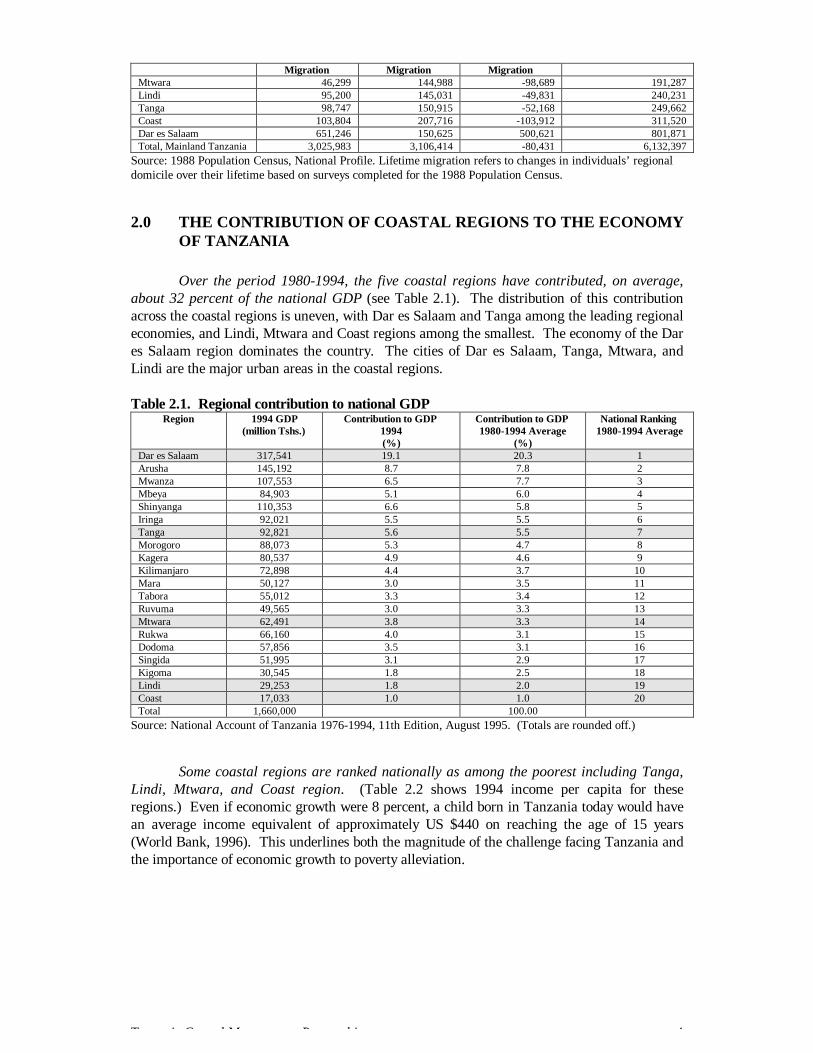
Migration Migration MigrationMtwara 46,299 144,988 -98,689 191,287Lindi 95,200 145,031 -49,831 240,231Tanga 98,747 150,915 -52,168 249,662Coast 103,804 207,716 -103,912 311,520Dar es Salaam 651,246 150,625 500,621 801,871Total, Mainland Tanzania 3,025,983 3,106,414 -80,431 6,132,397
Source: 1988 Population Census, National Profile. Lifetime migration refers to changes in individuals’ regionaldomicile over their lifetime based on surveys completed for the 1988 Population Census.
2.0 THE CONTRIBUTION OF COASTAL REGIONS TO THE ECONOMYOF TANZANIA
Over the period 1980-1994, the five coastal regions have contributed, on average,about 32 percent of the national GDP (see Table 2.1). The distribution of this contributionacross the coastal regions is uneven, with Dar es Salaam and Tanga among the leading regionaleconomies, and Lindi, Mtwara and Coast regions among the smallest. The economy of the Dares Salaam region dominates the country. The cities of Dar es Salaam, Tanga, Mtwara, andLindi are the major urban areas in the coastal regions.
Table 2.1. Regional contribution to national GDPRegion 1994 GDP
(million Tshs.)Contribution to GDP
1994(%)
Contribution to GDP1980-1994 Average
(%)
National Ranking1980-1994 Average
Dar es Salaam 317,541 19.1 20.3 1Arusha 145,192 8.7 7.8 2Mwanza 107,553 6.5 7.7 3Mbeya 84,903 5.1 6.0 4Shinyanga 110,353 6.6 5.8 5Iringa 92,021 5.5 5.5 6Tanga 92,821 5.6 5.5 7Morogoro 88,073 5.3 4.7 8Kagera 80,537 4.9 4.6 9Kilimanjaro 72,898 4.4 3.7 10Mara 50,127 3.0 3.5 11Tabora 55,012 3.3 3.4 12Ruvuma 49,565 3.0 3.3 13Mtwara 62,491 3.8 3.3 14Rukwa 66,160 4.0 3.1 15Dodoma 57,856 3.5 3.1 16Singida 51,995 3.1 2.9 17Kigoma 30,545 1.8 2.5 18Lindi 29,253 1.8 2.0 19Coast 17,033 1.0 1.0 20Total 1,660,000 100.00
Source: National Account of Tanzania 1976-1994, 11th Edition, August 1995. (Totals are rounded off.)
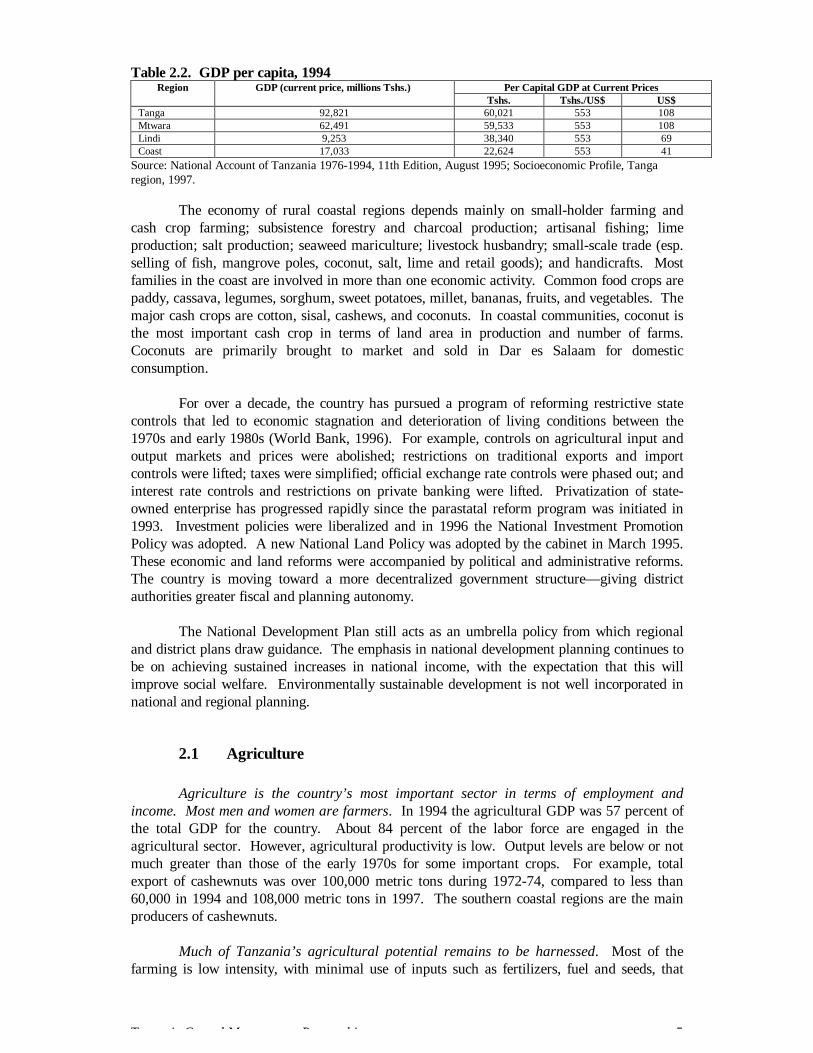
Some coastal regions are ranked nationally as among the poorest including Tanga,Lindi, Mtwara, and Coast region. (Table 2.2 shows 1994 income per capita for theseregions.) Even if economic growth were 8 percent, a child born in Tanzania today would havean average income equivalent of approximately US $440 on reaching the age of 15 years(World Bank, 1996). This underlines both the magnitude of the challenge facing Tanzania andthe importance of economic growth to poverty alleviation.
Tanzania Coastal Management Partnership 5
Table 2.2. GDP per capita, 1994Per Capital GDP at Current PricesRegion GDP (current price, millions Tshs.)
Tshs. Tshs./US$ US$Tanga 92,821 60,021 553 108Mtwara 62,491 59,533 553 108Lindi 9,253 38,340 553 69Coast 17,033 22,624 553 41
Source: National Account of Tanzania 1976-1994, 11th Edition, August 1995; Socioeconomic Profile, Tangaregion, 1997.
The economy of rural coastal regions depends mainly on small-holder farming andcash crop farming; subsistence forestry and charcoal production; artisanal fishing; limeproduction; salt production; seaweed mariculture; livestock husbandry; small-scale trade (esp.selling of fish, mangrove poles, coconut, salt, lime and retail goods); and handicrafts. Mostfamilies in the coast are involved in more than one economic activity. Common food crops arepaddy, cassava, legumes, sorghum, sweet potatoes, millet, bananas, fruits, and vegetables. Themajor cash crops are cotton, sisal, cashews, and coconuts. In coastal communities, coconut isthe most important cash crop in terms of land area in production and number of farms.Coconuts are primarily brought to market and sold in Dar es Salaam for domesticconsumption.
For over a decade, the country has pursued a program of reforming restrictive statecontrols that led to economic stagnation and deterioration of living conditions between the1970s and early 1980s (World Bank, 1996). For example, controls on agricultural input andoutput markets and prices were abolished; restrictions on traditional exports and importcontrols were lifted; taxes were simplified; official exchange rate controls were phased out; andinterest rate controls and restrictions on private banking were lifted. Privatization of state-owned enterprise has progressed rapidly since the parastatal reform program was initiated in1993. Investment policies were liberalized and in 1996 the National Investment PromotionPolicy was adopted. A new National Land Policy was adopted by the cabinet in March 1995.These economic and land reforms were accompanied by political and administrative reforms.The country is moving toward a more decentralized government structure— giving districtauthorities greater fiscal and planning autonomy.
The National Development Plan still acts as an umbrella policy from which regionaland district plans draw guidance. The emphasis in national development planning continues tobe on achieving sustained increases in national income, with the expectation that this willimprove social welfare. Environmentally sustainable development is not well incorporated innational and regional planning.
2.1 Agriculture
Agriculture is the country’s most important sector in terms of employment andincome. Most men and women are farmers. In 1994 the agricultural GDP was 57 percent ofthe total GDP for the country. About 84 percent of the labor force are engaged in theagricultural sector. However, agricultural productivity is low. Output levels are below or notmuch greater than those of the early 1970s for some important crops. For example, totalexport of cashewnuts was over 100,000 metric tons during 1972-74, compared to less than60,000 in 1994 and 108,000 metric tons in 1997. The southern coastal regions are the mainproducers of cashewnuts.
Much of Tanzania’s agricultural potential remains to be harnessed. Most of thefarming is low intensity, with minimal use of inputs such as fertilizers, fuel and seeds, that
Tanzania Coastal Management Partnership 6
would enhance productivity. Maize yield, for example, is about a third of the world average.Improved agricultural productivity is critical to reducing rural poverty. The main constraintsrelate to the need to access more productive technology; durable, low-cost implements;extension service support; supply of inputs, including fertilizers, fuel and seeds; and provisionof rural infrastructure, including transport and water resources (World Bank, 1996). Poorfarmers need extension assistance on sustainable farm practices. Improved rural infrastructure,particularly rural roads and low-cost public transport, is essential to the effective functioning ofmarkets. Other than the Postal Banks, rural financial institutions are lacking. Becausetransactions are small and costs high, formal institutions tend to limit their rural activities tomarket centers.
There is a need to strengthen extension, training, and awareness-building to promotesustainable agricultural practice; develop mechanisms to provide rural credit; makeavailable low-cost, appropriate technologies; demonstrate the feasibility of small irrigationschemes; improve marketing of agricultural products; and test the feasibility of alternativeagricultural activities (e.g. high value horticulture and beekeeping).
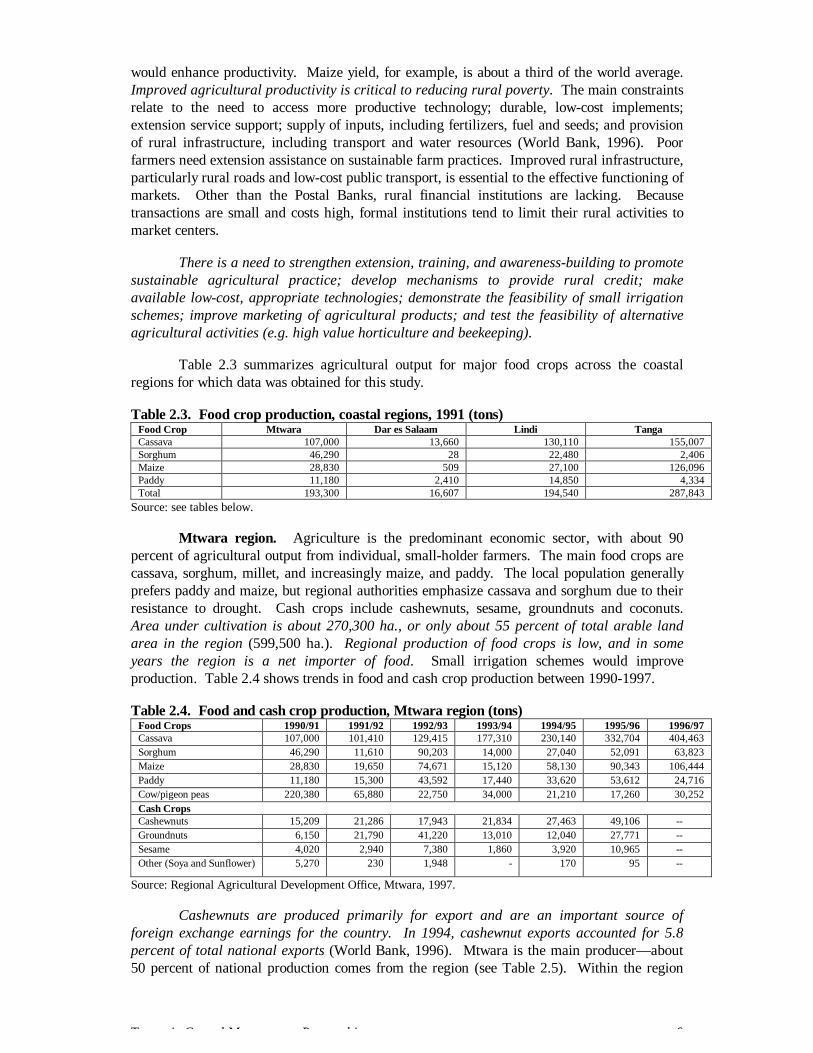
Table 2.3 summarizes agricultural output for major food crops across the coastalregions for which data was obtained for this study.
Table 2.3. Food crop production, coastal regions, 1991 (tons)Food Crop Mtwara Dar es Salaam Lindi TangaCassava 107,000 13,660 130,110 155,007Sorghum 46,290 28 22,480 2,406Maize 28,830 509 27,100 126,096Paddy 11,180 2,410 14,850 4,334Total 193,300 16,607 194,540 287,843
Source: see tables below.
Mtwara region. Agriculture is the predominant economic sector, with about 90percent of agricultural output from individual, small-holder farmers. The main food crops arecassava, sorghum, millet, and increasingly maize, and paddy. The local population generallyprefers paddy and maize, but regional authorities emphasize cassava and sorghum due to theirresistance to drought. Cash crops include cashewnuts, sesame, groundnuts and coconuts.Area under cultivation is about 270,300 ha., or only about 55 percent of total arable landarea in the region (599,500 ha.). Regional production of food crops is low, and in someyears the region is a net importer of food. Small irrigation schemes would improveproduction. Table 2.4 shows trends in food and cash crop production between 1990-1997.
Table 2.4. Food and cash crop production, Mtwara region (tons)Food Crops 1990/91 1991/92 1992/93 1993/94 1994/95 1995/96 1996/97Cassava 107,000 101,410 129,415 177,310 230,140 332,704 404,463Sorghum 46,290 11,610 90,203 14,000 27,040 52,091 63,823Maize 28,830 19,650 74,671 15,120 58,130 90,343 106,444Paddy 11,180 15,300 43,592 17,440 33,620 53,612 24,716Cow/pigeon peas 220,380 65,880 22,750 34,000 21,210 17,260 30,252Cash CropsCashewnuts 15,209 21,286 17,943 21,834 27,463 49,106 --Groundnuts 6,150 21,790 41,220 13,010 12,040 27,771 --Sesame 4,020 2,940 7,380 1,860 3,920 10,965 --Other (Soya and Sunflower) 5,270 230 1,948 - 170 95 --
Source: Regional Agricultural Development Office, Mtwara, 1997.
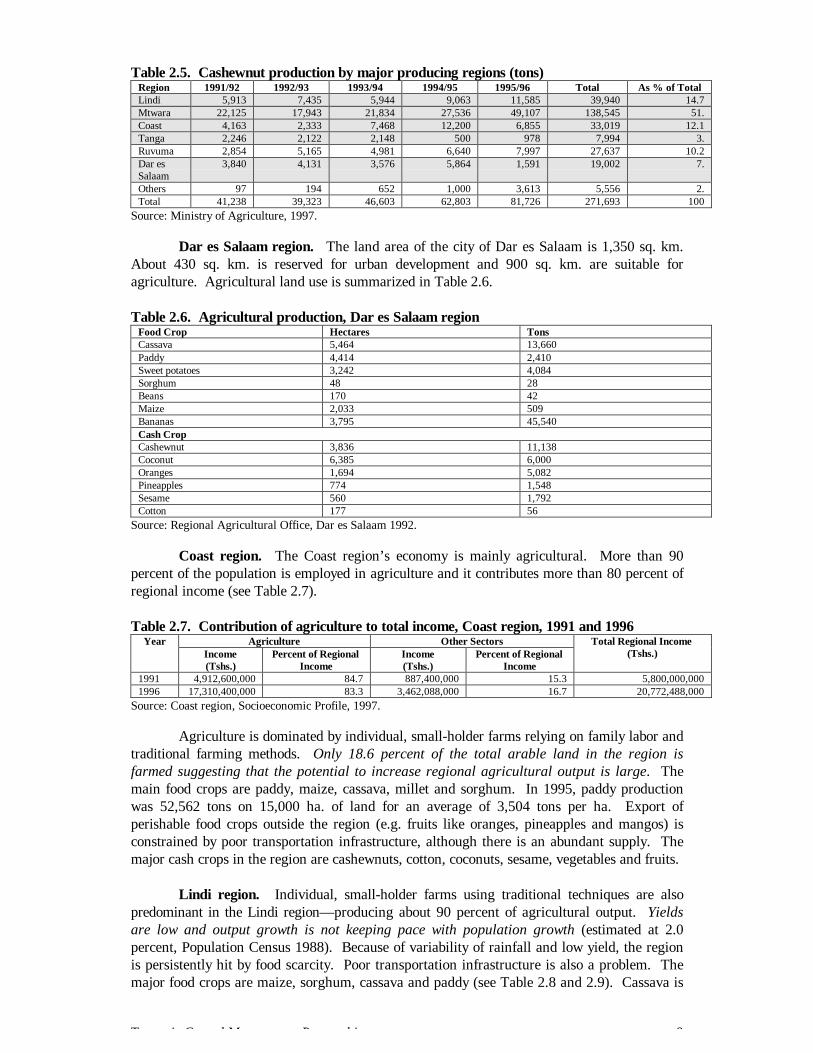
Cashewnuts are produced primarily for export and are an important source offoreign exchange earnings for the country. In 1994, cashewnut exports accounted for 5.8percent of total national exports (World Bank, 1996). Mtwara is the main producer— about50 percent of national production comes from the region (see Table 2.5). Within the region

Tanzania Coastal Management Partnership 7
over 50 percent of the cashewnut harvest comes from Newala district, while the Masasi andMtwara districts contribute 29 and 19 percent respectively.
Tanzania Coastal Management Partnership 8
Table 2.5. Cashewnut production by major producing regions (tons)Region 1991/92 1992/93 1993/94 1994/95 1995/96 Total As % of TotalLindi 5,913 7,435 5,944 9,063 11,585 39,940 14.7Mtwara 22,125 17,943 21,834 27,536 49,107 138,545 51.Coast 4,163 2,333 7,468 12,200 6,855 33,019 12.1Tanga 2,246 2,122 2,148 500 978 7,994 3.Ruvuma 2,854 5,165 4,981 6,640 7,997 27,637 10.2Dar esSalaam
3,840 4,131 3,576 5,864 1,591 19,002 7.
Others 97 194 652 1,000 3,613 5,556 2.Total 41,238 39,323 46,603 62,803 81,726 271,693 100
Source: Ministry of Agriculture, 1997.
Dar es Salaam region. The land area of the city of Dar es Salaam is 1,350 sq. km.About 430 sq. km. is reserved for urban development and 900 sq. km. are suitable foragriculture. Agricultural land use is summarized in Table 2.6.
Table 2.6. Agricultural production, Dar es Salaam regionFood Crop Hectares TonsCassava 5,464 13,660Paddy 4,414 2,410Sweet potatoes 3,242 4,084Sorghum 48 28Beans 170 42Maize 2,033 509Bananas 3,795 45,540Cash CropCashewnut 3,836 11,138Coconut 6,385 6,000Oranges 1,694 5,082Pineapples 774 1,548Sesame 560 1,792Cotton 177 56
Source: Regional Agricultural Office, Dar es Salaam 1992.
Coast region. The Coast region’s economy is mainly agricultural. More than 90percent of the population is employed in agriculture and it contributes more than 80 percent ofregional income (see Table 2.7).
Table 2.7. Contribution of agriculture to total income, Coast region, 1991 and 1996Agriculture Other SectorsYear
Income(Tshs.)
Percent of RegionalIncome
Income(Tshs.)
Percent of RegionalIncome
Total Regional Income(Tshs.)
1991 4,912,600,000 84.7 887,400,000 15.3 5,800,000,0001996 17,310,400,000 83.3 3,462,088,000 16.7 20,772,488,000
Source: Coast region, Socioeconomic Profile, 1997.
Agriculture is dominated by individual, small-holder farms relying on family labor andtraditional farming methods. Only 18.6 percent of the total arable land in the region isfarmed suggesting that the potential to increase regional agricultural output is large. Themain food crops are paddy, maize, cassava, millet and sorghum. In 1995, paddy productionwas 52,562 tons on 15,000 ha. of land for an average of 3,504 tons per ha. Export ofperishable food crops outside the region (e.g. fruits like oranges, pineapples and mangos) isconstrained by poor transportation infrastructure, although there is an abundant supply. Themajor cash crops in the region are cashewnuts, cotton, coconuts, sesame, vegetables and fruits.
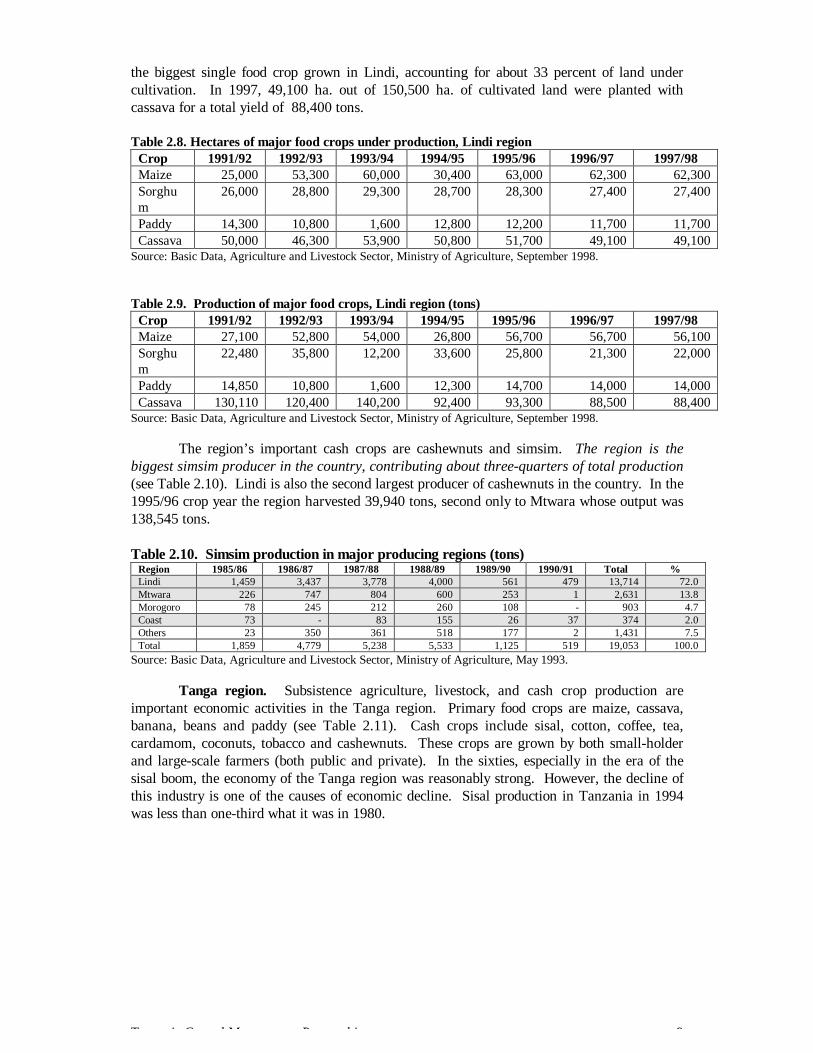
Lindi region. Individual, small-holder farms using traditional techniques are alsopredominant in the Lindi region— producing about 90 percent of agricultural output. Yieldsare low and output growth is not keeping pace with population growth (estimated at 2.0percent, Population Census 1988). Because of variability of rainfall and low yield, the regionis persistently hit by food scarcity. Poor transportation infrastructure is also a problem. Themajor food crops are maize, sorghum, cassava and paddy (see Table 2.8 and 2.9). Cassava is
Tanzania Coastal Management Partnership 9
the biggest single food crop grown in Lindi, accounting for about 33 percent of land undercultivation. In 1997, 49,100 ha. out of 150,500 ha. of cultivated land were planted withcassava for a total yield of 88,400 tons.
Table 2.8. Hectares of major food crops under production, Lindi regionCrop 1991/92 1992/93 1993/94 1994/95 1995/96 1996/97 1997/98Maize 25,000 53,300 60,000 30,400 63,000 62,300 62,300Sorghum
26,000 28,800 29,300 28,700 28,300 27,400 27,400
Paddy 14,300 10,800 1,600 12,800 12,200 11,700 11,700Cassava 50,000 46,300 53,900 50,800 51,700 49,100 49,100
Source: Basic Data, Agriculture and Livestock Sector, Ministry of Agriculture, September 1998.
Table 2.9. Production of major food crops, Lindi region (tons)Crop 1991/92 1992/93 1993/94 1994/95 1995/96 1996/97 1997/98Maize 27,100 52,800 54,000 26,800 56,700 56,700 56,100Sorghum
22,480 35,800 12,200 33,600 25,800 21,300 22,000
Paddy 14,850 10,800 1,600 12,300 14,700 14,000 14,000Cassava 130,110 120,400 140,200 92,400 93,300 88,500 88,400
Source: Basic Data, Agriculture and Livestock Sector, Ministry of Agriculture, September 1998.
The region’s important cash crops are cashewnuts and simsim. The region is thebiggest simsim producer in the country, contributing about three-quarters of total production(see Table 2.10). Lindi is also the second largest producer of cashewnuts in the country. In the1995/96 crop year the region harvested 39,940 tons, second only to Mtwara whose output was138,545 tons.
Table 2.10. Simsim production in major producing regions (tons)Region 1985/86 1986/87 1987/88 1988/89 1989/90 1990/91 Total %Lindi 1,459 3,437 3,778 4,000 561 479 13,714 72.0Mtwara 226 747 804 600 253 1 2,631 13.8Morogoro 78 245 212 260 108 - 903 4.7Coast 73 - 83 155 26 37 374 2.0Others 23 350 361 518 177 2 1,431 7.5Total 1,859 4,779 5,238 5,533 1,125 519 19,053 100.0
Source: Basic Data, Agriculture and Livestock Sector, Ministry of Agriculture, May 1993.
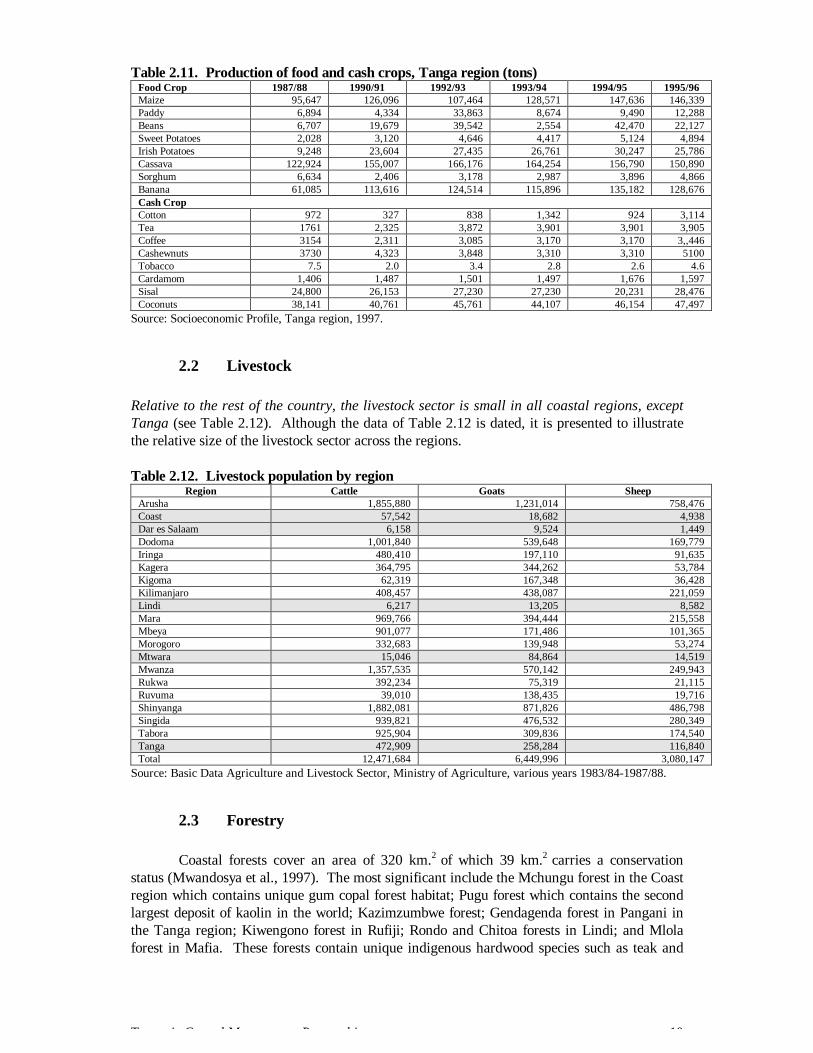
Tanga region. Subsistence agriculture, livestock, and cash crop production areimportant economic activities in the Tanga region. Primary food crops are maize, cassava,banana, beans and paddy (see Table 2.11). Cash crops include sisal, cotton, coffee, tea,cardamom, coconuts, tobacco and cashewnuts. These crops are grown by both small-holderand large-scale farmers (both public and private). In the sixties, especially in the era of thesisal boom, the economy of the Tanga region was reasonably strong. However, the decline ofthis industry is one of the causes of economic decline. Sisal production in Tanzania in 1994was less than one-third what it was in 1980.
Tanzania Coastal Management Partnership 10
Table 2.11. Production of food and cash crops, Tanga region (tons)Food Crop 1987/88 1990/91 1992/93 1993/94 1994/95 1995/96Maize 95,647 126,096 107,464 128,571 147,636 146,339Paddy 6,894 4,334 33,863 8,674 9,490 12,288Beans 6,707 19,679 39,542 2,554 42,470 22,127Sweet Potatoes 2,028 3,120 4,646 4,417 5,124 4,894Irish Potatoes 9,248 23,604 27,435 26,761 30,247 25,786Cassava 122,924 155,007 166,176 164,254 156,790 150,890Sorghum 6,634 2,406 3,178 2,987 3,896 4,866Banana 61,085 113,616 124,514 115,896 135,182 128,676Cash CropCotton 972 327 838 1,342 924 3,114Tea 1761 2,325 3,872 3,901 3,901 3,905Coffee 3154 2,311 3,085 3,170 3,170 3,,446Cashewnuts 3730 4,323 3,848 3,310 3,310 5100Tobacco 7.5 2.0 3.4 2.8 2.6 4.6Cardamom 1,406 1,487 1,501 1,497 1,676 1,597Sisal 24,800 26,153 27,230 27,230 20,231 28,476Coconuts 38,141 40,761 45,761 44,107 46,154 47,497
Source: Socioeconomic Profile, Tanga region, 1997.
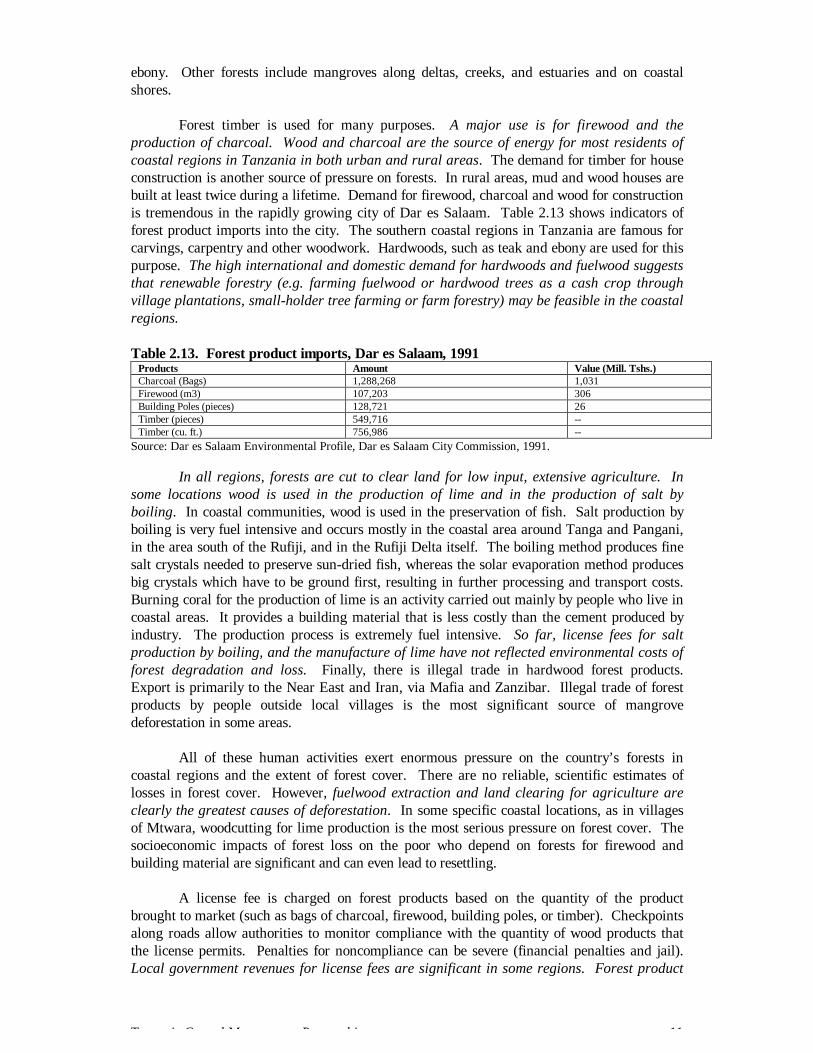
2.2 Livestock
Relative to the rest of the country, the livestock sector is small in all coastal regions, exceptTanga (see Table 2.12). Although the data of Table 2.12 is dated, it is presented to illustratethe relative size of the livestock sector across the regions.
Table 2.12. Livestock population by regionRegion Cattle Goats Sheep
Arusha 1,855,880 1,231,014 758,476Coast 57,542 18,682 4,938Dar es Salaam 6,158 9,524 1,449Dodoma 1,001,840 539,648 169,779Iringa 480,410 197,110 91,635Kagera 364,795 344,262 53,784Kigoma 62,319 167,348 36,428Kilimanjaro 408,457 438,087 221,059Lindi 6,217 13,205 8,582Mara 969,766 394,444 215,558Mbeya 901,077 171,486 101,365Morogoro 332,683 139,948 53,274Mtwara 15,046 84,864 14,519Mwanza 1,357,535 570,142 249,943Rukwa 392,234 75,319 21,115Ruvuma 39,010 138,435 19,716Shinyanga 1,882,081 871,826 486,798Singida 939,821 476,532 280,349Tabora 925,904 309,836 174,540Tanga 472,909 258,284 116,840Total 12,471,684 6,449,996 3,080,147
Source: Basic Data Agriculture and Livestock Sector, Ministry of Agriculture, various years 1983/84-1987/88.
2.3 Forestry
Coastal forests cover an area of 320 km.2 of which 39 km.2 carries a conservationstatus (Mwandosya et al., 1997). The most significant include the Mchungu forest in the Coastregion which contains unique gum copal forest habitat; Pugu forest which contains the secondlargest deposit of kaolin in the world; Kazimzumbwe forest; Gendagenda forest in Pangani inthe Tanga region; Kiwengono forest in Rufiji; Rondo and Chitoa forests in Lindi; and Mlolaforest in Mafia. These forests contain unique indigenous hardwood species such as teak and
Tanzania Coastal Management Partnership 11
ebony. Other forests include mangroves along deltas, creeks, and estuaries and on coastalshores.
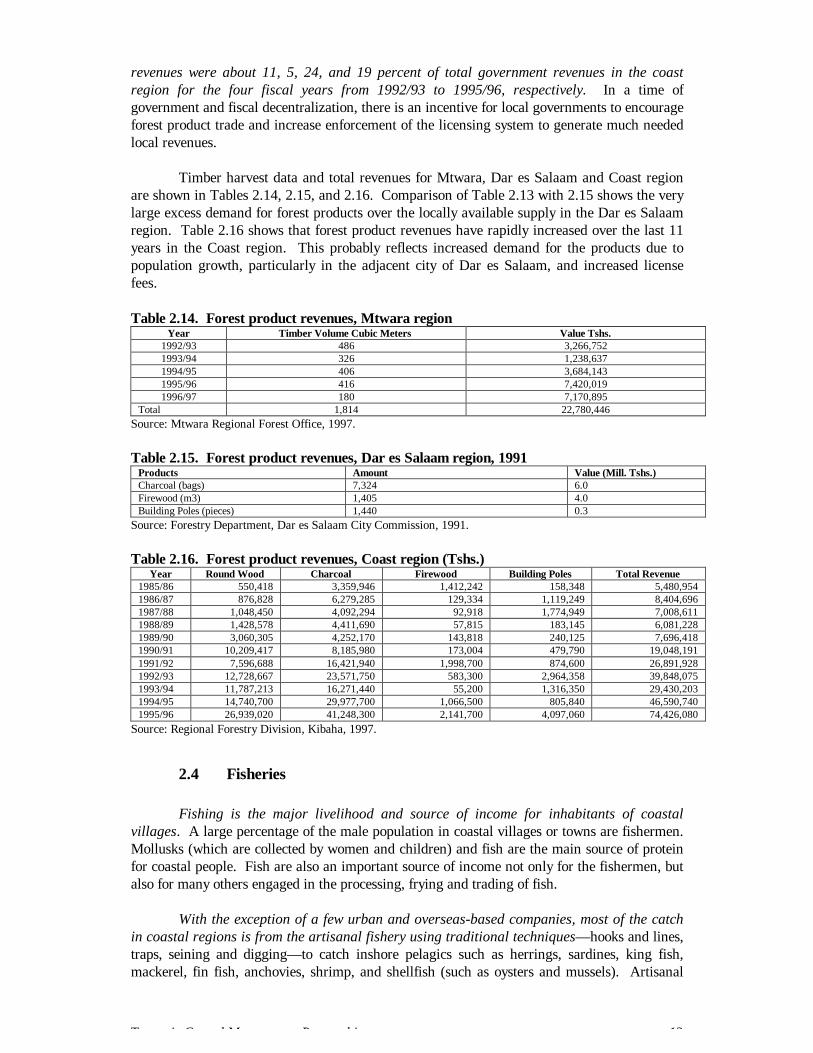
Forest timber is used for many purposes. A major use is for firewood and theproduction of charcoal. Wood and charcoal are the source of energy for most residents ofcoastal regions in Tanzania in both urban and rural areas. The demand for timber for houseconstruction is another source of pressure on forests. In rural areas, mud and wood houses arebuilt at least twice during a lifetime. Demand for firewood, charcoal and wood for constructionis tremendous in the rapidly growing city of Dar es Salaam. Table 2.13 shows indicators offorest product imports into the city. The southern coastal regions in Tanzania are famous forcarvings, carpentry and other woodwork. Hardwoods, such as teak and ebony are used for thispurpose. The high international and domestic demand for hardwoods and fuelwood suggeststhat renewable forestry (e.g. farming fuelwood or hardwood trees as a cash crop throughvillage plantations, small-holder tree farming or farm forestry) may be feasible in the coastalregions.
Table 2.13. Forest product imports, Dar es Salaam, 1991Products Amount Value (Mill. Tshs.)Charcoal (Bags) 1,288,268 1,031Firewood (m3) 107,203 306Building Poles (pieces) 128,721 26Timber (pieces) 549,716 --Timber (cu. ft.) 756,986 --
Source: Dar es Salaam Environmental Profile, Dar es Salaam City Commission, 1991.
In all regions, forests are cut to clear land for low input, extensive agriculture. Insome locations wood is used in the production of lime and in the production of salt byboiling. In coastal communities, wood is used in the preservation of fish. Salt production byboiling is very fuel intensive and occurs mostly in the coastal area around Tanga and Pangani,in the area south of the Rufiji, and in the Rufiji Delta itself. The boiling method produces finesalt crystals needed to preserve sun-dried fish, whereas the solar evaporation method producesbig crystals which have to be ground first, resulting in further processing and transport costs.Burning coral for the production of lime is an activity carried out mainly by people who live incoastal areas. It provides a building material that is less costly than the cement produced byindustry. The production process is extremely fuel intensive. So far, license fees for saltproduction by boiling, and the manufacture of lime have not reflected environmental costs offorest degradation and loss. Finally, there is illegal trade in hardwood forest products.Export is primarily to the Near East and Iran, via Mafia and Zanzibar. Illegal trade of forestproducts by people outside local villages is the most significant source of mangrovedeforestation in some areas.
All of these human activities exert enormous pressure on the country’s forests incoastal regions and the extent of forest cover. There are no reliable, scientific estimates oflosses in forest cover. However, fuelwood extraction and land clearing for agriculture areclearly the greatest causes of deforestation. In some specific coastal locations, as in villagesof Mtwara, woodcutting for lime production is the most serious pressure on forest cover. Thesocioeconomic impacts of forest loss on the poor who depend on forests for firewood andbuilding material are significant and can even lead to resettling.
A license fee is charged on forest products based on the quantity of the productbrought to market (such as bags of charcoal, firewood, building poles, or timber). Checkpointsalong roads allow authorities to monitor compliance with the quantity of wood products thatthe license permits. Penalties for noncompliance can be severe (financial penalties and jail).Local government revenues for license fees are significant in some regions. Forest product
Tanzania Coastal Management Partnership 12
revenues were about 11, 5, 24, and 19 percent of total government revenues in the coastregion for the four fiscal years from 1992/93 to 1995/96, respectively. In a time ofgovernment and fiscal decentralization, there is an incentive for local governments to encourageforest product trade and increase enforcement of the licensing system to generate much neededlocal revenues.
Timber harvest data and total revenues for Mtwara, Dar es Salaam and Coast regionare shown in Tables 2.14, 2.15, and 2.16. Comparison of Table 2.13 with 2.15 shows the verylarge excess demand for forest products over the locally available supply in the Dar es Salaamregion. Table 2.16 shows that forest product revenues have rapidly increased over the last 11years in the Coast region. This probably reflects increased demand for the products due topopulation growth, particularly in the adjacent city of Dar es Salaam, and increased licensefees.
Table 2.14. Forest product revenues, Mtwara regionYear Timber Volume Cubic Meters Value Tshs.
1992/93 486 3,266,7521993/94 326 1,238,6371994/95 406 3,684,1431995/96 416 7,420,0191996/97 180 7,170,895
Total 1,814 22,780,446Source: Mtwara Regional Forest Office, 1997.
Table 2.15. Forest product revenues, Dar es Salaam region, 1991Products Amount Value (Mill. Tshs.)Charcoal (bags) 7,324 6.0Firewood (m3) 1,405 4.0Building Poles (pieces) 1,440 0.3
Source: Forestry Department, Dar es Salaam City Commission, 1991.
Table 2.16. Forest product revenues, Coast region (Tshs.)Year Round Wood Charcoal Firewood Building Poles Total Revenue
1985/86 550,418 3,359,946 1,412,242 158,348 5,480,9541986/87 876,828 6,279,285 129,334 1,119,249 8,404,6961987/88 1,048,450 4,092,294 92,918 1,774,949 7,008,6111988/89 1,428,578 4,411,690 57,815 183,145 6,081,2281989/90 3,060,305 4,252,170 143,818 240,125 7,696,4181990/91 10,209,417 8,185,980 173,004 479,790 19,048,1911991/92 7,596,688 16,421,940 1,998,700 874,600 26,891,9281992/93 12,728,667 23,571,750 583,300 2,964,358 39,848,0751993/94 11,787,213 16,271,440 55,200 1,316,350 29,430,2031994/95 14,740,700 29,977,700 1,066,500 805,840 46,590,7401995/96 26,939,020 41,248,300 2,141,700 4,097,060 74,426,080
Source: Regional Forestry Division, Kibaha, 1997.
2.4 Fisheries
Fishing is the major livelihood and source of income for inhabitants of coastalvillages. A large percentage of the male population in coastal villages or towns are fishermen.Mollusks (which are collected by women and children) and fish are the main source of proteinfor coastal people. Fish are also an important source of income not only for the fishermen, butalso for many others engaged in the processing, frying and trading of fish.
With the exception of a few urban and overseas-based companies, most of the catchin coastal regions is from the artisanal fishery using traditional techniques— hooks and lines,traps, seining and digging— to catch inshore pelagics such as herrings, sardines, king fish,mackerel, fin fish, anchovies, shrimp, and shellfish (such as oysters and mussels). Artisanal
Tanzania Coastal Management Partnership 13
fisheries contribute to more than 96 percent of total marine fish landings. There are three maintypes of artisanal fisheries vessels: ngalawa (sailing outrigger canoe), hori and mitumbwi(dugout canoes), and mashua (dhow). The bulk of artisanal fishing is concentrated in the areabetween the shoreline, the outer edge of the fringing reef, and on the shallow shelf of Mafia andZanzibar channel. Fresh water fishing is carried out in large coastal rivers with small boats (2to 8 meters in length). Dynamite fishing is common along the coast although it is prohibited bythe government.
Domestic commercial fishing practices are largely carried out using trawlers andlongliners. Offshore fishing is very limited. The most important variety of fish often caught byoffshore commercial fishermen are pelagics such as tuna and swordfish. There is also agrowing number of foreign commercial vessels that are operating illegally inside the exclusivezone.
Table 2.17 shows that the inland freshwater fishery is over four times as large as themarine fishery in terms of number of fishers, vessels and quantity of catch. The differencebetween the two fisheries in terms of value, however, is not as great. In 1994 and 1995, theestimated value of the marine fishery catch was 46 and 55 percent, respectively, of the value ofthe freshwater fishery catch.
Table 2.17. Marine and freshwater fishery resourcesMarine waters 1992 1993 1994 1995Fishers 15,027 15,027 15,027 13,822Vessels 3,514 3,232 3,232 3,768Metric Tons (1,000) 43.9 36.7 40.8 48.8Value (million Tshs.) 6,167 10,207 14,228 24,662FreshwaterFishers 46,470 46,916 46,639 61,694Vessels 16,441 17,744 16,129 18,696Metric Tons (1,000) 291.6 294.8 228.0 197.6Value (million Tshs.) 19,947 31,239 30,949 44,730
Source: Fisheries Division, Ministry of Natural Resources and Tourism.
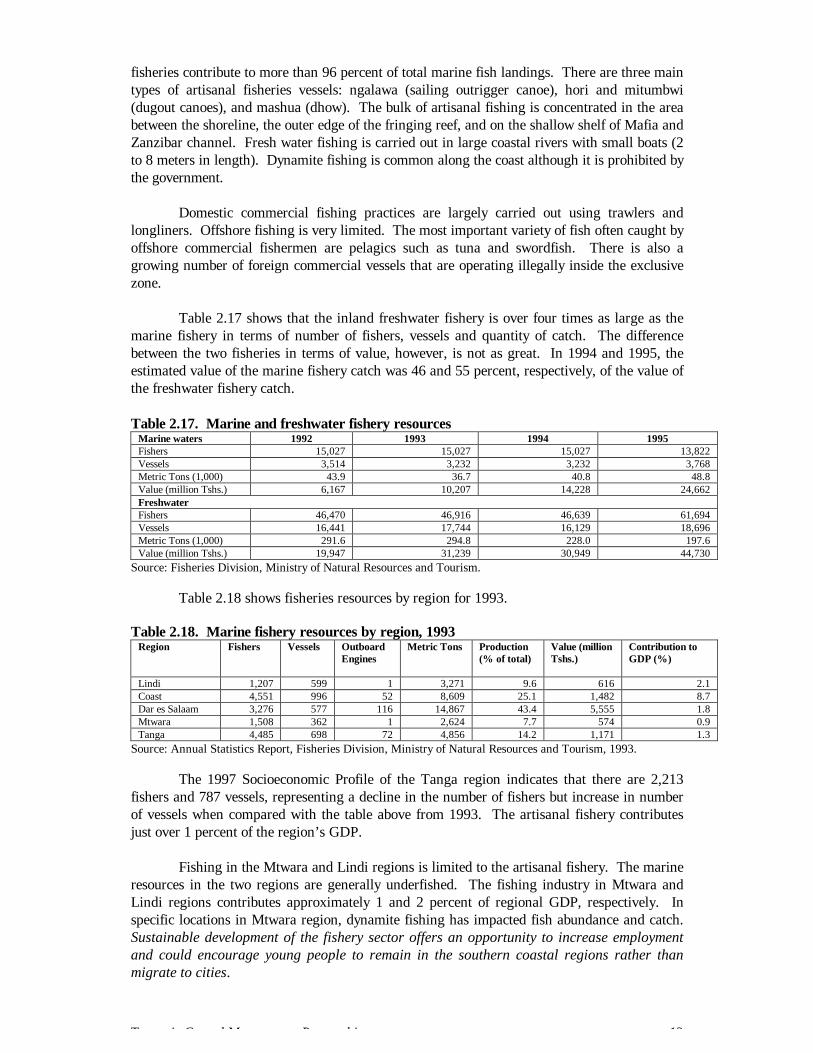
Table 2.18 shows fisheries resources by region for 1993.
Table 2.18. Marine fishery resources by region, 1993Region Fishers Vessels Outboard
EnginesMetric Tons Production
(% of total)Value (millionTshs.)
Contribution toGDP (%)
Lindi 1,207 599 1 3,271 9.6 616 2.1Coast 4,551 996 52 8,609 25.1 1,482 8.7Dar es Salaam 3,276 577 116 14,867 43.4 5,555 1.8Mtwara 1,508 362 1 2,624 7.7 574 0.9Tanga 4,485 698 72 4,856 14.2 1,171 1.3
Source: Annual Statistics Report, Fisheries Division, Ministry of Natural Resources and Tourism, 1993.
The 1997 Socioeconomic Profile of the Tanga region indicates that there are 2,213fishers and 787 vessels, representing a decline in the number of fishers but increase in numberof vessels when compared with the table above from 1993. The artisanal fishery contributesjust over 1 percent of the region’s GDP.
Fishing in the Mtwara and Lindi regions is limited to the artisanal fishery. The marineresources in the two regions are generally underfished. The fishing industry in Mtwara andLindi regions contributes approximately 1 and 2 percent of regional GDP, respectively. Inspecific locations in Mtwara region, dynamite fishing has impacted fish abundance and catch.Sustainable development of the fishery sector offers an opportunity to increase employmentand could encourage young people to remain in the southern coastal regions rather thanmigrate to cities.

Tanzania Coastal Management Partnership 14
The artisanal fisheries account for about 8 percent of GDP in the Coast region. It is aprimary economic activity and source of food for coastal communities. One of the mostimportant artisanal fish species in the Coast region, particularly the Rufiji district, is prawn.About 80 percent of the commercial prawn catch of Tanzania takes place in the Rufiji Delta,and about 40 percent of the catch comes from small-scale fishermen. The foreign market forprawns is large and the opportunity to increase harvest of this species has not been realized.The lack of reliable transport and cooling facilities are the biggest obstacles to furtherdevelopment of the prawn fishery. Large mangrove crabs are also an under-exploited resourcewith great market potential in both the domestic tourism market and abroad, if transportationand marketing constraints could be overcome.
In summary, the main constraints to improved performance of the marine fisheriessector appear to be the lack of transportation and infrastructure to market products; lack ofrural credit to finance growth; and the need for extension services to build awareness anddemonstrate low-cost, appropriate technologies.
2.5 Mining
Officially, mining accounts for less than 2 percent of national GDP, but the actualpotential for expansion is considered to be enormous (World Bank, 1996). Small-scalemining is growing, but large-scale mining performance has been limited by inadequatemanagement, poor physical infrastructure; and poor technology for exploring, extracting andprocessing mineral resources. Small-scale mining offers an opportunity to increase income incoastal regions. Extension services and technical assistance should be provided to promotethe activity in a way that is environmentally sustainable.
Tanga region. Mining is only small scale, although there is great potential forincreasing scale in production. Mineral deposits in the region are shown by districts in table2.19.
Table 2.19. Mineral deposits by district, Tanga regionDistrict MineralsTanga LimestoneHandeni Amethyst
Gamets (Gemstone)GemstoneTourmaline
Lushoto KyaniteGypsumFeldspar
Korogwe Kornerupine (Semi-precious gemstone)GemstoneZirconBauxiteAmethystRuby
Muheza TurquoiseTourmaline (Gemstone)
Source: Socioeconomic Profile, Tanga region, 1997.
Coast region. The most important mineral deposits are sodium chloride (commonsalt), calcite, gemstones and koelin (clay). Salt is produced by solar evaporation along theshore of Bagamoyo, Mkuranga, Rufiji and Mafia districts. There are several large producers,both private (e.g. The Stanley and Sons Salt Company, Bagamoyo) and public (e.g. CoastalSalt Company, Bagamoyo), but there are also many small producers.
Tanzania Coastal Management Partnership 15
Calcite (in various colors such as white, black, pink and red) is mined in Miono,Mkange and Mandera in Bagamoyo district. The mineral, which is commonly known as“terrazo,” is used for marbles, chicken feed, and in glass making. It is extracted by small-scaleminers for sale mainly in Dar es Salaam. Gemstones are mined in Mkange, Mbwewe andMiono in Bagamoyo district. High quality Kaolin (clay) deposits are found in the Pugu hills inKisarawe district. The Pugu Kaolin Company holds a mining license for the mine and has afactory for processing the raw product.
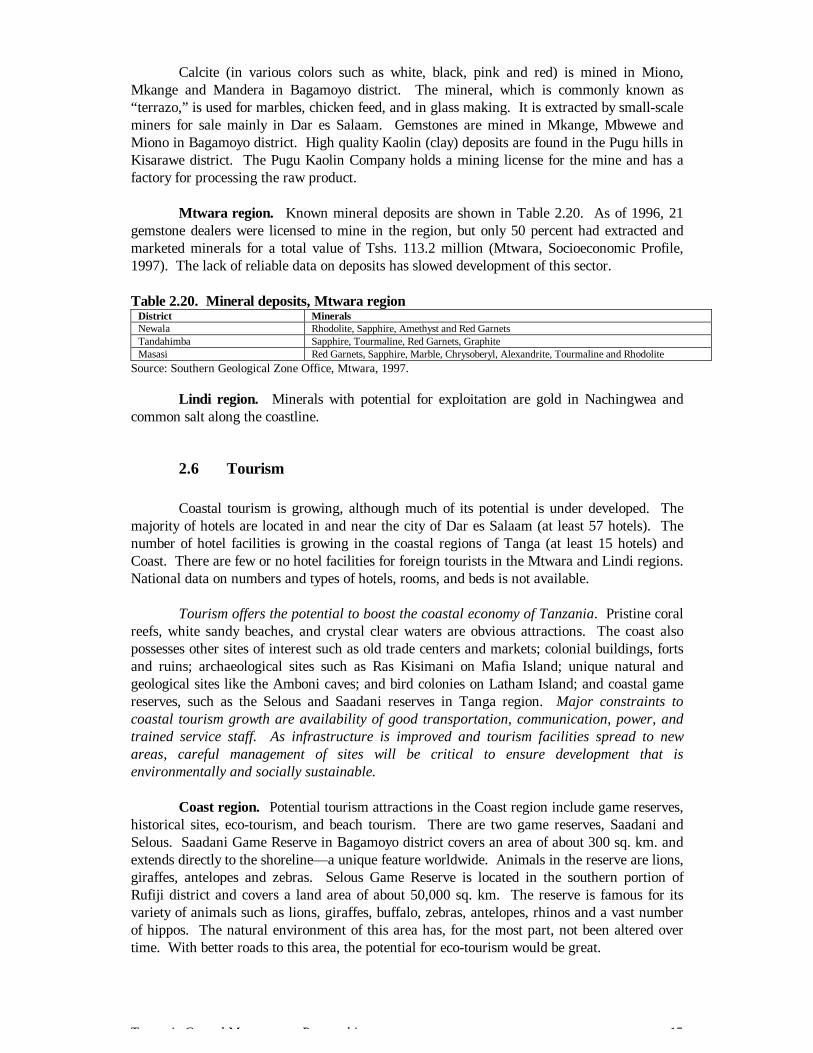
Mtwara region. Known mineral deposits are shown in Table 2.20. As of 1996, 21gemstone dealers were licensed to mine in the region, but only 50 percent had extracted andmarketed minerals for a total value of Tshs. 113.2 million (Mtwara, Socioeconomic Profile,1997). The lack of reliable data on deposits has slowed development of this sector.
Table 2.20. Mineral deposits, Mtwara regionDistrict MineralsNewala Rhodolite, Sapphire, Amethyst and Red GarnetsTandahimba Sapphire, Tourmaline, Red Garnets, GraphiteMasasi Red Garnets, Sapphire, Marble, Chrysoberyl, Alexandrite, Tourmaline and Rhodolite
Source: Southern Geological Zone Office, Mtwara, 1997.
Lindi region. Minerals with potential for exploitation are gold in Nachingwea andcommon salt along the coastline.
2.6 Tourism
Coastal tourism is growing, although much of its potential is under developed. Themajority of hotels are located in and near the city of Dar es Salaam (at least 57 hotels). Thenumber of hotel facilities is growing in the coastal regions of Tanga (at least 15 hotels) andCoast. There are few or no hotel facilities for foreign tourists in the Mtwara and Lindi regions.National data on numbers and types of hotels, rooms, and beds is not available.
Tourism offers the potential to boost the coastal economy of Tanzania. Pristine coralreefs, white sandy beaches, and crystal clear waters are obvious attractions. The coast alsopossesses other sites of interest such as old trade centers and markets; colonial buildings, fortsand ruins; archaeological sites such as Ras Kisimani on Mafia Island; unique natural andgeological sites like the Amboni caves; and bird colonies on Latham Island; and coastal gamereserves, such as the Selous and Saadani reserves in Tanga region. Major constraints tocoastal tourism growth are availability of good transportation, communication, power, andtrained service staff. As infrastructure is improved and tourism facilities spread to newareas, careful management of sites will be critical to ensure development that isenvironmentally and socially sustainable.
Coast region. Potential tourism attractions in the Coast region include game reserves,historical sites, eco-tourism, and beach tourism. There are two game reserves, Saadani andSelous. Saadani Game Reserve in Bagamoyo district covers an area of about 300 sq. km. andextends directly to the shoreline— a unique feature worldwide. Animals in the reserve are lions,giraffes, antelopes and zebras. Selous Game Reserve is located in the southern portion ofRufiji district and covers a land area of about 50,000 sq. km. The reserve is famous for itsvariety of animals such as lions, giraffes, buffalo, zebras, antelopes, rhinos and a vast numberof hippos. The natural environment of this area has, for the most part, not been altered overtime. With better roads to this area, the potential for eco-tourism would be great.
Tanzania Coastal Management Partnership 16
A number of hotels were recently constructed in Bagamoyo, both for its scenic beachesand its historic and cultural attributes (the Kaole Ruins and historic colonial buildings of theonce national capital). More hotel development is anticipated.
There are camping sites along the Rufiji River, such as at Mbuyu and Stigler’s Gorge,where photography, game viewing, swimming and boating are the attractions. The naturalbeauty of the beaches and marine environment are attractions of Mafia Island.
Lindi region. Part of the Selous game reserve is in Liwale district in Lindi region.However, poor transportation and communications infrastructure has hindered tourismdevelopment.
Mtwara region. There is currently little, if any, tourism in Mtwara region. As inLindi region, transportation and communications are the principal problems. With animproved road to Mtwara from the capital, the potential for tourism will increase dramatically.The region has two game reserves covering an area of 65,450 ha. These are Msanjesi andLukwika/Lumesile, both of which are in Masasi district, and contain a variety of wild animals.Msimbati Bay with 125 km. of coastline, Mikindani historical sites, and the famous “makonde”carvings are other potential tourist attractions.
2.7 Manufacturing and Industry
The coastal regions of Tanzania account for some 75 percent of the county’sindustries which are mainly concentrated in Dar es Salaam and Tanga. In the country as awhole, the contribution of industry to national GDP in 1994 was 16.7 percent (World Bank,1996). Major industries in Tanga and Dar es Salaam regions include manufacture of fertilizer,textiles, cement, hardwood floor tiles, sisal rope/twine, steel rollers, plastics, cigarettes, soapand detergents, food processing, soft drinks, and breweries.
Industries located in the Coast region include:
• Tanzania Automobile Assembly Company (TAMCO) in Kibaha district. It assemblestrucks, buses and tractors. In 1985 the company assembled 700 trucks per year, but tradeliberalization has brought the plant to a near standstill.
• Cashewnut Processing Factory in Kibaha. Disease, low productivity, and falling cashewprices have reduced sales dramatically.
• African Wood, Ltd. in Mkuranga. Manufactures wood flooring for export.• Two cotton ginneries in Bagamoyo and Rufiji.• Pugu Kaolin mineral processing factory in Kisarawe district.
There is very little industry in the Lindi and Mtwara regions. In Lindi, cashewnut-processing plants built by the government have long been closed due to the lack of spare parts,fuel, and low agricultural productivity. There are two oil-processing mills, four saw mills andtwo backyard soap-manufacturing plants. The poor transportation system within the region isa major reason for limited industrial development. Also, the national electrical power grid doesnot reach Lindi. The major industries in Mtwara region are also agriculture-based. There arefive cashewnut and two sisal processing plants, but they have all performed poorly. Thecashewnut plants are now being privatized.
Oil and Gas Industry. There are a number of known petroleum reserves along theTanzania coast that may result in mining operations with importance for the coast and nation.
Tanzania Coastal Management Partnership 17
• Selous Basin covers an area of 50,000 km.2. The site is isolated with no major town orroads except for Liwale on the eastern side. The Shell Company has 4,700 km. of seismicdata; one well was drilled, but was abandoned in 1995.
• Rufiji Trough covers an area of 16,000 km.2..mostly within the Rufiji River flood plain anddelta. The Shell Company has recorded 2,200 km. of seismic data on the site.
• Ruvu Basin covers an area of approximately 18,000 km.2. Some 5,000 km. of seismicdata was recorded and five wells were drilled.
• Pemba and Zanzibar Basins cover an area of 2,000 km.2. The BP Company drilled threewells in 1969 and found the first offshore well in the United Republic of Tanzania. About9,000 km. of seismic data was recorded.
• Songo Songo gas field is to the south of Kilwa district in the Coastal/Mafia Basin. Thebasin was licensed to Shell in 1991. It is expected that oil drilled from the gas field willcontribute significantly to the nation’s economy.
• Mandawa Basin covers an area of 15,000 km.2. Three deep wells drilled by Shell in 1991prove the existence of mature oil-prone source rocks. Tanganyika Oil Co. is negotiatingwith potential partners to drill two structures near the Indian Ocean about 270 km.southwest of Dar es Salaam.
3.0 THE INFORMAL SECTOR
In coastal regions, particularly in urban areas, the informal sector, or “second”economy, is becoming an increasingly substantial component of the economy. Growth of theinformal sector has occurred as the economic structure shifts from a centrally-planned to amarket-oriented. The number of people in the informal sector also grew as the economicsituation worsened and real wages declined. The informal sector has expanded faster thanofficial GDP, but is not measured by official statistics because of underreporting or non-reporting.
Informal sector activities are characterized by easy establishment; reliance uponindigenous resources both financial and material, family ownership; small-scale operation;labor intensity and dependence on family labor; adopted technology which requires skills thatcan be acquired outside the formal school system; and unregulated and competitive markets(Omari, 1989; Maliyamkono and Bagachwa, 1990). In Tanzania, the informal sector involveschild labor, sometimes to the detriment of their education (Wagner, 1991).
In developing countries worldwide, the informal sector has an important role to playbecause it provides income-earning opportunities for large numbers of unskilled and otherwisejobless people. The informal sector is particularly important for women because it providesincome-earning opportunities while still fulfilling their domestic and child-rearing role. InTanzania, the informal sector has been important in providing essential commodities andservices not provided by the government or any other non-government organization.
4.0 WOMEN’S DEVELOPMENT GROUPS IN COASTAL REGIONS
There is great potential to empower and increase the role of women in the economyand social development of coastal communities and coastal regions (see EPIQ 1998).Women dominate labor-intensive activities such as weaving, tailoring, pottery, beach seining,digging of shellfish, salt making, farming, preparing and selling food, brewing and sellingbeverages. The types of projects or activities that women engage in differ somewhat depending
Tanzania Coastal Management Partnership 18
upon the social class they belong to, as well as their education, age, occupation, tribe andreligion (Wagner, 1991). Women in the middle and upper income brackets may operatelivestock and poultry projects, export/import businesses, quarries, private day care centers, andtutorial classes (a common activity for professional teachers).
There are about 170 women’s economic development groups with a total of 2,073members in the Coast region (1997 Socioeconomic Profile of the Coast region). Thesewomen’s groups are involved in many different economic activities including vegetablegardens, retail shops of different types, restaurants and guest houses, sales of cooked food(mama Ntilie), embroidery and tailoring, pottery making, raising dairy cattle and poultry, grainmilling, fishing, and buying and selling maize.
One-hundred and fourteen of the women’s groups in the Coast region received loansand grants from various institutions, and another 57 groups are running their projects with theirown resources. Ninety-six women’s groups received loans from the government valued at atotal of Tshs. 21 million under the Women’s Development Fund. The basic objectives of theWomen’s Development Fund and other credit schemes are to establish or strengthenwomen’s groups, provide them with credit and technology, improve their marketing skills,and thus help improve their income earning potential.
Other institutions that provide loans and grants to women’s economic groups in theCoast region include UNDP (Women Appropriate Food Technology project), and the FordFoundation (Rural Women Initiated Economic Participation project). Both institutions haveprovided loans or grants to a total of 18 women’s economic groups amounting to over Tshs. 10million.
In Lindi region, women’s economic activities were funded by the Women’sDevelopment Fund for a total amount of Tshs. 35 million. In Mtwara region there are 459women’s economic development groups with 6,452 members involved in a variety of incomegenerating activities including services, production, and trade. Thirty-one women’s groupshave obtained loans through the Women’s Development Funds project for a total amount ofTshs. 11 million.
In Tanga region, women’s economic groups are involved in a wide array of activities,including farming, trading, tailoring, livestock husbandry, and food processing. Eighty-twogroups with 330 members received loans totaling Tshs. 10 million from the government in1997 under the Poverty Africa Project.
5.0 BALANCING DEVELOPMENT AND ENVIRONMENTALSUSTAINABILITY
The coastal zone is a dynamic area surrounding the interface between land and sea. Itencompasses the shoreline environment as well as adjacent coastal and marine waters. Thecoastal area and its natural resources offer great benefits and opportunities for human use.Most coastal activities in Tanzania rely on the natural resources that the coast offers (fishing,forestry, agriculture, tourism, mining, salt production, mariculture). Therefore, the conditionof coastal ecosystems and social well-being are closely linked. A decline in coastalecosystem productivity has a direct negative impact on society.
In nature, coastal systems maintain a dynamic equilibrium. Human activities, if leftunchecked, can threaten this sensitive equilibrium, and undermine the productivity of the

Tanzania Coastal Management Partnership 19
resource base and the very foundation of current and future livelihood opportunities. Coastalstewardship means that pollution, habitat destruction, and overexploitation of resources arekept in check. Without adequate government regulations and oversight, the carrying capacityof complex and fragile coastal ecosystems is soon exceeded resulting in degradation, or evencollapse of ecosystem functions.
In general, Tanzania is fortunate in that coastal ecosystems are in relatively goodcondition as a result of limited economic development and low population density in ruralareas. The challenge for the future is to increase coastal development and the well-being ofcoastal communities while continuing to protect the natural resource base.
There are already many cases of the impacts of coastal activities on the delicatebalance of the coastal ecosystem, and in urban areas, the trade-off between development andthe environment is readily observed. The importance of forest product trade on forestresource exploitation was already noted in Section 2. Other examples of the impact of coastalactivities on ecosystem health include:
• Extensive extraction of sand (for construction) from stream beds draining into theKunduchi beach area (located approximately 18 km. north of Dar es Salaam) hascontributed to beach erosion (Linden and Lundin, 1996).
• All along the coast, coral ecosystems are damaged from dynamite fishing, overfishing,mining of coral rocks for production of lime used in construction, and boat anchoring.
• Marine pollution from urban areas (e.g. Dar es Salaam and Tanga) is a growingproblem. Sewage from homes, municipal buildings, and factories, is discharged into thesea untreated. Sewage systems are not abundant in Tanzania, and are limited to cities.In Dar es Salaam only 15 percent of more than two million inhabitants are connected tothe sewer system (Linden and Lundin, 1996). Even where sewage systems are present,they are typically in poor condition and leak. Soak-away pit and septic tank systems areused in the city suburbs, where sludge is collected from the pits and taken to dump siteswithin the city limits. Settling pond systems are used in a few selected sites in the city.During rainy seasons, the pits and septic tanks tend to overflow and discharge into thesea via creeks, streams, and the surface drainage system. This results in thecontamination of coastal waters especially in the vicinity of runoff, and in creeks andestuaries where there is little water exchange.
• Untreated wastes from industries on the coast are dumped in the open and leach into theground or runoff into the sea. The city and region of Dar es Salaam contain about 70percent of the country’s industry ranging from textiles, food processing, beverages,tanneries, sisal factories, cement factories, and power generation.
6.0 HEALTH AND SOCIAL SERVICES
The improved well-being of coastal inhabitants, as indicated by education, health,sanitation, and social welfare is a major long-term goal of coastal management. This sectionpresents a number of social indicators that demonstrate that the standard for social welfare islow in coastal regions. The findings suggest the need to:
• Develop targeted public education and awareness-building activities• Demonstrate opportunities for low-cost, appropriate technologies for sanitation
Tanzania Coastal Management Partnership 20
• Promote formation of women’s groups and community groups to increase public healthawareness, share best methods for coping with difficult situations, and identify actionsto resolve problems and improve conditions
• Provide technical assistance to selected villages to enhance effectiveness of VillageWater Committees
• Increase household income and local revenues to improve standard of living• Support social programs through enhanced performance of current livelihood activities
and support alternative livelihood options.
6.1 Health
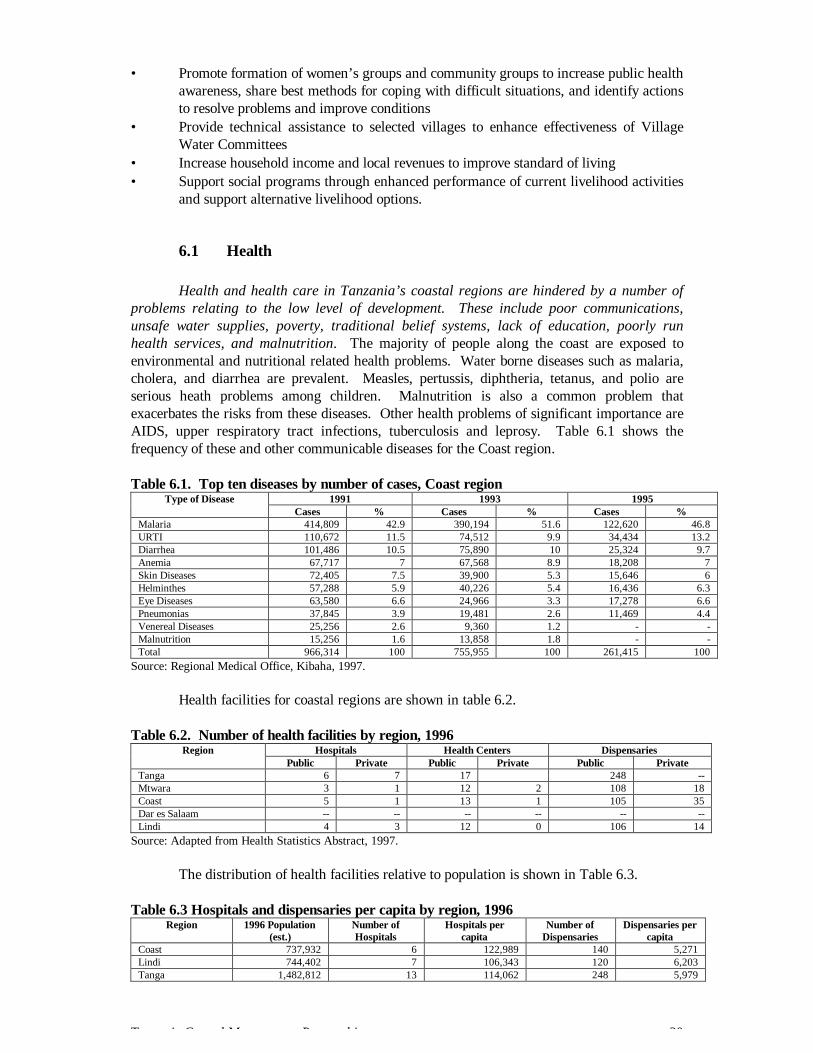
Health and health care in Tanzania’s coastal regions are hindered by a number ofproblems relating to the low level of development. These include poor communications,unsafe water supplies, poverty, traditional belief systems, lack of education, poorly runhealth services, and malnutrition. The majority of people along the coast are exposed toenvironmental and nutritional related health problems. Water borne diseases such as malaria,cholera, and diarrhea are prevalent. Measles, pertussis, diphtheria, tetanus, and polio areserious heath problems among children. Malnutrition is also a common problem thatexacerbates the risks from these diseases. Other health problems of significant importance areAIDS, upper respiratory tract infections, tuberculosis and leprosy. Table 6.1 shows thefrequency of these and other communicable diseases for the Coast region.
Table 6.1. Top ten diseases by number of cases, Coast region1991 1993 1995Type of Disease
Cases % Cases % Cases %Malaria 414,809 42.9 390,194 51.6 122,620 46.8URTI 110,672 11.5 74,512 9.9 34,434 13.2Diarrhea 101,486 10.5 75,890 10 25,324 9.7Anemia 67,717 7 67,568 8.9 18,208 7Skin Diseases 72,405 7.5 39,900 5.3 15,646 6Helminthes 57,288 5.9 40,226 5.4 16,436 6.3Eye Diseases 63,580 6.6 24,966 3.3 17,278 6.6Pneumonias 37,845 3.9 19,481 2.6 11,469 4.4Venereal Diseases 25,256 2.6 9,360 1.2 - -Malnutrition 15,256 1.6 13,858 1.8 - -Total 966,314 100 755,955 100 261,415 100
Source: Regional Medical Office, Kibaha, 1997.
Health facilities for coastal regions are shown in table 6.2.
Table 6.2. Number of health facilities by region, 1996Hospitals Health Centers DispensariesRegion
Public Private Public Private Public PrivateTanga 6 7 17 248 --Mtwara 3 1 12 2 108 18Coast 5 1 13 1 105 35Dar es Salaam -- -- -- -- -- --Lindi 4 3 12 0 106 14
Source: Adapted from Health Statistics Abstract, 1997.
The distribution of health facilities relative to population is shown in Table 6.3.
Table 6.3 Hospitals and dispensaries per capita by region, 1996Region 1996 Population
(est.)Number ofHospitals
Hospitals percapita
Number ofDispensaries
Dispensaries percapita
Coast 737,932 6 122,989 140 5,271Lindi 744,402 7 106,343 120 6,203Tanga 1,482,812 13 114,062 248 5,979
Tanzania Coastal Management Partnership 21
Dar es Salaam -- -- -- -- --Mtwara 1,005,405 4 251,351 126 7,979
Source: Adapted from Regional Socioeconomic Profiles, 1997.
The population per hospital bed (681) for Mtwara is the third best in the nation afterRuvuma (604) and Kilimanjaro (680). The national average is 981. The worst-served regionis Shinyanga with 1,448 per hospital bed.
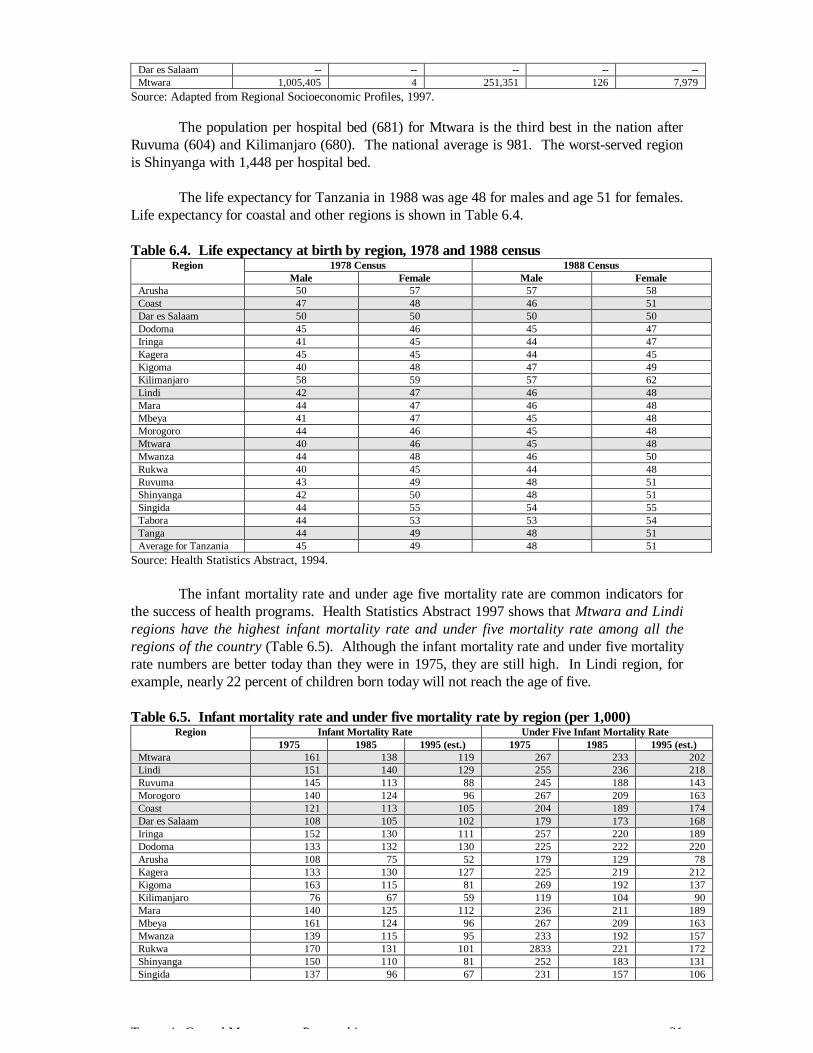
The life expectancy for Tanzania in 1988 was age 48 for males and age 51 for females.Life expectancy for coastal and other regions is shown in Table 6.4.
Table 6.4. Life expectancy at birth by region, 1978 and 1988 census1978 Census 1988 CensusRegion
Male Female Male FemaleArusha 50 57 57 58Coast 47 48 46 51Dar es Salaam 50 50 50 50Dodoma 45 46 45 47Iringa 41 45 44 47Kagera 45 45 44 45Kigoma 40 48 47 49Kilimanjaro 58 59 57 62Lindi 42 47 46 48Mara 44 47 46 48Mbeya 41 47 45 48Morogoro 44 46 45 48Mtwara 40 46 45 48Mwanza 44 48 46 50Rukwa 40 45 44 48Ruvuma 43 49 48 51Shinyanga 42 50 48 51Singida 44 55 54 55Tabora 44 53 53 54Tanga 44 49 48 51Average for Tanzania 45 49 48 51
Source: Health Statistics Abstract, 1994.
The infant mortality rate and under age five mortality rate are common indicators forthe success of health programs. Health Statistics Abstract 1997 shows that Mtwara and Lindiregions have the highest infant mortality rate and under five mortality rate among all theregions of the country (Table 6.5). Although the infant mortality rate and under five mortalityrate numbers are better today than they were in 1975, they are still high. In Lindi region, forexample, nearly 22 percent of children born today will not reach the age of five.
Table 6.5. Infant mortality rate and under five mortality rate by region (per 1,000)Infant Mortality Rate Under Five Infant Mortality RateRegion
1975 1985 1995 (est.) 1975 1985 1995 (est.)Mtwara 161 138 119 267 233 202Lindi 151 140 129 255 236 218Ruvuma 145 113 88 245 188 143Morogoro 140 124 96 267 209 163Coast 121 113 105 204 189 174Dar es Salaam 108 105 102 179 173 168Iringa 152 130 111 257 220 189Dodoma 133 132 130 225 222 220Arusha 108 75 52 179 129 78Kagera 133 130 127 225 219 212Kigoma 163 115 81 269 192 137Kilimanjaro 76 67 59 119 104 90Mara 140 125 112 236 211 189Mbeya 161 124 96 267 209 163Mwanza 139 115 95 233 192 157Rukwa 170 131 101 2833 221 172Shinyanga 150 110 81 252 183 131Singida 137 96 67 231 157 106
Tanzania Coastal Management Partnership 22
Tabora 140 101 73 236 166 116Tanga 112 106 100 187 176 166
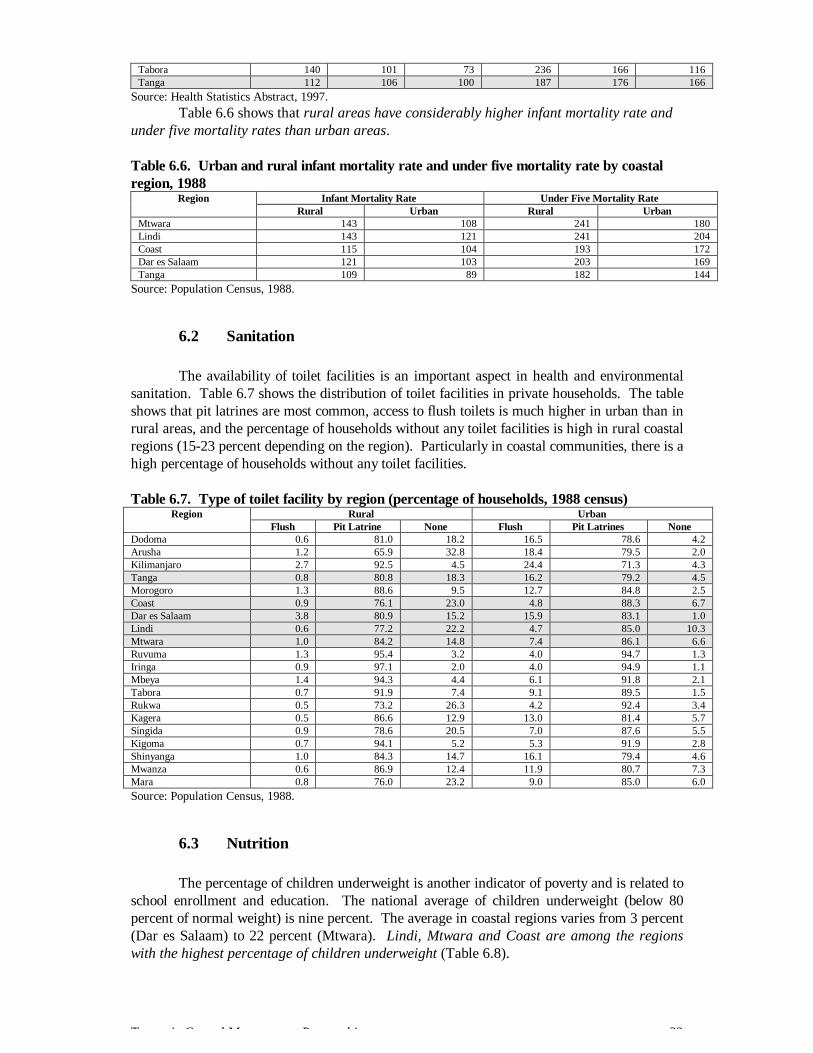
Source: Health Statistics Abstract, 1997.Table 6.6 shows that rural areas have considerably higher infant mortality rate and
under five mortality rates than urban areas.
Table 6.6. Urban and rural infant mortality rate and under five mortality rate by coastalregion, 1988
Infant Mortality Rate Under Five Mortality RateRegionRural Urban Rural Urban
Mtwara 143 108 241 180Lindi 143 121 241 204Coast 115 104 193 172Dar es Salaam 121 103 203 169Tanga 109 89 182 144
Source: Population Census, 1988.
6.2 Sanitation
The availability of toilet facilities is an important aspect in health and environmentalsanitation. Table 6.7 shows the distribution of toilet facilities in private households. The tableshows that pit latrines are most common, access to flush toilets is much higher in urban than inrural areas, and the percentage of households without any toilet facilities is high in rural coastalregions (15-23 percent depending on the region). Particularly in coastal communities, there is ahigh percentage of households without any toilet facilities.
Table 6.7. Type of toilet facility by region (percentage of households, 1988 census)Rural UrbanRegion
Flush Pit Latrine None Flush Pit Latrines NoneDodoma 0.6 81.0 18.2 16.5 78.6 4.2Arusha 1.2 65.9 32.8 18.4 79.5 2.0Kilimanjaro 2.7 92.5 4.5 24.4 71.3 4.3Tanga 0.8 80.8 18.3 16.2 79.2 4.5Morogoro 1.3 88.6 9.5 12.7 84.8 2.5Coast 0.9 76.1 23.0 4.8 88.3 6.7Dar es Salaam 3.8 80.9 15.2 15.9 83.1 1.0Lindi 0.6 77.2 22.2 4.7 85.0 10.3Mtwara 1.0 84.2 14.8 7.4 86.1 6.6Ruvuma 1.3 95.4 3.2 4.0 94.7 1.3Iringa 0.9 97.1 2.0 4.0 94.9 1.1Mbeya 1.4 94.3 4.4 6.1 91.8 2.1Tabora 0.7 91.9 7.4 9.1 89.5 1.5Rukwa 0.5 73.2 26.3 4.2 92.4 3.4Kagera 0.5 86.6 12.9 13.0 81.4 5.7Singida 0.9 78.6 20.5 7.0 87.6 5.5Kigoma 0.7 94.1 5.2 5.3 91.9 2.8Shinyanga 1.0 84.3 14.7 16.1 79.4 4.6Mwanza 0.6 86.9 12.4 11.9 80.7 7.3Mara 0.8 76.0 23.2 9.0 85.0 6.0Source: Population Census, 1988.
6.3 Nutrition
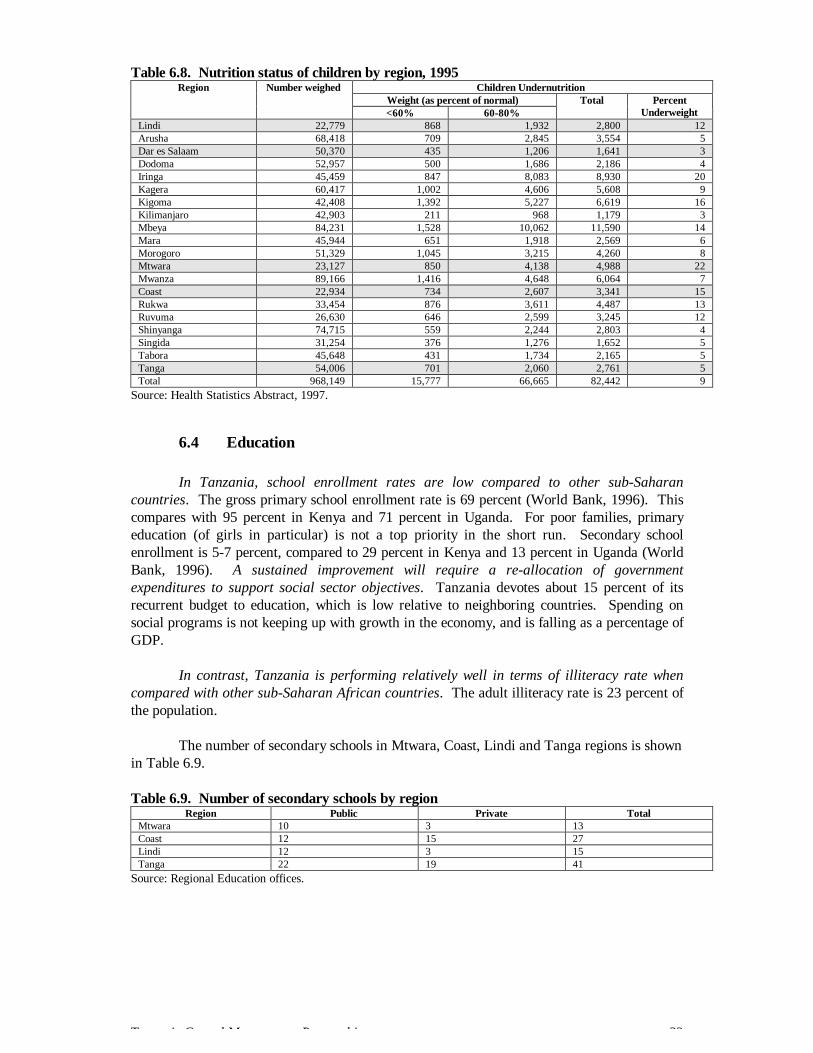
The percentage of children underweight is another indicator of poverty and is related toschool enrollment and education. The national average of children underweight (below 80percent of normal weight) is nine percent. The average in coastal regions varies from 3 percent(Dar es Salaam) to 22 percent (Mtwara). Lindi, Mtwara and Coast are among the regionswith the highest percentage of children underweight (Table 6.8).
Tanzania Coastal Management Partnership 23
Table 6.8. Nutrition status of children by region, 1995Children Undernutrition
Weight (as percent of normal)Region Number weighed
<60% 60-80%Total Percent
UnderweightLindi 22,779 868 1,932 2,800 12Arusha 68,418 709 2,845 3,554 5Dar es Salaam 50,370 435 1,206 1,641 3Dodoma 52,957 500 1,686 2,186 4Iringa 45,459 847 8,083 8,930 20Kagera 60,417 1,002 4,606 5,608 9Kigoma 42,408 1,392 5,227 6,619 16Kilimanjaro 42,903 211 968 1,179 3Mbeya 84,231 1,528 10,062 11,590 14Mara 45,944 651 1,918 2,569 6Morogoro 51,329 1,045 3,215 4,260 8Mtwara 23,127 850 4,138 4,988 22Mwanza 89,166 1,416 4,648 6,064 7Coast 22,934 734 2,607 3,341 15Rukwa 33,454 876 3,611 4,487 13Ruvuma 26,630 646 2,599 3,245 12Shinyanga 74,715 559 2,244 2,803 4Singida 31,254 376 1,276 1,652 5Tabora 45,648 431 1,734 2,165 5Tanga 54,006 701 2,060 2,761 5Total 968,149 15,777 66,665 82,442 9
Source: Health Statistics Abstract, 1997.
6.4 Education
In Tanzania, school enrollment rates are low compared to other sub-Saharancountries. The gross primary school enrollment rate is 69 percent (World Bank, 1996). Thiscompares with 95 percent in Kenya and 71 percent in Uganda. For poor families, primaryeducation (of girls in particular) is not a top priority in the short run. Secondary schoolenrollment is 5-7 percent, compared to 29 percent in Kenya and 13 percent in Uganda (WorldBank, 1996). A sustained improvement will require a re-allocation of governmentexpenditures to support social sector objectives. Tanzania devotes about 15 percent of itsrecurrent budget to education, which is low relative to neighboring countries. Spending onsocial programs is not keeping up with growth in the economy, and is falling as a percentage ofGDP.
In contrast, Tanzania is performing relatively well in terms of illiteracy rate whencompared with other sub-Saharan African countries. The adult illiteracy rate is 23 percent ofthe population.
The number of secondary schools in Mtwara, Coast, Lindi and Tanga regions is shownin Table 6.9.
Table 6.9. Number of secondary schools by regionRegion Public Private Total
Mtwara 10 3 13Coast 12 15 27Lindi 12 3 15Tanga 22 19 41
Source: Regional Education offices.
Tanzania Coastal Management Partnership 24
6.5 Water Supply
Water supply and access to clean water varies by coastal region. In Mtwara and Lindiregions, 87 and 61 percent, respectively, of the villages are supplied with clean water. InTanga, about 48 and 90 percent of the rural and urban population, respectively, are suppliedwith clean water. Relative to the country as a whole, water access is good in coastal regions.On average in Tanzania, only about 22 percent of the people in rural areas have access to safewater. During the dry season, drinking water problems are worse— it takes more time andeffort to obtain water and disease problems are much more severe.
In Mtwara, the main sources of water are the Ruvuma, Mbuo, Mambi and MbangalaRivers; Lakes Kitere and Chidya; and groundwater and rainwater. With respect to urban watersupply systems, Masasi has four main sources of water: Mchema dam, five deep wells atMagumchila, 50 shallow wells dug within the town area, and the water catchment from Mwenaand Mwili springs. A variety of sources also supply Mtwara and Mikindani townships. Thereare seven deep wells in Mtawanya valley, two deep wells within the Mikindani area, and aspring at Mchuchu. Newala town is served by the extensive Makonde plateau piped watersystem that relies on electricity.
Groundwater is the largest water supply source in the Lindi region. It is plentiful andaccessible from shallow wells. Shallow wells served by water pumps are common in thevillages. Because they are not open as the discharge is made through pumping, the wells arenot exposed to the risks of infestation and contamination. In 1996, about 50 percent of theregion’s population obtained their water needs from piped water. There are also numerousrivers and dams that can provide surface water.
The Tanga region has abundant water sources from underground and surface sources.Surface water supplies include the Pangani, Ruvu, Soni, Mkulumuzi and Sigi rivers. In 1995the region had 85 water supply schemes (gravity and pump), 475 shallow wells fitted with handpumps, 19 deep wells, and 11 dams.
About 26 percent of the population of the Coast region get their water supplies fromthe Wami, Rufiji and Ruvu rivers. Other sources of water are deep and shallow wells, naturaland man-made water dams, piped water, and rainwater harvesting. Many of the installed deepwells do not function due to salt water intrusion (especially in Bagamoyo district), lack ofpumps, and deterioration of old pumping machines (especially in Rufiji district). A highpercentage of the region’s shallow wells and dams are also out of operation.
In all the regions, water supply systems are generally operated and maintained byvillage water committees whose members are elected by villagers. Table 6.10 shows thenumber of village water committees and village water funds in the Coast, Mtwara, and Lindiregions.
Table 6.10. Number of village water committees and water funds by region, 1996District Total Number of
VillagesVillage WaterCommittees
Village WaterFunds
Funds Contributed (Tshs.)
Coast 377 138 79 10,000,000Mtwara 548 134 102 naLindi 365 241 157 4,039,892Source: Regional Water Office, Lindi, 1997; Regional Water Engineer, Mtwara, 1997; Regional WaterEngineer’s Office, Kibaha, 1997.
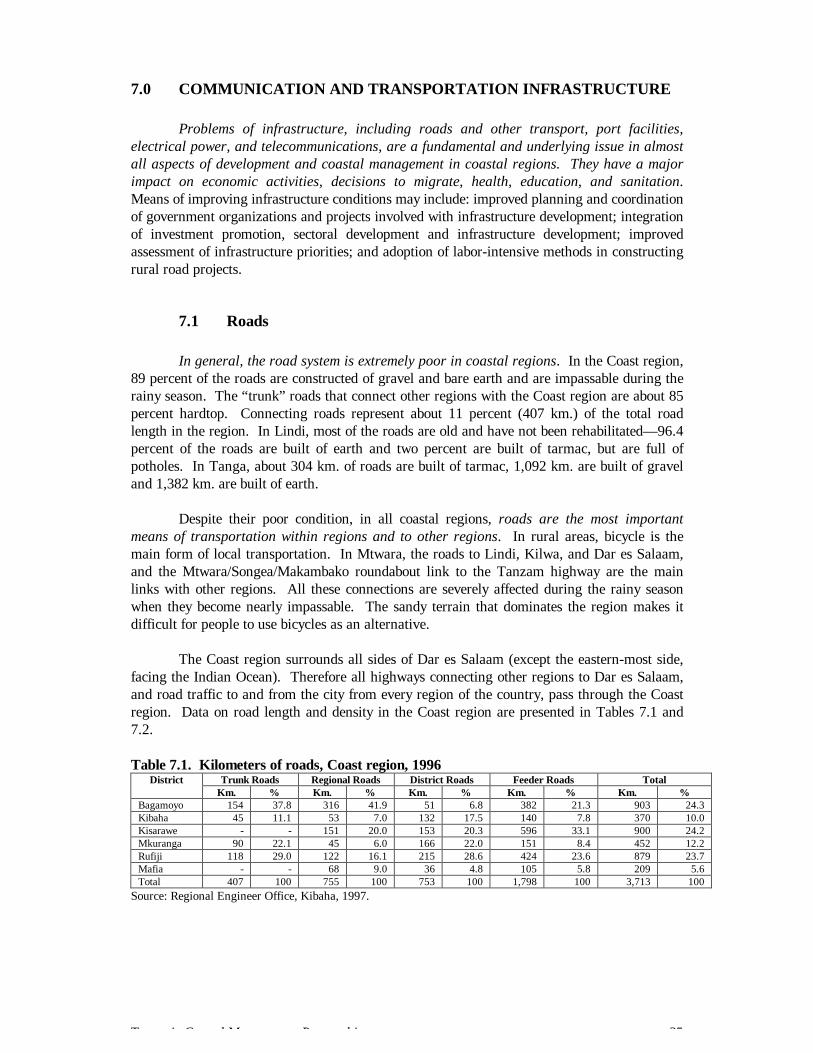
Tanzania Coastal Management Partnership 25
7.0 COMMUNICATION AND TRANSPORTATION INFRASTRUCTURE
Problems of infrastructure, including roads and other transport, port facilities,electrical power, and telecommunications, are a fundamental and underlying issue in almostall aspects of development and coastal management in coastal regions. They have a majorimpact on economic activities, decisions to migrate, health, education, and sanitation.Means of improving infrastructure conditions may include: improved planning and coordinationof government organizations and projects involved with infrastructure development; integrationof investment promotion, sectoral development and infrastructure development; improvedassessment of infrastructure priorities; and adoption of labor-intensive methods in constructingrural road projects.
7.1 Roads
In general, the road system is extremely poor in coastal regions. In the Coast region,89 percent of the roads are constructed of gravel and bare earth and are impassable during therainy season. The “trunk” roads that connect other regions with the Coast region are about 85percent hardtop. Connecting roads represent about 11 percent (407 km.) of the total roadlength in the region. In Lindi, most of the roads are old and have not been rehabilitated— 96.4percent of the roads are built of earth and two percent are built of tarmac, but are full ofpotholes. In Tanga, about 304 km. of roads are built of tarmac, 1,092 km. are built of graveland 1,382 km. are built of earth.
Despite their poor condition, in all coastal regions, roads are the most importantmeans of transportation within regions and to other regions. In rural areas, bicycle is themain form of local transportation. In Mtwara, the roads to Lindi, Kilwa, and Dar es Salaam,and the Mtwara/Songea/Makambako roundabout link to the Tanzam highway are the mainlinks with other regions. All these connections are severely affected during the rainy seasonwhen they become nearly impassable. The sandy terrain that dominates the region makes itdifficult for people to use bicycles as an alternative.
The Coast region surrounds all sides of Dar es Salaam (except the eastern-most side,facing the Indian Ocean). Therefore all highways connecting other regions to Dar es Salaam,and road traffic to and from the city from every region of the country, pass through the Coastregion. Data on road length and density in the Coast region are presented in Tables 7.1 and7.2.
Table 7.1. Kilometers of roads, Coast region, 1996Trunk Roads Regional Roads District Roads Feeder Roads TotalDistrict
Km. % Km. % Km. % Km. % Km. %Bagamoyo 154 37.8 316 41.9 51 6.8 382 21.3 903 24.3Kibaha 45 11.1 53 7.0 132 17.5 140 7.8 370 10.0Kisarawe - - 151 20.0 153 20.3 596 33.1 900 24.2Mkuranga 90 22.1 45 6.0 166 22.0 151 8.4 452 12.2Rufiji 118 29.0 122 16.1 215 28.6 424 23.6 879 23.7Mafia - - 68 9.0 36 4.8 105 5.8 209 5.6Total 407 100 755 100 753 100 1,798 100 3,713 100
Source: Regional Engineer Office, Kibaha, 1997.
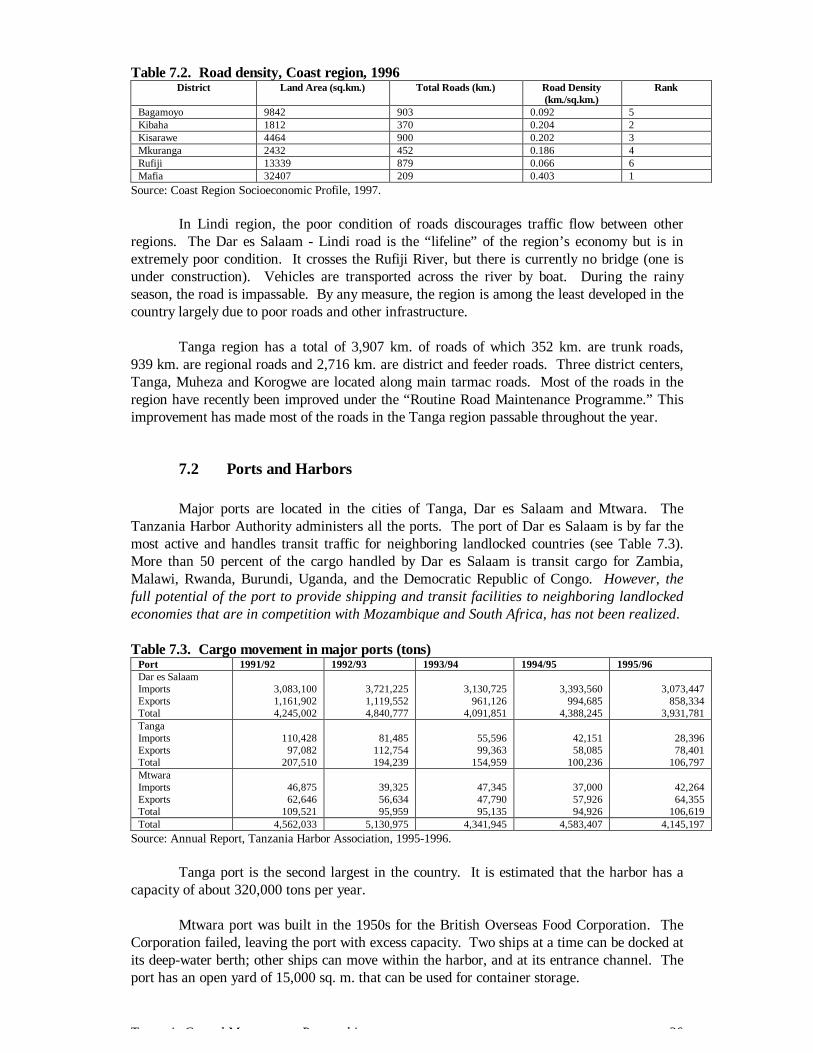
Tanzania Coastal Management Partnership 26
Table 7.2. Road density, Coast region, 1996District Land Area (sq.km.) Total Roads (km.) Road Density
(km./sq.km.)Rank
Bagamoyo 9842 903 0.092 5Kibaha 1812 370 0.204 2Kisarawe 4464 900 0.202 3Mkuranga 2432 452 0.186 4Rufiji 13339 879 0.066 6Mafia 32407 209 0.403 1
Source: Coast Region Socioeconomic Profile, 1997.
In Lindi region, the poor condition of roads discourages traffic flow between otherregions. The Dar es Salaam - Lindi road is the “lifeline” of the region’s economy but is inextremely poor condition. It crosses the Rufiji River, but there is currently no bridge (one isunder construction). Vehicles are transported across the river by boat. During the rainyseason, the road is impassable. By any measure, the region is among the least developed in thecountry largely due to poor roads and other infrastructure.
Tanga region has a total of 3,907 km. of roads of which 352 km. are trunk roads,939 km. are regional roads and 2,716 km. are district and feeder roads. Three district centers,Tanga, Muheza and Korogwe are located along main tarmac roads. Most of the roads in theregion have recently been improved under the “Routine Road Maintenance Programme.” Thisimprovement has made most of the roads in the Tanga region passable throughout the year.
7.2 Ports and Harbors
Major ports are located in the cities of Tanga, Dar es Salaam and Mtwara. TheTanzania Harbor Authority administers all the ports. The port of Dar es Salaam is by far themost active and handles transit traffic for neighboring landlocked countries (see Table 7.3).More than 50 percent of the cargo handled by Dar es Salaam is transit cargo for Zambia,Malawi, Rwanda, Burundi, Uganda, and the Democratic Republic of Congo. However, thefull potential of the port to provide shipping and transit facilities to neighboring landlockedeconomies that are in competition with Mozambique and South Africa, has not been realized.
Table 7.3. Cargo movement in major ports (tons)Port 1991/92 1992/93 1993/94 1994/95 1995/96Dar es SalaamImportsExportsTotal
3,083,1001,161,9024,245,002
3,721,2251,119,5524,840,777
3,130,725961,126
4,091,851
3,393,560994,685
4,388,245
3,073,447858,334
3,931,781TangaImportsExportsTotal
110,42897,082
207,510
81,485112,754194,239
55,59699,363
154,959
42,15158,085
100,236
28,39678,401
106,797MtwaraImportsExportsTotal
46,87562,646
109,521
39,32556,63495,959
47,34547,79095,135
37,00057,92694,926
42,26464,355
106,619Total 4,562,033 5,130,975 4,341,945 4,583,407 4,145,197
Source: Annual Report, Tanzania Harbor Association, 1995-1996.
Tanga port is the second largest in the country. It is estimated that the harbor has acapacity of about 320,000 tons per year.
Mtwara port was built in the 1950s for the British Overseas Food Corporation. TheCorporation failed, leaving the port with excess capacity. Two ships at a time can be docked atits deep-water berth; other ships can move within the harbor, and at its entrance channel. Theport has an open yard of 15,000 sq. m. that can be used for container storage.
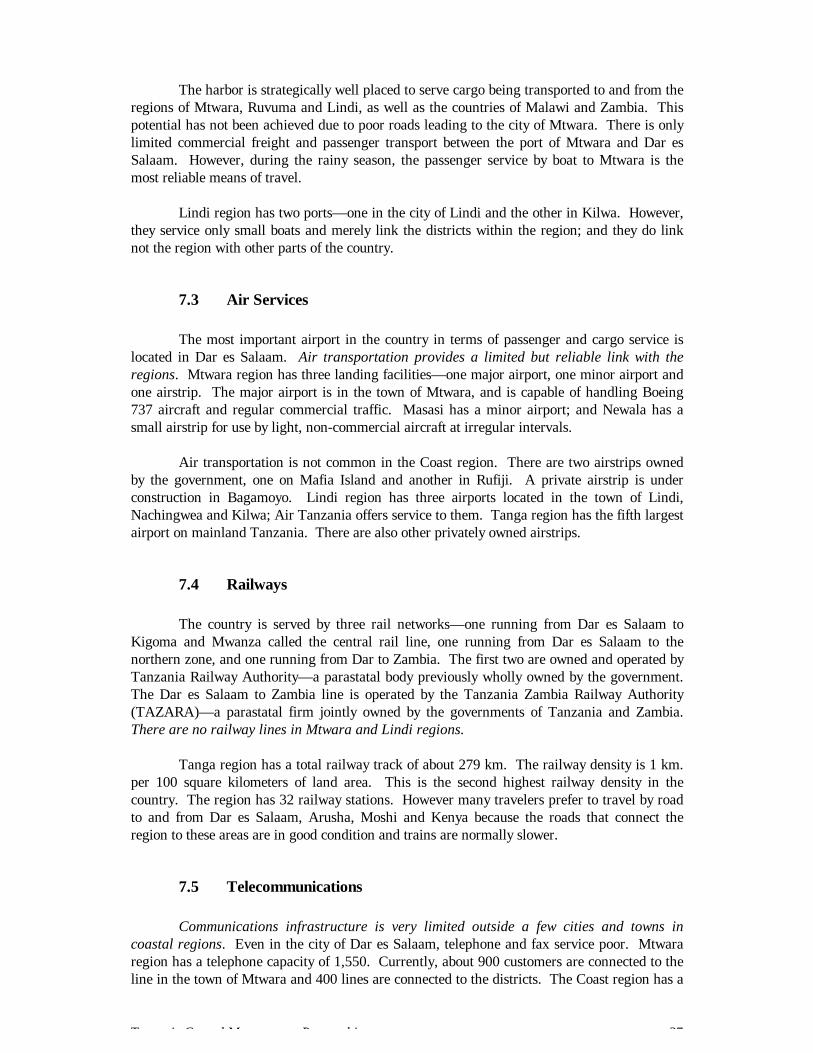
Tanzania Coastal Management Partnership 27
The harbor is strategically well placed to serve cargo being transported to and from theregions of Mtwara, Ruvuma and Lindi, as well as the countries of Malawi and Zambia. Thispotential has not been achieved due to poor roads leading to the city of Mtwara. There is onlylimited commercial freight and passenger transport between the port of Mtwara and Dar esSalaam. However, during the rainy season, the passenger service by boat to Mtwara is themost reliable means of travel.
Lindi region has two ports— one in the city of Lindi and the other in Kilwa. However,they service only small boats and merely link the districts within the region; and they do linknot the region with other parts of the country.
7.3 Air Services
The most important airport in the country in terms of passenger and cargo service islocated in Dar es Salaam. Air transportation provides a limited but reliable link with theregions. Mtwara region has three landing facilities— one major airport, one minor airport andone airstrip. The major airport is in the town of Mtwara, and is capable of handling Boeing737 aircraft and regular commercial traffic. Masasi has a minor airport; and Newala has asmall airstrip for use by light, non-commercial aircraft at irregular intervals.
Air transportation is not common in the Coast region. There are two airstrips ownedby the government, one on Mafia Island and another in Rufiji. A private airstrip is underconstruction in Bagamoyo. Lindi region has three airports located in the town of Lindi,Nachingwea and Kilwa; Air Tanzania offers service to them. Tanga region has the fifth largestairport on mainland Tanzania. There are also other privately owned airstrips.
7.4 Railways
The country is served by three rail networks— one running from Dar es Salaam toKigoma and Mwanza called the central rail line, one running from Dar es Salaam to thenorthern zone, and one running from Dar to Zambia. The first two are owned and operated byTanzania Railway Authority— a parastatal body previously wholly owned by the government.The Dar es Salaam to Zambia line is operated by the Tanzania Zambia Railway Authority(TAZARA)— a parastatal firm jointly owned by the governments of Tanzania and Zambia.There are no railway lines in Mtwara and Lindi regions.
Tanga region has a total railway track of about 279 km. The railway density is 1 km.per 100 square kilometers of land area. This is the second highest railway density in thecountry. The region has 32 railway stations. However many travelers prefer to travel by roadto and from Dar es Salaam, Arusha, Moshi and Kenya because the roads that connect theregion to these areas are in good condition and trains are normally slower.
7.5 Telecommunications
Communications infrastructure is very limited outside a few cities and towns incoastal regions. Even in the city of Dar es Salaam, telephone and fax service poor. Mtwararegion has a telephone capacity of 1,550. Currently, about 900 customers are connected to theline in the town of Mtwara and 400 lines are connected to the districts. The Coast region has a
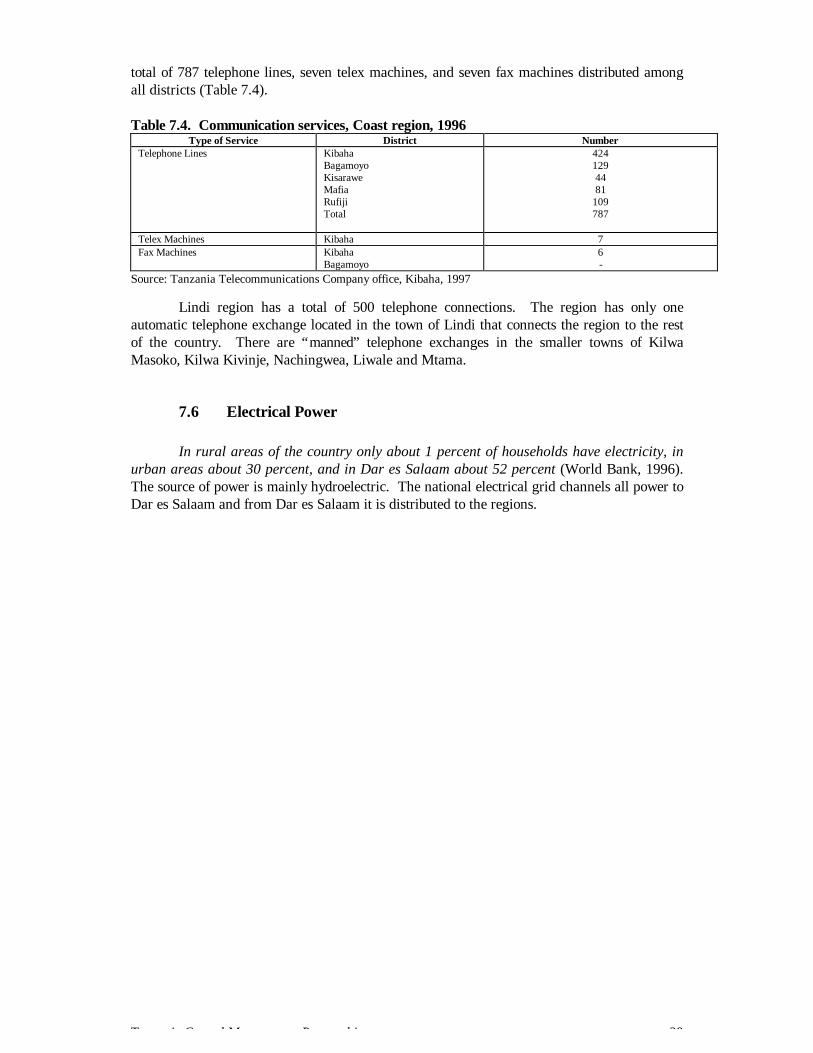
Tanzania Coastal Management Partnership 28
total of 787 telephone lines, seven telex machines, and seven fax machines distributed amongall districts (Table 7.4).
Table 7.4. Communication services, Coast region, 1996Type of Service District Number
Telephone Lines KibahaBagamoyoKisaraweMafiaRufijiTotal
4241294481
109787
Telex Machines Kibaha 7Fax Machines Kibaha
Bagamoyo6-
Source: Tanzania Telecommunications Company office, Kibaha, 1997
Lindi region has a total of 500 telephone connections. The region has only oneautomatic telephone exchange located in the town of Lindi that connects the region to the restof the country. There are “manned” telephone exchanges in the smaller towns of KilwaMasoko, Kilwa Kivinje, Nachingwea, Liwale and Mtama.
7.6 Electrical Power
In rural areas of the country only about 1 percent of households have electricity, inurban areas about 30 percent, and in Dar es Salaam about 52 percent (World Bank, 1996).The source of power is mainly hydroelectric. The national electrical grid channels all power toDar es Salaam and from Dar es Salaam it is distributed to the regions.
Tanzania Coastal Management Partnership 29
REFERENCES
EPIQ (1998), Gender Assessment for USAID/Tanzania SO2 Partners: Executive Summary.Environmental Policy and Institutional Strengthening Indefinite Quantity Project inTanzania. USAID. Dar es Salaam, Tanzania, April 1988.
Linden, O. and Lundin, C.G. (1996), Proceedings of the National Workshop on IntegratedCoastal Zone Management in Tanzania. The World Bank and SIDA.
Maliyamkono, T.L. and M.S.D. Bagachwa (1990), The Second Economy in Tanzania. EastAfrican Study Series. Ohio University Press.
Mwandosya, M.J. et al. (1997), Towards a Strategy for the Conservation of CoastalBiological Diversity of Mainland Tanzania. CEEST Publications. United Republic ofTanzania.
Omari, C.K. (1989), Rural Women, Informal Sector and Household Economy in Tanzania.Helsinki: Wider Working Papers.
United Republic of Tanzania (1997), Tanga Region Socioeconomic Profile. The PlanningCommission Dar es Salaam and Regional Commissioner’s office Tanga.
United Republic of Tanzania (1997), Lindi Region Socioeconomic Profile. The PlanningCommission Dar es Salaam and Regional Commissioner’s office Lindi.
United Republic of Tanzania (1997), Coast Region Socioeconomic Profile. The PlanningCommission Dar es Salaam and Regional Commissioner’s office Coast.
United Republic of Tanzania (1997), Mtwara Region Socioeconomic Profile. The PlanningCommission Dar es Salaam and Regional Commissioner’s office Mtwara.
United Republic of Tanzania (1988), Tanzania Population Census. National Profile. Bureau ofStatistics, President's Office, Planning Commission. Dar es Salaam, Tanzania.
Wagner, S.M. (1991), Women in the informal economy of Dar es Salaam suburbs: Theircontribution to the household budget. Thesis submitted as partial fulfillment of a B.A.in Sociology, University of Dar es Salaam, Tanzania.
World Bank (1996), Tanzania, The Challenge of Reforms: Growth, Incomes and Welfare.Report No. 14982-TA, Volume 1, The World Bank, Washington, D.C.