rep()rt ()f'referee - ulara watermaster
TRANSCRIPT
, "
, '( ':, • ': I ... " , .. ~ .. ,
.' '. -. ~ ~ ~ .. , " ,'r I , " ," ; r
• • " j ~
IN THE SUPERIOR COURT OF THE STATE OF CALrFQRNlA
IN AND FOR THE COUNTY OF lOS ANGELES
THE CITY OF LOS ANGELES, a Municipal Corporation,
Plaintiff, VS.
No. 650079
CITY OF SAN FERNANDO,
.... . . " .
• . . i '. .
• • . . ... I .
. . ', . '"
,,' ( . , ,
. . ', .. '.'
a Municipal Corporation, et aI.,
Defendants.
REP()RT ()F'REFEREE
Volume I
TEXT AND PLATES
By
STrATE WATER RIGHTS BOARD
REFEREE
July, 1962
APPROVAL AND ADOPTION BY STATE WATER RIGHTS BOARD
The State Water Rights Board, Referee in the action entitled
"The City of Los Angeles, a Municipal Corporation, Plaintiff, vs. City of
San Fernando, a Municipal Corporation, et ale, Defendants, 1/ before the
Superior Court of the State of California in and for the County of Los
Angeles, No. 650079, approves and adopts this "Report of Referee ll dated
July 1962, pursuant to the requirements of the "Order of Reference to
State Water Rights Board to Investigate and Report Upon the Physical Facts
(Section 2001, Water Code)," dated June 11, 1958, and the "Interim Order,"
dated November 19, 1958, entered by the Court in said action. In accord-
ance with paragraph III of said Order of Reference dated June 11, 1958,
the Board will file with the Court and retain in its office the basic data
upon which it bases its findings.
Approved and adopted by the State Water Rights Board at a meeting
duly called and held at Sacramento, California, on the 27th day of July,
1962.
Kent Silverthorne, Chairman
J ii
'- . .... .t;'I- ~~ _
~
"" , ~ .,
\
S::l QO S-4 N
Q ..... AN ()O v
Reseda "'\ I...
'-' ->
.....
F'C IT N -4
£: \ ' Von Nuys
o
NDO
" "1 /'V tJ.'r ( .<.
, : : ~ ): !, .":- ,. , .....,,'
. 0:-. ~. ___ ...
'.
- --.-
.-.
,. ... , _I
• t ,
:!I .. : . . .'
4-
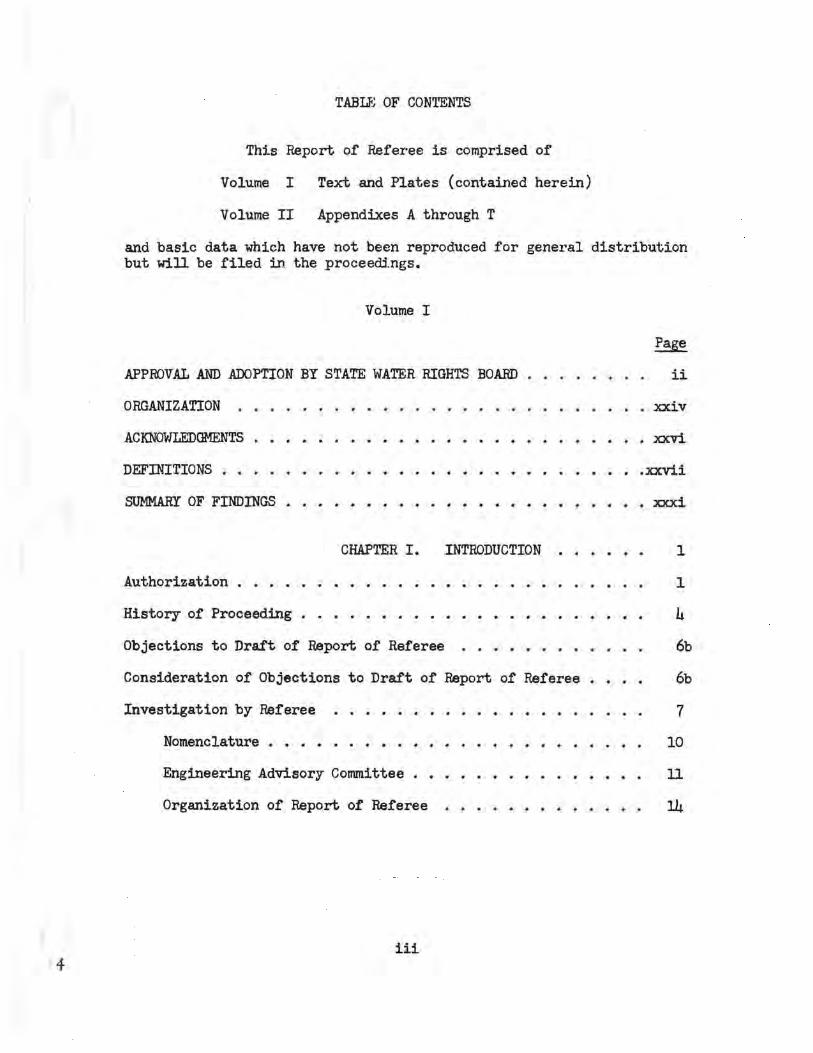
TABLF~ OF CONTENTS
This Report of Referee is comprised of
Volume I Text and Plates (contained herein)
Volume II Appendixes A through T
and basic data which have not been reproduced for general distribution but will be filed in the proceedings.
Volume I
APPROVAL AND ADOPTION BY STATE WATER RIGHTS BOARD
ORGANIZATION
ACKNOvlLEDGMENTS .
DEFINITIONS • .
SUMMARY OF FINDINGS •
Authorization . • . .
History of Proceeding •
CHAPTER I.
Objections to Draft of Report of Referee
INTRODUCTION
Consideration of Objections to Draft of Report of Referee
Investigation by Referee
Nomenclature • • • •
Page
ii
. xxiv
xxvi
.. xxvii
•• xxxi
I
1
4
6b
6b
7
10
Engineering Advisory Committee . . . . . . . . . . . 11
Organization of Report of Referee
iii
TABLE OF CO~ITENTS - Continued
CHAFT:L:R II. DESCRIPTION OF THE UPPER LOS ANGELES RIVER AP.EA . • •
Boundaries . . . . . . . Physiography · . . . . . . . .
Hill and Mountain Areas · . . . . Features Related to the Valley Floor
Surface Drainage System · . . . . . . . Soils . . . . . . . . . . . . . . . . . . . . . . . . . . . Climate . . . . . . . . . . . . . . . . . . . . . . . . . Culture . . . . . . . . . . . . . . . . . . . . . . . . . . . .
CHAPTER III. GEOLOGY • • • • • • • • •
Areal Geology . . . . . . . . . . . . . . . . . . . . . . . Previous Investigations . . . . . . . . . . . . . . . . . . . . Present Investigation · . . . . . . . . . . . . . Geologic Formations . . . . . . . . . . . . . . . . . . . . . .
Nonwater-Bearing Series • · . . . . . . . . . . . . . . . . irlater-Bearing Series · . . . . . . . . . . . . . .
Alluviation . . . . . . . . . . . . . . . . Saugus Formation . . . . Older Allu·,rium • . . . . . . . . Recent Alluvium . . . . . . . . . . . . . . . . . . .
Structural Features . . . . . . . . . . . . . . . . . . . . . .
iv
16
16
18
19
21
23
24
25
25
21
21
28
28
29
29
30
30
32
33
34
35
5
TABLE OF CONTENTS - Continued
Faulting • • • • •
Verdugo Fault Zone
Eagle Rock Fault
Raymond Fault • •
Smaller Unnamed Faults
Folding
Configuration of the Base of the Valley Fill
Description of Hydrologic Subareas
San Fernando Hydrologic Subarea
Sylmar Hydrologic Subarea
Verdugo Hydrologic Subarea
Eagle Rock Hydrologic Subarea
Specific Yield of Water-Bearing Materials • •
CHAPTER IV. WATER SUPPLY, UPPER LOS ANGELES RIVER AREA .
Precipitation •••••
Precipitation Characteristics
Quantity of Precipitation
Selection of Base Study Period
Special StuQy Periods • •
Hill and Mountain Runoff
Imported Water ••••••
v
35
35
36
37
38
39
40
43
46
51
55
58
61
64
65
65
67
71
73
74
77
TABLE OF CONTENTS - Continued
Los Angeles Aqueduct System of the City of Los Angeles • • • • • • •
Description and Capacity of Project
Quantities of Water Diverted and Used
Quantities Available for Diversion and Use
Colorado River Aqueduct of The Metropolitan Water District of Southern California • • • • •
Description and Capacity of Project . . . . Relative Rights of Constituent Areas of The
Metropolitan Water District •••• . . Water Rights of The Metropolitan Water District
Pendency of Ari~ona vs. California • •
Other Factors Affecting Water Availability to The Metropolitan Water District • • • •
Distribution System
Amounts of Imported Water • • · . Water Quality · .
. · . ·
. · . · · . ·
Standards of Water Quality . . . . . . . . . . . . . . . . . Chemical Characteristics of Water . • . . . . . Imported Water
SUrface Water • • . . · . . . . . . . . Ground Water
Effect of Importation of Owens River-Mono Basin Water • • • • • • • • • • • • • • . . . . . . . . . .
vi
Page
18
18
80
82
84
84
81
90
92
93
95a
96
98
98
98
99
100
103
10,
"
TABLE OF CONTENTS - Continued
CHAPTER V. WATER UTILIZATION AND DISPOSAL . . •
Joint Interest of Parties in Sources of Supply
Location of Wells and Surface Diversions • •
Extractions and Diversions • • • •
Capacity of Diversion Works • •
Quantity of Extractions and Diversions
Land Development and Use •
Land Use
Channel Improvements
Place and Character of Water Use •
Ground and Surface Water Exports from the Upper Los Angeles River Area
Deli vered Water . . . . . . . . . Gross Delivered Water in the Upper Los
Angeles River Ar~a . • • • • • • . •
Gross Del.iTered Water on Valley Fill and Hill and Mountain Areas •
Gross Available for Distribution
Spread Import • • • • • • • • • • •
Operational Releases, Net Deliveries and Water System Losses • • •
Sewage and Waste • • • •
Export of Sewage
Estimated Cesspool Recharge and Sewage from
. .
. .
Hill Areas • • • • -. •• • • • • • • . . . . . . .
vii
106
106
110
110
III
116
126
127
130
132
133
136
136
137
137
141
144
146
148
149
TABLE OF CONTENTS - Continued
Export of Sewer Infiltration and Flushing Water •
Industrial and Sanitary Wastes
Surface Runoff • • .
Native Water Spread
Subsurface Flow
Changes in Ground Water Storage
Determination of Consumptive Use by InflowOutflow Method . . • . • . • • • . . . . .
CHAPTER VI. HISTORIC GROUND WATER RECHARGE
Consumptive Use by Integration Method
Evaporation • • • •
Evaporation of Irrigation Water
Residual Rain on the Valley Fill Area
Irrigated, Native and Residential Land Use Areas
Industrial and Commercial Land Use Areas
Excess Consumptive Use in High Water Table Areas
Riparian Areas
Consumptive Use of Water System Losses
Summary
Comparison of Consumptive Use Values Determined by Inflow-Outflow and Integration Methods
Adjustment of Consumptive Use • • • . • . • .
viii
150
151a
152
156
159
162
167
171
172
173
173
173
174
176
177
178
179
180
185
188
1
TABLE OF CONTENTS - Continued
Adjusted Consumptive Use of Native and Delivered Waters on the Valley Fill Area • • • • • • • • • • • •
Historic Ground Water Recharge
Ground Water Draft . . " " . " . " " . . . "
Ground Water Inventory " " . . . . . "
CHAPTER VII. SAFE YIElD " " " " " " " "
Limitations and Factors Influencing Safe Yield
Conditions for Safe Yield Determination • • •
Conditions Affecting Recharge from Delivered Water on Land Use Class Areas • • • . • • • • •
Industrial Wastes . . Total Sewage, Sewage Export and Cesspool
Recharge . . . " " " " " " " •
Spread Import . . " . " " " . . " . . " " "
Operational Releases . . . Water System Loss " . . " . " " " " "
Conditions Affecting Recharge from Precipitation on Land Use Areas •• • • • • • • • • •
Conditions Affecting Native Recharge in the Stream System • • • • • • • • • • • • • • . " " . " " " "
Conditions Affecting Natural Depletions from the Ground Water Reservoir • • • • • • • • •
Average Delivered Water Requirement Under Safe Yield Conditions """". " . " " " " " " " " " " " " " "
Ground Water Recharge Under Safe Yield Conditions ." " " " " " " "
ix
196
198
198
198
205
206
208
209
213
213
215
215
216
218
220
224
228
230
TABLE OF CONTENTS - Continued
Gross Recharge of Delivered Water Required by the Culture . . • • • • • • • . • • • • • •
Gross Recharge of Precipitation on Land Use Areas
Gross Recharge of Native Spread Water . . . . " . . . . Gross Recharge of Native Waters from the Stream
System of the Valley Fill Area • • • •
Natural Depletions from the Ground Water Reservoir •
Net Recharge of Native and Delivered Waters . . . Evaluation of Safe Yield . . . . . " . .
Import and Export Conditions .
Safe Yield • • • • • • • • • .
Water Requirement and Supply Under Safe Yield Conditions ••••• ••• . . . . . . . . . . .
Effect of Import on Safe Yield . • • " • •
CHAPTER VIII. THE USE OF WATER BY THE CITY OF IDS ANGELES AND ITS lNHABITANTS
Use of Water By the City of Los Angeles Within the Territory of the Original Pueblo •••• " _ ••• " . . . . . . .
Use of Water By the City of Los Angeles Within Its Expanded Boundaries • • " • • " • • • • • • • •
Water Distributed By the City of Los Angeles for Use Outside Its Boundaries • • • • " • • • " •
x
. . . . . . . . .
230
232
234
237
240
242
244
244
246
248
250
251
251
253
257
8
Table No.
1
2
3
4
5
6
7
8
9
10
11
12
13
TABLE OF CONTENTS - Continued
TABLES
Annual Precipitation . • • • • • • . . . . . . Annual Precipitation in Percent of 85-Year
Normal . . . . . . . • • • • • • • •
Runoff to Valley Floor from Hill and Mountain Areas • • • • • • • •
Quantities Diverted and Delivered for Use by the City of Los Angeles Through the Los Angeles Aqueduct System • • • • • • • •
Stream Runoff Tributary to Los Angeles Aqueduct Diversion Works in Excess of Aqueduct Diversions •• • • • • • • • • • • • • • •
Net Diversion from Colorado River by The Metropolitan Water District • • • • . . . . .
Preferential Rights of Members of the Metropolitan Water District of Southern California as of November 30, 1959 Based on Total Cumulative
. .
Tax Collections • • • • •
Imported Water, Upper Los Angeles River Area
Representative Mineral Analyses of Water • • •
Cross Reference to Joint Interest of Parties •
Information on Water Development and Use By Parties and Their Predecessors ••• •
Ground Water Extractions and Surface Water Diversions by Parties and Their Predecessors, 1928-29 through 1957-58
. . . .
Estimated and Measured Ground Water Extractions and Surface Water Diversions of Parties and Their Predecessors Prior to 1928-29 from Sources in the Upper Los Angeles River Area
xi
69
70
76
81
83
86
88
97
101
107
112
117
120
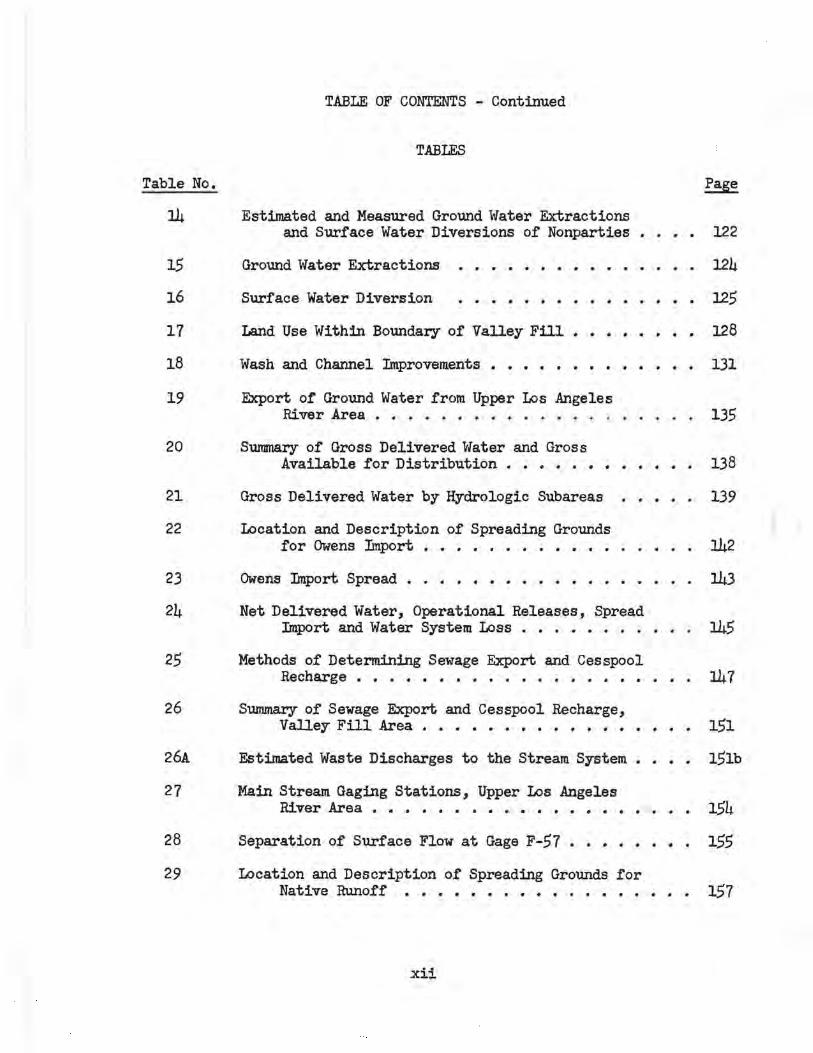
Table No.
15
16
17
18
TABLE OF CONTENTS - Continued
TABLES
Estimated and Measured Ground Water Extractions and Surface Water Diversions of Nonparties •
Ground Water Extractions . . . . . . Surface Water Diversion . . . . . . . . . . . . . Land Use Within Boundary of Valley Fill •
Wash and Channel Improvements • • • • • . . . . . 19 Export of Ground Water from Upper Los Angeles
20
21
22
23
24
.Hi ver Area . . . . . . . . . . .
Summary of Gross Delivered Water and Gross Available for Distribution • • • • • • • •
Gross Delivered Water by Hydrologic Subareas
Location and Description of Spreading Grounds for Owens Import • • . • • •
Owens Import Spread • . . . . . . . . .
. . . .
Net Delivered Water, Operational Releases, Spread Import and Water System Loss . • • • • • • •
25 Methods of Determining Sewage Export and Cesspool
122
124
125
128
131
135
138
139
142
143
145
Recharge . . . . . . . . . . . . . . . . . . l41
26 Summary of Sewage Export and Cesspool Recharge, hll~Fill~~ ••••••••••••••
26A Estimated Waste Discharges to the Stream System
27 Main Stream Gaging Stations, Upper Los Angeles
28
29
River ~ea • • • • • • • • • • • •• . . Separation of Surface Flow at Gage F-57 • • • • •
Location and Description of Spreading Grounds for Native Runoff • • • • • • • • • • • • • • •
xii
. .
. . .
. . .
151
151b
154
155
157
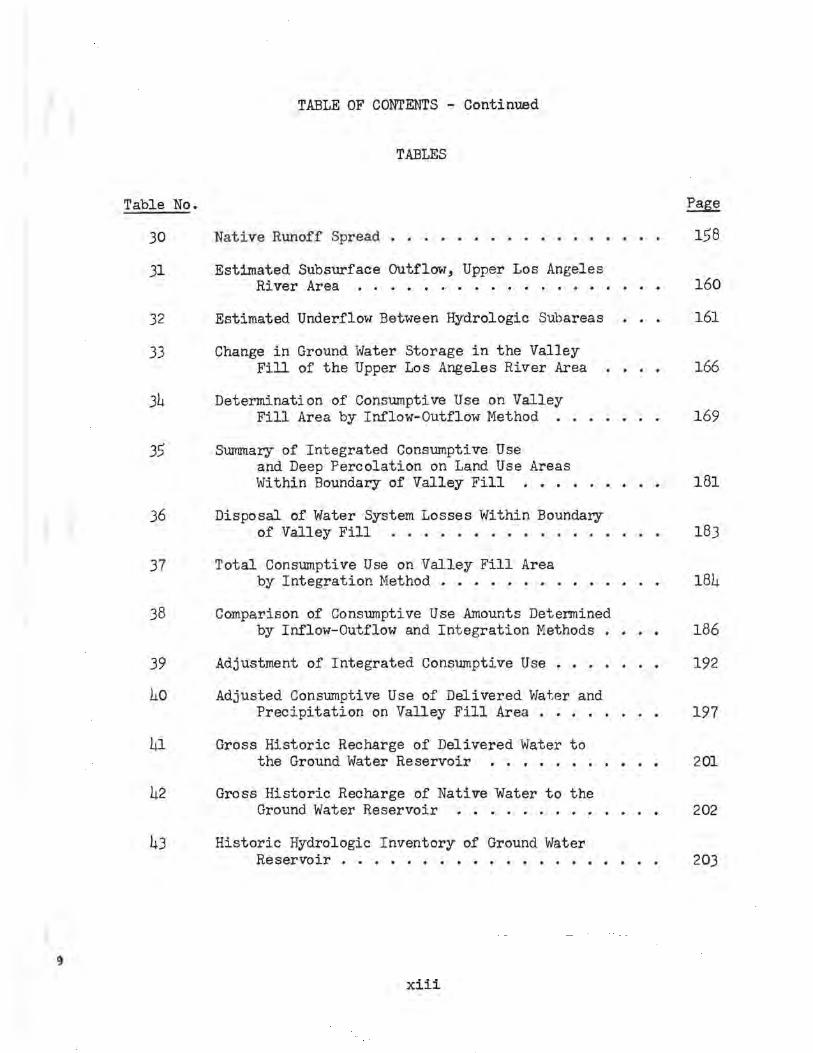
TABLE OF CONTENTS - Continued
TABLES
Table No.
30 Native Runoff Spread
31 Estimated Subsurface Outflow, Upper Los Angeles
32
33
34
35
36
37
38
39
40
41
42
River Area . . . . . . . . . . . . . . Estimated Underflow Between Hydrologic Subareas
Change in Ground Water Storage in the Valley Fill of the Upper Los Angeles River Area
Determination of Consumptive Use on Valley Fill Area by Inflow-Outflow Method . . • . . • .
Summary of Integrated Consumptive Use and Deep Percolation on Land Use Areas Within Boundary of Valley Fill . • . •
Disposal of Water System Losses Within Boundar,y of Valley Fill ..••.•..
Total Consumptive Use on Valley Fill Area by Integration Method • . • • .
Comparison of Consumptive Use Amounts Determined by Inflow-Outflow and Integration Methods .
Adjustment of Integrated Consumptive Use • • . •
Adjusted Consumptive Use of Delivered Water and Precipitation on Valley Fill Area . • • . •
Gross Historic Recharge of Delivered Water to the Ground Water Reservoir .. • . .
Gross Historic Recharge of Native Water to the Ground Water Reservoir • • . . •
43 Historic Hydrologic Inventory of Ground Water Reservoir . . • • • • • • • . . . . . . .
xiii
158
160
161
166
169
181
183
184
186
192
197
201
202
203
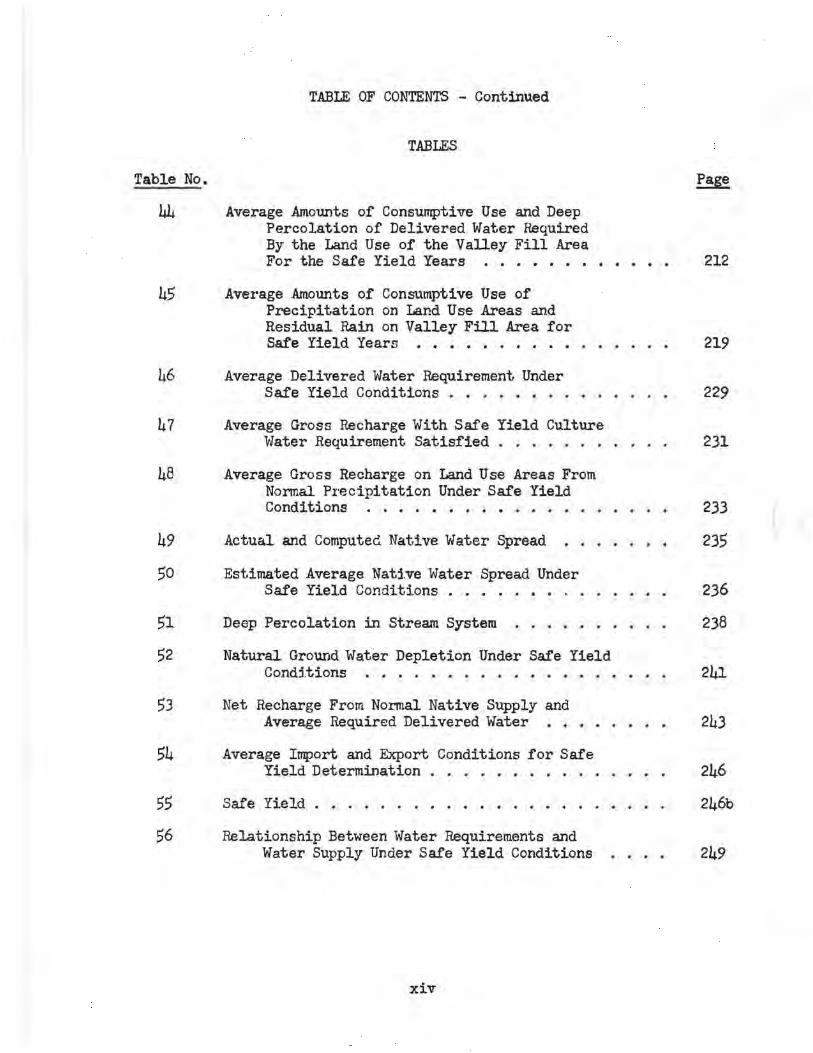
Table No.
44
45
46
47
48
49
50
51
52
53
54
55
56
TABLE OF CONTENTS - Continued
TABLES
Average Amounts of Consumptive Use and Deep Percolation of Delivered Water Required By the Land Use of the Valley Fill Area For the Safe Yield Years
Average Amounts of Consumptive Use of Precipitation on Land Use Areas and Residual Rain on Valley Fill Area for Safe Yield Years . • • • • • • . . •
Average Delivered Water Requirement Under Safe Yield Conditions • . . . . • . .
Average Gross Recharge With Safe Yield Culture Water Requirement Satisfied . . . . . . .
Average Gross Recharge on Land Use Areas From Normal PI'ecipitation Under Safe Yield Conditions . . • • • • . • • . . • .
Actua.l and Computed Na.t.ive Water Spread
Estimated Average Nati,ve Water Spread Under Safe Yield Conditions . • . . . • • , .
Deep Percolation in Stream System
Natural Ground Water Depletion Under Safe Yield Conditions . . . . . • . . . . • . •
Net Recharge From Normal Native Supply and Average Required Delivered Water
Average Import and Export Conditions for Safe Yield Determination .
Safe Yield . . . . . . . • . • . • • . . . •
Relationship Between Water Requirements and Water Supply Under Safe Yield Conditions
xiv
212
219
229
231
233
235
236
238
243
246
246b
249
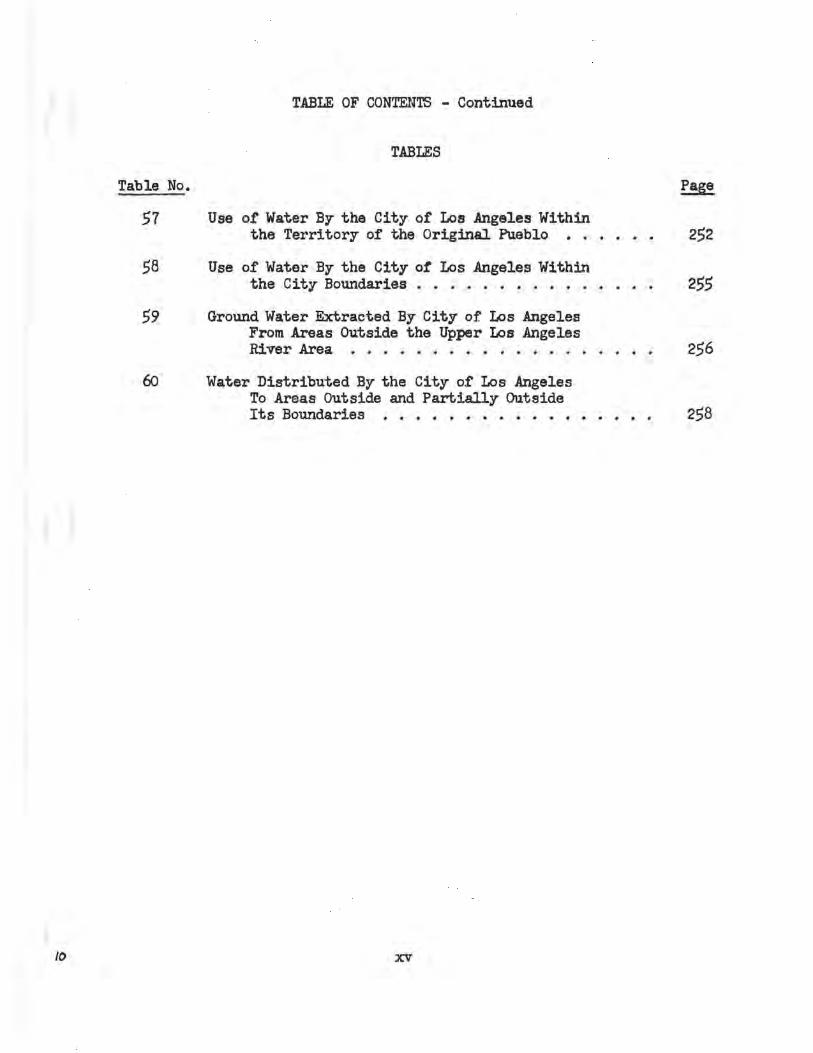
Table No.
57
58
59
60
/0
TABLE OF CONTENTS - Continued
TABLES
Use of Water By the City of Los Angeles Within the Territory of the Original Pueblo
Use of Water By the City ot Los Angeles Within the City Boundaries • . • . . . • . . • .
Ground Water Extracted By City of Los Angeles From Areas Outside the Upper Los Angeles River Area . . . . . . . . . . . . . . .
Water Distributed By the City of Los Angeles To Areas Outside and Partially Outside Its Boundaries •• • • • • • • • • • •
xv
256
258
Figure No.
1
2
3
4
5
6
7
8
9
10
11
12
TABLE OF CONTENTS - Continued
FIGURES
Land Use, Valley Fill Area
Gross Water Available for Distribution, Valley Fill Area
Diagram of Water Supply and Disposal, Upper Los Angeles River Area
Comparison of Annual Amounts of Consumptive Use on the Valley Fill Area Determined by Integration and Inflow-Outflow Methods . . . . .
Cumulative Adjustments to the Consumptive Use of Precipitation, and the Consumptive Use of Delivered Water • . . • •
Cumulative Adjustment to Consumptive Use and Remaining Difference . . • • . •
Hydrologic Equation for the Upper Los Angeles River Area Ground Water Reservoir Showing Items of Supply and Draft With Reference to the Ground Water Table • • • . •
Trend Curves for Consumptive Use, Deep Percolation and Waste Discharge of Water Delivered to Commercial and Industrial Land Use Areas • . • • • . • • • •
Trend Curves for Sewage
Trend Curves for Water System Loss and Operational Releases •.••••••.•••.•
Relationship Between Supply and Deep Percolation in the Stream System
Rising Water as a Function of Ground Water in Storage . . . . . . . . . . . . . .
xvi
129
140
168
187
191
195
200
211
214
217
223
226
13
14
II
Trend Curves for Natural Depletions of Ground Water . • • • • • • • • •
Trend Curves for Import to and Export From the Valley Fill Area • • • • • • • • . •
xvii
227
245
TABLE OF CONTENTS - Continued
PUT~
Plates 1-36 Follow Chapter VIII
Plate No.
1 Vicinity and Location Map
2 Physiography Map
3 Soils Map
4 Areal Geology
S Geologic Cross Section Index Map
5A Geologic Cross Sections A-A', B-B', C-C' and D-D'
5B Geologic Cross Sections E-E' and F-F'
5C Geologic Cross Sections G-G', H-H', I-I' and J-J'
5D Geologic Cross Sections K-KI and L-LI
5E Geologic Cross Sections M-MI and N-N'
5F Geologic Cross Sections 0-0' and P-P'
5G Geologic Cross Sections Q-Q' and R-R'
5H Geologic Cross Sections S-SI, Sylmar Notch and Pacoima Notch
5J Geologic Cross Sections - Block Diagram of Little Tujunga s,ncline
6 Contours on Base of Vall~ Fill
7 Areal Distribution of Soil Series in San Fernando Cienaga Area
8 Transects Across San Fernando Cienaga Area
9 Lines of Equal Precipitation, 85-Year Mean
10 Owmulative Deviation from 8S-Year Mean Precipitation
11 Los Angeles River 1893
12 Channel Lining and Improvements
xviii
'l.
Plate No.
13
14
15
16
17A
17B
17C
170
18
19
20
21
22
23
24
25
26
27
28
29
TABIE OF CONTENTS - Continued
Colorado River Aqueduct
Los Angeles River Aqueduct
Mineral Characteristics of Imported and Ground Water
Total Dissolved Solids, Sulfate and Chloride Content, Imported Water
Total Dissolved Solids, Sulfate and Chloride Content - Well Water
Total Dissolved Solids, Sulfate and Chloride Content - Well Water
Total Diss·olved Solids, Sulfate and Chloride Content - Well Water
Total Dissolved Solids, Sulfate and Chloride Content - Well Water
Location of Wells
Water Service Areas 1958
Place of Use, Small Users Service Area
Diagramatic Flow Chart for Import and Export System
Areal Culture 1928
Areal Culture 1949
Areal Culture 1955
Areal Culture 1958
Sewered Areas
Ground lvater Contollrs 1931
Ground Water Contours 1938
Ground Water Contours 1944
xix
TABLE OF CONTENTS - Cont inued
Plate No.
30 Ground Water Contours 1958
31 Change in Ground Water Elevations Fall 1931 - Fall 1958
3lA Distribution of Ground Water Extractions, 1931
3IB Distribution of Ground Water Extractions, 1958
32 Change in Ground Water Elevations Fall 1934 - Fall 1949
33 Change in Ground Water Elevations Fall 1944 - Fall 1958
34A Well Hydrographs
34B Well Hydrographs
34c Well Hydrographs
35 Pueblo Watershed and Other Sources of Supply
36 Terri~ory Annexed to the City of Los Angeles
xx
Appendu
A
B
C
D
E
F
G
H
I
J
K
L
M
N
0
I~
TABLE OF CONTENTS - Continued
Volume II
APPENDIXES
Geology • . . Soils • • . . . . Characteristics of Soils and Their Relationship
to Past Vegetative and Water Table Conditions in San Fernando Cienaga Area • • • • . . • .
Selection of Specific Yield Values
Precipitation •...
Hill and Mountain Runoff
Import to Upper Los Angeles River Area By City of Los Angeles
Water Quality • • • • .
History of Development of Water Sources By Parties, Methods of Determining Capacity of Diversion Works and Methods of Estimating and Measuring Extractions and Diversions • • . • • • • . .
Delivered Water in Upper Los Angeles River Area •.
Land Development and Use
Procedures for Estimating Average Consumptive Use and Deep Percolation on Various Land Use Classes • • . • . • • • . • • • .
Transfers of Imported Water and Ground Water Within and Out of Upper Los Angeles Ri ver Area . . . . . . . . . . . . . . . .
Sewage Export, Cesspool Recharge and Waste Discharge . . . . . . . . .
Separation of Surface Flow of the Los Angeles River at Gage F-57 . . . . . . . .
xxi
. . .
. . .
A-I
B-1
C-l
D-l
E-l
F-l
G-l
H-l
I-I
J-l
K-l
L-l
M-l
. . N-l
. . 0-1
Appendix
P
Q
R
S
T
TABLE OF CONTENTS - Continued
Methods of Determining Underflow at Hydrologic Boundaries • . • •
Change in Storage • •
Ground Water Recharge and Safe Yield . . Orders of Court • • • . . . . . . . Available Information on HYdrologic Subareas
xxii
P-l
Q-l
R-1
S-l
. . . . . T-l
14
Table
A
B
C
D
E
F
G
H
I
J
K
L
}II
N
o
P
TABLE OF CONTENTS - Continued
BASIC DATA
LOCATION AND DESCRIPTION OF WELLS
WELL LOGS
GROUND WATER LEVELS AT WELLS
GROUND WATER LEVELS AT PIEZOMETERS
PRECIPITATION
EVAPORATION
RUNOFF
SEWAGE DISCHARGE
IMPORTED WATER
FLOOD CONTROL RESERVOIR OPERATION
ANALYSES OF WATER
WATER SALES
DATA FOR DEPARTMENT OF WATER RESOURCES REPORT ON ·CHARACTERISTICS OF SOILS AND THEIR RELATIONSHIP TO PAST VEGEI'ATlVE AND WATER TABLE CONDITIONS IN SAN FERNANDO CIENAGA"
LAND USE
EXTRACTIONS AND DIVERSIONS
MISCELLANEOUS
xxiii
ORGANIZATION
STATE WATER RIGHTS BOARD
Kent Silverthorne Ralph J. McGill W. A. Alexander*
Leland K. Hill
Chair:u.an Member Member
Executive Officer
This Investigation Was Conducted And Report Prepared Under The General Direction Of
Leslie C. Jopson •• .. . • Chief Engineer
And The Technical Direction Of
John M. Page • . • •
Donald J. Finlayson
Wilbert T. Chung ••.••
Elwood C. Johnson David J. Leve Ronald H. Barrett Joseph F. Montagna.
Supervising Engi"·leer, Water Resources
By
Senior Engineer, Water Resources** In Charge of Los Angeles Office
Assisted By
Associate Engineer, Water Resources
Hydrologic Studies
Water Resources Engineering Associate
. . ..
• Assistant Civil Engineer Assistant Civil Engineer
••• Assistant Civil Engineer
Geologic And Water Quality Studies
Glenn A. Brown . . Joseph M. Gonzalez
Gilbert J. Matson Alvin L. Franks • • • • Ben Rinehart . John Shannon . . •
Senior Engineering Geologist*** . . . . . . . Geologic Aid
Special Studies By
xxiv
Senior Engineer, Water Resources Associate Engineering Geologist
• • • • Assistant Civil Engineer Land and Water Use Specialist***

is'
Table
A
B
C
D
E
F
G
H
I
J
K
L
M
N
o
P
TABLE OF CONTENTS - Continued
BASIC DATA
LOCATION AND DESCRIPTION OF WELLS
WELL LOGS
GROUND WATER LEVELS AT WELLS
GROUND WATER LEVELS AT PIEZOMETERS
PRECIPITATION
EVAPORATION
RUNOFF
SEWAGE DISCHARGE
IMPORTED WATER
FLOOD CONTROL RESERVOIR OPERATION
ANALYSES OF WATER
WATER SALES
DATA FOR DEPARTMENT OF WATER RESOORCES REPORT 01 -CHARACTERISTICS OF SOILS AND THEIR RELATIONSHIP TO PAST VEGETATIVE AND WATER TABLE CONDITIONS IN SAN FERNANDO CIENAGA n
LAND USE
EXTRACTIONS AND DIVERSIONS
MISCELLANEOUS
xxiii
I~
ORGANIZATION
STATE WATER RIGHTS BOARD
Kent Silverthorne Ralph J. McGill W. A. Alexander*
Leland K. Hill
Chairman Member Member
Executive Officer
This Investigation Was Conducted And Report Prepared Under The General Dil~ection Of
Leslie C. Jopson • • • • • Chief Engineer
And The Technical Direction Of
John M. Page . • • . • .
Donald J. Finlayson
Wilbert T. ChWlg • • • • •
Elwood C. Johnson David J. Leve Ronald H. Barrett Joseph F. Montagna
Supervising EngL"leer, Water Resources
By
Senior Engineer, Water ResoUrces** In Charge of Los Angeles Office
Assisted By
Associate Engineer, Water Resources
Hydrologic Studies
Water Resources Engineering Associate • • • • • • • Assistant Civil Eilgineer
• • • • • • • • Assistant Civil Engineer • • • • • • • Assistant Civil Engineer
Geologic And Water Quality Studies
Glenn A. Brown • • . Joseph M. Gonzalez . . • .
Gilbert J. Matson Alvin L. Franks • • • • Ben Rinehart . John Shannon . • • . • • •
Senior Engineering Geclogist*** • • • • • • . Geologic Aid
Special Studies By
. • Senior Engineer, Water Resources Associate Engineering Geologist
• • • • • • . Assistant Civil Engineer . Land and Water Use Specialist***
x>civ
11
Gavin M. Craig • • Luther H. Gulick ••
Virginia Richardson Leonard E. Grady ••
Legal Review By
. . . . . . . . . ~ . . . . . . . . . . .
Plates And Drawings By
. . .
• • • Chief Counsel Senior Attorney
Delineator Delineator
* Replaced W. P. Rowe whoae tel'lll expired on Jauuary 15" 1961" and who waa continued in office to AprU 9 J 1961.
** Resigned July 1" 1962. *** Under service agreement with the Department of Water Resourcea.
xxv
'8
ACKNOWLEDGMENTS
Preliminar.y study of the availability of hydrologic data in the
area involved in the reference indicated that much of the information needed
by the Referee was available from various public agencies and other sources.
As a result, the State Water Rights Board contacted various entities and
individuals not parties to the lawsuit ·to secure from them this information
prior to and during original investigations of its own.
The Board is greatly indebted to the sources contacted for the
material supplied, and wishes to acknowledge its appreciation of the coop
eration and helpful attitude of the entities and individuals and their
staffs in providing copies of the available information to the Board.
Particular appreciation is expressed to the'following agencies:
Soil and Water Conservation Research Division, Agricultural Research Service, U. S. Department of Agriculture
Ground Water and Surface Water Branches, Geological Survey, U. S. Department of Interior
California Forest and Range Experiment station, Forest Service, U. S. Department of Agriculture
state Department of Water Resources Division of Oil and Gas, State Department of Natural Resources Water Resources Center, University of California at Los Angeles Department of Irrigation, University of California at Davis Metropolitan Water District of Southern California Los Angeles County Flood Control District
The whole-hearted assistance of these agencies and their staffs
appreciably lightened the task of the Referee and lessened the time and ex-
pense which would otherwise have been required to develop the information
needed. Many other entities and parties not herein named were helpful in
tn.any ways and their services to the Board are appreciated.
xxvi
Legal Review By
Gavin M. Craig • Luther H. Gulick • . . . . . . . . . . . . . . . .
Virginia Richardson Leonard E. Grady • •
Plates And Drawings By
• • Chief Counsel • Senior Attorney
Delineator Delineator
* Replaced W. P. Rowe whose tel'lll expired on J8.1IU&I7 15, 1961, and who was continued in office to April 9, 1961.
** Re signed July 1, 1962. *** Under service agreement with the Department of Water Resources.
xxv
ACKNOWLEDGMENTS
Preliminar,y study of the availability of hydrologic data in the
area involved in the reference indicated that much of the information needed
by the Referee was available from various public agencies and other sources.
As a result, the State Water Rights Board contacted various entities and
individuals not parties to the lawsuit ,to secure from them this information
prior to and during original investigations of its own.
The Board is greatly indebted to the sources contacted for the
material supplied, and wishes to acknowledge its appreciation of the coop-
eration and helpful attitude of the entities and individuals and their
staffs in providing copies of the available information to the Board.
Particular appreciation is expressed to the following agencies:
SoU and Water Conservation Research Division, Agricultural Research Service, U. S. Department of Agriculture
Ground Water and Surface Water Branches, Geological Survey, U. S. Department of Interior
California Forest and Range Experiment Station, Forest Service, U. S. Department of Agriculture
State Department of Water Resources Division of Oil and Gas, State Department of Natural Resources Water Resources Center, University of California at Los Angeles Department of Irrigation, University of California at Davis Metropolitan Water District of Southern California Los Angeles County Flood Control District
The whole-hearted assistance of these agencies and their staffs
appreciably lightened the task of the Referee and lessened the time and ex
pense which would otherwise have been required to develop the information
needed. ~ other entities and parties not herein named were helpful in
many ways and their services to the Board are appreciated.
xxvi
zo
DEFlNITIONS
Alluvial Fan or con~/ - A body of alluvial material deposited by a stream debouching from the region undergoing erosion above the apex of the cone.
AquiclUdeSl - A formation which, although porous and capable of absorbing water slow~, will not transmit it fast enough to furnish an appreciable supply for a well or spring.
Aquiferg! - A geologic formation or structure that transmits water in sufficient quantity to supp~ pumping wells or springs.
Artesian!! - An adjective applied to ground water, or things connected with ground water, such as a well, underground basin, etc., where water is under pressure and will rise to a higher elevation if afforded an opportunity to do so.
caPill~ Fringe - The partly saturated zone immediate~ above the water ta:ie in which water is held above the water table by capillary forces.
Consumptive Use - The amount of water used by the vegetative growth of a given area in transpiration or building of plant tissue and evaporated from adjacent soil. It also includes the evaporation of precipitation intercepted by vegetative growth or impervious area, the water evaporated in industrial processes, household uses, or that which is permanently incorporated in the product.
Culture (Land Use) - The land use or land cover existing under natural conditions or as modified by man.
Deep Percolation!/ - The moisture which penetrates below the depths from which it may be used by plants; it represents that part of the water absorbed which exceeds the field capacity of the soil within the depth of root development. In this report deep percolation is water which moves downward from the surface of the ground and reaches the water table.
Evaporation!/ - The process by which water passes from a liquid state, at temperatures below the boiling point, to vapor.
Export - Water that is conveyed out of the drainage area in artificial conduits for use in other areas or as sewage.
Fall Soil Moisture Deficiency - The depth of water in inches required at the beginning of the rainy season to bring the soil up to field capacity.
xxvii
Field Capacity - The maximum amount of capillary water that can be held in a freely drained root zone, measured as the ratio of weight of water retained by the soil to the weight of the dry soil.
Ground WaterS! - The water in the zone of saturation.
Ground-Water Cascade - Descent of ground water on a steep hydraulic gradient to a lower and flatter water table slope. A cascade occurs when ground water flows over a sharp drop in the configuration of the nonwaterbearing rock forming the base of a free ground water body.
Ground Water I Confined~/ - A body of ground water overlain by material suffic1entlY impervious to sever free hydraulic connection with overlying ground water except at the intake.
Ground WatertoFree, (Unconfined)lV - Unconfined water is found in the zone of saturat n Whenever the upper surface of the zone forms a water table under atmospheric pressure, free to rise and fall with changes in volume of stored water.
Import - Water supplied from a source outside the area.
Irrigation Efficiency - The percentage of irrigation water applied that is consumed.
ISOh~t!/ - A line on the earth's surface as represented on a map connectng all points of equal precipitation.
Percolation!/ - The movement or flow of water through the interstices or the pores of a sailor other porous medium.
Permeability!! - The property of a material which permits appreciable movement of water through it when saturated and actuated by hydrostatic pressure of the magnitude normally encountered in natural subsurface water.
- I
p,ermeability, Coefficient of~/ - The rate of flow of a fluid through a cross section of a porous mass under a unit hydraulic gradient, at a temperature of 60°F. Yne standard coefficient of permeability used in the hydrologic work of the United States Geological Survey is defined as the rate of flow of water at 600F, in gallons a day, through a cross section of one square foot, under a hydraulic gradient of 100 percent.
Permeability, Field Coefficient of21 - The rate of flow of water, in gallons a day, under prevailing conditions, through each foot of thickness of ~ given aquifer in a width of one mile, for each foot per mile of hydraulic gradient.
xxviii
2.\
PhreatoPhyte!i 1/ - A plant that habitually obtains its water supply from the zone of saturation, either directly or through the capillary fringe.
Porosity - The sum of specific yield and specific retention which is equivalent to the total void space in the material, expressed as a percentage of the total volume ot the material.
PreciEitation1! - The total measurable supply of water received directly from clouds, as rain, snow, hail, and sleet; usually expressed as depth in a day, month, or year, and designated as dai~, month~ or annual precipitation.
Residual Rain - The residual amount of precipitation on a given impervious area a£ter evaporation has occurred, expressed either in units of depth or in acre-feet.
Rising Water - Ground water effluent which appears as surface flow in stream channels.
Safe Yield - The maximum quantity of water which can be withdrawn armually from a ground water supply under a given set of conditions without causing an undesirable result.
Sewage Export - Sewage that is removed from the dra~age area by pipelines or other artificial conduits.
Sewer Infiltration - Movement of ground water into conduits.
SpeCific Capacity - The discharge in gallons per minute per foot of drawdown in a pumped well.
§Pecific Retention - As applied to water-bearing material it is the ratio of the volume of water which will be retained by th~ material against the force of gravity, expressed as a percentage of the total volume of the material.
SpecifiC Yield - As applied to water-bearing materials it is the volume ot water drained by the force of gravity from a saturated material over a reasonably long period of time, expressed as a percentage ot the total volume of the saturated material.
Spread Water - Native or imported water discharged into spreading basins for the purpose of percolating to the zone of saturation •.
Storm Runoff - The residual of precipitation that is drained from the surface of the land and appears in surface streams. (Storm runoff does not include rising water, industrial waste, or sewage which ~ comprise a portion of the flow in surface streams).
xxix
Thiessen PoJ,ygon - The area, surrounding a precipitation station, which is cfrcumscribed by the perpendicular bisectors of straight lines drawn to adjacent stations.
Transmissibility - The characteristic property of the entire saturated portion of an aquifer to transmit water.
Transmissibility, Coefficient ofZ/ - The field coefficient of permeability multiplied by the thickness, in feet, of the saturated part of the aquifer.
Underflow - Relatively horizontal movement of water through saturated granular material under hydraulic gradients commonly developed underground.
Water Table - The upper surface of the body of free water which completely fills all openings in a granular material sufficiently pervious to permit percolation.
Wilt~ Point - The amount of water present in the soil when the leaves of p ants first undergo permanent reduction in their water content as the result of deficiency in the supply of soil moisture.
Year - Unless otherwise noted, the water year from October 1 to September 30. ---- The year 1928-29 is October 1, 1928 through September 30, 1929. The
period 1929-57 is October 1, 1928 through September 30, 1957.
Zone of Aeration - The zone above the water table in which interstices are partly filleq with air.
Zone of Saturation - The zone below the water table in which interstices are completely filled with ground water.
11 21 :2/ J±I
2.1
Glossary - Water and Sewage Control Engineering, APHA, ASCE, JiWWA, FSWA.
Tolman, C. F. - IIGround Water II , 1937. Glossary of Geology and Related Sciences, AGI,
2nd Edition, November, 1960. Ground Water Basin Management, ASCE Manual of
Engineering Practice No. 40. Meinzer, O.E. - IIHydrologyll, 1942.
:xxx
ZZ,
SUMMARY OF FINDINGS
The Order of Reference in the case of City of Los Angeles va.
City of San Fernando, et al., No. 650079, Superior Court, Los Angeles
County, directs the State Water Rights Board to investigate, find, and
report upon physical facts as enumerated in the Order. The results of
the referee's investigation are contained in this report and are summarized
as follows, with reference at the beginning of each section to the specific
requirements of the Order.
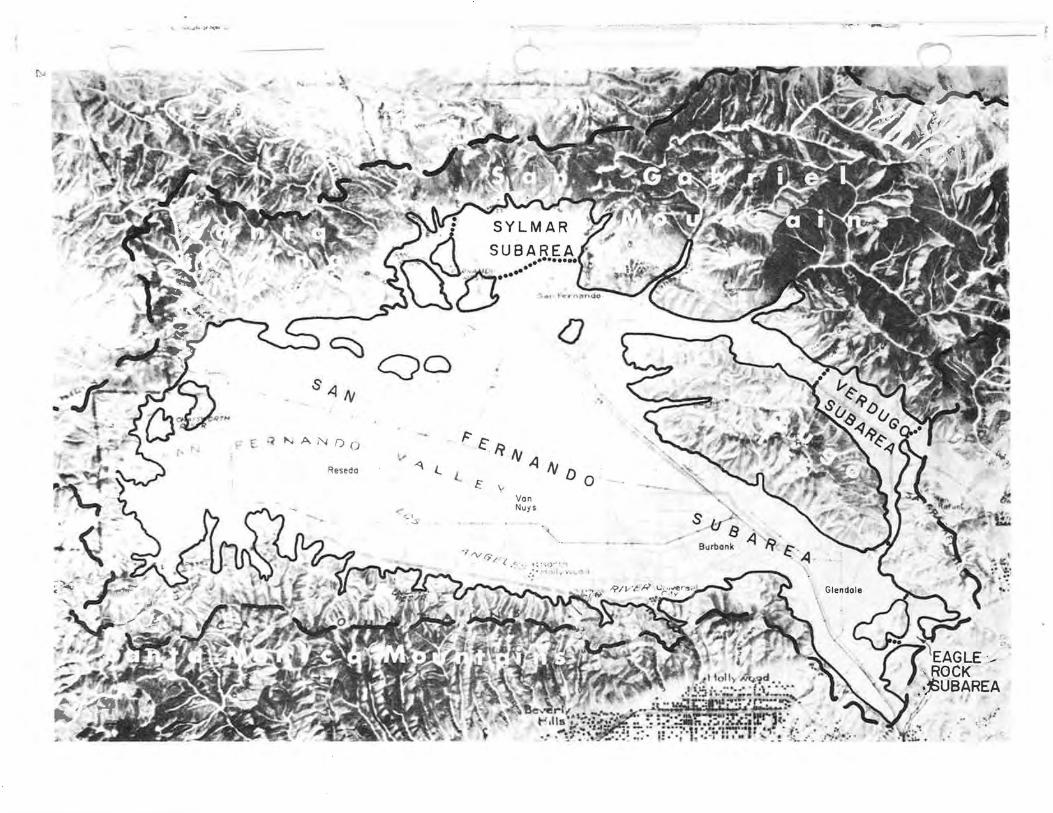
Description of Area
"1.1. THE GEOGRAPHIC AND HYDROLOGIC (SURFACE AND GROUND WATER) BOUNDARIES OF THE WATERSHED OF THE LOS ANGELES RIVER AND ITS TRIBUTARIES ABOVE THE JUNCTION OF THE SURFACE CHANNELS OF THE LOS ANGELES RIVER AND THE ARROYO SECO AT A POINT NOW DESIGNATED AS LOS ANGElES COUNTY FLOOD CONTROL DISTRICT GAUGING STATION NO. F57. (NOTE: IF SAID BOUNDARY DIFFERS FROM THAT DEPICTED ON AND DESCRIBED IN APPENDICES 'A' AND 'B' ATTACHED TO PLAINTIFF'S AMENDED COMPLAINT, THEN THE AREAS INCLUDED WITHIN BarH BOUNDARIES SHALL BE ::iTUDIED AND SHALL BE INCLUDED IN THE TERH 'SAID AREA' AS HEREINAFTER USED.) II
The term "Upper Los Angeles River Area II , as used in this report,
refers to the surface area comprising all of the watershed of the Los
Angeles River and its tributaries above the junction of the surface channels
of the Los Angeles River and the Arroyo Seco at a point now designated as
Los Angeles County Flood Control District gaging station No. F-57. The geo-
graphic boundary of this area has been interpreted to mean and is in fact
identical with the boundary of the Upper Los Angeles River area, and conforms
generally with that described in Appendixes A and B attached to Plaintiff's
Amended Complaint. This boundary is described on pages 11 and 18 and is the
waterShed boundary delineated on Plate 2. The hydrologic boundary has been
xxxi
interpreted as that boundary which delimits the areal extent of major
ground water sources within the Upper Los Angeles River area and is the
boundary of valley fill depicted on Plate 5 and described on pages 43 and
44 of Chapter III. A bedrock ridge located to the west of Pickens Canyon
traverses the valley fill in a southwesterly direction (see Plate 6 and
page 42) and is an impediment to ground water flow. The Report of Referee,
Raymond Basin Reference, used the easterly bank of Pickens Canyon as an
approximation of this impediment, the valley fill area to the east being a
portion of the Monk Hill Basin. For convenience this boundary has also been
adopted by the Referee for the San Fernando Valley Reference (see Plate 5).
The Upper Los Angeles River area is situated northwesterly of the
original Pueblo of Los Angeles and contains a total of about 329,000 acres,
of which about 123,000 are valley fill area and about 206,000 are hill and
mountain area. The major tributary streams, Pacoima Wash and Tujunga Wash,
originate in the San Gabriel Mountains, which form the northeasterly portion
of the watershed. These streams traverse the valley fill area in a southerly
direction and join the Los Angeles River, which follows an easterly course
along the base of the Santa Monica Mountains before it turns south through
the Los Angeles River Narrows leaving the Upper Los Angeles River area at
Gage F-57. Several minor streams in the Simi Hills and Santa Susana
Mountains in the westerly portion of the watershed are tributary to the Los
Angeles River in the westerly portion of the valley fill area. Other minor
streams, including Verdugo Wash, drain the easterly portion of the watershed
comprising the Verdugo Mountains, the Elysian, San Rafael and Repetto Hills
and the La Crescenta area.
xxxii
,
Ground Water Ocourrenoe and Movement
"I. 2 • THE CrnPLEl'E GEOLOGY, INSOFAR AS IT AFFECTS THE OCCURRENCE AND MOVEMENT OF GROUND WATER, AND THE SURFACE AND GROUND WATER HYDROLOGY OF SAID AREA, INCLUDING BASINS AND SUB-BASINS THEREIN, INCLUDING BUT NOT LIMlTED TO:
A. THE TOPOORAPHY AND SOILS.
B. THE SURFACE LOCATION OF THE BED AND BANKS OF THE CHANNELS OF THE LOS ANGELES R1VER AND ITS TRIBUTARIES.
C. THE AREAS, LIMITS AND DIRECTION OF FLCW OF ALL GROUND WATER IN SAID AREA, INCLUDING, BUT NOT LIMITED TO, ANY AND ALL WATERS PERCOLATING THEREiN."
The major water-bearing formation is the valley fill material
areally bounded by the generally nonwater-bearing hill and mountain forma
tions whioh also oomprise the underlying bedrock (See Plate 4 and pages 21
through 40). Topographically the valley fill area has a generally uniform
grade in a southerly and easterly direction with the slope gradually
decreasing from the base of the hills and mountains to the surface drain-
age outlet at Gage F-57. The valley fill soil mantle is of greatest
permeability along and easterly of Pacoima and Tujunga Washes and gener-
ally throughout the eastern portion of the valley fill area except in the
vicinity of the City of Glendale where it is of lesser permeability_
Valley soils west of Pacoima Wash are in turn generally less permeable
than those in the vicinity of Glendale _ Topography and soil types are
depicted on Plates 2 and 3 respectively. Source and characteristics of
the valley soils are described on pages 24 and 25.
Ground water occurs mainly within the valley fill with only
minor amounts occurring in hill a.nd mountain areas. Ground water move-
ment into the water-bearing valley fill from bedrock fractures and from
xxxiii
the small amounts of permeable materials existing in the hill and mountain (
formations is possible but is believed to be minor and is not susceptible
to eValuation. Available geologic data do not indicate that there are aqy
sources of native ground water other than that which is derived from
precipitation. No indications of juvenile water or water transported from
outside the watershed along faults or fracture systems have been found.
Ground water movement in the valley fill generally follows the
surface topography and drainage except where geologic or man-made impedi
ments occur or where the natural now has been modified by extensive
pumping. The area of the major water-bearing material is described by the
boundary of valley fill delineated on Plates 2 and 5. Vertical limits
of this water-bearing fill material are defined by the surface topo
graphy elevation shown on Plate 2 and the bedrock elevations depicted by
contours on Plate 6 and are described on pages 40 through 43. Direction
of ground water now within the water-bearing fill material is along the
gradient taken normal to the ground water contours.
The ground water conditions which have existed during the
1928-29 through 1957-58 period are illustrated by Plates 27, 28, 29 and 30
which show ground water contours for the years 1931, 1938, 1944 and 1958
respectively.
xxxiiia
· (
xxxiiib
The vall.ey- fill material is a heterogeneous mixture ot c1&1'8, suts,
sands and gravels laid down by tha alluviation process. Characteristic com-
position of the fUl is depicted on Plates ,A through.5B. ClaY'S and finer
materials predominate west ot Pacoima Wash, whereas coarser materials predollli-
nate in the easterly portion of the valley. Specific yields or water-yield1og
capacities of these materials T&ry froll 3 percent for clay' to 26 percent for
coarse sand or fine gravel. Specific yield ot the water-bearing II&terials is
.et torth on page 63.
The surface location ot the bed and banks of the Los Angeles River
and its tributaries is shown on Plata 2. Location of these channels on the
valley- floor in 1893 is shown on Plate 11 and the improved channels existing
in 1958 are shown on Plate 12.
Hydrologic Subareas
lfI.2,D. THE AREA, IDCATION, NATURE, CHARACTERISTICS AND LIMITS OF ANY AND ALL BASINS AND SUB-BABINS AND THE INTERCONNECTION OR INTERDEPENDEHCE THERIDF, WITHIN SAID AREA. tI
There are tour hydrologic subareas consisting of San Fernando, SylJDar,
Verdugo and Eagle Rock which, along with the portion of the Monk Hill Basin
within the area (609 acres), comprise the ground water reservoir' of the Upper
Los Angeles River area. The areal. extent of these subareas and the portion ot
Monk Hill Basin, which occupy the total valley fill area, are shown on Plate ,.
The subareas are bounded by ilRpedilllents to flow of ground water which are
caused by faulting, folding, alluvial constrictions or man-made works. The
San Fernando, Sylmar, Verdugo and Eagle Rock Subareas comprise 90.8, 4..5, 3.8
and 0.6 percent of the total valley fill respectively.
xxxiv
(
(
zS
The San Femando Subarea is adjacent to and receives surface drain
age trom each ot the other three subareas. The amount ot subsurface flow trom
the smaller subareas to San Fernando Subarea depends upon ground. water gradient,
transmissibility and the extent ot the connection between the subareas. The
Eagle Rock, Sylmar and, Verdugo Subareas are not directly interrelated or inter
dependent upon each other. Estimated amount ot subsurface tlow from the Sylmar
Subarea to the San Fernando Subarea is shown in Table )2, page 161, and aver
ages 550 acre-teet annuall.y; Subsurtace now from the Verdugo and Eagle Rock
Subareas to the San Fernando Subarea is insignificant and has been considered
as nil.·
The San Fernando Hydrologic Subarea contains 112 ,~7 acres and occupies
all of the valley fill area except that occupied by 'the other three Bubareas and
the Monk Hill Basin. The valley fill materials in the eastern portion of the sub
area are generally sand and gravel and have the ability to store a higher per
centage of water than the fine-grained materials in the western portion (see
pages 46 through ,0).
The Sylmar Hydrologic Subarea contains 5,565 acres and is located
northerly of the San Fernando Subarea. Both free and confined ground water areas
exist in this subarea. Subsurfac~ flow from the Sylmar Subarea to the San
Fernando Subarea takes place at two notches that have been eroded into the trun
cated south limb of the Little Tujunga syncline which forms the southern boundary
of the Sylmar Subarea (see pages 51 through 55).
The Verdugo Hydrologic Subarea is located northeasterly of the San
Fernando Subarea and contains 4,400 acres. Available information indicates that
movement of ground water from the Verdugo Subarea to the San Fernando Subarea is
almost completely controlled by a man-made submerged dam and well diversions by
the City of Glendale in the cross-sectional area of the Verdugo Wash Canyon between
the Verdugo Mountains and the San Rafael Hills. Subsurface outflow from the
portion of the Monk Hill Basin (609 acres) within the Upper Los Angeles River
area easterly ~o the main portion of the Monk Hill Basin is by means of a buried
erosion channel of ~ ancestral Pickens Canyon Wash and has ranged from 250 acre
feet to 400 acre-feet per year and has averaged 300 acre-feet per year during
the base period (see pages 42, 56 through 58, and Table 31 on page 160). Sub-
surface flow from Monk Hill Basin southwesterly to the Verdugo Subarea is pre
vented, in all but high ground water conditions, by a bedrock ridge on the
westerly side of the above ancestral Pickens Canyon Wash.
The Eagle Rock Hydrologic Subarea contains 807 acres and is situated
to the southeast of the San Fernando Subarea. Eagle Rock Subarea is an artesian
basin lying above the Raymond fault zone. Available information indicates that
subsurface flow to the'San Fernando- Subarea is entirely or almost entirely stopped
by this fault zone (see pages 58 through 61).
Amounts and Quality of Water'Supply
"I.2.E. THE QUALITY OF ALL WATERS WITHIN SAID .AREA AND THE EFFECT THERIDN OF THE IMPORTATION OF OWENS V ALLEY WATER.
I. 2 • F • THE SOURCE AND QUANTITY OF ALL WATERS, .AND THE PLACES OF APPLICATION .AND USE OF FOREIGN WATERS, ENTERING SAID AREA EACH . WATER YEAR FOR THE PERIOD COVERED BY AVAILABLE RECORDS .AND INFORMATION.
I. 7. ALL SOURCES OF WATER SUPPLY OF PLAINTIFF .AND DEFENDANTS, AND THE QUANTITY THERIDF FDR THE PERIOD OF AVAILABLE RECORDS AND INFOmATION ro AND INCLUDING THE DATE OF THE REPORT:
(a) DIVERTED AND USED; AND
(b) AVAILABLE FOlt .JIVERSION AND USE. "
The present water supply to the Upper Los Angeles River area is
comprised of precipitation on the watershed, import from the Mono Basin Owens
River System and import from the Colorado River. The average annual precipi-
tation for the 85-year period, 1871-72 through 1956-57 on the valley floor
is about 16.3 inches or 167,740 acre-feet, and on the hill and_mounta~ area
xxxvi
is about 22 inches or 377,110 acre-feet, making a total average annual
water crop of about 544,850 acre-feet. Of the rain on the mountain and
hill areas only an average of 44,000 acre-feet per year reached the valley
fill area as runoff during the 29-year base period from 1928-29 through
1956-57. During the 29-year base period, the annual precipitation was
above normal for about one-third of the years and subnormal for about
two-thirds. This approximates the proportion of years of subnormal and
above normal annual precipitation occurring in the 85-year period. Annual
precipitation for the 29-year period averaged 541,720 acre-feet or 99.5
per cent of the 85-year normal. During this 29-year period the annual water
crop from precipitation ranged from a minimum of about 50 per cent of normal
in 1947-48 and 1950-51, to a maximum of 224 per cent of normal in 1940-41.
Annual amounts of precipitation are listed in Table 1, page 69, for the
period 1928-29 through 1957-58.
Runoff from the hill and mountain area plus precipitation on the
valley fill less storm runoff at Gage F-57 is the native water supply
available to the valley fill area. An average of about 88 per cent of the
annual precipitation on the hill and mountain area is consumed there. Runoff
to the valley floor accounts for the remaining 12 per cent. Annual runoff
reaching the -valley floor from precipitation on the hill and mountain area
ranged from 3,450 acre-feet in 1950-51 to 191,400 acre-feet in 1940-41 and
averaged 44,000 acre-feet during the base period (Table 3, page 76 and
pages 74 and 75).
Annual storm runoff leaving the area at Gage F-57 has varied
from 1,330 acre-feet in 1929-30 to 138,990 acre-feet in 1940-41 and averaged
30,790 acre-feet during the base period 1928-29 through 1956-57 (Table 28,
Z~ page 155).
xxxvii
Owens River water was first served in the Upper Los Angeles
River area via the Los Angeles Aqueduct, owned and operated by the City
of Los Angeles, in May 1915. A portion of the water from this source
is passed through the area to serve other portions of the City of Los
Angeles. The net annual amount of Owens River water remaining in the
area during the 30-year period from 1928-29 through 1957-58 has varied
from 74,000 acre-feet in 1940-41 to about 162,000 acre-feet in 1957-58
including the portion which has been spread for direct recharge of ground
water which has averaged 7,800 acre-feet per year during the base period
(Table 8, page 97 and Table 24, page 145).
Colorado River water has been imported into the area since 1939-
40 with the 70 acre-feet imported that year increasing to 13,250 during
1956-57. Annual amounts imported from this source during the 19-year period
averaged about 4,300 acre-feet (Table 8, page 97).
The amounts of water available at their source of import for
diversion and import and use by the parties from sources outside the Upper
Los Angeles River area have been considered primarily from the viewpoint
of physical availability at points of diversion of existing works. A
determination of legal availability would involve findings concerning
other rights to these sources which are not within the purview of this
reference. Information available indicates that there is no additional
firm supply for plaintiff and for defendants from the Central and West
Coast Basins because these ground water sources are now overdrawn. Runoff
which has occurred in channels tributary to diversion works of the Los
Angeles Aqueduct from the G-I'lens and Hono Basins and amounts in excess
of the quantities diverted are shown in Table 5 on page 83. The net
xxxviii
(
diversions from the Colorado River by The Metropolitan Water District
( of Southern California are shown in Table 6 on page 86. Preferential
rights and priorities of members of The Metropolitan VJater District are
shown on pages 88 and 91 respectively.
cl
Annual amounts of water imported through the Lee An~eles and
Colorado River Aqueducts for delivery within the Upper Los Angeles River
area are listed in Table 8, page 97, for the years prior to 1958-59.
The water service areas are shown on Plates 19 and 20 respectively
for large and small entities. The annual amounts of imported water delivered
to each of the larger entities are listed by water service areas in Table M-2
for Mono Basin-Owens River water and in Table M-3 for Colorado River water.
Water delivered in the Upper Los Angeles River area may be imported
water, local ground water or local surface diversions, or a mixture depending
on the area and water system operation. In the 1928-29 through 1957-58 period,
gross ground water extractions in the Upper Los Angeles River area for all
purposes including export have increased from 67,330 acre-feet in 1932-33 to
163,270 acre-feet in 1956-57 and have averaged 111,920 acre-feet during the
base period (See Table 15, page 124). During the same period, surface water
diversions averaged 660 acre-feet and varied from 160 acre-feet in 1956-57
to 1,470 acre-feet in 1943-44 (See Table 16, page 125).
Quality of water imported from the Owens-Mono Basins is good, being
of sodium calcium bicarbonate character and averaging about 215 parts per
million (ppm) total dissolved solids (TDS). Colorado River import is of
sodium sulfate character and has averaged about 774 parts per million (ppm)
total dissolved solids (TDS). Surface runoff in the Upper Los Angeles River
area varies from a calcium sulfate type in the southwesterly portion to a
xxxix
predominantly calcium bicarbonate type from the north and easterly portion.
Concentration of total dissolved solids in surface runoff at the valley
outlet vary generally in an inverse proportion to the magnitude of runoff
rates and vary from about 100 ppm at peak flows to over 1,000 ppm during
times of minimum flow. Ground waters reflect the same general source
area influence on their character as indicated by surface flows, being
predominantly calcium sulfate in the westerly portion and calcium
bicarbonate in the remainder of the area. Ground waters of the basin
are generally within U. S. Public Health Drinking Water Standards of
1946 (See pages 98 through 105).
Quality characteristics of Upper Los Angeles River area ground
waters and waters imported thereto are shown on Plate 15. Concentrations
of total dissolved solids, and sulfate, chloride and nitrate ions found
in solution in ground waters in the area are shown in Table 9, on pages
101 and 102 and flates 17A, B, C and D.
Except for a short period of time in 1932 when boron concentra
tions were above normal, tne quality of waters imported from Owens River
and Mono Basin have been equal or superior to the native waters of the
Upper Los Angeles River area and have not otherwise adversely affected
the quality of the native waters (page 105).
xl
(
I'later Use and Disposal in the Upper Los Angeles River Area
"I • 2, G • THE NA WEE AND QUANTI TY OF ALL WATER LOSS AND DIMINUTION vJITHIN AND FROM SAID AREA, EACH WATER YEAR FOR THE PERIOD COVERED BY AVAILABLE RECORDS AND INFORMATION.
I.4. AS TO EACH PARTY TO THE WITHIN ACTION FOR THE PERIOD OF AVAILABLE RECORDS AND INFO~illTION:
(a) THE LOCATION AND CAPACITY OF HIS OR ITS DIVERSION WORKS;
(b) THE CHARACTER OF HIS OR ITS USE OR USES OF WATER; AND
(c) THE AMOUNT OF HIS OR ITS TAKING AND USE OF WATER. II
Water is used in the area for agricultural and municipal purposes,
the latter including commercial, industrial and recreational uses. Diminution
of water so used is by evaporation, or transpiration to the air or by leaving
the area as sewage or waste outflow in surface channels. Major surface
outflow occurs from storm runoff. Minor additional outflows occur
comprised of rising ground water and Owens River water released to the
river system in excess of percolation and rediversion. Minor subsurface
outflow occurs through the alluvium at Gage F-57 and from the Verdugo Subarea
immediately east of Pickens Canyon Wash.
Land U~e
During the 30-year period 1928-29 through 1957-58, the type of
land use has changed from primarily agricultural to urban. In that period
irrigated agriculture was reduced from 58,400 acres, or 47 per cent of the
123,400 acres of valley fill in 1928-29, to about 16,200 acres or 13 per cent
in 1957-58. Urban land use,' comprising residential, commercial and industrial
xli
acreage, has more than tripled during the period, increasing from about
22,000 acres in 1928-29 to about 75,400 acres during 1957-58 (See Plates
22 through 25, Table 17, page 128 and Figure 1, page 129).
Extraction and Export of Ground Water
In addition to import supplies, ground water is pumped from
the valley fill and applied thereon for the named uses. Total annual
extractions so used ranged from 34,890 acre-feet in 1928-29 to 73,390
acre-feet in 1952-53 and averaged 54,320 acre-feet during the base
period (Table 20, page 138).
The capacity and location of the diversion works of the parties
are listed in Tables 11 and 12 on pages 112 through 115 and 117 through
119 respectively. The location of all wells of record is shown on
Plate 18. Where more than one party has an interest in a diversion
works, the data on the diversion works are listed under the party believed
to have the major interest. A cross reference to joint interests of
part.ies is shown in Table 10 on pages 107 through 109.
The character of water use (accounted as municipal, domestic,
irrigation, industrial, commercial or recreation) is indicated for each of
the parti.es in Table 11 on pages 112 through 115.
Annual amounts of the taking of water by each of the parties
are listed in Tables 12 and 13 on pages 117 through 120 for the period
of available record.
Ground water has been pumped and exported from the area mainly
by the City of Los Angeles with minor amounts exported from the Verdugo
Subarea by La Canada Irrigation District. Total annual export of ground
xlii
(
water has varied from 32,010 acre-feet in 1932-33 to 90,750 acre-feet in
1956-57 and has averaged 57,600 acre-feet during the base period (Table 19,
page 135).
Sewage
Sewage has been exported from the area via the North Outfall sewer
since 1925 and the San Fernando Valley Sewer Relief tunnel since 1956.
Total annual sewage exported, including a minor amount of ground water
infiltration, has varied from 6,320 acre-feet in 1925-29 to 63,960 acre
feet in 1957-5S and averaged 24,670 acre-feet during the base period. A
portion of the water delivered in the area is disposed to the ground water
table through local disposal units including cesspools. This amount has
increased in recent years from 3,950 acre-feet in 1934-35 to 20,550 acre
feet during 1956-57 and has averaged 9,330 acre-feet annually during the
base period (Table 26, page 151).
Surface Outflow and Native Runoff Spread
Annual total surface outflow passing Gage F-57, which is comprised
of storm runoff, Owens River water, rising ground water and industrial waste,
including a small amount of spilled sewage, ranged from 1,660 acre-feet in
1929-30 to 164,960 acre-feet in 1940-41 and averaged 39,940 acre-feet during
the base period (Table 2S, page 155).
A portion of the mountain and hill runoff reaching the valley fill
has been spread for direct recharge of the ground water. Annual spreading
of runoff water ranged from zero in several years to 30,380 acre-feet in
19S7-SS and averaged 3,060 acre-feet during the base period (Table 30, page ISS).
xliii
Subsurface Outflow
Subsurface flow leaves the Upper Los Angeles River area at
two locations, one southerly through the L05 Angeles Narrows and the
other easterly in the vicinity of Pickens Canyon. Subsurface outflo~s
at these locations have averaged about equal amounts for a total of
650 acre-feet per year during the base period (Table 31, page 160).
Consumptive Use
Disposal of water from the valley fill area through the
corrhined consumptive use of precipitation, delivered water and ground
water has been computed in Chapter V by the Inflow-Outflow Method.
Consumptive use determined in this manner averaged 227,200 acre-feet
per year for the base period from 1928-29 through 1956-57 (Table 34,
page 169).
illv
(
(
30
Effect of Water Supply and Use on Ground Water Recharge and Storage
"I. 2. THE COMPLETE GIDIDGY, INSOFAR AS IT AFFECTS THE OCCURRENCE AND MOvmENT OF GROUND WATER, AND THE SURFACE AND GROUND WATER HYDROIDGY OF SAID AREA, INCLUDING BASmS AND SUB-:RASTN~ THEREIN. INCLUDING BUT NOT LIMITED TO·"
'.LCle ne-u eJ.,i ec-r. O~ Wd."er' Sl4.ppi..)I &,0. ul..sPOBcU. 15 refl.ected by the
ground water levels in the ground water reservoir. Water levels in the
westerly portion of the valley fill in San Fernando Subarea have had relatively
minor fluctuation indicating a net gain of about 10 feet during the 29-year
base period. In contrast, levels in the easterly portion of that subarea drop
ped slightly and recovered between 1928-29 and 1934-35 and then generally in
creased to a maximum in 1944, at which time the basin contained the maximum
amount of water in storage during the 1928-29 through 1957-58 period. After
1944 levels dropped at a rapid rate to record lows in 1957-58, when water in
storage was the minimum of record to that time~ Water levels in the Sylmar and
Eagle Rock Subareas have had relatively minor fluctuations during the period,
with those in the former indicating a small net drop and in the latter reflect
ing little net change. Water levels in the Verdugo Subarea followed the same
general pattern as those in the easterly portion of San Fernando Subarea but
with fluctuations of less magnitude.
Concentration of pumping activity in the Los Angeles Narrows area
has resulted in a reversal of the ground water gradient in that area subsequent
to 1958 (see Plates 27, 28, 29, 30, 31, 3lA, 3IB, 32, 33, 34A, 34B and 34c).
The maximum annual change in ground water storage during the base
period occurred in 1940-41 with an increase of water in storage of 128,020
acre-teet. The average annual change in storage during the base period was
a decrease of 11,950 acre-feet (see Table 33, page 166).
xly
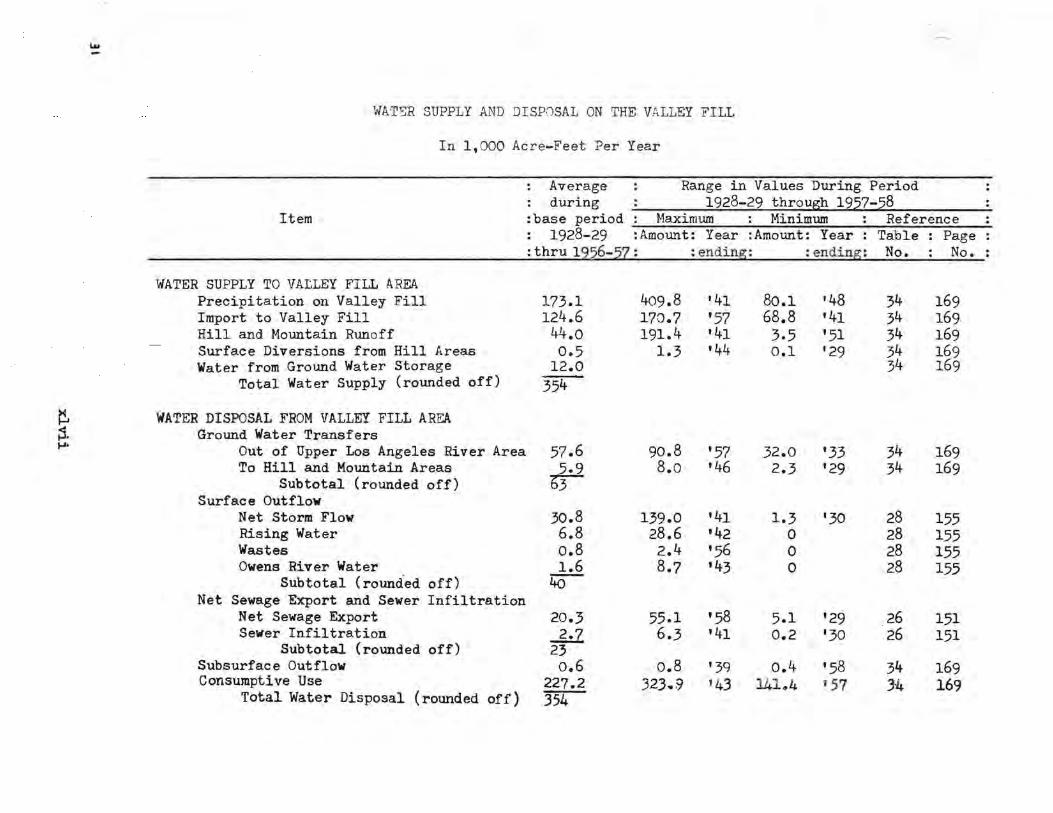
A summary of the items comprising the water supply and disposal
on the valley fill is presented in the following tabulation in terms of the
range in each item during the 30-year period 1928-29 through 1957-58 and the
average of each during the 29-year base period 1928-29 through 1956-57.
During the 29-year base period 1928-29 through 1956-57, total
annual historic ground water recharge has ranged from 58,700 acre-feet in
1928-29 to 247,200 acre-feet in 1940-41 and averaged 112,200 acre-feet (see
Table 43, page 203).
xlvi
WAT"SR SUPPLY AND DISP·)SAL ON THE VALLEY FILL
In 1,000 Acre-Feet Per Year
Average Range in Values During Period during 1928-29 through 1957-58
Item :base period Haximum Minimum Reference 1928-29 : Amount: Year :Amount: Year : Table Page
: thru 1956-57 : : ending: : ending : No. No.
WATER SUPPLY TO VALLEY FILL ~REA Precipitation on Valley Fill 173.1 409.8 '41 80.1 '48 34 169 Import to Valley Fill 124.6 170.7 '57 68.8 '41 34 169 Hill and Mountain Runoff 44.0 191.4 '41 3.5 '51 34 169 Surface Diversions from Hill Areas 0.5 1.3 '44 0.1 '29 34 169 Water from Ground Water Storage 12.0 34 169
Total Water Supply (rounded off) 354
~ WATER DISPOSAL FROM VALLEY FILL AREA is. Ground Water Transfers ~. Out of Upper Los Angeles River Area 57.6 90.8 '57 32.0 '33 34 169
To Hill and Mountain Areas 5.9 8.0 '46 2.3 '29 34 169 Subtotal (rounded off) b3
Surface Outflow Net Storm Flow 30.8 139.0 '41 1.3 '30 28 155 Rising Water 6.8 28.6 '42 0 28 155 Wastes 0.8 2.4 '56 0 28 155 Owens River Water 1.6 8.7 '43 0 28 155
Subtotal (round'ed ofr) 4() Net Sewage Export and Sewer Infiltration
Net Sewage Export 20.3 55.1 '58 5.1 '29 26 151 Sewer Infiltration ..b1. 6.3 '41 0.2 '30 26 151
Subtotal (rounded ofr) 23 Subsurface Outflow 0.6 0.8 '39 0.4 '58 34 169 Consumptive Use 227.2 323 .. .9 '43 141.4 '57 }4 169
Total Water Disposal (rounded off) 354
Safe Yield and the Effect of Import
"I. 2. H. THE SAFE YIELD, .AND THE EFFECT THEREON OF THE JMPORTATION OF FOREIGN WATERS, SHALL BE DETERMINED FOR THE WATER YEAR IMMEDIATELY PRECEDING THE FILING OF THE REPORT FOR WHICH DATA IS AVAILABLE, AND FOR THE WATER YEARS ENDING 1950 AND 1955."
The safe yield of the Upper Los Angeles River area ground water
reservoir has been determined as the maximum average annual pumpage draft
which can be continually withdrawn for useful purposes under a given set
of conditions without causing an undesired result.
Safe yield has been based on cultural conditions existing
during the water years 1949-50, 1954-55 and 1957-5B. The latter is the
last year preceding the filing of the report for which data are available.
Safe yield has been determined through the evaluation of the
average net ground water recharge which would occur if the culture of
the safe yield year and the average historic import and export for that
year had existed over a period of normal native supply. All items of
supply and disposal responsive to both precipitation and economic conditions
were based on the 9 year period from 1949-50 through 1957-58, whereas
items responsive primarily to precipitation on the valley fill area were
based on the 29 year base period 1928-29 through 1956-57. Base ground
water levels used were those existing as of the end of 1957-58 (See pages
208 through' 243).
xlviii
(
32
Availability of regulatory ground water storage space does not
impose any limitation on safe yield under the conditions adopted (see
page 207).
The safe yield, in acre-feet per year, of the Upper Los Angeles
River area ground water reservoir, determined under the conditions adopted,
is 100,800, 100,400 and 97,600 for the years 1949-50, 1954-55 and 1957-5B
respectively. That portion of the safe yield derived from native sources,
in acre-feet per year, is 62,100, 57,700 and 54,700 for the years 1949-50,
1954-55 and 1957-58 respectively. That portion of the safe yield derived
from import sources, in acre-feet per year, is 38,700, 42,700 and 42,900 for
the years 1949-50, 1954-55 and 1957-58 respectively (see Table 55, page 246b).
Importation of foreign waters increased the safe yield of the
ground water reservoir by 38,700, 42,700 and 42,900 acre-feet for the
respective safe yield years of 1949-50, 1954-55 and 1957-58. As a result
there was a decrease in deficiency of supply to meet the water requirements
ot the culture existing during the sate yield years to less than the
deficiency which would have occurred had local sources been the sole supply
(see Table 56, page 249 and page 250).
To eliminate the total water requirement not satisfied by total
water available under safe yield conditions of 33,900, 52,800 and 63,800
acre-teet per year for the respective safe yield years of 1949-50, 1954-55
and 1957-58, it would be necessary to modU'y the import, export and/or
demand (see Table 56, page 249). The foregoing deficiencies of water re
quirements are equivalent to a consumptive demand of 25,200, 38,500 and
46,800 acre-feet per year for the respective safe yield years of 1949-50,
1954-55 and 1957-58 (see Table 56, page 249).
xlix

Use of Hater by the City of Los Angeles and Others
"1.5. THE USE OF WATER BY THE CITY OF LOS ANGELES AND ITS INHABITANTS:
(a) SINCE 1948 WITHIN THE TERRITORY OF THE ORIGINAL PUEBLO; AND
(b) FOR THE PERIOD OF AVAILABLE RECORDS WITHIN THE EXPANDED BOUNDARIES OF SAID CITY AS THE SJUvIE E-XISTED FROI1 TIME TO TUm UP TO THE DA'IE OF THE REPORT HEREIN.
"1.6. THE AMOUNT OF IvATER DISTRIBUTED BY PLAI~'TIFF FOR THE PERIOD OF AVAILABLE RECORDS AND IN}'ORMATION TO AND INCLUDING THE DATE OF THE REPORT, FOR USE OUTSIDE ITS BOUNDARIES AS SUCH BOUNDARIES HAVE EXISTED FROM TIME TO TIME.
HI.7. AIL SOURCES OF WATER SUPPLY OF PLAINTIFF AND DEFENDANTS, AND THE QUANTITY THEREOF FOR THE PERIOD OF AVAILABLE RECORDS AND INFO~~TION TO AND INCLUDING THE DATE OF REPORT:
(a) DIVERTED AND USED; AND
(b) AVAIUBlli FOR DIVERSION AND USE."
Sources of water supply of the City of Los Angeles are the Owens
and Mono Basins via the Los Angeles Aqueduct, Colorado River via The Hetro-
politan Water District Aqueduct, surface diversions from the Los Angeles
River in the Upper Los Angeles River area and ground water extractions from
that area and from Central and West Coast Basins located outside the Upper
Los Angeles River area. Location of the Los Angeles and The Metropolitan
Water District Aqueduct systems and of well fields outside the Upper Los
Angeles River area are depicted on Plates 13, 14 and 35. Flow chart of
the import-export system in the Upper Los Angeles River area is depicted
on Plate 21. The Los Angeles Aqueduct has operated at full capacity since
prior to 1949-50. Design capacities along The Metropolitan Water District's
Santa Monica feeder which conveys Colorado River water to the area are shown
1
(
33
on the profile depicted on Plate 13.
Total annual water use by the City of Los Angeles within its
expanded boundaries, including all import and local supplies from West
Coast Basin, Central Basin and San Fernando Valley has varied since 1928-29
from 227,992 acre-feet in 1934-35 to 477,634 acre-feet in 1956-57 and
averaged 336,128 acre-feet during the 29-year period. Annual amounts of
water used by the City of Los Angeles and its inhabitants within its
expanded boundaries are shown on pages 255 through 257 by sources.
Deliveries by the city for use outside its boundaries varied
during the period 1950-51 through 1954-55 from 4,316 acre-feet in 1950-51
to 5,386 acre-feet in 1953-54. Annual amounts of water served by the City
of Los Angeles outside its boundaries are shown on page 258.
Use of water by the city within the territory of the original
Pueblo ranged ' from 73,533 acre-feet in 1949-50 down to 60,692 acre-feet
in 1957-58 and averaged 65,750 acre-feet during the nine-year period.
Annual amounts of water delivered by the City of Los Angeles within the
original Pueblo are shown on page 252 for the period 1949-50 through 1957-58.
Sources of water supply of defendants are Colorado River water
through The Metropolitan Water District Aqueduct and from the Upper Los
Angeles River area through surface diversions and ground water extractions
from wells. The amounts imported or diverted from these sources are set
forth in Tables 12 and 13 on pages 117 through 120 and in Tables J-3, J-4
and J-5 on pages J-12 through J-17 of Appendix J.
li
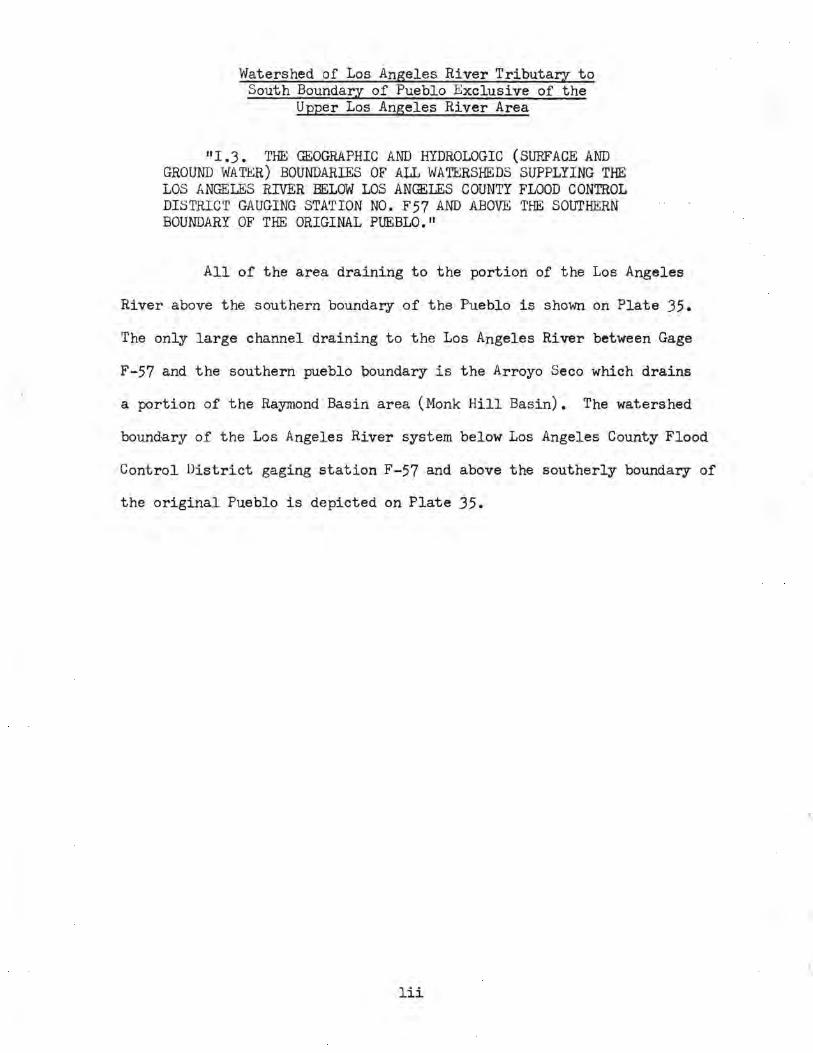
Watershed of Los Angeles River Tributary to South Boundary of Pueblo Exclusive of the
Upper Los Angeles River Area
"1.3. THE GEOGRAPHIC AND HYDROLOGIC (SURFACE AND GROUND WATER) BOUNDARIES OF ALL WATERSHEDS SUPPLYING THE LOS ANGELES RIVER BELOW LOS ANGELES COUNTY FLOOD CONTROL DISTRICT GAUGING STATION NO. F57 AND ABOVE THE SOlITHERN BOUNDARY OF THE ORIGINAL PUEBLO."
All of the area draining to the portion of the Los Angeles
River above the southern boundar,y of the Pueblo is shown on Plate 35.
The only large channel draining to the Los Angeles River between Gage
F-57 and the southern pueblo boundary is the Arroyo Seco which drains
a portion of the Raymond Basin area (Monk Hill Basin). The watershed
boundary of the Los Angeles River system below Los Angeles County Flood
Control District gaging station F-57 and above the southerly boundar,y of
the original Pueblo is depicted on Plate 35.
lii
CHAPTER I. INTRODUCTION
This report has been prepared for and pursuant to orders of the
Superior Court of California in and for the County of Los Angeles in action
No. 650,079 entitled liThe City of Los Angeles, a Municipal Corporation,
Plaintiff, vs. City of San Fernando, a Municipal Corporation, et al.,
Defendants." The complaint in the action requests a decree determining
that the plaintiff has a pueblo right paramount to the right of all
defendants; that the City has a prior right to all foreign water imported
by it, spread within the drainage area of the Los Angeles River, and
transmitted to the City's wells and other diversion works by the "surface
and subsurface channel" of the Los Angeles River; and that an injunction be
issued terminating pumping by the defendants within the watershed boundary
of the Los Angeles River above the confluence of Arroyo Seco.
Authorization
The basic Court order, pursuant to which this report has ,been
prepared, consists of the '~rder of Reference to State Water Rights Board to
Investigate and Report Upon the Physical Facts (Section 2001, Water Code),"
entered on June 11, 1958, as modified by: (1) Interim Order entered on
November 19, 1958, which directed that no further investigations, studies,
proceedings, or reports be made with respect to Paragraph II of the Refer
ence Order of June 11, 1958 unless further ordered; and (2) Orders made in
open Court on February 15, 1960, September 20, 1960 and November 15, 1960,
Reporter's Transcript, pages 5470, 6377, and 6756, respectively, and ex parte
orders extending the time for serving the draft report on the partie s, the
last such extension being to November 20, 1961, but ordering that copies
-1-
of the proposed draft report be made available to the parties at least
60 days prior to that date.
The Order of Reference of June 11, 1958, had been preceded by
an Interim Order of Reference entered by the Court on March 19, 1958,
pursuant to which the Board had studied the availability of records and
data and had given the COl~t its estimates of time and expense of reporting
thereon. In Paragraph I of the Order of Reference, the State Water Rights
Board is requested to investigate, find, provide data and report upon
phYsical facts in accordance with the authorization of Section 2001 of the
Water Code, as follows:
"1. The geo graphic and hydrologic (surf ace and ground water) boundaries of the watershed of the Los Angeles River and its tributaries above the junction of the surface channels of the Los Angeles River and the Arroyo Seco at a point now designated as Los Angeles County Flood Control District Gauging Station No. F57. (Note: If said boundar,y differs from that depicted on and described in Appendices 'A' and 'B' attached to plaintiff's Amended Complaint, then the areas included within both boundaries shall be studied and shall be included in the term 'said area' as hereinafter used.)
2. The complete geology, insofar as it affects the occ~rence and movement of ground water, and the surface and ground water hydrology of said area, including basins and sub-basins therein, including but not limited to:
A. The topography and soils.
B. The surface location of the bed and banks of the channels of the Los Angeles River and its tributaries.
C. The areas, limits and direction of flow of all ground water in said area, including, but not limited to, any and all waters percolating therein.
D. The area, location, nature, characteristics and limits of any and all basins and sub-basins and the interconnection or interdependence thereof, within said area.
E. The quality of all waters within said area, and the effect thereon of the importation of Owens Valley Water.
-2-
3S
F. The source and quantity of all waters, and the places of application and use of foreign waters, entering said area each water year for the period covered by available records and information.
G. The nature and quantity of all wc.ter loss and diminution within and from said area, each water year for the period covered by available records and information.
H. The safe yield~ and the effect thereon of the importation of foreign waters, shall be determined for the water year immediately preceding the filing of the report for which data is available, and for the water years ending 1950 and 1955.
3. The geographic and hydrologic (surface and ground lvater) boundaries of all lvatersheds supplying the Los Angeles River below Los Angeles County Flood Control District Gauging Station No. F57 and above the southern boundary of the original pueblo.
4. As to each party to the within action for the period of available records and information:
(a) The location and capacity of his or its diversion works;
(b) The character of his or its use or uses of water; and
(c) The amount of his or its taking and use of water.
5. The use of water by The City of Los Angeles and its inhabitants:
(a) Since 1948 within the territory of the original pueblo; and
(b) For the period of available records within the expanded boundaries of said city as the same existed from time to time up to the date of the Report herein.
6. The amount of 1'1ater distributed by plaintiff, for the period of available records and information to and including the date of the report, for use outside its boundaries as such boundaries have existed from time to time.
-3-
7. All sources of water supply of plaintiff and defendants, and the quantity thereof for the period of available records and information to and including the date of the report:
(a) Diverted and used; and
(b) Available for diversion and use."
Copies of the Interim Order of Reference, the Order of Reference,
and the Interim Order suspending further investigations, studies, or
reports pursuant to Paragraph II of the Order of Reference, are included
in Appendix S.
History of Proceeding
The case of City of Los Angeles, Plaintiff, vs. City of San
Fernando, Ci~y of Glendale, City of Burbank, et al., Defendants, is an
action for declarator,y relief, to quiet title to waters and water rights,
and for an injunction to restrain defendants from doing any act Which may
interfere with the free and uninterrupted flow of the" surface and sub sur-
face waters of the Los Angeles River and its tributaries and of the foreign
waters brought by the City of Los Angeles from sources outside the water-
shed of the Los Angeles River and spread within the watershed or served to
customers of the City of Los Angeles from its wells and other diversion
works Where such waters can be taken and used by the City of Los Angeles
for its inhabitants.
The complaint names some 214 defendants and includes numerous
Does alleged to have facilities Which are operated and maintained for the
taking of water, both surface and underground, from the upper Los Angeles
River drainage area as defined in Appendix A of the amended complaint.
-4-
"
I
Answers filed in the proceeding by various defendants allege that the water
taken and diverted has been necessary for the purposes for which it has
been taken and that each of them has a right to the water so taken.
The initial or Interim Order of Reference to State Water Rights
Board made by the Court on March 19, 1958 directed the Board to study the
availability of any and all public and private records, documents, reports
and data relating to a proposed order of reference tn the case and to
approximate the time required for, and to estimate the cost of obtaining,
correlating and reporting upon, such records, documenta, reports, and data,
and to report the results of its investigation and study to the Court on
June 9, 1958.
The Board, in making its report, presented an estimate that two
years would be required to complete the stUdies and prepare a report of
referee pursuant to the proposed order of reference.
On June 11, 1958, the Court by its Order of Reference to the
State Water Rights Board, appointed the Board as referee to investigate
and report within two years on the physical facts enumerated in the Order
of Reference in accordance with Section 2001 of the Water Code. The Board
was further instructed under Paragraph II of the Order of Reference to
investigate the nature, extent and availability of any and all records and
data reasonably necessary for the study of the Board with respect to water
years from and including that ending 1900 to the year preceding the Board's
report, and to report the results of such inVestigation to the court on
November 17, 1958.
-5-
On November 17, 1958, the State 1-vater Rights Board reported to
the Court, pursuant to Paragraph II of the Order of Reference, that in its
opinion insufficient data are available to justify a valid base period of
study or of safe yield determination prior to the water year 1928-29, and
that as to other items in Paragraph II, a report would be made at a later
date after the Board had proceeded further with its studies.
By Interim Order of November 19, 1958, the Court accepted the
Board's report of November 17, 1958 and released the Board from an,y further
investigation pursuant to Paragraph II of the Order of Reference until and
unless further ordered by the Court. The Court as a part of its order
instructed the Board to appear at pre-trial conference sessions in the
proceeding and to render progress reports, oral and written, on the
matters on vlhich it is required to report.
Representatives of the State Water Rights Board, in accordance
with the Order of November 19, 1958, appeared before the Court on
March 16, 1959, June 1, 1959, and February 15, 1960, and presented written
and oral reports as to the Board's progress in investigating and compiling
the data and information required under the Order of ~eference.
Upon being advised on the latter date that deficiencies in
available data had required additional time and added investigation by the
parties and by the Board of certain items of information essential to
answering portions of the Order of Reference, such added investigation
having been made with knowledge and approval of engineering representatives
of the parties, the Court by oral order in open Court extended the time
-6-
(
J1
allowed the Board for se~Tice of its Draft of Report of Referee on the
parties to December 12, 1960. The date for se~lice of the draft was fur
ther extended from time to time by verbal orders of the Court and by ex
parte order upon beL~g advised that additional time was required to fully
comply with the Order of Reference. The last order designated November 20,
1961 as the date for se~Tice and directed the Referee to make available to
the parties or their engineeri..ng representatives copies of the proposed
draft report at least 60 days prior to November 20, 1961. The COUl't fur
ther directed that distribution of the proposed draft 60 days prior to the
date of service of the draft was not to constitute a mailing of notice and
copies of the draft under Section 2014 of the Water Code.
The Draft of Report of Referee was app~oved and adopted by the
State vlater Rights Board on November 13, 1961, and was served on the
parties on November 20, 1961. The parties had thirty days to make formal
objection to the draft. At the request of the parties, the Court extended
the time to make objection an additional ninety days to March 20, 1962.
On February 23, 1962, the Referee transmitted to the parties a
document entitled "Errata to Draft of Report of Referee". The errata which
contained a list of errors, minor omissions and clarifications, was submit
ted to assist the parties in their review of the draft and to eliminate the
necessity for objecting to many minor items.
-6a-
Objections to Draft of Report of Referee
Objections (dated March 19, 1962 through March 21, 1962) to
the Draft of Report of Referee (November 1961) were received from the
following parties:
City of Los Angeles, Plaintiff.
City of San Fernando, Defendant No. l.
City of Glendale, Defendant No. 2 and City of Burbank, Defendant No.3.
La Canada Irrigation District, Defendant No.7, Crescenta Valley County Water District, Defendant No.8, and from Defendants Nos. 131, 171, 201 and 202 •
. Southern California Edison Company, Defendant No. 75.
Sparkletts Drinking Water Company, Defendant No. 78.
Deep Rock Artesian Water Company, Defendant No. 34, and from Defendants Nos. 12, 36, 37, 38, 39, 40, 43, 54, 64, 97, 100, 101, 102, 104, 106, 113, 117, 123, 140, 141, 142, 164, 168, 172, 181, 182, 186, 187 and 204.
Consideration of Objections to Draft of Report of Referee
All objections have been considered by the Referee. As a result
of objections by the parties and review by the Referee, the Report of
Referee contains the revisions to the Draft of Report of Referee set forth
in the following paragraphs.
-6b-
(
J8
A. rhe changes specified in -Errata to Dratt of Report of Referee"
have been made to the draft and carried through the various tables, diagrams
and plates, with the exception of items listed in the errata as Nos. 11, 34,
37, 43, 45, 46, 47, 56, 57 and 58, which were superseded by other changes or
made ineffective because of other corrections.
B. Modifioations by clarification of language, due to objections,
have been made to the following pages in Volumes I and II:
Pages xxxi, xxxiv, 10, 23, 53, 54, 82, 106, 115, 135, 138, 138a, 173, 189, 199, 233, 247, 248, 249, A-46, A-48, E-6, 1-3, 1-8, J-20, K-19 through K-24 and M-16.
c. Further clarification has been made by the Referee to improve
language, more clearly state meaning or to correct errors on the following
pages and plates in Volume I:
Pages xxiv, xxvi through xxxiii, xxxv through xxxix, xlii ~hrough li, 10, 14, 26, 29, 39, 40, 42, 43, 45, 52, 56, 57, 58, 59, 61, 68, 69, 70, 76, 79, 80, 88, 90, 93, 97, 101, 123 through 126, 130, 131, 135, 136, 137, 139, 145, 151a, 155, 160, 166, 168, 169, 176 through 179, 181 through 187, 189 through 197, 200 through 203, 205, 207, 208, 209, 211, 212, 217, 220, 221, 223, 226, 227, 229, 233, 235 through 239, 242 through 247, 249, 250, 255, 256, and on Plates 1, 2, 5A through $, 11 through 16, 22, 23, 28, 30, 31, 31A, 3IB, 32, 33 and 35.
Further clarification has been made in the appendixes on the
following pages:
Pages A-29, A-45, C-12, D-7, E-3, E-6, E-8, E-I0, E-12, E-15, F-2, F-4, F-7, F-8, F-13, F-17, F-18, F-24 through F-27, F-29 through F-32, G-8~ G-9, G-12, 1-8, 1-19, 1-23, 1-24, I-30, I-40, 1-41, I-56, J-6, J-7, J-12 through J-17, J-21, J-34, K-15, K-17, K-20, L-6, L-19, L-25, L-31, L-32, L-33, L-40, L-43, L-44, L-45, L-47, L-49, L-50, L-53, L-56 through L-68, L-70, L-71, L-75, M-7, M-8, M-10, M-12, M-14, M-18, N-4, N-9, N-34, N-36, 0-7, 0-12, Q-5, Q-6, R-4, R-5, R-8, R-9, R-IO, R-13, R-14, R-16 , R-17, R-18, and by adding pages L-49a and L-71a.
-6c-
-6<1-
D. Certain objections required more than claritication or
language improvement and material has been added or deleted in connection
with such objections. This has been done in regard to water supplY' and
disposal bY' subareas bY' adding Appendix T; in regard to the description
of the Little Tujunga syncline bY' adding Plate 5J; in regard to the de
scription of boundaries by adding material to pages 17 and 18; in regard.
to imported water by adding material on surplus Northern Calif'omia water
on page 95; and in regard to the presentation of information on geologic
defenses on pages A-6l through A-65 bY' changing the form of presentation.
E. Revisions of the Table of Contents to reflect the fore
going changes as well as those necessary to change from "draft report"
to "report" have been made.
Investigation by Referee
The Board started its investigation as Referee immediatelY' atter
entry of the Order of Reference on June 11, 1958 and contacted all parties
named in the action regarding the availabilitY' of records and data pertinent
to the proceeding.
Continuing contact was thereafter maintained with the parties and
with Los Angeles CountY' Flood Control District, state Department of Water
Resources, state Bureau or Mines~ United States Department of Agriculture
and other sources, both private and public, through which added material was
provided from time to time as deficiencies became apparent in the records and
data first made available.
Detailed investigation was made of the area referred to in the
Order of Reference as the watershed of the Los Angeles River and its
-7-
tributaries above the junction of the surface channels of the Los Angeles
River and the A~royo Seco at a point now designated as Los Angeles County
Flood Control District Gaging Station No. F-57. This area is referred to
in this report as the Upper Los Angeles River area. Investigation was
made outside the Upper Los Angeles River area as necessary to provide
information required by the Order of Reference concerning the Pueblo of
Los Angeles and of other sources of water supply available to the parties.
Investigation of physical facts indicated that records and data
prior to 1928 were lacking or incomplete regarding a number of phases of
the investigation, and that utilization of a period of analysis or base
period for water supply and disposal and safe yield prior to the 1928-29
water year would be difficult and costly to make. This was reported to the
Court on November 17, 1958. It was apparent also that any study extending
into the period of poor and inadequate records could not be supported when
compared to the results of a study over a period of more complete records
as were available beginning with the 1928-29 water year. Consideration of
these factors and release by the COQrt from reporting on other than the
requirements set forth in Paragraph I of the Order of Reference, resulted
in the adoption of a base period of study beginning with the 1928-29 water
year and continuing through the 1956-57 water year. However, all readily
available data of which the Referee has knowledge for years prior to 1928-29
and after 1956-57 have been compiled and included in the report and
accompanying basic data for reference and such use as may be justified.
-8-
( The Referee utilized material from all readily available published
and unpublished reports and other sources to determine the geologic and the
hydrologic factors applicable to the area of investigation. Factors thus
developed are believed to be appropriate for the particular area under study
although they may not be applicable elsewhere unless similar conditions
prevail.
The Referee, in using the records, data and information provided
as described, reviewed the material and where possible verified its
acceptability for the Referee's purposes and made field checks where data
permitted.
The need became apparent from time to time during the investigation
for added work to establish facts under controversy between engineering
representatives of certain of the parties and where uncertainties existed as
to the application of available data. Such work included the drilling of
20 test holes by the par-Gies and the Referee to determine the physical
characteristics of the southerly boundary of the Sylmar Subarea; a detailed
soil survey of the San Fernando cienaga area to determine the historic extent
of the moist area associated with the cienaga; pump tests and water analyses,
as well as an extended study of existing data relating to water origin in the
Eagle Rock Subarea; the observation of new well drillings and continued study
of existing wells throughout the period to provide more complete information
-9-
concerning the specific geologic contentions of the parties; and analyses
by different procedures to assure proper recognition of all factors
relating to various specific studies.
Nomenclature
The term hydrologic subarea has been used herein to designate
certain regions within the area of investigation for which the Referee
was instructed to ascertain the location, area, nature, characteristics,
limits and hydrologic and geologic interdependence thereof. For this
reason the area within the boundary of valley fill (Plate 5) of the Upper
Los Angeles River area was divided for stuqy purposes, according to
geologic and topographic conditions, into four subareas referred to in the
report as the San Fernando, Sylmar, Verdugo and Eagle Rock r~ydrologic
Subareas" or simply as "Subareas". These are shown on Plate 5 and further
described in Chapter III.
The wells referred to in this report are designated by Los
Angeles County Flood Control District numbers which had previously been
assigned to wells known to have existed in the area and which were and are
presently being utilized by local agencies to index well data. The well
number consists of four digits, the first two designating one of a series
of 6-minute U.S.G.S. quadrangles beginning at the southwest corner of
Los Angeles County, and the last two being rectangular coordinates within
the quadrangle with the coordinates beginning in the northwest corner
of the quaqrangle. The well number is followed by a letter to identify
-10-
4\
the actual well when more than a single well is located in that subdivision.
The first well in a subdivision is usually identii'ied by the number only
and designated on the map by a short line dralffl from the dot signifying the
well location. Locations of all wells referred to ¥t this report, with
the guide to the well numberLng system, are shown on Plate 18.
Stream flow stations and precipitation stations, referred to in
the report and shown on Plate 9, have been designated by the same numbers
assigned to them by the Los Angeles County Flood Control District.
The hydrologic "water year", which has generally been used
throughout this report, is from October 1 through the following September
30 and is indicated as 111957-58 11 • Whenever the calendar year is referred
to for any purpose it is designated in the conventional manner, e.g.,
"1954". Whenever a period different from those noted above is intended,
that period is identified at the place used in the report.
Engineering Advisory Committee
In accordance with recommendations by the Court in the Order of
Reference, the engineers of the parties and representatives of the Board
have maintained close contact and have met as a group to discuss procedures
utilized by the Board's representatives and to review results of computa
tions and of the material to be included in the Board's report to the
Court. This group, referred to in the proceeding as the IIEngineering
-11-
Advisory Committee", held a total of 22 meetings beginnlng Sept.ember 23,
195e, spaced at approximately monthly intervals. In addition, conferences
were held from time to time with engineering representatives of two or
more of the parties on special problems. The information developed as a
result of the meetings and conferences aided the staff of the Board
materially.
The names of the engineering representatives attending the
various meetings were as follows:
City of Los Angeles Samuel B. Morris (deceased) Milton Anderson Harold Conkling (resigned) Raymond A. Hill John F. Mann, Jr. E. C. Marliave
City of San Fernando R. E. James Stuart E. Bergman
City of Glendale Harold E. Butler (retired) Max Boolonan
City of Burbank Clarence Shadel Max Boolanan
Richard H. Gilman Gerald W. Jones Eldridge B. Lowry G. Marvin Litz Stanley A. Wilfong
A. L. Sonderegger (resigned) Ray Walker
A. W. Jagow Charles H. Lee
Alan Capon Charles H. Lee
Crescenta Valley County Water District A. L. Sonderegger (resigned) V. B. Tipton
California Mat,erials Company Vernon E. Lohr
-12-
.(
.,
Consolidated Rock Products Company Byron P. Weintz
Forest Lawn Company H. O. Adair John S. Clough
Luis E. Kemnitzer R. G. Spencer
Knickerbocker Plastic Company, Inc. Rudolph W. Chap1ar
Livingston Rock and Gravel Company E. Misenheimer
Lockheed Aircraft Corporation H. D. Pinkney (deceased) G. W. Stosskopf \
Southern California Edison Company Leonard Longacre E. L. Kerry"
Southern Pacific Railroad Company J. G. Sinclair M. J. Stephens R. E. Frame
Spark1etts Drinking Water R. Bruce Lockwood G. Austin Schroter
Technico1or Corporation T. A. Tarr
Sidney Smith IC. Q. Vo1k
Corporation Max Alex O. R. Angelillo
18th meeting) (through
In addition to the representatives of parties as named, various
representatives of interested public agencies attended meetings to supply
information and to mak~ suggestions regarding data and material provided
through their respective agencies as follows:
-13-
Uni-ted States Department of Agriculture Harry F. Blaney
State Department of Water Resources Jack J. Coe Robert Y. D. Chun H. C. Kelly (retired) Robert Thomas
Organization of Report of Referee
The Report of Referee contains Surnrnar.r of Findings and nine
chapters as follows:
I. Introduction
II. Description of the Upper Los Angeles River Area
III. Geology
IV. Water Supply, Upper Los Angeles River Area
v. Water Utilization and Disposal of Water
VI. Historic GroQ~d Water Recharge
VII. Determination of Safe Yield
VIII. The Use of Water by the City of Los Angeles and Its Inhabitants
These chapters present discussion and ~~ illustrations of
information developed by the Referee in an~~er to the requirements of the
Order of Reference. They are supported by tables and a group of 36 plates
containing 52 sheets ~diately foilowing the text. T\venty appendixes
wherein detailed methods and procedures followed by the Referee are set
forth, accompanied by extensive tabulations from which text summaries were
prepared, are included in Volume II. Included in the appendixes are copies
of relevant Orders of the Court.
-14-
43
The basic data upon which the Board bases its report and findings
will be available and filed with the Court in accordance with Paragraph III
of the Order of Reference dated June 11, 1958, and will be tabulated as
listed in the table of contents of this report.
-15-
CHAPTER II. DESCRIPTION OF THE UPPER IDS ANGELES RIVER AREA
A general description of the geographic and hydrologic boundaries,
physiography, soils, climate and culture of the Upper Los Angeles River area
is presented in this chapter. In addition, the geographic and hydrologic
boundaries of all watersheds supplying the Los Angeles River below Los
Angeles County Flood Control District Gaging Station No. F-57 and above the
southern boundary of the origin~l pueblo are described.
The location of the Upper Los Angeles River area within the State
and its relationship to Los Angeles County is delineated on Plate 1. The
area, with the exception of small portions of the Simi Hills and the Santa
Susana Mountains in Ventura County, is located within Los Angeles County.
Boundaries
The watershed boundary shown on Plate 2 is the boundary of the
Upper Los Angeles River area and is based on data shown on the United
States Geological Survey topographic maps covering the area. Maps of 7tminute series, dated from 1951 through 1953, were used wherever available
with maps of the 6-minute series, dated from 1933 through 1948, being used
for the northeastern portion of the area. A field check was made of loca-
tions where more than one interpretation of the topographic maps was
possible. The watershed boundary of the area as determined by the referee
conforms generally to that depicted on and described in Appendixes "A" and
"B" attached to the Plaintiff's Amended Complaint. The description of the
watershed boundary of the Upper Los Angeles River area is as follows:
-16-
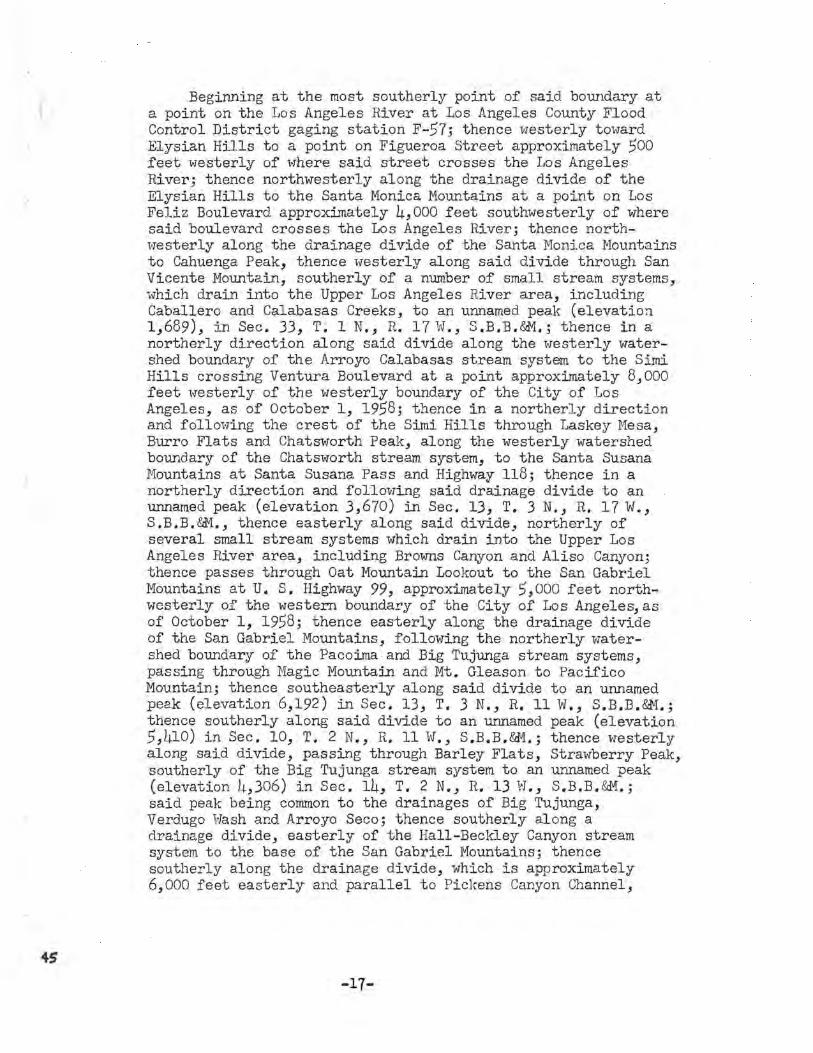
{
4S
Beginning at the most southerly point of said boundary at a point on the Los Angeles River at Los Angeles County Flood Control District gaging station F-57; thence westerly toward Elysian Hills to a point on Figueroa street approximately 500 feet 1t-Jesterly of Hhere said street crosses the Los Angeles River; thence northwesterly along the drainage divide of the Elysian Hills to the Santa Monica Mountains at a point on Los Feliz Boulevard approximately 4,000 feet southwesterly of where said boulevard crosses the Los Angeles River; thence northHesterly along the drainage divide of the Santa Monica Mountains to Cahuenga Peak, thence westerly along said divide through San Vicente Mountain, southerly of a number of small stream systems, which drain into the Upper Los Angeles River area, including Caballero and Calabasas Creeks, to an unnamed peak (elevation 1,689), in Sec. 33, T. 1 N., R. 171:J., S.B.B.&tI.; thence in a northerly direction along said divide along the loJesterly watershed boundary of the Arroyo Calabasas stream system to the Simi Hills crossing Ventura Boulevard at a point approximately 8,000 feet loJesterly of the westerly boundary of the City of Los Angeles, as of October 1, 1958; thence in a northerly direction and fol101\Ting the crest of the Simi Hills through Laskey Hesa, Burro Flats and Chatsworth Peak, along the westerly watershed boundary of the Chats1oJorth stream system, to the Santa Susana Mountains at Santa Susana Pass and Highvlay 118; thence in a northerly direction and following said drainage divide to an unnamed peak (elevation 3,670) in Sec. 13, T. 3 N., R. 17 W., S.B.B.&M., thence easterly along said divide, northerly of several small stream systems '\Thich drain into the Upper Los Angeles River area, including Brov-lns Canyon and Aliso Canyon; thence passes through Oat Mountain Lookout to the San Gabriel Mountains at U. S. Highway 99, approximately 5,000 feet northwesterly of the western boundary of the City of Los Angeles, as of October 1, 1958; thence easterly along the drainage divide of the San Gabriel Mountains, following the northerly VJ'atershed boundary of the Pacoima and Big Tujunga stream systems, passing through Magic Mountain and Mt. Gleason to Pacifico Mountain; thence southeasterly along said divide to an unnamed peak (elevation 6,192) in Sec. 13, T. 3 N., R. 11 W., S.B.B.&M.; thence southerly along said divide to an unnamed peak (elevation 5,410) in Sec. 10, T. 2 N., R. 11 W., S.B.B.~1.; thence westerly along said divide, passing through Barley Flats, Strawberry Peak, southerly of the Big Tujunga stream system to an unnamed peak (elevation 4,306) in Sec. 14, T. 2 N., R. 13 H., S.B.B.&:M.; said peak being common to the drainages of Big Tujunga, Verdugo Hash and Arroyo Seco; thence southerly along a drainage divide, easterly of the Hall-Beckley Canyon stream system to the base of the San Gabriel Nountains; thence southerly along the drainage divide, which is approximately 6,000 feet easterly and parallel to Pickens Canyon Channel,
-17-
to the San Rafael Hills; thence southerly along the crest of the San Rafael Hills, passing through Eagle Rock, to the Repetto Hills at the intersection of Colorado Boulevard and Avenue 64; thence in a southwesterly direction along the drainage divide of the Repetto Hills, passing through Mt. Washington to the base of the Repetto Hills at a point approximatelY 2,000 feet northeasterly of the intersection of Figueroa Street and San Fernando Road; thence southwesterly to the point of beginning.
The hydrologic (ground water) boundary is the areal boundary of
the major water-bearing formations within the Upper Los Angeles River area
and is delineated as the boundary of valley fill on Plate 5. This boundary
is more completely described on pages 43 and 44 of Chapter III. Boundaries
of hydrologic subareas within the hydrologic boundary of the area and the
criteria used in their determination are described on pages 44, et seq., of
Chapter III.
The surface drainage area tributary to the portion of the Los
Angeles River below gaging station F-57 and above the southern boundary of
the original Pueblo of Los Angeles, along with hydrologic (ground water)
boundaries within the area, are shown on Plate 35.
Physiography
The Los Angeles River drainage system comprises a portion of the
coastal watershed of Southern California. The general location of the area
is shown on Plate 1. The Upper Los Angeles River area is that portion
of the drainage system above the junction of Arroyo Seco at the lower
end of the Los Angeles River Narrows. Plate 2 shows the important physio-
graphic features associated with the area. Elevations range from a high of
7,124 feet above mean sea level at Pacifico Mountain to a low of 293 feet
at Gage F-57.
-18-
{
( The San Fernando Valley in general includes the alluvial-filled
portion of the Upper Los Angeles River area. The valley is composed
primarily of the complex surfaces of coalescing alluvial fans formed by
subaerial deposition from the various streams tributary to the Los Angeles
River above the IDs Angeles Narrows. It is roughly elliptical in shape
with a major axis of approximately 23 miles and a minor axis of approxi
mately 12 miles, comprising 123,428 acres of valley floor lands and
205,109 acres of hill and mountain lands for a total of 329,131 acres.
Hill and Mountain Areas
The valle7 is bounded on the northeast by the San Gabriel
Mountains, on the northwest b,y the Santa Susana Mountains, on the west by
tile Simi Hills, on the south by the Santa Monica Mountains and on the east
by the San Rafael Hills and the Repetto Hills. The Verdugo Mountains,
located in the northeast portion of the area, separate the Sunland-La
Crescenta area from the main valley.
The San Gabriel Mountains are the highest as well as the largest
mountain group in the area. They rise precipitously from the valley floor
and contain many steep-sided canyons and to a large degree are composed of
non water-bearing Basement Complex rocks which have been fractured and
faulted. These rocks form a portion of the basement, which with other
nonwater-bearing rocks, underlie at various depths the water-bearing
formations in the area.
-19-
The Santa Susana Mountains lie westerly of the San Gabriel
Mountains and are separated from them by an area of low relief in the
vicinity of State Highlvay 99. The Santa Susana Mountains attain a maximum
elevation of ),747 feet within the area. They are composed mainly of
sedimentary nomvater-bearing rocks which have been faulted and folded.
Petroleum production is obtained within the Santa Susana Mountains pri
marily from the Aliso Canyon field.
The Simi Hills are separated from the Santa Susana Mountains at
the pass crossed by Highway 118. The Simi Hills are a relatively low-lying
group with a maximum elevation of 2,)14 feet. These hills are composed of
essentially sedimentary nonwater-bearing rocks.
The Santa }lonica. Hountains are separated from the Simi Hills by
the area of low relief which is traversed by Highway 101. These mountains
separate the San Fernando Valley from the Coastal Plain. The maximum
elevation of 1,961 feet lies on the drainage boundary south of Encino
Reservoir. The Santa ~1onica Mountains are composed of nomTater-bearing
rocks of sedimentary, igneous and metamorphic types which have been axten.,.
sively faulted and folded. Rocks of the sedimentary type predominate in
the portion of these mountains lvithin the Upper Los Angeles River area.
In general these formations dip underneath the adjoining 'lImter-bearing
series. The eastern end of the Santa Monica 110untains is considered to
be the divide at Los Feliz Boulevard in the vicinity of the Los Angeles
River Narrows.
-20-
(
(
41
The Elysian Hills (maximum elevation 753 feet) form the southerly
boundary of the Los Angeles Hiver NarrovJB. These hills consist of intensely
folded nomrater-bearing materials.
The Verdugo Nountains represent a large block of nonwater-bearing
Basement Complex rocks which have been isolated from the main portion of
the San Gabriel l10untains by faulting. This block has a maximum elevation
of ),126 feet. The San Rafael 11il1s (maximum elevation 1,888 feet) south
east'of Verdugo Mountains and across Verdugo Wash are composed of crystal
line materials similar to those of the Verdugo Mountains. A small group of
hills southerly of Colorado Boulevard, comprised largely of nonwater-bearing
sedimentary rocks, is also considered a part of the San Rafael Hills.
The Repetto Hills are located south of the San Rafael Hills and
easterly of the Los Angeles River Narrows. These hills are composed of
sedimentary nomlater-bearing materials which have a maximum elevation of
about 880 feet.
Features Related to the Valley Floor
In addition to the surrounding hill and mountain formation there
are nine prominent physiographic features which are in contact with or
related to the valley floor. These are: The Burbank Piedmont Slope,
Pacoima Hills, Mission Hills, Northridge Hills, Chatsworth Hills, Woodland
Hills, Chalk Hills, Van Nuys Plain and the Sunland-La Crescenta Piedmont
Slope.
The Burbank Piedmont Slope is a series of coalescing alluvial fans
which have the Verdugo Mountains as their source area. The higher degree of
-21-
weathering on the surface of this feature indicates that it is somewhat
older than the deposits of the Van Nuys Plain.
The Pacoima Hills are composed of nonwater-bearing materials and
form one of the six hill groups in the valley. These hills probably repre
sent the northwesterly extension of the Verdugo Mountains which has been
eroded from the main mountain block by flows in Big Tujunga and Little
Tujunga Washes. Exploratory work for Hansen Dam, which connects the Pacoima
Hills to the Verdugo Mountains, indicates existence of sandstones at rela
tively shallow depths along the axis of the dam,
The Mission Hills are low hills which essentially surround Upper
and Lower San Fernando Reservoirs. They are composed of water-bearing and
nonwater-bearing materials which structurally are on the south flank of the
Little Tujunga syncline which has extensively affected the topography of
these portions of the valley.
The Northridge Hills constitute a short chain of low-lying hills
which ow'e their existence to movements along the Northridge Hills fault.
Tectonic disturbances have formed a complex structural pattern of anti
clines and synclines in the nonwater-bearing series which have been of
interest to oil companies in recent years. The upper surfaces of the hills
are composed of Older alluvium which is underlain by Saugus formation.
The Chatsworth Hills comprise a group of low hills in the
vicinity of Chats\vorth Reservoir. They are composed essentially of nomlater
bearing Modelo shales and Cretaceous sandstones. These formations are
capped in several places with a thin veneer of Older alluvium.
-22-
The Woodland and Chalk Hills are located in the southwestern
portion of the valley. They are nonwater-bearing and are composed essen
tially of the diatomaceous shale member of the Modelo formation.
The Vall Nuys Plain constitutes the major portion of the recently
alluviated valley floor. The surficial deposits vary from relatively
impermeable clays in the western part of the valley to permeable sands and
gravels in the eastern portion of the valley. The Los Angeles River NarrOlvS
area which passes through the topographic constriction between the Elysian
Hills on the west and the San Rafael and Repetto Hills to the east is con
sidered to be a feature genetically related to the Van Nuys Plain. Other
associated features on the valley floor are the incised channels of several
streams, the major ones being Tujunga and Pacoima Washes and the Los Angeles
River.
The Sunland-La Crescenta Piedmont Slope is a series of coalescing
alluvial fans which have had their source areas in the San Gabriel
Mountains. The fans are composed of coarse detritus with some boulders
reaching a size of four feet in diameter.
Surface Dr~g~ System
The Los Angeles River stream system is the surface drainage
medium of the Upper Los Angeles River area. The main stream extends
along the southerly side of the valley floor in a sout~ea3terly
direction through the Los Angeles NarrOl{s and out of the area. The
major drainage network is composed of the main stream and its principal
tributaries draining Big Tujunga, Little Tujunga, Pacoima, Aliso, Browns,
-23-
Bull and Arroyo Calabasas Canyons. Historic changes in the drainage
system are discussed in Chapter IV.
Soils
Soils are related to the 1vater supply insofar as they, in
combination with other factors, influence the rate of recharge to the
ground water. This is particularly true of the soils on the valley fill.
However, it is not feasible nor is it required for the purposes of the
investigation to make a quantitative evaluation of the infiltration
capacities of the various soils lmOvIn to exist in the area. Therefore,
only the relative infiltration characteristics of the valley soils ha.ve
been evaluated.
In general, the soils in the valley fill areas can be grouped
with respect to relative infiltration capacities in a manner utilized by
Musgrave (Water, the Yearbook of Agriculture, 1955, U.S.D.A.), 1-.Thich
takes into account the depth of soil, relative drainage, ability to retain
moisture and the degree of permeability based on grain size. The U. S.
Department of Agriculture Soil Surveys of 1917 and 1919 give a detailed
description of all soils found in the Upper Los Angeles River area.
These soils have been classified into High, Medium and LOIv infiltration
groups on the basis of Musgravets criteria~ Individual soils contained
in each group are shown in Appendix B and areal extent of each of the
three soil groups is shown on Plate 3.
In general the soils present in the Upper Los Angeles River area
consist of three types. First is the residual type soils including the
Holland, Altamont, Sites and Diablo soil series occupying the hill and
-24-
(
mountain areas which are derived in place by the weathering of granitic or
sedimentary rocks. Secondly is the Ramona series, which in contrast, are
old valley fill soils derived from ancient weathered, fluvial deposits.
The third type consists of the recent alluvial soils including the Hanford,
Tujunga, Yolo and Dublin soil series.
Climate
The Upper Los Angeles River area has the climate of an interior
coastal valley and is hotter in the summer and wetter in the winter than
the coastal area which has a Mediterranean type climate. The range of
temperature and occurrence of fog and frost vary within the valley with
the west and north sections being subject to the highest temperatures.
The variations of temperature and frost conditions within the
area is sufficient to have influenced the location of citrus orchards. The
northern edge of the valley along the base of the mountains where most of
the groves are located, is higher, warmer and more frost free than areas of
lower elevation in the westerly portio~
The central portion of the valley is at times swept by hot, dry
and strong winds of short duration.
Culture
The San Fernando Valley, prior to the importation of water from
Owens River by the City of Los Angeles, was mainly an area of large
holdings devoted to dry farming. The importation of water in 1915 brought
about a shift to irrigated agriculture and subdivision of the large holdings
-25-
into smaller farm and home acreages. The cities of Burbank, Glendale and San (
Fernando were incorporated prior to 191,. Durjng 191, tl~ City of Los Angeles
annexed large areas in the San Fernando Valley which resulted in the greater
portion of the valley fill and lower hill area being included in incorporated
areas.
Urbanization of the area has been a continuous process except
for the depression period from 1932 to 1938. Growth was further acceler
ated after the end of World War II by the general trend toward suburban
living and more recently by the development of new industries in the central
and west portions of the valley.
Continuing growth is evidenced by the filing during 1959 of tenta
tive subdivision maps for 8,100 lots on 5,500 acres of land within the
portion of the City of Los Angeles located west and north of Burbank. The
same area had 29,000 building permits, totaling $300 million in valuation,
issued during 1959.
-26-
.sO
CHAPTER III. GEOLOGY
This chapter is an evalu.at~_o!l of g';)ologic features and condi tiona
insofar as they affect the occurr'cnce and movement of ground water and the
surface and ground water hydrology of the Upper Los Angeles River area and
any subdivisions which may exist and the interconnection or interdependence
thereof. It is designed to satisfy in part, paragraphs I. 1, I. 2A, I.
2C, I. 2D, and I, 2G, of the Order of Reference. Items such as water
bearing and nonwater-bearing rocks, faults and folds which affect the
water-bearing materials, and the configuration of the valley fill and its
characteristics are discussed. The various hydrologic subareas and their
interrelation are described.
Area.l Geology
A map of the areal geology compiled from published sources ~nd
supplemented by unpublished Masters and Doctors theses from the graduate
schools of the colleges and universities in Southern California and
through investigation by the Referee, is presented on Plate 4. This map,
entitled "Areal Geology", presents the general geologic framework necessary
for the study of ground water and its movement within the Upper Los
Angeles River area. Plate 4 also shows the relative ages and briefly
describes the various lithologic units fOQnd within the area. The plate
also shows the relationship of mountain areas which are for the most part
composed of nonwater-bearing materials, and the valley fill which com
prises most of the water-bearing material •
-27-

The approximate depths of the nonwater-bearing materials below the valley
noor are indicated on Plate 6, entitled "Contours on Base of Valley Fillff.
The geologic cross sections on Plates 5A through 5H have been plotted to
aid the understanding of the relationship between the water-bearing
and nonwater-bearing formations. The location of the various cross
sections is shown on Plate 5.
Previous Investigations
The many bulletins and papers published on the geology of various
portions of the Upper Los Angeles River area have been related primarily to
the rocks Which surround the valley fill area of the basin. State Division
of Water Resources Bulletin 45 (1934) reports on the only investigation
Which has studied the water-bearing properties of alluvial materials.
This bulletin has been studied in detail and information therein pertaining
to geology, specific yield and ground water storage capacity, modified in
the light of additional and more recent data, has been incorporated into
this report.
Present Investigation
The present geological investigation has been limited to the
determination of the hydrologic units or subareas existing in the Upper
Los Angeles River area and to studying the nature and distribution of
alluvial materials Which would be considered a source of ground water.
Numerous wells and test holes were inspected and logged during the course
of the investigation. Many cuts, trenches and gravel pits were studied to
become familiar with the composition of the sediments in the various
-28-
(
Sf
portions of the basin and to aid in the interpretation of well logs.
Geologic mapping was mainly confined to the alluviated areas with special
attention being given to the contacts between the water-bearing and
nonwater-bearing units.
Detailed descriptions of the items covered in this chapter, as
well as a discussion of field investigations made during the investigation,
are contained in Appendix A.
Geologic Fo~~~
The ages of geologic rock units and formations of the Upper
Los Angeles River area represent a long span of geologic time. Rock units
of the Basement Complex have been assigned an age of Pre-Cambrian, whereas
other units within the Basement Complex represent various periods through
the upper Jurassic or Lower Cretaceous. The sedimenta~ formations present
in the area of investigation are represented by the Cretaceous Chico, lower
Eocene Martinez, middle Eocene Domengine, middle Miocene Topanga, upper
Miocene Modelo, lower Pliocene Repetto, upper Pliocene Pico and lower
Pleistocene Saugus formations. upper Pleistocene, Older alluvium and
Recent alluvium are unconsolidated deposits which are of special interest
in this study. The location of the different formations with geologic
legend is shown on Plate 4.
Nonwater-Bearing Series
The nonwater-bearing series are rocks which do not absorb,
transmit or yield water readily; however, they may contain a limited amount
of water in fractures. The nonwater-bearing series comprise the following
-29-
lithologic units: Basement Complex granitic and metamorphic rock types;
Chico sandstone and some conglomerates; Martinez shales and sandstones;
Domengine sandstone and conglomerate; Topanga conGlomerate sandstone with
interbedded volcanics, Modelo shale, sandstone and conglomerage; Repetto
siltstone, sandstone and conglomerate; and Pica shale and siltstone.
The Basement Complex yields small flo~·JS (20-30 gpm) of good
quality water from tunnels, while water wells drilled into the Chico,
Topanga and Modelo formations have very poor yields of generally poor
quality water. The Martinez and Domengine formations are of limited areal
extent and therefore of minor importance as possible sources of water.
Water-BBaring Series
The water-bearing series consist of rock units which absorb,
transmit and yield water to wells readily. The Saugus formation (including
Sunshine Ranch formation), Older alluvium (including Pacoima formation) and
Recent alluvium comprise this group,
Alluviation. Sedimentary deposits may orig~te from one of three
environments: marine, transitional or continental. The water-bearing
deposits of the Upper Los Angeles River area are classified as primarily
continental. They may be further subdivided as alluvial stream deposits.
In late Pleistocene and Recent time, when most of the water
bearing deposits were being laid down, the valley area was above sea level
and was lowering with respect to the continued rising of the San Gabriel
Mountain block. As the block rose, increased stream gradients resulted and
-30-
52.
heavier loads of debris were transported dmm the mountain block face. Upon
reaching the gentler piedmont slope at the mountain front, gradients and
velocities were sharply decreased with a resultant lessening of load
carrying capacity and deposition of the transported load commenced along
the mountain front.
Materials were deposited by the individual streams as large and
small alluvial fans. The coarser debris was normally deposited near the
conal apices while the finer materials were carried farther out toward the
distal portions of the cones. During wet and dry years or cycles when
stream carrying power varied considerably, coarse deposits might be
deposited over fines or vice versa, resulting in fine materials near the
apices in dry periods and coarse material in the distal portions in wet
periods.
Changes in stream position on the developing conal surfaces
caused centers or axes of deposition to shift ' from time to time. Over
lapping and interfingering of the conal deposits both laterally and axially
occurred. Frequent incision of the developing conal surfaces by the
streams resulted in reworking and redeposition of some of the original
conal material during the alluviation process. Crude stratification exists
locally, though in general the deposits are lenticular in shape with the
long axis roughly parallel to the main stream course.
During and after deposition, alternate wetting and drying of
buried material due to a fluctuating water table and other normal weathering
-31-
processes allowed accelerated weathering with a resultant development of
more clay in the coarser deposits than might be normally expected.
Weathering continues to occur at the surface and at depth, slowly increasing
the clay content of these materials. The increase in clay content has the
effect of redUcing the specific yield and general permeability. The latter
two items have been further reduced as a result of consolidation by load.
The most recent streams (present day) have incised their channels
in the older conal deposits, which have coalesced near the mountain front.
The most permeable deposits are now found in these channels. These channel
deposits are the best means of percolating stream flow to the underground
and transmitting underflow through the area.
Saugus Formation. The Saugus formation crops out in the hills and
southern slopes of the mountains along the northern part of the valley floor
and underlies the other members of the water-bearing series. The maximum
thickness of this unit as measured in Lopez Canyon is 6,400 feet. From here
the formation thins rapidly in an easterly direction to 2,000 feet thick two
miles east of little Tujunga Canyon and in a westerly direction to 3,000
feet of thickness at San Fernando Reservoir. There are no outcrops of the
Saugus formation in the Simi Hills, Santa Monica Mountains or Verdugo
Mountains, indicating that this formation probably underlies only the northern
portion of the valley floor. Only those portions of the Saugus formation
wh~ch are overlain by Older and Recent alluvium and are below the water table
are considered herein to be part of the ground water reservoir. The Saugus
formation has been included in the water-bearing materials comprising the
-32-
ground water reservoir within the Sylmar Hydrologic Subarea and in the
northern portion of the San Fernando Hydrologic Subarea. Those portions of
the exposed Saugus formation located in the hill and mountain area to the
east and west of the Sylmar Hydrologic Subarea have in general been con
sidered as part of the nonwater-bearing series because the change in storage
and extractions from those areas were negligible and the areas of recharge
are of limited extent.
The Saugus formation is composed of unceroonted conti.nental and
marine deposits of conglomerates, sands, silts and clays. Some of these
materials make good aquifers under saturated conditions whereas others are
aquicludes. The materials of the Saugus formation have been derived from
the Basement Complex in the eastern part of its exposures and from Terti
ary sedimentary formations in the area adjacent to the Santa Susana Moun
tains. There is a marked difference within the formational materials
derived from the different source areas in terms of porosity and permeabil
ity, with those deposits having their source areas in the San Gabriel
Mountains being the most permeable.
Older Alluvium. The Older alluvium is composed of generally
coarse-grained unconsolidated or uncemented deposits of modern streams laid
down in earlier cycles of erosion. The source areas of the streams during
earlier and present stages of erosion have undergone little change. With
the exception of remnants (terrace deposits) which have been isolated by
erosion around the margin of the valley floor, deposition has been nearly
continuous to the present time.
-33-
The materials that comprise Older alluvium consist of red-brown
to gray, dirty, unsorted, angular to subangular debris which is o£ local
origin. During the numerous intervals of time between periods of
deposition weathering played an important role in forming horizons which
represent ancient soils.
The water-bearing properties of these materials are variable,
depending upon the source areas; however, the permeabilities are generally
greater than that of the Saugus formation due primarily to the fact that
the Older alluvium is less compacted and less consolidated and also
generally contains less residual clay.
Recent Alluvium. Recent deposits east o£ Pacoima Wash and north
of the Los Angeles River consist o£ predominantly coarse accumulations of
boulders, gravels and sands in the £orm of coalescing alluvial fans derived
primarily from Basement Complex sources. The median particle diameter of
the fan deposits decreases as the distance increases from the canyon mouths.
Westerly of Pacoima Wash and south of the Los Angeles River the sediments
are derived primarily from sedimentary rocks and are finer grained and
deposited in much the same manner as the underlying Older alluvium. Hell
logs from the uestern portion of the valley floor indicate an average of
about 75 percent clay, 5 percent sand and 20 percent gravel, whereas the
materials underlying the eastern portion of the area average 20 percent
clay, 35 percent sand and 45 percent gravel.
-34-
(
54
Structural Features
The geologic structure of the Upper Los Angeles River area is
very complex. Extensive faulting and folding of the rocks that surround
the ground water reservoir indicate that the rocks beneath the valley fill
materials are also faulted and folded. The major faults and folds which
affect the movement of ground l'fater within the valley fill are discussed
below,
!!ulting
Faulting in the area of investigation is dominated by the San
Gabriel fault system. Faults of the Sierra Madre system are important
features in the Santa Susana and San Gabriel Mountains; however, only
thos,e faults which may affect the movement of ground water are described
in this report. The Verdugo, Eagle Rock and Raymond fault zones have an
effect on the movement of ground water in certain locations. The
Northridge Hills fault or folds are believed to have an effect on ground
water movement, but data to evaluate this effect are lacking. The locations
of the faults are shown on Plate 4. Detailed discussions of the faults and
fault zones are contained in Appendix A.
Verdugo Fault Zone. The water levels southerly of the City of
Glendale1s submerged dam suggest a gradient steeper than would normally be
expected. The Verdugo well 396)A, and well 3954 which is about 7,000 feet
southerly of the Verdugo well, show a difference in water levels of
approximately 300 feet. Measurements at well 3963 (destroyed in 1944)
-35-
indicate a water level above a hydraulic grade line connecting the two (
aforementioned wells. Depth to bedrock is 54 feet in the Verdugo well
(3963A), more than 535 feet at well 3954, and unknown at well 3963, although
this well is reported to be 100 feet deep. Water levels given in Water
Supply Paper 219 (1908) for Verdugo Canyon indicate a similar condition
existed at that time. On the basis of the foregoing information, a ground
water cascade controlled by offsets in bedrock along the Verdugo fault zone
has been postulated as the reason for the anomalous water level condition
(Plates 4 and 5G).
Movements on this fault s,rstem during the Quaternary period have
had some effect on the aquifers by the formation of clayey gouge seams in
the sands and gravels which extend between the Verdugo Mountains and· Pacoima
Hills. The effect of the faulting has been to create a zone of lower per-
meability which causes a distinct break in the ground water surface when
the Hansen spreading grounds are in operation. When the spreading grounds
are not in operation the difference in ground water elevations on either
side of the fault are of a much smaller magnitude.
Eagle Rock Fault. Presence of the aforementioned step-like
ground water cascade at the mouth of Verdugo Canyon may have been caused
by a northwesterly extension of the Eagle Rock fault to the Verdugo
faul t. Although no surface alluvium appears to have been displaced
by the Eagle Rock fault in this vicinity, the general structural pattern
suggests that the Eagle Rock fault may be related to the Verdugo
fault system (Plates 4, 5G and 5H). There has been some conjecture by
previous workers that this fault may extend westerly under the valley fill
-36-
passing near the junction of the Los Angeles River and Verdugo Wash. Such
an inferred extension would explain the abrupt rise in the nonwater-bearing
rocks which underlie the water-bearing series where the Los Angeles River
turns southerly into the Los Angeles River Narrow·s. This feature is shown
on Section M-M' on Plate 5E. A scissors-type movement on the Eagle Rock
fault would be necessary to explain the relationship of the blocks on either
side of the fault. More detailed geologic information is needed before the
relationship can be established between the Eagle Rock fault and the fault
in the nonwater-bearing series that underlies the alluvium near the south
side of the Los Angeles River immediately upstream from its confluence with
the Verdugo 'trJash.
Raymond Fault. The surface of the Older alluvium Vlhich overlies
( the trace of the Raymond fault (Plate 4) has not been disturbed by movement
on this fault within the area of investigation; however, movement along this
fault zone prior to the deposition of the uppermost strata of the Older
alluvium has faulted the water-bearing sediments against the nomJater-bearing
rocks of the Puente formation (Plate 5H) and thus forming a barrier to the
movement of ground water from the Eagle Rock Subarea. The movement necessary
to bring about this condition is contrary to the general direction of
movement on the fault to the east of the area of investigation.
55
Older movements on this fault have also affected the configuration
of the base of the valley fill in the central part of the Los Angeles River
Narrows. A small knob of nonwater-bearing rocks (Plate 6) is present
north of the fault and a depressed area lies immediately south of the fault.
The knob has created a constriction in the water-bearing materials and
-37-
probably is the cause of the rising water that has been reported in the
past near Los Feliz Boulevard.
Smaller Unnamed Faults. In the Sunland area, which is adjacent
to Big Tujunga Wash, there is an offset in the nonwater-beartng formations
below the valley fill amounting to about 30 feet (Pla~e 5F). The location
of this offset is in well grid coordinates 4983 (Plate 6). This feature
may be due to faulting which is evident in the hills to the northeast and
southwest of this feature. This feature has also caused a ground water
cascade of similar magnitude in the water-bearing mat.erials.
In the western portion of the San Fernando Subarea, there are
several faults which mayor may not have an effect on the movement of
ground water in the vicinity of Devonshire Street and Topanga Canyon
Boulevard (Plate 4). The most prominent of these faults extends north
easterly beneath the valley fill. This fault has displaced the nonwater
bearing materials forming a ground water cascade on the order of 80 feet
in height. The area is underlain at shallow depths by Cretaceous
sandstones northwest of the fault and by the Hodelo shale at greater
depths south of the fault. There is a small northwesterly-bearing fault
inferred in the water-bearing series paralleling the Northridge Hills
fault to the northeast and extending into the nonwater-bearing Cretaceous
sandstones to the northwest. The existence of such a feature is substan
tiated by the difference in ground water levels in this area.
-38-
Faults have affected the movement of ground water within the
Upper Los Angeles River area by formation of ground water cascades as a
result of offsetting nonwater-bearing series; by forming relatively
impervious gouge along fault planes during movement; by folding strata so
that their position is unfavorable for the percolation of water through
them; and by the tilting associated with fault movement which has caused
a reduced cross-sectional area for underfloit.
Folding
The dominant fold structures affecting the storage and flow of
ground water in the San Fernando Valley are located in the northern portion
of the valley and delineated on Plate 4. other folds have little or no
effect on the ground water and no extensive study l-laS made of them.
The Little Tujunga syncline (Plate 5J), located between the Verdugo
Mountains and the San Gabriel fault, is one of the principal structural
features along the north edge of the valley. The effects of this feature on
the movement of ground water are of interest in the Sylmar Hydrologic Subarea
and are discussed under the description of that subarea. The axis of this
fold closely parallels the trace of the Sierra Madre fault zone, following it
with a west northwest trend in the area from Tujunga to the Veterans
Hospital at Pacoima Canyon, where it may have been overridden by the
crystalline rocks along the Hospital fault. Continuing westward, the axis
changes to a southwest trend paralleling the northeastern end of the Santa
Susana fault. The dip of formations along the south limb ranges from 25 to
80 degrees; the north limb is very steep to overturned and has minor folds
-39-
superimposed on it. Saugus beds are overturned in several places along the
Lopez fault, particularly in upper Lopez Canyon (see Plate 5J). Overturning
of the Saugus formation also occurs along the Sunland fault where the north
limb of the syncline has been almost completely cut out by the fault.
The anticlines and synclines associated with the Northridge Hills
fault undoubtedly affect the movement of ground water; however, the extent
of the effect is unknown due to an absence of wells. A small anticline is
located in the southeast portion of the Mission Hills. This fold may be
related to movement on the inferred Mission Hills thrust fault and as a
result may not extend under the alluvium easterly of the hills.
Configuration of the Base of the Valley Fill
The configuration of the base of the valley fill is Shown by the
generalized contours on Plate 6 and by means of geologic cross sections
which are indexed on Plate 5. The base of the valley fill was determined
by plotting the elevation of the nonwater-bearing materials indicated by
various well logs throughout the area of investigation.
The contours on the base of the valley fill (Plate 6) in the
western portion of the San Fernando Subarea (Plate 5 and pages 46 to 50)
in the vicinity of Arroyo Calabasas and southerly of Bell Creek indicate
the existence of an old drainage system. This ancient drainage appears to
have flowed northerly, east of Aliso Canyon Wash into the deep portion of
the basin which is traversed by the Southern Pacific Railroad (S.P.R.R.).
-40-
(
51
The depth of water-bearing material is unknown in the central and
eastern portion of the subarea, but probably extends to depths of 1,000 to
1,,00 feet. An anomalous dome-like feature is present in the vicinity of
Lankershim Boulevard and Vanowen Street. The cause of this' feature and
its relationship to the geology of the area are unknown.
In the vicinity of the confluence of Verdugo Wash and the Los
Angeles River, the depth to nonwater-bearing material rapidly decreases as
the Los Angeles River enters the Los Angeles River Narrows. The reason
for this rapid change in the bedrock profile is not known; however, it has
been postulated that this feature is caused by a westerly extension of the
Eagle Rock fault or an unnamed fault, the scarp of which was modified by
erosion prior to burial. This feature is located in well grid coordinates
3914 and 3924 on Plate 6.
The Elysian Hills anticline, which is located on the southerly
side of the Los Angeles River Narrows, is of interest in that continued
movement on this feature after the mid-Pleistocene orogeny may have caused
the "reversed gradient" on the base of the water-bearing series in the
Los Angeles Narrows area. This "reversed gradient" feature shown in
profile on Section M-MI, Plate ,E, indicates that the base of the water
bearing materials is lower in elevation near Colorado Boulevard than at
Figueroa Street or Gage F-51. This is also shown by contours on the base
of valley fill on Plate 6. Another possible explanation of this feature
is that the Arroyo Seco flowed northerly into the San Fernando Subarea
tor a period of time in the mid-Pleistocene, as postulated by Homer Hamlin
-41-
in United States Geological Survey Water Supply and Irrigation Paper 112
(1905).
The Sylmar Hydrologic Subarea (Plate 5 and pages 51 to 55) is
almost entirely underlain by the folded Saugus formation which extends to
great depths. Immediately below the Saugus formation is the nonwater
bearing Repetto formation which is exposed in both banks of Pacoima Wash
at the Pacoima submerged dam, located in the vicinity of well 5989A.
These outcroppings and their westerly extension constitute the eastern
portion of the southern boundary of the subarea. In the Mission Hills and
possibly in the adjacent portion of the Sylmar Hydrologic Subarea, the
Saugus formation is underlain directly by the Pico formation. The Repetto
formation dips approximately 70 degrees to the north and drops rapidly in
elevation under the water-bearing materials.
Contours of the base of the valley fill (Plate 6) in the Verdugo
Hydrologic Subarea (Plate 5 and pages 55 to 58) show several interesting
features. The most important of these is the existence in the Basement
Complex of the buried erosion channel of an ancestral Pickens Wash draining
easterly into the Monk Hill Basin (Plate 35). Under low water table condi
tions this buried channel carries all tributary percolating water to the
Monk Hill Basin. Under high water table conditions the southwesterly
bedrock ridge, which is the westerly bank of the buried erosion channel,
has been overtopped and it is therefore believed that percolation in a
westerly direction has occurred.
A second important feature is the depression in the buried bed
rock surface in the vicinity of well 5058J. The bedrock elevation in this
-42-
(
58
depression is some 80 feet lower than the lowest bedrock surface in the
mouth of Verdugo Canyon. This depression may be due to displacement on
the La Crescenta Valley fault. Maximum depth of water-bearing materials
is about 54 feet at Verdugo well (3963) adjacent to the Verdugo submerged
dam, while upstream approximately 1-1/2 miles the depth of fill .material
has increased to a maximum of 190 feet.
The configuration of the base of the valley fill in the Eagle
Rock Hydrologic Subarea (Plate 5 and pages 58 to 61) is not shown in
detail on Plate 6 due to the small area involved and to the lOO-foot
contour interval which was utilized on the plate. A more graphic repre
sentation of the valley fill in the subarea is shown on Geologic Cross
Section S-S' on Plate 5H. This section shows the deepest portion of the
fill in this subarea to be located in the vicinity of the Raymond fault.
The configuration of the base of the valley fill along Colorado Boulevard
in the subarea is not known; however, the depth to bedrock at a well
located just northwest of the intersection of Colorado Boulevard and Eagle
Rock Boulevard was stated as 140 feet (well No. 333, U.S.G.S. Water Supply
Paper 219 field notes). The depth to the nommter-bearing Topanga formation
near the Raymond fault is about 200 feet.
Description of Hydrologic Subareas
The valley fill area of the Upper Los Angeles River area
comprises with a few minor exceptions, the areal extent of all Recent
alluvium and Older alluvium known to have been saturated or to overlie
water-bearing materials. Isolated areas of Saugus and Recent alluvium in
-43-
upper Little and Big Tujunga Canyons, as shown on Plate 4, have been
excluded from the valley fill area because of lack of information on
water-bearing properties, minor extra~tions and isolation from the
main ground water body. The valley fill boundary was mapped on 7i-minute
U.S.G.S. quadrangles from field observations and other available
information concerning extent and thickness of water-bearing materials.
This boundary was generalized across the mouths of minor canyons to
exclude thin tongues of alluvium which would not contain any appreciable
amounts of ground water in storage. The valley fill boundary so deter
mined is delineated on Plate 5.
Both the Basement Complex pre-Quaternar,y sediments and
volcanics, Which are known to underlie the valley fill area, are deep
seated and relatively impervious and any contribution by ground water
movement from them must therefore be small. This investigation has not
revealed evidence of any appreciable subsurface inflow from these rocks
although records of extractions from wells in these rocks indicate the
existence of small amounts of water therein. Water elevations in wells
and water inflows encountered in tunnels attest to the fact that where
water surfaces exist in these materials they are at elevations sub
stantially higher than the water levels in the valley fill areas. The
yield from these rock formations is apparently limited because of the
ver.y small specific capacity of wells in these materials, ranging from
0.0)6 to 0.)8 gallons per minute per foot of drawdown as compared to a
-~-
(
( range in specific capacitY' for wells located within the valleY' fill of froa
three to more than 264 gallons per minute per foot of drawdown.
The afore .. ntiol18d nlleY' till area of the Upper Los Angeles RiTer
area, excl.siTe of the portion ot the Monk Hill Basin located therein, has
been diTided into tour b1drologic subareas: San 'emando, S;ylaar, Verdugo
aDd Eagle Rock, cOlltaining 112,047, 5,565, 4,400 and 807 acre. 1'8sp8ctinlY'.
The total valleY' fill area, including the 609 acre. in the Honk Hill Basin
portion, is 123,428 acres. Each of these subareas has been defined on the
basis ot the existence of an apparent impairment ot ground vater !.low from
ODe to the other, caused bY' man-asde works and. physiographic or geologic
teattlres. The boundaries of the various subareas are shown on Plate 5.
The source of ground water supply in the Upper Los Angeles River
area is percolation of rainfall, surface runoff from adjacent valley areas,
and hill and mountain areas, spread waters, imported waters, and possibly
some underground percolation of water from the mountain !lasses to the allu
vium. Supply from this latter possible source is believed to be minor for
the reasons heretofore stated and is not feasible to evaluate. Disposal of
the supply, other than by export, evaporation from reservoirs, consumptive
use and surface runoff, is by underflow out of the area at the Los Angeles
Narrows and in the Pickens Canyon area. These amounts are relatively small
and amount to an average of 340 and 300 acre-feet per year at the Los
Angeles Narrows and from the Pickens Canyon areas, respectively. . Deter
minations of these amounts are discussed in detail in Appendix P and
annual values tabula ted in Chapter V.
-45-
San Fernando Hydrologic Subarea
The boundaries of the San Fernando Hydrologic Subarea, as shown
on Plate 5, are the alluvial contacts with the nonwater-bearing series
along the San Rafael Hills and Verdugo Mountains on the east and northeast,
the Santa Susana Mountains and Simi Hills on the northwest and west, and
the Santa Monica Mountains on the south. The Los Angeles River Narrows
area, also part of the San Fernando Hydrologic Subarea, is bounded on the
east by the alluvial contact with the San Rafael and Repetto Hills and on
the west by this contact with the Elysian Hills. The southern boundary of
this subarea has been established at Los Angeles County Flood Control
District gaging station F-57, which is about 300 feet upstream from the
Figueroa Place (Dayton Street) bridge. The San Fernando Subarea is
separated from the Sylmar Subarea to the north by the eroded south limb of
the Little Tujunga syncline which causes a break in the water surface of
about 40 to 50 feet. This latter boundary is discussed in detail under
the Sylmar Hydrologic Subarea.
The portion of the San Fernando Hydrologic Subarea westerly of
Pacoima Wash is generally composed of valley fill materials that have a
high clay content, whereas the portion that lies easterly of Pacoima Wash
is generally composed of coarse deposits of sand and gravel. The valley
fill westerly of Pacoima Wash is essentially fine-grained material derived
from the surrounding sedimentary rocks. This material transmits water
at a relatively slow rate, whereas easterly of Pacoima Wash the material
-46-
is composed of coarse detritus eroded mainly from the granitic Basement
Complex of the San Gabriel Mountains and transmits water at a relatively
rapid rate. The eroded debris of the eastern portion is generally very
coarse; in places boulders up to three feet in diameter are relatively
common. The deposits are essentially sand and gravel with some fines
in the interstices. These materials constitute about one-third of the
surface area of the ground water reservoir and contain approximately
two-thirds of the ground water storage capacity of the San Fernando
Hydrologic Subarea. Transition from the fine-grained materials in the
western portion to the coarse-grained materials in the eastern portion
is depicted on Section M-M' on Plate 5E.
An area of high ground water level is present in the western
portion of the hydrologic subarea. The area is bounded on the east by
Reseda Boulevard, on the south by the Los Angeles River and to the west
by De Soto Avenue. The northern boundary is some~mat L-shaped following
Saticoy Street to the vicinity of Tampa Avenue then northerly to Parthenia
Street. This area was studied by the United States Deparunent of
Agriculture Soil Conservation Service, Research, during the period 1947
through 1950 and is further discussed in Appendix L.
The aforementioned investigation pointed out the following:
water level fluctuations in the piezometers installed by the Soil
Conservation Service are cyclic with precipitation; these water levels
also respond to irrigation water applied in excess of the consumptive use;
and deep artesian and/or pressure wells within the area apparently leak
-47-
into the shallow zone to the extent that small ground water mounds are
developed·around certain wells. The source of the confined water derived
through these wells appears to be from aquifers in the older materials
which presumably underlie the alluvium at relatively shallow depths and
are recharged by precipitation.
Because of the existence of more permeable gravel stringers in
the fine-grained deposits found in the western portion of the subarea,
small localized pressure effects can be observed. These gravel stringers
represent the former stream channels which have braided over the fine
grained deposits and in turn have been buried by additional fine-grained
material.
The eastern portion of the San Fernando Subarea is composed of
very permeable deposits. It is in this area that the majority of the large
pumping plants are located. In addition to the pumping plants of the City
of Los Angeles, shown on Plate 21, the Cities of Burbank and Glendale also
extract large quantities of water fror.l this portion of the subarea. T~e
pumping patter-Ds existing in 1930-31 and 1957-58 are shovm on Plates 3lA
and 3lB, respectively. This heavy concentration of pumpi...'1g is reflected
by the large depression in ground vmter levels occurring in the area during
the period 1944 to 1958, as indicated on Plate 33.
The l-.Tater-bearing deposits of the Los Angeles River NarrOl-Js are
very permeable. The City of Los Angeles has tlvO pumping plants in the a.rea,
Due to heaV'J pumping, large depressions or pumping holes have been created
in the ground water surface. The largest of these pumping depressions is
located at the bend in the Los Angeles River where the river begins its
southerly course through the Narrovls. This well field, call ed the Crystal
-48-
( Springs well field, along with the City of Glendale's Grandview wells
immediately north of the City of Los Angeles' Cr,ystal Springs well field,
have created the ground water depression indicated by the ground water
contours shown on Plate 30. The heavy pumping of the Pollock well field.
of the City of Los Angeles has caused a second such depression to develop
during 1959 and 1960 and has caused a reversal of the ground wat.er gradient
in the Los Angeles Narrows.
Rising water which has occurred hi storically in reaches of the
Los Angeles River along the south side of the valley is due in part to the
reduction in the cross-sectional area of the water-bearing material as the
stream approaches the F-57 gage. The maximum depth of water-bearing mater
ials at Huron Street (Gage F-57) is about 110 feet, whereas the maximum
depth at the Pollock well field is 260 feet. A comparison of the two areas
is shown by sections K-K' and L-L' on Plate 5D.
Ground water moves in the direction of the hydraulic gradient or
slope of the ground water surface from areas of recharge to points of dis
charge. General direction of ground water flow is from the recharge areas
in the alluvial cones along the edges of the valley fill toward the dis
charge area in the IDs Angeles River Narrows.
Pumping large quantities of water for municipal uses has greatly
modified the predevelopment condition in the eastern portion of the San
Fernando Subarea with respect to the depths to water, hydraulic gradients
and local direction of ground water movement.
-49"';
Ground water elevation contours for the fall of 1931, 1938, 1944
and 1958 are shown on Plates 27, 28, 29 and 30, respectively. These con
tours were based upon the water level measurement data which were collected
from the various parties and the Los Angeles County Flood Control District.
The depths to water at the wells have been converted to elevation above sea
level (U.S.G.S. datum) by subtracting them from the surface elevation or
reference point elevation obtained by direct surveying methods or by
interpolation between contours on U.S.G.S. 7~-minute quadrangles. The
ground water contours are solid where a satisfactor.y degree of control and
accuracy exists and dashed where there is a paucity of information. The
not.ations "area of no control" and "area of poor control" are in valley fill
areas where there are insufficient measurements or lack of well information
from which to draw satisfactory contours.
The ,subsurface outflow from the San Fernando Subarea averaged
about 340 acre-feet per year during the 29-year base period. A detailed
discussion of this item is contained in Chapter V and Appendix P.
Water level fluctuations in the subarea are depicted by the
hydro graphs of wells considered generally representative and are shown on
Plates 34A and 34B.
-50-
(
( §ylmar Hydrologic Subarea
The Sylmar Hydrologic Subarea comprises the area enclosed by the
boundary of valley fill. contacting the San Gabriel Mountains on the north,
the Mission Hills on the southwest, the Upper Lopez Canyon Saugus formation
on the east along the east bank of Pacoima Wash, and tt2 eroded south limb
of the LittJ.e 'rujunga syncline on the south. The boundary of this subarea
is delineat,ed on Plate 5. The topographic divide in the valley fill lying
between the Mission Hills and San Gabriel Mountains has been utilized as
the subarea boundary because of lack of data with which to determine the
ground water divide. Although the eastern boundary has been taken as the
east bank of Pacoima Wash, it is possible that movement of ground water in
a westerly diraction can occur in the Saugus formation from the Upper wpez
Canyon and Upper Kagel Canyon area which lies irnrrediately to the east of
Pacoima Wash. Ava.ilable data a.re insufficient to evaluate this possible
movement; however, if such mO\~8ment does occur it is believed to be minor
in a.1IIOunt because of the small tributary drainages and rain con sumption of
native cover. The southern boundar! of the subarea is taken along the
contact between the Saugus formation and underlying Repetto formation in
the vicinity of Pacoima Wash, thence westerly to the intersection of
Foothill Boulevard and Fernmont Street, thence in a southwesterly direction
following the break in the ground wat.er surface, as defined by the test
dr.illing performed during the course of the investigation. This bOlmdary
intersects the Mis sion H:ills immediately southeast of the Mission well
field.
-51-
The geology of the Sylmar Subarea is greatly complicated by
faulting and folding. The nonwater-bearing materials to the north of the
subarea have been faulted and in part thrust southerly over portions of
the water-bearing Saugus formation. The compressive forces that are
related to the thrust faulting are also related to the formation of the
Little Tujunga syncline, (See Plate 5J for Block Diagram) which is the
most important feature of the subarea. At least 6,000 feet of Saugus
formation and an even greater thickness of older nonwater-bearing sediments
have been folded into an asymmetric syncline with the north limb over
turned. This syncline has been truncated by erosion and covered by a
relatively thin blanket of Older and Recent alluvium. The southeastern
boundary of the subarea, as hereinbefore noted, is formed by the steep
northerly dipping beds of the nonwater-bearing Repetto and Pico formations
that are part of the same synclinal structure. The Repetto formation is
exposed in both banks of the Pacoima Wash at the topographic constriction,
which is the site of the Pacoima submerged dam located about 2.5 miles
south of Pacoima Dam. These strata continue westerly under the cover
of the Older alluvium and are exposed in roadcuts near the intersections
of Gladstone Avenue and Maclay Avenue and Foothill Boulevard and Fernmont
Street (see Figure A-I for street locations).
The valley fill material in the gap between outcrops of nonwater
bearing materials extending from Foothill Boulevard to Mission Hills
contains a very marked discordance in water levels. In order to more
accurately locate the break in the water surface and the eroded south limb
of the Little TUjunga syncline, 20 bucket auger holes were drilled. Nine
-52-
(
of the twenty holes were drilled under the direction of and at the expense
of the City of San Fernando, five by the City of Los Angeles, and the
remainiqg six by the Referee. Representatives of the Referee were present
at the drilling of all holes and prepared detailed logs of each boring.
The locations of the test holes are shown on Figure A-I of Appendix A, and
relative locations of the formations are shown on Section H-HI (Plate 5c)
and Sylmar Notch (Plate 5H). The logs of the test holes are included in
the well log section of the basic data. The boundary of the subarea was
delineated in the gap area on the basis of water levels.
The analysis of available water level data, data obtained from
the test holes and the geology of the area indicate the following:
1. Water levels northwesterly of the break in the water surface
are about 50 feet higher than those to the southeast of the break. (See
Plate 30).
2. Water levels northwesterly of the break are related to the
eroded ends of confined aquifers in the Saugus formation.
3. Water levels southeasterly of the break are free ground water
levels and are associated with coarse alluvial deposits which had the
Pacoima drainage as a source area.
4. The discordance in water levels is related to the eroded
south flank of the Little Tujunga syncline which has been covered with a
thin veneer of alluvium.
5. Subsurface flow from the Sylmar Subarea into the San Fernando
Subarea occurs only at two places; namely, the Sylmar and Pacoima Notches
(see Plates 5 and 5H). There is hydraulic continuity between the confined
aquifers and the veneer of alluvium that overlies the eroded south flank of
the Little Tujunga syncline.
-53-
6. Continuity exists between the Sylmar and San Fernando Subareas (
through the saturated alluvium in the two notches.
7. The configuration of the break in water surface through the
Sylmar and Pacoima Notches is not sharp as would be caused by a fault but is
a steep gradient which is similar to that found in a ground water cascade.
The average underflow from Sylmar Subarea to the San Fernando
Subarea through the Pacoima and , Sylmar Notches is estimated at 160 and 400
acre-feet per annum, respectively, during the base period. The Pacoima
submerged dam which is located at the Pacoima Notch was constructed in 1888.
Prior to its construction and under conditions equivalent to those occurring
during the base period, it is estimated that 350 acre-feet per annum would
have moved southerly from Sylmar into San Fernando Subarea through the
Pacoima Notch. It is therefore concluded that when the Pacoima submerged
dam was not in place there was less opportunity for the underflow of Pacoima
Wash to move westerly within the Sylmar Subarea.
The information obtained from the test holes was necessary to
evaluate the occurrence and movement of ground water within the subarea.
The noticeable pressure rise of the water surface which took place in
several of the test holes during and immediately after drilling, coupled
with the fact that there are historic records of artesian flows for the
Mission well field of the City of Los Angeles and the City of San Fernando
well field at Fourth and Hubbard Streets, indicates that confined water
exists within the Sylmar Subarea. The existence of an area of free ground
water between the aforementioned well fields was also determined during the
test drilling. All wells in the subarea, however, derive their water
-54-
supplies from the confined aquifers of the Saugus formation. In 12 of
the test holes, the Saugus formation was penetrated before saturated
materials were reached.
There was a decline in water levels in the free ground water
area coincident with heavy pumping of the Mission well field. Therefore,
on the basis of the short period of record available (since December 1958),
it appears that the free ground water area is in hydraulic continuity
with the confined aquifer system.
The exact location and extent of the forebay or recharge area
for the confined aquifers are not definitely known; however, the porous
alluvial materials in the Pacoima Wash are in a favorable position to re
charge along the strike of the westerly plunging aquifers of the Saugus
formation. These aquifers are in contact with the stream gravels in the
incised and backfilled portion of Pacoima Wash. These permeable deposits,
which are 50 to 60 feet in depth, hold water behind the submerged dam,
increasing the possibility of percolation into the aquifers of the Saugus
formation. Ground water elevation contours (Plates 27 through 30) indi
cate that there is a slope of the water surface from Pacoima Wash toward
the lower portion of the subarea where the majority of extractions are
made.
Water level fluctuations within Sylmar Subarea during the base
period are represented by hydro graphs of wells 5939, 5969 and 5989A,
which are shown on Plate 34c.
Verdugo HYdrologic Subarea
The Verdugo Hydrologic Subarea, as shown on Plate 5, is located
in the northeastern portion of the San Fernando Valley. It is a narrow
-55-
alluvial-filled trough bounded by the alluvial contact with the nonwater
bearing hill and mountain groups. This contact is against the San Gabriel
Mountains on the north, the Verdugo Mountains to the south and west, and the
San Rafael Hills to the southeast. The western boundary has been taken as
the topographic divide between the drainage area that is tributary to Big
Tujunga Wash to the west and Verdugo Wash to the east. Location of the eastern
hydrologic boundary is variable dependent on whether ground water levels are
higher or lower than the bedrock ridge westerly of Pickens Canyon as described
on page 42. Geologic cross sections 0-01, p_pl and Q-QI on Plates 5F and 5G,
and contours showing the elevation of the base of the valley fill on Plate 6,
indicate that bedrock to the east of Pickens Canyon is lower than this ridge
and that a buried ancestral Pickens Canyon channel slopes to the east.
Available ground water elevations indicate that the bedrock ridge
diverts ground water to the east under low water table conditions as existed
in the fall of 1958, (see Plate )0) and is the ground water divide under these
conditions. During high water table periods, such as occurred in 1944, (see
Plate 29) ground water levels are above the ridge and water would also flow
across the ridge into the Verdugo Subarea. The ground water divide under this
condition would be situated to the east of Pickens Canyon toward the location
of the watershed boundary of the Upper Los Angeles River area. Because of
this variation in actual location of the ground water divide, depending on
water table elevations, the location of the Raymond Basin Reference boundary
(i.e. a line extending southerly along the eas~ bank of Pickens Canyon to
Foothill Boulevard, thence easterly along Foothill Boulevard to the edge of
the valley fill, see Plate 5) was adopted as the eastern hydrologic boundary
of the Upper Los Angeles River area and the Verdugo Hydrologic Subarea •.
-56-
The ground water elevation contours in Verdugo Subarea shown on
Plates 27 to 30 indicate a movement of ground water in a southerly direction
from the mouths of canyons in the San Gabriel Mountains toward Verdugo Canyon.
The surface and subsurface drainage from the Verdugo Subarea would thus naturallT
flow southerly through the relatively long and narrow Verdugo Canyon into the
San Fernando Hydrologic Subarea. The boundary between these subareas has
been taken at the submerged dam of the City of Glendale. The submerged dam
which was originally constructed in 1895 was reconstructed in 1935 when the
Verdugo Wash Channel was improved. The dam, as rebuilt, is shown in profile
on Plate 5H. The effect of the dam is discussed in Appendix p.
The water-bearing materials of the Verdugo Subarea are surrounded
b,y a complex of granitic and metamorphic rocks which have been highly
fractured. This Basement Complex yields only small amounts of water to
springs and tunnels from fracture systems which in turn are supplied by in
filtration of precipitation. Nine tunnels drilled into the Basement Complex
in the Verdugo area were observed to have flows ranging from 4 to 30 gallons
per minute with an average flow during September 1959 of 20 gpm.
The valley fill is composed essentially of coarse ditritus which
has been deposited in a series of coalescing fans. The principal source
area has been the San Gabriel Mountains. Well logs indicate a fairly high
content of sand, gravel and boulders; however, numerous clay designations
in well logs indicate that there is considerable clay in the matrix of
some of these materials. Well log information indicates that the material
in the area north of Foothill Boulevard has a lower specific yield than
elsewhere in the subarea with the result that wells in this area have a much
smaller specific capacity than those located in the southerly portion of the
subarea.
-57-
Most of the ground water extractions in the Verdugo Subarea are
by wells of Crescenta Valley County Water District located along the south
west side, by wells of the City of Glendale at the Glorietta well field
(see Plate 3lA), in Verdugo Canyon, and by the Verdugo submerged dam and
Verdugo well (3963). Studies described in Appendix P indicate that the
subsurface outflow from Verdugo Subarea to San Fernando Subarea has become
very small in magnitude as a result of the diversion and pumping u~ the
submerged dam by the City of Glendale.
Water level fluctuations within the Verdugo Subarea during the
base period are represented by the hydro graph of well 5058 shown on Plate 34C.
Eagle Rock Hydrologic Subarea
The Eagle Rock Hydrologic Subarea, shown on Plate 5, is located
in the eastern portion of the Upper Los Angeles River area, adjacent to the
east side of the Los Angeles River Narrows. The subarea is bounded by the
valley fill contact with the nonwater-bearing materials of the San Rafael
Hills on the north and west and the Repetto Hills to the east and south, with
the exception of the small alluvia ted area on the southeastern boundar,y of
the subarea which has been taken as the topographic divide. ~ll surface
drainage easterly of the topographic divide in this alluviated area is
tributary to the Arroyo Seeo via the Avenue 50 storm drain. Little subsurface
flow enters the Eagle Rock Subarea at this location due to the limited cross
sectional area, low permeability materials and a very flat hYdraulic gradient
through the valley fill materials from east to west.
-58-
The surface drainage within the subarea flows generally toward
the alluviated area between the San Rafael and Repetto Hills, then south
westerly to the Los Angeles Riv.er. G1asse11 Creek, a tributary to the
Los Angeles River, drained the area prior to urbanization and the instal
lation of drains. spot measurement made by J. B. Lippincott from 1898
through 1900 show a maximum discharge of 1.35 second-feet for Glassel1
Creek at the Los Angeles River.
The southern boundary of the subarea has been taken to be
along the buried trace of the Raymond fault zone. Southerly of the fault
zone the nonwater-bearing Puente formation is at or near the ground surface.
The total drainage area of the subarea above the Raymond fault zone (see
Plate 4) is about 2,910 acres. Of this total 807 acres constitute valley
fill area.
There is no direct hydraulic connection indicated between the
ground water in the main aquifer of the subarea and the ground water in
the Los Angeles River Narrows. The subarea is an artesian basin (see
Section S-SI, Plate 5H) in which all present day pumping is located at the
lower end of the pressure area in the vicinity of well 39871. This well
develops about 22 feet of artesian head over week ends when there is no
pumping. It should be noted that in the computation and description of
hydrologic items of supply and disposal, the Eagle Rock Subarea has been
combined with the San Fernando Subarea.
The water-bearing materials are essentially composed of older
alluvial deposits of sand, gravel and considerable clay. Recent alluvium
-59-
occurs only as a thin veneer along stream channels. There is no surface
indication that movement on the Raymond fault zone has affected the Older
alluvium in the subarea although this has occurred to the east in the
Raymond Basin. Some movement, with the direction of the throH' baing
reversed, must have occurred after the deposition of the gravelly aquifer
materials to cause the change to the essentially fine-grained materials
of the upper aquiclude. The lower aquiclude ruld aquifer terminate
abruptly against the nonwater-bearing Puente formation south of the Raymond
fault zone. The upper aquiclude may not have been affected by fault.i:lg and
may extend southerly of the fault zone. The pressure area extends
northerly from the fault zone toward Colorado Boulevard. Hydraulic
continuity exists between wells that are located immediately north of the
fault and a lvell Hhich is 3,000 feet north of it in the pressure area. All
wells located within the pressure area, estimated at 250 acres in extent,
have had a historic record of artesian flows. There are no wells with
water level measurements within the forebay or recharge portion of the
subarea.
The Eagle Rock artesian system is supplied from percolation of
runoff and deep percolation of applied water into the forebay area. This
area extends along Colorado Boulevard and easterly of Eagle Rock Boulevard
along Yosemite Drive. These waters recharge the pressure aquifer which
has lost about four feet of pressure head since 1941 (measured at well
3986B) •
-60-
The ground waters in the Eagle Rock Subarea move southerly from
the forebay areas into the pressure area. The direction of movement within
the pressure aquifer is southerly to the vicinity of the pumping wells
located above the Raymond fault. There is presently no known subsurface
escape of ground water from the pressure aquifer.
Water level fluctuations in the Eagle Rock Subarea are represented
by the hydro graph of well 3986B, which is shown on Plate 34c.
Specific Yield of Water-Bearing Materials
To select specific yield values applicable to the various materials
described in driller's logs in the Upper Los Angeles River area, the Referee
evaluated previous investigations and presently available data. A direct
measurement of specific yield by laborator,y methods was not considered feasi
ble d~e to time limitation.
The specific yield of water-bearing materials is defined as the
volume of water drained by the force of gravity from a saturated material
over a reasonably long period of time, expressed as a percentage of the total
volume of the saturated material.
The specific retention of a material is the ratio, expressed as a
percentage, of the volume of water which will be retained by the material
against the force of gravity to its own volume. The sum of specific yield
and specific retention thus equals the total porosity of the saturated
materials.
The particle size is an important textural element in fragmental
materials because it is related to the dynamic conditions of transportation
-61-
and deposition. The most common method of measuring particle size is by
sieving. This method consists of taking a sample, a sand for example, and
shaking it through a series of sieves. The particles are sorted into size
groups controlled by the openings in the sieves. The Wentworth grade scale
(1922) provides a means of standardizing terminology. Wentworth's grade
scale is used by the majority of sed~~entologists. This is a geometric
scale which is well adapted to the description of sediments because it
gives equal significance to the ratios of sizes, regardless of whether
these ratios occur in gravel, sand, silt or clay. The difference of a cen
timeter in the size of a boulder is negligible, whereas a difference as
small as one micron in the size of a clay particle may be enough to double
or halve it.
The original work on specific yield reported upon in Bulletin 45* utilized the Wentworth system for describing the various particles. This
system has also been utilized in the present investigation. The following
tabulation shows the grade limits of the various material classifications
by Wentworth size class and the comparable nomenclature used in this
investigation:
* See Appendix A
-62-
(
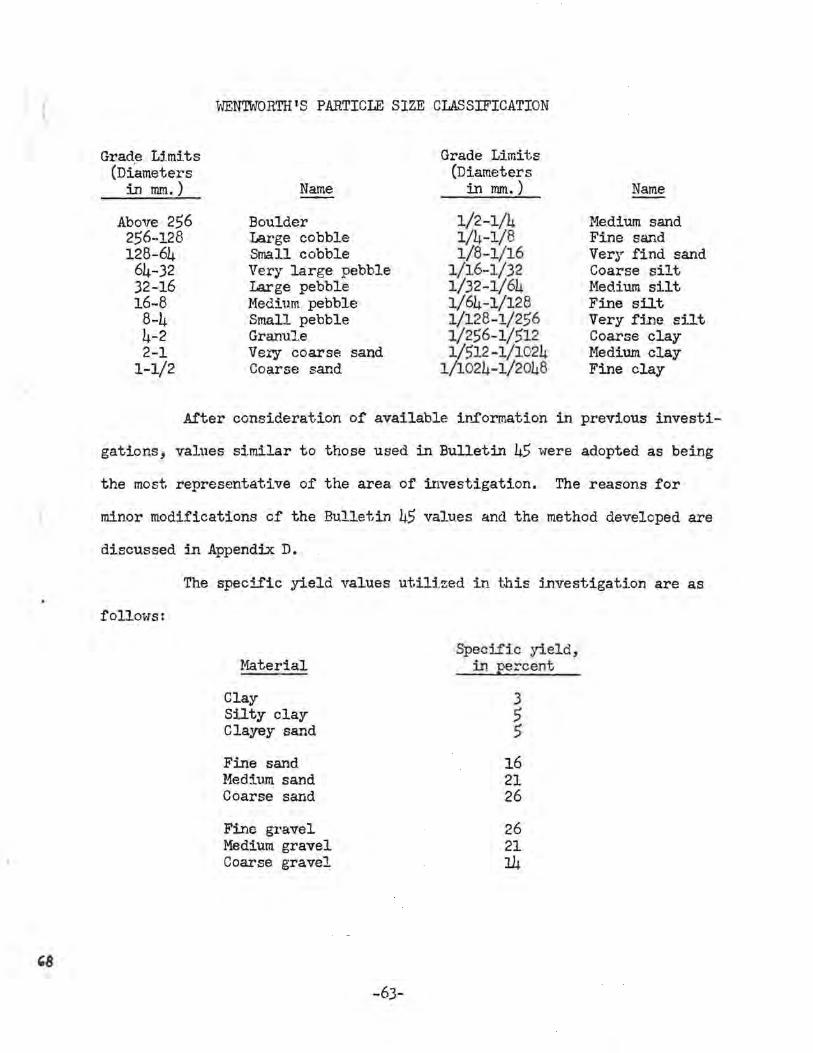
Grade Limits (Diameters
in rom.)
Above 256 256-128 128-64
64-32 32-16 16-8
8-4 4-2 2-1
1-1/2
WENTWORTH'S PARTICLE SIZE CLASSIFICATION
Name
Boulder Large cobble Small cobble Very large pebble Large pebble Medium pebble Small pebble Granule Very coarse sand Coarse sand
Grade Limits (Diameters
in mm.)
1/2-1/4 1/4-1/8 1/8-1/16
1/16-1/32 1/32-1/64 1/64-1/128 1/128-1/256 1/256-1/512 1/512-1/1024
1/1024-1/2048
Name
11e.dium sand Fine sand VerJr find sand Coarse silt Medium silt Fine silt Very fine silt Coarse clay Medium clay Fine clay
After consideration of available in~ormation in previous investi-
gations, values similar to those used in Bulletin 45 >fere adopted as being
the most representative of the area of lllvestigation. The reasons for
minor modifications of the Bulletin 45 values and the method developed are
discussed in Appendix D.
The specific yield values ut.iltzed in this investigat.ion are as
follows:
Material
Clay Silty clay Clayey sand
Fine sand Medium sand Coarse sand
Fine gravel Medium gravel Coarse gravel
-63-
Specific yield, in percent
3 5' 5'
16 21 26
26 21 14
CHAPTER IV. WA TER SUPPLY, UPPER lOS ANGELES RIVER AREA
This chapter contains eValuations of the gross water supply
of the Upper Los Angeles Rj ver area from all sour'ces, WID ch satisfies
in part the requirernents of paragraphs I, 2. E •.• I, 2. F. and I, 7.
of the Order of Reference ~ Included are the amounts of precj pi tation
and import, the historic quaIi ty of native and imported wat.ers in the
Upper Los Angeles River area, and the selection of base study periods
used in determining the safe yield.
The gross water supply to the Upper Los Angeles River area
comprises precipitation falling within the watershed and imports
through the Colorado River and Los Angeles Aqueducts. The water
supply available for ground water recharge is derived from precipita-
tion on the valley floor, runoff from precipitation on tributary hills
and mount ains , and imports.
-6h-
\
70
Precipitation
Precipitation in the Upper Los Angeles River area is generally
in the form of rainfall with snow occurring at times on the higher ridges
of the San Gabriel Mountains. Precipitation varies noticeably with eleva
tion and topographic influence as well as from season to season. The mean
seasonal precipitation varies from about 14 inches at the western end of
the valley to about 35 inches in the San Gabriel Mountains. Precipitation
in maximum seasons may be over twice the mean seasonal rainfall while in
minimum seasons it may be only one-half the mean. On the average, approxi
mately 80 percent of the annual rainfall occurs during the four winter
months of December through March.
Precipitation Characteristics
The greater portion of winter precipitation is derived from rain
storms which move inland from the Pacific Ocean. The storms, cyclonic in
nature, generally originate in the North Pacific and approach the Pacific
Coast moving generally in southeasterly and easterly directions, The storm
centers most frequently reach the coast north of San Francisco and in such
instances may cause only moderate precipitation in Southern California.
However, storm centers which strike the coast farther south often bring
intense precipitation to Southern California. Tropical storms which origi
nate in the South Pacific also can bring rain to the Los Angeles area. These
storms are irregular in occurrence and the resulting precipitation varies
considerably, often bringing warm and heavy rain. During the summer season
-65-
thunderstorms have occurred in the mountains and although the precipitation
may be of high intensity the areal extent of such storms is usually small.
Occasionally during the late summer season tropical air from Mexico moves
northward and produces heavy but short duration showers over the mountain
portion of the Upper Los Angeles River area.
The United states Weather Bureau has reported the distribution
of rain~(- as follows:
"In the case of the Los Angeles area, the orographic barriers determine to a great extent the general distribution of the highest amounts of rainfall. In the ten major storms there was some variation in the location of the highest centers of rainfall, but there was little variation in the location of the 10,000 square mile area over ~nich the maximum precipitation occurred. This fact demonstrates that the orographic features are the major controlling factors for precipitatine the moi.sture and determining its distribution over area. However, there is one important exception: Intense local rainfall associated with the convergent processes of the cyclonic system itself can and does occur over any area irrespective of topography. In the Los Angeles area this rainfall usually has a relatively short duration (less than 12 hours); for longer periods the larg~st amounts of precipitation occur over the windward slopes or ridges, Where precipitation continues as long as moist air flows in any direction that will force it up slope.
"Obviously, the topography of the region is effective in producing precipitation only when the wind is blowing up slope, any downslope motion being rain-inhibiting rather than rainproducing. Also to be considered is tile fact that air coming into the Southern California region from a direction other than betwe~n south-southeast (157.500 ), and west-northwest (292.50 ), clockwise, is either flowing down slope or is considerably drier than air coming from those directions. Examir~tion of all storms showed that when the wind vJaS from any direction outside this SSE-WNW range no appreciable rain occurred and therefore all winds outside this range could be disregarded, except in cases Where a front or marked trough extending in a west-to-east direction moved southward over California. During these conditions appreciable rain could occur in the air preceding the front or trough passage even though the isobars indicated movement of air from a direction slightly north to west-northwest."
* Uydrometeorologica1 Report Number 21B, United States Department of Commerce, December 29, 1945.
-66-
"
The isohyetal map (see Plate 9) clearly indicates the orographic
effects on the distribution of rainfall in the upper Los Angeles River area
from storms w.hich predominantly come from southerly and westerly directions.
The mean annual precipitation increases with increasing elevation on the
windward slopes of the San Gabriel and Santa Susana Mountains and then
diminishes on the leeward slopes.
As noted by the United States Weather Bureau, intense local rain
fall can occur over any area irrespective of topography_ It is possible
that this rainfall mayor may not be recorded at a precipitation station,
and in either case, because of the local nature of the rainfall, could
induce an undeterminable error in the quantity of precipitation deter
mined from such records.
Quantity of Precipitation
The mean depths of precipitation over the upper Los Angeles River
area, as shown on Plate 9, are based on the 85-Year Mean Seasonal Isohyetal
Map for Los Angeles Oounty for the period from 1872-73 through 1956-57,
prepared by the Los Angeles County Flood Control District. The isohyetal
map is based on 130 master precipitation stations established by the
District. The Los Angeles and Pasadena precipitation stations have records
throughout the 85-year period and all other master station records were
extended to that oeriod by methods described L~ Appendix E.
The 85-vear mean precipitation was computed by applying the Isohyetal
Method to the 85-year isohyets within polygons of a Thiessen network. The
Thiessen network was constructed by utilizing 22 controlling precipitation
stations (see Plate 9 and Table E-1) located within the Upper Los Angeles
River area. A more detailed discussion of this procedure is presented in
Appendix E. The Isohyeta1 Method was used to compute the 85-year normal
amounts of precipitat.ion rather than applying the normal annual depth of pre
cipitation at the controlling station over the entire polygon area because of
the variable effect on occurrence and amount of precipitation resulting from
topography and other influences. Some of these influences, particularly
those caused by topography, are generally reflected by the isohyets.
The annual amount of precipitation during any year was computed as
the product of the index of wetness for that year at the controlling station
(see Table E-5), the normal annual depth of precipitation on the polygon con
taining the station (as determined from the isohyets), and the area of the
polygon. The controlling station was considered to be representative of the
index of wetness at any point within the polygon because the resulting area
of influence is not large compared to the extent of most of the winter
storms from which the major portion of the precipitation is derived.
The annual amounts of precipitation on the valley floor hydrologic
subareas and the hill and mountain areas were computed separately and are
shown in Table 1 for the 30-year period 1928-29 through 1957-58. Annual
precipitation in percent of 85-year normal is shown in Table 2. It should
be noted that the average values shown in Table 2 indicate that the mean
annual precipitation on the valley floor for the 29-year period 1928-29
through 1956-57 is slightly greater than the 85-year normal; however, the
combination of valley fill and hill and mountain precipitation for this period
is practically the same as the BS-year normal for the total area.
-68-
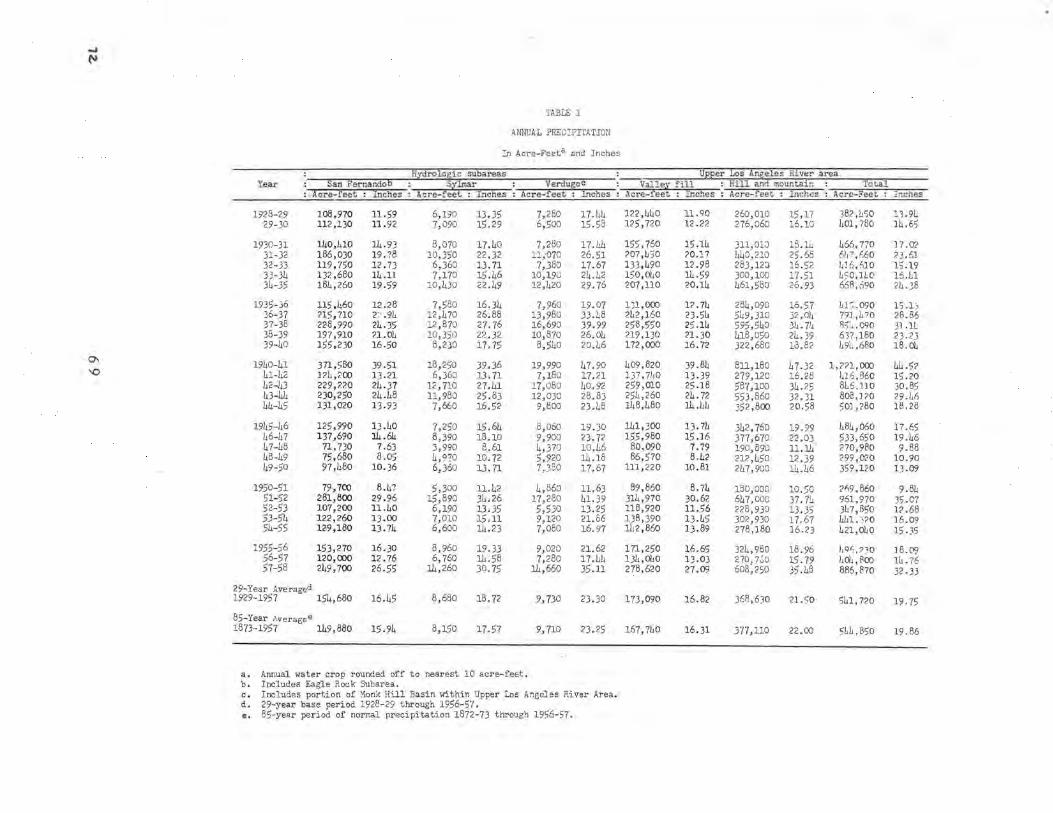
-.... t'J
TABLE 1
ANNUAL PRECIPITATION
In Acre-Feeta and Inches
H~olo~ic subareas Upper Los Angeles River area Year San Fernando5 S;!lmar Vlarougoe Vall"" till Hill anrl mountain To~al
Acre-feet Inches Acre feel. Inches Acre- feet : Inches : Acre-feet : Inches Acre-feet Inches AC.l"C-Fee ~ Inch~s
1928-29 108,970 11.59 6,190 13.35 7,280 17.44 122,440 11.90 260,010 15,17 ,82,LSO 1, .94 29-30 112,130 n.92 7,090 15.29 6,500 15.53 125,720 12.22 276,060 16.10 1,01,780 Ih.6~
1930-31 140,1.10 14.93 8,070 17.40 7,280 l7.hh 155,760 IS.lu 311,OlJ 18.11.. 466,770 17 .02 31-32 186,030 19.78 10,3,0 22.32 ll;070 26.51 ?07,u,O ?0.17 440,210 25.66 6I,7,f,60 23.6] 32-33 119,750 12.7) 6,360 13.71 7,380 17.67 133,490 12.98 283,12~ 16.52 1,]6,fil0 lS.19 33-34 132,680 14.11 7,170 15.46 10,190 24.42 150,01,0 lu·S9 300,100 17.51 4'0, ]40 16.ul 34-35 184,260 19.59 10,430 22.49 12,420 29.76 207,110 20.14 461,580 26.93 66A,ci90 2u.38
1935-36 115,460 12.28 7,580 16.34 7,960 19.07 1.)1,000 I? 74 284,090 16.57 01<::.090 ]5.I:! 36-37 ?I5,710 2:' .94 12,470 26.88 13,980 33.48 2u2,160 23.S4 549,310 32.01-1 79),470 28.86 37-38 228,990 24.35 12,870 27.76 16,690 39.99 258,5,0 25.14 595,540 31 •• 71-1 as!I.090 31.14 38-39 197,910 n.04 10,350 22.32 10,870 26.04 219,130 21.30 418,050 24.39 6,7,180 23.;;'3 39-40 155.230 16·50 8,230 17.75 8,540 20.46 172,000 16.72 322,680 la.82 1,911,680 18.04
0\ 1940-41 371,580 39.51 18,250 39.36 19,990 47.90 409,820 39.84 811,180 47.32 1,??l,OOO 44.5? \0 41-42 ]24,200 13.21 6,360 13.71 7,180 17.21 137,7110 13.39 279,120 16.28 IJ 16,86O 15.20
42-43 229,2<0 24.37 12,710 27.41 17,080 40.92 259,010 25·18 587,100 34.25 846. 1J 0 30.85 43-44 230,250 24.48 11,980 25.83 12,0)0 28.83 251,,260 24.72 553,860 32.31 808,1?0 29.1Ji'i 44-45 131,020 13.93 7,660 16.52 9,800 23.48 148,l,80 14./:1, 352,800 20.58 501,280 18.28
1945-46 125,990 13.40 7,250 15.64 8,060 19.30 141,300 13. ?u 342.760 19.99 u84,060 17.65 46-47 137,690 14.64 8,390 18.10 9,900 23.72 155,980 15.]6 377,670 22.03 533,650 19.46 47-48 71,730 7.63 3,990 8.61 4,370 10.46 80.090 7.79 190,890 11.14 270,980 9.88 48-49 75,680 8.05 4,??0 10.72 5,920 14.18 86;570 8.42 212,450 12.39 299,020 10.90 49-50 97,480 10.36 6,360 13.71 7,330 17.67 111,220 10.81 247,900 14.46 359,120 13.~
1950-51 79,700 8.h7 5,300 11.42 4,660 11.63 89,860 8.74 180,000 10.50 ?1)9.860 9.8u 51-52 281,800 29.96 15,890 34.26 17,280 41.39 31u,970 30.62 647,000 37.74 961,970 3',.07 52-53 107,200 11.40 6,190 13.35 5,530 13.25 118,920 11.56 228,930 13.35 3u7,8,o 1?68 53-54 122,260 13.00 7,010 15.11 9,120 21. 86 138,390 13.45 302,930 l7.67 4ul. "<?O ]6.09 54-55 129,180 1).74 6,600 14.23 7,080 16.97 11.,2.860 13.89 278,]80 16.23 ['21,040 15.35
1955-56 153,270 16.30 8,960 19.33 9,020 21.62 171,250 16.65 324,980 18.96 11 Q<;.?30 ]8.09 56-57 120,000 12.76 6,760 14.58 7,280 17.44 134,oUO 13.03 270,7:-0 15.79 1;OI,BOO lU.76 57-58 249,700 26.55 14,260 30.75 14,660 35.11 278,620 27.09 608,250 3,.48 886,870 32.33
29-Year Averaged 1929-1957 154,680 16.4, 8,680 18.72 9,730 23.30 17),090 16.82 36A,630 21.<;0 5ul,720 19.75
85-Year ,\verage e 1873-1957 149,880 15.94 8,150 17.57 9,710 23.25 167,740 16.31 377,110 22.00 5Lu,B50 19.86
a. Annual water crop rounded off to nearest 10 acre-feet. b. Includes Eagle Rock Subarea. c. Includes portion of Monk Hill Basin within Upper Los Angeles River Area. d. 29-year base period 1928-29 through 1956-57. e. 85-year period of normal precipitation 1872-73 through 1956-57.
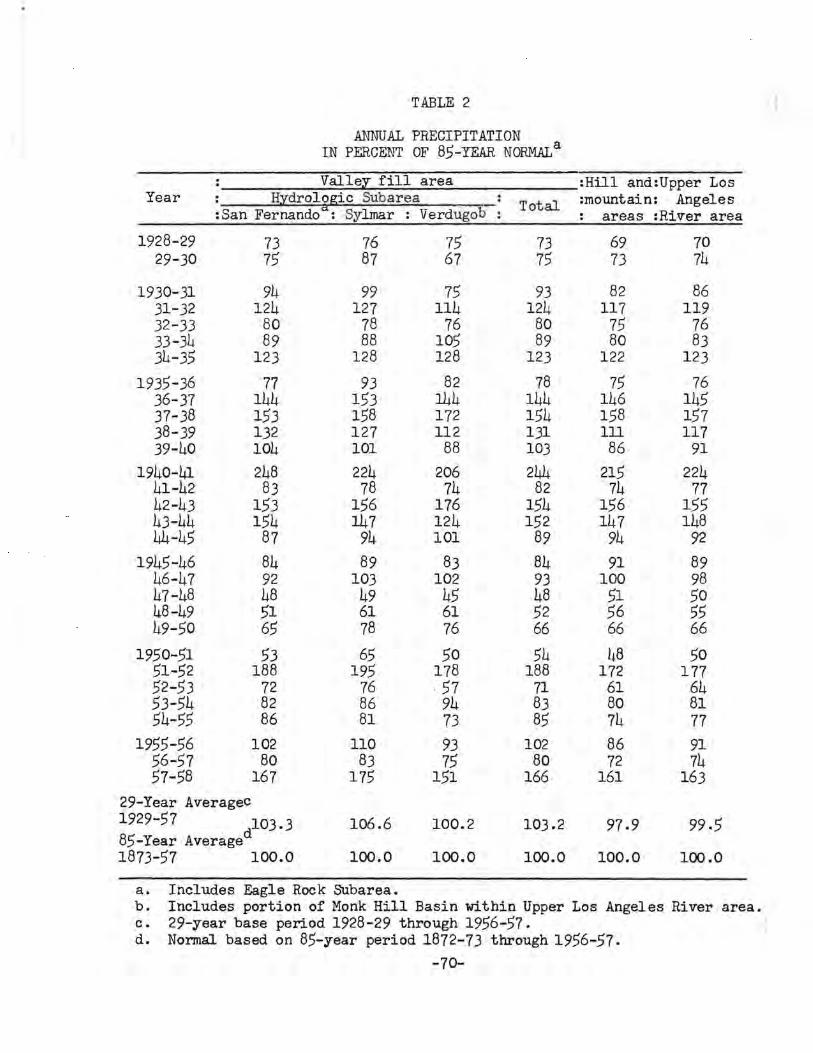
TABLE 2
ANNUAL PRECIPITATION IN PERCENT OF 85-YEAR NORMALa
Vallel fill area :Hi11 and:Upper Los Year Hl dro10gic Subarea : Tot al :mountain: Angeles
:San Fernandoa : Sylmar : Verdugob : areas :River area
1928-29 73 76 75 73 69 70 29-30 75 87 67 75 73 74
1930-31 94 99 75 93 82 86 31-32 124 127 114 124 117 119 32-33 80 78 76 80 75 76 33-34 89 88 105 89 80 83 34-35 123 128 128 123 122 123
1935-36 77 93 82 78 75 76 36-37 144 153 144 144 146 145 37-38 153 158 172 154 158 157 38-39 1)2 127 112 131 111 117 39-40 104 101 88 103 86 91
1940-LJ. 248 224 206 244 215 224 41-42 83 78 74 82 74 77 42-43 153 156 176 154 156 155 43-44 154 147 124 152 147 148 44-45 87 94 101 89 94 92
1945-46 84 89 83 84 91 89 46-47 92 103 102 93 100 98 47-48 48 49 45 48 51 50 48-49 51 61 61 52 56 55 49-50 65 78 76 66 66 66
1950-51 53 65 50 54 48 50 51-52 188 195 178 188 172 177 52-53 72 76 · 57 71 61 64 53-54 82 86 94 83 80 81 54-55 86 81 73 85 74 77
1955-56 102 110 93 102 86 91 56-57 80 83 75 80 72 74 57-58 167 175 151 166 161 163
29-Year AverageC
1929-57 d1O).3 106.6 100.2 103.2 97.9 99.5 85-Year Average 1873-57 100.0 100.0 100.0 100.0 100.0 100.0
a. Includes Eagle Rock Subarea. b. Includes portion of Monk Hill Basin within Upper Los Angeles River area. c. 29-year base period 1928-29 through 1956-57. d. Normal based on 85-year period 1872-73 through 1956-57.
-70-
(
13
Selection of Base StuQy Period
The desirable base study period is one during which precipita
tion characteristics in the Upper Los Angeles River area approximate
the 85-year period of record, 1872-73 through 1956-57. A further require
ment of such a period is that additional hYdrologic information is avail
able sufficient to permit an eValuation of the amount, occurrence and
disposal of the normal water supply under recent culture conditions. The
desirable base period includes both wet and dr,y periods similar in magni
tude and occurrence to the normal supply, and during wnich there are
sufficient measurements and observations to relate the hydrology to
recent culture.
Subsequent to 1927-28, records of stream outflow, culture distri
bution and water utilization on the valley floor, and ground water levels
at wells are fairly comprehensive and adequate. In contrast, earlier
records concerning these items are available only on a limited basis.
There is a paucity of earlier measurements required to determine basin
wide ground water levels and continuous stream outflow. Because of the
aforementioned requirements and limitations, the selection of a base
period was restricted to years subsequent to 1927-28.
To determine the regimen of occurrence of rain in the Upper Los
Angeles River area, selected precipitation stations on the valley floor
having long periods of record were studied for an indication of periods
with an occurrence of rain equivalent to the normal period. The 8S-year
mean seasonal precipitation was used to compute the indices of wetness for
-71-
these selected stations, and annual averages of these indices of wetness (
were utilized to construct the cumulative percentage deviation mass diagram
for the Upper Los Angeles River area, shown on Plate 10.
Comparison of the preCipitation trends in the Upper Los Angeles
River area with those reflected by the longer record of preCipitation at
Los Angeles, Pasadena, Acton and Sawtelle Soldiers Home, also shown on
Plate 10, indicates that even though the magnitude of the annual deviation
varies, the cyclic trends of these four stations are generally in agreement
with the trends indicated by preCipitation records within the area.
The 29-year period, 1928-29 through 1956-57, was selected as the
base study period for the following reasons:
1. It was a period of normal preCipitation during which sufficient records
were available for purposes of detennining safe yield.
2. It was a representative period of normal precipitation including both
wet and dr.r periods of magnitude and occurrence similar to long-time
mean supply conditions of 1872-73 through 1956-57. A wet period
occurred from 1936-37 through 1944-45, and a predOminantlY dry period
from 1945-46 through 1956-57. The 29-year period 1926-29 through
1956-57 contains nine years when preCipitation was predominantlY above
average, that is, 115 percent of normal or greater. These nine years
comprise 31 percent of the 29-year period as compared to 29 years of
similar wetness occurring during the 65-year or normal period which
comprise about 34 percent of that period. The average annual amount of
precipitation during the 29-year period approximates the long-time mean
-72-
having the following average annual deviation from the 85-year mean
expressed as a percentage thereof:
Valley lands +3.5 percent
Hill and mountain areas -2.2 percent
Combined -0.4 percent
3. The years immediately preceding the first and last years of this
period were of below normal wetness, which thereby minimized the
difference of unaccounted-for water in transit to the water table
at the start and end of the period.
4. It includes a period of record of supply and disposal under condi
tions of culture which approximate those existing in 1949-50, 1954-
55 and 1957-58, the years during which safe yield is to be deter
mined.
Special Study Periods
The period 1933-34 through 1948-49 is of significance in that
it can be used to check change in storage computations. During this
16-year period a substantial rise and fall of ground water levels occurred
with average levels at the beginning and end of the period being approxi
mately the same elevation.
The 29-year base stuQy period contains periods of differing
practices as to the use of water which are related to change in land use,
economic conditions, living standards and technological improvements.
Thus, to properly evaluate the use of water under current conditions, a
study period during recent years having a rain supply equivalent to the
long-time mean was desirable. The 9-year period 1949-50 through 1957-58
-73-
was selected as a special stuqy period for the valley floor area since
the average annual precipitation on the valley floor was 99.7 percent
of the 85-year mean and this period included economic conditions and
water use practices prevalent during the safe yield years. Hill and
mountain precipitation and resulting runoff were less than normal
during this same period; because of this the 9-year period was restrict
ed to eValuation of the effects of rain on culture in the valley.
Hill and Mountain Runoff
The surface runoff from 205,709 acres of hill and mountain
lands contributes to the water supply on the valley fill. The average
annual surface runoff during the base period from these areas was 43,100
acre-feet per year. In a dry year such as 1941-48, the runoff from hill
and mountain lands was less than 4,000 acre-feet, while in a wet year such
as 1940-41, it was approximately 190,000 acre-feet. This wide variation
in the annual amount of runoff is the result of changes in both precipita
tion and the retentive characteristics of the watersheds.
Surface runoff from about 42 percent of the hill and mountain
areas is measured by two stream gaging stations (Plate 9). They are
located on Pacoima Creek above Pacoima Dam and Big Tujunga Creek at Gold
Canyon. The remaining hill and mountain areas consist of smaller water
sheds at lower elevations. The amount of surface runoff contributed by
these watersheds under native conditions has been estimated by corre
lating the surface runoff and index of wetness with runoff measurements of
-74-
(
( ( comparable watersheds located in and near the Upper Los Angeles River area
(see Appendix F). It was determtbed from this study that under native
conditions the long-time mean runoff for these watersheds was equal to nine
percent of the long-time mean precipitation. The annual quantities of
surface runoff thus estimated for these smaller watersheds were further
adjusted by applying an annual factor based on the difference between the
measured and the estimated runoffs of the control watersheds.
Residential development along the foothills produces a larger
amount of runoff than would have occurred under native conditions. The
amount of increased runoff was calculated as the difference between
runoff on impervious areas of residential lots, as shown in Appendix L,
and the runoff under native conditions as detailed in Appendix F.
The methods of estimating hill and mountain runoff under
native and developed conditions, as well as the amount of runoff tribu
tar,y to water supply reservoirs, are contained in Appendix F.
Annual amounts of surface runoff from hill and mountain lands
to the hydrologic subareas and the entire valley floor are shown in
Table 3 for the base period. The total amounts shown include contrib
utions to water supply reservoirs from this source.
-75-
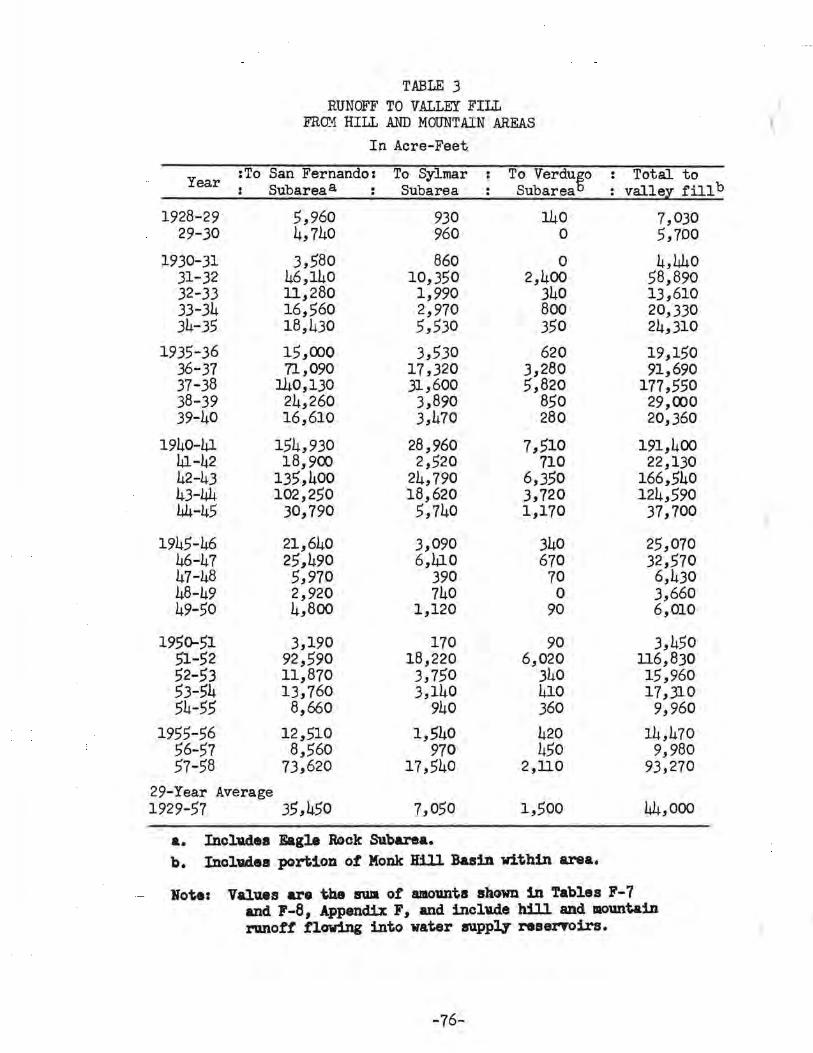
TABLE 3 RUNOFF TO V ALLEY FlU
FRC!'1 HILL AND MOUNTAIN AREAS ( In Acre-Feet
Year :To San Fernando: To Sylmar To Verdu~o Total to Subarea a Subarea Subarea vallel fill b
1928-29 5,960 930 140 7,030 29-30 4,740 960 0 5,700
1930-31 3,580 860 0 4,440 31-32 46,140 10,350 2,400 58,890 32-33 11,280 1,990 340 13,610 33-34 16,560 2,970 800 20,330 34-35 18,430 5,530 350 24,310
1935-36 15,000 3,530 620 19,150 36-37 71,090 17,320 3,280 91,690 37-38 140,130 31,600 5,820 177,550 38-39 24,260 3,890 850 29,000 39-40 16,610 3,470 280 20,360
1940-41 154,930 28,960 7,510 191,400 hl-42 18,900 2,520 710 22,130 42-43 135,400 24,790 6,350 166,540 43-44 102,250 18,620 3,720 124,590 44-45 30,790 5,740 1,170 37,700
1945-46 21,640 3,090 340 25,070 46-47 25,490 6,hlO 670 32,570 47-48 5,970 390 70 6,430 48-49 2,920 740 0 3,660 49-50 4,800 1,120 90 6,010
1950-51 3,190 170 90 3,450 51-52 92,590 18,220 6,020 116,830 52-53 11,870 3,750 340 15,960 53-54 13,760 3,140 410 17,310 54-55 8,660 940 360 9,960
1955-56 12,510 1,540 420 14,470 56-57 8,560 970 450 9,980 57-58 73,620 17,540 2,1l0 93,270
29-Year Average 1929-57 35,450 7,050 1,500 44,000
a. Incl\ldaa Eagle Rock Subarea. b. Inoloas portion ot Monk Hill Basin within area.
Note: Values are the swa of amounts shown in Tables F-7 and F-8, Appendix F, and inclllde hill and mountain runoff flowing into water supply reservoirs.
-76-
(' Imported Water
The inadequacy of local water resources in the South Coastal
area of California to meet the needs of rapidly increasing population and
expanding industry made the early import of additional water supplies a
necessity. The City of Los Angeles, to meet this demand in its service
area, constructed the Loa Angeles Aqueduct and related facilities to bring
water from the Owens River into the City. The system was subsequently
extended into Mono Basin to make water from that area available for diver
sion into the aqueduct. The first water delivered from the aqueduct to
the area of investigation was in May 1915, although some water was used
in the Los Angeles downtown area starting in 1913. The Department of Water
and Power of the City of Los Angeles owns and operates the Los Angeles
Aqueduct.
The need for additional water throughout the South Coastal area
culminated in the 1921 State Legislature authorizing the formation of The
Metropolitan Water District to construct and operate an aqueduct to import
Colorado River water.
Construction of the Colorado River Aqueduct pursuant to the
authorizing legislation, resulted in delivery in 1940 of the first water
from the Colorado River to the South Coastal area of which the City of Los
Angeles is a part. The aqueduct S,1stem was put on an operational basis in
1941. Other than by these two systems there are no significant importations
of foreign water into the area of investigation.
-11-
There follows a description of the works and the apparent water
supply under the two aqueduct 5,Ystems.
Los Angeles Aqueduct System of the City of Los Angeles
The Los Angeles Aqueduct s,ystem as shown on Plate 14 was con
structed to utilize the water supply of the Owens River and Mono Basin to
serve the municipal demands of the City of Los Angeles. Construction was
initiated in 1901 and the first Owens River water delivered to the City in
1913 and to the Upper Los Angeles River area in May 1915. Subsequent
extension of the s,ystem into the Mono Basin made water from that area
available in 1940.
Description and Capacity of Project. Owens River, tributar,y to
a closed interior basin east of the Sierra Nevada, originally drained into
the now dry Owens Lake. Mono Basin drains naturally into Mono Lake and is
located immediately north of the Owens River, the two being separated by a
low divide.
Diversion from the Owens River is made by the -City of Los Angeles
upstream from Owens Lake through a diversion canal of 700 cubic feet per
second capacity. The canal intercepts the flow of several streams along
its course and empties into the 58,525 acre-foot capacity Haiwee Reservoir
which is a storage and regulating basin at the head of the aqueduct.
The aqueduct from Haiwee Reservoir is a closed conduit approxi
mately 140 miles in length having a maximum capacity of 500 cubic feet per
second. It delivers water into Fairmont Reservoir, the first of several
-78-
I storage and regulating reservoirs near and within the Upper Los Angeles River
area. The overall storage in the group of reservoirs along the aqueduct
77
below Haiwee and above San Fernando Reservoir is 44,763 acre-feet. The maxi
mum capacity of the conduit between these reservoirs and the San Fernando
Reservoir inlet is 485 cubic feet per second, which is the controlling capacity
of the system with respect to rate of delivery to the Upper Los Angeles Ri ver
area and the City of Los Angeles.
Based on a limiting capacity of 485 cubic feet per second and a
seven percent annual shutdown period, it appears that the aqueduct has operated
at or near capacity during the latter portion of the base period.
Upstream on the Owens River, a short distance from the head of the
aqueduct diversion, is located Tinemaha Reservoir of 16,405 acre-feet capacity
which is used as a regulating reservoir to equalize variations in stream flow.
Pleasant Valley Reservoir of 3,885 acre-feet capacity located immediately
below the lowermost Owens Gorge power plant, is used to stabilize the power
plant discharge. Crowley Lake, located above the gorge with a capacity of
18),465 acre-feet, is used to store and regulate upstream runoff.
Water from Mono Basin is delivered into Owens River Valley through
the Mono Craters Tunnel, which has a capacity of 365 cubic feet per second.
The Mono Basin system has a further limitation in that not more than a total
of 93,540 acre-feet per year and 200 cubic feet per second may be diverted from
Leevining, Walker, Parker and Rush Creeks into Gr~~t Lake, which stores and
regulates the flow before it is released into the Mono Craters Tunnel conduit.
Grant Lake Reservoir has a capacity of 47,525 acre-feet.
Further detailed description of the aqueduct system and its operation
is set forth in Appendix G.
-79-
Quantities of Water Diverted and Used. The quantity of water
diverted by the City of Los Angeles from the Mono Basin-Owens River system
is considere~ to be the inflow to Haiwee Reservoir, which is the sum of the
diversion from the Owens River measured in the vicinity of Cartago below the
Cottonwood Power Plant gates plus the flows of Ash and Braley Creeks which
are intercepted by the diversion canal downstream of the power plant.
Import to the Upper Los Angeles River area as measured in the
vicinity of San Fernando Reservoir, the terminus of the Los Angeles
Aqueduct, is considered as the quantity delivered for use by the City of
Los Angeles through the aqueduct. From 1933 to date, all measurements of
import were made in the vicinity of the terminus of the aqueduct. Prior to
1933 all measurements were made at Dry Canyon Reservoir.
Quantities diverted and delivered for use by the City of Los
Angeles through the Los Angeles Aqueduct system are shown in Table 4. The
differences betueen quantities diverted and quantities delivered for use
can be attributed to seepage and evaporation losses, inaccuracies of
measuring devices, operational losses and unmeasured distribution along
the aqueduct. Further details are presented in Appendix G.
-80 ..
f
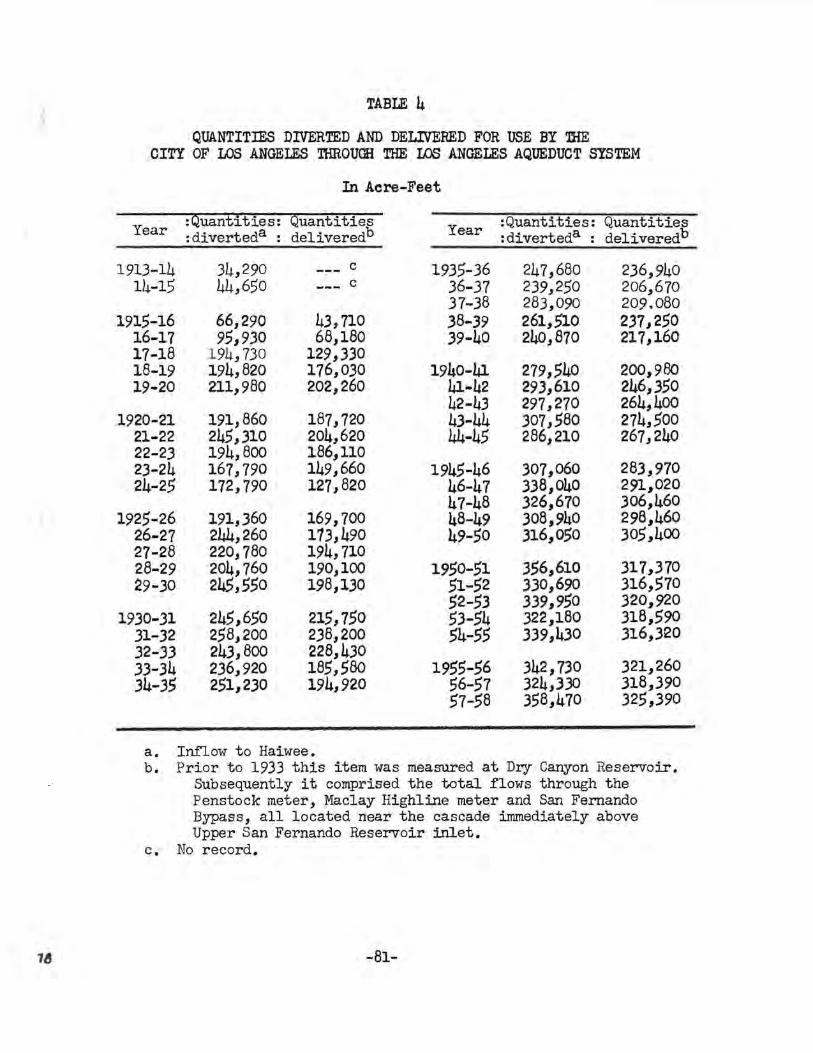
TABLE 4
QUANTITIES DIVERTED AND DELIVERED FOR USE BY THE CITY OF LOS ANGELES nmOUGH THE LOS ANGELES AQUEDUCT SYSTEM
In Acre-Feet
Year : Quantities: Quantities :diverteda : deliveredb Year :Quantities: Quantities
:diverteda : deliveredb
1913-14 34,290 c 1935-36 247,680 236,940 14-15 44,650
___ c 36-37 239,250 206,670 37 ... 38 283,090 209.080
1915-16 66,290 43,710 38 .. 39 261,510 237,250 16-17 95,930 68,180 39-40 240,870 217,160 17-18 194, 730 129,330 18-19 194,820 176,030 1940-41 279,540 200,980 19-20 2l1,980 202,260 41-42 293,610 246,350
42-43 297,270 264,400 1920-21 191,860 187,720 43-44 307,580 274,500
21-22 245,310 204,620 44-45 286,210 267,240 22-23 194,800 186,110 23-24 167,790 149,660 1945-46 307,060 283,970 24-25 172,790 127,820 46-47 338,040 291,020
47-48 326,670 306,460 1925-26 191,360 169,700 48-49 308,940 298,460
26-27 244,260 113,490 49-50 316,050 305,400 27-28 220,780 194,710 28-29 204,760 190,100 1950-51 356,610 317,370 29-30 245,550 198,130 51-52 330,690 316,570
52-53 339,950 320,920 1930-31 245,650 215,750 53-54 322,180 318,590
31-32 258,200 238,200 54-55 339,430 316,320 32-33 243,800 228,430
321,260 33-34 236,920 185,580 1955-56 342,730 34-35 251,230 194,920 56-57 324,330 318,390
57-58 358,470 325,390
a. Inflow to Haiwee. b. Prior to 1933 this item was measured at Dry Canyon Reservoir.
Subsequently it comprised the total flows through the Penstock meter, Maclay Highline meter and San Fernando Bypass, all located near the cascade immediately above Upper San Fernando Reservoir inlet.
c. No record.
-81-
Quantities Available for Diversion and Use. The water supply of
the Mono Basin-Owens Valley area available for use is composed of storm
runoff and well water. For a limited period the City of Los Angeles
extracted water from deep wells in Owens Valley. These wells were pumped
continuously from May 1928 to December 1931 and intermittently pumped to
1935. During the years of the period 1918 through 1958 in which there was
no pumping, the annual artesian well flow reaching the aqueduct averaged
approximately 11,500 acre-feet.
Runoff tributary to the diversion works of the Los Angeles
Aqueduct and the amount that it exceeds actual diversions into the aqueduct
are shown in Table 5. A detailed determination of these values is contained
in Appendix G.
Quantities of water available for diversion and use by the City
of Los Angeles from sources tributary to Mono Basin and to the Owens River
are limited by the capacity of the Los Angeles Aqueduct system. Transpor
tation of additional water to the City of Los Angeles would require the
construction of additional works. Water in excess of the capacity of the
aqueduct has existed in the Mono Basin-Owens Valley area; however, towns,
communities and some irrigated lands in Owens Valley and Mono Basin have
historically used water and rights may pertain thereto. The water use by
these entities is not considered within the scope of this reference and
therefore has not been determined.
-82-
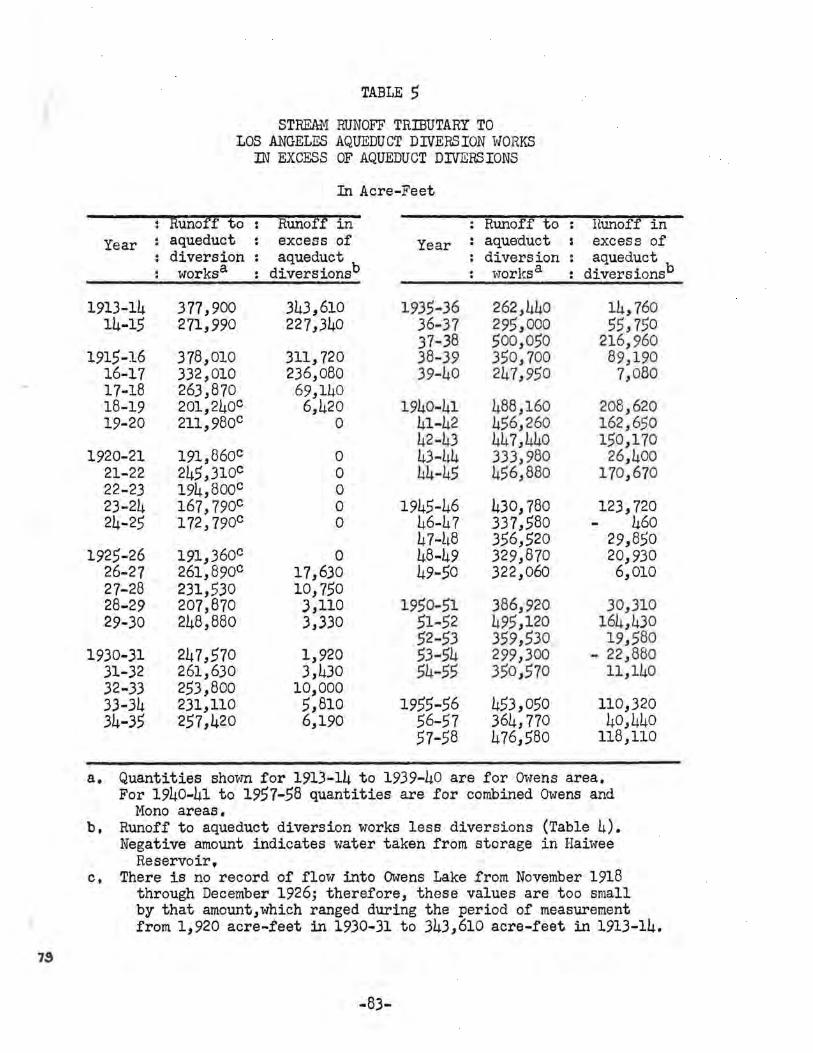
( TABLE 5
STREAM RUNOFF TRIBUTARY TO LOS ANGELES AQUEDUCT DIVERSION WORKS
IN EXCESS OF AQUEDUCT DIVERSIONS
In Acre-Feet
Runoff to Runoff in Runoff to Hunoff in Year aqueduct excess of Year aqueduct s excess of
diversion works a
aqueduct diversionsb
diversion works a
aqueduct diversionsb
1913-14 377 ,900 343,610 1935-36 262,440 14,760 14-15 271,990 227,340 36-37 295,000 55,750
37-38 500,050 216,960 1915-16 378,010 311,720 38-39 350,700 89,190
16-17 332,010 236,080 39-40 247,950 7,080 17-18 263,870 69,140 18-19 201,240c 6,420 1940-41 488,160 208,620 19-20 211, 98oc 0 41-42 456,260 162,650
42-43 447,440 150,170 1920-21 191,860c 0 43-h4 333,980 26,400
21-22 245,310c 0 44-45 456,880 170,670 22-23 194,800c 0 23-24 167, 790c 0 1945-46 430,780 123,720 24-25 172, 790c ° 46-47 337,580 460
47-h8 356,520 29,850 1925-26 191,360c
° 48-49 329,870 20,930 26-27 261, 890c 17,630 49-50 322,060 6,010 27-28 231,530 10,750 28-29 207,870 3,110 1950-51 386,920 30,310 29-30 248,880 3,330 51-52 495,120 164,1.~30
52-53 359,530 19,580 1930-31 247,570 1,920 53-54 299,300 - 22,880
31-32 261,630 3,430 54-5S 350,570 11,140 32-33 253,800 10,000 33-34 231,110 5,810 1955-56 453,050 110,320 34-35 257,420 6,190 56-57 364,770 40,440
57-58 476,580 118,110
a. Quantities shown for 1913-14 to 1939-40 are for Owens area. For 1940-41 to 1957-58 quantities are for combined Owens and
Mono areas. b. Runoff to aqueduct diversion works less diversions (Table 4).
Negative amount indicates water taken from storage in Haiwee Reservoir,
c. There is no record of flow into Owens Lake from November 1918 through December 1926; therefore, these values are too small by that amount, which ranged during the period of measurement from 1,920 acre-feet in 1930-31 to 343,610 acre-feet in 1913-14.
7S
-83-
Colorado River Aqueduct of The Metropolitan Water District of Southern California
The Metropolitan Water District was organized in December 1928
under the authority of The Metropolitan Water District Act (California
Statutes of 1927, Chapter 429, page 694). The Metropolitan Water District
serves Colorado River system water to all of the municipalities and water
districts within the area described in Appendixes A and B attached to the
Amended Complaint in Los Angeles vs. San Fernando, et al., with the excep-
tiona of the City of San Fernando and the Los Angeles County Waterworks
District No. 21. The City of San Fernando, although within the exterior
boundaries of the City of Los Angeles, is not a part of The Metropolitan
Water District service area.
Description and Capacity of Project. The Colorado River Aqueduct
Project (see Plate 13), financed and constructed by The Metropolitan Water
District, diverts from the main stream of the Colorado River above Parker
Dam 155 miles below Hoover Dam and 175 miles above the Mexican border.
The major works of the main aqueduct, large scale construction of
wh~ch began in 1933 and which was completed to the point of delivery of
water in 1941, consist of transmission line s, pumping plants, tunnels,
canals, covered conduits, inverted syphons, reservoirs, and related works
with a designed capacity of 1,605 cfs and a maximum delivery capacity of
1,800 cfs.* The main aqueduct is 242 miles long, including 92 miles of
16-foot diameter lined tunnels and five pumping plants capable of raising
the water a net 1,617 feet over mountains intervening between the Colorado
River and the coastal plain of Southern California.
* Page 62 of Twenty-First Annual Report of The Metropolitan Water District dated 1959.
-84-
(
80
Service of lofater through the Colorado River Aqueduct system, which
commenced in 1941 with three pumping units, has continued since that date.
Construction authorized in 1952 to bring the system up to full capacity was
completed in 1960.
Under this authorization Pumping Unit No. 4 'tofas placed in oper
ation in August 1956. Pumping Unit No. 5 began operating in May 1957 and
Pumping Unit No. 6 in January 1959, permitting a maximum delivery of 1,200
cubic feet per second or more until full aqueduct capacity was attained in
1960. Net diversion from the Colorado River by The Metropolitan Water
District from 1940-41 through 1958-59 is shown in Table 6. Quantities of
Colorado River water delivered to parties are shown in Table M-3 of
Appendix M.
Deducting estimated losses in transit, the aqueduct will have
the planned capacity to deliver to terminal reservoirs in the Southern
California Coastal Basin 1,180,000 acre-feet per annum of the 1,212,000
acre-feet per annum claimed for diversion from the Colorado River.
The major works of the distribution system consist of 232 miles
of pipeline, tunnels, reservoirs, and related works serving parts of The
Metropolitan Water District in Los Angeles, Orange, Riverside, and San
Bernardino Counties, and 71.1 miles of the San Diego Aqueduct (a branch of
the Colorado River Aqueduct) serving the parts of Metropolitan Water
District in San Diego. Construction of 150 miles of that part of the
system serving Los Angeles and vicinity was completed in 1941 and since
that time arulexations and increased demands have required a continued
-85-
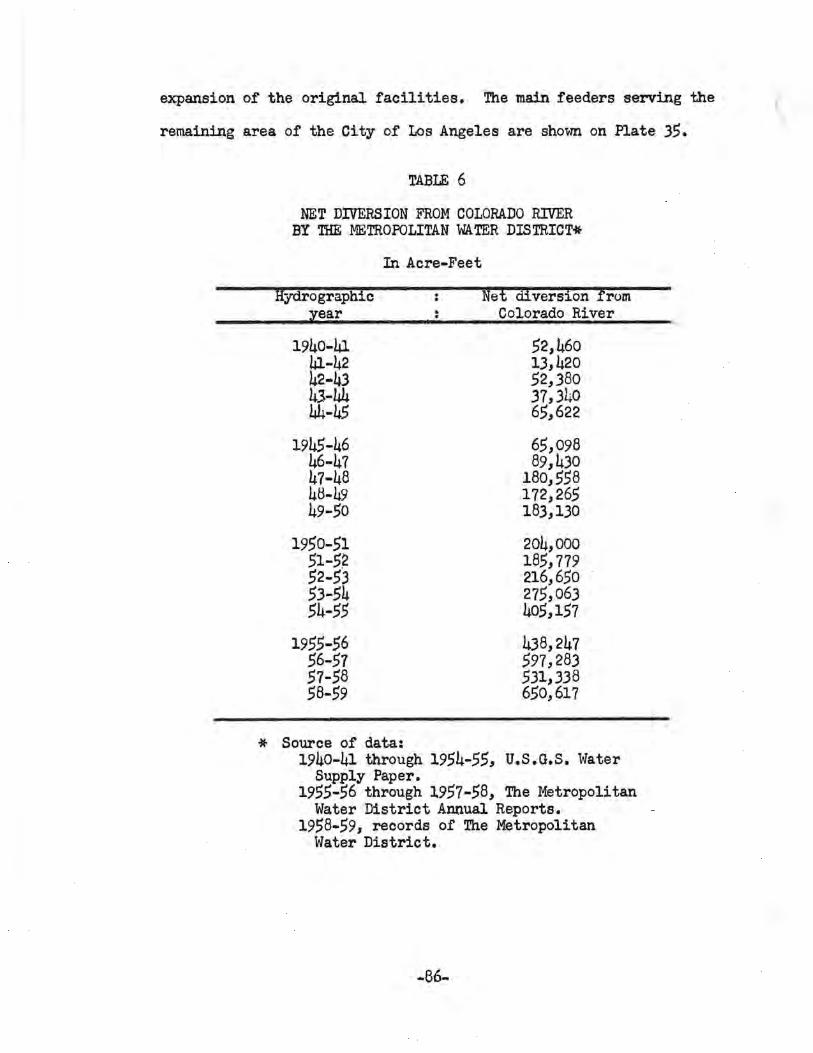
expansion of the original facilities. The main feeders serving the
remaining area of the City of Los Angeles are shown on Plate 35.
TABLE 6
NET DIVERSION FROM COLORADO RIVER BY THE METROPOLITAN WATER DISTRICT*
Hydrographic year
1940-41 l.iJ.-42 42-43 43-44 44-45
1945-46 46-47 47-48 48-49 49-50
1950-51 51-52 52-5j 53-54 54-55
1955-56 56-57 57-58 58-59
In Acre-Feet
* Source of data:
Net diversion from Colorado River
52,460 13,420 52,380 37,340 65,622
65,098 89,430
180,558 172,265 183,130
204,000 185,779 216,650 275,063 405,157
438,247 597,283 531,338 650,617
1940-41 through 1954-55, U.S.G.S. Water Supply Paper.
1955-56 through 1957-58, The Metropolitan Water District Annual Reports.
1958-59, records of The Metropolitan Water District •
... 86 ..
(
al
District.
Relative Rights of Constituent Areas of the Metropolitan Water
The Metropolitan Water District delivers Colorado River water to
their constituents (cities, districts, and other public entities) at various
service connections.
Section 5-1/2 of The Metropolitan Water District Act provides as
fol101-1S:
"Section 5-1/2. Each city, the area of which shall be a part of any district incorporated hereunder, shall have a preferential right to purchase from the district for distribution by such city, or a~ public utility therein empowered by said city for the purpose, for domestic and municipal uses within such city a portion of the water served by the district which shall, from time to time, bear the same ratio to all of the water supply of the district as the total accumulation of amounts paid by such city to the district on tax assessments and otherwise, excepting purchase of water, toward the capital cost and operating expense of the district's works shall bear to the total payments received by the district on account of tax assessments and otherwise, excepting purchase of water, toward such capital cost and operating expense."
This preferential right does not, at present, limit the quantity of water
available to any member but will become effective ~hen the demand of The
Metropolitan Water District equals the supply available to the District.
A summary, in terms of percentages, of the preferential rights as
of November 30, 1959, of all municipalities and water districts entitled
to a preferential right under Section 5-1/2 of The Metropolitan Water
District Act is presented in Table 7.
.. 87-
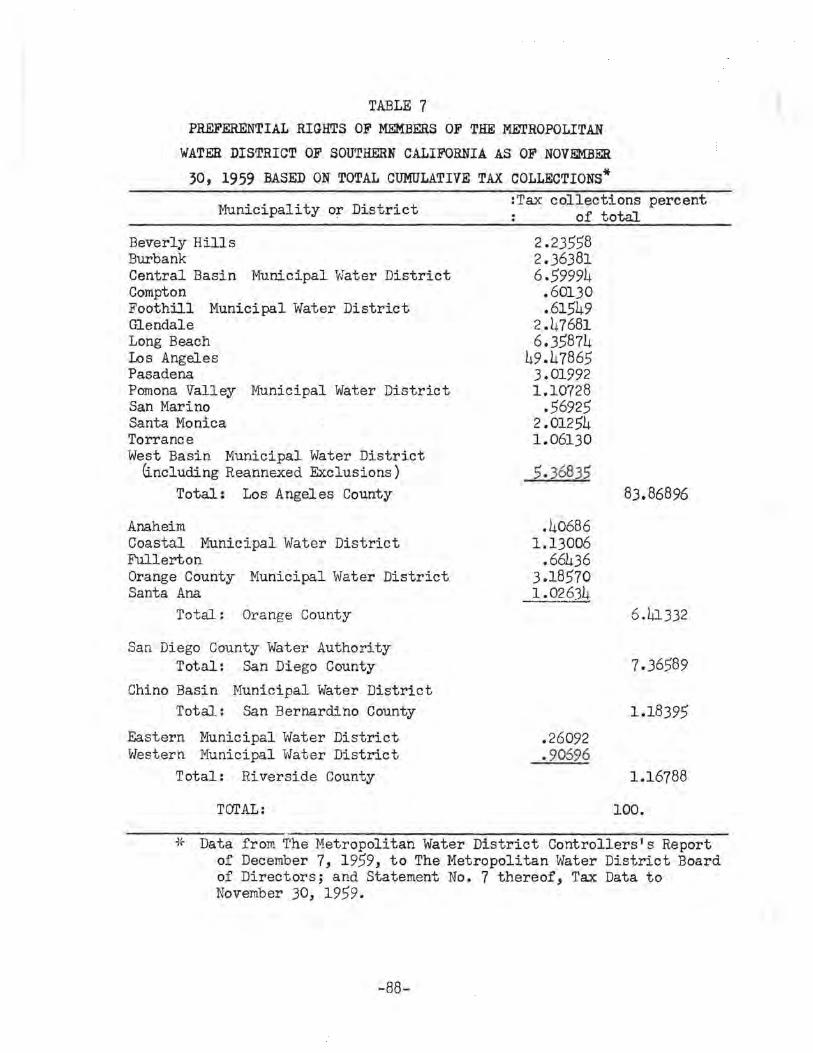
TABLE 7 PREFERENTIAL RIGHTS OF MEMBERS OF THE METROPOLITAN
WATER DISTRICT OF SOUTHERN CALIFORNIA AS OF NOVEMBER
30, 1959 BASED ON TOTAL CUMULATIVE TAX COLLECTIONS*
Municipality or District :Tax collections percent
of total
Beverly Hills Burbank Central Basin Hunicipal vJater District Compton Foothill Municipal Water District Glendale Long Beach Los Angeles Pasadena Pomona Valley Municipal Water District San Harino Santa Monica Torrance West Basin Municipal Water District
lincluding Reannexed Exclusions) Total: Los Angel es County
Anaheim Coastal Municipal Water District Fullerton Orange County Municipal Water District Santa Ana
Total: Orange County
San Diego County Water Authority Total: San Diego County
Chino Basin Jvlunicipal Water District Total: San Bernardino County
Eastern Municipal Water District vlestern Municipal lj..J"ater District
Total: Riverside County
TarAL:
2.23558 2.36381 6.59994
.60130
.61549 2.47681 6.35874
49.47865 3.01992 1.10728
.56925 2.01254 1.06130
5.36835
.40686 1.13006
.66436 3.18570
_1.02634
.26092
.90696
83.86896
6.41332
7.36589
1.18395
1.16788
100.
~(- Data from The Metropolitan Water District Controllers's Report of December 7, 1959, to The Metropolitan Water District Board of Directors; and Statement No. 7 thereof, Tax Data to November 30, 1959.
-88-
(
(
8Z
According to a statement of policy approved by the Board of
Directors of the District on December 16, 1952, "The Metropolitan Water
District of Southern California is prepared, with its existing governmental
powers and its present and projected distribution facilities, to provide
its service area with adequate supplies of water to meet expanding and
incre~sing needs in the years ahead ••• ". In regard to distribution
facilities it has been the policy of the District to provide trunk feeder
lines of sufficient capacity to supply the demands for Colorado River water
in its constituent municipalities. If a request for more capacity in a
trunk line to supply increased demand were made by a constituent munici
pality, and it were sho~m that the increased requirements of the constituent
municipality could not be supplied by Metropolitan's facilities then avail
able, it would be necessary in accordance with Metropolitan's policy to
provide additional feeder capacity for service to the constituent munici
pality. This applies to the cities of Glendale and Burbank as well as to
other constituent municipalities.
Although it has been the general policy of the District to
provide trunk feeder lines so that each constituent municipality would have
at least one point of connection within the boundaries of the constituent
municipality, the terms and conditions of mu~exation fixed by the District
in some of the more recent annexations have required the constituent
municipality to construct its own transportation facilities to a point
remote from its boundaries to obtain service.
-89-
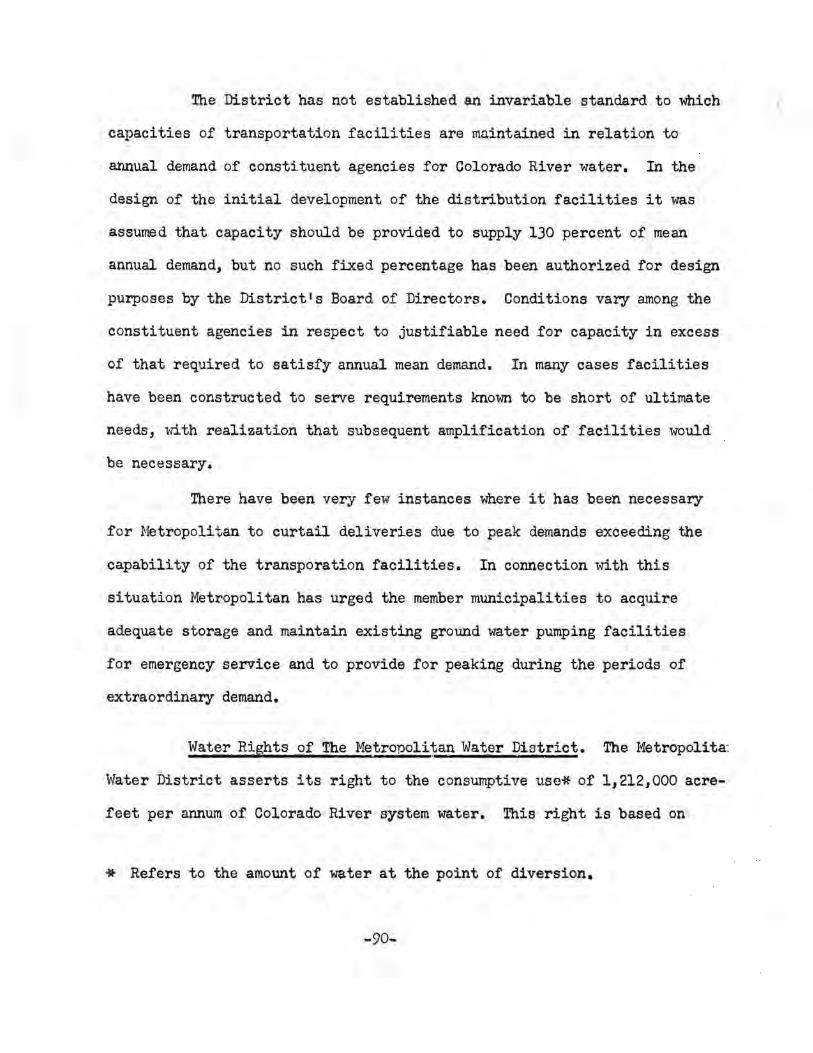
The District has not established an invariable standard to which
capacities of transportation facilities are maintained in relation to
annual demand of constituent agencies for Colorado River water. In the
design of the initial development of the distribution facilities it was
assumed that capacity should be provided to supply 130 percent of mean
annual demand, but no such fixed percentage has been authorized for design
purposes by the District's Board of Directors. Conditions vary among the
constituent agencies in respect to justifiable need for capacity in excess
of that required to satisfy annual mean demand. In many cases facilities
have been constructed to serve requirements known to be short of ultimate
needs, with realization that subsequent amplification of facilities would
be necessary.
There have been very few instances where it has been necessar,y
for Metropolitan to curtail deliveries due to peak demands exceeding the
capability of the transporation facilities. In connection with this
situation Metropolitan has urged the member municipalities to acquire
adequate storage and maintain existing ground water pumping facilities
for emergency service and to provide for peaking during the periods of
extraordinar,y demand.
Water Rights of The Metropolitan Water District. The Metropo1ita:
Water District asserts its right to the consumptive use* of 1,212,000 acre
feet per annum of Colorado River system water. This right is based on
* Refers to the amount of water at the point of diversion.
-90-
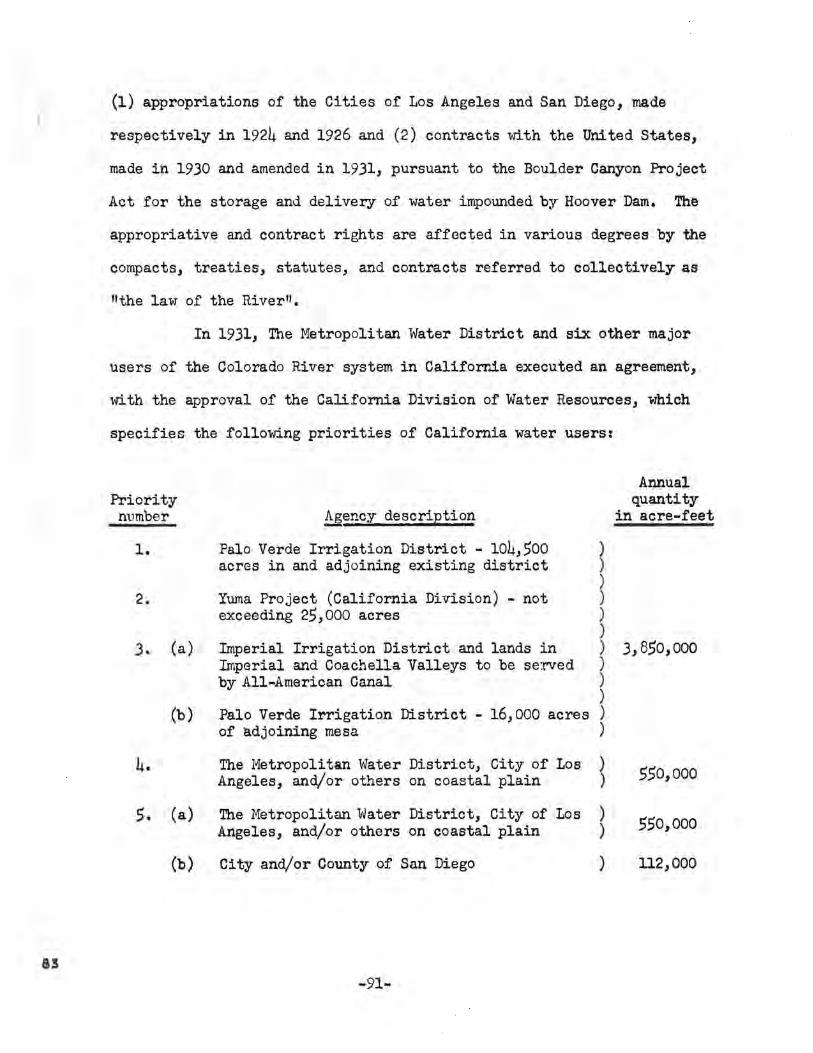
(
8S
(1) appropriations of the Cities of Los Angeles and San Diego, made
respectively in 1924 and 1926 and (2) contracts with the United States,
made in 1930 and amended in 1931, pursuant to the Boulder Canyon Project
Act for the storage and delivery of water impounded by Hoover Dam. The
appropriative and contract rights are affected in various degrees by the
compacts, treaties, statutes, and contracts referred to collectively as
"the law of the River".
In 1931, The Metropolitan Water District and six other major
users of the Colorado River system in California executed an agreement,
with the approval of the California Division of Water Resources, which
specifies the following priorities of California water users:
Priority nvmber
1.
2.
3. (a)
(b)
4.
5. (a)
(b)
~ency description
Palo Verde Irrigation District - 104,500 acres in and adjoining existing district
Yuma Project (California Division) - not exceeding 25,000 acres
Imperial Irrigation District and lands in Imperial and Coachella Valleys to be se:rved by All-American Canal
) ) ) ) ) )
~ ) )
Palo Verde Irrigation District - 16,000 acres ) of adjoining mesa )
The Metropolitan Water District, City of Los ) Angeles, and/or others on coastal plain )
The Metropolitan Water District, City of Los ) Angeles, and/or others on coastal plain )
City and/or County of San Diego )
-91 ...
Annual quantity
in acre-feet
3,850,000
550,000
550,000
112,000
Priority number
6. (a)
(b)
7.
Agency description
Imperial Irrigation District and lands in Imperial and Coachella Valleys to be served by All-American Canal
~ ) )
Annual quantity
in acre-feet
300,000 Palo Verde Irrigation District - 16,000 acres ) of adjoining mesa )
TOTAL
Agricultural use in the Colorado River basin in California, as the basin is designated on Map 23000, u. S. Bureau of Reclamation
5,362,000
) All remaining ) water avail) able for use ) in California
This agreement is incorporated in General Regulations of the
Secretary of the Interior promulgated in 1931 pursuant to Section 5 of the
Boulder Canyon Project Act and in water delivery contracts between the
United States and the several California agencies using Colorado River
system wa.ter.
Pendency of Arizona vs. California. The quantity of Colorado River
system water Which will be available for diversion by The Metropolitan Water
District is involved in, and may be affected by the decision in Arizona vs.
California, No. 9 Original, October Term 1959, initiated by the State of
Arizona in 1952 and now pending before the United States Supreme Court.
The case was under submission to Special Master Simon H. Rifkind of New
York City, who was appointed by the Court to hear the parties and report
to the Court with proposed findings of fact and conclusions of law, and a
recommended decree. The Special Master released his proposed report to
-92-
{
84
the parties on May 10, 1960 and during August 1960 heard objections to the
report by the parties preliminary to submitting his report to the Court.
The proposed report was substantially adverse to the contentions of the
California defendants in most major respects. The Special Master's' final
report, dated December 5, 1960, materially unchanged from his draft report,
has been submitted to the Court. The parties have filed exceptions to the
report, and supporting briefs, pursuant to order of the Court. A final
decision of the Supreme Court in this suit is anticipated sometime in 1962.
Other Factors Affecting Water Availability to The Metropolitan
Water District. At the present time, the water supply of the Colorado River
system is sufficient to satisfy fully the right of all California water
users and main stream users in other states of the lower Colorado River
area for all their existing projects. When, whether, and to What extent
a shortage develops for California water users depends on three major
factors;
(1) long range dependable water supply which is determined by
runoff and its conservation;
(2) the rapidity of development of water uses throughout the
Colorado River Basin, particularly in the relatively
undeveloped upper Colorado River Basin; and
(3) the resolution of legal issues, some of which are
involved in Arizona VB. California, and some of which
concern the rights of the upper Oolorado River Basin
-93-
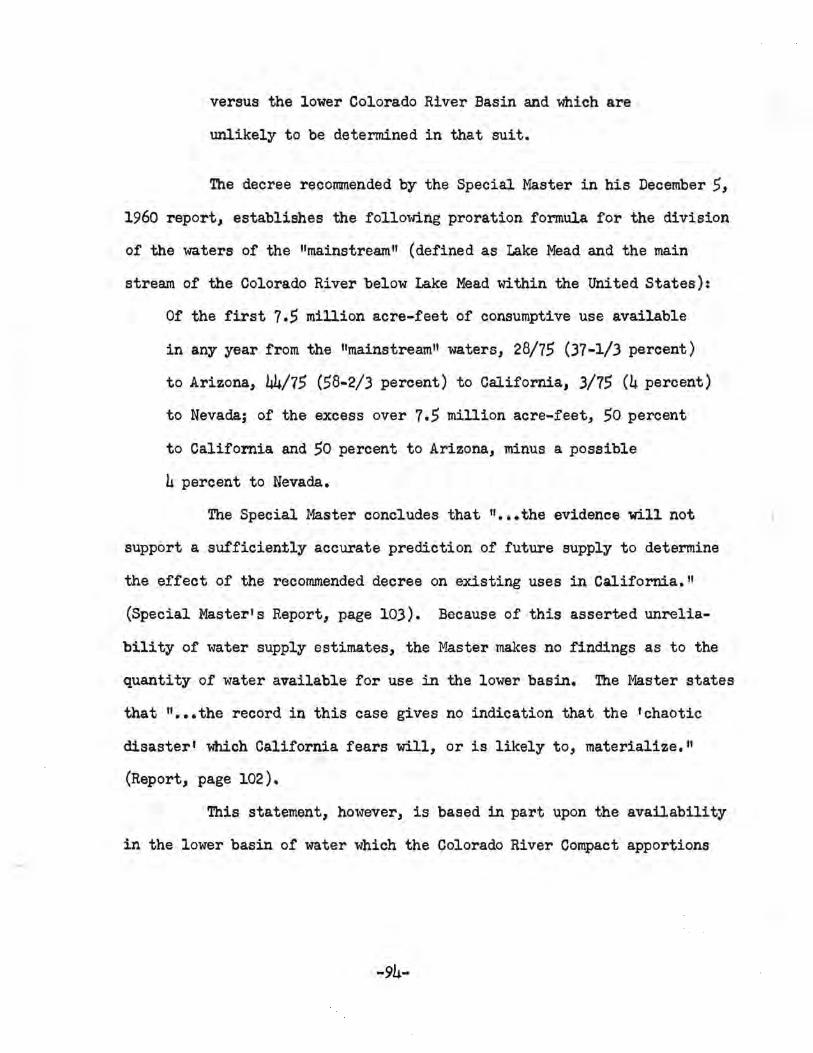
versus the lower Colorado River Basin and which are
unlikely to be determined in that suit.
The decree recommended by the Special Master in his December 5,
1960 report, establishes the following proration formula for the division
of the waters of the "mainstream" (defined as Lake Mead and the main
stream of the Colorado River below Lake Mead within the United States):
Of the first 7.5 million acre-feet of consumptive use available
in any year from the "mainstream" waters, 28/75 (37-1/3 percent)
to Arizona, 44/75 (58-2/3 percent) to California, 3/75 (4 percent)
to Nevada; of the excess over 7.5 million acre-feet, 50 percent
to California and 50 percent to Arizona, minus a possible
4 percent to Nevada.
The Special Master concludes that " ••• the evidence will not
support a sufficiently accurate prediction of future supply to determine
the effect of the recommended decree on existing uses in California."
(Special Master's Report, page 103). Because of this asserted unrelia
bility of water supply estimates, the Master makes no findings as to the
quantity of water available for use in the lower basin. The Master states
that " ••• the record in this case gives no indication that the 'chaotic
disaster' which California fears will, or is likely to, materialize."
(Report, page 102).
This statement, however, is based in part upon the availability
in the lower basin of water which the Colorado River Compact apportions
-94-
(
8S
in perpetuity to the upper basin. The quantity so apportioned is 7,500,000
acre-feet per annum (subject to certain obligations with respect to the
outflow at Lee Ferry). As the present upper basin uses (now approaching
2,500,000 acre-feet per annum) increase, the temporary supply available
from the "mainstream" for use in Arizona, California and Nevada will
diminish. Accordingly, the District's Colorado River supply under the
seven party priority agreement could be adversely affected by about 1970
and in gradually increasing degree thereafter. Thus, it appears probable,
if the Supreme Court approves the Special Master's Report, that the
District would receive a full supply of Colorado River uater for about
10 years and gradually decreasing quantities for about the succeeding
25 years, with the possibility of loss of its entire Colorado River supply
at some time approaching the turn of the centUl'Y.
It should be noted, however, that water made and to be made
available to the Metropolitan Water District is firm through a contract
entered into between the District and the State of California, Depart
ment of Water Resources, entered into prior to November 8, 1960, for
1,500,000 acre-feet per annum from the surplus waters of Northern
California to be made available to the District by water facilities
to be financed by the State (1) through the issuance of $1.75 billion
in bonds authorized by the people at the General Election, November 8,
1960; (2) by the Water Fund; and (3) by the general authority of the
State of California.
-95-
The California defendants opposed the recommendation of the
Special Master in exceptions to his report before the Court. If the
Master's recommendation is reversed by the Court in any material respect,
a substantial portion of the District's water supply would be assured from
the dependable or permanent supply of the Colorado River.
Distribution System. The distribution mains supplying members
of The Metropolitan Water District are shown on Plates 13, 21 and 35. The
La Canada Irrigation District and Crescenta Valley County Water District
receive Colorado River water through the mains of the Foothill Municipal
Water District. The City of Los Angeles takes water from the Upper Feeder.
The Cities of Burbank and Glendale receive water through the Santa Monica
-95a-
.l
-95b-

Feeder. Design capacity of the Santa MOnica Feeder under full flow hydrau-
lic gradient is shown on the profile on Plate 13 and listed below.
DESIGN CAPACITY OF SANTA MONICA FEEDER UNDER FULL FIDW HYDRAULIC GRADIENT
Section*
San Rafael Tunnel No.2 to Glendale Take-out
Glendale Take-out to Burbank Take-out
Burbank Take-out to Hollywood Tunnel
* Plates 13 and 21.
Amounts of Imported Water
:Design capacity, : in second feet
125
77
49
Sole significant importations of water to the Upper Los Angeles
River area are supplies brought in via the Colorado River and the Los Angeles
Aqueducts by members of The Metropolitan Water District and the City of Los
Angeles, respectively. The amount of Owens River water imported for use
within the Upper Los Angeles River area has been determined as the quantity
of Owens water delivered at the Los Angeles Aqueduct terminus, as set forth
in Table 4, less the portion of this water exported out of the area, meas-
ured at the inlets to Franklin and Stone Canyon Reservoirs and at the North
Hollywood Pumping Plant shown on Plate 21, plus the amount which is returned
through the City's s,ystem for use within the Narrows water service area of
the City of los Angeles. Annual amounts of Owens River import thus deter-
mined and purchases of Colorado River water delivered to entities in the
Upper Los Angeles River area are shown in Table a along with the total
import.
-96-
{
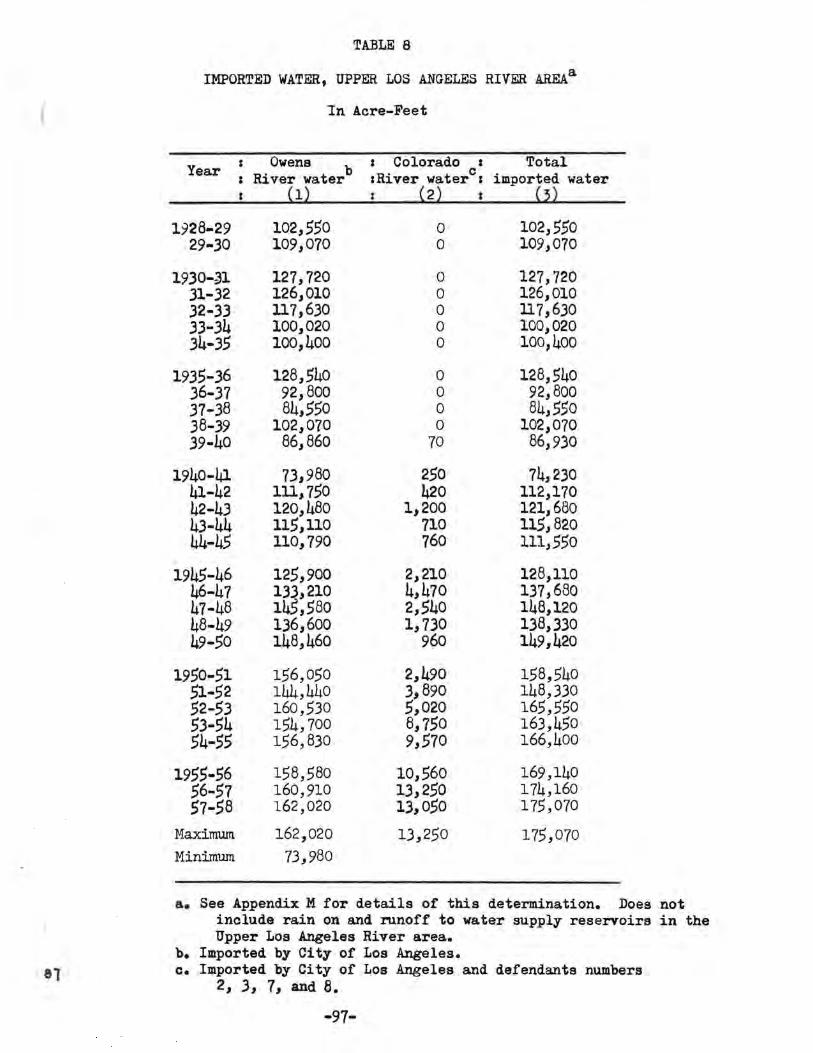
TABLE 8
IMPORTED WATER, UPPER LOS ANGELES RIVER AREAa
( In Acre-Feet
Year Owens b , Colorado , Total
, River water ,River waterC, imported water
(1) (2) (3)
1928-29 102,550 0 102,550 29-30 109,070 0 109,070
1930-J1 127,720 0 127,720 31-32 126,010 0 126,010 32-33 117,630 0 117,630 33-34 100,020 0 100,020 34-35 100,400 0 100,400
1935-36 128,540 0 128,540 36-37 92,800 0 92,800 37-38 84,550 0 84,550 38-39 102,070 0 102,070 39-40 86,860 70 86,930
1940-41 73,980 250 74,230 41-42 111,750 420 112,170 42-43 120,480 1,200 121,680 43-44 115,110 710 115,820 44-45 110,790 760 111,550
1945-46 125,900 2,210 128,110 46-47 13~,210 4,470 137,680 47-48 145,580 2,540 148,120 48-49 136,600 1,730 138,330 49-50 148,460 960 149,420
1950-51 156,050 2,490 158,540 51-52 144,440 3,890 148,330 52-53 160,530 5,020 165,550 53-54 154, 700 8,750 163,450 54-55 156,830 9,570 166,400
1955-56 158,580 10,560 169,140 56-57 160,910 13,250 174,160 57-58 162,020 13,050 175,070
Maximum 162,020 13,250 175,070 Minimum 73,980
a. See Appendix M for details of this determination. Does not include rain on and runoff to water supply reservoirs in the Upper Los Angeles River area.
b. Imported by City of Los Angeles. 81 c. Imported by City of Los Angeles and defendants numbers
2, 3, 7, and B.
-97-
Water Quality
To determine the quality of waters within the area of investiga
tion and effect thereon of the importation of Owens Valley and Colorado
River waters, approximately 1,500 ground water analyses, 125 surface water
analyses and 500 analyses of imported water were compiled and studied.
The standards of water quality and the quality of native and
imported waters are discussed herein with detailed information on water
quality contained in Appendix H.
Standards of Water Quality
The drinking water standards adopted by the state of California
are generally based on the United States Public Health Service Drinking
Water Standards of 1946. However, the adopted standards were revised by
the State in 1959 to, in effect, reduce the maximum allowable fluoride
content from the previous limit of 1.5 parts per million (ppm) to less than
1.0 ppm for the San Fernando Valley area. The California Department of
Public Health has also adopted a policy of issuing temporar,y permits allow
ing higher limits for total solids, sulfate, chloride and magnesium than
it requires when issuing regular permits.
Chemical Characteristics of Water
The chemical character of water provides a means of identifying
the water source and the movement of a particular water as it occurs as
runoff or as ground water. The characteristics are expresssed in percent
cations (positive ions) and percent anions (negative ions) of the dominant
-98-
( elements or compounds. For example, a sodium bicarbonate water is one in
which the sodium is equal to or greater than 50 percent of the cations and
the bicarbonate is equal to or greater than 50 percent of the anions; a
sodium-calcium bicarbonate water is one in which sodium is more abundant
than calcium but is less than 50 percent of the total cationsj and a sodium
chloride-sulfate water is one in Which chloride exceeds sulfate but is less
than 50 percent of the total anions. A discussion of the chemical charac
teristics of imported water, surface water and ground water within the
Upper Los Angeles River area follows.
Imported Water
The Los Angeles Aqueduct waters from Owens River and Mono Basin
are of excellent quality, being of sodium-calcium bicarbonate character.
The total dissolved solids have averaged abQut 215 ppm for the past 20 years
at the Upper San Fernando Reservoir inlet. The highest total dissolved
solids content of record, 322 ppm, occurred on April 1, 1946, whereas the
low of 149 ppm occurred on September 17, 1941. For a short period of time
in 1932 the boron content exceeded one part per million. The high boron
water was diluted by the addition of Mono Basin water to the s.rstem and by
increased storages. The boron content during the following years varied
between 0.20 and 0.B8 parts per million and averaged approximately 0.53 ppm.
No effect of these boron waters on ground waters of the Upper Los Angeles
River area has been found.
Untreated Colorado River waters are predominantly calcium sodium
sulfate in character changing to sodium sulfate after treatment to reduce
the total hardness. Analysis of random samples of softened Colorado River
-99-
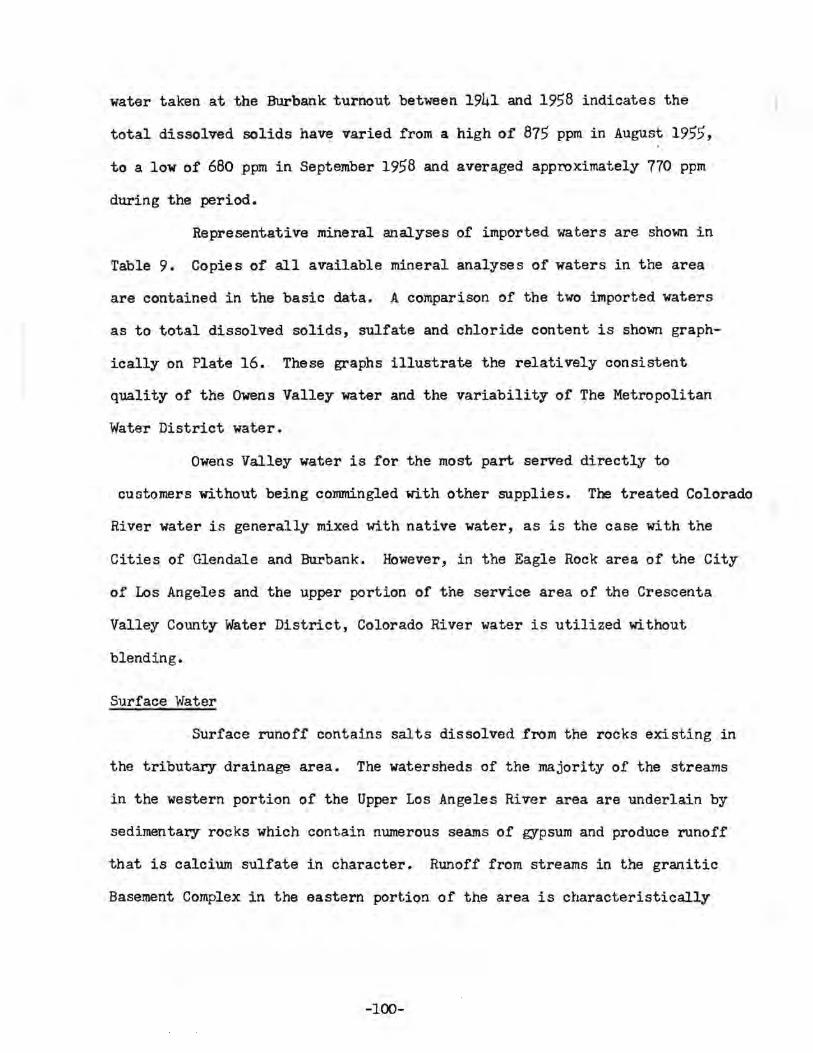
water taken at the Burbank turnout between 1941 and 1958 indicates the
total dissolved solids have varied from a high of 875 ppm in August 1955,
to a low of 680 p.pm in September 1958 and averaged approximately 770 ppm
during the period.
Representative mineral analyses of imported waters are shown in
Table 9. Copies of all available mineral analyses of waters in the area
are contained in the basic data. A comparison of the two imported waters
as to total dissolved solids, sulfate and chloride content is shown graph
ically on Plate 16. These graphs illustrate the relatively consistent
quality of the Owens Valley water and the variability of The Metropolitan
Water District water.
Owens Valley water is for the most part served directly to
customers without being commingled with other supplies. The treated Colorado
River water is generally mixed with native water, as is the case with the
Cities of Glendale and Burbank. However, in the Eagle Rock area of the City
of Los Angeles and the upper portion of the service area of the Crescenta
Valley County Water District, Colorado River water is utilized without
blending.
Surface Water
Surface runoff contains salts dissolved from the rocks existing in
the tributary drainage area. The watersheds of the majority of the streams
in the western portion of the Upper Los Angeles River area are underlain by
sedimentary rocks which contain numerous seams of gypsum and produce runoff
that is calcium sulfate in character. Runoff from streams in the granitic
Basement Complex in the eastern portion of the area is characteristically
-100-
(
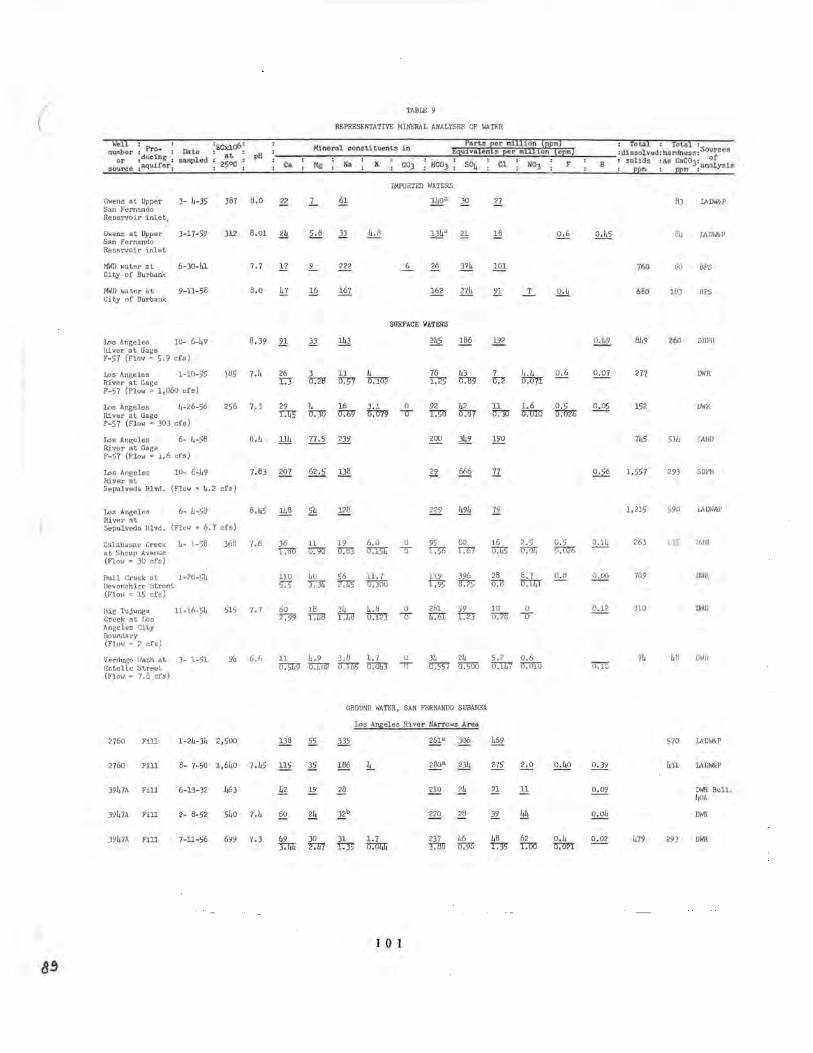
TABlE 9
REPRESENTATIVE MINERAL ANALYSES OF WATER
wen n"".!>or Pro- ilo:te :ECd06 ~ KInoral cons1J.~uent:! in Parts pOT Cllllon (ppm) Tota.! : 10tal:
: __ -; __ -:' __ ....,. __ -:-__ -:' ___ §~u~i:.::v.!ar!:.~n!;t::!.-peE!!r~ii\U1!!:~!~o:!!,,~(C!.lP"'!!!!)"'""',.--- ;d!:l801\lt!'d .h.a..J'dn&3s: SourCCfJ ar duelng.
DiOurc.C aQ:u.1L'(lr; .;unplod' R~ • pit
; 2SOC ; 'CO lICO,,' SO,. " Cl .'. IrOJ .... F' a .ol1d. : as Caco)' ~; 1 ,3 " Q ep'" : ppm ,,an ... )' ••
Owens at Upper San Fernando
3- 4-35 387 8.0
IMroRTEIl WATERS
140a 2£ He servoir inlet.
Owens at Upper 3-17-59 312 8.01 ~ San Fernando Reservoir inlet
MWD water at 6-30-41 City of Burbank
IftID water at 9-11-58 8.0 162 City of Burbank
SURFACE VATERS
Los Angeles 10- 6-49 River at Gage F-57 (Flow = 5.9 cfs)
Los Angeles 1-10-55 River at Gage F-57 (Flow' 1,060 cfs)
Los Angeles 4-26-56 River at Gage F-57 (Flow - 303 cfs)
Los Angeles 6- 4-58 River at Gage F-57 (Flow' 1.6 ds)
8.39 .2!
185 7.4
256 7.3
8.4
26 D
29 4 16 3.1 0 I":"li5 D.jlj ~ lJ.ll79 U
Los Angeles 10- 6-49 7.83 207 River at Sepulveda Blvd. (Flow - 4.2 cfs)
Los Angeles 6- 4-58 8.45 148 River at Sepulveda Blvd. (Flow' 6.7 cfs)
Calabasa:; Creek L.- 1-58 at Shoup Avenue (Flow = 30 ds)
Bull L'reek at 1-20-54 Devonshire street (Flo" = 15 cfs)
Big Tujunga 11-16-54 Creek at Los Angeles ::::ity Boundary (Flow'" 2 cfs)
368 7.6
515 7.7
36 11 19 6.0 0 r.tlll ll.9O lJ.8'j ll'":E4 u
110 D
40 56 11.7 J.34 2.4> 0.300
60 18 34 4.8 0 2.99 l.lill' l.lill' o.m u
92 42 Wl5 IJ.1!7
200
95 eo l,3'l'; r:7J7
119 396 ~ ll":E
281 59 4.bI r:n
101
7 0,""2"
11 1.6 0.5 o.:m o.mt1 lJ."l:m
11
12.
16 2.5 D.I3 "i'i:OIi
28 1J.1j
6.7 0.1! o:m
10 0 ~ u
Verdugo \lash at J- 1-51 Estelle Street
94 6.~ 11 4.93.81.7 0 34 24 5.2 0.6
(FloH - 7.e cfs)
2760 Fill
2760 Fill
3947A Fill
3947A Fill
3947A Fill
~ ~ ~ 0,0ljj '"0 o.m 0:>00 o:TIi7 O. 010
GROUND WATER, SAN FERNANDO SUBAREA
Los Angeles River "ArroWS AreA
1-24-34 2,500
8- 7-50 1,640 7.45 115
6-13-32 463
2- 8-52 540 7.4
7-11-56 699 7.3
28
60
6930311.7 J.1j!j 2.Ii7 ~ Q.iiIiJi
101
210
237 46 J.lllJ D.%
2.0
21 11
48 62 ~ r.oo
0.4 ~
8)
760 80
680 163
849 260
277
152
745 5l1J
1,557 293
1,215 590
263 us
789
310
'14 46
570
431
479 293
IAllW'IoP
IADW&P
BPS
BPS
SDPH
IMR
IlWH.
IAIID
SDPH
IADW&?
It-III
mill
IADW&P
IADW&P
IJWl! Bull . 40A
DWR
DWR
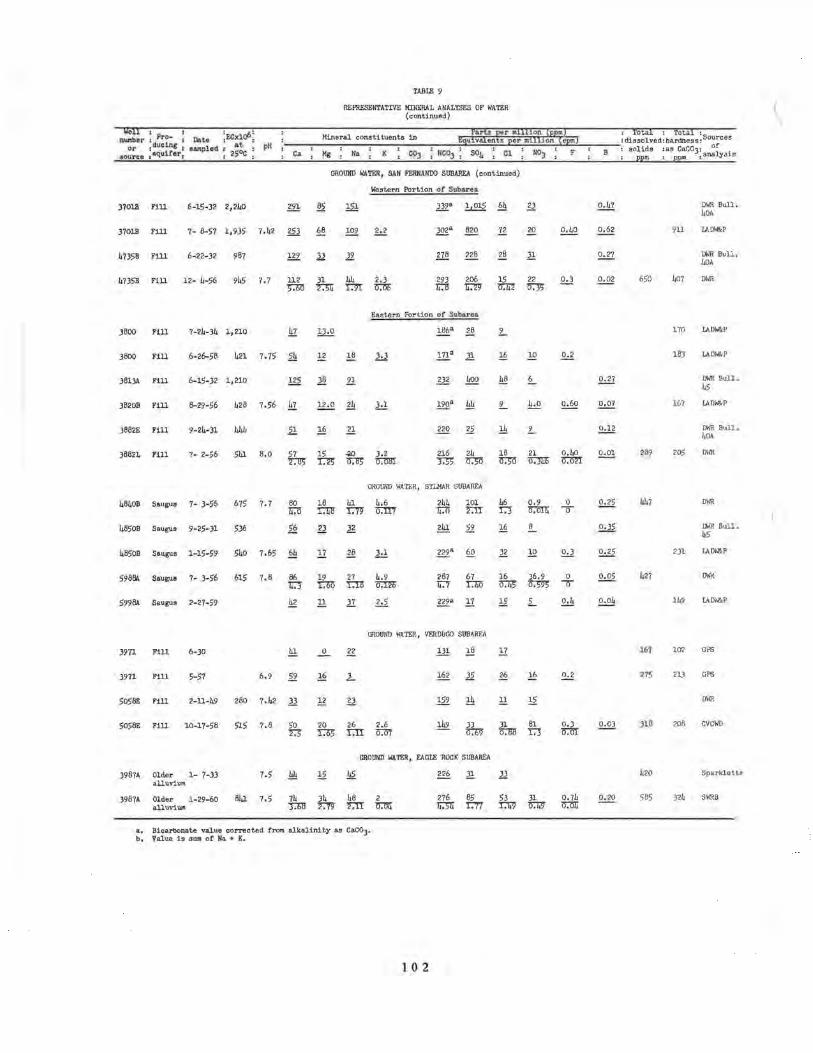
TABLE 9
REPRESENTATIVE IIDlERAL ANALYSES OF WATER (continued)
o I Pro- ' : ECxl06 m~~ar ~du~.1ng: Dnta . at. Dour •• ,Aquifor. ''''''plod : 2S"C
ota : ota : __ -:-_M_in_e-:r&l __ c_on-:.~t_it_u_e_nt:-._in_-:-__ .:;::s:u=v:=:.~n~to:....t:::.!...r,::"==o::.n ,-l!"1!:!!-___ diesolved!hardness :Saurces
; II : K ' ' HCO' SO' '110' r B solids ,as CaC03' of . Ca )(8: a, ,CO) I 3 : h: 01, ): ppm , ppm : ana1y51s
GROUND WATER, SAN FERNANDO SUBAREA (continued)
Western Portion of 5ubuea
370lB Fill 6-15-32 2,240
370lB Fill 7- 8-57 1,935 7.42 253 2!!
47J5B Fill 6-22-32 987
4735B Fill 12- 4-56 945 7.7 112 31 44 2.3 "Pi1l ~ ~ Q.110
293 206 15 22 4.B ~ ~ Q.1;
Eastern Portion or Subarea
3800 Fill 7-24-34 1,210
3800 Fill 6-26-58 421 7.75 2! IB 16 10
381JA Fill 6-15-32 1,210
3820B Fill 8-29-56
3882& Fill 9-24-31
3BB2I. Fill 7- 2-56
4840B Saugue 7 - 3-56
4850B Saugus 9-25-31
4850B Saugus 1-15-59
5988.\ Saugue 7 - 3-56
599BA Saugu. 2-27-59
3971 Fill 6-30
)971 Fill 5-57
50S8E Fill 2-11-49
505BE Fill 10-17-58
3987A Older 1- 7-)) alluvi1JM
3987A Older 1-29-60 alluvium
428 7.56 !!l
541 B.o 216 24 16 21 0.40 J.5'5' lJ.S'1l lJ.S'1l Q.)ljO ~
GROUND WATER. SYLMAR SUBAREA
675 7.7
536
615 7.8 56 19 27 4.9 4.1 r.oo r.rB o.m
0.9 0 o:on; 0
~
287 67 16 36. 9 0 4.'i r.1i5 ~ o.m 0
GROUND WATER, VERDUGO SUBAREA
6.9
841 ?5
l...
So 20 26 2.6 2.; ~ r.rr O"":m
131 !Q
162 12
33 Q.b9
16
31 Bl Q.Sll 1.1
0.3 D.1iI
GROUND WATER, EAOLE ROCK SUBAREA
74 34 48 2 J.bB 2.'79 nr 1J.l54
276 85 5) 31 0.74 li3Ii r.77 ~ lJ.1i9" o.m;
102
911
650 407
170
183
167
205
231
Ln
149
161 102
275 213
:)18 208
420
5B5 324
DWR Bull. 40A
LA~P
~ Bull. 40A
DWR
LADWI<P
LADW&P
DWR Bull. 45
LADI<&P
IJ\oIR Bull. LOA
mlR
mlR
DWR Bull. 45
LAD\&P
OWl!
LADW&P
OPS
OPS
cvcwo
Sparkletts
ShRB
(
( calcium bicarbonate. The normal character of surface waters passing stream
gage F-57 during storm runoff periods is also calcium bicarbonate.
Because of a shorter period of contact between water and rock
and increased dilution at large discharge rates, storm flows at Gage F-S7
normally have a lower concentration of salt s than doe s water of reduced
flows. Low flows of the Los Angeles River ranging from 3 to IS cfs at
Gage F-S7 had a total dissolved solids content of about 1,000 ppm in 1948,
whereas an analysis of a sample taken at a flow of 3,000 cfs in 1938
indicates lIS ppm total dissolved solids. There is evidence that a large
part of the increased salinity of the lower flows has been caused by the
increased discharge of industrial wastes into the river during recent years.
Representative mineral analyses of surface waters are shown in Table 9.
Ground Water
Ground waters from the major water-bearing formations of the
Upper Los Angeles River area are of two general characters, each reflecting
the composition of the surface runoff waters draining from the immediately
adjacent watersheds within the area. Ground water in the western portion of
the area is calcium sulfate in character whereas water pumped from the
eastern portion of the area, including Sylmar and Verdugo Hydrologic Sub
areas, is of calcium bicarbonate character. Representative analyses of
ground water in various sections of the area are shown in Table 9.
Ground waters of the area are generally within the recommended
limits as set forth in the U. S. Public Health Service Drinking Water
Standards,1946. Principal exceptions to this are wells in the west end of
-103-
the San Fernando Valley which penetrate the Modelo formation and which have (
excessive concentrations of sulfate, and waters from wells in the lower part
of Verdugo Subarea which have abnormally high concentrations of nitrate.
Ground waters of the Upper Los Angeles River area are classed as
moderately hard to very hard. Geochemical charts on Plate 15 show the plots
of constituents in these waters in terms of percentage reacting values.
All of the native waters in the area fall into the calcium-magnesium
sulfate-bicarbonate group. A comparison of the plots (Plate 15) indicates
that the ground waters have remained in the same character group over the
period of record. Analyses of water from well 4947A, however, indicate a
pronounced increase in the total chlorides and nitrates. This increase
may have been caused by the large amounts of chemical fertilizers known to
have been applied in neighboring areas.
Representative records of the total dissolved solids and sulfate,
chloride and nitrate ion concentrations found in water from various wells
in each of the hy'drologic subareas are plotted on Plates l7A through l7D.
These records indicate a general chronologie increase of total dissolved
solids in all subareas with a marked increase in the San Fernando Subarea
at wells 370lB and 357lJ and at most of the wells in the Verdugo Subarea
which, in , several instances, also reflect a pronounced increase in nitrate
concentration. Total dissolved solids at wells 2760 and 3673 in the San
Fernando Subarea, however, decreased about 600 ppm at the former during the
period 1936 to 1942 and about 200 ppm at the latter in the period 1955 to
1957.
-104-
(
91
Effect of Importation of Owens River-Mono Basin Water
Water quality studies made by the Referee indicate that, except
for a short period of time in 1932 when boron concentrations were above
normal, the quality of waters imported from Owens River and Mono Basin have
been equal or superior to the native waters of the Upper Los Angeles River
area and have not otherwise adversely affected the quality of the native
waters.
-105-
CHAPTER V. WATER UTILIZATION AND DISPOSAL
Presented herein are data and information on water development
and use in the Upper Los Angeles River area including a determination of
consumptive use by the Inflow-Outflow Method.
The data and information pertains to the requirements of
Paragraphs I. 2, F., I. 2, G. and I. 4, of the Order of Reference in
regard to location and capacity of diversion works of all parties* and non-
parties, the amount of each party I s taking and use, the place and character
of the use or uses of import and other waters, and the nature and quantity
of all water use and diminution within and from the area. Material is
included to show the effect of changing land use and of channel improvements
on the percolation of surface water supplies to the underground.
Joint Interest of Parties in Sources of Supply
In many instances several parties have an interest in the same
source (well or diversion). In reporting data on a particular source, an
attempt has been made to list all information under the party having the
major interest. A cross reference pertaining to the joint interest in any
source is listed in Table 10.
-~ Plaintiff and all defendants named in the Amended Complaint and
in subsequent proceedings prior to July 1, 1961.
-106-
CHAPTER V. WATER UTILIZATION AND DISPOSAL
Presented herein are data and information on water development
and use in the Upper Los Angeles River area including a determination of
consumptive use by the Inflow-Outflow Method.
The data and information pertains to the requirements of
Paragraphs I. 2, F., I. 2, G. and I. 4, of the Order of Reference in
regard to location and capacity of diversion works of all parties* and non-
parties, the amount of each party I s taking and use, the place and character
of the use or uses of import and other waters, and the nature and quantity
of all water use and diminution within and from the area. Material is
included to show the effect of changing land use and of channel improvements
on the percolation of surface water supplies to the underground.
Joint Interest of Parties in Sources of Suppl"l
In many instances several parties have an interest in the same
source (well or diversion). In reporting data on a particular source, an
attempt has been made to list all information under the party having the
major interest. A cross reference pertaining to the joint interest in any
source is listed in Table 10.
* Plaintiff and all defendants named in the Amended Complaint and in subsequent proceedings prior to July 1, 1961.
-106-
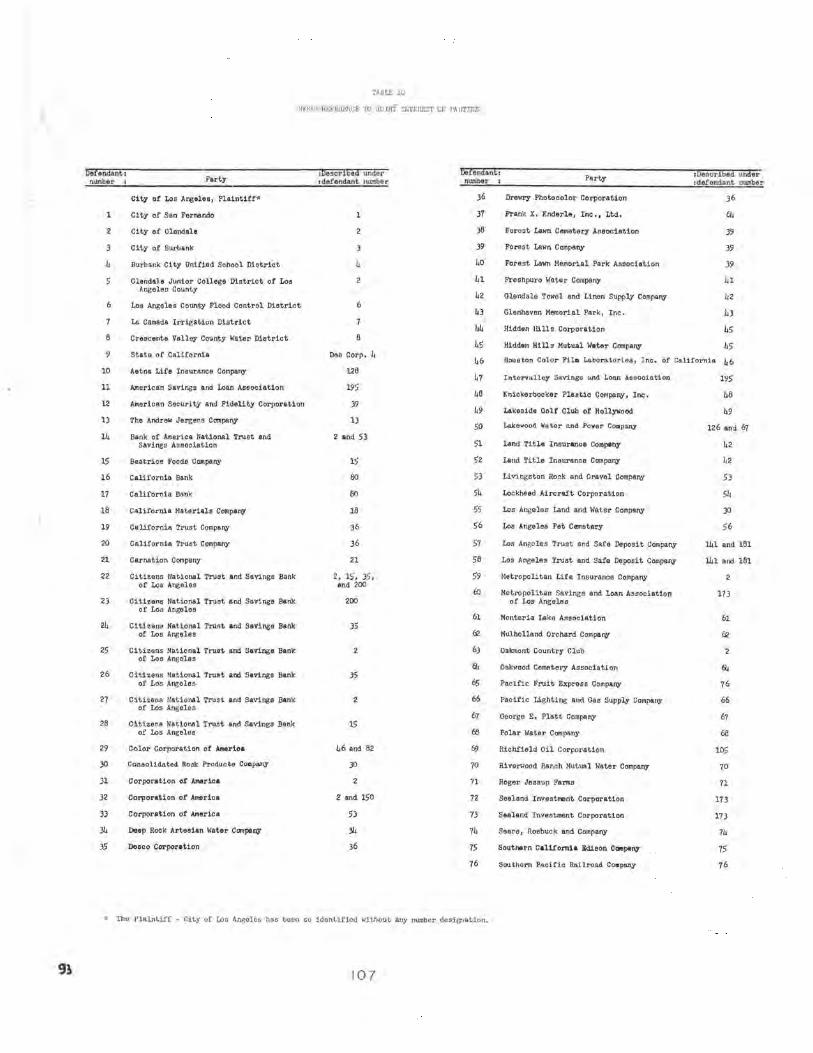
TABLE 10
CIlDSS IillFElIDICE TO JOOO INTEflEST CF PARTIES
be:tendllnt: .Described under !lOt~ndant: Party :Doncribed UnaGr
n~t:Dr • Part,. rdatendant number "umb6r- , rdaCondant. TlUl:!$bt! r
Cit)' of Los Angele., Plainti!f~ 36 Drewry Photocolor Corporation 36
1 City of San Fernando 1 31 Frank X. Enderle J Inc., Ltd. a. City of Glendalo )8 Forest Lawn Cmstery Asaociation 39
City of Burbank 39 Forest Lawn Company 39
4 Burbank Cit), Unified School District 4 40 Forest Lawn Memorial Park Association 39
Glendale Junior College District of L08 41 Freshpuro Water Company 41 Angeles County
42 Glendale Towel and Linen Supply Company 42 6 Los Angeles County Flood Control Dietrict 6
43 Glenhaven Memorial Park, Inc. 43 La Canada Irrigation District
44 Hidden Hill. Corporation 45 Crescenta ValIer County water District
4S Hidden HiU. Mutual Water Compal1Y 45 state of California Doe Corp. 4 Houston Color Fila Laboratories, Inc. 46 of California 46
10 Aetna Life Insurance Company 128 47 Intervalle7 Savings and Loan Association 195
11 American Savings and loan Associat1on 195 46 Knickerbocker Plastio Company. Inc. 48
12 American Security and Fidelity Corporation 39 49 Lake.ide Oolf Club ot Hollywood 49
13 The Andrew Jergens Ccmpany 13 50 LakeW'ood Water and PoW'er Cozapa.J\1' 126 and 61
14 Bank of America Nat10nal Trust and 2 and 53 Savings Association 51 land Title Insurance Company 42
IS Beatrice Foods CQIlpany IS 52 Land Title Insurance Company 42
16 Californ1a Bank 60 53 Livingston Rock and Cravel Company 53
11 CaUfornia Dank 80 54 Lockheed Aircraft Corporation 54
18 California Materials COJlpal1Y 18 55 Los Angeles Land and Water Company }1
19 California Trust Company )6 56 Los Angele. Pet Cemetery 56
20 California Trust Company 36 S7 Los Angeles Trust and Safe Deposit Compal1Y 141 and 181
21 Carnation Company 21 58 Los Angeles Trust and Safe Deposit Compaf\Y 141 and 181
22 Citizens ?Iational Trust and Savings Bank 2, 1~, 35, 59 Metropolitan Life Insurance Company of Los Angeles and 200
fIJ Metropolitan Savings and. Loan Association 173 23 Citizens National Trust and Savinge Bank 200 of Los Angele a
of Los Angeles 61 Monteria Lake Association 61
24 Citizen. National Trust and Saving. Bank 3S of Los Angeles 62 Mulholland Orchard Compal1Y 62
25 Citizens National Trust and Saving. Bank 63 Oakmont country Club of Los AllEele.
a. Oakwood Cemetery Association a. 26 Citizens National Truet and Savings Bank 35
of Los Angeles &; Pacific Fruit Express Company 16
27 Citizens National Trust and Savings Bank 66 Pacific Lighting and Ga. Supply Compal1Y 66 of Los Angeles
67 George E. Platt Company 67 28 Citizens National Trust and Savings Bank 15
of Los Angeles (Xl Polar water Company (Xl
29 Color Corporation of Amerioa 46 end 82 69 Richfield Oil Corporation lOS
)0 Coneolidated Rook Products Company 3D 70 Rivenmod Ranch Mutual Water Company 70
31 Corporation ot America n Roger Jessup Fame 71
32 Corporation or America 2 and 150 72 Sealand Investment Corporation 173
33 Corporation at America 53 73 S8aland Investment Corporation 173
34 Deep Rook Art.oian Water Compal\Y 34 74 Seare J Roebuc k and Company 74
35 Desco Corporation 36 75 Southarn California Bdison CClllPOI\Y 75
16 Sou thern Pacific Railroad COIRPa.ny 76
The Plaintiff - City of Los Angeles has been so identilied without any number designation.
107
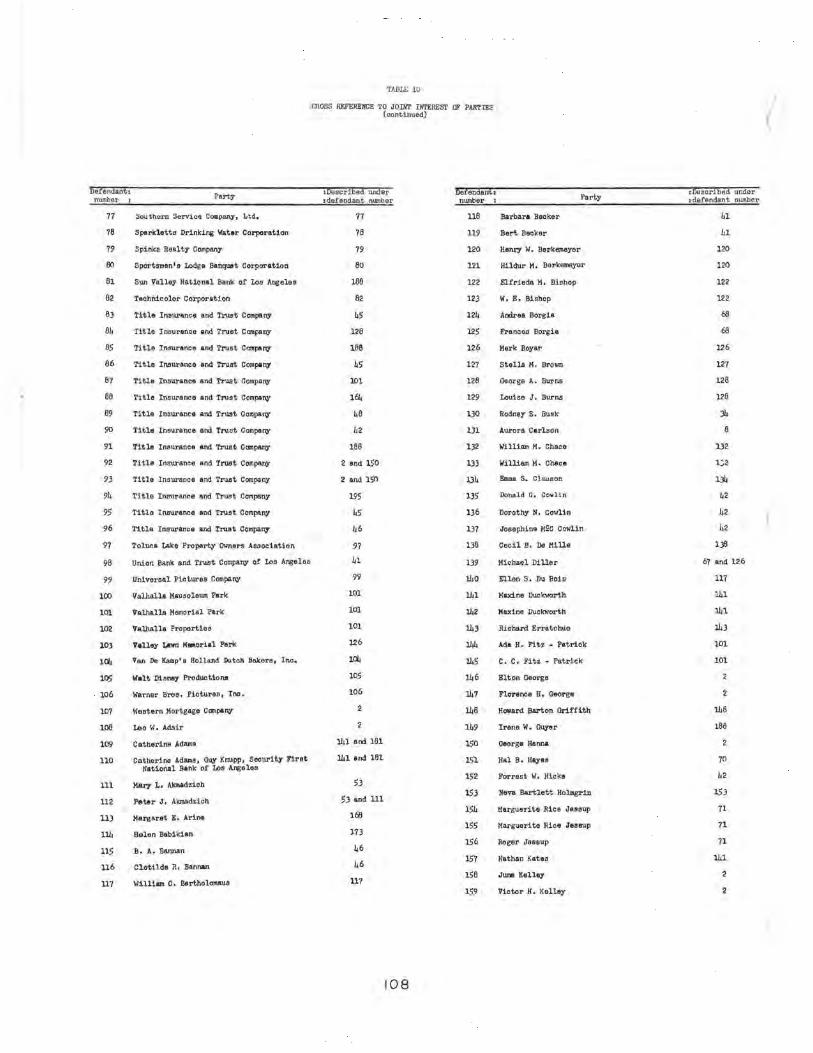
Defendant: number t
77
78
79
80
81
82
83
84
8S
86
87
88
89
90
91
92
93
94
9S
96
91
98
99
100
101
102
103
104
10$
106
101
108
109
110
111
112
113
114
115
116
117
Party
Sou thern Service CO.Pa.J\7, Ltd.
Sparkletts Drinking Wat~r Corporation
Spinks Realty Cornpan)'
Sportsmen I S Lodge Banquet Corporation
Sun Valley Nat10nal Bank of los Alllela.
Technicolor Corporation
Titl. Insuranoe and Trust C""'plln)'
Title Insurance and Trust Company
Title Insurance and Trust Company
T1 tIe Insuranoe and Trust Compan)'
Title Insurance and Trust COl1lpal\Y
T1 tle Insuranoe and Trust Compal\Y
Title Insuranoe and Trust Compan)'
Title Insurance and Trust Compa~
Title Insuranoe and Trust Company
Title Insuranoe and Trust Compan)'
Title Ins uranoe and Trust CompaD)'
Title Insurance and Trust Company
Title Insurance and Trust Company'
Title Insurance and Truet Compan;r
To1uoa Laka Pro party Owner. Association
Union Bank end Trust CompaD)' of 1.08 Angelas
Univsrsa1 Pictures CompaD)'
Valhalla Mausoleum Park
Valhalla Memorial Park
Valhalla Proparties
Valloy Lawn H ... orial Pori<
Van De Kampl B Holland Dutch. Bakera, Inc.
Walt Disney Productiono
Warner Bro8. Pictures, Ina.
~Ie.tern Mortgage CClOlpaD)'
Leo W. Adair
Catherine Adams
Catherine Adams, Ouy Knupp, Security fir.t National Bank of 1.0. Angele.
Mary L. Akmadzioh
Pete r J . Akmadzioh
Margaret i. Arine
Melen Babikien
B. A. Bannan
Clotilda R. Bannon
W1.l11am O. Bartho lomau.
TABLE 10
CROSS REFERENCE TO J OIH'l' INl'EREST r:J;' PARTIES ( continued)
:Descri bed uOder ::de.teodant numbe.r
77
78
79
80
188
82
45
128
188
4,
101
lit.
48
42
188
2 and ISO
2 and 150
19,
4S
46
97
41
99
101
101
101
126
104
105
106
141 and 181
141 and 181
,3 S3 and III
168
113
46
46
117
Dei'endant: number
118
119
120
121
122
123
124
12S
126
127
128
129
130
131
132
133
134
IJS
136
137
138
139
140
141
142
143
144
14,
146
141
148
149
150
151
152
IS3
IS4
IS5
1,6
IS7
158
Party
Barbara Becker
Bert Beoker
Henry W. Berkemsyer
Hlldur M. Earkemeyor
Elfrieda M. Bishop
W. E. Bishop
Ardrea Borgia
Frances Eorgia
Mark Boyar
Stella M. Brown
George A. Burns
Louise J. Burns
Rodney E. Busk
Aurora Carlson
Wi lliam M. Chaoo
William M. Chaoo
Emma S. Clauson
Donald G. Cowli n
Dorothy N. Cowl1n
Josephine MgC C""l1n
Ceo11 B. Do Mille
Miohael Diller
Ellen S . Du Boi.
Max! ne DUe kworth
Maxine Duckt/orth
Richard Erretohue
Ad. H. Fit. - Patriok
c. c. Fi t. - Patri ok
I!lton Georg.
Florence H. George
Howard Earton Griffith
Irene W. Guyer
Deorge Hanna
Hal B. Hay ••
Forrest W. Hicks
Ne"" Bartlett Holmgrin
Marguerite Rice Jessup
Marguerite Rice Jessup
Roger Jessup
Nathan Kates
JW1II Kelley
IS9 Viotor H. Kellay
108
:Described under I defendant number
41
41
120
120
122
122
68
68
126
127
128
128
132
134
42
42
42
1)8
67 and 126
117
141
141
143
101
101
148
188
70
42
1,3
71
71
71
141
I (
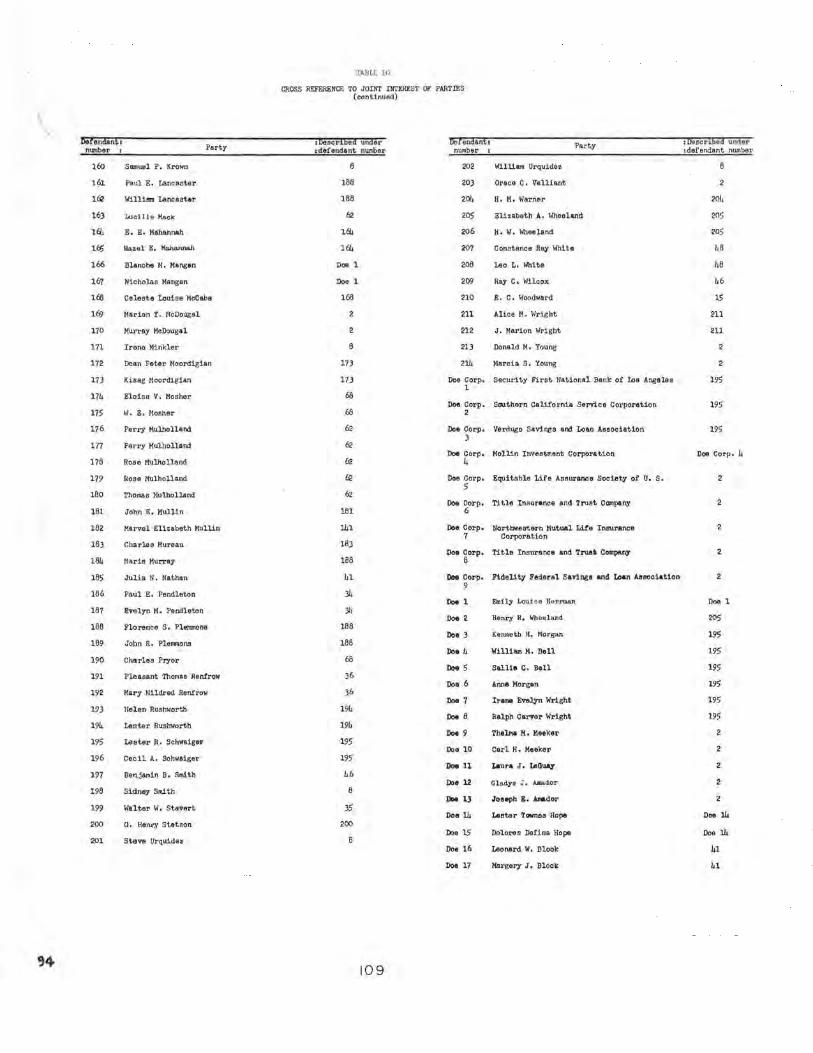
TABLE 10
GROSS REFERENCE TO JOINT INTEREST (F PARTIES ( continued)
De!. rutiiit I Party
sb8,~,.ibed under bOrol1d1lnt. Party : bBsorlbiid undor nwnbor ,defendant OIlIIIber number :defendant nwnber
l{o SBJIluel P. Krown 8 202 William Urquidez
161 Paul E. Lancaster 188 20) Orace C. Valliant
1(;e Willi ... Lancaster 188 201, H. M. Warner 204
16) Lucille Mack (;e 205 Elizabeth A. Whe911nd 205
1~ E. E. Mahannah 1~ 206 H. W. Wheeland 205
1~ Hazel E. Mahannah 1~ 207 Constance Rey White 48
166 Blanche 11. Mangan Doe 1 208 Leo L. White 1,8
167 Nicholas Mangan Doe 1 209 Ray C. Wilcox 46
11:6 Celeste Louise MoCabe 11:6 210 E. C. Woodward 15
1/$ Marian Y. HcDougal 211 Alice M. Wright 211
170 Murray MoDougal 212 J. Marion Wright 211
171 Irene Minkler 21) Donald M. Young
172 Dean Peter Moordigian 173 214 Marcia S. Young
17) K1sag Moordigian 173 Doe Corp. Security First National Bank of loa Angeles 195 1
174 Eloise V. Mosher 1:6 Doe Corp. Southern California SerVice Corporation 195
175 W. E. Mosher 1:6 2
176 Perry lIulholland 62 Doe Corp_ Verdugo Savings and LoBn AfH;ociation 195 )
177 Perry Mulholland (;e Doe Corp. Mollin Investment Corpora ticn Doe Corp. 4
178 Rose Mulholland (;e 4
179 Rose Mulholland (;e Doe Corp. Equitable Life Assurance Society of U. S. 5
180 Thomas Mulholland 62 Doe Corp. Title Insurance and Trust Company
181 John E. Mullin 181 6
182 Marvel ·Elizabeth Mullin 141 Doe Corp. Northwestern Mutual Lite Insurance 7 Corporation
18) Charles Mureau 18) Doe Corp. Title Insurance and True' Compan1'
184 Marie Murray 188 8
185 Julia N. Nathan 41 Doe Corp. Fidelity Fodera1 Saving. and Loan Aeoociat1on 9
186 Paul E. Pendleton 34 Doe 1 Emily Louise Herrman Doe 1
187 Evelyn M. Pendleton 34 Doe 2 Henry R. Wheeland. 205
188 Florence S. Plemmons 188 Doe ) Kenneth H. Morgan 195
189 John R. PleJll1l.onB 188 Doe 4 Willi ... M. BoU 195
190 Charles Pryor 1:6 Doe 5 Sa111. C. Bell 195
191 Pleasant Thomas Renfrow )6 Doo 6 Anne Horgan 195
192 Mary ~I11drad Renfrow )6 Doe 7 Irene Evelyn Wright 195
193 Helen RushworUl 194 Doe 8 Ralph Ca,..,or Wright 195
194 Lester Rushworth 194 Doe 9 TholJu M. Meeker
195 Lester R. Schwaiger 195 Doe 10 Carl H. Meeker
196 Cecil A. Schwaiger 195 Doe 11 Laura J. LaQuq
197 Benjamin B. Smith 46 Doo 12 Gladys J. Amador
198 Sidney Smith 8 Doe 1) ",o.eph g. !mador
199 Walter W. Staverl )5 Doo14 Lester T"""". Hope Doe 14
200 Q. Henry Stetson 200 Doo 15 Dolores Defina Hope Doe 14
201 Steve Urquidez Doe 16 Leonard W. B100k 41
Doe 17 Margery J. Block 41
109

Location of' Wells and Surface Diver::d.ons
The locations of wells and surface diversions utjlized by each
of the parties during the period October 1, 1928 thrO'.;gh September 30, 1958
are listed in Table 11. The locations of the wells are indicated by Los
Angeles County Flood Cont.rol Distri.ct well number while the surface diver
sion locations are indicat.ed by the name of the stream upon which the
diversion is located and the well grid coordinates wherein the diversion
point is situated. The locations of all such wells known to have existed
within the area of investigation are shown on Plate 18.
Extractions and Diversions'
At the beginning of the investigation each party was contacted
by letter ar~ d requested to indicate the information which each could furnish
regarding his use of water. Those indicating that they had information were
interviewed, as were rr~ny well operators and long-time residents of the area
who had kno .. rledge of the use of water extracted or diverted.
The greater part of the historical data concerning the use of
water from ;"'ells for the period from 1930 to 1955 was obtained from the
files of the City of Los Angeles Department of Water and Po,,,er. These
data were compiled by Department of Water and POl-Ter employees in conjunction
with the Department's well measurement program. Ehgineers of the Board
have attempted to verify all data used in determining the extractions or
diversions by the partj es through comparison of results with correlated
-110-
(
information concerning types and areas of crops grown, well logs, pump
records and duty of water.
Information as to the beginning of extraction or diversion, the
present status of the source and type of use of water (i.e., as of
September 30, 1958) are listed for each party in Table 11. The term
"present", where used in other tabulations presented within this chapter,
also refers to September 30, 1958.
Capacity of Diversion Works
The maximum rate at which a party can extract or divert water
with presently existing works has been considered herein as the capacity
of his diversion works. In this regard, it should be noted that the com
bined capacity of a series of wells forming a well field may be less than
the aggregate of these wells operated individually because of possible
differences in discharge head and increased pumping lifts which may occur
under combined operation. Because of the complexity of certain systems
and the operational difficulties involved in establishing comparable test
conditions for the various well fields belonging to the various parties,
the capacity of the combined works belonging to a party has been evaluated
as the aggregate of the individual extraction rates of the vIe lIs in that
system. These values were determined by individual well tests where
possible and from name plate or manufacturer's rating where the former
method was not feasible. Capacities so determined for the present l'lorks
of each party are set forth in Table 11.
-111-
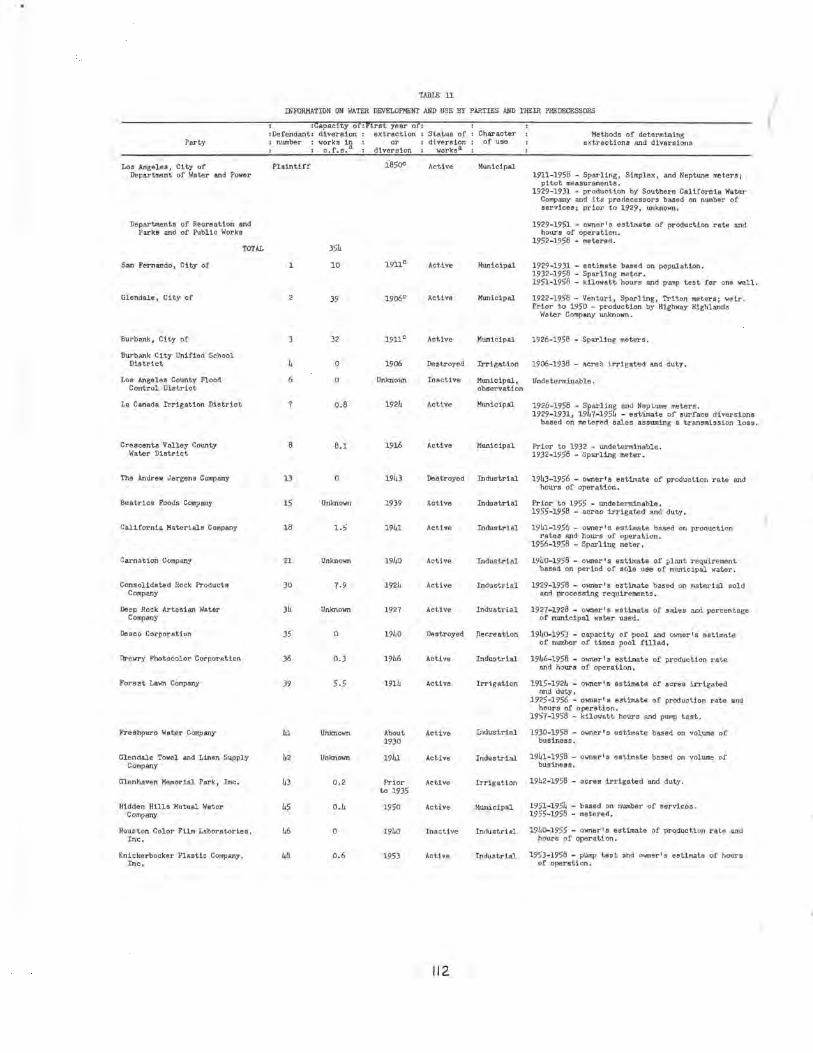
Party
Los Angeles, City of Department of Water and Power
Departments of Recreation and Parke and of Public Works
San Fernando, City of
Glendale. City of
Burbank, City of
Burbank City Unified School District
L08 Angeles County nood Control District
La Canada Irrigation District
Crescenta Valley County Water District
The Andrew Jergens Company
Beatrice Foods Company
TOTAL
California Materials Company
Carnation Company
Consolidated Rock Products Company
Deep Rock Artesian Water Company
Desoo Corporation
Drewry Photocolor Corporation
Forest Lawn Company
J'reshpuro Water Company
Glendale Towel and Linen Supply Company
Glenhaven Memorial Park, Inc.
Hidden Hills Mutual Water Company
Houston Color Film Laboratories, Inc.
Knickerbocker Plastic Company, Inc.
TABlE II
INRlRMATION ON WATER DEVELOFllENT AND USE BY PARTIES AND THEIR PREDECESSORS
:Capaclty of ,rrst year or Defendant: diversion extraction
number : 'Works in c.f.s. a
Plaintiff
)54
1 10
39
32
4 ° 6 ° 7 0.8
8.1
1) o
15 Unknown
18 1.5
21 Unknown
30
Unknown
35 ° 36 0.3
39 5.5
Unlmovn
42 UnlmolfIl
4) 0.2
45 0.4
46 o
48 0.6
or diversion
i850C
1911"
1906"
1906
Unknown
1924
1916
1943
19)9
1941
1940
1924
1927
1940
1946
1914
About 1930
1941.
Prior to 19)5
1950
1940
195)
Status of diversion
works a
Active
Active
Active
Active
Character of use
Municipal
Municipal
Municipal
Municipal
Methods of determining extractions and diversions
1911-1958 - Sparling, Simplex, and Neptune metersj pitot measurements.
1929-1931 - production by Southern California Water Company and its predecessors baaed on number of service!1j prior to 1929, unknown.
1929-1951 - owner! B estimate of production rate and hours of operation.
1952-1958 - metered.
1929-19)1 - estimate based on population. 1932-1958 - Sparling meter. 1951-1958 - kilowatt hours and pump test for one well.
1922-1958 - Venturi, Sparling, Triton metersj weir. Prior to 1950 - production by Highwa..y Highlands
Water Company unknown.
1926-1958 - Sparling meters.
Destroyed Irrigation 1906-1938 - acres i rrigated and duty.
Inactive Municipal, Undeterminable . observation
Active Municipal 1926-1958 - Sparling and Neptune meters .
Active Municipal
Destroyed Industrial
Active Industrial
Active Industrial
Active Industrial
Active Industrial
Active Industrial
Destroyed Recreation
Active Industrial
Active Irrigation
Active Industrial
Active Industrial.
Active Irrigation
Active Municipal
Inscti ve Industrial
Active Industrial
112
1929-1931, 1947-1954 - estimate of surface divers10ns based on JTletered Bales assuming a tramnnission 109s.
Prior to 1932 - Wldeterminable. 1932-1958 - Sparling meter.
1943-1956 - owner I s estimate of' production rate and hours of operation.
Prior to 1955 - undeterminable. 1955-1958 - acres irrigated and duty.
19u1-1956 - owmer! s estiJnate based on proauction rates and hours of operation.
1956-1958 - Sparling meter.
1900-1958 - owner! B estimate of plant requirement based on period of sale use of municipal water .
1929-195'8 - owner I s estimate based on material sold and processing requirements.
1927-1928 - owner I s estimate of sales and percentage of municipal water used.
1940-1953 - capacity of pool and owner's estimate of number of times pool filled.
19L6-1958 - owner! S estimate of production rate and hours of operation.
1915-1924 - owner! s estiInste of acres irrigated IUld duty.
1925-1956 - owner! s e~iJll8.te of production rate and hours of operation.
1957-1958 - kilowatt hours and pwnp test.
1930-1958 - owner's estimate based on volume of busine:ss .
1941-1958 - owner's estimate based on volume of businees.
1942-1958 - acre. irrigated and duty.
1951-1954 - based on number of services. 1955-1?58 - metered.
1940-1955 - owner's estimate of production rate and hours of operation.
195)-1958 - pump test and owner I s estimate of hours of operation.
(
(
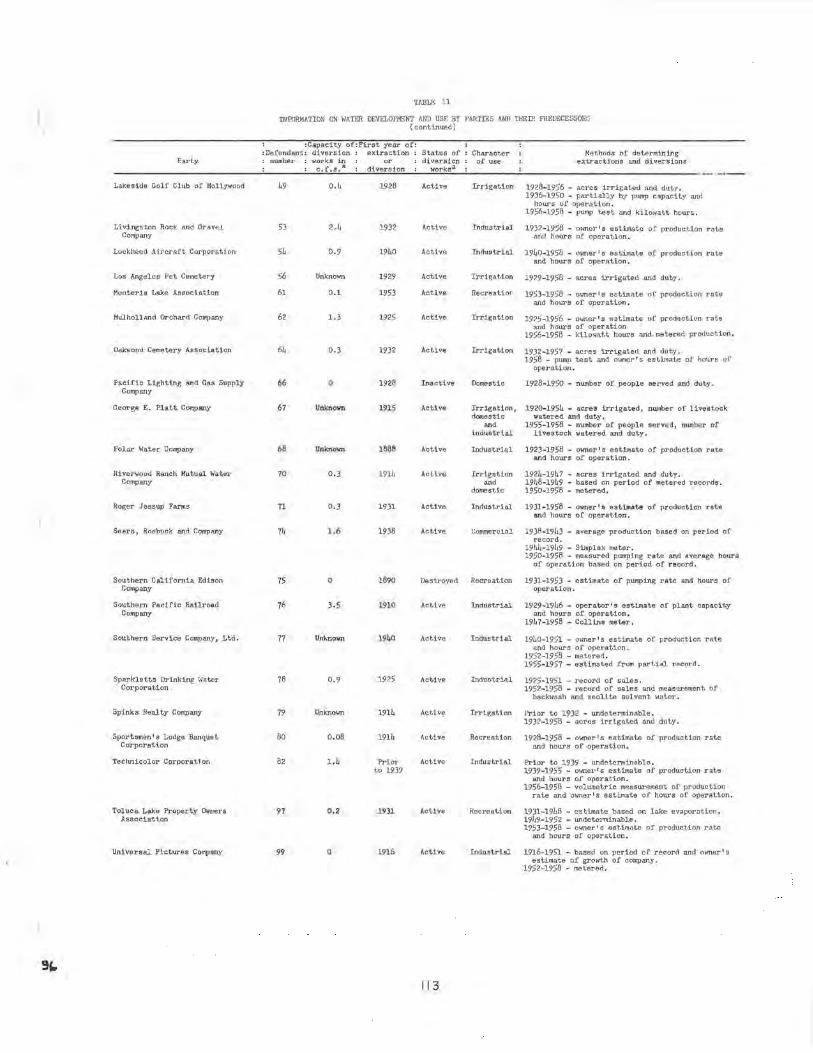
TABIE 11
INFORMATION ON WATER DEVELOPMENT AND USE BY PARTIES AND THEIR PREDECESSORS ( continued)
Capacity of First year of: : Defendant diversion extraction Status of" Character
Party number works in or diversion of use Methods of determining
extractions and diversions ____________________________ ~ ______ ~~c~.~f~.~s~.a __ ~~d~1~v~er~s~i~o~n~~~wo~r~k~s~a~~ ________ ~ ____________________________________ • _ __ __
Lakeside Golf Club of Hollywood
Livingston Rock and Gravel Company
Lockheed Aircraft Corporation
L05 Angeles Pet Cemetery
Manteria Lake Association
Mulholland Orchard Company
Oakwood Cemetery Association
Pacific Lighting and Gas Supply Company
George E. Platt Company
Polar Water Company
Riverwood Ranch Mutual Water Company
Roger Jessup Farms
Sears, Roebuck and Company
Southern California Edison Company
Southern Pacific Railroad Company
Southern Service Company, Ltd.
Sparkletts Drinking Water Corporation
Spinks Realty Company
Sportsmen I s Lodge Banquet Corporation
Technicolor Corporati on
Toluca Lake Property Owners Association
Universal Pictures Company
53
54
56
61
62
64
67
68
70
n
7"
75
76
77
78
79
80
82
99
0.4
2."
b.9
Unknown
0.1
1.3
0.3
o
Unknown
0.3
0.3
l.b
o
3.5
Unknown
0.9
Unlmown
0.08
1."
0.2
o
1928
1932
1940
1929
1953
1925
1932
1928
1915
18&6
191"
1931
1938
1690
1910
1940
1925
1914
19lL
Prior to 1939
1931
1916
Active
Active
Active
Active
Active
Active
Active
Inactive
Active
Active
Active
Active
Active
Irrigation
Industrial
Industrial
Irrigation
Recreatior
Irrigation
Irrigation
Domestic
Irrigation, domestic
and industrial
Industrial
Irrigation and
domestic
Industrial
Conunercial
1928-1956 - acres irrigated and duty. 1936-1950 - partially by pump capacity and
hours of operation. 1956-1958 - pump test and kilowatt hours.
1932-1958 - owner I s estimate or production rate and hours of operation.
1940-1958 - owner I 5 estimate of production rate and hours of operation.
1929-1958 - acres irrigated and duty.
1953-1958 - owner I B estimate of production rate and hours of operation.
1925-1956 - owner I s estimate of production rate and hours of operation
1956-1958 - kilo'flatt hours and metered production.
1932-1957 - acres irrigated and duty. 1958 - pump test and owner I 5 estimate of hours of
operation.
1928-1950 - number of people served and duty.
1920-19.5L. - acres irrigated, number of livestock watered and duty.
1955-1958 - number of people served, number of livestock watered and duty.
1923-1958 - owner I s estimate of production rate and hours of operation.
1924-1947 - acres irrigated and duty. 19~8-1949 - based on period of metered records. 1950-1958 - metered.
1931-1958 - owner I s estimate of production rate and hours of operation.
1938-19LJJ - average production based on period of record.
1944-1949 - Simplex meter. 1950-19.58 - measured pumping rate and average hours
of operation based on period of record.
Destroyed Recreation 1931-1953 - estimate of pwnping rate and hours of operation.
Active Industrial. 1929-1946 - operator I s estimate of plant capacity and hours of opera.tion.
19"7-1958 - Collin. meter.
Active Industrial 1940-1951 - owner I s estimate of production rate and hours of operation.
1952-1958 - metered. 1955-1957 - estimated from partial record.
Active Industrial 1925-1951 - record of sales. 1952-19.58 - record of sales and measurement of
backwash and zeoli te solvent water.
Active Irrigation Prior to 1932 - undeterminable. 1932-19.58 - acres irrigated and duty.
Active Recreation 1928-1958 - Olmer I s estimate of production rate and hours of operation.
Active Industrial P:rior to 1939 - undeterminable. 1939-1955 - owner I s estimate of production rate
and hours of operation. 1956-1958 - volui'netric measurement of production
rate and owner I s estimate of hours of' operation.
Active Recreation 1931-1948 - estimate based on lake evaporation. 1949-1952 - undeterminable. 1953-1958 - owner I s estimate of production rate
and hours of operation.
Active Industrial 1916-1951 - based on period of' record and ower I s estimate of growth of company.
1952-1958 - metered.
113
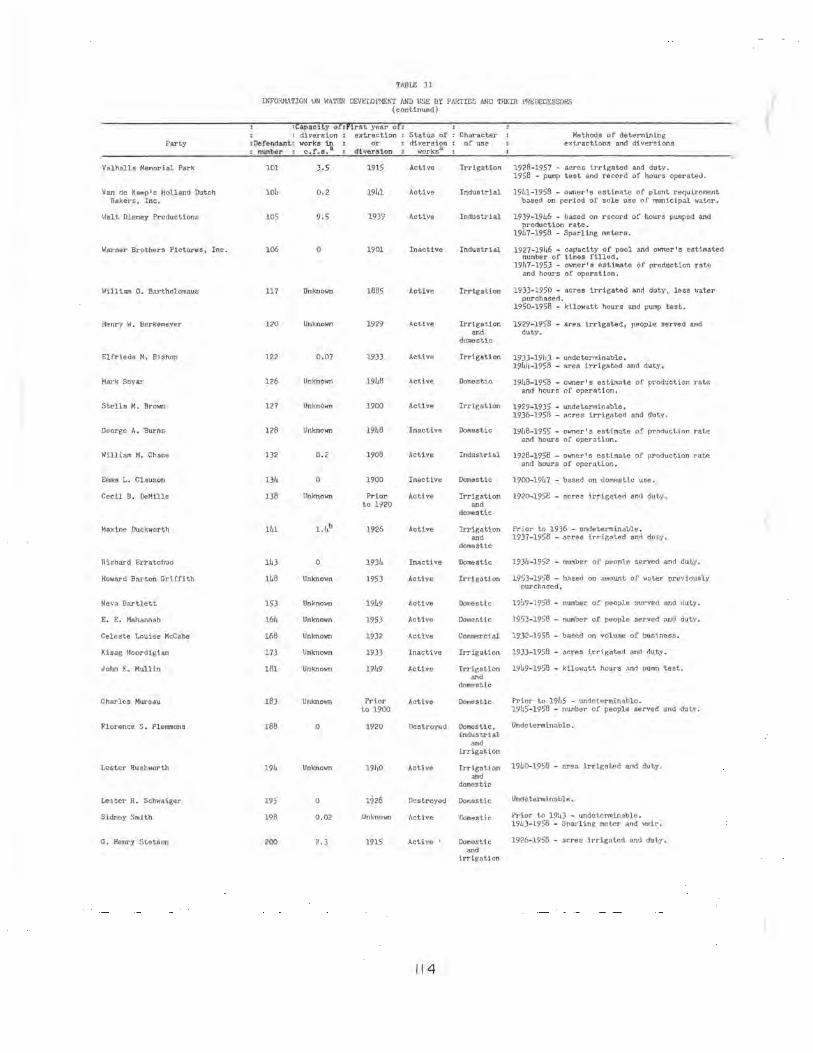
Party
Valhalla Memorial Park
Van de Kamp I s Holland Dutch Bakers, Inc.
Wal t Disney Productions
Warner Brothers Pictures, Inc.
Will iarn O. Bartholomaus
Henry W. Berkemeyer
Elfrieda M. Bishop
Hark Boyar
Stella M. Brown
George A. Burns
William M. Chace
Emma L. Clauson
Cecil B. DeMille
Maxine Duckworth
Richard Erratchuo
Howard Barton Griffith
Neva Bartlett
E. E. Mahannah
Celeste Louise McCabe
Kisag r~oordiglan
John E. Mullin
Charles Mureau
Florence S. Plemmons
Lester Rushworth
Lester R. Schwaiger
Sidney Smith
G. Henry Stetson
TABlE 11
INFORMATION LIN WATER DEVEr.oPl1ENT AND USE BY PARTIES AND THEIR PREDECESSORS (cont.inued)
.C8paelt.y On first year or diversion extraction Status of Character
: OeJend&nt.! works in or diversion of use Methods of determining
extract1.ons and diversions number c. r. 8. a 41 ver .,10n worksa
101
10L
105
106
117
120
122
126
127
128
132
134
138
ILl
143
148
153
164
168
173
181
183
188
194
195
198
200
3.5
0.2
9.5
o
Unknown
Unknown
0.07
Unknown
Unknown
Unknown
0.2
o
Unknown
o
Unknown
Unknown
Unknown
Unknown
Unknown
Unknown
Unknown
o
Unknown
o
0.02
2.3
1915
1941
1939
1901
1885
1929
1933
1948
1900
1948
1908
1900
Prior to 1920
1926
1934
1953
1949
1953
1932
1933
19L9
Prior to 1900
1920
19Lo
Unknown
1915
Active
Active
Active
Inactive
Active
Active
Active
Active
Active
Inactive
Active
Inactive
Active
Active
Inactive
Active
Active
Active
Active
Inacti ve
Active
Irrigation 1928-1957 - acres irrigated and duty. 1958 - pump test and record of hours operated.
Industrial 19L.1-1958 - owner I s estimate of plant requirement based on period or sole use or municipal water.
Industrial 1939-1946 - based on record of hours pumped and production rate.
1947-1958 - Sparling meters.
Industrial 1927-19u6 - ca}1acity of pool and owner's estima.ted number of times filled.
19u7-1953 - owner I s estimate of production rate and hours of operation.
Irrigation 1933-1950 - acres irrigated and duty, less lIater purchased.
1950-1958 - kilowat.t hours and pump test.
Irrigation 1929-1958 - area irrigated, people served and and duty.
domestic
Irrigation 1933-1903 - undeterminable. 194L-1958 - area irrigated and duty.
Domestic 19L8-19S8 - Olmer I s estimate of production rate and hours of operation.
Irrigation 1929-1935 - undeterminable. 1936-195B - acres irrigated and duty.
Domestic 19L8-1955 - owner's estimate oE' production rate a.."ld hours of operation.
Industrial 192B-195B - owner I s estimate of production rate and hours of operation.
Domestic 1900-1947 - based on domestic use.
Irrigation 1920-1958 - acres irrigated and duty. and
domestic
Irrigation Prior to 1936 - undeterminable. and 1937-195B - acres irrigated and duty.
domestic
Domestic 1934-1952 - nU'Ilber of people served 31ld duty.
Irrigation 1953-195B - brtsed on amount of water previously purchased.
Domestic 19!J9-195B - number of peo;>le served and duty.
Domestic 1953-195B - number of people served (lIld duty.
Commercial. 1932-1958 - based on volume of business.
Irrigation 1933-1958 - acres irrigated and duty.
Irrigation 19lI9-1958 - kilowatt hours :m'; pum!l test. and
domestic
Active Domestic Prior to 19!15 - unde terminable. 1945-195B - nu.."Tlber of people served and duty.
Destroyed Domestic, Undeterminable. industrial
and irrigation
Active Irrigation 19LO-19SB - area irrigated and duty. and
domestic
Destroyed Domestic
Active Domestic
Active I Domestic
114
and irrigation
Undeterminable.
Prior to 1943 - undeterminable. 19L3-195B - Sparling meter and weir.
1926-195B - acres irrigated and duty.
(
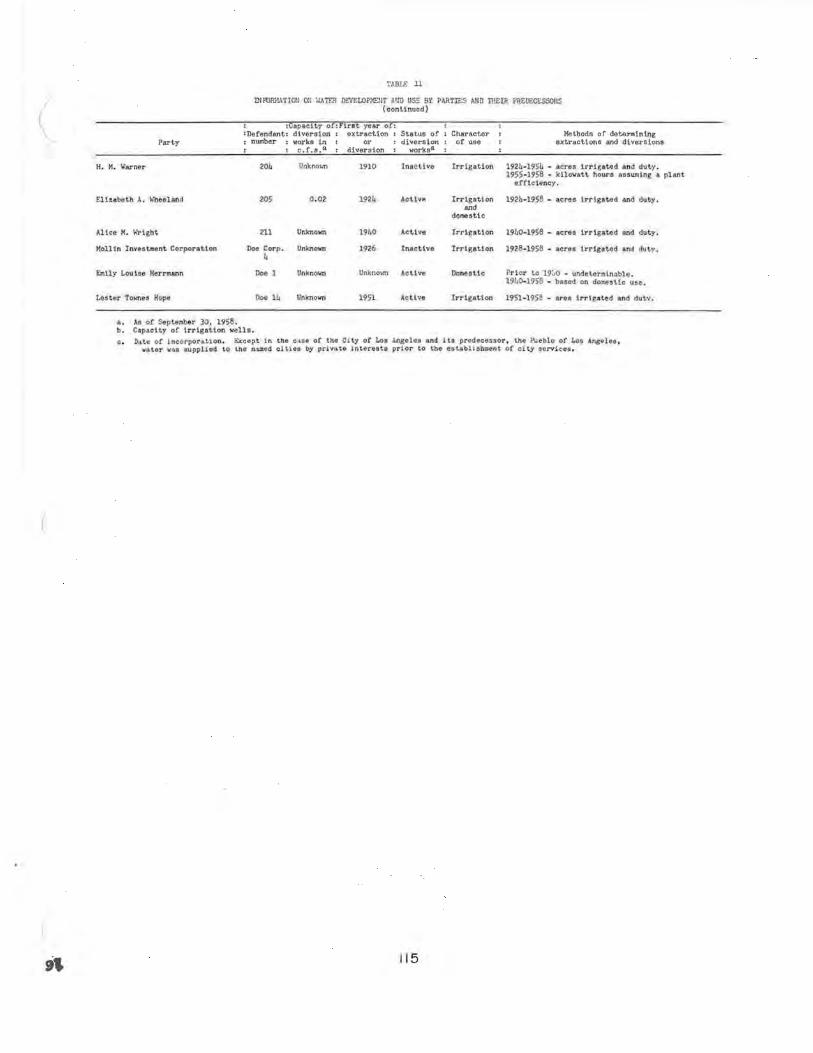
(
Party
U. JoI. W.arner
£It..both A. Whoo1and
Alice M • • ·rigM
Hollin lnveatmenll Corpor-At,ton
Emll.,:.· Lou i.s.t Her r'lnIUln
Lester Towne! Hop,6
• • A. of Sop .. O>bor )0, 19S8.
TABIE 11
DIFO!I)lATIOl.' O!I WArm IliM:LOmmT Aim os~ Uy PAlITIES oI!l~ THEIR PREIl&l!:SSOl~ (oon~\nu.d )
:oap.llcU.y or First.. yesr ()r: : Defendant: dtversicro extraction Status of Cnaracte:r Methods of detem.in1r)g numbe~ works in or diversion of une e·xtractions and diversions
c.f.s.a diversion works4
20L Unknor..n 1910 In(uH,l\re IrrIgation 192b-19SL - .ern udgd.,d and du~y . 1155-19,8 • ~Uovatt hoy ... u.""lng " plMt
.((telency.
20$ 0 .02 1924 Aet,.jv,. rrr1gat.ion 1921,-1956 - aor~ Irdgoted Md du ty. and
do .... tic
211 Unknown 19hO Act-lve Irrigat.ion 191,0-1958 - acr •• Irrls.ted And duty.
Doe forp. Unknown 1926 Inacthe Irr-1 atlon 1926-1956 - aor •• trr~ted and dut' .
Doe l Unknown Unkntl;..'J'\ Ac:t1vlI Domestie Prior to 19,,0 - uM_termln abl e. 19h 19S8 - blUod on do:nesUe Uce.
Doe l.I. Unkno-.m 1951 Active lrrigatton 1951-19$e - ar •• 1I'1'IMt.d .nd dut·,.
b. C.p.cttr of" lrrl8a~l.on ",.Us. c:~ D-...lte o t lneorpot t.ton . E.xObP t. In the olue or tho Ci "y or l.o. Aogalos and. Ito preilece.5I:I!or . t.he i"I.l e'blo of 1.00 AJl8l!lea ,
vn.t~r 11.1 ouppUocl to "ho named ciUeo by p-riyu.tG ln t oT"Bsu prior to the OGit bl u,h£;ent or ci ty .sorv.1 c.s .
115
Quantity of Extractions and Diversions
The annual amounts of water extracted and diverted by each of
the parties have been determined from meter records or estimated on the
basis of the duty of water, pumpage rates and hours of operation, or
power consumption and plant efficiency. Whenever possible, estimated
amounts were determined by more than one method. The primary method
utilized to determine the extractions and diversions of each of the
various parties is listed in Table 11. The aggregate annual amounts of
water extracted and diverted by all parties are shown for the period
1928-29 through 1957-58 and the years prior to 1928-29, in Tables 12 and
13, respectively. The amounts shown in Table 12 and 13 include water
extracted and diverted on the valley floor and in hill and mountain areas.
The latter are comparatively minor in magnitude. The annual amounts of
ground water extracted and surface water diverted from individual sources
within the Upper Los Angeles River area are included in the Basic Data.
-116-
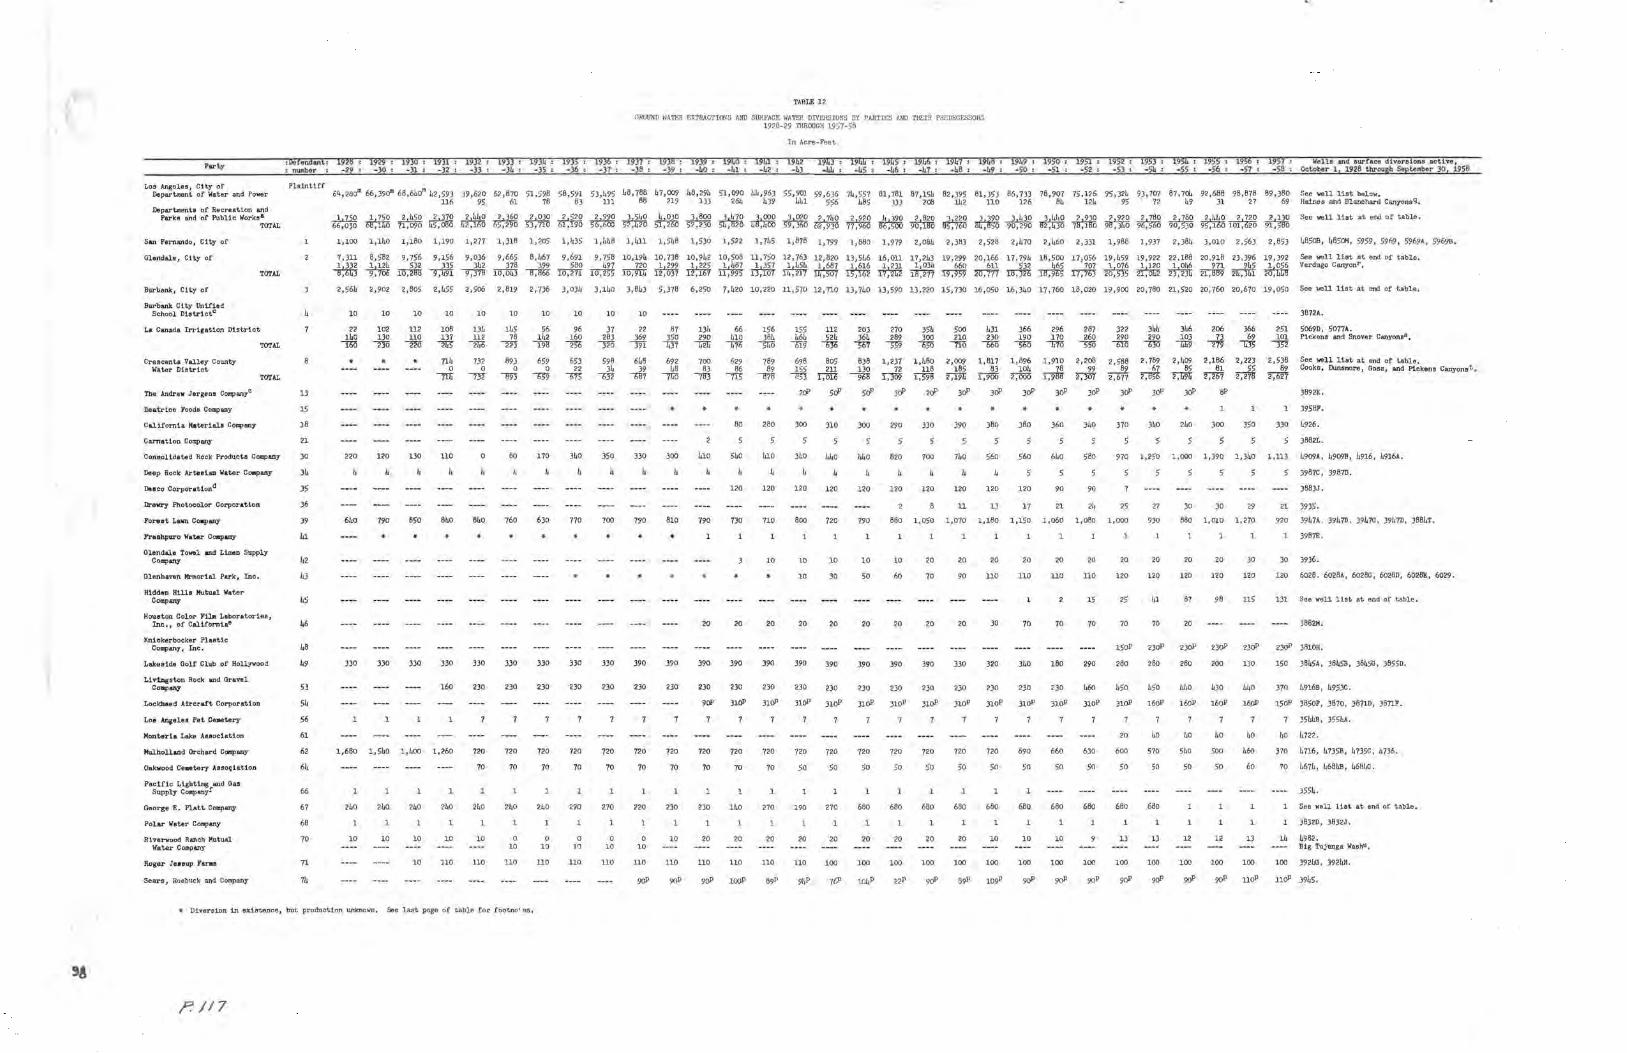
Los Angeles, CHy of Department of Water and Pover
Departments of Recreation and Parke and of Public WorkeR
TOTAL
San Fernando. City of
Glendale J C1 ty of
Burbank, City of
Burbank Ctty Unified School DletrlctC
TOTAL
La Canada Irrigation District
Crescenta Valley County Water D1etrlct
'The Andrew Jergens CompanyC
Beatrice Foods Company
California Materla1s Company
Carnation Company
TOTAL
TOTAL
Consolidated Rock Producte COlapaDy
Deep Rock Artedan liater COIIpany
Deeco Corporationd
Drewry Photocolor Corporation
Forest Lawn Co.p~
Freshpuro Water CotllpaIlJl'
Glendale Tavel md LineD Supply COlIIPaIIJ'
Glenhaven Mrmorial Park, Inc.
Hidden Hill_ Mutual Water CompaIlJ'
Houeton Color F1.l.m Laboratories, Inc., of Ca11forniae
Knickerbocker Plaetic Company, Inc.
Lakeside Oolf Club of Hollywood
Llv1.n&ston Rock and Gravel Col!Ipal\Y'
Lockheed Aircraft Corporation
Loe AnJelea Pet CeJletery
Monteri. Lake Association
Hul.holland Orchard C __
Oakwood Ceaetery AS9olJ,iation
Pacific Lighting and Oas. Supply Co.panyf
George E. Platt Company
Polar Water Company
Rl vervood Ranch Hutual Water COflPIJ'lY
Roger Je.eup Fanu
Sears, Roebuck and Company
TABLE 12
GROUND ,lATER EXTRACTIOOS AND SURFACE WATER DIVERSIONS BY PARTIES AND THEIR PREDECESSORS 1926-29 THROUGH 1957-56
In Acre-Feet
,lIOt.ndlU'lt: 1928 , }929 1930 ' 19)1 19J2 ' 19JJ: 19)6 193> I 19)6, 19)7 mB ·)2
1939 I llll,o, 1%1 · bO: ·"1 I -12
19Li .L)
liM, 19&L , 19L5, 19L6 19&7 .lJIhB l§/'9' 1950 I 1951 -51 - 52
19S2 1953 1.9$6 -57
19;7 -S8
Wells- and l5urr8~ dlvlJIr'8:ions ,set.tvo, Oet.<>ber 1, 1928 t/U"ough Sopt.e:r.b~r 30, 1956 ,nUllbor : - 29 I - 30 I - 31 I - )2 - 33 -)b: -}" .)6 , -)7 - ) 8 -lJ. -hS -16 - b 1 : .b8 I - 49 I -So! -53' - 5b
Plaintiff
13
15
18
21
30
34
)5
36
)9
bI
42
4)
45
46
46
49
5)
54
56
61
62
64
66
67
66
70
n
74
See well list below. 64,260m 66,39~ 68,6bO" L2,59) )9,620 62,670 51,596 58,591 53,b95 b8,766 b7,OO9 48,29L 51,090 U,963 55,901 59,636 Th,557 81,781 87,15L 82,395 61,)53 86,733 76,907 75,126 95,32b 93,107 67.70;. 92,686 96,676 69,360 116 95 61 78 83 III 86 219 133 26b 439 441 556 465 33) 208 lb2 110 126 6b 12b 95 72 49 31 27 69 Heines and Blanchard Canyonsq.
~6~,7U'MO~42'~0~523,'071)0062 Ii205gl~90dLO~~5W046,lm~62'7L§/!9~~902,'18§00~~~8~!~n9n9ng~§920,!g8300~1~§~2!~rl° 66,030 ,10 I. 0 13,080 2,1 0 ~O 1, 90 ,00 2, 20 ~ ~ J 20 w.JW 2,9) 1,9"8b300 ~ ~ 90,290 ,J 1 ,10 9 tJ 0 9, 9 ,1 101,620 91, 0 See well list at end of table.
1 ,100 1,140 1,180 1 ,190 1,277 1,318 1 ,205 l,L35 1,LL6 1,411 l ,5L8 1,530 1,522 l,7b5 1,678 1,799 1,660 1,979 2,08L 2,383 2,526 2,b70 2,460 2,»1 1 ,966 1,937 2,384 ),010 2,56) 2,853 46500, 485OM, 5959, 5969, 5969A, 5969B.
7,)11 6,582 9,756 9,156 9,0)6 9,665 8,467 9,691 9,75B 10,194 10,736 10,942 10,508 11,750 12,763 12,820 13,546 16,011 17,24) 19,299 20,166 17,794 16,500 17,056 19,b59 19,922 22,168 20.918 23,396 19,392
Ul~§:9LoJ~~d§~~10,~g~10J~10,mio,~L~:g~1~:ig~lHL~;mla;WLt:~~Lg:m19:~U:~~ld~~20,mlaJLdz§17,m2~:~jLi:~r~2~:~Ll,~~§24,m28:~~ See well list at end of table. Verdugo Cany-onr •
2,564 2,902 2,805 2,b55 2,506 2,619 2,736 ),034 ),140 ),64) 5,)76 6,250 7,420 10,220 11.57u 12,no 13,740 13,590 13,220 15,730 16,050 16,340 17 ,760 18,020 19,900 20,780 21.520 20, 760 20,670 19 ,050 See ""Ulist at end ot table.
ID
22 140 ---m *
220
640
)30
1
10
102 130
2jij
*
120
4.
190
*
»0
1
10
112 110
--m!
130
650
3)0
10
108 137
245'
n4 o
714
110
640
*
)30
16D
1,680 1,540 1,400 1,260
240 240 240 240
1
10 10 10 10
10 110
10
13b 112
2liO
732 o
-m
o
6bo
3)0
230
720
70
2bo
1
10
110
10
145 76
22J
693 o
--m
60
760
*
)30
2)0
120
70
240
o 10
110
10
56 142
19l!
659 o ~
170
630
)30
2)0
720
70
1
2bO
o 10
110
10
96 160 ~
65) 22
-or;
3bo
770
330
230
720
70
1
290
o 10
110
10
)7 263
J20
598 )4
0j2
)50
700
3)0
230
720
70
270
o 10
110
10
22 369
J9I
648 39
blJ7
)30
790
)90
230
720
70
220
o 10
110
87 )50
---zo'/
692 b8
""""740
)00
610
*
390
2)0
120
70
1
2)0
1
10
110
134 290
"li2li
700 63
7lJj
*
bIO
4
790
*
20
)90
2)0
90P
120
70
1
2)0
20
110
66 410
--rn 629
86 -m
80
540
120
730
20
390
230
310P
720
70
1
Ibo
20
110
156 )8b
SUo
769 69
Cl7l!
* 280
bIO
120
no
10
*
20
390
2)0
310P
720
70
1
270
20
110
155 46b
hl9
698 155
tm 2,y
)00
340
120
600
10
10
20
390
2)0
112 524
0j0
605 211
r,m
)10
5
Lto
120
720
10
)0
20
)90
2)0
)101' )101'
720 720
50 50
190 270
1
20 20
110 100
20) 364
-;6'7
636 1)0
90S"
5ri'
)00
5
Lto
120
790
10
50
20
)90
230
)loP
720
50
680
1
20
100
270 289
-m 1,237
72 ~
)ri'
* 29D
354 )00
0;0
l,b80 118
'i"";">9lJ
2ri'
»0
500 210
"'lID
390
b)l 2)0
bOO
1,817 63
1,900
)ri'
* 380
5
366 190
"Wi
1,896 104
2,000
360
296 170
li70
1,910 78
l,"9W
)01'
*
267 260
550
2,208 99
2,307
340
322 290
bIli
2.586 69
2,677
)oP
* 370
)44 290
""""6Jij
2 , 769 67 ~
)oP
)40
)1,6 103
!ili9
2,409 85
2,li9li
)01'
240
206 73
2'T9
2,186 81 ~
)00
5
)66 69
""liE
2,22) 55
2,278
1
350
5
3872A.
251 50690, 5077A. 101 Pickens and Snover Canyon!B.
J>2
2,536 89
2;b2'f
See well l1st at end of table. Cooks, Dunsmore, Goss, and Pickens Canyonst.
3692K.
1 )9561'.
3)0 b926.
5 )882L.
620 700
5
740
4
560
5
560
360
5
640 560 970 1,250 1,000 1,390 1,) 40 1,113 b909A, 49098, 4916, 4916A.
120 120 120 120 120 90 90
11 13 17 21 25
880 1,050 1,070 1,160 1,150 1,060 1,080 1,000
10
60
20
)90
230
)lOP
720
50
660
1
20
100
20
70
20
)90
2)0
)lOP
720
50
660
1
20
100
1
20
90
20
330
2)0
)loP
720
50
680
1
20
100
20
110
)0
)20
2)0
)10P
720
50
680
1
10
100
10~
1
20
110
70
)40
2)0
)lOP
690
50
1
660
1
10
100
1
20
110
70
160
230
310P
660
50
660
10
100
20
110
15
70
290
460
)10P
630
50
660
100
1
20
120
25
70
150P
280
450
)10P
20
600
50
680
13
100
21
9)0
20
120
41
70
2)OP
280
450
160P
bo
570
50
680
1)
100
5
)0 30 29
880 1, OlD 1,270
20
120
67
20
2)OP
260
440
160P
40
5bo
50
1
12
100
1
20
120
2)01'
200
L30
160P
40
500
50
1
1
12
100
1
)0
120
115
2)oP
130
440
160P
40
460
60
1
13
100
1101'
3967C, )9&7D.
)88)J •
21 )935.
920 )9b7A . 394?B. 3947C, 39b7D, 3684T.
1 )967E.
30 3936.
120 6028. 6028A, 60280, 60280, 6026E, 60;>9.
131 See well l1st at end of table.
)6B2M.
2)01' 3810H.
150 )645A, )84SB, )8450, )855D.
370 4916B, 4953C.
150P )8501', 3670, )6710, )6m.
354LB, 3551:A.
40 4722 .
370 4716, 47358 , 47)5c, 4736.
70 4674, 468bB, L684c.
)554.
See well list at end of table.
)8)2D, 3832J.
14 4962. Big TujllI\g. W.Bhu .
100 )92ioG, )92bB.
l10P )945.
* Diversion in existence, but production W'l.knO\ffi. See last page of ta.ble for footno~ es.
r: /17
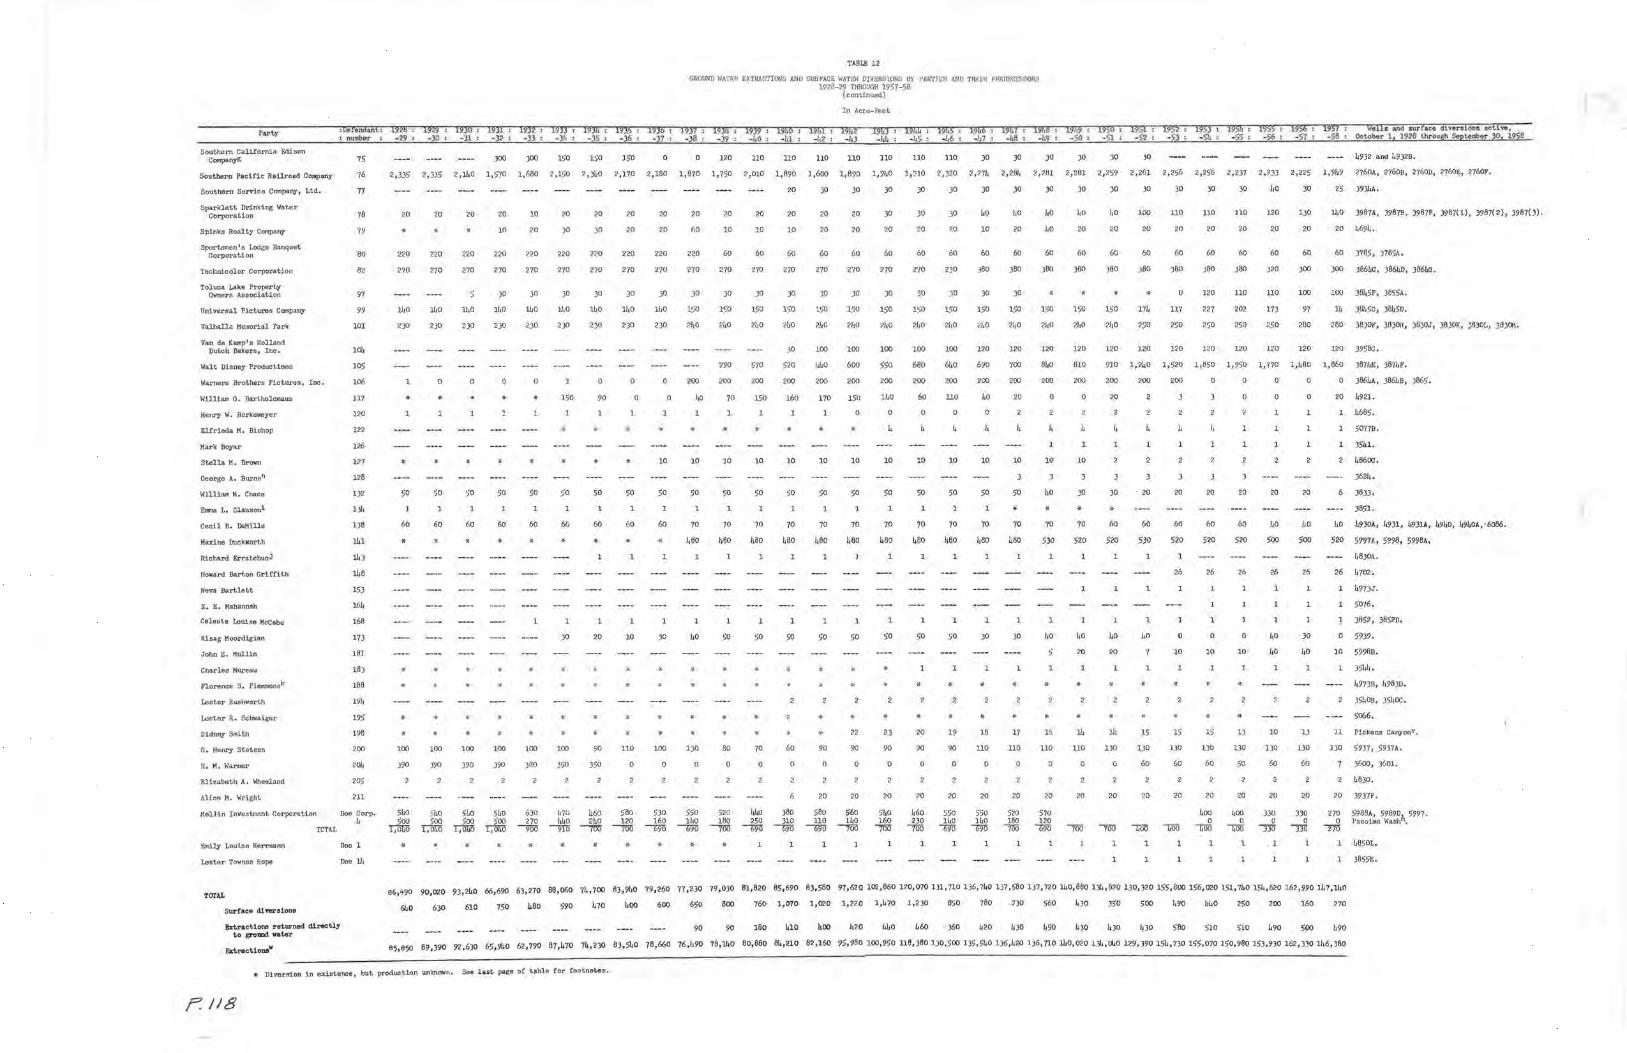
TABLE 12
GROUND IfATER EXTRACTIONS AND SURFACE WATER OIVERSIOlIS BY PARTIES AND THEIR PRF.DECESSORS 1928-29 TllROUGH 1957-56
( continued)
In Acre-Feet
: DelenaAnt..% 1928 1929 - )0
1930: 1931 19n t9JJ I 19)L 1m -)6
19]:6, (§j7 1959 1M -J.t2
19111 -1.3
t9l1l: 191rL: l%S, Wbo 1M -h8
191r8 -1<9
1350 -51
11,,[ -52
1952 - S3
19!i1r: 19$$; H$6 -): -$6: -S7
1957 ·S8
~'ells UKI S'Ul"fiClII dlversio"" .8et.ive. October 1 , 1928 !.hrousn Sop~ 30, 1928 nUlllb= - 29 -)1: -:It: - )): -)1, - JS - 3'/ -38 -1,0 -~ll: -b~ : -J.t6 -~7
Southern Call.tornia Edison Companyll
Southern Pacific Railroad Company
Southern Service Company, Ltd.
Sparklett Drinking: Water Corporation
Spinks Realty Company
Sportsmen I S Lodge Banquet Corporation
Technicolor Corporation
Toluca Lake Property OWners Association
Universal Pietures Canpany
Valhalla Memorial Park
Van de lamp's Holland Dutch Bakers, Inc.
Walt Disney Productions
Warners Brothers Pictures J Inc.
William O. Bartholomaus
Henry W. Berkereyer
Elfrieda K. Bishop
Hark Boyar
Stella K. Brown
George A. Burneh
William H. Chace
Emma L. Clauson!
Cecil B. DeMille
Maxine Duc north
Richa.rd Erratchuoj
Howard Barton Griffith
Neva Bartlett
E. E. Mahannah
Celeete Louise McCabe
Kisag Hoordigian
John E. Hullin
Charles Hureau
Florence S. Plemrnonsk
~ster Rushworth
~ster R. Schwaiger
Sidney Sm! th
G. Henry Stehon
H. M. Warner
Elizabeth A. Wheeland
Alice M. Wright
75
76
77
78
79
60
62
97
99
101
lob
105
106
U7
120
122
126
127
128
132
131.
138
lbl
lb3
lb6
153
16b
166
173
161
163
168
19b
195
198
200
20l,
205
211
Mallin Investment Corporation Doe Corp.
TOTAL
Emily Louise Hermann
Laster Townes Hope
TarAt
Surface d11'8rsions
Extractions returned directly to sroUDd water
Erlractlonav
b
Doe 1
Doe lb
300 300 150 ISO 150 o o 120 110 110 110 UO 110 110 UO 30 30 30 30 30 30 b932 and b9)2B,
2,335 2,3)5 2,lbO 1,570 1,680 2,150 2,3bO 2,170 2,180 1,670 1,750 2,010 1,890 1,600 1,690 1,9bO 1,nO 2,320 2,27b 2,26b 2,261 2,261 2,259 2,261 2,256 2,256 2,237 2,233 2,225 1,9b9 2760A, 2760B, 2760D, 2760E, 2760F.
20
.. 220
270
lbO
230
* 1
..
so
60
*
..
..
* .. 100
390
Sbo 500
r,oTiO
*
20
.. 220
270
lbO
2)0
o
..
..
so 1
60
..
100
390
Sbo 500
1,040
20
*
220
270
5
11,0
230
o
1
..
50
1
60
..
..
..
.. *
100
390
5bo 500
r;1i41i
*
20
10
220
270
)0
lbO
230
.. 1
*
so
60
*
* ..
.. *
100
39D
5bo 500
l,Oli6
10
20
220
270
30
lbO
230
o
*
*
so
60
*
..
..
..
100
)60
630 270
900
20
)0
220
270
30
lbO
230
1
150
•
..
so 1
60
1
30
.. *
.. ..
100
3S0
L70 ~O ~
..
20
)0
220
270
30
lbO
230
o
90
1
.. so
1
60
.. 1
1
20
..
..
.. 90
3S0
1.60 240
---mi
..
20
20
220
270
30
11,0
2)0
o
o
.. 50
60
1
1
10
..
* .. no
o
*
20
20
220
270
30
lbO
230
1
10
50
60
30
"
.. 100
o
5)0 160
"b9li
*
o
20
60
220
270
30
ISO
240
200
40
1
•
10
SO
1
70
480
1
40
.. *
* .. 130
o
550 140
"b9li
*
20
10
60
270
30
ISO
240
290
200
70
•
10
SO
1
70
460
1
1
SO
.. *
..
.. 80
o
520 180
---.,00
..
20
10
60
270
30
150
240
570
200
ISO 1
10
50
1
70
b80
1
1
SO
..
.. 70
o
~O 250
b90
20
20
10
60
270
30
ISO
240
30
520
200
160
1
10
50
1
70
480
1
1
50
*
.. * 60
o
6
)80 )10
095
1
30
20
20
60
270
30
ISO
240
100
~O
200
170
10
50
1
70
480
1
50
..
.. 90
o
20
1
30
20
20
60
270
30
150
240
100
600
200
150
o
•
10
SO
1
70
460
1
SO
.. *
* 22
90
o
20
560 140
-ml
30
30
20
60
270
)0
150
240
100
550
200
140
o
4
10
50
1
70
460
1
1
So
* .. .. 23
90
o
20
540 160
""/00
1
)0
30
20
60
270
30
ISO
240
100
680
200
60
o
10
50
1
70
480
1
1
50
1
..
20
90
o
20
460 230
""""'700
1
)0
)0
20
60
230
)0
150
240
100
640
200
liO
o
4
10
50
1
70
480
1
50
1
..
19
90
o
20
550 140
b95
1
30
bo
10
60
)60
30
150
240
120
690
200
40
o
4
10
50
70
480
1
)0
1
*
.. 16
110
o
20
550 140
b95
)0
40
20
60
380
30
ISO
240
120
700
200
20
4
10
SO
70
1.80
30
1
..
* 17
110
20
520 180
700
1
30
40
40
60
360
* 150
240
120
840
200
o
4
10
40
.. 70
530
1
40
5
..
* 16
110
20
510 120
b95
30
40
20
60
380
.. 150
240
120
610
200
o
10
30
" 70
520
40
20
1
"
" lb
110
o
20
30
40
20
60
380
.. 150
240
120
30
100
20
60
360
* 174
250
120
30
no
20
60
360
o
117
250
120
30
110
20
60
380
120
227
250
120
30
110
20
60
360
110
202
250
120
40
120
20
60
320
uO
173
250
120
30
130
20
60
300
100
97
260
120
25 3931.A,
11,0 3967A, 39818, 3987F, 3987(1), 3987(2), 3987(3),
20 4691..
60 3765, 376SA.
300 3864c, 3864D, 3864<1,
100 3845F, 38S5A.
lb 3645C, 384SD.
260 3830F, 38)OR, 3830J, 3630K, 3830L, 363()!.
120 395Bc.
910 1,240 1,520 1,650 1,950 1,770 1,460 1,660 367bE, 3674F.
200
20
4
1
30
60
520
1
1
1
40
20
1
*
* lb
130
o
20
1
200
1
20
60
530
1
1
40
..
* 15
130
60
20
1
200
4
1
20
60
520
1
26
1
10
1
..
IS
130
60
20
1
o
20
60
520
26
1
o
10
*
.. 15
1)0
60
20
400 o
liOO
1
o
o
1
20
60
520
26
o
10
1
13
130
50
20
LOO o
liOO
1
o
o
1
1
1
20
40
500
26
1
40
40
1
10
130
60
20
330 o
J30 . 1
1
o
o
1
1
1
20
40
500
26
1
1
1
. 30
40
1
13
130
60
20
330 o
J30
o 3664A, 3664B, 3665,
20 4921-
1 4665.
50778 •
3541-
466oe.
)624.
6 3633.
3851-
1.0 4930.1., 4931, 493ll, 491.0, 4940.1.,' 6066.
520 5997A, 5996, 5998A.
4830A,
26 4702.
4973J.
5076.
1 3652, )852D,
o 5939.
10 5996B.
1 35~.
4973B, 4963D •
354OB, 354oe.
5066.
11 Pickens Canyonv.
130 5937, 5931 A.
3600, 3601.
4630.
20 3937F.
270 o
2fci 1 4650L.
3655E.
66,490 90,020 93,240 66,690 6),210 88,060 74,700 83,940 79,260 77,2)0 19,0)0 61,820 85,690 8),560 91,62Q 102,860120,070131,7101)6,71.0137,560137,120 lbO,660 131.,820 130,320 155,600 156,020 151,140 154,620 162,990 147,11,0
640 630 610 750 460 590 470 400 600 650 800 760 1,070 1,020 1,220 1,1>70 1,230 650 780 .:no 560 430 350 500 490 bIIo 250 200 160 270
90 90 160 410 400 420 bIIo 460 420 4)0 450 4)0 430 430 580 510 510 490 490
65,650 89,)90 92,630 65,940 62,790 87,470 71.,2)0 6),SUO 76,660 76,490 78,lbO 60,660 64,210 62,160 95,960100,950116,3801)0,500 135,540 136,4.0136,710 lbO,020 131.,(1,0 129,390 154,730 155,070 150,960 153,930 162,330146,360
... Diversion in existence, but production unknown. See last page of table for footnotes.
F. 118
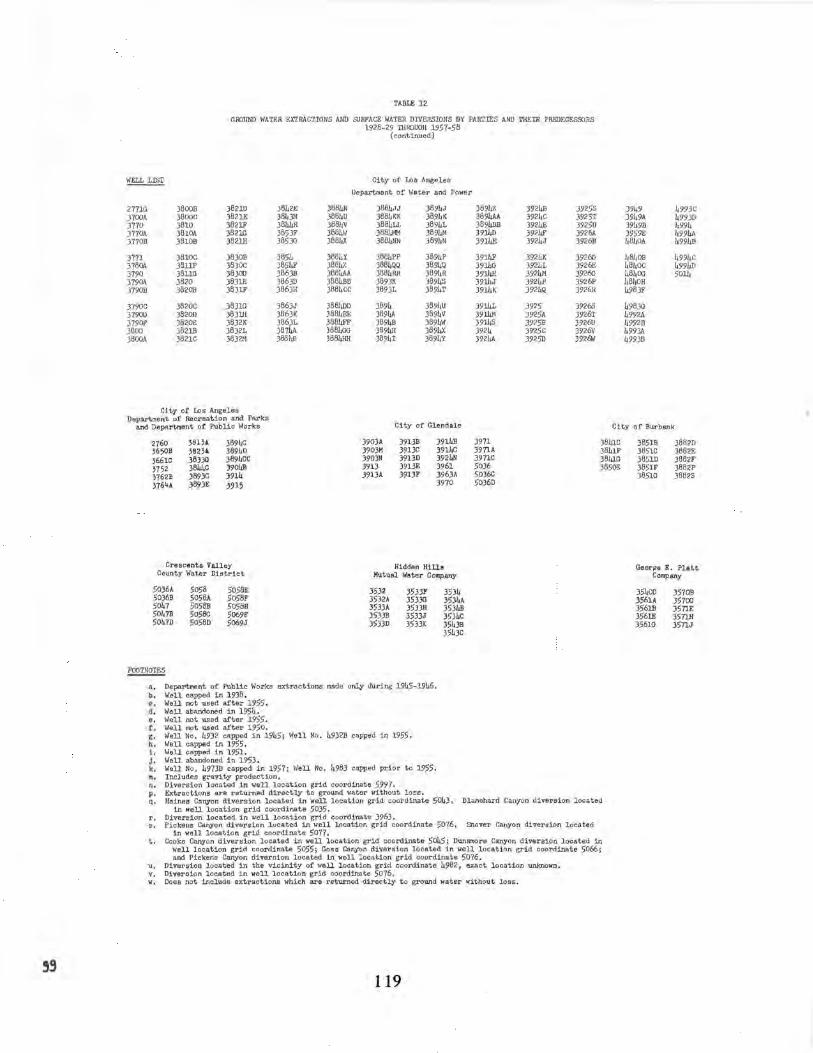
TABLE 12
GROUND WATER EXTRACTIONS AND SURFACE WATER DIVERSIONS BY PARTIES AND THEIR PREDECESOORS 1928-29 THRCUGH 1957-58
( continued)
~ City of Los Angeles
Department of Water and POller
2771G 3800B 382lD 3842E 3884N 3884JJ 3894J 38942 3924B 3925S 3949 4993C 3700A 3800c 382lE 3843M 3884u 38841(]( 3894K 3894AA 3924c 3925T 3949A 4993D 3770 3810 382lF 3844R 3884v 3884LL 3894L 3894BB 3924E 3925U 3949B 4994 3770A 3810A 382lG 3853F 3884w 3884MM 3894J{ )9l4D 3924F 392M 3959E 499M 3770B 3810B 382lH 3853G 3884X 3884NN 3894N 39l4E 3924J 3926B 4840A 4994B
3?71 3810C 3830B )854 3884Y 3884PP 3894p 39l4P 3924K 3926D 4840B 4994c 3780A 38llF 38)Oc 3854F 38842 3884QQ 3894Q 39140 3924L 392M 4840C 49940 3790 3811G )83OD 3863B 3884AA 3884RR 3894R 39l4H 3924M 3926C 48400 5014 3790A 3820 383lE 3863D 3884BB 3893K 38945 3914J 3924P 3926P 4840H 3790B 3820B 383lF 3863H 3884cc 3893L 3894T 3914K 3924Q 3926R 498)F
3790C 3820C 3831G 3863J 38840D 3894 3894u 39141 3925 3926S 4983G 37900 3820D 383lH 3863K 3884EE 389M 3894v 39l4H 3925A 3926T 4992A 3790F 3820E 3832K 3863L 3884FF 3894B 3894W 39145 3925B 3926u 4992B 3800 382lB 3832L 387M 3884GG 3894H 3894X 3924 3925c 3926V 4993A 3800A 3821C 3832M 3884G 3884HH 3894r 3894Y 392M 39250 392& 4993B
City of Los Angeles Department of Recreation and Parks
and Department of Public Works Cl ty of Glendale City or Burbank
2760 38l}A 3894c 3903A 3913B 3914B 3650B 3823-" 38940 3903M 3913C 3914C 3661C 38330 3894cc 3903N 39130 3924N
3752 3844C 3904B 3913 3913E 3961 3762B 3893C 3914 3913A 3913F 3963A
3764.1. 3893E 3915 3970
Crescenta Valley Hidden Hill. County Water District Mutual 'Water Company
5036A 5058 5058E 3532 3533F 5036B 5058A 5058F 3532A 3533G 5047 ,05BB 5058H 3533A 3533H 5047B 5058C 5069F 3533B J533J 5047D ,058D 5069J 3533D 3533K
FOOTNOTES
8 , Department of Public Works extractions made only during 1945-1946. 1> . Well capped in 1938. (I , Well not used after 1955. d. Well abandoned in 1954. Q . Well not used after 1955. r. Well not used after 1950. g. Well No. 4932 capped in 1945; Wen No. 4932B capped in 1955. h . Well capped in 1955. :1. Well capped in 1951. j . Well abandoned in 1953. Jr. Well No. 4973B capped in 1957; Well No. 4983 capped prior to 1955. D . Includes gravi.ty production. n. Diversion located in well location grid coordinate 5997.
3534 353M 3534B 3534c 3543B 3543C
3971 3841C 3971A 3841F 3971C 3841G 5036 3850E 5036C 50360
p. Extractions are returned directly to ground water without loss. q. Haines Canyon diversion located in well location grid coordinate 504.3. Blanchard Canyon diversion located
in well location grid coordinate 5035. r. Diversion located in well location grid coordinate 3963. s. Pickens Canyon diversion located in lIell location grid coordinate 5076. Snover Canyon diversion located
in well location grid coordinate 5077. t. Cooks Canyon diversion located in well location grid coordinate 5045; Dunsmore Canyon diversion located in
well location grid coordinate 5055; Goss Canyon diversion located in well location grid coordinate 5066; and Pickens Canyon diversion located in_ well location grid coordinate 5076.
u. Diversion located in the vicinity o:f weil location grid coordinate 4982, exact location unknown. v. Diversion located in well location grid coordinate 5076. w. Does not include extractions which are returned directly to ground water without loss.
119
385lB 3882D 3851C 3882E 38510 3882F 3851F 3882P 3851G 38825
Geor~e E. Platt Company
3540D 356lA 356lB 356lE 3561G
3570B 35700 357lE 3571H 3571J
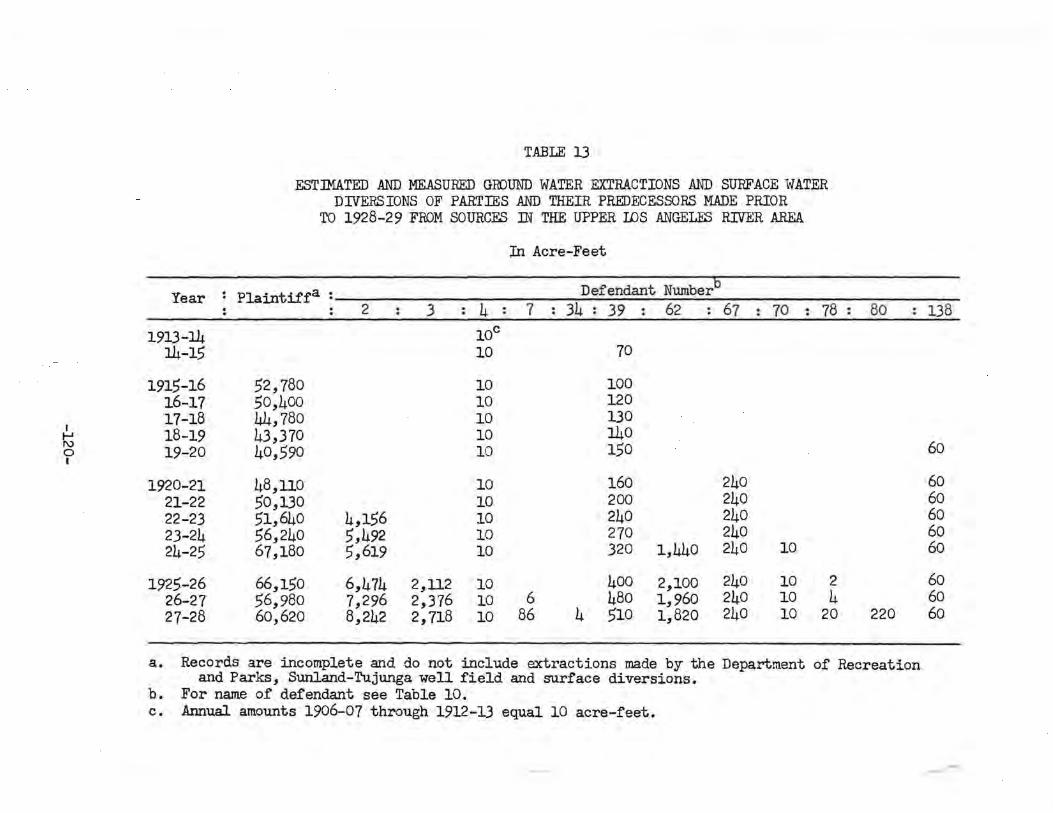
TABLE 13
ESTIMATED AND MEASURED GROUND WATER EXTRACTIONS AND SURFACE WATER DIVERSIONS OF PARTIES AND THEIR PREDECESSORS MADE PRIOR
TO 1928-29 FROM SOURCES m THE UPPER IDS ANGE1E3 RIVER AREA
In Acre-Feet
Year Plaintiffa : Defendant NumberD 2 3 4 : 7 34 : 39 : 62 : 67 70 78 80 138
1913-14 10c
14-15 10 70
1915-16 52,780 10 100 16-17 50,400 10 120 17-18 44,780 10 130
I 18-19 43,370 10 140 .......
I'\)
19-20 40,590 10 150 60 0 I
1920-21 48,110 10 160 240 60 21-22 50,130 10 200 240 60 22-23 51,640 4,156 10 240 240 60 23-24 56,240 5,492 10 270 240 60 24-25 67,180 5,619 10 320 1,440 240 10 60
1925-26 66,150 6,474 2,112 10 400 2,100 240 10 2 60 26-27 56,980 7,296 2,376 10 6 480 1,960 240 10 4 60 27-28 60,620 8,242 2,718 10 86 4 510 1,820 240 10 20 220 60
a. Records are incomplete and do not include extractions made by the Department of Recreation and Parks, Sunland-Tujunga well field and surface diversions.
b. For name of defendant see Table 10. c. Annual amounts 1906-07 through 1912-13 equal 10 acre-feet.
-
100
Extractions by nonparties, other than those directly known by
the Referee to have extracted or diverted water, were determined from the
records of the City of Los Angeles Department of Water and Power. These
records, which covered the period 1932 through 1949, were compiled by
Mr. Frank Carr in the course of his duties while employed by that city.
The data contained information as to the owner, well location, crop and
acreage irrigated, and Mr. Carr's estimate of the annual amount extracted.
The Referee's staff, whenever possible, confirmed Mr. Carr's data from
other data collected in the course of the investigation. Prior to 1932,
the amounts of extractions by nonparties were determined from the acreages
irrigated by these entities. Data for the years subsequent to 1949 were
collected by the Board staff to complete the amounts of water extracted
by nonparties during the 29-year base periQd. The data collected by the
Board staff formed the basis for a report filed with the Court on current
extractions of nonparties made pursuant to a request of parties in Open
Court on July 29, 1960. The report included all other nonparties known
by the Board staff to presently be taking significant amounts of water
except single domestic users in the hill and mountain areas. The names
and amounts of extractions and diversions by nonparties shown in Table 14
are based on the information presented in the aforementioned report and
on other records as heretofore noted.
-121-

TABLE 11
ESTIMATED AND MEASURED GroUND WATER EXTRACTIONS AND 9JIlFACE WATEn DIVERSIONS OF NONPARTIES
In Acre-Feet
l~r I j I $
!lonpa.rt.t num'bBr3 6A : 9 : I : 8 I 911 9C 9D !h: Othersb
1928-29 20 340 3,510 29-30 20 340 3,500
1930-31 20 340 3,420 31-32 20 190 3,270 32-33 20 540 3,980 33-34 20 460 4,010 34-35 0 320 4,310
1935-36 0 350 4,370 36-37 0 60 480 4,470 37-38 20 40 60 410 5,210 38-39 20 30 60 0 380 5,620 39-40 20 40 70 20 180 901' 5,170
1940-41 20 40 70 20 80 1501' 3,550 41-42 20 40 60 20 100 1501' 4,060 42-43 20 50 90 20 60 1501' 3,llO 43-44 20 50 90 20 llO 1501' 3,290 44-45 20 60 70 20 no 15cf 3,570
1945-46 20 70 60 20 100 1501' 2,500 46-47 20 20 80 40 20 100 1501' 1,320 47-48 20 20 60 10 20 100 1501' 1, 220 48-49 20 40 60 0 20 150 1501' 1,080 49-50 20 50 60 10 20 200 1501' 790
1950-51 10 30 20 60 80 20d 0 200 15cf 590 51-52 10 30 10 20 60 90 30d 0 200 15cf 430 52-53 10 30 10 20 50 80 60d 0 200 15cf 180 53-54 10 30 10 20 40 80 70d 0 70 0 180 54-55 10 30 10 20 C 30 70 120d 10 240 0 40
1955-56 10 30 10 20 10 40 60 29Q'1 )0 230 0 0 10 56-57 10 30 10 20 10 20 80 490d 10 230 30e 0 30 57-58 10 30 10 20 10 40 90 620d 40 280 Joe 0 0
a. Nonparty numbers are those referred to in the Report made pursuant to request made in Court on July 29. 1960. Nonparty numbers and names are tabulated below.
b. Determined from the records of Los Angeles Department of' rlater and Power employee Frank CarrJ
1929 through 1949. c. Total considered as all extractions but contains minor amoW1ts of surface diversions. d. Includes ",ater extracted adjacent to and outside of the Upper Los Angeles RiV'er topographic
boundary. e • Included in amounts shown under nonparty No.7. f. InclUded 1n amounts shown under Defendant No. 511.
Nonparty
~ Method of estimating
extractions and diVllTl$lQno
TotalC
3,870 3,860
3,780 3,480 4,540 4,490 4,630
4,720 5,010 5,140 6,llO 5,500
3,780 4,300 3,350 3,580 3,850
2,770 1,660 1,450 1,370 1,150
1,010 880 640 510 580
730 940
1,110
Simi Hills Development Association Production rate and hours of operation.
4
5
6
Chatsworth Lake Mutual Water Corporation
Twin Lakes Park Company
Restland Memorial Park
Aqua Sierra Sportsman Club
los Angeles County
A. Dexter Park B. Waterworks District No. 21
North American AViation, Inc. Rocketdyne Division
Louis J. Le Mesnager
United States of America
A. Veterans Hospital, NO,r:'theast of San Fernando
C. Sepulveda Dam lease to Frank Ghiglia
D. Ajacent to North American Aviation, Inc.
E. Adjacent to wckheed Aircraft Corporation
122
Production rate and hours of operation.
Use per capita.
Acres irrigated and duty of water.
Acres irrigated and duty of water.
Acres irrigated and duty of water
Pump test and kilowatt hours. Pump test and kilowatt hours.
Measured.
Water sales.
Extension of one year I s measurements.
Acres irrigated and duty of water.
Measured.
Production rate and hours of' operation.
( (
101
Tables 12, 13 &1d 14 list the extractions and diversions within
the Upper Los Angeles River area that have been made by entities who are
parties and nonparties including known nonparty entities and taking by
others whose individual identity is unknown. Total amounts extracted
from the valley fill and hill and mountain areas, compiled from the data
in Tables 12 and 14 and the records on private wells maintained 'by the
City of Los Angeles Department of Water and Power, are shown in Table l5~
Surface diversions for use on the valley floor are shown in Table 16.
The total amount of ground water extracted annually during the
29-year base period has increased generally with time, from approximately
70,000 acre-feet in the early 1930's to 150,000 acre-feet in the late
1950's. During the 29-year base period the minimum and maximum annual
extractions were 67,333 and 163,270 aore-feet in 1932-33 and 1956-57,
respectively.
-123-
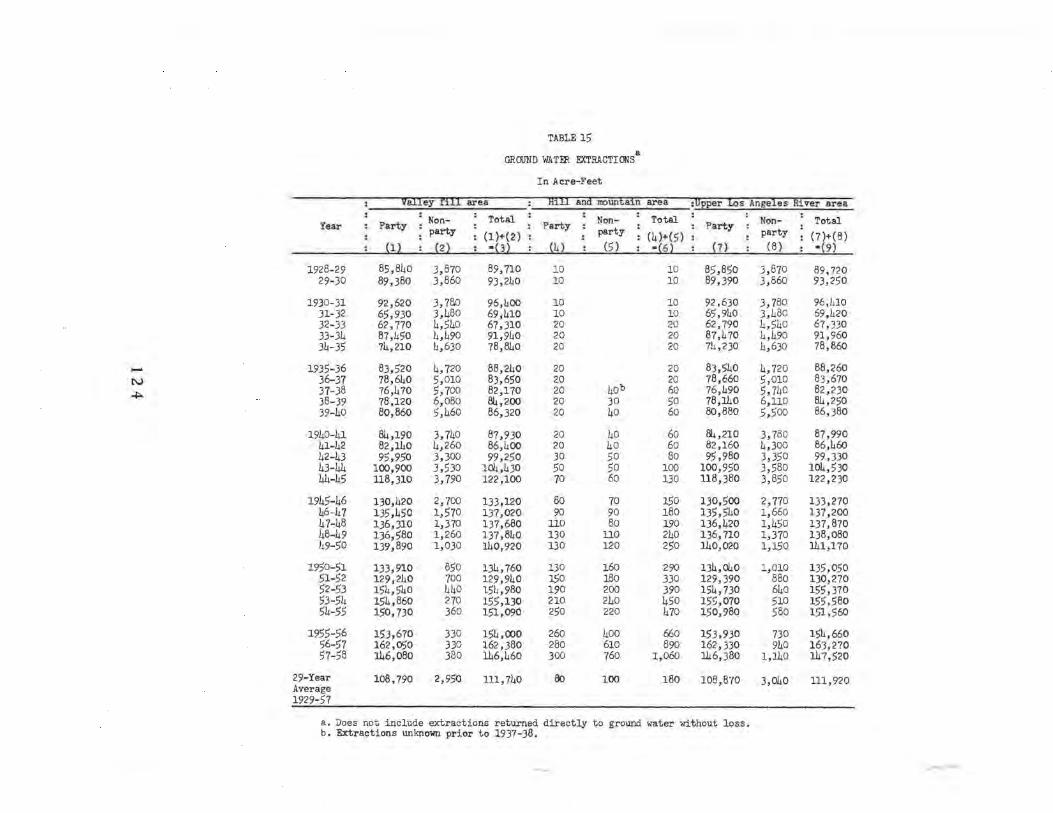
-l\,)
+-
Year
1928-29 29-30
1930-31 31-32 32-33 33-34 34-35
1935-36 36-37 37-38 38-39 39-40
1940-41 41-42 42-43 43-44 44-45
1945-46 46-47 47-48 48-49 49-50
1950-51 51-52 52-53 53-54 54-55
1955-56 56-57 57-58
29-Year Average 1929-57
TABLE 15 a
GROOND WATER EXTRACTIONS
In Acre-Feet
Villey fill area - ~ano:liiOW'itarna;rea :Upper LOs Angeles River area
Non- Total p rt Non- Total P rt Non- Total Party a yay party (1)+(2) party (4)+(5) party (7)+(8)
(1) : _(2) -=- -OL liLL (5) _ =- -(6) (?) (8) -(9)
8S,840 89,380
92,620 65,930 62,770 87,450 74,210
83,520 78,640 76,470 78,120 80,860
84,190 82,140 95,950
100,900 118,310
130,h20 135,450 136,310 136,580 139,890
133,910 129,2ho 154,540 154,860 150,730
153,670 162,050 146,080
108,790
3,870 3,860
3,78.0 3,480 4,5ho 4,490 4,630
4,720 5,010 5,700 6,080 5,h60
3,740 h,260 3,300 3,530 3,790
2,700 1,570 1,370 1,260 1,030
850 700 440 270 360
330 330 380
2,950
89,710 93,240
96,400 69,410 67,310 91,940 78,840
88,240 83,650 82,170 84,200 86,320
87,930 86,400 99,250
104,h30 122,100
133,120 137,020 137,680 137,840 Iho,no
134,760 129,940 154,980 155,130 151,090
154,000 162,380 146,460
111,740
10 10
10 10 20 20 20
20 20 20 20 20
20 20 30 50 70
80 90
110 130 130
130 150 190 210 250
260 280 300
eo
40b 30 40
40 40 50 50 60
70 90 80
llO 120
160 180 200 240 220
400 610 760
100
10 10
10 10 20 20 20
20 20 60 50 60
60 60 80
100 130
150 180 190 240 250
290 330 390 450 470
660 890
1,060
180
85,850 89,390
92,6)0 65,940 62,790 87,470 74,2)0
8),540 78,660 76,490 78,140 80,880
84,210 82,160 95,980
100,950 118,380
130,500 135,540 136,420 136, no 140,020
1)4,040 129,390 154,730 155,070 150,980
15),9)0 162,330 146,380
108,870
3,870 3,860
3,780 3,480 4,540 4,490 4,630
4,720 5,010 5,740 6,llO 5,500
3,780 4,300 3,350 3,580 3,850
2,770 1,660 1,450 1,370 1,150
1,010 880 640 510 580
730 940
1,140
3,040
89.720 93,250
96,410 69,420 67,330 91,960 78,860
88,260 83,670 82,230 84,250 86,380
87,990 86,460 99,3)0
104,530 122,230
133,270 137,200 137,870 138,080 141,170
135,050 130,270 155,370 155,580 151,560
1511,660 163,270 147,520
111,920
a. Does not include extractions returned directly to ground water without loss. b. Extractions unknown prior to 1937-38.
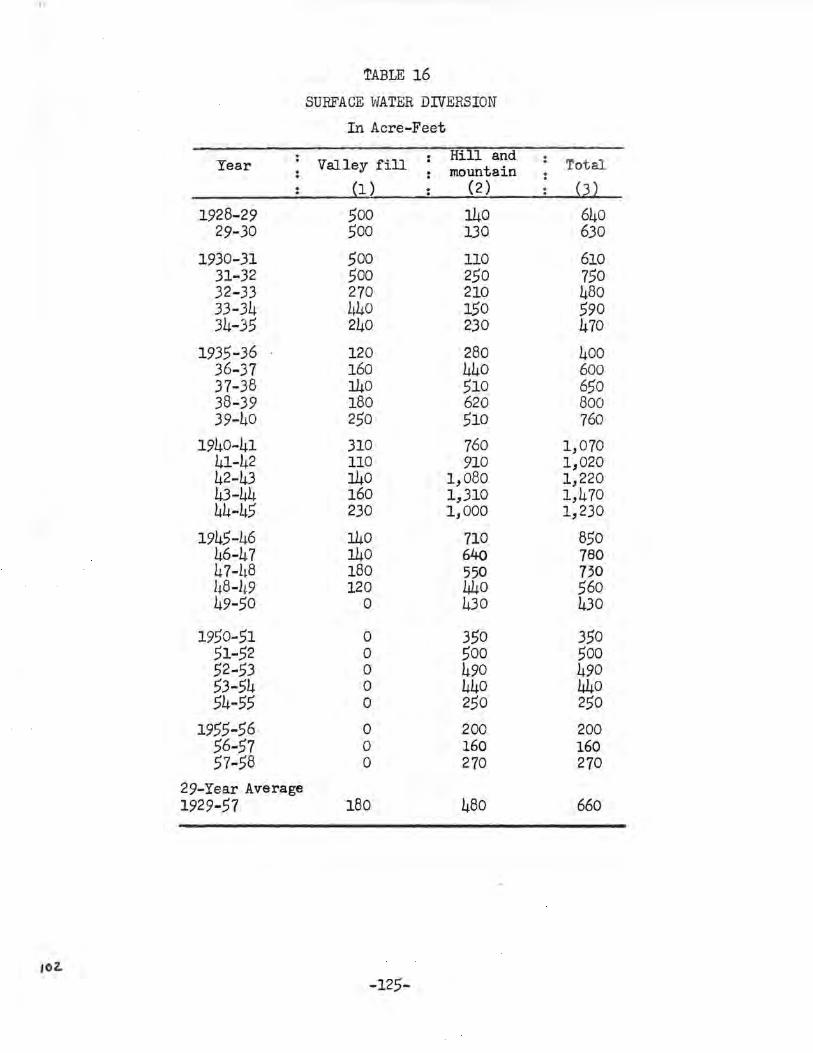
TABLE 16
SURFACE WATER DIVERSION
In Acre-Feet
Year Valley fill Hill and Total mountain . (1 ) (2 ) ~~ ~ .
1928-29 500 140 640 29-30 500 DO 630
1930-31 500 110 610 31-32 500 250 750 32-33 270 210 480 33-34 440 150 590 34-35 240 230 470
1935-36 120 280 400 36-37 160 440 600 37-38 140 510 650 38-39 180 620 800 39-40 250 510 760
1940-41 310 760 1,070 41-42 110 910 1,020 42-43 140 1,080 1,220 43-44 160 1,310 1,470 44-45 230 1,000 1,230
1945-46 140 710 850 46-47 140 640 780 47-h8 180 550 730 h8-h9 120 440 560 49-50 0 430 430
1950-51 0 350 350 51-52 0 500 500 52-53 0 490 490 53-5J~ 0 440 440 54-55 0 250 250
1955-56 0 200 200 56-57 0 160 160 57-58 0 270 270
29-Year Average 1929-57 180 480 660
,02.
-125-
Land Development and Use
of agricultural land into a modern suburban area. Prior to 1915, the Upper
Los Angeles River area had been devoted ma~ to nonirrigated agriculture.
In 1928-29, irrigated agriculture occupied 47 percent of the valley floor
and by 1957-58 constituted only 13 percent of the valley floor. On the
other hand, residential, commercial and industrial acreage has tripled
during the period 1928-29 through 1957-58 (see Figure 1). Accompanying
this rapid change in land use has been a population growth of from 203,000
persons in 1930 to 850,000 in 1956. Land use in the area has been classi-
fied in four general types based on the varying influence of each on water
supply and disposal. These general culture types are as follows:
1. Dry farm and native crops 2. Irrigated crops 3. Residential 4. Commercial and industrial
The areal extent of lands occupied by the major culture types re
quiring water (i.e., residential, commercial and industrial and irrigated
crops) during the years 1928, 1949, 1955 and 1958 is depicted on Plates 22,
23, 24 and 25 respectively. These plates are based on land use surveys made
in 1932, 1942, 1949, 1954 and 1958; aerial photographs taken in 1928 and
1956; crop records for the period 1925 through 1958; and censuses for the
years 1930, 1940, 1950 and 1956 (see Appendix K).
-126-
(
IO~
Land Use
Extent of the four major culture types within the valley fill
area for each year of the base period is summarized in Table 17. The
variation of acreages in the dry farm and native group, irrigated crops,
residential, and commercial and industrial uses during the period 1928-29
through 1957-58 is illustrated graphically on Figure 1, which indicates
the general trend of land use from agricultural to urban during the last
thirty years.
A detailed discussion of the data available and the methods
utilized to determine the areal culture for each of the years in the 1928-29
through 1957-58 period for each of the hydrologic subareas is contained in
Appendix K.
-127-
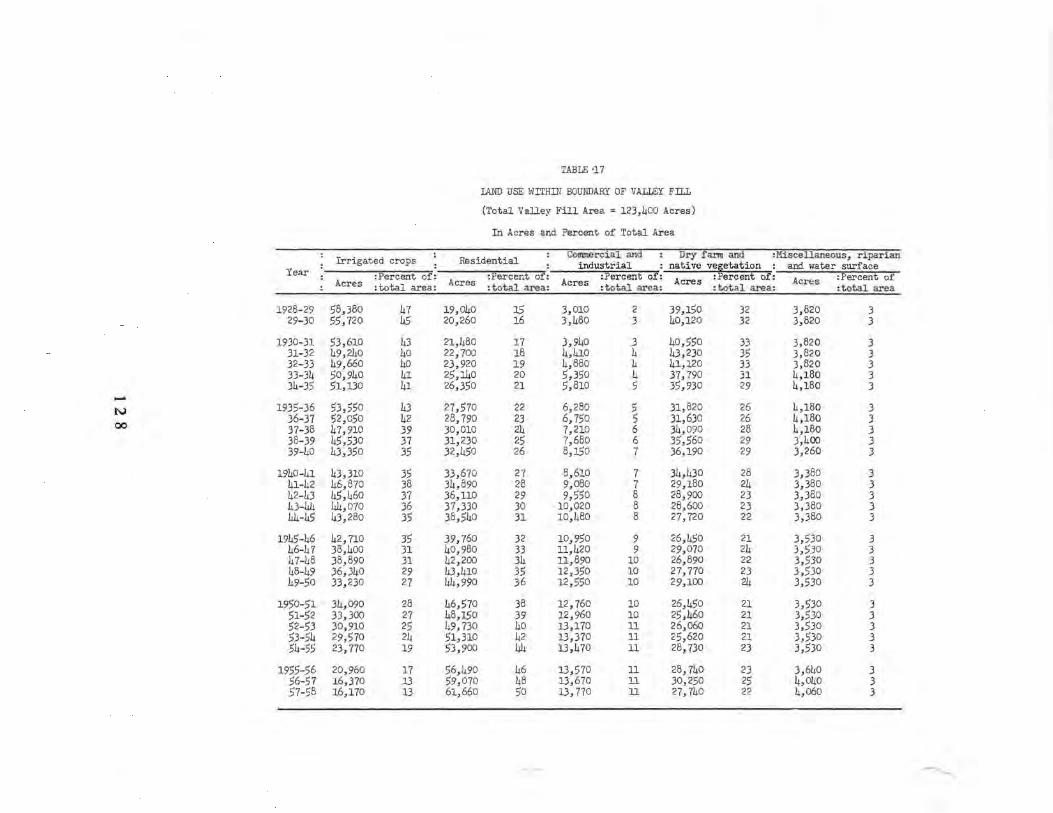
TABLE '17
lAND USE VlITHIN BOUNDARY OF VALlEY FILL
(Total Valley Fill Area = 123,400 Acres)
In Acres and Percent of Total Area
Irrigated crops Residential Conunercial al')d Dry farm and : M.:lscellaoeous , riparian
Year industrial native ve~etation and water surface
Acres :Percent of: Acres :Percent of: Acres :Percent of: Acres :Percent of: Acres :Percent of :total area: : total area: :total area: : total area: :total area
1928-29 58,380 47 19,040 15 3,010 2 39,150 32 3,820 3 29-30 55,720 45 20,260 16 3,480 3 40,120 32 3,820 3
1930-31 53,610 43 21,480 17 3,940 3 40,550 33 3,820 3 31-32 49,240 40 22,700 18 4,410 4 43,230 35 3,820 3 32-33 49,660 40 23,920 19 4,880 4 41,120 33 3,820 3 33-34 50,940 41 25,140 20 5,350 4 37,790 31 4,180 3 34-35 51,130 41 26,350 21 5,810 5 35,930 29 4,180 3 -N 1935-36 53,550 43 27,570 22 6,280 5 31,820 26 4,180 3 36-37 52,050 42 28,790 23 6,750 5 31,630 26 4,180 3
00 37-38 47,910 39 30,010 24 7,210 6 34,090 28 4,180 3 38-39 45,530 37 31,230 25 7,680 6 35,560 29 3,400 3 39-40 43,350 35 32,450 26 8,150 7 36,190 29 3,260 3
1940-41 43,310 35 33,670 27 8,610 7 34,430 28 3,380 3 41-42 46,870 38 34,890 28 9,080 7 29,180 24 3,380 3 42-43 45,460 37 36,110 29 9,550 8 28,900 23 3,380 3 43-44 44,070 36 37,330 30 10,020 8 28,600 23 3,380 3 44-45 43,280 35 38,540 31 10,480 8 27,720 22 3,380 3
1945-46 42,710 35 39,760 32 10,950 9 26,450 21 3,530 3 46-47 38,400 31 40,980 33 11,420 9 29,070 24 3,530 3 47-48 38,890 31 42,200 34 11,890 10 26,890 22 3,530 3 48-49 36,)40 29 43,410 35 12,350 10 27,770 23 3,530 3 49-50 33,230 27 44,990 36 12,550 10 29,100 24 3,530 3
1950-51 34,090 28 46,570 38 12,760 10 26,450 21 3,530 3 51-52 33,300 27 48,150 39 12,960 10 25,460 21 3,530 3 52-53 30,910 25 49,730 40 13,170 11 26,060 21 3,530 3 53-54 29,570 24 51,310 42 13,370 11 25,620 21 3,530 3 54-55 23,770 19 53,900 44 13,470 11 28,730 23 3,530 3
1955-56 20,960 17 56,490 46 13,570 11 28,740 23 3,640 3 56-57 16,370 13 59,070 48 13,670 11 30,250 25 4,040 3 57-58 16,170 13 61,660 50 13,770 11 27,740 22 4,060 3
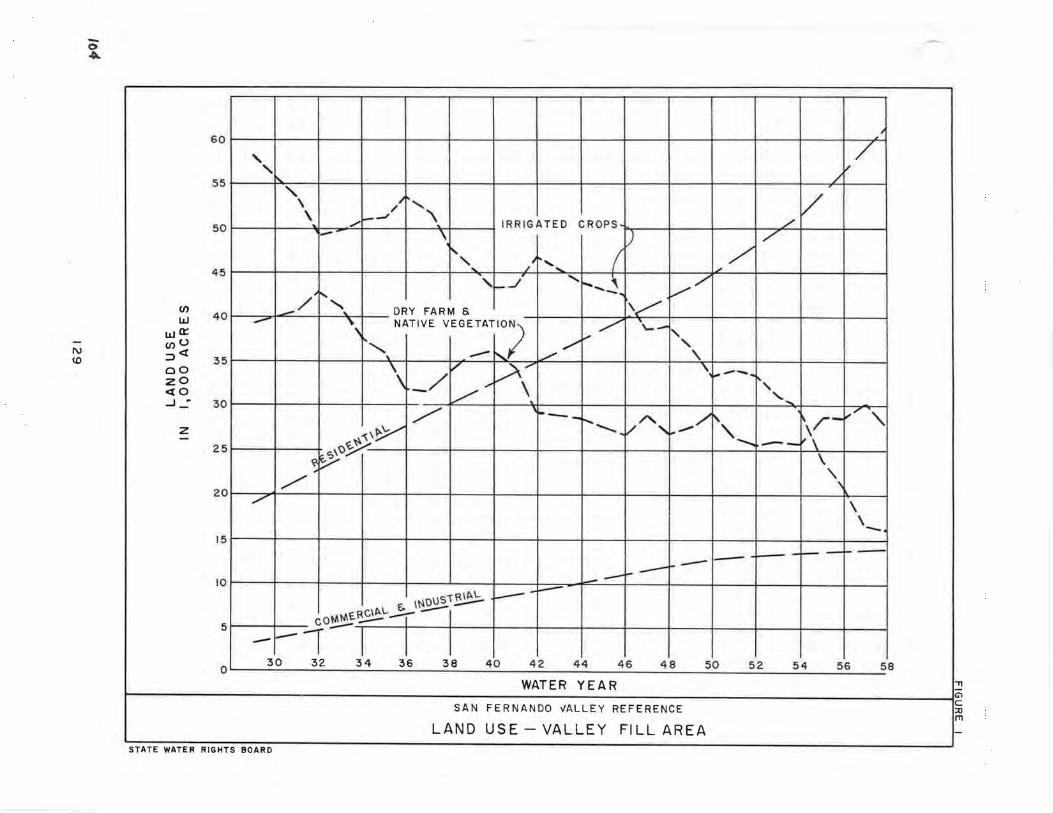
-o ~
en w
w(t: N ene.> <D ::><X
00 zO <x0 ....J"':
z
1 ........ I ....... 1--'/ '\ IRRIG ATED CROPS- /' /"
V /
/
~ I \ D / 1'-, I...... ( ~ / I J
I I 1 ...,/·.... _, /' I I 1 45 I ' J 'I- I ~ /
I- .... - V
_/ "~ DRY FARM S '/ 40 _ I '\ NAT IVE VEGETAT IOiN ./' '- __ , -, ~~ ,
r-~ ~.r \ I J I I --, ..-r
35
1
\\ V ~,"'" "'_I-- --.. _/ V" \ ''-,
30 / ~-_.... /'- ,/~ ~ r-r .... " r..\"'/ ........... V '"..-" v\ ~ ,~ ....... -- \
2 5 S''\)~ \
~~ \ - , /' 1
20 / 1 \
-15 rl --T-~r--+--~--r-~--~--+-~~-+--4---~~--~~
- '- I--- -I-- --+- -
101 I I I I L:: p-f=~--I I I I I I Eo I I>IOIJSi~
t.\ t. R CIt\. I. __ ;:.;;.--
51 -~io~r I 0 1 30 32 34 36 38 40 42 44 46 4 8 50 52 54 56 58
.--
WATER YEAR I~ c :u IT1
SAN FERNANDO vALLEY REFERENCE
LAND USE - VALLEY FILL AREA STATE WATER RIGHTS BOARD
Coincident with urbanization of the area there has been an increase
in the proportion of the residential lot (including street rights of way)
that is impervious and an increase in the miles of natural channels and
washes that have been replaced by lined channels or conduits. From 1928 to
1958 the increase of impervious area occurring in privately held and publicly
held areas that make up the residential lot was as follows:
Period
1928-29 through 1944-45
1946-47 through 1949-50
1950-51 through 1954-55
1955-56 through 1957-58
Channel I~rovements
Percent of impervious area in a typical z:esidential lot
35
40
45
50
The increased area of impervious lands has caused larger amounts of
runoff to be discharged into the drainage system of the area. The quantity
of runoff which becomes recharge to the ground water reservoir is limited by
the pervious area over which the runoff flows. The need for flood control
has resulted in the improvement of most of the Los Angeles River Channel and
many of the tributary washes and channels. The urbanization of the area and
present channel improvements have the combined effect of reducing the oppor-
tunity of native waters to recharge the ground water reservoir. The eA~ent
of channel improvements since 1928 is sh~wn in Table 18 by a listing of the
main wash and channel improvements having a constructed bottom width of 10
feet or greater and their cumulative length in relation to the total length
of main channels. The locatlons of major improved channel reaches as well
as the major storm drains existing as of 1958 are shown on Plate 12.
-130-
(
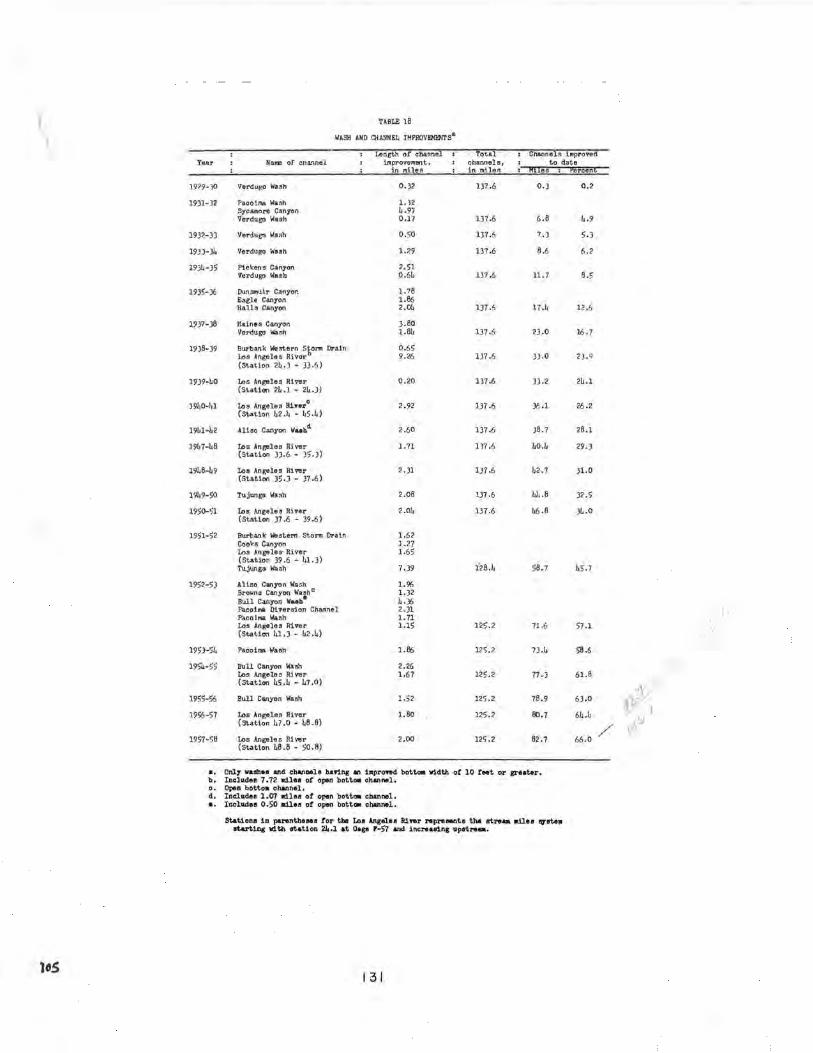
( TABLE 18
WASH AND CHANNEL IHPROV!lIDITS'
Length of channel I Total Channels improved Year Harre or channel 1Jnpro\l'ement. channels, to date
in miles in mi1e~ I HLles I P~:re:Q n t
19?9- )0 Verduf,o Wa:.h 0.32 137.6 0.3 0.2
1931-) 2 Pacoima Wa:lh 1. ,2 Sycamore Canyon L .97 Verdugo Wash 0.17 137.6 6.8 L.9
1932-33 Verdug? Wa sh 0.50 137.S 7.3 5.3
19))-3L Verdugo Wash 1.29 137.6 8.6 6.2
193L-35 Pickens Canyon 2.51 Verdugo Wash 0.6L 1)7.6 11. 7 8.5
19)5-36 Dun SlnIJir Canyor. 1.78 Eagle Canyon loBS Halls Canyon 2.0L 1)7.S 17.L 12.6
19)7-38 Haines Canyon 3.80 Verdugo Wa.:sh 1.8L 137.S 23.0 16.7
1938-39 Burbank Western Storm Oraln 0.65 los Angela s River 9.26 1)7.6 33 .0 2). " (StatiO' 2L.) - J3.&}
1939-110 Ins Angeles Riftr 0.20 1)7.6 )).2 2L.l (StaUon 2L .1 - 2L.3)
19LO-I,l los Angeles Ri.erc
(Station L2.L - L5.L) 2.92 137.6 )6.1 26.2
19L1-L2 Aliso Canyor. "'ubd. 2.60 137.6 )8.7 26.1
19L7-L8 los Angeles Ri ver (Station 3).6 - )S.3)
1.?l 1>7.6 LO .L 29.3
19L8-L9 Los Angeles River (StaUon 35.3 - 37.6)
2.31 137.6 L2.7 31.0
19L9-50 Tujunga Wash 2.08 137.6 LL.8 32.5
1950-51 IDs Angeles River (Station 37.6 - 39.6)
2.0h 137.6 L6 .8 )L.O
1951-52 Durban k westem Storm Drain 1.62 Cooks Canyon 1.27 Los Angeles- River 1.65 (Station 39 .6 - L1.)}
i2B.L Tujunga Wash 7.39 58.7 L5.7
1952-5) Aliso Canyon War-h 1.96 Browns Canyon Wa:h C 1.32 Bull CMlyon Wub L.36 Paeol .... OiTersion Channel 2.31 (1 ' Paeolma Wash 1.71 Los Angeles RiYer 1.15 12~.2 71.6 57.1 ~b (Station 41.3 - L2.L)
1953-5L P&coima Wash loBS l2~.2 73.L 58.6 -: 1954-55 Bull Canyon "aM 2.26 I\) U
los Angeles Ri ver 1.67 125.2 77 .3 61.8 \ (Station LS.L - L7.0)
'\ 1955-56 Bull Canyon "'aM 1.52 12S.2 78.9 6).0 81:>' 1956-57 los Angeles RiveT 1.80 12!).2 80.7 6L.L ,/ l
(Station L7.0 - L8.8) /
/J 1957-58 Los Angele s Rl Wlr 2.00 1".2 82.7 66.0
\ ~ (Station L8.8 - 50.8)
a. Onl.7 vash ... and cbanDila h.rt", .., laproftd botta. Vidtb. ot 10 teet 01" g •• tar. b, Include .. 7.72 aile a ot open botto. ch.annel. c. OpeD bottoa channel. d. Incl1ldes 1.07 1111 .. ot open bottOll channel. a. Includ •• OsO 1111 •• ot open bott ... chan .. 1.
Stations 10 pa"ntheNs tor tba Lo. Angelea Riftr np"aents the at"_ .uea 1!I71!1"t;.e1l start1.,. with station 2L.l at 0 ... r-57 and incnoao1ns .. pst ......
105 131
Place and Character of Water Use
The major portion of the water delivered within the Upper Los
Angeles River area is served by six agencies: the Cities of Burbank,
Glendale, San Fernando and Los Angeles; the Crescenta Valley County Water
District, and the La Canada Irrigation District. The service area to which
each of these agencies delivers or serves water within the area of investi
gation is shown on Plate 19. In all but two of these service areas the
water delivered is a mixture of imported water and local ground water.
These exceptions are the Owens River service area of the City of Los Angeles
where only imported Owens River water is delivered and the City of San
Fernando where the sole source of supply is local ground water.
The place of use (service area) of each of the remaining parties
serving water in the area, including 77 individuals, corporations, and
water companies, is shown on Plate 20. The separate location of each is
identified by the defendant number used in the complaint and as listed in
Table 11. Additional sources of supply may be available to the service
areas of individual parties through the distribution systems of cities or
districts in which the service area is located.
The character of water use or uses of each party is set forth in
Table 11. The definition of each of the six general types of use reported
therein is as follows:
1. Domestic - Use for residences, including incidental irrigated garden
and orchard.
2. Industrial - Use by a manufacturing or service industry which requires
water to be used directly in the manufacturing process or service.
-132-
{
3. Commercial - Use by dry manufacturing and other commercial establishments
whose prirnar,r water requirement is the lavatory needs of employees and
clients and includes incidental irrigation of ornamental plants.
4. Irrigation - Use for irrigated agriculture including incidental stock-
water and domestic use.
5. Recreation - Use for swimming, boating, hunting or fishing.
6. Municipal - Use for domestic, industrial, commercial, irrigation and
recreation purposes including appurtenant fire protection and use for
other municipal functions of entities serviced by a municipality, public
utility or district.
Ground and Surface Water Exports From the Upper Los Angeles River Area
Waters derived from ground and surface water sources within the
Upper Los Angeles River area have been exported therefrom by the City of
Los Angeles and the La Canada Irrigation District. During the 1928-29
through 1957-58 period ground water export has been made ever,y year by the
City of Los Angeles. Both ground and surface waters were exported by the
La Canada Irrigation District from 1928-29 through 1949-50.
Ground water extracted by the City of Los Angeles from the Los
Angeles River System, comprised of the North Hollywood, Erwin, Whitnall,
Verdugo, Deep Gallery, Headworks, Crystal Springs and Pollock well fields,
is all measured and is transported to reservoirs outside the Upper Los
Angeles River area (see Plate 21). A portion of this water is returned to
the area to meet part of the water requirement in the City of Los Angeles
Narrows service area. The difference between these amounts is equal to the
ground water exported by the City of Los Angeles and is shown in Table 19.
-133-
Forty-two percent of the La Canada Irrigation District service
area is located within the Upper Los Angeles River area. The District
obtains its supply from surface and ground water sources in the area and
from outside sources. Export by this entity has been evaluated as the
amount that its extractions and diversions within the Upper Los Angeles
River area have exceeded 42 percent of the total amount delivered within
the District boundaries. Export occurred under these conditions during
1928-29 through 1949-50 and the amounts so determined are tabulated in
Table 19. Derivation of these values is contained in Appendix M.
-134-
(
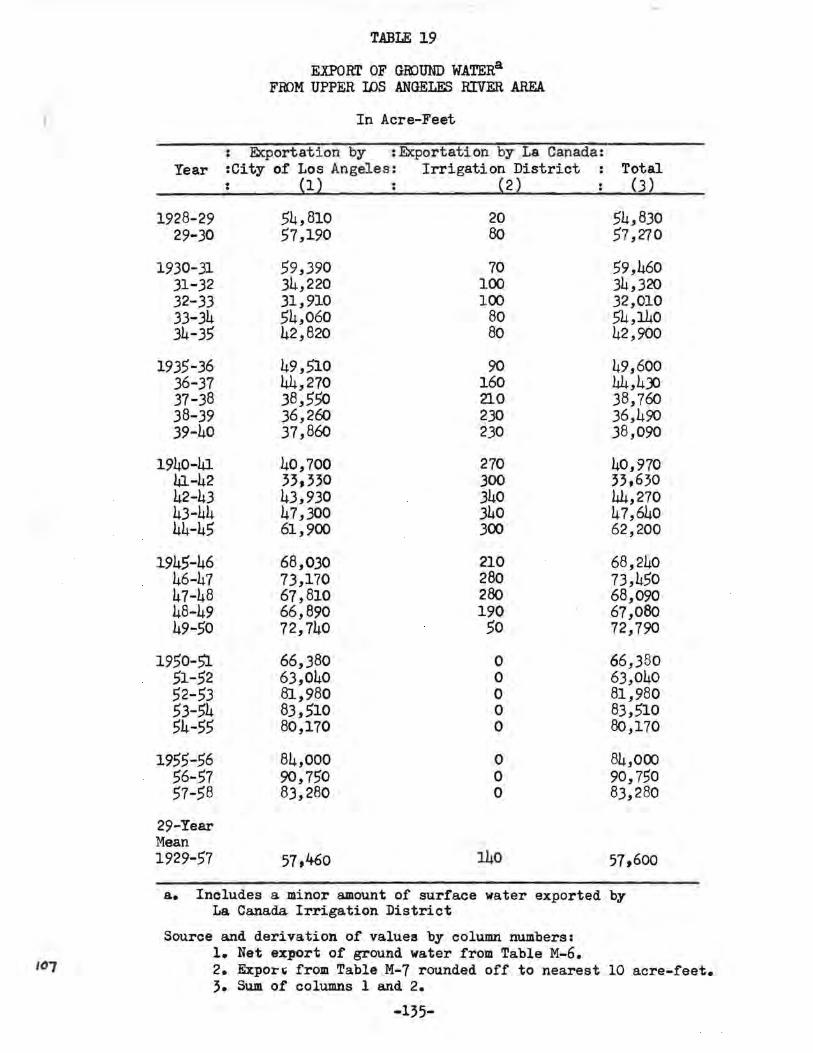
1(J7
TABLE 19
EXPORT OF GROUND WATERa
FROM UPPER IDS ANGELES RIVER AREA
In Acre-Feet
EXportation by : Exportation by La Canada: Year :City of Los Angeles: Irrigation District
1928-29 29-30
1930-31 31-32 32-33 33-34 34-35
1935-36 36-37 37-38 38-39 39-40
1940-41 41-42 42-43 43-44 44-45
1945-46 46-47 47-48 48-49 49-50
1950-51 51-52 52-53 53-54 54-55
1955-56 56-57 57-58
29-Year Mean 1929-57
(1) (2)
54,810 57,190
59,390 34,220 31,910 54,060 42,820
49,510 44,270 38,550 36,260 37,860
40,700 33,330 43,930 47,300 61,900
68,030 73,170 67,810 66,890 72,740
66,380 63,040 81,980 83,510 80,170
84,000 90,750 83,280
57,460
20 80
70 100 100
80 80
90 160 210 230 230
270 300 340 340 300
210 280 280 190
50
o o o o o
o
° o
140
Total (3)
54,830 57,270
59,460 34,320 32,010 54,140 42,900
49,600 44,4.'Xl 38,760 36,490 38,090
40,970 33.630 44,270 47,640 62,200
68,240 73,450 68,090 67,080 72,790
66,380 63,040 81,980 83,510 Be ,170
84,000 90,750 83,280
57,600
a. Includes a minor amount of surface water exported by La Canada Irrigation District
Source and derivation of values by oolumn numbers: 1. Net export of ground water from Table M-6. 2. Expo~, from Table M-7 rounded off to nearest 10 acre-feet. 3. Sum of columns 1 and 2.
-135-
Delivered Water
The total amount of water made available to water systems in the
Upper Los Angeles River area through importation, ground water extractions,
surface diversions and including minor amounts of precipitation on and
runoff into surface water supply reservoirs has been considered as the
gross delivered water in the area. The "gross available for distribution"
has been taken as the gross delivered water less the evaporative loss in
surface water supply reservoirs. Gross amounts supplied to distribution
systems serving hill and mountain areas and valley fill areas have been
determined separately as have the amounts of water from each basic source
(i.e., import, ground water and surface diversion) which comprise the gross
water available for distribution in each hydrologic subarea.
Net deliveries for use have been taken as the total of all waters
delivered to agricultural, residential, commercial and industrial areas and
are based primarily on the amounts of metered sales to customers. Use of
water for operational spills and spreading operations and loss of water in
the water system have been evaluated separately.
Gross Delivered Water in the Upper Los Angeles River Area
Annual amounts of gross delivered water have been determined
for each year of the 1928-29 through 1957-58 period as the sum of the
total import shown in Table 8, local ground water extractions shown
in Table 15, and local surface diversions shown in Table 16, less net
exportations of ground water shown in Table 19. The net effect of
precipitation and local runoff inflow plus water withdrawn from storage
in San Fernando, Chatsworth and Encino reservoirs, have been added to
the foregoing to evaluate the gross delivered water listed in Table 20.
-136-
Gross Delivered Water on Valley Fill and Hill and Mountain Areas.
The annual amounts of delivered water served to acreages in the hill and
mountain areas were estimated on the basis of the acreage served and the
duty of water as set forth in Appendixes J and K. Gross delivered water
on the valley fill area is the total gross water delivered within the Upper
Los Angeles River area less gross deliveries to the hill and mountain areas.
Delivered water derived from each of the basic sources (i.e., the import,
extractions and diversions) was determined for portions of the major water
service areas contained in each hydrologic subarea (see Appendix J).
Delivered water derived from each of these basic sources was determined for
each hydrologic subarea as the sum of the above portions. Gross delivered
water on the valley fill area thus determined for each hydrologic subarea
is set forth in Table 21.
Gross Available for Distribution
The gross delivered water and gross available for distribution are
identical for hill and mountain areas. In the valley fill area the gross
delivered exceeds the gross available for distribution by the amount of the
reservoir evaporation from the three major water supply reservoirs of the
City of Los Angeles located around the edge of the valley fill. The historic
variation in gross available for distribution on the valley fill area is
shown on Figure 2, page 140. Annual amounts of gross water available for
distribution on the valley fill area are shown by ordinates on Figure 2 and
are tabulated in column 18, Table 20.
-137-
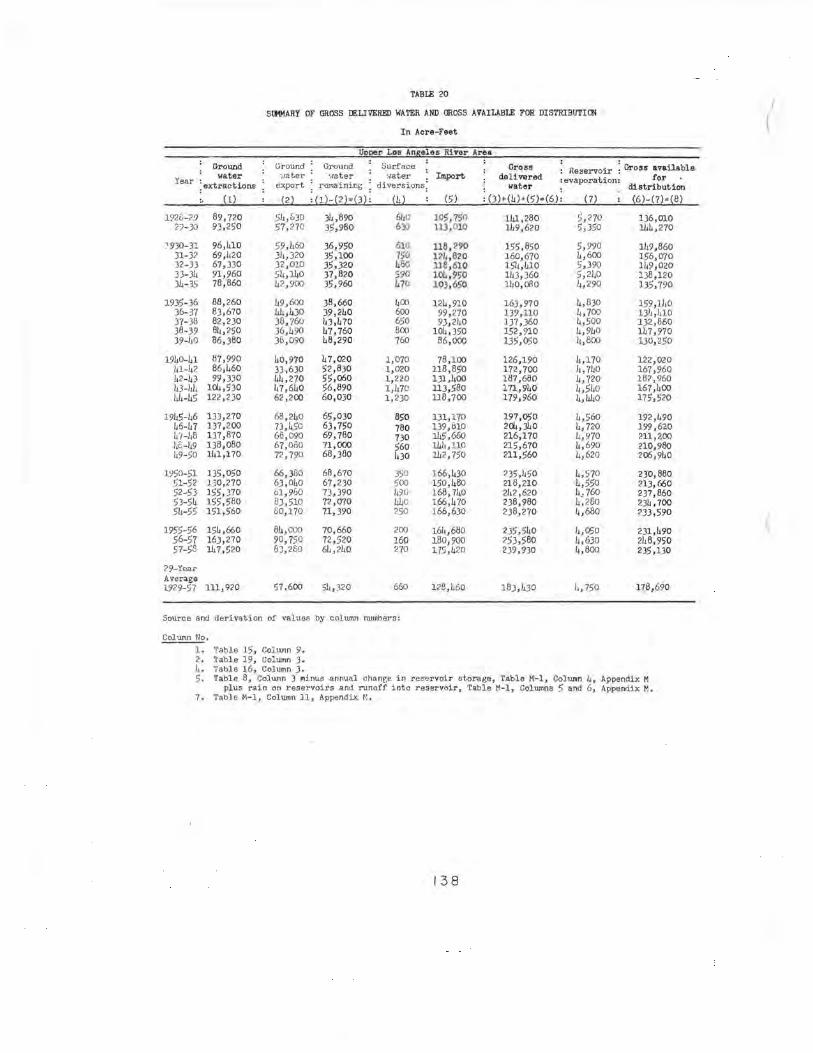
TABLE 20
SlJoIKARY OF GROSS DELIVERED WATER AND GROSS AVAILABLE FOR DISTRIBUTICN
In Acre-Feet
li!l2!!r L<!9 Angeles River Area
Ground Oround Ground Surface :
Gross : Gr0 9S available. : Reservoir Year
water -dater '.·/ater ':later Import delivered evaporation: for : extractions export re~ining diversions: water distribution
(1) (2l :(1) - (2) =(3) (4 l (5) 0 )+(4)+(5 )= (6) (7) (6 )-( 7)x(8 )
1920-2? 89,720 54,530 34,890 61.0 105 , 750 141,280 5,270 136,010 27-30 93,250 57,27C 35,980 630 113, 010 11,9,620 5,350 144,270
, 930-31 96,410 59,460 36, 950 610 1l~, 2,)0 155,850 5,990 149,860 31-32 69,/;20 34,320 35,100 750 121. , 620 160,670 /;,600 156,070 32-33 67,330 32,010 35,320 1,60 1l e ,610 151J,410 5 ,390 149,020 33-34 91,960 54,140 37, 820 590 101.,950 143,360 5 ,240 138,120 34-35 78,'860 42,900 35,960 1,70 10) , 6$0 140,080 4,290 135,790
1935-36 88,260 49,600 38, 660 /;00 124,910 163,970 4,830 159,140 36-37 83,670 44,4)0 ) 9 ,240 600 99,270 139,110 4,700 134,410 )7-38 82,230 )8,760 4) ,470 650 93,240 137,)60 4,500 132,860 38-39 84,250 36,490 47 , 760 800 104,)50 152,910 4,91,0 147,970 39-40 86,)80 )8,090 48,290 760 86,000 1)5,050 4,800 1)0,250
1940-41 1l7,990 40,970 47,020 1,070 78,100 126,190 4,170 122,020 41-42 86,460 )),6)0 52 ,8) 0 1,020 118,850 172 ,700 4,740 167,960 42-43 99,330 44,270 55,060 1,220 131,400 187, 680 4,720 182,960 43-44 101;,530 /;7,640 56, 890 1,470 li3,580 171, 940 4,540 167,400 44-45 122,2)0 62,200 60,030 1,230 li8,700 179, 960 4,440 175,520
1945-46 133,270 68,240 65, 0)0 850 131,170 197,050 4, 560 192,490 46-47 1)7,200 73,450 6) ,750 780 1)9,610 2a., J40 4,720 199 ,62.0 47-45 1)7,870 66,090 69, 780 7)0 145,660 216,170 4,970 211,200 he -49 1)8,080 67,000 71 , 000 560 144,110 215,670 4,690 210,980 49-50 141,170 72,790 68,)80 430 142,750 211,560 4,620 206,940
l Y50-51 1)5,050 66,)80 68,670 y;o 166,430 235,450 4,570 2)0,880 51-52 130,270 6),040 67,2)0 500 150,480 218,210 4,550 21), 660 52-53 155,370 61,960 7),)90 490 168,740 242,620 40760 237,860 53-54 155,580 83,510 72,070 440 166,470 2)6,960 4, 260 2)4,700 54-55 151,560 60,170 71;390 250 166,630 238,270 4,680 233, 590
1955-56 154,660 84,000 70,660 200 164,680 235,540 4,050 2)1,490 56-57 163,270 90,750 72,520 160 180,900 253,560 4,630 248, 950 57-58 147,520 8],280 64, 21.0 270 175,420 239,930 4,600 235 ,130
29-Year Average 1929-57 111,920 57,600 54,320 660 128,460 183,1.,30 4,750 178, 690
Source and derivation of values by column numbers:
Column No. 1. Table 15, Column 9. 2. Table 19, Column 3. 4. Table 16, Column ). 5. Table 8, Column 3 minus annual chanee in reservoir storage, Table M-I, Column 4, Appendix II,
plus rain on reservoirs and runoff into reservoir, Table 11,-1, Columns 5 and 6 , Appendix M. 7. Table 11,-1, Column 11, Appendix t·!.
138
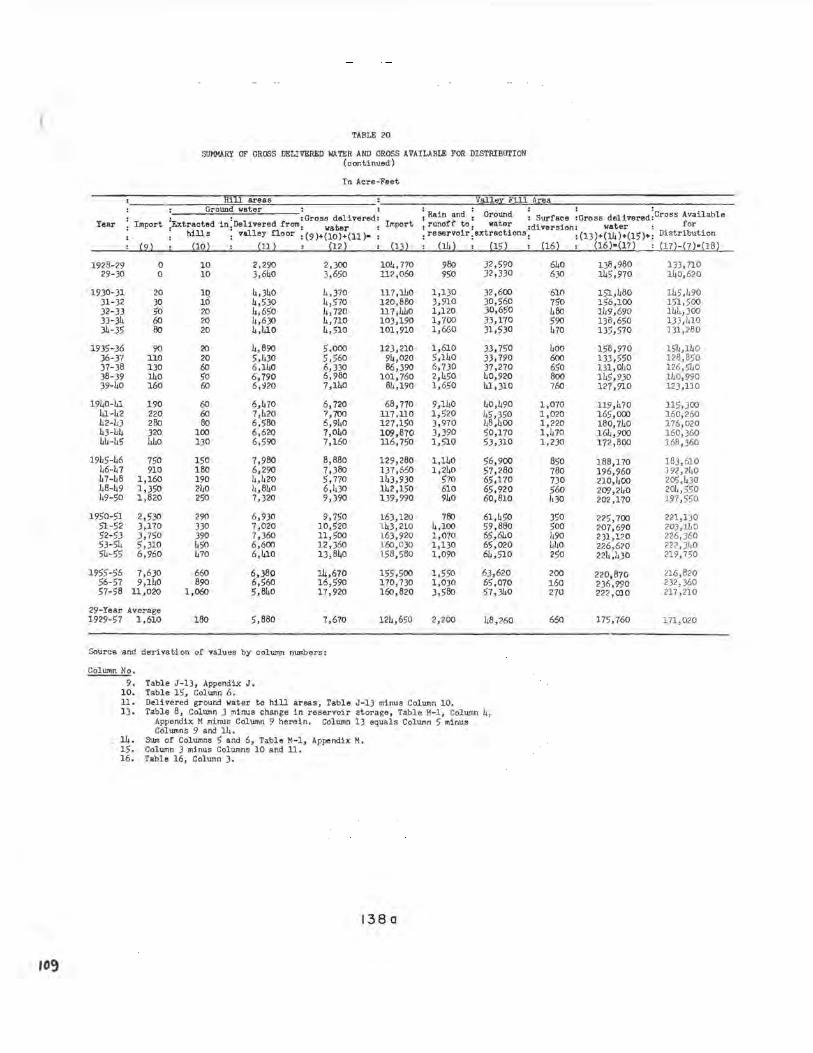
TABLE 20
SUMKARY OF GROSS DELIVERED WATER AND GROSS AVAILABLE FOR DISTRIBUTION (continued)
In Acre-Feet
Hili areas Valley Fill Area
Rain and ~ Ground : Surface :Gross delivered Gross Available runoff to: wate: :di version: water for
: Ground water : : :Gross delivered: .Extracted in : Deli vered from I water : Import Year Import . hills valley floor :(9)+(10)+(11)- reservoir :extrBchons: : (13 )+(1.4 )+(15). Distribution
(9) (10) (11) (12) (13) (lL) (15) (16) (16)-(17) (17H7)-(18)
1928-29 29-)0
1930-31 31-32 )2-)) ))-)4 34-35
1935-)6 )6-)7 )7-38 38-)9 39-1,0
1940-41 41-42 42-43 43-44 41,-45
1945-46 46-47 47-48 48-49 49-50
1950-51 )1-52 52-5) 53-54 54-55
1955-56 56-57 57-58
o o
20 30 50 60 80
90 110 1)0 140 160
190 220 280 )20 440
750 910
1,160 1,)50 1,820
2,5)0 ),170 ),750 5,310 6,960
7,6)0 9,140
11,020
29-YeBr Average 1929-57 1,610
10 10
10 10 20 20 20
20 20 60 50 60
60 60 80
100 130
150 180 190 240 250
290 330 390 450 1,70
660 890
1,060
180
2,290 3,640
4,340 1,,530 1,,650 1,,6)0 4,410
4,890 5,430 6,140 6,790 6,:120
6,470 7,420 6,580 6,620 6,590
7,980 6,290 4,420 4,840 7,)20
6,930 7,020 7,360 6,600 6,410
6,380 6,560 5,840
5,880
2,300 ),650
4,)70 4,5'70 4,720 4,710 4,510
5,000 5,560 6,)30 6,980 7,140
6,720 7;100 6,940 7,040 7,160
8,880 7,)80 5,770 6,u30 9,390
9,750 10,520 11,500 12,360 13,840
14,670 16,590 17,920
7,670
Source and derivation of values by column numbers:
Column No. 9. Table J-13, Appendix J.
10. Table 15, Column 6.
104,770 112,060
117,140 120,880 117,UO 103,190 101,910
123,210 9u,020 86,390
101,760 8u,190
68,770 117,UO 127;150 109,870 U6,750
129,280 137,660 lu),930 142,150 139,990
163,120 143,210 16),920 160,0)0 158,580
155,5'00 170,730 160,820
124,650
980 950
1,130 ),910 1,120 1,700 1,660
1,610 5,11,0 6,730 2,u50 1,650
9,luO 1,520 3,970 3,)90 1,510
1,140 1,240
570 610 940
780 4,100 1,070 1,1)0 1,090
1,550 1,030 3,580
2,200
11. Delivered ground vater to hill areas, Table J-13 minus Column 10.
32,590 32,330
32,600 30,560 30,650 33,170 31,530
33,750 33,790 37,270 40,920 41,310
40,490 45,350 L8,400 50,170 53,310
56,900 57,280 65,170 65,920 60,810
61,450 59,880 65,640 65,020 64,510
63,620 65,070 57,340
48,260
13. Table 8, Column 3 minus change in reservoir storage, Table M-1, Column 4, Appendix M minus Column 9 herein. Column 1) equals Column 5 minus Columns 9 and 14.
14. Sum of Columns 5 and 6, Table M-1, Appendix M. 15. Column 3 minus Columns 10 and 11. 16. Table 16, Column 3.
138 a
640 6)0
610 750 u80 590 470
400 600 650 800 760
1,070 1,020 1,220 l,u70 1,230
850 780 730 560 1.30
350 500 490 Uo 250
200 160 270
660
1)8,980 lu5,970
1)1,480 156,100 149,690 138,650 135,570
158,970 133,550 131,OLO 145,930 127,9l0
119,u70 165,000 180,740 164,900 172,800
188,170 196,960 210,400 209,2Lo 202,170
225,700 207,690 231,120 226,620 224,430
220,870 236,990 222,010
175,760
133,710 140,620
1u5,u90 151,500 144,}00 133,u10 JJ1,280
154,140 128,850 126,5uO 140,990 123,110
115,)00 160,260 176,020 160,360 168,360
183,610 192,240 205,u30 204,550 197,550
221,130 203,140 226,360 222,)40 219,750
216,820 232,360 217,210
171,020
(
(
-13Bb-
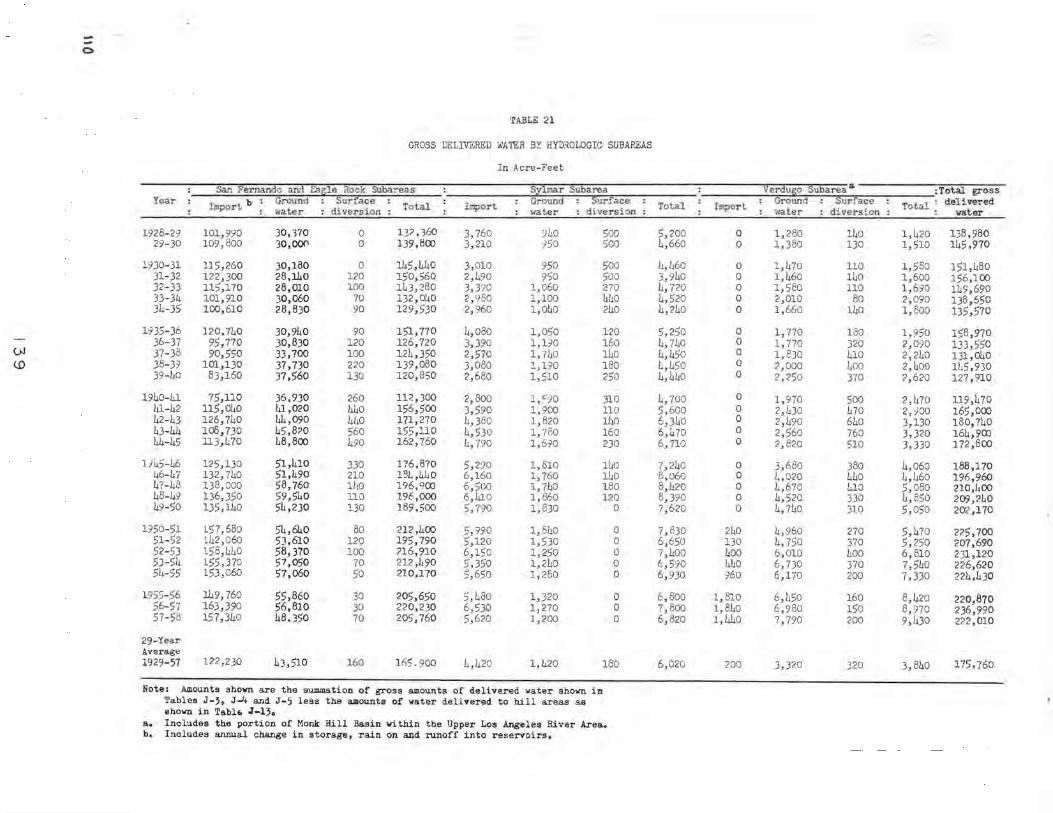
o
'rABLE 21
GROSS DELIVERED WATER BY HYDROLOGIC SUBAREAS
In Acre-Feet
San Fernando and ~g1e Rock Suba~eas Sllmar Subarea Verau~o Subarea a Total gross Year Import b Ground Surface G:-ound Surface Total Import Grounrl Surface Total delivered
water diversi<>n Total ,Unport water diversion water diversion water
1928-29 101,990 30, 170 0 13?,360 3,760 :140 500 5,200 0 1,280 140 1,420 138,980 29-30 109,800 30,00C' 0 139,tloo 3,210 950 500 4,660 0 1,380 130 1,510 145,970
1930-31 115,260 30,180 0 145,440 3,010 950 500 4,460 0 1,470 110 1,580 151,480 31-32 122,300 28,110 120 150,560 2,490 9,)0 500 3,940 0 1,460 140 1,600 156,100 32-33 115,170 28,010 100 143,280 3,3')0 1,060 270 4,720 0 1,580 110 1,690 149,690 33-34 101,910 30,060 70 132,040 2,\/80 1,100 440 4,520 0 2,010 80 2,090 138,650 34-35 100,610 26,630 90 129,530 2,960 1,040 240 4,?40 0 1,660 140 1,800 135,570
1935-36 120,740 30,940 90 151,770 4,080 1,050 120 5,250 0 1,770 130 1,950 158,970 36-37 95,770 30,630 120 126,720 3,390 1,190 160 4,'140 0 1,770 320 2,090 133,550
()J 37-38 90,550 33, 700 100 124,350 2,570 1,740 140 4,450 0 1,8JO 410 2,240 131,040 W 38-3:1 101,130 37,730 220 139,060 3,080 1,170 180 4,450 0 2,000 400 2,400 Ih5,930
39-40 83,160 37,560 130 120,B50 2,680 1,510 250 4,440 0 ?,250 370 ?,620 127,nO
1940-41 75,110 36 ,930 260 11::>,300 2,800 1,0')0 310 4,700 0 1,970 500 2,470 119,470 41-42 115,040 41,020 440 156,500 3,590 1,900 110 5,600 0 2,430 470 2,900 165,000 42-43 126,740 44,090 4110 171,270 4,380 1,820 140 6,340 0 2,490 640 3,130 IBO,740 43-44 108,730 45,8;>0 560 155,110 4,530 1,780 160 6,470 0 2,560 760 3,320 164,900 44-45 113,470 L8 , 8OO 490 162,760 4, 7,)0 1,6:10 230 6,710 0 2,820 510 3,330 172,800
1)45-46 125,1)0 51,410 330 176,B70 5,2')0 1,810 140 7,240 0 3,680 380 4,060 188,170 46-47 132,740 51,490 210 IBh,LJ"o 6,160 1,760 140 8,060 0 I., 020 440 11,460 196,960 47-48 138,000 58 ,760 Iho 196,900 6,500 1,740 180 8,420 0 4,670 410 5,080 210,400 48-49 1)6,350 59 ,540 110 196,000 6,410 1,860 120 8,390 0 4,520 330 4,850 209 ,240 49-50 135,140 54,230 130 189,500 5,7')0 1,830 0 7,620 0 4,740 310 5,050 202 ,170
1950-51 157,680 54 ,640 80 212,Loo 5,990 1,840 0 7,830 240 4,960 270 5,470 225,700 51-52 l42,060 5), 610 120 195,790 5,120 1,530 0 6,650 130 4, 750 370 5,250 207,690 52-53 158,440 58,370 100 216,910 6,150 1,250 0 7,400 400 6,010 400 6,810 231,120 53-54 155,370 57,050 70 212,490 5,350 1,240 0 6,590 440 6,730 370 7,540 226,620 54-55 153,060 57,060 50 210,170 5,650 1,2eO 0 6,930 960 6,170 200 7,330 224,430
1955-56 149,760 55,860 30 205,650 5,480 1,320 0 6,800 1,810 6,450 160 8,420 220.870 56-57 163,390 56 ,810 30 220,2)0 6,530 1,270 0 7,800 1,840 6,980 150 8,970 236~990 57-58 157,340 48. 350 70 205,760 5,620 1,200 0 6,820 1,440 7,790 200 9,430 2?2,010
29-Year Average 1929-57 122,230 43,510 160 lfi5'.900 4,420 1,420 180 6,020 200 3,320 320 3,840 175,760
Notes Amounts shovn are the summation of gross amounts of delivered wat er shown in Tables J-~, J-4 and J-5 less the amounts of vater delivered to hil l areas as shown in Tabl& J-l~.
a. Includes the portion of Monk Hill Basin within the Upper Los Angeles River Area. b. Includes annual change in storage, r ain on and runoff into reservoirs.
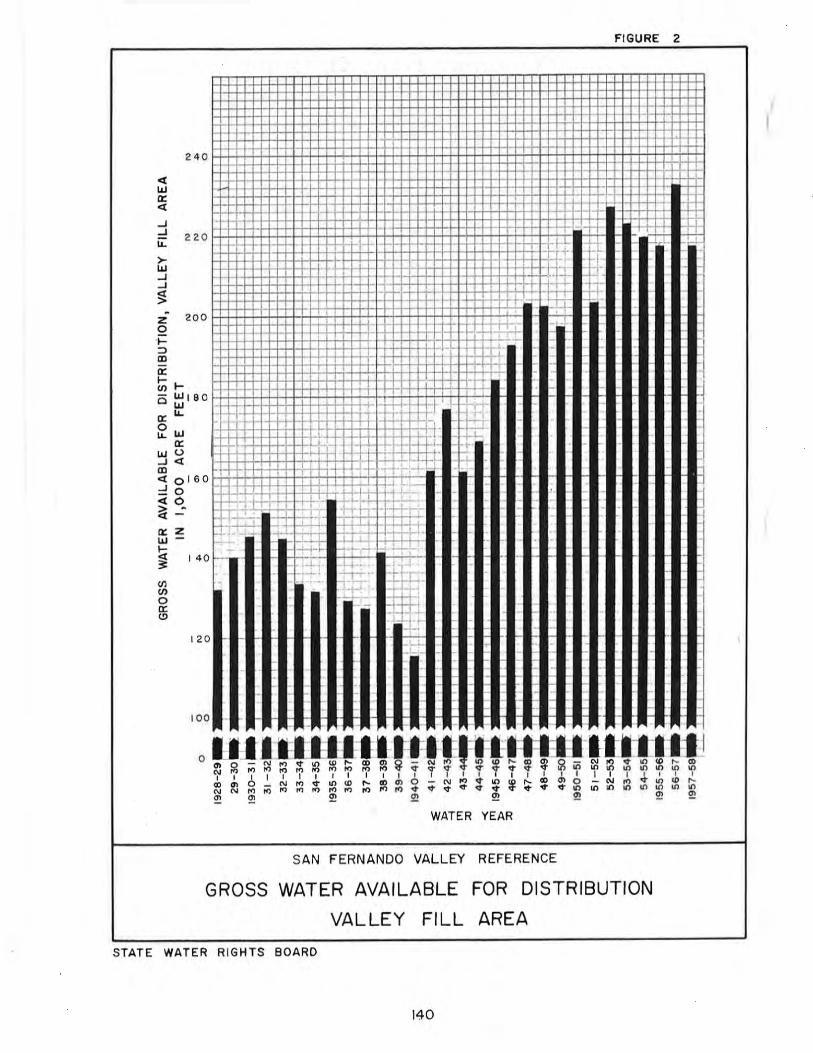
~
o
~ ~----------,-------------------------------------------------------------------------------------------------
----
--,
~ ~ ~
~
~
l>
~ ~
;;u
;;u
(i)
:J: ~ ~
ED
o l>
;;u
o
~
r r rr1
-< " r r l>
:0
rr1
l>
(j)
::0
o (f)
(f) ~ -4
I'T\
:0
l>
~
r l>
rn
r I'T\ " o :0
o (f) -4
::0
CD
C
-4
o Z
(f) l>
Z " I'T1 ::u
z l>
z o o § r r I'T1 -<
::u
I'T1
."
JT1 ::u
I'T1 z ()
I'T1
o o
GR
OS
S
WA
TER
A
VA
ILA
BL
E
FOR
D
IST
RIB
UT
ION
, V
AL
LE
Y
FIL
L
AR
EA
IN
1
,00
0
AC
RE
F
EE
T
(I) o
N o o
N
I'll o
N "'" o
19
28
-29
== 0
~ "'"
.
0 m
29
-30
:1
""
. -
j .• I
0
'93
0-3
1 ~ _'
.,
i " Ii
' l1:'t
.UJ·
' .
:~.
~,
_1-
_I.
..L
31 _
32
iii
_
.,.
.. i'
I L
_
=-L
-
.
=.
' " " , ~
I. -. C
,;
32
-33
-=-,' ,.
I
.',
•
33
-34
Ii
".
+
-,
, .
" -
• I
I ..
..
-
34
-35
II
. "
' _
J -
'935-3
6.~' ,
. "
, ... i I
f1i-
~j 1-
36
-3
7"
' '
. +,
i .
~ .
. ,
37
-3
8_
.
I •
' ,tF+
-+:~-t ft.
lt.i :-
t-I
. -
...
38
-39
""-
, ,.
.
.,.'1';.
11','
j ~ 1-
---
39
-<1
0-
",' .
" 1
1' .J
-~ I
:i,~ -
. .
;
'-'-t"!
' =r
' t-+
1
-1-
1
'94
0-4
' '
,,
'"
r;:'C
' L-
M'
,H
+.J
, r·L
L
!t+
+--J'
±
; '9}~J~ :,
:",::~ :~::::~
: ~:C:::::~I~
\_II
IIIIIIIIII~
46
- 471
' .
" . 'I I'
,rH~'
11
' 'i
+-
47
-48
•
' .
. •
1 -
" I"
' I'
• 1':1
48
-49
.
! 'I
I .
"'T"
"::-1-1
,
I I
1 I
' -
" "
. , "
' 4
9-S
O
' ""
' ,
, ,
, ""
!' ,
I "
, I
• "
I.
I I
, ,
--,
. ",
'."
' ,"
,
' .,
• •
' ,
I .
11 Ii'
"-52~ ~ 'J ,
.~.J. ,J
. .
. "
' ·iJ:
: + '0
" 5
2-5
3"'"
.
. J
J ". '
.L!
,J'
,'"
,
. :
" ,
,J";
jTJj
8:.l R
=F..L
5
3-
54. S' '
~ ,,"
1"'r'
J
54
-55
I
19
55
-56
I I
56
-57
1957
-58
\ ! I 1
;,
H-~i='FR I
I I
I I
I I
I I
I I
I I
I I
I I
I ,
I
, /
1-1
, •
, .
f 1
1
.. , ,
T
i=1
+H
I I
I I
I I-H
I I
I I
I I
I I
I
, ,
I !
:
I I
.1
!I
,I
aI
ll
l I
.
::!!
(i)
C
::0 ~
IV
(
" ,
Spread Import
Owens River water delivered by the Los Angeles Aqueduct is the
only import supply of which a part is spread for direct recharge of the
ground water. The City of Los Angeles commenced this operation in 1928-29
with the experimental spreading of 589 acre-feet in the vicinity of Vanowen
Street and Whitsett Avenue near Tujunga 1'Jash during that year. Including
the 1928-29 experimental work, the City has spread water at its Tujunga Wash
and Gravel Pits spreading grounds during 20 years of the base period. In
addition to direct -spreading the City rediverts Owens River water from the
Los Angeles River Channel to the Headworks spreading grounds for infil
tration to an underground gallery (Deep Gallery). 1'Jater collected by this
gallery is then extracted through well 3884G.
The location and description of the spreading grounds and Deep
Gallery are shown in Table 22 and on Plates 12 and 21. Annual amounts of
Owens River water spread for direct recharge of the ground vlater at the
Tujunga and Gravel Pits spreading grounds along with the amounts diverted
to the Headworks spreading grounds from the Los Angeles River are shown
in Table 23. It should be noted that the amounts of river water diverted
to the Headworks spreading ground are comprised primarily of Owens River
water which has been released, spilled or returned thereto from the Owens
River distribution system including return from the early operation (i.e.,
prior to 1940) of the Los Angeles Department of Water and Power Coldwater
Canyon Power Plant, line blowoff, and operational spills from reservoirs.
The amounts of these diversions are included in the ground water extractions
by the City of Los Angeles in Table 13.
-141-
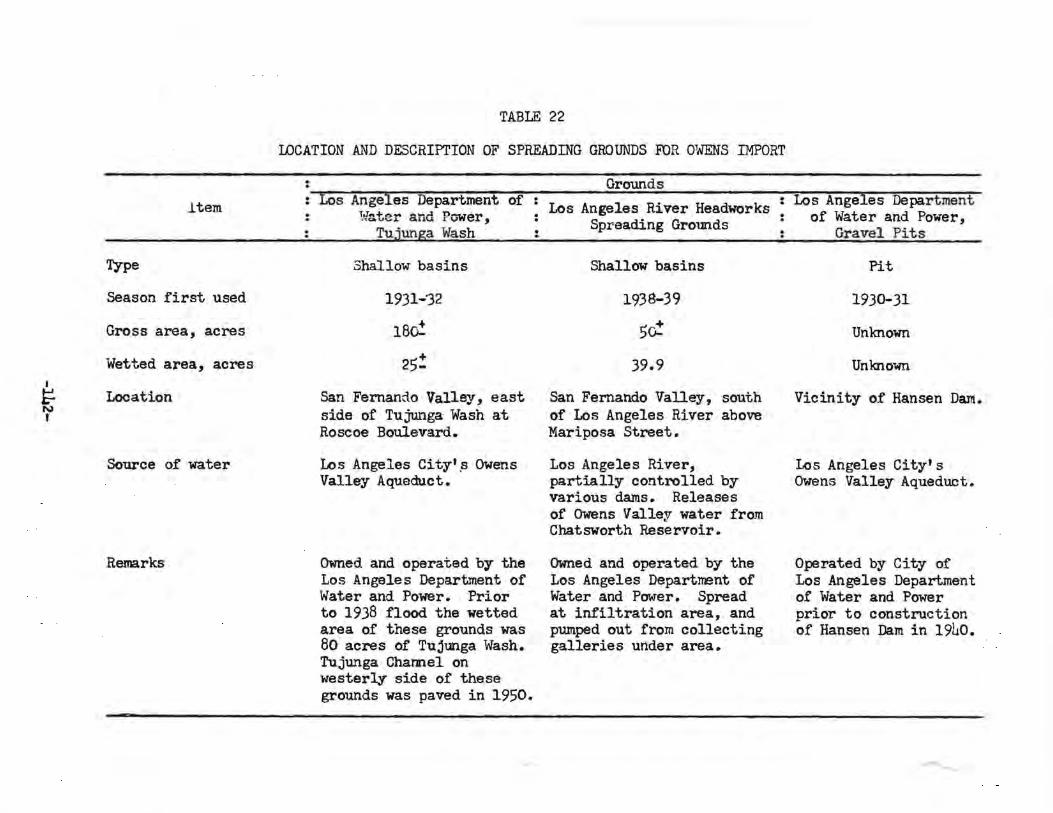
.1
t! N ,
item
Type
Season first used
Gross area, acres
Wetted area, acres
Location
Source of water
Remarks
TABLE 22
LOCATION AND DESCRIPI'ION OF SPREADING GROUNDS FDR OWENS IMPORT
Grounds t : : Los Angeles Departmen : LOs Angeles Department of Los Angeles River Headworks of Water and Power,
Water and Power, Spreading Grounds : Gravel P~ts : 'l'ujunga W~sh : .
Shallow basins
1931-'32
IBo!
2S!
San Fernando Valley, east side of Tujunga Wash at Roscoe Boulevard.
Los Angeles City'~ Owens Valley Aqueduct.
Owned and operated by the Los Angele s Department of Water and Power. Prior to 193B flood the wetted area of these grounds was Bo acres of Tujunga Wash. Tujunga Channel on westerly side of these grounds was paved in 1950.
Shallow basins
1938-39
so!
39.9
San Fernando Valley, south of Los Angeles River above Mariposa Street.
Los Angeles River, partially controlled by various dams. Releases of Owens Valley water from Chatsworth Reservoir.
Owned and operated by the Los Angeles Department of Water and Power. Spread at infiltration area, and pumped out from collecting galleries under area.
Pit
1930-31
Unknown
Unknown
Vicinity of Hansen Dam.
Los Angeles City's Owens Valley Aqueduct.
Operated by City of Los Angeles Department of Water and Power prior to construction of Hansen Dam in 1940.
-
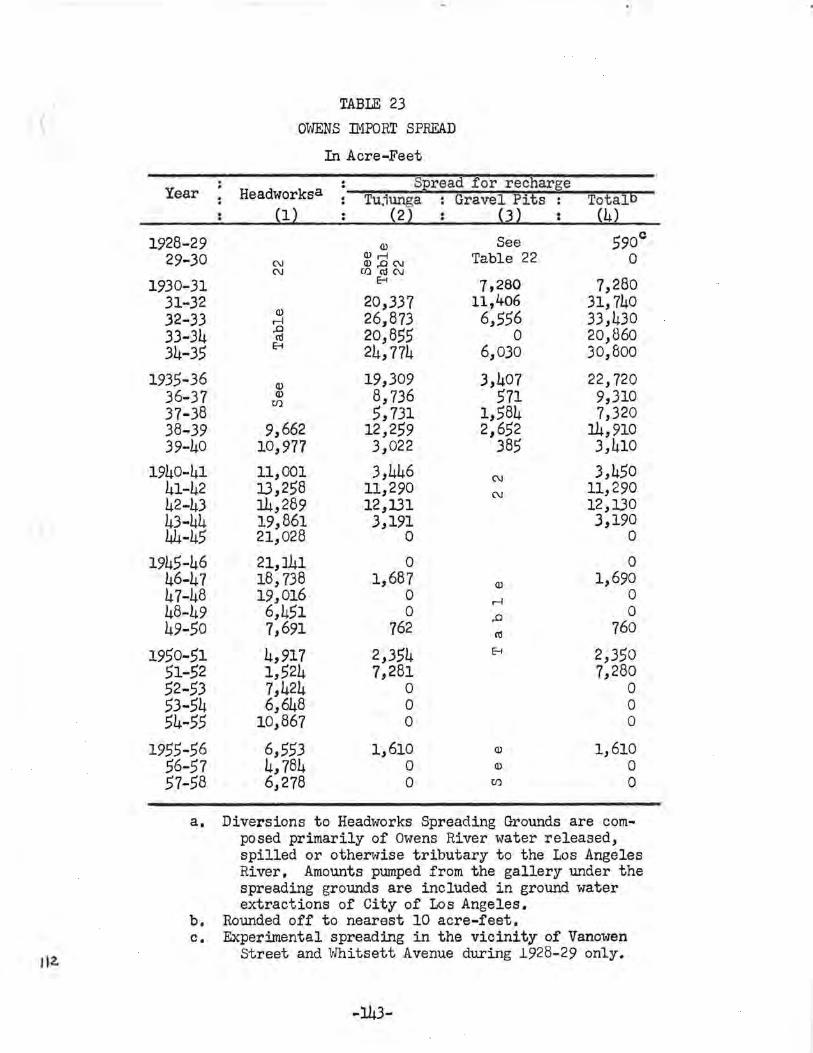
/11.
Year
1928-29 29-30
1930-31 31-32 32-33 33-34 34-35
1935-36 36-37 37-38 38-39 39-40
1940-41 41-42 42-43 43-44 44-45
1945-46 46-47 47-48 48-49 49-50
1950-51 51-52 52-53 53-54 54-55
1955-56 56-57 57-58
TABLE 23 OWENS IMPORT SPREAD
Headworksa
(1)
C\J C\J
<l> <l>
(f)
9,662 10,977 11,001 13 ,258 14,289 19,861 21,028
21,141 18,738 19,016 6,451 7,691
4,917 1,524 7,424 6,648
10,867
6,553 4,784 6,278
In Acre-Feet
Spread for recharge Tu~unga Gravel Pits
(2) (3)
QJ QJ,-l QJ.QC\J
(f)cdC\J E-i
20,337 26,873 20,855 24,774
19,309 8,736 5,731
12,259 3,022
3,446 11,290 12,131 3,191
o o
1,687 o o
762
2,354 7,281
o o o
1,610 o o
See Table 22
7,280 11,406 6,556
o 6,030
3,407 571
1,584 2,652
385
C\J
C\J
Q)
Q)
(f)
5900
o 7,280
31,740 33,430 20,860 30,800
22,720 9,310 7,320
14,910 3,410 3,450
11,290 12,DO 3,190
o o
1,690 o o
760
2,350 7,280
o o o
1,610 o o
a. Diversions to Headworks Spreading Grounds are composed primarily of Owens River water released, spilled or otherwise tributary to the Los Angeles River, Amounts pumped from the gallery under the spreading grounds are included in ground water extractions of City of Los Angeles.
b. Rounded off to nearest 10 acre-feet. c. Experimental spreading in the vicinity of Vanowen
Street and Whitsett Avenue during 1928-29 only.
-143-
Operational Releases, Net Deliveries and Water System Losses
Operational releases of Owens River import, comprised of spills
from reservoirs, return from power plant operations and line blowoff, are
indicated in Table 24 under the caption, Operational Releases.
The net amounts of water delivered to the valley fill area have
been primarily determined from metered water sales to customers when the
water is transported to the customer through a distribution system. For
systems comprised of a single well and for small companies where the
distribution system is not extensive and sales records were not available,
the gross amounts and net amounts have been taken as identical since in
these instances the water system loss is minor. Net delivered water does
not include water spread or spilled.
Water system loss is composed of leakage from the distribution
system, unmetered water (including sewer flushing water) and meter Slippage,
and is equal to the gross amount of water available for distribution minus
net water delivered, water spread and water spilled. The annual amounts of
the foregoing items and the resulting water system loss for the Upper Los
Angeles River area are shown in Table 24. The water 5,1stem loss is also
shown therein (column 7) as a percent of the gross water available for
distribution.
The percent water system loss was assumed to apply equally to
valley fill and hill areas. The total wate~ system loss was split between
the valley fill and hill areas on the basis of the gross amounts of water
available for distribution in each area (see Table 20). The net delivered
water on the valley fill area (Table 24) is the gross available for distri-
bution less water spread, spilled and ~stem loss for the valley fill area.
-144-
( (
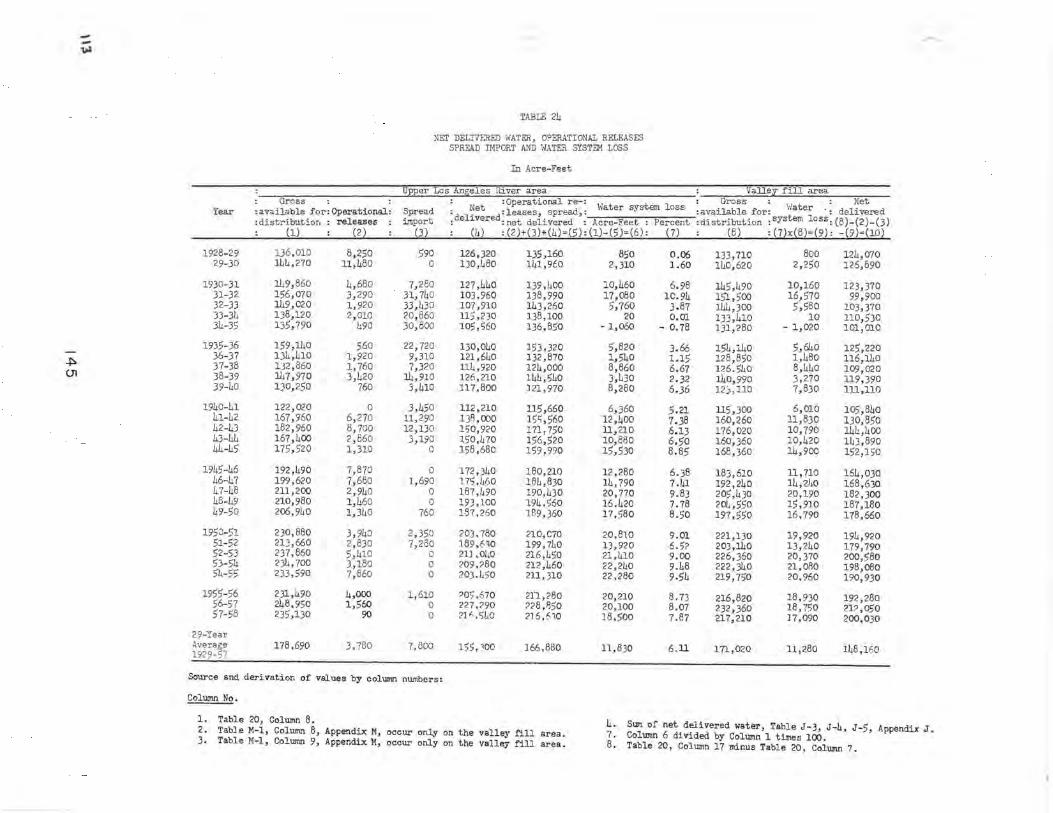
~ (J1
--~
Year
1928-29 29-30
1930-31 31-32 32-33 33-34 34-35
1935-36 36-37 37-38 38-39 39-40
1940-41 41-42 42-43 43-44 44-45
1945-46 46-47 47-48 48-49 49-50
1950-51 51-52 52-53 53-54 54-55
1955-56 56-57 57-58
29-Year I'.verag!! 1929-57
Gross :available for: Operational: : distributiorl releases
(1) (2)
U6,010 144,270
149,860 156,070 149,020 138,120 135,790
159,140 134,410 132,860 147,970 130,250
122,020 167,960 182,960 167,400 175,520
192,490 199,620 211,200 210,980 206,940
230,880 21),660 237,860 234,700 233,590
231,490 248.950 235,130
178,690
8,250 11,480
4,680 3,290 1,920 2,010
490
560 1,920 1,760 3,420
760
o 6,270 8,700 2,860 1,310
7,870 7,680 2,940 1,460 1,340
3,940 2,830 5,410 3,180 7,860
4,000 1,560
90
3,780
TABIE 24
NET DELIVERED WATER, OPERATIONAL RELEASES SPREAD IMPORT AND WATER SYSTEM LOSS
In Acre-Feet
lJpp-er:r.os Angeles Iliver area --: -- n --V"lleyrrrr area :Operational re-: W ttl : Gross : W t : Net
Spread d ~et :leases, spread,: a er sys em ass :available for: a er ': delivered import el~vered:net delivered : Acre-Feet: Percent :distribution :system loss: (8)-(2)-(3) OJ_ (4) : (2)+(J)+(4H51: (lH~)=(6): (7) (8) . : Wx(§j=(9): -(9)=(10)
590 o
7,280 31,740 33,430 20,860 30,800
22,720 9,310 7,320
14,910 3,410
3,450 11,290 12,DO 3,190
o
o 1,690
o o
760
2,350 7,280
o o o
1,610 o o
7,800
126,320 130,1.80
127 ,440 103,960 107,910 115,2)0 105,560
130,040 121,61.0 114,920 126,210 117,800
112,210 IJf!,OOO 150,920 150,1!70 158,680
172 ,340 175.460 187,1.90 19),100 1·97,260
203.780 189,610 21) .01,0 ?09.?80 203.450
?0S'.670 227,?90 ?l~ .SLo
15~, '100
1)5,160 141,9CO
139,1,00 138,990 143,260 138,100 136,850
153,320 132,870 124,000 144,540 J 21, 970
115,660 15~,560 171,750 156,520 159,990
] 80,210 184,830 190,430 194.%0 189,360
210,C70 199,740 216,450 212,460 211,310
2n,?80 ??8,1l50 2J5,610
166.880
850 2,310
10,460 17,080 5,760
20 - 1,060
5,820 1,540 8,860 3,430 8,280
6.360 12;400 il,210 10,880 15,530
12,280 14,790 20,770 16.420 17,580
20.810 13,920 21,410 22,240 22,280
20,210 20,100 ]8,500
11,830
0.06 1.60
6.98 lC.94 3.87 0.01
- 0.78
3.66 1.15 6.67 2.32 6.36
5.21 7.38 6.13 6.50 8.85
6.38 7.1+1 9.83 7.78 8.50
9.01 6."? 9.00 9.48 9.54
8.73 8.07 7 .87
6.il
133,710 140,620
145,490 1)1,500 144,300 133,410 131,280
154,140 128,850 126.540 140,990 12],110
115,300 160,260 176,020 160,360 168,360
183,610 192 ,240 205,430 204,550 197,550
221,130 20),140 226, )60 222,340 219,750
216,820 232,360 217,210
171,020
800 2,250
10,160 16,570 5,580
10 - 1,020
5,640 1,480 8,440 3,270 7,830
6,010 11,830 10,790 10,420 14,900
11,710 14,21.0 20,190 15,910 16.790
19,920 13,240 20,370 2l,OBo 20.960
18,930 18,750 17,090
11,280
124,070 126,890
123,370 99,900
103,370 110,530 101,010
125,220 116,140 109,020 119,)90 111,110
105,840 130,850 141!,4OO 14),890 152,150
164,030 168,6)0 182,300 187,180 178,660
194,920 179,790 200,580 198,080 190,930
192 ,280 21?,050 200,030
148,160
Source and derivation of values by column numbers:
Column No.
-
1. Table 20, Column 8. 2. Table M-l, Column 8, Appendix M, occur only on the valley fill area. 4. Sum of net delivered water, Table J-3, J-4, J-5, Appendix J.
7. Column 6 dl vlded by Column 1 times 100. 3. Table }!-1, Column 9, Appendix M, occur only on the valley fill area. 8. Table 20, Column 17 minus Table 20, Column 7.
Sewage and Waste
All of the sewage exported from the Upper Los Angeles River
area, with the exception of occasional overflows and discharges into the
Los Angeles River, is conveyed tl~ough the City of Los Angeles sewerage
s,ystem to the city's treatment plant. Small amounts of ground water
that infiltrate the sewer mains are also exported through the sewerage
system as are minor amounts of delivered water used to flush the sewer
lines. A large number of individual local sewage disposal s,ystems,
mainly cesspools and septic tanks, have been and still are in use in the
area. The effluent from these represent a significant source of recharge
to the ground water reservoir; also, industrial waste and sewage that
have been discharged into the Los Angeles River result in minor amounts
of recharge in the river channel. The methods of determining sewage
export from the major water service areas within the Upper Los Angeles
River area are listed in Table 25. The methods of estimating cesspool
recharge in these areas is also shown in Table 25.
-146-
{ (
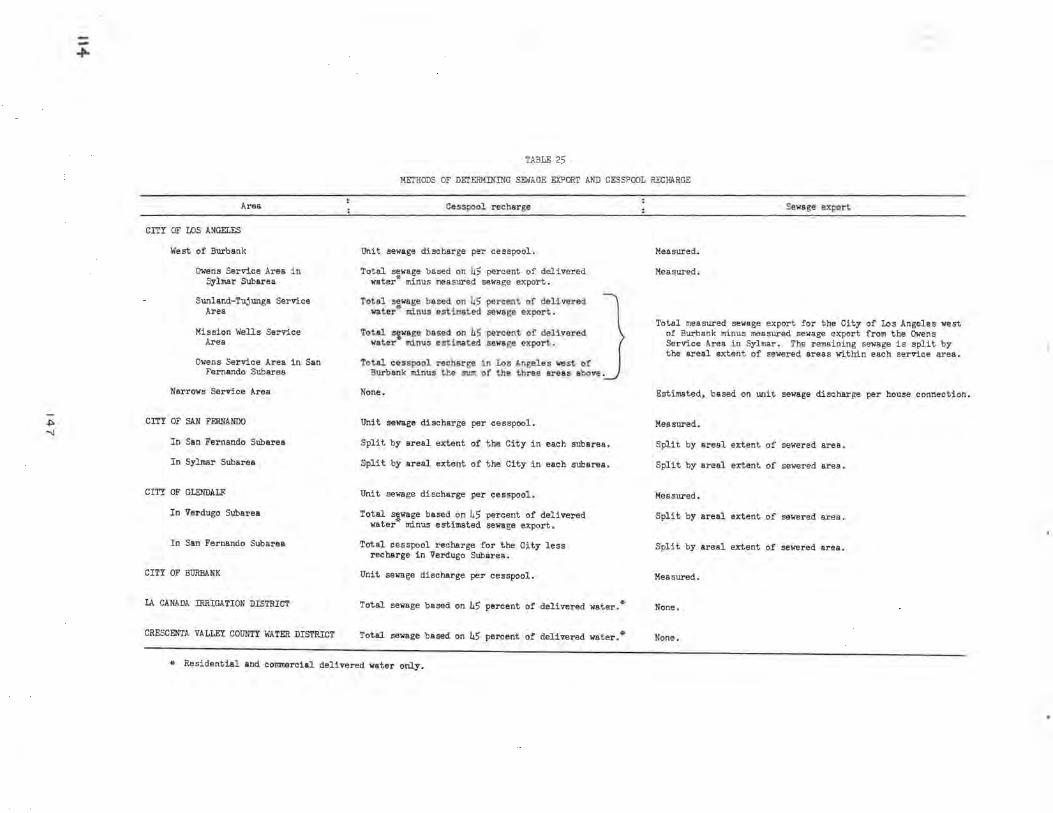
~ -.,J
-~
Area
CITY OF LOS ANGELES
West of Burbank
Owens Service Area in Sylmar Subarea
Sunland-Tuj unga Service Area
Mission Wells Service Area
Owens Service Area in San Fernando Subarea
Narrows Service Area
CITY OF SAN FERNANDO
In San Fernando Subarea
In Sylmar Subarea
CITY OF GLENDALF.
In Verdugo Subarea
In San Fernando Subarea
CITY OF BURBANK
LA CANADA IRRIGATION DISTRICT
CRESCENTA VALLEY COUNTY WATER DISTRICT
TABLE 2" MEI'HODS OF DEI'ERMINING SEWAGE EXPORT AND CESSPOOL RECHARGE
Cesspool re~harge
Unit sewage di scharge per cesspool.
Total sewage based on 45 percent of delivered water* minus measured sewage export.
Total s~"age based on uS percent of deliVered 'WBt e.r minus estimated sewa ge expor t .
Total st"age based on IS percent of delivered lIat er minus estimated sewage expor t .
Total ces·spool r eoharge in los Angeles ,,-est of Burbank minus the ~~ or the t hr ee arees above.
None.
Unit sewage discharge per cesspool.
Split by areal extent of the City in each subarea .
Split by areal extent of the City in each subarea.
Unit sewage discharge per cesspool.
Total siwage based on 45 percent of delivered water roinus estimated sewage export.
Total cesspool recharge for the City less recharge in Verdugo Subarea.
Unit sewage discharge per cesspool.
Total sewage based on 1,5 percent of delivered water.*
Total sewage based on 45 percent of delivered water.*
Sewage export
Measured.
Measured.
Total measured sewage export for the City of Los Angeles west of Burbank minus measured sewage export from the Owens Service Area in Sylmar. The remaining sewage is split by t he areal extent of sewered areas withi n each service area.
Estimated, based on uni t sewage discharge per house connection.
Measured.
Split by areal extent of sewered area.
Split by areal extent of sewered area.
Measured.
Split by areal extent of sewered area.
Split by areal extent of sewered area.
Measured.
None.
None.
* Residential and commercial delivered water only.
Export of Sewage
The City of Los Angeles North Outfall Sewer (Plate 26) which
was placed in operation in 1926 was the first trunk sewer conveying sewage
out of the Upper Los Angeles River area and initially served the Cities of
Burbank, Glendale and the portion of Los Angeles south of Glendale.
Commencing in 1929, portions of the City of Los Angeles west of Burbank
were connected to the North Outfall Sewer. The City of San Fernando
operated its own treatment plant and discharged the effluent into Pacoima
Wash until 1952 at which time its sewerage system was connected to the
City of Los Angeles system.
Rapid growth of the San Fernando Valley caused a rapid increase
in the amounts of sewage being exported. The capacity of the North Outfall
Sewer was exceeded in 1952-53 and small amounts of sewage overflowed into
the Los Angeles River at a point downstream from its confluence with the
Verdugo Wash. The Valley Settling Basin was constructed on the south bank
of the Los Angeles River south of the City of Burbank in 1954 to provide
storage during peak sewage flows. On brief occasions when the capacities
of the trunk sewer and the Valley Settling Basin were both exceeded, the
stored sewage was chlorinated and discharged into the Los Angeles River.
The amounts of sewage overflowing or discharged into the Los Angeles River
are listed in Table 26.
The San Fernando Valley Relief Sewer Tunnel (Plate 26) was
completed in June 1956. The amount of sewage conveyed through this sewer
trunk is not measured; therefore, export of sewage from the Upper Los
Angeles River area for the period 1955-56 through 1957-58 was estimated on
-148-
(
\,!)
the basis of the number of s~~er connections and the expected sewage flow
per connection (see Appendix N).
The amount of flow through sewer mains leaving the Upper Los
Angeles River area is based on the records of sewage gaging stations of the
City of Los Angeles. Location of these stations is indicated on Plate 26.
Although the sewage gaging stations operate for only one week per month,
the weekly measured flow has been accepted by the cities as being the
average weekly flow for the month. Amounts of sewage overflowing into the
Los Angeles River are estimated from partial records of the State Department
of Public Health. Discharges from the Valley Settling Basin, shown in
Table 26, are based on operational records of the City of L08 Angeles.
Estimated Cesspool Recharge and Sewage from Hill Areas
In areas that were not completely sewered, sewage export and
cesspool recharge were separated by determining the sewage discharge per
house connection or the percent of delivered water becoming sewage. Studies
detailed in Appendix N show that 45 percent of the delivered water becomes
sewage and the sewage flows per house connection varied from 0.17 acre-foot
in 1928-29 to 0.28 acre-foot in 1957-58 and averaged 0.20 during the 29-year
base period. Neither of the above values include infiltration of water into
the sewers. The methods utilized to determine the amounts of sewage export
and cesspool recharge in each area are discussed in Appendix N. Amounts of
cesspool recharge and sewage from hill areas so estimated are shown in
Table 26,
-149-
Export of Sewer Infiltration and Flushing Water
The amounts of water entering the sewe~ mains as infiltration
were determined by comparison of the trends in sewage per connection for
each of the gaged areas (see Appendix N). The amount thus determined for
the City of Glendale was the sum of infiltration and flushing water. The
amounts of unmetered delivered water discharged into the City of Glendale IS
sewers as flushing water constitute a portion of the city's water system
loss. The water flowing through the flushing devices amounted to 25.3
percent of the gross deliveries in 1954-55. The city commenced removing
the flushing devices in 1957 with the result that the water system loss
was reduced to 7.2 percent in 1958-59. A comparison of the water distri
bution systems of the City of Burbank, which does not provide sewer
flushing water, and the City of Glendale indicates that the two systems
are otherwise comparable and that their water losses should therefore be
approximately the same. The amounts of flushing water in the City of
Glendale sewer mains were estimated by first comparing the water system
loss in Glendale with the average water system loss for Burbank (see
Appendix N) and then comparing this amount with the combined quantity of
infiltration and flushing water previously estimated. Estimated amounts
of sewer infiltration and flushing water exported in the sewer trunks are
shown in Table 26.

--fJ""
TABLE 26
SUMMARY OF SE,i,AGE EXPORT AND CESSPOOL RECHARGE , VALLEY FliL AREA
In Acre-Feet
Sewalle--: Estimated Estimated Net elfport of Estimated Se<;.,.ge - - - ;-- EStimatoo Total export sewage !'rom seller se",age from sewer flushing di.schargoo to ce.sspool
Year U.L.A.R. hill areas infiltration valley :fi.ll 'later rivet' recharge se>tage (1) (2) (3) (4)=1-2- 3 (5) (6) (7) ~8)..t.-5<-6+7
1920-29 6,320 870 34C 5,1l0 0 0 4,940 10,050
29-30 7,100 880 170 6,050 320 0 4,920 10,650
1930-31 8,490 900 430 7,160 490 0 4,930 11,600 31-32 9,900 910 880 8,1l0 810 0 4,560 11,860 32-33 9,970 920 430 8,620 610 0 4,160 12,170 33-34 10,340 940 310 9,090 700 0 2~,O30 12,420 34-35 11,850 960 1,700 9,190 450 0 3,950 12,690
1935-36 12,450 970 1,570 9,910 560 0 4,030 13,380 36-37 13,230 990 1,860 10,380 200 0 4,570 14,750 37-38 14,360 1,060 2,170 1l,130 350 0 5,060 15,840 38-39 16,470 1,080 3,280 12,1l0 300 0 5,790 17,600 39-40 17,440 1,090 3,250 13,100 250 0 6,480 19,330
1940-41 21,630 1,170 6,290 14,170 150 0 7,290 21,310 41-42 21,910 1,190 5,730 14,990 170 0 7,920 22,740 42-43 22,470 1,200 5,780 15,490 0 0 8,100 23,590 43-44 23,470 1,220 6,1l0 16,140 0 0 7,950 24,090 44-45 23,780 1,320 5,310 17,150 90 0 8,400 25,460
(J1 1945-46 24,030 1,350 4,000 18,680 500 0 9,040 27,220
46-47 27,080 1,450 5,260 20,370 1,230 () 10,800 29,940 47-48 28,880 1,500 4,040 23,340 l,900 0 11,220 32,660 48-49 30,340 1,570 2,)20 26,450 2,290 0 1l,160 35,320 49-50 31,950 1,840 1,240 28,870 1,320 0 11,510 39,060
1950-51 35,660 2,160 1,170 32,330 1,520 0 13,500 44,310 51-52 39,950 2,540 2,090 35,320 2,530 0 14,600 47,390 52-53 41,590 2,890 950 37,750 2,090 10 15,400 51,070 53-54 47,260 3,470 1,840 41,950 2,620 190 17,150 56,670 54-55 45,670 4,100 1,950 39,620 2,240 4,840 18,630 60,850
1955-56 51,860 4,860 2,970 44,030 3,660 4,540 19,850 64,760 56-57 60,060 5,540 3,290 51,230 3,270 60 20,550 68,570 57-58 63,960 6,550 ~,330 55,080 1,650 240 20,150 73,820
29-Y8ar Average 1929-57 24,670 1,760 2,650 20,270 1,060 9,330 28,870
Source and derivation of va.lues by colwllu number:
Col~
1- Colwnn entitled "Total savage export out of Upper 5. Colwnn entitled··Saver flushing Glendale", Table N-5, 2.
Los Angeles River area" in Table N-8, Appendix N. Appendix N. Colwnn entitled "Total", Table N-9, Appendix N. 6. Table N-I0, Colwnn 4, Appendix N. 3. Column entitled "Total", Table N-5, Appendix N. 7. Sum of the cesspool recharge for each service area in
Table N-7, Appendix N.
Industrial and Sanitary Wastes
Industrial wastes discharged into the Los Angeles River were com
puted for the 1946-47 through 1957-58 period from permits issued by the City
of Los Angeles, and for the years 1939-40 through 1946-47 by extrapolation.
Industrial wastes discharged into the Burbank-Western storm drain were
estimated from low flow measurements for the 1951-52 through 1957-58 period
and by extrapolation back to 1939-40. Sewage discharged from the North
Outfall Sewer and Valley Settling Basin and the total industrial wastes
discharged into the Los Angeles River are shown in Table 26A. Waste dis
charges are discussed further in Appendix N. Industrial waste from the City
of Los Angeles Valley Steam Plant is spread on adjacent land and is included
as deep percolation on commercial and industrial land use areas (see Appendix
L).
-15la-
( (
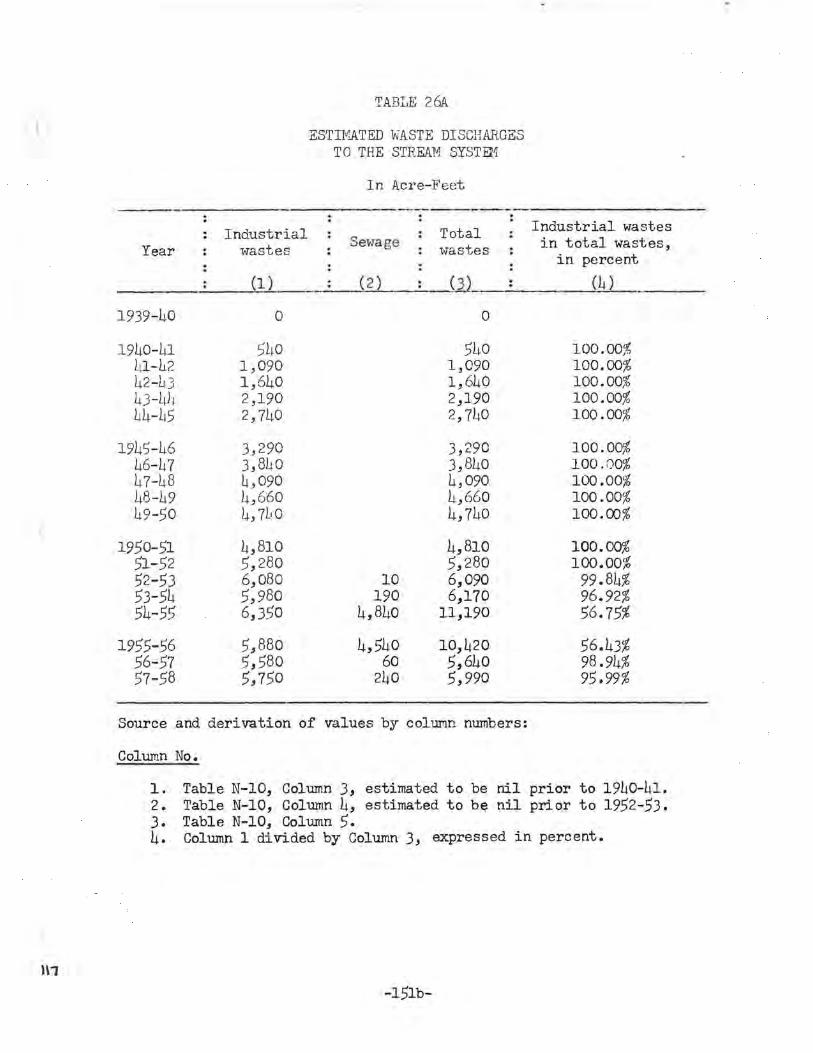
(
Industrial Year wastes
(1)
1939-40 0
1940-41 51fO h1-L.2 1,090 42-LJ 1,640 43-Ld~ 2,190 44-45 2,740
1945-46 3,290 46-47 3,840 47-48 4,090 48-49 4,660 49-50 1+,7L,0
1950-51 4,810 51-52 5,280 52-53 6,080 53-54 5,980 54-55 6,350
1955-56 5,880 56-57 S,580 57-58 5,750
TABLE 2M
ESTINATED wASTE DISCHARGES TO THE STREAM SYSTBM
In Acre-Feet
Total Se ... Ta ge w"astes
(2 ) ()]
0
540 1,090 1,640 2,190 2,740
3,290 3,840 4,090 4,660 4,740
4,810 5,280
10 6,090 190 6,170
4,840 11,190
4,540 10,420 60 5,640
240 5,990
Industrial wastes in total wastes,
in percent
(4)
100.00% 100.00% 100.00% 100.00% 100.00%
100.00% 100.00% 100.00% 100.00% 100.00%
100.00% 100.00%
99.84% 96.92% 56.75%
56.43% 98.94% 95.99%
Source and derivation of values by column numbers:
Column No.
1- Table N-10, Column 3, estimated to be nil prior to 1940-41. 2. Table N-IO, Column 4, estimated to be nil prior to 1952-53. 3. Table N-IO, Column 5. 4. Column 1 divided by Column 3, expressed in percent.
-151b-
Surface Runoff
The drainage basin of the Upper Los Angeles River area is comprised
of 329,137 acres of which 205,709 acres are hill and mountain lands. The
surface flow in the streams in the area originates as storm runoff from hill
and mountain areas, storm runoff from impervious areas on the valley floor,
operational spills of imported water, industrial and sanitary waste discharges
and rising water in the Los Angeles River.
The drainage system of the area is made up of the Los Angeles River
and its tributaries. The important changes that have taken place in the
drainage system in the past 30 years have previously been noted in Table 18.
The changes that have occurred from the period when the area was essentially
undeveloped to its present urbanized state may be readily seen by comparing
the drainage system of 1893 as depicted on Plate 11 with that of 1958 as
shown on Plate 12. As was noted in the discussion of channel improvement,
the reduction in the length of pervious channels has been large.
The gaging stations at which surface flows in the drainage system
are measured are shown on Plate 9 and listed as to location and length of
record in Table 27. Surface outflow from the area has been measured by Los
Angeles County Flood Control District at gaging station F-57 by a continuous
water stage recorder, beginning in December 1929. In the period January to
August 1929, only weekly measurements were available. During the remaining
months, October 1928 to December 1929, no precipitation and therefore no
storm runoff occurred. Various published references have been made as to
-152-
(
(
III
the amount of water flowing in the Los Angeles River from 1898 to 1929.
Some references as to the amount of water flowing in the Los Angeles River
are found in the "Annual Reports" of the Los Angeles Department of Water
and Power. However, the values presented in these publi.cations lacked
sufficient companion information to determine what these values represent.
It is questionable as to whether they reflect the summer or average flow
in the river or the amounts diverted or pumped. These were considered as
incomplete data and were therefore not used.
Hydrographs of the surface flow of the Los Angeles River at
gaging station F-57, prepared from daily records, were utilized to
separate the surface flow into base low flow which is made up of rising
wat.er and waste discharges, and surface runoff which is composed of storm
runoff and operational spills of Owens River water. The separation of the
surface flow into its constituent parts is derived in Appendix O. The
results of the study are presented in Table 28.
-153-

Station number*
2
5
9
15
16
19
43
44
57
105
105
106
110
III
118
149
152
168
213
244
252
266
270
287
299
300
305
E-5-C
E-20-C
E-285
U-12
TABLE 27
MAIN -STREAM GAGING srATIONS, UPPER LOS ANGELES RIVER AHEA
Location
Browns Canyon Wash at Devonshire Avenue, Chatsworth
Los Angeles River below Sepulveda Dam
Verdugo Storm Drain at Glen Oaks Boulevard, Glendale
Pacoima Wash at Van Nuys Boulevard
Pacoima Wash at Parthenia Street
Little Tujunga Wash at Foothill Boulevard
Sycamore Canyon Channel above Solway Street
Sycamore Canyon Channel at Adams Square
Los Angeles River above Arroyo Seco
Tujunga Wash at Magnolia Boulevard
Tujunga Wash below Moorpark street
Tujunga Wash - Central Branch at Magnolia Boulevard
Big Tujunga - Fox Creek, one-fourth mile above mouth
Big Tujunga Creek below Mill Creek
Pacoima Creek Flume below Pacoima Dam
Limekiln Creek at Devonshire Street
Aliso Wash below Nordhoff Street
Big Tujunga Creek below Big Tujunga Dam
Big Tujunga Creek above Gold Canyon
Verdugo Channel at Don Carlos Street
Verdugo Channel at Estelle Avenue
Los Angeles River at Mariposa Street;
Calabasas Creek at Ventura Boulevard
La Tuna Creek below Debris Basin
Los Angeles River at Radford Avenue
Los Angeles River at Tujunga Avenue
Pacoima Diversion at Branford Street
Los Angeles River below Sepulveda Dam
Tujunga ~lash above Glen Oaks Boulevard
Burbank-l'lestern Storm Drain at Riverside Drive
Haines Creek above mouth of canyon
* LACFCD gaging station number. See Plate 9 for location.
154
Period of record
December 1928 - September 1932 October 1936 - September 1939
December 1928 - March 1952
December 1928 - November 1933
October 1952 - September 1958
December 1928 - August 1952
December 1928 - September 1958
October 1938 - September 1958
December 1927 - September 1935 October 1936 - April 1937 October 1938 - September 1958
December 1929 - September 1958
August 1930 - February 1938 October 1938 - April 1948
October 1950 - September 1958
August 1930 - February 1938 November 1941 - September 1958
October 1930 - September 1937
December 1930 - September 1958
March 1916 - September 1958
November 1939 ~ September 1957
November 1939 - August 1947 September 1948 - September 1958
December 1931 - October 1932 January 1938 - September 1958
October 1932 - September 1958
December 1934 - September 1936
April 1936 - September 1958
December 1938 - September 1958
February 1940 - November 1950
October 1946 - September 1958
February 1950 - September 1958
May 1950 - September 1958
October 1953 - September 1958
May 1943 - September 1958
May 1932 - February 1938 August 1940 - September 1958
October 1950 - September 1958
February 1917 - September 1934 October 1935 - September 1958
(
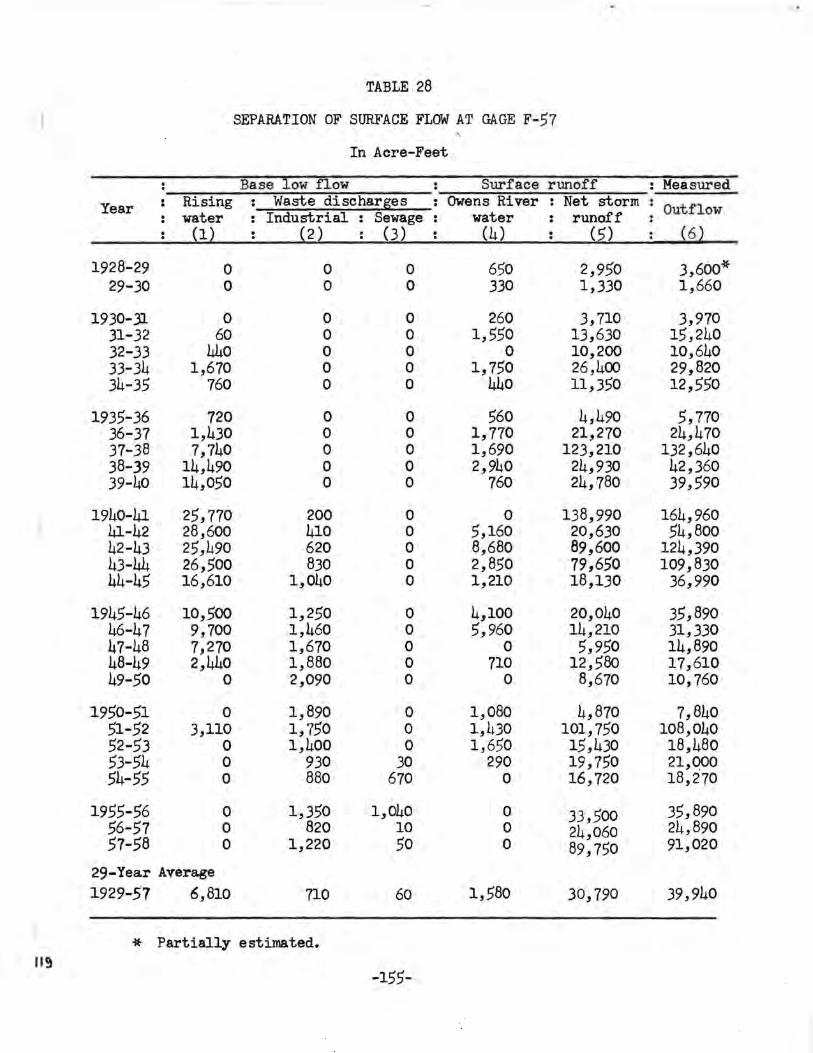
TABLE 28
( SEPARATION OF SURFACE FLOW AT GAGE F-57
In Acre-Feet
Base iow flow Surface runoff : Measured Year Rising Waste dischar~es Owens River : Net storm Outflow water Industrial Sewage water runoff
(1) (2 ) (3) (4) (5) (6 )
1928-29 0 0 0 650 2,950 3,600* 29-30 0 0 0 330 1,330 1,660
1930-31 0 0 0 260 3,710 3,970 31-32 60 0 0 1,550 13,630 15,240 32-33 440 0 0 0 10,200 10,640 33-34 1,670 0 0 1,750 26,400 29,820 34-35 760 0 0 440 11,350 12,550
1935-36 720 0 0 560 4,490 5,770 36-37 1,430 0 0 1,770 21,270 24,470 37-38 7,740 0 0 1,690 123,210 132,640 38-39 14,490 0 0 2,940 24,930 42,360 39-40 14,050 0 0 760 24,780 39,590
1940-41 25,770 200 0 0 138,990 164,960 41-42 28,600 410 0 5,160 20,630 54,800 42-43 25,490 620 0 8,680 89,600 124,390 43-44 26,500 830 0 2,850 79,650 109,830 44-45 16,610 1,040 0 1,210 18,130 36,990
1945-46 10,500 1,250 0 4,100 20,040 35,890 46-47 9,700 1,460 0 5,960 14,210 31,330 47-48 7,270 1,670 0 0 5,950 14,890 48-49 2,440 1,880 0 710 12,580 17,610 49-50 0 2,090 0 0 8,670 10,760
1950-51 0 1,890 0 1,080 4,870 7,840 51-52 3,110 1,750 0 1,430 101,750 108,040 52-53 0 1,400 0 1,650 15,430 18,480 53-54 0 930 30 290 19,750 21,q<)0 54-55 0 880 670 0 16,720 18,270
1955-56 0 1,350 1,040 0 33,500 35,890 56-57 0 820 10 0 24,060 24,890 57-58 0 1,220 50 0 89,750 91,020
29-Year Average 1929-5-7 6,810 710 60 1,580 30,790 39,940
* Partially estimated. 119
-155-
Native Water Spread
Early protection from flood waters was provided by the construc
tion of Pacoima and Big Tujunga Reservoirs in 1929 and 1931, respectively,
by the Los Angeles County Flood Control District. Subsequent additional
flood protection was provided on the valley floor area by the construction
of Hansen and Sepulveda flood control reservoirs by the U. S. Corps of
Engineers in 1940 and 1941, respectively.
Pacoima, Big Tujunga and Hansen Reservoirs have been operated
for water conservation as a secondary function along with flood control.
The location of these reservoirs and the spreading grounds situated down
stream thereof are depicted on Plate 12. During the base period controlled
releases from these reservoirs have been spread to recharge ground water.
Four spreading grounds with an aggregate area of 266 acres have been con
structed and operated for this purpose since 1932-33. The locations and
descriptions of these, namely, the Pacoima, Hansen, Lopez and Branford
spreading grounds, are shown in Table 29. Annual amounts of native water
spread to recharge the ground waters at each of these grounds during the
period 1928-29 through 1957-58 are shown in Table 30.
-156-
(
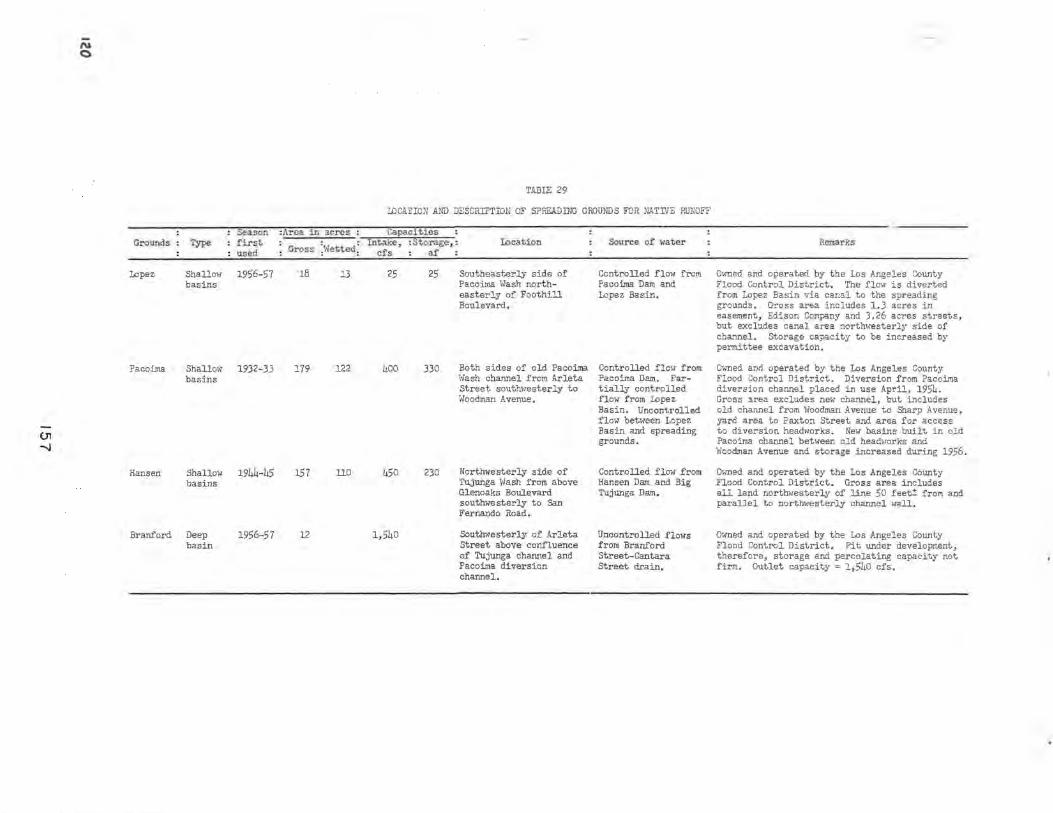
(J1
-..J
N ()
Grounds
Lopez
Pacoima
Hansen
Branford
Type
Shallow basins
Shallow basins
Shallow basins
Deep basin
Season :Area in acres : first.
Gross ;Hett.ed ; used
1956-57 18 13
1932-33 179 122
1944-45 157 liD
1956-57 12
TABLE 29
WCATION AND DESCRIPTION OF SPREADING GROUNDS FOR NATIVE RUNOFF
---capacities Intake., : Storage, : Location Source of water Remarks
cfs af
25 25 Southeasterly side of Controlled flow from Owned and operated by the Los Angeles County Pacoima Wash north- Pacoima Dam and Flood Control District. The flow is diverted easterly of Foothill Lopez Basin. from Lopez Basin via canal to the spreading Boulevard. grounds. Gross area includes 1.3 acres in
easement, Edison Company and 3.26 acres streets, but excludes canal area northl-1esterly side of channel. Storage capacity to be increased by permittee excavation.
400 330 Both sides of old Pacoima Controlled flc;[ from Owned and operated by the Los Angeles County Hash channel from Arleta Pacoima Dam. Par- Flood Control District. Diversion from Pacoima Street southHesterly to tially controlled diversion channel placed in use April, 1954. Woodman Avenue. flow from Lopez Gross area excludes new channel, but includes
Basin. Uncontrolled old channel from Hoodman Avenue to Sharp Avenue, flow between Lopez yard area to Paxton Street and area for access Basin and spreading to diversion head'-Iorks. New basins built in old grounds. Pacoima channel between old head;rorks and
Woodman Avenue and storage increased during 1956.
450 230 Northwesterly side of Controlled flow from Owned and operated by the Los Angeles County Tujunga Wash from above Hansen Dam and Big Flood Control District. Gross area includes Glenoaks Boulevard Tujunga Dam. all land northwesterly of line 50 feet! from and southwesterly to San parallel to northwesterly channel wall. Fernando Road.
1,540 Southwesterly of Arleta Uncontrolled flows Owned and operated by the Los Angeles County Street above confluence from Branford Flood Control District. Pit under development, of Tujunga channel and Street-Cantara therefore, storage and percolating capacity not Pacoima diversion Street drain. firm. Outlet capacity = 1,540 cfs. channel.
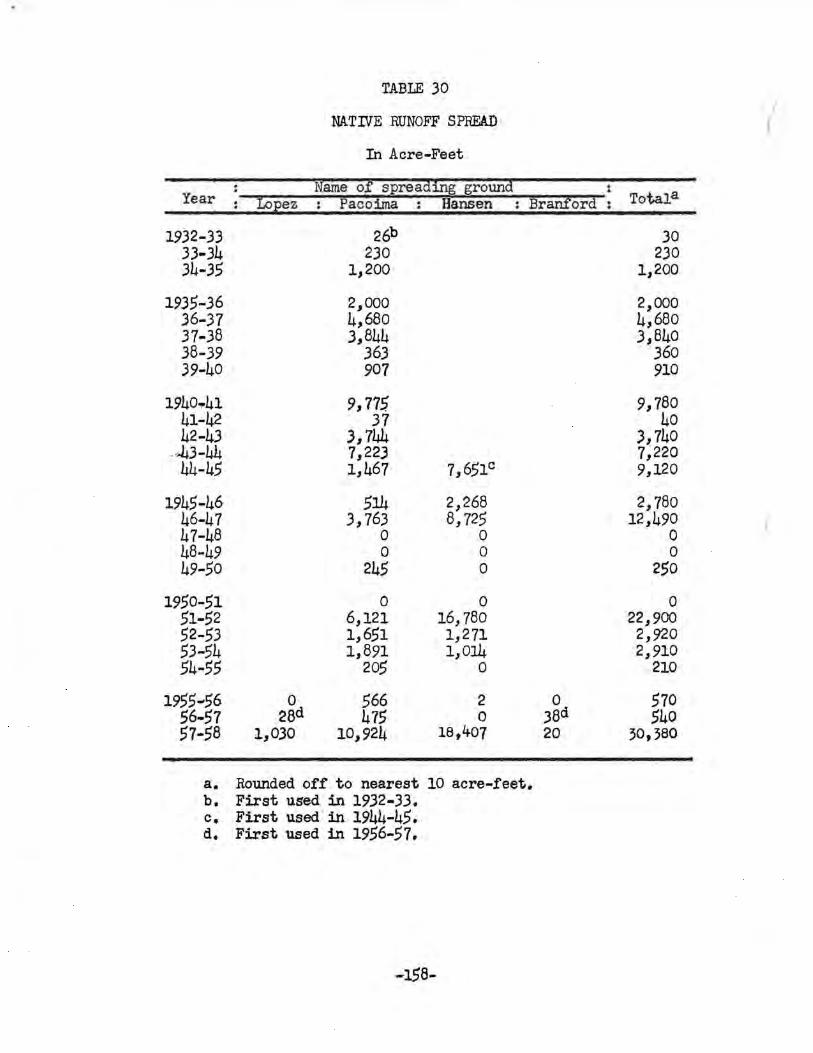
TABLE 30
NATIVE RUNOFF SPREAD
In Acre-Feet
Year ,Eez : Branford Totala
1932-33 26b 30 33-34 230 230 34-35 1,200 1,,200
1935-36 2,,000 2,,000 36-37 4,680 4,680 37-38 3,844 3,840 38-39 363 360 39-40 907 910
1940~41 9,77S 9,780 41-42 37 40 42-43 J" 744 3,740
··Jd-44 7,22; 7,220 44-45 1,467 7, 651c 9,120
1945-46 514 2,268 2,780 46-47 3,763 8, 725 12,490 47-48 0 ° 0 48-49 0 0 0 49-50 245 0 250
1950-51 0 0 0 51-52 6,121 16,780 22,900 52-53 1,651 1,271 2,920 53-54 1,891 1,014 2,910 54-55 205 0 210
1955 ... 56 0 566 2 0 570 56-57 28d 475 0 38d 540 51-58 1,030 10,924 18,401 20 30,380
a. Rounded off to nearest 10 acre-feet. b. First used in 1932-33. c. First used in 1944-45. d. First used in 1956-57.
-158-
,~,
Subsurface Flow
Subsurface flow leaves the Upper Los Angeles River area at two
locations, one southerly through the Los Angeles Narrows (Gage F-57 on
the Los Angeles River) and the other easterly across the topographic divide
in the vicinity of Pickens Canyon.
Subsurface flow takes place through the relatively thin section
of water-bearing material shown as Section L-LI on Plate 5D (in vicinity
of Gage F-57). Computation of annual quantities of underflow at this
point by the slope area method is discussed in Appendix p. Subsurface
flow from the Verdugo area easterly to the Monk Hill Basin was estimated
for high and low water table conditions at the narrowest section of the
valley fill east of the Verdugo Subarea boundary (about midway between
Pickens Canyon Wash and the topographic boundary). The annual flow values
were then determined from these data and water level conditions as indicated
by well hydrographs. The total estimated annual amounts of underflow leaving
the Upper Los Angeles River area near gaging station F-57 and in the vicinity
of Pickens Canyon are presented in Table 31.
Conditions limiting subsurface flow between hydrologic subareas
have previously been described in Chapter III. Annual amounts of such
flow are discussed in Appendix P and summarized in Table 32.
-159-
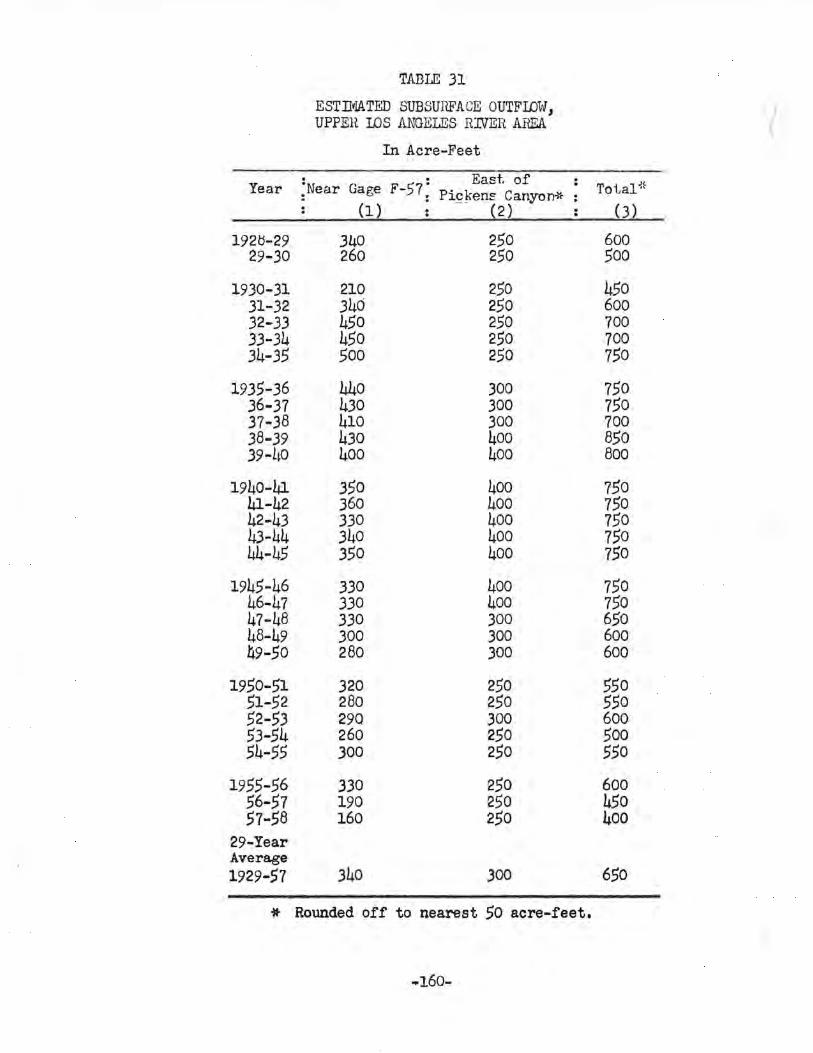
TABlE 31
ESTn~IATED SUBSURFACE OUTFIDt-l, ( UPPEH IDS ANGELES RIVEH AREA
In Acre-Feet
Year :N ' 5 : East. of : Tota1~~ : ear Gage F- 7: Pi~¥ens Canyon* : : (1) : (2) : (3)
1921:1-29 340 250 600 29-30 260 250 500
1930-31 210 250 450 31-32 340 250 600 32-33 450 250 700 33-34 450 250 700 34-35 500 250 750
1935-36 440 300 750 36-37 430 300 750 37-38 410 300 700 38-39 430 400 850 39-40 400 400 800
1940-41- 350 400 750 41-42 360 400 750 42-43 330 400 750 43-44 340 400 750 44-45 350 400 750
1945-46 330 400 750 46-47 330 400 750 47-48 330 300 650 48-49 300 300 600 49-50 280 300 600
1950-51 320 250 550 51-52 280 250 550 52-53 290 300 600 53-54 260 250 500 54-55 300 250 550
1955-56 330 250 600 56-57 190 250 450 57-58 160 250 400
29-Year Average 1929-57 340 300 650
* Rounded off to nearest 50 acre-feet.
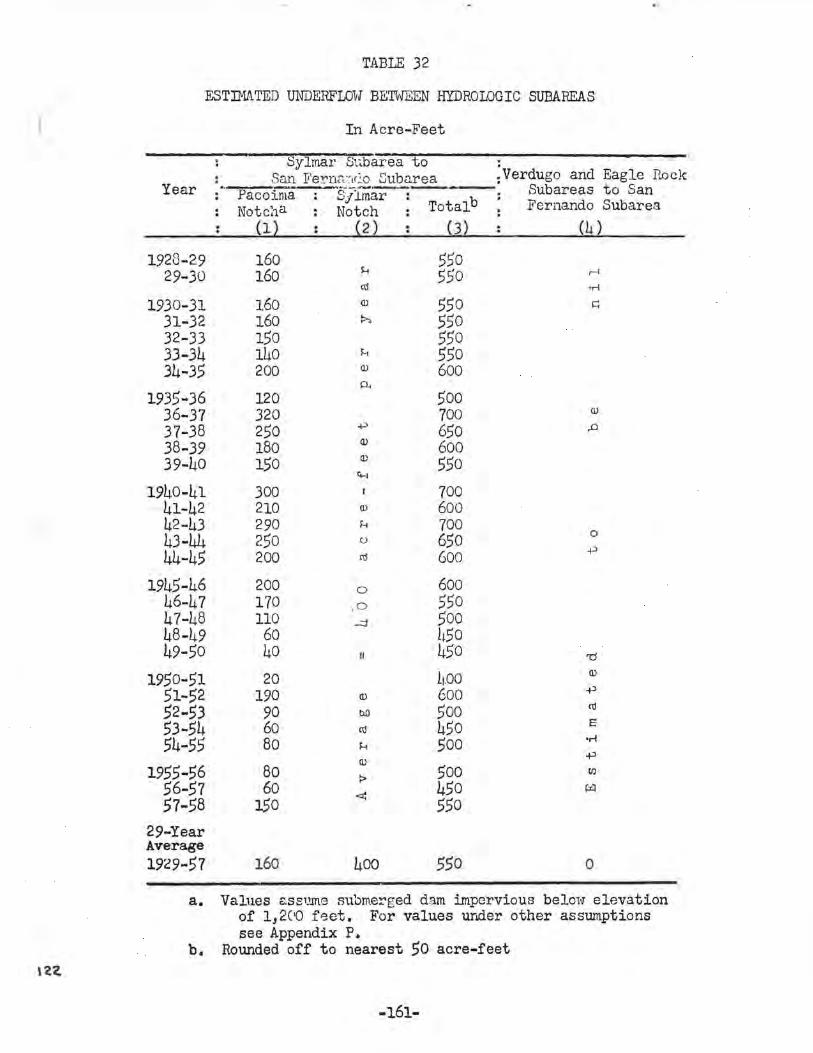
TABIE 32
ESTTI1ATED UNDERFL01rJ BETVVEEN HYDROLOGIC SUBAREAS
In Acre-Feet
Sylmar Sl .. barea to :Verdugo and Eagle nock ,san Fern<1,:~l(~O 0ubarea
Year Paco:Gi'ia -§j:Lmar- ; Subareas to San Notc~1a Notch Totalb Fernando Subarea
(ll {2 ~ . (3~ (4 ) . 1923-29 160 550
29-30 160 H 550 r-l
cU .r!
1930-31 160 Q) 550 ~
31-32 160 p., 550 32-33 150 550 33-34 140 H 550 34-35 200 Q) 600
p..
1935-36 120 500 36-37 320 700 Q)
37-38 250 .j..:> 650 .0
38-39 180 Q) 600 39-40 150 Q)
Ct-I 550
1940-41 300 700 41-42 210 Q) 600 42-43 290 H 700 43-44 250 650 0
C)
44-45 200 cU 600 +>
1945-46 200 0 600 46-47 1'10 ,0 550 47-48 110 ....:::t 500 48-49 60 !~50 49-50 40 II 450 '0
1950-51 20 Loo Q)
51-52 190 Q) 600 +>
52-53 90 bJl 500 cU
53-54 60 cU 450 E
54-55 80 500 'r! H
Q) +>
1955-56 80 ? 500 CJJ
56-57 60 ~
450 ~
57-58 150 550
29-Year Average 1929-57 160 400 550 0
a. Values c:.SS1.1!TlG submerged da.m impervious belm" elevation of 1,2('0 f'3et. For values urrler other assumptions
b. see Appendix P.
Rounded off to nearest 50 acre-feet ,~~
-161-
Changes in Ground Water Storage
Water in excess of other demands remains in the area, percolates (
to the water table and results in increased ground water in storage.
Conversely, water must necessarily corne from ground water storage if all
dew~nds in excess of other supplies are to be met. The r-esultant change
of ground water in storage is indicated by rising ground water levels as
water goes into storage and falling levels as water comes out of storage.
Water in transit to the water table is not feasible of evaluation and on
the average has been removed from consideration since both the start and
end of the base period are preceded by dry years cruIsing this unaccounted-
for water to be relatively minor.
The volume of material saturated or drained is the product of the
area and the mean change of ground water level s occurring therein. The
resultant change in storage was evaluated as the product of this volume and
the mean specific yield of the material. Methods of determining the
specific yields utilized are discussed in Chapter III and Appendix D.
In general the change in storage computation procedure consisted
of determining the change in each of 52 separate storage units selected so
that each area contained homogeneous hydrologic and geologic characteristics.
Change in storage within a hydrologic subarea was computed as the summation
of the changes ih the group of storage units contained therein. Details
of this procedure are described in Appendix Q.
Water level data on a large number of wells were available for
the area within the boundary of the valley fill. The locations of wells
having water level measurements during at least a portion of the 29-year
-162-
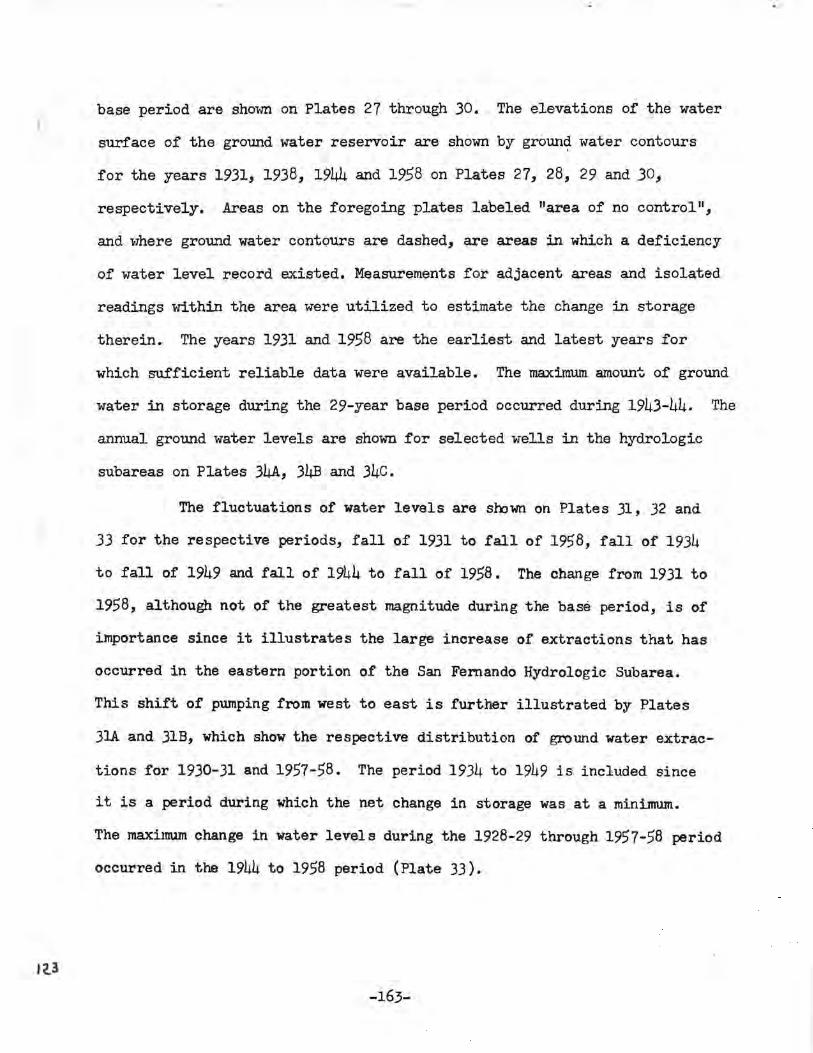
( base period are shown on Plates 27 through 30. The elevations of the water
surface of the ground water reservoir are shown by groun9 water contours
for the years 1931, 1938, 1944 and 1958 on Plates 27, 28, 29 and 30,
respectively. Areas on the foregoing plates labeled "area of no controlll,
and where ground water contours are dashed, are areas in which a deficiency
of water level ~ecord existed. Measurements for adjacent areas and isolated
readings within the area were utilized to estimate the change in storage
therein. The years 1931 and 1958 are the earliest and latest years for
which sufficient reliable data were available. The maximum amount of ground
water in storage during the 29-year base period occurred during 1943-44. The
annual ground water levels are shown for selected wells in the hydrologic
subareas on Plates 34A, 34B and 34c.
The fluctuations of water levels are shown on Plates 31, 32 and
33 for the respective periods, fall of 1931 to fall of 1958, fall of 1934
to fall of 1949 and fall of 1944 to fall of 1958. The change from 1931 to
1958, although not of the greatest magnitude during the base period, is of
importance since it illustrates the large increase of extractions that has
occurred in the eastern portion of the San Fernando Hydrologic Subarea.
This shift of pumping from west to east is further illustrated by Plates
31A and 31B, which show the respective distribution of ground water extrac
tions for 1930-31 and 1957-58. The period 1934 to 1949 is included since
it is a period during which the net change in storage was at a minimum.
The maxilmwn change in water levels during the 1928-29 through 1957-58 period
occurred in the 1944 to 1958 period (Plate 33).
-163-
Ground water levels used for change in storage were generally
measured in October of each year. The beginning of the water year was
considered the best annual reference point because at this time the water
surface had generally recovered from localized effects of heavy summer
pumping and it ~.ras usually prior to winter rainfall which might cause
abnormalities in the ground water surface. In several instances where
measurements in October were not available, measurements in November and
December wero utilized resulting, in some cases, in the use of measurements
taken after appreciable precipitation had occurred. In these cases, the
computed change in storage may be in error for that year and subsequent
hydrologic years because of the influence of rain on pumping draft and
related water level effects. The error, however, will compensate over a
period where comparable water levels were obtained; this is believed to be
no greater than two years during the base period and is of major consequence
only in the period 1955-56 through 1957-58.
Free ground water conditions are generally found to exist in the
major portion of the valley fill including the San Fernando and Verdugo
Hydrologic Subareas. Confined ground water conditions are indicated in the
Eagle Rock and Sylmar Hydrologic Subareas; thus change in storage in these
subareas was considered to have occurred only in the free water table or
forebay portion thereof. A paucity of well data precluded a determination
of the forebay extent in the Sylmar area and change in storage in this
area was determined from water level changes and specific yields occurring
throughout that subarea, It is believed that this approximation gives
-164-
I (
l results which will not grossly affect the accuracy of the overall deter
mination of change in storage in the combined subareas because of the
relatively small specific yields used and the relatively moderate cyclic
variation of water levels which has occurred in the Sylmar Subarea during
the base period.
The Eagle Rock forebay area comprises 535 acres or 69 percent
of that small hydrologic subarea. Specific yields for this area were
obtained by correlation of existing geologic information with specific
yield data determined for the neighboring valley fill in the vicinity of
the City of Glendale.
Annual and cumulative amounts of change in storage in the valley
fill material of the Upper Los Angeles River area thus determined are
shown in Table 33.
-165-
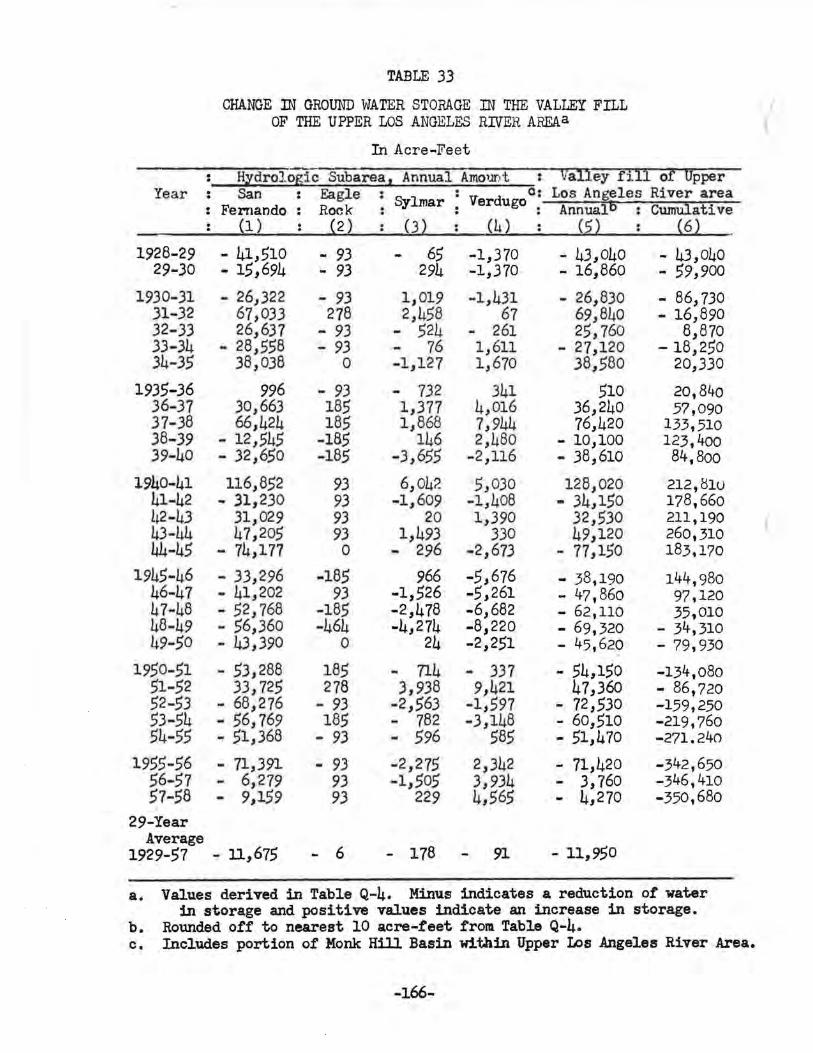
TABLE 33
CHANGE m GROUND WATER STORAGE IN THE VALLEY FILL I OF THE UPPER LOS ANGELES RIVER AREAa
In Acre-Feet
H:i:droloii c Subarea I Annual Amount Valley fill of Upper Year San Eagle • • o· Los Angeles River area
Fernando Rock : Sylmar : Verdugo : Annua1b : CumUlative . . . ~1 ) ~2 ~ C3~ ~4 ~ (2 } ~6l
1928-29 - 41,510 - 93 65 -1,370 - 43,040 - 43,040 29-30 - 15,694 - 93 294 -1,370 - 16,860 - 59,900
1930-31 - 26,322 .. 93 1,019 -1,431 - 26,830 - 86,730 31-32 67,033 278 2,458 67 69,840 - 16,890 32-33 26,637 .. 93 .. 524 - 261 25,760 8,870 33-34 - 28,558 - 93 76 1,611 .. 27,120 - 18,250 34-35 38,038 0 -1,127 1,670 38,580 20,330
1935-36 996 .. 93 .. 732 341 510 20,840 36-37 30,663 185 1,377 4,016 36,240 57,090 37-38 66,424 185 1,868 7,944 76,420 133,510 38-39 - 12,545 -185 146 2,480 - 10,100 123,400 39-40 - 32,650 -185 -3,655 -2,116 - 38,610 84,800
1940-41 116,852 93 6,042 5,030 128,020 212,81U 41-42 - 31,230 93 -1,609 -1,408 - 34,150 178,660 h2-43 31,029 93 20 1,390 32,530 211,190 43-44 47,205 93 1,493 330 49,120 260,310 4h-45 - 74,177 0 - 296 -2,673 - 77,150 183.170
1945-46 - 33,296 -185 966 -5,676 - 38,190 144,980 46-47 - 41,202 93 -1,526 -5,261 - 47,860 97,120 47-48 - 52,768 -185 -2,478 -6,682 - 62,110 35,010 48-49 - 56,360 -464 -4,274 -8,220 - 69,320 .. 34,310 49-50 - 43,390 0 24 -2,251 - 45,620 .. 79,930
1950-51 - 53,288 185 - 714 - 337 - 54,150 -134,080 51-52 33,725 278 3,938 9,421 47,360 - 86,720 52-53 - 68,276 - 93 -2,563 -1,597 - 72,530 -159,250 53-54 .. 56,769 185 - 782 -3,148 - 60,510 -219,760 54-55 - 51,368 - 93 - 596 585 - 51,470 -271.240
1955-56 .. 71,391 .. 93 -2,275 2,342 .. 71,420 -342,650 56-57 - 6,279 93 -1,505 3,934 - 3,760 -346,410 57-58 .. 9,159 93 229 4,565 - 4,270 -350,680
29-Year Average
.. 11,950 1929-57 - 1l,675 - 6 - 178 91
a. Values derived in Table Q-4. Minus indicates a reduction of water in storage and positive values indicate an increase in storage.
b. Rounded off to nearest 10 acre-feet from Table Q-4. c. Includes portion of Monk Hill Basin within Upper Los Angeles River Area.
-166-
( Determination of Consumptive Use by Inflow-Outflow Method
Consumptive use or disposal of water to the atmosphere through
evapotranspiration accounts for a large port,ion of the water diminution
in the Upper Los Angeles River area. It includes the amounts of water
evaporated by natural or industrial processes, the water transpired by
plants and the relatively minor quantities of water incorporated in plant
fiber, industrial products and household uses.
Total consumptive use is computed in this chapter as the differ-
-ence between already determined items of water supply and disposal by
equating all such items in an inflow-outflow water inventory for the area.
The various items of supply and disposal used are shown diagrammatically
on Figure 3 to illustrate their physical relationship and composition.
This procedure for determining consumptive-use is called the Inflow-outflow
Method and the values derived by this method are shown in Table 34.
-167-
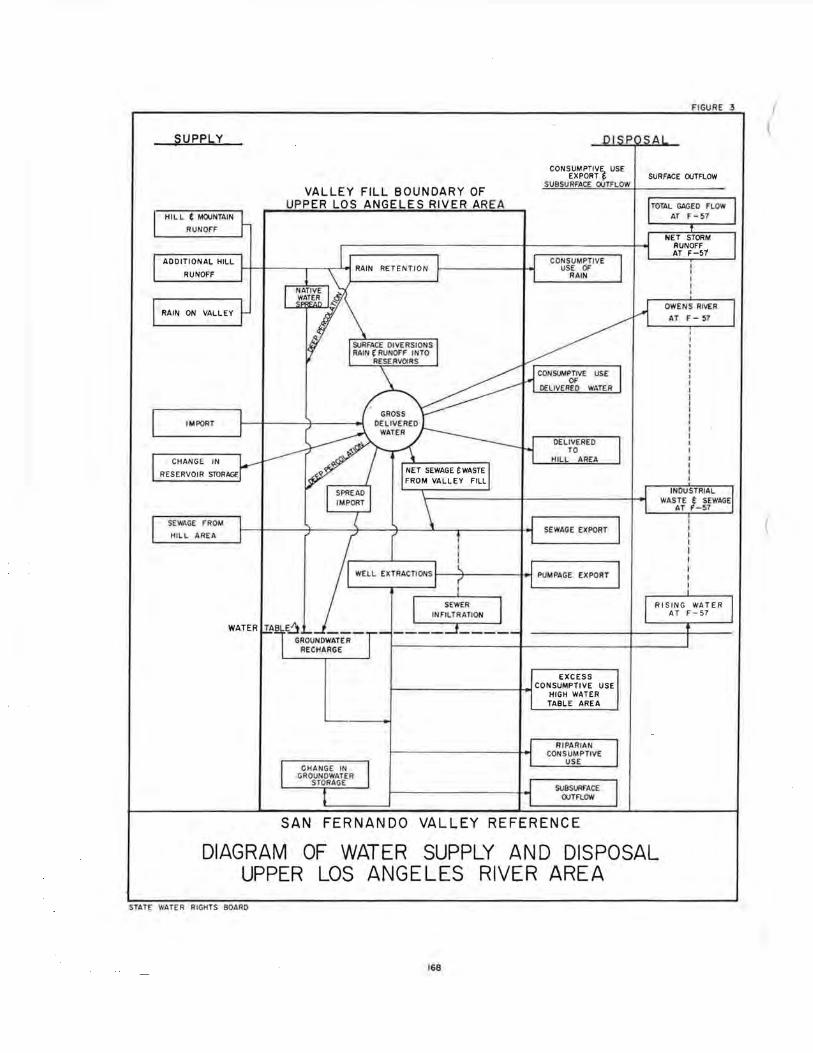
SUPPLY
I HIL L t MOUNTAIN L RUNOfF r
VALLEY FILL BOUNDARY OF UPPER LOS ANGELES RIVER AREA
FIGURE 3
DISPOSAL
CON SEu::.~WEt USE
SUBSURFACE OUTflOW SURFACE OUTFLOW
lTOTAL GAGED FLOW I AT f - ~7
J NET STORM 1
1r--------------------------t--------------~~-1 :~~~~1
l ADDITIONAL HILL 1 1 I CONSUMPnVE I RUNOFF IH-f-------,J---~-.---L.j RAIN RETENTION II--_____ ~J US~AI;r i
1 ~71~! I
1 ~ .. ~ OWEN S RIVER 1 RAIN ON VALLEY L AT F - 51
I
<I. SURFACE DIVERSIONS I II RAIN ~ RUNOFF INTO I
RESERVOIRS I
HCONSUMPTlV£ USE I
Of : O€LlVERED WATER I
I 1 I GROSS !
I ,,:~:':, ~ ~'~~;'f:" --IL-"':H:.:!°IE:JL~=_~"'...:o:~R~!:D~A __ ....J ;
RESERVOIR STORAGff I NET SEWAGE tWASTE I I FROM VALLEY FILL I I
SPREAD 1 \ .1 INDUSTRIAL ,I AT F-57
IMPO (RT\--\------------+---------------+-.ll WASTE t SEWAGE
1 S£WAGE FROM 1t----f------r------+-----+------lL---.--------+..j ! HILL AREA ] SEWAGE EXPORT ( i ~--~ I
( : 1
SEWER 1 1 RISING WATER 1 INFILTRAnON AT F-57 l1 WELL EXTRACTIONS :1----: i.,1 ~----f-.l PUMPAGE EXPORT !
WATER ~i8LEE.1 ______ ---1_____ _ _____ -+ ____ +-t __
GROUNDWATE R 1 RECHARGE r------------------t--------------~------~
I OHANGE IN J
GROUNDWATER STORAGE
EXCESS
I-------------------f-...j CO NH~~~P!~~~ RUSE
TABLE AREA
RIPARIAN I CONSUMPTIVE
USE
SUBSURFACE OUTFLQW
SAN FERNANDO VALLEY REFERENCE
DIAGRAM OF WATER SUPPLY UPPER LOS ANGELES
AND DISPOSAL RIVER AREA
STATE wATER RIGHTS BOARD
168
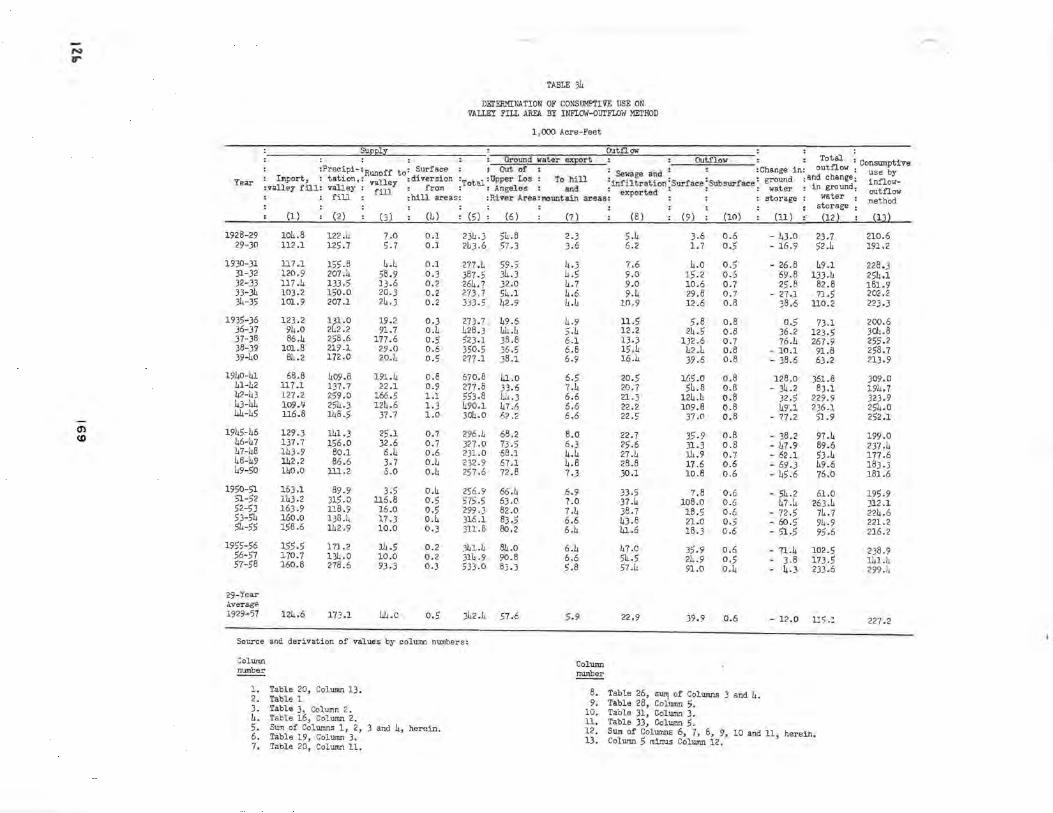
(
-170-
CHAPTER VI. HISTORIC GROUND WATER RECHARGE
To determine the effect of import on the safe yield of the ground
water reservoir of the Upper Los Angeles River area, a determination of the
amount of recharge to the reservoir originating from supplies imported to
the area is required. In Table 34, page 169, an evaluation bas been made
of the disposal of the combined supply of native and imported water to the
valley fill area. To identify the proportion or amount of the imported
supplies which reaches the ground water reservoir as recharge, requires a
breakdown of consumptive use quantities on the basis of whether the use
was made from native or imported supplies and the proportion of the supply
which contributed to recharge through deep percolation.
The "Integration Method" for determination of consumptive use
provides the means of making the required breakdown and in addition provides
a check on the combined consumptive use heretofore determined by the "InfloW'
OutfloW'Method." The ground water reservoir of the Upper Los Angeles River
area consists of water-bearing materials in the valley fill area as deter
mined on Plate 5. The maximum water in storage within the range of water
levels in materials watered and deW'atered during the period 1928-29 through
1957-58 occurred in 1943-44. The minimum occurred in 1957-58.,
-171-
r
Consumptive Use by Integration Method
Annual amounts of consumptive use are determined by the Integration
Method through the use of data on unit evapotranspiration or consumptive use
of water for each culture type and on the acreage devoted to that culture.
The total consumptive use occurring on the valley fill lands is aetermined by
this method as the summation of the parts. These parts are the product of
unit consumptive use and area of each type of land use, the consumptive use
of water system losses and the excess consumptive use on high ground water
areas. The sum of these parts, each of which is separately derived, is the
total consumptive use on the valley fill area.
Computations of unit consumptive use have been made by determining
the supply of native and delivered water available to the areas devoted to
each culture type or land use class and computing the portions of the supply
disposed of through evaporation, runoff, transpiration, deep percolation and
storage in the soil.
Recognition of seasonal effect on consumptive use is made by com
puting the consumptive use by months for the winter season of October through
April when the supply is largely uncontrolled rainfall, and as a lump sum for
the summer months of May through September when the use is almost exclusively
from delivered water to which a relatively uniform irrigation efficiency is
applicable.
Unit values of consumptive use have been determined as described in
Appendix L and separate computations of unit consumptive use for ea~h year are
summarized for each culture or land use class in Tables L-13, L-14 and L-15.
Methods of computation are illustrated on Figures L-1 and L-2.
-172-
. IZB
The areas of different types of vegetative cover and of land and
water surface areas were determined for each year of the base period from
aerial maps, photographs and field surveys as described in Appendix K.
Evaporation
Evaporation is a function of vapor pressure which varies with
humidity, temperature and wind movement. The evaporation pan is sensitive
to these factors and is commonly utilized to determine rates of evaporation
from water surfaces. Moist surfaces, such as saturated soils and wet
impervious areas, have been considered to baYe an evaporation rate equivalent
to that of a water surface. Average daily rates of evaporation were determined
for each month for days of rain and for days of no rain. The average daily
rates of evaporation were applied separately to pervious and impervious
areas with the maxi~lm evaporation allowed being 0.60 and 0.50 of an inch,
respectively, during and following each storm (see Appendix L).
Evaporation of Irrigation Water. The evaporation of irrigation
water is estimated to be 15 percent of the delivered water and is included
in the consumptive use.
Residual Rain on the Valley Fill Area. Precipitation falling on
the pervious portions of the valley fill area is assumed to be either con
sumed or to percolate while precipitation falling on the impervious portions
will either evaporate or become runoff. This runoff originating on impervious
areas is termed residual rain. A portion of the residual. rain percolates in
transit to Gage F-57 and the remainder becomes part of the storm now passing
Gage F-57 •
-173-
Irrigated, Native and Residential Land Use Areas
Computations of consumptive use for land use classes containing
areas of vegetation were made for two separate periods: (1) the winter
season of October 1 through April 30 and (2) the summer period May 1 through
September 30. Two separate periods were used because of the different rate
of plant growth and the variation in the amount of water available to the
plant during the two periods. During the winter season large variations
occur in the amounts of precipitation; therefore, the winter season compu
tations were made monthly by first determining the water received by the
soil, which was thus available for plant growth. This was taken as the sum
of precipitation and delivered water reaching pervious areas less the evapo
ration of each. The water available, thus determined, was considered to
be first utilized in satisfying the monthly transpiration requirements
of the crop and secondly to satisfy any deficiency in the soil moisture
within the root zone. The remainder was considered as deep percolation
recharging the ground water.
Transpiration rates of the crops found in the area were determined
from field investigations made in the San Fernando Valley by the Soil
Conservation Service during the late 1940lS or by transposing a value deter
mined in another area similar to the Upper Los Angeles River area. The
amount of soil moisture that could be held in storage within the root zone
was determined from investigations made by the Soil Conservation Service and
from published information on rooting depths and moisture-holding capacities
-174-
It9
of soils. In months when water available to the plant was less than the
transpiration requirements, water was taken from storage within the root
zone.
Consumptive use on irrigated lands during the summer season was
determined by applying an irrigation efficiency for the particular crop to
the known water deliveries. Depths of water delivered for each crop during
the winter months and the summer growing season for each year of the base
period are determined in Appendix J. The irrigation efficiency was based
on work done by the Soil Conservation Service in the area and on discussions
with Mr. H. F. Blaney who was in charge of the work. The consumptive use as
determined for each of the periods was split into the parts derived from
precipitation and delivered water in proportion to the amounts of each
supply available. The sum of the consumptive use of each supply for the two
periods is applicable to the net area of the land use and was adjusted to
the gross area by weighting the net values for percent of each crop or im
pervious area included in a land use class. Unit values of consumptive use
determined by the above methods for each of the hydrologic subareas are
shown in Tables ~-13, 1-14 and 1-15 in Appendix 1, in which further details
of the computations are set forth. Average annual consumptive use during
the 29-year base period from irrigated agriculture and residential land
use classes overlying the valley fill was 105,410 and 60,430 acre-feet,
respectively.
-175-
Industrial and Commercial Land Use Areas
Consumptive use by industrial and cOJllllercial. areas varies with
the type of industrial process and was estimated on an annual basis. The
annual depth Qf water consumed on industrial and commercial areas was
based on values published in Bulletin 2, entitled '~ater Utilization and
Requirements of California", State Water Resources Board. Bulletin 2
gives values of 0.40 to 1.4 acre-feet per acre for consumptive use by
industrial and commercial areas, based on total water delivered to this
type of land use less sewage discharged into a sewerage ~stem.
On the basis of the above values and 1958 land use data, the
Referee selected the value of 0.85 acre-foot per acre as being represent
ative of the difference between delivered water and sewage discharged to
the sewerage s,ystem for industrial and commercial areas (see Appendix L).
Therefore, the 0.85 acre-foot per acre represents consumptive use plus
industrial wastes discharged to the stream system. Records of water
sales indicate that defense industries in Burbank, Glendale and the Los
Angeles Narrows used larger amounts of delivered vater during the war
years; therefore, the depth of consumptive use was "increased during the
war years (see Appendix L). Water sales records for the breweries and
steam plant in the valley show that these plants used water greatly in
excess of the amount estimated by the above method. The additional use
by these plants after 1952-53 is estimated in Appendix L.
Deep percolation of water delivered to commercial and industrial
areas occurs primarily from the discharge of industrial wastes in the
channels of the stream system with minor amounts occurring on commercial
and industrial land use areas. The amount occurring in the stream
-176-
{

130
system are equal to the difference between industrial wastes discharged
to the stream system (Table 26A, page l51b) and wastes passing Gage F-57
(Table 28, page 153). A relatively small amount of deep percolation has
been found to occur in the area of use at the Valley Steam Plant of the
City of Los Angeles (see Appendix L, page L-40).
The annual constUII.ptive use by cODllllereia1. and industrial areas
averaged 6,710 acre-feet during the base period, comprising les9 than
seven percent of the total average conswaptive use of delivered water.
Excess Consumptive Use in High ~ter Table Areas
In areas where ground water is wi thin 10 feet of the ground
surface, an incremental evaporation occurs from moisture brought to the
surface by capillary action in the 80il and certain plants increase their
transpirational use because of the more readily available supply.
Areas of high ground water have existed in the San Fernando Subarea
and in the lower portion of the Sylmar Subarea. Extent of the high ground
water area in the western portion of the San Fernando Subarea was determined
from water level measurements at wells and piezometers observed for this
purpose by the U. S. SoU Conservation Service in cooperation with the City
of Los Angeles. The extent of the high ground water area in the fall of
1944 is shown on Plate 29. Due to the paucit.y of water level data in the
western portion of the Sylmar Subarea, the extent of this area where excess
consumptive use of ground water occurred was determined from the relative
concentration of calcium carbonate existing in the soil. Using these data
to limit the area, excess consumptive use during the base period was calcu
lated by using water level observations at wells of the City of San Fernando,
the Mission Well Field of the City of Los Angeles, and test hole data.
-177-
Characteristics of soils and their relationship to past vegetative and -
water table conditions in the cienaga of the Sylmar Subarea were investi-
gated by the Department of Water Resources in cooperation with the Referee.
The Department I s report is set forth in Appendix C and on Plates 7 and 8.
The depth of consumptive use in high ground water areas in excess
of that which would normally occur was estimated as the difference between
consumption based on high water table conditions and the normal consumption
shown in Tables L-13 through L-15. Consumption under high ground water
conditions is based on experiments in the LoHer San 1uis Rey Valley. The
basic data and procedures utilized in these studies are set forth in
Appendix 1. The 29-year average annual consumptive use of ground water
(excess consumptive use) in areas of high ground water is 2,640 acre-feet.
(see Table 1-22, page 1-70).
Riparian Areas
Consumptive use by riparian vegetation, located in and adjacent
to stream channels, has occurred during the base period mainly in the lower
reaches of the Los Angeles River. The total annual depth of consumptive use
for this type of vegetation was taken as equal to the annual transpiration
rate for similar type growth in the Upper Santa Ana Valley, transposed by
mean temperatures, plus the evaporation of rain. The annual depth of con-
(
sumptive use of ground water was taken as the total annual depth of consumptive
I
use less the precipitation and is shown in Tables 1-13 and 1-15 (see Appendix 1).
The average annual consumptive use of ground water on riparian areas during
the base period is 2,000 acre-feet.
-178-
\3\
ConsUT:\ptive Use of Water Sy~tem IJosRes
~'later ~ystem 10sr,8f3 are comprised of sewer flushing water, distrib
ution loss and oth8r J OS[;. Only t.hE! latter ti-1O items contain portions that
may become coriSlunpti ve use. The amount of sew"er flushing water exported in
sewer mains h:~s been evaluated. in Chapter V (see Table 26). Data available
on comparable systems indicated that the maximum continuous pipe system
1 Aakage, or distribution loss, to be expected was approximatel.y sL~ percent,
computed as a percentage of the gross available for dist.ribut.ion.
Foliage and plant growth along the roadw~s is estimated, on the
average, to overhang approximately 20 percent of the paved area underlain
by the pipes of the distribution system; thus, it is believed that the root
system of this vegetation would have access to and transpire approximate~
the equivalent percentage of distribution losses.
The system loss in excess of sewer flushing and distribution loss
is termed other loss and is comprised of meter slippage and unmetered de
liveries. This portion of the system loss is taken as consumptively used
in the same proportion as is water applied to the land use classes (i.e.,
net delivered water less sewage and wastes). The remainder of the system
loss was considered as deep percolation. Negative values shown in Table 36
indicate that the amounts shown as available were less than the amounts
shown as delivered. The negative values are retained in this and following
tables to permit an accounting that is mathematically correct. During the
base period consumptive use of water system losses averaged 3,250 acre-feet
per year.
-179-
Summary
The armual amount of consumpti va use on the valley fill area is
the summation of the annual amount occurring on land use class areas, ex
cess consumptive use, and consumptive use of water system losses. The annual
amount of consumptive use on land use classes and excess consumptive use are
shown in Table 35. The consumptive use of water system losses is shown in
Table 36. The total amount of consumptive use on the valley fill area is
the total of the amounts in Tables 35 and 36 and is shown in Table 37.
During the 29-year base period, consumptive use on irrigated
lands and on residential areas averaged 46 and 26 percent, respectively,
of the average total consumptive use on the valley fill area. The
effect of urbanization is shown by the averages for the base period and
the 9-year period (1949-50 through 1957-58). During this latter period
consumptive use on irrigated lands and on residential areas averaged 31
and 43 percent respective~.
-180-
{

TABLE 35
SUMMARY OF INTEGRATED CQNSUMPTIVE USE AND DEEP PERCOLATIOOa 00 LAND USE AREl.S WITHIN BOUNDARY OF VALLEY FILL
In Acre-Feet
r .. cr ops ReSl ent1.a I'!i. sce.n a 080 U.
'{~r nsumpt ve use eep ~rco tion Consumpt1 ve use ~eep percolatlon Consumptive use : Deep percolation
O"liverl,HI : Dell veri!d ileUve red Llelive cO<! lI.lin : Delivered : Rain .,.·rater n...in 'dilter lI.lin wa. t.c 1'" Rain
" .. Ler : >later : Rain
(1) (2) (3) (L2 (S) (6) (7) {8) (9) : (10) (11)
1928-29 55,830 76,910 260 17,940 15,350 14,750 450 1,340 42,470 4,390 u 29-30 53,010 77 ,860 2,220 17,020 14,520 15,740 2,040 2,630 44,070 4,410 0
1930-31 59,500 72,200 5,900 17,840 18,140 15,620 3,260 2,810 54,510 4,880 0 31-32 62,210 54,690 16,760 17,330 21,670 9,840 7,470 2,530 68,710 3,240 7,920 32-33 41,760 58,570 9,860 17,040 15,410 9,720 4,410 1,730 44,790 4,550 2,600 33-34 47,220 61,960 10,430 17,730 17,41C 12,030 4,860 2,130 45,760 4,270 3,620 34-35 76,580 57,490 4,330 15,420 30,990 9,460 3,260 1,120 64,370 2,880 1,190
1935-36 49,490 74,600 4,670 19,200 20,330 11,230 2,660 1,460 37,000 3,840 690 36-37 71,590 62,030 25,560 21,290 30,960 10,670 12,220 1,830 57,220 2,990 11,240
. 37-38 61,170 53,570 34,000 19,320 29,870 11,670 17,780 2,820 . S6,060 2,840 22,500 38-39 60,970 58,780 16,910 19,040 35,100 15,000 7,320 2,900 62,620 3,520 3,960 39-40 50,480 52,130 8,010 14,640 29,970 15,950 5,350 2,380 52,550 3,650 550
1940-41 70,900 42,570 65,800 18,200 41,950 12,110 40,)70 3,370 70,140 1,500 48,830 41-42 49,900 65,040 340 13,810 30,230 18,600 1,460 1,810 34,960 3,870 0 42-43 56,200 61,140 33,890 22,960 35,190 21,550 21,6)0 4,800 45,550 3,070 20,450 43-44 55,600 58,670 31,220 21,950 36,400 22,270 21,470 6,070 45,110 2,860 17 ,350 44-45 48,350 68,860 1,500 15,120 32,050 27,090 ),990 3,210 )6,0)0 3,440 760
1945-46 42,580 70,67c 4,520 16,660 29,660 )1,580 5,180 7,500 )2,050 3,590 480 46-47 41,640 68,930 4,850 15,870 31,980 38,070 7,420 6,210 39,300 3,670 770 47-48 24,100 76,240 30 11,560 20,950 46,330 490 3,850 19,210 4,440 0 48-49 24,350 74,510 130 11,270 24,260 49,090 1,000 4,)50 21,890 4,08(· 0 49-50 27,260 62,730 1,770 11,570 29,490 49,870 2,600 5,070 29,000 3,750 0
1950-51 24,200 69,270 90 10,780 27,600 55,830 1,060 3,790 21,640 3,840 0 51-52 50,350 45,360 30, no 17,020 49,490 47,270 34,940 10,540 49,610 2,390. 21,050 52-53 28,690 57,240 6'JO 9,440 33,110 62,080 4,580 7,470 27,860 3,870 0 53-54 28,460 44,970 3,100 10,370 33,290 60,980 9,080 10,950 30,930 3,300 740 54-55 26,400 37,840 740 6,490 45,670 62,030 4,450 6,470 36,450 3,720 0
1955-56 25,110 30,190 2,910 6,860 40,230 63,020 12,930 9,6Go 42,420 2,740 100 56-57 15,660 32,230 1,550 7,160 36,520 75,200 8,700 9,570 35,560 3,700 ° 57-58 24,440 24,410 11,160 8,710 60,280 66,180 31,830 8,170 55,850 2,650 12,750
29-Year Average 1929-57 45,850 59,560 11,130 15,200 29,580 30,850 8,700 4,500 43.030 3,560 5,680
a. Excludes deep percolation in the stream system. b. Includes miscellaneous, dry farm and native vegetation, water surface evaporation and riparian vegetation.
Source and derivation of valuea by colmnn numbers:
Column No.
1 through
' 11. Swnmation of the weighted unit values for each land use classification and respective subarea (Tables L-13, L-14 and L-15) multiplied by the respective acreage (Table K-6) except for water surface evaporation. Water surface evaporation computed as per Appendix L.
181
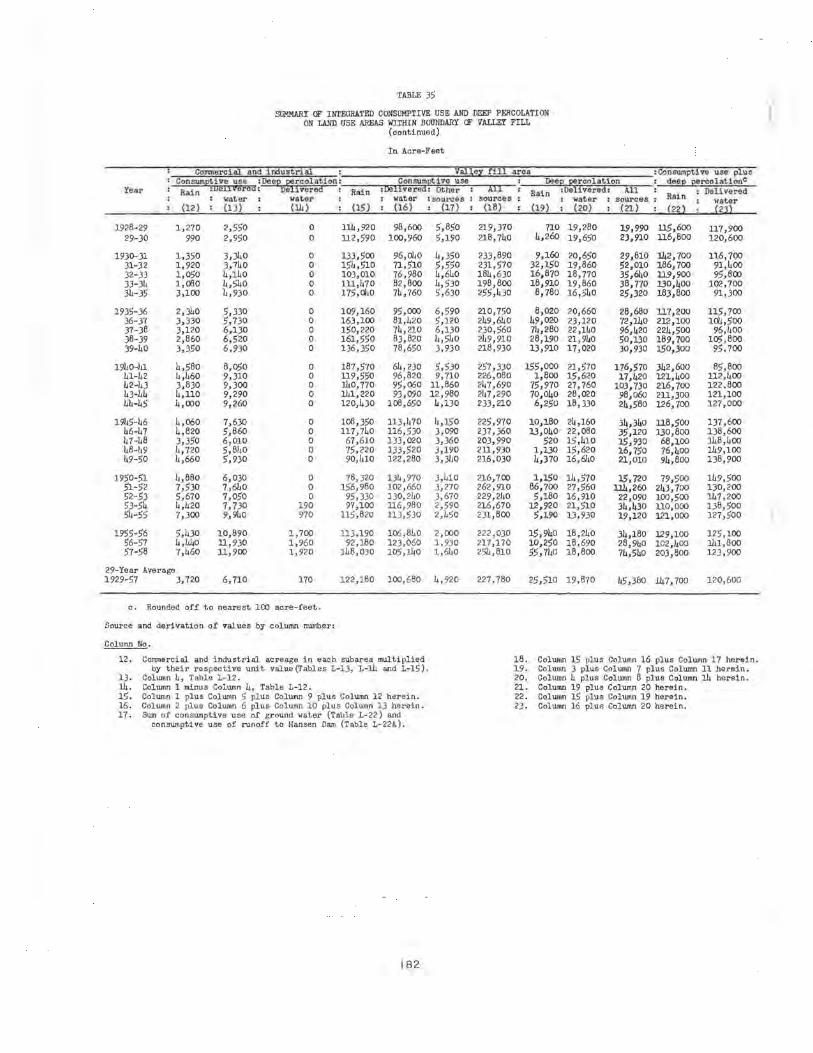
TABLE 35
{ SUMMARY (F INTEGRATED CONSUMPTIVE USE AND DEEP PERCOLATION ON LAND USE AREAS WITHIN BOUNDARY <F VALLEY FILL
(continued)
In Acre-Feet
Co ... ercinl a nd industrial Val!el rill nre ... Consumpt1ve use Plus Consumptive use :Deep ~Tcolation Con5Wl1~i\f6 use DeeQ ~rCOlat.1on desQ Q!!rcolat.1onc
Year Rain :nellJ! ercd : 1Jel V'ored Rain :OeIhe .. ea: otlra r ill Rain ,Oohered: All Delivered : "ster ""Ur 114tsr , SOUrces sources t water : sources Rain
"atel" (12) (13 ) (lia ) (lS) (16) (17) (18) (19) ( 20) (21) (222 (2l1
1928-29 1,270 2,550 0 Ilia, 920 98,600 5,850 219,370 710 19,280 19,990 115,600 117,900 29-30 990 2,950 0 ll2,590 100,960 5,190 218,740 4,260 19,650 23,910 116,800 120,600
1930-31 1,350 3,)40 0 133,500 96,040 4,350 233,890 9,160 20,650 29,810 142,700 116,700 31-32 1,920 3,740 0 154,510 71,510 5,550 231,570 32,150 19,860 52,010 186,700 91,400 32-33 1,050 4,140 0 103,010 76,980 4,640 184,630 16,870 18,770 35,640 119,900 95,800 33-34 1,080 4,540 0 111,470 82,800 4,5)0 198,800 18,910 19,860 38,770 130 ,400 102,700 34-35 3,100 "4,930 0 175,040 74,760 5,630 255,430 8,780 16,540 25,320 183,800 91,300
1935-36 2,)40 5,330 0 109,160 95,000 6,590 210,750 8,020 20,660 28,680 117,200 115,700 36-37 3,330 5,7)0 0 163,100 81,420 5,120 249,640 49,020 2),120 72,140 212,100 104,500 37-38 3,120 6,130 0 150,220 74,210 6,130 230,560 74,280 22,140 96,420 224,500 96,400 38-39 2,860 6,520 0 161,550 83,820 4,540 249,910 28,190 21,940 50,130 189,700 105,800 39-40 3,350 6,930 0 136,350 78,650 3,930 218,930 13,910 17,020 )0,930 150,300 95.700
1940-41 4,580 8,050 0 187,570 64,230 5,530 257,330 155,000 21,570 176,570 342,600 85,800 41-42 4,460 9,310 0 119,550 96,820 9,710 226,080 1,800 15,620 17,420 121,400 112,400 42-43 3,830 9,300 0 140,770 95,060 11,860 247,690 75,970 27,760 10),7)0 216,700 122.800 43-44 u,110 9,290 0 141,220 93,090 12,980 247,290 70,040 28,020 98,060 211,300 121,100 4u-45 4,000 9,260 0 120,430 108,650 4,130 233,210 6,250 18,330 24,580 126,700 127,000
1945-46 4,060 7,630 0 108,350 113,470 4,150 225,970 10,180 2u,160 34,340 118,500 137,600 u6-47 4,820 5,860 0 117,740 116,530 ),090 237,)60 13,040" 22,080 35,120 130,800 138,600 47-48 3,350 6,010 0 67,610 133,020 3,360 203,990 520 15,410 15,930 68,100 148,400 48-49 4,720 5,840 0 75,220 133,520 3,190 211,930 1,130 15,620 16,750 76,400 149,100 49-50 4,660 5,930 0 90,410 122,280 3,340 216,030 4,370 16,640 21,010 94,800 1)8,900
1950-51 4,880 6,0)0 0 78,320 134,970 ),410 216,700 1,150 14,570 15,720 79,500 149,500 51-52 7,5)0 7,640 0 156,980 102,660 3,270 262,910 86,700 27,560 114,260 243,700 130,200 52-53 5,670 7,050 0 95,330 1)0,240 3,670 229,240 5,180 16,910 22,090 100,500 147,200 53-54 4,420 7,7)0 190 97 ,100 ll6,980 2,590 216,670 12,920 21,510 34,430 110,000 138,500 SL-55 7,300 9,940 970 115,820 113,530 2,450 231,800 5,190 13,930 19,120 121,000 127,500
1955-56 5,430 10,890 1,700 113,190 106 , 840 2,000 222,030 15,940 18,240 34,180 129,100 125,100 56-57 1,,440 11,9)0 1,960 92,180 123,060 1,930 217 ,170 10,250 18,690 28,940 102,400 141,800 57-58 7,460 11,900 1,920 148,030 105,140 1,640 2SL,810 55,740 18,800 74,540 20),800 123,900
29-Year Average 1929-57 3,720 6,710 170 122,180 100,680 4,920 227,780 25,510 19,870 45,)80 147,700 120,600
c. Rounded off to nearest 100 acre-feet.
Source and derivation of values by column number:
Column No.
12. Commercial and industrial acreage in each subarea multiplied 18. Column 15 plus Column 16 plus Column 17 herein. by their respective unit value (Tables L-13, L-14 and L-15) . 19. Column 3 plus Column 7 plus Column 11 herein.
13. Column 4, Table L-12. 20. Column 4 plus Column B plus Column 14 herein. 14. Column 1 minus Column h, Table L-12. 2l. Column 19 plus Column 20 herein. 15. Column 1 plus Column 5 plus Column 9 plus Column 12 herein. 22. Column 15 plus Column 19 herein. 16. Column 2 plus Column 6 plus Column 10 plus Column 13 herein. 23. Column 16 pluS Column 20 herein. 17. Sum of consumptive use of ground water (Table L-2 2 ) and
consumptive use of runoff to Hansen Darn (Table L-22A).
182
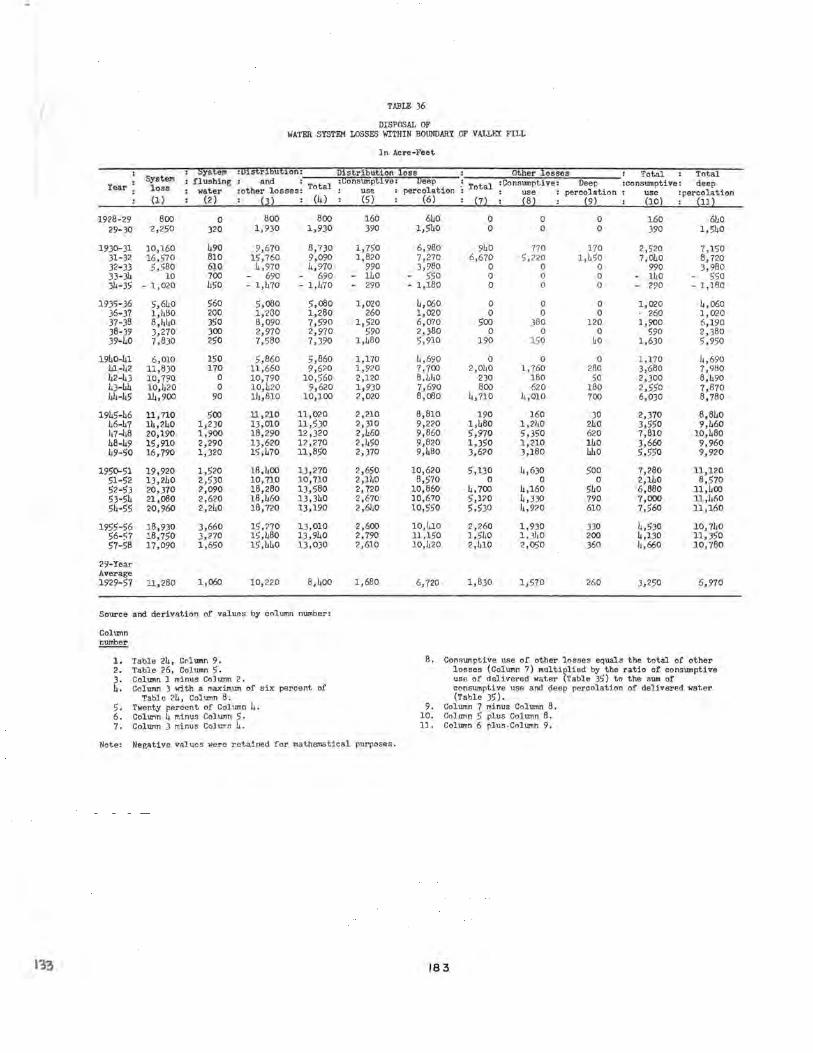
( TABLE 36
DISPOSAL OF WATER SYSTEM LOSSES WITHIN BOUNDARY OF VALLEY FILL
In Acre-Feet
5),stelll 1Uistribut1.0n: Dist r i bu.t.ion lOBS Other losses Total Total 5),st .... flushi ng and : ConS\Dnptlve: Deep :Consmnptive: Deep consumptive deep Year 10 •• Total Total water lother losses: use percolation use percolation use percolation
(1) (2) (~) (4) (5) (6) (7) (8) (9) (10) (11)
1928-29 800 0 800 800 160 640 0 0 0 160 640 29-30 2,250 )20 1,930 1,9)0 390 1,540 0 0 0 390 1,540
1930-31 10,160 490 9,670 8,730 1,750 6,980 940 770 170 2,520 7 ,150 31-32 16 ,570 810 15,760 9,090 1,820 7,270 6, 670 5,220 1 ,450 7,040 8,720 32-33 5,580 610 4,970 4,970 990 3,980 0 0 0 990 3,980 33-JL 10 700 690 690 - 140 550 0 0 0 - 140 550 JL-35 - 1,020 450 - 1,470 - 1,470 - 290 - 1,180 0 0 0 - 290 - 1,180
1935-36 5,640 560 5,080 5,080 1,020 4,060 0 0 0 1,020 4,060 36-37 1,4tlO 200 1,230 1,280 260 1,020 0 0 0 260 1,020 37-3!l 8,440 350 8,090 7,590 1,520 6,070 500 380 120 1,900 6,190 38-39 3,270 300 2,970 2,970 590 2,380 0 0 0 590 2,380 39-40 7,830 250 7,580 7,390 1,480 5,910 190 150 40 1,630 5,950
1940-41 6,010 150 5,860 5,860 1,170 4,690 0 0 0 1,170 4,690 41-42 11,830 170 11,660 9,620 1,920 7,700 2,040 1,760 280 3,680 7,9tlO 42-43 10,790 0 10,790 10,560 2,120 8,uuO 230 180 50 2,300 8,490 43-44 10,420 0 10,420 9,620 1,930 7,690 800 620 180 2,550 7,870 44-45 14,900 90 14,810 10,100 2,020 8,080 4,710 4,010 700 6,030 8,780
1945-46 11,no 500 U,210 11,020 2,210 8,610 190 160 30 2,370 8,840 46-47 14,240 1,230 13,010 11,530 2,3JO 9,220 1,460 1,240 240 3,550 9,460 47-48 20,190 1,900 18,290 12,320 2,L60 9,860 5,970 5,350 620 7,610 10,480 48-49 15,910 2,290 13,620 12,270 2,450 9,820 1,350 1,210 140 3,660 9,960 49-50 16,790 1,320 15,470 11,850 2,370 9,480 3,620 3,180 440 5,550 9,920
1950-51 19,920 1,520 18,400 13,270 2,650 10,620 5,130 4,630 500 7,280 11,120 51-52 13,240 2,s30 10,nO 10,710 2,140 8,570 0 0 0 2,140 6,570 52-53 20,)70 2,090 18,280 1),560 2,720 10,860 4,700 4,160 540 6,880 11,400 5)-54 21,080 2,620 16,460 13,340 2,670 10,670 5,120 4,330 790 7,000 11,MO 54-55 20,960 2,240 16,720 13,190 2,640 10,550 5,530 /',9?0 610 7,560 11,160
1955-56 16,930 3,660 15,no 13,010 2,600 10,410 2,260 1,930 330 /',530 10,740 56-q 18,750 3,270 15,460 13,940 2,790 11,150 1,540 l. }40 200 4,130 11,350 57-56 17,090 1,650 15,440 13,030 2,610 10,420 2,410 2,050 360 4,660 10,780
29-Year Average 1929-57 11,260 1,060 10,220 6,400 1,660 6,720 1,630 1,570 260 3,250 6,970
Source and derivation of values by colwnn nwnber:
Colmnn ~
l. Table 24, Colmnn 9. 6. Consumptive use of other losses equals the total of other 2. Table 26, Column 5. losses (Column 7) multiplied by the ratio of consumptive 3 . Column 1 minus Co] umn 2. use of delivered water (Table 35) to the sum of 4. Column 3 with a maximum of six percent of conSUJTlptive use and deep percolation of delivered water
Table 24, Cohunn B. (Table 35). 5. Twenty percent of Column 4. 9. Column 7 minus Column 8. 6. Colunn 4 minus ColUlnn 5. 10. Column 5 plus Column 8. 7. Column 3 minus Colll1'n 4 . 11. Column 6 plus.Column 9.
Note: Negative values were retained for mathematical purposes.
183
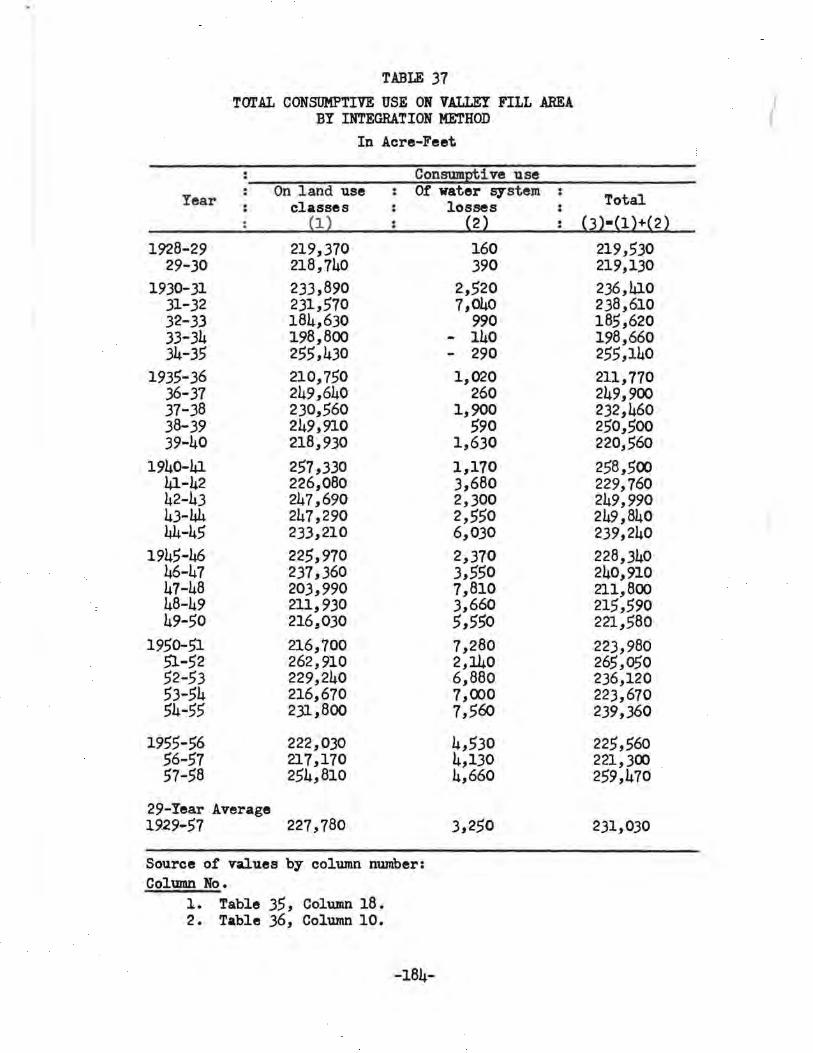
TABLE 37 TOTAL CONSUMPTIVE USE ON VALLEY FILL AREA ( BY INTEGRATION METHOD
In Acre-Feet
: Consum2!:i ve use
Year On land use Of water 57stem Total classes · losses : · : ~12 · ~22 . ~~2·~ll+~2~ · . 1928-29 219,370 160 219,530
29-30 218,740 390 219,130 1930-31 233,890 2,520 236,410
31-32 231,570 7,040 238,610 32-33 184,630 990 185,620 33-34 198,800 - 140 198,660 34-35 255,430 - 290 255,140
1935-36 210,750 1,020 211,710 36-37 249,640 260 249,900 37-38 230,560 1,900 232,460 38-39 249,910 590 250,500 39-40 218,930 1,630 220,560
1940-41 257,330 1,170 258,500 41-42 226,080 3,680 229,160 42-43 241,690 2,300 249,990 43-44 241,290 2,550 249,840 44-45 233,210 6,030 239,240
1945-46 225,910 2,370 228,340 46-47 237,360 3,550 240,910 41-48 203,990 7,810 211,800 48-49 211,930 3,660 215,590 49-50 216,030 5,550 221,580
1950-51 216,100 7,280 223,980 51-52 262,910 2,140 265,050 52-53 229,240 6,880 236,120 53-54 216,670 1,000 223,670 54-55 231,800 7,560 239,360
1955-56 222,030 4,530 225,560 56-57 217,110 4,130 221,300 51-58 254,810 4,660 259,410
29-Year Average 1929-57 227,180 3,250 231,030
Source of values by column number: Column No.
1. Table 35, Column 18. 2. Table 36, Column 10.
-184-
134
Comparison of Consumptive Use Values Determined by the Infiow-Outflolo1 and Integration Methods
The annual and cumulative amounts of conslunptive use as deter-
mined by the Inflow-Outflow Met.'hod (Table 3L, page 169) and by the Inte
gration Hethod (Table 37, page l8L) are shown in Table 38. The average
annual consumptive uses for the 29-year base period are 227,200 acre-feet
(inflow-outflow) and 231,000 acre-feet (integration). The difference of
3,800 acre-feet between the two average values is approximately one and
one-half percent of the average consQmptive use and well within the
accuracy of the data. The annual differences between the t1vO consumptive
use values are shown in column 5, Table 38. The annual consumptive use
as determined by each method and the annual and cumulative differences
are plotted on Figure L.
-185-
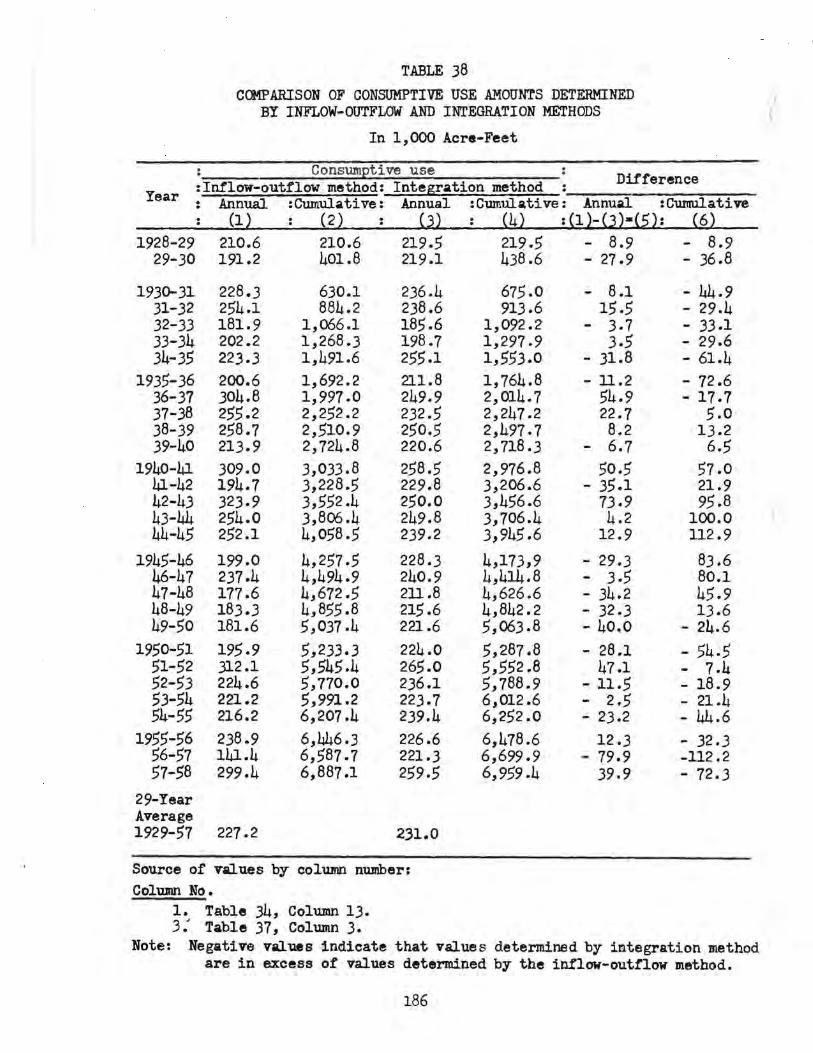
TABLE 38 COMPARISON OF CONSUMPTIVE USE AMOUNTS DETERMINED
BY INFLOW-OUTFLOW AND INTEGRATION METHODS
In 1,000 Acre-Feet
. ConsUDlEtive use . Difference Year :In!10w-outr10w method: Integration method
Annual :Cumulative: Annual : Cumulative : Annual : Cumulative (1) (2~ L1) ~4~ :~ll-t:~~·~~): {6~
1928-29 210.6 210.6 219.5 219.5 - 8.9 - 8.9 29-30 191.2 401.8 219.1 438.6 - 27.9 - 36.8
1930-31 228.3 630.1 236.4 675.0 - 8.1 - 44.9 31-32 254.1 884.2 238.6 913.6 15.5 - 29.4 32-33 181.9 1,066.1 185.6 1,092.2 - 3.7 - 33.1 33-34 202.2 1,268.3 198.7 1,297.9 3.5 - 29.6 34-35 223.3 1,491.6 255.1 1,553.0 - 31.8 - 61.4
1935-36 200.6 1,692.2 211.8 1,764.8 - 11.2 - 72.6 36-37 304.8 1,997.0 249.9 2,014.7 54.9 - 17.7 37-38 255.2 2,252.2 232.5 2,247.2 22.7 5.0 38-39 258.7 2,510.9 250.5 2,497.7 8.2 13.2 39-40 213.9 2,724.8 220.6 2,718.3 - 6.7 6.5
1940-41 309.0 3,033.8 258.5 2,976.8 50.5 57.0 41-42 194.7 3,228.5 229.8 3,206.6 - 35.1 21.9 42-43 323.9 3,552.4 250.0 3,456.6 73.9 95.8 43-44 254.0 3,806.4 249.8 3,706.4 4.2 100.0 44-45 252.1 4,058.5 239.2 3,945.6 12.9 112.9
1945-46 199.0 4,257.5 228.3 4,173,9 - 29.3 83.6 46-47 237.4 4,494.9 240.9 4,414.8 - 3.5 80.1 47-48 177.6 4,672.5 211.8 4,626.6 - 34.2 45.9 48-49 183.3 4,855.8 215.6 4,842.2 - 32.3 13.6 49-50 181.6 5,037.4 221.6 5,063.8 - 40.0 - 24.6
1950-51 195.9 5,233.3 224.0 5,287.8 - 28.1 - 54.5 51-52 312.1 5,545.4 265.0 5,552.8 47.1 - 7.4 52-53 224.6 5,770.0 236.1 5,788.9 - 11.5 - 18.9 53-54 221.2 5,991.2 223.7 6,012.6 - 2.5 - 21.4 54-55 216.2 6,207.4 239.4 6,252.0 - 23.2 - 44.6
1955-56 238.9 6,446.3 226.6 6,478.6 12.3 - 32.3 56-57 141.4 6,587.7 221.3 6,699.9 - 79.9 -1l2.2 57-58 299.4 6,887.1 259.5 6,959.4 39.9 - 72.3
29-Year Average 1929-57 227.2 231.0
Source of values by column number: Column No.
1. Table 34, Column 13. 3.' Table 37, Column 3.
Note: Negative values indicate that values determined by integration method are in excess or values determined by the inflow-outflow method.
186
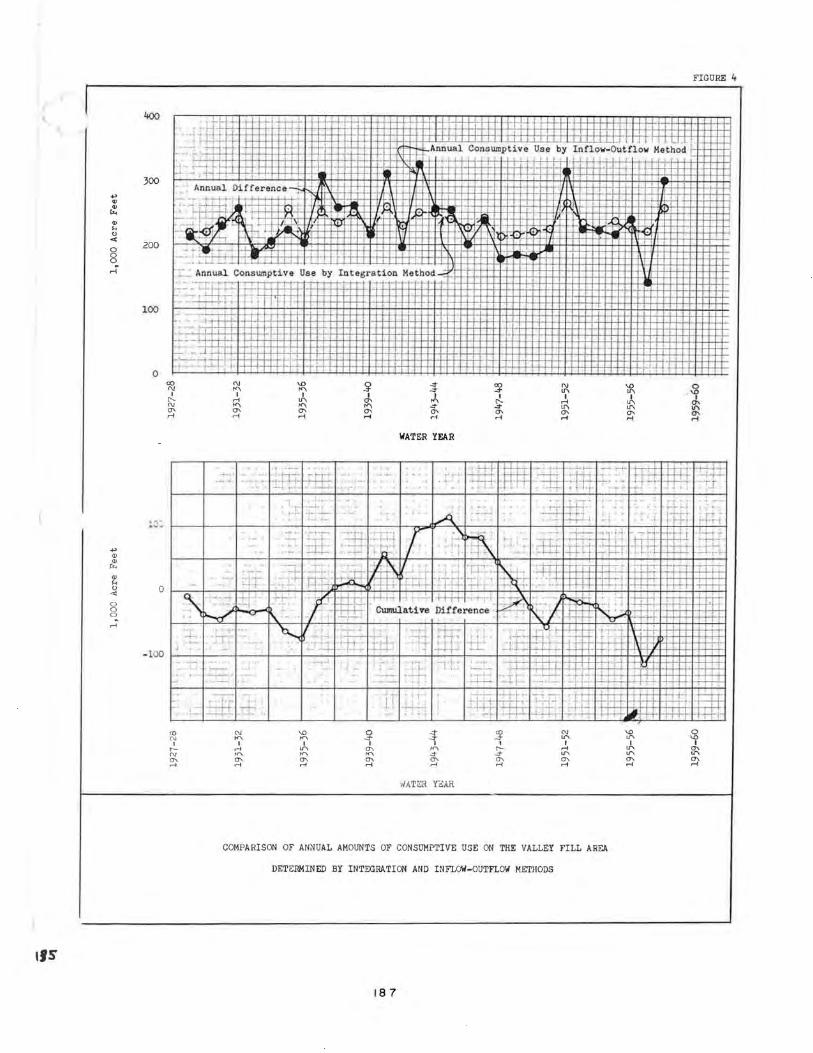
I
IfS'
.... ., ., r.. ., " 0 c(
a a a ..4
.... ., Q)
rr. Q)
" o <>1 o o o .....
300
200
100
o
1-1- ..J..
- ~ ~~ I ~::Li:LW-l-UI. . . rl-
1,1, 1 I I I . LI.l :CLtD~Annual Consumptive Use by Inflow-Outflow Method
tt , ,
, /-I .. I l-. I I ,
I
I , I
- . .. I
--:: . Annual Cons ump tive Use by Integr ation Method. - -
--:,Pi~ • I I
..J ·1
I , + -111 I
'D ..-:t ex) N \D
FIGURE It
h
I-
0 !l-P<\ ..-:t ..-:t LI\ LI\ '1 I I I I I I LI\ 0' P<\ r-- ..... LI\ P<\ P<\ ..-:t ..-:t LI\
<ll N
I r-
'" '" ri
0' 0' 0' 0' 0' ..... ..... ..... ..... .....
WATER YEAR
\D :J j CD N
"" .or lr\ I I I I I
U'\ '" "" r- ..... N"\ N"\ -'i' .or '" 0' '" '" '" '" ..... ..... ri ..... .....
,yATER 'U:m
COMPARISON OF ANNUAL AMOUNTS OF CONSUMPTIVE USE ON THE VALLEY FILL AREA
DETERMINED BY INTEGRATION AND INFLOW-OUTFLOW METHODS
187
LI\ LI\ 0' '" ..... .....
\D 0 U'\ \D I I
'" '" '" U"\
'" '" ..... ri
Adjustment of Consumptive Use
The consumptive use shown in Table 34 and summarized in Table 38
is based on items of inflow, outflow and change in storage. The items of
inflow and outflow are based directly or indirectly on measured items.
Variations that could exist in the calculation of these items are small
in comparison to the amount of the difference. The change in storage of
surface reservoirs is measured indirectly and is small. Adjustment of the
computed change in ground water storage would require an adjustment of
water levels and/or specific yield values. Water levels are influenced,
as discussed in Chapter V, by the change in pumping rate from year to year
during the period water levels are being measured and by taking measure-
ments at different times from year to year. Both of these possible varia-
tions in ground water measurements produc~ some differences in ground water
calculations.
It appears from the above discussion that the difference between
the two computations of consumptive use is more like~ to be caused by
inaccuracies in the integration method. The inflow-outflow method is used
as a guide to make refinements in the integration method.
The trends of cumulative differences (Figure 4) are similar to
the annual fluctuations of water levels (Plate 34A-c) and the mass diagram
of precipitation (Plate 10). It is concluded that the item or items to be
adjusted are related to precipitation. The consumptive use (plus the
residual value, deep percolation) in the basin is large compared to any of
the other disposal items (see Table 34) and is known to be responsive to
-188-
( (
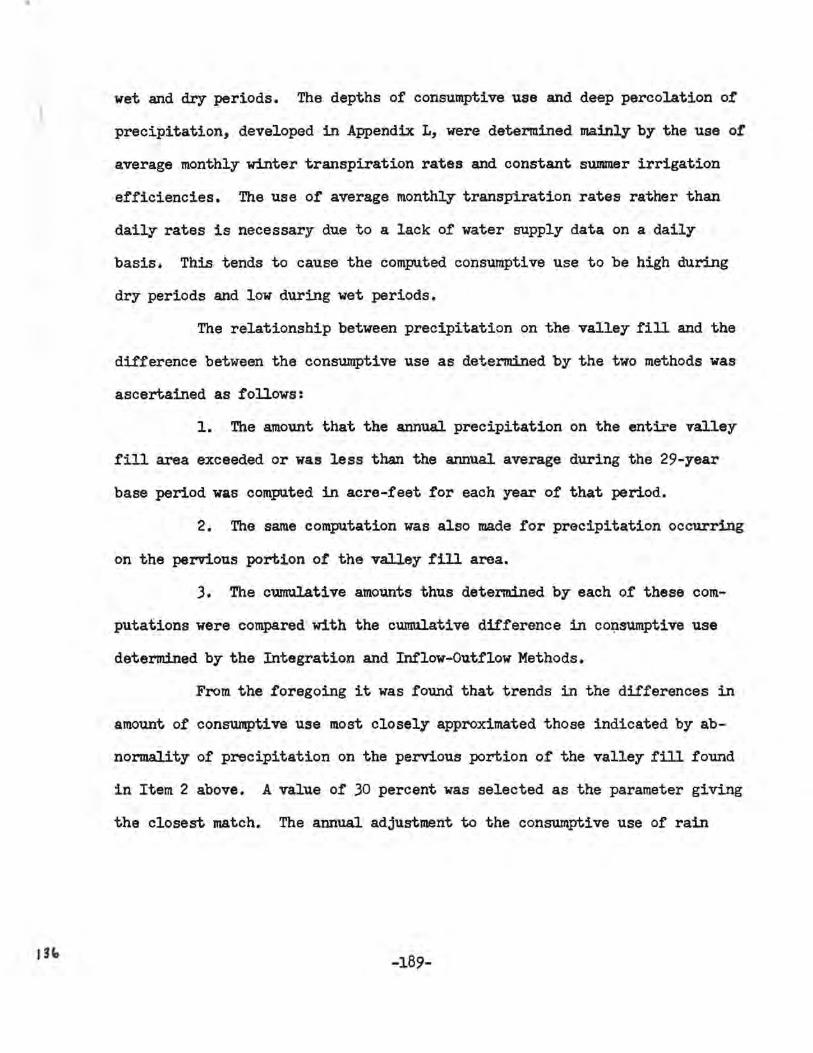
( wet and dry periods. The depths of consumptive use and deep percolation of
precipitation, developed in Appendix L, were determined mainly by the use of
average monthly winter transpiration rates and constant summer irrigation
efficiencies. The use of average monthly transpiration rates rather than
daily rates is necessary due to a lack of water supply data on a daily
basis. This tends to cause the computed consumptive use to be high during
dry periods and low during wet periods.
The relationship between precipitation on the valley fill and the
difference between the consumptive use as determined by the two methods was
ascertained as follows:
1. The amount that the annual precipitation on the entire valley
fill area exceeded or was less than the annual average during the 29-year
base period was computed in acre-feet for each year of that period.
2. The same computation was also made for precipitation occurring
on the pervious portion of the valley fill area.
3. The cumulative amounts thus determined by each of these com
putations were compared with the cumulative difference in co~sumptive use
determined by the Integration and Inflow-Outflow Methods.
From the foregoing it was found that trends in the differences in
amount of consumptive use most closely approximated those indicated by ab
normality of precipitation on the pervious portion of the valley fill found
in Item 2 above. A value of 30 percent was selected as the parameter giving
the closest match. The annual adjustment to the consumptive use of rain
-189-
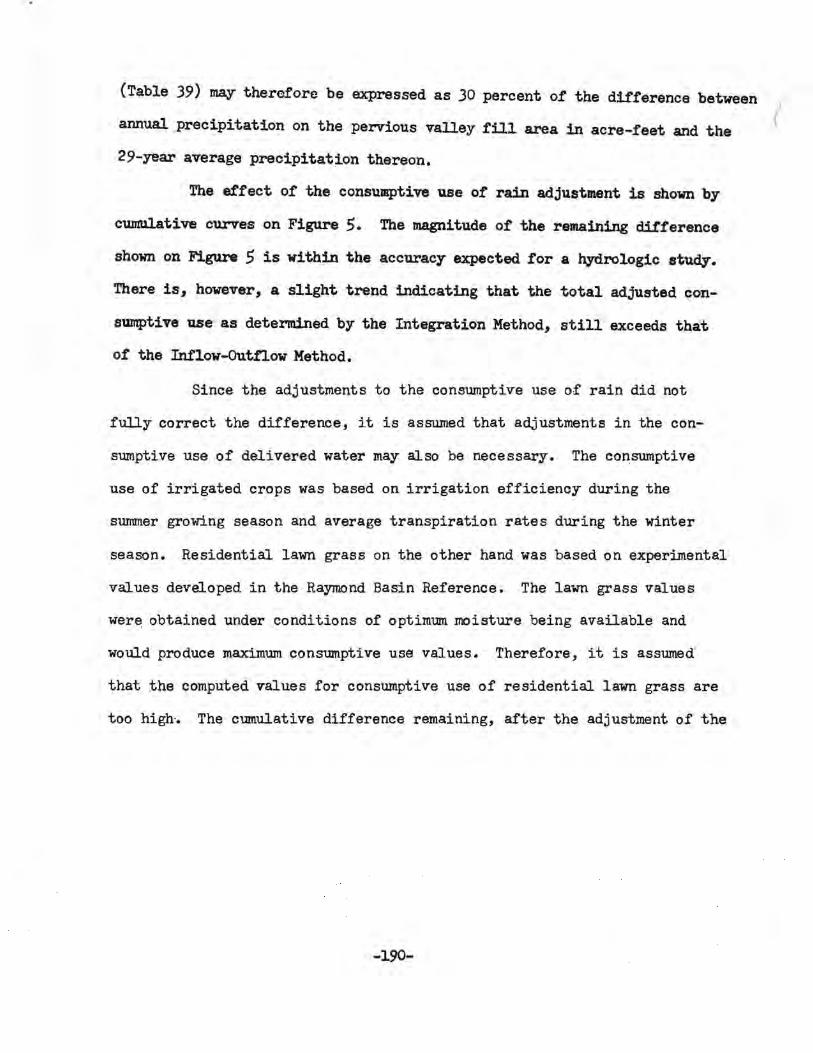
(Table 39) may therefore be expressed as 30 percent of the difference between
annual precipitation on the pervious valley fill area in acre-feet and the
29-year average precipitation thereon.
The effect of the consumptive use of rain adjustment is shown by
cumulative curves on Figure 5. The magnitude of the remaining difference
shown on Figure 5 is within the accuracy expected for a hydrologic study.
There is, however, a slight trend indicating that the total adjusted con
sumptive use as determined by the Integration Method, still exceeds that
of the Inflow-Outflow Method.
Since the adjustments to the consumptive use of rain did not
fully correct the difference, it is assumed that adjustments in the con
sumptive use of delivered water may also be necessary. The consumptive
use of irrigated crops was based on irrigation efficiency during the
summer growing season and average transpiration rates during the winter
season. Residential lawn grass on the other hand was based on experimental
values developed in the Raymond Basin Reference. The lawn grass values
wer~ obtained under conditions of optimum moisture being available and
would produce maximum consumptive use values. Therefore, it is assumed
that the computed values for consumptive use of residential lawn grass are
too high-. The cumulative difference remaining, after the adjustment of the
-190-
( (
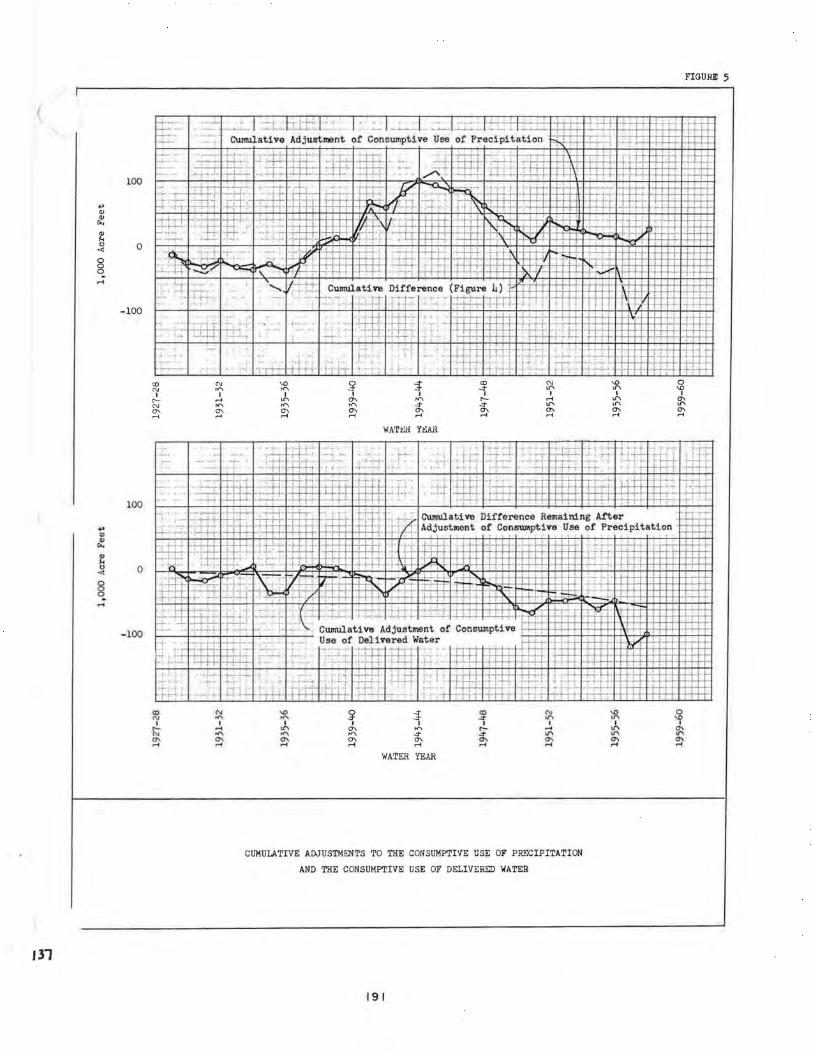
100
..., <ll <ll r.. <ll ,.. 0 0 ..: a a a ....
-100
100
... <ll <ll r.. <II ... 0 0 .., 8 .....
- 100
131
FIGURE 5
,_-1 _ -' -, _ .. ::- ·rtf -;:lJ, I -!-
r-' ..
'" N , <-N
'" ....
CD
'" , ..... N 0'\ ....
t~ : l'~ I-L 11!- LI'lj±l, ~ _~~ ;:r:n:- :1-' .. ;+ I ·-t . I_ 1';-• .,. .. - - r - . \ T, 1 ~rr+ I ~ ... rh--", ,-,. 'TT -j+tt i-
N '" ~ :1 CD N '" a '" '" .oj- "" '" '" , , , , , , , , .... It'-. '" '" <- .... '" a-
'" '" '" .oj- .oj- "" '" '" ~ '" '" '" '" '" '" '" .... .... .... .... .... ..... ....
WATJili Y&\R
-- :=-R= I£J:"' .... . . - . r~ ~-L ., : . .,.. . 1;:- -- · .. qi~ [~.. !H _ .- ,... ~ .~.... .. .. ri--.. -,--- t j. ~ ~.L.: ~ f+L 1 r-H-i-- ..... - - - . *' ..... -1 .. 0---, f .. -t rH-t ~ . . '--,- Trt r 11-ttt
N
'" , ..... "" '" .....
'" a :1 !!i- N
'" j "" I " , , , II' '" '" to- .... "" '" .oj- j "" 0'\ '" '" '"' O'i .... .... .... .... ....
WATER YEAR
CUMULATIVE ADJUSTMENTS TO THE CONSUMPTIVE USE OF PRECIPITATION
AND THE CONSUMPTIVE USE OF DELIVERED WATER
191
--,-"" rH
++ I,
\D 0
'" \l) , I
'" ~ '" O'i a-.... .....
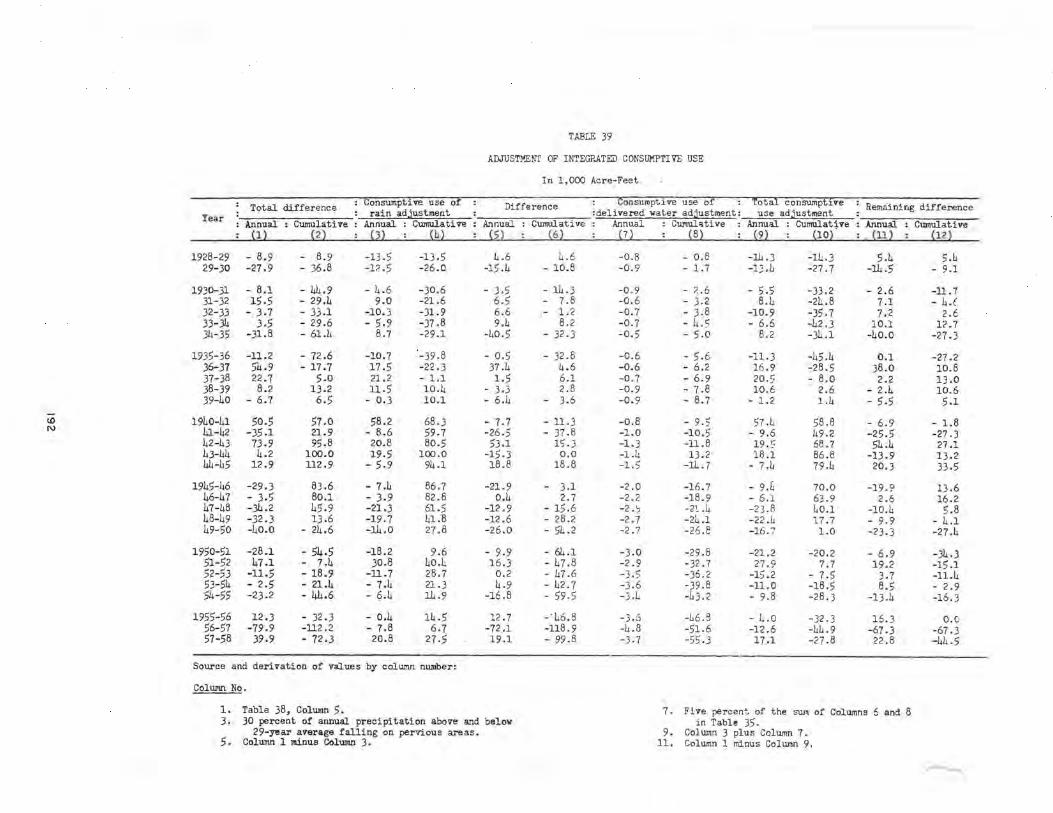
TABLE 39
ADJUSTMENr OF INTEGRATED CONSUMPTIVE USE
In 1,000 Acre-Feet
Total difference ~onsumptive use of Difference ~on5Umptive use of Tota! consumptlve ; Remaining difference Yea.r rain adjustment :delivered water adjustment: use adjustment
Annual : Cumulative Annual Cumulative Annual CUITlUlati ve Annual Cumuh.ti ve Annual Cumulaqve : Annual Cumulative (1) (2) 01 (4) {S) (6 ) P) (8) (9) (10) {ill (12)
1928-29 - 8.9 - 8.9 -13.5 -13.5 4.6 4.6 -0.8 - 0.8 -11.3 -14.3 5.4 5.4 29-30 -27.9 - 36.8 -12.5 -26.0 -15.4 - 10.8 -0.9 - 1.7 -1;.4 -27.7 -11.5 - 9.1
1930-31 - 8.1 - 44.9 - 4.6 -30.6 - 3.5 - 14.3 -0.9 - ?.6 - 5.5 -33.2 - 2.6 -11. 7 31-32 15.5 - 29.4 9.0 -21.6 6.5 - 7.8 -0.6 - 3.2 8.4 -24.8 7.1 - 4.{ 32-33 - 3.7 - 33.1 -10.3 -31.9 6.6 - 1.2 -0.7 - 3.8 -10.9 -35.7 7.2 2.6 33-34 3.5 - 29.6 - 5.9 -37.8 9.4 8.2 -0.7 - 4.5 - 6.6 -42.3 10.1 1?7 34-35 -31.8 - 61.4 8.7 -29.1 -40.5 - 32·3 -0.5 - 5.0 8.2 -34.1 -40.0 -27.3
1935-36 -11.2 - 72.6 -10.7 -39.8 - 0.5 - 32.8 -0.6 - 5.6 -11.3 -45.4 0.1 -27.2 36-37 54.9 - 17.7 17.5 -22.3 37.4 4.6 -0.6 - 6.2 16.9 -28.5 38.0 10.8 37-38 22.7 5·0 21.2 - 1.1 1.5 6.1 -0.7 - 6.9 20.S - B.O 2.2 13.0 3B-39 B.2 13·2 11.5 10.4 - 3.3 2.8 -0.9 - 7.8 10.6 2.6 - 2.4 10.6 39-40 - 6.7 6.5 - 0.3 10.1 - 6.4 - 3.6 -0.9 - 8.7 - 1.2 1.4 - 5.5 5.1
ID 1940-41 50.5 57.0 5B.2 6B.3 - 7.7 - 11.3 -0.8 - 9., 57.4 5B.8 - 6.9 - 1.8 N 41-42 -35.1 21.9 - B.6 59.7 -26.5 - 37.8 -1.0 -10.5 - 9.6 49.2 -25.5 -27·3
42-43 73.9 95.B 20.B Bo.5 53.1 lS.3 -1.3 -11.8 19., 68.7 54.4 27.1 43-44 4.2 100.0 19.5 100.0 -15.3 0.0 -1.4 13.2 18.1 B6.8 -13.9 13.2 44-45 12.9 112.9 - 5.9 94.1 18.8 18.8 -1.5 -14.7 - 7.L 79.4 20.3 33.5
1945-46 -29.3 83.6 - 7.4 86.7 -21.9 - 3.1 -2.0 -16.7 - 9.4 70.0 -19.9 13.6 46-47 - 3.5 80.1 - 3.9 82.8 0.4 2.7 -2.2 -18.9 - 6.l 63.9 2.6 16.2 47-4B -34.2 45.9 -21.3 61.5 -12.9 - 15.6 -2., -21.4 -23.8 40.1 -10.4 5.8 48-49 -32.3 13.6 -19.7 41.B -12.6 - 28.2 -2.7 -24.1 -22.4 17.7 - 9.9 - 4.1 49-50 -40.0 - 24.6 -14.0 27.8 -26.0 - 54.2 -2.7 -26.8 -16.7 1.0 -23.3 -27.4
1950-51 -28.1 - 54.5 -lB.2 9.6 - 9.9 - 64.1 -3.0 -29.8 -21.2 -20.2 - 6.9 -34.3 51-52 47.1 - 7.4 30.8 40.4 16.3 - 47.8 -2.9 -32.7 27.9 7.7 19.2 -15.1 52-53 -11.5 - 18.9 -11. 7 2B.7 0.2 - 47.6 -3.5 -36.2 -15.2 - 7.5 3.7 -11.4 53-54 - 2.5 - 21.4 - 7.4 21.3 4.9 - 42.7 -3.6 -39.8 -11.0 -lB.5 8.5 - 2.9 54-55 -23.2 - 44.6 - 6.4 14.9 -16.8 - 59.5 -3.4 -43.2 - 9.B -2B.3 -13.4 -16.3
1955-56 12.3 - 32.3 - 0.4 14.5 12.7 -'46.8 -3.6 -46.8 - 4.0 -32.3 16.3 O.C· 56-57 -79.9 -il2.2 - 7.8 6.7 -72.1 -11B.9 -4.8 -51.6 -12.6 -44.9 -67.3 -67.3 57-58 39.9 - 72.3 20.8 27.5 19.1 - 99.8 -3.7 -55.3 17.1 -27.8 22.8 -44.5
Source and derivation of values by column number:
Column No.
1- Table 38, Column 5. 7. Five percent of the sum of Columns 6 and 8 3. 30 percent of annual preCipitation above and below in Table 35.
29-year average falling on perVious areas. 9. Column 3 plus Column 7. 5. Column 1 minus Column 3. 11. Column 1 minus Column 9.
..-..
( consumptive use of precipitation has been made (Figure 5), is an increasing
function. The acreage put to residential use is also an increasing func
tion while lands used for irrigated and nonirrigated crops have been
decreasing. Both the method of determining consumptive use of residential
lawn grass and the land use trends indicate that the adjustment of the
consumptive use of delivered water is related to residential delivered
water. An adjustment equal to five percent of residential delivered water
applied to land areas (excluding sewage) was found to be the best match to
the remaining difference and was adopted as the adjustment to the consump
tive use of delivered water.
The annual and cumulative adjustments of the consumptive use of
precipitation and delivered water and the sum of both are shown in Table 39.
These adjustments are applied to the consumptive use as determined by
the integration method. The effects of the adjustments are to increase
the consumptive use of precipitation during wet years and to decrease
it during dry years, and to decrease the consumptive use of delivered
water for all years. The adjustments are transfers of water between
the amounts of consumptive use and deep percolation computed by the in
tegration method; therefore, the sum of consumptive use and deep perco
lation is unchanged.
-193-
The total cumulative adjustments to the integrated consumptive (
use and the cumulative difference remaining between the adjusted integrated
consumptive use and Inflow-Outflow Method consumptive use are shown on
Figure 6.
The CWMUlative difference curve which represents the chronological
accumulation of all differences between the two values of consumptive use
after adjustment shows that the adjustment formula are applicable throughout
the range of precipitation influences and other effects concerning delivered
water occurring throughout the base period.
-194-
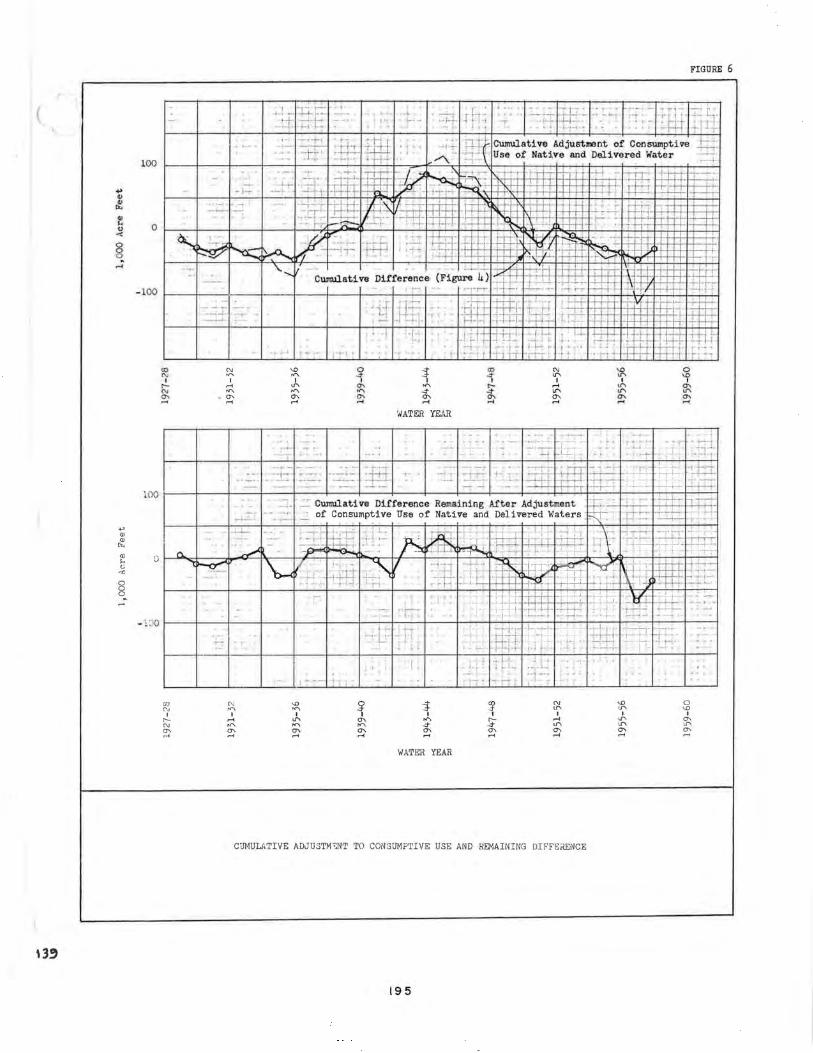
FIGURE 6
~ - :i' .. ;::j., .;,if-l " j - ::L - CUmulati va Adj ustment of Oon~ptiVll -l:::i-T..): .:::L----::- ~-+r-~ -""'\ ~ -~- .. Use of Nat i ve and Delivered Water ~
100 .. --.. ., -, .....
& - - , -f 0 u «
~ I -g '-r-;I
-""'27 """'0;: .... .... -- --- 100 .--- - --.
----=--'-;-
'iJ ''J j: a> N 'iR 0 "' .,. "" 'i' I , I , I j
"" 0- "' ..... .... on '" "' '" .01- -'f" '" or. or.
'" 0- '" '" '" '" '" .... ..... .... ..... .... ,... .... 'HATER YEAR
100 - -= C1lJI!IIl.ative Difference Remaining Arter AdjUstment. :::J=.":':"~"+ t~~ -i- _~ of Consumptive Use of Native and Delivered Waters o:q:::::.~!: ~ ~-~ .:p:::::::-
.., OJ OJ
'" OJ 0 0. ~,
G ~-."
0 0 o.
',...,--.. ! - I' 0 , .-
.. ~ -I : .
..I' I. ; , .; i . ._..t_ .-. -r:' , , ,
OJ N 'iJ 0 .01- '" '-" 'iJ
I , , , r--- .... '-" 0'0
.01- '" '" '" 0'0 '" :::; '" rl ... rl
WATER YEAR
Cffi1ULATIVE ADJUSTMSNT TO CONSUMPTIVE USE AND REMAINING DIFFSRENCE
195
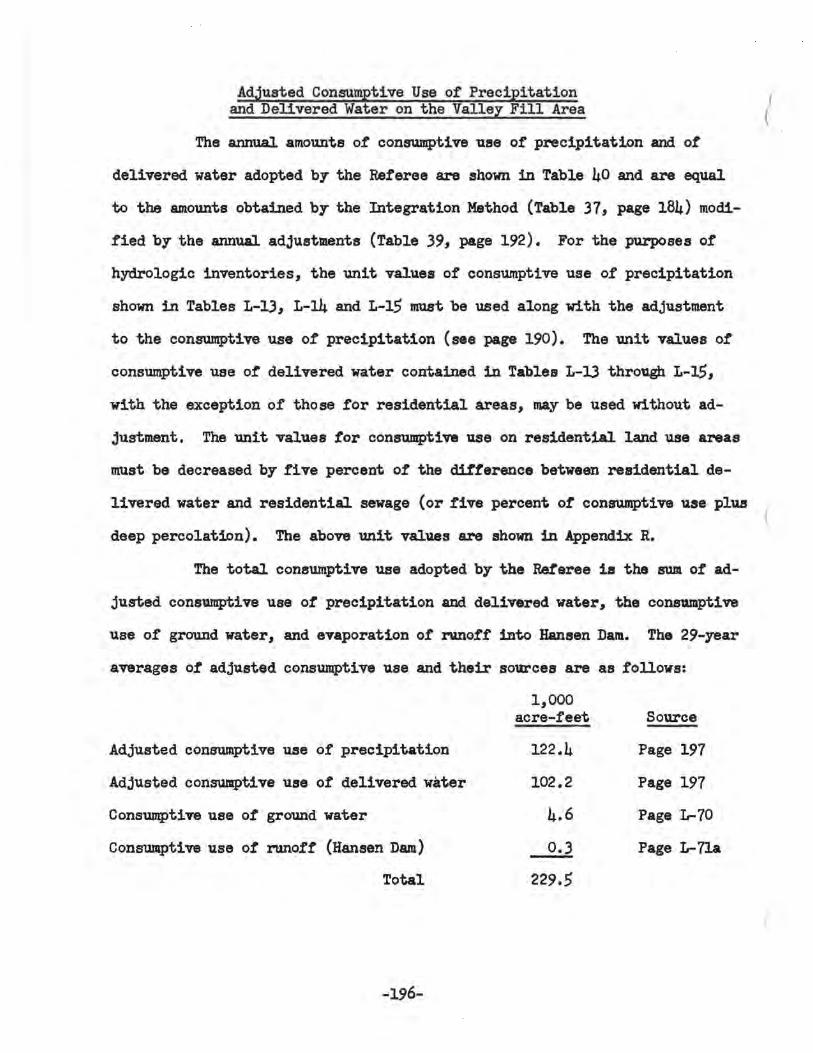
Adjusted Consumptive Use of Precipitation and Delivered Water on the Valley Fill Area
The annual amounts of consumptive use of precipitation and of
delivered water adopted by the Referee are shown in Table 40 and are equal
to the amounts obtained by the Integration Method (Table 37, page 184) modi
fied by the annual adjustments (Table 39, page 192). For the purposes of
hydrologic inventories, the unit values of consumptive use of precipitation
shown in Tables L-13, L-14 and L-l, must be used along with the adjustment
to the consumptive use of precipitation (see page 190). The unit values of
consumptive use of delivered water contained in Tables 1-13 through L-l"
with the exception of those for residential areas, may be used without ad-
justment. The unit values for consumptive use on residential land use areas
must be decreased by five percent of the difference between residential de
livered water and residential sewage (or five percent of consumptive use plus
deep percolation). The above unit values are shown in Appendix R.
The total consumptive use adopted by the Referee is the sum of ad
justed consumptive use of precipitation and delivered water, the consumptive
use of ground water, and evaporation of l'Wloff into Hansen Dalll. The 29-year
averages of adjusted consumptive use and their
Adjusted consumptive use of precipitation
Adjusted consumptive use of delivered water
Consumptive use of ground water
Consumptive use of runoff (Hansen Dam)
Total
-196-
sources are
1,000 acre-feet
122.4
102.2
4.6
0.3
229.5
as follows:
Source
Page 197
Page 197
Page L-70
Page L-7la
( (
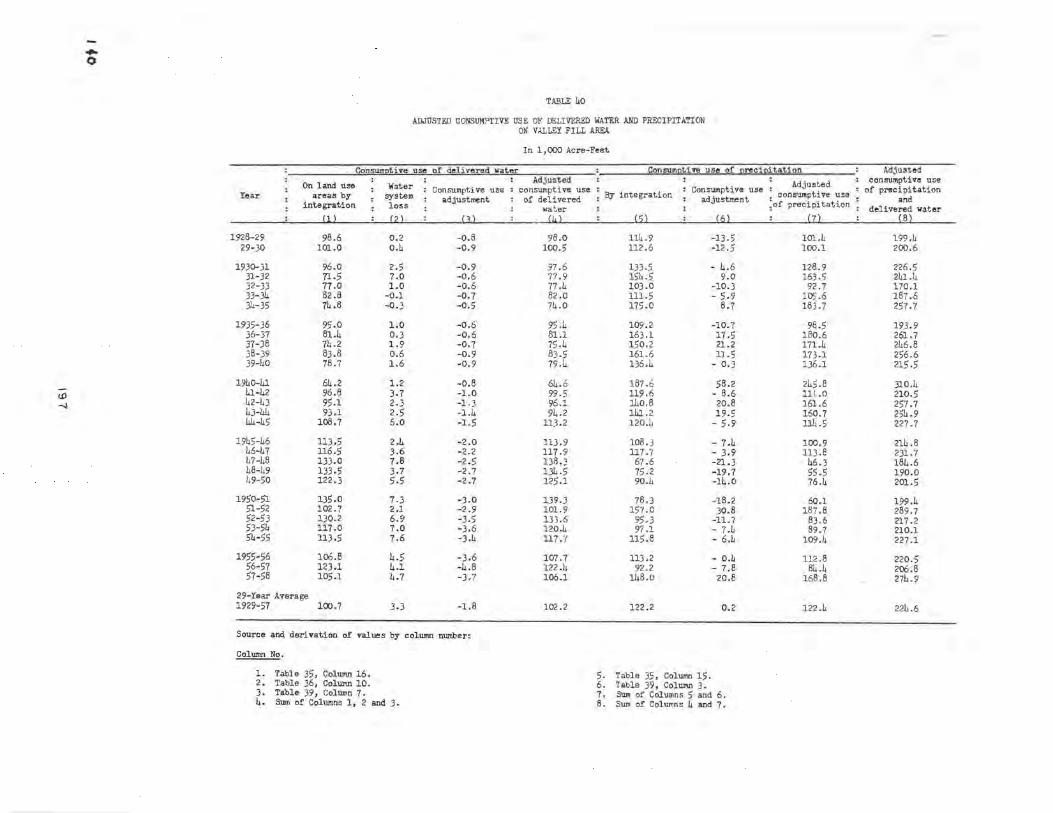
IJ)
--l
... o
TABLE 40
ADJUSTED CONSUMPTIVE USE OF DELIVERED WATER AND PRECIPITATION ON VALLEY FILL AREA
In 1,000 Acre-Feet
Consumptive use of deli ve red water ConSWllntive use of precioitation Adj1l3ted o 1 nd W Adj usted Adjusted consumptive use
n a ~se ater Consumptive use consumptive use B 1 t t' Consumptive use' t. of precipitation Year areas y system adjustment of delivered y negra lon adjustment ,consump lve ,:,se and
integration lo~s water ,of precipltatlon delivered water (ll (2) ("11 (L.l (5) (6) (7) (8)
1928-29 29-30
1930-31 31-32 32-33 33-34 34-35
1935-36 36-37 37-38 38-39 39-40
1940-41 41-42 42-43 43-44 44-45
1945-46 46-47 47-48 48-49 49-50
1950-51 51-52 52-53 53-54 54-55
1955-56 56-57 57-58
29-Year Average 1929-57
98.6 101.0
96.0 n.5 77.0 82.8 74.8
95·0 81.4 74.2 83.B 78.7
64.2 96.8 95.1 93.1
108.7
113.5 116.5 133.0 133.5 122 .3
135.0 102.7 130.2 117.0 113.5
106.8 123.1 105.1
100.7
0.2 0.4
2.5 7.0 1.0
-0.1 -0.3
1.0 0.3 1.9 0.6 1.6
1.2 3.7 2. 3 2. 5 6 .0
2.4 3.6 7.8 3.7 5.5
7.3 2.1 6.9 7.0 7.6
4.5 4.1 4.7
3.3
-0.8 -0.9
-0.9 -0.6 -0.6 -0.7 -0.5
-0.6 -0.6 -0.7 -0.9 -0.9
-0.8 -1.0 -1 ·3 -1.4 -1.5
-2.0 -2. 2 -2.5 -2 .7 -2.7
-3.0 -2.9 -3.5 -3.6 -3.4
-3.6 -4.8 -3.7
-1.8
Source and den vatioD of val. ues by column number'
Column No.
1. Table 35, Column 16. 2. Table 36, Column 10. 3. Table 39, Column 7. 4. Sum of Columns 1, 2 and 3.
98.0 100.5
97.6 77 .9 77 .L. 82.0 74.0
95.4 81.1 75.4 83.5 79.4
64.6 99.5 96 .1 94.2
113.2
113.9 117.9 13B.3 134.5 125.1
139.3 101.9 133.6 120.4 117.'1
107.7 122.4 106.1
102.2
IlL. .9 112.6
133.5 154.5 103·0 111.5 175.0
109.2 163.1 150.2 161.6 136.4
187.6 119.6 lL.0.8 141.2 120.t,
lOB.3 11'7.'( 67.6 75·2 90.4
7B.3 157.0
95.3 97 .1
115.8
113.2 92.2
148.0
122.2
5. Table 35. Column 15. 6. Table 39. Column 3.
-13.5 -12.5
- 4.6 9.0
-10.3 - 5.9
8.7
-10.7 17.5 21.2 11.5
- 0.3
58.2 - 8.6 20.8 19.5
- 5.9
- 7.4 - 3.9 -21.3 -19.7 -14.0
-18.2 30.B
-11.'( - 7." - 6.4
- 0.4 - 7.8
20.8
0.2
7. SUm of Columns 5 and 6. 8. Sum of Column. 4 and 7.
, 10l.u 100.1
128.9 163.,
92.7 105.6 183.7
98.5 180.6 17l.4 17).1 136.1
245.8 111.0 161.6 160.7 llL..5
100.9 113.8 46.3 55.5 76.4
60.1 187.8
83.6 89.7
109.4
112.8 84.4
168.8
122.4
199 .4 200.6
226.5 24l.4 170.1 187.6 257.7
193.9 261.7 246.8 256.6 215.5
310.4 210.5 257.7 254.9 227.7
214.8 231.7 184.6 190.0 201.5
199.4 289.7 217.2 210.1 227.1
220.5 206.8 274.9
224.6
Historic Ground Water Recharge
The items comprising recharge to and draft on the ground water
reservoir are shown on Figure 7. Recharge of delivered water is shown
in Table 41 an~is computed as surface supply to the valley fill area
less consumptive use, exports and outflows of that supply. Recharge
from native water is shown in Table 42 and is computed in three parts:
that occurring on land use classes; that occurring in channels of the
stream system; and that resulting from the spreading of native water.
The first portion equals the precipitation on land use class areas on
the valley fill area less consumptive use and residual rain (i.e., pre
cipitation not retained on land use class areas). The second is the
recharge from native water in transit across the valley fill to the
point of surface escape and is equal to the amounts of native water
tributary to the stream channel system less diversions for spreading
and use and storm outflows at Gage F-57. Recharge of delivered water
in the stream channels has been included in the total recharge of
delivered water.
Ground Water Draft
The draft on the ground water reservoir, shown in Table 43,
is composed of well extractions, for use on the valley fill area and
for export, and natural depletions.
Ground Water Inventory
The basic equation for ground water inventory (Figure 7) is
ground water supply minus ground water draft equals change in ground
-198-
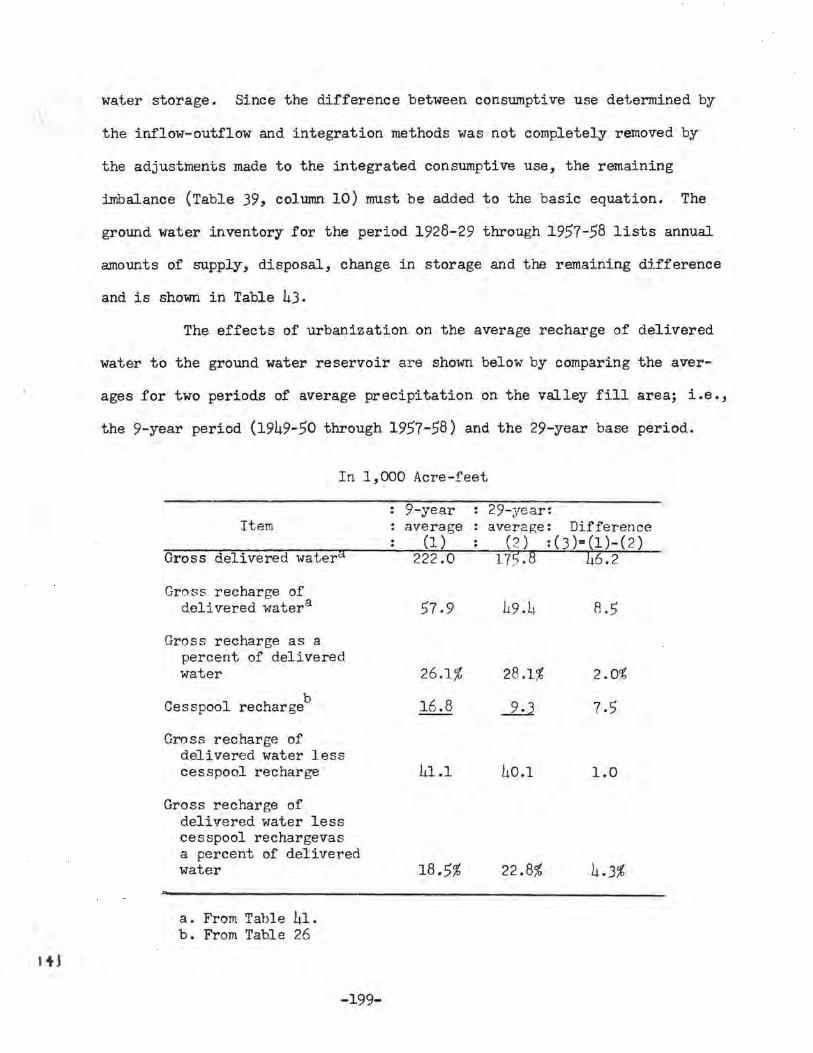
I +J
water storage. Since the difference between consumptive use determined by
the inflow-outflow and integration methods was not completely removed by
the adjustments made to the integrated consumptive use, the remaining
imbalance (Table 39, column 10) must be added to the basic equation. The
ground water inventory for the period 1928-29 through 1957-58 lists annual
amounts of supply, disposal, change in storage and the remaining difference
and is shown in Table 43.
The effects of urbanization on the average recharge of delivered
water to the ground water reservoir are shown below by comparing the aver-
ages for two periods of average precipitation on the valley fill area; i.e.,
the 9-year period (1949-50 through 1957-58) and the 29-year base period.
In 1,000 Acre-feet
Item
Gross delivered watera
Gross recharge of delivered watera
Gross recharge as a percent of delivered water
b Cesspool recharge
Gross recharge of delivered water less cesspool recharge
Gross recharge of delivered water less cesspool rechargevas a percent of delivered water
a. From Table 41. b. From Table 26
-199-
9-year average
(1 ) 222.0
57.9
26.1%
16.8
hl.l
18.5%
29-year: average: Difference
(2) :(3)=(1)-(2) 175.8 G6.2
8.5
28.1% 2.0%
7.5
40.1 1.0
22.8% 4.3%
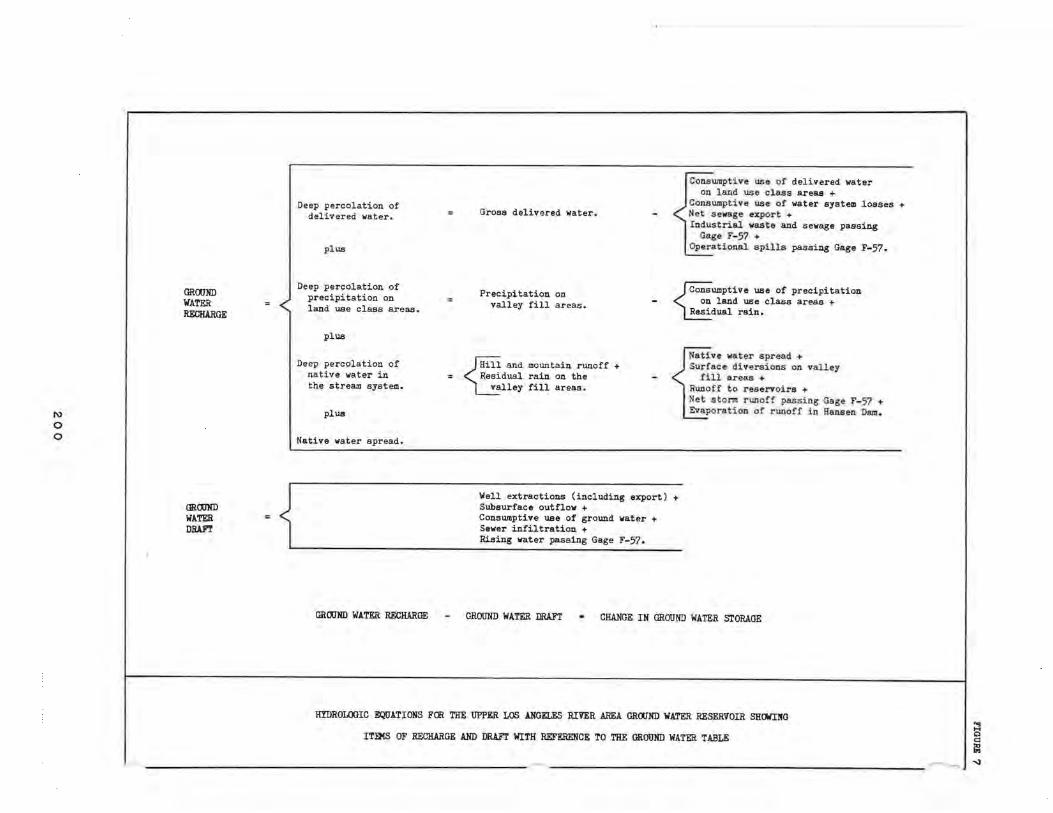
I\)
o o
GROOND WATER RECHARGE
aacmro WATER DRAFr
Deep percolation of delivered water.
plus
Deep percolation of precipitation on land use class areas.
plus
Deep percolation of native water in the stream system.
plus
Native water spread.
GROOND WATER RECHARGE
Groas delivered water.
Precipitation on valley fill areas.
~Hill and mountain runoff + Residual rain on the
valley fill areas.
Well extractions (including export) + Subsurface outflow + Consumptive use of ground water + Sewer infiltration + Rising water passing Gage F-57.
GROUND WATER DRAFT CHANGE IN GROUND WATER STORAGE
HYDROLOGIC EQUATIONS FCR THE UPPER LOS ANGELES RIVER AREA GROOND WATER RESERVOIR SH~JfO
IT»!:S OF RECHARGE AND DRAFT WITH REFERENCE TO THE GROUND WATER TABLE
areas +
valley
------------------------------------------------------~
s c::: jg
""
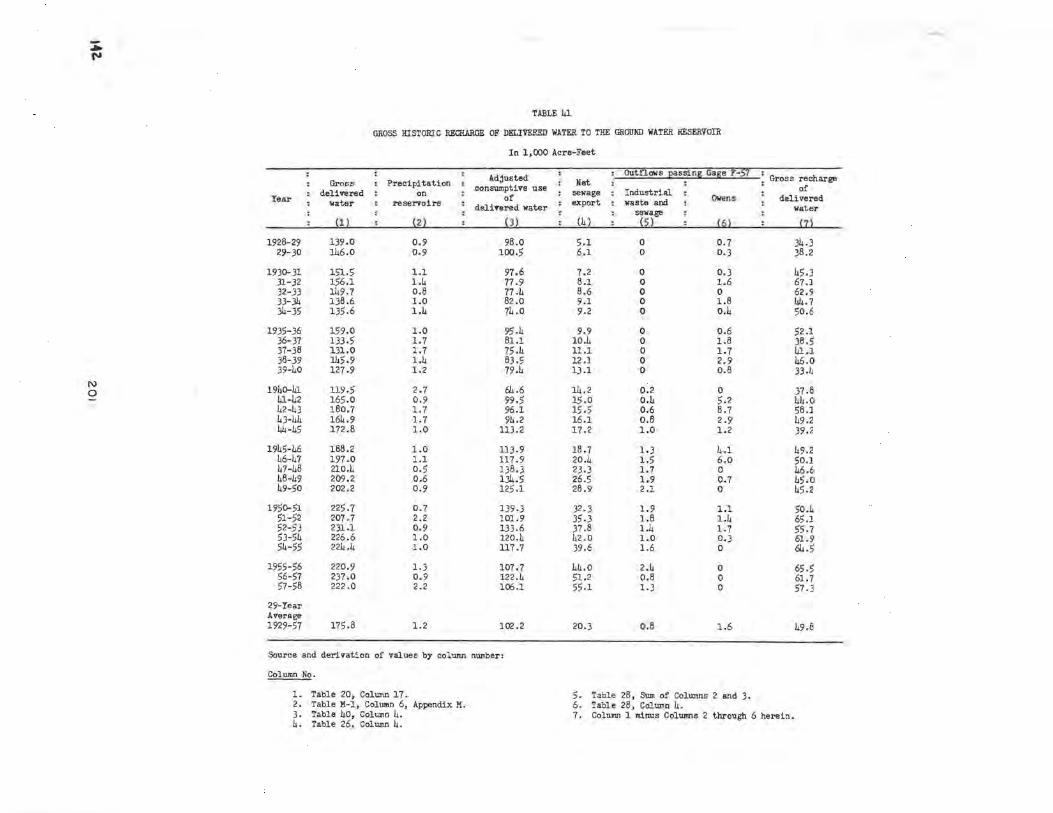
~ C'I
N o
Year
Gross delivered
vater
TABLE 41
GROSS HISTORIC RECHARGE OF DELIVERED WATER TO THE GROUND WATER RESERVOIR
Precipitation on
reservoirs
In 1,000 Acre-Feet
Adjusted consumptive use
of
Net Outnaws passing Gage r~
Owens delivered vater sevage
sewage export
Industrial waste and
Gros s rech ar ge of
delivered vater
(1 ) (2) 0) (k) (5L_ _16) (7)
1926-29 29-30
1930-31 31-32 32-33 33-34 34-35
1935-36 36-37 37-38 36-39 39-40
1940-41 41-42 42-43 43-44 44-45
1945-46 46-47 47-46 48-49 49-50
1950-51 51-52 52-53 53-54 54-55
1955-56 56-57 57-58
29-Year Average 1929-57
139.0 146.0
151.5 156.1 149.7 138.6 135.6
159.0 133.5 131.0 145.9 127 .9
119.5 165.0 160.7 164.9 172.6
186.2 197.0 210.4 209.2 202.2
225.7 207.7 231.1 226.6 224.4
220.9 237.0 222.0
175.6
0.9 0.9
1.1 1.4 0.6 1.0 1.4
1.0 1.7 1.7 1.4 1.2
2.7 0.9 1.7 1.7 1.0
1.0 1.1 0.5 0.6 0.9
0.7 2.2 0.9 1.0 1.0
1.3 0.9 2.2
1.2
98.0 100.5
97.6 77.9 71.4 82.0 74.0
95.4 81.1 75.4 83.5 79.4
64.6 99.5 96.1 94.2
113.2
113·9 117.9 136.3 134.5 125.1
139·3 101.9 133.6 120.4 117.7
107.7 122.4 106.1
102 .2
Source and derivation of values by column number:
Column No.
1. Table 20, Column 17. 2. Table M-l, Column 6, Appendix M. 3. Table 40, Column 4. 4. Table 26, Column 4.
5.1 6.1
7.2 6.1 8.6 9.1 9.2
9.9 10.4 11.1 12.1 13.1
14.2 15·0 15.5 16.1 17.2
18.7 20.4 23.3 26.5 28.9
32.3 35.3 37.8 42.0 39.6
44.0 51.2 55.1
20.3
o o
o o o o o
o o o o o
0.2 0.4 0.6 0.8 1.0
1.3 1.5 1.7 1.9 2.1
1.9 1.8 1.4 1.0 1.6
2.4 0.8 1.3
0.8
0.7 0.3
0.3 1.6 o 1.6 0.4
0.6 1.8 1.7 2.9 0.6
o 5.2 6.7 2.9 1.2
4.1 6.0 o 0.7 o
1.1 1.4 1.7 0.3 o
o o o
1.6
5. Table 26, Sum of Columns 2 and 3. 6. Table 28, Column 4. 7. Column 1 minus Columns 2 through 6 herein.
34.3 38.2
45.3 67.1 62.9 44.7 50.6
52.1 38.5 41.1 46.0 33.4
37.8 44.0 58.1 49.2 39.2
49.2 50.1 46.6 45.0 45.2
50.4 65.1 55.7 61.9 64.5
65.5 61. 7 57.3
49.6
....-
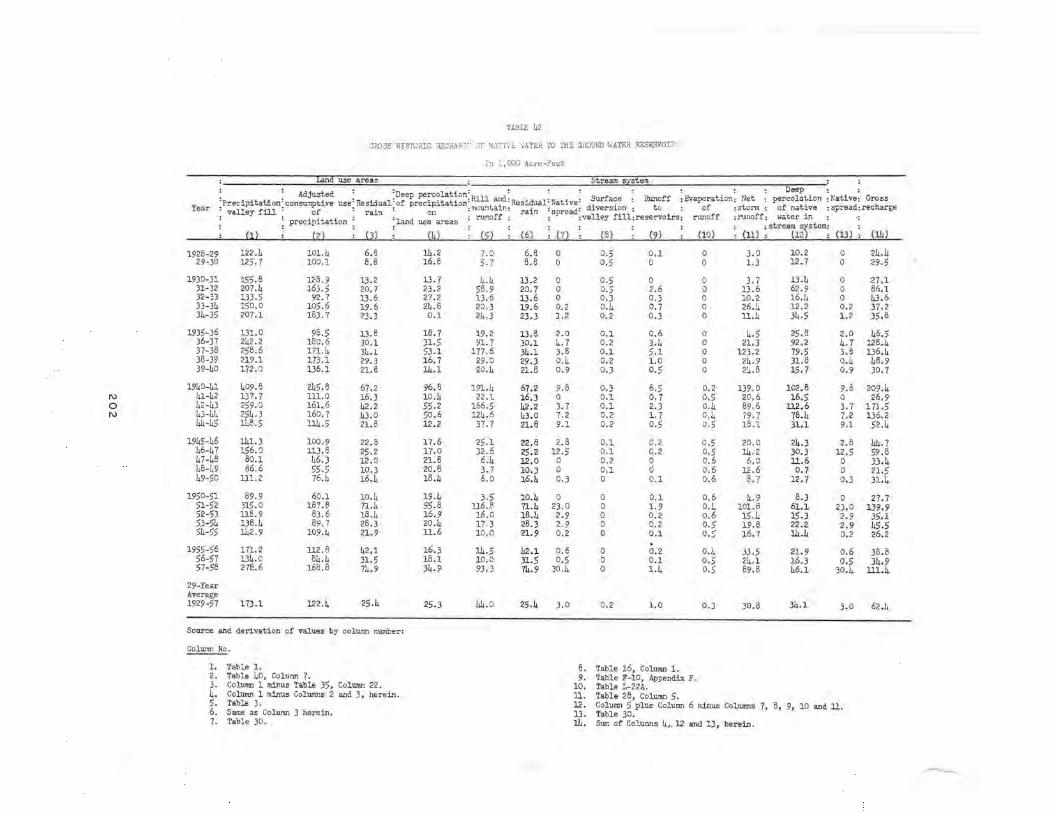
I\)
o I\l
TABLE 42
GRDSS HIsruaIc RECHAR'l: :JF NATT'I£ 'HTEH TO THE GllOUND WATER RESERVOIR
In 1,000 Acre-Yeet
Land use areas %ream s-~cm . . Adjusted 'Deep percolation: , : : Deep:: . Precipitation : consumptive use: Residual: of precipitation: H~11 and: Residual: Native: ~urface Runoff: Evaporation: Net percolation: Native: Gross
'lea.l'" valley fll1 . of . rain: on : mou..,tain: rain : spread: d~version: to : of : storm of native : spread:recharge precipita.tion :land use areas runoff : :valley fill:reservoirs: runoff : runoff: water in :
(1 ) (2) ()J_;_ (4) {5} (6) (7)(8t (9); ___ (l.Q) __ ~~ ~ .trc(~)~t.em; (D ) (14)
1928-29 29-30
1930-31 31-32 32-33 33-34 34-35
1935-36 36-37 37-38 38-39 39-40
1940-41 41-42 42-43 43-44 44-45
1945-46 46-47 47-48 48-49 49-50
1950-51 51-52 52-53 53-54 54-55
1955-56 56-57 57-58
29-Year Average 1929-57
122.4 125.7
155.8 207.4 133.5 150.0 207.1
131.0 242.2 258.6 219.1 172.0
409.8 137.7 259.0 254.3 148.5
141.3 156.0
80.1 86.6
111.2
89.9 315.0 116.9 138,4 142.9
171.2 134.0 278.6
173.1
101.4 100.1
128.9 163.5
92.7 105.6 183.7
98.5 180.6 171.4 173.1 136.1
245.8 111.0 161.6 160.7 114.5
100.9 113.8
46.3 55.5 76.4
60.1 187.8
83.6 89,7
109.4
112.8 84.4
168.8
122.4
6.8 8.8
13.2 20.7 13.6 19.6 23.3
13.8 30.1 34.1 29.3 21.8
67.2 16.3 42.2 43.0 21.8
22.8 25.2 12.0 10.3 16.4
10.4 71.4 18.4 28.3 21.9
42.1 31.5 74.9
25.4
Source and derivation of values by column number:
~.
1. Table 1. 2. Table 40, Column 7. 3. Column 1 minus Table 3.5, Column 22. 4. Column 1 minus Columns 2 and 3, herein. 5. Table 3. 6. Same as Column 3 herein. 7. Table 30.
14.2 16.8
13.7 23.2 27.2 24.8 0.1
18.7 31.5 53.1 16.7 14.1
96.8 10.4 55.2 50.6 12.2
17.6 17.0 21.8 20.8 18.4
19.4 55.8 16.9 20.4 11.6
16.3 18.1 34.9
25.3
7.0 5.7
4.4 58.9 13.6 20.3 24.3
19.2 91. 7
177.6 29.0 20.4
191.4 22.1
166.5 124.6
37.7
25.1 32.6 6.4 3.7 6.0
3.5 116.e 16.0 17.3 10.0
14 . .5 10.0 93.3
44.0
6.8 8.8
13.2 20.7 13.6 19.6 23.3
13.8 30.1 34.1 29.3 21.8
67.2 16.3 42.2 43.0 21.8
22.8 2.5.2 12.0 10.3 16.4
10.4 71.4 18.4 28.3 21.9
42.1 31 • .5 74.9
25.4
o o
o o o 0.2 1.2
2.0 4.7 3.8 0.4 0.9
9.8 o 3.7 7.2 9.1
2.8 12.5 o o 0.3
o 23.0 2.9 2.9 0.2
0.6 0 • .5
30.4
3.0
0.5 0.5
0.5 0.5 0.3 0.4 0.2
0.1 0.2 0.1 0.2 0.3
0.3 0.1 0.1 0.2 0.2
0.1 0.1 0.2 0.1 a
o a o o o
o a o
0.2
0.1 o
a 2.6 0.3 0.7 0.3
0.6 3.4 5.1 1.0 0.5
6.5 0.7 2.3 1.7 0.5
0.2 0.2 a a 0.1
0.1 1.9 0.2 0.2 0.1
0.2 0.1 1.4
l.0
8. Table 16, Column 1. 9. Table F -10, Appendix F.
10. Table L-22A. 11. Table 28, Column 5.
o o
a o o o o
o o o o o
0.2 0.5 0.4 o.~ 0.,
0.5 0.5 0.6 0.6 0.6
0.6 0.4 0.6 0.5 O.~
0.4 0.5 O.~
0.3
3.0 1.3
3.7 13.6 10.2 26.4 11.4
4.5 21.3
123.2 24.9 24.8
139.0 20.6 89.6 79.7 18.1
20.0 14.2
6.0 12.6 8.7
4.9 101.8 15.4 19.8 16.7
33.5 24.1 89.8
30.8
10.2 12.7
13.4 62.9 16.4 12.2 34.5
2.5.8 92.2 79.5 31.8 1.5.7
102.8 16.5
112.6 78.4 31.1
24.3 30.3 11.6 0.7
12.7
8.3 61.1 15.3 22.2 14.4
21.9 16.3 Lt6.1
34.1
o 24.4 o 29.5
o 27.1 o 86.1 o 43.6 0.2 37.2 1.2 35.8
2.0 46.5 4.7 128.4 3.8 136.4 0.4 48.9 0.9 30.7
9.8 209.4 o 26.9 3.7171.5 7.2 136.2 9.1 52.4
2.8 12.5 o a 0.3
o 23.0 2.9 2.9 0.2
0.6 0.5
30.4
3.0
44.7 59.8 33.4 21.5 31.4
27.7 139.9
35.1 45.5 26.2
38.8 34.9
111.4
62.4
12. Column 5 plus Column 6 minus Columns 7, 8, 9, 10 and 11. 13. Table 30. 14. Sum of Columns 4,,12 and 13, herein.
--....
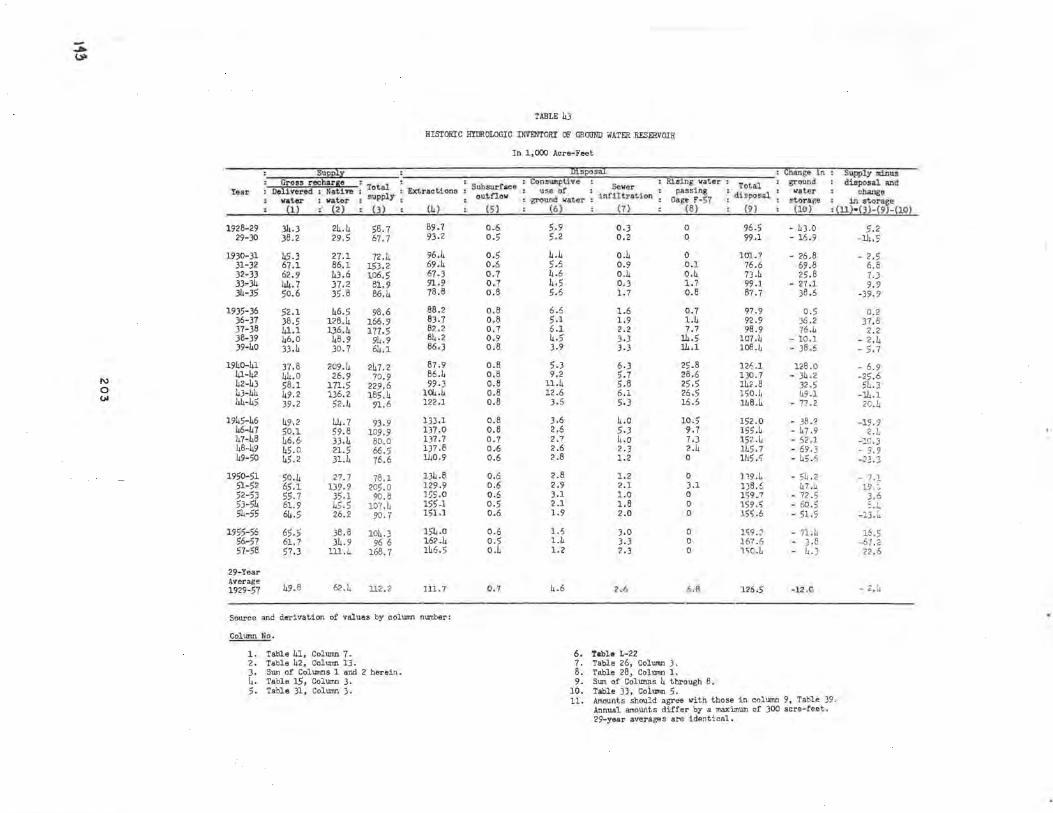
-... ~
TABLE 43
HISTORIC HYDROLOGIC INVENTORY OF GROOND WATER RESERVOIR
In 1,000 Acre-Feet
SUPPlY DHposa:r- ---- Change in Supply .nn1U! Gron recharge : Total • Subsurface Con~"",pt1ve Sewer RLiing vo1-"r Total ground lliposal and
lear Delivered NaU ... ,~, Extrac .ions uta use of i rilt t i passi ng di a1 "ater change vater vater I 8Up ...... y 0 ov ground water n ra on Gage 1'-57 . pas norage: in storaee
(1) : 121 (3) (I.) (5) (6) (?) (8) (9) (10) : (ll)- (3l=(9)-(10)
1928-29 34.3 24.4 58.7 89.7 0.6 5.9 0.3 0 96.5 - u3.0 5.2 29-30 38.2 29.5 67.7 93.2 0.5 5.2 0.2 0 99.1 - 16 .9 -11.. 5
1930-31 45.3 27.1 72.4 96.4 0.5 4.4 0.4 0 101. 7 - 26.8 - 2.5 31-32 67.1 86.1 153.2 69.4 0.6 5.6 0.9 0.1 76.6 69.8 6.8 32-33 62.9 43.6 106.5 67.3 0.7 4.6 0.4 0.1. 73.1. 25.B 7.3 J~-34 44.7 37.2 B1.9 91.9 0.7 4.5 0.3 1.7 99.1 - 27.1 9.9 34-35 50.6 35.8 86.4 78.8 0.8 5.6 1.7 0.8 87.7 38.6 -39.9
1935-36 52.1 46.5 98.6 88.2 0.8 6.6 1.6 0.7 97.9 0.5 0.2 36-37 38.5 128.4 166.9 83.7 0.8 5.1 1.9 1.1. 92.9 36.2 37.8 37-38 41.1 1)6.4 177.5 82.2 0.7 6.1 2.2 7.7 98.9 76.1. 2.2 38-39 46.0 1.8.9 94.9 81..2 0.9 1..5 3.3 11..5 107.1. - 10.1 - 2.4 39-40 33.1. 30.7 64.1 86.3 0.8 3.9 3.3 11..1 108.4 - 38.6 - 5.7
194o-Ul 37.8 209.4 247.2 87.9 0.8 5.3 6.3 25.8 12~. 1 128 .0 - 6.9 41-1.2 44.0 26.9 70.9 86.1. 0.8 9.2 5.7 28.6 1 30 .7 - 3u.2 -25.6
N 42-43 58.1 171.5 229.6 99.3 0.8 11.4 5.8 25.5 142.8 32.5 54.3 0 43-44 49.2 136.2 185.4 1(1, .1. 0.8 12.6 6.1 26.5 150.1. 49.1 -11..1 VI 44-1.5 39.2 52.4 91.6 122.1 0.8 3.6 5.3 16.6 lu8.1. - 77.2 2c.4
1945-46 1.9.2 44.7 93.9 133.1 0.8 3.6 4.0 10.5 152.0 - 38.2 -19 .9 46-47 50.1 59.8 109.9 137.0 0.8 2.6 5.3 9.7 155.u - 1.7.9 2.1: 47-48 46.6 33.4 80.0 137.7 0.7 2.7 4.0 7.3 152.4 - 62.1 -IC.3 48-49 1.5.0 21.5 66.5 137.8 0.6 2.6 2.3 2.4 1L5.7 - 69.3 - 9.9 49-50 45.2 31.4 76.6 140.9 0.6 2.8 1.2 0 Ih5.~ - 1.5.6 -23.3
1950-51 50.4 27.7 78.1 134.8 0.6 2.8 1.2 0 119.L - 54.2 - 7.1 51-52 65.1 139.9 205.0 129.9 0.6 2.9 2.1 3.1 138.6 47.4 19 . :. 52-53 55.7 35.1 9C.8 1)5.0 0.6 3.1 1.0 0 159.7 - 72.5 3.6 53-54 61.9 1.5.5 107 .4 155.1 0.5 2.1 1.8 0 159.<; - 60.5 < , _.w 54-55 61..5 26.2 90.7 151.1 0.6 1.9 2.0 0 15~ .6 - 51.5 -13.4
1955-56 65.S 36.8 l old 154.0 0.6 1.6 3.0 0 1<;9.2 - 71.4 16.5 56-57 61.7 34.9 96 6 162.4 0.5 1.4 3.3 0 167.6 - J .8 -67.2 57-58 57.3 111.4 168 . 7 146.5 0.4 1.2 2.3 0 I<;O.L - 4.3 22.6
29-Year Average
49.8 62.4 1929-57 112. 2 In.7 0.1 1..6 2.6 6.ft 126.5 -12.0 - 2.1.1
Source and derivation of values by column number:
Column No.
1- Table 41, Colwnn 7. 6. Table L-22 2. Table 42, Column 13. 7. Table 26, Column J. 3· Sum of Columns 1 and 2 herein. 8. Table 28, Column 1. 4. Table 15, Column 3. 9 . Sum of Columns 4 through 8. 5· Table 31, Column J. 10 . Table 33, Column 5.
11. Amounts should agree with those in column 9, Table 39. Annual amounts differ by a maximum of 300 acre-feet. 29-year averages are identical.
I
(
-204-
. ' \~4
CHAPTER VII. SAFE YIElD
This chapter contains the determination of the safe yield of
the ground water reservoir of the Upper Los Angeles River area based
on cultural conditions existing during the water years 1949-50, 1954-55
and 1957-58. The effect of the importation of foreign waters on the
safe yield is also determined. These determinations are made to satisfy
Paragraph I. 2, H. of the Order of Reference:
"The safe yield, and the effect thereon of the importation of foreign waters, shall be determined for the water year immediately preceding the filing of the report for which data is available, and for the water years ending 1950 and 1955."
The safe yield of the ground water reservoir of the Upper
Los Angeles River area is defined as the maximum average annual ground
water extractions which can be continually withdrawn for useful purposes
under a given set of condit ions wit.hout causing an undesirable result.
Conditions imposed herein for the determination of safe yield are
sUJmna.rl:~ed in Table 55, page 246b, and the maximum avera.ge annual ground
water extr'j,ctions which could be taken under thc:;se conditions without
the ll..'1.desirable occurrence of continued lowering of the ground water
levels is determ.ined as the safe yield •
-205-
Limitations and Factors Influencing Safe Yield
Analysis has been restricted to the two potential limitations
on ground water yield which are believed pertinent within the scope of
the reference. These are the amount of the ground water recharge from
native and imported water sources under conditions imposed for determi
nation of safe yield, and the ability of the ground water reservoir to
regulate this supply under those conditions.
The amount of the safe yield is dependent upon the average
amount of water which can be stored in and used from the ground water
reservoir over a period of normal water supply under a given set of con
ditions. Thus, safe yield is related to factors which influence or con
trol ground water recharge and to the amount of storage space available
to carryover recharge occurring in years of above average supply to
years of deficient supply.
Recharge, in turn, depends on the available surface water
supply and the factors influencing the percolation of that supply to the
water table. The 29-year base period, 1928-29 through 1956-57, has been
adopted as representative of normal native water supply conditions
because the magnitude and occurrence of annual water supply from precipi
tation is representative of the long-time mean. The major land use trend
of the base period is from agricultural to urban development and has
resulted in an increased proportion of impervious area affecting rain re
charge to the ground water reservoir through increased runoff and reduced
-206-
/
opportunity for consumptive use. Concurrent improvement of drainage channels
has partially removed a major medium of ground water recharge from the native
supply.. Reduction in recharge from these changes has been offset to some
extent by the construction and operation of spreading works during the base
period to increase the native water recharge. Urbanization of the valley
also has affected the ground water recharge from import supplies, mainly
through increased sewage outflows and changes in potential consumptive use.
The above conditions have been considered in the determination of safe yield.
The change in ground water storage in the valley fill of the Upper
Los Angeles River area from 1943-44 to 1957-58 ground water levels was a
reduction of 611,000 acre-feet (see Table 33, page 166). An operational
study- of the ground water reservoir, using the condi·tions under which safe
yield is determined, indicates that a maximum of about 360,000 acre-feet of
storage is required for regulation of supply over the 29-year base period.
Under such operation, about 210,000 acre-feet of this maximum amount was
found to be required above the 1957-58 levels and about 150,000 acre-feet was
found to be required below these levels. The data available since 1957-58
indicate that a total of at least 150,000 acre-feet has been taken from
storage below the 1957-58 levels. Therefore, the availability of ground
water storage space is not a limitation on safe yield under the conditions
adopted.
-207-
Conditionn for Safe Yield Determination
Safe yield is determined herein by eValuation of the average net (
ground "Tater recharge .. "hich would occur if the culture of the safe yield
year and t.he average historic import and export for the safe yield year
had existed each year over a period of normal native supply. The average
gross recharge of average historic import is obtained by (1) determining
the average delivered water required by the culture and conditions of the
safe yield year; (2) calculating the average gross recharge therefrom
as a percent of the average delivered water; and (3) applying this per-
centage to the average historic import. In evaluating the average amounts
of each item of supply and disposal, consideration has been given not OIllY
to the historic variation of the item but also to the factors causing the
variation.
Gross recharge from native sources occurs as percolation from
precipitation on land use areas on the valley fill, percolation from runoff
in the stream system and percolation of native spread water, and is deter
mined under normal precipitation and runoff conditions with the culture
existing during the safe yield year.
In order to determine safe yields on a comparable basis with
regard to availability of regulatory storage capacity and items dependent
thereon, such as rejected recharge and riSing water, the ground water
levels existing as of 1957-58 are used as a beginning point for basin oper
ation in the evaluation of safe yield for each of the three years.
The annual depths of water delivered to land use classes (Tables
J-8 and J-12) during the 1932-40 period are small when compared to the
amounts delivered in the 1949-58 period, which includes the safe yield
years. This difference in depths of delivered water is believed related
-208-
to changing economic conditions and in particular to the economic depres-
sion of the early 1930 1s. To eliminate this economic effect from the safe
yield computations, the determination of recharge from delivered water for
items responsive to both precipitation and economics is based on the 9-year
period from 1949-50 through 1957-58. Items dependent only on precipitation
on the valley fill area are evaluated over the 29-year base period. This
9-year period compares favorab~ with the 29-year base period and has an
average precipitation on the valley floor that differs from the normal by
less than one percent. The remaining items are based on historic amounts
for the safA yield year adjusted by use of trend curves. In all instances
the amount derived is the best average for the stated condition; i.e.,
the culture of the safe yield year existing over a period of normal supply
Conditions AffectinfaRecharge from Delivered Water onnd Use Class Areas
The annual amounts of water consumed and percolating on land use
class areas (except commercial and industrial areas) are affected by, but
not directly related to, the annual amounts of precipitation. The average
amounts are therefore best obtained by averaging the historic amounts over
a period of normal precipitation which contains the safe yield years, thus
also including the effect of economic conditions. The 9-year period,
1949-50 through 1957-58, meets these requirements and is used to obtain
average values of net recharge for all affected land use classes except as
noted. The average adjusted depths of conswmptive use and deep percolation
for residential land use differ from the historic values in that they are
-209-
adjusted to reflect the percent of the residential area that was pervious
during the safe yield year. The average annual amounts of consumptive use
and deep percolation for safe yield determination are therefore computed
as the product of these adjusted 9-year average depths (see Table R-2)
and the acreage of each type of land use existing during the safe yield
year.
Commercial and industrial consumptive use is not affected by
variations in precipitation. To obtain the average consumptive use and
deep percolation on this land use class for the safe yield years, the
annual amounts are plotted on Figure 8 and a trend curve drawn. The
amounts for the safe yield years are then taken from the trend curve on
Figure 8.
Evaporation from water system reservoirs (Table M-l) is depend
ent on climate and was computed for each year. The 29-year period average
is used as representative of normal. The portion of this evaporation
assigned to precipitation is trucen as the 29-year average rain on the
reservoirs (Table M-l). The remainder of the evaporation is taken to be
imported water.
A su~~ry of average amounts of consumptive use and deep perco
lation of delivered water on land use class areas thus determined is
shown in Table 44 along with a reference to the source and derivation of
the values.
-210-
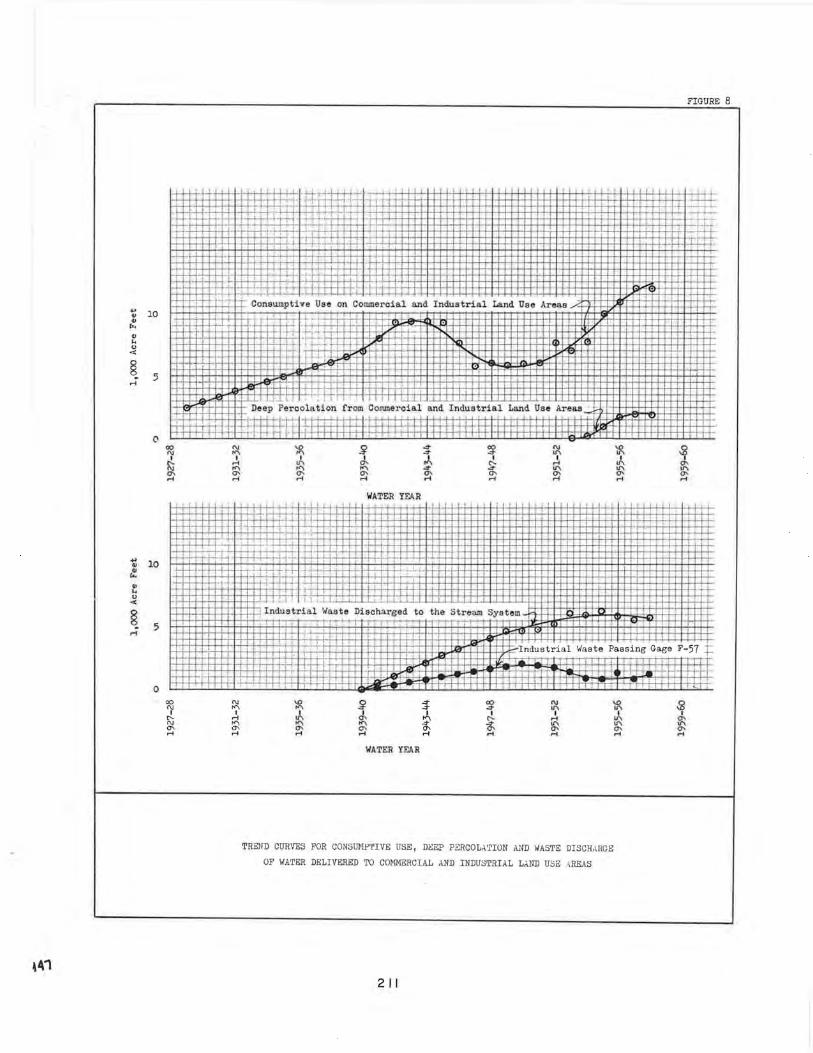
~ 10
'" I«
" ... " «
§ M
t! " «
5
('I
5
o
00 N
~
-
00 N , '" N C'> M
-
. .
I
I
;+ .1-
, I • ! , -~h- ' ,
, ::ct I - R+f-ht' -- - I
1--!+t- ' , ,
;.1 -+ , I
I . I . .
-i~ I~~~-i~ T Conew.ptive Use on Commercial and Industrial Land Uee Area-s
±t , m i' ,: I !-+.!t - -ofT -i=h-Ll "
Hi- ,!-,-,H-!-I-ti- TtIt; ~, ,
I , .- ,
, I J. I ... I I Ll.1..1
Deep Percola.tion fxc:>m Oommereial and Industrial Land Uee Are8.11
1-1- i-! p: I I I
WATER YEAR . I , . I
j! , --I I
-~-- , -++14 , -I -T I
~f+ " ... , I _ .L,_ , ,
t I: 1111._ -
Industrial Waste Disoh~aed to' the Stream Syste/ll 1
1 : I , , , I , ~ I
I ~..,..
I , I::-l:ndustrial Waste Passing Gage I I -
f-H-H., I
-~ q ~ ..i ,
rt-I-I-f' "
N 1<\ t
M 1<\ C'> M
\0 1 ..... 00 N 'oR '" ..... "'" 11'\
t t , , 11'\ 1<'\ .:;: :;:!. '" '" ..... ~ (1'00 C'> (1'00 0-
M M r< ... VATER YEAR
TREND CURVES FOR CONSUMPTIVE USE, DEEP PERCOLATION fu~D WASTE DISCHARGE
OF WATER DELIVERED TO COMMERCIAL AND INDUSTRIAL LAND USE{REAS
2 I I
~ a-....
I
,
FIGURE 8
I~ x= i-:r:r--
~
, h+H-
F-57 T T
-I
:i t
~ a-....
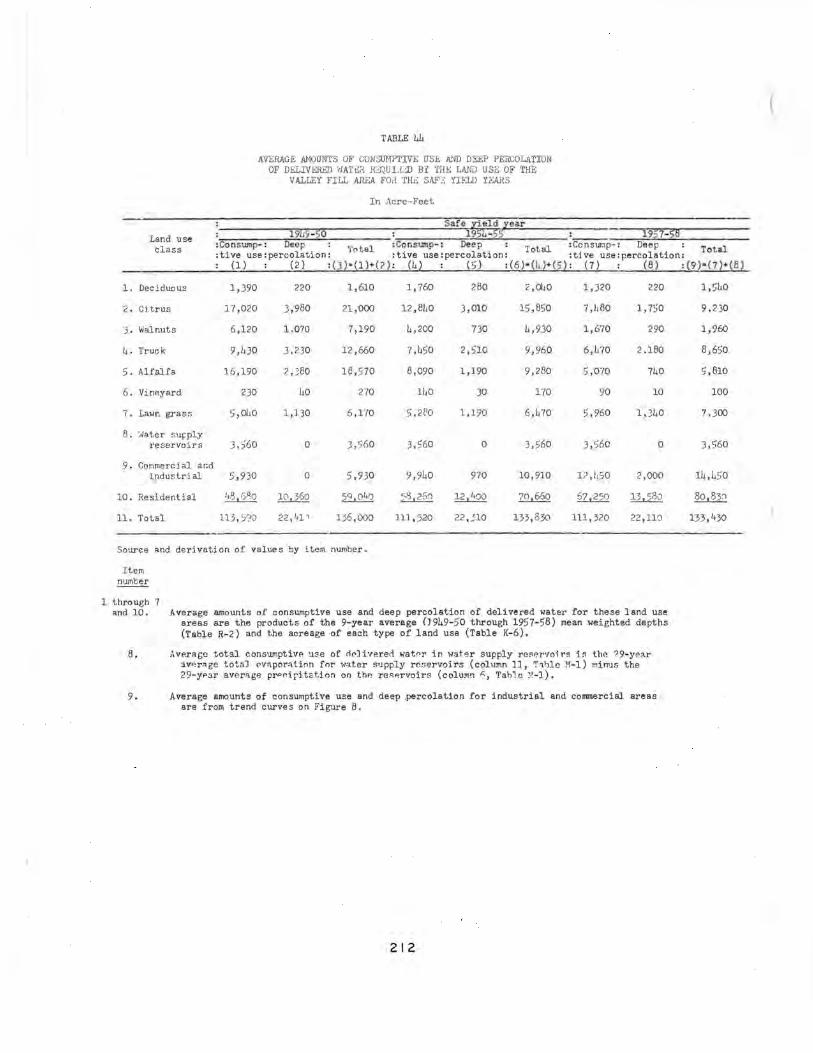
1
Land use class
1. Deciduous
2. Citrus
J. Walnuts
4. Truck
5. Alfalfa
6. Vineyard
7. Lawn grass
8. ~4ater su"ply
1,390
17,020
6,120
9,lJ30
16,190
230
5,OlJo
reservoirs 3,560
9. Co~~ercial and industrial 5,930
10. Re sidential 48, 6~0
11. Total 113, 5?O
TABLE 4L
AVERAGE »tOUNTS OF CONSUl1PTIVE USE Al'ill DEEP PERCOLATION OF DELIVERED \-IATt':,'l R",,:)UI:t;,;[) Bl THE LAND USE OF THE
VALLEY FILL AHEA FOil. THE SAFi; YIELD YEARS
220
3.980
1,070
),230
lJO
1,1)0
o
o
22,41 '
In Acre-Feet
1,610
21,000
7,190
12,660
18,570
270
6,170
3,560
5,930
136,000
1,760
12,840
lJ,200
7,h50
8,090
llJO
5,2~O
3,560
9,91.0
111,520
Safe yield year
280
3,010
730
2,510
1,190
30
1,190
o
970
22,;10
15,850
lJ,930
9,960
9,280
170
6,lJ70
3.560
10,910
70,660
133,830
Source and derivation of valwes by item number.
Item nwnGer
through 7
1,320
7,lJ80
1,670
6,1J70
5,070
90
5,960
3,560
1l,h50
111,320
220
1,750
290
2.180
740
10
1,340
o
2,000
22 ,llO
and 10. Average amounts of cons~ptive use and deep percolation of delivered water for these land use areas are the products of the 9-year average ()949-50 through 1957-58) mean weighted depths (Table R-2) and the acreage of each type of land use (Table K-6).
8. Avera{;e total consumptive '.lse of rio) h'eren watnr in 1<at.",r supply reser'/ai r5 i ~ the ?9-year 3Vp.r:tge tot,,] ('v'lpor'lUnn for ;Iater "'Jpply rn::;ervoirs (column 11, T,,!)lc !-I-I) ",i",JS the 29-ypar averA.ge prpdrit"tion on th" resp.rvoirs (colu!'!" 1;, Tab1c !'-1).
9. Average amounts of consumptive use and deep _percolation for industrial and commercial areas are from trend curves on Figure 8.
212
1,5hO
9.230
1,960
8,650
5,810
100
7,300
3,)60
14,450
80,83:1
133,430
( Industrial Wastes. Waste discharges from industrial plants to
the stream channels vary annually. To obtain the average amount of
industrial wastes discharged to the stream channels for each of the safe
yield years, the annual amounts (Table 26A, page 151b) are plotted on
Figure 8 and a trend curve drawn. The amounts of industrial waste dis
charged to the stream channels for each of the safe yield years are taken
as the ordinate of the trend curve for that year.
Annual amounts of industrial wastes passing Gage F-57 are also
plotted on Figure 8 and a trend curve drawn. Comparison of industrial
wastes discharged and the amounts passing Gage F-57 shows that a larger
portion of these wastes percolated during the years after 1949-50. For
safe ~~eld computations the amount of industrial waste passing Gage F-57
is taken as the ordinate of the trend curve for that year.
Total Sewage z Sewage Export and Cesspool Recharge. The total
amounts of sewage discharged to sewer lines and to cesspools have increased
with the urbanization of the area and are dependent on the population of
the area. The historic variation in amounts of total sewage (Table 26)
is plotted on Figure 9. The trend curve is a close approximation of the
historic points and is used to determine the average amounts for the safe
yield years. Annual amounts of cesspool recharge and sewage export (plus
sewer flushing water) are also plotted on Figure 9 and trend curves con
structed. Sewage discharged to the Los Angeles River is considered as a
random occurrence that would not recur and these amounts are included in
sewage export. Amounts of sewer infiltration and sewer flushing water
are not included in total sewage but are treated separately.
-213-
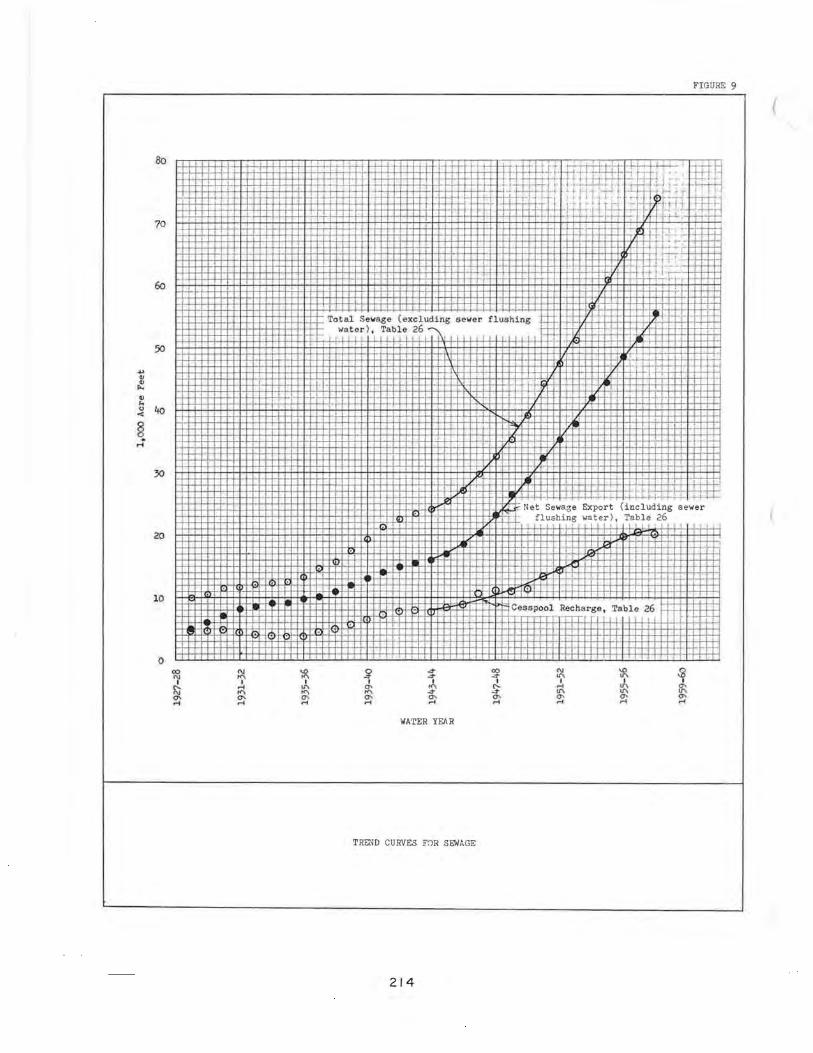
80
70
60
20
10
o
FIGURE 9
Total Sewage (excluding s·ewer flushing wa ter ) , Table 26
I , i ,
-, ,
WATER YEAR
TREND CURVES F8R SEWAGE
2)4
- -b,· , , I· "
-'
-:P I
1-1+ -"Net Sewage Export (including sewer
flushin~ water), Tabl~ 26
Cesspool Recharge, Table 26
'" 11"\ I
.-< 11"\
'" ....
(
( Spread Import. Imported water has been spread only by the City
of Los Angeles (Table 23, page 143). During the 9-year period, 1949-50
through 1951-58, the Los Angeles Aqueduct has operated at or near capacity
with spreading occurring during four of the nine years. Spreading of
import occurring during this period is considered to be caused by opera
tional procedures; therefore, these amounts, which averaged 1,330 acre-feet
per year, are included as an augmentation of operational releases, discussed
hereafter, and the average amount of water imported for the purpose of
spreading for each of the safe yield years is taken as zero.
Operational Releases. The annual amounts of operational releases
of Owens River water to the stream system (Table 24, page 145) and the por
tion passing Gage F-51 (Table 28, page 155) are plotted on Figure 10. The
annual variations were considered to be too irregular to permit use of a
trend curve; therefore, the averages of these two items, based on a period
of normal wetness (1949-50 through 1951-58) subsequent to the Los Angeles
Aqueduct reaching capacity (circa 1949), are used. For the same reason the
average amount of import spread due to operational procedures is also based
on the 1949-50 through 1951-58 period. The average amount of operational
release for each of the safe yield years is taken as the sum of average
operational release of Owens River water (i.e., 3,300 acre-feet per year,
Figure 10), and an additional operational release in lieu of spreading which
averaged 1,330 acre-feet per year (i.e., average of annual import spread
shown in Table 23, page 143, for the 9-year period 1949-50 through 1957-58).
-215-
Water System Loss. Water system loss for safe yield determi- (
nation is computed as the sum of three parts; sewer flushing water, con-
sumptive use of water s,ystem loss, and deep percolation of water s,ystem
loss. The annual historic amounts of these items are show in Table 36
and plotted on Figure 10. Trend curves were constructed to obtain
average values and the amounts for safe yield conditions were obtained
from ordinates of the curves for each safe yield year.
-216-
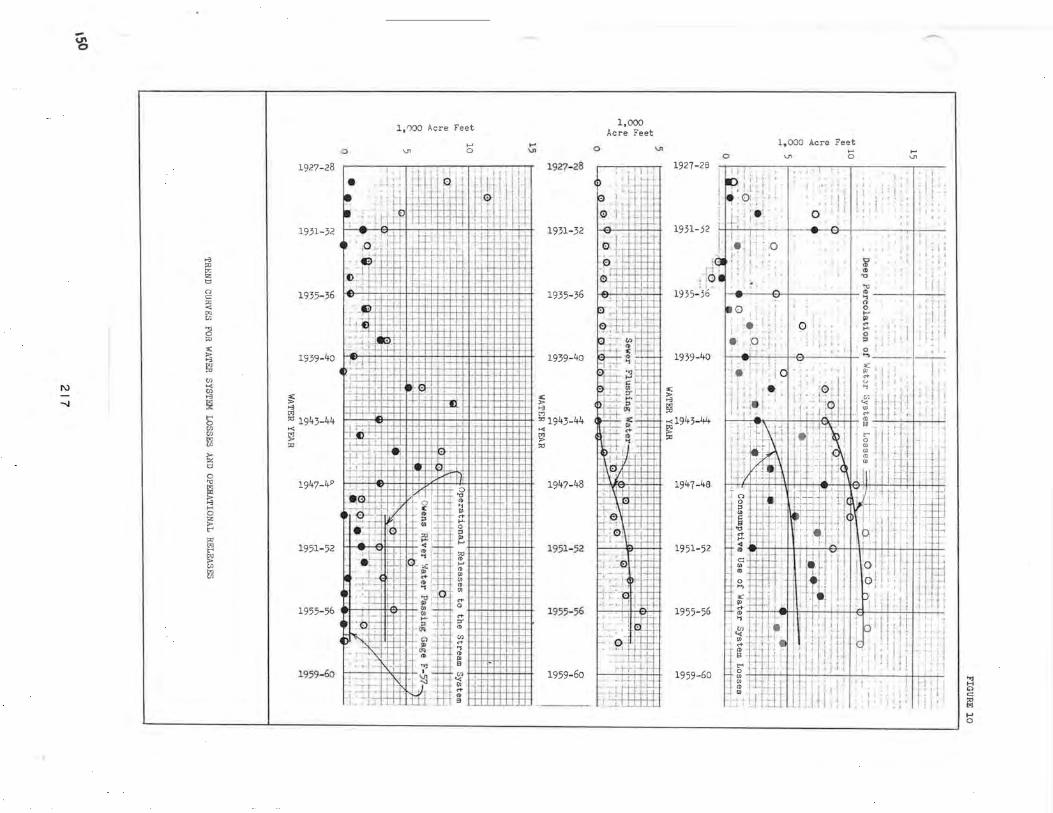
-~
1-3 ~
t;l t:l
0 c :.g t<J Ul
'-.:1 0 ~
0;: :0-1-3
fil Ul
N >< Ul 1-3
" S! I:-' 0 Ul Ul tzJ en >-'" t:l
0
~ H 0
'" :0-I:-'
~ I:-'
S? en tzJ en
1927-28
1931-32
1935-36
1,I)Q0 Acre Feet
VI ..... o
1939-40 1-4)-.-+!+-L.f-Lf+-
~ 1-3 t>l ~ 1943-44 >< ~ ~
1947-4P
1951-52
1955-56
1959- 60
'-I -
~r
..... '"
~ ,. 1-3 M
1927- 28
1931-32
1935-36
1939-40
'" 1943-44 >< ~ '"
1947-48
1951- 52
1955-56
1959-60
1,000 Acre Feet
0 VI
r1i 1927-28
~
I ~ l!! I! q 1951-52
1939-40
~ gJ
f 943-44
1947-48
1951-52
1955-56
1959-60
0
1,000 Acre Feet
'"
I I.' t
I ~ o :li
..... o
I' " I; I 'I' ;, I
~ co 'tI
.... \Jl
~----e 1 ~ ---I-(') o ..... ~ .. ... ' o
o "
1 e' "" I 0 " 0 ' "'---1-
To o ::> CD
~ .. ~- If ' If 1\ '[' 'I ' I \' 'I I t4 ~ IIf + ! I , I 0 I' I j r I _ jl-l~ . CD
'" o ...,
~ c l!l .... o
Conditions Affecting Recharge From Precipitation on Land Use Areas
The amounts of water applied either through deliveries or rainfall
and the percent of the area that is impervious have an affect on the con-
sumptive use of rain. The percentage of residential land that is impervious
has increased, while agricultural areas have remained unchanged in this
respect during the base period. The type of use on pervious residential areas
has also changed during the base period and has affected the residential use
of delivered water and precipitation.
The mean depths of consumptive use for the land use class areas are
shown for the 29-year and 9-year periods in Tables L-13 through L-15 and Table
R-2 respectively. The 29-year average unit values of consumptive use of pre-
cipitation are approximately three percent greater than the 9-year average
values for the land use classes that are predominantly pervious. Average unit
values for residential areas for the 29 and 9-year periods cannot be compared
due to the variation in percent pervious. The best approximation of recharge
from precipitation on the valley fill area under safe yield conditions is
obtained by the conmination of normal precipitation from Table 1, 9-year aver
age consumptive use of precipitation derived in Table 45, and the 29-year
average residual rain shown in Table 45. The 9-year average unit consumptive
use values are compatible with normal precipitation on the valley fill area
and include the influence of changing amounts of delivered water on consump-
tive use. The. 29-year average is used for unit residual rain values because
residual rain is unaffected by economic conditions and to provide continu.ity
with the computation of recharge in the stream system which is based on the
29-year average.
-21 8-
(
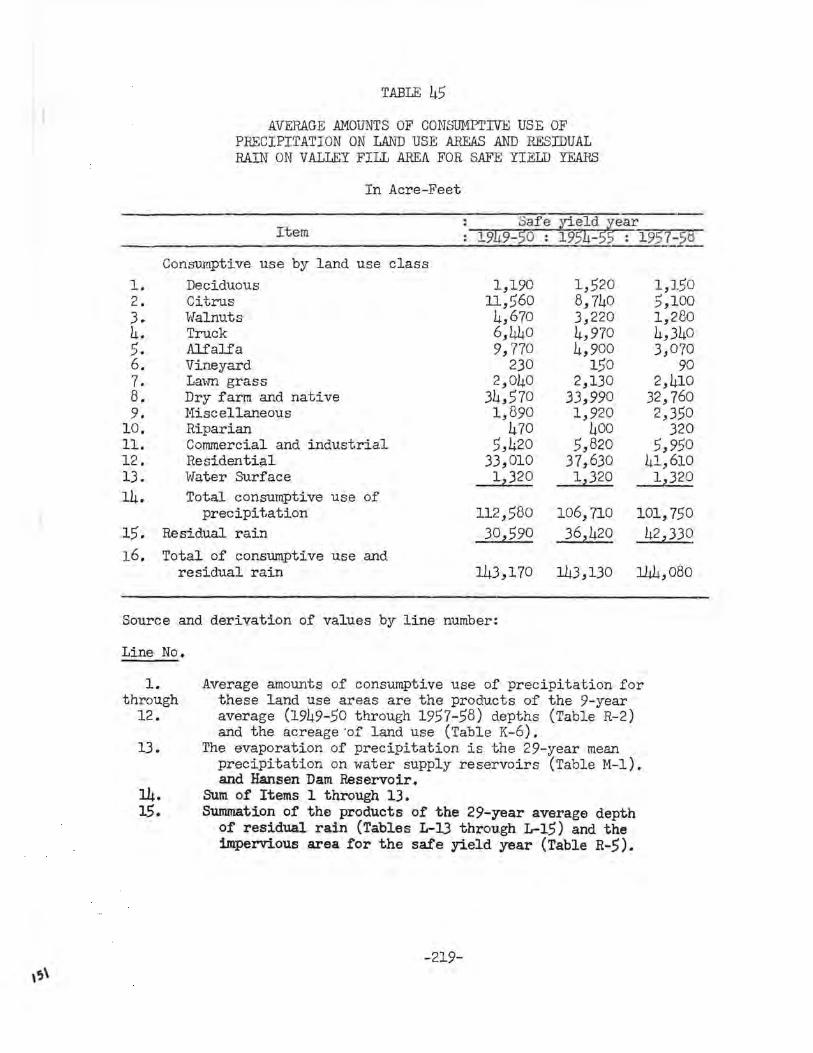
TABLE 45
AVERAGE AMOUNTS OF CON,s'UMPTIVE USE OF PP£CIPITATION ON LAND USE AREAS AND RESIDUAL RAIN ON VALLEY FILL AREA FOR SAFE YIELD YEARS
In Acre-Feet
Item Safe liel d ~ear 1949- ) 0 : 19>4- ) - : 1957-~ci
Consumptive use by land use class I. Deciduous 1,190 1,520 1,150 2. Citrus 1l,560 8,740 5,100 3. ~{alnuts 4,670 3,220 1,280 4. Truck 6,4L.0 4,970 4,340 5. Alfalfa 9,770 4,900 3,070 6. Vineyard 230 150 90 7. La1m grass 2,040 2,130 2,410 8. Dry farm and native 34,570 33,990 32,760 9. Miscellaneous 1,890 1,920 2,350
10. Riparian 470 400 320 II. Commercial and industrial 5,420 5,820 5,950 12. Residenti~l 33,010 37,630 41,610 13. Water Surface lz320 1,2320 1,!32O 14. Total consumptive use of
precipitation 112,580 106,710 101,750 15. Residual rain 30z590 36z42O 42 z330
16. Total of consumptive use and residual rain 143,170 143,130 144,080
Source and derivation of values by line number:
Line No.
I. through
12.
13.
14. 15.
Average amounts of consumptive use of precipitation for these land use areas are the products of the 9-year average (1949-50 through 1957-58) depths (Table R-2) and the acreage 'of land use (Table K-6).
The evaporation of precipitation is the 29-jr ear mean precipitation on water supply reservoirs (Table M-l). and Hansen Dam Reservoir.
SUm of Items 1 through 13. Summation of the products of the 29-year average depth
of residual rain (Tables L-13 through L-15) and the impervious area for the safe yield year (Table R-5).
-219-
Conditions Affecting Native Recharge in the Stream System
Recharge of native waters in the stream s,ystem is based on the
assumption that the condition of the stream s.ystem existing during the
safe yield year prevailed over a period of normal runoff. The available
data on supply to and recharge from the stream system are shown in Table
42, page 202, for the 1928-29 through 1957-58 period. These data are
plotted on Figure 11 and the relationship between annual amounts of
supply and recharge for each of the safe yield years is determined in
the form of a curve. The average amount of recharge of native water in
the stream s.ystem is based on the 29-year base period, since runoff from
hill and mountain areas is normal for this period.
To ascertain the relationship between native supply to the
river s,ystem and deep percolation therein, the annual amounts of native
supply less amounts diverted and spread are plotted against annual
amounts of deep percolation on Figure 11. The deep percolation, as plot-
ted on Figure 11, shows a decrease with time and in general varies
inversely with the amount of improvements made to channels. The historic
improvements made to the main channels are summarized in Table 18, page
131. The decreasing percent of the total length of main channels remaining
unpaved is an indication of the loss of percolation capacity of the stream
system. In order to construct curves showing the relationship between native
supply and deep percolation of that supply, the years are grouped on the basis
of length of channel remaining unpaved as follows:
-220-
(
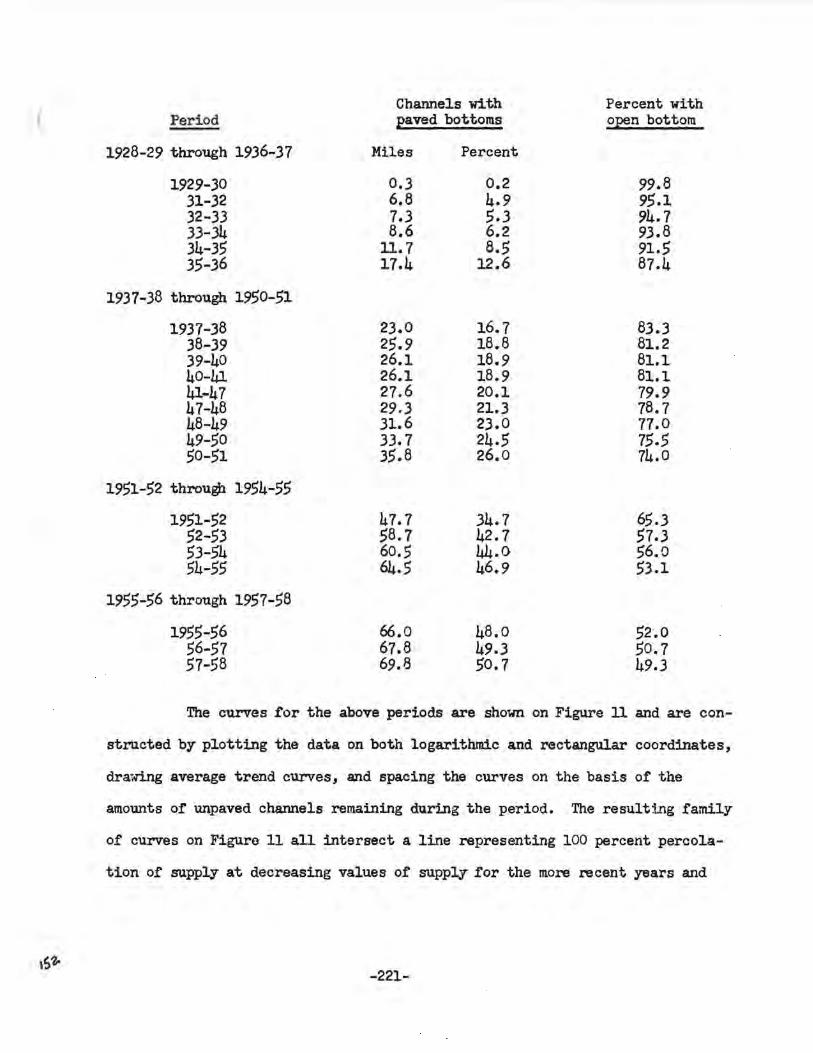
Channels with Percent with ( Period £aved bottoms o~n bottom
1928-29 through 1936-37 Miles Percent
1929-30 0.3 0.2 99.8 31-32 6.8 4.9 95.1 32-33 7.3 5.3 94.7 33-34 8.6 6.2 93.8 34-35 11. 7 8.5 91.5 35-36 17.4 12.6 87.4
1937-38 through 1950-51
1937-38 23.0 16.7 83.3 38-39 25.9 18.8 81.2 39-40 26.1 18.9 81.1 40-41 26.1 18.9 81.1 41-47 27.6 20.1 79.9 41-48 29.3 21.3 18.7 48-49 31.6 23.0 77.0 49-50 33.1 24.5 75.5 50-51 35.8 26.0 74.0
1951-52 through 1954-55
1951-52 41.7 34.1 65.3 52-53 58.7 42.7 51.3 53-54 60.5 44.0 56.0 54-55 64.5 46.9 53.1
1955-56 through 1957-58
1955-56 66.0 48.0 52.0 56-57 61.8 49.3 50.7 57-58 69.8 50.7 49.3
The curves for the above periods are shown on Figure 11 and are con-
structed by plotting the data on both logarithmic and rectangular coordinates,
drawing average trend curves, and spacing the curves on the basis of the
amounts of unpaved channels remaining during the period. The resulting family
of curves on Figure 11 all intersect a line representing 100 percent percola-
tion of supply at decreasing values of supply for the more recent years and
-221-
all diverge for increasing amounts of supply. The spacing of the curves
indicates reduced percolation with reduced length of open bottom channels.
The curves for the 1949-50 and 1954-55 safe yield years were drawn by inter
polating between historic curves on the basis of the relative amounts of
open bottom channels remaining during the safe yield year. The curve for
1957-58 is drawn in a similar manner by extrapolation.
The net supply to the stream system is the sum of hill and
mountain runoff and residual rain draining off the valley fill area minus
the runoff reaching water system reservoirs, native water spread, and sur
face diversions. Modifications of runoff items to conform to safe yield
conditions are derived in Appendix R. These conditions differ from his
toric due to increased impervious areas in the hills and diversions works
(constructed after 1941) which bypass runoff around water system reservoirs.
DurL~g the base period the amounts of surface water diverted on
the valley fill area (Table 16, page 125) have not exceeded 500 acre-feet
and have averaged 180 acre-feet per year. Surface diversions were not made
during the 1949-50 through 1957-58 period. The amount of surface diversions
on the valley fill area for each of the safe yield years has therefore been
taken as zero. The amount of native water spread is that amount which would
have been spread if the spreading grounds existing during the safe yield year
(see Table 29, page 157) had existed over the period of normal supply
(29-year period).
-222-
(
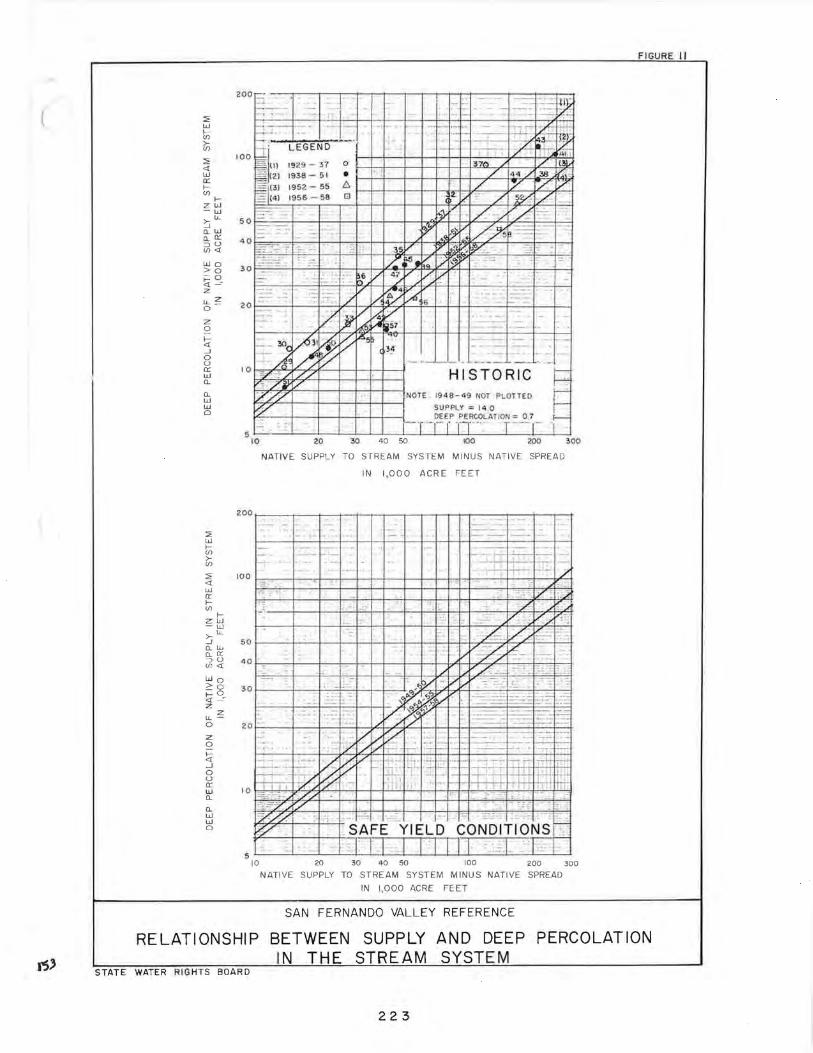
::;: W
t1 >(J)
::;: <t W 0::: f(J)
fzW -W
~"(LW
(LO:::
::JU (J)<t
Wo >0
~s Z
"-z 0-
z o f-<t --' o U 0::: W (L
(L
W W o
::< W f(J) >(J)
:;;: <t W 0::: f(J)
fzw -w ">-
--' (Ll"-> (LO' -, U 0~ c:r
Wo >0 ~O <t---" z
Z LL-o z o f<t --' o U 0' W (L
(L
W W o
FIGURE I r
lLl:;;';r~·'7/1- L7-+_+--+_f---,H-INOTE . 19 4 8-49 NOT PLQTTE.O .E lQ7 . SUPPLY = I~ _ O
DEEP PERtOLATlON = 0,7
S~·~- ~-~~~JJ-L~~T~·-rL·-ru· l~·l ~··.~T_--_-Lr-~·I~ 10 20 30 40 50 100 200 ~OO
NATIVE SUPPLY TO STREAM SYSTEM MINUS NATIVE SPREAD
IN 1.000 ACRE FEET
200
-- - _. - - --~ I~ -.. - - .. --'---'--;-
=!= 100 - -;--f- ./
.. 5 L-~~~~~~~-L_L-~~~-L~.~'~" ~-~~~~
10 20 30 40 50 100 200 300
NATIVE SUPPLY TO STREAM SYSTEM MINUS NATIVE SPREAD
IN 1,000 ACRE FEET
SAN FERNANDO VALLEY REFERENCE
RELATIONSHIP BETWEEN SUPPLY AND DEEP PERCOLATION IN THE STREAM SYSTEM
STATE WATER RIG HTS BOARD
223
Conditions Affecting Natural Depletions from the Ground Water Reservoir
Natural depletions consist of rising water, subsurface outflows,
sewer infiltration and direct consumption of ground water on land use areas
(riparian and excess consumptive use). The average amounts of rising water
passing Gage F-57 are controlled by the relative position of the stream
channel invert and average ground water surface configuration. The latter
is in turn dependent on basin operation. To provide a uniform basis for
comparison of the safe yield for the three years, basin operation for each
of the three years is assumed to commence with configuration of ground
water levels the same as existed during 1957-58. Operation of the ground
water reservoir under safe yield conditions requires a maximum of approx-
imately 210,000 acre-feet of storage space above the 1957-58 water levels.
This amount of storage space is required for the 1949-50 safe yield condi-
tion with the other two safe yield years requiring lesser amounts.
Historic rising water passing Gage F-57 is plotted against storage above
1957-58 levels on Figure 12. This relationship indicates that the riSing
water outflow which would occur within the storage fluctuation noted above
is nil; therefore, for the three safe yield years, average rising water
has been taken as zero.
Subsurface outflows (Table 31) at Gage F-57 are plotted on Figure
13. The annual amounts have declined gradually from 500 acre-feet in 1934-
35 to 160 acre-feet in 1957-58. The average amounts for the safe yield
years have been taken from the curve. Estimated annual subsurface flows
out of the Upper Los Angeles River area in the vicinity of Pickens Canyon
-224-
(
( have varied with the amount of natural supply and within a narrow range
(250 to 400 acre-feet) during the 29-year period; therefore, the 29-year
average has been used for the subsurface outflow in this vicinity.
Annual amounts of sewer infiltration (Table 26, page 151) are
plotted on Figure 13 and the trend curve, drawn to represent average sewer
infiltration, reflects the general decline in ground water levels during
the 1940lS and increase in length of sewer lines during the 1950's. For
safe yield computations, average values were taken as the ordinate to the
trend curve for the safe yield year.
Improvement of channels made in 1938 through 1940 and the 1938
flood removed a large amount of riparian growth from the stream channels.
The trend curve on Figure 13 from 1941 to 1947 shows a small increase in
riparian use followed by a steady decline. The annual historic amounts of
excess consumptive use presented in Table L-17 are for a depth to ground
water interval of 0 to 10 feet. The area which had a depth to ground
water of less than four feet is present~ subdivided. It is believed that
recurrence of a ver,y high ground water table will be avoided since exten
sive damage to the homes would result. For this reason the trend curve
for excess consumptive use shown on Figure 13 is based on the historic
amounts for a depth to ground water interval of 4 to 10 feet. Average
values for safe yield conditions were taken as the ordinate to the trend
curve for the safe yield year.
-225-
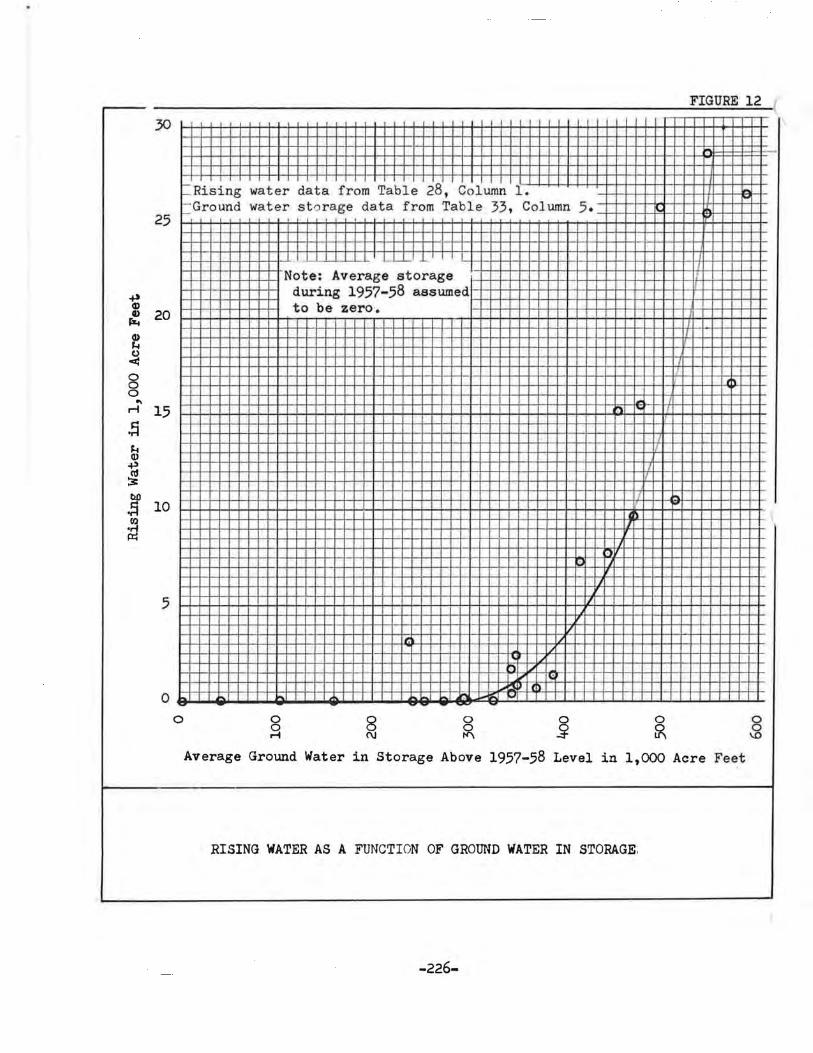
FIGURE 12
:::Ris i ng water dat a from Table 28, Column 1.
25 ~Ground water st0rage da ta f rom Table 33, Column 5.
I
I .... ....
Note: Average storage ~
during 1957-58 assumed Q) Q) 20 rz.
to be zero'.
Q) r; 0 < 0 0 I
0 "' I
M 15 .~ r; (l)
~ --
~ tID
;i 10 (I)
'n p:::
5
l'"
o o 8
(\j
o ~
Average Ground Water in Storage Above 1957-58 Level in 1,000 Acre F'eet
RISING WATER AS A FUNCTION OF GROUND WATER IN STORAGE;
-226-
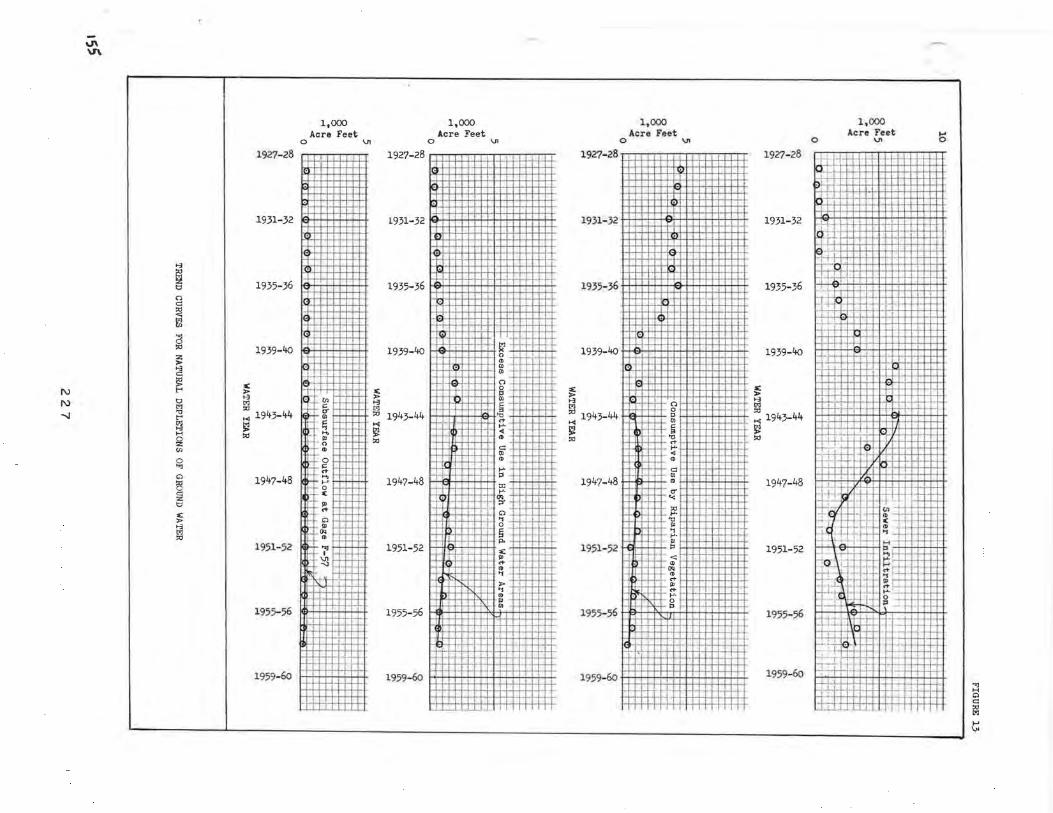
N f\)
-..J
'" V\
8
~ t::j
0 d :g f;J
d :0
z >-t-3 d
~ t-' t::j l'l '"Cl t-'
~ H 0 Z til
a "'1
'" i3 ~ t::j
:£ > ~ :>:I
1927-28
1931-32
1935-36
1939-40
1C >-t-3 l'l :c ><l1943-" ~ :0
1947-48
1951-52
1955-56
1959-60
1,000 Aore Feet
a
til
& en <' '1 .... III 0
" 0 <' rt ..., .... 0 0:
III rt
'" III co
111
"'1 I
V! --,J
- ~.'
1,000 Aore Feet
V! a V!
1927-28 1927-28
L931-32 1931-32
1935-36 1935-36
k' 1939-40 1939-40 0
" m OJ
0 0 :£ :; ~ >-Dl t-3 t-3 <' l"l .a : 1943-44 :0 1943-44 <1" . >< ....
. ~ - < ~ " :c 2j
d Dl
" .... ~
1947-48 1947-48 ::I1 .... co ;T
"' . '1 0
.§ - . P.
1951-52 :: - 1951- 52 .. "
" '1
r; -CD III
1955-56 rn
1955-56
1959-60 1959-60
1,000 Acre Feet
a \11
1927- 28
H
1931-32
1935-36
1939-40
~ 8
0 l'l 0 :c ~ _ >< 1943-44 OJ
~ ~ '"Cl :>:I <1" - .... < " d OJ 111 1947-48 .,. '< :c ....
'tJ III '1 .... . g <l- 1951-52 CD
co " <1" III .. .... 0 t:l
1955-56
1959-60
1,000 Acre Feet
a VI
~-!d-l
fi
.q:J. I
I+H+-# 1- t . Itr' -- ", -i-
I~~ 1- ' 111 0: 111 '1
-1"" '--r " H -
H ' ~ I--.... "'0 i ..., . p:: :; ...... --I < ~l - t
Ill , .
::r·W ~ -i, ' H<
-t·, I
I::-t : ""'.-r
I~
H= I-LL.!..U.
b
"'1 H
'" d
[:il .... VI
Average Delivered Water Reguirement Under Safe Yield Conditions
Average delivered water required by the culture of the safe
yield year over a perioq of normal native supply is the sum of average
demands and uses of delivered water by the culture of the safe yield
year. The conditions governing these average demands and uses of
delivered water are discussed in the preceding sections of this chapter.
The average amounts of the demands and uses along with their source and
derivation are shown in Table 46.
The average delivered water requirement for the 1957-58
culture conditions is 34,000 acre-feet greater than for the 1949-50
conditions. This change results from urbanization of the area and is
reflected in the increase in the total of sewage export and cesspool
recharge shown in Table 46.
-228-
(
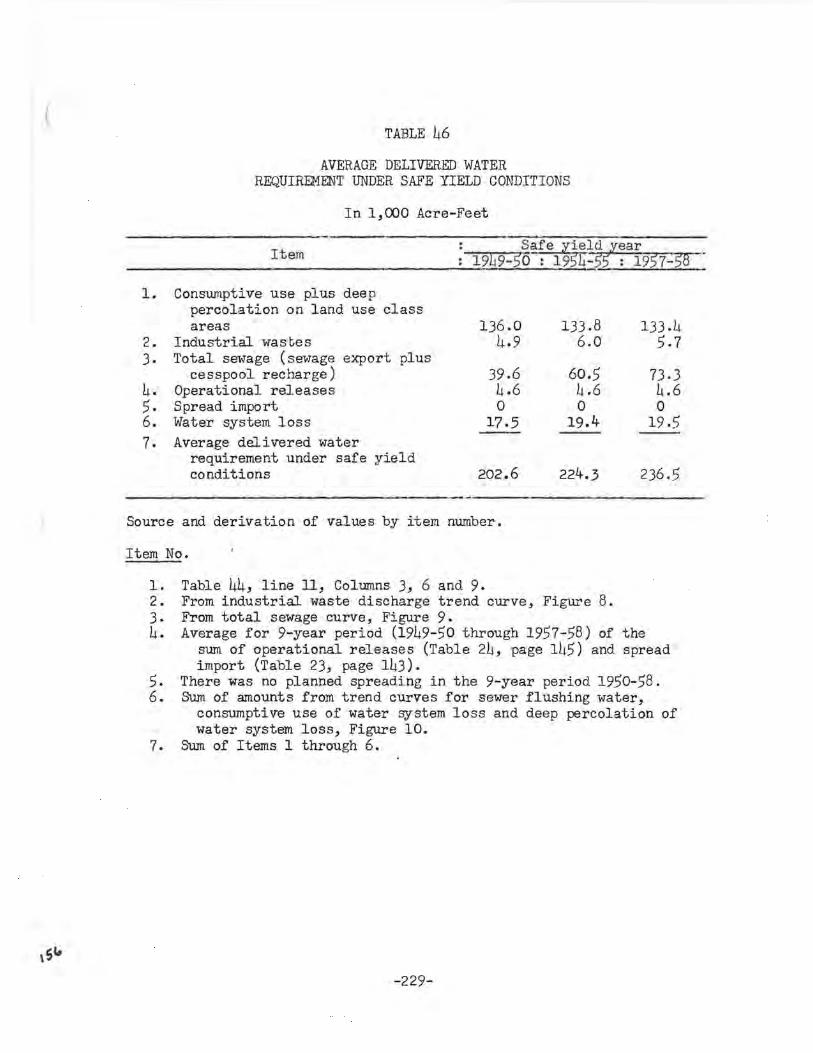
( TABLE 46
AVERAGE DELIVERED WATER REQUIR~1ENT m~DER SAFE YIELD CONDITIONS
In 1,000 Acre-Feet
Safe yield year _______ I_t_e_m _______ .::.l~24t"""!9,....,-5~J6 : 1954":55 : 1957-W--
l. Consumptive use plus deep percolation on land use class areas 136.0 133.8 133.4
2. Industrial waSGes 4.9 6.0 5.7 3. Total sewage (sewage export plus
cesspool recharge) 39.6 60.5 73.3 4. Operational releases 4.6 4.6 4.6 5. Spread import 0 0 0 6. Water system loss 17.5 19.4 19.5 7. Average delivered water
requirement under safe yield conditions 202.6 224.3 236 •. r)
Source and derivation of values by item number.
Item No.
1. Table 44, line 11, Col~mns 3, 6 and 9. 2. From industrial waste discharge trend curve, Figure 8. 3. From total sewage curve, Figure 9. 4. Average for 9-year period (1949-50 through 1957-58) of the
sum of operational releases (Table 24, page 145) and spread import (Table 23, page 143).
5. There was no planned spreading in the 9-year period 1950-58. 6. Sum of amounts from trend curves for sewer flushing water,
consumptive use of water ~stem loss and deep percolation of water system loss, Figure 10.
7. Sum of Items 1 through 6.
-229-
Ground Water Recharge Under Safe Yield Conditions
Gross ground water recharge under the safe yield conditions hereto
fore established has been evaluated as the supply from deliveries and native
sources less consumptive use and outflows including sewage export. Net re
charge has been determined as the gross recharge less natural ground water
depletions under safe yield conditions. Gross recharge of the delivered
water requirement is computed as a lump sum while gross recharge of native
water is calculated in three parts: from land use areas, from the stream s,ys
tem and from native spread water.
Gross Recharge of Delivered Water ReqUired by the Culture
The gross recharge from the average delivered water requirement
under safe yield conditions is shown in Table 47 and is the difference between
the average delivered water and its consumptive uses, outflows and exports.
-230-
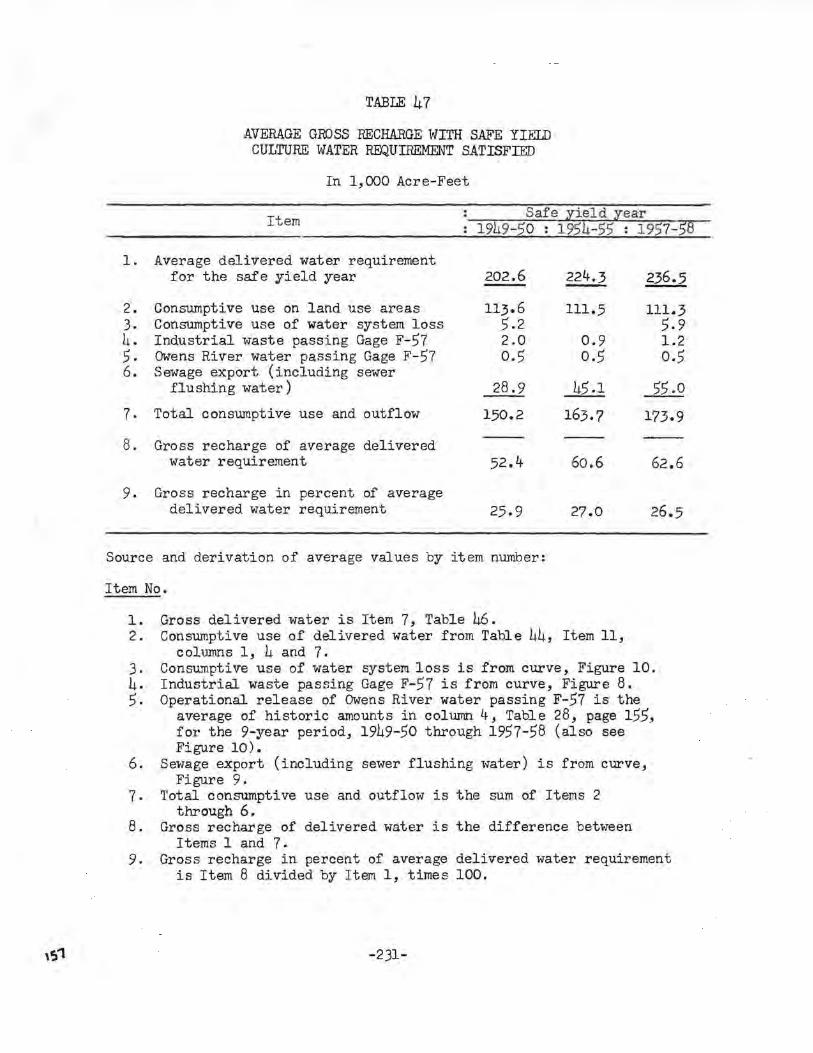
TABLE 47
AVERAGE GROSS RECHARGE WITH SAFE YIELD CULTURE WATER REQUIREMENT SATISFIED
In 1,000 Acre-Feet
Safe yield year Item 1949-50 1954-55 1957-58
1. Average delivered water requirement for the safe yield year 202.6 224.3 236.5
2. Consumptive use on land use areas 113·6 111.5 111.3 3. Consumptive use of water system loss 5.2 5.9 4. Industrial waste passing Gage F-57 2.0 0.9 1.2 5. Owens River water passing Gage F-57 0.5 0.5 0.5 6. Sewage export (including sewer
flushing water) 28.9 45.1 55.0
7. Total consumptive use and outflow 150.2 163.7 173.9
8. Gross recharge of average --delivered water requirement 52.4 60.6 62.6
9. Gross recharge in percent of average delivered water requirement 25.9 27.0 26.5
Source and derivation of average values by item number:
Item No.
1. Gross delivered water is Item 7, Table 46. 2. Consumptive use of delivered water from Table 44, Item 11,
columns 1, 4 and 7. 3. Consumptive use of water system loss is from curve, Figure 10. 4. Industrial waste passing Gage F-57 is from curve, Figure 8. 5. Operational release of Owens River water passing F-57 is the
average of historic amounts in column 4, Table 28, page 155, for the 9-year period, 1949-50 through 1957-58 (also see Figure 10).
6. Sewage export (including sewer flushing water) is from curve, Figure 9.
7. Total consumptive use and outflow is the sum of Items 2 through 6.
8. Gross recharge of delivered water is the difference between Items 1 and 7.
9. Gross recharge in percent of average delivered water requirement is Item 8 divided by Item 1, times 100.
\~1 -231-
Gross Recharge of Precipitation on Land Use Areas
The gross recharge of precipitation on land use areas is the
normal precipitation on the valley fill area (Table 1) minus the consump
tive use and residual rain on the land use areas (Table 45). The average
amounts of these items, their source, and the resulting gross recharge
pre listed in Table 48 for each of the three safe yield years.
-232-
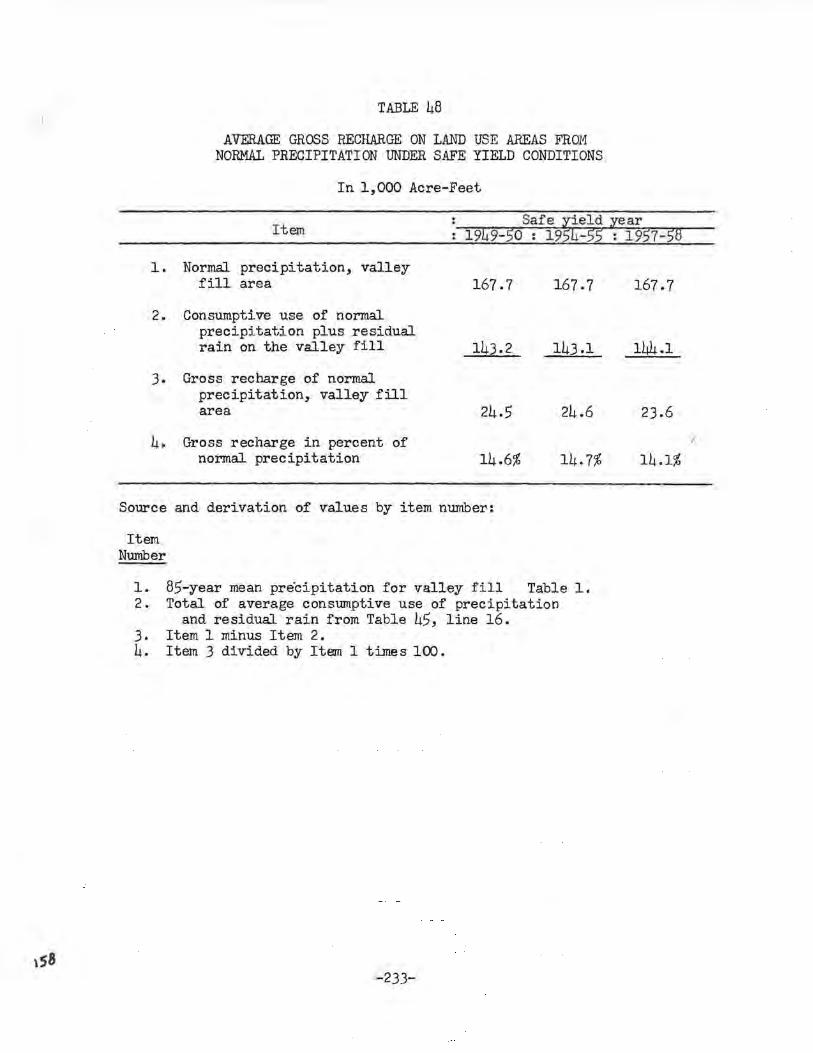
TABLE 48
AVERAGE GROSS RECHARGE ON LAND USE AREAS FROM NORMAL PRECIPITATION UNDER SAFE YIELD CONDITIONS
In 1,000 Acre-Feet
Item Safe ~ield year 1949-50 : 19 4-55 : 1957-58
1. Normal precipitation, valley fill area 167.7
2. Consumptive use of normal precipitation plus residual rain on the valley fill 143.2
3. Gross recharge of normal precipitation, valley fill area 24.5
4. Gross recharge in percent of normal precipitation 14.6%
Source and derivation of values by item number:
Item Number
167.7
143.1
24.6
14.7%
1. 85-year mean pre"cipitation for valley fill Table 1. 2. Total of average consumptive use of precipitation
and residual rain from Table 45, line 16. 3. Item 1 minus Item 2. 4. Item 3 divided by Item 1 times 100.
-233-
167.7
144.1
23.6
14.1% I
Gross Recharge of Native Spread Water
The historic amounts of net water spread at the four spreading
grounds operated by the Los Angeles County Flood Control District are
shown in Table 49. The average amount of native water spread is the esti
mated amount of water that would have been spread if the spreading grounds
existing during a safe yield year had operated during a period of normal
supply. The 29-year base period is the only period of near normal precip
itation and runoff having adequate records. The amount of surface runoff
which may be spread at these basins is a function of the occurrence and
intensities of rainfall and the operating procedures of Pacoima, Big
Tujunga and Hansen flood control dams. Pacoima spreading grounds have the
longest period of record, with operation commencing in 1932-33. Hansen
spreading grounds were completed and began operation in 1944-45 with Lopez
and Branford being completed in 1955-56. Urbanization has been minor in
areas tributary to the spreading grounds; therefore, the amount of native
water spread historically during a given year has been used as the amount
which could have been spread during that year under safe yield conditions.
Estimation of spreading during the remainder of the 29-year base period is
based on the historic amounts spread.
Water spread at Pacoima spreading grounds from 1928-29 through
1931-32 was taken as equal to stream runoff at Gage 118 multi~lied by the
average ratio of the annual amounts of water spread for the period of
record (1932-33 through 1957-58) to the annual amount of hill and mountain
runoff from Pacoima Canyon, measured at Gage 118 (see Plate 9 and Table 27).
The annual estimated amount which could have been spread at the Lopez
-234-
(
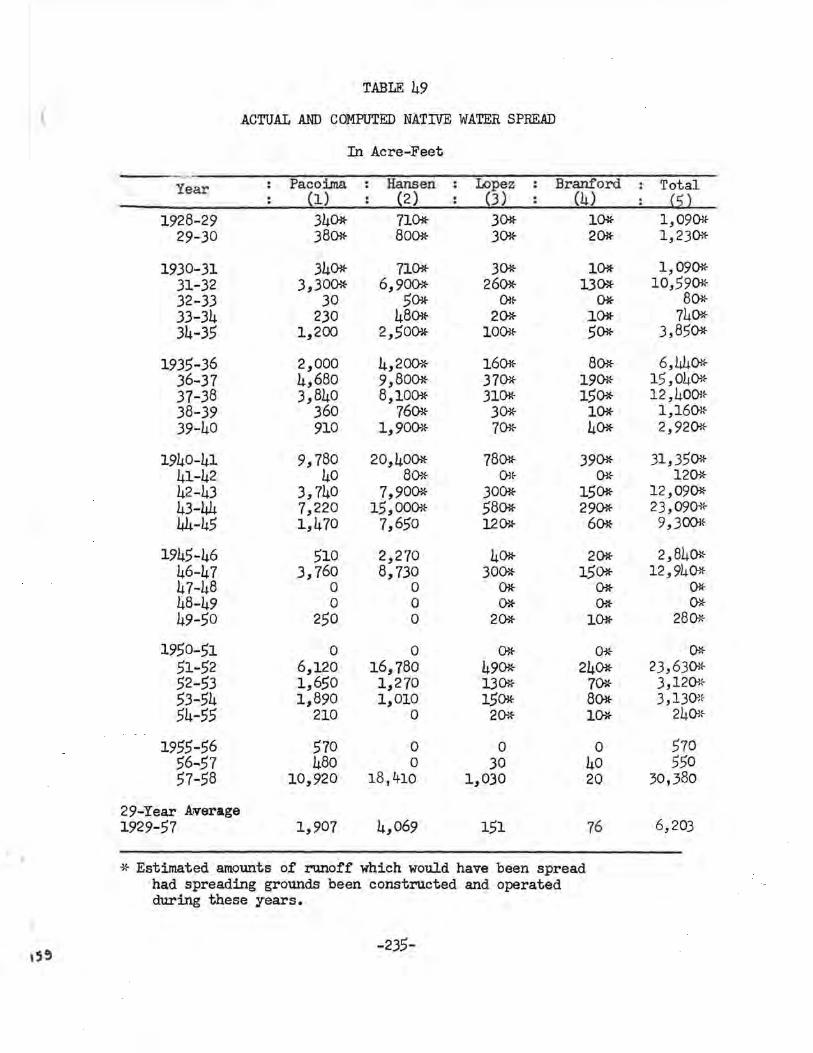
TABLE 49
( ACTUAL AND COMPUTED NATIVE WATER SPREAD
In Acre"';Feet
Year Pacoima Hansen Lopez Branford Total (1) ~2) ~3 ) (4) ( ~ }
1928-29 34C* 710* 30* 10* 1,090* 29-30 380* 800* 30lf- 20* 1,230*-
1930-31 340lf- 71C* 30lf- 10*- 1,090* 31-32 3,300* 6,90(}-)I- 260* 13(}-)I- 10,590* 32-33 30 50lf- em- 0*- 80* 33-34 230 480*- 20* 1<>* 740* 34-35 1,200 2,500lf- 10~E- 50* 3,850*-
1935-36 2,000 4,2Q(}-)I- 160* 80* 6,440'A-36-37 4,680 9,800* 37(}-)I- 190*- 15,04~!-37-38 3,840 8,100* 31c* 150*- 12,40~~
38-39 360 760lf- 3D* 10* 1, 160''} 39-40 910 1,900* 70* 4D* 2,920*
1940-41 9,780 20,400* 78em- 390*- 31,350* 41-42 40 8(}-)I- CHI- 0*- 12~-
42-43 3,740 7,90C* 30(}>'} 150*- 12,090* 43-44 7,220 15,00~!- 580* 290* 23,090* 44-45 1,470 7,650 12C* 60*- 9 ,300l~
1945-46 510 2,270 4C* 20*- 2,84~'-
46-47 3,760 8,730 30C* 150*- 12, 94cr.~ 47-48 0 0 C* 0*- 0* 48-49 0 0 0-)1- o,'f- 0* 49-50 250 0 20* lOi1- 280*-
1950-51 0 0 em- Oil- 0*-51-52 6,120 16,780 49C* 240i1- 23,63cr.~ 52-53 1,650 1,270 130* 7D* 3,120'A-53-54 1,890 1,010 15D* 8 Oil- 3,130'A-54-55 210 0 20* 10i1- 24~!-
1955-56 570 0 0 0 570 56-57 480 0 30 40 550 57-58 10,920 18,410 1,030 20 30,380
29-Year Average 1929-57 1,907 4,069 151 76 6,203
* Estimated amounts of runoff which would have been spread had spreading grounds been constructed and operated during these years.
I'~ -235-
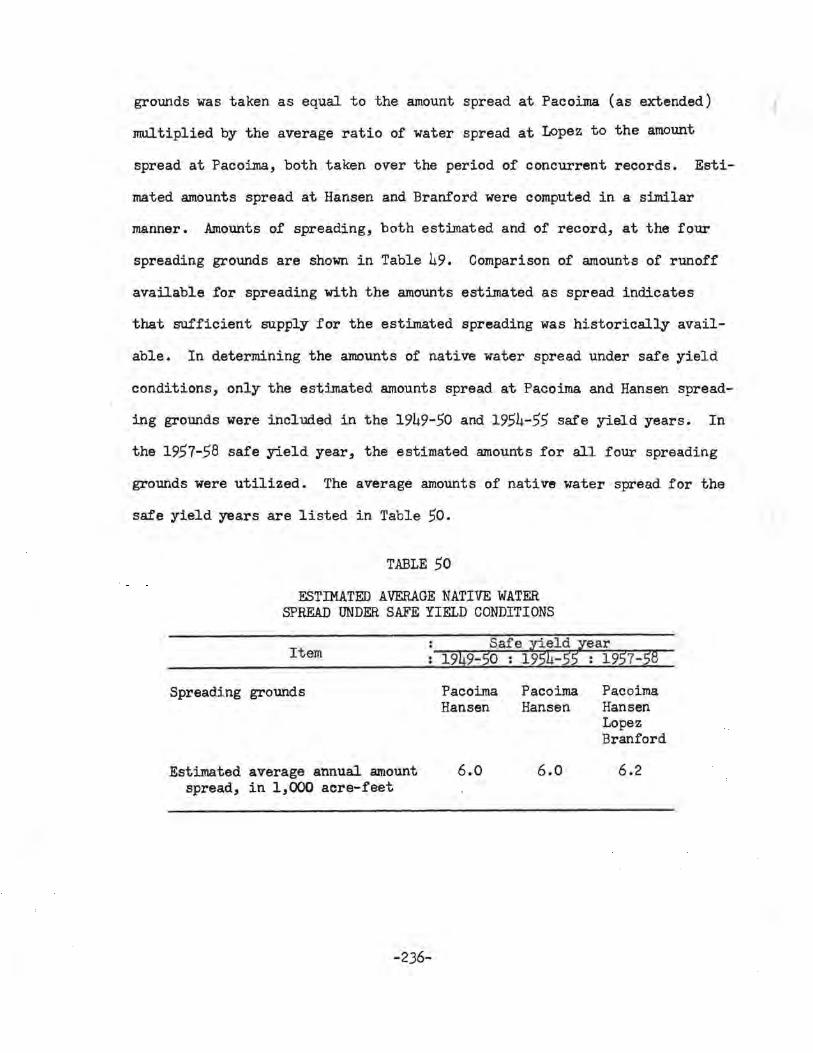
grounds was taken as equal to the amount spread at Pacoima (as extended) (
multiplied by the average ratio of water spread at Lopez to the amount
spread at Pacoima, both taken over the period of concurrent records. Esti-
mated amounts spread at Hansen and Branford were computed in a similar
manner. Amounts of spreading, both estimated and of record, at the four
spreading grounds are shown in Table 49. Comparison of amounts of runoff
available for spreading with the amounts estimated as spread indicates
that sufficient supply for the estimated spreading was historically avail-
able. In determining the amounts of native water spread under safe yield
conditions, only the estimated amounts spread at Pacoima and Hansen spread-
ing grounds were included in the 1949-50 and 1954-55 safe yield years. In
the 1957-58 safe yield year, the estimated amounts for all four spreading
grounds were utilized. The average amounts of native water spread for the
safe yield years are listed in Table 50.
Spreading
Estimated spread,
TABLE 50
ESTIMATED AVERAGE NATIVE WATER SPREAD UNDER SAFE YIELD CONDITIONS
Item Safe ~eld year 19~9-20 : 19 4-2~: 19~7-28
grounds Pacoima Pacoima Pacoima Hansen Hansen Hansen
Lopez Branford
average annual amount 6.0 6.0 6.2 in 1,000 acre-feet
-236-
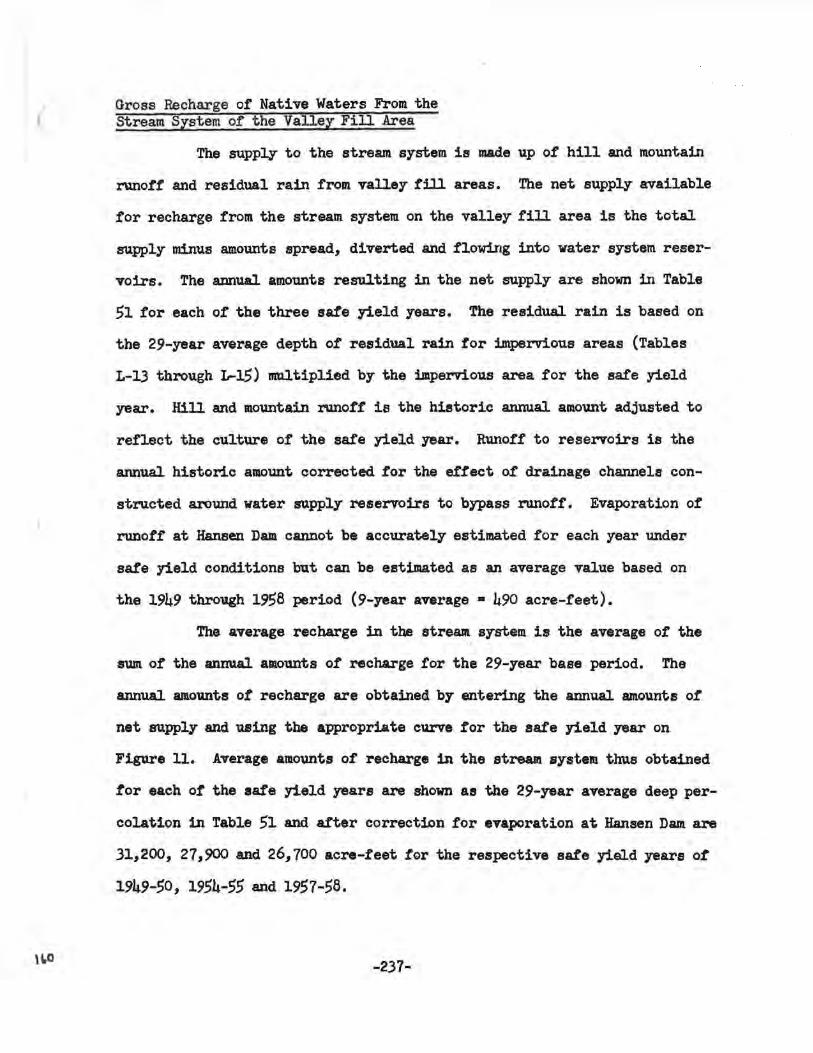
Gross Recharge of Native Waters From the Stream System of the Valley Fill Area
The supply to the stream system is made up of hill and mountain
runoft and residual rain from valley till areas. The net supply available
for recharge from the stream system on the valley fill area is the total
supply minus amounts spread, diverted and flowing into water system reser
voirs. The annual amounts resulting in the net supply are shown in Table
51 for each of the three sate yield years. The residual rain is based on
the 29-year average depth ot residual rain for impervious areas (Tables
L-13 through 1-15) multiplied by the impervious area for the safe yield
year. Hill and mountain runoff is the historic annual amount adjusted to
reflect the culture of the safe yield year. Runoft to reservoirs is the
annual historic amount corrected for the effect of drainage channels con-
structed around water supply reservoirs to bypass runoff. Evaporation ot
runoff at Hansen Dam cannot be accurately estimated for each year under
sate yield conditions but can be estimated as an average value based on
the 1949 through 1958 period (9-year average • 490 acre-teet).
The average recharge in the stream system is the average of the
sum of the annual amounts ot recharge for the 29-year base period. The
annual amounts ot recharge are obtained by entering the annual amounts ot
net supply and using the appropriate curve for the safe yield year on
Figure 11. Average amounts of recharge in the stream system thus obtained
tor each ot the sare yield years are shown as the 29-year average deep per
colation in Table 51 and after correction for evaporation at Hansen Dam are
31,200, 27,900 and 26,700 acre-feet tor the respective safe yield years ot
1949-50, 1954-55 and 1957-58.
-237-
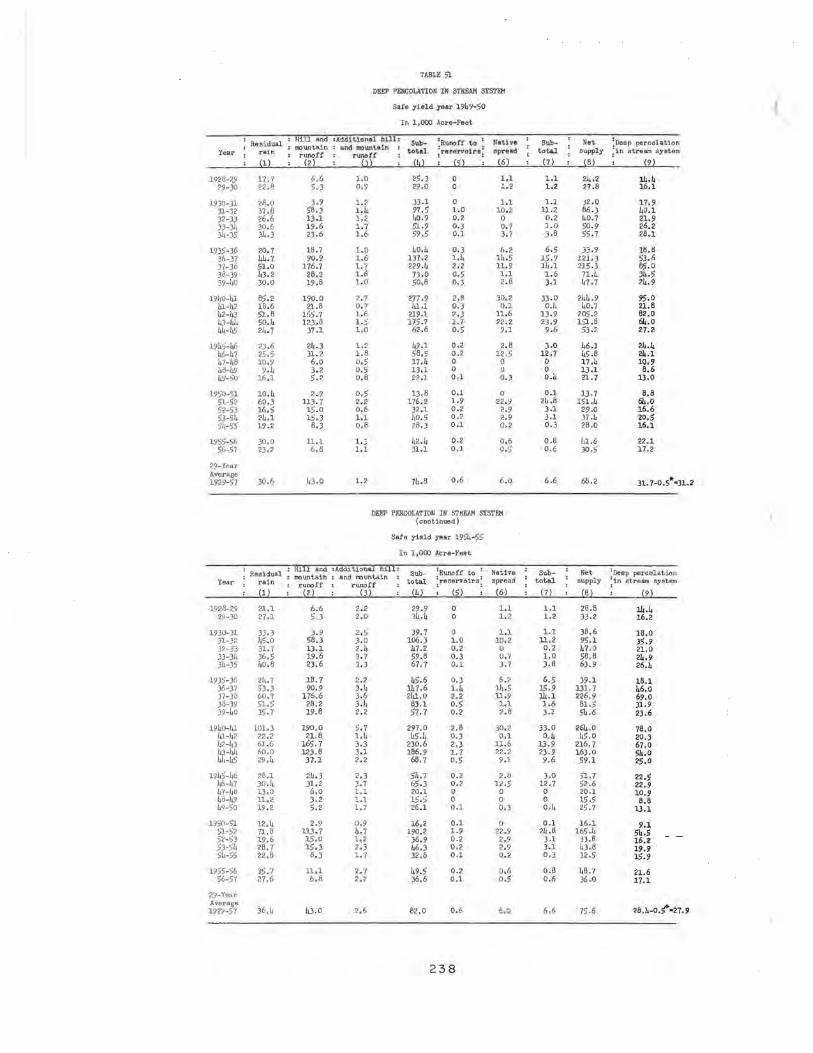
TABLE 51
DEEP PERCOLATION IN STREAM SYSTFl!
Safe yield year 1949-50
In 1,000 Acre-Feet
Residual Hill and IAdcl1UonoJ. ~Ul: Sub· :Runofr to 1l.",SvD Sub- Net :Deep percolation
rain muntain and mount.ajll I total ;rIllD&rvo1re IIIprud total. supply ; 1n stream sy8tem. Year runoff runoff
~1) (2) ~l) (~) ,~) (6) (7) ~8 ) (9)
1928-Z9 17.7 6.6 1.0 25.3 0 1.1 1.1 24 .2 lL.4 29-30 22.8 5.3 0.9 29.0 0 1. 2 1.2 27 .8 16. 1
1930-31 28.0 3.9 1.2 33.1 a 1.1 1.1 32.0 17.9 31-32 37.8 58.3 1.4 97.5 1.0 10.2 ll.2 86.3 40.1 32-33 26.6 13.1 1.2 40.9 0.2 0 0.2 40.7 21.9 33-34 30.6 19.6 1.7 51.9 0.3 0.7 1.0 50.9 26.2 34-35 34.3 23.6 1.6 59.5 0.1 3.7 3.8 55.7 28.1
1935-36 20.7 18.7 1.0 40.4 0.3 6.2 6.5 33.9 18.8 36-37 44.7 90.9 1.6 137.2 1.4 14.5 15. 9 121.3 53.6 37-38 51.0 176.7 1.7 229.4 2.2 11.9 Ill.1 215.3 85.0 38-39 43.2 28.2 1.6 73.0 0.5 1.1 1.6 71.4 34.5 39-40 30.0 19.8 1.0 50.8 0.3 2.8 3.1 47.7 24.9
1940-41 85.2 190. 0 2.7 277.9 2.8 30.2 33.0 244.9 95 .0 41-42 18.6 21.8 0.7 41.1 0.3 0.1 0.4 40.7 21.8 42-43 51.8 165.7 1.6 219.1 2.3 11.6 13.9 205.2 82.0 43-44 50.4 123.8 1.5 175.7 1.7 22.2 23.9 151.8 64.0 44-45 24.7 37.1 1.0 62.8 0,5 9.1 9.6 53.2 27.2
1945-46 23.6 24.3 1.2 49.1 0.2 2.8 3.0 46 .1 24.4 46-47 25.5 31.2 1.B 58,5 0.2 12.5 12.7 45 .8 24 .1 47-48 10.9 6.0 0.5 17.4 0 0 0 17 .4 10.9 48-49 9.4 3.2 0.5 13.1 0 0 0 13 .1 8.6 49-50 16.1 5.2 O.B 22.1 0.1 0.3 0.4 21. 7 13.0
1950-51 10.4 2.9 0.5 13.8 0.1 0 0.1 13.7 8.8 51-52 60.3 113.7 2.2 176.2 1.9 22.9 24.B 151.4 64.0 52-53 16,5 15.0 0.6 32.1 0.2 2.9 3.1 29.0 16. 6 53-5ll 24.1 15.3 1.1 40,5 0.2 2. 9 3.1 37.4 20.5 54-55 19.2 8.3 D.B 28 .3 0.1 0.2 0.3 28.0 16.1
1955-56 30.0 11.1 1.~ 42.4 0.2 0.6 O.B 41.6 22.1 56-57 23.2 6.B 1.1 31.1 0.1 0.5 0.6 30.5 17.2
29-Year Average 1929-57 30.6 43.0 1.2 74.8 0.6 6.0 6.6 68.2 31. 7-0.5*-31.2
DEEP PERCOLATION IN STREAM SYSTFl! (continued)
Safe yield year 1954-55
In 1,000 Acre-Feet
Residual Hili and Addi tlon&l hili Sub- Runoff to Native Sub- Net Deep percolation
rain mountain and lI'Ountain
total reservoirs spread total supply 1n stream system Year runoff runoff ~1) (2) P) ~41 (2) (6) (7) (8) ~
1928-29 21.1 6.6 2.2 29.9 0 1.1 1.1 28.8 lL.4 29-30 27.1 53 2.0 34.4 0 1.2 1.2 33.2 16.2
1930-31 33.3 }.9 2.5 39.7 0 1.1 1.1 38.6 18.0 31-32 45.0 58.3 3.0 106.3 1.0 10.2 ll.2 95.1 35 .9 32-33 31.7 13.1 2.4 47.2 0.2 0 0.2 47.0 21.0 33-34 36.5 19.6 3.7 59.8 0.3 0.7 1.0 58.8 24.9 34-35 40.8 23.6 3.3 67.7 0.1 3.7 3.8 63.9 26.4
1935-36 24.7 IB.7 2.2 45.6 0.3 6.2 6.5 39.1 18.1 36-37 53.3 90.9 3.4 lL7.6 1.4 14.5 15.9 131. 7 46.0 37-38 60.7 176.6 3.6 241.0 2.2 ll.9 lL.l 226.9 69.0 38-39 51.5 28.2 3.4 83.1 0.5 1.1 1.6 81.5 31.9 39-40 35.7 19.8 2.2 57.7 0.2 2.8 3.1 54.6 23.6
1940-41 101.3 190.0 5.7 297.0 2.8 30.2 33.0 264.0 78. 0 41-42 22.2 21.8 1.4 45.4 0.3 0.1 0.4 45.0 20.) 42-43 61.6 165.7 3.3 230.6 2.3 11.6 13.9 216.7 67. 0 43-44 60.0 123.B 3.1 186.9 1.7 22.2 23.9 163.0 54.0 44-45 29.4 37.1 2.2 68.7 0.5 9.1 9.6 59.1 25.0
1945-46 28.1 24.3 2.3 54.7 0.2 2.8 3.0 51. 7 22-5 46-47 30.4 31.2 3.7 65.3 0.2 12.5 12.7 52.6 22 .9 47-48 13.0 6.0 1.1 20 .1 0 0 0 20.1 10. 9 48-49 11.2 3.2 1.1 15.5 0 0 0 15.5 8.8 49-50 19.2 5.2 1.7 26.1 0.1 0.3 0.4 25.7 13.1
1950-51 12.4 2.9 0.9 16.2 0.1 0 0.1 16.1 9.1 51-52 n.8 113.7 4.7 190.2 1.9 22.9 24.B 165.4 54.5 52-53 19.6 15.0 1.2 36.9 0.2 2.9 3.1 33.8 16. 2 53-54 28.7 15.3 2.3 46.3 0.2 2.9 3.1 43.8 19. 9 54-55 22.8 B.3 1.7 32.8 0.1 0.2 0.3 32.5 15.9
1955-56 35.7 11.1 2.7 49.5 0.2 0.6 0.8 4B.7 21.6 56-57 27.6 6.8 2.2 36.6 0.1 0,5 0.6 36.0 17.1
29-Year Average
~8.h-0.5*-27.9 1921-57 36.4 43.0 2.6 82.0 0.6 6.0 6.6 75.6
238
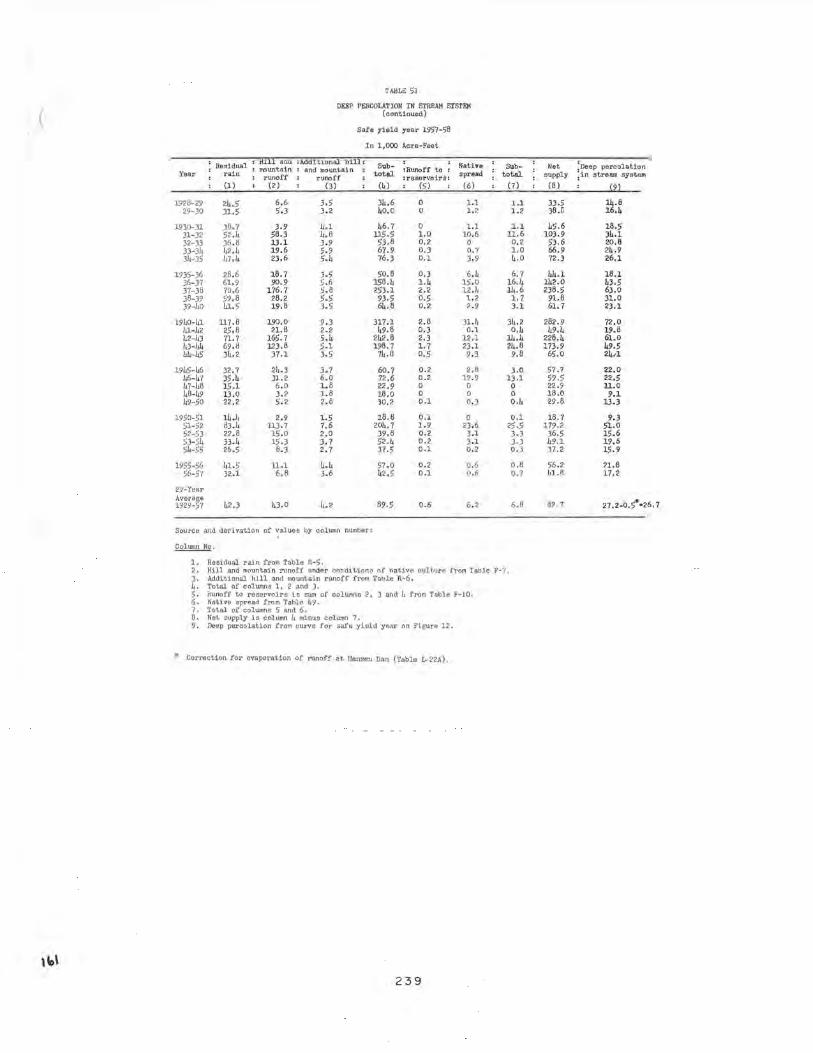
TABLE 51
DEEP PERCOLATIOn IN STREAM SISTEK (continued)
Safe yield :rear 1957-58
In 1,000 Acre-Feet
Residual Riii and Add! tiona! hill. Sub- Native Sub-muntain and mountain Runoff to : Net Deep percolation Year rain runoff rurnf!
total reservoirs I spread total supply in stream system
(1) (2) 0) (4 ) (5) I (6) (7) (8) (91
1928-29 24.5 6.6 3.5 34.6 0 1.1 1.1 )).5 11!.8 29-30 31.5 5 .3 3.2 40.0 0 1. 2 1.2 )8.[. 16.4
1930-31 38.7 3.9 4.1 46.7 0 1.1 1.1 45.6 18.5 )1-)2 52.4 58.3 4.8 u5.5 1.0 10.6 11. 6 103.9 34.1 32-33 36.8 13.1 3.9 53.8 0.2 0 0.2 53.6 20.8 33-34 42.4 19.6 5.9 67.9 0.3 0.7 1.0 66.9 24.9 34-35 47.4 23.6 5.4 76.3 0.1 3.9 4.0 72.3 26.1
1935-36 28.6 18.7 3.5 50.8 0.3 6.4 6.7 44.1 18.1 36-37 61.9 90.9 5.6 156.4 1.4 15.0 16.4 142.0 43 .5 37-38 70.6 176.7 5.8 253.1 2.2 12.4 14.6 236.5 63.0 38-39 59.8 28.2 5.5 93.5 0.5 1.2 1.7 91.8 31.0 39-40 41.5 19.8 3.5 64.8 0.2 2 .9 3.1 61. 7 23.1
1940-41 U7.8 190.0 9.3 317.1 2.8 31.4 34.2 282.9 72.0 41-42 25.8 21.8 2.2 49.8 0.3 0.1 O./' /'9.4 19.8 42-43 71. 7 165.7 5./, 242.8 2.3 12.1 14.4 228./, 61.0 43-44 69 .8 123.8 5.1 198.7 1.7 23 .1 2/,.8 173.9 /'9.5 44-/'5 34.2 37.1 3.5 74.8 0.5 9.3 9.8 65.0 24.·1
1945-46 32.7 24.3 3.7 60.7 0.2 2.8 3.0 57.7 22.0 46-/'7 35.4 31.2 6.0 72.6 0.2 12.9 13.1 59.5 22.5 /'7-/'8 15.1 6 . 0 1.8 22.9 0 0 0 22.9 U.O 48-49 13.0 3 . 2 1.8 18.0 0 0 0 18.0 9.1 /'9-50 22.2 5 . 2 2.8 )0.2 0.1 0.3 0.4 29.8 13.3
1950-51 14.4 2.9 1.5 18.8 0.1 0 0.1 18.7 9.3 51-52 83 .4 113.7 7.6 204.7 1.9 23 .6 25.5 179.2 51 . 0 52-53 22 . 8 15.0 2.0 39.8 0.2 3.1 ).3 36.5 15.6 53-5/' 33.4 15.3 3.7 52.4 0.2 3 .1 ).) 49.1 19.6 54-55 26.5 8. 3 2.7 37.5 0.1 0.2 0.) 37.2 15. 9
1955-56 41.5 11.1 4.4 57 . 0 0. 2 0.6 0.8 56 .2 21.8 56-57 32.1 6.8 3.6 42.5 0.1 0.6 0.7 41.8 17.2
29-Year
t9~9~~~ 42.3 43.0 4.2 89.5 0.6 6.2 6.B 8~ . 1 27.2-0.5*·26.7
Source and derivation of val-ues by column number:
~.
1. Residual. rain from Table R-5. 2. Hill and mountain runoff under condition s of native culture from Table F-7. 3. Additional. hill and lnOuntain runoff from Table R-6. 4. Total of colwnns 1, 2 and 3. 5. itunoff to reservoirs is sum of colUlflns 2, J and L from Table F-IO. 6. Native spread from Table L9. 7. Total of columns 5 and 6. 8. Net supply is colUJM 4 minus column 7. 9. Deep percolation from curve for safe yield year on Figure 12 .
. Correction for evaporation of runoff at Hansen Dam (Table L-22A).
110\ 239
Natural Depletions from the Ground Water Reservoir
The average annual amounts of natural ground water depletions
over a period of normal supply, along with their source and derivation,
are shown in Table 52. Average amounts of natural depletions consisting
of subsurface outflows, rising water, sewer infiltration and consumptive
use of ground water are, with the exception of average subsurface outflow
in the vicinity of Pickens Canyon (29-year average), based on the trend
curves. The conditions governing these items are discussed in preceding
portions of this chapter.
-240-
(
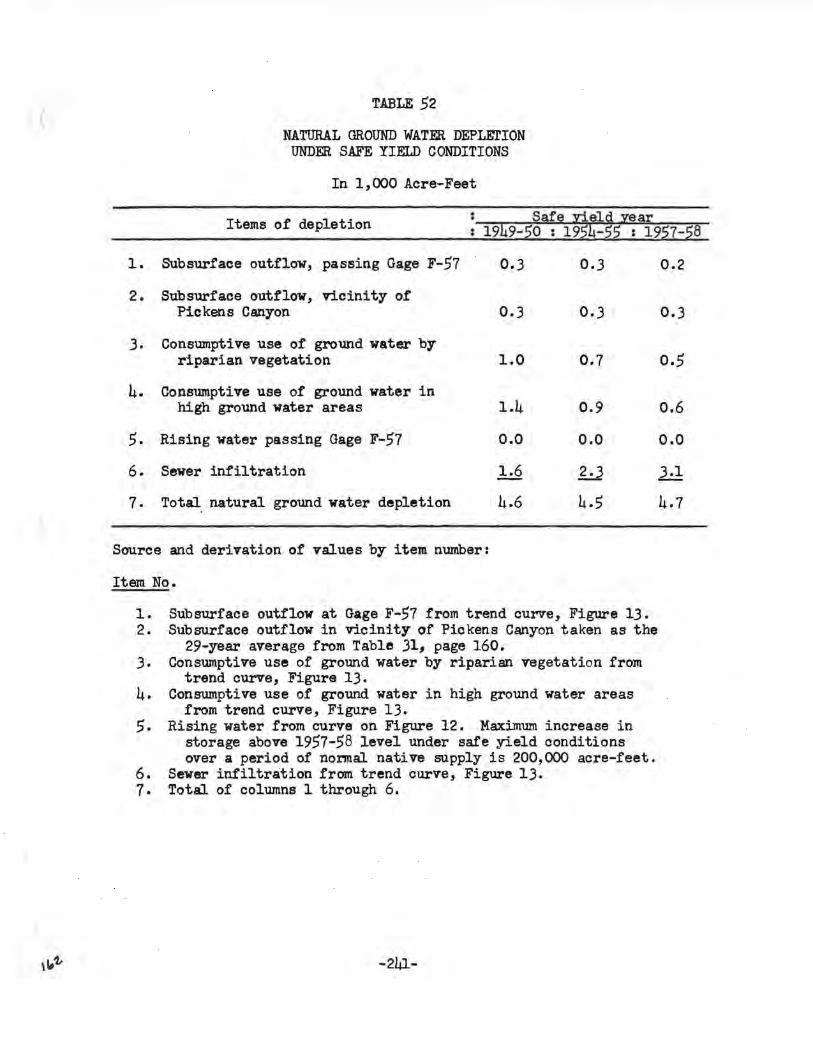
TABLE 52
NATURAL GROUND WATER DEPLEl'ION UNDER SAFE YIELD CONDITIONS
In 1,000 Acre-Feet
Items of depletion
1- Subsurface outflow, passing Gage F-57 0.3 0.3
2. Subsurfaoe outflow, vicinity of Pickens Canyon 0.3 0.3
3. Consumptive use of ground water by riparian vegetation 1.0 0.7
4. Consumptive use of ground water in high ground water areas 1.4 0.9
5. Rising water passing Gage F-57 0.0 0.0
6. Sewer infiltration 1.6 2.3
7. Total, natural ground water depletion 4.6 4.5
Source and derivation of values by item number:
Item No.
1. Subsurface outflow at Gage F-57 from trend curve, Figure 13. 2. Subsurface outflow in vicinity of Pickens Canyon taken as the
29-year average from Table 31, page 160. 3. Consumptive use of ground water by riparian vegetation from
trend curve, Figure 13. 4. Consumptive use of ground water in high ground water areas
from trend curve, Figure 13. 5. Rising water from curve on Figure 12. Maximum increase in
storage above 1957-58 level under safe yield conditions over a period of normal native supply is 200,000 acre-feet.
6. Sewer infiltration from trend curve, Figure 13. 1. Total of columns 1 through 6.
-241-
0.2
0.3
0.5
0.6
0.0
3.1
4.7
Net Recharge of Native and .Delivered Waters
The net recharge from normal native supply and average delivered
water requirement is determined in Table 53 and is equal to the difference
between the gross recharge and natural ground water depletion. The deter
mination of net recharge demonstrates the effect of urbanization on recharge.
The average gross recharge of native water was approximately 5,000 acre-feet
greater for 1949-50 safe yield conditions than for the 1951-58 conditions.
The average gross recharge of the delivered water requirement was approxi
mately 10,000 acre-feet less for 1949-50 conditions than for 1951-58 condi
tions. The decrease in recharge of native water is primarily due to improve
ment of the drainage system. The increase in recharge of delivered water is
due to the increase in cesspool recharge which has accompanied urbanization
of the area. The average natural depletions are approximately the same for
the three safe yield years. The resulting average net recharge for 1954-55
safe yield conditions is approximately 5,000 acre-feet greater than for the
1949-50 conditions and has remained about the same for 1951-58 conditions.
The increase in recharge of delivered water has therefore kept pace with the
decrease in recharge of native supply. It should be noted that if the entire
area were connected to the sewer system the recharge of delivered water would
be considerably less.
-242-
(
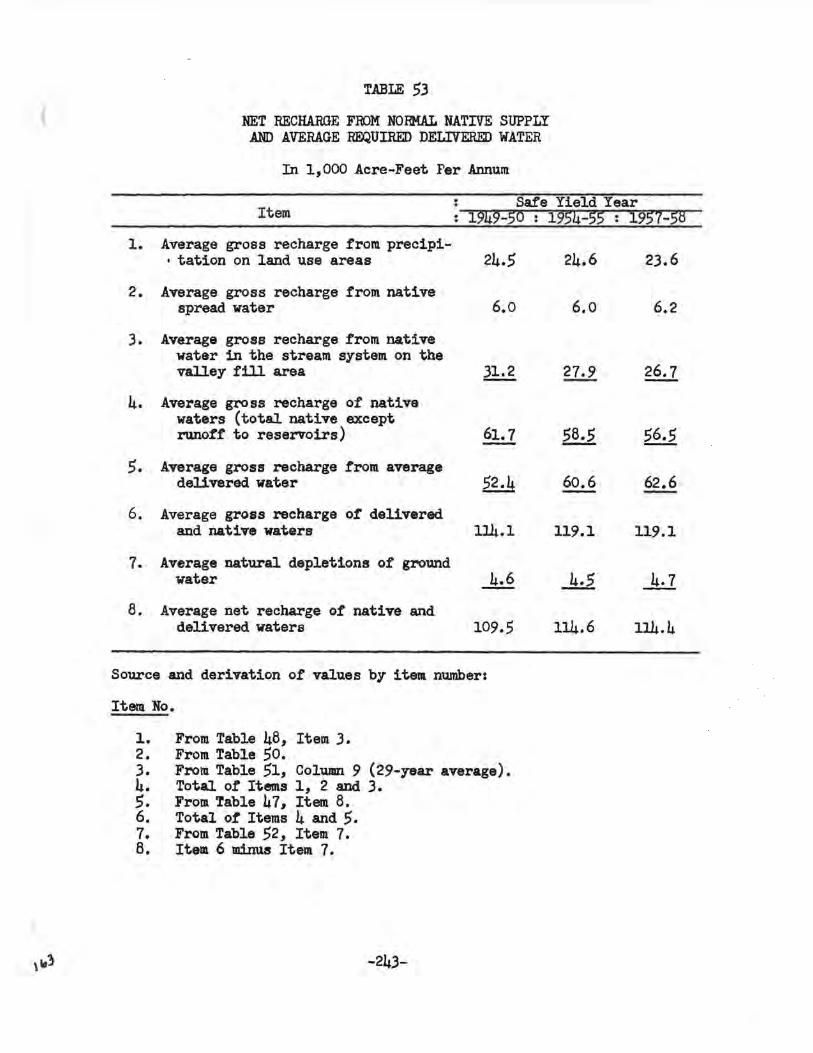
( TABLE 53
NET RECHARGE FROM NORMAL NATIVE SUPPLY AND AVERAGE REQUIRED DELIVERED WATER
In 1,000 Acre-Feet Per Annum
Safe Yield Year Item 1949-50 1954-55 1957-58
1. Average gross recharge from precipi, tation on land use areas
2. Average gross recharge from native spread water
3. Average gross recharge from native water in the stream system on the valley fill area
4. Average gross recharge of native waters (total native except
6.0
runorf to reservoirs) 61.7
5. Average gross recharge from average delivered water 52.4
6. Average grOBS recharge of delivered and native waters 114.1
7. Average natural depletions of ground water 4.6
B. Average net recharge of native and delivered waters 109.5
Source and derivation of values by item number:
Item No.
1. From Table 48, Item 3. 2. From Table 50. 3. From Table 51, Column 9 (29-year average). 4. Total of Items 1, 2 and 3. 5. From Table 47, Item B. 6. Total of Items 4 and 5. 7. From Table 52, Item 7. 8. Item 6 minus Item 7.
24.6 23.6
6.0 6.2
58.5 56.5
60.6 62.6 -119.1 119.1
4.5 4.7
114.6 114.4
\~~ -243-
Evaluation of Safe Yield
The average net recharge from normal native supply and from average
delivered water requirement can be the safe yield only if the delivered water
requirement of, and export from, the valley fill area is met by import and
ground water yield of imported and native waters. Thus, the amount of safe
yield is affected by both the import and export conditions adopted for its
determination.
Import and Export Conditions
Since the Order of Reference requires a determination of the effect
of import on safe yield, and since export is related to import and also to
the use of water in the City of Los Angeles outside the valley fill, the
average historic amounts of import and export are used as a safe yield condi
tion. The historic amounts of import to and export from the valley fill area
are plotted on Figure 14 and trend curves representing the averages drawn.
The ground water export (sum of columns 6 and 7, Table 34) includes amounts
exported to hill and mountain areas and to areas outside the Upper Los
Angeles River area. The annual amounts of import (column 1, Table 34)
plotted on Figure 14 are those amounts available on the valley fill area
after correction for changes in reservoir storage and do not include
amounts of rain and runoff entering the water supply reservoirs (column
13, Table 20). It is apparent from Figure 14 that the historic amounts
of each are influenced by both precipitation and operational procedures
of municipal water supply systems. The average amounts of import and
export taken from Figure 14 and the difference betweeen them are shown
in Table 54.
-244-
(
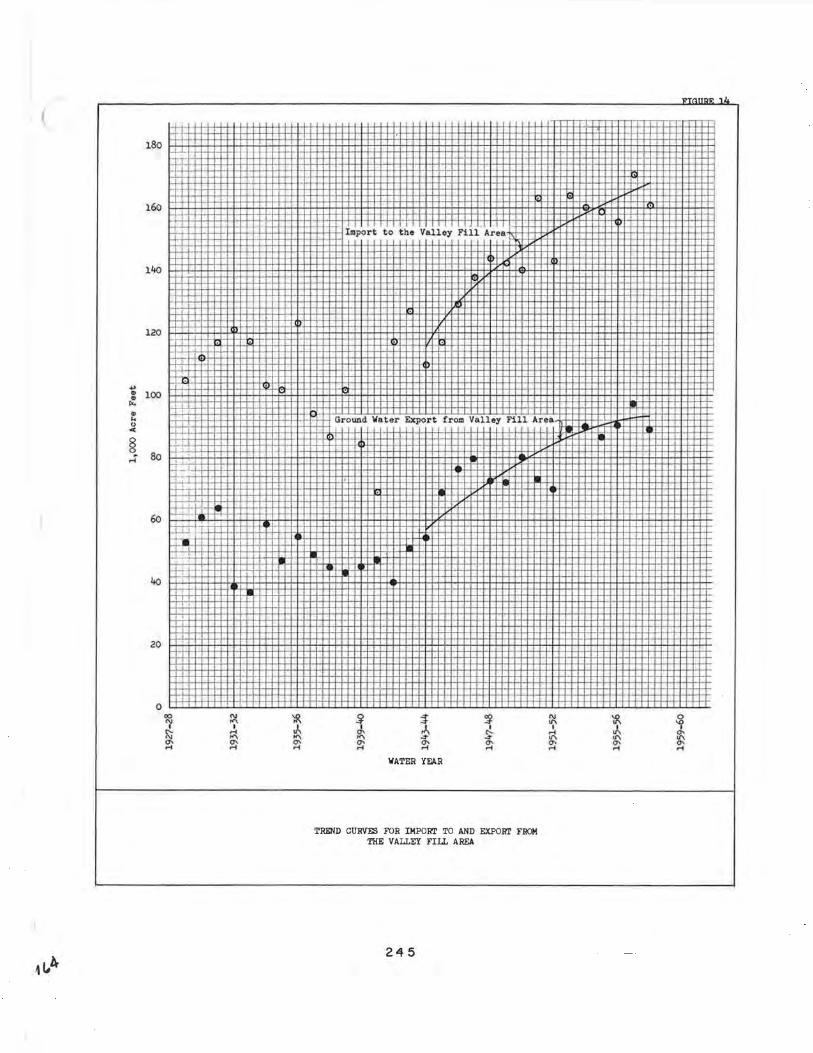
(
160
140
120
.. .. 100 ~ .. .. () c(
§ ,..j 80
60
20
0
h- I-+ rL-
::r~ ; , I~.-
l..l..u
" .
00
tot ~ 0-rl
, I
N ~ '" I J,. rl
B '" 0-rl
Import to the Valley Fill Area
Ground Water Export from Valley Fill Area
~ j ~ I A I
0- S '" -'" 0- ;'j' 0-rl rl
WATER YEAR
TREND CURVES FOR IMPORT TO AND EXPORT FROM THE VALLEY FILL AREA
245
N 11\ I
~ 0-rl
"T(lIIIlF. ,.,.
\.0 .s 11\
:A I
0-11\
~ 0-rl
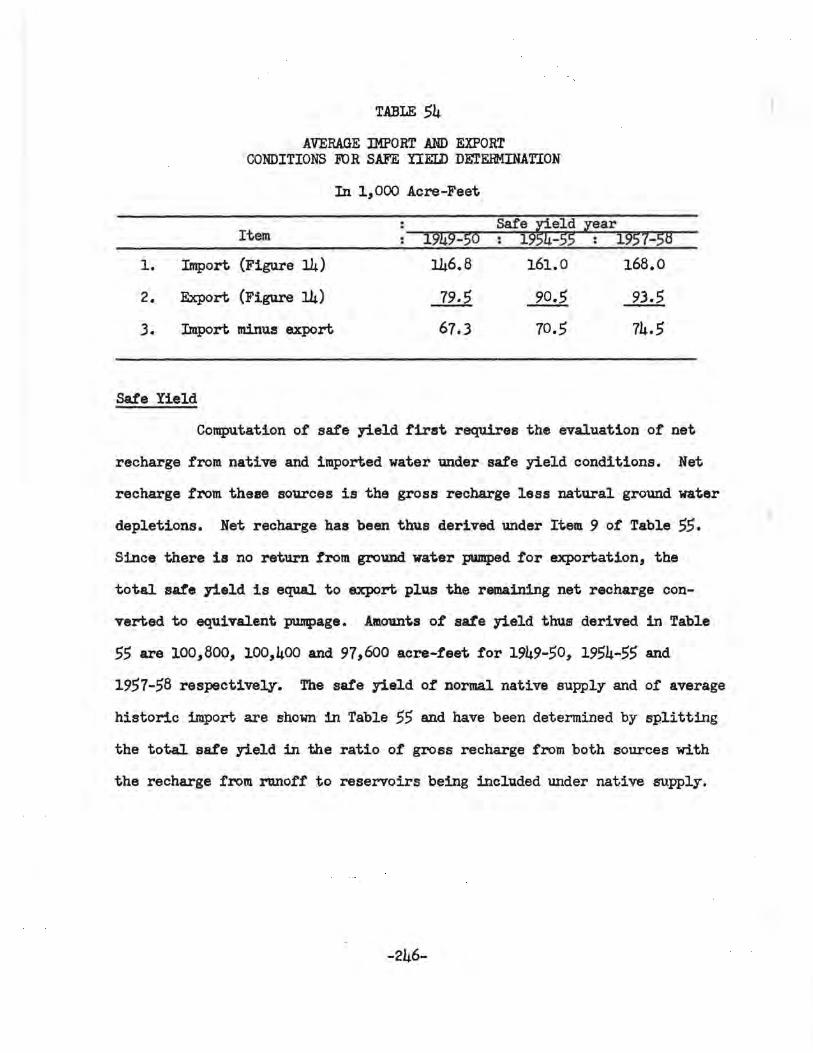
1.
2.
3.
TABLE 54
AVERAGE IMPORT AND EXPORT CONDITIONS FOR SAFE YIELD DETEItlINATION
In 1,000 Acre-Feet
Item 1949-50 Safe ~eld year : 19 -55 : 1957-58
Import (Figure 14) 146.8 161.0 168.0
Export (Figure 14) 79.5 90.5 93.5
Import minus export 67.3 70.5 74.5
Sate Yield
Computation of safe yield first requires the evaluation of net
recharge from native and imported water under safe yield conditions. Net
recharge from these sources is the gross recharge less natural ground water
depletions. Net recharge has been thus derived under Item 9 of Table 55.
Since there is no return from ground water pumped for exportation, the
total safe yield is equal to export plus the remaining net recharge con
verted to equivalent pumpage. Am.ounts of safe yield thus derived in Table
55 are 100,800, 100,400 and 97,600 acre-feet for 1949-50, 1954-55 and
1957-58 respectively. The safe yield of normal native supply and of average
historic import are shown in Table 55 and have been determined by splitting
the total safe yield in the ratio of gross recharge from both sources with
the recharge from runoff' to reservoirs being included under native supply_
-246-
(
-2460-
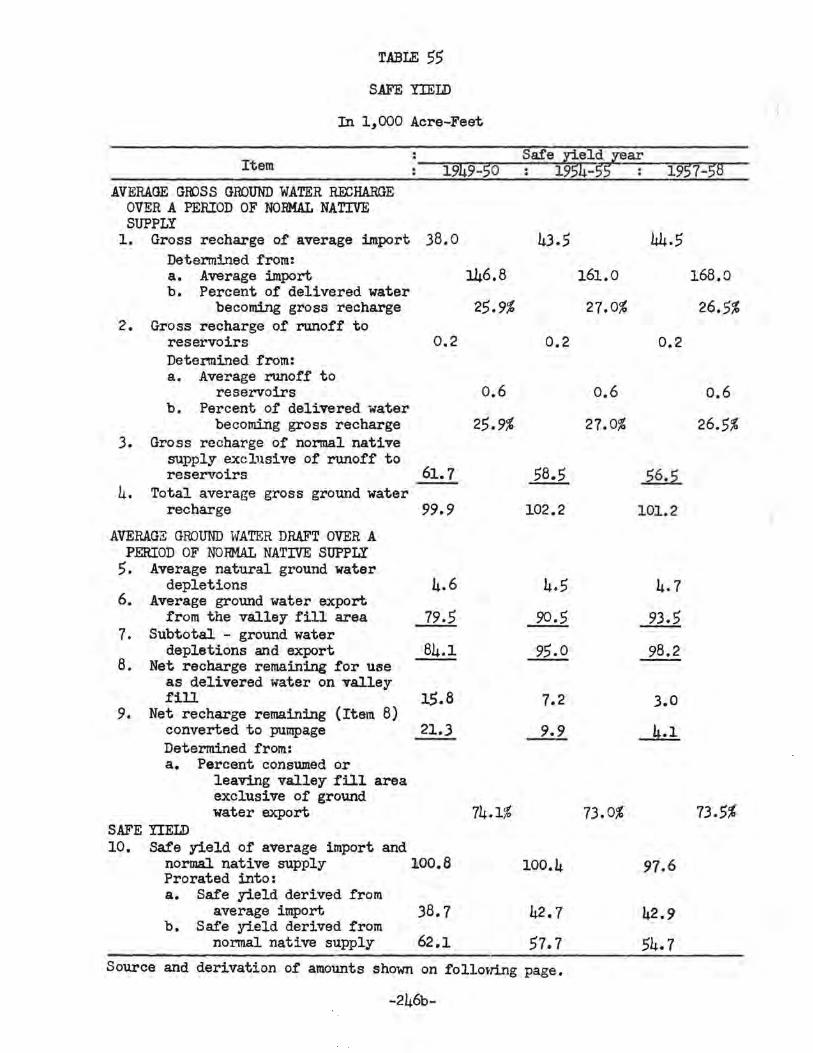
TABLE 55
SAFE YIElD
In 1,000 Acre-Feet (
Item 1949-~0 Safe ~eld year : 194-55'""": 19~7-~8
AVERAGE GROSS GROUND WATER RECHARGE OVER A PERIOD OF NORMAL NATIVE SUPPLY
1. Gross recharge of average import 38.0 43.5 44.5 Detemined from: a. Average import 146.8 161.0 168.0 b. Percent of delivered water
becoming groBs recharge 25.9% 27.0% 26.5% 2. Gross recharge of runoff to
reservoirs 0.2 0.2 0.2 DetermL~ed from: a. Average runoff to
reservoirs 0.6 0.6 0.6 b. Percent of delivered water
becoming gross recharge 25.9% 27.0% 26.5% 3. Gross recharge of normal native
supply exclusive of runoff to 61.7 reservoirs 58.5 ~
4. Total average gross ground water recharge 99.9 102.2 101.2
AVERAGZ GROUND \fATER DRAFT OVER A PERIOD OF NORMAL NATIVE SUPPLY
5. Average natural ground water depletions 4.6 4.5 4.7
6. Average ground water export from the valley fill area 79.5 90.5 93.5
7. Subtotal - ground water depletions and export 84.1 95.0 98.2
B. Net recharge remaining for use as delivered water on valley fill l5.B 7.2 3.0
9. Net recharge remaining (Item 8) converted to pump age 21.3 9.9 4.1 Determined from: a. Percent consumed or
leaving valley fill area exclusive of ground water export 74.1% 73.0% 73.5%
SAFE YIELD 10. Safe yield of average import and
normal native supply 100.8 Prorated into:
100.4 97.6
a. Safe yield derived from average import 38.7 42.7 42.9
b. Safe yield derived from normal native supply 62.1 57.7 54.7
Source and derivation of amounts shown on folloning page.
-246b-
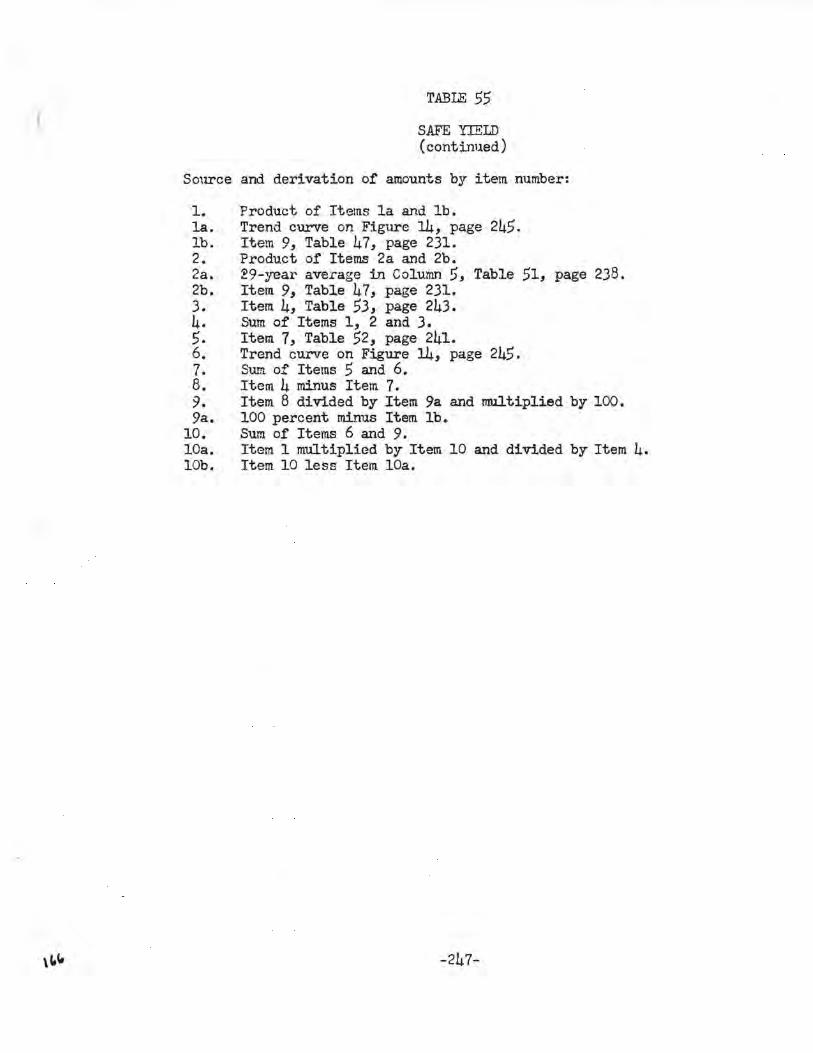
( TABIE 55
SAFE YIELD (continued)
Source and derivation of amounts by item number:
l. la. lb. 2. 2a. 2b. 3. 4. 5. 6. 7. 8. 9. 9a.
10. lOa. lOb.
Product of Items la and lb. Trend curve on Figure 14, page 245. Item 9, Table 47, page 231. Product of Items 2a and 2b. ~9-year average in Colu~~ 5, Table 51, page 238. Item 9, Table 47, page 231. Item 4, Table 53, page 243. SUm of Items 1, 2 and 3. Item 7, Table 52, page 241. Trend curve on Figure 14, page 245. Stun. of Items 5 and 6. Item 4 minus Item 7. Item 8 divided by Item 9a and multiplied by 100. 100 percent minus Item lb. Sum of Items 6 and 9. . Item 1 multiplied by Item 10 and divided by Item 4. Item 10 less Item lOa.
-247-
Water Requirement and Supply Under Safe Yield Conditions
The relationship between delivered water required under safe yield
conditions and the delivered water available under the same conditions is
set forth in Table 56. The water requirements are those determined in Table
46 plus the export of ground water from the valley fill area. The available
water is the sum of native surface water diversion, imported water, and
pumped ground water which is limited to the safe yield. Since the available
water i8 less than the required water, it is apparent that under the import
and export conditions set forth, a greater amount of ground water has his-
torically been extracted than was replenished by recharge from normal native
supply and average import. The result of this condition has been a progres-
sive annual reduction of ground water in storage. To eliminate the deficiency
that would exist between the water requirements under safe yield conditions
and water supply under safe yield conditions, it would be necessary to adopt
one or a combination of the following:
1. A reduction in extractions for export in the amount of Item 12,
Table 56, while meeting average import and delivered water requirements.
2. An additional import in the amount of Item. 12, Table 56, while
meeting average export and delivered water requirements.
3. A reduction in extractions for delivery to the valley fill
area in the amount of Item 10, Table 56, while meeting average import
and export requirements.
-248-
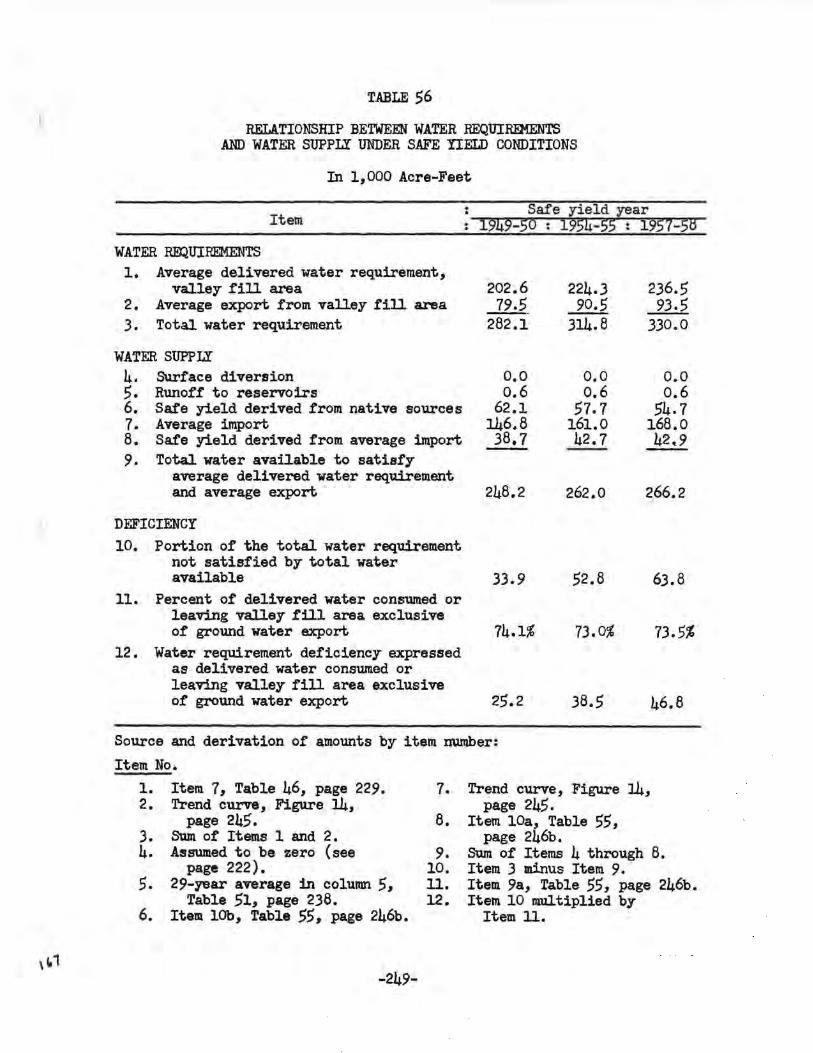
TABLE 56
RELATIONSHIP BETWEEN WATER REQUIREMENTS AND WATER SUPPLY UNDER SAFE YIELD CONDITIONS
In 1,000 Acre-Feet
: Safe yield year Item : !~4~-50 : !954-5~ : 1957-~8
WATER ~UIREMENTS 1. Average delivered water requirement,
valley fill area 202.6 224.3 236.5 2. Average export from valley fill area 79.5. 90.5 93.5 3. Total water requirement 282.1 314.8 330.0
WATER SUPPLY 4. Surface diversion 0.0 0.0 0.0 5. Runoff to reservoirs 0.6 0.6 0.6 6. Safe yield derived from native sources 62.1 57.1 54.7 7. Average import 146.8 161.0 168.0 8. Safe yield derived from average import 38.7 42.7 42~9 9. Total water available to satisfy
average delivered water requirement and average export 248.2 262.0 266.2
DEFICIENCY 10. Portion of the total water requirement
not satisfied by total water available 33.9 52.8 63.8
11. Percent of delivered water consumed or leaving valley fill area exclusive of ground water export 14.1% 73.0% 73.5%
12. Water requirement deficiency expressed as delivered water consumed or leaving valley fill area exclusive of ground water export 25.2 38.5 46.8
Source and derivation of amounts by item number:
Item No. 1. Item 7, Table 46, page 229. 2. Trend curve, Figure 14,
page 245. 3. Sum of Items 1 and 2. 4. Assumed to be zero (see
page 222). 5. 29-year average in colunm 5,
Table 51, page 238. 6. Item lOb, Table 55, page 246b.
-249-
1.
8.
9. 10. 11. 12.
Trend curve, Figure 14, page 245.
Item lOa, Table 55, page 246b.
Sum of Items 4 through 8. Item 3 minus Item 9. Item 9a, Table 55, page 246b. Item 10 multiplied by
Item 11.
That the foregoing amounts represent a consumptive demand that (
would not be satisfied under conditions ot average import and export, is
shown in the following example for the 1949-50 safe yield year be comparing
the consumptive use and outflows of delivered water and ground water to the
water available to satisfy these demands.
The consumptive demand consists of:
Average consumptive use and outflows of delivered water of 150,200 acre-feet (Item 7, Table 47, page 231).
Average natural depletions of ground water of 4,600 acre-feet (Item 7, Table 52, page 241).
Average export of ground water ot 79,500 acre-feet (Item 2, Table 54, page 246).
For a total consumptive demand of 234,300 acre-feet.
The water available to satisfy the above demand consists of:
Average gross recharge of native waters of 61,700 acre-feet (Item 3, Table 55, page 246b).
Average runoff to reservoirs of 600 acre-feet (29-year average in Column 5, Table 51, page 238).
Average import to the valley fill area of 146,800 acre-feet (Item 1, Table 54, page 246).
For a total available water of 209,100 acre-feet.
The excess of consumptive demand over available water amounts to 25,200 acre-feet and is equivalent to the 25,200 acre-feet determined as Item 12 in Table 56.
Effect of Import on Safe Yield
Importation ot foreign waters increased the safe yield of the
ground water reservoir by 38,700,42,700 and 42,900 acre-feet tor the
respective safe yield years of 1949-50, 1954-55 and 1957-58. As a result
there was a decrease in deficiency of supply to meet the water requirements
ot the culture existing during the safe yield years to less than the deficiency
which would have occurred had local sources been the sale supply.
-250-

( CHAPTER VIII. THE USE OF WATER BY
THE CITY OF LOS .A)TGELES AND ITS INHABITANTS
The scope of this chapter is limited to an evaluation of the
gross water use from all sources by the City of Los Angeles and its
inhabitants within the territory of the original Pueblo (since 1948) and
within its expanded boundaries, and of the amounts of water distributed
by the City of Los Angeles for use outside its boundaries, and satisfies
the requirements of Paragraph I-5 and I-6 of the Order of Reference.
Use of Water by the City of Los Angeles Within the Territory of the Original Pueblo
The original Los Angeles Pueblo area contained four square
leagues, the Spanish equivalent of 17,756 acres. However, the title of
the land given to the City as a successor to the Pueblo, as surveyed in
1858, was only 17,172. The boundaries of the original Pueblo are
delineated and record~d in the Book of Patents Number 3, pages 64 and 65.
The amount of water delivered by the City of Los Angeles for
use within the original Pueblo boundary, as shown on Plate 36, has been
determined by the City of Los Angeles for the period from 1949-50 through
1957-58. These values, including both measured and estimated amounts,
consist of metered sales to customers, water pumped by the City Department
-251-
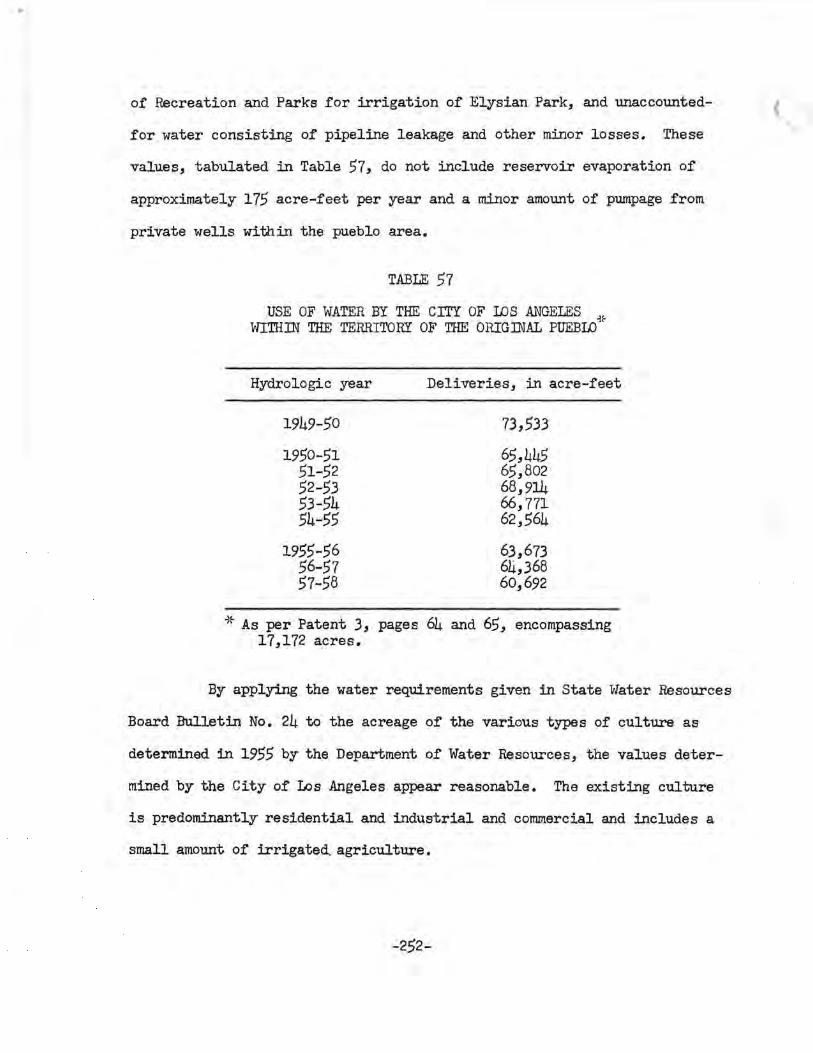
of Recreation and Parks for irrigation of Elysian Park, and unaccounted-
for water consisting of pipeline leakage and other minor losses. These
values, tabulated in Table 57, do not include reservoir evaporation of
approximately 175 acre-feet per year and a minor amount of pumpage from
private wells within the pueblo area.
TABLE 57
USE OF WATER BY THE CITY OF IDS ANGELES ~~ WITHIN THE TERRITORY OF THE ORIGINAL PUEBID
Hydrologic year
1949-50
1950-51 51-52 52-53 53-54 54-55
1955-56 56-57 57-58
Deliveries, in acre-feet
73,533
65,445 65,802 68,914 66,771 62,564
63,673 64,368 60,692
* As per Patent 3, pages 64 and 65, encompassing 17,172 acres.
By applying the water requirements given in State Water Resources
Board Bulletin No. 24 to the acreage of the various types of culture as
determined in 1955 by the Department of Water Resources, the values deter-
mined by the City of Los Angeles appear reasonable. The existing culture
is predominantly residential and industrial and commercial and includes a
small amount of irrigated.. agriculture.
-252-
Use of Water by the City of Los Angeles Within its Expanded Boundaries
The total use of water by the City of Los Angeles within its
expanded boundaries, including the original Pueblo, is considered to be
that quantity of water which has been delivered to its distribution system
to supply demands for all uses within the boundary in existence at that
time. The present boundary of the City of Los Angeles and the changes in
the boundary that have occurred from time to time are shown on Plate 36.
In addition to consumer deliveries, use includes operational losses and
use by the several city departments. Records of ground water pump age by
all private parties for use within the city's boundaries are not readily
available and therefore are not included in the values of total use pre-
sented herein. Water distributed for use outside the city boundaries is
discussed subsequently and included in the total use.
Water delivered to the City of Los Angeles distribution system
includes the major portion of Owens-Mono Basin import measured in San
Fernando Valley, Colorado River water measured at the several connections
to Metropolitan Water District feeders and all local extractions by the
several city departments in the Coastal Plain and in San Fernando Valley.
Owens-Mono Basin water which is spread in San Fernando Valley and that
which is spilled into the Los Angeles River were not considered to be in
-253-
the distribution system and were subtracted from the measured import.
Exchange of water between the City of Los Angeles and The Metropolitan
Water District has occurred in several instances where the city supplies
other agencies and is reimbursed with Colorado River water. That quan
tity has been subtracted from the city's Colorado River import. Measured
change in storage in the surface reservoirs within the city's boundaries
has also been included in the determination of total use.
Table 58 shows the water use within the expanded boundaries of
the City of Los Angeles along with the items of supply to the distribu
tion system and the modification~that were made in arriving at the use
values.
A portion of the water used by the City of Los Angeles is
extracted from the ground water supply of Central and West Coast Basins
in the Coastal Plain. There exists, however, a state of overdraft in
each basin (References: State Water Resources Board, "Central Basin
Investigation", Bulletin No.8, March, 1952; Department of Public Works,
Draft of Report of Referee, West Coast Basin Reference, February, 1952).
The amounts of ground water extracted by the City of Los
Angeles from areas outside the Upper Los Angeles River area and used by
the City of Los Angeles within its boundaries, are listed in Table 59.
-254-
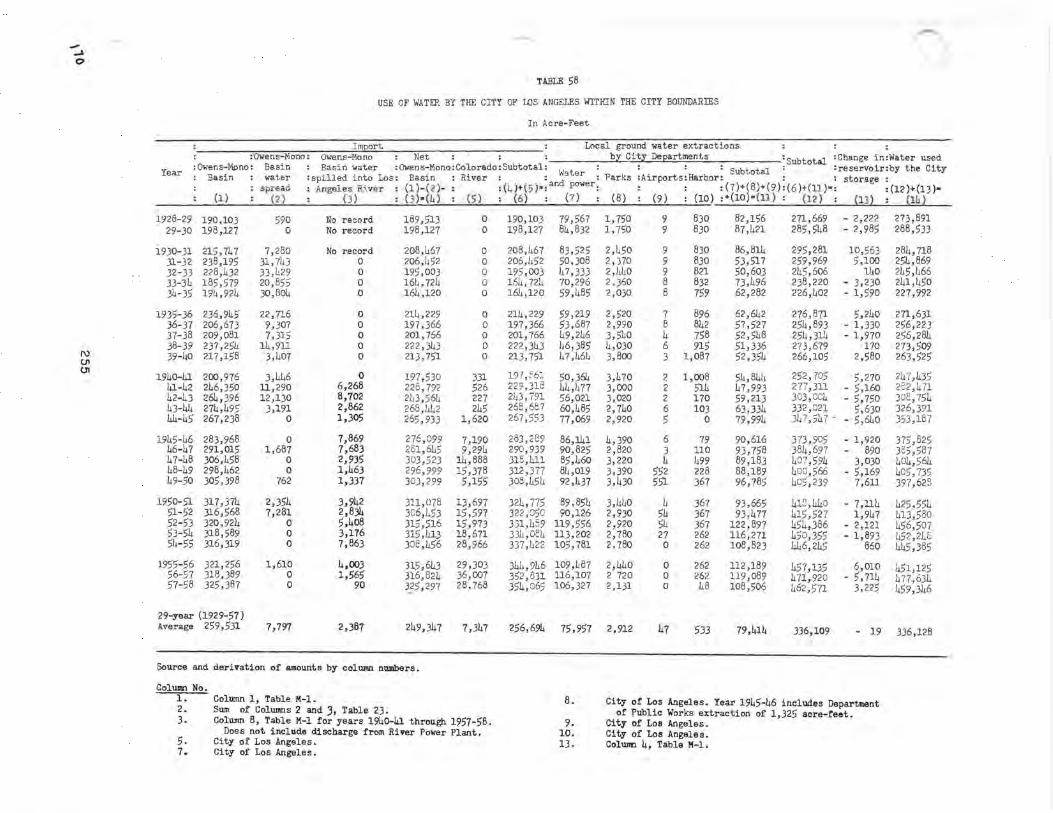
--' o
N (JI (J1
:Owens-Mono: ();lens-Mpno: Basin
TABLE 58
USE OF WATER BY THE CITY OF LOS ANGELES WITHIN THE CITY BOUNDARIES
In Acre-Feet
Import Local ground water extractions Owens-Mono Net by City Departments :Subtotal :Change in:Water used
Basin wat.er Basin water : Owens-Mono: Colorado Subtotal: W t : : : :oubtotal : :reservoir:by the City
:spil1ed into Los: Basin River : da er : Parks :Airports:Harbor: : : storage: Angeles iU.ver (1) - ('2 )- :(L)+(5)_:an power: :(7)+(8)+(9):(6)+(1l)-: :(12)+(13)-
Year spnaad
(1) (2 ) () m o(u ) (5) (6) (7) (8) (9 ) (10) :+(1O) ~(1l): (12) : (13) (lL)
1928-29 190,103 29-30 198,127
1930-31 215,747 )1-32 238,195 32-33 228,432 33-34 185,579 34-35 194,924
1935-36 36-37 37-38 38-39 39-40
1940-41 41-42 42-43 43-44 44-45
1945-46 46-47 47-48 48-49 49-50
1950-51 51-52 52-53 53-54 54-55
236,945 206,673 209,081 237,254 217,158
200,976 246,350 264,396 274,495 267,238
283,968 291,015 306,458 298,462 305,398
317,374 )16,568 320,924 318,589 316,319
1955-56 321,256 56-57 318,389 57-58 325,387
29-year (1929-57) Average 259,531
590 o
7,280 31,743 33,429 20,855 30,804
22,716 9,307 7,315
14,911 3,407
3,446 1l,290 12,130
3,191 o
o 1,687
o o
762
2,354 7, 281
o o o
1,610 o o
7,797
No r ecord No record
No record o o o o
o o o o o
o 6,268 8,702 2,B62 1,)05
7,869 7,68) 2,9)5 1,463 1,337
3,942 2,834 5,408 ),176 7,863
4,003 1,565
90
2,)87
189,513 198,127
208,467 206,452 195,003 164,724 164,120
214,229 197,366 201,766 222,343 213,751
197,530 228,792 2L3,564 265,442 265,933
276,099 281,645 303,523 296,999 303,299
311,078 306,L.53 315,516 315,413 308, 456
315,643 316,82u 315,297
249,347
Source and derivation of amounts by column nambers.
ColUJm No . 1. 2.
Column 1, Table M-l. Sum of ColWl11ls 2 and 3, Table 23.
o o
o
° ° ° ° o
° o o o
331 526 227 245
1,620
7,190 9,294
14,888 15,378 5,155
13,697 15,597 15,973 18,671 28,966
29,)03 36,007 28,768
7,347
3. Column B, Table M-l for years 1940-41 through 1957-58.
5. 7.
Does not include discharge from River Power Plant. City of Los Angeles. City of Los Angeles.
190,103 79,567 1,750 198,127 84,832 1,750
208,467 206,1152 195,003 161.,72h 164,120
21u,229 197,366 201,766 222,343 213,751
191, ~61 229,31B 243,791 268,687 267,55)
283,2 B9 290,939 318,411 )12 ,377 308,454
324,775 322,050 331,459 3J4,oe4 )37,422
8),525 50.308 47,3)3 70,296 59,48,
59,219 53,687 49,246 46, )85 47,U64
,0,)64 44,477 56,021 60,485 77,069
86,lLl 90,825 85,460 84,019 92,437
89.854 90,126
119,556 113,202 105,781
)4h,9u6 109,L87 352, 831 116,107 )5u,065 106,327
2,h50 2,370 2,hhO 2.360 2,030
2,520 2,990 3, SUO 4,0)0 3,800
3,470 3,000 ),020 2,740 2,920
u,390 2,820 3,220 3,390 3,430
3,440 2,9)0 2,920 2,780 2.780
2,440 2 720 2,131
256 ,694 75,957 2,912
9 9
9 9 9 8 8
7 8 4 6 3
2 2 2 6 5
6 3 4
552 551
4 54 54 27 o
o o o
!J7
8)0 830
830 830 821 832 759
896 842 758 915
1,087
1,008 514 170 10)
o
79 110 499 228 367
367 367 367 262 262
262 262 48
533
82,156 87,421
86,814 53,517 50,603 73,496 62,282
62,642 57,527 52,548 51,336 52,354
54,84h u7,993 59,213 63,334 79,994
90,616 93,758 89,183 88,189 96,785
93,665 93,h77
122,897 116,271 108,823
112,189 119,089 108,506
79,414
271,669 285,548
295,281 259,969 245,606 238,220 226,h02
276,871 254,893 254,314 273,679 266,105
252,705 277,311 303,oCu 332, 021 347,547 -
373 ,905 384,697 407,594 400,566 405,239
410,440 415,527 45h,386 450,355 446,245
h57,135 471,920 h62,571
336,109
- 2,222 273,891 - 2,985 288,53)
10,563 5,100
Iho - 3,2)0 - 1,590
5,240 - 1,3)0 - 1,970
170 2,580
5,270 - 5,160 - 5,750
5,6)0 - 5,640
- 1,920 890
3,0)0 - 5,169
7,611
- 7,114 1,947
- 2,121 - 1,893
860
6,010 - 5,714
3,225
284,718 254,869 245,466 241,450 227,992
271,631 256,223 256,284 273,509 263,525
247,4)5 282 ,471 308,754 326,391 353,187
375,825 3e5,587 404,564 405,735 )97,628
425.554 413;580 456,507 h52,2h[ 445,385
h51,125 477,6)4 459,346
- 19 336,128
B.
9. 10. 13.
City of Los Angeles. Year 1945-46 includes Department of Public Works extraction of 1,)25 acre-feet.
City of LOB Angeles. City of Los Angeles. Column 4, Table M-l.
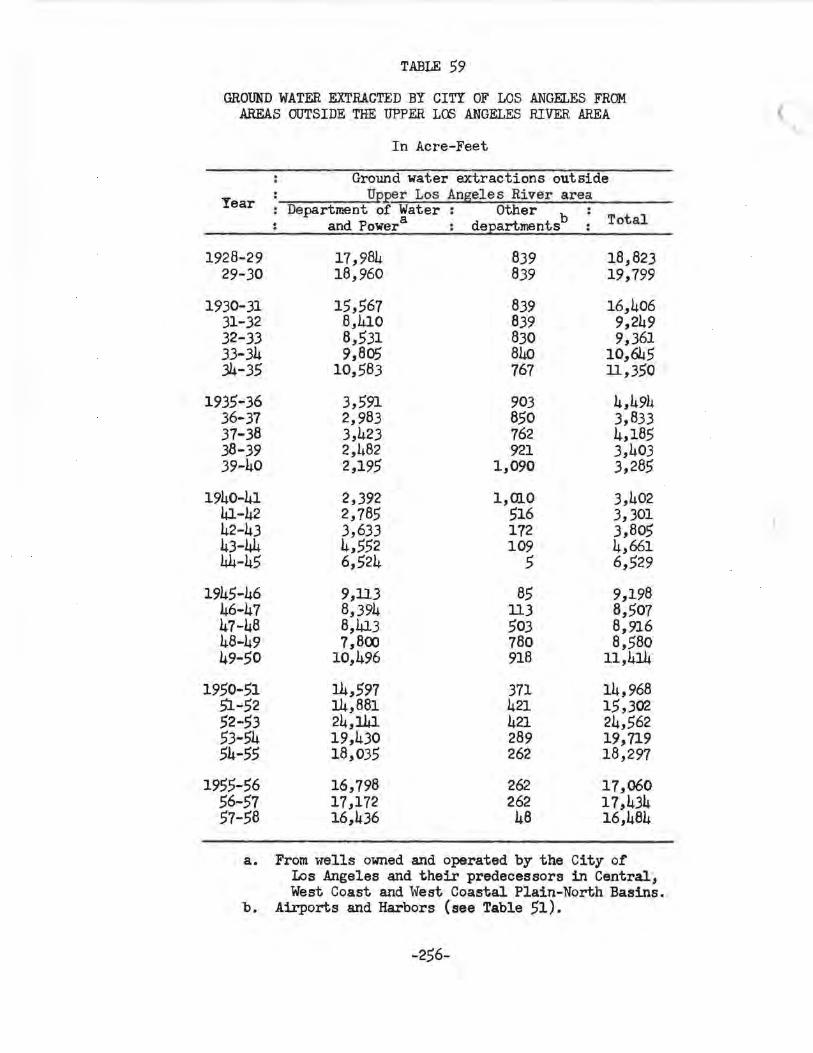
TABLE 59
GROUND WATER EXTRACTED BY CITY OF LOS ANGELES FROM AREAS OUTSIDE THE UPPER LOO ANGELES RIVER AREA
In Acre-Feet
Ground water extractions outside
Year UPEer Los Angeles River area Department of Water Other b Total and Powera deEartments
1928-29 11,984 839 18,823 29-30 18,960 839 19,799
1930-31 15,561 839 16,406 31-32 8,410 839 9,249 32-33 8,531 830 9,361 33-34 9,805 840 10,645 34-35 10,583 761 11,350
1935-36 3,591 903 4,494 36-37 2,983 850 3,833 37-38 3,423 762 4,185 38-39 2,482 921 3,403 39-40 2,195 1,090 3,285
1940-41 2,392 1,010 3,402 41-42 2,785 516 3,301 ( 42-43 3,633 172 3,805 43-44 4,552 109 4,661 44-45 6,524 5 6,529
1945-46 9,113 85 9,198 46-47 8,394 113 8,507 47-48 8,413 503 8,916 48-49 7,800 180 8,580 49-50 10,496 918 11,414
1950-51 14,591 371 14,968 51-52 14,881 421 15,302 52-53 24,141 421 24,562 53-54 19,430 289 19,719 54-55 18,035 262 18,297
1955-56 16,198 262 11,060 56-51 11,172 262 11,434 57-58 16,436 48 16,484
a. From wells owned and operated by the City of Los Angeles and their predecessors in Central, West Coast and West Coastal Plain-North Basins.
b. Airports and Harbors (see Table 51).
-256-
Water Distributed by the City of Los Angeles ~ for Use Outside Its Boundaries
Records of water distributed by the City of Los Angeles for use
outside its boundaries, but not including unmeasured distribution along
the Los Angeles Aqueduct or exchange water supplied to others for The
Metropolitan Water District, are readily available only for the period from
1950-51 through 1954-55 and for the year 1959-60. The water so distributed
during the 1950-51 through 1954-55 period is grouped into four categories:
(1) acquired services are those served by a water company purchased by the
City, (2) governmental services are either Federal, State, County or City
agencies, (3) miscellaneous services are those in unincorporated areas and
(4) reciprocal services are those in adjacent incorporated municipalities
and in County Water Works District No.3 supplied by the City and, in
return, the City of Los Angeles is given a like amount by the entity in
which the services are located. The water distributed during 1959-60 is
shown as a total of these groups.
Amounts of water delivered by the City of Los Angeles for use
to parcels partially outside and to parcels completely outside its bound-
aries for the 5-year period from 1950-51 through 1954-55 are shown in
Table 60. The total amount served to both types of parcels is also shown
in Table 60 for the period 1950-51 through 1959-60.
-257-
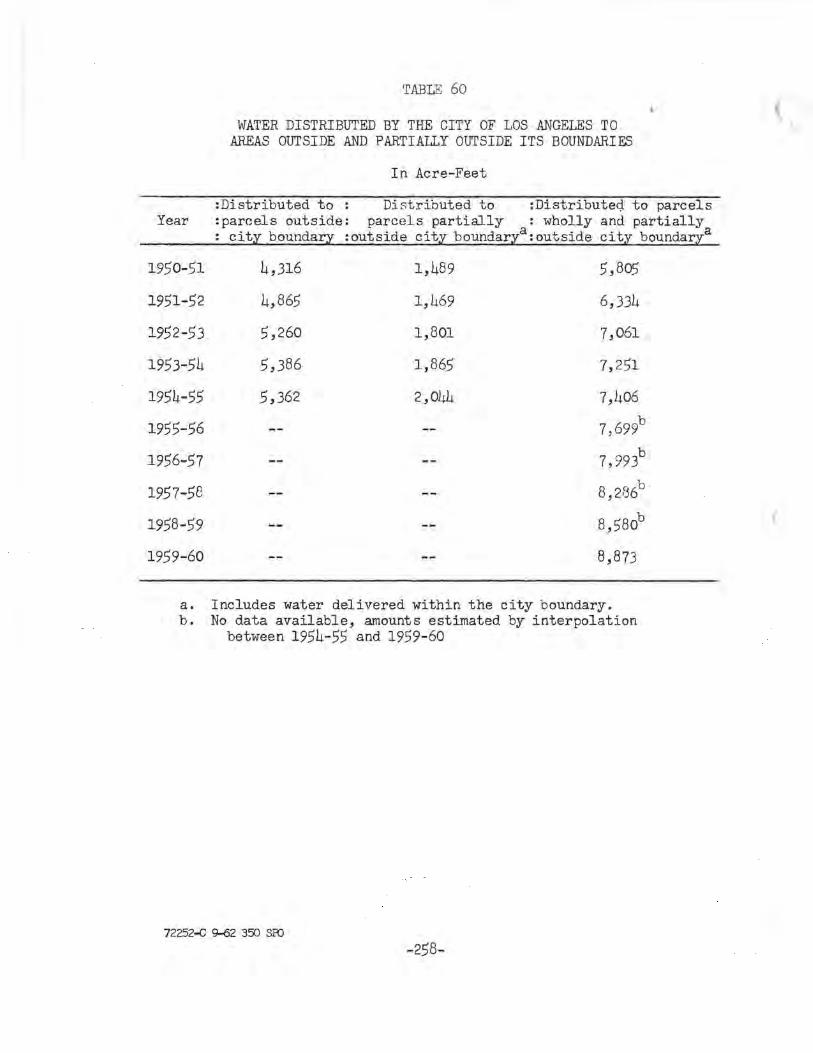
TABLE 60
WATER DISTRIBUTED BY THE CITY OF LOS ANGELES TO AREAS OUTSIDE AND PARTIALLY OUTSIDE ITS BOUNDARIES
In Acre-Feet
..
:Distributed to: Distributed to :Distribute~ to parcels Year :parcels outside: parcels partially : wholly and partially
city boundary :outside city boundarya:outside city boundarya
1950-51
1951-52
1952-53
1953-54
1954-55
1955-56
1956-57
1957-58
1958-59
1959-60
4,316
4,865
5,260
5,386
5,362
1,489
1,469
1,801
1,865
2,044
5,805
6,334
7,061
7,251
7,406
7,699b
7,993b
b 8,2,36
8,580b
8,873
a. Includes water delivered within the city boundary. b. No data available, amounts estimated by interpolation
between 1954-55 and 1959-60
72252~ 9-62 350 sm -258-
(
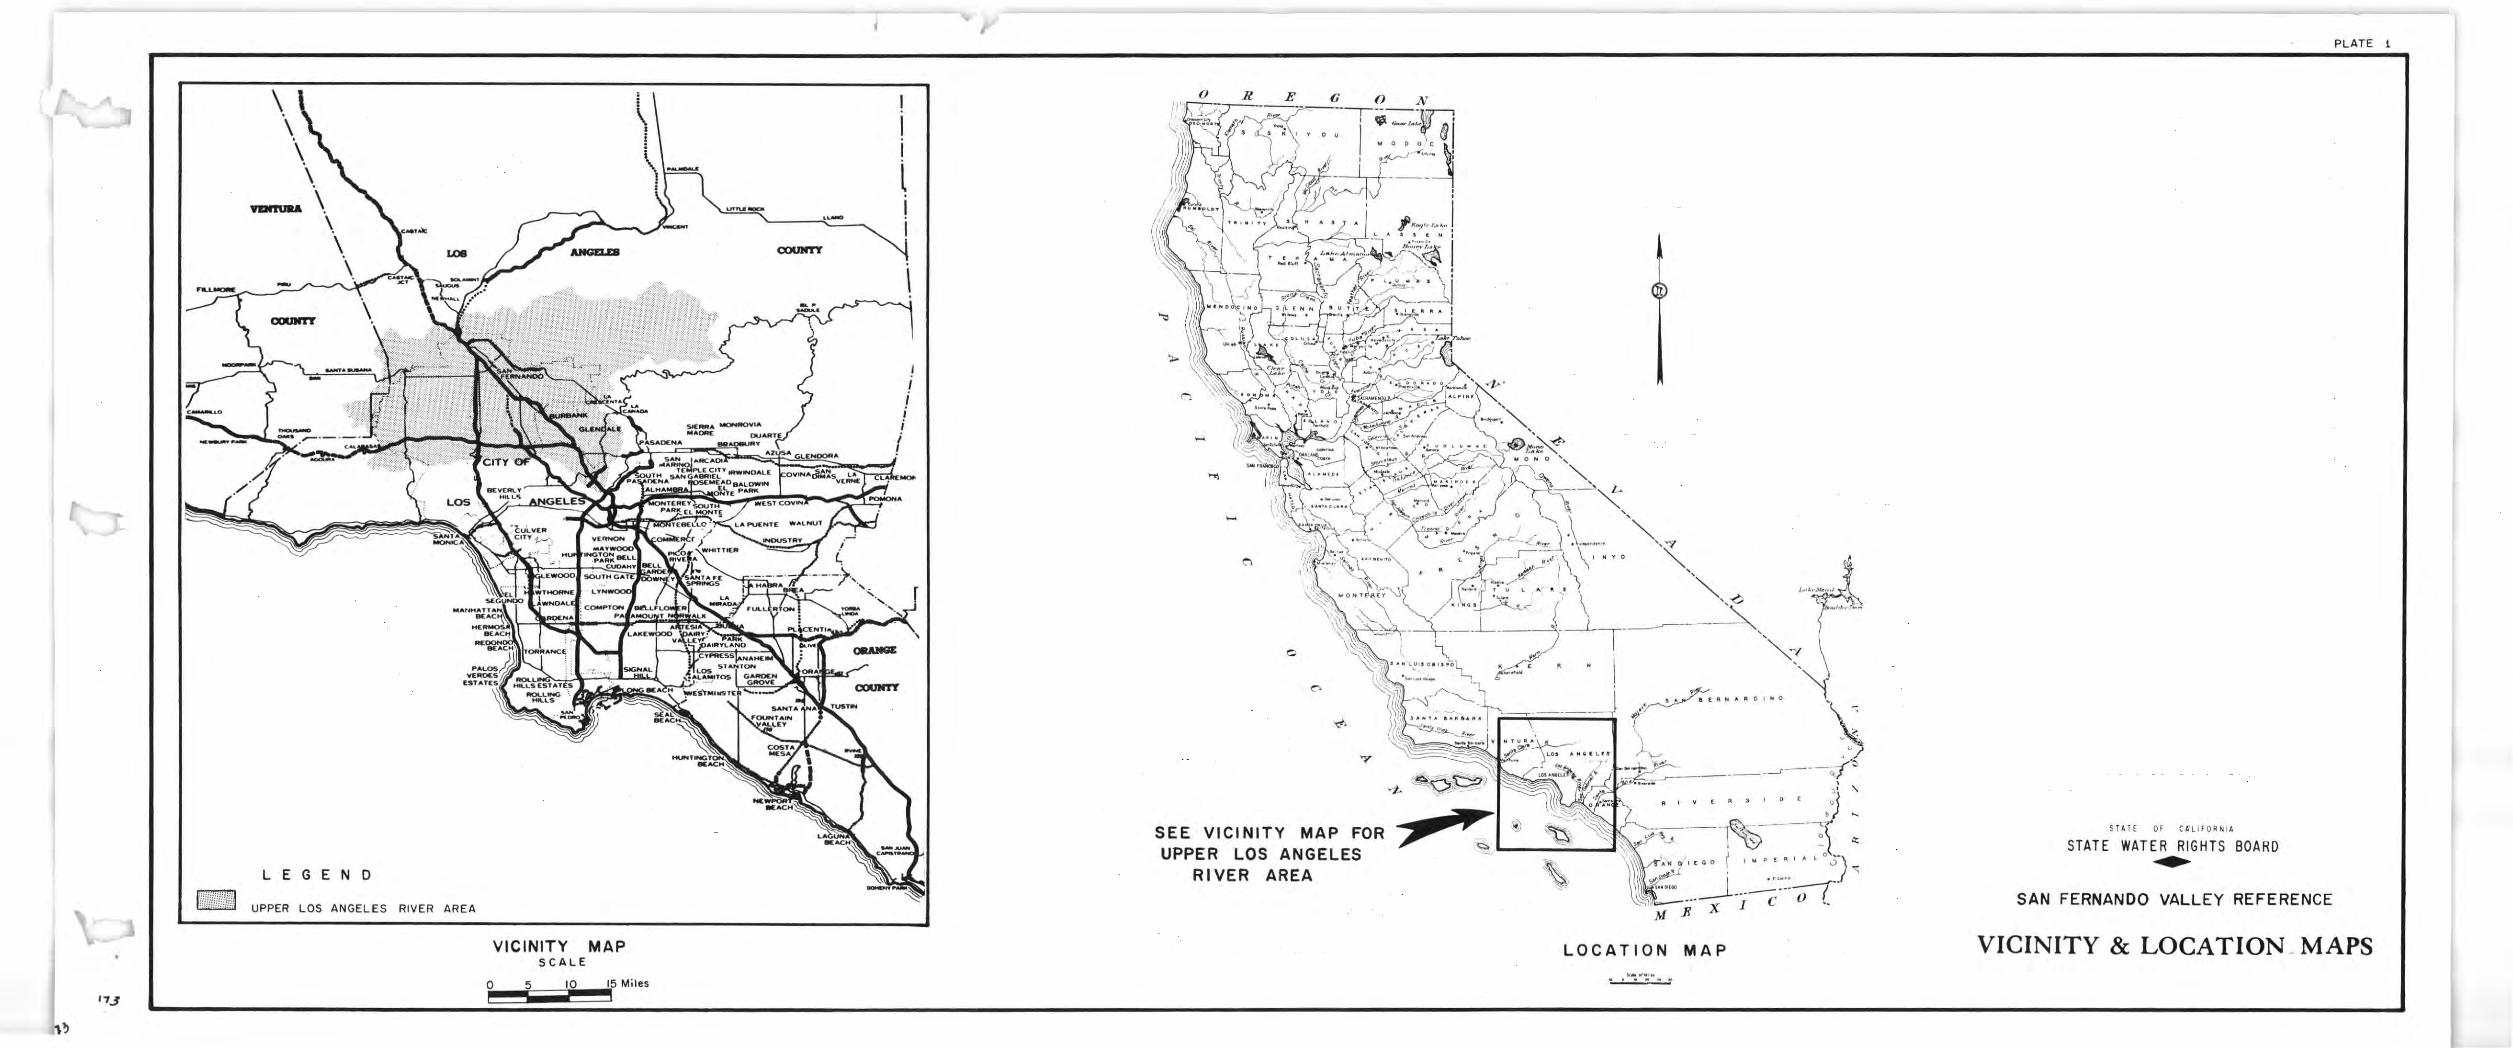
-
LEG END
\ - UPPER LOS ANGELES RIVER AREA
•
173
.,
VICINITY MAP SCALE
o 5 10 15 M;les
SfEMA MC)HAOYlot. M .....
00UNn'
•
I
l
0UJtGI"
COUIIft
I I
o
,...,
~
o
C">
"" v
SEE VICINITY MAP FOR ~I ® ~~, ~ UPPER LOS ANGELES .~L-__ ~~ __ ~
RIVER AREA
LOCATION MAP " ... ..... ' ..
STATE OF CA' UFQR NI A
STATE WATER RIGHTS BOARD ~
SAN FERNANDO VALLEY REFERENCE
PLATE i
VICINITY & LOCATION _ MAPS
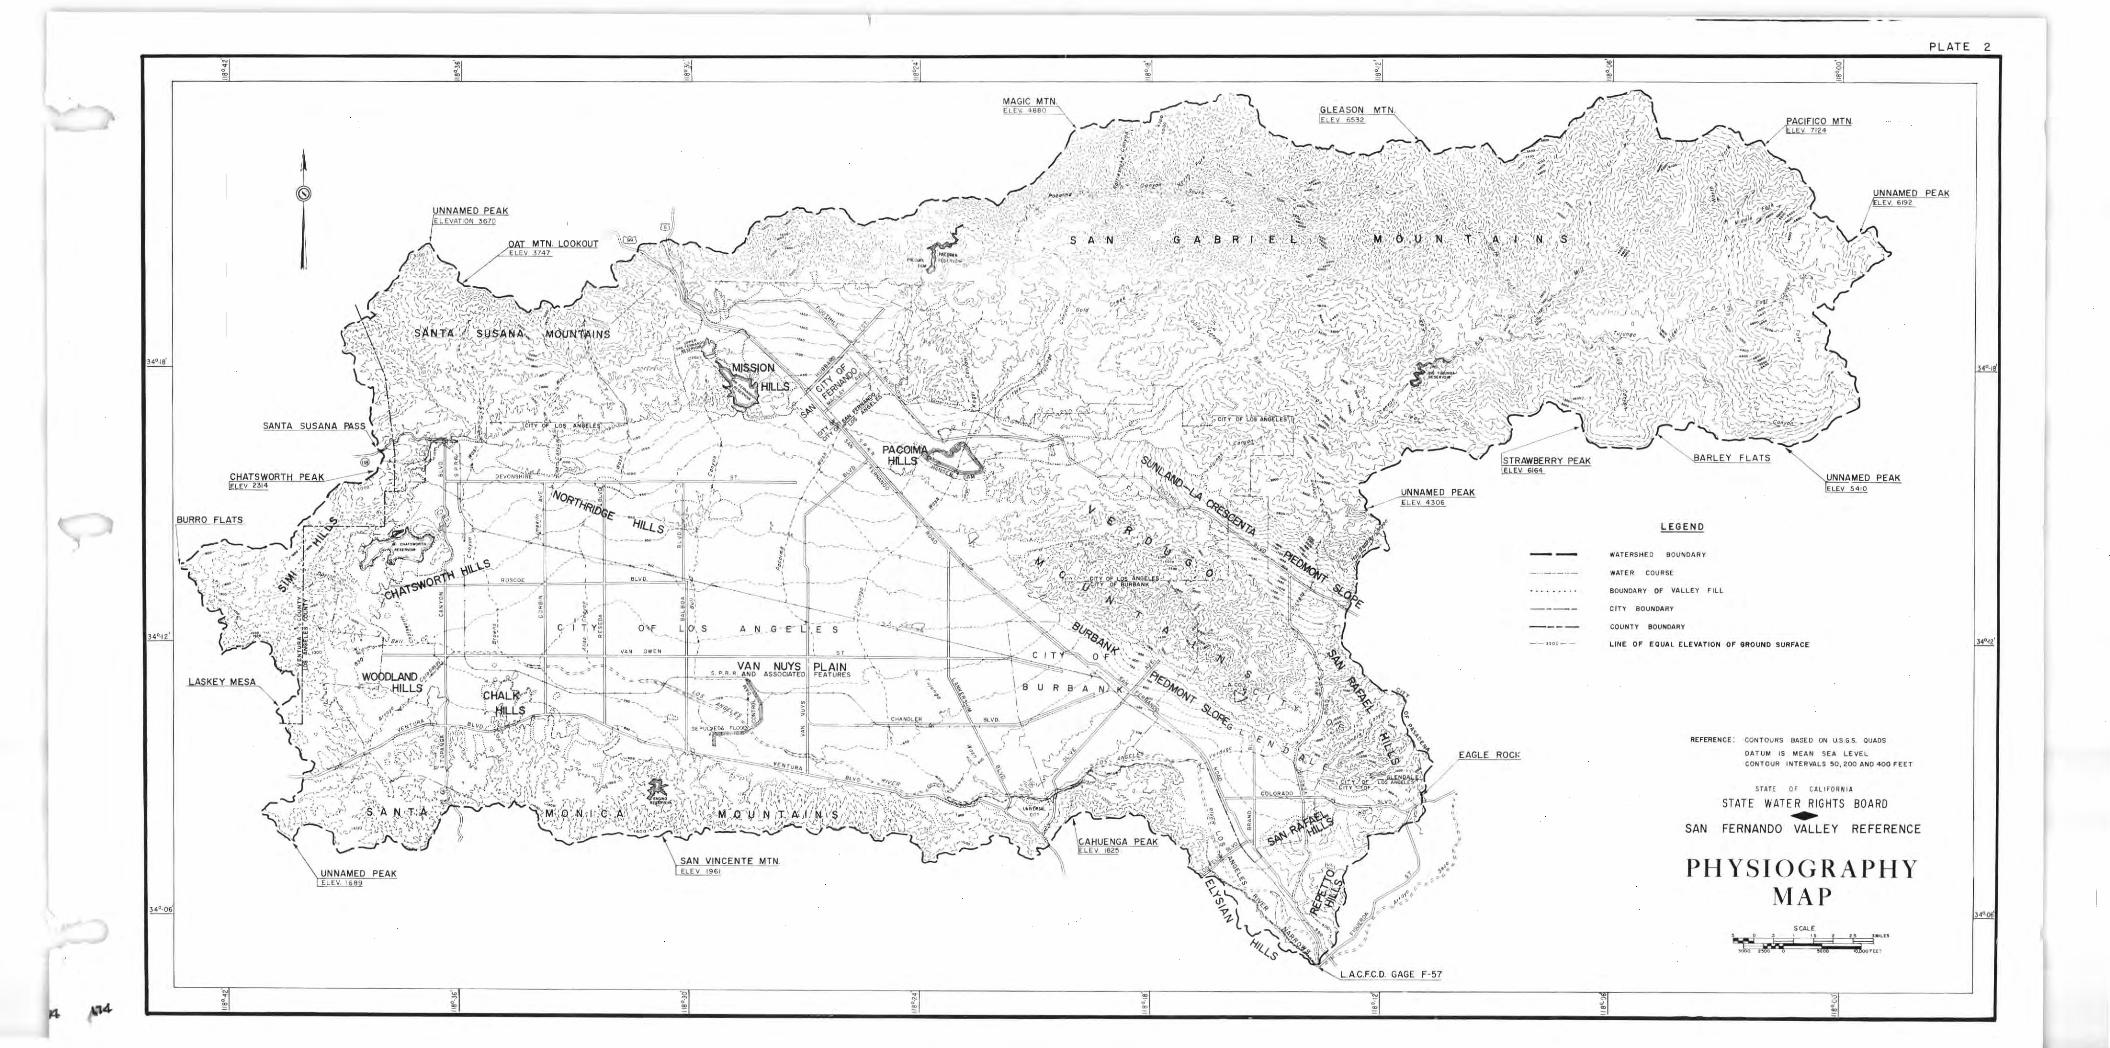
'"
,OC>o911
'.
, . o : ,-'
>
• >
~
• z
~
, 0 z
• , 0 •
>
>
>
z , >
0
u u
, , '
':-
;4; .. ,,,,;/,:, __
" I ~
': '
: VJ
,
-...... ,~
,,-----~,-r.'·~"d
/
o 0:
0:
..
:
'N
'" >-
u z
::t :
'" !
§ a::
a
'" 0...
'" lL
« 0
'"
• u : • , • 0 z , 0 • • • 0
: m
a::
-< $1(>-0;11
· z '" >-
0:::: 0...
• >--
:: z:
w
., ~'=.:::J
0 -< ~-'
v '"
«
"'"
>
0 ~
o W
" 0 0 -
· ,. Z
If)
·
« w
z
>->--
a:: «
'" >--
lL
'" z 0 ~
~ • "
::t z
0... « en
• " • , 0 • • 0 • z ::;
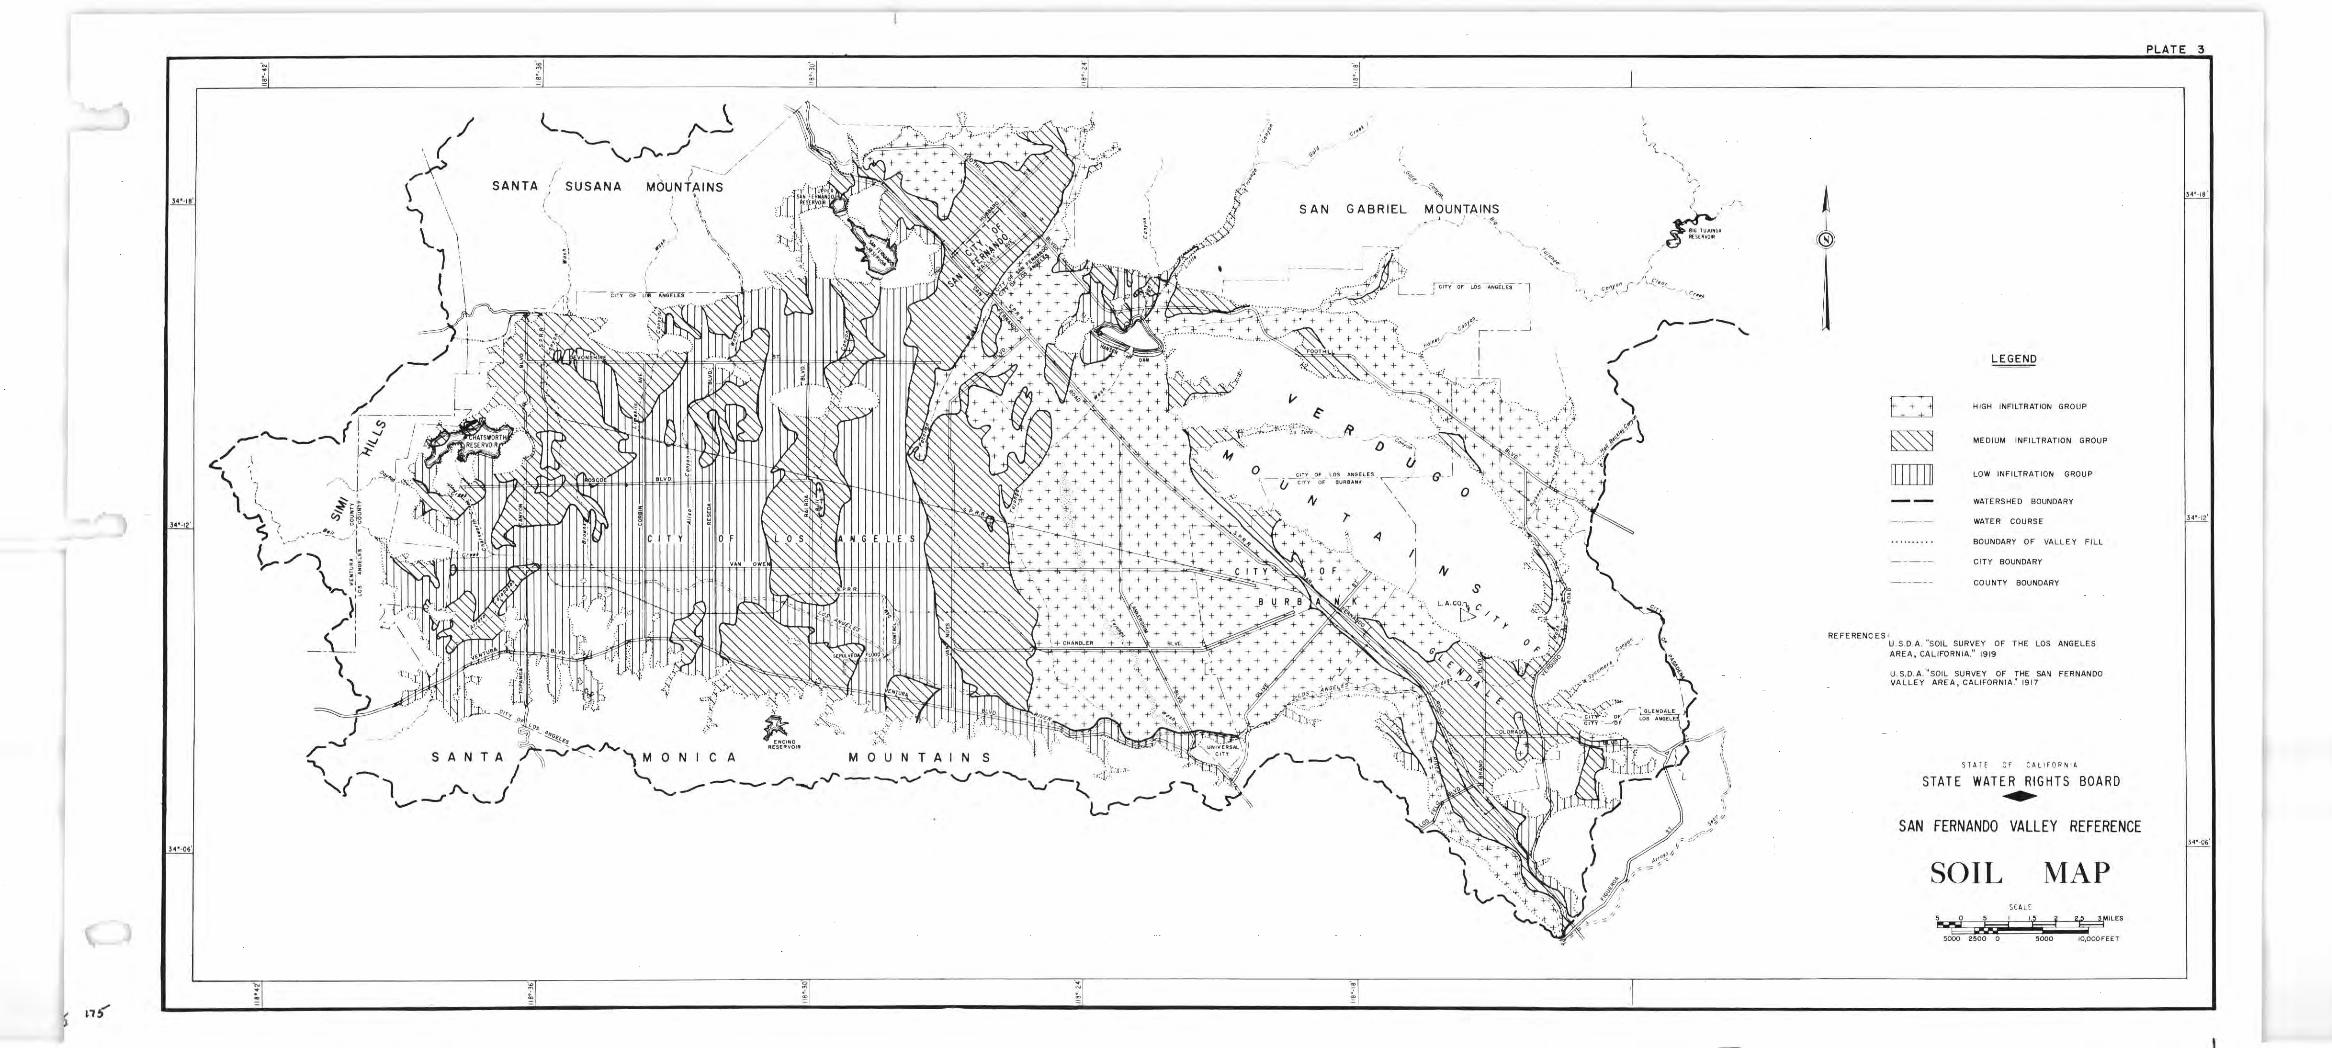
H'-Ie '
34' -1"
]4 ' ·06'
~, 115
-~I ~/ !/ !/ ~I
(/
".-'X:! \ .., ~
1 ' { \
SANTA
(.----- I'~ '-....f'v.../
SUSANA
!\ Ii ' .,
MOUN'/ -~
'\ ,t, . ' .. ~ .
,-'
\ r - -- C'TYOF - J.- ANO"fflT - - -
~~~,~-x " ~ \ '1' . . ,'
,/ /-
/ L r __________ ,
/ /
" -~ , ," c
~.~.
SAN
v ~
, ~" " f
,f'
'. ~-- - <
''""},
, (./~
C,
(
"' (
G ABRIEL MOUNTAINS .J"_
", ... , .. , -",
'-" -" ,~ .. ' ~ ..
L __ ;e."y-0,-~,-----'--;;GiLi$ -l -- , " c,:"i :"_) ' L.c!.!~ '::-.!" ,
, ------I 1'----.... /" '-
,/
, ) . ."
''t- . . '+ !~ 'l + . . ,0'1- ,' ~' .JI
( j '" -- ,- -- --~\~-,........ "'- ____ ~ : ;:;' / " , ~ ATSWORT .~'" _ '
~"'<, -"", 'ff ,;:.:.{:;'f.:. ··'t:"~u;,oa. ~ - + + "+ +.: "~ ~ + + -+:, ' '-, .. ~~} '
/ p:.... J :' RfSER~OIR I -, -- I. - -wl~ l ~ . - - . --l -, :
"' '-, ,---,-1 I ',-
.. l. ,, ' I " ~ ,~
~ \ '" '-f!:. " • 8t_ -, '. ~~ . ~ -.' .!':'( / 1
,-- ,- 1
(,.,-./") a :~ \ !I' ~ I ~
)i" / :
_~_I ) \.
r SANTA
" - I ........ { ') -..Jf'..,-.1 '-""'"
~, -
""',' MOUNTAINS " --v<"::.A.- .... M 0 N I C A "'-'-1 ......... "'-, ----I -, J'\.
1 -J'---..-v- '-' " r- ~ '""-- ----~ ~~~~ ~
~ -tl -~ I
CoTY (IF LO~ .N(I[LU
o "';'''.' "..",;,
f.i \- U ----c;T~ or' IUiIBiN-'-' \ -,--
o \
4
'I '" s
. L.A. CO.) C +": [, '> / /"
+,. .- r + 0' ., .. +
-~
+ + ::+;.. t..V + ~ +.... fJ
+~+' + + ~"~"-t:r
,0.
,'/,1 ;'. - "';
i
REFERENCES '
D ~ []]]]]
LEGEND
H IGH INFILTRATION GROUP
MEDIUM INFILTRATION GROUP
LOW INFILTRAT ION GROUP
WATERSHED BOUNDARY
WATER COURSE
BOUNDARY OF VAL LEY F ILL
CITY BOUNDARY
COUNTY BOUNDARY
U.S.D. A " SOIL SURVEY OF THE LOS ANGELES AREA, CALIFORNIA." 1919
U. S . D . A .~SOIL SURVEY OF THE SAN FERNANDO VALLEY AREA, CALIFORNIA ." 1917
S TA T[ Of CAL if ORN IA
STATE WATE R RIGHT S BOARD ~
SAN FERNANDO VALLEY REFERENCE
SOIL MAP o SC ALE 2 5 3 r
lLES ::eo. ~ 2500 0 '000 IO,OOO fEE T
PLATE 3
34 0 ' 18 '
34'·12 '
]4" 06'
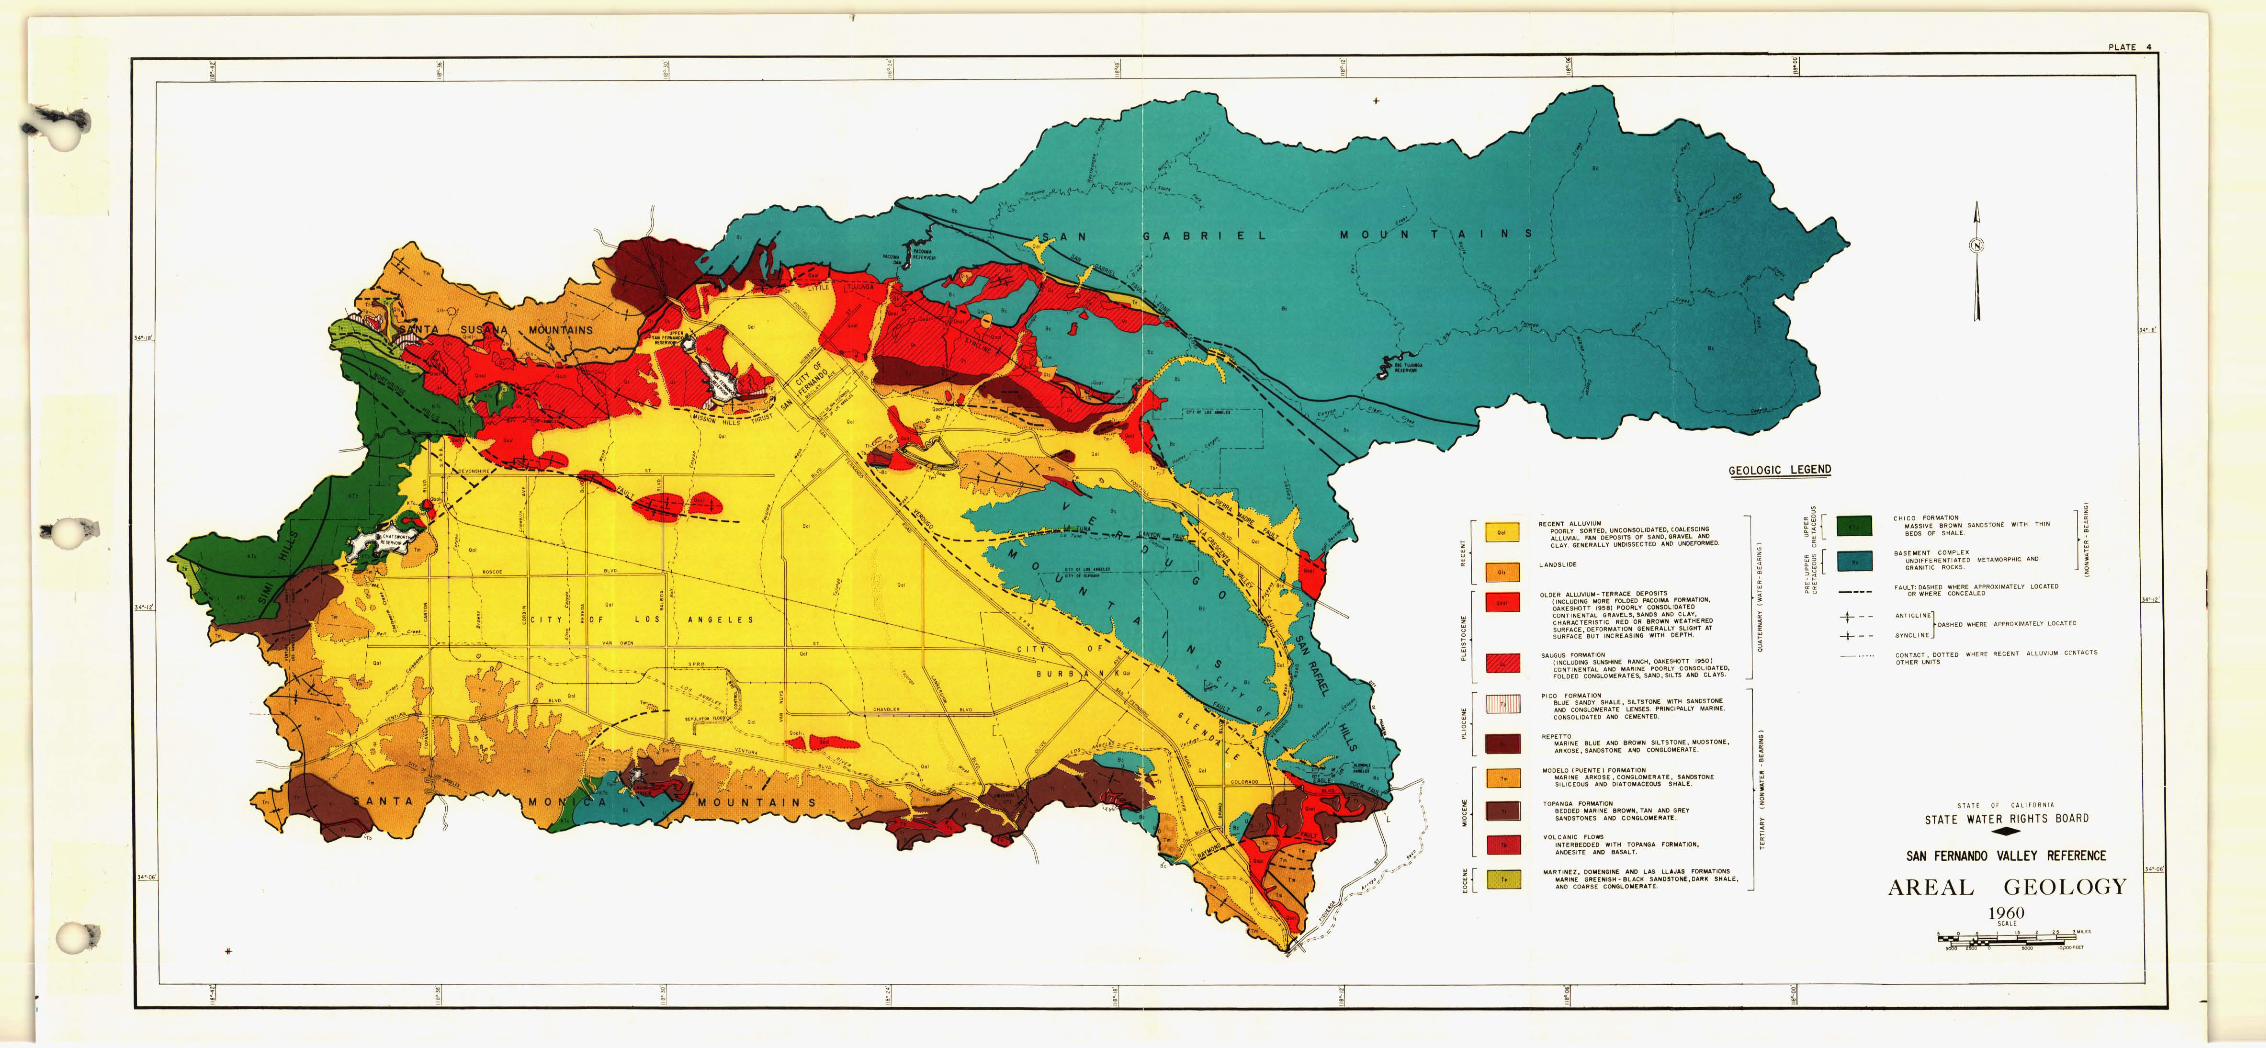
, ' 1
'£:1':
H "ai'
.. , '. • •
~: "
lOS II I A N GEL E 5
00 ,
" 1, ,"
'0
~
" . "
:,-
'"
'~I
~
+
.'
. " ," ~ ~ ~
~[ 8 ~ L:.:J
~ Q
•
--[:
D ---Hc=J
• •
GEOLOGIC LEGEND
R[CENT ALLUVIUM POORLY SORTED. UNCONSOLIDATED, {,O,l,LESCI NG AU.UVlAL rAN DEPOSITS OF SAND, GR,I,VEL AND CLAY , GENERALLY UNDISSECTED .l.N(l UNOEFOfIMEO
LANDSLIDE
OLDER ALLUVIUM - TERRACE DEPOSITS (I"ICLUDltlG IoIORE FOLO£O PIlCOIMA FORMATION, OAKESHOTT 1'581 POO"LY CONSOL IDATED CO IHIN ENTAL GRAVELS, SANDS ... ,.. 0 CL iI,'I', CHARACTERIST IC RED OR BROWN WE",THEREO SURFACE . OEFOR~ATION GENERALLY SLIGHT AT SURFACE BUT INCREASING WITH DEPTH .
SAUGUS FOR~AT ION l l NCLUOING SUNSHINE RANCH.OAKESHOTT 19M) CO NTlNfNTAL AND M"RINE POORLY COHSOLIOATEO, FOLOED CONGLOMERATES, SAND,SILTS AND CLAYS .
PICO FORM"TION 8LUE SANOY SHALE, SILTSTONE WITH SANOSTONE "'10 CONGLOMERATE LENSES PRINCIP"LLY MARINE. CONSOL IDATED ANO CE~ENTEO.
REPETTO M"RI NE 8LUE AND 8ROWN SILTSTONE. IoI UOSTONE, ARKOSE. SANDSTONE AND CONGLO IoI ERATE
MODELO 1 PUENTE I FORMATION MARINE ARKOSE, CONGLOMERUE. SANDSTONE SILICEOUS AN D DIATOMACEOUS SHALf .
TOPUIGA FORMATION 8EOOEO MAR INE 8ROWN. fA '" AND GREY SA"'DSTONES AND CO NGLOMEIUTt: .
VOLCANIC FLOWS INTfR8EOOEO WITH TOf'A"IGA FOII~ATIOH,
ANDESITE AND 8ASALT .
~ARTINEZ. OOMENGINE AND LAS ll .tJU FORMATIONS MARINE GREENISH - B LACK SA/oI OSTOHE , CAR. SHALE, AND COARSE CONGLOIllERAT[.
. ; g
~I[ -'~[ -
+-+--
~I ~I~[ .~ ~I II -- -------~
PLATE 4
CMICO FORMATION MASSIVE BROWN SANDSTONE WITIi nliN BEDS OF SHALE
8ASE ME'IT COMPLEX UNDIFFERENTIATED METAMO"PH~ AND GR.l.NITIC ROCKS.
FAULT: DASHED WI'EFIE APPROXIMATELY LOCAno OR WHERE CONCEALED
l! ANTI CL I NE}
DASHED WHERE
SYNC LI NE
./IPPRQXIM ATELY LOC AT ED
CONTACT.OOTTEO WHE RE RE CENT ALLU VIUM CC' NTAC1 S OTHER UNITS
SlA l[ 0 , CALI f OR NI A
STATE WATER RIGHTS BOARD ~
SAN FERNANDO VALLEY REFERENCE
AREAL GEO LOGY 1960
SCllE " B ,~ .. "
,OO><"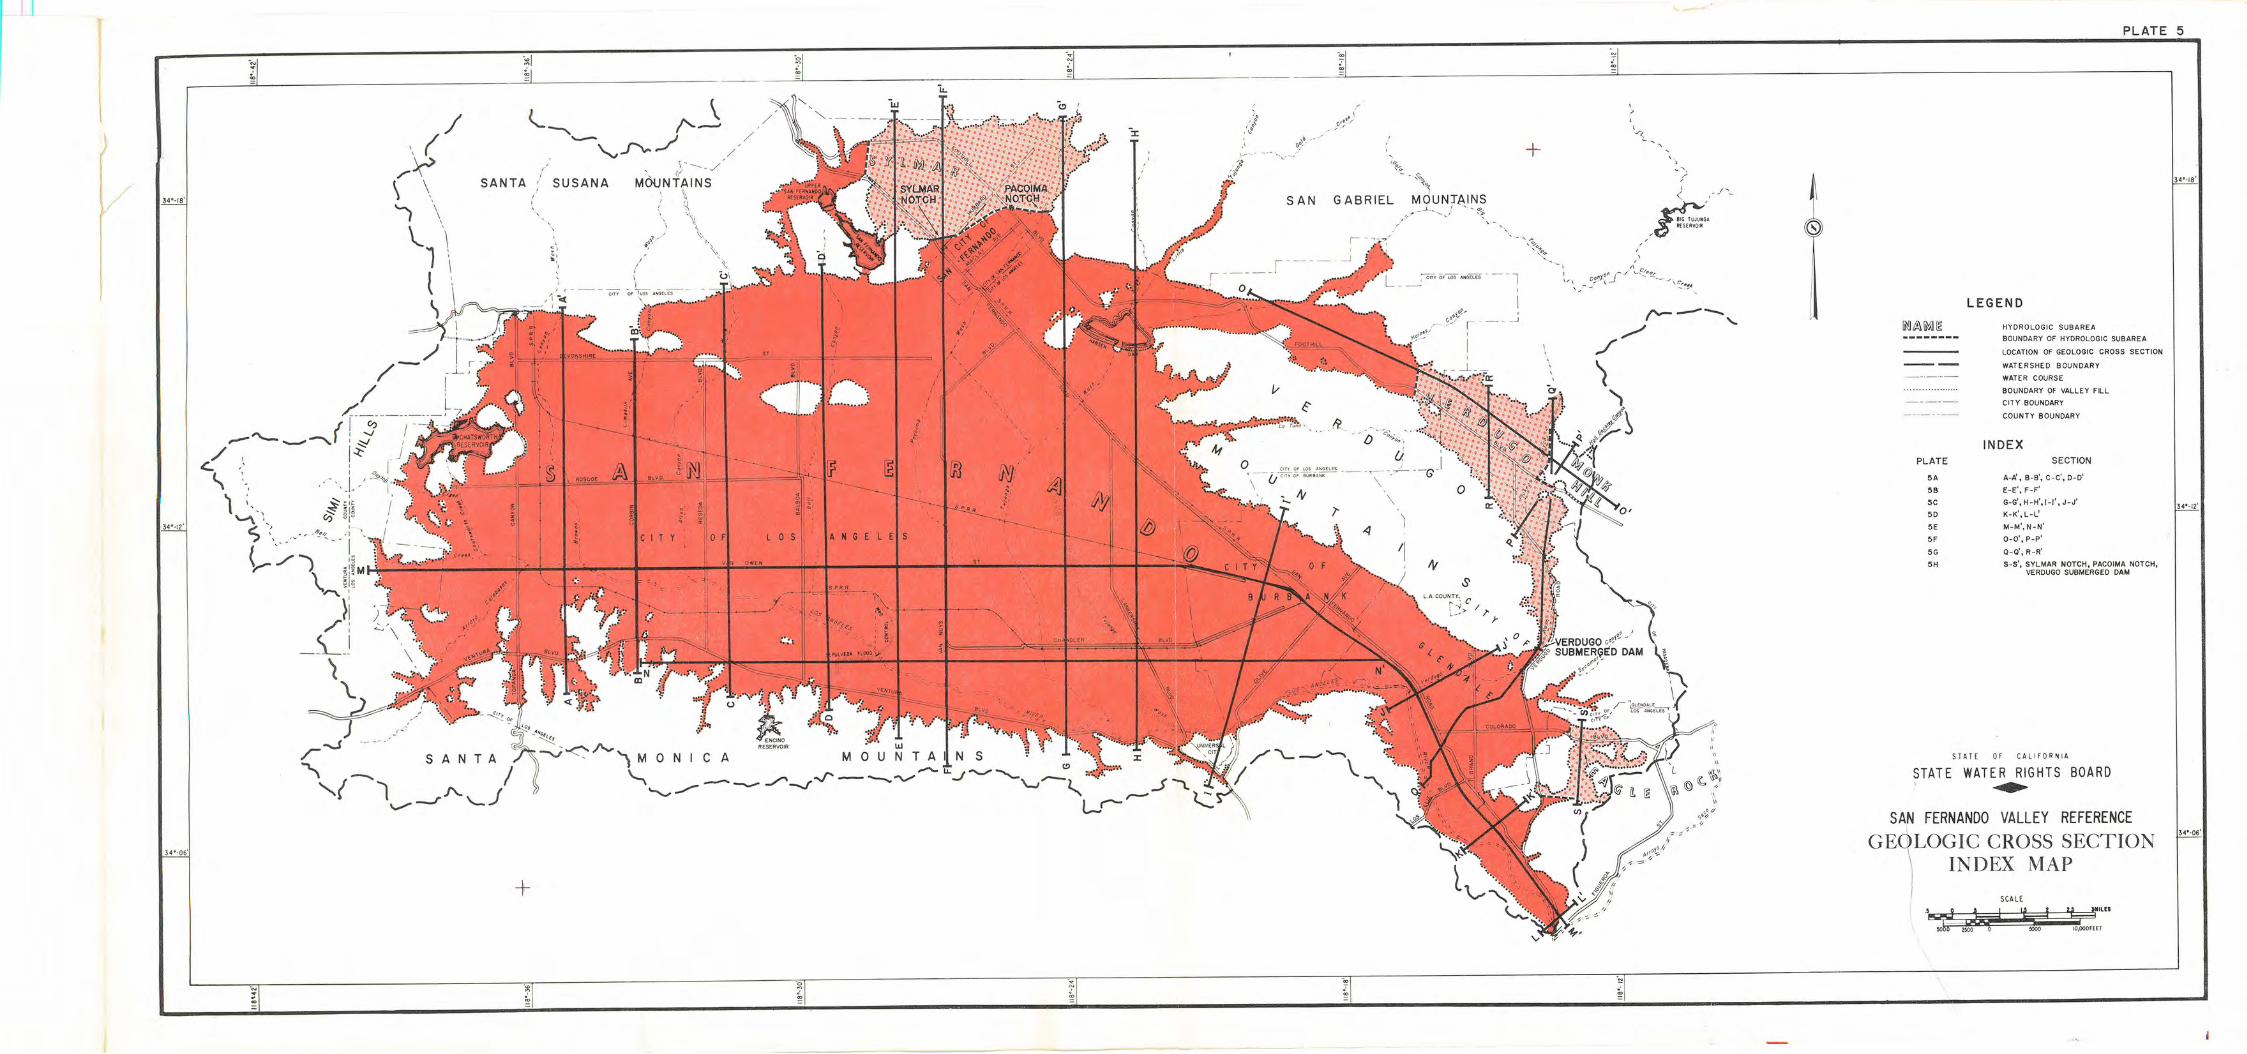
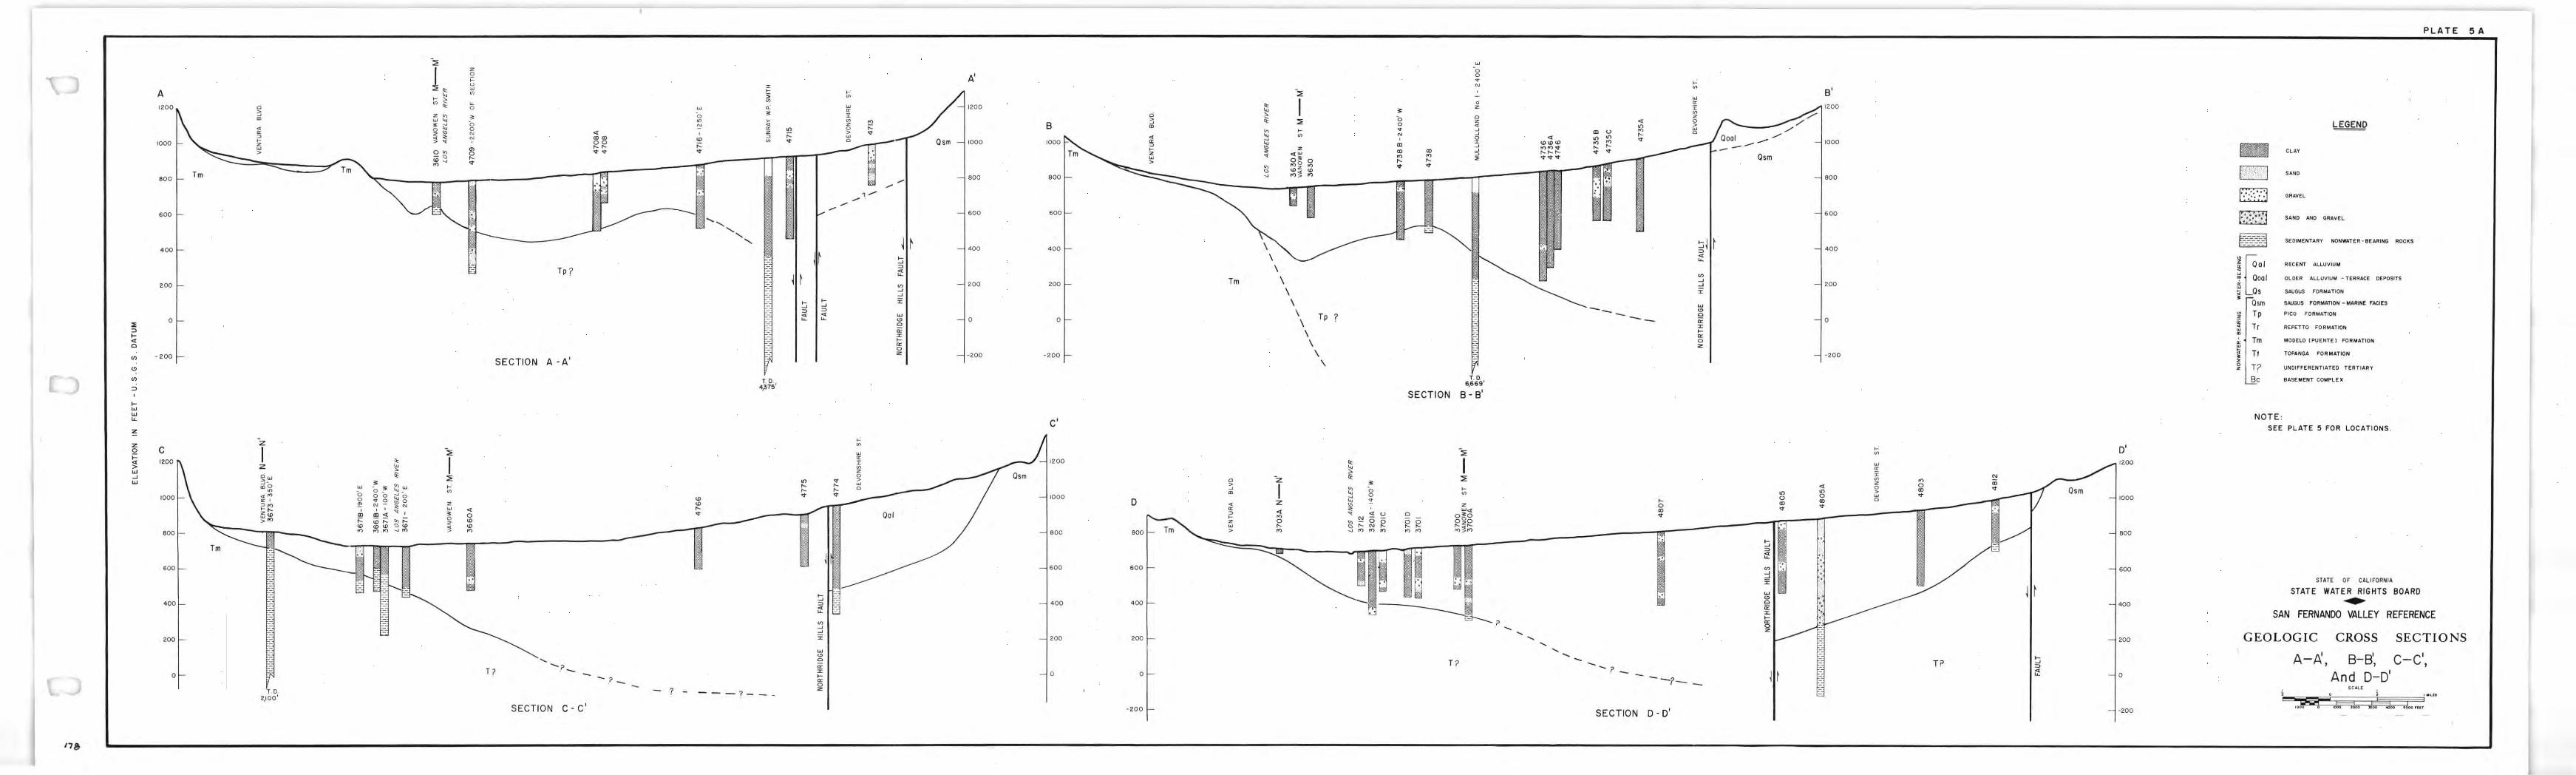
, " '"
EL
EV
AT
ION
IN
F
EE
T
-U
. S
.G.
S.
DA
TU
M
en '" " --< o z o o N
o •
(J) '" o --<
(5
z o o ~ a
N
4'
0>
CI)
(5
N
O
08
g
8 8
8 g
~
3
=--
-g -4
""
5l':'i.
:,: ,i.:
,i.!,!,
:, :,!.: l
il!I!1
i,!,:.!.
: I:'!,:
,:,:.:
,5'f
~p
•
VE
NT
UR
Il.
BL
va
N --
N'
36
73
' 3
50
'E
.~
.~
~
.~
I .~
I
~
I
1:1:
1 I:'
NORT
HRI
DG
E H
ilL
S
FAU
LT
o o
~
~ I ,
/ / I
~
I I J, I I
.... . ~
FAU
LT
o l>
:>
l>
I l>_
/
N g 8 I I
~
I
PI • 8
• g
• •
8 8
o.
:
NORT
HRID
GE
Hill
S
FAUL
T
1; C)
tTl o t O
C) -()
,~:. "'
; : ... ::
..
'" l> :z ~
8
~ E
m
:z
_ l>
•
Z
~~
8 ~
,.,
8
,:1
36
71
8-1
90
0' E
36
61
8-2
40
0'W
36
71.0
. -
10
0'W
LO
S
AN
G£L
eS
R
IVE
R
36
71
-2
00
' E
VA
NO
WE
N
Sf.
M--
M'
36
60A
47
66
47
75
47
74
DE
VO
NS
HIR
E
ST
• o o rn g ~
o •
<;
o o
o
VE
NT
UR
A
8L
VD
.
37
Q3
A N
-N
'
N o o
LO
S
AN
GE
LE
S
RtV
£R
37
12
32
0IA
'14
00
'W
37
0IC
37
0ID
'10
1
37
00
I
I/.l.N
DW
EN
$
T
M -
M
3700
.0.
• o o
48
07
48
05
4805
.0.
OEY
DN
SH
IRE
S
T.
46
03
48
12
8 o "
0 o
• o
1~lg
o.cp
OllJ
()
;00 o 00
00
+'" .
~
:Q'"
r "'
~
r -
. '"
"'"
-<
::J:
"i
I .-
o ()
11 ~
• , 00
~
()
-3 - o z 0
0
:tI m " m ~ n m
..,.
<n ~
'" " >- '" "
,
o
z o ~~
m",
m
~
r ~ m
~
~
a D
r g ... -< <5 z ~
, ~
N
-"
0>
(I)
-
00
80
00
8
~ ~
I 0
0 0
0 g
en '" o --<
o z J>
J>
I ~ I
....
~
~
~
/
/ / / /
o
,-,
~
3
:;;>
'
VE
NTU
R6
BLV
D.
36
10
IIAN
OW
EN
ST
M
-M
' LO
S
t4.N
GC
l..£5
R
IVE
R
41
09
-2
20
0''1
1
OF
S
EC
TIO
N
47
08
A
47
08
47
16-
12
50
'£
~"
I ;::.
!=' ""4J
;>:,!I!
,:,:,:,
:,:,:,:,
:,l,I':'
:':':':':
':':':':
,M4M
§@)
W@
hiiiM
S
UN
FA
Y
.... P
. S
MIT
H
(J) '" () --<
o z CD
"
FAU
LT
fAU
L T
NO
RTH
RID
GE
H
ILL
S
FAU
LT
N 8 N o o / "
o o
" ",
,"
.., ~ .~
" N o o N 8 ~
3 " "
~
• a o 8 " "
\ • 8
\ \
47
15
DE
VO
N5H
I"E
$
T
\ &F"W~ 4
713
\ \ • o o m 8
" ~ • g o § ID
vENT~4
BLV
D.
N o o
LO.';
A
NG
ELE
S
RIV
ER
36
30
A
I
vAN
OW
EN
S
T M
--
M
36
:30
47
38
a -2
40
0'
W
47
38
J>.
-1:-<
IJ
J_ ~P
"""':1:
,:,:,:,:
,:,:,:,:
,:",:.:
,:,:,:,:
,)4#
, .
\ _
} ,jA
A4@
ilIT\
l@
, M
ULL
HOLL
,I,N
D
No.
1-
24
00
'E
I I I I I
NO
RT
HR
IDG
E
HIL
LS
FA
ULT
, N o o
o N
g
~ON"'4TER -
8E
AR
I'I(.
l W
.lTE
IiI-
I3[I
IH!N
G
1(11
-I
--.of
--
I -I
-I o
lb
0 0
n .'"
\)
-3
...
"Q
3
... 8
c
• c
>
z ~
0 · ' m
• · ~ " ~ ~ ~
;:. ~
• •
• 0 • • · " >
• <
" o ~ • g • b
~ -
• • • • = • z
~ ~ • ~ • ~ ~
• ~ d ~ • • • i
. ~ .
8 i
~ c
c •
• , o
, ~
~
(1
• ••
~ ~
E
it
0 ~
~ g i ~ •
o " ~ • ~ " ~ c • " ~ • • ~ ~ ;I
• ~ • ~ • ~ < c •
• o o
~ o • • ~ ! l ;: • • • ~ ~ g ~
47
36
4
73
6A
4
746
47
35
B
4135
C
41
35
A
oe:V
ON
SH
IFlE
S
T.
m g
• o o
" • 3
is 8
f.::1
f.lt01
. B
uEfJ
_ • : o
~ " ~
• ~ o p ~
r '" I~ z o
N
ID
g
."
r J> .... '" ~
~------------------------------------------------~(
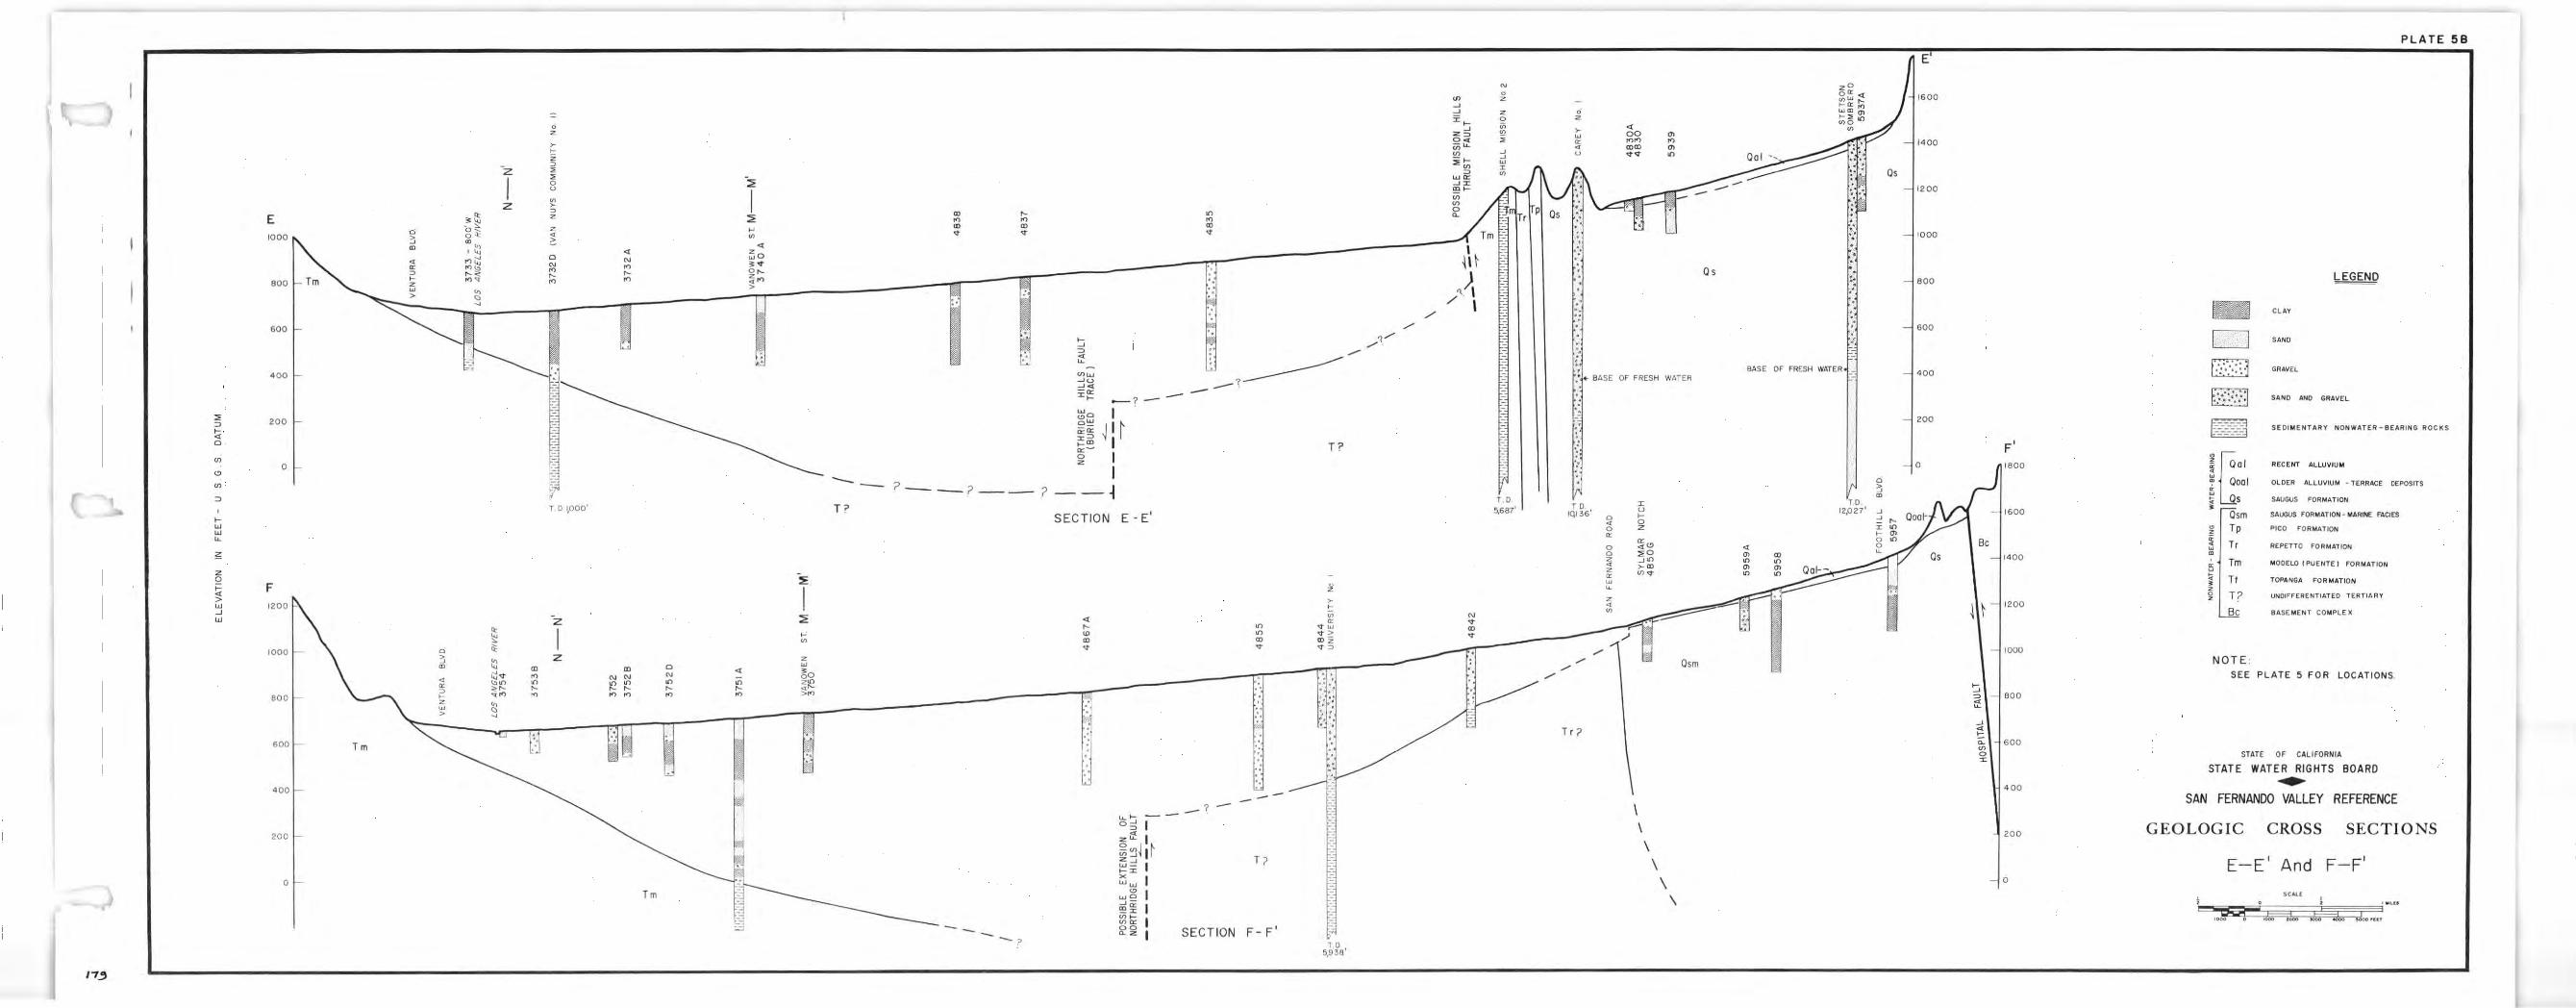
CD on
'" ~ <t
...J Q
.
w
0 0 ~
0 0 !
Q£8
v '0'0
£81;0
0 0 ~
0 z '" '" '" ...J
0 0
0
" 0 00
>
0 •
z "
• u
•
I 0
0 0 '"
• · u 0 • 0 z 0 • w ~ , • w > • •
" z
w
0 >
z
~ >
0
• • 0
>
z z
• "
w
'" •
~
0
" z
• •
w
0 •
· ill] [] .' .
':': ..
'.' ....
....
lJ..
0 0
0 0
• N
· " • 0 • ~ • w 0
z w
~
0 >
u
~
• •
~ •
• • •
• ~
• •
• ~
~ z
0 z
w
• z
• 2
>
0 ~
2 >
~
• ~
z • •
0 ,
2 w
w
•
;; •
>
2 •
>
• • • •
• >
•
z •
0 ,
• • • ~
w
0 " u
" 0
• •
" •
, z
• 0
• •
w
>
• 0
z •
0 •
• ~
• ~
w
• ~
• >
g
0 •
w
w
§ ~
w
z •
w
u 0
, 0
0 :
" •
w
" •
• u
w
0 0
z •
• 0
• •
;: •
• >
,
~
C
E
0 ,,-,
0 •
• Q
. E
all
0 a 0110 >-
::: >-
;: f-
!>NI}A
r3B-1j3
l." ..... tlN
II:f'138
-1j3
J.'O' ..... NO
N
0 0
0 0
0 0
0 0
~
~
~
~
0
'OA
1S l1
1H1
00
:l \ ~OS8.
H8
10
N ~
'O'~lAS
al;l'o
~ OON
l;I'N~3~
Nl;I'S
'" z 0 <
)
>-'"
« co:
U
0 0
'" -'
• ;; II:
~
en ~
0 ~
::t: ...
::; '" • :+
'" u
'" >-• 0
« U
J
-' 0
-0
-w
co:
> ~
• W
'" >
'" •
UJ
f-"'
f-a
co: Z
0
-en
8 0
0 0
~
0 0
0 00
00 •
llnV3
lVlld
SO
H
\'-,------\ \ \ \
w
<.> z w
a: w
Lo.. w
a: >-W
-'
-' ~
8 Z
<0: Z
a: w
Lo..
Z
<0: <
J)
Z O
N NO
ISSI~
11
3H
S
'" I II IIII
I1
11
1 II
III1
11
1 IIIII1
nn
Y3
lsn~Hl
SlllH
NOISS
IW
318
1SS0d
\ \ \ \ \
'.'
.'
,.' \ \ \ \ ~,
w
I "ON
A.lIS
I:f3A
INn
vv8
v
\ \:==:. ::;:::.: . '~
... ,:::::::: ... ;:.:::
.. ' .::::;:. : .;::;'):. \ \
L~ __ _ .....
w
z a ~
u w
Vl
L£
eto
s£et-
Y O~H
,~--~
IS
N3M
ON
M
'0'2£
2.£
iI 'O
N
A.lIN
nl"lr-lO
) 5A
nN
N
l;I'Aj
a 2£
2.£
,N-N
'.
( 3JY~1
nnY3
Sll
lH
\%"-.
~.
tON
Y
S3
73
9Nrt
50
7 ~[i'il~::'JI:L
M ,0
08
-££2.£
,
'OA1
8
tf~n.i.N3
1\
o o
W
"
o o '" o o 00
o o •
031~n8 )
3~OI~Hl~ON
o o N
o
\ I "-
I / I I
n., f-'0 0 Q
. 0 >
\fl98
t>
,', . ~ ...... .
,IIJ--W
1
5 O
Sl£
N3
MO
N'1A
aZ
GL
£:
BZ
SH
ZSl
£
,N--N
8£~L£
v~L£
Y3
NtI
S3
73
9N
tt S
07
"01\18
V
tlnl
N3
/\
o o lJ..
N
o o o o o '"
.~
.. ' . o o 00
.... mllla
"S" £)
" s n -.133.:1
NI
NO
W1A
3l3
o o • \ \ \ rJl Z
0 -E--U
~
rJl
rJl rJl 0 0:: U
U -Cl 0 -l 0 ~ Cl 0 0 N
LL I LL
"'0
c:: <
!
W
I W
I
~
0
i I !
lJ.. I
lJ..
Z
o IU
W
Vl
1 __
'"'=-__
_ ---
11nV
3 Slll
H 3~OI~Hl~ON
30 NO
ISN31
X3
3181SSO
d
o o N
o
E
>-
I I I I
~ -
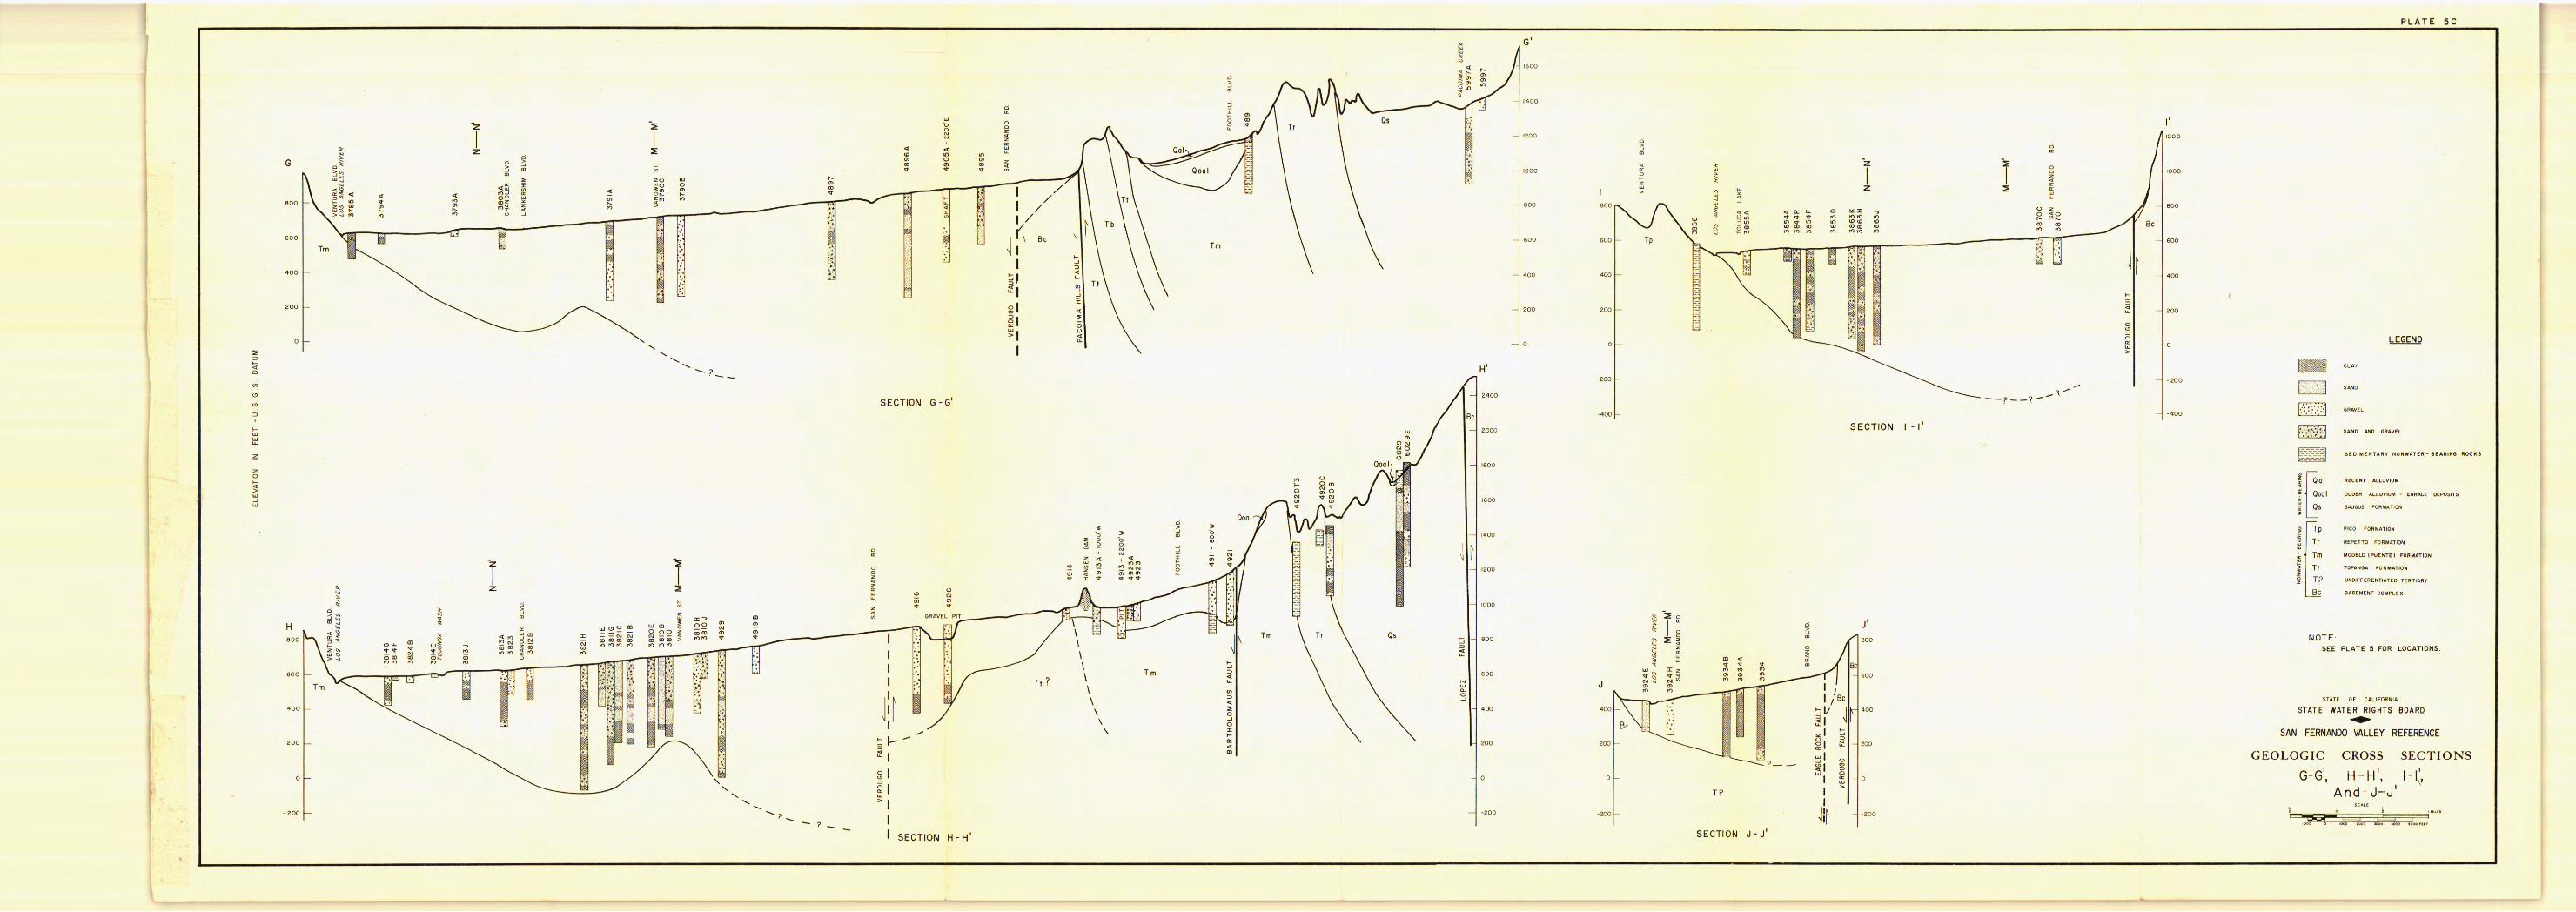
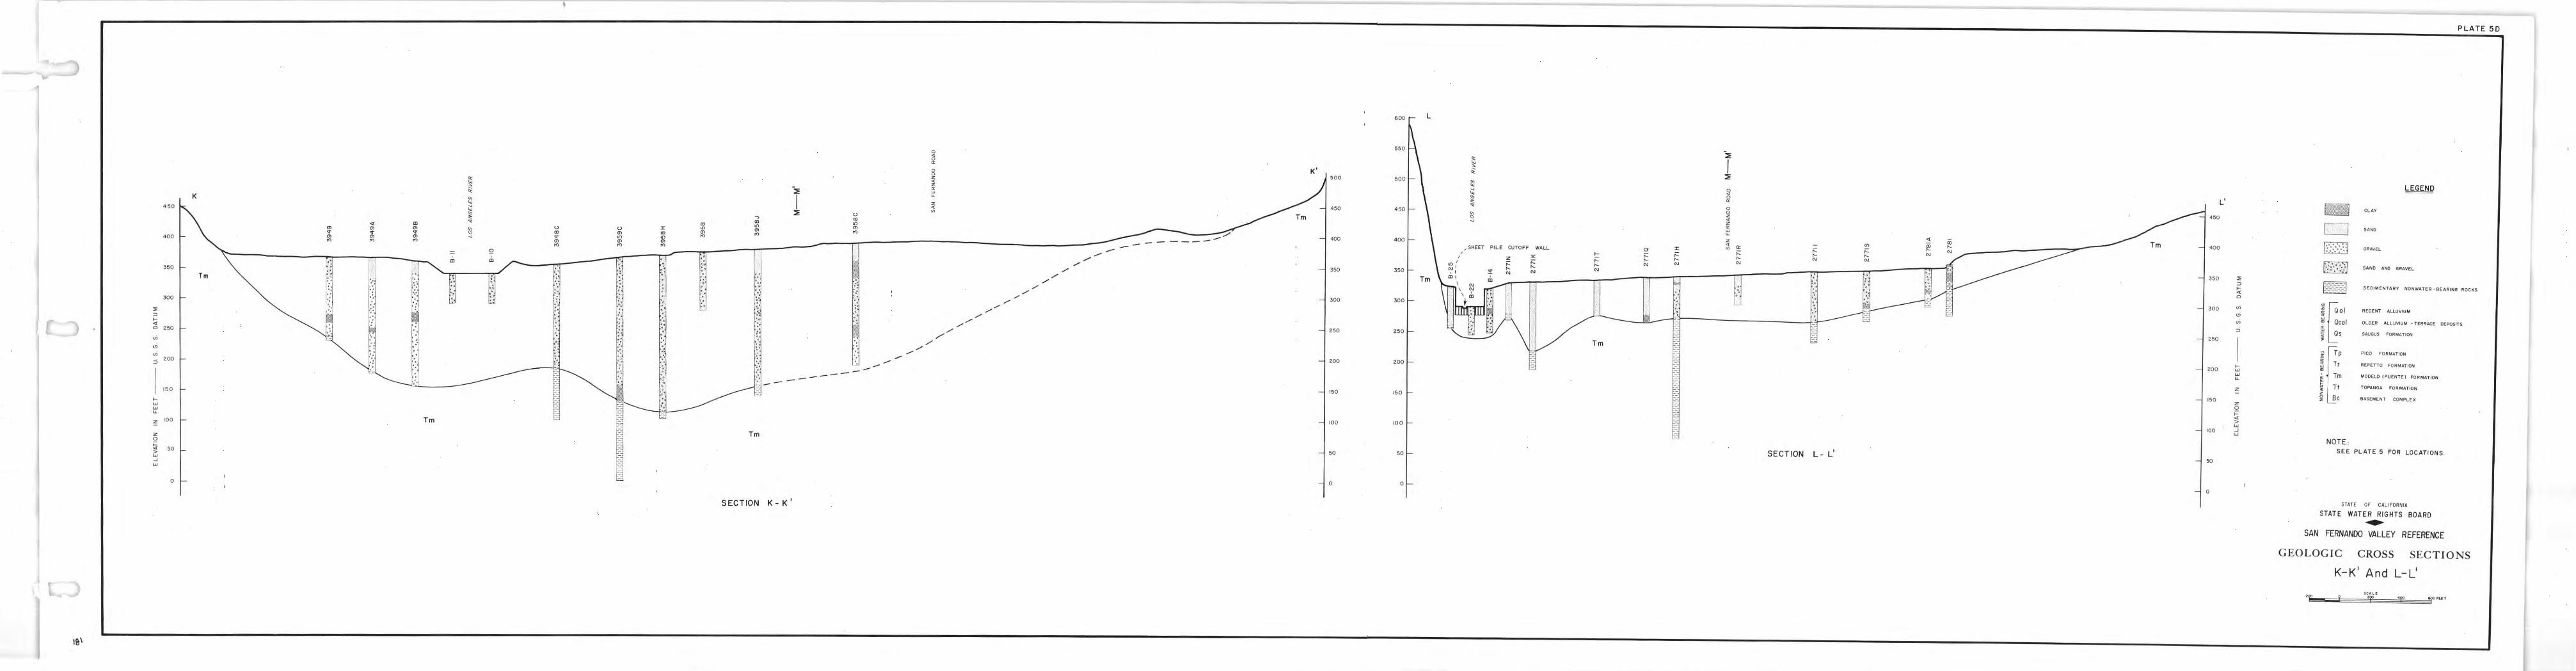
or---------------------------------____________________________________ -, ~
'" >-~ -' "-
8 • o • •
I o o • o o •
, " \
..1 ,
,~-
-~
• •
• • g • ~ • • • • , • • l ! ~ , • • • c • •
;; -08
L'~
, '"
"'-
_E
_<
.>
o
11f-....
':" I-
<01
Wf"l.lV
(J 'S
'9'S
n --
-.1
33.1 H
I N
OIJM
3,3
, o • •
o o •
ISlZ
\'G':JIIE'~'~' 0' 0' IT"",' \
,;." . ','
,
\ ( Ii.lG
" "':'-::"',"
"1"
,
~ \ \ 1 I I I I t
lila
H 1
HZ
ora<=:
.LIL
Li!
j • '!I: )l1.L.L2
,
\ \ \ \ \ \ \ \
I 8 •
\ \ \ \ \ \ \ \ \ \ o • " \ \
g " I
\ \ \ \ \
....• ::.. •. .::: .. _ .. ~ W.':;:,·, \ \ \ 1 \ \ I \ I \ I
o •
... ,. ",' !:. "" ,j:: ,", '.~:.' :;., :. :.' .•.. : ,J,!!!!. o •
Ha
S6
£
,-.
, '
" ',-.,' "
:.-
•.••• 1
' .........
....
... I
o 2
8 ,
• z o
• • " • " • • W
w
>-.
o z
'...J , ...J
z o >u w
'" I ,
I
o o ,
.......... -",. .. : ......... : .......... : -4
""'lirilil l"':lil:'i':':'!""':'!
't6t>
6£
6t>
6£
• ••••
• ,", ••••••••••• '
••
•••••• ,
, I
I 1
","
I I
01-8 ~ ••• :
11·8
',.:
.
/ E
... ; .. : ........... , ...... ,
~., .... : .. ~
.......... : 1IIE:p''''
/
o • • 8 •
o •
>-o u o •
Wn
l'lO
S 9
'S 'n -
--
13
3.1
NI
NO
llv,,:n
3
o
o '" , '" z Q
>u UJ
'" I
(J)
z o -f-U
UJ (J)
u -(:J o ..J o '" (:J
, ....
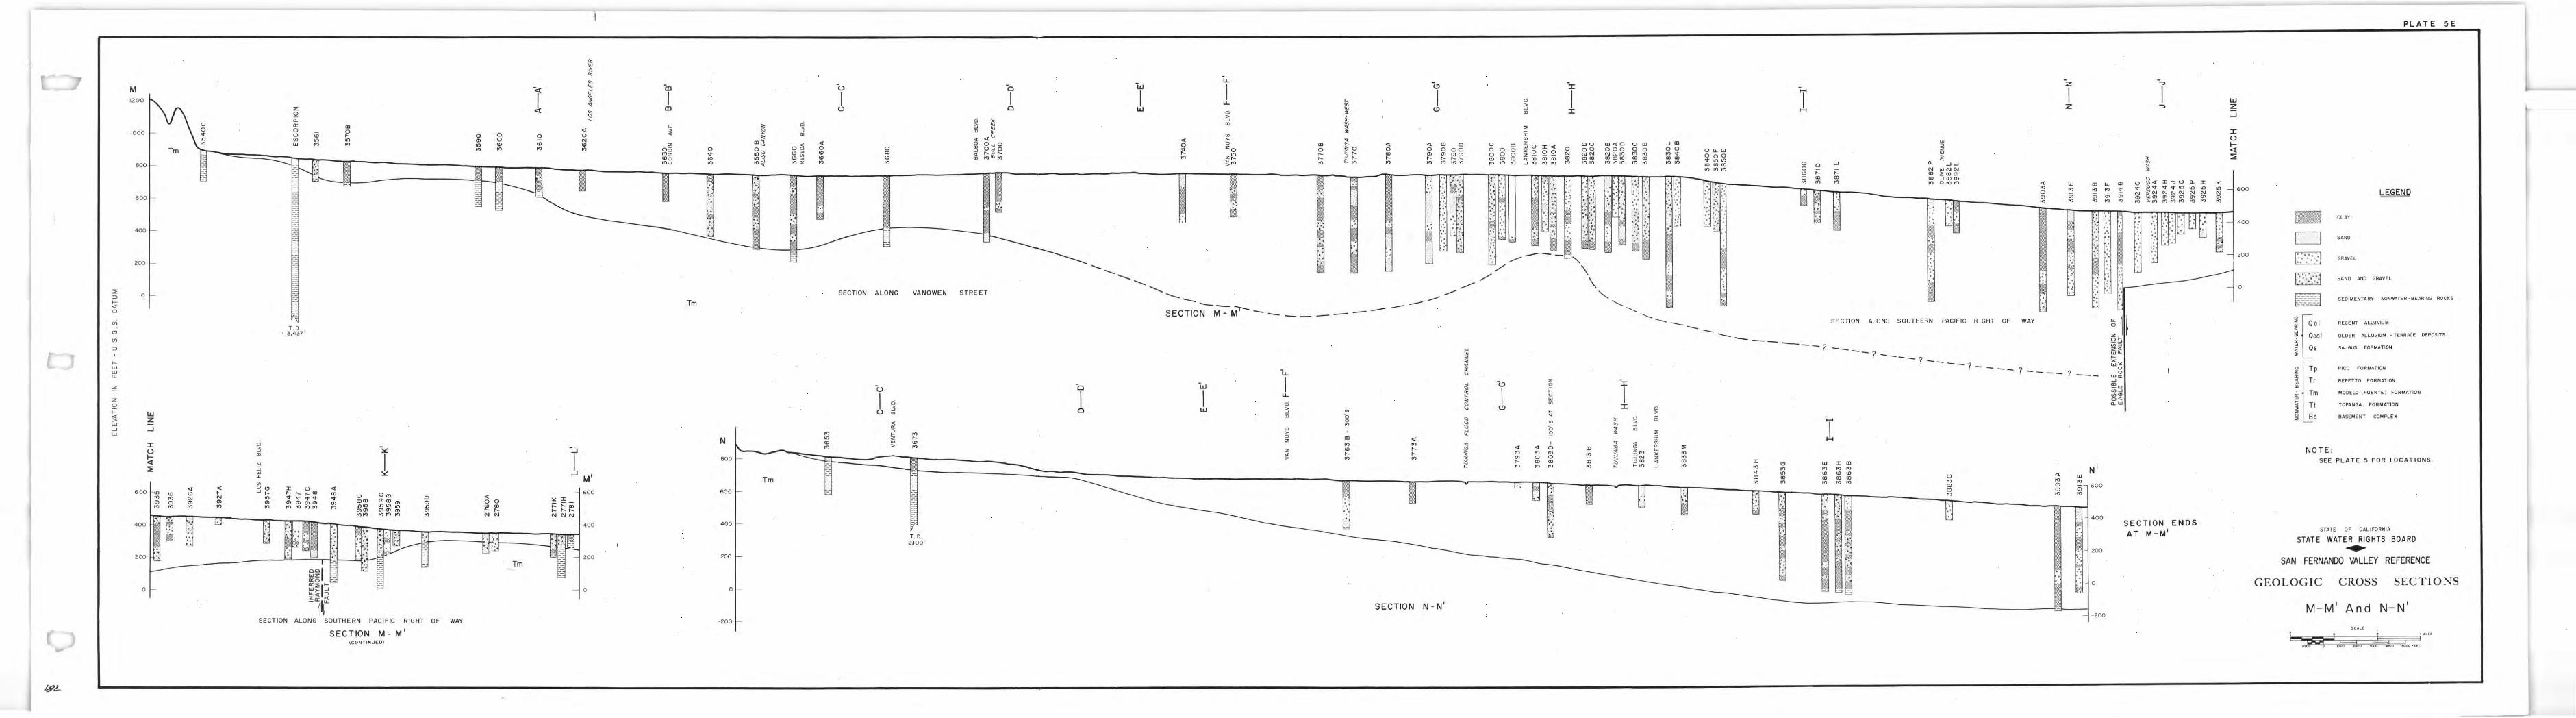
~
'" '" " 0
--<
~
o -< 6 z • 5 z o
0-
<0
'
2 ~
, "
. S~ ~
'"
III
1 , ;; • o ~
o , ~ ~ o
" 8 V> '" () ... o z z z :s:
I :s:
1>
~
a.
Z I Z
o o
N 8
t o
,:,:,:1
:1
elE
VA
TIO
N
IN
fEE
T
-u.
s G
.S.
DA
TU
M
• o o
3"
39
36
39
26
A
39
27
A
MA
TCH
LI
NE
LOS
FELI
Z BL
VD
. 3
93
7G
39
47
H
39
47
3
94
7C
3
94
8
39
48
A
39~8C
3':1
58
39
!59
C
39
58
G
39
09
39
59
0
2760
1'1
27
60
K--
K'
o 8
11 I
-,
g ~
~
" 8
U.tl!h
!dl!i
!i 3~40C
~
/ .
, oo
!='
,','
,',"
,," ''''
,',,
" II
.... '
'"
ES
CO
RP
ION
3561
35
10
B
Ti~ i
~ ~ i:
i 3
59
0
I I
36
00
;;; '"
o o
~ /
o C"l
t"l o r o C"l n n ;<; o '" '" '" t"l n .., - o z (f)
27
7rK
27
71
H
I '-
I 2
78
1
L--
L'
8 §
. . '"
8
8
8 • g
... 3
';1[1
:1:'
~
2 o
36
53
C-C
'
VE
NTU
RA
ew
o.
",~~"-
-"""
,,,~,
'-:-'
"I
i'il,
,1,
',1,1
,1,1
, ,
g-~
36
13
D-D
'
E--
E'
"fiN
N
UY
S
BL.
VD
. F
--F
'
37
63
8 -
130
0'S
3773
1'1
~ ~ ~
o g z • S z '" ~ Z o • m z • -< • ~ ~ -< /
~ I
~ I
o 2/
~I
"'j I I I I \ \ \ \ \ \ \
/
I I /
1:1
.~. '"
,:1'
36
10
A-A
'
3620
1'1
LOS
A
NG
EL
ES
R
IVeR
36
30
CO
flU
lN
AV
E.
6-6
'
I' .'-.
3
64
0
,*** ..
· .. ·h
I· ." ;1
35
50
B
AU
SO
C
AN
YON
I!,:
I!I
,:,
, '"
36
60
RES
EOI>
. B
l\l[
).
36
60
A
36
80
BA
LBO
A
BLV
D.
37
00
A
BU
Ll
CR
{"£
K
31
00
37
40
A
C-c'
D-D
'
E--
E'
VA
N
NU
YS
B
LVD
. F
--F
' 3
75
0
37
10
B
nJJU
NG
A
WA
$!H
fI€
Si
37
70
' ..
3
78
0A
.' -: ;
;
";':
" ..
:'.:~.;~
. '. '.
,::;~
'.~:~: .. ;.
~"" . ...
.... .
37
90
A
37
90
B
37
90
3
79
0D
G--
G'
ium
NG
A
FL
OC
!)
CO
NrR
OL
C
HA
NN
EL
\ \
g
,.'"
... '" n
<::::
' ,
0 ",Z
'" Z " o o
o
'" l> Z ill
'" ... ~ ... ~ z
• ~
~~
8 !:
i'"
li
;:0
""
•~O
r "
0 r
->
'"
o
r -<
::I:
'"
'" '" ~ '"
...
0
~ . »
~
o ~ " o
'"
\ ! •
•••
'.:":
\ fl·
: .•.•
..
G-G
' .....
..
37
93
A
\ E
.... ;
' .. . ' .. '
. --
-
38
00
C
38
00
38
00
B
\ L
AN
I(E
RS
HIM
B
LV
D
38
03
A
38
03
D-
1100
'S A
T S
EC
TIO
N
38
138
TU
JUN
GA
W
AS
H
H--
H'
TUJU
NG
A B
LVD
. 3
82
3
LA
NI(
ER
S",
IM
BLV
D.
3833
PA
38
43
H
J6
53
G
38
S3
E
J6
G3
H
Ja
G3
B
36
83
C
1-['
I I I I , , ~ , , , ,
.~ , , I I
~ I , , , - , I I
~
/ I I
I / / I • ~ o " 6 z s ~ w
o ~ ~ ~ • Z ~ , ;;
~
o ~
o , • •
I I
.....
38
10
C
f •• '
.,:
:'.' '
:."
~:t.
3810
H
~E!;""
1 ."
-3
81
0A
./
/'
J
.--;
..
... ;.
, 3
6Z
0
.......
".' .. -
" ..
_. · ..
.......
. .: :-
.;~
38
20
0
38
Z0
C
.-.--;
-;-.
'-'-
... '"
'.'
36
20
B
38
20
A
38
30
0
g.:
....
.. ,:.:
.: ..
. .-;.
36
30
C
38
30
8
-.. ', .. _ .
....
.,.~
., :
"
.:;.
' -..
' 3
83
0L
3
84
0B
.:
.. -.. -.
~::."
-.-•..
ro-: ••
• _.:
. _
::"
rT=
~.
IllE
... -
38
40
C
38
!i0
F 3
85
0E
38G
OG
38
710
38
71
E
38
82
P
OLI
VE
A
VE
NU
E
38
6Z
L
38
92
L
-<
, I
~:
'.*
;;
4';"
1 3
90
3A
39
036
. E
• 2
g
z o · ...
::i'"
, r >
-< ~ • , o • 5 n > -< o z •
~
PO
SS
IBLE
E
)(TE
NS
IQN
O
F
(AG
lE
RO
CK
FA
ULT
----
---=
--
NO
NlI
'AT
ER
· B
EA
RIN
G
(D
-I
-I
.....
-I
<'>
-3
-"=
'
: ~ • ~ ! . ~ ~ , ~ • , o •
• •
~ ~
5 3 , ~ ; • • , ~
• ! , ~
~ " o ! , i
W,"
,H'l
·6E
AA
NG
o '>
0
• •
c
~ G
g
" · .
, ~
o r
• c
~ ~
~ ~ o E
" " ;
• " " • ~ < c •
I' .:.
:;;-4t.~.
~;
..
,-.. :.:
' .....
-:~~r:
.-·:.
;T:
.
.-., .-.
; '.
' ,-
,---:
-;::-
:_,;
,
--
o.!.
..... •
• ~~
~
o ~ " ~ ~ ~ • · " · · , ~
'-"
:;'-
" ...
.. .. -..
.. :-'
"-.-..
.:.::'
;:.~':
., I·
.. ' ~
c=
I \
o ~ o
0:0<0
-"
"
. ~
c'
.. . .
· · ~ • ~ r
~ ~ · · ~
8 p ,
3913
E
39
13
B
39
13
F
.j'J
14 B
39
24
C
VE
HlJ
U("
.o
WA
SH
39
24,0
1,
39
24
H
39
24
J 3
92
5C
39
2!i
P
39Z~H
39
25
K
• o o l~
MA
TCH
H-H
'
I-I'
N--
N'
J--
J'
LIN
E
."
r ,. ... '" " '"
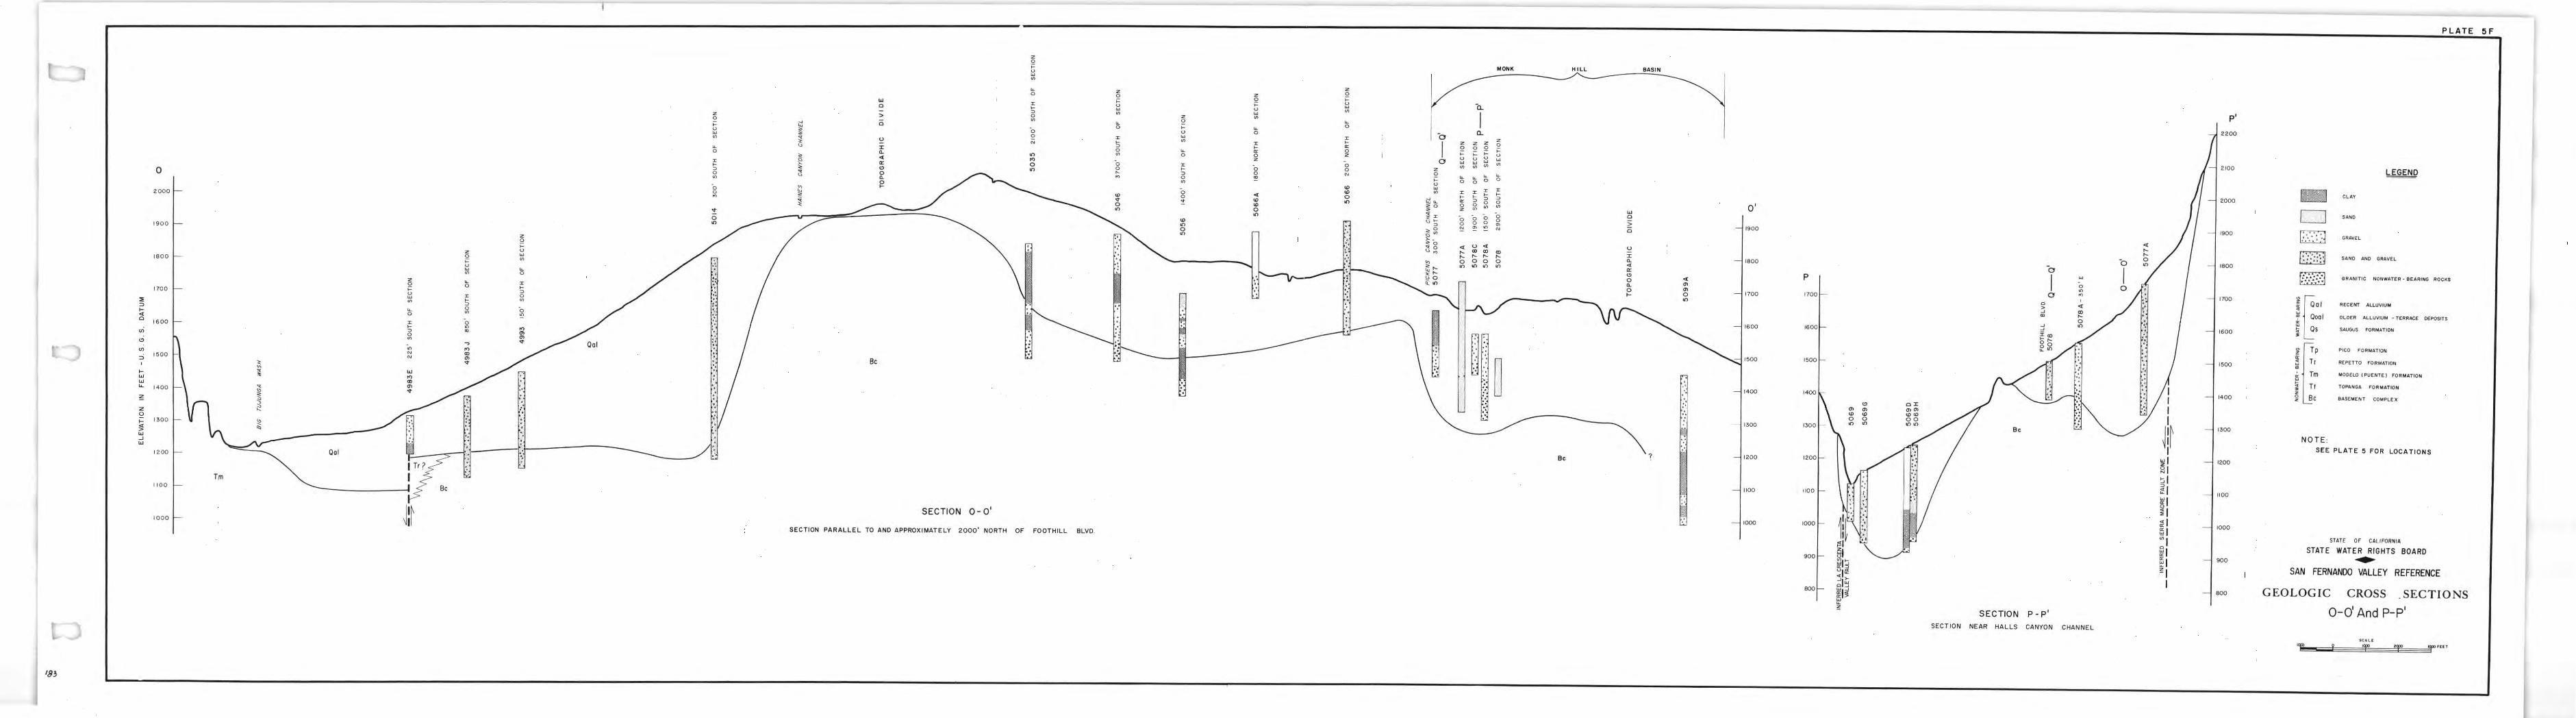
"-on
'" t-'" -' ..
~ ~
• •
, z
~
• •
u •
0
I 0 0 -;:
a. 8
0 0
8 0
8 N
N
N
N
•
• u ~
• • •
~ z
• 0
· ~
" ·
• •
• •
• z
~
• ~
z • •
. ~
• •
0 Q
· >
;
• • , • • " • <
,
• ~
2 •
• 0
~ 3
• •
~
• 8
i •
~
• e
• 0
• •
, ,
u E
~
, ~
• ~
~ •
• •
,-~
• "
~
z
~ :
• " ,
• • ~
• :.
• •
• •
• •
• •
• ~
•
[1 D -.
"8 · ~,
-~
E
.... ' .
0 0
0 II~ ~ ~
>=-alJ -"
-:', ....
ON
I¥I>'3II-!t]l1M
~~I~~B -IIH
" .... O
ON
8 ~
0 0
• •
,0-
-0
3,0
;£ -
V' SlO~
,0--
0 a
lO!>
'01
\,9
1'
111100>1
§ 8 , H
69
0!ii
C6
90!l
0
• a ~
• U a ~ ~
0 ... ~
w ~
• ~ "-w
'" w
~ ~
0 z
8 0 §
0 Q
o Q
0 0 • • • • ~ u " 0 w
· -
() --i~'------i~'-____ -iR ______ -T~ _______ ~~-,-_____ ~;-______ ~~ ______ 2~ ______ ~~ ______ §~ __ .
• • • • • 5 •
3011\10
:>IH
d'V
tI!>O
dO
l
,d
-d
'1011
:J3S
>10
Hin
os .006~
NC
I1:l3
S
NO
IJ.:J3S
JO
HJ.flO
S
,00101
>10 H
.lno
s ,0
061
0-
0 __
__
__
_ -"-_
__
__
_ '_
NO
I J. :J3S
ole IoU
n as ,0
0 (:
73NN'I'N~ N
OJ.N
r.r"
,"1011:)35 jO
H
HIO
N ,coa
99
0!:
. ,"
':".,:.
10101.1:135 ::10
Hlb
'ON
,O
Oi
l '9
90
;
NO
I.!.):3S
""0
H
lno
s
,00
t'1
NOI.L~~S
dO
H.LllO
S
,OO
H:
' .. " .' , ."
· .....
~····
·:···*·
····M
( .. ' ... ' .. · ... ··:· .. ·.;.·.·.1 F. • .•••
,'!
,*,%" •• I"
",~
. ...
--
.' '
,'.
. ' ....
NO
IJ.:03S
dO
HJ.n
os
,OO
lt o;f.O
o;
3Q
l,.dO
:>
IHd
VIH
IOd
OJ.
UN~HJ
NO
"NP
'J
NO
IJ.:l3S
dO
H
.LnOS
,0010:
vlO
Ili
o
o o
0 ~
NO
IJ.::I3S
dO
H
J.nOS
,0<;;1
it:66t>
· . '.' . ' ... ' ','
~,"
',
NO
IJ.:J3S
dO
I·u-n
os
,01<8 r
£8
6t>
.... , ...... .
NO
I.L:J3S
dO
H.Ln
os
,I<Z
Z
3£
86
t>
HS
YM
'?
9N
nrn
.1
91
9
o o • g •
g " w
nJ.'VO
'S
'!) S
"n -.J.33:l
NI
NQ
I.lV1I3
13
.....
o o
& o o
'0
, 0 Z
0 t-U
UJ
V>
0 ~ • " " I ~ 0 ~ " a I >-~ a • " a 0 N
~
w
~
• • • 0 ~ "-"-• 0 • • ~ " • " " • ~ • "-z a ~
u w
0
'" Z 0 -,
!oJ '-'
.... Z
c
II! u
'" c '"
W
0 "-
'" .,
'" -0..
Q:
~
t-d.
r >-
'" !oJ
'" '"
"C
--'
:+ --'
0 '!!
c: ;
<>: «
'" U
b
!;; 8
.. z
I
"" 0
'" ~
U
t-Ie -
c ~
" ~
Z
0 ""
...l '"
0 W
" 0
0 ~
2
" w • • • I U
Z
a. a >
•
a. • u Z
0
0 ~ ~
iO • U
I
W ~
'" • w z • 2 ~ u w
-
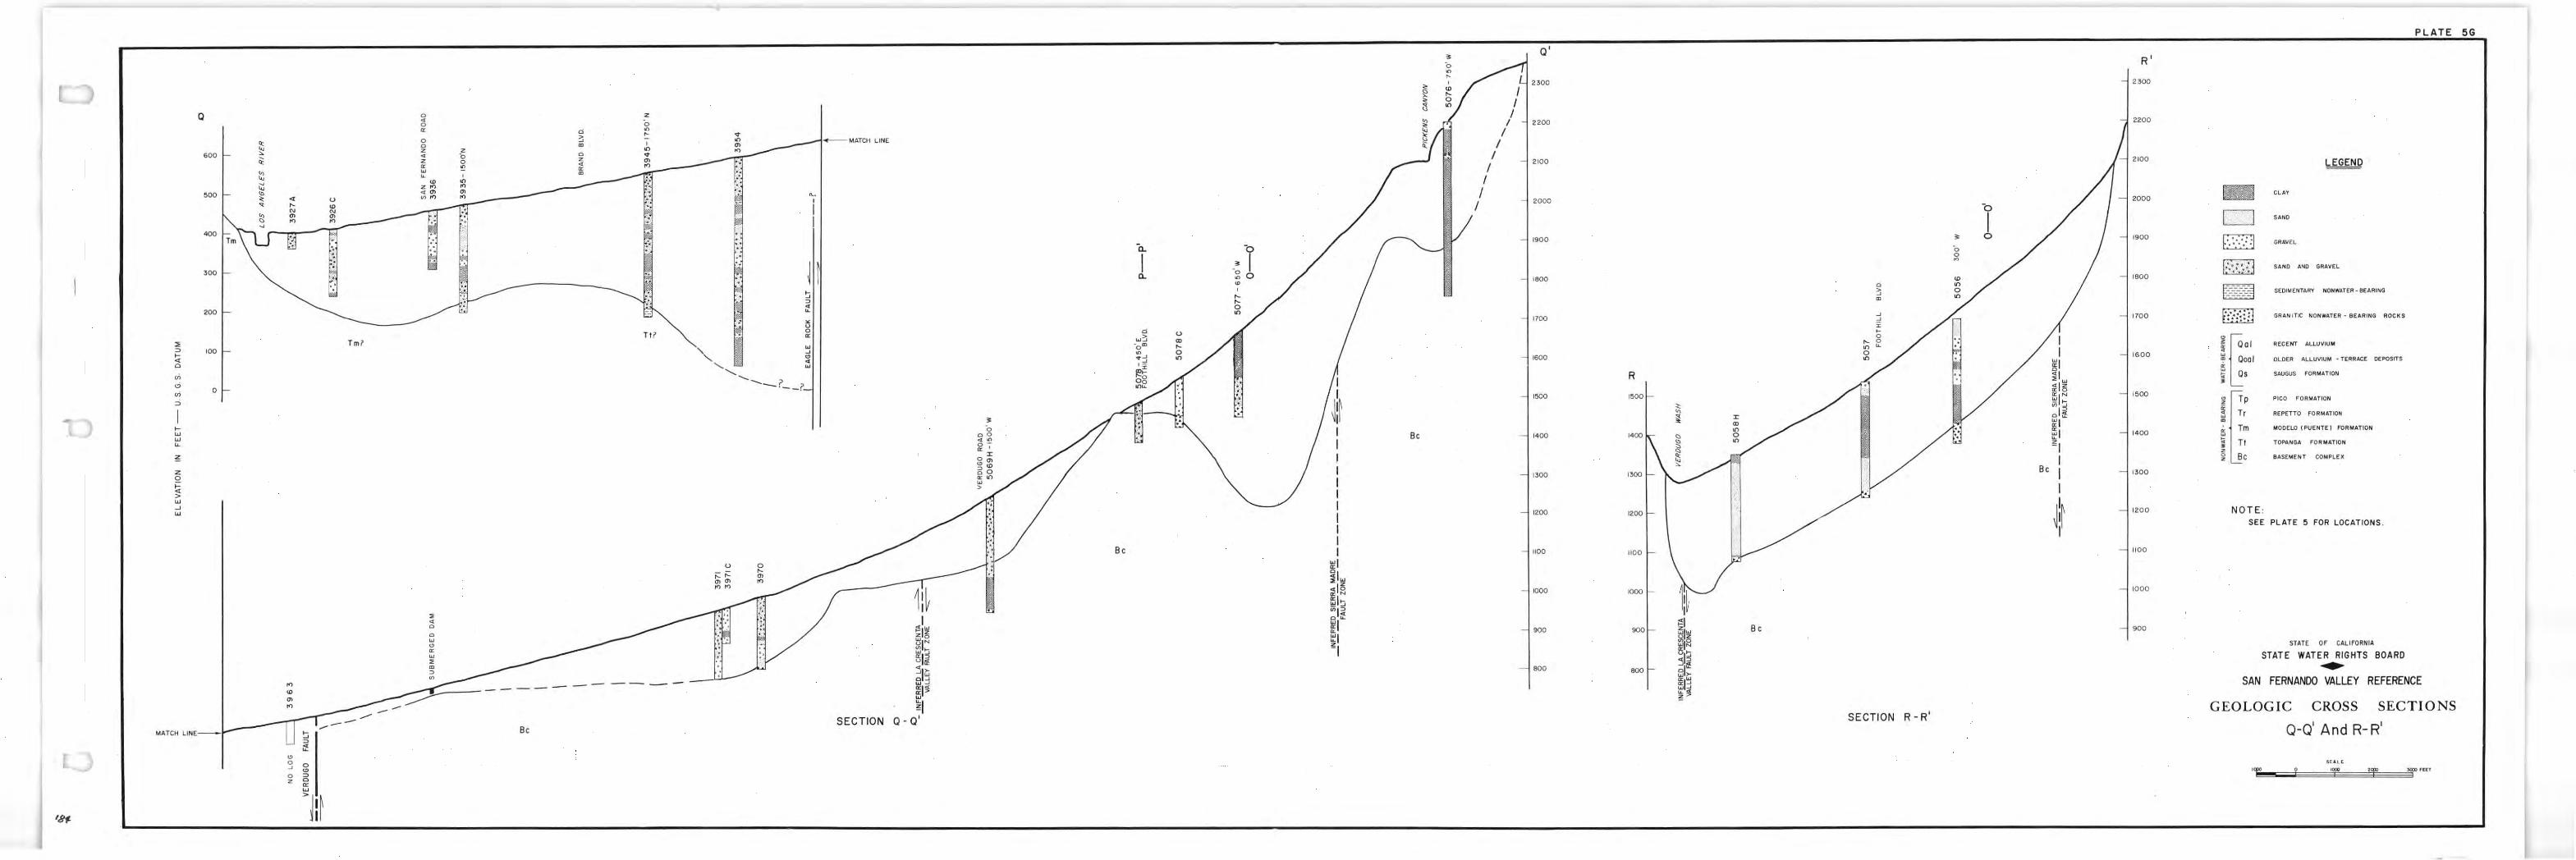
~
NO
L
OG
~ ~ ri ~ ~ i
EL
EV
AT
ION
IN
F
EE
T -
U. S
. G.
S·
DA
TU
M
o 8
39
63
g ~ g
o 8
~ g
N g
LO
S
AN
GE
LE
S
RIV
ER
39
27
A
~EROUGO
FAU
LT '" n
(J)
fT1
()
--i
(5
Z o o
I \ 1 1 I \ I I I I \ SU
BM
ER
GE
D
DA
M
\
\
' .•.
~, ••.
:.>-
.>-•
• • "1
»1-.
';: _
••
, ;-.
. ; ..
.. ~,:
--.. ..;c:.,
3971
3
97
fC
INFE
RR
ED
LA
CR
ESC
ENTA
---
=::::
::::".
-
VALlE
Y F
iafl
5N
E-~
\ ~
VER
DU
GO
RO
AD
L-
@
4'&.· •
• \*·
.• ·.
""0
':".:
5
06
9H
-15
00
'W
,
'" n .:~
:;.-:
~..,!!:;
;. "
//
/
~
3
~ .,
.". ~~
tt-;
.~~·
.. ,;··
· -,;
:392
6 C
SA
N
FE
RN
AN
DO
R
OA
O
\ :=
\ 3936
-':.~
;~':2'-~l'-1·
~&: "; "',
,: .. .
...
39
35
-15
00'N
\
\ B
RA
ND
B
Lva
.
[1.!c.S_~~~.:
._·:.~
.~ .• ~ ... ~~
_~".~~.·:
.:-l39
45-17~O'
N
1 •• ,l\j;
•• !fO
l!l1..%
, •• ;W
:;,;
':;:
\%%W
;!& ..
.... :
':\39
54
/ / I .~
I I l" E
AG
LE
RO
CK
F
AU
LT
50
78
-4
'0'E
F
OO
TH
ILL
BLV
D.
---
f'
p--p
'
1 • ~ ~ r • "
.• ~o:
~,: ... ,.
" 5
07
7 -
65
0'W
0--0
'
INfE
RR
ED
SI
ER
RA
M
AD
RE
~
---~U~E------------~--
'" n C
AN
YON
50
76
-7
50
' W
........ -...
._-
(J) '" () --i o Z :;u
:;u
g 8 o
~
§ ~
§
tNF
ER
RE
JLLA
CR
ESC
ENTA
_-==
=-V
ALL
EY F
AU
lJ Z
ON
E -=
:.--
'" n
8 6 o
8 ~
; 8 .~-;
.
8 §
~ 0;
8
g :;u
WA
SH
50
57
F
OO
TH
ILL
B
LV
D
50
56
~ o
30
0'
W
N o o u
0--0
'
g
o
6 o o (5
o
'" ~
INF
ER
RE
D
SIE
RR
A M
AD
RE
-~-----
--F
AlA.T
z<i'E----
;;;
o o ~
o o ; 8
8 ~
o o 2 o
0; o o
§ " g
tTl
.""w
"'.· "
""'"
WA
"'·""
"'.'
~.:
D" O'
D· It
o ;3
1"' .
........
.......
110
00
.::"
'::
.::'
r ~
(,1)
-4
..,-3
....
"'
0
V>
[Q
•••
• '.
"'
O
Z
~m
~
m
CJ"'
T1
;!
"1
I)-4
1:
:V
"'llIllO
:O
",,,,IIIC
>II>
O
"""""
rTI
-..
I r
I>
Oo
mc=
; ~rm
::J
m
J>
::u
J>
r ,.
....
, --.
---.,
~
"''0
0'''0
C
ot:'>
J>
<:>
Z
..
Z
..
O
\.J
.....
",
-4
m
,.
III
m
a m
m
z
iii: 0
<
0 -<
Zl>
~
1"1
~~5::l"'l
U;:v
~ =
1:Z
j!l
l:ti
l>
z,,_
oo
n
....
~
O
z __
;;:: U
I'"
"V
::I
I "'~I>
~
0
8-
... C
""'I
/:
Or,...
Z
-,..
...,
-i
"'rI
01
'1
0,.
l:Icr
0 -<
....
....
N 6 o ~ g
\.J
l'T'I
o 0
g%l~~~
~~Si:
Z
~ l>
...
. ""
.::0
..... ::0
r!
PI
.. ~
~ ~
e: ~
~ ~
r '
n f"
¥
l>
"V:j~::::
<;>
c: ...
Z
m
I'll
·a ~
~
0 r
::0
C">
~ ~
(5
CI
~ z
~!
r G
")
... a.
(f'J
r
Gi ~
0"
Z
;:g
;;;;;l
rrI
m
-c:
21
"'::.:0
Z
:::
0 (f
) -<
:J
:....
. ~
,.
;a
PI
-Ig
--t
-I
I';
J>
CD
0 I
Cl)
z
<5 0:
"'::!
m
::c
i=
z Z
~~
::u
r"
rTJ
ttl
(I)
1i: 2:
-
v~
."
0 "11
:v
'"
t"rjrrl:t.o
g
g ,....
., ::c
:::
0 ~
'"
.... , .....
... N
:;: N
N o o
N ~ g N ~ 8
o
:;u
\.J
f'TI
C
'"
III
..., ~
I" ~
_t'T
I
r ,
0 »
Z
~ (f
)
<II "
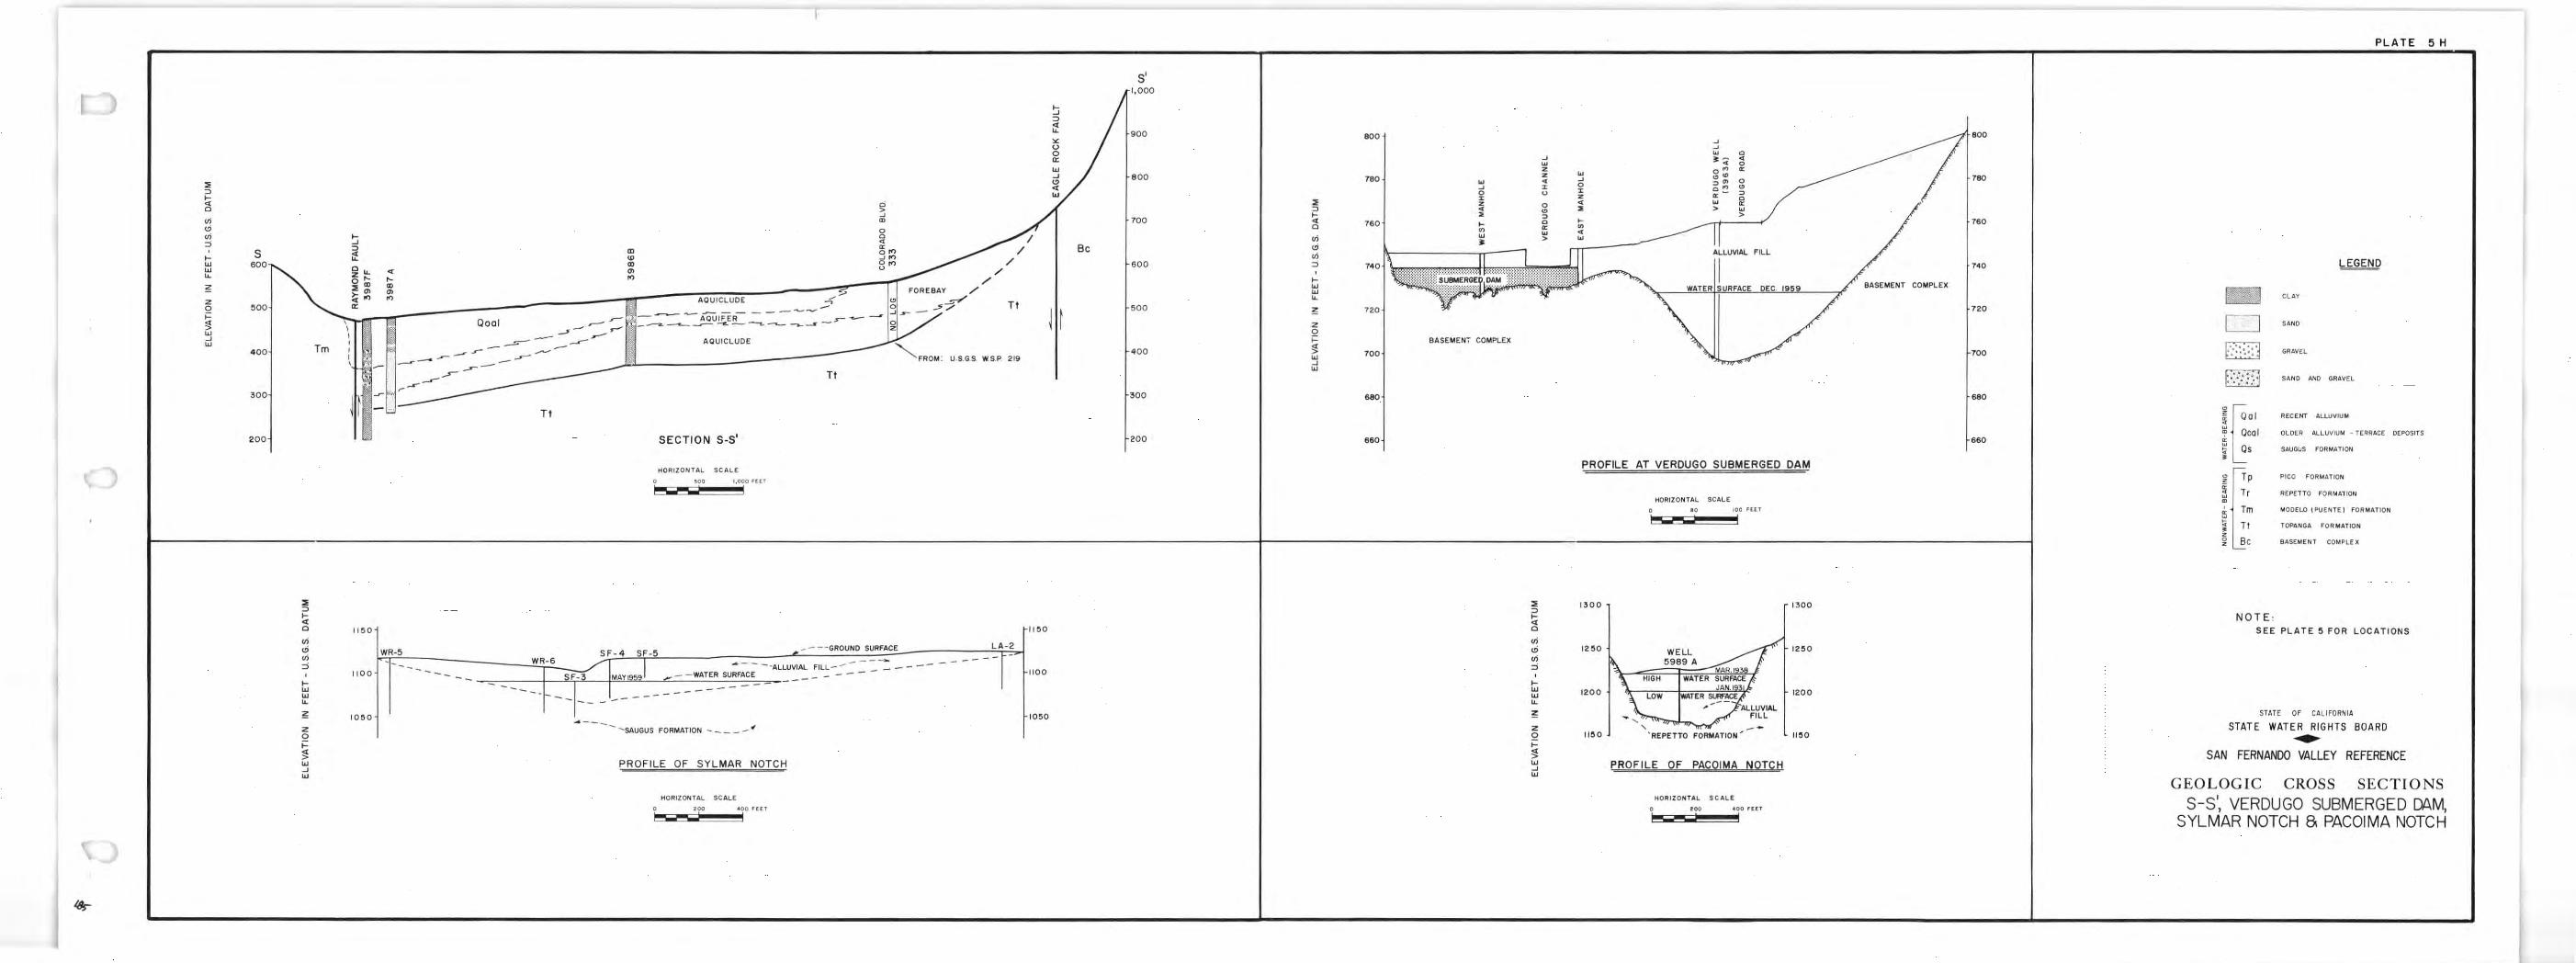
'" => t-« 0
u; 0 u; ::;
t- S OJ OJ ... ;; z 0 i= ~
, OJ -oJ OJ
4 00 Tm
300
200
'" => t-
" 0
U;
'" U; ::;
t-OJ OJ "-;; Z 0 ;:: ~ OJ -oJ OJ
I8s-
\ , , , , ,
~ => ~
OJ
'" <XI
"- " '"
d > -' ~
o o q ~
0 '" -' ''' 8 '"
1'- 1'- " . ______ ;:-;:~::;'::;~--------_:::;:r----T.r <XI <XI
'" '" '-' It') 1"'1 AQU ICLUDE ...::; C!) -FOREBAY /'
~ .., / __ ____ ...J.s-
r:>: 0001 __ -- =-.--._~U~EL--....-.......... __ _ s-- 0
.-s -' r-" Y.S. Z
/ ",
I /
/
TI
--=- - -s-- ,- I' _ 70S ___
~ -- ..- .-r-- .......-- .J"l-----------------------_- 2>..
AQUICLUDE
~FROM : U.S.G,S. W.S.P 219 "I' .-s-- ____
~~ TI -r ~
r ~
Tt
SECTION S-S'
HOR IZONTAL SCALE
o ~oo 1,000 F[[T
,"",- I
II 50 II 50
1100 1100
WR-5 S F-4 5F-5 I '" ---GROUND SURFACE L A- 2
, WR-6 ----MAY 1959 1
= -- ... - - --ALLUVIAL FILL-- - - - - - - -- - - - - --
--- SF:3 - WATER SURFACE - - - - -- - - -- ------- -, ------- ---.-----
~ => It '" u o a:
w
1050 1050 ~ ---- - SAUGUS FORMATION -_ - '
PROFILE OF SY LMAR NOTCH
HORIZONTAL SCALE
o 200 4 00 fur ,"",;;0;1 ,
Be
s' 1,000
900 BOO ~
-' w 0 ~ w ~- q
q 0
800 780
'" => t-
700 " 160 0
u;
z w
z w
-' • -' o~ ~
0 % 0
"U>
% U %
=>" 0
z z
o~ " • 0 •
~- =>
~ " 2
w 0
=>
~
0 ~
> w
~ '" >
w • '" > w 0 ul
~ " FILL
600 ::;
t-OJ OJ "-
500 ;; z 0 i= BASEMENT COMPLEX
400 ~ OJ -' OJ
300
200
PROFILE AT VERDUGO SUBMERGED DAM
HORIZONTAL SCALE
o 10 +00 rEET
1»"1 ;;0;1
'" 1300 ~'300 =>
t-« 0
u;
'" 1250 WELL 1250 u; 5989 A ::; ,
HIGH WATER t-OJ ~ 1200 OJ 1200 LOW ;fER ~-.,.. ... ...
". ~ ........ , .... ;; -- FILL l ,
z , --5< 1150 ' REPETTO FORMATION .... 1150 t-~ OJ PROFILE OF PACOIMA NOTCH -oJ OJ
HORI ZONTAL SCALE , ... 400 H(f
E ~760
140
BASEMENT COMPLEX
120 IJJl C to:: :,:: 'J
Em', .. : ." .. .. . "
~G ~ 001
; 0001
i Os
o z
~ w • ffi \; • z o z
Tp
Tr
Tm
TI
Be
NOTE ,
PLATE 5 H
LEGEND
CLAY
SAND
GRAVi:l
SAND AND GRAVEL
RECENT ALLUVIUM
OLDER AllUVIUM - TERRACE DEPOSITS
SAUGUS FORMATION
PICO FORMATION
REPETTO FORMATION
MOOELO (PUENTE) FORMATION
TOPANGA FORMATION
BASEMENT COMPLEX
SEE PLATE 5 FOR LOCATIONS
STATE OF CALIFORNIA
STATE WATER RIGHTS BOARD ~
SAN FERNANDO VALLEY REFERENCE
GEOLOGIC CROSS SECTIONS S-S', VERDUGO SUBMERGED DAM,
SYLMAR NOTCH B PACOIMA NOTCH

(9,
r- /.. .j <
4 r-" " L. .J'~.(
"1
" " -'
HOSPITAL FAULT
DIAGRAMMATIC
.' .... . ,;,:::
BLOCK DIAGRAM
IN SYLMAR
PACOIMA NOTCH
:.::: .:.
..
o Q <> co .. .. .. Qa J<> ~ . . . . "
-: .000 1 :.-:' illIT2ill:::: ::::::;:: ;=:::::::;:;:
~ ~
•---------------:-:::-:::-'Tr'-:::-::----- -- -.... ------------- - -- -- -
~
~" >BeV <; >
GEOLOGIC LEGEND
PEcon ALLUVIUM
STR(I'; ,.. DEPOSITS.
OLDER 4 LL UVIUM
FOl.N 0£1>051 1 $
SAUGUS FORMATION
CON TINENTAL AlW VIAL 0[1'0511$
COMPOSED OF AQU ICLUDES AND
LENTI CUL AR AQUIFERS .
R[PE TTO fOHMlI l lON
MARINE SI LTSTOOE, S HALE , AND CONGlOWERb.TE
MODELO FORMATION
SH~LE AND SA NDSTONE
BAS£M[N T COMPLEK
GRIlNITIC AND t.I[T IIMDI'WHIC
RDeIlS,
ILLUSTRATING THE LI TTLE
HYDROLOGIC SUBAREA
TUJUNGA SYNCLINE
o z
~ ,[
i z
'. <-
all: .' .
'/~:
./;:: ~
,
• ' ...
" / "",v"'" / ,'"
~v 0 01
00 1
Be
" " 000 1 - . -~'-':- ;-:-.. -.:. . .,. - - -...."",.. - -
TUJUNGA ·.~YtCLlNE-~
'L . ",. . '" ••• 00 01
PLAN SECT ION OF /7 _____
BLOCK DIAGRAM ~ -
LOP EZ
C)~ '"
(.;-0-\ ~~C) ~~~
.<r. «;
&
LOCATION MAP SCALE
/ ">1 /
~o~ ) , ,c . .. " . '+-~/ ~
...,,\,/ ~"'~ / ..... ~
· s ,c
001
o I 2Md~s
j ~ ! o 5,000 10,000 Feet
PACOIIIA RESERVO IR J /'ACOIIiA
DAII (
Be
j Tr
\
i ' . AIP.:-: Tm D\ - _.... ,
--::". '0. ., - . . :l
.' .... "0: of o. • •
." 0"" . .....
Os
~ -I
r·. I . I , ,
~
L I®'
!
NOTE " FOR IDENTIFICATION AND DECRIPTION OF
GEOLO GIC SYMBOLS SHO WN ON THE LOCATION MA P S EE " GEOLOG IC LEGENO" ON PLAT E 4 .
PLATE 5 J
SlATE OF CAL IFORNIA
STATE WATER RIG HTS BOARD -SAN FERNANDO VALLEY REFERENCE
GEOLOGIC CROSS SECTION
BLOCK DIAGRAM of
LITTLE TUJUNGA SYNCLINE
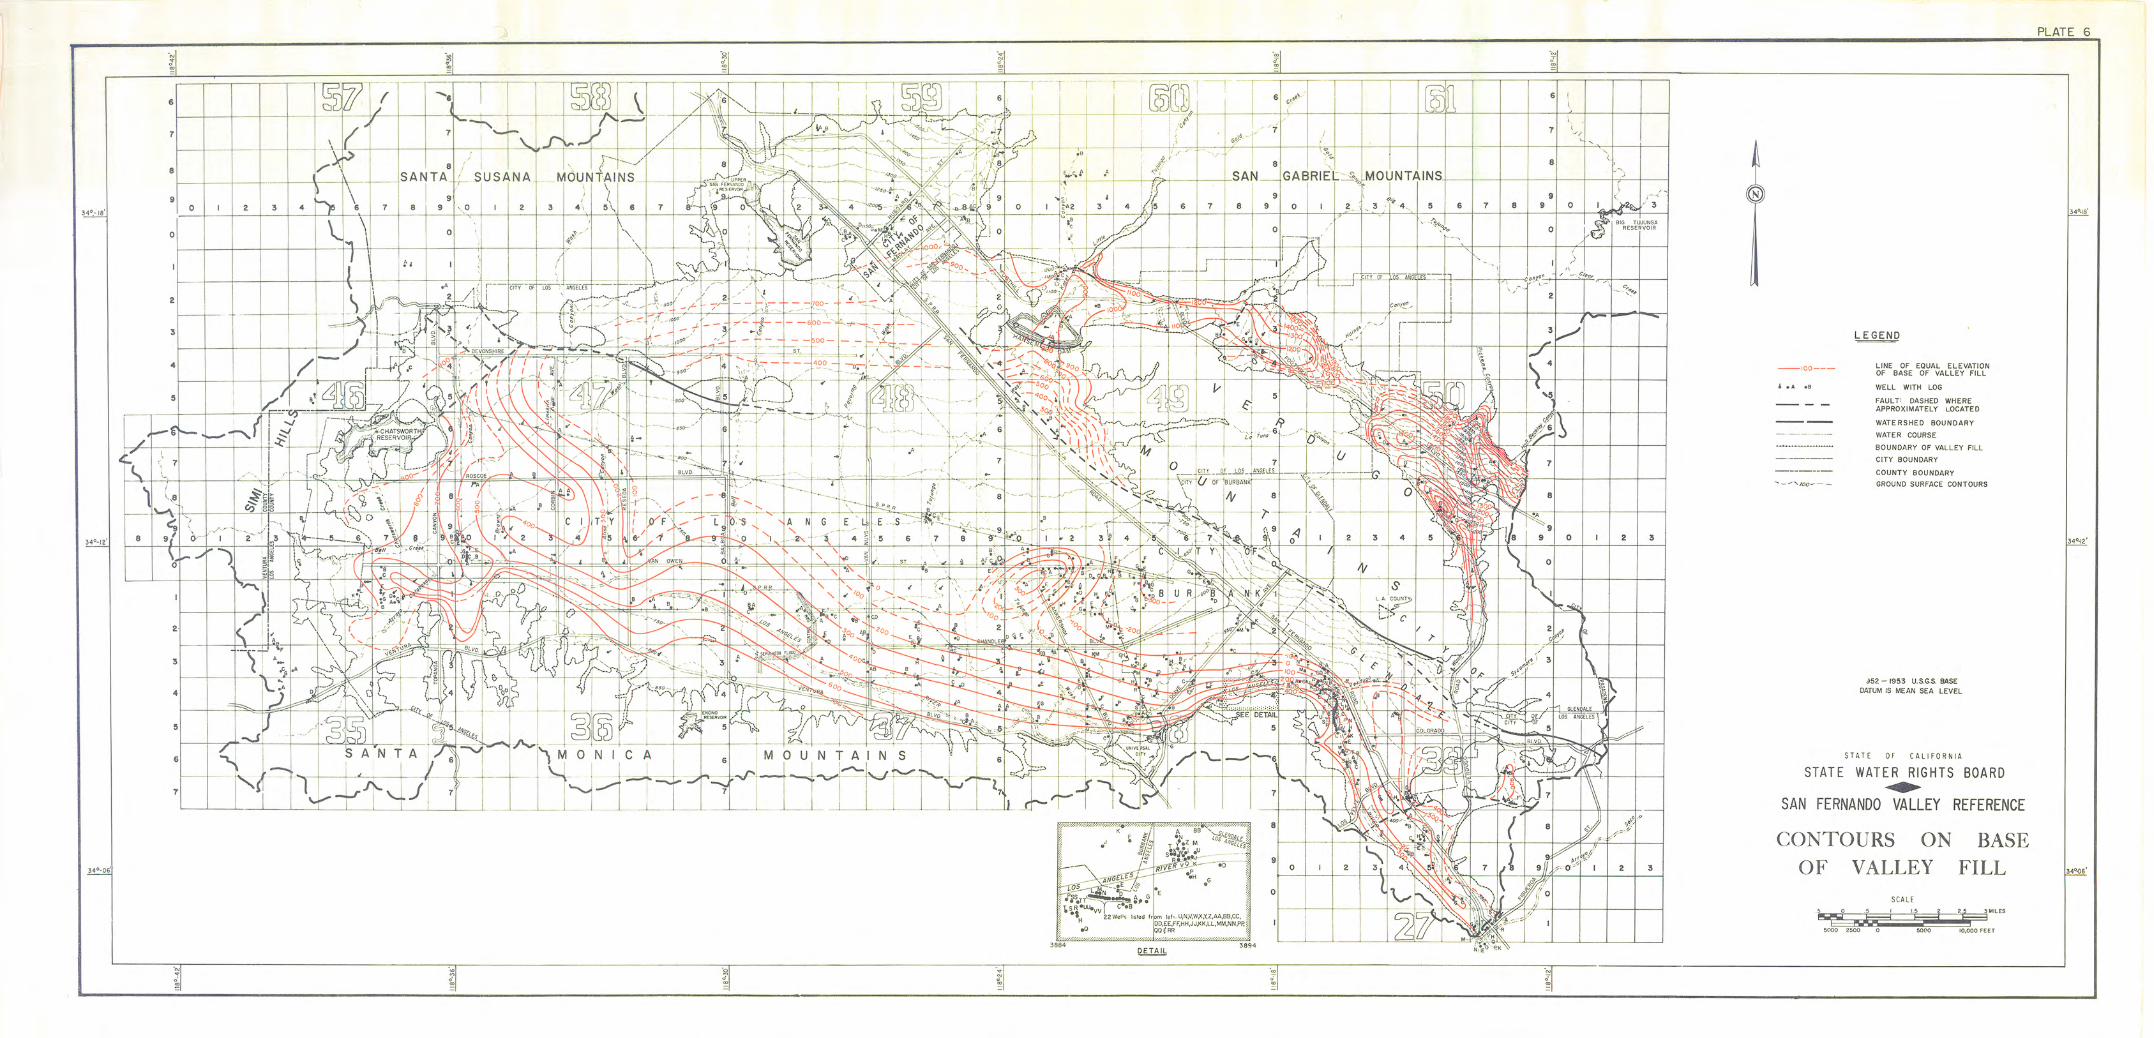
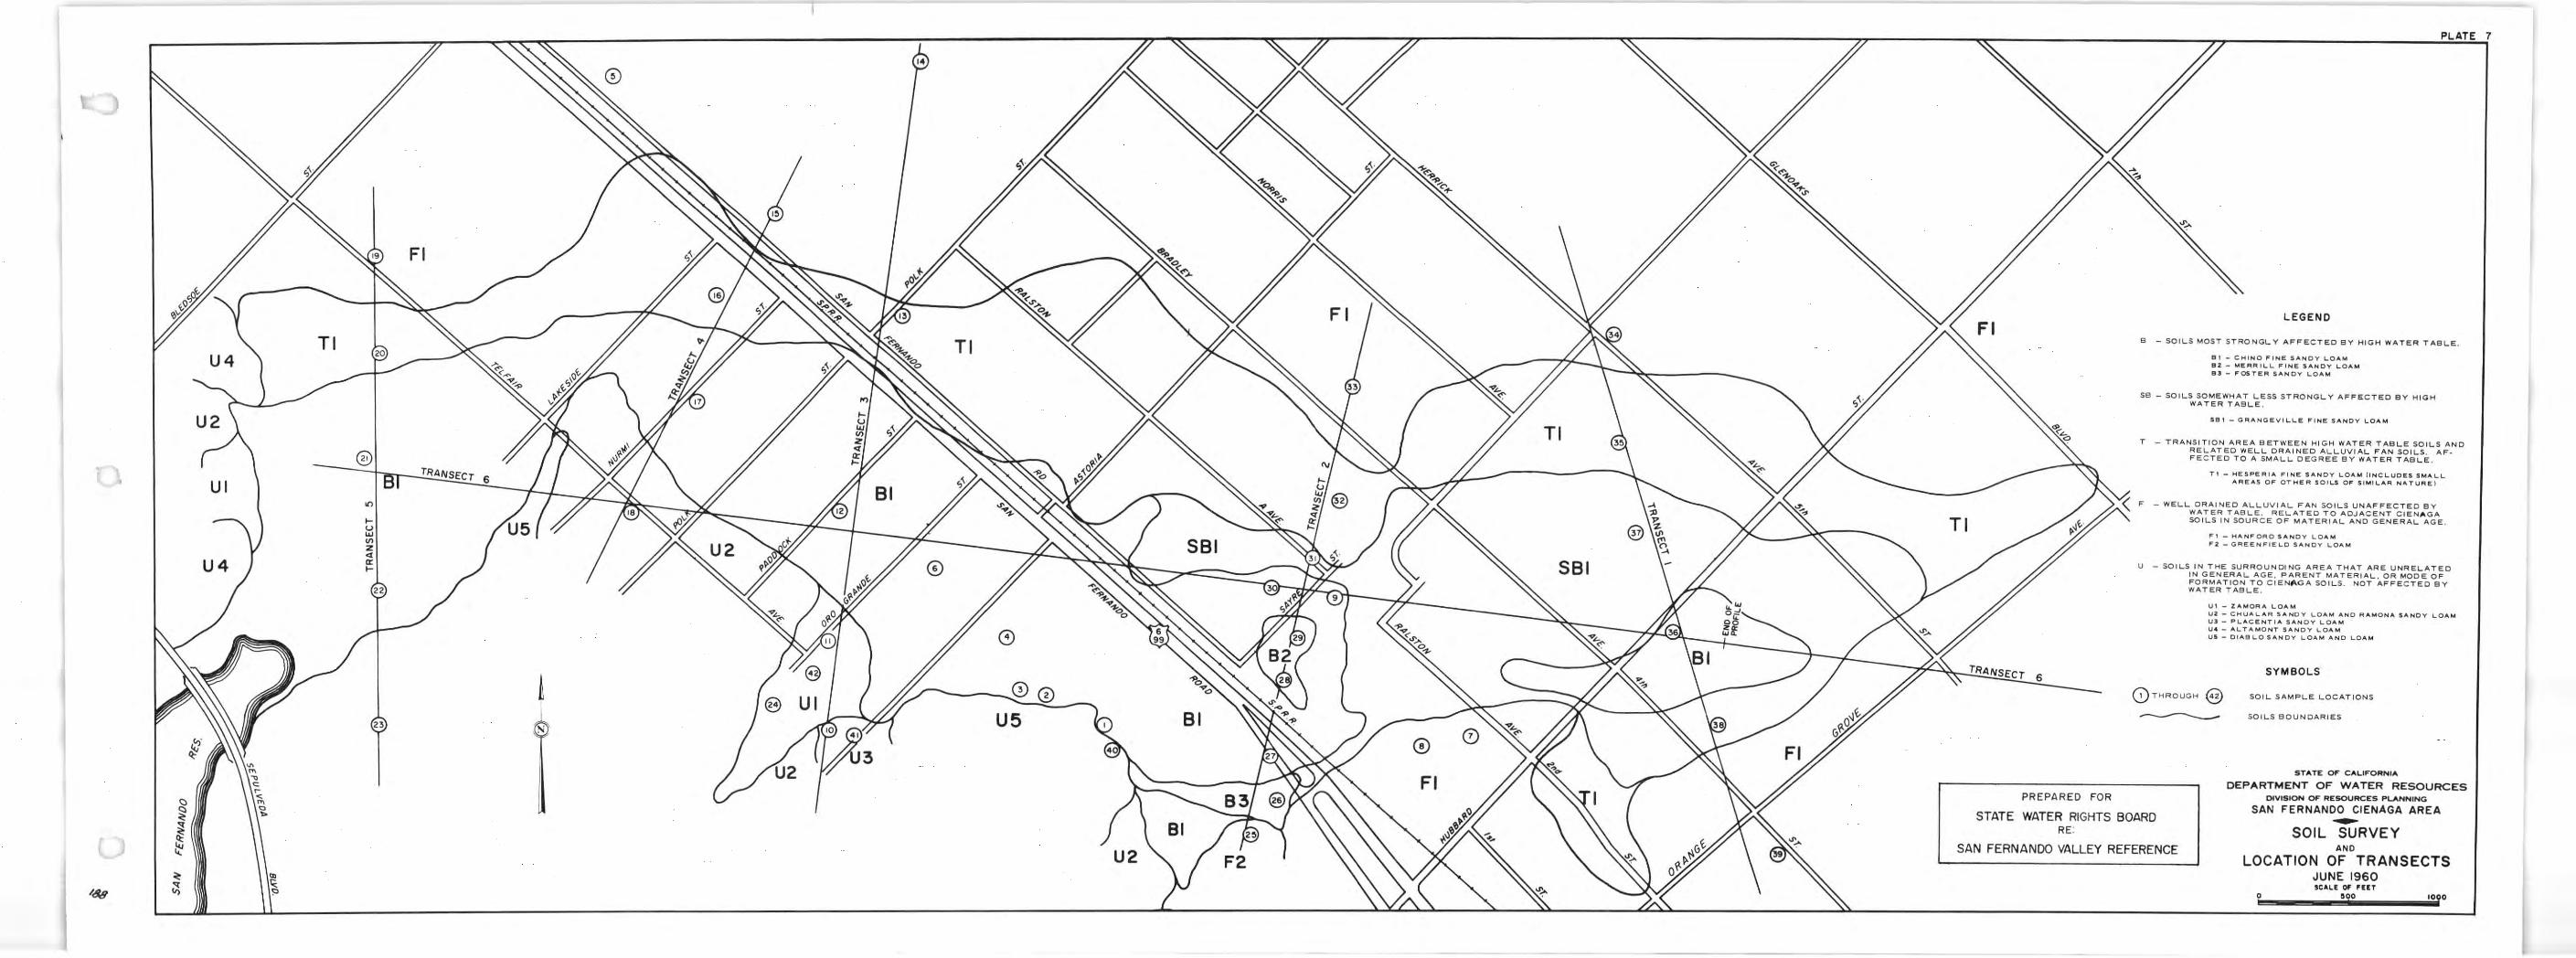
'&9
~ ~ ~ <.:
~ ;:j
TI U4
UI
@
'" .... tl en z .. a: ....
TRANSECT 6
o
o
23 1 ~ U5
TI
581
~i ~f
o~~ r,~
TRANSECT 6
PREPARED FOR
F'LATE 7
"'-:"
LEGEND
8 - SOIL':; MOST STRONGLY AFFECTED BY HIGH WATER TABLE.
Bl - CHINO FINE SANOY L.OAM B2 - M~RAILL FINE SANOY '-CAM aJ - "'OSTEFI SANOY LOAM
58 - SOILS SOMEWHAT LESS STRONG LY AFFECTED BY HIGH WATER TABLE .
5BI - GRANGEVILLE FINE SANOY '-CAM
T TRANSITION AREA BETWEEN HIGH WATER TABLE SO IL S AND RELATED WELL DRAINED ALLUVIAL FAN SOILS. AF. FECTED TO A SMALL DEGREE BY WATER TABLE .
T, - MESPI!:A 'A FINE SANOY LO"h4 [INCLUDES SMALL AREAS OF OTHER SOILS OF SI MILAR NATURE'
WELL DRAINED ALLUVIAL FAN SO ILS UNAFFECTED BY WATER TABLE. RELATEO TO ADJACENT eIEN A- GA SOILS IN SOURCE OF MATERIAL AND GENERAL AGE .
FI -HANFOROSANOY LOAM F2 _ GREENFII!:LO SANOY LOAM
U SO ILS IN THE SURROUNDING AREA THAT ARE UNRELATED IN GENERAL AGE, PARENT MATERIAL, OR MODE OF FORMATION TO CIENA GA SOILS. NOT AFFECTED BY WATER TABLE.
UI - ZAMORA LOAM U2 - CHUALAR SA N OY LOAM AND RAMONA SANOY LOAM Ul - PLACI!:NTIA SANOY LOAM U. - ALTAMONT SANOY LOA M UI - OIAe LO SANOY LOAM ANO LOA M
0THROUGH @
----------SYMBOLS
SOIL SAMPL E LOCATIONS
SOILS BOUNDARI ES
STATE OF CALIFORNIA
DEPARTMENT OF WATER RESOURCES OtVISION OF RESOURCES PLANNING
STATE WATER RIGHTS BOARD RE :
SAN FERNANDO CIENAGA AREA -SOIL SURVEY SAN FERNANDO VALLEY REFERENCE AND
LOCATION OF TRANSECTS JUNE 1960 SCAL.l Of fUT
o 500 1090
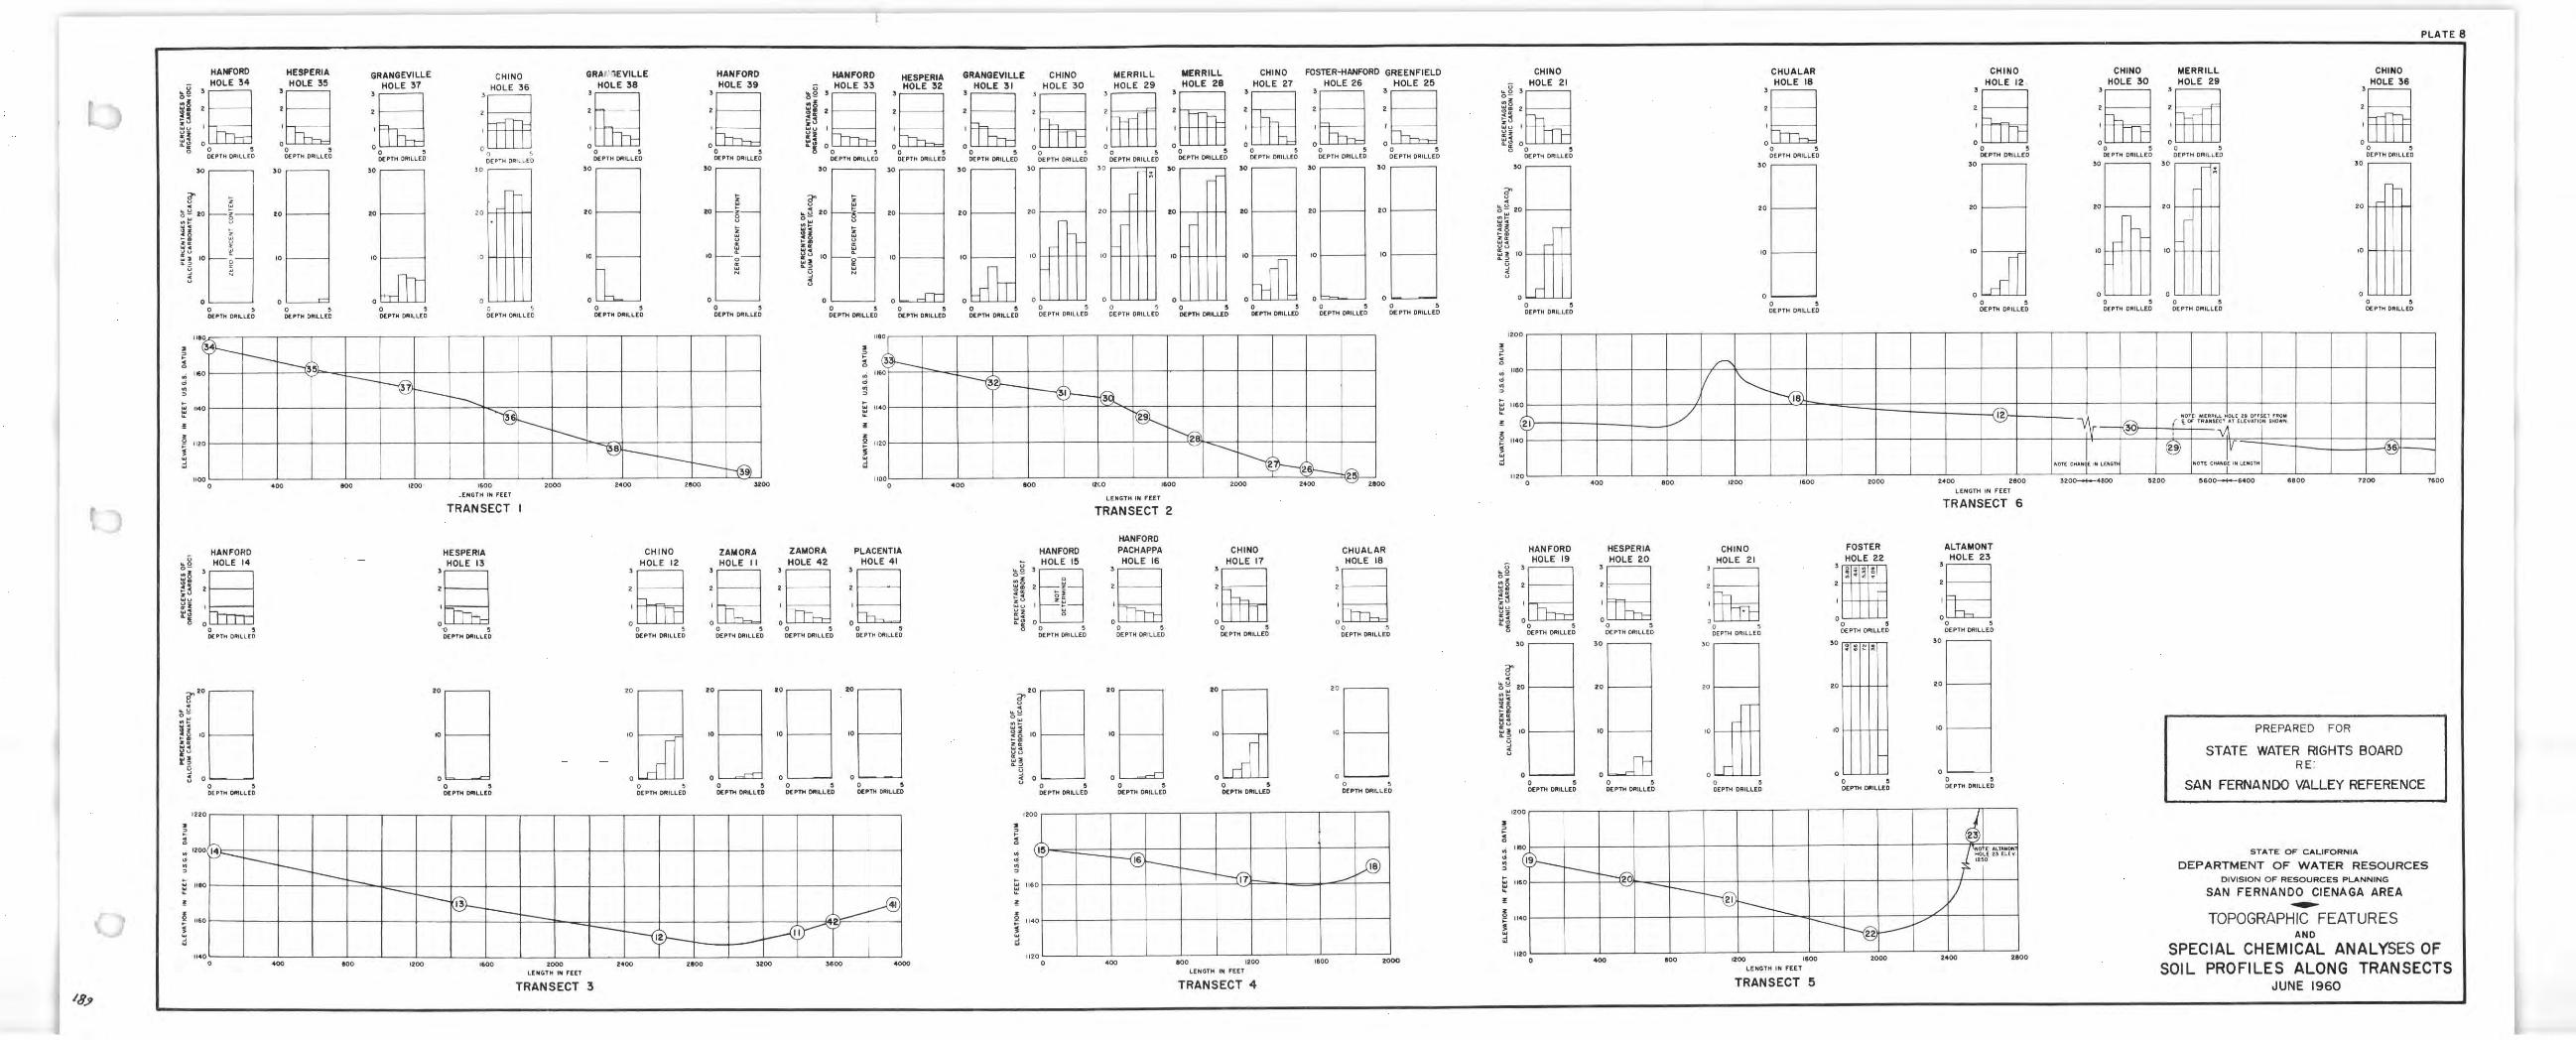
'8.,
HANfORO HESPERIA GRANGEVILLE
:~:~ :~ CHINO GRA r,'n EVllLE
HOLE 38 HANFORD HANFORD HESPERIA GRANGEVILLE CHINO MERRilL MERRILL CHINO FOSTER-HANFORD GREENFIELD
:§HOLE 39 il :~HOLE 33 :§HOLE 32 :~HOLE 31 :~HOLE 30 :~HOLE 29 :rniHOLE 28 :~HOLE 27 :~HOLE 26 :§HOLE 25 ~~ :§
~~ Of '. , ...... I I I I I I I I r
~. ~~ 00 .5 00 .5 00 .5
D£,TII OIIlllED 1)(I'1H DRILLEO D[PTH DRI LLED
:~ o o ,
:~ , , o Lil 0 0 0 0 0 0 0 0 0 o .5 !O 50 'OS 0 .5 0 .5 0 S O !I 0 SO .5 Il(PTH OiltlLLED OEPTII OIIllL EO DEPTH [)fIILLED DEPTH [lIIIILl£D DEPTH OF!lLl[O DEPTH ORILLED DEPTH OIIILLEO D(P1II DI!1LLED O[PTH OllllLED OEPTI1 DRILLED
" rl-----, "rl ----, "e' -----, 0['111 ORlli.£O
30 I
DEPTH DRILLEO
SO I SO, '0, '0, SO, lOj SO l ;::::::J~i ;W, 3D, !O, SOr
a- ~z v • . . ~~ t o §-i!i ~ .2 " .!: ~ ~~ 10 0--
:t? ~ 5 N
, LI __ ---" , , «I'TH O/IILL[D
"1-1 --I
"f-I ----I
o I rl , , D£I'TH DIIILLEO
" f--I _----.J
,'II------j
1m , , Q[PTH DfllLUD
" I R I I I
,'I I I I I I
o I I II I I o , OEPTH DIIiLLED
" f-I -----1
"f-I ----I
,tL , , O£I'TH DflIlL[D
8 I:O~"" 8 --
~ "I-~ e--'LI __ ---" , ,
DEI'TlI DfllLlEO
B' ~ . . :!;!& 10 ~-•• ~. ~ .... ~ lj z. • ~j 10 ~ t! ~-
g ~ ~
, LI __ -, , , O£PTH (HIIILLEO
,,11----1
" If---------i
OL dTI , , Q[I'TH DIULLED
"f-I ----I
"f-I ----I
,ldh o , OEI'TH OItlllED
"f--I _----.J
" I I I I I I
o I I I I I I , , OEP TH OFIILLEO
"I I I I I
" I I I I I I
o I ! " I t , , 0[1'111 DRILLEO
"I-I ---r++--l
"I I I I I I
o I I I I I I , , D£I'TlI OItIlt...[O
'" f-I ----I
"f-I ~=--l
JJ , , Q[PTH OItlLL.ED
"f-I ----I
"f-I ----I
, '=-, , DEPTH I)IIILLEO
" f-I ---I
"f-I ----I
o I ---.J , , DEPTH D"'LL[D
III~
::I t34J--1110 1,-- ,---,---,--,---,--,--,---,---,--,--,--,--,--,
~, r--.. J, I I I I I I I I I ~a .6f-= '" ,," T I I ~ -u~ : I ---....... I I I I I I I
~ • ~j)... -= I I I I I ... 1140 ~ ; ,., '®--- : ~ ~ 1 '-rw I I ~ 1120 ----, I
i 158 d I ~ -- ~
i 1120 • ___ T l
d I ~ 1_ _ i ~I 1100 2~
o 400 800 1200 1600 2000 2400 21100 ltOO o 400 100 12(,0 taOO ilOCO 2400 2800
HANFORD HOLE 14 ~~
:~ ~. !i~ ~i ·l .~ :~ r 20
~ ~
, , DEI'TH DIIILLtD
!i "f-I------j ~~ r! " t 0 1'-__ -' , ,
D[I'TH OfIIllED
_ENGTH IN rEEf
TRANSECT I
HESPERIA
:~ ~ , D£I'TH DflILLED
20,,----,
~ If---------i
Ob d , , Q[I'TH OfIIlL[D
CH I NO ZAMORA ZAMORA PLACENTIA
:~ :~L~:§ o ~ 0 50 ~o 5 Q[I'TH DflILLED DEI'TH OAILLEO D£I'TH DflILLEO DEPTH DRillED
"e, ---,
" I ~
,Ld , , DEPTH DRi l lED
" rl----,
"f-I - ---I
o 1 ,....0=1 , , DEI'TH DRilLED
"rl------,
" 11----1
,IL __ ..J , , Q[I'TH DRILLED
20,,---,
"f-I ----I
,I...I ___ ..J , , Q[I'TH OAIlL[D
1220 1,---,----,----,----,----,----,----,,---,----.----,----,----,---,----,,---,----,----,----,----,---, z
~ ",,,1;4. I I I I I .11 I I I I I I I I I I ~ "-------"-- I I , . ~r---t:. 11.0 t-
~ --• 13~ ~ ~ 1160 2~
§ ~ ~~1 "_ 5 o -400 100 1200 1100 2000 2400 2100 3200 3100 4000
LENGTH IN F[ET
TRANSECT 3
~ '(;2
~g o. e· Z O
~i .' .~
HANFORD HOLE I~
:~~ ~l , ~
~ , , , D£PTH DRILLED
rIO ~~ .~ .. ~ g 10 f-I ----1 z. •• ~o .> ., ~ 0
1 "---~ v, , OlPTH DRILLED
LENGTH IN FEET
TRANSECT 2
HANFORD PACHAPPA CHINO
:~ :~ o 5 0 5 OEPT H DRILl(D DEPTH DRILlEO
" rl----,
" f-I ----I
o I c=d , , DEPTH DRILLED
"rl----,
" II-----r--l
,lJ , , D£PTlI OftILL[D
CHUALAR HOLE IB
:E:d , , DEPTH DflllLED
" r'----,
" 11----1
, 1'-_--' o , DEPTH DRillED
''''
~ 15 -=n=1 =t=t-H-+--+-l---~ ",,[I W-+-t+tt1J: i d
1120 IL _ __.l __ i __ -L __ L __ L_~L _ __.l __ __L __ -L _ _.J o 400 '00 1200 leoo 2000
L[NGTH tN ~EET
TRANSECT 4
" )!;9 .~ .. ~. ~~
~~ ~~
f
CHINO HOLE 21
:~ , , O(PTH DRILLED
" c, ------,
:;;~ 20 11---•• ~i z • .. ~i "I I I I I ~
,U: o , DEPTH DRillED
CHUALAR HOLE 18
:~ , , OEPT14 [)fIILLED
so i
"f-I ---I
"f-I ----I
, LI __ --' , , DEPTH DRILL[D
CHINO HOLE 12 .
:~ , , DEPTM mUllED
so i
"f-I ----I
" I rI
,Ld , , DEPTH OIIILLED
CHINO MERRILL
:~:~ I) ~ 0 ~ [)(PTH ORILLEO OEPTH DRILLEO
:!D I :!o I :::::::i:;1
"f-I ----I
"I I I I I I
o I I I I I I , , DEPTH ORILLEO
"I I I I I
"I I I I I I
o II ! ! I I , , DEPTH DRILLED
CHINO HOLE 36
~i " ,
DePTH OFIILLED
'0 I
"I F1 I I I
" I I I I I I
0 111111 , , DEPTH DRillED
PLATE 8
1200 1,---,----,----,----,----,----,----,----,----,----,----,,---,----,----,----,----,----,----,----,----,----,----,---,----,----,----, >
~.. ~ I I I I I I I I I I I I I I I I I I f" / ~ I l :; "GO '---(i8). I I I ~ 2 / .fiV- -V _ NOTlf M[RRILL 1.( If o"in '~OOI • 1 \r _ .[,n'\.. ( ~ 01' !flANsteT ,.T HEVAT'ON lHOwN.
z ~~ , 2 1140 ---- I
§ @ IV- ~ ... t;OT[ e"AN IN L[NOT!< NOT( CH ..... + 'N .. [NOTH
IIZD o 400 800 IZOO 1600 ZOOO il400 2800 3200.......-4800 !5ilDD 15600_6400 8800 7ZOO Taoo
v :;;2 :3~ o. e· ;!i ~ ffi! .~
B' •
HANFORD HESPERIA
:~ :~ o 5 0 :5 DEPTH DRiLLED DEPTH OAlllED
!lO,~---, "e, ----,
:;; ~ ilO fl-----i "f-I ----I ~~ z. ~~ ~~ 10fl----
~ ,LI __ ...J , ,
DEPTH Oflll..L[D
" f-I ----I
,1m , , OEPTH DRILLED
CHINO HOLE 21
:~ , , O[PTH OFIllLEO
"
"f-I ----I
" I I I I I
, u: o , DE~fH DRILLED
LE NGTH IN rEEl
TRANSECT 6
FOSTER ALTAMONT
, 8JiliH~L; ;2 '~HOlE 23 01 :; =: ~ , ,
, , , ,
o 5 0 5 DE PT" DRILLED OEPTH OAILlED
30 1~ 1=1~1::t:
"I I I I I I
"I I I I I I
o I I I I I I , , OlPTH OAllL[D
30 1,---,
"II------j
"f-I ----I
, LI ___ ~ o , OE PTH DRILLED
~- j I ~ ~ 0Ii 1180 9J- I 'to( [: .LT ....... • ~'9 I "OlE ti"(iiv · ~ ,-, ---t:. llao 20 ; r---f---@ / ~ "" --_ /' I i ___ ~ _V I ~ --(221 • ~ I ,. I I I
o 400 100 i200 1800 ilOOO 2400 2.100
lENGTH IN FEEf
TRANSECT 5
PREPARED FOR
STATE WATER RIGHTS BOARD RE :
SAN FERNANDO VALLEY REFERENCE
STATE OF CALIFORNIA
DEPARTMENT OF WATER RESOURCES DIVISION OF RESOURCES PLANNING
SAN FERNANDO CIENAGA AREA -TOPOGRAPHIC FEATURES AND
SPECIAL CHEMICAL ANALYSES OF SOIL PROFILES ALONG TRANSECTS
JUNE 1960
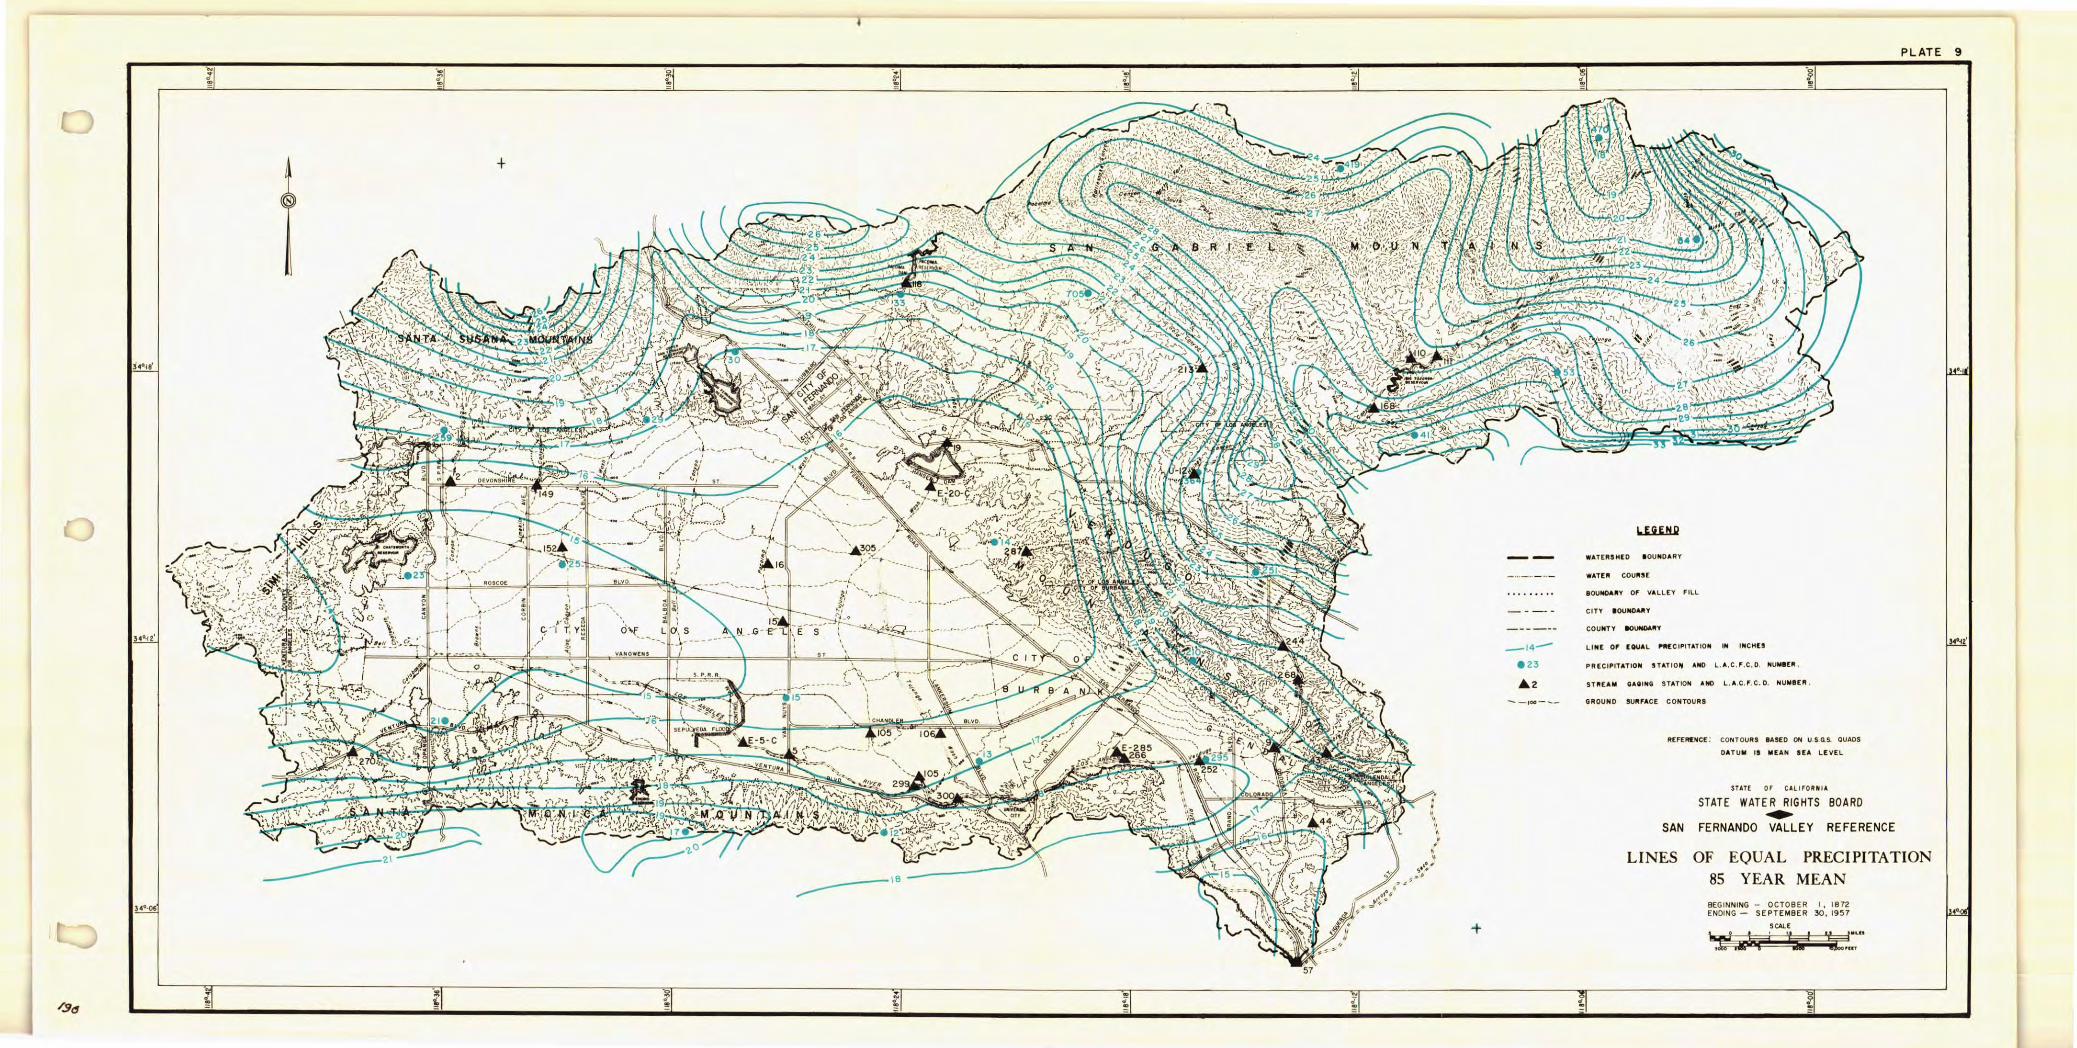
-~
'" ..
'" ... Z
« -'
0 "-
-'"
E-u
~ z '"
Q
a: -i
• Il.
0
'" '"
, •
<t
LL -N~
, ,
" U
Z
~~
0
" 0
'" ~~
'" >
'"
a: \.oJ
<: • "
, -'Ii
,; " · '"
r::.:: \.oJ
· ,00-.811
> •
0 >
->-
Il. ~
,811
• "
'" '"
•• "
~ •
~~
• •
~.-' m
m
" •
0 •
" '" -'
o.
"" I
>
• ...J
r::.:: .~ ~
• ~ "
'" ~
o.
>
: • -
<: <:
O~
• ci
0 .., ~
• • ci
.; · •
>-0
::> \.oJ
'" •
• <
t u
.; "'
> •
· '" 0
0 >-
~I
• .:
.; 0
, Z
..
• ·
\.oJ Z~
.; • -
· «
• .. C
0
• ..,
Z
zz
" 0
>-If)
(!ii5
-' <
t a:
00
i!I~
• i
• •
>-'"
~
2 Ii
• •
u '"
LL 0
" =
•
, •
" •
I "
;; 2
e ~
§ >
• -
• Z
•
>
u 0
• 0
" <
[ rJl
• •
f ~
~ u
• 0
" (J
) \.oJ
• "
>
• >
~
• •
• •
Z
0 · • I
" u
• •
: •
~ •
• •
-• -
~ •
, 0
Ii a
2 •
, ...J
0 8
• -•
• •
> •
• •
• · •
· i
• >
0
• •
0
~ •
-~
• •
• >
•
• •
, -
• ~
• ,
• •
0
• •
0 • -
• •
• u
u J
• •
• 90..,811
_" ,
\ ,
'" I
~
N
! N
... \ •
I (
+
".'U
" .. III
-'
+
,lIiblil
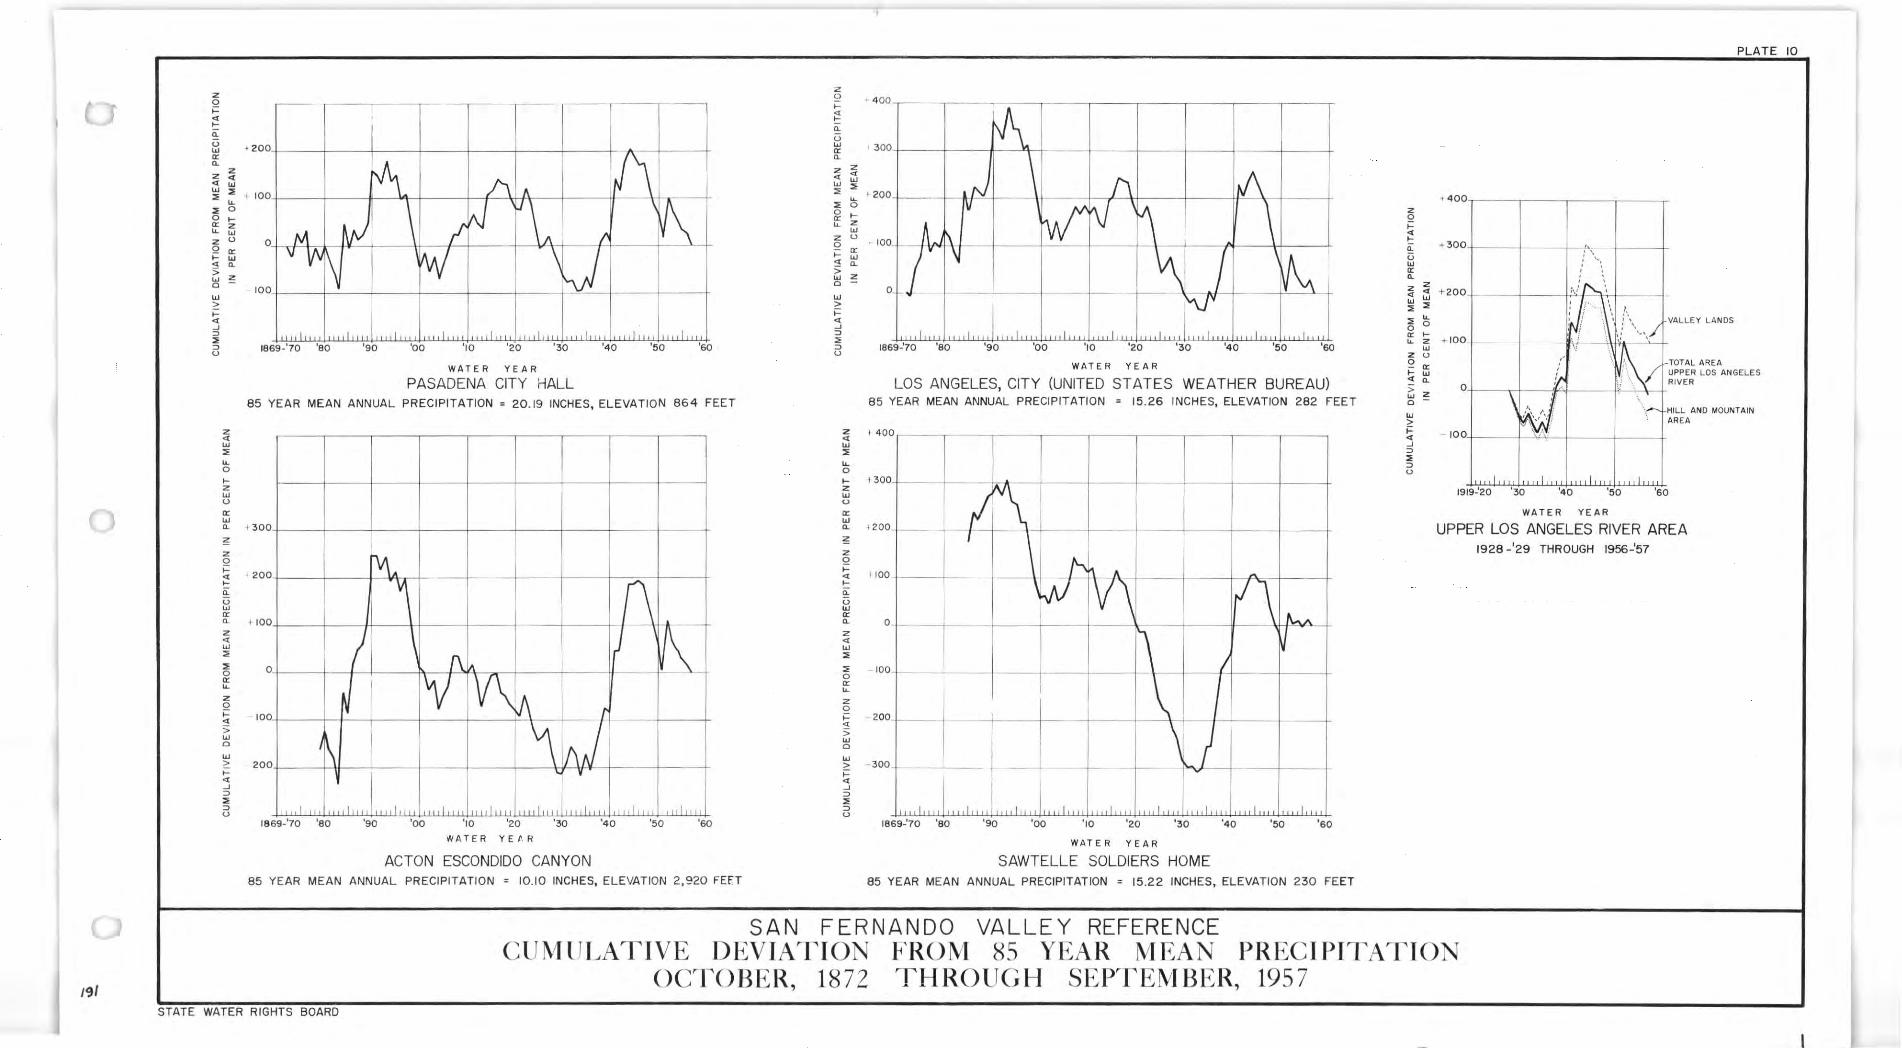
/91
z o >= '" !:: a.
~ -+ 200
'" a. z
z '" '" '" ~ ::l + 100 ... " 0 o I-
'" Z ... '" z" 0 Q '" I- '" ., a. ;; w z a - _ 100
'" " I-
'" -' =>
M V V"-
\
~ 1869-'70 '80
" , I
~ rvv
,I ,I 90
/\ A /\ N ~\A \
~ \ I I'
'(vi \ J , I , ,I , ,I I ,I ,I
00 , ~ 10 ,~ ~
20 , ~
30 , . ~ 4 0 , -
~o '60
WATER YEAR
PASADENA CITY HALL 85 YEAR MEAN ANNUAL PRECIPITATION = 20 .19 INCHES, ELEVATION 864 FEET
z
'" '" " ... 0 I-Z
'" " '" w a. + 300 .. z Q I-
-'- 200 ., I-a: " '" '" ~ 100 a.
~A 'Vi \
z
" w
" " 0 0
'" ... z 0 >= - 100.
" ;; w
" '" " 200
I [\It. ,1 ~
I IV V\'J\ r I
'\ II\J 1\ I I- • " -' :0
" => u , I· ,I .I , .I ,I , I ,I, ,I ,I
1869-'70 '80 90 '0 0 '.-10 20 30 40 '50 60
WA TER YEfd-l
ACTON ESCONDIDO CANYON 85 YEAR MEAN ANNUAL PRECIPITATION = 10. 10 INCHES, ELEVATION 2,920 fEET
z Q f-
~ 4 00
" I-a. u
1 300 w
'" a.
z :i " w ~ ::E ~ 200 ... " 0 o I-
'" Z ... W
Z U ! 100 Q '" I- W " a. ;; z ~ -w > >= " -' =>
o
~ 1869-'70 u
'so 90 '00 10 20 30 '40 50 60
WATER YEAR
LOS ANGELES, CITY (UNITED STATES WEATHER BUREAU) 85 YEAR MEAN ANNUAL PRECIPITATION = 15.26 INCHES, ELEVATIO N 282 fEET
, ~ ~ ! 400 w
" ... o ~ -+ 300. z w u
'" '" a.. 1200 .. +-----~. -~. -101- ' ----t--
I--
, +-- +--z Q
~ 11 00 I-
~
- r.-Jt-J, A
U
'" '" a. 0
I tJv '11 II z
M 1\
'0. ____ :1 " '" " :e - 100 o 0: ...
j
Z o i= - 200 ., ;; w
"
I I I '---,-rt \ I ~ - 300
>= " -' :0
" :0 U J.u"I, ,I " ,1 .. 1 1 ,I .I ' I , I
1869-'70 'aD '90 '00 '10 '20 '30 '40 '50
WATER YEAR
SAWTELLE SOLDIERS HOME
'60
85 YEAR MEAN ANNUAL PRECIPITATION = 15.2 2 INCHES, ELE VATI ON 230 FEET
SAN FERNANDO VALLEY REFERENCE
z o ;:: "
-t 400
t + 300 a.
" w 0: a.
z :i + 200 " w \>! " " ... o 0
'" I-"- z + 100
w z " 0 - '" f- w " a. > z 0 w
" w > >= - 100. " -' =>
" :0 U
,.
~ , wi ~
, ';":\/ \ } .i
lee ,I ,I
A ; \ : '-,
! 1'- " iv' "
~r" , : " '. ~, I : '
! \ ' '. , ,
: '. / \I \.
~ .' \
,:-r ..... .-......
.1 .1
PLATE 10
VALLEY LANDS
TOTAL AREA UPPER LOS ANGELES RIVER
HILL AND MOUNTAIN AREA
1919-'20 '30 '.-'40 '--50 60
WATER YEAR
UPPER LOS ANGELES RIVER AREA 1928 ·'29 THROUGH 1956~57
CUMU LATIVE DEVIATION FROM 85 YEAR MEAN PRECIPITATION SEPTEMBER, 1957 OCTOBER, 1872 THROUGH
STATE WATER RIGHTS BOARD
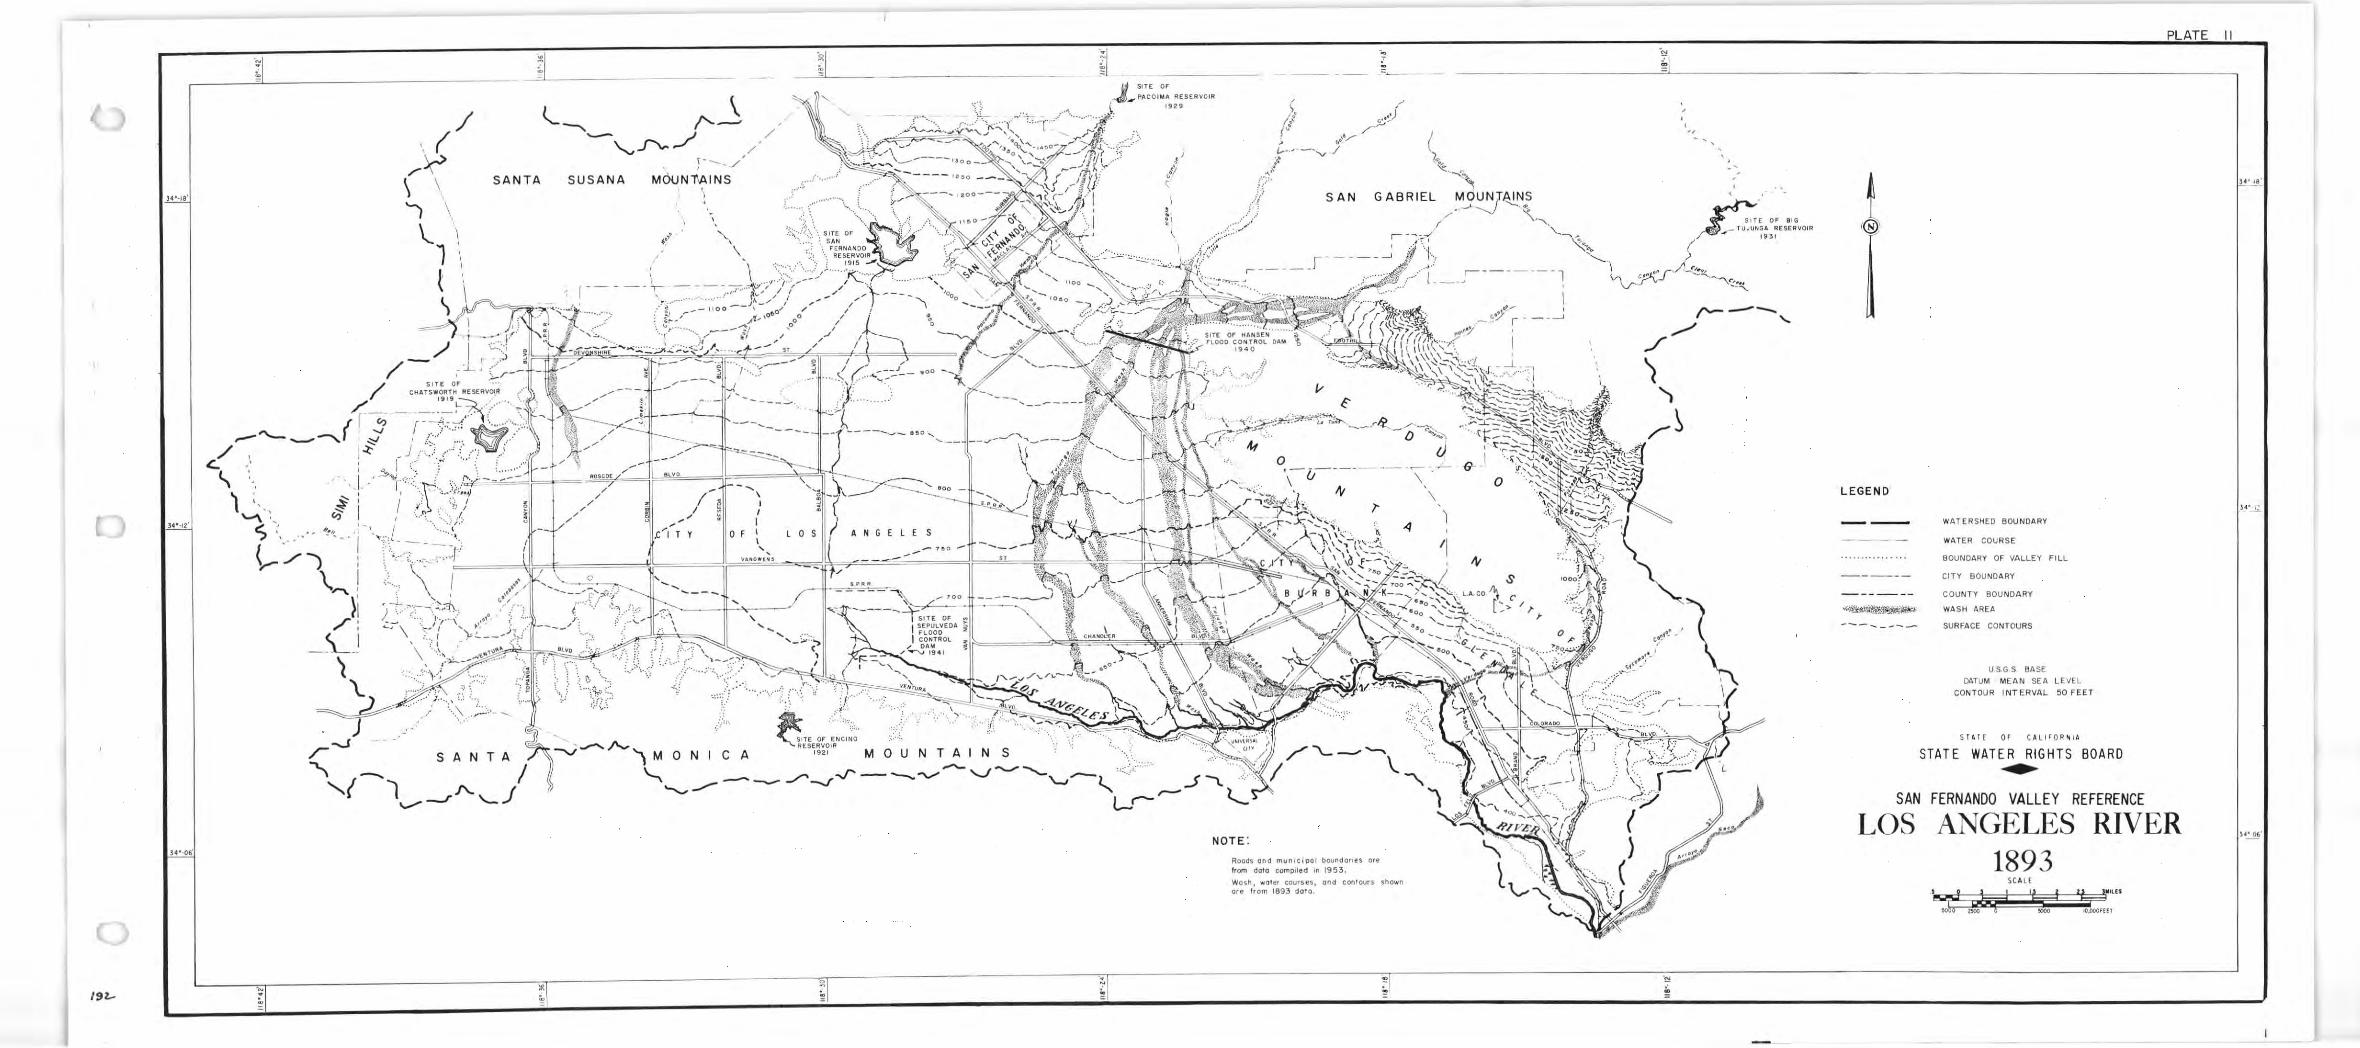
w
f-« ...J "-
,ZI-::-SII I I .il-.IU
• <; > ~ .. . .
... .. ~
o •
'" e c • . .
/ I
"1 I
<-\
,h-.S
It
( ..J } ~ )
!I ""'i01
« z « (J)
::> (J)
« fZ
« (J) " ..J W
tl: CD « '" z « (J)
® /.{
I I : . I )
I
0 Z
UJ
C>
UJ
..J
c:b I , /'
l/ I , I
~I
> ~
0 0 z ~ 0 m
0 W
r 00 ~
w
~
• • I I
~
~
~
>
w
~
~
w
~ 00 ~
~
~
0 0 U
>
~
0 ~
0 w
z
~
~
• 0
• m
w
~
~
Z 4
> ~ • 0 z ~ 0 m
> ~
U , I I I
> ~
4 0 Z ~
0 m
> ~
z ~ 0 u I , , I o u
~I
0:::: ~
~>
C)
~-
• ex:
t50:::: '"
~
0 l4
. w
C
D
W
~
w
· a::
(fJ
w ~
z en
~ ~ •
I-~~
~
~::c
~
~ w
0
-'
5~+ o
ow
o
::l~ O\
~ o
00 >
00
m
~
:;~
• ~
zw
oo
~ ~
00 4
~
~
ex: 0
Wz
~
~
C? ::t;:
-O
w
(j
Z
00 I-
0 •
0 ::::i:=;:
~
Cl
w
u
-'"
~ ~
W
~
0
· ~
Z Z
•
S~
<t
u :!
~
z ,
0 w
~
00 ~
u a::
• ~
I-
W
• 00
'" l4
. I-
en Z
~ \
<t (fJ
en
, 0
~
, ~
I
~
i , · .
\ I ,
,
./~
~
-r
-, j l..
.ZI-.911
tl-"II
Oh
'U
......... «
'\
f-)
Z
<
« (f) )
._, )
I
( 7
'" \J~/
,l •• ill
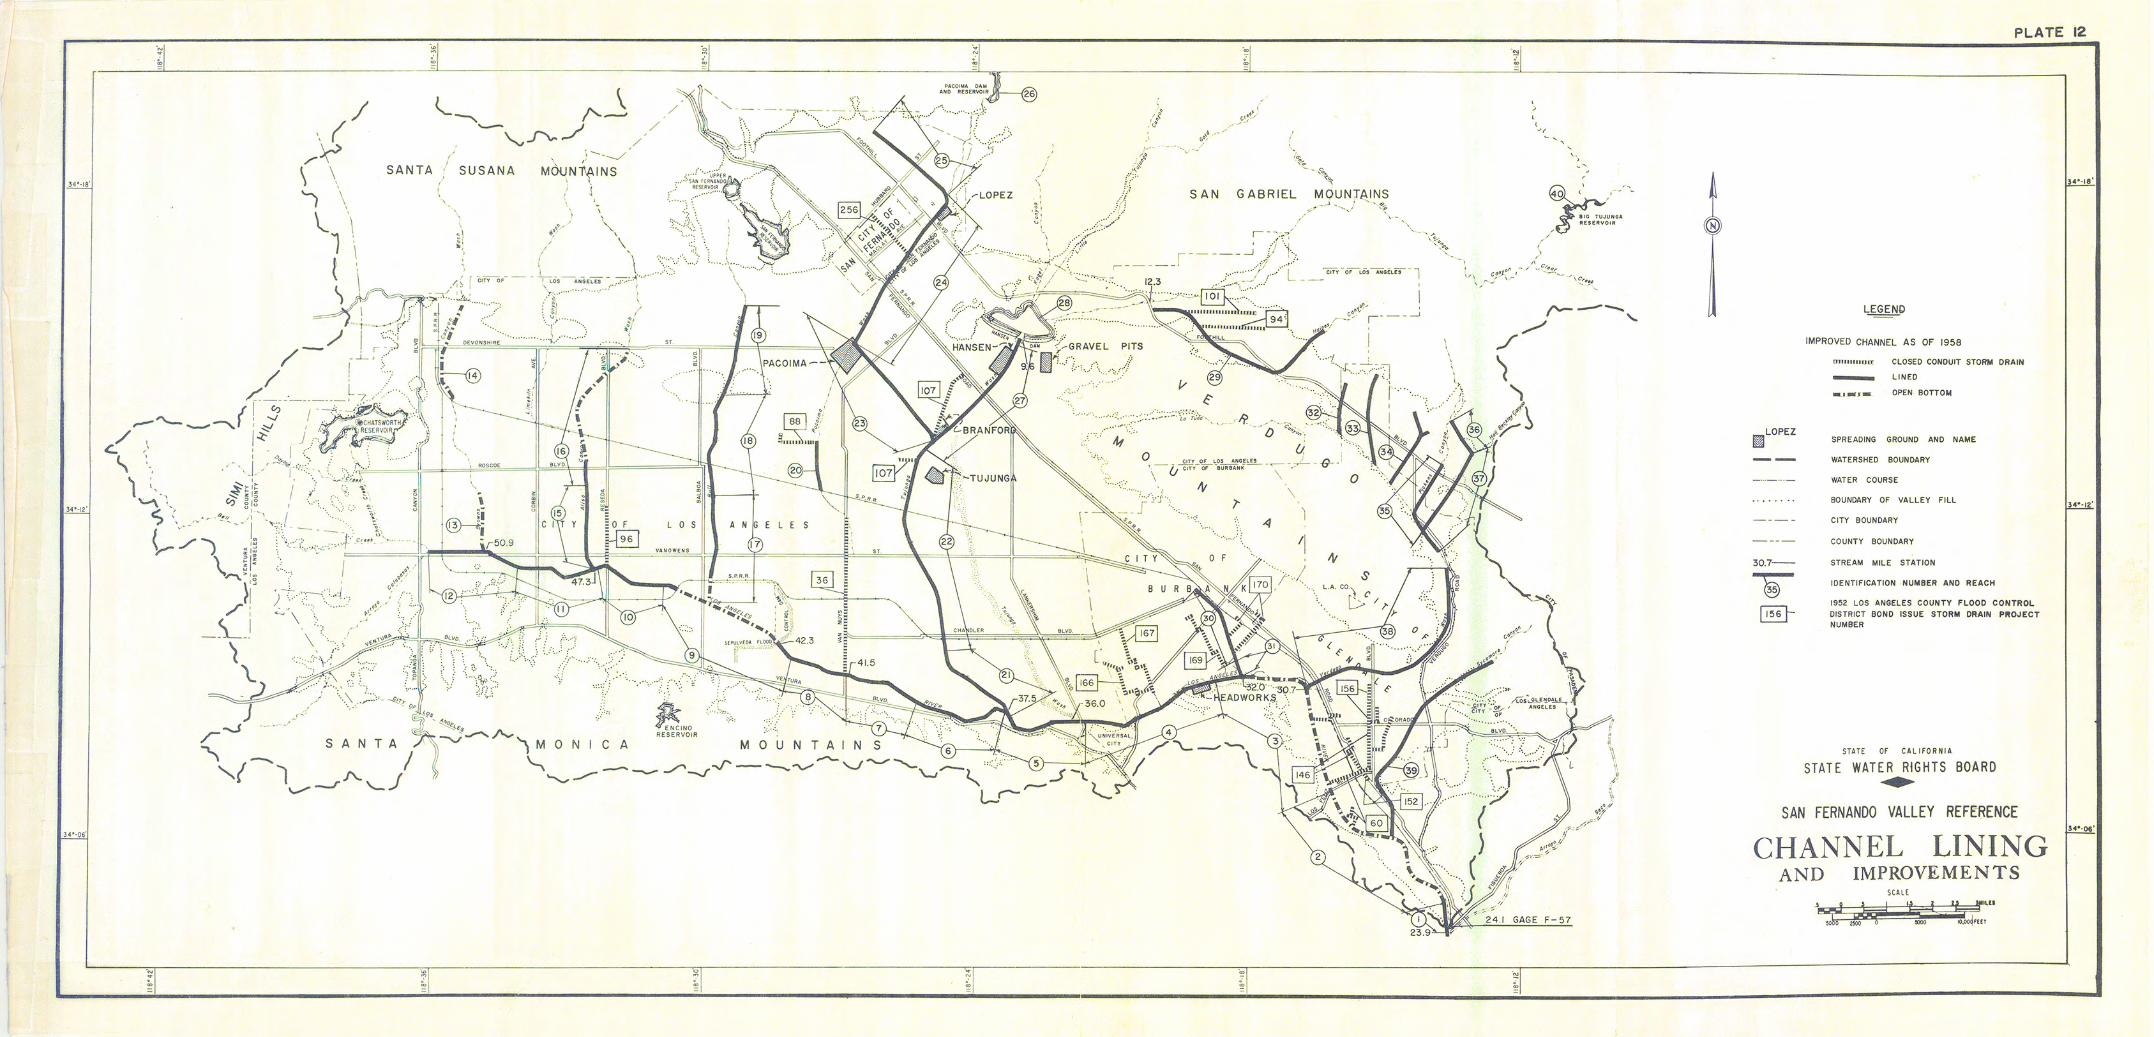
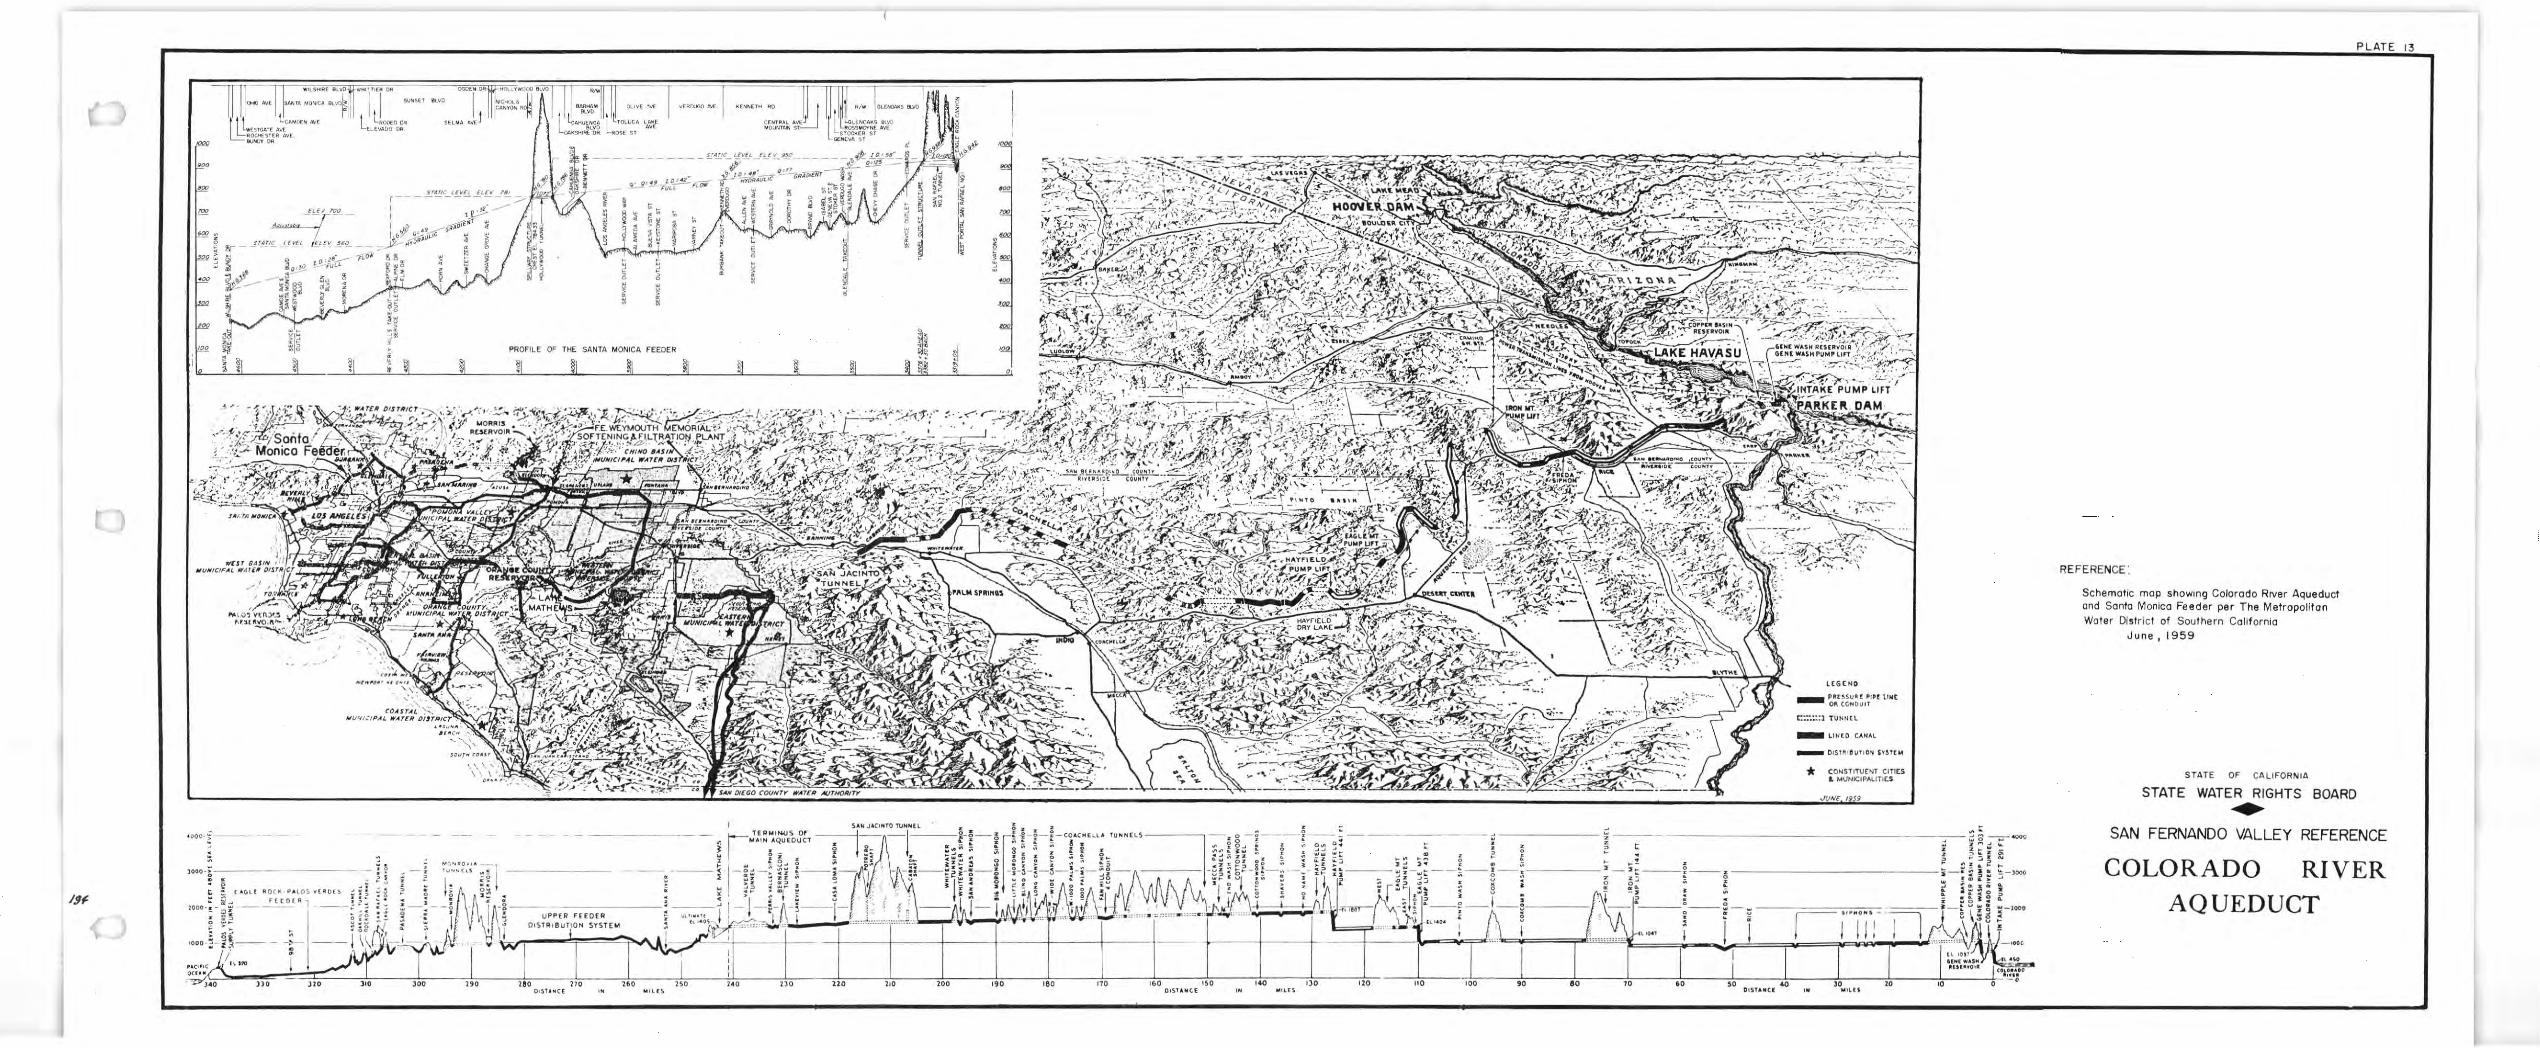
I'f
SUNSET I lVO
"~?r;';;;:~ .7 :-T::-:_':
r ___ E~C_£!!~ et Ci' 761
...Jgvroo I --:---::;--
~-- ' '9 ---~ I ~o 9---=- #Ellr ~ ~ I!r __ FE'£" uvn £uv 560 I./,r-' ~lJ~IC G I!:' ~ > ___ ~~t:!l ~
~ ! ~ r O't~:.--f[Oi'!5! .. 11 ,.. , ,0. !-!'-fUll.. ~ II/:!i I ~
:~ ...
I A f . fll
wtST SAJIN ,:J r/~ 'i" I~~ M UN IC/FAt W;;WI ol1t~/~r t ,J 11 5
0000 §--'
)Ooo . ~ -----
I S UI J ACII'ITO TlJ""'U '"' :; z z ~ oJ
LE G[ ND
_ PillU ~uH 'IP ! lINt 01'. CC." Du , T
C::::.:::J t UNtlEL
_ Li NtO C. A"'AL
_ O,STJItl ll U1,Ol! SVnu,4
* CONSTITUENT CITIES &. tAUNIC.PAl ITl[.S
'" 101 ... , ... AQUEOUCT z 0: ~ f : 0; ~ ; ~ ~" .,. ! 8.. :r. ~ 0", c : .. :: z ~ .:;: '; g -' ::' l & _ ~~:: =~: ;;; ;;; s,," " ~ ~ ~ '!;~ ~ .'" ~" ~~ ;1:: ;; ~ ~ e : ~ ~ ~ ~ 0;
.. .. ~ E Z" ~ ~: :.. .. .... '" 0: 0 : ~ .. ;; "'!: L"' .. z= " !; :; liZ ;;: _ ~"'..... ~ .. L . ~ :> ":I '" '"
---- --- --- - r,,,·,,," so' ~--J ~~- '~''' - ~-:-''''''''''"''['';;l- c ---:~ :---------- " "--- "~-.~c
"li ... ,", 0",.0" " ___ 1 1- 1 '" !;8-,0 '" f " N" JZ ~ : ~.~ .. "" ~:> .. Z "::?" gO .. it ,..z,..-' 2"-'~""" ~ ... ~- .. .,.lr L 2 ... ---- ' . i ' '''' 'al~ "I ----- 0( _ 0-' _ "'.", ... f _ __ ' __ i - ;~-- .. ~~- .. -- ... _; _~ - ~-S-~ - i- .. O~-U Z :; ..... - : - .. . - - .. , • • ---- ..,~ - ... --~-- ' -- E lI" _ .::I ... ____ --- z "' _ :;;; :1 - "' - )000
~5 ~ ~ ~ ~ : l::;:;;~ ~ ~ ~.. i"' ", ': e .. '" .. ... : ;; ~~ :':~ 1 81 : ;; ~ 'i ZI"I z~ ... ~ z ~;' .. e :: z~ ~ .::I ~:'l::::; .. z .. l ~ '""< ~ ~ ~ ~:~ it '" , • j!:'" ~ ~ .. ": "'~O.. ....... "I <> ~ ,. ~ L ::: r ""' ~ ~ ! .. ): °L L ~ .,. .. .;; L
' ~:!',',-~;~o; "=-n~ H ~ -! - j~~~L- '~ ;-'I"-L1 -~-gl- { !:; _ PI- ·I J:1A' !,~l .l UNi- " ," '-h)f.'\ \ i LrA r.mr-(t,' :ll!~ ~-;-r_~ .~ i_ i__ LH!~ !_,~, o ~o : ! ~ : I I ! UPPUi'HEDER ! u, " u ll J 1 "I n t t ~rl \'{\f fA t -,'# · ~w' ~ ' • . ' . ... ,., .•• '.. .. . .. ,.:. "t •• : : ~ 0 ~ : !!' r-""'OOI" - ~~ I z\ .. g :: 'Il \~~.. : All ' ,f O''''' 'T" ""'"_ !I ";~I'-""'''?-''I .. "" 0,, ''1-'' • ..",,.'..i" _.CO.": ' r ""., , j j I I II i I I , ~ rii 1 "
;:\,:~,L .- 1 ~~r~ I vWI I rY ! I ''''
: ~ : ;; .. lit ...
ZOOO. ; -~~
'? ';'''' :: ~~ IOOO ' ~ - i~--- - _ .ooe
,~ llO 310 310 lOa 190 180 110 160 1S0 140 no 110 110 200 190 180 110 160 ISO 140 ')0 110 -----,,~'O;;---- ,"o"o:-------,.to;----c.~o'----,to'---~c:-----~;----~,-----~;----+.-----±----+ O'~U .. C( II, ~ 'l[~ OISTA IIC£ IN ""~(~ o,SU'''CI III
REFERENCE:
Schematic map showing Colora do Rrver Aqueducf and Santa Monica Feeder per The Metropolitan Woter Di5triCt of Southern California
June I 1959
STATE OF CALIFORN IA
STATE WATER RIGHTS BOARD ~
PLATE 13
SAN FERNANDO VALLEY REFERENCE
COLORADO RIVER AQUEDUCT
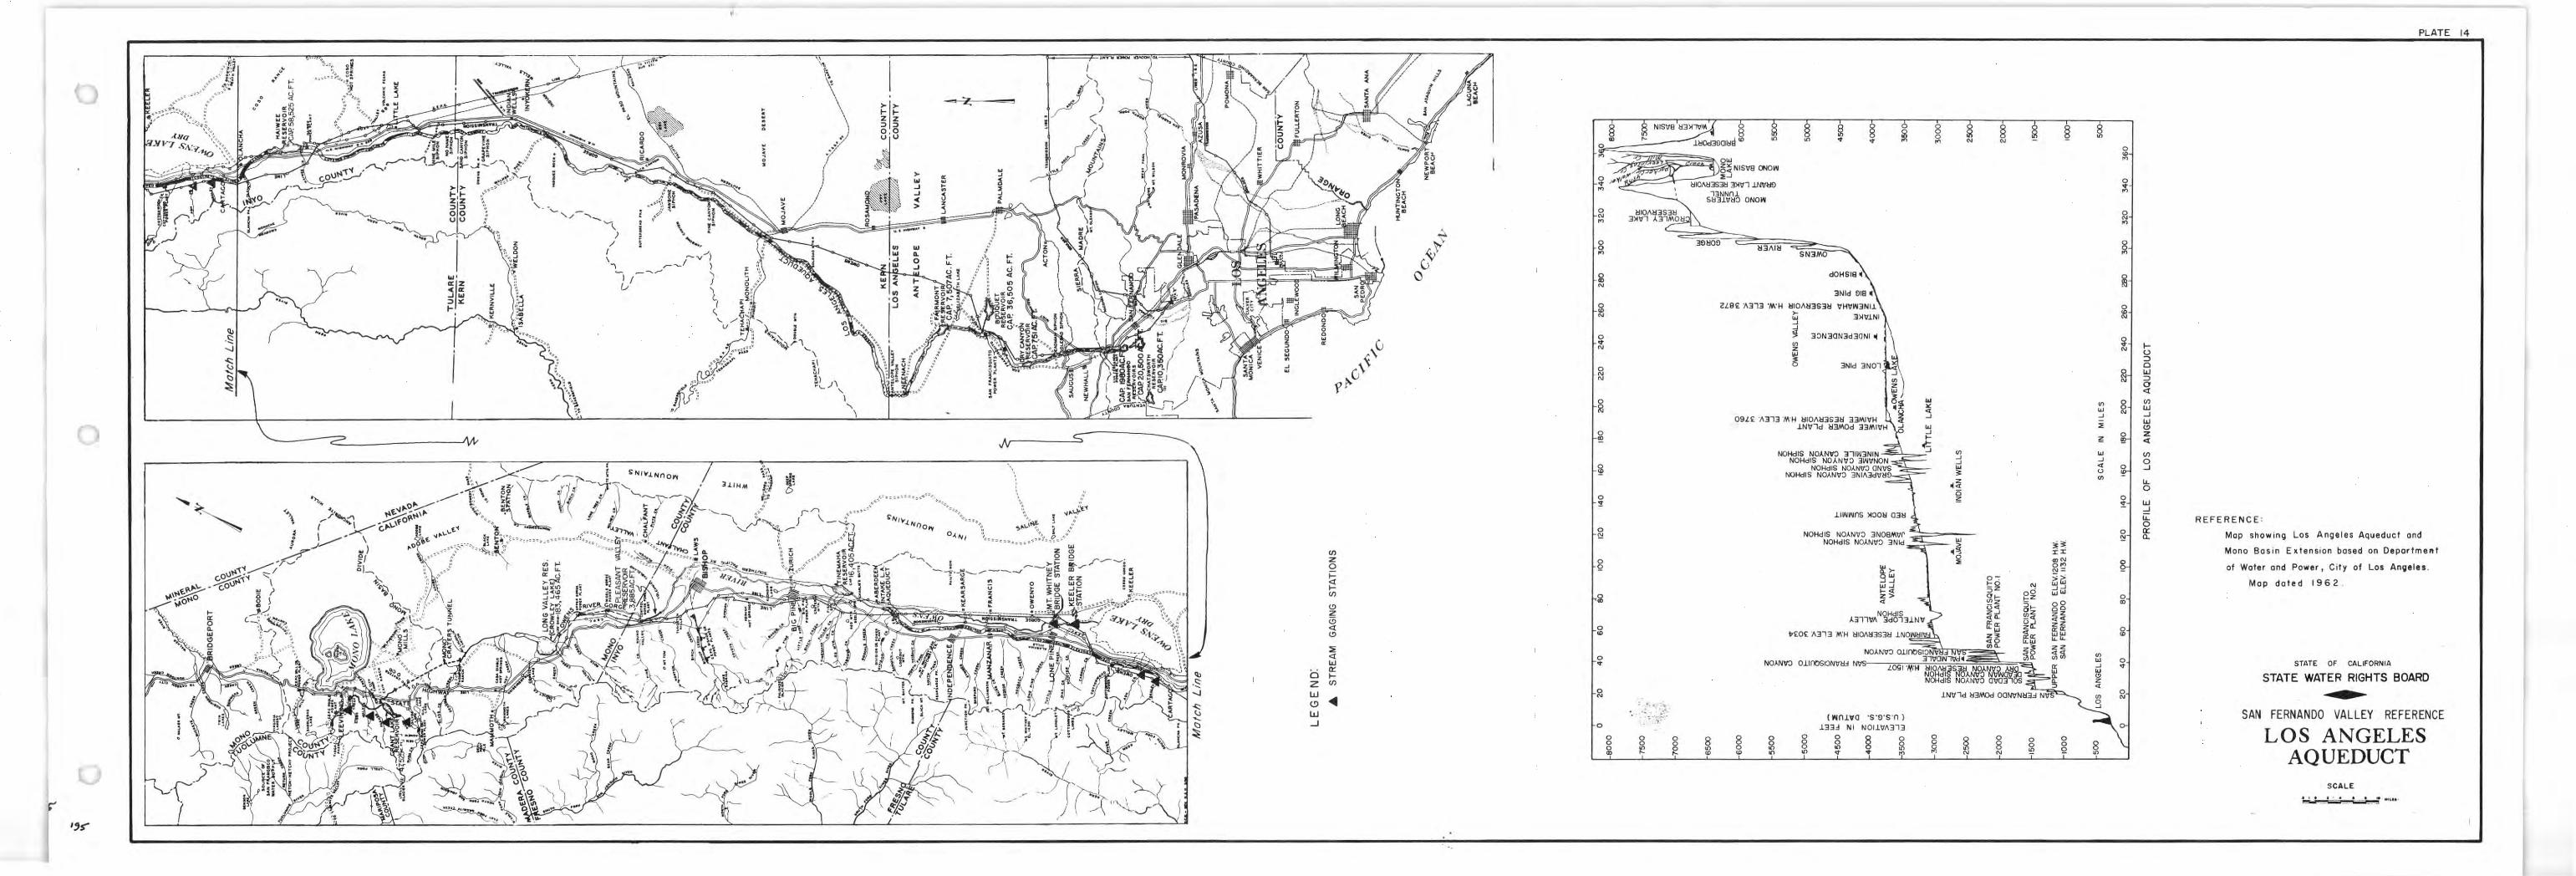
~
"\
( , \ ,. '" n ,. ,... '"
LE
GE
ND
:
I
/~
~ '00 'i\
1'~.L
" '~-,
--''i
\ .'
('1'\"'"
,,,,,
/
.,,+.1
o"..r
--,
~ ,,0 ,t
OIV'O~
......
. x-j--
\
~
z ~
z ~ o •
CoS-
; ~
z ~ o ~ "
o "i'
;
l)' :: ... .
,.~ .... '
~, 't,
: ...... ~'.'
: <""
f;
,-;--'
~,~-
........
'\
'"
.. "- ,;-
S,I
OG
E
-~~ .
. ~} __
\ ~
~~.~
'> \ ( ....
. _ ...
• S
TR
EA
M
GA
GIN
G
ST
AT
ION
S
f-
;~ .
,,
;.", .
':''':
.~;;
w_
~~
z>
--
.. " z o
' -'
" f-
• §~
w"!
J"
w_
~ ~ ., '"
0 f-0 '"
~ :>
w
" J
z w
~
" ~
:I'
>-a:
w
~
J
:1 ~ J
a: ~
~ w ~
AN
TELO
PE
0:
16 "
f-~i
t V
ALL
EY
-e
z :-!
U,.
~
~ 5~
if
z "'"
0
v;Z~
Z "
z!!
' Z
O ~
0'"
~~zz
~~
f-Z_O~
~""-
:i'
"'>
-u~
:i",
~:i
" iil W
)o.O
....
J
>-0
~~
IIJE
Z
w
'" >u~w
~~
" ~ocx~
0 <!
;z~z
w"
0:
Ia;q
z 1"
I z~
0 w
0:,
a:
0 '" ... '" :> W
J w 3f "
f- zO
: «
0
.J>
Q
,a:
W
0:"
,
~i:!
Q,w
~~
W ..
~:r
~ "
;ne
<. " '.
~t!~f'S[RVOLft
+~f>
\\\ '/C
AP. 5
8,52
5 A
t;. F
T.
I
---+--~~ _
____
J COU~T~_~l~ _
__
__
K
ER
N
r1 C
OU
NT
Y
~,=!
ioIf
'+U
\ ,
(' / \ I /
,J~-
'-(
,_I
...... r ... I ) \ ) I '}
I <
•
I' /
"_
1"'-./--./
......
. _'
H .
... '
..... '>
I (----
'- ~
_/
C \
EL
SEC
UNDO
~·--;
....:. 7'0
:.
;0""
, /0
N ... .. '" :> w
J W 3f "
OW
ENS ~LEY5
>
a:
w
w
0 '"
Z
w
w
a:
" w
z
<t
'" W
"
" d
W
Z 0:
°c -C
---14
>
28
0
30
0
VA
LL
EY
LA
NC
AS
TE
R
j
"O
J.V
I D
,SI_
T
~~U
NTV
• _
__
_ _
CO
UN
T."
....
L1
tTL
E
LA
KE
en
:t>
;Z
(f)
l'
i;!
'T1 m
>0
:0
--I
;Z
IT!
'"
:t>
iJ O
r::/}
z :Ii:
~
0 1>
'"
0
t ~ 0 C
> <:
:0
~
MZ~
:u
\! O()~
G)
!:
:z: C
l C
-<
--
I '"
C
jM:o
(f
) ~ ,.
....
,l'~
CD
~
Mm
r:
:/}~
:u
0
Z
(")
fT1
&
&
MO
JAVE
IN
DIA
N W
ElL
S
SAN
FE
RN
AN
DO
E
LEV.
120B
H.W
. SA
N
FE
RN
AN
DO
E
LEV
. 11
32 H
.W
0 ;0
:
-0
~
~
0 ;0
: 0
CD
0 m
0
'0
, ~
0 Q
. ~
~
0 Q
.
.. ."
'" •
Q.
0 ;;
• ..
~
<D
, ~ 0'
0>
() ~
'" ~
~
0 ~
0 m
-Q.
r 0
0 ~
~
0
" ..
~
'0
., 0
.. .. 3
M
.. '"
PR
OF
ILE
O
F LO
S
AN
GE
LES
AQ
UE
DU
CT
'" '" .., '" ;0
: '" '"
0 '0
Z
()
~
'" ~
0 • 5 '" r 0 ~
l> " '" m m
~
l>
D c .. Q
. c n - 0 ~
Q.
~
Is '" ...
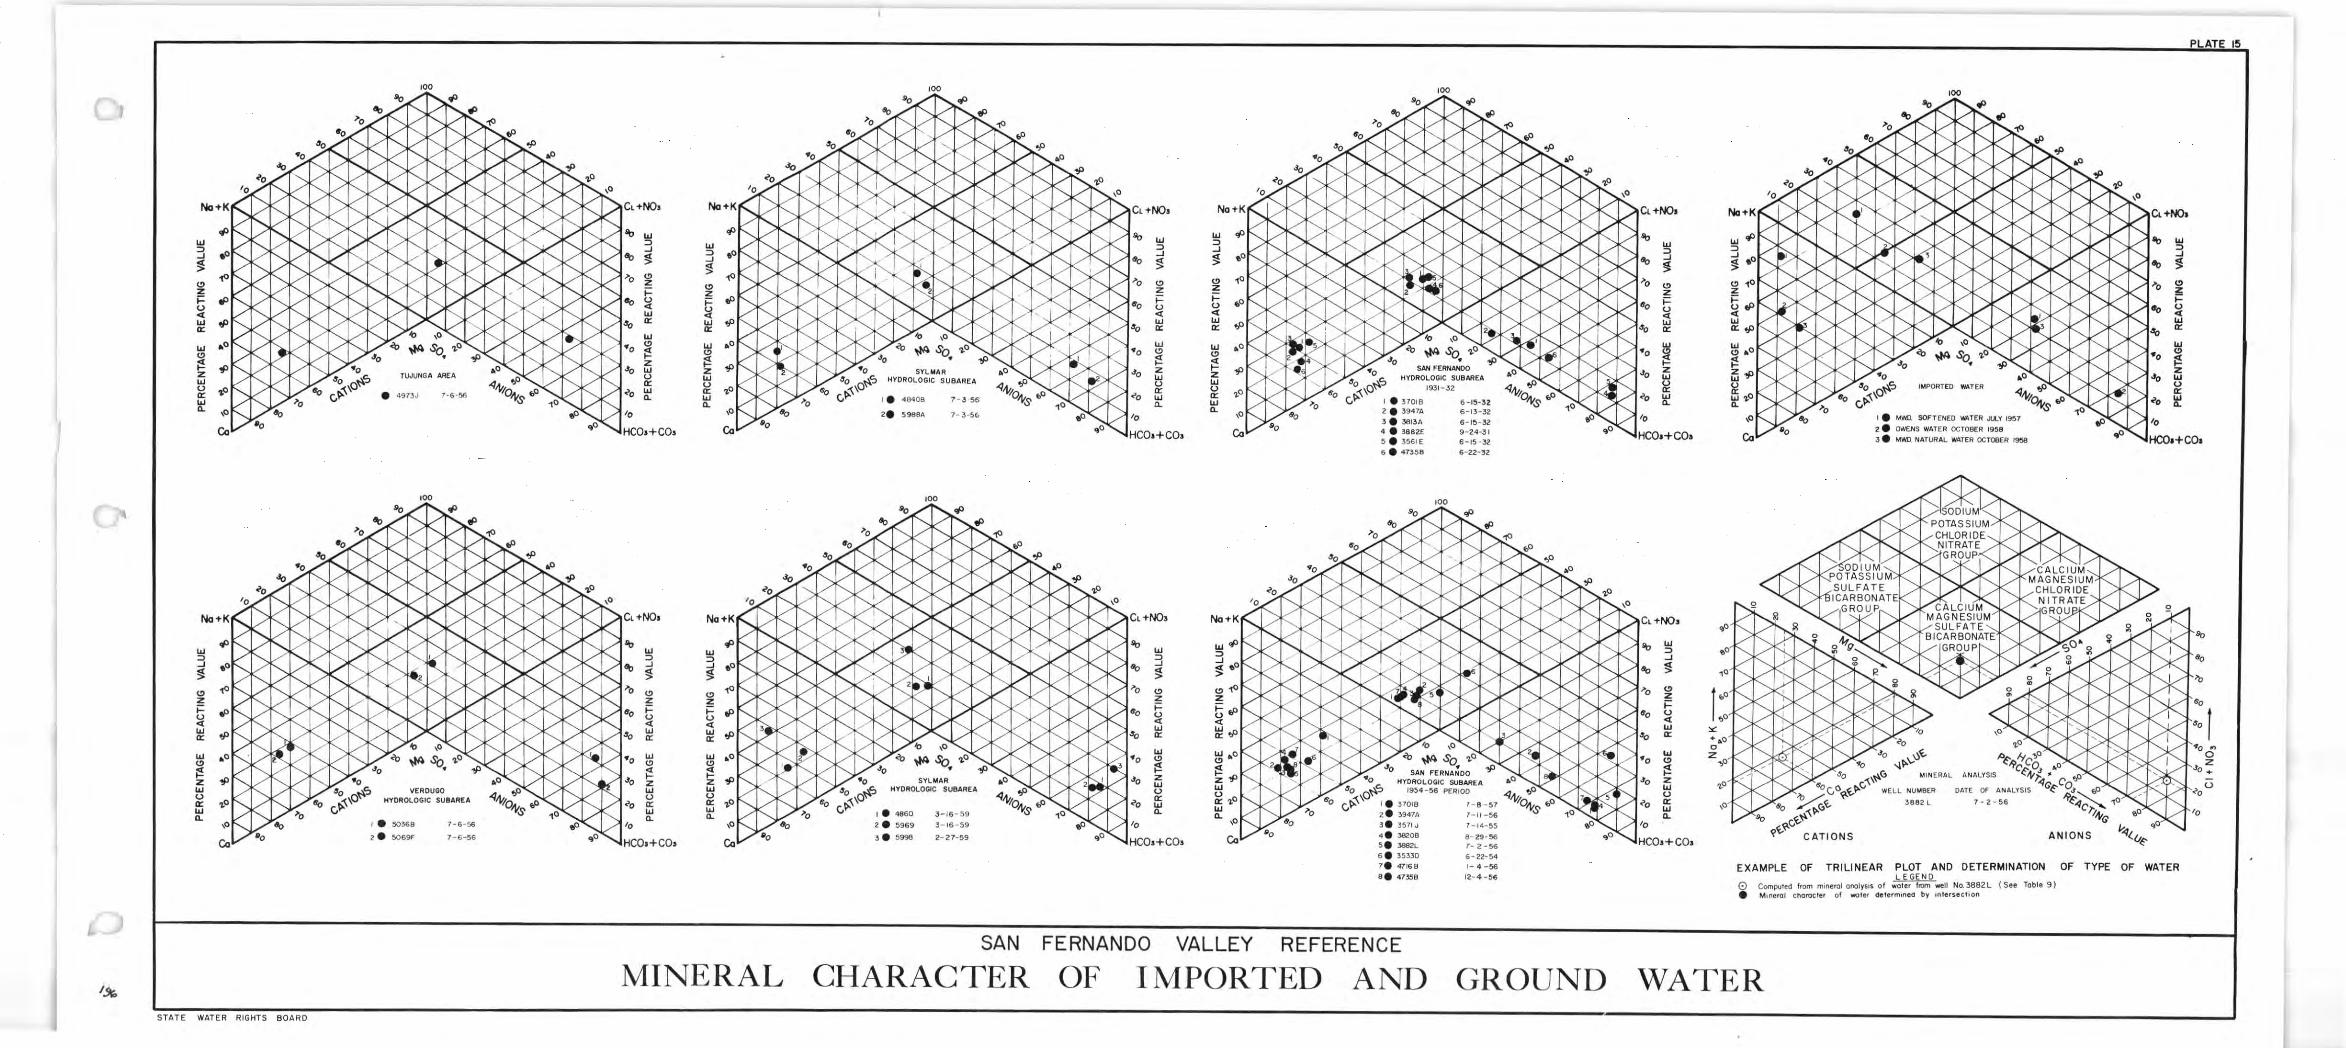
'.%
w :3 ~ <!> Z ;:: <>
"" W 0:
W <!> ;! Z W <> 0: W 0.
w :3 ~ <!> Z ;:: ~ i:! W <!> ;! Z W <> 0: W 0.
.p
.., ,0
Co
.p
~o
,0
Co
~ '0
~ '0
STATE WATER RIGHTS BOARD
100
~ '"
'0 .p
TUJUNGA AREA
• 4973J 1-6-56
100
~ '"
'0 .p <0
'0 ~? (,.;\0
VERDUGO HYDROLOGIC SUBAREA
t • 50368
2 . 5069F
7 ~ 6 - 56
7-6-56
,0 , .p
4~/O~S tP
,0 , .p
4~/O~S tP ,0
tP ,0
CL+NO,
.., ~ ...J
~ ~
>0 ~ ;:: .., ~ W 0:
W <!>
'0 ...
lz "" w <>
0: C""O If ' 0
HCO.+CO.
Ct +NO,
.., w :::> ...J
~ ~ '0 <!>
Z
eo t; ... w
"" 0:
·0 ~ ;!
'0 z t!
c""o ffi 0.
'0
HCO.+ CO.
w 3 .0 ~
~ <!>
~ ,p ~ i:! .p
~ .Q
;! Z W <> 15 0.
.p
,0 .p
Co
Na~K
'" w :3 .0 ~ <!> ~ z t til ... i:! .p
w ,0
~ lz .p w <> ~ 1.
0
0. ,0
Co
'0
'0
'0 '0
MINERAL
100
.., tP
~ SO ~o • .p
· 0 SYL MAR " 0 ~S HYDROLOGIC SUBAREA ~\O
c,po.: ' . 48408 7 - " '56
2. 5988.0. 7 - 3 -56
100
~ SO ~o • .p
SYLMAR HYDROLOGIC SUBAREA
2 . 5969
3 . 5996
3-16-59
3- 16 - 59
2- 27- 59
tP
,0
,0
,0
tP .p
,0
,0 , .p
4~O~S tP ,0
CL +NO,
..,
.., '0
'0
"" ' 0
'0 '0 '0
w :3 ~ <!> Z ;:: ~ W 0:
'" <!> ;! Z W <> 0: W 0.
HCO.+CO.
CL+N03
..,
.., '0
'0
"" ' 0
'0 '0 '0
w :3 ~ <!> Z ;:: ~ W 0:
w
'" ;! z w <> 0: W 0.
HCO.+ CO.
w :::> ...J
~
<!> Z ;:: <> ... W 0:
'" <!>
;! Z W <> 0: W 0.
<I'
,0 ,0
tP
.p
,0
.p
,0
,0
Co
Na~K
w<l' :::> ...J ~ .0
<!>~ z ~tP ... w o:.p
~ . 0
;! z.p w <> 0: ,0 W 0.
,0
Co
'0
FERNANDO VALLEY
100
"0
.. SAN FERNANOO " 0 5 HYDROLOGIC SUBAREA
~~\O~ 1931-32
c,i>- ' . 37018 6-15-32
' 0 ' 0
2 . 3947.0. 6-13-32
" . 3813.0. 6 -15 - 32 " • 3882E 9-24-] I :I . 3!i6IE 6-15 - 32 6 . 473 5 6 6-22-::12
100
'0 /"'t'-... <I' .., '0
, 0
,0
./
/'
/
'0 ·0 HYDROLOGIC SUBAREA
30 O~c;, 1954 -56 PERIOD
(,~'I. ' . 31018 7 - 8 - 57 2 . 3947.0. 7- 11-56
' 0 3 . 3571J 7 - 14- 55 ,0 ' 0
" . 38206 B- 29- 56 . 0 5 . J882L 7- 2:-56
6 . ~533D 6-22-54 7 . 4716B 1- 4 -56
B . 47~B 12-4-:16
REFERENCE SAN
CHARACTER OF IMPORTED AND GROUND
,0
,0
Ct +NO,
.., w :3
~ ~ '0 <!>
Z ;::
'0 u ... w
"" 0:
·0 ~ ;!
.to ~ ~
'0 W 0.
' 0
HCO.+CO.
CL +NO,
..,
.., '0
'0
""
w :::> ...J
~
<!> Z ;:: <> ... W 0:
·0 ~ ;!
'0 z w <>
.?o ffi 0.
'0
HCO.+CO.
PLATE 15
100
Na~K c..~NCn
, 0
. 0 '
,0
r .0
,0
"" +,0 o
Z .• p
,0 ,0
w<l' :::> ...J ~ .0 l1~ ;:: !;loP W o:.p
W <!> ,0
;! ~.p IE ~ ~o
,0 .., ' 0
'0
'0 ~? '0 .., (,.;\0
IMPORTED WATER
I . MYt1l SOFTENED Wo\TER ..u...y 19!H
2 . OWENS WATER OCTOBER 1958
.., ~
'0
.., ~
w :::> ...J
~ <!> Z ;:: <> ... W 0:
W <!>
·0 t! z
"" t! 0: ~o ~
'0
Co :5 . M'Ml NATURAL WATER OCTOBER 1958 tP HCO.+CO.
2 g
~ ~
,0 .to \,)~ j:J Iy~O
" -l~" ~~C Co ,0 "0 \~G MINERAL ANALYSIS ~"'l. .. .p
"-b ftoc.()~~~c,"\ WE LL NUMBER DATE Of" ANALYSIS 4G'e-CO,r .......... EP
60 Xi(... 3882L 7-2-56 1»~4c':--"" ~ '''0 ~",~I>' Jf"'G ,p ~ k
q CATIONS ANIONS ;q(lt~
EXAMPLE OF TRILINEAR PLOT ANO OETERMINATION OF TYPE OF WATER LEGENO o Computed from mineral analySIS of waler hom well No. 3882 L (See Table 9)
• Minerai ctKlrocler 01 WIlIer delermlned by In lerseclion
.., ."
'l>
:: I 90 0
Z '0 +
u '0 ' 0
WATER
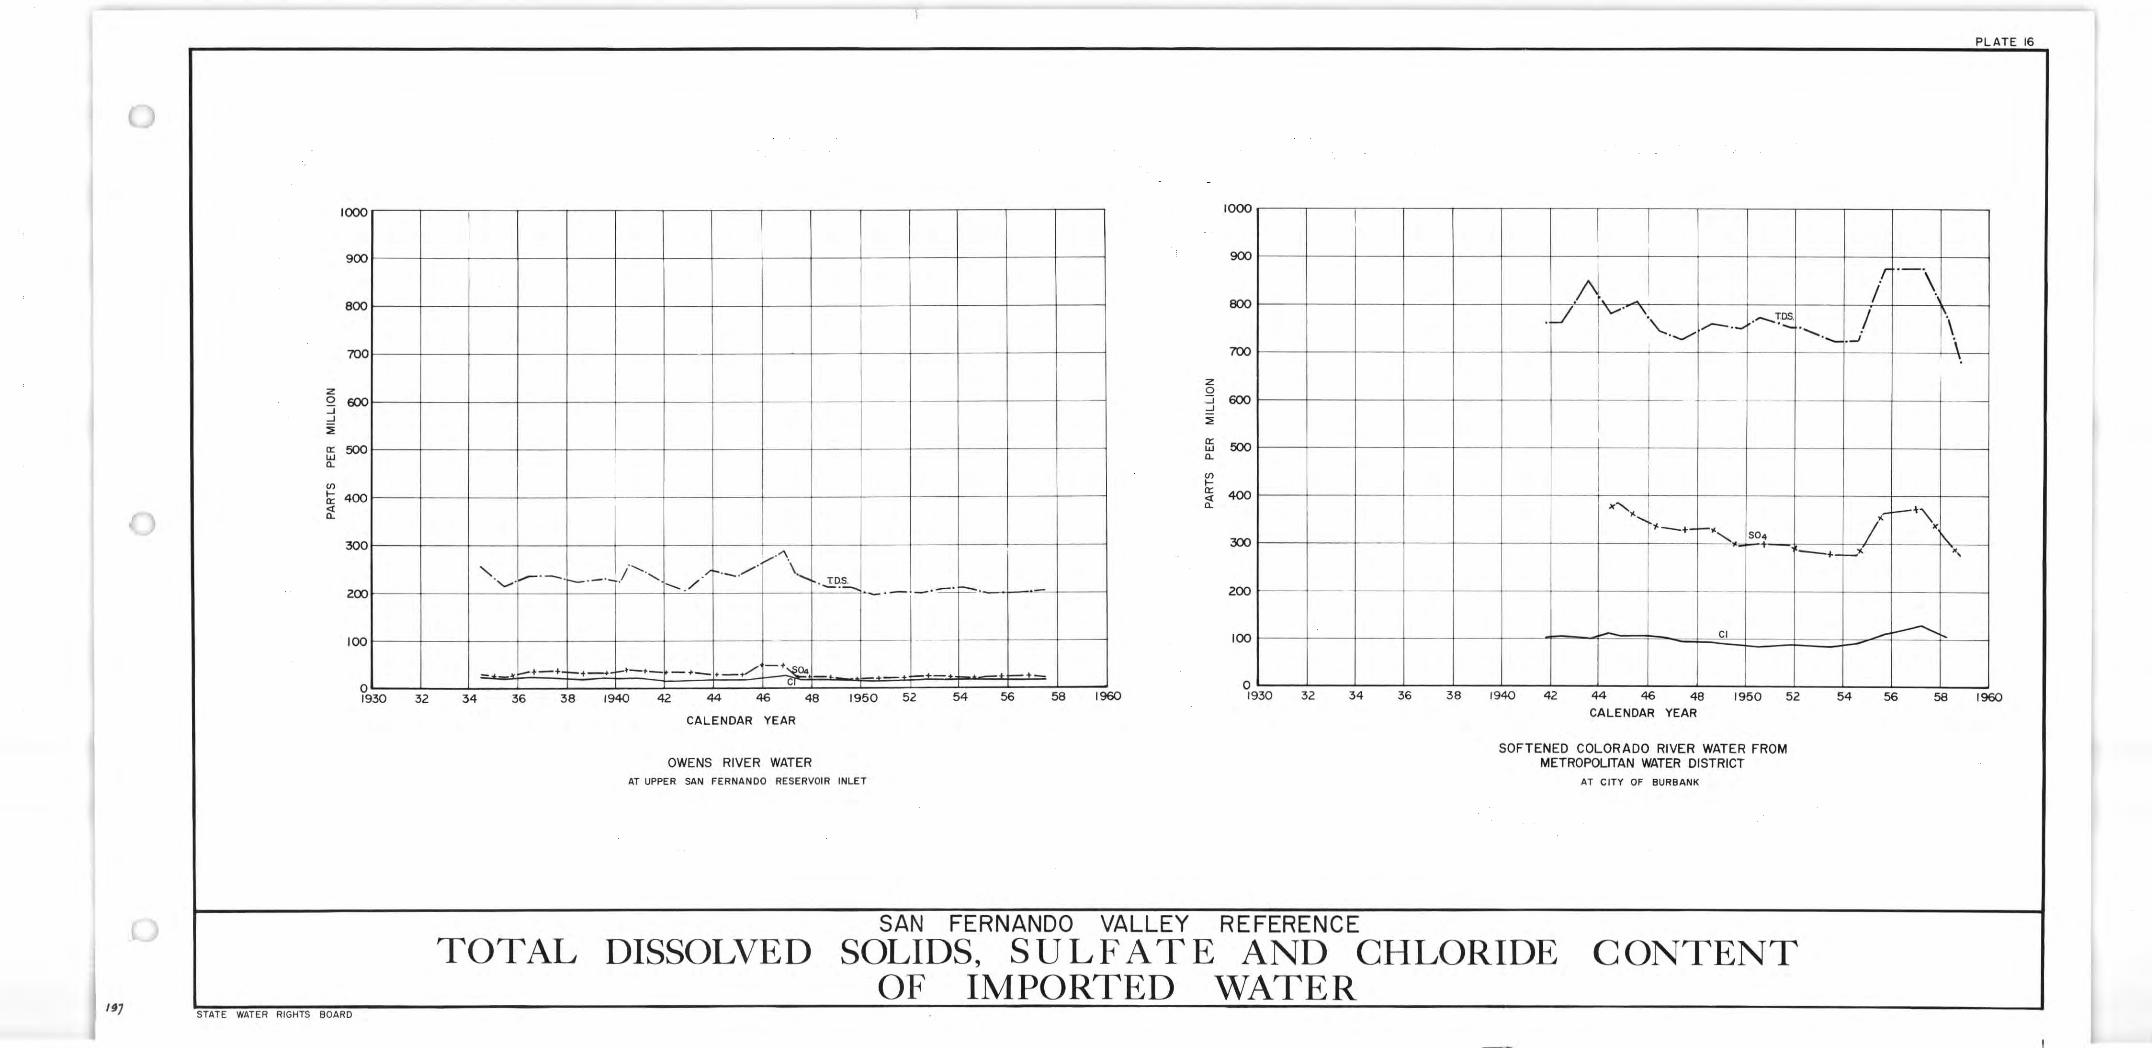
If7
PLATE 16
1000 1000
I
900 900
800
700
800
700
/' I I I I /T-\ .V IV '." .~f~·~·---~~·,.J.j I f1
I z 0 600 ::::; -' :ij
z 0 :J 600 -' ::;;
---j--- + ~--. I
- 1---+--+--+
a: 500 w a.
Ul
Ii: 400 rt
300
20C
a: w 500 a.
Ul f-a: 400 .. a.
:300
200
I I I
I '
W I x'""lt I
4'-+T-" Iso.
I
jth\i __ -f.+-lt "",
I I I "'Vr·~b·-·+/" l,,/t-/r~·>f.~~.- .- ! -.=t=. I .- I I
---100 1--1 --+--------1f---+---+---+--+--t--- -j- ---I--\-- 100 CI ..-
o ' I 01 I -*='f+-·t+-t-·-t-+-I· /r+~1 . ·b· +_t +_.=+:+ 1930 32 34 36 38 1940 42 44 46 48 1950 52 54 56 58 1960 1930 32 34 36 38 1940 42 44 46 48 1950 52 54 56 58 1960
TOTAL
STATE WATER RIGHTS BOARD
CALENDAR YEAR
OWENS RIVER WATER
AT UPPER SAN FERNANDO RESERVOIR INLET
SAN FERNANDO VALLEY REFERENCE
CALENDAR YEAR
SOFTENED COLORADO RIVER WATER FROM METROPOLITAN WATER DISTRICT
AT CITY OF BURBANK
DISSOLVED SOLIDS, S U L FAT E AND CHLORIDE CONTENT OF IMPORTED WATER
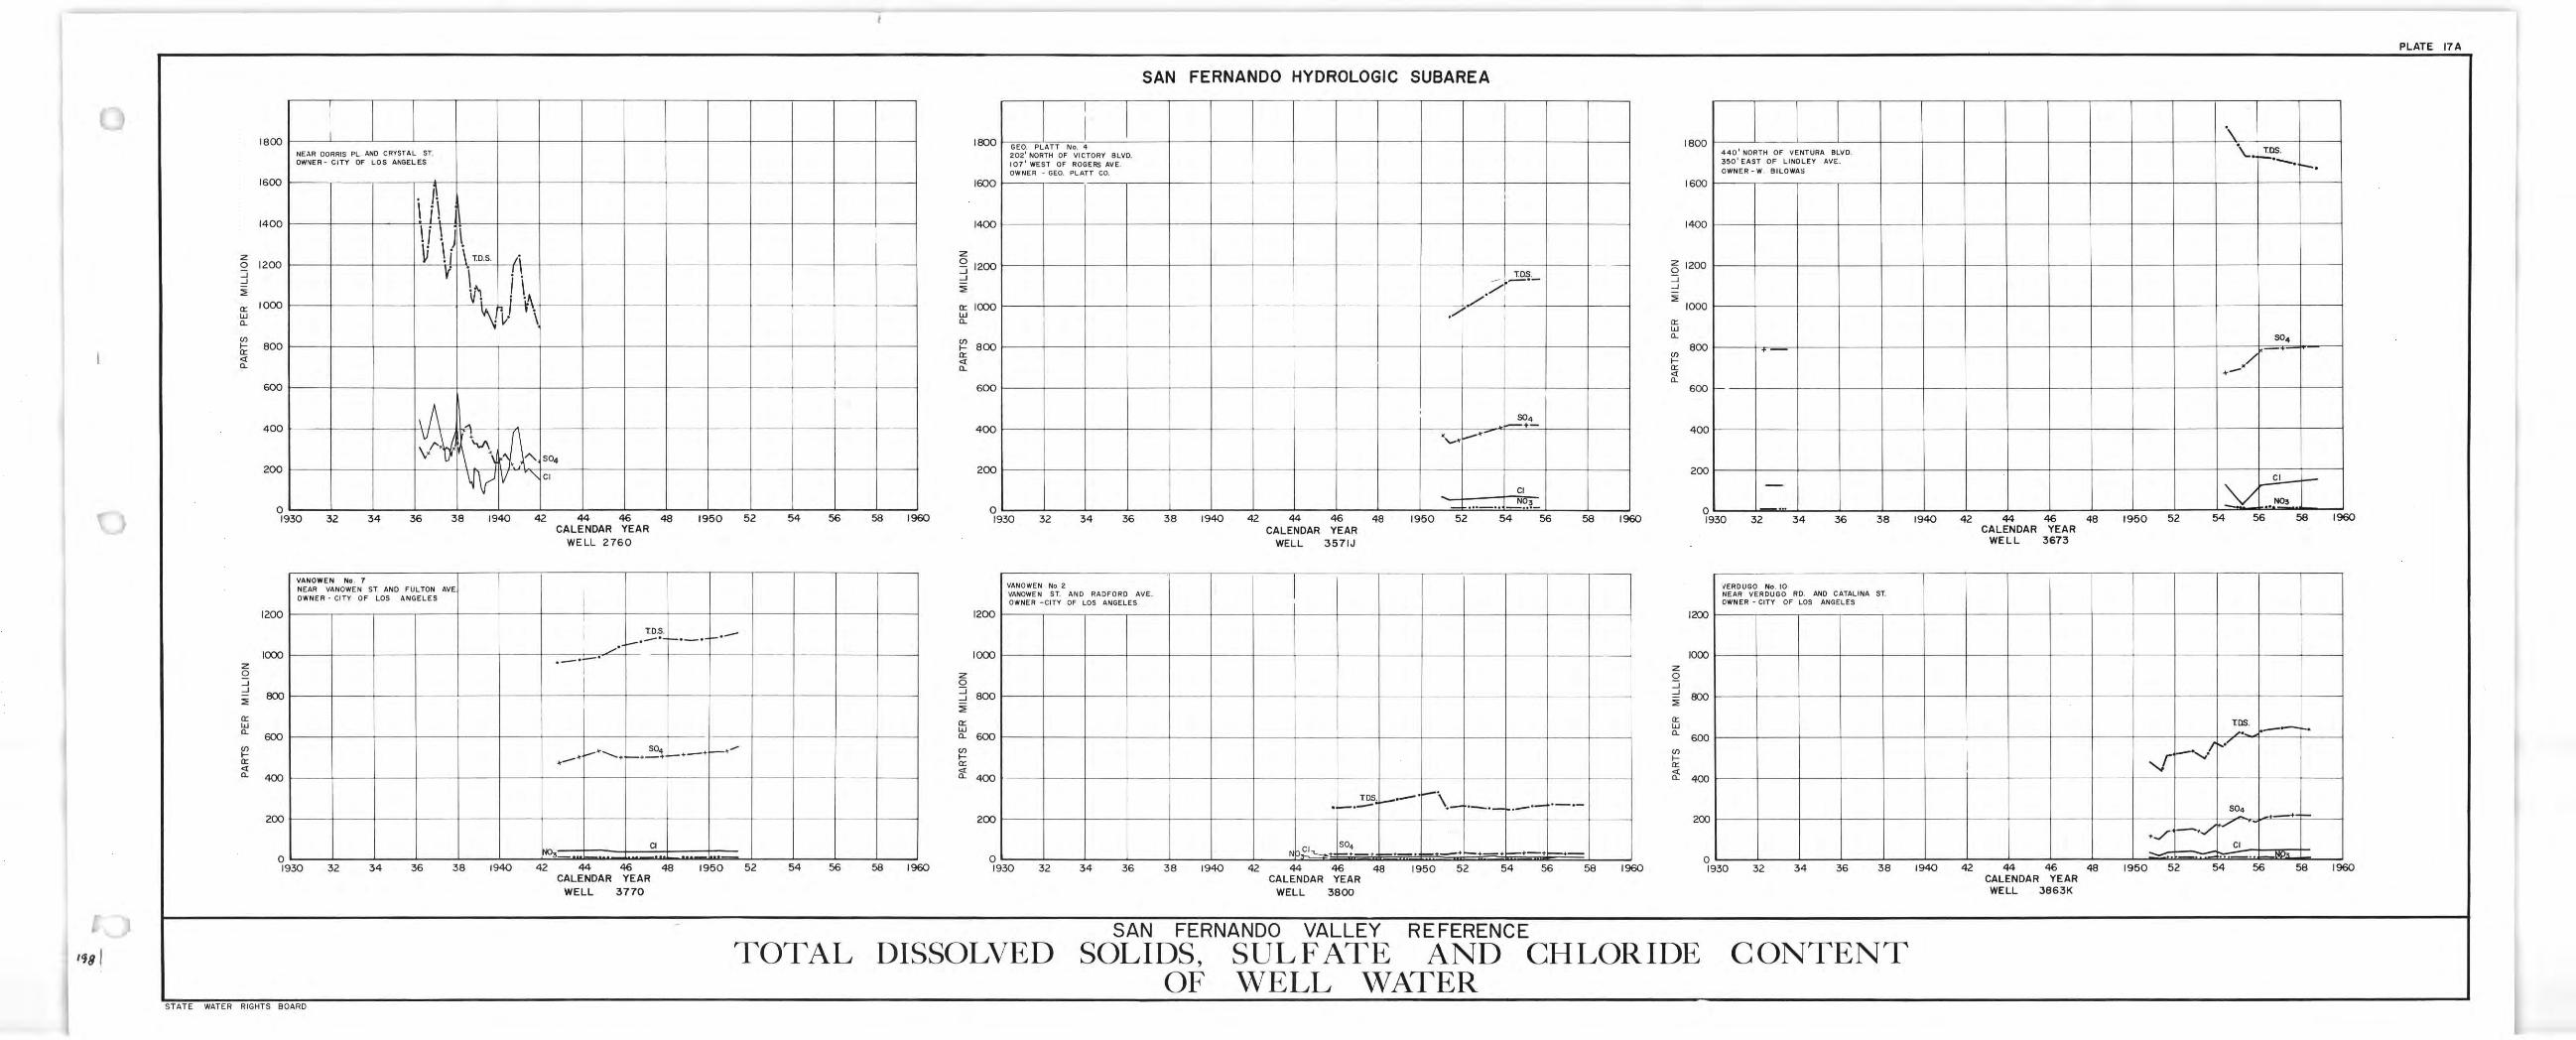
/98 1
z 0 :J --'
" 0:
'" "-U) t-0:
" "-
z Q --' -'
" 0:
'" "-
~ 0:
" "-
1800~1--~----L---L---4---~---+----~--+_--4_---+---4----~--+---4---~
1600
1400
1200
1000
800
600
400
200
NEAR DORRIS PL AND CRYSTAL ST, OWNE R- CITY OF LOS ANGELES
. ~ \ . \ /.
I \ { I I I I I I I J V \~ ' r~ ---+---.~ \f~! . \
II A v L1f+
1 \1 ttr\ ~~, ,,,,", J504
~VIV CI
I---~ 1--
O ~'~--~----~----~----~--~~~--~----~--~~----L---~~----L---~~--~~--~~---J. 1930 32 34 36 38 1940 42 44 46 48 1950 52 54 56 58 1960
CALENDAR YEAR WELL 2760
VAN OWEN No . 7 NEAR VANOWEN 5T AND FULTON AVE OWN ER· CITY OF LOS AN GELES
1200 ~I ----,----,---,---4----+---4----t__--+_---j----+----II----t_--4----j---__j
~~+-.-+.-I I I I I I I '-'r' -<t · 1000
800
600 • __ +_.--....1--. SOtj-._·t-,/ 40C
200
CI
0 1930 32 34 36 38 1940 42 44 46 48 1950 52 54 56 58 1960
CALENDAR YEAR WELL 3770
SAN FERNANDO HYDROLOGIC SUBAREA
IBOO , GED. PLATT No. 4 202' NORTH OF VICTORY BLVD. 107' WEST OF ROGERS AVE. OWNER - GEO. PLATT co.
1600
1400
z Q 1200 -' --- + 1 U)~ __ 1 1- --'
" 0:
'" "-
U) t-o:
" "-
1000 ./
800
600
/rL ·
so. I ~ ..... -1=+- 1 400
1 ~ 200~1--~--~--~--~--~--~--~--~--~--~--~--~--~--~--__j
CI NO, o I =t... ..~ .. ,
1930 32 34 36 38 1940 42 44 46 48 1950 52 54 56 58 1960
VANOWEN No.2 VANOWEN ST. AND RADFORD AVE . OWNER -C ITY OF LOS ANGELES
CALENDAR YEAR WELL 3571J
I 1200 1-1 ----,------,----,----+---t---t-------1r------1---t---t---+---+----t----t-----1
1000 I I ----1
~ 6OO,±P=R=++iJ-bll1i--~r ....• ~ 0:
it 400 I
200 I I I I I I I I ·k~t·-t\=+-·i·-·i-· I I o I rP~'b; .L .6.-.1-. ok· += 1930 32 34 36 38 1940 42 44 46 48 1950 52 54 56 58 1960
CALENDAR YEAR WELL 3800
1800 I 1 1 1 I I i I I 1 I I I \~f~~L. I 440' NORTH OF VENTURA BLVD. 350 ' EAST OF LINDLEY AVE . OW NER - W. B ILOWAS
1600 1~--,----,--_,----+_---+---4----+_--~---4----+_--_+_--~----t_--_+_--~
1400
a 1200 :J -'
" 0:
'" "-
U) t-o: " "-
z Q -' -'
" 0:
'" "-
U) t-o: it
1000
800
600r
400
200
0 1930 32 34 36 38
VERDUGO No. 10 NEAR VERDUGO RD. AND CATALINA ST. OWNER - CITY OF LOS ANGELES
1940 42 44 CALENDAR
WELL
so.
.-./
CI
NO> Iv 46 48 1950 52 54 56 58 1960 YEAR
3673
1200~I--_,----,_---r--_,----+_--_r--~----+_--_+_--_+----r_--4_--_+----t__~
1000~1--4---t-_4---+--_t_--t-____1--_+--_+_--+-____1--_+--_+_--+-~
800
600
400
200
0 1930 32 34 36 38 1940 42 44 46 48
CALENDAR YEAR WELL 3863K
1950
TOS. ~.
-..J --......I!-...
so.
• ../1--....'1--" CI
52 54 56
-,J.-.
58 1960
TOTAL DISSOLVED REFERENCECHLORIDE SAN FERNANDO VALLEY SULFATE AND WELL WATER
SOLIDS, OF
CONTENT
STATE WATER RIGHTS BOARD
PLATE /7A
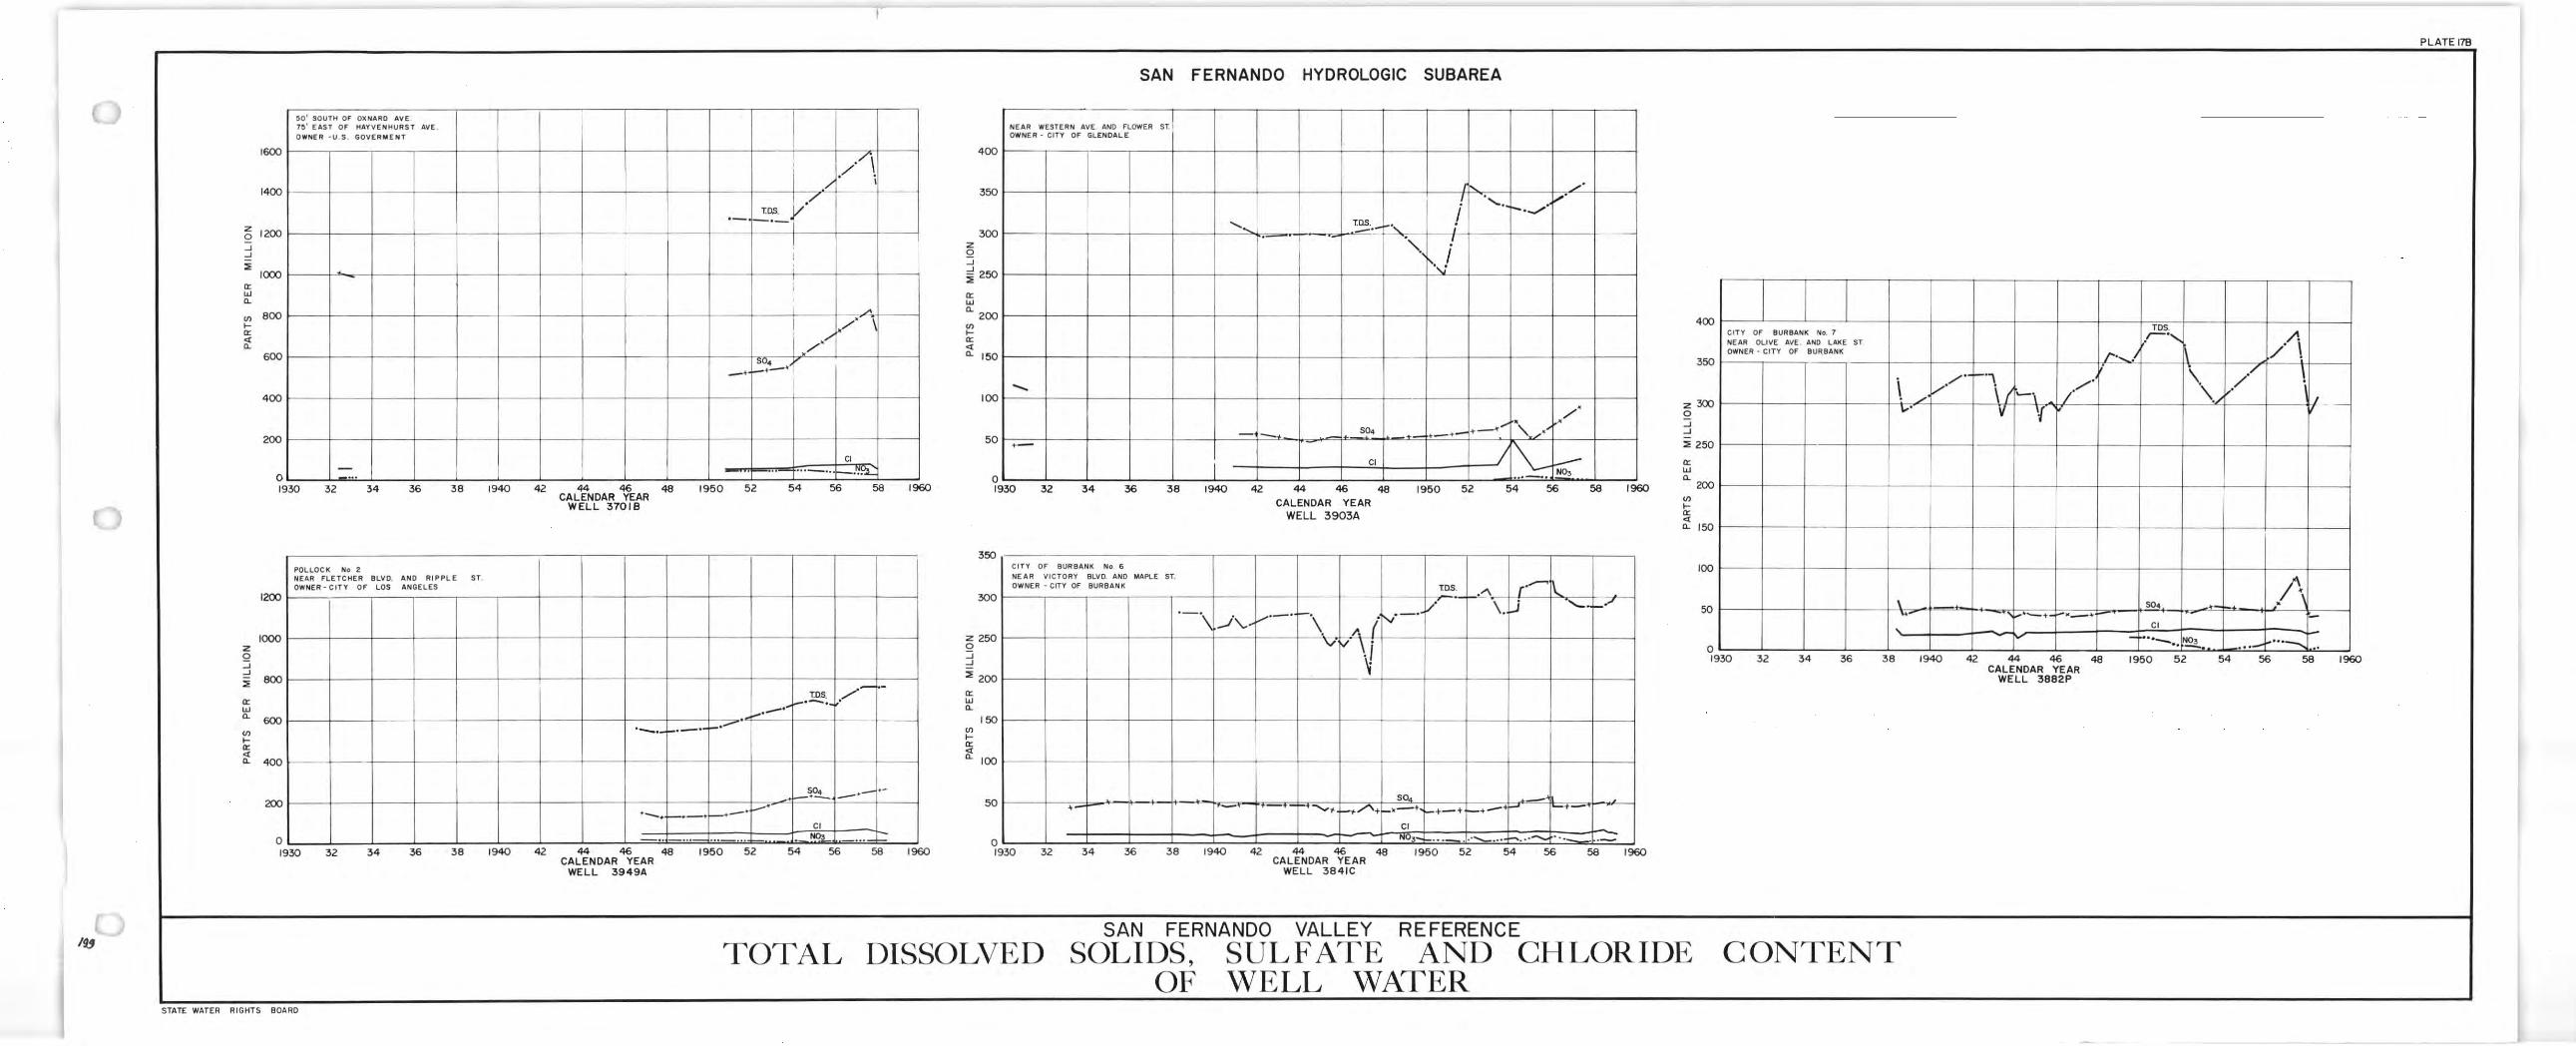
191
1400
!iO' SOU TH OF OX NAR O AV E 7:1 ' E AST OF HAY VEN HU RS T AVE. OWNER - U. S . GOV ERMENT
1 1 1 1 I i /J/7\1 1 ~ 1200
~ I I I I I I I I I I I _t=~ V-I I I I I I I I I I I I I I
...J
...J
::Ii 1000
0: OJ 0. VI 800 .... 0: « 0.
A
1./ //
600 ~o .. )'
_ + t-~ :
400 1~_+--+_~--~--+-_+--~--r-_+--~--~_+--+_~--~
2OO 1~__I-----+--_+--_+---r--_r--~--__+_--+_--+_~--_+--_+--_t_--~
01 I .... I t-",--+,,-,,-E.~ 1930 32 34 36 38 1940 42 44 46 48 1950 52 54 56 58 1960
CALENDAR YEAR WELL 37018
POL LOCK No 2 NEAR FLETCHER BLVD. AND RI PPLE ST. OWNER - C ITY OF J nc: b.Nr. I".I" C;
1200~I --~--,---,---,---,---~--r---i--~---+---+---r---r--~~
1000~1 --~--+---r-~r--+---r--~--~--+_~r-~--_+--_r--+-~
~ :1 1 1 1 1 1 I 1 IJJ.-l-f"-t/t I ~ 400 1 I I I I I I I I I I I I I I I
200 I I I I I I I I I .-.L-.~.-.f> ~~-·1·· I o I .J ... ;;1... ...L L~i. wi: 1930 32 34 36 38 1940 42 44 46 48 1950 52 54 56 58 1960
CALENDAR YEAR WELL 3949A
SAN FERNANDO HYDROLOGIC SUBAREA
I /' I
i T.US_ . .J-., _ t-i I ,--I - . t-"." . I -~--~-t--t-_tt~-'I~·==·],==J__ . I ~ '-.j
'-. .y . .j... T7 . .../
I'~ I el l I I li +_+-1+--,1\, L./' _ 'w ..... " 50
1 +- 1 I -r so,
0 1 I I 1930 32 34 36 38 1940 42 44 46 48 1950 52 54 56
CALENDAR YEAR WELL 3903A
58 1960
350 ,---------------,---,--,---,---,---,---,---,---,---,---, CI T Y OF BURBANK No. 6 NE AR VICTORY BLVC. AND MAPl.E ST. OWNER - CITY OF BURBAN K
300 I I· ·~j~t·-l\ I r _·yT.US;t-""df;-"'I'-',-i-r-1\ (
Z 25T I I I I I I I vr \ ' too . ~ I I I I I I I 0: OJ 0.
150rl --+--+--~--r--+--~~'--r--+-~--~--+-_+--~~
VI t==t=~--+=~--i---~-t--t- t==~~=::t==~=+~ .... ~ 0. ,00 1
5: I I 'j ' I ' I' . 1'-' l' ·t~·t~l·:l~:.t~t.l .. j~ I 1930 32 34 36 38 1940 42 44 46 48 1950 52 54 56 58 1960
CALENDAR YEAR WELL 38 41C
SAN FERNANDO
~ 300 i ,/ '\
I I I I I I ii i I i I 0: OJ
0.200rl ~--+-~-+--~~-r~--+-~-+--~~-+~ VI
t;: ~ 150 t-I --_r----+---+_--+---+_--r-__�-----+--_+- -+----j---1---1-------jr----i
:1 1 I I I ~ 1930 32 34 36 38 1940 42
,.-+~.-.
44 46 48 CALENDAR YEAR
WELL 3882P
so. /\ CI
+··-.. l~. ... -.....J .•
1950 52 54 56 58 1960
TOTAL DISSOLVED SOLIDS, OF
REFERENCECHLORIDE VALLEY SULFATE AND WELL WATER
CONTENT
STATE WATER RI GHTS BOA RD
PLATE 178
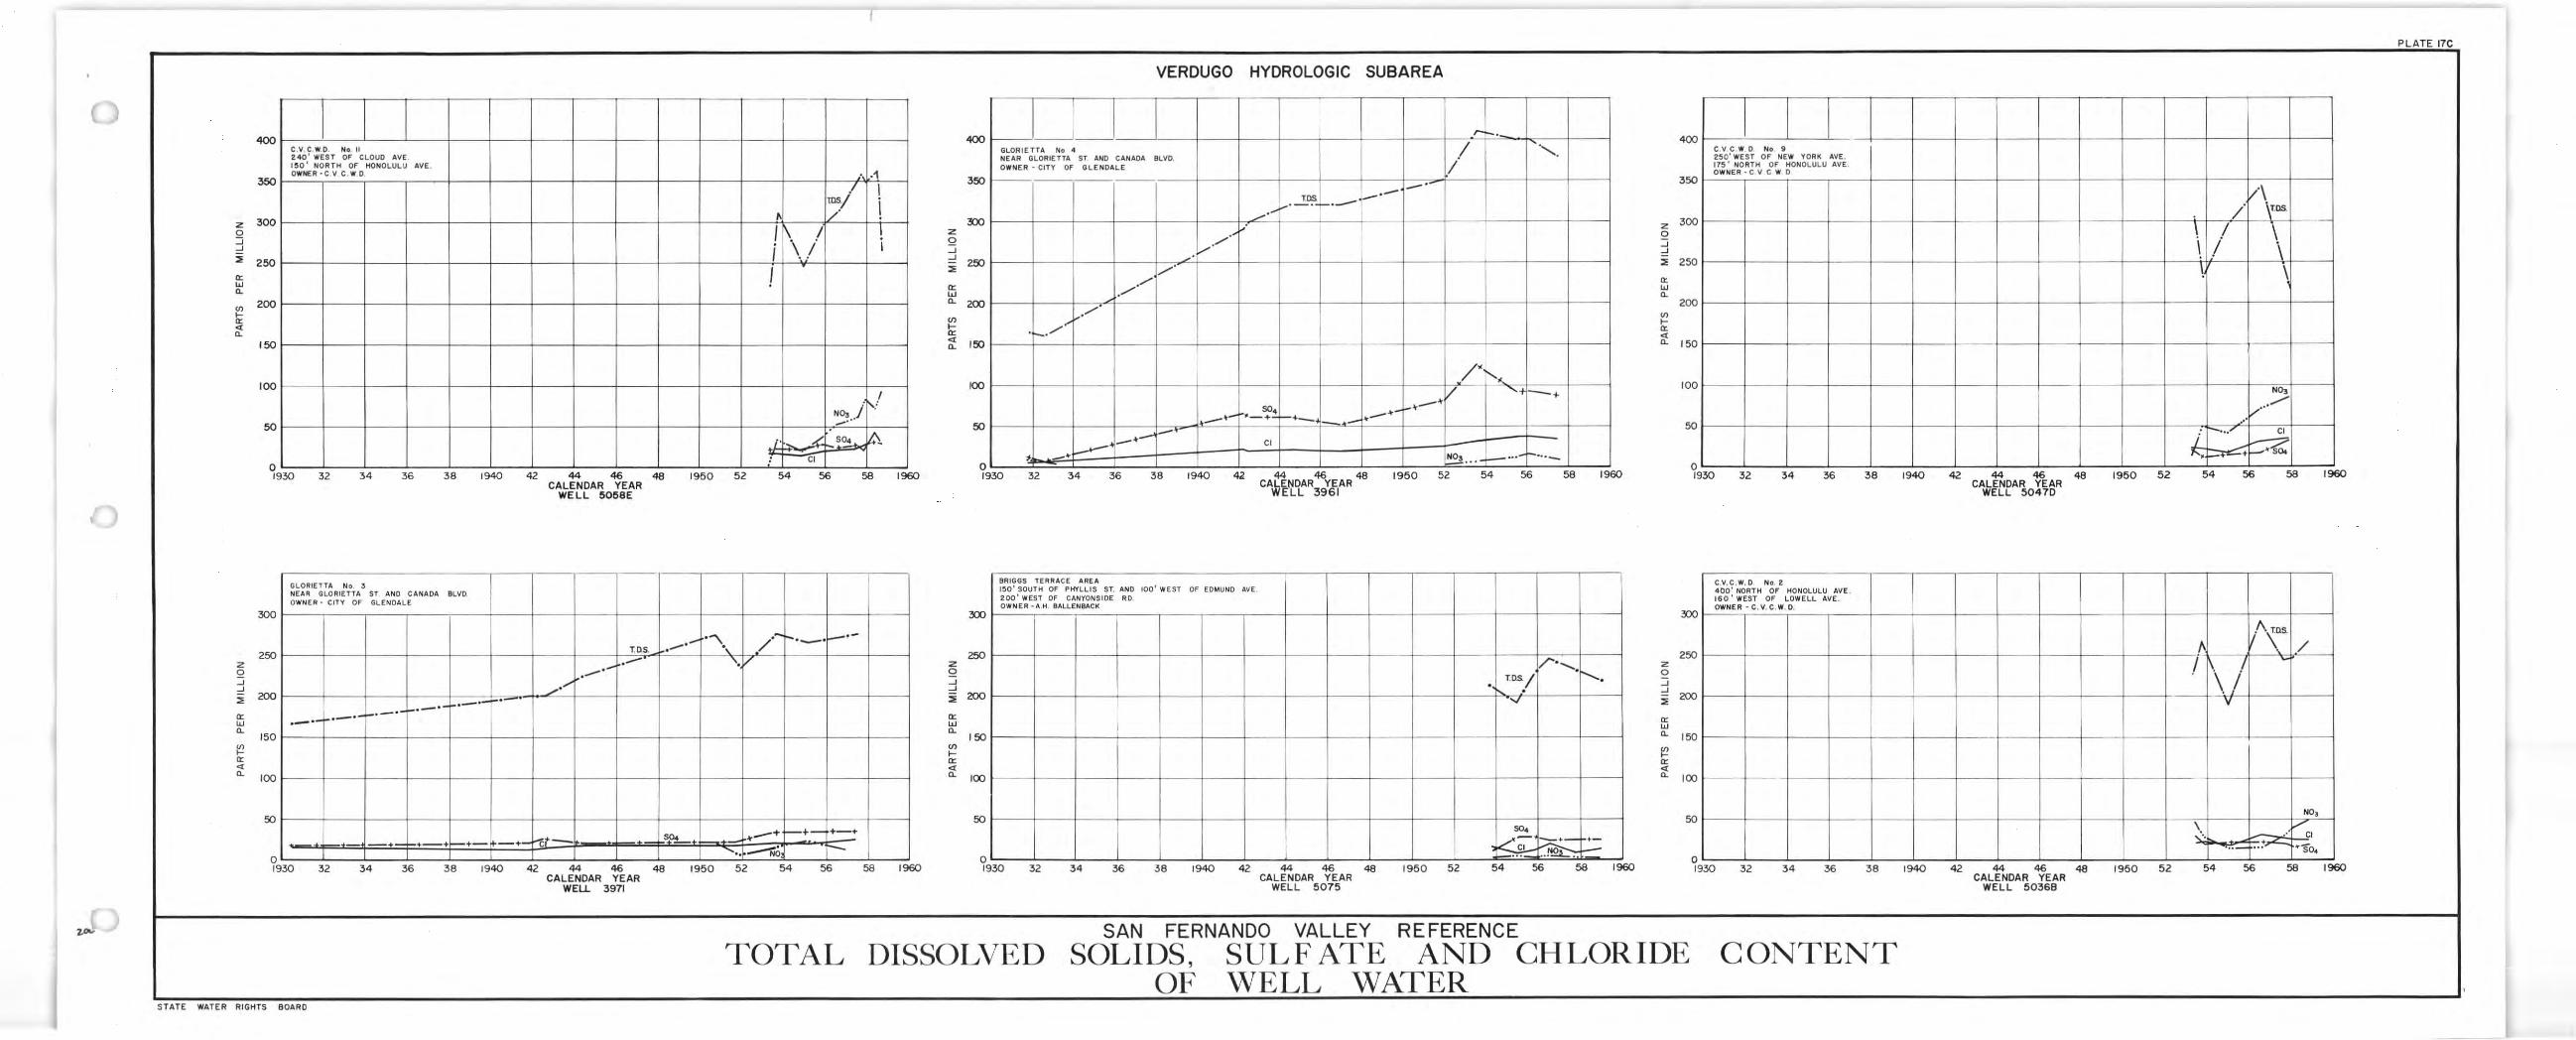
z.oo;
0: W Q.
12 0: .. Q.
100 I I I I
1 1 1 1 I 'f'.' NO, J .
50 1 1 1 1 1 1 1 _ ".
1 1 1 1 1 tf~ ' So. It0. o 1 1 1 1 1 : CI
1930 32 34 36 38 1940 42 44 46 48 1950 52 54 56 58 1960 CALENDAR YEAR
WELL 5058E
GLO RIETTA No. 3 NEAR GLO RI ETTA ST AND CANADA BLVD. OWNER - CITY OF GLENDALE 1 ~~~~~~~-+-t-i-l!-~~4:1 ' 1 =~
250 I I 1 1 1 1 1 1 L~~f.-·i·-'\.~/=r-·~·- I 1
150 1-1 -+--+___+--I----j--+--I- -I---t---t---1--+-_+_-+---1
loorl ---r---r---r---r---r---r---r---r---r---r---r---r---+---+--~
501-1 -+---1--I----j--~-+--t--t-__+-_+_-+_--1--I--+-__1
J + +_. j .+. +-. t .+t-f + 1 t 1 \0.'1 st::::;P'T+ I 1930 32 34 36 38 1940 42 44 46 48 1950 52 54 56 58 1960
CALENDAR YEAR WEll 3971
z Q ..J ..J
:0;
'" W Q.
(f) I-
'" ex Q.
z Q ..J ..J ,. '" W Q.
(f)
I-0: .. Q.
VERDUGO HYDROLOGIC SUBAREA
GLOR IE TTA. No " NEAR GLORIETTA ST. '''10 CANADA BLVO. OWNER - CITV OF GL ENDAL.E
4001 I I I.----J 1 1 1 1 1 1 1 / t '- 1'", 1 1 /
3501 I_ ..... r
=
250 1// 200
./
./ 150
J/
y 1---'''''''''
L.,..-_. -~--.--tOS~ ...,..,..:. ....-r • I
/'1'.." ....... -+1--+
:1 L.kJ-+-t-llt·fT-LLLI 1
100
1930 32 34 36 38 1940 42 CA~NDAR 46YEAR 48 1950 52 54 56 58 1960
WELL 3961
BRIGGS TERRA CE AREA 150' SOUTH OF PHYLLIS ST. AND 100 ' WE ST OF ED MUND AVE 2 00' WEST OF CANYONS IDE RD.
3CO I OW NER -A ,H. BALLENBACI(
250
200
1/,'--... Tos/I 'I'-, 'v
1501r---~--~--~--~--~--~--~--~--~--+_--+_--+_--1----+_~
1001I--__+--I--+--t--4--+--4--+---1--+-_+_-+--I--__+-~
~I I I I I I I I I I I I ~ I 1930 32 34 36 38 1940 42 44 46 48 1950 52 54 56 58 1960
CALENDAR YEAR WELL 5075
4001-1 --~---L---L--~--~--~--~--~--~--~--~--~--~--_+--=i c .... C .W. O. NO. 9 250' WEST OF NEW YORK AVE . 175 ' NORTH OF HONOLULU AVE .
350 I OWNER -C .V C W O
~~ M 3 . /~ >E 2SO -\! \ ---1
'" W Q.
\ ! \ I. \ l
20011---+---r--+---t--4---+---t---+--I---+---I---+---1---+--~
~ 150 1L--l--~--+---~~--_+--i_--t-_1--_t--_!--t_--j=~--~
':1 1 1 1 1 1 1 1 I I I I lEI I 0' [ I I I I I
1930 32 34 36 38 1940 42 44 46 48 1950 52 54 56 58 1960
C.V. C.W. D. No. 2 4 00' NORTH OF HONOLULU AVE . 160' WEST OF LOWELL AilE .
300 I OWNER - C.V. C. W. O.
CALENDAR YEAR WELL 50470
~ : 1 1 1 1 1 1 1 1 1 1 1 1 ([vfl ~ ISO It ==t==t==~~--+--t--t--f--i--i--~=1==J===~ 12 0:
~ lOO t--
50 11---+---I---+--1---r--+-~1__-+----j---+_~ ~~ .. ,P-:' .... :+;:z:::Fio~
56 58 O'L-__ -J ____ -L ____ ~ __ ~L_ __ ~~--~-----L----~--~L---~----~----~--~~--1930 32 34 36 38 1940 42 44 46 48
CALENDAR YEAR WELL 5036B
I~OU O£ 0"
I 1960
TOTAL DISSOLVED SAN
SOLIDS, OF
FERNANDO VALLEY SULFATE AND WELL WATER
REFERENCECHLORIDE CONTENT
STATE WATER RI GHTS BOARD
PLATE 17C
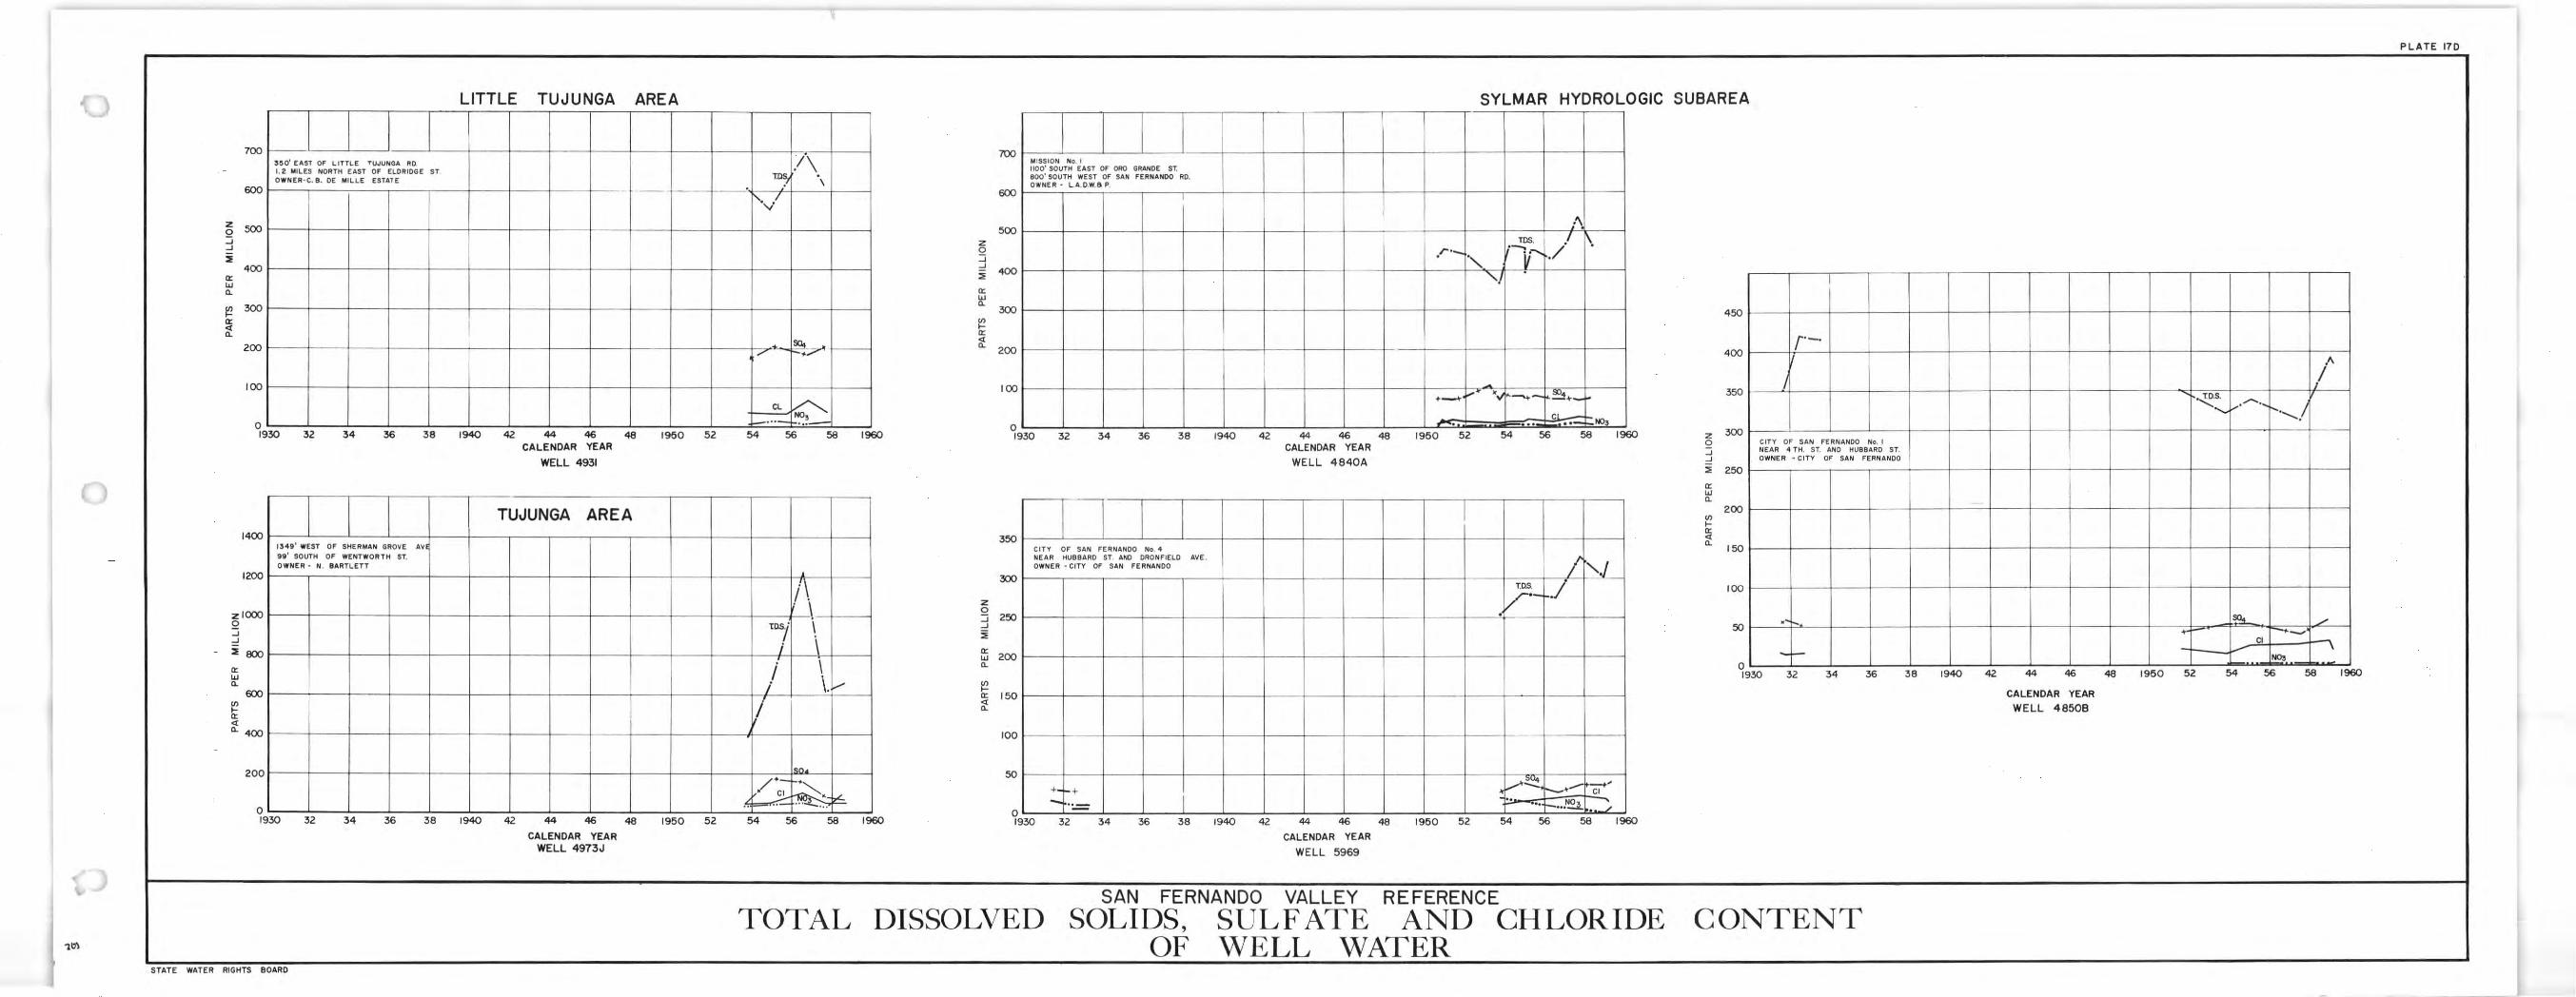
"1111
z 0 :::; ..J
2'
0:
'" Q.
~ 0:
'" Q.
LITTLE TUJUNGA AREA
5S0' EAST OF LITTLE TUJUNGA Ro. r. 2 MILES NORTH EAST OF ELDRIDGE ST. OWNER- C. e. DE MIL LE ESTAl E
1 I. 1 /\
700 1 _ +_ -+ .k i1 "I . " roo~1 ~~~~~~'--r--t-~-~
500
400
300
200 sa, ./ --r-......
1001r-~--r-~-r-~--+-1--+-~--+-~-+--~-+-~
01 L.~~ 1930 32 34 36 38 1940 42 44 46 48 1960 52 54 56 58 1960
1400 1 I 1349' WEST OF SHERMAN GROVE AV
99' SOUTH OF WENTW ORTH ST. OWNER· N. 8ARTLETT
CALENDAR YEAR
WELL 4931
TUJUNGA AREA
1200 I 1/\ 1 \ I I
z 1000 tll£," \ o i :::; i ~ ..J
0:
'" Q.
i800 i \ I I I i 1.1--- J
===t==t==t=~==~==~-t==i==i==j===~=4t.;~~~ __ ~
. 1 ~ I 1 I ~ I ~ I I I f 1 600 1 I I I I I I I /
it ~I
200
1 I I I I I I I I I I I !/$.t I 0' I I .. ,- ! -." j I
1930 32 34 36 38 1940 42 44 46 48 1960 52 54 56 58 1960
CALENDAR YEAR WELL 4973J
SYLMAR HYDROLOGIC SUBAREA
100 - MISSION No. I HOO' SOUTH EAST OF ORO GRANDE S1; 800' SOUTH WEST OF SAN FE.RHANOO RD. OWHE R ' L .A.D,W.S P. 500 1-1 '-------,'---'----',----,---.
.\ 500 •
z '-'- !~ o r ·o 'r- / :3 . - " V" i~ "I 0:
~ 300
~ '" Q. 200
100 , T ' +--' '-+-4" J 1 1::[ "rJ~~ 1930 32 34 36 38 1940 42 44 46 48 1960 52 54 56 58 1960
350 I~---'----'---'-CITY OF SAN fERNANDO No. "
CALENDAR YEAR
WELL 4840A
1
300 I OWNER · CITY OF SAN FERNANDO 'J NEAR "'BARD ST. AND DRO",IE'D AVE . P + 4
to.: ./ ~ _ I . ..J i
~ 200 Q.
~ a:: 150 it
100
:I t~ I {::t:;;:ts 1930 32 34 36 38 1940 42 44 46 48 1960 52 54 56 58 1960
CALENDAR YEAR
WELL 5969
SAN FERNANDO VALLEY REFERENCE
I
450 1-1-~-+-~--+-~-+-~--+-~-+-~r--T-~-+-~
400 1 1("-' 1 f\
/
350 1 'I I I I I I I I I I i~q:"~·t.".% I z 3OO rl~~~~~~;l--t--t-~--+--t-~L-~~~~jt~r= ~ 250 1 ~ CITY OF SAN FERNANDO No. I
NEAR 4 TH. ST. AND HUBBARD ST. OWNER - CIT V OF SAN FERNANDO
0:
'" Q.
U)
to: it
200~1 --~~--~~--~-+--~-+--+--+--+--+--+--+~
15O~1 --~--r--4---r--~--r-~---r--~--r-~---+--~--r-~
1 00~1 --~--r-~---r--~--r-~---r-~-I--~---+--~--r-~
50 1 -t. I I I I I I I I I +, -t~ CI~-1 / I o I =t J L... I""'" I ".. I 1930 32 34 36 38 1940 42 44 46 48 1950 52 54 56 58 1960
CALENDAR YEAR WELL 48508
TOTAL DISSOLVED SOLIDS, OF
SULF ATE AND CHLORIDE CONTENT WELL WATER
STATE WATER RIGHTS BOARD
PLATE 170
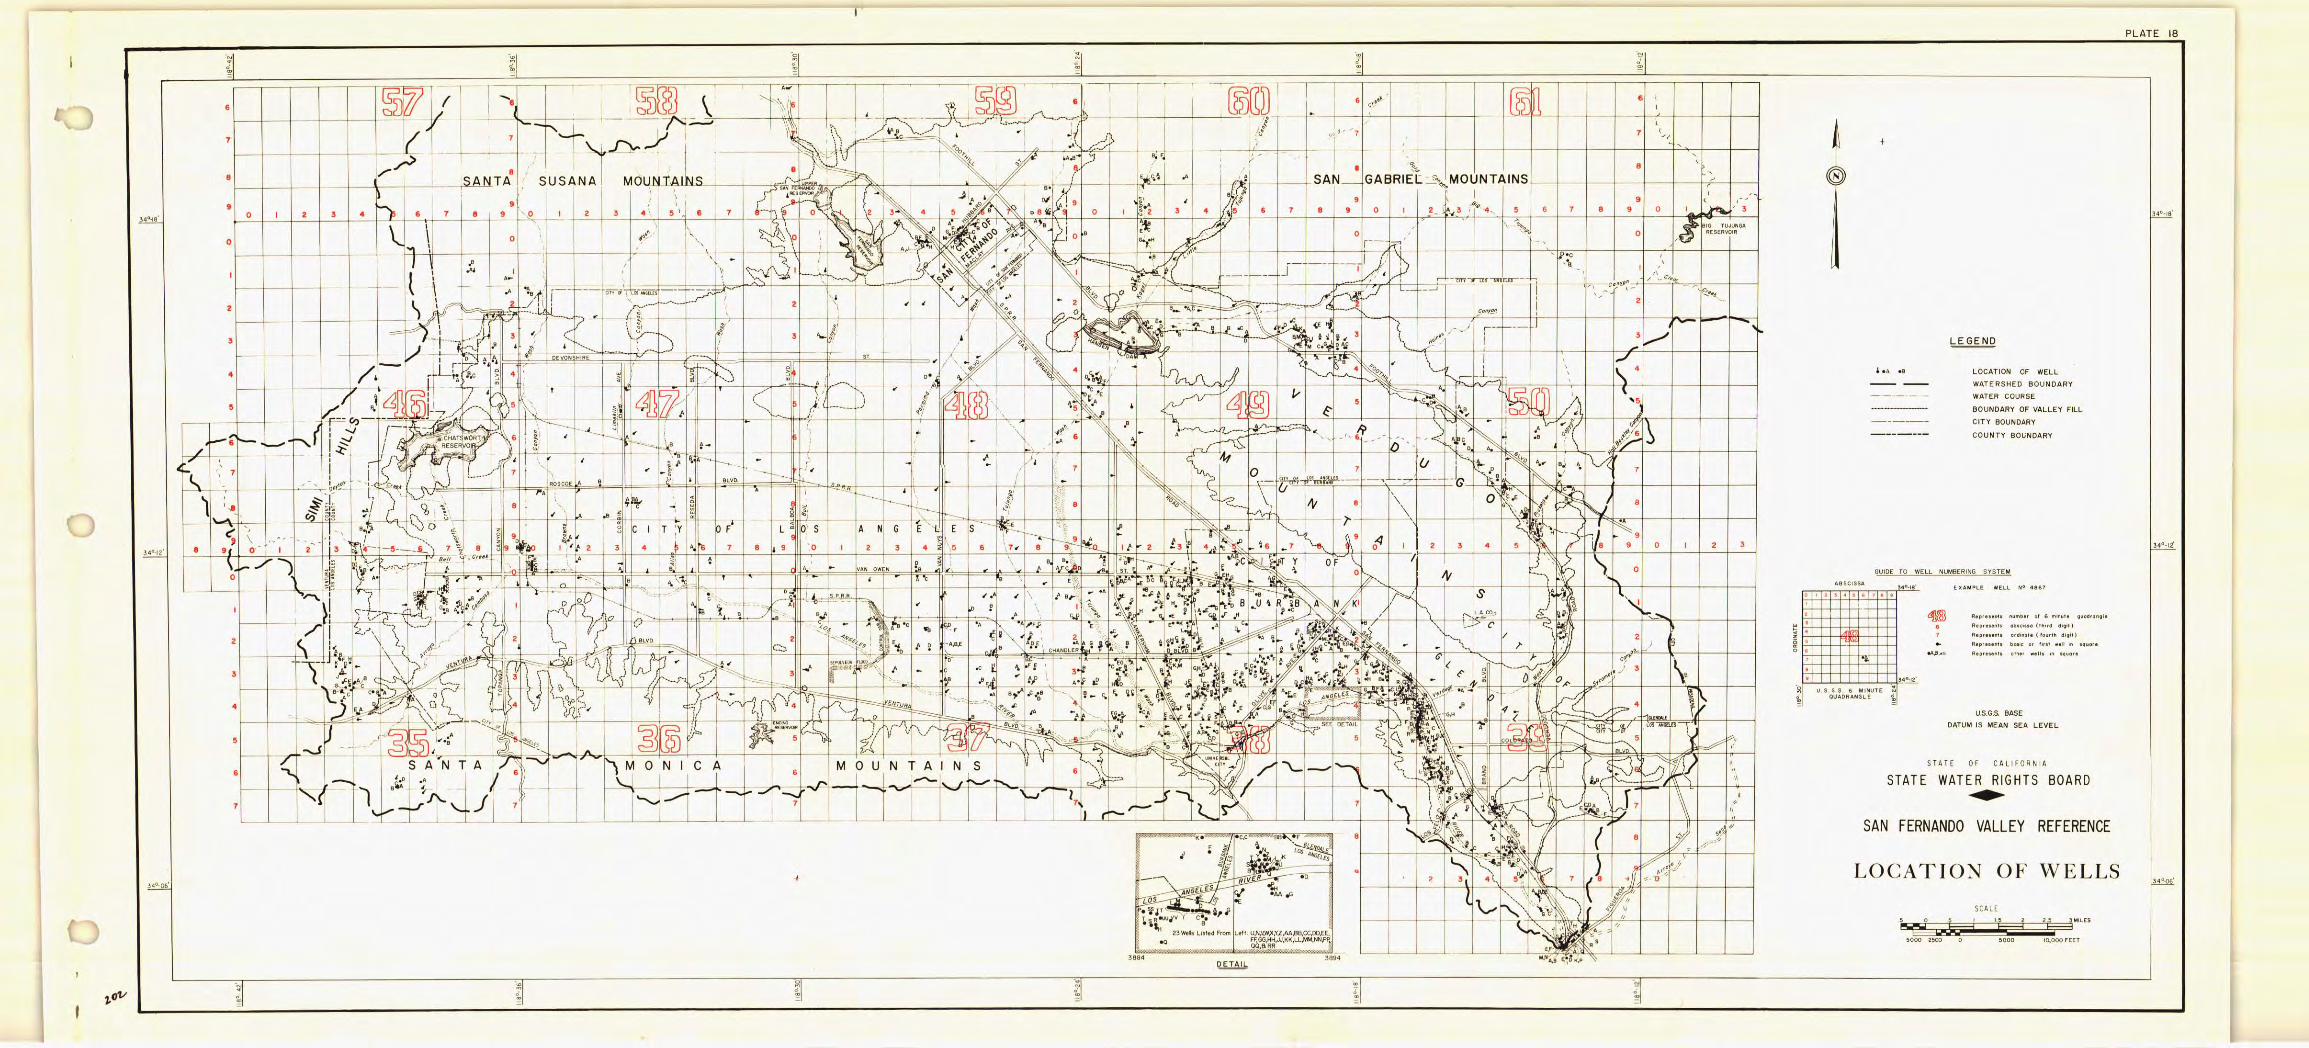
'4 0~B'
34'·12'
~
~oV I
~I ~I ~ ~ 'QI ~ ~I ~ I ~ I
Irmn ' I ' ' 1 I I I t -~t/ l'--l "0 ,-.~r I_T~~~I.' t~(, l,'"J L i \~'C~~~~," I ! i ' ~~ I I. • ,~ ',.. 1 71 , ~ 7 + , r-.. I,..J I , I'~~ ,\\ ' ~. • .!i ::j J I I,' "I" " , 7 '"
, -+--,- -- ' - ~- , , -- ,.",L, I -- --t ' '" - ~" -.r " " ~~V '" ... Vi " . " 1 ' ' j ..J ". -' I ' ''--''\, " ~ ~I, ,," '
. 1 I I I I /" I S/lNTA' ." SUSANA , M O LJ ~Lf' IN S I Jli-.J s-~ " /" ,. ' t 1 , ,,:; , , ~ i , : ~ SAN~ GABRI~t:.':: ..... MOUNTAINS . ' ~ , 'I " ) .-'- '" J~' .J~~~, ~'I · , ' I W, --9 1 9 i , I Q.~ \ .A Q nI I 9 t" ,} 9 . 9 (~~
o I I 1 2 I 3 I 4 ~ , 6 I 7 It 9 ' .9 I Z 3 4 '. 5 'I 6 1 f-. \ .; 0 ~ ~ { 2 3 4 ~5 "'b,,, ... ~ ~ 0 e * ' 0 I ... ~ 3 4 / 5 6 1 8 9 0 I 2 _ "4' :5 ~''''·'4 " 5 6 7 8 9 0 I -' 3
"- '\ ' " I \ >":: I'h" l L '\;1- ~ ~ , ,'" .~o 0 ;, .~-.'. ~j .'1: ~ , ' , " :"", ..s;. .ro m~" I I I
0 ",o~' ~ , I~.A/ \~ )I,'" ~ ~ . 0 B ' A - 0 ' ..... 0 ~ A __ ~A •• A.A
o ..., , I" " .: , .. '~ , ~ ~~ " , ..... r-- ~ ' - , , ' , ., "." " ... ~4~ • ' ",. , ---,' ~ -, - - ,.,-, , '~- "
I 1 • ' • I ~v " ,." ' '''' ..,' I ' ' ., , "" ' ~ , " ~-6 J I ·
1 \ ~ A_I ( I I, I ' Ill- ~~ '" "'.,.1.';" I --<~ 'I ____ J------. " ~ ' ~ B. _, I ,,"
- l ~ t .. -,; , -+ + , .... L·---7~ ""~ -- __ ~I:f \,- ",,:f! ~ " • 'VrL ~ ~ ~ l r-~'-~ 1 ---',~,,--<. ," • , l ,\ ,,'" / L\ ! (j' " ._~~_....r ' ' \ ' " ,)n,: . , '1. \")0,, . ------ y ,, -I& ::':l i " 2 -~'"
01 1:. - '-"-.. I? " - ' , ,~.,.., O~~t - · _II' p.,., , 1 " ~ ~' , I £. -:::_ ;;."" OC 1 I .. I ~ i" ';/" ... 8 '" oC Fj) of,E 1 - , ,- ____ J
, I I I I r I -~f' '" <f--. I \,(' r----- : , ,- ,' ,I ~"' ( r '" :'1 ' , \. ~ i" " . , ' < ,., .. ", 'I , I .J' j .J 1"- $ ' I ~ , 1--> I /"1-~ " I~ M C.
G D '\f \ -' V-
-- _ i"" - : r-7.~~ - : ' ,." ~ , ' /" ;/ '~ , ~7,~. ~ -- ' ~'I .\ . I , ,./ 4 1 I I / "IL.: I~ ~ 4 : ' ~ --;-~ ~ . " " ,' -'V '''''<b~ 4 ,~ ' ~f\ jJ ----- 4 ~: '-----'---.:- .L~, '~ \ 4
~;i ~ ~T ' -+- , " ):' '''-------' , --~ ~ -i" V
1-
-.J: "rl r '1t'.1 '= ~~~ .-", '.' '- " • ~ ' 0 J- ", ,." ~ ' . 1 - ' < " ~ ,~ "/ ,~!']) '" ,~~CHAT WORT -, 6 ,,' , - i" " 6 A ,. " ~T -/- . - _' 1;::- I "r~ , ,,,,,,,,~ "" , ., '---'c __ I . ' . ' " ,,'., , ~ .... ::---<"' " ' -,' ': ', ,< .~ \ , r- I ...... __ ~ A:,;;:::; \~ <>, - 1-----rlC-,I • ,I '" / I -~ n ' " 0 r.: , " 7 I' 1 ' ')y, ', OJ 'i'" I , , • i; _ ._ > " -:" ' , 7 'iii c 'If u ,'--'- . ~I~' , •• \ • --. A ... , \;!j 7 t \ ~ - ~' ~ I 0 7 1'"'" 0 ~ ~. '-"' <..j 7 -" _ ~' -, ~.,,-, ' J 5".. ~ 11_ I L". I , ~tL • L "" --.. ~ I ! . , , "'> '~f-,l·miill"- - - , -;->" --- -b "'{I '- ~ ~.
~ ,' I~' • , Pt • I = '--- ' \ " -2 , u " " .,~ , :--.. . , ',' , .. - I ~- .... , ..... ~ \:" ~ .. ... '.. ~ ,!, .. 1 9,-,,, • \. . • • ;, -----I--C. $' . • re.- \, I\i • \ 0 ,\,~ ' l L I • 4'~ i;f ~; " _. ;,.~ , , d ~ ~ _ _ ~ i5-- _ ';:;: " k,. f-,.-\,-f. \ , ,'li "~! 1"1. I I I
" I.!" •. f;, J\'0o ~ . ! er e I T Y pl - L : kJ: S A N G E ' L E S ----~~ I ' ~ -I-~ "--- _ I'_.. . ?- 2' ~:'(-' ? ! ~ I \ • , - _ ' I , I -......... 'i; >- 90 ~'} . ;; " - 9 A \ ---p I --- 9 ---... ~ - f-: L ""'" 9 , 1.( 0 ' ' I '," I i , irI~- --<>-__ .:> 7 _\~,~, .. ! 0\0 I"~ , , 4 ~ r. 7 • I ' ' 0 , , , 4 [ , • ',7, --;;---~i"4 I t , ! 3 ' 4 '~ " ~ 7 i'-.... ~' ~ , , , 4 , ~ --J. • 0 1 , 1 , 1 '
\- ..... ~ ') ;I! ~~~-:--- I[-T "i' ( 1 itfi __ '." ~ ~, ' ' ~ .. ,." I.! \ I ' I,,";A i " I",r--.--r,!..." i , ,",e~ Z Ot \.___ I ,,~ \ 0 I I 1 ~~ _ ~~ _ A. I g ' --;- ~ ~ n .- '-. B _ .... ' ~ I ~ "c __ ( " IIiI r;atA:le g 8 G H ~~ \ ,1", J\t II ~V
:..-""'\,1 g ; .s.,l 0 - ! , o , ~ P~R ~ • ./ \ /, 11,. ... . " ~#-tt a.c;·8 ,.a · 8 I I S 4 11 I , I ,_ _1· ,, ' ~ ':':RJ,.· I ",X IIo..U '-----.. , I, 1 ~ ~ '~ ' 1 ' , 'f\- • ,,! " I ", I It,..' • -;9 ". :. t .. ",,!'>" B "u ,~~ N 1, /,Ntc-, I' ~I\ l ,,- I
: I" I '"''9 ' '·v I C., D 11 - 81" ~~ ~ ,-. I %J O o£ o·"'r;i ef Ji ' n0f'" / 1\ r--,~ ii!. ,. '~'-~ / 11 ,C/, ~ -- I ' ~' IV ,<~, , : -', 1" ' .. , c.=:;~" -"" I • ~ ~~ "~~"" 1-4 1.I (j{~% '"'--- " '\ -- C' ~~J
2 I ,,' II 2. r RL~ [) 2. ~ ~'J'c", 't I \ 2 .. "; A ~ I! '.!II :-"'"~ "i" / 2 (,~ , ,e ' I ;" -';' C" ' <'s ~ ''' ''''' ,'4.', M! .. , : ",,.Ii, ,, ,, ~ . I . ~ . • \. ?-'~," ~" r ---- J- ' 'I , ,,\ , .. \ _ ~" j ~ -----4;:-;:- _ ---.{\ ._. _ ..... • , C~ANOLEfI f lA" \\~ '~~ B ~~ .. i l!':,j"olIj'i ~~ .. \..,. , j
~,~ ~ \ "':';..u .. A ~ w: ..... , ,, .. ::: [) ... IN.. , OFA "",,~ (i' r co.l, '~I~ 'if ::- I~i" -= c _/f(~J'J ~~ ../' ,,,,, ,, ~ ,? , , ~ I , ! , .,: ,::~" ~ ,, " ",'~ fi: ! : ~ 'Ii. .... ~~~ 0 '"jf?' , , ~ I ~ ~~J ~~" , I : ~ ~ (>'1 t..J.~ ;)"'-.f" ?'J/, '~F:-~ 3 III ' ~ .e ~ " tl \ A ·~ ~ ~ J ~~ 1 ~~ ~K7~V ~: rt .. ~; ~~ 3 ~oIl~ M, .. (' 4' ~ {)ct1;- o~ i'.~:!~ ~· \'1 ~ .... ,:, . '\' ('? \ , \ "q",J ~(),----'---.--'--1 Ai' " 0 --;; ", _ e M , ," , .;' -- --. 1_, tli-~" ~-~Jft,. "--' I ,~ ' .1., ! • .!",,~ . ·IJitJ. '!"~"-~ ~'--- 1r---1 ' { l\
.. ~~,. '~ _~I _~"r " V' ~).. i j/ :1/ V, t _ ~ II " !r ~ 0 T" ",.('':''':~ jA ":A F~:i' ~/ kt ~ .P~ i~~,,:ElI.r o:l'B.c, -/ S~ jj 43 -,z" l GlI fl e 4; Cc..;::> 4 f,r
, I I 4 J .. - '-~ ".,: r 1~~ ",,, I I S)~ I}.. i -'''';~ '11 -)Ir v-- f-:6i]tJf--, "" ~;~ , .. , .. £ r ... . , ~~~ .';:-~~~ -ct:.:"7"'''''': ~C:'~i~' l' ,,2 ,[<: ~'if~ ~/ , , ...... '"l C/.
_ ----s 2ff:21_ ~ ""'::0. ..-.,-"- ~LQ) J t1 l~l J ~, \ < ';£;." " , ?~ -n,,~~ ;-., f,V.r .~ 1 , SA 'NTA i ~~ I ,M O NI C A • M O UN;AIN S ' . "'\ ~'-z':'~~ /"\... __ -----. T,~~ ~ /'f' -.J I:::'i ~ ,-, 'i I.J ':, _ ~ 1 , .. ' 1 .;{ - r -~ \. I ..J"I J~II'-dr 0<' p ~" '\.....----'J::,t~ ~ &,r-J : t. k- ";O -----) , ,, "
7 " I \ ... J: i ,-.11 7 I ~-- ~~~ '~_I l -J' 17 r-I"-- """.~~ 7 '" ~~,~~,,)~!& hf 7 \' .(
: ~'lJJ ~.... ......, '--'; { Y ' q K_ , . e,c BB~~F 8 """'" ~ tl~ " , ,'" e __ ~:
, $/ A I~"''!!:,-"h ~ ,I . ' - -'" • <iI! QI' ~ . .. ~
• i/O r;.M' "or" I.... "" :" . .#' ' ""ii Q "\ "...... B~\\ '7" _ (.j~. f
.. 1--",-~ RI R?: 0' , , ' i ~ ,,~. ! 7 )~< <til ' I ~"]!2!,, ;/ OM ., { ~' R\,~! \ ~, rrO~--~j~ 1£ ,, ~ ~,\ .;,'<i II
?"i" ~ l;;i" \..- "\. '- '. ",,,,, "( " ,, I I T \ R ...... l v Y Ce. ~ _ G ( I 'I • It. 2~WeIh li~!' d F.on'I LeI! UJ'O,v;N)I.,Y;I..AA.B6.CC.DD.EE, '''-~\ , ,~, I ~~ I,
ea I!~GG.HH,JJ.KK,LL""",~ '$ ......,6R11 = • W' '1\ " II I I I I
3884 3894 ~ \'. i'i M P ," ~ · ..... l'w •• '
.~ ~ "I ~ ~ J ~I ;
~I
,
, .
'iN" ~
+
,.,. _8
LEG EN D
LOCATION OF WEll
WATERSHED BOUND ARY
WATER COURSE
BOUNDARY OF VA LLE Y FILL
CITY BOUNDARY
COU NTY BOU NDARY
GUIDE TO WELL NUMBERING SYSTE ~
ABSC ISSA ~4°·'8· EX U ' PLE WE LL NO 48'7
, 12 1. 1_ 1. 11 1, 11 1.
34o. IZ'
U S G S 6 "" NUTE ';1 QU AORANGLE ~
R. O,. ... " .b,e".. Un i.d d,,;,)
RIP''''.'' .,d'""" (I •• ,," f l , ;,)
R, p,,,, . to b ...... ' Ii,,, w," ,n " .".,
oNI,.. R, p' .. '." . ,",' ,,,'" ,n 'Q'."
U,S.G.s. BASE
OATUM IS MEAN SEA LEVEL
STATE OF CALIFOR NIA
STATE WATER RI GHT S BOARD ~
SAN FERNANDO VALLEY REFERENCE
LOCAT I ON O F W ELLS
SC ALE . _ _ , ,__ .z .• ~ ~ "' l l[5
~ooo 2~ 5000 10,000 FEEl
PLATE 18
1340•18'
134°' 12'
1 34"-06'
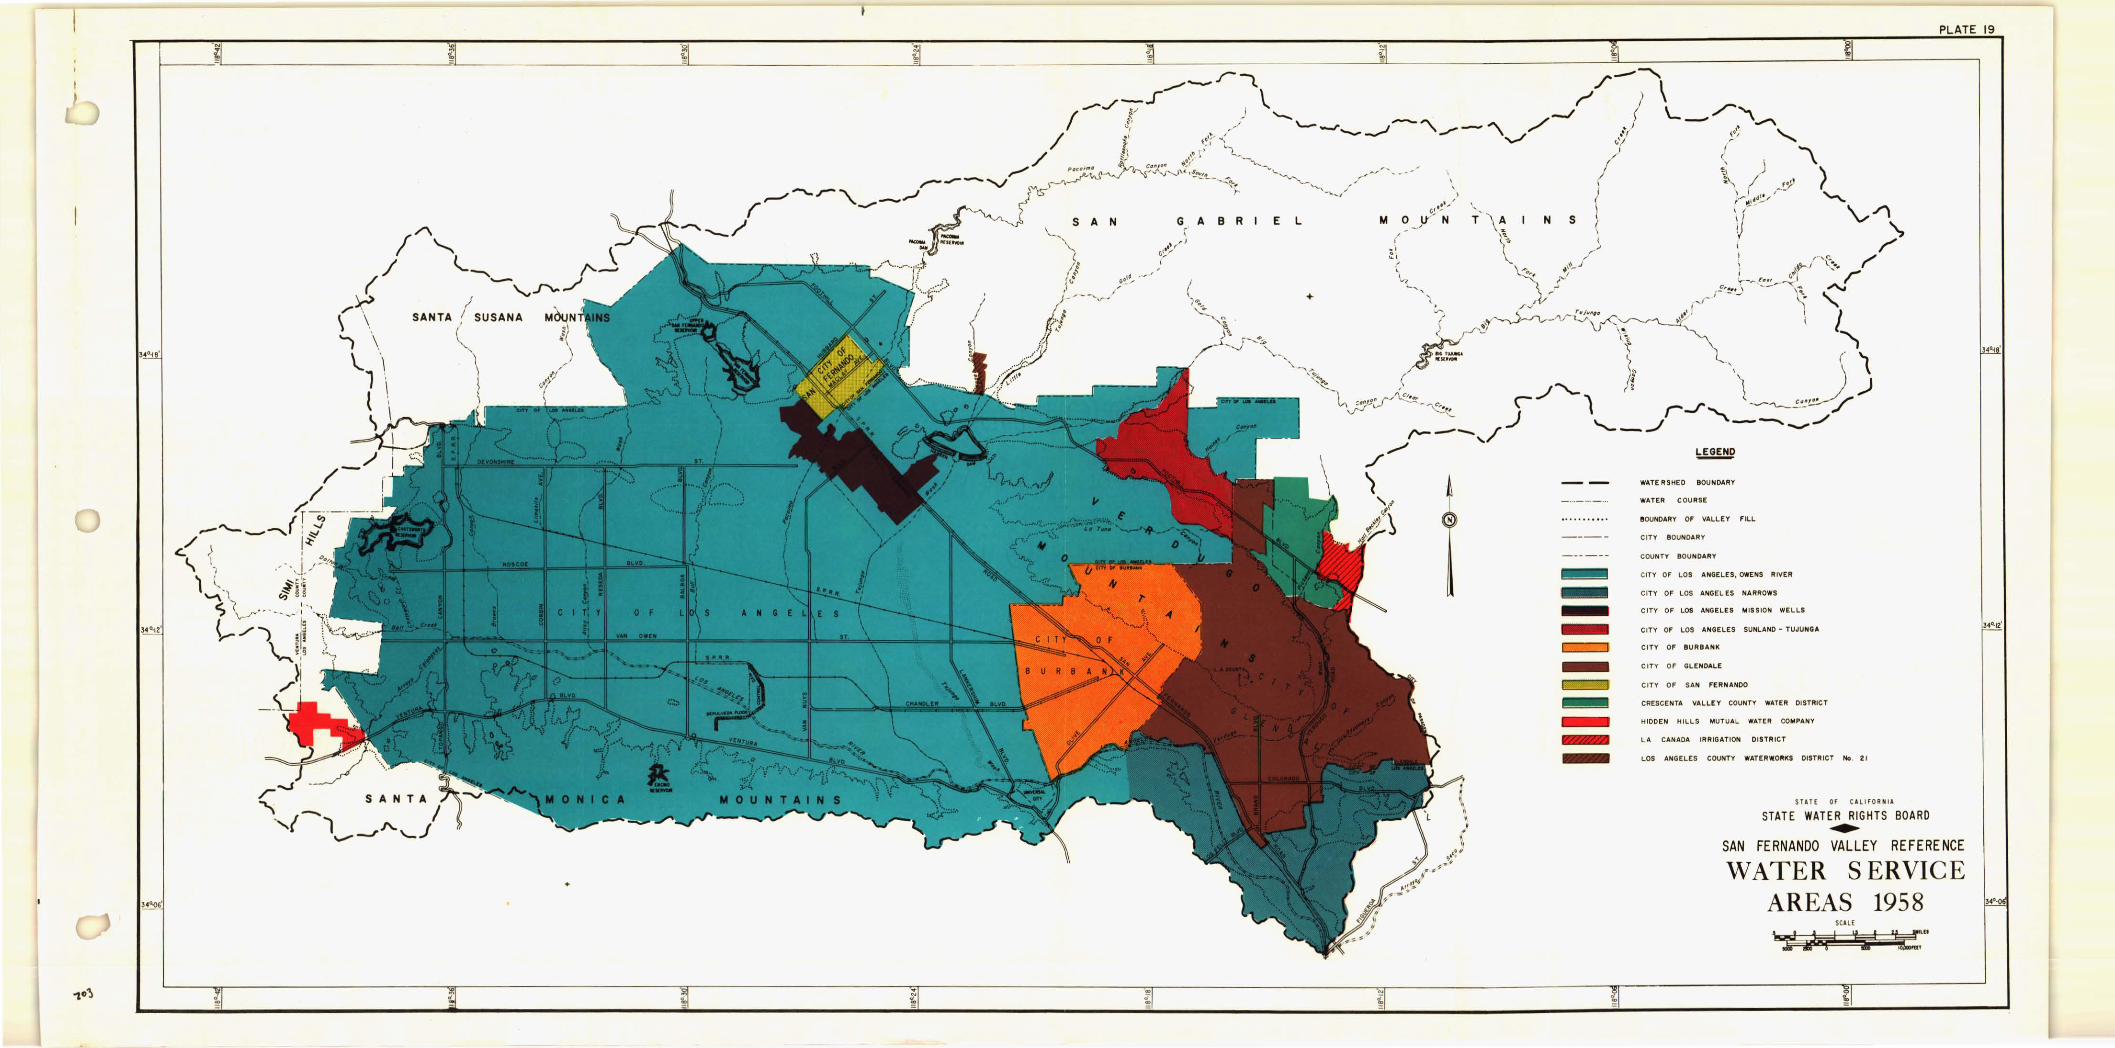
1 0;
PLATE 19
-~I ~ ~ ~I ~ -N, ~I i
...,...-_J"I.
(--./7 £ \.
/
" ) ~ ,-""", ., .1 ., \
, ,.'" .-- '-- -.r ) ~ / b'" ~ - r r ____ ~ '\. ~ __ ,,'-- _,C' <~ _ "" "'- -' ,,~- " r--' Lr-~- /,' _-,,-I r--""--F~~~'" ~ , / , L /',
'" ,,- ~ - , r - , ____ J "'- ' "~ ~, .." "'- "" , "" '~ " '" , ,' ", , " / / i ......
- ,- '" -" " , GABR , I \. "'" c 1 E L " ' " J \
, .. " ' ' . ,," ' 0 , ,, " ' ~ I ' \ ,~~ ,_ ,u N T \ A \ -" r~7 ( " • 1 N S ' ,,;,!~, ,,-. \ ,,( , " ~ :( j' ~ lj \ .. /\
, ~ / ' /A .........
IJ4048'
/~/
/
_"- ( f-.;-------~ , "
Co. > W ~ \ ' , )--, I' /
\ l, '--• ~ ~I,. '-"\ ~ ,.. ,Co! <;; !
34 "-12'IS { "., - I
:.-./
/ "--.,. /'--~"'f"\.../
SANTA / SUSANA
--,{ I "--.---'
• HOl.06"
~I ~ - ---~-- --------- - -- il
,0 .. .. -,
" /
- .. ~-.....r.#/,. -
!I
., \~. ",-, ' --.... ... --" .-• ~ J ' /
, - ..,. , .... _...-, " t J , ' -'. r ,r , ,~,j \" ~, ~' c. <. __ , _,." "I .... t""
fo\ .r _"./'-'\'.1.... [-.1-' -,' \~. J - ./''' " ....
_ • _ r ,;;~1,,,, 1 "
',,-, ( '_ 'I \ , /, ~/"", ~ :" "'" "/''-1 " \ ) '\
+
r- __ .J r J ' / I --' J ...... - J -.,. '~,",""'''/'' / _~_/r
~
t •
,
r;::: -- - I
~I ..
WATE RSHEO BOU NDARY
WATER COU RSE
BOUNOARY OF VALLEY f iLL
CITY BOUNDARY
COUNTY BOUNDARY
CITY OF LOS ANGELES, OWENS RIVER
CITY OF LOS ANGEL ES NARROWS
CITY OF LOS ANGELES IoII ISSION WELLS
CITY OF LO' ANGELES SUNLANO - TUJUNGA
CITY 0' IIURBANK
CITY 0' OLfHOAL f
CITY Of SAN FERHANOC
CRESCEHTA .... ALLEY COUNTY WATER DISTRICT
HIDDEN HILLS MUTUAL WATER COMPANY
LA CA NADA IRRIGATIOH DISTRICT
LOS ANGELES COUNTY WATER'4(ORKS DISTRICT No . 2 1
STAT[ OF CALIFOR NIA
STATE WATER RIGHTS BOARD ~
SAN FERNANDO VALLEY REFERENCE
WATER SERVICE AREAS 1958
SCALE Urr!:"" : It f
1 ' :1 lP"1 .... - _ ·000000000T
40~ -'
34Q.I2'
I'"
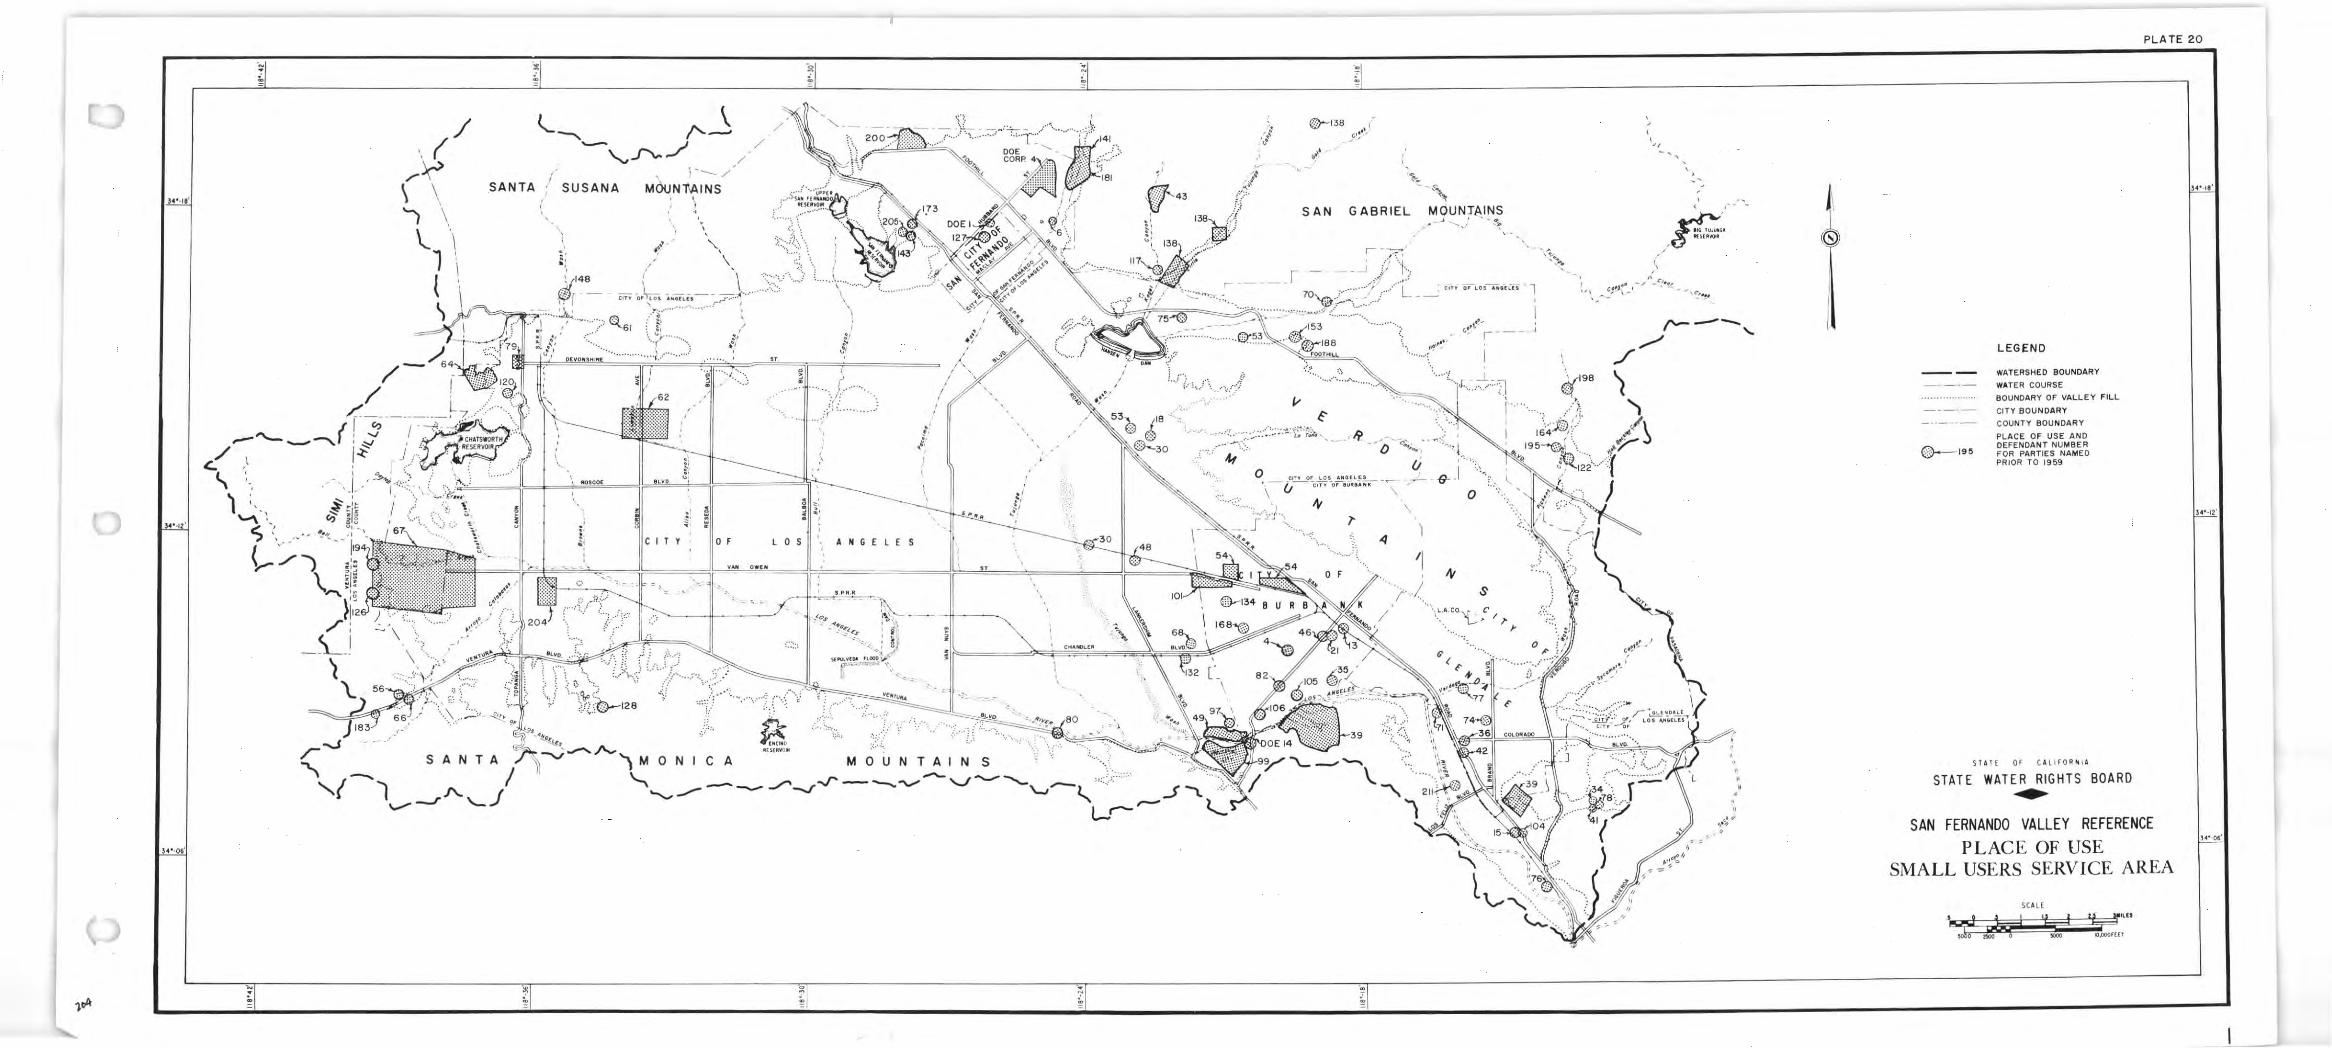
4'-1"
34',0,'
,oA I
I 1 '4' t ~ , f ' '~
, (/ ...... ~ \ \ 'I \
SANTA
,,- " 1 \ t )
// ' r _,__ L
_"'- ( I Go ------ ,
/ -~ : ,, " " ,\ I ~
l : ' " ' . )
" "", I " , --, ,.. , IlL.-. '.. ...,; .. '>--, ; ~ 'I' It!: " Go H
-, '. , •• , #.."ot' u, _,
(,..:;. '") ..
\ ii! ""' '
, _\... ,1
) \.
r SANTA
" -. I ,{ '1 -' f',. ,-.J '--'
~I ~I
t...____ I'~
" I
----".f"',.. ./ / SUSANA
" ~
, \,
; ,
" ~ :
~ --- /'
MOONlIAlNS " , • ,
'\. \
" , .. ~ ,
"
" ~ '
I , Y
/
, \\
: .' > ~ ..
(' "'. /: .... ,',:
,;' ,
)
ANGELES
~,
" " ,G.:
:, ! . , JI "
' <:' '~'---
, ' i£l.--43 W
.... , .... :: ..... . .... ... - -:: ..
41 :/:.
MOUNTAINS ~~A., • 0 , , , , _,, ____ '-'_. . ->"-, 1 ...r _ -..... ""'" "',..- "-~ ~~~~ ~ ",,---
~ I ~ I
'. ' I ' : .. ' v
®-138 •• ' , ... P~ ./
,< ,~
'~ .. -, 0
" <, GABRIEL MQUNJII,INS
. ..... - " ',' - ~~ SAN
-' , '
\, ..• "' ... r - ----. '
70'oz~;.~;~~': -L ___ : eon .,,--Lu---.oi.-rLii -l
\!,:~.
..... ;., . .;. .. , ,, -.~
1 ",
, , -, - ,
, •
C~J:._ ' -" ,\~ c:. !,! _ ... '~,,!,#
, 1'1,';;- , - r ----I r----.-/ '-
v t'
.. ~'.:..::.:."!',~;;;ii.. ,
. ~~" .~. , ...... <
.("~ ~/. ~;. . .. . <:' () ,~ "'I
o ~ , , _ 5!!!....9!. LOS A NG EL!:S ' 1 \ u e>TY -o~i;,-';;- -.,-- -.-. -'- , {J- '
I\' '\
}"
.q
.~
'\
)
'I I\'
,/ (('98 )
.~ .:<\ " 16';':£)",· ./~
I : ,f6 195-0" \. . .7'
, it) .... .~( ':~122:"" "<
_ -1...
',' : ... '
o
s C / /::
",
•
," , .. "
'~ ~
PLATE 20
LEGEND
WATERSHEO BOUNDARY WATE R COURSE
BOUNDARY OF VALLEY FIL.L
CITY BOUNDARY
COUNTY BOUNDARY
@--.9. PLACE OF USE AND DEFENOANT NUMBER FOR PARTIES NAPwtED PRI OR TO 1959
STATE Of CALIF ORNIA
STATE WATER RIGHTS BOARD ~
SAN FERNANDO VALLEY REFERENCE
PLACE OF USE SMALL USERS SERVICE AREA
SCll[
• t j It If !llU
InI ~ $)O(l lO,OCIt)fUI
H"'"
H" lt
H"Ofi'
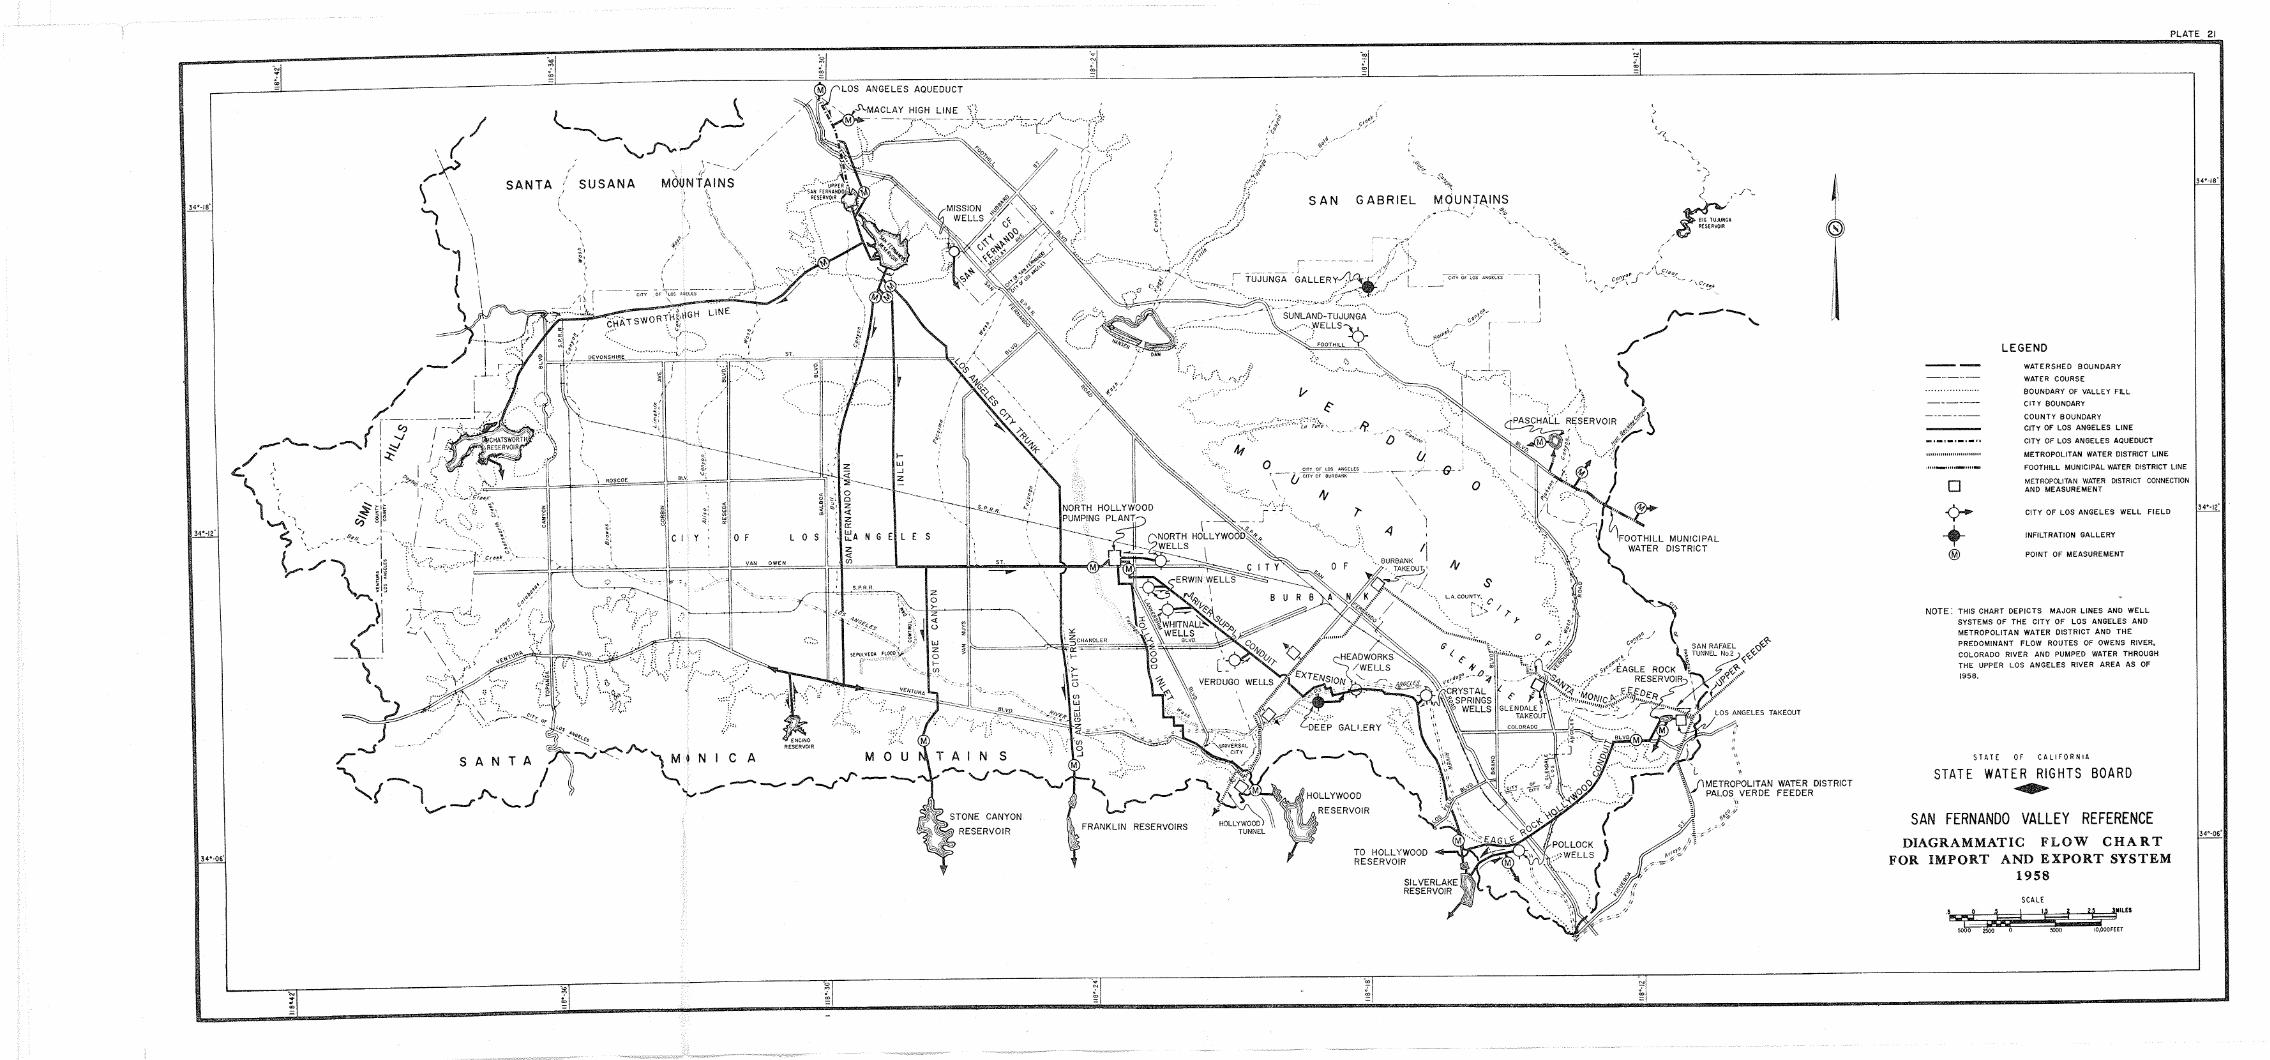
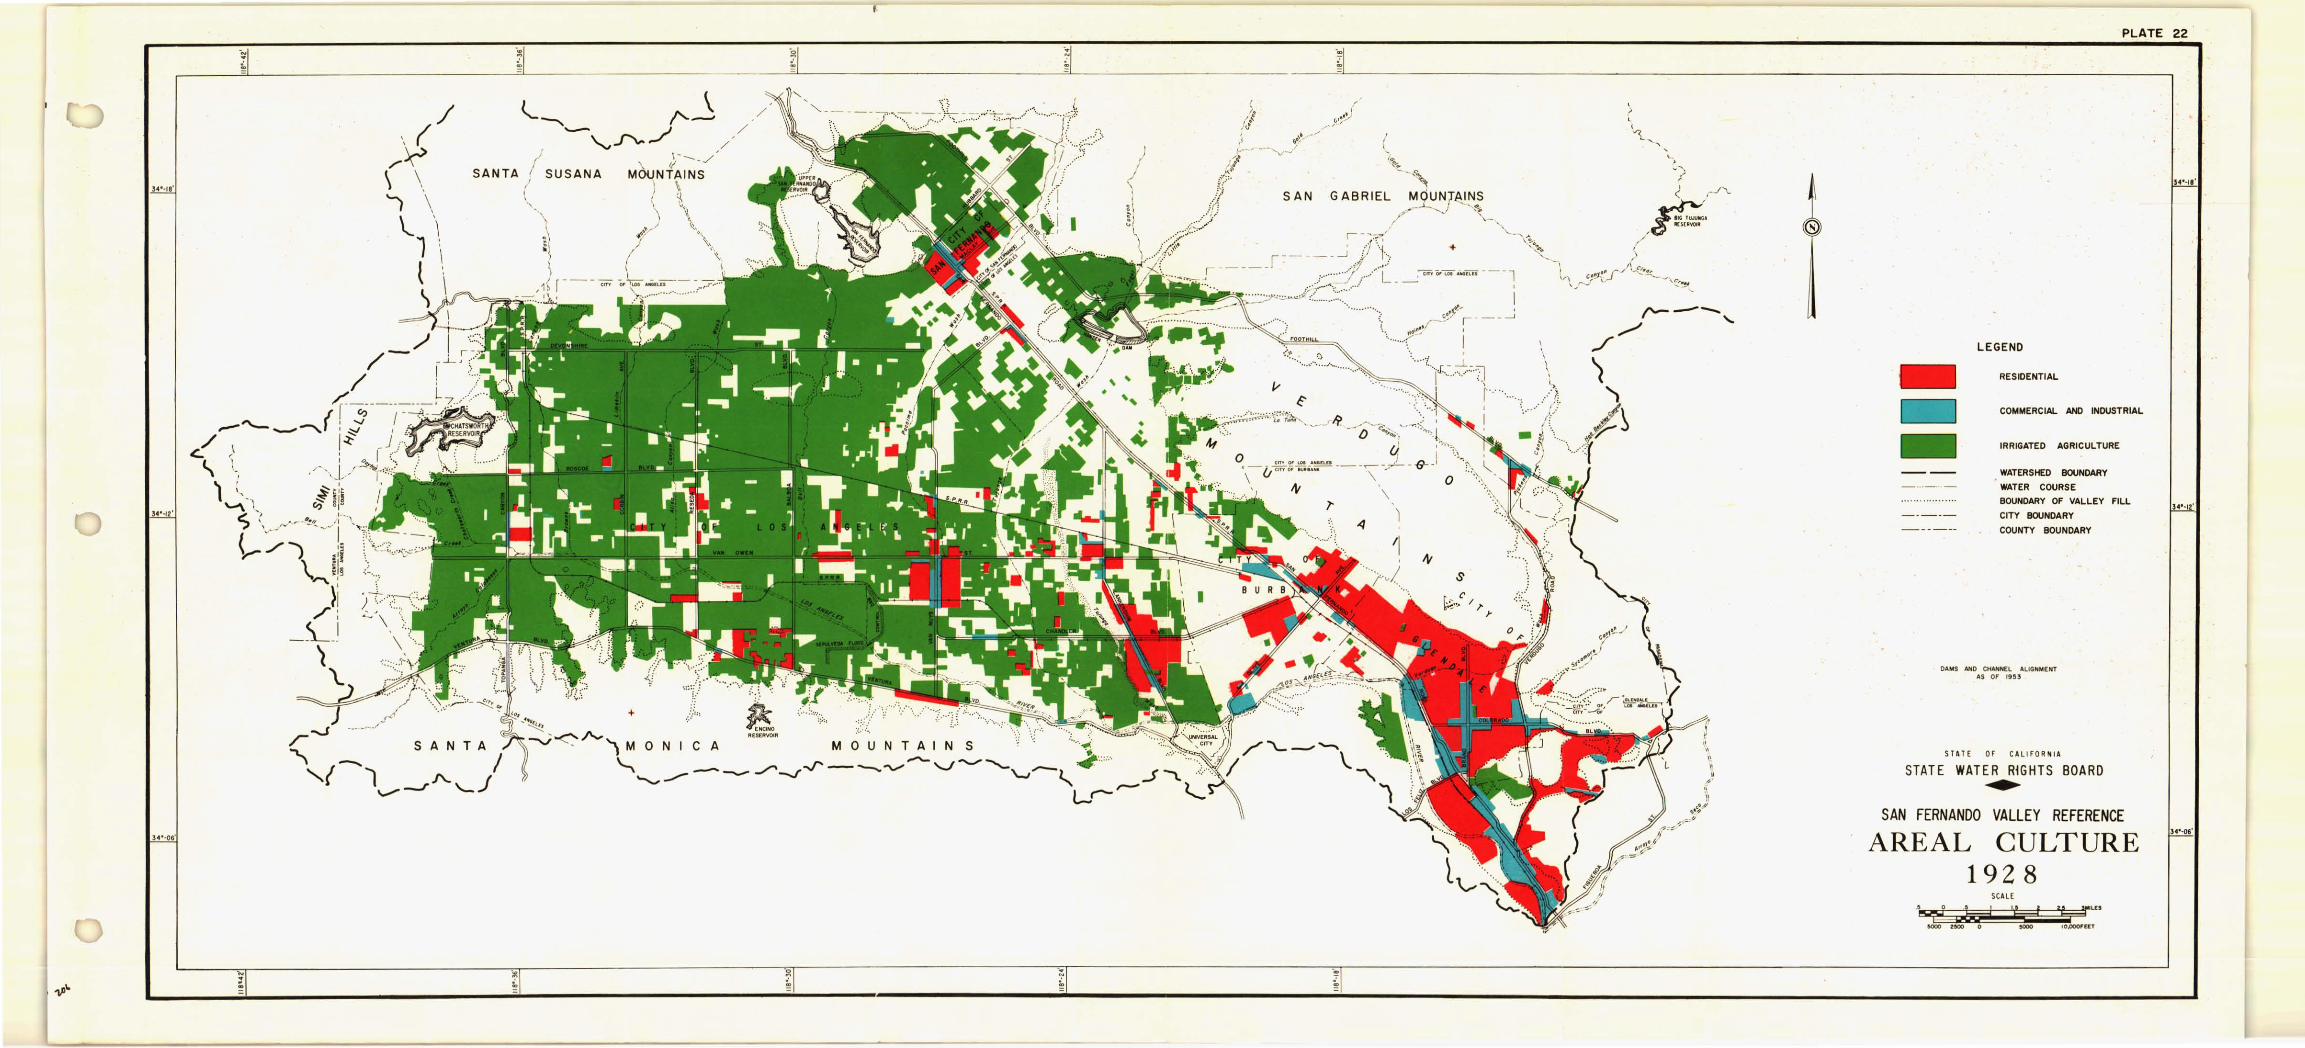
4'-18'
,4 '-12'
'4"OS'
1/" I
'~
~
\ (/ /'~ \ \. ., \ l \
;; ~
~____ I'j '-..,f'\,./ , ,
SANTA ( SUSANA / \ ~
M
f,
m ~
/
) i
{
, I.t
/~l , ,< ~~',- - - -'
.... v··
SAN
I ,
~, .. ,' / _.,,," '
"
( i. "'-" , s..
" G ABRIEL '::9_UNr~-'~.S /?~ - ,J '\_
I' "'\.~'_" \"'~,j. +
, ( ,
....... t,
'-, ' - , /'
<. r-''c
1 \ l \
~ ,,_,,_, r "----~ :~ ....... '
'~-L , __ ;<m o.""LiiI ......-nn --- l
/ ( -'
" v", ,:9\".1'/ '~~'!{
" .......... ~ -... \ c,
/-/ -/ !
/ _ __ _ i.. _"- ( I '" --- --- ,
/ _--. : -..J I '- ,I 1.:1
l '\ ' "') ~, / -. " , \ ~~. / '
" :-.... I
'-"\ '\" ! i I! S .. /""'. , ...•. q I - • . ~ ( .,'- "--'/i ' y./) ,:j '
\ '"
~ ~I§
,)! _~I
) --\.
r SANTA
~ -. / '-...{ 'I .....J"-,-J
...."
II
+
--..; -<::- ,A,...... M 0 N I C A "'- '--' ....., "'-'-'---1 _ J""\. ..... 1 ..J'---...-v- '" r- ~ ........ ...---~ -~~~ ~
~I '~I -~I
v C'
~~.,.rlt! __ ............ ~ .... , ".-.< D ~-.; , '00' 1
,
[ --- ---1
_ --1. ,/
".' -, .:.1 '
..... !!l , r----.-/ "-
" .'. , .. , .'C]. ) , I
r /io ')
t/. ,"-err. ... 1M u ncI. ; I
, / ' / \ . ~\ /7' :'
§\ ' r - l.iC' .. MMiOi.;;;:- ___ • .,-- -.r- _.g... .1
\
'"
/'-----"'""-
-- -------- '. ~
4
\."
\
I
'I '"
o
s
, • .' ~
!)
",.;' )r --& .1 ·;=~~
~(, o1! ~ -==~
~ ~
PLATE 22
LEGEND
--
RESIDENTIAL
COMMERCIAL AND INDUSTRIAL
IRRIGATED AGRICULTURE
WATERSHED BOUNDARY
WATER COURSE
BOUNDARY OF VALLEY FILL
CITY BOUNDARY
COUNTY BOUNDARY
DAMS AND CKANNEL ALIG NMENT AS OF 1955
SUTE OF CALIFOR NIA
STATE WATER RiGHTS BOARD ~
SAN FERNANDO VALLEY REFERENCE
AREAL CULTURE 1928
SCALE ., ., 1. 5 13 ~I.U
aooo noo 0 ,.,. IO,oool'UT
34·· •• '
34'· 1."'
34'·06'
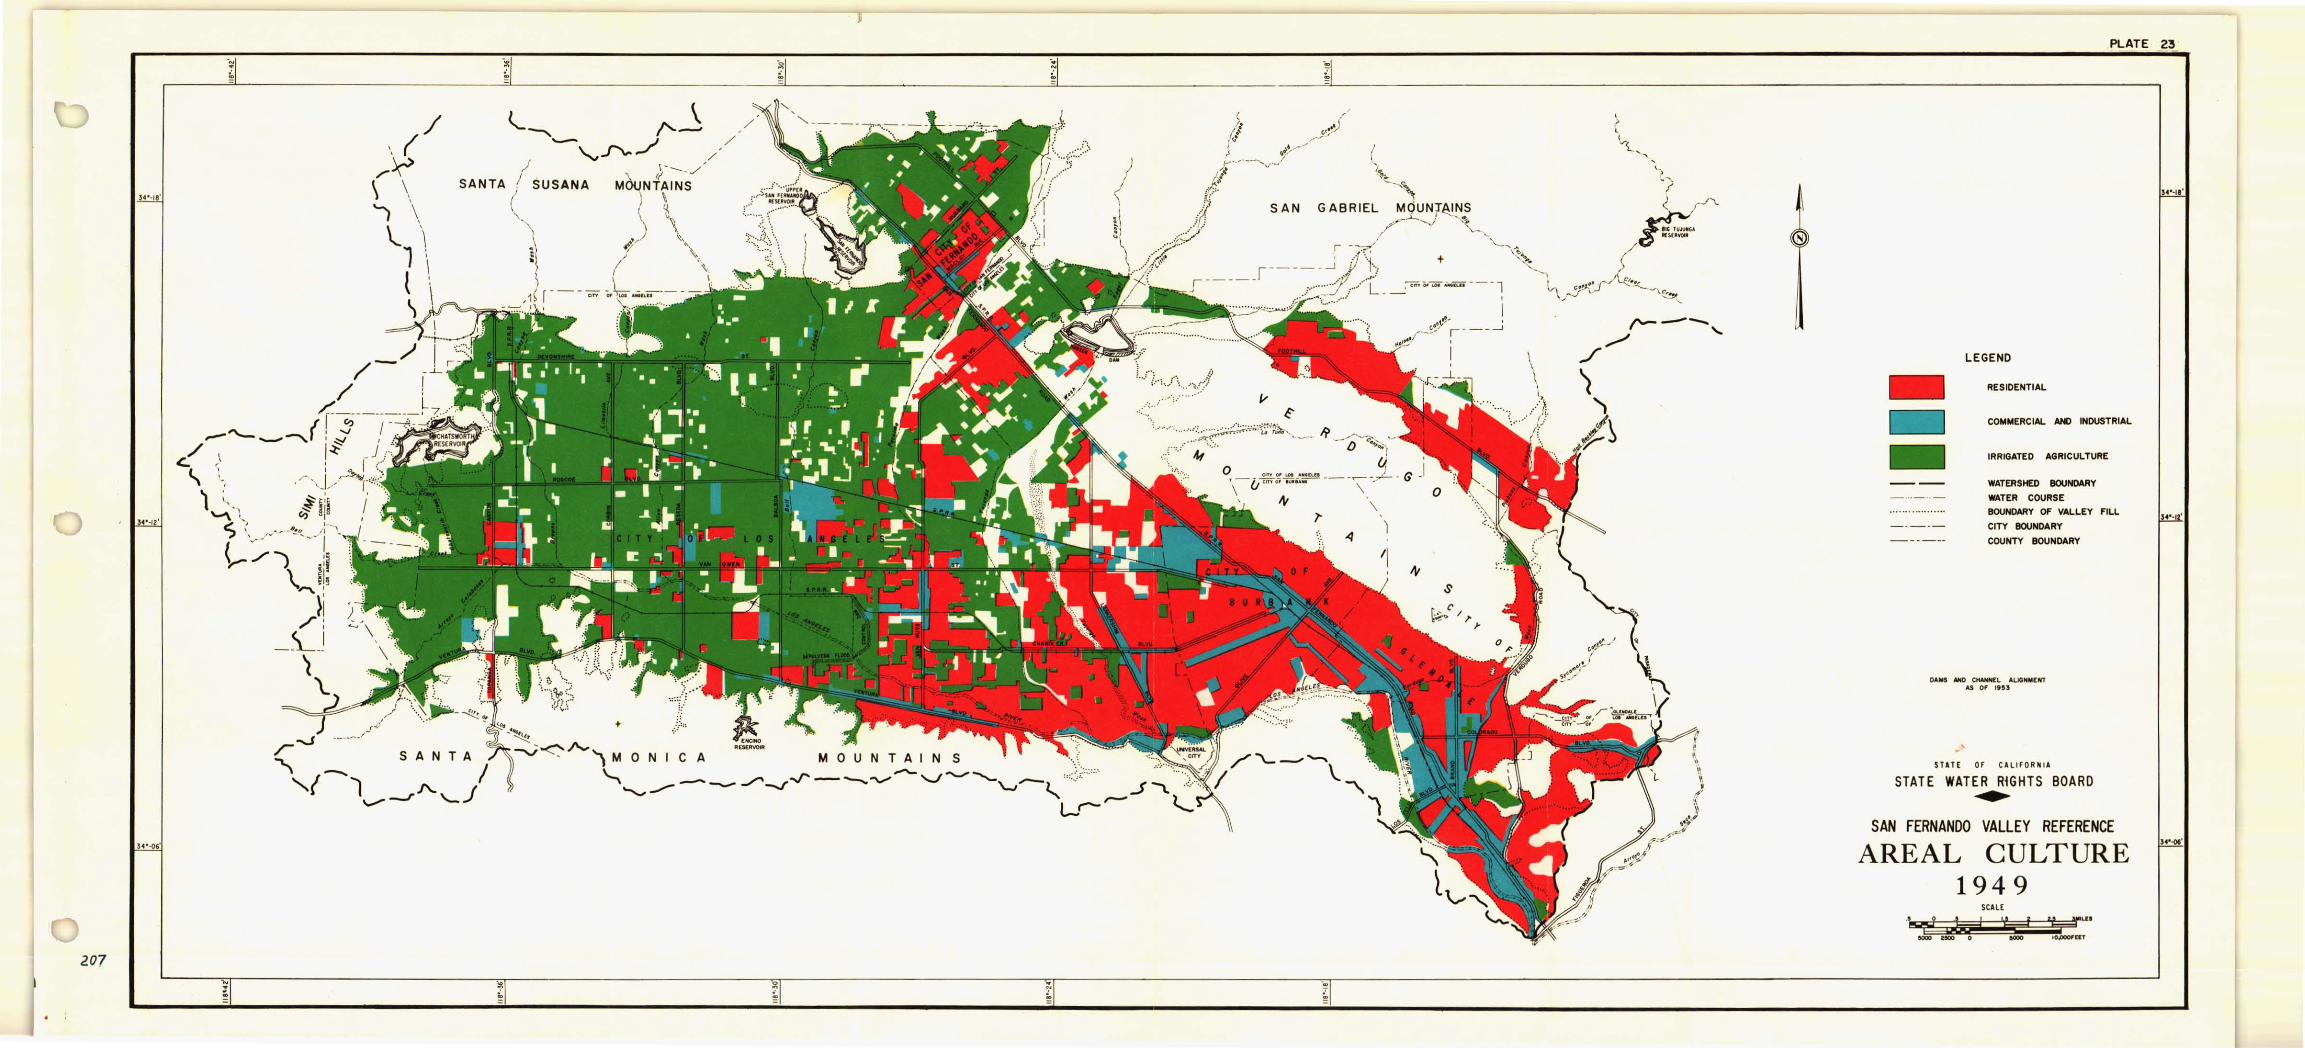
4',. , '
]4' ,0, "
207
'* .. ~ ~
t...._____ I'~ '-v..f"'l,./ /
, (/ ,....~ \ SANTA ( SUSANA
'I \. 1 t
/-/ /
/. /-"-_-J ! j -- ';-"-~ (\ I ~ '" \ '
I < $ '-\ "', ;;; S " ,y' , . • • • • " -( ,-' --'---i
:.--./") "
\ Ii! ""' ,"
.)i _~ i
~ -.
\.
r-..J SAN T A
" -"'-.t '1 -.J'''",-.J Y'
~
~
• , M
' <' .I'-. ..... M 0 N I C A ........ '-./"'-/-...., ' ___ 1 -V - 1 ...r _ --. "'""" ....., '"' ~ --~~ ~ "'--
. ~ ' . ~ ~
'. ~
SAN GABRIEL
t
.... ... ___ .. ~.,. L ;c;;;o.: .. ' - -__ uuu , 1: ',',' .- _ .... --1 -.:-.._ ..... .1'-'.:.:.:..........,y" •• ••••. .
7 , ,II':,
r - --~
... -.,,// v
f' _,;' ~:.::'::;::~;~"f:~7ik ... , ~ _/_~ . A1 () ~";;""
o J , __ ~'l!~_.!!!!!:!! J I \ l.J ern ........ u.. - -- -.-- ",r- - G .
I\' \ \ .,.
) .q
'I I\' oS C'
r~ ... / I" 1 - }-
.~
-
~ \ "-L
"
--.> - ",
I' .: ,rJ'\.
~ 6:u(~; a
( ,.", ' .-J'c.!C' " ,#.--J :,J - .~ .... -......
\~~
./ 1'---/ '-
)
~ ~
PLATE _2~
LEGEND
- RESIDENTIAL
COMMERCIAL. AN) INDUSTRIA~
- IRRIGATED AGRICULTURE
WATERSHED BOUNDARY WATER COURSE
BOUNDARY OF VALLEY FILL
CITY BOUNDARY
COUNTY BOUNDARY
D.t. .. , AHO CHANNEL AUONM[N'T AS Of .,,'
-' SUTE or CALIF ORM I ..
STATE WATER RIGHTS BOARD ~
SAN FERNANDO VALLEY REFERENCE
AREAL CULTURE 1949
SCAlE ,. j :J " " ru. - .~ )0 ,(UJOOIu ,--~
'.'-1"
4" 1- '
14'0(1&'
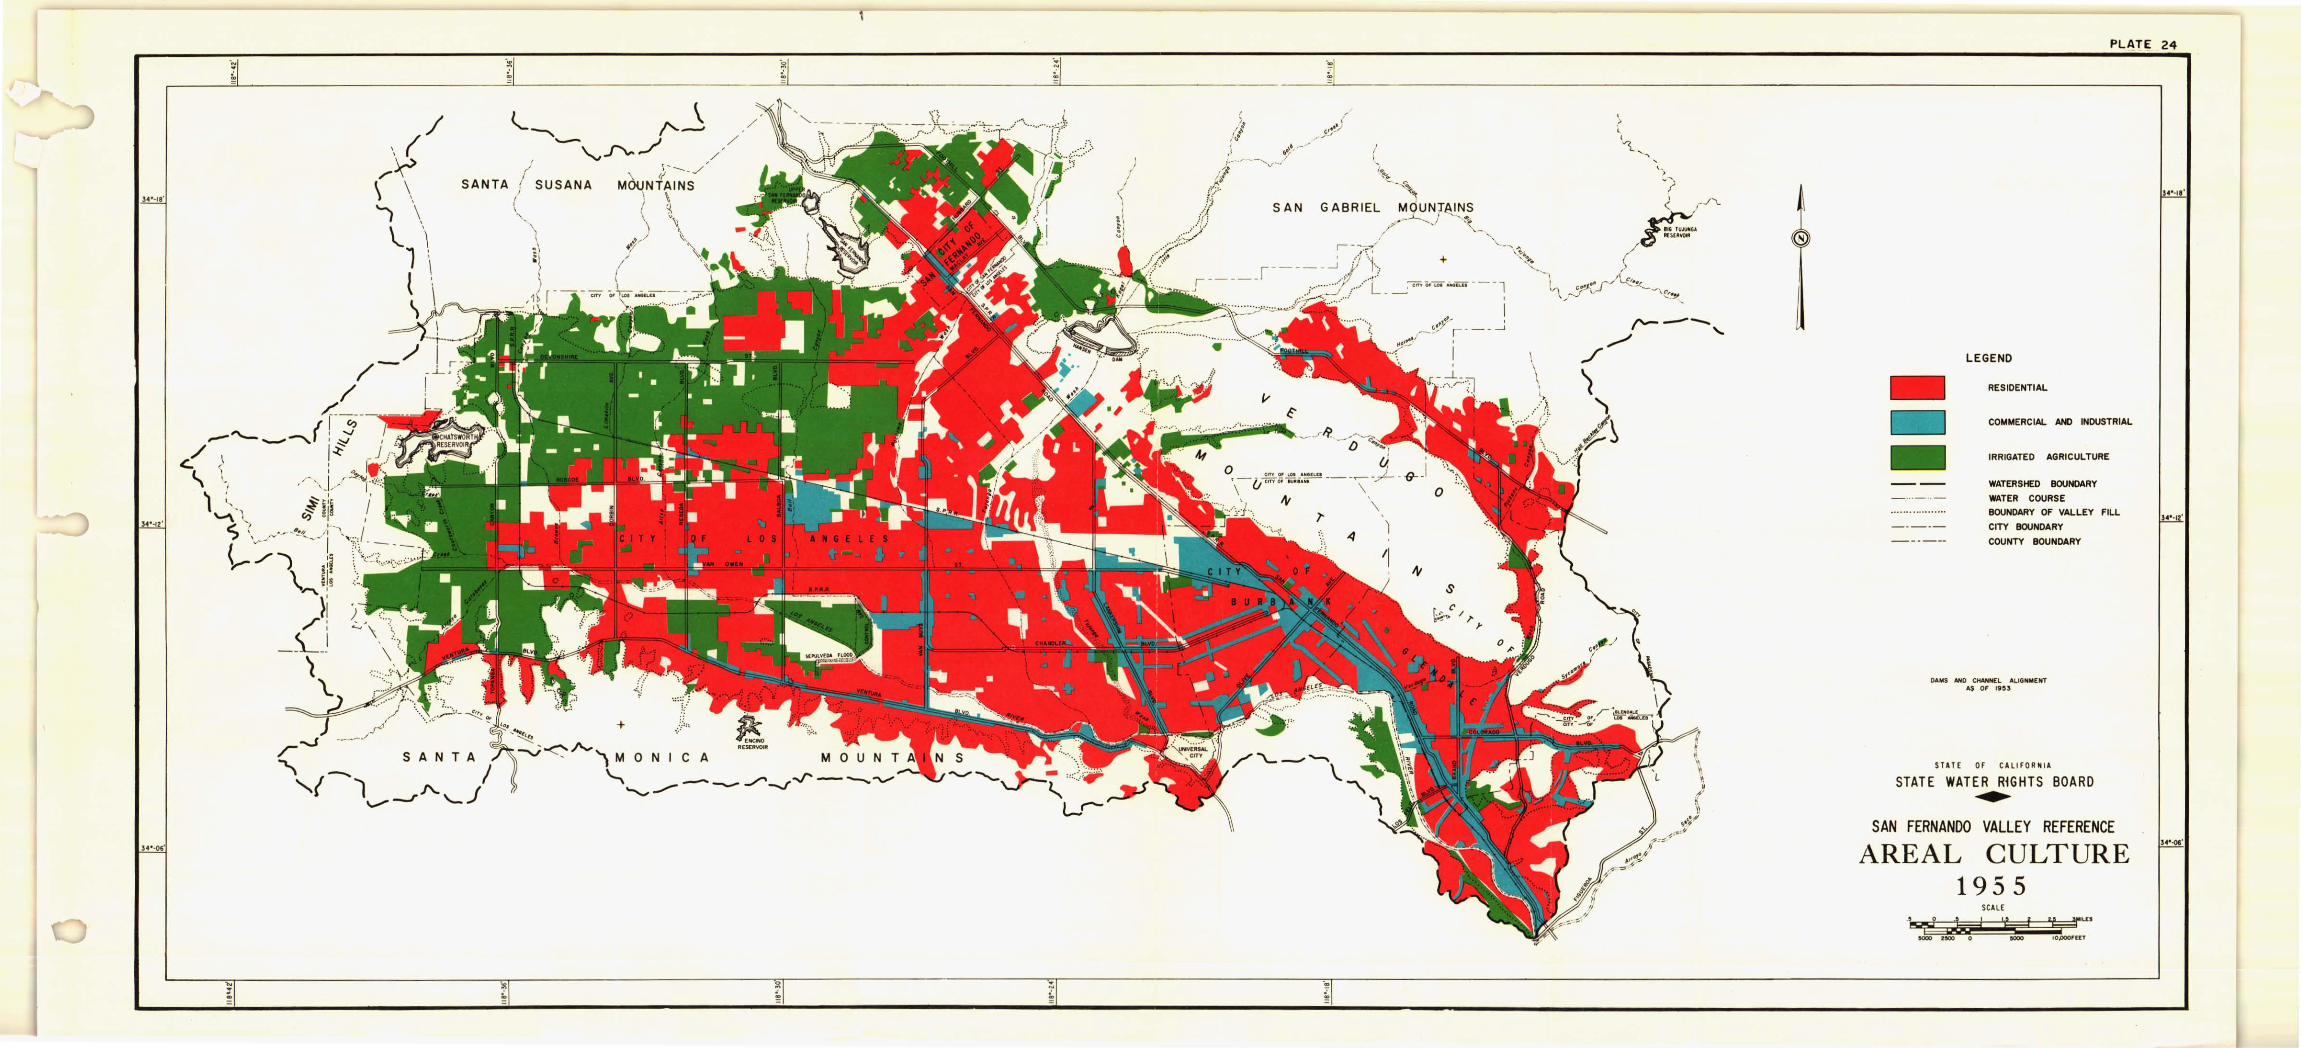
4"-.,'
;4' -1 2'
54°.0,"
-~
~ -. i,
,, (/ ....-~
<---_. I'-~ -.....- ..I /
'" J"\,. ,./ /
/ ' \ r~ - -/ \ \ ., \
,,- " 1 \
//
l \
/. _"-- ( I -;;--......
/ ........... ~ : " c:.. ) I-i" ~ \. ' , /'
l -', ,-,\'1
( :,~fv '·~·-,/ i :--/) "
\ "i II' ~~t!
,)! _~ i
) --\.
SANTA , SUSANA MOUNTAINS r' \""1
' \ ~\
\ ,1 \ r'
~.
+
SAN T A -",;<,.1'--
, ')MONICA
1
~ ~
-- I ,( "I -,.1'-,-.1 \...., '-' __ --"" __ ./" -...I'..../' - ---...,.....
'-"""
~I ~I -~I ~ -~I
( /: ' .' / .... , ri.·"·- ....
_·_-.... ·v .. ·/
-,
{ c.,.~
~.-..;-~
SAN GABRIEL
.: __ __ .r---- --'
v ~
o -lJ ~:;:S :. .. ::n .. ____ \ _. \ I\t
\ l'
4
-. ~
-I-
___ ' ~rnM""UiO""'iLU - -- l ,
I
'I I\t s C'
k~' / J' ;
/
~ \ \.,..~ ...
,-• . , "
{'---,/ '-
~ ~
PLI\TE 24
--
LEGEND
RESIDENTIAL
COMMERCIAL AM) INDUSTRIAL
IRRIGATED AGRICULTURE
WATERSHED BOUNDARY WATER COURSE
BOUNDARY OF VALLEY FILL
CITY BOUNDARY
COUNTY BOUNDARY
DAMS NrlO CHAMiEL AUG HN£NT AS Of" Its)
SUTE Of CALIFORNIA
STATE WATER RiGHTS BOARD ~
SAN FERNANDO VALLEY REFERENCE
AREAL CULTURE 1955
SClLE
.~ to j !II "TlJ:t - , _ _ .0_[1
' O,oool'(lf -
,.0·11'
H··r~'
J4.~'
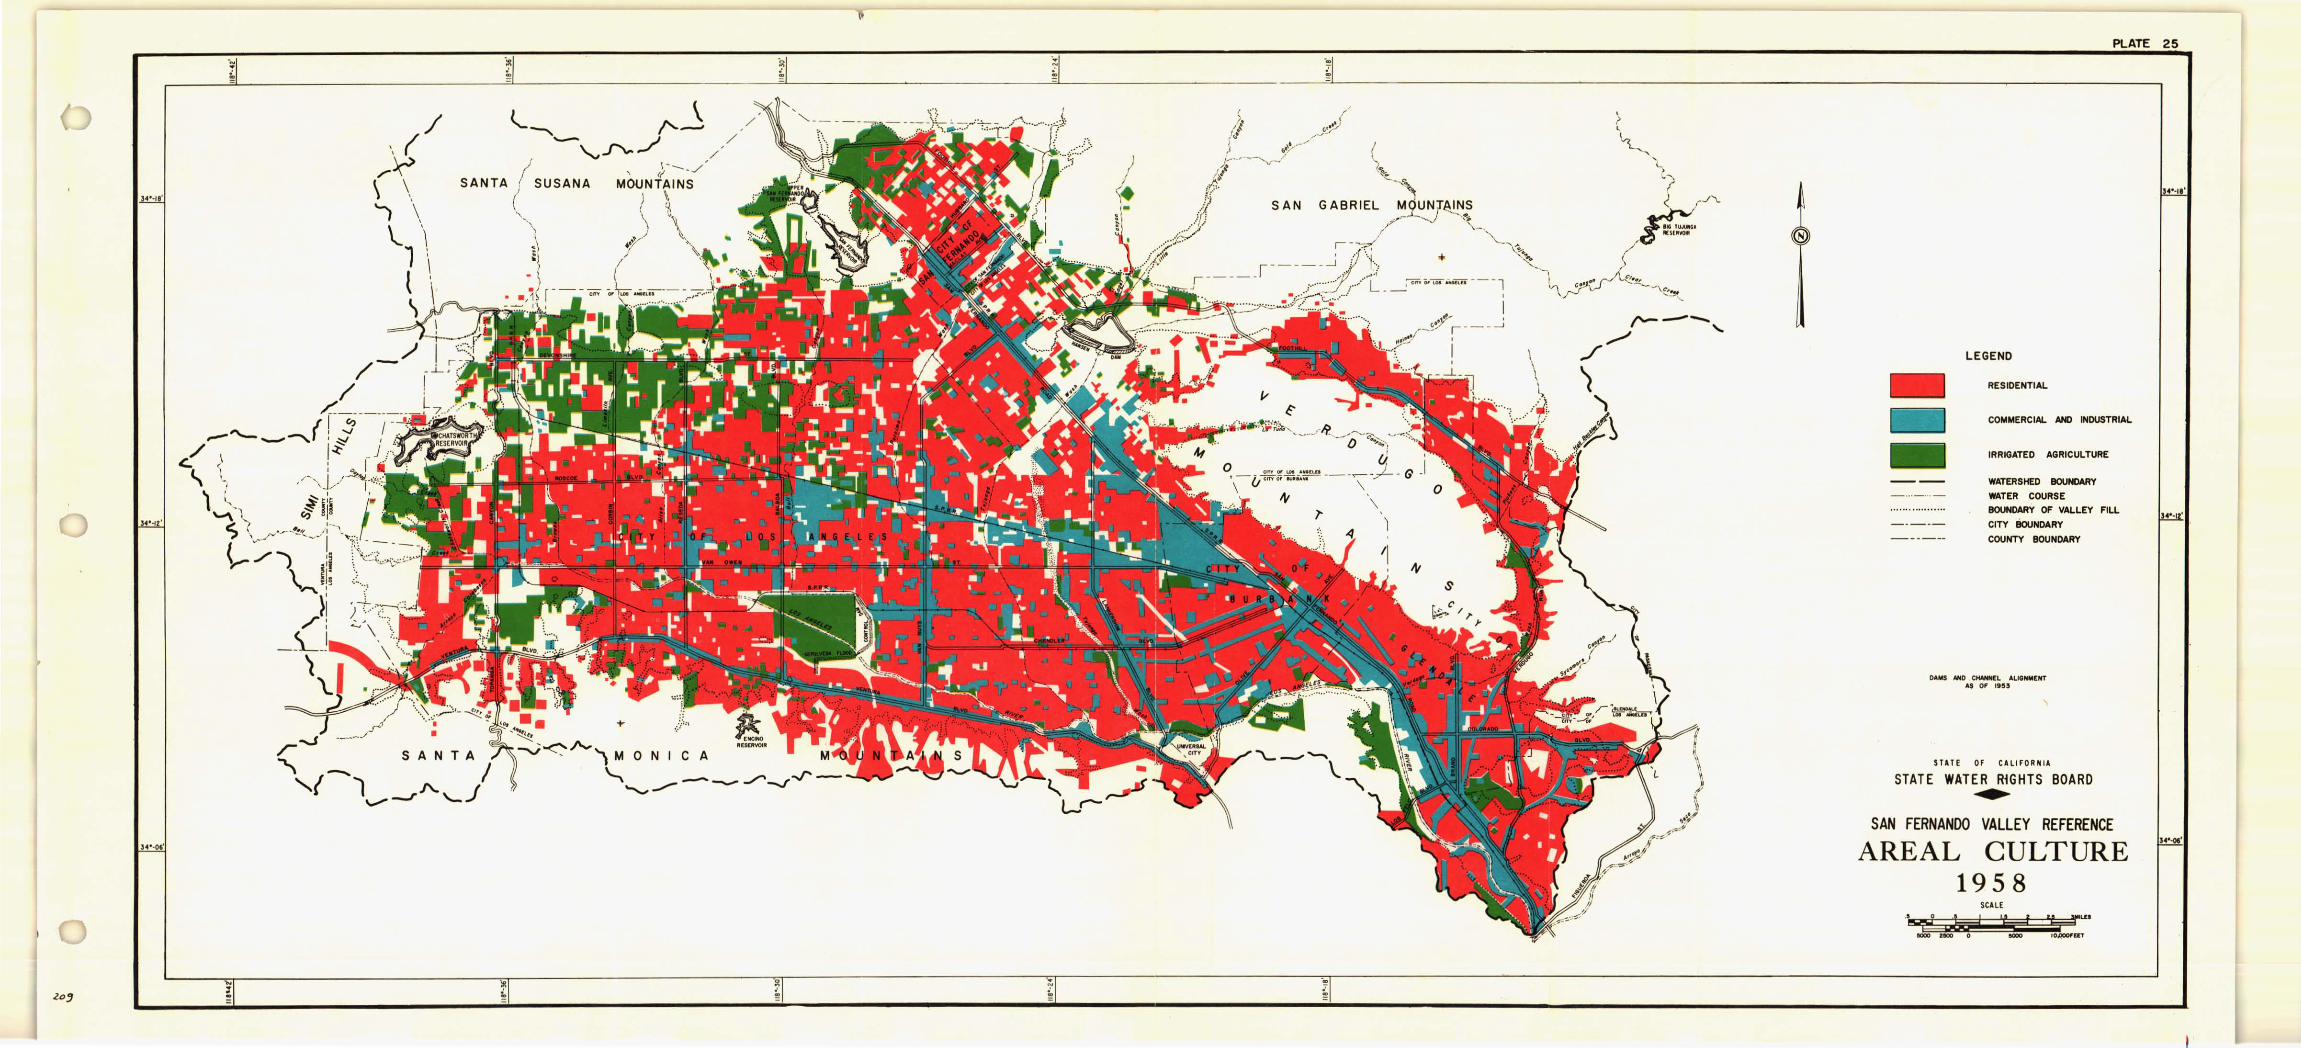
.. 0.,,'
,,0 . .- '
]4"·0'"
Zo ,
PLATE 25
-~I 21 zl ~I _-~~- I _ ______________ -----, I \ ~~,,- '"'- / '---. I'-~
----'-v ~./ / \ (/ /~ \ \
, I'
SANTA ( SUSANA MOUN{~;~./
('1 'I \ \.. \
1 \ l \ \
/-/ /
/. _"- ( I 0 ------' ·
/
_-"'- ' -oJ
c:.. \ I' ~ " \. ' .:t-
) ~ '-"\\ s ,
( .
:--./) ,-
\ ,Ii II'
" ~
, . '" " ,)
-~ ) --
\.
SAN T A
"" - I ,{ '1 -J.f\..,-.1 '-"""
1< ~
~ \ -\ (r---=-
+
--v<,,A, - ')MONICA
'"' ......... __ ---- _ ../" -...r..J' -
. ~
~ ~
GABRIEL
oj. .r _____ r-- ---...J ;'~""'" _ ... :-'-
·-L . __ ;c;no.""'i;Oi""..:o.iiUi" --- l
v ~
• _ _ ~,!!....!::!!!. _U"LU \ l./ CfT. or _u...--- ----~-~
~
"'- ---" ........
\."
.. ~
\
I
'I
,
r ---~
~
./ )
,
'~
1'----,/ "-
~ ~
LEGEND
- RESIDENTIAL
COMMERCIAL AND INDUSTRIAL
- IRRIGATED AGRICULTURE
WATERSHED BOUNDARY
WATER COURSE
BOUNDARY OF VALLEY FILL
CITY BouNDARY
COUNTY BOUNDARY
04M' AHD ~L ALIGNIiIENT A' 01'" 1'5'
,
STATE OF CALIFORNIA
STATE WATER RiGHTS BOARD ~
SAN FERNANDO VALLEY REFERENCE
AREAL CULTURE 1958
SCAlE .• 1 j " zr ru[1 - .~ ~ :10 ,ODOOfn: 'O~aT
" ...• '
,,0 '1:'"
H· .. •
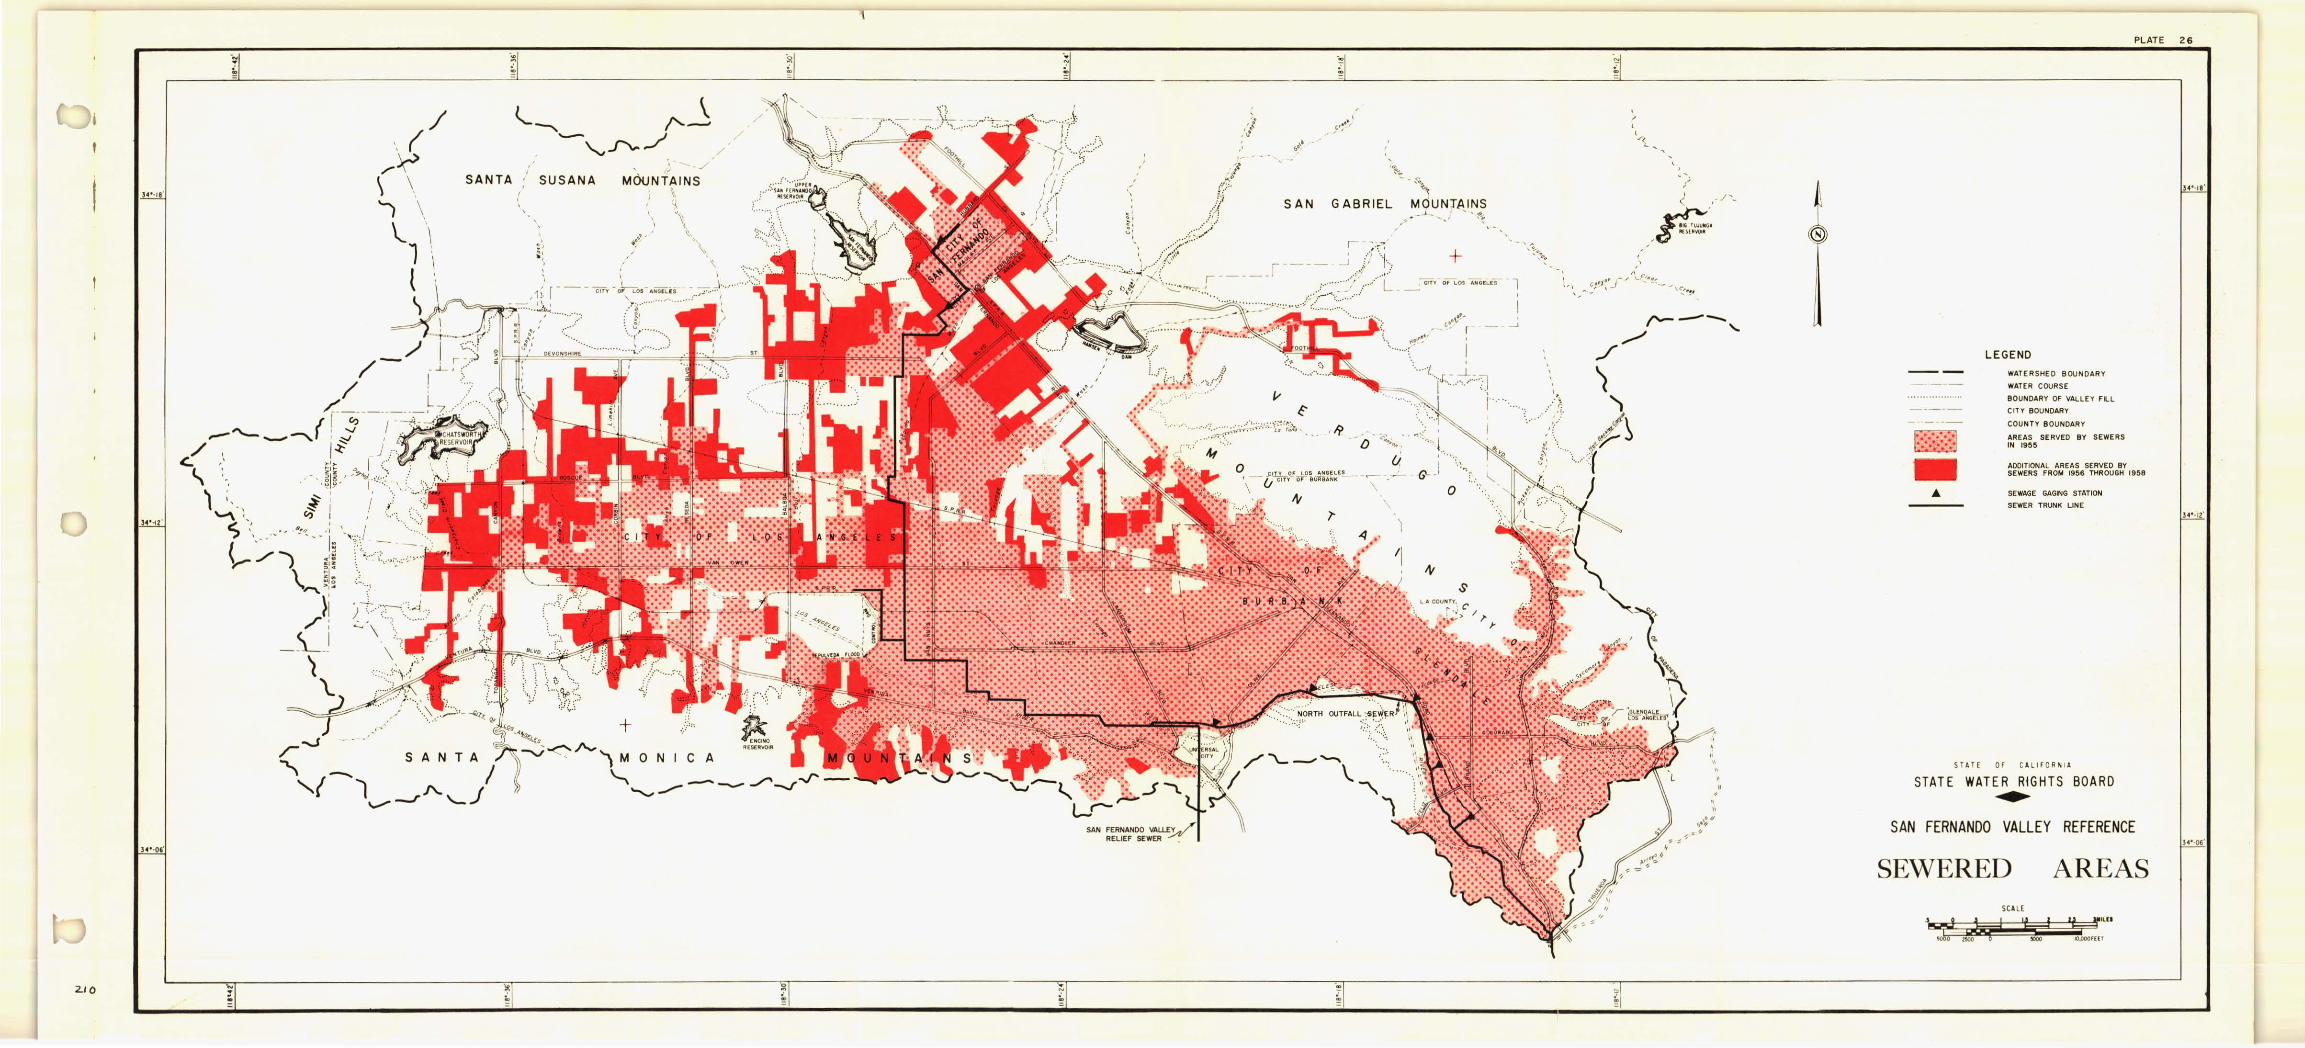
~ 4·-l e '
34" 0,"
2./0 I
,{
PLATE 2 6
~I ~I ;1 ;1 _____ ...=L~I _______ _____"'_~I _______ ________ ____, '. '. '.
, (/ (.-..-- I'~ '-vJ'v../
/~ \ \ 'I \
,,- \
1 \ l \ )
/-/ / !
/ _ ___ L _"-- ( I '" ------,
/ -~ : ,, " '- ,~ 1% "
l : ". I ") ~, ' 11' i ,;',." , ' '::' ~ - I'
" :--.. I
'-"\ :. ~ i I s : '" I '. _ 0" "' "-"'( ,;, I
~ ./ '") -'!~ "+; .. \ ~i ~ ~ "I "
.. )i _~ i
) " \.
./ SANTA SUSANA MOuNTAINS
\
!i ~ ;,
" , .f~ .
~ ''I •
~ 1'[ -' , ~ ClfY - Of'--__ 1 \ lO .... --
.. ~ ....... ..tt..: " NGf.L lS . , . . ........ . r ~.·"··· . J; ... ·fl"· .. •..
+
, \.
SAN T A <,A-
- ')MONICA
/
- I ,( ') -,./'...,-.1 '--""-- ____ --- ___ .../" -.J..J' -
........
~I ;1 ~ I ~ I
SAN FERNANDO VAU£~/ RELIEF SEWER
" · 1 "
, " " .:
SAN
, y ; ....
'. "'--.0 .. "
GABRIEL MduNTAINS , :> ~ . ...1 ~ ,.,: "~~
r -.
, ____ .r----- ..J + · ... c •• ..
" , L _ ~ CllV Of ~OS "'N GI~i!-l
:)
""<~;'
v ("
." .. ~;?',:.~,-~:;~:·:;~:.;:::·l~: ~:l~ , '. '.
, ,<j> ,'--. " " - ~ 0 "' .... ;.... . '.., ., l
~.'< G,' ,
-7-:1 r "
o CllLQf LQ S ANOiELU , - & cITl- o"-iluR8ANK-~
C; ' ,
\ \ Iv
_....:.- --G- -1 '" : .. '
\ 0
4 I
?'
'I Iv
s
~I
~
.'.', ....... :' /'
\ ...... ' •...
'-,
, r'i. ,
-',
" , ( . J"'_
" " 0' ._" '-.c:.!~,_ .. '! j \ _I 'C:-!'
1'---"./ '-./ )
"I .1\
~/f' ~ ,,<"r ..
~I
• " ," ," . '
~ -&
LEGEND
Ej .. ...... .. " ..... :
-A
WATER SHE D BOUNDARY
WATER COURSE
BOUNDARY OF VALLEY FLL
CITY BOUNDARY
COU NTY B OU NDAR Y
AREAS SERVED BY SEWERS IN 19S!!
A.DOITIONAL AREAS SERVED BY SEWERS FROM 19156 THR OUGH 1958
SEWAGE GAGING STATION
SEWER TRUNK LINE
STATE OF CALIFO RNIA
ST ATE WATER RIGHTS BOARD ~
SAN FERNANDO VALLEY REFERENCE
SEWERED AREAS
SCAlE It JrllU I 't '! j 10 _"
H'-1 8'
34 0 .12'
) .0·06'
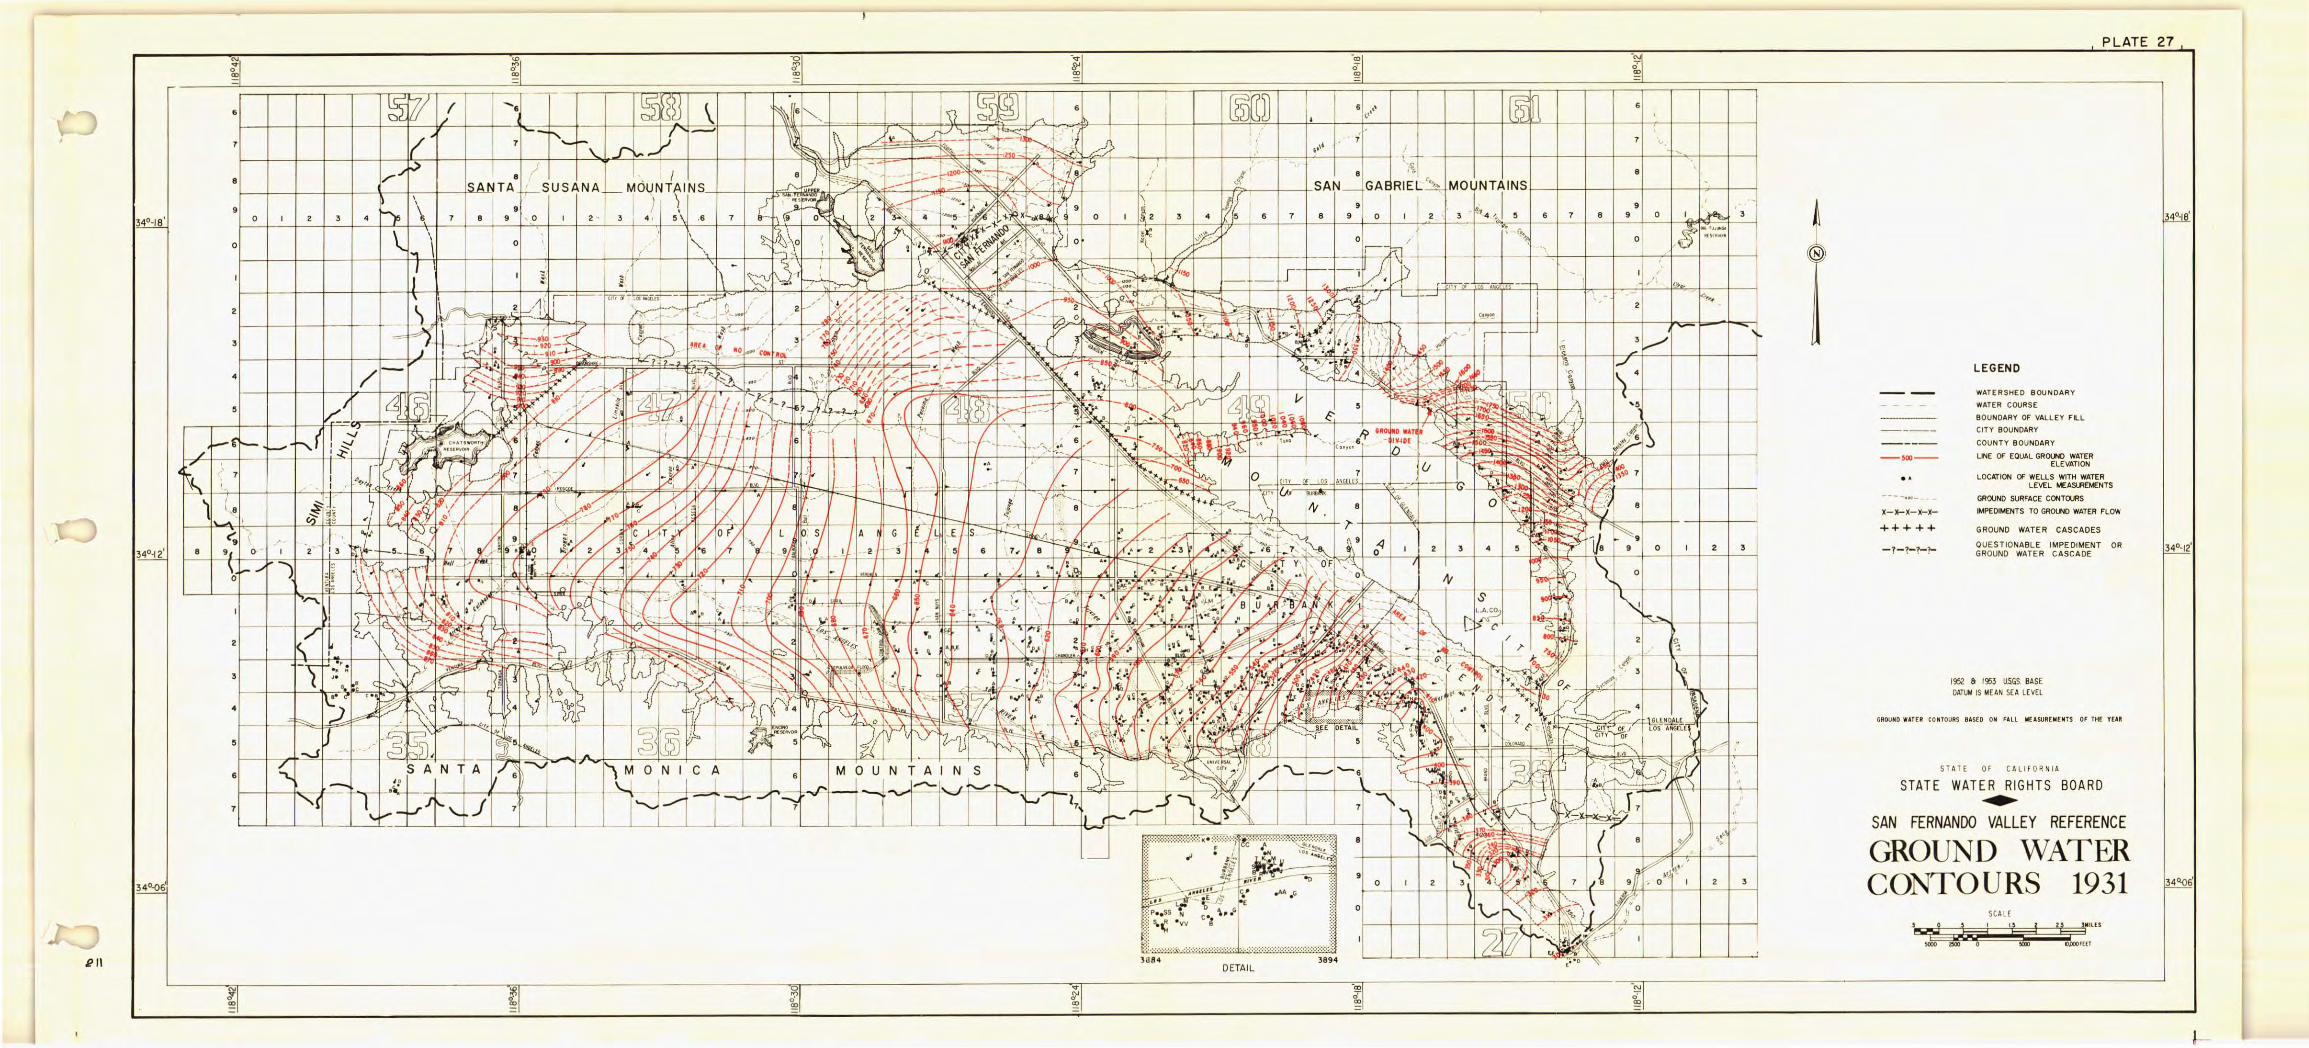
N ~ "01 -~ I -~I -NI ~t ~I ~ ~ ~ ~ r ----~~--------------------------~----------------------------~--------------------------~~--------------------------~----------------------------~---------------------
-I I I I I i~W ! -. --- ~~~ " r\ ."", -;; ~~JJ A • 1 I [ill'aD . .1, ... , [ -mn .
211
134°-16'
134°-1 z'
134"-06'
I ,/ '--" ) ---' I . ~ rV-"..,-' ~':$ . " , , I I I I I II 1/ ' I ---I-\. r k \' ./ 10 __ .,L. , - "'~ ~" '"-- i~1 " ',' " , i ; , " _ ~ . j I'&. ""0 t _ -Xt~.;)\ ~ ," ,. _:_ ',k I I I
j ,L> ) I '\\'\' ~\_V " - """ , "' . /f"'-, 7 ' _'1 , " ' .•
.;--_1 8 ,' I I 8 ~ -l- , __ _ ,1OO~ _ _ " ," f- a T , .r 8 '. 8
·1 1 1 1 1 SANTA ';""' SUS ANA __ MOliNTAINS .rJd, . '- ----- . ::: :§..: :11- ,-- ,:N " .£ SAN __ GA RIEL~ MO NTAINS '
, '. ) . '1 (.: , .. ':'tf' ~ ~-- - i ."-~. ~,,,- -'~ V \ If, 1 ' 9 9 ' , - _ •• c'\.. ... (' ! 9 9 9 ,,'
1 0 , , , ,r,. \ , •• ',0 , , . , I " .\ .• , , If 0l:'k-1. , " i::.,:- _,,~X~ ~ ~ 0 ' I~ : ' , •• , •• 0 ' "' --' '' ''', : , • , , • 0 ' "~ ' \ .. 0 • . ' ',,- >:; r7z, 0 ~ ~~lY-@ ;.<j tL ~'r4~-> j 0 ~l' Iv'~V 0 / " ~ 0 ,;5 ." ... .... .., \ ' " h . ' ~ ~11, ~~.~ (" "\~~~'i l >-~', ....-:::V '--'Il _ 1- _'
)1 , i .,' I \ - I<-,~ .. ) ';:("':" ~ 0" \ :p'>riJ '''- ~" " -s; ",}Y'('", .f --. , ~ f, 'I,> " ' . I
lo. : I ~ IY - , h .,." '.. V -~ ---, __ ... ~ '---~~~, .... 7~~ - -- " V , ~ ~~",- -- ' ,,' 10 .. \ , : r- CO" <>' .01 '".:nu _ - - -.:;:;-+-....... -" -./, '" ,, - / " -" _ , '1-"'" ~'.. ....oil... ~---hQ\ ~'~ -...., ~ '" L J L-!_---.J I ", - -" I ·1 .... ,
21 I I I I I I. \ ,r ,,-,,11 ! ' ____ +-----,..-' 1,,' , -- -10-/ // r • / , _;-". "" , """ /--2~"'; 1 ( '"" ' -' '- ~,=- % ::.;::. 'j I ' , I I .. __ 1 _¥ _ _ --.!...!~ f "'- ... r- ..... -'!. -,~- f :J /- ~;'-~~ ...... ~~ _-s. ~ . .... ' --- ~, 0 ~. - ~: .. , -' ~ ' \'I; - ... "J C.!.",,!
, ,, ,' 1. 'II ..... /" // ,.,- .... I,':..... 1· 1 ~ .. <".f.I .. \ 'I \\ IJ> :c~ .~- - . III' I')1 I ~ __ ,':' _,- ~ - , ... " / / ,,/ 'f; - r- " ...) ~ -"'o! l-~~ ~ ~ - ~ , ,,-""' " (I I ' ... - r- -- . ' I 1 1 1 1 . ~i I I-f. , ~ -:::.~ .::r~ ~..-J.,. _ " .. 1 '0 ..... ) '.i f / / / / // ~ _- I,,~"'- ( J~~'~ . ' ~.~ ",!!:' ' u~ "' '': ol' ~ i ,; ,1 _____
I ~-, ~7--~O- ~ 1_ 1 )~ ' ___ "' c.. " // - " V-"~, ,r~ .. _ 1-___ ~ , . " iS l'r)'J~ '" ... _ I, ~ ~. ' " ' __~: ~" t:~::-... <:.; AJ I ,I', '\1 >, " (f9 ! ~ 1,.../
' 1 I I I / _1.,[ f<;-- C,.,. >--"' ~ .' , / ,,' ~ '::--" ' , .. ,,,,,,~ 1/'[,:::< , --( " r» ::~ .~ l<l- ' , '-: -'Ii , I r-. ~ jJ -;:-< fr,) ' K~\';<'". ,~~Io , '~ \t· 1 t i - ........ ""'~ '~.;. . "Y _- . ;1 _..., ~ / '.t',,,. ~~"j ~.sl /;/ >-_ ~ ~-- ~ ""!.",,,-~ __ , r"J.r-4.)\ ~~""""' l:::\ ,~ --L- . \ _(
'1 1 1 I j ~W81r . )7~~ "",\:; ~:>~' ,:/ f /.1il7l, t ·f 1,. 7'-, \--l f$~/ I/ 1 1 ~ ~j'f - ":;'- _~~~ '~-~~ -~Q> ~ ~v-v~ rc,, _ v , - ~,,~ ~ i~ >. ", ' V-_. _ _J ,. -". ,V -...., ,1\ ): .. I Y /- / ... _~lf:f. ... t / I /_ t"'0 _ IJ: > : ~.{ ~, Ic:.!l (Q) v. -, ~~. r ... -~..... ~ ~ C!Q - f". ! k-~ - _ :.; /~ _
.r ! -.J , - --&- , ....... ,-',' /"-17 '-: _. 1;- L /' ,r ',---, ", .' '1"._ f ' / ~ ., , "1. tf, "" '". D .. TO ~ b.:::....., ..... t'-'\, ;;;:;WIC-." '''- I ~ . ~ I. --. ,-.J ;" r""; '# ,"."-,, j '\,'" ;( ' r-:-: : / , I' , .. ' I t I I 1\ \1 - ',-., ". ' ,.' . , ;---' 1"-, \;:'\1 II jl:rJ-' " ',.. -'.... . . '!"''' ., - . ~ :;,::, : 1:''':-/ r--'" Ii: L:, - jg: omo_v ~ ~- ,/ .L I I, I I 1\ ---. ~-':.:. ;: .... " ~ So .\(htltnri \b. c •• , •• ·- n F<1~J ' - ...... ~~ ~ - ~/
" . -- 1- J f~'j~ ... - , / j" U ~~ ~:s ' '\ V - ."'~- ' -<t '"' '~- L?-'. '_~~ q ' "-."-.. - , - [' ~ ..", ' r" ') , I I ' .. I~ J - ,.... , I I \ I "!. > ~-- ---., roo::':.. ,-' U I --- l~D~"" ~ ,:~ .... 'l:-:~-~ fIIl
~: \L ' .. : P~J~utl'· ,; ~- /(, Z , '-' Ill ! / · -..,.,'_J~ IL_:..:_J -,. ~ ______ -.---::, : ' k' ;-~~ O--;;; (; OC..ill~ ' ,- : I,::. " : ~' ~~ "'" I I I I ... (" ~J, ~ \,p rtf /.' / , V '\ , • .;: ' ~(' ,..{ /' / I I / "::- --- -..J I , I f , 1"" '. -7- ___ ,.---I%,.,~<i:.._? \, i,;' , \. 0 ~' ~~ ~ ~!S~ , I I I I , cf ~i " [i'"~ r~,,, .of ' /' .:G - ,. 1/ /' . /~ II l ' r--I __ : ' I, "0.~_ .-..rv?- ' ,"" I',I ~~
1 • .-,.,, ' f V " V V~' /7'''' ',/ ~i < s"= ' .J ' ' v ~i" "' > l' & ' "' ~-' I ~, <:: \' , .,. , .- I ' • , A _ " , L , SAG [ , - - , - ' ...,.1, , __ --' ~- '-, ', ,_ -., .• ~""~ ? _ 9 .'. .. ' , ~,, /' ~ / ~ , - \ I __ ....... _ YiJ. -- ,..-- \ / '-' 9 '!'" III , - 9 ~, 0 '" '" , '-, '!i\4. -._ ~ ';', ', .t.: : f -, ~~ ~'Y 2/ ' , ' "" '. 1 .. 1 ·L f_J. ; . . lL--·2 3 -- • • \ " • --r-~, /.:' 2 Z ' '. 1'. ~'~, ~ ~' 0
4 , , , , • ~:~ V. • 0 I , I , I , \ ~ -""") ,1j .l \\\ ,\",,'1' r" '(i ( Iri: ./, .1/ / / ).p 1./ r rr. J I .J -J . ' J'...", A IX-:H( Y ;C ~ . ~.\ \ O,F i'":"~ ~ > ~ \ 0 1
:': )\ iL.'o .1/' I ' ~. " ", " . ~(; , I I 'j '1" V ' - J ' " " :'-Z, ," :. . ' ~<k, ' ," ~ tv c;..~'~ V ~I I I I I " , 'f l ;\. __ ' _ • ~ j " ~,.. " ..... ';!,. A & • . ' ' ... . .. < ... _ - ,
I I I,..." 1 7-, , , ~, ~, ',...-r -..,- "'- .} 0 ~ " z " l -_ 1..-;, - - rF -. -\\ ! ~ " a . i ,! ,~. ' " l " A' /.~ ' ' I-/', 0 j)J '~A {1 . --.t :~;f -'- N s ,I , , .1" , . , .• 'r ", ':::fl', \ .... '. ~ , '~ '. '. 11 ' l- ' . • \ ,_.,. '. , "'.; _ l.': - ' • • 't.·'!f.I ' ---, <o. ,~ '-'-'OJ
I 't, " ,."'.~ / I '" <-' '' ~'r7 -' --.- - • .....t ~ x.:: ~. a ¥. ,.. :: 0 ~ • ' c "'" I~ \\JJ ', 1: ... - \.ot: e; .. " , ~ , ~;!::: ~... f'~ • ~ ~, ~J' ~,"'~' - =/ ,,: --_ -"» IV ' ~~ '.- . - j< " , • N ' , -- -i " - /._. ' ' ,- C' ~~
21 I (~ • ',~ ~:~f:::i~ __ Il? fJ ~",:~~ ,~~~ ~~I~[, ~\ ~ , ; , .f~",.tu':f ~ .f.~J~.'-V ·, ~~~ ~. ,i\~~'..:- ~ ~=-~" -~ k ~~ ~ ' , ~ I I I , I I ',,-' :: ' : \ 1,>-' ~"", 'V . '\' '1:,'J ' J! r jJ~ 1> ~~;::. " <:. <:~ "''\;~~'~~ ' }-- f' "Ii!: ,,! ~ \ ~.I/ "'" ,~--" =-i/ f · ~~~~ >?~ :::;-,/g.~ ~M~';~'- ( ~~l" ,'1',;~;;:W /' , l~
(, ~ . ,:" , # , , ' '--, >Cyj '~ > _ ,~, '-=- ~, .'\ ~ \ ' .\ -~ , . -, . .)':_ 'i i' -;7'" J 4'. 7 ","';1-::; , ~'~r.J, ·t'·iJ ',f~~, ' Y,i:, ,",( ). !/,~ - ' ('..; ',',:;. r,;' o"" .P;. \ I I I I ~')'" ' '' :;A\c \~ 1'112. 21 . 1;-> .J,;_:--;: I;:' ~ , ' \ "\ ' :\" '\ '~'"'H I'%3' _? ·"' V .~· -'.~ v. . .y " r;' ,~~ "~~ . 7'::&J''I' tL~ -:~ , ", IfT) ·;~~<~" "' ~· · O , - '<,... ,,10- 1.....-;; l l\
• J ?:r;, '--, • V r' V ,.;'1[1 ~ '1 , " r ~\ J I I ~' """, ., \ ... l ~ /'~ " If ,a·' /' v:l\' ", '" I" C;:> 4 ~ I"-:::::,... _ ,,~ ~ ". _ _ _ 1 ( ~\ () \ " ,t~~ 1" .... t' -- , I.,. • ~ c ;.t _ J/ i" __ < "~,,~,,~~ ~ l 1 ' _ (, ... 1 li.1..~~I.t._.
J .~ ~ - CSl rc;::?, it- J§ '::f_ "") / MJ
..... v .., _ ',,~-< '. k ' 1~7 .. A ~ Wh: ~ ~ ~'O"'" s -::' ' I,;q, 1-"-: (; , =]..-< ,~!"~.' co • • ",hi f-'H -...s - - <~:~, ~~' " . ~~~ .~ ~ . ~ ?J.' v tjl~~ \-< ' c , ;;:. ," ~ . ,Ji!' -" '~~ ci~ • ~<;. ~~ ~ , , - - ", ,( -- "n I ~" ~ . • ~ SAN T A /~ ""V ') M 0 N 1 CA. M 0 U N TAl N S ~ . "\ ~ ',:.:~! /' '- ____ - . ;;;C ~~ ! (2 ~ ~ 3 ~i 5J~ ' 1'1 11) rl
-., .'=-- til I ~ I l.--r::I'-' '......... ..... ~ = '-Y ,'ffj -l :, ~ .. , . ~;i - (:..q:-L~' ,,\ " "( \ ..... -..rlj'-'-.f ' ~ ....... J.j- ] .,J'I' I_-,,_-'-', ""'-"V I ,'!. "'\ ' :" " ' ~ {7'.:::.-l ~.:~~,j, \ "
. _ - . I ...... ,-~ - I -~'('~ '\::"ft fiVb- ,- ..., /;'~ ...:.:-.=£7 --- --'~ ,-~ M ~ ~n M
r"""""""""""""'''' ''''''''''''''j' !t·······,·,·,·,·,·,·,·,·:,,·,·,·,·,·,·,·,·,·q · ..... ' ~ ~"? ~". -:J J • oW ,!' ::: ..! ; c -:. :O~':;;'<J .r:A 11i~ J} \ &", >'
-- :: Ii ;;.~ ~ ''1 L...,y u ' II ,/" , :;:: _, ~ ..., __ ~-'t" 9 '\ ... I 'fr; , to!), T""', -r~-!:"';" '0 0 ' " /:..'~Y ' ~,{ .ff ,o ,1, 1 , '~.'. .....'iJ.!.-c' v . M , " . f!; 1 ~~ . E '" .... • "\ , , ' ~ __ L:- - r- .~ [ t . ~ :.::.-. 'I
i pe • SS ~ co. ,\, .CO 0 \,.., ~: ~~ ~~"'<> --~ ( " ' :::: \ " . vv 9 " :'> ~0.c! .A ;
! " , C)1I/..... 'itf···" '. , ~," ,I ~" .................. ,.,.,........... / L u l I 388" 3894 - . ..
o
,
A
~ ~
~I - - - - ---_ . __ ._. __ .. - - _.-
~I ~I il r-' 'N
;:r
" "
PLATE 27
LEGEND
WATER SHEO B OU NDARY
WAT ER COURSE
BOUNDARY OF VALLEY Fl.L
----- - CITY BOU NDARY
------ COUNTY BOUNDARY
--500-- LINE OF EaUAL GR~O WATER ELEVATION .. LOC AT ION CI' WELLS WITH WATER
LEVEL MEASl..R£MENTS
----, .. - GROONO SURFACE CONT~
X-lC-X- X-X- IMPEOIMENTS TO GROLNO WATER FLOW
+++++
- ?- ?- ?- ?-
GROUNO WATER
OUE ST IONABLE GROUND WAT ER
195.2 8: 1953 U.SG.S. BASE OArUM IS MEAN SE A LEVEL
CASC ADES
IMPEDIMENT OR CASCADE
GROUND WATER CO NTOURS U SEO ON FUL 1II£.lSU RUI £ Nl$ OF nl£ H AN
STATE or CALl f Ofl~I A
STATE WATER RIGHTS BOARD ~
SAN FERNANDO VALLEY REFERENCE
GROUND WATER CONTOURS 1931
SCA Lf J j !.S B JIll ILU
"'" "'" 'iDl O1lODf(
~
1340_12'
134"06'
I-
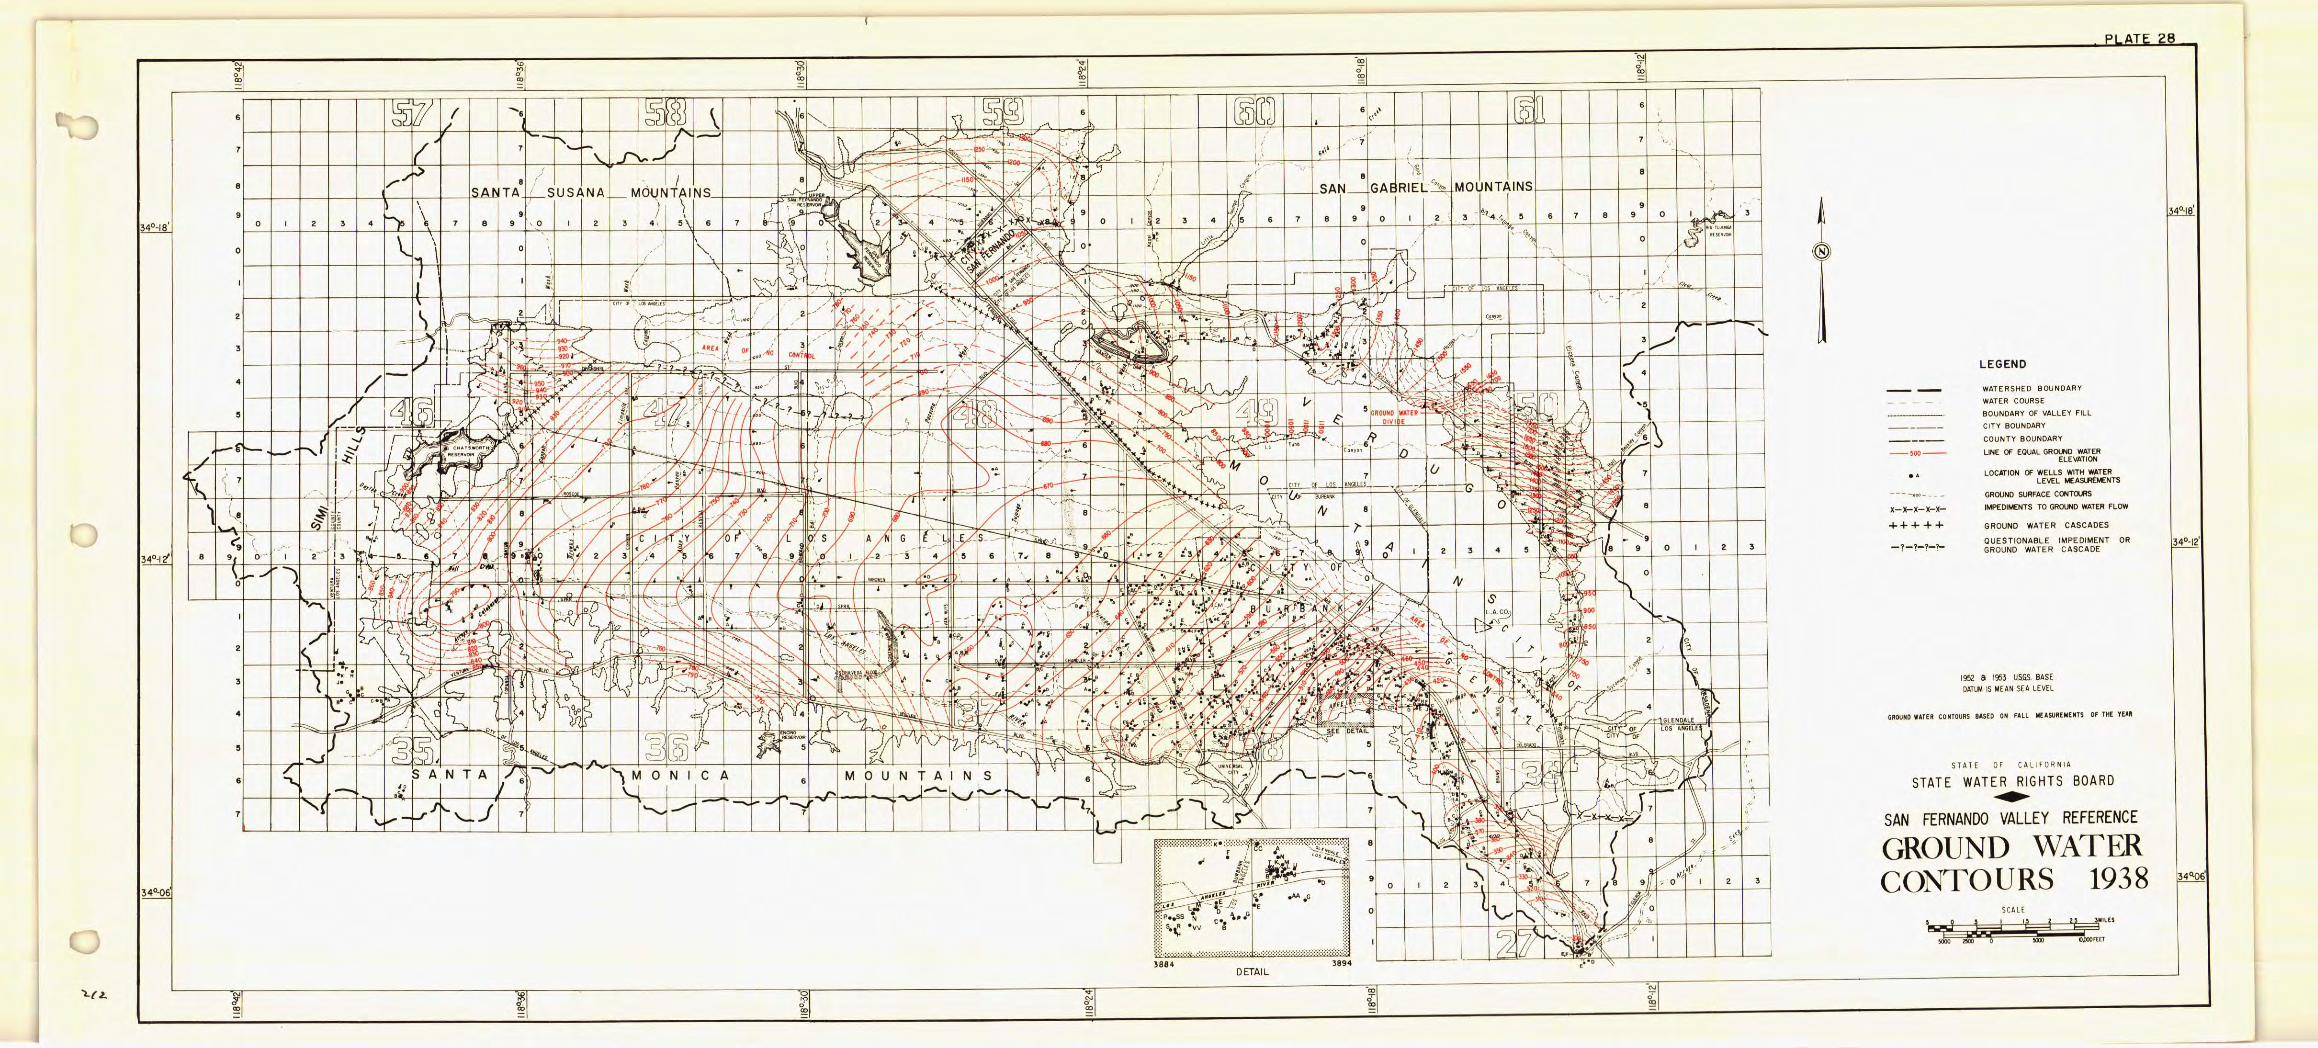
tl ~I m
"~
~ "", .. '"
"N I .-'" ~
'"
1[8' ( ~. \ - 1 ~~D -i,,'" _
_
134°"18 '
j340"2"
F:,
1 1 ''-'
:y 1 " I J I I I ~~:< - " - ~ ' ~~ "8 ~ " - " r'-, I J"'-8 1 I I I I .,.-./ 8 /' " 1 ,1.. 8 ,~ . .... -~~.::.:: _~50 ~<;.: ~ f --- ~-) , ,'{~ y- /' .1'( " 1 - 8 1%1 c \ I 8
, SANTA +.-SUSAN A _ M04 NTAIN S J'.... '-' ~/ ,, --. ~ ,'%( / \ , ;y , ~, SAN _ GA R I El~ MO NTAINS ' , ) \ i "., ~ ... " ~ ~ ,-." 'Y) (";~'" I" ' 1j;I \ Wi, I ' J 9 1 9 I, .' " Q Jr. [n _ _ __ - . " ' (~, -- --~ I ~ 9 . - 9 _ ~ 8" 9 , , -o • 2 3 4 ~ \ 7 8 9 ~~O • 2 3 4 , 5 \ 6 7 ,\9 O~~ 2 / ' 4 '~!5- - ~ ~ X~ ' ~ 0 I 1) 2 3 4 !5 6 7 B 9 0 I 2 ' 3 - -4,~ !1 6 1 8 9 0 I ~ 3
01 \ \ \ 0 '~ ;," ',,- ~~ ° ( ~,.y~~, )"\ \;:'c:," "I~. ~;=~J-'~:)j ° ~; /v,-v.. ° ~ _/ 'I':'"·." , ° I ~·.~::I "-... ' '-" , ~ ~lIil I t/:~'1'A~~"{ ,s;~ " //p , " '. rOO I 0- .... "' -- '~'#"~?' ~....( '/ y;' ~'
I I I I I I I J , ~ .,' \- ""'( - .:... ~~ cr, ~.",~ ~ ,~-~, -"3 AJ" " '", J -- . ' . " J) L L ', ' I ,; 1 ' : 1 ~'.> . " ".. .,.~ '- ... ~. ~~:"<P -;/<~_ ~ .... _-- -.:':.:, ..,.,,:,~ - - 0 i!_ # I ' II-ri"'" "M'"" -:- :-r.--- . ..j / .rk.
_
'\., ' ~ , r-, "" ' r ... ... " --;;:'" _ ' -- __ f . , _v"~ v , '" ~" v" , ~",-\-- ")" " ,,- '- "'i; , j..J '-----' I" '" ,,-I I I I I I ~
2 " I \' i ~ I ~ /'I / ,," , ,~ ,," -" ~.:: - ..... , , - & i '..... 'i -....... f~ -c;; ~ 2 2 ~ , '<'" 1-" -' ~ " , 2 It.l "' / /" ' __ ' " " --~ - ~ ~' 1' IF / , ~ t,,- ,,_J" '- ____ - 1._ '''' / // ~ 't" !:) / ..:: '~~ __ ° '. - \ ~ '. ~> _ , ." i' /) ... c • .,~ _ 'i" -- , - - ~ 7" -"" - '", _v. T ' · , -
I '" _ ( ; ~ "- - __ ~ ,--_, . -- /" I) I '\" ' ~ I -', E- . ... ... ( (I '))) , l - , . " "" ,-Pll-d" ''"''"'', 1.-." .•. , . / , ' , I. '.~ >c. '- " , ~' - · ' '' Pi.~j" ,t !" ,', j ' , ," ,- , , ~ I ), .. I - ~ f . ?-~ nor I .">,., '-( I -.l-~ '---.., ', ___ ~ /PIO co)IIf PI. ' / / / l' ~~ - ~'j ~...... , . .J)l 0 ~ \~~ : r. ' : i ) A )r:-.l. ./.J ~ ~
_ l '~: ~ , ', -, , -, " I~ ~~,,"~ ,,>, -, " " / t.": I, ', i', ' 1\ , ' 2(' ,of> i. 1> ,/ . , I I I , / r "I -)::- -" k< ~.", ::: ,::.." ///_ " " "'; l0 / " , ," // ~ __ ' ',W " "-" ~ ( , t ,,,:- , , , "" I ~ {\ A -:/' ~ ' ( . ~;)\ ~;,>Y- ~lv' '''' ' ];t>_ 's Il4
I ............... - .p94O' }( //: - -' _ : _ 7 1~"' " \'~"' I \ J .... ;o - ":-~ ............ --- ..... ..r."r :.: .... 1'- j ... .:- __ ~L-, J/ l~~? -"' --:" i I ' - I I I I /
I " , L:-,X / ' /', , ' " " ' /L " " _ , , F7 '" " - .~,', ;::0 , T ~ _'I('" I' / " :$"' _ I ' _ _ ? ~"! /./,. r-~ . /~ ........, V V - '( -;:- -~" - L.r- l ie ... · l.c1 ~ r~l7/'~ ~~ ~/ »>/ t -~. tlll "''( ' 7/ ~J'V' :' l,! ( ~ mt~-...,-~ " ~ '~~:v- ~ ~ , , _ ~ ' RO:::, ~"": ,, _ ~: ~";':.~ ~ U A '\ ,I !.::; r- &~~ -'~ "7-7 / ' - ,u- """ -- - '!-' "" . " ~ .' "'" 1. "'0 ~ 0 ~ '; ~'3.::; -- ~1-~ ~-)<;; ;"-,:v I. I I I I
/1- "~I : i' 1/ ~ ~~;::;':ioiil' V '.V/ .!'~ r::-: __ V ; "j r-" :;"'! / "-~ -""'" -- -" .~:/::: ~ , ''''', " :~ " , r:;..(' " "" "-" ,;;;;;- ---- Il" ~. -,; ,:£ ~~~ .£~ 7" ;, 1 r l-r!'M' : II' T .' / ;< 'Z-/ ' ./ ~p; ., ~r ', > ' i) '~ ' 7 ",,-- -"~ 15: - ', "' .... , I"'" u 1 =-~ ~::; ~ 'I I p ::&rr 1_ r ~,.c. , ..... ~; I ,J ~ ,.¥-)I, , I 7 . " :s:: - ~ ~ v_ 7
i,. .", , ' ."f"I1,f. '-7 ' l- " ,;'P" • ~Ii __ __"'" ' ,,_ _ __ " ~" f-'lO- _ ~ > ,,~ 0 ~ "" ....m lli<W , c-: " ' §;§ [;~>, ,."ji... I I I J -... ' ~ ' I ' ~ '').~V~ " #. /' /" V ' -"' I V /~ ,,,," ' - ,,-' ----.J ' ''' '-"if" ~~ • . );,,1_ \" (p - 't" -_,~,?-" I 1 \ ~ , i ~i ./ (?lJt ;/. /~I... • X / :.-- ~ '~/L- -;/X'" ,/ / .:J l F"--"c-. / ~t . '--- T'-': ~;:.;;<~~ tv . ', 0 .~ ~~ •
<; <, I , .., .. '-. }),)'C/ v /I I , /V~ / /; f ""rriY / 0( ', L , S A ,.11 G l ' ~ U2s ,, ~ " .r, " /# ' V /- i .. ~7" '''~~ 7- ~ s.."" ~~ _ ' ~, • " iv ' , . ' 2'" I, ' :-,4- 1-' _ !< /{~ ' " / §'=, ~ ~'2 , ~- 1.-0 ~ -I \ '/- _! '/ " ,_ ./" -"3" "-~- V. _ \1, ~~~ ~ -;> :.',~ rl~ ' il" :3; ~ r ~ , 2 , • , ~~y V. • ° I 2 ,
\~./") ;I! · 1 '1'.'t / ~ /""i " /<.77 ' / .j/ / / / " . ! 7...-; ";~"". ;' h.-.{ .' ~< "~~( ~> ~~O.:F "~~ 1 =,-<' ~') \ ° 1 :" )1 i ]i,,/ r ' ) , ~ '" 0;,,, , ~ . ! ' I ' ' Y , ' ''' ''" J • "'. " Y "";< J\ t", .". t7.~: V -~",,' ~ tv ~
" 1 { ! :fT'iJ '<' , --;,- ' " f~ \>''5,' .. \., /;. '-l...-- ' -' , y ~, '" _" '/ 1 n ' j{ 1'., • ~>;.> ~~~ - :"'.1 S ~ I''' , , I ...l..\ \ I I .... t1 "\: y r..~"; I -Y::::.Ri '=::::: ' '... ~,- -- -oo\ '~~-"~'" ~ . - .,--_ ... ~ ,, ~ __ ~. -.--:..:~ ''.'-.- J e,. " ~_ \\ .; ~ 1' ;: /~ '1 ~ff'Jn 'N ~: ~~ -:-_ ~~ ~ L Aca " '. 00 '! , , . '" ::' ;.rr " " V '" :~" ",-, "" I ! ./';'-": \ ,,\1 - ; -- F i' \. /' -''''/ ' %0 ;: I,j ';,~ .. -/ iv , ', ' - /'~~'t';;0_ -+' ;:c'~ 4 '; ' -- ",-"
2 {/ l ~J\\\~,, ;:E: ~~ d\ 0-:"", f, :- .,_,.,~~~-' ?-S~, "" ~}~/ :.:;;;// ,.,,' r J , ~ / ' I, A 1 },'V'" ,7 /. ; (' )~~; ~ /'" ~~--::' ~ - ~?::t::o::~",-- .,, :> '-", / • ~:" 2 . " ... I \ .... _ ---- ~;:71- ' '1 '' ,,-... ~ _~ , .. ~"' l >"" ,, ~ " \ \~ ,, ~ : , ~ ... ~ V '~K • ~ I~ ,.C, ~y: _ /y.. 1\\/- . ~y~ . ..-::;;l W ...... / I /.-.M1 ~ • ~ ~ --~ "" ~ .i. -~I.,.. _~ - --' '" I I I
1 1 7 i\ \A _ I' ,Y'i \. \) ___ I, ' , .
134'-06'
0. .~ L-.... ' r- __ ,/ " ' .. " ',,, ' , \ \ ·:.) - l . " A _ .... ,., jo A. C ' ) 4 a_X .. . '<: t " ' c~ ... r .. ~ \~~ 1t _ 11 ') 0-<,. <~
41 I I S ;;~~\( 1- >. 'Ii I~'oo~ J,j r~p)' 'r i'.!, I / ~ "~,,\ ~\ \ \~:~~~~t;:.:'" f '-,~V'~~~~ :~~l((;!W;:Zt.,. :j>!)'/ ~ ,/~ ~ .... . "'(' }: .. ' O ~ '> '0 lr-2 p 4 ~~ \, "'S, ,, I ~ . =; I ( ' 0 ' W , ,- .I l ' , , .(,, ~, r~;~ft:/.1 ,}"l.rf. / '. '","""''''-' "\ (. , (,. bW,lt'
. 1 I J ,/J""'''':S''~ . " ~!(!" ~~ '" l' u"";~ IJ'\jI.\:j-PIJ\ [~~,, ___ " " ' ~' ,\{~ t! . r?";~- ~~ ~.~ " 'r; ~~y~~''''''~ ~fl' l ~;. J \ . ~ '" ~ ,· .. tf:'1I:,r:.!f;/ "s ... "~ ~. _, . ", ' 2; ~ '" .. « f" '. ') " " . -.. .-r .......... J r.:= I .... , '- . ~ • .,; ! / '.. ... \ \" - - '<D "'\. ~ <. ' SAN T A/ _ ......." M 0 N I C A _ M 0 U N T Al N S ~ . r\ '" ~ ''':':~! ./ '- ___ - _ .? M '~ " '-::J.lA" j "i :::-- t~ .. /) ')'/~ I "., I
I ,- ,f,! \. I ~..-..... I ' ", = '-c:::: ,'$ ~ /' 1 '- ",<if ' ' .. ~I'.$ r;"r- ' 'J~ -0 It", "
1[ I "l 1\,.f--_-rJ,-'-...f 1 r ......... -~ .-.,. f- ..... -r ....J' 11 .A.-- --"t..4~ 1 - "\ ;J:~' ~~~ ~ '.\\J1 \ ::' ,- - I- ' ~ ,' "
r'~'''f'~w'r~:'J ' 'J~~~ ( . lI ," - ", "' .,:: 1.::1' ~ , '~'7'if ,, ;.c , . , l I/'" ; : ~: i~ ~7':. :::: 9 '<... .. i~:-, P'" ~(J.'t"
}--" ', . .5-~l "' :" 0' 2 ~ 41.., ',I~ If 7 J off .. , 0 ,'Ji' , ~' '" . ~ ~. ... .' ", ~~' ' '\ fJ.'; I : . :~f' L " - -e:..J~ £ ::: ( " .;;.\~ ,,- 'I '"0 ,', ' ,"- \" .,. ~ 0 m "8 \ •• ' m 0 V -.:"., ~~ ,I ..p ,'!".
ill "' HH ' ~W ~~~ V,;;",'" 'I I I I I
3864 3894 - .·0 ~ DETAIL
">-{.l. ~I ~ I ~I il ~I ~I
fN' ~
PLATE 28
--'00--. , ----, .. ----X-J'- x- x-x
+++++
- 7- 7- 7-?-
LEGEND
WATER SHED B OU NDAR Y
WAT ER COURSE
BOUNDARY OF VA LLEY FILL
CITY BOU NDARY
COU NTY B OU NDARY
LINE OF EQUAL GROUND WATER ELEVATION
LOC'{!"ION Of WELLS WITH WATER LEVEL MEASLREMENTS
GROUND SURfACE CQNTClI..m
IMPEDIMENTS TO GROlND WATER FLOW
GROUND WAT ER CASCADES
QUESTIONABLE IMPE DIMENT OR GROUND WATER CASCADE
1952 &- 1~3 Us.GS. BASE DATUM IS ~ E AN SE A LEVEL
GROUND WATER CO NTOU RS 8ASEO ON FALL MEASUREMENTS OF THE YEO
STATE O' CA.l I FORN IA
STATE WATE R RI GHT S BOARD ~
SAN FERNANDO VALLEY REFERENCE
GROUND WATER CONTOURS 1938
SCALE
tY
j " U J IIIU$
- ~ :I(JJU o.ooof[(T !IOOO 1'5 ••
134°,,8'
134°,,2'
134'-06"
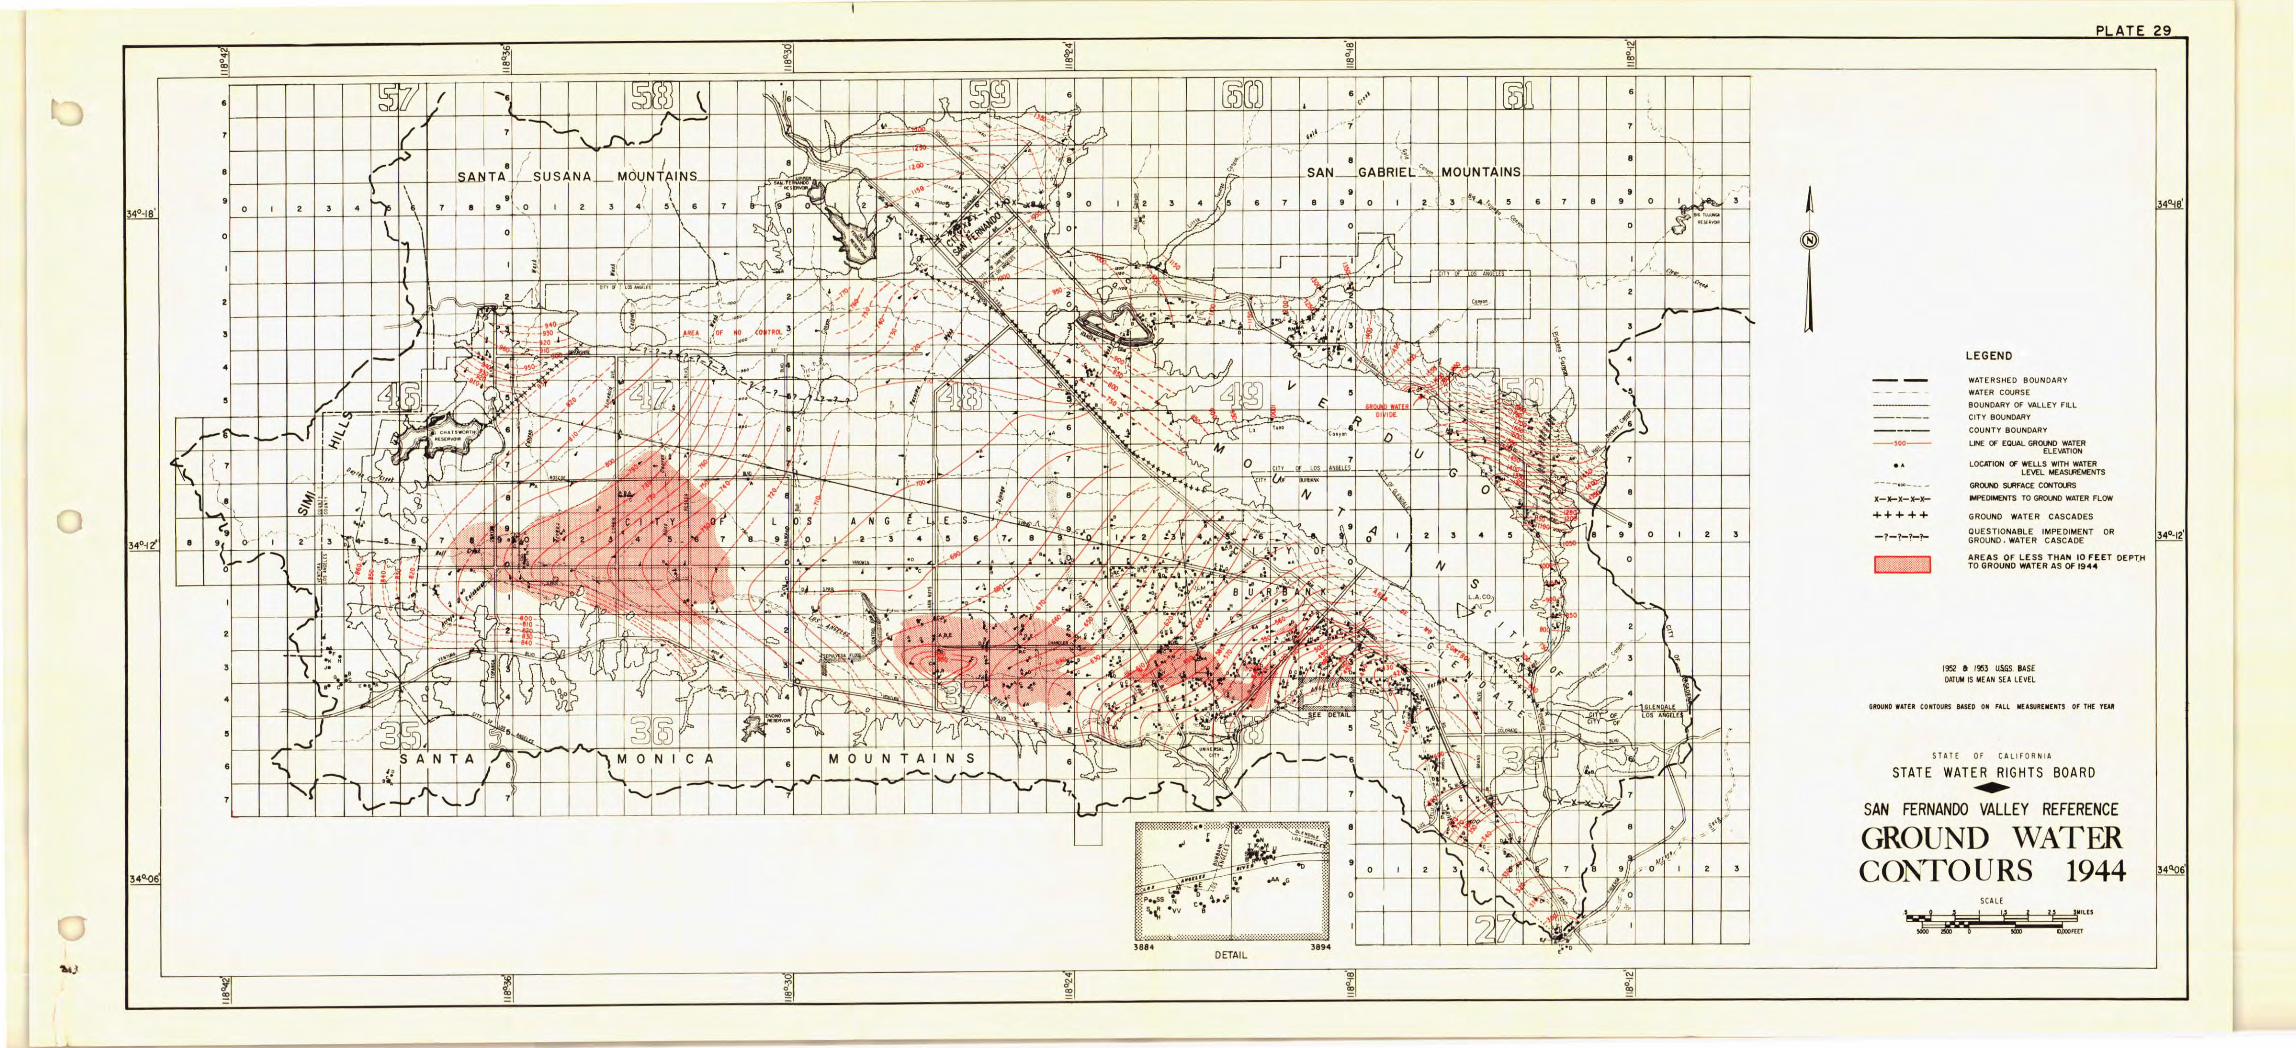
134' -16 '
134"2"
134'-06
~)
-~ ~
!i; ~ ~
-,. ~
o
-~
or ., -NI
~
1 1 \...
•
r~ -
s 1 ~r l I (~ I ,c;'i! I v Ct-~ & , ~,/ 1; 251 17/, i/,f , ,~e.:. - ' ~J' l" I r l i01 (~\ '-', b-~ ~~"'-:I ' : k-.-hr-Y~n~~ I v i I .j ~,;t-'>.~lr2J?'il 1 l, 1 1 \ u
11:"_. l'=S: :idi-t7~JrJ.~2~" ./ ~ -'~IM t '/,',' i7/' :..- ~, \ I~) U;~ \ • ;rD r~ '" ~J ~ I Ir - V),l -...J r - ..... - , '. /' -J / __ ~, I _ I I ~ I .~--~ - r l,_ ' • 1. ~ ~ ..... 4::::3 -, -:;-:,w.. .... .; ... ~ ~"I ! L. ~ .,,' i"-,? " ~ , , '/' '. -- -.-<, ' ~ . ' , ... I . p, " . ~ ~ - '"" ~l I ~ I ~ ~ , ~ -::r"- ' -/_ . , ._' , \ I ...... _ , ... , " « :'T < ... _ I.[". _' v.. '#-; ... .(~ _ -J ,,, I! ' ~ " .... :;r.", "" ' ., " .••. / 11 / ' , / ' Ii ' ('-' ,.-..1 /. , .. • ,,- ' ,t , , ; I'C , " ,," " ' • ,,-.. - < 11- '''''~ ~' " I ~ 1 / ~ )ir"H._ 1Iif' , /~ " ,/ -,. " I i /l I , I V--~-':.t ·_ .... ~,-...l .. _ ,II.. . ?'r~ c .. ... ~ !D "' - _'::... '" ::'-...'.s.':t:- ",tV
l .... " .- "r1/V 'p- iT ';1 \I /. , . ,.0. ' . _. L._L _ .... ' r ~ , . ' ~" . ..-:: ---.. ~~-- ' ,", ~ " r~' '- " K ' __ ~ i'l..w ( ., ! If . r "'7 /_r.(-·J' .?i;. .. .' . .---~ ~ -, J ~ I / .... , /" 7 _ ,.... I 7 V S :-- J~~:>-.:-.- K:~< 7 h.. t .-. i " ~, _ ~,,, '~ , '-- j ' , l,." ,·;f.f . Vil /, L --' .... ' . _ ~ _---'~' / . 1---' ~ > b O~"" ---""'.0= · t-C ,, :t£S ~~ I I I I
. ~ ~ ,,:IJ ~ '1 ' ['Vi) -\ / /0 .: -V ... ./ kf ,.;-"C ~~~ .' "" 1/ ~, - :-.~ / ------k t "" i / " , " . /.- __ /:: -~ .• " ~ k--> I '< Vi '" • ~~ 0 ~~ " ~.~ • " £ I ~i /! (_ ,,, " ', /,/ - '\ .r<" 1/v ": " ../ ' I' ~ V ' ----I-- <' / / ~ )%~.I·~vw. '" ,,<i ' l"t"&~ I I I I
c-; (__ .,I · "" "',.e C / ", ,';.; r ~~; ~t jili0Vl ~A'l'j0 : .• r F'" ,/ l :} y N G ~~~ .f.- s:':5~ -'l y . :..._.1.. 1t ' '1~~ :z:~r;: 7'. ~ , ,.. -' ~ ~I 0'" ·'2'"11. lr\4- ,-s- L!" ' 7 (i,~ . .. " j(. Y" ~ A<V~1 l' ",(" : ' 'o. __ ~ ' <,0 _ ,V" , -,·S · . ' S V \7/ • ~~ 1/ 2/ !I'r j~ 1/ ,. :'7~ ~t' {I , 2 •• S , -Y V • • 0 I I I 2 1 · \10- .... "") :Ij .\): , ~ "" - '1 " ' I . }; / . ,/ .~ .. X; / -, , .. _" ' /' . ; ,Q / .. 17' ";4;-L{-.' / / " IN- ~- ~:, ,~~~ <';; ' -: -7' , - 0 I I I
~; )f l ., s " "'. 'kV I. * k~ .)% £~ . { / V ' ., , _ / ( , ... : _N '. '" ?~~ -.\~ ~> i)--,... '" "'1" l. .... _ I I I l ~." , 't.;._, ' ",,-:, ... --,;;;::~~ .~ ~ , • '\ 'Sr. I I • ,~'., ~ . '" ... ,'" -- I S -
-, "" 1 \ I~,; " """., -.. '..,.. ... .: """- ::,:0:,,,: -.: " _ ~ " ." , '--,- . ,.,. Lr • c;; JHI' ... -- ... I ., , I i " 1 '~ , >\;" _ I , ~~~-;,~ ~",,- ._ ,~~ J(y _ , '- ---- ~ , ___ --- ";"~ , ~/o- , ;l ",.: ,:,II " ~hV'6 1 .ii~y.~, ~ ~~ :-3;~ ,"0 . ~ __ . . ~,~_ ' , -~" '~ ,"-.) ... _ 00- '" ~ V I.. -""l ~"'~ " "'.:.. ;,;. " ,""" ' ~ 4 ~.\': ';,~ ~ ... _ __ . ,\" :.:,~ .y---- o . \ ';-- c ,~.. \. ~ _ : ,-{ "-"All II ~~ ' y ~ ~ i£=: ; ~( ,,'" " -r~ ;? - ~ ~_ ~..,.. I I I
, ", :-r , '-,1 ' ___ , , "---- ' "', ' "', " _ ,, , ' , i d ' A.i '''to 1: ,. .,."" .-' rti12 'i."· ' <. ' >,., II ) ~ , :.- • . "' , -_ " --.. ' 2 0 I \ -__ "'... -< I - -&40 ~': .,-l _~,,) - ":>,.' "'.. ' ~ \ ' h.. ; J ... A"i~' ~ . . 'Y"' ._' 'II ",:,". . .,:. ... , • ..iJo ~/ . .,c.ofl ~ , • .. - --, ..... --- _ ~ _ ~-' ::.
~F:~: , ,,~~~ ~~I( ! -~ \ -"'IlU ~J~P,:~t~~~~~~, .~ ~'" 'r):~f "~~~~~;~ '~ ~. )~ .. ~ , r:WiP':~ . ; .' .. ; <~ .•. <. fl" :~K~t) ~~r ~~ ,~,-? '\ ~ ' kin f-..,\ ( I I- ~. \~ 1'S ... g 7J 'r7 ~- ),;' '11. 1' ..., '-- "" ', ",,~ :· l~ ~--: I'< rt*, /"'~ ~ , . . ~; .~. "ffi~!' ~' _"C~~'- ~, ''' : , b ,---"", > I..--J: • l '
;~ ::.2 ~v " \' I,"," " I v: '} v / ! ( '-' , 0 ' , \...::. W" ~9, !'t.""" 1"' ";- J ~.0 , , ~~ :,J/I ~7.' ",~.~, ' \\', ' .. " 4 ,. ( r c. p ,It' IT _, ,;" ~ r"'!(lo ~ffiJ '" " ,--;~ IJ~W~:2.."" ' .......... " ~' . , ~j- ' ,rt' • , ,~, ' Irf~ . r:::::~'""''' <.I-~:~ : , ~ ... \:> I" , '<; ".tt-== '-£-';r:~( m ... 0:'1 ~ _ , -'" I~ ... "I~ , i -"' I .... : .>.· R: ' ,I\' , " '1 l~ \{ S "')(\ " .. ..... r , , '> , • .....s .. -.- r'J ->Q. A CJ I ~ 1' ,\ [ \ , .->~ . ' " , ' ..... J ~ ".:. , '. ;-..., ,p-
oi I <- SAN T A I, • "" '" M 0 N 1 C A . M 0 U N T A I NS ~ . '"'l.,'1 ~ .~~ 'f .... "\.. ___ '-. I?' ,* ll'~\;:\~"'! ' '-:J rt _lJ 'I :=t~r "tf!1 ':, ,_ .1.' I i.. ~..--... / -' .. ..);p I~' II" 1 '-- -<"!,i , \ ~ . ,:::r;t':1' rl..)"-'v) ]'-'~ r '\ "
"l ',~_f.rJI'-,-.f 7 • ........ 1- .... ~.~ 1-" I, - ,,-1..-- -' r l'"~ 7'"", ;'1-G;-~ ~A-i---l f\ ./~~~J 7 , ;' _ (I-- \ ,.:;ij( \z iJj .v . r~.:=X \\
.,,"""""""""""" """ " """ ".''''';' !ri·.····:,:;;-,·,·,·,·,·," 'S;;,·,·,·"Jj 0 ;, ~ -~" X ~q-;:: J 0 J ;t' _ ;::. _' ! ,' ,,:"... .oi'~~: ~-~ ..,.v ~t~ { ~ ~ ~
.. , r • .• ..:;~~ ... , ~ ~ ,l i . ii JrJ""'&" : . ~ "'; '0:; id V ".t'" +~;.; ... - '\ . . -"" .!!.!!-- '" 0 ' 2 " 4 )1,,, ~ 7 II .ff , 0 I 2 I • ", . ..... ; .. 'i.' ... . ' t ~. ~l~'\ f!c :... . . .-.~.~ [ .y"
i~: P • .sS ~ c. \ IO.G 0 \..,., "'" '" '~~ ", ~~ i f! :'. \,,: ·w I " '~ .,.",
t ... , .. ·'.N I ~r~~'~<" ,
2
• • S
7
388 4 3894 0·0 ~ DETA IL
'i ~ ~
'.,. ~ ~
'~
%; 'N
~ ~ ~
~ ~
PLATE 29
--".--••
----... --- -x- .... x- x-x-
+++++
- 1- ?- ?-'!-
[~:;;;@;;:ta
LEGEND
WATE RSHE D B OUNDARY
WATER COURSE
BOUNDARY OF VALLE Y F I.L
CITY BOUNDARY
COU NTY B OUNDARY
~E OF EQUAL GROlN) WATER ELEVATION
LOCATION ~ MLlS WITH WATER LEVEL MEASLRa£NTS
GROUND SURFACE CONTOORS
N"EOItENTS TO GROLN> WATER FLOW
GROUND WATE R CASC ADES
OUESTIONABLE IMPE DIMENT OR GROUND. WATE R CASCADE
ARE A S OF L E SS THAN 10 FEET OEPT:H TO GROUND WATER AS Of 190404
1952 a 1953 USGS. 8AS£ DATUM IS M[ AN SEA L[V[l
GWOtJ MO WU ER ( On OOR5 BASf I) OM 'ALL IfUSURUIE MTS 0' THE YWI
STA T[ OF CALI FOR NIA
STATE WATER RIGHT S BOARD ~
SAN FERNANDO VALLEY REFERENCE
GROUND WATER CONTOURS 1944
SC ALE
.1 l ' ~ It IS IfII lLES
'IIntI ;oar VRl t1nMfJ"r ,.. UJ) G,OOOf((T
~
134' -IZ'
134"06'
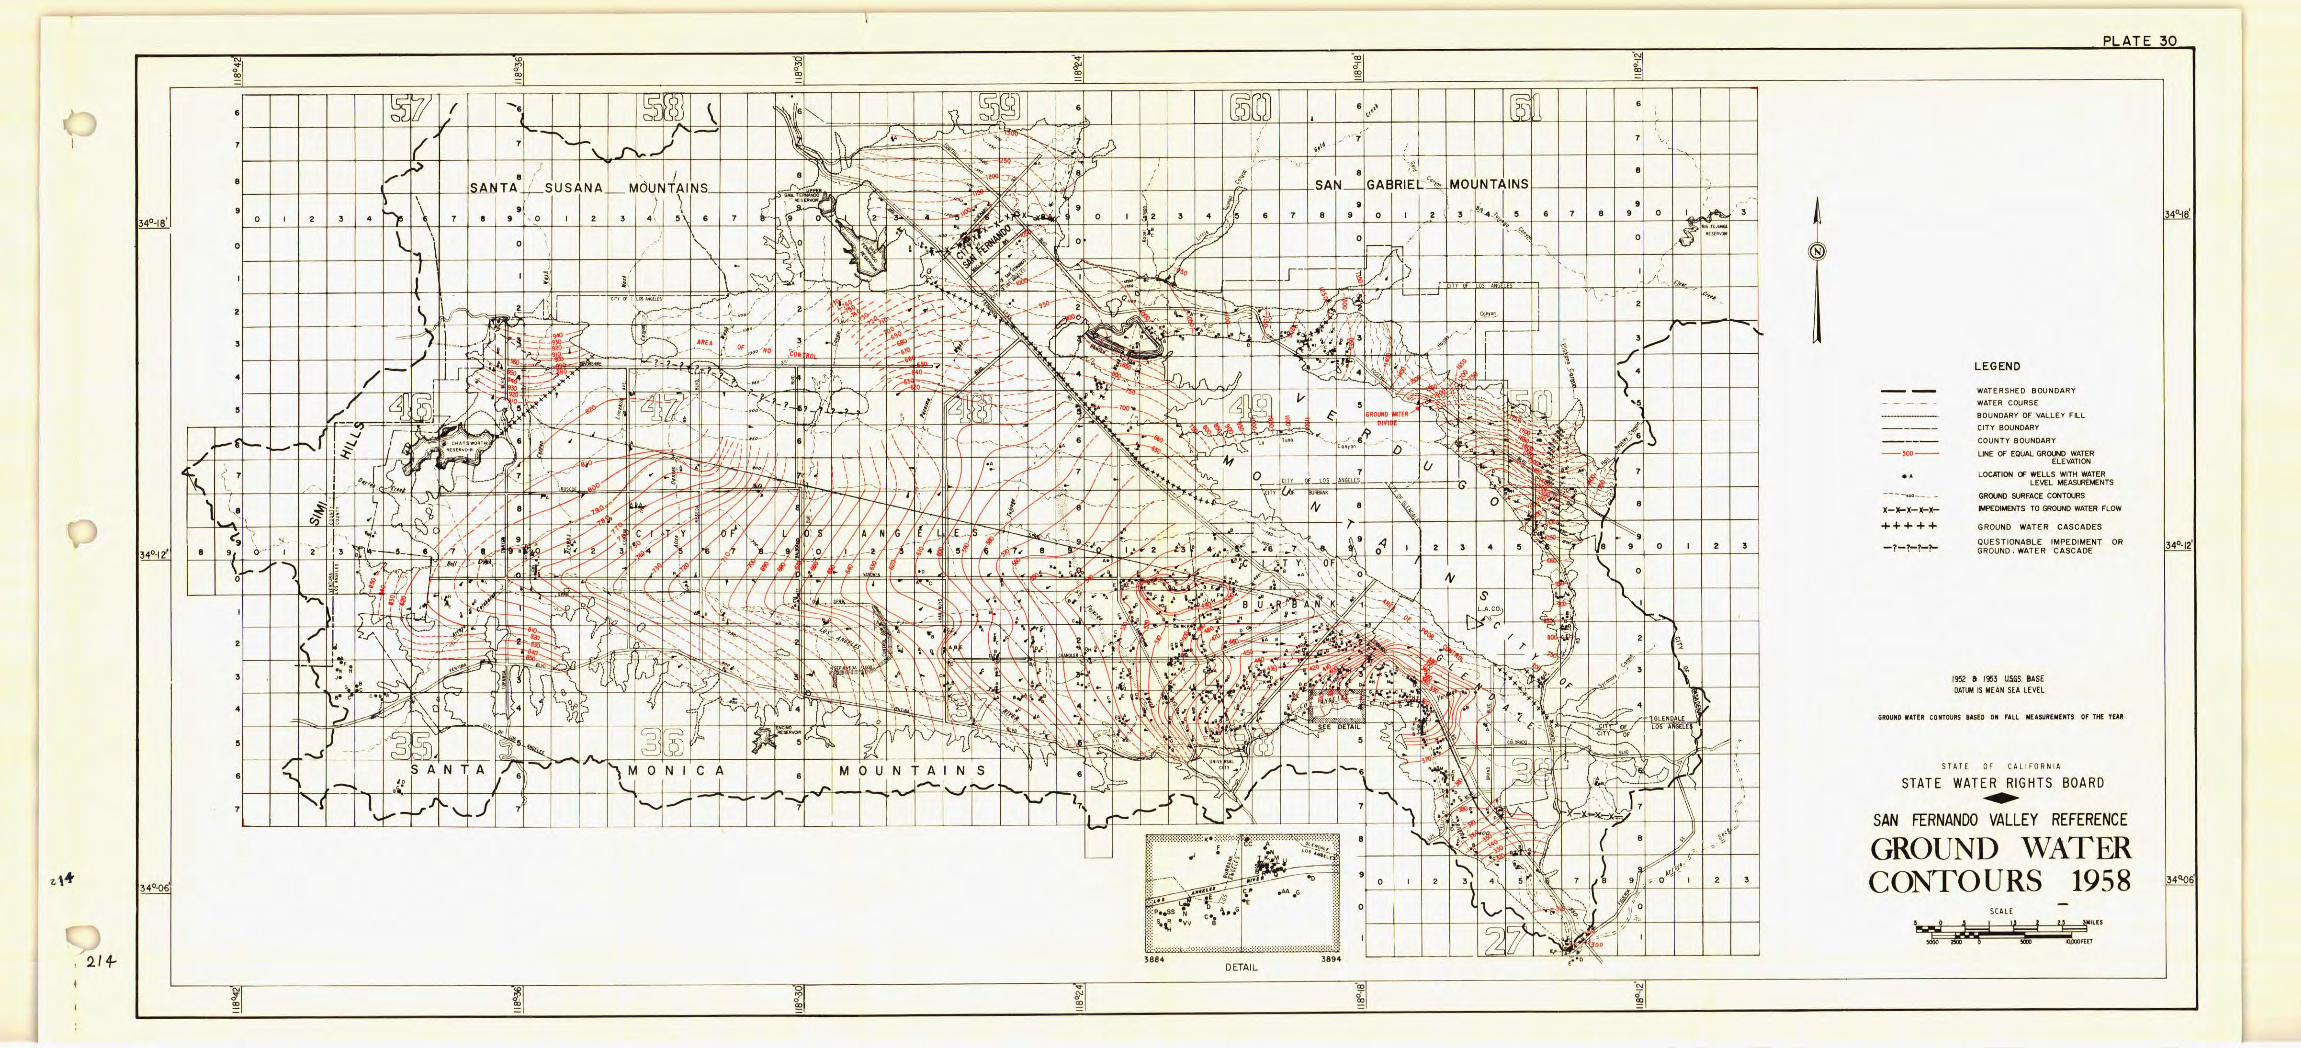
34°'16' I
f 40-12'
~1'" 13 4"<>6'
, 2/4-
N .. '&.1
•
~I ]'I 00
' .. ~
'00
J" 00
'",
i,1
~w If~' ~ill~ \. "'. ",,, _ ID ~~ A · I amTI . . "", ~~ . , 1
/' --......... ) ~ ~, / '" r~~~-~ ,J : - 1/",' " 7 r . ./ ,,', '. \ . ( I ' 7 7 v' , f'.,. __ ~ 'J ,~-'-_ ~ - . " - ' , N,x.;! L!- I;' ", - I- ' .
,f,> ; '!.,\''''lV", ' -- , ' '-'' - , " I{'~ ./ " H1 1 ~ "", -',,- '-,< • /' • ' . I • 12>..c. " - ---=:: '-, '~ ... ,,0.:' 1', J '1 .o'r ! ",I • '··1 I 1 •
, ISA TA ~SUSANA f- MOliNTAINS ~ '- A,. --- ----=o.,~ ~' /,~ .:1)( " c', : SAN _ GAl RIEl'~ MO NTAINS -, } \ d ,/ 0' ", J~~ - --' , ~.' \ " Y \ . I ' >-9 t I ..E. ~ - - ( -..\ .... .- (: 9 ' " . 9 , - . o I 2 3 ~ ~ \ 1 8 9 , 0 I 2 3 4 . 5\ 6 7 • ,\s ~~ tz- ,--- , ~\~ ~~ "~:X~~ ~ 0 112 3 4 - 5 6 7 8 9 0 I 2_;' , ,- !7-4_"' ,. 5 6 1 8 9 0 I '~ ' 3
"\ ., " '",- , ~~ .~ ,_ .,: ,~:~<;l'~~'-- ,\ , ~; ",,-/ .: ' ~. I ~ M:'~:: I O [ ': .. \ 0 ' // "--, <.; ~ .O : ~~~ ::'_', ":.~ '~tf{~;; ]\!i'J 0 ' l\".--;;19 0 _, ,~/ ' '>, __ ', 0 rV
I.' , i .: r\ - J --: .. ~ .--. , ' :t,~i'" __ / ~" ,""'--"" 1- 1", .r f-- a J £ iT:.' '- , ' ,: I I · ' : 1 "' - \ . A ,;,: .. - -_ '\. ;":4>~ ---" '---- ~'-- ,' \ '6 / 1 [...+1, --h' ,/ '" :::::, ~ ...- ~ 'I:::: ... "' - $' "V _ - )..,<"0 ... . _ ' I l , --
1\ " ~ < r- "". T -_" ---;;p- --- /-- __ \'( ' OC - , "' - ,- ','" ~ __ - - ~<~O' U ' -- _ '--- - , - :; '-,-' 'I ~ -,-- .. 0,., , ) ~ ,_~=' '\ 1 (;;( _ r" , " , • __ ,~ /.._ / /~ ":5,- "" ~~_ _,oJ> 2 ' '''''' ;'.", co' " 1"- - ;r. 8 "t ' 2 - .
I I I I I ~I-~ I' J . ':;; _~L "" ';' ~t")-~,' ~~- ~,:':: ./ / ,-- .,/ ;,'~~~~ ~:: .:;'.~ :: ' > ~~-(7.~C ~~ :~ t.( t ;;~S, .\,, /, [i( !' I I~~ ,~ v'-' ";:' ~; "./ ~ ! 1 _,,,·,,, ...... _ .... · '.~ _~ t_ ~-=?:: >.. . ~"fA 1 Of ,,/ ~ - '1' / " ",,.. __ ~ ,.... - - -...,,'2,~ _ 1 .... . .. ,...;-~-~ 0 :-': .,\l JI 1 3 \') -1 ) ~ i ' 3
I I ...... .... ":"1.. ,irJ- _~ ') -- ---." , ___ .... 110 'Co ! "" _,,'IQ _ "Z.' _ _ ,- f " ~ ~ ,r'I ! I II { ,, :... ~ -- J -, , - - '7 - ;:, ~ - ~ j ' ... , ~:- ' ;!r ' I I ! I ( , '\' .. ! ~ ,/
. , 1 1 1 , / ,J .< ' !". ' -:::; " '.~ " '.'", >:::--, f ,'. ,"' -~- " --, ', ' , ', ~ ~ ",,-• . ~'::.- " ," n '(\ n -> o/ ( . f<,;;J'~.,. ,~~, r~, : '~. \.' I" 1'.":" ~ ;: ..... ~_< ,.... _~ ~ _"' _ ~ ./ ~ ... ~I!,J ) \ / / 0 " - _ .... -...... ~. W1? "' ... ,_--::- ~1r1.. ,.Jf ~'7\ ... ~ -~ :v ..d~ .....L ' _(-
!-
· ... 1 4[ 51 /_--'<-11 '. ~~ / / '1 ~1-l'7/' ,, ___ ::t::,-'-.,f l 2i~ ::,~' :~>,-~~-- roo:· .>~v-/c1 7'\1 v • ._~~~t~; ~Ir) ), '~ I '-__ _ _ ~././ ~ r~~ ~ : " -' ... ...J~Lt( ~ )). __ i, '(,/ ~OJ, / // ,~~ r .. .... , .., ~J =:: f". GROUND ... TU '" ~~ .... " - _ //t I I I
.:::J , - ... . ..A. ~~ - 1' - \~ ::r=--- J' - - I '... ~... I~--" ~-- - ; - '1-'~_ ' ,,/ / 1 •• "':"L ,,'fb ~~ fi '( ~- .... ::.:::- .... ..,~ ;-~ " -':. ';1 <..l _r_ _, -f ! ~ ! " ~ ,., .. ;;;:;,"J ~ . :( ' ----<-. \ ,r·- I I'~ ... --- , ,\ I ' -L '-", ,;. -- , .,: • / .., Xi '\ :,..~( " h" <'" .. i Y",--, , .-! -15?l~~ ;::'~ ~ft $ '';' \
/ " - ,. I~ ~ ~<r ""'~""'(iif/ ~ /~' -,' .... il II/I '; I ' \ ' \ \ ' \ ~-'~-').: r ........ r ~ ~~ ' ,,- I> 't \.,'). c .. ,on f) '" ..AI "" ~ "\ s ,,!::C ~/..) -1-' , I ,L' 0"t 7r , II' I'f' 1:~ , ..-> ,1> /' r ./ ,, ' ' - ,J _ .~.j I :1 >, " '\ \ ' \ l ' '/ / ', '-,- -~ c:,"- <"<' !\j " I E:+>-».M .. " 7 ,-/ ~ ,. - II ,/ /_ r:'"" .... , ./ /' , I ~ 1 ./ , \ \ I \ .... .......- 7 I .. , V -...: '" - ';' - ':JIi' \ ... ?fi~~ !\. \ "' : , '., \u .' -L-_- , '~ ~ ;. d'/ ' / <, ...--0 fl:i '+---- t;L. '. ,k " ' \'-, ,_ : _ ___ A , :,_ / / ?;' , :;:-;, 0r-;;;&;;;::"...J. -: ~ ~ ... :=:" ~~ 71 I I I I
~ \ ~ , J1il ,; ? I", ~ - " , // / • ~~ ~~~ ~t1: ~R::~I)V7/~~G7 AI t-V 1~ '7 ,-~ "'--~;:~ -\t • \ ° .. ~~, /, ~ · 1 I I I I <:: ( , [_, ;::; 'C;(0C / '" ' ~/ ~ v ,~! ic --( rr:';:y :O~{ .. irtl lS~:, jI A / N I ~/I { / ~ E..~:-::::C~ -- ---;" . / V / . __ 'l+"3."' k---_~,',,~"'-- 1" <l!,' 1:;;; t: ·~ ~ ~
9 .J. '. " / , ,/ • 10/ ;/ ~ • II. I 1/ _ 1/'" -.1:- .f . ' ~ ... s .l.- __ - ~ - I --~ /" r ~ 9 --- ... l "'""' 9 • I ., 0-' 1 2" , i 3 [\4- -.-1':0 /--7 " " -. ~~/j ~f' X V 0 ' _, _Y 'oj ___ ' 1 -- ' ~ • • .. • ~ ,t" ,A--r: ~f"l,:; --- ,..,. /.' I--H ," ~ 7. :'1~ ~ ~' 0
4 , , 3 • • 'k -r V. • '[ 0 [ , [ 2 [ ,
\1--'; ') ;11 ' ~ ' ''1:; . , "", >, I '· , Jt": :;: ,/ ; ' " .~<'> ~ 1.1 l ~-f i q W •• " \ 1 ( f~ •. , ~ ;; X:~ ~f--- :";C~/) : ::' ,:o:'r:-~ I -~~~ \ 0
I~' ) f'!/ , ' \ ' " ,~ 1' \: ,-, j . . _ " I 7 ' / [ ' J\ ~ " '\ " '!\ . ' :. ''''~ ~J'~~ \ \' ,-, ,'>--. -\t K~ , ~ I J/ N ~.~~~¥ ~~~~; ~~ I:~ff:,· ~~~~~ .~~fi ':'''~ ~:~\!~~f}~~,~· ,~~~~-'-' ~~~:~~~}.R~A~~~ ::~1~i'\ ":,~ 2~: I ~~ ..
2 /l 7J'\ \ : ,:-______ J1-sJ. I Ace: . ·~:__ I1- V' n Il-» ' ,' ::::---: > ,."'< 'Sf:' ,~0~ " ~/ 'I ir,. , ' \ \ .... 1 ~ I n ..... .. . _,'_~0. ______ " -/ ~~. 2 0
" , , lo; .-_ ~ "--- _ ,::r' K? \ , ': , . ' , ',," ,"-." b , ,~ ', ""';; i· \J ~ I,'\., f\-" , [I '~ l,: , .... /, I J,--~ i" t--f -;. ~ r \' ..,.., -- .. '--,'.ii ,,=~ ;- -"<!, l7H' .. ,, "- I I I
-" . .': '\ r>; ~~ -ll J!\ - F"\ ""1! JIt~" ·}§~, ' , '" ", ,, "II<>.'f" ,I\; ' A I\, \ :1\.-"": , i \, Y!:: II - . \ {). (\ ~.y ":~r ~, ' ~~ > l'f,~~q:-: ~.,;i 3lY ,, ~'!' 3 l.,,~ .... <.r!t , 3
;~ s.~ ~~~, ~ "r~' \j I~I~ JJ hr -e~' 1(f?· " t~, '~:,! ~ , \, ~\-~ 11~~'~:~~ . .' ~~ :"it~M~:r~A/{tfl t:?~/~iR~IW)( rt,:?J3 0f]:\1>clJ ~ J '~' :~: ""'~"' ~ffiJ Il ~lbO'-:;"''\l IJ\I"~ '-., '-!---"V1J' "d..'~ "~' \\\ 'v;o::;l",,,-. '1;,"". " .... ~ ~f.dc:'~~y~---!f'"'''' ,F~'~ }, " <; ', "f--..'·1I,',r::..'ff,;( ""'''''''1' _, ;)"G ~ r ~ 5 V V -z...... ~~\ "" ~.i ::.::s. ~\;," ,"' . "'0~;~~ "," \ .-...j 5 ~ . ' ~ .. --{... ......... Of ,
-......s .. __ ._J r== h. , .C<=' A c:.J ~ " . .,I"~~. ~ .. ~~i\\ ' ; l. ·11 .. ' - - ,""" ~ •
., <., r-----""- SAN T AI:' ~ '" ") M 0 N I CA. M 0 UN T A INS ' . ,\ ~ ',,:'~":'/JJ / '- _____ '-. r +'H~ , '~~,J .,-I<:"\":r ,,'11 ) ':, . _ ,~f \. 1 ...--.. '-' ~ F= c.::::: ,'Iff,, " '--- ,,'\\' #\~ . ~N rt..r,"\J~ r----J t"'\ "
'( l....,,-vJ'-,-.J 7 '"'-..!- -... -"~ "-J- -J' 17 , __ """", 4~ 7 "I. i}~ '" A-~ '-:! '\~ .J 7 \ .: I I- ' . ..... ~ _ 1_ --' ~ 0';"'1. ~ __..."---=>- .
t"""""""""""" "" " """""""j' 1!<,·,····,,·,·,·,·,·,,'-,·,":\;-'·,·,·'·'·'1I . ,,~~~ . ;;;h ,71 ( ;-;' . .) ,t !/ _ :::.: .,! ;" c ~ ~/;;:!.. .j ,, :~ :t)~..,p ~~ I -:f7 ~, ~
-.- r . " .t.:::~, ,,~ ~".. .' J h7 ::~ : ;:i'2 " ::: ~ 7 .. . i~~\. ~ tl. '; '
~}--'. !i! -J.L->--- ., ::: • 0 I 2 3 4 t ~.¥ 7 • • If , 0 '''''' , [2 [ 3 :.: " ,.1 11 ~ .:.: ,\ ~ ' )j . I .,. " ' , '- 'i. oM." " ~'.' ~ ' '.\ f!~ I .. ~ ., .. -. i..'" E ;.: ' .. I ..
f,; .. , r Y. \,.' ~~: 0 ( \,.- "" " \' , ,~,\ , ( ,;'0 :::: \ R . VV , ::: " ,~\"\, , . ·E :.: " ": ~ Z---':"-' I ~~~.~" ,
// "i " I I 1 L-I ~ r., ., I~
•
•
71
(- .. ... -........ 3884 3894 ~·-ii - ~-
OETAIL
~I ~I ~I ~I ~I ~ I
~ ~
PLATE 30
---- - - - -
------------- ->00--
.. ----... --- -x-~x-)(-x-
+++++ - 1-?-1-?-
LEGEND
WATER SHED BOUNDARY
WATER COURSE
BOUNDARY OF VALLEY FILL
CITY BOUNDARY
COUNTY BOUNDARY
UNE OF EQUAL GRQUIID WATER ELEVATION
LOCIJION OF WELLS WITH WATER LEVEL MEASlREMENTS
GROlINO SURFACE CONTOURS
IMPEDIMENTS TO GROl.tID WATER FLOW
GROUND WATER
QUESTIONAB LE GROUND, WATER
1952 a 1~3 US/U. IIASE
OATUM IS WEAN SEA LEVEL
C ASCADES
IMPEDI MENT OR CASC ADE
GROUND .'TER CD NTOliltS U SED ON FALL ME'SU~(.I.ENTS OF THE lEAR
STATE OF CAUFORNIA
STATE WATER RIGHTS BOARD ~
SAN FERNANDO VALLEY REFERENCE
GROUND WATER CONTOURS 1958
SCALE
.J IJ 1 .~IIILn
~ i!OO nIO 0.000,"([1
~
!340-12'
134"06'
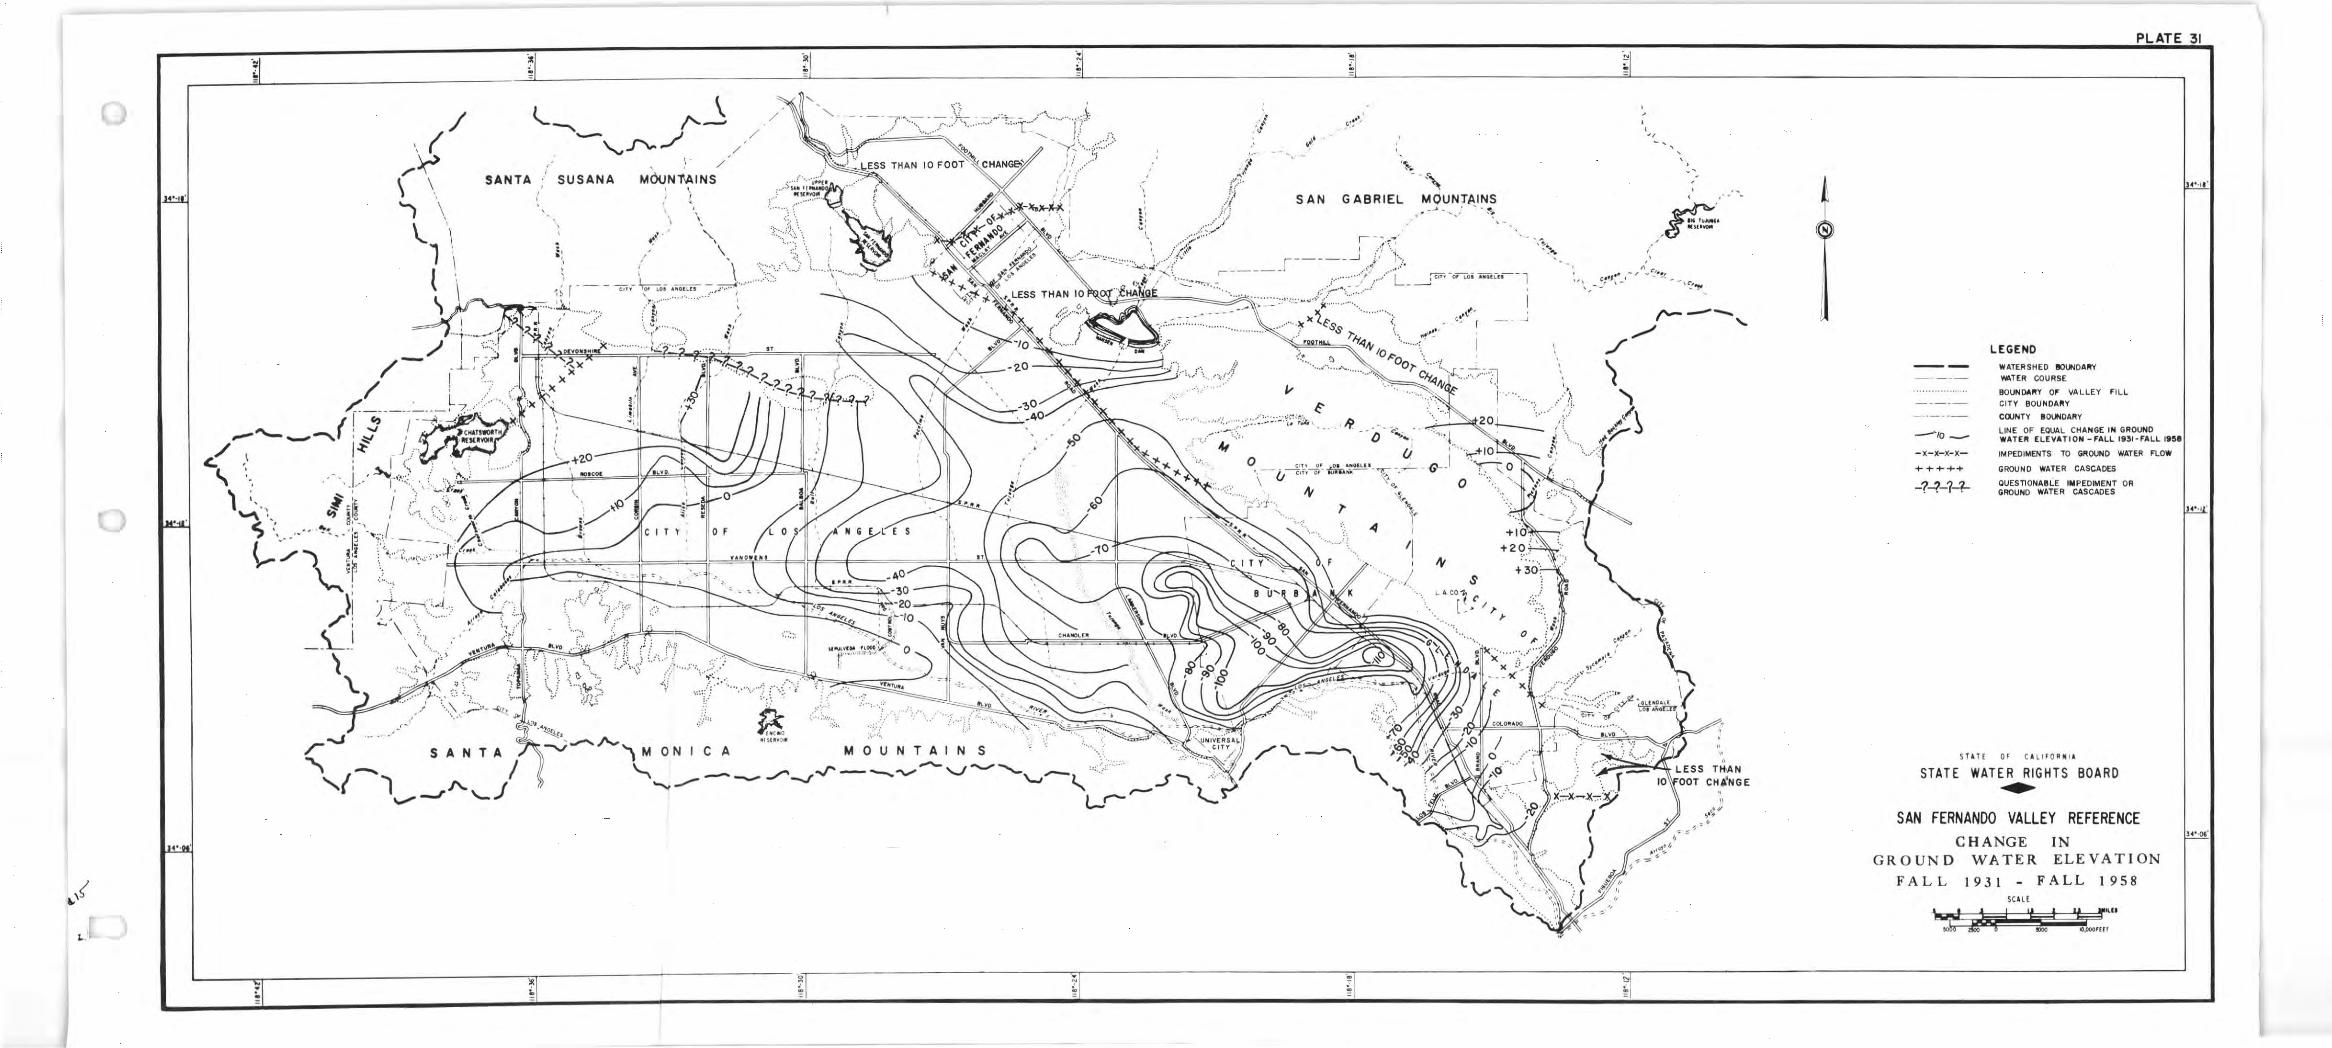
.. _,--
4' ''-- '
",l \. .
"
.~ ~ '. N' . ~
\ 1'----~---- ..I / ~ . h
S THAN -- .f"\,. .,./ . '-'=-"'~
/ '-.. . ,-- -- .. /".:;:- '.7 Y. :::,"· 'T.;:t·: .. ~· .. ·
.... ==~~ / , (
,.X:> \ \ 'I \
SANTA
"-, \ l I"
==b ,) I':J _ ,r .. _
/ ,-'- ' \
'-v \. / ' . " , N T\A INS ' .~~~::;:- . f ' '. "; .. ~. J ' SUSANA MOO '1 . '~\ .;
:
\ " ,J ' ~~ '".. ~~ I \ \ .. ",;;\) , .... \ ........ r;:.
- -:::1-" --~i .. ~ ...•. r~ I - e,n ' r ....... ....... .
.. t: : : ,
. ' . . ~
\
.' , \..~ , . .
'x ..... ~-::. . .:.: ...... . .''''H
" ."'; I ..
'1 ' II -' e . ~ .
,,' '=i'-:y ....... Z,· '.','; ;' '-?-. /< ____ :.... __ :-h J .
[' ., I "" 'f" .JS!'",-",
-,,---J ii .. Jr'.J" '~ ,~\. +20-~IC'~L "'?5t:tf / I ," v ' '. ....... " ~"~" . 1 \ ' " . , .
" ': "" i .. ·· ~··:<,J,);,c.. / , . .. ) :'.., ! ~i~ ! (', 'i \
! !
)
; ":"-i ~ : :
o f
0· · ~ , .'h .' ]1 ~'
:":.
.. ~:j
'1,. '-: .... ~, --':1'''''';1. - . - - .-%:l\_ , II .. 40 '7 ',-- " ,. I '''' . _ . • .. :-. __
\..- ..... ") '~ ",-~." ,',. ',' ' . , "~~ IV "'-: +T'} , ,.' ?';'f' . ·... ~i; " ": .';;;.. . II ). . ..... '. ...... ,' .' '. . '. ~" ...... ". 0
y
. ~l ' I
~.
". ;'l ., " .~
SAN
., ~
, . ,~, ~."
'~ ... - ' -'\ ,
GABRIEL MOUNTAINS /.,. .. . .-1 • • ~.: "" ~~
r--:.~",,; ' ' '- .. .. , .. ', \1 -"
r .. - - - -~ .• ~ " ' J~;;;':/"C __ ~;<m -....... 'i .... c,. -l -,.."
~ .... ... . <,- .(-.. ~)( ~s. .:. ,J _ _ 8- "'J.t. \ ",j~~"
'4~ ....... ,
G ~ r .~
"~~ ........... ~.,,'-.. . 101': ", 00,. ..... '!.. __ .
~ .. ~4~t " l .j\ ..... (~l
.... ...
v ...... :" ...... . <~::~.:.:. :t;;;~ ,f" ,-i> .... . ........ -~\. .., -- 0 C'-..; ... .
o tI. ' , ~ _ ---f!!...' ---2'. ~ uou ,-,' . I \ V CIT, 0' 1Uffi"- -~ ".-'- . ~ -
~ e· ~ ... .,
J' ,.
-4
'I j)
~
r
o
$ l A C01('
[, . I ,,;
......
'"
......
~:
;
, , -, .. -.-,
~. 6 ir';('.;
/
'.!'J :~_' - ,,'I_ t',:" !t _ ~ '0:.,.
1"---,./ '-./ )
"I ,/\
.;",J .t'
'::'r '.
J
.' ' (,/'~ --. ' ~.' ~
~t<' - 0 -\~ -\·~r ",. }~1 \' 0\:;J!iM Lf ':;t' ii" • r -' :- . , . ..: r,\._ · ""' • • B , . """,.,
"a / ,i..';<~:<:/ ~.,,,, '1/ '. con -"if - LOI utllll: .(
" '.", •••• " '" , H " , r ~'~Ao," '" , A _,,_'-~_, J ..... ,
-v 1 ...r __ "'V" "',...- '-
" -- -- ./' -.J l..f"""' ""'-I../'"
r-..J 5 ANT A
"" - I ,{ '\,. -".I'\. '- j
"I '~I' . . . .~ ., ~
<' .. " ~\,,<~ ".
<.....:::.
...... , ....
;;>
,,' ~
,'V ,,, ..
N
PLATE 31
LEGEND
- 10 _ - X-)(-X-X-
-t--r+++
-1+7-1-
WATERSHED IOUNDAffY W6.TER COURSE
BOUNDA~Y OF VALLEY FILL CITY BOUNDAfty
COJNTY I OUNOAlfty
LINE OF EQUAL CHANGE IN GROUND WATEIit ELEVATION - FALL. Ut31 - FALL "58
IMPEDIMENTS TO GROUND WATER fLOW
GROUND WATER CASCADES
QUESTI ONABLE IMPEDIMENT OR GROUND WATER CASCADES
S U TE OF CAl i FORN IA
STATE WATER RIGHTS BOARD ~
SAN FERNANDO VALLEY REFERENCE CHANGE
GRO UN D WATER
FALL 1931
IN ELE VATI ON
FALL 195 8
SCA LE It ,.tm . 'I{ 1 " 36 0 t:lOO OO,OOO'U,
." 11'
4' ·r '
34"06'
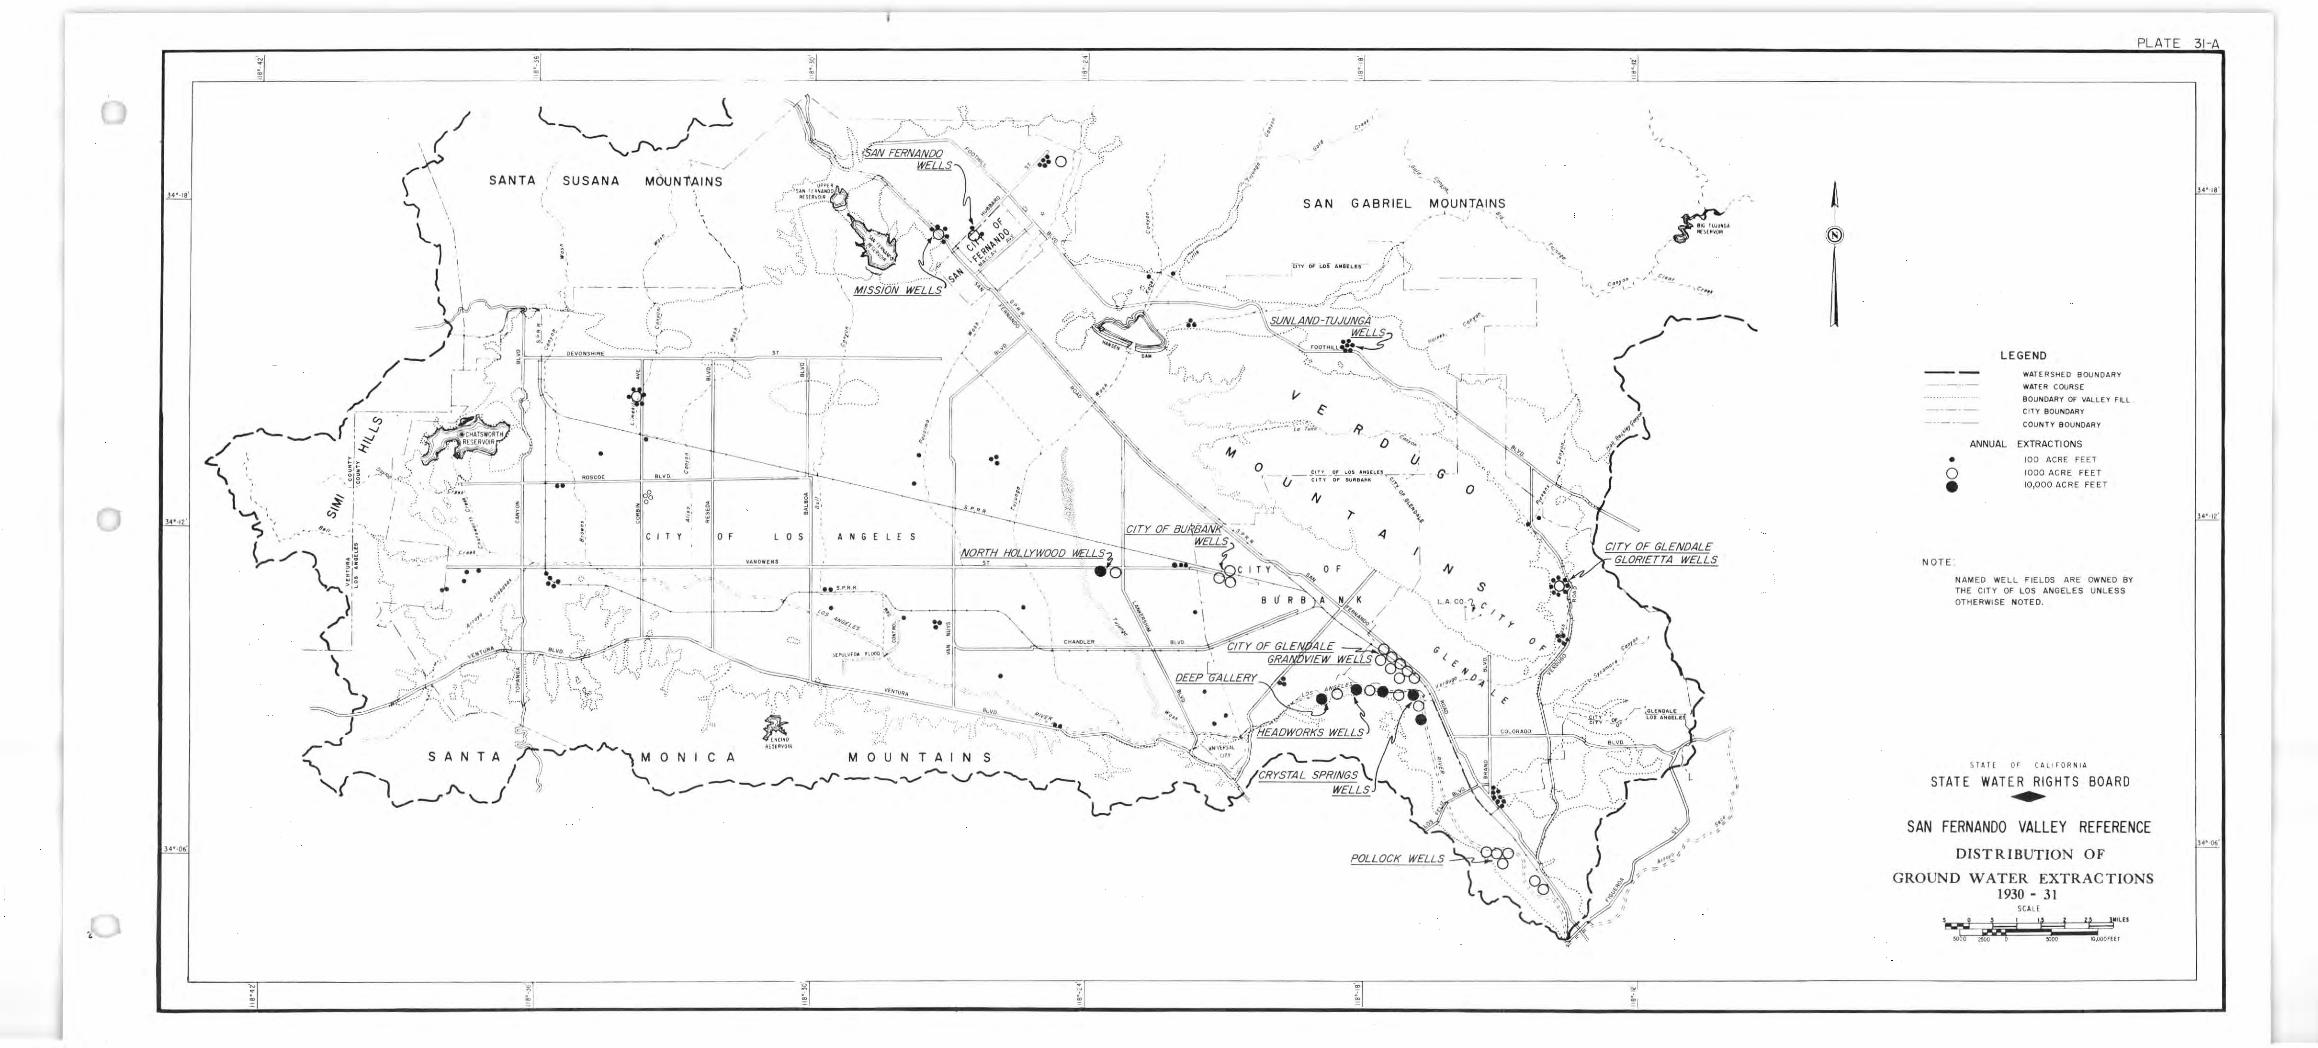
""18'
34'-12'
H' ·O"
"
-,
, (/ /~ \ \ '1 \
"- \ 1
"/ 1
(.-...-- I'-~ '-vf"'-,./
" / , - ~./
SANTA SUSANA MOuN'JlAINS
"-\
" -,~
-;
/
~ ~
'>~
.. ~ o ; / ., . ., " . , , , i ,--' -.
" !.:
-. J'
.... -:-:.' Co'
l.:; ,-,
,(: .. >:.:"':
--L -_ __ J _ ~ I
. ~. ".l
" "
SAN
.' ." , '
~ .. , _ 0
" <, GABRIEL MOUN TAIN S , . ' . ...
",' '''?
!. - , .
';;.~ "
, , ., - ,
"
t )
-: f " \ "_ I; .,....-...
~..,. " \ -----_, __ ~__ h---- ----- ______ -----,7',' -------- ----:t~ ~~,~ r- l __ ~'- ---- l
_ F" 0 ' -~O!" A>iULU
...... ... C!,"J:"_' - , " - .:-.'.!~ - __ ''::.!' ", ,.;
',', .. ~ . ...",; ;,.- I (- .
G~· r - -- -- _ J . ~ _ 0
-.. f"" ' " .:' " " ~, , ... .... tI"·~· ' ,/
/-
// L v ··'·l
( ro;--'i--:----' ,--"-- ---~ : ;;' ,
,. ,. "
f' ..... <, . ~ :::~.:.:. ~~'· i;"'. ,
~ D ";'-'0_ 1 ",,", - ,
...... .. J.;,:., . / , I-i' J ~ .' :.. 1-
l ' ' ,' 0
""\ '_, ·,·,, ~I~ ,'r~"'"I · <"::·~ ,
• • •• • . ' ""
',.-, o \
__ .El!.!... . c.!.....il-S.A.!!!!J,..! "..-- _ ,~ - G- _ I ····~ u ~OT' 0' .u~eA~K ~-
I :.. ~ -: ;' ---'-'\ ' ~ I
• .. " ~I ,
S ': --" - .~" .: -'-, ; \: ! '. -- ,- I <' .• -. , • •
\, .. J,) ;1 ',",::1 ':' ,,', IL J "'_". II" I:~''';>;'' """- ~Wl~~ ~ :.. ? .,. \.9
6' • ~ :";;: I' ~ ~ . , .-- ~ ... _S.PRR . -~ " \.., ~
A N GE LES
'. ~" ~r
I\' o
-,--4
'I I\'
I
s \ ~ I~ · I . .' . ' . co' - - ~ -- , - 11 , II : II " . " - ell
)1 '_-:>~ :.J • ~. - .;-- _ _ ~ .I- ,: I,. '. ',:;" . " , . 8 if R 8 ).,A""--"", /" I ~ ..... , ....... .. ,,1 ' ~... '. I 1 -/' of+. ,e • ....
<.. 'I ...... \ . ~~. ... ... _ - .- ... ~(~s _. _ : I" \. L A. CO'[1 c /
: , '" 1'"
.L ,,,,,, ,' .... , - - ) , \ ; . > ".; ;- {~ ."r~ ".;;,~ . i l~ ~\ r;u ClTY OF,~~:!i!!/!,7,: .~
\.
r-.J
" -- I ....... { ') -J-"- "-- j \,.0""
SAN T A
L -"'-'l · '\~ ~ . ~' < ~,. .... "~.. '.. " ~ ...... '~/ ... .. ,. --==~"= . " ~~~~,~~: ~o
'-...... m(·,ol~ OU NTAINS
-...;""" A"" M 0 N I CA M ---- '-./ "'-/ "-, _'---1 J ~ ._ 1 -./' - __ ""-" "-'" r- ) ~ -~~~ I~ ~ ~---- \..--J
/,----,,,"""SPRINGS \.
WELLS
POLLOCK WEL LS--"'i'-+::C
]:'I ~I~I~I .~ ~ ~ ~
r----/ '-
>~ "
,/
~
(..~j'! - '
Sj··~·: ·-.:~~' " -
". :.:
····.' .. ~·~mf~·~'~r
• ~I
•
," ,'. , . , -
£ 'N" o\Cb
PLATE 31 -A
•
LEGEND WATERSHED BOUNDARY WATE R COURSE
BOUNDAR Y OF VALL EY FLL
ellY BOU NDARY
COU NTY BOUNDAR Y
ANNUAL EXTRAC TIONS
o • 100 ACRE FEET
1000 ACRE FE ET
10,000 ACRE FEET
NOTE :
N AMED WE LL FIELDS ARE OWN ED BY THE CITY' OF LOS ANGELES UNL ESS
OTHERWISE NOTED.
S TA TE Of CALi fOR NIA
STATE WATE R RIG HT S BOARD ~
SAN FERNANDO VALLEY REFERENCE
DISTR IBUTION OF
GROUN D WATER EXTRACTIONS 1930 - 31
SC ALE
!!SF t j 's l.s 1111lU
:hQ & ~ lO,ooorw
34" 18'
l" "z'
14"~'
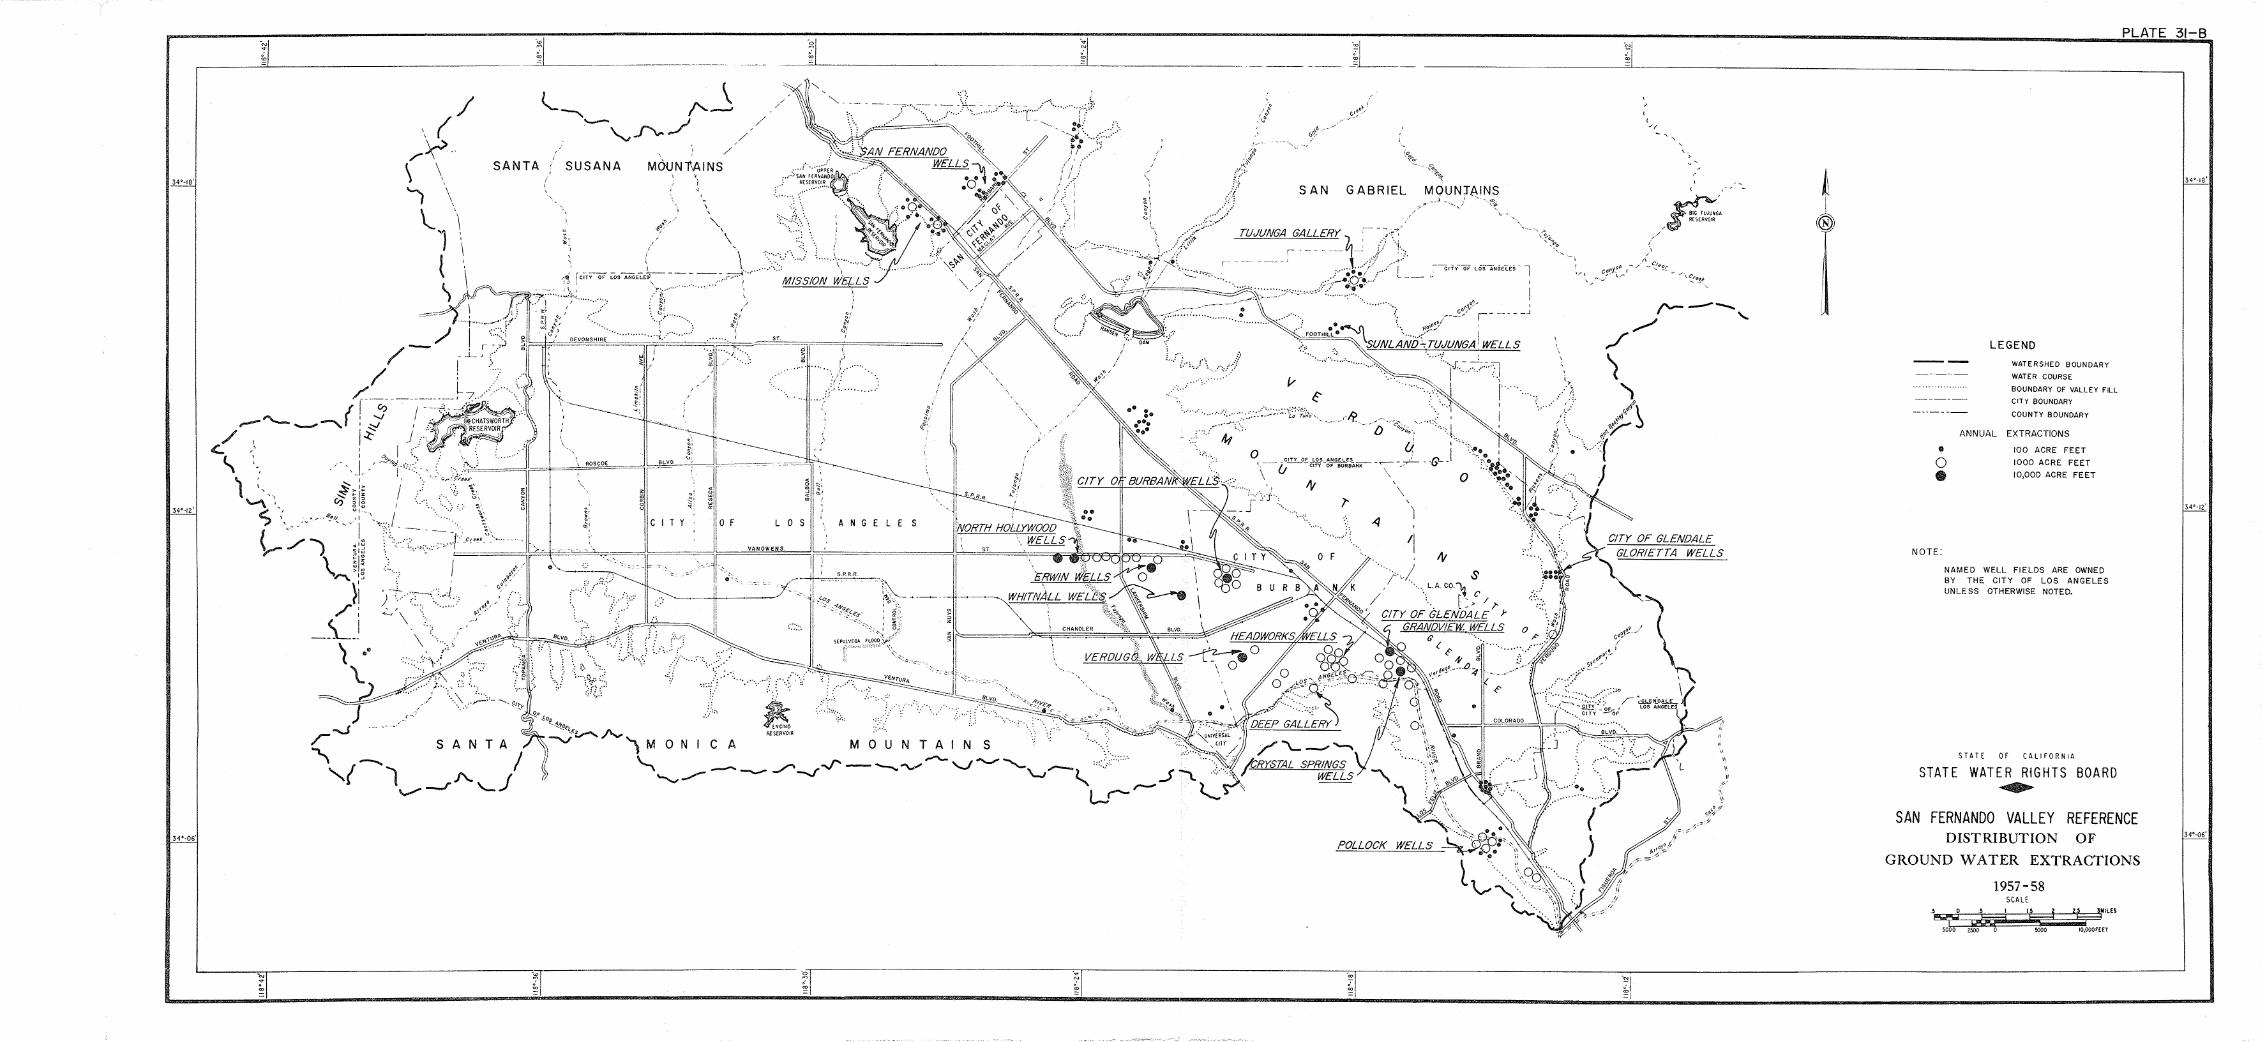
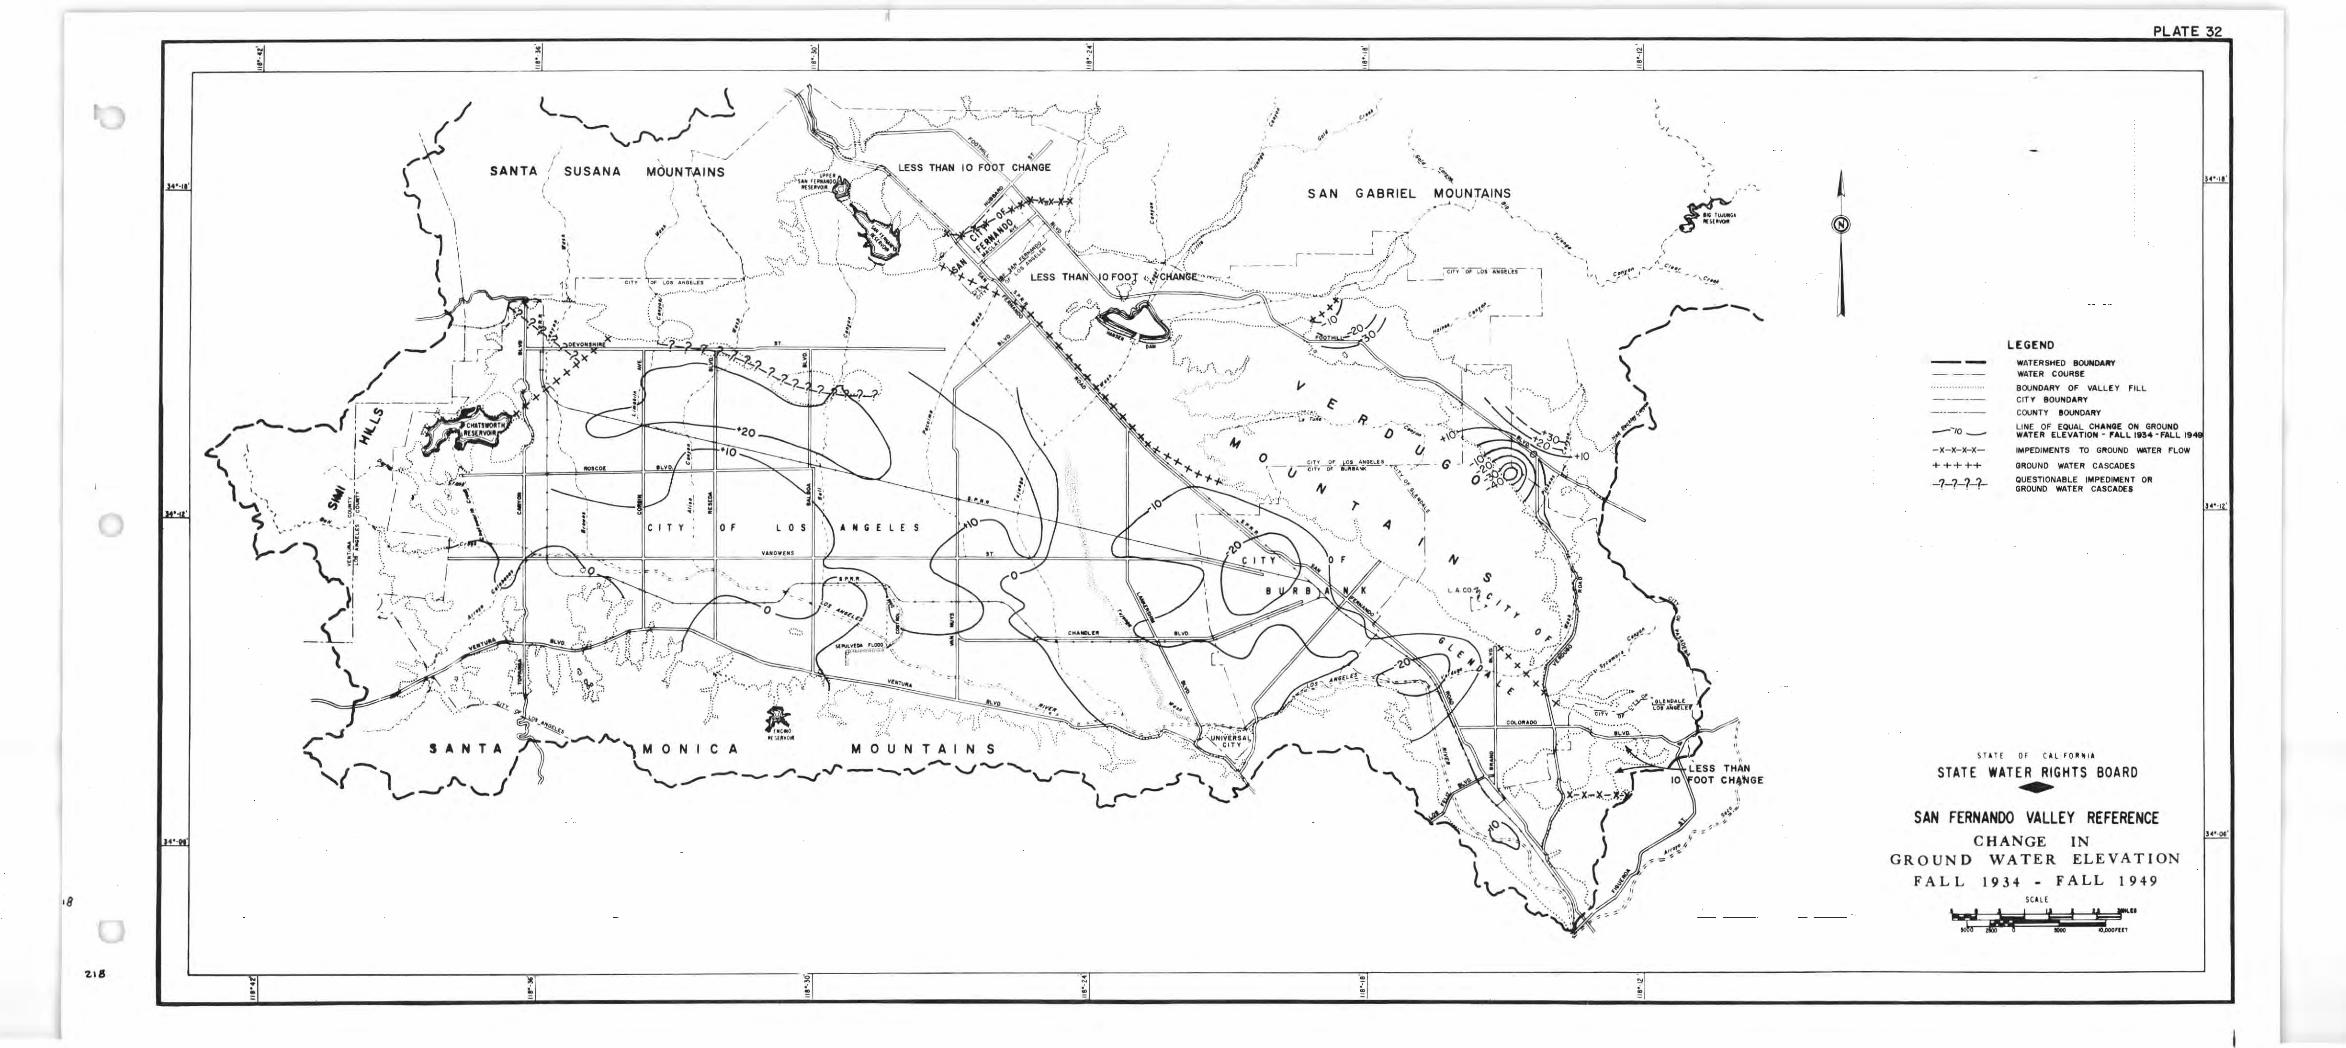
4 0,. - '
•... '
.0.,.-"
'8
'Z.IIJ •
';1 ~I :1 ~I ~I ~ I
, (/ ,...~ \ \ ., \
l...__ /'-~ --- .J / ,-.f"'\,. -' /
./ . :~ -~J
SANTA / SUSANA MOUNT-AINS
\
" , , '\ . '
" ~ :
·l , " . , c., •• ~ . '
f,l
'';-. - - f',\
~
SAN GABRIEL MOUNTAINS "' • • • .,J . . .... ,: .~- ~:lo
\. \ 1 \ l \
." .-.. ~., " "-, ' I, "' ...
, / ~ J ,
..•. \ "iqH.'-N'~.- r ,-, _ .1- --- __ -1 . • •• ~ .N L _ ~""CiTT - oTTO I ANU L-r ' -l
"'7NoiL" --
\
/ /- ,
/ ! / _---.. - .. - ~
( I '" r -"-- '""" : ,;' .
/ ,I !~
.. .. , ..
, .' ,.
i : .'
- - - --
If' .·· .... f~l
v
~:;;/ " ;> 'f:,;;;,. .e- . -i' .. D" ~<
C'~(~ . - r- - - ·....J
" ' , " ,'. I .
, • \ P . ,,'
) . ,
o (/, , __ ---.EJ T.. • ........2~ ~."HLII • \ u c,,. O~ T\iiiTU"'- -~ --~. -' - . G
-1r ,.
": 1', ...
, " , ",,'\ I 'li
C; '. i,u,., ' ...... p O ..... _ I: ' ,··,:1 _ .. .. \ ' _I CIT y 0 F , .....
" i \ ... -::- -- -.. ,: c, 'I.... .! : : : '-. '~. \ ,,,,0 , .. ~. , ' ". , ~~~ .' I~L t.-./) I " ~ "Ue"'c-"'~4 ~ . . '''''~I 4=::: ( II " \£1 ' ~ ( ~ \ .~ : I ,,' I SO: ",,,. ~, ,:,1I.- I, _u ." . i ""' __
~ , .
tl
)i / :
_~.I
)\.
.r
'" -,t '\_-,~,-
~I
.:.'-
MOUNTAINS / . -.I'- .... M 0 N I C A ---...J- ........ ',-.I . J""'\) ~, -r-_~ _" ~ '-~ -~~~ ~ ........ ---
'~I ~r-
~"'''' 'G~ ... ~
-4
'I -1r S
L ACO"", "
( (. (~ - ;
~ I
'~:~ "
• , -, -,
.. "
, , - '
, ,
" < "\ _ ct,r.,. "- - : o!!: _ "\ (',~ , - ~ ~
,/
)
1'--/ "-
.• t' I GO'!:"- ~
."_ r .. ~ , ~ . -
~
~
" THAN CH."GE
, . ... ...; .#'
~ . ~
PLATE 32
- - 10 _
-x-x-x-x
+++++
-7-7-?-?-
LEGEND WATERSHED 8OUHOrAWI' WATER COURSE
BOUNDARY OF VALLEY FilL
CIT Y BOUNDA,.V
COUNTY 1lI000DAAV
LINE OF EQUAL CHANGE ON GROUND WATER ELEVATION - ,ALL 1134 - FALL 19
IMPEDIMENTS TO GROUND WOolER FLOW
GROUND WATER CASCADES
QUESTI ONABLE IMPEDIMENT OR GROUNO WATER CASCAOU
saT[ Of Clll r OJl ''1101,
STATE WATER RIGHTS BOARD ~
SAN FERNANDO VALLEY REFERENCE CHANGE
GROUND WATER
FALL 1934 SCALE
IN ELEVATION
FALL 1949
.• ",It ., ... 5a 12' __ lCI.DOOml -. ... IClPOO'In
H·· •• '
140 ' 1--
H··Qt '
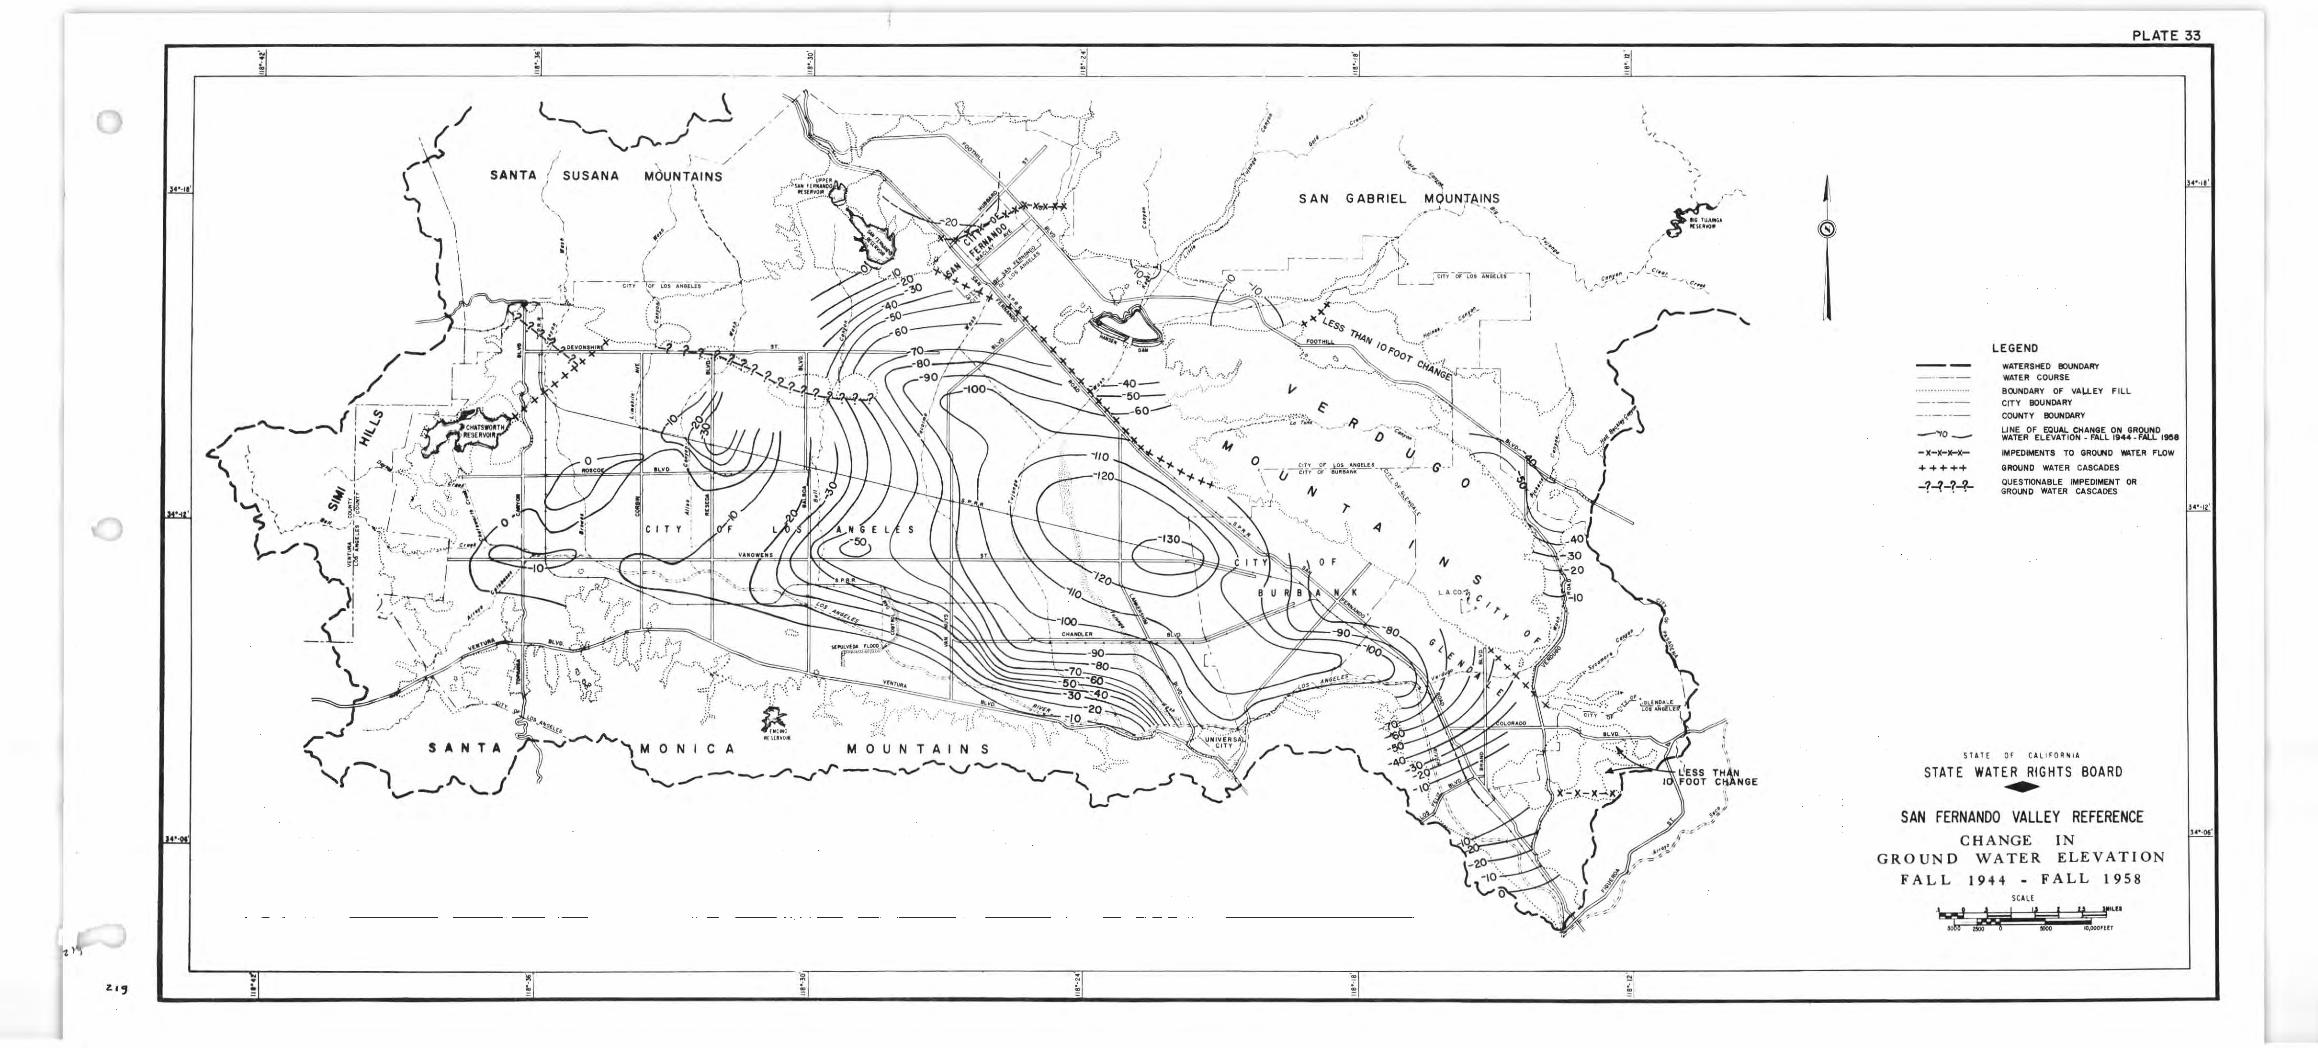
4"1
.. _'
"
ZI,
'~ '. ~ ~
, (/ ,...Jr>
\ \ SANTA (
'I \ \, \
/ ,I SUSANA
~I , . • • • • - ,.
,j.' .•. / • fr" . .
t
" c., .~./ ... '
,I .... - -.1 __ ,, __ ,
~ '~ ,'t. ~~ .,. ( //. .,\ ~\.:gi SAN GABRIEL > ,~g~~l"-I~i
• .
, • -,
", - '
/ ,. --'"\..
~. \ "\ \\ l) '\.. \.. ... f ; , 1 : ; ) \
\ '\ ,/ '\ .,: ... . . ". . I ' t, ... " . ..... \ \ 1~1 r -- - e.yy-~ lo ....... ,iu:....-- -.7-.,." .... -.... :
,:) . ,:"".J ,/ \.-
.. := ""'-" Ii'",l)/:,;t:: .. _ .. _, r " _ ~ _ . -e;l{., " " V~~ ... :.': R~i-.«( . .:.:.::.~ .. :~ 'l. j" .... .. -:/ ... L ___ :em--o:)P"LOt "iiOGf(li'--- l
6;';"n'~;
(/
\/, ,,~J,'. ,_ .. ,,flv C"/~. \ . _.r- '- -- .!
\ ~. : i· -~· t, , ! ' .. ~;' t .J ,f '" ~~.. . .... ~/:
-t-----~ r ~ ~,.. .... "r ': • / I ,::.j t • ~~"Q(YOII , " ,j(-··· · · .. · ··· ·L:.·#j····;:· i /- .L;:· ....
/ I .' .. : :'
(f-;;"-';-:-~, ~7 ~ ,...... "'- --... : _ ':' • ' CHATSWOUH • - ... I '0:::' J 1. , R[9(ItVOlIt
~ \ , ~ I" f·r·. "',
iii)
1:1 .! : -
"'u
l \ ' ,5> ", "' " /', J ,, ' l':':::"'" .. · .. ,··~=-ji=44=FF=nI~~ ) , " . ' -" ' ,",'
I ., ~I~ I': :;:. t I '1 ~ 'I' r.. .."'.... .\ i '-'\ ". '" aB r -, :'" • .; :., ~' ; U
II! < . ......... ,:-.... \ I ....... \:' 0 ~ . --,"-" -......... ' I ~ "'~:; -_ __ >: i l / T
r : (~ .... ;. ~"_t;., ,,,
\ ;~ ." ' -' ... ,.". , ... ':..-....
~ ~ ~ /. ~.:-~:..
n .
'" I "
,)j {~;~~:: ~ r.":·:~": ~> t' ';'" ,: .",
~ ::t , ... t:. ::.
!.,~:
~ , l~~;7 ''"~:;':-''h '' ,,(.. . i ~ \. •• .•. .J(>< I..e-s
s (. . t ,. r---- ~
',) h.. . ~ . I"I'~" ;:... '99'NM- ' . '7.4 .... I ........ .
" 01::0 ' o '. r c;; ... ·1 I ·'4·, .. ·· , .. -, "l ..~' ... G4u ........... r··2.!
r
'.~.
J~::.: ,./\ ./":;// ~
., ... ,." ,.
'-. V
.......... ...... :.: .. .. ; . .:.-.·<::::::.:. ·.t~;~ -~ ____ J J9 ._,/ ..... , 00--. ".'
O
() .""~. " '- :< I' ~I . .. ;" . , __ ~'TV 0' ~ \
. (j"'f,,,,JEL" "'" lI, , "'.: '. eu~ •• ,..- _~_ .' I ~ ~ ... , ...... ' '" ,,,~ .. G-- ' "r, l" "," . .j.. ~ f· '.'... '- ,
, ". .,. ~" 0 ·c. ' .0,
I'
...... .... ;::.,. ~
"'1, ...
4
'I . .. .... / s
/" ;.. '. L A C01, C' h... [ ( )
. . ~ '. . - )-
(,.
~
;,' Io?o"\t-... , "'~o';\ 'WT. ---------, ..... _ T.
"'00 ~ N.""'fll -~ .. , \ -' "" " ...... ,. '. ,( .-' ,-,,, .. , ~ .-.. ~ '"'' ''
~'- 'j}/{\ J '~~~'J '''r~jf ' ' !:t; \~~ " ,: ,~ r SANTA --..., \MONICA MOUNTAINS "
",{ - "'\ / '"' ........ ....- --- --- .../" -..,r...r - - "'-"" -- "-./ ......., ""-'-.1----, J '""\. 1,-" -' "- '- j L.f"'" ,..- ~
. ~ ~ ~ " ::. - =
-~
~ ' 0
~
'~., 1"---/ "-
\ ./ \ ) /';, ') ,( ./~ I: " <'. .t".-~ '. I ' J"/(
J
t,~-:j i
"'-"-- ' \j<' ~ ,
/~ - .
. :,L:·. ,::<~:·: ,, · '- \ •. ..• ~-.: . .. "'/- ~IIE.lL f (
' . _ ~' TY + m ' lot M IIllR" \
'"
;, ~
, , •
~ ~
PLATE 33
-'''10 _
- X-)(-)f-X
+++++
-?-1-1+
LEGEND WATERSHED 8:)IJNDARY WATER COURSE
BOONOARY OF VAU-EY FIL L
CITY BOUNDARY
COUNTY BOUNDARY
UNE OF EQUAL CHANGE ON GROUND WATER EL EVAT ION _ FALL li44 · FAlL 11&8
IMPEDlMENTS TO GRO~O _TER FLOW
GROUND WATER CASCAOES
QUESTlONABLE IMPEDIMENT OR GRO~D WATER CASCADES
SHTE Of CH IFORnl
STATE WATER RIGHTS BOARD ~
SAN FERNANDO VALLEY REFERENCE CH A NGE IN
GROUND
FALL
WATER ELEVATION
1944 FALL 1958
• , j 10 ~
SC "' LE U !'LU It ,
,..°'1
34',0. '
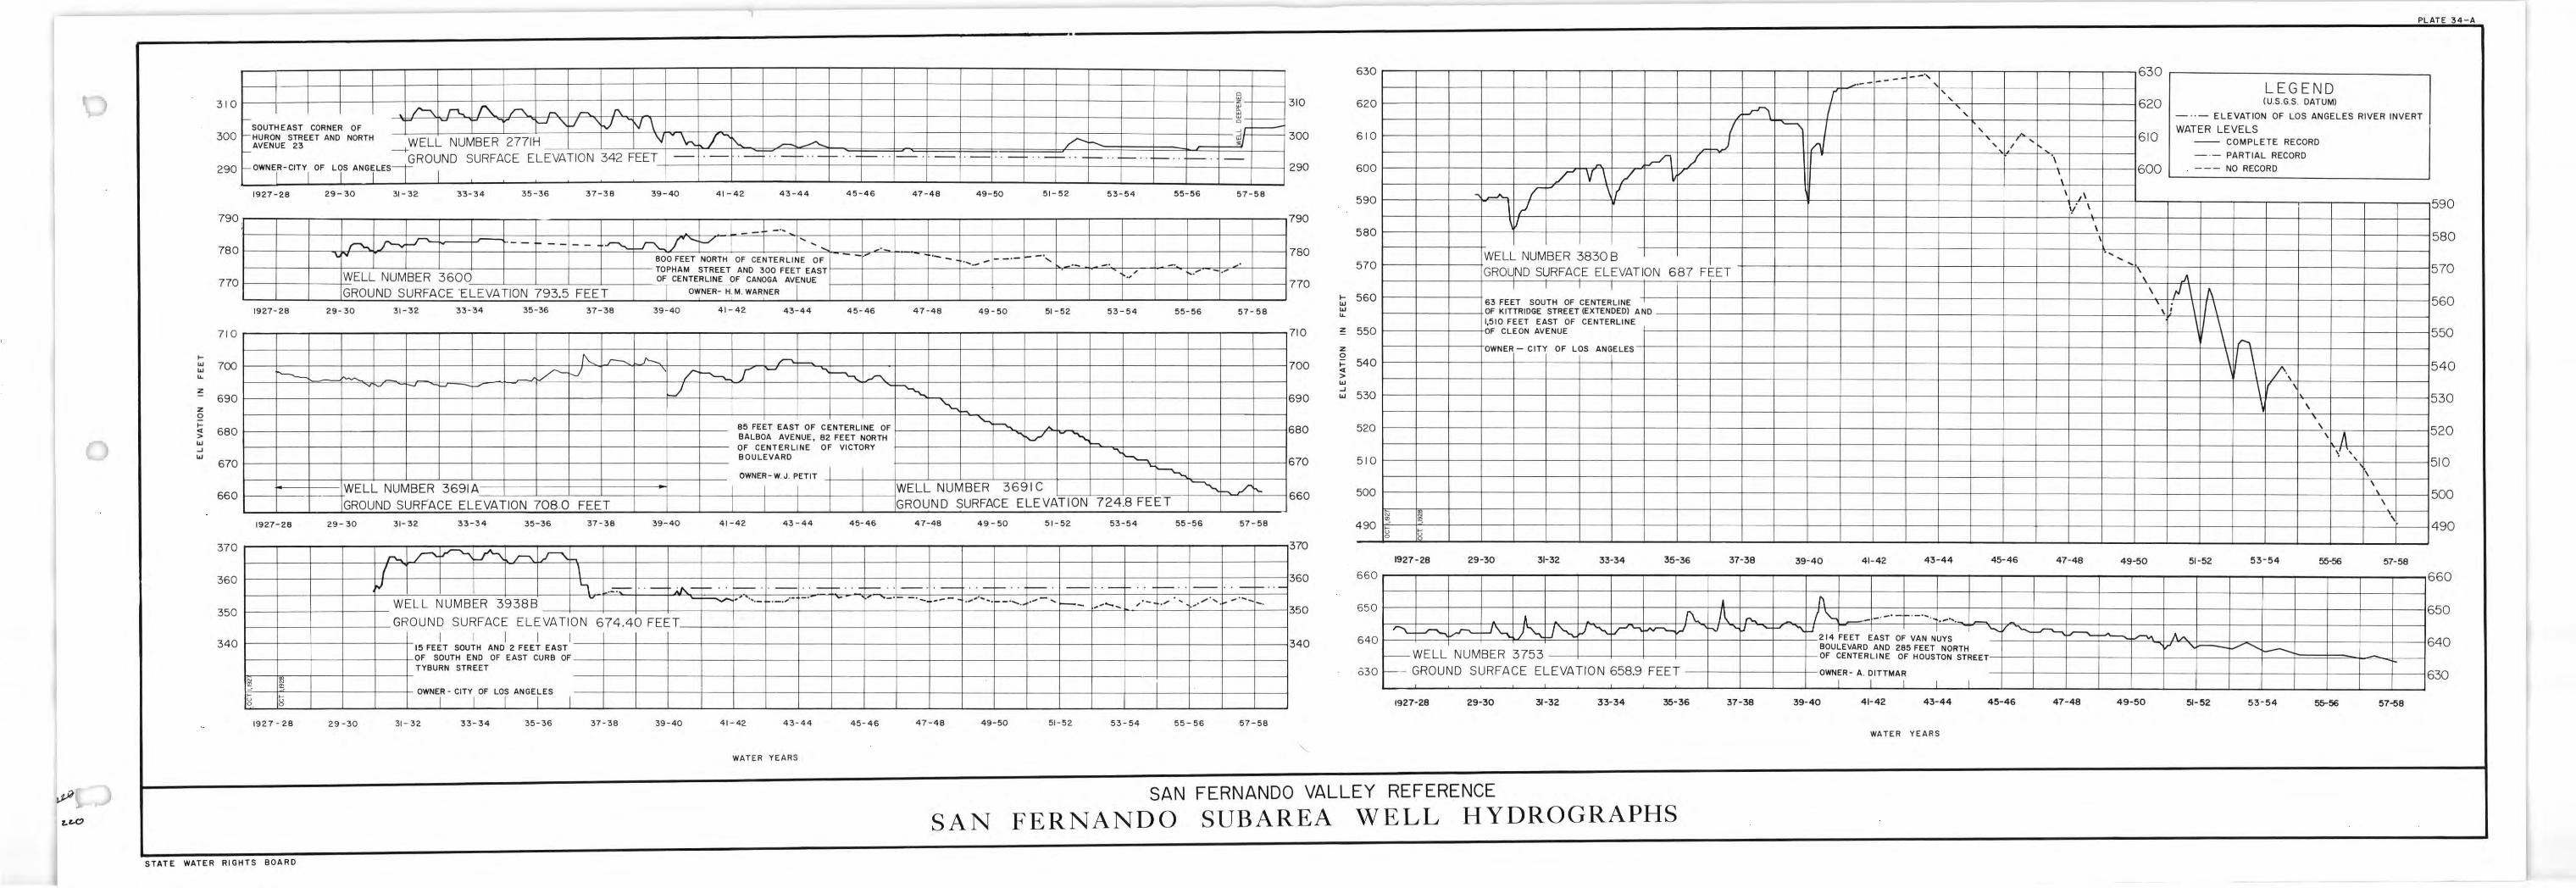
.. ..0
.... '" '" "'
310 I 1 1 1
I-SOUT~ EAST 1 CORNE! OF I /"'--..{"'\. A. '" J" J~ f'. ~ 300 r HURON STREET AND NORTH J tJ \ ~ 310
_ AVENUE 23 ---+ WELL NUMBER 277IH \J ""- / \.. ~ 290 I-0WNE,R-CITY, OF L9
S ANGELES~ROUND SURFACE ELEVATION 342 FEET . " _ .' -+- .. -+- . _ . . . . ---- gJ 300 I I I 'I 1 1 . " -1 " -+,, +- " 1- . 1- " f-- . 290
1927 -28 29-30 31-32 33-34 35-36 37-38 39- 40 41 - 4 2 43-44 45-46 47-48 49-50 51-52 53- 54 55-56 57-58
790 1 1790 -- -' ..
780 l ~ I ~./""--P==;: --::F== ::. ~ f ",", f"'.. rTY 1 1 I' _ _ ' . _. 780 I I I ' I' 1 800 FEET NORTH OF CENTER LINE OF - - . ". __ - - ' ~ .... ._ _. _. .
TOPHAM STREET AND 300 FEET EAST / ."" .... 770 I 1 1 IWELL NUMBER 3600 OF CENTERLINE OF CANOGA AVENUE ~ 770
lGROUND SURFACE ELE VATION 793.5 FEET J OWNER- H.M. WARNER I 19 27- 28 29-30 31-32 33-34 35-36 37-38 39-40 41- 42 43-44 4 5-46 47-48 49-50 51-52 53-54 55-56 51- 58
710 171 0
700 1 k±± 1_ 1 1 1 I =±dtj=-t~1 LkJ? jcPl ~ 1 1 1 1 I L I 1 ill 1 1700
~ 690 I I liT T IT 1- 1 1 1 r 1 1 I I£-I ~ 1 1 1 1690 z o
~ 6801-1 ---1----1----1----1----1----1----1----1----1----1----1----1----1----1--'" ~ '"
85 FEET EAST OF CENTERLINE OF ""--h BALBOA AVENUE , 82 FEET NORTH V "'" I l ·680 OF CENTERLINE OF VICTORY
670 I I I I BOU LEVARD h 670
I I I I OWNER-W.J. PETIT ~ 660 WELL NUMBER 3691 A I I I WELL NUMBER 3691 C ~h ./
GROUND SURFACE ELEVATION 7080 FEET T 1 1 GROUND SURFACE ELE VATION 724.8 FEET 660
1927 - 2 8 29-30 31-32 33-34 35-36 37-38 39-40 41-42 43 - 44 45-46 47-48 4 9 - 50 51-52 53-54 55-56 57-58
::: 1 1 I 1 &~i1?R~lnps t.~JjN\±E I. -l lt l-.IJIE I -l lt .I-llJ: 350 I I WELL NUMBER 3938B I - I I 'f=:1·-·- t,-,'·-r- I ~- r 'T -· -t--- l--· 't -·-·1·--'r- I/--- ~ ---l ... ·' {-/'t --''!- bo I I I I I GROUNO SURFACE "'VAT!ON
'" ~ I I \'~:\~n\:,~:·I,,;:'L::·;: 1 1 1 1 1 1 1 1 1 1 1 1 1 1 1 1 1 1 1 1 1 I'"
674.40FEET--f---r--+--+--1---f---I---+--+--1-~---I---r--+--+-~---I---f---1
OWNER - CITY OF LOS AN GE LES
1 1 1 1 Ig. ~
g
1927 - 28 29-30 31 - 32 33-3 4 35-36 37-38 39-40 41-42 43-44 45-46 47-48 49-50 51-52 53-54 55-56 57-58
" WATER YEARS
PLATE 34-A
630 _____ - ".1 1 1 I I I 1630 rl -----------------,
620 r .-- ,~i-·-- I 1 1 I 1620
LE GE ND ..r"'\ I " I I I I
I I / ~ J ' I I I I I
(U.S.G.S. DATUMI - " - ELEVATION OF LOS ANGELES RIVER INVERT WATER LEVE LS
---- CO MPLE TE RECORD 610 1 I I I I I I I I I l ,.l l.d 1 ' J , ' l I 1610
::: 1 1 1 1 =tF 1 vt t]/ 1 1 1 r 1 1 1 1 - I I\l/\ HGOO II ~-= ::";;:~":"M' 1590
580 1 T 1 \1 1580
I IWELL NUMBER 3830B I I 1 ", I I I I I I. 570 GROUND SURFACE ELEVATION 687 FEET ',- .A I I I 570
I I I I 1 . \ ,J\ 1\ t;; 560 1 1 1 163 FEET SOUTH OF CENTERLINE . \ 560 ~ OF KITTRIDGE STREET (EXTENDED) AND \ '
1-_ -1 __ +-_+,.5'0 FEET EAST OF CENTERLI NE \
'!: 550 OF CLEON AVENUE I l ,... 550
! ~~ 1 1 1 I ~'T 'T " r ''1'''' 1 1 1 1 1 1 1 1 1 1 1 1 1 1 1 1 1 1 l t 'j, 1 1 1 I::: , , 520 I I \ 1 /1 1520
-,' , 510 I I' ' j 1510 , , 500 I I ' I 1500 ,
490 ~ ~.- I I I I 1 1 1 1 1 1 1 \1 1490
1927 -28 29-30 31-32 33-34 35-36 37-38 39-40 41- 42 43-44 45-46 47-4B 49-50 51-52 53-54 55-!56 57-58
660 1 1660
I f\ I ~ I I I 650 650 , 1\ Il l " / \...J-I--· + -·'J.-.,. I
, ~"" )"-", J"'-.fJ ".r' -J 11"'-f-' '" ~ 214 ~EET ~AST OF VAN N~YS I -- II" 640 640 BOULEVARD AND 285 FEET NORTH V
I--- WELL NUMBER 3753 OF CENTERLINE OF HOUSTON STREET 030 1--- GRO UND SURFACE EL EVATION 658.9 FEET OWNER - A. DITTMAR
I I I -r--r--+--+--+--+--+--+--4--4-~--~~~~16~
1927-28 29-30 3/-32 33-34 35-36 37-38 39-40 41-42 43-44 45-46 47-48 49-50 51-52 53-54 55-56 57-58
WATER YEARS
SAN SAN FERNANDO VALLEY REFERENCE
FERNANDO SUBAREA WELL HYDROGRAPHS STATE WATER RIGHTS BOARD
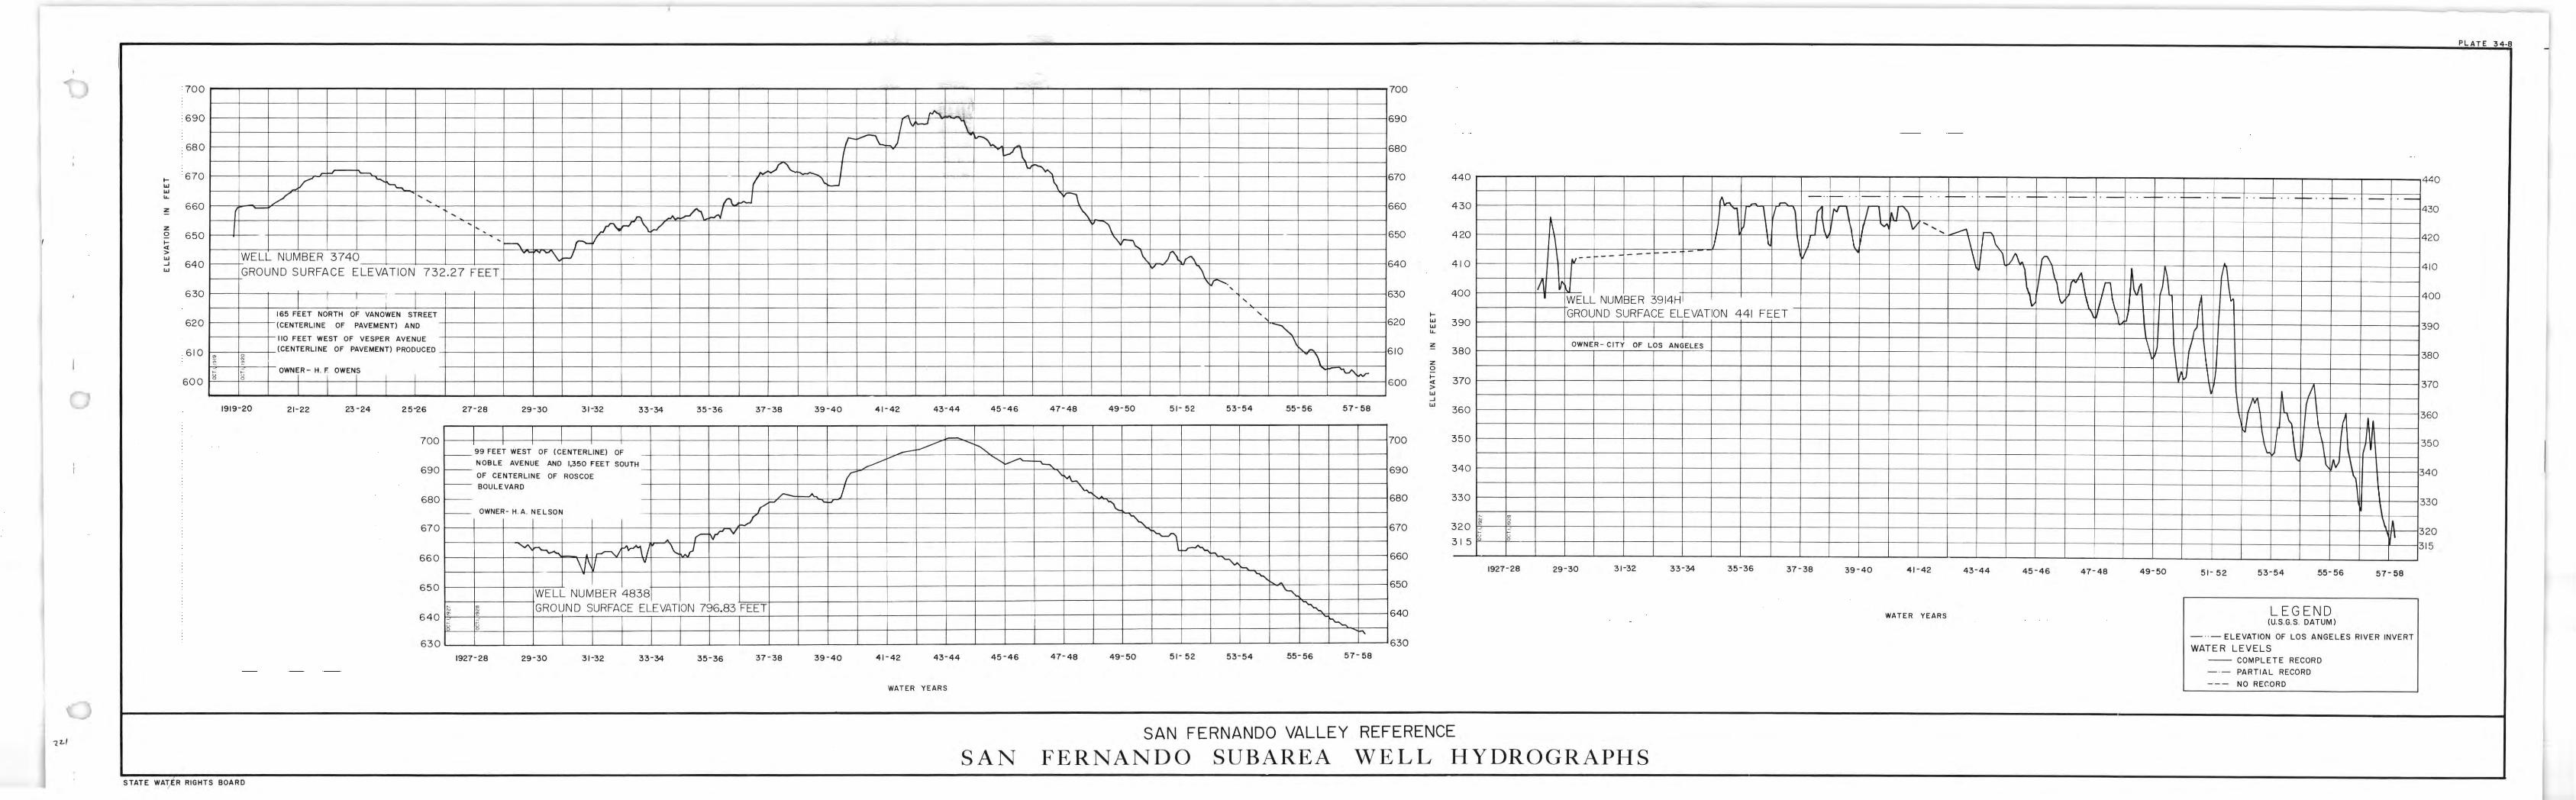
1~'
"" . r
f"t--' '\ r \..J.... J t\,
v~ V" ~
v be.. ~ ~ -"--./ AW "\ , - l/\U " ' h rfl 'fll I I IT ' IIII F\k 11 111 WELL NUMBER 3 740 1 I 1 1 I ~ I I I I I I I I I I I I I I I I I I \J hi'" J I I I I I I ~=::GROUN D SURFAC E ELEVATION 732 .2 7 FEE T ~ + ~~Jr-:::.
, _L ,
165 FEET NOR TH OF VANOWE N STREET 1 I ~ (CENTERLINE OF PAVEMENT) AND
,
I 110 FEET WEST OF VESPER AVENUE
I... 12 (CENTERLI NE OF PAVEMENT) PRODUCED I' u"\. • g OWNER - H. F. OWENS
1 -1.1 __ -,- ~
I 1919 - 20 2 1-22 23-24 2~-26 27-28 29-30 31-32 33-34 35-36 37 - 38 39-40 4 1-42 43-44 45 - 46 47 - 48 49 - 50 5 1- 52 53-54 55- 56 57 - 58
I I 11.1.1 700 700 _ , 99 FEET WEST OF {CENTERLlNEj OF I NOBLE AVENUE AND 1,350 FEET SOUTH / 6 9 0
690 f----- OF CE NTERLINE OF ROSCOE I k. f----- BOULEVARD I "- I I I I I I I I 1680
680 f----- t' '- I I I I I I I I I OWNER- H. A. NELSON J '"" I I I I
670 I I I I I I i"-rI I 1 1 1 670
~ ,-V v -"- I I I I I I ~ . '~II ~.} I I '-I I I I I 1660 66 0 jJ'i J vJ J J + ---f
I I I I I " 650 650 WEL L NUMBER 48381. J J I I """ ". GRO UN D SURFACE ELEVATION 796.83 FEET " 640
640 ~ Ii J J 1 J J 1 J ~ 630 I" l' 1630
1927-26 29-30 3 1-32 33-34 35-36 37-38 39-40 41-42 43-44 45-46 47-48 49-50 5 1- 52 ~3-54 55-56 57 - 58
WATER YEARS
~
"' "' ~ :!:
z 0 ~ ~ > "' J
"'
440
430
4 20
4 10
400
390
380
370
360
350
340
330
'" ., __ L __ .-I ~ ' ---
III WELL NUMBER 3914H
I--t--+--+IGROUND SURFACE ELEVATION
OWNER - CITY OF LOS AN GELES
320 I~ Iii 315
1927-28 29-30 3 1-32 33-34
SAN FERNANDO VALLEY REFERENCE SAN FERNANDO SUBAREA WELL HYDROGRAPHS
STATE WA~ER RIGHTS BOARD
I I .1-4. ~ I. I -I--II~ f- 1 H,- :
1/ If" ! I \ ~ I \ f '1- "1'-_ 1.....-'\
r \ \ 1/\ (\
\ I A
\1r\ l r
441 FEET il l 1 1 1 1 1 ~ 'i \Jj \-4
3~ -36 37 -38 39-40 41-42 43 - 44 45-46 47-48
WAT ER YEARS
=1= += ~ I ! L . G I I-
\j,
49-50
(
11 f1
1/ ~
\.t{
51- 52 53-54 55-56
LE GEND (US.G.S. OATUM)
- ELE VAT ION OF LOS ANGELE S RIVER INVERT
WATER LE VELS -- COMP LET E RECORD
PARTIAL RECORD
NO REC.ORD
PLATE 3 4 -B
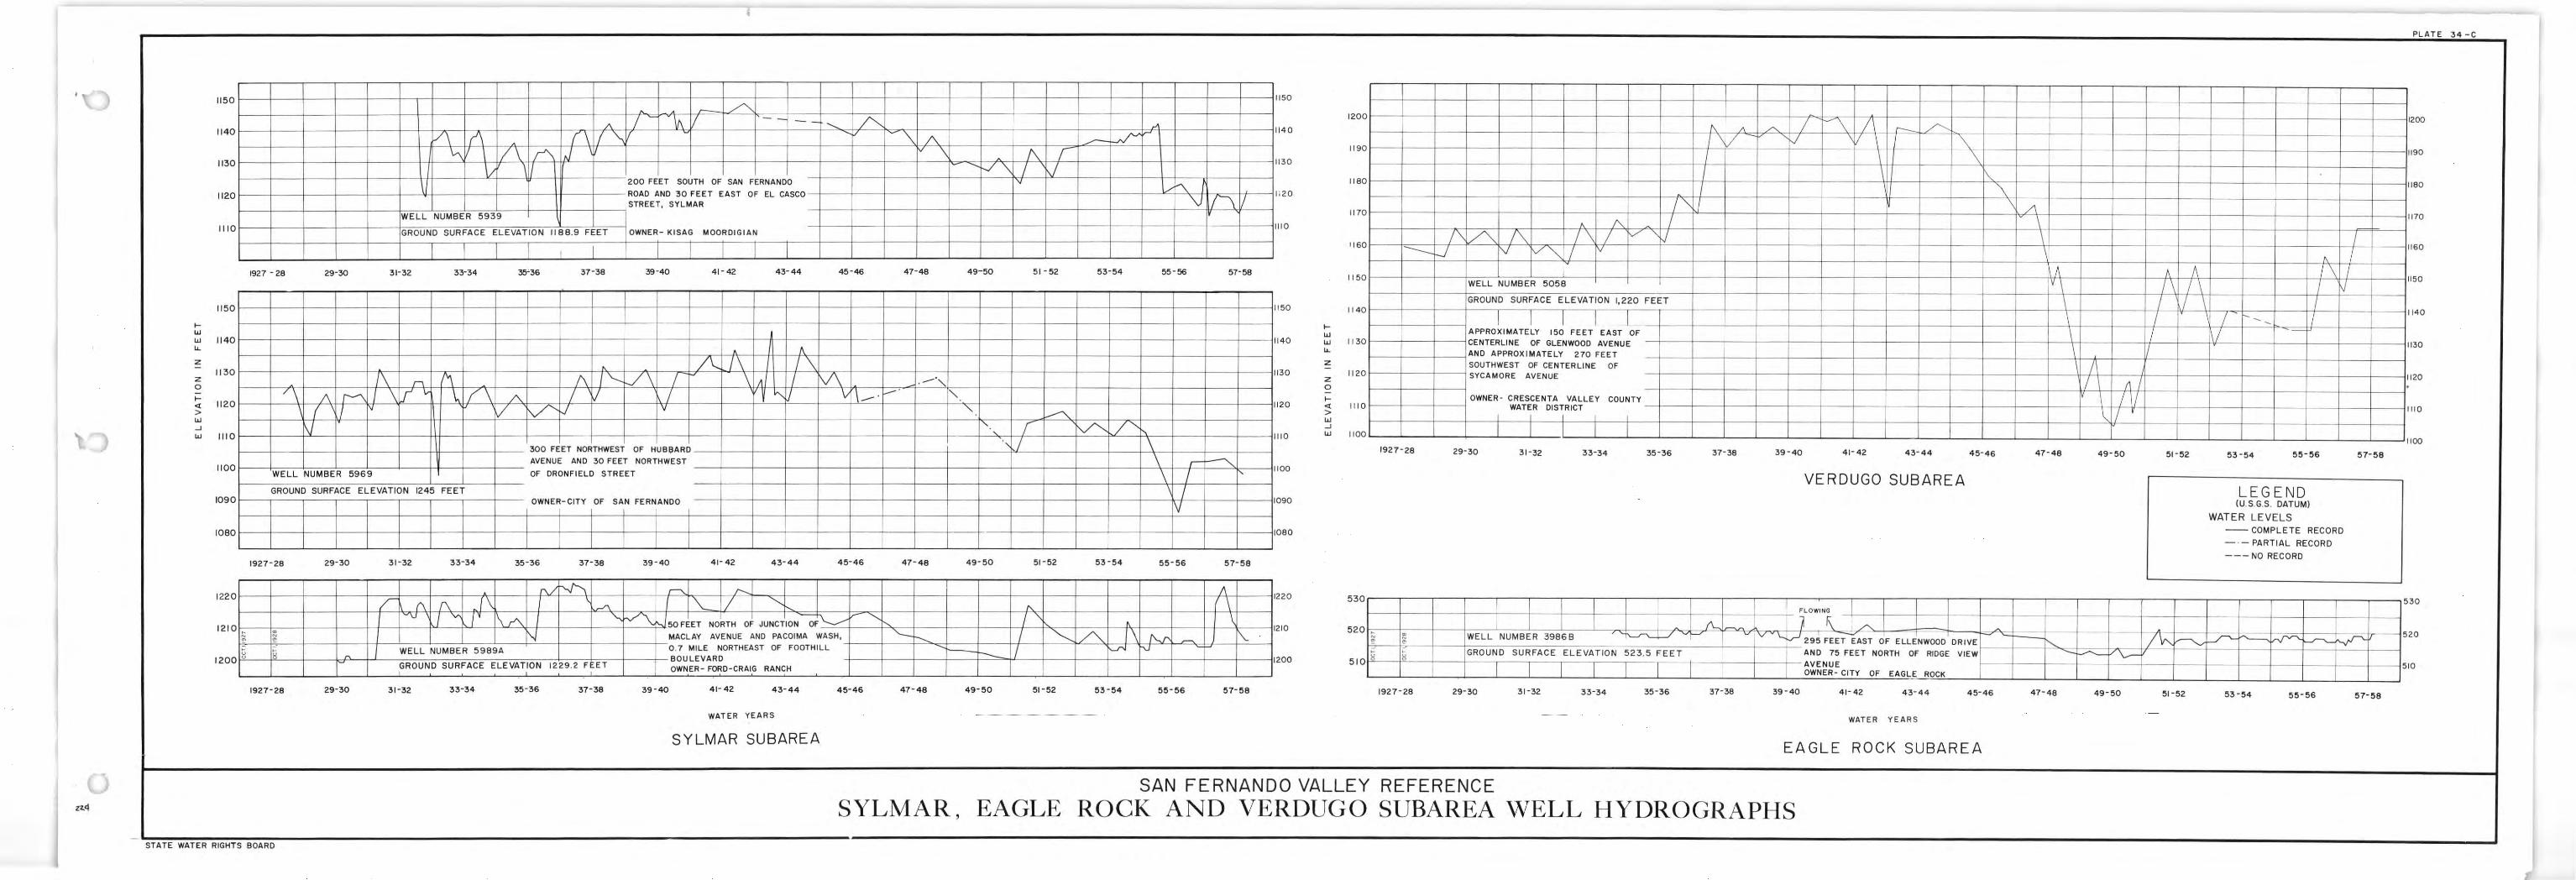
zt~
0-W W Ie
z
z o >'" > W ..J W
11501 1 I 1 I~I -/--+--+--+---j---+--+--+-+--1111 50
I I A 7~ l!\ 17 ' - - - - "- A I -" I
1140 1 I /\ r' (\ ( " ~ '\ A l~ \ I I I \"40
11301 I I I I I I ~ II \ f\ I,J ~ \ .b,. ( 1130 '1 I V II ~ '\ / J I I I
200 FEET SOUTH OF SAN FERNANDO v ~
1120 I \1 1 ROAD AND 30 FEET EAST OF EL CASCO "f!! "II 1' 120 STREET, SYLMAR ~ -V-
IWELL NUMBER 5939
1110 IGROUND SURFACE ELEVATION 1188.9 FEET I OWNER- KISAG MOORDIGIAN -+-+--t---+--t----t---t--+-+--t---+--+---t---t--1\IIIO
L
1927 - 28 29-30 31-32 33-34 35"36 37-38 39-40 41-42 43-44 45-46 47-48 49-50 51 -~2 53-54 55 - 56 57-58
11501 1" 50
1140 I I h I 11 I A I I I I I I I I I I I I 1" 40
1130 1 1 1 1 1 /\ 1 n 1 R 1 _ 1 1 1 1\ 1 t~\ 1 7 +/1 1\ U \ 1 / \0s I, 1 J. ---,J 1 1 1 1 1 1 1 1 1 /113 0
11201 I 7~ /\1P( \r-1l1f7 S{;At;Vu Y--r- }J ml- I----TPf 1 1L-r'l I\~! 1 E 1 1" 20
11101 I V -- 1 1 1 ] ] ]--- I I' (f/',/'i, 1110
I I ' 300 F~ET NO~THWESi OF H'UB8ARb : " j I \
I AVENUE AND 30 FEET NORTHWEST I \ r " 1100
OF DRONFIELO STREET I \ / 100 I I I I I I , I WELL NUMBER 5969
.1. .1 .1 .1 I I I I I I I I I I / I I 1'090
I I I I I I C{ I I r GROUND SURFACE ELEVATION 1245 FEET
1090 ~1--.--,--,--,---.--.--,-~--- OWNER-CITY OF SAN FERNANDO
1090 I 1'090
1927-28 29-30 31-32 33-34 35-36 37-38 39-40 41- 42 43- 44 45-46 47-48 49-50 51-52 53-54 55-56 57-59
12201 I I I I I ,, /~ '" r-. "
'1 / (\ f\ ( \ I -" '\. / ""'- " \ i'220
1210 , 'V ,/ '" /' \A '-,~ . 50FEET NORTH OF JUNCTION OF~ " 7 • " N I MACLAY AVENUE AND PACOIMA WASH, '--I-- / '-... .~ I \ "- "'-g WELL NUMBER 5989A I 0.7 MILE NORTHEAST OF FOOTHILL I I ~ 1'1 ,r II
1200 80ULEVARD I I GROUND SURFACE ELEVATION 1229.2 FEET 1 OWNER- FORD-CRAIG RANCH 1
'200
1210
1927-28 29-30 31-32 33-34 35-36 37- 38 39-40 41-42 43-44 45-46 47-48 49-50 51-52 53-~4 55-56 57-58
WATER YEARS
SYLMAR SUBAREA
0-W W Ie
Z
Z o 0-
'" > W ..J W
PLATE 34-C
':::1 1 1 1 1 1 . 1 1 1 1 rkf6f F¥\ltff\1 1 1 1 1 1 1 1 1 1 I 1 1 I'· 1190
.... I '1~Yl1P ( ~ t ' 1 1 ' 1 ' 1 ' , , 11 ' I ' 1 1 ' I I .. V I~· 1150 I ~NUMBER 5058 f I I I I I 1/\ 1 I 1;\ All 1 [\? "50
GROUND SURFAC E ELEVATION 1,220 FEET l' 7 J l' 17 1140
1140 I I I I I \ / / r- - _ 1/
APPROXIMATELY 150 FEET EAST OF \. II \/ 1130 1130 CENTERLINE OF GLENWOOD AVENUE \ II
AND APPROXIMATELY 270 FEET \ II I SOUTHWEST OF CENTERLINE OF I' A I I I I I I I 1120
II 20 SYCAMORE AVENUE : / 1\ /1 I I I
OWNER, CRESCENTA VALLEY COUNTY I 1 T 1 1 1 1 1 1 1 1 1 1 / 1/ I ----j 1111 0
11 10 1 I I I I WAT~R DIS~RICT I j j j j 1 j j 1 1 j j j J ~IL 1100 1 [ 1
1100 1927 - 28 29-30 31-32 33-34 3~-36 37-38 39-40 41-42 43-44 45-46 47-48 49-~O 51-52 53-54 5~-56 57-58
VERDUGO SUBAREA LEGEND
(U.S.G.S. DATUM)
WATER LEVELS -- COMPLETE RECORD
- . - PARTIAL RECORD
--- NO RECORD
5301 1530
-.l ...l .1 ...l FLOWING I
520 I I I I 1 J f\ . fl 1\ _ /'.. I ~ I ,A _ _ 520 " WELL NUM8ER 3996 B v . '--v-l 295 FEET EAST OF ELLENWOOD DRIVE / "'~f-/ ~ --v
g GROUND SURFACE ELEVATION 523.5 FEET AND 75 FEET NORTH OF RIDGE VIEW \--510 I AVENUE 510
OWNER- CITY OF EAGLE ROCK
1921-28 29-30 31-32 33-34 35-36 37-38 39-40 41-42 43-44 45-46 47-48 49-50 51-52 53-~4 55-56 57-59
WATER YEARS
EAGLE ROCK SUBAREA
SAN FERNANDO VALLEY REFERENCE SYLMAR, EAGLE ROCK AND VERDUGO SUBAREA WELL HYDROGRAPHS
STATE WATER RIGHTS BOARD
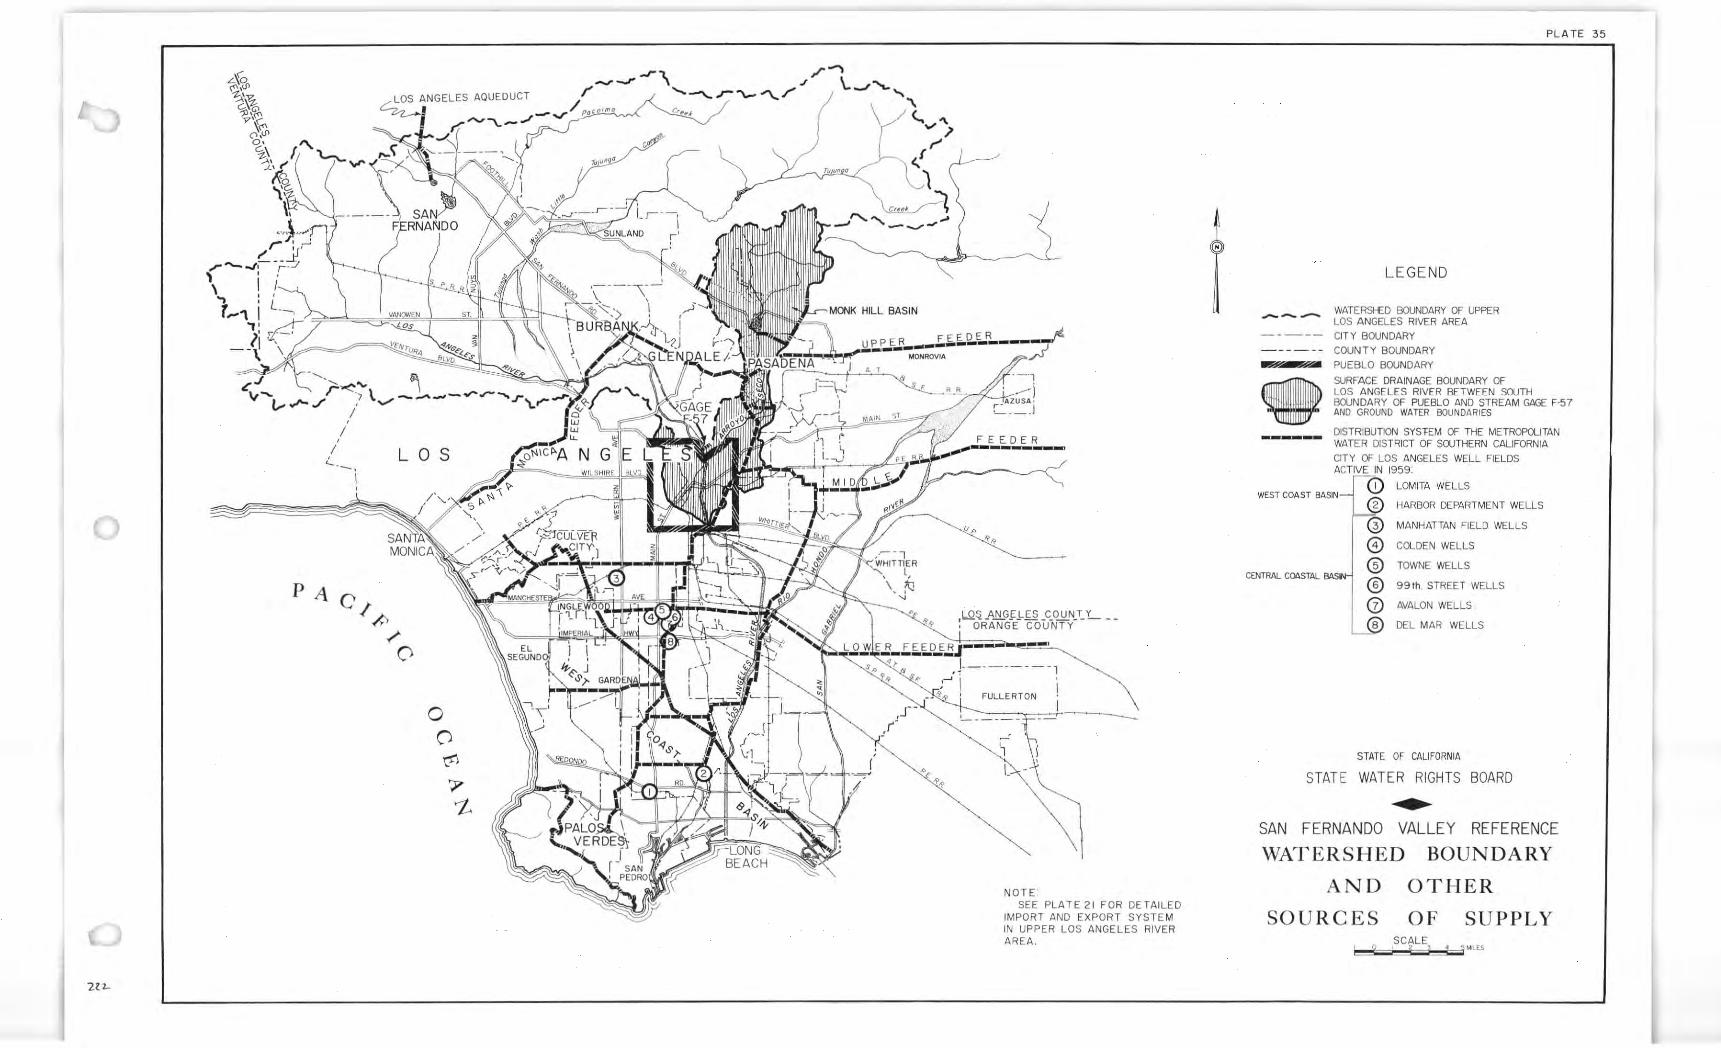
212-
c: "X<a, <" , ~i% ~\~
17\;-<" ("> ,<1' 0 ,
'i\ '-', -'-'
,r-"\ J \.oJ ...... " ...r\ /' ( " .....,. -" .... """'- r "\.- ""- \ j <.. '\ ~I' \.../ ")1 / om. C" ., t"
-..., p. { ""-"" -
I LOS L.._
PJ\c;-/;>
/' o
o o ~
'7 7-.
,~
,LO~ _ANGl'.!-ES _C_OU~T_ L __ , ORAN GE COUNTY
- ---- - --1 ,
FULLER TON !
NOTE SEE PLATE 21 FOR DETAILED
IMPORT AND EXPORT SYSTEM IN UPPER LOS ANGELES RIVER AREA.
e
----LEGEND
WATERSl-ED OOUNDARY OF UPPER LOS ANGELES RIVER AREA
CITY BOUNDARY
PLATE 35
------ COUNTY BOUNDARY
---
PUEBLO BOUNDARY
SURFACE DRAINAGE BOUNDARY OF LOS ANGELES RIVER BETWEEN SOUTH OOUNDARY OF PUEBLO AND STREAM GAGE F-57 AND GROUND WATER BOUNDARIES
DISTRIBUTION SYS, EM OF THE METROPOLITAN WATER DISTRICT OF SOUTHERN CALIFORNIA
CITY OF LOS ANGELES WELL FIELDS ACTIVE IN 1959:
WEST COAST BASIN o LOMITA WELLS
® HARBOR DEPARTMENT WELLS
'0 MANHATTAN FIELD WELLS
(3) COLDEN WELLS
CENTRAL COASTAL ® TOWNE WELLS
® 991h. STREET WELLS
o AVALON WELLS
® DEL MAR WELLS
STATE OF CALIFORNIA
STAT E WATER RIGHTS BOARD
~
REFERENCE BOUNDARY
SAN FERNANDO VALLEY
WATERSHED
AND
SOURCES
OTHER
OF SUPPLY SCALE 5 MILES
? I 2 r
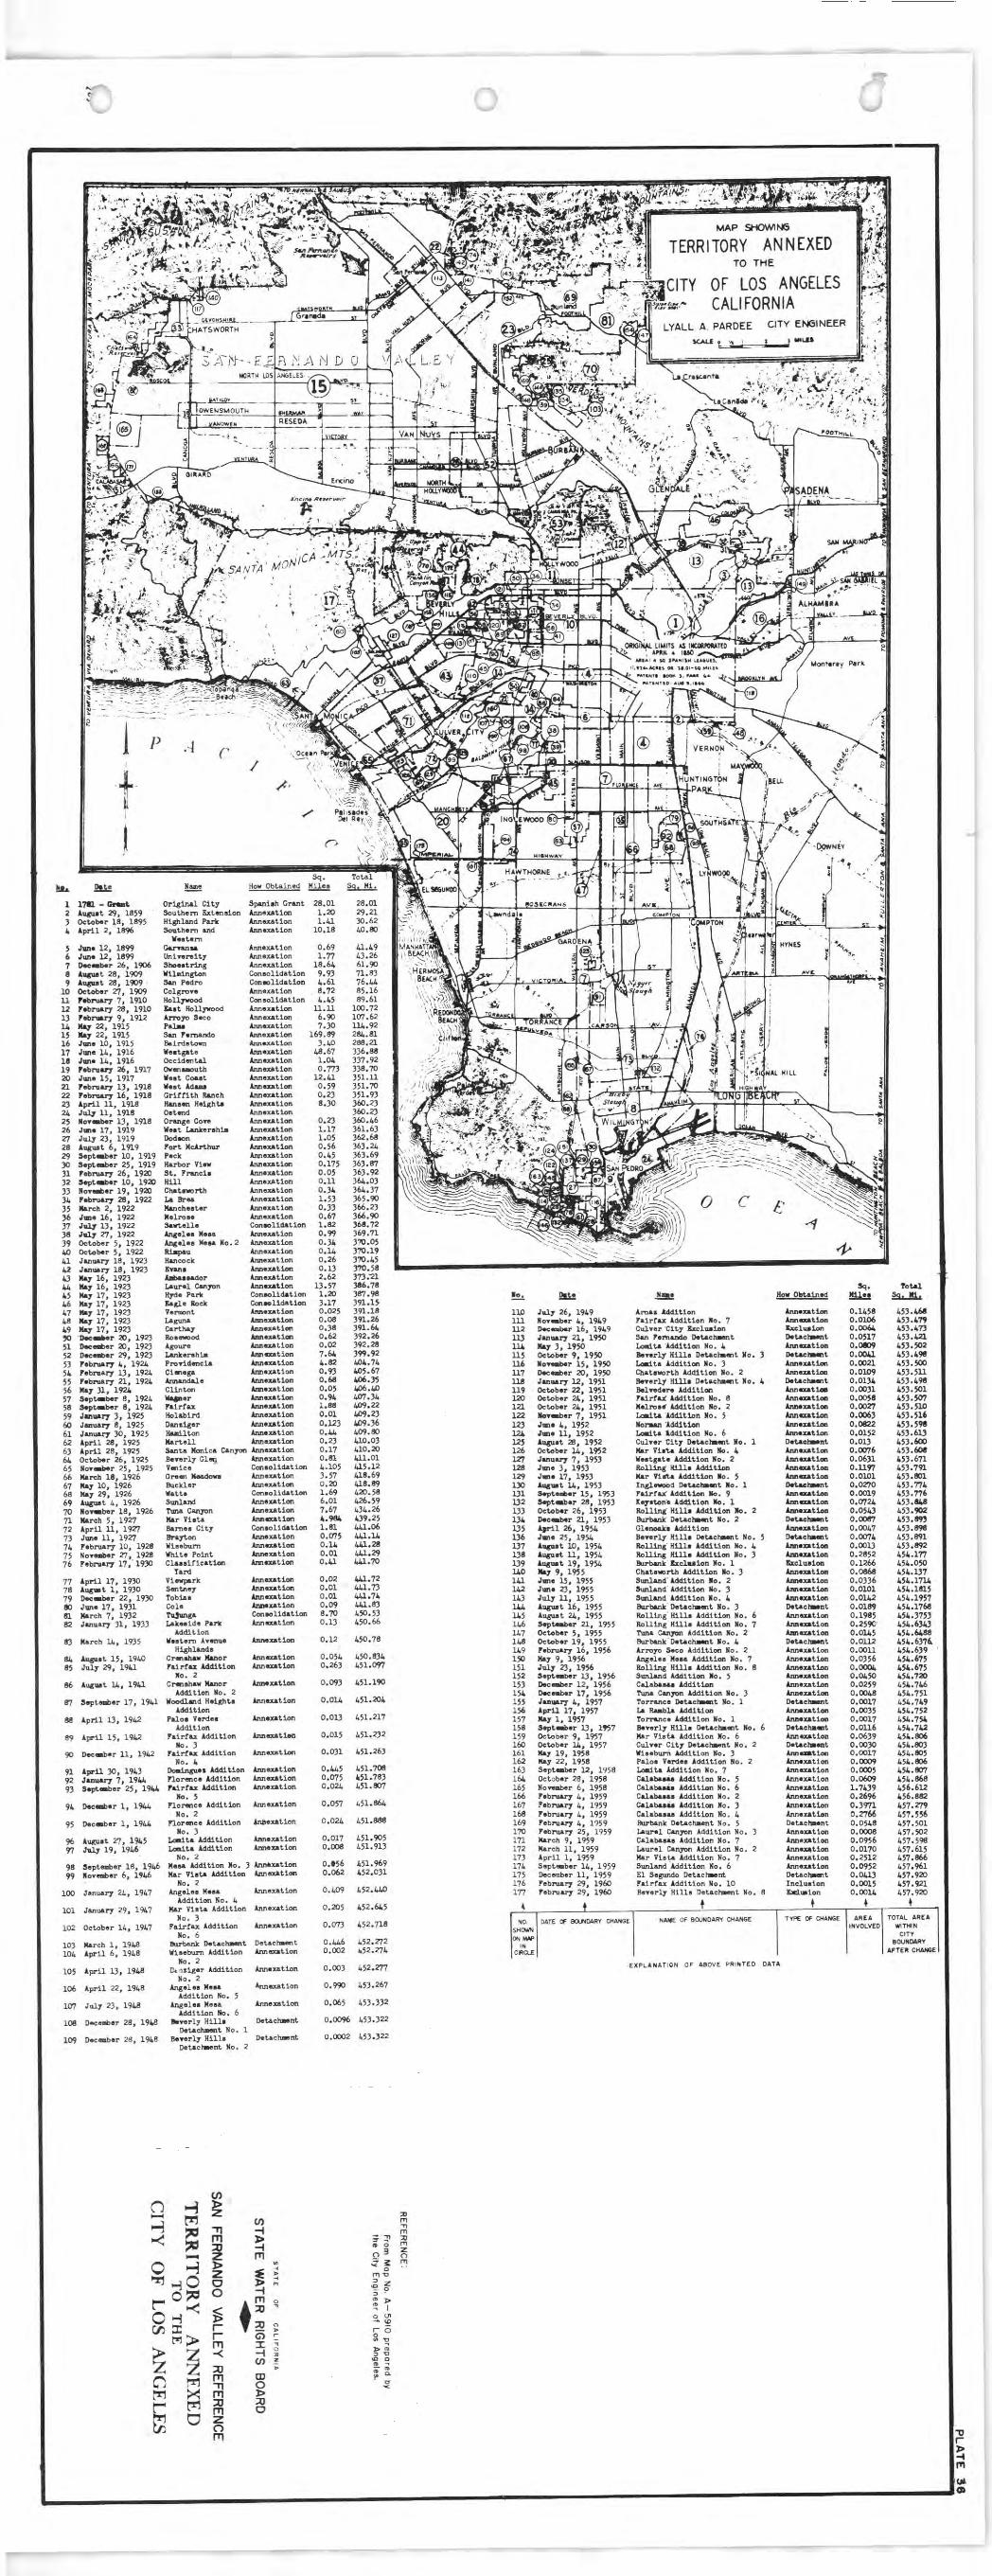
.' ,
J\: ;.\ 1\1 D 0 trt(Iil.H!
.-.~,!
1 p .-1 c /
~, + f /'
~ ... l!!ll
1 17&1 - ar.t 2 AUCUllt. 29 J lSS9 ) OetobtoJ:' 18, 1895 4 April 2, 1896
5 Jan. 12, 1m 6 June 12, 1899 7 o.e""r 26, 1906 8 !''*&WIt. 28, 1909 9 .lQPlt 28, 1909 .
.10 OctoMr Z7. 1909 U · P.tInu'T 7. 1910 12 Pebru.t.ry 28, 1910 13 JPebna17 9, 191.2 14 Kq 22, 1915 15 11&,. 22, 1915 16 J-.rII 10, 1915 17 June l4, 1916 18 Janl 14. 1916 19 ,.bra.,.,. 26. 1917 20 June IS, 1917 21 ,.brul.l7 I), 1918 22 FebRaJ7 16, 1918 23 April 11, 1918 24 J\llT 11, 1918 25 .o,..uu 13, 1918 26 Jan. 17, 1919 27 July 2), 1919 28 Aquat 6, 1919 29 Septlaber 10, 1919 )0 Sept...tMIr 25, 1919 )1 FebNA1'7 26, 1920 32 Sept~r 10, 193) J) JloT"'er 19, l~ 31. ,ebruary 28, 1922 )S March 2, 1922 )6 J •• 16, 1922 )7 JW:i lJ. 1922 38 J-.l7 27. 1922 39 October 5, 1922 40 October 5. 1922 .u JAnGU7 18, 1923 4.2 Janu.e.17 18, 1923 4J Ma1' 16. 1923 4.4 Mar 16, 1923 45 )1&,. 17. 192) 46 Ma,.17,192) 47 Ma,. 17. 1923 48 M&7 17. 1923 49 ,..,. 17. 1923 " "Dec"'r 20, 1m 51 D.e.-ber 20, 1923 52 o.e""r 29. 1923 53 r.bl'II&17 4, 1924 54 'lbn._17 13. 1924 55 ,.bnary 21, 1924 . 56 )fa1 31, 1m 57 s.pt..btol" 8, 1924 sa Sept_btol" 8. 1924 59 JarnaAfT), 1925 I:IJ Janual"J 8, 1925 61 Janua17)O, 1925 62 April 28, 1925 6) April 28, 1925 64 Oetobu 26, 1925 65 NOT.t.n 25, 1925 66 March 18, 1926 67 Kay 10, 1926 68 Kay 29, 1926 69 lU«U"t 4, 1926 70 .o~bel" 18, 1926 n Mareh 5. 1927 72 Apl"il 11 , 1927 7) Jilin. 11, 1927 74 '.bl"'U6l"1 10, 1928 75 NO ....... l" 27 , 1928 76 P'.brua17 17,·19)0
77 lpri1 17, 1930 78 AUAWt 1, 1930 79 Oec.-bel" 22, 19)0 80 J1II"I.17,19)1 81 Kar-eh 7, 19)2 82 January )1, 19))
It) Mar-eh u., 19)5
84 .tu.su_t. 15, 1940 85 July 29, 1941
86 lu.gUllt u.. 19U
87 S-pt.ab.l" 17. 1941
88 April 13. 1942
B9 April 15, 1942
90 o.e.t>.l" 11, 1942
91 April )O, 194) 92 Janu&17 7, 1944 9) 5ept.t>.l" 25 , 191t4
94 Dec"'.r I, 1944
95 Dee.aber I, 1944
96 lugu.t. 27, 1945 77 "'Illy 19, 19.1.6·
98 Sept.ember 18, ·1946 99 Nov"'.r 6, 1'46
100 J.nuarJ 24, 1947
101 January 29 , 1947
102 Oetob"l" 14, 1947
10) Mal"ch 1, 1948 104 April 6, 1948
105 April 13, 1948
106 April 22 , 1948
107 J ui1 2), 19l.8
lOS December 28, 1948
109 Dee_bel" 28, 1948
!!!!!. Original Cit.1 Southern !xt.ennon Hi&hland Parle Sout.hern and
V •• t.em G&nanK Un1Y.nit.1 Sho •• t.ring Wllidn_ San Pedro Colgro .... Ho11JWOOd laet. Ko11JWOOd. Arro1" Seeo .. _ San 'emando Bairdetown V .. tgat.e Occidental OwenUlOut.h Veat. Co ... t. V .. t. Ad ... Gritfit.h Ranch Han.en Height..a O.t.end Onnge Con Ve_t. Lanker.ha
"""-'ort. McArthur Peek /f.a.rbor View St.. P'nncb H111 Chat.nol"'th La BrM Manch .. t.er Me1ro •• Sawtelle Angel .. M .. ... q.le. Me .... No.2 ..... u Hancock ...... ...... a.ador Laur.l Can1"n lfJde Parle &a&l.e iock V.naont La""", Cart-ha1 "'.-_ .. ure
Lankl&l"&ha
How Obtained
Span1eh Grant AnneXAtion Anne.x.at.ion Anneu.t.ion
AM.:u.t.ion Annexation Annuat.1on Conso1idat.ion Conaol1dat.ion Annexation Conaol1d.ation Annexation Annexation Annexation AnneXAtion Annuaticm Anneu.tion Annu..t.ion Annexation AnneXAtion Annuation lnnuation Annu ... t.ion Ann.xation Annu.ation Annexation Annnation Annu ... tion A.Mexation Annu.ation Annexat.ion Annexation Annexation Annexation Annexation innu.ation Conaol1d&tion .lnnent.ion Annent.ion Annention Annexation AMuation 4nnuat.ion Annuation Con.alidat.1on Con_lidat.ion Ann.xation ArInexation Ar.nexat.1C11'1 Annuation Annual10n lnnuation
Pro ... idencia Annexation Cia'\ega Annent.ion Annandal.e Annexat.ion Clinton Ann.xation Waper Annu.at.ion P'airtu Ann.xation Holabird Annention Dansiger Ann.xat.ion KaJI1lton Ann.nt.ion Kart-ell Annexat.ion Santa Monica Can)'lln Annexation Be,..,rl,. GII11J. Armention Venice Con.olldetion Green ~ Annexation Buckler Annuat.ion Vat.te Con.ol1det.ion Sunlard AnneXAt ion Tuna C&n1t'n Annent.ion Mal" Vht.a Anncution Bamn Cit1 Cooaol1d.ation ltra,-ton iJme;xat.1on Vieeburn Armexat.ion Whit. Point Annexation C1 .. e1fication Alwtexation
Yo"' Vievparle SentneT Tobi .... Colo """"",. Lake.ide Park
Addition W.et.m A ... &mI.e
Hi&b1and.. Cratahaw Manor 1a1rtu Add1t1on
No.2 Cren.haw Manor
Addi t.lon 10. 2 Woodlatd He1«hte
Addit.ion
Annexation Annexat.ion Annexat.ion Annnat.ion Con.al1dat.ion Annexat.ion
AIlnexation
Annexation Annexat.ion
Armaxation
Annaxat.ion
Palo. Verde. Annuation l.ddition
'airfu Addition AnnGation No. )
P'airtu Addition Annu..t.i.on No.4
Doa1n!un Addi t.ion Annexat.ion P'lor-.tc. Addition Annexat.ion 'airtu Addition Ann.ntion
No. , P'lol'W\ce Additlon Annexat.ion
Mo. 2 P'lol"atce Addition Wexation
No. ) Lo-ita Addition AnMIxat.ion Lca1t ... Addition Annexation
No.2 Me .. Addition Mo. ) A.nMntion Mar Vista Addition Ann~tion
No.2 Angelee M.e. Annent.ion
Addition No.4 Kar neta Addition Annent.ion
No . 3 'airtu Addit.ion Annention
No.6 !ur"b&nk Oet. ... c.,..,.t O"t.achltent. Viaeburn Addit.ion Annexation
No.2 o. rl ligel" Addit.ion Annention
No.2 -'"8.1es Me.. Anneution
Addit.lon No. Angd .. Me.a Ann.xat.ion
Addition Mo. 6 8 ... rl1 Hilla OetachMnt Oeta~t. No.1
BeTel"l1 Hill. O.taen-nl Oetact..nl No. 2
(j ...j ~
~ ~
-.., -<: ~ -o ...j 'Tl..,0 t""'0::z::, 0",-<: CJl:I:
t"1;J;>
~ 2 C"l ~ ~ >< t""' ~ t;l 0
~ Z o o
lii r r fT1 -< ::tJ fT1
~ ::tJ fT1 Z (') fT1
U)
E fT1 . ~ ~ -i "
tlTl O ::0 '
::0 0 - > G') r :I: ;; -i 0
c.n ~ (D
~ ::0 o
>
0.69 1.77
18.64 ,.9) 4.61 8.72 4 .... 5
11.11 6.90 7.)0
169.89 ).l,O
48.67 1.04 o.m
12.101. 0.59 0 .23 8.)0
0.2) 1.17 1.05 0.56 0 .45 0.175 0.05 0.11 0.)4 1 .5) 0.)) 0.67 1.82
0." 0.)4 0.14 0.26 0.1) 2.62
13.57 1,20 3 . 17 0.025 0.08 0.)8 0.62 0.02 7.6. 4.82 0.9) 0.68 0.05 0.94 1.88 0.01 0.123 0.44 0.23 0.17 o.sl 4.105 3 .57 0 .20 1.69 6.01 7.67 ...... 1.81 0.075 0 .14 0.01 O.U
0.02 0.01 0.01 0.09 8.70 0.1)
0.12
0.054 0.26)
0.093
0.014
0.01)
0.015
0.0)1
0.445 0.075 0 . 024
0.057
0.024
0.017 0.008
0.'56 0.062
0."" 0.205
0.07)
O.W 0.002
0.00)
0 .990
41.49 4).26 61.90 71.8) 76.44 85.16 89.61
100.72 107.62 114.92 284.81 288.2l ))6 .88 ))7.92 )36.70 )51.ll )51.70 351.9) )60.23 )60.2) }6O.46 361.6) )62.68 )6) . 24 )6).69 )6).87 )6).92 364.0) )64.37 )65.90 )66.2) )66.90 )68.72 )69.n )10.05 370.19 )70.45 370.58 )73.'21 )86.78 )87.98 )91.1} )91 .18 391.26 391.64 )92.26 )92.28 )99.92 404.74 405.67 406.,., 4O6.l,O 407 .)4 409.22 4fJ9.23 loD9.)6 409.(1) UO.O) 410.20 411.01 415.12 418.69 418.89 "".58 426.59 4)4.26 -.39.25 441.06 441.14 1oU.28 441.29 1oU.70
W..72 441.73 441.74 1oU.S) 450.5) 450.66
450.78
450.834 451.097
451.190
451.204
451.217
451.2)2
451.26)
451.708 451.78) 451. f!JJ7
451.864
451.888
451.905 451.913
451.969 452.0)1
452.440
"'52.645
452.718
452.272 452.274
452.277
45).267
0.065 45).))2
0.0096 453.)22
0 .0002 45).)22
" '" ~ ~ ~ ~ • 0 '" 0 3 Z
.: ~ ~ o
"'~ ~ z ~. ~ · .. ~ I o ~
-'" b O .~ .. ~ , ~ ~ 0 · , ~~ ~
••• llO III 112 1lJ 114 11, ill 117 lL8 119 120 121 122 123 l24 1.2, 126 127 128 129 1)0 131 13' m 134 135 136 m 1)S 139 140 lU 142 143 144 14, 146 147 ",S
14' 150 151 152 15) ,,,, m 1>6 157 158
'" 160 161 162 16) 164 16, 166 167 168 16, 170 171 172 173 174 17> 176 177
"" 'H .... I"""" '" ,.'"
!!!ll
.JUT 26, 1949 Mo ... _bel" I., 1949 Dee..tMt.t 16, 1949 JanGal"J 21, 1950 Ma1 ), 1950 Octobtor 9, 1950 Monaber 15, 1950 Dee"'.r 20, 1950 .JanWlry 12, 1951 Octob'r 22, 1951 October 24, 1951 October 24, 1951 loYE.r 7, 1951 .I ... I., 1952 J .. e U, 1952 .1u.gu.t. OB, 1952 Octobtor 14, 1952 Jan~&l"J 7, 195) .J1&f\' ) , 195) J •• 17, 195) hI.t 14, 195) Sept""r 15, 1953 Sept. •• r 28, 195) Oetober 26 , 195) Dec.-ber 2l, 195) A,nl 26, 1954 03.,. 25, 1954 Aap.t 10, 1954 Aupat 11, 1954 .1ua--t 19. 1954 ..,. 9, 1955 JWle IS, 1955 Jilin. 23, 1955 July 11, 1955 .1U«U"t 16, 1955 Auguat. 24, 1955 hpt.e.b4r · 21,l955 Octobtor 5, 1955 October 19, 1955 P'.brual""J 16 , 1956 Ma1 9, 1'56 o3ul7 23, 1956 Sept..tler 13, 1956 o.c..t>lr 12, 1956 Dee.llber 17. 1956 Jaz!.1aAl""J I., 1957 .1prll. 17, 1957 KaT I, 1957 Sept ... r 13, 19'57 October 9, 1957 Octob.r 14, 1957 )fa1 19, 1958 Ml.1 22, 1958 S"pt.-.ber 12, 1958 Oct.ob.r 28, 1958 1I0n.ber 6. 1958 '.bru&rJ I., 1959 'ebNarJ 4, 1959 ,.brual""J I., 1959 P'ebru&l"J I., 1959 'ebrua17 25, 1959 Much 9 , 1959 Kuch 11, 1959 Apl"U 1, 1959 S.pteaber 14, 1959 Decemb.r 11, 1959 'ebrua17 29, 1960 'ebru&l"J 29, 1960
DATE IY! ~OARY CHANGE
MAP SHOW1NG
ANNEXED TO THE
OF LOS ANGELES CALIFORNIA
LYALL A. PARDEE CITY ENGINEER
KALl t 'It , .....
~:.:. \,,;.": .. _ ,: .:·'i,"~ .;.: ~.,: .. :; ~.' ~.!.'tt', ... J. ",,-'V.I ;t- .; . . .1'1' . ..-:"' .. \0 '-'- ; . .. . , .. ~ ~ . A ,.'\ . .. ..... 1 · J .( ; :" . . _. .~ :;,.'''" / ·1./ .::' ~
o
.!!II! Amas Addition 'airtax Addition No. 7 C\al .... l" ""Cit1 Cltc1uion San P'etnanclo Det.aett.nt. t.o.1 ta . .1ddi tion No. 4
c
."'1'11 Kill. Detacta~t Mo. ) t.o.1ta Addit.ion Mo. ) Chat..wort.h Atlc:U.tion '0. 2 Benrlt Hill. Detactw.lt Ro. 4 8elnc1." Addition P'Ul"tu Add.ition Mo. 8 Kalro ... Addition Ro. 2 Lca1ta ·1dd.1t.lon Mo. 5 No~ '.ldd..1tion t.o.1ta Udit.ion No. 6 Cui .... r Cil1 Detactaatt Ro. 1 Mar Viet... .1d.dit.ion Mo. 4 W"tcah Add.1t.1on No. 2 Rol..l.1nt Hill. AOdition )f&r Vi.u. Addit.lon 10. 5 In&l....od Oet.achall1t. Mo. 1 P'alrtax .ld.d1tlon Mo. 9 1C.,.,..ton·. Addition 110. 1 Ro111nt Hilli .ldd.1 tJ.on 10. 2 Burbank· Detaet.ant. No. 2 Glanoakl .ld.d.1 lion B .... er17· Hill. Detact.ent Mo. Rolling· Hill. Addit.ion No. 4 Rollina; Hill • .ldd.itJ.on Wo. ) Burbank &xel.uion No. 1 Chateworth .ldd1tlon 110. ) Sunland· Add.it.ion Ro. 2 Sunland· Addit.ion No. , S..u.and Addition 110 . 4 Burb&nlt· Detact.ant. Ro. ) Rolling· Hills Addition Jlo. 6 Rolling ·HUla AdditJ.on No.7 Tuna CanJOn Addition Ro. 2 Bur~k · Det.actt.att Mo. 4 Al"ro1" Seco Addition )10. 2 Angel .. M •• a Additiotl 110. 7 Rolling · Hill. Addition Mo. 8 Slttllancl A4d.1 tion 10. 5 Calaba .... Addition t'un.a Canton A4dition )10. ) Torranc. Detac'-.t 110. 1 La Raabla Addition Torranc. Addition )10. 1 e .... "rl1 Hilla Detect-.,t No. 6 Mal" Vista Addit.ion Mo. 6 Cui .... r CitT Oetac~t No.2 Vieebw'i\ A4d1t.ion No.3 Palo. Verde. Addition No. 2 Ltait...a Mdition No.7 C&!aba .... .ld.dition 110. 5 Calab&.a. Addit.ion 110. 6 Cal.abUa. Atld.it.ion No. 2 Calabuu Addition No. 3 c ... laba ... Ad.d.1t.lon No. 4 .Burbank ·D.t.ac~t. No.5 Laur.l Can1"n Addition No. Caiaba..as Addition No. 7 Laurel canyon Addition No.2 )f&r Vist.a Addition No.7 Sunland ·Addition No.6 El Segundo Det.act.lllnt. P'airtu Addition No. 10 8","","ly ·Hills D"tac~t No.8
t NAlilE OF BOlJNOAIfI' CH ANGE
E; -1
How Obtained
Annexat.ion AM .... t.1on beluaion Det.ac~t Annexat.ion Det.aet..tt. AnnnatiCln Annu.at.ior:I Detac"-att. Ann .... t.u. AnnuatiOll Annu.atiOfl .1nnuatiCln Ann.xat.iCIn .lm.exatiCln Oetac_ftt .lnn.u.ation .u.nu.at.1on 1M.uation .lnn .... t1on .,....-, Annexati.oa Ann .... tion 1ane:u.t1oG o.tac~t. ....... ,"'" o.tachMrlt. .1nneu.t.1.oa .1nnu.at.ion &xcluaion Annexation Anna:u.tion .1nnuat.i.oa Annuat.ion Det.ac_ftt Annaxation AnrteutiOt1 AzlnuatiOll Oetac~t Annent.ion Annexat.ion Annexat.ion Ann.ntion Ann.xat.ion lruooxoU .. Oet.ac'-1t. Annuat.iOll .lnMxation Oet..achall'llt. Ann ex.atiOrl Detac'--nt Annuat.1.oa Annexation Annexation Ann.xation Annexation Anna:u.tion Ann.xation AnnnatLon Det.act.ent. Ann • .u. t ion AMention Ann-.tiorl Annexation Ann.xation Detae~t.
Inclueion Ix:l.taion
,. :':,
-.
1-
Sq. !!l.l!! 0.1458 0.0106 0.0064 0.0517 0.0lI09 O.COU 0.0021 O.Ol.O9 0.01)4 0.00)1 0.0058 0.0027 0.(06) 0.0822 0.0152 O.Olj 0.0076 0.06)1 O.ll97 0.0101 0.0270 0 .0019 0.07.24 0.0543 0.0087 0.0047 0.0074 0.0013 0.2852 0.1266 0.0868 0.0))6 0.0101 0.0142 0.0189 0.1985 0.2590· 0.0145 0.0112 0.0011 0.0)56 0.0004 0.0450 0.0259 0.004S 0.0017 0.00)5 0.0017 0.ou6 0.06)9 0.00)0 0.0017 0.0009 0.0005 0 • .-1.74)9 0.2696 o.)m 0.2766 0.0548 O.oooe 0.0956 0.0170 0.2512 0.0952 0.041) 0.0015 0.0014
I TYPE Of CHANGE AR[A
INVOLVED
.E)(PLANATION OF ABOVE PRINTED DATA
total ~
453 • .t.68 453.479 453.4'" 45).421 45).502 45).498 45).500 45).5U 45).498 45).501 45).507 45).510 4.5).516 45).598 45).6l.J 45).600 45).608 45).671 453.791 45).801 45).774 453.77£ 453.144 45).1}O2 45).893 45).898 45).891 45).892 454.177 454.050 454.137 454.1714 454.1815 454.1957 454.1768 454.)75) 454.634) 454.6488 454.6)76. 454.6)9 454.675 454.675 454.720 454.7J.b 454.751 454.74' 454.752 454.754 454.742 454.806 454.80) 454.805 454.806 454.807 454.868 456.6u 456.882 457.279 457.556 457.501 457.502 457.598 457.615 457.866 457.961 457.920 457.921 457.920
I TOTAL AREA
WITHIN CITY
BOUNDARY MUll! CKANGE
~ r ~ ~
~ I ,~