task force on climate-related financial disclosures
TRANSCRIPT
Task Force on Climate-related Financial Disclosures Guidance on Metrics, Targets, and Transition Plans
October 2021
A. Overview and Background 1
1. Overview 2
2. Background 4
B. Scope and Approach 6
1. Organizations in Scope 7
2. Approach 7
3. Key Considerations 8
C. Climate-Related Metrics 10
1. Characteristics of Effective Climate-Related Metrics 11
2. Disclosing Climate-Related Metrics 13
3. Driving Toward Comparability: Cross-Industry Metric Categories 14
4. Portfolio Alignment Metrics for the Financial Sector 27
D. Climate-Related Targets 29
1. Characteristics of Effective Climate-Related Targets 31
2. Disclosing Climate-Related Targets 35
E. Transition Plans 38
1. Characteristics of Effective Transition Plans 40
2. Transition Plan Considerations 41
3. Disclosing Transition Plan Information 43
F. Financial Impacts 45
1. Inputs for Estimating Financial Impacts 48
2. Disclosing Financial Impacts 49
Appendix 1: Further Information on Select Cross-Industry, 54 Climate-Related Metric Categories
1. Scope 3 GHG Emissions 54
2. Internal Carbon Prices 59
Appendix 2: Example Disclosures 61
Appendix 3: Glossary and Abbreviations 65
Appendix 4: References 68
Contents

A. Overview and Background
The Task Force on Climate-related Financial Disclosures
A. Overview and Background
B. Scope and Approach
C. Climate-Related Metrics
D. Climate-Related Targets
E. Transition Plans
F. Financial Impacts
Appendices
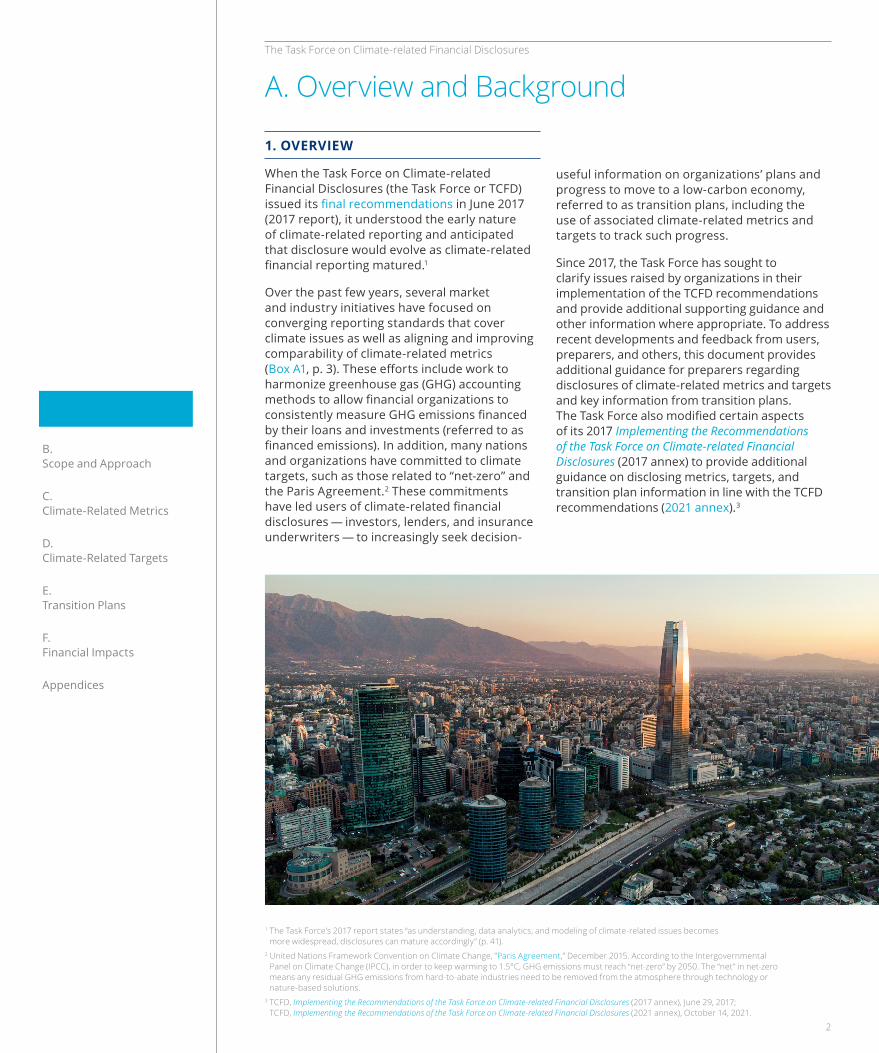
1. OVERVIEW
When the Task Force on Climate-related Financial Disclosures (the Task Force or TCFD) issued its final recommendations in June 2017 (2017 report), it understood the early nature of climate-related reporting and anticipated that disclosure would evolve as climate-related financial reporting matured.1
Over the past few years, several market and industry initiatives have focused on converging reporting standards that cover climate issues as well as aligning and improving comparability of climate-related metrics (Box A1, p. 3). These efforts include work to harmonize greenhouse gas (GHG) accounting methods to allow financial organizations to consistently measure GHG emissions financed by their loans and investments (referred to as financed emissions). In addition, many nations and organizations have committed to climate targets, such as those related to “net-zero” and the Paris Agreement.2 These commitments have led users of climate-related financial disclosures — investors, lenders, and insurance underwriters — to increasingly seek decision-
A. Overview and Background
1 The Task Force’s 2017 report states “as understanding, data analytics, and modeling of climate-related issues becomes more widespread, disclosures can mature accordingly” (p. 41).
2 United Nations Framework Convention on Climate Change, ”Paris Agreement,” December 2015. According to the Intergovernmental Panel on Climate Change (IPCC), in order to keep warming to 1.5°C, GHG emissions must reach “net-zero” by 2050. The “net” in net-zero means any residual GHG emissions from hard-to-abate industries need to be removed from the atmosphere through technology or nature-based solutions.
3 TCFD, Implementing the Recommendations of the Task Force on Climate-related Financial Disclosures (2017 annex), June 29, 2017; TCFD, Implementing the Recommendations of the Task Force on Climate-related Financial Disclosures (2021 annex), October 14, 2021.
useful information on organizations’ plans and progress to move to a low-carbon economy, referred to as transition plans, including the use of associated climate-related metrics and targets to track such progress.
Since 2017, the Task Force has sought to clarify issues raised by organizations in their implementation of the TCFD recommendations and provide additional supporting guidance and other information where appropriate. To address recent developments and feedback from users, preparers, and others, this document provides additional guidance for preparers regarding disclosures of climate-related metrics and targets and key information from transition plans. The Task Force also modified certain aspects of its 2017 Implementing the Recommendations of the Task Force on Climate-related Financial Disclosures (2017 annex) to provide additional guidance on disclosing metrics, targets, and transition plan information in line with the TCFD recommendations (2021 annex).3
2
The Task Force on Climate-related Financial Disclosures
A. Overview and Background
B. Scope and Approach
C. Climate-Related Metrics
D. Climate-Related Targets
E. Transition Plans
F. Financial Impacts
Appendices
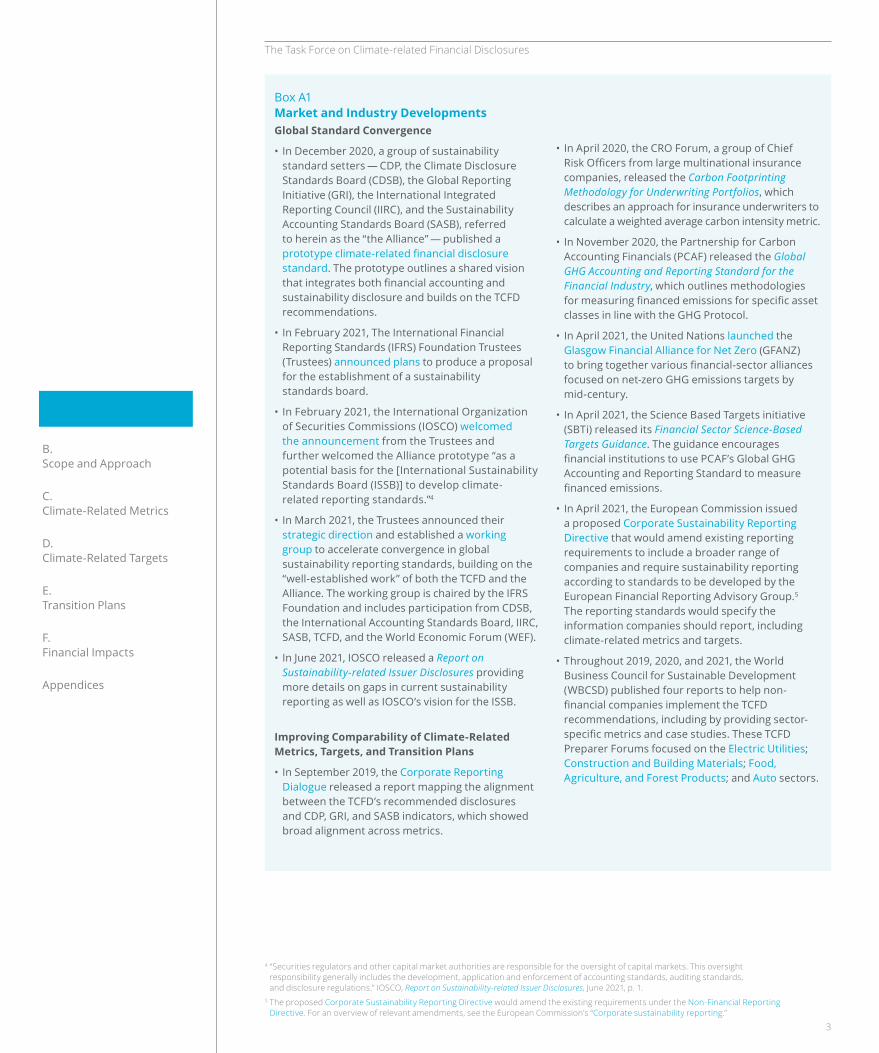
Box A1 Market and Industry DevelopmentsGlobal Standard Convergence
• In December 2020, a group of sustainability standard setters — CDP, the Climate Disclosure Standards Board (CDSB), the Global Reporting Initiative (GRI), the International Integrated Reporting Council (IIRC), and the Sustainability Accounting Standards Board (SASB), referred to herein as the “the Alliance” — published a prototype climate-related financial disclosure standard. The prototype outlines a shared vision that integrates both financial accounting and sustainability disclosure and builds on the TCFD recommendations.
• In February 2021, The International Financial Reporting Standards (IFRS) Foundation Trustees (Trustees) announced plans to produce a proposal for the establishment of a sustainability standards board.
• In February 2021, the International Organization of Securities Commissions (IOSCO) welcomed the announcement from the Trustees and further welcomed the Alliance prototype “as a potential basis for the [International Sustainability Standards Board (ISSB)] to develop climate-related reporting standards.”4
• In March 2021, the Trustees announced their strategic direction and established a working group to accelerate convergence in global sustainability reporting standards, building on the “well-established work” of both the TCFD and the Alliance. The working group is chaired by the IFRS Foundation and includes participation from CDSB, the International Accounting Standards Board, IIRC, SASB, TCFD, and the World Economic Forum (WEF).
• In June 2021, IOSCO released a Report on Sustainability-related Issuer Disclosures providing more details on gaps in current sustainability reporting as well as IOSCO’s vision for the ISSB.
Improving Comparability of Climate-Related Metrics, Targets, and Transition Plans
• In September 2019, the Corporate Reporting Dialogue released a report mapping the alignment between the TCFD’s recommended disclosures and CDP, GRI, and SASB indicators, which showed broad alignment across metrics.
• In April 2020, the CRO Forum, a group of Chief Risk Officers from large multinational insurance companies, released the Carbon Footprinting Methodology for Underwriting Portfolios, which describes an approach for insurance underwriters to calculate a weighted average carbon intensity metric.
• In November 2020, the Partnership for Carbon Accounting Financials (PCAF) released the Global GHG Accounting and Reporting Standard for the Financial Industry, which outlines methodologies for measuring financed emissions for specific asset classes in line with the GHG Protocol.
• In April 2021, the United Nations launched the Glasgow Financial Alliance for Net Zero (GFANZ) to bring together various financial-sector alliances focused on net-zero GHG emissions targets by mid-century.
• In April 2021, the Science Based Targets initiative (SBTi) released its Financial Sector Science-Based Targets Guidance. The guidance encourages financial institutions to use PCAF’s Global GHG Accounting and Reporting Standard to measure financed emissions.
• In April 2021, the European Commission issued a proposed Corporate Sustainability Reporting Directive that would amend existing reporting requirements to include a broader range of companies and require sustainability reporting according to standards to be developed by the European Financial Reporting Advisory Group.5 The reporting standards would specify the information companies should report, including climate-related metrics and targets.
• Throughout 2019, 2020, and 2021, the World Business Council for Sustainable Development (WBCSD) published four reports to help non-financial companies implement the TCFD recommendations, including by providing sector-specific metrics and case studies. These TCFD Preparer Forums focused on the Electric Utilities; Construction and Building Materials; Food, Agriculture, and Forest Products; and Auto sectors.
4 “Securities regulators and other capital market authorities are responsible for the oversight of capital markets. This oversight responsibility generally includes the development, application and enforcement of accounting standards, auditing standards, and disclosure regulations.” IOSCO, Report on Sustainability-related Issuer Disclosures, June 2021, p. 1.
5 The proposed Corporate Sustainability Reporting Directive would amend the existing requirements under the Non-Financial Reporting Directive. For an overview of relevant amendments, see the European Commission’s “Corporate sustainability reporting.”
3
The Task Force on Climate-related Financial Disclosures
A. Overview and Background
B. Scope and Approach
C. Climate-Related Metrics
D. Climate-Related Targets
E. Transition Plans
F. Financial Impacts
Appendices
2. BACKGROUND
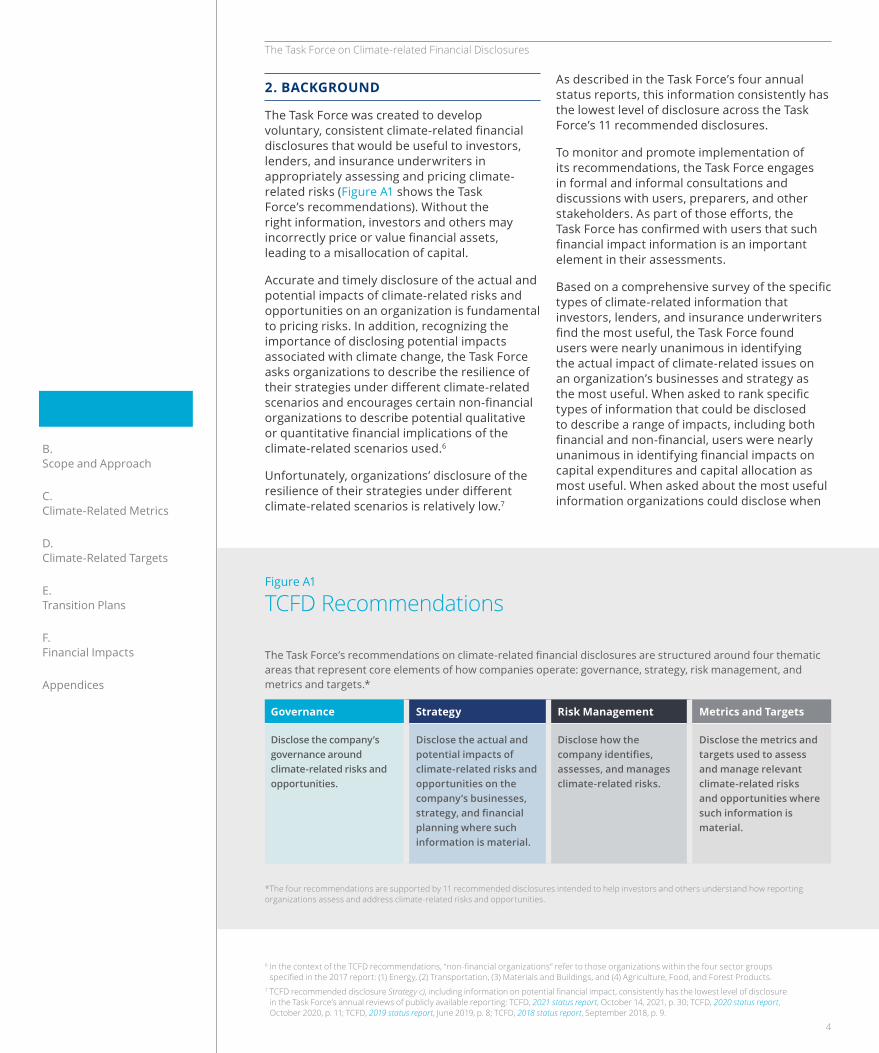
The Task Force was created to develop voluntary, consistent climate-related financial disclosures that would be useful to investors, lenders, and insurance underwriters in appropriately assessing and pricing climate-related risks (Figure A1 shows the Task Force’s recommendations). Without the right information, investors and others may incorrectly price or value financial assets, leading to a misallocation of capital.
Accurate and timely disclosure of the actual and potential impacts of climate-related risks and opportunities on an organization is fundamental to pricing risks. In addition, recognizing the importance of disclosing potential impacts associated with climate change, the Task Force asks organizations to describe the resilience of their strategies under different climate-related scenarios and encourages certain non-financial organizations to describe potential qualitative or quantitative financial implications of the climate-related scenarios used.6
Unfortunately, organizations’ disclosure of the resilience of their strategies under different climate-related scenarios is relatively low.7
As described in the Task Force’s four annual status reports, this information consistently has the lowest level of disclosure across the Task Force’s 11 recommended disclosures.
To monitor and promote implementation of its recommendations, the Task Force engages in formal and informal consultations and discussions with users, preparers, and other stakeholders. As part of those efforts, the Task Force has confirmed with users that such financial impact information is an important element in their assessments.
Based on a comprehensive survey of the specific types of climate-related information that investors, lenders, and insurance underwriters find the most useful, the Task Force found users were nearly unanimous in identifying the actual impact of climate-related issues on an organization’s businesses and strategy as the most useful. When asked to rank specific types of information that could be disclosed to describe a range of impacts, including both financial and non-financial, users were nearly unanimous in identifying financial impacts on capital expenditures and capital allocation as most useful. When asked about the most useful information organizations could disclose when
Figure A1
TCFD Recommendations
The Task Force’s recommendations on climate-related financial disclosures are structured around four thematic areas that represent core elements of how companies operate: governance, strategy, risk management, and metrics and targets.*
Governance Strategy Risk Management Metrics and Targets
Disclose the company’s governance around climate-related risks and opportunities.
Disclose the actual and potential impacts of climate-related risks and opportunities on the company’s businesses, strategy, and financial planning where such information is material.
Disclose how the company identifies, assesses, and manages climate-related risks.
Disclose the metrics and targets used to assess and manage relevant climate-related risks and opportunities where such information is material.
*The four recommendations are supported by 11 recommended disclosures intended to help investors and others understand how reporting organizations assess and address climate-related risks and opportunities.
6 In the context of the TCFD recommendations, “non-financial organizations” refer to those organizations within the four sector groups specified in the 2017 report: (1) Energy, (2) Transportation, (3) Materials and Buildings, and (4) Agriculture, Food, and Forest Products.
7 TCFD recommended disclosure Strategy c), including information on potential financial impact, consistently has the lowest level of disclosure in the Task Force’s annual reviews of publicly available reporting: TCFD, 2021 status report, October 14, 2021, p. 30; TCFD, 2020 status report, October 2020, p. 11; TCFD, 2019 status report, June 2019, p. 8; TCFD, 2018 status report, September 2018, p. 9.
4
The Task Force on Climate-related Financial Disclosures
A. Overview and Background
B. Scope and Approach
C. Climate-Related Metrics
D. Climate-Related Targets
E. Transition Plans
F. Financial Impacts
Appendices
The remainder of this document is organized as follows:
• Section B. Scope and Approach. This section outlines the types of organizations addressed in this report, the approach the Task Force took to develop this guidance, as well as some key considerations for preparers.
• Section C. Climate-Related Metrics. This section provides information on selecting and disclosing metrics, including the Task Force’s view on a set of metrics that all organizations should disclose.
• Section D. Climate-Related Targets. This section provides guidance on selecting and disclosing climate-related targets as well as details on the role of scenario analysis in determining targets.
• Section E. Transition Plans. This section describes how organizations might include aspects of their transition plans in their climate-related financial disclosures.
• Section F. Financial Impacts. This section underscores the way in which climate-related metrics, targets, and information from transition plans provide useful underlying information with which to estimate the actual or potential impact of climate-related issues on an organization’s financial performance and position.
describing the resiliency of their strategies to climate-related issues — in other words, potential impact — users identified an indication of the direction or ranges of potential financial implications under different climate-related scenarios as most useful. For a summary of the complete survey results, please see the Task Force’s 2020 status report.8
Given the importance to users of information describing the actual and potential financial impacts of climate-related issues on organizations and the low levels of disclosure associated with the latter, the Task Force undertook work in 2021 to better understand the types of information organizations use to describe the financial impacts associated with climate change and challenges associated with making such disclosures.
Based on the Task Force’s findings (as described in its 2021 status report) as well as market and industry developments, the Task Force believes it is critical to reinforce the importance of organizations disclosing the actual and potential financial impacts of climate change on their businesses and strategies to support users’ assessments. In addition, based on feedback through interviews and the Task Force’s 2021 public consultation on its Proposed Guidance on Metrics, Targets, and Transition Plans, users are keenly interested in organizations disclosing certain fundamental categories of metrics that are critical inputs for measuring financial risk.9, 10
The Task Force developed this guidance to support preparers in disclosing decision-useful metrics, targets, and transition plan information and linking those disclosures with estimates of financial impacts. Such information will enable users to appropriately assess their investment and lending risks.
8 TCFD, 2020 status report, pp. 27–34 and 93–103. 9 For more information on the interviews, see TCFD, 2021 status report, p. 58.10 For a summary of responses from the consultation, see TCFD, Proposed Guidance on Metrics, Targets,
and Transition Plans Consultation: Summary of Responses, October 14, 2021.
5
B. Scope and Approach
The Task Force on Climate-related Financial Disclosures
A. Overview and Background
B. Scope and Approach
C. Climate-Related Metrics
D. Climate-Related Targets
E. Transition Plans
F. Financial Impacts
Appendices
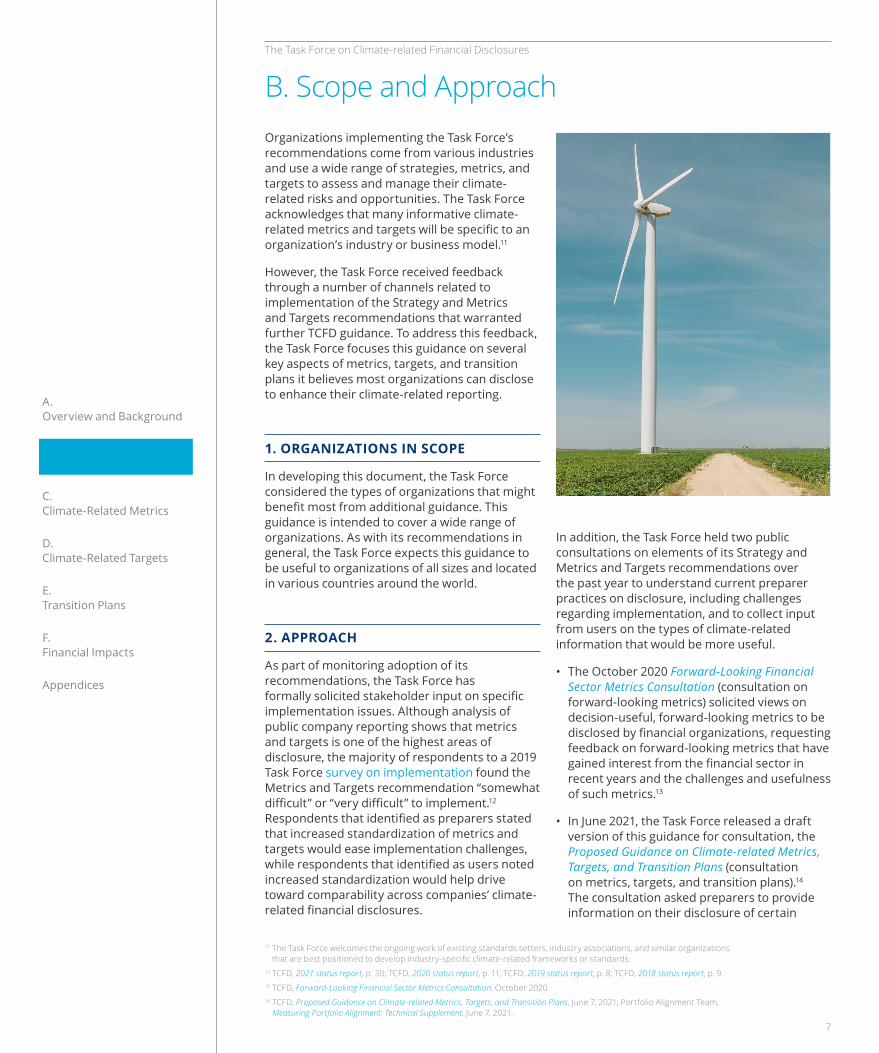
Organizations implementing the Task Force’s recommendations come from various industries and use a wide range of strategies, metrics, and targets to assess and manage their climate-related risks and opportunities. The Task Force acknowledges that many informative climate-related metrics and targets will be specific to an organization’s industry or business model.11
However, the Task Force received feedback through a number of channels related to implementation of the Strategy and Metrics and Targets recommendations that warranted further TCFD guidance. To address this feedback, the Task Force focuses this guidance on several key aspects of metrics, targets, and transition plans it believes most organizations can disclose to enhance their climate-related reporting.
1. ORGANIZATIONS IN SCOPE
In developing this document, the Task Force considered the types of organizations that might benefit most from additional guidance. This guidance is intended to cover a wide range of organizations. As with its recommendations in general, the Task Force expects this guidance to be useful to organizations of all sizes and located in various countries around the world.
2. APPROACH
As part of monitoring adoption of its recommendations, the Task Force has formally solicited stakeholder input on specific implementation issues. Although analysis of public company reporting shows that metrics and targets is one of the highest areas of disclosure, the majority of respondents to a 2019 Task Force survey on implementation found the Metrics and Targets recommendation “somewhat difficult” or “very difficult” to implement.12 Respondents that identified as preparers stated that increased standardization of metrics and targets would ease implementation challenges, while respondents that identified as users noted increased standardization would help drive toward comparability across companies’ climate-related financial disclosures.
In addition, the Task Force held two public consultations on elements of its Strategy and Metrics and Targets recommendations over the past year to understand current preparer practices on disclosure, including challenges regarding implementation, and to collect input from users on the types of climate-related information that would be more useful.
• The October 2020 Forward-Looking Financial Sector Metrics Consultation (consultation on forward-looking metrics) solicited views on decision-useful, forward-looking metrics to be disclosed by financial organizations, requesting feedback on forward-looking metrics that have gained interest from the financial sector in recent years and the challenges and usefulness of such metrics.13
• In June 2021, the Task Force released a draft version of this guidance for consultation, the Proposed Guidance on Climate-related Metrics, Targets, and Transition Plans (consultation on metrics, targets, and transition plans).14 The consultation asked preparers to provide information on their disclosure of certain
B. Scope and Approach
11 The Task Force welcomes the ongoing work of existing standards setters, industry associations, and similar organizations that are best positioned to develop industry-specific climate-related frameworks or standards.
12 TCFD, 2021 status report, p. 30; TCFD, 2020 status report, p. 11; TCFD, 2019 status report, p. 8; TCFD, 2018 status report, p. 9.13 TCFD, Forward-Looking Financial Sector Metrics Consultation, October 2020.14 TCFD, Proposed Guidance on Climate-related Metrics, Targets, and Transition Plans, June 7, 2021; Portfolio Alignment Team,
Measuring Portfolio Alignment: Technical Supplement, June 7, 2021.
7

The Task Force on Climate-related Financial Disclosures
A. Overview and Background
B. Scope and Approach
C. Climate-Related Metrics
D. Climate-Related Targets
E. Transition Plans
F. Financial Impacts
Appendices
topics covered in this guidance. Nevertheless, the Task Force believes it is critical to emphasize the importance of disclosing certain climate-related metrics and targets and to explicitly address the types of information organizations should disclose as it relates to their plans for transitioning to a low-carbon economy, where such disclosures are appropriate.
3. KEY CONSIDERATIONS
The Task Force encourages preparers to read the guidance in the context of the following considerations.
Principles for Effective Disclosures. To underpin its recommendations and help guide developments in climate-related financial reporting, the Task Force developed a set of fundamental principles for effective disclosure (Figure B1). These principles can help achieve high-quality and decision-useful disclosures that enable users to understand the impact of climate change on organizations. The Task Force encourages organizations adopting its recommendations to consider these principles as they develop climate-related financial disclosures.
metrics, targets, and transition plan elements, as well as the challenges of disclosure, and for users to assess the usefulness of such disclosures. The consultation also asked about proposed updates to the supplemental guidance for financial sectors, including on disclosure of Scope 3 GHG emissions and alignment of financial sector business activities with a 2°C or lower GHG emissions pathway (“portfolio alignment”).15 In addition, respondents provided input on developments and changes in user expectations since the original guidance was released in 2017.
Responses to these public consultations allowed the Task Force to better assess the burden of disclosure on preparers as well as the need for consistent and decision-useful information for users, a balance that is foundational to the Task Force’s work. Based on the over 400 responses received through both consultations, the Task Force has clarified and simplified the proposed guidance and updated specific sections of its Implementing the Recommendations of the Task Force on Climate-related Financial Disclosures (2021 annex).16
The Task Force’s guidance for all sectors released in 2017 explicitly or implicitly addresses the
15 Though the language released for consultation referenced a 2°C or lower temperature pathway, the Task Force recommendation on portfolio alignment has been updated to reference article two of the 2015 Paris Agreement, which commits parties to “holding the increasing in the global average temperature to well below 2°C above pre-industrial levels and pursuing efforts to limit the temperature increase to 1.5°C above pre-industrial levels” (emphasis added).
16 TCFD, Implementing the Recommendations of the Task Force on Climate-related Financial Disclosures (2021 annex), October 14, 2021.
Figure B1
Principles for Effective Disclosures
1Disclosures should represent relevant information
2Disclosures should be specific and complete
3Disclosures should be clear, balanced, and understandable
4Disclosures should be consistent over time
5Disclosures should be comparable among companies within a sector, industry, or portfolio
6Disclosures should be reliable, verifiable, and objective
7Disclosures should be provided on a timely basis
8
The Task Force on Climate-related Financial Disclosures
A. Overview and Background
B. Scope and Approach
C. Climate-Related Metrics
D. Climate-Related Targets
E. Transition Plans
F. Financial Impacts
Appendices
In addition, following the Task Force’s consultation on forward-looking metrics, this guidance discusses the disclosure of the alignment of a financial organization’s business activities with a temperature pathway well below 2°C (“portfolio alignment”) in Sub-Section C.4. Portfolio Alignment Metrics for the Financial Sector.17 The Task Force requested that an independent group of expert analysts from financial organizations (the Portfolio Alignment Team) develop technical considerations outlining its views on developing portfolio alignment metrics and areas of further work as a resource for organizations interested in exploring portfolio alignment.18
Transition Plans. While the Task Force’s Strategy recommendation asks for disclosure of the actual and potential impacts of climate-related risks and opportunities on the organization’s businesses, strategy, and financial planning, reporting on transition plans has emerged more recently as important to users. Therefore, guidance on transition plans is provided in Section E. Transition Plans and in the 2021 annex to assist preparers with developing disclosures that meet current user expectations.
Implementation Over Time. The Task Force recognizes that some areas addressed in this guidance are still maturing. While some organizations already disclose the information in this guidance today, others may need additional time to source appropriate data as well as update their internal processes and reporting capabilities before publicly disclosing some elements. The Task Force encourages reporting based on the updated 2021 annex to be implemented as soon as possible.
The Task Force’s disclosure principles are informed by the qualitative and quantitative characteristics of financial information and further the overall goals of the Task Force to promote more effective climate-related financial disclosure. The principles, taken together, are designed to assist organizations in making clear the linkages and connections between climate-related issues and their governance, strategy, risk management, and metrics and targets. The Task Force’s fundamental principles for effective disclosure are described in Appendix 3 of the TCFD 2017 report.
Cross-Industry Metric Categories. In Section C. Climate-Related Metrics, the Task Force identifies a set of climate-related metric categories that all organizations should disclose, where data and methodologies allow. It is important to note that the cross-industry metric categories do not prescribe the exact metrics and units of measure to be used. Rather, they reflect broader categories of information that investors, lenders, and insurance underwriters find useful in making financial decisions. The Task Force recognizes that organizations may operationalize the metric categories in different ways most relevant to their industry, capabilities, and business model. Therefore, the metric categories help drive toward further comparability in disclosure in response to market feedback, but also allow flexibility for organizations, industries, standard setters, and jurisdictions to develop specific climate-related metrics within those defined categories.
Financial Sector Metrics. This guidance primarily addresses all types of organizations; however, there are certain areas in which it provides specific considerations for financial sector organizations due to the nature of their business activity. For example, within Scope 3 GHG emissions reporting, financial sector organizations are specifically encouraged to disclose GHG emissions related to their investing, lending, and underwriting activities.
17 Article two of the 2015 Paris Agreement commits parties to “holding the increasing in the global average temperature to well below 2°C above pre-industrial levels and pursuing efforts to limit the temperature increase to 1.5°C above pre-industrial levels.”
18 Portfolio Alignment Team, Measuring Portfolio Alignment: Technical Considerations, October 2021.
9
C. Climate-Related Metrics
The Task Force on Climate-related Financial Disclosures
A. Overview and Background
B. Scope and Approach
C. Climate-Related Metrics
D. Climate-Related Targets
E. Transition Plans
F. Financial Impacts
Appendices
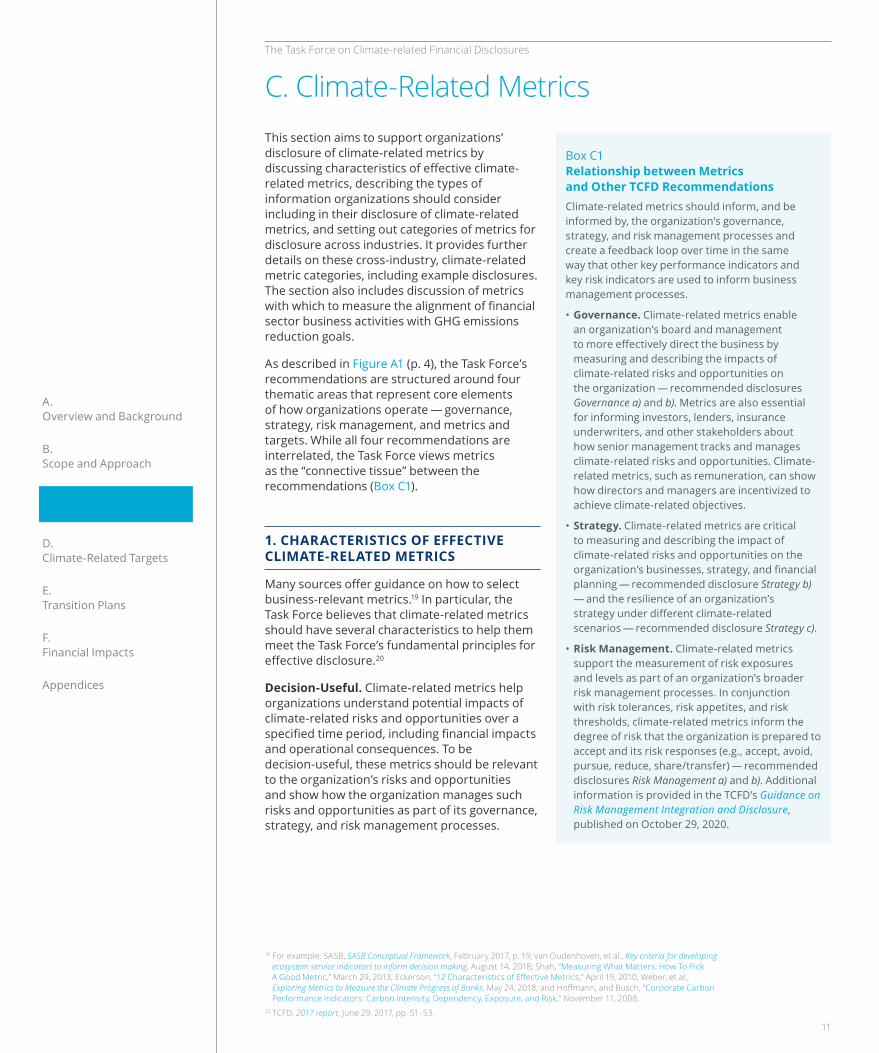
This section aims to support organizations’ disclosure of climate-related metrics by discussing characteristics of effective climate-related metrics, describing the types of information organizations should consider including in their disclosure of climate-related metrics, and setting out categories of metrics for disclosure across industries. It provides further details on these cross-industry, climate-related metric categories, including example disclosures. The section also includes discussion of metrics with which to measure the alignment of financial sector business activities with GHG emissions reduction goals.
As described in Figure A1 (p. 4), the Task Force’s recommendations are structured around four thematic areas that represent core elements of how organizations operate — governance, strategy, risk management, and metrics and targets. While all four recommendations are interrelated, the Task Force views metrics as the “connective tissue” between the recommendations (Box C1).
1. CHARACTERISTICS OF EFFECTIVE CLIMATE-RELATED METRICS
Many sources offer guidance on how to select business-relevant metrics.19 In particular, the Task Force believes that climate-related metrics should have several characteristics to help them meet the Task Force’s fundamental principles for effective disclosure.20
Decision-Useful. Climate-related metrics help organizations understand potential impacts of climate-related risks and opportunities over a specified time period, including financial impacts and operational consequences. To be decision-useful, these metrics should be relevant to the organization’s risks and opportunities and show how the organization manages such risks and opportunities as part of its governance, strategy, and risk management processes.
C. Climate-Related Metrics
19 For example: SASB, SASB Conceptual Framework, February 2017, p. 19; van Oudenhoven, et al., Key criteria for developing ecosystem service indicators to inform decision making, August 14, 2018; Shah, “Measuring What Matters: How To Pick A Good Metric,” March 29, 2013; Eckerson, “12 Characteristics of Effective Metrics,” April 19, 2010; Weber, et al., Exploring Metrics to Measure the Climate Progress of Banks, May 24, 2018; and Hoffmann, and Busch, “Corporate Carbon Performance Indicators: Carbon Intensity, Dependency, Exposure, and Risk,” November 11, 2008.
20 TCFD, 2017 report, June 29, 2017, pp. 51–53.
Box C1 Relationship between Metrics and Other TCFD RecommendationsClimate-related metrics should inform, and be informed by, the organization’s governance, strategy, and risk management processes and create a feedback loop over time in the same way that other key performance indicators and key risk indicators are used to inform business management processes.
• Governance. Climate-related metrics enable an organization’s board and management to more effectively direct the business by measuring and describing the impacts of climate-related risks and opportunities on the organization — recommended disclosures Governance a) and b). Metrics are also essential for informing investors, lenders, insurance underwriters, and other stakeholders about how senior management tracks and manages climate-related risks and opportunities. Climate-related metrics, such as remuneration, can show how directors and managers are incentivized to achieve climate-related objectives.
• Strategy. Climate-related metrics are critical to measuring and describing the impact of climate-related risks and opportunities on the organization’s businesses, strategy, and financial planning — recommended disclosure Strategy b) — and the resilience of an organization’s strategy under different climate-related scenarios — recommended disclosure Strategy c).
• Risk Management. Climate-related metrics support the measurement of risk exposures and levels as part of an organization’s broader risk management processes. In conjunction with risk tolerances, risk appetites, and risk thresholds, climate-related metrics inform the degree of risk that the organization is prepared to accept and its risk responses (e.g., accept, avoid, pursue, reduce, share/transfer) — recommended disclosures Risk Management a) and b). Additional information is provided in the TCFD’s Guidance on Risk Management Integration and Disclosure, published on October 29, 2020.
11
The Task Force on Climate-related Financial Disclosures
A. Overview and Background
B. Scope and Approach
C. Climate-Related Metrics
D. Climate-Related Targets
E. Transition Plans
F. Financial Impacts
Appendices
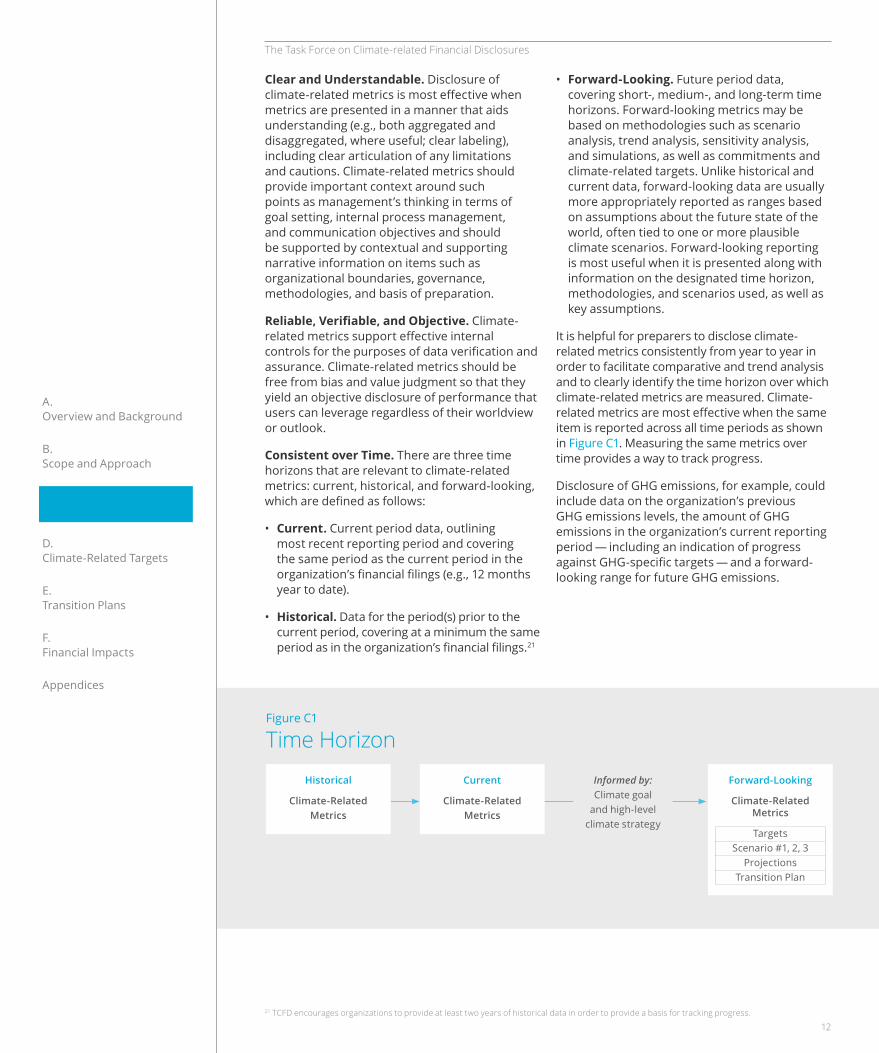
• Forward-Looking. Future period data, covering short-, medium-, and long-term time horizons. Forward-looking metrics may be based on methodologies such as scenario analysis, trend analysis, sensitivity analysis, and simulations, as well as commitments and climate-related targets. Unlike historical and current data, forward-looking data are usually more appropriately reported as ranges based on assumptions about the future state of the world, often tied to one or more plausible climate scenarios. Forward-looking reporting is most useful when it is presented along with information on the designated time horizon, methodologies, and scenarios used, as well as key assumptions.
It is helpful for preparers to disclose climate-related metrics consistently from year to year in order to facilitate comparative and trend analysis and to clearly identify the time horizon over which climate-related metrics are measured. Climate-related metrics are most effective when the same item is reported across all time periods as shown in Figure C1. Measuring the same metrics over time provides a way to track progress.
Disclosure of GHG emissions, for example, could include data on the organization’s previous GHG emissions levels, the amount of GHG emissions in the organization’s current reporting period — including an indication of progress against GHG-specific targets — and a forward-looking range for future GHG emissions.
Clear and Understandable. Disclosure of climate-related metrics is most effective when metrics are presented in a manner that aids understanding (e.g., both aggregated and disaggregated, where useful; clear labeling), including clear articulation of any limitations and cautions. Climate-related metrics should provide important context around such points as management’s thinking in terms of goal setting, internal process management, and communication objectives and should be supported by contextual and supporting narrative information on items such as organizational boundaries, governance, methodologies, and basis of preparation.
Reliable, Verifiable, and Objective. Climate-related metrics support effective internal controls for the purposes of data verification and assurance. Climate-related metrics should be free from bias and value judgment so that they yield an objective disclosure of performance that users can leverage regardless of their worldview or outlook.
Consistent over Time. There are three time horizons that are relevant to climate-related metrics: current, historical, and forward-looking, which are defined as follows:
• Current. Current period data, outlining most recent reporting period and covering the same period as the current period in the organization’s financial filings (e.g., 12 months year to date).
• Historical. Data for the period(s) prior to the current period, covering at a minimum the same period as in the organization’s financial filings.21
21 TCFD encourages organizations to provide at least two years of historical data in order to provide a basis for tracking progress.
Figure C1
Time HorizonHistorical
Climate-Related Metrics
Current
Climate-Related Metrics
Informed by: Climate goal
and high-level climate strategy
Forward-Looking
Climate-Related Metrics
TargetsScenario #1, 2, 3
ProjectionsTransition Plan
12
The Task Force on Climate-related Financial Disclosures
A. Overview and Background
B. Scope and Approach
C. Climate-Related Metrics
D. Climate-Related Targets
E. Transition Plans
F. Financial Impacts
Appendices
2. DISCLOSING CLIMATE-RELATED METRICS
Effective disclosure of climate-related metrics generally involves providing metrics along with contextual and supporting narrative to help users understand the meaning and use of climate-related metrics and the basis on which they have been prepared. Climate-related metrics, and associated narrative, should be integrated with an organization’s other disclosures to provide a coherent set of information on the organization’s climate-related risks and opportunities and actual and potential financial impacts.22 Organizations should also consider which metrics to present as point estimates and which to present as ranges or qualitative categories, and whether to include the level of confidence associated with the value of the metric.
In presenting climate-related metrics and associated contextual information in their disclosures, an organization should consider providing the following, where relevant:23
• Types of measurements used, including whether information comes from direct measurements, estimates, proxy indicators, or financial and management accounting processes.
• Methodologies and definitions used, including the scope of application, data sources, critical factors or parameters, assumptions, and limitations of the methodology. For example, the GHG Protocol suggests that organizations discuss GHG emissions factors, scope, and boundaries. For metrics informed by scenario analysis, organizations should include information on which climate scenarios were used and their assumptions and limitations (Box C2). Organizations should also provide context if they adjust the methodology or definition of particular metrics.
• Trend data to allow for consideration of how metrics have changed in absolute and relative amounts over time, including whether acquisitions, divestments, or policies have affected results.
• How results are connected with business units, company strategy, and financial performance and position. Where it aids understanding, organizations should consider disaggregating information by categories such as geographic area, business unit, asset, type, upstream and downstream activities, source, and vulnerability of area.
• How value chains will be affected over time by climate-related transition and physical risks, including life cycle GHG emissions reporting.
• Reconciliation with financial accounting standards, if needed. If climate-related metrics are presented in financial terms, disclosures should clarify how such metrics reconcile with financial accounting standards and explain any differences.
22 For more information see, for example, Section 3.5 Key Performance Indicators (pp. 12–20) within the European Commission, Guidelines on non-financial reporting: Supplement on reporting climate-related information, June 20, 2019.
23 TCFD, 2021 annex, pp. 7–8, provides more detail on location of disclosure.
Box C2 Importance of Disclosing Details on Climate-Related Scenario Analysis
As noted in the 2020 TCFD Guidance on Scenario Analysis for Non-Financial Companies, users desire greater transparency into the types of scenarios preparers are using and their impact on the organization’s strategy. In particular, preparers should “describe processes used for scenario analysis; the range and assumptions of scenarios used; key findings; whether it is a standalone analysis or integrated with company’s risk management and strategy processes,” TCFD, Guidance on Scenario Analysis for Non-Financial Companies, October 29, 2020, p. 45.
Using a common set of scenarios and inputs (e.g., parameters, timelines, industry-specific metrics, methodologies) increases comparability across companies, provides greater reliability and relevance, and can help reduce the resources required by preparers to develop scenarios in-house. On the other hand, using a common set of scenarios across organizations may reduce their ability to assess their individual situations and how climate-related risks may uniquely affect them, and thus could increase concentration of risk.
13
The Task Force on Climate-related Financial Disclosures
A. Overview and Background
B. Scope and Approach
C. Climate-Related Metrics
D. Climate-Related Targets
E. Transition Plans
F. Financial Impacts
Appendices
disclosures and guidance for all sectors since the release of its 2017 report. In selecting metric categories, the Task Force sought to emphasize categories that meet several criteria, as follows:
• indicative of many basic aspects and drivers of climate-related risks and opportunities;
• useful for understanding how an organization is managing climate-related risks and opportunities;
• widely requested by climate reporting frameworks, lenders, investors, insurance underwriters, and regional and national disclosure requirements; and,
• key inputs for estimating financial impacts of climate change on organizations.
The Task Force, however, is not a standard-setting body and has defined metric categories broadly to allow flexibility for organizations, industries, and jurisdictions to develop and adopt specific climate-related metrics to support these metric categories. The current ability of organizations and industries to specify metrics applicable to these categories will vary, and the state of methodologies and data may need to further evolve in some areas. The TCFD believes, however, that it is important to articulate a common set of metric categories to encourage industries and standard setters to further operationalize specific metrics that address each category. In the meantime, preparers should use common taxonomies or methodologies, where appropriate.
3. DRIVING TOWARD COMPARABILITY: CROSS-INDUSTRY METRIC CATEGORIES
Climate-related metrics can be generally categorized into two groups — those that apply to all organizations (cross-industry) and those that are specific to an industry (industry-specific).24 In its 2020 status report, the Task Force acknowledged industry associations, standard setters, and similar organizations are best positioned to identify and operationalize industry-specific metrics and highlighted many of the groups working on such metrics. Notably, the IFRS Foundation has since announced plans to establish the International Sustainability Standards Board (ISSB) to meet the need for globally consistent sustainability reporting.25
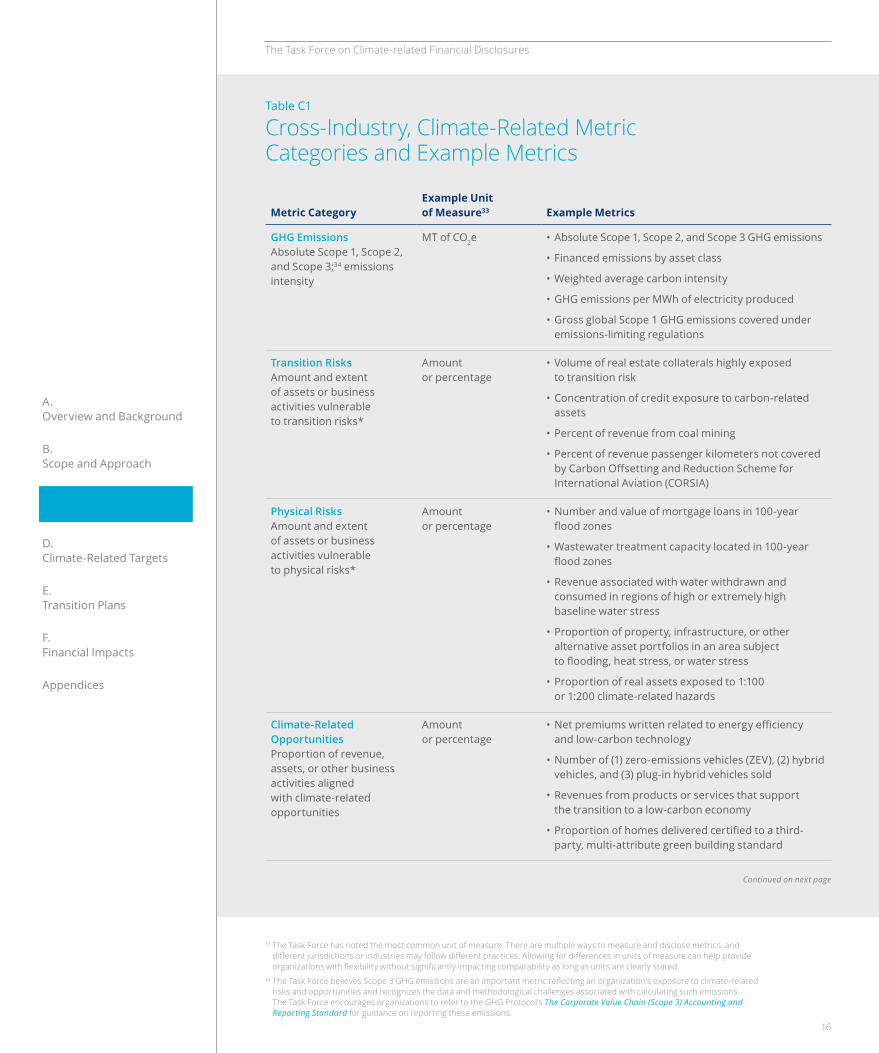
The Task Force has identified seven categories of climate-related metrics from the Task Force’s 11 recommended disclosures and guidance for all sectors that all organizations should disclose (Table C1, p. 16), recognizing that for some categories, implementation may take time as data and methodologies evolve. The Task Force encourages reporting based on the updated 2021 annex to be implemented as soon as possible, as disclosure of metrics aligned with these seven categories will support convergence in the disclosure of key metrics.
Importantly, the seven metric categories are not additions to the Metrics and Targets recommendation as they relate to metrics that have been part of the Task Force’s recommended
24 For further discussion of the distinction between cross-industry and industry-specific disclosures, see SASB, Climate Risk Technical Bulletin, April 13, 2021, p. 21.
25 IFRS, Consultation Paper on Sustainability Reporting, September 2020; IFRS, “IFRS Foundation Trustees announce next steps in response to broad demand for global sustainability standards,” February 2, 2021.
14
The Task Force on Climate-related Financial Disclosures
A. Overview and Background
B. Scope and Approach
C. Climate-Related Metrics
D. Climate-Related Targets
E. Transition Plans
F. Financial Impacts
Appendices
The Task Force recommends that preparers disclose metrics consistent with the cross-industry, climate-related metric categories for the current, historical, and forward-looking periods.26 Forward-looking information, particularly information related to the organization’s medium- and long-term time horizons, may be more appropriate to report as ranges, qualitative directions, or numbers tied to specific assumptions about the future state of the world, such as those informed by scenario analysis.27 It is also important to note that the recommended disclosures within both the Strategy and Metrics and Targets recommendations are subject to materiality, except for the disclosure of Scope 1 and Scope 2 GHG emissions (Box C3).
The Task Force encourages all preparers to begin disclosing metrics consistent with the cross-industry, climate-related metric categories, but acknowledges not all will have the resources to present quantitative information across all metric categories. Instead, the Task Force encourages organizations to begin where resources and expertise allow; for example, by disclosing qualitative information first or focusing on the sectors, business lines, or assets with the most significant climate-related risks and opportunities and improving quantitative disclosures over time.
Organizations typically use a wide variety of information internally and externally to manage their operations. These cross-industry, climate-related metric categories are not meant to supplant or replace other information that organizations track as part of their business planning or that industries converge on to track climate-related risks or opportunities specific to their industry or organization. Rather, the Task Force intends for this set of cross-industry metric categories to provide a base of comparability across and within industries and form a framework for the types of climate-related metrics that all organizations should report.
Box C3 Application of Materiality
When the Task Force released its recommendations and implementing guidelines in 2017, it noted that “[t]he disclosures related to the Strategy and Metrics and Targets recommendations involve an assessment of materiality,” while the disclosures related to governance and risk management do not.28
As part of the Proposed Guidance on Metrics, Targets, and Transition Plans, the Task Force requested that respondents comment on whether the cross-industry metric categories, or a subset of them, should be disclosed independent of an assessment of materiality.29 Respondents expressed strong support for disclosure of Scope 1 and Scope 2 GHG emissions independent of an assessment of materiality, with 70% saying Scope 1 and Scope 2 GHG emissions should be disclosed. An additional 47% supported disclosure of Scope 3 GHG emissions independent of a materiality assessment.30 Further analysis of open-text responses highlighted the importance of Scope 1, Scope 2, and Scope 3 GHG emissions information as foundational data with which to assess climate-related risks and opportunities. Disclosure of the other metric categories was more mixed, with 33%–42% of respondents requesting disclosure independent of a materiality assessment across the remaining six categories.
Based on the consultation on metrics, targets, and transition plans, the Task Force has updated its 2021 annex to specify that “[t]he Task Force believes all organizations should disclose absolute Scope 1 and Scope 2 GHG emissions independent of a materiality assessment. The disclosure of Scope 3 GHG emissions is subject to materiality; however, the Task Force encourages organizations to disclose such emissions.”31, 32 The other cross-industry, climate-related metric categories remain subject to materiality. Organizations should determine materiality for climate-related metrics consistent with how they determine the materiality of other information included in their financial filings.
26 As noted in the 2021 annex, “Asset owners and asset managers should report to their beneficiaries and clients, respectively, through existing means of financial reporting, where relevant and where feasible. Asset owners and asset managers are also encouraged to disclose publicly via their websites or other public avenues of disclosure” (p. 8).
27 For more information, see TCFD, Guidance on Scenario Analysis for Non-Financial Companies, October 2020, pp. 46–51. 28 TCFD, 2017 report, pp. 33–34; TCFD, 2017 annex, p. 3.29 TCFD, Proposed Guidance on Metrics, Targets, and Transition Plans, June 7, 2021, p. 31.30 Forty-seven percent responded that Scope 3 GHG emissions should be disclosed irrespective of materiality; 43% responded
that they should be disclosed based on a materiality assessment; 10% were not sure. TCFD, Consultation on Proposed Guidance on Metrics, Targets, and Transition Plans: Summary of Responses, October 14, 2021.
31 TCFD, 2021 annex, p. 7.32 While the Task Force agreed that organizations should disclose Scope 1 and 2 GHG emissions independent of a materiality
assessment, a few Task Force members preferred keeping such disclosures as subject to materiality.
15
The Task Force on Climate-related Financial Disclosures
A. Overview and Background
B. Scope and Approach
C. Climate-Related Metrics
D. Climate-Related Targets
E. Transition Plans
F. Financial Impacts
Appendices
Table C1
Cross-Industry, Climate-Related Metric Categories and Example Metrics
Metric CategoryExample Unit of Measure33 Example Metrics
GHG Emissions Absolute Scope 1, Scope 2, and Scope 3;34 emissions intensity
MT of CO2e • Absolute Scope 1, Scope 2, and Scope 3 GHG emissions
• Financed emissions by asset class
• Weighted average carbon intensity
• GHG emissions per MWh of electricity produced
• Gross global Scope 1 GHG emissions covered under emissions-limiting regulations
Transition Risks Amount and extent of assets or business activities vulnerable to transition risks*
Amount or percentage
• Volume of real estate collaterals highly exposed to transition risk
• Concentration of credit exposure to carbon-related assets
• Percent of revenue from coal mining
• Percent of revenue passenger kilometers not covered by Carbon Offsetting and Reduction Scheme for International Aviation (CORSIA)
Physical Risks Amount and extent of assets or business activities vulnerable to physical risks*
Amount or percentage
• Number and value of mortgage loans in 100-year flood zones
• Wastewater treatment capacity located in 100-year flood zones
• Revenue associated with water withdrawn and consumed in regions of high or extremely high baseline water stress
• Proportion of property, infrastructure, or other alternative asset portfolios in an area subject to flooding, heat stress, or water stress
• Proportion of real assets exposed to 1:100 or 1:200 climate-related hazards
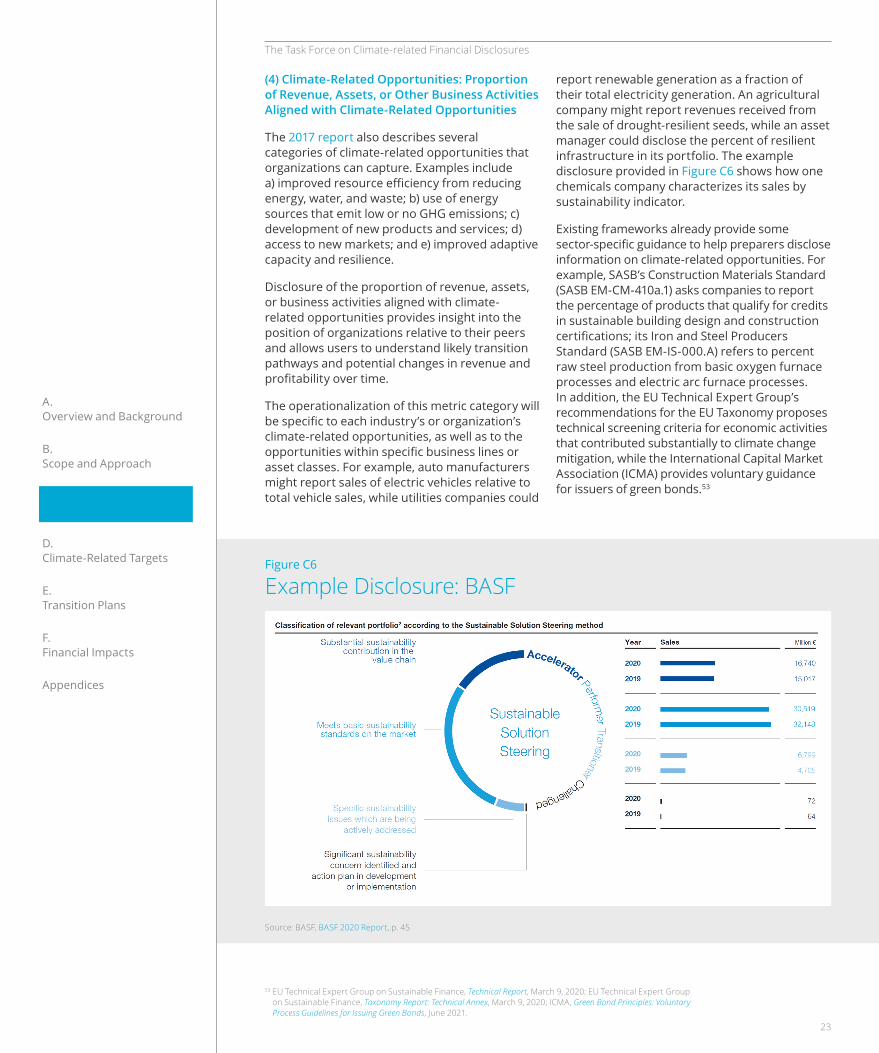
Climate-Related Opportunities Proportion of revenue, assets, or other business activities aligned with climate-related opportunities
Amount or percentage
• Net premiums written related to energy efficiency and low-carbon technology
• Number of (1) zero-emissions vehicles (ZEV), (2) hybrid vehicles, and (3) plug-in hybrid vehicles sold
• Revenues from products or services that support the transition to a low-carbon economy
• Proportion of homes delivered certified to a third-party, multi-attribute green building standard
33 The Task Force has noted the most common unit of measure. There are multiple ways to measure and disclose metrics, and different jurisdictions or industries may follow different practices. Allowing for differences in units of measure can help provide organizations with flexibility without significantly impacting comparability as long as units are clearly stated.
34 The Task Force believes Scope 3 GHG emissions are an important metric reflecting an organization’s exposure to climate-related risks and opportunities and recognizes the data and methodological challenges associated with calculating such emissions. The Task Force encourages organizations to refer to the GHG Protocol’s The Corporate Value Chain (Scope 3) Accounting and Reporting Standard for guidance on reporting these emissions.
Continued on next page
16
The Task Force on Climate-related Financial Disclosures
A. Overview and Background
B. Scope and Approach
C. Climate-Related Metrics
D. Climate-Related Targets
E. Transition Plans
F. Financial Impacts
Appendices
Metric CategoryExample Unit of Measure33 Example Metrics
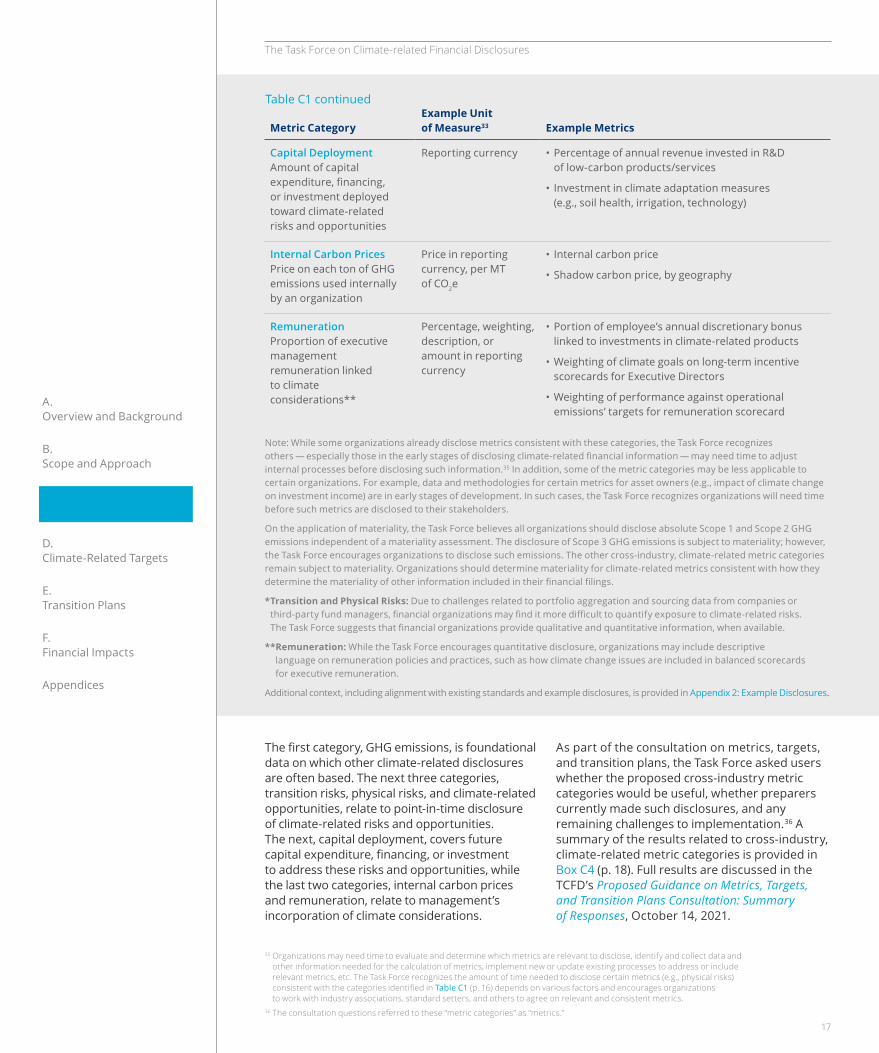
Capital Deployment Amount of capital expenditure, financing, or investment deployed toward climate-related risks and opportunities
Reporting currency • Percentage of annual revenue invested in R&D of low-carbon products/services
• Investment in climate adaptation measures (e.g., soil health, irrigation, technology)
Internal Carbon Prices Price on each ton of GHG emissions used internally by an organization
Price in reporting currency, per MT of CO2e
• Internal carbon price
• Shadow carbon price, by geography
Remuneration Proportion of executive management remuneration linked to climate considerations**
Percentage, weighting, description, or amount in reporting currency
• Portion of employee’s annual discretionary bonus linked to investments in climate-related products
• Weighting of climate goals on long-term incentive scorecards for Executive Directors
• Weighting of performance against operational emissions’ targets for remuneration scorecard
Note: While some organizations already disclose metrics consistent with these categories, the Task Force recognizes others — especially those in the early stages of disclosing climate-related financial information — may need time to adjust internal processes before disclosing such information.35 In addition, some of the metric categories may be less applicable to certain organizations. For example, data and methodologies for certain metrics for asset owners (e.g., impact of climate change on investment income) are in early stages of development. In such cases, the Task Force recognizes organizations will need time before such metrics are disclosed to their stakeholders.
On the application of materiality, the Task Force believes all organizations should disclose absolute Scope 1 and Scope 2 GHG emissions independent of a materiality assessment. The disclosure of Scope 3 GHG emissions is subject to materiality; however, the Task Force encourages organizations to disclose such emissions. The other cross-industry, climate-related metric categories remain subject to materiality. Organizations should determine materiality for climate-related metrics consistent with how they determine the materiality of other information included in their financial filings.
* Transition and Physical Risks: Due to challenges related to portfolio aggregation and sourcing data from companies or third-party fund managers, financial organizations may find it more difficult to quantify exposure to climate-related risks. The Task Force suggests that financial organizations provide qualitative and quantitative information, when available.
** Remuneration: While the Task Force encourages quantitative disclosure, organizations may include descriptive language on remuneration policies and practices, such as how climate change issues are included in balanced scorecards for executive remuneration.
Additional context, including alignment with existing standards and example disclosures, is provided in Appendix 2: Example Disclosures.
Table C1 continued
The first category, GHG emissions, is foundational data on which other climate-related disclosures are often based. The next three categories, transition risks, physical risks, and climate-related opportunities, relate to point-in-time disclosure of climate-related risks and opportunities. The next, capital deployment, covers future capital expenditure, financing, or investment to address these risks and opportunities, while the last two categories, internal carbon prices and remuneration, relate to management’s incorporation of climate considerations.
As part of the consultation on metrics, targets, and transition plans, the Task Force asked users whether the proposed cross-industry metric categories would be useful, whether preparers currently made such disclosures, and any remaining challenges to implementation.36 A summary of the results related to cross-industry, climate-related metric categories is provided in Box C4 (p. 18). Full results are discussed in the TCFD’s Proposed Guidance on Metrics, Targets, and Transition Plans Consultation: Summary of Responses, October 14, 2021.
35 Organizations may need time to evaluate and determine which metrics are relevant to disclose, identify and collect data and other information needed for the calculation of metrics, implement new or update existing processes to address or include relevant metrics, etc. The Task Force recognizes the amount of time needed to disclose certain metrics (e.g., physical risks) consistent with the categories identified in Table C1 (p. 16) depends on various factors and encourages organizations to work with industry associations, standard setters, and others to agree on relevant and consistent metrics.
36 The consultation questions referred to these “metric categories” as “metrics.”
17
The Task Force on Climate-related Financial Disclosures
A. Overview and Background
B. Scope and Approach
C. Climate-Related Metrics
D. Climate-Related Targets
E. Transition Plans
F. Financial Impacts
Appendices
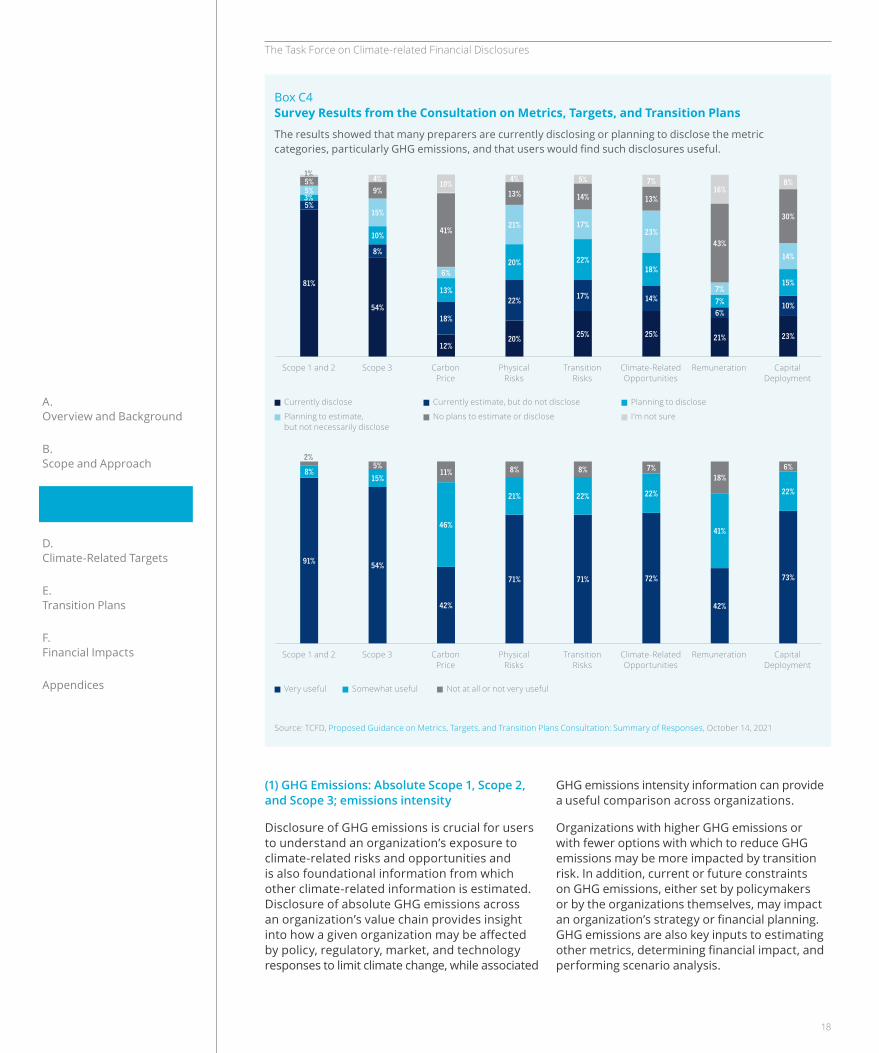
Box C4 Survey Results from the Consultation on Metrics, Targets, and Transition Plans
The results showed that many preparers are currently disclosing or planning to disclose the metric categories, particularly GHG emissions, and that users would find such disclosures useful.
Source: TCFD, Proposed Guidance on Metrics, Targets, and Transition Plans Consultation: Summary of Responses, October 14, 2021
(1) GHG Emissions: Absolute Scope 1, Scope 2, and Scope 3; emissions intensity
Disclosure of GHG emissions is crucial for users to understand an organization’s exposure to climate-related risks and opportunities and is also foundational information from which other climate-related information is estimated. Disclosure of absolute GHG emissions across an organization’s value chain provides insight into how a given organization may be affected by policy, regulatory, market, and technology responses to limit climate change, while associated
GHG emissions intensity information can provide a useful comparison across organizations.
Organizations with higher GHG emissions or with fewer options with which to reduce GHG emissions may be more impacted by transition risk. In addition, current or future constraints on GHG emissions, either set by policymakers or by the organizations themselves, may impact an organization’s strategy or financial planning. GHG emissions are also key inputs to estimating other metrics, determining financial impact, and performing scenario analysis.
18
Scope 1 and 2 Scope 3 Carbon Price
Physical Risks
Transition Risks
Climate-Related Opportunities
Remuneration Capital Deployment
Scope 1 and 2 Scope 3 Carbon Price
Physical Risks
Transition Risks
Climate-Related Opportunities
Remuneration Capital Deployment
Currently disclose
Planning to estimate, but not necessarily disclose
Very useful
Currently estimate, but do not disclose
No plans to estimate or disclose
Somewhat useful
Planning to disclose
I’m not sure
Not at all or not very useful
81%
91%
54%
54%
12%
42%
20%
71%
25%
71%
25%
72%
21%
42%
23%
73%
5%
8%
8%
18%
22% 17% 14%
6%10%
5%
15%
6%
21% 17%23%
7%
14%
5% 4%
5%
4%
8%
5%
8%
7%
7%
16%
18%
8%
6%
9% 13% 14% 13%
43%
30%
41%10%
15%
10%
11%
13%
46%
20%
21%
22%
22%
18%
22%
7%
41%
15%
22%
3%
1%
2%
The Task Force on Climate-related Financial Disclosures
A. Overview and Background
B. Scope and Approach
C. Climate-Related Metrics
D. Climate-Related Targets
E. Transition Plans
F. Financial Impacts
Appendices
Recommended disclosure Metrics and Targets b) calls for organizations to disclose “Scope 1, Scope 2, and, if appropriate, Scope 3 greenhouse gas (GHG) emissions” and specifies in the guidance that such disclosures should be made in line with the GHG Protocol methodology to allow for aggregation across organizations and jurisdictions.37, 38
Since 2017, there have been two major developments impacting the reporting of GHG emissions, including by broadening the range of organizations for which Scope 3 GHG emissions are appropriate.
• An increasing number of organizations are reporting Scope 1, Scope 2, and Scope 3 GHG emissions, suggesting that organizations are gaining experience with such reporting.39
• There has been significant work to advance the understanding and calculation of GHG emissions for financial organizations, allowing financial preparers to disclose their own Scope 3 GHG emissions in a more comparable and complete manner.
The Task Force believes all organizations should disclose absolute Scope 1 and Scope 2 GHG emissions independent of a materiality assessment given the foundational aspect of these emissions in assessing exposure to climate-related issues. In addition, the Task Force strongly encourages all organizations to disclose Scope 3 GHG emissions.40, 41 The Task Force believes that disclosure of GHG emissions is critical to understanding an organization’s exposure to climate-related risks and
opportunities and hopes that encouraging more disclosure of GHG emissions will help support and accelerate improvements in methodology and coverage of disclosure.
The Task Force recognizes several challenges associated with disclosure of Scope 3 GHG emissions, including data availability, calculation methodologies, scoping, and organizational barriers (Appendix 1: Further Information on Select Cross-Industry, Climate-Related Metric Categories provides further details). In addition, there are inherent limitations of the methodology for Scope 3 GHG emissions accounting and reporting, including the issue of double counting emissions.42 The most well-known and widely referenced Scope 3 reporting methodology is the GHG Protocol’s Corporate Value Chain (Scope 3) Accounting and Reporting Standard, commonly referred to as the Scope 3 Standard, which notes that “companies shall publicly report [a] list of scope 3 categories and activities included in the inventory. A list of scope 3 categories or activities excluded from the inventory with justification of their exclusion.”43
Nonetheless, disclosure of Scope 3 GHG emissions is an essential component of climate-related risk analysis in commercial and financial markets and is increasingly being requested by investors and other market participants. In particular, better disclosure of GHG emissions is necessary to inform lending, investing, and insurance underwriting decisions. Recognizing their importance, a growing number of organizations are working to improve how they calculate and disclose their Scope 3 GHG emissions.44
As with all TCFD recommendations, organizations should take account of their regional or national
37 While challenges remain, the GHG Protocol methodology is the most widely recognized and used international standard for calculating GHG emissions. Organizations may use national reporting methodologies if they are consistent with the GHG Protocol methodology.
38 In collaboration with the World Resources Institute and WBCSD, the GHG Protocol established a Land Sector and Removals Initiative to develop new guidance on GHG accounting related to carbon removals and land use. The guidance will build on the GHG Protocol Standards to cover the following activities: land use, land use change, carbon removals and storage, bioenergy and other biogenic products, and related topics. The guidance is expected for publication in Q4 2022.
39 Eighty-one percent of respondents in the Task Force’s consultation on metrics, targets, and transition plans said they currently disclose Scope 1 and Scope 2 GHG emissions, with another 54% disclosing Scope 3 GHG emissions. Task Force analysis of 2,500 organizations within the MSCI All Country World Index (ACWI Index) found that from 2017–2019, organizations disclosing Scope 1 GHG emissions grew from 43% to 52%; organizations disclosing Scope 2 GHG emissions grew from 42% to 51%; and organizations disclosing Scope 3 GHG emissions grew from 28% to 34%.
40 When considering whether to disclose Scope 3 GHG emissions, organizations should consider whether such emissions are a significant portion of their total GHG emissions. For example, see discussion of 40% threshold in SBTi’s paper SBTi Criteria and Recommendations, Version 4.2, April 2021, Section V, p. 10.
41 CDP, Transparency to Transformation: A Chain Reaction, February 2021, p. 14.42 GHG Protocol, Corporate Value Chain (Scope 3) Accounting and Reporting Standard, September 2011, p. 6, notes “Use of
this standard is intended to enable comparisons of a company’s GHG emissions over time. It is not designed to support comparisons between companies based on their Scope 3 GHG emissions. Differences in reported emissions may be a result of differences in inventory methodology or differences in company size or structure.”
43 GHG Protocol, Corporate Value Chain (Scope 3) Accounting and Reporting Standard, September 2011, p. 119.44 WWF, Overcoming Barriers for Corporate Scope 3 Action in the Supply Chain, November 2019; Blanco, Caro, and Corbett,
The State of Supply Chain Carbon Footprinting: Analysis of CDP Disclosures by US Firms, May 17, 2016; BHP, Addressing greenhouse gas emissions beyond our operations: Understanding the ‘scope 3’ footprint of our value chain, August 2018.
19
The Task Force on Climate-related Financial Disclosures
A. Overview and Background
B. Scope and Approach
C. Climate-Related Metrics
D. Climate-Related Targets
E. Transition Plans
F. Financial Impacts
Appendices
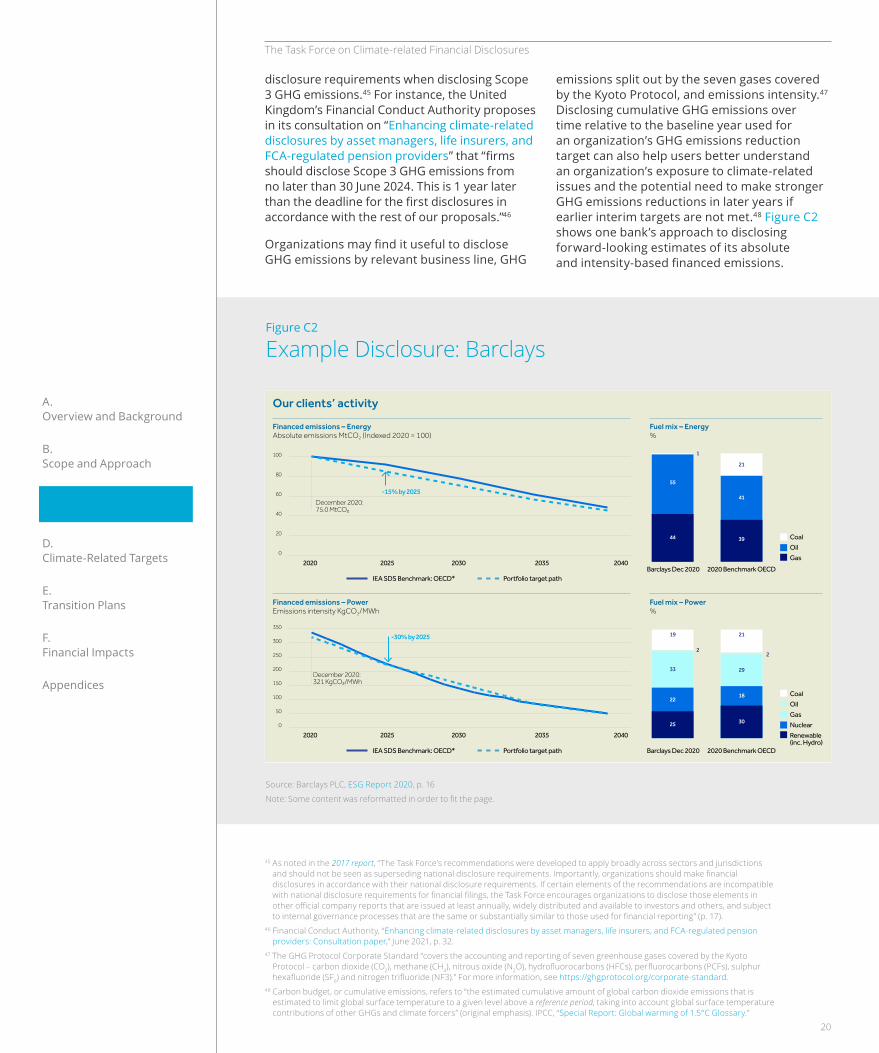
emissions split out by the seven gases covered by the Kyoto Protocol, and emissions intensity.47 Disclosing cumulative GHG emissions over time relative to the baseline year used for an organization’s GHG emissions reduction target can also help users better understand an organization’s exposure to climate-related issues and the potential need to make stronger GHG emissions reductions in later years if earlier interim targets are not met.48 Figure C2 shows one bank’s approach to disclosing forward-looking estimates of its absolute and intensity-based financed emissions.
disclosure requirements when disclosing Scope 3 GHG emissions.45 For instance, the United Kingdom’s Financial Conduct Authority proposes in its consultation on “Enhancing climate-related disclosures by asset managers, life insurers, and FCA-regulated pension providers” that “firms should disclose Scope 3 GHG emissions from no later than 30 June 2024. This is 1 year later than the deadline for the first disclosures in accordance with the rest of our proposals.”46
Organizations may find it useful to disclose GHG emissions by relevant business line, GHG
Figure C2
Example Disclosure: Barclays
Source: Barclays PLC, ESG Report 2020, p. 16
Note: Some content was reformatted in order to fit the page.
Our clients’ activity
Financed emissions – EnergyAbsolute emissions MtCO2 (Indexed 2020 = 100)
Fuel mix – Energy%
100
80
60
40
20
0
2020 2025
-15% by 2025
2030 2035 2040
IEA SDS Benchmark: OECD* Portfolio target path
2020 2025 2030 2035 2040
IEA SDS Benchmark: OECD* Portfolio target path
December 2020: 75.0 MtCO₂
55
44
Barclays Dec 2020
21
41
39
2020 Benchmark OECD
Barclays Dec 2020 2020 Benchmark OECD
CoalOilGas
Financed emissions – PowerEmissions intensity KgCO2/MWh
Fuel mix – Power%
350
300
250
200
150
100
50
0
-30% by 2025
December 2020: 321 KgCO₂/MWh
19
2
1
2
33
22
25
21
29
18
30
CoalOilGasNuclearRenewable(inc. Hydro)
45 As noted in the 2017 report, “The Task Force’s recommendations were developed to apply broadly across sectors and jurisdictions and should not be seen as superseding national disclosure requirements. Importantly, organizations should make financial disclosures in accordance with their national disclosure requirements. If certain elements of the recommendations are incompatible with national disclosure requirements for financial filings, the Task Force encourages organizations to disclose those elements in other official company reports that are issued at least annually, widely distributed and available to investors and others, and subject to internal governance processes that are the same or substantially similar to those used for financial reporting” (p. 17).
46 Financial Conduct Authority, “Enhancing climate-related disclosures by asset managers, life insurers, and FCA-regulated pension providers: Consultation paper,” June 2021, p. 32.
47 The GHG Protocol Corporate Standard “covers the accounting and reporting of seven greenhouse gases covered by the Kyoto Protocol – carbon dioxide (CO2), methane (CH4), nitrous oxide (N2O), hydrofluorocarbons (HFCs), perfluorocarbons (PCFs), sulphur hexafluoride (SF6) and nitrogen trifluoride (NF3).” For more information, see https://ghgprotocol.org/corporate-standard.
48 Carbon budget, or cumulative emissions, refers to “the estimated cumulative amount of global carbon dioxide emissions that is estimated to limit global surface temperature to a given level above a reference period, taking into account global surface temperature contributions of other GHGs and climate forcers” (original emphasis). IPCC, “Special Report: Global warming of 1.5°C Glossary.”
20
The Task Force on Climate-related Financial Disclosures
A. Overview and Background
B. Scope and Approach
C. Climate-Related Metrics
D. Climate-Related Targets
E. Transition Plans
F. Financial Impacts
Appendices
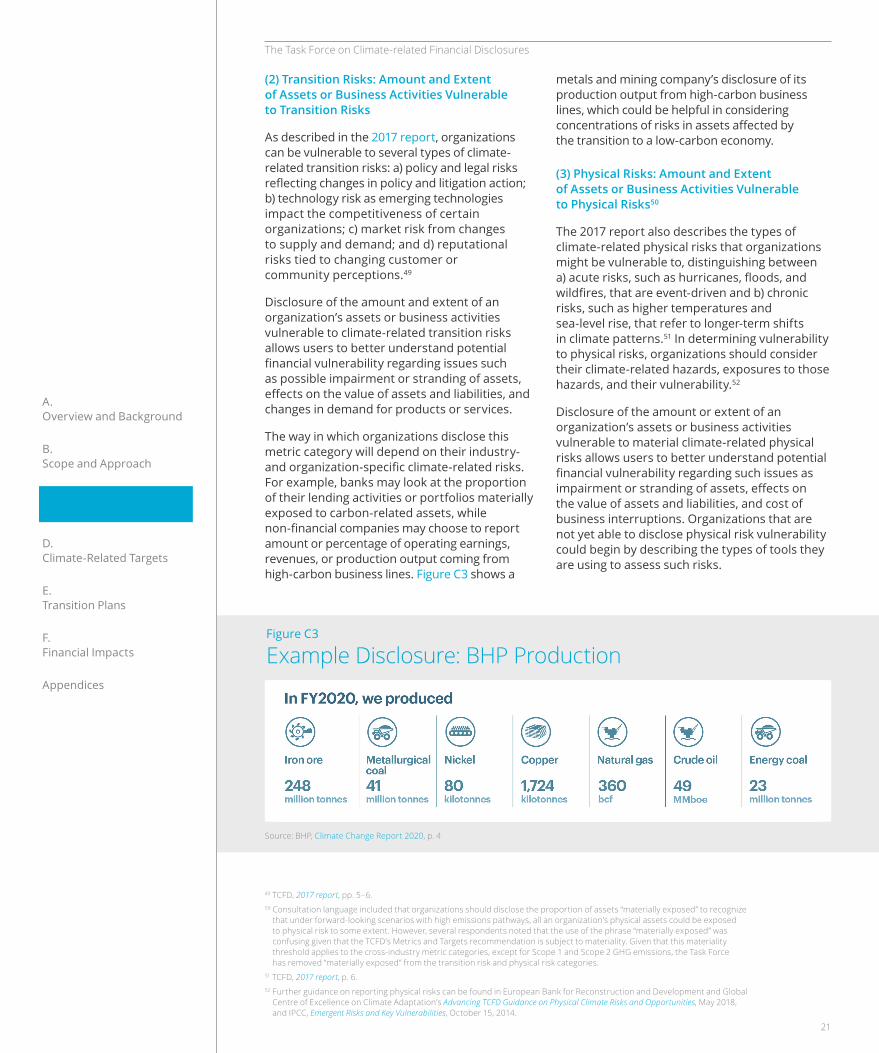
metals and mining company’s disclosure of its production output from high-carbon business lines, which could be helpful in considering concentrations of risks in assets affected by the transition to a low-carbon economy.
(3) Physical Risks: Amount and Extent of Assets or Business Activities Vulnerable to Physical Risks50
The 2017 report also describes the types of climate-related physical risks that organizations might be vulnerable to, distinguishing between a) acute risks, such as hurricanes, floods, and wildfires, that are event-driven and b) chronic risks, such as higher temperatures and sea-level rise, that refer to longer-term shifts in climate patterns.51 In determining vulnerability to physical risks, organizations should consider their climate-related hazards, exposures to those hazards, and their vulnerability.52
Disclosure of the amount or extent of an organization’s assets or business activities vulnerable to material climate-related physical risks allows users to better understand potential financial vulnerability regarding such issues as impairment or stranding of assets, effects on the value of assets and liabilities, and cost of business interruptions. Organizations that are not yet able to disclose physical risk vulnerability could begin by describing the types of tools they are using to assess such risks.
(2) Transition Risks: Amount and Extent of Assets or Business Activities Vulnerable to Transition Risks
As described in the 2017 report, organizations can be vulnerable to several types of climate-related transition risks: a) policy and legal risks reflecting changes in policy and litigation action; b) technology risk as emerging technologies impact the competitiveness of certain organizations; c) market risk from changes to supply and demand; and d) reputational risks tied to changing customer or community perceptions.49
Disclosure of the amount and extent of an organization’s assets or business activities vulnerable to climate-related transition risks allows users to better understand potential financial vulnerability regarding issues such as possible impairment or stranding of assets, effects on the value of assets and liabilities, and changes in demand for products or services.
The way in which organizations disclose this metric category will depend on their industry- and organization-specific climate-related risks. For example, banks may look at the proportion of their lending activities or portfolios materially exposed to carbon-related assets, while non-financial companies may choose to report amount or percentage of operating earnings, revenues, or production output coming from high-carbon business lines. Figure C3 shows a
49 TCFD, 2017 report, pp. 5–6.50 Consultation language included that organizations should disclose the proportion of assets “materially exposed” to recognize
that under forward-looking scenarios with high emissions pathways, all an organization’s physical assets could be exposed to physical risk to some extent. However, several respondents noted that the use of the phrase “materially exposed” was confusing given that the TCFD’s Metrics and Targets recommendation is subject to materiality. Given that this materiality threshold applies to the cross-industry metric categories, except for Scope 1 and Scope 2 GHG emissions, the Task Force has removed “materially exposed” from the transition risk and physical risk categories.
51 TCFD, 2017 report, p. 6.52 Further guidance on reporting physical risks can be found in European Bank for Reconstruction and Development and Global
Centre of Excellence on Climate Adaptation’s Advancing TCFD Guidance on Physical Climate Risks and Opportunities, May 2018, and IPCC, Emergent Risks and Key Vulnerabilities, October 15, 2014.
Figure C3
Example Disclosure: BHP Production
Source: BHP, Climate Change Report 2020, p. 4
21

The Task Force on Climate-related Financial Disclosures
A. Overview and Background
B. Scope and Approach
C. Climate-Related Metrics
D. Climate-Related Targets
E. Transition Plans
F. Financial Impacts
Appendices
sea-level rise, or drought. Some disclosures focus on the risk type by business activity or asset category, such as the disclosure by the insurance company in Figure C4, while other organizations may choose to disclose their aggregate assets based on a severity characterization, such as the asset owner disclosure in Figure C5.
Physical risks will be specific to the geography where the assets or activities are located and their likely exposure or vulnerability to the risk. For example, certain assets may be most vulnerable to acute risks from hurricanes or wildfires, while others are more at risk from chronic changes in average temperature,
Figure C4
Example Disclosure: Ilmarinen
Figure C5
Example Disclosure: ERAFP
Proportional shares of physical risk
0% 20% 40% 60% 80% 100%
Corporate bond portfolio 2020
Equity portfolio 2020
Composite Sensitivity-Adjusted Risk Score by Type
Wildfire Coldwave Heatwave Water Stress Coastal Flood Flood Hurricane
0 0.2 0.4 0.6 0.8 1
Global aggregate portfolio
Benchmark index
15.9% 17.0%
1.0% 1.5%
83.2% 81.6%90%
80%
70%
60%
50%
40%
30%
20%
10%
0Low risk (0-20) Moderate risk (21-40) High risk (41-100)
EXPOSURE TO PHYSICAL RISKS (% OF ASSETS)Source — Trucost, 30 November 2020
+ The risk score is less than or equal to 20 (low risk) for 83.2% of the value of the global aggregate portfolio. This is higher than the low-risk proportion of the benchmark (81.6%).
+ The risk score is less than or equal to 40 (high risk) for 1.0% of the value of the global aggregate portfolio. This is lower than the high-risk proportion of the benchmark (1.5%).
Source: Ilmarinen, Annual and Sustainability Report 2020, p. 50
Note: Some content was reformatted in order to fit the page.
Source: ERAFP, Public Report 2020, p. 89
Note: Some content was reformatted in order to fit the page.
22
The Task Force on Climate-related Financial Disclosures
A. Overview and Background
B. Scope and Approach
C. Climate-Related Metrics
D. Climate-Related Targets
E. Transition Plans
F. Financial Impacts
Appendices
report renewable generation as a fraction of their total electricity generation. An agricultural company might report revenues received from the sale of drought-resilient seeds, while an asset manager could disclose the percent of resilient infrastructure in its portfolio. The example disclosure provided in Figure C6 shows how one chemicals company characterizes its sales by sustainability indicator.
Existing frameworks already provide some sector-specific guidance to help preparers disclose information on climate-related opportunities. For example, SASB’s Construction Materials Standard (SASB EM-CM-410a.1) asks companies to report the percentage of products that qualify for credits in sustainable building design and construction certifications; its Iron and Steel Producers Standard (SASB EM-IS-000.A) refers to percent raw steel production from basic oxygen furnace processes and electric arc furnace processes. In addition, the EU Technical Expert Group’s recommendations for the EU Taxonomy proposes technical screening criteria for economic activities that contributed substantially to climate change mitigation, while the International Capital Market Association (ICMA) provides voluntary guidance for issuers of green bonds.53
(4) Climate-Related Opportunities: Proportion of Revenue, Assets, or Other Business Activities Aligned with Climate-Related Opportunities
The 2017 report also describes several categories of climate-related opportunities that organizations can capture. Examples include a) improved resource efficiency from reducing energy, water, and waste; b) use of energy sources that emit low or no GHG emissions; c) development of new products and services; d) access to new markets; and e) improved adaptive capacity and resilience.
Disclosure of the proportion of revenue, assets, or business activities aligned with climate-related opportunities provides insight into the position of organizations relative to their peers and allows users to understand likely transition pathways and potential changes in revenue and profitability over time.
The operationalization of this metric category will be specific to each industry’s or organization’s climate-related opportunities, as well as to the opportunities within specific business lines or asset classes. For example, auto manufacturers might report sales of electric vehicles relative to total vehicle sales, while utilities companies could
53 EU Technical Expert Group on Sustainable Finance, Technical Report, March 9, 2020; EU Technical Expert Group on Sustainable Finance, Taxonomy Report: Technical Annex, March 9, 2020; ICMA, Green Bond Principles: Voluntary Process Guidelines for Issuing Green Bonds, June 2021.
Figure C6
Example Disclosure: BASF
Source: BASF, BASF 2020 Report, p. 45
23
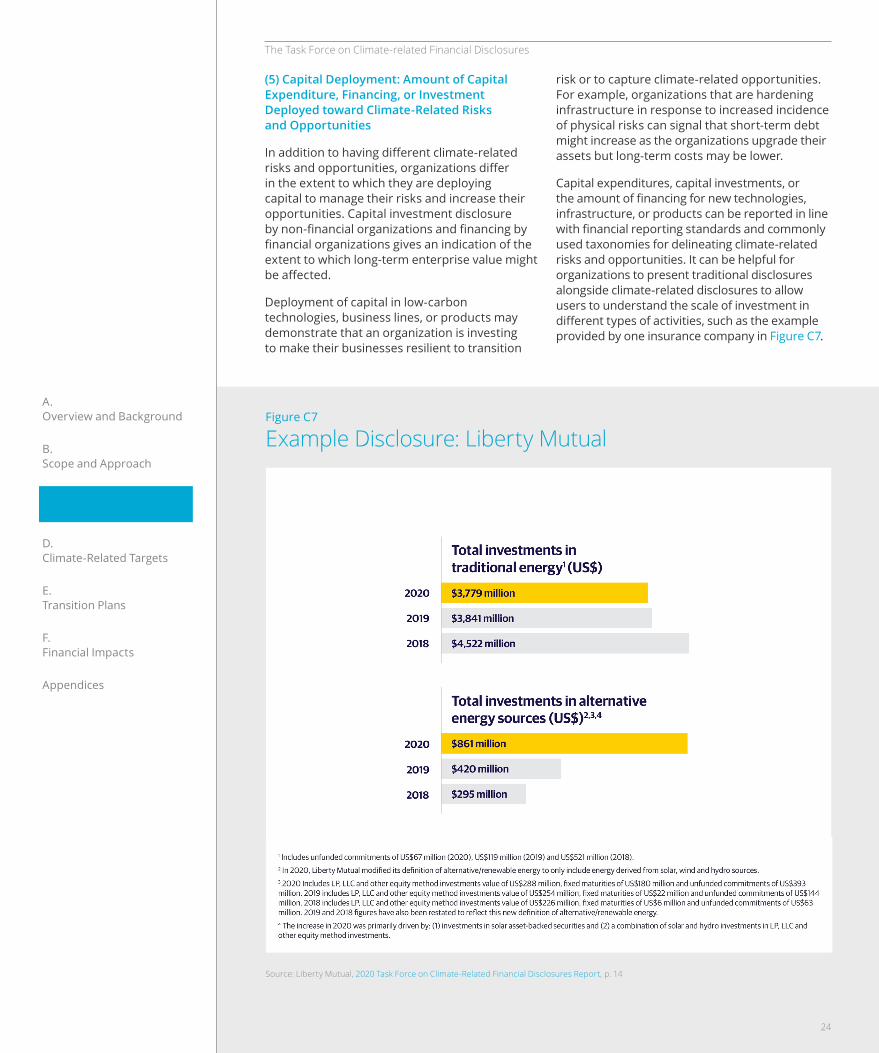
The Task Force on Climate-related Financial Disclosures
A. Overview and Background
B. Scope and Approach
C. Climate-Related Metrics
D. Climate-Related Targets
E. Transition Plans
F. Financial Impacts
Appendices
risk or to capture climate-related opportunities. For example, organizations that are hardening infrastructure in response to increased incidence of physical risks can signal that short-term debt might increase as the organizations upgrade their assets but long-term costs may be lower.
Capital expenditures, capital investments, or the amount of financing for new technologies, infrastructure, or products can be reported in line with financial reporting standards and commonly used taxonomies for delineating climate-related risks and opportunities. It can be helpful for organizations to present traditional disclosures alongside climate-related disclosures to allow users to understand the scale of investment in different types of activities, such as the example provided by one insurance company in Figure C7.
(5) Capital Deployment: Amount of Capital Expenditure, Financing, or Investment Deployed toward Climate-Related Risks and Opportunities
In addition to having different climate-related risks and opportunities, organizations differ in the extent to which they are deploying capital to manage their risks and increase their opportunities. Capital investment disclosure by non-financial organizations and financing by financial organizations gives an indication of the extent to which long-term enterprise value might be affected.
Deployment of capital in low-carbon technologies, business lines, or products may demonstrate that an organization is investing to make their businesses resilient to transition
Figure C7
Example Disclosure: Liberty Mutual
Source: Liberty Mutual, 2020 Task Force on Climate-Related Financial Disclosures Report, p. 14
24
The Task Force on Climate-related Financial Disclosures
A. Overview and Background
B. Scope and Approach
C. Climate-Related Metrics
D. Climate-Related Targets
E. Transition Plans
F. Financial Impacts
Appendices
The Task Force acknowledges that internal carbon prices may not be relevant to all organizations, such as those without material physical or transition risks or those already subject to external carbon prices. Disclosure of how internal carbon prices relate to prices used in external sources, such as those used in publicly available scenarios, can help to provide further transparency into the alignment of internal prices with carbon prices that are consistent with various public climate scenarios. For example, the energy company shown in Figure C8 (p. 26)provides its internal planning assumptions along with prices from two IEA scenarios.57
(7) Remuneration: Proportion of Executive Management Remuneration Linked to Climate Considerations
Remuneration policies are important incentives for achieving an organization’s goals and objectives and may provide insight on an organization’s governance, oversight, and accountability for managing climate-related issues. The ways in which organizations link executive compensation to performance on issues related to climate change will be specific to their company and governance structure. Some organizations choose to report the percentage of the executive’s pay linked to climate considerations, while others discuss weighting factors or total amount of compensation that could be impacted. For example, one bank’s disclosure notes the percentage weighting given to climate consideration within the scorecards of its executive and managing directors (Figure C9, p. 26).
Several respondents to the public consultation noted that remuneration might be best reported with qualitative language. While the Task Force encourages quantitative disclosure, organizations may include descriptive language on remuneration policies and practices, such as how climate change issues are included in balanced scorecards for executive remuneration.
(6) Internal Carbon Prices: Price on Each Ton of GHG Emissions Used Internally by an Organization
Internal carbon pricing is a mechanism by which organizations can put a value on their GHG emissions to facilitate analysis of the actual and potential impacts of climate-related risks and opportunities. For example, non-financial organizations may use an internal carbon price to understand the potential future costs associated with developing new carbon-related assets. Financial organizations may use internal carbon prices to inform their decision-making; for example, by considering the impact of a given carbon price on an organization’s profitability as part of the investing, lending, or insurance underwriting process.54
Internal carbon prices also provide users with an understanding of the reasonableness of an organization’s risk and opportunity assessment and strategy resilience.55 The disclosure of internal carbon prices can help users identify which organizations have business models that are vulnerable to future policy responses to climate change and which are adapting their business models to ensure resilience to transition risks.
While internal carbon prices can take a variety of forms and amounts, an increasing number of companies are setting an internal notional or actual price on the amount of CO2 emitted from assets and investment projects so they can see how, where, and when their GHG emissions could affect their strategy, profit-and-loss (P&L) statements, and investment choices.56
There is no definitive source on what an organization’s carbon price should be, and there are a variety of ways that the cost of carbon can be integrated into business practices. Appendix 1.2. Internal Carbon Prices provides additional considerations and resources to help organizations set an internal carbon price.
54 Several organizations offer additional information on the use of carbon pricing within financial organizations, including Mikolajczjk, et. al., Internal Carbon Pricing and Climate Finance Tracking for Banks, September 2017, and Carbon Pricing Unlocked Partnership, Internal Carbon Pricing for Low-Carbon Finance, July 2019.
55 For example, the CDP report Putting a Price on Carbon notes, “Despite 1,830 companies disclosing that they currently face or expect carbon pricing regulation, 60% (over 1,100) of these companies did not identify this regulation as a substantive risk to their stakeholders in their CDP disclosure — highlighting a potential gap in information that investors should explore” (April 2021, p. 5).
56 CDP, Putting A Price on Carbon: The state of internal carbon pricing by corporates globally, April 2021; The Conference Board, Internal Carbon Pricing: A Key Element of Climate Strategy, January 2021; Carbon Pricing Unlocked, Internal Carbon Pricing for Low-Carbon Finance, July 2019; Yale University, Internal Carbon Pricing: Policy Framework and Case Studies; Aldy and Gianfrate, Future-Proof Your Climate Strategy, May–June 2019.
57 For instance, depending on the baseline scenario, there are different carbon prices that are consistent with a 2°C pathway. For more information, see Riahi, et al., The shared socioeconomic pathways and their energy, land use, and greenhouse gas emissions implications: an overview, July 2017, pp. 153–168, and CDP, Carbon Pricing Corridors, May 2017.
25
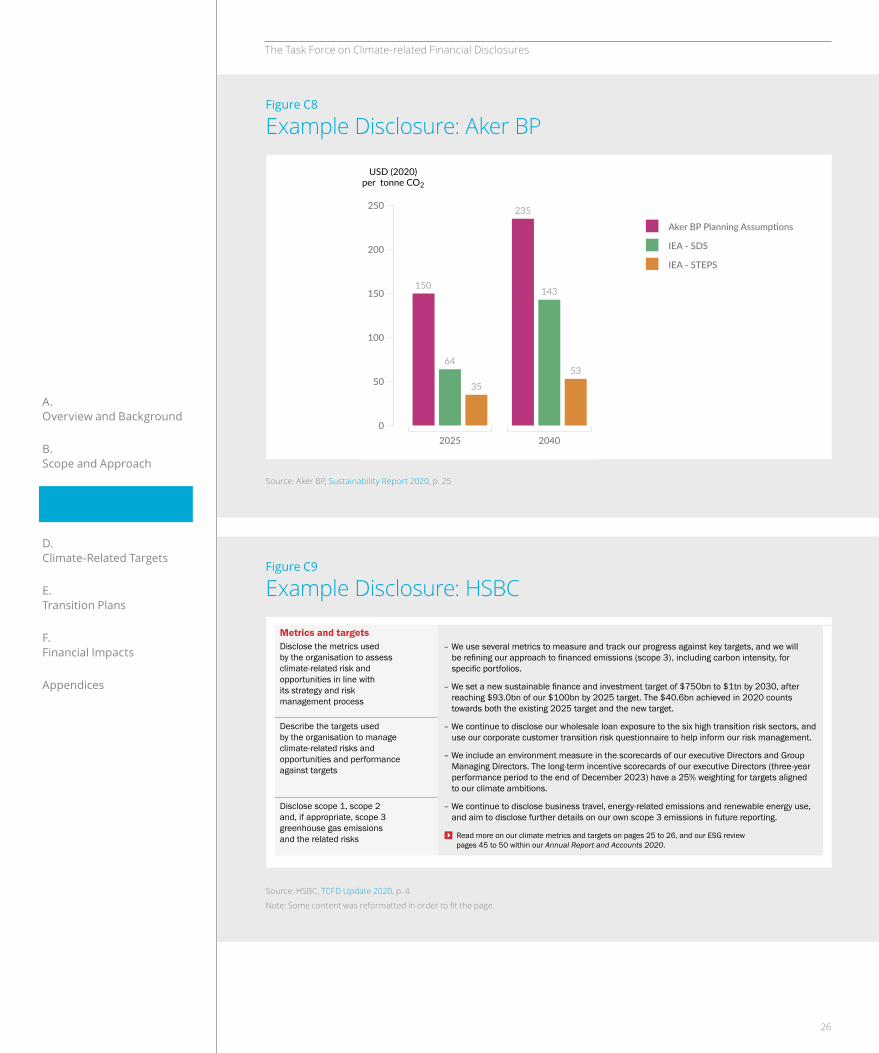
The Task Force on Climate-related Financial Disclosures
A. Overview and Background
B. Scope and Approach
C. Climate-Related Metrics
D. Climate-Related Targets
E. Transition Plans
F. Financial Impacts
Appendices
Figure C8
Example Disclosure: Aker BP
Figure C9
Example Disclosure: HSBC
Source: Aker BP, Sustainability Report 2020, p. 25
Source: HSBC, TCFD Update 2020, p. 4
Note: Some content was reformatted in order to fit the page.
250
200
150
100
50
02025 2040
150
64
35
235
143
53
USD (2020)per tonne CO2
IEA - SDS
IEA - STEPS
Read more on our climate metrics and targets on pages 25 to 26, and our ESG review pages 45 to 50 within our Annual Report and Accounts 2020.
– We use several metrics to measure and track our progress against key targets, and we will be refining our approach to financed emissions (scope 3), including carbon intensity, for specific portfolios.
– We set a new sustainable finance and investment target of $750bn to $1tn by 2030, after reaching $93.0bn of our $100bn by 2025 target. The $40.6bn achieved in 2020 counts towards both the existing 2025 target and the new target.
– We continue to disclose our wholesale loan exposure to the six high transition risk sectors, and use our corporate customer transition risk questionnaire to help inform our risk management.
– We include an environment measure in the scorecards of our executive Directors and Group Managing Directors. The long-term incentive scorecards of our executive Directors (three-year performance period to the end of December 2023) have a 25% weighting for targets aligned to our climate ambitions.
– We continue to disclose business travel, energy-related emissions and renewable energy use, and aim to disclose further details on our own scope 3 emissions in future reporting.
Metrics and targetsDisclose the metrics used by the organisation to assess climate-related risk and opportunities in line with its strategy and risk management process
Describe the targets used by the organisation to manage climate-related risks and opportunities and performance against targets
Disclose scope 1, scope 2 and, if appropriate, scope 3 greenhouse gas emissions and the related risks
250
200
150
100
50
02025 2040
150
64
35
235
143
53
USD (2020)per tonne CO2
IEA - SDS
IEA - STEPS
26
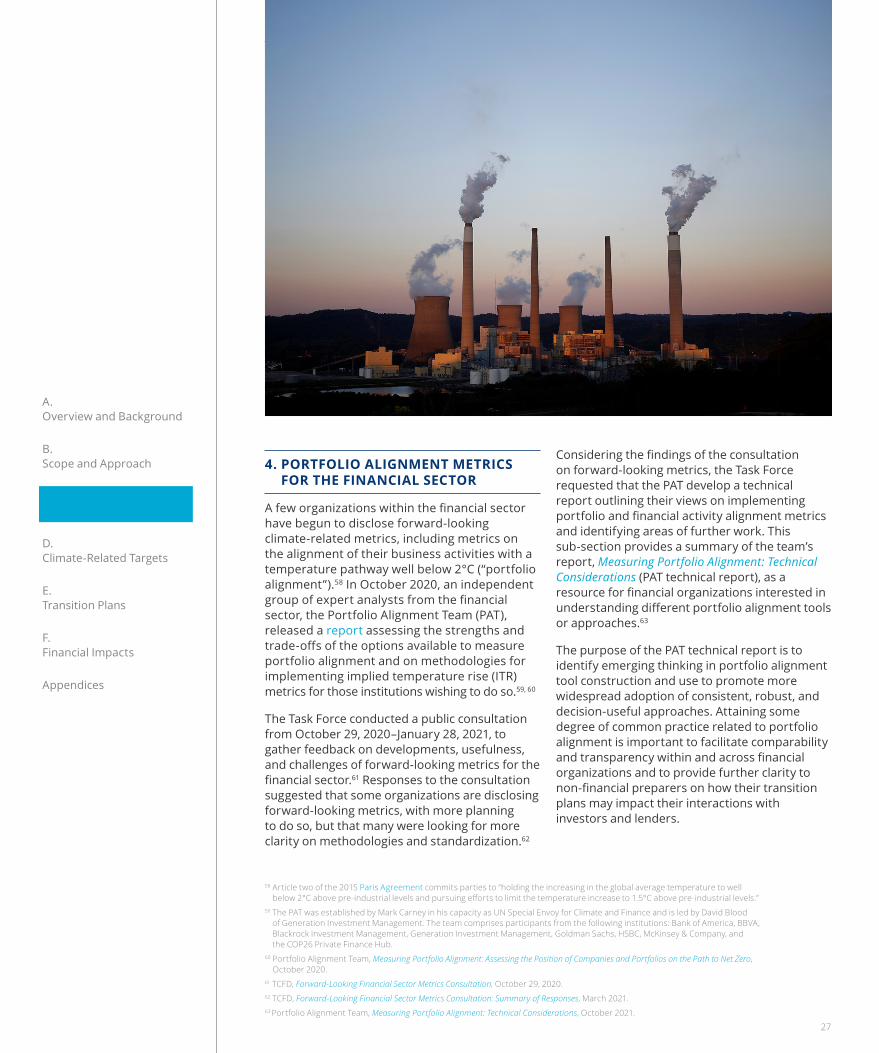
The Task Force on Climate-related Financial Disclosures
A. Overview and Background
B. Scope and Approach
C. Climate-Related Metrics
D. Climate-Related Targets
E. Transition Plans
F. Financial Impacts
Appendices
Considering the findings of the consultation on forward-looking metrics, the Task Force requested that the PAT develop a technical report outlining their views on implementing portfolio and financial activity alignment metrics and identifying areas of further work. This sub-section provides a summary of the team’s report, Measuring Portfolio Alignment: Technical Considerations (PAT technical report), as a resource for financial organizations interested in understanding different portfolio alignment tools or approaches.63
The purpose of the PAT technical report is to identify emerging thinking in portfolio alignment tool construction and use to promote more widespread adoption of consistent, robust, and decision-useful approaches. Attaining some degree of common practice related to portfolio alignment is important to facilitate comparability and transparency within and across financial organizations and to provide further clarity to non-financial preparers on how their transition plans may impact their interactions with investors and lenders.
4. PORTFOLIO ALIGNMENT METRICS FOR THE FINANCIAL SECTOR
A few organizations within the financial sector have begun to disclose forward-looking climate-related metrics, including metrics on the alignment of their business activities with a temperature pathway well below 2°C (“portfolio alignment”).58 In October 2020, an independent group of expert analysts from the financial sector, the Portfolio Alignment Team (PAT), released a report assessing the strengths and trade-offs of the options available to measure portfolio alignment and on methodologies for implementing implied temperature rise (ITR) metrics for those institutions wishing to do so.59, 60
The Task Force conducted a public consultation from October 29, 2020–January 28, 2021, to gather feedback on developments, usefulness, and challenges of forward-looking metrics for the financial sector.61 Responses to the consultation suggested that some organizations are disclosing forward-looking metrics, with more planning to do so, but that many were looking for more clarity on methodologies and standardization.62
58 Article two of the 2015 Paris Agreement commits parties to “holding the increasing in the global average temperature to well below 2°C above pre-industrial levels and pursuing efforts to limit the temperature increase to 1.5°C above pre-industrial levels.”
59 The PAT was established by Mark Carney in his capacity as UN Special Envoy for Climate and Finance and is led by David Blood of Generation Investment Management. The team comprises participants from the following institutions: Bank of America, BBVA, Blackrock Investment Management, Generation Investment Management, Goldman Sachs, HSBC, McKinsey & Company, and the COP26 Private Finance Hub.
60 Portfolio Alignment Team, Measuring Portfolio Alignment: Assessing the Position of Companies and Portfolios on the Path to Net Zero, October 2020.
61 TCFD, Forward-Looking Financial Sector Metrics Consultation, October 29, 2020.62 TCFD, Forward-Looking Financial Sector Metrics Consultation: Summary of Responses, March 2021.63 Portfolio Alignment Team, Measuring Portfolio Alignment: Technical Considerations, October 2021.
27
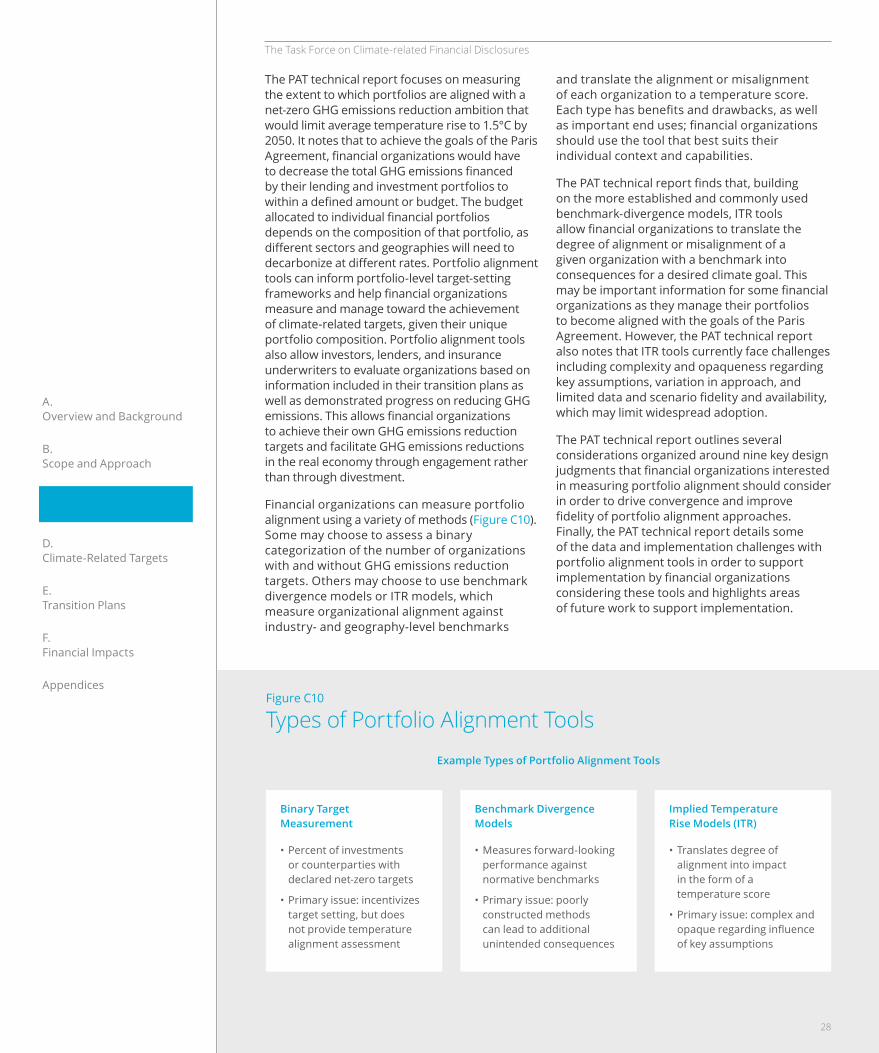
The Task Force on Climate-related Financial Disclosures
A. Overview and Background
B. Scope and Approach
C. Climate-Related Metrics
D. Climate-Related Targets
E. Transition Plans
F. Financial Impacts
Appendices
and translate the alignment or misalignment of each organization to a temperature score. Each type has benefits and drawbacks, as well as important end uses; financial organizations should use the tool that best suits their individual context and capabilities.
The PAT technical report finds that, building on the more established and commonly used benchmark-divergence models, ITR tools allow financial organizations to translate the degree of alignment or misalignment of a given organization with a benchmark into consequences for a desired climate goal. This may be important information for some financial organizations as they manage their portfolios to become aligned with the goals of the Paris Agreement. However, the PAT technical report also notes that ITR tools currently face challenges including complexity and opaqueness regarding key assumptions, variation in approach, and limited data and scenario fidelity and availability, which may limit widespread adoption.
The PAT technical report outlines several considerations organized around nine key design judgments that financial organizations interested in measuring portfolio alignment should consider in order to drive convergence and improve fidelity of portfolio alignment approaches. Finally, the PAT technical report details some of the data and implementation challenges with portfolio alignment tools in order to support implementation by financial organizations considering these tools and highlights areas of future work to support implementation.
The PAT technical report focuses on measuring the extent to which portfolios are aligned with a net-zero GHG emissions reduction ambition that would limit average temperature rise to 1.5°C by 2050. It notes that to achieve the goals of the Paris Agreement, financial organizations would have to decrease the total GHG emissions financed by their lending and investment portfolios to within a defined amount or budget. The budget allocated to individual financial portfolios depends on the composition of that portfolio, as different sectors and geographies will need to decarbonize at different rates. Portfolio alignment tools can inform portfolio-level target-setting frameworks and help financial organizations measure and manage toward the achievement of climate-related targets, given their unique portfolio composition. Portfolio alignment tools also allow investors, lenders, and insurance underwriters to evaluate organizations based on information included in their transition plans as well as demonstrated progress on reducing GHG emissions. This allows financial organizations to achieve their own GHG emissions reduction targets and facilitate GHG emissions reductions in the real economy through engagement rather than through divestment.
Financial organizations can measure portfolio alignment using a variety of methods (Figure C10). Some may choose to assess a binary categorization of the number of organizations with and without GHG emissions reduction targets. Others may choose to use benchmark divergence models or ITR models, which measure organizational alignment against industry- and geography-level benchmarks
Figure C10
Types of Portfolio Alignment ToolsExample Types of Portfolio Alignment Tools
Binary Target Measurement
• Percent of investments or counterparties with declared net-zero targets
• Primary issue: incentivizes target setting, but does not provide temperature alignment assessment
Benchmark Divergence Models
• Measures forward-looking performance against normative benchmarks
• Primary issue: poorly constructed methods can lead to additional unintended consequences
Implied Temperature Rise Models (ITR)
• Translates degree of alignment into impact in the form of a temperature score
• Primary issue: complex and opaque regarding influence of key assumptions
28
D. Climate-Related Targets
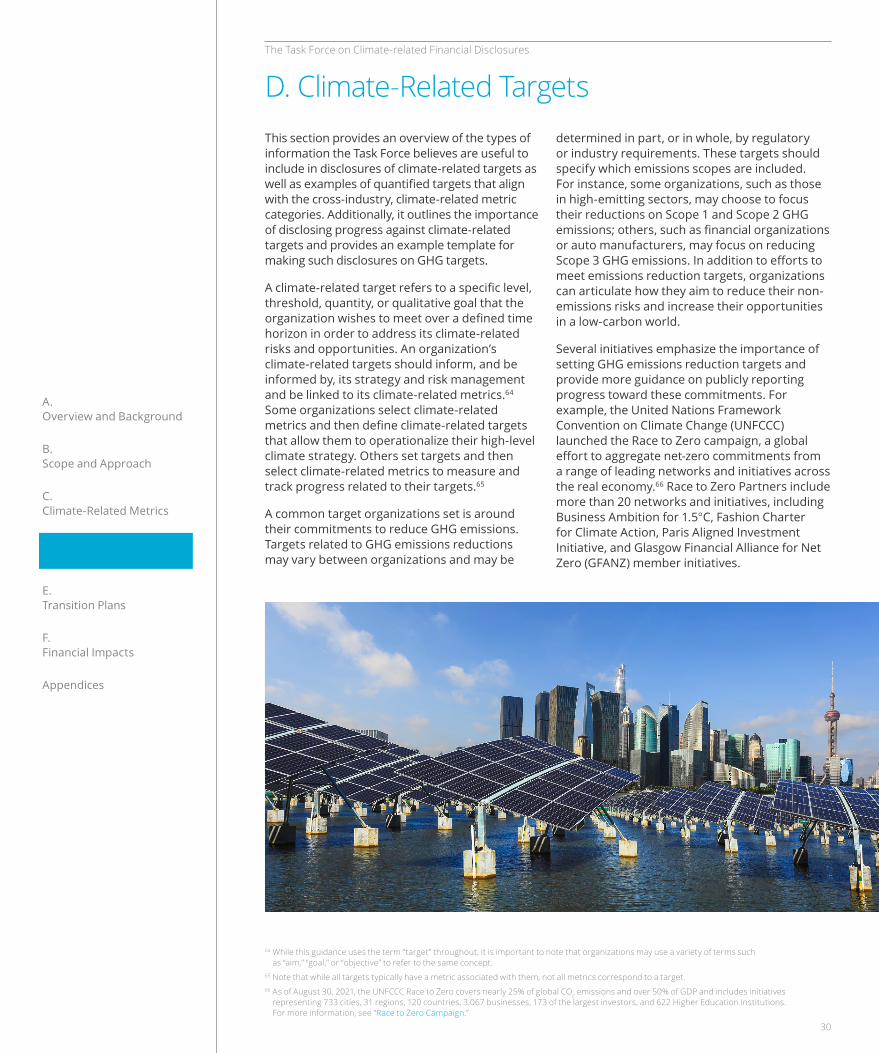
The Task Force on Climate-related Financial Disclosures
A. Overview and Background
B. Scope and Approach
C. Climate-Related Metrics
D. Climate-Related Targets
E. Transition Plans
F. Financial Impacts
Appendices
This section provides an overview of the types of information the Task Force believes are useful to include in disclosures of climate-related targets as well as examples of quantified targets that align with the cross-industry, climate-related metric categories. Additionally, it outlines the importance of disclosing progress against climate-related targets and provides an example template for making such disclosures on GHG targets.
A climate-related target refers to a specific level, threshold, quantity, or qualitative goal that the organization wishes to meet over a defined time horizon in order to address its climate-related risks and opportunities. An organization’s climate-related targets should inform, and be informed by, its strategy and risk management and be linked to its climate-related metrics.64 Some organizations select climate-related metrics and then define climate-related targets that allow them to operationalize their high-level climate strategy. Others set targets and then select climate-related metrics to measure and track progress related to their targets.65
A common target organizations set is around their commitments to reduce GHG emissions. Targets related to GHG emissions reductions may vary between organizations and may be
determined in part, or in whole, by regulatory or industry requirements. These targets should specify which emissions scopes are included. For instance, some organizations, such as those in high-emitting sectors, may choose to focus their reductions on Scope 1 and Scope 2 GHG emissions; others, such as financial organizations or auto manufacturers, may focus on reducing Scope 3 GHG emissions. In addition to efforts to meet emissions reduction targets, organizations can articulate how they aim to reduce their non-emissions risks and increase their opportunities in a low-carbon world.
Several initiatives emphasize the importance of setting GHG emissions reduction targets and provide more guidance on publicly reporting progress toward these commitments. For example, the United Nations Framework Convention on Climate Change (UNFCCC) launched the Race to Zero campaign, a global effort to aggregate net-zero commitments from a range of leading networks and initiatives across the real economy.66 Race to Zero Partners include more than 20 networks and initiatives, including Business Ambition for 1.5°C, Fashion Charter for Climate Action, Paris Aligned Investment Initiative, and Glasgow Financial Alliance for Net Zero (GFANZ) member initiatives.
D. Climate-Related Targets
64 While this guidance uses the term “target” throughout, it is important to note that organizations may use a variety of terms such as “aim,” “goal,” or “objective” to refer to the same concept.
65 Note that while all targets typically have a metric associated with them, not all metrics correspond to a target. 66 As of August 30, 2021, the UNFCCC Race to Zero covers nearly 25% of global CO2 emissions and over 50% of GDP and includes initiatives
representing 733 cities, 31 regions, 120 countries, 3,067 businesses, 173 of the largest investors, and 622 Higher Education Institutions. For more information, see “Race to Zero Campaign.”
30
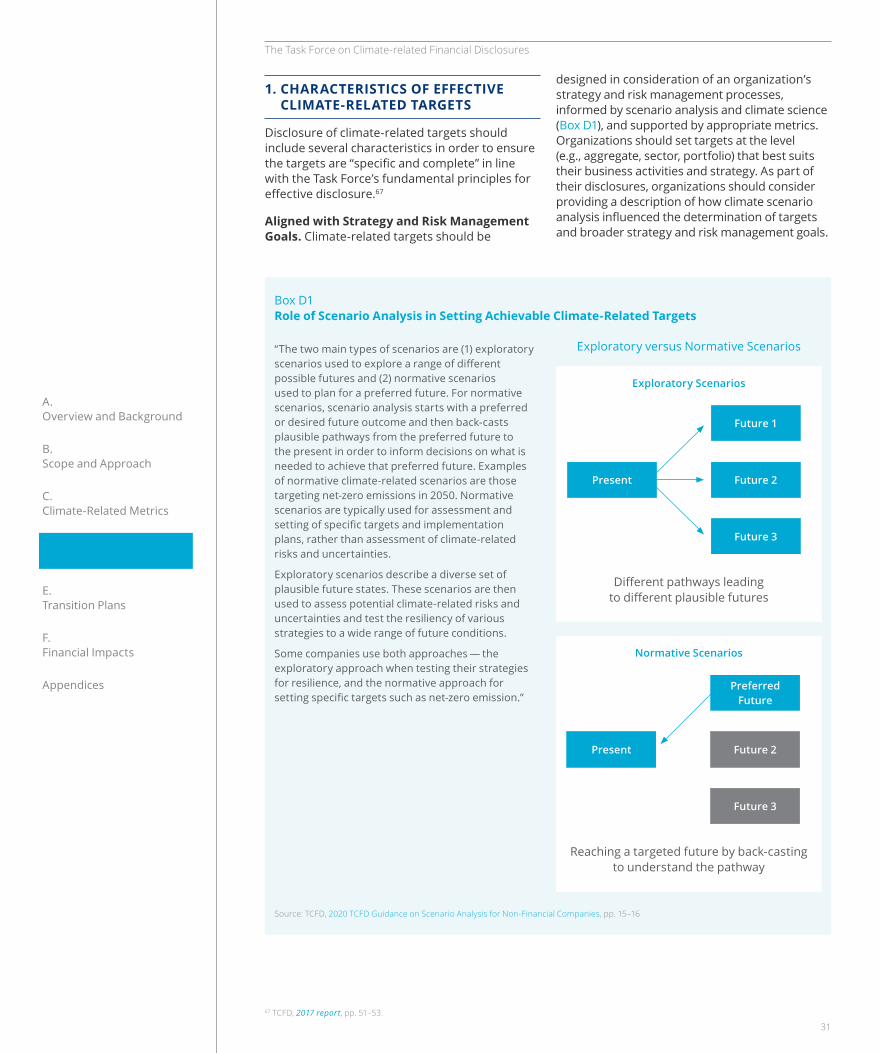
The Task Force on Climate-related Financial Disclosures
A. Overview and Background
B. Scope and Approach
C. Climate-Related Metrics
D. Climate-Related Targets
E. Transition Plans
F. Financial Impacts
Appendices
designed in consideration of an organization’s strategy and risk management processes, informed by scenario analysis and climate science (Box D1), and supported by appropriate metrics. Organizations should set targets at the level (e.g., aggregate, sector, portfolio) that best suits their business activities and strategy. As part of their disclosures, organizations should consider providing a description of how climate scenario analysis influenced the determination of targets and broader strategy and risk management goals.
1. CHARACTERISTICS OF EFFECTIVE CLIMATE-RELATED TARGETS
Disclosure of climate-related targets should include several characteristics in order to ensure the targets are “specific and complete” in line with the Task Force’s fundamental principles for effective disclosure.67
Aligned with Strategy and Risk Management Goals. Climate-related targets should be
Exploratory versus Normative Scenarios
Box D1 Role of Scenario Analysis in Setting Achievable Climate-Related Targets
“The two main types of scenarios are (1) exploratory scenarios used to explore a range of different possible futures and (2) normative scenarios used to plan for a preferred future. For normative scenarios, scenario analysis starts with a preferred or desired future outcome and then back-casts plausible pathways from the preferred future to the present in order to inform decisions on what is needed to achieve that preferred future. Examples of normative climate-related scenarios are those targeting net-zero emissions in 2050. Normative scenarios are typically used for assessment and setting of specific targets and implementation plans, rather than assessment of climate-related risks and uncertainties.
Exploratory scenarios describe a diverse set of plausible future states. These scenarios are then used to assess potential climate-related risks and uncertainties and test the resiliency of various strategies to a wide range of future conditions.
Some companies use both approaches — the exploratory approach when testing their strategies for resilience, and the normative approach for setting specific targets such as net-zero emission.”
Exploratory Scenarios
Different pathways leading to different plausible futures
Present
Future 1
Future 2
Future 3
Normative Scenarios
Reaching a targeted future by back-casting to understand the pathway
Present
Preferred Future
Future 2
Future 3
Source: TCFD, 2020 TCFD Guidance on Scenario Analysis for Non-Financial Companies, pp. 15–16
67 TCFD, 2017 report, pp. 51–53.
31
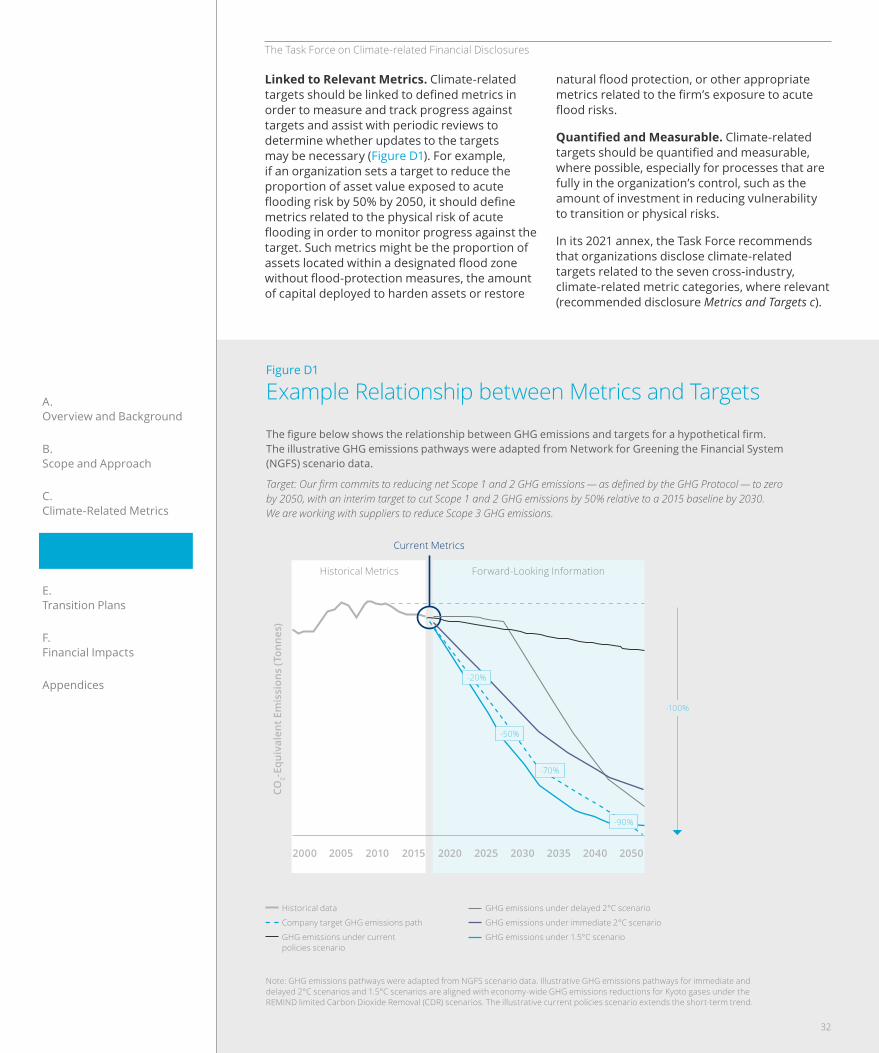
The Task Force on Climate-related Financial Disclosures
A. Overview and Background
B. Scope and Approach
C. Climate-Related Metrics
D. Climate-Related Targets
E. Transition Plans
F. Financial Impacts
Appendices
natural flood protection, or other appropriate metrics related to the firm’s exposure to acute flood risks.
Quantified and Measurable. Climate-related targets should be quantified and measurable, where possible, especially for processes that are fully in the organization’s control, such as the amount of investment in reducing vulnerability to transition or physical risks.
In its 2021 annex, the Task Force recommends that organizations disclose climate-related targets related to the seven cross-industry, climate-related metric categories, where relevant (recommended disclosure Metrics and Targets c).
Linked to Relevant Metrics. Climate-related targets should be linked to defined metrics in order to measure and track progress against targets and assist with periodic reviews to determine whether updates to the targets may be necessary (Figure D1). For example, if an organization sets a target to reduce the proportion of asset value exposed to acute flooding risk by 50% by 2050, it should define metrics related to the physical risk of acute flooding in order to monitor progress against the target. Such metrics might be the proportion of assets located within a designated flood zone without flood-protection measures, the amount of capital deployed to harden assets or restore
Figure D1
Example Relationship between Metrics and Targets
The figure below shows the relationship between GHG emissions and targets for a hypothetical firm. The illustrative GHG emissions pathways were adapted from Network for Greening the Financial System (NGFS) scenario data.
Target: Our firm commits to reducing net Scope 1 and 2 GHG emissions — as defined by the GHG Protocol — to zero by 2050, with an interim target to cut Scope 1 and 2 GHG emissions by 50% relative to a 2015 baseline by 2030. We are working with suppliers to reduce Scope 3 GHG emissions.
Note: GHG emissions pathways were adapted from NGFS scenario data. Illustrative GHG emissions pathways for immediate and delayed 2°C scenarios and 1.5°C scenarios are aligned with economy-wide GHG emissions reductions for Kyoto gases under the REMIND limited Carbon Dioxide Removal (CDR) scenarios. The illustrative current policies scenario extends the short-term trend.
Historical Metrics Forward-Looking Information
Current Metrics
Historical data
Company target GHG emissions path
GHG emissions under current policies scenario
GHG emissions under delayed 2°C scenario
GHG emissions under immediate 2°C scenario
GHG emissions under 1.5°C scenario
CO2-
Equi
vale
nt E
mis
sion
s (T
onne
s)
2000 20502040203520302025
-100%
2020201520102005
-20%
-50%
-70%
-90%
32
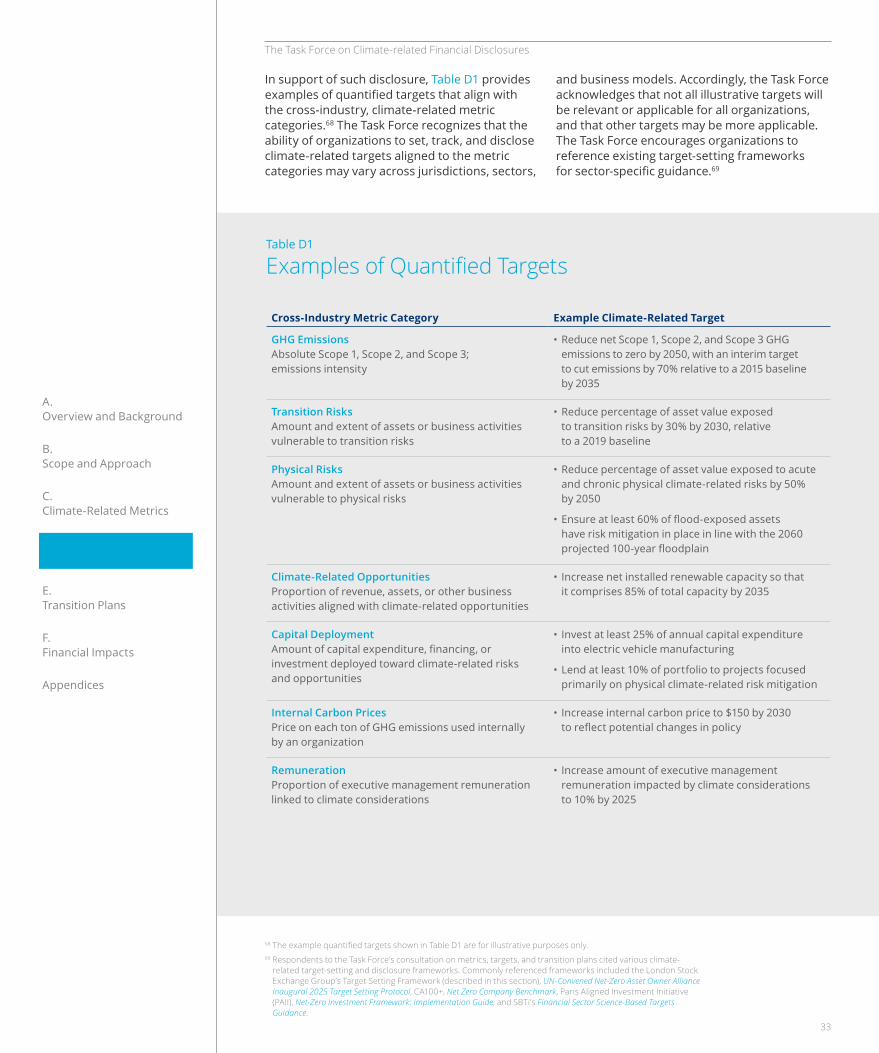
The Task Force on Climate-related Financial Disclosures
A. Overview and Background
B. Scope and Approach
C. Climate-Related Metrics
D. Climate-Related Targets
E. Transition Plans
F. Financial Impacts
Appendices
and business models. Accordingly, the Task Force acknowledges that not all illustrative targets will be relevant or applicable for all organizations, and that other targets may be more applicable. The Task Force encourages organizations to reference existing target-setting frameworks for sector-specific guidance.69
In support of such disclosure, Table D1 provides examples of quantified targets that align with the cross-industry, climate-related metric categories.68 The Task Force recognizes that the ability of organizations to set, track, and disclose climate-related targets aligned to the metric categories may vary across jurisdictions, sectors,
68 The example quantified targets shown in Table D1 are for illustrative purposes only. 69 Respondents to the Task Force’s consultation on metrics, targets, and transition plans cited various climate-
related target-setting and disclosure frameworks. Commonly referenced frameworks included the London Stock Exchange Group’s Target Setting Framework (described in this section), UN-Convened Net-Zero Asset Owner Alliance Inaugural 2025 Target Setting Protocol, CA100+, Net Zero Company Benchmark, Paris Aligned Investment Initiative (PAII), Net-Zero Investment Framework: Implementation Guide, and SBTi’s Financial Sector Science-Based Targets Guidance.
Table D1
Examples of Quantified Targets
Cross-Industry Metric Category Example Climate-Related Target
GHG Emissions Absolute Scope 1, Scope 2, and Scope 3; emissions intensity
• Reduce net Scope 1, Scope 2, and Scope 3 GHG emissions to zero by 2050, with an interim target to cut emissions by 70% relative to a 2015 baseline by 2035
Transition Risks Amount and extent of assets or business activities vulnerable to transition risks
• Reduce percentage of asset value exposed to transition risks by 30% by 2030, relative to a 2019 baseline
Physical Risks Amount and extent of assets or business activities vulnerable to physical risks
• Reduce percentage of asset value exposed to acute and chronic physical climate-related risks by 50% by 2050
• Ensure at least 60% of flood-exposed assets have risk mitigation in place in line with the 2060 projected 100-year floodplain
Climate-Related Opportunities Proportion of revenue, assets, or other business activities aligned with climate-related opportunities
• Increase net installed renewable capacity so that it comprises 85% of total capacity by 2035
Capital Deployment Amount of capital expenditure, financing, or investment deployed toward climate-related risks and opportunities
• Invest at least 25% of annual capital expenditure into electric vehicle manufacturing
• Lend at least 10% of portfolio to projects focused primarily on physical climate-related risk mitigation
Internal Carbon Prices Price on each ton of GHG emissions used internally by an organization
• Increase internal carbon price to $150 by 2030 to reflect potential changes in policy
Remuneration Proportion of executive management remuneration linked to climate considerations
• Increase amount of executive management remuneration impacted by climate considerations to 10% by 2025
33
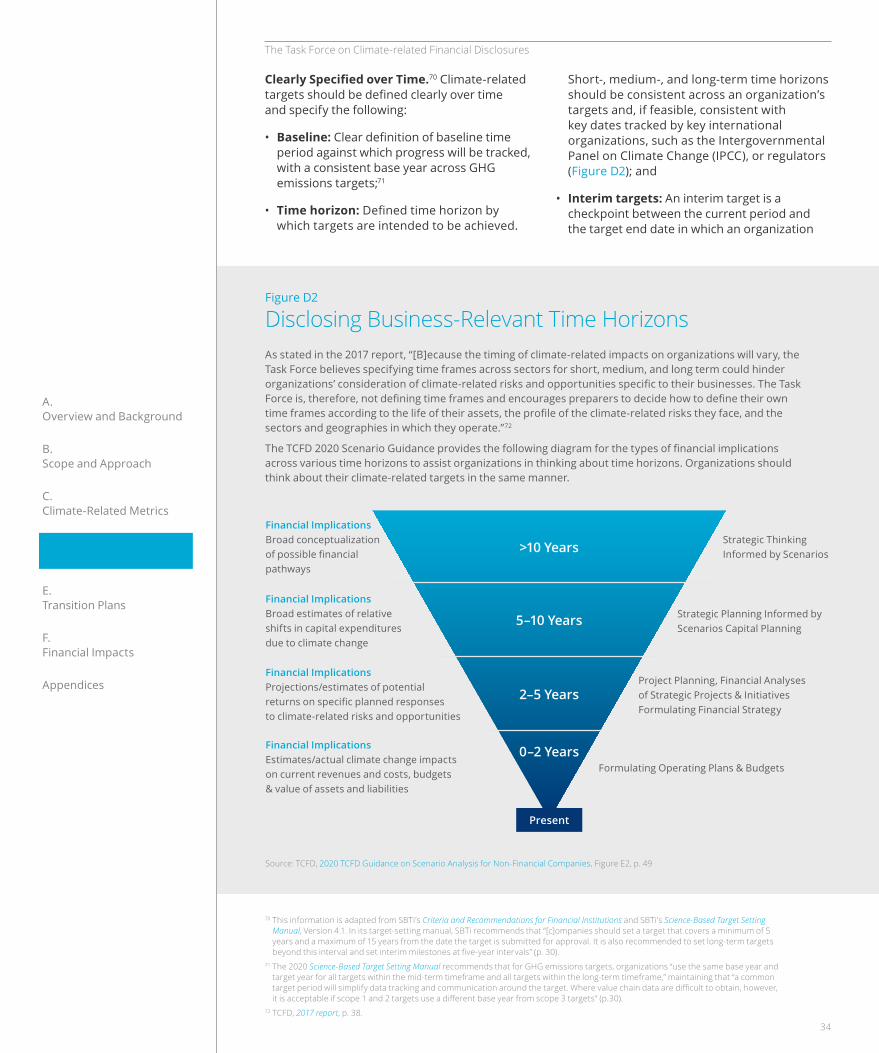
The Task Force on Climate-related Financial Disclosures
A. Overview and Background
B. Scope and Approach
C. Climate-Related Metrics
D. Climate-Related Targets
E. Transition Plans
F. Financial Impacts
Appendices
Short-, medium-, and long-term time horizons should be consistent across an organization’s targets and, if feasible, consistent with key dates tracked by key international organizations, such as the Intergovernmental Panel on Climate Change (IPCC), or regulators (Figure D2); and
• Interim targets: An interim target is a checkpoint between the current period and the target end date in which an organization
Clearly Specified over Time.70 Climate-related targets should be defined clearly over time and specify the following:
• Baseline: Clear definition of baseline time period against which progress will be tracked, with a consistent base year across GHG emissions targets;71
• Time horizon: Defined time horizon by which targets are intended to be achieved.
70 This information is adapted from SBTi’s Criteria and Recommendations for Financial Institutions and SBTi’s Science-Based Target Setting Manual, Version 4.1. In its target-setting manual, SBTi recommends that “[c]ompanies should set a target that covers a minimum of 5 years and a maximum of 15 years from the date the target is submitted for approval. It is also recommended to set long-term targets beyond this interval and set interim milestones at five-year intervals” (p. 30).
71 The 2020 Science-Based Target Setting Manual recommends that for GHG emissions targets, organizations “use the same base year and target year for all targets within the mid-term timeframe and all targets within the long-term timeframe,” maintaining that “a common target period will simplify data tracking and communication around the target. Where value chain data are difficult to obtain, however, it is acceptable if scope 1 and 2 targets use a different base year from scope 3 targets” (p.30).
72 TCFD, 2017 report, p. 38.
Figure D2
Disclosing Business-Relevant Time Horizons
Present
Financial ImplicationsBroad conceptualization of possible financial pathways
Strategic Thinking Informed by Scenarios
Strategic Planning Informed by Scenarios Capital Planning
Project Planning, Financial Analyses of Strategic Projects & Initiatives Formulating Financial Strategy
Formulating Operating Plans & Budgets
Financial ImplicationsBroad estimates of relative shifts in capital expenditures due to climate change
Financial ImplicationsProjections/estimates of potential returns on specific planned responses to climate-related risks and opportunities
Financial ImplicationsEstimates/actual climate change impacts on current revenues and costs, budgets & value of assets and liabilities
>10 Years
5–10 Years
2–5 Years
0–2 Years
Source: TCFD, 2020 TCFD Guidance on Scenario Analysis for Non-Financial Companies, Figure E2, p. 49
As stated in the 2017 report, “[B]ecause the timing of climate-related impacts on organizations will vary, the Task Force believes specifying time frames across sectors for short, medium, and long term could hinder organizations’ consideration of climate-related risks and opportunities specific to their businesses. The Task Force is, therefore, not defining time frames and encourages preparers to decide how to define their own time frames according to the life of their assets, the profile of the climate-related risks they face, and the sectors and geographies in which they operate.”72
The TCFD 2020 Scenario Guidance provides the following diagram for the types of financial implications across various time horizons to assist organizations in thinking about time horizons. Organizations should think about their climate-related targets in the same manner.
34
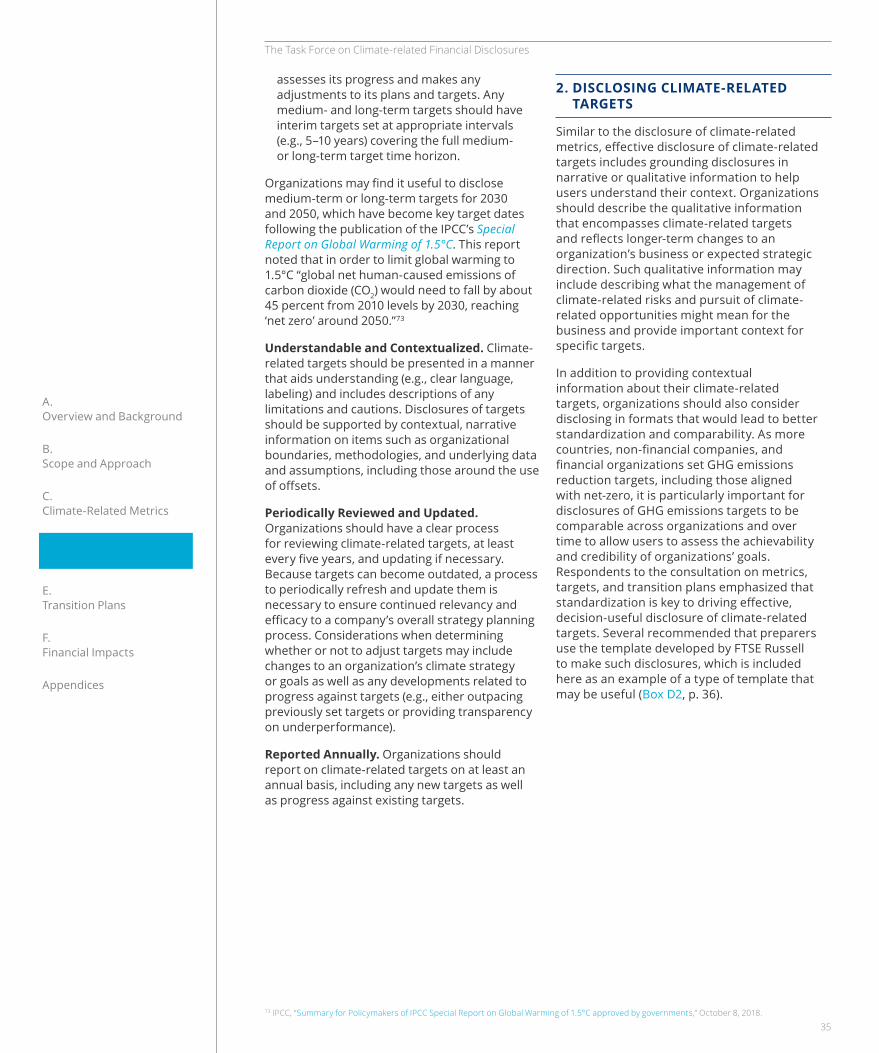
The Task Force on Climate-related Financial Disclosures
A. Overview and Background
B. Scope and Approach
C. Climate-Related Metrics
D. Climate-Related Targets
E. Transition Plans
F. Financial Impacts
Appendices
2. DISCLOSING CLIMATE-RELATED TARGETS
Similar to the disclosure of climate-related metrics, effective disclosure of climate-related targets includes grounding disclosures in narrative or qualitative information to help users understand their context. Organizations should describe the qualitative information that encompasses climate-related targets and reflects longer-term changes to an organization’s business or expected strategic direction. Such qualitative information may include describing what the management of climate-related risks and pursuit of climate-related opportunities might mean for the business and provide important context for specific targets.
In addition to providing contextual information about their climate-related targets, organizations should also consider disclosing in formats that would lead to better standardization and comparability. As more countries, non-financial companies, and financial organizations set GHG emissions reduction targets, including those aligned with net-zero, it is particularly important for disclosures of GHG emissions targets to be comparable across organizations and over time to allow users to assess the achievability and credibility of organizations’ goals. Respondents to the consultation on metrics, targets, and transition plans emphasized that standardization is key to driving effective, decision-useful disclosure of climate-related targets. Several recommended that preparers use the template developed by FTSE Russell to make such disclosures, which is included here as an example of a type of template that may be useful (Box D2, p. 36).
assesses its progress and makes any adjustments to its plans and targets. Any medium- and long-term targets should have interim targets set at appropriate intervals (e.g., 5–10 years) covering the full medium- or long-term target time horizon.
Organizations may find it useful to disclose medium-term or long-term targets for 2030 and 2050, which have become key target dates following the publication of the IPCC’s Special Report on Global Warming of 1.5°C. This report noted that in order to limit global warming to 1.5°C “global net human-caused emissions of carbon dioxide (CO2) would need to fall by about 45 percent from 2010 levels by 2030, reaching ‘net zero’ around 2050.”73
Understandable and Contextualized. Climate-related targets should be presented in a manner that aids understanding (e.g., clear language, labeling) and includes descriptions of any limitations and cautions. Disclosures of targets should be supported by contextual, narrative information on items such as organizational boundaries, methodologies, and underlying data and assumptions, including those around the use of offsets.
Periodically Reviewed and Updated. Organizations should have a clear process for reviewing climate-related targets, at least every five years, and updating if necessary. Because targets can become outdated, a process to periodically refresh and update them is necessary to ensure continued relevancy and efficacy to a company’s overall strategy planning process. Considerations when determining whether or not to adjust targets may include changes to an organization’s climate strategy or goals as well as any developments related to progress against targets (e.g., either outpacing previously set targets or providing transparency on underperformance).
Reported Annually. Organizations should report on climate-related targets on at least an annual basis, including any new targets as well as progress against existing targets.
73 IPCC, “Summary for Policymakers of IPCC Special Report on Global Warming of 1.5°C approved by governments,” October 8, 2018.
35
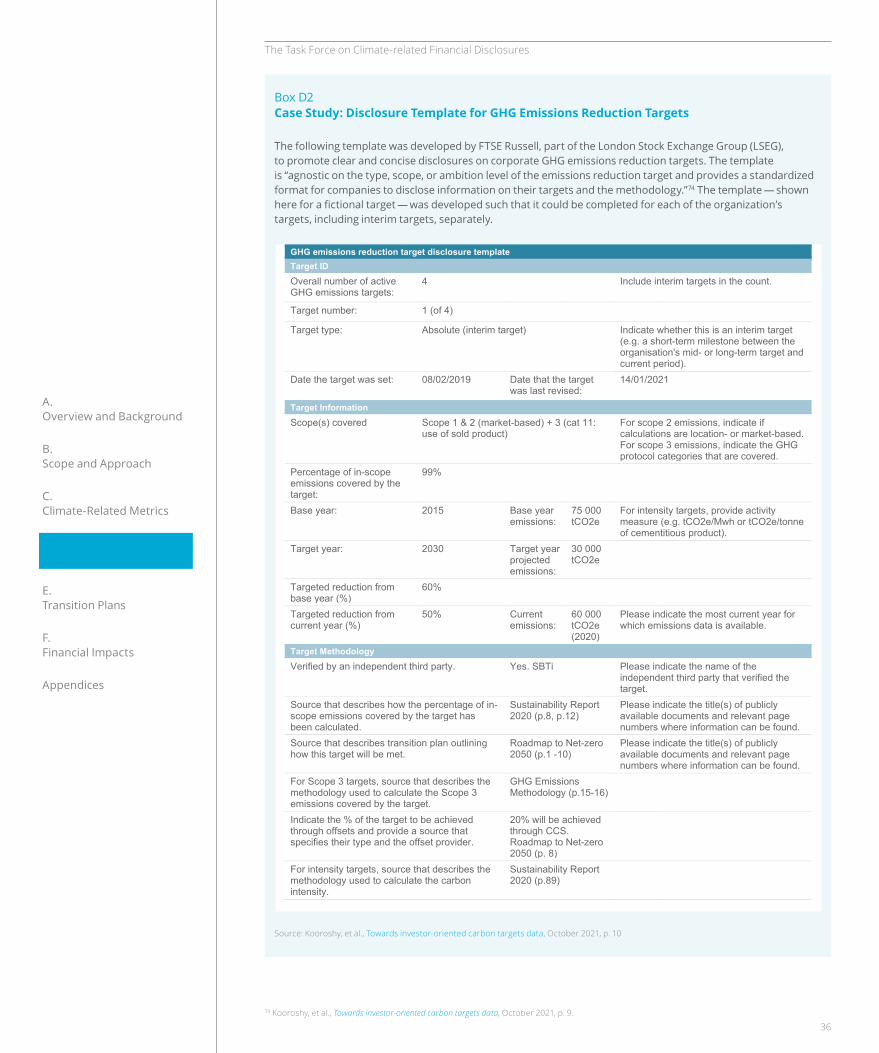
The Task Force on Climate-related Financial Disclosures
A. Overview and Background
B. Scope and Approach
C. Climate-Related Metrics
D. Climate-Related Targets
E. Transition Plans
F. Financial Impacts
Appendices
Box D2 Case Study: Disclosure Template for GHG Emissions Reduction Targets
The following template was developed by FTSE Russell, part of the London Stock Exchange Group (LSEG), to promote clear and concise disclosures on corporate GHG emissions reduction targets. The template is “agnostic on the type, scope, or ambition level of the emissions reduction target and provides a standardized format for companies to disclose information on their targets and the methodology.”74 The template — shown here for a fictional target — was developed such that it could be completed for each of the organization’s targets, including interim targets, separately.
Source: Kooroshy, et al., Towards investor-oriented carbon targets data, October 2021, p. 10
ftserussell.com 10
GHG emissions reduction target disclosure template Target ID
Overall number of active GHG emissions targets:
4 Include interim targets in the count.
Target number: 1 (of 4)
Target type: Absolute (interim target) Indicate whether this is an interim target (e.g. a short-term milestone between the organisation's mid- or long-term target and current period).
Date the target was set: 08/02/2019 Date that the target was last revised:
14/01/2021
Target Information
Scope(s) covered Scope 1 & 2 (market-based) + 3 (cat 11: use of sold product)
For scope 2 emissions, indicate if calculations are location- or market-based. For scope 3 emissions, indicate the GHG protocol categories that are covered.
Percentage of in-scope emissions covered by the target:
99%
Base year: 2015 Base year emissions:
75 000 tCO2e
For intensity targets, provide activity measure (e.g. tCO2e/Mwh or tCO2e/tonne of cementitious product).
Target year: 2030 Target year projected emissions:
30 000 tCO2e
Targeted reduction from base year (%)
60%
Targeted reduction from current year (%)
50% Current emissions:
60 000 tCO2e (2020)
Please indicate the most current year for which emissions data is available.
Target Methodology
Verified by an independent third party. Yes. SBTi Please indicate the name of the independent third party that verified the target.
Source that describes how the percentage of in-scope emissions covered by the target has been calculated.
Sustainability Report 2020 (p.8, p.12)
Please indicate the title(s) of publicly available documents and relevant page numbers where information can be found.
Source that describes transition plan outlining how this target will be met.
Roadmap to Net-zero 2050 (p.1 -10)
Please indicate the title(s) of publicly available documents and relevant page numbers where information can be found.
For Scope 3 targets, source that describes the methodology used to calculate the Scope 3 emissions covered by the target.
GHG Emissions Methodology (p.15-16)
Indicate the % of the target to be achieved through offsets and provide a source that specifies their type and the offset provider.
20% will be achieved through CCS. Roadmap to Net-zero 2050 (p. 8)
For intensity targets, source that describes the methodology used to calculate the carbon intensity.
Sustainability Report 2020 (p.89)
74 Kooroshy, et al., Towards investor-oriented carbon targets data, October 2021, p. 9.
36
The Task Force on Climate-related Financial Disclosures
A. Overview and Background
B. Scope and Approach
C. Climate-Related Metrics
D. Climate-Related Targets
E. Transition Plans
F. Financial Impacts
Appendices
• whether making such information public may cause a considerable economic loss for the organization.75
If an organization determines that a particular climate-related target is confidential, the organization should provide relevant information in broader terms to support users’ decision-making.76
Finally, the Task Force encourages organizations not to assume their climate-related targets contain confidential business information that would harm the organization if publicly disclosed. When evaluating whether certain climate-related targets contain confidential business information, the organization should consider the following:
• whether the information provides the organization with an economic benefit that translates into a competitive advantage because the information is unknown to its competitors and
75 European Innovation Council and SMEs Executive Agency (European Commission), Trade Secrets: Managing Confidential Business Information, July 2021, pp. 2–4.
76 Based on footnote 10 from the European Commission Guidelines on non-financial reporting: Supplement on reporting climate-related information.
37

E. Transition Plans

The Task Force on Climate-related Financial Disclosures
A. Overview and Background
B. Scope and Approach
C. Climate-Related Metrics
D. Climate-Related Targets
E. Transition Plans
F. Financial Impacts
Appendices
This section provides guidance on considerations around the disclosure of transition plans, including example disclosures. The Task Force recognizes that an organization’s transition plan is one component of its strategy to address its climate-related risks and opportunities and believes its recommendations implicitly cover the key aspects of transition plans. However, given the increasing focus on such plans, as described below, the Task Force determined explicit guidance may be useful. Another important component of an organization’s strategy to address climate-related risks and opportunities is its adaptation plan, which is beyond the scope of this guidance.77 Both transition and adaptation plans may be components of an organization’s overall business strategy (Figure E1).
A transition plan is an aspect of an organization’s overall business strategy that lays out a set of targets and actions supporting its transition toward a low-carbon economy, including actions such as reducing its GHG emissions. Many organizations are making GHG emissions
reduction commitments or are domiciled in jurisdictions that have done so. In fact, a recent study found that over 60% of countries and nearly 10% of states and regions in the largest emitting countries have committed to net-zero.78 The study also found that of the 2,000 largest public companies, over 20% have net-zero commitments, representing annual sales of nearly $14 trillion.79 These commitments inherently, and in some cases explicitly, require a plan; and many organizations are already preparing such plans. From its consultation on metrics, targets, and transition plans, the Task Force found two-thirds of respondents had either developed a transition plan or planned to do so in the next year, with another 22% reporting they planned to develop a transition plan in the future.80
Organizations’ transition plans are of particular interest to users, especially when they are seeking to verify the credibility of organizations’ commitments related to climate change. Users are particularly interested in information on how
E. Transition Plans
77 An adaptation plan lays out how an organization aims to minimize risks and capture opportunities associated with physical climate changes. Though guidance on adaptation planning is not included in this document, the Task Force encourages other frameworks and standard setters to consider developing guidance on designing and disclosing adaptation plans.
78 The Energy & Climate Intelligence Unit and Oxford Net Zero, Taking Stock: A global assessment of net zero targets, March 2021.79 Ibid. 80 TCFD, Proposed Guidance on Metrics, Targets, and Transition Plans Consultation: Summary of Responses, October 14, 2021.
Figure E1
Relationship between Business Strategy, Climate Strategy, and Transition Plan
Climate strategy
Transition plan and adaptation plan
Overall business strategy
Transition Plan
Focus of this section
Adaptation Plan
39
The Task Force on Climate-related Financial Disclosures
A. Overview and Background
B. Scope and Approach
C. Climate-Related Metrics
D. Climate-Related Targets
E. Transition Plans
F. Financial Impacts
Appendices
1. CHARACTERISTICS OF EFFECTIVE TRANSITION PLANS
As part of determining key characteristics of effective transition plans, the Task Force reviewed publicly available materials published by various groups focused on the transition to a low-carbon economy, including Climate Action 100+, Transition Pathway Initiative, the UNFCCC Race to Zero (including SBTi and GFANZ), the Institutional Investors Group on Climate Change, and the Investor Agenda.85 Some of the materials describe criteria the groups use to assess an organization’s transition to a low-carbon economy while others provide guidance or describe requirements for their members on climate-related metrics and targets, which are core aspects of transition plans. While the materials may not provide explicit guidance on developing a transition plan, they provide information that organizations may find useful in developing and disclosing information from their transition plans. For example, Climate Action 100+’s Net Zero Company Benchmark Indicators describes ten indicators and associated sub-indicators it uses to assess an organization’s transition to a low-carbon economy, such as sub-indicators on the proportion of GHG emissions to include in GHG emissions reduction commitments and the actions or elements of a decarbonization strategy. The Task Force drew from these materials to identify key characteristics of effective transition plans that are in line with its fundamental principles for effective disclosure.86
Aligned with Strategy. A transition plan should be a part of, and aligned with, an organization’s broader activities for addressing climate-related risks and opportunities, which in turn should be a part of, and aligned with, the organization’s overall business strategy.
organizations will adjust their strategies or business models, including the specific actions they will take to reduce risks and increase opportunities as they transition to a low-carbon economy. As part of the consultation, 96% of users responded that organizations’ disclosure of transition plans would be “very useful” or “somewhat useful.”81 As an example of users’ interest in transition plans, Climate Action 100+ (CA100+) — an investor group focusing on the largest corporate GHG emitters and their progress in transitioning to a low-carbon economy — recently began assessing those companies’ transition plans through its Net Zero Company Benchmark Indicators.82, 83
A specific type of transition planning that has gained attention recently focuses on achieving a “net-zero” target. Attention around net-zero transition planning began primarily in response to the IPCC’s Special Report on Global Warming of 1.5°C, which found that GHG emissions need to decline by about 45% by 2030 and reach net-zero around 2050 in order to achieve a 1.5°C temperature target.84 The report also highlights that the impact of 2°C of warming would be significantly worse than 1.5°C and brought renewed urgency to the effort to limit the global temperature increase to 1.5°C. The IPCC report shifted the language used by the public and private sector on climate change from a focus on limiting warming to 2°C to achieving net-zero GHG emissions by 2050.
81 TCFD, Proposed Guidance on Metrics, Targets, and Transition Plans Consultation: Summary of Responses, October 14, 2021.82 Climate Action 100+, Net-Zero Company Benchmark, accessed April 30, 2021.83 CA100+, “Blog: Climate Action 100+ Zeroes In On Industry-Wide Decarbonization,” August 2021.84 IPCC, Special Report on Global Warming of 1.5°C, October 2018.85 Several organizations offer resources that may be useful to organizations in developing transition plans, including:
Climate Action 100+, Climate Action 100+ Net-Zero Company Benchmark Indicators, March 2021; SBTi, Science-Based Target Setting Manual, Version 4.1, April 2020; SBTi, Foundations for Science-Based Net Zero Target Setting in the Corporate Sector, Version 1.0, September 2020; SBTi, Financial Sector Science-Based Targets Guidance, Pilot Version 1.1, April 2021; and United Nations Framework Convention on Climate Change (UNFCCC)’s Race to Zero Expert Peer Review Group, Interpretation Guide, Version 1.0, April 2021. TCFD Knowledge Hub provides additional resources.
86 TCFD, 2017 report, pp. 51–53.
40
The Task Force on Climate-related Financial Disclosures
A. Overview and Background
B. Scope and Approach
C. Climate-Related Metrics
D. Climate-Related Targets
E. Transition Plans
F. Financial Impacts
Appendices
Periodically Reviewed and Updated. A transition plan should be reviewed at least every five years and updated if necessary. Organizations should review their transition plans in line with their review process for their climate-related targets in order to ensure continued relevancy and efficacy to an organization’s overall strategy planning process.
Reported Annually to Stakeholders. Organizations should report publicly or to stakeholders their initial transition plans and significant updates to the plans. In addition, organizations should report progress against their transition plans annually and include a comparison of completed actions to planned actions in the prior reporting period.
2. TRANSITION PLAN CONSIDERATIONS
The transition plan elements described in this sub-section are meant as high-level guidance to support organizations as they develop transition plans. The guidance is meant to be applicable to a wide range of organizations and, therefore, describes general elements that organizations should consider as part of their transition planning. These elements are shown in Table E1 (p. 42) and are grouped into the four categories of the TCFD recommendations.
Importantly, an organization’s transition plan should reflect its individual circumstances, including relevant industry-specific information. The TCFD recognizes the transition to a low-carbon economy will have industry-specific nuances and encourages industry associations and others to develop industry-specific guidance on transition plans as needed.
Anchored in Quantitative Elements, Including Climate-Related Metrics and Targets. A transition plan should be designed to consider and help achieve specific targets in an organization’s planned transition to a low-carbon economy. Progress against the organization’s targets should be regularly tracked using appropriate metrics. The transition plan should be consistent with broader economy- or sector-wide science-based pathways to a low-carbon economy.87
Subject to Effective Governance Processes. A transition plan should describe the approval process and oversight and accountability responsibilities within an organization, including the role of the board and senior management in overseeing the plan.
Actionable, Specific Initiatives. A transition plan should articulate specific initiatives and actions the organization will undertake to effectively execute the transition plan, including regular milestones. For example, the transition plan may articulate how an organization plans to reduce Scope 1 GHG emissions by investing in new technologies and processes or by encouraging suppliers to reduce GHG emissions in their operations.
Credible. A transition plan should contain sufficient information to enable users to assess its credibility. For example, the plan should describe the organization’s current capabilities, technologies, transition pathways, and financial plan. Organizations may also want to describe significant limitations, constraints, and uncertainties in the transition plan, such as challenges regarding GHG emissions reductions of hard-to-decarbonize sectors.
87 These pathways may be nonlinear depending on the specifics of an organization’s industry and GHG emissions reduction opportunities.
41
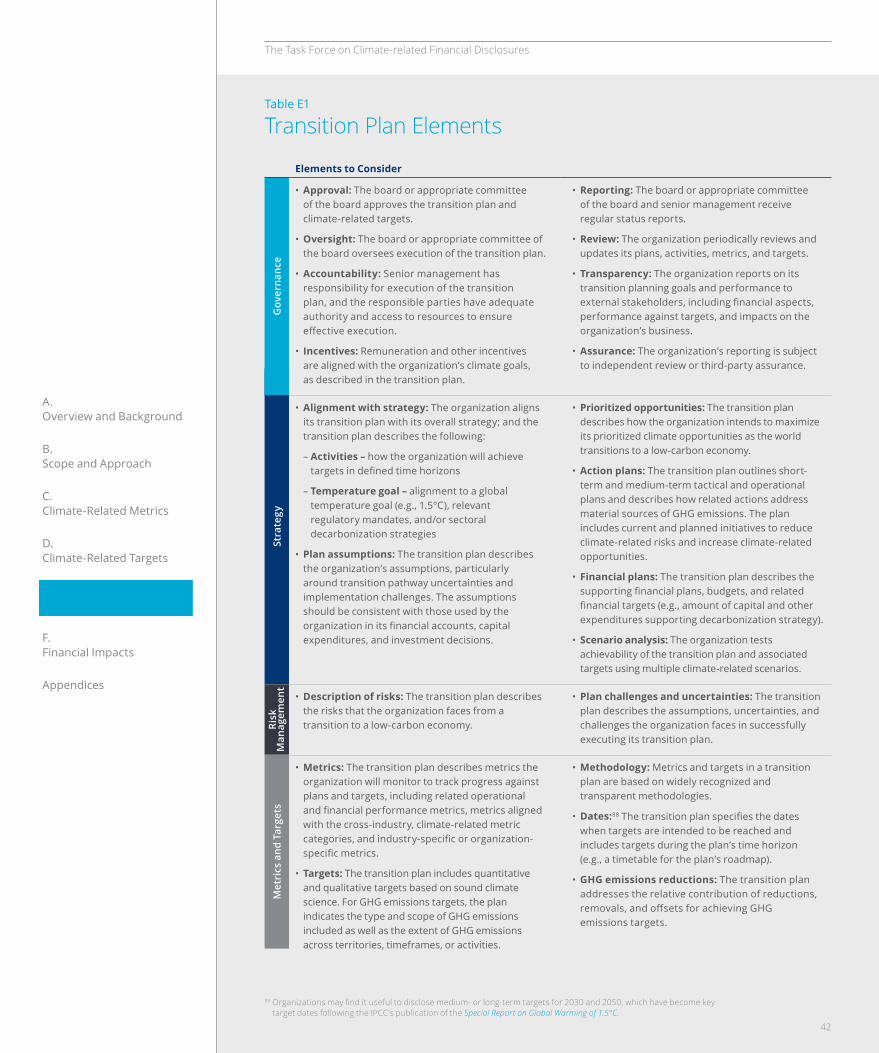
The Task Force on Climate-related Financial Disclosures
A. Overview and Background
B. Scope and Approach
C. Climate-Related Metrics
D. Climate-Related Targets
E. Transition Plans
F. Financial Impacts
Appendices
Stra
tegy
Gov
erna
nce
Risk
M
anag
emen
tM
etri
cs a
nd T
arge
ts
Table E1
Transition Plan Elements
Elements to Consider
• Approval: The board or appropriate committee of the board approves the transition plan and climate-related targets.
• Oversight: The board or appropriate committee of the board oversees execution of the transition plan.
• Accountability: Senior management has responsibility for execution of the transition plan, and the responsible parties have adequate authority and access to resources to ensure effective execution.
• Incentives: Remuneration and other incentives are aligned with the organization’s climate goals, as described in the transition plan.
• Reporting: The board or appropriate committee of the board and senior management receive regular status reports.
• Review: The organization periodically reviews and updates its plans, activities, metrics, and targets.
• Transparency: The organization reports on its transition planning goals and performance to external stakeholders, including financial aspects, performance against targets, and impacts on the organization’s business.
• Assurance: The organization’s reporting is subject to independent review or third-party assurance.
• Alignment with strategy: The organization aligns its transition plan with its overall strategy; and the transition plan describes the following:
– Activities – how the organization will achieve targets in defined time horizons
– Temperature goal – alignment to a global temperature goal (e.g., 1.5°C), relevant regulatory mandates, and/or sectoral decarbonization strategies
• Plan assumptions: The transition plan describes the organization’s assumptions, particularly around transition pathway uncertainties and implementation challenges. The assumptions should be consistent with those used by the organization in its financial accounts, capital expenditures, and investment decisions.
• Prioritized opportunities: The transition plan describes how the organization intends to maximize its prioritized climate opportunities as the world transitions to a low-carbon economy.
• Action plans: The transition plan outlines short-term and medium-term tactical and operational plans and describes how related actions address material sources of GHG emissions. The plan includes current and planned initiatives to reduce climate-related risks and increase climate-related opportunities.
• Financial plans: The transition plan describes the supporting financial plans, budgets, and related financial targets (e.g., amount of capital and other expenditures supporting decarbonization strategy).
• Scenario analysis: The organization tests achievability of the transition plan and associated targets using multiple climate-related scenarios.
• Description of risks: The transition plan describes the risks that the organization faces from a transition to a low-carbon economy.
• Plan challenges and uncertainties: The transition plan describes the assumptions, uncertainties, and challenges the organization faces in successfully executing its transition plan.
• Metrics: The transition plan describes metrics the organization will monitor to track progress against plans and targets, including related operational and financial performance metrics, metrics aligned with the cross-industry, climate-related metric categories, and industry-specific or organization-specific metrics.
• Targets: The transition plan includes quantitative and qualitative targets based on sound climate science. For GHG emissions targets, the plan indicates the type and scope of GHG emissions included as well as the extent of GHG emissions across territories, timeframes, or activities.
• Methodology: Metrics and targets in a transition plan are based on widely recognized and transparent methodologies.
• Dates:88 The transition plan specifies the dates when targets are intended to be reached and includes targets during the plan’s time horizon (e.g., a timetable for the plan’s roadmap).
• GHG emissions reductions: The transition plan addresses the relative contribution of reductions, removals, and offsets for achieving GHG emissions targets.
88 Organizations may find it useful to disclose medium- or long-term targets for 2030 and 2050, which have become key target dates following the IPCC’s publication of the Special Report on Global Warming of 1.5°C.
42
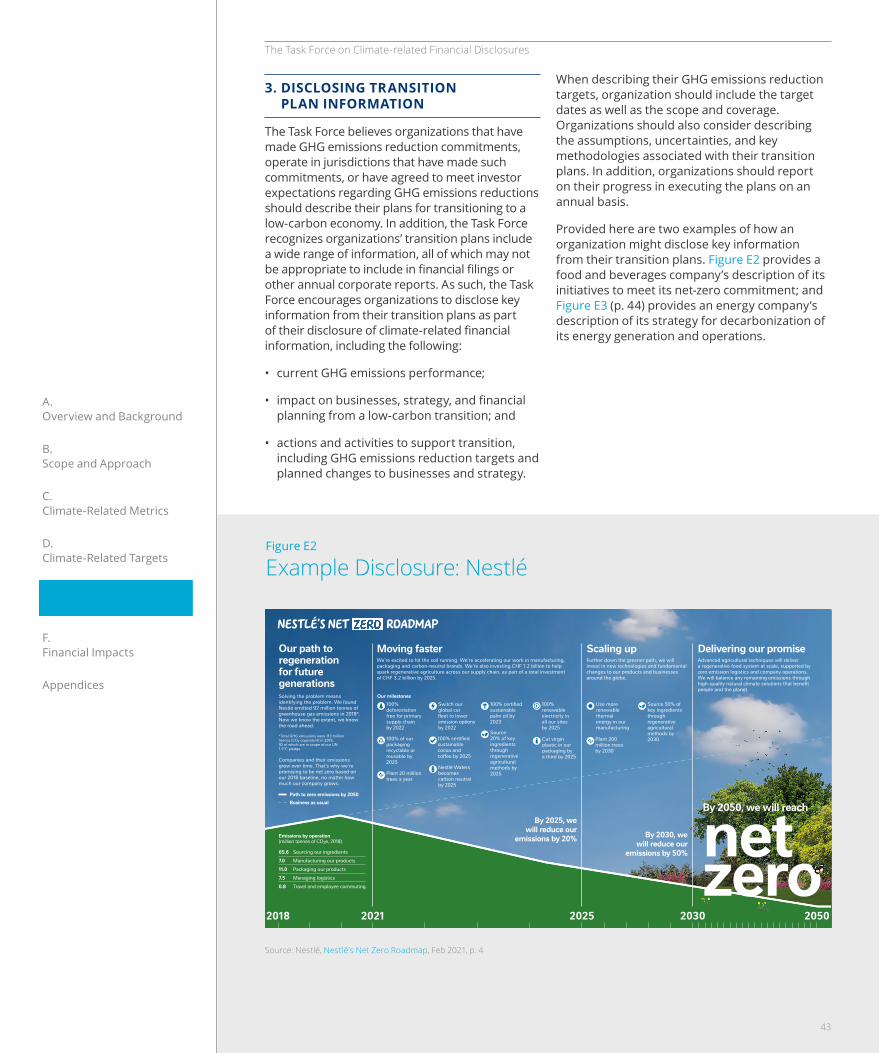
The Task Force on Climate-related Financial Disclosures
A. Overview and Background
B. Scope and Approach
C. Climate-Related Metrics
D. Climate-Related Targets
E. Transition Plans
F. Financial Impacts
Appendices
When describing their GHG emissions reduction targets, organization should include the target dates as well as the scope and coverage. Organizations should also consider describing the assumptions, uncertainties, and key methodologies associated with their transition plans. In addition, organizations should report on their progress in executing the plans on an annual basis.
Provided here are two examples of how an organization might disclose key information from their transition plans. Figure E2 provides a food and beverages company’s description of its initiatives to meet its net-zero commitment; and Figure E3 (p. 44) provides an energy company’s description of its strategy for decarbonization of its energy generation and operations.
3. DISCLOSING TRANSITION PLAN INFORMATION
The Task Force believes organizations that have made GHG emissions reduction commitments, operate in jurisdictions that have made such commitments, or have agreed to meet investor expectations regarding GHG emissions reductions should describe their plans for transitioning to a low-carbon economy. In addition, the Task Force recognizes organizations’ transition plans include a wide range of information, all of which may not be appropriate to include in financial filings or other annual corporate reports. As such, the Task Force encourages organizations to disclose key information from their transition plans as part of their disclosure of climate-related financial information, including the following:
• current GHG emissions performance;
• impact on businesses, strategy, and financial planning from a low-carbon transition; and
• actions and activities to support transition, including GHG emissions reduction targets and planned changes to businesses and strategy.
Figure E2
Example Disclosure: Nestlé
Source: Nestlé, Nestlé’s Net Zero Roadmap, Feb 2021, p. 4
4 Nestlé’s Net Zero Roadmap
Nestlé’s Net Roadmap
Our path to regeneration for future generationsSolving the problem means identifying the problem. We found Nestlé emitted 92 million tonnes of greenhouse gas emissions in 2018*.Now we know the extent, we know the road ahead.
Delivering our promiseAdvanced agricultural techniques will deliver a regenerative food system at scale, supported by zero emission logistics and company operations. We will balance any remaining emissions through high-quality natural climate solutions that benefit people and the planet.
Moving fasterWe’re excited to hit the soil running. We’re accelerating our work in manufacturing, packaging and carbon-neutral brands. We’re also investing CHF 1.2 billion to help spark regenerative agriculture across our supply chain, as part of a total investment of CHF 3.2 billion by 2025.
Scaling upFurther down the greener path, we will invest in new technologies and fundamental changes to our products and businesses around the globe.
Sourcing our ingredients
Manufacturing our products
Packaging our products
Managing logistics
Travel and employee commuting
65.6
7.0
11.0
7.5
0.8
Emissions by operation (million tonnes of CO2e, 2018)
Our milestones
Path to zero emissions by 2050Business as usual
*Total GHG emissions were 113 million tonnes (CO2 equivalent) in 2018, 92 of which are in scope of our UN 1.5°C pledge.
Source 50% of key ingredients through regenerative agricultural methods by 2030Plant 200
million trees by 2030
Use more renewable thermal energy in our manufacturing
2030202520212018
By 2050, we will reach
net zero2050
100% deforestation free for primary supply chain by 2022
Plant 20 million trees a year
100% certified sustainable cocoa and coffee by 2025
Source 20% of key ingredients through regenerative agricultural methods by 2025
Cut virgin plastic in our packaging by a third by 2025
100% of our packaging recyclable or reusable by 2025
100% renewable electricity in all our sites by 2025
Switch our global car fleet to lower emission options by 2022
100% certified sustainable palm oil by 2023
Nestlé Waters becomes carbon neutral by 2025
Companies and their emissions grow over time. That’s why we’re promising to be net zero based on our 2018 baseline, no matter how much our company grows.
By 2025, we will reduce our
emissions by 20% By 2030, we will reduce our
emissions by 50%
43
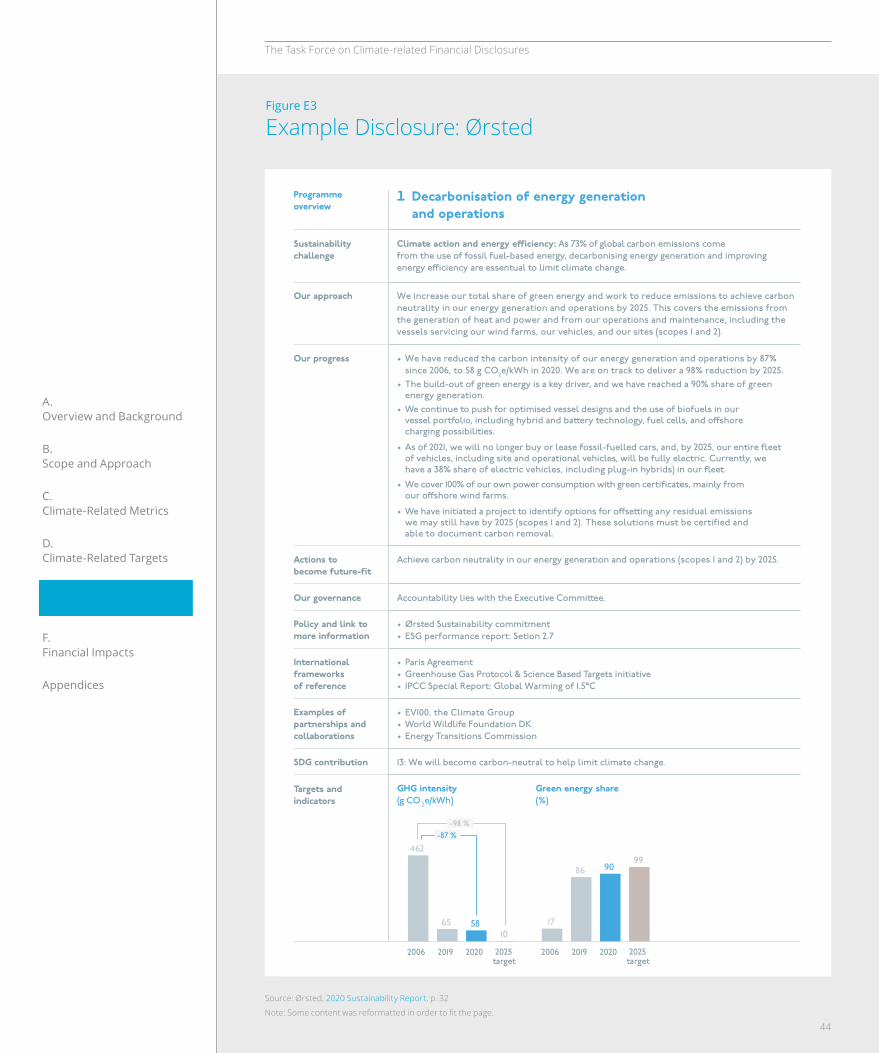
The Task Force on Climate-related Financial Disclosures
A. Overview and Background
B. Scope and Approach
C. Climate-Related Metrics
D. Climate-Related Targets
E. Transition Plans
F. Financial Impacts
Appendices
Figure E3
Example Disclosure: Ørsted
Source: Ørsted, 2020 Sustainability Report, p. 32
Note: Some content was reformatted in order to fit the page.
44
F. Financial Impacts
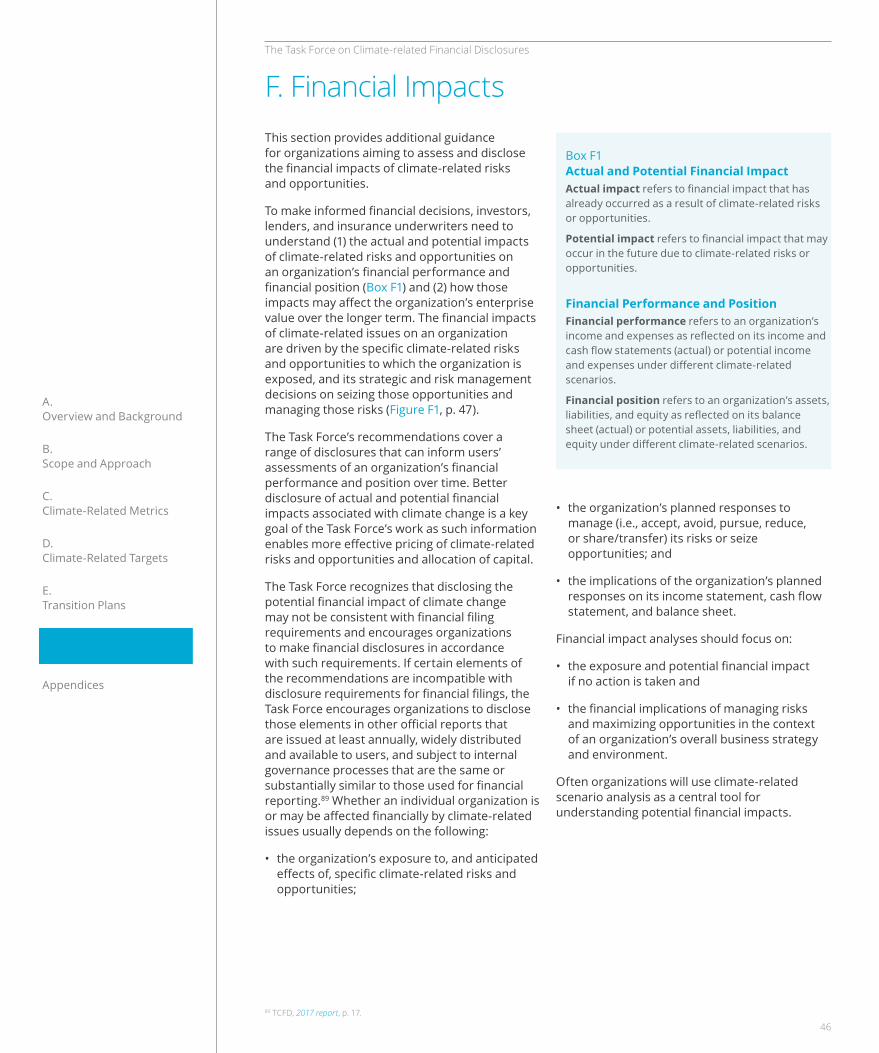
The Task Force on Climate-related Financial Disclosures
A. Overview and Background
B. Scope and Approach
C. Climate-Related Metrics
D. Climate-Related Targets
E. Transition Plans
F. Financial Impacts
Appendices
This section provides additional guidance for organizations aiming to assess and disclose the financial impacts of climate-related risks and opportunities.
To make informed financial decisions, investors, lenders, and insurance underwriters need to understand (1) the actual and potential impacts of climate-related risks and opportunities on an organization’s financial performance and financial position (Box F1) and (2) how those impacts may affect the organization’s enterprise value over the longer term. The financial impacts of climate-related issues on an organization are driven by the specific climate-related risks and opportunities to which the organization is exposed, and its strategic and risk management decisions on seizing those opportunities and managing those risks (Figure F1, p. 47).
The Task Force’s recommendations cover a range of disclosures that can inform users’ assessments of an organization’s financial performance and position over time. Better disclosure of actual and potential financial impacts associated with climate change is a key goal of the Task Force’s work as such information enables more effective pricing of climate-related risks and opportunities and allocation of capital.
The Task Force recognizes that disclosing the potential financial impact of climate change may not be consistent with financial filing requirements and encourages organizations to make financial disclosures in accordance with such requirements. If certain elements of the recommendations are incompatible with disclosure requirements for financial filings, the Task Force encourages organizations to disclose those elements in other official reports that are issued at least annually, widely distributed and available to users, and subject to internal governance processes that are the same or substantially similar to those used for financial reporting.89 Whether an individual organization is or may be affected financially by climate-related issues usually depends on the following:
• the organization’s exposure to, and anticipated effects of, specific climate-related risks and opportunities;
• the organization’s planned responses to manage (i.e., accept, avoid, pursue, reduce, or share/transfer) its risks or seize opportunities; and
• the implications of the organization’s planned responses on its income statement, cash flow statement, and balance sheet.
Financial impact analyses should focus on:
• the exposure and potential financial impact if no action is taken and
• the financial implications of managing risks and maximizing opportunities in the context of an organization’s overall business strategy and environment.
Often organizations will use climate-related scenario analysis as a central tool for understanding potential financial impacts.
F. Financial Impacts
Box F1 Actual and Potential Financial ImpactActual impact refers to financial impact that has already occurred as a result of climate-related risks or opportunities.
Potential impact refers to financial impact that may occur in the future due to climate-related risks or opportunities.
Financial Performance and PositionFinancial performance refers to an organization’s income and expenses as reflected on its income and cash flow statements (actual) or potential income and expenses under different climate-related scenarios.
Financial position refers to an organization’s assets, liabilities, and equity as reflected on its balance sheet (actual) or potential assets, liabilities, and equity under different climate-related scenarios.
89 TCFD, 2017 report, p. 17.
46

The Task Force on Climate-related Financial Disclosures
A. Overview and Background
B. Scope and Approach
C. Climate-Related Metrics
D. Climate-Related Targets
E. Transition Plans
F. Financial Impacts
Appendices
financial accounts, longer climate horizons as compared to business horizons, and securing approval to publicly disclose the results.
More than 90% of users responding to the consultation on metrics, targets, and transition plans noted that information on the impact of climate-related issues on an organization’s financial performance or position is useful for decision-making.92 Additionally, users interviewed for the 2021 status report highlighted that they are increasingly working to incorporate findings from preparer disclosures on financial impacts into their financial decision-making. Several users reported conducting their own financial impact analysis on organizations and comparing the outcomes with those disclosed by the organizations, frequently fostering constructive dialogue between users and preparers.
The remainder of this section provides additional guidance on how climate-related metrics and targets, and information from transition plans, can be used as inputs for estimating financial impact as well as considerations for disclosing financial performance and position.
The Task Force’s annual assessments of the state of disclosures have shown some progress in organizations disclosing potential financial impacts, but that continues to be one of the lowest areas of disclosure.90 The 2021 status report notes that “[d]isclosure of the resilience of companies’ strategies under different climate-related scenarios (Strategy c), although still the least reported recommended disclosure, encouragingly increased from 5% of companies in 2018 to 13% in 2020. ...[Nonetheless, the] percentage of companies disclosing the resilience of their strategies continues to be the lowest of all recommended disclosures.”91 Further detail on challenges to, and solutions for, estimating climate-related financial impact is included in Section C. Disclosure of Financial Impact in the 2021 status report.
In the 2021 status report, the Task Force describes several challenges highlighted by preparers around effectively assessing and disclosing the financial impact of their climate-related risks and opportunities. These include challenges around organizational alignment, data, risk evaluation, attribution of impacts in
90 TCFD, 2018 status report, p. 13; TCFD, 2019 status report, pp. iv and 51; and 2020 status report, pp. 4, 8, and 12.91 TCFD, 2021 status report, p. 31.92 TCFD, Proposed Guidance on Metrics, Targets, and Transition Plans Consultation: Summary
of Responses, October 14, 2021.
Figure F1
Climate-Related Risks, Opportunities, and Financial Impact
Source: TCFD, 2017 report, pp. 8–9
47
Recommendations of the Task Force on Climate-related Financial Disclosures 8
A Introduction B Climate-Related Risks, Opportunities, and Financial Impacts C Recommendations and Guidance D Scenario Analysis and Climate-Related Issues E Key Issues Considered and Areas for Further Work F Conclusion Appendices
3. Financial Impacts Better disclosure of the financial impacts of climate-related risks and opportunities on an organization is a key goal of the Task Force’s work. In order to make more informed financial decisions, investors, lenders, and insurance underwriters need to understand how climate-related risks and opportunities are likely to impact an organization’s future financial position as reflected in its income statement, cash flow statement, and balance sheet as outlined in Figure 1. While climate change affects nearly all economic sectors, the level and type of exposure and the impact of climate-related risks differs by sector, industry, geography, and organization.30
Fundamentally, the financial impacts of climate-related issues on an organization are driven by the specific climate-related risks and opportunities to which the organization is exposed and its strategic and risk management decisions on managing those risks (i.e., mitigate, transfer, accept, or control) and seizing those opportunities. The Task Force has identified four major categories, described in Figure 2 (p. 9), through which climate-related risks and opportunities may affect an organization’s current and future financial positions.
The financial impacts of climate-related issues on organizations are not always clear or direct, and, for many organizations, identifying the issues, assessing potential impacts, and ensuring material issues are reflected in financial filings may be challenging. Key reasons for this are likely because of (1) limited knowledge of climate-related issues within organizations; (2) the tendency to focus mainly on near-term risks without paying adequate attention to risks that may arise in the longer term; and (3) the difficulty in quantifying the financial effects of climate-related issues.31 To assist organizations in identifying climate-related issues and their impacts, the Task Force developed Table 1 (p. 10), which provides examples of climate-related risks and their potential financial impacts, and Table 2 (p. 11), which provides examples of climate-related opportunities and their potential financial impacts. In addition, Section A.4 in the Annex provides more information on the major categories of financial impacts—revenues, expenditures, assets and liabilities, and capital and financing—that are likely to be most relevant for specific industries.
30 SASB research demonstrates that 72 out of 79 Sustainable Industry Classification System (SICS™) industries are significantly affected in some
way by climate-related risk. 31 World Business Council for Sustainable Development, “Sustainability and enterprise risk management: The first step towards integration.”
January 18, 2017.
Figure 1 Climate-Related Risks, Opportunities, and Financial Impact
Opportunities Transition Risks
Physical Risks
Chronic Acute
Policy and Legal Technology Market Reputation
Resource Efficiency Energy Source Products/Services Markets Resilience
Financial Impact
Strategic Planning Risk Management
Risks Opportunities
Revenues
Expenditures Capital & Financing Assets & Liabilities Balance
Sheet Cash Flow Statement
Income Statement
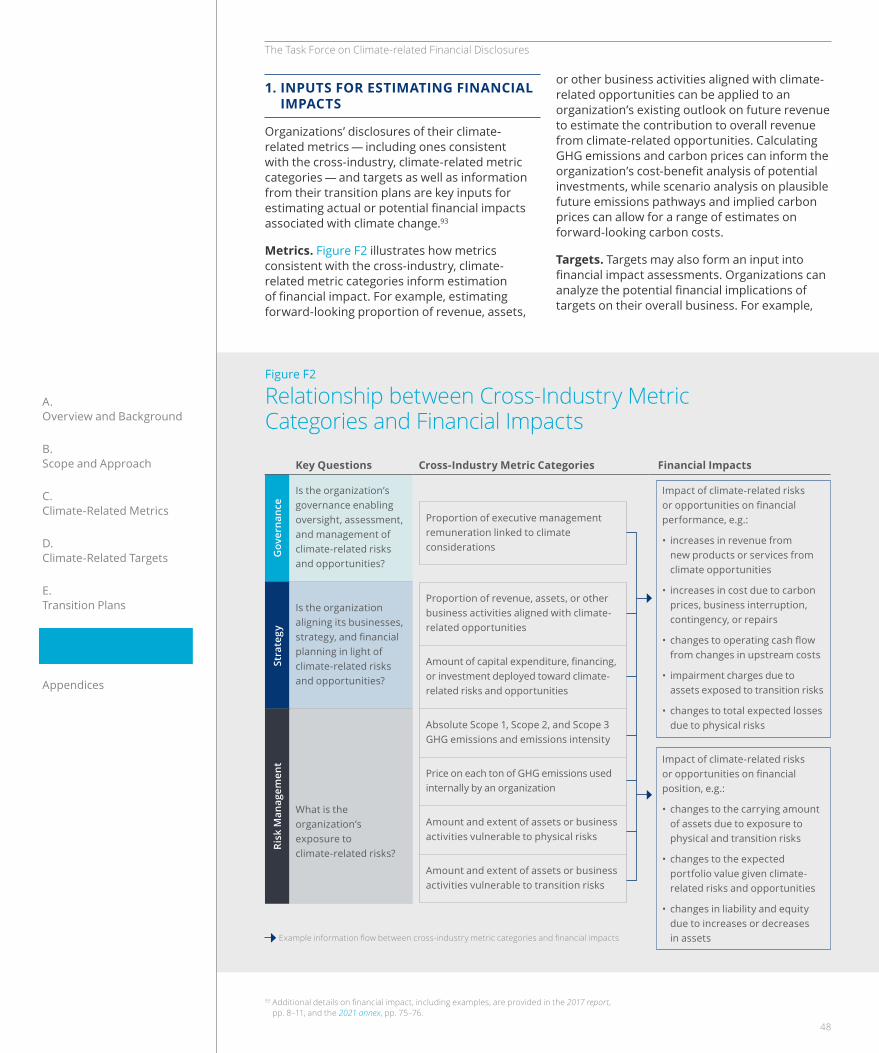
The Task Force on Climate-related Financial Disclosures
A. Overview and Background
B. Scope and Approach
C. Climate-Related Metrics
D. Climate-Related Targets
E. Transition Plans
F. Financial Impacts
Appendices
or other business activities aligned with climate-related opportunities can be applied to an organization’s existing outlook on future revenue to estimate the contribution to overall revenue from climate-related opportunities. Calculating GHG emissions and carbon prices can inform the organization’s cost-benefit analysis of potential investments, while scenario analysis on plausible future emissions pathways and implied carbon prices can allow for a range of estimates on forward-looking carbon costs.
Targets. Targets may also form an input into financial impact assessments. Organizations can analyze the potential financial implications of targets on their overall business. For example,
1. INPUTS FOR ESTIMATING FINANCIAL IMPACTS
Organizations’ disclosures of their climate-related metrics — including ones consistent with the cross-industry, climate-related metric categories — and targets as well as information from their transition plans are key inputs for estimating actual or potential financial impacts associated with climate change.93
Metrics. Figure F2 illustrates how metrics consistent with the cross-industry, climate-related metric categories inform estimation of financial impact. For example, estimating forward-looking proportion of revenue, assets,
Figure F2
Relationship between Cross-Industry Metric Categories and Financial Impacts
Gov
erna
nce
Stra
tegy
Risk
Man
agem
ent
Key Questions Cross-Industry Metric Categories Financial Impacts
Is the organization’s governance enabling oversight, assessment, and management of climate-related risks and opportunities?
Impact of climate-related risks or opportunities on financial performance, e.g.:
• increases in revenue from new products or services from climate opportunities
• increases in cost due to carbon prices, business interruption, contingency, or repairs
• changes to operating cash flow from changes in upstream costs
• impairment charges due to assets exposed to transition risks
• changes to total expected losses due to physical risks
Impact of climate-related risks or opportunities on financial position, e.g.:
• changes to the carrying amount of assets due to exposure to physical and transition risks
• changes to the expected portfolio value given climate-related risks and opportunities
• changes in liability and equity due to increases or decreases in assets
Is the organization aligning its businesses, strategy, and financial planning in light of climate-related risks and opportunities?
What is the organization’s exposure to climate-related risks?
Proportion of executive management remuneration linked to climate considerations
Proportion of revenue, assets, or other business activities aligned with climate-related opportunities
Amount of capital expenditure, financing, or investment deployed toward climate-related risks and opportunities
Absolute Scope 1, Scope 2, and Scope 3 GHG emissions and emissions intensity
Price on each ton of GHG emissions used internally by an organization
Amount and extent of assets or business activities vulnerable to physical risks
Amount and extent of assets or business activities vulnerable to transition risks
93 Additional details on financial impact, including examples, are provided in the 2017 report, pp. 8–11, and the 2021 annex, pp. 75–76.
Example information flow between cross-industry metric categories and financial impacts
48
The Task Force on Climate-related Financial Disclosures
A. Overview and Background
B. Scope and Approach
C. Climate-Related Metrics
D. Climate-Related Targets
E. Transition Plans
F. Financial Impacts
Appendices
2. DISCLOSING FINANCIAL IMPACTS
The Task Force views disclosures of financial impact of climate-related risks and opportunities as falling under two broad categories, as follows:
1) impact of climate-related risks or opportunities on financial performance and
2) impact of climate-related risks or opportunities on financial position.
The remainder of this sub-section provides additional details on disclosing these two categories, including example disclosures of financial impact.
(1) Performance: Impact of Climate-Related Risks or Opportunities on Financial Performance
Actual or potential changes to income and cash flow statements or other appropriate financial performance measures as a result of climate-related risks and opportunities provide insight into management priorities and strategic efforts. Impact on financial performance can include the following:
• increases in revenue from new products or services from climate opportunities;
• increases in cost due to carbon prices, business interruption, contingency, or repairs;
• changes to operating cash flow from changes in upstream costs;
• impairment charges due to assets exposed to transition risks; and
• changes to total expected losses due to physical risks.
Figure F3 (p. 50) shows an example disclosure of actual financial impact, including proportion of earnings before interest, taxes, depreciation, and amortization (EBITDA) aligned to low-carbon products, services, and technologies. Figure F4 (p. 51) includes an example of potential impact on financial performance — the long-term impact of extreme rainfall.
an auto manufacturer may want to set a target to expand its electric vehicle sales to 50% of its total sales by 2030. It could then leverage scenario analysis to understand how various factors and future pathways could impact different elements of its financial performance or position assuming such a target. Similarly, users may explore how a specific organization’s targets may impact its financial performance and position. For example, if an organization sets a target to upgrade 75% of its transmission lines by 2030 to reduce wildfire risk, then a user may be able to infer that the organization’s future cost of business interruptions may decline.
Transition Plans. Finally, financial impact assessments can also be informed by information included in an organization’s transition plan. When an organization develops a transition plan, it may estimate the potential financial impact of planned actions and align its financial plans accordingly. Similarly, users may consider a specific organization’s disclosure of key information from transition plans as well as the user’s assessment of the plan’s viability as a key input into its estimation of that organization’s potential financial performance and position. A description of planned initiatives as well as the process for monitoring, assuring, and achieving GHG emissions reductions targets can provide useful inputs for assessing an organization’s potential financial impacts, such as expected future revenue streams from renewable energy or capital expenditures to upgrade assets with lower-carbon alternatives.94
94 IOSCO, Report on Sustainability-Related Issuer Disclosures, June 21, 2021, pp. 22–24.
49
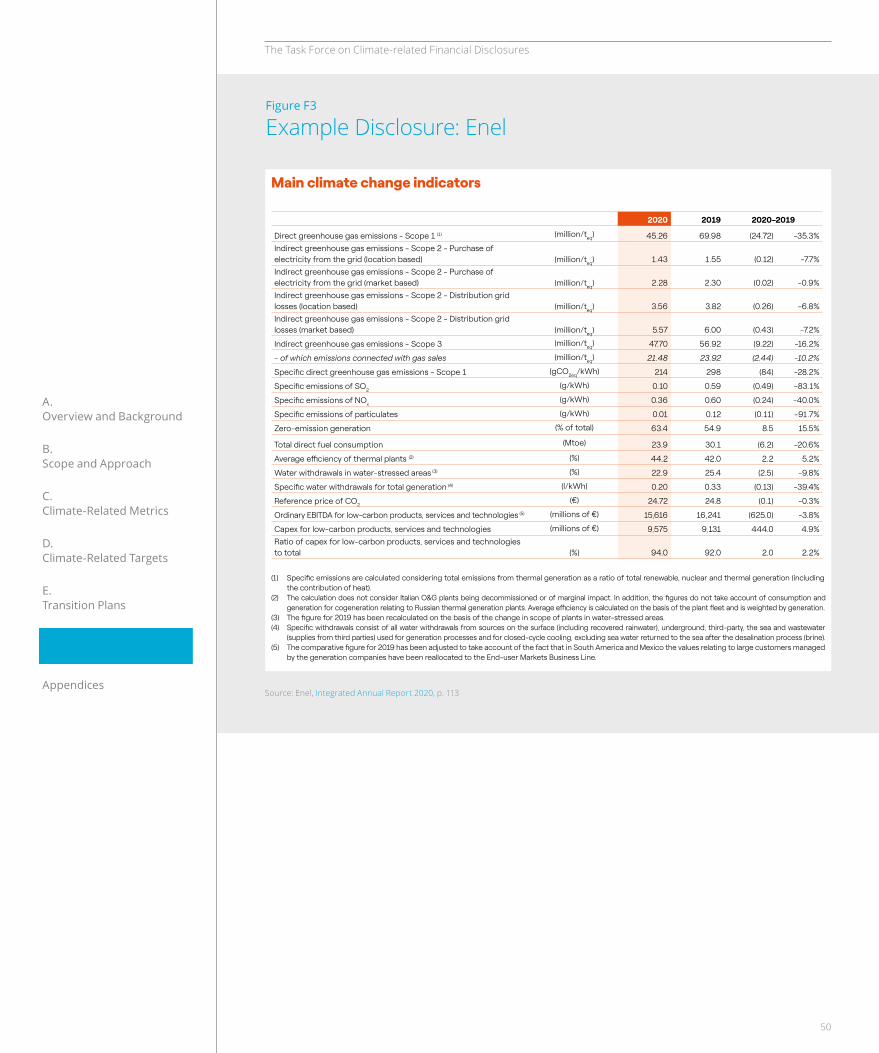
The Task Force on Climate-related Financial Disclosures
A. Overview and Background
B. Scope and Approach
C. Climate-Related Metrics
D. Climate-Related Targets
E. Transition Plans
F. Financial Impacts
Appendices
Figure F3
Example Disclosure: Enel
113Integrated Annual Report 2020
214 20.4
€15,616
63.4%
€9,575
SPECIFIC DIRECT GREENHOUSE GAS EMISSIONS - SCOPE 1
TOTAL WATER CONSUMPTION
ORDINARY EBITDA FOR LOW-CARBON PRODUCTS, SERVICES AND TECHNOLOGIES
ZERO-EMISSION GENERATION
CAPEX FOR LOW-CARBON PRODUCTS, SERVICES AND TECHNOLOGIES
(gCO2eq/kWh) millions of m3
million million
-28.2% on 2019-64.9% on 2019 (% of total)
Fighting climate change and ensuring environmental sustainability
Main climate change indicators
2020 2019 2020-2019
Direct greenhouse gas emissions - Scope 1 (1) (million/teq) 45.26 69.98 (24.72) -35.3% Indirect greenhouse gas emissions - Scope 2 - Purchase of electricity from the grid (location based) (million/teq) 1.43 1.55 (0.12) -7.7%Indirect greenhouse gas emissions - Scope 2 - Purchase of electricity from the grid (market based) (million/teq) 2.28 2.30 (0.02) -0.9%Indirect greenhouse gas emissions - Scope 2 - Distribution grid losses (location based) (million/teq) 3.56 3.82 (0.26) -6.8%Indirect greenhouse gas emissions - Scope 2 - Distribution grid losses (market based) (million/teq) 5.57 6.00 (0.43) -7.2%
Indirect greenhouse gas emissions - Scope 3 (million/teq) 47.70 56.92 (9.22) -16.2%
- of which emissions connected with gas sales (million/teq) 21.48 23.92 (2.44) -10.2%
Specific direct greenhouse gas emissions - Scope 1 (gCO2eq/kWh) 214 298 (84) -28.2%
Specific emissions of SO2 (g/kWh) 0.10 0.59 (0.49) -83.1%
Specific emissions of NOx(g/kWh) 0.36 0.60 (0.24) -40.0%
Specific emissions of particulates (g/kWh) 0.01 0.12 (0.11) -91.7%
Zero-emission generation (% of total) 63.4 54.9 8.5 15.5%
Total direct fuel consumption (Mtoe) 23.9 30.1 (6.2) -20.6%
Average efficiency of thermal plants (2) (%) 44.2 42.0 2.2 5.2%
Water withdrawals in water-stressed areas (3) (%) 22.9 25.4 (2.5) -9.8%
Specific water withdrawals for total generation (4) (l/kWh) 0.20 0.33 (0.13) -39.4%
Reference price of CO2 (€) 24.72 24.8 (0.1) -0.3%
Ordinary EBITDA for low-carbon products, services and technologies (5) (millions of €) 15,616 16,241 (625.0) -3.8%
Capex for low-carbon products, services and technologies (millions of €) 9,575 9,131 444.0 4.9%Ratio of capex for low-carbon products, services and technologies to total (%) 94.0 92.0 2.0 2.2%
(1) Specific emissions are calculated considering total emissions from thermal generation as a ratio of total renewable, nuclear and thermal generation (including the contribution of heat).
(2) The calculation does not consider Italian O&G plants being decommissioned or of marginal impact. In addition, the figures do not take account of consumption and generation for cogeneration relating to Russian thermal generation plants. Average efficiency is calculated on the basis of the plant fleet and is weighted by generation.
(3) The figure for 2019 has been recalculated on the basis of the change in scope of plants in water-stressed areas.(4) Specific withdrawals consist of all water withdrawals from sources on the surface (including recovered rainwater), underground, third-party, the sea and wastewater
(supplies from third parties) used for generation processes and for closed-cycle cooling, excluding sea water returned to the sea after the desalination process (brine).(5) The comparative figure for 2019 has been adjusted to take account of the fact that in South America and Mexico the values relating to large customers managed
by the generation companies have been reallocated to the End-user Markets Business Line.
Source: Enel, Integrated Annual Report 2020, p. 113
50
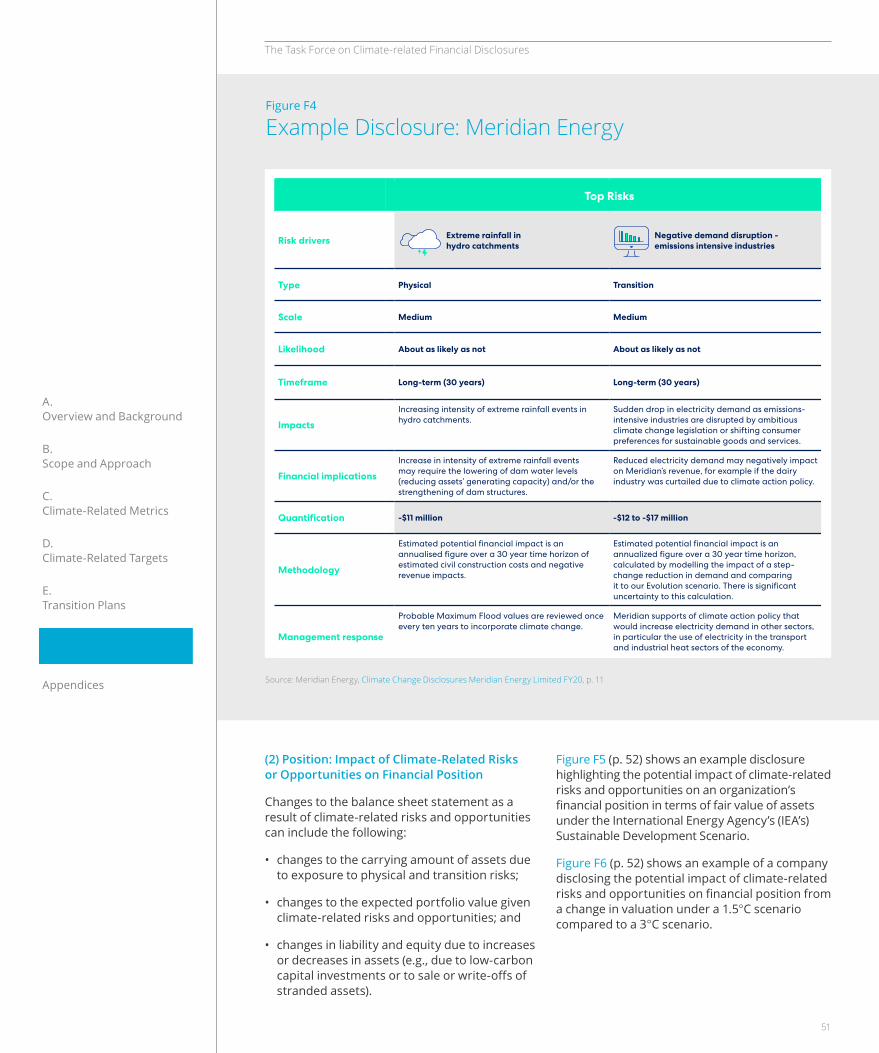
The Task Force on Climate-related Financial Disclosures
A. Overview and Background
B. Scope and Approach
C. Climate-Related Metrics
D. Climate-Related Targets
E. Transition Plans
F. Financial Impacts
Appendices
Figure F4
Example Disclosure: Meridian Energy
Source: Meridian Energy, Climate Change Disclosures Meridian Energy Limited FY20, p. 11
(2) Position: Impact of Climate-Related Risks or Opportunities on Financial Position
Changes to the balance sheet statement as a result of climate-related risks and opportunities can include the following:
• changes to the carrying amount of assets due to exposure to physical and transition risks;
• changes to the expected portfolio value given climate-related risks and opportunities; and
• changes in liability and equity due to increases or decreases in assets (e.g., due to low-carbon capital investments or to sale or write-offs of stranded assets).
Figure F5 (p. 52) shows an example disclosure highlighting the potential impact of climate-related risks and opportunities on an organization’s financial position in terms of fair value of assets under the International Energy Agency’s (IEA’s) Sustainable Development Scenario.
Figure F6 (p. 52) shows an example of a company disclosing the potential impact of climate-related risks and opportunities on financial position from a change in valuation under a 1.5°C scenario compared to a 3°C scenario.
CLIMATE CHANGE DISCLOSURES MERIDIAN ENERGY LIMITED FY20 | 11
Table 1. Top climate-related financial risks for Meridian Energy
Top Risks
Risk drivers Extreme rainfall in hydro catchments
Negative demand disruption - emissions intensive industries
Increase in electricity spot price volatility
Type Physical Transition Transition
Scale Medium Medium Medium
Likelihood About as likely as not About as likely as not Likely
Timeframe Long-term (30 years) Long-term (30 years) Medium-term (5-10 years)
Impacts
Increasing intensity of extreme rainfall events in hydro catchments.
Sudden drop in electricity demand as emissions-intensive industries are disrupted by ambitious climate change legislation or shifting consumer preferences for sustainable goods and services.
As New Zealand increases its share of renewable generation, it may lead to higher levels of electricity spot price volatility.
Financial implications
Increase in intensity of extreme rainfall events may require the lowering of dam water levels (reducing assets’ generating capacity) and/or the strengthening of dam structures.
Reduced electricity demand may negatively impact on Meridian’s revenue, for example if the dairy industry was curtailed due to climate action policy.
Increased costs of commodity risk management due to increases in the percentage of grid-connected renewable electricity generation.
Quantification -$11 million -$12 to -$17 million -$1 to -$40 million
Methodology
Estimated potential financial impact is an annualised figure over a 30 year time horizon of estimated civil construction costs and negative revenue impacts.
Estimated potential financial impact is an annualized figure over a 30 year time horizon, calculated by modelling the impact of a step-change reduction in demand and comparing it to our Evolution scenario. There is significant uncertainty to this calculation.
Estimated potential financial impact is a high-level estimate, an annual cost, and informed by actual costs of current risk instruments and internal views on magnitude of potential changes to electricity spot price volatility.
Management response
Probable Maximum Flood values are reviewed once every ten years to incorporate climate change.
Meridian supports of climate action policy that would increase electricity demand in other sectors, in particular the use of electricity in the transport and industrial heat sectors of the economy.
Meridian has a mature commodity risk framework that includes specific limits for allowable exposure to spot electricity price risk. Within that framework the cost of mitigation is traded-off against the impact of accepting the risk.
51
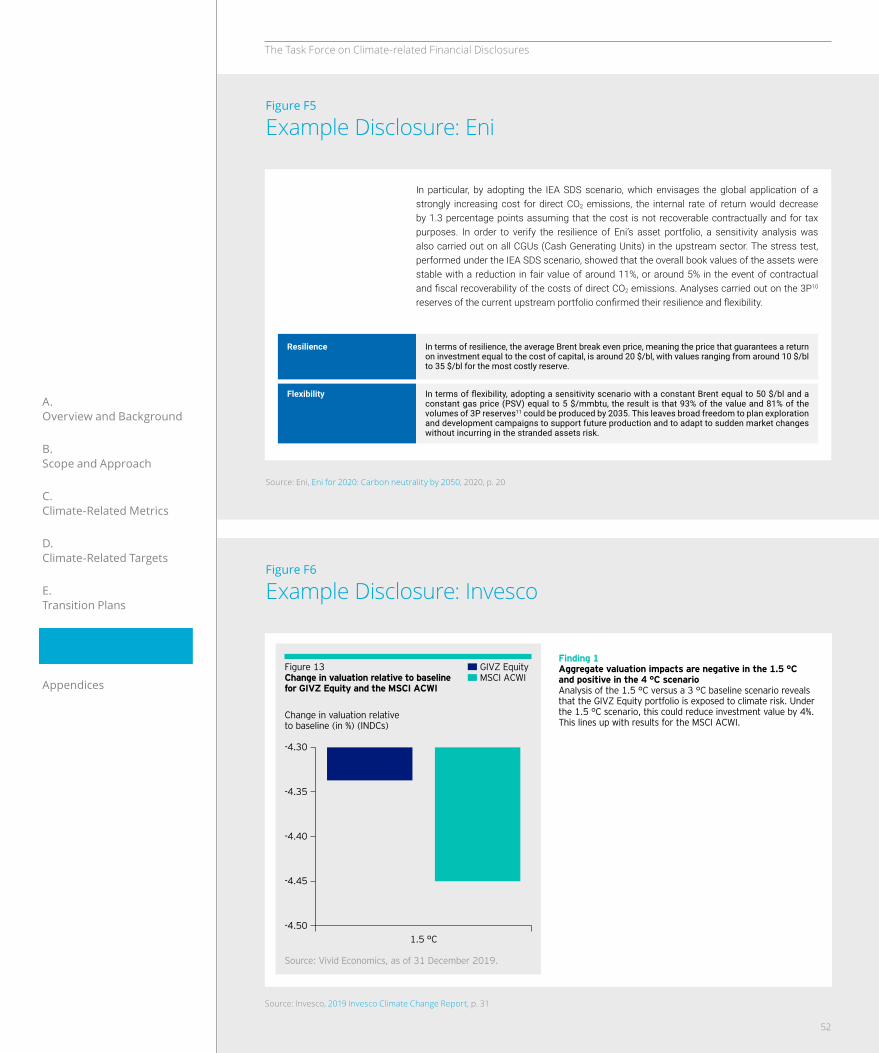
The Task Force on Climate-related Financial Disclosures
A. Overview and Background
B. Scope and Approach
C. Climate-Related Metrics
D. Climate-Related Targets
E. Transition Plans
F. Financial Impacts
Appendices
Figure F5
Example Disclosure: Eni
Figure F6
Example Disclosure: Invesco
Source: Eni, Eni for 2020: Carbon neutrality by 2050, 2020, p. 20
Source: Invesco, 2019 Invesco Climate Change Report, p. 31
20
Resilient and flexible Oil & Gas portfolio
PORTFOLIO RESILIENCEEni’s decarbonisation path includes, in the short term, a progressive growth of hydrocarbon production until a plateau is reached in 2025, followed by a downward trend mainly in the oil component. With the adoption of a model of operational excellence based on successful exploration at competitive costs, reduction of time-to-market of reserves, a phase-based approach to project development and continuous control of operating expenditure, Eni has built a resilient Oil & Gas portfolio. Today, in fact, the main upstream projects in progress feature a break even price of 23 $/bl and an overall internal rate of return (IRR) of about 18% at the Eni price scenario. Projects remain competitive even under less favourable scenarios; specifically, at a 20% price reduction, the internal rate of return (IRR) drops by approximately 2 percentage points. Resilience of the investments portfolio is also measured through a monitoring process aimed at identifying and assessing potential risks deriving from the market scenario and legislative and technological evolution. In this respect, profitability of the most important new investment projects is subject to a sensitivity to carbon pricing using two sets of assumptions: • hydrocarbon price and CO2 cost from Eni scenario;• hydrocarbon price and CO2 cost from IEA SDS scenario.In particular, by adopting the IEA SDS scenario, which envisages the global application of a strongly increasing cost for direct CO2 emissions, the internal rate of return would decrease by 1.3 percentage points assuming that the cost is not recoverable contractually and for tax purposes. In order to verify the resilience of Eni’s asset portfolio, a sensitivity analysis was also carried out on all CGUs (Cash Generating Units) in the upstream sector. The stress test, performed under the IEA SDS scenario, showed that the overall book values of the assets were stable with a reduction in fair value of around 11%, or around 5% in the event of contractual and fiscal recoverability of the costs of direct CO2 emissions. Analyses carried out on the 3P10
reserves of the current upstream portfolio confirmed their resilience and flexibility.
THE ROLE OF GASAs the hydrocarbon production mix evolves, gas will play an increasingly important role with the aim of achieving a 60% share by 2030 and more than 90% by 2050. LNG also plays a crucial role in the growth of gas and Eni is developing a new model which guarantees a leading position in the market. Over the next few years, the portfolio is expected to grow with a forecast for traded volumes of 14 MTPA12 by 2024, a significant increase (+45%) with respect to 2020 traded volumes. This growth will mainly come from new projects in Indonesia, Nigeria, Angola, Mozambique and Egypt, where the Damietta start-up has been completed. These actions contribute to make the Group’s portfolio more sustainable and enhance the value of natural gas as a fossil fuel with lower GHG emissions. The use of technological solutions such as Carbon, Capture, Utilization and Storage applied to power generation plants, LNG plants and
Resilience In terms of resilience, the average Brent break even price, meaning the price that guarantees a return on investment equal to the cost of capital, is around 20 $/bl, with values ranging from around 10 $/bl to 35 $/bl for the most costly reserve.
Flexibility In terms of flexibility, adopting a sensitivity scenario with a constant Brent equal to 50 $/bl and a constant gas price (PSV) equal to 5 $/mmbtu, the result is that 93% of the value and 81% of the volumes of 3P reserves11 could be produced by 2035. This leaves broad freedom to plan exploration and development campaigns to support future production and to adapt to sudden market changes without incurring in the stranded assets risk.
10) 3P reserves include: proven reserves (P1), probable reserves (P2), possible reseves (P3).11) Properly risked, considered 70% (P2) and 30% (P3).12) Million Tonnes per year.
Resilience of the investments portfolio is also measured through a monitoring process aimed at identifying and assessing potential risks deriving from the market scenario and legislative and technological evolution
Gas will play an increasingly important role in the evolution of Eni's hydrocarbons productive mix
Eni for 2020 Carbon neutrality by 2050
Overview | Governance | Risk Management | Strategy | Metrics & Targets
31
In this report, we are presenting the results of the 1.5 °C scenario analysis only. We think that this scenario offers the best means of evaluating the changes needed to align portfolios to the Paris Agreement. In fact, a 4 °C scenario12 assumes there will be no intervention to combat global temperature increase, meaning that emissions-intensive and fossil fuel sectors gain considerable value, as they are no longer subject to the risks of climate action and the resulting limits on their activities. This result, however, reinforces an ecological disaster that threatens the existence of humanity and much other life on the planet.
The results of the modelling take into account the macroeconomic costs of changes to restrict future climate change to ‘only’ +1.5 °C, and the model assumes those measures are not taken in the +4 °C scenario. To mitigate these long-term risks, climate transition risk must take place in the short term, and there is a cost to it.
Inaction may present possible gains. These gains can be outweighed, however, by mitigating portfolio risks from a 1.5 °C scenario to avoid potential losses. We can’t afford not to exceed +1.5 °C; the cost that this involves is one that must be borne for the sake of our future. Our role as active managers is to engage with our current holdings as well as search out and find new investments in issuers that are investing in technologies and other adaptations to both limit the temperature increase and create value for our investors. This would be a long-term climate strategy that would be true to our company values and be worth pursuing for the benefit of our clients and our shareholders at large.
The 1.5 °C scenario analysis pilot project reveals the following findings, which we explore further throughout this section:
1. Aggregate valuation impacts are negative in the 1.5 °C scenario.
2. Transition risk impacts outweigh physical risk impacts.
3. As with emissions intensity, the majority of transition risk impacts are driven by a small number of sectors.
4. Impacts from chronic physical risk are more significant than those from acute physical risk.
5. On average, equity valuations are worse affected than debt valuations. This is also driven by the duration and maturity of the underlying bond portfolio.
Finding 1 Aggregate valuation impacts are negative in the 1.5 °C and positive in the 4 °C scenario Analysis of the 1.5 °C versus a 3 °C baseline scenario reveals that the GIVZ Equity portfolio is exposed to climate risk. Under the 1.5 °C scenario, this could reduce investment value by 4%. This lines up with results for the MSCI ACWI.
Figure 13 Change in valuation relative to baseline for GIVZ Equity and the MSCI ACWI
Change in valuation relative to baseline (in %) (INDCs)
1.5 °C-4.50
-4.40
-4.45
-4.35
-4.30
Source: Vivid Economics, as of 31 December 2019.
GIVZ EquityMSCI ACWI
12 A 4 °C scenario is relative to the baseline Invesco chose for this analysis. The 3 °C baseline scenario sees countries implement the ambitions set out in their Nationally Determined Contributions to the Paris Agreement, while the 4 °C scenario sees no further policy action than what is already in place today. This means that emissions-intensive and fossil fuel sectors gain considerable value, as they are no longer subject to the short-term risks of climate action under the baseline, freeing them from the resulting limits on their activities. On the other hand, the additional ecological damage of moving from 3 °C to 4 °C will only become significant in the long run (beyond 2040). Given the current composition of our GIVZ Equity holdings and the MSCI ACWI, the gains from reducing transition risks outweigh the losses from potential physical risks due to climate change under a 4 °C scenario. These financial valuations are also heavily impacted by discounting, which weights earlier impacts (in the next 10 years) much more than later impact (in more than 20 years). As physical risks manifest later in time, discounting at a standard equity rate of 7.75% as in this analysis presents transition risks as more significant to investors. That is not to say that physical risks will not be more detrimental from a societal perspective in the long term.
52

Appendices

The Task Force on Climate-related Financial Disclosures
A. Overview and Background
B. Scope and Approach
C. Climate-Related Metrics
D. Climate-Related Targets
E. Transition Plans
F. Financial Impacts
Appendices
This appendix provides additional information on select cross-industry, climate-related metric categories. The first sub-section provides an overview of the importance and challenges of Scope 3 GHG emissions disclosure as well as a summary of developments related to Scope 3 GHG emissions reporting for financial institutions. This sub-section focuses on Scope 3 GHG emissions in order to highlight developments on the research and disclosure of these emissions since 2017. It is important to emphasize that organizations should disclose Scope 1 and Scope 2 GHG emissions independent of a materiality assessment, given their importance as an input to calculating Scope 3 GHG emissions and as a critical aspect of understanding climate-related risks and opportunities. The second sub-section provides information to support disclosure of internal carbon prices.
1. SCOPE 3 GHG EMISSIONS
The most well-known and widely referenced classification of greenhouse gases is the GHG Protocol Corporate Standard, which defines the three scopes of GHG emissions from the perspective of the reporting company as follows:95, 96
• Scope 1 GHG emissions are direct emissions from owned or controlled sources. Note that one company’s Scope 1 (direct) emissions are Scope 3 (indirect) emissions for a company or consumer who is in the first company’s value chain.
• Scope 2 GHG emissions are indirect emissions from the generation of purchased energy.
• Scope 3 GHG emissions are all indirect emissions (not included in Scope 2) that occur in the value chain of the reporting company, including both upstream and downstream emissions. The GHG Protocol’s Scope 3 schema contains 15 stages, eight of which are upstream, seven downstream.
The GHG Protocol Scope 3 Standard notes that “while a company has control over its direct emissions, it has influence over its indirect emissions.”97
Appendix 1: Further Information on Select Cross-Industry, Climate-Related Metric Categories
95 The GHG Protocol Corporate Standard, commonly referred to simply as the Corporate Standard, is a methodology developed by the GHG Protocol Initiative and is the methodology recommended by the Task Force for calculating and reporting GHG emissions (2017 TCFD Final Report, Section C3, p. 22, footnote 40). It covers the accounting and reporting of the six greenhouse gases covered by the Kyoto Protocol — carbon dioxide (CO2), methane (CH4), nitrous oxide (N2O), hydrofluorocarbons (HFCs), perfluorocarbons (PFCs), and sulphur hexafluoride (SF6). The first edition of the Corporate Standard was published in 2001 and then updated in 2004 with additional guidance clarifying how companies can measure GHG emissions from electricity and other energy purchases, and account for GHG emissions from throughout their value chains. Building on the Corporate Standard, the GHG Protocol then developed a more detailed approach to Scope 3 GHG emissions, and in 2011 published the Corporate Value Chain (Scope 3) Accounting and Reporting Standard, commonly referred to as the Scope 3 Standard. A supplement to the Scope 3 Standard was published in 2013 providing additional details on calculating Scope 3 GHG emissions, namely the Technical Guidance for Calculating Scope 3 Emissions.
96 For more information, see GHG Protocol, Frequently Asked Questions.97 GHG Protocol, Corporate Value Chain (Scope 3) Accounting and Reporting Standard, September 2011, p. 27.
54
The Task Force on Climate-related Financial Disclosures
A. Overview and Background
B. Scope and Approach
C. Climate-Related Metrics
D. Climate-Related Targets
E. Transition Plans
F. Financial Impacts
Appendices
Components, Consumer Durables and Apparel, and Technology — downstream Scope 3 GHG emissions were predominant. For 13 industries, upstream GHG emissions were predominant. Only three of the 24 industry groups had indirect emissions less than 50%: Utilities, Transportation, and Materials.
In addition, CDP’s 2020 Supply Chain Report, evaluating the state of environmental risks in supply chains for 8,098 suppliers, found that upstream Scope 3 GHG emissions are on average 11.4 times higher than operational emissions across sectors (Figure A1-2, p. 56).
An increasing number of companies are reporting Scope 3 GHG emissions. Task Force analysis of 2,500 organizations within the MSCI All Country World Index (ACWI Index) found that from 2017–2019, organizations disclosing Scope 3 GHG emissions grew from 28% to 34%.100
Industry and investor initiatives are calling for the disclosure of Scope 3 GHG emissions. For example, Climate Action 100+ (CA100+), an investor initiative of 615 investors representing $55 trillion in assets under management, engages with companies to “reduce greenhouse gas emissions across the value chain” in line with the Paris Agreement.101 Necessarily, this engagement includes Scope 3 GHG emissions within its focus. CA100+ also asks companies to enhance their climate-related disclosures in line with the TCFD recommendations.
There is increasing urgency on reducing GHG emissions — both direct and indirect — to zero, which stems from a shift in international dialogue from a focus on carbon budgets consistent with the Paris Agreement to a focus on achieving net-zero GHG emissions by 2050, with governments and investors increasingly focusing on the full value chain of emissions. As an increasing number of jurisdictions formally move to net-zero targets, they may require more comprehensive GHG reporting from companies within their borders.
Financial organizations require effective disclosure of GHG emissions data, including Scope 3 GHG emissions, to track their GHG emissions reduction commitments and meet their disclosure obligations. Banks, insurance companies, asset managers, and asset owners will need better disclosure of GHG emissions
Since 2017, Scope 3 GHG emissions, including the Scope 3 investment category, have received increasing attention in both the public and private sectors. Scope 3 GHG emissions are becoming an essential component of climate-related risk analysis in commercial and financial markets. As companies’ and jurisdictions’ commitments to reduce GHG emissions — both direct and indirect — to net-zero continue to grow, investors, lenders, and insurance underwriters want insight into value chain GHG emissions and how they could be affected by such commitments. In response to widespread interest, an increasing number of companies are reporting GHG emissions, including Scope 3 GHG emissions.
A. Importance of Disclosure of Scope 3 GHG Emissions
Scope 3 GHG emissions are an important component of overall GHG emissions for several reasons.
Scope 3 GHG emissions are increasingly understood as an important indicator of risk, as risk is embedded in buying inputs or selling products that are carbon intensive. A 2017 study by CDP found that of the three GHG emissions scopes, “approximately 40% of global GHG emissions are driven or influenced by organizations through their purchases (i.e., purchased goods and services) and through the products they sell” (in other words, through their Scope 3 GHG emissions).98
Scope 3 GHG emissions are a critical component of overall GHG emissions. A growing body of research shows that in certain sectors, Scope 3 GHG emissions can account for several times the impact of a company’s Scope 1 and Scope 2 GHG emissions.
For example, a 2015 report by the sell-side investment research house Kepler-Cheuvreux analyzed the GHG emissions for 24 industry groups under the Global Industry Classification Standard (GICS) (Figure A1-1, p. 56). It found that 21 industry groups had indirect GHG emissions (Scope 3 GHG emissions upstream and downstream and Scope 2 upstream GHG emissions) greater than 50% of their overall carbon emissions.99 For eight of these 21 industries — Banks, Insurance, Real Estate, Energy, Capital Goods, Automobiles and
98 SBTi, Gold Standard, and Navigant, Value Change in the Value Chain: Best Practices in Scope 3 GHG Management, citing CDP’s 2017/2018 Global Supply Chain report Closing the Gap: Scaling Up Sustainable Supply Chains, November 2018, p. 9.
99 For more information, see Kepler Cheuvreux, Carbon Compass: Investor Guide to Carbon Footprinting and the section titled “Fasten your seat belt,” pp. 19–23.
100 Task Force analysis of MSCI ACWI Index data.101 For more information, see Climate Action 100+.
55
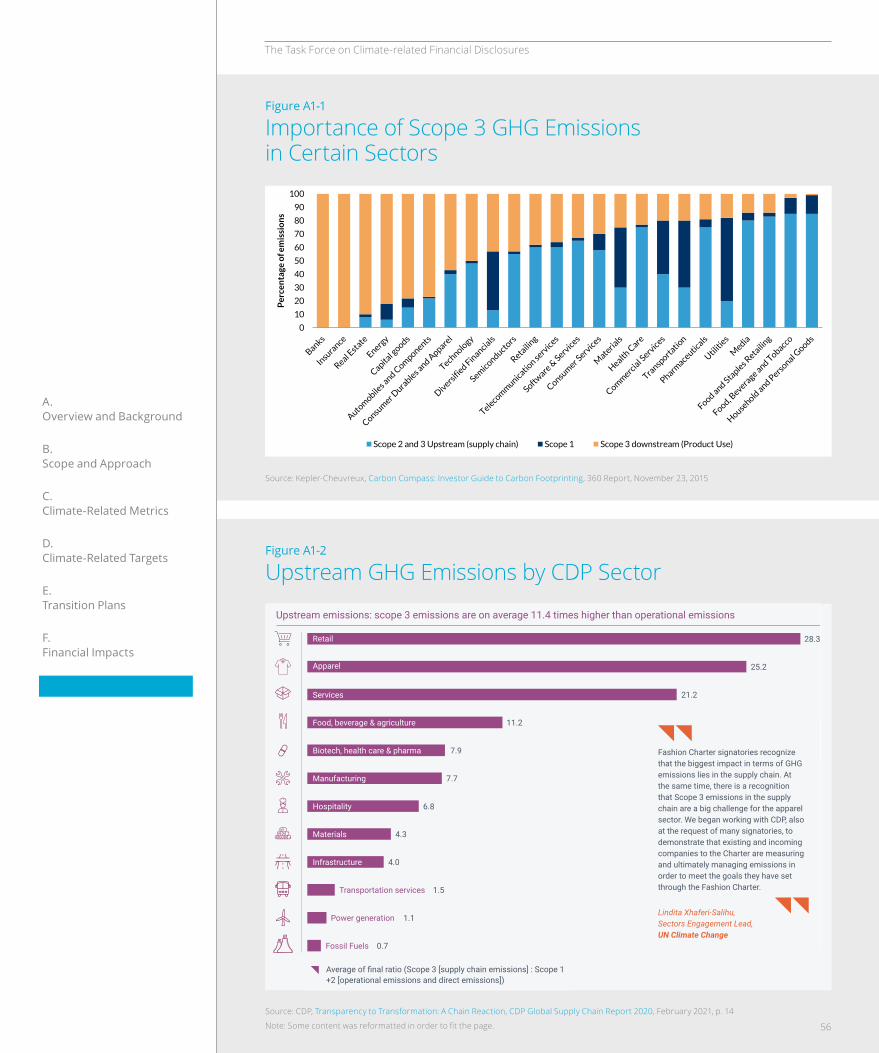
The Task Force on Climate-related Financial Disclosures
A. Overview and Background
B. Scope and Approach
C. Climate-Related Metrics
D. Climate-Related Targets
E. Transition Plans
F. Financial Impacts
Appendices
Figure A1-1
Importance of Scope 3 GHG Emissions in Certain Sectors
Source: Kepler-Cheuvreux, Carbon Compass: Investor Guide to Carbon Footprinting, 360 Report, November 23, 2015
Energy Transition & Climate Change
20 keplercheuvreux.com
What scope should I include? The GHG Protocol ‘Corporate Accounting and Reporting Standard’ (link) has
developed a standard to measure the GHG emissions of companies using three
‘scopes’.
Scope 1 emissions are the direct emissions of a company, notably from company vehicles and energy use in facilities.
Scope 2 emissions are indirect upstream emissions that come from the purchase of electricity, heating and cooling.
Scope 3 emissions are also indirect and refer to both upstream supply-chain emissions such as upstream logistics and purchased goods and services, as well as downstream activities, notably emissions from the use and disposal of sold products, as well as emissions from franchises. The GHG emissions from investments (‘financed emissions’) also fall into this category.
One could argue that a company has more influence on its Scope 1 and 2 emissions
compared to its Scope 3 emissions. Note that this varies across Scope 3 categories
(e.g. an automobile company has a large influence on the emissions of its cars).
Chart 5: Scope 3 – it matters!
Source: Based on Inrate data
Yet, most companies do not disclose Scope 3 emissions, beyond categories such as
‘business travel’. Only approximately 10 out of the world’s 800 largest publicly-
listed companies provide information on each of the 15 Scope 3 categories on a basis
of ‘comply-or-explain’ (i.e. explanation is given as to why a Scope 3 category is not
reported, usually because it is not relevant to the sector or business model) (link).
0
10
20
30
40
50
60
70
80
90
100
Per
cen
tage
of e
mis
sio
ns
Scope 2 and 3 Upstream (supply chain) Scope 1 Scope 3 downstream (Product Use)
Figure A1-2
Upstream GHG Emissions by CDP Sector
Source: CDP, Transparency to Transformation: A Chain Reaction, CDP Global Supply Chain Report 2020, February 2021, p. 14
Note: Some content was reformatted in order to fit the page.
Upstream emissions: scope 3 emissions are on average 11.4 times higher than operational emissions
Average of final ratio (Scope 3 [supply chain emissions] : Scope 1 +2 [operational emissions and direct emissions])
Retail 28.3
Apparel 25.2
Services 21.2
Food, beverage & agriculture 11.2
Biotech, health care & pharma 7.9
Manufacturing 7.7
Hospitality 6.8
Materials 4.3
Infrastructure 4.0
Transportation services 1.5
Power generation 1.1
Fossil Fuels 0.7
Fashion Charter signatories recognize that the biggest impact in terms of GHG emissions lies in the supply chain. At the same time, there is a recognition that Scope 3 emissions in the supply chain are a big challenge for the apparel sector. We began working with CDP, also at the request of many signatories, to demonstrate that existing and incoming companies to the Charter are measuring and ultimately managing emissions in order to meet the goals they have set through the Fashion Charter.
Lindita Xhaferi-Salihu, Sectors Engagement Lead, UN Climate Change
11.4x higherSupply chain emissions are 11.4 times higher than operational emissions
37% of suppliers are taking supply chain action themselves, down from 39% in 2019
Suppliers are turning the spotlight on their own supply chains.
In 2020, suppliers reported upstream emissions that were, on average, 11.4 times greater than those produced through their direct operations.
This is a big jump from 2019, when the reported upstream emissions were five and a half times greater than operational emissions. This is not an indication of an increase in supply chain emissions. Rather, this statistic promisingly shows that more suppliers are measuring emissions in their supply chain (known as scope 3 emissions), and accounting for those emissions over the full lifecycle of their products or services in line with the GHG protocol.
These figures underline that real climate leadership cannot be achieved without tackling scope 3 impacts.
Supplier engagement continues to remain the exception rather than the norm.
Measuring scope 3 emissions is only a first step, however. Despite the quantification of risk exposure and upstream emissions, only 37% of suppliers are taking action and engaging with their own suppliers, down from 39% in 2019.
CDP GLOBAL SUPPLY CHAIN REPORT 2020 14
56
The Task Force on Climate-related Financial Disclosures
A. Overview and Background
B. Scope and Approach
C. Climate-Related Metrics
D. Climate-Related Targets
E. Transition Plans
F. Financial Impacts
Appendices
Boundary Challenges. Establishing clear value chain boundaries when calculating Scope 3 GHG emissions presents another challenge.102 While in principle the fifteen GHG emissions categories defined by the Scope 3 Standard are designed to be mutually exclusive, applying the Scope 3 Standard in practice can cause an overlap in reporting boundaries due to an organization’s involvement at multiple points in the life cycle of products and can result in double counting of Scope 3 GHG emissions.
Organizational Challenges. The calculation of Scope 3 GHG emissions requires personnel, resources, expertise, and data management and quality processes.
C. Scope 3 GHG Emissions for Financial Organizations
Category 15 of the GHG Protocol’s Scope 3 Standard relates to investments, which the GHG Protocol notes are a form of Scope 3 GHG emissions “applicable to investors and companies that provide financial services. Investments are categorized as a downstream Scope 3 category because the provision of capital or financing is a service provided by the reporting company.”103, 104 For financial organizations, Scope 3 GHG emissions, especially category 15, are by far the largest component of their total GHG emissions.105 However, assessing and pricing exposure to climate-related risks within the financial system depends on the effectiveness of the climate-related disclosures of the companies that are financed by banks, asset owners, and asset managers and underwritten by insurance companies. If the disclosures made by organizations with significant direct and indirect GHG emissions do not include sufficient information on Scope 1, Scope 2, and Scope 3 GHG emissions, then the banking and insurance industries’ understanding of the concentration of carbon-related assets on their balance sheets may be incomplete and asset owner and asset managers will have limited visibility into risk associated with carbon-intensive issuers.
Since the TCFD published its final report in June 2017, a number of initiatives have emerged to improve the disclosure and reporting of financial organizations’ GHG emissions. Two of these developments are of particular relevance for the Task Force’s guidance on this topic: (1) the
from preparers to understand GHG emissions from their lending, investing, and insurance underwriting activities and evaluate how these activities may expose them to carbon-related assets and their associated risks.
B. Challenges in Determining Scope 3 GHG Emissions
Despite increased demand and reporting, the disclosure of Scope 3 GHG emissions faces a number of challenges, including:
Data Challenges. Organizations struggle to collect relevant and sufficiently granular primary data and to manage the amount of data needed to determine Scope 3 GHG emissions; this often requires formal data management plans and resources. Using secondary data or industry-average GHG emissions factors also presents issues, such as how to account for uncertainties in industry-average GHG emissions factors around data collection or quality and an uneven distribution of GHG emissions within an industry.
In feedback to the Task Force’s consultation on metrics, targets, and transition plans, several financial sector respondents expressed concern about reporting on GHG emissions related to their own or their clients’ investments, given the current data challenges and existing accounting guidance on how to measure and report GHG emissions associated with investments. In particular, they voiced concerns about the accuracy and completeness of the reported data.
Methodology Challenges. Accurately capturing Scope 3 GHG emissions also has methodological challenges, including estimating GHG emissions for suppliers that do not calculate their own emissions, defining an appropriate calculation approach for each Scope 3 category, and recognizing double counting that may occur when GHG emissions are aggregated across multiple organizations. Even when an appropriate methodology is determined, users of an organization’s disclosures must understand sources of uncertainty regarding whether a value accurately represents the activity in the organization’s value chain, whether variation in calculated GHG emissions are due to methodological choices, and whether there are any limitations as a result of the modeling approaches used to reflect the real world.
102 The GHG Protocol Corporate Standard allows companies flexibility in choosing which, if any, scope 3 activities to include in the GHG inventory when the company defines its operational boundaries.
103 GHG Protocol, Corporate Value Chain (Scope 3) Accounting and Reporting Standard, September 2011, p. 51.104 The GHG Protocol’s Category 15: Investments was designed primarily for financial institutions and includes Scope 3 emissions
associated with the reporting company’s investments, not already included in Scope 1 or Scope 2. For more information, see GHG Protocol, Technical Guidance for Calculating Scope 3 Emissions, p. 136.
105 For more information, see CDP, The Time to Green Finance, April 2021, p. 33.
57
The Task Force on Climate-related Financial Disclosures
A. Overview and Background
B. Scope and Approach
C. Climate-Related Metrics
D. Climate-Related Targets
E. Transition Plans
F. Financial Impacts
Appendices
in collaboration with members of the Net-Zero Insurance Alliance as well as other insurance companies to develop a methodology for measuring GHG emissions associated with underwriting activities.109
PCAF recognizes the difficulties inherent in the comparability, coverage, transparency, and reliability of Scope 3 GHG emissions data, but notes that “by requiring Scope 3 reporting for selected sectors, PCAF seeks to make Scope 3 GHG emissions reporting more common practice by improving data availability and quality over time.” To support Scope 3 GHG emissions data challenges, the PCAF Standard provides recommendations and requirements for disclosures, as well as guidance on data quality scoring per asset class to facilitate data transparency and quality in the medium and long term.
The CRO Forum’s Carbon Footprinting Methodology for Underwriting PortfoliosIn April 2020, the CRO Forum published Carbon Footprinting Methodology for Underwriting Portfolios, a report summarizing “a range of options, methodologies, and barriers for the carbon-footprinting of insurance companies’ underwriting portfolios” (p. 5).110, 111, 112
The CRO report states that the weighted average carbon intensity (WACI) metric for asset owners and asset managers recommended by the TCFD in its 2017 final report is also applicable — with appropriate changes — to underwriting portfolios. The CRO Forum’s report recommends using WACI as a first step in gauging the financial risks posed to underwriting portfolios by climate change. The CRO Forum’s WACI metrics are calculated on the basis of the insured entities’ Scope 1 and Scope 2 GHG emissions only, with the Scope 3 GHG emissions of entities underwritten excluded from the calculation.
Partnership for Carbon Accounting Financials (PCAF) and (2) the Climate Risk Officer (CRO) Forum methodology on carbon footprinting for the insurance industry.
The PCAF Global GHG Accounting and Reporting StandardIn November 2020, PCAF issued the first edition of the Global GHG Accounting and Reporting Standard for the Financial Industry (the PCAF Standard).106 The PCAF Standard builds on the GHG Protocol Scope 3 accounting rules, providing methodological guidance to assist in the measurement and disclosure of GHG emissions associated with six asset classes: (1) listed equity and corporate bonds, (2) business loans and unlisted equity, (3) project finance, (4) commercial real estate, (5) mortgages, and (6) motor vehicle loans.
The PCAF Standard provides guidance for each asset class to aid calculation of the GHG emissions resulting from activities in the real economy that are financed through lending and investment portfolios. GHG emissions are attributed to financial organizations based on accounting rules that are specific for each asset class. This approach is used by the SBTi as part of their guidance for financial organizations on setting targets on their GHG emissions.107
The PCAF Standard currently does not provide explicit guidance on calculating GHG emissions for certain financial products including private equity that refers to investment funds, green bonds, sovereign bonds, loans for securitization, exchange traded funds, derivatives, and initial public offering (IPO) underwriting and notes “guidance on such financial products will be considered and published in later editions of the Standard.”108 In addition, PCAF is working
106 PCAF, Global GHG Accounting and Reporting Standard for the Financial Industry, November 18, 2020. 107 SBTi, Financial Sector Science-Based Targets Guidance, Pilot Version 1.1, April 2021.108 PCAF, Global GHG Accounting and Reporting Standard for the Financial Industry, November 18, 2020, p. 44.109 PCAF, “Partnership for Carbon Accounting Financials collaborates with UN-convened Net-Zero Insurance Alliance to develop
standard to measure insured emissions,” September 6, 2021.110 For more information, see Carbon Footprinting Methodology for Underwriting Portfolios, April 29, 2020.111 The CRO Forum is an initiative established in 2004 bringing together the Chief Risk Officers of leading insurance companies
to advance risk management practices in the insurance industry.112 The Net-Zero Insurance Alliance (NZIA), convened by the UN Environment Programme’s Principles for Sustainable Insurance
Initiative (PSI) and contributing to the UNFCCC Race to Zero Campaign and the Glasgow Financial Alliance for Net Zero (GFANZ), provides additional guidance and/or requirements for insurance and reinsurance signatory companies. For more information, see the NZIA “Statement of commitment by signatory companies.”
58
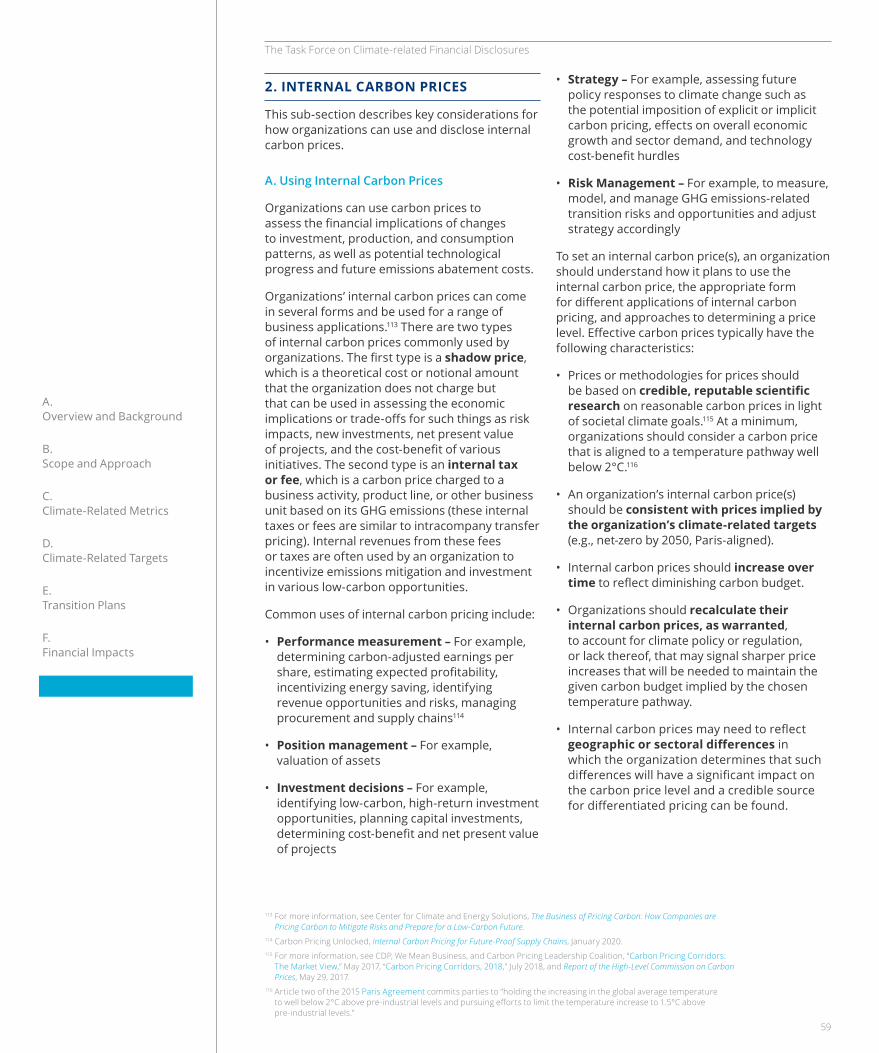
The Task Force on Climate-related Financial Disclosures
A. Overview and Background
B. Scope and Approach
C. Climate-Related Metrics
D. Climate-Related Targets
E. Transition Plans
F. Financial Impacts
Appendices
• Strategy – For example, assessing future policy responses to climate change such as the potential imposition of explicit or implicit carbon pricing, effects on overall economic growth and sector demand, and technology cost-benefit hurdles
• Risk Management – For example, to measure, model, and manage GHG emissions-related transition risks and opportunities and adjust strategy accordingly
To set an internal carbon price(s), an organization should understand how it plans to use the internal carbon price, the appropriate form for different applications of internal carbon pricing, and approaches to determining a price level. Effective carbon prices typically have the following characteristics:
• Prices or methodologies for prices should be based on credible, reputable scientific research on reasonable carbon prices in light of societal climate goals.115 At a minimum, organizations should consider a carbon price that is aligned to a temperature pathway well below 2°C.116
• An organization’s internal carbon price(s) should be consistent with prices implied by the organization’s climate-related targets (e.g., net-zero by 2050, Paris-aligned).
• Internal carbon prices should increase over time to reflect diminishing carbon budget.
• Organizations should recalculate their internal carbon prices, as warranted, to account for climate policy or regulation, or lack thereof, that may signal sharper price increases that will be needed to maintain the given carbon budget implied by the chosen temperature pathway.
• Internal carbon prices may need to reflect geographic or sectoral differences in which the organization determines that such differences will have a significant impact on the carbon price level and a credible source for differentiated pricing can be found.
2. INTERNAL CARBON PRICES
This sub-section describes key considerations for how organizations can use and disclose internal carbon prices.
A. Using Internal Carbon Prices
Organizations can use carbon prices to assess the financial implications of changes to investment, production, and consumption patterns, as well as potential technological progress and future emissions abatement costs.
Organizations’ internal carbon prices can come in several forms and be used for a range of business applications.113 There are two types of internal carbon prices commonly used by organizations. The first type is a shadow price, which is a theoretical cost or notional amount that the organization does not charge but that can be used in assessing the economic implications or trade-offs for such things as risk impacts, new investments, net present value of projects, and the cost-benefit of various initiatives. The second type is an internal tax or fee, which is a carbon price charged to a business activity, product line, or other business unit based on its GHG emissions (these internal taxes or fees are similar to intracompany transfer pricing). Internal revenues from these fees or taxes are often used by an organization to incentivize emissions mitigation and investment in various low-carbon opportunities.
Common uses of internal carbon pricing include:
• Performance measurement – For example, determining carbon-adjusted earnings per share, estimating expected profitability, incentivizing energy saving, identifying revenue opportunities and risks, managing procurement and supply chains114
• Position management – For example, valuation of assets
• Investment decisions – For example, identifying low-carbon, high-return investment opportunities, planning capital investments, determining cost-benefit and net present value of projects
113 For more information, see Center for Climate and Energy Solutions, The Business of Pricing Carbon: How Companies are Pricing Carbon to Mitigate Risks and Prepare for a Low-Carbon Future.
114 Carbon Pricing Unlocked, Internal Carbon Pricing for Future-Proof Supply Chains, January 2020.115 For more information, see CDP, We Mean Business, and Carbon Pricing Leadership Coalition, “Carbon Pricing Corridors:
The Market View,” May 2017, “Carbon Pricing Corridors, 2018,” July 2018, and Report of the High-Level Commission on Carbon Prices, May 29, 2017.
116 Article two of the 2015 Paris Agreement commits parties to “holding the increasing in the global average temperature to well below 2°C above pre-industrial levels and pursuing efforts to limit the temperature increase to 1.5°C above pre-industrial levels.”
59
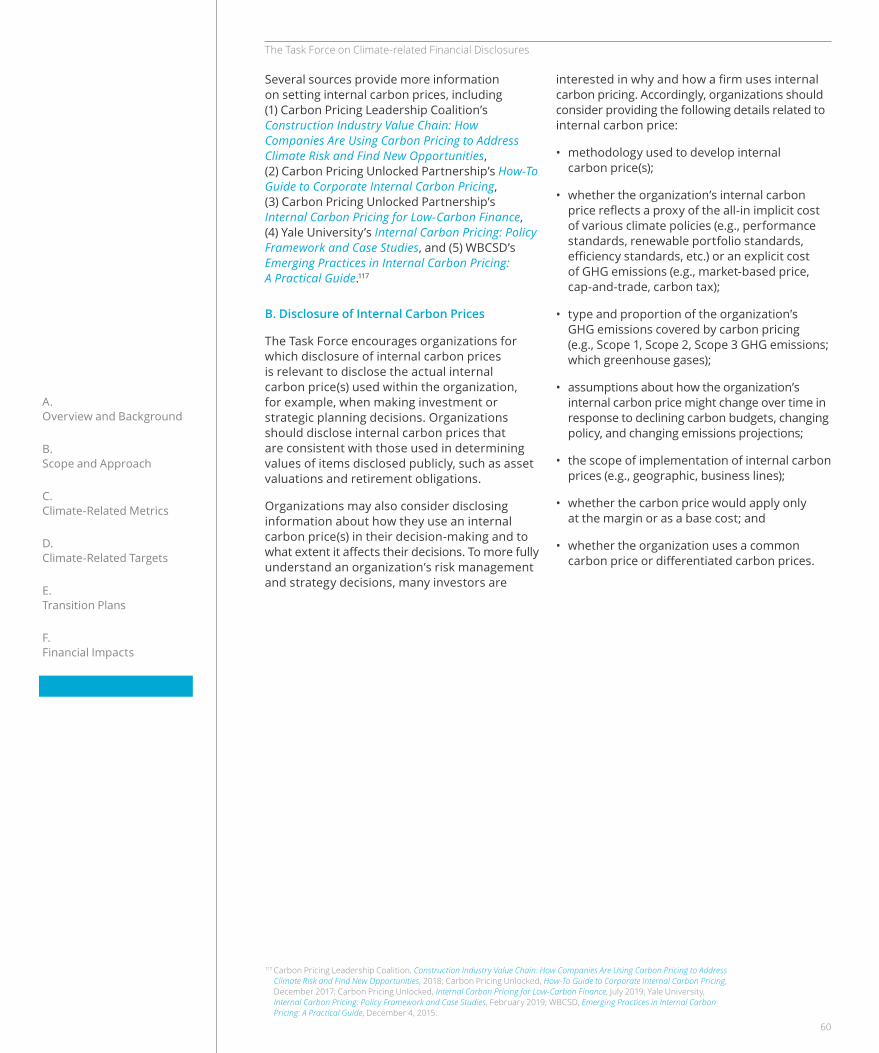
The Task Force on Climate-related Financial Disclosures
A. Overview and Background
B. Scope and Approach
C. Climate-Related Metrics
D. Climate-Related Targets
E. Transition Plans
F. Financial Impacts
Appendices
interested in why and how a firm uses internal carbon pricing. Accordingly, organizations should consider providing the following details related to internal carbon price:
• methodology used to develop internal carbon price(s);
• whether the organization’s internal carbon price reflects a proxy of the all-in implicit cost of various climate policies (e.g., performance standards, renewable portfolio standards, efficiency standards, etc.) or an explicit cost of GHG emissions (e.g., market-based price, cap-and-trade, carbon tax);
• type and proportion of the organization’s GHG emissions covered by carbon pricing (e.g., Scope 1, Scope 2, Scope 3 GHG emissions; which greenhouse gases);
• assumptions about how the organization’s internal carbon price might change over time in response to declining carbon budgets, changing policy, and changing emissions projections;
• the scope of implementation of internal carbon prices (e.g., geographic, business lines);
• whether the carbon price would apply only at the margin or as a base cost; and
• whether the organization uses a common carbon price or differentiated carbon prices.
Several sources provide more information on setting internal carbon prices, including (1) Carbon Pricing Leadership Coalition’s Construction Industry Value Chain: How Companies Are Using Carbon Pricing to Address Climate Risk and Find New Opportunities, (2) Carbon Pricing Unlocked Partnership’s How-To Guide to Corporate Internal Carbon Pricing, (3) Carbon Pricing Unlocked Partnership’s Internal Carbon Pricing for Low-Carbon Finance, (4) Yale University’s Internal Carbon Pricing: Policy Framework and Case Studies, and (5) WBCSD’s Emerging Practices in Internal Carbon Pricing: A Practical Guide.117
B. Disclosure of Internal Carbon Prices
The Task Force encourages organizations for which disclosure of internal carbon prices is relevant to disclose the actual internal carbon price(s) used within the organization, for example, when making investment or strategic planning decisions. Organizations should disclose internal carbon prices that are consistent with those used in determining values of items disclosed publicly, such as asset valuations and retirement obligations.
Organizations may also consider disclosing information about how they use an internal carbon price(s) in their decision-making and to what extent it affects their decisions. To more fully understand an organization’s risk management and strategy decisions, many investors are
117 Carbon Pricing Leadership Coalition, Construction Industry Value Chain: How Companies Are Using Carbon Pricing to Address Climate Risk and Find New Opportunities, 2018; Carbon Pricing Unlocked, How-To Guide to Corporate Internal Carbon Pricing, December 2017; Carbon Pricing Unlocked, Internal Carbon Pricing for Low-Carbon Finance, July 2019; Yale University, Internal Carbon Pricing: Policy Framework and Case Studies, February 2019; WBCSD, Emerging Practices in Internal Carbon Pricing: A Practical Guide, December 4, 2015.
60
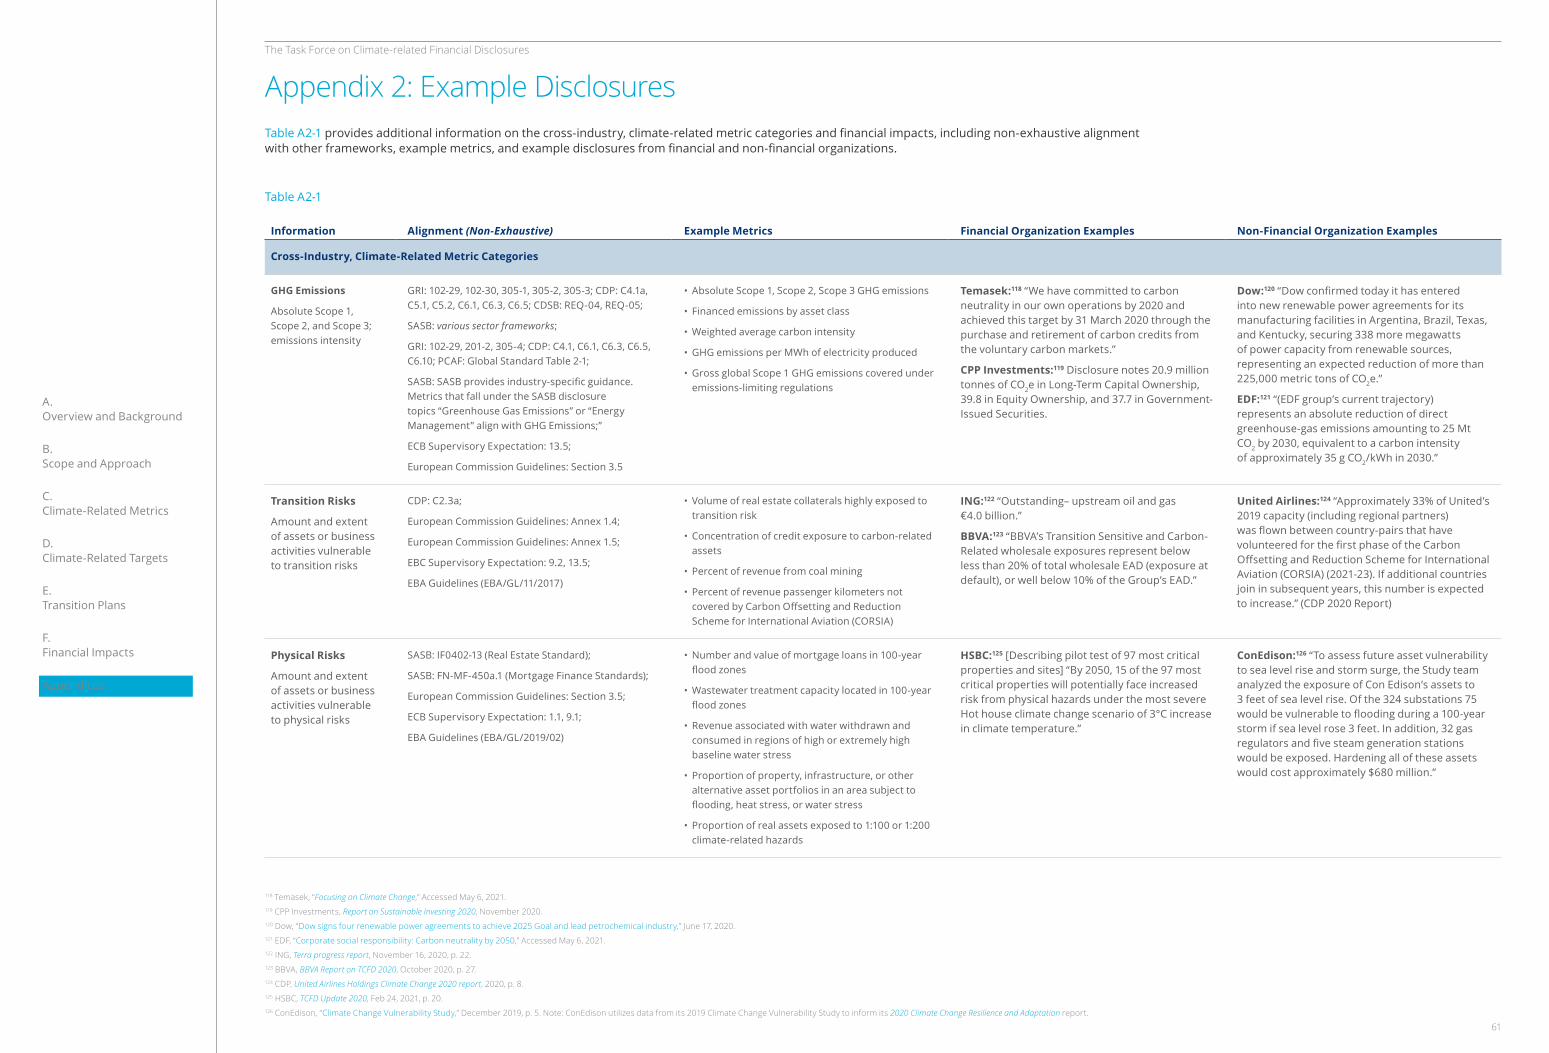
The Task Force on Climate-related Financial Disclosures
A. Overview and Background
B. Scope and Approach
C. Climate-Related Metrics
D. Climate-Related Targets
E. Transition Plans
F. Financial Impacts
Appendices
Information Alignment (Non-Exhaustive) Example Metrics Financial Organization Examples Non-Financial Organization Examples
Cross-Industry, Climate-Related Metric Categories
GHG Emissions
Absolute Scope 1, Scope 2, and Scope 3; emissions intensity
GRI: 102-29, 102-30, 305-1, 305-2, 305-3; CDP: C4.1a, C5.1, C5.2, C6.1, C6.3, C6.5; CDSB: REQ-04, REQ-05;
SASB: various sector frameworks;
GRI: 102-29, 201-2, 305-4; CDP: C4.1, C6.1, C6.3, C6.5, C6.10; PCAF: Global Standard Table 2-1;
SASB: SASB provides industry-specific guidance. Metrics that fall under the SASB disclosure topics “Greenhouse Gas Emissions” or “Energy Management” align with GHG Emissions;”
ECB Supervisory Expectation: 13.5;
European Commission Guidelines: Section 3.5
• Absolute Scope 1, Scope 2, Scope 3 GHG emissions
• Financed emissions by asset class
• Weighted average carbon intensity
• GHG emissions per MWh of electricity produced
• Gross global Scope 1 GHG emissions covered under emissions-limiting regulations
Temasek:118 “We have committed to carbon neutrality in our own operations by 2020 and achieved this target by 31 March 2020 through the purchase and retirement of carbon credits from the voluntary carbon markets.”
CPP Investments:119 Disclosure notes 20.9 million tonnes of CO2e in Long-Term Capital Ownership, 39.8 in Equity Ownership, and 37.7 in Government-Issued Securities.
Dow:120 “Dow confirmed today it has entered into new renewable power agreements for its manufacturing facilities in Argentina, Brazil, Texas, and Kentucky, securing 338 more megawatts of power capacity from renewable sources, representing an expected reduction of more than 225,000 metric tons of CO2e.”
EDF:121 “(EDF group’s current trajectory) represents an absolute reduction of direct greenhouse-gas emissions amounting to 25 Mt CO2 by 2030, equivalent to a carbon intensity of approximately 35 g CO2/kWh in 2030.”
Transition Risks
Amount and extent of assets or business activities vulnerable to transition risks
CDP: C2.3a;
European Commission Guidelines: Annex 1.4;
European Commission Guidelines: Annex 1.5;
EBC Supervisory Expectation: 9.2, 13.5;
EBA Guidelines (EBA/GL/11/2017)
• Volume of real estate collaterals highly exposed to transition risk
• Concentration of credit exposure to carbon-related assets
• Percent of revenue from coal mining
• Percent of revenue passenger kilometers not covered by Carbon Offsetting and Reduction Scheme for International Aviation (CORSIA)
ING:122 “Outstanding– upstream oil and gas €4.0 billion.”
BBVA:123 “BBVA’s Transition Sensitive and Carbon-Related wholesale exposures represent below less than 20% of total wholesale EAD (exposure at default), or well below 10% of the Group’s EAD.”
United Airlines:124 “Approximately 33% of United’s 2019 capacity (including regional partners) was flown between country-pairs that have volunteered for the first phase of the Carbon Offsetting and Reduction Scheme for International Aviation (CORSIA) (2021-23). If additional countries join in subsequent years, this number is expected to increase.” (CDP 2020 Report)
Physical Risks
Amount and extent of assets or business activities vulnerable to physical risks
SASB: IF0402-13 (Real Estate Standard);
SASB: FN-MF-450a.1 (Mortgage Finance Standards);
European Commission Guidelines: Section 3.5;
ECB Supervisory Expectation: 1.1, 9.1;
EBA Guidelines (EBA/GL/2019/02)
• Number and value of mortgage loans in 100-year flood zones
• Wastewater treatment capacity located in 100-year flood zones
• Revenue associated with water withdrawn and consumed in regions of high or extremely high baseline water stress
• Proportion of property, infrastructure, or other alternative asset portfolios in an area subject to flooding, heat stress, or water stress
• Proportion of real assets exposed to 1:100 or 1:200 climate-related hazards
HSBC:125 [Describing pilot test of 97 most critical properties and sites] “By 2050, 15 of the 97 most critical properties will potentially face increased risk from physical hazards under the most severe Hot house climate change scenario of 3°C increase in climate temperature.”
ConEdison:126 “To assess future asset vulnerability to sea level rise and storm surge, the Study team analyzed the exposure of Con Edison’s assets to 3 feet of sea level rise. Of the 324 substations 75 would be vulnerable to flooding during a 100-year storm if sea level rose 3 feet. In addition, 32 gas regulators and five steam generation stations would be exposed. Hardening all of these assets would cost approximately $680 million.”
Appendix 2: Example Disclosures
118 Temasek, “Focusing on Climate Change,” Accessed May 6, 2021.119 CPP Investments, Report on Sustainable Investing 2020, November 2020.120 Dow, “Dow signs four renewable power agreements to achieve 2025 Goal and lead petrochemical industry,” June 17, 2020. 121 EDF, “Corporate social responsibility: Carbon neutrality by 2050,” Accessed May 6, 2021.122 ING, Terra progress report, November 16, 2020, p. 22.123 BBVA, BBVA Report on TCFD 2020, October 2020, p. 27.124 CDP, United Airlines Holdings Climate Change 2020 report, 2020, p. 8.125 HSBC, TCFD Update 2020, Feb 24, 2021, p. 20.126 ConEdison, “Climate Change Vulnerability Study,” December 2019, p. 5. Note: ConEdison utilizes data from its 2019 Climate Change Vulnerability Study to inform its 2020 Climate Change Resilience and Adaptation report.
Table A2-1
Table A2-1 provides additional information on the cross-industry, climate-related metric categories and financial impacts, including non-exhaustive alignment with other frameworks, example metrics, and example disclosures from financial and non-financial organizations.
61
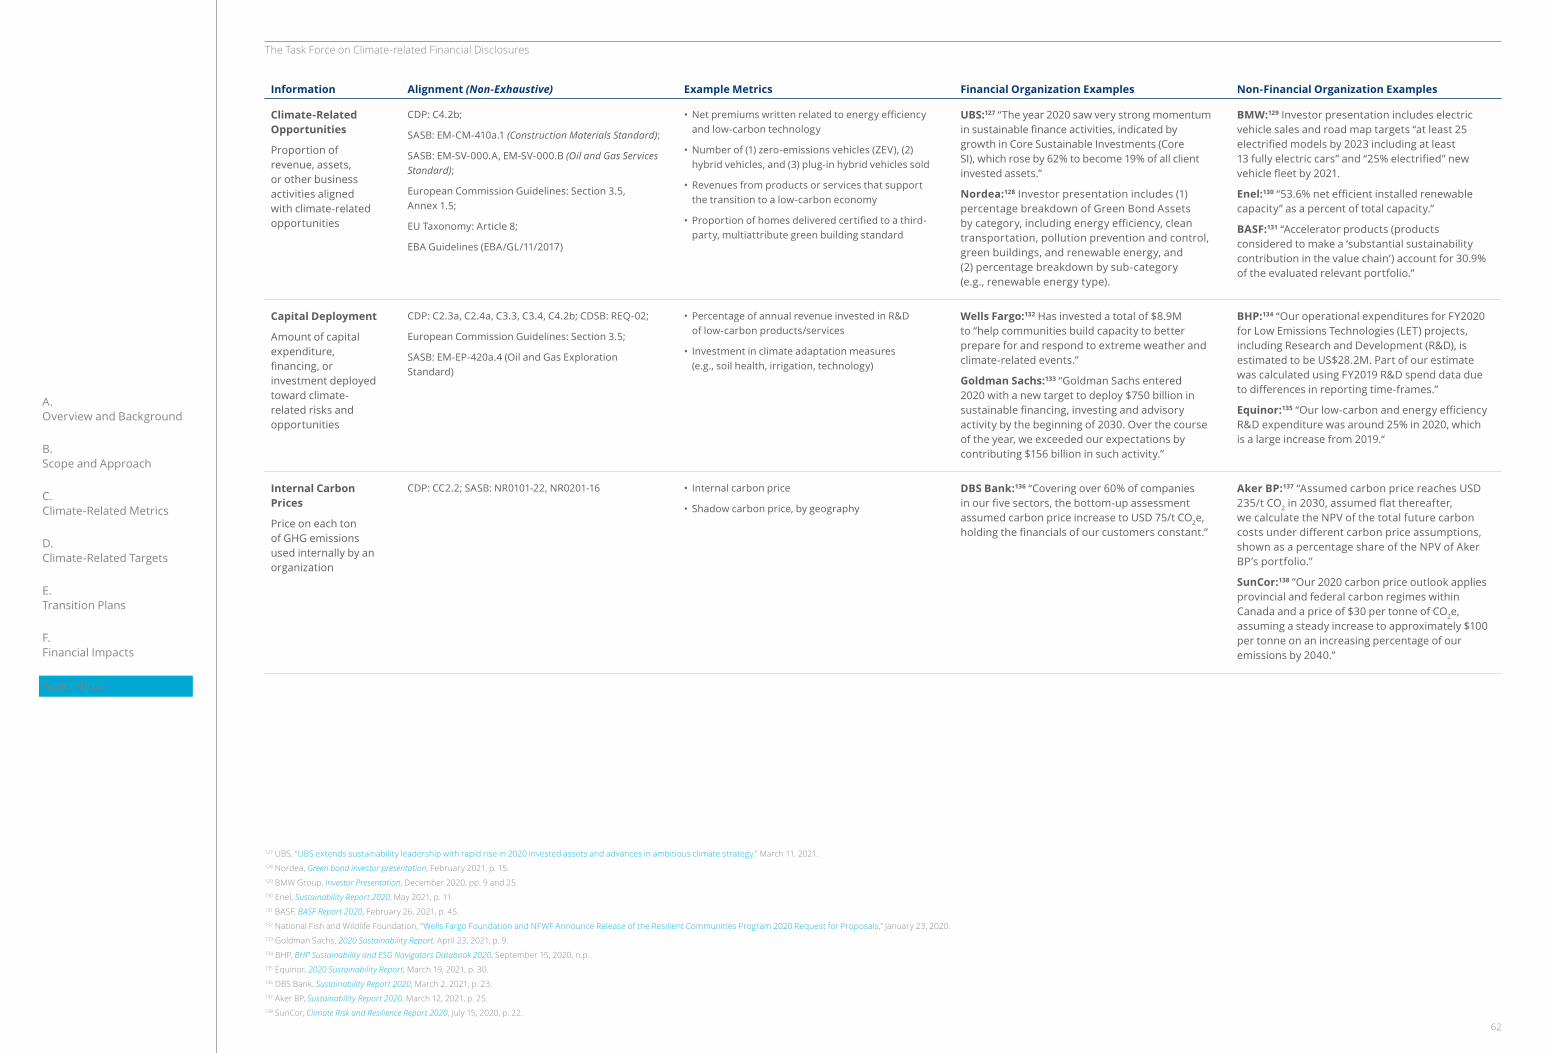
The Task Force on Climate-related Financial Disclosures
A. Overview and Background
B. Scope and Approach
C. Climate-Related Metrics
D. Climate-Related Targets
E. Transition Plans
F. Financial Impacts
Appendices
Information Alignment (Non-Exhaustive) Example Metrics Financial Organization Examples Non-Financial Organization Examples
Climate-Related Opportunities
Proportion of revenue, assets, or other business activities aligned with climate-related opportunities
CDP: C4.2b;
SASB: EM-CM-410a.1 (Construction Materials Standard);
SASB: EM-SV-000.A, EM-SV-000.B (Oil and Gas Services Standard);
European Commission Guidelines: Section 3.5, Annex 1.5;
EU Taxonomy: Article 8;
EBA Guidelines (EBA/GL/11/2017)
• Net premiums written related to energy efficiency and low-carbon technology
• Number of (1) zero-emissions vehicles (ZEV), (2) hybrid vehicles, and (3) plug-in hybrid vehicles sold
• Revenues from products or services that support the transition to a low-carbon economy
• Proportion of homes delivered certified to a third-party, multiattribute green building standard
UBS:127 “The year 2020 saw very strong momentum in sustainable finance activities, indicated by growth in Core Sustainable Investments (Core SI), which rose by 62% to become 19% of all client invested assets.”
Nordea:128 Investor presentation includes (1) percentage breakdown of Green Bond Assets by category, including energy efficiency, clean transportation, pollution prevention and control, green buildings, and renewable energy, and (2) percentage breakdown by sub-category (e.g., renewable energy type).
BMW:129 Investor presentation includes electric vehicle sales and road map targets “at least 25 electrified models by 2023 including at least 13 fully electric cars” and “25% electrified” new vehicle fleet by 2021.
Enel:130 “53.6% net efficient installed renewable capacity” as a percent of total capacity.”
BASF:131 “Accelerator products (products considered to make a ‘substantial sustainability contribution in the value chain’) account for 30.9% of the evaluated relevant portfolio.”
Capital Deployment
Amount of capital expenditure, financing, or investment deployed toward climate-related risks and opportunities
CDP: C2.3a, C2.4a, C3.3, C3.4, C4.2b; CDSB: REQ-02;
European Commission Guidelines: Section 3.5;
SASB: EM-EP-420a.4 (Oil and Gas Exploration Standard)
• Percentage of annual revenue invested in R&D of low-carbon products/services
• Investment in climate adaptation measures (e.g., soil health, irrigation, technology)
Wells Fargo:132 Has invested a total of $8.9M to “help communities build capacity to better prepare for and respond to extreme weather and climate-related events.”
Goldman Sachs:133 “Goldman Sachs entered 2020 with a new target to deploy $750 billion in sustainable financing, investing and advisory activity by the beginning of 2030. Over the course of the year, we exceeded our expectations by contributing $156 billion in such activity.”
BHP:134 “Our operational expenditures for FY2020 for Low Emissions Technologies (LET) projects, including Research and Development (R&D), is estimated to be US$28.2M. Part of our estimate was calculated using FY2019 R&D spend data due to differences in reporting time-frames.”
Equinor:135 “Our low-carbon and energy efficiency R&D expenditure was around 25% in 2020, which is a large increase from 2019.“
Internal Carbon Prices
Price on each ton of GHG emissions used internally by an organization
CDP: CC2.2; SASB: NR0101-22, NR0201-16 • Internal carbon price
• Shadow carbon price, by geography
DBS Bank:136 “Covering over 60% of companies in our five sectors, the bottom-up assessment assumed carbon price increase to USD 75/t CO2e, holding the financials of our customers constant.”
Aker BP:137 “Assumed carbon price reaches USD 235/t CO2 in 2030, assumed flat thereafter, we calculate the NPV of the total future carbon costs under different carbon price assumptions, shown as a percentage share of the NPV of Aker BP’s portfolio.”
SunCor:138 ”Our 2020 carbon price outlook applies provincial and federal carbon regimes within Canada and a price of $30 per tonne of CO2e, assuming a steady increase to approximately $100 per tonne on an increasing percentage of our emissions by 2040.”
127 UBS, “UBS extends sustainability leadership with rapid rise in 2020 invested assets and advances in ambitious climate strategy,” March 11, 2021.128 Nordea, Green bond investor presentation, February 2021, p. 15.129 BMW Group, Investor Presentation, December 2020, pp. 9 and 25.130 Enel, Sustainability Report 2020, May 2021, p. 11.131 BASF, BASF Report 2020, February 26, 2021, p. 45.132 National Fish and Wildlife Foundation, “Wells Fargo Foundation and NFWF Announce Release of the Resilient Communities Program 2020 Request for Proposals,” January 23, 2020.133 Goldman Sachs, 2020 Sustainability Report, April 23, 2021, p. 9.134 BHP, BHP Sustainability and ESG Navigators Databook 2020, September 15, 2020, n.p.135 Equinor, 2020 Sustainability Report, March 19, 2021, p. 30.136 DBS Bank, Sustainability Report 2020, March 2, 2021, p. 23.137 Aker BP, Sustainability Report 2020, March 12, 2021, p. 25.138 SunCor, Climate Risk and Resilience Report 2020, July 15, 2020, p. 22.
62
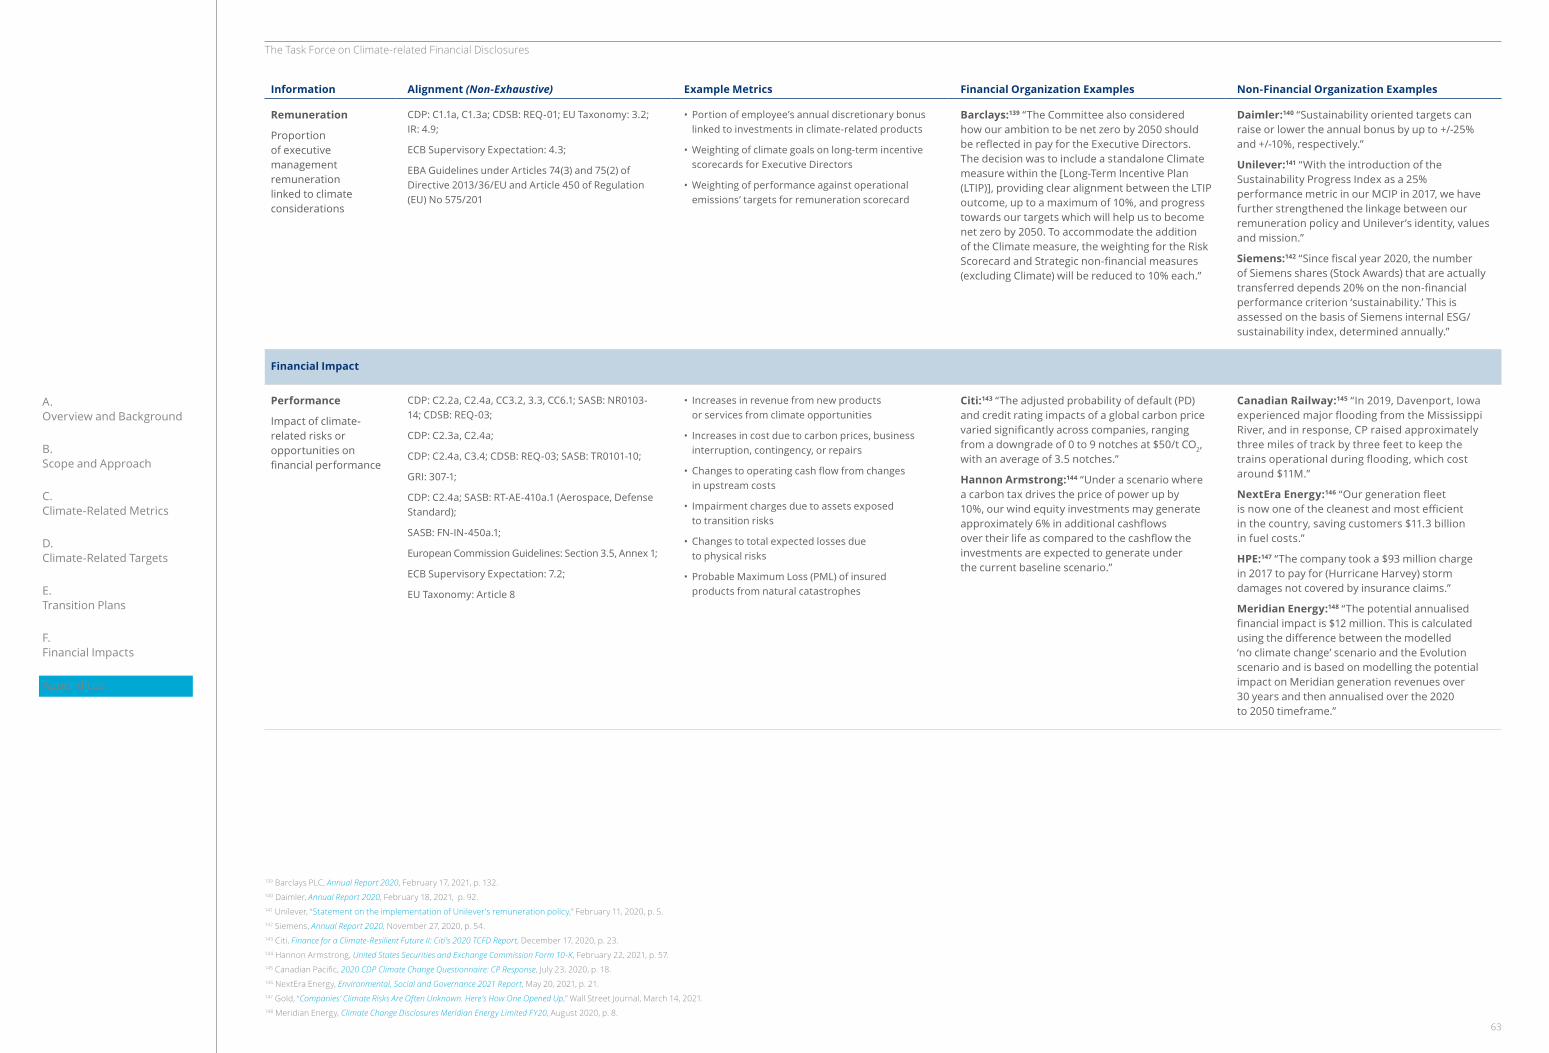
The Task Force on Climate-related Financial Disclosures
A. Overview and Background
B. Scope and Approach
C. Climate-Related Metrics
D. Climate-Related Targets
E. Transition Plans
F. Financial Impacts
Appendices
Information Alignment (Non-Exhaustive) Example Metrics Financial Organization Examples Non-Financial Organization Examples
Remuneration
Proportion of executive management remuneration linked to climate considerations
CDP: C1.1a, C1.3a; CDSB: REQ-01; EU Taxonomy: 3.2; IR: 4.9;
ECB Supervisory Expectation: 4.3;
EBA Guidelines under Articles 74(3) and 75(2) of Directive 2013/36/EU and Article 450 of Regulation (EU) No 575/201
• Portion of employee’s annual discretionary bonus linked to investments in climate-related products
• Weighting of climate goals on long-term incentive scorecards for Executive Directors
• Weighting of performance against operational emissions’ targets for remuneration scorecard
Barclays:139 “The Committee also considered how our ambition to be net zero by 2050 should be reflected in pay for the Executive Directors. The decision was to include a standalone Climate measure within the [Long-Term Incentive Plan (LTIP)], providing clear alignment between the LTIP outcome, up to a maximum of 10%, and progress towards our targets which will help us to become net zero by 2050. To accommodate the addition of the Climate measure, the weighting for the Risk Scorecard and Strategic non-financial measures (excluding Climate) will be reduced to 10% each.”
Daimler:140 “Sustainability oriented targets can raise or lower the annual bonus by up to +/-25% and +/-10%, respectively.”
Unilever:141 “With the introduction of the Sustainability Progress Index as a 25% performance metric in our MCIP in 2017, we have further strengthened the linkage between our remuneration policy and Unilever’s identity, values and mission.”
Siemens:142 “Since fiscal year 2020, the number of Siemens shares (Stock Awards) that are actually transferred depends 20% on the non-financial performance criterion ‘sustainability.’ This is assessed on the basis of Siemens internal ESG/sustainability index, determined annually.”
Financial Impact
Performance
Impact of climate-related risks or opportunities on financial performance
CDP: C2.2a, C2.4a, CC3.2, 3.3, CC6.1; SASB: NR0103-14; CDSB: REQ-03;
CDP: C2.3a, C2.4a;
CDP: C2.4a, C3.4; CDSB: REQ-03; SASB: TR0101-10;
GRI: 307-1;
CDP: C2.4a; SASB: RT-AE-410a.1 (Aerospace, Defense Standard);
SASB: FN-IN-450a.1;
European Commission Guidelines: Section 3.5, Annex 1;
ECB Supervisory Expectation: 7.2;
EU Taxonomy: Article 8
• Increases in revenue from new products or services from climate opportunities
• Increases in cost due to carbon prices, business interruption, contingency, or repairs
• Changes to operating cash flow from changes in upstream costs
• Impairment charges due to assets exposed to transition risks
• Changes to total expected losses due to physical risks
• Probable Maximum Loss (PML) of insured products from natural catastrophes
Citi:143 “The adjusted probability of default (PD) and credit rating impacts of a global carbon price varied significantly across companies, ranging from a downgrade of 0 to 9 notches at $50/t CO2, with an average of 3.5 notches.”
Hannon Armstrong:144 “Under a scenario where a carbon tax drives the price of power up by 10%, our wind equity investments may generate approximately 6% in additional cashflows over their life as compared to the cashflow the investments are expected to generate under the current baseline scenario.”
Canadian Railway:145 “In 2019, Davenport, Iowa experienced major flooding from the Mississippi River, and in response, CP raised approximately three miles of track by three feet to keep the trains operational during flooding, which cost around $11M.”
NextEra Energy:146 “Our generation fleet is now one of the cleanest and most efficient in the country, saving customers $11.3 billion in fuel costs.”
HPE:147 “The company took a $93 million charge in 2017 to pay for (Hurricane Harvey) storm damages not covered by insurance claims.”
Meridian Energy:148 “The potential annualised financial impact is $12 million. This is calculated using the difference between the modelled ‘no climate change’ scenario and the Evolution scenario and is based on modelling the potential impact on Meridian generation revenues over 30 years and then annualised over the 2020 to 2050 timeframe.”
139 Barclays PLC, Annual Report 2020, February 17, 2021, p. 132.140 Daimler, Annual Report 2020, February 18, 2021, p. 92. 141 Unilever, “Statement on the implementation of Unilever’s remuneration policy,” February 11, 2020, p. 5.142 Siemens, Annual Report 2020, November 27, 2020, p. 54.143 Citi, Finance for a Climate-Resilient Future II: Citi’s 2020 TCFD Report, December 17, 2020, p. 23. 144 Hannon Armstrong, United States Securities and Exchange Commission Form 10-K, February 22, 2021, p. 57.145 Canadian Pacific, 2020 CDP Climate Change Questionnaire: CP Response, July 23, 2020, p. 18.146 NextEra Energy, Environmental, Social and Governance 2021 Report, May 20, 2021, p. 21.147 Gold, “Companies’ Climate Risks Are Often Unknown. Here’s How One Opened Up,” Wall Street Journal, March 14, 2021.148 Meridian Energy, Climate Change Disclosures Meridian Energy Limited FY20, August 2020, p. 8.
63
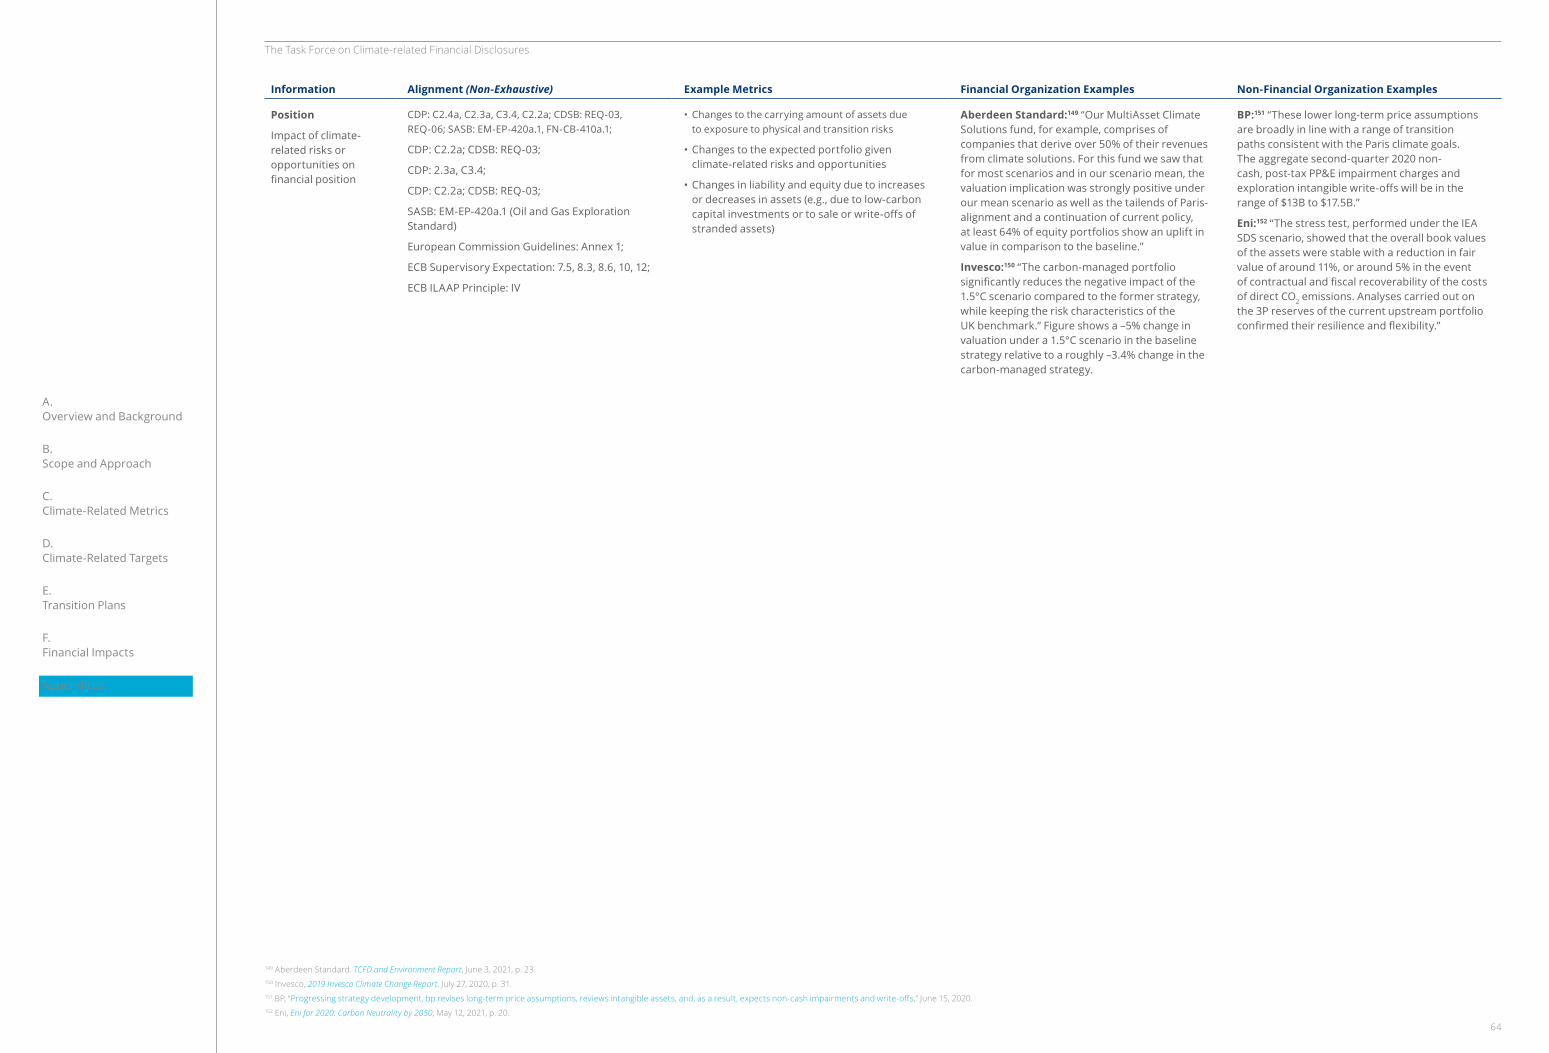
The Task Force on Climate-related Financial Disclosures
A. Overview and Background
B. Scope and Approach
C. Climate-Related Metrics
D. Climate-Related Targets
E. Transition Plans
F. Financial Impacts
Appendices
Information Alignment (Non-Exhaustive) Example Metrics Financial Organization Examples Non-Financial Organization Examples
Position
Impact of climate-related risks or opportunities on financial position
CDP: C2.4a, C2.3a, C3.4, C2.2a; CDSB: REQ-03, REQ-06; SASB: EM-EP-420a.1, FN-CB-410a.1;
CDP: C2.2a; CDSB: REQ-03;
CDP: 2.3a, C3.4;
CDP: C2.2a; CDSB: REQ-03;
SASB: EM-EP-420a.1 (Oil and Gas Exploration Standard)
European Commission Guidelines: Annex 1;
ECB Supervisory Expectation: 7.5, 8.3, 8.6, 10, 12;
ECB ILAAP Principle: IV
• Changes to the carrying amount of assets due to exposure to physical and transition risks
• Changes to the expected portfolio given climate-related risks and opportunities
• Changes in liability and equity due to increases or decreases in assets (e.g., due to low-carbon capital investments or to sale or write-offs of stranded assets)
Aberdeen Standard:149 “Our MultiAsset Climate Solutions fund, for example, comprises of companies that derive over 50% of their revenues from climate solutions. For this fund we saw that for most scenarios and in our scenario mean, the valuation implication was strongly positive under our mean scenario as well as the tailends of Paris-alignment and a continuation of current policy, at least 64% of equity portfolios show an uplift in value in comparison to the baseline.”
Invesco:150 “The carbon-managed portfolio significantly reduces the negative impact of the 1.5°C scenario compared to the former strategy, while keeping the risk characteristics of the UK benchmark.” Figure shows a –5% change in valuation under a 1.5°C scenario in the baseline strategy relative to a roughly –3.4% change in the carbon-managed strategy.
BP:151 “These lower long-term price assumptions are broadly in line with a range of transition paths consistent with the Paris climate goals. The aggregate second-quarter 2020 non-cash, post-tax PP&E impairment charges and exploration intangible write-offs will be in the range of $13B to $17.5B.”
Eni:152 “The stress test, performed under the IEA SDS scenario, showed that the overall book values of the assets were stable with a reduction in fair value of around 11%, or around 5% in the event of contractual and fiscal recoverability of the costs of direct CO2 emissions. Analyses carried out on the 3P reserves of the current upstream portfolio confirmed their resilience and flexibility.”
149 Aberdeen Standard, TCFD and Environment Report, June 3, 2021, p. 23.150 Invesco, 2019 Invesco Climate Change Report, July 27, 2020, p. 31.151 BP, “Progressing strategy development, bp revises long-term price assumptions, reviews intangible assets, and, as a result, expects non-cash impairments and write-offs,” June 15, 2020.152 Eni, Eni for 2020: Carbon Neutrality by 2050, May 12, 2021, p. 20.
64
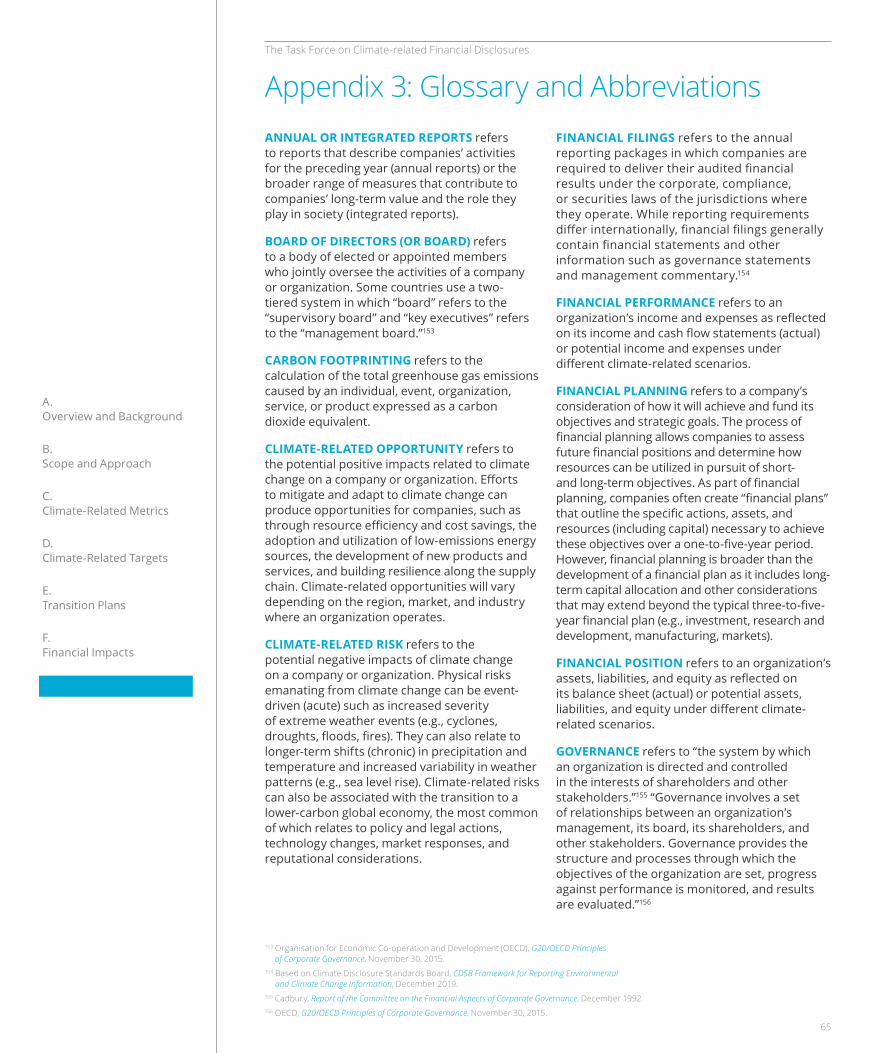
The Task Force on Climate-related Financial Disclosures
A. Overview and Background
B. Scope and Approach
C. Climate-Related Metrics
D. Climate-Related Targets
E. Transition Plans
F. Financial Impacts
Appendices
ANNUAL OR INTEGRATED REPORTS refers to reports that describe companies’ activities for the preceding year (annual reports) or the broader range of measures that contribute to companies’ long-term value and the role they play in society (integrated reports).
BOARD OF DIRECTORS (OR BOARD) refers to a body of elected or appointed members who jointly oversee the activities of a company or organization. Some countries use a two-tiered system in which “board” refers to the “supervisory board” and “key executives” refers to the “management board.”153
CARBON FOOTPRINTING refers to the calculation of the total greenhouse gas emissions caused by an individual, event, organization, service, or product expressed as a carbon dioxide equivalent.
CLIMATE-RELATED OPPORTUNITY refers to the potential positive impacts related to climate change on a company or organization. Efforts to mitigate and adapt to climate change can produce opportunities for companies, such as through resource efficiency and cost savings, the adoption and utilization of low-emissions energy sources, the development of new products and services, and building resilience along the supply chain. Climate-related opportunities will vary depending on the region, market, and industry where an organization operates.
CLIMATE-RELATED RISK refers to the potential negative impacts of climate change on a company or organization. Physical risks emanating from climate change can be event-driven (acute) such as increased severity of extreme weather events (e.g., cyclones, droughts, floods, fires). They can also relate to longer-term shifts (chronic) in precipitation and temperature and increased variability in weather patterns (e.g., sea level rise). Climate-related risks can also be associated with the transition to a lower-carbon global economy, the most common of which relates to policy and legal actions, technology changes, market responses, and reputational considerations.
FINANCIAL FILINGS refers to the annual reporting packages in which companies are required to deliver their audited financial results under the corporate, compliance, or securities laws of the jurisdictions where they operate. While reporting requirements differ internationally, financial filings generally contain financial statements and other information such as governance statements and management commentary.154
FINANCIAL PERFORMANCE refers to an organization’s income and expenses as reflected on its income and cash flow statements (actual) or potential income and expenses under different climate-related scenarios.
FINANCIAL PLANNING refers to a company’s consideration of how it will achieve and fund its objectives and strategic goals. The process of financial planning allows companies to assess future financial positions and determine how resources can be utilized in pursuit of short- and long-term objectives. As part of financial planning, companies often create “financial plans” that outline the specific actions, assets, and resources (including capital) necessary to achieve these objectives over a one-to-five-year period. However, financial planning is broader than the development of a financial plan as it includes long-term capital allocation and other considerations that may extend beyond the typical three-to-five-year financial plan (e.g., investment, research and development, manufacturing, markets).
FINANCIAL POSITION refers to an organization’s assets, liabilities, and equity as reflected on its balance sheet (actual) or potential assets, liabilities, and equity under different climate-related scenarios.
GOVERNANCE refers to “the system by which an organization is directed and controlled in the interests of shareholders and other stakeholders.”155 “Governance involves a set of relationships between an organization’s management, its board, its shareholders, and other stakeholders. Governance provides the structure and processes through which the objectives of the organization are set, progress against performance is monitored, and results are evaluated.”156
Appendix 3: Glossary and Abbreviations
153 Organisation for Economic Co-operation and Development (OECD), G20/OECD Principles of Corporate Governance, November 30, 2015.
154 Based on Climate Disclosure Standards Board, CDSB Framework for Reporting Environmental and Climate Change Information, December 2019.
155 Cadbury, Report of the Committee on the Financial Aspects of Corporate Governance, December 1992.156 OECD, G20/OECD Principles of Corporate Governance, November 30, 2015.
65
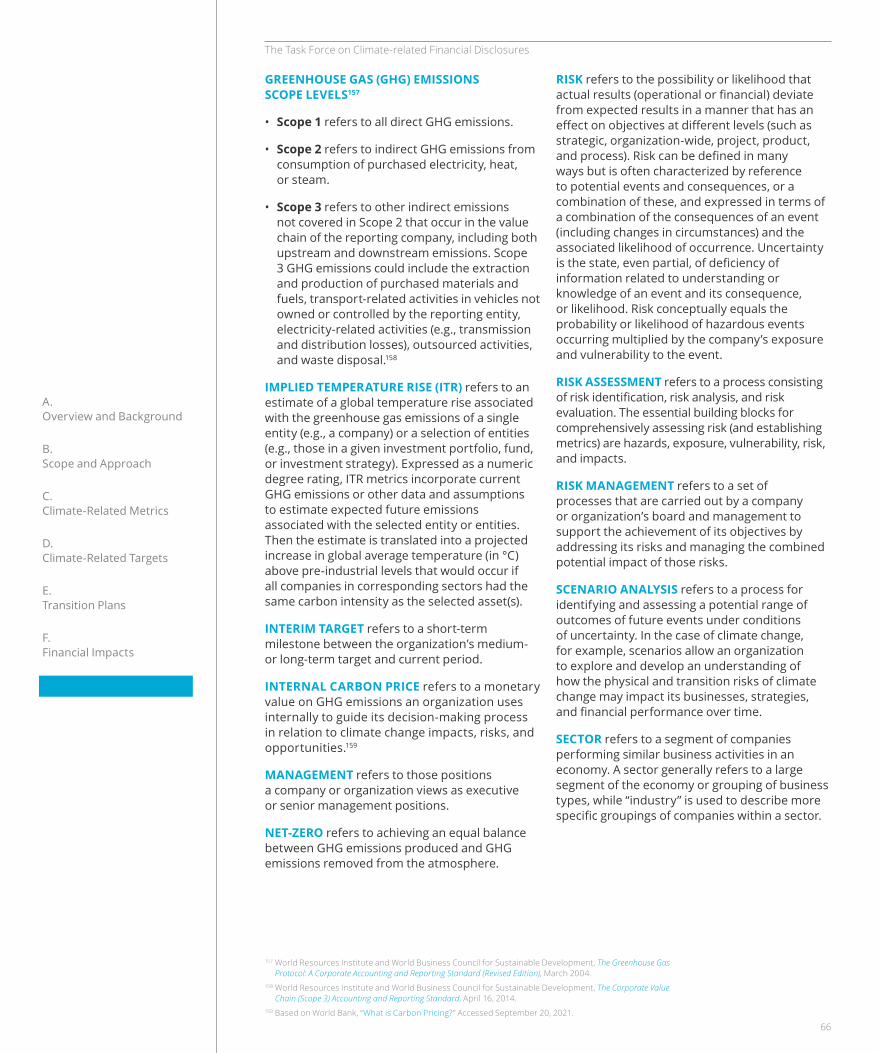
The Task Force on Climate-related Financial Disclosures
A. Overview and Background
B. Scope and Approach
C. Climate-Related Metrics
D. Climate-Related Targets
E. Transition Plans
F. Financial Impacts
Appendices
RISK refers to the possibility or likelihood that actual results (operational or financial) deviate from expected results in a manner that has an effect on objectives at different levels (such as strategic, organization-wide, project, product, and process). Risk can be defined in many ways but is often characterized by reference to potential events and consequences, or a combination of these, and expressed in terms of a combination of the consequences of an event (including changes in circumstances) and the associated likelihood of occurrence. Uncertainty is the state, even partial, of deficiency of information related to understanding or knowledge of an event and its consequence, or likelihood. Risk conceptually equals the probability or likelihood of hazardous events occurring multiplied by the company’s exposure and vulnerability to the event.
RISK ASSESSMENT refers to a process consisting of risk identification, risk analysis, and risk evaluation. The essential building blocks for comprehensively assessing risk (and establishing metrics) are hazards, exposure, vulnerability, risk, and impacts.
RISK MANAGEMENT refers to a set of processes that are carried out by a company or organization’s board and management to support the achievement of its objectives by addressing its risks and managing the combined potential impact of those risks.
SCENARIO ANALYSIS refers to a process for identifying and assessing a potential range of outcomes of future events under conditions of uncertainty. In the case of climate change, for example, scenarios allow an organization to explore and develop an understanding of how the physical and transition risks of climate change may impact its businesses, strategies, and financial performance over time.
SECTOR refers to a segment of companies performing similar business activities in an economy. A sector generally refers to a large segment of the economy or grouping of business types, while “industry” is used to describe more specific groupings of companies within a sector.
GREENHOUSE GAS (GHG) EMISSIONS SCOPE LEVELS157
• Scope 1 refers to all direct GHG emissions.
• Scope 2 refers to indirect GHG emissions from consumption of purchased electricity, heat, or steam.
• Scope 3 refers to other indirect emissions not covered in Scope 2 that occur in the value chain of the reporting company, including both upstream and downstream emissions. Scope 3 GHG emissions could include the extraction and production of purchased materials and fuels, transport-related activities in vehicles not owned or controlled by the reporting entity, electricity-related activities (e.g., transmission and distribution losses), outsourced activities, and waste disposal.158
IMPLIED TEMPERATURE RISE (ITR) refers to an estimate of a global temperature rise associated with the greenhouse gas emissions of a single entity (e.g., a company) or a selection of entities (e.g., those in a given investment portfolio, fund, or investment strategy). Expressed as a numeric degree rating, ITR metrics incorporate current GHG emissions or other data and assumptions to estimate expected future emissions associated with the selected entity or entities. Then the estimate is translated into a projected increase in global average temperature (in °C) above pre-industrial levels that would occur if all companies in corresponding sectors had the same carbon intensity as the selected asset(s).
INTERIM TARGET refers to a short-term milestone between the organization’s medium- or long-term target and current period.
INTERNAL CARBON PRICE refers to a monetary value on GHG emissions an organization uses internally to guide its decision-making process in relation to climate change impacts, risks, and opportunities.159
MANAGEMENT refers to those positions a company or organization views as executive or senior management positions.
NET-ZERO refers to achieving an equal balance between GHG emissions produced and GHG emissions removed from the atmosphere.
157 World Resources Institute and World Business Council for Sustainable Development, The Greenhouse Gas Protocol: A Corporate Accounting and Reporting Standard (Revised Edition), March 2004.
158 World Resources Institute and World Business Council for Sustainable Development, The Corporate Value Chain (Scope 3) Accounting and Reporting Standard, April 16, 2014.
159 Based on World Bank, “What is Carbon Pricing?” Accessed September 20, 2021.
66

The Task Force on Climate-related Financial Disclosures
A. Overview and Background
B. Scope and Approach
C. Climate-Related Metrics
D. Climate-Related Targets
E. Transition Plans
F. Financial Impacts
Appendices
GHG — Greenhouse gas
GICS — Global Industry Classification Standard
GRI — Global Reporting Initiative
IFRS — International Financial Reporting Standards
IIRC — International Integrated Reporting Council
IOSCO — International Organization of Securities Commissions
IPCC — Intergovernmental Panel on Climate Change
ISSB — International Sustainability Standards Board
NGFS — Network for Greening the Financial System
NZIA — Net-Zero Insurance Alliance
PCAF — Partnership for Carbon Accounting Financials
SASB — Sustainability Accounting Standards Board
SBTi — Science Based Targets initiative
TCFD — Task Force on Climate-related Financial Disclosures
UNFCCC — United Nations Framework Convention on Climate Change
WACI — Weighted average carbon intensity
WBCSD — World Business Council for Sustainable Development
STRATEGY refers to an organization’s desired future state. An organization’s strategy establishes a foundation against which it can monitor and measure its progress in reaching that desired state. Strategy formulation generally involves establishing the purpose and scope of the organization’s activities and the nature of its businesses, taking into account the risks and opportunities it faces and the environment where it operates.
SUSTAINABILITY REPORT refers to a report that describes a company’s or organization’s impact on society, often addressing environmental, social, and governance issues.
TRANSITION PLAN refers to an aspect of an organization’s overall business strategy that lays out a set of targets and actions supporting its transition toward a low-carbon economy, including actions such as reducing its GHG emissions.
ABBREVIATIONS
1.5°C — 1.5° Celsius
2°C — 2° Celsius
CA100+ — Climate Action 100+
CDSB — Climate Disclosure Standards Board
CO2e — Carbon dioxide equivalent
ESG — Environmental, social, and governance
FSB — Financial Stability Board
G20 — Group of 20
GFANZ — Glasgow Financial Alliance for Net Zero
67
The Task Force on Climate-related Financial Disclosures
A. Overview and Background
B. Scope and Approach
C. Climate-Related Metrics
D. Climate-Related Targets
E. Transition Plans
F. Financial Impacts
Appendices
Aberdeen Standard. TCFD and Environment Report. June 3, 2021. https://www.aberdeenstandard.com/docs?editionId=8add93e9-5b15-42da-a6f3-bee24b615677.
Aker BP. Sustainability Report 2020. March 12, 2021. https://mb.cision.com/Public/1629/3313545/bdef52ed4fde0572.pdf.
Aldy, J. and G. Gianfrate. Future-Proof Your Climate Strategy. Harvard Business Review. May–June 2019. https://hbr.org/2019/05/future-proof-your-climate-strategy.
The Alliance. Reporting on enterprise value: Illustrated with a prototype climate-related financial disclosure standard. December 2020. https://29kjwb3armds2g3gi4lq2sx1-wpengine.netdna-ssl.com/wp-content/uploads/Reporting-on-enterprise-value_climate-prototype_Dec20.pdf.
Barclays PLC. Annual Report 2020. February 17, 2021. https://home.barclays/content/dam/home-barclays/documents/investor-relations/reports-and-events/annual-reports/2020/Barclays-PLC-Annual-Report-2020.pdf.
Barclays PLC. ESG Report 2020. February 18, 2021. https://home.barclays/content/dam/home-barclays/documents/investor-relations/reports-and-events/annual-reports/2020/Barclays-PLC-2020-ESG-Report-2020.pdf.
BASF. BASF Report 2020 (BASF Group). February 26, 2021. https://report.basf.com/2020/en/servicepages/downloads/files/basf-report-2020-basf-ar20.pdf.
BBVA. BBVA Report on TCFD 2020. October 2020. https://shareholdersandinvestors.bbva.com/wp-content/uploads/2020/10/BBVA-report-on-TCFD_Eng.pdf.
BHP. Addressing greenhouse gas emissions beyond our operations: Understanding the ‘scope 3’ footprint of our value chain. August 2018. https://www.bhp.com/-/media/documents/media/prospects/180824_prospects_understandingscope3footprintofourvaluechain.pdf?la=en#:~:text=Double%20counting%20between%20companies%20is,the%20simultaneous%20action%20of%20multiple.
BHP. BHP Sustainability and ESG Navigators Databook 2020. September 15, 2020. https://www.bhp.com/-/media/documents/investors/annual-reports/2020/200914_sustainability-and-esg-navigators-and-databook-2020.xlsx?la=en.
BHP. Climate Change Report 2020. September 10, 2020. https://www.bhp.com/-/media/documents/investors/annual-reports/2020/200910_bhpclimatechangereport2020.pdf.
Blanco, Christian, Felipe Caro, and Charles J. Corbett. The State of Supply Chain Carbon Footprinting: Analysis of CDP Disclosures by US Firms. May 17, 2016. http://manuscript.elsevier.com/S0959652616308095/pdf/S0959652616308095.pdf.
BMW Group. Investor Presentation. December 2020. https://www.bmwgroup.com/content/dam/grpw/websites/bmwgroup_com/ir/downloads/en/2020/Investor_Presentation/BMW_Investor_Presentation_2020.pdf.
BP. “Progressing strategy development, bp revises long-term price assumptions, reviews intangible assets, and, as a result, expects non-cash impairments and write-offs.” June 15, 2020. https://www.bp.com/en/global/corporate/news-and-insights/press-releases/bp-revises-long-term-price-assumptions.html.
Cadbury, A. Report of the Committee on the Financial Aspects of Corporate Governance (The Cadbury Report). 1992. http://cadbury.cjbs.archios.info/report.
Canadian Pacific. 2020 CDP Climate Change Questionnaire: CP Response. July 23, 2020. https://sustainability.cpr.ca/downloads/cdp-program-submission-2020.pdf.
Appendix 4: References
68
The Task Force on Climate-related Financial Disclosures
A. Overview and Background
B. Scope and Approach
C. Climate-Related Metrics
D. Climate-Related Targets
E. Transition Plans
F. Financial Impacts
Appendices
Carbon Disclosure Project (CDP). Carbon Pricing Corridors: The Market View 2017. May 2017. https://b8f65cb373b1b7b15feb-c70d8ead6ced550b4d987d7c03fcdd1d.ssl.cf3.rackcdn.com/cms/reports/documents/000/002/112/original/Carbon-Pricing-Corridors-the-market-view.pdf?1495638527.
CDP. Closing the Gap: Scaling Up Sustainable Supply Chains. November 2018. https://www.cdp.net/en/research/global-reports/global-supply-chain-report-2018.
CDP. Carbon Pricing Corridors: The Market View 2018. July 2018. https://6fefcbb86e61af1b2fc4-c70d8ead6ced550b4d987d7c03fcdd1d.ssl.cf3.rackcdn.com/cms/reports/documents/000/003/326/original/Carbon-Pricing-Corridors-2018.pdf?1526464647.
CDP. Putting A Price on Carbon: The state of internal carbon pricing by corporates globally. April 2021. https://6fefcbb86e61af1b2fc4-c70d8ead6ced550b4d987d7c03fcdd1d.ssl.cf3.rackcdn.com/cms/reports/documents/000/005/651/original/CDP_Global_Carbon_Price_report_2021.pdf?1618938446.
CDP. The Time to Green Finance: CDP Financial Services Disclosure Report 2020. April 2020. https://6fefcbb86e61af1b2fc4-c70d8ead6ced550b4d987d7c03fcdd1d.ssl.cf3.rackcdn.com/cms/reports/documents/000/005/741/original/CDP-Financial-Services-Disclosure-Report-2020.pdf?1619537981.
CDP. Transparency to Transformation: A Chain Reaction. February 2021. https://6fefcbb86e61af1b2fc4-c70d8ead6ced550b4d987d7c03fcdd1d.ssl.cf3.rackcdn.com/cms/reports/documents/000/005/554/original/CDP_SC_Report_2020.pdf?1614160765.
CDP. United Airlines Holdings Climate Change 2020 Report. 2020. https://www.cdp.net/en/responses/19569?.
Carbon Pricing Leadership Coalition. Construction Industry Value Chain: How Companies Are Using Carbon Pricing to Address Climate Risk and Find New Opportunities. 2018. https://openknowledge.worldbank.org/bitstream/handle/10986/31055/132770-WP-Construction-Industry-Value-Chain-PUBLIC.pdf?sequence=1&isAllowed=y.
Carbon Pricing Leadership Coalition. Report of the High-Level Commission on Carbon Prices. May 29, 2017. https://static1.squarespace.com/static/54ff9c5ce4b0a53decccfb4c/t/59b7f2409f8dce5316811916/1505227332748/CarbonPricing_FullReport.pdf.
Carbon Pricing Unlocked. How-To Guide to Corporate Internal Carbon Pricing. December 2017. http://b8f65cb373b1b7b15feb-c70d8ead6ced550b4d987d7c03fcdd1d.r81.cf3.rackcdn.com/cms/reports/documents/000/002/740/original/cpu-2017-how-to-guide-to-internal-carbon-pricing.pdf?1521554897.
Carbon Pricing Unlocked. Internal Carbon Pricing for Future-Proof Supply Chains. January 2020. https://guidehouse.com/-/media/www/site/insights/energy/2020/carbon-pricing-unlocked-2020-icp-supply-chains.pdf.
Carbon Pricing Unlocked. Internal Carbon Pricing for Low-Carbon Finance. July 2019. https://6fefcbb86e61af1b2fc4-c70d8ead6ced550b4d987d7c03fcdd1d.ssl.cf3.rackcdn.com/cms/reports/documents/000/004/655/original/carbon_pricing_unlocked_internal_carbon_pricing_low-carbon_finance.pdf?1563353352.
Center for Climate and Energy Solutions. The Business of Pricing Carbon: How Companies are Pricing Carbon to Mitigate Risks and Prepare for a Low-Carbon Future. September 2017. https://www.c2es.org/document/the-business-of-pricing-carbon-how-companies-are-pricing-carbon-to-mitigate-risks-and-prepare-for-a-low-carbon-future/.
Citi. Finance for a Climate-Resilient Future II: Citi’s 2020 TCFD Report. December 17, 2020. https://www.citigroup.com/citi/sustainability/data/finance-for-a-climate-resilient-future-2.pdf?ieNocache=90.
Climate Action 100+. “Blog: Climate Action 100+ Zeroes In On Industry-Wide Decarbonization”. August 2021. https://www.climateaction100.org/news/blog-climate-action-100-zeroes-in-on-industry-wide-decarbonisation/.
69
The Task Force on Climate-related Financial Disclosures
A. Overview and Background
B. Scope and Approach
C. Climate-Related Metrics
D. Climate-Related Targets
E. Transition Plans
F. Financial Impacts
Appendices
Climate Action 100+. “Climate Action 100+.” https://www.climateaction100.org/.
Climate Action 100+. “Climate Action 100+ Net Zero Company Benchmark.” March 2021. https://www.climateaction100.org/wp-content/uploads/2021/03/Climate-Action-100-Benchmark-Indicators-FINAL-3.12.pdf.
Climate Action 100+. “Net-Zero Company Benchmark.” Accessed April 30, 2021. https://www.climateaction100.org/progress/net-zero-company-benchmark/.
Climate Disclosure Standards Board. CDSB Framework for Reporting Environmental and Climate Change Information. December 2019. https://www.cdsb.net/sites/default/files/cdsb_framework_2019_v2.2.pdf.
ConEdison. Climate Change Vulnerability Study. December 2019. https://www.coned.com/-/media/files/coned/documents/our-energy-future/our-energy-projects/climate-change-resiliency-plan/climate-change-vulnerability-study.pdf?la=en.
ConEdison. 2020 Climate Change Resilience and Adaptation. January 2021. https://www.coned.com/-/media/files/coned/documents/our-energy-future/our-energy-projects/climate-change-resiliency-plan/climate-change-resilience-adaptation-2020.pdf.
The Conference Board. Internal Carbon Pricing: A Key Element of Climate Strategy. January 2021. https://conference-board.org/pdfdownload.cfm?masterProductID=23586.
Corporate Reporting Dialogue. “Better Alignment Project.” https://corporatereportingdialogue.com/better-alignment-project/#report.
CPP Investments. Report on Sustainable Investing 2020. November 2020. https://cdn2.cppinvestments.com/wp-content/uploads/2020/11/CPP-Investments-2020-SI-Report-EN-Optimized.pdf.
CRO Forum. Carbon footprinting methodology for underwriting portfolios. April 29, 2020. https://www.thecroforum.org/wp-content/uploads/2020/05/CRO-Carbon-Foot-Printing-Methodology.pdf.
Daimler. Annual Report 2020. February 18, 2021. https://www.daimler.com/documents/investors/reports/annual-report/daimler/daimler-ir-annual-report-2020-incl-combined-management-report-daimler-ag.pdf.
DBS Group Holdings Ltd. Stronger Together: Sustainability Report 2020. March 2, 2021. https://links.sgx.com/1.0.0/corporate-announcements/02EJ20XRJ2L83UP7/651247_DBS%20Sustainability%20Report%202020.pdf.
Dharmesh, S. “Measuring What Matters: How to Pick A Good Metric.” OnStartUps Blog. March 29, 2013. https://www.onstartups.com/tabid/3339/bid/96738/Measuring-What-Matters-How-To-Pick-A-Good-Metric.aspx.
Dow. “Dow signs four renewable power agreements to achieve 2025 Goal and lead petrochemical industry.” June 17, 2020. https://www.dow.com/en-us/news/dow-signs-four-renewable-power-agreements-to-achieve-2025-goal.html.
EBRD and Global Centre of Excellence on Climate Adaptation. Advancing TCFD Guidance on Physical Climate Risks and Opportunities. May 2018. https://www.physicalclimaterisk.com/media/EBRD-GCECA_draft_final_report_full.pdf.
Eckerson, W. “12 Characteristics of Effective Metrics.” Transforming Data With Intelligence (TDWI Blog). April 19, 2010. https://tdwi.org/Blogs/TDWI-Blog/2010/04/Effective-Metrics.aspx?m=1.
EDF. “Corporate social responsibility: Carbon neutrality by 2050.” https://www.edf.fr/en/the-edf-group/taking-action-as-a-responsible-company/our-six-corporate-responsibility-goals/doing-even-more-to-reduce-co2-emissions.
Enel. Integrated Annual Report 2020. https://www.enel.com/content/dam/enel-com/documenti/investitori/informazioni-finanziarie/2020/annuali/en/integrated-annual-report_2020.pdf.
Enel. Sustainability Report 2020. May 2021. https://www.enel.com/content/dam/enel-com/documenti/investitori/sostenibilita/2020/sustainability-report_2020.pdf.
70
The Task Force on Climate-related Financial Disclosures
A. Overview and Background
B. Scope and Approach
C. Climate-Related Metrics
D. Climate-Related Targets
E. Transition Plans
F. Financial Impacts
Appendices
The Energy & Climate Intelligence Unit and Oxford Net Zero. Taking Stock: A global assessment of net zero targets. March 23, 2021. https://eciu.net/analysis/reports/2021/taking-stock-assessment-net-zero-targets.
Eni. “Eni for 2020: Carbon neutrality by 2050.” 2020. https://www.eni.com/assets/documents/eng/just-transition/2020/Eni-for-2020-Carbon-neutrality-by-2050.pdf.
Equinor. Sustainability Report 2020. March 19, 2021. https://www.equinor.com/content/dam/statoil/documents/sustainability-reports/2020/equinor-sustainability-report-2020-LR.pdf.
ERAFP. Public Report 2020. August 3, 2021. https://www.rafp.fr/en/sites/rafp_en/files/publication/file/rafp-ra-2020-uk-web-v2.pdf.
European Commission. “Communication from the Commission: Guidelines on non-financial reporting: Supplement on reporting climate-related information (2019/C 209/01).” June 20, 2019. https://eur-lex.europa.eu/legal-content/EN/TXT/PDF/?uri=CELEX:52019XC0620(01)&from=GA.
European Commission. “Corporate sustainability reporting.” September 21, 2021. https://ec.europa.eu/info/business-economy-euro/company-reporting-and-auditing/company-reporting/corporate-sustainability-reporting_en.
European Commission. “Corporate Sustainability Reporting Directive.” April 21, 2021. https://eur-lex.europa.eu/legal-content/EN/TXT/?uri=CELEX:52021PC0189.
European Commission. “Non-Financial Reporting Directive.” October 22, 2014. https://eur-lex.europa.eu/legal-content/EN/TXT/?uri=CELEX%3A32014L0095.
European Innovation Council and SMEs Executive Agency (European Commission). Trade Secrets: Managing Confidential Business Information. July 2021. https://op.europa.eu/en/publication-detail/-/publication/5f1c6d8a-f015-11eb-a71c-01aa75ed71a1/language-en/format-PDF/source-227370609.
EU Technical Expert Group on Sustainable Finance (EU TEG). Taxonomy Report: Technical Annex. March 9, 2020. https://ec.europa.eu/info/sites/default/files/business_economy_euro/banking_and_finance/documents/200309-sustainable-finance-teg-final-report-taxonomy-annexes_en.pdf.
EU TEG. Technical Report. March 9, 2020.https://ec.europa.eu/info/sites/default/files/business_economy_euro/banking_and_finance/documents/200309-sustainable-finance-teg-final-report-taxonomy_en.pdf.
Financial Conduct Authority, “Enhancing climate-related disclosures by asset managers, life insurers, and FCA-regulated pension providers: Consultation paper.” June 2021. https://www.fca.org.uk/publication/consultation/cp21-17.pdf.
GHG Protocol. A Corporate Accounting and Reporting Standard (Revised Edition). March 2004. https://ghgprotocol.org/sites/default/files/standards/ghg-protocol-revised.pdf.
GHG Protocol. “Corporate Standard.” https://ghgprotocol.org/corporate-standard.
GHG Protocol. Corporate Value Chain (Scope 3) Accounting and Reporting Standard. 2011. https://ghgprotocol.org/sites/default/files/standards/Corporate-Value-Chain-Accounting-Reporing-Standard_041613_2.pdf.
GHG Protocol. “Frequently Asked Questions.” https://ghgprotocol.org/calculationg-tools-faq.
GHG Protocol. Land Sector and Removals Initiative. July 2021. https://ghgprotocol.org/sites/default/files/GHG%20Protocol%20-%20Land%20Sector%20and%20Removals%20Initiative%20-%20Overview%20%287-21%29%20v2.pdf.
GHG Protocol. “New Greenhouse Gas Protocol Guidance on Carbon Removals and Land Use.” October 15, 2019. https://ghgprotocol.org/blog/new-greenhouse-gas-protocol-guidance-carbon-removals-and-land-use.
71
The Task Force on Climate-related Financial Disclosures
A. Overview and Background
B. Scope and Approach
C. Climate-Related Metrics
D. Climate-Related Targets
E. Transition Plans
F. Financial Impacts
Appendices
GHG Protocol. Technical Guidance for Calculating Scope 3 Emissions (Version 1). 2013. https://ghgprotocol.org/sites/default/files/ghgp/Scope3_Calculation_Guidance.pdf.
Gold, R. “Companies’ Climate Risks Are Often Unknown. Here’s How One Opened Up.” Wall Street Journal. March 14, 2021. https://www.wsj.com/articles/companies-climate-risks-are-often-unknown-heres-how-one-opened-up-11615738526.
Goldman Sachs. 2020 Sustainability Report. April 23, 2021. https://www.goldmansachs.com/our-commitments/sustainability/sustainable-finance/documents/reports/2020-sustainability-report.pdf?source=website.
Hannon Armstrong Sustainable Infrastructure Capital, Inc. Form 10-K 2020. February 22, 2021. https://d18rn0p25nwr6d.cloudfront.net/CIK-0001561894/e54092ce-7ecd-424c-a1ef-5a3bdb802dbb.html.
Hoffmann, V. H. and T. Busch. “Corporate Carbon Performance Indicators: Carbon Intensity, Dependency, Exposure, and Risk.” Journal of Industrial Ecology, Vol. 12, Number 4. November 11, 2008. https://onlinelibrary.wiley.com/doi/full/10.1111/j.1530-9290.2008.00066.x.
HSBC. TCFD Update 2020. Feb 24, 2021. https://www.hsbc.com/-/files/hsbc/investors/hsbc-results/2020/annual/pdfs/hsbc-holdings-plc/210223-task-force-on-climate-related-financial-disclosures-tcfd-update-2020.pdf?download=1.
ICMA. “Green Bond Principles: Voluntary Process Guidelines for Issuing Green Bonds.” June 2021. https://www.icmagroup.org/assets/documents/Sustainable-finance/2021-updates/Green-Bond-Principles-June-2021-140621.pdf.
Ilmarinen. Annual and Sustainability Report 2020. March 24, 2021. https://www.ilmarinen.fi/media_global/liitepankki/ilmarinen/taloudellisia-tietoja/vuosikertomus/2020/ilmarinens-annual-and-sustainability-report-2020.pdf.
ING. Terra progress report. November 16, 2020. https://www.ing.com/MediaEditPage/2020-ING-Terra-progress-report.htm.
Intergovernmental Panel on Climate Change (IPCC). Global Warming of 1.5°C: Summary for Policymakers. October 2018. https://www.ipcc.ch/site/assets/uploads/sites/2/2018/07/SR15_SPM_version_stand_alone_LR.pdf.
IPCC. “Special Report: Global warming of 1.5°C Glossary.” Accessed September 2, 2021. https://www.ipcc.ch/sr15/chapter/glossary/.
IPCC. Special Report on Global Warming of 1.5°C. https://www.ipcc.ch/sr15/.
IPCC. “Summary for Policymakers of IPCC Special Report on Global Warming of 1.5°C approved by governments.” October 8, 2018. https://www.ipcc.ch/2018/10/08/summary-for-policymakers-of-ipcc-special-report-on-global-warming-of-1-5c-approved-by-governments/.
IPCC. Oppenheimer, et al. Emergent risks and key vulnerabilities; Climate Change 2014: Impacts, Adaptation, and Vulnerability. Cambridge University Press, Cambridge, United Kingdom and New York, NY, USA. 2014. pp. 1039–1099. https://www.ipcc.ch/site/assets/uploads/2018/02/WGIIAR5-Chap19_FINAL.pdf.
International Financial Reporting Standards (IFRS). Consultation Paper on Sustainability Reporting. September 2020. https://www.ifrs.org/content/dam/ifrs/project/sustainability-reporting/consultation-paper-on-sustainability-reporting.pdf.
IFRS. “IFRS Foundation Trustees announce next steps in response to broad demand for global sustainability standards.” February 2, 2021. https://www.ifrs.org/news-and-events/news/2021/02/trustees-announce-next-steps-in-response-to-broad-demand-for-global-sustainability-standards/.
IFRS. “IFRS Foundation Trustees announce strategic direction and further steps based on feedback to sustainability reporting consultation.” March 8, 2021. https://www.ifrs.org/news-and-events/news/2021/03/trustees-announce-strategic-direction-based-on-feedback-to-sustainability-reporting-consultation/.
72
The Task Force on Climate-related Financial Disclosures
A. Overview and Background
B. Scope and Approach
C. Climate-Related Metrics
D. Climate-Related Targets
E. Transition Plans
F. Financial Impacts
Appendices
IFRS. “IFRS Foundation Trustees announce working group to accelerate convergence in global sustainability reporting standards focused on enterprise value.” March 22, 2021. https://www.ifrs.org/news-and-events/news/2021/03/trustees-announce-working-group/.
International Organization of Securities Commissions (IOSCO). “IOSCO sees an urgent need for globally consistent, comparable, and reliable sustainability disclosure standards and announces its priorities and vision for a Sustainability Standards Board under the IFRS Foundation.” February 24, 2021. https://www.iosco.org/news/pdf/IOSCONEWS594.pdf.
IOSCO. Report on Sustainability-related Issuer Disclosures. June 28, 2021. https://www.iosco.org/library/pubdocs/pdf/IOSCOPD678.pdf.
Invesco. 2019 Invesco Climate Change Report. https://www.invesco.com/content/dam/invesco/apac/en/pdf/insights/2020/july-2020/invesco-tcfd-task-force-on-climate-related-financial-disclosures-report-jul-2020.pdf.
Kepler-Cheuvreux. Carbon Compass: Investor Guide to Carbon Footprinting. Institutional Investors Group on Climate Change, 2° Investing Initiative, and Deloitte. November 23, 2015. https://www.longfinance.net/media/documents/Kepler_Cheuvreux_2015_-_Carbon_Compass.pdf.
Kooroshy, J., et al. Towards investor-oriented carbon targets data. FTSE Russell. October 2021. https://www.ftserussell.com/research/towards-investor-oriented-carbon-targets-data.
Liberty Mutual. Task Force on Climate-Related Financial Disclosures Report. April 2021. https://www.libertymutualgroup.com/documents/task-force-climate-financial-disclosures.pdf.
Meridian Energy. Climate Change Disclosures Meridian Energy Limited FY20. August 2020. https://www.meridianenergy.co.nz/assets/Sustainability/Meridian-Climate-Change-Disclosures-TCFD-Report-FY20.pdf.
Mikolajczjk, et al. Internal Carbon Pricing and Climate Finance Tracking for Banks. September 2017. https://www.climatefocus.com/sites/default/files/Carbon%20Pricing%20and%20Climate%20Finance%20Tracking%20Report%202017.pdf.
MSCI. “ACWI Index.” Accessed August 30, 2021. https://www.msci.com/acwi.
National Fish and Wildlife Foundation. “Wells Fargo Foundation and NFWF Announce Release of the Resilient Communities Program 2020 Request for Proposals.” January 23, 2020. https://www.nfwf.org/media-center/press-releases/wells-fargo-foundation-and-nfwf-announce-release-resilient-communities-program-2020-request.
Nestlé. Nestlé’s Net Zero Roadmap. February 2021. https://www.nestle.com/sites/default/files/2020-12/nestle-net-zero-roadmap-en.pdf.
Network for Greening the Financial System. Progress Report on Bridging Data Gaps. May 26, 2021. https://www.ngfs.net/sites/default/files/medias/documents/progress_report_on_bridging_data_gaps.pdf.
Net-Zero Asset Owner Alliance. Inaugural 2025 Target Setting Protocol. March 2021. https://www.unepfi.org/wordpress/wp-content/uploads/2021/01/Alliance-Target-Setting-Protocol-2021.pdf.
Net-Zero Insurance Alliance. “Statement of commitment by signatory companies.” https://www.unepfi.org/psi/wp-content/uploads/2021/07/NZIA-Commitment.pdf.
NextEra Energy. Environmental, Social and Governance 2021 Report. May 20, 2021. https://www.nexteraenergy.com/content/dam/nee/us/en/pdf/2021_NEE_ESG_Report.pdf.
Nordea. Green bond investor presentation. February 2021. https://www.nordea.com/en/doc/nordea-green-bond-investor-presentation-2021.pdf.
Organisation for Economic Co-operation and Development. G20/OECD Principles of Corporate Governance. 2015. https://www.oecd.org/daf/ca/Corporate-Governance-Principles-ENG.pdf.
73
The Task Force on Climate-related Financial Disclosures
A. Overview and Background
B. Scope and Approach
C. Climate-Related Metrics
D. Climate-Related Targets
E. Transition Plans
F. Financial Impacts
Appendices
Ørsted. 2020 Sustainability Report. February 2021. https://orstedcdn.azureedge.net/-/media/annual2020/sustainability-report-2020.ashx?la=en&rev=552cd4dd7bc3499c8bf2311549d-36b94&hash=53664FE832CA1812F310DE35856DA3F4.
Paris Aligned Investment Initiative. Net Zero Investment Framework: Implementation Guide. March 2021. https://www.parisalignedinvestment.org/media/2021/03/PAII-Net-Zero-Investment-Framework_Implementation-Guide.pdf.
Partnership for Carbon Accounting Financials (PCAF). Global GHG Accounting and Reporting Standard for the Financial Industry. First Edition. November 18, 2020. https://carbonaccountingfinancials.com/files/downloads/PCAF-Global-GHG-Standard.pdf.
PCAF. “Partnership for Carbon Accounting Financials collaborates with UN-convened Net-Zero Insurance Alliance to develop standard to measure insured emissions.” September 6, 2021. https://www.unepfi.org/psi/wp-content/uploads/2021/09/PCAF-NZIA-announcement.pdf.
Portfolio Alignment Team (PAT). Measuring Portfolio Alignment: Assessing the Position of Companies and Portfolios on the Path to Net Zero. 2020. https://www.tcfdhub.org/resource/measuring-portfolio-alignment-assessing-the-position-of-companies-and-portfolios-on-the-path-to-net-zero/.
PAT. Measuring Portfolio Alignment: Technical Considerations. October 2021. https://www.tcfdhub.org/resource/measuring-portfolio-alignment-technical-considerations.
PAT. Measuring Portfolio Alignment: Technical Supplement. June 7, 2021. https://assets.bbhub.io/company/sites/60/2021/05/2021-TCFD-Portfolio_Alignment_Technical_Supplement.pdf.
Riahi, K., et al. The shared socioeconomic pathways and their energy, land use, and greenhouse gas emissions implications: an overview. January 2017. https://www.sciencedirect.com/science/article/pii/S0959378016300681.
Science Based Targets initiative (SBTi). Criteria and Recommendations. TWG-INF-002 Version 4.2. April 2021. https://sciencebasedtargets.org/resources/files/SBTi-criteria.pdf.
SBTi. Financial Sector Science-Based Targets Guidance. Pilot Version 1.1. April 2021. https://sciencebasedtargets.org/resources/files/Financial-Sector-Science-Based-Targets-Guidance-Pilot-Version.pdf.
SBTi. Science-Based Target Setting Manual. Version 4.1. April 2020. https://sciencebasedtargets.org/resources/legacy/2017/04/SBTi-manual.pdf.
SBTi. Value Change in the Value Chain: Best Practices in Scope 3 Greenhouse Gas Management. May 25, 2018. https://sciencebasedtargets.org/resources/files/SBT_Value_Chain_Report-1.pdf.
Siemens. Annual Report 2020. November 27, 2020. https://assets.new.siemens.com/siemens/assets/api/uuid:7e60bb9a-dbad-41ff-8803-a98776d4a1f1/Siemens-AR2020-Compensation-Report.pdf.
SunCor. Climate Risk and Resilience Report 2020. July 15, 2020. https://sustainability-prd-cdn.suncor.com/-/media/project/ros/shared/documents/climate-reports/2020-climate-risk-and-resilience-report-en.pdf?modified=20201216022313.
Sustainability Accounting Standards Board (SASB). Climate Risk Technical Bulletin. April 13, 2021. https://www.sasb.org/wp-content/uploads/2021/04/Climate-Risk-Technical-Bulletin2021-041221pm.pdf.
SASB. SASB Conceptual Framework. February 2017. https://www.sasb.org/wp-content/uploads/2019/05/SASB-Conceptual-Framework.pdf.
Task Force on Climate-related Financial Disclosures (TCFD). Final Report: Recommendations of the Task Force on Climate-related Financial Disclosures. June 29, 2017. https://assets.bbhub.io/company/sites/60/2020/10/FINAL-2017-TCFD-Report-11052018.pdf.
TCFD. Forward-Looking Financial Sector Metrics Consultation. October 29, 2020. https://assets.bbhub.io/company/sites/60/2021/03/2020-TCFD-Forward-Looking-Financial-Metrics-Consultation.pdf.
74
The Task Force on Climate-related Financial Disclosures
A. Overview and Background
B. Scope and Approach
C. Climate-Related Metrics
D. Climate-Related Targets
E. Transition Plans
F. Financial Impacts
Appendices
TCFD. Forward-Looking Financial Sector Metrics Consultation: Summary of Responses. March 2021. https://assets.bbhub.io/company/sites/60/2021/03/Summary-of-Forward-Looking-Financial-Metrics-Consultation.pdf.
TCFD. Guidance on Risk Management Integration and Disclosure. October 29, 2020. https://www.fsb.org/wp-content/uploads/P291020-2.pdf.
TCFD. Guidance on Scenario Analysis for Non-Financial Companies. October 29, 2020. https://assets.bbhub.io/company/sites/60/2020/09/2020-TCFD_Guidance-Scenario-Analysis-Guidance.pdf.
TCFD. Implementing the Recommendations of the Task Force on Climate-related Financial Disclosures (2017 annex). June 29, 2017. https://www.fsb-tcfd.org/wp-content/uploads/2017/12/FINAL-TCFD-Annex-Amended-121517.pdf.
TCFD. Implementing the Recommendations of the Task Force on Climate-related Financial Disclosures (2021 annex). October 14, 2021. https://assets.bbhub.io/company/sites/60/2021/07/2021-TCFD-Implementing_Guidance.pdf.
TCFD. Proposed Guidance on Climate-Related Metrics, Targets, and Transition Plans. June 7, 2021. https://assets.bbhub.io/company/sites/60/2021/05/2021-TCFD-Metrics_Targets_Guidance.pdf.
TCFD. Proposed Guidance on Metrics, Targets, and Transition Plans Consultation: Summary of Responses. October 14, 2021. https://assets.bbhub.io/company/sites/60/2021/08/Summary-of-June-2021-Public-Consultation.pdf.
TCFD. 2018 Status Report. September 2018. https://assets.bbhub.io/company/sites/60/2020/10/FINAL-2018-TCFD-Status-Report-092518.pdf.
TCFD. 2019 Status Report. June 5, 2019. https://assets.bbhub.io/company/sites/60/2020/10/2019-TCFD-Status-Report-FINAL-0531191.pdf.
TCFD. 2020 Status Report. October 29, 2020. https://assets.bbhub.io/company/sites/60/2020/09/2020-TCFD_Status-Report.pdf.
TCFD. 2021 Status Report. October 14, 2021. https://assets.bbhub.io/company/sites/60/2021/07/2021-TCFD-Status_Report.pdf.
TCFD Knowledge Hub. “Knowledge Hub Home.” Accessed September 24, 2021. https://www.tcfdhub.org/.
Temasek. “Focusing on Climate Change.” Accessed May 6, 2021. https://www.temasek.com.sg/en/sustainability/focusing-on-climate-change.
UBS. “UBS extends sustainability leadership with rapid rise in 2020 invested assets and advances in ambitious climate strategy.” March 11, 2021. https://www.ubs.com/global/en/media/display-page-ndp/en-20210311-sustainability-report.html.
UN Framework Convention on Climate Change (UNFCCC). COP26 And the Glasgow Financial Alliance for Net Zero (GFANZ). April 21, 2021. https://racetozero.unfccc.int/wp-content/uploads/2021/04/GFANZ.pdf.
UNFCCC. “Paris Agreement.” December 2015. https://unfccc.int/sites/default/files/english_paris_agreement.pdf.
UNFCCC. “Press Release: New Financial Alliance for Net Zero Emissions Launches.” April 21, 2021. https://unfccc.int/news/new-financial-alliance-for-net-zero-emissions-launches.
UNFCCC. “Race to Zero Campaign.” Accessed August 2021. https://unfccc.int/climate-action/race-to-zero-campaign#eq-1.
Unilever. “Statement on the implementation of Unilever’s remuneration policy.” February 11, 2020. https://www.unilever.com/Images/statement-on-the-implementation-of-unilevers-remuneration-policy_tcm244-544072_en.pdf.
75
The Task Force on Climate-related Financial Disclosures
A. Overview and Background
B. Scope and Approach
C. Climate-Related Metrics
D. Climate-Related Targets
E. Transition Plans
F. Financial Impacts
Appendices
van Oudenhoven, A. P. E., et al. Key criteria for developing ecosystem service indicators to inform decision making. Ecological Indicators 95: 417–426. August 14, 2018. https://www.sciencedirect.com/science/article/pii/S1470160X18304606.
Weber, C., et. al. Exploring Metrics to Measure the Climate Progress of Banks. World Resources Institute, UNEP Finance Initiative, and 2o Investing Initiative. May 24, 2018. https://www.wri.org/publication/exploring-metrics-to-measure-the-climate-progress-of-banks.
World Bank. “What is Carbon Pricing?” Accessed September 20, 2021. https://carbonpricingdashboard.worldbank.org/what-carbon-pricing.
World Business Council for Sustainable Development (WBCSD). “Construction and Building Materials share TCFD implementation experience.” July 2020. https://www.wbcsd.org/Programs/Redefining-Value/TCFD/Resources/Construction-and-Building-Materials-share-TCFD-implementation-experience.
WBCSD. Emerging Practices in Internal Carbon Pricing: A Practical Guide. December 4, 2015. https://www.wbcsd.org/contentwbc/download/1367/17733/1.
WBCSD. Food, Agriculture and Forest Products TCFD Preparer Forum. April 2020. https://docs.wbcsd.org/2020/04/WBCSD-TCFD-Food-Agriculture-and-Forest-Products%C2%AC-Preparer-Fourm-report.pdf.
WBCSD. “Planning to scale the e-mobility transition: climate-related financial disclosure and the automotive sector.” May 2021. https://www.wbcsd.org/Programs/Redefining-Value/TCFD/Resources/Planning-to-scale-the-e-mobility-transition-climate-related-financial-disclosure-and-the-automotive-sector.
WBCSD. TCFD Electric Utilities Preparer Forum. July 2019. https://docs.wbcsd.org/2019/07/WBCSD_TCFD_Electric_Utilities_Preparer_Forum.pdf.
WBCSD and World Resources Institute. The Greenhouse Gas Protocol: A Corporate Accounting and Reporting Standard (Revised Edition). March 2004. https://ghgprotocol.org/corporate-standard.
WWF. Overcoming Barriers for Corporate Scope 3 Action in the Supply Chain. November 2019. https://www.wwf.de/fileadmin/fm-wwf/Publikationen-PDF/WWF-Overcoming-barriers-for-corporate-scope-3.pdf.
Yale University. Internal Carbon Pricing: Policy Framework and Case Studies. https://cbey.yale.edu/sites/default/files/2019-09/Internal%20Carbon%20Pricing%20Report%20Feb%202019.pdf.
76

For more information, please visit fsb-tcfd.org
Nothing in this document constitutes an offer or a solicitation of an offer to buy or sell a security or financial instrument or investment advice or recommendation of a security or financial instrument. The Task Force on Climate-related Financial Disclosures believes the information herein was obtained from reliable sources but does not guarantee its accuracy. Copyright 2021 The Task Force on Climate-related Financial Disclosures.