talent for responsive agriculture - icar
TRANSCRIPT

Talent for Responsive Agriculture
EdllRtlon DIva-Ion I~ CouncIl ~Agr1cuIIlnI R".lrot1
KrWJi~ ~ II, PuN, ~ o.r.110012
wwwJcer.argJn
Talent for
Responsive Agriculture
Education DivisionIndian Council of Agricultural Research
Krishi Anusandhan Bhavan II, Pusa, New Delhi 110 012
www.icar.org.in
ByDr. M. K. AgnihotriDr. N. RanaDr. S. P. SinghDr. K. SharmaDr. Arvind Kumar
All Rights Reserved2014, Education Division© Indian Council of Agricultural Research, New Delhi
Design and ProductionDr V.K. Bharti and K.B. GuptaDirectorate of Knowledge ManagementKrishi Anusandhan Bhavan-I, PusaNew Delhi 110 012
Published byEducation DivisionIndian Council of Agricultural ResearchKrishi Anusandhan Bhavan-IIPusa, New Delhi 110 012
Laser typeset at M/s Print-O-World, 2579, Mandir Lane, Shadipur, New Delhi-110 008,and printed at M/s Royal Offset Printers, A-89/1, Naraina Industrial Area, Phase-I,Delhi-110 028
ii
Foreword
Globalization has brought in substantial changes to the character and
function of education worldwide. The complexities of and interactions
between local, regional and global forces are exerting a profound
influence on education policies. In agriculture education sector, such
complexities have created unending demand for agricultural knowledge,
skill and attitude in rural youth.
Development of quality human resources is one of the crucial
parameters for sustainable development of agriculture across diversified
agro-ecological regions of India. To realize the ever increasing targets
of growth rate for agriculture sector, adequate trained manpower to
provide teaching, research, extension and development in NARS
(National Agricultural Research System) is required for technical
backstopping. In order to address the challenges for manpower
development in agriculture, ICAR has fostered a countrywide
arrangement with the universities under ICAR-AU system to set aside
15% and 25% of their seats for Bachelor and Master's degree
programmes to be filled through All India Entrance Examination for
Admission (AIEEA) conducted annually by Education Division. All India
Competitive Examination to award 202 Senior Research Fellowships
for pursuing Doctoral degree programmes is also annually conducted
by the Education Division.
The Education Division has brought out “Talent for Responsive
Agriculture” a utilitarian compilation of the trends in UG, PG and
SRF(PGS) examination over the years. In-depth analysis of trends
related to talent getting attracted towards higher agricultural education
and comparative performance-based ranking of different universities
throws light on a more proactive role required on part of SAUs for
creating the awareness to attract best talent and generation of
competent human resources to address the new and emerging
challenges in Agricultural Sector.
Systematic capacity building in agriculture requires a supportive
and enabling policy environment and a realistic investment in both
formal and non-formal agricultural education. This document is
expected to provide insights into the dynamics of talent requirements
iii
for Agricultural Education System (AES) for policy planning and working
towards achieving uniform performance standards across the board
in all Universities.
I congratulate the Education Division for bringing out this
publication.
(S. Ayyappan)
Dated the 16th
December, 2013
New Delhi
T A L E N T F O R R E S P O N S I V E A G R I C U L T U R E
iv
¥ -~.
Preface
Strengthening and streamlining of higher agricultural education system
to enhance the quality of human resource in agri-supply chain is one
of the important requirements to meet future challenges in agriculture
sector in the country. This calls for regular manpower planning with
focus on research and development system.
The Education Division of ICAR annually conducts All India Entrance
Examination for Admission (AIEEA) to undergraduate (AIEEA-UG) and
postgraduate (AIEEA-PG) programmes along with the All India
Competitive Examination for the award of Senior Research Fellowships
for pursuing Doctoral degree programmes in Agriculture and Allied
Sciences in the universities under ICAR-AU system. The basic objective
of these examinations is to reduce inbreeding in agricultural education
by encouraging mobility amongst students, infuse merit, encourage
talent and national integration and promote uniform examination
standards across the universities, thereby leading to an overall
improvement in the quality of Higher Agricultural Education in the
country. In 2013, ICAR conducted 18th All India Entrance Examination
for filling 2,285 seats in UG and 2,851seats in PG programme in 65
Agricultural Universities along with All India Competitive Examination
to award 202 Senior Research Fellowships in different disciplines of
Agriculture and Allied Sciences. The number of applicants for AIEEA-
UG-2013 has remarkably increased by 66.70% vis-à-vis AIEEA-UG-
2012. The percentage of candidates from rural areas is more or less
static at least for the last three years that warrants aggressive
campaigning to popularize agricultural education amongst the rural
youths/students.There was 13.82% increase in the number of
applicants for AIEEA-PG-2013 in comparison to last year. In comparison
to 2010, the number of female applicants has increased to the tune
of 6% in UG and 7% in PG, reflecting gradually increasing interest of
girls towards higher agricultural education in the country. About 28%
increase in the number of female awardees without SRF was registered
in 2013 vis-à-vis 2011 indicating an encouraging picture in terms of
the total number of females qualifying this examination.
v
The present report “Talent for Responsive Agriculture” containing
an assessment of the past examination trends and providing insights
into future examination trends is expected to be beneficial to the SAUs,
students, academicians, policy planners and agricultural educationists
directly or indirectly working for strengthening and development of
higher agricultural education in the country. This publication is also
intended to provide clues to the low performing universities so that
they can take required corrective measures to be in line and offer
competition to the universities with better performance.
The inspiration and motivation received from Dr. S. Ayyappan,
Secretary (DARE) & DG (ICAR), Dr. Arvind Kumar, DDG (Edn.) and Dr.
K. Sharma, ADG (HRD) is gratefully acknowledged.
(M.K. Agnihotri)
vi
T A L E N T F O R R E S P O N S I V E A G R I C U L T U R E ¥ -~.
Contents
Foreword iii
Preface v
1. Introduction 1
2. Emerging Challenges in Agriculture Sector 2
3. Agricultural Education System (AES) in India 3
4. Critical Gaps and Concerns in Higher Agricultural Education 4
5. Role of Agricultural Education in Food and Nutritional Security 5
6. New Initiatives in Agricultural Education 5
7. Globalization of Indian Agricultural Education 6
8. All India Entrance Examinations for Admission (AIEEA) 7
8.1 All India Entrance Examination for UG Admissions 8
(AIEEA-UG)
8.1.1 Trends in UG Admissions 9
8.2 All India Entrance Examination for PG Admissions 13
(AIEEA-PG)
8.2.1 Trends in PG Admissions 15
9. All India Competitive Examination for the Award of ICAR’s 22
Senior Research Fellowship (SRF-PGS) for Ph.D
10. Performance of the Universities 27
11. Talent getting attracted towards Higher Agricultural Education 28
12. Scope of Higher Agricultural Education 33
13. Need for greater investment in Agricultural Education to 34
attract and retain talent

1
T A L E N T F O R R E S P O N S I V E A G R I C U L T U R E
Talent for Responsive Agriculture
1.0 IntroductionThe history of agricultural education in India can be traced back
to medieval period when study of agriculture was included in the
curricula of Nalanda and Takshashila Universities as an important
subject. However, formalized courses in agricultural education began
only at the beginning of 20th
Century when six agricultural colleges
were established at Kanpur, Lyalpur, Coimbatore, and Nagpur in
1905, at Pune in 1907
and at Sabour in 1908
under the General
Universities. After
independence in 1947,
the Government of
India initiated an
extensive planning
process. To ensure
orderly growth, the
ICAR took the lead and
drafted a Model Act,
and encouraged the
setting up of exclusive
State Agricultural Universities for research and education support.
The first Agriculture University in the country was set up in 1960
at Pantnagar (now in Uttarakhand State), which paved the way for
establishment of agricultural universities in other states. By the year
1978-79, 21 SAUs were established which at present has gone up
to 56. The intake capacity of students, which was less than 5,000
in 1960, has now gone up to 37,000. With about 317 constituent
colleges, these AUs enroll, on annual basis, about 15,230 students
at UG level, over 11,400 at Masters’ level and 1,000 in Ph.D.
programmes. In addition to this, there are 158 private affiliated
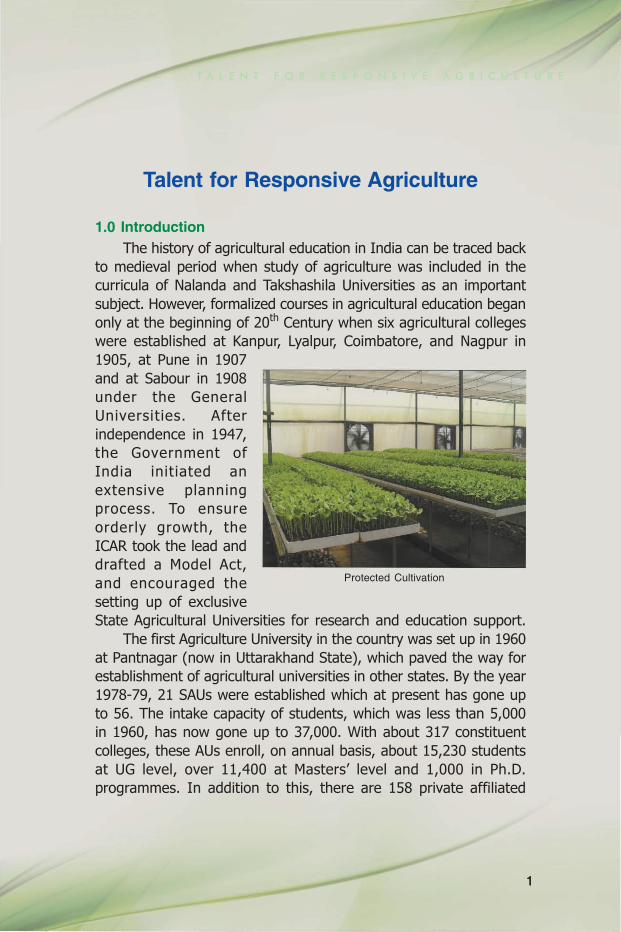
Protected Cultivation
1
2
T A L E N T F O R R E S P O N S I V E A G R I C U L T U R E
colleges and 41 colleges under general universicities enrolling around
10,000 students annually. Degree courses at undergraduate level
are offered with an emphasis on learning through hands on practice
sessions and rural work experience.
Sixty six years ago, Pt. Jawahar Lal Nehru, the first Prime
Minister of India, said that –‘Everything else can wait but not
agriculture’ which holds true even today, agriculture being a driver
of country’s economic growth. One of the prime focuses of the
nation is to ensure food and nutritional security for its burgeoning
population.
After independence, from the state of deficiency, the country
has reached the stage of self-sufficiency in foodgrain production
thereby making a visible impact on the national food and nutritional
security. The Growth rate in agriculture sector during 2012-13 was
1.91% as against 3.65% in 2011-12. Contribution of Agriculture &
Allied sector to GDP is 13.69 % for Agriculture as against 59.57%
for Service sector and 26.75% for the Industry.
The key to success has been the establishment of institutions
of higher agricultural education under ICAR-AU system leading to
development of new breed of quality human resource for generating
new technologies. Still India’s food security situation continues to
rank as “alarming”(IFPRI, 2011). India ranks 67th
out of 81 countries
with extremely “Alarming” food security status. The disparity in per
worker GDP in agriculture and non-agriculture sector during the past
20 years has widened from 1:3 to1:5.
2.0 Emerging Challenges in Agriculture SectorToday, agriculture faces many challenges such as stagnating/
declining productivity and profitability, depleting quality of natural
resources, biotic and abiotic stresses, inefficient use of agro-inputs,
unsafe livelihoods for millions of small and marginal farmers, regional
imbalances in agricultural productivity, a general lack of qualified
manpower in the frontier areas to deliver at grassroots level, rising
input costs, changing food habits and quality concerns, high post-
harvest losses, lack of value addition and processing, fossil fuel crisis
and growing emphasis on biofuels, rising quality competitiveness
under the pressure of globalization, etc. To address these
challenges, some extraordinary efforts are required to be made
especially for development of quality human resource that is critical
¥ -~.
3
T A L E N T F O R R E S P O N S I V E A G R I C U L T U R E
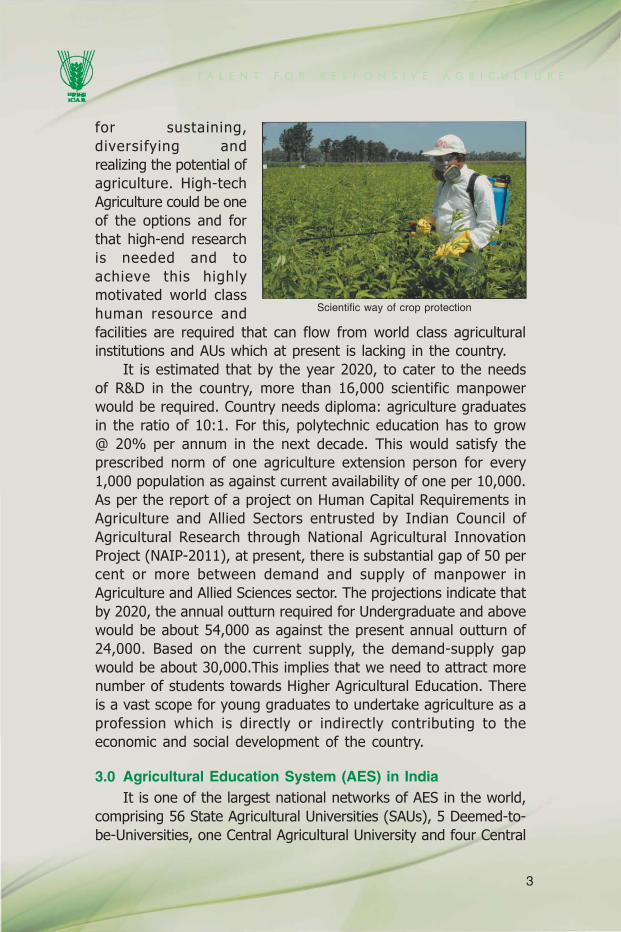
for sustaining,
diversifying and
realizing the potential of
agriculture. High-tech
Agriculture could be one
of the options and for
that high-end research
is needed and to
achieve this highly
motivated world class
human resource and
facilities are required that can flow from world class agricultural
institutions and AUs which at present is lacking in the country.
It is estimated that by the year 2020, to cater to the needs
of R&D in the country, more than 16,000 scientific manpower
would be required. Country needs diploma: agriculture graduates
in the ratio of 10:1. For this, polytechnic education has to grow
@ 20% per annum in the next decade. This would satisfy the
prescribed norm of one agriculture extension person for every
1,000 population as against current availability of one per 10,000.
As per the report of a project on Human Capital Requirements in
Agriculture and Allied Sectors entrusted by Indian Council of
Agricultural Research through National Agricultural Innovation
Project (NAIP-2011), at present, there is substantial gap of 50 per
cent or more between demand and supply of manpower in
Agriculture and Allied Sciences sector. The projections indicate that
by 2020, the annual outturn required for Undergraduate and above
would be about 54,000 as against the present annual outturn of
24,000. Based on the current supply, the demand-supply gap
would be about 30,000.This implies that we need to attract more
number of students towards Higher Agricultural Education. There
is a vast scope for young graduates to undertake agriculture as a
profession which is directly or indirectly contributing to the
economic and social development of the country.
3.0 Agricultural Education System (AES) in IndiaIt is one of the largest national networks of AES in the world,
comprising 56 State Agricultural Universities (SAUs), 5 Deemed-to-
be-Universities, one Central Agricultural University and four Central
Scientific way of crop protection
, ~.

4
T A L E N T F O R R E S P O N S I V E A G R I C U L T U R E
Universities having
agriculture faculty. ICAR
works in a partnership
mode with SAUs and
has contributed
significantly in
developing first rate
human resource by way
of co-ordinating,
supporting and guiding various aspects of higher agricultural
education. It provides funds for development and strengthening
facilities in vital areas, training to faculty and scholarships/fellowships
to the students for quality assurance. To reduce the inbreeding in
agricultural education, students are being encouraged to go to other
states for pursuing their higher studies by providing them National
Talent Scholarship, Junior Research Fellowships and SRF (PGS).
4.0 Critical Gaps and Concerns in Higher AgriculturalEducationThe Gross Enrolment Ratio for Agricultural Education, out of
the total eligible population in the country is only 0.03% and against
the total eligible rural population, it is 0.04% which is quite low.
Low access of agricultural education to rural students, non-
contemporary course curricula and delivery methods, inadequate
state funding, unplanned proliferation of SAUs and colleges, regional
imbalances in agricultural education facilities, lecture methods still
dominating the teaching, lack of brand value for most of SAUs,
complete disconnect between the requirements of industry and the
education being imparted, poor quality education imparted in 158
private colleges and 41 colleges under 15 general universities
admitting about 10,000 students, gender inequality, mismatch of
infrastructure for quality education, research & extension, extensive
inbreeding in faculty recruitment, poor faculty strength, poor
governance, lack of environment for nurturing and retaining talent,
lack of faculty-competence in cutting edge technologies, low priority
to agricultural education as career option & declining quality of
students admitted, growing unemployment (43% graduates,25%
post graduates), shifting employment opportunities from public to
private sector are some of the issues that need to be tackled to
Secy. DARE & DG, ICAR addressing the candidates
¥ -~.
5
T A L E N T F O R R E S P O N S I V E A G R I C U L T U R E
make the agricultural education more vibrant and attractive. Instead
of being the world’s largest ICAR-AU system, the country needs to
have the world’s finest ICAR-AU system.
5.0 Role of Agricultural Education in Food and NutritionalSecurityThe growth achieved in agricultural sector has been attributed
to the concerted efforts of skilled human resource developed through
AES. After independence, from the state of deficiency, country has
moved to the stage of self-sufficiency in foodgrain production. It has
enabled the country to increase production of food grains by 4-fold,
horticultural crops by 6-fold, fish by 9-fold (marine 5-fold and inland
17-fold), milk by 6-fold, and eggs by 27-fold since 1950-51, thus
making a visible impact on the national food and nutritional security.
Thus, human resource developed through Agricultural Education
System in the country was primarily responsible for various agricultural
revolutions, viz. green, white, blue, yellow, pink leading to enhanced
agricultural production and productivity. Not only this, the scientific
expertise developed and research facilities manned by highly skilled
and trained persons have been internationally recognized and a
number of developing and developed countries have shown keen
interest to work together and get mutually benefited through
exchange programmes and collaborative research projects. Due to
shrinking resources, there is a need to shift from input-based to
knowledge-based increase in agricultural production to produce
“More from Less for More”. Though the country has achieved self-
sufficiency in cereal (starch) production, there is need to shift from
starch to protein and fat (oil) self-sufficiency to combat the widely
prevalent hidden hunger and malnutrition in rural women and
children.
6.0 New Initiatives in Agricultural EducationTo tackle these issues and emerging challenges and make the
agricultural education more need-based, multi-pronged efforts are
required. The efforts are underway to revise the course curricula
at undergraduate level to cover education related to cutting edge
technologies such as biosensors, genomics, biotechnology,
alternative sources of energy, nanotech-nology, diagnostics and
vaccine, conservation agriculture, processing, value addition, food
¥ -~.
6
T A L E N T F O R R E S P O N S I V E A G R I C U L T U R E
safety & quality and
information technology
and the IPR issues.
In addition to
various other proposed
new initiatives, to
improve the course
curriculum further, a
one-year composite
programme has been
recommended under
XII Plan with the name ‘Rural Entrepreneurship and Awareness
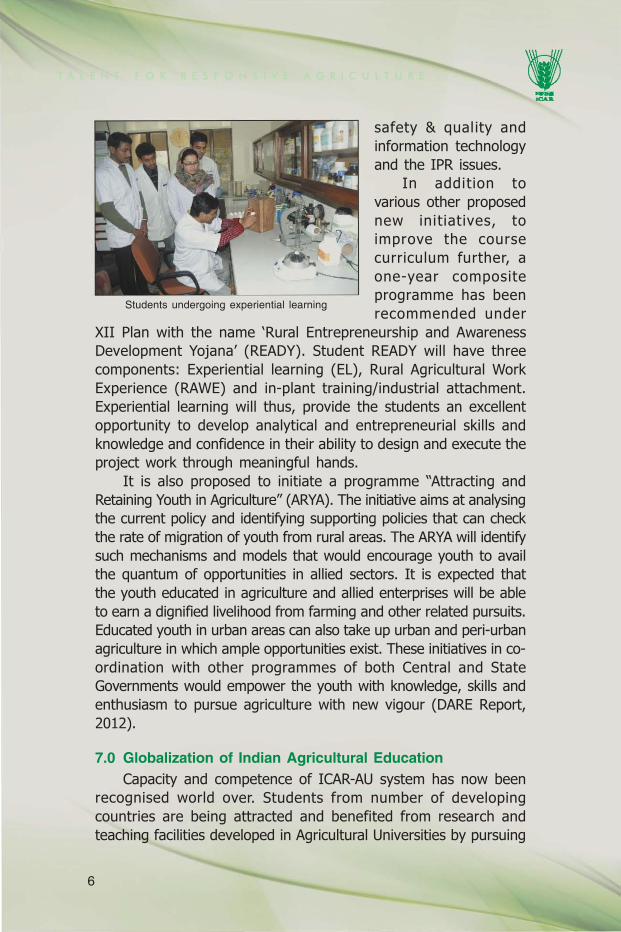
Development Yojana’ (READY). Student READY will have three
components: Experiential learning (EL), Rural Agricultural Work
Experience (RAWE) and in-plant training/industrial attachment.
Experiential learning will thus, provide the students an excellent
opportunity to develop analytical and entrepreneurial skills and
knowledge and confidence in their ability to design and execute the
project work through meaningful hands.
It is also proposed to initiate a programme “Attracting and
Retaining Youth in Agriculture” (ARYA). The initiative aims at analysing
the current policy and identifying supporting policies that can check
the rate of migration of youth from rural areas. The ARYA will identify
such mechanisms and models that would encourage youth to avail
the quantum of opportunities in allied sectors. It is expected that
the youth educated in agriculture and allied enterprises will be able
to earn a dignified livelihood from farming and other related pursuits.
Educated youth in urban areas can also take up urban and peri-urban
agriculture in which ample opportunities exist. These initiatives in co-
ordination with other programmes of both Central and State
Governments would empower the youth with knowledge, skills and
enthusiasm to pursue agriculture with new vigour (DARE Report,
2012).
7.0 Globalization of Indian Agricultural EducationCapacity and competence of ICAR-AU system has now been
recognised world over. Students from number of developing
countries are being attracted and benefited from research and
teaching facilities developed in Agricultural Universities by pursuing
Students undergoing experiential learning
¥ -~.

7
T A L E N T F O R R E S P O N S I V E A G R I C U L T U R E
their higher studies. To support their higher studies in India, number
of new programmes/fellowships have been initiated,viz. India-Africa
fellowship Programme, Indo–Afghan fellowship. Council has also
initiated ICAR International Fellowships with dual objectives of
facilitating education of Indian nationals abroad, and facilitating
admission of foreign students in Indian Agricultural Universities to
help demonstrate the strengths of Indian Agricultural system. DARE/
ICAR also provides admission to foreign students on regular basis
and over 250 foreign students of more than 20 countries are
admitted every year.
8.0 All India Entrance Examinations for Admission (AIEEA)With an aim to reduce the inbreeding in agricultural education
by encouraging mobility amongst students to go for study outside
their home states, infuse merit and encourage the talent and
national integration and promote uniform examination standards
across the AUs, Council made an arrangement with Agricultural
Universities to set aside 15% of their seats for Bachelor’s and 25%
seats for Master’s degree programmes to be filled through All India
Entrance Examinations. Accordingly, ICAR conducts two All India
Entrance Examinations for Admission (AIEEA)-one for Bachelor’s
degree and another for Master’s degree programme, every year.
For the ICAR-Deemed-to-be-Universities such as IARI, IVRI, NDRI
and CIFE, 100% seats are filled through the above examinations.
The programme started in the year 1996-97 and so far, Education
Division has conducted 18 All India Entrance Examinations for
Admission (AIEEA) to various UG and PG Degree programmes.
Degree courses in 11 UG disciplines are offered with emphasis on
learning through hands-on-practice sessions and field experience
training. The PG programmes are offered in about 95 disciplines.
As per the provisional figures of HRD ministry (2012), the
Gross Enrolment Ratio (GER) for higher education in India has shot
up from 12.4 to 20.2 % and if the same trend continues, by 2029,
it is expected to achieve the figure of 30-35%. The ratio for
developed countries is 35-40%, whereas the world average is 23%.
The Gross Enrolment Ratio for Agricultural Education, out of the
total eligible population in the country, is below 1% which is
abysmally low. In the recent past, the number of applicants especially
for UG admissions has increased significantly showing growing
¥ -~.
8
T A L E N T F O R R E S P O N S I V E A G R I C U L T U R E
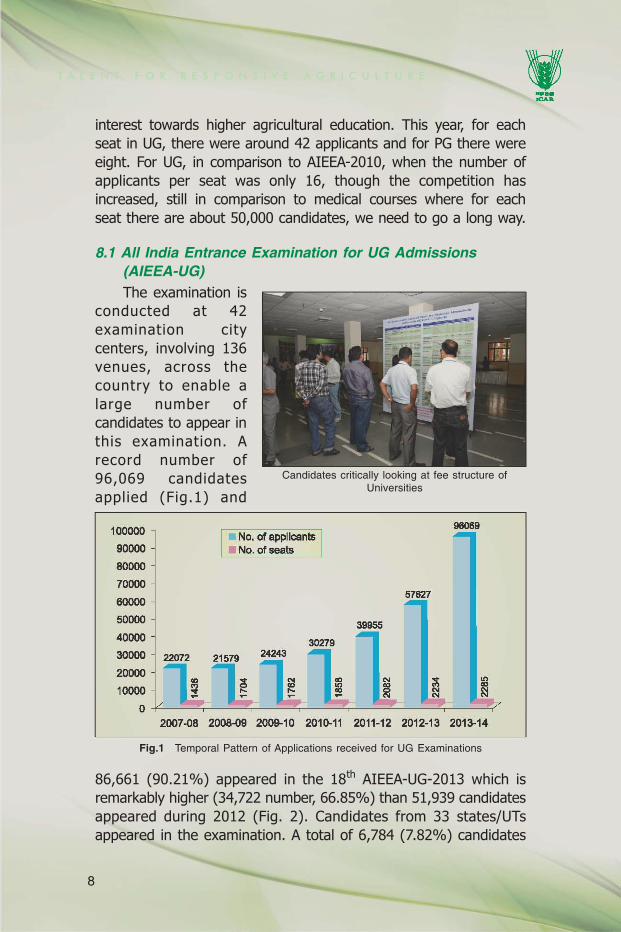
Candidates critically looking at fee structure ofUniversities
interest towards higher agricultural education. This year, for each
seat in UG, there were around 42 applicants and for PG there were
eight. For UG, in comparison to AIEEA-2010, when the number of
applicants per seat was only 16, though the competition has
increased, still in comparison to medical courses where for each
seat there are about 50,000 candidates, we need to go a long way.
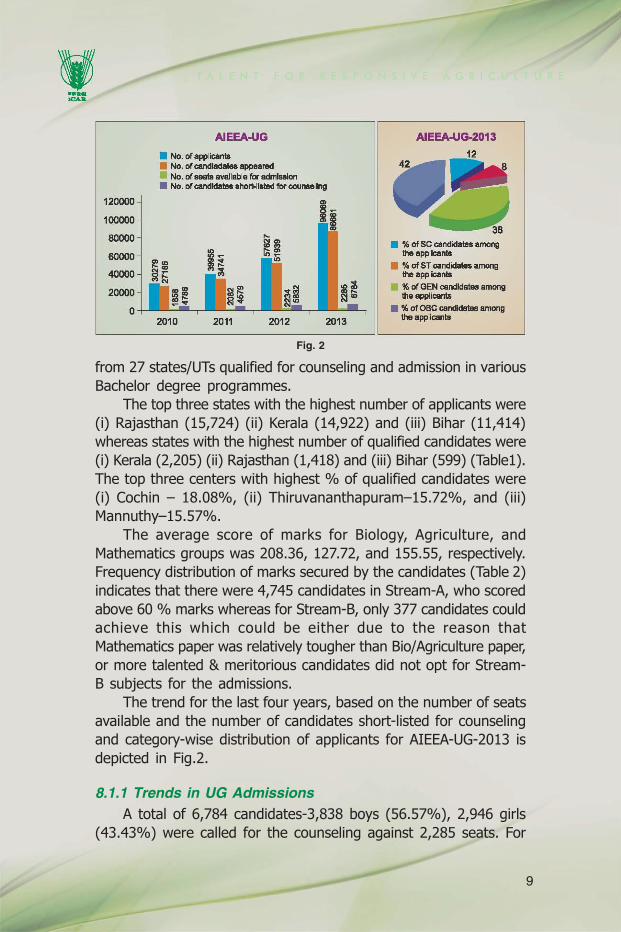
8.1 All India Entrance Examination for UG Admissions(AIEEA-UG)The examination is
conducted at 42
examination city
centers, involving 136
venues, across the
country to enable a
large number of
candidates to appear in
this examination. A
record number of
96,069 candidates
applied (Fig.1) and
Fig.1 Temporal Pattern of Applications received for UG Examinations
86,661 (90.21%) appeared in the 18th
AIEEA-UG-2013 which is
remarkably higher (34,722 number, 66.85%) than 51,939 candidates
appeared during 2012 (Fig. 2). Candidates from 33 states/UTs
appeared in the examination. A total of 6,784 (7.82%) candidates
100000
90000
60000
70000
60000
50000
40000
30000
20000
10000
No. of applicants No. of seats
96069
57627
39955
O+-~==,--=~--~~----~~~~--~~--~
2007-08 2008-09 20011-10 2011l-11 2011-12 2012-13 2013-14
9
T A L E N T F O R R E S P O N S I V E A G R I C U L T U R E
from 27 states/UTs qualified for counseling and admission in various
Bachelor degree programmes.
The top three states with the highest number of applicants were
(i) Rajasthan (15,724) (ii) Kerala (14,922) and (iii) Bihar (11,414)
whereas states with the highest number of qualified candidates were
(i) Kerala (2,205) (ii) Rajasthan (1,418) and (iii) Bihar (599) (Table1).
The top three centers with highest % of qualified candidates were
(i) Cochin – 18.08%, (ii) Thiruvananthapuram–15.72%, and (iii)
Mannuthy–15.57%.
The average score of marks for Biology, Agriculture, and
Mathematics groups was 208.36, 127.72, and 155.55, respectively.
Frequency distribution of marks secured by the candidates (Table 2)
indicates that there were 4,745 candidates in Stream-A, who scored
above 60 % marks whereas for Stream-B, only 377 candidates could
achieve this which could be either due to the reason that
Mathematics paper was relatively tougher than Bio/Agriculture paper,
or more talented & meritorious candidates did not opt for Stream-
B subjects for the admissions.
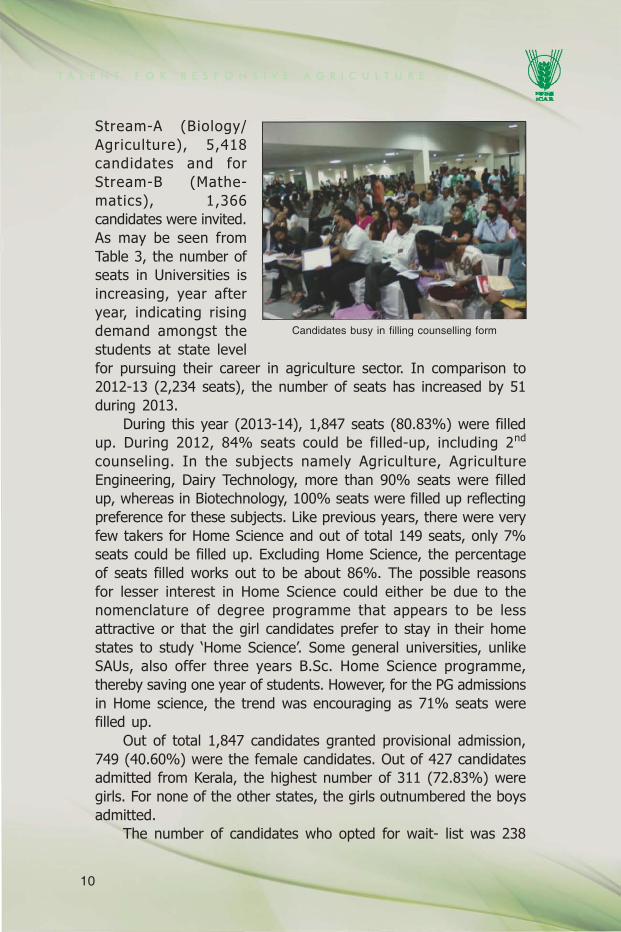
The trend for the last four years, based on the number of seats
available and the number of candidates short-listed for counseling
and category-wise distribution of applicants for AIEEA-UG-2013 is
depicted in Fig.2.
8.1.1 Trends in UG AdmissionsA total of 6,784 candidates-3,838 boys (56.57%), 2,946 girls
(43.43%) were called for the counseling against 2,285 seats. For
Fig. 2
A1EEA-UG
• No. of applicants • No. of canclladates appeared
No. of seats available for admission • No. of candldatee short-listed for counseling
2010 2011 2012 2013
A1EEA-UG-2013
• % of SC candidates among the applicants
• % of ST candidaWs among the applicants
% of GEN candidates among the applicants
• % of OBC candidaWs among the applicants
10
T A L E N T F O R R E S P O N S I V E A G R I C U L T U R E
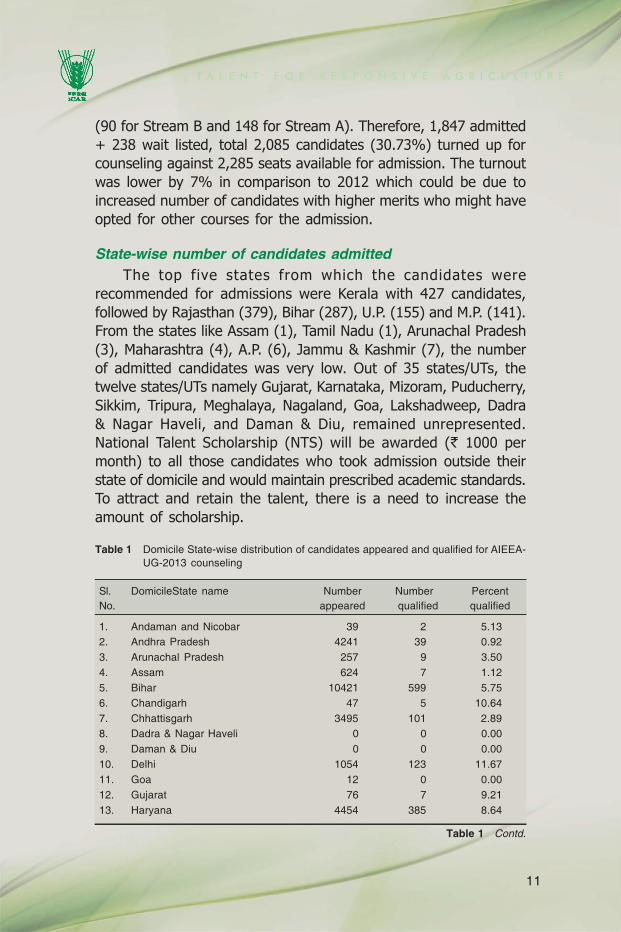
Candidates busy in filling counselling form
Stream-A (Biology/
Agriculture), 5,418
candidates and for
Stream-B (Mathe-
matics), 1,366
candidates were invited.
As may be seen from
Table 3, the number of
seats in Universities is
increasing, year after
year, indicating rising
demand amongst the
students at state level
for pursuing their career in agriculture sector. In comparison to
2012-13 (2,234 seats), the number of seats has increased by 51
during 2013.
During this year (2013-14), 1,847 seats (80.83%) were filled
up. During 2012, 84% seats could be filled-up, including 2nd
counseling. In the subjects namely Agriculture, Agriculture
Engineering, Dairy Technology, more than 90% seats were filled
up, whereas in Biotechnology, 100% seats were filled up reflecting
preference for these subjects. Like previous years, there were very
few takers for Home Science and out of total 149 seats, only 7%
seats could be filled up. Excluding Home Science, the percentage
of seats filled works out to be about 86%. The possible reasons
for lesser interest in Home Science could either be due to the
nomenclature of degree programme that appears to be less
attractive or that the girl candidates prefer to stay in their home
states to study ‘Home Science’. Some general universities, unlike
SAUs, also offer three years B.Sc. Home Science programme,
thereby saving one year of students. However, for the PG admissions
in Home science, the trend was encouraging as 71% seats were
filled up.
Out of total 1,847 candidates granted provisional admission,
749 (40.60%) were the female candidates. Out of 427 candidates
admitted from Kerala, the highest number of 311 (72.83%) were
girls. For none of the other states, the girls outnumbered the boys
admitted.
The number of candidates who opted for wait- list was 238
¥ -~.
11
T A L E N T F O R R E S P O N S I V E A G R I C U L T U R E
(90 for Stream B and 148 for Stream A). Therefore, 1,847 admitted
+ 238 wait listed, total 2,085 candidates (30.73%) turned up for
counseling against 2,285 seats available for admission. The turnout
was lower by 7% in comparison to 2012 which could be due to
increased number of candidates with higher merits who might have
opted for other courses for the admission.
State-wise number of candidates admittedThe top five states from which the candidates were
recommended for admissions were Kerala with 427 candidates,
followed by Rajasthan (379), Bihar (287), U.P. (155) and M.P. (141).
From the states like Assam (1), Tamil Nadu (1), Arunachal Pradesh
(3), Maharashtra (4), A.P. (6), Jammu & Kashmir (7), the number
of admitted candidates was very low. Out of 35 states/UTs, the
twelve states/UTs namely Gujarat, Karnataka, Mizoram, Puducherry,
Sikkim, Tripura, Meghalaya, Nagaland, Goa, Lakshadweep, Dadra
& Nagar Haveli, and Daman & Diu, remained unrepresented.
National Talent Scholarship (NTS) will be awarded (` 1000 per
month) to all those candidates who took admission outside their
state of domicile and would maintain prescribed academic standards.
To attract and retain the talent, there is a need to increase the
amount of scholarship.
Table 1 Domicile State-wise distribution of candidates appeared and qualified for AIEEA-UG-2013 counseling
Sl. DomicileState name Number Number PercentNo. appeared qualified qualified
1. Andaman and Nicobar 39 2 5.132. Andhra Pradesh 4241 39 0.923. Arunachal Pradesh 257 9 3.504. Assam 624 7 1.125. Bihar 10421 599 5.756. Chandigarh 47 5 10.647. Chhattisgarh 3495 101 2.898. Dadra & Nagar Haveli 0 0 0.009. Daman & Diu 0 0 0.0010. Delhi 1054 123 11.6711. Goa 12 0 0.0012. Gujarat 76 7 9.2113. Haryana 4454 385 8.64
Table 1 Contd.

12
T A L E N T F O R R E S P O N S I V E A G R I C U L T U R E
14. Himachal Pradesh 2043 94 4.6015. Jammu & Kashmir 473 16 3.3816. Jharkhand 1747 79 4.5217. Karnataka 547 1 0.1818. Kerala 13643 2205 16.1619. Lakshadweep 14 3 21.4320. Madhya Pradesh 6802 360 5.2921. Maharashtra 1108 14 1.2622. Manipur 1186 86 7.2523. Meghalaya 110 2 1.8224. Mizoram 10 0 0.0025. Nagaland 79 0 0.0026. Odisha 5855 511 8.7327. Puducherry 16 0 0.0028. Punjab 1619 89 5.5029. Rajasthan 14554 1418 9.7430. Sikkim 13 0 0.0031. Tamil Nadu 271 15 5.5432. Tripura 40 0 0.0033. Uttarakhand 1609 83 5.1634. Uttar Pradesh 8174 420 5.1435. West Bengal 1844 104 5.6436. Not specified 184 7 3.80
Total 86,661 6,784 7.82%
Table 1 (Concluded)
Sl. DomicileState name Number Number PercentNo. appeared qualified qualified
Table-2 Frequency distribution of marks secured by the candidates appeared in AIEEA-UG-2013
% marks Marks No. of candidates No. of candidatessecured secured in Stream-A in Stream-B
< 10 # 72 10068 4972
10-20 73-144 18161 8468
21-30 145-216 12562 4959
31-40 217-288 7928 2897
41-50 289-360 7928 2897
51-60 361-432 3758 753
61-70 433-504 2838 300
71-80 505-576 1568 67
81-90 577-648 337 10
>90 >648 2 0
Note : Maximum Marks: 720; Highest secured in Stream-A : 651;Highest secured inStream-B: 615
13
T A L E N T F O R R E S P O N S I V E A G R I C U L T U R E
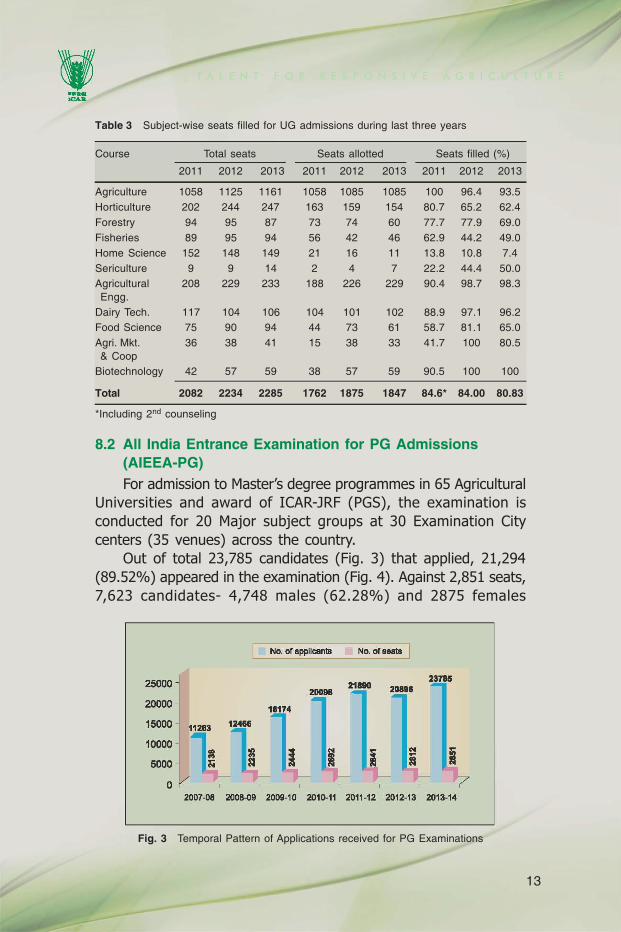
Table 3 Subject-wise seats filled for UG admissions during last three years
Course Total seats Seats allotted Seats filled (%)
2011 2012 2013 2011 2012 2013 2011 2012 2013
Agriculture 1058 1125 1161 1058 1085 1085 100 96.4 93.5Horticulture 202 244 247 163 159 154 80.7 65.2 62.4Forestry 94 95 87 73 74 60 77.7 77.9 69.0Fisheries 89 95 94 56 42 46 62.9 44.2 49.0Home Science 152 148 149 21 16 11 13.8 10.8 7.4Sericulture 9 9 14 2 4 7 22.2 44.4 50.0Agricultural 208 229 233 188 226 229 90.4 98.7 98.3Engg.
Dairy Tech. 117 104 106 104 101 102 88.9 97.1 96.2Food Science 75 90 94 44 73 61 58.7 81.1 65.0Agri. Mkt. 36 38 41 15 38 33 41.7 100 80.5& Coop
Biotechnology 42 57 59 38 57 59 90.5 100 100
Total 2082 2234 2285 1762 1875 1847 84.6* 84.00 80.83
*Including 2nd counseling
8.2 All India Entrance Examination for PG Admissions(AIEEA-PG)For admission to Master’s degree programmes in 65 Agricultural
Universities and award of ICAR-JRF (PGS), the examination is
conducted for 20 Major subject groups at 30 Examination City
centers (35 venues) across the country.
Out of total 23,785 candidates (Fig. 3) that applied, 21,294
(89.52%) appeared in the examination (Fig. 4). Against 2,851 seats,
7,623 candidates- 4,748 males (62.28%) and 2875 females
Fig. 3 Temporal Pattern of Applications received for PG Examinations
25000
20000
15000
10000
5000
No. of applicants
200 ..
No. of seats I
23785 2 ....
O~--~--~~--~--~,---~--~,---~
2007-08 2008-09 2009-10 2010-11 2011-12 2012-13 2013-14

14
T A L E N T F O R R E S P O N S I V E A G R I C U L T U R E
(37.72%) were short-listed for the counseling in 2013. In comparison
to 2010, there has been a significant increase in the number of
applicants. Still there is scope to attract more agricultural graduates
to go for post-graduation to meet the increasing demand of
manpower for teaching, research, and extension by increasing the
number and amount of fellowships.
The top ranking three states with the highest number of
qualifying candidates were (i) Karnataka (1195) (ii) Maharashtra
(706) and (iii) Uttar Pradesh (704) (Table 4).
Table 4 DomicileState-wise distribution of qualified candidates for AIEEA-PG-2013counseling
Sl. Domicile State name Number Number PercentNo. appeared qualified qualified
1. Andaman and Nicobar 9 1 11.112. Andhra Pradesh 1263 471 37.293. Arunachal Pradesh 70 31 44.294. Assam 197 73 37.065. Bihar 1168 565 48.376. Chandigarh 6 0 07. Chhattisgarh 1029 158 15.358. Dadra and Nagar Haveli 1 0 09. Daman & Diu 0 0 010. Delhi 433 104 24.0211. Goa 13 7 53.8512. Gujarat 260 145 55.7713. Haryana 401 129 32.1714. Himachal Pradesh 303 161 53.1415. Jammu & Kashmir 305 213 69.8416. Jharkhand 264 123 46.5917. Karnataka 2542 1195 47.0118. Kerala 605 306 50.5819. Lakshadweep 6 4 66.6720. Madhya Pradesh 968 383 39.5721. Maharashtra 3534 706 19.9822. Manipur 235 97 41.2823. Meghalaya 98 37 37.7624. Mizoram 40 24 60.0025. Nagaland 80 13 16.2526. Odisha 588 323 54.9327. Puducherry 48 19 39.5828. Punjab 297 97 32.6629. Rajasthan 1556 699 44.9230. Sikkim 40 22 55.0031. Tamil Nadu 978 254 25.9732. Tripura 154 76 49.3533. Uttarakhand 476 260 54.6234. Uttar Pradesh 2860 704 24.6235. West Bengal 424 210 49.5336. Not specified 43 13 25.00
Total 21294 7623 35.80
15
T A L E N T F O R R E S P O N S I V E A G R I C U L T U R E
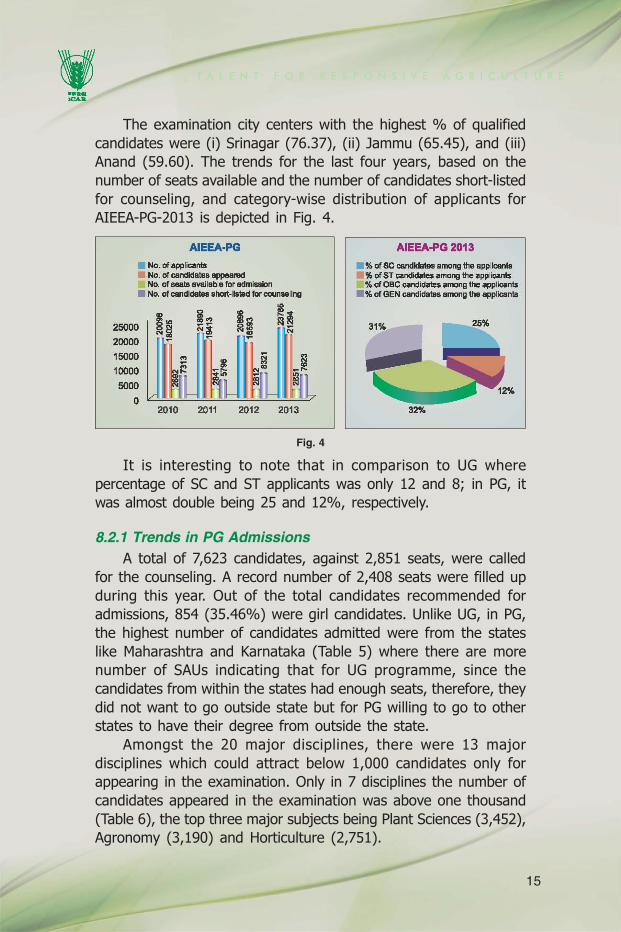
The examination city centers with the highest % of qualified
candidates were (i) Srinagar (76.37), (ii) Jammu (65.45), and (iii)
Anand (59.60). The trends for the last four years, based on the
number of seats available and the number of candidates short-listed
for counseling, and category-wise distribution of applicants for
AIEEA-PG-2013 is depicted in Fig. 4.
Fig. 4
It is interesting to note that in comparison to UG where
percentage of SC and ST applicants was only 12 and 8; in PG, it
was almost double being 25 and 12%, respectively.
8.2.1 Trends in PG AdmissionsA total of 7,623 candidates, against 2,851 seats, were called
for the counseling. A record number of 2,408 seats were filled up
during this year. Out of the total candidates recommended for
admissions, 854 (35.46%) were girl candidates. Unlike UG, in PG,
the highest number of candidates admitted were from the states
like Maharashtra and Karnataka (Table 5) where there are more
number of SAUs indicating that for UG programme, since the
candidates from within the states had enough seats, therefore, they
did not want to go outside state but for PG willing to go to other
states to have their degree from outside the state.
Amongst the 20 major disciplines, there were 13 major
disciplines which could attract below 1,000 candidates only for
appearing in the examination. Only in 7 disciplines the number of
candidates appeared in the examination was above one thousand
(Table 6), the top three major subjects being Plant Sciences (3,452),
Agronomy (3,190) and Horticulture (2,751).
25000 20000 15000 10000 5000
o 2010
A1EEA·PG
2011 2012 2013
AIEEA·PG 2013
• % of se candidates among the applicants • % of ST candidates among the applicants
% of CBC candidates among the applicanb • % of GEN candidaws among u.. applicants
31%
32%

16
T A L E N T F O R R E S P O N S I V E A G R I C U L T U R E
Table 5 Number of candidates admitted during AIEEA-PG-2013-14 who graduated fromthe agricultural universities
Sl No. State No. of SAU’s, CAU Central Universities No. admitted with Agriculture Faculty & DUs
1. Andhra Pradesh 3 1702. Chhattisgarh 2 573. Maharashtra 5 3594. Himachal Pradesh 2 465. Punjab 2 276. Uttarakhand 2 747. Madhya Pradesh 2 978. Gujarat 4 659. Karnataka 6 34010. Kerala 3 10011. Haryana 1+1 2612. Rajasthan 2 15213. Uttar Pradesh 5+1 16514. Odisha 1 9315. Bihar 2 2716. Jammu & Kashmir 2 10017. Assam 1 4818. Tamil Nadu 3 7219. West Bengal 3+1 8720. Manipur (CAU) 1 11621. Nagaland (CU) 1 322. Jharkhand 1 523. Delhi (CU) 1 1824. Others 161
Total 2408
Table 6 Subject-wise distribution of candidates appeared and qualified for PG admissions
Code Major Subject Applied Appeared Qualified
01 Plant Biotechnology 1635 1435 40202 Plant Sciences 3757 3452 119203 Physical Science 875 793 36904 Entomology and Nematology 1635 1507 47405 Agronomy 3496 3190 48006 Social Sciences 1374 1248 59107 Statistical Sciences 205 178 3808 Horticulture 2962 2751 73909 Forestry/Agroforestry and Silviculture 471 412 19110 Agricultural Engineering and Technology 1155 975 32511 Water Science and Technology 21 17 512 Home Science 602 547 24713 Animal Biotechnology 870 722 19814 Veterinary Science 1328 1134 90015 Animal Sciences 981 843 54516 Fisheries Science 553 501 37017 Dairy Science 211 181 6718 Dairy Technology 334 287 10919 Food Science Technology 784 647 14120 Agri Business Management 536 474 240
Total 23,785 21,294 7,623

17
T A L E N T F O R R E S P O N S I V E A G R I C U L T U R E
The number of candidates who opted for wait-list was 846 (for
20 major subjects). Therefore, 2,408 admitted + 846 wait listed,
total 3,254 candidates (42.68%) turned up for the counseling
against 2,851 seats available for the admission. In comparison to
UG, the turnup was almost 12% higher.
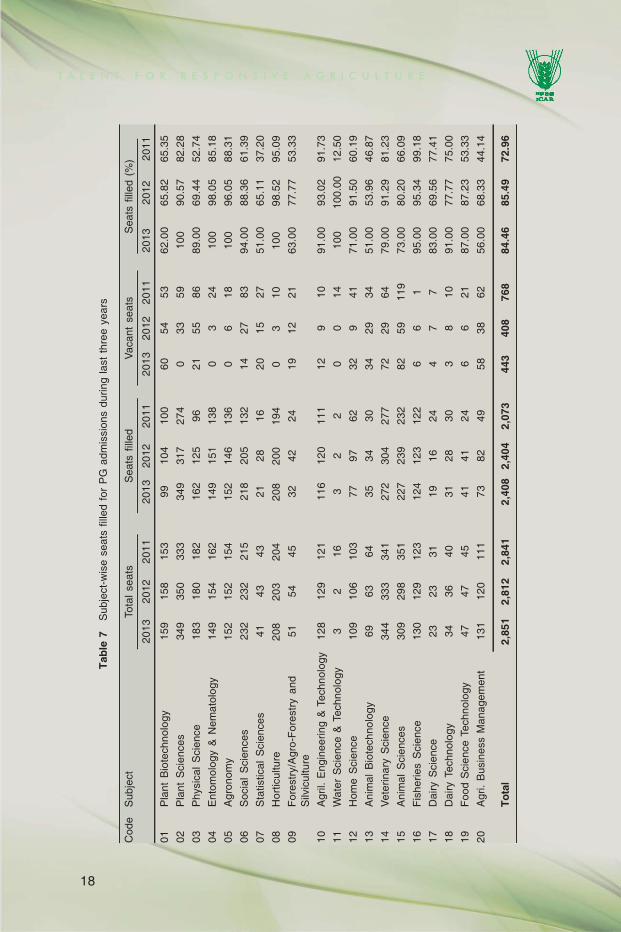
For the subjects like Plant Sciences, Entomology & Nematology,
Agronomy, Horticulture, and Water Science & Technology, 100%
seats while for Fisheries Science, Dairy Technology, Agricultural
Engineering & Technology, and Social Sciences above 90% seats
were filled up. For the subjects namely Animal Biotechnology,
Statistical Sciences, and Agribusiness Management, there were only
very few takers as almost half of the seats remained unfilled
(Table 7).
The highest number of 110 female candidates (out of 349
candidates admitted) took admission in Plant Sciences followed by
106 (out of 272) in Veterinary Science, 86 (out of 218) in Social
Science and 75 (out of 77) in Home Science.
The ICAR-Junior Research Fellowship (` 12,600 per month for
Veterinary graduates and ` 8,640 per month in other cases plus
contingent grant of ` 6000/ per year for two years) for post-graduate
studies (ICAR-JRF-PGS) was awarded to 474 candidates, out of 475
JRFs available, based on their merit in AIEEA-PG-2013 and taking
admissions in universities other than from where the candidates had
graduated. For Veterinary, and Animal Sciences courses, with higher
fellowship amount some seats could be filled up but still 49% seats
in Animal Biotechnology, 27% in Animal Sciences and 21% seats
in Veterinary Science remained unfilled (Table 7). Trend of seats
filled for the last three years indicates decrease interest of students
towards animal production side subjects. Under 8 Major subjects,
there were 9 sub-subjects in which less than 50% seats were filled
(Table 8) which is a matter of concern considering their need for
teaching and research in these areas.
Rural vs. Urban candidatesOut of the total candidates that applied for UG Examination,
59% were from villages, 20% from towns and remaining 21% from
the cities (Fig.5). In PG, the percentage of candidates appeared
from villages was lower than UG being 51%. The percentage of
candidates from rural areas is more or less static at least for the
¥ -~.
18
T A L E N T F O R R E S P O N S I V E A G R I C U L T U R E
Tab
le 7
Sub
ject
-wis
e se
ats
fille
d fo
r P
G a
dmis
sion
s du
ring
last
thr
ee y
ears
Cod
eS
ubje
ctTo
tal
seat
sS
eats
fill
edV
acan
t se
ats
Sea
ts f
illed
(%
)
2013
2012
2011
2013
2012
2011
2013
2012
2011
2013
2012
2011
01P
lant
Bio
tech
nolo
gy15
915
815
399
104
100
6054
5362
.00
65.8
265
.35
02P
lant
Sci
ence
s34
935
033
334
931
727
40
3359
100
90.5
782
.28
03P
hysi
cal
Sci
ence
183
180
182
162
125
9621
5586
89.0
069
.44
52.7
4
04E
ntom
olog
y &
Nem
atol
ogy
149
154
162
149
151
138
03
2410
098
.05
85.1
8
05A
gron
omy
152
152
154
152
146
136
06
1810
096
.05
88.3
1
06S
ocia
l S
cien
ces
232
232
215
218
205
132
1427
8394
.00
88.3
661
.39
07S
tatis
tical
Sci
ence
s41
4343
2128
1620
1527
51.0
065
.11
37.2
0
08H
ortic
ultu
re20
820
320
420
820
019
40
310
100
98.5
295
.09
09F
ores
try/
Agr
o-F
ores
try
and
5154
4532
4224
1912
2163
.00
77.7
753
.33
Silv
icul
ture
10A
gril.
Eng
inee
ring
& T
echn
olog
y12
812
912
111
612
011
112
910
91.0
093
.02
91.7
3
11W
ater
Sci
ence
& T
echn
olog
y3
216
32
20
014
100
100.
0012
.50
12H
ome
Sci
ence
109
106
103
7797
6232
941
71.0
091
.50
60.1
9
13A
nim
al B
iote
chno
logy
6963
6435
3430
3429
3451
.00
53.9
646
.87
14V
eter
inar
y S
cien
ce34
433
334
127
230
427
772
2964
79.0
091
.29
81.2
3
15A
nim
al S
cien
ces
309
298
351
227
239
232
8259
119
73.0
080
.20
66.0
9
16F
ishe
ries
Sci
ence
130
129
123
124
123
122
66
195
.00
95.3
499
.18
17D
airy
Sci
ence
2323
3119
1624
47
783
.00
69.5
677
.41
18D
airy
Tec
hnol
ogy
3436
4031
2830
38
1091
.00
77.7
775
.00
19F
ood
Sci
ence
Tec
hnol
ogy
4747
4541
4124
66
2187
.00
87.2
353
.33
20A
gri.
Bus
ines
s M
anag
emen
t13
112
011
173
8249
5838
6256
.00
68.3
344
.14
To
tal
2,85
12,
812
2,84
12,
408
2,40
42,
073
443
408
768
84.4
685
.49
72.9
6

19
T A L E N T F O R R E S P O N S I V E A G R I C U L T U R E
last three years warranting aggressive campaigning to popularise
agricultural education amongst the rural youths/students.
Table 8 Major subjects/ sub-subjects in which less than 50% seats were filled up duringPG counseling
Sl. Major subject Sub-subject Total No. SeatsNo. with code with code of seats filled (%)
1. Statistical Science (07) 7.1 Agricultural Statistics 28 362. Forestry (09) 9.1 Forest Products 5 203. Home Science (12) 12.2 Human Development and 21 48
Family Studies/ Child development12.3 Home Mgmt. /Family Resources 18 44
Mgmt.4. Animal Bio-technology 13.2 Veterinary/Animal 36 44
(13) Bio-Chemistry5. Veterinary Science (14) 14.1 Veterinary Anatomy 26 46
(& Histology)6. Animal Science (15) 15.1 Animal Husbandry/Animal 36 44
Science/Dairy Science7. Fisheries Science (16) 16.1 Fisheries Sciences/Fish Hydro/ 3 33
Fish Env./ Fish Indus. Tech.8. Agribusiness 20.2 Agri. Marketing & Cooperation 4 40
Management (20) etc.
Total 177
Fig. 5 Area-wise distribution of applicants
A1EEA-UG 2013
A1EEA-PG 2013
• % of candidates from vlliagee • % of candidates from town % of candid.to from cities
20
T A L E N T F O R R E S P O N S I V E A G R I C U L T U R E
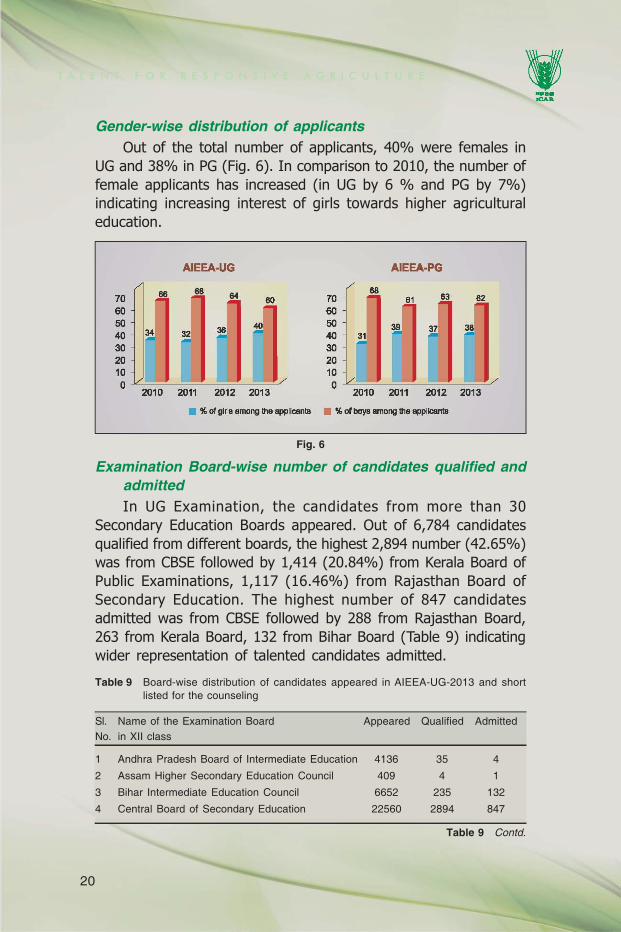
Fig. 6
Gender-wise distribution of applicantsOut of the total number of applicants, 40% were females in
UG and 38% in PG (Fig. 6). In comparison to 2010, the number of
female applicants has increased (in UG by 6 % and PG by 7%)
indicating increasing interest of girls towards higher agricultural
education.
Table 9 Board-wise distribution of candidates appeared in AIEEA-UG-2013 and shortlisted for the counseling
Sl. Name of the Examination Board Appeared Qualified AdmittedNo. in XII class
1 Andhra Pradesh Board of Intermediate Education 4136 35 4
2 Assam Higher Secondary Education Council 409 4 1
3 Bihar Intermediate Education Council 6652 235 132
4 Central Board of Secondary Education 22560 2894 847
Table 9 Contd.
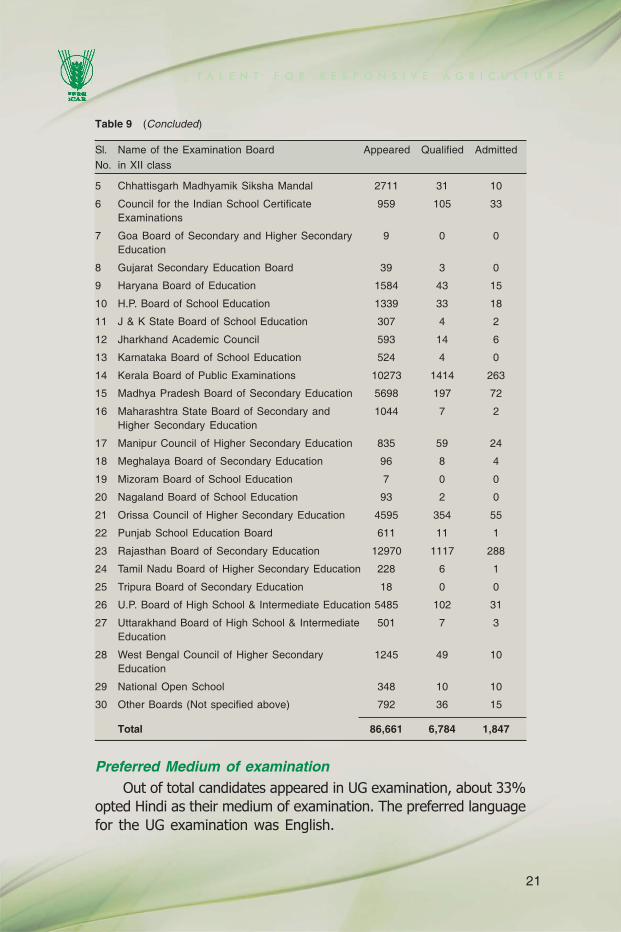
Examination Board-wise number of candidates qualified andadmittedIn UG Examination, the candidates from more than 30
Secondary Education Boards appeared. Out of 6,784 candidates
qualified from different boards, the highest 2,894 number (42.65%)
was from CBSE followed by 1,414 (20.84%) from Kerala Board of
Public Examinations, 1,117 (16.46%) from Rajasthan Board of
Secondary Education. The highest number of 847 candidates
admitted was from CBSE followed by 288 from Rajasthan Board,
263 from Kerala Board, 132 from Bihar Board (Table 9) indicating
wider representation of talented candidates admitted.
A1EEA-UG AIEEA-PG .. 6 • .. .. 70 70 63
60 60 50 50 40 34 32 40 31 30 30 20 20 10 10 0
2010 2011 2012 2013 0
2010 2011 2012 2013
• "of girls among the applicants • % of boys among the applicants
21
T A L E N T F O R R E S P O N S I V E A G R I C U L T U R E
Preferred Medium of examinationOut of total candidates appeared in UG examination, about 33%
opted Hindi as their medium of examination. The preferred language
for the UG examination was English.
5 Chhattisgarh Madhyamik Siksha Mandal 2711 31 10
6 Council for the Indian School Certificate 959 105 33Examinations
7 Goa Board of Secondary and Higher Secondary 9 0 0Education
8 Gujarat Secondary Education Board 39 3 0
9 Haryana Board of Education 1584 43 15
10 H.P. Board of School Education 1339 33 18
11 J & K State Board of School Education 307 4 2
12 Jharkhand Academic Council 593 14 6
13 Karnataka Board of School Education 524 4 0
14 Kerala Board of Public Examinations 10273 1414 263
15 Madhya Pradesh Board of Secondary Education 5698 197 72
16 Maharashtra State Board of Secondary and 1044 7 2Higher Secondary Education
17 Manipur Council of Higher Secondary Education 835 59 24
18 Meghalaya Board of Secondary Education 96 8 4
19 Mizoram Board of School Education 7 0 0
20 Nagaland Board of School Education 93 2 0
21 Orissa Council of Higher Secondary Education 4595 354 55
22 Punjab School Education Board 611 11 1
23 Rajasthan Board of Secondary Education 12970 1117 288
24 Tamil Nadu Board of Higher Secondary Education 228 6 1
25 Tripura Board of Secondary Education 18 0 0
26 U.P. Board of High School & Intermediate Education 5485 102 31
27 Uttarakhand Board of High School & Intermediate 501 7 3Education
28 West Bengal Council of Higher Secondary 1245 49 10Education
29 National Open School 348 10 10
30 Other Boards (Not specified above) 792 36 15
Total 86,661 6,784 1,847
Table 9 (Concluded)
Sl. Name of the Examination Board Appeared Qualified AdmittedNo. in XII class
22
T A L E N T F O R R E S P O N S I V E A G R I C U L T U R E
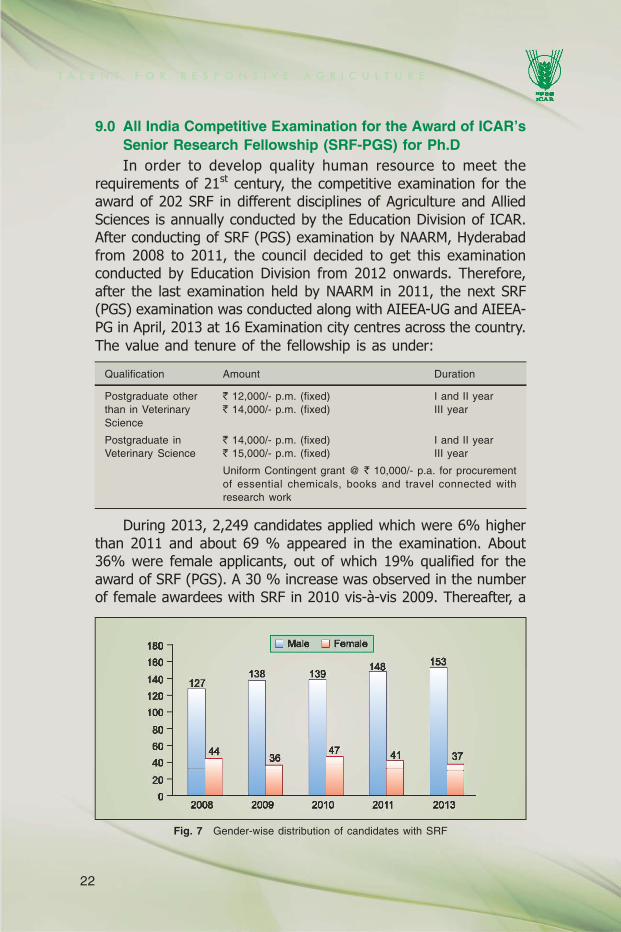
9.0 All India Competitive Examination for the Award of ICAR’sSenior Research Fellowship (SRF-PGS) for Ph.DIn order to develop quality human resource to meet the
requirements of 21st
century, the competitive examination for the
award of 202 SRF in different disciplines of Agriculture and Allied
Sciences is annually conducted by the Education Division of ICAR.
After conducting of SRF (PGS) examination by NAARM, Hyderabad
from 2008 to 2011, the council decided to get this examination
conducted by Education Division from 2012 onwards. Therefore,
after the last examination held by NAARM in 2011, the next SRF
(PGS) examination was conducted along with AIEEA-UG and AIEEA-
PG in April, 2013 at 16 Examination city centres across the country.
The value and tenure of the fellowship is as under:
Qualification Amount Duration
Postgraduate other ` 12,000/- p.m. (fixed) I and II yearthan in Veterinary ` 14,000/- p.m. (fixed) III yearScience
Postgraduate in ` 14,000/- p.m. (fixed) I and II yearVeterinary Science ` 15,000/- p.m. (fixed) III year
Uniform Contingent grant @ ` 10,000/- p.a. for procurementof essential chemicals, books and travel connected withresearch work
During 2013, 2,249 candidates applied which were 6% higher
than 2011 and about 69 % appeared in the examination. About
36% were female applicants, out of which 19% qualified for the
award of SRF (PGS). A 30 % increase was observed in the number
of female awardees with SRF in 2010 vis-à-vis 2009. Thereafter, a
Fig. 7 Gender-wise distribution of candidates with SRF
180 160
140
120 100
80 60 40
20
o
-
-
-
ill
1 2008
10M I O F .e emae
~ ~
n £.
2009 2010
14l ~
1 37 n
2011 2013
23
T A L E N T F O R R E S P O N S I V E A G R I C U L T U R E
Fig. 8 Gender-wise distribution of candidates without SRF
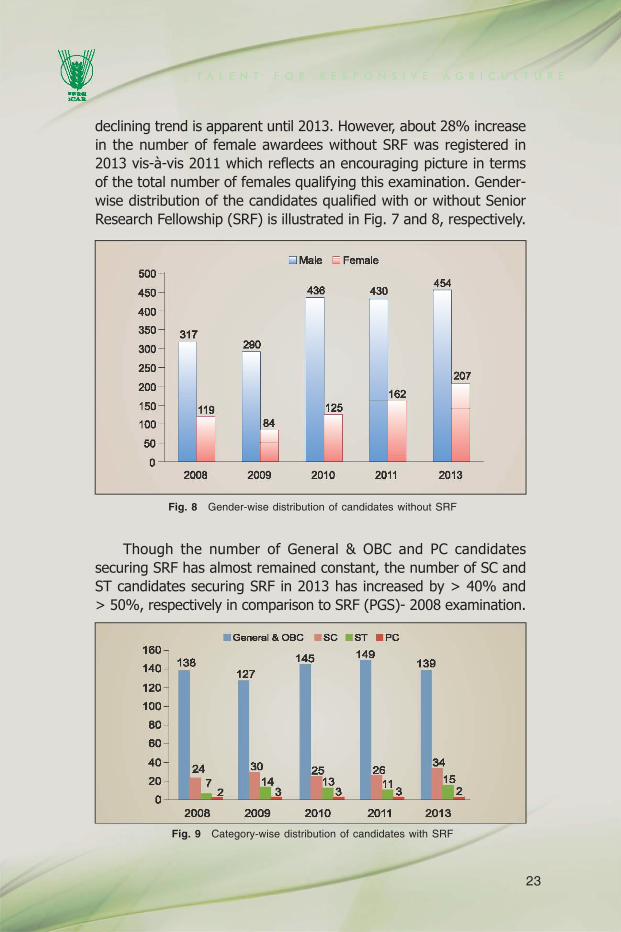
declining trend is apparent until 2013. However, about 28% increase
in the number of female awardees without SRF was registered in
2013 vis-à-vis 2011 which reflects an encouraging picture in terms
of the total number of females qualifying this examination. Gender-
wise distribution of the candidates qualified with or without Senior
Research Fellowship (SRF) is illustrated in Fig. 7 and 8, respectively.
Though the number of General & OBC and PC candidates
securing SRF has almost remained constant, the number of SC and
ST candidates securing SRF in 2013 has increased by > 40% and
> 50%, respectively in comparison to SRF (PGS)- 2008 examination.
Fig. 9 Category-wise distribution of candidates with SRF
i;j Male ~ Female
436 430
317
207
2008 2009 2010 2011 2013
• General & OBC • SC . ST . PC 160 149
138 145 139 140 127 120
100
80
60
40 24 \ 34
~ 26
~2 20 ~2 14 13 1li3 0
3 3
2008 2009 2010 2011 2013
24
T A L E N T F O R R E S P O N S I V E A G R I C U L T U R E
Apart from one composite paper on General Knowledge, which
is common to all the subjects, the SRF(PGS) examination was
conducted in 14 major subject groups comprising 56 sub-subjects.
For computing the merit, 75% weightage was given for the marks
obtained in written examination while 25% weightage was given to
the past academic performance of the candidates for UG (10%) and
PG (15%).
With the number of fellowship slots remaining constant for
different disciplines, an increase in the number of candidates
securing SRF in 2013 vis-a-vis 2011 was observed in the disciplines
belonging to Major Subject Groups of Plant Sciences, Biochemistry
& Biotechnology, Veterinary & Animal Sciences-III and Agricultural
Engineering. A decrease in the number of students qualifying
without fellowship was recorded only for the disciplines of Plant
Protection & Related Sciences, Dairy Science, Dairy Technology &
Food Science and Agricultural Engineering. Discipline-wise number
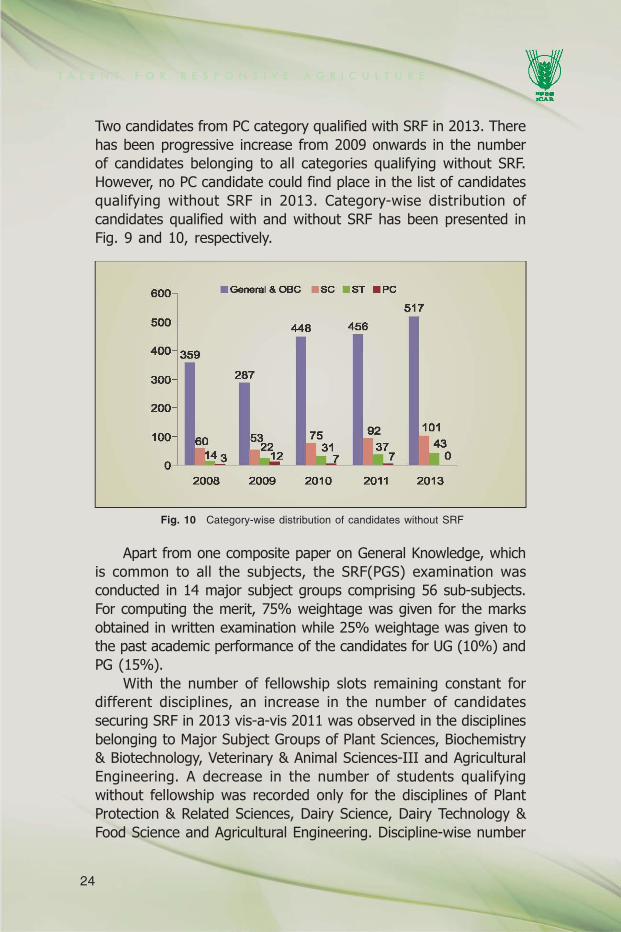
Fig. 10 Category-wise distribution of candidates without SRF
Two candidates from PC category qualified with SRF in 2013. There
has been progressive increase from 2009 onwards in the number
of candidates belonging to all categories qualifying without SRF.
However, no PC candidate could find place in the list of candidates
qualifying without SRF in 2013. Category-wise distribution of
candidates qualified with and without SRF has been presented in
Fig. 9 and 10, respectively.
• General & eBC • SC • ST • PC
517
448 456
287
92 101
2008 2009 2010 2011 2013
25
TA
LE
NT
F
OR
R
ES
PO
NS
IV
E
AG
RI
CU
LT
UR
E
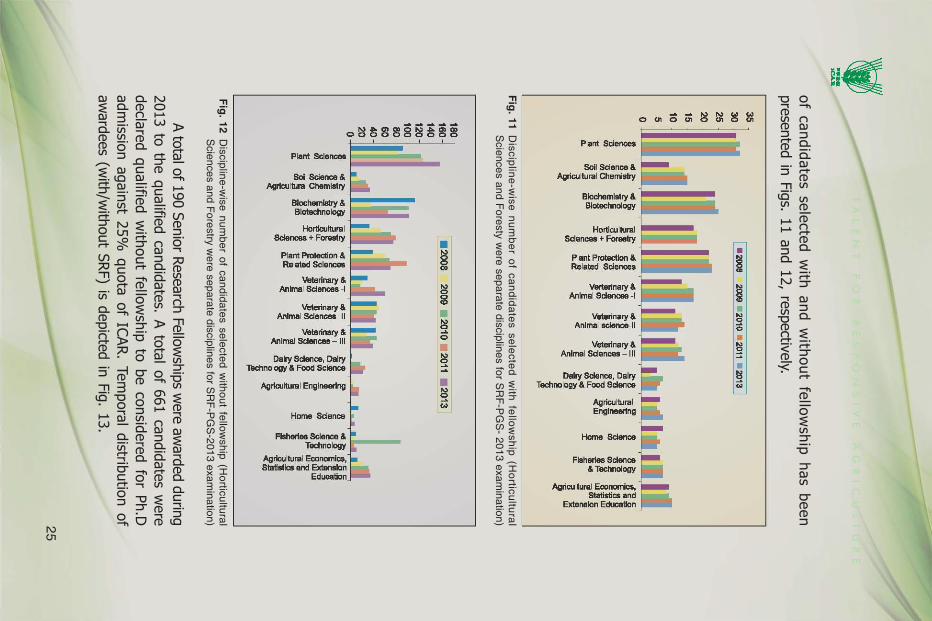
of candidates selected w
ith and w
ithout fellow
ship has been
presented in
Fig
s. 11 and 12, respectiv
ely
.
Fig
. 11D
isciplin
e-w
ise n
um
be
r of ca
nd
ida
tes se
lecte
d w
ith fe
llow
ship
(Ho
rticultu
ral
Sciences and F
oresty were separate disciplines for S
RF
-PG
S- 2013 exam
ination)
Fig
. 12D
iscipline-wise num
ber of candidates selected without fellow
ship (Horticultural
Sciences and F
orestry were separate disciplines for S
RF
-PG
S-2013 exam
ination)
A total of 190 Senio
r Research Fello
wship
s w
ere aw
arded durin
g
2013 to the qualif
ied candid
ates. A total
of 661 candid
ates w
ere
decla
red qualif
ied w
ithout fello
wship
to be consid
ered for Ph.D
adm
issio
n again
st 25%
quota of ICAR
. Tem
poral
dis
trib
utio
n of
aw
ardees (w
ith/w
ithout SRF) is
depic
ted in
Fig
. 13.
o~c!;~~§~~~~ I Plant Sclencae ~~ _______ _
Soil Science & Agricultural Chemistry
Biochemistry & 1--.......... -Biotechnology J---"-
Horticultural J===' ScIences + Foreetry
Plant Protection & J===JoRelated Sclel"lC88
Veterinary & Animal Sciences-I
Veterinary & Animal ScIences-II
Veterinary & Animal Sciences-III
Dairy Science, Dairy Technology & Food Science
Agricultural Engineering
Home Science
Fisheries ScIence & Technology
Agricultural Economics, Statistics and Extension
Education
-
• ~
~ ~ o
~
• ~ '"
0'" o~~~~&l
Plant Sciences J :::--.:: So;IS';."""~ Agricultural Chemistry
Biochemistry & Biotechnology •
Horticultural Sclencae + Forestry
Plant Protection & Related Sciences
Vert.rinary & Animal Sciences-I
VeWrinary& ~ Animal science-II ~
Veterinary& ~ Animal ScIences -III ~
Dairy Science, Dairy Technology & Food Science
Agricultural Engineering
Agricultural Economics, Statistics and
Extension Education
• ~
~ ~ o
• ~ • !l
"
~I«

26
T A L E N T F O R R E S P O N S I V E A G R I C U L T U R E
Fig. 13 Temporal distribution of awardees (with/without SRF)
Based on the SRF (PGS) secured by the postgraduates of
various universities, the three top ranking universities in 2013 were
IARI, New Delhi; IVRI, Izatnagar, Bareilly; and UAS, Bangalore
(Table 11). Out of the total 12 SRF(PGS) which could not be
awarded on account of lack of qualified candidates, maximum five
slots each in Dairy Science/Dairy Technology & Food Science, and
Home Science remained vacant followed by one each in Plant
Biochemistry & Biotechnology, and Veterinary & Animal Sciences-I.
A Committee was recently constituted by ICAR in 2013 to review
the existing pattern/system and modification/updation of syllabus
of SRF(PGS) examination. The recommendations made by the
Committee as approved by the Competent Authority in ICAR are
available at http://www.icar.org.in/en/node/978 on the ICAR
website. Briefly, eligibility qualifications for SRF(PGS) have been
harmonized with NET/ARS for different subjects at all the universities
under ICAR-AU system. The revised format of the examination
consists of a single paper of 3 hrs duration and the existing practice
of awarding weightage of past academic performance (UG and PG)
to the candidates for ICAR SRF(PGS) examination has been
dispensed with. To align with the recommendations of Dr. R. S.
Paroda Committee Report (‘Review of disciplines and eligibility
qualifications for recruitment of ARS Scientists at the entry level’),
the 56 disciplines have been re-grouped to fall under 16 Major
Subject Groups for the purpose of conducting ICAR-SRF(PGS)
700
60
50
40
30
200
100
0
0
0
0
o
436 .--
171 -2008
592 ~1 ~1 I"'"
~4
F ,!! ~ 190
2009 2010 2011 2013
I With SRF . Without SRF I
27
T A L E N T F O R R E S P O N S I V E A G R I C U L T U R E
examination. Considering the recent advancements in different
disciplines of Agriculture and Allied Sciences vis-à-vis NET/ARS
syllabus, the syllabus for ICAR SRF (PGS) examination has been
modified and updated. These recommendations have come into
force and shall be applicable with effect from SRF(PGS)-2014
examination.
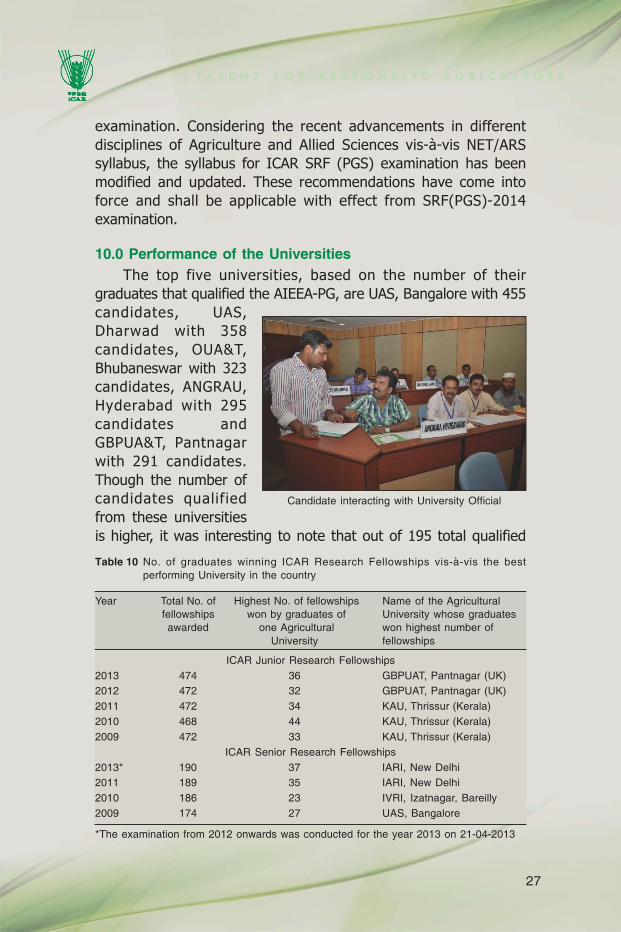
10.0 Performance of the UniversitiesThe top five universities, based on the number of their
graduates that qualified the AIEEA-PG, are UAS, Bangalore with 455
candidates, UAS,
Dharwad with 358
candidates, OUA&T,
Bhubaneswar with 323
candidates, ANGRAU,
Hyderabad with 295
candidates and
GBPUA&T, Pantnagar
with 291 candidates.
Though the number of
candidates qualified
from these universities
is higher, it was interesting to note that out of 195 total qualified
Candidate interacting with University Official
Table 10 No. of graduates winning ICAR Research Fellowships vis-à-vis the bestperforming University in the country
Year Total No. of Highest No. of fellowships Name of the Agriculturalfellowships won by graduates of University whose graduatesawarded one Agricultural won highest number of
University fellowships
ICAR Junior Research Fellowships2013 474 36 GBPUAT, Pantnagar (UK)2012 472 32 GBPUAT, Pantnagar (UK)2011 472 34 KAU, Thrissur (Kerala)2010 468 44 KAU, Thrissur (Kerala)2009 472 33 KAU, Thrissur (Kerala)
ICAR Senior Research Fellowships2013* 190 37 IARI, New Delhi2011 189 35 IARI, New Delhi2010 186 23 IVRI, Izatnagar, Bareilly2009 174 27 UAS, Bangalore
*The examination from 2012 onwards was conducted for the year 2013 on 21-04-2013
28
T A L E N T F O R R E S P O N S I V E A G R I C U L T U R E
candidates from CAU Imphal, 116 (59.48%) took admission,
indicating better turn out percentage and the rising interest of NE
students in higher agricultural education.
One of the yardsticks to measure the performance of
Universities could be the number of JRFs and SRF(PGS) produced.
The GBPUA&T Pantnagar with production of 36 JRFs in 2013-14
ranked first (Table 10) followed by UAS, Bangalore and Dr. PDKV,
Akola at second with 24 JRFs, and SKUAS&T, Srinagar with 20
JRF at third position. With 474 candidates admitted with JRF, 71
preferred IVRI, 68 IARI, 38 Pantnagar and 35 NDRI, Karnal
indicating the higher “brand value” for ICAR DU’s. Amongst the
SAUs, both in terms of “brand value” as well as performance in
AIEEA-PG, GBPUA&T, Pantnagar ranked the best during 2013-14.
In so far as award of SRF (PGS) is concerned, the candidates
having their Master’s degree from IARI secured highest 37 SRFs in
SRF (PGS)-2013 examination followed by IVRI (26); UAS, Bangalore
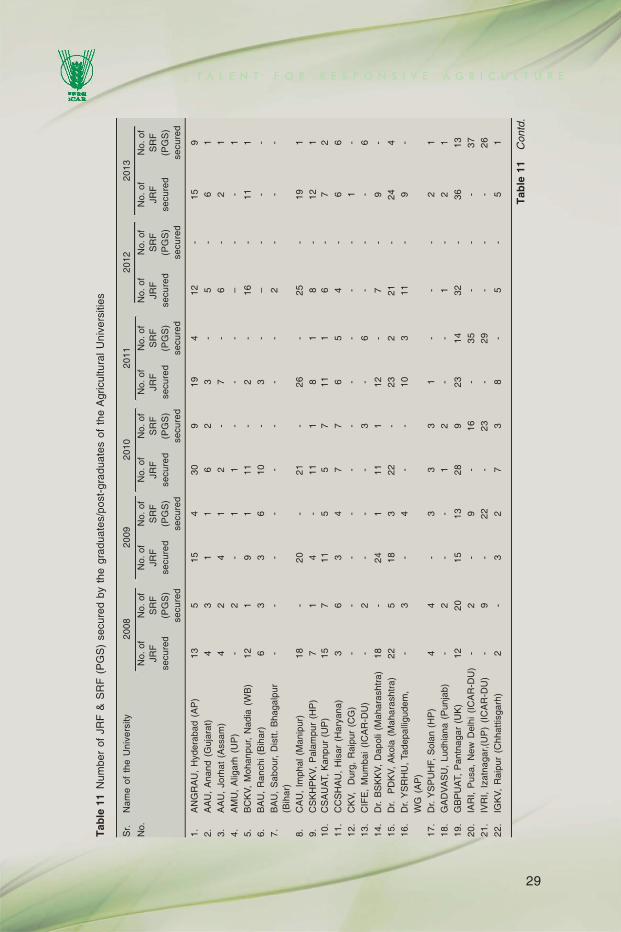
(15) and GBPUAT, Pantnagar (13). Comparative number of JRF and
SRFs secured by graduates/postgraduates of different universitites,
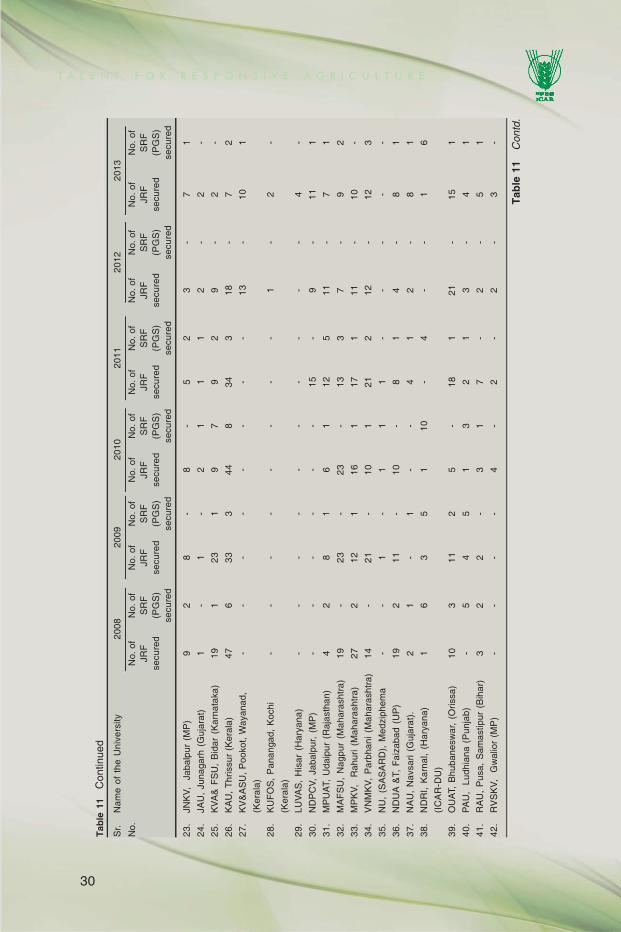
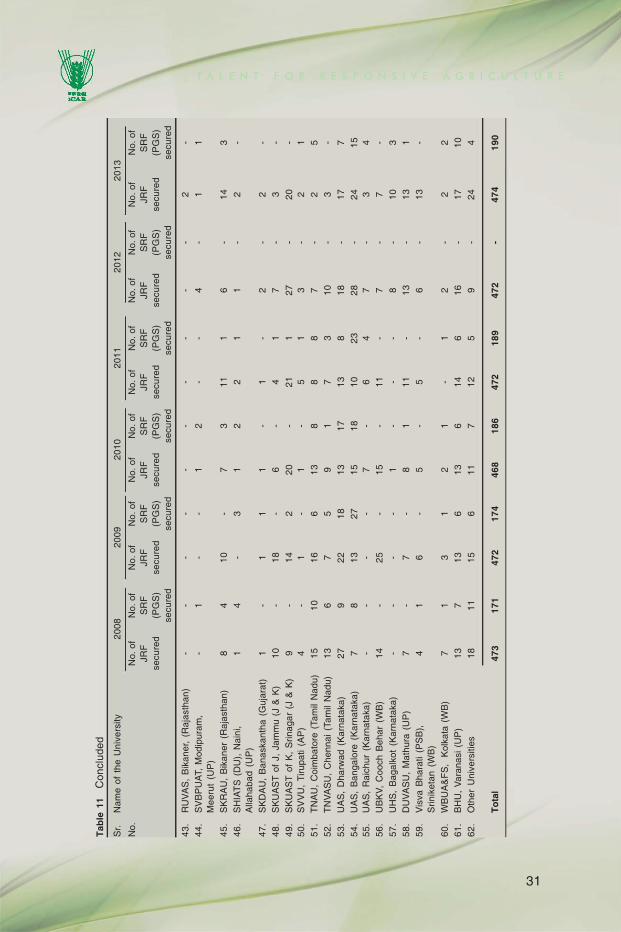
from 2008-2013, has been shown in (Table 11).
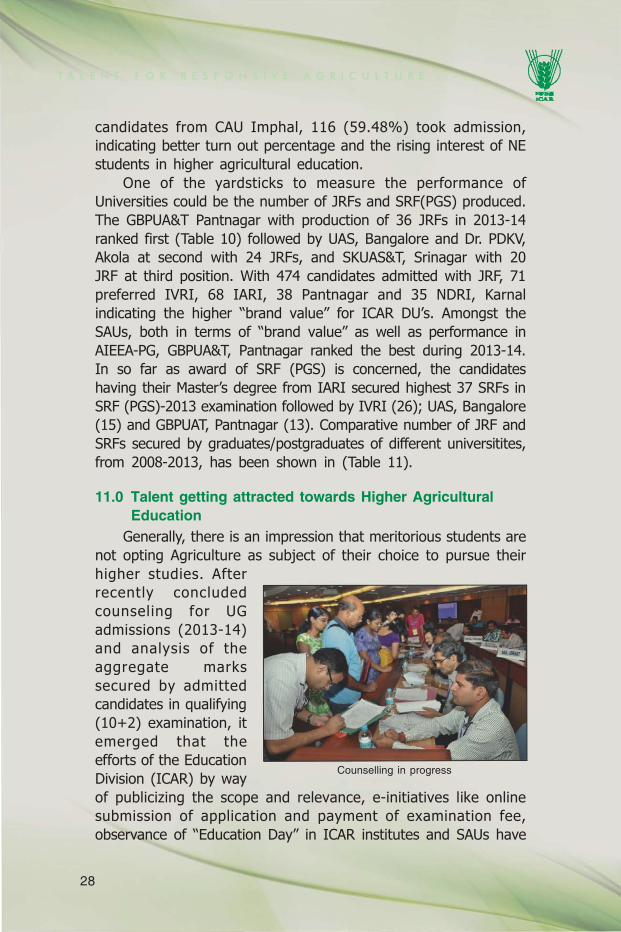
11.0 Talent getting attracted towards Higher AgriculturalEducation
Generally, there is an impression that meritorious students are
not opting Agriculture as subject of their choice to pursue their
higher studies. After
recently concluded
counseling for UG
admissions (2013-14)
and analysis of the
aggregate marks
secured by admitted
candidates in qualifying
(10+2) examination, it
emerged that the
efforts of the Education
Division (ICAR) by way
of publicizing the scope and relevance, e-initiatives like online
submission of application and payment of examination fee,
observance of “Education Day” in ICAR institutes and SAUs have
Counselling in progress
¥ -~.
29
T A L E N T F O R R E S P O N S I V E A G R I C U L T U R E
Tab
le 1
1N
umbe
r of
JR
F &
SR
F (
PG
S)
secu
red
by t
he g
radu
ates
/pos
t-gr
adua
tes
of t
he A
gric
ultu
ral
Uni
vers
ities
Sr.
Nam
e of
the
Uni
vers
ity20
0820
0920
1020
1120
1220
13
No.
No.
of
No.
of
No.
of
No.
of
No.
of
No.
of
No.
of
No.
of
No.
of
No.
of
No.
of
No.
of
JRF
SR
FJR
FS
RF
JRF
SR
FJR
FS
RF
JRF
SR
FJR
FS
RF
secu
red
(PG
S)
secu
red
(PG
S)
secu
red
(PG
S)
secu
red
(PG
S)
secu
red
(PG
S)
secu
red
(PG
S)
secu
red
secu
red
secu
red
secu
red
secu
red
secu
red
1.
AN
GR
AU
, H
yder
abad
(A
P)
135
154
309
194
12-
159
2.
AA
U,
Ana
nd (
Guj
arat
)4
31
16
23
-5
-6
13
.A
AU
, Jo
rhat
(A
ssam
)4
24
12
-7
-6
-2
14
.A
MU
, A
ligar
h (U
P)
-2
-1
1-
--
–-
-1
5.
BC
KV
, M
ohan
pur,
Nad
ia (
WB
)12
19
111
-2
-16
-11
16
.B
AU
, R
anch
i (B
ihar
)6
33
610
-3
-–
--
-7
.B
AU
, S
abou
r, D
istt.
Bha
galp
ur-
--
--
--
-2
--
-(B
ihar
)8
.C
AU
, Im
phal
(M
anip
ur)
18-
20-
21-
26-
25-
191
9.
CS
KH
PK
V,
Pal
ampu
r (H
P)
71
4-
111
81
8-
121
10.
CS
AU
AT,
Kan
pur
(UP
)15
711
55
711
16
-7
211
.C
CS
HA
U,
His
ar (
Har
yana
)3
63
47
76
54
-6
612
.C
KV
, D
urg,
Rai
pur
(CG
)-
--
--
--
--
-1
-13
.C
IFE
, M
umba
i (I
CA
R-D
U)
-2
--
-3
-6
--
-6
14.
Dr.
BS
KK
V,
Dap
oli
(Mah
aras
htra
)18
-24
111
112
-7
-9
-15
.D
r. P
DK
V,
Ako
la (
Mah
aras
htra
)22
518
322
-23
221
-24
416
.D
r. Y
SR
HU
, Ta
depa
lligu
dem
,-
3-
4-
-10
311
-9
-W
G (
AP
)17
.D
r. Y
SP
UH
F, S
olan
(H
P)
44
-3
33
1-
--
21
18.
GA
DV
AS
U,
Ludh
iana
(P
unja
b)-
2-
-1
2-
-1
-2
119
.G
BP
UA
T, P
antn
agar
(U
K)
1220
1513
289
2314
32-
3613
20.
IAR
I, P
usa,
New
Del
hi (
ICA
R-D
U)
-2
-9
-16
-35
--
-37
21.
IVR
I, Iz
atna
gar,(
UP
) (I
CA
R-D
U)
-9
-22
-23
-29
--
-26
22.
IGK
V,
Rai
pur
(Chh
attis
garh
)2
-3
27
38
-5
-5
1
Tab
le 1
1C
ontd
.
30
T A L E N T F O R R E S P O N S I V E A G R I C U L T U R E
23.
JNK
V,
Jab
alpu
r (M
P)
92
8-
8-
52
3-
71
24.
JAU
, Ju
naga
rh (
Guj
arat
)1
-1
-2
11
12
-2
-
25.
KV
A&
FS
U,
Bid
ar (
Kar
nata
ka)
191
231
97
92
9-
2-
26.
KA
U,
Thr
issu
r (K
eral
a)47
633
344
834
318
-7
2
27.
KV
&A
SU
, P
ooko
t, W
ayan
ad,
--
--
--
--
13-
101
(Ker
ala)
28.
KU
FO
S,
Pan
anga
d, K
ochi
--
--
--
--
1-
2-
(Ker
ala)
29.
LUV
AS
, H
isar
(H
arya
na)
--
--
--
--
--
4-
30.
ND
PC
V,
Jaba
lpur
, (M
P)
--
--
--
15-
9-
111
31.
MP
UA
T, U
daip
ur (
Raj
asth
an)
42
81
61
125
11-
71
32.
MA
FS
U,
Nag
pur
(Mah
aras
htra
)19
-23
-23
-13
37
-9
2
33.
MP
KV
, R
ahur
i (M
ahar
asht
ra)
272
121
161
171
11-
10-
34.
VN
MK
V,
Par
bhan
i (M
ahar
asht
ra)
14-
21-
101
212
12-
123
35.
NU
, (S
AS
AR
D),
Med
ziph
ema
--
1-
11
1-
--
--
36.
ND
UA
&T,
Fai
zaba
d (U
P)
192
11-
10-
81
4-
81
37.
NA
U,
Nav
sari
(Guj
arat
).2
1-
1-
-4
12
-8
1
38.
ND
RI,
Kar
nal,
(Har
yana
)1
63
51
10-
4-
-1
6
(IC
AR
-DU
)
39.
OU
AT,
Bhu
bane
swar
, (O
rissa
)10
311
25
-18
121
-15
1
40.
PA
U,
Lud
hian
a (P
unja
b)-
54
51
32
13
-4
1
41.
RA
U,
Pus
a, S
amas
tipur
(B
ihar
)3
22
-3
17
-2
-5
1
42.
RV
SK
V,
Gw
alio
r (M
P)
--
--
4-
2-
2-
3-
Tab
le 1
1C
ontin
ued
Sr.
Nam
e of
the
Uni
vers
ity20
0820
0920
1020
1120
1220
13
No.
No.
of
No.
of
No.
of
No.
of
No.
of
No.
of
No.
of
No.
of
No.
of
No.
of
No.
of
No.
of
JRF
SR
FJR
FS
RF
JRF
SR
FJR
FS
RF
JRF
SR
FJR
FS
RF
secu
red
(PG
S)
secu
red
(PG
S)
secu
red
(PG
S)
secu
red
(PG
S)
secu
red
(PG
S)
secu
red
(PG
S)
secu
red
secu
red
secu
red
secu
red
secu
red
secu
red
Tab
le 1
1C
ontd
.
31
T A L E N T F O R R E S P O N S I V E A G R I C U L T U R E
43.
RU
VA
S,
Bik
aner
, (R
ajas
than
)-
--
--
--
--
-2
-44
.S
VB
PU
AT,
Mod
ipur
am,
-1
--
12
--
4-
11
Mee
rut
(UP
)45
.S
KR
AU
, B
ikan
er (
Raj
asth
an)
84
10-
73
111
6-
143
46.
SH
IAT
S (
DU
), N
aini
,1
4-
31
22
11
-2
-A
llaha
bad
(UP
)47
.S
KD
AU
, B
anas
kant
ha (
Guj
arat
)1
-1
11
-1
-2
-2
-48
.S
KU
AS
T o
f J,
Jam
mu
(J &
K)
10-
18-
6-
41
7-
3-
49.
SK
UA
ST
of
K,
Srin
agar
(J
& K
)9
-14
220
-21
127
-20
-50
.S
VV
U,
Tiru
pati
(AP
)4
-1
-1
-5
13
-2
151
.T
NA
U,
Coi
mba
tore
(Ta
mil
Nad
u)15
1016
613
88
87
-2
552
.T
NV
AS
U,
Che
nnai
(Ta
mil
Nad
u)13
67
59
17
310
-3
-53
.U
AS
, D
harw
ad (
Kar
nata
ka)
279
2218
1317
138
18-
177
54.
UA
S,
Ban
galo
re (
Kar
nata
ka)
78
1327
1518
1023
28-
2415
55.
UA
S,
Rai
chur
(K
arna
taka
)-
--
-7
-6
47
-3
456
.U
BK
V,
Coo
ch B
ehar
(W
B)
14-
25-
15-
11-
7-
7-
57.
UH
S,
Bag
alko
t (K
arna
taka
)-
--
-1
--
-8
-10
358
.D
UV
AS
U,
Mat
hura
(U
P)
7-
7-
81
11-
13-
131
59.
Vis
va B
hara
ti (P
SB
),4
16
-5
-5
-6
-13
-S
rinik
etan
(W
B)
60.
WB
UA
&F
S,
Kol
kata
(W
B)
71
31
21
-1
2-
22
61.
BH
U,
Var
anas
i (U
P)
137
136
136
146
16-
1710
62.
Oth
er U
nive
rsiti
es18
1115
611
712
59
-24
4
To
tal
473
171
472
174
468
186
472
189
472
-47
419
0
Tab
le 1
1C
oncl
uded
Sr.
Nam
e of
the
Uni
vers
ity20
0820
0920
1020
1120
1220
13
No.
No.
of
No.
of
No.
of
No.
of
No.
of
No.
of
No.
of
No.
of
No.
of
No.
of
No.
of
No.
of
JRF
SR
FJR
FS
RF
JRF
SR
FJR
FS
RF
JRF
SR
FJR
FS
RF
secu
red
(PG
S)
secu
red
(PG
S)
secu
red
(PG
S)
secu
red
(PG
S)
secu
red
(PG
S)
secu
red
(PG
S)
secu
red
secu
red
secu
red
secu
red
secu
red
secu
red
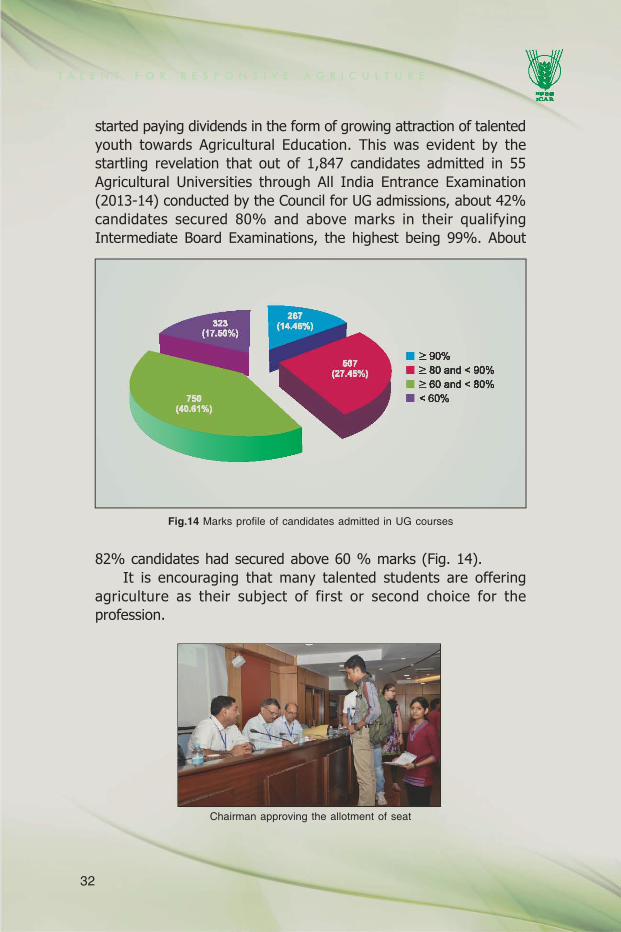
32
T A L E N T F O R R E S P O N S I V E A G R I C U L T U R E
started paying dividends in the form of growing attraction of talented
youth towards Agricultural Education. This was evident by the
startling revelation that out of 1,847 candidates admitted in 55
Agricultural Universities through All India Entrance Examination
(2013-14) conducted by the Council for UG admissions, about 42%
candidates secured 80% and above marks in their qualifying
Intermediate Board Examinations, the highest being 99%. About
Fig.14 Marks profile of candidates admitted in UG courses
Chairman approving the allotment of seat
82% candidates had secured above 60 % marks (Fig. 14).
It is encouraging that many talented students are offering
agriculture as their subject of first or second choice for the
profession.
• ,,90% • ,,80 and < 90% • ,,60 and < 80%
• <60%
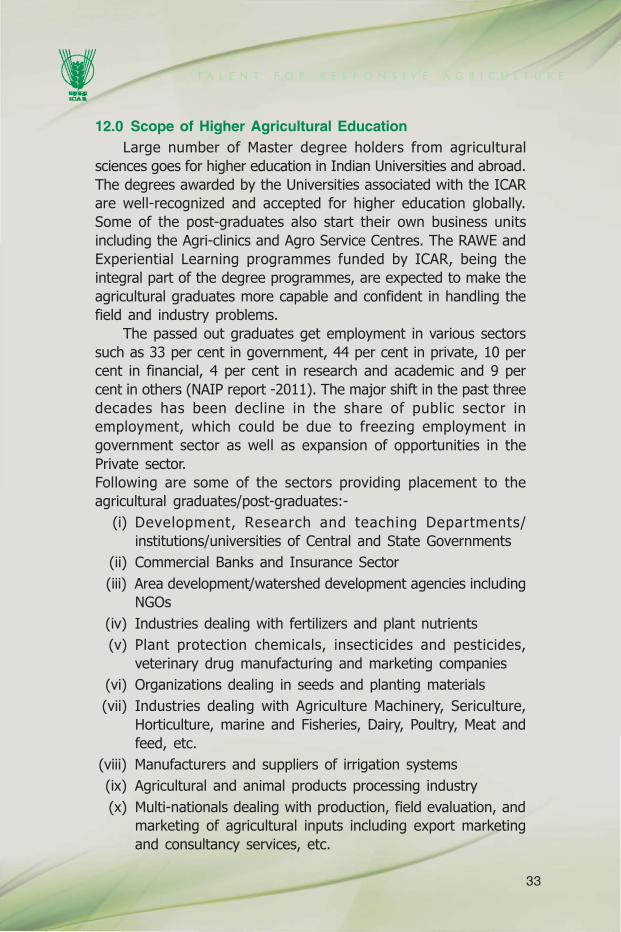
33
T A L E N T F O R R E S P O N S I V E A G R I C U L T U R E
12.0 Scope of Higher Agricultural EducationLarge number of Master degree holders from agricultural
sciences goes for higher education in Indian Universities and abroad.
The degrees awarded by the Universities associated with the ICAR
are well-recognized and accepted for higher education globally.
Some of the post-graduates also start their own business units
including the Agri-clinics and Agro Service Centres. The RAWE and
Experiential Learning programmes funded by ICAR, being the
integral part of the degree programmes, are expected to make the
agricultural graduates more capable and confident in handling the
field and industry problems.
The passed out graduates get employment in various sectors
such as 33 per cent in government, 44 per cent in private, 10 per
cent in financial, 4 per cent in research and academic and 9 per
cent in others (NAIP report -2011). The major shift in the past three
decades has been decline in the share of public sector in
employment, which could be due to freezing employment in
government sector as well as expansion of opportunities in the
Private sector.
Following are some of the sectors providing placement to the
agricultural graduates/post-graduates:-
(i) Development, Research and teaching Departments/
institutions/universities of Central and State Governments
(ii) Commercial Banks and Insurance Sector
(iii) Area development/watershed development agencies including
NGOs
(iv) Industries dealing with fertilizers and plant nutrients
(v) Plant protection chemicals, insecticides and pesticides,
veterinary drug manufacturing and marketing companies
(vi) Organizations dealing in seeds and planting materials
(vii) Industries dealing with Agriculture Machinery, Sericulture,
Horticulture, marine and Fisheries, Dairy, Poultry, Meat and
feed, etc.
(viii) Manufacturers and suppliers of irrigation systems
(ix) Agricultural and animal products processing industry
(x) Multi-nationals dealing with production, field evaluation, and
marketing of agricultural inputs including export marketing
and consultancy services, etc.
¥ -~.
34
T A L E N T F O R R E S P O N S I V E A G R I C U L T U R E
13.0 Need for greater investment in Agricultural Education toattract and retain talentThe lack of qualified manpower in adequate numbers in the
frontier areas of agricultural science and technology is one of the
major constraints to deliver at grassroots levels for achieving farm
prosperity and in taking forward the desired growth rate in
agriculture sector. There is a direct relationship between investment
in education and poverty elevation as it helps in sustenance of
agricultural productivity and profitability. SAUs need to play a greater
and more proactive role in attracting best talent by providing
enabling environment and facilities at the colleges for the all round
development, growth and employment of students. States should
provide more funds to the SAUs to modernize and strengthen the
infrastructural facilities to better equip themselves to meet the newer
challenges in the sector.
To achieve average annual growth of above 4%, allied sectors
have to be taken on board as we would require not only food but
a balanced diet with adequate nutrition. For increasing production
and productivity on sustainable basis, new technologies developed
through concerted R&D efforts are going to hold the key for success.
Some bigger initiatives with mega investments would be required
to produce competent human resource, not only for the research
and teaching purposes but also to effectively deliver the technologies
at the grassroots level to give momentum to get the optimum
production.
Agriculture as a subject is generally opted by the students who
do not get admission in medicine/engineering/management/
veterinary courses to pursue their career. Therefore, talent within
the available pool has to be nurtured by providing excellent teaching
environment and facilities. The faculty should be adequately
knowledgeable, updated, trained and highly motivated to teach the
newer concepts and methodologies. The college campuses ought
to be world class to offer ‘first sight love’ to the institution by
students and ultimately to the profession. The frail infrastructure
and facilities available in the educational institutions can in no way
enthuse a new entrant about the profession.
In the line of IIMs, IITs, AIIMS, this is the high time to establish
world class institution of higher agricultural education in the country
mainly focussing PG teaching and related research to attract and
¥ -~.

35
T A L E N T F O R R E S P O N S I V E A G R I C U L T U R E
nurture the best talent and also draw more number of foreign
students. For globalizing agricultural education, campuses can be
set up abroad; more collaborative projects may be initiated along
with more student exchange programmes. Public funding in several
states to AUs especially to newly created one has to improve.
Instead of creating new universities, the existing universities should
be strengthened. There should be serious efforts for reduced
inbreeding, improving quality and number of faculty. For better
employability of students focus may be given on attaining excellence
in areas of strategic importance such as IPRs, WTO-related areas,
techno-legal specialties, Agri-business, etc. New centres/Meta-
universities under emerging cutting-edge technologies, viz.
biosensors, genomics, biotechnology, nanotech-nology, biotic &
abiotic stress management, etc. may be thought of. There is need
for institutional capacity building, and establishing linkages/
partnerships with other institutions/stakeholders and faculty and
student exchange programmes. The number and scope of
fellowships needs to be substantially enlarged to attract and retain
the young talents.
In 12th
Plan, emphasis is on achieving the growth rate of 4%
in agriculture sector. To achieve this target, a large number of
technically trained manpower would be required to provide the
teaching, research, extension and development backup and support.
The Education Division, ICAR is making all out efforts to attract
talent from all over country getting it exposed to different socio-
cultural environment and nurture it, to provide quality manpower
that is willing to work beyond regional and linguistic barriers as per
emerging need in the coming years.
_________
¥ -~.

36
T A L E N T F O R R E S P O N S I V E A G R I C U L T U R E

sefecting rr'afent
for ~sponsi'Ve Jlgricu{ture ...