ta-clustering: cluster analysis of gene expression profiles through temporal abstractions
TRANSCRIPT
International Journal of Medical Informatics (2005) 74, 505—517
TA-clustering: Cluster analysis of gene expressionprofiles through Temporal Abstractions
Lucia Sacchia,∗, Riccardo Bellazzia, Cristiana Larizzaa, Paolo Magnia,Tomaz Curkb, Uros Petrovicc, Blaz Zupanb,d
a Dipartimento di Informatica e Sistemistica, Universita di Pavia, via Ferrata 1, 27100 Pavia, Italyb Faculty of Computer and Information Science, University of Ljubljana,Trzaska 25, SI-1000 Ljubljana, Sloveniac J. Stefan Institute, Jamova 39, SI-1000 Ljubljana, Sloveniad Department of Molecular and Human Genetics, Baylor College of Medicine,
1 Baylor Plaza, Houston, TX 77030, USAReceived 2 November 2004; received in revised form 25 March 2005; accepted 31 March 2005
KEYWORDSBioinformatics;Data mining;Clustering;Temporal Abstractions;Gene expression analysis
Summary This paper describes a new technique for clustering short time seriesof gene expression data. The technique is a generalization of the template-basedclustering and is based on a qualitative representation of profiles which are labelledusing trend Temporal Abstractions (TAs); clusters are then dynamically identifiedon the basis of this qualitative representation. Clustering is performed in an effi-cient way at three different levels of aggregation of qualitative labels, each levelcorresponding to a distinct degree of qualitative representation. The developed TA-clustering algorithm provides an innovative way to cluster gene profiles. We showthe developed method to be robust, efficient and to perform better than the stan-dard hierarchical agglomerative clustering approach when dealing with temporaldislocations of time series. Results of the TA-clustering algorithm can be visualizedas a three-level hierarchical tree of qualitative representations and as such easyto interpret. We demonstrate the utility of the proposed algorithm on a set of twosimulated data sets and on a study of gene expression data from S. cerevisiae.© 2005 Elsevier Ireland Ltd. All rights reserved.
1. Introduction
DNA microarray technology gives researches thepossibility to simultaneously measure the expres-sion level of thousands of genes in a single exper-
∗ Corresponding author.E-mail address: [email protected] (L. Sacchi).
iment. A number of recent studies in this fieldhave focused on the analysis of time series of geneexpression data [1—5], collected by performing DNAmicroarray experiments at several points in time.A time series describing the expression level ofa gene over time is also called a gene expres-sion profile. Gene expression profiles are usuallyconsidered “short” time series as they are typi-
1386-5056/$ — see front matter © 2005 Elsevier Ireland Ltd. All rights reserved.doi:10.1016/j.ijmedinf.2005.03.014
506 L. Sacchi et al.
cally composed of up to 20 time points. Relyingon assumption that genes with similar expressionprofiles are functionally related [1], most of themethods proposed in the current gene expressionanalysis literature attempt to identify groups ofgenes with similar expression profiles. The mostcommonly used techniques are clustering (unsu-pervised) techniques, which are particularly wellsuited for an exploratory investigation of this kindof data. Supervised methods that use a train sig-nal (usually a functional class label) have also beendeveloped recently (e.g., [6,7]).
Following the classification proposed by Zhong[8], clustering approaches presented in literaturemight be divided into two broad categories:similarity-based (or discriminative) and model-based (or generative) approaches. The key featureof similarity-based approaches is the definition ofa distance or similarity function between pairs ofobjects (in this case time series); “similar” objectsare then grouped together into the same cluster[1,3,5,9]. The prevalent similarity-based approachfor the analysis of DNA microarray data is the hier-archical agglomerative clustering strategy [1,3,5],where most-often correlation is used as a measure
time series; such techniques have already beenimplemented in popular software products, e.g.in GenespringTM [15]. Their most attractive fea-ture is that numerical values of expression arereplaced by a set of prototypical patterns (tem-plates), which are used to describe qualitativechanges over sub-intervals. In a typical setting,a user would define a set of templates to bematched with each profile on every sub-intervalof the original time series. Genes are then clus-tered together according to their qualitative sim-ilarities in one or more sub-intervals. The mainadvantage of this qualitative, template-based rep-resentation of temporal profiles is the ability to findsimple, qualitative models that can be used to eas-ily relate different time series. For instance, twotime series can be considered similar if they matchthe same template. The biggest drawback of theapproach is that all various templates to be usedin analysis need to be enlisted in advance, thusin a way forcing the user to exhaustively hypoth-esize the templates prior to the start of analy-sis. To relieve the user from this potentially verytime consuming and complex step, we propose anew and alternative technique that discovers thetpfit[
2
Fmcrit
phasclust
of distance between two time series (see Section3 for details). Model-based methods [4,10—12],on the other hand, are based on the assumptionthat the data were generated by some underlyingmodel and attempt to infer these models fromdata. Data generated by the same model is thenconsidered to be “similar” and clustered together.The main advantage of the model-based methodsis their reliance on a highly structured theoreticalbasis. Also, the choice of the optimal number ofclusters and the selection of the best model canbe performed using sound statistical criteria suchas [10,11].
Besides discriminative and generative appro-aches, template matching classification techniques[7,13,14] can be used for the analysis of short
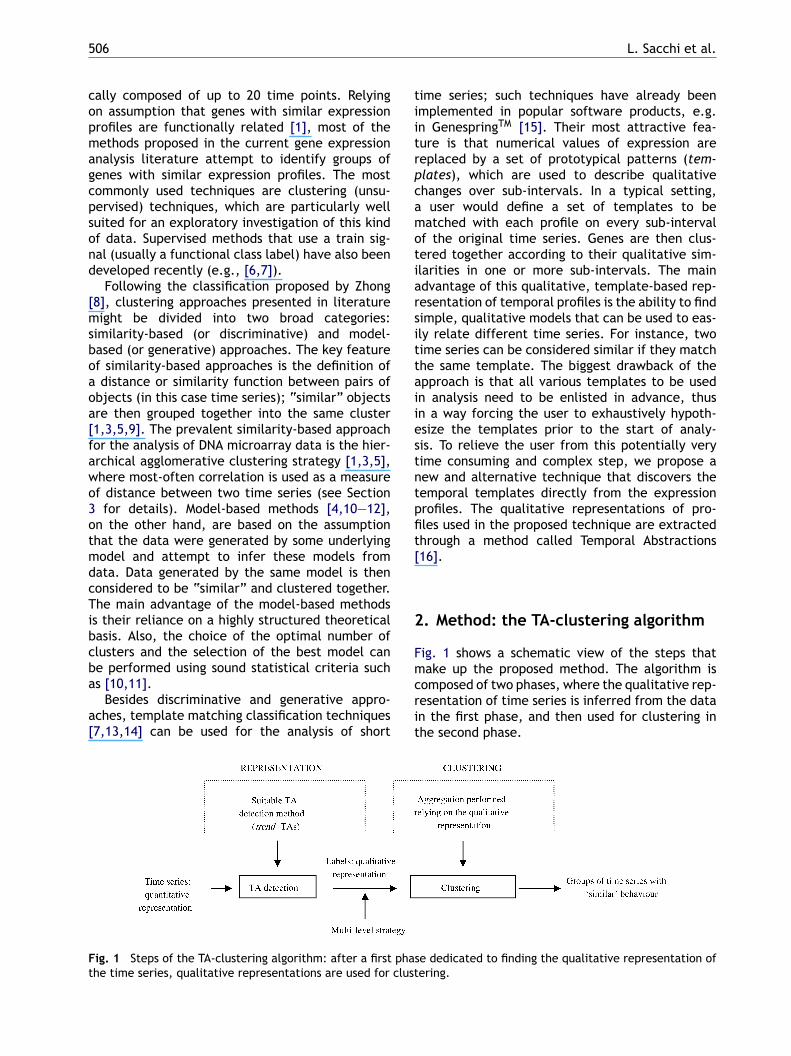
Fig. 1 Steps of the TA-clustering algorithm: after a firstthe time series, qualitative representations are used for
emporal templates directly from the expressionrofiles. The qualitative representations of pro-les used in the proposed technique are extractedhrough a method called Temporal Abstractions16].
. Method: the TA-clustering algorithm
ig. 1 shows a schematic view of the steps thatake up the proposed method. The algorithm isomposed of two phases, where the qualitative rep-esentation of time series is inferred from the datan the first phase, and then used for clustering inhe second phase.
e dedicated to finding the qualitative representation ofering.
TA-clustering: Cluster analysis of gene expression profiles through Temporal Abstractions 507
2.1. The Temporal Abstractions formalism
Temporal Abstractions (TAs) are a methodologyfrom Artificial Intelligence that takes a quanti-tative time series and from it infers a compre-hensive, interval-based qualitative representation,thus aiming at extracting specific patterns from thedata. Such pattern-based description can summa-rize the original data and can be used to discoverfeatures that characterize the dynamics of the sys-tem under observation. The fundamental steps ofTA-based analysis are the so-called TA mechanisms.These are algorithms that can transform an inputtime series into a series of interval abstractions.
Temporal Abstractions are often classified withintwo categories [17]: basic and complex abstrac-tions. Basic TAs are used to detect simple patternsand include trend Temporal Abstractions to cap-ture increasing, decreasing or stationary trends ina numerical time series, and State TAs, to detectqualitative patterns corresponding to low, high ornormal values in a numerical or symbolic timeseries. Complex TAs, on the other hand, correspondto intervals, which can be characterized with spe-cific temporal relationships between basic or otherctattct
2r
Ta
mL
most commonly used representation of temporalprofiles for data mining applications [19—23], andhas innumerable advantages, including provisionof means for data compression and noise filtering[19,23,24]. We use piecewise linear approximationof time series through modification of an algorithmfor linear space curve approximation applied inimage filtering and described in [25], and in orderto appropriately deal with noise, we use this rep-resentation only for sub-intervals with significantslope changes in gene expression. For simplicity,we will first assume that the data includes onlytime series of same length and equally-spacedtime points. Possible extensions that can dealwith missing data and different time scales will beintroduced in Section 4.
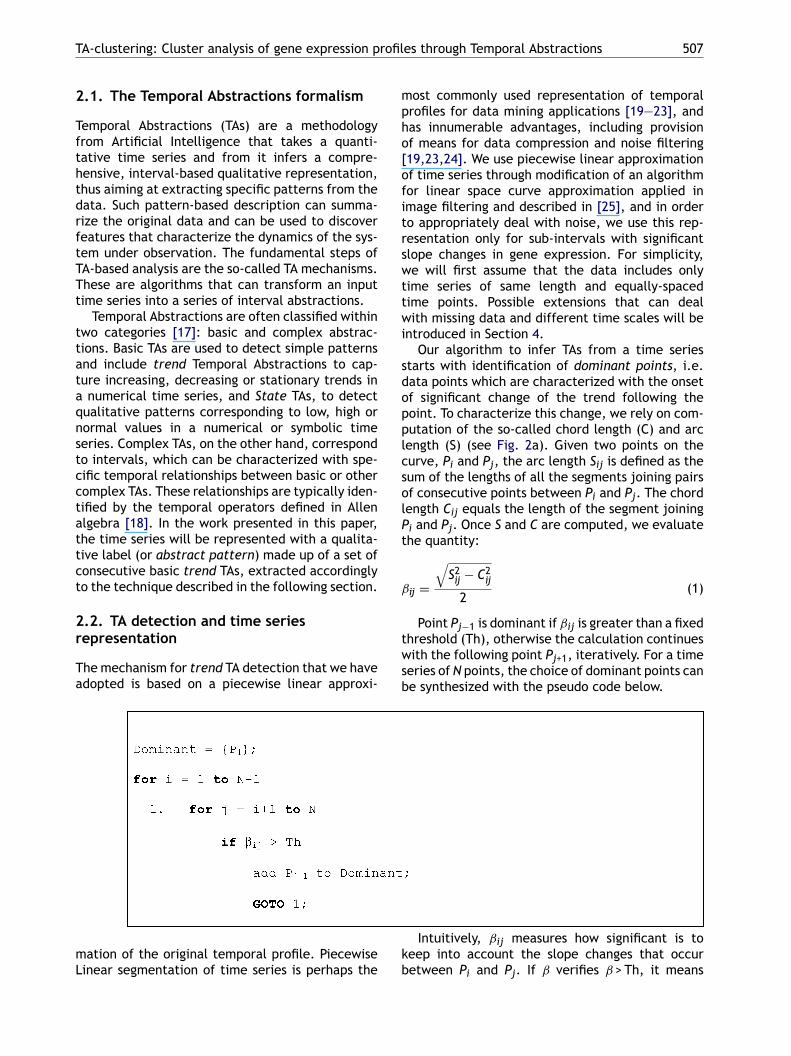
Our algorithm to infer TAs from a time seriesstarts with identification of dominant points, i.e.data points which are characterized with the onsetof significant change of the trend following thepoint. To characterize this change, we rely on com-putation of the so-called chord length (C) and arclength (S) (see Fig. 2a). Given two points on thecurve, Pi and Pj, the arc length Sij is defined as thesum of the lengths of all the segments joining pairsolPt
ˇ
twsb
kb
omplex TAs. These relationships are typically iden-ified by the temporal operators defined in Allenlgebra [18]. In the work presented in this paper,he time series will be represented with a qualita-ive label (or abstract pattern) made up of a set ofonsecutive basic trend TAs, extracted accordinglyo the technique described in the following section.
.2. TA detection and time seriesepresentation
he mechanism for trend TA detection that we havedopted is based on a piecewise linear approxi-
ation of the original temporal profile. Piecewiseinear segmentation of time series is perhaps the
f consecutive points between Pi and Pj. The chordength Cij equals the length of the segment joiningi and Pj. Once S and C are computed, we evaluatehe quantity:
ij =√
S2ij − C2
ij
2(1)
Point Pj−1 is dominant if ˇij is greater than a fixedhreshold (Th), otherwise the calculation continuesith the following point Pj+1, iteratively. For a timeeries of N points, the choice of dominant points cane synthesized with the pseudo code below.
Intuitively, ˇij measures how significant is toeep into account the slope changes that occuretween Pi and Pj. If ˇ verifies ˇ > Th, it means
508 L. Sacchi et al.
Fig. 2 (a) A time series of 7 points. The distance between chord (C13) and arc (S13 =C12 +C23) is used to detect significantchanges in the slope. A point in which a change is found is selected as a dominant point. (b) Once the piecewiselinear approximation is found, the trend is abstracted according to slope sign detection and interval aggregation. (c)Starting from trend abstractions, a multi-level representation is derived by performing different degrees of intervalaggregation.
that, going from Pj−1 to Pj, there are slope changesthat cannot be neglected, thus Pj−1 has to bedeclared dominant. The procedure starts at thefirst point of the time series and considers it in apair with each of the following points, and thencontinues with the remaining time points. To findthe final approximating curve, we then considercouples of consecutive dominant points and wecompute a linear regression on the points of theoriginal curve. In this way, we obtain a piecewiselinear curve as an approximation of the originalone.
After checking the statistical significance of theslope of segments that make up the approximat-ing curve, we label each interval on the originaltemporal profile with a proper TA, derived from theslope itself (Fig. 2b). More precisely, we associateto each interval a [Steady] TA if the slope of thecorresponding segment on the approximation is notsignificantly different from zero, an [Increasing] TAif its slope is greater than zero and a [Decreasing] TAif the slope is less than zero. Following this proce-dure, each interval of the original curve is labelledwith the appropriate TA. For example, the final
TA-clustering: Cluster analysis of gene expression profiles through Temporal Abstractions 509
label for the time series in Fig. 2b is [IncreasingIncreasing Steady Steady Decreasing Decreasing].
The qualitative representation obtained in theTA detection phase can be further extended toother levels of abstraction by considering differentdegrees of interval aggregation. In particular, wehave developed a three-level representation of thetemporal pattern associated with each time series(see Fig. 2c):
- No aggregation (L3) (immediate output of the TAdetection phase): a label corresponding to a par-ticular TA is attached to every interval found inthe original time series.
- Consecutive interval aggregation (L2): here weaggregate consecutive interval labels of samekind into a single label. For example, the set[Increasing Increasing Steady Steady DecreasingDecreasing] in Fig. 2c thus becomes [IncreasingSteady Decreasing].
- High level of aggregation (L1): from the setof labels coming from the consecutive intervalaggregation (L2) we remove all elements of thetype Steady, and then aggregate adjacent labelsof same kind into a single label. For example, thefinal label in Fig. 2c becomes [Increasing Decreas-
apotop
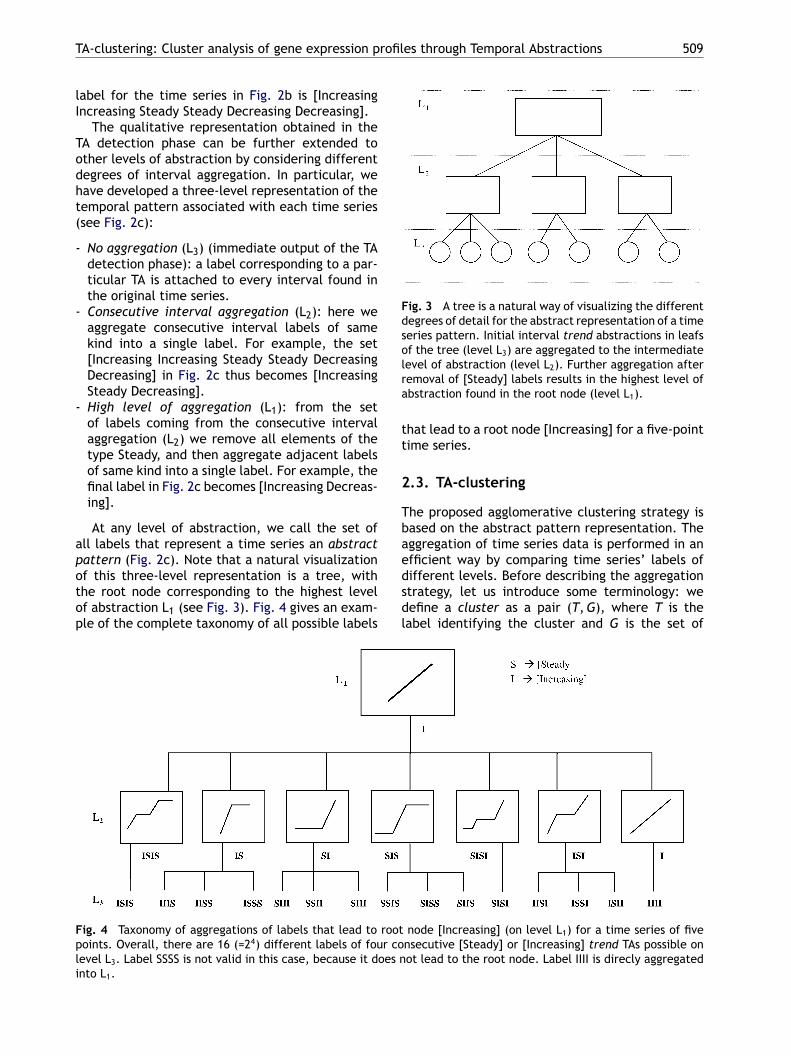
Fig. 3 A tree is a natural way of visualizing the differentdegrees of detail for the abstract representation of a timeseries pattern. Initial interval trend abstractions in leafsof the tree (level L3) are aggregated to the intermediatelevel of abstraction (level L2). Further aggregation afterremoval of [Steady] labels results in the highest level ofabstraction found in the root node (level L1).
that lead to a root node [Increasing] for a five-pointtime series.
2.3. TA-clustering
The proposed agglomerative clustering strategy isbased on the abstract pattern representation. Theaggregation of time series data is performed in anefficient way by comparing time series’ labels ofdifferent levels. Before describing the aggregationstrategy, let us introduce some terminology: wedefine a cluster as a pair (T,G), where T is thelabel identifying the cluster and G is the set of
F rootp r col oes ni
ing].
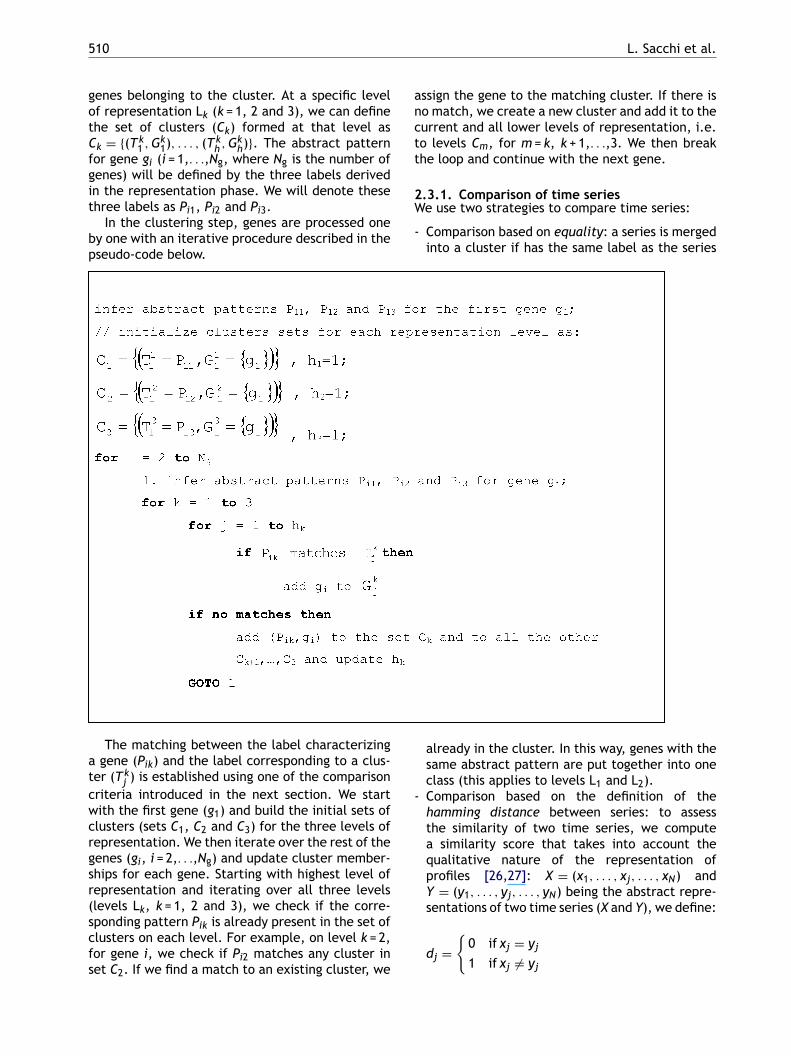
At any level of abstraction, we call the set ofll labels that represent a time series an abstractattern (Fig. 2c). Note that a natural visualizationf this three-level representation is a tree, withhe root node corresponding to the highest levelf abstraction L1 (see Fig. 3). Fig. 4 gives an exam-le of the complete taxonomy of all possible labels
ig. 4 Taxonomy of aggregations of labels that lead tooints. Overall, there are 16 (=24) different labels of fouevel L3. Label SSSS is not valid in this case, because it dnto L1.
node [Increasing] (on level L1) for a time series of fivensecutive [Steady] or [Increasing] trend TAs possible onot lead to the root node. Label IIII is direcly aggregated
510 L. Sacchi et al.
genes belonging to the cluster. At a specific levelof representation Lk (k = 1, 2 and 3), we can definethe set of clusters (Ck) formed at that level asCk = {(Tk
1 , Gk1), . . . , (Tk
h , Gkh)}. The abstract pattern
for gene gi (i = 1,. . .,Ng, where Ng is the number ofgenes) will be defined by the three labels derivedin the representation phase. We will denote thesethree labels as Pi1, Pi2 and Pi3.
In the clustering step, genes are processed oneby one with an iterative procedure described in thepseudo-code below.
assign the gene to the matching cluster. If there isno match, we create a new cluster and add it to thecurrent and all lower levels of representation, i.e.to levels Cm, for m = k, k + 1,. . .,3. We then breakthe loop and continue with the next gene.
2.3.1. Comparison of time seriesWe use two strategies to compare time series:
- Comparison based on equality: a series is mergedinto a cluster if has the same label as the series
-
The matching between the label characterizinga gene (Pik) and the label corresponding to a clus-ter (Tk
j ) is established using one of the comparisoncriteria introduced in the next section. We startwith the first gene (g1) and build the initial sets ofclusters (sets C1, C2 and C3) for the three levels ofrepresentation. We then iterate over the rest of thegenes (gi, i = 2,. . .,Ng) and update cluster member-ships for each gene. Starting with highest level ofrepresentation and iterating over all three levels(levels Lk, k = 1, 2 and 3), we check if the corre-sponding pattern Pik is already present in the set ofclusters on each level. For example, on level k = 2,for gene i, we check if Pi2 matches any cluster inset C2. If we find a match to an existing cluster, we
already in the cluster. In this way, genes with thesame abstract pattern are put together into oneclass (this applies to levels L1 and L2).Comparison based on the definition of thehamming distance between series: to assessthe similarity of two time series, we computea similarity score that takes into account thequalitative nature of the representation ofprofiles [26,27]: X = (x1, . . . , xj, . . . , xN) andY = (y1, . . . , yj, . . . , yN) being the abstract repre-sentations of two time series (X and Y), we define:
dj ={
0 if xj = yj
1 if xj �= yj
TA-clustering: Cluster analysis of gene expression profiles through Temporal Abstractions 511
and the distance,
D = 1N
N∑j=1
dj
We compute the pairwise similarity of the gene tobe clustered and the time series corresponding togenes already in the cluster. If all the computeddistances are smaller than a certain threshold,and the average of these distances is the smallestamong the average of the distances computedon other clusters, the gene can then be mergedto the first cluster (this applies to level L3).
From the computational viewpoint, the abovealgorithm can be implemented efficiently throughsimple label-matching. Also, the classification ofexpression profiles can be performed immediatelyafter the inference of abstract pattern. As we willalso show in the next section, the resulting clustersare self-explanatory and easy to interpret.
3. Experimental results
We have studied the properties and utility of thepds
3
Wirpeattksb
ilarities in shape without emphasizing the magni-tude scale of the time series being compared. Forthese reason, Eisen’s method has become a refer-ence method for the analysis of gene expressiontemporal profiles.
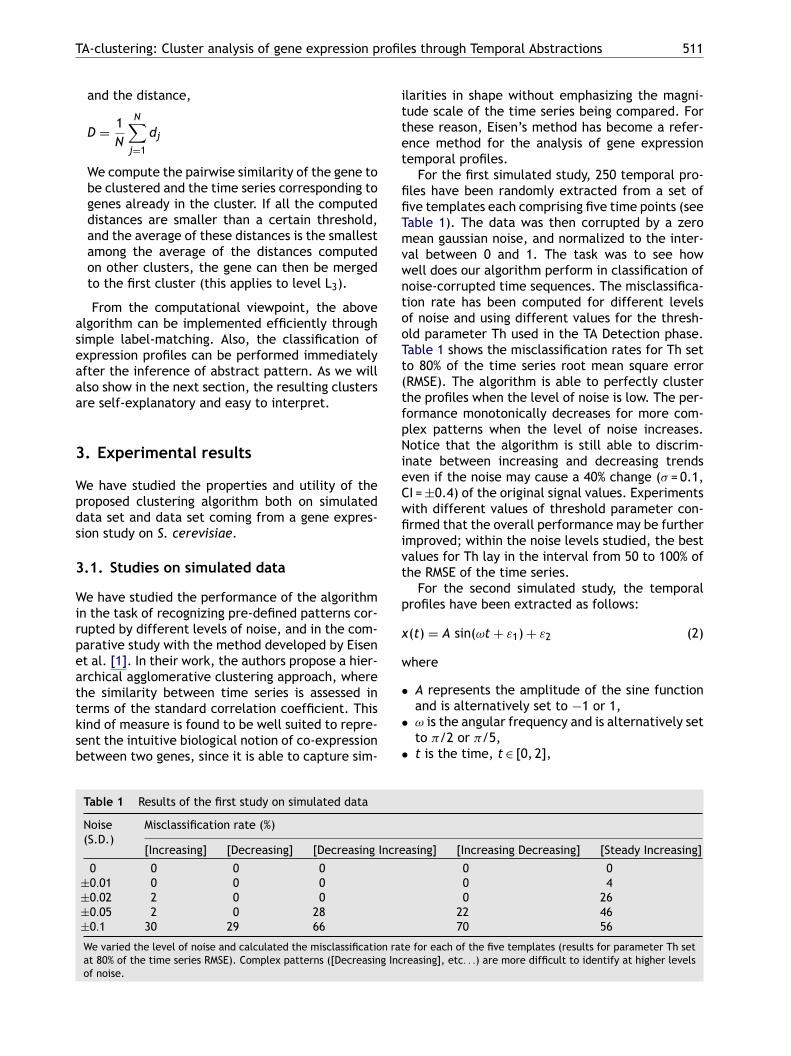
For the first simulated study, 250 temporal pro-files have been randomly extracted from a set offive templates each comprising five time points (seeTable 1). The data was then corrupted by a zeromean gaussian noise, and normalized to the inter-val between 0 and 1. The task was to see howwell does our algorithm perform in classification ofnoise-corrupted time sequences. The misclassifica-tion rate has been computed for different levelsof noise and using different values for the thresh-old parameter Th used in the TA Detection phase.Table 1 shows the misclassification rates for Th setto 80% of the time series root mean square error(RMSE). The algorithm is able to perfectly clusterthe profiles when the level of noise is low. The per-formance monotonically decreases for more com-plex patterns when the level of noise increases.Notice that the algorithm is still able to discrim-inate between increasing and decreasing trendseven if the noise may cause a 40% change (� = 0.1,Cwfiivt
p
x
w
•
•
•
Incre
n ratg Inc
roposed clustering algorithm both on simulatedata set and data set coming from a gene expres-ion study on S. cerevisiae.
.1. Studies on simulated data
e have studied the performance of the algorithmn the task of recognizing pre-defined patterns cor-upted by different levels of noise, and in the com-arative study with the method developed by Eisent al. [1]. In their work, the authors propose a hier-rchical agglomerative clustering approach, wherehe similarity between time series is assessed inerms of the standard correlation coefficient. Thisind of measure is found to be well suited to repre-ent the intuitive biological notion of co-expressionetween two genes, since it is able to capture sim-
Table 1 Results of the first study on simulated data
Noise(S.D.)
Misclassification rate (%)
[Increasing] [Decreasing] [Decreasing
0 0 0 0±0.01 0 0 0±0.02 2 0 0±0.05 2 0 28±0.1 30 29 66
We varied the level of noise and calculated the misclassificatioat 80% of the time series RMSE). Complex patterns ([Decreasinof noise.
I =±0.4) of the original signal values. Experimentsith different values of threshold parameter con-rmed that the overall performance may be furthermproved; within the noise levels studied, the bestalues for Th lay in the interval from 50 to 100% ofhe RMSE of the time series.
For the second simulated study, the temporalrofiles have been extracted as follows:
(t) = A sin(ωt + ε1) + ε2 (2)
here
A represents the amplitude of the sine functionand is alternatively set to −1 or 1,ω is the angular frequency and is alternatively setto �/2 or �/5,t is the time, t∈ [0, 2],
asing] [Increasing Decreasing] [Steady Increasing]
0 00 40 26
22 4670 56
e for each of the five templates (results for parameter Th setreasing], etc. . .) are more difficult to identify at higher levels
512 L. Sacchi et al.
• ε1 and ε2 are two zero mean Gaussian variableswith standard deviations �ε1 and �ε2, respec-tively.
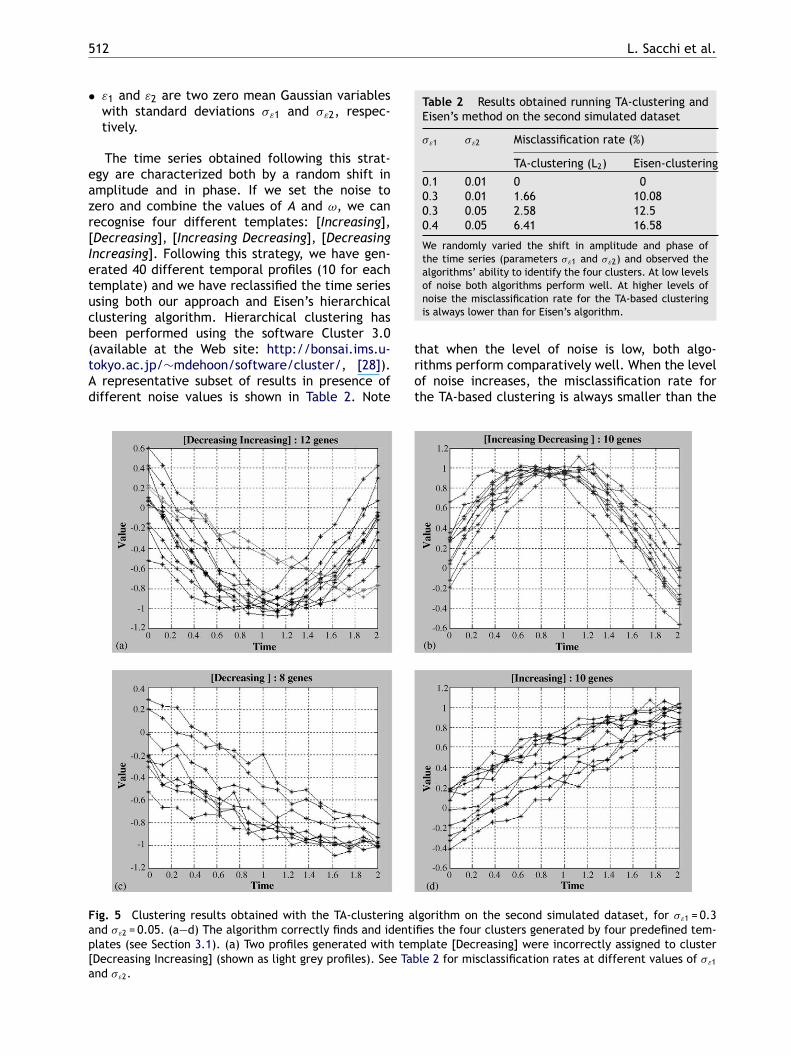
The time series obtained following this strat-egy are characterized both by a random shift inamplitude and in phase. If we set the noise tozero and combine the values of A and ω, we canrecognise four different templates: [Increasing],[Decreasing], [Increasing Decreasing], [DecreasingIncreasing]. Following this strategy, we have gen-erated 40 different temporal profiles (10 for eachtemplate) and we have reclassified the time seriesusing both our approach and Eisen’s hierarchicalclustering algorithm. Hierarchical clustering hasbeen performed using the software Cluster 3.0(available at the Web site: http://bonsai.ims.u-tokyo.ac.jp/∼mdehoon/software/cluster/, [28]).A representative subset of results in presence ofdifferent noise values is shown in Table 2. Note
Table 2 Results obtained running TA-clustering andEisen’s method on the second simulated dataset
�ε1 �ε2 Misclassification rate (%)
TA-clustering (L2) Eisen-clustering
0.1 0.01 0 00.3 0.01 1.66 10.080.3 0.05 2.58 12.50.4 0.05 6.41 16.58
We randomly varied the shift in amplitude and phase ofthe time series (parameters �ε1 and �ε2) and observed thealgorithms’ ability to identify the four clusters. At low levelsof noise both algorithms perform well. At higher levels ofnoise the misclassification rate for the TA-based clusteringis always lower than for Eisen’s algorithm.
that when the level of noise is low, both algo-rithms perform comparatively well. When the levelof noise increases, the misclassification rate forthe TA-based clustering is always smaller than the
Fig. 5 Clustering results obtained with the TA-clustering aland �ε2 = 0.05. (a—d) The algorithm correctly finds and identiplates (see Section 3.1). (a) Two profiles generated with tem[Decreasing Increasing] (shown as light grey profiles). See Taband �ε2.
gorithm on the second simulated dataset, for �ε1 = 0.3fies the four clusters generated by four predefined tem-plate [Decreasing] were incorrectly assigned to clusterle 2 for misclassification rates at different values of �ε1
TA-clustering: Cluster analysis of gene expression profiles through Temporal Abstractions 513
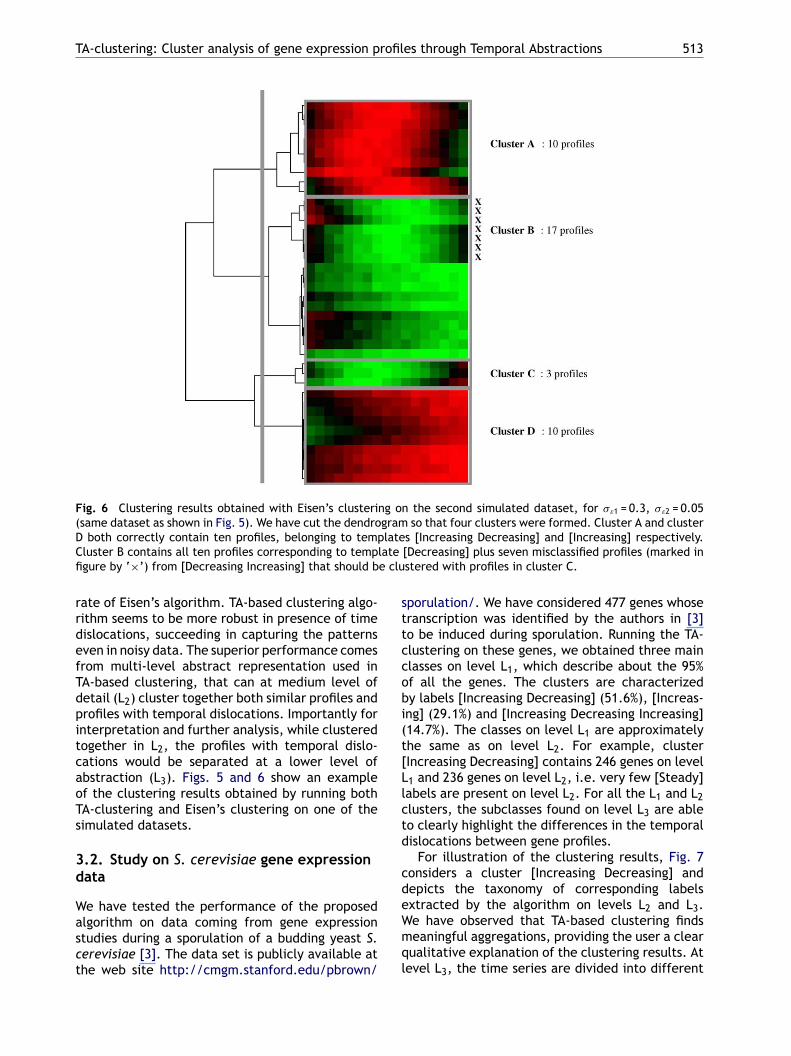
Fig. 6 Clustering results obtained with Eisen’s clustering on the second simulated dataset, for �ε1 = 0.3, �ε2 = 0.05(same dataset as shown in Fig. 5). We have cut the dendrogram so that four clusters were formed. Cluster A and clusterD both correctly contain ten profiles, belonging to templates [Increasing Decreasing] and [Increasing] respectively.Cluster B contains all ten profiles corresponding to template [Decreasing] plus seven misclassified profiles (marked infigure by ‘×’) from [Decreasing Increasing] that should be clustered with profiles in cluster C.
rate of Eisen’s algorithm. TA-based clustering algo-rithm seems to be more robust in presence of timedislocations, succeeding in capturing the patternseven in noisy data. The superior performance comesfrom multi-level abstract representation used inTA-based clustering, that can at medium level ofdetail (L2) cluster together both similar profiles andprofiles with temporal dislocations. Importantly forinterpretation and further analysis, while clusteredtogether in L2, the profiles with temporal dislo-cations would be separated at a lower level ofabstraction (L3). Figs. 5 and 6 show an exampleof the clustering results obtained by running bothTA-clustering and Eisen’s clustering on one of thesimulated datasets.
3.2. Study on S. cerevisiae gene expressiondata
We have tested the performance of the proposedalgorithm on data coming from gene expressionstudies during a sporulation of a budding yeast S.cerevisiae [3]. The data set is publicly available atthe web site http://cmgm.stanford.edu/pbrown/
sporulation/. We have considered 477 genes whosetranscription was identified by the authors in [3]to be induced during sporulation. Running the TA-clustering on these genes, we obtained three mainclasses on level L1, which describe about the 95%of all the genes. The clusters are characterizedby labels [Increasing Decreasing] (51.6%), [Increas-ing] (29.1%) and [Increasing Decreasing Increasing](14.7%). The classes on level L1 are approximatelythe same as on level L2. For example, cluster[Increasing Decreasing] contains 246 genes on levelL1 and 236 genes on level L2, i.e. very few [Steady]labels are present on level L2. For all the L1 and L2clusters, the subclasses found on level L3 are ableto clearly highlight the differences in the temporaldislocations between gene profiles.
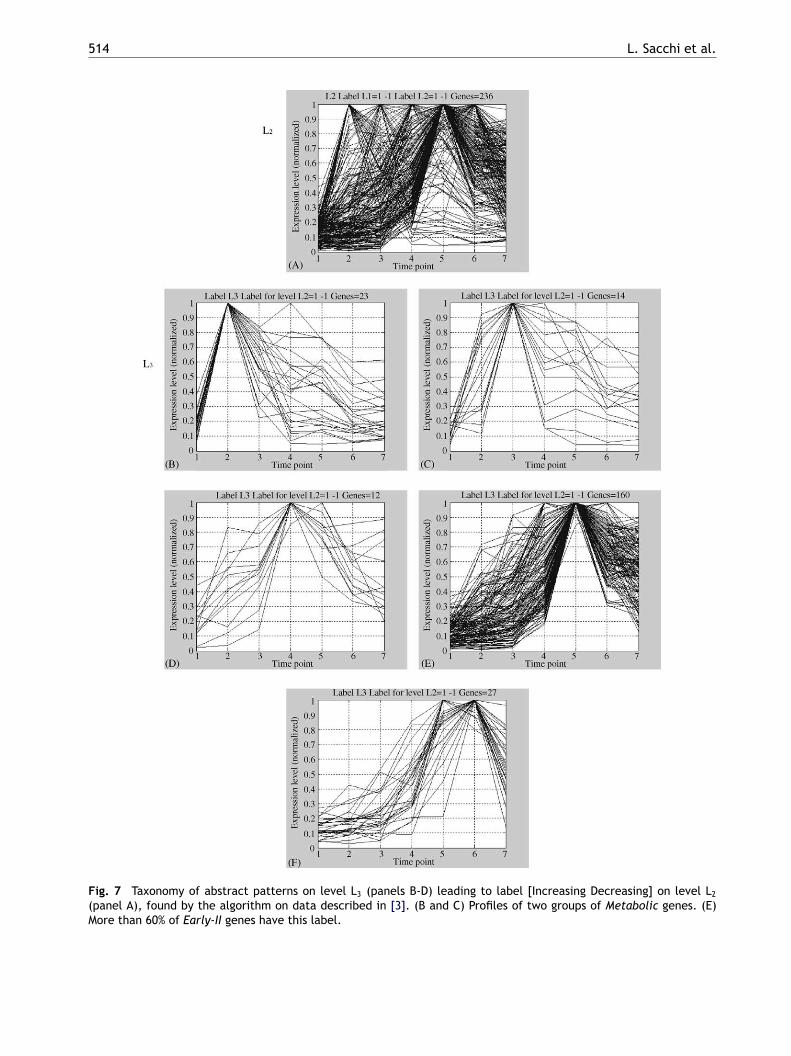
For illustration of the clustering results, Fig. 7considers a cluster [Increasing Decreasing] anddepicts the taxonomy of corresponding labelsextracted by the algorithm on levels L2 and L3.We have observed that TA-based clustering findsmeaningful aggregations, providing the user a clearqualitative explanation of the clustering results. Atlevel L3, the time series are divided into different
514 L. Sacchi et al.
Fig. 7 Taxonomy of abstract patterns on level L3 (panels B-D) leading to label [Increasing Decreasing] on level L2
(panel A), found by the algorithm on data described in [3]. (B and C) Profiles of two groups of Metabolic genes. (E)More than 60% of Early-II genes have this label.
TA-clustering: Cluster analysis of gene expression profiles through Temporal Abstractions 515
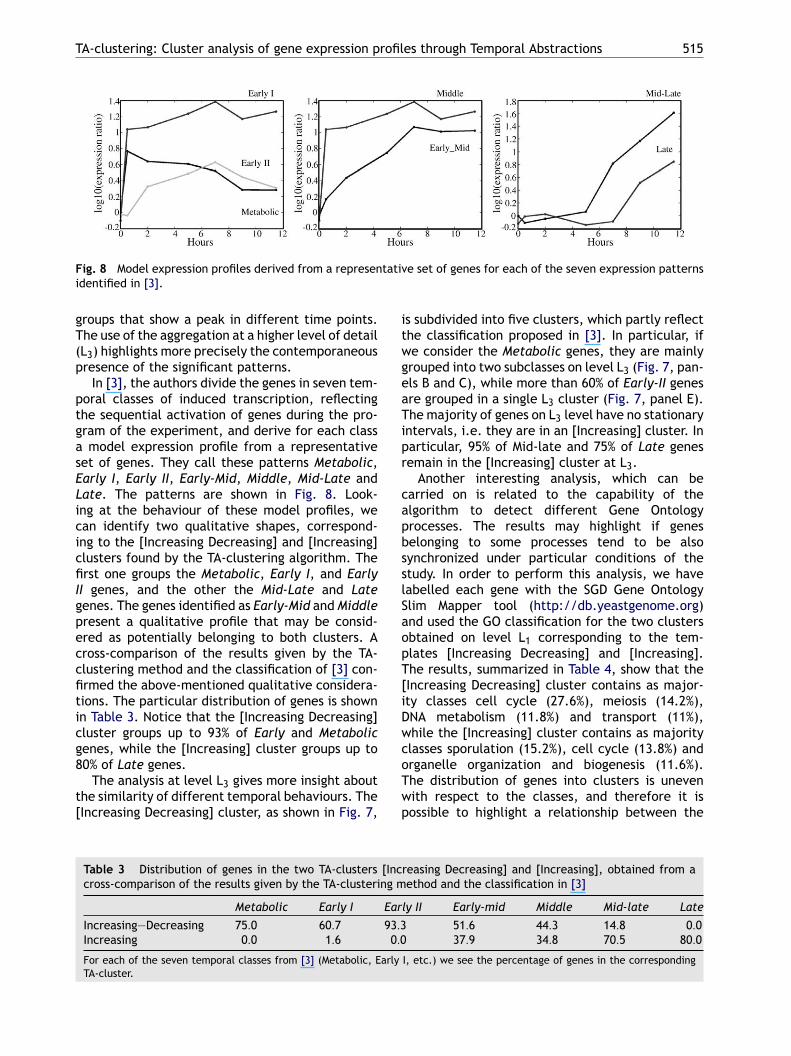
Fig. 8 Model expression profiles derived from a representative set of genes for each of the seven expression patternsidentified in [3].
groups that show a peak in different time points.The use of the aggregation at a higher level of detail(L3) highlights more precisely the contemporaneouspresence of the significant patterns.
In [3], the authors divide the genes in seven tem-poral classes of induced transcription, reflectingthe sequential activation of genes during the pro-gram of the experiment, and derive for each classa model expression profile from a representativeset of genes. They call these patterns Metabolic,Early I, Early II, Early-Mid, Middle, Mid-Late andLate. The patterns are shown in Fig. 8. Look-ing at the behaviour of these model profiles, wecan identify two qualitative shapes, correspond-ing to the [Increasing Decreasing] and [Increasing]clusters found by the TA-clustering algorithm. Thefirst one groups the Metabolic, Early I, and EarlyII genes, and the other the Mid-Late and Lategenes. The genes identified as Early-Mid and Middlepresent a qualitative profile that may be consid-ered as potentially belonging to both clusters. Across-comparison of the results given by the TA-clustering method and the classification of [3] con-firmed the above-mentioned qualitative considera-tions. The particular distribution of genes is shownicg8
t[
is subdivided into five clusters, which partly reflectthe classification proposed in [3]. In particular, ifwe consider the Metabolic genes, they are mainlygrouped into two subclasses on level L3 (Fig. 7, pan-els B and C), while more than 60% of Early-II genesare grouped in a single L3 cluster (Fig. 7, panel E).The majority of genes on L3 level have no stationaryintervals, i.e. they are in an [Increasing] cluster. Inparticular, 95% of Mid-late and 75% of Late genesremain in the [Increasing] cluster at L3.
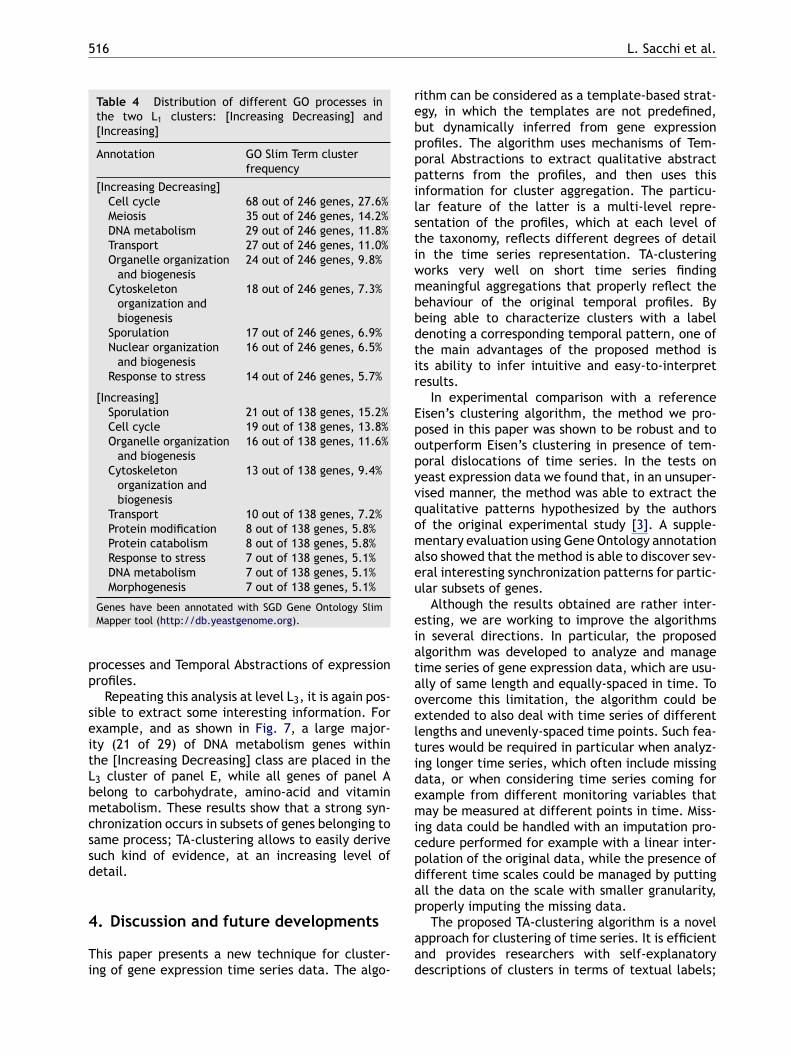
Another interesting analysis, which can becarried on is related to the capability of thealgorithm to detect different Gene Ontologyprocesses. The results may highlight if genesbelonging to some processes tend to be alsosynchronized under particular conditions of thestudy. In order to perform this analysis, we havelabelled each gene with the SGD Gene OntologySlim Mapper tool (http://db.yeastgenome.org)and used the GO classification for the two clustersobtained on level L1 corresponding to the tem-plates [Increasing Decreasing] and [Increasing].The results, summarized in Table 4, show that the[Increasing Decreasing] cluster contains as major-ity classes cell cycle (27.6%), meiosis (14.2%),DwcoTwp
[Incng m
Ear
93.30.0
arly
n Table 3. Notice that the [Increasing Decreasing]luster groups up to 93% of Early and Metabolicenes, while the [Increasing] cluster groups up to0% of Late genes.The analysis at level L3 gives more insight about
he similarity of different temporal behaviours. TheIncreasing Decreasing] cluster, as shown in Fig. 7,
Table 3 Distribution of genes in the two TA-clusterscross-comparison of the results given by the TA-clusteri
Metabolic Early I
Increasing—Decreasing 75.0 60.7Increasing 0.0 1.6
For each of the seven temporal classes from [3] (Metabolic, ETA-cluster.
NA metabolism (11.8%) and transport (11%),hile the [Increasing] cluster contains as majoritylasses sporulation (15.2%), cell cycle (13.8%) andrganelle organization and biogenesis (11.6%).he distribution of genes into clusters is unevenith respect to the classes, and therefore it isossible to highlight a relationship between the
reasing Decreasing] and [Increasing], obtained from aethod and the classification in [3]
ly II Early-mid Middle Mid-late Late
51.6 44.3 14.8 0.037.9 34.8 70.5 80.0
I, etc.) we see the percentage of genes in the corresponding
516 L. Sacchi et al.
Table 4 Distribution of different GO processes inthe two L1 clusters: [Increasing Decreasing] and[Increasing]
Annotation GO Slim Term clusterfrequency
[Increasing Decreasing]Cell cycle 68 out of 246 genes, 27.6%Meiosis 35 out of 246 genes, 14.2%DNA metabolism 29 out of 246 genes, 11.8%Transport 27 out of 246 genes, 11.0%Organelle organization
and biogenesis24 out of 246 genes, 9.8%
Cytoskeletonorganization andbiogenesis
18 out of 246 genes, 7.3%
Sporulation 17 out of 246 genes, 6.9%Nuclear organization
and biogenesis16 out of 246 genes, 6.5%
Response to stress 14 out of 246 genes, 5.7%
[Increasing]Sporulation 21 out of 138 genes, 15.2%Cell cycle 19 out of 138 genes, 13.8%Organelle organization
and biogenesis16 out of 138 genes, 11.6%
Cytoskeletonorganization andbiogenesis
13 out of 138 genes, 9.4%
Transport 10 out of 138 genes, 7.2%Protein modification 8 out of 138 genes, 5.8%Protein catabolism 8 out of 138 genes, 5.8%Response to stress 7 out of 138 genes, 5.1%DNA metabolism 7 out of 138 genes, 5.1%Morphogenesis 7 out of 138 genes, 5.1%
Genes have been annotated with SGD Gene Ontology SlimMapper tool (http://db.yeastgenome.org).
processes and Temporal Abstractions of expressionprofiles.
Repeating this analysis at level L3, it is again pos-sible to extract some interesting information. Forexample, and as shown in Fig. 7, a large major-ity (21 of 29) of DNA metabolism genes withinthe [Increasing Decreasing] class are placed in theL3 cluster of panel E, while all genes of panel Abelong to carbohydrate, amino-acid and vitaminmetabolism. These results show that a strong syn-chronization occurs in subsets of genes belonging tosame process; TA-clustering allows to easily derivesuch kind of evidence, at an increasing level ofdetail.
4. Discussion and future developments
This paper presents a new technique for cluster-ing of gene expression time series data. The algo-
rithm can be considered as a template-based strat-egy, in which the templates are not predefined,but dynamically inferred from gene expressionprofiles. The algorithm uses mechanisms of Tem-poral Abstractions to extract qualitative abstractpatterns from the profiles, and then uses thisinformation for cluster aggregation. The particu-lar feature of the latter is a multi-level repre-sentation of the profiles, which at each level ofthe taxonomy, reflects different degrees of detailin the time series representation. TA-clusteringworks very well on short time series findingmeaningful aggregations that properly reflect thebehaviour of the original temporal profiles. Bybeing able to characterize clusters with a labeldenoting a corresponding temporal pattern, one ofthe main advantages of the proposed method isits ability to infer intuitive and easy-to-interpretresults.
In experimental comparison with a referenceEisen’s clustering algorithm, the method we pro-posed in this paper was shown to be robust and tooutperform Eisen’s clustering in presence of tem-poral dislocations of time series. In the tests onyeast expression data we found that, in an unsuper-vqomaeu
eiataoeltidemicpdap
aad
ised manner, the method was able to extract theualitative patterns hypothesized by the authorsf the original experimental study [3]. A supple-entary evaluation using Gene Ontology annotationlso showed that the method is able to discover sev-ral interesting synchronization patterns for partic-lar subsets of genes.Although the results obtained are rather inter-
sting, we are working to improve the algorithmsn several directions. In particular, the proposedlgorithm was developed to analyze and manageime series of gene expression data, which are usu-lly of same length and equally-spaced in time. Tovercome this limitation, the algorithm could bextended to also deal with time series of differentengths and unevenly-spaced time points. Such fea-ures would be required in particular when analyz-ng longer time series, which often include missingata, or when considering time series coming forxample from different monitoring variables thatay be measured at different points in time. Miss-
ng data could be handled with an imputation pro-edure performed for example with a linear inter-olation of the original data, while the presence ofifferent time scales could be managed by puttingll the data on the scale with smaller granularity,roperly imputing the missing data.The proposed TA-clustering algorithm is a novel
pproach for clustering of time series. It is efficientnd provides researchers with self-explanatoryescriptions of clusters in terms of textual labels;
TA-clustering: Cluster analysis of gene expression profiles through Temporal Abstractions 517
moreover, thanks to the label aggregation, it allowsthe visualization and interpretation of results atdifferent levels of detail. The resulting hierarchycan be viewed as complementary to the hierar-chy produced by the standard hierarchical cluster-ing. Instead of aggregating similar time series interms of expression values and point correlation,our method aggregates time series based on thesimilarity in their qualitative behaviour and tem-poral dislocation. TA-clustering can be thereforeconsidered a novel instrument which provides analternative and more informed view of the data,and will help facing the present and forthcomingchallenges of data analysis in functional genomics.
References
[1] M. Eisen, P.T. Spellman, D. Botstein, P.O. Brown, Clusteranalysis and display of genome-wide expression patterns,Proc. Natl. Acad. Sci. U.S.A. 95 (1998) 14863—14868.
[2] R.J. Cho, M. Huang, M.J. Campbell, H. Dong, L. Steinmetz,L. Sapinoso, G. Hampton, S.J. Elledge, R.W. Davis, D.J.Lockhart, Transcriptional regulation and function during thehuman cell cycle, Nat. Genet. 27 (2001) 48—54.
[3] S. Chu, J. De Risi, M.B. Eisen, J. Mullholland, D. Botstein,P.O. Brown, The transcriptional program of sporulation in
[
[11] K.Y. Yeung, C. Fraley, A. Murua, A.E. Raftery, W.L.Ruzzo, Model-based clustering and data transformationfor gene expression data, Bioinformatics 17 (2001) 977—987.
[12] X. Ji, J. Li-Ling, Z. Sun, Mining gene expression data usinga novel approach based on hidden Markov models, FEBS 542(2003) 125—131.
[13] J. Komorowski, T.R. Hvidsten, T.K. Jenssen, D. Tjeldvoll, E.Hovig, A.K. Sandvik, A. Laegreid, Towards knowledge dis-covery from cDNA microarray gene expression data, PKDD(2000) 470—475, LNAI 1910.
[14] T.R. Hvidsten, J. Komorowski, A.K. Sandvik, A. Lægreid,Predicting gene function from gene expressions and ontolo-gies, in: Proceedings of The Pacific Symposium on Biocom-puting (PSB), 6, 2001, pp. 299—310.
[15] GeneSpringTM software (Silicongenetics, Redwood, Califor-nia).
[16] Y. Shahar, A framework for knowledge-based TemporalAbstraction, Artificial Intelligence 90 (1997) 79—133.
[17] R. Bellazzi, C. Larizza, A. Riva, Temporal Abstractions forinterpreting diabetic patients monitoring data, IntelligentData Anal. 2 (1998) 97—122.
[18] J.F. Allen, Towards a general theory of action and time,Artificial Intelligence 23 (1984) 123—154.
[19] E. Keogh, S. Chu, D. Hart, M. Pazzani, An online algo-rithm for segmenting time series, in: Proceedings of 2001IEEE International Conference on Data Mining, 2001, pp.289—296.
[20] E. Keogh, M. Pazzani, Relevance feedback retrieval of timeseries data, in: Proceedings of the 22nd Annual Interna-
budding yeast, Science 282 (1998) 699—705.[4] M.F. Ramoni, P. Sebastiani, I.S. Kohane, Cluster analysis of
gene expression dynamics, Proc. Natl. Acad. Sci. U.S.A. 99(2002) 9121—9126.
[5] V.R. Iyer, M.B. Eisen, D.T. Ross, G. Schuler, T. Moore, J.C.F.Lee, J.M. Trent, L.M. Staudt, J. Hudson, M.S. Boguski, D.Lashkari, D. Shalon, D. Botstein, P.O. Brown, The tran-scriptional program in the response of human fibroblaststo serum, Science 283 (1999) 83—87.
[6] M.P. Brown, W.N. Grundy, D. Lin, N. Cristianini, C.W. Sugnet,T.S. Furey, M. Ares Jr., D. Haussler, Knowledge-based anal-ysis of microarray gene expression data by using supportvector machines, Proc. Natl. Acad. Sci. U.S.A. 97 (2000)262—267.
[7] T.R. Hvidsten, A. Lægreid, J. Komorowski, Learning rule-based models of biological process from gene expressiontime profiles using Gene Ontology, Bioinformatics 19 (2003)1116—1123.
[8] S. Zhong, J. Ghosh, A Unified Framework for Model-basedClustering, J. Machine Learn. Res. 4 (2003) 1001—1037.
[9] L. Heyer, S. Kruglyak, S. Yooseph, Exploring expression data:identification and analysis of coexpressed genes, GenomeRes. 9 (1999) 1106—1115.
10] M. Ramoni, P. Sebastiani, P. Cohen, Bayesian clustering bydynamics, Machine Learn. 47 (2002) 91—121.
tional ACM-SIGIR Conference on Research and Developmentin Information Retrieval, 1999, pp. 183—190.
[21] E. Keogh, M. Pazzani, An enhanced representation of timeseries which allows fast and accurate classification, cluster-ing and relevance feedback, Proceedings of the 4th Interna-tional Conference on Knowledge Discovery and Data Mining,AAAI Press, 1998, pp. 239—241.
[22] E. Keogh, P. Smith, A probabilistic approach to fast patternmatching in time series databases, in: Proceedings of the3rd International Conference of Knowledge discovery andData Mining, 1997, pp. 24—30.
[23] T. Pavlidis, S. Horowitz, Segmentation of plane curves, IEEETrans. Comput. 23 (1974) 860—870.
[24] T. Pavlidis, Waveform segmentation through functionalapproximation, IEEE Trans. Comput. 22 (1973) 689—697.
[25] J.A. Horst, I. Beichl, A simple algorithm for efficient piece-wise linear approximation of space curves, in: InternationalConference on Image Processing (ICIP 1997), vol. 2, 1997,pp. 744—747.
[26] R.W. Hamming, Error-detecting and error-correcting codes,Bell System Tech. J. 29 (1950) 147—160.
[27] D.R. Wilson, T.R. Martinez, Improved heterogeneous dis-tance functions, J. Artificial Intelligence Res. 6 (1997)1—34.
[28] M.J.L. de Hoon, S. Imoto, J. Nolan, S. Miyano, Open sourceclustering software, Bioinformatics 20 (2004) 1453—1454.