systematic regional variations in purkinje cell spiking patterns
TRANSCRIPT

Systematic Regional Variations in Purkinje Cell SpikingPatternsJianqiang Xiao1, Nadia L. Cerminara2, Yuriy Kotsurovskyy1, Hanako Aoki4, Amelia Burroughs2,
Andrew K. Wise3, Yuanjun Luo4, Sarah P. Marshall1, Izumi Sugihara4,5, Richard Apps2*", Eric J. Lang1*"
1 Department of Neuroscience & Physiology, New York University School of Medicine, New York, New York, United States of America, 2 School of Physiology and
Pharmacology, University of Bristol, Bristol, United Kingdom, 3 The Bionics Institute, East Melbourne, Victoria, Australia, 4 Department of Systems Neurophysiology,
Graduate School of Medicine, Tokyo Medical and Dental University, Tokyo, Japan, 5 Center for Brain Integration Research, Tokyo Medical and Dental University, Tokyo,
Japan
Abstract
In contrast to the uniform anatomy of the cerebellar cortex, molecular and physiological studies indicate that significantdifferences exist between cortical regions, suggesting that the spiking activity of Purkinje cells (PCs) in different regionscould also show distinct characteristics. To investigate this possibility we obtained extracellular recordings from PCs indifferent zebrin bands in crus IIa and vermis lobules VIII and IX in anesthetized rats in order to compare PC firingcharacteristics between zebrin positive (Z+) and negative (Z2) bands. In addition, we analyzed recordings from PCs in theA2 and C1 zones of several lobules in the posterior lobe, which largely contain Z+ and Z2 PCs, respectively. In both datasetssignificant differences in simple spike (SS) activity were observed between cortical regions. Specifically, Z2 and C1 PCs hadhigher SS firing rates than Z+ and A2 PCs, respectively. The irregularity of SS firing (as assessed by measures of interspikeinterval distribution) was greater in Z+ bands in both absolute and relative terms. The results regarding systematic variationsin complex spike (CS) activity were less consistent, suggesting that while real differences can exist, they may be sensitive toother factors than the cortical location of the PC. However, differences in the interactions between SSs and CSs, includingthe post-CS pause in SSs and post-pause modulation of SSs, were also consistently observed between bands. Similar,though less strong trends were observed in the zonal recordings. These systematic variations in spontaneous firingcharacteristics of PCs between zebrin bands in vivo, raises the possibility that fundamental differences in informationencoding exist between cerebellar cortical regions.
Citation: Xiao J, Cerminara NL, Kotsurovskyy Y, Aoki H, Burroughs A, et al. (2014) Systematic Regional Variations in Purkinje Cell Spiking Patterns. PLoS ONE 9(8):e105633. doi:10.1371/journal.pone.0105633
Editor: Alain Chedotal, Institut de la Vision, France
Received March 17, 2014; Accepted July 23, 2014; Published August 21, 2014
Copyright: � 2014 Xiao et al. This is an open-access article distributed under the terms of the Creative Commons Attribution License, which permits unrestricteduse, distribution, and reproduction in any medium, provided the original author and source are credited.
Data Availability: The authors confirm that, for approved reasons, some access restrictions apply to the data underlying the findings. Example raw data recordsare available within the paper. The entire recording set, which is hundreds of gigabytes in size, is available upon request. Requests may be sent to thecorresponding authors.
Funding: This work was supported by grants to EJL from the National Science Foundation, United States of America (www.NSF.gov) (Grant: IOS-1051858) andNational Institute of Neurological Disorders and Stroke (www.ninds.nih.gov) (Grant: NS-37028), to RA and NLC from the Medical Research Council, UnitedKingdom (www.mrc.ac.uk/index.htm) (Grant: G1100626), and to IS from the Japan Society for the Promotion of Science (JSPS) (www.jsps.go.jp/english/) (Grants-in-Aid for Scientific Research-KAKENHI, 25430032). The funders had no role in study design, data collection and analysis, decision to publish, or preparation of themanuscript.
Competing Interests: IS is a PLOS ONE Editorial Board member and this does not alter the authors’ adherence to PLOS ONE Editorial policies and criteria.
* Email: [email protected] (EJL); [email protected] (RA)
" RA and EJL are joint senior authors on this work.
Introduction
The circuitry and the physiological properties of a brain region’s
cellular constituents constrain its computational properties. The
cerebellar cortex offers what appears to be perhaps a unique
opportunity for deriving structure-function correlations, because,
with few exceptions, it is an essentially anatomically uniform
structure whose few morphologically distinct cell types are
interconnected according to relatively simple geometric rules.
This uniformity is not absolute; for example, unipolar brush cells
are limited primarily to so-called vestibulocerebellar regions [1];
nevertheless, the microcircuitry of most cerebellar cortical regions
appears to be quite alike, suggesting that most cortical regions
perform similar computations, and indeed, theories of cerebellar
function have tended to be global in nature and based largely on a
generic anatomical circuit diagram [2–7].
Belying this apparent uniformity, it has become increasingly
clear that cerebellar cortical regions vary considerably on a
genetic/molecular level [8–11]. A number of genes are expressed
only in specific areas, and, indeed, the differential expression
patterns of various molecules have been used to subdivide the
cortex into discrete compartments [8,11].
Among the various gene expression patterns that can be used to
compartmentalize the cerebellar cortex that of zebrin II (aldolase
C) is the most well-characterized. In mammals and birds, regions
in which Purkinje cells (PCs, the sole output neurons of the
cerebellar cortex) express zebrin (Z+) alternate with ones that do
not (Z2), subdividing much of the cerebellar cortex into
longitudinally running alternating Z+ and Z2 bands [11–15].
PLOS ONE | www.plosone.org 1 August 2014 | Volume 9 | Issue 8 | e105633

This zebrin banding pattern is particularly useful as a frame of
reference because it shows at least some correspondence with the
topographies of the afferent (particularly the olivocerebellar zonal
system) and efferent projections to and from the cortex [8,16–24].
Moreover, the expression patterns of a number of other genes can
be straightforwardly mapped onto that of zebrin, and many of
these likely affect neuronal activity. For example, excitatory amino
acid transporter 4 (EAAT4), which is preferentially localized to
perisynaptic regions of the PC dendritic plasma membrane, is
much more highly expressed in Z+ than Z2 PCs [25,26], and loss
of its activity significantly enhances both parallel fiber and
climbing fiber evoked EPSCs [27–32].
Such results suggest that the spiking patterns of PCs could vary
significantly between cerebellar cortical regions, which, in turn,
could lead to differences in the integrative/computational
properties between local cortical regions, and potentially to
differences in the functional states of the targets of these local
cortical regions. Yet, the issues of whether the spontaneous spiking
patterns of cerebellar cortical regions vary systematically between
molecularly-defined compartments, and the behavioral conse-
quences of such variation, remain unknown. Here we focus on the
first part of this issue, and show that spontaneous PC activity varies
systematically between Z+ and Z2 bands of the cerebellar cortex.
Zones defined on the basis of physiological responses to
stimulation of cerebellar afferents represent a second well-
established scheme for compartmentalizing the cerebellar cortex
[33–35]. Thus, we also looked for differences in PC firing patterns
between such zones. A large degree of overlap between
physiologically-defined zones and zebrin bands exists, and so, a
priori, similar results should be found using both compartmental-
ization criteria. Yet, although the physiological zones and zebrin
bands overlap extensively, they are not congruent, and thus
comparisons between these two schemes could reveal fundamental
organizational principles of cerebellar function.
In sum, a significant number of differences in the molecular and
physiological properties of Z+ and Z2 bands have been described.
Such differences make it plausible that PC spiking activity should
also vary between Z+ and Z2 bands. Here, we report on the
differences in spontaneous in vivo firing patterns of PCs between
Z+ and Z2 bands, and compare them with similar findings
between different physiological zones.
Methods
Experiments were performed in accordance with the NIH’s
Guide for the Care and Use of Laboratory Animals and the UK
Animals (Scientific Procedures) Act 1986. Experimental protocols
were approved by the Institutional Animal Care and Use
Committees of New York University School of Medicine and
the institutional Ethical Review Group at the University of Bristol.
General surgical proceduresIn most experiments in which the zebrin band of the recorded
PCs was determined, female Sprague-Dawley rats (225–300 g)
were initially anesthetized with ketamine (100 mg/kg) and
xylazine (8 mg/kg) intraperitoneally. Supplemental anesthetic
was given via a femoral catheter (ketamine, ,260 mg/kg/min;
xylazine, ,50 mg/kg/min) to maintain a constant depth of
anesthesia. In the other experiments urethane was used as the
anesthetic and an initial dose of 1.2–1.5 g/kg (i.p.) was given with
supplemental doses given if needed. In experiments where PCs
were assigned to physiologically-identified cerebellar cortical
zones, recordings were obtained from male Wistar rats anesthe-
tized with ketamine (100 mg/kg) and xylazine (5 mg/kg) intra-
peritoneally, and supplementary doses of anesthetic were admin-
istered as required. In all experiments, the depth of anesthesia was
regularly assessed by a paw pinch to monitor reflex muscle tone.
Rectal temperature was maintained at 37uC. To gain access to the
cerebellum, animals were placed in a stereotaxic frame, and a
craniotomy performed to expose the posterior lobe of the
cerebellum.
Recording and localization of PCsZebrin band experiments. Following removal of the dura,
the cortical surface was stabilized and protected by covering it with
an electron microscope grid pre-embedded in a thin sheet of
silicone rubber. The grid was cemented onto the skull surrounding
the craniotomy. Extracellular recordings of PC activity at the
somatic level were obtained from the apices of crus II and vermis
lobule VIII using glass microelectrodes filled with 2.0 M NaCl
solution and mounted on a motorized 3D manipulator (MCL-3,
Lang GmbH & Co. KG). A 3 to 5-min continuous recording of
spontaneous activity was made when simple spikes (SSs) and
complex spikes (CSs) were both observed, usually at a depth
between 200 and 300 mm. The presence of SSs and the initial
positivity of the CS waveform indicated that the recordings were
made at or close to the PC soma. Neural activity was recorded
using a multichannel recording system (MultiChannel Systems,
Germany) with a 25 kHz/channel sampling rate, gain of 1000x,
and band pass filters set at 0.2–8.0 kHz.
Recordings of dendritic CSs from a dataset that was used for
other purposes in a previous study were also analyzed [36]. In
these experiments a multielectrode recording approach was used
in which CS activity was obtained from arrays of crus 2a PCs
simultaneously. The surgical procedures were essentially identical
to those just described for the somatic recordings. The electrodes
used in the multielectrode experiments were filled with a 1:1
mixture of 2.0 M NaCl and glycerin (the addition of glycerin
slowed evaporation of the internal electrode solution). Details of
the construction and implantation of the electrodes can be found
in [37]. In brief, individual electrodes were generally implanted to
depths of 100–150 mm below the brain surface, corresponding to
mid-molecular layer levels, and then were released from the
micromanipulator. Once all electrodes in the array have been
implanted CSs were recorded simultaneously from all electrodes
for a 20-min period. It should be noted that SSs are not observed
when recording CS activity from the middle molecular layer. This
is consistent with the poor back propagation of somatic sodium
spikes into the dendrites [38].
At the end of every experiment, the recording pipette was
drained of the NaCl solution, refilled with alcian blue solution, and
connected to a pressure-injection system, while the pipette
remained in place on the microdrive. Injections were then made
either at the corners of the recording platform, or, when only a few
PCs were recorded in the experiment, to the location of each
recorded PC based on its coordinates relative to an origin point
defined on the surface of the lobule. To make the injection, the
pipette was lowered into the cortex to a depth of 200–300 mm and
pressure applied to eject a small amount of the dye solution. The
animal was then intracardially perfused with phosphate buffered
saline (PBS) followed by 4% paraformaldehyde. The brains were
embedded in gelatin and cut in the plane parallel to the cerebellar
surface of the recording area into 80 mm-thick serial sections. This
thickness (unusually large for immunostaining) was used to locate
the injection marks in a small number of sections. All serial
sections were then processed for zebrin staining as previously
described [12,13]. Briefly, sections were incubated with the
biotinylated rabbit anti-Aldoc antibody (#69076, immunogen:
Variation of Purkinje Cell Activity between Zebrin Bands
PLOS ONE | www.plosone.org 2 August 2014 | Volume 9 | Issue 8 | e105633

amino acids 322–344 of rat Aldoc; produced in one of the
laboratories and tested for specificity with Western blot [12];
320 ng/ml) for 48 hours, then with biotinylated peroxidase-avidin
complex (PK6100 Elite ABC kit; Vector Laboratories, Burlin-
game, CA) for 8–12 hr, and finally incubated with diaminoben-
zidine (0.5 mg/ml), glucose oxidase (0.01 mg/ml; type II, G-6125;
Sigma, St. Louis, MO), ammonium chloride (4 mg/ml), and beta-
D(+)-glucose (2 mg/ml) in phosphate-buffered saline for 60 min.
Sections were mounted on glass slides, dried and coverslipped with
Permount (Fisher Scientific, Fair Lawn, NJ). Serial sections were
photographed with 4x objective. Image files of photos were
trimmed at the cerebellar surface and superimposed by referring
to the folial contour and the labeled zebrin bands by using
graphics software (Illustrator, Adobe, San Jose, CA, U.S.A.). The
location of the recording sites relative to zebrin bands in crus II or
lobule VIII was determined based on the stained zebrin bands and
recovered dye marks, which emerged in the superimposed
assembly of photographs, and the coordinates of the recording
sites (Fig. 1). Due to uneven shrinkage of the tissue, and the
narrowness of some zebrin bands, not all cells could be confidently
localized to a specific zebrin band. Only cells located with high
confidence were included in the analyses.
Zonal experiments. Recordings of PCs in this study were
from a dataset that was used previously [39]. Glass-insulated
tungsten microelectrodes (Alpha-Omega, Israel) were used to
record PC activity extracellularly. The recordings of individual
PCs lasted approximately 30 min on average. Waveforms were
filtered between 0.3–5.0 kHz. Recordings were digitized on-line
(sampling rate, 21 kHz) using a Cambridge Electronic Design
(CED, Cambridge, UK) 1401 analog-to-digital converter and
Spike2 software (CED).
Climbing fiber fields were first evoked by peripheral stimulation
and recorded using a surface electrode in order to map the
approximate positions of the physiologically-identified A2 and C1
zones as a guide for the single unit recordings (for details see [40]).
In brief, bipolar percutaneous stimulating electrodes were inserted
into the contralateral whisker pad and the ipsilateral forelimb.
Stimuli were given (single pulse; 0.1 ms duration, 1 Hz) at an
intensity sufficient to evoke a small but visible muscle twitch from
the stimulated body part.
The criteria used to classify individual PCs as located within a
particular cerebellar cortical zone were as follows: (i) If the
recording track was located no more than 0.6 mm lateral from the
paravermal vein, (ii) less than 2.5 mm from the cortical surface,
and (iii) the cell responded to contralateral face stimulation with an
increase in CSs with an onset latency ,30 ms, then it was
classified as located in the A2 zone. Similarly, if the recording track
was (i) between 0.6–1.3 mm lateral from the paravermal vein, (ii)
less than 2.5 mm from the cortical surface, and (iii) the cell
responded to ipsilateral forelimb stimulation with an increase in
CSs with an onset latency ,25 ms, then the PC was classified as
located in the neighboring C1 zone.
Data AnalysisIn zebrin band experiments, spikes were detected and sorted
offline using Igor Pro (Wavemetrics, Lake Oswego). For PCs
recorded in the zonal experiments, SS and CS activity was
discriminated independently via a template matching algorithm
(Principal component analysis, Spike2). In all experiments cross-
correlation between the firing time of SSs and CSs was performed
to ensure that they were recorded from the same PC, based on the
presence of a post-CS pause in SS firing. The pause was measured
as the latency from the onset of a CS to the first SS that occurred
Figure 1. Zebrin staining of the hemisphere of the rat cerebellum viewed in coronal section. Sulci between lobules indicated by dashedlines. The alcian blue dye spots used to locate the PC recording sites are marked with arrows (location of spot indicated by label at tail end of arrow).Z bands 4+ to 7+ are labeled. Abbreviations: Cr = crus; Par, paramedian; and inj = injection site.doi:10.1371/journal.pone.0105633.g001
Variation of Purkinje Cell Activity between Zebrin Bands
PLOS ONE | www.plosone.org 3 August 2014 | Volume 9 | Issue 8 | e105633

following that CS. Subsequent analyses of zebrin band experi-
ments were performed using custom routines in Igor Pro, Matlab
(Mathworks, Natick), and Excel (Microsoft). Analysis of zonal
experiments was performed using Neuroexplorer (Nex Technol-
ogies, Madison, AL) and Prism (Graphpad, La Jolla).
Some of the data were found to be normally distributed, but
others were not. Thus, for the sake of simplicity and consistency, a
non-parametric Mann–Whitney U-test was used for testing the
statistical significance and medians are presented. In rare cases,
which are noted in the text, when the data were normally
distributed and the parametric t-test gave a different result than
the non-parametric test, the results of the t-test (and mean 6s.d.)
are also presented and took precedence.
The duration of the post-CS pause in SSs is different in Z+ and
Z- bands (see Results). To investigate how much of this difference
was due to differences in baseline SS firing rates between bands we
first calculated the expected pause duration as if it were simply a
function of SS firing rate; that is, under the assumption that CSs
and SSs occur independently. Deviations from this value could
then be used as a measure of the active suppression that was
present.
The expected pause value under the assumption of indepen-
dence equals one half the mean SS interspike interval (ISISS),
which can be shown as follows. Take two successive SSs (SSk and
SSk+1) separated by the time interval, ti, with a CS occurring
between them. Since the CSs and SSs are independent, the CS
occurs with equal probability at any point in the interval ti. Thus,
the probability of the CS occurring at time t is Pr(t) = 1/ti and the
average time of the CS in the interval is given by
ECS(t)~
ðti
0
Pr(t) � tdt
which evaluates to ti/2. The expected pause is then the difference
from the average time of the CS to the second SS, ti–ti/2 = ti/2. In
general, the ISISS will vary between SSs so that the average pause
for a SS train will be given by:
1
N
XN
i~1
Epause(i)~1
N(t1
2z
t2
2z:::
tN
2z)~
1
2(
1
N(t1zt2z:::ztN ))
This sum, however, is simply half the mean of all ISISS that
contain a CS. Given the assumption of independence these ISIs
should represent a random sample of all ISISS, and thus be an
unbiased estimate of the mean ISISS of the complete SS
population. The ratio of the SS pause to the mean ISISS is
therefore 0.5.
Results
DatabaseThis study presents results related to differences in PC activity
between Z+ and Z2 bands using four specific datasets, the first
three consist of recordings of PC activity under ketamine/xylazine
anesthesia. The first set consists of crus IIa and vermis lobule VIII
PCs whose locations were verified histologically using reconstruct-
ed zebrin maps (n = 38 PCs, 11 animals) (see Methods, ‘Recording
and localization of PCs’). A second dataset of recordings of SS and
CS activity were analyzed from PCs whose locations were
physiologically identified to be in the A2 or C1 zones (n = 26
PCs, 14 animals). Although the physiological zones and zebrin
bands are not entirely congruent in the posterior lobe of the rat
cerebellum, the A2 zone comprises mainly Z+ bands whereas the
C1 zone comprises mainly Z2 ones [17]. Because these zones are
not fully equivalent to the zebrin bands, we present the data from
the zebrin and zonally-identified PCs separately for each analysis.
Furthermore, later we present anatomical and statistically analyses
in support of the validity of using the A2 and C1 zones as
surrogates for Z+ and Z2 bands (see later Results subsection
‘Degree of overlap of physiologically-defined zones with zebrinbands’). The third dataset consists of multielectrode recordings
from a prior study [36], which, because of electrode placement in
the mid to upper molecular layer (see Methods), consists only of
CS activity. In this dataset PC locations with respect to the zebrin
bands were verified histologically as described in the Methods.
The fourth dataset consists of PC activity from lobules VIII and IX
that was recorded and identified in exactly the same manner as
described for the first dataset, except that urethane was used as the
anesthetic.
The specific locations of all recordings are listed in Table 1.
Examples of the recordings in each dataset are shown in figure 2.
In the presentation below we describe the results from the
ketamine/xylazine recordings (data sets 1, 2 and 3). In the final
Results subsection we compare these results with those from the
urethane recordings.
PCs in Z2 bands show higher SS firing ratesComparison of SS average firing rates (total number of SSs
divided by recording duration) between PCs in Z+ and Z2 bands
revealed a significant difference between these populations. Under
ketamine, Z2 cells fire at rates that are 92% higher, on average,
than Z+ cells (Z2 = 44.8 Hz, n = 18; Z+ = 22.5 Hz, n = 20;
p = 0.0006). Figure 3A plots the entire distribution of SS firing
rates of somatically-recorded, zebrin-identified PCs, and shows
that while the distributions of the two PC populations overlap, the
Z2 distribution is shifted toward higher firing rates.
We also examined PCs recorded in the A2 and C1 zones in
medial aspects of crus II, paramedian lobule, and copula
pyramidis, and found a similar difference in the average SS firing
rates of PCs between the two zones. SS rates for C1 (mainly Z2)
were significantly higher (67%) than for A2 (mainly Z+), consistent
with our first dataset (Fig. 3B; medians: C1 = 34.9 Hz, n = 8;
A2 = 20.2 Hz, n = 16; p = 0.0537, Mann–Whitney U-test; means:
C1 = 33.2611.9 Hz, n = 8; A2 = 19.9613.2 Hz, n = 16;
p = 0.022, t-test; note that in two cells from the A2 zone only
CSs were recorded and so these PCs were not included in this
analysis).
If the two datasets are combined, the difference between the
Z+/A2 and Z2/C1 groups remains highly statistically significant
(Z2/C1: 40.1 Hz, n = 26; Z+/A2: 20.2 Hz, n = 36; p,0). In sum,
the results as a whole indicate that SS rates are higher in Z2
bands than in Z+ ones throughout much, if not all, of the posterior
lobe.
The regularity of SS activity varies between Z+ and Z2
bandsRegularity of SS activity may be a critical parameter governing
the efficacy of transmission of information to the cerebellar nuclei,
particularly if PCs use a rate code, as is often assumed (e.g., see
[5]). Thus, we investigated whether the regularity of SS activity
varied between Z+ and Z2 bands, as any differences might point
to differences in the way Z+ and Z2 cortical bands interact with
their target cerebellar nuclear regions.
We measured the absolute and relative regularity of the SS
trains using the standard deviation and coefficient of variation
Variation of Purkinje Cell Activity between Zebrin Bands
PLOS ONE | www.plosone.org 4 August 2014 | Volume 9 | Issue 8 | e105633

(CV = SD/mean), respectively, of the interspike interval (ISI)
distribution. The spike trains of Z+ PCs were more irregular in
both absolute and relative terms (Fig. 4A, B; SDs: Z2 = 14.2 ms,
n = 18; Z+ = 54.3 ms, n = 20; p = 0.0018; CVs: Z2 = 0.57, n = 18;
Z+ = 0.97, n = 20; p = 0.0172).
For the zonal data, trends consistent with the zebrin data were
found, although these differences were not statistically significant
(Fig. 4C, D; SDs: C1 = 53.6 ms, n = 8; A2, 101.0 ms, n = 16;
p = 0.0708; CVs: mainly Z2 C1 = 1.54, n = 8, mainly Z+A2 = 2.08, n = 16, p = 0.4812).
CS firing rate relationship to Z bandsIt is known that CS and SS rates can influence each other,
leading to either an inverse or a direct correlation in rates,
depending on the experimental manipulation [41–47]. Thus,
given the observed differences in SS firing rates between Z+ and
Z2 bands we next investigated whether CS firing rates also varied.
In contrast to the SS results, those for CSs were not consistent
between datasets. For the somatic recordings from PCs in zebrin-
identified locations, the distribution of firing rates overlapped
substantially with no statistical difference in the medians (Fig. 5A;
Z2 = 1.15 Hz; n = 18; Z+ = 1.16 Hz, n = 20; p = 0.92). In con-
trast, in recordings from zonally-identified PCs, A2 cells showed
significantly higher CS firing rates than did C1 cells (Fig. 5B;
C1 = 0.24 Hz, n = 8; A2 = 0.66 Hz, n = 18; p = 0.0083).
It is perhaps not surprising that the results from these two
datasets differ with regard to CS firing rates, as CSs are generated
in response to activity arising in inferior olivary neurons rather
than by local cerebellar cortical network activity, and thus CS
firing rates may be less completely determined by factors related to
the molecular make up of zebrin bands than are SS rates. In
particular, CS firing rates not only are influenced by GABAergic
inhibitory inputs from the cerebellar nuclei (whose activity is
indeed modulated by PC activity), but also by non-GABAergic,
Table 1. Spatial distribution of the recorded cells.
A. Zebrin bands Somatic Dendritic All
Ketamine/Xylazine
Crus IIa 42 1 3 4
Crus IIa 4b2 2 4 6
Crus IIa 4b+ 1 1
Crus IIa 52 10 13 23
Crus IIa 5+ 5 20 25
Crus IIa 5a2 2 2
Crus IIa 5a+ 3 3
Crus IIa 62 8 8
Crus IIa 6+ 4 15 19
Crus IIa 7+ 2 2
Lobule VIII 12 2 2
Lobule VIII 1+ 1 1
Lobule VIII 2+ 3 3
Urethane
Lobule VIII 12 2 2
Lobule VIII 2+ 2 2
Lobule VIII 22 1 1
Lobule VIII 3+ 1 1
Lobule VIII 32 1 1
Lobule VIII 42 1 1
Lobule IX 2+ 11 11
Lobule IX 3+ 4 4
Sum 57 65 122
B. Physiological zones Somatic
Crus II A2 13
Crus II C1 1
Paramedian A2 5
Paramedian C1 4
Copula Pyramidis C1 3
Sum 26
A) The zebrin bands for all PCs were histologically identified. Some of the cells were somatically recorded; others dendritically. B) The zonal locations of an additionalsample of PCs were physiologically determined. All cells were somatically recorded. A2 zone comprises mainly Z+ bands while the C1 zone comprises mainly Z2 bands.Two cells recorded in Crus II A2 zone did not fire SSs and were not included in the analysis of SS firing rate.doi:10.1371/journal.pone.0105633.t001
Variation of Purkinje Cell Activity between Zebrin Bands
PLOS ONE | www.plosone.org 5 August 2014 | Volume 9 | Issue 8 | e105633

presumably glutamatergic inputs from extra-cerebellar regions
[48].
Thus, to determine the relationship between CS firing rates and
zebrin, if any, it would be ideal to hold these other potential
variables constant. While we could not do that, we examined CS
activity recorded from PCs that were recorded simultaneously, and
hence under an identical brain state (dataset 3) [36]. The CS firing
rates in this larger dataset overlapped substantially with those of
the somatically recorded CSs, with median CS firing rates that fell
in between those of the two somatic datasets (Fig. 5C; Z+= 0.62 Hz, n = 37; Z2 = 0.81 Hz, n = 28). A small but statistically
significant difference in CS average firing rates between Z+ and
Z2 PCs was found (p = 0.0499); however, in this case it was the
Z2 PCs that showed the higher rates. Although the difference was
small, it was generally consistent across experiments, as shown by
comparing the median CS firing rates for pairs of Z+ and Z2 PCs
obtained in the same experiment (Fig. 5D). In five of six
experiments rates were higher for Z2 cells (p = 0.018, paired t-
test).
In sum, there were mixed findings relating to CS firing rates in
relation to zebrin bands. However, CSs also have a profound
influence on subsequent SS activity and the following sections
consider this aspect of CS activity in more detail.
Differences in the post-CS pauses in SS activity betweenZ+ and Z2 bands
One of the distinctive interactions between SSs and CSs is the
pause in SS activity following most CSs [49–51]. The post-CS
pause has also been suggested to be a potentially important
mechanism for distinguishing CS and SS activity by the cerebellar
nuclei [52]. Thus, we investigated whether the characteristics of
the pause varied between Z+ and Z2 bands.
The interval between each CS and the SS immediately
following it was measured and the median pause duration was
calculated for each cell. The population median pause duration of
PCs in Z+ bands were found to be 56.5% longer than those in Z2
bands (Z2 = 21.9 ms, n = 18; Z+ = 34.2 ms, n = 20; p = 0.0068;
Fig. 6A). In addition, as a population, PCs from Z+ bands showed
a much wider distribution in the cell-to-cell variation of pause
duration than did PCs from Z2 bands, even when this variation
was normalized to account for the differences in the mean pause
duration of the Z+ and Z2 populations (CV: Z+ = 0.554; Z2
= 0.288).
Analysis of the zonal dataset showed results consistent with the
zebrin data. A2 PCs (mainly Z+) showed longer pauses than did
C1 PCs (mainly Z2) (C1 = 28.2 ms, n = 8; A2 = 37.2 ms, n = 16);
however, the difference in medians did not reach statistical
significance (p = 0.0922, Mann–Whitney U-test). Nevertheless, as
shown in Fig. 6B, the difference in the distribution of pause
durations between A2 and C1 cells shows good agreement with the
Z+ and Z2 data, respectively. Also consistent with the zebrin data,
was the finding that the normalized variation in pause duration
among A2 PCs was higher than that among C1 PCs (CV: A2,
0.747; C1, 0.396).
For the zebrin data, we next analyzed factors that could
contribute to the significant difference in pause duration. First we
investigated the effect of the slower SS firing rates of Z+ PCs. With
a slower average firing rate the duration of the time between a CS
and the immediately succeeding SS will be greater on average.
Specifically, assuming that the occurrences of SSs and CSs are
independent, the expected latency of a SS following a CS is equal
to half the mean SS ISI (see Methods). Secondly, we investigated
whether any of the difference in post-CS pause duration between
Z+ and Z2 bands involved differences in active suppression of SS
activity.
To separate the contribution of these two factors to the
difference in pause duration between Z+ and Z2 bands, we
normalized the mean SS pause duration of each PC by the mean
SS ISI. This ratio should equal 0.5 (pause = ISI/2, so pause/
ISI = 1/2) if the entire pause in SSs is simply a function of SS firing
rate. The majority of PCs in both Z+ and Z2 bands show ratios
Figure 3. Z2 PCs have higher SS firing rates. The difference in SSfiring rate is consistent for both histologically (A) and physiologically (B)located PCs. Circles represent the overall firing rates of individual PCs inZ2 bands or C1 zone (blue) and in Z+ bands or A2 zone (red). In eachdistribution, the bar indicates the mean. Error bars indicate one SD ofthe distribution.doi:10.1371/journal.pone.0105633.g003
Figure 2. Extracellular recordings of PC activity. (A–B) Samplerecordings from zebrin localized PCs recorded under ketamine/xylazine(A) and urethane (B) that show both SSs and a CS (indicated by ‘*’). Notethe pause in SSs following the CS. (C) Recording of PC from the zonaldatabase displaying both SSs and a CS (indicated by ‘*’). Again note thepause in SSs following the CSs. The recording in C was filtered with ahigher cutoff frequency for the high pass filter, eliminating the slowerpotential that can be seen in the recordings in (A and B), and on whichthe spikelets ride. (D) Extracellular traces showing three CSs fromrecorded from a PC with the electrode in the molecular layer,approximately 100 mm below the folial surface of crus 2a. Note howthe number and size of the spikelets varies between CSs, but that thesize and shape of the initial spike are nevertheless relatively constant,indicating that a single unit is being recorded.doi:10.1371/journal.pone.0105633.g002
Variation of Purkinje Cell Activity between Zebrin Bands
PLOS ONE | www.plosone.org 6 August 2014 | Volume 9 | Issue 8 | e105633

that are higher than 0.5 (Fig. 7), which indicates that the pause in
SSs is longer than would be expected if the pause duration is based
solely on SS firing rate. Thus, there is active suppression of SSs
following a CS in both Z+ and Z2 bands. However, the ratios of
the Z2 PCs are significantly higher than those of the Z+PCs (Z2
= 1.51, n = 18; Z+ = 1.14, n = 20; p = 0.0317), indicating a greater
active suppression of SSs by CSs in Z2 bands.
In sum, although the absolute pause duration is greater in Z+PCs, this is largely attributable to the lower SS firing rates (i.e.,
longer mean ISIs) in those PCs, because when mean ISI is
controlled for, Z2 PCs show a greater relative pause in SS activity
following a CS.
PCs in Z+ bands have a stronger increase in SS localactivity after CS
After the initial pause in SSs following a CS, there is often a
longer latency modulation in SSs, which may take the form of a
delayed return to baseline activity or a transient overshoot in
activity [53]. To test whether the post-pause modulation differs
between Z+ and Z2 PCs, we measured the average firing rate of
SS in a 100-ms time window that started at the onset of each CS.
This post-CS firing rate was normalized by the overall SS firing
rate of the same cell to provide a ratio that reflected the post-CS
change in SS firing rate relative to the overall spiking level of the
cell. This ratio was significantly different between Z+ and Z- cells
(Fig. 8A; Z2 = 1.05, n = 18; Z+ = 1.16, n = 20; p = 0.0065).
Thus, in Z+ bands there is a stronger positive modulation of SS
activity following each CS; this relative increase in activity
occurred despite the longer initial pause of PCs in Z+ bands.
Furthermore, the CV of the distribution of ratio values was much
wider for Z+ cells than for Z2 cells (Z2 = 0.160, Z+ = 0.437; or
1:2.7), indicating that PCs in Z+ bands are more heterogeneous
with regard to how SSs and CSs interact.
PCs in the A2 and C1 zones showed a similar differential in
their post-pause modulation of SSs to the Z+ and Z2 PCs
(Fig. 8B). That is, A2 PCs had a relatively higher modulation of SS
levels than did C1 PCs, but the difference in the modulation ratios
was not statistically significant (C1 = 1.22, n = 8; A2 = 1.26, n = 16;
p = 0.8303). The CV of the ratio value for the A2 cell population
was larger than that for the C1 population (C1 = 0.31, A2 = 1.04;
or 1:3.4), consistent with the zebrin data.
Figure 5. Variable relationship of CS firing rate to Z+ and Z2 bands. (A–C) Distribution of CS firing rates for Z2 (or C1) and Z+ (or A2) cells.Circles represent the firing rates of individual PCs. In each distribution, the box indicates the 1st and 3rd quartile and the black line represents themedian of the distribution. (A) Somatically recorded Z+/2 PCs show comparable CS firing rate. (B) Somatically recorded PCs in C1 zone showsignificantly lower firing rates than those in A2 zones. (C) Dendritically recorded PCs in Z2 bands had a higher median rate than Z+ bands despite thewide scatter of values within each type of band. (D) Median firing rates compared between Z+ and Z2 bands within individual experiments. Eachcircle represents median CS firing rate for all Z2 (blue) or Z+ (red) PCs from an individual experiment. Lines connect the Z+ and Z2 cells obtained inthe same experiment.doi:10.1371/journal.pone.0105633.g005
Figure 4. Z2 PCs have more regular SS trains than do Z2 PCs. Plots of the SD (A) and CV (B) of the ISI distributions for SS trains from Z+ andZ2 PCs. Analogous plots for the zonal data are shown in (C) and (D). In each plot data the circles represent values from individual PCs, the horizontallines show the medians of the various distributions, and the boxes indicate the interquartile ranges.doi:10.1371/journal.pone.0105633.g004
Variation of Purkinje Cell Activity between Zebrin Bands
PLOS ONE | www.plosone.org 7 August 2014 | Volume 9 | Issue 8 | e105633

Differences in Z+ and Z2 PC activity under urethaneTo rule out the possibility that the observed differences between
Z+ and Z2 PCs reflect the particular anesthetic state in which the
recordings were obtained we investigated whether similar differ-
ences between Z+ and Z2 PCs existed under urethane, an
anesthetic that acts via different mechanisms than ketamine/
xylazine. Recordings were obtained of Z+ and Z2 PCs from
vermis lobules VIII and IX (Z2, n = 5; Z+, n = 18; for details on
lobular and zebrin band distribution see Table 1). With one
exception, all of the parameters that showed significant differences
between Z+ and Z2 under ketamine/xylazine showed identically-
directed differences under urethane. Specifically, under urethane,
statistically significant differences were found for SS firing rate
(Z2 = 44.2 Hz; Z+ = 21.0 Hz; p = 0.0009), the SD of the SS ISI
(Z2 = 6.67 ms; Z+ = 14.47 ms; p = 0.0041), and the post-CS
pause in SSs (Z2 = 40.9 ms; Z+ = 82.4 ms; p = 0.0279). For the
CV of the SS ISI distribution, the difference between Z+ and Z2
cells was not significant (Z2 = 0.272; Z+ = 0.370; p = 0.1679). The
post-pause modulation of SS activity in the 100 ms post-CS period
could not be compared with the values under ketamine/xylazine
because the pause duration under urethane was longer than half of
this period in most PCs (hence no spikes were present for at least
the first half of the period). The differences in the various
parameters between Z+ and Z2 PCs are summarized in the top
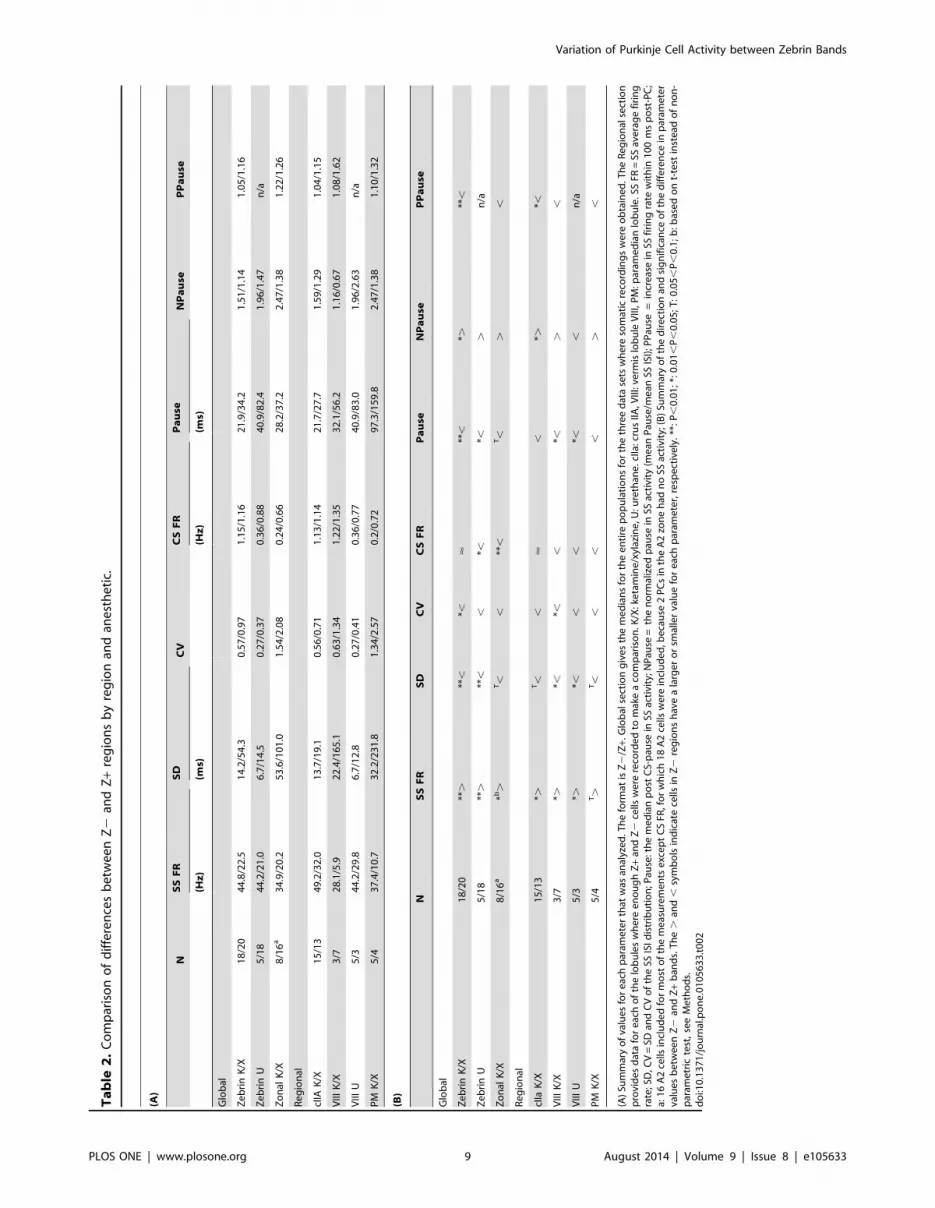
halves of Tables 2A and B (labeled ‘Global’), and show the
consistency of the results the three data sets where SS activity was
recorded. That is, for each parameter analyzed (except CS firing
rate), the inequality sign points in the same direction for all three
datasets (Table 2B, Global).
Zebrin-related differences are present in multiple regionsThe above results suggest that the differences between Z+ and
Z2 PC firing patterns are a general phenomena, at least
throughout much of the posterior lobe of the cerebellar cortex.
To test the generality of the results further, we analyzed the
differences between Z+ and Z2 bands for individual lobules. For
the zebrin experiments enough Z+ and Z2 PCs were present in
crus IIa and vermis lobule VIII to make comparisons. For the
zonal recordings this was the case for the paramedian lobule.
Figure 8. Stronger increase in SS activity after CS in Z+ than Z2bands. The difference is consistent for both histologically (A) andphysiologically (B) located PCs. Each circle represents the median ratioof the SS firing rate for the 100-ms period after a CS to the overall SSfiring rate for the individual PCs in the Z2 bands or the C1 zone (blue)and in the Z+ bands or the A2 zone (red). The black lines indicate theoverall median across each group, and the grey boxes indicate therange from 25% to 75% of each distribution.doi:10.1371/journal.pone.0105633.g008
Figure 6. PCs in Z+ bands show longer absolute post-CS pausesin SS than those in Z2 bands. The difference is consistent for bothhistologically (A) and physiologically (B) located PCs. Each circlerepresents the median duration of the pause of individual PCs in Z2bands or C1 zone (blue) and in Z+ bands or A2 zone (red). The blacklines indicate the overall median across each group, and the grey boxesindicate the range from 25% to 75% of each distribution. Note that Z+bands and A2 zone also consistently show higher variation than Z2
bands and C1 zone.doi:10.1371/journal.pone.0105633.g006
Figure 7. CSs in Z2 bands cause a relatively stronger activesuppression of SSs. The mean SS pause duration of each PC wasnormalized by dividing by its mean SS ISI. The distribution of ratio isshown for Z+ and Z2 PCs. Dashed line indicates the expected ratio ifthe latency from a CS to the first succeeding SS is solely a function of SSfiring rate. The solid black lines indicate the overall median across eachgroup, and the grey boxes indicate the range from 25% to 75% of eachdistribution.doi:10.1371/journal.pone.0105633.g007
Variation of Purkinje Cell Activity between Zebrin Bands
PLOS ONE | www.plosone.org 8 August 2014 | Volume 9 | Issue 8 | e105633
Ta
ble
2.
Co
mp
aris
on
of
dif
fere
nce
sb
etw
ee
nZ
2an
dZ
+re
gio
ns
by
reg
ion
and
ane
sth
eti
c.
(A)
NS
SF
RS
DC
VC
SF
RP
au
seN
Pa
use
PP
au
se
(Hz
)(m
s)(H
z)
(ms)
Glo
bal
Ze
bri
nK
/X1
8/2
04
4.8
/22
.51
4.2
/54
.30
.57
/0.9
71
.15
/1.1
62
1.9
/34
.21
.51
/1.1
41
.05
/1.1
6
Ze
bri
nU
5/1
84
4.2
/21
.06
.7/1
4.5
0.2
7/0
.37
0.3
6/0
.88
40
.9/8
2.4
1.9
6/1
.47
n/a
Zo
nal
K/X
8/1
6a
34
.9/2
0.2
53
.6/1
01
.01
.54
/2.0
80
.24
/0.6
62
8.2
/37
.22
.47
/1.3
81
.22
/1.2
6
Re
gio
nal
cIIA
K/X
15
/13
49
.2/3
2.0
13
.7/1
9.1
0.5
6/0
.71
1.1
3/1
.14
21
.7/2
7.7
1.5
9/1
.29
1.0
4/1
.15
VIII
K/X
3/7
28
.1/5
.92
2.4
/16
5.1
0.6
3/1
.34
1.2
2/1
.35
32
.1/5
6.2
1.1
6/0
.67
1.0
8/1
.62
VIII
U5
/34
4.2
/29
.86
.7/1
2.8
0.2
7/0
.41
0.3
6/0
.77
40
.9/8
3.0
1.9
6/2
.63
n/a
PM
K/X
5/4
37
.4/1
0.7
32
.2/2
31
.81
.34
/2.5
70
.2/0
.72
97
.3/1
59
.82
.47
/1.3
81
.10
/1.3
2
(B)
NS
SF
RS
DC
VC
SF
RP
au
seN
Pa
use
PP
au
se
Glo
bal
Ze
bri
nK
/X1
8/2
0**
.**
,*,
<**
,*.
**,
Ze
bri
nU
5/1
8**
.**
,,
*,*,
.n
/a
Zo
nal
K/X
8/1
6a
*b.
T,
,**
,T,
.,
Re
gio
nal
cIIa
K/X
15
/13
*.T,
,<
,*.
*,
VIII
K/X
3/7
*.*,
*,,
*,.
,
VIII
U5
/3*.
*,,
,*,
,n
/a
PM
K/X
5/4
T.
T,
,,
,.
,
(A)
Sum
mar
yo
fva
lue
sfo
re
ach
par
ame
ter
that
was
anal
yze
d.T
he
form
atis
Z2
/Z+.
Glo
bal
sect
ion
giv
es
the
me
dia
ns
for
the
en
tire
po
pu
lati
on
sfo
rth
eth
ree
dat
ase
tsw
he
reso
mat
icre
cord
ing
sw
ere
ob
tain
ed
.Th
eR
eg
ion
alse
ctio
np
rovi
de
sd
ata
for
eac
ho
fth
elo
bu
les
wh
ere
en
ou
gh
Z+
and
Z2
cells
we
rere
cord
ed
tom
ake
aco
mp
aris
on
.K/X
:ke
tam
ine
/xyl
azin
e,U
:ure
than
e.c
IIa:c
rus
IIA,V
III:v
erm
islo
bu
leV
III,P
M:p
aram
ed
ian
lob
ule
.SS
FR=
SSav
era
ge
firi
ng
rate
;SD
,CV
=SD
and
CV
of
the
SSIS
Id
istr
ibu
tio
n;P
ause
:th
em
ed
ian
po
stC
S-p
ause
inSS
acti
vity
;NP
ause
=th
en
orm
aliz
ed
pau
sein
SSac
tivi
ty(m
ean
Pau
se/m
ean
SSIS
I);P
Pau
se=
incr
eas
ein
SSfi
rin
gra
tew
ith
in1
00
ms
po
st-P
C;
a:1
6A
2ce
llsin
clu
de
dfo
rm
ost
of
the
me
asu
rem
en
tse
xce
pt
CS
FR,f
or
wh
ich
18
A2
cells
we
rein
clu
de
d,b
eca
use
2P
Cs
inth
eA
2zo
ne
had
no
SSac
tivi
ty;(
B)
Sum
mar
yo
fth
ed
ire
ctio
nan
dsi
gn
ific
ance
of
the
dif
fere
nce
inp
aram
ete
rva
lue
sb
etw
ee
nZ
2an
dZ
+b
and
s.T
he
.an
d,
sym
bo
lsin
dic
ate
cells
inZ
2re
gio
ns
hav
ea
larg
er
or
smal
ler
valu
efo
re
ach
par
ame
ter,
resp
ect
ive
ly.
**:P
,0
.01
;*:0
.01
,P
,0
.05
;T
:0.0
5,
P,
0.1
;b
:bas
ed
on
t-te
stin
ste
ado
fn
on
-p
aram
etr
icte
st,
see
Me
tho
ds.
do
i:10
.13
71
/jo
urn
al.p
on
e.0
10
56
33
.t0
02
Variation of Purkinje Cell Activity between Zebrin Bands
PLOS ONE | www.plosone.org 9 August 2014 | Volume 9 | Issue 8 | e105633

In almost all cases, each individual lobule showed the same
trends as were observed in the combined population (Table 2A,B,
bottom halves labeled ‘Regional’). That is, relative to their Z+counterpart, each Z2 region had higher SS firing rates, greater
absolute and relative regularity, shorter absolute but longer
relative pauses, and a less positive post-CS modulation of SSs
following the initial pause. In most cases these differences were
statistically significant (indicated by * or ** in Table 2B). There
was just one exception other than CS firing rate: the normalized
pause duration in vermis VIII under urethane. Thus, the general
consistency in the results across lobules and anesthetics suggests
that the observed differences between PC activity in Z+ and Z2
bands is a common organizational principle of the cerebellar
posterior lobe, and possibly the entire cerebellum.
Degree of overlap of physiologically-defined zones withzebrin bands
To validate the use of the A2 and C1 zones, respectively, as
surrogates for Z+ and Z2 bands, we estimated the zebrin
composition of these zones for the regions of cortex where PC
activity was recorded. In zebrin (aldolase C) immunostained
brains, Z+ band 4+ is generally located under the paravermal vein
and extends up to 0.5–0.6 mm laterally in crus IIa, crus IIb and
paramedian lobule (Fig. 9A). Since fixed tissue for immunostaining
is slightly shrunken from the physiological brain, the boundary
between 4+ and 4a- (0.5–0.6 mm lateral to the center of the
paravermal vein) is likely to correspond to the physiological
boundary between the A2 and C1 zones (i.e. 0.6 mm from the
paravermal vein, see Methods). As our A2 recordings were located
no more than 0.6 mm lateral from the paravermal vein (see
Methods), we can therefore safely assume that the PCs we
recorded in the A2 zone were all Z+.
The Z2 band 4a2 (,0.18 mm wide, measured in crus IIb in
the center panel of Fig. 9A) is located immediately lateral to 4+,
followed by a very narrow Z+ band (4b+, ,0.08 mm wide), a Z2
band (4b2, ,0.33 mm wide), a very narrow Z+ band (5a+,
,0.05 mm wide) and a Z- band (5a2, ,0.21 mm wide; making a
total of 0.85 mm and Z+: Z2 ratio of 0.13: 0.72). These measures
were variable among lobules (crus IIa, IIb and paramedian lobule)
and among individuals to some extent. As our C1 recordings were
located within the range 0.6–1.3 mm lateral to the paravermal
vein, we can assume that C1 zone mostly corresponds to the series
of Z2/Z+ bands between 4a2 and 5a2 or the medial part of
these series. Then, assuming a random positional sampling of PCs,
we can estimate that a PC in the C1 zone in the areas of cortex
under study has an 85% ( = 0.72/(0.13+0.72)) chance of being Z2.
Although the anatomical estimate indicates that random
samples of PCs from the A2 and C1 zones from the lobules we
recorded should be good surrogates for Z+ and Z2 PC
populations, respectively, it does not necessarily imply that the
PCs in the actual dataset represent random samples. Thus, to test
further whether the A2 and C1 data were Z+ and Z2 surrogates,
we generated mixed populations of Z+ and Z2 PCs from the
Figure 9. Zebrin composition of A2 and C1 zones. (A) Anatomical estimate of zebrin bands for A2 and C1 zones in crus II and paramedianlobule. In horizontal sections on which the apical area of crus IIa, crus IIb, and paramedian lobules were seen, the distance between the putativeposition of the paravermal vein and the boundary between Z+ band 4+ and Z2 band 4a2 was measured. Circle indicates the putative position of theparavermal vein. This boundary roughly corresponded to the physiological boundary between A2 and C1 zones (0.6 mm, Methods). (B) Plots ofnormalized spike train parameters (firing rate, SS pause, SD of ISI, and CV of ISI) for populations consisting of different percentages of Z+ PCs.Simulated population averages indicated by filled small red circles. Values for experimental zebrin datasets indicated by large unfilled red circles (Z2at 0%, Z+ at 100%). Lines are least squares fits to the simulated population data. Large unfilled black circles show zonal data (C1 shown by left circle ineach plot, A2 by right circle). Placement of black circles along x-axis was determined using the experimental parameter value in the correspondingregression equation, and thus provided an estimate of the percentage of Z+ PCs in the population (indicated by dashed black lines).doi:10.1371/journal.pone.0105633.g009
Variation of Purkinje Cell Activity between Zebrin Bands
PLOS ONE | www.plosone.org 10 August 2014 | Volume 9 | Issue 8 | e105633

zebrin dataset by randomly sampling with replacement the Z+ and
Z2 identified PC populations. Each population had a total of 20
PCs. For each ratio of Z+ to Z2 PCs (Z+/Z2: 20/0, 19/1, …, 0/
20) 100 populations were generated, and the average value of a
normalized spiking parameter (SS firing rate, SD and CV of the
SS firing rate, and absolute pause duration) was calculated. The
parameters were normalized such that the overall mean of each
parameter was equal to one for the entire zonal and zebrin
populations, which was done to eliminate the absolute differences
in these parameters between the zonal and zebrin datasets. Thus,
only the relative differences between Z+ and Z2 cells, and
correspondingly, A2 and C1 cells, remained.
The average value of each parameter from the simulated
populations was then plotted as a function of the percentage of Z+cells in the population (Fig. 9B, small red filled circles). The true
experimental populations are indicated by large unfilled red circles
at 0% (Z2) and 100% (Z+) on the plots, and closely match the
averages of the corresponding simulated populations. A line was
then fit (least squares) to the simulated data for each parameter.
The parameter values for the A2 and C1 datasets were then
entered into the linear regression equations to calculate an
estimate of the percentage of Z+ cells in each zonal population.
Firing rate was the parameter showing the most robust
difference between Z+ and Z2 PCs and it provided estimates
that most closely matched that of the anatomical estimates for the
A2 (81.5% Z+) and C1 (24.3% Z+, physically one cannot have
less than 0% but the value of the zonal data falls slightly above that
of the regression line at 0% leading to the negative percentage
estimate) zones. Based on the four parameters the average estimate
of the percentage of Z+ PCs for the C1 zone was 5.7620.5%, and
that for the A2 zone was 76.4611.6%, both of which are close to
that of the anatomical estimates.
In sum, both anatomical and statistical analyses suggest that our
C1 zone recordings consisted of a pure or nearly pure Z2
population of PCs. These analyses also support the use of our A2
zone recordings as a good, though not perfect, surrogate for a Z+population because the large majority of the recordings are likely
Z+.
Discussion
The principal finding of this paper is that consistent differences
exist in the spontaneous activity of PCs in different regions of the
cerebellar cortex, which implies that the cerebellar cortex is
functionally heterogeneous despite its uniform circuitry. In
particular, SSs were found to have higher firing rates and less
variable spike trains in Z2 compared to Z+ bands. Significant
differences in the basic interactions between SSs and CSs were also
found. The PC recordings covered a significant amount of the
cerebellar posterior lobe, suggesting that the observed differences
in firing pattern between Z+ and Z2 regions likely reflects a
general organizational principle of the cerebellar cortex. More-
over, essentially the same findings were obtained for most of the
parameters under two distinct types of anesthesia, indicating that
the observed differences between the spontaneous firing patterns
in Z+ and Z2 bands are robust, and therefore that they likely will
be observed in other physiological brain states.
Methodological IssuesMost of the experiments were done under ketamine/xylazine
anesthesia, which raises the issue of how applicable the results are
to the awake brain state, in particular. The possibility that the
observed differences in activity between Z+ and Z2 PCs are
specific to the ketamine anesthesia state was ruled out by finding
similar differences using urethane anesthesia. Moreover, there are
additional reasons to believe that the results have general validity.
Specifically, the SS results appear to be robust in that similar
differences between Z+ and Z2 regions in SS firing rates and
patterns, and in SS-CS interactions, were observed in two
independent laboratories even though recordings were obtained
from different rat strains using different (albeit similar) anesthetic
and recording protocols, and the recorded PCs were located in
different cerebellar regions. (Differences in CS firing rates were not
consistent, but possible reasons for this are discussed later.)
Furthermore, other aspects of cerebellar cortical physiology (e.g.,
CS synchrony patterns) are similar in ketamine/xylazine anesthe-
tized preparations and in awake animals [54–59], suggesting that
many of the parameters governing the cerebellar cortical network
are similar in both the waking and ketamine-anesthetized
conditions, though the specific activity patterns in the anesthetized
animal almost certainly do not precisely match those that occur in
the awake animal, and some parameters of activity can differ
significantly [60]. Finally, while this paper was under review,
similar findings were reported in awake mice, extending the
generality of the findings of zebrin-related differences in spike
activity [61]. In particular, the two studies found similar
differences in SS firing rates and absolute SS pause duration
between Z+ and Z2 bands. Regarding CS activity Zhou et al.
found higher rates in Z2 cells whereas our datasets were not fully
consistent.
Possible mechanisms underlying differences in SS activitybetween Z+ and Z2 bands
A number of mechanisms exist that potentially could explain the
difference in SS firing rates between zebrin compartments
observed here. The most straightforward is the possibility that
there are systematic differences in the intrinsic excitability between
PCs. Specifically, PCs have an intrinsic spike generator that allows
them to fire spontaneously in the absence of synaptic drive [45,62–
64], and systematic variations in this generator between Z+ and
Z2 band PCs could lead to differences in SS firing patterns.
Indeed, such a systematic regional variation has been described for
the depolarization-induced slow current (DISC), which increases
PC excitability, and which is expressed more strongly in posterior
vermis PCs [65,66], but posterior vermis is largely Z+, and thus
DISC expression appears to be the opposite of what would explain
the differences in SS rates found here. However, evidence has just
been reported that differences related to the activity of TRPC3
(transient receptor potential cation channel type C3) in PCs
contribute to differences in spiking characteristics between Z+ and
Z2 bands [61].
Alternatively, or in combination with any differences in PC
intrinsic excitability, variations in the synaptic input to PCs could
exist, either because of differences in the activity levels of the mossy
fiber/granule cell input pathway to Z+ and Z2 regions or because
of differences in synaptically-related conductances between zebrin
compartments. Differences in the activity levels of mossy fiber/
granule cell input pathway to Z+ and Z2 regions seems less
plausible as a general mechanism, because the great diversity of
mossy fiber sources makes it less likely for there to be a consistent
matching of low and high activity levels to the Z+ and Z2 bands,
respectively. Also, while some mossy fiber systems align well with
specific zebrin bands [8,18,24], in other cases the relationship is
more complex [16].
Thus, a more likely possibility is that the synaptic efficacy of the
parallel fiber-PC synapse varies between zebrin bands. Indeed,
differences in the expression levels of several molecules exist
between Z+ and Z2 PCs that could lead to differences in synaptic
Variation of Purkinje Cell Activity between Zebrin Bands
PLOS ONE | www.plosone.org 11 August 2014 | Volume 9 | Issue 8 | e105633

transmission that could, in turn, explain the differences in SS rates
we found. In particular, excitatory amino acid transporters
(EAATs) act to limit EPSCs at parallel fiber synapses onto PCs
[29–31]. One of these transporters, EAAT4, is found predomi-
nantly at perisynaptic regions on the PC dendritic membrane, and
is highly expressed in Z+ PCs but not Z2 PCs [25,26,67]. Given
this differential expression of EAAT4, the excitatory drive from
parallel fibers could be weaker in Z+ PCs, thereby leading to lower
SS rates.
Another possible mechanism that could underlie the differences
in overall SS firing rates is differential activation of molecular layer
interneurons (MLIs; i.e., basket and stellate cells) in Z+ and Z2
bands by parallel fiber activity [68]. Activation of a beam of
parallel fibers leads to a traveling wave of excitation of the PCs and
MLIs contacted by the parallel fibers [69,70]. The activation of the
MLIs then produces a wave of inhibition that travels in the wake of
the excitatory wave to PCs directly underneath the parallel fiber
beam, and to PCs located on either side of the parallel fiber beam
[70,71]. However, the amplitude of the evoked inhibition on PCs
is not constant, but rather waxes and wanes as this second wave
travels along the parallel fiber beam, such that strong activation of
MLIs occurs in Z+ bands and weak activation in Z2 bands [68].
Thus, parallel fiber drive to PCs would be more strongly countered
by inhibition in the Z+ bands, which potentially would lead to
lower SS firing rates.
The relative contributions of these and other possible mecha-
nisms to the differences in SS activity we reported here will require
study of synaptic currents and the intrinsic properties of PCs at the
single and network level.
Variations in CS firing rates between zebrin bandsWe obtained mixed results when comparing CS activity across
zebrin bands obtained from our different datasets. Nevertheless,
that differences were found in two of three datasets suggests that
CSs may also vary systematically between cerebellar cortical
regions. However, multiple factors may underlie this variation,
only some of which are correlated with zebrin expression. In fact,
several factors that are known to contribute to CS firing rates can
have opposite effects, and which one dominates may vary between
different behavioral contexts, leading to a differing relationship
between SS and CS activity levels.
For example, in the case of zonal recordings of CS firing rates,
these were higher in the A2 zone, and thus varied inversely with
SS rates. This inverse relationship is consistent with the well-
known observation that changes in CS rates induced by direct
manipulation of inferior olive excitability produce an inverse effect
on SS rates [41–44,72]. This inverse correlation of SS and CS is
driven, at least in part, by climbing fiber activation of cerebellar
cortical interneurons [43,50,73,74] (however, see, [41,42]), and is
likely mediated via spillover of glutamate from climbing fiber-PC
synapses [75–77].
In contrast, in the zebrin dataset a positive correlation of CS
and SS firing rates was found across Z+ and Z2 bands (i.e., both
were higher in the Z2 band). Such a relationship could be driven
by the difference in SS activity that feeds into the disynaptic PC-
cerebellar nucleo-inferior olivary pathway. Given the closed loop
nature of the pathways interconnecting the cerebellar cortex,
cerebellar nuclei and inferior olive, and that Z+ and Z2 PCs
project to separate cerebellar nuclear regions [23,78], this raises
the possibility that the relatively higher SS activity in Z2 bands
would more strongly inhibit the cerebellar nuclei. This, in turn,
could lead to a relatively stronger disinhibition of the inferior
olivary regions projecting back to the Z2 bands, resulting in
increased CS activity. Support for the significance of this
mechanism comes from studies showing manipulation of SS levels
in discrete cortical regions produces correlated changes in CS
activity [46,47].
During behavior, examples of both positive and negative
correlation of SSs and CSs exist [79,80]. In sum, the inconsistency
with regard to CS firing rate we observed may be attributable to
the fact that CSs are evoked by inferior olivary activity, which is
not part of the cerebellar cortex. As a result CSs, are likely to be
subject to more factors uncorrelated with the pattern of zebrin
expression than is the case for the cerebellar cortical neurons
responsible for generating and modulating SS activity.
CS-SS interactionsAlthough the absolute duration of the pause in SSs following a
CS was longer in Z+ bands, a greater active suppression of SS
activity was found for Z2 regions when SS firing rate differences
were controlled for. Evidence indicates that the pause in SSs is at
least partly caused by activation of MLIs and GABA release
[46,50,73,74]. However, MLIs appear not to receive climbing
fiber synapses [81], but instead are activated by climbing fiber
activity via glutamate spillover from climbing fiber-PC synapses
[75,76,82]. EAAT4 is found in the perisynaptic membrane of
climbing fiber-PC synapses [25,67], and controls glutamate
spillover at those synapses [27,83], raising the possibility that the
differing EAAT4 expression levels may also underlie the observed
differences in active suppression of SSs between Z+ and Z2
bands. That is, the relatively weak expression of EAAT4 in Z2
band PCs could allow climbing fiber activity to cause greater MLI
activation, leading to greater active inhibition of SSs following
each CS.
The post-CS pause in SSs is generally followed by a subsequent
modulation of SSs [53], which was found to be more pronounced
in Z+ regions, although this effect was subtle. This difference may
also be ascribable to variations in EAAT4 expression. This is
because the post-pause SS modulation is also likely mediated by
MLIs, as local block of GABA-A receptors reduces this modula-
tion, for both negative and positive directions [46]. Moreover,
glutamate spillover has recently been shown to cause not only
activation of MLIs but also to lead to feed-forward inhibition of
MLIs, which can last on the order of 100 ms [82], the same
timescale as the duration of the modulation. Thus, in Z2 bands
the lower EAAT4 level allows the CS to activate more strongly the
MLI network, which can then more strongly modulate SS activity.
Implications for cerebellar functionThe differences in spontaneous PC activity between Z+ and Z2
bands observed here are raise the possibility that information
arriving via different cerebellar afferent systems could be
transformed by networks characterized by quite distinct opera-
tional states. Moreover, it may be more complex than a simple
binary choice (Z+ versus Z2), because not all afferent systems
respect the zebrin-defined compartments. In this regard it is
interesting to compare the band and zone results, because while
the bands and zones are closely aligned in the cortical regions we
recorded, they are not congruent, and although the zebrin and
zonal datasets showed the same trends (except for CS firing rates),
the stronger, more statistically significant results were always found
for the zebrin dataset. This suggests that the observed firing
pattern differences are a reflection of the intrinsic organization of
the cerebellar cortex, and that differences in the spiking patterns
between zones are likely a secondary consequence of the close
spatial alignment between zones and bands from the recorded
regions. However, since the degree of alignment between bands
and zones varies among afferent systems and cerebellar cortical
Variation of Purkinje Cell Activity between Zebrin Bands
PLOS ONE | www.plosone.org 12 August 2014 | Volume 9 | Issue 8 | e105633

regions, the Z+/Z2 ratio of an afferent’s target region will vary
among afferents, and thus may be an important functional
parameter for determining the type of information processing that
different input signals undergo.
Finally, the difference in the regularity of the firing patterns
between Z+ and Z2 PCs may have important implications for the
transmission of information from the cerebellar cortex to the
cerebellar nuclei. This is because Z+ and Z2 PCs target distinct
regions in the cerebellar nuclei [23,78]. PCs are often assumed to
use rate coding, and if this is the case, the greater variability in the
ISI distribution of Z+ PCs raises the possibility that information
transmission from Z+ bands to the cerebellar nuclei is less efficient,
as the efficiency of a rate code depends strongly on the regularity
of the firing pattern [84].
The functional significance of this difference in SS regularity is
difficult to gauge, because of uncertainties about the actual code
used by PCs and about the exact convergence ratio of PCs to
nuclear neurons. For example, a large degree of convergence in
the PC-cerebellar nuclear projection, as suggested by anatomical
results [85], could minimize the importance of differences in
regularity by allowing averaging across the converging PC
population, assuming that the ‘‘noise’’ in the SS activity in
different PCs is independent. However, several physiological
studies have suggested that the convergence in the PC-cerebellar
nuclear projection may be relatively small (on the order of 10’s:1
rather than 100’s:1) [4,86], in which case the differing noise levels
may have a significant impact on coding efficiency. Regardless of
what the exact convergence ratio turns out to be, if PCs really only
use rate coding, it seems surprising to have approximately half of
them generate significantly more irregular spike trains. Thus, the
present results suggest that SSs use additional coding mechanisms,
consistent with other reports (for review see [87].
Increased irregularity in SS activity has been proposed as a
cause of motor coordination disorders including ataxia and
dystonia [88–90]. However, recent theoretical and experimental
findings have questioned the association of irregular SS firing
patterns and motor coordination deficits [91,92]. Our finding that
PCs can display differing levels of firing regularity under normal
physiological conditions would also argue against irregular firing
patterns necessarily being pathological. Instead, as suggested
above, this variation in regularity suggests that the cerebellar
cortex employs multiple coding schemes, and that the specific
code(s) used may vary between cerebellar regions. These results
need to be verified in awake animals, but the demonstration of
regularity differences in spiking between Z+ and Z2 bands under
two distinct anesthetic states raises the likelihood of this being an
important characteristic of cerebellar activity that needs to be
taken into account in future hypotheses of cerebellar function.
Author Contributions
Conceived and designed the experiments: NLC RA IS EJL. Performed the
experiments: JX NLC YK HA AKW SPM RA EJL. Analyzed the data: JX
NLC YK HA AB AKW YL SPM IS RA EJL. Contributed reagents/
materials/analysis tools: JX AB EJL. Contributed to the writing of the
manuscript: JX NLC RA IS EJL.
References
1. Dino MR, Willard FH, Mugnaini E (1999) Distribution of unipolar brush cellsand other calretinin immunoreactive components in the mammalian cerebellar
cortex. J Neurocytol 28: 99–123.
2. Marr D (1969) A theory of cerebellar cortex. J Physiol (Lond) 202: 437–470.
3. Albus JS (1971) A theory of cerebellar function. Math Biosci 10: 25–61.
4. Eccles JC, Ito M, Szentagothai J (1967) The Cerebellum as a Neuronal Machine.
Berlin: Springer-Verlag.
5. Eccles JC (1973) The cerebellum as a computer: patterns in space and time.J Physiol (Lond) 229: 1–32.
6. Braitenberg V (2002) In defense of the cerebellum. Ann N Y Acad Sci 978:175–183.
7. Bloedel JR (1992) Functional heterogeneity with structural homogeneity: How
does the cerebellum operate? Behavioral Brain Science 15: 666–678.
8. Apps R, Hawkes R (2009) Cerebellar cortical organization: a one-map
hypothesis. Nat Rev Neurosci 10: 670–681.
9. Hawkes R, Gravel C (1991) The modular cerebellum. Prog Neurobiol 36: 309–327.
10. Hawkes R (1997) An anatomical model of cerebellar modules. Prog Brain Res
114: 39–52.
11. Voogd J, Ruigrok TJH (1997) Transverse and longitudinal patterns in the
mammalian cerebellum. Prog Brain Res 114: 21–37.
12. Sugihara I, Shinoda Y (2004) Molecular, topographic, and functionalorganization of the cerebellar cortex: a study with combined aldolase C and
olivocerebellar tracing. J Neurosci 24: 8771–8785.
13. Sugihara I, Quy PN (2007a) Identification of aldolase C compartments in themouse cerebellar cortex by olivocerebellar labeling. J Comp Neurol 500: 1076–
1092.
14. Brochu G, Maler L, Hawkes R (1990) Zebrin II: a polypeptide antigen expressed
selectively by Purkinje cells reveals compartments in rat and fish cerebellum.J Comp Neurol 291: 538–552.
15. Hawkes R, LeClerc N (1987) Antigenic map of the rat cerebellar cortex: the
distribution of parasagittal bands as revealed by monoclonal anti-Purkinje cell
antibody mabQ113. J Comp Neurol 256: 29–41.
16. Ji Z, Hawkes R (1994) Topography of Purkinje cell compartments and mossyfiber terminal fields in lobules II and III of the rat cerebellar cortex:
spinocerebellar and cuneocerebellar projections. Neuroscience 61: 935–954.
17. Voogd J, Pardoe J, Ruigrok TJH, Apps R (2003) The distribution of climbing
and mossy fiber collateral branches from the copula pyramidis and theparamedian lobule: Congruence of climbing fiber cortical zones and the pattern
of zebrin banding within the rat cerebellum. J Neurosci 23: 4645–4656.
18. Quy PN, Fujita H, Sakamoto Y, Na J, Sugihara I (2011) Projection patterns ofsingle mossy fiber axons originating from the dorsal column nuclei mapped on
the aldolase C compartments in the rat cerebellar cortex. J Comp Neurol 519:
874–899.
19. Pijpers A, Apps R, Pardoe J, Voogd J, Ruigrok TJ (2006) Precise spatial
relationships between mossy fibers and climbing fibers in rat cerebellar cortical
zones. J Neurosci 26: 12067–12080.
20. Pakan JM, Graham DJ, Wylie DR (2010) Organization of visual mossy fiber
projections and zebrin expression in the pigeon vestibulocerebellum. J Comp
Neurol 518: 175–198.
21. Sugihara I, Shinoda Y (2007c) Molecular, topographic, and functional
organization of the cerebellar nuclei: analysis by three-dimensional mapping
of the olivonuclear projection and aldolase C labeling. J Neurosci 27: 9696–
9710.
22. Sugihara I (2011) Compartmentalization of the deep cerebellar nuclei based on
afferent projections and aldolase C expression. Cerebellum 10: 449–463.
23. Chung SH, Marzban H, Hawkes R (2009) Compartmentation of the cerebellar
nuclei of the mouse. Neuroscience 161: 123–138.
24. Cerminara NL, Aoki H, Loft M, Sugihara I, Apps R (2013) Structural basis of
cerebellar microcircuits in the rat. J Neurosci 33: 16427–16442.
25. Dehnes Y, Chaudhry FA, Ullensvang K, Lehre KP, Storm-Mathisen J, et al.
(1998) The glutamate transporter EAAT4 in rat cerebellar Purkinje cells: a
glutamate-gated chloride channel concentrated near the synapse in parts of the
dendritic membrane facing astroglia. J Neurosci 18: 3606–3619.
26. Nagao S, Kwak S, Kanazawa I (1997) EAAT4, a glutamate transporter with
properties of a chloride channel, is predominantly localized in Purkinje cell
dendrites, and forms parasagittal compartments in rat cerebellum. Neuroscience
78: 929–933.
27. Otis TS, Kavanaugh MP, Jahr CE (1997) Postsynaptic glutamate transport at
the climbing fiber-Purkinje cell synapse. Science 277: 1515–1518.
28. Brasnjo G, Otis TS (2001) Neuronal glutamate transporters control activation of
postsynaptic metabotropic glutamate receptors and influence cerebellar long-
term depression. Neuron 31: 607–616.
29. Barbour B, Keller BU, Llano I, Marty A (1994) Prolonged presence of glutamate
during excitatory synaptic transmission to cerebellar Purkinje cells. Neuron 12:
1331–1343.
30. Takahashi M, Kovalchuk Y, Attwell D (1995) Pre- and postsynaptic
determinants of EPSC waveform at cerebellar climbing fiber and parallel fiber
to Purkinje cell synapses. J Neurosci 15: 5693–5702.
31. Takayasu Y, Iino M, Ozawa S (2004) Roles of glutamate transporters in shaping
excitatory synaptic currents in cerebellar Purkinje cells. Eur J Neurosci 19:
1285–1295.
32. Tzingounis AV, Wadiche JI (2007) Glutamate transporters: confining runaway
excitation by shaping synaptic transmission. Nat Rev Neurosci 8: 935–947.
33. Ruigrok TJ (2011) Ins and outs of cerebellar modules. Cerebellum 10: 464–474.
34. Voogd J (2012) A note on the definition and the development of cerebellar
Purkinje cell zones. Cerebellum 11: 422–425.
Variation of Purkinje Cell Activity between Zebrin Bands
PLOS ONE | www.plosone.org 13 August 2014 | Volume 9 | Issue 8 | e105633

35. Cerminara NL, Apps R (2011) Behavioural significance of cerebellar modules.
Cerebellum 10: 484–494.36. Sugihara I, Marshall SP, Lang EJ (2007b) Relationship of complex spike
synchrony to the lobular and longitudinal aldolase C compartments in crus IIA
of the cerebellar cortex. J Comp Neurol 501: 13–29.37. Sasaki K, Bower JM, Llinas R (1989) Multiple Purkinje cell recording in rodent
cerebellar cortex. Eur J Neurosci 1: 572–586.38. Llinas R, Sugimori M (1980b) Electrophysiological properties of in vitro Purkinje
cell dendrites in mammalian cerebellar slices. J Physiol (Lond) 305: 197–213.
39. Wise AK, Cerminara NL, Marple-Horvat DE, Apps R (2010) Mechanisms ofsynchronous activity in cerebellar Purkinje cells. J Physiol (Lond) 588: 2373–
2390.40. Atkins MJ, Apps R (1997) Somatotopical organisation within the climbing fibre
projection to the paramedian lobule and copula pyramidis of the rat cerebellum.J Comp Neurol 389: 249–263.
41. Colin F, Manil J, Desclin JC (1980) The olivocerebellar system. I. Delayed and
slow inhibitory effects: an overlooked salient feature of cerebellar climbing fibers.Brain Res 187: 3–27.
42. Rawson JA, Tilokskulchai K (1981) Suppression of simple spike discharges ofcerebellar Purkinje cells by impulses in climbing fibre afferents. Neurosci Lett 25:
125–130.
43. Montarolo PG, Palestini M, Strata P (1982) The inhibitory effect of theolivocerebellar input on the cerebellar Purkinje cells in the rat. J Physiol (Lond)
332: 187–202.44. Demer JL, Echelman DA, Robinson DA (1985) Effects of electrical stimulation
and reversible lesions of the olivocerebellar pathway on Purkinje cell activity inthe flocculus of the cat. Brain Res 346: 22–31.
45. Cerminara NL, Rawson JA (2004) Evidence that climbing fibers control an
intrinsic spike generator in cerebellar Purkinje cells. J Neurosci 24: 4510–4517.46. Marshall SP, Lang EJ (2009) Local changes in the excitability of the cerebellar
cortex produce spatially restricted changes in complex spike synchrony.J Neurosci 29: 14352–14362.
47. Chaumont J, Guyon N, Valera AM, Dugue GP, Popa D, et al. (2013) Clusters of
cerebellar Purkinje cells control their afferent climbing fiber discharge. Proc NatlAcad Sci USA 110: 16223–16228.
48. Lang EJ (2002) GABAergic and glutamatergic modulation of spontaneous andmotor-cortex-evoked complex spike activity. J Neurophysiol 87: 1993–2008.
49. Granit R, Phillips CG (1956) Excitatory and inhibitory processes acting uponindividual Purkinje cells of the cerebellum in cats. J Physiol (Lond) 133: 520–
547.
50. Bloedel JR, Roberts WJ (1971) Action of climbing fibers in cerebellar cortex ofthe cat. J Neurophysiol 34: 17–31.
51. Ebner TJ, Bloedel JR (1981a) Temporal patterning in simple spike discharge ofPurkinje cells and Its relationship to climbing fiber activity. J Neurophysiol 45:
933–947.
52. Aizenman CD, Linden DJ (1999) Regulation of the rebound depolarization andspontaneous firing patterns of deep nuclear neurons in slices of rat cerebellum.
J Neurophysiol 82: 1697–1709.53. McDevitt CJ, Ebner TJ, Bloedel JR (1982) The changes in Purkinje cell simple
spike activity following spontaneous climbing fiber inputs. Brain Res 237: 484–491.
54. Lang EJ, Sugihara I, Welsh JP, Llinas R (1999) Patterns of spontaneous Purkinje
cell complex spike activity in the awake rat. J Neurosci 19: 2728–2739.55. Ozden I, Sullivan MR, Lee HM, Wang SS (2009) Reliable coding emerges from
coactivation of climbing fibers in microbands of cerebellar Purkinje neurons.J Neurosci 29: 10463–10473.
56. Lang EJ (2009) Functional imaging confirms principles of cerebellar functioning
found with multisite recording [electronic response to Ozden, I., Sullivan, M.R.,Lee, H.M., Wang, S.S.H. Reliable coding emerges from coactivation of climbing
fibers in microbands of cerebellar Purkinje neurons. J. Neurosci. 29, 10463–10473.]. J Neurosci 29.
57. Mukamel EA, Nimmerjahn A, Schnitzer MJ (2009) Automated analysis of
cellular signals from large-scale calcium imaging data. Neuron 63: 747–760.58. Armstrong DM, Rawson JA (1979) Activity patterns of cerebellar cortical
neurones and climbing fibre afferents in the awake cat. J Physiol (Lond) 289:425–448.
59. Shin SL, Hoebeek FE, Schonewille M, De Zeeuw CI, Aertsen A, et al. (2007)Regular patterns in cerebellar Purkinje cell simple spike trains. PLoS One 2:
e485.
60. Schonewille M, Khosrovani S, Winkelman BH, Hoebeek FE, De Jeu MT, et al.(2006) Purkinje cells in awake behaving animals operate at the upstate
membrane potential.Nat Neurosci 9: 459–461; author reply 461.61. Zhou H, Lin Z, Voges K, Ju C, Gao Z, et al. (2014) Cerebellar modules operate
at different frequencies. eLife 3: e02536.
62. Llinas R, Sugimori M (1980a) Electrophysiological properties of in vitro Purkinjecell somata in mammalian cerebellar slices. J Physiol (Lond) 305: 171–195.
63. Hausser M, Clark BA (1997) Tonic synaptic inhibition modulates neuronaloutput pattern and spatiotemporal synaptic integration. Neuron 19: 665–678.
64. Raman IM, Bean BP (1999) Ionic currents underlying spontaneous actionpotentials in isolated cerebellar Purkinje neurons. J Neurosci 19: 1663–1674.
65. Kim YS, Shin JH, Hall FS, Linden DJ (2009) Dopamine signaling is required for
depolarization-induced slow current in cerebellar Purkinje cells. J Neurosci 29:
8530–8538.
66. Shin JH, Kim YS, Linden DJ (2008) Dendritic glutamate release produces
autocrine activation of mGluR1 in cerebellar Purkinje cells. Proc Natl Acad SciUSA 105: 746–750.
67. Tanaka J, Ichikawa R, Watanabe M, Tanaka K, Inoue Y (1997) Extra-junctional localization of glutamate transporter EAAT4 at excitatory Purkinje
cell synapses. Neuroreport 8: 2461–2464.
68. Gao W, Chen G, Reinert KC, Ebner TJ (2006) Cerebellar cortical molecular
layer inhibition is organized in parasagittal zones. J Neurosci 26: 8377–8387.
69. Eccles JC, Llinas R, Sasaki K (1966b) The inhibitory interneurones within the
cerebellar cortex. Exp Brain Res 1: 1–16.
70. Eccles JC, Llinas R, Sasaki K (1966c) Parallel fibre stimulation and the responsesinduced thereby in the Purkinje cells of the cerebellum. Exp Brain Res 1: 17–39.
71. Eccles JC, Sasaki K, Strata P (1966h) The profiles of physiological eventsproduced by a parallel fibre volley in the cerebellar cortex. Exp Brain Res 2: 18–
34.
72. Savio T, Tempia F (1985) On the Purkinje cell activity increase induced by
suppression of inferior olive activity. Exp Brain Res 57: 456–463.
73. Latham A, Paul DH (1971) Spontaneous activity of cerebellar Purkinje cells and
their responses to impulses in climbing fibres. J Physiol (Lond) 213: 135–156.
74. Burg D, Rubia FJ (1972) Inhibition of cerebellar Purkinje cells by climbing fiber
input. Pflugers Arch 337: 367–372.
75. Szapiro G, Barbour B (2007) Multiple climbing fibers signal to molecular layer
interneurons exclusively via glutamate spillover. Nat Neurosci 10: 735–742.
76. Mathews PJ, Lee KH, Peng Z, Houser CR, Otis TS (2012) Effects of climbing
fiber driven inhibition on Purkinje neuron spiking. J Neurosci 32: 17988–17997.
77. Jorntell H, Ekerot CF (2003) Receptive field plasticity profoundly alters the
cutaneous parallel fiber synaptic input to cerebellar interneurons in vivo.J Neurosci 23: 9620–9631.
78. Sugihara I, Fujita H, Na J, Quy PN, Li BY, et al. (2009) Projection ofreconstructed single Purkinje cell axons in relation to the cortical and nuclear
aldolase C compartments of the rat cerebellum. J Comp Neurol 512: 282–304.
79. Simpson JI, Belton T, Suh M, Winkelman B (2002) Complex spike activity in the
flocculus signals more than the eye can see. Ann N Y Acad Sci 978: 232–236.
80. Winkelman BH, Belton T, Suh M, Coesmans M, Morpurgo MM, et al. (2014)
Nonvisual complex spike signals in the rabbit cerebellar flocculus. J Neurosci 34:3218–3230.
81. Hamori J, Szentagothai J (1980) Lack of evidence of synaptic contacts by
climbing fibre collaterals to basket and stellate cells in developing rat cerebellar
cortex. Brain Res 186: 454–457.
82. Coddington LT, Rudolph S, Vande Lune P, Overstreet-Wadiche L, Wadiche JI
(2013) Spillover-mediated feedforward inhibition functionally segregates inter-neuron activity. Neuron 78: 1050–1062.
83. Brasnjo G, Otis TS (2004) Isolation of glutamate transport-coupled charge flux
and estimation of glutamate uptake at the climbing fiber-Purkinje cell synapse.
Proc Natl Acad Sci USA 101: 6273–6278.
84. Stein RB (1967) The information capacity of nerve cells using a frequency code.
Biophys J 7: 797–826.
85. Palkovits M, Mezey E, Hamori J, Szentagothai J (1977) Quantitative histological
analysis of the cerebellar nuclei in the cat. I. Numerical data on cells and onsynapses. Exp Brain Res 28: 189–209.
86. Person AL, Raman IM (2012) Purkinje neuron synchrony elicits time-locked
spiking in the cerebellar nuclei. Nature 481: 502–505.
87. Heck DH, De Zeeuw CI, Jaeger D, Khodakhah K, Person AL (2013) The
neuronal code(s) of the cerebellum. J Neurosci 33: 17603–17609.
88. Walter JT, Alvina K, Womack MD, Chevez C, Khodakhah K (2006) Decreases
in the precision of Purkinje cell pacemaking cause cerebellar dysfunction andataxia. Nat Neurosci 9: 389–397.
89. Hoebeek FE, Stahl JS, van Alphen AM, Schonewille M, Luo C, et al. (2005)Increased noise level of Purkinje cell activities minimizes impact of their
modulation during sensorimotor control. Neuron 45: 953–965.
90. Alvina K, Khodakhah K (2010) The therapeutic mode of action of 4-
aminopyridine in cerebellar ataxia. J Neurosci 30: 7258–7268.
91. Glasauer S, Rossert C, Strupp M (2011) The role of regularity and synchrony of
cerebellar Purkinje cells for pathological nystagmus. Ann N Y Acad Sci 1233:162–167.
92. Stahl JS, Thumser ZC (2013) 4-aminopyridine does not enhance flocculusfunction in tottering, a mouse model of vestibulocerebellar dysfunction and
ataxia. PLoS One 8: e57895.
Variation of Purkinje Cell Activity between Zebrin Bands
PLOS ONE | www.plosone.org 14 August 2014 | Volume 9 | Issue 8 | e105633