synthesizing self-report & observational information to assess implementation fidelity
TRANSCRIPT

Synthesizing Self-Report
&
Observational Information to
Assess Implementation Fidelity
Thomas J. Gross & Kristin Duppong Hurley
University of Nebraska-Lincoln
Ronald W. Thompson, Kathleen A. Shadoan, &
Jordan R. Ross
National Research Institute, Father Flanagan’s Boys Home (Boys Town)
Treatment Fidelity
• Adherence – Number of treatment components delivered
• Quality – How components were delivered
• Dosage – Proportion of session time spent on components

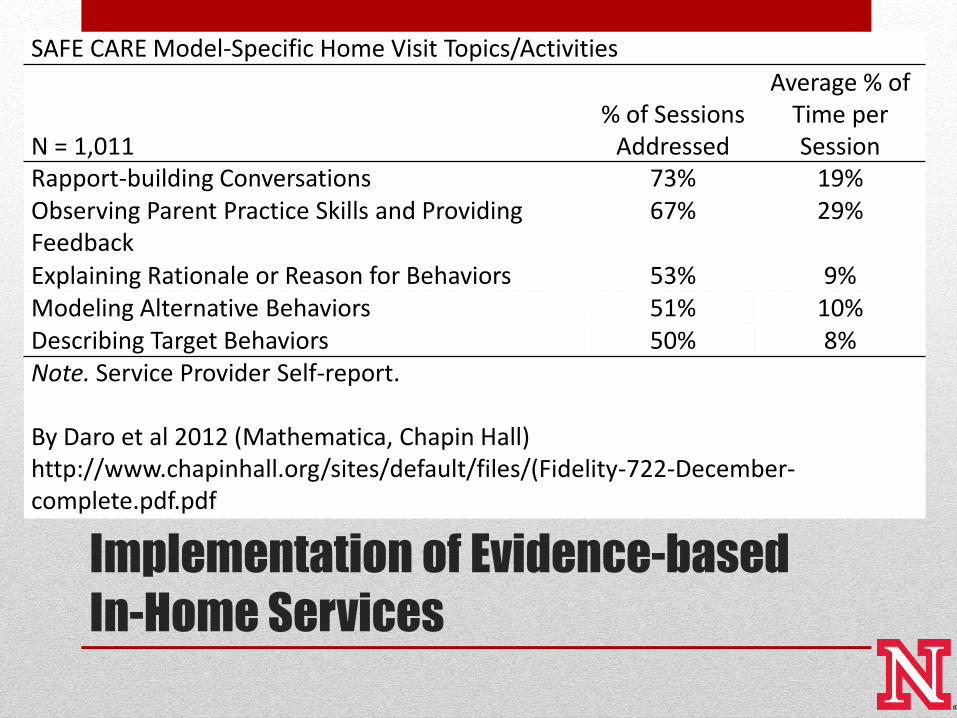
Implementation of Evidence-based
In-Home Services
SAFE CARE Model-Specific Home Visit Topics/Activities
N = 1,011 % of Sessions
Addressed
Average % of Time per Session
Rapport-building Conversations 73% 19% Observing Parent Practice Skills and Providing Feedback
67% 29%
Explaining Rationale or Reason for Behaviors 53% 9% Modeling Alternative Behaviors 51% 10% Describing Target Behaviors 50% 8% Note. Service Provider Self-report. By Daro et al 2012 (Mathematica, Chapin Hall) http://www.chapinhall.org/sites/default/files/(Fidelity-722-December-complete.pdf.pdf
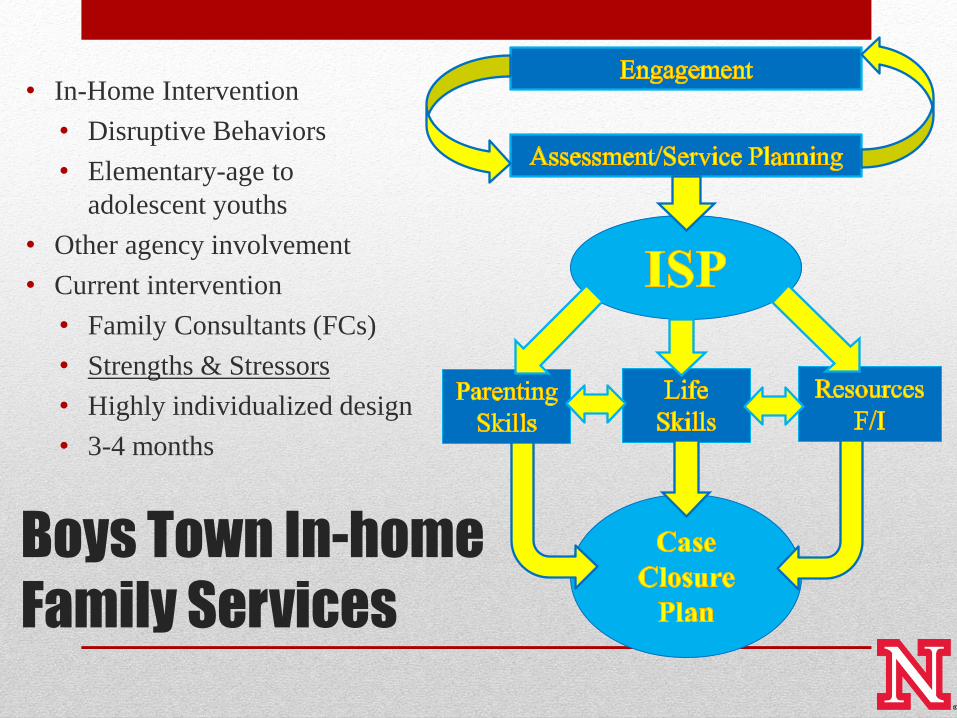
Boys Town In-home
Family Services
• In-Home Intervention
• Disruptive Behaviors
• Elementary-age to
adolescent youths
• Other agency involvement
• Current intervention
• Family Consultants (FCs)
• Strengths & Stressors
• Highly individualized design
• 3-4 months
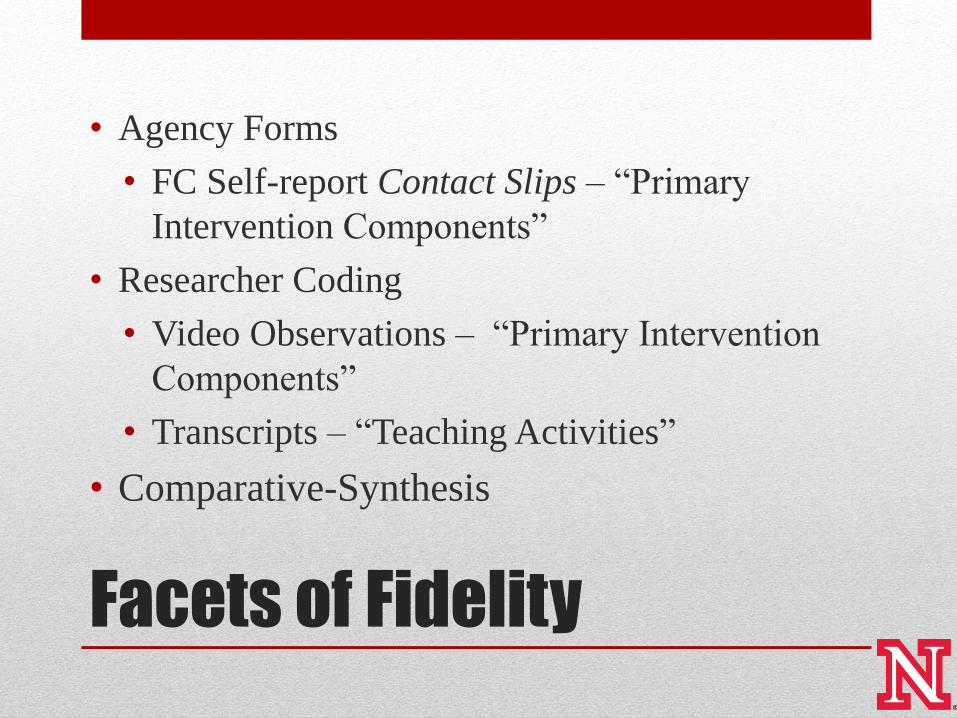
Facets of Fidelity
• Agency Forms
• FC Self-report Contact Slips – “Primary
Intervention Components”
• Researcher Coding
• Video Observations – “Primary Intervention
Components”
• Transcripts – “Teaching Activities”
• Comparative-Synthesis
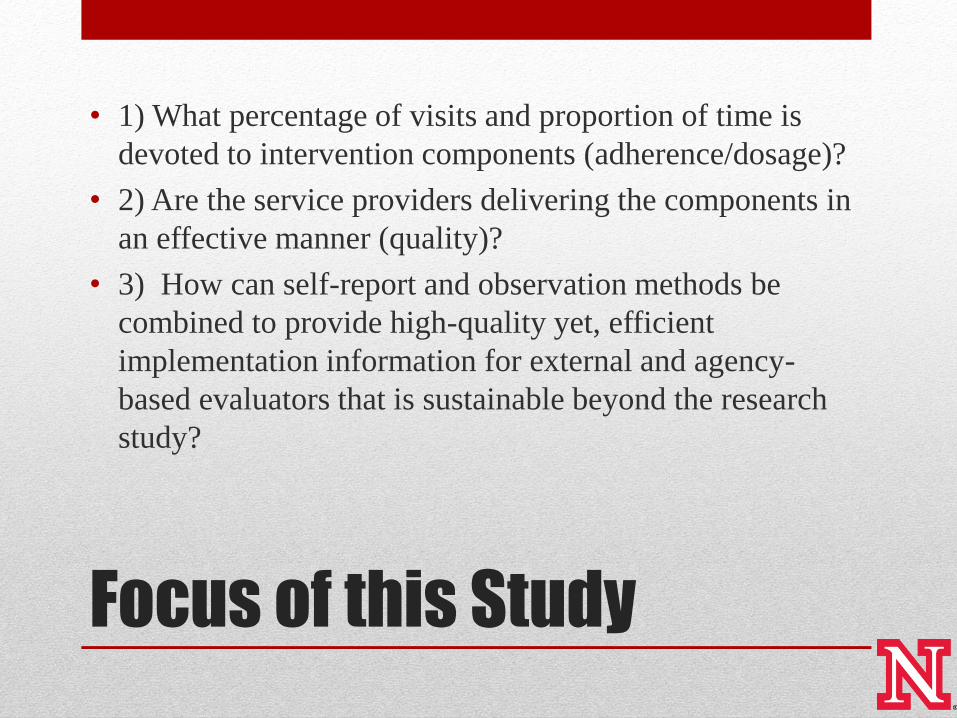
Focus of this Study
• 1) What percentage of visits and proportion of time is
devoted to intervention components (adherence/dosage)?
• 2) Are the service providers delivering the components in
an effective manner (quality)?
• 3) How can self-report and observation methods be
combined to provide high-quality yet, efficient
implementation information for external and agency-
based evaluators that is sustainable beyond the research
study?
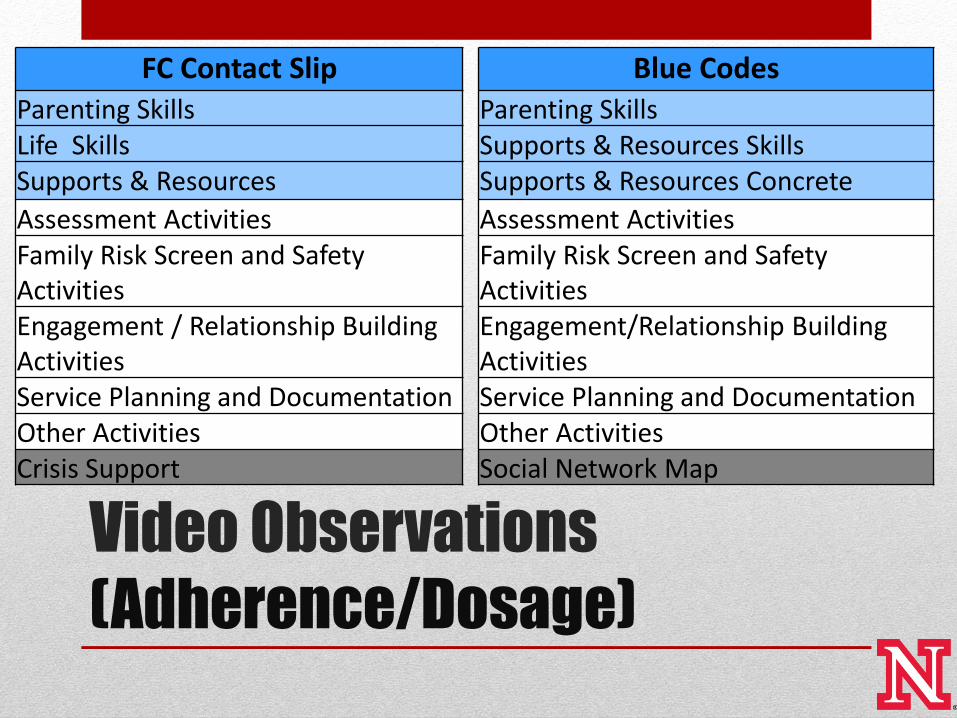
Video Observations
(Adherence/Dosage)
FC Contact Slip Blue Codes
Parenting Skills Parenting Skills Life Skills Supports & Resources Skills Supports & Resources Supports & Resources Concrete
Assessment Activities Assessment Activities Family Risk Screen and Safety Activities
Family Risk Screen and Safety Activities
Engagement / Relationship Building Activities
Engagement/Relationship Building Activities
Service Planning and Documentation Service Planning and Documentation Other Activities Other Activities Crisis Support Social Network Map
Video Observations
• 637 Contact Slips
• 127 Videos
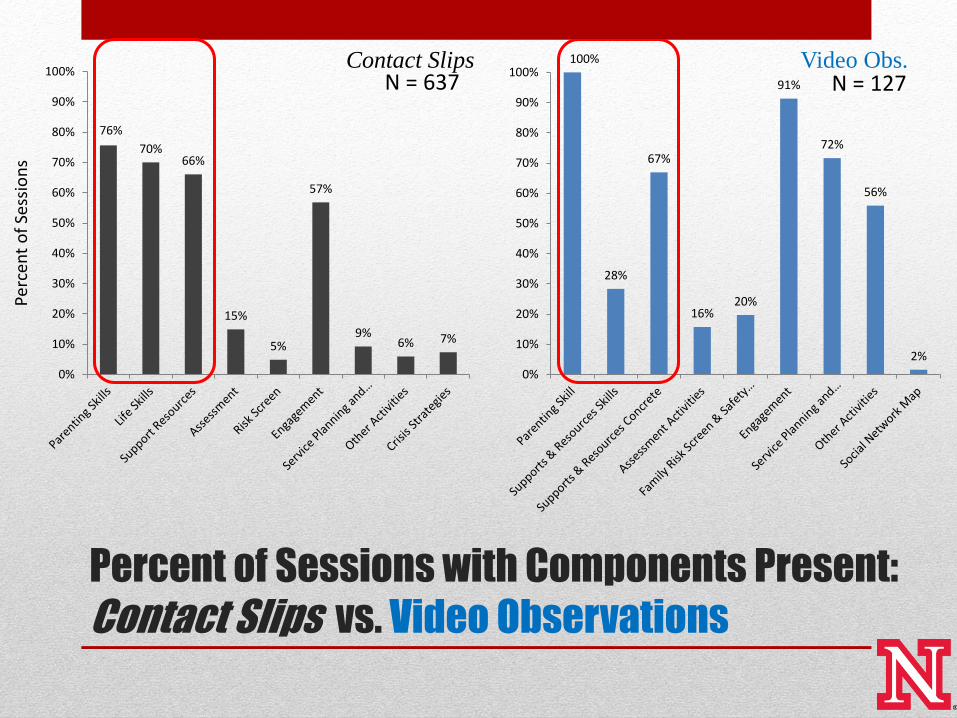
Percent of Sessions with Components Present:
Contact Slips vs. Video Observations
76%
70% 66%
15%
5%
57%
9% 6% 7%
0%
10%
20%
30%
40%
50%
60%
70%
80%
90%
100%
Per
cen
t o
f Se
ssio
ns
N = 637 100%
28%
67%
16% 20%
91%
72%
56%
2%
0%
10%
20%
30%
40%
50%
60%
70%
80%
90%
100%N = 127
Contact Slips Video Obs.
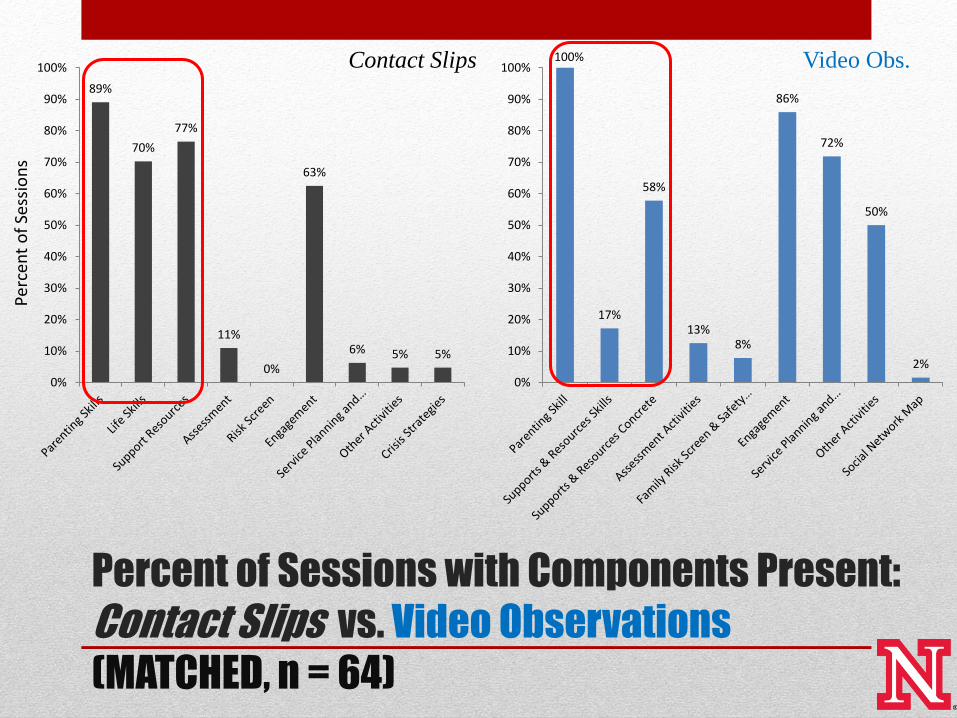
Percent of Sessions with Components Present:
Contact Slips vs. Video Observations
(MATCHED, n = 64)
89%
70%
77%
11%
0%
63%
6% 5% 5%
0%
10%
20%
30%
40%
50%
60%
70%
80%
90%
100%
Per
cen
t o
f Se
ssio
ns
100%
17%
58%
13% 8%
86%
72%
50%
2%
0%
10%
20%
30%
40%
50%
60%
70%
80%
90%
100%Contact Slips Video Obs.
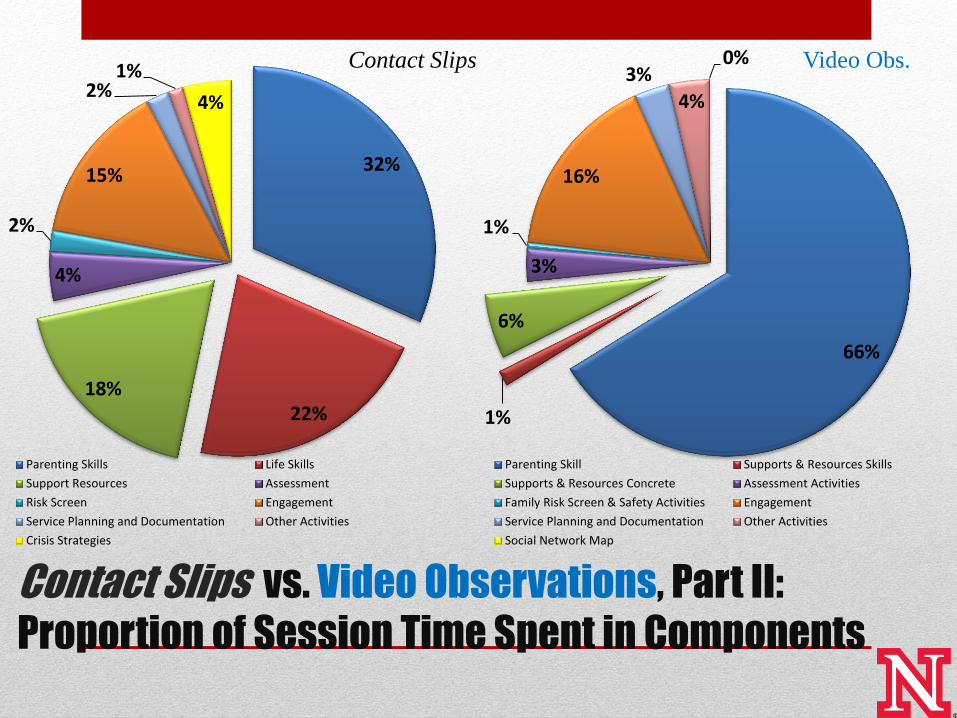
Contact Slips vs. Video Observations, Part II:
Proportion of Session Time Spent in Components
32%
22% 18%
4%
2%
15%
2% 1%
4%
Parenting Skills Life Skills
Support Resources Assessment
Risk Screen Engagement
Service Planning and Documentation Other Activities
Crisis Strategies
66%
1%
6%
3%
1%
16%
3%
4%
0%
Parenting Skill Supports & Resources Skills
Supports & Resources Concrete Assessment Activities
Family Risk Screen & Safety Activities Engagement
Service Planning and Documentation Other Activities
Social Network Map
Contact Slips Video Obs.
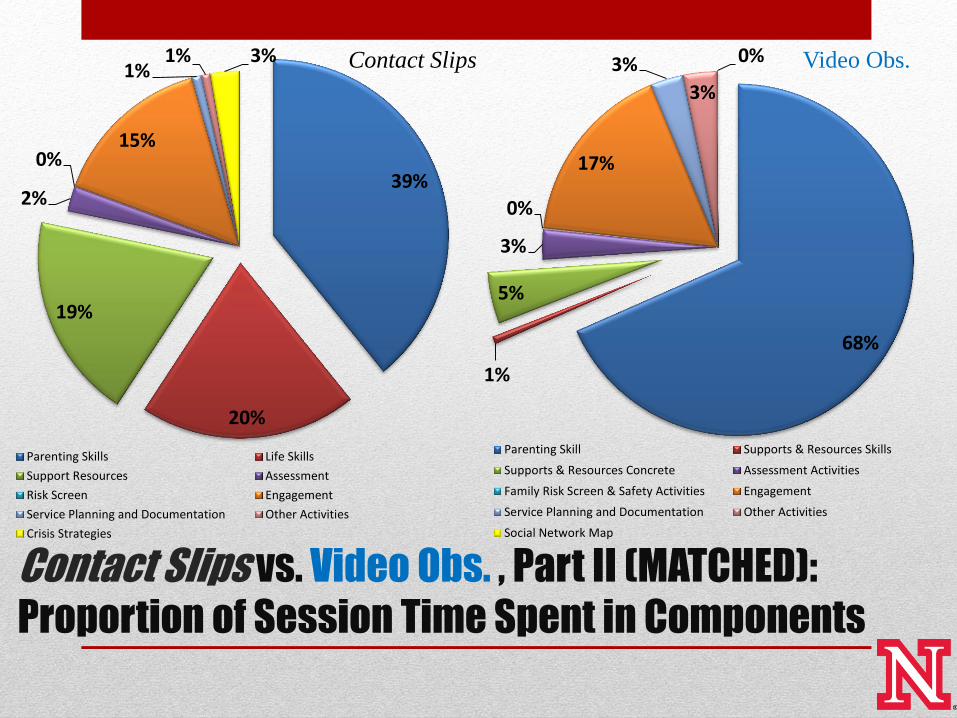
Contact Slips vs. Video Obs. , Part II (MATCHED):
Proportion of Session Time Spent in Components
39%
20%
19%
2%
0% 15%
1% 1% 3%
Parenting Skills Life Skills
Support Resources Assessment
Risk Screen Engagement
Service Planning and Documentation Other Activities
Crisis Strategies
68%
1%
5%
3%
0%
17%
3%
3%
0%
Parenting Skill Supports & Resources Skills
Supports & Resources Concrete Assessment Activities
Family Risk Screen & Safety Activities Engagement
Service Planning and Documentation Other Activities
Social Network Map
Contact Slips Video Obs.
Implementation of Evidence-based
In-Home Services
SAFE CARE Model-Specific Home Visit Topics/Activities
N = 1,011 % of Sessions
Addressed
Average % of Time per Session
Rapport-building Conversations 73% 19% Observing Parent Practice Skills and Providing Feedback
67% 29%
Explaining Rationale or Reason for Behaviors 53% 9% Modeling Alternative Behaviors 51% 10% Describing Target Behaviors 50% 8% Note. Service Provider Self-report. By Daro et al 2012 (Mathematica, Chapin Hall) http://www.chapinhall.org/sites/default/files/(Fidelity-722-December-complete.pdf.pdf
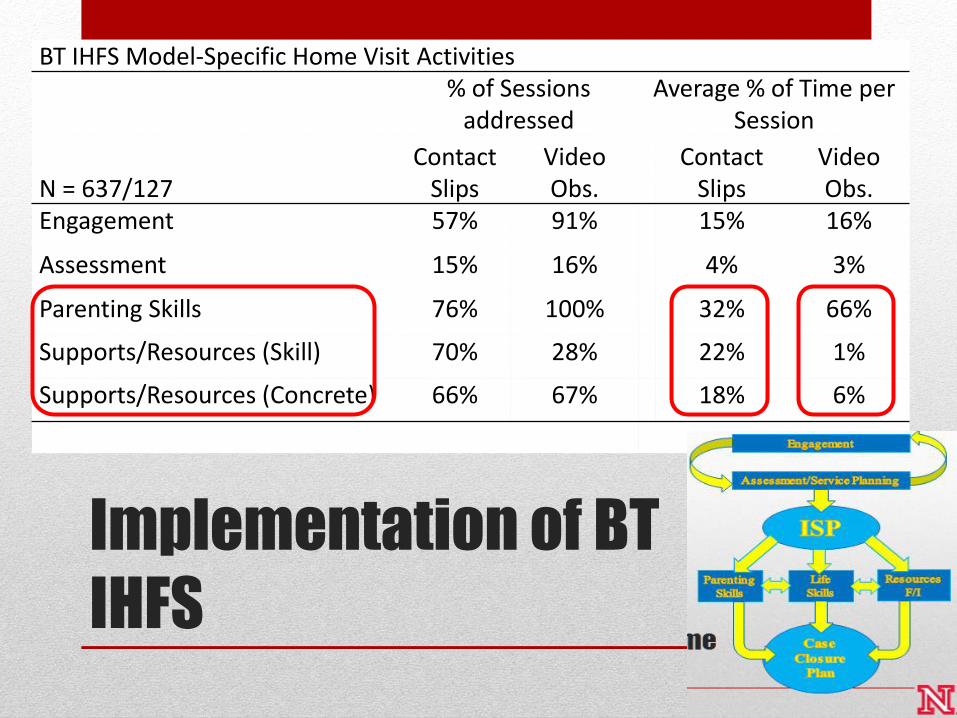
Implementation of BT
IHFS
BT IHFS Model-Specific Home Visit Activities % of Sessions
addressed Average % of Time per
Session
N = 637/127 Contact
Slips Video Obs.
Contact Slips
Video Obs.
Engagement 57% 91% 15% 16%
Assessment 15% 16% 4% 3%
Parenting Skills 76% 100% 32% 66%
Supports/Resources (Skill) 70% 28% 22% 1%
Supports/Resources (Concrete) 66% 67% 18% 6%
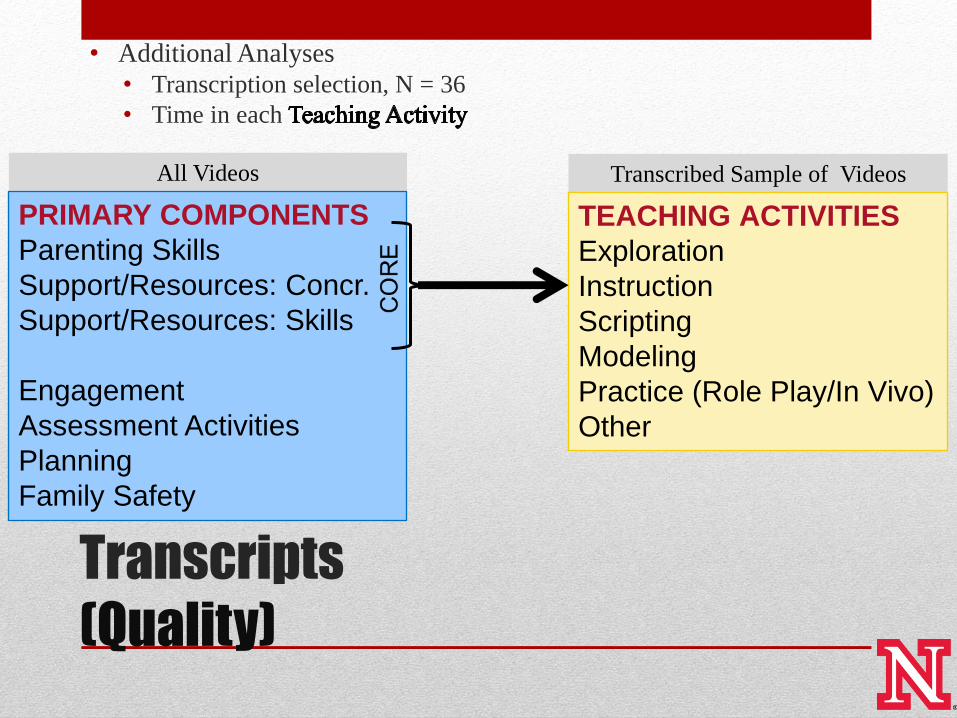
Transcripts
(Quality)
• Additional Analyses
• Transcription selection, N = 36
• Time in each
All Videos
PRIMARY COMPONENTS
Parenting Skills
Support/Resources: Concr.
Support/Resources: Skills
Engagement
Assessment Activities
Planning
Family Safety
Transcribed Sample of Videos
TEACHING ACTIVITIES
Exploration
Instruction
Scripting
Modeling
Practice (Role Play/In Vivo)
Other
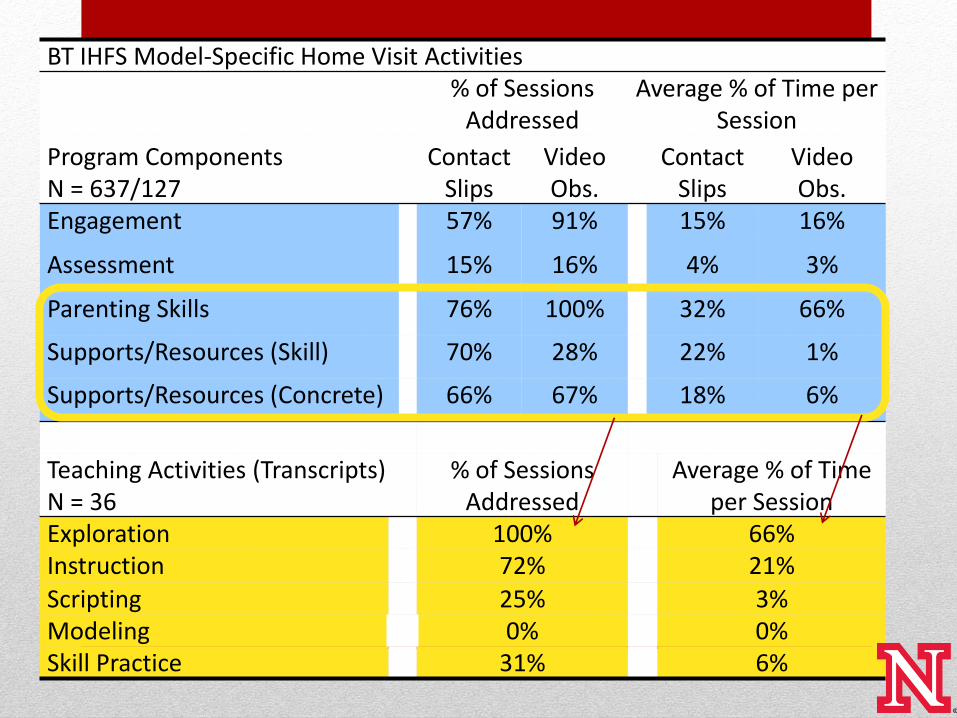
BT IHFS Model-Specific Home Visit Activities % of Sessions
Addressed Average % of Time per
Session
Program Components N = 637/127
Contact Slips
Video Obs.
Contact Slips
Video Obs.
Engagement 57% 91% 15% 16%
Assessment 15% 16% 4% 3%
Parenting Skills 76% 100% 32% 66%
Supports/Resources (Skill) 70% 28% 22% 1%
Supports/Resources (Concrete) 66% 67% 18% 6%
Teaching Activities (Transcripts) N = 36
% of Sessions Addressed
Average % of Time per Session
Exploration 100% 66% Instruction 72% 21%
Scripting 25% 3% Modeling 0% 0% Skill Practice 31% 6%
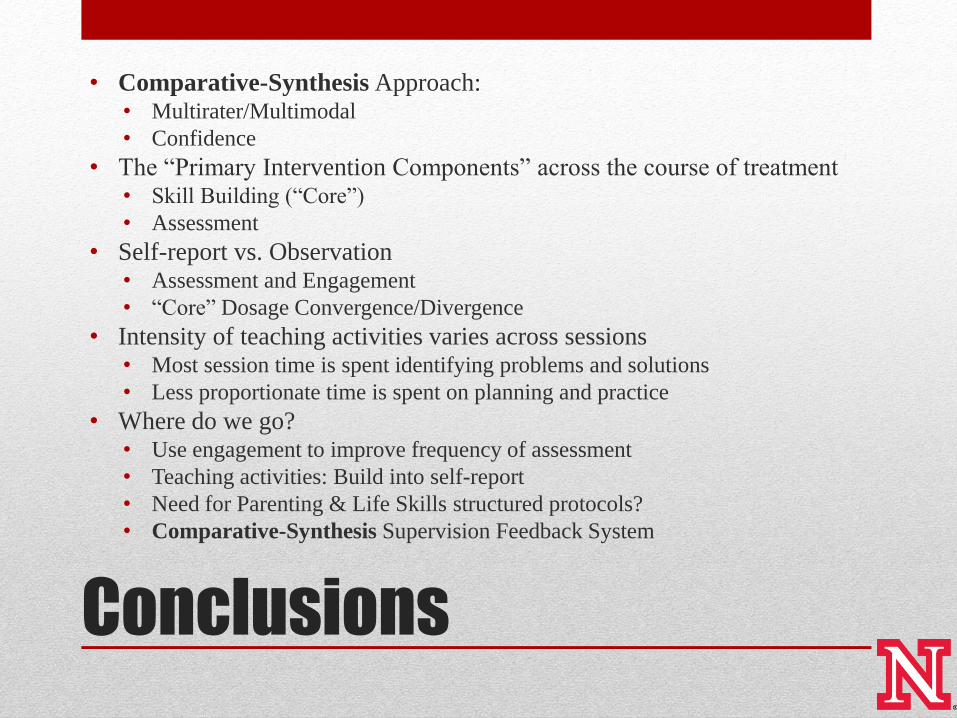
Conclusions
• Comparative-Synthesis Approach: • Multirater/Multimodal
• Confidence
• The “Primary Intervention Components” across the course of treatment • Skill Building (“Core”)
• Assessment
• Self-report vs. Observation • Assessment and Engagement
• “Core” Dosage Convergence/Divergence
• Intensity of teaching activities varies across sessions • Most session time is spent identifying problems and solutions
• Less proportionate time is spent on planning and practice
• Where do we go? • Use engagement to improve frequency of assessment
• Teaching activities: Build into self-report
• Need for Parenting & Life Skills structured protocols?
• Comparative-Synthesis Supervision Feedback System
A Special Thanks
• In-home Service Providers
• Video Coders
• Transcriptionists & Coders
• Center for Child and Family Well-Being:
• Dr. Michael Esptein, Dr. Lori Synhorst, Tammy Laird
• Father Flanagan's Boys' Home (Boys Town)
• National Research Institute for Child and Family Studies
• Boys’ Town In-home Family Services
• For more information: [email protected]