swimming performance and energetics as a function of temperature in killifish fundulus heteroclitus
TRANSCRIPT
389
Swimming Performance and Energetics as a Function of Temperature
in Killifish Fundulus heteroclitus
* Corresponding author. Present address: Department of Ecology, Evolution and
Biology, University of California, Santa Barbara, California 93106; e-mail:
Physiological and Biochemical Zoology 81(4):389–401. 2008. � 2008 by TheUniversity of Chicago. All rights reserved. 1522-2152/2008/8104-70232$15.00DOI: 10.1086/589109
Nann A. Fangue*Milica MandicJeffrey G. RichardsPatricia M. SchulteDepartment of Zoology, University of British Columbia,Vancouver, British Columbia V6T 1Z4, Canada
Accepted 12/18/2007; Electronically Published 5/30/2008
ABSTRACT
Populations of the common killifish Fundulus heteroclitus arefound along a latitudinal temperature gradient in habitats withhigh thermal variability. The objectives of this study were to assessthe effects of temperature and population of origin on killifishswimming performance (assessed as critical swimming speed,Ucrit). Acclimated fish from northern and southern killifish pop-ulations demonstrated a wide zone (from 7� to 33�C) over whichUcrit showed little change with temperature, with performancedeclining significantly only at lower temperatures. Although weobserved significant differences in swimming performance be-tween a northern and a southern population of killifish in oneexperiment, with northern fish having an ∼1.5-fold-greater Ucrit
than southern fish across all acclimation temperatures, we wereunable to replicate this finding in other populations or collectionyears, and performance was consistently high across all popu-lations and at both low (7�C) and high (23�C) acclimation tem-peratures. The poor swimming performance of southern killifishfrom a single collection year was correlated with low muscle[glycogen] rather than with other indicators of fuel stores orbody condition. Killifish acclimated to 18�C and acutely chal-lenged at temperatures of 5�, 18�, 25�, or 34�C showed modestthermal sensitivity of Ucrit between 18� and 34�C, with perfor-mance declining substantially at 5�C. Thus, much of the zone ofrelative thermal insensitivity of swimming performance is in-trinsic in this species rather than acquired as a result of accli-mation. These data suggest that killifish are broadly tolerant ofchanging temperatures, whether acute or chronic, and demon-strate little evidence of local adaptation in endurance swimmingperformance in populations from different thermal habitats.
Introduction
Common killifish (Fundulus heteroclitus) are found in estuariesand salt marshes along the east coast of North America fromNewfoundland to central Florida. Killifish populations encountera steep latitudinal temperature gradient across the species’ rangesuch that monthly mean water temperatures are, on average,13�C higher in the south than in the north at any given time ofyear. However, there is substantial seasonal variation within lo-calities, such that monthly mean temperatures range from 3� to31.6�C, depending on the location and the time of year (cal-culated from NOAA NERRS [2004] data for Sapelo Island, GA,and Wells Inlet, ME). At the extremes of the species’ range,northern fish are exposed to mean monthly temperatures be-tween 3� and 21�C, while southern fish encounter mean monthlytemperatures between 7� and 31.6�C, resulting in only a relativelynarrow temperature range between 7� and 21�C that is commonto northern and southern killifish populations. In addition toseasonal temperature variation, daily temperature fluctuations of5�–10�C are common in most months and across the entiredistribution range (Sidell et al. 1983 and calculated from NOAANERRS [2004] data). Clearly, the ability to cope with seasonaland daily temperature fluctuations is critical to all killifish pop-ulations, but the temperature range over which they must makeadjustments differs between populations and seasons. Consistentwith their highly variable thermal environment, we demonstratedthat killifish from either extreme of the species’ distribution canbe acclimated to temperatures from 2� to 35�C and have thermaltolerance values that are among the highest ever recorded forfish (Fangue et al. 2006).
Correlated with differences in their thermal environment,substantial variation between northern and southern popula-tions of killifish has been demonstrated for morphological, mo-lecular, genetic, and physiological traits (reviewed in Powers etal. 1993; Powers and Schulte 1998; Schulte 2001; Fangue et al.2006), and this variation is consistent with adaptation to dif-ferent environmental temperatures. Biochemical studies of gly-colytic enzymes indicate that metabolic organization differs be-tween killifish populations. Extensive work on the lactatedehydrogenase-B (Ldh-B) locus has shown that the Ldh-B ge-notype is tightly correlated with latitude/temperature, with theLdh-Bb genotype found in northern populations and the Ldh-Ba genotype most common in southern fish (Powers et al.1991). These LDH-B isozymes are known to differ in theirkinetic properties such that LDH-Bb (northern genotype) has
390 N. A. Fangue, M. Mandic, J. G. Richards, and P. M. Schulte
greater catalytic efficiency than LDH-Ba (southern genotype) atlow temperatures and vice versa at warmer temperatures (re-viewed in Powers et al. 1993). Northern killifish also have higherlactate dehydrogenase (LDH) activity in heart (Pierce andCrawford 1997; Podrabsky et al. 2000) and liver (Segal andCrawford 1994) when compared with southern fish across avariety of acclimation temperatures.
There is also a correlation between Ldh-B genotype andswimming performance in killifish (DiMichele and Powers1982). These authors found that killifish sampled from a Del-aware population (near the center of the species distribution)differed in critical swimming speed (Ucrit) such that the fishbearing the northern Ldh-B genotype (Ldh-Bb) outperformedfish bearing the southern Ldh-B genotype (Ldh-Ba) when testedat 10�C. However, the performance of the two genotypes con-verged at warmer temperatures (25�C). DiMichele and Powers(1982) ascribed this pattern to differences in Ldh-B genotypecausing differences in glycolytic flux in erythrocytes, whichcause differences in erythrocyte ATP levels and thus blood he-moglobin oxygen affinities between populations, resulting innorthern fish having a greater ability to deliver oxygen to tissuesat low temperatures.
Although DiMichele and Powers (1982) showed that tem-perature differentially affected swimming performance in kil-lifish bearing alternate Ldh-B genotypes, the magnitude of theeffect of temperature on swimming performance was modest( for Ldh-Bb and 1.3 for Ldh-Ba) at acclimation tem-Q p 1.210
peratures from 10� to 25�C. These findings are consistent withwork by Targett (1978), who showed that killifish have a largezone of temperature-independent metabolic rate, from ∼13� to30�C, over which the Q10 of respiration rate was just greaterthan 1. At very low temperatures, however, oxygen consump-tion declined steeply and showed a strong effect of temperature( from 13� to 5�C; Targett 1978). This steep declineQ p 4.410
in resting oxygen consumption at temperatures below 13�Csuggests that a largely aerobic process such as sustained swim-ming performance might be strongly affected at low temper-atures. These low temperatures are environmentally relevantfor northern populations of killifish but are seldom experiencedby fish in southern populations, and the effects of Ldh-B ge-notype at these temperatures are unknown.
In this study, we assessed the effects of temperature on Ucrit
in killifish populations acclimated to temperatures between 5�
and 32�C. Additionally, we tested whether the relative thermalindependence of swimming performance observed by Di-Michele and Powers (1982) is a result of temperature accli-mation or an intrinsic insensitivity to temperature by com-paring Ucrit values of fish tested at their acclimation temperaturewith values of those acutely challenged at various temperatures.We also examined metabolic differences that could underliedifferential swimming performance between populations, usinga standardized exercise challenge to determine the patterns ofmetabolic fuel use and energy reserves supporting exercise me-tabolism across acclimation temperatures in a variety of tissuesbefore and after exercise.
Material and Methods
Experimental Animals
Adult killifish of the northern subspecies (Fundulus heteroclitusmacrolepidotus) were collected from Hampton, New Hampshire(NH; 42�54�46�N). Individuals of the southern subspecies (Fun-dulus heteroclitus heteroclitus) were collected from Brunswick,Georgia (GA; 31�7�31�N). Collections were made in late springof 2002. A second collection was conducted in spring of 2004that again included the original NH and GA killifish collectionlocations, as well as two additional northern collection locationsfrom Salsbury Cove, Maine (ME; 44�25�54�N), and Antigonish,Nova Scotia (NS; 45�37�0�N), Canada, and two additional south-ern collection locations from Whitney Island, Florida (WI;29�39�34�N), and Fernandina Beach, Florida (FB; 30�40�51�N).
Fish were held in a 6,000-L recirculating aquarium system withbiological filtration at 20 ppt salinity, , and a20� � 2�C12L : 12D photoperiod for a minimum of 3 wk before transferto 75-L experimental acclimation tanks. Acclimation tempera-tures were controlled with calibrated temperature controllers and250-W submersible heaters (Fisherbrand, Fisher Scientific, Ne-pean, Ontario). Water temperatures were adjusted at a rate of0.5�C d�1 until the desired acclimation temperature was reached.Before all experiments, killifish were acclimated for a minimumof 21 d to each treatment temperature (ranging from ∼5� to30�C) under a 12L : 12D photoperiod and 20 ppt salinity. Weelected to utilize a common photoperiod for all comparisons,despite the possibility of photoperiod influencing swimming per-formance (Kolok 1991; Smiley and Parsons 1997; Day and Butler,2005), in order to allow the direct determination of the effectsof temperature independent of other factors. The northern andsouthern source populations that we used experience only a rel-atively narrow temperature band in common and are exposedto these temperatures in different seasons. However, when alllocalities along the coast with resident populations of killifish areconsidered, mean monthly temperatures ranging from 6� to 28�Care found in combination with a 12L : 12D photoperiod (cal-culated from NOAA NERRS [2004] data), suggesting that es-sentially all of the temperatures that we tested could, in principle,be encountered by killifish acclimatized to a 12L : 12D photo-period in the natural habitat.
Fish were fed TetraMin fish flakes supplemented with com-mercial trout chow (PMI Nutrition, Brentwood, MO) daily tosatiation but were not fed for 24 h before experimental trials.Treatment of all experimental animals was in accordance withthe University of British Columbia animal care protocol A01-0180.
Critical Velocity Measures
To establish the swimming capacity of killifish, critical or max-imum prolonged swimming speed (Ucrit) was determined usingthe methodology described by Brett (1964). Individual fish wereintroduced into a Beamish-style swim tunnel (4,000-mL vol-ume) and allowed to acclimatize at a linear water velocity of
Swimming Performance in Fundulus heteroclitus 391
3 cm s�1 for 30 min. During this acclimatization period, fishoriented to the water current but maintained a stationary po-sition on the bottom of the swim tube with little body move-ment. After the acclimatization period, fish were given a pretrialswim that entailed an initial 10-min swim at 1 body length(BL) s�1 followed by water velocity increases of 0.3 BL s�1 every2 min until the fish fell against the back screen. This pretrialswim was performed in order to allow the fish to becomefamiliarized with the tunnel (Jain et al. 1997; MacNutt et al.2004). All fish completed the pretrial swim, and the Ucrit de-termined in the pretrial was qualitatively similar to that deter-mined in the test protocol. Following the pretrial, each fish wasgiven a 3-h recovery period, which has been shown to be suf-ficient for the recovery of Ucrit (Jain et al. 1998). For the de-termination of Ucrit, water velocity was increased stepwise by0.3 BL s�1 every 10 min, from a starting velocity of 1 BL s�1,until the fish fatigued. A swimming interval of 10 min waschosen based on a synthesis of literature showing that 10 minis an appropriate interval for Ucrit determination (Jones 1971;Beamish 1980; Hammer 1995). When fish failed to maintainswim performance, water velocity was decreased to 0 to allowthe fish to come off of the screen and resume swimming. Ve-locity was then increased to the velocity of failure within 10 s.Final fatigue was established when the fish fell against the backscreen three consecutive times. Ucrit was then calculated usingthe following formula from Brett (1964):
tiU p U � # U ,crit i ii( )tii
where Ui is the highest speed fish swam for the full time period(cm s�1), Uii is the incremental speed increase (cm s�1), ti isthe time the fish swam at the final speed (min), and tii is theprescribed period of swimming per speed (10 min). The cross-sectional areas of the fish were between 8% and 12% of thearea of the swimming chamber; therefore, the measured swim-ming speeds were corrected for solid blocking effects accordingto the calculations described by Bell and Terhune (1970). Theabsolute value of Ucrit was converted to relative swimming speedin BL s�1 by taking the Ucrit value (cm s�1) and dividing it bythe total BL (cm) of each fish (Kolok 1999). The water currentin the tunnel was produced by a submersible pump (Little GiantPump, Oklahoma City, OK), and water velocity was controlledwith a rheostat. The tunnel water velocities were calibrated withan inline flowmeter (Onicon, Clearwater, FL).
We conducted two kinds of swimming performance trials.For the first type of Ucrit determination, which involved deter-mination of performance at the fish’s acclimation temperature,the swimming chambers were submerged in thermostated waterbaths, and water temperatures were maintained within �0.5�Cof the specified acclimation temperature for each experiment,using calibrated temperature controllers and 250-W submers-ible heaters (Fisherbrand). The second type of swimming per-formance measure involved an acute temperature challenge in
which fish acclimated to 18�C were introduced to the swimmingchamber at one of four challenge temperatures (5�, 18�, 25�,or 34�C). After the 30-min tunnel acclimatization at the chal-lenge temperature, the pretrial swim and Ucrit were conductedat the challenge temperature, and temperatures were main-tained as described above. In all experiments, Ucrit was deter-mined for six fish per population and experimental treatment.Following exercise trials, fish were removed from the tunnel,weighed ( ), and measured (wet mass � 0.1 g total length�
). Fulton’s condition factor (k) was calculated according0.1 cmto the formula
total mass (g)k p # 100.
3( )total length (cm)
Standardized Exercise Challenge
Temperature-dependent metabolic fuel availability and mobi-lization patterns were measured in populations of killifish ex-posed to a standardized exercise challenge protocol. Killifishwere given a pretrial swim (as described for Ucrit) and a 3-hrecovery followed by a 2-h exercise challenge. During the ex-ercise challenge, velocity was increased over a 30-min periodto a swimming speed that corresponded to 80% of the Ucrit
determined for that temperature, population, and fish length.Fish were then swum at this speed for 1.5 h. Control fish werealso kept in a swim tunnel with circulating aerated water for3 h at a velocity of 3 cm s�1. At the end of the swimmingperiod, 8 mL of an ethyl p-amino-benzoate solution (benzo-caine; Sigma-Aldrich, Oakville, Ontario; stock solution madeby dissolving 62.5 g of benzocaine in 500 mL ethanol) wasintroduced to the tunnel. Fish continued to swim for ∼1 minand then fell against the back screen at complete anesthesia.Fish were quickly sampled for blood plasma, white muscle (lat-eral portion posterior to the dorsal fin), and liver. Tissues wereimmediately frozen with aluminum blocks precooled in liquidnitrogen, and sampling time never exceeded 1 min per fish.
Analytical Techniques
Frozen white muscle and liver samples were ground into a finepowder under liquid nitrogen in an insulated mortar and pestle.Metabolites were extracted by adding ∼100 mg of powderedtissue to 1.0 mL of ice-cold HClO4 (1 mol L�1) and homog-enizing at 0�C for 20 s with a PowerGen homogenizer (FisherScientific). Two hundred mL of each homogenate was removedand frozen at �80�C for glycogen determination. The remain-ing homogenate was centrifuged at 10,000 g for 10 min at 4�C,and the supernatant was neutralized with 3 mol L�1 K2CO3.The neutralized extract was then centrifuged at 10,000 g for 10min at 4�C. The resulting supernatant was immediately assayedspectrophotometrically for ATP and phosphocreatine accordingto the methods of Bergmeyer (1983) and stored at �80�C for
392 N. A. Fangue, M. Mandic, J. G. Richards, and P. M. Schulte
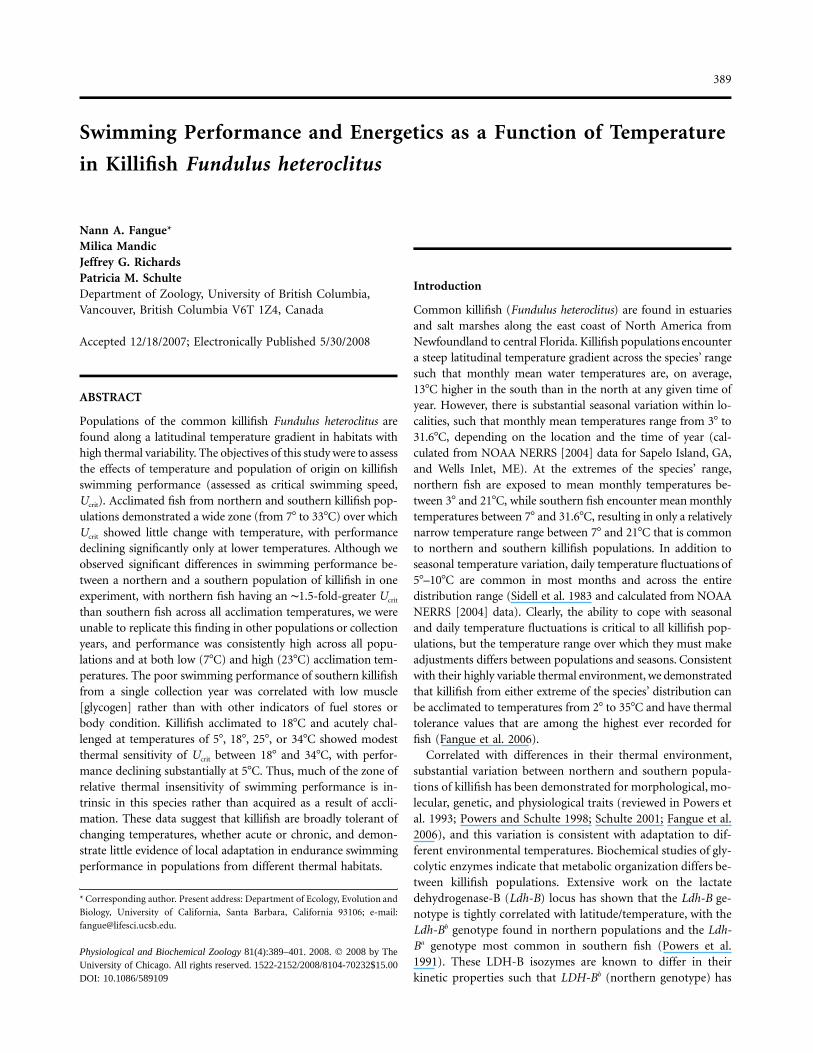
Figure 1. Critical swimming speed (Ucrit; body lengths [BL]) s�1) ofnorthern (NH; triangles) and southern (GA; circles) killifish collectedin 2002 and acclimated to temperatures between 5.2� and 32.4�C (ex-periment 1). Different letters indicate significant differences in Ucrit
within a population. Asterisks indicate a significant difference in Ucrit
between populations at a given acclimation temperature. Data areexpressed as mean � SE; n p 6 and P ! 0.001 for all significantcomparisons.
later lactate and glucose determination. Samples for glycogendetermination were enzymatically digested according to themethods of Hassid and Abraham (1957), and all samples wereanalyzed for glucose following the methods of Bergmeyer(1983), modified for spectrophotometry. Plasma was analyzeddirectly for lactate and glucose as above.
Muscle total lipid was determined by the sulphophospho-vanilun method described by Barnes and Blackstock (1973).Intramuscular triacylglycerol (IMTG) was determined using themethodology outlined by Denton and Randle (1967). Glycerolwas assayed following the methods of Bergmeyer (1983), mod-ified for spectrophotometry.
Statistical Analysis
To determine whether Ucrit (expressed as either cm s�1 or BLs�1) varied with body mass or condition factor, correlationanalysis was performed within each killifish population as wellas for the pooled data for all populations. Ucrit and exercisechallenge metabolite data sets were analyzed by multipleANOVA with population, temperature, and/or rest/exercise asindependent categorical variables. All experiments were con-ducted independently, and fish were never used in more thanone experiment or treatment group. Thus, all data points canbe considered as independent. All data met the assumptions ofnormality, and data were log transformed where necessary tomeet assumptions of homogeneity of variance. When inter-action terms were not significant, post hoc comparisons wereperformed among the groups with the Student-Newman-Keulsmultiple range test (SNK MRT). If the interaction terms weresignificant, the data were separated and analyzed independentlyusing one-way ANOVA followed by SNK MRT. All statisticaldecisions are based on an .a p 0.05
Results
Body Size
Fish used in this experiment were all of similar size, and therewere no significant differences in body mass between popu-lations or treatment groups. The mean mass of northern kil-lifish was g ( ), and the mass of southern5.39 � 0.60 mean � SEkillifish was g. Condition factors ranged from 1.445.94 � 0.50to 1.68 for all killifish groups, and there were no significantcorrelations between body mass or condition factor with Ucrit
(expressed as either cm s�1 or BL s�1) in any of our experimentaltreatments.
Experiment 1: Effects of Acclimation
Ucrit for northern (NH) and southern (GA) killifish from the2002 collection year acclimated to temperatures of 5.2�, 10.4�,14.7�, 21.5�, 28.7�, and 32.4�C were analyzed using two-wayANOVA with population and acclimation temperature as fac-tors (Fig. 1). Two-way ANOVAs revealed a significant effect ofpopulation and acclimation temperature ( for bothP ! 0.001
comparisons) with no significant interaction ( ). PostP p 0.379hoc tests revealed that, at all acclimation temperatures, northernkillifish had significantly higher Ucrit values than southern kil-lifish (SNK MRT, for all comparisons). Within theP ! 0.001northern population, there were no differences in Ucrit valuesbetween acclimation temperatures of 10.4� and 32.4�C (P valuesranging from 0.217 to 0.858), while the Ucrit’s of both northernand southern fish acclimated to 5.2�C were significantly lowerthan those at all other acclimation temperatures (SNK MRT,
for all comparisons). The patterns in the southernP ! 0.001population were qualitatively similar, although the 28.7�Cgroup had very slightly, but significantly, higher performancethan the 21.5�C acclimation group.
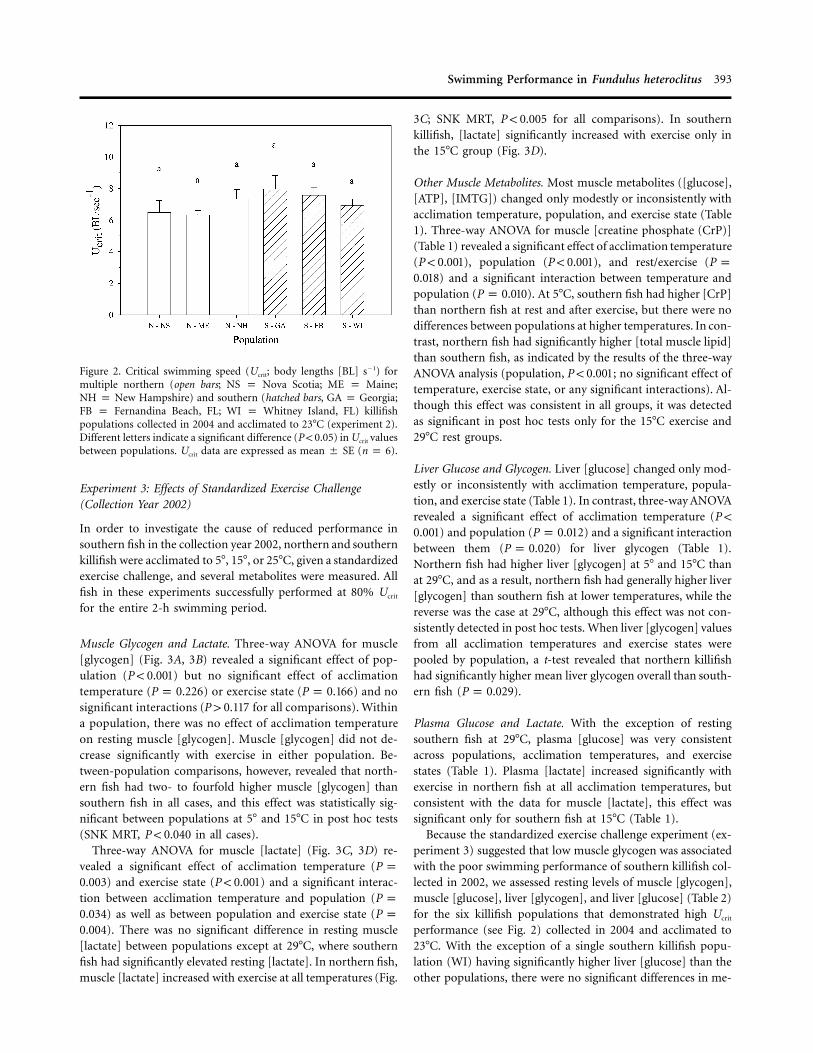
Experiment 2: Multiple Populations
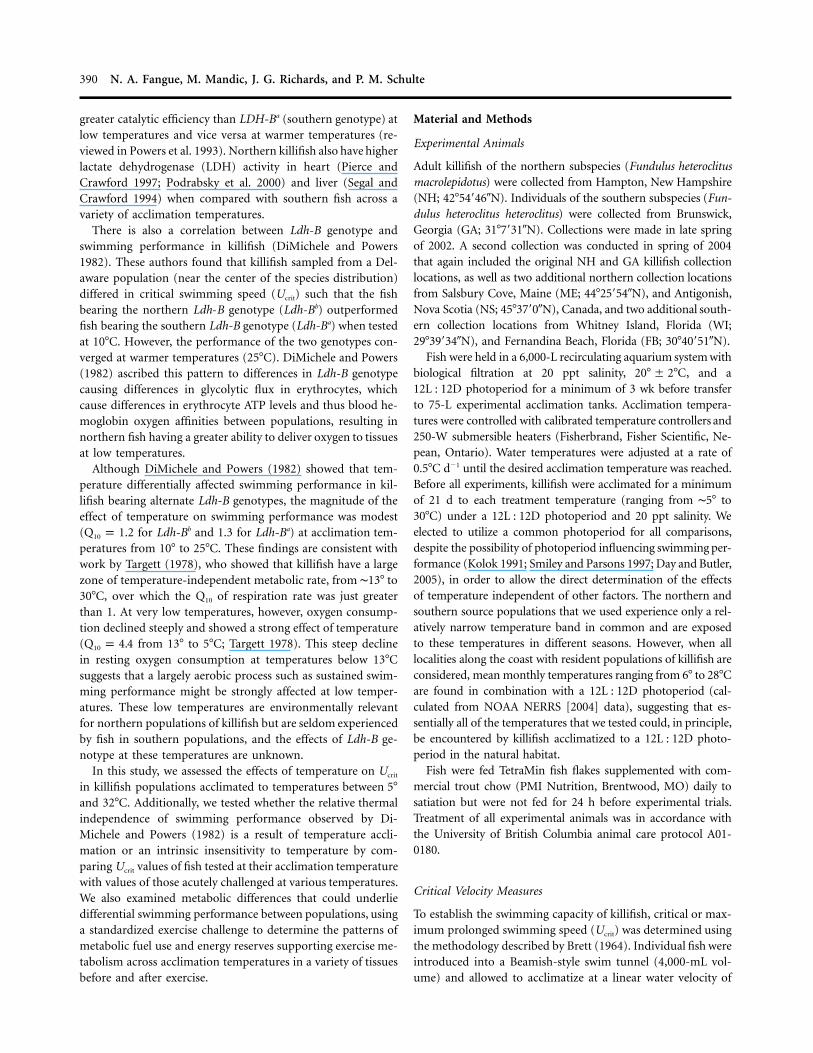
In order to determine whether Ucrit differences between north-ern and southern killifish were consistent across multiple pop-ulations within a subspecies, we quantified Ucrit in samples ofkillifish from six different populations (three of the northernsubspecies and three of the southern subspecies; collection year2004) acclimated to a common temperature of 23�C (Fig. 2).One-way ANOVA comparing killifish populations revealed nodifferences in Ucrit among any of the populations tested (P p
). The Ucrit values of all six killifish populations were con-0.345sistent with those of northern fish from the first experiment(cf. Figs. 1, 2).
Swimming Performance in Fundulus heteroclitus 393
Figure 2. Critical swimming speed (Ucrit; body lengths [BL] s�1) formultiple northern (open bars; NS p Nova Scotia; ME p Maine;NH p New Hampshire) and southern (hatched bars, GA p Georgia;FB p Fernandina Beach, FL; WI p Whitney Island, FL) killifishpopulations collected in 2004 and acclimated to 23�C (experiment 2).Different letters indicate a significant difference (P ! 0.05) in Ucrit valuesbetween populations. Ucrit data are expressed as mean � SE (n p 6).
Experiment 3: Effects of Standardized Exercise Challenge(Collection Year 2002)
In order to investigate the cause of reduced performance insouthern fish in the collection year 2002, northern and southernkillifish were acclimated to 5�, 15�, or 25�C, given a standardizedexercise challenge, and several metabolites were measured. Allfish in these experiments successfully performed at 80% Ucrit
for the entire 2-h swimming period.
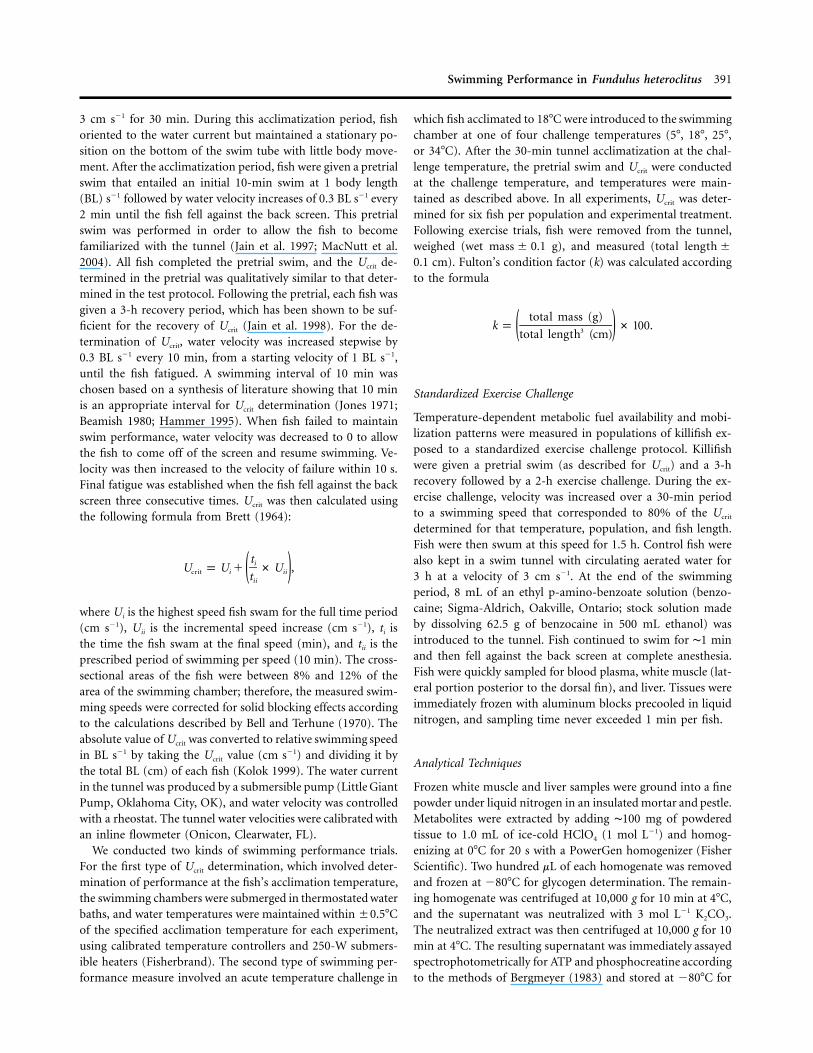
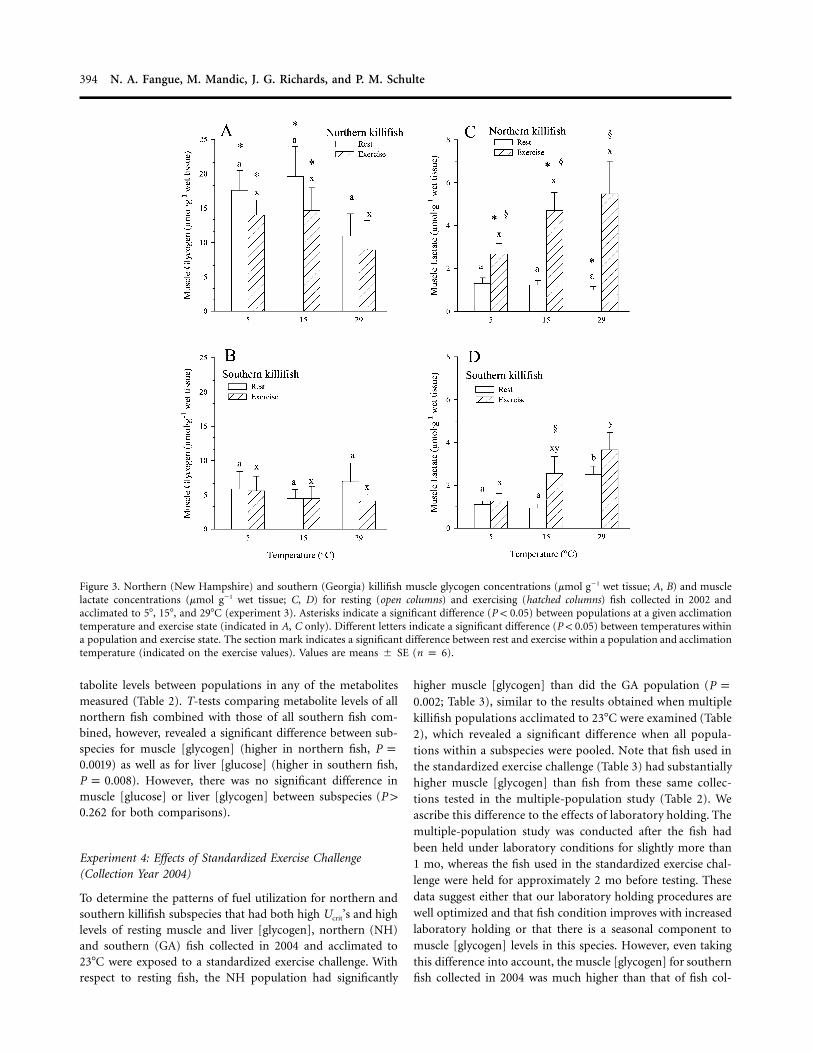
Muscle Glycogen and Lactate. Three-way ANOVA for muscle[glycogen] (Fig. 3A, 3B) revealed a significant effect of pop-ulation ( ) but no significant effect of acclimationP ! 0.001temperature ( ) or exercise state ( ) and noP p 0.226 P p 0.166significant interactions ( for all comparisons). WithinP 1 0.117a population, there was no effect of acclimation temperatureon resting muscle [glycogen]. Muscle [glycogen] did not de-crease significantly with exercise in either population. Be-tween-population comparisons, however, revealed that north-ern fish had two- to fourfold higher muscle [glycogen] thansouthern fish in all cases, and this effect was statistically sig-nificant between populations at 5� and 15�C in post hoc tests(SNK MRT, in all cases).P ! 0.040
Three-way ANOVA for muscle [lactate] (Fig. 3C, 3D) re-vealed a significant effect of acclimation temperature (P p
) and exercise state ( ) and a significant interac-0.003 P ! 0.001tion between acclimation temperature and population (P p
) as well as between population and exercise state (0.034 P p). There was no significant difference in resting muscle0.004
[lactate] between populations except at 29�C, where southernfish had significantly elevated resting [lactate]. In northern fish,muscle [lactate] increased with exercise at all temperatures (Fig.
3C; SNK MRT, for all comparisons). In southernP ! 0.005killifish, [lactate] significantly increased with exercise only inthe 15�C group (Fig. 3D).
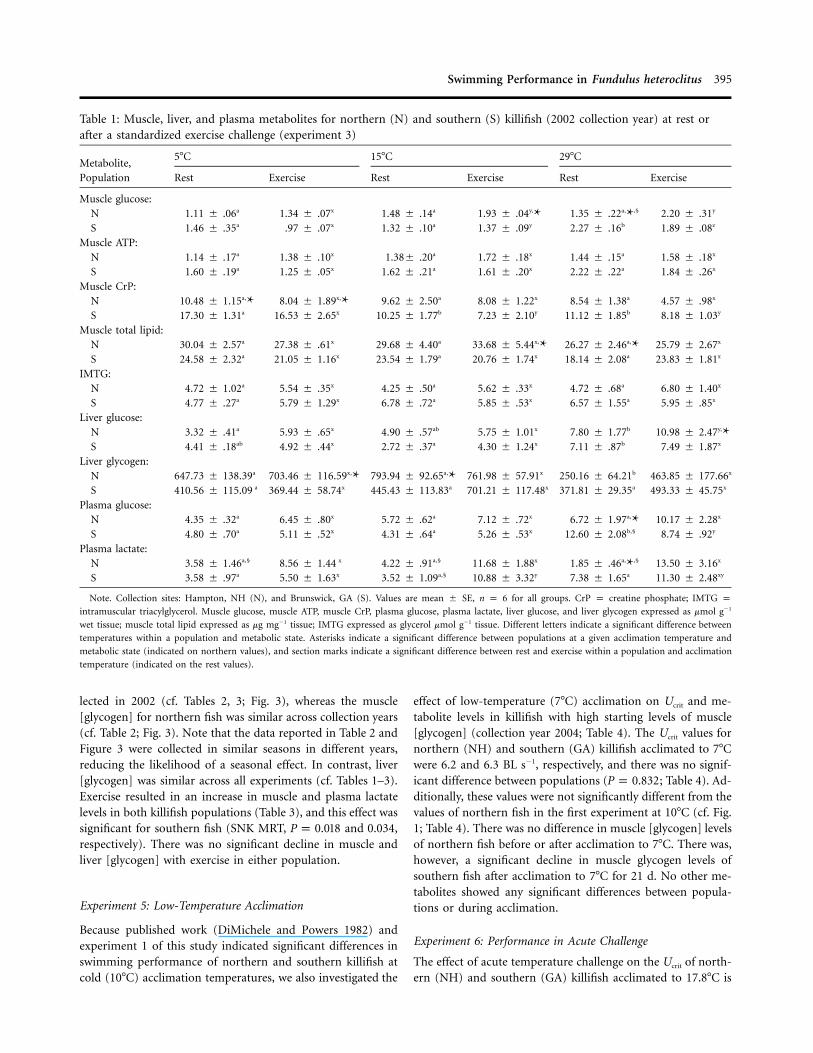
Other Muscle Metabolites. Most muscle metabolites ([glucose],[ATP], [IMTG]) changed only modestly or inconsistently withacclimation temperature, population, and exercise state (Table1). Three-way ANOVA for muscle [creatine phosphate (CrP)](Table 1) revealed a significant effect of acclimation temperature( ), population ( ), and rest/exercise (P ! 0.001 P ! 0.001 P p
) and a significant interaction between temperature and0.018population ( ). At 5�C, southern fish had higher [CrP]P p 0.010than northern fish at rest and after exercise, but there were nodifferences between populations at higher temperatures. In con-trast, northern fish had significantly higher [total muscle lipid]than southern fish, as indicated by the results of the three-wayANOVA analysis (population, ; no significant effect ofP ! 0.001temperature, exercise state, or any significant interactions). Al-though this effect was consistent in all groups, it was detectedas significant in post hoc tests only for the 15�C exercise and29�C rest groups.
Liver Glucose and Glycogen. Liver [glucose] changed only mod-estly or inconsistently with acclimation temperature, popula-tion, and exercise state (Table 1). In contrast, three-way ANOVArevealed a significant effect of acclimation temperature (P !
) and population ( ) and a significant interaction0.001 P p 0.012between them ( ) for liver glycogen (Table 1).P p 0.020Northern fish had higher liver [glycogen] at 5� and 15�C thanat 29�C, and as a result, northern fish had generally higher liver[glycogen] than southern fish at lower temperatures, while thereverse was the case at 29�C, although this effect was not con-sistently detected in post hoc tests. When liver [glycogen] valuesfrom all acclimation temperatures and exercise states werepooled by population, a t-test revealed that northern killifishhad significantly higher mean liver glycogen overall than south-ern fish ( ).P p 0.029
Plasma Glucose and Lactate. With the exception of restingsouthern fish at 29�C, plasma [glucose] was very consistentacross populations, acclimation temperatures, and exercisestates (Table 1). Plasma [lactate] increased significantly withexercise in northern fish at all acclimation temperatures, butconsistent with the data for muscle [lactate], this effect wassignificant only for southern fish at 15�C (Table 1).
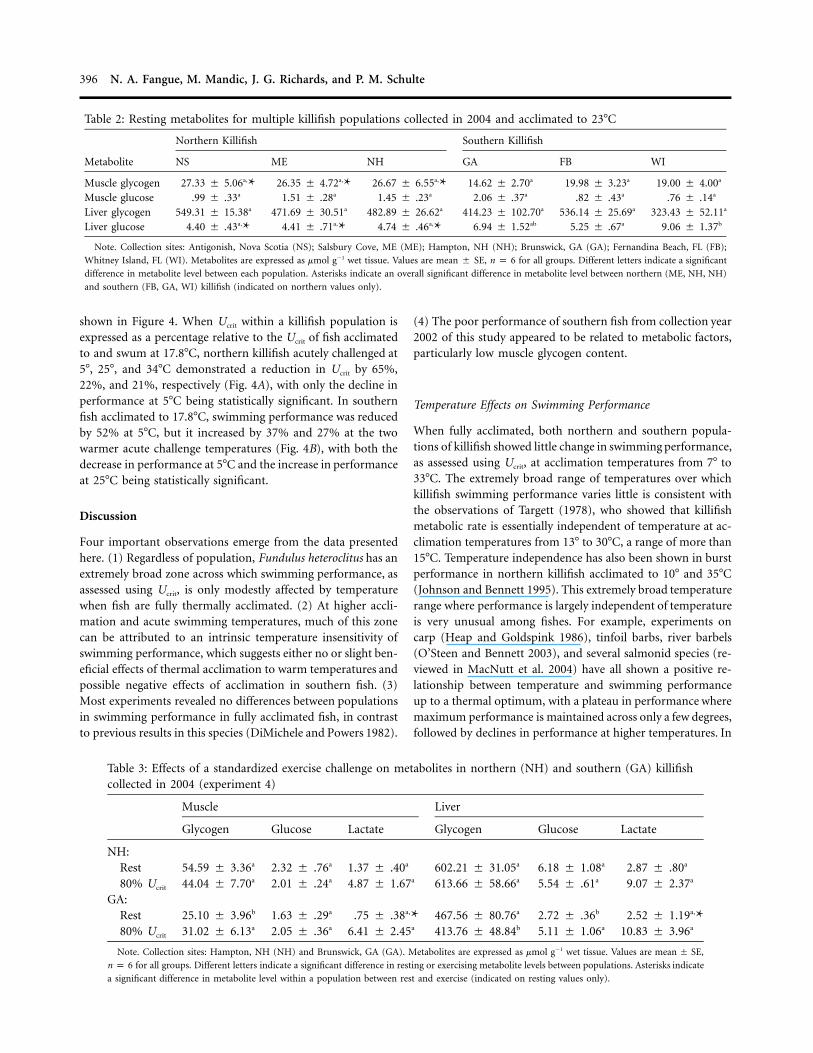
Because the standardized exercise challenge experiment (ex-periment 3) suggested that low muscle glycogen was associatedwith the poor swimming performance of southern killifish col-lected in 2002, we assessed resting levels of muscle [glycogen],muscle [glucose], liver [glycogen], and liver [glucose] (Table 2)for the six killifish populations that demonstrated high Ucrit
performance (see Fig. 2) collected in 2004 and acclimated to23�C. With the exception of a single southern killifish popu-lation (WI) having significantly higher liver [glucose] than theother populations, there were no significant differences in me-
394 N. A. Fangue, M. Mandic, J. G. Richards, and P. M. Schulte
Figure 3. Northern (New Hampshire) and southern (Georgia) killifish muscle glycogen concentrations (mmol g�1 wet tissue; A, B) and musclelactate concentrations (mmol g�1 wet tissue; C, D) for resting (open columns) and exercising (hatched columns) fish collected in 2002 andacclimated to 5�, 15�, and 29�C (experiment 3). Asterisks indicate a significant difference (P ! 0.05) between populations at a given acclimationtemperature and exercise state (indicated in A, C only). Different letters indicate a significant difference (P ! 0.05) between temperatures withina population and exercise state. The section mark indicates a significant difference between rest and exercise within a population and acclimationtemperature (indicated on the exercise values). Values are means � SE (n p 6).
tabolite levels between populations in any of the metabolitesmeasured (Table 2). T-tests comparing metabolite levels of allnorthern fish combined with those of all southern fish com-bined, however, revealed a significant difference between sub-species for muscle [glycogen] (higher in northern fish, P p
) as well as for liver [glucose] (higher in southern fish,0.0019). However, there was no significant difference inP p 0.008
muscle [glucose] or liver [glycogen] between subspecies (P 1
for both comparisons).0.262
Experiment 4: Effects of Standardized Exercise Challenge(Collection Year 2004)
To determine the patterns of fuel utilization for northern andsouthern killifish subspecies that had both high Ucrit’s and highlevels of resting muscle and liver [glycogen], northern (NH)and southern (GA) fish collected in 2004 and acclimated to23�C were exposed to a standardized exercise challenge. Withrespect to resting fish, the NH population had significantly
higher muscle [glycogen] than did the GA population (P p; Table 3), similar to the results obtained when multiple0.002
killifish populations acclimated to 23�C were examined (Table2), which revealed a significant difference when all popula-tions within a subspecies were pooled. Note that fish used inthe standardized exercise challenge (Table 3) had substantiallyhigher muscle [glycogen] than fish from these same collec-tions tested in the multiple-population study (Table 2). Weascribe this difference to the effects of laboratory holding. Themultiple-population study was conducted after the fish hadbeen held under laboratory conditions for slightly more than1 mo, whereas the fish used in the standardized exercise chal-lenge were held for approximately 2 mo before testing. Thesedata suggest either that our laboratory holding procedures arewell optimized and that fish condition improves with increasedlaboratory holding or that there is a seasonal component tomuscle [glycogen] levels in this species. However, even takingthis difference into account, the muscle [glycogen] for southernfish collected in 2004 was much higher than that of fish col-
Swimming Performance in Fundulus heteroclitus 395
Table 1: Muscle, liver, and plasma metabolites for northern (N) and southern (S) killifish (2002 collection year) at rest orafter a standardized exercise challenge (experiment 3)
Metabolite,Population
5�C 15�C 29�C
Rest Exercise Rest Exercise Rest Exercise
Muscle glucose:N 1.11 � .06a 1.34 � .07x 1.48 � .14a 1.93 � .04y,* 1.35 � .22a,*,§ 2.20 � .31y
S 1.46 � .35a .97 � .07x 1.32 � .10a 1.37 � .09y 2.27 � .16b 1.89 � .08z
Muscle ATP:N 1.14 � .17a 1.38 � .10x 1.38� .20a 1.72 � .18x 1.44 � .15a 1.58 � .18x
S 1.60 � .19a 1.25 � .05x 1.62 � .21a 1.61 � .20x 2.22 � .22a 1.84 � .26x
Muscle CrP:N 10.48 � 1.15a,* 8.04 � 1.89x,* 9.62 � 2.50a 8.08 � 1.22x 8.54 � 1.38a 4.57 � .98x
S 17.30 � 1.31a 16.53 � 2.65x 10.25 � 1.77b 7.23 � 2.10y 11.12 � 1.85b 8.18 � 1.03y
Muscle total lipid:N 30.04 � 2.57a 27.38 � .61x 29.68 � 4.40a 33.68 � 5.44x,* 26.27 � 2.46a,* 25.79 � 2.67x
S 24.58 � 2.32a 21.05 � 1.16x 23.54 � 1.79a 20.76 � 1.74x 18.14 � 2.08a 23.83 � 1.81x
IMTG:N 4.72 � 1.02a 5.54 � .35x 4.25 � .50a 5.62 � .33x 4.72 � .68a 6.80 � 1.40x
S 4.77 � .27a 5.79 � 1.29x 6.78 � .72a 5.85 � .53x 6.57 � 1.55a 5.95 � .85x
Liver glucose:N 3.32 � .41a 5.93 � .65x 4.90 � .57ab 5.75 � 1.01x 7.80 � 1.77b 10.98 � 2.47y,*S 4.41 � .18ab 4.92 � .44x 2.72 � .37a 4.30 � 1.24x 7.11 � .87b 7.49 � 1.87x
Liver glycogen:N 647.73 � 138.39a 703.46 � 116.59x,* 793.94 � 92.65a,* 761.98 � 57.91x 250.16 � 64.21b 463.85 � 177.66x
S 410.56 � 115.09 a 369.44 � 58.74x 445.43 � 113.83a 701.21 � 117.48x 371.81 � 29.35a 493.33 � 45.75x
Plasma glucose:N 4.35 � .32a 6.45 � .80x 5.72 � .62a 7.12 � .72x 6.72 � 1.97a,* 10.17 � 2.28x
S 4.80 � .70a 5.11 � .52x 4.31 � .64a 5.26 � .53x 12.60 � 2.08b,§ 8.74 � .92y
Plasma lactate:N 3.58 � 1.46a,§ 8.56 � 1.44 x 4.22 � .91a,§ 11.68 � 1.88x 1.85 � .46a,*,§ 13.50 � 3.16x
S 3.58 � .97a 5.50 � 1.63x 3.52 � 1.09a,§ 10.88 � 3.32y 7.38 � 1.65a 11.30 � 2.48xy
Note. Collection sites: Hampton, NH (N), and Brunswick, GA (S). Values are mean � SE, n p 6 for all groups. CrP p creatine phosphate; IMTG pintramuscular triacylglycerol. Muscle glucose, muscle ATP, muscle CrP, plasma glucose, plasma lactate, liver glucose, and liver glycogen expressed as mmol g�1
wet tissue; muscle total lipid expressed as mg mg�1 tissue; IMTG expressed as glycerol mmol g�1 tissue. Different letters indicate a significant difference between
temperatures within a population and metabolic state. Asterisks indicate a significant difference between populations at a given acclimation temperature and
metabolic state (indicated on northern values), and section marks indicate a significant difference between rest and exercise within a population and acclimation
temperature (indicated on the rest values).
lected in 2002 (cf. Tables 2, 3; Fig. 3), whereas the muscle[glycogen] for northern fish was similar across collection years(cf. Table 2; Fig. 3). Note that the data reported in Table 2 andFigure 3 were collected in similar seasons in different years,reducing the likelihood of a seasonal effect. In contrast, liver[glycogen] was similar across all experiments (cf. Tables 1–3).Exercise resulted in an increase in muscle and plasma lactatelevels in both killifish populations (Table 3), and this effect wassignificant for southern fish (SNK MRT, and 0.034,P p 0.018respectively). There was no significant decline in muscle andliver [glycogen] with exercise in either population.
Experiment 5: Low-Temperature Acclimation
Because published work (DiMichele and Powers 1982) andexperiment 1 of this study indicated significant differences inswimming performance of northern and southern killifish atcold (10�C) acclimation temperatures, we also investigated the
effect of low-temperature (7�C) acclimation on Ucrit and me-tabolite levels in killifish with high starting levels of muscle[glycogen] (collection year 2004; Table 4). The Ucrit values fornorthern (NH) and southern (GA) killifish acclimated to 7�Cwere 6.2 and 6.3 BL s�1, respectively, and there was no signif-icant difference between populations ( ; Table 4). Ad-P p 0.832ditionally, these values were not significantly different from thevalues of northern fish in the first experiment at 10�C (cf. Fig.1; Table 4). There was no difference in muscle [glycogen] levelsof northern fish before or after acclimation to 7�C. There was,however, a significant decline in muscle glycogen levels ofsouthern fish after acclimation to 7�C for 21 d. No other me-tabolites showed any significant differences between popula-tions or during acclimation.
Experiment 6: Performance in Acute Challenge
The effect of acute temperature challenge on the Ucrit of north-ern (NH) and southern (GA) killifish acclimated to 17.8�C is
396 N. A. Fangue, M. Mandic, J. G. Richards, and P. M. Schulte
Table 2: Resting metabolites for multiple killifish populations collected in 2004 and acclimated to 23�C
Metabolite
Northern Killifish Southern Killifish
NS ME NH GA FB WI
Muscle glycogen 27.33 � 5.06a,* 26.35 � 4.72a,* 26.67 � 6.55a,* 14.62 � 2.70a 19.98 � 3.23a 19.00 � 4.00a
Muscle glucose .99 � .33a 1.51 � .28a 1.45 � .23a 2.06 � .37a .82 � .43a .76 � .14a
Liver glycogen 549.31 � 15.38a 471.69 � 30.51a 482.89 � 26.62a 414.23 � 102.70a 536.14 � 25.69a 323.43 � 52.11a
Liver glucose 4.40 � .43a,* 4.41 � .71a,* 4.74 � .46a,* 6.94 � 1.52ab 5.25 � .67a 9.06 � 1.37b
Note. Collection sites: Antigonish, Nova Scotia (NS); Salsbury Cove, ME (ME); Hampton, NH (NH); Brunswick, GA (GA); Fernandina Beach, FL (FB);
Whitney Island, FL (WI). Metabolites are expressed as mmol g�1 wet tissue. Values are mean � SE, n p 6 for all groups. Different letters indicate a significant
difference in metabolite level between each population. Asterisks indicate an overall significant difference in metabolite level between northern (ME, NH, NH)
and southern (FB, GA, WI) killifish (indicated on northern values only).
Table 3: Effects of a standardized exercise challenge on metabolites in northern (NH) and southern (GA) killifishcollected in 2004 (experiment 4)
Muscle Liver
Glycogen Glucose Lactate Glycogen Glucose Lactate
NH:Rest 54.59 � 3.36a 2.32 � .76a 1.37 � .40a 602.21 � 31.05a 6.18 � 1.08a 2.87 � .80a
80% Ucrit 44.04 � 7.70a 2.01 � .24a 4.87 � 1.67a 613.66 � 58.66a 5.54 � .61a 9.07 � 2.37a
GA:Rest 25.10 � 3.96b 1.63 � .29a .75 � .38a,* 467.56 � 80.76a 2.72 � .36b 2.52 � 1.19a,*80% Ucrit 31.02 � 6.13a 2.05 � .36a 6.41 � 2.45a 413.76 � 48.84b 5.11 � 1.06a 10.83 � 3.96a
Note. Collection sites: Hampton, NH (NH) and Brunswick, GA (GA). Metabolites are expressed as mmol g�1 wet tissue. Values are ,mean � SE
for all groups. Different letters indicate a significant difference in resting or exercising metabolite levels between populations. Asterisks indicaten p 6
a significant difference in metabolite level within a population between rest and exercise (indicated on resting values only).
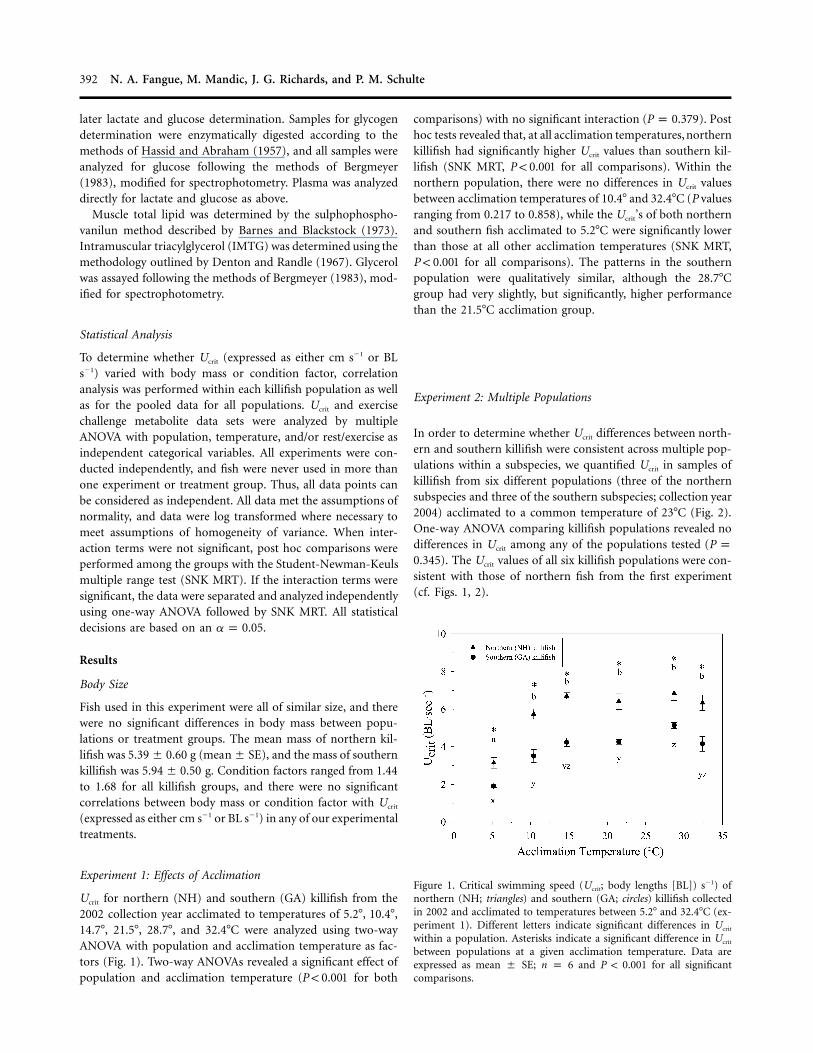
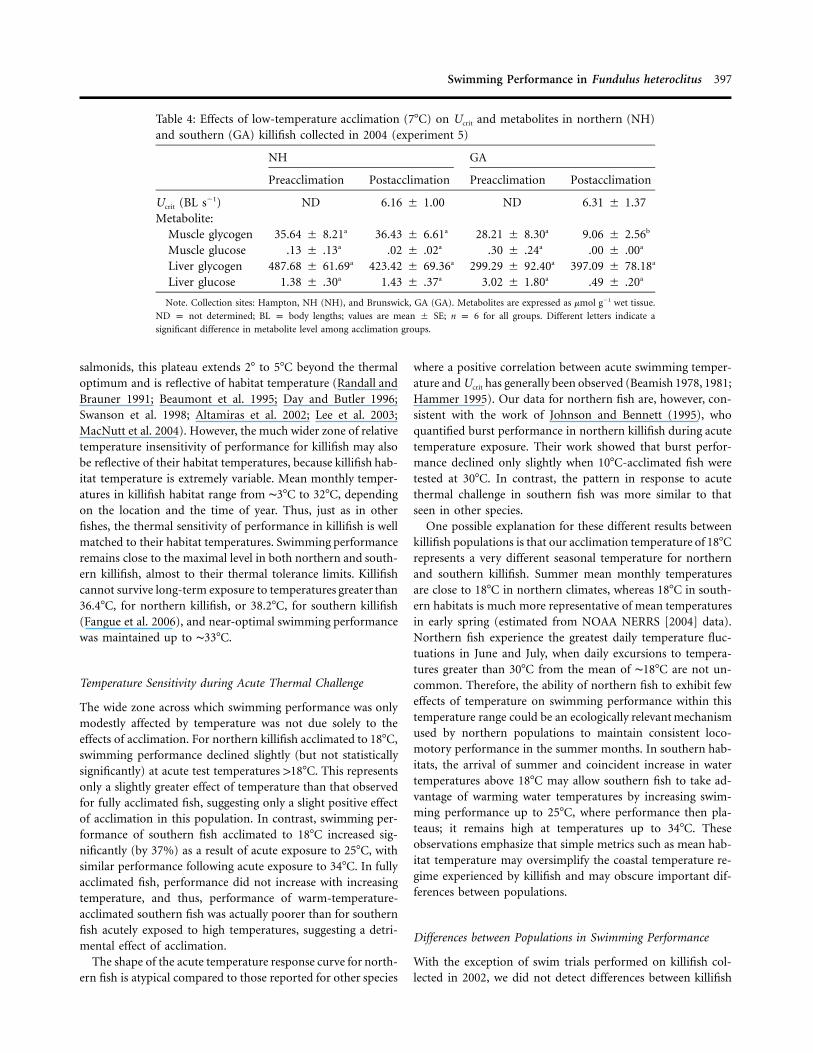
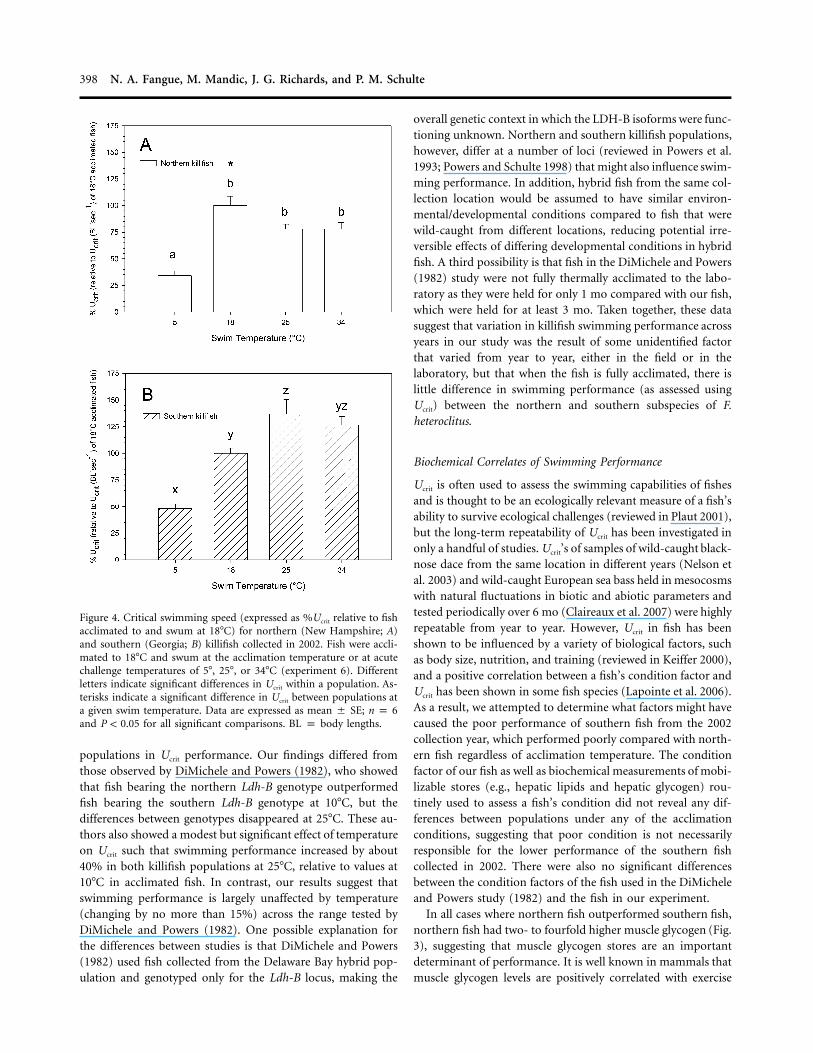
shown in Figure 4. When Ucrit within a killifish population isexpressed as a percentage relative to the Ucrit of fish acclimatedto and swum at 17.8�C, northern killifish acutely challenged at5�, 25�, and 34�C demonstrated a reduction in Ucrit by 65%,22%, and 21%, respectively (Fig. 4A), with only the decline inperformance at 5�C being statistically significant. In southernfish acclimated to 17.8�C, swimming performance was reducedby 52% at 5�C, but it increased by 37% and 27% at the twowarmer acute challenge temperatures (Fig. 4B), with both thedecrease in performance at 5�C and the increase in performanceat 25�C being statistically significant.
Discussion
Four important observations emerge from the data presentedhere. (1) Regardless of population, Fundulus heteroclitus has anextremely broad zone across which swimming performance, asassessed using Ucrit, is only modestly affected by temperaturewhen fish are fully thermally acclimated. (2) At higher accli-mation and acute swimming temperatures, much of this zonecan be attributed to an intrinsic temperature insensitivity ofswimming performance, which suggests either no or slight ben-eficial effects of thermal acclimation to warm temperatures andpossible negative effects of acclimation in southern fish. (3)Most experiments revealed no differences between populationsin swimming performance in fully acclimated fish, in contrastto previous results in this species (DiMichele and Powers 1982).
(4) The poor performance of southern fish from collection year2002 of this study appeared to be related to metabolic factors,particularly low muscle glycogen content.
Temperature Effects on Swimming Performance
When fully acclimated, both northern and southern popula-tions of killifish showed little change in swimming performance,as assessed using Ucrit, at acclimation temperatures from 7� to33�C. The extremely broad range of temperatures over whichkillifish swimming performance varies little is consistent withthe observations of Targett (1978), who showed that killifishmetabolic rate is essentially independent of temperature at ac-climation temperatures from 13� to 30�C, a range of more than15�C. Temperature independence has also been shown in burstperformance in northern killifish acclimated to 10� and 35�C(Johnson and Bennett 1995). This extremely broad temperaturerange where performance is largely independent of temperatureis very unusual among fishes. For example, experiments oncarp (Heap and Goldspink 1986), tinfoil barbs, river barbels(O’Steen and Bennett 2003), and several salmonid species (re-viewed in MacNutt et al. 2004) have all shown a positive re-lationship between temperature and swimming performanceup to a thermal optimum, with a plateau in performance wheremaximum performance is maintained across only a few degrees,followed by declines in performance at higher temperatures. In
Swimming Performance in Fundulus heteroclitus 397
Table 4: Effects of low-temperature acclimation (7�C) on Ucrit and metabolites in northern (NH)and southern (GA) killifish collected in 2004 (experiment 5)
NH GA
Preacclimation Postacclimation Preacclimation Postacclimation
Ucrit (BL s�1) ND 6.16 � 1.00 ND 6.31 � 1.37Metabolite:
Muscle glycogen 35.64 � 8.21a 36.43 � 6.61a 28.21 � 8.30a 9.06 � 2.56b
Muscle glucose .13 � .13a .02 � .02a .30 � .24a .00 � .00a
Liver glycogen 487.68 � 61.69a 423.42 � 69.36a 299.29 � 92.40a 397.09 � 78.18a
Liver glucose 1.38 � .30a 1.43 � .37a 3.02 � 1.80a .49 � .20a
Note. Collection sites: Hampton, NH (NH), and Brunswick, GA (GA). Metabolites are expressed as mmol g�1 wet tissue.
ND p not determined; BL p body lengths; values are mean � SE; n p 6 for all groups. Different letters indicate a
significant difference in metabolite level among acclimation groups.
salmonids, this plateau extends 2� to 5�C beyond the thermaloptimum and is reflective of habitat temperature (Randall andBrauner 1991; Beaumont et al. 1995; Day and Butler 1996;Swanson et al. 1998; Altamiras et al. 2002; Lee et al. 2003;MacNutt et al. 2004). However, the much wider zone of relativetemperature insensitivity of performance for killifish may alsobe reflective of their habitat temperatures, because killifish hab-itat temperature is extremely variable. Mean monthly temper-atures in killifish habitat range from ∼3�C to 32�C, dependingon the location and the time of year. Thus, just as in otherfishes, the thermal sensitivity of performance in killifish is wellmatched to their habitat temperatures. Swimming performanceremains close to the maximal level in both northern and south-ern killifish, almost to their thermal tolerance limits. Killifishcannot survive long-term exposure to temperatures greater than36.4�C, for northern killifish, or 38.2�C, for southern killifish(Fangue et al. 2006), and near-optimal swimming performancewas maintained up to ∼33�C.
Temperature Sensitivity during Acute Thermal Challenge
The wide zone across which swimming performance was onlymodestly affected by temperature was not due solely to theeffects of acclimation. For northern killifish acclimated to 18�C,swimming performance declined slightly (but not statisticallysignificantly) at acute test temperatures 118�C. This representsonly a slightly greater effect of temperature than that observedfor fully acclimated fish, suggesting only a slight positive effectof acclimation in this population. In contrast, swimming per-formance of southern fish acclimated to 18�C increased sig-nificantly (by 37%) as a result of acute exposure to 25�C, withsimilar performance following acute exposure to 34�C. In fullyacclimated fish, performance did not increase with increasingtemperature, and thus, performance of warm-temperature-acclimated southern fish was actually poorer than for southernfish acutely exposed to high temperatures, suggesting a detri-mental effect of acclimation.
The shape of the acute temperature response curve for north-ern fish is atypical compared to those reported for other species
where a positive correlation between acute swimming temper-ature and Ucrit has generally been observed (Beamish 1978, 1981;Hammer 1995). Our data for northern fish are, however, con-sistent with the work of Johnson and Bennett (1995), whoquantified burst performance in northern killifish during acutetemperature exposure. Their work showed that burst perfor-mance declined only slightly when 10�C-acclimated fish weretested at 30�C. In contrast, the pattern in response to acutethermal challenge in southern fish was more similar to thatseen in other species.
One possible explanation for these different results betweenkillifish populations is that our acclimation temperature of 18�Crepresents a very different seasonal temperature for northernand southern killifish. Summer mean monthly temperaturesare close to 18�C in northern climates, whereas 18�C in south-ern habitats is much more representative of mean temperaturesin early spring (estimated from NOAA NERRS [2004] data).Northern fish experience the greatest daily temperature fluc-tuations in June and July, when daily excursions to tempera-tures greater than 30�C from the mean of ∼18�C are not un-common. Therefore, the ability of northern fish to exhibit feweffects of temperature on swimming performance within thistemperature range could be an ecologically relevant mechanismused by northern populations to maintain consistent loco-motory performance in the summer months. In southern hab-itats, the arrival of summer and coincident increase in watertemperatures above 18�C may allow southern fish to take ad-vantage of warming water temperatures by increasing swim-ming performance up to 25�C, where performance then pla-teaus; it remains high at temperatures up to 34�C. Theseobservations emphasize that simple metrics such as mean hab-itat temperature may oversimplify the coastal temperature re-gime experienced by killifish and may obscure important dif-ferences between populations.
Differences between Populations in Swimming Performance
With the exception of swim trials performed on killifish col-lected in 2002, we did not detect differences between killifish
398 N. A. Fangue, M. Mandic, J. G. Richards, and P. M. Schulte
Figure 4. Critical swimming speed (expressed as %Ucrit relative to fishacclimated to and swum at 18�C) for northern (New Hampshire; A)and southern (Georgia; B) killifish collected in 2002. Fish were accli-mated to 18�C and swum at the acclimation temperature or at acutechallenge temperatures of 5�, 25�, or 34�C (experiment 6). Differentletters indicate significant differences in Ucrit within a population. As-terisks indicate a significant difference in Ucrit between populations ata given swim temperature. Data are expressed as mean � SE; n p 6and P ! 0.05 for all significant comparisons. BL p body lengths.
populations in Ucrit performance. Our findings differed fromthose observed by DiMichele and Powers (1982), who showedthat fish bearing the northern Ldh-B genotype outperformedfish bearing the southern Ldh-B genotype at 10�C, but thedifferences between genotypes disappeared at 25�C. These au-thors also showed a modest but significant effect of temperatureon Ucrit such that swimming performance increased by about40% in both killifish populations at 25�C, relative to values at10�C in acclimated fish. In contrast, our results suggest thatswimming performance is largely unaffected by temperature(changing by no more than 15%) across the range tested byDiMichele and Powers (1982). One possible explanation forthe differences between studies is that DiMichele and Powers(1982) used fish collected from the Delaware Bay hybrid pop-ulation and genotyped only for the Ldh-B locus, making the
overall genetic context in which the LDH-B isoforms were func-tioning unknown. Northern and southern killifish populations,however, differ at a number of loci (reviewed in Powers et al.1993; Powers and Schulte 1998) that might also influence swim-ming performance. In addition, hybrid fish from the same col-lection location would be assumed to have similar environ-mental/developmental conditions compared to fish that werewild-caught from different locations, reducing potential irre-versible effects of differing developmental conditions in hybridfish. A third possibility is that fish in the DiMichele and Powers(1982) study were not fully thermally acclimated to the labo-ratory as they were held for only 1 mo compared with our fish,which were held for at least 3 mo. Taken together, these datasuggest that variation in killifish swimming performance acrossyears in our study was the result of some unidentified factorthat varied from year to year, either in the field or in thelaboratory, but that when the fish is fully acclimated, there islittle difference in swimming performance (as assessed usingUcrit) between the northern and southern subspecies of F.heteroclitus.
Biochemical Correlates of Swimming Performance
Ucrit is often used to assess the swimming capabilities of fishesand is thought to be an ecologically relevant measure of a fish’sability to survive ecological challenges (reviewed in Plaut 2001),but the long-term repeatability of Ucrit has been investigated inonly a handful of studies. Ucrit’s of samples of wild-caught black-nose dace from the same location in different years (Nelson etal. 2003) and wild-caught European sea bass held in mesocosmswith natural fluctuations in biotic and abiotic parameters andtested periodically over 6 mo (Claireaux et al. 2007) were highlyrepeatable from year to year. However, Ucrit in fish has beenshown to be influenced by a variety of biological factors, suchas body size, nutrition, and training (reviewed in Keiffer 2000),and a positive correlation between a fish’s condition factor andUcrit has been shown in some fish species (Lapointe et al. 2006).As a result, we attempted to determine what factors might havecaused the poor performance of southern fish from the 2002collection year, which performed poorly compared with north-ern fish regardless of acclimation temperature. The conditionfactor of our fish as well as biochemical measurements of mobi-lizable stores (e.g., hepatic lipids and hepatic glycogen) rou-tinely used to assess a fish’s condition did not reveal any dif-ferences between populations under any of the acclimationconditions, suggesting that poor condition is not necessarilyresponsible for the lower performance of the southern fishcollected in 2002. There were also no significant differencesbetween the condition factors of the fish used in the DiMicheleand Powers study (1982) and the fish in our experiment.
In all cases where northern fish outperformed southern fish,northern fish had two- to fourfold higher muscle glycogen (Fig.3), suggesting that muscle glycogen stores are an importantdeterminant of performance. It is well known in mammals thatmuscle glycogen levels are positively correlated with exercise
Swimming Performance in Fundulus heteroclitus 399
endurance (Widrick et al. 1993; Johnson et al. 2004; Rauch etal. 2005). The relationship between endurance and white mus-cle glycogen has been investigated to some extent in fish, andhigh levels of muscle glycogen have been linked with elevatedlactate during exercise (Pearson et al. 1990; Schulte et al. 1992),faster recovery from exhaustion (Scarabello et al. 1991), greatersurvivability on stream release (Hochachka and Sinclair 1962),and overall higher endurance performance (McFarlane andMcDonald 2002). At this point, we have no specific hypothesesto advance that would account for the low muscle glycogen insouthern fish collected in 2002 compared with those collectedin 2004. Laboratory housing and feeding conditions and thelength of the acclimation period were similar between years,and northern and southern fish were maintained in multiplereplicate split tanks, eliminating the possibility of a tank effectcausing the low muscle glycogen in southern fish comparedwith northern fish. We also saw no obvious differences in thereproductive condition of southern fish from different collec-tion years at any of the acclimation temperatures or any evi-dence of disease or parasitism in southern fish. Because of thesplit-tank design of these experiments, any diseases would prob-ably have been transmitted to northern fish as well. However,it is still possible that some uncontrolled factor in the laboratorythat differed from year to year, to which southern fish weresusceptible but northern fish were not, might have resulted inthe low muscle [glycogen] and poor swimming performanceof southern fish from the 2002 collection year. Alternatively,exposure to some factor that differed between collection lo-cations and from year to year in the field that resulted in anirreversible decline in the performance of the southern fish fromthe 2002 collection year could have been responsible for thesedifferences in muscle glycogen and swimming performance.
Conclusions
The results presented here demonstrate that killifish are im-pressive eurytherms that are able to maintain very similar Ucrit
across acclimation temperatures from 7� to 33�C, when testedat their acclimation temperature. This zone of relative tem-perature insensitivity was not due solely to the effects of thermalacclimation, because even acute thermal challenge resulted inonly small (∼20%) changes in swimming performance when18�C-acclimated fish were tested at higher temperatures. Acutechallenge at low temperatures (5�C) resulted in a significant(150%) decline in performance, and this decline was similarto those observed in 5�C-acclimated fish in both northern andsouthern populations. The performance of southern fish variedamong fish collected from the same location in different years,whereas performance of northern fish was much more re-peatable. At a biochemical level, performance was most clearlyrelated to [glycogen] in the muscle rather than to other indi-cators of fuel stores or body condition. Our data suggest thatkillifish populations, regardless of geographic origin and localthermal regime, are broadly tolerant of both acute and chronicthermal challenges, providing little evidence for local thermal
adaptation in endurance swimming performance (as assessedusing Ucrit methodology) in this species.
Acknowledgments
This work was financially supported through a Natural Sciencesand Engineering Research Council of Canada Discovery Grantto P.M.S. N.A.F. was supported by Izaak Walton Killam andUniversity of British Columbia predoctoral fellowships. We aregrateful to Dr. George Kidder and Dr. Bill Marshall for Maineand Nova Scotia killifish specimens, respectively. Thanks toJulia Wierzchowski for help in swimming many fish. We aregrateful to Anne Dalziel, Dr. Wendy Tymchuk, and severalanonymous reviewers for constructive comments on thismanuscript.
Literature Cited
Altamiras J., M. Axelsson, G. Claireaux, C. Lefrancois, C. Mer-cier, and A.P. Farrell. 2002. Cardiorespiratory status of trip-loid brown trout during swimming at two acclimation tem-peratures. J Fish Biol 42:177–188.
Barnes H. and J. Blackstock. 1973. Estimation of lipids in ma-rine animals and tissues: detailed investigation of the sul-phophosphovanilun method for “total” lipids. J Exp MarBiol Ecol 12:103–118.
Beamish F.W.H. 1978. Swimming capacity. Pp. 101–187 in W.S.Hoar and D.J. Randall, eds. Fish Physiology. Academic Press,New York.
———. 1980. Swimming performance and oxygen consump-tion of the charrs. Pp. 739–748 in E.K. Balon, ed. Charrs:Salmonid Fishes of the Genus Salvelinus. Junk, The Hague.
———. 1981. Swimming performance and metabolic rate ofthree tropical fishes in relation to temperature. Hydrobio-logia 83:245–254.
Beaumont M.W., P.J. Butler, and E.W. Taylor. 1995. Plasmaammonia concentration in brown trout in soft acidic waterand its relationship to decreased swimming performance. JExp Biol 198:2213–2220.
Bell W.H. and L.D.B. Terhune. 1970. Water tunnel design forfisheries research. Fish Res Board Can Tech Rep 195:1–69.
Bergmeyer H.U. 1983. Methods of Enzymatic Analysis. Aca-demic Press, New York.
Brett J.R. 1964. The respiratory metabolism and swimmingperformance of young sockeye salmon. J Fish Res Board Can21:1183–1226.
Claireaux G., C. Handelsman, E. Standen, and J.A. Nelson.2007. Thermal and temporal stability of swimming perfor-mance in the European sea bass. Physiol Biochem Zool 80:186–196.
Day N. and P.J. Butler. 1996. Environmental acidity and whitemuscle recruitment during swimming in the brown trout(Salmo trutta). J Exp Biol 199:1947–1959.
———. 2005. The effects of acclimation to reversed seasonal
400 N. A. Fangue, M. Mandic, J. G. Richards, and P. M. Schulte
temperatures on the swimming performance of adult browntrout Salmo trutta. J Exp Biol 208:2683–2692.
Denton R.M. and P.J. Randle. 1967. Concentrations of glyc-erides and phospholipids in rat heart and gastrocnemiusmuscles. Biochem J 104:416–422.
DiMichele L. and D.A. Powers. 1982. Physiological basis forswimming endurance differences between LDH-B genotypesof Fundulus heteroclitus. Science 216:1014–1016.
Fangue N.A., M. Hofmeister, and P.M. Schulte. 2006. Intra-specific variation in thermal tolerance and heat shock proteingene expression in common killifish, Fundulus heteroclitus.J Exp Biol 209:2859–2872.
Hammer C. 1995. Fatigue and exercise tests with fish. CompBiochem Physiol A 112:1–20.
Hassid W.Z. and S. Abraham. 1957. Chemical procedures foranalysis of polysaccharides. Pp. 34–37 in S.P. Colowick andN.O. Kaplan, eds. Methods Enzymology. Academic Press,New York.
Heap S.P. and G. Goldspink. 1986. Alterations to the swimmingperformance of carp Cyprinus carpio as a result of temper-ature acclimation. J Fish Biol 29:747–754.
Hochachka P.W. and A.C. Sinclair. 1962. Glycogen stores introut tissues before and after stream planting. J Fish ResBoard Can 19:127–136.
Jain K.E., I.K. Birtwell, and A.P. Farrell. 1998. Repeat swimmingperformance of mature sockeye salmon following a briefrecovery period: a proposed measure of fish health and waterquality. Can J Zool 76:1488–1496.
Jain K.E., J.C. Hamilton, and A.P. Farrell. 1997. Use of a rampvelocity test to measure critical swimming speed in rainbowtrout (Oncorhynchus mykiss). Comp Biochem Physiol A 117:441–444.
Johnson N.N., S.R. Stannard, and M.W. Thompson. 2004. Mus-cle triglyceride and glycogen in endurance exercise: impli-cations for performance. Sports Med 34:151–164.
Johnson T.P. and A.F. Bennett. 1995. The thermal acclimationof burst escape performance in fish: an integrated study ofmolecular and cellular physiology and organismal perfor-mance. J Exp Biol 198:2165–2175.
Jones D.R. 1971. The effect of hypoxia and anaemia on theswimming performance of rainbow trout (Salmo gairdneri).J Exp Biol 55:541–551.
Keiffer J.D. 2000. Limits to exhaustive exercise in fish. CompBiochem Physiol A 126:161–179.
Kolok A.S. 1991. Photoperiod alters the critical swimmingspeed of juvenile largemouth bass, Micropterus salmoides,acclimated to cold water. Copeia 1991:1085–1090.
———. 1999. Interindividual variation in the prolonged lo-comotor performance of ectothermic vertebrates: a com-parison of fish and herpetofaunal methodologies and a briefreview of the recent fish literature. Can J Fish Aquat Sci 56:700–710.
Lapointe D., H. Guderley, and J.D. Dutil. 2006. Changes in thecondition factor have an impact on metabolic rate and swim-
ming performance relationships in Atlantic cod (Gadus mor-hua L.). Physiol Biochem Zool 79:109–119.
Lee C.G., A.P. Farrell, A. Lotto, M.J. MacNutt, S.G. Hinch, andM.C. Healey. 2003. The effect of temperature on swimmingperformance and oxygen consumption in adult sockeye (On-corhynchus nerka) and coho salmon (O. kisutch) salmonstocks. J Exp Biol 206:3239–3251.
MacNutt M.J., S.G. Hinch, A.P. Farrell, and S. Topp. 2004. Theeffect of temperature and acclimation period on repeat swim-ming performance in cutthroat trout. J Fish Biol 65:342–353.
McFarlane W.J. and D.G. McDonald. 2002. Relating intra-muscular fuel use to endurance in juvenile rainbow trout.Physiol Biochem Zool 75:250–259.
Nelson J.A., P.S. Gotwalt, and J.W. Snodgrass. 2003. Swimmingperformance of blacknose dace (Rhinichthys atratulus) mir-rors home-stream current velocity. Can J Fish Aquat Sci 60:301–308.
NOAA-NERRS (National Oceanic and Atmospheric Admin-istration, Office of Ocean and Coastal Resource Manage-ment, National Estuarine Research Reserve SystemwideMonitoring Program). 2004. Centralized Data ManagementOffice, Baruch Marine Field Lab, University of South Car-olina. http://cdmo.baruch.sc.edu.
O’Steen S. and A.F. Bennett. 2003. Thermal acclimation effectsdiffer between voluntary, maximum and critical swimmingvelocities in two cyprinid fishes. Physiol Biochem Zool 76:484–496.
Pearson M.P., L.L. Spriet, and E.D. Stevens. 1990. Effect ofsprint training on swim performance and white muscle me-tabolism during exercise and recovery in rainbow trout. JExp Biol 149:45–60.
Pierce V.A. and D.L. Crawford. 1997. Phylogenetic analysis ofglycolytic enzyme expression. Science 276:256–259.
Plaut I. 2001. Critical swimming speed: its ecological relevance.Comp Biochem Physiol A 131:41–50.
Podrabsky J.E., C. Javillonar, S.C. Hand, and D.L. Crawford.2000. Intraspecific variation in aerobic metabolism and gly-colytic enzyme expression in heart ventricles. Am J Physiol279:R2344–R2348.
Powers D.A., T. Lauerman, D. Crawford, and L. DiMichele.1991. Genetic mechanisms for adapting to a changing en-vironment. Annu Rev Genet 25:629–659.
Powers D.A. and P.M. Schulte. 1998. Evolutionary adaptationsof gene structure and expression in natural populations inrelation to a changing environment: a multidisciplinary ap-proach to address the million-year saga of a small fish. J ExpZool 282:71–94.
Powers D.A., M. Smith, L. Gonzalez-Villasenor, L. DiMichele,D. Crawford, G. Bernardi, and T. Lauerman. 1993. A mul-tidisciplinary approach to the selectionist/neutralist contro-versy using the model teleost, Fundulus heteroclitus. Pp. 43–107 in D. Futuyma and J. Antonovics, eds. Oxford Surveysof Evolutionary Biology. Vol. 9. Oxford University Press,Oxford.
Swimming Performance in Fundulus heteroclitus 401
Randall D.J. and C. Brauner. 1991. Effects of environmentalfactors on exercise in fish. J Exp Biol 160:113–126.
Rauch H.G., A. St. Clair Gibson, E.V. Lambert, and T.D.Noakes. 2005. A signaling role for muscle glycogen in theregulation of pace during prolonged exercise. Br J SportsMed 39:34–38.
Scarabello M., C.M. Wood, and G.J.F. Heigenhauser. 1991. Gly-cogen depletion in juvenile rainbow trout as an experimentaltest of the oxygen debt hypothesis. Can J Zool 69:2562–2568.
Schulte P.M. 2001. Environmental adaptations as windows onmolecular evolution. Comp Biochem Physiol B 128:597–611.
Schulte P.M., C.D. Moyes, and P.W. Hochachka. 1992. Inte-grating metabolic pathways in post-exercise recovery of whitemuscle. J Exp Biol 166:181–195.
Segal J.A. and D.L. Crawford. 1994. LDH-B enzyme expression:the mechanisms of altered gene expression in acclimationand evolutionary adaptation. Am J Physiol 267:R1150–R1153.
Sidell B.D., I.A. Johnston, T.S. Moerland, and G. Goldspink.
1983. The eurythermal myofibrillar protein complex of themummichog (Fundulus heteroclitus): adaptation to a fluc-tuating thermal environment. J Comp Physiol B 153:167–173.
Smiley P.C. and G.R. Parsons. 1997. Effects of photoperiod andtemperature on swimming performance of white crappies.Trans Am Fish Soc 126:495–499.
Swanson C., P.S. Young, and J.C. Cech Jr. 1998. Swimmingperformance of delta smelt: maximum performance, and be-havioural and kinematic limitations of swimming at sub-maximal velocities. J Exp Biol 201:333–345.
Targett T. E. 1978. Respiratory metabolism of temperature ac-climated Fundulus heteroclitus (L.): zones of compensationand dependence. J Exp Mar Biol Ecol 32:197–206.
Widrick J.J., D.L. Costill, W.J. Fink, M.S. Hickey, G.K. Mc-Conell, and H. Tanaka. 1993. Carbohydrate feedings andexercise performance: effect of initial muscle glycogen con-centration. J Appl Physiol 74:2998–3005.