sustainable land management in the philippines
TRANSCRIPT

SUSTAINABLE LAND MANAGEMENT IN THE PHILIPPINES
Rodelio B. Carating and Rodrigo B. Badayos Bureau of Soils and Water Management Senior Science Research Specialist,
and Professor, University of the Philippines Los Baños, respectively
Paper presented during the APEC Workshop on Sustainable Land Management to Enhance Food Production of APEC Members
28-30 November 2012, Chiang Mai, Thailand
Introduction
Sustainable land management (SLM) refers to a type of land management that does not damage the ecological processes and functions nor impacts negatively the environment by diminishing the biodiversity but rather enhances natural capital – the soil, water, and air and contributes to the health and prosperity of the communities. Since agriculture is exploitative and nutrient mining in nature, SLM is strategic component of the national agriculture program as expressed in the Philippine Development Plan 2011-2016. It addresses both processes of agricultural resource degradation and the underlying causes of unsustainability, and recommends courses of actions. SLM is a national concern and undertaking and this paper only covers the agricultural component. The forestry, fisheries, biodiversity, and environmental sub-components of SLM are coordinated by different government agencies - the Forestry Management Bureau (FMB), the Bureau of Fisheries and Aquatic Resources (BFAR), the Parks and Wildlife Bureau (PAWB), and the Environment Management Bureau (EMB).Except for BFAR which is under the Department of Agriculture, the other bureaus are under the Department of Environment and Natural Resources. Because the Philippines is a Party to the United Nations Convention to Combat Desertification (UNCCD) with the National Action Plan (NAP) as its main implementation instrument, a member also of the World Conservation Approaches and Technologies (WOCAT), the Asia Soil Conservation Network (ASOCON), and currently undertakes land degradation assessment (LADA) under a UN Food and Agriculture Organization (FAO) technical cooperation, much of the principles, concepts, and approaches to sustainable agricultural land management are based on what these international bodies espoused. UNCCD-Philippines where the Bureau of Soils and Water Management (BSWM) is the Focal Point, coordinates the SLM-relevant activities of the other natural resource management agencies, including those of the academe for a holistic approach to NAP implementation and monitoring.
Land use and its effects on food security
Within the context of UNCCD/FAO-LADA, assessment of the complexity of land degradation is based on DPSIR analysis – Driving Forces, Pressures, State, Impacts, and Responses. Land use is considered the major driving force of land degradation as it is focused on interventions on the land which directly affect status and impacts on goods and services. To characterize land use in a systematic and
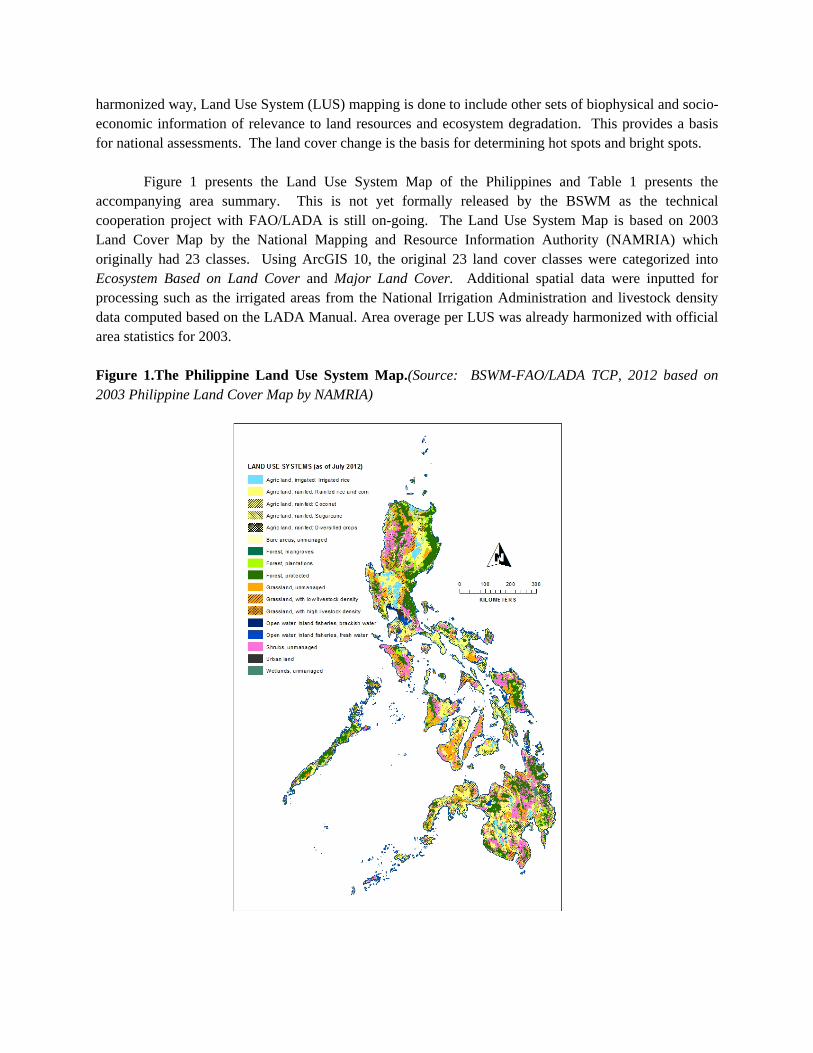
harmonized way, Land Use System (LUS) mapping is done to include other sets of biophysical and socio-economic information of relevance to land resources and ecosystem degradation. This provides a basis for national assessments. The land cover change is the basis for determining hot spots and bright spots. Figure 1 presents the Land Use System Map of the Philippines and Table 1 presents the accompanying area summary. This is not yet formally released by the BSWM as the technical cooperation project with FAO/LADA is still on-going. The Land Use System Map is based on 2003 Land Cover Map by the National Mapping and Resource Information Authority (NAMRIA) which originally had 23 classes. Using ArcGIS 10, the original 23 land cover classes were categorized into Ecosystem Based on Land Cover and Major Land Cover. Additional spatial data were inputted for processing such as the irrigated areas from the National Irrigation Administration and livestock density data computed based on the LADA Manual. Area overage per LUS was already harmonized with official area statistics for 2003. Figure 1.The Philippine Land Use System Map.(Source: BSWM-FAO/LADA TCP, 2012 based on 2003 Philippine Land Cover Map by NAMRIA)

Table 1.Philippine Land Use System area summary. (Area summary as of August 2012)
Land Use System Area Agricultural land, irrigated: Irrigated rice 1,272,283.18 Agricultural land, rainfed: rice and corn 6,044,257.57 Agricultural land, rainfed: Coconut 3,562,485.22 Agricultural land, rainfed: Sugarcane 374,996.77 Agricultural land, rainfed: Diversified crops 24,805.69 Bare areas, unmanaged 99,783.41 Forest, mangroves 212,256.80 Forest, plantations 1,045,681.18 Forest, protected 6,286,312.17 Grasslands, unmanaged 3,164,905.32 Grasslands, with low livestock density 1,526,856.43 Grasslands, with high livestock density 144,267.83 Open water, inland fisheries, brackish water 189,596.81 Open water, inland fisheries, fresh water 261,204.52 Shrubs, unmanaged 5,009,810.86 Wetlands, unmanaged 154,405.32 Urban lands 222,584.27 TOTAL AREA 29,596,493.35
Since the 2010 Land Cover Map from NAMRIA is not yet available, to be able to conduct land
use change analysis, the 2009 Global Cover (GC) map was compared against 2000 GLC for the
Philippines. The GC 2009 was released by the European Space Agency (ESA) and was produced using
12 months of data from Envisat Medium Resolution Imaging Spectrometer at resolution of 300 m. The
map legend used the UN FAO Land Cover Classification System. The GLC 2000 was the output of the
collaboration of a network of international partners lead by the Global Vegetation Monitoring (GBM)
Unit of the Joint Research Centre (JRC) using data acquired by SPOT4 Vegetation instrument covering
14 months of pre-processed daily global data. Since the two images were already pre-processed and not
compatible, the results of the pixel by pixel analyses were not reasonable but overall, the exercise was
useful in terms of assessing land degradation trends. It was reasonable also in the sense that most of the
land use changes were along forest margins.
Figure 2 shows the results of the initial overlay for the whole country with the red colored
mapping units representing change in land use. It can be seen that most of the forest edges have been
encroached by other land uses. Table 3 is the summary of the initial results for forestry. We are still
working on the analysis of the agricultural areas since we decided to segregate the upland rice and corn,
coconut, sugarcane, and diversified upland crop farming systems from the original rainfed agricultural
areas. Both Figure 2 and Table 3 actually has no segregation yet of the rainfed areas.

Despite unreasonable pixel by pixel analysis, it is evident that from the results of the GIS
generated overlay of GLC2000 with GC2009 as presented in Table 3, that the minimum of 10%
conversion of forest to other land uses has been exceeded in all regions of the country; in fact, most of the
regions showed more than 30% of their forests were converted for agriculture and shrubs. This means
that more marginal areas originally under forest are now intensively used for agricultural production
either under subsistence or commercial level. In many areas in Luzon, Visayas, and Mindanao, corn is
being planted in areas with slope and fertility limitations because of the high demand for yellow corn by
animal feed producers.
Figure 2.Results of overlay, GLC2000 vs GC2009 for the Philippines.(Source: BSWM-FAO LADA TCP)

Table 3.Summary of extent of forest conversion to agriculture and other land uses per region based on comparative GLC2000 and GLC2009 study.
REGION 2000 FOREST AREA LOST IN 2009 (has)
% change of Forest Cover to other LUS
ARMM 111,611.82 26.9 CAR 310.776.74 34.9 Region 1 63,437.08 37.5 Region 2 436,208.70 37.5 Region 3 209,900.13 37.9 Region 4A 169,681.29 36.6 Region 4B 322,218.71 33.0 Region 5 146,119.22 37.9 Region 6 65,719.74 37.6 Region 7 27,859.97 33.0 Region 8 270,347.77 29.3 Region 9 103,932.89 33.7 Region 10 171,324.05 31.1 Region 11 123,970.69 21.9 Region 12 93,216.79 27.4 Region 13 314,683.05 31.5
We have not totaled the forest area lost to other land uses for all the regions because this is not the
true picture and the unreasonable pixel by pixel results of the study. We also have to consider the total
forest gained from the reversion of other land uses back to forest from 2000 to 2009. However, based on
the initial (at aggregated agricultural rainfed areas) study, forest and shrub areas posted a net increase
compared to agricultural areas. There is also conversion of forests and agricultural areas to shrubs. Some
of the slash-and burn agricultural areas might have regenerated to secondary forests.
It is noticeable that as we look at the initial data for GC2009 as summarized in Table 4, there has
been practically an increase in almost all LUS, including agricultural areas.

Table 4.Initial summary of GC2009 and % change compared to GLC2000 (Note: computations based on March 2012 LUS area coverage, the % change computations not yet final. The August 2012 LUS area update is officially released, already harmonized with official 2003 area statistics. Initial summary released for APEC conference just to show trends)
Land Use System Area % change Agricultural land, irrigated: Irrigated rice 1,243,678.96 0.938 Agricultural land, rainfed 10,055,735.91 6.332 Bare areas, unmanaged 119,859 0.405 Forest, mangroves 284,878.57 0.963 Forest, plantations 189,379.01 0.640 Forest, protected 6,682,449.70 22.578 Grasslands, unmanaged 3,189,500.49 10.776 Grasslands, with low livestock density 1,607,140.31 4.024 Grasslands, with high livestock density 152,122 0.514 Open water, inland fisheries, brackish water 214,105.98 0.723 Open water, inland fisheries, fresh water 312,908.57 1.057 Shrubs, unmanaged 5,092,190.94 17.205 Wetlands, unmanaged 150,173.52 0.507 Urban lands 302,743.37 1.023 TOTAL AREA 29,596,866.57
There are inherent limitations in change detection analysis as we compare the GLC2000 with
GC2009; with some unrealistic changes such as from forest to water bodies and from water bodies to
agricultural or forest LUS. In fact, as far as the BSWM/FAO-LADA project is concerned, this is more of
exercise to comply with the project terms of reference. The reasons are as follows:
1. Errors due to different pixel resolutions: GLC2000 has about 1km x 1km while GC2009 has 300m x
300m, land cover that can still be discriminated into different classes by the 300mX300m image would
not be recognized by a 1kmX1km image. A number of examples can be illustrated by some known water
bodies (lakes) that were not detected by GLC2000 but were clearly mapped by the GC2009. This would
result into a detection of change from for example forest into water body or shrubs into water body or
agricultural land into water body.
2. Spectral limitations of the imageries to segregate land cover classes: For example, the identification
between forest and shrubs may be based on contiguity of canopies, thus shrubs that are clustered closely
may be identified as forest. Thick vegetation along agricultural lands may also be identified as forest in
the imagery which may only be closely clustered fruit trees on the ground. The difficulty in
discriminating agricultural lands against shrublands and even grasslands may also be attributed to spectral
limitations of the imageries.
3. Inter-seasonal variation: this is another limitation of the imageries being used, the production of GC2009
for example was mosaicked from a number of multi-temporal data sets, hence cutting across different
seasons. Imageries of the same area during the dry season would significantly be different during the wet

season. Rice paddies for example may be identified as water bodies when waterlogged during the start of
the wet season, while simply agricultural land or even grassland during the dry season. Shorelines of lakes
are also affected by inter-seasonal variation, during the dry season lakes may have less water hence
receding shorelines, and vice versa during the wet season. This may help explain some land cover
changes that tend to show for example shrubs to water body or water body to agricultural land.
4. Inter-tidal variation: significant differences may also be identified when imageries are taken during high
tide as against low tide. Some mangroves or other vegetation may disappear during high tide while
detected as forest during low tide. Coastlines may also be significantly different between high and low
tides, resulting to significant land cover changes along the coasts.
Despite the spectral limitations of the satellite images, these provide baseline data with which to
validate existing agricultural land use data and its implication in the national food security concerns. The
total agricultural land in the Philippines is about 11 million hectares. Of this figure, we have about 8
million hectares for food crops and 3 million hectares for non-food crops. Of the area utilized for food
production, we have about 1.5 million hectares for irrigated rice and another 2 million hectares for corn
and rainfed rice or total of 3.5 million hectares. We have another 1 million hectare interphase (planted to
either rice or corn or other crops like sugarcane or root crops as dictated by market forces) or total of 4.5
million hectares for food grains. The remaining 3.5 million hectares are for other food crops, with
coconut-based farming system most dominant at about 3 million. The remaining 3 million hectares for
non-food crops are not only pertaining to fiber crops and industrial starches but also to energy crops
which include sugarcane and coconut. Because we still import corn to complement animal feedstock
supply, present government policy does not allow the use of corn for biofuel production.
At 1.5 million hectares for rice, or 3 million hectares at two cropping seasons per year, and with
population of about 104 million, per capita consumption of 267 grams per day (Abdullah, et.al., undated),
and total rice production at 17 million metric tons – there is indeed a great deficit and the importance of
rice imports to tide over the country until the next rice harvest as well as to have sufficient buffer stock.
Recognizing this reality, the Department of Agriculture is now pursuing staple food rather than rice
sufficiency program. Food Staples Sufficiency Program is the current administration’s banner medium
term program to attain food sufficiency, increase productivity and income of farmers and for them to be
globally competitive (National Rice Program, 2012). While rice remains the main focus of this program,
other equally healthy staples are included in the program. These include white corn, cassava, sweet
potato, and cooking bananas which are eaten either solely or in combination with rice in some rural areas
of the country. As the eighth largest consumer of rice in the world, and the global rice market far from

ideal, the production and consumption of non-rice staples as substitute for rice is being promoted and
encouraged. Nevertheless, the Department of Agriculture is optimistic to harvest 22.73 million metric
tons of rice by the end of 2016, raising further current statistical yield data. Since the country has already
developed its best agricultural lands and further expansion areas are already marginal, productivity
increases are to be attained through strategies and interventions in rainfed areas such as promotion of
small water impounding projects, development of high yielding seeds, capability building and skills
development, and financing - post harvest – marketing services. Organic agriculture is the current
national government thrust; for soil fertility management – promotion of composting using compost
fungus enhancers, vermicomposting, and use of biofertilizers are part of the program.
Problems and constraints on land management and crop production
Land Use Policy. There are three categories of lands in the Philippines (1) forest (protected
areas), (2) alienable and disposable lands, and (3) privately owned lands. Of the total 30 million hectares
of land area, 15.88 million hectares are forests and 14.12 million hectares are alienable and disposable
which are generally titled and privately owned. As could be seen from Table 1, based on 2003 Philippine
Land Use System Map which was extracted from 2003 NAMRIA Land Cover Map, the total for the forest
protected and forest plantation is barely 7.39 million. Since forests have been defined as lands with slope
higher than 18 percent, a look at the BSWM Slope Map shows the following:
Table 5. Area summary of slope map (Source: BSWM spatial data holding)
Slope (%) Description Area (has.) 0-3 Level to nearly level 6,638,097.92 3-8 Gently sloping to undulating 2,334,443.70
8-18 Undulating to rolling 4,834,515.09 18-30 Rolling to moderately steep 4,743,427.19 30-50 Steep 4,665,094.65 >50 Very steep 5,773,911.09
Rivers 466,704.69 Total 29,456,194.33
The total for the lands above 18 percent is 15,182,432.93 hectares which is very close to the
official estimates of forest at 15.88 million which are supposed to be non-alienable and non-disposable.
The country’s forest cover was 21 million hectares in 1900 and down to 7 million hectares by 2003.
Logging was initially responsible for forest denudation. But not all logged primary forests
become secondary forest. Soils classified as Ultisols, or low fertility acid soils, become grasslands,

unable to regenerate forest again. Logging opens up the area initially to shifting cultivation. It was a long
period of forest-fallow type of subsistence farming. Intensive cultivation follows later as population
pressure drives migration to these ecologically fragile areas. Agricultural intrusions have been made on
our forests, and that slopes higher than 18 degrees are being intensively cultivated at commercial level of
production. Resource degradation follows.
At the lowlands, we also have issues of agrarian reform lands being converted to non-agricultural
uses. The current political economy that establishes social preferences on land use results in the absence
of a clear and consistent land use policy (Llanto and Ballesteros, 2003). The sectors that demand land for
housing, business, and other non-agricultural uses are being favored and various laws have been enacted
for the reclassification of lands into other uses. We have for instance Presidential Decree 399 which
reserves strip lands along highways for human settlements and other non-agricultural uses. Republic Act
(RA) 7279 defines urban lands and potential urban lands and reserves them for urban development and
social housing purposes. RA 7916 identifies areas reserved for economic zone development and
prescribes the manner of identifying such areas. RA 7160 also known as the Local Government Code
provides the mechanism for apportioning agricultural lands at the local government level. RA 7357 and
7668 reserves certain lands for tourism development. RA 8370 or the Indigenous Peoples’ Rights Act
recognizes ancestral domains on lands or pre-conquest ownership of protected lands by tribal or cultural
communities. RA 7942 also known as the Mining Act provides that all natural resources particularly
minerals are owned by the State. There is a need to review these laws for a consistent and socially
acceptable land policy framework that supports the requirements for sustainable economic growth, equity,
and poverty alleviation.
Agricultural zoning. RA 8435 or the Agriculture and Fisheries Modernization Act (AFMA)
identifies a Network of Protected Areas for Agriculture and Agro-Industrial Development (NPAAAD).
Within this network of agricultural protected areas is the Strategic Agriculture and Fisheries Development
Zones (SAFDZ) or the best of the prime agricultural lands. These are not only highly suitable for the
production of agricultural crops but these are strategic in the sense that adjacent are post-harvest and agro-
processing facilities, markets, good roads, piers and airports, urban and commercial centers. Zoning
power is vested upon the local government and BSWM only provides the technical assistance in the
delineation. The law provides that SAFDZ has to be integrated with the comprehensive land use plan of
the local government. With local government elections being held every three years, a change of local
government could mean non-continuity of previous programs or change in priority or both.

In theory, SAFDZ’s are delineated but in practice, the implementation is left much to the hands of
the local government units whose resources are already spread too thinly for the sub-zones (crops,
livestock, fisheries) to be prioritized in development. As the criteria for delineation was national or too
broad in scope, and considering the wide variation of conditions among local government units, the
reason for delineating the SAFDZ was lost in the process, and the delineated SAFDZ’s were considered
of little consequence. For instance, the Strategic Crop Development Sub-zone encompassed all existing
cropped areas and could include marginalized grasslands. The basic concept of SAFDZ serving as the
center for agriculture and fisheries development could not be implemented; and putting into operation an
integrated development plan consisting of production, processing, investment, marketing, and human
resources development could not be achieved.
In the review and evaluation of the implementation of the AFMA, one main conclusion is that the
SAFDZ component was not implemented. The stipulations and the implementing rules and regulations
are beyond the capability of the concerned institutions and individuals to accomplish within the specified
time frame. In amending this law, there is a need to clarify the budget, objectives, and targets, as well as
institutional arrangements. The root cause of the non-compliance with the SAFDZ concept was
concluded to be the flawed process of delineating the SAFDZ. In fact, most local governments, thinking
that development funds would come in corresponding to the size of their SAFDZ’s, delineated almost the
whole of their NPAAAD as SAFDZ. The remaining NPAAAD was almost very small and nil. This
explained why some local governments included marginalized grasslands in their SAFDZ when it is
supposed to be the best of the prime agricultural lands.
Soil quality: soil fertility decline. Agricultural intensification through excessive use of fertilizers
and pesticides lead to polluted waters and degraded soils. The indicators are declining soil organic
matter, soil acidity, micronutrient deficiency, and general nutrient imbalance.
Since the Green Revolution of the mid-1960s characterized by government investments in
irrigation systems and modernization of agriculture through the use of high yielding varieties, inorganic
fertilizers, chemical pesticides, and other synthetic chemical inputs like the use of antibiotics and growth
hormones in the livestock sector, the Philippine agriculture has become predominantly conventional by
the 1980s. The general trend based on soil analysis covering the period 1970s to 1990s indicated very
active soil mining resulting in increased fertilizer inputs to sustain farm productivity. The period 1960-
1970 is characterized by the need to use nitrogen fertilizers only. The succeeding decade of 1970-1980
requires higher phosphorus fertilizer inputs in addition to nitrogen to maintain yield. The years 1980-

1990 requires not only nitrogen and phosphorus fertilizers but also increased potassium plus
micronutrients such as zinc for rice and magnesium for corn. The excessive use of urea fertilizers beyond
the normal ratio of 3N:1P contributed to the stagnation of rice and corn yields and nutrient imbalance in
the soil.
Table 6.The yearly trend and ratio of N, P, and K utilization (in metric tons per year).(Source BSWM)
Year N P K Ratio (N/P) 1980 224,866 53,784 55,782 4.18 1981 209,875 51,163 60,620 4.10 1982 232,840 56,139 57,435 4.10 1983 244,179 54,784 64,496 4.46 1984 180,569 45,372 38,617 3.99 1985 205,364 42,822 35,060 4.80 1986 298,323 42,771 46,267 6.97 1987 371,925 63,340 48,661 5.87 1988 372,118 77,471 54,934 4.80 1989 375,940 84,101 77,260 4.47 1990 394,767 46,188 68,512 8.55 1991 292,483 30,397 54,197 9.62 1992 331,537 36,025 61,628 9.20 1993 395,183 42,473 93,331 9.30 1994 396,751 46,920 38,944 8.46 1995 389,295 56,817 59,098 6.85 1996 462,776 65,055 90,346 7.11 1997 541,112 65,253 93,331 8.29 1998 408,778 53,299 81,740 7.67
By 2005, there has been a major shift in government policies owing to accelerated increases in
the prices of farm inputs beyond the reach of ordinary farmers and a host of other issues like land
degradation, climate change and biodiversity decline. Executive Order 481 was issued by President
Gloria Macapagal Arroyo in December 27, 2005 to promote and develop organic agriculture as a farming
scheme and to regulate the organic certification procedures. In 2010, the Philippine legislature enacted
RA 10068 also known as the Organic Agriculture Act. This is a significant milestone in the Philippine
agricultural production policy as we refocus on our natural resources than on our external resources with
which to establish our agricultural production systems. The national government recognizes that farming
methods which neglect the ecology of the soil, crops, and nature damage the farming environment and
inimical to our national interest.

Soil quality: soil losses through erosion. Hillyland and mountain agriculture contribute to soil
loss. The estimated soil loss for land uses and slopes in tons per year is as follows:
Table 7.Estimated soil loss for land uses and slopes (tons/year). (Source: Coxhead and
Shively, 1998)
Land Use Slope category (%)
18-30 >30 Total
Rice 15,750,000 5,250,000 21,000,000
Corn with fallow 217,250,000 240,190,000 457,340,000
Other agriculture 14,800,000 4,812,500 19,612,000
Non-agriculture (forest) - - 7,900,000
All uses - - 505,852,500
Participatory approaches on sustainable land management
As per FAO brochure (undated), sustainable land management (SLM) is crucial to minimizing
land degradation, rehabilitating degraded areas, and ensuring the optimal use of land resources for the
benefit of the present and future generations. SLM is based on four common principles:
Land use driven and participatory approaches
Integrated use of natural resources at ecosystem and farming system levels
Multi-level and multi-stakeholder involvement
Targeted policy and institutional support, including development of incentive mechanisms for
SLM adoption and income generation at the local level.
Muchena and Bliek (1997) discussed that land use planning aims to improve sustainalbe use and
management of resources and this implies that those who use and manage the resources are the key
players in the planning process. It is thus important that all the stakeholders are involved and the
participatory approach to land use planning is introduced and developed. SLM, improved technologies,
and improved economic performance are central to the goals of sustainable agriculture.
Muchena and Bliek further discussed that in the natural resource planning, resource inventories
provided basic information but are often not understood by the local non-technical staff who are not
familiar with the resource classification. The need for more participatory approach to land use planning is

premised on the fact that the land users will be the final decision makers and implementers of land sue
changes. There is a need to consider different spatial and temporal dimensions while analyzing resource
issues and searching for solutions. The individual user needs cannot be considered in isolation, especially
in more fragile areas, or with types of resource uses that have impacts on larger areas.
Intensification of land use, hand-in-hand with sustainable resource management increases agro-
ecosystem efficiency and reduces the pressure on rapid land degradation processes. Efforts on
participatory approaches are geared towards preserving and enhancing the productive capabilities of the
land in the cropped areas; and implement actions to minimize if not reverse land degradation. Guimaraes
(2009) quoting Cohen and Uphof stresssed participation as a process of empowerment of the deprived and
the excluded, in this case, the hillyland and mountain land migrants consisting basically of landless
subsistence farmers whose unsustainable farming practices exacerbate their marginal economic
conditions. He further quoted OECD that participation is built upon dialogue among the various actors
during which the agenda is jointly set, rather than having an externally set project agenda dominating.
Guimaraes described the ladder of participation typology to range from passive participation to functional
participation to interactive participation, and to self-mobilization at the highest level. This means that in a
participatory approach to SLM, the extension worker aims to empower the stakeholders to take decisions
independently of external institutions. This is quite a long process that starts from dependency to
“liberation” stage and attained through recognition by the farmers themselves that they are part of the
solution.
Best practices of land management/case studies
BSWM promotes the Soil Conservation Guided Farm for upland farming system. With the
Local Government Code vesting agricultural extension function to the Local Government Units, The
Guided Farms are collaborated with the local government who usually provide the funding requirements
in terms of the required inputs while BSWM provides the technical expertise.
The Project: The San Roque Soil Conservation Guided Farm was established in 2008 by the Soil
Conservation Division, BSWM in San Jose Del Monte City, Bulacan province. The area stood in what
was once a logged over area on the footslopes of the Sierra Madre mountain range. But because the soil
is classified as low fertility acid soil, it could not regenerate into secondary forest and the area remained
grassland with continuing human intrusions. It was reported during rapid rural appraisal of the area that
insurgents used to hide into these once-forested area even as late as the 1970’s. But by the time BSWM

started the Soil Conservation Guided Farm in 2008, a community was already established, and the
grasslands that emerged from the logged-over area was already privately titled and tenanted. It would not
be surprising that the farmer-beneficiaries were former insurgents themselves who returned to the fold of
the law. This is an advantage to the project because SLM requires value formation and we have farmer
cooperators who are not at dependency stage but are fast moving towards self-mobilization stage.
Population increase as well as the basic need to satisfy their economic well-being pushed
marginal and subsistence farmers to cultivate the fragile ecosystem. Nutrient mining and erosion due to
cultivation of slopes greater than 18 percent contribute to the pressures on the productive capacity of the
land already hindered by being inherently a low fertility acid soil. Loss of biodiversity, observed crop
yield decline, disturbances in the water cycle with increasing length of seasonal aridity or dry period were
among the impacts observed. Interestingly, community response recognized the need to be trained on
natural resource conservation and management and the farmer leaders themselves initiated contact with
BSWM to avail of technical assistance in the establishment of Soil Conservation Guided Farms. Initially
started with three farmer cooperators, the program now involves about two-thirds of the farmers in the
community, and their number is still growing.
The Project Components
1. Participatory rural appraisal (PRA) is the process of understanding people, their resources,
their socio-economic conditions, and a process of exploring their problems, their aspirations
and potentials, and the PRA is considered an integral part of the Soil Conservation Guided
Farms development framework. Crucial is not only the availability of the information to the
upland farmers but we have to develop their ability to analyze this information and act
accordingly. Usually, a final output is for farmers to map their current farm land use so that
they will be able to contrast with their final land use plan.
2. Topographic mapping. Since existing topographic maps are available from our national
mapping agency at 1:50,000 scale, the Soil Conservation Staff complemented a more detailed
farm topographic map with field topographic survey conducted at map scale of 1:20,000.
This provides a base map with which to indicate current land use and with which to put into a
map plan the envisioned Soil Conservation Guided Farm.
3. Land use planning and capacity building. Two forms of institutional building are vital to
capacitate the farmers on soil conservation and management practices – (1) farmer groups for
knowledge sharing; and (2) a consortium/council of stake holders for decision making. This
means also involving the extension staff of the City Agriculturist Office and the barangay

officials where the farming community belongs. The barangay is the lowest political unit and
consists of several sitios. This is easier said than done as it involves community immersion
for the BSWM Soil Conservation staff handling the project. The fundamental soil
conservation extension philosophy is that we could not come to a community educating them
on the solutions to their problems when they do not know that they have a problem in the first
place. Community immersion involves eating with the farmers, drinking with the farmers,
sleeping with the farmers, talking with the farmers on their agricultural production concerns
and issues. Soil conservation extension work involves huge investment in time with the
farmers since we are working with value formation and behavioral change, not just technical
and social issues relating to land degradation and SLM. When the farmer recognizes his
problem concerning productivity decline and that he is part of the solution by changing his
ways through SLM practices, can soil conservation efforts can move forward to its desired
goal.
4. Soil Fertility Management and Erosion Control. A major part of farm-level land use planning
is development of fertility enriching as well as soil conservation practices. Generally, a mix
of organic fertilization, crop rotation and diversification, terracing and strip cropping,
mulching, zero or minimum tillage, etc., are incorporated into the BSWM-guided farm plan.
The crop choices are dependent on land suitability, farmer’s choices and familiarity, market
demand, climatic risks and vulnerabilities, etc. The Local Government Unit provides the
seeds and seedlings and other forms of material assistance. Each farm plan is unique except
for the soil conservation technologies and SLM principles espoused.
5. Water Resources Management. Eventually, as the number of farmers practicing SLM grew,
they became more organized and coherent to initiate solutions to the land degradation issues
they faced. Recognizing climate change and prolonged dry season, the farmers themselves
initiated to negotiate with the local government unit and with BSWM for water resources
development in the area. Thus, they were able to put up a solar-powered small water
impounding project and a hydraulic ram pump irrigation system with funding and technical
assistance from the said government agencies. A hydraulic ram pump uses the energy of a
small stream falling into a small height to lift a small amount of that water, usually about 20
percent of the water that flows, to a much greater height.
Challenges and Key to Success.
1. Local community participation in all aspects of the program; and in-fact, the infrastructure
components were locally initiated based on their felt needs

2. Local government unit support in the soil and water conservation
3. Capacity building by BSWM on land use planning and principles of soil conservation
References
Abdullah, Alias Bin, Shoichi Ito, and KelaliAdhana.Undated.Estimat of Rice Consumption in Asian Countries and the World Towards 2050. [On-line]: http://worldfood.apionet.or.jp/alias.pdf
Coxhead, I. and G. Shively. 1998. Some economic and environmental implications of technical progress in Philippine corn agriculture: An economy-wide perspective. Journal of Agricultural Economics and Development, 26 (1-2): 60-90.
Guimaraes, J. P. de Campos. 2009. Working Paper on Participatory Approaches to Rural Development and Rural Povery Alleviation. Economic and Social Commision in Asia and the Pacific (ESCAP). [Online]: http://www.unescap.org/pdd/publications/poverty_and_development/participatory_rural.pdf
Food and Agriculture Organization of the United Nations. Undated. Sustainable Land Management. [On-line]: http://www.un.org/esa/sustdev/csd/csd16/documents/fao_factsheet/land.pdf
Llanto, Gilberto M. and Marife M. Ballesteros. 2003. Land Issues in Poverty Reduction Strategies and Development Agenda: Philippines. [On-line]: http://www3.pids.gov.ph/ris/dps/pidsdps0303.pdf
Muchena, Fredrick N. and Julie van der Bliek. 1997. Planning sustainable land management: Finding a balance between user needs and possibilities. ITC Journal 1997-3/4
National Rice Program. 2012. Food Staples Sufficiency Program 2011-2016. Department of Agriculture. Elliptical Road, Diliman, Quezon City.
World Bank. 2006. Sustainable Land Management: Challenges, Opportunities, and Trade-offs. Washington D.C.