suspended-sediment response to pulses in river flow and semidiurnal and fortnightly tidal variations...
TRANSCRIPT

Marine Chemistry, 43 (1993) 21-31 21 0304-4203/93/$06.00 © 1993 - Elsevier Science Publishers B.V. All rights reserved
Suspended-sediment response to pulses in river flow and semidiurnal and fortnightly tidal variations in a mesotidal estuary
Carlos Vale*, Carlota Cortes~o, Odete Castro, Ana M. Ferreira Instituto Nacional de Investiga, cdo das Peseas, Av. Brasilia, 1400 Lisboa, Portugal
(Received 26 September 1991; revision accepted 14 November 1992)
Abstract
The effects of the tidal regime and high river flows on the suspended sediment concentration field have been separated and the retention time of fluvial sediment has been determined. The study was carried out in the upper Sado estuary, Portugal, and included surveys at high and low tide in different semidiurnal tide ranges every month for 1 year, including contrasting freshwater discharge. DDT and its metabolites (DDD and DDE) were determined in the suspended sediment and in the whole soft tissues of oysters, and they have been used as tracers of the derived flood material in the upper estuary. The tide is responsible for the relatively slow relaxation time following a winter runoff event.
Introduction
The evaluation of residence time of river- sourced suspended sediment in the upper part of estuaries is important, since physical and che- mical characteristics of particles can affect the chemistry of estuaries namely by adsorption and absorption processes (Morris, 1990). The residence time of fluvial sediments in the mixing zone of estuaries can be difficult to determine because of the variability of the concentration field of suspended sediment (Avoine et al., 1981). Studies of meso and macrotidal estuaries have shown that the suspended sediment concen- tration field may vary on semidiurnal, fort- nightly and seasonal time scales (Allen et al., 1980; Castaing and Allen, 1981; Gelfenbaum, 1983; Lee, 1985; Vale and Sundby, 1987). Escape of sediments from macrotidal estuaries may occur principally during spring tides and high river flows (Castaing and Allen, 1981). Episodic events, such
* Corresponding author.
as runoff following a storm, can thus be used to document the impact of a sharp increase of fresh- water inflow and associated sediments in the upper part of an estuary (Nichols, 1977; Shubel and Pritchard, 1986).
The principal objective of this study was to separate the effects of the tidal regime and high river flows on the suspended sediment concen- tration field, and to determine the retention time of fluvial sediment in a mesotidal estuary. The study was carried out in the upper Sado estuary, Portugal, and included surveys at high and low tide in different semidiurnal tide ranges every month for one year, including contrasting freshwater discharge. DDT, DDD and DDE were used as tracers of the fluvial sediment in the upper estuary.
Characteristics of the Sado estuary
The Sado estuary comprises a wide bay and a narrow channel through which the Sado River enters (Fig. 1). The bay is about 5 km wide and

22 C. Vale et al./Marine Chemistry 43 (1993) 21-31
b a /
\
£? D ?
O p p ~
SrOARy
% h ! I Atc6cer " 1 . : d o
• Sol
q~:.. . . . .
N ~oo, c
5Kin I I
Fig. 1. The Sado River estuary: locations of the sampling stations.
20 km long and has a complex topography. The average depth is about 10 m. The narrow chan- nel, which constitutes the upper estuary, is 35 km long and 700 m wide, and the average depth is about 5 m. The tides are semidiurnal with ampli- tudes that range from about 1 m at neap tide to about 3.5 m at spring tide. The tidal effect reaches 70 km landward of the mouth of the estuary. The hydrodynamics of the narrow chan- nel are relatively simple and may be described by a one-dimensional transport model (Neves, 1986). The bottom sediment in the bay consists of a mixture of fluvial and marine-derived mate- rial. The upper channel is floored with sand but has abundant areas of mud deposits in the inter- tidal zone (Vale and Sundby, 1982; Quevauviller, 1988). The intertidal areas of the upper channel contain several natural grounds of the oyster Crassostrea angulata.
The Sado River, which drains an area of 6700 km 2, is the principal source of fresh water to the
estuary. Most of its tributaries have irrigation dams. In spite of this, the Sado River discharge normally shows a pronounced dry-season/ wet-season signal. The mean monthly flow varies from 1 m 3 s -1 in July/August to 60 m 3 s -1 in February.
M e t h o d s
Three stations in the upper Sado estuary and one in the Sado river (Fig. 1) were occupied monthly between November 1987 and Decem- ber 1988, and in July 1990. Each survey included both a high and a low tide. The series of surveys included a range of tidal amplitudes from 1.6 to 3.1 m, and situations of very contrasting river flows. In each survey, water samples were col- lected at the surface and at 1 m above the bot- tom. At station 3, measurements of the suspended sediment concentration were also

C. Vale et al./Marine Chemistry 43 (1993) 21-31 23
2so-I
200 -
I
"~ 150
o
100
n, ,
50,
0 O N D J F M A M J J A S
160
!/.0
;20 i
100 E
80 0,,. U')
60
z.0
20
I a_ o i i !
0 N D
Months
Fig. 2. Daily measurements of Sado River flow (m 3 s 1) at Gamitinha (source: Caudais Ano Hidrolbgico 1987/88, Hydraulic Services) and monthly observations of the concentration of river suspended matter (mg 1-1) at S. RomSo (station 0).
carried out over semidiurnal tidal cycles during a spring tide in July 1985 and a neap tide in May 1987. Oysters, of approximately 5 cm length were collected monthly at stations 2 and 3 between November 1987 and December 1988.
To determine the concentration of suspended matter, 0.3-1.0 1 subsamples were filtered by suction through preweighed 0.4 m Nuclepore filters (Nuclepore, Pleasanton, USA). The filters were dried for 15 h at 60C, and reweighed. For DDT analysis of the suspended matter, 20 1 of water were filtered under N2 pressure through glass fiber Gelman A/E filters (Gelman, Ann Arbor, MI, USA). Filters were previously pre- treated by hexane extraction and subsquent heat- ing at 350C. The dry suspended matter samples were soxhlet extracted with n-hexane for 16 h, the extracts were purified on a Florisil column (Floridin, USA), and DDT and its metabolites were determined using a Hewlett-Packard 5880A gas chromatograph (Hewlett-Packard, PA, USA) (Castro et al., 1990). Oysters were dis- sected and soft tissue, composite samples of 25 individuals were homogenized, extracted with n- hexane for 6 h, and the residues of DDT com- pounds determined following a similar analytical
procedure. To identify and quantify DDT and its metabolites EPA standards were used. In this paper DDT means the sum of pp DDT, pp D D D and pp DDE. Salinity values were measured in situ using a YSI salinometer (Simp- son-Electric, Elgin, IL, USA). River flow data were provided by the Hydraulic Services.
Results
River input
River flow and suspended sediment concen- trations were monitored at station 0, approxi- mately 10 km upstream of the limit of the tidal influence. Both the river flow and the suspended sediment concentration showed a pronounced seasonal variation. During most of the year, the flow varied between 0.5 and 5 m 3 s -1 but during a short period in winter the flow reached 248 m 3 s -1 (Fig. 2). The concentration pattern of suspended sediment was similar. During low flows the concentration ranged from 5 to 22 mg 1 -l , but during the high flows in winter it reached 144 mg 1-1 (Fig. 2).
A linear relationship between the logarithm of

24
S P M ( m 9 . 9 -1 ) IlQQO =
o o
Q
f n t~ D o
o
t
Q.| 1 . . . . . . . . . . . . . " ' " " ' . . . . . . t 11o
R s v e r f l o w ( r n ~ s - 1 )
Fig. 3. Relationship between the suspended particulate mat- ter (SPM) concentration (mg 1-1) and river flow (rn 3 s - l ) in the Sado River.
suspended sediment concentration (SPM, mg 1-1) and the logarithm of river flow (F, m 3 s -1) was found
logSPM = 0.411ogF+ 0.97n = 20; r = 0.61;
e < 0.01 (1)
This relationship (Fig. 3) indicates that the concen- tration of suspended sediment in the river responds within a broad range of values to a sharp increase of water flow. Because high water flows and sus- pended sediment are sporadic and brief (Fig. 2), the annual discharge of fluvial suspended sediment to the estuary is difficult to estimate on the basis of monthly observations. We therefore estimated the daily suspended sediment discharge by multiplying the daily measured flow by the SPM concentration calculated using Eq. 1. The annual input estimated this way amounts to about 15 × 103t. As observed in many other runoff-sensitive riverine systems (Schubel and Pritchard, 1986) the quantity of sedi- ment arriving in the Sado estuary was quite irre- gular over the year (Fig. 4). The suspended sediment discharge corresponding to the three peaks in river flow in December and January amounted to about 90% of the total input.
The suspended sediment distribution in the upper estuary
The 13 synoptic surveys of the suspended sedi- ment distribution in the upper Sado estuary
C. Vale et al./Marine Chemistry 43 (1993) 21-31
o - 1.5
t~ o
1
o.s U3
N J
, , , , , T , , ,
F M A M J J A S 0 M o n t h s
Fig. 4. Daily suspended sediment influx (103 t) from the Sado River over 1 year; values were estimated using equa- tion log SPM = 0.41 log F + 0.97.
showed that the concentration of suspended sediment in the estuary varies with the ampli- tude of the tide, with the semidiurnal fluctuation of the tide, and with the freshwater inflow. A maximum turbidity zone, defined as an area with suspended sediment concentration greater than 50 mg 1-1, was always present. During most of the surveys this zone was centered near the upper limit of the salt intrusion.
Fluctuations of the suspended sediment concentration with the tidal amplitude
We can use the observations during low river flows to isolate the effect of the tide on the sus- pended sediment distributions. Distributions of the suspended sediment concentration in the upper estuary, corresponding to low and high tide during neap, intermediate and spring tides during the periods of low-to-moderate river flow, are shown in Fig. 5. The neap-spring variation of the suspended sediment distribution can be seen by looking at the area where the concentration is more than 50 mg 1-1 . The area included in the turbidity maximum increased with the tidal ampli- tude and covered the entire channel at the low tide of spring tide. The high tidal amplitude distri- bution was different at high tide. The turbidity maximum was then more confined to the bottom.
Fluctuations of the suspended sediment concentration with the semidiurnal tide
The suspended sediment concentration was always higher at low tide than at high tide,

C. I/ale et al./Marine Chemistry 43 (1993) 21-31 25
Low-t ida River
0 .1 5 2 1.2 "3 stations 0 ' "J I ~ %
SO t ;..-.1-;.. .-.. • .,r" • "....:.: ".1". / i • .'":.:" ..:':: / I
1
I O 15 I0 I 20 I
~ :i:!i'E:i?'ii:i!i::h'" ' 10
0 ' 0 I 5 I0 I ZOI
~l::.:.:.;r:.:.~:::;t:::- . . . '~ i • .:.:. :::::::::::::::::::::::::
1
0 t 0 I 5 IO I 20 I
150 / t ":':': " ..:.. I -
o . . . . . . . . . ' !z
1
River High-t ide
0 o . _ ~ ,o,o 2 313 0 sta, ions t ,:. ,.: ::: j / "
:::::: ::: I /
JUL. 90 1.6m
I o is io zo, i ~3o
t _ l::':t::
26 C. Vale et al./Marine Chemistry 43 (1993) 21-31
E r
Q .
0
1
2
3
4
5
9 :0 i; 12 13 !Z, ',5 ;6 17 :8 i$ hours l I I 1 I 1 I I I l I
f e e ~ • < 2 5 e • ~ i
. k k / . ,so, .
L) I0 II 12 13 I~ 15 16 17 18 19 I t m 1 i I I I | l
0-
. \ . . 5-
20 hours i
Fig. 6. Diurnal fluctuations of the suspended sediment con- centration (mg 1 -I) in the upper channel (station 3) of the Sado estuary during a neap tide (top) and spring tide (bottom).
with the exception of the landward most station. The semidiurnal fluctuation is important, parti- cularly during spring tide. For example, during the April spring tide the SPM concentration ran- ged from 50 to 469 mg 1-1 at low tide, while at high tide the interval was much narrower (12-75 mg 1-1) (Fig. 5). The lower suspended sediment concentrations at high tide are commonly observed in estuaries. This can be attributed either to asymmetry in the current velocity over the tidal cycle which results, at high tide, in a longer time period for the settling of suspended material on the bottom than at low tide (Postma, 1967), and to mixing with less turbid water. Presumably, in the lower part of the Sado chan- nel, mixing with inside-bay-water containing a smaller quantity of suspensions is the main mechanism occurring during the higher ampli- tude tides. Between low tide and high tide the isohalines were displaced landward, producing a tidal excursion of 5-10 km. The tidal excur- sion of the suspended sediment concentration
isolines was more extensive, presumably due to the loss of particles from the water column by settling to the bottom. This would explain why, at high tide, the highest concentration of sus- pended sediment was observed near the bottom (see the 50 mg 1-1 isoline). The diurnal variation at the station near the upper limit of the estuary did not always reflect the high tide-low tide pattern of the other stations. Measurements landward of the salt intrusion limit showed higher suspended sediment concentration dur- ing the high tide. Similar observations have been made in the Tagus estuary and have been interpreted as a landward advection of sediment- rich water (Vale and Sundby, 1987).
The semidiurnal fluctuation of suspended sedi- ment was investigated at station 3 during tides of 1.4 and 2.7 m amplitude (Fig. 6). The overall level of sediment in suspension agreed with the tidal-amplitude-dependent pattern established by the synoptic surveys, as did the difference between low and high tide. At high tidal ampli- tudes, the suspended-sediment variation over the semidiurnal tidal cycle was greater than the over- all variation over the neap-spring cycle.
Variation of the suspended sediment distribution with the river flow
During this study, the river discharge of water and suspended sediment showed pronounced peaks during a few weeks in winter. The result- ing spatial distribution of suspended sediment and salinity at low tide and high tidal ampli- tudes between November 1987 and April 1988, and at low and high tide in February, is shown in Fig. 7.
The position of the 5%o isohaline in the November, December and January surveys showed that the leading edge of salt water was displaced seaward with increasing freshwater discharge. During low river flows, this isohaline (5%o) moved landward and seaward in response to fluctuation of the tide (Fig. 5). The February observations indicate the same type of variation, but the salinity gradient was steeper at high tide.

C. Vale et al./Marine Chemistry 43 (1993) 21-31 27
Low-t ide River
0 0 q ,o 2z0 ~ stQtions
0] :::i:" - ========================= 1 NOV.
o , ' .-:.::::::::::::::::i:i:!:::: .::::::'"DEC
r-
E3
O - ' , jO l ~t '""'""'""'"""'"" "'"":'"'" "":'."':.".".':.".;"':." ::i:::::~ 5
1 JAN.
o . ' - , . ~ . . . L~ ;o,
~t ====================== """ 1 FEB.
High-t ide River
0 - 1 2 3 stot ions I U 51 I0 ZOl I
it 1 FEB.
i 0 1 5 1 0 I 20 I
===================================
I MAR.
SPM ( rag[ -1 )
[ ' - - -7 < 50 I 0 5 I0 j 201
i t ::!:i!i:i . . . . . ~ i " i : ~ 50 - 200 ~ 200 - 8 o o
APR. ~ >800
Fig. 7. The distribution of suspended sediment (mg 1 -l) at a river station along the upper Sado estuary at low tide (and high tide in February) during tidal amplitudes greater than 2.7 m, following a river flood in December/January. The 0, 10, 20 and 30%0 salinity isohalines are indicated by broken lines.
However, the tidal excursion of the 5%0 isohaline was similar to excursion at low river flows. The large flux of fresh water with its high sediment load caused several modifications in the sus- pended sediment distribution: the amount of sediment in suspension increased, the center of the turbidity maximum was displaced 16 km seaward, and the suspended sediment distribu- tion became vertically stratified with near-bot- tom concentrations reaching 1500 mg 1-1. In spite of these changes, observations in February show that the low tide-high tide pattern was maintained.
The sequence of spacial distributions pre- sented in Fig. 7 illustrates how the estuary recovers from the peak in the runoff. In Novem- ber, representative of low fiver flows, suspended sediment was trapped in a turbidity maxi- mum centered on station 1 at the limit of the salt intrusion. When river flow increased, the suspended sediment was trapped in a deeper part of the channel about 16 km seaward of station 1. As the freshwater flow decreased to normal values, the center of the turbidity maxi- mum moved landward again to the previous position.
28 C. Vale et al./Marine Chemistry 43 (1993) 21-31
Retention time of fluvial sediment in the upper estuary
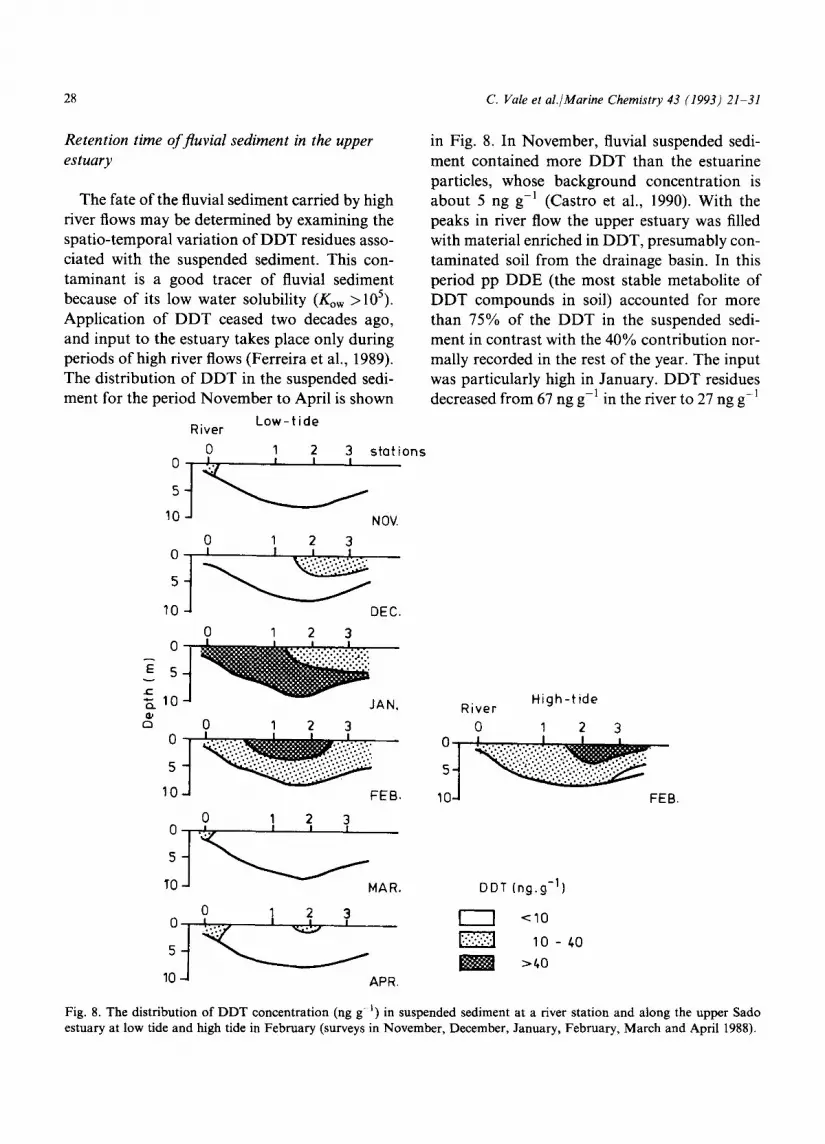
The fate of the fluvial sediment carried by high fiver flows may be determined by examining the spatio-temporal variation of DDT residues asso- ciated with the suspended sediment. This con- taminant is a good tracer of fluvial sediment because of its low water solubility (Kow >105). Application of DDT ceased two decades ago, and input to the estuary takes place only during periods of high river flows (Ferreira et al., 1989). The distribution of DDT in the suspended sedi- ment for the period November to April is shown
L o w - t i d e River
0 1 2 3 s ta t ions
NOV.
0 1 2 3
o s ~ J ::":::::'::::":" 10 DEC.
0 1 2 3 o d ~ ~ . . . - - ' . . . . ' --
E 5 t -
~. 10 JAN,
o 0 1 2 3
t . . . . . . . . 10 FEB.
in Fig. 8. In November, fluvial suspended sedi- ment contained more DDT than the estuarine particles, whose background concentration is about 5 ng g-1 (Castro et al., 1990). With the peaks in river flow the upper estuary was filled with material enriched in DDT, presumably con- taminated soil from the drainage basin. In this period pp DDE (the most stable metabolite of DDT compounds in soil) accounted for more than 75% of the DDT in the suspended sedi- ment in contrast with the 40% contribution nor- mally recorded in the rest of the year. The input was particularly high in January. DDT residues decreased from 67 ng g-1 in the fiver to 27 ng g-1
River High- f ide
0 1 2 3
ij . 1 FEB.
0 1 2 3
MAR. DDT (ng.g -11
0 1 2 3 t . . . , , , ~ t , I I < 1 0
, n t ~ ~ lo-4o m >40 10 APR.
Fig. 8. The distribution of DDT concentration (ng g-l) in suspended sediment at a river station and along the upper Sado estuary at low tide and high tide in February (surveys in November, December, January, February, March and April 1988).

C. Vale et aL/Marine Chemistry 43 (1993) 21-31 29
Table 1 Concentrations (ng g-1 ) of DDT and pp~DDE in the bottom sediments of the upper channel of the Sado estuary (from 5 km upstream of station 1 to 33 km downstream)
Station
1 2 3
Kilometers -5 -2 -0.6 0 1.5 15 23 28 33 Upstream/ downstream DDT 4 1 4 2 2 < 1 < l < l < I pp'DDE 2 < 1 2 1 1 < 1 < 1 < 1 < 1
in the estuary. The distribution in February was different, and the highest residues were found in surface particles in the middle channel. In March the values decreased th roughout and in April they had reached the baseline level. The concen- trat ions of D D T and pprDDE in the bo t tom sediments collected along the upper estuary in April 1987 are presented in Table 1.
After a period of low river discharge (river flows in 1987 and 1988 were similar), the bo t tom sediment contained low residues of DDT, parti- cularly downst ream of station 1 (<1 ng g-I) .
These results reinforce the idea that suspended sediment t ranspor ted on the floods, in part icular the small particles, leaves the upper estuary in about 2 months.
Recording of fluvial sediment discharge in oysters
The discharge of fluvial pp 'DDE-con tami - nated sediment in the upper estuary in winter may also be recorded in the whole soft tissues
2.8-
of oyster C. angulata. Seasonal variat ion of p p ' D D E concentrat ions in oysters f rom stations 2 and 3 showed pronounced peaks in January and February , respectively (Fig. 9). Because con- centrat ions are expressed on a lipid weight basis, increases recorded in winter reflect the entrance of ppIDDE-contamina ted particles. The peak delay between the two stations indicates the travel of the contaminated fluvial sediment along the channel.
D i s c u s s i o n
Most of the year, the dynamics in the upper Sado estuary are dominated by the tide. River sediment input is small and suspended sediment in the estuary reflects mainly tidal resuspension f rom the bed. Suspended part iculate mat ter (SPM) concentrat ions rise and fall as a function of the semidiurnal and the fortnightly tidal cycle. A zone o f maximum SPM concentrat ions is located in the upper reaches of the estuary.
= 1.8" ~(. 2 o
a 1
W
a 0.8
0 i i i i i | i i
M o n k s
Fig. 9. Seasonal variation of pp DDE concentrations on a lipid weight basis (g g-I) in whole soft tissues of oysl~er C. angulata from station 2 and station 3 from the Sado estuary.

30 C. Vale et al./Marine Chemistry' 43 (1993) 21-31
This pattern is similar to that observed in the Tagus, a mesotidal estuary (Vale and Sundby, 1987). A pulse in river runoff changes the situa- tion dramatically in agreement with responses recorded in other estuaries following a river flood (Nichols, 1977; Castaing and Allen, 1981; Schubel and Pritchard, 1986): as flood energy dissipates throughout the upper estuary, it breaks down the normal structure of salt intru- sion, changes the position of the turbidity max- imum seaward, and transports sediment seaward.
Greater changes took place in the upper reaches of the estuary when the moving mass of fresh water pushed the salt intrusion sea- ward. The seaward displacement of the conver- gence position may be interpreted as net transport, in the upper part, changing from land- ward to seaward. In the Gironde, a macrotidal estuary, Castaing and Allen (1981) showed that river flood, by pushing the turbidity maximum close to the mouth of the estuary, promotes the escape of sediments to the sea, which may be particularly significant if river flood occurs dur- ing spring tide. In the Sado, the center of the turbidity maximum was maintained within the channel, which indicates that the magnitude of the flood was not enough to produce an abrupt export of a large amount of sediment to the lower estuary. Using DDT as a tracer, one may conclude that flood material is only temporarily trapped, being moved in progressive steps towards the lower estuary. Owing to the slow desorption rate of DDT compounds from the particles (Picer et al., 1977) the progressive reduction of their concentration in the sus- pended load is likely to result from the escape of small particles. DDT-contaminated particles took about 2 months to cross the upper estuary, when sediment distribution returned to its nor- mal state, which may be interpreted as the time for recovery. The occurrence of pp 'DDE concen- tration peaks in oysters, from grounds distanced 10 km, at separated months corroborates the slow passage of fluvial contaminated sediment along the upper channel and its escape. In
Rappahannock estuary, a microtidal funnel- shaped estuary, Nichols (1977) reported that sediment transport returned to normal rates within 2 weeks of a major storm event. The rela- tively slow relaxation time in the Sado may also be attributed to the effect of the tide because, despite the large volume of freshwater inflow, the channel continued to be filled with salty water, mainly during spring tide. Consequently, flood-borne material was mixed with the resus- pended sediment, the tide acting like a pump that attenuated abrupt input modifications and pro- gression of flood material along the upper estu- ary (Postma, 1967). Low concentration of DDT in the bottom sediment of the channel, and in the suspended load and in the oysters' tissues after recovery indicates the dispersion of the flood material. Using kepone as a sediment tracer in the James estuary, Nichols (1986) also came to conclusions about the dispersal sediment regime in the upper estuarine zone.
It seems, therefore, that the upper Sado estu- ary does not assimilate the new-freshwater mate- rial transported every winter by the runoff, but the bulk of flood load is retained for a relatively long period owing to the effect of the tide.
References
Allen, G.P., Salomon, J.C., Bassoulet, P., Du Penhoat, Y. and DeGrandpre, C., 1980. Effects of tides on mixing and suspended sediment transport in macrotidal estu- aries. Sediment. Geol., 26: 69-90.
Avoine, J., Allen, G.P., Nichols, M., Salomon, J.C. and Larsonneur, C., 1981. Suspended-sediment transport in the Seine estuary, France: effect of man-made modifica- tions on estuary-shelf sedimentology. Mar. Geol., 40: 119 137.
Castaing, P. and Allen, G.P., 1981. Mechanisms controlling seaward escape of suspended sediment from the Gironde: a macrotidal estuary in France. Mar. Geol., 40: 10l 118.
Castro, O., Ferreira, A.M. and Vale, C., 1990. Transport and distribution of DDT and PCB in the upper Sado estuary, and accumulation in oysters: importance of run- off. In: G. Angeletti and A. Bjorseth (Editors), Organic Micropollutants in the Aquatic Environment. Kluwer, London, pp. 80 88.
Ferreira, A.M., Castro, O.G. and Vale, C., 1989. Factors controlling PCB and DDT variations in the upper
