survival prediction in high-grade gliomas using ct perfusion imaging
TRANSCRIPT
Western UniversityScholarship@Western
Medical Biophysics Publications Medical Biophysics
4-11-2015
Survival prediction in high-grade gliomas using CTperfusion imaging.Timothy Pok Chi Yeung
Yong Wang
Wenqing He
Benedetta Urbini
Roberta Gafà
See next page for additional authors
Follow this and additional works at: http://ir.lib.uwo.ca/biophysicspub
Part of the Medical Biophysics Commons
Citation of this paper:Yeung, Timothy Pok Chi; Wang, Yong; He, Wenqing; Urbini, Benedetta; Gafà, Roberta; Ulazzi, Linda; Yartsev, Slav; Bauman, Glenn;Lee, Ting-Yim; and Fainardi, Enrico, "Survival prediction in high-grade gliomas using CT perfusion imaging." (2015). MedicalBiophysics Publications. Paper 67.http://ir.lib.uwo.ca/biophysicspub/67

AuthorsTimothy Pok Chi Yeung, Yong Wang, Wenqing He, Benedetta Urbini, Roberta Gafà, Linda Ulazzi, SlavYartsev, Glenn Bauman, Ting-Yim Lee, and Enrico Fainardi
This article is available at Scholarship@Western: http://ir.lib.uwo.ca/biophysicspub/67
CLINICAL STUDY
Survival prediction in high-grade gliomas using CT perfusionimaging
Timothy Pok Chi Yeung1,2,6• Yong Wang2
• Wenqing He4• Benedetta Urbini5 •
Roberta Gafa10• Linda Ulazzi10
• Slav Yartsev1,3,6• Glenn Bauman1,3,6
•
Ting-Yim Lee1,2,3,7,8• Enrico Fainardi9 • The Project of Emilia-Romagna Region on
Neuro-Oncology (PERNO) Study Group
Received: 1 September 2014 / Accepted: 2 April 2015
� Springer Science+Business Media New York 2015
Abstract Patients with high-grade gliomas usually have
heterogeneous response to surgery and chemoirradiation.
The objectives of this study were (1) to evaluate serial
changes in tumor volume and perfusion imaging pa-
rameters and (2) to determine the value of these data in
predicting overall survival (OS). Twenty-nine patients with
World Health Organization grades III and IV gliomas un-
derwent magnetic resonance (MR) and computed tomog-
raphy (CT) perfusion examinations before surgery, and 1,
3, 6, 9, and 12 months after radiotherapy. Serial measure-
ments of tumor volumes and perfusion parameters were
evaluated by receiver operating characteristic analysis, Cox
proportional hazards regression, and Kaplan–Meier sur-
vival analysis to determine their values in predicting OS.
Higher trends in blood flow (BF), blood volume (BV), and
permeability-surface area product in the contrast-enhanc-
ing lesions (CEL) and the non-enhancing lesions (NEL)
were found in patients with OS \ 18 months compared to
those with OS C 18 months, and these values were sig-
nificant at selected time points (P \ 0.05). Only CT per-
fusion parameters yielded sensitivities and specificities of
C70 % in predicting 18 and 24 months OS. Pre-surgery BF
in the NEL and BV in the CEL and NEL 3 months after
radiotherapy had sensitivities and specificities [80 % in
predicting 24 months OS in patients with grade IV glio-
mas. Our study indicated that CT perfusion parameters
were predictive of survival and could be useful in assessing
early response and in selecting adjuvant treatment to pro-
long survival if verified in a larger cohort of patients.
Keywords High-grade gliomas � Glioblastoma
multiforme � Computed tomography � CT perfusion �Overall survival
A complete list of the members of the PERNO study group appears in
the ‘‘Appendix’’.
Electronic supplementary material The online version of thisarticle (doi:10.1007/s11060-015-1766-5) contains supplementarymaterial, which is available to authorized users.
& Ting-Yim Lee
1 Department of Medical Biophysics, Western University,
London, ON, Canada
2 Robarts Research Institute, P.O. Box 5015, 100 Perth Drive,
London, ON, Canada
3 Department of Oncology, Western University, London, ON,
Canada
4 Department of Statistical and Actuarial Sciences, Western
University, London, ON, Canada
5 Oncology Unit, Specialized Medical Department, Azienda
Ospedaliero-Universitaria, Arcispedale S. Anna, Ferrara,
Italy
6 London Regional Cancer Program, London Health Sciences
Centre, London, ON, Canada
7 Department of Medical Imaging, Western University,
London, ON, Canada
8 Lawson Health Research Institute, London, ON, Canada
9 Neuroradiology Unit, Department of Neurosciences and
Rehabilitation, Azienda Ospedaliero-Universitaria,
Arcispedale S. Anna, Ferrara, Italy
10 Section of Pathology and Biomolecular Diagnostics,
Department of Morphology, Surgery and Experimental
Medicine, University of Ferrara, Ferrara, Italy
123
J Neurooncol
DOI 10.1007/s11060-015-1766-5
Introduction
High-grade gliomas account for over 70 % of all malignant
brain tumors, and survival remains dismal even after max-
imal safe resection, radiotherapy, and temozolomide che-
motherapy. The median survival is typically 12–15 months
and 2–5 years for patients with World Health Organization
(WHO) grade IV and grade III gliomas, respectively [1].
However, there is considerable heterogeneity in patients’
treatment response. At present, widely accepted prognostic
factors of survival in high-grade gliomas are WHO grade,
extent of surgical resection, age, and performance status [2].
Molecular biomarkers, such as isocitrate dehydrogenase 1
(IDH1) mutation status, O6-methylguanine-DNA-methyl-
transferase (MGMT) methylation status and 1p19q loss of
heterozygosity are also recognized as prognostic biomarkers
in these patients [3].
Magnetic resonance (MR) is the standard imaging
method for assessing high-grade gliomas [4]. For radio-
graphic assessment, the typical MR protocol includes a T2-
weighted or fluid-attenuated inversion recovery (FLAIR)
MR and a gadolinium-enhanced T1-weighted MR [5]. The
gadolinium-enhanced T1-weighted MR images depict the
contrast-enhancing lesion (CEL) with disrupted blood–
brain barrier. The T2-weighted or FLAIR MR images de-
tect regions of T2 hyperintensity that are suspicious of
tumor infiltration and vasogenic edema. This T2 hyperin-
tense region is the non-enhancing lesion (NEL).
In addition to anatomical imaging, functional imaging,
such as perfusion imaging, provides quantitative information
regarding tumor biology that may be related to patient
prognosis [6]. Measurements of tumor blood flow (BF),
blood volume (BV), and permeability obtained by perfusion
imaging have been shown to correlate with WHO grade [7,
8], histopathologic marker of tumor angiogenesis (e.g. mi-
crovessel density) [9,10], and outcome [11–13]. Most per-
fusion imaging studies that evaluated the relationships
between tumor perfusion parameters and overall survival
(OS) have focused on MR perfusion imaging at a single time
point [14] or two time points [15]. CT perfusion has not been
studied extensively despite the ubiquity of CT scanners [16].
However, CT perfusion can help distinguish between high
and low grade gliomas [7, 17–19] and between tumor re-
currence and radiation necrosis [20, 21]. Therefore, CT
perfusion should be considered as a potentially valuable
perfusion imaging modality in neuro-oncology. To our
knowledge this study is the first to investigate serial changes
in tumor BF, BV, and permeability-surface area (PS) in the
CEL and NEL of patients with high-grade gliomas for up to a
year after radiotherapy. In this analysis, we used these data to
evaluate the prognostic value of CT perfusion imaging in
predicting OS of these patients.
Materials and methods
Patient population
This study was conducted in compliance with the institu-
tional research ethics committee, and informed consent was
obtained from patients. Patients with suspected WHO
grade III and IV gliomas were prospectively recruited prior
to surgery. Exclusion criteria were (1) prior diagnosis or
therapy of a brain lesion, (2) clinically unstable, (3) con-
traindications to contrast materials, and (4) contraindica-
tions to MR imaging such as metallic implants,
claustrophobia, and obesity. Our study included 29 patients
with high-grade gliomas. The median age at diagnosis was
61 (range 31–81) years. Patients underwent serial MR and
CT perfusion examinations prior to surgery and one, three,
six, nine, and 12 months after radiotherapy. After surgery,
genomic DNA was extracted from formalin-fixed paraffin-
embedded tissue samples using a DNA extraction kit
(Qiagen, Germany) after micro-dissection. MGMT pro-
moter methylation status was determined for WHO grade
IV glioma patients by methylation specific polymerase
chain reaction after prior DNA bisulfite modification [22].
For WHO grade III glioma patients, IDH1 mutation was
assessed by exon 4 direct DNA sequencing [23]. Primer
extension sequencing was performed with the use of the
Big Dye Terminator v1.1 Cycle Sequencing Kit (Applied
Biosystems, Foster City, CA, USA). Sequences were de-
termined using the ABI PRISM 310 Genetic Analyzer
(Applied Biosystems) and the Sequencing analysis 5.2
software (Applied Biosystems).
All patients underwent surgery followed by radiotherapy
(60 Gy in 30 fractions, N = 28; 45 Gy in 15 fractions with
stereotactic boost of 24 Gy in 3 fractions, N = 1). Twenty-
six patients received concurrent and adjuvant temozolo-
mide chemotherapy. Six patients underwent second surgi-
cal resection after radiotherapy, and corticosteroids were
administered to patients before the second surgery. WHO
grade IV patients were also given Fotemustine at the time
of progression. The median follow-up was 18.2 (range,
4.7–60.4) months.
MR and CT perfusion examinations
MR images were acquired with a 1.5 T Signa HDXT (GE
Healthcare, Milwaukee, WI) or a 1.5 T Achieva scanner
(Philips Medical Systems, Best, The Netherlands). The MR
protocol included the following sequences: axial T1-
weighted spin-echo, axial T2-weighted spin-echo or axial
FLAIR, coronal FLAIR, and post-gadolinium axial T1-
weighted spin echo.
All CT perfusion studies were performed using a mul-
tidetector-row CT scanner (Lightspeed VCT, GE) that
J Neurooncol
123
covered eight 5-mm sections of tissue. Ten patients were
imaged with a one-phase CT perfusion protocol while 19
patients were imaged with a two-phase CT perfusion pro-
tocol. For the one-phase protocol, a bolus of non-ionic
contrast (Iomeron, Bracco Imaging, Konstanz, Germany;
350 mg I/ml, 40 ml) was injected at a rate of 4 mL/s. A
cine scan of 50 s duration was initiated at 5 s after the
injection (100 mA, 80 kV, 1 rotation/s), and the images
were reconstructed at 0.5 s intervals. For the two-phase
protocol, images were reconstructed at 0.5 s intervals in the
initial 44 s cine scan, followed by eight additional axial
images at 15 s intervals for another 105 s. The total scan
duration was 150 s.
Image analysis
Maps of BF, BV, and PS were computed using CT Per-
fusion 4D (GE Healthcare) [24, 25]. Averaged CT images
were produced by averaging the cine CT images of the
same sections. MR images were rigidly registered to the
averaged CT images using 3D Slicer [26]. A radiologist
with 8 years of experience delineated the entire contrast-
enhancing lesion (CEL) and the entire non-enhancing le-
sion (NEL). The NEL was the peritumoral T2 hyperintense
region outside the CEL, central necrosis, and surgical
cavity. Thus, the NEL included peritumoral edema and
post-radiation T2 changes around the CEL. Mean volume,
BF, BV, and PS in both the CEL and NEL were used for
analysis.
Statistical analysis
Statistical analysis was performed using SPSS (IBM�
SPSS�, version 21.0, Chicago, IL) and R (http://www.r-
project.org/) to evaluate whether the imaging parameters
were candidate biomarkers of OS. Patients were stratified
by their OS using 12, 18, and 24 months OS as endpoints.
Patients were designated as ‘‘long-term survivors’’
(OS C 18 months) or ‘‘short-term survivors’’ (OS \18 months) based on the 18 months OS endpoint. The
imaging parameters in patients with short-term versus
long-term OS were examined longitudinally. The Friedman
test followed by the Wilcoxon signed-rank test were used
for longitudinal comparisons within-group, and the Mann–
Whitney U test examined the differences between groups.
Only imaging data from pre-surgery, one, three, and
6 months post-radiotherapy were included for analysis due
to patient dropouts resulting from deaths or complete re-
gression of tumors at nine and 12 months post-
radiotherapy.
For the entire cohort of 29 patients, receiver operating
characteristic analyses were performed to consider all
possible cut points to differentiate patients with long-term
and short-term OS. The optimal cut point for each imaging
parameter was selected for use in Cox proportional hazards
regression and Kaplan–Meier survival analyses. Cox pro-
portional hazards regression analyses were performed to
determine the relationships between OS and the imaging
parameters. A separate Cox proportional hazards regres-
sion model was computed for each imaging parameter at
each time point while adjusting for age, Karnofsky per-
formance status, extent of surgical resection, and WHO
grade. The hazard ratios (HR) and their 95 % confidence
intervals (CI) were computed. IDH1 mutation status was
not adjusted in the Cox proportional hazards regression due
to the small number of WHO grade III patients (N = 5).
Kaplan–Meier survival analysis and log-rank test compared
the OS of patients with high versus low values of imaging
parameters.
For patients with grade IV gliomas (N = 24), Cox
proportional hazards regression and Kaplan–Meier survival
analysis were repeated. MGMT promoter status, age,
Karnofsky performance status, and the extent of resection
were also included in the Cox proportional hazards re-
gression. A P B 0.05 was considered statistically sig-
nificant. Lastly, joint modeling of OS and the longitudinal
covariates was performed to evaluate whether changes in
these imaging parameters correlate with OS [27].
Results
Patient characteristics and outcomes
A total of 150 CT perfusion and 150 MR examinations
were acquired, and 109 CT perfusion and 109 MR scans
from the first 4 times points were analyzed. Twenty-two
patients had imaging studies available from the first four
time points while seven patients had imaging studies
available from the first three time points. No radiation-
induced side effects (e.g. skin erythema) from the serial CT
perfusion scans was noted. The median OS was 18 months
(range, 5–60 months) with three patients alive at the end of
the study. Table 1 summarizes patient characteristics and
the corresponding OS data. In univariate analyses, gender,
extent of surgical resection, Karnofsky performance status,
re-operation, and second-line Fotemustine were not sig-
nificant predictors of OS. Older patients (C50 years) had
worse OS than younger patients, but this was marginally
significant (P = 0.06). WHO grade IV was associated with
worse OS when compared to grade III (P = 0.04), while
patients with unmethylated MGMT promoter status was
associated with worse OS compared to patients with
methylated MGMT promoter (P \ 0.001). IDH1 mutation
could be associated with OS (P = 0.05), but the sample
size was too small to be conclusive (wild-type N = 1).
J Neurooncol
123
Serial analysis
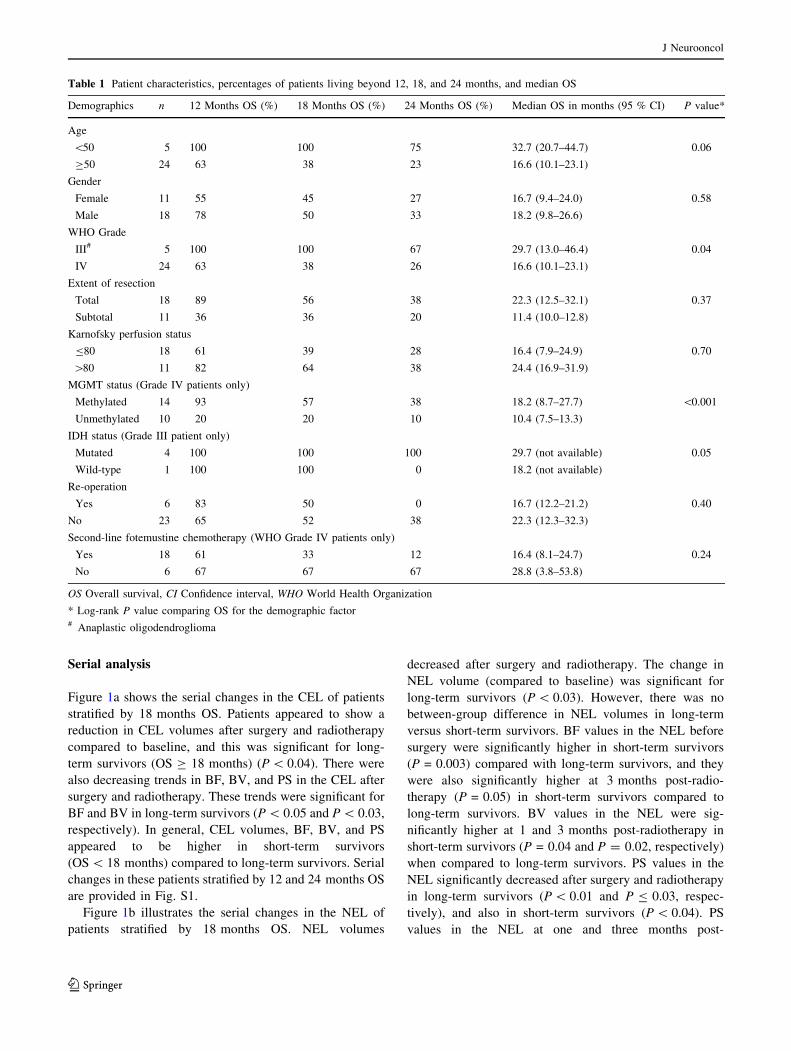
Figure 1a shows the serial changes in the CEL of patients
stratified by 18 months OS. Patients appeared to show a
reduction in CEL volumes after surgery and radiotherapy
compared to baseline, and this was significant for long-
term survivors (OS C 18 months) (P \ 0.04). There were
also decreasing trends in BF, BV, and PS in the CEL after
surgery and radiotherapy. These trends were significant for
BF and BV in long-term survivors (P \ 0.05 and P \ 0.03,
respectively). In general, CEL volumes, BF, BV, and PS
appeared to be higher in short-term survivors
(OS \ 18 months) compared to long-term survivors. Serial
changes in these patients stratified by 12 and 24 months OS
are provided in Fig. S1.
Figure 1b illustrates the serial changes in the NEL of
patients stratified by 18 months OS. NEL volumes
decreased after surgery and radiotherapy. The change in
NEL volume (compared to baseline) was significant for
long-term survivors (P \ 0.03). However, there was no
between-group difference in NEL volumes in long-term
versus short-term survivors. BF values in the NEL before
surgery were significantly higher in short-term survivors
(P = 0.003) compared with long-term survivors, and they
were also significantly higher at 3 months post-radio-
therapy (P = 0.05) in short-term survivors compared to
long-term survivors. BV values in the NEL were sig-
nificantly higher at 1 and 3 months post-radiotherapy in
short-term survivors (P = 0.04 and P = 0.02, respectively)
when compared to long-term survivors. PS values in the
NEL significantly decreased after surgery and radiotherapy
in long-term survivors (P \ 0.01 and P B 0.03, respec-
tively), and also in short-term survivors (P \ 0.04). PS
values in the NEL at one and three months post-
Table 1 Patient characteristics, percentages of patients living beyond 12, 18, and 24 months, and median OS
Demographics n 12 Months OS (%) 18 Months OS (%) 24 Months OS (%) Median OS in months (95 % CI) P value*
Age
\50 5 100 100 75 32.7 (20.7–44.7) 0.06
C50 24 63 38 23 16.6 (10.1–23.1)
Gender
Female 11 55 45 27 16.7 (9.4–24.0) 0.58
Male 18 78 50 33 18.2 (9.8–26.6)
WHO Grade
III# 5 100 100 67 29.7 (13.0–46.4) 0.04
IV 24 63 38 26 16.6 (10.1–23.1)
Extent of resection
Total 18 89 56 38 22.3 (12.5–32.1) 0.37
Subtotal 11 36 36 20 11.4 (10.0–12.8)
Karnofsky perfusion status
B80 18 61 39 28 16.4 (7.9–24.9) 0.70
[80 11 82 64 38 24.4 (16.9–31.9)
MGMT status (Grade IV patients only)
Methylated 14 93 57 38 18.2 (8.7–27.7) \0.001
Unmethylated 10 20 20 10 10.4 (7.5–13.3)
IDH status (Grade III patient only)
Mutated 4 100 100 100 29.7 (not available) 0.05
Wild-type 1 100 100 0 18.2 (not available)
Re-operation
Yes 6 83 50 0 16.7 (12.2–21.2) 0.40
No 23 65 52 38 22.3 (12.3–32.3)
Second-line fotemustine chemotherapy (WHO Grade IV patients only)
Yes 18 61 33 12 16.4 (8.1–24.7) 0.24
No 6 67 67 67 28.8 (3.8–53.8)
OS Overall survival, CI Confidence interval, WHO World Health Organization
* Log-rank P value comparing OS for the demographic factor# Anaplastic oligodendroglioma
J Neurooncol
123
radiotherapy were significantly higher in short-term sur-
vivors when compared to long-term survivors (P \ 0.01
and P = 0.02, respectively). Figure S2 shows these serial
changes in patients stratified by 12 and 24 months OS.
Survival analysis
For the entire cohort of patients (N = 29), the Cox pro-
portional hazards regression model of the ‘‘classical’’
prognostic factors (i.e. age, performance status, extent of
resection, and WHO grade) showed that higher WHO
grade (HR = 49.6, 95 % CI = 5.1–483.2, P \ 0.001) and
lower extent of resection (HR = 19.0, 95 % CI = 3.6–99.5,
P \ 0.001) were associated with significant hazards of
death. Cox proportional hazards regression models of the
imaging parameters were evaluated while adjusting for age,
performance status, extent of resection and WHO grade.
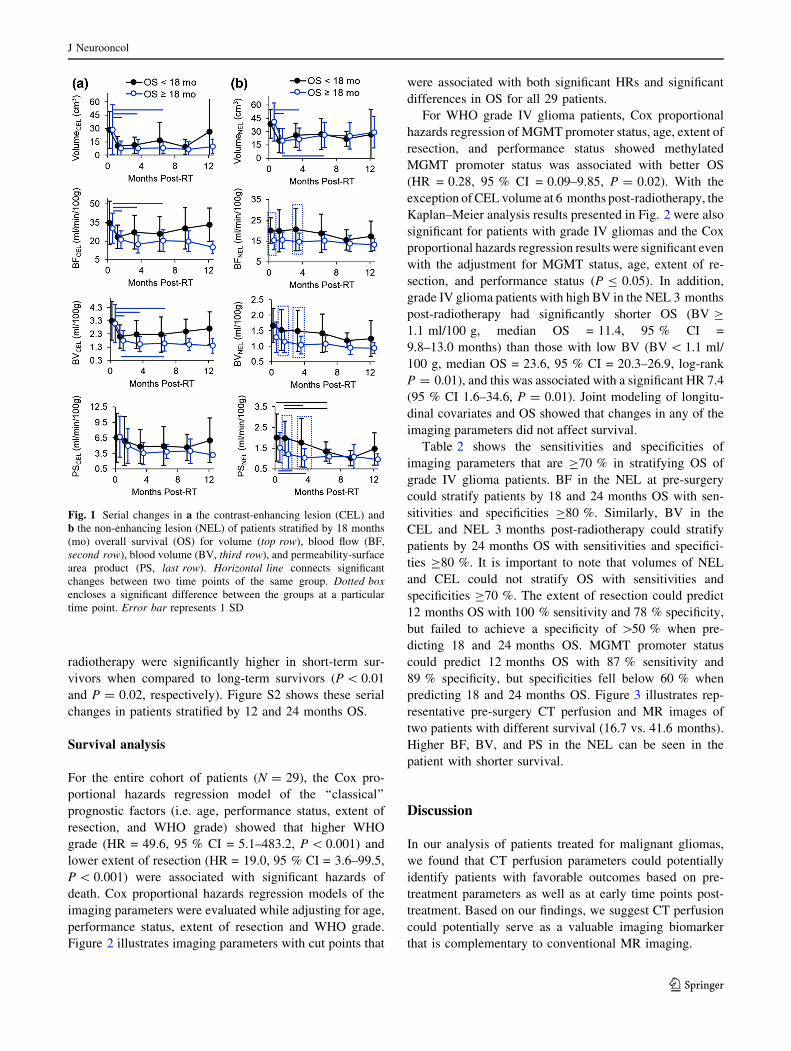
Figure 2 illustrates imaging parameters with cut points that
were associated with both significant HRs and significant
differences in OS for all 29 patients.
For WHO grade IV glioma patients, Cox proportional
hazards regression of MGMT promoter status, age, extent of
resection, and performance status showed methylated
MGMT promoter status was associated with better OS
(HR = 0.28, 95 % CI = 0.09–9.85, P = 0.02). With the
exception of CEL volume at 6 months post-radiotherapy, the
Kaplan–Meier analysis results presented in Fig. 2 were also
significant for patients with grade IV gliomas and the Cox
proportional hazards regression results were significant even
with the adjustment for MGMT status, age, extent of re-
section, and performance status (P B 0.05). In addition,
grade IV glioma patients with high BV in the NEL 3 months
post-radiotherapy had significantly shorter OS (BV C
1.1 ml/100 g, median OS = 11.4, 95 % CI =
9.8–13.0 months) than those with low BV (BV \ 1.1 ml/
100 g, median OS = 23.6, 95 % CI = 20.3–26.9, log-rank
P = 0.01), and this was associated with a significant HR 7.4
(95 % CI 1.6–34.6, P = 0.01). Joint modeling of longitu-
dinal covariates and OS showed that changes in any of the
imaging parameters did not affect survival.
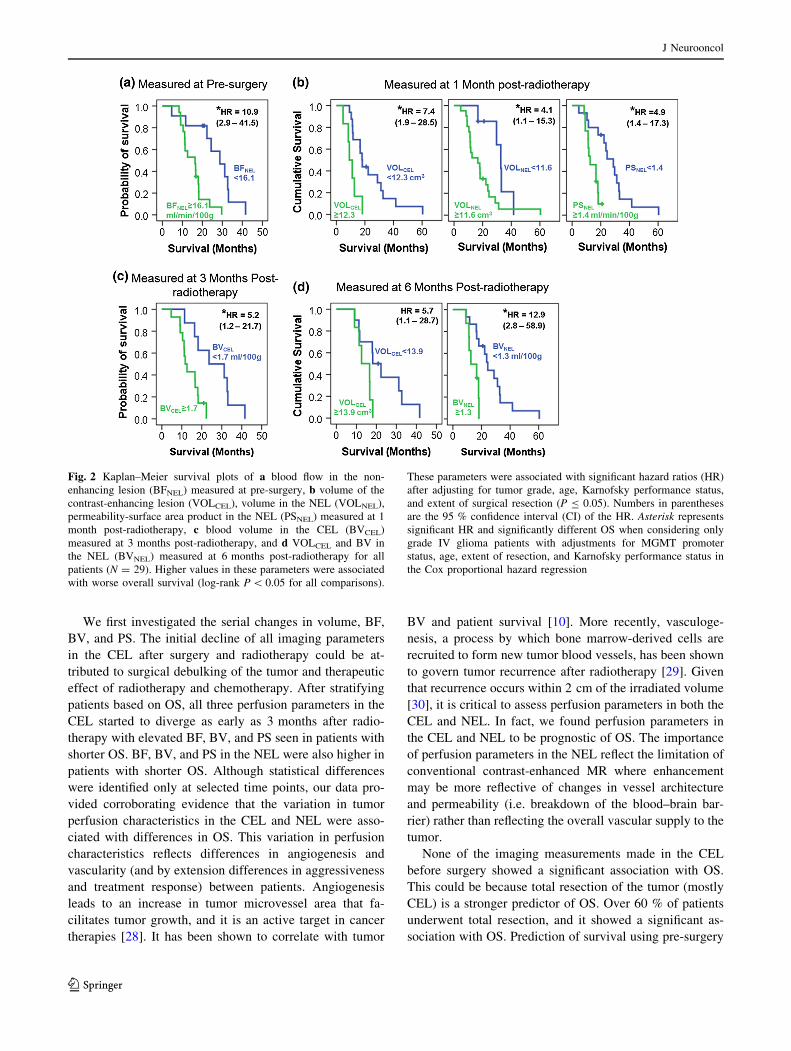
Table 2 shows the sensitivities and specificities of
imaging parameters that are C70 % in stratifying OS of
grade IV glioma patients. BF in the NEL at pre-surgery
could stratify patients by 18 and 24 months OS with sen-
sitivities and specificities C80 %. Similarly, BV in the
CEL and NEL 3 months post-radiotherapy could stratify
patients by 24 months OS with sensitivities and specifici-
ties C80 %. It is important to note that volumes of NEL
and CEL could not stratify OS with sensitivities and
specificities C70 %. The extent of resection could predict
12 months OS with 100 % sensitivity and 78 % specificity,
but failed to achieve a specificity of [50 % when pre-
dicting 18 and 24 months OS. MGMT promoter status
could predict 12 months OS with 87 % sensitivity and
89 % specificity, but specificities fell below 60 % when
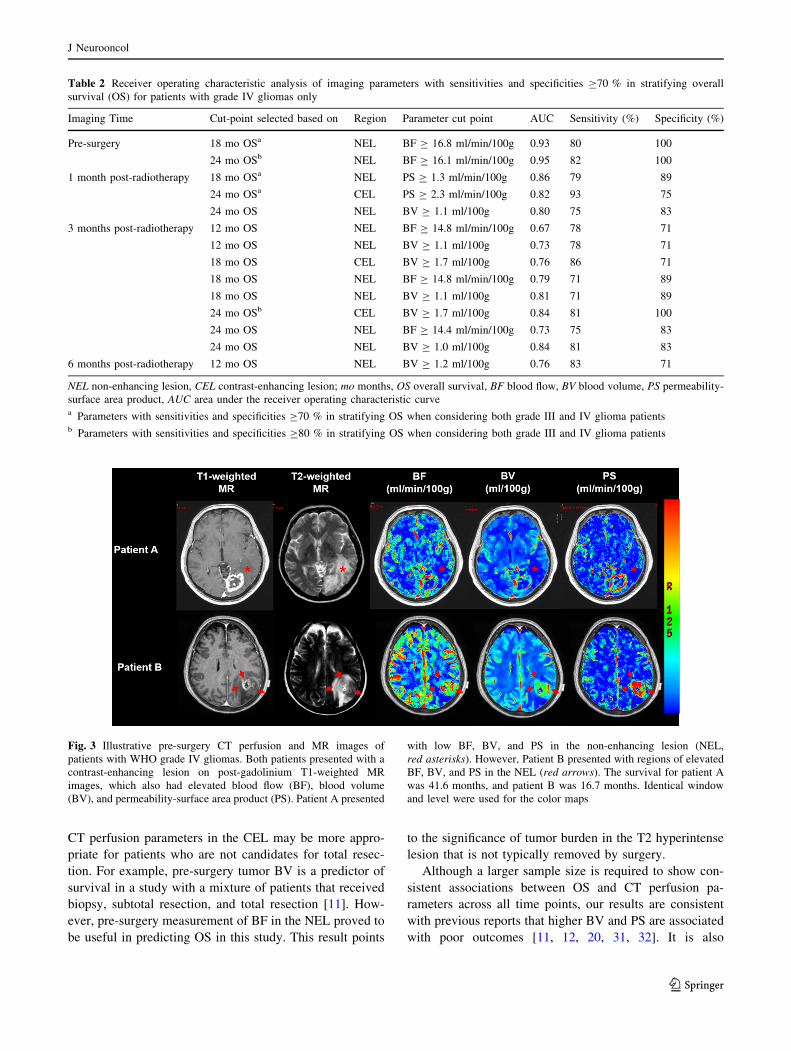
predicting 18 and 24 months OS. Figure 3 illustrates rep-
resentative pre-surgery CT perfusion and MR images of
two patients with different survival (16.7 vs. 41.6 months).
Higher BF, BV, and PS in the NEL can be seen in the
patient with shorter survival.
Discussion
In our analysis of patients treated for malignant gliomas,
we found that CT perfusion parameters could potentially
identify patients with favorable outcomes based on pre-
treatment parameters as well as at early time points post-
treatment. Based on our findings, we suggest CT perfusion
could potentially serve as a valuable imaging biomarker
that is complementary to conventional MR imaging.
Fig. 1 Serial changes in a the contrast-enhancing lesion (CEL) and
b the non-enhancing lesion (NEL) of patients stratified by 18 months
(mo) overall survival (OS) for volume (top row), blood flow (BF,
second row), blood volume (BV, third row), and permeability-surface
area product (PS, last row). Horizontal line connects significant
changes between two time points of the same group. Dotted box
encloses a significant difference between the groups at a particular
time point. Error bar represents 1 SD
J Neurooncol
123
We first investigated the serial changes in volume, BF,
BV, and PS. The initial decline of all imaging parameters
in the CEL after surgery and radiotherapy could be at-
tributed to surgical debulking of the tumor and therapeutic
effect of radiotherapy and chemotherapy. After stratifying
patients based on OS, all three perfusion parameters in the
CEL started to diverge as early as 3 months after radio-
therapy with elevated BF, BV, and PS seen in patients with
shorter OS. BF, BV, and PS in the NEL were also higher in
patients with shorter OS. Although statistical differences
were identified only at selected time points, our data pro-
vided corroborating evidence that the variation in tumor
perfusion characteristics in the CEL and NEL were asso-
ciated with differences in OS. This variation in perfusion
characteristics reflects differences in angiogenesis and
vascularity (and by extension differences in aggressiveness
and treatment response) between patients. Angiogenesis
leads to an increase in tumor microvessel area that fa-
cilitates tumor growth, and it is an active target in cancer
therapies [28]. It has been shown to correlate with tumor
BV and patient survival [10]. More recently, vasculoge-
nesis, a process by which bone marrow-derived cells are
recruited to form new tumor blood vessels, has been shown
to govern tumor recurrence after radiotherapy [29]. Given
that recurrence occurs within 2 cm of the irradiated volume
[30], it is critical to assess perfusion parameters in both the
CEL and NEL. In fact, we found perfusion parameters in
the CEL and NEL to be prognostic of OS. The importance
of perfusion parameters in the NEL reflect the limitation of
conventional contrast-enhanced MR where enhancement
may be more reflective of changes in vessel architecture
and permeability (i.e. breakdown of the blood–brain bar-
rier) rather than reflecting the overall vascular supply to the
tumor.
None of the imaging measurements made in the CEL
before surgery showed a significant association with OS.
This could be because total resection of the tumor (mostly
CEL) is a stronger predictor of OS. Over 60 % of patients
underwent total resection, and it showed a significant as-
sociation with OS. Prediction of survival using pre-surgery
Fig. 2 Kaplan–Meier survival plots of a blood flow in the non-
enhancing lesion (BFNEL) measured at pre-surgery, b volume of the
contrast-enhancing lesion (VOLCEL), volume in the NEL (VOLNEL),
permeability-surface area product in the NEL (PSNEL) measured at 1
month post-radiotherapy, c blood volume in the CEL (BVCEL)
measured at 3 months post-radiotherapy, and d VOLCEL and BV in
the NEL (BVNEL) measured at 6 months post-radiotherapy for all
patients (N = 29). Higher values in these parameters were associated
with worse overall survival (log-rank P \ 0.05 for all comparisons).
These parameters were associated with significant hazard ratios (HR)
after adjusting for tumor grade, age, Karnofsky performance status,
and extent of surgical resection (P B 0.05). Numbers in parentheses
are the 95 % confidence interval (CI) of the HR. Asterisk represents
significant HR and significantly different OS when considering only
grade IV glioma patients with adjustments for MGMT promoter
status, age, extent of resection, and Karnofsky performance status in
the Cox proportional hazard regression
J Neurooncol
123
CT perfusion parameters in the CEL may be more appro-
priate for patients who are not candidates for total resec-
tion. For example, pre-surgery tumor BV is a predictor of
survival in a study with a mixture of patients that received
biopsy, subtotal resection, and total resection [11]. How-
ever, pre-surgery measurement of BF in the NEL proved to
be useful in predicting OS in this study. This result points
to the significance of tumor burden in the T2 hyperintense
lesion that is not typically removed by surgery.
Although a larger sample size is required to show con-
sistent associations between OS and CT perfusion pa-
rameters across all time points, our results are consistent
with previous reports that higher BV and PS are associated
with poor outcomes [11, 12, 20, 31, 32]. It is also
Table 2 Receiver operating characteristic analysis of imaging parameters with sensitivities and specificities C70 % in stratifying overall
survival (OS) for patients with grade IV gliomas only
Imaging Time Cut-point selected based on Region Parameter cut point AUC Sensitivity (%) Specificity (%)
Pre-surgery 18 mo OSa NEL BF C 16.8 ml/min/100g 0.93 80 100
24 mo OSb NEL BF C 16.1 ml/min/100g 0.95 82 100
1 month post-radiotherapy 18 mo OSa NEL PS C 1.3 ml/min/100g 0.86 79 89
24 mo OSa CEL PS C 2.3 ml/min/100g 0.82 93 75
24 mo OS NEL BV C 1.1 ml/100g 0.80 75 83
3 months post-radiotherapy 12 mo OS NEL BF C 14.8 ml/min/100g 0.67 78 71
12 mo OS NEL BV C 1.1 ml/100g 0.73 78 71
18 mo OS CEL BV C 1.7 ml/100g 0.76 86 71
18 mo OS NEL BF C 14.8 ml/min/100g 0.79 71 89
18 mo OS NEL BV C 1.1 ml/100g 0.81 71 89
24 mo OSb CEL BV C 1.7 ml/100g 0.84 81 100
24 mo OS NEL BF C 14.4 ml/min/100g 0.73 75 83
24 mo OS NEL BV C 1.0 ml/100g 0.84 81 83
6 months post-radiotherapy 12 mo OS NEL BV C 1.2 ml/100g 0.76 83 71
NEL non-enhancing lesion, CEL contrast-enhancing lesion; mo months, OS overall survival, BF blood flow, BV blood volume, PS permeability-
surface area product, AUC area under the receiver operating characteristic curvea Parameters with sensitivities and specificities C70 % in stratifying OS when considering both grade III and IV glioma patientsb Parameters with sensitivities and specificities C80 % in stratifying OS when considering both grade III and IV glioma patients
Fig. 3 Illustrative pre-surgery CT perfusion and MR images of
patients with WHO grade IV gliomas. Both patients presented with a
contrast-enhancing lesion on post-gadolinium T1-weighted MR
images, which also had elevated blood flow (BF), blood volume
(BV), and permeability-surface area product (PS). Patient A presented
with low BF, BV, and PS in the non-enhancing lesion (NEL,
red asterisks). However, Patient B presented with regions of elevated
BF, BV, and PS in the NEL (red arrows). The survival for patient A
was 41.6 months, and patient B was 16.7 months. Identical window
and level were used for the color maps
J Neurooncol
123
noteworthy that while we showed significant hazards of
death associated with both volumetric and CT perfusion
parameters, only CT perfusion parameters resulted in
sensitivities and specificities C70 % in stratifying OS
while volumetric parameters did not. Volume of the CEL
may not be a reliable predictor of outcome because the
volume of contrast-enhancement may be affected by many
nontumoral processes including inflammation, postsurgical
changes, pseudoprogression, and treatment-induced
necrosis [33–36]. Similarly, the volume of the NEL en-
compasses many causes of T2 hyperintensity such as va-
sogenic edema, gliosis, cystic changes, inflammation, and
tumor infiltration [37–39]. It is evident from Fig. 3 that
tumors can have regions of high BF, BV, and PS that are
bigger than the CEL. These regions can potentially lead to
future sites of recurrence. Although this is hypothesis-
generating, there is preliminary evidence to suggest that
there could be better spatial concordance between CT
perfusion parameters with the site of future recurrence than
the concordance between CEL and the site of future re-
currence [24].
Some limitations must be noted. Firstly, a one-phase
rather than two-phase CT perfusion protocol was used in
one-third of the patients. Although a shorter scan duration
of the CT perfusion protocol can affect measurements of
PS, the effects on BF and BV are smaller [25]. The iden-
tified predictors of OS are unlikely to change, but the cut
points of these predictors could change with a larger cohort
of patients studied with a uniform two-phase protocol. It is
important to use a two-phase CT perfusion protocol in
future studies. Secondly, we could not adjust for the effect
of IDH1 mutation status in our regression models due to a
small number of WHO grade III glioma patients. Finally, a
CT perfusion scan at the time point of pre-radiotherapy but
post-surgery could be a better baseline scan than a pre-
surgery perfusion imaging scan. The prognostic importance
of CT perfusion parameters obtained pre-radiotherapy
compared to post-radiotherapy remains to be demonstrated.
Conclusions
BF, BV, and PS are potential biomarkers of OS in patients
with high-grade gliomas treated with multi-modality
therapies (surgery, radiotherapy, chemotherapy) even after
adjustments for age, WHO grade, Karnofsky performance
status, the extent of resection, and MGMT promoter status.
The results of this study, if verified in a larger cohort of
patients, could establish CT perfusion imaging as a reliable
early predictor of survival.
Acknowledgments This project was funded by The Project of
Emilia-Romagna region on Neuro-Oncology (PERNO) study group,
the Canadian Institutes of Health Research (CIHR), and the CIHR
Strategic Training Program in Cancer Research and Technology
Transfer.
Funding Ting-Yim Lee licenses CT Perfusion software to and re-
ceives funding from GE Healthcare.
Appendix
Steering committee
Baruzzi A. (Chair), Albani F., Calbucci F., D’Alessandro
R., Michelucci R. (IRCCS Institute of Neurological Sci-
ences, Bologna, Italy), Brandes A. (Department of Medical
Oncology, Bellaria-Maggiore Hospitals, Bologna, Italy),
Eusebi V. (Department of Hematology and Oncological
Sciences ‘‘L. & A. Seragnoli’’, Section of Anatomic
Pathology at Bellaria Hospital, Bologna, Italy), Ceruti S.,
Fainardi E., Tamarozzi R. (Neuroradiology Unit, Depart-
ment of Neurosciences and Rehabilitation, S. Anna
Hospital, Ferrara, Italy), Emiliani E. (Istituto Oncologico
Romagnolo, Department of Medical Oncology, Santa
Maria delle Croci Hospital, Ravenna, Italy), Cavallo M.
(Division of Neurosurgery, Department of Neurosciences
and Rehabilitation, S. Anna Hospital, Ferrara, Italy).
Executive committee
Franceschi E., Tosoni A. (Department of Medical On-
cology, Bellaria-Maggiore Hospitals, Bologna, Italy),
Cavallo M. (Division of Neurosurgery, Department of
Neurosciences and Rehabilitation, S. Anna Hospital, Fer-
rara, Italy), Fiorica F. (Department of Radiation Oncology,
S. Anna Hospital, Ferrara, Italy), Valentini A. (Division of
Neurosurgery, Nuovo Ospedale Civile S. Agostino-
Estense, Baggiovara, Modena, Italy), Depenni R. (Depart-
ment of Oncology, Policlinico di Modena, Italy), Muccia-
rini C. (Department of Oncology, Ramazzini Hospital,
Carpi, Modena, Italy), Crisi G. (Department of Neurora-
diology, Maggiore Hospital, Parma, Italy), Sasso E.
(Department of Neurological Sciences, Maggiore Hospital,
Parma, Italy), Biasini C., Cavanna L. (Department of On-
cology and Hematology, Guglielmo da Saliceto Hospital,
Piacenza, Italy), Guidetti D. (Department of Neurology,
Guglielmo da Saliceto Hospital, Piacenza, Italy), Marcello
N., Pisanello A. (Department of Neurology, Istituto in
tecnologie avanzate e modelli assistenziali in oncologia,
IRCCS, S. Maria Nuova Hospital, Reggio Emilia, Italy),
Cremonini A.M., Guiducci G. (Division of Neurosurgery,
M. Bufalini Hospital, Cesena, Italy).
Registry Coordination Office: de Pasqua S., Testoni S.
(IRCCS Institute of Neurological Sciences, Bologna, Italy).
J Neurooncol
123
Participants
Agati R., Ambrosetto G., Bacci A., Baldin E., Baldrati A.,
Barbieri E., Bartolini S., Bellavista E., Bisulli F., Bonora
E., Bunkheila F., Carelli V., Crisci M., Dall’Occa P., Ferro
S., Franceschi C., Frezza G., Grasso V., Leonardi M.,
Morandi L., Mostacci B., Palandri G., Pasini E., Pastore
Trossello M., Poggi R., Riguzzi P., Rinaldi R., Rizzi S.,
Romeo G., Spagnolli F., Tinuper P., Trocino C. (Bologna),
Dall’Agata M., Frattarelli M., Gentili G., Giovannini A.,
Iorio P., Pasquini U., Galletti G., Guidi C., Neri W., Pat-
uelli A., Strumia S. (Forlı-Cesena), Faedi M. (IRCCS
Istituto Scientifico Romagnolo per lo Studio e la Cura dei
Tumori), Casmiro M., Gamboni A., Rasi F. (Faenza R.A.),
Cruciani G. (Lugo, RA), Cenni P., Dazzi C., Guidi A.R.,
Zumaglini F. (Ravenna), Amadori A., Pasini G.,
Pasquinelli M., Pasquini E., Polselli A., Ravasio A., Viti B.
(Rimini), Sintini M. (Cattolica, RN), Ariatti A., Bertolini
F., Bigliardi G., Carpeggiani P., Cavalleri F., Meletti S.,
Nichelli P., Pettorelli E., Pinna G., Zunarelli E. (Modena),
Artioli F., Bernardini I., Costa M., Greco G., Guerzoni R.,
Stucchi C. (Carpi M.O.), Iaccarino C., Ragazzi M., Rizzi
R., Zuccoli G. (Istituto di Ricovero e Cura a Carattere
Scientifico, Reggio Emilia), Api P., Cartei F., Colella M.,
Fallica E., Farneti M., Frassoldati A., Granieri E., Latini F.,
Monetti C., Saletti A., Schivalocchi R., Sarubbo S., Ser-
aceni S., Tola M.R., Urbini B., Zini G. (Ferrara), Giorgi C.,
Montanari E. (Fidenza P.R.), Cerasti D., Crafa P., Dascola
I., Florindo I., Giombelli E., Mazza S., Ramponi V., Ser-
vadei F., Silini E.M., Torelli P. (Parma), Immovilli P.,
Morelli N., Vanzo C. (Piacenza), Nobile C. (Padova).
References
1. Wen PY, Kesari S (2008) Malignant gliomas in adults. N Engl J
Med 359:492–507
2. Curran WJ, Scott CB, Horton J et al (1993) Recursive partitioning
analysis of prognostic factors in three radiation therapy oncology
group malignant glioma trials. J Natl Cancer Inst 85:704–710
3. Weller M, Stupp R, Hegi ME et al (2012) Personalized care in
neuro-oncology coming of age: why we need MGMT and 1p/19q
testing for malignant glioma patients in clinical practice. Neuro
Oncol 14(suppl iv):100–108
4. Wen PY, Macdonald DR, Reardon DA et al (2010) Updated
response assessment criteria for high-grade gliomas: response
assessment in neuro-oncology working group. J Clin Oncol
28:1963–1972
5. Essig M, Anzalone N, Combs SE et al (2012) MR imaging of
neoplastic central nervous system lesions: Review and recom-
mendations for current practice. Am J Neuroradiol 33:803–817
6. Cha S (2006) Update on brain tumor imaging: from anatomy to
physiology. Am J Neuroradiol 27:475–487
7. Jain R, Ellika SK, Scarpace L et al (2008) Quantitative estimation
of permeability surface-area product in astroglial brain tumors
using perfusion CT and correlation with histopathologic grade.
Am J Neuroradiol 29:694–700
8. Weber MA, Henze M, Tuttenberg J et al (2010) Biopsy targeting
gliomas: do functional imaging techniques identify similar target
areas? Invest Radiol 45:755–768
9. Jain R, Gutierrez J, Narang J et al (2011) In vivo correlation of
tumor blood volume and permeability with histologic and
molecular angiogenic markers in gliomas. Am J Neuroradiol
32:388–394
10. Hu LS, Eschbacher JM, Dueck AC et al (2012) Correlations
between perfusion MR imaging cerebral blood volume, mi-
crovessel quantification, and clinical outcome using stereotactic
analysis in recurrent high-grade glioma. Am J Neuroradiol
33:69–76
11. Jain R, Narang J, Griffith B et al (2013) Prognostic vascular
imaging biomarkers in high-grade gliomas: tumor permeability as
an adjunct to blood volume estimates. Acad Radiol 20:478–485
12. Shankar JJ, Woulfe J, Silva VD, Nguyen TB (2013) Evaluation of
perfusion CT in grading and prognostication of high-grade glio-
mas at diagnosis: a pilot study. AJR Am J Roentgenol
200:W504–W509
13. Law M, Young RJ, Babb JS et al (2008) Gliomas: predicting time
to progression or survival with cerebral blood volume measure-
ments at dynamic susceptibility-weighted contrast-enhanced
perfusion MR imaging. Radiology 247:490–498
14. Bisdas S, Kirkpatrick M, Giglio P, Welsh C, Spampinato MV,
Rumboldt Z (2009) Cerebral blood volume measurements by
perfusion-weighted MR imaging in gliomas: ready for prime time
in predicting short-term outcome and recurrent disease? Am J
Neuroradiol 30:681–688
15. Galban CJ, Chenevert TL, Meyer CR et al (2011) Prospective
analysis of parametric response map-derived MRI biomarkers:
Identification of early and distinct glioma response patterns not
predicted by standard radiographic assessment. Clin Cancer Res
17:4751–4760
16. Jain R (2011) Perfusion CT imaging of brain tumors: an over-
view. AJNR Am J Neuroradiol 32:1570–1577
17. Ding B, Ling HW, Chen KM, Jiang H, Zhu YB (2006) Com-
parison of cerebral blood volume and permeability in preop-
erative grading of intracranial glioma using CT perfusion
imaging. Neuroradiology 48:773–781
18. Fainardi E, Di Biase F, Borrelli M et al (2010) Potential role of
CT perfusion parameters in the identification of solitary intra-
axial brain tumor grading. Acta Neurochir Suppl 106:283–287
19. Ellika SK, Jain R, Patel SC et al (2007) Role of perfusion CT in
glioma grading and comparison with conventional MR imaging
features. Am J Neuroradiol 28:1981–1987
20. Jain R, Narang J, Schultz L et al (2011) Permeability estimates in
histopathology-proved treatment-induced necrosis using perfu-
sion CT: Can these add to other perfusion parameters in differ-
entiating from recurrent/progressive tumors? Am J Neuroradiol
32:658–663
21. Vidiri A, Guerrisi A, Pinzi V et al (2012) Perfusion Computed
Tomography (PCT) adopting different perfusion metrics: recur-
rence of brain metastasis or radiation necrosis? Eur J Radiol
81:1246–1252
22. Herman JG, Graff JR, Myohanen S, Nelkin BD, Baylin SB
(1996) Methylation-specific PCR: a novel PCR assay for
methylation status of CpG islands. Proc Natl Acad Sci USA
93:9821–9826
23. Hartmann C, Meyer J, Balss J et al (2009) Type and frequency of
IDH1 and IDH2 mutations are related to astrocytic and oligo-
dendroglial differentiation and age: a study of 1,010 diffuse
gliomas. Acta Neuropathol 118:469–474
24. Yeung TPC, Yartsev Y, Lee TY et al (2014) Relationship of
computed tomography perfusion and positron emission tomog-
raphy to tumour progression in malignant glioma. J Med Radiat
Sci 61:4–13
J Neurooncol
123
25. Yeung TPC, Yartsev S, Bauman G, He W, Fainardi E, Lee TY
(2013) The effect of scan duration on the measurement of per-
fusion parameters in CT perfusion studies of brain tumors. Acad
Radiol 20:59–65
26. Pieper S, Lorensen B, Schroeder W, Kikinis R (2006) The NA-
MIC Kit: ITK, VTK, pipelines, grids and 3D slicer as an open
platform for the medical image computing community. In: Pro-
ceedings of the 3rd IEEE international symposium biomedical
imaging: From Nano Macro, vol 1, pp 698–701
27. Rizopoulos D (2010) JM: an R package for the joint modelling of
longitudinal and time-to-event data. J Stat Softw 35:1–33
28. Jain RK, di Tomaso E, Duda DG, Loeffler JS, Sorensen AG,
Batchelor TT (2007) Angiogenesis in brain tumours. Nat Rev
Neurosci 8:610–622
29. Kioi M, Vogel H, Schultz G, Hoffman RM, Harsh GR, Brown JM
(2010) Inhibition of vasculogenesis, but not angiogenesis, pre-
vents the recurrence of glioblastoma after irradiation in mice.
J Clin Invest 120:694–705
30. Milano MT, Okunieff P, Donatello RS et al (2010) Patterns and
timing of recurrence after temozolomide-based chemoradiation
for glioblastoma. Int J Radiat Oncol Biol Phys 78:1147–1155
31. Voglein J, Tuttenberg J, Weimer M et al (2011) Treatment
monitoring in gliomas: comparison of dynamic susceptibility-
weighted contrast-enhanced and spectroscopic MRI techniques
for identifying treatment failure. Invest Radiol 46:390–400
32. Mangla R, Singh G, Ziegelitz D et al (2010) Changes in relative
cerebral blood volume 1 month after radiation-temozolomide
therapy can help predict overall survival in patients with
glioblastoma. Radiology 256:575–584
33. van den Bent MJ, Vogelbaum MA, Wen PY, Macdonald DR,
Chang SM (2009) End point assessment in gliomas: novel
treatments limit usefulness of classical Macdonald’s Criteria.
J Clin Oncol 27:2905–2908
34. Finn MA, Blumenthal DT, Salzman KL et al (2007) Transient
postictal MRI changes in patients with brain tumors may mimic
disease progression. Surg Neurol 67:246–250
35. Ulmer S, Braga TA, Barker FG 2nd et al (2006) Clinical and
radiographic features of peritumoral infarction following resec-
tion of glioblastoma. Neurology 67:1668–1670
36. Kumar AJ, Leeds NE, Fuller GN et al (2000) Malignant gliomas:
MR imaging spectrum of radiation therapy- and chemotherapy-
induced necrosis of the brain after treatment. Radiology
217:377–384
37. Oh J, Cha S, Aiken AH et al (2005) Quantitative apparent dif-
fusion coefficients and T2 relaxation times in characterizing
contrast enhancing brain tumors and regions of peritumoral
edema. J Magn Reson Imaging 21:701–708
38. Hattingen E, Jurcoane A, Daneshvar K et al (2013) Quantitative
T2 mapping of recurrent glioblastoma under Bevacizumab im-
proves monitoring for non-enhancing tumor progression and
predicts overall survival. Neuro Oncol 15:1395–1404
39. Li Y, Lupo JM, Polley MY et al (2011) Serial analysis of imaging
parameters in patients with newly diagnosed glioblastoma mul-
tiforme. Neuro Oncol 13:546–557
J Neurooncol
123