survival disparities among african american women with invasive bladder cancer in florida
TRANSCRIPT

Survival Disparities Among AfricanAmerican Women With InvasiveBladder Cancer in FloridaKathleen F. Brookfield, MD, PhD, MPH1; Michael C. Cheung, MD2; Christopher Gomez, MD3;
Relin Yang, MD, MPH2; Alan M. Nieder, MD3; David J. Lee, PhD4; and Leonidas G. Koniaris, MD2
BACKGROUND: The authors sought to understand the effect of patient sex, race, and socioeconomic
status (SES) on outcomes for bladder cancer. METHOD: The Florida Cancer Data System and the Agency
for Health Care Administration data sets (1998-2003) were merged and queried. Survival outcomes for
patients with bladder cancer were compared between different races, ethnicities, and community poverty
levels. RESULTS: A total of 31,100 people with bladder cancer were identified. Overall median survival time
was 62.7 months. Statistically significantly longer survival times were observed in men (62.8 months vs
62.3 months for women), whites (63.0 months vs 39.6 months for African Americans [AAs], P < .001),
non-Hispanics (62.9 months vs 56.4 months for Hispanics, P < .001), and patients from more affluent
communities (74.0 months where <5% live in poverty vs 53.0 months where >15% live in poverty, P < .001).
Surgery was associated with dramatically improved survival. AA women diagnosed with bladder cancer
were significantly less likely to have endoscopic surgical resection compared with white women (P < .001).
On multivariate analysis, independent predictors of poorer outcomes were older age, AA race, female sex,
degree of community poverty, histologic tumor grade, advanced tumor stage, and lack of surgical
treatment. CONCLUSIONS: Racial and SES disparities in bladder cancer survival were not fully explained by
late-stage presentation and undertreatment. Although earlier diagnosis and greater access to surgery
would likely yield some improvement in outcomes for AA women, more research is needed to understand
the remaining survival gap for this population. Cancer 2009;115:4196–209. VC 2009 American Cancer
Society.
KEY WORDS: African Americans, bladder cancer, race, socioeconomic status.
Disparities in diagnosis, treatment, and outcome for cancers in African Americans (AAs) and whiteshave been documented over the past 30 years.1 The Annual Report to the Nation on the Status of Cancer
(1975-2002) showed that the incidence of urinary bladder cancer deaths is highest for AA males (9.3 per100,000), followed by white and Hispanic males (8.0 per 100,000) and AA females (2.8 per 100,000).2
Many studies demonstrating disparities in cancer outcomes among different races and ethnicities havepointed to a lack of screening and therefore delays in diagnosis and treatment.3-12 The increased risk of
Received: October 9, 2008; Revised: February 2, 2009; Accepted: February 24, 2009
Published online June 30, 2009 in Wiley InterScience (www.interscience.wiley.com)
DOI: 10.1002/cncr.24497, www.interscience.wiley.com
Corresponding author: Leonidas G. Koniaris, MD, University of Miami School of Medicine, 3550 Sylvester Comprehensive Cancer Center, 1475 NW
12th Ave, Miami, FL 33136; Fax: (305) 243-7083; [email protected]
1Department of Obstetrics and Gynecology, University of Miami Miller School of Medicine, Miami, Florida; 2DeWitt Daughtry Family Department of
Surgery, University of Miami Miller School of Medicine, Miami, Florida; 3Department of Urology, University of Miami, Miller School of Medicine,
Miami, Florida; 4Department of Epidemiology and Public Health, University of Miami Miller School of Medicine, Miami, Florida
4196 Cancer September 15, 2009
Original Article

death for AAs with bladder cancer has not so far been at-tributable to underutilization of cancer screening, as priorstudies have demonstrated no effective screening methodfor this type of cancer.
The literature describing survival differences
between Hispanics and non-Hispanics is sparse relative to
that published regarding AA survival.13-15 Underwood
et al,15 Prout et al,14 and Lee et al13 found that after
adjustment for demographic and clinical factors, AA
women with bladder cancer had an increased risk of death
compared with their white counterparts; however, none
of these studies commented on survival outcomes for
Hispanic women. Watson and Sidor,16 in contrast,
reported decreased survival rates for Native Americans
and Alaskan Natives with bladder cancer. The lack of data
on survival outcomes for Hispanic women bears further
exploration to examine whether or not they too are subject
to presentation at a later stage relative to their white
counterparts.
Low socioeconomic status (SES) has also been
linked to poor outcomes in cancer patients,16,17 with
bladder cancer being no exception.15 A clear relationship
exists between race and SES, as evidenced by the finding
that the median income of whites in the United States was
approximately 60% more than that of AAs in 2006.18
Additional factors implicated in survival disparities
among racial and ethnic minorities and the poor are
advanced stage at presentation,15,19-25 treatment differen-
ces,19-21,23,26,27 and comorbidities.27
Bladder cancer represents the fourth most common
malignancy diagnosed in the United States among men
and the 12th most common malignancy among women.
Approximately 68,810 new cases of bladder cancer were
expected to be diagnosed in 2008, with 14,100 deaths
directly related to these types of tumors.28 We sought to
examine differences in survival observed in patients with
bladder cancer based on race, sex, and SES in an ethnically
diverse population. Although studies thus far have dem-
onstrated relatively consistent results pointing to
decreased survival times for AAs, the current study further
elucidates survival disparities by including ethnicity and
evaluating the independent effects of race and SES in a
population-based sample. We hoped by revisiting this
topic using a large state cancer registry, we might identify
possible points of intervention that will lead to improved
survival in these groups.
MATERIALS AND METHODS
The 2007 Florida Cancer Data System (FCDS) data set
was used to identify all incident cases of invasive
bladder cancer diagnosed in the state of Florida from
1998-2002. Patients with carcinoma in situ and benign
bladder neoplasms were excluded from the analysis. The
FCDS data set was enhanced with 2007 data linked
from the Florida Agency for Health Care Administra-
tion (AHCA) data set. AHCA maintains 2 databases
(Hospital Patient Discharge Data and Ambulatory Out-
patient Data) on all patient encounters within hospitals
and freestanding ambulatory surgical and radiation ther-
apy centers in Florida. All hospitals have been required
to report all discharges and outpatient encounters to
AHCA since 1987. The AHCA data sets used in this
study contain diagnoses and procedures performed
during every hospitalization or outpatient encounter in
the state of Florida, for the period 1998-2003. The
comorbidity data obtained from the AHCA data set
allowed for better correction of covariates. Tobacco and
alcohol consumption data are self-reported at the time
of cancer diagnosis, and information on duration of use
was not available.
Cases in the FCDS and AHCA data sets were linked
on the basis of unique identifiers.29,30 These matches were
confirmed with the patient’s date of birth and sex. Postal
codes listed in the FCDS-AHCA database were then used
to determine community poverty levels according to the
2007 US Census Bureau report.31 Non-Florida residents
were not included in the analysis, because follow-up for
such patients, particularly survival information, may be
inaccurate in up to 10% of such patients (FCDS personal
communication). The University of Miami Miller School
of Medicine Institutional Review Board approved this
study.
The staging criteria used by the FCDS are consistent
with the Surveillance, Epidemiology, and End Results
(SEER) summary staging. In this study, local staging rep-
resents disease that does not extend beyond the primary
organ, whereas those having positive lymph nodes at the
time of resection were classified as having regional disease.
Documentation of distant metastases during the perioper-
ative period led to classification of affected patients as
having distant disease.
Statistical analysis was performed with SPSS Statisti-
cal Package version 15.0 (SPSS Inc., Chicago, Ill).
Disparities in Bladder Cancer/Brookfield et al
Cancer September 15, 2009 4197

Correlations between categorical variables were made
using the chi-square test. Median survival rates were calcu-
lated by the Kaplan-Meier method. Because the FCDS
collects only primary cause of death, we analyzed only
overall survival and not disease-specific survival. Survival
was calculated from the time of the initial diagnosis to
date of last contact, or date of death, which was the time
of censoring. The univariate effects of demographic, clini-
cal, and treatment variables on survival were tested by the
log-rank test for categorical values. To estimate the impact
of race, ethnicity, and SES on survival outcomes, we used
a Cox proportional hazards model, adding demographic,
clinical, and treatment variables in a stepwise fashion.
RESULTS
Patient Demographics and Clinical
Characteristics
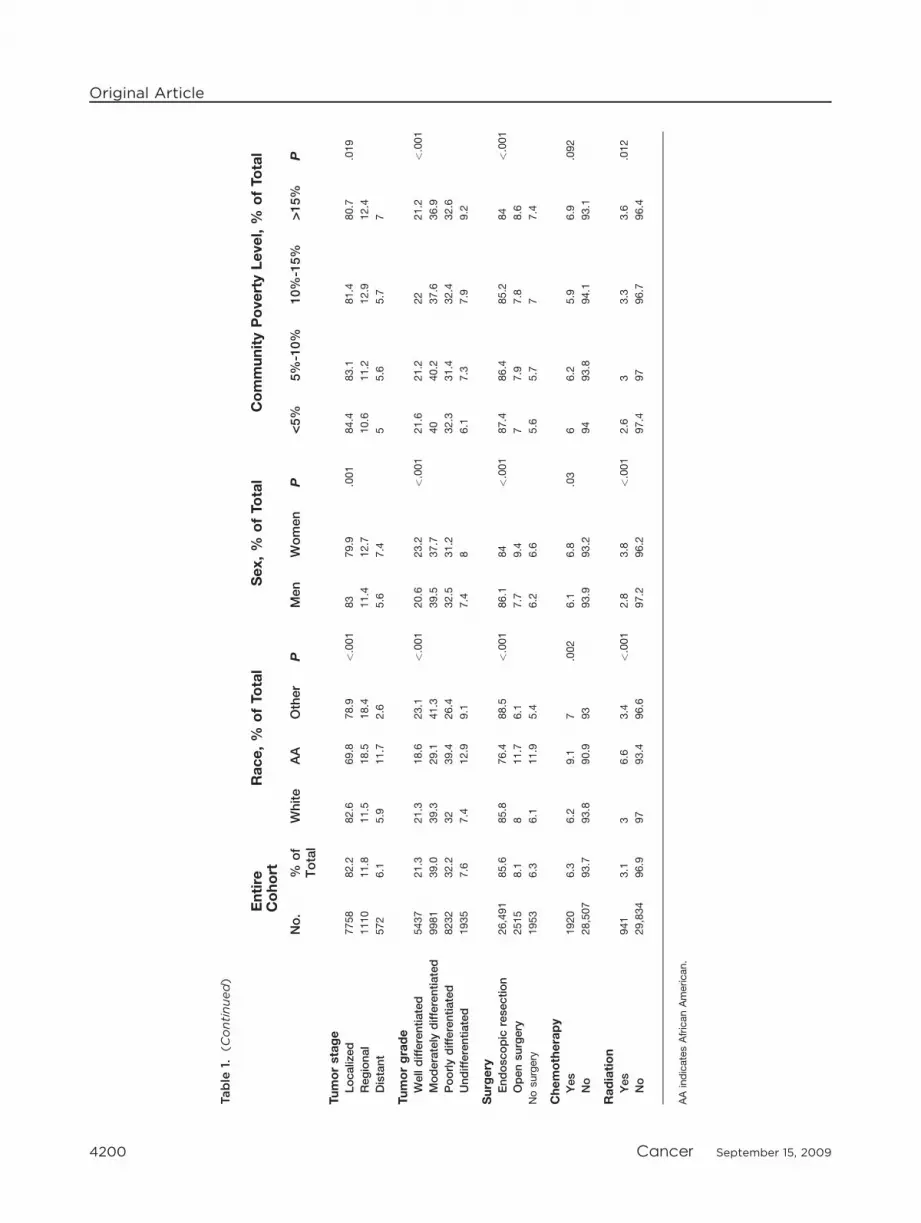
Over the 5-year period studied, 31,100 patients with
bladder cancer were identified. Demographics, social, and
tumor characteristics of the entire study population,
including subset analysis, are summarized in Table 1. The
majority of the patients were men (n ¼ 23,432, 75.3%),
white (n ¼ 29,734, 96.6%), and non-Hispanic (n ¼28,511, 92.6%). Most patients were also>65 years old (n
¼ 23,766, 76.4%) and were smokers (n ¼ 15,948,
64.7%). The majority of tumors were moderately differ-
entiated (n ¼ 9981, 39.0%) or poorly differentiated (n ¼8232, 32.2%) in histology. Localized disease was most
common (n ¼ 7758, 82.2%). Approximately 36.6% of
the study population lived in a community where >10%
of the area population was living below the poverty line.
Survival
Median survival rates of the entire study population,
including subset analyses, are summarized in Table 2. The
median survival time (MST) for the entire cohort was
62.7 months. Significantly longer survival times were
observed in younger patients at the time of diagnosis
(median survival not yet reached vs 54.7 months for
patients �66 years old, P < .001), men (62.8 months vs
62.3 months for women, P < .001), whites (63.0 months
vs 39.6 months for AAs, P < .001), non-Hispanics (62.9
months vs 56.4 months for Hispanics, P ¼ .048), and
patients who live in communities where<5% of the pop-
ulation dwell in poverty (74.0 months vs 53.0 months
where >15% live in poverty, P < .001). Survival was sig-
nificantly longer in patients who did not drink alcohol
(63.5 months vs 53.8 months, P< .001), but was not sig-
nificantly different for smokers compared with non-
smokers (62.2 months vs 62.1 months, P ¼ .895).
Survival was significantly longer for patients with local-
ized disease compared with distant disease (65.2 months
vs 11.4 months, P < .001). Patients with well-differenti-
ated tumors fared better than those with poorly differenti-
ated tumors (median survival not reached vs 40.5 months,
P < .001). Similarly, patients treated with only endo-
scopic surgical resection had significantly longer survival
times than patients treated with open surgery or those
who had no surgery (68.2 months vs 34.2 months vs 29.8
months, P < .001). This difference based upon surgical
approach likely is because of differences in the use of lapa-
roscopy versus open approaches based on tumor stage.
AAs Have Worse Survival Outcomes
Compared with whites, AAs tended to be diagnosed at an
earlier age and lived in communities with significantly
higher levels of poverty (Table 1). A smaller percentage of
AAs reported tobacco usage compared with their white
counterparts. With respect to clinical characteristics, AAs
presented with more regional and distant disease and had
more poorly differentiated tumors compared with whites.
A greater proportion of AAs diagnosed with bladder can-
cer underwent radiation or chemotherapy treatment com-
pared with whites. Univariate subset analysis
demonstrated that AA race conferred a significantly
poorer prognosis for bladder cancer (Table 2). MST of
AAs with bladder cancer was significantly shorter than for
whites among men and women; however, differences in
median survival were particularly disparate for black
women (63.4 months for whites vs 25.5 months for AAs;
P < .001). For all tumor stages and grades, MST for AA
patients was significantly less than for whites. At all pov-
erty level strata, AAs had a shorter MST than whites.
Differences in treatment modality and outcomes
between AA and white patients were also observed.
Whereas more white patients underwent endoscopic sur-
gical resection or open surgery (93.8% vs 88.1%), AA
patients received more radiation therapy (6.6% vs 3.0%,
Original Article
4198 Cancer September 15, 2009

Table
1.Demographic,Social,andClinicalCharacteristicsofth
eStu
dyGro
upAccord
ingto
Race,Eth
nicity,andSocioeconomic
Statu
s
Entire
Cohort
Race,%
ofTotal
Sex,%
ofTotal
CommunityPovertyLevel,%
ofTotal
No.
%of
Total
White
AA
Other
PMen
Women
P<5
%5%-10%
10%-15%
>15%
P
Medianageatdiagnosis,y
72.4
72.5
68.7
67.9
<.001
72.3
72.8
.002
72.2
72.7
72.8
71.7
<.001
Agegroups,y
£40
356
1.1
1.1
2.9
2<.001
1.1
1.4
.015
1.1
1.1
1.2
1.4
<.001
41-65
6968
22.4
22
32.9
37.2
22.6
21.9
22.1
21
22.7
24.9
‡65
23,766
76.4
76.9
64.3
60.8
76.4
76.7
76.8
77.9
76.1
73.8
Sex Men
23,432
75.3
76
64.3
70.9
<.001
——
—76.8
75.7
74.5
72.7
<.001
Women
7658
24.7
24
35.7
29.1
——
23.2
24.3
25.5
27.3
Race
White
29,734
96.6
——
——
97.1
95.2
<.001
98.2
97.9
97.3
91.3
<.001
AA
899
2.9
——
—2.5
4.2
1.3
1.6
2.2
8.2
Other
148
0.5
——
—0.5
0.6
0.5
0.4
0.5
0.5
Ethnicity
Non-H
ispanic
28,511
92.6
92.6
96.2
88.8
<.001
92.4
93.3
.009
96.1
94.6
91.7
85.5
<.001
Hispanic
2270
7.4
7.4
3.8
11.2
7.6
6.7
3.9
5.4
8.3
14.5
Communitypovertylevel
<5%
8389
28.3
28.8
13.1
28.1
<.001
28.9
26.5
<.001
——
——
—
5%-10%
10,425
35.2
35.6
19.6
33.1
35.4
34.5
——
——
10%-15%
5146
17.4
17.5
13.1
18.7
17.2
17.9
——
——
>15%
5695
19.2
18.1
54.2
20.1
18.6
21.2
——
——
Alcoholuse
Yes
1098
3.8
3.7
4.9
3.8
.204
4.2
2.5
<.001
3.4
3.5
3.8
4.9
<.001
No
28,044
96.2
96.3
95.1
96.2
95.8
97.5
96.6
96.5
96.2
95.1
Tobaccouse
Yes
15,948
64.7
65.1
55.5
57.9
<.001
67.7
55.4
<.001
64.6
64.8
63.9
64.8
.794
No
8703
35.3
34.9
44.5
42.1
32.3
44.6
35.4
35.2
36.1
35.2 (C
ontinued)
Disparities in Bladder Cancer/Brookfield et al
Cancer September 15, 2009 4199
Table
1.(C
ontinued)
Entire
Cohort
Race,%
ofTotal
Sex,%
ofTotal
CommunityPovertyLevel,%
ofTotal
No.
%of
Total
White
AA
Other
PMen
Women
P<5
%5%-10%
10%-15%
>15%
P
Tumorstage
Localized
7758
82.2
82.6
69.8
78.9
<.001
83
79.9
.001
84.4
83.1
81.4
80.7
.019
Regional
1110
11.8
11.5
18.5
18.4
11.4
12.7
10.6
11.2
12.9
12.4
Distant
572
6.1
5.9
11.7
2.6
5.6
7.4
55.6
5.7
7
Tumorgrade
Welldifferentiated
5437
21.3
21.3
18.6
23.1
<.001
20.6
23.2
<.001
21.6
21.2
22
21.2
<.001
Moderately
differentiated
9981
39.0
39.3
29.1
41.3
39.5
37.7
40
40.2
37.6
36.9
Poorlydifferentiated
8232
32.2
32
39.4
26.4
32.5
31.2
32.3
31.4
32.4
32.6
Undifferentiated
1935
7.6
7.4
12.9
9.1
7.4
86.1
7.3
7.9
9.2
Surgery
Endoscopic
resection
26,491
85.6
85.8
76.4
88.5
<.001
86.1
84
<.001
87.4
86.4
85.2
84
<.001
Opensurgery
2515
8.1
811.7
6.1
7.7
9.4
77.9
7.8
8.6
Nosurgery
1953
6.3
6.1
11.9
5.4
6.2
6.6
5.6
5.7
77.4
Chemotherapy
Yes
1920
6.3
6.2
9.1
7.002
6.1
6.8
.03
66.2
5.9
6.9
.092
No
28,507
93.7
93.8
90.9
93
93.9
93.2
94
93.8
94.1
93.1
Radiation
Yes
941
3.1
36.6
3.4
<.001
2.8
3.8
<.001
2.6
33.3
3.6
.012
No
29,834
96.9
97
93.4
96.6
97.2
96.2
97.4
97
96.7
96.4
AAindicatesAfricanAmerican.
Original Article
4200 Cancer September 15, 2009

Table 2. Median Survival According to Race, Ethnicity, and Socioeconomic Status
EntireCohort
Median Survival, mo
Race Sex Community Poverty Level
Median
Survival,
mo
P White AA P Men Women P <5% 5%-10% 10%-15% >15% P
Age groups<40 NR <.001 NR NR .581 NR NR .550 NR NR NR NR .702
40-64 NR NR NR <.001 NR NR .485 NR NR NR NR <.001
‡65 54.7 NR NR <.001 55.2 53.3 <.001 62.2 55.1 51.4 45.6 <.001
SexMen 62.8 <.001 62.8 45.1 <.001 — — — 72.7 63.6 58.9 53.7 <.001
Women 62.3 63.4 25.5 <.001 — — — 76.1 62.8 59.4 51.5 <.001
RaceWhite 63.0 <.001 — — — 62.8 63.4 .002 73.9 63.4 59.5 54.0 <.001
AA 39.6 — — — 45.1 25.5 <.001 53.8 45.1 29.6 36.3 .079
EthnicityNon-Hispanic 62.9 .048 63.4 39.5 <.001 63.1 62.5 <.001 73.9 63.6 59.5 52.7 <.001
Hispanic 56.4 55.4 NR .603 56.7 54.3 .162 NR 53.7 54.8 56.7 .098
Communitypoverty level<5% 74.0 <.001 73.9 53.8 .026 72.7 76.1 .573 — — — — —
5%-10% 63.4 63.4 45.1 .003 63.6 62.8 .023 — — — — —
10%-15% 59.1 59.5 29.6 <.001 58.9 59.4 .018 — — — — —
>15% 53.0 54.0 36.3 <.001 53.7 51.5 .006 — — — — —
Alcohol useYes 53.8 <.001 53.7 53.6 .645 53.6 55.7 .631 57.6 58.1 51.4 44.3 .197
No 63.5 63.6 37.5 <.001 63.5 63.5 <.001 76.2 64.0 60.4 54.0 <.001
Tobacco useYes 62.2 .895 62.3 40.3 <.001 61.0 65.9 .949 72.1 60.9 60.5 53.6 <.001
No 62.1 63.0 33.2 <.001 64.4 55.7 <.001 77.2 63.6 56.0 50.1 <.001
Localized 65.2 <.001 65.3 44.3 <.001 65.9 64.4 .088 76.5 64.5 61.5 60.0 <.001
Regional 22.2 22.5 17.3 .261 23.7 18.5 .200 27.1 19.9 23.8 17.9 .015
Distant 11.4 12.0 5.7 .086 12.4 7.6 .348 9.6 12.3 8.5 10.1 .764
Tumor gradeWell differentiated NR <.001 NR NR .162 NR NR .029 NR NR NR 83.9 .004
Moderately
differentiated
76.9 76.9 63.1 <.001 76.2 80.8 .855 NR 73.1 70.0 70.1 <.001
Poorly differentiated 40.5 41.0 23.5 <.001 43.5 30.1 <.001 45.0 40.5 37.6 31.2 <.001
Undifferentiated 29.4 30.0 18.7 .001 32.6 23.5 .002 34.1 31.2 21.8 25.7 .003
SurgeryEndoscopic
resection
68.2 <.001 68.6 45.9 <.001 67.8 68.7 <.001 80.5 66.6 65.0 60.4 <.001
Open surgery 34.2 34.8 28.6 .277 33.8 36.3 .524 38.0 34.2 32.5 28.0 .055
No surgery 29.8 30.5 12.8 <.001 32.5 20.3 <.001 31.8 38.2 27.8 20.2 .007
ChemotherapyYes 27.5 <.001 27.8 18.0 <.001 29.4 21.7 .030 28.4 25.3 29.4 23.8 .077
No 64.9 65.1 41.2 <.001 64.7 65.1 <.001 76.5 65.1 61.5 56.8 <.001
RadiationYes 16.6 <.001 17.2 10.6 .003 18.0 14.7 .038 15.0 14.7 17.1 18.5 .074
No 64.9 65.0 41.5 <.001 64.6 65.4 <.001 76.7 65.0 61.5 56.2 <.001
AA indicates African American; NR, not reached.
Disparities in Bladder Cancer/Brookfield et al
Cancer September 15, 2009 4201
P < .001) and chemotherapy (9.1% vs 6.2%; P ¼ .002).
Regardless of whether or not patients underwent endo-
scopic procedures, open surgical procedures, or no surgery
at all, AA patients had decreased survival times compared
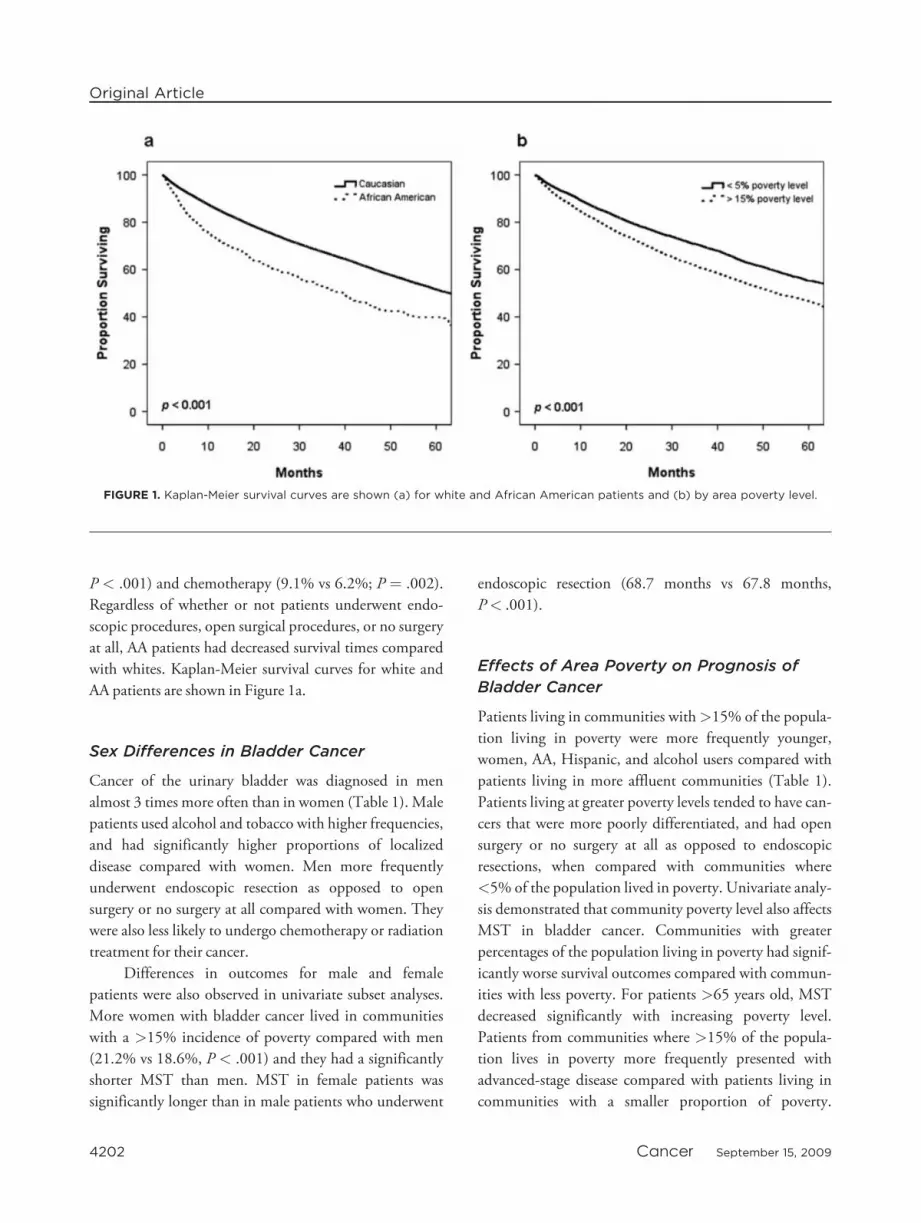
with whites. Kaplan-Meier survival curves for white and
AA patients are shown in Figure 1a.
Sex Differences in Bladder Cancer
Cancer of the urinary bladder was diagnosed in men
almost 3 times more often than in women (Table 1). Male
patients used alcohol and tobacco with higher frequencies,
and had significantly higher proportions of localized
disease compared with women. Men more frequently
underwent endoscopic resection as opposed to open
surgery or no surgery at all compared with women. They
were also less likely to undergo chemotherapy or radiation
treatment for their cancer.
Differences in outcomes for male and female
patients were also observed in univariate subset analyses.
More women with bladder cancer lived in communities
with a >15% incidence of poverty compared with men
(21.2% vs 18.6%, P < .001) and they had a significantly
shorter MST than men. MST in female patients was
significantly longer than in male patients who underwent
endoscopic resection (68.7 months vs 67.8 months,
P< .001).
Effects of Area Poverty on Prognosis of
Bladder Cancer
Patients living in communities with>15% of the popula-
tion living in poverty were more frequently younger,
women, AA, Hispanic, and alcohol users compared with
patients living in more affluent communities (Table 1).
Patients living at greater poverty levels tended to have can-
cers that were more poorly differentiated, and had open
surgery or no surgery at all as opposed to endoscopic
resections, when compared with communities where
<5% of the population lived in poverty. Univariate analy-
sis demonstrated that community poverty level also affects
MST in bladder cancer. Communities with greater
percentages of the population living in poverty had signif-
icantly worse survival outcomes compared with commun-
ities with less poverty. For patients >65 years old, MST
decreased significantly with increasing poverty level.
Patients from communities where >15% of the popula-
tion lives in poverty more frequently presented with
advanced-stage disease compared with patients living in
communities with a smaller proportion of poverty.
FIGURE 1. Kaplan-Meier survival curves are shown (a) for white and African American patients and (b) by area poverty level.
Original Article
4202 Cancer September 15, 2009

Patients living in communities with the greatest amount
of poverty were less likely to undergo endoscopic resection
of their bladder cancer, and among all patients under-
going endoscopic procedures, those patients living in the
poorest communities experienced worse survival out-
comes compared with patients living in communities with
the least amount of poverty (60.4 months vs 80.5 months;
P < .001). Kaplan-Meier survival curves by area poverty
level are shown in Figure 1b.
Tobacco
Whites diagnosed with bladder cancer were significantly
more likely to use tobacco compared with AAs (65.1% vs
55.5%, P < .001), and men diagnosed with bladder can-
cer were significantly more likely to use tobacco compared
with women (67.7% vs 55.4%, P< .001). The survival of
white smokers was significantly longer than that of their
AA counterparts (62.3 months vs 40.3 months, P <
.001). A survival advantage was also observed in whites
who did not smoke when compared with AA nonsmokers
(63.0 months vs 33.2 months, P < .001). Women who
used tobacco had longer MST than men who used
tobacco; however, this result was not statistically signifi-
cant (65.9 months vs 61.0 months, P ¼ .949). Smoking
was not an effect modifier for race or sex. Among smokers
and nonsmokers, women who lived in communities with
>15% of the population living in poverty had signifi-
cantly diminished median survival times.
Comorbidities in Bladder Cancer
The frequency of comorbidities in the study population is
shown in Table 3. The most frequent comorbidity was
hypertension (61.4%), whereas the most infrequent ill-
ness observed was human immunodeficiency virus/
acquired immune deficiency syndrome (HIV/AIDS)
(0.2%). Compared with whites, AAs were more likely to
be diagnosed with hypertension, diabetes, renal failure,
liver disease, HIV/AIDS, anemia, and fluid and electro-
lyte disorders in addition to bladder cancer. Women were
more often diagnosed with hypothyroidism, obesity,
weight loss, anemia, depression, and fluid and electrolyte
imbalances. Patients living in less affluent areas were more
often diagnosed with congestive heart failure, hyperten-
sion, paralysis, pulmonary diseases, diabetes, renal failure,
liver disease, obesity, weight loss, anemia, and depression.
By univariate analysis, all listed comorbid conditions
significantly affected MST, with the exception of
hypertension and AIDS/HIV.
Multivariate Analysis
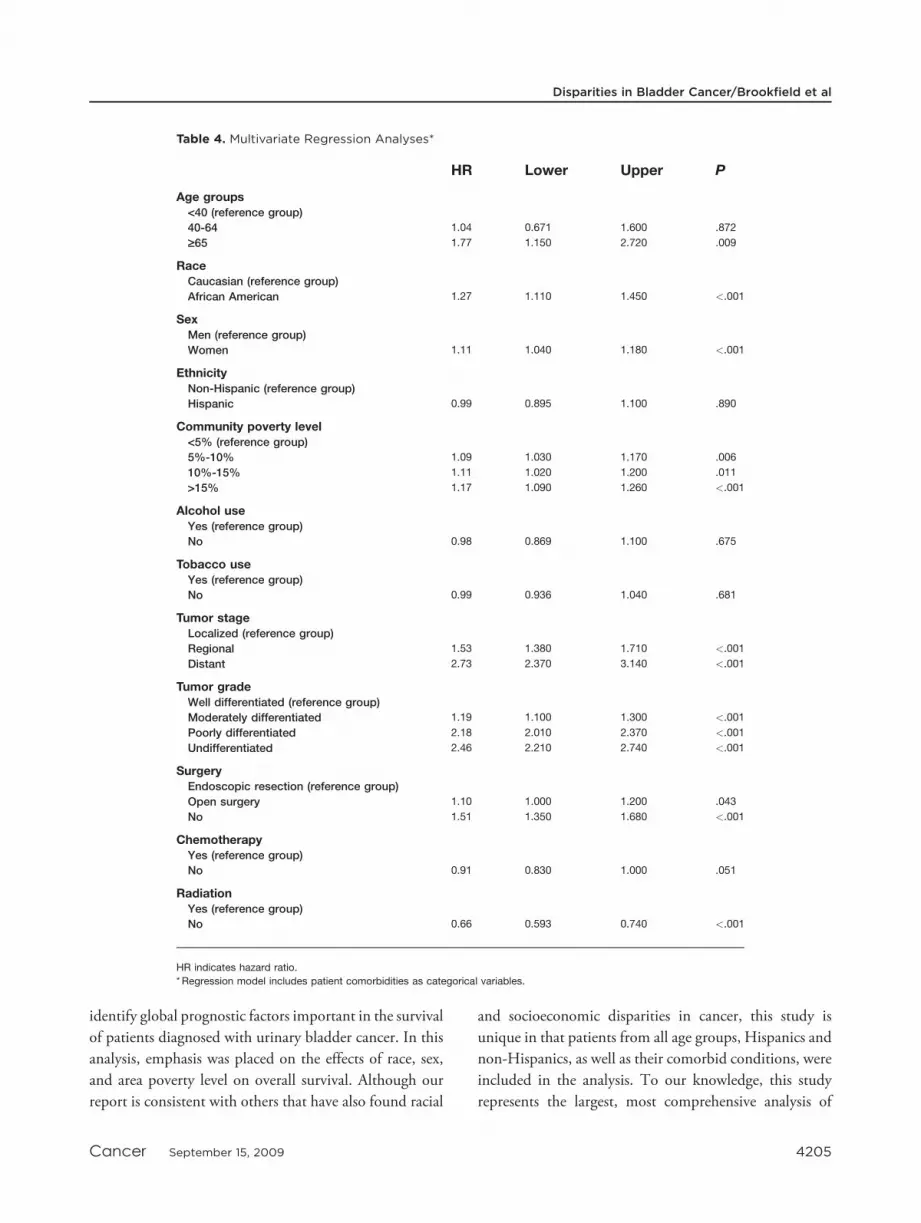
Results of multivariate analysis using the Cox regression
model are summarized in Table 4. Independent predictors
of survival of bladder cancer in the final model included
age >65 years, AA race, female sex, community poverty
level, histologic tumor grade, tumor stage, and surgical
treatment. No differences were observed between
ethnicity, alcohol consumption, tobacco usage, and
chemotherapy.
AA patients were 27% more likely to die during the
study period compared with white patients (P < .001),
and women were 11% more likely to die during the study
period compared with men (P < .001). Patients living in
areas where >15% of the residents live in poverty were
17% more likely to die during the study compared with
patients living in areas where <5% of the residents live in
poverty (P ¼ .001). Clinical and treatment characteristics
proved to have the largest effect on survival outcomes.
Patients with regional disease were 1.53 times more likely
to die during the study period, and patients with distant
disease were 2.73 times more likely to die during the study
period compared with patients with localized disease (P<
.001). A dose-response effect was observed between tumor
grade and risk of death during the study period. Patients
with poorly differentiated tumors were 2.18 times more
likely to die during the study period compared with
women with well-differentiated tumors. Patients who
were not treated surgically had a 51% increased risk of
death compared with those who received any surgical
therapy (P < .001). Those who did not receive radiation
treatment had a 34% decreased risk of death compared
with patients who received radiation therapy (P< .001).
DISCUSSION
Differences in cancer survival based on race, ethnicity,
and SES remain a major issue despite recognition of these
inequalities for>30 years. In an effort to understand out-
comes for bladder cancer patients and potentially improve
survival, we examined a population-based registry to
Disparities in Bladder Cancer/Brookfield et al
Cancer September 15, 2009 4203

Table
3.ElixhauserComorb
iditiesAccord
ingto
Race,Sex,andSES
Frequency
MedianSurvival
Overall,
%Race,%
Sex,%
PovertyLevel,%
Present,
mo
Not
Present,
mo
P
White
AA
Other
PMen
Women
P<5
%5%-10%
10%-15%
>15%
P
Congestiveheartfailure
20.6
22.08
23.20
15.04
.109
22.9
19.4
<.001
20.0
22.0
23.6
23.9
<.001
39.5
77.5
<.001
Cardiacarrhythmias
31.6
34.08
26.56
22.56
<.001
35.6
28.2
<.001
33.2
34.2
34.5
33.0
.184
48.7
78.8
<.001
Valvulardisease
19.7
21.25
14.06
15.04
<.001
21.9
18.0
<.001
21.3
21.1
21.3
19.9
.183
55.0
66.3
<.001
Pulm
onary
circulationdisorders
2.7
2.88
3.73
1.50
.226
2.9
3.0
.688
2.9
2.8
3.0
3.1
.687
37.4
64.1
<.001
Peripheralvasculardisease
15.7
16.95
12.62
14.29
.003
18.1
12.7
<.001
16.1
17.1
17.6
16.6
.096
54.5
65.1
<.001
Hypertension
61.4
65.35
73.80
65.41
<.001
65.8
64.5
.047
64.1
65.9
66.1
66.1
.028
60.8
67.3
.262
Paralysis
2.8
2.99
3.97
1.50
.160
3.1
2.8
.268
2.6
2.9
3.1
3.6
.008
38.0
64.2
<.001
Neurologicaldisorders
9.2
9.81
11.30
7.52
.244
10.2
8.7
<.001
9.5
9.9
9.5
10.5
.249
38.9
68.6
<.001
Chronic
pulm
onary
disease
39.1
42.00
37.62
31.58
.002
43.4
36.7
<.001
37.9
41.1
43.9
46.3
<.001
50.1
78.5
<.001
Diabetes,uncomplicated
20.4
21.44
31.01
29.32
<.001
23.2
17.4
<.001
20.2
21.9
22.3
23.4
<.001
58.1
64.4
<.001
Diabetes,complicated
5.0
5.26
8.65
4.51
<.001
5.7
4.4
<.001
5.1
5.3
5.4
5.9
.184
45.1
64.4
<.001
Hypothyroidism
8.8
9.53
5.29
9.02
<.001
6.5
18.2
<.001
9.7
9.5
9.2
8.9
.384
58.7
63.5
.004
Renalfailure
11.6
12.11
21.88
13.53
<.001
13.2
9.8
<.001
10.8
12.1
13.2
14.4
<.001
33.3
72.1
<.001
Liverdisease
13.1
13.88
20.55
14.29
<.001
14.3
13.1
.010
13.1
13.7
14.1
15.8
<.001
39.9
67.0
<.001
Pepticulcerdisease
4.0
4.22
4.33
4.51
.975
4.3
4.0
.250
4.0
4.2
4.5
4.3
.606
54.2
63.5
.003
AIDS/H
IV0.2
0.15
0.72
0.00
<.001
0.2
0.1
.582
0.2
0.1
0.1
0.2
.750
67.3
62.9
.760
Lymphoma
1.7
1.90
1.32
1.50
.462
1.9
1.7
.403
1.8
1.9
2.1
1.6
.393
41.0
63.6
<.001
Rheumatoid
arthritis/collagen
vasculardisease
22.8
24.42
24.04
23.31
.928
24.2
24.8
.295
24.4
23.2
25.8
24.8
.003
67.0
60.8
<.001
Coagulopathy
7.7
8.19
9.38
6.02
.308
8.5
7.1
<.001
7.9
8.3
7.9
8.6
.508
35.2
67.2
<.001
Obesity
5.3
5.58
8.05
4.51
.008
5.3
6.6
<.001
4.9
5.7
5.8
6.3
.004
73.0
62.2
<.001
Weightloss
8.7
9.16
13.82
11.28
<.001
9.0
10.0
.010
8.1
9.0
9.7
10.9
<.001
31.1
69.2
<.001
Fluid
andelectrolyte
disorder
31.3
33.08
45.07
35.34
<.001
32.1
37.1
<.001
29.6
33.7
34.1
37.3
<.001
33.6
NA
<.001
Bloodlossanemia
7.0
7.27
14.30
7.52
<.001
7.2
8.3
.002
6.4
7.4
7.5
8.7
<.001
32.8
66.2
<.001
Anemia,deficiency
5.0
4.92
9.98
3.01
<.001
4.7
6.0
<.001
4.5
5.2
4.9
5.7
.014
47.5
64.0
<.001
Drugabuse
1.9
2.02
1.80
0.75
.531
2.1
1.8
.217
1.8
2.0
1.9
2.4
.066
52.2
63.2
.015
Psychoses
4.8
5.13
5.17
2.26
.323
5.1
5.1
.911
5.4
4.9
4.8
5.3
.354
76.0
62.2
<.001
Depression
8.9
9.58
7.81
6.02
.090
8.6
12.3
<.001
8.6
9.2
10.5
10.6
<.001
43.6
66.1
<.001
SESindicatessocioeconomic
status;AA,AfricanAmerican;AIDS/H
IV,humanim
munodeficiencyvirus/acquiredim
munedeficiencysyndrome.
Original Article
4204 Cancer September 15, 2009
identify global prognostic factors important in the survival
of patients diagnosed with urinary bladder cancer. In this
analysis, emphasis was placed on the effects of race, sex,
and area poverty level on overall survival. Although our
report is consistent with others that have also found racial
and socioeconomic disparities in cancer, this study is
unique in that patients from all age groups, Hispanics and
non-Hispanics, as well as their comorbid conditions, were
included in the analysis. To our knowledge, this study
represents the largest, most comprehensive analysis of
Table 4. Multivariate Regression Analyses*
HR Lower Upper P
Age groups<40 (reference group)
40-64 1.04 0.671 1.600 .872
‡65 1.77 1.150 2.720 .009
RaceCaucasian (reference group)
African American 1.27 1.110 1.450 <.001
SexMen (reference group)
Women 1.11 1.040 1.180 <.001
EthnicityNon-Hispanic (reference group)
Hispanic 0.99 0.895 1.100 .890
Community poverty level<5% (reference group)
5%-10% 1.09 1.030 1.170 .006
10%-15% 1.11 1.020 1.200 .011
>15% 1.17 1.090 1.260 <.001
Alcohol useYes (reference group)
No 0.98 0.869 1.100 .675
Tobacco useYes (reference group)
No 0.99 0.936 1.040 .681
Tumor stageLocalized (reference group)
Regional 1.53 1.380 1.710 <.001
Distant 2.73 2.370 3.140 <.001
Tumor gradeWell differentiated (reference group)
Moderately differentiated 1.19 1.100 1.300 <.001
Poorly differentiated 2.18 2.010 2.370 <.001
Undifferentiated 2.46 2.210 2.740 <.001
SurgeryEndoscopic resection (reference group)
Open surgery 1.10 1.000 1.200 .043
No 1.51 1.350 1.680 <.001
ChemotherapyYes (reference group)
No 0.91 0.830 1.000 .051
RadiationYes (reference group)
No 0.66 0.593 0.740 <.001
HR indicates hazard ratio.
* Regression model includes patient comorbidities as categorical variables.
Disparities in Bladder Cancer/Brookfield et al
Cancer September 15, 2009 4205

these variables on the outcomes of patients with bladder
cancer to date.
We observed that after controlling for sociodemo-
graphic, clinical, and treatment characteristics, as well as
comorbidities, race, sex, and poverty were independent
predictors of urinary bladder cancer survival. With respect
to race, these results are supported by previous studies that
lacked comorbidity data.13-15,32 Prior published studies
examining racial and gender disparities in bladder cancer
have included data on patients diagnosed over many deca-
des. The results of the current study suggest that despite
the knowledge of existing disparities, little progress in
improving survival of urinary bladder cancer has been
made. In the cohort reported herein, AA patients had sig-
nificantly more regional and distant disease and more
poorly differentiated tumors compared with their white
counterparts. AAs and women were also significantly less
likely to have endoscopic resection compared with their
white and male counterparts. Our comorbidity data did
not indicate that AAs were more likely to be of increased
operative risk secondary to poor health; however, the
findings of more advanced disease at presentation may
indicate that the extent of disease made these patients
more likely to be inoperable at time of diagnosis, leading
to more frequent use of chemotherapy or radiation
treatment.
Survival of AA patients who underwent endoscopic
resection was significantly shorter than that of whites by
univariate analysis, whereas no difference in survival was
noted with open procedures. After controlling for socio-
demographic variables and clinical disease characteristics
in multivariate analysis, endoscopic resection was associ-
ated with superior outcomes. These results indicate that
for patients who receive surgical treatment for urothelial
cancer, race, sex, and poverty were all independent predic-
tors of survival. In part because bladder cancer is 3 times
less common in women than in men, many health practi-
tioners may overlook presenting symptoms of bladder
cancer in women and reflexively attribute hematuria to
cystitis or a variety of gynecologic pathologies. The find-
ings of our study indicate that poor survival outcomes,
particularly for AA women, regardless of poverty level, are
at least in part the result of delays in diagnosis and treat-
ment, or less than adequate treatment, and presentation
of illness in advanced stages. These findings are particu-
larly troubling considering that the incidence of bladder
cancer in AA women is increasing. Previous studies from
the 1980s and 1990s have also demonstrated that there is
often a delay in diagnosis of bladder cancer, especially for
women compared with men.33,34
In a much smaller study, Prout et al14 found that
black patients working in the most affluent occupations
did not significantly differ in terms of survival compared
with whites. Our study results suggest patients living in
communities with>15% of the population living in pov-
erty had significantly decreased MST compared with
patients living in communities with less poverty, even
when they had surgical treatment for their bladder cancer.
After adjustment for confounding variables in the multi-
variate analysis, community poverty level continued to be
an independent predictor of survival. These results suggest
that when socioeconomically disadvantaged patients with
bladder cancer are treated, their survival outcomes con-
tinue to be poorer relative to those of patients living in
more affluent communities. Our findings are likely more
robust, as we included a larger and more heterogeneous
population of patients. Much like the association between
AA race and survival, these results likely indicate poorer
patients may be subject to incomplete follow-up of physi-
cian visits and treatment.
The American Cancer Society (ACS) has suggested
that low SES in AAs is responsible for many inequalities.35
Moreover, the ACS, in collaboration with the National
Cancer Institute and Center for Disease Control, issued a
landmark report highlighting the key issues.36 The poor
were found to have worse outcomes because of financial
hardship and lack of insurance, and therefore poor access
to healthcare. This report also suggested that the poor
endured more pain and suffering when diagnosed with
cancer and that they did not benefit from cancer educa-
tion and outreach programs. Finally, the report suggested
that poor patients regard cancer diagnoses with a sense of
resignation and futility, and therefore are less likely to
seek medical treatment.36 In our final Cox regression
model, race, sex, and poverty remained independent
predictors of survival, along with lack of surgical
treatment for bladder cancer.
In light of the finding that access to care has been
highlighted as a major factor affecting cancer survival,
many organizations have increased their efforts to level
the playing field in the burden of cancer. The ACS has
made this issue the centerpiece of their goal to be attained
Original Article
4206 Cancer September 15, 2009
by the year 2015,37 and the US Department of Health
and Human Services has made a commitment to reduce
cancer disparities with the Healthy People 2010 initiative.
These efforts are primarily focused on modifiable, socioe-
conomic factors such as poverty level, education, and
healthcare. The results of our study suggest programs that
increase the likelihood of AAs and the poor to seek treat-
ment and education programs aimed at better compliance
with treatment programs may have the most substantial
impact on bladder cancer survival.
Although significant differences in survival by race
and SES were observed, no survival disparities were
observed for Hispanic men and women with bladder can-
cer. No significant difference in survival times was
observed relative to white non-Hispanic patients. Ethnic-
ity also failed to reach significance in the final multivariate
regression model. Previous studies examining bladder
cancer survival have not commented on possible ethnic
differences outside that of the Native American and
Native Alaskan populations.16 Although only 7.4% of our
sample identified themselves as Hispanic, this observation
may reflect the finding that ethnicity does not play as large
a role as race or sex in predicting bladder cancer survival.
In addition, the predominately Cuban population of
South Florida has been shown to have more favorable
health outcomes relative to other Hispanics, and therefore
these results may not be generalizable to other Hispanic
subgroups, such as Mexican Americans. These results may
also point to improving awareness of signs and symptoms
of bladder cancer in the Hispanic population and earlier
identification of the disease at more treatable stages. Previ-
ously we have also failed to observe disparate outcomes for
Florida Hispanics for several other cancers.29,38,39
We have provided the most comprehensive analysis
of bladder cancer to date using a linked FCDS and
AHCA database. This linkage dramatically improved the
power of the study, as it provided additional data such as
comorbidities, enhanced follow-up, socioeconomic infor-
mation, and improved treatment information. Our study
was restricted to 1998-2003, as linkage of these data sets
was not possible in data sets for prior years. The FCDS,
which currently includes over 2.7 million records, is a
population-based registry of all cancer cases diagnosed or
treated in the state of Florida, which represents about 6%
of the total US population. The data collected from large
cancer registries provide insight into tumor behavior and
allow us to examine outcomes from current treatment
strategies.40-45 Although this represents an excellent data-
base for comparative outcomes analysis, it is not without
limitations. By using area poverty as a proxy for SES may
result in misclassification of some patients whose postal
codes do not accurately reflect the true income level of the
individual. In addition, FCDS records only primary cause
of death; as a result, we were unable to include disease-
specific survival in our examination. Furthermore,
although data on radiotherapy and chemotherapy were
examined, information on specific regimens and dosages
were also not available.
In conclusion, after controlling for socioeconomic
factors, clinical characteristics, and treatment modality,
we demonstrate significant racial, gender, and SES dispar-
ities exist in bladder cancer survival. The inequalities were
observed in both the univariate and multivariate analysis.
Programs geared toward diminishing disparities in blad-
der cancer survival should be aimed both at providing ear-
lier diagnosis and assuring optimal delivery of therapies,
including increased use of minimally invasive surgical
treatment to patients, particularly AAs and women whose
diagnosis is often under-recognized.
Conflict of Interest Disclosures
Supported in part by a grant from the James and Ester KingTobacco Grant from the State of Florida.
References
1. Henschke UK, Leffall LD Jr, Mason CH, et al. Alarmingincrease of the cancer mortality in the U.S. black popula-tion (1950-1967). Cancer. 1973;31:763-768.
2. Surveillance, Epidemiology and End Results (SEER) Pro-gram. Bethesda, MD: National Cancer Institute; 2005.
3. Carey P, Gjerdingen DK. Follow-up of abnormal Papani-colaou smears among women of different races. J FamPract. 1993;37:583-587.
4. Chang SW, Kerlikowske K, Napoles-Springer A, et al.Racial differences in timeliness of follow-up after abnormalscreening mammography. Cancer. 1996;78:1395-1402.
5. Eley JW, Hill HA, Chen VW, et al. Racial differences insurvival from breast cancer. Results of the National CancerInstitute Black/White Cancer Survival Study. JAMA.1994;272:947-954.
6. Hegarty V, Burchett BM, Gold DT, Cohen HJ. Racial dif-ferences in use of cancer prevention services among olderAmericans. J Am Geriatr Soc. 2000;48:735-740.
7. Liu WL, Kasl S, Flannery JT, et al. The accuracy of pros-tate cancer staging in a population-based tumor registry
Disparities in Bladder Cancer/Brookfield et al
Cancer September 15, 2009 4207

and its impact on the black-white stage difference (Con-necticut, United States). Cancer Causes Control. 1995;6:425-430.
8. McCarthy BD, Yood MU, Boohaker EA, et al. Inadequatefollow-up of abnormal mammograms. Am J Prev Med.1996;12:282-288.
9. Optenberg SA, Thompson IM, Friedrichs P, et al. Race,treatment, and long-term survival from prostate cancer inan equal-access medical care delivery system. JAMA.1995;274:1599-1605.
10. Shavers VL, Brown ML. Racial and ethnic disparities in thereceipt of cancer treatment. J Natl Cancer Inst. 2002;94:334-357.
11. Suarez L, Pulley L. Comparing acculturation scales andtheir relationship to cancer screening among older Mexi-can-American women. J Natl Cancer Inst Monogr. 1995;(18):41-47.
12. Sung HY, Kearney KA, Miller M, et al. Papanicolaousmear history and diagnosis of invasive cervical carcinomaamong members of a large prepaid health plan. Cancer.2000;88:2283-2289.
13. Lee CT, Dunn RL, Williams C, Underwood W III.Racial disparity in bladder cancer: trends in tumor presenta-tion at diagnosis. J Urol. 2006;176:927-933; discussion933-934.
14. Prout GR Jr, Wesley MN, Greenberg RS, et al. Bladdercancer: race differences in extent of disease at diagnosis.Cancer. 2000;89:1349-1358.
15. Underwood W III, Dunn RL, Williams C, Lee CT.Gender and geographic influence on the racial disparity inbladder cancer mortality in the US. J Am Coll Surg.2006;202:284-290.
16. Watson RA, Sidor M. Bladder cancer in Native Americansand Alaskan Natives. Urology. 2008;72:10-14.
17. Zell JA, Cinar P, Mobasher M, et al. Survival for patientswith invasive cutaneous melanoma among ethnic groups:the effects of socioeconomic status and treatment. J ClinOncol. 2008;26:66-75.
18. DeNavas-Walt C, Proctor BD, Smith J. Income, Poverty,and Health Insurance Coverage in the United States: 2006.Washington, DC: U.S. Census Bureau; 2006.
19. Brooks SE, Baquet CR, Gardner JF, et al. Cervicalcancer—the impact of clinical presentation, health and raceon survival. J Assoc Acad Minor Phys. 2000;11:55-59.
20. del Carmen MG, Montz FJ, Bristow RE, et al. Ethnicdifferences in patterns of care of stage 1A and stage 1Acervical cancer: a SEER database study. Gynecol Oncol.1999;75:113-117.
21. Howell EA, Chen YT, Concato J. Differences in cervicalcancer mortality among black and white women. ObstetGynecol. 1999;94:509-515.
22. Jones WB, Shingleton HM, Russell A, et al. Patterns ofcare for invasive cervical cancer. Results of a national surveyof 1984 and 1990. Cancer. 1995;76(10 suppl):1934-1947.
23. Leath CA III, Straughn JM Jr, Kirby TO, et al. Predictorsof outcomes for women with cervical carcinoma. GynecolOncol. 2005;99:432-436.
24. Mandelblatt J, Andrews H, Kerner J, et al. Determinants oflate stage diagnosis of breast and cervical cancer: the impactof age, race, social class, and hospital type. Am J PublicHealth. 1991;81:646-649.
25. Mitchell JB, McCormack LA. Time trends in late-stagediagnosis of cervical cancer. Differences by race/ethnicityand income. Med Care. 1997;35:1220-1224.
26. Eifel PJ, Moughan J, Owen J, et al. Patterns of radiother-apy practice for patients with squamous carcinoma of theuterine cervix: patterns of care study. Int J Radiat OncolBiol Phys. 1999;43:351-358.
27. Mundt AJ, Connell PP, Campbell T, et al. Race and clini-cal outcome in patients with carcinoma of the uterine cer-vix treated with radiation therapy. Gynecol Oncol. 1998;71:151-158.
28. Cancer Facts & Figures 2008. Atlanta, GA: American Can-cer Society; 2008.
29. Brookfield KF, Cheung MC, Lucci J, Fleming LE, KoniarisLG. Disparities in survival among women with invasivecervical cancer: a problem of access to care. Cancer.2009;115:166-178.
30. Molina MA, Cheung MC, Perez EA, et al. African Ameri-can and poor patients carry a dramatically worse prognosisfor head and neck cancer: an examination of 20,915patients. Cancer. 2008;113:2797-2806.
31. DeNavas-Walt C, Proctor B, Mills R. Current PopulationReports. Washington, DC: US Census Bureau; 2007:P60-P226.
32. Nieder AM, Mackinnon JA, Huang Y, et al. Floridabladder cancer trends 1981 to 2004: minimal progress indecreasing advanced disease. J Urol. 2008;179:491-495;discussion 495.
33. Mansson A, Anderson H, Colleen S. Time lag to diagnosisof bladder cancer—influence of psychosocial parametersand level of health-care provision. Scand J Urol Nephrol.1993;27:363-369.
34. Mommsen S, Aagaard J, Sell A. Presenting symptoms,treatment delay and survival in bladder cancer. Scand JUrol Nephrol. 1983;17:163-167.
35. Special Report on Cancer in the Economically Disadvan-taged. Atlanta, GA: American Cancer Society; 1986.
36. Cancer in the Poor: A Report to the Nation. Atlanta, GA:American Cancer Society; 1989.
37. Byers T, Mouchawar J, Marks J, et al. The AmericanCancer Society challenge goals. How far can cancer ratesdecline in the US by the year 2015? Cancer. 1999;86:715-727.
38. Cheung MC, Hamilton K, Sherman R, et al. Impact ofteaching facility status and high-volume centers on out-comes for lung cancer resection: an examination of 13,469surgical patients. Ann Surg Oncol. 2009;16:3-13.
Original Article
4208 Cancer September 15, 2009

39. Gutierrez JC, Hurley JD, Housri N, et al. Are many com-munity hospitals undertreating breast cancer?: lessons from24,834 patients. Ann Surg. 2008;248:154-162.
40. Cheung MC, Perez EA, Molina MA, et al. Defining therole of surgery for primary gastrointestinal tract melanoma.J Gastrointest Surg. 2008;12:731-738.
41. Gutierrez JC, Perez EA, Moffat FL, et al. Should soft tissuesarcomas be treated at high-volume centers? An analysis of4205 patients. Ann Surg. 2007;245:952-958.
42. Hodgson N, Koniaris LG, Livingstone AS, Franceschi D.Gastric carcinoids: a temporal increase with proton pumpintroduction. Surg Endosc. 2005;19:1610-1612.
43. Perez EA, Gutierrez JC, Jin X, et al. Surgical outcomes ofgastrointestinal sarcoma including gastrointestinal stromaltumors: a population-based examination. J Gastrointest Surg.2007;11:114-125.
44. Perez EA, Koniaris LG, Snell SE, et al. 7201carcinoids: increasing incidence overall and dispro-portionate mortality in the elderly. World J Surg. 2007;31:1022-1030.
45. Perez EA, Livingstone AS, Franceschi D, et al. Currentincidence and outcomes of gastrointestinal mesenchymaltumors including gastrointestinal stromal tumors. J Am CollSurg. 2006;202:623-629.
Disparities in Bladder Cancer/Brookfield et al
Cancer September 15, 2009 4209