subcellular heterogeneity of voltage-gated ca2+ channels in cells of the oligodendrocyte lineage
TRANSCRIPT
GLIA 13:l-12 (1995)
Subcellular Heterogeneity of Voltage-Gated Ca" Channels in Cells of the
Oligodendrocyte Lineage S. KIRISCHUK, J. SCHERER, T. MOLLER, A. VERKHRATSKY, AND H. KETTENMANN
Max-Delbriick Center for Molecular Medicine, Berlin-Buch, Germany
KEY WORDS Calcium channels, Oligodendrocytes, Cortex, Development, Confocal microscopy, Fluo-3 fluorescence
ABSTRACT We studied the distribution of voltage-gated Ca2+ channels in cells of the oligodendrocyte lineage from retinal and cortical cultures. Influx of Ca2+ via voltage- gated channels was activated by membrane depolarization with elevated extracellular K+ concentration ([K+],) and local, subcellular increases in cytosolic free Ca2+ concentra- tion ([Ca2+Iin) could be monitored with a fluometric system connected to a laser scanning confocal microscope. In glial precursor cells from both retina and cortex, small depolar- izations (with 10 or 20 mM K+) activated Ca2+ transients in processes indicating the presence of low-voltage-activated Ca2+ channels. Larger depolarizations (with 50 mM Kt ) additionally activated high-voltage-activated Ca2+ channels in the soma. An uneven distribution of Ca2+ channels was also observed in the mature oligodendrocytes; Ca2+ transients in processes were considerably larger. Recovery of Ca2' levels after the volt- age-induced influx was achieved by the activity of the plasmalemmal Ca2+ pump, while mitochondria played a minor role to restore Ca2+ levels after an influx through voltage- operated channels. During the development of white matter tracts, cells of the oligoden- drocyte lineage contact axons to form myelin. Neuronal activity is accompanied by in- creases in [Ktle; this may lead to Ca2+ changes in the processes and the Ca2+ increase might be a signal for the glial precursor cell to start myelin formation. 0 1995 Wiley-Liss, Inc.
INTRODUCTION
Voltage-activated Ca2+ channels play a key role for Ca2+ signalling in many eucariotic cells. These chan- nels are activated by membrane depolarization, e.g., induced by neurotransmitter receptor activation, lead- ing to a transmembrane Ca2+ influx and a resulting increase in cytoplasmic free calcium concentration ([Ca"],). The increase of [Ca2+Ii,, in turn, plays an unique role in the regulation of various cellular func- tions, such as cell excitability, secretion, synaptic plas- ticity, activity of cytoplasmic enzymes and gene expres- sion (Smith and Augustine, 1988; Marty, 1989; McCormack et al., 1990; Szekely et al., 1990; Kasai, 1993). The biophysical and pharmacological properties and the functional importance of Ca2+ channels were thoroughly studied in a number of preparations, includ- 0 1995 Wiley-Liss, Inc.
ing muscle, secretory cells, and neurons (Bean, 1989; Kostyuk, 1989; Hess, 1990). In the central nervous sys- tem, voltage-gated channels are not restricted to neu- rons, but are also expressed by the different types of glial cells. Ca2+ channels have been described for glial precursor cells, oligodendrocytes and astrocytes (MacVicar, 1984; MacVicar and Tse, 1988; Barres et al., 1988,1989; Verkhratsky et al., 1990; Blankenfeld et al., 1992). In a cell culture system from the cortex of mice, cells from the oligodendrocyte lineage could be enriched
Received April 8,1994; accepted August 16,1994. S. Kirischuk and A. Verkhratsky are now at Bogomoletz Institute of Physiol-
Address reprint requests to H. Kettenmann, Max-Delbruck Center for Molecu- ogy, Bogomoletz Street 4, Kiev-24, Ukraine.
lar Medicine, Berlin-Buch, Robert-Rossle-Strasse 10, Germany.
2 KIRISCHUK ET AL.
at various developmental stages. Combining physiolog- ical approaches with immunocytochemical cell identifi- cation using stage-specific antibodies, at least four stages of the oligodendrocyte development were distinguished (Sontheimer et al., 1989). Ca2+ channels were present in early glial precursor cells, were not detected in late precursors and immature oligodendrocytes, but could be activated in more mature oligodendrocytes. More- over, in both, early precursors and late oligodendro- cytes, two types of voltage-gated Ca2+ channels were distinguished, characterized as low- and high-voltage- activated Ca2+ channels (Verkhratsky et al., 1990; Blan- kenfeld et al., 1992). The presence of Ca2+ channels was subsequently also demonstrated for glial precursor cells in situ, namely, in a thin slice preparation of the corpus callosum (Berger et al., 1992). Since glial cells do not generate action potentials as an activating event for the voltage-gated Ca2+ channels, other depolarizing events were searched for to find a natural stimulus which might activate these channels in brain tissue. Indeed, activa- tion of GABA receptors leads to a depolarizing event sufficient to activate the voltage-gated Ca2+ channels and thus triggers an increase in [Ca2+lin (Kirchhoff and Kettenmann, 1992). This Ca2+ signal may play a func- tional role during development, as it has been specu- lated for immature neurons where a similar response was described (Yuste, R. and Katz, L.C., 1991). GABA mediated Ca2+ signalling is operative in glial precursor cells, but not in oligodendrocytes since in the latter cells GABA does not trigger a depolarizing event sufficient to activate the voltage gated Ca2+ channels (Gilbert et al., 1989). During the development of white matter tracts, glial precursors of the oligodendrocyte lineage form the first interaction with neuronal elements by contacting primarily large diameter axons with their processes (Sturrock, 1980). We assume that Ca2+ might play a role in such cell-to-cell interaction and addressed the question whether Ca2+ channels might be concen- trated a t the process tips or at other specific cellular sites. With the use of microfluorometric methods em- ploying the high spatial resolution of a confocal micro- scope, we were able to resolve subcellular regions with a high susceptibility for Ca2+ entry.
METHODS Retinal Culture
Cultures were obtained from retinae of 14- to 18-day- old New Zealand white rabbits. Rabbits were killed by an overdose of barbiturate (thiopental), enucleated, and the medullary ray area of the neural retina was isolated as described in Scherer and Schnitzer (1989). This reti- nal tissue was incubated in a 0.3% trypsine solution for 30 min at 37"C, and after addition of DNase mechani- cally dissociated with a fire-polished Pasteur pipette. After spinning and resuspending, this cell suspension was plated onto poly-L-lysine coated glass coverslips in 24 well tissue culture plates. Culture medium was a 1 : l mixture of DMEM and Hams F12 according to Gard
and Pfeiffer (1989) with minor modifications. 24 h after plating coverslips were flipped over, so that cells were upside down facing the bottom of the culture plate. This resulted in a better cell survival and differentiation. Cultures were kept for up to two weeks, either adding some fresh medium after 1 week or maintaining cells without a change of medium.
Cortical Culture
Cultures were obtained from brains of 14- to 16-day- old embryos of NMRI mice as described by Trotter et al. (1989). After 3-5 days in vitro neurones were elimi- nated by complement-dependent immunocytolysis us- ing the monoclonal antibody M5, directed against surfaces of central nervous system neurons, and guinea-pig complement (Keilhauer e t al., 1985; Trotter et al., 1989). After 1 week an astrocytic cell layer was formed with oligodendrocytes and precursor cells grow- ing on the top. By shaking these cultures of mixed glial cells by hand for a few seconds, oligodendrocytes and precursor cells could be removed from the bed-layer of astrocytes. These cells were replated on coverslips and gave rise to cultures highly enriched in oligodendro- cytes and precursor cells. They were plated and main- tained in Sat0 medium (as described in Trotter et al., 1989) containing 10% horse serum for 1 to 14 days. Such cultures contain over 95% oligodendrocytes and putative precursor cells at the initial plating and less than 5% other cell types such as glial fibrillary acidic protein-positive astrocytes.
Antibody Staining
For identifying cell types, cultured cells were stained with 0 4 and 010 antibodies (Sommer and Schachner, 1981,1982), prior to recording. Briefly, cells were washed in Hanks balanced salt solution, and incubated for 20 min in either 04 , or 010 antibody, respectively, fol- lowed by two washes. The binding of monoclonal anti- bodies was visualized by immunofluorescence using the goat anti mouse-tetramethyl-rhodamine-isothiocyanate (TR1TC)-antibody (1:lOO Cappel, Durham, NC).
Fluo-3 Measurements
[Ca2+Ii, transients were measured with the Ca2+- sensitive fluorescent dye fluo-3 (Minta et al., 1989). Cultured oligodendrocytes were loaded with dye by in- cubation of glass coverslips with adhered cells in nor- mal physiological solution supplemented with 5 FM fluo- 3/AM (diluted in DMSO) and 0.02% pluronic-127 detergent for 30 min at 22°C. At the end of this incuba- tion period cells were washed twice in normal solution and then incubated in the same solution for additional 30 min to ensure that the dye was converted into the membrane impermeable form. For measuring the [Ca2+],,
DISTRIBUTION OF CA2+ CHANNELS IN GLIAL CELLS
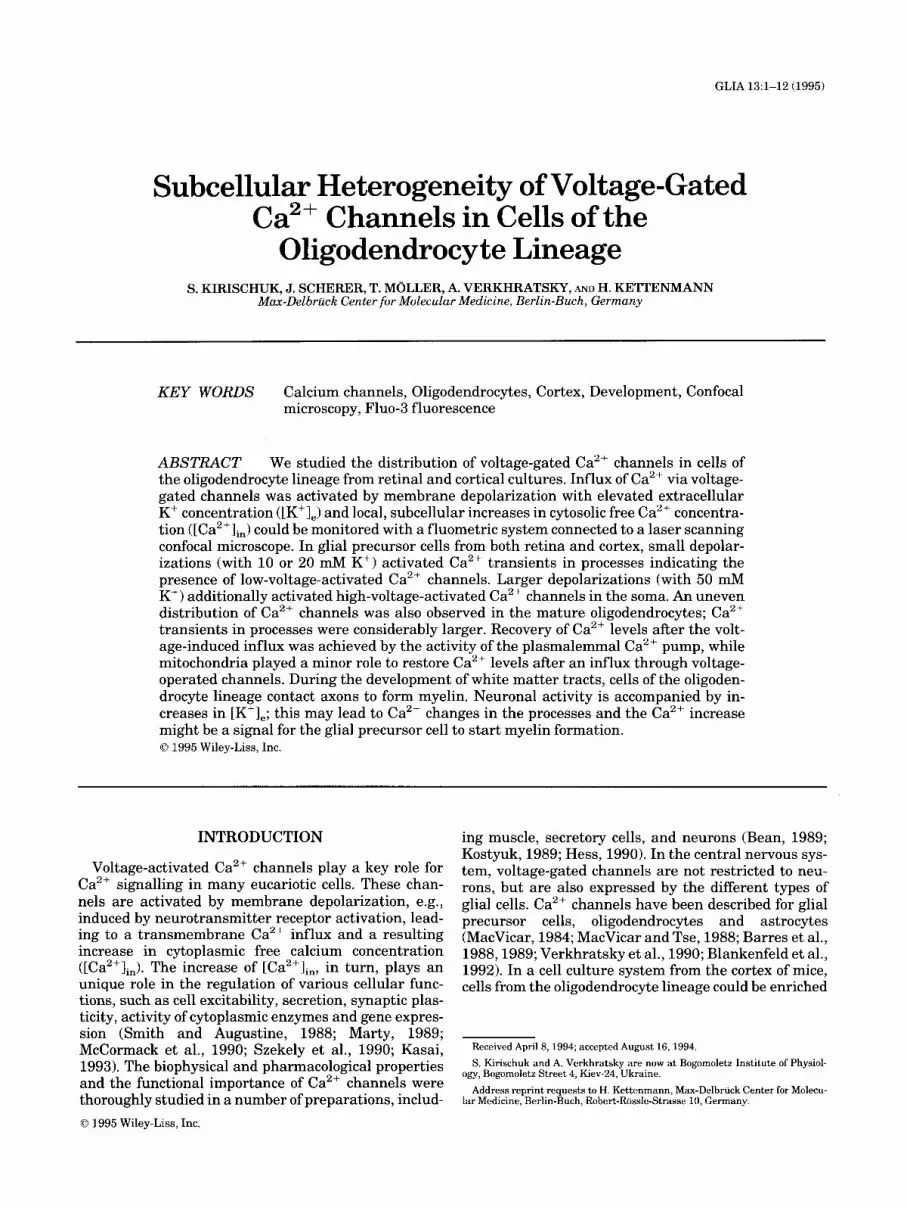
Fig. 1. Immunocytochemical characterization of precursor cells and oligodendrocytes. The photomicro- graphs show strainings of cells of the oligodendrocyte lineage with antibodies against 0 4 (A,B) and 010 (C). Cells were cultured for 2 (A), 3 (B), and 7 (C) days. The bar in B corresponds to A and B; bars denote 50 pm. The cell in A has the morphology of a typical simple precursor cell, in B of a more complex precursor celVimmature oligodendrocyte, and in C of a more mature oligodendrocyte.
3
KIRISCHUK ET AL. 4
A
soma (a) processes (b)
I '3 50 rnM K+
25 s
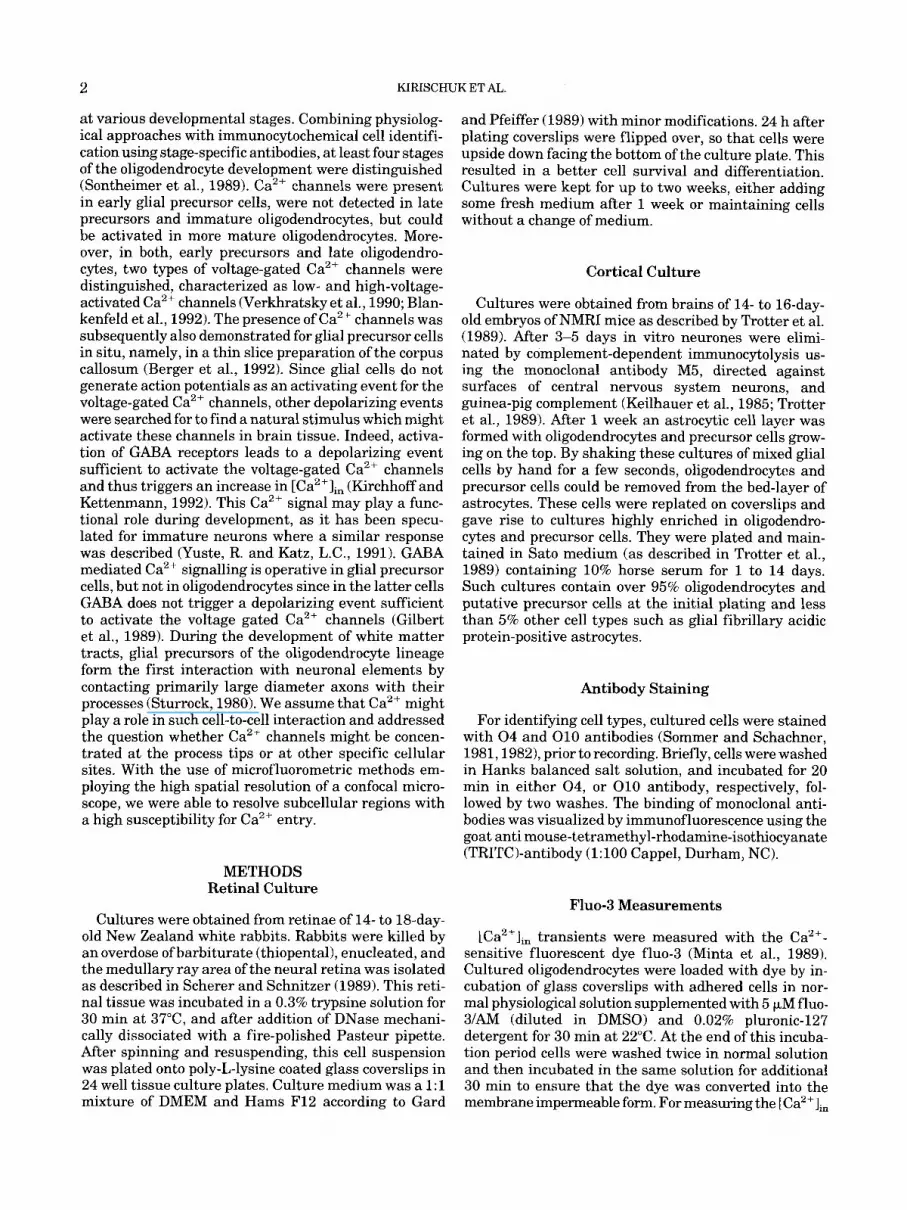
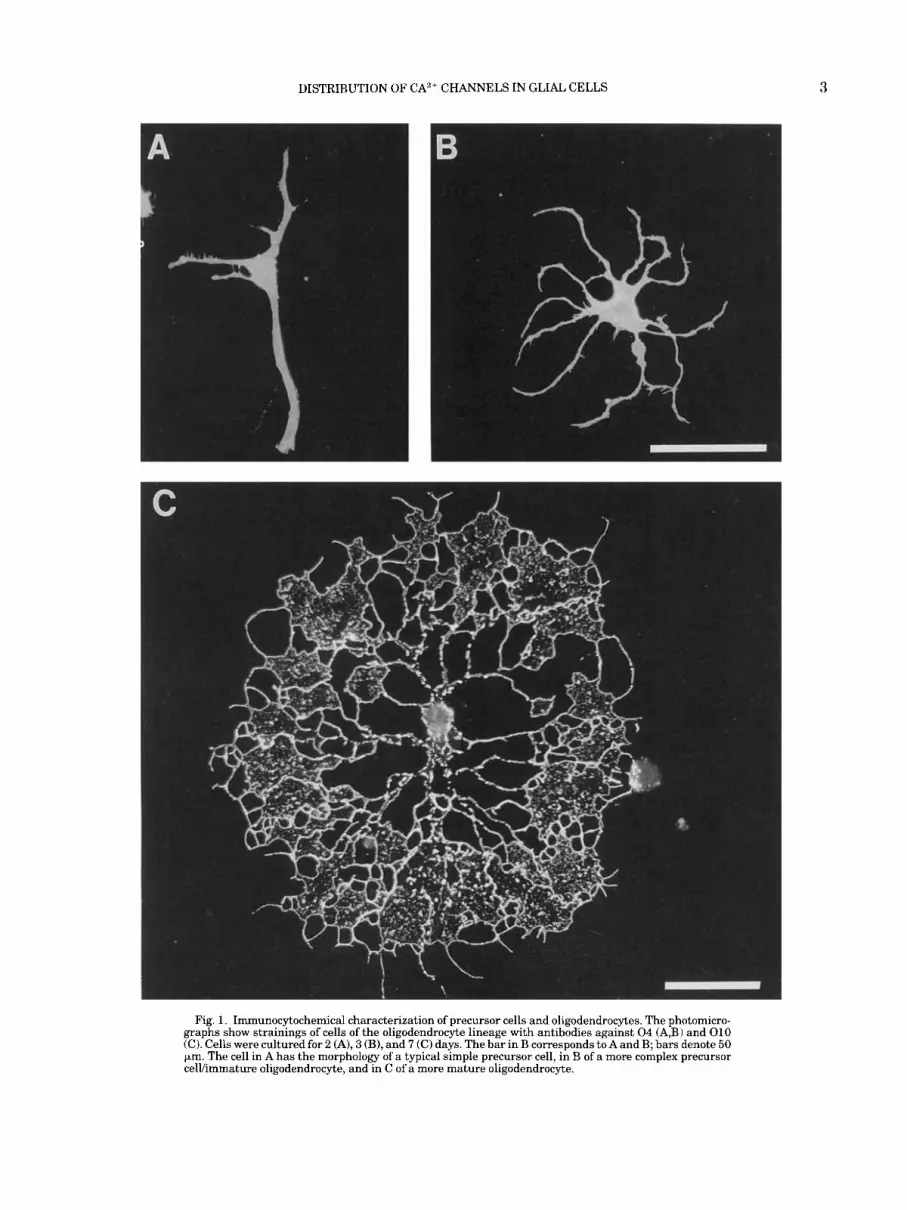
Fig. 2. ICa2+l,, transients elicited by high LK'],. An 04-positive cell was selected prior to recording and loaded with fluo-3. In A, the mor- phological features of the cell are shown in the fluo-3 fluorescence. Two areas were selected demarked as boxes, at the soma (a) and at a process (b). The measurements of a change in the fluo-3 fluorescence signal (F/F,) in B are taken from the two demarked areas. LK'], was increased from the normal level (5.4 mM) to 50 mM as indicated by bar.
transients we have used the confocal laser scanning microscope Sarastro 2000 (Molecular Dynamics, Sunny- vale, CA). The scanner was mounted on the upright microscope (Axioscope from Zeiss, Germany) equipped with 40 x water immersion objective; numerical aper- ture 0.75; the thickness of the focal plane was esti- mated to be in a range of 0.5 pm. An argon laser with a wavelength of 488 nm was used for optical excitation. Fluorescence was measured at an emission wavelength of 530 nm selected with an appropriate band pass filter. The power of the laser was set between 9 and 10 mW (the actual energy applied to the cell was less than 1 mW) to minimize fluo-3 bleaching. The images were acquired every 5 s with a resolution of 256 x 256 pixels
in the image scan mode of the confocal system. Prior to an experiment for a given cell, the optimal position for the focal plane was determined by evaluating sections at different focal planes. For measuring [Caz+lin changes with a high time resolution the line scan mode of the confocal system was used. In this configuration a single line was repetitively scanned at a fixed position with a frequency of 100 Hz. Since fluo-3 is not a ratiometric dye, all data are presented as normalized fluorescence intensity and were not calibrated as absolute [Ca2+lin values. To obtain the fluorescence intensity ratio, the resting fluorescence value was determined at the be- ginning of each experiment. This resting fluorescence was the result of averaging ten images in the image scan mode or 100 lines in the line-scan mode. All subse- quently determined images were divided by these rest- ing values.
Dye-loaded cells were mounted on the stage of the microscope, and the recording chamber was continu- ously superfused with a physiological salt solution at a rate 5 mumin. Substances were applied by changing the perfusate. All experiments were performed at 20- 22°C.
Data Acquisition and Analysis
Data acquisition and image analysis were performed using the software provided by Molecular Dynamics for the Silicon Graphics workstation. To analyze the fluo- rescent signal, programs for IBM-compatible computer systems were developed (S.K.) and data were trans- fered from the Silicon Graphics work station. All data are given as mean 2 s.e.m.
Solutions and Reagents
All solutions were freshly prepared from refrigerated stock solutions. The bathing salt solution was composed of (in mM): NaC1, 150; KCI, 5.4; CaCI,, 2.5; MgCl,, 1.1; HEPES/NaOH, 10; glucose, 10; pH, 7.4. In the calcium free solution, CaCI, was omitted, MgClz was increased to 2 mM and 0.5 mM EGTA was added, yielding an estimated Ca2+ concentration of about 30 nM. The ele- vated K+ solution was equivalent to normal bathing solution except that part of Na+ was replaced by Kt. Fluo-3/AM was obtained from Molecular Probes (Eu- gene, OR) BAY K 8644 was from RBI (Natick, MA), and all other chemicals were from Sigma Chemical Co. (Taufkirchen, Germany).
RESULTS Depolarization of Glial Precursors Leads to an
Increase in [Ca2+li, With Subcellular Heterogeneity
For the majority of experiments, we studied glial pre- cursor cells in the retinal cultures. By staining the culture with antibodies against 0 4 prior to the Ca2+
50 mM K
+
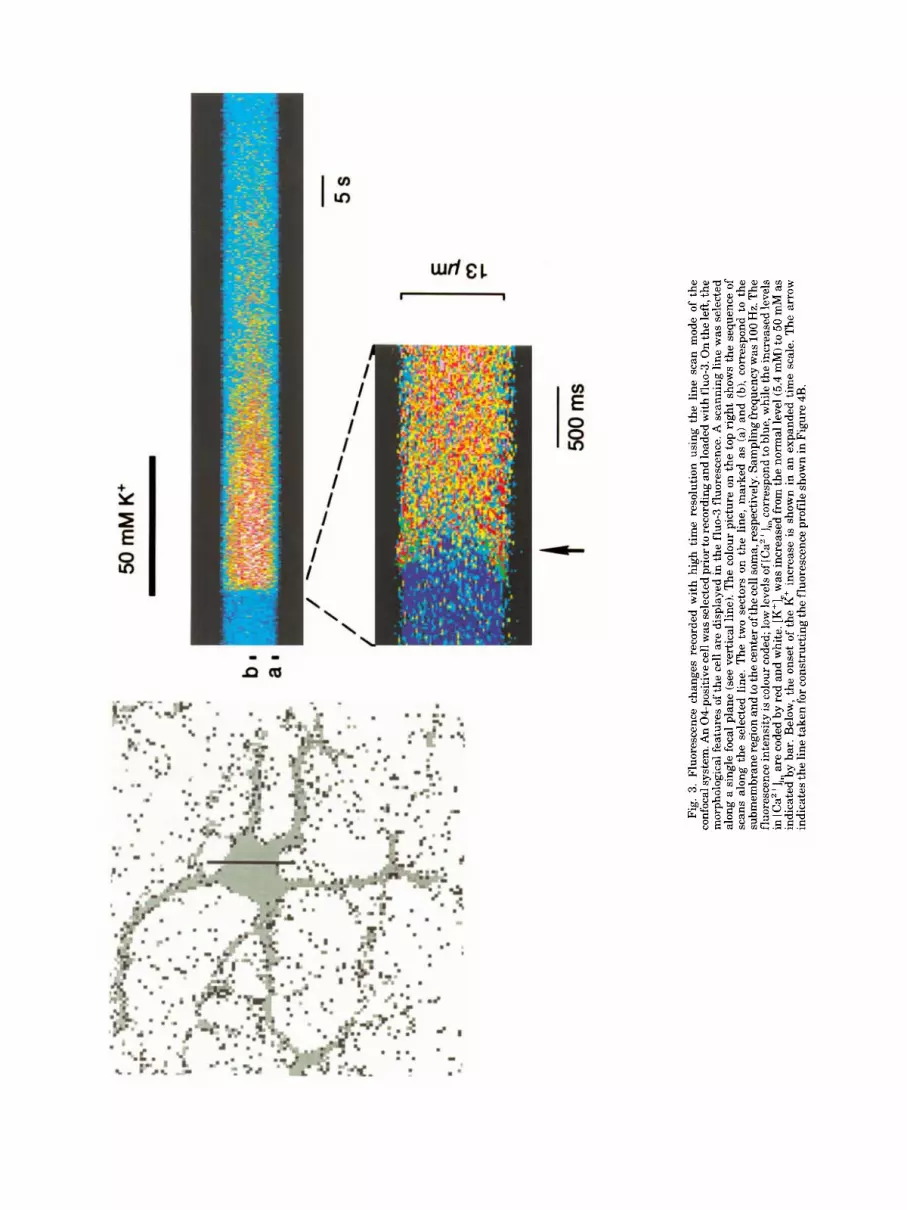
Fig.
3.
Fluo
resc
ence
cha
nges
rec
orde
d w
ith
high
tim
e re
solu
tion
usin
g th
e li
ne s
can
mod
e of
the
co
nfoc
al sy
stem
. An
04-p
osit
ive c
ell w
as se
lect
ed p
rior
to re
cord
ing
and
load
ed w
ith
fluo
-3. O
n th
e le
ft, t
he
mor
phol
ogic
al f
eatu
res o
f the
cel
l are
dis
play
ed in
the
fluo
-3 fl
uore
scen
ce. A
sca
nnin
g li
ne w
as s
elec
ted
alon
g a
sing
le fo
cal p
lane
(se
e ve
rtic
al l
ine)
. The
col
our
pict
ure
on t
he to
p ri
ght
show
s th
e se
quen
ce o
f sc
ans
alon
g th
e se
lect
ed l
ine.
The
tw
o se
ctor
s on
the
lin
e, m
arke
d as
(a)
and
(b)
, cor
resp
ond
to t
he
subm
embr
ane r
egio
n an
d to
the
cent
er of
the
cell
som
a, re
spec
tivel
y. S
ampl
ing
freq
uenc
y w
as 1
00 H
z. T
he
fluo
resc
ence
inte
nsit
y is
col
our c
oded
; low
leve
ls o
f [Ca
"],,
corr
espo
nd to
blu
e, w
hile
the
incr
ease
d le
vels
in
ICa2
'l,,
are
code
d by
red
and
whi
te, [
K+]
, was
incr
ease
d fr
om th
e no
rmal
leve
l (5.
4 m
M) t
o 50
mM
as
indi
cate
d by
bar
. B
elow
, the
ons
et o
f th
e K'
in
crea
se i
s sh
own
in a
n ex
pand
ed t
ime
scal
e. T
he a
rrow
in
dica
tes t
he li
ne ta
ken
for c
onst
ruct
ing
the
fluo
resc
ence
pro
file
show
n in
Fig
ure
4B.
6 KIRISCHUK ET AL
A
3.0
0
$
1 .0
b
a
B
5.0
0
k u_
1 .o
500 ms
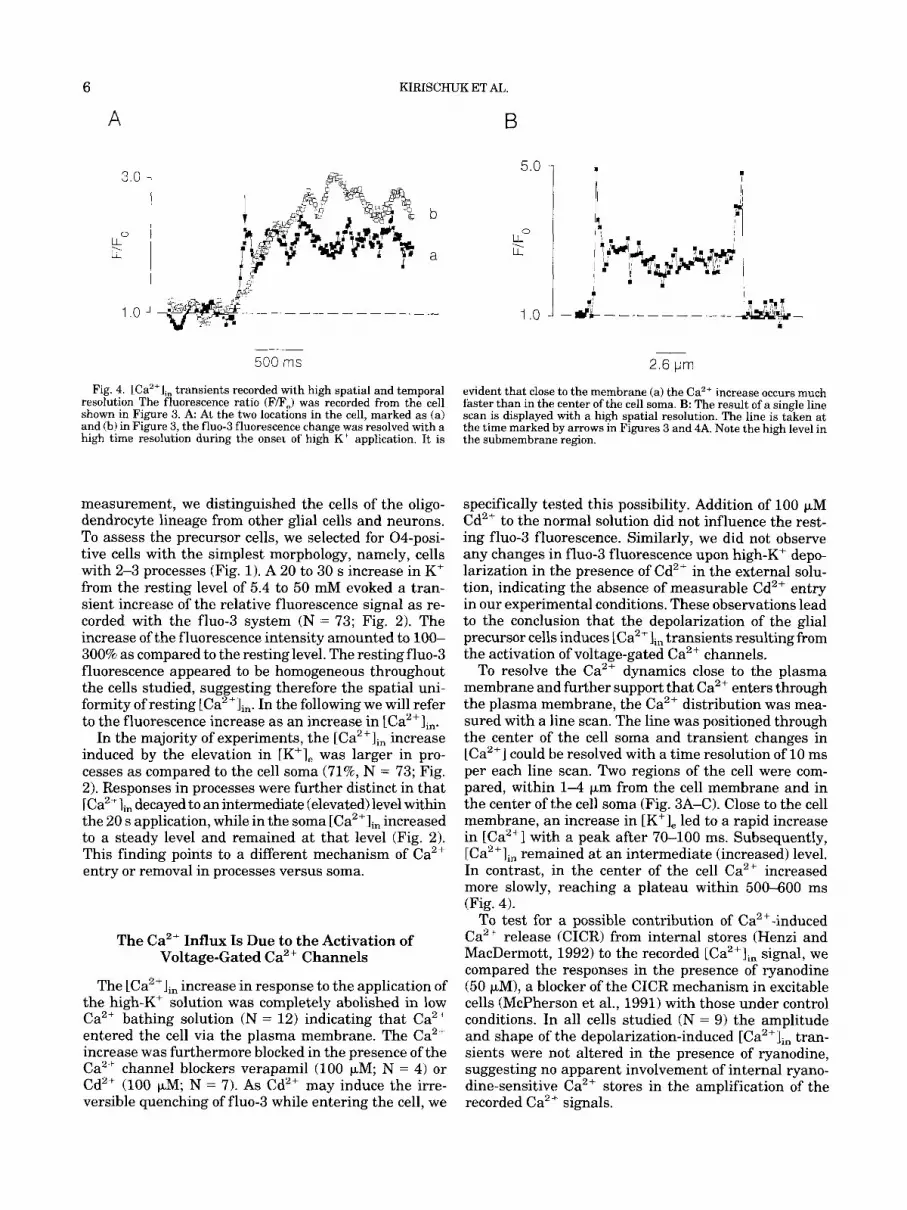
Fig. 4. lCa2'l,, transients recorded with high spatial and temporal resolution The fluorescence ratio (F/F,) was recorded from the cell shown in Figure 3. A At the two locations in the cell, marked as (a) and (b) in Figure 3, the fluo-3 fluorescence change was resolved with a high time resolution during the onset of high K' application. It is
2.6 pm
evident that close to the membrane (a) the Ca2+ increase occurs much faster than in the center of the cell soma. B: The result of a single line scan is displayed with a high spatial resolution. The line is taken at the time marked by arrows in Figures 3 and 4A. Note the high level in the submembrane region.
measurement, we distinguished the cells of the oligo- dendrocyte lineage from other glial cells and neurons. To assess the precursor cells, we selected for 04-posi- tive cells with the simplest morphology, namely, cells with 2-3 processes (Fig. 1). A 20 to 30 s increase in K+ from the resting level of 5.4 to 50 mM evoked a tran- sient increase of the relative fluorescence signal as re- corded with the fho-3 system (N = 73; Fig. 2). The increase of the fluorescence intensity amounted to 100- 300% as compared to the resting level. The resting fluo-3 fluorescence appeared to be homogeneous throughout the cells studied, suggesting therefore the spatial uni- formity of resting [Ca2+lin. In the following we will refer to the fluorescence increase as an increase in [Ca2+lin.
In the majority of experiments, the [Ca2+Iin increase induced by the elevation in [K+l, was larger in pro- cesses as compared to the cell soma (71%, N = 73; Fig. 2). Responses in processes were further distinct in that [Ca2+Ii, decayed to an intermediate (elevated) level within the 20 s application, while in the soma [Ca2+lin increased to a steady level and remained at that level (Fig. 2). This finding points to a different mechanism of Ca2+ entry or removal in processes versus soma.
The Ca2+ Influx Is Due to the Activation of Voltage-Gated Ca2+ Channels
The [Ca2+lin increase in response to the application of the high-K+ solution was completely abolished in low Ca2' bathing solution (N = 12) indicating that Ca2+ entered the cell via the plasma membrane. The Ca2+ increase was furthermore blocked in the presence of the Ca2+ channel blockers verapamil (100 pM; N = 4) or Cd2+ (100 FM; N = 7). As Cd2+ may induce the irre- versible quenching of fluo-3 while entering the cell, we
specifically tested this possibility. Addition of 100 p M Cd2+ to the normal solution did not influence the rest- ing fluo-3 fluorescence. Similarly, we did not observe any changes in fluo-3 fluorescence upon high-K+ depo- larization in the presence of Cd2+ in the external solu- tion, indicating the absence of measurable Cd2+ entry in our experimental conditions. These observations lead to the conclusion that the depolarization of the glial precursor cells induces [Ca2+lin transients resulting from the activation of voltage-gated Ca2+ channels.
To resolve the Ca2+ dynamics close to the plasma membrane and further support that Ca2+ enters through the plasma membrane, the Ca2+ distribution was mea- sured with a line scan. The line was positioned through the center of the cell soma and transient changes in [Ca2+] could be resolved with a time resolution of 10 ms per each line scan. Two regions of the cell were com- pared, within 1-4 pm from the cell membrane and in the center of the cell soma (Fig. 3A-C). Close to the cell membrane, an increase in [K+], led to a rapid increase in [Ca2+l with a peak after 70-100 ms. Subsequently, [Ca2+], remained at an intermediate (increased) level. In contrast, in the center of the cell Ca2+ increased more slowly, reaching a plateau within 500-600 ms (Fig. 4).
To test for a possible contribution of Ca2+-induced Ca2+ release (CICR) from internal stores (Henzi and MacDermott, 1992) to the recorded [Ca2+li, signal, we compared the responses in the presence of ryanodine (50 pM), a blocker of the CICR mechanism in excitable cells (McPherson et al., 1991) with those under control conditions. In all cells studied (N = 9) the amplitude and shape of the depolarization-induced [Ca2+Iin tran- sients were not altered in the presence of ryanodine, suggesting no apparent involvement of internal ryano- dine-sensitive Ca2+ stores in the amplification of the recorded Ca2+ signals.
A
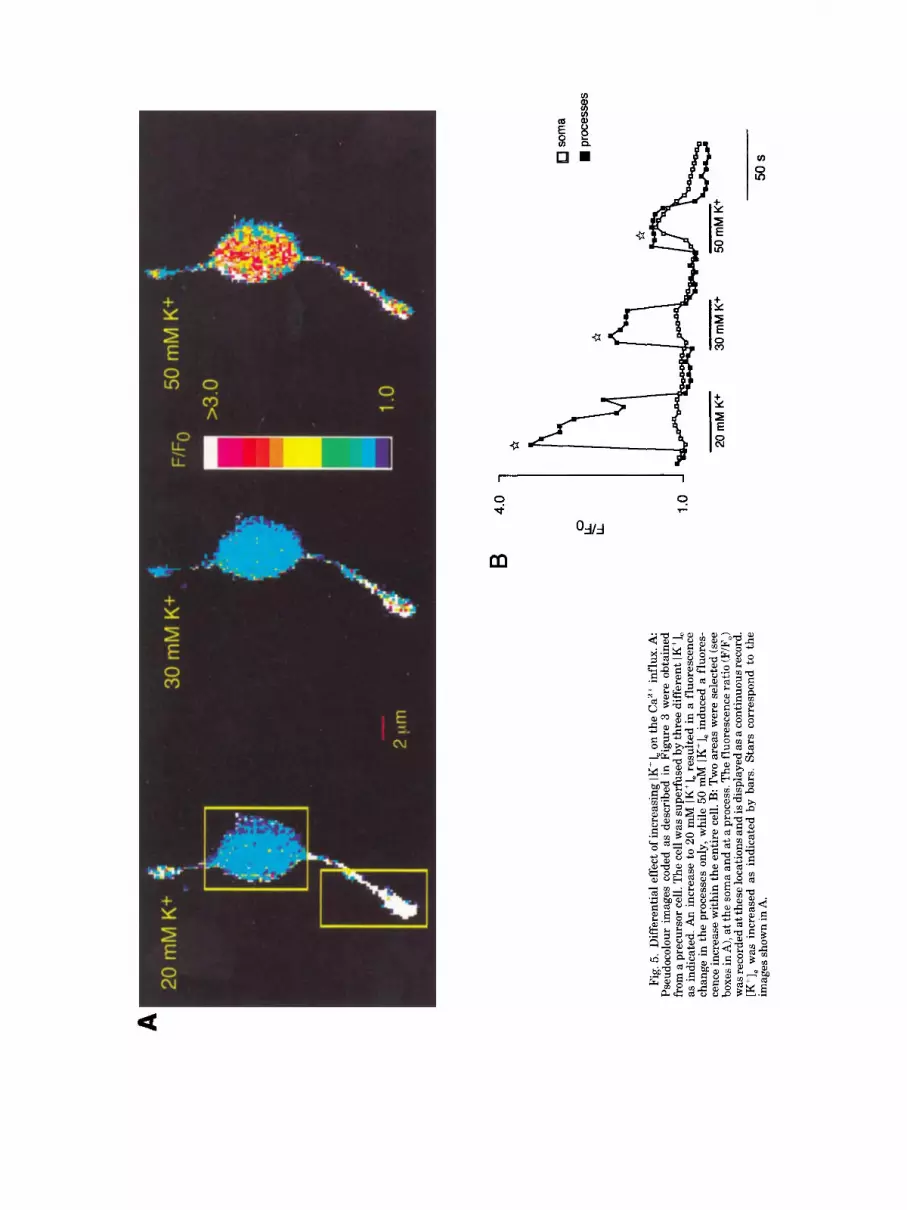
* k Fi
g. 5
. Dif
fere
ntia
l eff
ect o
f inc
reas
ing
LK'I,
on th
e C
a2 ' i
nflu
x. A
Ps
eudo
colo
ur i
mag
es c
oded
as
desc
ribe
d in
Fig
ure
3 w
ere
obta
ined
fr
om a
pre
curs
or c
ell.
The
cel
l was
sup
erfu
sed
by th
ree
diff
eren
t [K'
l, as
indi
cate
d. A
n in
crea
se to
20
mM
[K
+ 1, r
esul
ted
in a
flu
ores
cenc
e ch
ange
in t
he p
roce
sses
onl
y, w
hile
50
mM
LK']
, in
duce
d a
fluo
res-
ce
nce
incr
ease
wit
hin
the
enti
re c
ell.
B: T
wo
area
s w
ere
sele
cted
(se
e bo
xes i
n A
), at
the
som
a an
d at
a pr
oces
s. T
he fl
uore
scen
ce ra
tio
(FIF
O)
was
reco
rded
at t
hese
loca
tions
and
is d
ispl
ayed
as a
con
tinu
ous r
ecor
d.
[K'],
was
inc
reas
ed a
s in
dica
ted
by b
ars.
Sta
rs c
orre
spon
d to
the
im
ages
show
n in
A.
1 .o
som
a
proc
esse
s
50 s
8
A
- _
KIRISCHUK ET AL.
B
soma (a) . I
2'2 1
processes (b) 2.2 1
LLo \ LL
1 .o
i i A
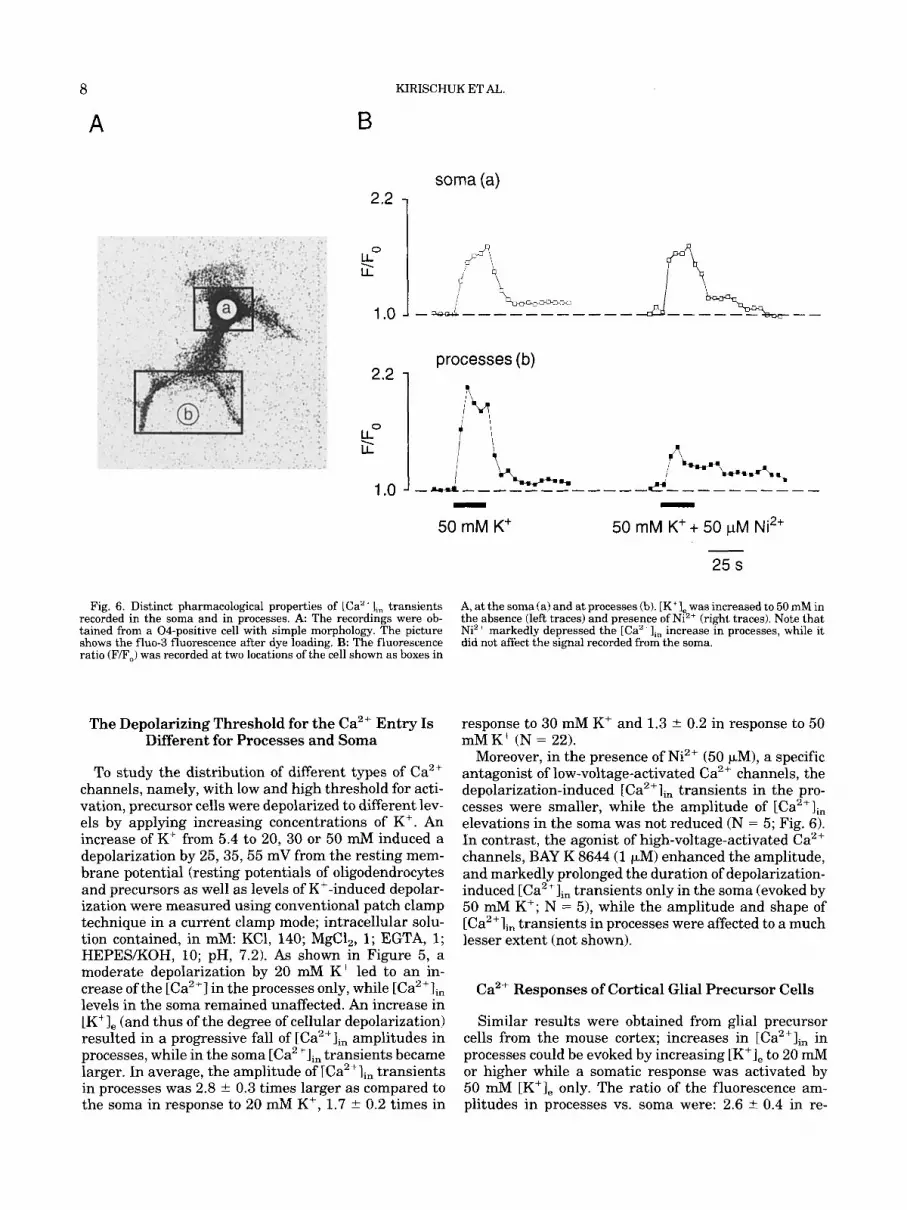
Fig. 6. Distinct pharmacological properties of ICa" + I,, transients recorded in the soma and in processes. A The recordings were ob- tained from a 04-positive cell with simple morphology. The picture shows the fluo-3 fluorescence after dye loading. B The fluorescence ratio (F/F,) was recorded at two locations of the cell shown as boxes in
50 mM K+ 50 mM K++ 50 pM Ni2+ - 25 s
The Depolarizing Threshold for the Ca2' Entry Is Different for Processes and Soma
To study the distribution of different types of Ca2+ channels, namely, with low and high threshold for acti- vation, precursor cells were depolarized to different lev- els by applying increasing concentrations of K+. An increase of K' from 5.4 to 20, 30 or 50 mM induced a depolarization by 25, 35,55 mV from the resting mem- brane potential (resting potentials of oligodendrocytes and precursors as well as levels of K+-induced depolar- ization were measured using conventional patch clamp technique in a current clamp mode; intracellular solu- tion contained, in mM: KC1, 140; MgCl,, 1; EGTA, 1; HEPESKOH, 10; pH, 7.2). As shown in Figure 5, a moderate depolarization by 20 mM K+ led to an in- crease of the [Ca2+1 in the processes only, while [Ca2+lin levels in the soma remained unaffected. An increase in [K+], (and thus of the degree of cellular depolarization) resulted in a progressive fall of [Ca"Iin amplitudes in processes, while in the soma [Ca2+Iin transients became larger. In average, the amplitude of [Ca2+li, transients in processes was 2.8 2 0.3 times larger as compared to the soma in response to 20 mM Kf , 1.7 t 0.2 times in
A, at the soma fa) and at processes fb). [K'I, was increased to 50 mM in the absence (left traces) and presence of Ni"+ (right traces). Note that Niz+ markedly depressed the [Ca"'],, increase in processes, while it did not affect the signal recorded from the soma.
response to 30 mM K' and 1.3 ? 0.2 in response to 50 mM K+ (N = 22).
Moreover, in the presence of Ni2+ (50 FM), a specific antagonist of low-voltage-activated Ca2+ channels, the depolarization-induced [Ca2+lin transients in the pro- cesses were smaller, while the amplitude of [Ca2+Iin elevations in the soma was not reduced (N = 5; Fig. 6). In contrast, the agonist of high-voltage-activated Ca2+ channels, BAY K 8644 (1 pM) enhanced the amplitude, and markedly prolonged the duration of depolarization- induced [Ca2+Iin transients only in the soma (evoked by 50 mM K+; N = 51, while the amplitude and shape of [Ca2+li, transients in processes were affected to a much lesser extent (not shown).
Ca2+ Responses of Cortical Glial Precursor Cells
Similar results were obtained from glial precursor cells from the mouse cortex; increases in [Ca2+Iin in processes could be evoked by increasing [K'], to 20 mM or higher while a somatic response was activated by 50 mM [K'l, only. The ratio of the fluorescence am- plitudes in processes vs. soma were: 2.6 ? 0.4 in re-
DISTRIBUTION OF CA2+ CHANNELS IN GLIAL CELLS 9
A
B
1 .o
o soma(a) rn processes (b)
- - - 20 rnM K+ 30 mM K+ 50 rnM K+
50 s
C
. :;I 1.0 +
10 mM K' 20 s
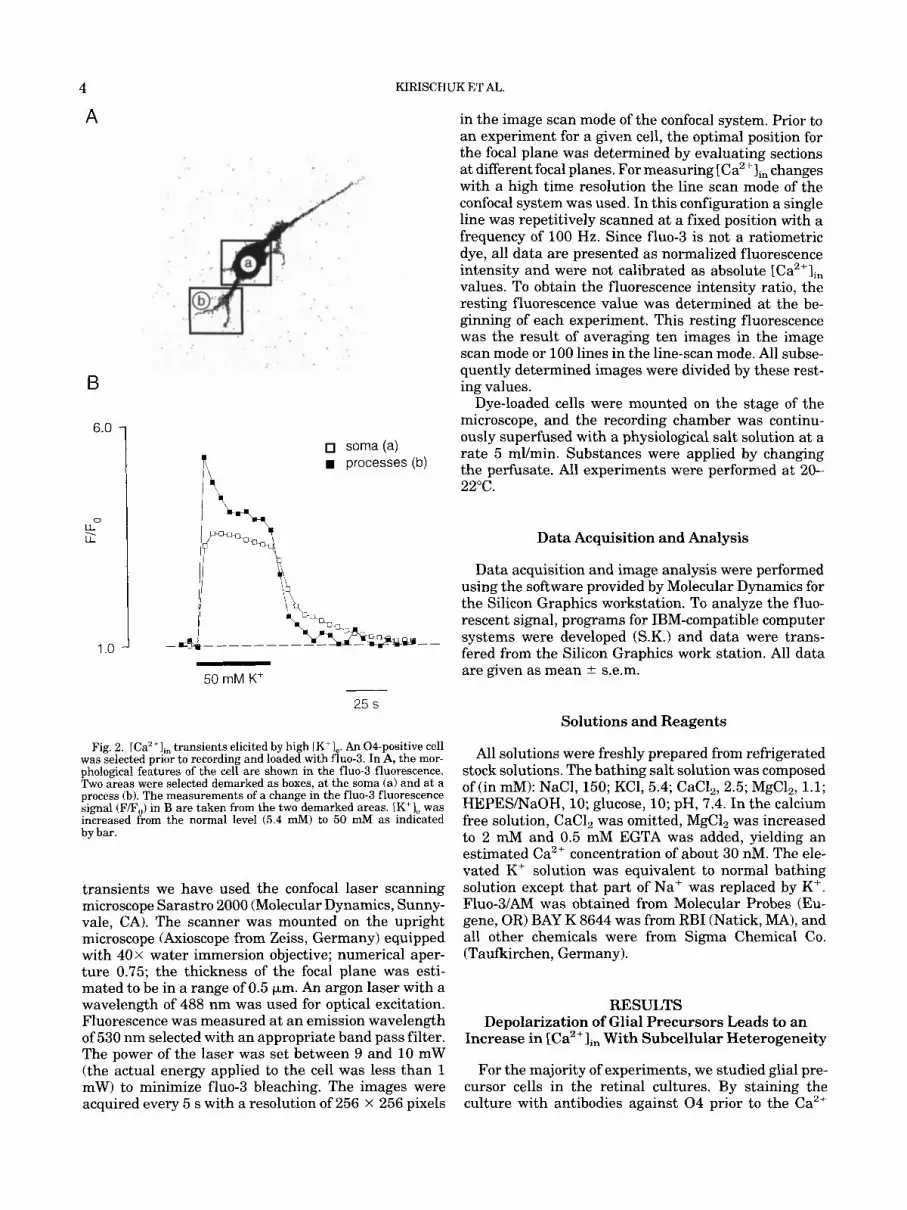
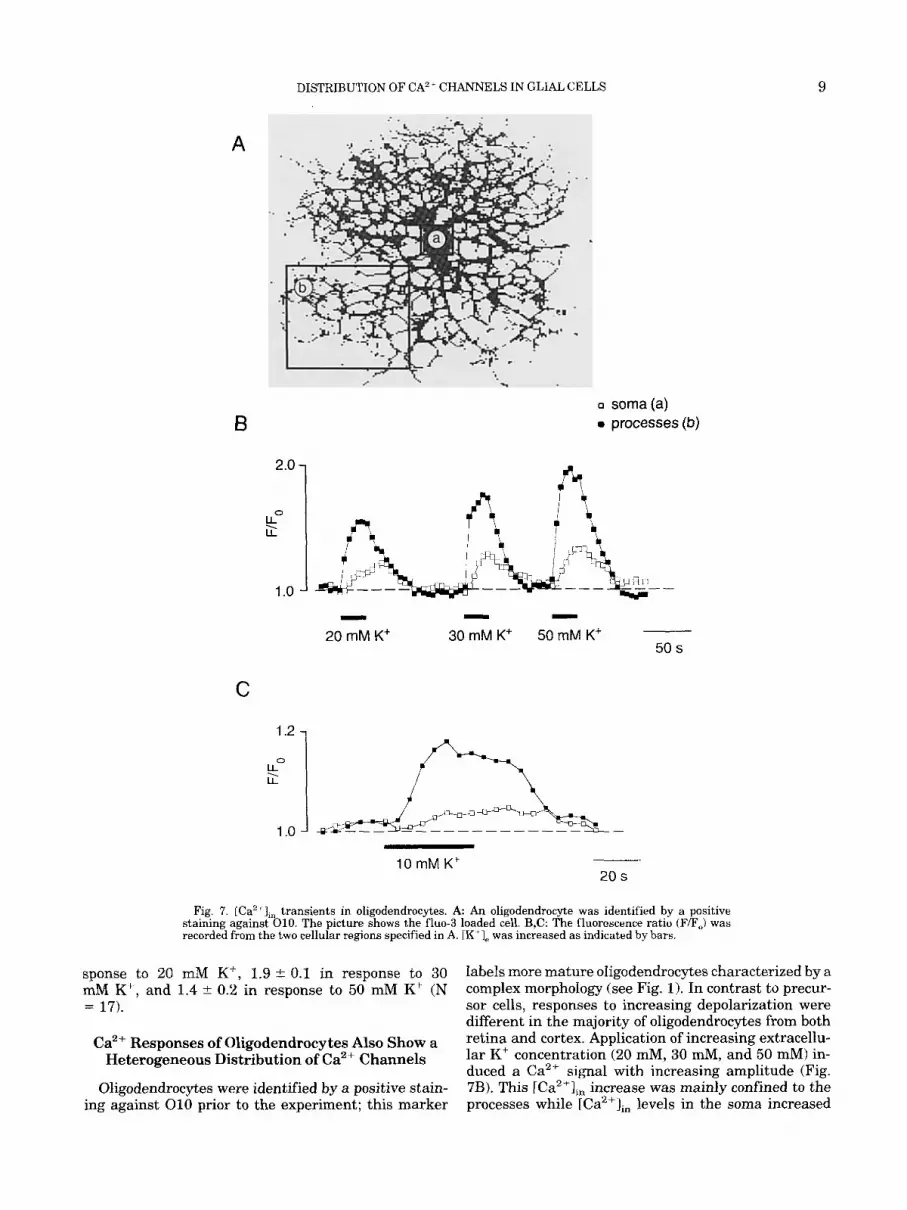
Fig. 7. [Ca2 + J,, transients in oligodendrocytes. A An oligodendrocyte was identified by a positive staining against 010. The picture shows the fluo-3 loaded cell. B,C: The fluorescence ratio (F/F,) was recorded from the two cellular regions specified in A. IK 'I, was increased as indicated by bars.
sponse to 20 mM K', 1.9 2 0.1 in response to 30 mM K', and 1.4 i 0.2 in response to 50 mM K+ (N = 17).
labels more mature oligodendrocytes characterized by a complex morphology (see Fig. 1). In contrast to precur- sor cells, responses to increasing depolarization were different in the majority of oligodendrocytes from both retina and cortex. Application of increasing extracellu- lar K' concentration (20 mM, 30 d, and 50 a) in- duced a Ca2+ signal with increasing amplitude (Fig. 7B). This [Ca2'],, increase was mainly confined to the processes while [Ca"], levels in the soma increased
ca2+ Responses of Oligodendrocytes ~l~~ Show a Heterogeneous Distribution ofCa2+ Channels
Oligodendrocytes were identified by a positive stain- ing against 010 prior to the experiment; this marker
10
3.0 1 KIRISCHUK ET AL.
0 L L U ,
1.0 1 -
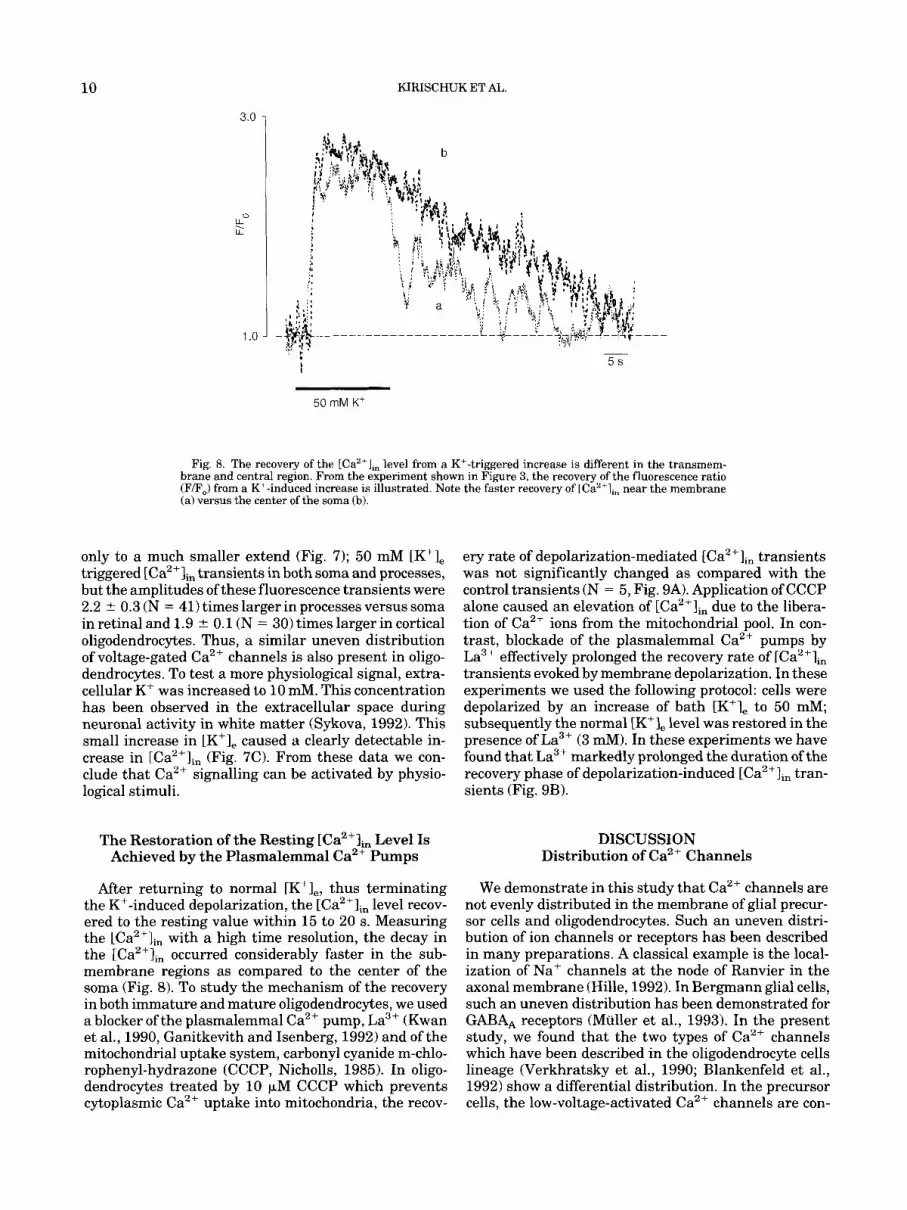
Fig. 8. The recovery of the tCa2'],, level from a K+-triggered increase is different in the transmem- brane and central region. From the experiment shown in Figure 3, the recovery of the fluorescence ratio (F/F,) from a K+-induced increase is illustrated. Note the faster recovery of LCa"],, near the membrane (a) versus the center of the soma (b).
only to a much smaller extend (Fig. 7); 50 mM [K+], triggered [Ca2+lin transients in both soma and processes, but the amplitudes of these fluorescence transients were 2.2 2 0.3 (N = 41) times larger in processes versus soma in retinal and 1.9 t 0.1 (N = 30) times larger in cortical oligodendrocytes. Thus, a similar uneven distribution of voltage-gated Ca2+ channels is also present in oligo- dendrocytes. To test a more physiological signal, extra- cellular K' was increased to 10 mM. This concentration has been observed in the extracellular space during neuronal activity in white matter (Sykova, 1992). This small increase in [K+], caused a clearly detectable in- crease in [Ca2+Ii, (Fig. 7C). From these data we con- clude that Ca2+ signalling can be activated by physio- logical stimuli.
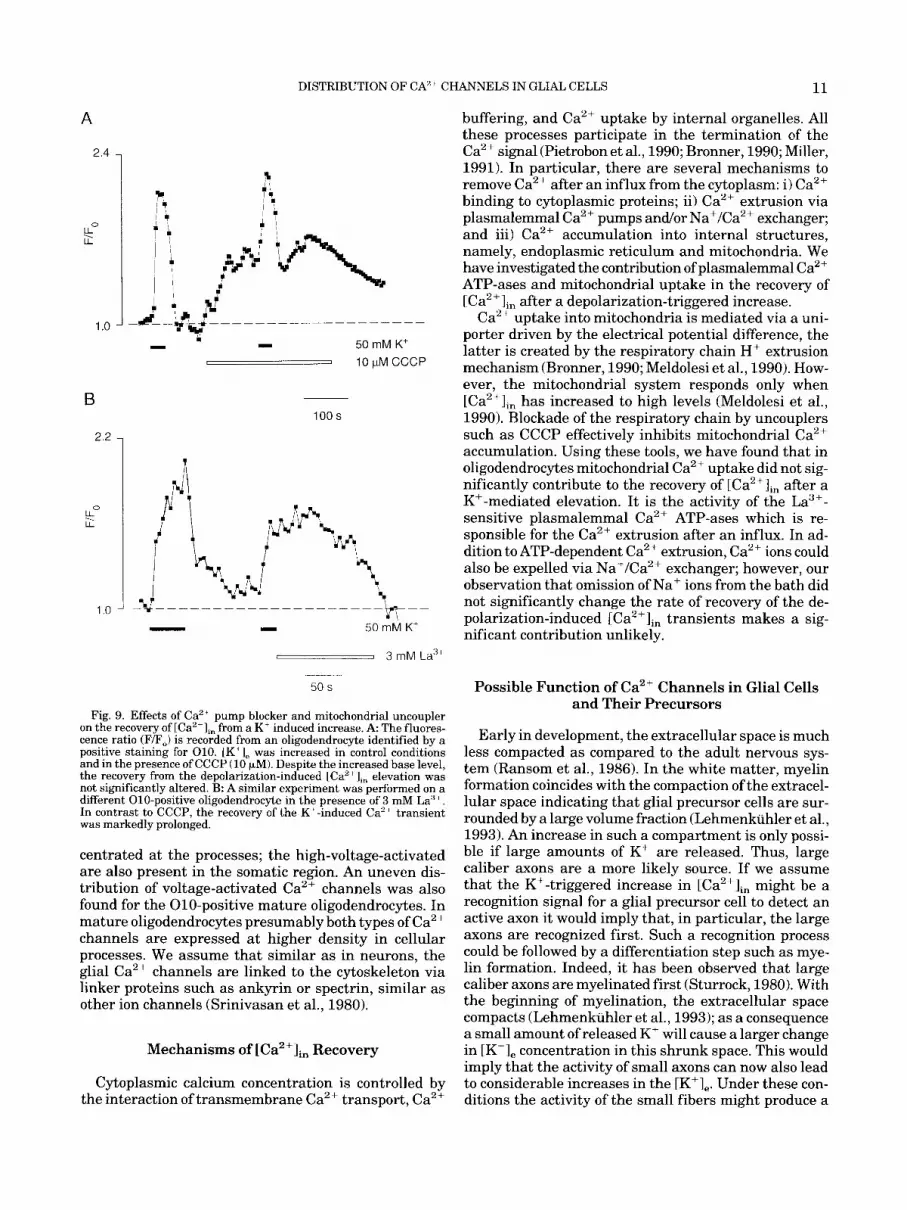
ery rate of depolarization-mediated [CaZflin transients was not significantly changed as compared with the control transients (N = 5, Fig. 9A). Application of CCCP alone caused an elevation of [Ca2+Iin due to the libera- tion of Ca2' ions from the mitochondrial pool. In con- trast, blockade of the plasmalemmal Ca2+ pumps by La3+ effectively prolonged the recovery rate of [Ca2+lin transients evoked by membrane depolarization. In these experiments we used the following protocol: cells were depolarized by an increase of bath [K'], to 50 mM; subsequently the normal [K+], level was restored in the presence of La3+ (3 mM). In these experiments we have found that La3+ markedly prolonged the duration of the recovery phase of depolarization-induced [Ca2+lin tran- sients (Fig. 9B).
The Restoration of the Resting [Ca2+lin Level Is Achieved by the Plasmalemmal Ca2+ Pumps
DISCUSSION Distribution of Ca2' Channels
After returning to normal [K+],, thus terminating the K+-induced depolarization, the [Ca2+Im level recov- ered to the resting value within 15 to 20 s. Measuring the [Ca2+Iin with a high time resolution, the decay in the [Ca2+Iin occurred considerably faster in the sub- membrane regions as compared to the center of the soma (Fig. 8). To study the mechanism of the recovery in both immature and mature oligodendrocytes, we used a blocker of the plasmalemmal Ca2+ pump, La3+ (Kwan et al., 1990, Ganitkevith and Isenberg, 1992) and of the mitochondrial uptake system, carbonyl cyanide m-chlo- rophenyl-hydrazone (CCCP, Nicholls, 1985). In oligo- dendrocytes treated by 10 FM CCCP which prevents cytoplasmic Ca2+ uptake into mitochondria, the recov-
We demonstrate in this study that Ca2+ channels are not evenly distributed in the membrane of glial precur- sor cells and oligodendrocytes. Such an uneven distri- bution of ion channels or receptors has been described in many preparations. A classical example is the local- ization of Na' channels at the node of Ranvier in the axonal membrane (Hille, 1992). In Bergmann glial cells, such an uneven distribution has been demonstrated for GABA, receptors (Muller et al., 1993). In the present study, we found that the two types of Ca2+ channels which have been described in the oligodendrocyte cells lineage (Verkhratsky et al., 1990; Blankenfeld et al., 1992) show a differential distribution. In the precursor cells, the low-voltage-activated Ca2+ channels are con-
DISTRIBUTION OF CA2 ' CHANNELS IN GLIAL CELLS 11
2.4 -
0
k U
1.0 -
2.2 -
0 :
1.0 -
I 50 mM K+ Y I
I 10pMCCCP
100 s
a
50 s
Fig. 9. Effects of Ca'' pump blocker and mitochondrial uncoupler on the recovery of [Ca"],, from a K' induced increase. A The fluores- cence ratio (F/F,) is recorded from an oligodendrocyte identified by a positive staining for 010. 1K' 1, was increased in control conditions and in the presence of CCCP (10 wM). Despite the increased base level, the recovery from the depolarization-induced LCa2 elevation was not significantly altered. B: A similar experiment was performed on a different 010-positive oligodendrocyte in the presence of 3 mM La" +. In contrast to CCCP, the recovery of the K'-induced Ca2+ transient was markedly prolonged.
centrated at the processes; the high-voltage-activated are also present in the somatic region. An uneven dis- tribution of voltage-activated Ca2+ channels was also found for the 010-positive mature oligodendrocytes. In mature oligodendrocytes presumably both types of Ca2+ channels are expressed at higher density in cellular processes. We assume that similar as in neurons, the glial Ca2+ channels are linked to the cytoskeleton via linker proteins such as ankyrin or spectrin, similar as other ion channels (Srinivasan et al., 1980).
Mechanisms of [Ca2+lin Recovery
Cytoplasmic calcium concentration is controlled by the interaction of transmembrane Ca2+ transport, Ca2'
buffering, and Ca2+ uptake by internal organelles. All these processes participate in the termination of the Ca2+ signal (Pietrobon et al., 1990; Bronner, 1990; Miller, 1991). In particular, there are several mechanisms to remove Ca2+ after an influx from the cytoplasm: i) Ca2+ binding to cytoplasmic proteins; ii) Ca2+ extrusion via plasmalemmal Ca2+ pumps andor Na+/Ca2+ exchanger; and iii) Ca2+ accumulation into internal structures, namely, endoplasmic reticulum and mitochondria. We have investigated the contribution of plasmalemmal Ca2+ ATP-ases and mitochondrial uptake in the recovery of [Ca2+],, after a depolarization-triggered increase.
Ca2+ uptake into mitochondria is mediated via a uni- porter driven by the electrical potential difference, the latter is created by the respiratory chain H+ extrusion mechanism (Bronner, 1990; Meldolesi et al., 1990). How- ever, the mitochondrial system responds only when [Ca2+Iin has increased to high levels (Meldolesi et al., 1990). Blockade of the respiratory chain by uncouplers such as CCCP effectively inhibits mitochondrial Ca2+ accumulation. Using these tools, we have found that in oligodendrocytes mitochondrial Ca2+ uptake did not sig- nificantly contribute to the recovery of [Ca2+Ii, after a K+-mediated elevation. It is the activity of the La3+- sensitive plasmalemmal Ca2+ ATP-ases which is re- sponsible for the Ca2+ extrusion after an influx. In ad- dition to ATP-dependent Ca2+ extrusion, Ca2+ ions could also be expelled via Na+/Ca2+ exchanger; however, our observation that omission of Na+ ions from the bath did not significantly change the rate of recovery of the de- polarization-induced [Ca2+Ii, transients makes a sig- nificant contribution unlikely.
Possible Function of Ca" Channels in Glial Cells and Their Precursors
Early in development, the extracellular space is much less compacted as compared to the adult nervous sys- tem (Ransom et al., 1986). In the white matter, myelin formation coincides with the compaction of the extracel- lular space indicating that glial precursor cells are sur- rounded by a large volume fraction (Lehmenkuhler et al., 1993). An increase in such a compartment is only possi- ble if large amounts of K+ are released. Thus, large caliber axons are a more likely source. If we assume that the K+-triggered increase in [Ca"],, might be a recognition signal for a glial precursor cell to detect an active axon it would imply that, in particular, the large axons are recognized first. Such a recognition process could be followed by a differentiation step such as mye- lin formation. Indeed, it has been observed that large caliber axons are myelinated first (Sturrock, 1980). With the beginning of myelination, the extracellular space compacts (Lehmenkiihler et al., 1993); as a consequence a small amount of released K' will cause a larger change in [K+], concentration in this shrunk space. This would imply that the activity of small axons can now also lead t o considerable increases in the [K+l,. Under these con- ditions the activity of the small fibers might produce a
12 KIRISCHUK ET AL.
K+ signal large enough to activate Ca2+ responses in the precursor cells or even in oligodendrocytes. Indeed, we have shown that increases in [K+l, in the physiolog- ical range (10 mM) is already sufficient to produce a reasonable [Ca2+lin elevations. As a working hypothe- sis, we thus propose that neuronal activity leads to a Ca2+ influx into the processes of precursor cells and this [Ca2+],, increase is a signal for the glial precursor cell t o start myelin formation.
ACKNOWLEDGMENTS
This research was supported by Bundesministerium fur Forschung und Technologie (Grant to H. K.). A. V. was supported by Deutsche Forschungsgemeinschaft (Grant UKR 436). The authors thank R. Kraulj for ex- cellent technical assistance.
REFERENCES
Barres, B.A., Chun, L.L.Y., and Corey, D.P. (1988) Ion channel expres- sion by white matter glia: Type 2 astrocytes and oligodendrocytes. Glia, 1:10-30.
Barres, B.A., Chun, L.L.Y., and Corey, D.P. (1989) A calcium current in cortical astrocytes: induction by CAMP and neurotransmitters, and permissive effect of serum factors. J. Neurosci., 9:3169-3175.
Bean, B.P. (1989) Classes of calcium channels in vertebrate cells. Annu. Reu. Physiol., 51:367-384.
Berger, T., Schnitzer, J., Orkand, P.M., and Kettenmann, H. (1992) Sodium and calcium currents in glial cells of the mouse corpus callosum slices. Eur. J . Neurosci., 4:1277-1284.
Blankenfeld, G., Verkhratsky, A., and Kettenmann, H. (1992) Ca'+ channel expression in the oligodendrocyte lineage. Eur. J. Neurosci., 4:1035-1048.
Bronner, F. (1990) Intracellular Calcium Regulation. Wilev-Liss, Inc.. - , . New York, pp. 480.
Ganitkevitch, V.Ya., and Isenberg, G. (1992) Caffeine-induced release and reuptake of Ca"+ by Ca2+ stores in myocytes from guinea-pig urinary bladder. J. Physiol. (London), 458:99-117.
Gard, A.L., and Pfeiffer, S.E. (1989). Oligodendrocyte progenitors iso- lated directly from developing telencephalon at a specific phenotypic stage: myoelinogenic potential in a defined environment. Deuelop- ment, 106:119-132.
Gilbert, P., Kettenmann, H., and Schachner, M. (1984) Gamma-ami- nobutyric acid directly depolarizes cultured oligodendrocytes. J. Neurosci., 4561469.
Henzi, V., and MacDermott, A.B. (1992) Characteristics and function of Ca2+ and inositol 1,4,5-triphosphate-releasable stores of Ca2+ in neurones. Neuroscience, 46:251-274.
Hess, P. (1990) Calcium channels in vertebrate cells. Annu. Reu. Neu- rosci., 13:337-356.
Hille, B. (1992) Ionic Channels ofExcitable Membranes, 2nd ED. Sin- auer Press, Sunderland, MA.
Kasai, H. (1993) Cytosolic Ca2 + gradients, Ca2+ binding proteins and synaptic plasticity. Neurosci. Res., 16:l-7.
Keilhauer, G., Faissner, A., and Schachner, M. (1985) Differential inhibition of neurone-neurone, neurone-astrocyte and astrocyte-as- trocyte adhesion by L1, L2 and N-CAM antibodies. Nature, 316:72% 730.
Kirchhoff, F., and Kettenmann, H. (1992). GABA triggers a [Ca2 'I, increase in murine precursor cells of the oligodendrocyte lineage. Eur. J. Neurosci., 4:1049-1058.
Kostyuk, P.G. (1989) Diversity of calcium ion channels in cellular membranes. Neuroscience, 28:253-261.
Kostyuk, P.G., Mironov, S.L., Tepikin, A.V., and Belan, P.V. (1989) Cytoplasmic free Ca in isolated snail neurones as revealed by fluo- rescent probe fura-2: Mechanisms of Ca recovery after Ca load and Ca release from intracellular stores. J . Membrane Biol., 11O:ll-18.
Kwan, C.Y., Takemura, H., Obie, J.F., Thastrup, O., and Putney, J.W.,
Jr. (1990) Effects of MeCh, thapsigargin, and La3' on plasmalem- ma1 and intracellular Ca2+ transport in lacrimal acinar cells. Am. J. Physiol., 258:C1006-C1015.
Lehmenkuhler, A., Sykova, E., Svoboda, J., Zilles, J.K., and Nicholson, C. Extracellular space parameters in the rat neocortex and subcorti- cal white matter during postnatal development determined by diffu- sion analysis. Neuroscience. (in Dress).
MacVicar, B.A. (1984) Voltage-dependent calcium channels in glial cells. Science. 226:134&1347.
MacVicar, B.A.; and Tse, F.W.Y. (1988) Norepinephrine and adenosine 3,5 cyclic monophosphate enhance a nifedipine-sensitive calcium current in cultured rat astrocytes. Glia, 1:359-365.
Marty, A. (1989) The physiological role of calcium-dependent chan- nels. Trends Neuroscr., 12:420-424.
McCormack, J.G., Halestrap, A.P., and Denton, R.M. (1990) Role of calcium ions in the regulation of mammalian intramitochondreal metabolism. Physiol Reu., 70:391-425.
McPherson, P.S., Kim, Y.K., Valdivia, H., Knudson, C.M., Takekura, H., Franz in i -hs t rong , C., Coronado, R., and Campbell, K.P. (1991) The brain ryanodine receptor: A caffeine-sensitive calcium release channel. Neuron, 7:17-25.
Meldolesi, J., Maddedu, L., and Pozzan, T. (1990) Intracellular Ca2' organelles in non muscle cells: Heterogeneity and functional assign- ment, Biochim. Bioohvs. Acta. 1055:130-140.
Miller, R.J. (1991) T&e control of neuronal-Ca2+ homeostasis. Progr.
Minta, A,, Kao, J., and Tsien, R (1989) Fluorescent indicators for Neurobiol., 37:255-285.
cytosolic calcium based on rhodamine and fluorescein chromophores. J. Biol. Chem., 264:8171-8182.
Muller, T., Fritschy, J.M., Grosche, J., Mohler, H., and Kettenmann, H. (1994) Developmental changes in the membrane current pattern and the expression of GABA, receptors on Bergmann glial cells in cerebellar slices. J . Neurosci., (in press).
Nicholls, D.G. (1985) A role for the mitochondrion in the protection of the cells against calcium overload? Progr. Brain Res., 63:97-106.
Pietrobon, D., Di Virgilio, F., and Pozzan, T. (1990) Structural and functional aspects of calcium homeostasis in eukariotic cells. Eur. J . Biochem., 193:599-622.
Ransom, B.R., Carlini, W.G., and Connors, B.W. (1986) Brain extracel- Mar space: Developmental studies in rat optic nerve, Ann. New York Acad. Sci., 481:87-105.
Scherer, J., and Schnitzer, J. (1989). The rabbit retina: a suitable mammalian tissue for obtaining astroglia-free Muller cells. Neuro- sci. Lett., 97:51-56.
Smith. S.J.. and Aumstine, G.J. (1988) Calcium ions. active zones and synaptic transmitlter release. Trends Neurosci., 111458464.
Sommer, I., and Schachner, M. (1981) Monoclonal antibodies (010 to 04) to oligodendrocyte surfaces: An immunocytological study in the central nervous system. Deu. Biol., 83:311-323.
Sommer, I., and Schachner, M. (1982) Cells that are 0 4 antigen posi- tive and 01-antigen negative differentiate into 01 antigen-positive oligodendrocytes. Neurosci. Lett., 29:183-188.
Sontheimer, H., Trotter, J., Schachner, M., and Kettenmann, H. (1989) Developmental regulation of channel expression in cultured oligo- dendrocytes. Neuron, 2:1135-1145.
Srinivasan, Y., Elmers, L., Davis, J., Bennett, V., Angelides, K., (1980) Ankhyrin and spectrin associate with voltage-dependent sodium channels in brain, Nature, 333:177-180.
Sturrock, R.R. (1980) Myelination of the mouse corpus callosum. Neu- ropathol. Appl. Neurobiol., 6:415-420.
Sykova, E. (1992) Ionic and Volume Changes in the Microenvironment ofNerue and Receptor Cells. Springer-Verlag, Heidelberg, Germany.
Szekely, A.M., Costa, E., and Gayson, D.R. (1990) Transcriptional program coordination by N-methyl-D-aspartate sensitive glutamate receptor stimulation in primary cultures of cerebellar neurones. Mol. Pharmacol., 38:624-633.
Thayer, S.A., and Miller, R.J. (1990) Regulation of the intracellular free calcium concentration in single rat dorsal root ganglion neurons in vitro. J. Physiol. (London), 425:85-115.
Trotter, J . , Bitter-Suermann, D., and Schachner, M. (1989) Differenti- ation-regulated loss of the polysialylated embryonic form and ex- pression of different polypeptides of the neural cell adhesion mole- cule (N-CAM) by cultured oligodendrocytes and myelin. J. Neurosci. Res., 44:369-384.
Verkhratsky, A.N., Trotter, J., and Kettenmann, H. (1990): Cultured glial precursor cells from mouse cortex express two types of calcium currents. Neurosci. Letters, 112:19&198.
Yuste, R., and Katz, L.C. (1991) Control of postsynaptic Ca2+ influx in developing neocortex by excitatory and inhibitory neurotransmit- ters. Neuron, 6:333-344.