subaru prime focus camera — suprime-cam
TRANSCRIPT

PASJ: Publ. Astron. Soc. Japan 54, 833–853, 2002 December 25c© 2002. Astronomical Society of Japan.
Subaru Prime Focus Camera — Suprime-Cam
Satoshi MIYAZAKI,1,2 Yutaka KOMIYAMA,3 Maki SEKIGUCHI,4 Sadanori OKAMURA,5,6
Mamoru DOI,6,7 Hisanori FURUSAWA,3,5 Masaru HAMABE,8 Katsumi IMI,3,∗ Masahiko KIMURA,4,†
Fumiaki NAKATA,1,5 Norio OKADA,1 Masami OUCHI,5 Kazuhiro SHIMASAKU,5,6
Masafumi YAGI,1 and Naoki YASUDA1,2
1National Astronomical Observatory, Mitaka, Tokyo 181-85882The Graduate University for Advanced Studies (Sokendai), Mitaka, Tokyo 181-8588
[email protected] Astronomical Observatory of Japan, Hilo, Hawaii 96720, U.S.A.
4Institute for Cosmic Ray Research, The University of Tokyo, Kashiwa, Chiba 277-85825Department of Astronomy, The University of Tokyo, Bunkyo, Tokyo 113-8654
6Research Center for the Early Universe, The University of Tokyo, Tokyo 113-86547Institute of Astronomy, The University of Tokyo, Mitaka, Tokyo 181-0015
8Department of Mathematical and Physical Sciences, Japan Women’s University, Bunkyo, Tokyo 112-8681
(Received 2002 July 9; accepted 2002 October 25)
Abstract
We have built an 80-mega pixels (10240× 8192) mosaic CCD camera, called Suprime-Cam, for the wide-fieldprime focus of the 8.2 m Subaru telescope. Suprime-Cam covers a field of view 34′×27′, a unique facility among the8–10 m class telescopes, with a resolution of 0.′′202 per pixel. The focal plane consists of ten high-resistivity 2k×4kCCDs developed by MIT Lincoln Laboratory, which are cooled by a large Stirling-cycle cooler. The CCD readoutelectronics was designed to be scalable, which allows the multiple read-out of tens of CCDs. It takes 50 seconds toreadout entire arrays. We designed a filter-exchange mechanism of the jukebox type that can hold up to ten largefilters (205× 170× 15 mm3). The wide-field corrector is basically a three-lens Wynne-type, but has a new type ofatmospheric dispersion corrector. The corrector provides a flat focal plane and an un-vignetted field of view of 30′in diameter. The achieved co-planarity of the focal array mosaic is smaller than 30 µm peak-to-peak, which realizesmostly the seeing limited image over the entire field. The median seeing in the Ic-band, measured over one year anda half, is 0.′′61. The PSF anisotropy in Suprime-Cam images, estimated by stellar ellipticities, is about 2% underthis median seeing condition. At the time of commissioning, Suprime-Cam had the largest survey speed, which isdefined as the field of view multiplied by the primary mirror area of the telescope, among those cameras built forsub-arcsecond imaging.
Key words: instrumentation: detectors — techniques: image processing — telescopes
1. Introduction
In the mid 1980’s during a concept study of Subaru tele-scope, a working group on wide-field astronomy stated that theminimum required field of view is 0.5 in diameter. This con-clusion was based on the statistics of the apparent size of var-ious objects. The recommended field of view was realized atthe prime focus. The wide-field prime focus became a uniquefeature of Subaru among very large telescopes, such as Keckand VLT. We designed and built a CCD mosaic camera forthe prime focus: Subaru Prime Focus Camera, Suprime-Cam.This paper presents the hardware and performance of Suprime-Cam.
In order to take full advantage of the good image quality onMauna Kea, we set the goal of Suprime-Cam as the realizationof natural seeing limited images over the entire field of view.We assumed the best natural seeing to be 0.′′4 based on the∗ Present address: Communication Network Center (Tsu-den), Mitsubishi
Electric, Amagasaki, Hyogo 661-8661† Present address: Department of Astronomy, Kyoto University, Sakyo,
Kyoto 606-8502
achievements by HRCam (McClure et al. 1989) and a medianvalue of 0.′′7–0.′′8. One of the most critical components regard-ing the image quality of Suprime-Cam is the wide field correc-tor for the prime focus. Takeshi (2000) worked out a noveldesign of the corrector to realize compact size while maintain-ing image quality. At a telescope elevation angle of 90 thediameter encircling the 80% energy of a point source is 0.′′15at the field center for the design wavelength (546.1 nm) andless than 0.′′3 for the entire wavelength region at any positionin the field of view. The co-planarity and stability of the coldfocal plane is another key for image quality. The fast F-ratioof 1.86 of the prime focus requires a tight tolerance. We havedeveloped a new method of mounting CCDs (subsection 2.3)and a mechanically stable frame (subsection 2.8).
The observing efficiency is also an important design goal.Because of the very fast F-ratio, the exposure times for broad-band filters are relatively short. In particular, they are on theorder of a few to several minutes at longer wavelengths wherethe sky brightness is high. The overhead due to CCD readoutshould be minimized. CCDs that can be clocked fast combinedwith high speed readout electronics are crucial for this purpose.
Dow
nloaded from https://academ
ic.oup.com/pasj/article/54/6/833/1551077 by guest on 24 June 2022
834 S. Miyazaki et al. [Vol. 54,
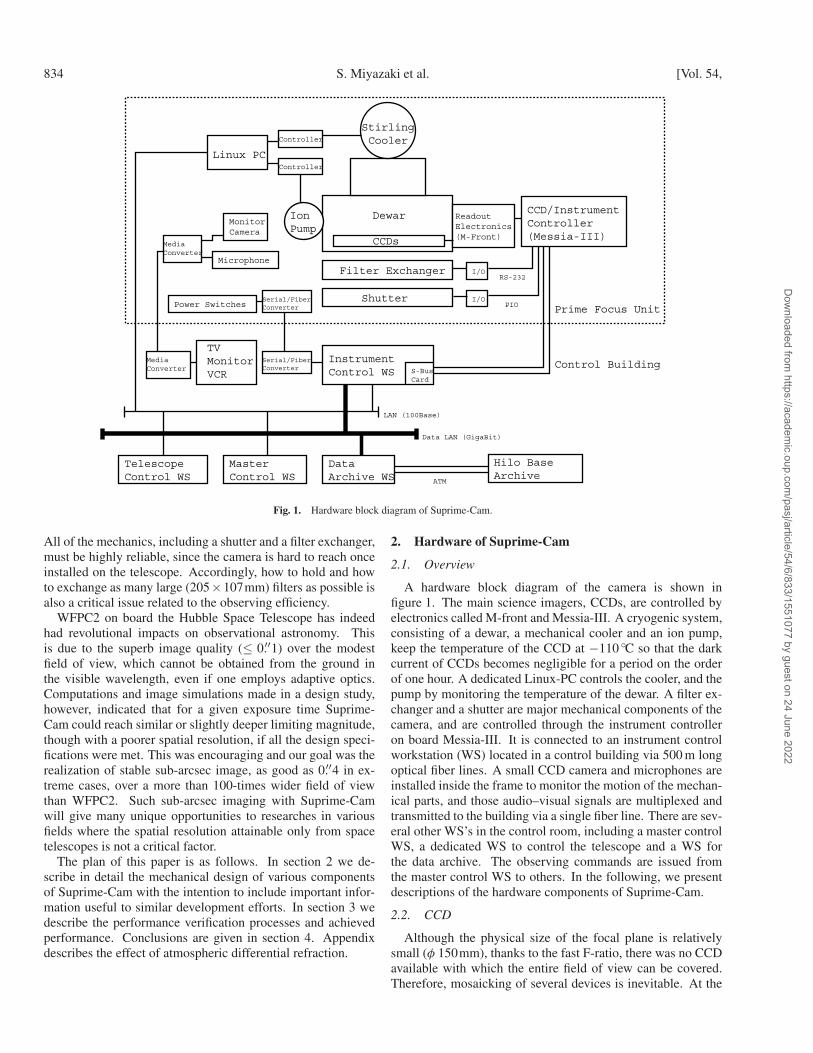
Fig. 1. Hardware block diagram of Suprime-Cam.
All of the mechanics, including a shutter and a filter exchanger,must be highly reliable, since the camera is hard to reach onceinstalled on the telescope. Accordingly, how to hold and howto exchange as many large (205×107mm) filters as possible isalso a critical issue related to the observing efficiency.
WFPC2 on board the Hubble Space Telescope has indeedhad revolutional impacts on observational astronomy. Thisis due to the superb image quality (≤ 0.′′1) over the modestfield of view, which cannot be obtained from the ground inthe visible wavelength, even if one employs adaptive optics.Computations and image simulations made in a design study,however, indicated that for a given exposure time Suprime-Cam could reach similar or slightly deeper limiting magnitude,though with a poorer spatial resolution, if all the design speci-fications were met. This was encouraging and our goal was therealization of stable sub-arcsec image, as good as 0.′′4 in ex-treme cases, over a more than 100-times wider field of viewthan WFPC2. Such sub-arcsec imaging with Suprime-Camwill give many unique opportunities to researches in variousfields where the spatial resolution attainable only from spacetelescopes is not a critical factor.
The plan of this paper is as follows. In section 2 we de-scribe in detail the mechanical design of various componentsof Suprime-Cam with the intention to include important infor-mation useful to similar development efforts. In section 3 wedescribe the performance verification processes and achievedperformance. Conclusions are given in section 4. Appendixdescribes the effect of atmospheric differential refraction.
2. Hardware of Suprime-Cam
2.1. Overview
A hardware block diagram of the camera is shown infigure 1. The main science imagers, CCDs, are controlled byelectronics called M-front and Messia-III. A cryogenic system,consisting of a dewar, a mechanical cooler and an ion pump,keep the temperature of the CCD at −110 C so that the darkcurrent of CCDs becomes negligible for a period on the orderof one hour. A dedicated Linux-PC controls the cooler, and thepump by monitoring the temperature of the dewar. A filter ex-changer and a shutter are major mechanical components of thecamera, and are controlled through the instrument controlleron board Messia-III. It is connected to an instrument controlworkstation (WS) located in a control building via 500 m longoptical fiber lines. A small CCD camera and microphones areinstalled inside the frame to monitor the motion of the mechan-ical parts, and those audio–visual signals are multiplexed andtransmitted to the building via a single fiber line. There are sev-eral other WS’s in the control room, including a master controlWS, a dedicated WS to control the telescope and a WS forthe data archive. The observing commands are issued fromthe master control WS to others. In the following, we presentdescriptions of the hardware components of Suprime-Cam.
2.2. CCD
Although the physical size of the focal plane is relativelysmall (φ 150mm), thanks to the fast F-ratio, there was no CCDavailable with which the entire field of view can be covered.Therefore, mosaicking of several devices is inevitable. At the
Dow
nloaded from https://academ
ic.oup.com/pasj/article/54/6/833/1551077 by guest on 24 June 2022
No. 6] Subaru Suprime-Cam 835
Table 1. CCD related parameters of Suprime-Cam.
C.F. Read noise Pixel rate Saturation level Dark current (−110C)
2.6± 0.1e−/ADU 5–10e− 6µs 92000e− 2–3e−/hr
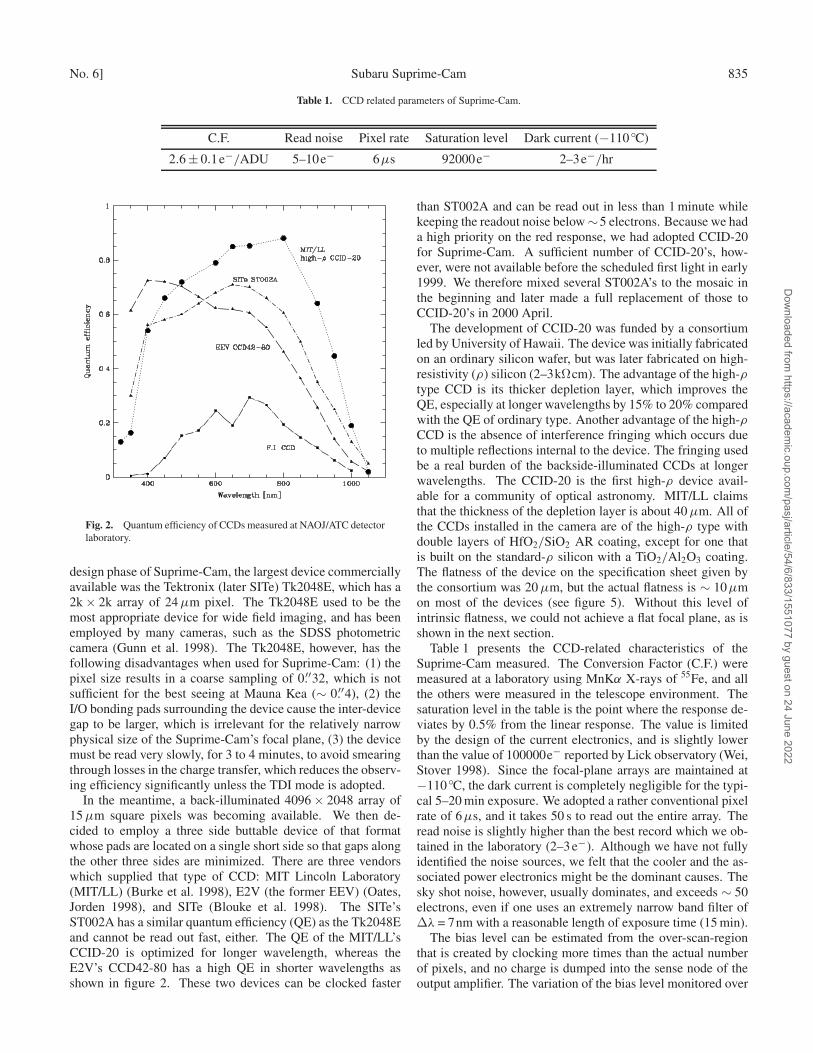
Fig. 2. Quantum efficiency of CCDs measured at NAOJ/ATC detectorlaboratory.
design phase of Suprime-Cam, the largest device commerciallyavailable was the Tektronix (later SITe) Tk2048E, which has a2k × 2k array of 24 µm pixel. The Tk2048E used to be themost appropriate device for wide field imaging, and has beenemployed by many cameras, such as the SDSS photometriccamera (Gunn et al. 1998). The Tk2048E, however, has thefollowing disadvantages when used for Suprime-Cam: (1) thepixel size results in a coarse sampling of 0.′′32, which is notsufficient for the best seeing at Mauna Kea (∼ 0.′′4), (2) theI/O bonding pads surrounding the device cause the inter-devicegap to be larger, which is irrelevant for the relatively narrowphysical size of the Suprime-Cam’s focal plane, (3) the devicemust be read very slowly, for 3 to 4 minutes, to avoid smearingthrough losses in the charge transfer, which reduces the observ-ing efficiency significantly unless the TDI mode is adopted.
In the meantime, a back-illuminated 4096 × 2048 array of15 µm square pixels was becoming available. We then de-cided to employ a three side buttable device of that formatwhose pads are located on a single short side so that gaps alongthe other three sides are minimized. There are three vendorswhich supplied that type of CCD: MIT Lincoln Laboratory(MIT/LL) (Burke et al. 1998), E2V (the former EEV) (Oates,Jorden 1998), and SITe (Blouke et al. 1998). The SITe’sST002A has a similar quantum efficiency (QE) as the Tk2048Eand cannot be read out fast, either. The QE of the MIT/LL’sCCID-20 is optimized for longer wavelength, whereas theE2V’s CCD42-80 has a high QE in shorter wavelengths asshown in figure 2. These two devices can be clocked faster
than ST002A and can be read out in less than 1 minute whilekeeping the readout noise below ∼5 electrons. Because we hada high priority on the red response, we had adopted CCID-20for Suprime-Cam. A sufficient number of CCID-20’s, how-ever, were not available before the scheduled first light in early1999. We therefore mixed several ST002A’s to the mosaic inthe beginning and later made a full replacement of those toCCID-20’s in 2000 April.
The development of CCID-20 was funded by a consortiumled by University of Hawaii. The device was initially fabricatedon an ordinary silicon wafer, but was later fabricated on high-resistivity (ρ) silicon (2–3kΩcm). The advantage of the high-ρtype CCD is its thicker depletion layer, which improves theQE, especially at longer wavelengths by 15% to 20% comparedwith the QE of ordinary type. Another advantage of the high-ρCCD is the absence of interference fringing which occurs dueto multiple reflections internal to the device. The fringing usedbe a real burden of the backside-illuminated CCDs at longerwavelengths. The CCID-20 is the first high-ρ device avail-able for a community of optical astronomy. MIT/LL claimsthat the thickness of the depletion layer is about 40 µm. All ofthe CCDs installed in the camera are of the high-ρ type withdouble layers of HfO2/SiO2 AR coating, except for one thatis built on the standard-ρ silicon with a TiO2/Al2O3 coating.The flatness of the device on the specification sheet given bythe consortium was 20 µm, but the actual flatness is ∼ 10µmon most of the devices (see figure 5). Without this level ofintrinsic flatness, we could not achieve a flat focal plane, as isshown in the next section.
Table 1 presents the CCD-related characteristics of theSuprime-Cam measured. The Conversion Factor (C.F.) weremeasured at a laboratory using MnKα X-rays of 55Fe, and allthe others were measured in the telescope environment. Thesaturation level in the table is the point where the response de-viates by 0.5% from the linear response. The value is limitedby the design of the current electronics, and is slightly lowerthan the value of 100000e− reported by Lick observatory (Wei,Stover 1998). Since the focal-plane arrays are maintained at−110C, the dark current is completely negligible for the typi-cal 5–20 min exposure. We adopted a rather conventional pixelrate of 6µs, and it takes 50 s to read out the entire array. Theread noise is slightly higher than the best record which we ob-tained in the laboratory (2–3 e−). Although we have not fullyidentified the noise sources, we felt that the cooler and the as-sociated power electronics might be the dominant causes. Thesky shot noise, however, usually dominates, and exceeds ∼ 50electrons, even if one uses an extremely narrow band filter of∆λ = 7nm with a reasonable length of exposure time (15 min).
The bias level can be estimated from the over-scan-regionthat is created by clocking more times than the actual numberof pixels, and no charge is dumped into the sense node of theoutput amplifier. The variation of the bias level monitored over
Dow
nloaded from https://academ
ic.oup.com/pasj/article/54/6/833/1551077 by guest on 24 June 2022
836 S. Miyazaki et al. [Vol. 54,
about one year is no more than 1% around the mean thanks tothe stable operating temperature.
A flat-field frame is usually created by stacking tens of blanksky images. Below 450 nm (i.e., in the B band), the non-uniformity of the QE of the CCD becomes apparent. Thenon-uniformity, called brick wall pattern, is an imprint ofthe laser stepping pattern during the backside passivation pro-cess. The degree of non-uniformity badly depends on the de-vice temperature. The variation of the non-uniformity, definedas (max−min)/mean, is about −0.5%/deg at −110 C (Wei,Stover 1998). Therefore, the change is little if the tempera-ture control system functions normally to realize ∆T < ±0.3.The scatter of QE averaged over each device among the ninehigh-ρ CCDs is not broad, 3–4% around the mean. The onestandard-ρ device installed has about 25–30% less QE over theentire sensitive wavelength than others, since the AR coatingof this particular device was not fully optimized.
The interference fringing is actually not visible on high-ρCCDs up to the Ic band, whereas a slight sign of fringingsometimes appears on the z ′ band images. This is, however,quite small (about 0.2% at most) compared with sky shot noise,and disappears without any subtraction of a fringe frame afterdithered exposures are stacked.
2.3. CCD Mounting
2.3.1. The requirementsThe prime-focus corrector is designed to give a flat focal
plane where the focal depth is simply estimated by the pixelsize (15 µm) multiplied by the F-ratio (1.86), ∼ ±30µm (seesubsection 2.9). In order to realize the seeing-limited image,the CCD surface, i.e., the imaging area of the CCDs, over theentire field of view should be located within the focal depth.We set the specification of the co-planarity at half of the focaldepth (= ±15 µm) to leave a margin for any mechanical er-rors in the flatness of the large cold plate. Another designrequirement is the easiness of installation and un-installation ofCCDs. This is important, since the best-quality high-ρ deviceshad been hard to obtain in bulk in time during our developmentphase of the camera. We actually had to swap the CCDs severaltimes for upgrades. Thus we have developed a new scheme formounting CCDs to meet these requirements.
2.3.2. Compensating tilt of CCDsThe CCD surface is usually tilted with respect to the bottom
surface of the package. Thus, the height of the CCD surfacefrom the bottom surface is different over a CCD chip. Theheight difference sometimes exceeds 100 µm. A conventionalmethod to compensate for the tilt is to insert a metal shim blockbetween a CCD and the cold plate (Wolfe et al. 1998). Thisrequires a precise relative alignment of the CCD and the blocks.Furthermore, since the heat path between the CCD and the coldplate is limited to the narrow channel through the metal block,which results in a longer cooling time, additional cold strapsare necessary to make the heat path wide. We felt that thesecould make the installation process overwhelming. We there-fore developed a new method of CCD mounting. A detaileddescription of the method was first given in Nakata et al. (2000)during the course of the development. Here, we show the finalresults as well as a summary of the procedure.
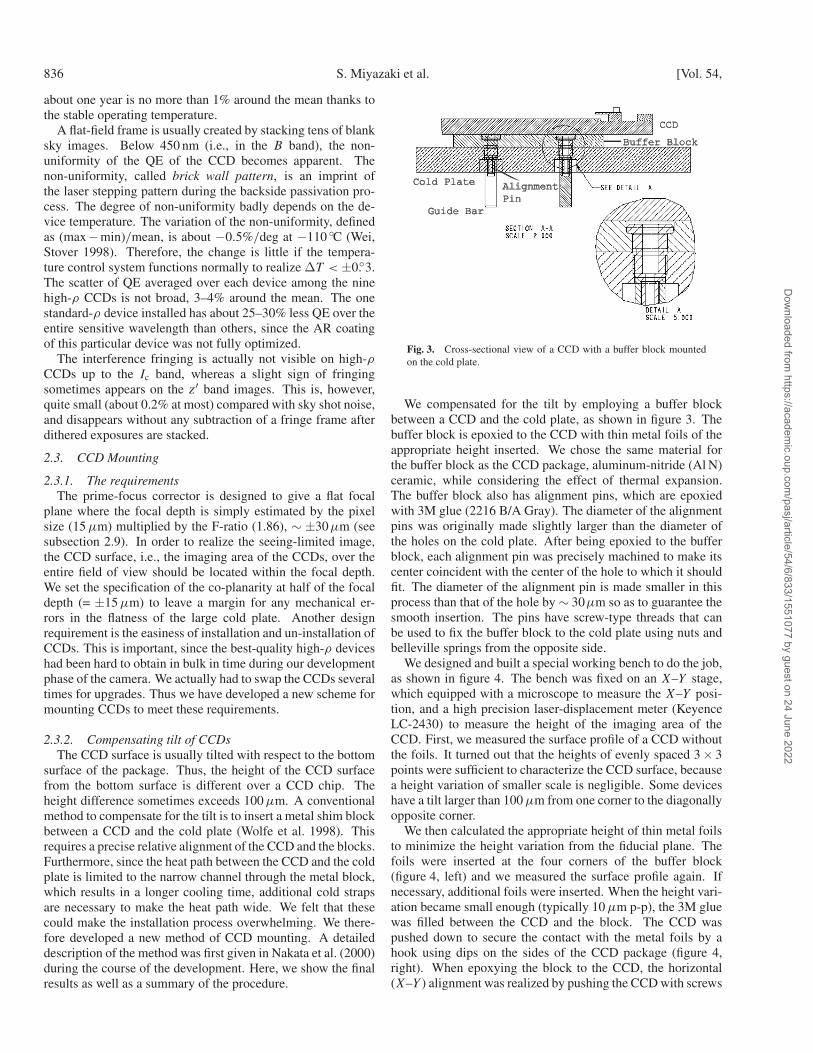
Fig. 3. Cross-sectional view of a CCD with a buffer block mountedon the cold plate.
We compensated for the tilt by employing a buffer blockbetween a CCD and the cold plate, as shown in figure 3. Thebuffer block is epoxied to the CCD with thin metal foils of theappropriate height inserted. We chose the same material forthe buffer block as the CCD package, aluminum-nitride (Al N)ceramic, while considering the effect of thermal expansion.The buffer block also has alignment pins, which are epoxiedwith 3M glue (2216 B/A Gray). The diameter of the alignmentpins was originally made slightly larger than the diameter ofthe holes on the cold plate. After being epoxied to the bufferblock, each alignment pin was precisely machined to make itscenter coincident with the center of the hole to which it shouldfit. The diameter of the alignment pin is made smaller in thisprocess than that of the hole by ∼ 30µm so as to guarantee thesmooth insertion. The pins have screw-type threads that canbe used to fix the buffer block to the cold plate using nuts andbelleville springs from the opposite side.
We designed and built a special working bench to do the job,as shown in figure 4. The bench was fixed on an X–Y stage,which equipped with a microscope to measure the X–Y posi-tion, and a high precision laser-displacement meter (KeyenceLC-2430) to measure the height of the imaging area of theCCD. First, we measured the surface profile of a CCD withoutthe foils. It turned out that the heights of evenly spaced 3× 3points were sufficient to characterize the CCD surface, becausea height variation of smaller scale is negligible. Some deviceshave a tilt larger than 100 µm from one corner to the diagonallyopposite corner.
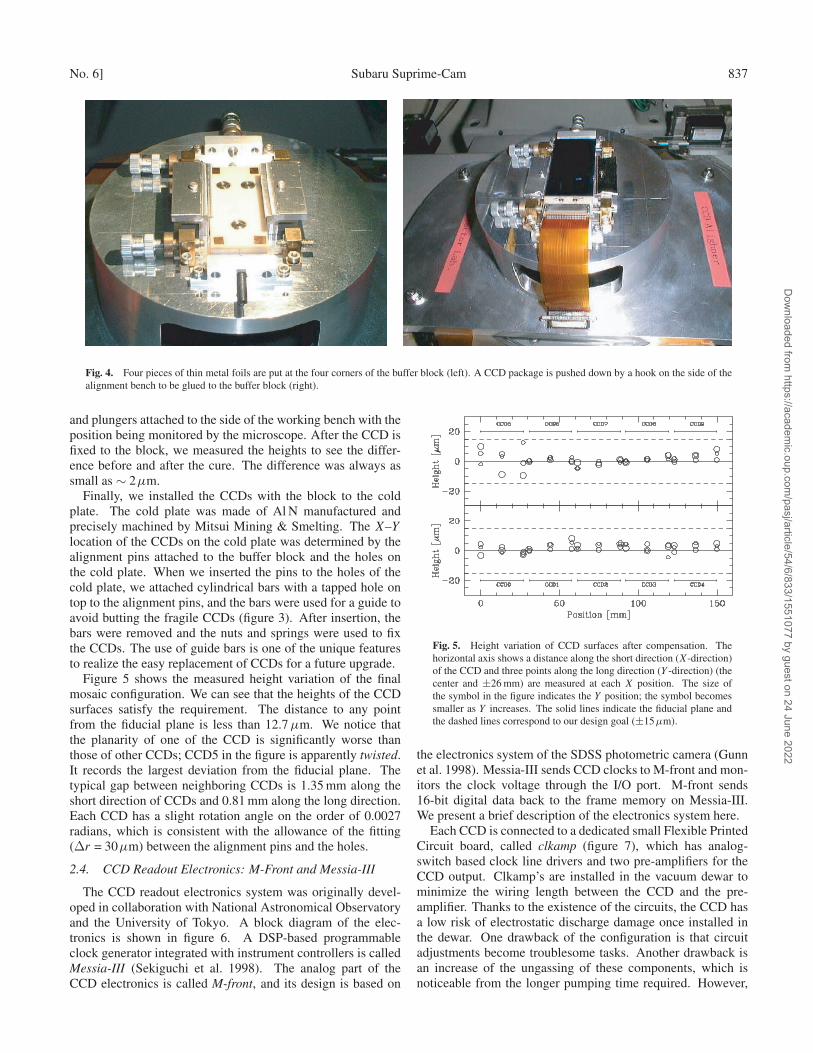
We then calculated the appropriate height of thin metal foilsto minimize the height variation from the fiducial plane. Thefoils were inserted at the four corners of the buffer block(figure 4, left) and we measured the surface profile again. Ifnecessary, additional foils were inserted. When the height vari-ation became small enough (typically 10 µm p-p), the 3M gluewas filled between the CCD and the block. The CCD waspushed down to secure the contact with the metal foils by ahook using dips on the sides of the CCD package (figure 4,right). When epoxying the block to the CCD, the horizontal(X–Y ) alignment was realized by pushing the CCD with screws
Dow
nloaded from https://academ
ic.oup.com/pasj/article/54/6/833/1551077 by guest on 24 June 2022
No. 6] Subaru Suprime-Cam 837
Fig. 4. Four pieces of thin metal foils are put at the four corners of the buffer block (left). A CCD package is pushed down by a hook on the side of thealignment bench to be glued to the buffer block (right).
and plungers attached to the side of the working bench with theposition being monitored by the microscope. After the CCD isfixed to the block, we measured the heights to see the differ-ence before and after the cure. The difference was always assmall as ∼ 2µm.
Finally, we installed the CCDs with the block to the coldplate. The cold plate was made of Al N manufactured andprecisely machined by Mitsui Mining & Smelting. The X–Y
location of the CCDs on the cold plate was determined by thealignment pins attached to the buffer block and the holes onthe cold plate. When we inserted the pins to the holes of thecold plate, we attached cylindrical bars with a tapped hole ontop to the alignment pins, and the bars were used for a guide toavoid butting the fragile CCDs (figure 3). After insertion, thebars were removed and the nuts and springs were used to fixthe CCDs. The use of guide bars is one of the unique featuresto realize the easy replacement of CCDs for a future upgrade.
Figure 5 shows the measured height variation of the finalmosaic configuration. We can see that the heights of the CCDsurfaces satisfy the requirement. The distance to any pointfrom the fiducial plane is less than 12.7 µm. We notice thatthe planarity of one of the CCD is significantly worse thanthose of other CCDs; CCD5 in the figure is apparently twisted.It records the largest deviation from the fiducial plane. Thetypical gap between neighboring CCDs is 1.35 mm along theshort direction of CCDs and 0.81 mm along the long direction.Each CCD has a slight rotation angle on the order of 0.0027radians, which is consistent with the allowance of the fitting(∆r = 30µm) between the alignment pins and the holes.
2.4. CCD Readout Electronics: M-Front and Messia-III
The CCD readout electronics system was originally devel-oped in collaboration with National Astronomical Observatoryand the University of Tokyo. A block diagram of the elec-tronics is shown in figure 6. A DSP-based programmableclock generator integrated with instrument controllers is calledMessia-III (Sekiguchi et al. 1998). The analog part of theCCD electronics is called M-front, and its design is based on
Fig. 5. Height variation of CCD surfaces after compensation. Thehorizontal axis shows a distance along the short direction (X-direction)of the CCD and three points along the long direction (Y -direction) (thecenter and ±26 mm) are measured at each X position. The size ofthe symbol in the figure indicates the Y position; the symbol becomessmaller as Y increases. The solid lines indicate the fiducial plane andthe dashed lines correspond to our design goal (±15µm).
the electronics system of the SDSS photometric camera (Gunnet al. 1998). Messia-III sends CCD clocks to M-front and mon-itors the clock voltage through the I/O port. M-front sends16-bit digital data back to the frame memory on Messia-III.We present a brief description of the electronics system here.
Each CCD is connected to a dedicated small Flexible PrintedCircuit board, called clkamp (figure 7), which has analog-switch based clock line drivers and two pre-amplifiers for theCCD output. Clkamp’s are installed in the vacuum dewar tominimize the wiring length between the CCD and the pre-amplifier. Thanks to the existence of the circuits, the CCD hasa low risk of electrostatic discharge damage once installed inthe dewar. One drawback of the configuration is that circuitadjustments become troublesome tasks. Another drawback isan increase of the ungassing of these components, which isnoticeable from the longer pumping time required. However,
Dow
nloaded from https://academ
ic.oup.com/pasj/article/54/6/833/1551077 by guest on 24 June 2022
838 S. Miyazaki et al. [Vol. 54,
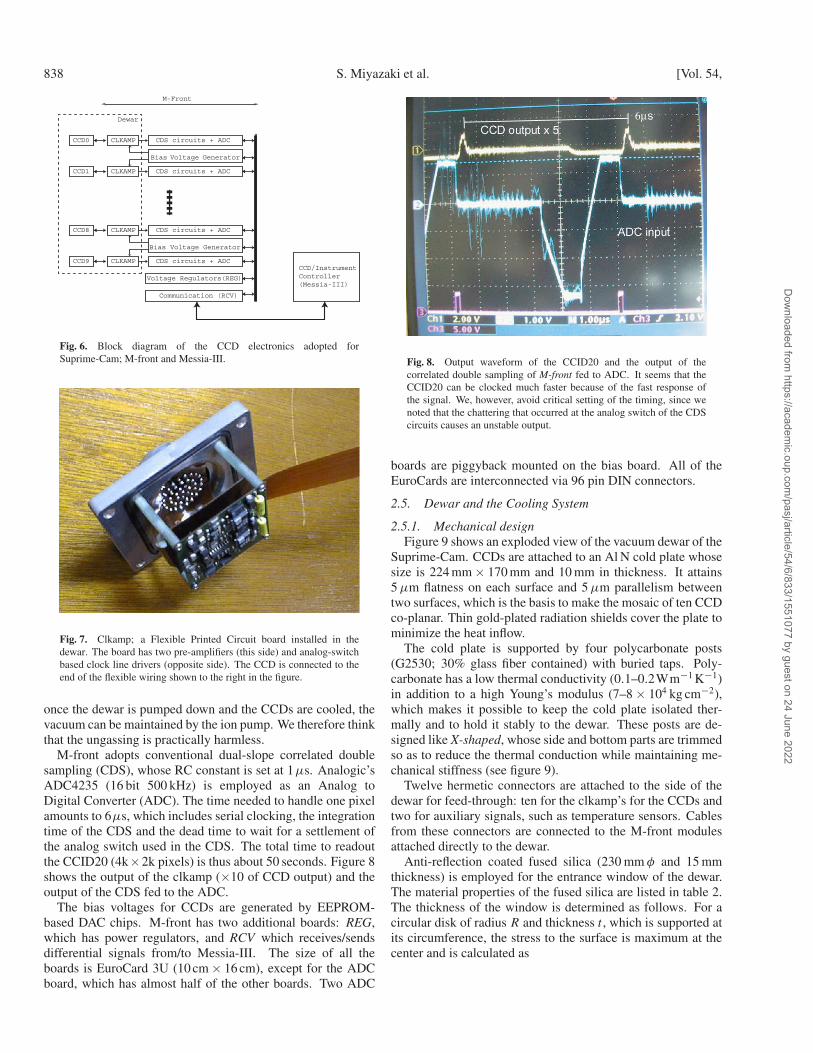
Fig. 6. Block diagram of the CCD electronics adopted forSuprime-Cam; M-front and Messia-III.
Fig. 7. Clkamp; a Flexible Printed Circuit board installed in thedewar. The board has two pre-amplifiers (this side) and analog-switchbased clock line drivers (opposite side). The CCD is connected to theend of the flexible wiring shown to the right in the figure.
once the dewar is pumped down and the CCDs are cooled, thevacuum can be maintained by the ion pump. We therefore thinkthat the ungassing is practically harmless.
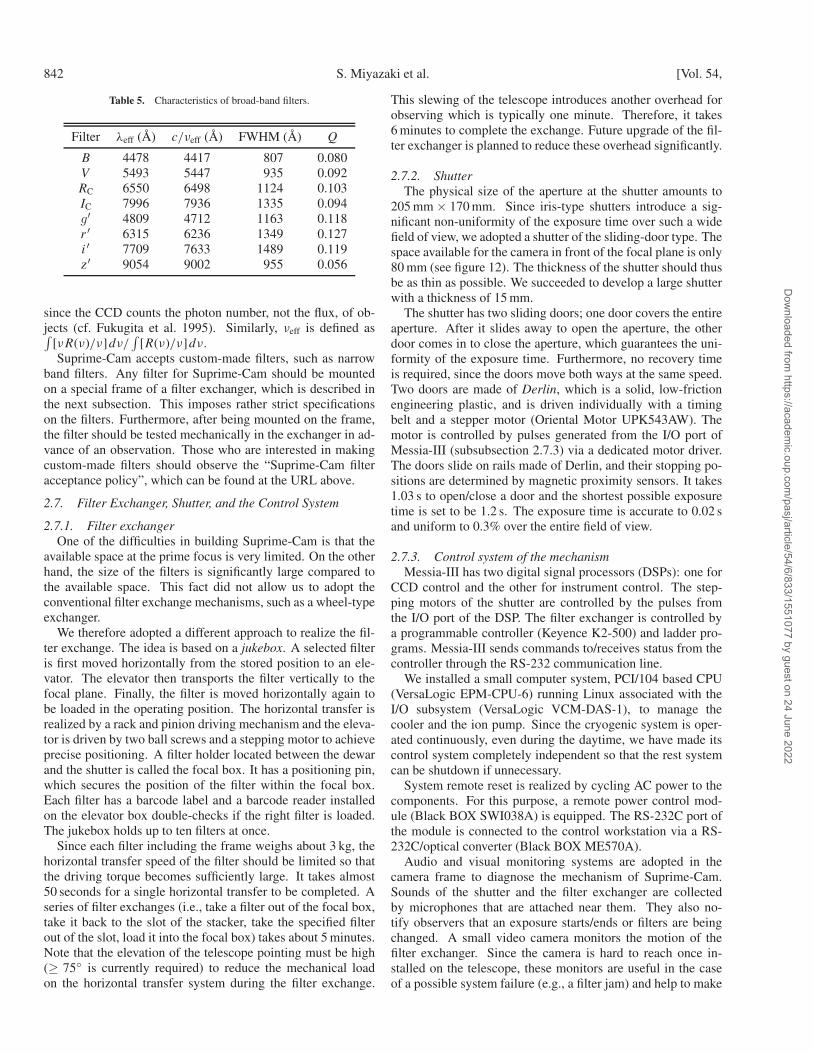
M-front adopts conventional dual-slope correlated doublesampling (CDS), whose RC constant is set at 1µs. Analogic’sADC4235 (16 bit 500 kHz) is employed as an Analog toDigital Converter (ADC). The time needed to handle one pixelamounts to 6µs, which includes serial clocking, the integrationtime of the CDS and the dead time to wait for a settlement ofthe analog switch used in the CDS. The total time to readoutthe CCID20 (4k×2k pixels) is thus about 50 seconds. Figure 8shows the output of the clkamp (×10 of CCD output) and theoutput of the CDS fed to the ADC.
The bias voltages for CCDs are generated by EEPROM-based DAC chips. M-front has two additional boards: REG,which has power regulators, and RCV which receives/sendsdifferential signals from/to Messia-III. The size of all theboards is EuroCard 3U (10 cm × 16 cm), except for the ADCboard, which has almost half of the other boards. Two ADC
Fig. 8. Output waveform of the CCID20 and the output of thecorrelated double sampling of M-front fed to ADC. It seems that theCCID20 can be clocked much faster because of the fast response ofthe signal. We, however, avoid critical setting of the timing, since wenoted that the chattering that occurred at the analog switch of the CDScircuits causes an unstable output.
boards are piggyback mounted on the bias board. All of theEuroCards are interconnected via 96 pin DIN connectors.
2.5. Dewar and the Cooling System
2.5.1. Mechanical designFigure 9 shows an exploded view of the vacuum dewar of the
Suprime-Cam. CCDs are attached to an Al N cold plate whosesize is 224 mm × 170 mm and 10 mm in thickness. It attains5 µm flatness on each surface and 5 µm parallelism betweentwo surfaces, which is the basis to make the mosaic of ten CCDco-planar. Thin gold-plated radiation shields cover the plate tominimize the heat inflow.
The cold plate is supported by four polycarbonate posts(G2530; 30% glass fiber contained) with buried taps. Poly-carbonate has a low thermal conductivity (0.1–0.2Wm−1 K−1)in addition to a high Young’s modulus (7–8 × 10⁴ kg cm−2),which makes it possible to keep the cold plate isolated ther-mally and to hold it stably to the dewar. These posts are de-signed like X-shaped, whose side and bottom parts are trimmedso as to reduce the thermal conduction while maintaining me-chanical stiffness (see figure 9).
Twelve hermetic connectors are attached to the side of thedewar for feed-through: ten for the clkamp’s for the CCDs andtwo for auxiliary signals, such as temperature sensors. Cablesfrom these connectors are connected to the M-front modulesattached directly to the dewar.
Anti-reflection coated fused silica (230 mm φ and 15 mmthickness) is employed for the entrance window of the dewar.The material properties of the fused silica are listed in table 2.The thickness of the window is determined as follows. For acircular disk of radius R and thickness t , which is supported atits circumference, the stress to the surface is maximum at thecenter and is calculated as
Dow
nloaded from https://academ
ic.oup.com/pasj/article/54/6/833/1551077 by guest on 24 June 2022

No. 6] Subaru Suprime-Cam 839
Fig. 9. Exploded view of the vacuum dewar of Suprime-Cam.
σmax =3P (3 + ν)
8
(R
t
)2
, (1)
where P is the pressure difference between the inner and outersurfaces of the window and ν is the Poisson ratio (Lifshitz,Landau 1953). This stress must be less than the breakingstrength, Fa with a safety factor of S (i.e., σmax < SFa). Toprevent the window from cracking by tiny impact, it is recom-mended that S > 3. Hence, we adopt t = 10 mm for the win-dow (R = 113.2mm). In this condition, the bow at the windowcenter, l, is calculated as
l =3P (1− ν)(5 + ν)
16E
R4
t3 , (2)
where E is Young’s modulus. We obtain l = 192.1 µm. Wefound by ray tracing that the bow introduces little optical degra-dation. Continuous flow of dry air is provided to the windowsurface to prevent water condensations during observing runs.
2.5.2. Thermal designIn order to maintain the dark current to be negligible, the
temperature of the CCDs should be kept below −105 C. Weset the operating temperature at −110 C while allowing forsome margin. Under this condition, the dominant componentsof thermal inflow are the radiation from the window (a) andthe wall of the dewar (b). Other components include con-duction through the polycarbonate posts (c) and the wiring of
Table 2. Material properties of fused silica.
Breaking strength (Fa) 4.892× 10⁷ PaYoung’s modulus (E) 6.966× 10¹⁰ PaPoisson ratio (ν) 0.17
electronics (d). The convection by the remaining molecules inthe dewar is less than 10−3 W, and can be negligible if thedewar is evacuated down to 10−6 Torr. We give the thermalinflow of the four components, (a)–(d), above.
Thermal transfer due to the radiation from a high-temperature surface (temperature TH with emissivity εH) to alow-temperature surface (TL and εL) is calculated as
Qrad = σA(T 4H − T 4
L )εHεL
εH + εL − εHεL, (3)
where σ is the Stephan–Boltzmann constant (5.67 ×10⁸ Wm−2 K−4) and A is the area (Luppino, Miller 1992). Thetransfer due to the conduction is
Qcond =κA
L(TH − TL), (4)
where κ is the average conductivity, A the section and L thelength of the material. The total thermal inflow amounts to7.22 W, as is given in table 3 together with the input parametersof the dewar.
Dow
nloaded from https://academ
ic.oup.com/pasj/article/54/6/833/1551077 by guest on 24 June 2022

840 S. Miyazaki et al. [Vol. 54,
Table 3. Thermal inflows to the dewar.
Component Amount (W) Input parameters∗
(a) 6.2 εH = 1.0 (Window), εL = 0.5 (CCD),A = 224× 170mm2
(b) 0.24 εH = 0.06 (Wall: Al), εL = 0.02 (Gold-plated radiation shield),A = 224× 170 + 2× (224 + 170)× 10mm2
(c) 0.58 κ = 0.2Wm−1 K−1 (Polycarbonate),A = 16× 15mm2, L = 40mm, 4 posts
(d) 0.20 κ = 420Wm−1 K−1 (Cu),A = 75× 18µm2, L = 100mm, 300 lines for 10 CCDs
Total 7.22∗ TH = 283K and TL = 163K are assumed.
2.5.3. Cooling systemWe adopted a Stirling-cycle cooler (Daikin Industries Co.,
Ltd WE-5000) that runs stand-alone without any externalequipment. Daikin claimed that the capacity is 5 W at 80 K;we tested it by changing the ohmic heat load and verified itscapacities. The result is shown in figure 10. The WE-5000had a capacity of about 16 W at −110C, where the CCDs areoperated. The value was sufficiently larger than the requiredvalue of 7.22 W.
The vibration of the cooler could affect the image qualityif it induces vibration of the focal plane. In the case thatthe dewar is heavier than the cooler and is stiffly attached tothe mechanical structure of the telescope, it is likely that theinduced vibration of the dewar is small. Inside the dewarthe cooler head is connected to a cold plate with a flexiblecopper braid (38mm2 cross section and 33 mm length) so thatthe transfer of the vibration becomes small. We measured thedegree of vibration of the cold plate using a laser displacementmeter (LT8110, Keyence Co., Ltd), and found that the inducedvibration is as small as 2 µm (rms) both vertically and horizon-tally, which is, in fact, negligible compared with the pixel size(15µm = 0.′′202).
In order to maintain a sufficiently high vacuum, charcoal isoften used as a getter of molecules, such as water. This typeof getter is, however, practically useless unless it is cooleddown to ∼ 80 K. Since we use a Stirling cooler there is noplace where such a low temperature is achieved. We thereforeadopted an ion pump (Noble Pump 912-7120; 20 l/s pumpingspeed; Anelva Co.) as an active getter. The pump has a finitelifetime, which is long enough (20000–35000 hr) if the pumpis operated under a high vacuum (< 10−5 Torr).
The cold plate is cooled down to −110 C in 5 hours fromroom temperature. Once the system is cooled down, the poewrof the cooler is regulated by monitoring the temperature of thecold plate. Once stabilized, the cooler consumes less than 80%of the maximum operation power, i.e., it exhausts about 11 W,which nearly equals the thermal inflow to the dewar. Under thisstable operational condition, inside of the dewar is kept below5× 10−7 Torr at which point the thermal inflow by convectionis completely negligible. One drawback of the Stirling cooler isthat the overhaul maintenance cycle is relatively short, 5000 hr.It is one and a half years if we use the cooler for 10 days per
Fig. 10. (a) Ultimate temperature of the cooler head as a function ofthe heat input to the head. The cooler is operated at the maximum op-eration voltage (90 V). (b) Heat exhaust power plotted as a function ofthe operation voltage of the cooler. The cooler head is kept at −100C.
month. The overhaul costs approximately 15 K, which is aboutone third of the price of the cooler.
2.6. Filters
We have adopted two photometric band systems for broad-band filters, the Johnson–Morgan–Cousins system (Johnson,Morgan 1953; Cousins 1978; Bessell 1990) and the SloanDigital Sky Survey (SDSS) system (Fukugita et al. 1996). Thebroadband filters available at the time of this writing were B,V , RC, IC of the Johnson–Morgan–Cousins system and g′, r ′,i′, z ′ of the SDSS system. We have built an SDSS u′ filter aswell, but this filter has not been made available for open usesince the transmission of the prime focus corrector is quite lowat the wavelengths of this filter. The transmission of the correc-tor is zero at <3400A and increases to 50% at 3700 A and 80%at 4000 A. Note that the QE of the MIT/LL CCDs is also lowat UV wavelengths: 20% at 3500 A and 50% at 4000 A.
The specifications for the dimensions of a filter are 205.0±0.5 mm (height), 170.0 ± 0.5 mm (width), and 15.0 ± 0.2 mm(thickness), with a corner cut of C5-C8 (mm) for each of thefour corners. The typical weight of a filter is 1.3 kg. A detaileddescription of the specifications can be found on-line.1
The filters are made of one or two Schott color-glass el-ements together with two or three neutral-glass elements.A shortpass multilayer interference film is coated on one1 〈http://subarutelescope.org/Observing/Instruments/SCam/user filters.html〉
Dow
nloaded from https://academ
ic.oup.com/pasj/article/54/6/833/1551077 by guest on 24 June 2022

No. 6] Subaru Suprime-Cam 841
Table 4. Physical components of the broad-band filters.
Filter Glass (thickness in mm) Coating
B GG385(3) + BG40(3) + BK7∗(3) + BK7(6) short-pass coatingV GG495(5) + BK7(5) + BK7(5) short-pass coatingRC OG590(5) + BK7(5) + BK7(5) short-pass coatingIC RG9(5) + BK7(5) + BK7(5) short-pass coatingg′ GG400(3) + BG40(3) + BK7(3) + BK7(6) short-pass coatingr ′ OG550(4) + BK7(3) + BK7(3) + BK7(5) short-pass coatingi′ RG695(4) + BK7(5) + BK7(6) short-pass coatingz ′ RG695(4) + BK7(5) + BK7(6) band-pass coating
∗ BK7 is neutral glass.
glass–air surface for B, V , RC, IC, g′, r ′, i′, and a bandpassmultilayer interference film is put between two glass elementsfor z ′. Except for z ′, the shape of the transmission at the short-wavelength side is determined by the long-pass transmission ofcolor glass. The physical components of the filters are summa-rized in table 4.
Laboratory experiments have revealed that the transmissionfunction at the long-wavelength side, which is defined by thecoating, of the B, V , RC, IC, g′, r ′, i′ filters, changes by a non-trivial amount with the temperature and humidity. That is, thecutoff wavelength (wavelength where the transmission is 50%of the maximum) becomes shorter with decreasing temperatureand humidity. This is caused by the absorption of water va-por in the air; the maximum amount of the absorption dependssolely on the temperature. Since the absorption saturates whenthe humidity exceeds an extremely low threshold, the transmis-sion of filters is expected to shift by the maximum amount forthe temperature during the operation of Suprime-Cam (≈ 0Cwith a typical variation of less than 5). It has been foundfrom experiments that the maximum shift of the cutoff wave-length from T = 20C to 0C is ∆λ =−40 to −80A, dependingon the filters. In addition, the cutoff wavelength at the short-wavelength side (except for z ′), which is determined by colorglass, is also found to depend on the temperature, though theamount of the shift is as small as ∼ −10 A for ∆T = −20.Note, however, that the variation in the temperature at the fil-ter during the operation of Suprime-Cam is typically smallerthan ∼ 5. Thus, the transmission curve of the filters doesnot change significantly during the observation. The band-pass film of the z ′ filter is put between two glass elements, notcoated on an air–glass surface, and thus no wavelength shift isseen at either side.
The fast F-ratio, 1.86, also changes the transmission func-tions of the filters. The change in the part defined by the coat-ing film depends on the filters, and amounts to as large as 50 A,while the change is negligibly small for the part defined bycolor glass. Note that the optics of the prime focus of Subaru isnearly telecentric. Thus, the incident angle of light on the filterdiffers at most by only 3 over the filter surface. The non-uniformity of the transmission due to this amount of differenceis negligible for usual observations.
For each filter, we adopt as the fiducial transmission the oneat T = 0C for the F/1.86 beam, which is calculated by an ex-trapolation of the measurement at a room temperature. The
Fig. 11. Transmission curves of Suprime-Cam standard filters (solidline). The dotted lines indicate the combined net responses while con-sidering the CCD quantum efficiency, the throughput of the prime focuscorrector, the reflection of the primary mirror, and atmospheric absorp-tion at sec z = 1.2. The deep absorption seen around 7600 A is theA-band of molecular oxygen.
fiducial transmission functions of the eight filters are plotted infigure 11 by the solid lines. The dotted lines in the same fig-ure indicate the net responses, which are defined as the com-bination of the fiducial transmissions with the CCD quantumefficiency, the throughput of the prime focus corrector, the re-flection of the primary mirror, and atmospheric absorption atsecz = 1.2. The reflection by the window glass of the dewar isaround 1% per surface, since an anti-reflection coating is madeon both surfaces. Table 5 presents four quantities of these netresponses: (i) λeff, effective wavelength against a spectrum offλ = const., (ii) νeff, effective frequency against a spectrum offν = const., (iii) FWHM, and (iv) Q value, which is defined as∫
[R(ν)/ν]dν, where R is the net response. Here, λeff is de-fined as
∫[λR(λ)/ν]dλ/
∫[R(λ)/ν]dλ; an extra ν is inserted
Dow
nloaded from https://academ
ic.oup.com/pasj/article/54/6/833/1551077 by guest on 24 June 2022
842 S. Miyazaki et al. [Vol. 54,
Table 5. Characteristics of broad-band filters.
Filter λeff (A) c/νeff (A) FWHM (A) Q
B 4478 4417 807 0.080V 5493 5447 935 0.092RC 6550 6498 1124 0.103IC 7996 7936 1335 0.094g′ 4809 4712 1163 0.118r ′ 6315 6236 1349 0.127i′ 7709 7633 1489 0.119z ′ 9054 9002 955 0.056
since the CCD counts the photon number, not the flux, of ob-jects (cf. Fukugita et al. 1995). Similarly, νeff is defined as∫
[νR(ν)/ν]dν/∫
[R(ν)/ν]dν.Suprime-Cam accepts custom-made filters, such as narrow
band filters. Any filter for Suprime-Cam should be mountedon a special frame of a filter exchanger, which is described inthe next subsection. This imposes rather strict specificationson the filters. Furthermore, after being mounted on the frame,the filter should be tested mechanically in the exchanger in ad-vance of an observation. Those who are interested in makingcustom-made filters should observe the “Suprime-Cam filteracceptance policy”, which can be found at the URL above.
2.7. Filter Exchanger, Shutter, and the Control System
2.7.1. Filter exchangerOne of the difficulties in building Suprime-Cam is that the
available space at the prime focus is very limited. On the otherhand, the size of the filters is significantly large compared tothe available space. This fact did not allow us to adopt theconventional filter exchange mechanisms, such as a wheel-typeexchanger.
We therefore adopted a different approach to realize the fil-ter exchange. The idea is based on a jukebox. A selected filteris first moved horizontally from the stored position to an ele-vator. The elevator then transports the filter vertically to thefocal plane. Finally, the filter is moved horizontally again tobe loaded in the operating position. The horizontal transfer isrealized by a rack and pinion driving mechanism and the eleva-tor is driven by two ball screws and a stepping motor to achieveprecise positioning. A filter holder located between the dewarand the shutter is called the focal box. It has a positioning pin,which secures the position of the filter within the focal box.Each filter has a barcode label and a barcode reader installedon the elevator box double-checks if the right filter is loaded.The jukebox holds up to ten filters at once.
Since each filter including the frame weighs about 3 kg, thehorizontal transfer speed of the filter should be limited so thatthe driving torque becomes sufficiently large. It takes almost50 seconds for a single horizontal transfer to be completed. Aseries of filter exchanges (i.e., take a filter out of the focal box,take it back to the slot of the stacker, take the specified filterout of the slot, load it into the focal box) takes about 5 minutes.Note that the elevation of the telescope pointing must be high(≥ 75 is currently required) to reduce the mechanical loadon the horizontal transfer system during the filter exchange.
This slewing of the telescope introduces another overhead forobserving which is typically one minute. Therefore, it takes6 minutes to complete the exchange. Future upgrade of the fil-ter exchanger is planned to reduce these overhead significantly.
2.7.2. ShutterThe physical size of the aperture at the shutter amounts to
205 mm × 170 mm. Since iris-type shutters introduce a sig-nificant non-uniformity of the exposure time over such a widefield of view, we adopted a shutter of the sliding-door type. Thespace available for the camera in front of the focal plane is only80 mm (see figure 12). The thickness of the shutter should thusbe as thin as possible. We succeeded to develop a large shutterwith a thickness of 15 mm.
The shutter has two sliding doors; one door covers the entireaperture. After it slides away to open the aperture, the otherdoor comes in to close the aperture, which guarantees the uni-formity of the exposure time. Furthermore, no recovery timeis required, since the doors move both ways at the same speed.Two doors are made of Derlin, which is a solid, low-frictionengineering plastic, and is driven individually with a timingbelt and a stepper motor (Oriental Motor UPK543AW). Themotor is controlled by pulses generated from the I/O port ofMessia-III (subsubsection 2.7.3) via a dedicated motor driver.The doors slide on rails made of Derlin, and their stopping po-sitions are determined by magnetic proximity sensors. It takes1.03 s to open/close a door and the shortest possible exposuretime is set to be 1.2 s. The exposure time is accurate to 0.02 sand uniform to 0.3% over the entire field of view.
2.7.3. Control system of the mechanismMessia-III has two digital signal processors (DSPs): one for
CCD control and the other for instrument control. The step-ping motors of the shutter are controlled by the pulses fromthe I/O port of the DSP. The filter exchanger is controlled bya programmable controller (Keyence K2-500) and ladder pro-grams. Messia-III sends commands to/receives status from thecontroller through the RS-232 communication line.
We installed a small computer system, PCI/104 based CPU(VersaLogic EPM-CPU-6) running Linux associated with theI/O subsystem (VersaLogic VCM-DAS-1), to manage thecooler and the ion pump. Since the cryogenic system is oper-ated continuously, even during the daytime, we have made itscontrol system completely independent so that the rest systemcan be shutdown if unnecessary.
System remote reset is realized by cycling AC power to thecomponents. For this purpose, a remote power control mod-ule (Black BOX SWI038A) is equipped. The RS-232C port ofthe module is connected to the control workstation via a RS-232C/optical converter (Black BOX ME570A).
Audio and visual monitoring systems are adopted in thecamera frame to diagnose the mechanism of Suprime-Cam.Sounds of the shutter and the filter exchanger are collectedby microphones that are attached near them. They also no-tify observers that an exposure starts/ends or filters are beingchanged. A small video camera monitors the motion of thefilter exchanger. Since the camera is hard to reach once in-stalled on the telescope, these monitors are useful in the caseof a possible system failure (e.g., a filter jam) and help to make
Dow
nloaded from https://academ
ic.oup.com/pasj/article/54/6/833/1551077 by guest on 24 June 2022
No. 6] Subaru Suprime-Cam 843
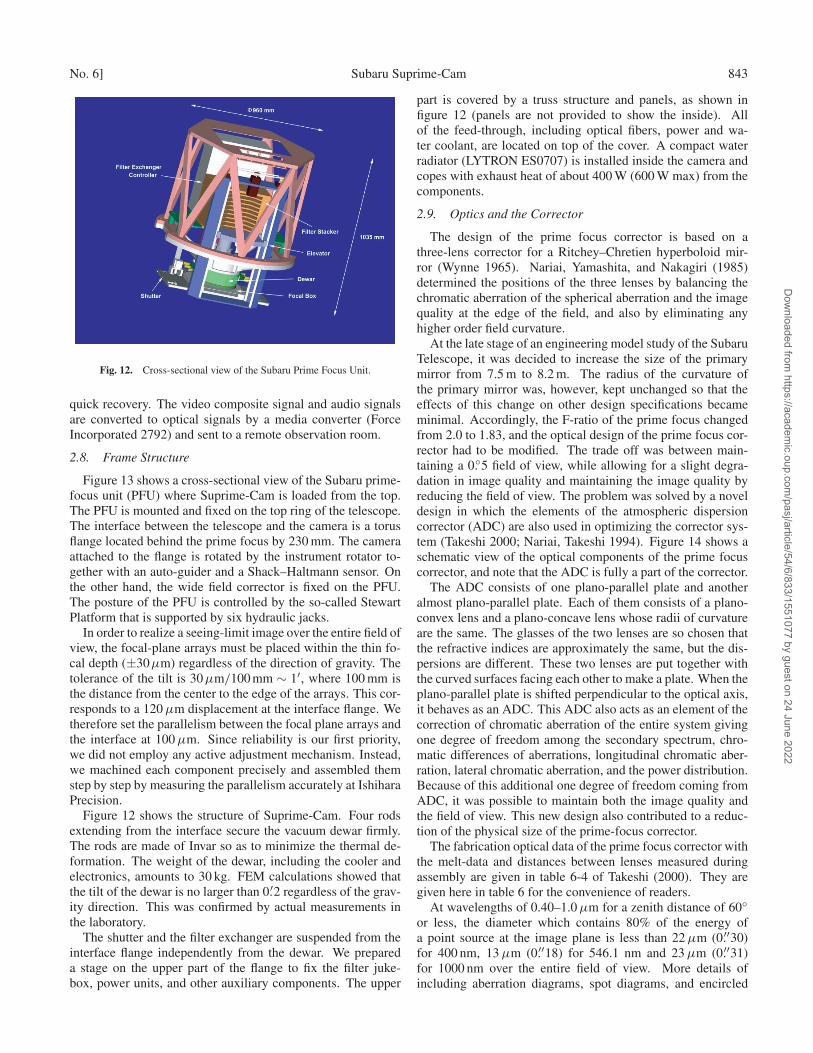
Fig. 12. Cross-sectional view of the Subaru Prime Focus Unit.
quick recovery. The video composite signal and audio signalsare converted to optical signals by a media converter (ForceIncorporated 2792) and sent to a remote observation room.
2.8. Frame Structure
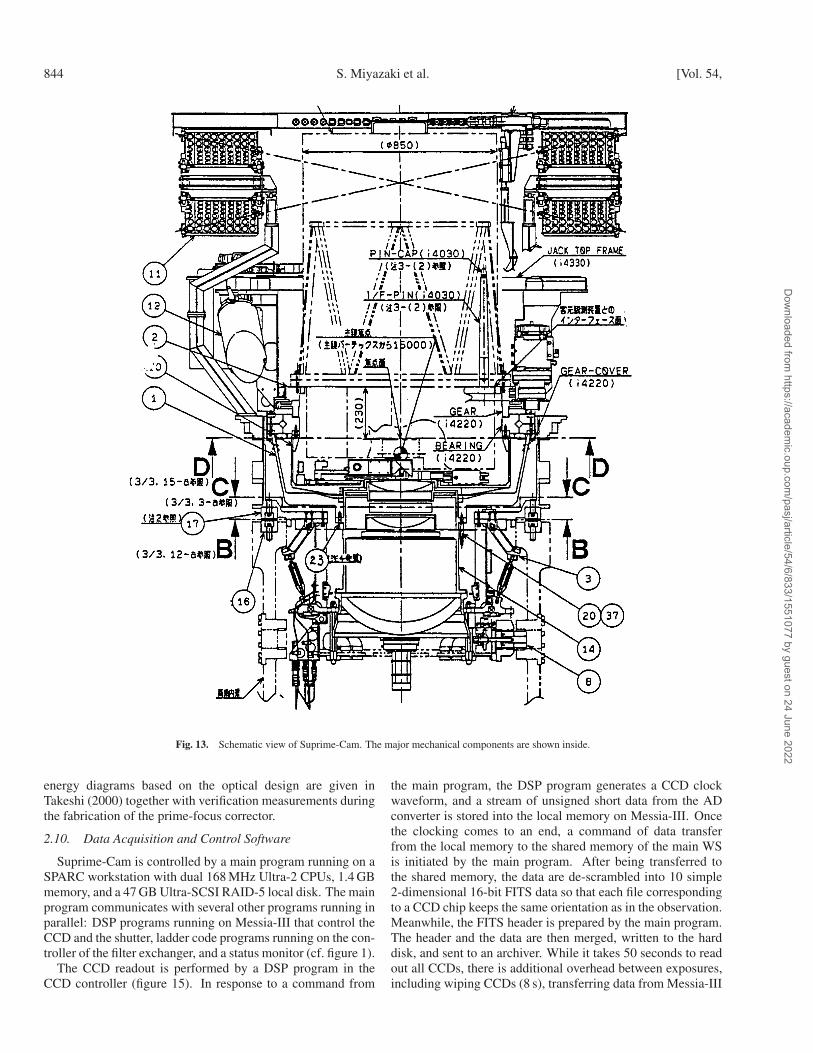
Figure 13 shows a cross-sectional view of the Subaru prime-focus unit (PFU) where Suprime-Cam is loaded from the top.The PFU is mounted and fixed on the top ring of the telescope.The interface between the telescope and the camera is a torusflange located behind the prime focus by 230 mm. The cameraattached to the flange is rotated by the instrument rotator to-gether with an auto-guider and a Shack–Haltmann sensor. Onthe other hand, the wide field corrector is fixed on the PFU.The posture of the PFU is controlled by the so-called StewartPlatform that is supported by six hydraulic jacks.
In order to realize a seeing-limit image over the entire field ofview, the focal-plane arrays must be placed within the thin fo-cal depth (±30µm) regardless of the direction of gravity. Thetolerance of the tilt is 30µm/100 mm ∼ 1′, where 100 mm isthe distance from the center to the edge of the arrays. This cor-responds to a 120 µm displacement at the interface flange. Wetherefore set the parallelism between the focal plane arrays andthe interface at 100 µm. Since reliability is our first priority,we did not employ any active adjustment mechanism. Instead,we machined each component precisely and assembled themstep by step by measuring the parallelism accurately at IshiharaPrecision.
Figure 12 shows the structure of Suprime-Cam. Four rodsextending from the interface secure the vacuum dewar firmly.The rods are made of Invar so as to minimize the thermal de-formation. The weight of the dewar, including the cooler andelectronics, amounts to 30 kg. FEM calculations showed thatthe tilt of the dewar is no larger than 0.′2 regardless of the grav-ity direction. This was confirmed by actual measurements inthe laboratory.
The shutter and the filter exchanger are suspended from theinterface flange independently from the dewar. We prepareda stage on the upper part of the flange to fix the filter juke-box, power units, and other auxiliary components. The upper
part is covered by a truss structure and panels, as shown infigure 12 (panels are not provided to show the inside). Allof the feed-through, including optical fibers, power and wa-ter coolant, are located on top of the cover. A compact waterradiator (LYTRON ES0707) is installed inside the camera andcopes with exhaust heat of about 400 W (600 W max) from thecomponents.
2.9. Optics and the Corrector
The design of the prime focus corrector is based on athree-lens corrector for a Ritchey–Chretien hyperboloid mir-ror (Wynne 1965). Nariai, Yamashita, and Nakagiri (1985)determined the positions of the three lenses by balancing thechromatic aberration of the spherical aberration and the imagequality at the edge of the field, and also by eliminating anyhigher order field curvature.
At the late stage of an engineering model study of the SubaruTelescope, it was decided to increase the size of the primarymirror from 7.5 m to 8.2 m. The radius of the curvature ofthe primary mirror was, however, kept unchanged so that theeffects of this change on other design specifications becameminimal. Accordingly, the F-ratio of the prime focus changedfrom 2.0 to 1.83, and the optical design of the prime focus cor-rector had to be modified. The trade off was between main-taining a 0.5 field of view, while allowing for a slight degra-dation in image quality and maintaining the image quality byreducing the field of view. The problem was solved by a noveldesign in which the elements of the atmospheric dispersioncorrector (ADC) are also used in optimizing the corrector sys-tem (Takeshi 2000; Nariai, Takeshi 1994). Figure 14 shows aschematic view of the optical components of the prime focuscorrector, and note that the ADC is fully a part of the corrector.
The ADC consists of one plano-parallel plate and anotheralmost plano-parallel plate. Each of them consists of a plano-convex lens and a plano-concave lens whose radii of curvatureare the same. The glasses of the two lenses are so chosen thatthe refractive indices are approximately the same, but the dis-persions are different. These two lenses are put together withthe curved surfaces facing each other to make a plate. When theplano-parallel plate is shifted perpendicular to the optical axis,it behaves as an ADC. This ADC also acts as an element of thecorrection of chromatic aberration of the entire system givingone degree of freedom among the secondary spectrum, chro-matic differences of aberrations, longitudinal chromatic aber-ration, lateral chromatic aberration, and the power distribution.Because of this additional one degree of freedom coming fromADC, it was possible to maintain both the image quality andthe field of view. This new design also contributed to a reduc-tion of the physical size of the prime-focus corrector.
The fabrication optical data of the prime focus corrector withthe melt-data and distances between lenses measured duringassembly are given in table 6-4 of Takeshi (2000). They aregiven here in table 6 for the convenience of readers.
At wavelengths of 0.40–1.0 µm for a zenith distance of 60or less, the diameter which contains 80% of the energy ofa point source at the image plane is less than 22 µm (0.′′30)for 400 nm, 13 µm (0.′′18) for 546.1 nm and 23 µm (0.′′31)for 1000 nm over the entire field of view. More details ofincluding aberration diagrams, spot diagrams, and encircled
Dow
nloaded from https://academ
ic.oup.com/pasj/article/54/6/833/1551077 by guest on 24 June 2022
844 S. Miyazaki et al. [Vol. 54,
Fig. 13. Schematic view of Suprime-Cam. The major mechanical components are shown inside.
energy diagrams based on the optical design are given inTakeshi (2000) together with verification measurements duringthe fabrication of the prime-focus corrector.
2.10. Data Acquisition and Control Software
Suprime-Cam is controlled by a main program running on aSPARC workstation with dual 168 MHz Ultra-2 CPUs, 1.4 GBmemory, and a 47 GB Ultra-SCSI RAID-5 local disk. The mainprogram communicates with several other programs running inparallel: DSP programs running on Messia-III that control theCCD and the shutter, ladder code programs running on the con-troller of the filter exchanger, and a status monitor (cf. figure 1).
The CCD readout is performed by a DSP program in theCCD controller (figure 15). In response to a command from
the main program, the DSP program generates a CCD clockwaveform, and a stream of unsigned short data from the ADconverter is stored into the local memory on Messia-III. Oncethe clocking comes to an end, a command of data transferfrom the local memory to the shared memory of the main WSis initiated by the main program. After being transferred tothe shared memory, the data are de-scrambled into 10 simple2-dimensional 16-bit FITS data so that each file correspondingto a CCD chip keeps the same orientation as in the observation.Meanwhile, the FITS header is prepared by the main program.The header and the data are then merged, written to the harddisk, and sent to an archiver. While it takes 50 seconds to readout all CCDs, there is additional overhead between exposures,including wiping CCDs (8 s), transferring data from Messia-III
Dow
nloaded from https://academ
ic.oup.com/pasj/article/54/6/833/1551077 by guest on 24 June 2022

No. 6] Subaru Suprime-Cam 845
Table 6. Fabrication optical data of the primary corrector with the melt-data and distances between lenses measured during assembly.
k Aperture Radius Distance Glass ne n(400 nm) n(1000 nm) Note
1 8200 30000∗ 14207.88 1 1 12 506.8 326.76 55.94 BSL7Y 1.518880 1.53097 1.507703 467 319.65 398.5995 1 1 14 275 −4475.19983∗ 15.856 BSL7Y 1.51854 1.53062 1.507365 251.4 213.36 65.111 1 1 16 (337) 0 25.77 PBM5 1.60743 1.63341 1.587757 (337) −897.65 13.962 BSM51Y 1.605811 1.62094 1.592398 (337) 0 5.4995 1 1 19 258.6 825.93 14.99 PBM2Y 1.624213 1.65236 1.60319
10 257.2 391.195 30.451 BSL7Y 1.518550 1.53062 1.5073611 257.2 5355.97529∗ 0.836 1 1 112 257.3 268.24 48.083 S-FPL51 1.498524 1.50774 1.4902713 254.5 −1098.3 125.50955 1 1 114 15.0 SiO2 1.460280 1.47032 1.45056 filter15 14.5 1 1 116 15.0 SiO2 1.460280 1.47032 1.45056 window17 10.0 1 1 118 image
k r e2 B C D D′ E
1 30000 1.008354 −4475.19983 3.38267E-9 -8.36303E-14 2.03782E-18 -1.33838E-20 3.49307E-23
11 5355.97529 1.30769E-9 -5.38888E-14 -6.67037E-18 6.94170E-20 -2.28747E-22∗ Aspheric constants for the cases indicated are given in the lower table where meaning of letters is as follows:
x = (h2/r)/ [
1 +√
1− (1− e2)(h/r)2]
+ Bh4 + Ch6 + Dh8 + D′h9 + Eh10, h =√
y2 + z2.
Fig. 14. Prime-focus corrector for Suprime-Cam based on athree-lens corrector design (Wynne 1965), but optimized with addi-tional optical components for ADC.
to WS (52 s) and handling the data on the WS (10 s), which is2 minutes in total.2
The shutter is controlled by a DSP program, which uses2 In 2002 August right after submission of this paper, we upgraded the elec-
tronics Messia-III to the new one Messia-V (H. Nakaya 2002 in preprepa-ration) as well as the local WS to an 2.2 GHz dual Pentium-based Linuxbox. The overhead is now shortened down to 58 s. Recent statistics showsthat the ratio of total exposure time to usable observing time during thenight reaches up to 80% on average.
interrupt signals from the Real Time Clock (RTC) on boardMessia-III to ensure the preciseness of the exposure time re-gardless of the load of main WS. The precision is less than1 ms. For the filter exchanger, the main program sends com-mand strings, such as “initialize”, “set filter”, or “restore filter”to Messia-III. It simply passes the strings to the filter exchangercontroller via RS-232C. When “set filter” command is issued,the controller also reads the barcode of the filter which is goingto be loaded into the focal box to check if it is the correct filter,and returns the status to the main WS.
The status monitor of Suprime-Cam is implemented as aCGI (Common Gateway Interface) program. CGI is a standardWWW technique for sending dynamic information. The cur-rent status of the components and internal status of the mainprogram are written into the shared memory of the main WSand constantly updated. The CGI program reads the memoryand formats the current status into HTML (figure 16). As themonitor program is a CGI, any WWW browsers can be used asa remote status monitor. We did not develop our GUI clients,because the evolution of GUI is currently very rapid. UsingHTTP, CGI, and HTML, which are stable and standard proto-cols for sending formatted information, we can easily maintainthe status monitor.
During an observation, Suprime-Cam is controlled fromthe Subaru Observation Software System; SOSS (Kosugiet al. 1997; Sasaki et al. 1998). The telescope control, data
Dow
nloaded from https://academ
ic.oup.com/pasj/article/54/6/833/1551077 by guest on 24 June 2022

846 S. Miyazaki et al. [Vol. 54,
Fig. 15. Command and data-flow diagram of reading the CCD.Command flow is expressed as the thin arrows, and data flow as thethick arrows.
Fig. 16. Command and data flow diagram of the status monitor.Command flow is expressed as the solid arrows, and status as thedashed arrows. The status from the master control WS, the CCD elec-tronics, the shutter controller and the filter-exchanger are written intothe shared memory and always updated by the main program. Usersaccess to httpd running at the instrument control WS and receive thecurrent status in HTML format.
archive, and main program of Suprime-Cam are commandedfrom a scheduler process in the master control WS in SOSS,and act as slave processes. Since the control is centralized inthe scheduler process, the observation with Suprime-Cam ishighly automated. Such an automation is implemented aimingfor future queue observations and service observations. Thescheduler also controls the synchronicity of commands so thatthe dead time should be minimum.
3. Performance Verification
3.1. Optical Performance
3.1.1. Alignment of the wide field correctorThere are three main factors that affect the image quality of
the camera: the primary mirror, the wide-field corrector, andtelescope tracking. Image degradation due to the primary mir-ror is controlled to be well below 0.′′2 FWHM, judging fromresults of Shack–Hartmann tests. Image degradation due to thewide-field corrector is smaller than 0.′′27 FWHM, as describedin subsection 2.9. The telescope tracking error has been provedto be less than 0.′′07 for a typical ten-minute exposure whenassisted by an auto-guider under negligible wind condition thatmight cause the shaking of the telescope. Since the quadraticsum of the three components is 0.′′34, the normal seeing (typi-cally ≥ 0.′′4) dominates the image-quality degradation once allthe adjustments of optics are made appropriately.
We introduce the ellipticity of a stellar image, which is ameasure of the PSF anisotropy, which is useful to diagnose anyadjustments of the optics, defined by
e1,e2 = I11 − I22,2I12/(I11 + I22). (5)
The moments, Iij , are calculated by
Iij =∫
d2xW (x)xixjf (x), (6)
where f (x) is the surface-brightness distribution of a stellarimage and W (x) is a Gaussian weighting function (Kaiser et al.1995).
The first step of the adjustment is alignment of the opticalaxis of the wide-field corrector to that of the primary mirror. Ifthe misalignment is small, its two components, the decenteringand the tilt, can be treated separately. The decentering causescoma aberration while the tilt causes astigmatism. Since thecoma aberration is almost uniform over the field of view, itis sufficient to measure it at some small portion of the field.In fact, the decentering was measured and corrected througha Shack–Hartmann test performed near the field center, whichcontrols not only the decentering of the corrector, but also theshape of the primary mirror.
The shear induced by the astigmatism, on the other hand, isa function of the field position. It is efficient to use Suprime-Cam, which covers most of the field at once, to measure theshear. For example, if the tilt amounts to θy around the Y -axis,we note that the ellipticities of stars,e defined by equation (5),can be well approximated as
e = kθyx, (7)
where x is the field position relative to the optical axis and k
is a constant which is dependent on the degree of defocus. Anexample of the ellipticity map is shown in figure 17, wherethe mean ellipticities of stars in 11 × 11 partitions in the fieldof view are shown illustrated by ellipses. By measuring theellipticities of stars over the entire field we can estimate thedirection and degree of the tilt at the same time based on equa-tion (7). After repeating the cycle of measurement and the ad-justment several times, we were able to make the tilt below 0.′5,which was sufficiently small. We monitored the tilt by chang-ing the elevation of the telescope and no apparent change of the
Dow
nloaded from https://academ
ic.oup.com/pasj/article/54/6/833/1551077 by guest on 24 June 2022

No. 6] Subaru Suprime-Cam 847
Fig. 17. Example of an ellipticity map (e = 0.5x; see the text) showingthe astigmatism induced by the tilt along the Y -axis of the optical axisof the wide-field corrector with respect to that of the telescope. Themean ellipticities of stars in 11 × 11 partitions in the field of view areillustrated by the ellipses.
Fig. 18. Stellar image sizes averaged over each of the ten CCDs as afunction of the focus position. The exposure is in the Ic band and theintegration time is 10 s at each position.
tilt was seen.
3.1.2. Coplanarity of the focal planeWe examined the coplanarity of the focal plane composed
by 10 CCDs. An exposure of 10 seconds was made throughthe Ic band filter under a seeing of ∼ 0.′′4 by changing the fo-cus position. Figure 18 shows the stellar image sizes averagedover each of ten CCDs plotted as a function of the focus po-sition. Since the best focus position is the same for all of theCCDs, as can be seen in figure 18, the co-planarity of the fo-cal plane seems to be accomplished at a satisfactory level, i.e.,any deviation from coplanarity is not visible even under superbseeing. The figure also shows that an image quality as good as0.′′4 can be achieved on Suprime-Cam, which proves that the
Fig. 19. Long-term seeing statistics of Suprime-Cam. The closed cir-cles represent the data taken in the Ic or i′ band, which are the mostfrequently used filters, and the open squares show the data for all otherbands. The median seeing is 0.′′61 in the Ic(i′) band and 0.′′69 whenall bands are taken into account.
three components mentioned in subsubsection 3.1.1 remainsminimal, indeed.
3.1.3. Seeing statisticsWe monitored the seeing during the commissioning phase
over a period of one and a half years. The data are based onimages taken for the focus adjustment procedure; the resultsare shown in figure 19. The closed circles show the data takenin the Ic band, including a similar i′ band, which are the mostfrequently used bands, and the open squares show the data ofall other bands. The median seeing is 0.′′61 in the Ic(i′) bandand 0.′′69 when all of the bands are taken into account. Thebest seeing that we have ever obtained was 0.′′37 in an Ic bandimage of 180 s exposure. The image of 0.′′4–0.′′45 seeing isroutinely obtained at longer wavelength (redder than V -band)with an exposure time of typically 5 to 10 min.
3.1.4. Image quality of Suprime-CamThe left panel of figure 20 shows the stellar ellipticities
measured on a certain image of 6 min exposure in the Rcband. The seeing size of the image is 0.′′6, a typical value.The mean value of the ellipticities over the field of viewis about 2% and the standard deviation, σe, is about 1.5%.These values are quite small compared with those of a cam-era mounted on an earlier generation telescope. For example,UH8K mounted on CFHT shows 5–7% ellipticities accord-ing to van Waerbke et al. (2000). This demonstrates that weachieved sufficiently good optical and mechanical adjustmentsof the telescope/camera system.
3.1.5. Deriving the distortion parametersA science exposure usually consists of several stacked im-
ages. Image stacking is not a trivial procedure because of thelarge distortion of the optics. Here, we describe how to derivethe distortion parameters. We employ a geometrical model offield distortion using a 4th-order polynomial function,
Dow
nloaded from https://academ
ic.oup.com/pasj/article/54/6/833/1551077 by guest on 24 June 2022

848 S. Miyazaki et al. [Vol. 54,
Table 7. Parameters of the optical distortion.
a b c d
7.16417× 10⁻⁸ 3.03146× 10⁻¹⁰ 5.69338× 10⁻¹⁴ −6.61572× 10⁻¹⁸
Fig. 20. Ellipticities of stars evaluated on a certain single image of0.′′6 seeing (top) and the ellipticity map (bottom) where the ellipticitiesare ten-times exaggerated for clarity.
R − r
r= ar + br2 + cr3 + dr4, (8)
where R and r are the distances from the optical axis in unitsof pixel on the CCD coordinates and the celestial coordinates,respectively. The displacement and the rotation of each CCDfrom its nominal position, (∆x,∆y,∆φ)c, are set as free pa-rameters. We change the telescope pointing typically by 1′–2′between successive exposures. The offset and the rotation ofthe telescope pointing between the exposures, (∆X,∆Y,∆Φ)e,
Fig. 21. Optical distortion of the prime-focus corrector. The solid cir-cles represent the distortion calculated by ray-tracing and the solid lineshows the geometrical solution of Suprime-Cam (see text). Both agreequite well, which implies the reliability of the solution.
are set as free parameters as well. All of these parameters canbe determined by minimizing the distance of the same starsidentified on different exposures. The residual of the distancesis a measure of the error of this mosaic-stacking procedure.The rms value of the residuals is typically about 0.5 pixel.
The distortion parameters determined by this procedure aresummarized in table 7. Figure 21 shows the distortion com-puted based on our model with the parameters given in table 7compared with that calculated by a ray-tracing program. Themeasured distortion agrees quite well with the computation,which suggests that the solution of the geometry is reliable.The displacement (t) and the rotation (φ) of each CCD are con-sistent with the allowance of fitting (∆r = 30µm) between thealignment pins and the holes of the CCD mounting (subsubsec-tion 2.3.2), and are found to be stable (dt ∼4µm, dθ ∼0.05radfor about a year), which is natural.
3.2. Limiting Magnitude
3.2.1. Magnitude zero pointsWe derived the magnitude zero point, i.e., the AB magnitude
corresponding to a flux of 1 ADU per second, for the B, V , RC,i′, and z ′ bands using data of photometric (B, V , RC) and spec-trophotometric (i′, z ′) standard stars taken in the commission-ing phase of Suprime-Cam. Table 8 presents the results at anairmass of secz = 1.2, together with predictions for secz = 1.2calculated with the system throughput we evaluated, which are
Dow
nloaded from https://academ
ic.oup.com/pasj/article/54/6/833/1551077 by guest on 24 June 2022
No. 6] Subaru Suprime-Cam 849
Table 8. System throughput and magnitude zero points.
Band B V RC i′ z ′
Zero point (AB mag)∗
Measured 27.40 27.54 27.70 27.92 27.05Calculated 27.42 27.58 27.70 27.85 27.03
Throughput
Mirror 0.91 0.90 0.89 0.86 0.90Corrector 0.85 0.92 0.93 0.92 0.85CCD 0.61 0.75 0.84 0.85 0.54Filter 0.88 0.97 0.94 0.96 0.93
∗ Typical airmass (secz) of 1.2 is assumed.
Table 9. Limiting magnitudes of Suprime-Cam.∗
Band AB mag (1 hr) AB mag (exp.time) Field
B 27.2 27.7 (151 min) SDFV 27.1 27.4 (109 min) SDFRC 26.8 26.4 ( 30 min) CL1604i′ 26.5 26.8 (103 min) SDFz ′ 25.9 26.0 ( 68 min) SDF
∗ These data were taken on dark, mostly clear nights. Their imagequality was on the average good, with a seeing size of 0.′′6–0.′′8.
also given in the table. The typical uncertainties in the ob-served and predicted values were estimated to be ∼ ±0.05and ±0.1 mag, respectively. It is found that the predictionsagree with the observed values with discrepancies of less than±0.07mag. This demonstrates that we have correctly evaluatedall of the factors, including the telescope optics, that contributeto the total throughput of Suprime-Cam.
3.2.2. Limiting magnitudesWe estimated the limiting magnitudes for a 1-hr exposure
for the B, V , Rc, i′, and z ′ bands based on deep imaging datataken during the commissioning phase. We used data of theSubaru Deep Field [SDF; a blank field centered at RA(2000) =13h24m21.s4, DEC(2000) = + 2729′23′′] for B, V , i’, z ′, andthose of CL1604 + 43 (a distant cluster at z 0.9) for RC. TheSDF is one of the two deep fields observed with Suprime-Camto study the properties of distant field galaxies. These data weretaken on dark, mostly clear nights. Their image quality was onthe average good, with a seeing size of 0.′′6–0.′′8.
The estimated limiting magnitudes in the AB system aresummarized in table 9. Here, the limiting magnitude is definedas the brightness corresponding to 3σsky on a 2′′-diameter aper-ture, where σsky is the sky noise measured as the standard devi-ation. Column 2 of table 9 shows the limiting magnitude for a1-hr exposure scaled from the raw value for the exposure timeshown in the parentheses (column 3) made at the field given incolumn 4.
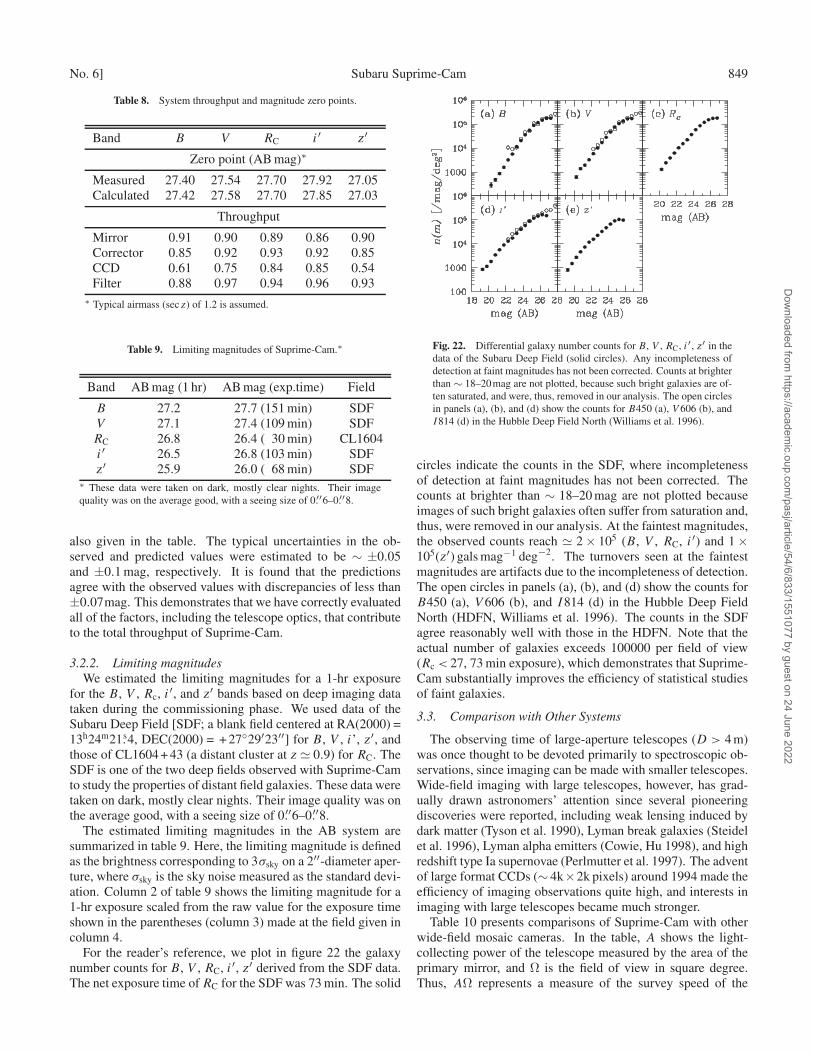
For the reader’s reference, we plot in figure 22 the galaxynumber counts for B, V , RC, i′, z ′ derived from the SDF data.The net exposure time of RC for the SDF was 73 min. The solid
Fig. 22. Differential galaxy number counts for B, V , RC, i′, z′ in thedata of the Subaru Deep Field (solid circles). Any incompleteness ofdetection at faint magnitudes has not been corrected. Counts at brighterthan ∼ 18–20mag are not plotted, because such bright galaxies are of-ten saturated, and were, thus, removed in our analysis. The open circlesin panels (a), (b), and (d) show the counts for B450 (a), V 606 (b), andI814 (d) in the Hubble Deep Field North (Williams et al. 1996).
circles indicate the counts in the SDF, where incompletenessof detection at faint magnitudes has not been corrected. Thecounts at brighter than ∼ 18–20 mag are not plotted becauseimages of such bright galaxies often suffer from saturation and,thus, were removed in our analysis. At the faintest magnitudes,the observed counts reach 2 × 10⁵ (B, V , RC, i′) and 1 ×10⁵(z ′) gals mag−1 deg−2. The turnovers seen at the faintestmagnitudes are artifacts due to the incompleteness of detection.The open circles in panels (a), (b), and (d) show the counts forB450 (a), V 606 (b), and I814 (d) in the Hubble Deep FieldNorth (HDFN, Williams et al. 1996). The counts in the SDFagree reasonably well with those in the HDFN. Note that theactual number of galaxies exceeds 100000 per field of view(Rc < 27, 73 min exposure), which demonstrates that Suprime-Cam substantially improves the efficiency of statistical studiesof faint galaxies.
3.3. Comparison with Other Systems
The observing time of large-aperture telescopes (D > 4 m)was once thought to be devoted primarily to spectroscopic ob-servations, since imaging can be made with smaller telescopes.Wide-field imaging with large telescopes, however, has grad-ually drawn astronomers’ attention since several pioneeringdiscoveries were reported, including weak lensing induced bydark matter (Tyson et al. 1990), Lyman break galaxies (Steidelet al. 1996), Lyman alpha emitters (Cowie, Hu 1998), and highredshift type Ia supernovae (Perlmutter et al. 1997). The adventof large format CCDs (∼ 4k×2k pixels) around 1994 made theefficiency of imaging observations quite high, and interests inimaging with large telescopes became much stronger.
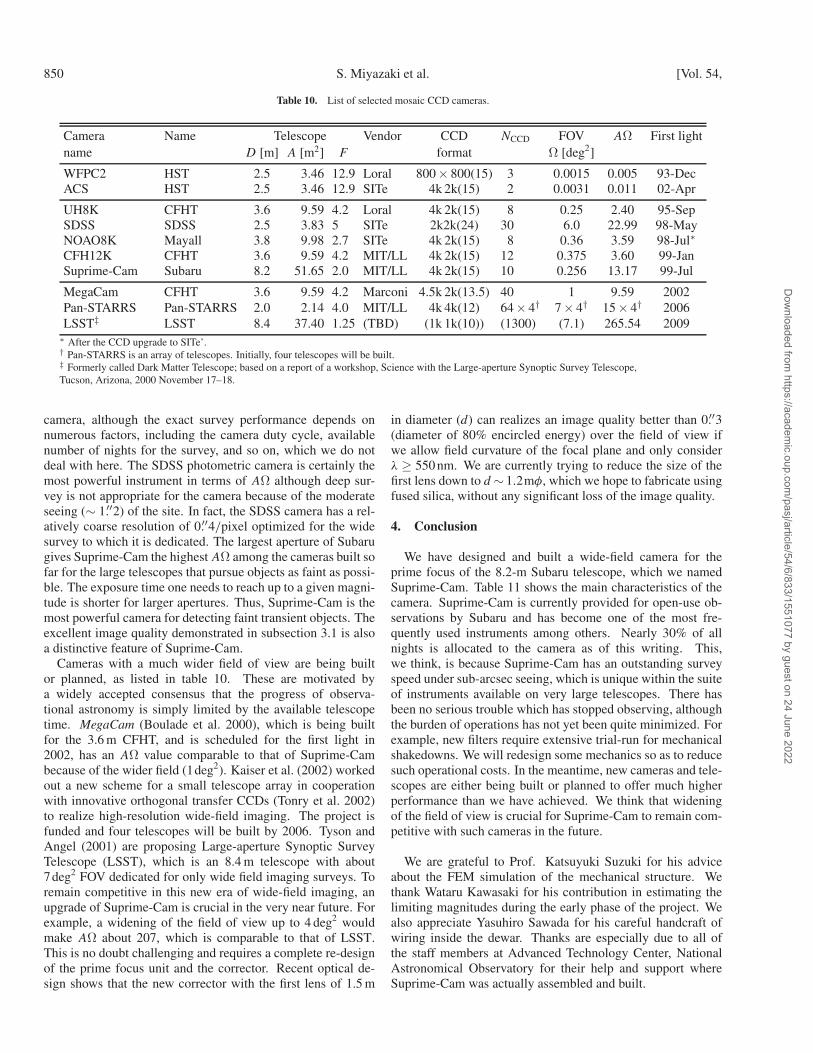
Table 10 presents comparisons of Suprime-Cam with otherwide-field mosaic cameras. In the table, A shows the light-collecting power of the telescope measured by the area of theprimary mirror, and Ω is the field of view in square degree.Thus, AΩ represents a measure of the survey speed of the
Dow
nloaded from https://academ
ic.oup.com/pasj/article/54/6/833/1551077 by guest on 24 June 2022
850 S. Miyazaki et al. [Vol. 54,
Table 10. List of selected mosaic CCD cameras.
Camera Name Telescope Vendor CCD NCCD FOV AΩ First lightname D [m] A [m2] F format Ω [deg2]
WFPC2 HST 2.5 3.46 12.9 Loral 800× 800(15) 3 0.0015 0.005 93-DecACS HST 2.5 3.46 12.9 SITe 4k 2k(15) 2 0.0031 0.011 02-Apr
UH8K CFHT 3.6 9.59 4.2 Loral 4k 2k(15) 8 0.25 2.40 95-SepSDSS SDSS 2.5 3.83 5 SITe 2k2k(24) 30 6.0 22.99 98-MayNOAO8K Mayall 3.8 9.98 2.7 SITe 4k 2k(15) 8 0.36 3.59 98-Jul∗CFH12K CFHT 3.6 9.59 4.2 MIT/LL 4k 2k(15) 12 0.375 3.60 99-JanSuprime-Cam Subaru 8.2 51.65 2.0 MIT/LL 4k 2k(15) 10 0.256 13.17 99-Jul
MegaCam CFHT 3.6 9.59 4.2 Marconi 4.5k 2k(13.5) 40 1 9.59 2002Pan-STARRS Pan-STARRS 2.0 2.14 4.0 MIT/LL 4k 4k(12) 64× 4† 7× 4† 15× 4† 2006LSST‡ LSST 8.4 37.40 1.25 (TBD) (1k 1k(10)) (1300) (7.1) 265.54 2009
∗ After the CCD upgrade to SITe’.† Pan-STARRS is an array of telescopes. Initially, four telescopes will be built.‡ Formerly called Dark Matter Telescope; based on a report of a workshop, Science with the Large-aperture Synoptic Survey Telescope,Tucson, Arizona, 2000 November 17–18.
camera, although the exact survey performance depends onnumerous factors, including the camera duty cycle, availablenumber of nights for the survey, and so on, which we do notdeal with here. The SDSS photometric camera is certainly themost powerful instrument in terms of AΩ although deep sur-vey is not appropriate for the camera because of the moderateseeing (∼ 1.′′2) of the site. In fact, the SDSS camera has a rel-atively coarse resolution of 0.′′4/pixel optimized for the widesurvey to which it is dedicated. The largest aperture of Subarugives Suprime-Cam the highest AΩ among the cameras built sofar for the large telescopes that pursue objects as faint as possi-ble. The exposure time one needs to reach up to a given magni-tude is shorter for larger apertures. Thus, Suprime-Cam is themost powerful camera for detecting faint transient objects. Theexcellent image quality demonstrated in subsection 3.1 is alsoa distinctive feature of Suprime-Cam.
Cameras with a much wider field of view are being builtor planned, as listed in table 10. These are motivated bya widely accepted consensus that the progress of observa-tional astronomy is simply limited by the available telescopetime. MegaCam (Boulade et al. 2000), which is being builtfor the 3.6 m CFHT, and is scheduled for the first light in2002, has an AΩ value comparable to that of Suprime-Cambecause of the wider field (1deg2). Kaiser et al. (2002) workedout a new scheme for a small telescope array in cooperationwith innovative orthogonal transfer CCDs (Tonry et al. 2002)to realize high-resolution wide-field imaging. The project isfunded and four telescopes will be built by 2006. Tyson andAngel (2001) are proposing Large-aperture Synoptic SurveyTelescope (LSST), which is an 8.4 m telescope with about7deg2 FOV dedicated for only wide field imaging surveys. Toremain competitive in this new era of wide-field imaging, anupgrade of Suprime-Cam is crucial in the very near future. Forexample, a widening of the field of view up to 4 deg2 wouldmake AΩ about 207, which is comparable to that of LSST.This is no doubt challenging and requires a complete re-designof the prime focus unit and the corrector. Recent optical de-sign shows that the new corrector with the first lens of 1.5 m
in diameter (d) can realizes an image quality better than 0.′′3(diameter of 80% encircled energy) over the field of view ifwe allow field curvature of the focal plane and only considerλ ≥ 550 nm. We are currently trying to reduce the size of thefirst lens down to d ∼ 1.2mφ, which we hope to fabricate usingfused silica, without any significant loss of the image quality.
4. Conclusion
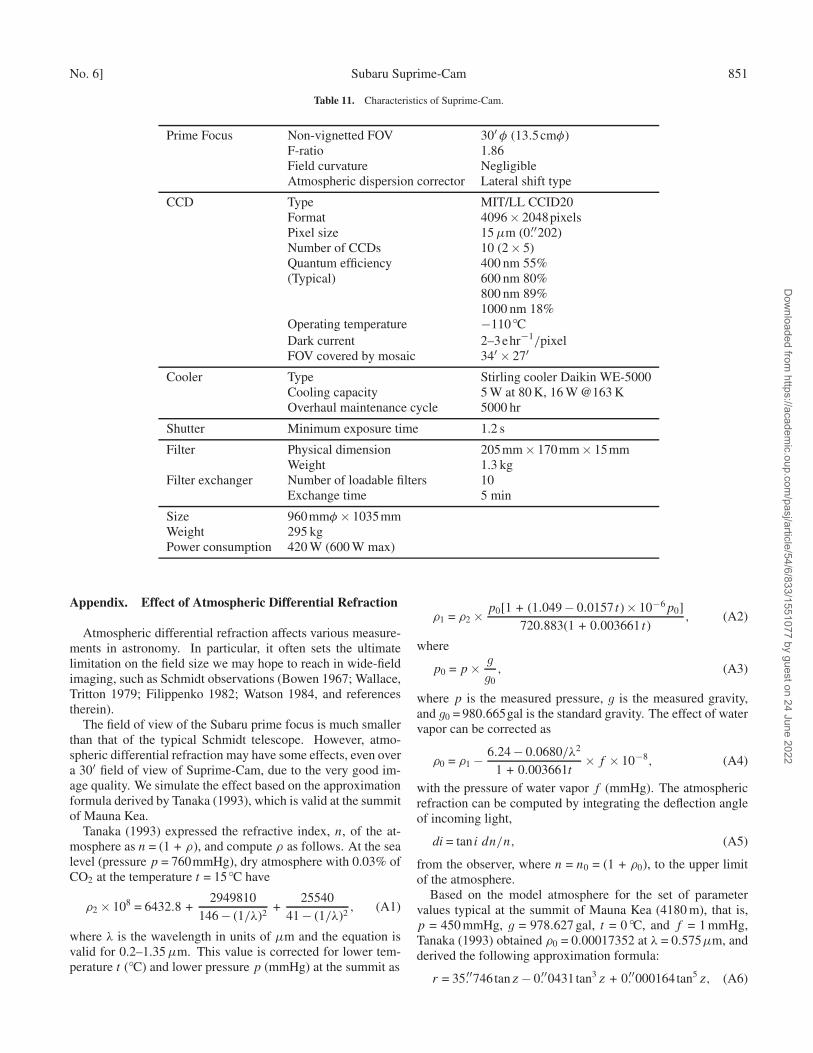
We have designed and built a wide-field camera for theprime focus of the 8.2-m Subaru telescope, which we namedSuprime-Cam. Table 11 shows the main characteristics of thecamera. Suprime-Cam is currently provided for open-use ob-servations by Subaru and has become one of the most fre-quently used instruments among others. Nearly 30% of allnights is allocated to the camera as of this writing. This,we think, is because Suprime-Cam has an outstanding surveyspeed under sub-arcsec seeing, which is unique within the suiteof instruments available on very large telescopes. There hasbeen no serious trouble which has stopped observing, althoughthe burden of operations has not yet been quite minimized. Forexample, new filters require extensive trial-run for mechanicalshakedowns. We will redesign some mechanics so as to reducesuch operational costs. In the meantime, new cameras and tele-scopes are either being built or planned to offer much higherperformance than we have achieved. We think that wideningof the field of view is crucial for Suprime-Cam to remain com-petitive with such cameras in the future.
We are grateful to Prof. Katsuyuki Suzuki for his adviceabout the FEM simulation of the mechanical structure. Wethank Wataru Kawasaki for his contribution in estimating thelimiting magnitudes during the early phase of the project. Wealso appreciate Yasuhiro Sawada for his careful handcraft ofwiring inside the dewar. Thanks are especially due to all ofthe staff members at Advanced Technology Center, NationalAstronomical Observatory for their help and support whereSuprime-Cam was actually assembled and built.
Dow
nloaded from https://academ
ic.oup.com/pasj/article/54/6/833/1551077 by guest on 24 June 2022
No. 6] Subaru Suprime-Cam 851
Table 11. Characteristics of Suprime-Cam.
Prime Focus Non-vignetted FOV 30′φ (13.5cmφ)F-ratio 1.86Field curvature NegligibleAtmospheric dispersion corrector Lateral shift type
CCD Type MIT/LL CCID20Format 4096× 2048pixelsPixel size 15 µm (0.′′202)Number of CCDs 10 (2× 5)Quantum efficiency 400 nm 55%(Typical) 600 nm 80%
800 nm 89%1000 nm 18%
Operating temperature −110CDark current 2–3ehr−1/pixelFOV covered by mosaic 34′ × 27′
Cooler Type Stirling cooler Daikin WE-5000Cooling capacity 5 W at 80 K, 16 W @163 KOverhaul maintenance cycle 5000 hr
Shutter Minimum exposure time 1.2 s
Filter Physical dimension 205mm× 170mm× 15mmWeight 1.3 kg
Filter exchanger Number of loadable filters 10Exchange time 5 min
Size 960mmφ × 1035mmWeight 295 kgPower consumption 420 W (600 W max)
Appendix. Effect of Atmospheric Differential Refraction
Atmospheric differential refraction affects various measure-ments in astronomy. In particular, it often sets the ultimatelimitation on the field size we may hope to reach in wide-fieldimaging, such as Schmidt observations (Bowen 1967; Wallace,Tritton 1979; Filippenko 1982; Watson 1984, and referencestherein).
The field of view of the Subaru prime focus is much smallerthan that of the typical Schmidt telescope. However, atmo-spheric differential refraction may have some effects, even overa 30′ field of view of Suprime-Cam, due to the very good im-age quality. We simulate the effect based on the approximationformula derived by Tanaka (1993), which is valid at the summitof Mauna Kea.
Tanaka (1993) expressed the refractive index, n, of the at-mosphere as n = (1 + ρ), and compute ρ as follows. At the sealevel (pressure p = 760mmHg), dry atmosphere with 0.03% ofCO2 at the temperature t = 15C have
ρ2 × 108 = 6432.8 +2949810
146− (1/λ)2 +25540
41− (1/λ)2 , (A1)
where λ is the wavelength in units of µm and the equation isvalid for 0.2–1.35 µm. This value is corrected for lower tem-perature t (C) and lower pressure p (mmHg) at the summit as
ρ1 = ρ2 × p0[1 + (1.049− 0.0157 t)× 10−6p0]720.883(1 + 0.003661 t)
, (A2)
where
p0 = p× g
g0, (A3)
where p is the measured pressure, g is the measured gravity,and g0 = 980.665gal is the standard gravity. The effect of watervapor can be corrected as
ρ0 = ρ1 − 6.24− 0.0680/λ2
1 + 0.003661t× f × 10−8, (A4)
with the pressure of water vapor f (mmHg). The atmosphericrefraction can be computed by integrating the deflection angleof incoming light,
di = tan i dn/n, (A5)
from the observer, where n = n0 = (1 + ρ0), to the upper limitof the atmosphere.
Based on the model atmosphere for the set of parametervalues typical at the summit of Mauna Kea (4180 m), that is,p = 450 mmHg, g = 978.627 gal, t = 0 C, and f = 1 mmHg,Tanaka (1993) obtained ρ0 = 0.00017352 at λ = 0.575µm, andderived the following approximation formula:
r = 35.′′746tanz − 0.′′0431tan3 z + 0.′′000164tan5 z, (A6)
Dow
nloaded from https://academ
ic.oup.com/pasj/article/54/6/833/1551077 by guest on 24 June 2022

852 S. Miyazaki et al. [Vol. 54,
Fig. 23. Trails of eight hypothetical stars showing the effect of theatmospheric differential refraction for the fields centered at δc = −30(a), 0 (b), + 30 (c), and 60 (d). The stars are placed at dξ = 0, ±15′,and dη = 0, ±15′ from the field center, which correspond to the edgeof the field of view of Suprime-Cam. The simulated exposure was 6 hrfrom hour angle h = −3h to h = + 3h with a dot every 0.5 hr. North isup and the position of each trail is arbitrarily shifted so that the eighttrails fit in one figure.
where r is the atmospheric refraction and z is the zenith dis-tance. The differential refraction is also approximated as
dr/dz = 0.′′624sec2 z (deg−1). (A7)
We assume that the guide star is at the field center, andcompute the positions of 8 hypothetical stars projected ontothe standard coordinates (ξ, η) on the focal plane. The off-set from the optical axis (field center) of the eight stars are∆α/cosδ = 0′, ±15′ and ∆δ = 0′, ±15′. The computation pro-ceeds as follows. Assume that the celestial sphere is a unitsphere, and let the celestial North Pole and field center bep = (0, 0, 1) and sc = (cos δ, 0, sin δ), respectively. Then, thezenith is expressed by
z = (coshcosφ,sinhcosφ,sinφ), (A8)
where h is the hour angle, and φ is the latitude of the observer.The zenith distance of the field center is given by
coszc =sc ·z. (A9)
This expression can be used to compute
tanzc = [1/cos2 zc − 1]1/2, (A10)
and then the atmospheric refraction rc according to equa-tion (A6). Using the thus-computed rc, the coordinates of therefracted field center are given by
s′c =(
cosrc − sinrc
tanzc
)sc +
sinrc
sinzcz. (A11)
Similarly, a star located off the field center by (∆α,∆δ) with
s = [cos∆α cos(δ + ∆δ),sin∆α cos(δ + ∆δ),sin(δ + ∆δ)](A12)
is also refracted to
Fig. 24. Maximum exposure time plotted as a function of the air mass(sec z) at the beginning of an exposure. The maximum exposure timeis defined as the time during which the distortion of stars at the edgeof the Suprime-Cam field does not exceed 0.′′1. Computations weremade for 12 fields centered between δc = + 80 and δc = −40 with∆δc = 10. For each field 13 exposures were simulated, which start athour angles of between h = −3h and h = + 3h with ∆h = 0.5hr.
s′ =(
cosr − sinr
tanz
)s +
sinr
sinzz. (A13)
We then project s′ onto s′c using the North Pole vector,p, toobtain
ξ =1
s′ ·s′c(s′c ×p)
|s′c ×p| ·s′, (A14)
η =1
s′ ·s′cs′c × (s′c ×p))
|s′c ×p| ·s′. (A15)
Figure 23 shows the trail of 8 hypothetical stars around thefield centers of δc = −30, 0, + 30, and + 60, respectively.The simulated exposure was 6 hr from hour-angle h = −3h toh = + 3h with a dot at every 0.5 hour. Figure 24 shows themaximum exposure time during which the distortion of thestars at the edge of the Suprime-Cam field does not exceed0.′′1. Computations were made for 12 fields centered betweenδc = + 80 and δc = −40 with ∆δc = 10. For each field 13exposures were simulated which start at hour angles betweenh = −3h and h = + 3h with ∆h = 0.5 hr. The abscissa was thesecz at the beginning of the exposure.
We make a few remarks based on this simulation. First, ifwe took 0.′′1 as the limit of distortion, the longest allowableexposure time was about 40 min at z = 30 and about 15 min atz = 45. It is noted, however, that a longer exposure could bemade depending upon the location of the field. Second, evenin the case we stacked many short exposure frames, image dis-tortion could become a problem if individual exposures scatterin the wide range of the zenith distances. Finally, actual guid-ing was provided using a star near the edge of the field. Theamount of the guiding which gave the best image at the fieldcenter could be computed by taking the effect of the differen-tial refraction into account.
Dow
nloaded from https://academ
ic.oup.com/pasj/article/54/6/833/1551077 by guest on 24 June 2022
No. 6] Subaru Suprime-Cam 853
References
Bessell, M. S. 1990, PASP, 102, 1181Blouke, M. M., Woody, T., Dosluoglu, T., Elliott, S. T., Janesick,
J. R., Reed, R., & Stover, R. 1998, in Optical Detectors forAstronomy, ed. J. W. Beletic & P. Amico (Dordrecht, KluwerAcademic Publisher), 3
Boulade, O., Charlot, X, Abbon, P., Aune, S., Borgeaud, P., Carton,P.-H., Carty, M., Desforge, D., et al. 2000, Proc. SPIE, 4008, 657
Bowen, I. S. 1967, QJRAS, 8, 9Burke, B. E., Gregory, J. A., Mountain, R. W., Kosicki, B. B., Savoye,
E. D., Daniels, P. J., Dolat, V. S., Lind, T. L., et al. 1998, inOptical Detectors for Astronomy, ed. J. W. Beletic & P. Amico(Dordrecht: Kluwer Academic Publisher), 19
Cousins, A. W. J. 1978, Mon. Notes Astron. Soc. S. Afr., 37, 8Cowie, L. L, & Hu, E. M. 1998, AJ, 115, 1319Filippenko, A. V. 1982, PASP, 94, 715Fukugita, M., Ichikawa, T., Gunn, J. E., Doi, M., Shimasaku, K., &
Schneider, D. P. 1996, AJ, 111, 1748Fukugita, M., Shimasaku, K., & Ichikawa, T. 1995, PASP, 107, 945Gunn, J. E., Carr, M., Rockosi, C., Sekiguchi, M., Berry, K., Elms, B.,
de Haas, E., Ivezic, Z., et al. 1998, AJ, 116, 3040Johnson, H. L., & Morgan, W. W. 1953, ApJ, 117, 313Kasier, N., et al. 2002, Proc. SPIE, 4836 in pressKaiser, N., Squires, G., & Broadhurst, T. 1995, ApJ, 449, 460Kosugi, G., Sasaki, T., Aoki, T., Kawai, J. A., Koura, N., & Kusumoto,
T. 1997, Proc. SPIE, 3112, 284Lifshiftz, E. M., & Landau, L. D. 1953, Theory of elasticity, Course
of theoretical physics, vol.7 (London: Pergamon Press)Luppino, G. A., & Miller, K. R. 1992, PASP, 104, 215McClure, R. D., Grundmann, W. A., Rambold, W. N., Fletcher, J. M.,
Richardson, E. H., Stillburn, J. R., Racine, R., Christian, C. A., &Waddell, P. 1989, PASP, 101, 1156
Nakata, F., Miyazaki, S., Okada, N., Kimura, M., & Sekiguchi, M.2000, in Optical Detectors for Astronomy II, ed. P. Amico & J. W.Beletic (Dordrecht: Kluwer Academic Publisher), 133
Nariai, K., & Takeshi, K. K. 1994, Proc. SPIE, 2199, 532
Nariai, K., Yamashita, Y., & Nakagiri, M. 1985, Ann. Tokyo Astron.Obs., 2nd Series, 20, 431
Oates, A. P., & Jorden, P. R. 1998, in Optical Detectors for Astronomy,ed. J. W. Beletic & P. Amico, (Dordrecht: Kluwer AcademicPublisher), 143
Perlmutter, S., Gabi, S., Goldhaber, G., Gooban, A., Groom, D. E.,Hook, I. M., Kim, A. G., Kim, M. Y., et al. 1997, ApJ, 483, 565
Sasaki, T., Kosugi, G., Noumaru, J., Takata, T., Mizumoto, Y.,Ogasawara, R., Chikada, Y., Tanaka, W., & Kawai, J. A. 1998,Proc. SPIE, 3349, 427
Sekiguchi, M., Nakaya, H., Kataza, H., & Miyazaki, S. 1998, inOptical Detectors for Astronomy, ed. J. W. Beletic & P. Amico(Dordrecht: Kluwer Academic Publisher), 157
Steidel, C. C., Giavalisco, M., Pettini, M., Dickinson, M., &Adelberger, K. L. 1996, ApJ, 462, L17
Takeshi, K., 2000, PhD Thesis, The graduate university for advancedstudies
Tanaka, W. 1993, Report of National Astron. Obs. Japan, 1, 349 (inJapanese)
Tonry, J. L., Luppino, G. A., Kaiser, N., Burke, B., & Jacoby, G. 2002,Proc. SPIE, 4836 in press
Tyson, A., & Angel, R. 2001, ASP Conf. Ser., 232, 347Tyson, J. A., Wenk, R. A., & Valdes, F. 1990, ApJ, 349, L1van Waerbeke, L., Mellier, Y., Erben, T., Cuillandre, J. C.,
Bernardeau, F., Maoli, R., Bertin, E., Mc Cracken, H. J., et al.2000, A&A, 358, 30
Wallace, P. T., & Tritton, K. P. 1979, MNRAS, 189, 115Watson, F. G. 1984, MNRAS, 206, 661Wei, M., & Stover, R. J. 1998, Proc. SPIE, 3355, 598Williams, R. E., Blacker, B., Dickinson, M., van Dyke Dixon, W.,
Ferguson, H. C., Fruchter, A. S., Giavalisco, M., Gilliland, R. L.,Heyer, I., et al. 1996, AJ, 112, 1335
Wolfe, T., Reed, R., Blouke, M. M., Boroson, T. A., Armandroff, T.,& Jacoby, G. H. 1998, Proc. SPIE, 3355, 487
Wynne, C. G. 1965, Appl. Opt., 4, 1185
Dow
nloaded from https://academ
ic.oup.com/pasj/article/54/6/833/1551077 by guest on 24 June 2022