subagreement number oaa-a-11-00024-01-msh ... - usaid
TRANSCRIPT
Revised Final
DRC-IHPplus Quarterly Report: Year 1, Quarter Three (January 1-March 31, 2016)
Subagreement Number OAA-A-11-00024-01-MSH under USAID Cooperative Agreement Number AID-OAA-A-11-00024
Submitted to USAID/DRC on May 15, 2016
DRC-IHPplus Year One Quarter Three Report: January 1-March 31, 2016 Page 2 of 82
Cover photo: Albertine Tshibuabua cradles her new twins as she receives instructions on breastfeeding from a provider at the Bilomba General Referral Hospital. Lessons learned from IHPplus-supported trainings helped hospital staff to safely deliver the twins when Albertine went into convulsions during labor. Project Name: Integrated Health Project Plus (IHPplus) in the Democratic Republic of Congo, Subagreement No. OAA-A-11-00024-01-MSH, Under Cooperative Agreement Number: AID-OAA-A-11-00024 Contact information in DRC: Avenue des Citronniers, No. 4, Commune Gombe, Kinshasa Chief of Party: Dr. Ousmane Faye, +243 0992006180 Contact information in the U.S: 200 Rivers Edge Drive Medford, MA 02155 Regional Director: Kristin Cooney, Tel: +1 617-250-9168
DRC-IHPplus Year One Quarter Three Report: January 1-March 31, 2016 Page 3 of 82
TABLE OF CONTENTS
TABLE OF CONTENTS ..................................................................................................................................... 3
ACRONYMS ................................................................................................................................................... 4
PROJECT BACKGROUND ................................................................................................................................ 6
EXECUTIVE SUMMARY .................................................................................................................................. 8
PROJECT PERFORMANCE .......................................................................................................................... 8
KEY ACHIEVEMENTS ................................................................................................................................ 11
PROJECT PERFORMANCE ............................................................................................................................ 14
Component 1: Health Services ................................................................................................................ 14
Intermediate Result 1 (IR1): Access to and availability of Minimum Package of Activities (MPA) and
Complementary Package of Activities (CPA) services and products in target health zones increased
............................................................................................................................................................ 15
Intermediate Result 2: Quality of key family health care services in target health zones increased . 31
Intermediate Result 3: Knowledge, attitudes, and practices to support health-seeking behaviors
increased in target health zones ......................................................................................................... 68
Component 2: Health Systems Strengthening ........................................................................................ 76
Intermediate Result 4: Health sector leadership and governance in target provinces improved ..... 76
PROJECT MANAGEMENT ............................................................................................................................ 78
FAMILY PLANNING AND HIV AND AIDS STATUTORY REQUIREMENTS ....................................................... 79
ENVIRONMENTAL MONITORING AND MITIGATION PLAN ......................................................................... 80
CHALLENGES ENCOUNTERED ...................................................................................................................... 81
WAY FORWARD: PLANNED ACTIVITIES FOR NEXT QUARTER ..................................................................... 82
LIST OF APPENDICES ................................................................................................................................... 82
ACRONYMS
ACT Artemisinin-based Combination Therapy
AFP Acute flaccid paralysis AMTSL Active Management of Third
Stage Labor ANC Antenatal care AOP Annual operational plan ART Antiretroviral therapy BBF Brother’s Brother Foundation BCC Behavior Change
Communication CBD Community-based distribution
or community-based distributor CBO Community-based organization CPLT Coordination Unit for Leprosy
and TB i-CCM Integrated Community Case
Management CHW Community health worker CODESA Comité de Développement
Sanitaire (health development committee)
CDR Centrale de Distribution Régionale (regional distribution center)
CEPAC Communauté Eglises Pentecôtistes en Afrique Centrale
CPA Complementary Package of Activities
CLTS Community-led total sanitation CSDT Centre de Santé de Diagnostic
et Traitement CYP Couple Years of Protection DEP Direction Etudes et Planification
(Direction of Studies and Planning)
DPS Division Provinciale de la Santé DRC Democratic Republic of the
Congo E2A Evidence to Action EGM Essential generic medicines EPI Expanded Program on
Immunization ETL Education through listening FOSACOF Formation Sanitaire
Complètement Fonctionnelle
(Fully Functional Service Delivery Point)
GBV Gender-based violence GRH General referral hospital HIV Human Immunodeficiency Virus IHP Integrated Health Project IMCI Integrated Management of
Childhood Illness IPTp Intermittent preventive
treatment (of malaria) in pregnancy
IRC International Rescue Committee
IYCF Infant and young child feeding LDP Leadership Development
Program LLIN Long-lasting insecticide-treated
net MDR-TB Multidrug-resistant tuberculosis MOH Ministry of Health MNCH Maternal, newborn, and child
health MPA Minimum Package of Activities MSH Management Sciences for
Health NACP National Aids Control Program NGO Nongovernmental organization ORS Oral rehydration solution OSC Overseas Strategic Consulting,
Ltd. PEPFAR President’s Emergency Plan for
AIDS Relief PMI President’s Malaria Initiative PMP Performance monitoring plan PMTCT Prevention of mother-to-child
transmission PNAM Programme National
d’Approvisionnement en Médicaments (National Drug Supply Program)
PNDS Plan National de Développement Sanitaire (National Health Development Plan)
PNLT Plan National de Lutte contre la Tuberculose (National Tuberculosis Control program)
DRC-IHPplus Year 1 Quarter Three Report: January – March 2016 Page 5 of 82
PNLP Programme National de Lutte Contre le Paludisme (National Malaria Control Program) ProVIC Integrated HIV Program PRONANUT Programme National de
Nutrition RBF Results-Based Financing RDQA Routine Data Quality
Assessment RDT Rapid diagnostic test SBA Skilled birth attendant SIAPS Systems for Improved Access to
Pharmaceuticals and Services SP Sulfadoxine Pyrimethamine TB Tuberculosis UNICEF United Nations Children's Fund USAID United States Agency for
International Development USG United States Government WASH Water, sanitation, and hygiene WHO World Health Organization
PROJECT BACKGROUND
This report covers the third quarter reporting period (January 1 – March 31, 2016) of Year 1 of the USAID-funded Integrated Health Project Plus (IHPplus) in the Democratic Republic of Congo (DRC). Implemented by Management Sciences for Health (MSH) and Overseas Strategic Consulting, Ltd (OSC) under a subcontract via Pathfinder/Evidence to Action (E2A), IHPplus is a two-year “bridge” to avoid a gap in services in USAID-supported health zones upon completion of the USAID Health Office’s current five-year flagship Integrated Health Project (IHP). DRC-IHP worked closely with the Government of the DRC to strengthen the country’s health system at every level and achieve the Ministry of Health (MOH) targets of saving 437,000 lives of children and mothers over five years. Data modeling using the Lives Saved Tool (LiST) shows that DRC-IHP interventions saved the lives of more than 150,000 children over just three years. The project improved health services for more than 12 million people—17 percent of the Congolese population.
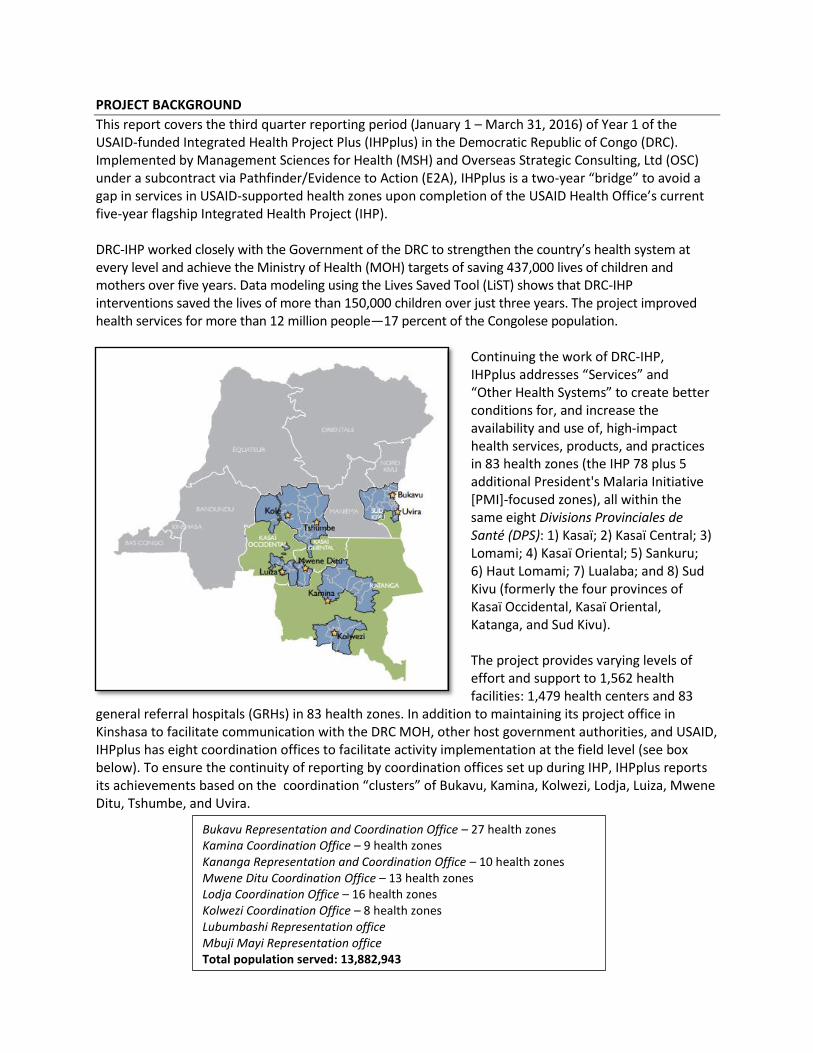
Continuing the work of DRC-IHP, IHPplus addresses “Services” and “Other Health Systems” to create better conditions for, and increase the availability and use of, high-impact health services, products, and practices in 83 health zones (the IHP 78 plus 5 additional President's Malaria Initiative [PMI]-focused zones), all within the same eight Divisions Provinciales de Santé (DPS): 1) Kasaï; 2) Kasaï Central; 3) Lomami; 4) Kasaï Oriental; 5) Sankuru; 6) Haut Lomami; 7) Lualaba; and 8) Sud Kivu (formerly the four provinces of Kasaï Occidental, Kasaï Oriental, Katanga, and Sud Kivu). The project provides varying levels of effort and support to 1,562 health facilities: 1,479 health centers and 83
general referral hospitals (GRHs) in 83 health zones. In addition to maintaining its project office in Kinshasa to facilitate communication with the DRC MOH, other host government authorities, and USAID, IHPplus has eight coordination offices to facilitate activity implementation at the field level (see box below). To ensure the continuity of reporting by coordination offices set up during IHP, IHPplus reports its achievements based on the coordination “clusters” of Bukavu, Kamina, Kolwezi, Lodja, Luiza, Mwene Ditu, Tshumbe, and Uvira.
Bukavu Representation and Coordination Office – 27 health zones Kamina Coordination Office – 9 health zones Kananga Representation and Coordination Office – 10 health zones Mwene Ditu Coordination Office – 13 health zones Lodja Coordination Office – 16 health zones Kolwezi Coordination Office – 8 health zones Lubumbashi Representation office Mbuji Mayi Representation office Total population served: 13,882,943
DRC-IHPplus Year 1 Quarter Three Report: January – March 2016 Page 7 of 82
The project’s vision is that:
People in the 83 project health zones will continue to participate more fully in determining their health outcomes by virtue of greater access to higher-quality comprehensive care
Service delivery systems will be accountably and effectively managed in their interests
Family-centered communication will reflect healthy behaviors that people understand and can act on in their daily lives.
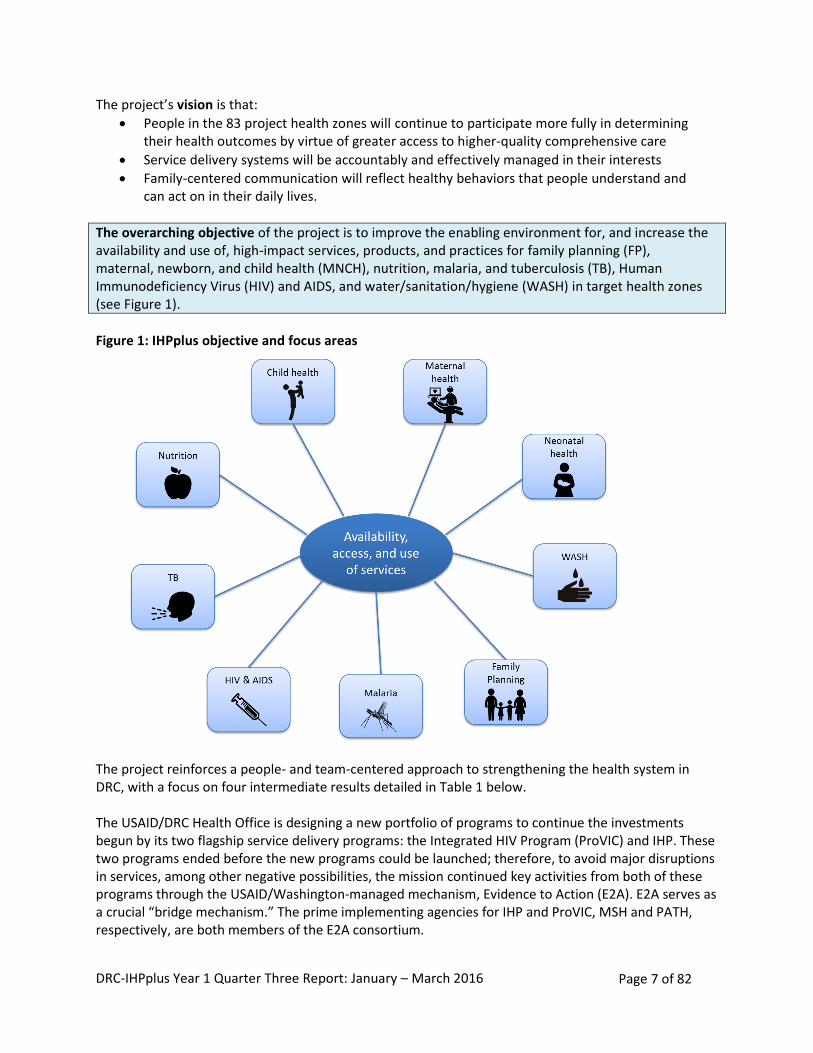
The overarching objective of the project is to improve the enabling environment for, and increase the availability and use of, high-impact services, products, and practices for family planning (FP), maternal, newborn, and child health (MNCH), nutrition, malaria, and tuberculosis (TB), Human Immunodeficiency Virus (HIV) and AIDS, and water/sanitation/hygiene (WASH) in target health zones (see Figure 1).
Figure 1: IHPplus objective and focus areas The project reinforces a people- and team-centered approach to strengthening the health system in DRC, with a focus on four intermediate results detailed in Table 1 below. The USAID/DRC Health Office is designing a new portfolio of programs to continue the investments begun by its two flagship service delivery programs: the Integrated HIV Program (ProVIC) and IHP. These two programs ended before the new programs could be launched; therefore, to avoid major disruptions in services, among other negative possibilities, the mission continued key activities from both of these programs through the USAID/Washington-managed mechanism, Evidence to Action (E2A). E2A serves as a crucial “bridge mechanism.” The prime implementing agencies for IHP and ProVIC, MSH and PATH, respectively, are both members of the E2A consortium.
DRC-IHPplus Year 1 Quarter Three Report: January – March 2016 Page 8 of 82
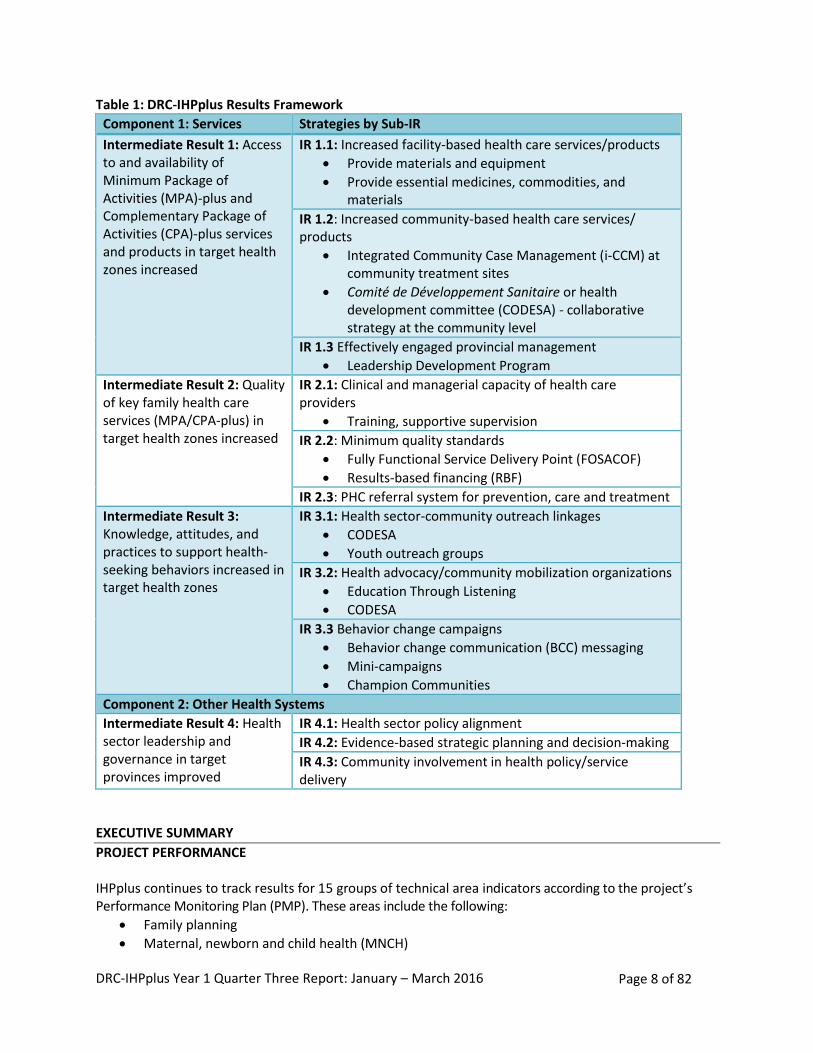
Table 1: DRC-IHPplus Results Framework
Component 1: Services Strategies by Sub-IR
Intermediate Result 1: Access to and availability of Minimum Package of Activities (MPA)-plus and Complementary Package of Activities (CPA)-plus services and products in target health zones increased
IR 1.1: Increased facility-based health care services/products
Provide materials and equipment
Provide essential medicines, commodities, and materials
IR 1.2: Increased community-based health care services/ products
Integrated Community Case Management (i-CCM) at community treatment sites
Comité de Développement Sanitaire or health development committee (CODESA) - collaborative strategy at the community level
IR 1.3 Effectively engaged provincial management
Leadership Development Program
Intermediate Result 2: Quality of key family health care services (MPA/CPA-plus) in target health zones increased
IR 2.1: Clinical and managerial capacity of health care providers
Training, supportive supervision
IR 2.2: Minimum quality standards
Fully Functional Service Delivery Point (FOSACOF)
Results-based financing (RBF)
IR 2.3: PHC referral system for prevention, care and treatment
Intermediate Result 3: Knowledge, attitudes, and practices to support health-seeking behaviors increased in target health zones
IR 3.1: Health sector-community outreach linkages
CODESA
Youth outreach groups
IR 3.2: Health advocacy/community mobilization organizations
Education Through Listening
CODESA
IR 3.3 Behavior change campaigns
Behavior change communication (BCC) messaging
Mini-campaigns
Champion Communities
Component 2: Other Health Systems
Intermediate Result 4: Health sector leadership and governance in target provinces improved
IR 4.1: Health sector policy alignment
IR 4.2: Evidence-based strategic planning and decision-making
IR 4.3: Community involvement in health policy/service delivery
EXECUTIVE SUMMARY
PROJECT PERFORMANCE IHPplus continues to track results for 15 groups of technical area indicators according to the project’s Performance Monitoring Plan (PMP). These areas include the following:
Family planning
Maternal, newborn and child health (MNCH)
DRC-IHPplus Year 1 Quarter Three Report: January – March 2016 Page 9 of 82
Nutrition
Tuberculosis (TB)
HIV and AIDS
Malaria
Water and sanitation (WASH)
Leadership, management, and governance (LMG)
Gender and gender-based violence (GBV)
Referral systems
Stock-outs of pharmaceuticals
Health service quality and availability
Community mobilization
Behavior change communication (BCC)
Project management Of the 81 IHPplus indicators, 47 were achieved at the 75% or greater level; of these, 31 surpassed their targets at the 100% level. Five of the new HIV indicators were not applicable this quarter. IHPplus made notable improvements in increasing facility-based health care services and products in target health zones. All health centers targeted during the quarter are providing the MPA, and the project exceeded the target number of GRHs providing CPA. Also, the health services utilization rate for each of the eight coordination zones surpassed the national average of 35% during the quarter.
Working in close collaboration with IHPplus, the Systems for Improved Access to Pharmaceuticals and Services (SIAPS) program helps ensure the availability of essential generic medicines (EGM) at all IHPplus-supported sites. SIAPS continued to monitor the IHPplus PY1 order with suppliers IDA, IMRES, MEG, and ASRAMES, and to date, the regional distribution centers (CDRs) and warehouses have received 28% of the total expected delivery from these four suppliers. Moreover, 93% of the first IHP PY5 order has reached the health zones, and the second IHP PY5 order is still being delivered to all CDRs, concurrent with the remaining IHPplus PY1 deliveries. Finally, for IHPplus PY1 order #2, the first shipment arrived in DRC on April 28, 2016, and amounts to 17% of the order’s total expected value. Reducing stock-outs of tracer medicines remains challenging, although several gains were achieved during the quarter. Strong performance was noted in reducing the number of stock-outs for folic acid and oral rehydration solution (ORS). The project exceeded the target for folic acid and almost achieved its target related to stock-outs of ORS, whereas the number of stock-outs for ACT and Depo-Provera were higher than last quarter and did not achieve their respective targets. The i-CCM strategy remains effective for increasing community-based health care services. In total, 50,896 cases of malaria (21,364), pneumonia (10,994), and diarrhea (18,538) were treated at i-CCM sites during the quarter. IHPplus continued to treat cases of childhood pneumonia, diarrhea, and malaria in all United States Government (USG)-supported facilities. A total of 115,009 children with pneumonia were treated with antibiotics (95% of the target); 164,316 new cases of childhood diarrhea were treated with packs of combined ORS and zinc supplements (108% of the target); and 304,155 children with malaria were treated during the quarter. Health Development Committees (CODESAs) continue to play an important role in increasing the use of community health care services. The number of identified CODESA for this quarter was 1,398, and out of these, 1,295 were reported as active. In addition, 94% of these active CODESAs have communication action plans for addressing health problems through locally-proposed solutions.
DRC-IHPplus Year 1 Quarter Three Report: January – March 2016 Page 10 of 82
Project performance in increasing community-based WASH services improved compared to the last quarter, as IHPplus achieved its target for bringing access to improved drinking water supply (162,741, or 103% of the targeted population) and almost achieved the target for sanitation facilities (89,149 people, or 84% of the targeted population). Strong performance was also recorded in increasing nutritional counseling services for mothers, as 104% (177,885 of 170,478) of targeted mothers received these services. Results from the provincial teams participating in the Leadership Development Program (LDP) are promising. During the quarter, the project evaluated 59 of 78 (80%) health zone management teams that started their LDPs in August 2015; 47 of the 59 teams (80%) achieved at least 80% of the targets for improving service delivery in their action plans between October and December 2015. IHPplus continues to make great strides towards improving quality health care services. Results were particularly strong in the areas of MNCH, nutrition, HIV, malaria, and LDP. The project exceeded targets for several HIV indicators, including the percentage of PEPFAR-supported sites achieving 90% ARV or ART coverage for HIV+ pregnant women and the number of HIV-positive adults and children receiving a minimum of one clinical service, among others. The project met its target for MNCH indicators related to pregnant women attending antenatal care (ANC), receiving active management of the third stage of labor, and newborns receiving newborn care. The project fell slightly below the PMP targets for other indicators related to deliveries with a skilled birth attendant (SBA), the number of newborns receiving antibiotic treatment for infection from appropriate health workers, and the number of postpartum/newborn visits within three days of birth that occurred during this quarter. Vaccination coverage rates remain high, as four out of seven vaccines had a coverage rate of 99% or greater (DTP HepB-Hib1 and Hib3, Tetanus vaccine 2+, and measles). These results contribute to improved child health in IHPplus-supported health zones. The project performed relatively well in improving malaria prevention among pregnant women with intermittent preventive treatment (IPTp), as it was very shy of meeting its targets in this area with 99% achievement rate. With regards to the purchase and delivery of malaria commodities, IHPplus’ performance was strong, as all results almost met (one indicator) or exceeded targets (three indicators) for the provision of long-lasting insecticide-treated nets (LLINs), Sulfadoxine-Pyrimethamine (SP), Artemisinin-based Combination Therapy (ACT), and rapid diagnostic tests (RDTs) at health facilities. However, the project malaria indicators who faced challenges during this quarter were the ones related to ACT stock outs and number of health workers trained in malaria case management, including prevention and diagnosis. In family planning, the project achieved a couple-year of protection (CYP) of 140,143, compared to the target of 144,873 (97% achievement rate). Moreover, IHPplus almost met its target on the number of counseling visits for family planning and reproductive health (96% achievement rate) the number of new acceptors of modern contraceptive methods (88%). However, the project was well below its target on the number of Depo-Provera stock outs reported this quarter. In nutrition, 177,885 expected mothers with children two years of age or younger received counseling, against a target of 170,478 (104% achievement). Moreover, 132% (176,801 out of 134,107 expected) of pregnant women received iron-folate supplements (against a target of 89%,which represents a 149% achievement rate). Finally, only 167 facilities of the 200 expected experienced stock-outs in folic acid. Performance against TB and GBV indicators was weaker. While the case detection rate reached its target, other TB indicators (case notification rate, percent of all registered TB patients who are tested
DRC-IHPplus Year 1 Quarter Three Report: January – March 2016 Page 11 of 82
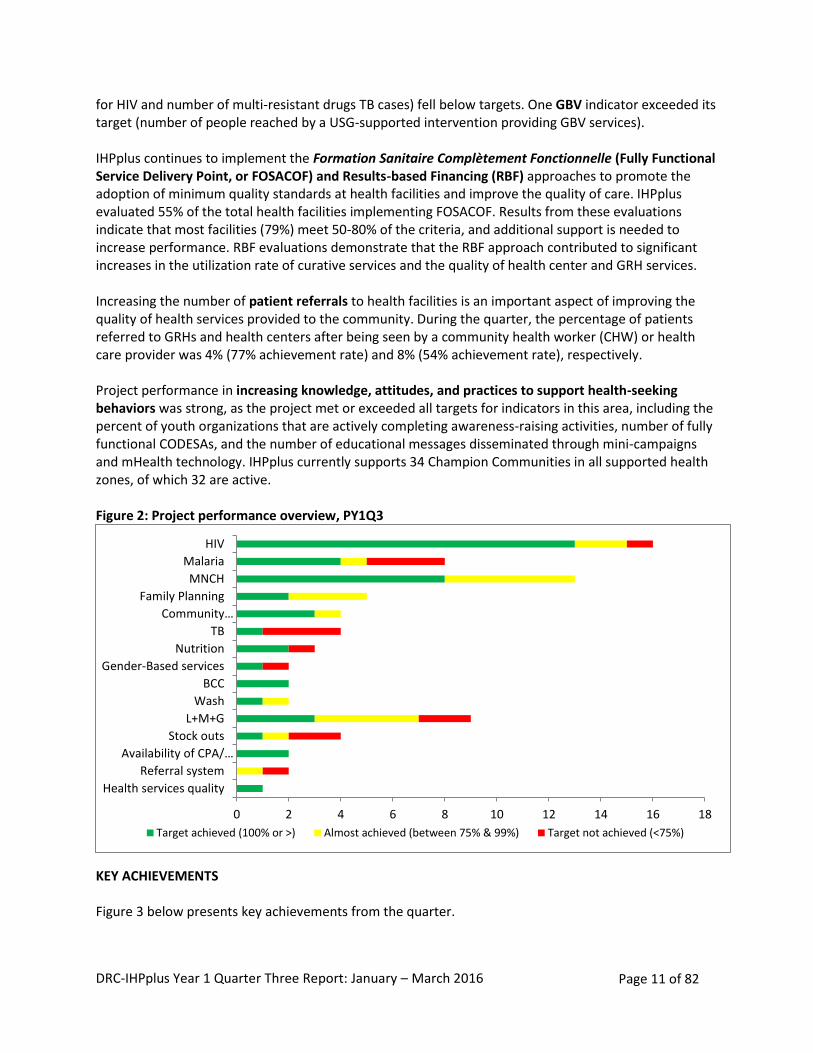
for HIV and number of multi-resistant drugs TB cases) fell below targets. One GBV indicator exceeded its target (number of people reached by a USG-supported intervention providing GBV services). IHPplus continues to implement the Formation Sanitaire Complètement Fonctionnelle (Fully Functional Service Delivery Point, or FOSACOF) and Results-based Financing (RBF) approaches to promote the adoption of minimum quality standards at health facilities and improve the quality of care. IHPplus evaluated 55% of the total health facilities implementing FOSACOF. Results from these evaluations indicate that most facilities (79%) meet 50-80% of the criteria, and additional support is needed to increase performance. RBF evaluations demonstrate that the RBF approach contributed to significant increases in the utilization rate of curative services and the quality of health center and GRH services. Increasing the number of patient referrals to health facilities is an important aspect of improving the quality of health services provided to the community. During the quarter, the percentage of patients referred to GRHs and health centers after being seen by a community health worker (CHW) or health care provider was 4% (77% achievement rate) and 8% (54% achievement rate), respectively. Project performance in increasing knowledge, attitudes, and practices to support health-seeking behaviors was strong, as the project met or exceeded all targets for indicators in this area, including the percent of youth organizations that are actively completing awareness-raising activities, number of fully functional CODESAs, and the number of educational messages disseminated through mini-campaigns and mHealth technology. IHPplus currently supports 34 Champion Communities in all supported health zones, of which 32 are active. Figure 2: Project performance overview, PY1Q3
KEY ACHIEVEMENTS Figure 3 below presents key achievements from the quarter.
0 2 4 6 8 10 12 14 16 18
Health services quality
Referral system
Availability of CPA/…
Stock outs
L+M+G
Wash
BCC
Gender-Based services
Nutrition
TB
Community…
Family Planning
MNCH
Malaria
HIV
Target achieved (100% or >) Almost achieved (between 75% & 99%) Target not achieved (<75%)
DRC-IHPplus Year 1 Quarter Three Report: January – March 2016 Page 12 of 82
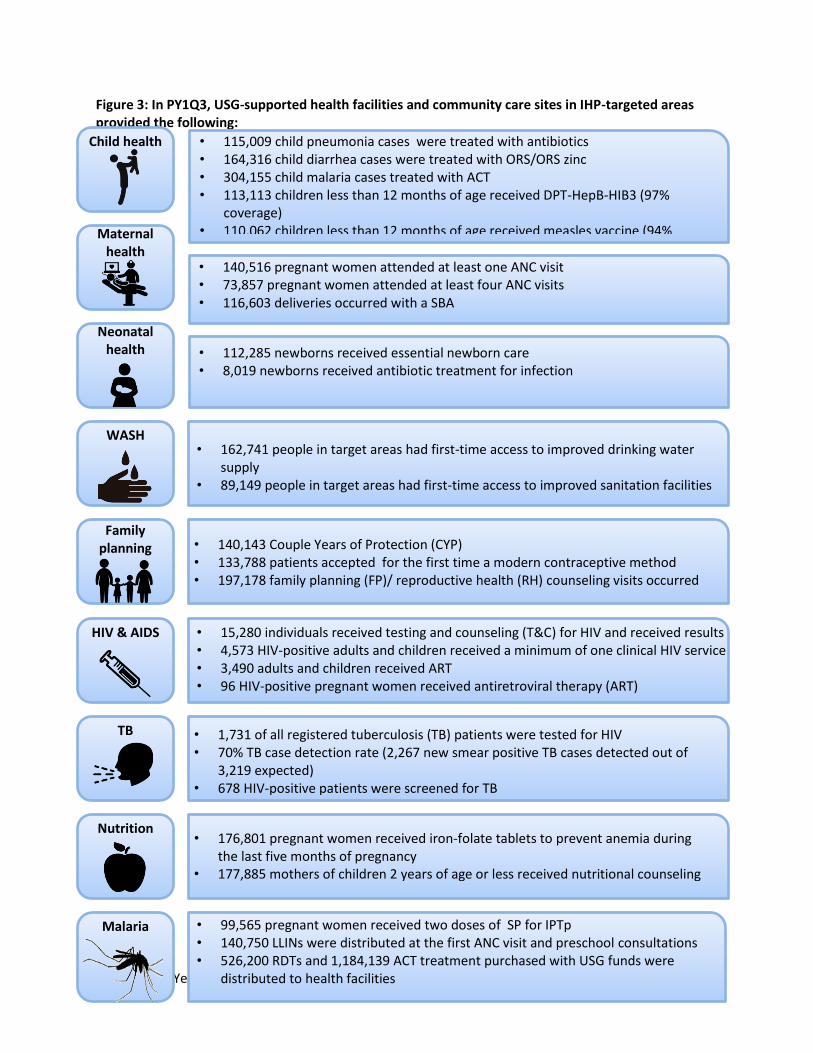
Figure 3: In PY1Q3, USG-supported health facilities and community care sites in IHP-targeted areas provided the following:
Child health
Maternal health
Neonatal health
WASH
Family planning
HIV & AIDS
TB
Nutrition
Malaria
• 115,009 child pneumonia cases were treated with antibiotics • 164,316 child diarrhea cases were treated with ORS/ORS zinc • 304,155 child malaria cases treated with ACT • 113,113 children less than 12 months of age received DPT-HepB-HIB3 (97%
coverage) • 110,062 children less than 12 months of age received measles vaccine (94%
coverage)
• 140,516 pregnant women attended at least one ANC visit • 73,857 pregnant women attended at least four ANC visits • 116,603 deliveries occurred with a SBA
• 112,285 newborns received essential newborn care • 8,019 newborns received antibiotic treatment for infection
• 162,741 people in target areas had first-time access to improved drinking water supply
• 89,149 people in target areas had first-time access to improved sanitation facilities
• 140,143 Couple Years of Protection (CYP) • 133,788 patients accepted for the first time a modern contraceptive method • 197,178 family planning (FP)/ reproductive health (RH) counseling visits occurred
• 15,280 individuals received testing and counseling (T&C) for HIV and received results • 4,573 HIV-positive adults and children received a minimum of one clinical HIV service • 3,490 adults and children received ART • 96 HIV-positive pregnant women received antiretroviral therapy (ART) •
• 1,731 of all registered tuberculosis (TB) patients were tested for HIV • 70% TB case detection rate (2,267 new smear positive TB cases detected out of
3,219 expected) • 678 HIV-positive patients were screened for TB
• 176,801 pregnant women received iron-folate tablets to prevent anemia during the last five months of pregnancy
• 177,885 mothers of children 2 years of age or less received nutritional counseling
• 99,565 pregnant women received two doses of SP for IPTp • 140,750 LLINs were distributed at the first ANC visit and preschool consultations • 526,200 RDTs and 1,184,139 ACT treatment purchased with USG funds were
distributed to health facilities
DRC-IHPplus Year 1 Quarter Three Report: January – March 2016 Page 13 of 82
Key challenges and way forward:
1. Challenge: Health facilities continue to report stock-outs of tracer medicines. During PY1Q3, ACT and Depo-Provera stock-outs exceeded the target number of stock-outs (146 stock-outs against a target of 100, and 243 stock-outs against a target of 100, respectively). Way forward: IHPplus and SIAPS will continue to address bottlenecks that contribute to high stock-out levels at the facility level. Consolidating the supply chain, streamlining procedures for ordering essential medicines, and building capacity to manage inventories and quantify essential medicine orders will help ensure adequate supplies of medicines and commodities throughout the system.
2. Challenges: There is inconsistency between the number of deliveries by skilled birth attendants
and other indicators related to childbirth, such as the number of women receiving Active Management of Third Stage Labor (AMTSL) and the number of newborns receiving essential care. The norms and standards for assisted deliveries include AMTSL and essential care for newborns; therefore, the data should be similar. Way forward: IHPplus will conduct additional trainings (using the new MNCH competency-based training methodology) for health facilities to reinforce their knowledge and application of the skilled birth norms, and increase the number of supervision visits to health facilities to strengthen monitoring practices for deliveries.
3. Challenge: TB screening for HIV-positive patients remains low. In PY1Q3, 678 of the targeted 3,600 (19%) HIV-positive patients were screened for tuberculosis in an HIV care or treatment setting. The project result fell below the target of 70%, with an achievement rate of 27%. Way forward: IHPplus will continue to provide TB screening equipment in two coordination areas to improve performance and will continue to conduct post-training follow-up and provide on-site technical assistance to health care providers and health zone management teams.
4. Challenge: Project performance on the referral system was low during PY1Q3 as one indicator almost met the target (80%) and the other achieved only a little over half (54%). During this quarter, the percentage of patients referred to GRHs after being seen by a CHW or health care provider was 4%, against a PMP target of 5% (80% achievement rate) and the percentage of patients referred to health centers after being seen by a CHW is 8%, against a PMP target of 15% (54% achievement rate). For the first indicator, one of the factors for the moderate performance reported is the location of GRHs in remote areas (Kamina and Luiza coordination). However, since Kolwezi is 80% urban and still report lower referral rate, the project is still looking into the underlying reasons for the poor results reported by this coordination. For the second indicator, the project’s overall performance was negatively impacted by the low level of community involvement in some coordinations (Luiza and Mwene Ditu) while other were more impacted by the lack of health zone management team supervision visits to health centers (Luiza). The Ministry of Health mobilized the CHWs during this period to contribute to a number of activities, in particular the vaccination campaign, planning process, and other activities. Way Forward: During the next quarter, IHPplus will procure EGM for GRHs and health centers, including community care sites, working with health zone management teams during supervision visits to health facilities to help with flow chart use and meeting planning and organization between head nurses, CHWs, and nurses working in community care sites; brief head nurses who work for health centers connected to community care sites on how to properly use the coaching checklist with CHWs; and expand the integrated community case management
DRC-IHPplus Year 1 Quarter Three Report: January – March 2016 Page 14 of 82
approach by implementing more community care sites. The project will also expand the i-CCM approach by implementing more community care sites in Mwene Ditu and Luiza.
PROJECT PERFORMANCE
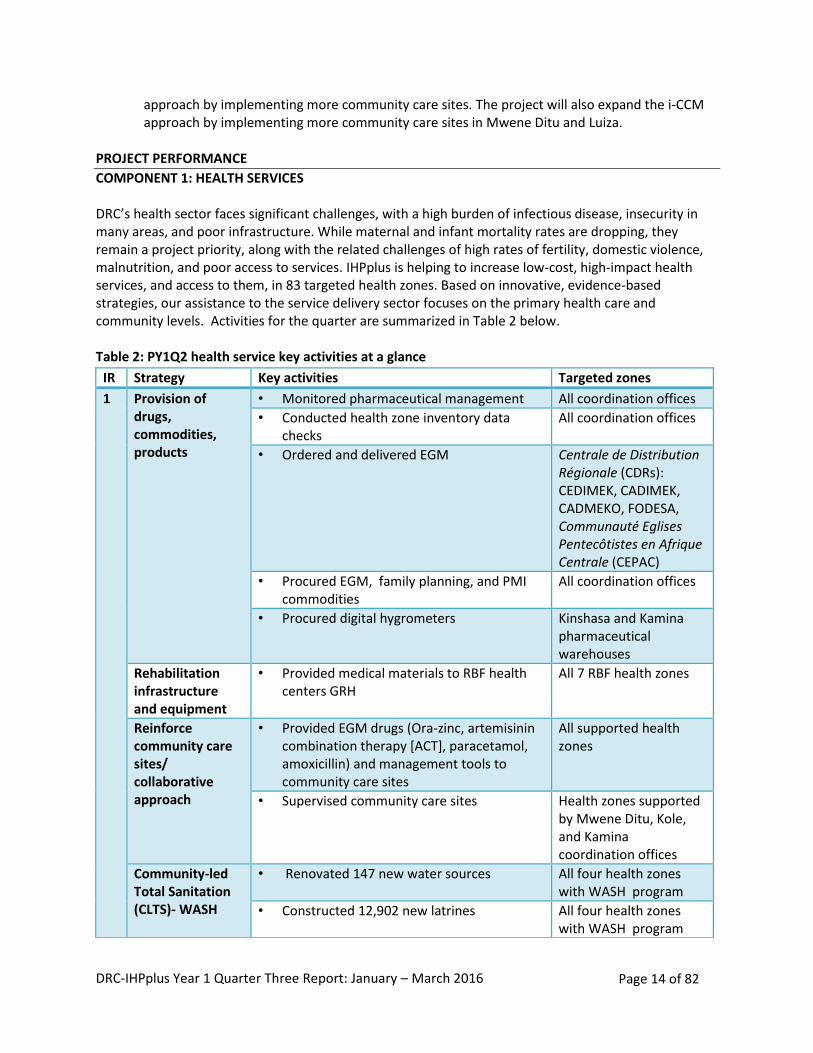
COMPONENT 1: HEALTH SERVICES DRC’s health sector faces significant challenges, with a high burden of infectious disease, insecurity in many areas, and poor infrastructure. While maternal and infant mortality rates are dropping, they remain a project priority, along with the related challenges of high rates of fertility, domestic violence, malnutrition, and poor access to services. IHPplus is helping to increase low-cost, high-impact health services, and access to them, in 83 targeted health zones. Based on innovative, evidence-based strategies, our assistance to the service delivery sector focuses on the primary health care and community levels. Activities for the quarter are summarized in Table 2 below. Table 2: PY1Q2 health service key activities at a glance
IR Strategy Key activities Targeted zones
1 Provision of drugs, commodities, products
• Monitored pharmaceutical management All coordination offices
• Conducted health zone inventory data checks
All coordination offices
• Ordered and delivered EGM Centrale de Distribution Régionale (CDRs): CEDIMEK, CADIMEK, CADMEKO, FODESA, Communauté Eglises Pentecôtistes en Afrique Centrale (CEPAC)
• Procured EGM, family planning, and PMI commodities
All coordination offices
• Procured digital hygrometers Kinshasa and Kamina pharmaceutical warehouses
Rehabilitation infrastructure and equipment
• Provided medical materials to RBF health centers GRH
All 7 RBF health zones
Reinforce community care sites/ collaborative approach
• Provided EGM drugs (Ora-zinc, artemisinin combination therapy [ACT], paracetamol, amoxicillin) and management tools to community care sites
All supported health zones
• Supervised community care sites
Health zones supported by Mwene Ditu, Kole, and Kamina coordination offices
Community-led Total Sanitation (CLTS)- WASH
• Renovated 147 new water sources All four health zones with WASH program
• Constructed 12,902 new latrines All four health zones with WASH program
DRC-IHPplus Year 1 Quarter Three Report: January – March 2016 Page 15 of 82
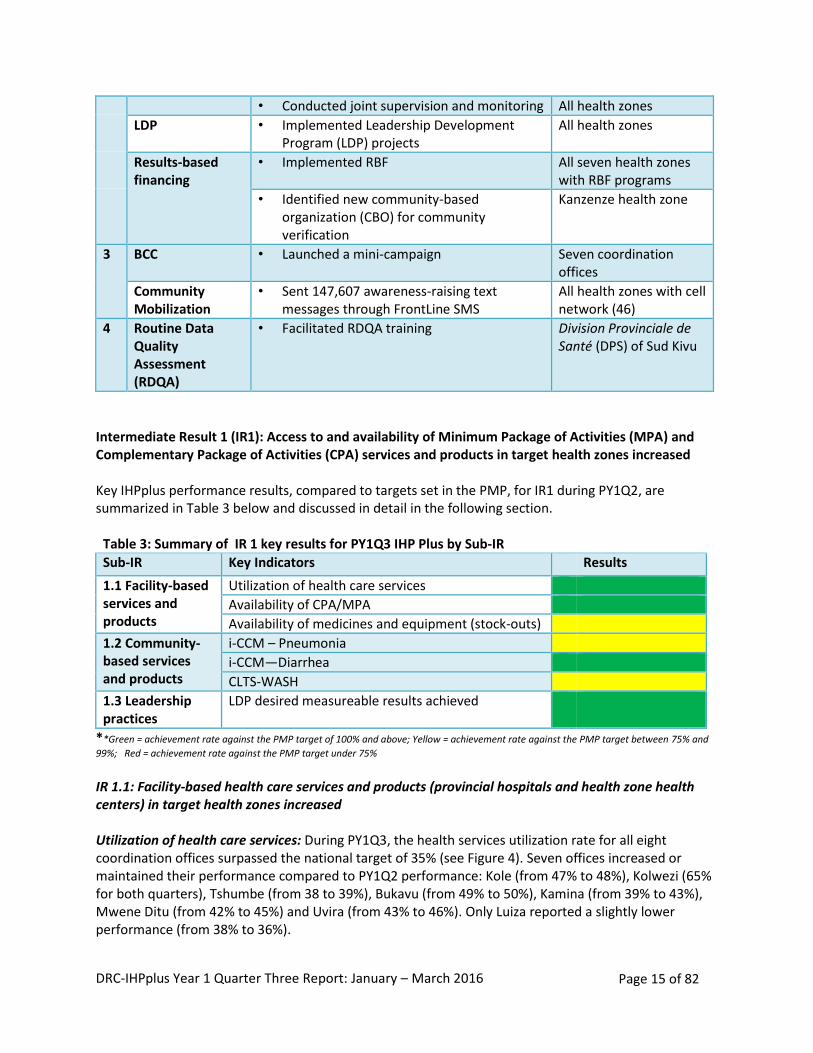
Intermediate Result 1 (IR1): Access to and availability of Minimum Package of Activities (MPA) and Complementary Package of Activities (CPA) services and products in target health zones increased Key IHPplus performance results, compared to targets set in the PMP, for IR1 during PY1Q2, are summarized in Table 3 below and discussed in detail in the following section.
Table 3: Summary of IR 1 key results for PY1Q3 IHP Plus by Sub-IR
Sub-IR Key Indicators Results
1.1 Facility-based services and products
Utilization of health care services
Availability of CPA/MPA
Availability of medicines and equipment (stock-outs)
1.2 Community-based services and products
i-CCM – Pneumonia
i-CCM—Diarrhea
CLTS-WASH
1.3 Leadership practices
LDP desired measureable results achieved
**Green = achievement rate against the PMP target of 100% and above; Yellow = achievement rate against the PMP target between 75% and
99%; Red = achievement rate against the PMP target under 75%
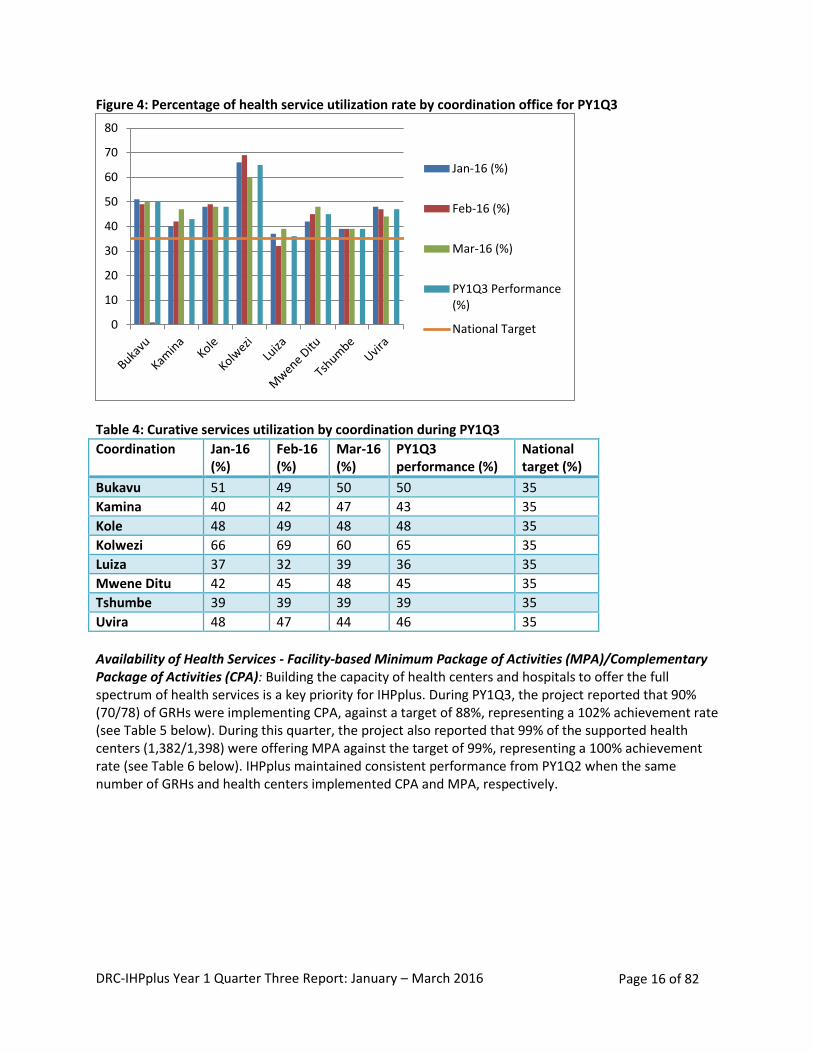
IR 1.1: Facility-based health care services and products (provincial hospitals and health zone health centers) in target health zones increased Utilization of health care services: During PY1Q3, the health services utilization rate for all eight coordination offices surpassed the national target of 35% (see Figure 4). Seven offices increased or maintained their performance compared to PY1Q2 performance: Kole (from 47% to 48%), Kolwezi (65% for both quarters), Tshumbe (from 38 to 39%), Bukavu (from 49% to 50%), Kamina (from 39% to 43%), Mwene Ditu (from 42% to 45%) and Uvira (from 43% to 46%). Only Luiza reported a slightly lower performance (from 38% to 36%).
• Conducted joint supervision and monitoring All health zones
LDP • Implemented Leadership Development Program (LDP) projects
All health zones
Results-based financing
• Implemented RBF All seven health zones with RBF programs
• Identified new community-based organization (CBO) for community verification
Kanzenze health zone
3 BCC • Launched a mini-campaign Seven coordination offices
Community Mobilization
• Sent 147,607 awareness-raising text messages through FrontLine SMS
All health zones with cell network (46)
4 Routine Data Quality Assessment (RDQA)
• Facilitated RDQA training Division Provinciale de Santé (DPS) of Sud Kivu
DRC-IHPplus Year 1 Quarter Three Report: January – March 2016 Page 16 of 82
Figure 4: Percentage of health service utilization rate by coordination office for PY1Q3
Table 4: Curative services utilization by coordination during PY1Q3
Coordination Jan-16 (%)
Feb-16 (%)
Mar-16 (%)
PY1Q3 performance (%)
National target (%)
Bukavu 51 49 50 50 35
Kamina 40 42 47 43 35
Kole 48 49 48 48 35
Kolwezi 66 69 60 65 35
Luiza 37 32 39 36 35
Mwene Ditu 42 45 48 45 35
Tshumbe 39 39 39 39 35
Uvira 48 47 44 46 35
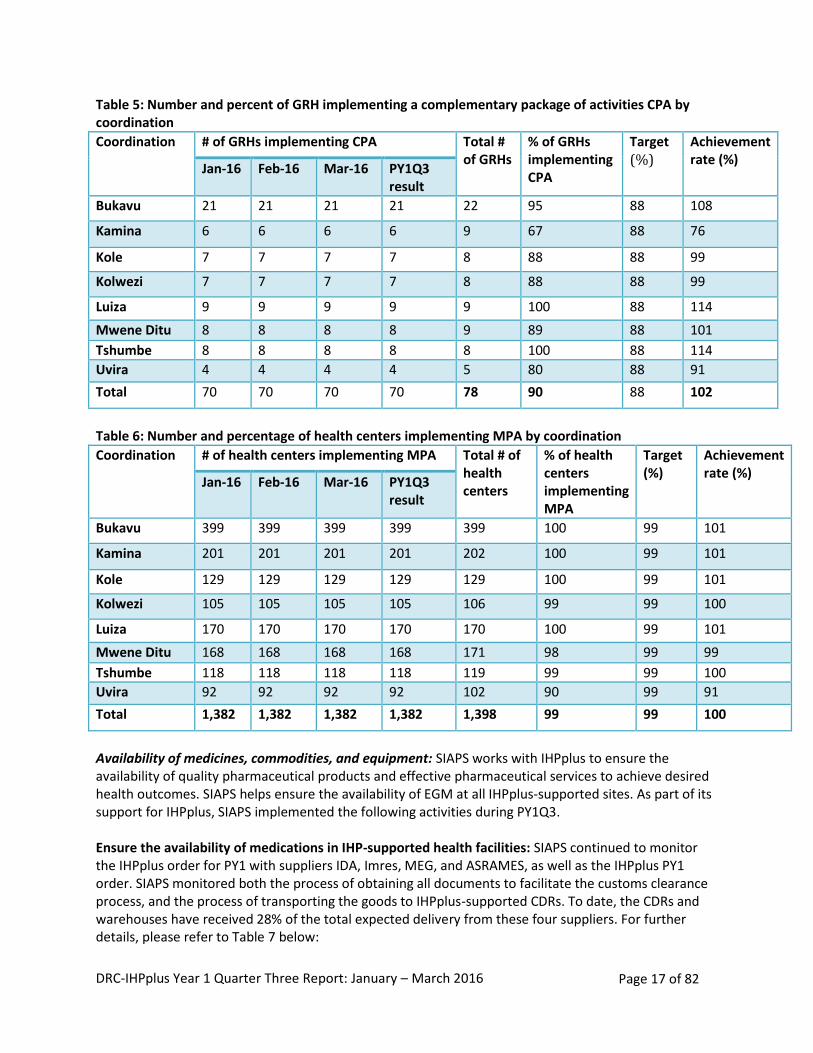
Availability of Health Services - Facility-based Minimum Package of Activities (MPA)/Complementary Package of Activities (CPA): Building the capacity of health centers and hospitals to offer the full spectrum of health services is a key priority for IHPplus. During PY1Q3, the project reported that 90% (70/78) of GRHs were implementing CPA, against a target of 88%, representing a 102% achievement rate (see Table 5 below). During this quarter, the project also reported that 99% of the supported health centers (1,382/1,398) were offering MPA against the target of 99%, representing a 100% achievement rate (see Table 6 below). IHPplus maintained consistent performance from PY1Q2 when the same number of GRHs and health centers implemented CPA and MPA, respectively.
0
10
20
30
40
50
60
70
80
Jan-16 (%)
Feb-16 (%)
Mar-16 (%)
PY1Q3 Performance(%)
National Target
DRC-IHPplus Year 1 Quarter Three Report: January – March 2016 Page 17 of 82
Table 5: Number and percent of GRH implementing a complementary package of activities CPA by coordination
Coordination # of GRHs implementing CPA Total # of GRHs
% of GRHs implementing CPA
Target (%)
Achievement rate (%)
Jan-16 Feb-16 Mar-16 PY1Q3 result
Bukavu 21 21 21 21 22 95 88 108
Kamina 6 6 6 6 9 67 88 76
Kole 7 7 7 7 8 88 88 99
Kolwezi 7 7 7 7 8 88 88 99
Luiza 9 9 9 9 9 100 88 114
Mwene Ditu 8 8 8 8 9 89 88 101
Tshumbe 8 8 8 8 8 100 88 114
Uvira 4 4 4 4 5 80 88 91
Total 70 70 70 70 78 90 88 102
Table 6: Number and percentage of health centers implementing MPA by coordination
Coordination # of health centers implementing MPA Total # of health centers
% of health centers implementing MPA
Target (%)
Achievement rate (%)
Jan-16 Feb-16 Mar-16 PY1Q3 result
Bukavu 399 399 399 399 399 100 99 101
Kamina 201 201 201 201 202 100 99 101
Kole 129 129 129 129 129 100 99 101
Kolwezi 105 105 105 105 106 99 99 100
Luiza 170 170 170 170 170 100 99 101
Mwene Ditu 168 168 168 168 171 98 99 99
Tshumbe 118 118 118 118 119 99 99 100
Uvira 92 92 92 92 102 90 99 91
Total 1,382 1,382 1,382 1,382 1,398 99 99 100
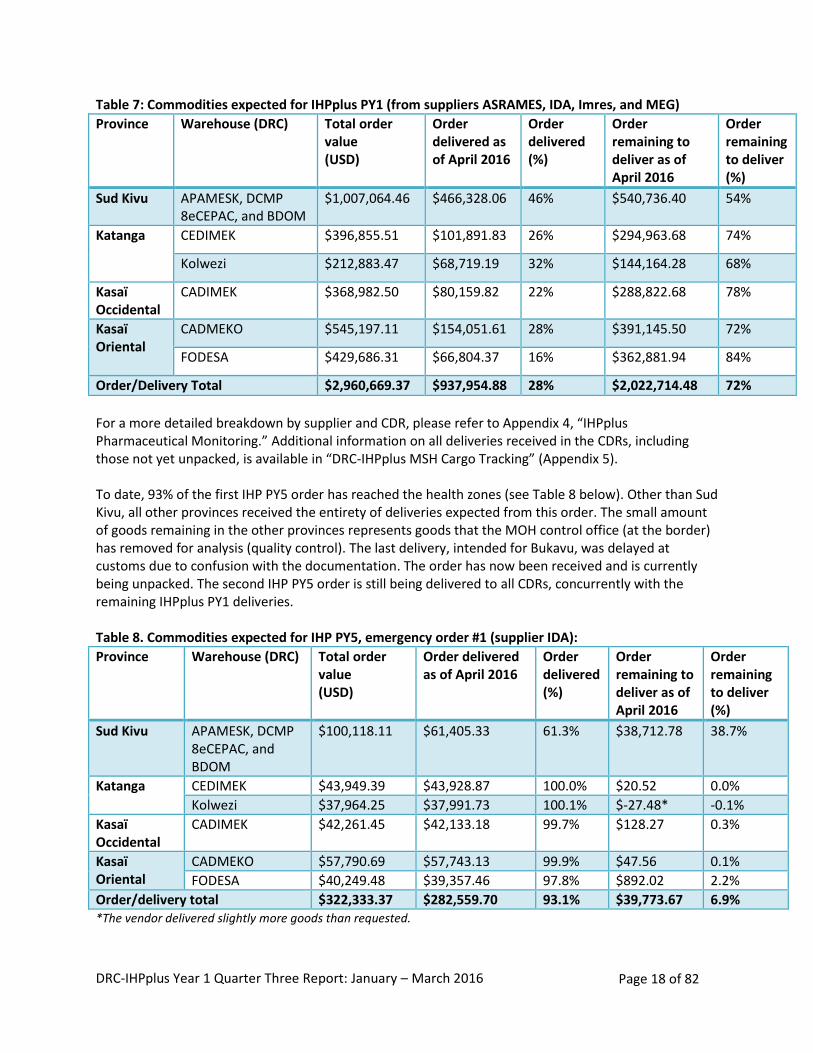
Availability of medicines, commodities, and equipment: SIAPS works with IHPplus to ensure the availability of quality pharmaceutical products and effective pharmaceutical services to achieve desired health outcomes. SIAPS helps ensure the availability of EGM at all IHPplus-supported sites. As part of its support for IHPplus, SIAPS implemented the following activities during PY1Q3. Ensure the availability of medications in IHP-supported health facilities: SIAPS continued to monitor the IHPplus order for PY1 with suppliers IDA, Imres, MEG, and ASRAMES, as well as the IHPplus PY1 order. SIAPS monitored both the process of obtaining all documents to facilitate the customs clearance process, and the process of transporting the goods to IHPplus-supported CDRs. To date, the CDRs and warehouses have received 28% of the total expected delivery from these four suppliers. For further details, please refer to Table 7 below:
DRC-IHPplus Year 1 Quarter Three Report: January – March 2016 Page 18 of 82
Table 7: Commodities expected for IHPplus PY1 (from suppliers ASRAMES, IDA, Imres, and MEG)
Province Warehouse (DRC) Total order value (USD)
Order delivered as of April 2016
Order delivered (%)
Order remaining to deliver as of April 2016
Order remaining to deliver (%)
Sud Kivu APAMESK, DCMP 8eCEPAC, and BDOM
$1,007,064.46 $466,328.06 46% $540,736.40 54%
Katanga CEDIMEK $396,855.51 $101,891.83 26% $294,963.68 74%
Kolwezi $212,883.47 $68,719.19 32% $144,164.28 68%
Kasaï Occidental
CADIMEK $368,982.50 $80,159.82 22% $288,822.68 78%
Kasaï Oriental
CADMEKO $545,197.11 $154,051.61 28% $391,145.50 72%
FODESA $429,686.31 $66,804.37 16% $362,881.94 84%
Order/Delivery Total $2,960,669.37 $937,954.88 28% $2,022,714.48 72%
For a more detailed breakdown by supplier and CDR, please refer to Appendix 4, “IHPplus Pharmaceutical Monitoring.” Additional information on all deliveries received in the CDRs, including those not yet unpacked, is available in “DRC-IHPplus MSH Cargo Tracking” (Appendix 5). To date, 93% of the first IHP PY5 order has reached the health zones (see Table 8 below). Other than Sud Kivu, all other provinces received the entirety of deliveries expected from this order. The small amount of goods remaining in the other provinces represents goods that the MOH control office (at the border) has removed for analysis (quality control). The last delivery, intended for Bukavu, was delayed at customs due to confusion with the documentation. The order has now been received and is currently being unpacked. The second IHP PY5 order is still being delivered to all CDRs, concurrently with the remaining IHPplus PY1 deliveries. Table 8. Commodities expected for IHP PY5, emergency order #1 (supplier IDA): Province Warehouse (DRC) Total order
value (USD)
Order delivered as of April 2016
Order delivered (%)
Order remaining to deliver as of April 2016
Order remaining to deliver (%)
Sud Kivu APAMESK, DCMP 8eCEPAC, and BDOM
$100,118.11 $61,405.33 61.3% $38,712.78 38.7%
Katanga CEDIMEK $43,949.39 $43,928.87 100.0% $20.52 0.0%
Kolwezi $37,964.25 $37,991.73 100.1% $-27.48* -0.1%
Kasaï Occidental
CADIMEK $42,261.45 $42,133.18 99.7% $128.27 0.3%
Kasaï Oriental
CADMEKO $57,790.69 $57,743.13 99.9% $47.56 0.1%
FODESA $40,249.48 $39,357.46 97.8% $892.02 2.2%
Order/delivery total $322,333.37 $282,559.70 93.1% $39,773.67 6.9% *The vendor delivered slightly more goods than requested.
DRC-IHPplus Year 1 Quarter Three Report: January – March 2016 Page 19 of 82
For IHPplus PY1 order #2, the first shipment arrived in DRC on April 28, 2016. This shipment amounts to 17% of the order’s total expected value, and 27% of its total weight. ASRAMES has stored it in its warehouses in Goma and will distribute it to the CDRs. SIAPS is waiting for notes verbales to be issued by USAID to complete the customs clearance for this first shipment. SIAPS also continued to support the distribution of the rest of the IHP PY4 drugs from the CDRs to the health zones by analyzing requisitions and the distribution plan and monitoring CDR deliveries to the health zones. To date, nearly all IHP PY4 deliveries have reached the health zones. Distribution is ongoing, including specific commodities for malaria and family planning. Strengthen the management of essential medicines and medical consumables: From January 18-21, 2016, SIAPS and IHPplus conducted a drug-management training for 11 health zone management teams in Kolwezi in the Lualaba Province, in collaboration with the Programme National d’Approvisionnement en Médicaments (National Drug Supply Program, or PNAM). This training aimed to reinforce the technical capacity of DPS, CDRs, and health zone management teams, to manage medicines and other health commodities (see Appendix 6). In total, 40 participants took part in the training, including 32 men and 8 women. At the end of the training, participants developed a post-training action plan and had it approved by the DPS (see Appendix 7). These newly-trained staff will disseminate their knowledge by training health center service providers during PY1Q4. In September 2015, SIAPS produced a situational analysis of the MSH warehouse in Kamina, resulting in two recommendations: equip the warehouse with office furniture and supplies, security/compliance and reporting tools, and storage equipment; and hire an additional full-time warehouse employee to manage drug stocks daily. At the beginning of March 2016, more than 50% of the total expected shipment of medical equipment was delivered to the warehouse. The shipment mainly included IT kits, office furniture, a power generator, fire extinguishers, refrigerators, and forklifts. A new drug stock manager was hired and began working in Kamina’s warehouse in March 2016. From March 27 to April 3, 2016, a joint SIAPS-IHPplus-PNAM team visited Kamina with the following objectives:
Provide a technical orientation to the new drug stock manager
Produce a procedures manual to improve management of the warehouse
Monitor the response to recommendations from the evaluation that PNAM conducted at the CEDIMEK RDC in September 2015.
At the end of this visit, the team produced a procedures manual and a job description for the stock manager. They submitted both documents to the Project Directors of SIAPS and IHPplus for their approval (see Appendix 8). Following up on the PNAM evaluation, the two PNAM delegates from the joint team reported that the CEDIMEK CDR had not yet reached the standard required to store medicines (see Appendix 9). To date, it has only met 4 of the 14 recommendations (28.6%) made by PNAM in September 2015. As mentioned in the PY1Q2 report, alerts raised by SIAPS and involvement from the local USAID mission saved a supply of 13,665,006 male condoms that were at risk of expiring. In IHP PY5Q2 (February 2015), as a result of using the expiration-warning system that SIAPS set up as part of MSH’s warehouse monitoring system, IHP identified 19,244,157 condoms that were at risk of expiring. The total estimated value of this supply was $769,766 USD. USAID was officially alerted and called an urgent meeting to
DRC-IHPplus Year 1 Quarter Three Report: January – March 2016 Page 20 of 82
develop a redeployment plan in order to save the supply. After a year of consumption, thanks to the involvement of USAID partners, 13,665,006 of the 19,244,157 condoms (71%) were successfully distributed. Despite these joint efforts and support from USAID, the remaining 5,579,151 condoms expired in April 2016 before they could be distributed. During PY1Q2 of IHPplus, SIAPS alerted USAID that a stock of 173,571 oral contraceptives (Microgynon) in the Kinshasa warehouse was at risk of expiring as well. Unfortunately, this supply of Microgynon also expired in April 2016 before it could be distributed. The expired condoms were valued at $223,166 USD and the Microgynon was valued at $46,864 USD. These expired supplies will be destroyed during PY1Q4.
Support quarterly visits to supervise medicines management in the health zones, health facilities, and CDRs supported by IHPplus: SIAPS did not support medicines management supervision during PY1Q3. During the quarter staff time was focused on participating in trainings, conducting end-user verification surveys, and receiving goods delivered to CDRs.
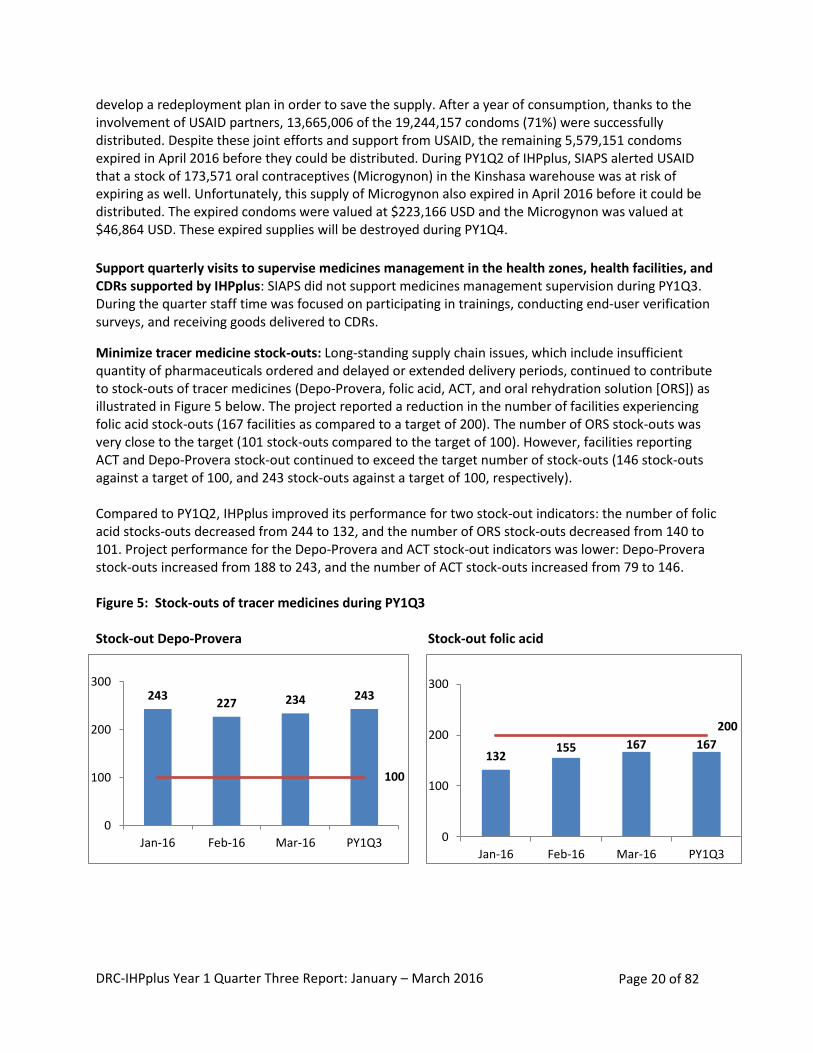
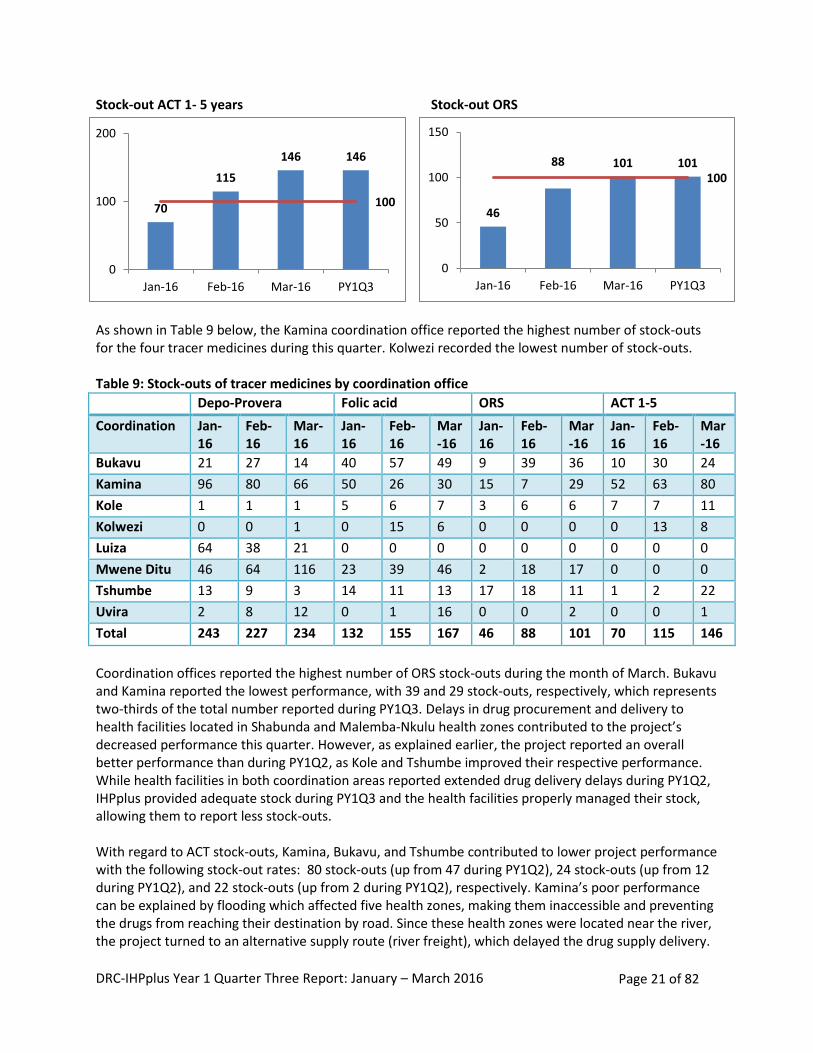
Minimize tracer medicine stock-outs: Long-standing supply chain issues, which include insufficient quantity of pharmaceuticals ordered and delayed or extended delivery periods, continued to contribute to stock-outs of tracer medicines (Depo-Provera, folic acid, ACT, and oral rehydration solution [ORS]) as illustrated in Figure 5 below. The project reported a reduction in the number of facilities experiencing folic acid stock-outs (167 facilities as compared to a target of 200). The number of ORS stock-outs was very close to the target (101 stock-outs compared to the target of 100). However, facilities reporting ACT and Depo-Provera stock-out continued to exceed the target number of stock-outs (146 stock-outs against a target of 100, and 243 stock-outs against a target of 100, respectively). Compared to PY1Q2, IHPplus improved its performance for two stock-out indicators: the number of folic acid stocks-outs decreased from 244 to 132, and the number of ORS stock-outs decreased from 140 to 101. Project performance for the Depo-Provera and ACT stock-out indicators was lower: Depo-Provera stock-outs increased from 188 to 243, and the number of ACT stock-outs increased from 79 to 146. Figure 5: Stock-outs of tracer medicines during PY1Q3 Stock-out Depo-Provera Stock-out folic acid
132 155 167 167
200
0
100
200
300
Jan-16 Feb-16 Mar-16 PY1Q3
243 227 234 243
100
0
100
200
300
Jan-16 Feb-16 Mar-16 PY1Q3
DRC-IHPplus Year 1 Quarter Three Report: January – March 2016 Page 21 of 82
Stock-out ACT 1- 5 years Stock-out ORS
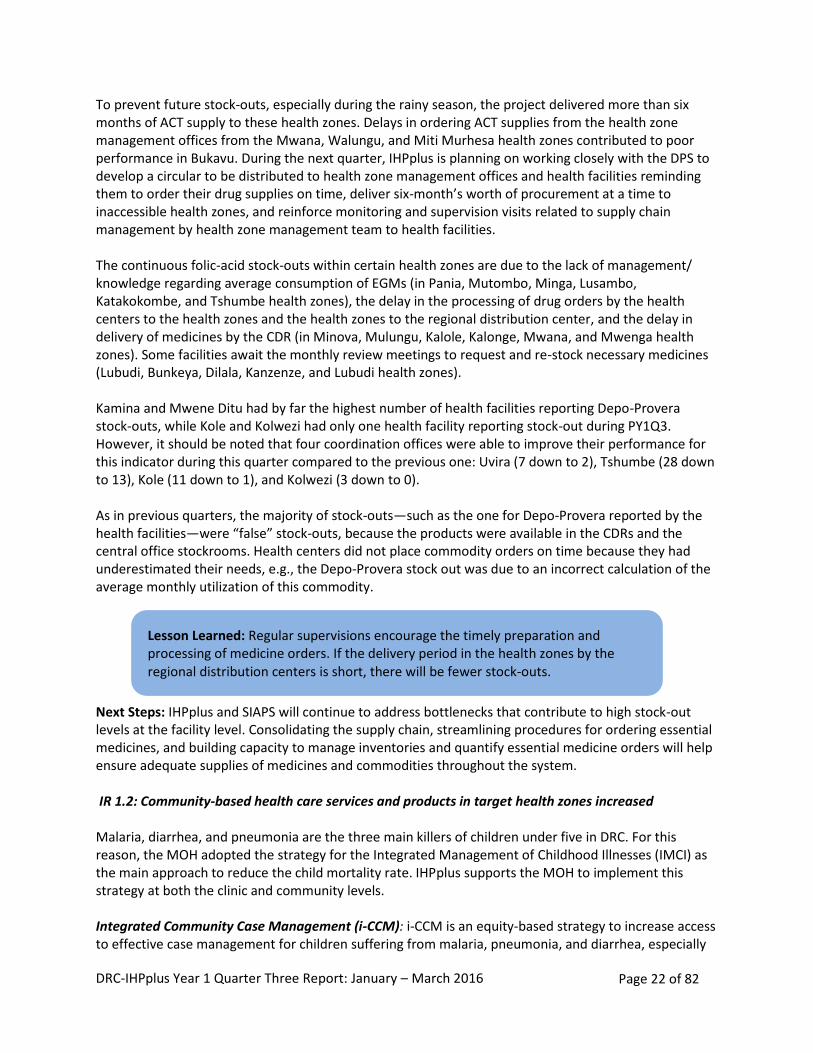
As shown in Table 9 below, the Kamina coordination office reported the highest number of stock-outs for the four tracer medicines during this quarter. Kolwezi recorded the lowest number of stock-outs. Table 9: Stock-outs of tracer medicines by coordination office
Depo-Provera Folic acid ORS ACT 1-5
Coordination Jan-16
Feb-16
Mar-16
Jan-16
Feb-16
Mar-16
Jan-16
Feb-16
Mar-16
Jan-16
Feb-16
Mar-16
Bukavu 21 27 14 40 57 49 9 39 36 10 30 24
Kamina 96 80 66 50 26 30 15 7 29 52 63 80
Kole 1 1 1 5 6 7 3 6 6 7 7 11
Kolwezi 0 0 1 0 15 6 0 0 0 0 13 8
Luiza 64 38 21 0 0 0 0 0 0 0 0 0
Mwene Ditu 46 64 116 23 39 46 2 18 17 0 0 0
Tshumbe 13 9 3 14 11 13 17 18 11 1 2 22
Uvira 2 8 12 0 1 16 0 0 2 0 0 1
Total 243 227 234 132 155 167 46 88 101 70 115 146
Coordination offices reported the highest number of ORS stock-outs during the month of March. Bukavu and Kamina reported the lowest performance, with 39 and 29 stock-outs, respectively, which represents two-thirds of the total number reported during PY1Q3. Delays in drug procurement and delivery to health facilities located in Shabunda and Malemba-Nkulu health zones contributed to the project’s decreased performance this quarter. However, as explained earlier, the project reported an overall better performance than during PY1Q2, as Kole and Tshumbe improved their respective performance. While health facilities in both coordination areas reported extended drug delivery delays during PY1Q2, IHPplus provided adequate stock during PY1Q3 and the health facilities properly managed their stock, allowing them to report less stock-outs. With regard to ACT stock-outs, Kamina, Bukavu, and Tshumbe contributed to lower project performance with the following stock-out rates: 80 stock-outs (up from 47 during PY1Q2), 24 stock-outs (up from 12 during PY1Q2), and 22 stock-outs (up from 2 during PY1Q2), respectively. Kamina’s poor performance can be explained by flooding which affected five health zones, making them inaccessible and preventing the drugs from reaching their destination by road. Since these health zones were located near the river, the project turned to an alternative supply route (river freight), which delayed the drug supply delivery.
46
88 101 101 100
0
50
100
150
Jan-16 Feb-16 Mar-16 PY1Q3
70
115
146 146
100
0
100
200
Jan-16 Feb-16 Mar-16 PY1Q3
DRC-IHPplus Year 1 Quarter Three Report: January – March 2016 Page 22 of 82
To prevent future stock-outs, especially during the rainy season, the project delivered more than six months of ACT supply to these health zones. Delays in ordering ACT supplies from the health zone management offices from the Mwana, Walungu, and Miti Murhesa health zones contributed to poor performance in Bukavu. During the next quarter, IHPplus is planning on working closely with the DPS to develop a circular to be distributed to health zone management offices and health facilities reminding them to order their drug supplies on time, deliver six-month’s worth of procurement at a time to inaccessible health zones, and reinforce monitoring and supervision visits related to supply chain management by health zone management team to health facilities. The continuous folic-acid stock-outs within certain health zones are due to the lack of management/ knowledge regarding average consumption of EGMs (in Pania, Mutombo, Minga, Lusambo, Katakokombe, and Tshumbe health zones), the delay in the processing of drug orders by the health centers to the health zones and the health zones to the regional distribution center, and the delay in delivery of medicines by the CDR (in Minova, Mulungu, Kalole, Kalonge, Mwana, and Mwenga health zones). Some facilities await the monthly review meetings to request and re-stock necessary medicines (Lubudi, Bunkeya, Dilala, Kanzenze, and Lubudi health zones). Kamina and Mwene Ditu had by far the highest number of health facilities reporting Depo-Provera stock-outs, while Kole and Kolwezi had only one health facility reporting stock-out during PY1Q3. However, it should be noted that four coordination offices were able to improve their performance for this indicator during this quarter compared to the previous one: Uvira (7 down to 2), Tshumbe (28 down to 13), Kole (11 down to 1), and Kolwezi (3 down to 0). As in previous quarters, the majority of stock-outs—such as the one for Depo-Provera reported by the health facilities—were “false” stock-outs, because the products were available in the CDRs and the central office stockrooms. Health centers did not place commodity orders on time because they had underestimated their needs, e.g., the Depo-Provera stock out was due to an incorrect calculation of the average monthly utilization of this commodity. Next Steps: IHPplus and SIAPS will continue to address bottlenecks that contribute to high stock-out levels at the facility level. Consolidating the supply chain, streamlining procedures for ordering essential medicines, and building capacity to manage inventories and quantify essential medicine orders will help ensure adequate supplies of medicines and commodities throughout the system. IR 1.2: Community-based health care services and products in target health zones increased Malaria, diarrhea, and pneumonia are the three main killers of children under five in DRC. For this reason, the MOH adopted the strategy for the Integrated Management of Childhood Illnesses (IMCI) as the main approach to reduce the child mortality rate. IHPplus supports the MOH to implement this strategy at both the clinic and community levels. Integrated Community Case Management (i-CCM): i-CCM is an equity-based strategy to increase access to effective case management for children suffering from malaria, pneumonia, and diarrhea, especially
Lesson Learned: Regular supervisions encourage the timely preparation and processing of medicine orders. If the delivery period in the health zones by the regional distribution centers is short, there will be fewer stock-outs.
DRC-IHPplus Year 1 Quarter Three Report: January – March 2016 Page 23 of 82
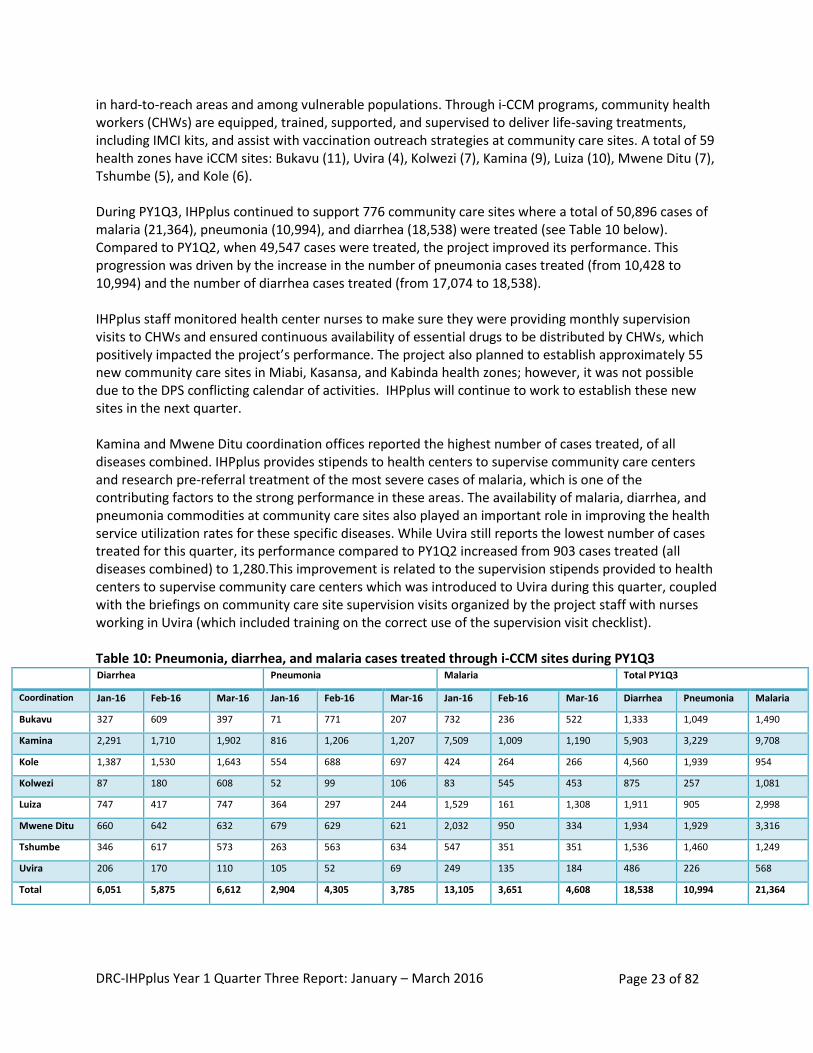
in hard-to-reach areas and among vulnerable populations. Through i-CCM programs, community health workers (CHWs) are equipped, trained, supported, and supervised to deliver life-saving treatments, including IMCI kits, and assist with vaccination outreach strategies at community care sites. A total of 59 health zones have iCCM sites: Bukavu (11), Uvira (4), Kolwezi (7), Kamina (9), Luiza (10), Mwene Ditu (7), Tshumbe (5), and Kole (6). During PY1Q3, IHPplus continued to support 776 community care sites where a total of 50,896 cases of malaria (21,364), pneumonia (10,994), and diarrhea (18,538) were treated (see Table 10 below). Compared to PY1Q2, when 49,547 cases were treated, the project improved its performance. This progression was driven by the increase in the number of pneumonia cases treated (from 10,428 to 10,994) and the number of diarrhea cases treated (from 17,074 to 18,538). IHPplus staff monitored health center nurses to make sure they were providing monthly supervision visits to CHWs and ensured continuous availability of essential drugs to be distributed by CHWs, which positively impacted the project’s performance. The project also planned to establish approximately 55 new community care sites in Miabi, Kasansa, and Kabinda health zones; however, it was not possible due to the DPS conflicting calendar of activities. IHPplus will continue to work to establish these new sites in the next quarter. Kamina and Mwene Ditu coordination offices reported the highest number of cases treated, of all diseases combined. IHPplus provides stipends to health centers to supervise community care centers and research pre-referral treatment of the most severe cases of malaria, which is one of the contributing factors to the strong performance in these areas. The availability of malaria, diarrhea, and pneumonia commodities at community care sites also played an important role in improving the health service utilization rates for these specific diseases. While Uvira still reports the lowest number of cases treated for this quarter, its performance compared to PY1Q2 increased from 903 cases treated (all diseases combined) to 1,280.This improvement is related to the supervision stipends provided to health centers to supervise community care centers which was introduced to Uvira during this quarter, coupled with the briefings on community care site supervision visits organized by the project staff with nurses working in Uvira (which included training on the correct use of the supervision visit checklist). Table 10: Pneumonia, diarrhea, and malaria cases treated through i-CCM sites during PY1Q3
Diarrhea Pneumonia Malaria Total PY1Q3
Coordination Jan-16 Feb-16 Mar-16 Jan-16 Feb-16 Mar-16 Jan-16 Feb-16 Mar-16 Diarrhea Pneumonia Malaria
Bukavu 327 609 397 71 771 207 732 236 522 1,333 1,049 1,490
Kamina 2,291 1,710 1,902 816 1,206 1,207 7,509 1,009 1,190 5,903 3,229 9,708
Kole 1,387 1,530 1,643 554 688 697 424 264 266 4,560 1,939 954
Kolwezi 87 180 608 52 99 106 83 545 453 875 257 1,081
Luiza 747 417 747 364 297 244 1,529 161 1,308 1,911 905 2,998
Mwene Ditu 660 642 632 679 629 621 2,032 950 334 1,934 1,929 3,316
Tshumbe 346 617 573 263 563 634 547 351 351 1,536 1,460 1,249
Uvira 206 170 110 105 52 69 249 135 184 486 226 568
Total 6,051 5,875 6,612 2,904 4,305 3,785 13,105 3,651 4,608 18,538 10,994 21,364
DRC-IHPplus Year 1 Quarter Three Report: January – March 2016 Page 24 of 82
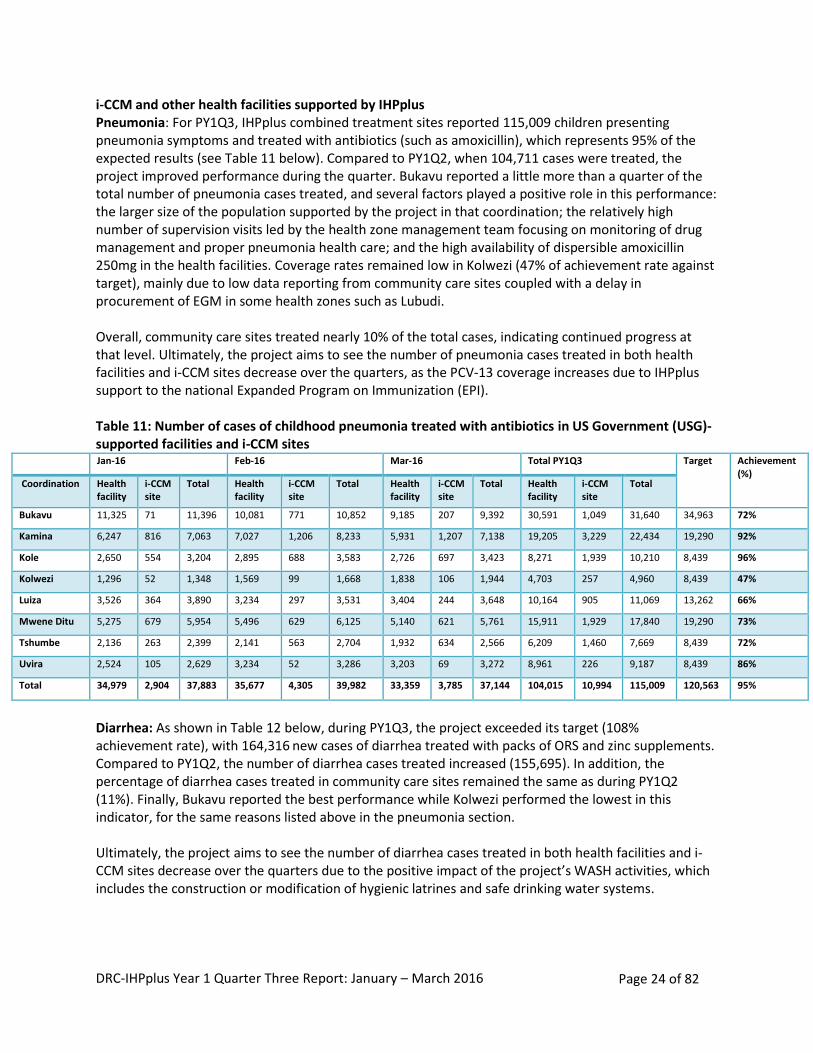
i-CCM and other health facilities supported by IHPplus Pneumonia: For PY1Q3, IHPplus combined treatment sites reported 115,009 children presenting pneumonia symptoms and treated with antibiotics (such as amoxicillin), which represents 95% of the expected results (see Table 11 below). Compared to PY1Q2, when 104,711 cases were treated, the project improved performance during the quarter. Bukavu reported a little more than a quarter of the total number of pneumonia cases treated, and several factors played a positive role in this performance: the larger size of the population supported by the project in that coordination; the relatively high number of supervision visits led by the health zone management team focusing on monitoring of drug management and proper pneumonia health care; and the high availability of dispersible amoxicillin 250mg in the health facilities. Coverage rates remained low in Kolwezi (47% of achievement rate against target), mainly due to low data reporting from community care sites coupled with a delay in procurement of EGM in some health zones such as Lubudi. Overall, community care sites treated nearly 10% of the total cases, indicating continued progress at that level. Ultimately, the project aims to see the number of pneumonia cases treated in both health facilities and i-CCM sites decrease over the quarters, as the PCV-13 coverage increases due to IHPplus support to the national Expanded Program on Immunization (EPI). Table 11: Number of cases of childhood pneumonia treated with antibiotics in US Government (USG)-supported facilities and i-CCM sites
Jan-16 Feb-16 Mar-16 Total PY1Q3 Target Achievement (%)
Coordination Health facility
i-CCM site
Total Health facility
i-CCM site
Total Health facility
i-CCM site
Total Health facility
i-CCM site
Total
Bukavu 11,325 71 11,396 10,081 771 10,852 9,185 207 9,392 30,591 1,049 31,640 34,963 72%
Kamina 6,247 816 7,063 7,027 1,206 8,233 5,931 1,207 7,138 19,205 3,229 22,434 19,290 92%
Kole 2,650 554 3,204 2,895 688 3,583 2,726 697 3,423 8,271 1,939 10,210 8,439 96%
Kolwezi 1,296 52 1,348 1,569 99 1,668 1,838 106 1,944 4,703 257 4,960 8,439 47%
Luiza 3,526 364 3,890 3,234 297 3,531 3,404 244 3,648 10,164 905 11,069 13,262 66%
Mwene Ditu 5,275 679 5,954 5,496 629 6,125 5,140 621 5,761 15,911 1,929 17,840 19,290 73%
Tshumbe 2,136 263 2,399 2,141 563 2,704 1,932 634 2,566 6,209 1,460 7,669 8,439 72%
Uvira 2,524 105 2,629 3,234 52 3,286 3,203 69 3,272 8,961 226 9,187 8,439 86%
Total 34,979 2,904 37,883 35,677 4,305 39,982 33,359 3,785 37,144 104,015 10,994 115,009 120,563 95%
Diarrhea: As shown in Table 12 below, during PY1Q3, the project exceeded its target (108% achievement rate), with 164,316 new cases of diarrhea treated with packs of ORS and zinc supplements. Compared to PY1Q2, the number of diarrhea cases treated increased (155,695). In addition, the percentage of diarrhea cases treated in community care sites remained the same as during PY1Q2 (11%). Finally, Bukavu reported the best performance while Kolwezi performed the lowest in this indicator, for the same reasons listed above in the pneumonia section. Ultimately, the project aims to see the number of diarrhea cases treated in both health facilities and i-CCM sites decrease over the quarters due to the positive impact of the project’s WASH activities, which includes the construction or modification of hygienic latrines and safe drinking water systems.
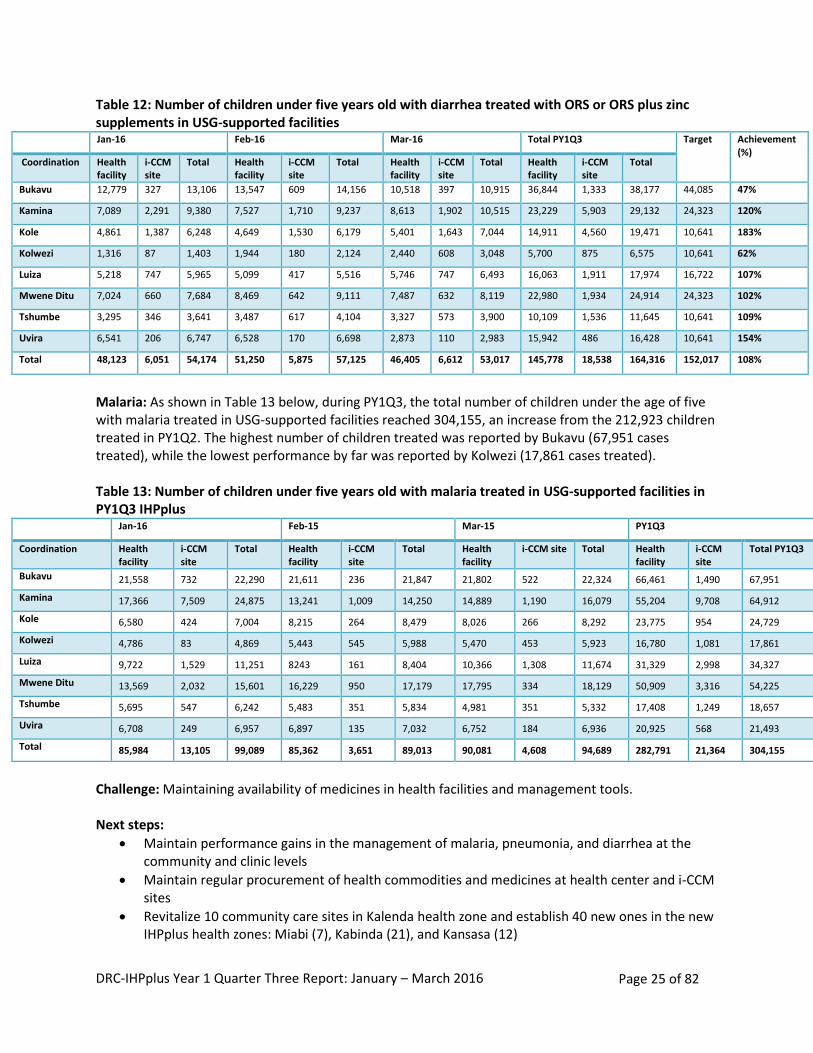
DRC-IHPplus Year 1 Quarter Three Report: January – March 2016 Page 25 of 82
Table 12: Number of children under five years old with diarrhea treated with ORS or ORS plus zinc supplements in USG-supported facilities
Jan-16 Feb-16 Mar-16 Total PY1Q3 Target Achievement (%)
Coordination Health facility
i-CCM site
Total Health facility
i-CCM site
Total Health facility
i-CCM site
Total Health facility
i-CCM site
Total
Bukavu 12,779 327 13,106 13,547 609 14,156 10,518 397 10,915 36,844 1,333 38,177 44,085 47%
Kamina 7,089 2,291 9,380 7,527 1,710 9,237 8,613 1,902 10,515 23,229 5,903 29,132 24,323 120%
Kole 4,861 1,387 6,248 4,649 1,530 6,179 5,401 1,643 7,044 14,911 4,560 19,471 10,641 183%
Kolwezi 1,316 87 1,403 1,944 180 2,124 2,440 608 3,048 5,700 875 6,575 10,641 62%
Luiza 5,218 747 5,965 5,099 417 5,516 5,746 747 6,493 16,063 1,911 17,974 16,722 107%
Mwene Ditu 7,024 660 7,684 8,469 642 9,111 7,487 632 8,119 22,980 1,934 24,914 24,323 102%
Tshumbe 3,295 346 3,641 3,487 617 4,104 3,327 573 3,900 10,109 1,536 11,645 10,641 109%
Uvira 6,541 206 6,747 6,528 170 6,698 2,873 110 2,983 15,942 486 16,428 10,641 154%
Total 48,123 6,051 54,174 51,250 5,875 57,125 46,405 6,612 53,017 145,778 18,538 164,316 152,017 108%
Malaria: As shown in Table 13 below, during PY1Q3, the total number of children under the age of five with malaria treated in USG-supported facilities reached 304,155, an increase from the 212,923 children treated in PY1Q2. The highest number of children treated was reported by Bukavu (67,951 cases treated), while the lowest performance by far was reported by Kolwezi (17,861 cases treated). Table 13: Number of children under five years old with malaria treated in USG-supported facilities in PY1Q3 IHPplus
Jan-16 Feb-15 Mar-15 PY1Q3
Coordination Health facility
i-CCM site
Total Health facility
i-CCM site
Total Health facility
i-CCM site Total Health facility
i-CCM site
Total PY1Q3
Bukavu 21,558 732 22,290 21,611 236 21,847 21,802 522 22,324 66,461 1,490 67,951
Kamina 17,366 7,509 24,875 13,241 1,009 14,250 14,889 1,190 16,079 55,204 9,708 64,912
Kole 6,580 424 7,004 8,215 264 8,479 8,026 266 8,292 23,775 954 24,729
Kolwezi 4,786 83 4,869 5,443 545 5,988 5,470 453 5,923 16,780 1,081 17,861
Luiza 9,722 1,529 11,251 8243 161 8,404 10,366 1,308 11,674 31,329 2,998 34,327
Mwene Ditu 13,569 2,032 15,601 16,229 950 17,179 17,795 334 18,129 50,909 3,316 54,225
Tshumbe 5,695 547 6,242 5,483 351 5,834 4,981 351 5,332 17,408 1,249 18,657
Uvira 6,708 249 6,957 6,897 135 7,032 6,752 184 6,936 20,925 568 21,493
Total 85,984 13,105 99,089 85,362 3,651 89,013 90,081 4,608 94,689 282,791 21,364 304,155
Challenge: Maintaining availability of medicines in health facilities and management tools. Next steps:
Maintain performance gains in the management of malaria, pneumonia, and diarrhea at the community and clinic levels
Maintain regular procurement of health commodities and medicines at health center and i-CCM sites
Revitalize 10 community care sites in Kalenda health zone and establish 40 new ones in the new IHPplus health zones: Miabi (7), Kabinda (21), and Kansasa (12)
DRC-IHPplus Year 1 Quarter Three Report: January – March 2016 Page 26 of 82
Train 64 CHWs in i-CCM case management
Support the health zone management teams from Kole and Tshumbe health zones in monitoring proper management and use of EGM in health facilities and community care sites
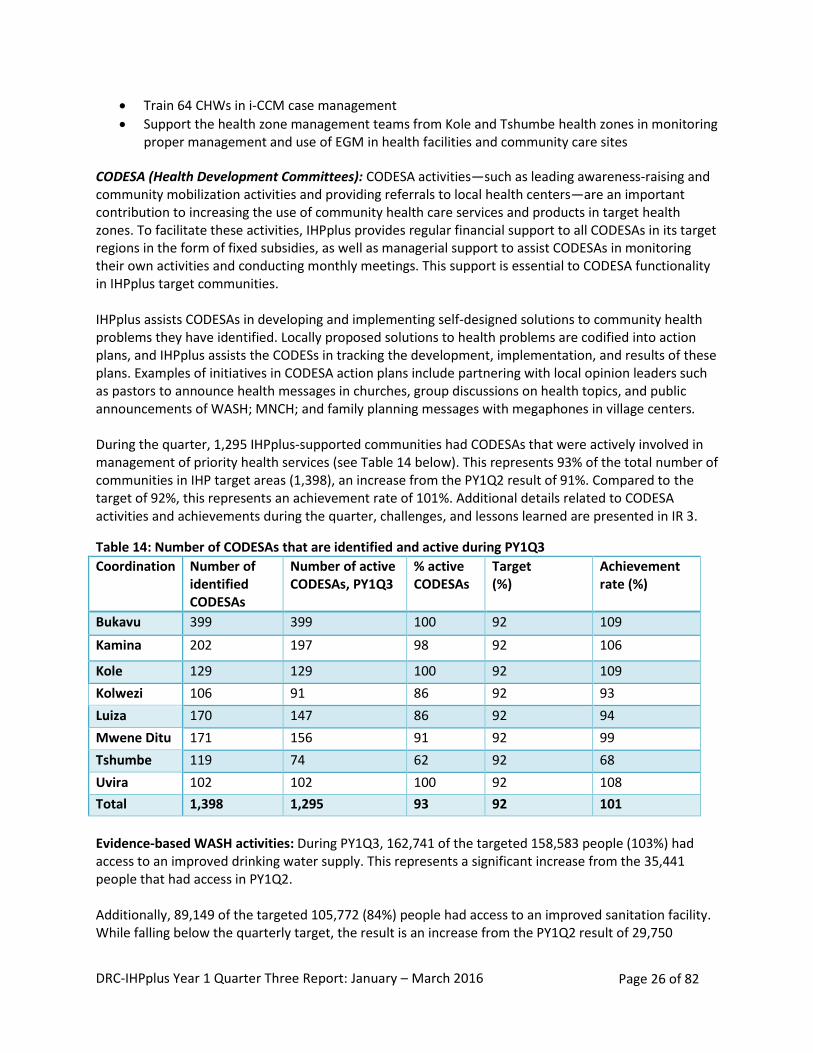
CODESA (Health Development Committees): CODESA activities—such as leading awareness-raising and community mobilization activities and providing referrals to local health centers—are an important contribution to increasing the use of community health care services and products in target health zones. To facilitate these activities, IHPplus provides regular financial support to all CODESAs in its target regions in the form of fixed subsidies, as well as managerial support to assist CODESAs in monitoring their own activities and conducting monthly meetings. This support is essential to CODESA functionality in IHPplus target communities. IHPplus assists CODESAs in developing and implementing self-designed solutions to community health problems they have identified. Locally proposed solutions to health problems are codified into action plans, and IHPplus assists the CODESs in tracking the development, implementation, and results of these plans. Examples of initiatives in CODESA action plans include partnering with local opinion leaders such as pastors to announce health messages in churches, group discussions on health topics, and public announcements of WASH; MNCH; and family planning messages with megaphones in village centers. During the quarter, 1,295 IHPplus-supported communities had CODESAs that were actively involved in management of priority health services (see Table 14 below). This represents 93% of the total number of communities in IHP target areas (1,398), an increase from the PY1Q2 result of 91%. Compared to the target of 92%, this represents an achievement rate of 101%. Additional details related to CODESA activities and achievements during the quarter, challenges, and lessons learned are presented in IR 3.
Table 14: Number of CODESAs that are identified and active during PY1Q3
Coordination Number of identified CODESAs
Number of active CODESAs, PY1Q3
% active CODESAs
Target (%)
Achievement rate (%)
Bukavu 399 399 100 92 109
Kamina 202 197 98 92 106
Kole 129 129 100 92 109
Kolwezi 106 91 86 92 93
Luiza 170 147 86 92 94
Mwene Ditu 171 156 91 92 99
Tshumbe 119 74 62 92 68
Uvira 102 102 100 92 108
Total 1,398 1,295 93 92 101
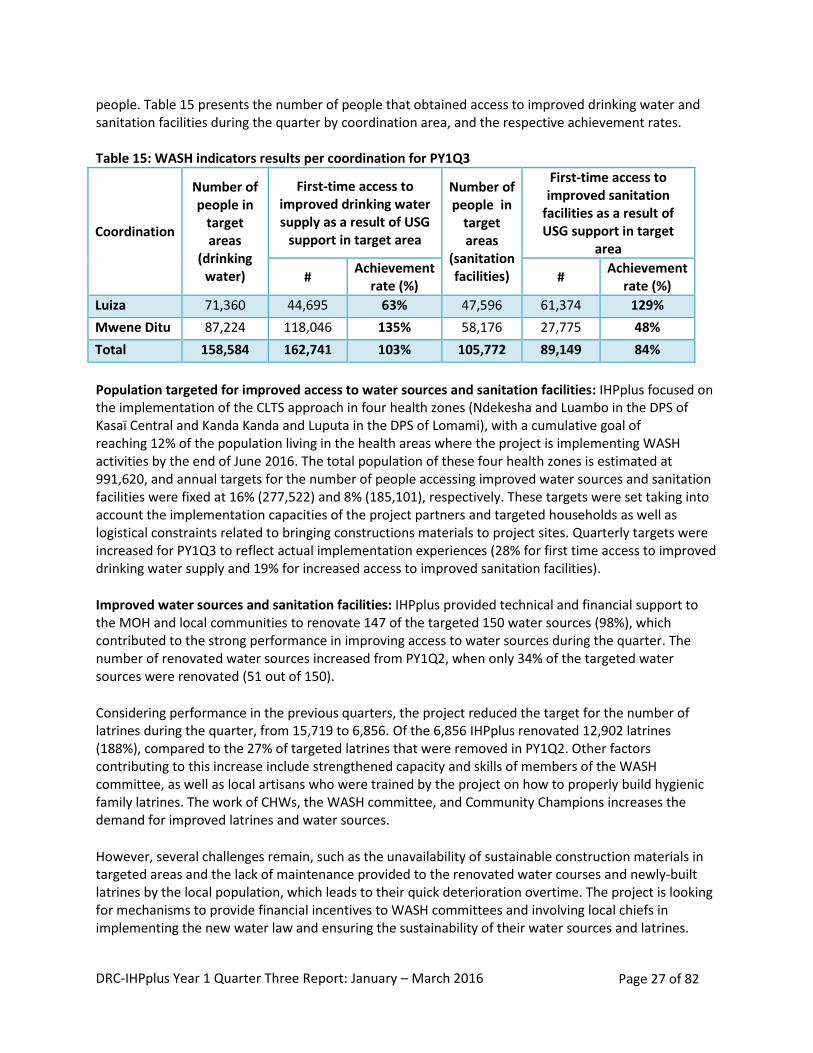
Evidence-based WASH activities: During PY1Q3, 162,741 of the targeted 158,583 people (103%) had access to an improved drinking water supply. This represents a significant increase from the 35,441 people that had access in PY1Q2. Additionally, 89,149 of the targeted 105,772 (84%) people had access to an improved sanitation facility. While falling below the quarterly target, the result is an increase from the PY1Q2 result of 29,750
DRC-IHPplus Year 1 Quarter Three Report: January – March 2016 Page 27 of 82
people. Table 15 presents the number of people that obtained access to improved drinking water and sanitation facilities during the quarter by coordination area, and the respective achievement rates. Table 15: WASH indicators results per coordination for PY1Q3
Coordination
Number of people in
target areas
(drinking water)
First-time access to improved drinking water supply as a result of USG
support in target area
Number of people in
target areas
(sanitation facilities)
First-time access to improved sanitation
facilities as a result of USG support in target
area
# Achievement
rate (%) #
Achievement rate (%)
Luiza 71,360 44,695 63% 47,596 61,374 129%
Mwene Ditu 87,224 118,046 135% 58,176 27,775 48%
Total 158,584 162,741 103% 105,772 89,149 84%
Population targeted for improved access to water sources and sanitation facilities: IHPplus focused on the implementation of the CLTS approach in four health zones (Ndekesha and Luambo in the DPS of Kasaï Central and Kanda Kanda and Luputa in the DPS of Lomami), with a cumulative goal of reaching 12% of the population living in the health areas where the project is implementing WASH activities by the end of June 2016. The total population of these four health zones is estimated at 991,620, and annual targets for the number of people accessing improved water sources and sanitation facilities were fixed at 16% (277,522) and 8% (185,101), respectively. These targets were set taking into account the implementation capacities of the project partners and targeted households as well as logistical constraints related to bringing constructions materials to project sites. Quarterly targets were increased for PY1Q3 to reflect actual implementation experiences (28% for first time access to improved drinking water supply and 19% for increased access to improved sanitation facilities).
Improved water sources and sanitation facilities: IHPplus provided technical and financial support to the MOH and local communities to renovate 147 of the targeted 150 water sources (98%), which contributed to the strong performance in improving access to water sources during the quarter. The number of renovated water sources increased from PY1Q2, when only 34% of the targeted water sources were renovated (51 out of 150).
Considering performance in the previous quarters, the project reduced the target for the number of latrines during the quarter, from 15,719 to 6,856. Of the 6,856 IHPplus renovated 12,902 latrines (188%), compared to the 27% of targeted latrines that were removed in PY1Q2. Other factors contributing to this increase include strengthened capacity and skills of members of the WASH committee, as well as local artisans who were trained by the project on how to properly build hygienic family latrines. The work of CHWs, the WASH committee, and Community Champions increases the demand for improved latrines and water sources.
However, several challenges remain, such as the unavailability of sustainable construction materials in targeted areas and the lack of maintenance provided to the renovated water courses and newly-built latrines by the local population, which leads to their quick deterioration overtime. The project is looking for mechanisms to provide financial incentives to WASH committees and involving local chiefs in implementing the new water law and ensuring the sustainability of their water sources and latrines.
DRC-IHPplus Year 1 Quarter Three Report: January – March 2016 Page 28 of 82
Other activities led this quarter by the project related to WASH were:
Provided assistance to develop a national public water strategy following the government’s enactment of the new water law on January 4, 2016. As the law describes the roles of user associations and local committees for water and sanitation, it is important to clarify their roles in relation to the health sector and compared to the heads of decentralized entities that are responsible for providing potable water.
Within the context of support to the development of the new WASH national policy, IHPplus supported a WASH consortium made up of five nongovernmental organizations (NGOs) to develop a guide for WASH stakeholders involved in the implementation of the new water law.
Per USAID/DRC request, IHPplus’ WASH technical advisor attended the monthly meeting of the WASH inter-donor group, which discusses sector-wide issues, advocacy, and other common items.
The project led a joint field visit with the USAID/Washington WASH Manager in the Lualaba province from February 13-21, 2016. During this mission, the team visited Kanzenze and Lubudi health zones as well as Lualaba Provincial Health Division in Kolwezi to evaluate WASH achievements accomplished with the project’s continuous support. The main observations from this visit were:
o Although the project recently renovated water sources in these supported health zones, they are not regularly maintained by the beneficiaries. This is probably due to the lack of: an ownership strategy, clear monitoring mechanism, and a maintenance fund that could be used to cover maintenance costs and fed through household contribution. Despite the unwritten rule that everyone should have free access to water, it should be noted that this maintenance fund strategy has already been implemented in Lubudi health zone where water hand pumps were installed and beneficiaries currently contribute to their maintenance by paying US$0.50 per household and per month. However, this strategy still needs to be improved as this amount was randomly determined, with no reference to the actual cost of maintenance and repair.
o While households seem to have adopted several good hygiene practices, there is still a gap between knowledge and action, especially regarding latrine maintenance and coverage, establishing hand washing routines with soap or ashes, automatic hand washing after defecation, etc.
o Sustainability of WASH installations (both water pumps and hygienic latrines) is at risk as they are often built with local construction materials, meaning they lack quality and durability. A solution could be to sub-contract these WASH activities to small local construction companies which will then be responsible for finding reliable and higher-quality procurement sources.
Next steps:
Continue to renovate water and latrine sources in local communities
Work with WASH committees and local leaders to create community ownership to ensure the sustainability of renovated water sources and newly built latrines
Improve the engagement of local leadership and communities in the maintenance of water and sanitation sources by emphasizing the importance of monitoring the quality of the water, analysis of epidemiological data, and considering the impact of pollution
Explore the possibility of introducing sanitation marketing to address the lack of adequate materials in certain health zones
DRC-IHPplus Year 1 Quarter Three Report: January – March 2016 Page 29 of 82
From January to March 2016
78 health zone management teams were trained on the LDP approach
59 of 78 (80%) health zone management teams completed an evaluation of their LDP action plans (these teams started the LDP in August 2015)
47 of 59 (80%) projects implemented by leadership teams achieved over 80% of desired performance according to indicators in their action plans within six months of completing the LDP projects (between October and December 2015)
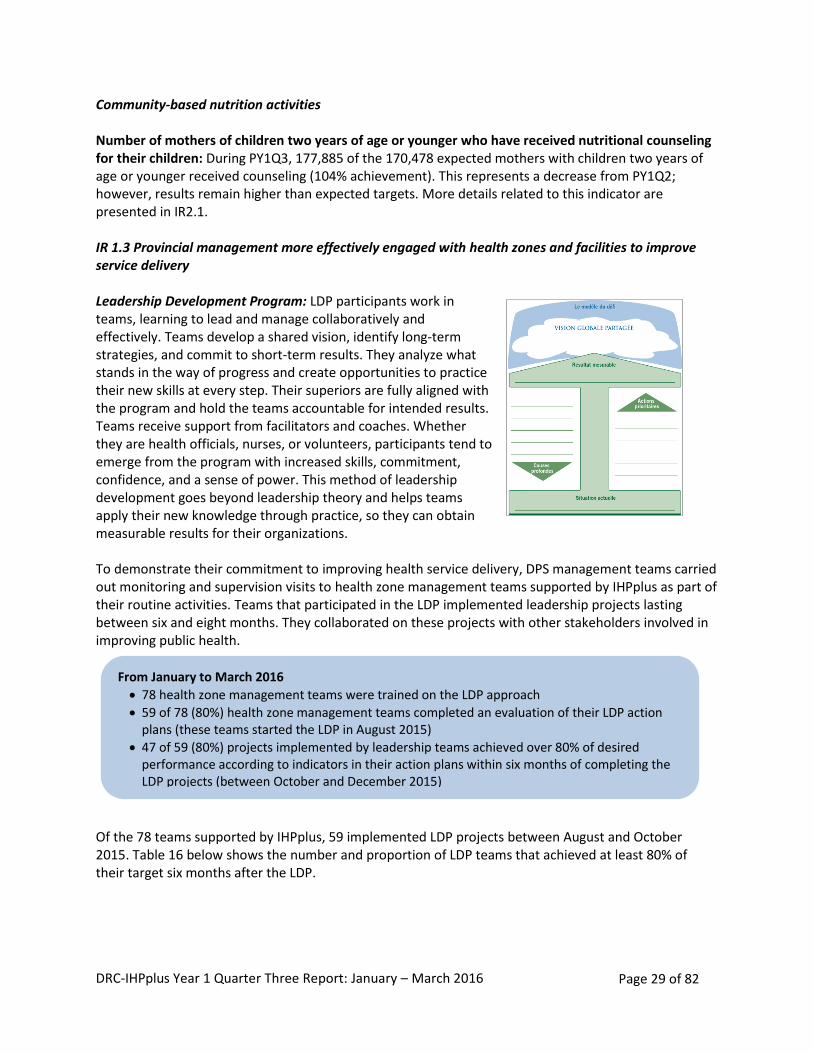
Community-based nutrition activities Number of mothers of children two years of age or younger who have received nutritional counseling for their children: During PY1Q3, 177,885 of the 170,478 expected mothers with children two years of age or younger received counseling (104% achievement). This represents a decrease from PY1Q2; however, results remain higher than expected targets. More details related to this indicator are presented in IR2.1. IR 1.3 Provincial management more effectively engaged with health zones and facilities to improve service delivery Leadership Development Program: LDP participants work in teams, learning to lead and manage collaboratively and effectively. Teams develop a shared vision, identify long-term strategies, and commit to short-term results. They analyze what stands in the way of progress and create opportunities to practice their new skills at every step. Their superiors are fully aligned with the program and hold the teams accountable for intended results. Teams receive support from facilitators and coaches. Whether they are health officials, nurses, or volunteers, participants tend to emerge from the program with increased skills, commitment, confidence, and a sense of power. This method of leadership development goes beyond leadership theory and helps teams apply their new knowledge through practice, so they can obtain measurable results for their organizations. To demonstrate their commitment to improving health service delivery, DPS management teams carried out monitoring and supervision visits to health zone management teams supported by IHPplus as part of their routine activities. Teams that participated in the LDP implemented leadership projects lasting between six and eight months. They collaborated on these projects with other stakeholders involved in improving public health.
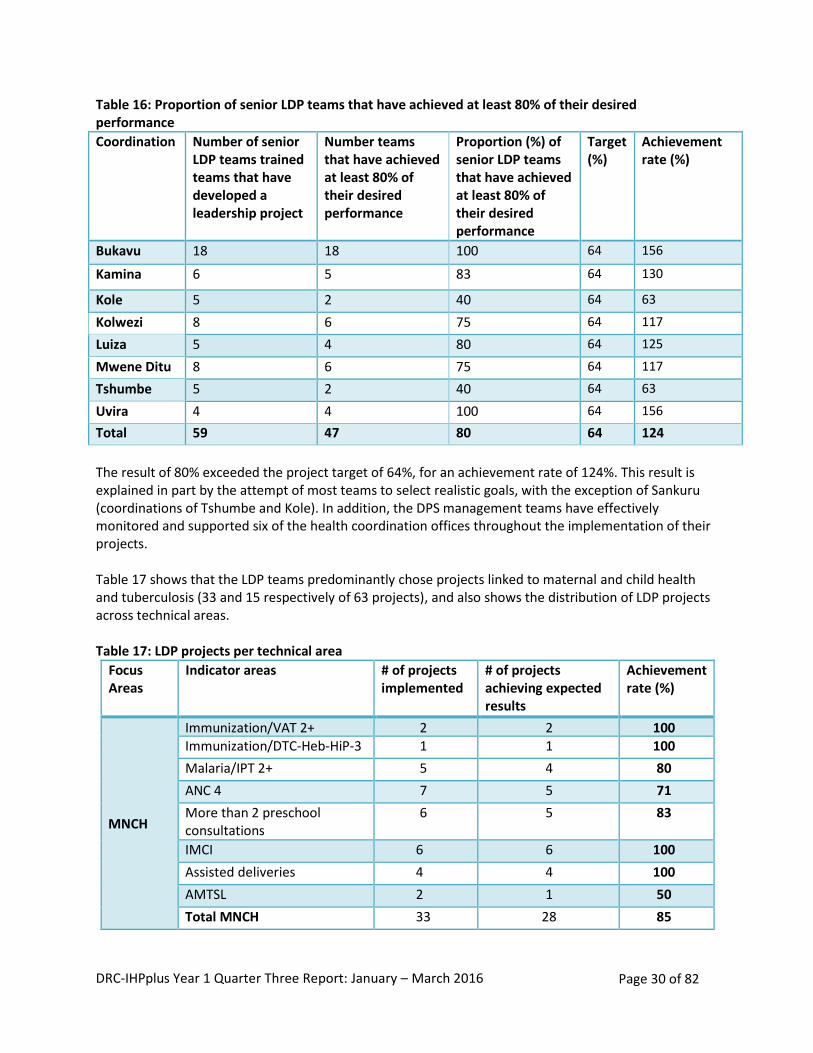
Of the 78 teams supported by IHPplus, 59 implemented LDP projects between August and October 2015. Table 16 below shows the number and proportion of LDP teams that achieved at least 80% of their target six months after the LDP.
DRC-IHPplus Year 1 Quarter Three Report: January – March 2016 Page 30 of 82
Table 16: Proportion of senior LDP teams that have achieved at least 80% of their desired performance
Coordination Number of senior LDP teams trained teams that have developed a leadership project
Number teams that have achieved at least 80% of their desired performance
Proportion (%) of senior LDP teams that have achieved at least 80% of their desired performance
Target (%)
Achievement rate (%)
Bukavu 18 18 100 64 156
Kamina 6 5 83 64 130
Kole 5 2 40 64 63
Kolwezi 8 6 75 64 117
Luiza 5 4 80 64 125
Mwene Ditu 8 6 75 64 117
Tshumbe 5 2 40 64 63
Uvira 4 4 100 64 156
Total 59 47 80 64 124
The result of 80% exceeded the project target of 64%, for an achievement rate of 124%. This result is explained in part by the attempt of most teams to select realistic goals, with the exception of Sankuru (coordinations of Tshumbe and Kole). In addition, the DPS management teams have effectively monitored and supported six of the health coordination offices throughout the implementation of their projects. Table 17 shows that the LDP teams predominantly chose projects linked to maternal and child health and tuberculosis (33 and 15 respectively of 63 projects), and also shows the distribution of LDP projects across technical areas. Table 17: LDP projects per technical area
Focus Areas
Indicator areas # of projects implemented
# of projects achieving expected results
Achievement rate (%)
MNCH
Immunization/VAT 2+ 2 2 100 Immunization/DTC-Heb-HiP-3 1 1 100
Malaria/IPT 2+ 5 4 80
ANC 4 7 5 71
More than 2 preschool consultations
6 5 83
IMCI 6 6 100
Assisted deliveries 4 4 100
AMTSL 2 1 50
Total MNCH 33 28 85
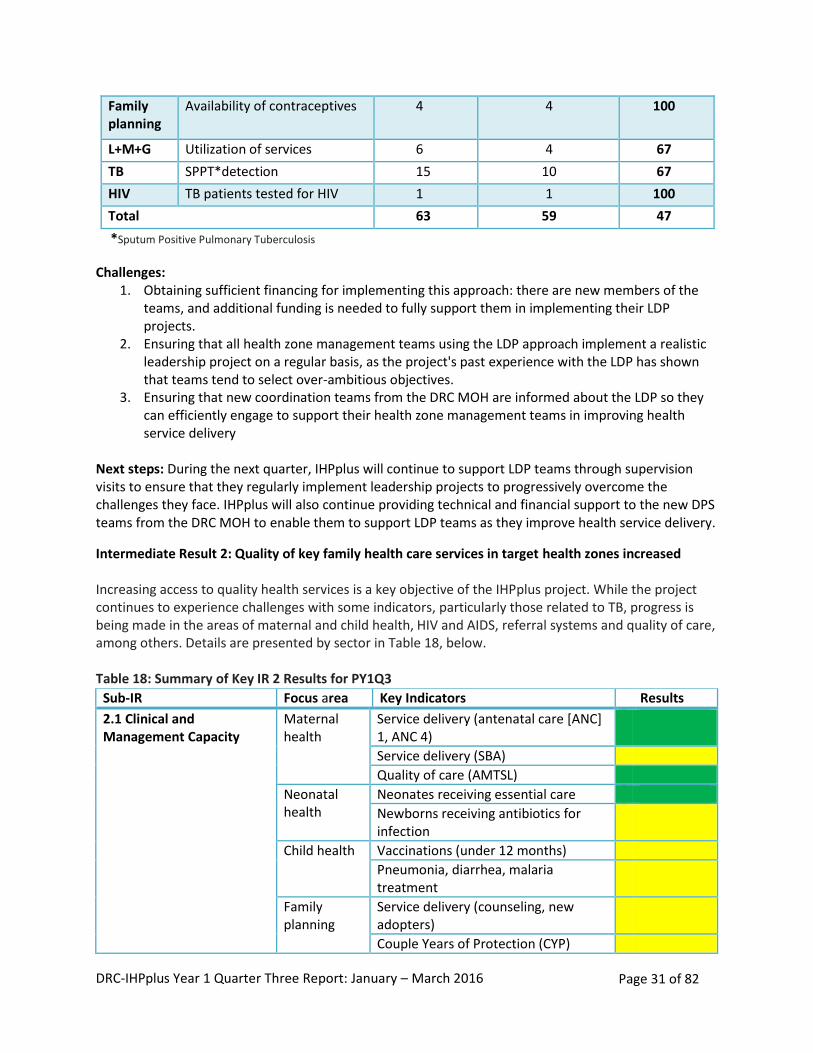
DRC-IHPplus Year 1 Quarter Three Report: January – March 2016 Page 31 of 82
Family planning
Availability of contraceptives 4 4 100
L+M+G Utilization of services 6 4 67
TB SPPT*detection 15 10 67
HIV TB patients tested for HIV 1 1 100
Total 63 59 47
*Sputum Positive Pulmonary Tuberculosis
Challenges: 1. Obtaining sufficient financing for implementing this approach: there are new members of the
teams, and additional funding is needed to fully support them in implementing their LDP projects.
2. Ensuring that all health zone management teams using the LDP approach implement a realistic leadership project on a regular basis, as the project's past experience with the LDP has shown that teams tend to select over-ambitious objectives.
3. Ensuring that new coordination teams from the DRC MOH are informed about the LDP so they can efficiently engage to support their health zone management teams in improving health service delivery
Next steps: During the next quarter, IHPplus will continue to support LDP teams through supervision visits to ensure that they regularly implement leadership projects to progressively overcome the challenges they face. IHPplus will also continue providing technical and financial support to the new DPS teams from the DRC MOH to enable them to support LDP teams as they improve health service delivery.
Intermediate Result 2: Quality of key family health care services in target health zones increased Increasing access to quality health services is a key objective of the IHPplus project. While the project continues to experience challenges with some indicators, particularly those related to TB, progress is being made in the areas of maternal and child health, HIV and AIDS, referral systems and quality of care, among others. Details are presented by sector in Table 18, below. Table 18: Summary of Key IR 2 Results for PY1Q3
Sub-IR Focus area Key Indicators Results
2.1 Clinical and Management Capacity
Maternal health
Service delivery (antenatal care [ANC] 1, ANC 4)
Service delivery (SBA)
Quality of care (AMTSL)
Neonatal health
Neonates receiving essential care
Newborns receiving antibiotics for infection
Child health Vaccinations (under 12 months)
Pneumonia, diarrhea, malaria treatment
Family planning
Service delivery (counseling, new adopters)
Couple Years of Protection (CYP)
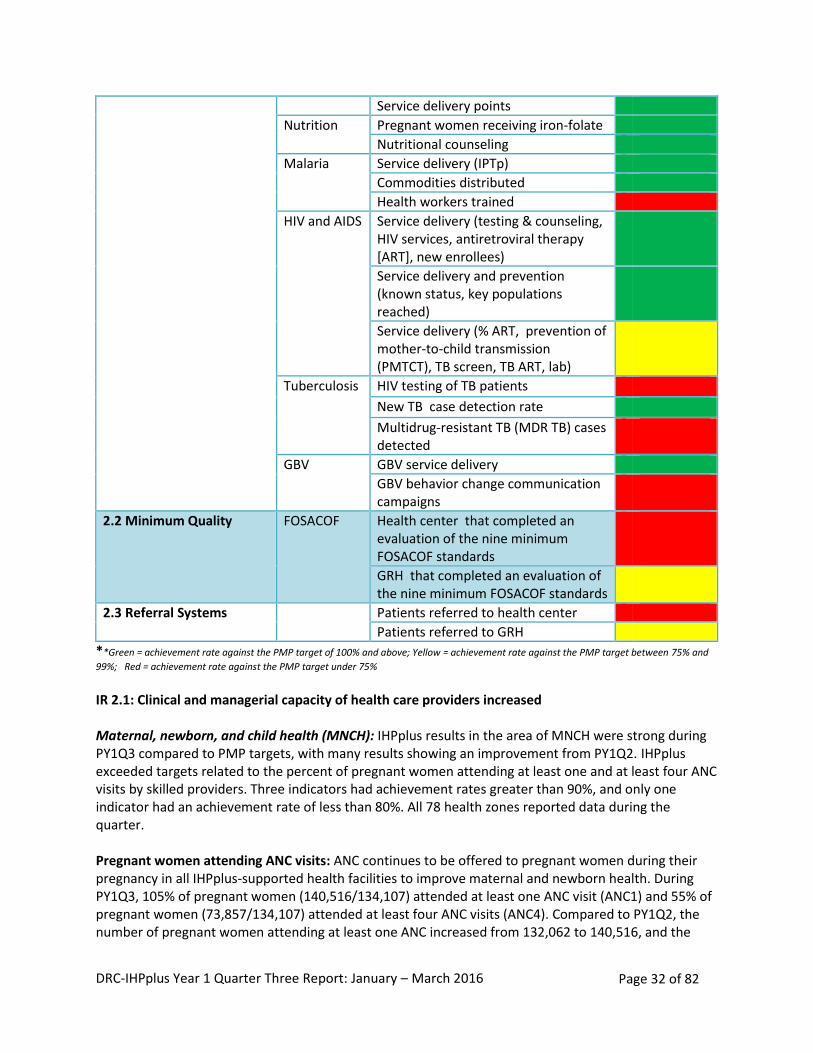
DRC-IHPplus Year 1 Quarter Three Report: January – March 2016 Page 32 of 82
**Green = achievement rate against the PMP target of 100% and above; Yellow = achievement rate against the PMP target between 75% and
99%; Red = achievement rate against the PMP target under 75%
IR 2.1: Clinical and managerial capacity of health care providers increased Maternal, newborn, and child health (MNCH): IHPplus results in the area of MNCH were strong during PY1Q3 compared to PMP targets, with many results showing an improvement from PY1Q2. IHPplus exceeded targets related to the percent of pregnant women attending at least one and at least four ANC visits by skilled providers. Three indicators had achievement rates greater than 90%, and only one indicator had an achievement rate of less than 80%. All 78 health zones reported data during the quarter. Pregnant women attending ANC visits: ANC continues to be offered to pregnant women during their pregnancy in all IHPplus-supported health facilities to improve maternal and newborn health. During PY1Q3, 105% of pregnant women (140,516/134,107) attended at least one ANC visit (ANC1) and 55% of pregnant women (73,857/134,107) attended at least four ANC visits (ANC4). Compared to PY1Q2, the number of pregnant women attending at least one ANC increased from 132,062 to 140,516, and the
Service delivery points
Nutrition Pregnant women receiving iron-folate
Nutritional counseling
Malaria Service delivery (IPTp)
Commodities distributed
Health workers trained
HIV and AIDS Service delivery (testing & counseling, HIV services, antiretroviral therapy [ART], new enrollees)
Service delivery and prevention (known status, key populations reached)
Service delivery (% ART, prevention of mother-to-child transmission (PMTCT), TB screen, TB ART, lab)
Tuberculosis HIV testing of TB patients
New TB case detection rate
Multidrug-resistant TB (MDR TB) cases detected
GBV GBV service delivery
GBV behavior change communication campaigns
2.2 Minimum Quality FOSACOF Health center that completed an evaluation of the nine minimum FOSACOF standards
GRH that completed an evaluation of the nine minimum FOSACOF standards
2.3 Referral Systems Patients referred to health center
Patients referred to GRH
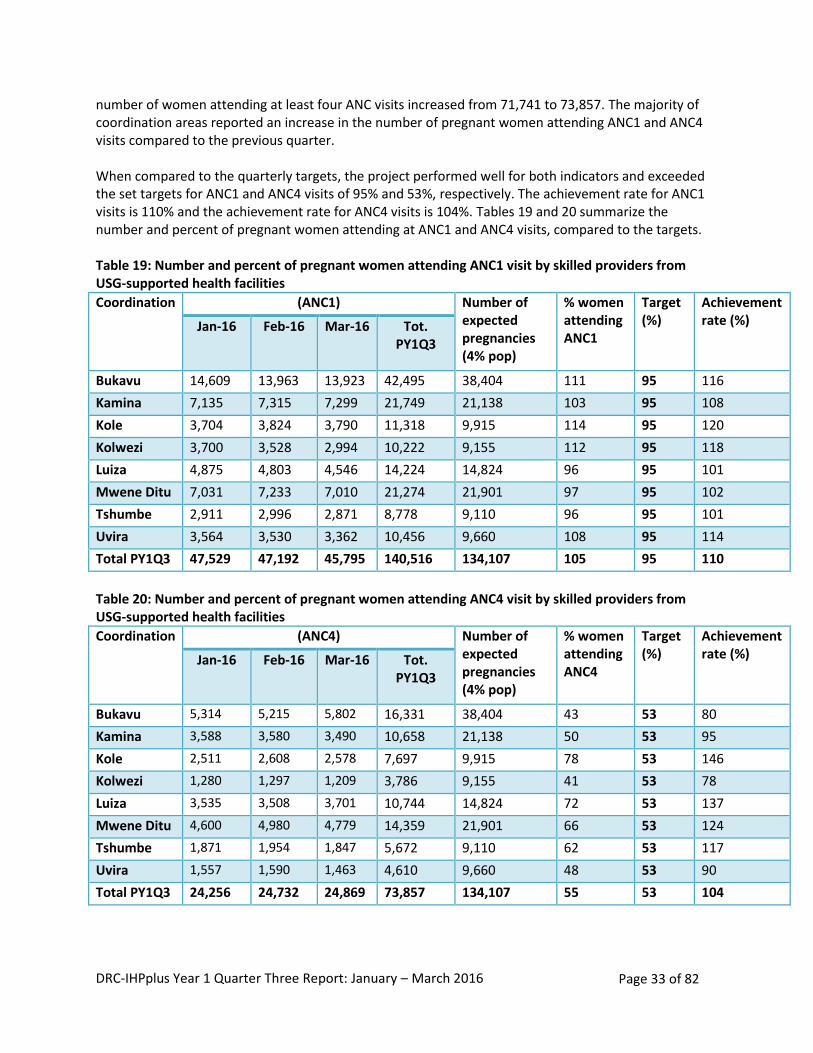
DRC-IHPplus Year 1 Quarter Three Report: January – March 2016 Page 33 of 82
number of women attending at least four ANC visits increased from 71,741 to 73,857. The majority of coordination areas reported an increase in the number of pregnant women attending ANC1 and ANC4 visits compared to the previous quarter. When compared to the quarterly targets, the project performed well for both indicators and exceeded the set targets for ANC1 and ANC4 visits of 95% and 53%, respectively. The achievement rate for ANC1 visits is 110% and the achievement rate for ANC4 visits is 104%. Tables 19 and 20 summarize the number and percent of pregnant women attending at ANC1 and ANC4 visits, compared to the targets. Table 19: Number and percent of pregnant women attending ANC1 visit by skilled providers from USG-supported health facilities
Coordination (ANC1) Number of expected pregnancies (4% pop)
% women attending ANC1
Target (%)
Achievement rate (%) Jan-16 Feb-16 Mar-16 Tot.
PY1Q3
Bukavu 14,609 13,963 13,923 42,495 38,404 111 95 116
Kamina 7,135 7,315 7,299 21,749 21,138 103 95 108
Kole 3,704 3,824 3,790 11,318 9,915 114 95 120
Kolwezi 3,700 3,528 2,994 10,222 9,155 112 95 118
Luiza 4,875 4,803 4,546 14,224 14,824 96 95 101
Mwene Ditu 7,031 7,233 7,010 21,274 21,901 97 95 102
Tshumbe 2,911 2,996 2,871 8,778 9,110 96 95 101
Uvira 3,564 3,530 3,362 10,456 9,660 108 95 114
Total PY1Q3 47,529 47,192 45,795 140,516 134,107 105 95 110
Table 20: Number and percent of pregnant women attending ANC4 visit by skilled providers from USG-supported health facilities
Coordination (ANC4) Number of expected pregnancies (4% pop)
% women attending ANC4
Target (%)
Achievement rate (%) Jan-16 Feb-16 Mar-16 Tot.
PY1Q3
Bukavu 5,314 5,215 5,802 16,331 38,404 43 53 80
Kamina 3,588 3,580 3,490 10,658 21,138 50 53 95
Kole 2,511 2,608 2,578 7,697 9,915 78 53 146
Kolwezi 1,280 1,297 1,209 3,786 9,155 41 53 78
Luiza 3,535 3,508 3,701 10,744 14,824 72 53 137
Mwene Ditu 4,600 4,980 4,779 14,359 21,901 66 53 124
Tshumbe 1,871 1,954 1,847 5,672 9,110 62 53 117
Uvira 1,557 1,590 1,463 4,610 9,660 48 53 90
Total PY1Q3 24,256 24,732 24,869 73,857 134,107 55 53 104
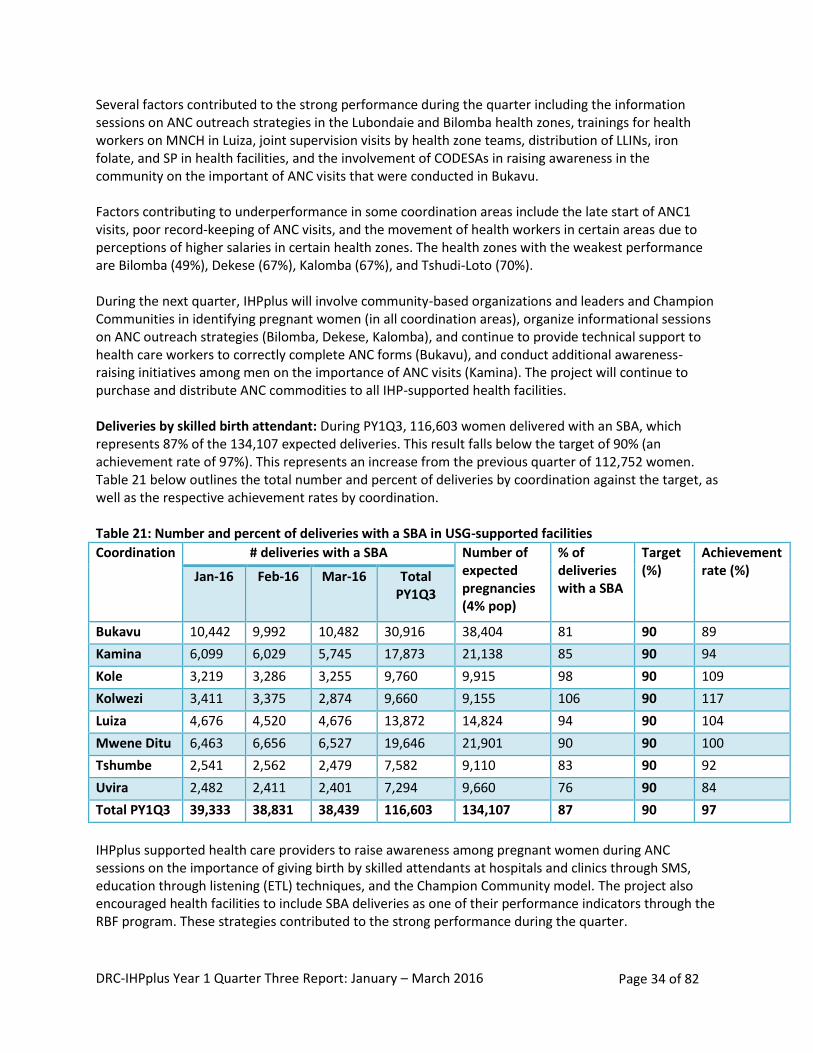
DRC-IHPplus Year 1 Quarter Three Report: January – March 2016 Page 34 of 82
Several factors contributed to the strong performance during the quarter including the information sessions on ANC outreach strategies in the Lubondaie and Bilomba health zones, trainings for health workers on MNCH in Luiza, joint supervision visits by health zone teams, distribution of LLINs, iron folate, and SP in health facilities, and the involvement of CODESAs in raising awareness in the community on the important of ANC visits that were conducted in Bukavu. Factors contributing to underperformance in some coordination areas include the late start of ANC1 visits, poor record-keeping of ANC visits, and the movement of health workers in certain areas due to perceptions of higher salaries in certain health zones. The health zones with the weakest performance are Bilomba (49%), Dekese (67%), Kalomba (67%), and Tshudi-Loto (70%). During the next quarter, IHPplus will involve community-based organizations and leaders and Champion Communities in identifying pregnant women (in all coordination areas), organize informational sessions on ANC outreach strategies (Bilomba, Dekese, Kalomba), and continue to provide technical support to health care workers to correctly complete ANC forms (Bukavu), and conduct additional awareness-raising initiatives among men on the importance of ANC visits (Kamina). The project will continue to purchase and distribute ANC commodities to all IHP-supported health facilities. Deliveries by skilled birth attendant: During PY1Q3, 116,603 women delivered with an SBA, which represents 87% of the 134,107 expected deliveries. This result falls below the target of 90% (an achievement rate of 97%). This represents an increase from the previous quarter of 112,752 women. Table 21 below outlines the total number and percent of deliveries by coordination against the target, as well as the respective achievement rates by coordination. Table 21: Number and percent of deliveries with a SBA in USG-supported facilities
Coordination # deliveries with a SBA Number of expected pregnancies (4% pop)
% of deliveries with a SBA
Target (%)
Achievement rate (%) Jan-16 Feb-16 Mar-16 Total
PY1Q3
Bukavu 10,442 9,992 10,482 30,916 38,404 81 90 89
Kamina 6,099 6,029 5,745 17,873 21,138 85 90 94
Kole 3,219 3,286 3,255 9,760 9,915 98 90 109
Kolwezi 3,411 3,375 2,874 9,660 9,155 106 90 117
Luiza 4,676 4,520 4,676 13,872 14,824 94 90 104
Mwene Ditu 6,463 6,656 6,527 19,646 21,901 90 90 100
Tshumbe 2,541 2,562 2,479 7,582 9,110 83 90 92
Uvira 2,482 2,411 2,401 7,294 9,660 76 90 84
Total PY1Q3 39,333 38,831 38,439 116,603 134,107 87 90 97
IHPplus supported health care providers to raise awareness among pregnant women during ANC sessions on the importance of giving birth by skilled attendants at hospitals and clinics through SMS, education through listening (ETL) techniques, and the Champion Community model. The project also encouraged health facilities to include SBA deliveries as one of their performance indicators through the RBF program. These strategies contributed to the strong performance during the quarter.
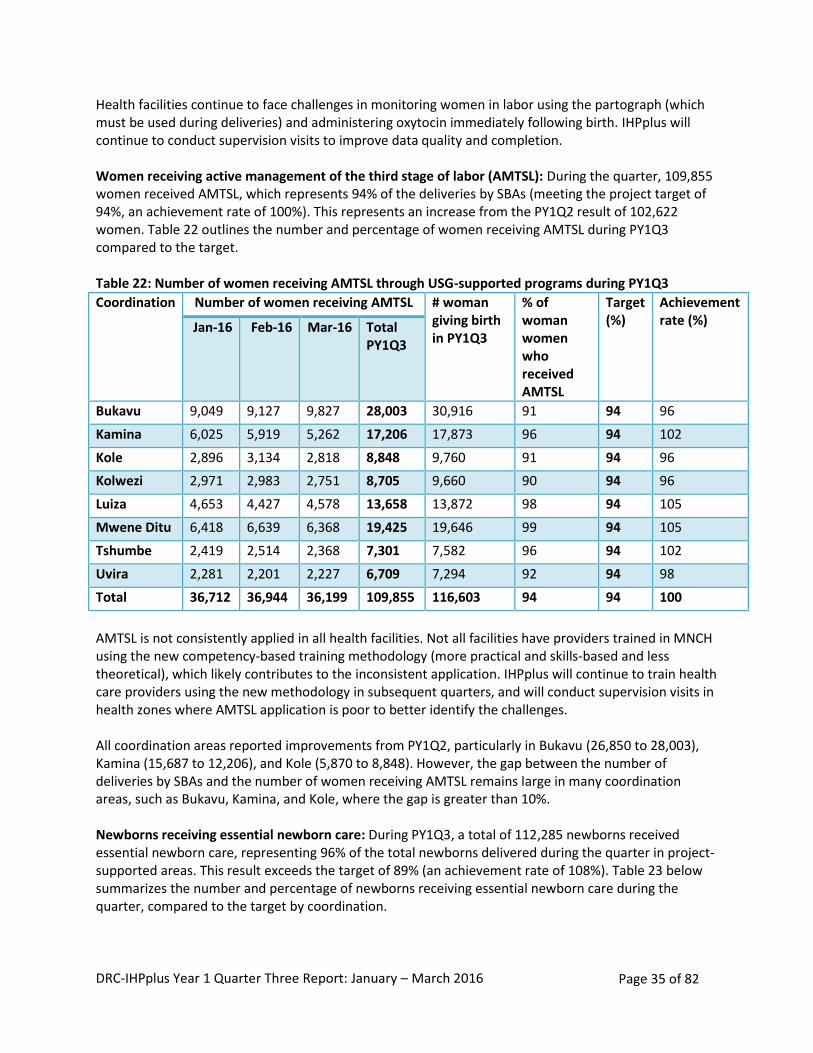
DRC-IHPplus Year 1 Quarter Three Report: January – March 2016 Page 35 of 82
Health facilities continue to face challenges in monitoring women in labor using the partograph (which must be used during deliveries) and administering oxytocin immediately following birth. IHPplus will continue to conduct supervision visits to improve data quality and completion. Women receiving active management of the third stage of labor (AMTSL): During the quarter, 109,855 women received AMTSL, which represents 94% of the deliveries by SBAs (meeting the project target of 94%, an achievement rate of 100%). This represents an increase from the PY1Q2 result of 102,622 women. Table 22 outlines the number and percentage of women receiving AMTSL during PY1Q3 compared to the target. Table 22: Number of women receiving AMTSL through USG-supported programs during PY1Q3
Coordination Number of women receiving AMTSL # woman giving birth in PY1Q3
% of woman women who received AMTSL
Target (%)
Achievement rate (%) Jan-16 Feb-16 Mar-16 Total
PY1Q3
Bukavu 9,049 9,127 9,827 28,003 30,916 91 94 96
Kamina 6,025 5,919 5,262 17,206 17,873 96 94 102
Kole 2,896 3,134 2,818 8,848 9,760 91 94 96
Kolwezi 2,971 2,983 2,751 8,705 9,660 90 94 96
Luiza 4,653 4,427 4,578 13,658 13,872 98 94 105
Mwene Ditu 6,418 6,639 6,368 19,425 19,646 99 94 105
Tshumbe 2,419 2,514 2,368 7,301 7,582 96 94 102
Uvira 2,281 2,201 2,227 6,709 7,294 92 94 98
Total 36,712 36,944 36,199 109,855 116,603 94 94 100
AMTSL is not consistently applied in all health facilities. Not all facilities have providers trained in MNCH using the new competency-based training methodology (more practical and skills-based and less theoretical), which likely contributes to the inconsistent application. IHPplus will continue to train health care providers using the new methodology in subsequent quarters, and will conduct supervision visits in health zones where AMTSL application is poor to better identify the challenges. All coordination areas reported improvements from PY1Q2, particularly in Bukavu (26,850 to 28,003), Kamina (15,687 to 12,206), and Kole (5,870 to 8,848). However, the gap between the number of deliveries by SBAs and the number of women receiving AMTSL remains large in many coordination areas, such as Bukavu, Kamina, and Kole, where the gap is greater than 10%. Newborns receiving essential newborn care: During PY1Q3, a total of 112,285 newborns received essential newborn care, representing 96% of the total newborns delivered during the quarter in project-supported areas. This result exceeds the target of 89% (an achievement rate of 108%). Table 23 below summarizes the number and percentage of newborns receiving essential newborn care during the quarter, compared to the target by coordination.
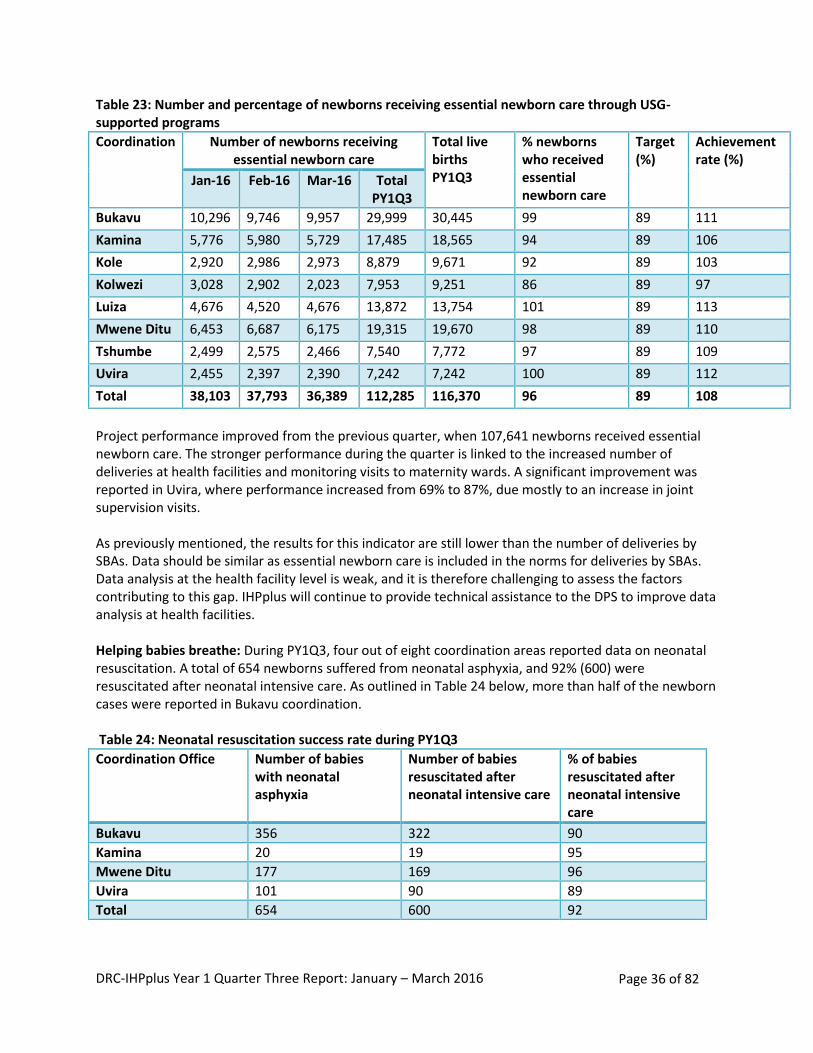
DRC-IHPplus Year 1 Quarter Three Report: January – March 2016 Page 36 of 82
Table 23: Number and percentage of newborns receiving essential newborn care through USG-supported programs
Coordination Number of newborns receiving essential newborn care
Total live births PY1Q3
% newborns who received essential newborn care
Target (%)
Achievement rate (%)
Jan-16 Feb-16 Mar-16 Total PY1Q3
Bukavu 10,296 9,746 9,957 29,999 30,445 99 89 111
Kamina 5,776 5,980 5,729 17,485 18,565 94 89 106
Kole 2,920 2,986 2,973 8,879 9,671 92 89 103
Kolwezi 3,028 2,902 2,023 7,953 9,251 86 89 97
Luiza 4,676 4,520 4,676 13,872 13,754 101 89 113
Mwene Ditu 6,453 6,687 6,175 19,315 19,670 98 89 110
Tshumbe 2,499 2,575 2,466 7,540 7,772 97 89 109
Uvira 2,455 2,397 2,390 7,242 7,242 100 89 112
Total 38,103 37,793 36,389 112,285 116,370 96 89 108
Project performance improved from the previous quarter, when 107,641 newborns received essential newborn care. The stronger performance during the quarter is linked to the increased number of deliveries at health facilities and monitoring visits to maternity wards. A significant improvement was reported in Uvira, where performance increased from 69% to 87%, due mostly to an increase in joint supervision visits. As previously mentioned, the results for this indicator are still lower than the number of deliveries by SBAs. Data should be similar as essential newborn care is included in the norms for deliveries by SBAs. Data analysis at the health facility level is weak, and it is therefore challenging to assess the factors contributing to this gap. IHPplus will continue to provide technical assistance to the DPS to improve data analysis at health facilities. Helping babies breathe: During PY1Q3, four out of eight coordination areas reported data on neonatal resuscitation. A total of 654 newborns suffered from neonatal asphyxia, and 92% (600) were resuscitated after neonatal intensive care. As outlined in Table 24 below, more than half of the newborn cases were reported in Bukavu coordination. Table 24: Neonatal resuscitation success rate during PY1Q3
Coordination Office Number of babies with neonatal asphyxia
Number of babies resuscitated after neonatal intensive care
% of babies resuscitated after neonatal intensive care
Bukavu 356 322 90
Kamina 20 19 95
Mwene Ditu 177 169 96
Uvira 101 90 89
Total 654 600 92
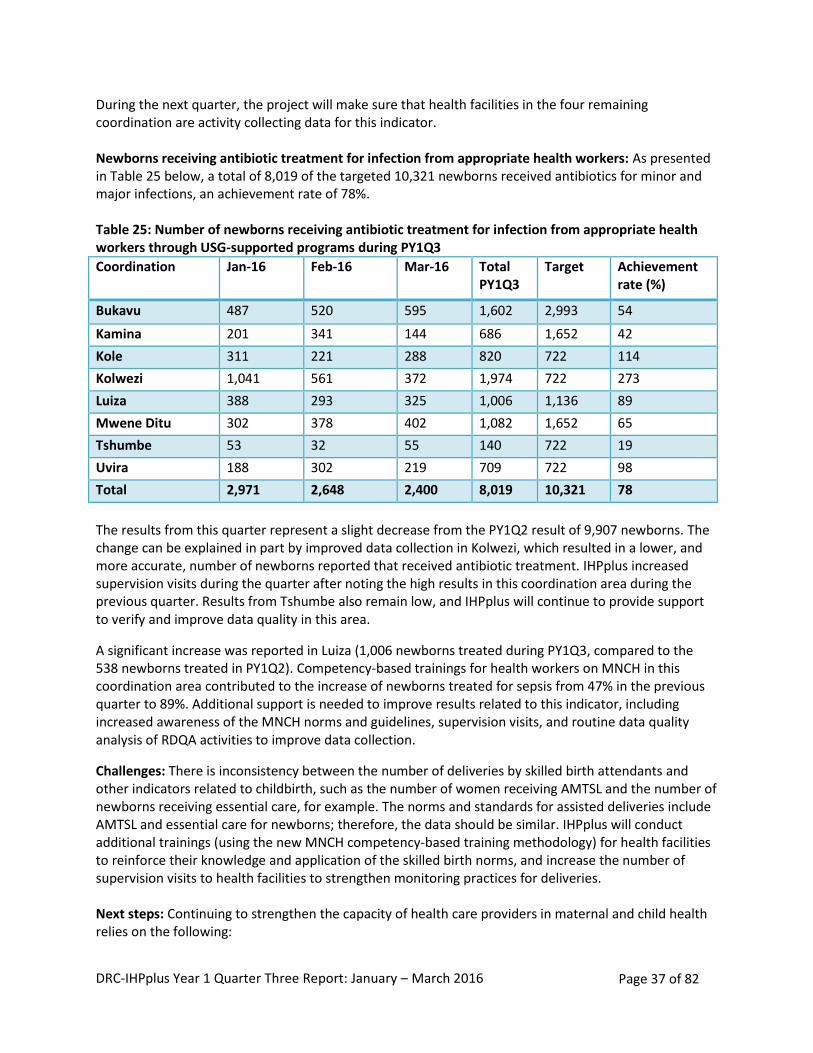
DRC-IHPplus Year 1 Quarter Three Report: January – March 2016 Page 37 of 82
During the next quarter, the project will make sure that health facilities in the four remaining coordination are activity collecting data for this indicator. Newborns receiving antibiotic treatment for infection from appropriate health workers: As presented in Table 25 below, a total of 8,019 of the targeted 10,321 newborns received antibiotics for minor and major infections, an achievement rate of 78%. Table 25: Number of newborns receiving antibiotic treatment for infection from appropriate health workers through USG-supported programs during PY1Q3
Coordination Jan-16 Feb-16 Mar-16 Total PY1Q3
Target Achievement rate (%)
Bukavu 487 520 595 1,602 2,993 54
Kamina 201 341 144 686 1,652 42
Kole 311 221 288 820 722 114
Kolwezi 1,041 561 372 1,974 722 273
Luiza 388 293 325 1,006 1,136 89
Mwene Ditu 302 378 402 1,082 1,652 65
Tshumbe 53 32 55 140 722 19
Uvira 188 302 219 709 722 98
Total 2,971 2,648 2,400 8,019 10,321 78
The results from this quarter represent a slight decrease from the PY1Q2 result of 9,907 newborns. The change can be explained in part by improved data collection in Kolwezi, which resulted in a lower, and more accurate, number of newborns reported that received antibiotic treatment. IHPplus increased supervision visits during the quarter after noting the high results in this coordination area during the previous quarter. Results from Tshumbe also remain low, and IHPplus will continue to provide support to verify and improve data quality in this area.
A significant increase was reported in Luiza (1,006 newborns treated during PY1Q3, compared to the 538 newborns treated in PY1Q2). Competency-based trainings for health workers on MNCH in this coordination area contributed to the increase of newborns treated for sepsis from 47% in the previous quarter to 89%. Additional support is needed to improve results related to this indicator, including increased awareness of the MNCH norms and guidelines, supervision visits, and routine data quality analysis of RDQA activities to improve data collection.
Challenges: There is inconsistency between the number of deliveries by skilled birth attendants and other indicators related to childbirth, such as the number of women receiving AMTSL and the number of newborns receiving essential care, for example. The norms and standards for assisted deliveries include AMTSL and essential care for newborns; therefore, the data should be similar. IHPplus will conduct additional trainings (using the new MNCH competency-based training methodology) for health facilities to reinforce their knowledge and application of the skilled birth norms, and increase the number of supervision visits to health facilities to strengthen monitoring practices for deliveries. Next steps: Continuing to strengthen the capacity of health care providers in maternal and child health relies on the following:
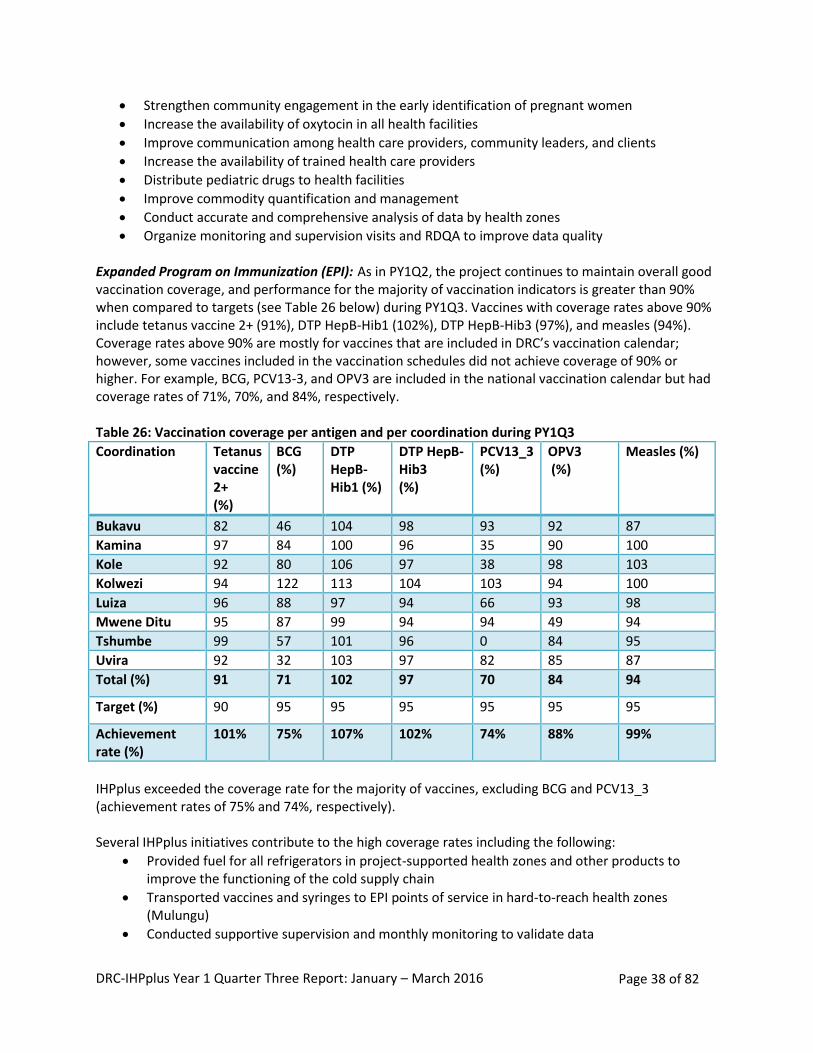
DRC-IHPplus Year 1 Quarter Three Report: January – March 2016 Page 38 of 82
Strengthen community engagement in the early identification of pregnant women
Increase the availability of oxytocin in all health facilities
Improve communication among health care providers, community leaders, and clients
Increase the availability of trained health care providers
Distribute pediatric drugs to health facilities
Improve commodity quantification and management
Conduct accurate and comprehensive analysis of data by health zones
Organize monitoring and supervision visits and RDQA to improve data quality Expanded Program on Immunization (EPI): As in PY1Q2, the project continues to maintain overall good vaccination coverage, and performance for the majority of vaccination indicators is greater than 90% when compared to targets (see Table 26 below) during PY1Q3. Vaccines with coverage rates above 90% include tetanus vaccine 2+ (91%), DTP HepB-Hib1 (102%), DTP HepB-Hib3 (97%), and measles (94%). Coverage rates above 90% are mostly for vaccines that are included in DRC’s vaccination calendar; however, some vaccines included in the vaccination schedules did not achieve coverage of 90% or higher. For example, BCG, PCV13-3, and OPV3 are included in the national vaccination calendar but had coverage rates of 71%, 70%, and 84%, respectively. Table 26: Vaccination coverage per antigen and per coordination during PY1Q3
Coordination Tetanus vaccine 2+ (%)
BCG (%)
DTP HepB-Hib1 (%)
DTP HepB-Hib3 (%)
PCV13_3 (%)
OPV3 (%)
Measles (%)
Bukavu 82 46 104 98 93 92 87
Kamina 97 84 100 96 35 90 100
Kole 92 80 106 97 38 98 103
Kolwezi 94 122 113 104 103 94 100
Luiza 96 88 97 94 66 93 98
Mwene Ditu 95 87 99 94 94 49 94
Tshumbe 99 57 101 96 0 84 95
Uvira 92 32 103 97 82 85 87
Total (%) 91 71 102 97 70 84 94
Target (%) 90 95 95 95 95 95 95
Achievement rate (%)
101% 75% 107% 102% 74% 88% 99%
IHPplus exceeded the coverage rate for the majority of vaccines, excluding BCG and PCV13_3 (achievement rates of 75% and 74%, respectively). Several IHPplus initiatives contribute to the high coverage rates including the following:
Provided fuel for all refrigerators in project-supported health zones and other products to improve the functioning of the cold supply chain
Transported vaccines and syringes to EPI points of service in hard-to-reach health zones (Mulungu)
Conducted supportive supervision and monthly monitoring to validate data
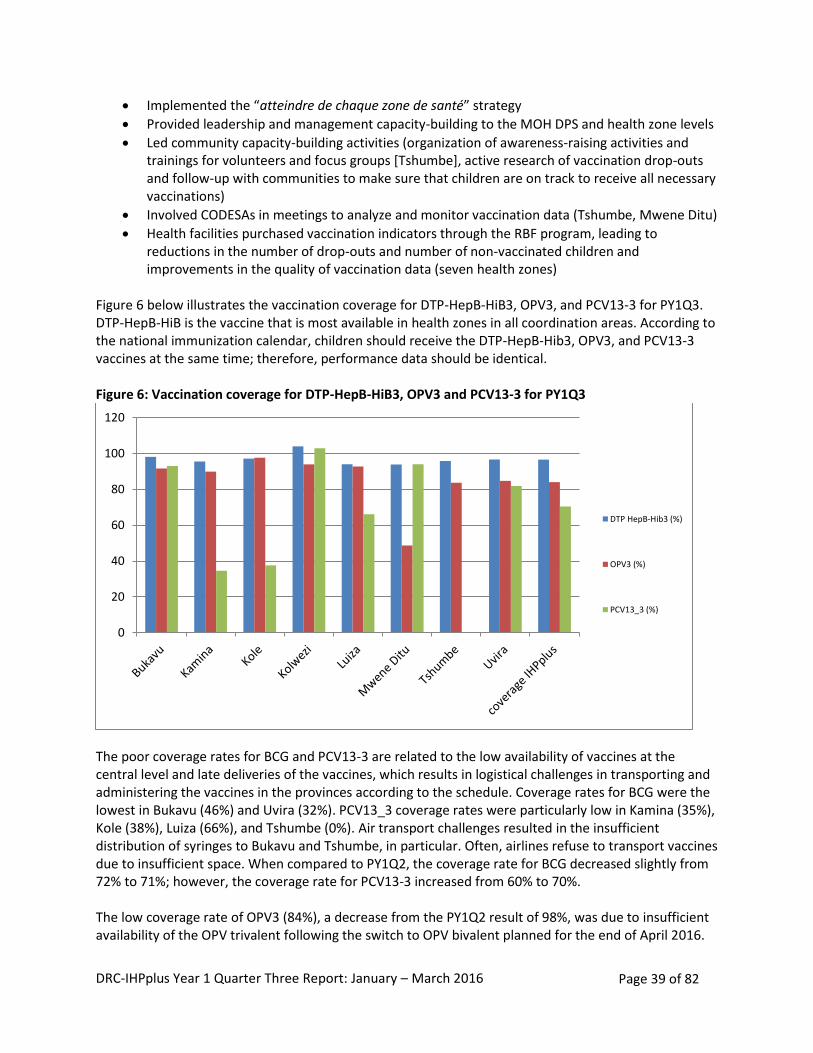
DRC-IHPplus Year 1 Quarter Three Report: January – March 2016 Page 39 of 82
Implemented the “atteindre de chaque zone de santé” strategy
Provided leadership and management capacity-building to the MOH DPS and health zone levels
Led community capacity-building activities (organization of awareness-raising activities and trainings for volunteers and focus groups [Tshumbe], active research of vaccination drop-outs and follow-up with communities to make sure that children are on track to receive all necessary vaccinations)
Involved CODESAs in meetings to analyze and monitor vaccination data (Tshumbe, Mwene Ditu)
Health facilities purchased vaccination indicators through the RBF program, leading to reductions in the number of drop-outs and number of non-vaccinated children and improvements in the quality of vaccination data (seven health zones)
Figure 6 below illustrates the vaccination coverage for DTP-HepB-HiB3, OPV3, and PCV13-3 for PY1Q3. DTP-HepB-HiB is the vaccine that is most available in health zones in all coordination areas. According to the national immunization calendar, children should receive the DTP-HepB-Hib3, OPV3, and PCV13-3 vaccines at the same time; therefore, performance data should be identical. Figure 6: Vaccination coverage for DTP-HepB-HiB3, OPV3 and PCV13-3 for PY1Q3
The poor coverage rates for BCG and PCV13-3 are related to the low availability of vaccines at the central level and late deliveries of the vaccines, which results in logistical challenges in transporting and administering the vaccines in the provinces according to the schedule. Coverage rates for BCG were the lowest in Bukavu (46%) and Uvira (32%). PCV13_3 coverage rates were particularly low in Kamina (35%), Kole (38%), Luiza (66%), and Tshumbe (0%). Air transport challenges resulted in the insufficient distribution of syringes to Bukavu and Tshumbe, in particular. Often, airlines refuse to transport vaccines due to insufficient space. When compared to PY1Q2, the coverage rate for BCG decreased slightly from 72% to 71%; however, the coverage rate for PCV13-3 increased from 60% to 70%. The low coverage rate of OPV3 (84%), a decrease from the PY1Q2 result of 98%, was due to insufficient availability of the OPV trivalent following the switch to OPV bivalent planned for the end of April 2016.
0
20
40
60
80
100
120
DTP HepB-Hib3 (%)
OPV3 (%)
PCV13_3 (%)
DRC-IHPplus Year 1 Quarter Three Report: January – March 2016 Page 40 of 82
DRC, and the entire sub-region, must begin using OPV bivalent instead of OPV trivalent during vaccination campaigns during this period. On January 13, 2016, DRC identified a case of vaccine-derived poliovirus, type 2 (with laboratory confirmation on March 1, 2016).1 Following the identification, the country planned national vaccination days for children 0 to 59 months (a total of 18,266,268 children were targeted). The first vaccination campaign took place from March 24-26, 2016, and a total of 17,058,304 children were vaccinated against polio (approximately 95% of the target population). Partners conducted independent monitoring exercises in households that verified that 5% of children were not vaccinated (strong performance). Monitoring outside of the household in public places indicated that 6% of children were not vaccinated. The second vaccination campaign is planned for April 14-16, 2016, and results will be presented in the next quarter. Rather than the 61 cases reported in the previous report, DRC had 66 polio-compatible cases at the end of 2015 (the five additional cases were confirmed after the original classification by the Intercounty Support Team [IST] Afrique Centrale, Libreville, Gabon, on April 25, 2016). DRC continued to conduct field visits to follow up on the identified cases, and a workshop was conducted in April 2016 to officially classify these polio-compatible cases. With regards to the monitoring of acute flaccid paralysis (AFP) cases, 93 cases were reported from the 78 IHPplus supported sites, and stool samples were collected for laboratory confirmation. The majority of health zones that have not reported AFP cases are those with populations of fewer than 100,000 inhabitants (according to the norms, 2-3 cases of AFP are expected for every 100,000 inhabitants aged under 15). The probability of identifying cases in health zones with a population of less than 100,000 is lower; the population of those under 15 years old represents approximately 48% of the total population. For health zones that have fewer than 100,000 inhabitations, the population of those under 15 years of age is smaller (approximately 50,000 inhabitants), which reduces the probability of identifying AFP cases. Additional efforts are needed to strengthen monitoring and community surveillance in areas with a population of less than 100,000 inhabitants where no cases were reported. As shown in Figure 7 below, the average drop-out rate for DTP-HepB-HiB3 among children less than 12 months of age is 5%, meeting the project target of 5% (achievement rate of 100%). This result was a slight increase from the 4% drop-out rate in PY1Q3. No drop-out rates were higher than 10% (the national performance standard is set between 0 and 10%).
1 Please see the following documents in appendix 12 for additional information: Mise à jour hebdomadaire sur
l’Initiative d’Eradication de la Polio en Afrique Centrale, Mise à jour du 14 mars 2016, IST Afrique Centrale, Libreville-GABON, slide 2, last bullet; and the Activités d’éradication de la poliomyélite (IEP), République Démocratique du Congo, Mise à jour du 15 avril 2016, slide 3.
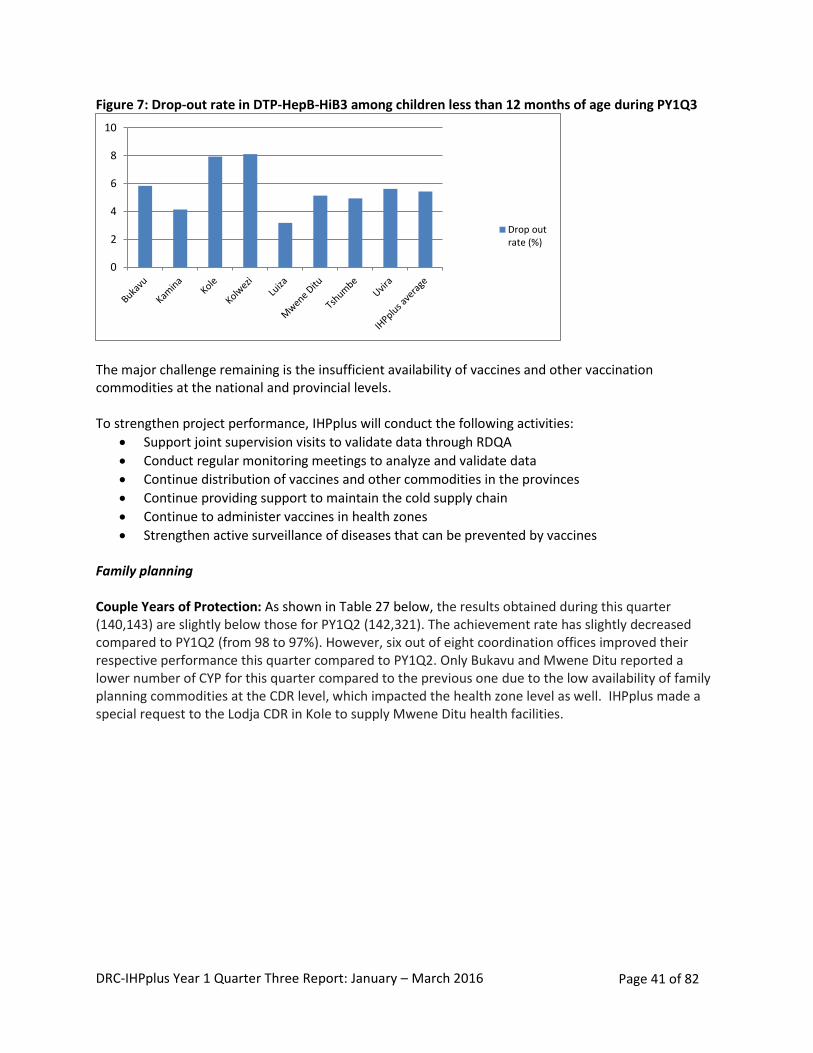
DRC-IHPplus Year 1 Quarter Three Report: January – March 2016 Page 41 of 82
Figure 7: Drop-out rate in DTP-HepB-HiB3 among children less than 12 months of age during PY1Q3
The major challenge remaining is the insufficient availability of vaccines and other vaccination commodities at the national and provincial levels. To strengthen project performance, IHPplus will conduct the following activities:
Support joint supervision visits to validate data through RDQA
Conduct regular monitoring meetings to analyze and validate data
Continue distribution of vaccines and other commodities in the provinces
Continue providing support to maintain the cold supply chain
Continue to administer vaccines in health zones
Strengthen active surveillance of diseases that can be prevented by vaccines Family planning Couple Years of Protection: As shown in Table 27 below, the results obtained during this quarter (140,143) are slightly below those for PY1Q2 (142,321). The achievement rate has slightly decreased compared to PY1Q2 (from 98 to 97%). However, six out of eight coordination offices improved their respective performance this quarter compared to PY1Q2. Only Bukavu and Mwene Ditu reported a lower number of CYP for this quarter compared to the previous one due to the low availability of family planning commodities at the CDR level, which impacted the health zone level as well. IHPplus made a special request to the Lodja CDR in Kole to supply Mwene Ditu health facilities.
0
2
4
6
8
10
Drop outrate (%)
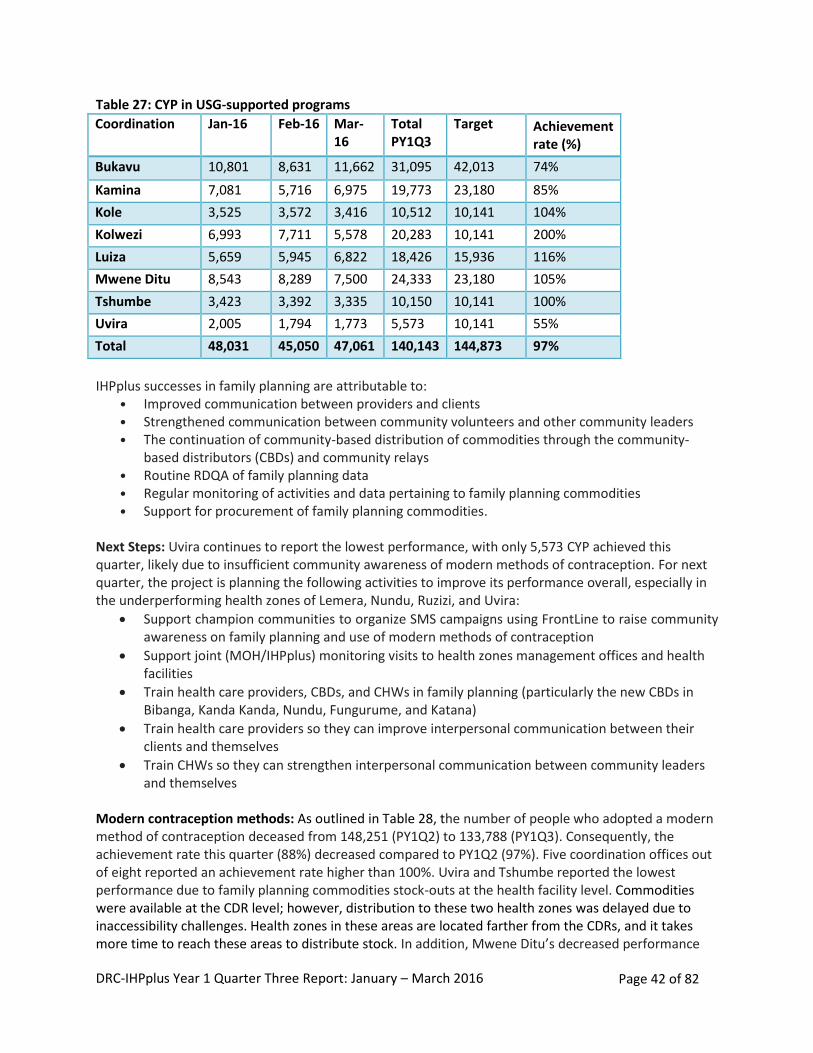
DRC-IHPplus Year 1 Quarter Three Report: January – March 2016 Page 42 of 82
Table 27: CYP in USG-supported programs
Coordination Jan-16 Feb-16 Mar-16
Total PY1Q3
Target Achievement rate (%)
Bukavu 10,801 8,631 11,662 31,095 42,013 74%
Kamina 7,081 5,716 6,975 19,773 23,180 85%
Kole 3,525 3,572 3,416 10,512 10,141 104%
Kolwezi 6,993 7,711 5,578 20,283 10,141 200%
Luiza 5,659 5,945 6,822 18,426 15,936 116%
Mwene Ditu 8,543 8,289 7,500 24,333 23,180 105%
Tshumbe 3,423 3,392 3,335 10,150 10,141 100%
Uvira 2,005 1,794 1,773 5,573 10,141 55%
Total 48,031 45,050 47,061 140,143 144,873 97%
IHPplus successes in family planning are attributable to:
• Improved communication between providers and clients • Strengthened communication between community volunteers and other community leaders • The continuation of community-based distribution of commodities through the community-
based distributors (CBDs) and community relays • Routine RDQA of family planning data • Regular monitoring of activities and data pertaining to family planning commodities • Support for procurement of family planning commodities.
Next Steps: Uvira continues to report the lowest performance, with only 5,573 CYP achieved this quarter, likely due to insufficient community awareness of modern methods of contraception. For next quarter, the project is planning the following activities to improve its performance overall, especially in the underperforming health zones of Lemera, Nundu, Ruzizi, and Uvira:
Support champion communities to organize SMS campaigns using FrontLine to raise community awareness on family planning and use of modern methods of contraception
Support joint (MOH/IHPplus) monitoring visits to health zones management offices and health facilities
Train health care providers, CBDs, and CHWs in family planning (particularly the new CBDs in Bibanga, Kanda Kanda, Nundu, Fungurume, and Katana)
Train health care providers so they can improve interpersonal communication between their clients and themselves
Train CHWs so they can strengthen interpersonal communication between community leaders and themselves
Modern contraception methods: As outlined in Table 28, the number of people who adopted a modern method of contraception deceased from 148,251 (PY1Q2) to 133,788 (PY1Q3). Consequently, the achievement rate this quarter (88%) decreased compared to PY1Q2 (97%). Five coordination offices out of eight reported an achievement rate higher than 100%. Uvira and Tshumbe reported the lowest performance due to family planning commodities stock-outs at the health facility level. Commodities were available at the CDR level; however, distribution to these two health zones was delayed due to inaccessibility challenges. Health zones in these areas are located farther from the CDRs, and it takes more time to reach these areas to distribute stock. In addition, Mwene Ditu’s decreased performance
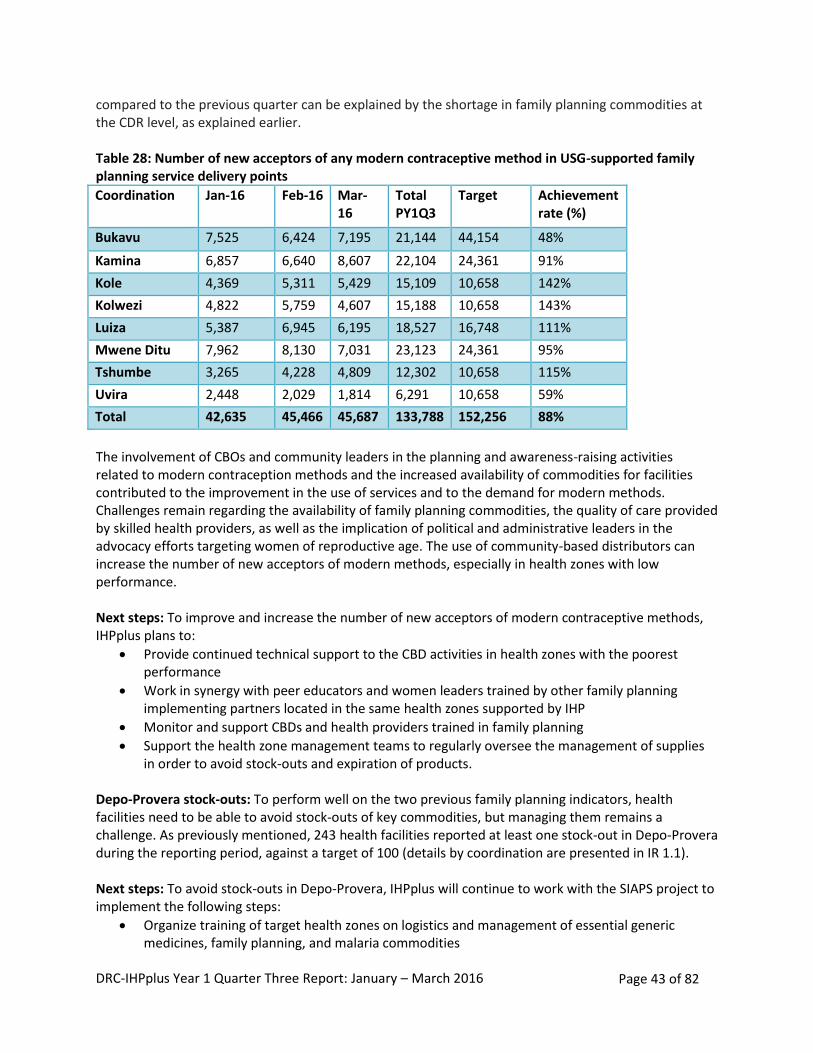
DRC-IHPplus Year 1 Quarter Three Report: January – March 2016 Page 43 of 82
compared to the previous quarter can be explained by the shortage in family planning commodities at the CDR level, as explained earlier. Table 28: Number of new acceptors of any modern contraceptive method in USG-supported family planning service delivery points
Coordination Jan-16 Feb-16 Mar-16
Total PY1Q3
Target Achievement rate (%)
Bukavu 7,525 6,424 7,195 21,144 44,154 48%
Kamina 6,857 6,640 8,607 22,104 24,361 91%
Kole 4,369 5,311 5,429 15,109 10,658 142%
Kolwezi 4,822 5,759 4,607 15,188 10,658 143%
Luiza 5,387 6,945 6,195 18,527 16,748 111%
Mwene Ditu 7,962 8,130 7,031 23,123 24,361 95%
Tshumbe 3,265 4,228 4,809 12,302 10,658 115%
Uvira 2,448 2,029 1,814 6,291 10,658 59%
Total 42,635 45,466 45,687 133,788 152,256 88%
The involvement of CBOs and community leaders in the planning and awareness-raising activities related to modern contraception methods and the increased availability of commodities for facilities contributed to the improvement in the use of services and to the demand for modern methods. Challenges remain regarding the availability of family planning commodities, the quality of care provided by skilled health providers, as well as the implication of political and administrative leaders in the advocacy efforts targeting women of reproductive age. The use of community-based distributors can increase the number of new acceptors of modern methods, especially in health zones with low performance. Next steps: To improve and increase the number of new acceptors of modern contraceptive methods, IHPplus plans to:
Provide continued technical support to the CBD activities in health zones with the poorest performance
Work in synergy with peer educators and women leaders trained by other family planning implementing partners located in the same health zones supported by IHP
Monitor and support CBDs and health providers trained in family planning
Support the health zone management teams to regularly oversee the management of supplies in order to avoid stock-outs and expiration of products.
Depo-Provera stock-outs: To perform well on the two previous family planning indicators, health facilities need to be able to avoid stock-outs of key commodities, but managing them remains a challenge. As previously mentioned, 243 health facilities reported at least one stock-out in Depo-Provera during the reporting period, against a target of 100 (details by coordination are presented in IR 1.1). Next steps: To avoid stock-outs in Depo-Provera, IHPplus will continue to work with the SIAPS project to implement the following steps:
Organize training of target health zones on logistics and management of essential generic medicines, family planning, and malaria commodities
DRC-IHPplus Year 1 Quarter Three Report: January – March 2016 Page 44 of 82
Determine the contraceptives that are about to expire or that are overstocked in the health zones supported by E2A and IHPplus, return them to the provincial coordination offices, and redistribute them to other health zones where they are needed
Return the overstock to the provincial coordination office for the National Reproductive Health Plan, once per quarter or as often as needed
Perform monthly assessments of the supply management of contraceptives
Perform monthly assessments of the provincial supply management of contraceptives
Verify the contraceptive data reported by the health centers on a monthly basis Nutrition: Performance on the three nutrition indicators reported and analyzed in this report (number of children under 5 years who received vitamin A supplements, number of pregnant women who received iron and folic acid supplements, and number of mothers of children 2 years or less receiving nutritional counseling for their children) is related to procurement of nutrition commodities, capacity building, monitoring, and community strengthening. The integration of the nutrition support group approach—infant and young child feeding (IYCF)—and culinary demonstrations contributed to the improvement of the number of mothers and children under two years receiving nutritional support. USAID Multi-Sectoral Nutrition Strategy Conference: Per USAID/DRC recommendation, the IHPplus Nutrition Senior Technical Advisor participated in a conference in Accra, Ghana, from January 17–23, 2016. The objectives of the conference were the following:
Improve understanding of USAID’s Multi-Sectoral Nutrition Strategy
Utilize learnings from recent evidence and technical advice to guide multi-sectoral nutrition programs
Share and learn from other participant’s recent experiences
Identify weaknesses and strengthen promising strategies within the multi-sectoral nutrition program
During the course of the conference, from the briefing on the multi-sectoral strategy for nutrition presented by the USAID Nutrition team in Washington, DC, and the sharing of experiences among experts present, it was acknowledged that nutrition is key in meeting the sustainable development objectives. Reducing chronic malnutrition cases by 20% requires a multi-sectoral strategy on nutrition, by supporting high-impact interventions such as the First 100 Days (which promotes that women and children get the right nutrition during the 1000 days between a woman’s pregnancy and her child’s second birthday) as well as strategies targeting adolescent girls. The adolescent nutrition interventions are explained in detail in the presentation “Adolescent Girls and Women’s Nutrition: Moving the Agenda Forward” in Appendix 10. The key nutrition interventions in the First 1000 Days are:
Improve nutrition before and during pregnancy: food and nutrition security, women’s education, WASH
Promote optimal breastfeeding
Gradually introduce nutritious, affordable, and preferably local foods from 6 to 24 months old
Provide early and effective treatment of Global Acute Malnutrition (GAM) with therapeutic methods
Create an environment favorable to improving nutrition
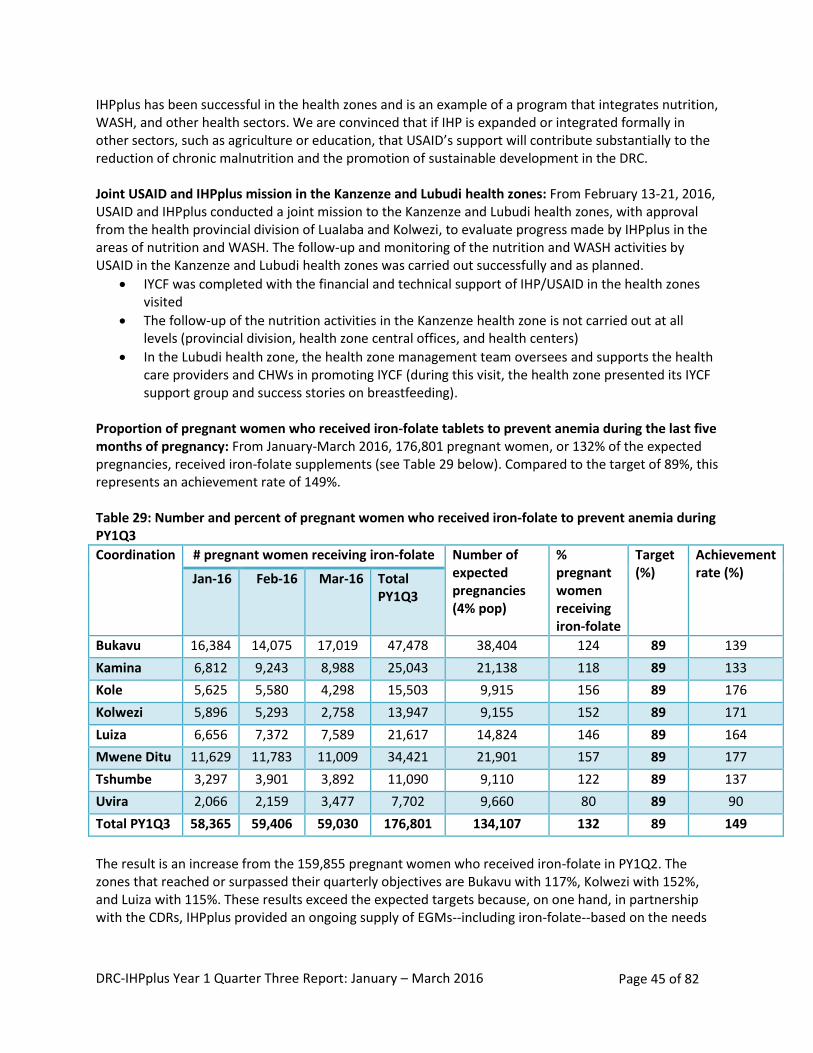
DRC-IHPplus Year 1 Quarter Three Report: January – March 2016 Page 45 of 82
IHPplus has been successful in the health zones and is an example of a program that integrates nutrition, WASH, and other health sectors. We are convinced that if IHP is expanded or integrated formally in other sectors, such as agriculture or education, that USAID’s support will contribute substantially to the reduction of chronic malnutrition and the promotion of sustainable development in the DRC. Joint USAID and IHPplus mission in the Kanzenze and Lubudi health zones: From February 13-21, 2016, USAID and IHPplus conducted a joint mission to the Kanzenze and Lubudi health zones, with approval from the health provincial division of Lualaba and Kolwezi, to evaluate progress made by IHPplus in the areas of nutrition and WASH. The follow-up and monitoring of the nutrition and WASH activities by USAID in the Kanzenze and Lubudi health zones was carried out successfully and as planned.
IYCF was completed with the financial and technical support of IHP/USAID in the health zones visited
The follow-up of the nutrition activities in the Kanzenze health zone is not carried out at all levels (provincial division, health zone central offices, and health centers)
In the Lubudi health zone, the health zone management team oversees and supports the health care providers and CHWs in promoting IYCF (during this visit, the health zone presented its IYCF support group and success stories on breastfeeding).
Proportion of pregnant women who received iron-folate tablets to prevent anemia during the last five months of pregnancy: From January-March 2016, 176,801 pregnant women, or 132% of the expected pregnancies, received iron-folate supplements (see Table 29 below). Compared to the target of 89%, this represents an achievement rate of 149%. Table 29: Number and percent of pregnant women who received iron-folate to prevent anemia during PY1Q3
Coordination # pregnant women receiving iron-folate Number of expected pregnancies (4% pop)
% pregnant women receiving iron-folate
Target (%)
Achievement rate (%) Jan-16 Feb-16 Mar-16 Total
PY1Q3
Bukavu 16,384 14,075 17,019 47,478 38,404 124 89 139
Kamina 6,812 9,243 8,988 25,043 21,138 118 89 133
Kole 5,625 5,580 4,298 15,503 9,915 156 89 176
Kolwezi 5,896 5,293 2,758 13,947 9,155 152 89 171
Luiza 6,656 7,372 7,589 21,617 14,824 146 89 164
Mwene Ditu 11,629 11,783 11,009 34,421 21,901 157 89 177
Tshumbe 3,297 3,901 3,892 11,090 9,110 122 89 137
Uvira 2,066 2,159 3,477 7,702 9,660 80 89 90
Total PY1Q3 58,365 59,406 59,030 176,801 134,107 132 89 149
The result is an increase from the 159,855 pregnant women who received iron-folate in PY1Q2. The zones that reached or surpassed their quarterly objectives are Bukavu with 117%, Kolwezi with 152%, and Luiza with 115%. These results exceed the expected targets because, on one hand, in partnership with the CDRs, IHPplus provided an ongoing supply of EGMs--including iron-folate--based on the needs
DRC-IHPplus Year 1 Quarter Three Report: January – March 2016 Page 46 of 82
of the zones. On the other hand, through prenatal consultations, pregnant women coming from surrounding areas, outside the funded health zones, also received supplements through Bukavu. Despite the strong overall results compared to initial targets, some health zones did not reach their targets due to the late processing of EGMs at the regional CDR level, including Bagira, Kalole, Kitutu, Kamituga, Mulungu (Bukavu coordination), Songa (Kamina coordination), Dekese (Luiza coordination), and Ruzizi (Uvira coordination). The challenge is the delay in processing of medicine requests, including iron-folate in weak performing health zones. The lesson learned during PY1Q3 is that the availability of iron-folate positively influences the use of ANC services across health zones. In order to strengthen the weaker performance in some health zones, IHPplus will provide technical assistance, through field visits, to carry out a situational analysis and to develop a recovery plan that will standardize requisitions at the CDR level, the timeliness of the reporting system, and the management of EGMs.
Next steps: IHPplus will increase the number of pregnant women receiving these supplements in the next quarters by continuing distribution of iron and folic acid supplements in five health zones, supporting health zone management teams to better manage these commodities at health facilities, and encouraging the teams to put in place a distribution plan and assume responsibility for transport costs to health facilities. Number of mothers of children two years of age or younger who have received nutritional counseling for their children: During PY1Q3, 177,885 of a target of 170,478 expected mothers with children two years of age or younger received counseling (104%). This result is lower than the second quarter when 144% performance was achieved. However, results still remain higher than expected targets. IHPplus staff and Programme National de Nutrition (PRONANUT) provincial office teams conducted joint missions in February of 2016, to follow up on IYCF integration through the IYCF support groups and at the health facilities in the following health zones: Ndekesha and Kalomba (Luiza), Ruzizi, Nunu Uvira, and Lemera (Uvira). During the missions, the teams observed that health zone management teams provided poor feedback and guidance to health care providers. CHWs continue to conduct home visits to provide household counseling on breastfeeding and on food fortification for children. IYCF support groups are still operational; and the topics linked to good nutrition practices are presented by the providers during the nutrition and health training sessions of the preschool consultation, ANC, etc. With regards to the weaknesses noted within each facility, IHPplus worked with stakeholders to develop immediate action and recovery plans. IHPplus also extended the integration of IYCF in March 2016 by funding a health care provider and CHW training in IYCF in all of the health zones of Mpokolo and Dibindi. PRONANUT experts from the Eastern Kasaï province facilitated this training. IYCF support groups and active CODESA both contribute to the strengthening of information and the adaption of good practices regarding infant nutrition. The continuation of the IYCF within the health areas requires the guidance of the health zone management team, as well as the need for activities on areas of interest such as food security. Planned actions for the next quarter include financial support for a visit to follow up on the revitalization of the IYCF support groups targeted by each IHPplus office in the province and to expand the integration of the IYCF training in the health areas.
DRC-IHPplus Year 1 Quarter Three Report: January – March 2016 Page 47 of 82
Number of people trained in child health and nutrition through USG-supported : The project is reporting on this indicator for the first time this quarter. Only Mwene Ditu provided financial and technical support to train 74 health staff in child health and nutrition from Mpokolo and Dibindi health zones. In each health zone, a total of 37 people were trained: two members of the health zone management team, 10 nurses from the health centers, and 25 community health workers. The other coordinations were unable to organize any training during PY1Q3, due to conflicting activity calendars. Planned actions for the next quarter: Each coordination office will determine its quarterly target for this indicator. In addition, IHPplus plans to conduct a child health and nutrition training in Bibanga health zone and one preschool consultation training in at least two health zones in every coordination office.
Malaria Prevention: During PY1Q3, 99,565 of pregnant women, or 74% of the expected pregnancies, received at least two doses of IPTp. Compared to the target of 75%, this represents an achievement rate of 99%. Compared to PY1Q2 performance (89,134), the number of pregnant women who received at least two doses of IPTp increased by 12%. As shown in Table 30 below, five out of eight coordination offices either met or exceeded their target of 75%, with the exception of Kamina (70%), Kolwezi (68%), and Uvira (55%).
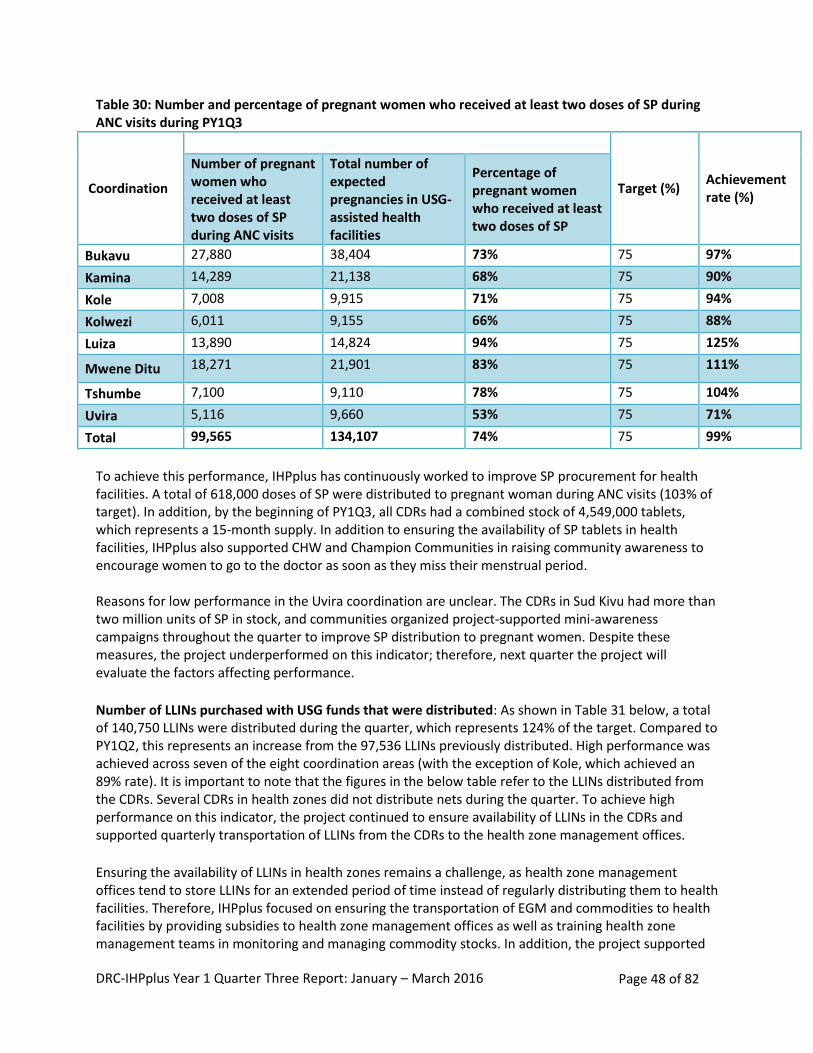
DRC-IHPplus Year 1 Quarter Three Report: January – March 2016 Page 48 of 82
Table 30: Number and percentage of pregnant women who received at least two doses of SP during ANC visits during PY1Q3
Coordination
Target (%) Achievement rate (%)
Number of pregnant women who received at least two doses of SP during ANC visits
Total number of expected pregnancies in USG-assisted health facilities
Percentage of pregnant women who received at least two doses of SP
Bukavu 27,880 38,404 73% 75 97%
Kamina 14,289 21,138 68% 75 90%
Kole 7,008 9,915 71% 75 94%
Kolwezi 6,011 9,155 66% 75 88%
Luiza 13,890 14,824 94% 75 125%
Mwene Ditu 18,271 21,901 83% 75 111%
Tshumbe 7,100 9,110 78% 75 104%
Uvira 5,116 9,660 53% 75 71%
Total 99,565 134,107 74% 75 99%
To achieve this performance, IHPplus has continuously worked to improve SP procurement for health facilities. A total of 618,000 doses of SP were distributed to pregnant woman during ANC visits (103% of target). In addition, by the beginning of PY1Q3, all CDRs had a combined stock of 4,549,000 tablets, which represents a 15-month supply. In addition to ensuring the availability of SP tablets in health facilities, IHPplus also supported CHW and Champion Communities in raising community awareness to encourage women to go to the doctor as soon as they miss their menstrual period. Reasons for low performance in the Uvira coordination are unclear. The CDRs in Sud Kivu had more than two million units of SP in stock, and communities organized project-supported mini-awareness campaigns throughout the quarter to improve SP distribution to pregnant women. Despite these measures, the project underperformed on this indicator; therefore, next quarter the project will evaluate the factors affecting performance.
Number of LLINs purchased with USG funds that were distributed: As shown in Table 31 below, a total of 140,750 LLINs were distributed during the quarter, which represents 124% of the target. Compared to PY1Q2, this represents an increase from the 97,536 LLINs previously distributed. High performance was achieved across seven of the eight coordination areas (with the exception of Kole, which achieved an 89% rate). It is important to note that the figures in the below table refer to the LLINs distributed from the CDRs. Several CDRs in health zones did not distribute nets during the quarter. To achieve high performance on this indicator, the project continued to ensure availability of LLINs in the CDRs and supported quarterly transportation of LLINs from the CDRs to the health zone management offices.
Ensuring the availability of LLINs in health zones remains a challenge, as health zone management offices tend to store LLINs for an extended period of time instead of regularly distributing them to health facilities. Therefore, IHPplus focused on ensuring the transportation of EGM and commodities to health facilities by providing subsidies to health zone management offices as well as training health zone management teams in monitoring and managing commodity stocks. In addition, the project supported
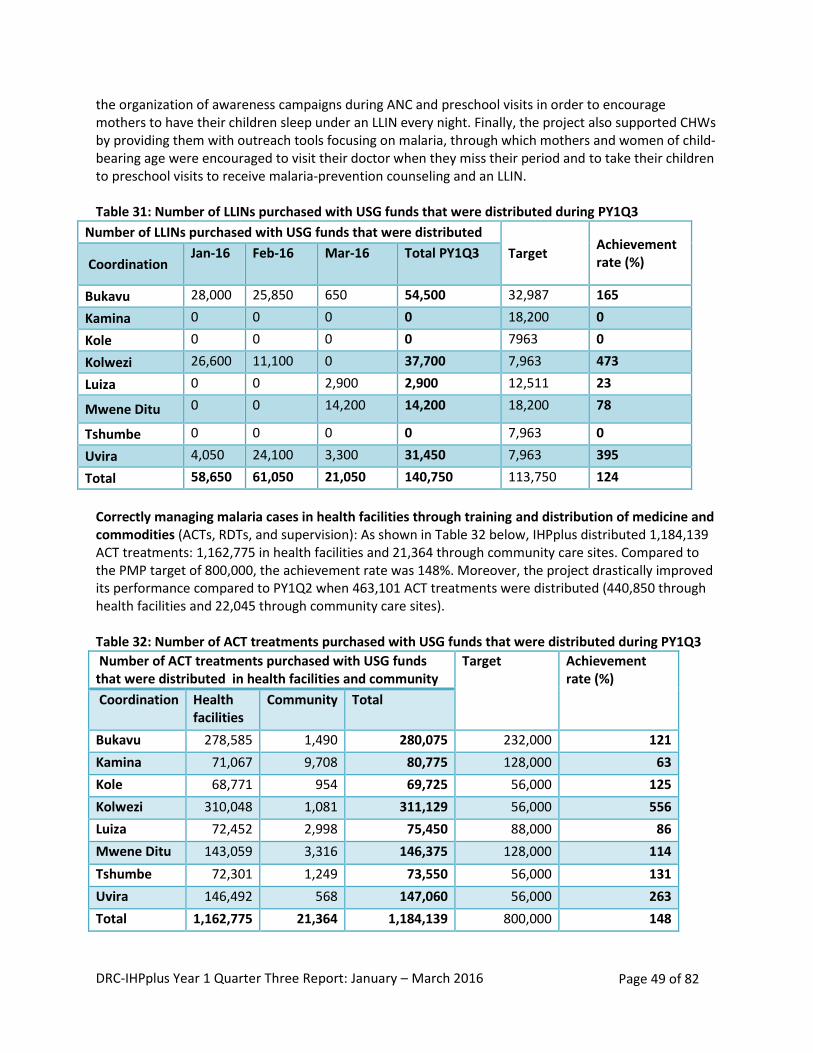
DRC-IHPplus Year 1 Quarter Three Report: January – March 2016 Page 49 of 82
the organization of awareness campaigns during ANC and preschool visits in order to encourage mothers to have their children sleep under an LLIN every night. Finally, the project also supported CHWs by providing them with outreach tools focusing on malaria, through which mothers and women of child-bearing age were encouraged to visit their doctor when they miss their period and to take their children to preschool visits to receive malaria-prevention counseling and an LLIN. Table 31: Number of LLINs purchased with USG funds that were distributed during PY1Q3
Number of LLINs purchased with USG funds that were distributed
Target Achievement rate (%) Coordination
Jan-16 Feb-16 Mar-16 Total PY1Q3
Bukavu 28,000 25,850 650 54,500 32,987 165
Kamina 0 0 0 0 18,200 0
Kole 0 0 0 0 7963 0
Kolwezi 26,600 11,100 0 37,700 7,963 473
Luiza 0 0 2,900 2,900 12,511 23
Mwene Ditu 0 0 14,200 14,200 18,200 78
Tshumbe 0 0 0 0 7,963 0
Uvira 4,050 24,100 3,300 31,450 7,963 395
Total 58,650 61,050 21,050 140,750 113,750 124
Correctly managing malaria cases in health facilities through training and distribution of medicine and commodities (ACTs, RDTs, and supervision): As shown in Table 32 below, IHPplus distributed 1,184,139 ACT treatments: 1,162,775 in health facilities and 21,364 through community care sites. Compared to the PMP target of 800,000, the achievement rate was 148%. Moreover, the project drastically improved its performance compared to PY1Q2 when 463,101 ACT treatments were distributed (440,850 through health facilities and 22,045 through community care sites). Table 32: Number of ACT treatments purchased with USG funds that were distributed during PY1Q3
Number of ACT treatments purchased with USG funds that were distributed in health facilities and community
Target Achievement rate (%)
Coordination Health facilities
Community Total
Bukavu 278,585 1,490 280,075 232,000 121
Kamina 71,067 9,708 80,775 128,000 63
Kole 68,771 954 69,725 56,000 125
Kolwezi 310,048 1,081 311,129 56,000 556
Luiza 72,452 2,998 75,450 88,000 86
Mwene Ditu 143,059 3,316 146,375 128,000 114
Tshumbe 72,301 1,249 73,550 56,000 131
Uvira 146,492 568 147,060 56,000 263
Total 1,162,775 21,364 1,184,139 800,000 148
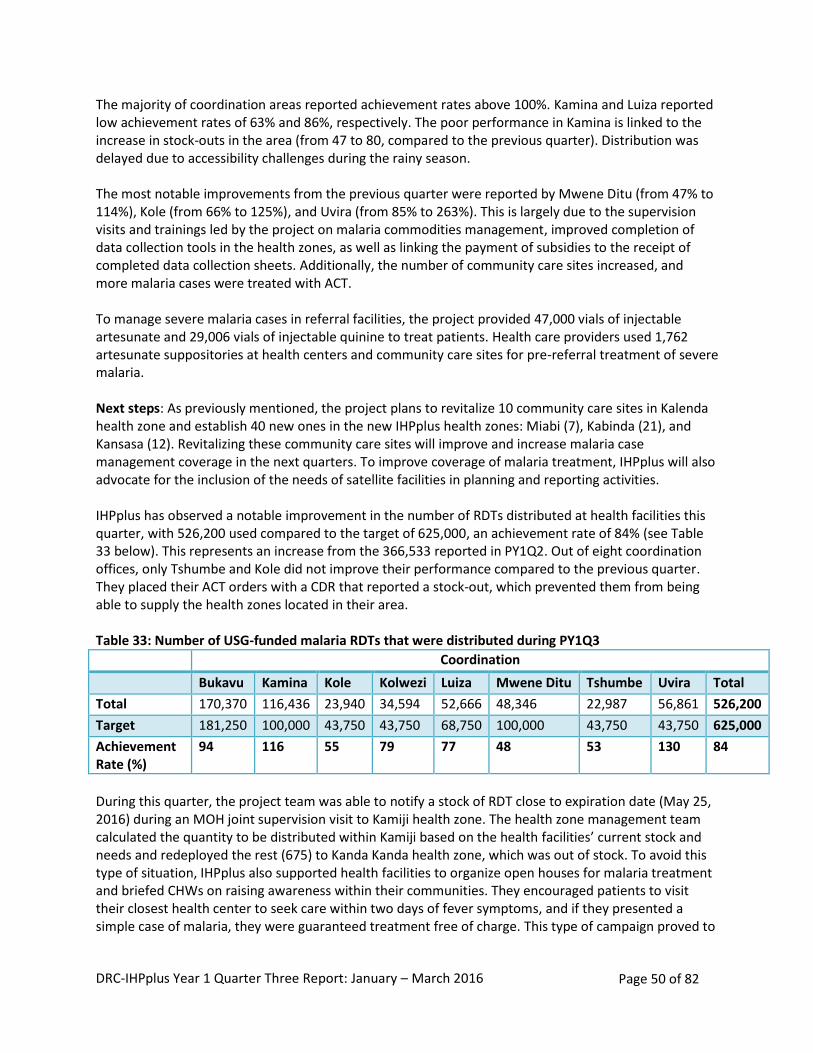
DRC-IHPplus Year 1 Quarter Three Report: January – March 2016 Page 50 of 82
The majority of coordination areas reported achievement rates above 100%. Kamina and Luiza reported low achievement rates of 63% and 86%, respectively. The poor performance in Kamina is linked to the increase in stock-outs in the area (from 47 to 80, compared to the previous quarter). Distribution was delayed due to accessibility challenges during the rainy season. The most notable improvements from the previous quarter were reported by Mwene Ditu (from 47% to 114%), Kole (from 66% to 125%), and Uvira (from 85% to 263%). This is largely due to the supervision visits and trainings led by the project on malaria commodities management, improved completion of data collection tools in the health zones, as well as linking the payment of subsidies to the receipt of completed data collection sheets. Additionally, the number of community care sites increased, and more malaria cases were treated with ACT. To manage severe malaria cases in referral facilities, the project provided 47,000 vials of injectable artesunate and 29,006 vials of injectable quinine to treat patients. Health care providers used 1,762 artesunate suppositories at health centers and community care sites for pre-referral treatment of severe malaria. Next steps: As previously mentioned, the project plans to revitalize 10 community care sites in Kalenda health zone and establish 40 new ones in the new IHPplus health zones: Miabi (7), Kabinda (21), and Kansasa (12). Revitalizing these community care sites will improve and increase malaria case management coverage in the next quarters. To improve coverage of malaria treatment, IHPplus will also advocate for the inclusion of the needs of satellite facilities in planning and reporting activities. IHPplus has observed a notable improvement in the number of RDTs distributed at health facilities this quarter, with 526,200 used compared to the target of 625,000, an achievement rate of 84% (see Table 33 below). This represents an increase from the 366,533 reported in PY1Q2. Out of eight coordination offices, only Tshumbe and Kole did not improve their performance compared to the previous quarter. They placed their ACT orders with a CDR that reported a stock-out, which prevented them from being able to supply the health zones located in their area. Table 33: Number of USG-funded malaria RDTs that were distributed during PY1Q3
Coordination
Bukavu Kamina Kole Kolwezi Luiza Mwene Ditu Tshumbe Uvira Total
Total 170,370 116,436 23,940 34,594 52,666 48,346 22,987 56,861 526,200
Target 181,250 100,000 43,750 43,750 68,750 100,000 43,750 43,750 625,000
Achievement Rate (%)
94 116 55 79 77 48 53 130 84
During this quarter, the project team was able to notify a stock of RDT close to expiration date (May 25, 2016) during an MOH joint supervision visit to Kamiji health zone. The health zone management team calculated the quantity to be distributed within Kamiji based on the health facilities’ current stock and needs and redeployed the rest (675) to Kanda Kanda health zone, which was out of stock. To avoid this type of situation, IHPplus also supported health facilities to organize open houses for malaria treatment and briefed CHWs on raising awareness within their communities. They encouraged patients to visit their closest health center to seek care within two days of fever symptoms, and if they presented a simple case of malaria, they were guaranteed treatment free of charge. This type of campaign proved to
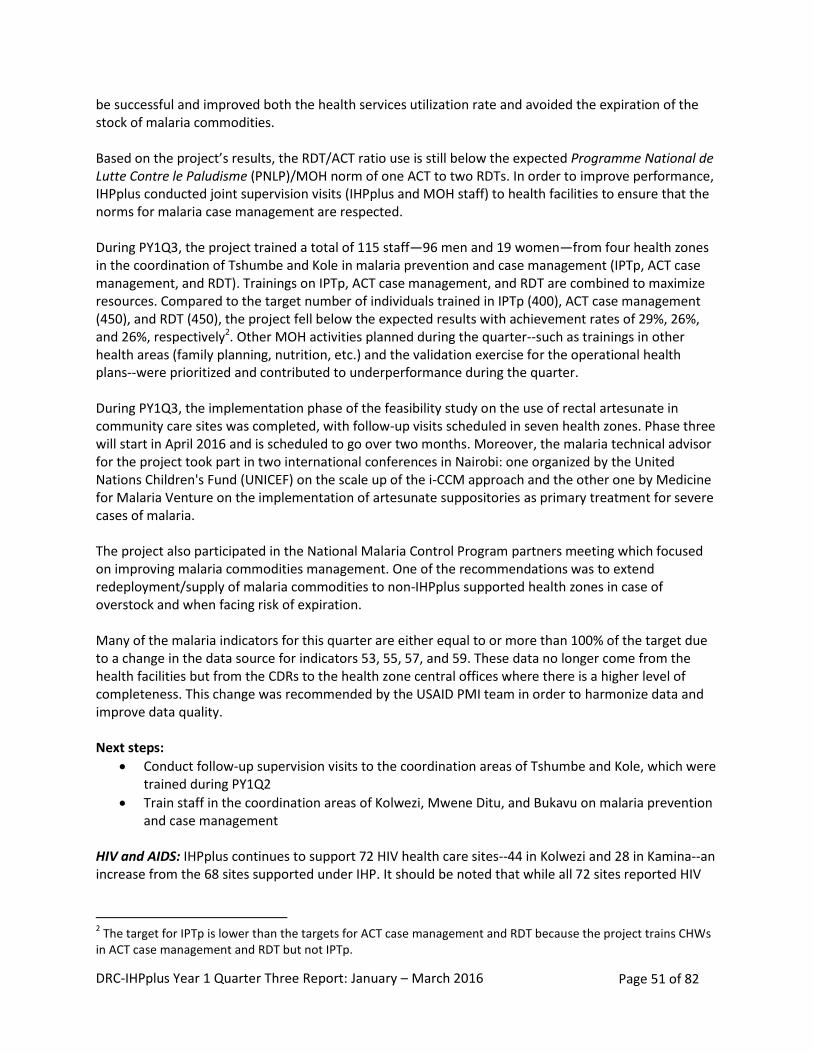
DRC-IHPplus Year 1 Quarter Three Report: January – March 2016 Page 51 of 82
be successful and improved both the health services utilization rate and avoided the expiration of the stock of malaria commodities. Based on the project’s results, the RDT/ACT ratio use is still below the expected Programme National de Lutte Contre le Paludisme (PNLP)/MOH norm of one ACT to two RDTs. In order to improve performance, IHPplus conducted joint supervision visits (IHPplus and MOH staff) to health facilities to ensure that the norms for malaria case management are respected. During PY1Q3, the project trained a total of 115 staff—96 men and 19 women—from four health zones in the coordination of Tshumbe and Kole in malaria prevention and case management (IPTp, ACT case management, and RDT). Trainings on IPTp, ACT case management, and RDT are combined to maximize resources. Compared to the target number of individuals trained in IPTp (400), ACT case management (450), and RDT (450), the project fell below the expected results with achievement rates of 29%, 26%, and 26%, respectively2. Other MOH activities planned during the quarter--such as trainings in other health areas (family planning, nutrition, etc.) and the validation exercise for the operational health plans--were prioritized and contributed to underperformance during the quarter. During PY1Q3, the implementation phase of the feasibility study on the use of rectal artesunate in community care sites was completed, with follow-up visits scheduled in seven health zones. Phase three will start in April 2016 and is scheduled to go over two months. Moreover, the malaria technical advisor for the project took part in two international conferences in Nairobi: one organized by the United Nations Children's Fund (UNICEF) on the scale up of the i-CCM approach and the other one by Medicine for Malaria Venture on the implementation of artesunate suppositories as primary treatment for severe cases of malaria. The project also participated in the National Malaria Control Program partners meeting which focused on improving malaria commodities management. One of the recommendations was to extend redeployment/supply of malaria commodities to non-IHPplus supported health zones in case of overstock and when facing risk of expiration. Many of the malaria indicators for this quarter are either equal to or more than 100% of the target due to a change in the data source for indicators 53, 55, 57, and 59. These data no longer come from the health facilities but from the CDRs to the health zone central offices where there is a higher level of completeness. This change was recommended by the USAID PMI team in order to harmonize data and improve data quality. Next steps:
Conduct follow-up supervision visits to the coordination areas of Tshumbe and Kole, which were trained during PY1Q2
Train staff in the coordination areas of Kolwezi, Mwene Ditu, and Bukavu on malaria prevention and case management
HIV and AIDS: IHPplus continues to support 72 HIV health care sites--44 in Kolwezi and 28 in Kamina--an increase from the 68 sites supported under IHP. It should be noted that while all 72 sites reported HIV
2 The target for IPTp is lower than the targets for ACT case management and RDT because the project trains CHWs
in ACT case management and RDT but not IPTp.
DRC-IHPplus Year 1 Quarter Three Report: January – March 2016 Page 52 of 82
data for this quarter, four sites in the Kabongo health zone submitted their March 2016 data late to the Kamina coordination; therefore these data were not included in this report. In Kolwezi, the Mwangeji GRH, considered a hub, also reported data collected by two satellite health centers, Zikito and Mariopolis. In addition, the Manika health zone management team decided to shift its support from Bethsaida health center (deemed unproductive and non-collaborative) to Orthodoxe hospital, as agreed with Lualaba DPS. In addition, IHPplus completed data verification exercises in Kolwezi, particularly in Manika, and provided assistance to previously non-productive HIV sites (Nseke/Kanzenze, Kalwa, Kikobe/Lubudi, Mwanfwe, Kisanfu/Lualaba, and Mukabe/Lubudi) to test and treat new HIV-positive cases. This is an important success for the project, as these sites did not report any new HIV-positive cases in the previous quarters. PEPFAR and the MOH have agreed to have one HIV implementing partner by health zone. Negotiations were completed in Kolwezi during the quarter to determine the implementing partner. There are also changes to the project’s support in Kamina due to PEPFAR’s rationalization process with the Global Fund3. IHPplus will no longer support HIV sites in Kamina, as they will be supported by the Global Fund. Additionally, two teams from the PNLS national office and provincial one (ex-Katanga) led an evaluation in the HIV site laboratories, with the support of the project. No stock-outs of HIV testing or treatment commodities were recorded during this quarter. Percentage of PEPFAR-supported sites achieving 90% ARV or ART coverage for HIV+ pregnant women: During PY1Q3, 98% (39/40) of the PEPFAR-supported sites providing PMTCT services achieved 90% antiretroviral treatment coverage for seropositive pregnant women. This result exceeds the PMP target of 76%, an achievement rate of 129%. The PY1Q3 result is an increase from the coverage rate of 88% recorded in PY1Q2. Kamina achieved 100% coverage and Kolwezi achieved 97% coverage. The strong performance during the quarter is due to the availability of ARVs at health facilities and the implementation of option B+. Number and percentage of pregnant women with known status (includes women who were tested for HIV and received their results): A total of 7,690 women out of the 8,054 women (95%) tested for HIV were aware of their HIV status and received their results during prenatal visits and in the labor and delivery ward, an increase from the 7,618 women reported in PY1Q2. This result exceeds the target of 85% and represents an achievement rate of 112%. In Kolwezi, 98% of pregnant women who were tested for HIV are aware of their status, and 95% of tested women in Kamina know their status. Among the tested pregnant women in the 72 IHPplus-supported PMTCT sites, 109 tested positive for HIV (1%). Only 6 out of the 109 (6%) women were aware of their status upon admission and 103 (94%) new HIV cases were detected. The overall seropositivity rate increased from 1.3% to 1.41% in the 72 sites. In the coordination areas of Kolwezi/Lualaba and Kamina/Haut Lomami, 2.26% and 0.35% of pregnant women tested positive for HIV, respectively. During this quarter, the seropositivity rate among pregnant woman increased in Kamina (from 0.03% during PY1Q2) as more women were tested for HIV
3 PEPFAR and Global Fund-financed programs are undergoing a rationalization process in DRC to improve program
coordination, decrease costs, and create greater efficiencies between Global Fund and USG investments in order to increase the coverage of essential HIV services and save more lives. A USG-Government of DRC agreement specifies areas of implementation for each donor.
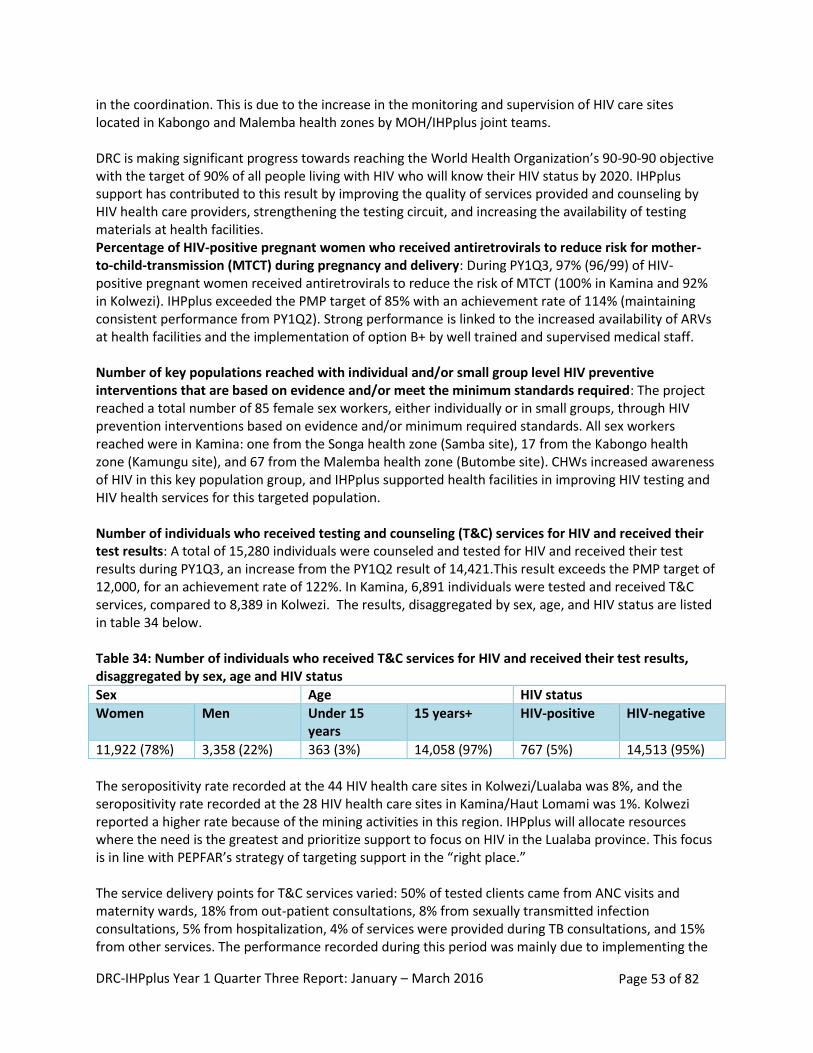
DRC-IHPplus Year 1 Quarter Three Report: January – March 2016 Page 53 of 82
in the coordination. This is due to the increase in the monitoring and supervision of HIV care sites located in Kabongo and Malemba health zones by MOH/IHPplus joint teams. DRC is making significant progress towards reaching the World Health Organization’s 90-90-90 objective with the target of 90% of all people living with HIV who will know their HIV status by 2020. IHPplus support has contributed to this result by improving the quality of services provided and counseling by HIV health care providers, strengthening the testing circuit, and increasing the availability of testing materials at health facilities. Percentage of HIV-positive pregnant women who received antiretrovirals to reduce risk for mother-to-child-transmission (MTCT) during pregnancy and delivery: During PY1Q3, 97% (96/99) of HIV-positive pregnant women received antiretrovirals to reduce the risk of MTCT (100% in Kamina and 92% in Kolwezi). IHPplus exceeded the PMP target of 85% with an achievement rate of 114% (maintaining consistent performance from PY1Q2). Strong performance is linked to the increased availability of ARVs at health facilities and the implementation of option B+ by well trained and supervised medical staff. Number of key populations reached with individual and/or small group level HIV preventive interventions that are based on evidence and/or meet the minimum standards required: The project reached a total number of 85 female sex workers, either individually or in small groups, through HIV prevention interventions based on evidence and/or minimum required standards. All sex workers reached were in Kamina: one from the Songa health zone (Samba site), 17 from the Kabongo health zone (Kamungu site), and 67 from the Malemba health zone (Butombe site). CHWs increased awareness of HIV in this key population group, and IHPplus supported health facilities in improving HIV testing and HIV health services for this targeted population. Number of individuals who received testing and counseling (T&C) services for HIV and received their test results: A total of 15,280 individuals were counseled and tested for HIV and received their test results during PY1Q3, an increase from the PY1Q2 result of 14,421.This result exceeds the PMP target of 12,000, for an achievement rate of 122%. In Kamina, 6,891 individuals were tested and received T&C services, compared to 8,389 in Kolwezi. The results, disaggregated by sex, age, and HIV status are listed in table 34 below. Table 34: Number of individuals who received T&C services for HIV and received their test results, disaggregated by sex, age and HIV status
Sex Age HIV status
Women Men Under 15 years
15 years+ HIV-positive HIV-negative
11,922 (78%) 3,358 (22%) 363 (3%) 14,058 (97%) 767 (5%) 14,513 (95%)
The seropositivity rate recorded at the 44 HIV health care sites in Kolwezi/Lualaba was 8%, and the seropositivity rate recorded at the 28 HIV health care sites in Kamina/Haut Lomami was 1%. Kolwezi reported a higher rate because of the mining activities in this region. IHPplus will allocate resources where the need is the greatest and prioritize support to focus on HIV in the Lualaba province. This focus is in line with PEPFAR’s strategy of targeting support in the “right place.” The service delivery points for T&C services varied: 50% of tested clients came from ANC visits and maternity wards, 18% from out-patient consultations, 8% from sexually transmitted infection consultations, 5% from hospitalization, 4% of services were provided during TB consultations, and 15% from other services. The performance recorded during this period was mainly due to implementing the
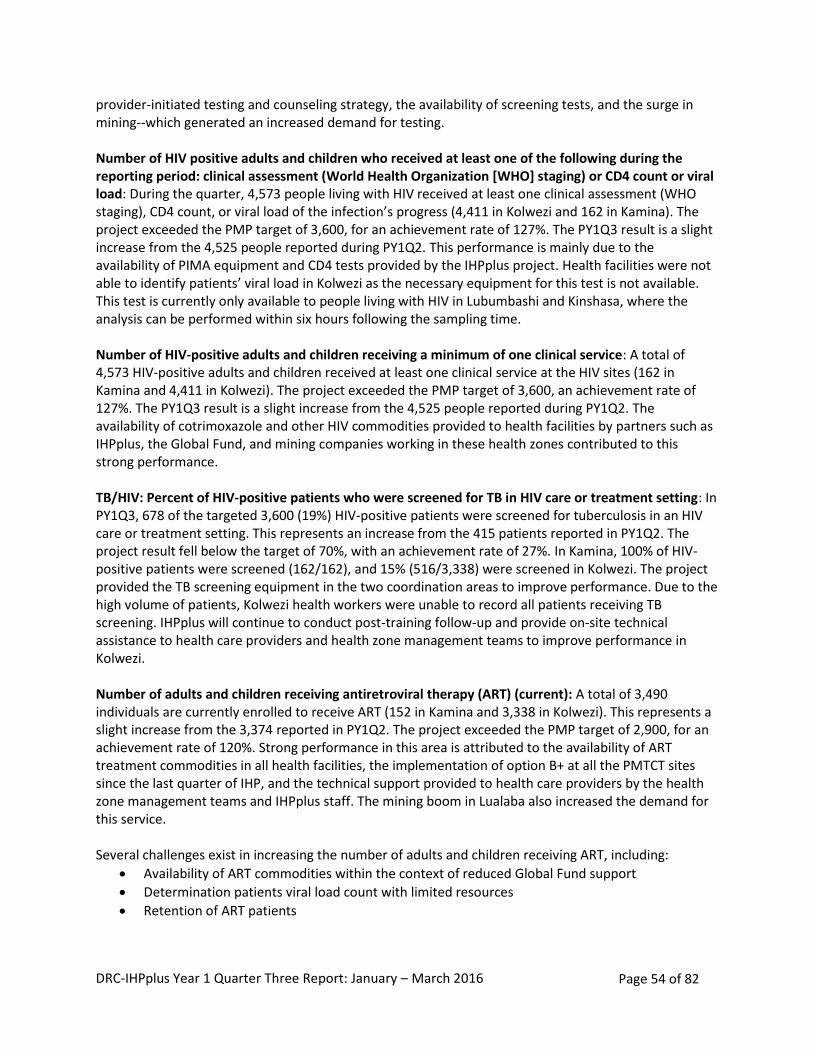
DRC-IHPplus Year 1 Quarter Three Report: January – March 2016 Page 54 of 82
provider-initiated testing and counseling strategy, the availability of screening tests, and the surge in mining--which generated an increased demand for testing. Number of HIV positive adults and children who received at least one of the following during the reporting period: clinical assessment (World Health Organization [WHO] staging) or CD4 count or viral load: During the quarter, 4,573 people living with HIV received at least one clinical assessment (WHO staging), CD4 count, or viral load of the infection’s progress (4,411 in Kolwezi and 162 in Kamina). The project exceeded the PMP target of 3,600, for an achievement rate of 127%. The PY1Q3 result is a slight increase from the 4,525 people reported during PY1Q2. This performance is mainly due to the availability of PIMA equipment and CD4 tests provided by the IHPplus project. Health facilities were not able to identify patients’ viral load in Kolwezi as the necessary equipment for this test is not available. This test is currently only available to people living with HIV in Lubumbashi and Kinshasa, where the analysis can be performed within six hours following the sampling time. Number of HIV-positive adults and children receiving a minimum of one clinical service: A total of 4,573 HIV-positive adults and children received at least one clinical service at the HIV sites (162 in Kamina and 4,411 in Kolwezi). The project exceeded the PMP target of 3,600, an achievement rate of 127%. The PY1Q3 result is a slight increase from the 4,525 people reported during PY1Q2. The availability of cotrimoxazole and other HIV commodities provided to health facilities by partners such as IHPplus, the Global Fund, and mining companies working in these health zones contributed to this strong performance. TB/HIV: Percent of HIV-positive patients who were screened for TB in HIV care or treatment setting: In PY1Q3, 678 of the targeted 3,600 (19%) HIV-positive patients were screened for tuberculosis in an HIV care or treatment setting. This represents an increase from the 415 patients reported in PY1Q2. The project result fell below the target of 70%, with an achievement rate of 27%. In Kamina, 100% of HIV-positive patients were screened (162/162), and 15% (516/3,338) were screened in Kolwezi. The project provided the TB screening equipment in the two coordination areas to improve performance. Due to the high volume of patients, Kolwezi health workers were unable to record all patients receiving TB screening. IHPplus will continue to conduct post-training follow-up and provide on-site technical assistance to health care providers and health zone management teams to improve performance in Kolwezi. Number of adults and children receiving antiretroviral therapy (ART) (current): A total of 3,490 individuals are currently enrolled to receive ART (152 in Kamina and 3,338 in Kolwezi). This represents a slight increase from the 3,374 reported in PY1Q2. The project exceeded the PMP target of 2,900, for an achievement rate of 120%. Strong performance in this area is attributed to the availability of ART treatment commodities in all health facilities, the implementation of option B+ at all the PMTCT sites since the last quarter of IHP, and the technical support provided to health care providers by the health zone management teams and IHPplus staff. The mining boom in Lualaba also increased the demand for this service. Several challenges exist in increasing the number of adults and children receiving ART, including:
Availability of ART commodities within the context of reduced Global Fund support
Determination patients viral load count with limited resources
Retention of ART patients
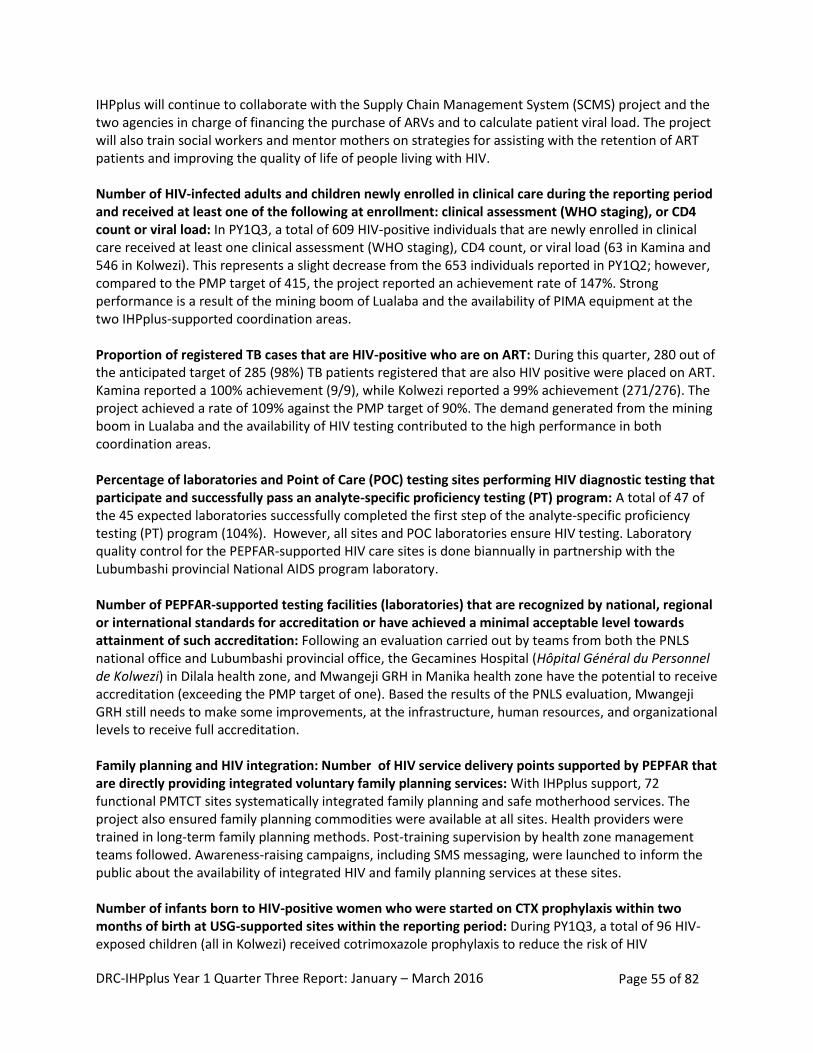
DRC-IHPplus Year 1 Quarter Three Report: January – March 2016 Page 55 of 82
IHPplus will continue to collaborate with the Supply Chain Management System (SCMS) project and the two agencies in charge of financing the purchase of ARVs and to calculate patient viral load. The project will also train social workers and mentor mothers on strategies for assisting with the retention of ART patients and improving the quality of life of people living with HIV. Number of HIV-infected adults and children newly enrolled in clinical care during the reporting period and received at least one of the following at enrollment: clinical assessment (WHO staging), or CD4 count or viral load: In PY1Q3, a total of 609 HIV-positive individuals that are newly enrolled in clinical care received at least one clinical assessment (WHO staging), CD4 count, or viral load (63 in Kamina and 546 in Kolwezi). This represents a slight decrease from the 653 individuals reported in PY1Q2; however, compared to the PMP target of 415, the project reported an achievement rate of 147%. Strong performance is a result of the mining boom of Lualaba and the availability of PIMA equipment at the two IHPplus-supported coordination areas. Proportion of registered TB cases that are HIV-positive who are on ART: During this quarter, 280 out of the anticipated target of 285 (98%) TB patients registered that are also HIV positive were placed on ART. Kamina reported a 100% achievement (9/9), while Kolwezi reported a 99% achievement (271/276). The project achieved a rate of 109% against the PMP target of 90%. The demand generated from the mining boom in Lualaba and the availability of HIV testing contributed to the high performance in both coordination areas. Percentage of laboratories and Point of Care (POC) testing sites performing HIV diagnostic testing that participate and successfully pass an analyte-specific proficiency testing (PT) program: A total of 47 of the 45 expected laboratories successfully completed the first step of the analyte-specific proficiency testing (PT) program (104%). However, all sites and POC laboratories ensure HIV testing. Laboratory quality control for the PEPFAR-supported HIV care sites is done biannually in partnership with the Lubumbashi provincial National AIDS program laboratory. Number of PEPFAR-supported testing facilities (laboratories) that are recognized by national, regional or international standards for accreditation or have achieved a minimal acceptable level towards attainment of such accreditation: Following an evaluation carried out by teams from both the PNLS national office and Lubumbashi provincial office, the Gecamines Hospital (Hôpital Général du Personnel de Kolwezi) in Dilala health zone, and Mwangeji GRH in Manika health zone have the potential to receive accreditation (exceeding the PMP target of one). Based the results of the PNLS evaluation, Mwangeji GRH still needs to make some improvements, at the infrastructure, human resources, and organizational levels to receive full accreditation. Family planning and HIV integration: Number of HIV service delivery points supported by PEPFAR that are directly providing integrated voluntary family planning services: With IHPplus support, 72 functional PMTCT sites systematically integrated family planning and safe motherhood services. The project also ensured family planning commodities were available at all sites. Health providers were trained in long-term family planning methods. Post-training supervision by health zone management teams followed. Awareness-raising campaigns, including SMS messaging, were launched to inform the public about the availability of integrated HIV and family planning services at these sites. Number of infants born to HIV-positive women who were started on CTX prophylaxis within two months of birth at USG-supported sites within the reporting period: During PY1Q3, a total of 96 HIV-exposed children (all in Kolwezi) received cotrimoxazole prophylaxis to reduce the risk of HIV
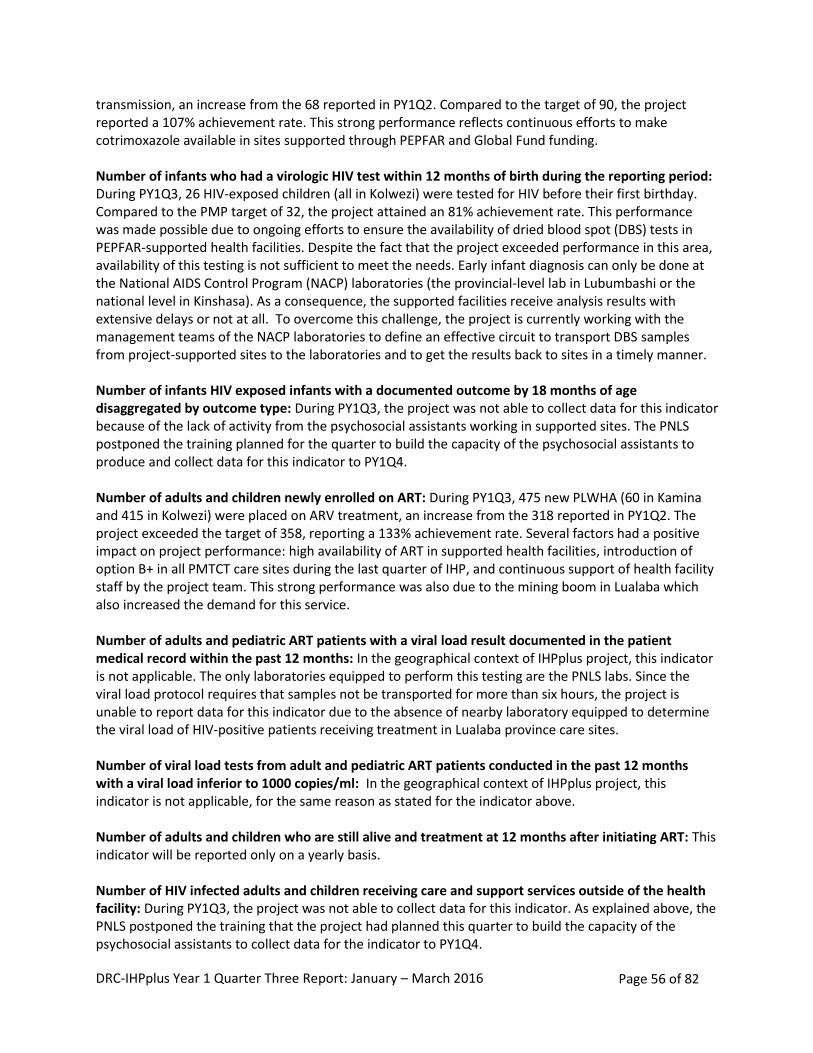
DRC-IHPplus Year 1 Quarter Three Report: January – March 2016 Page 56 of 82
transmission, an increase from the 68 reported in PY1Q2. Compared to the target of 90, the project reported a 107% achievement rate. This strong performance reflects continuous efforts to make cotrimoxazole available in sites supported through PEPFAR and Global Fund funding. Number of infants who had a virologic HIV test within 12 months of birth during the reporting period: During PY1Q3, 26 HIV-exposed children (all in Kolwezi) were tested for HIV before their first birthday. Compared to the PMP target of 32, the project attained an 81% achievement rate. This performance was made possible due to ongoing efforts to ensure the availability of dried blood spot (DBS) tests in PEPFAR-supported health facilities. Despite the fact that the project exceeded performance in this area, availability of this testing is not sufficient to meet the needs. Early infant diagnosis can only be done at the National AIDS Control Program (NACP) laboratories (the provincial-level lab in Lubumbashi or the national level in Kinshasa). As a consequence, the supported facilities receive analysis results with extensive delays or not at all. To overcome this challenge, the project is currently working with the management teams of the NACP laboratories to define an effective circuit to transport DBS samples from project-supported sites to the laboratories and to get the results back to sites in a timely manner. Number of infants HIV exposed infants with a documented outcome by 18 months of age disaggregated by outcome type: During PY1Q3, the project was not able to collect data for this indicator because of the lack of activity from the psychosocial assistants working in supported sites. The PNLS postponed the training planned for the quarter to build the capacity of the psychosocial assistants to produce and collect data for this indicator to PY1Q4. Number of adults and children newly enrolled on ART: During PY1Q3, 475 new PLWHA (60 in Kamina and 415 in Kolwezi) were placed on ARV treatment, an increase from the 318 reported in PY1Q2. The project exceeded the target of 358, reporting a 133% achievement rate. Several factors had a positive impact on project performance: high availability of ART in supported health facilities, introduction of option B+ in all PMTCT care sites during the last quarter of IHP, and continuous support of health facility staff by the project team. This strong performance was also due to the mining boom in Lualaba which also increased the demand for this service. Number of adults and pediatric ART patients with a viral load result documented in the patient medical record within the past 12 months: In the geographical context of IHPplus project, this indicator is not applicable. The only laboratories equipped to perform this testing are the PNLS labs. Since the viral load protocol requires that samples not be transported for more than six hours, the project is unable to report data for this indicator due to the absence of nearby laboratory equipped to determine the viral load of HIV-positive patients receiving treatment in Lualaba province care sites. Number of viral load tests from adult and pediatric ART patients conducted in the past 12 months with a viral load inferior to 1000 copies/ml: In the geographical context of IHPplus project, this indicator is not applicable, for the same reason as stated for the indicator above. Number of adults and children who are still alive and treatment at 12 months after initiating ART: This indicator will be reported only on a yearly basis. Number of HIV infected adults and children receiving care and support services outside of the health facility: During PY1Q3, the project was not able to collect data for this indicator. As explained above, the PNLS postponed the training that the project had planned this quarter to build the capacity of the psychosocial assistants to collect data for the indicator to PY1Q4.
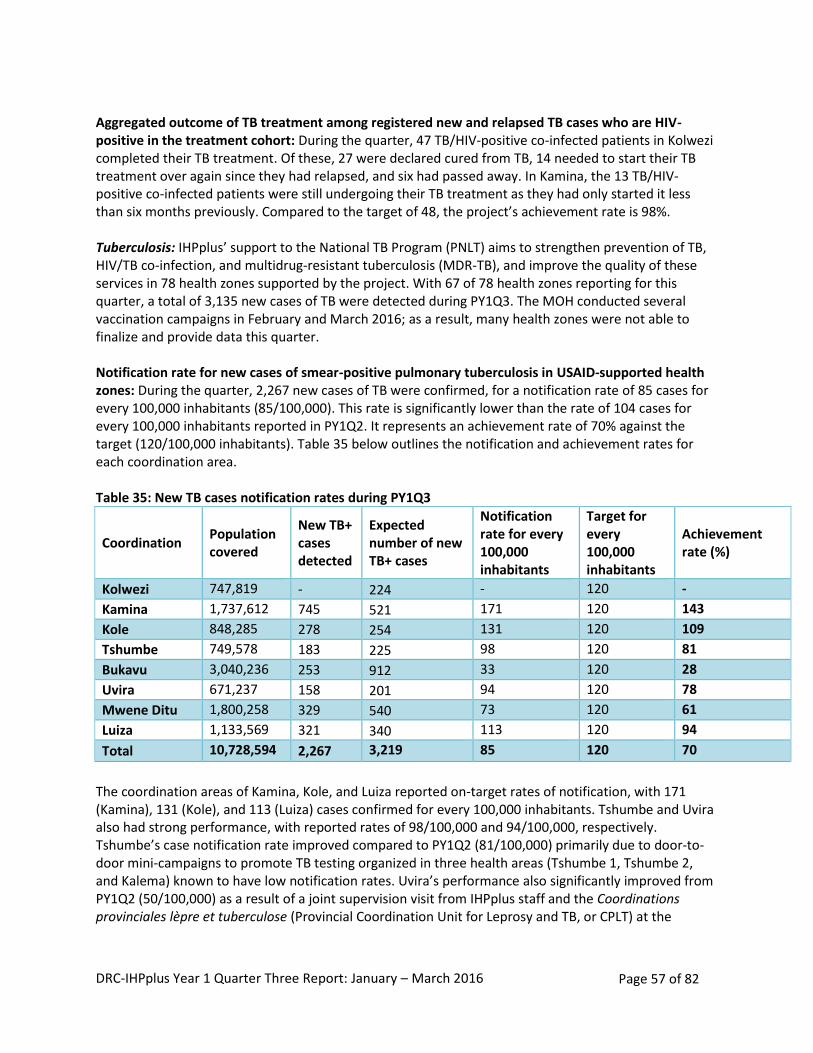
DRC-IHPplus Year 1 Quarter Three Report: January – March 2016 Page 57 of 82
Aggregated outcome of TB treatment among registered new and relapsed TB cases who are HIV-positive in the treatment cohort: During the quarter, 47 TB/HIV-positive co-infected patients in Kolwezi completed their TB treatment. Of these, 27 were declared cured from TB, 14 needed to start their TB treatment over again since they had relapsed, and six had passed away. In Kamina, the 13 TB/HIV-positive co-infected patients were still undergoing their TB treatment as they had only started it less than six months previously. Compared to the target of 48, the project’s achievement rate is 98%. Tuberculosis: IHPplus’ support to the National TB Program (PNLT) aims to strengthen prevention of TB, HIV/TB co-infection, and multidrug-resistant tuberculosis (MDR-TB), and improve the quality of these services in 78 health zones supported by the project. With 67 of 78 health zones reporting for this quarter, a total of 3,135 new cases of TB were detected during PY1Q3. The MOH conducted several vaccination campaigns in February and March 2016; as a result, many health zones were not able to finalize and provide data this quarter. Notification rate for new cases of smear-positive pulmonary tuberculosis in USAID-supported health zones: During the quarter, 2,267 new cases of TB were confirmed, for a notification rate of 85 cases for every 100,000 inhabitants (85/100,000). This rate is significantly lower than the rate of 104 cases for every 100,000 inhabitants reported in PY1Q2. It represents an achievement rate of 70% against the target (120/100,000 inhabitants). Table 35 below outlines the notification and achievement rates for each coordination area. Table 35: New TB cases notification rates during PY1Q3
Coordination Population covered
New TB+ cases detected
Expected number of new TB+ cases
Notification rate for every 100,000 inhabitants
Target for every 100,000 inhabitants
Achievement rate (%)
Kolwezi 747,819 - 224 - 120 -
Kamina 1,737,612 745 521 171 120 143
Kole 848,285 278 254 131 120 109
Tshumbe 749,578 183 225 98 120 81
Bukavu 3,040,236 253 912 33 120 28
Uvira 671,237 158 201 94 120 78
Mwene Ditu 1,800,258 329 540 73 120 61
Luiza 1,133,569 321 340 113 120 94
Total 10,728,594 2,267 3,219 85 120 70
The coordination areas of Kamina, Kole, and Luiza reported on-target rates of notification, with 171 (Kamina), 131 (Kole), and 113 (Luiza) cases confirmed for every 100,000 inhabitants. Tshumbe and Uvira also had strong performance, with reported rates of 98/100,000 and 94/100,000, respectively. Tshumbe’s case notification rate improved compared to PY1Q2 (81/100,000) primarily due to door-to-door mini-campaigns to promote TB testing organized in three health areas (Tshumbe 1, Tshumbe 2, and Kalema) known to have low notification rates. Uvira’s performance also significantly improved from PY1Q2 (50/100,000) as a result of a joint supervision visit from IHPplus staff and the Coordinations provinciales lèpre et tuberculose (Provincial Coordination Unit for Leprosy and TB, or CPLT) at the
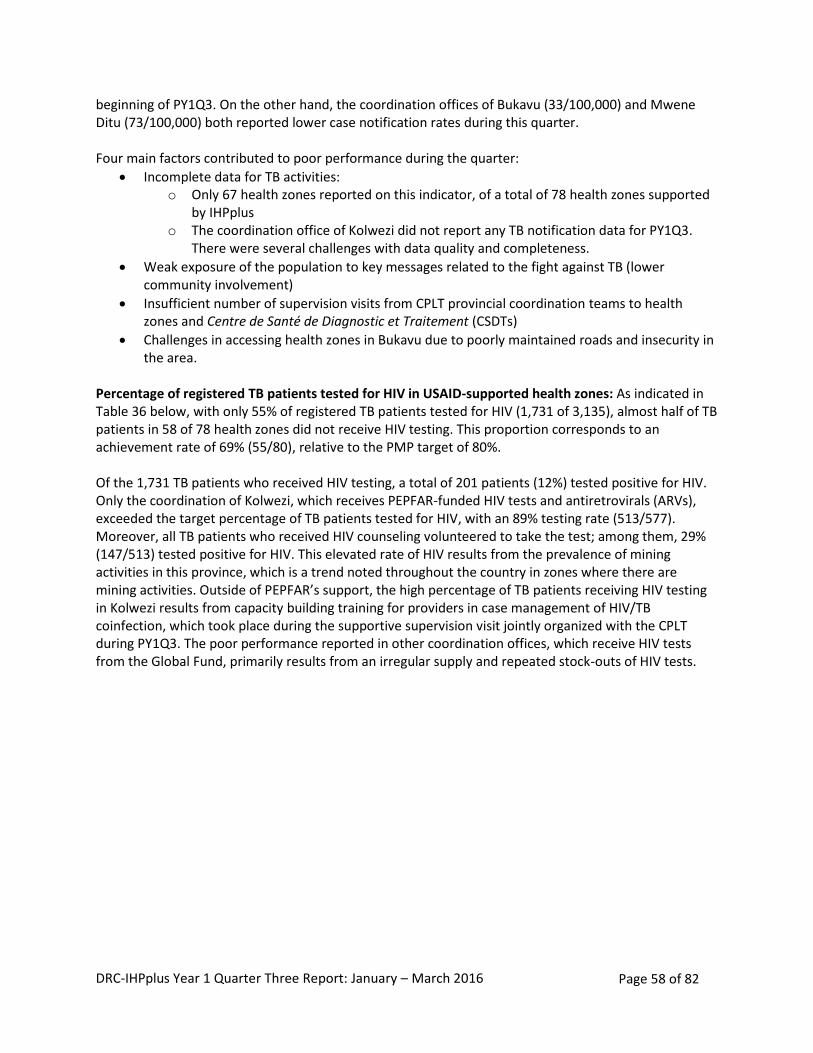
DRC-IHPplus Year 1 Quarter Three Report: January – March 2016 Page 58 of 82
beginning of PY1Q3. On the other hand, the coordination offices of Bukavu (33/100,000) and Mwene Ditu (73/100,000) both reported lower case notification rates during this quarter. Four main factors contributed to poor performance during the quarter:
Incomplete data for TB activities: o Only 67 health zones reported on this indicator, of a total of 78 health zones supported
by IHPplus o The coordination office of Kolwezi did not report any TB notification data for PY1Q3.
There were several challenges with data quality and completeness.
Weak exposure of the population to key messages related to the fight against TB (lower community involvement)
Insufficient number of supervision visits from CPLT provincial coordination teams to health zones and Centre de Santé de Diagnostic et Traitement (CSDTs)
Challenges in accessing health zones in Bukavu due to poorly maintained roads and insecurity in the area.
Percentage of registered TB patients tested for HIV in USAID-supported health zones: As indicated in Table 36 below, with only 55% of registered TB patients tested for HIV (1,731 of 3,135), almost half of TB patients in 58 of 78 health zones did not receive HIV testing. This proportion corresponds to an achievement rate of 69% (55/80), relative to the PMP target of 80%. Of the 1,731 TB patients who received HIV testing, a total of 201 patients (12%) tested positive for HIV. Only the coordination of Kolwezi, which receives PEPFAR-funded HIV tests and antiretrovirals (ARVs), exceeded the target percentage of TB patients tested for HIV, with an 89% testing rate (513/577). Moreover, all TB patients who received HIV counseling volunteered to take the test; among them, 29% (147/513) tested positive for HIV. This elevated rate of HIV results from the prevalence of mining activities in this province, which is a trend noted throughout the country in zones where there are mining activities. Outside of PEPFAR’s support, the high percentage of TB patients receiving HIV testing in Kolwezi results from capacity building training for providers in case management of HIV/TB coinfection, which took place during the supportive supervision visit jointly organized with the CPLT during PY1Q3. The poor performance reported in other coordination offices, which receive HIV tests from the Global Fund, primarily results from an irregular supply and repeated stock-outs of HIV tests.
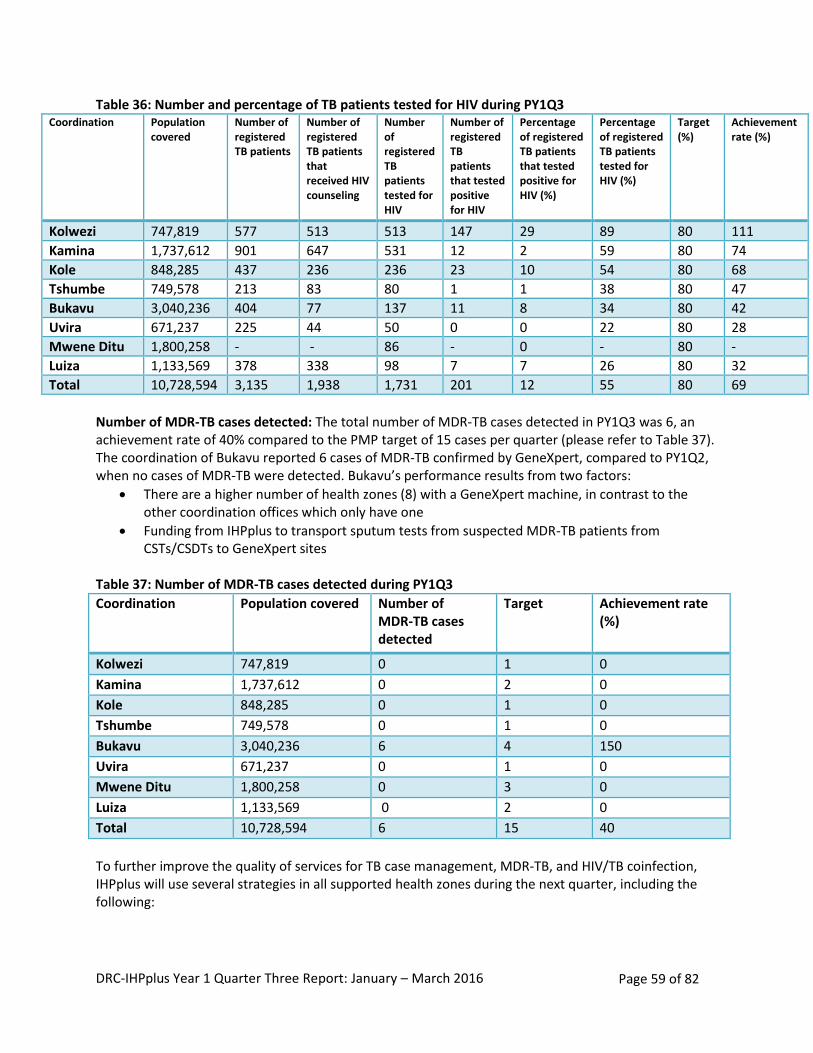
DRC-IHPplus Year 1 Quarter Three Report: January – March 2016 Page 59 of 82
Table 36: Number and percentage of TB patients tested for HIV during PY1Q3 Coordination Population
covered
Number of registered TB patients
Number of registered TB patients that received HIV counseling
Number of registered TB patients tested for HIV
Number of registered TB patients that tested positive for HIV
Percentage of registered TB patients that tested positive for HIV (%)
Percentage of registered TB patients tested for HIV (%)
Target (%)
Achievement rate (%)
Kolwezi 747,819 577 513 513 147 29 89 80 111
Kamina 1,737,612 901 647 531 12 2 59 80 74
Kole 848,285 437 236 236 23 10 54 80 68
Tshumbe 749,578 213 83 80 1 1 38 80 47
Bukavu 3,040,236 404 77 137 11 8 34 80 42
Uvira 671,237 225 44 50 0 0 22 80 28
Mwene Ditu 1,800,258 - - 86 - 0 - 80 -
Luiza 1,133,569 378 338 98 7 7 26 80 32
Total 10,728,594 3,135 1,938 1,731 201 12 55 80 69
Number of MDR-TB cases detected: The total number of MDR-TB cases detected in PY1Q3 was 6, an achievement rate of 40% compared to the PMP target of 15 cases per quarter (please refer to Table 37). The coordination of Bukavu reported 6 cases of MDR-TB confirmed by GeneXpert, compared to PY1Q2, when no cases of MDR-TB were detected. Bukavu’s performance results from two factors:
There are a higher number of health zones (8) with a GeneXpert machine, in contrast to the other coordination offices which only have one
Funding from IHPplus to transport sputum tests from suspected MDR-TB patients from CSTs/CSDTs to GeneXpert sites
Table 37: Number of MDR-TB cases detected during PY1Q3
Coordination Population covered Number of MDR-TB cases detected
Target Achievement rate (%)
Kolwezi 747,819 0 1 0
Kamina 1,737,612 0 2 0
Kole 848,285 0 1 0
Tshumbe 749,578 0 1 0
Bukavu 3,040,236 6 4 150
Uvira 671,237 0 1 0
Mwene Ditu 1,800,258 0 3 0
Luiza 1,133,569 0 2 0
Total 10,728,594 6 15 40
To further improve the quality of services for TB case management, MDR-TB, and HIV/TB coinfection, IHPplus will use several strategies in all supported health zones during the next quarter, including the following:
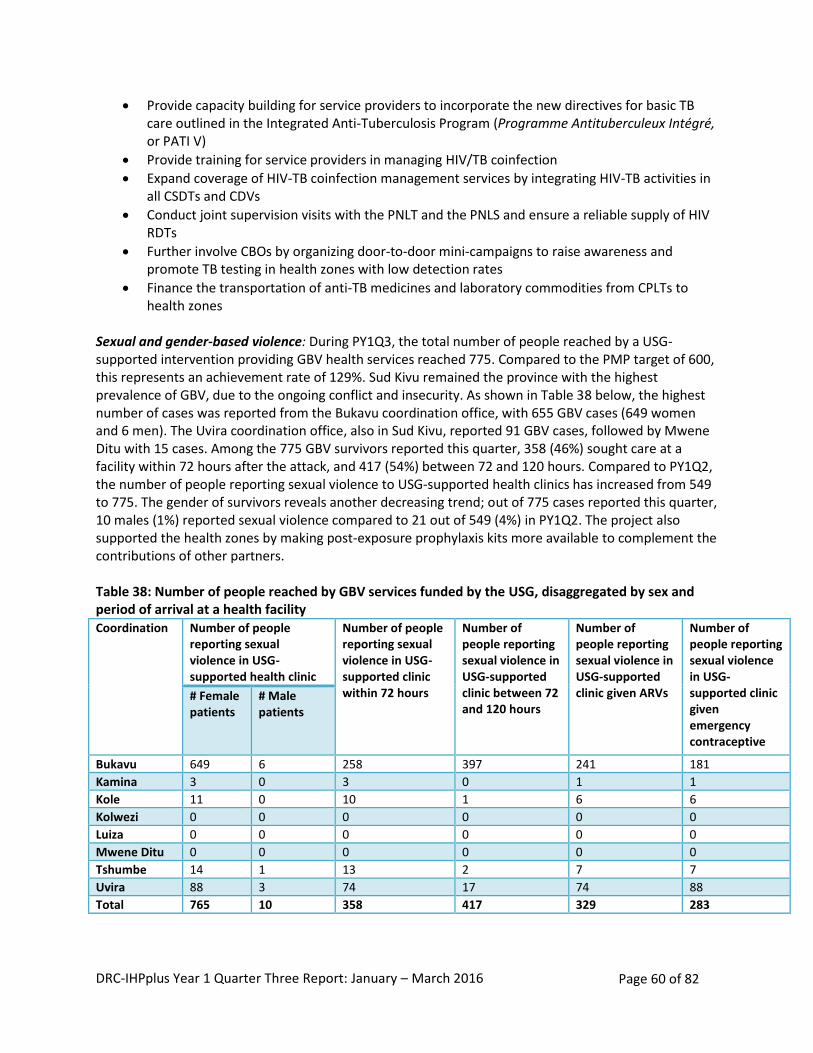
DRC-IHPplus Year 1 Quarter Three Report: January – March 2016 Page 60 of 82
Provide capacity building for service providers to incorporate the new directives for basic TB care outlined in the Integrated Anti-Tuberculosis Program (Programme Antituberculeux Intégré, or PATI V)
Provide training for service providers in managing HIV/TB coinfection
Expand coverage of HIV-TB coinfection management services by integrating HIV-TB activities in all CSDTs and CDVs
Conduct joint supervision visits with the PNLT and the PNLS and ensure a reliable supply of HIV RDTs
Further involve CBOs by organizing door-to-door mini-campaigns to raise awareness and promote TB testing in health zones with low detection rates
Finance the transportation of anti-TB medicines and laboratory commodities from CPLTs to health zones
Sexual and gender-based violence: During PY1Q3, the total number of people reached by a USG-supported intervention providing GBV health services reached 775. Compared to the PMP target of 600, this represents an achievement rate of 129%. Sud Kivu remained the province with the highest prevalence of GBV, due to the ongoing conflict and insecurity. As shown in Table 38 below, the highest number of cases was reported from the Bukavu coordination office, with 655 GBV cases (649 women and 6 men). The Uvira coordination office, also in Sud Kivu, reported 91 GBV cases, followed by Mwene Ditu with 15 cases. Among the 775 GBV survivors reported this quarter, 358 (46%) sought care at a facility within 72 hours after the attack, and 417 (54%) between 72 and 120 hours. Compared to PY1Q2, the number of people reporting sexual violence to USG-supported health clinics has increased from 549 to 775. The gender of survivors reveals another decreasing trend; out of 775 cases reported this quarter, 10 males (1%) reported sexual violence compared to 21 out of 549 (4%) in PY1Q2. The project also supported the health zones by making post-exposure prophylaxis kits more available to complement the contributions of other partners. Table 38: Number of people reached by GBV services funded by the USG, disaggregated by sex and period of arrival at a health facility Coordination Number of people
reporting sexual violence in USG-supported health clinic
Number of people reporting sexual violence in USG-supported clinic within 72 hours
Number of people reporting sexual violence in USG-supported clinic between 72 and 120 hours
Number of people reporting sexual violence in USG-supported clinic given ARVs
Number of people reporting sexual violence in USG-supported clinic given emergency contraceptive
# Female patients
# Male patients
Bukavu 649 6 258 397 241 181
Kamina 3 0 3 0 1 1
Kole 11 0 10 1 6 6
Kolwezi 0 0 0 0 0 0
Luiza 0 0 0 0 0 0
Mwene Ditu 0 0 0 0 0 0
Tshumbe 14 1 13 2 7 7
Uvira 88 3 74 17 74 88
Total 765 10 358 417 329 283
DRC-IHPplus Year 1 Quarter Three Report: January – March 2016 Page 61 of 82
Fistula: IHPplus supports Kaziba GRH in providing fistula repairs (vesico-vaginal and recto-vaginal) as well as uterine and rectal prolapse repair to women living in the Bukavu coordination. From January to March 2016, among the 80 female patients who visited the hospital to consult about urinary incontinence, 81% (65) were diagnosed with fistula. Kaziba GRH repaired 92% (60) of these 65 cases in a routine procedure. Among the 60 fistula patients on whom the Kaziba staff operated, the majority (66%) were between the ages of 20 and 34, and the primary causes were obstructed labor (45%) and home births (33%). By the end of PY1Q3, 53 patients (83%) who received operations had been released from the hospital with their fistula repair site fully closed and dry. The seven failed operations were relapses from previous fistulas. Next steps:
Conduct supportive supervision visits on partogram usage in Kaziba health zone to help service providers quickly decide whether to refer women with obstructed labor to the GRH
Organize awareness-raising activities in the health zone and surrounding areas to encourage women to attend the fourth ANC visit and give birth at the hospital rather than at home.
IR 2.2: Minimum quality standards for health facilities (general referral hospitals and health zone health centers) and services developed and adopted FOSACOF approach: IHP and IHPplus have trained 611 teams (from the DPS and health zone coordination offices), 1,474 health service providers at health facilities, and 3,685 community leaders to implement the FOSACOF approach. Overall, 737 health centers and 38 GRHs are using FOSACOF across the 78 health zones supported by IHPplus. During PY1Q3, 402 of the 737 health facilities (health centers and GRHs), or 55%, completed an evaluation of the nine FOSACOF criteria (see box at right). This result falls below the target of 76%, an achievement rate of 72%; however, it is an increase from the 378 health facilities that were evaluated on the FOSACOF criteria during PY1Q2. Of the 402 health facilities, 118 were evaluated as part of the RBF program during quarterly verification exercises. Table 39 below presents the results of the FOSACOF evaluations of health facilities during the quarter.
FOSACOF CRITERIA 1. Infrastructure 2. Equipment 3. Essential medicines and supplies 4. Personnel 5. In-service training 6. Community approach 7. Community support 8. Clinical quality 9. Management
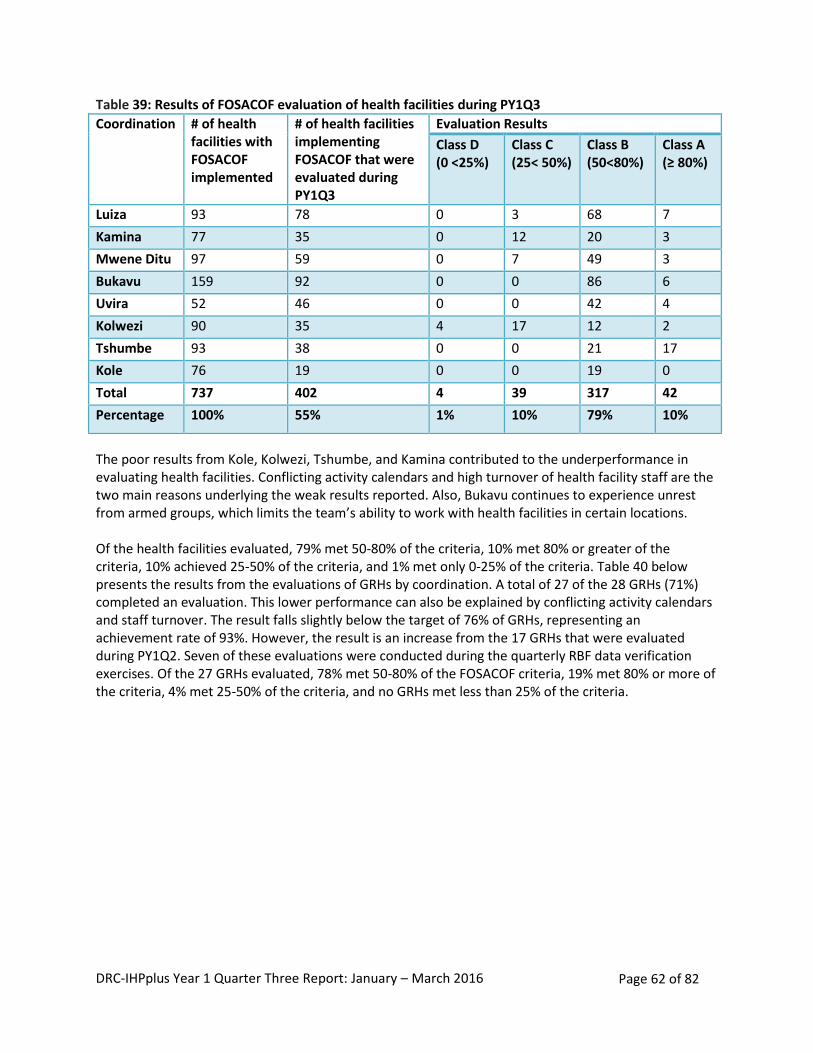
DRC-IHPplus Year 1 Quarter Three Report: January – March 2016 Page 62 of 82
Table 39: Results of FOSACOF evaluation of health facilities during PY1Q3
Coordination # of health facilities with FOSACOF implemented
# of health facilities implementing FOSACOF that were evaluated during PY1Q3
Evaluation Results
Class D (0 <25%)
Class C (25< 50%)
Class B (50<80%)
Class A (≥ 80%)
Luiza 93 78 0 3 68 7
Kamina 77 35 0 12 20 3
Mwene Ditu 97 59 0 7 49 3
Bukavu 159 92 0 0 86 6
Uvira 52 46 0 0 42 4
Kolwezi 90 35 4 17 12 2
Tshumbe 93 38 0 0 21 17
Kole 76 19 0 0 19 0
Total 737 402 4 39 317 42
Percentage 100% 55% 1% 10% 79% 10%
The poor results from Kole, Kolwezi, Tshumbe, and Kamina contributed to the underperformance in evaluating health facilities. Conflicting activity calendars and high turnover of health facility staff are the two main reasons underlying the weak results reported. Also, Bukavu continues to experience unrest from armed groups, which limits the team’s ability to work with health facilities in certain locations. Of the health facilities evaluated, 79% met 50-80% of the criteria, 10% met 80% or greater of the criteria, 10% achieved 25-50% of the criteria, and 1% met only 0-25% of the criteria. Table 40 below presents the results from the evaluations of GRHs by coordination. A total of 27 of the 28 GRHs (71%) completed an evaluation. This lower performance can also be explained by conflicting activity calendars and staff turnover. The result falls slightly below the target of 76% of GRHs, representing an achievement rate of 93%. However, the result is an increase from the 17 GRHs that were evaluated during PY1Q2. Seven of these evaluations were conducted during the quarterly RBF data verification exercises. Of the 27 GRHs evaluated, 78% met 50-80% of the FOSACOF criteria, 19% met 80% or more of the criteria, 4% met 25-50% of the criteria, and no GRHs met less than 25% of the criteria.
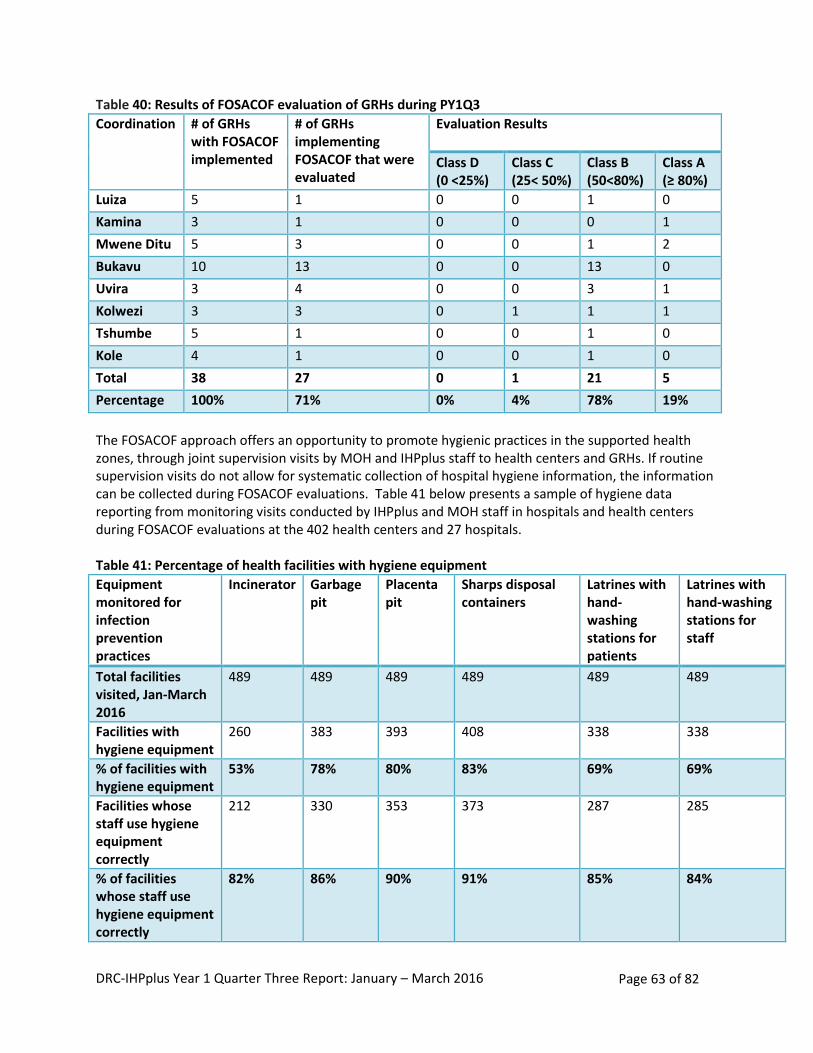
DRC-IHPplus Year 1 Quarter Three Report: January – March 2016 Page 63 of 82
Table 40: Results of FOSACOF evaluation of GRHs during PY1Q3
Coordination # of GRHs with FOSACOF implemented
# of GRHs implementing FOSACOF that were evaluated
Evaluation Results
Class D (0 <25%)
Class C (25< 50%)
Class B (50<80%)
Class A (≥ 80%)
Luiza 5 1 0 0 1 0
Kamina 3 1 0 0 0 1
Mwene Ditu 5 3 0 0 1 2
Bukavu 10 13 0 0 13 0
Uvira 3 4 0 0 3 1
Kolwezi 3 3 0 1 1 1
Tshumbe 5 1 0 0 1 0
Kole 4 1 0 0 1 0
Total 38 27 0 1 21 5
Percentage 100% 71% 0% 4% 78% 19%
The FOSACOF approach offers an opportunity to promote hygienic practices in the supported health zones, through joint supervision visits by MOH and IHPplus staff to health centers and GRHs. If routine supervision visits do not allow for systematic collection of hospital hygiene information, the information can be collected during FOSACOF evaluations. Table 41 below presents a sample of hygiene data reporting from monitoring visits conducted by IHPplus and MOH staff in hospitals and health centers during FOSACOF evaluations at the 402 health centers and 27 hospitals. Table 41: Percentage of health facilities with hygiene equipment
Equipment monitored for infection prevention practices
Incinerator Garbage pit
Placenta pit
Sharps disposal containers
Latrines with hand-washing stations for patients
Latrines with hand-washing stations for staff
Total facilities visited, Jan-March 2016
489 489 489 489 489 489
Facilities with hygiene equipment
260 383 393 408 338 338
% of facilities with hygiene equipment
53% 78% 80% 83% 69% 69%
Facilities whose staff use hygiene equipment correctly
212 330 353 373 287 285
% of facilities whose staff use hygiene equipment correctly
82% 86% 90% 91% 85% 84%
DRC-IHPplus Year 1 Quarter Three Report: January – March 2016 Page 64 of 82
Table 41 shows that the majority of health facilities have sufficient equipment for infection prevention and that personnel in health facilities correctly use hygiene equipment. A high percentage of health facilities have placenta pits and containers for disposing sharp items (80% and 83%, respectively) and a large number of staff at the facilities know how to use them correctly (90% and 91%, respectively). Incinerators were the least prevalent, with only 53% of facilities reporting having this equipment. Most facilities face difficulties paying for this equipment, and additional support is needed to fill this gap. On average, 85% of facility staff use all hygiene equipment correctly. Sud Kivu--particularly the coordination areas of Bukavu and Uvira--is the province with the most well-equipped health facilities. Challenges: IHPplus staff encountered the following challenges during the quarter in implementing the FOSACOF approach:
Financing the implementation of this approach
Ensuring that health zone management teams conduct quarterly evaluations in at least 80% of health facilities, develop and implement quarterly improvement plans, organize evaluation meetings, and share successful experiences.
To improve health facility hygiene, additional support is needed from partners to procure the necessary equipment that is used to effectively prevent infections, as most health facilities lack sufficient funding. Lessons learned:
The FOSACOF approach continues to provide an effective strategy for improving hygiene practices in IHPplus supported health zones.
The use of the FOSACOF approach for evaluating the quality of services offered by health facilities has improved in almost all health facilities visited due to improvements in health facility inventory systems, good environmental management practices (disposing of waste), and improved archiving systems.
Next steps: In the next quarter, IHPplus will continue to strengthen support to the coordination areas of Kole, Kolwezi, Tshumbe, and Kamina during routine supervision visits. Results-based Financing: RBF provides incentives to health service providers to improve performance. Under RBF, facilities receive payments based on achievement of agreed-upon targets, rather than for inputs or processes as in traditional financing. During this quarter, the project implemented the following RBF activities:
Entered validated IHP Quarter 4 performance data into the DRC RBF web portal by a joint IHPplus and MOH RBF unit team
Supported the MOH to organize a review and presentation of the achievements and results after two years of implementing RBF
Organized supervision visits to monitor RBF program progress throughout 7 RBF health zones (118 health centers, 7 GRHs, 7 health zone central offices, and 14 community organizations) by a joint IHPplus/RBF MOH unit/Provincial Health Division
Organized a monitoring visit with joint RBF MOH unit/IHPplus team to ensure activity monitoring between verifications
Organized technical data verification of Quarter 1 data in the seven health zones
Organized the counter-verification of Quarter 1 verified data in seven health zones by 14 CBOs
Paid each structure its Quarter 1 performance-related bonus
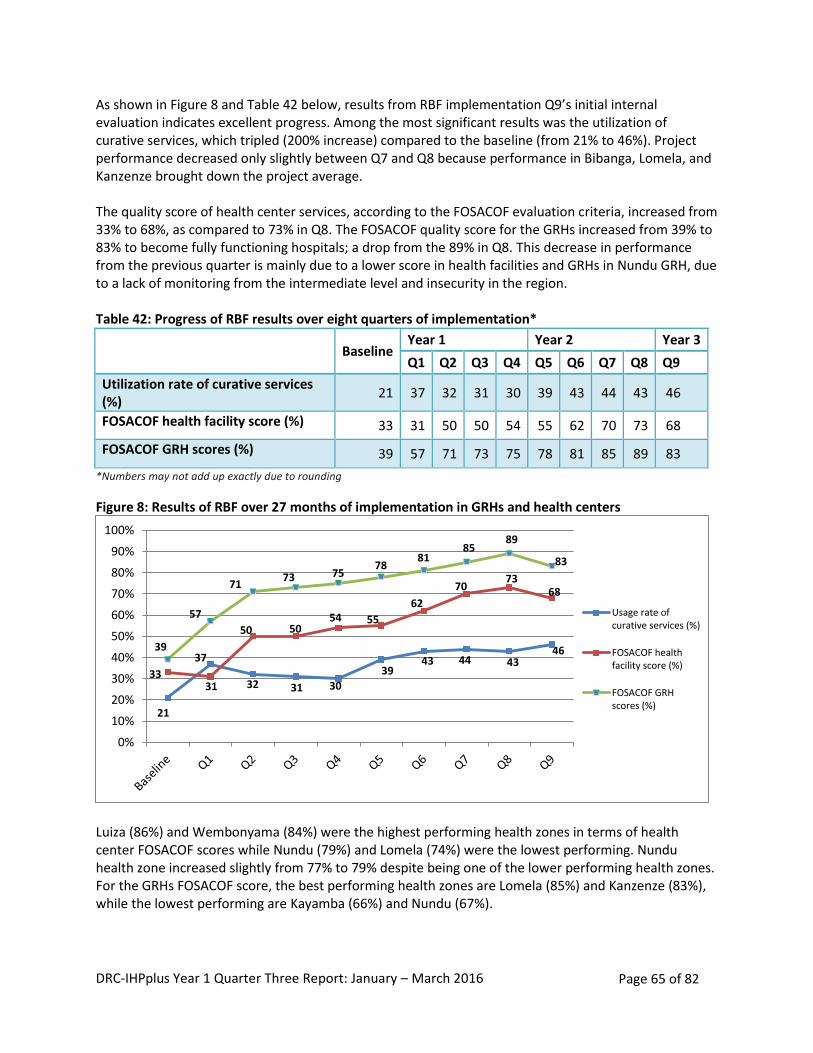
DRC-IHPplus Year 1 Quarter Three Report: January – March 2016 Page 65 of 82
As shown in Figure 8 and Table 42 below, results from RBF implementation Q9’s initial internal evaluation indicates excellent progress. Among the most significant results was the utilization of curative services, which tripled (200% increase) compared to the baseline (from 21% to 46%). Project performance decreased only slightly between Q7 and Q8 because performance in Bibanga, Lomela, and Kanzenze brought down the project average. The quality score of health center services, according to the FOSACOF evaluation criteria, increased from 33% to 68%, as compared to 73% in Q8. The FOSACOF quality score for the GRHs increased from 39% to 83% to become fully functioning hospitals; a drop from the 89% in Q8. This decrease in performance from the previous quarter is mainly due to a lower score in health facilities and GRHs in Nundu GRH, due to a lack of monitoring from the intermediate level and insecurity in the region. Table 42: Progress of RBF results over eight quarters of implementation*
Baseline
Year 1 Year 2 Year 3
Q1 Q2 Q3 Q4 Q5 Q6 Q7 Q8 Q9
Utilization rate of curative services (%)
21 37 32 31 30 39 43 44 43 46
FOSACOF health facility score (%) 33 31 50 50 54 55 62 70 73 68
FOSACOF GRH scores (%) 39 57 71 73 75 78 81 85 89 83
*Numbers may not add up exactly due to rounding
Figure 8: Results of RBF over 27 months of implementation in GRHs and health centers
Luiza (86%) and Wembonyama (84%) were the highest performing health zones in terms of health center FOSACOF scores while Nundu (79%) and Lomela (74%) were the lowest performing. Nundu health zone increased slightly from 77% to 79% despite being one of the lower performing health zones. For the GRHs FOSACOF score, the best performing health zones are Lomela (85%) and Kanzenze (83%), while the lowest performing are Kayamba (66%) and Nundu (67%).
21
37
32 31 30
39 43 44 43
46
33 31
50 50 54 55
62
70 73
68
39
57
71 73 75
78 81
85 89
83
0%
10%
20%
30%
40%
50%
60%
70%
80%
90%
100%
Usage rate ofcurative services (%)
FOSACOF healthfacility score (%)
FOSACOF GRHscores (%)
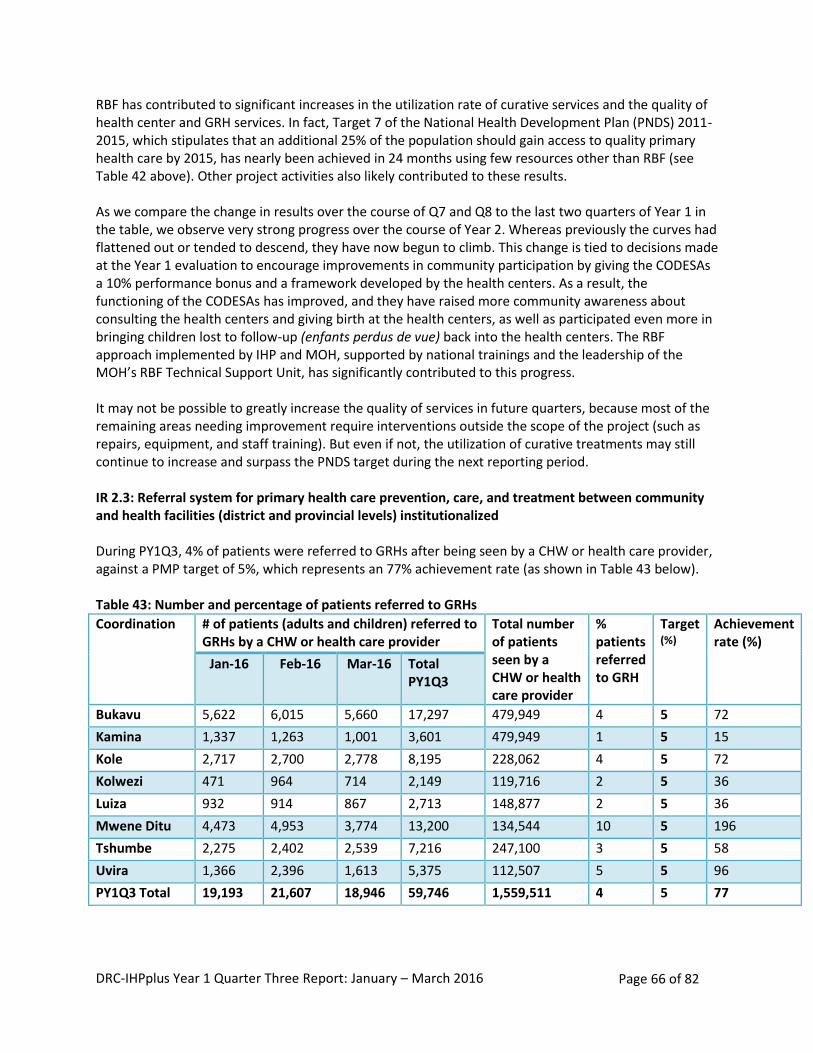
DRC-IHPplus Year 1 Quarter Three Report: January – March 2016 Page 66 of 82
RBF has contributed to significant increases in the utilization rate of curative services and the quality of health center and GRH services. In fact, Target 7 of the National Health Development Plan (PNDS) 2011-2015, which stipulates that an additional 25% of the population should gain access to quality primary health care by 2015, has nearly been achieved in 24 months using few resources other than RBF (see Table 42 above). Other project activities also likely contributed to these results. As we compare the change in results over the course of Q7 and Q8 to the last two quarters of Year 1 in the table, we observe very strong progress over the course of Year 2. Whereas previously the curves had flattened out or tended to descend, they have now begun to climb. This change is tied to decisions made at the Year 1 evaluation to encourage improvements in community participation by giving the CODESAs a 10% performance bonus and a framework developed by the health centers. As a result, the functioning of the CODESAs has improved, and they have raised more community awareness about consulting the health centers and giving birth at the health centers, as well as participated even more in bringing children lost to follow-up (enfants perdus de vue) back into the health centers. The RBF approach implemented by IHP and MOH, supported by national trainings and the leadership of the MOH’s RBF Technical Support Unit, has significantly contributed to this progress. It may not be possible to greatly increase the quality of services in future quarters, because most of the remaining areas needing improvement require interventions outside the scope of the project (such as repairs, equipment, and staff training). But even if not, the utilization of curative treatments may still continue to increase and surpass the PNDS target during the next reporting period. IR 2.3: Referral system for primary health care prevention, care, and treatment between community and health facilities (district and provincial levels) institutionalized During PY1Q3, 4% of patients were referred to GRHs after being seen by a CHW or health care provider, against a PMP target of 5%, which represents an 77% achievement rate (as shown in Table 43 below).
Table 43: Number and percentage of patients referred to GRHs
Coordination # of patients (adults and children) referred to GRHs by a CHW or health care provider
Total number of patients seen by a CHW or health care provider
% patients referred to GRH
Target (%)
Achievement rate (%)
Jan-16 Feb-16 Mar-16 Total PY1Q3
Bukavu 5,622 6,015 5,660 17,297 479,949 4 5 72
Kamina 1,337 1,263 1,001 3,601 479,949 1 5 15
Kole 2,717 2,700 2,778 8,195 228,062 4 5 72
Kolwezi 471 964 714 2,149 119,716 2 5 36
Luiza 932 914 867 2,713 148,877 2 5 36
Mwene Ditu 4,473 4,953 3,774 13,200 134,544 10 5 196
Tshumbe 2,275 2,402 2,539 7,216 247,100 3 5 58
Uvira 1,366 2,396 1,613 5,375 112,507 5 5 96
PY1Q3 Total 19,193 21,607 18,946 59,746 1,559,511 4 5 77
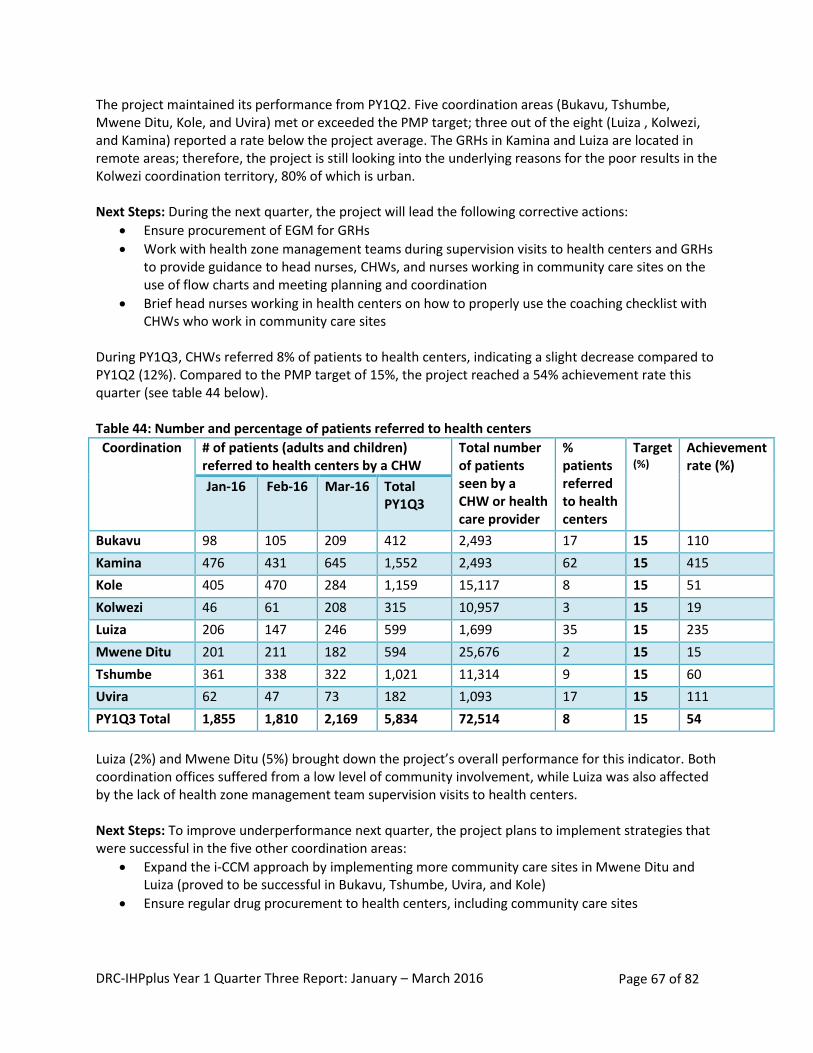
DRC-IHPplus Year 1 Quarter Three Report: January – March 2016 Page 67 of 82
The project maintained its performance from PY1Q2. Five coordination areas (Bukavu, Tshumbe, Mwene Ditu, Kole, and Uvira) met or exceeded the PMP target; three out of the eight (Luiza , Kolwezi, and Kamina) reported a rate below the project average. The GRHs in Kamina and Luiza are located in remote areas; therefore, the project is still looking into the underlying reasons for the poor results in the Kolwezi coordination territory, 80% of which is urban. Next Steps: During the next quarter, the project will lead the following corrective actions:
Ensure procurement of EGM for GRHs
Work with health zone management teams during supervision visits to health centers and GRHs to provide guidance to head nurses, CHWs, and nurses working in community care sites on the use of flow charts and meeting planning and coordination
Brief head nurses working in health centers on how to properly use the coaching checklist with CHWs who work in community care sites
During PY1Q3, CHWs referred 8% of patients to health centers, indicating a slight decrease compared to PY1Q2 (12%). Compared to the PMP target of 15%, the project reached a 54% achievement rate this quarter (see table 44 below). Table 44: Number and percentage of patients referred to health centers
Coordination # of patients (adults and children) referred to health centers by a CHW
Total number of patients seen by a CHW or health care provider
% patients referred to health centers
Target (%)
Achievement rate (%)
Jan-16 Feb-16 Mar-16 Total PY1Q3
Bukavu 98 105 209 412 2,493 17 15 110
Kamina 476 431 645 1,552 2,493 62 15 415
Kole 405 470 284 1,159 15,117 8 15 51
Kolwezi 46 61 208 315 10,957 3 15 19
Luiza 206 147 246 599 1,699 35 15 235
Mwene Ditu 201 211 182 594 25,676 2 15 15
Tshumbe 361 338 322 1,021 11,314 9 15 60
Uvira 62 47 73 182 1,093 17 15 111
PY1Q3 Total 1,855 1,810 2,169 5,834 72,514 8 15 54
Luiza (2%) and Mwene Ditu (5%) brought down the project’s overall performance for this indicator. Both coordination offices suffered from a low level of community involvement, while Luiza was also affected by the lack of health zone management team supervision visits to health centers. Next Steps: To improve underperformance next quarter, the project plans to implement strategies that were successful in the five other coordination areas:
Expand the i-CCM approach by implementing more community care sites in Mwene Ditu and Luiza (proved to be successful in Bukavu, Tshumbe, Uvira, and Kole)
Ensure regular drug procurement to health centers, including community care sites
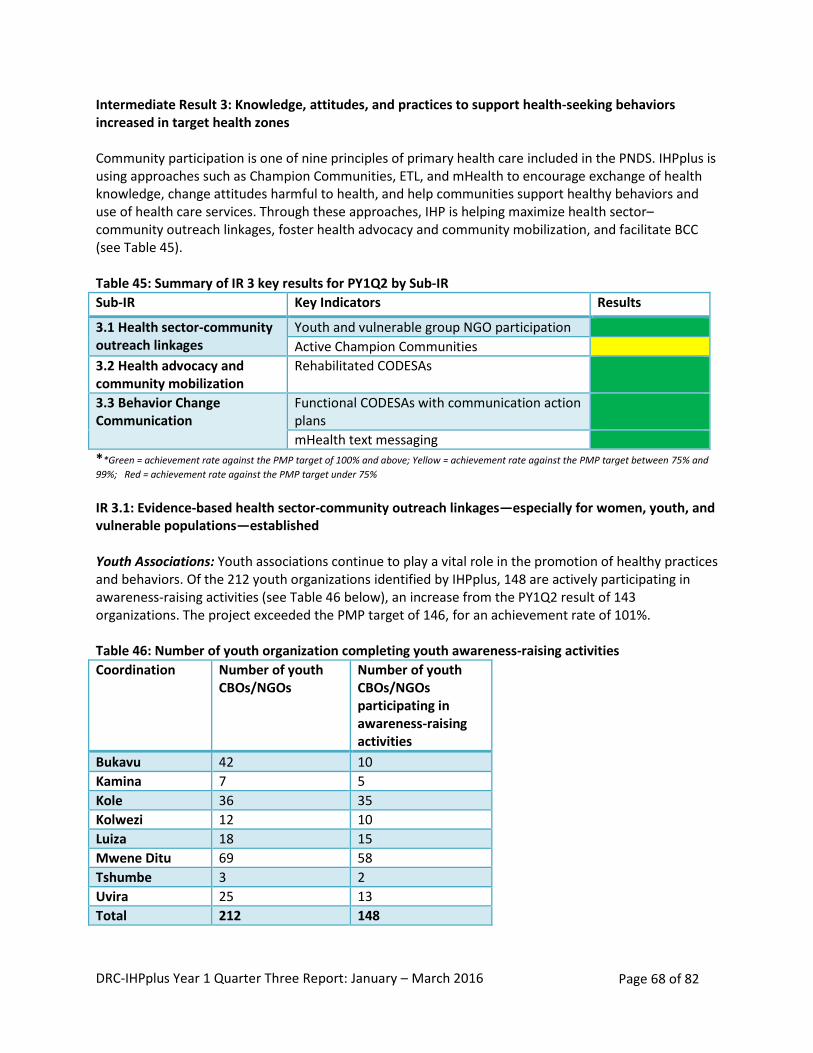
DRC-IHPplus Year 1 Quarter Three Report: January – March 2016 Page 68 of 82
Intermediate Result 3: Knowledge, attitudes, and practices to support health-seeking behaviors increased in target health zones Community participation is one of nine principles of primary health care included in the PNDS. IHPplus is using approaches such as Champion Communities, ETL, and mHealth to encourage exchange of health knowledge, change attitudes harmful to health, and help communities support healthy behaviors and use of health care services. Through these approaches, IHP is helping maximize health sector–community outreach linkages, foster health advocacy and community mobilization, and facilitate BCC (see Table 45). Table 45: Summary of IR 3 key results for PY1Q2 by Sub-IR
Sub-IR Key Indicators Results
3.1 Health sector-community outreach linkages
Youth and vulnerable group NGO participation
Active Champion Communities
3.2 Health advocacy and community mobilization
Rehabilitated CODESAs
3.3 Behavior Change Communication
Functional CODESAs with communication action plans
mHealth text messaging
**Green = achievement rate against the PMP target of 100% and above; Yellow = achievement rate against the PMP target between 75% and
99%; Red = achievement rate against the PMP target under 75%
IR 3.1: Evidence-based health sector-community outreach linkages—especially for women, youth, and vulnerable populations—established Youth Associations: Youth associations continue to play a vital role in the promotion of healthy practices and behaviors. Of the 212 youth organizations identified by IHPplus, 148 are actively participating in awareness-raising activities (see Table 46 below), an increase from the PY1Q2 result of 143 organizations. The project exceeded the PMP target of 146, for an achievement rate of 101%. Table 46: Number of youth organization completing youth awareness-raising activities
Coordination Number of youth CBOs/NGOs
Number of youth CBOs/NGOs participating in awareness-raising activities
Bukavu 42 10
Kamina 7 5
Kole 36 35
Kolwezi 12 10
Luiza 18 15
Mwene Ditu 69 58
Tshumbe 3 2
Uvira 25 13
Total 212 148
DRC-IHPplus Year 1 Quarter Three Report: January – March 2016 Page 69 of 82
The project continued to assist the health zone management teams, CODESAs, and Champion Communities to improve their collaboration with CBOs and youth NGOs by providing technical support in workplanning development and implementation. During the quarter, IHPplus held 15 knowledge-sharing meetings in 5 health zones (Luiza, Kolwezi, Kamina, Tshumbe, and Kole) with representatives from these various groups to discuss workplan implementation and activity monitoring. Additionally, IHPplus facilitated working meetings for 12 CBOs, youth organizations, Champion Communities, and health zone management teams to plan and discuss activities. In Kolwezi, Kole, and Kamina, youth were incorporated into the Champion Communities. Parent committees organized 16 awareness-raising sessions in schools and churches on GBV, HIV and AIDS, hygiene, and the importance of education. Approximately 2,800 youths participated in the sessions. These sessions resulted in the reporting of six cases of GBV in Kole (Lodja) by community members to the appropriate authorities. In the Kamina coordination, the health zone management teams of Kabongo and Songa educated five CBOs in group management and teamwork. IHPplus helped the territorial chief establish a steering committee for collaboration and discussion on youth issues, as well as youth participation in community development activities. These efforts led to communities identifying and vaccinating 204 children (134 in Kabongo health zone and 70 in Songa health zone) who were missed during the last measles vaccination campaigns. In Mwene Ditu, the youth NGOs and CBOs, in conjunction with Forum SIDA (FOSI) and Réseau des associations des jeunes contre le SIDA (RACOJ), organized mini-campaigns on HIV and AIDS and family planning in schools. The project helped them brief management teams on the use of communications methods (advocacy, group interviews, community debates, and personal communication). The campaign targeted 24 secondary schools and 1,200 youth. After the campaigns, 43 sought testing for HIV. A large number of the youth that participated in the campaigns felt that it was important to learn about family planning. Challenges: ETL activities have slowed, especially in Mwene Ditu, due to project-trained ETL personnel moving to other zones.
Lessons learned: Engaging youth groups and organizations is an effective way of raising awareness on sexually transmitted infections, sexual violence, and early marriage. Increased awareness on these subjects leads to greater youth participation in health-related discussions, testing for sexually transmitted infections, and reporting on suspected cases. Next steps:
Provide technical support to health zones and youth CBOs to reestablish the ETL teams and trainers
Assist in the implementation of the CBO and NGO workplan activities
Assist the health zones, Champion Communities, CBOs, and NGOs in documenting and archiving youth and adolescent activities
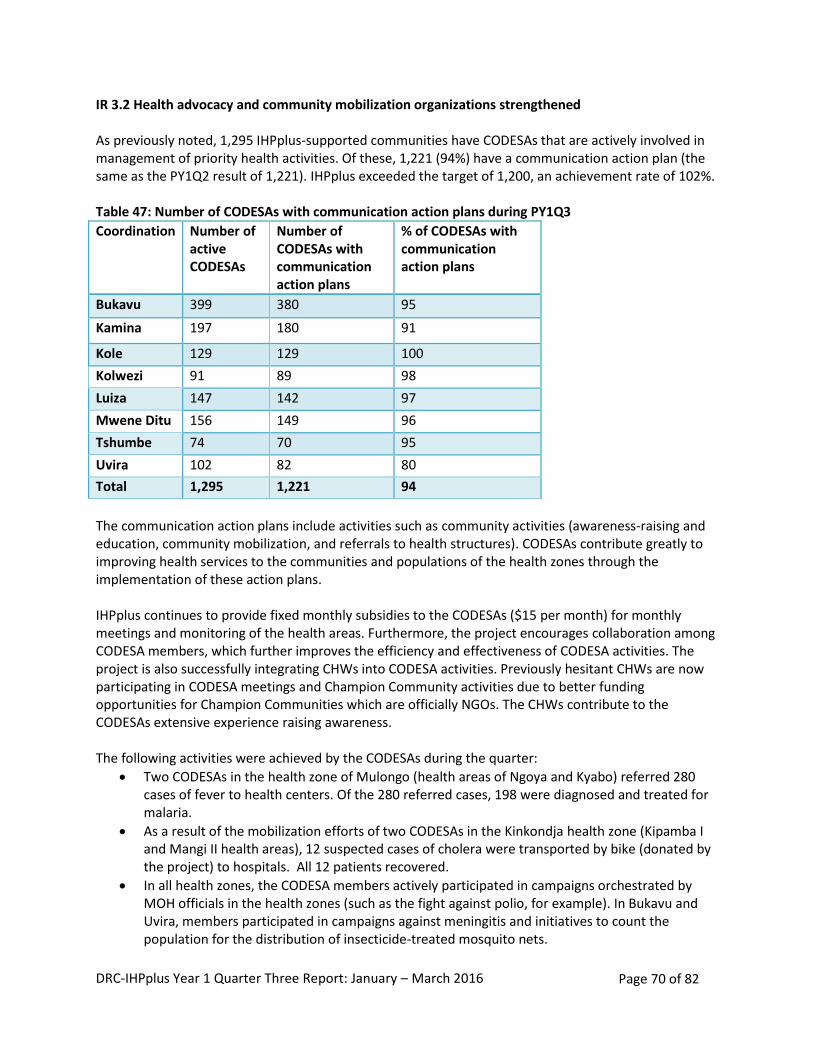
DRC-IHPplus Year 1 Quarter Three Report: January – March 2016 Page 70 of 82
IR 3.2 Health advocacy and community mobilization organizations strengthened As previously noted, 1,295 IHPplus-supported communities have CODESAs that are actively involved in management of priority health activities. Of these, 1,221 (94%) have a communication action plan (the same as the PY1Q2 result of 1,221). IHPplus exceeded the target of 1,200, an achievement rate of 102%. Table 47: Number of CODESAs with communication action plans during PY1Q3
Coordination Number of active CODESAs
Number of CODESAs with communication action plans
% of CODESAs with communication action plans
Bukavu 399 380 95
Kamina 197 180 91
Kole 129 129 100
Kolwezi 91 89 98
Luiza 147 142 97
Mwene Ditu 156 149 96
Tshumbe 74 70 95
Uvira 102 82 80
Total 1,295 1,221 94
The communication action plans include activities such as community activities (awareness-raising and education, community mobilization, and referrals to health structures). CODESAs contribute greatly to improving health services to the communities and populations of the health zones through the implementation of these action plans. IHPplus continues to provide fixed monthly subsidies to the CODESAs ($15 per month) for monthly meetings and monitoring of the health areas. Furthermore, the project encourages collaboration among CODESA members, which further improves the efficiency and effectiveness of CODESA activities. The project is also successfully integrating CHWs into CODESA activities. Previously hesitant CHWs are now participating in CODESA meetings and Champion Community activities due to better funding opportunities for Champion Communities which are officially NGOs. The CHWs contribute to the CODESAs extensive experience raising awareness. The following activities were achieved by the CODESAs during the quarter:
Two CODESAs in the health zone of Mulongo (health areas of Ngoya and Kyabo) referred 280 cases of fever to health centers. Of the 280 referred cases, 198 were diagnosed and treated for malaria.
As a result of the mobilization efforts of two CODESAs in the Kinkondja health zone (Kipamba I and Mangi II health areas), 12 suspected cases of cholera were transported by bike (donated by the project) to hospitals. All 12 patients recovered.
In all health zones, the CODESA members actively participated in campaigns orchestrated by MOH officials in the health zones (such as the fight against polio, for example). In Bukavu and Uvira, members participated in campaigns against meningitis and initiatives to count the population for the distribution of insecticide-treated mosquito nets.
DRC-IHPplus Year 1 Quarter Three Report: January – March 2016 Page 71 of 82
IHPplus provided technical support to CODESAs to organize household visits to increase health awareness and promote related behaviors. The visits were used to collect data on households.
Challenges: Project staff experienced challenges accessing certain health areas and zones due to difficult terrain and security problems caused by armed groups and conflicts in Bukavu, Uvira, and Kole (health zones of Shabunda, Kalole, Mulungu, Haut Plateau, Lemera, and Pania Mutombo). Lessons learned:
Health zone involvement in CODESAs’ work motivates CODESA members and fosters an environment conducive to collaborative work-planning and joint implementation of activities.
The development of income-generating activities (livestock, stores, community farming) fosters greater member participation.
Participation from the local population in CODESA activities enabled the rehabilitation and use of health centers, rural roads, potable water supplies, and latrines.
Monitoring and supervising CODESAs in the development of their workplans reinforces CODESA leadership, strengthens the implementation of activities, and leads to greater achievement of goals and results.
Next steps:
Continue to provide technical and financial support to CODESAs to implement their activities
Provide technical support to health zones to evaluate achievement of CODESAs’ communication action plans
Continue to encourage the health zone management teams to perform regular visits to the CODESAs
Strive for equal representation between men, women, and youth in CODESA membership
Monitor the CODESAs in conjunction with the health zones and Division Provinciale de la Santé IR 3.3: Behavior change campaigns involving opinion leaders and cultural influences (people and technologies) launched Behavior Change Communication Champion Communities: IHPplus currently supports 34 Champion Communities in the eight coordination areas, of which 32 are active. Neighboring communities, desiring to improve their own health standards, have adopted the Champion Community method on their own. Three operational autonomous Champion Communities (Tshumbe, Lodja, and Luiza) were created through community initiatives, with technical assistance from IHPplus supported Champion Communities. Another three autonomous Champion Communities in the health zones of Bilomba, Dibaya, and Ruzizi are in the initial phases of operation and receiving assistance from project Champion Communities (see Table 48 below).
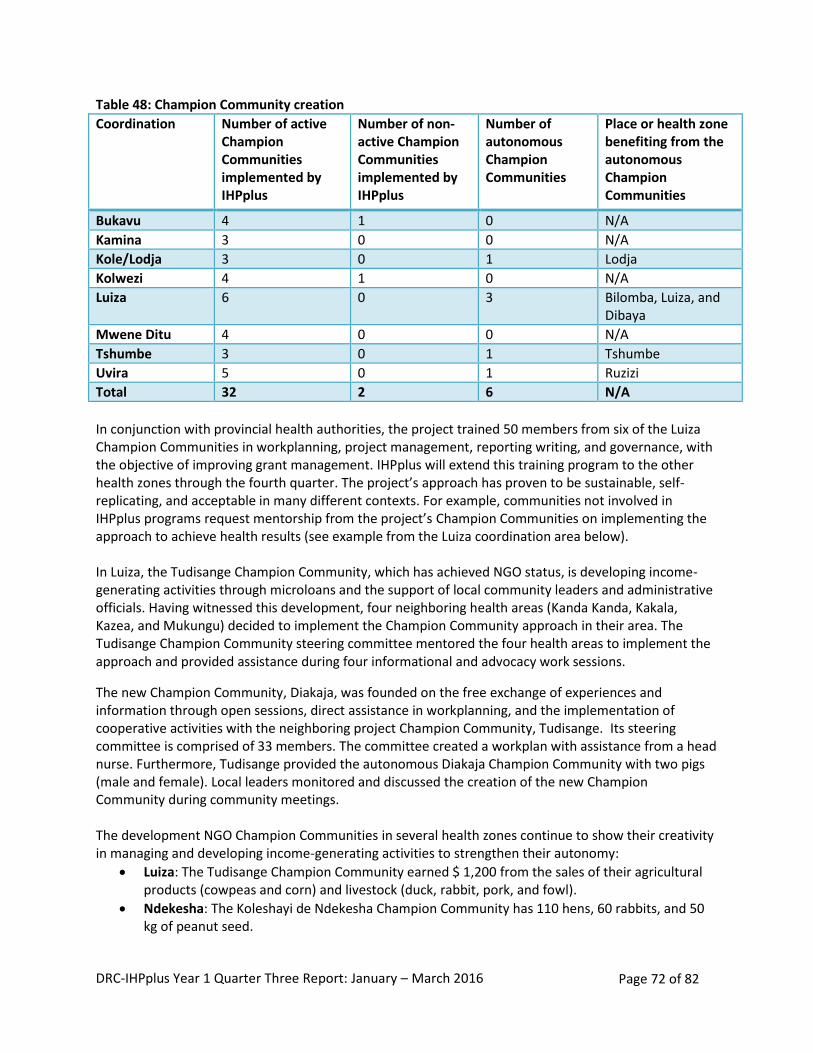
DRC-IHPplus Year 1 Quarter Three Report: January – March 2016 Page 72 of 82
Table 48: Champion Community creation
Coordination Number of active Champion Communities implemented by IHPplus
Number of non-active Champion Communities implemented by IHPplus
Number of autonomous Champion Communities
Place or health zone benefiting from the autonomous Champion Communities
Bukavu 4 1 0 N/A
Kamina 3 0 0 N/A
Kole/Lodja 3 0 1 Lodja
Kolwezi 4 1 0 N/A
Luiza 6 0 3 Bilomba, Luiza, and Dibaya
Mwene Ditu 4 0 0 N/A
Tshumbe 3 0 1 Tshumbe
Uvira 5 0 1 Ruzizi
Total 32 2 6 N/A
In conjunction with provincial health authorities, the project trained 50 members from six of the Luiza Champion Communities in workplanning, project management, reporting writing, and governance, with the objective of improving grant management. IHPplus will extend this training program to the other health zones through the fourth quarter. The project’s approach has proven to be sustainable, self-replicating, and acceptable in many different contexts. For example, communities not involved in IHPplus programs request mentorship from the project’s Champion Communities on implementing the approach to achieve health results (see example from the Luiza coordination area below). In Luiza, the Tudisange Champion Community, which has achieved NGO status, is developing income- generating activities through microloans and the support of local community leaders and administrative officials. Having witnessed this development, four neighboring health areas (Kanda Kanda, Kakala, Kazea, and Mukungu) decided to implement the Champion Community approach in their area. The Tudisange Champion Community steering committee mentored the four health areas to implement the approach and provided assistance during four informational and advocacy work sessions.
The new Champion Community, Diakaja, was founded on the free exchange of experiences and information through open sessions, direct assistance in workplanning, and the implementation of cooperative activities with the neighboring project Champion Community, Tudisange. Its steering committee is comprised of 33 members. The committee created a workplan with assistance from a head nurse. Furthermore, Tudisange provided the autonomous Diakaja Champion Community with two pigs (male and female). Local leaders monitored and discussed the creation of the new Champion Community during community meetings. The development NGO Champion Communities in several health zones continue to show their creativity in managing and developing income-generating activities to strengthen their autonomy:
Luiza: The Tudisange Champion Community earned $ 1,200 from the sales of their agricultural products (cowpeas and corn) and livestock (duck, rabbit, pork, and fowl).
Ndekesha: The Koleshayi de Ndekesha Champion Community has 110 hens, 60 rabbits, and 50 kg of peanut seed.
DRC-IHPplus Year 1 Quarter Three Report: January – March 2016 Page 73 of 82
Kalomba: The Tuye Kumpala Kalomba Champion Community has 3 goats, 14 pigs, 2 hectares of planted peanut plants, and 40 kg of peanut seed.
Bilomba: The Bobumue Bilomba Champion Community has saved $370 and has 2 pigs with 10 piglets, as well as 200 kg of rice.
Kabongo: The Kabongo Champion Community has saved $345 and has 9 pigs, 7 goats, and 1.5 hectares of corn.
The implementation of Champion Community workplans resulted in the following:
Uvira: Mwangaza Champion Community enabled 873 children to receive required infant immunizations, referred and brought 295 pregnant women to maternity clinics, raised awareness of family planning and contraception methods among 226 women of childbearing age, and taught over 10,611 people about WASH. These activities were achieved in schools, churches, house visits, and via SMS messaging.
The International Rescue Committee (IRC) requested the assistance of the Champion Community in fighting cholera in the health zone of Uvira. A cooperative workplan is currently being developed.
Kamina: The members of the Champion Community in Songa health zone referred 50 people with coughs to a CSDT. Eighteen of these people tested positive for TB and were provided with the appropriate treatment. These referrals and treatments were the result of house visits (130), ETL information sessions (43), and monitoring of suspected cases of TB.
Using well-developed incentive schemes that allow financial independence, Champion Communities are able to develop, fund, and realize health projects that are identified by the community. Unlike previous Champion Community approaches in the DRC which did not continue after the cessation of funding, the IHPplus model has proven to be not only successful but sustainable and “naturally transitioning.” The IHPplus Champion Community model adaption in DRC is now a gold standard.
Challenges:
Implementation of a Champion Community, but with an alternate structure, by E2A in a health area already covered by IHPplus. This creates confusion on structure and activities.
Weak leadership within some Champion Community steering committees.
Insufficient supervision by community supervisors associated with the health zones. Lessons Learned:
The Champion Communities with NGO status are true partners to the health zones and are capable of improving living and health standards for the population.
The Champion Communities are driven by the community in their development activities. The community is assuming responsibility for its own development.
Other communities have begun to realize the benefits and are now starting their own autonomous Champion Communities and using IHPplus Champion Communities to mentor them in the process of development.
Next steps:
Create regular meetings for the Champion Community steering committees to share their experiences.
Continue to reinforce the Champion Community steering committees’ knowledge of community project inception and management.
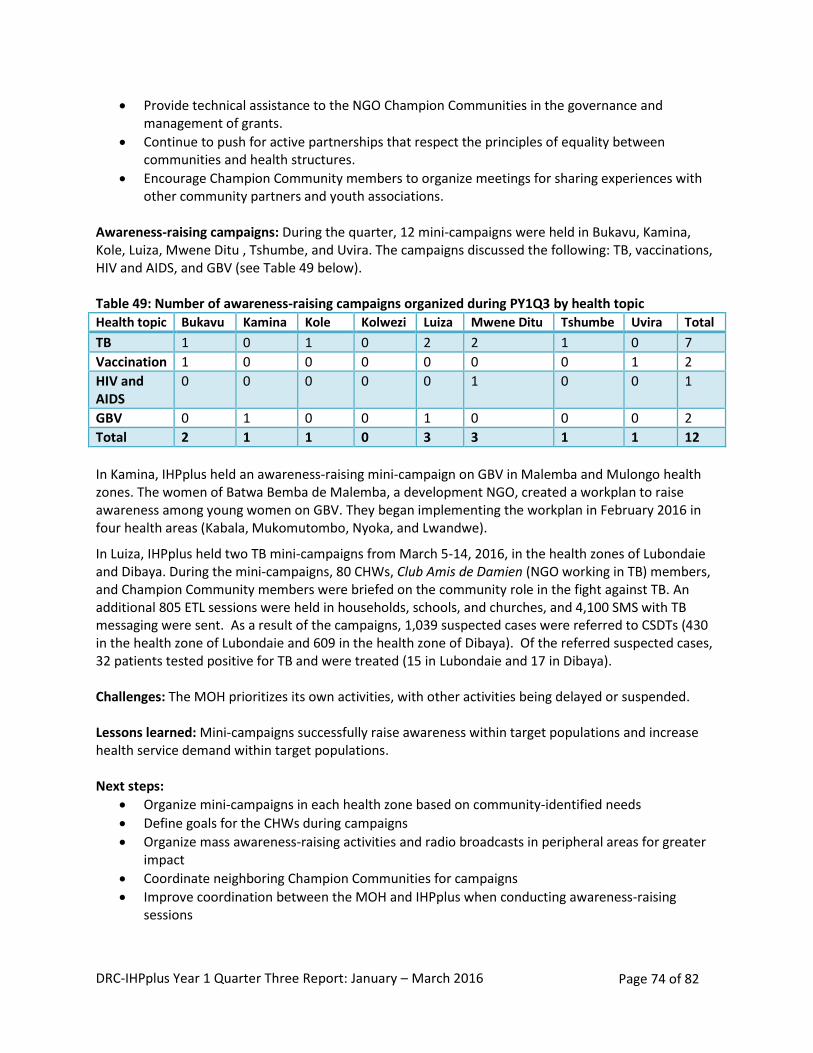
DRC-IHPplus Year 1 Quarter Three Report: January – March 2016 Page 74 of 82
Provide technical assistance to the NGO Champion Communities in the governance and management of grants.
Continue to push for active partnerships that respect the principles of equality between communities and health structures.
Encourage Champion Community members to organize meetings for sharing experiences with other community partners and youth associations.
Awareness-raising campaigns: During the quarter, 12 mini-campaigns were held in Bukavu, Kamina, Kole, Luiza, Mwene Ditu , Tshumbe, and Uvira. The campaigns discussed the following: TB, vaccinations, HIV and AIDS, and GBV (see Table 49 below). Table 49: Number of awareness-raising campaigns organized during PY1Q3 by health topic
Health topic Bukavu Kamina Kole Kolwezi Luiza Mwene Ditu Tshumbe Uvira Total
TB 1 0 1 0 2 2 1 0 7
Vaccination 1 0 0 0 0 0 0 1 2
HIV and AIDS
0 0 0 0 0 1 0 0 1
GBV 0 1 0 0 1 0 0 0 2
Total 2 1 1 0 3 3 1 1 12
In Kamina, IHPplus held an awareness-raising mini-campaign on GBV in Malemba and Mulongo health zones. The women of Batwa Bemba de Malemba, a development NGO, created a workplan to raise awareness among young women on GBV. They began implementing the workplan in February 2016 in four health areas (Kabala, Mukomutombo, Nyoka, and Lwandwe).
In Luiza, IHPplus held two TB mini-campaigns from March 5-14, 2016, in the health zones of Lubondaie and Dibaya. During the mini-campaigns, 80 CHWs, Club Amis de Damien (NGO working in TB) members, and Champion Community members were briefed on the community role in the fight against TB. An additional 805 ETL sessions were held in households, schools, and churches, and 4,100 SMS with TB messaging were sent. As a result of the campaigns, 1,039 suspected cases were referred to CSDTs (430 in the health zone of Lubondaie and 609 in the health zone of Dibaya). Of the referred suspected cases, 32 patients tested positive for TB and were treated (15 in Lubondaie and 17 in Dibaya). Challenges: The MOH prioritizes its own activities, with other activities being delayed or suspended. Lessons learned: Mini-campaigns successfully raise awareness within target populations and increase health service demand within target populations. Next steps:
Organize mini-campaigns in each health zone based on community-identified needs
Define goals for the CHWs during campaigns
Organize mass awareness-raising activities and radio broadcasts in peripheral areas for greater impact
Coordinate neighboring Champion Communities for campaigns
Improve coordination between the MOH and IHPplus when conducting awareness-raising sessions
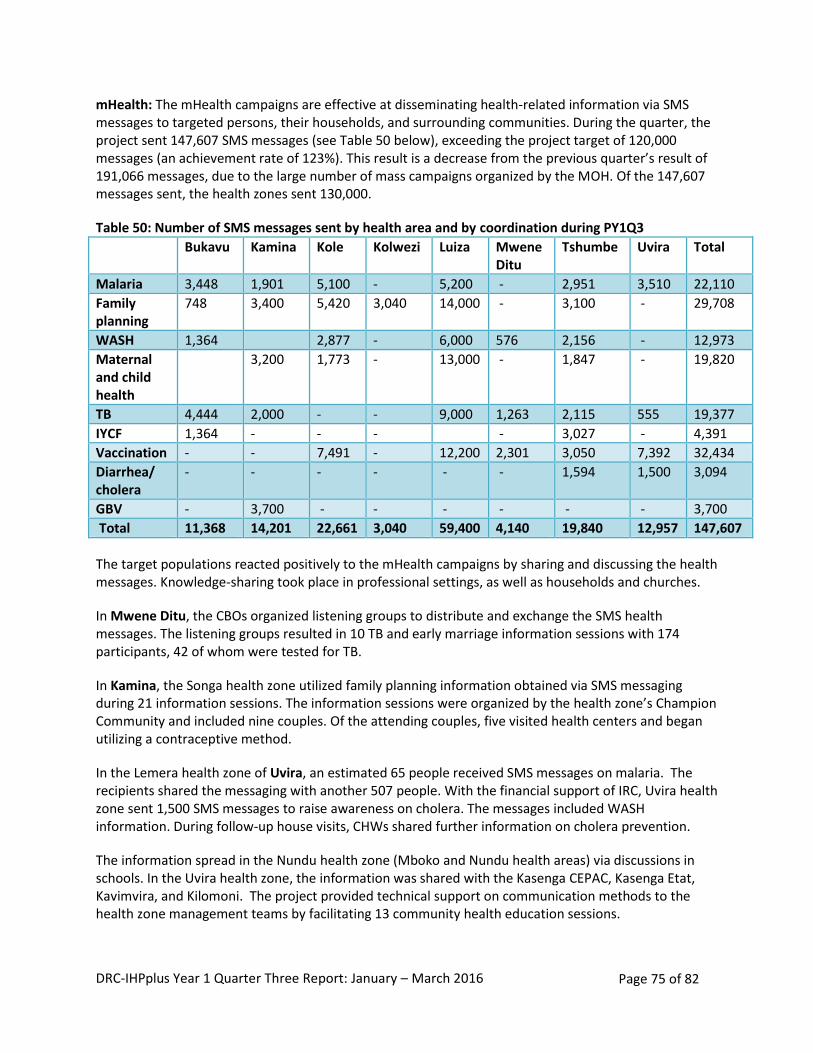
DRC-IHPplus Year 1 Quarter Three Report: January – March 2016 Page 75 of 82
mHealth: The mHealth campaigns are effective at disseminating health-related information via SMS messages to targeted persons, their households, and surrounding communities. During the quarter, the project sent 147,607 SMS messages (see Table 50 below), exceeding the project target of 120,000 messages (an achievement rate of 123%). This result is a decrease from the previous quarter’s result of 191,066 messages, due to the large number of mass campaigns organized by the MOH. Of the 147,607 messages sent, the health zones sent 130,000.
Table 50: Number of SMS messages sent by health area and by coordination during PY1Q3
Bukavu Kamina Kole Kolwezi Luiza Mwene Ditu
Tshumbe Uvira Total
Malaria 3,448 1,901 5,100 - 5,200 - 2,951 3,510 22,110
Family planning
748 3,400 5,420 3,040 14,000 - 3,100 - 29,708
WASH 1,364 2,877 - 6,000 576 2,156 - 12,973
Maternal and child health
3,200 1,773 - 13,000 - 1,847 - 19,820
TB 4,444 2,000 - - 9,000 1,263 2,115 555 19,377
IYCF 1,364 - - - - 3,027 - 4,391
Vaccination - - 7,491 - 12,200 2,301 3,050 7,392 32,434
Diarrhea/ cholera
- - - - - - 1,594 1,500 3,094
GBV - 3,700 - - - - - - 3,700
Total 11,368 14,201 22,661 3,040 59,400 4,140 19,840 12,957 147,607
The target populations reacted positively to the mHealth campaigns by sharing and discussing the health messages. Knowledge-sharing took place in professional settings, as well as households and churches.
In Mwene Ditu, the CBOs organized listening groups to distribute and exchange the SMS health messages. The listening groups resulted in 10 TB and early marriage information sessions with 174 participants, 42 of whom were tested for TB.
In Kamina, the Songa health zone utilized family planning information obtained via SMS messaging during 21 information sessions. The information sessions were organized by the health zone’s Champion Community and included nine couples. Of the attending couples, five visited health centers and began utilizing a contraceptive method.
In the Lemera health zone of Uvira, an estimated 65 people received SMS messages on malaria. The recipients shared the messaging with another 507 people. With the financial support of IRC, Uvira health zone sent 1,500 SMS messages to raise awareness on cholera. The messages included WASH information. During follow-up house visits, CHWs shared further information on cholera prevention.
The information spread in the Nundu health zone (Mboko and Nundu health areas) via discussions in schools. In the Uvira health zone, the information was shared with the Kasenga CEPAC, Kasenga Etat, Kavimvira, and Kilomoni. The project provided technical support on communication methods to the health zone management teams by facilitating 13 community health education sessions.
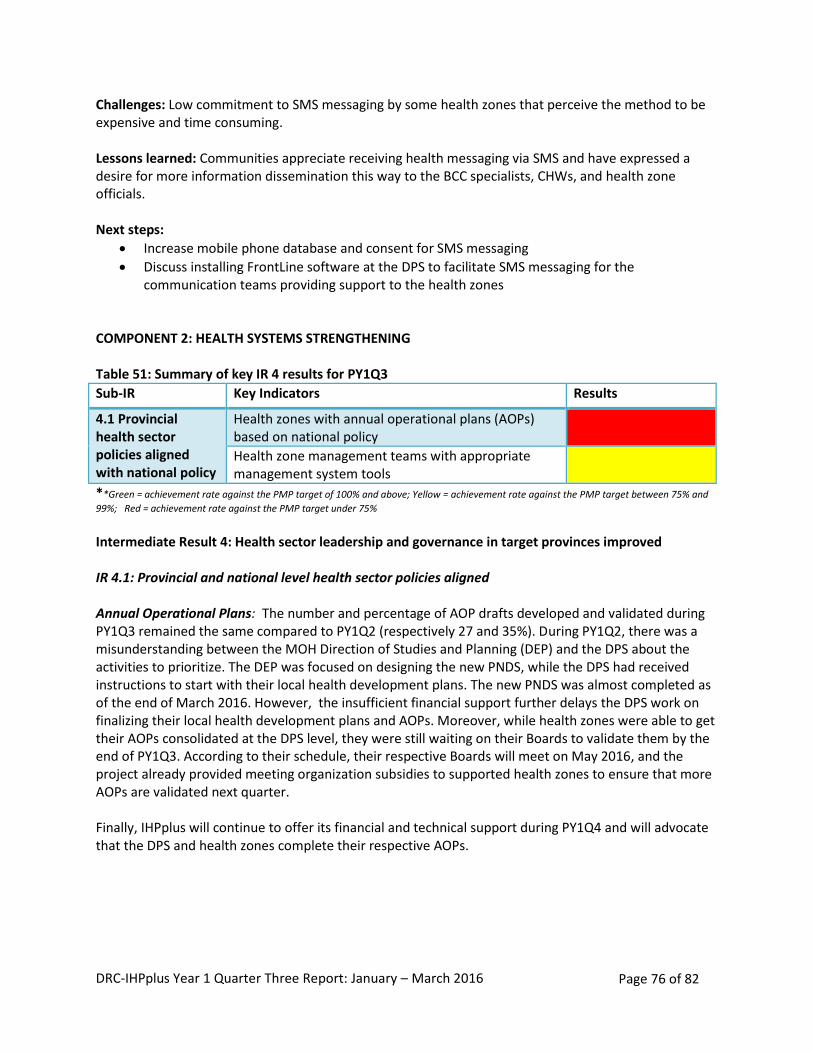
DRC-IHPplus Year 1 Quarter Three Report: January – March 2016 Page 76 of 82
Challenges: Low commitment to SMS messaging by some health zones that perceive the method to be expensive and time consuming. Lessons learned: Communities appreciate receiving health messaging via SMS and have expressed a desire for more information dissemination this way to the BCC specialists, CHWs, and health zone officials. Next steps:
Increase mobile phone database and consent for SMS messaging
Discuss installing FrontLine software at the DPS to facilitate SMS messaging for the communication teams providing support to the health zones
COMPONENT 2: HEALTH SYSTEMS STRENGTHENING Table 51: Summary of key IR 4 results for PY1Q3
Sub-IR Key Indicators Results
4.1 Provincial health sector policies aligned with national policy
Health zones with annual operational plans (AOPs) based on national policy
Health zone management teams with appropriate management system tools
**Green = achievement rate against the PMP target of 100% and above; Yellow = achievement rate against the PMP target between 75% and
99%; Red = achievement rate against the PMP target under 75%
Intermediate Result 4: Health sector leadership and governance in target provinces improved IR 4.1: Provincial and national level health sector policies aligned Annual Operational Plans: The number and percentage of AOP drafts developed and validated during PY1Q3 remained the same compared to PY1Q2 (respectively 27 and 35%). During PY1Q2, there was a misunderstanding between the MOH Direction of Studies and Planning (DEP) and the DPS about the activities to prioritize. The DEP was focused on designing the new PNDS, while the DPS had received instructions to start with their local health development plans. The new PNDS was almost completed as of the end of March 2016. However, the insufficient financial support further delays the DPS work on finalizing their local health development plans and AOPs. Moreover, while health zones were able to get their AOPs consolidated at the DPS level, they were still waiting on their Boards to validate them by the end of PY1Q3. According to their schedule, their respective Boards will meet on May 2016, and the project already provided meeting organization subsidies to supported health zones to ensure that more AOPs are validated next quarter. Finally, IHPplus will continue to offer its financial and technical support during PY1Q4 and will advocate that the DPS and health zones complete their respective AOPs.
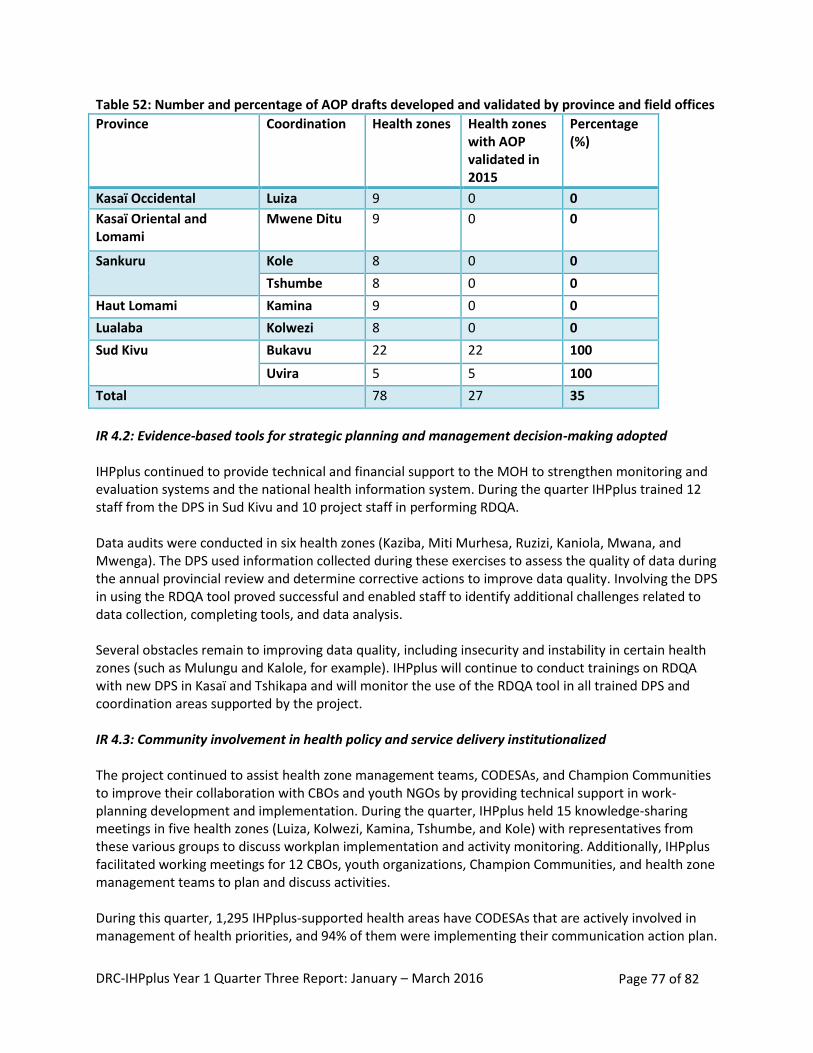
DRC-IHPplus Year 1 Quarter Three Report: January – March 2016 Page 77 of 82
Table 52: Number and percentage of AOP drafts developed and validated by province and field offices
Province Coordination Health zones Health zones with AOP validated in 2015
Percentage (%)
Kasaï Occidental Luiza 9 0 0
Kasaï Oriental and Lomami
Mwene Ditu 9 0 0
Sankuru Kole 8 0 0
Tshumbe 8 0 0
Haut Lomami Kamina 9 0 0
Lualaba Kolwezi 8 0 0
Sud Kivu Bukavu 22 22 100
Uvira 5 5 100
Total 78 27 35
IR 4.2: Evidence-based tools for strategic planning and management decision-making adopted IHPplus continued to provide technical and financial support to the MOH to strengthen monitoring and evaluation systems and the national health information system. During the quarter IHPplus trained 12 staff from the DPS in Sud Kivu and 10 project staff in performing RDQA. Data audits were conducted in six health zones (Kaziba, Miti Murhesa, Ruzizi, Kaniola, Mwana, and Mwenga). The DPS used information collected during these exercises to assess the quality of data during the annual provincial review and determine corrective actions to improve data quality. Involving the DPS in using the RDQA tool proved successful and enabled staff to identify additional challenges related to data collection, completing tools, and data analysis. Several obstacles remain to improving data quality, including insecurity and instability in certain health zones (such as Mulungu and Kalole, for example). IHPplus will continue to conduct trainings on RDQA with new DPS in Kasaï and Tshikapa and will monitor the use of the RDQA tool in all trained DPS and coordination areas supported by the project. IR 4.3: Community involvement in health policy and service delivery institutionalized The project continued to assist health zone management teams, CODESAs, and Champion Communities to improve their collaboration with CBOs and youth NGOs by providing technical support in work-planning development and implementation. During the quarter, IHPplus held 15 knowledge-sharing meetings in five health zones (Luiza, Kolwezi, Kamina, Tshumbe, and Kole) with representatives from these various groups to discuss workplan implementation and activity monitoring. Additionally, IHPplus facilitated working meetings for 12 CBOs, youth organizations, Champion Communities, and health zone management teams to plan and discuss activities. During this quarter, 1,295 IHPplus-supported health areas have CODESAs that are actively involved in management of health priorities, and 94% of them were implementing their communication action plan.
DRC-IHPplus Year 1 Quarter Three Report: January – March 2016 Page 78 of 82
The NGO Champion Communities in several health zones continues to show their creativity in managing and developing income-generating activities to strengthen their autonomy while implementing their workplan activities to support service delivery, mainly in health centers through referrals: e.g., in Uvira, 873 children received required infant immunizations, 295 pregnant women were referred and brought to maternity clinics, and 226 women of childbearing age were sensitized on family planning. PROJECT MANAGEMENT
Success stories: The project produced eight success stories to contribute toward the annual target of 24 stories. They are found in the last section of the report. During this quarter, the topics covered were RBF (two stories), TB (one story), MNCH (one story), nutrition (one story), WASH (one story), BCC (one story), and family planning (one story). During the next quarter, the project will develop more success stories on the LDP, malaria, i-CCM, FOSACOF, HIV, GBV, and access to care to ensure fair representation of each health topic across the project. Cost share: Brother's Brother Foundation (BBF) is a nonprofit international humanitarian relief organization that equips the world’s most resource-limited medical facilities with donated medical supplies and equipment. MSH started working with BBF under IHP and continues this collaboration under IHPplus. BBF recently donated 53 hospital beds as well as one bulk roll of vinyl material to cover mattresses. The estimated value of this cost share is $23,860 (fair market value of all donated goods). These items arrived in country on November 2, 2015, and were distributed to GRHs located in health zones prioritized by the MOH for support. Due to the sudden departure of BBF’s Vice President (who was also the project’s main point of contact), IHPplus has not yet received the signed cost share documentation, but is following up closely to remedy to this situation during the next quarter. IHPplus also worked during the quarter to pursue two additional cost share opportunities with Project CURE and Vitamin Angels. Project CURE (a US-based gift-in-kind donation agency) shipped eight 40-foot containers of medical supplies for IHP, and additional donations are planned under IHPplus. To determine the type and quantity of medical supplies needed, a volunteer for Project CURE conducted a needs assessment in eight hospitals located in Sud Kivu from March 13–19 and submitted a report (including packing list requests) on April 22. IHPplus is working on reviewing the needs assessment report and drafting a scope of work (including number of containers, allocation, and sequencing strategy) to be shared with Project CURE during next quarter. The second cost-share opportunity is with Vitamin Angels, a California-based nonprofit helping to alleviate global micronutrient deficiency among at-risk populations—specifically pregnant women, new mothers, and children under five—and help them gain access to lifesaving vitamins and minerals. IHPplus is exploring a partnership with Vitamin Angels to secure donations for the project’s ongoing vitamin A supplementation program. IHPplus will submit the needs assessment for this commodity in the next quarter. Status of pharmaceutical procurement order #1: The first IHPplus pharmaceutical order was placed with IDA, ASRAMES, IMRES, and MEG in August 2015, for pickup in December 2015. A total of 23 shipments have been managed by global shipping and logistics experts and distributed in the country by GTM. The pharmaceutical shipments are well under way. At the time this report is being submitted, only one note verbale is still pending for the last ocean shipment. The majority (95%) of the order has already reached its final destination and the remaining (5%) delivery should be completed before the end of May 2016.
DRC-IHPplus Year 1 Quarter Three Report: January – March 2016 Page 79 of 82
Status of pharmaceutical procurement order #2: The second order of pharmaceuticals was placed with MissionPharma in December 2015 and is 50% delivered. All shipments from countries of origin to Goma, DRC, are managed by Bollore and will be stored and distributed in the country by ASRAMES. The first two deliveries are now in Goma and stored at ASRAMES warehouse. Warehousing: In IHP PY5Q2, as a result of using the expiration-warning system that SIAPS set up within MSH’s warehouse monitoring system, IHP identified 19,244,157 condoms that were at risk of expiring. The total estimated value of this supply was $769,766. The project officially alerted USAID and called an urgent meeting to develop a redeployment plan in order to distribute the supply. Following this meeting, it was agreed that MSH would redistribute 69% (13,183,000) of these condoms to partnering CDRs. By the end of PY1Q3, 71% of the total stock had been distributed (13,665,006 out of 19,244,157) which was a combined effort of all USAID partners. Unfortunately, the 5,579,151 condoms left (valued at $223,166) expired on April 2016. During PY1Q2, SIAPS also alerted USAID of a stock of 173,571 oral contraceptives (Microgynon) valued at $46,864 at risk of expiring in the Kinshasa warehouse. Regrettably, it was too late to develop a redeployment plan, as the contraceptives expired in April 2016. The destruction of both stocks of expired commodities is planned for PY1Q4.
In September 2015, SIAPS produced a situational analysis report of MSH’s warehouse in Kamina. Two main recommendations were made: (1) better equip the warehouse with office furniture and supplies, security/compliance, reporting tools, storage equipment; and (2) hire an additional full-time employee (warehouse manager) to manage drug stocks daily. IHPplus purchased additional materials to equip the warehouse (estimated value of $37,558) and more than 50% of the order was delivered to Kamina at the beginning of March 2016. In addition, the warehouse wiring was completed by mid-February 2016. Regarding recruitment, a warehouse manager was hired and started working on March 2016. Moreover, SIAPS also organized a joint supervision visit with the Programme National d’Approvisionnement en Médicaments (Drug Procurement National Program) to Kamina warehouse in order to: (1) provide a technical orientation training to the new warehouse manager; (2) draft a manual on optimal warehouse management procedures; and (3) monitor the implementation of the recommendations that were made by SIAPS in the situational analysis report. Upon completion of this mission, SIAPS technical advisor provided a draft of both the procedures manual and an updated version of the warehouse manager job description to IHPplus and SIAPS project directors for review and approval. FAMILY PLANNING AND HIV AND AIDS STATUTORY REQUIREMENTS
During PY1Q3, IHPplus staff and service providers at IHPplus-supported health facilities provided family planning and HIV and AIDS services while ensuring that USAID’s regulations concerning family planning and HIV and AIDS were followed. 1. Family planning: During this quarter, IHPplus led several family planning activities to ensure clients’
willingness and informed consent. The project supplied a wide selection of contraceptive products (CycleBeads, male condoms, female condoms, Depo-Provera, ParaGard copper intrauterine devices, Implanon NXT, Microlut, and Microgynon) to service delivery points, which ensured that clients could make an educated selection from a range of methods after attending a family-planning counseling session. Over the course of PY1Q3, 68 IHPplus technical staff members and 10 partners from the MOH completed the online course on USG family planning regulations. IHPplus staff continued to monitor
DRC-IHPplus Year 1 Quarter Three Report: January – March 2016 Page 80 of 82
adherence to the USG family planning regulations during family planning supervision visits to all coordination offices, post-training follow-up in Luiza and Mwene Ditu, and data verification activities in the seven health zones implementing the RBF program.
2. HIV and AIDS: All IHPplus staff involved in HIV care have previously received HIV and AIDS training,
and IHPplus has trained and briefed providers at all HIV care sites. All HIV care sites continued to provide HIV pre-test and post-test counseling. They also provided counseling to people living with HIV/AIDS prior to initiating ART. Condoms distributed at IHPplus HIV care sites were accompanied by accurate and specific medical information, including the public health benefits of condom usage and the condom failure rate. Providers at IHPplus-supported HIV and AIDS care sites continued to observe and enforce infection-control regulations by taking universal personal precautions (washing hands, wearing masks and gloves, using condoms to prevent sexually transmitted infections/HIV) administrative precautions (properly ventilating workplaces, spacing out medical visits for TB patients and people living with HIV/AIDS), and environmental precautions (properly managing biomedical waste, specifically by sorting waste and using incinerators).
Next steps:
Systematically apply statutory requirements to the areas of family planning and HIV and AIDS into the supervision program
Request additional Tiahrt posters from USAID to replace old, unreadable, and damaged posters at health facilities
Bring IHPplus technical staff from the Kolwezi and Kamina coordination offices who are involved in implementing the HIV package of services to take the online course on HIV and AIDS Legal and Policy Requirements.
ENVIRONMENTAL MONITORING AND MITIGATION PLAN
The MOH and IHPplus conducted field visits to 489 health facilities. The assessment of the proper disposal of biohazard wastes and appropriate individual hygiene practices were included in the field visit assessment. In general, the majority of health facilities have sufficient equipment for infection prevention and personnel in health facilities correctly use hygiene equipment. A high percentage of health facilities have placenta pits and containers for disposing sharp items (80% and 83%, respectively) and a large number of staff at the facilities know how to use them correctly (90% and 91%, respectively). The availability of functional incinerators is lower—at only 53% of facilities visited; however, their proper utilization is at 82%. IHPplus continued supporting the health zone management teams in implementing the following actions:
Mobilize local resources to ensure that each health facility has a functional incinerator (on a case by case basis, IHPplus may contribute materials for health facilities that demonstrate their commitment)
Continue to evaluate health facilities during the health zone management team monthly supervision visits
DRC-IHPplus Year 1 Quarter Three Report: January – March 2016 Page 81 of 82
Sensitize head nurses on the importance of compliance with recommended biohazard waste management and individual and facility hygiene practices during the monthly monitoring meetings and field visits
During this quarter, IHPplus focused on the implementation of the community-led total sanitation approach in four health zones (Ndekesha and Luambo in Kasaï Central and Kanda Kanda and Luputa located in Haut Lomami). The project provided access to improved drinking water supply to 162,741 people, against a targeted population of 158,584 by renovating 147 water sources. The project empowered the community to build 12,902 hygienic family latrines and to grant first-time access to improved sanitation facilities to 89,149 people, against a targeted population of 105,772. As mentioned from the joint USAID/IHPplus field visit in February 2016 in Kanzenze, additional investment is needed to further empower the communities for a sustained ownership of the WASH hardware including maintenance of water sources and adequate utilization of household latrines. IHPplus will support the DPS in revising and standardizing the training modules for WASH committees and local artisans, as well as intensifying the mini-campaigns for adoption of hygiene and sanitation practices. CHALLENGES ENCOUNTERED
The main challenges that the project experienced during PY1Q3 included the following: Delay in obligating IHPplus funds: IHPplus did not receive the additional obligation that was expected by end of January 2016 (expected $14,290,000). Partial funds were made available (i.e., $7,144,457) to the project on March 28, 2016. As a result, most of the training activities planned for January-March were postponed to the next quarter pending the availability of the information about the remaining obligation for IHPplus PY1. Supply Chain Management System: The weak quality of the logistics management information system (LMIS) remains a great challenge. As a result, health facilities continue to report stock-outs of tracer medicines. During the quarter, ACT and Depo-Provera stock-out exceeded the target number of stock-outs (146 stock-outs against a target of 100, and 243 stock-outs against a target of 100, respectively). IHPplus and SIAPS will continue to address bottlenecks that contribute to high stock-out levels at the facility level. This includes but not limited to continuing to organize training activities for health zones management teams and health facility staff. On January 18-21, 2016, SIAPS and IHPplus conducted a drug-management training for 11 health zone management teams in Kolwezi, in collaboration with the National Drug Supply Program. Data Quality: Ensuring the quality of data remains a challenge. For example, inconsistency in data was reported between the number of deliveries by skilled birth attendants and other indicators related to childbirth, such as the number of women receiving AMTSL and the number of newborns receiving essential care. IHPplus continued to work with the DPS and health zone management teams to identify and address data inaccuracies. IHPplus provided technical and financial support to the MOH’s HMIS Office (DSNIS) to train two new provincial health division management teams of Sud Kivu to perform RDQAs. Security: During this quarter, armed group activities continued in Sud Kivu. The health zones that were affected were mostly the same zones reported during the previous last quarter. IHPplus continues to work closely with the health zones and health authorities in the affected health zones to make sure that basic support is provided for health facilities, including timely delivery of essential medicines,
DRC-IHPplus Year 1 Quarter Three Report: January – March 2016 Page 82 of 82
commodities to maintain the cold chain for vaccines, as well as the grants to health zone management teams and DPS. During next quarter the MSH Security Officer will travel to DRC to support IHPplus and other MSH projects in further improving the organization’s security system. WAY FORWARD: PLANNED ACTIVITIES FOR NEXT QUARTER
Please refer to Appendix 11: DRC-IHPplus PY1Q4 planned activities. LIST OF APPENDICES
Appendix 1: DRC-IHPplus Performance Monitoring Plan, PY1Q3 Appendix 2: DRC-IHPplus International Travel (STTA Plan) Appendix 3: DRC-IHPplus Organizational Chart Appendix 4: SIAPS Delivery Tracker for IHPplus as of April 2016 Appendix 5: DRC-IHPplus MSH Cargo Tracking Appendix 6: Mission Report on drug inventory management training with Lualaba DPS - January 2016 Appendix 7: Post training action plan for training of trainers on drug inventory management - Lualaba DPS - January 2016 Appendix 8: DRC-IHPplus Kamina MSH Warehouse Management Guidelines as of March 2016 Appendix 9: DRC-IHPplus CEDIMEK CDR situational analysis report from April 2016 Appendix 10: Adolescent girls and woman's nutrition, moving the agenda forward by USAID and Strengthening Partnerships, Results, and Innovations in Nutrition Globally (SPRING) Appendix 11: DRC-IHPplus PY1Q4 way forward (Gantt chart) Appendix 12: PowerPoint Presentations on polio eradication activities: Mise à jour hebdomadaire sur l’Initiative d’Eradication de la Polio en Afrique Centrale, Mise à jour du 14 mars 2016, IST Afrique Centrale, Libreville-GABON, slide 2, last bullet; and the Activités d’éradication de la poliomyélite (IEP), République Démocratique du Congo, Mise à jour du 15 avril 2016, slide 3 *Appendices 4, 5, and 11 are attached separately as Excel files
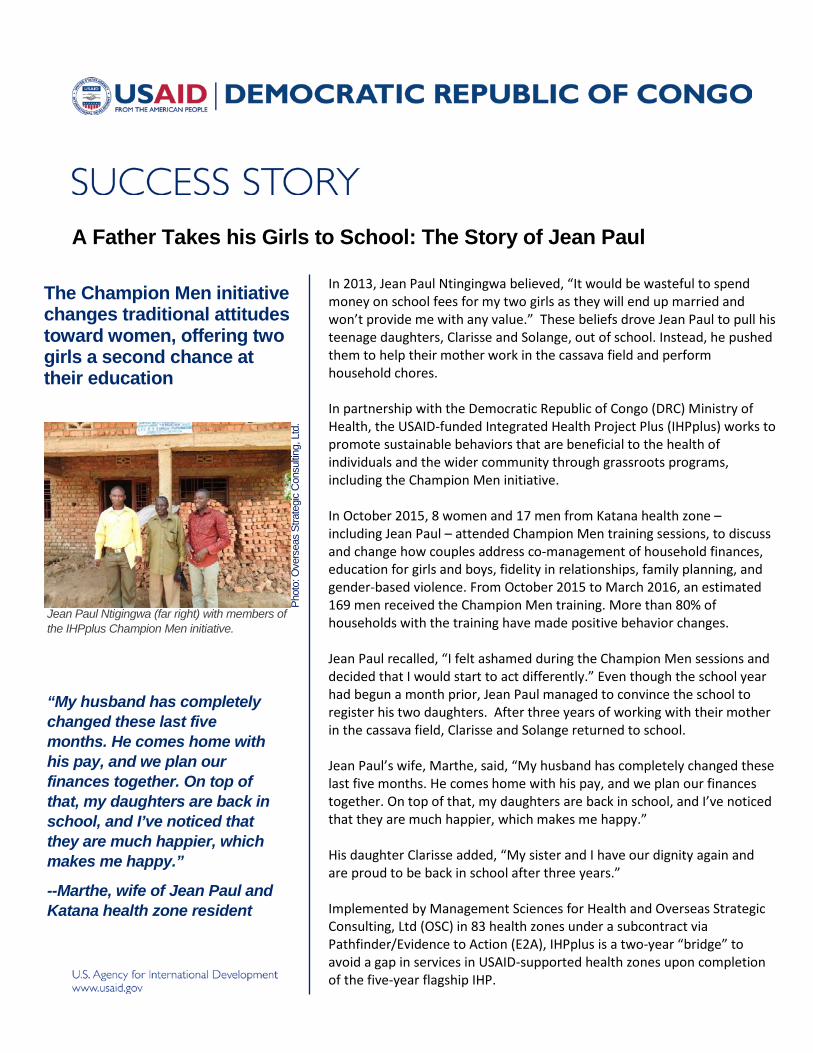
A Father Takes his Girls to School: The Story of Jean Paul
The Champion Men initiative changes traditional attitudes toward women, offering two girls a second chance at their education
Jean Paul Ntigingwa (far right) with members of the IHPplus Champion Men initiative.
“My husband has completely changed these last five months. He comes home with his pay, and we plan our finances together. On top of that, my daughters are back in school, and I’ve noticed that they are much happier, which makes me happy.”
--Marthe, wife of Jean Paul and Katana health zone resident
Phot
o: O
vers
eas
Stra
tegi
c C
onsu
lting,
Ltd
. In 2013, Jean Paul Ntingingwa believed, “It would be wasteful to spend money on school fees for my two girls as they will end up married and won’t provide me with any value.” These beliefs drove Jean Paul to pull his teenage daughters, Clarisse and Solange, out of school. Instead, he pushed them to help their mother work in the cassava field and perform household chores. In partnership with the Democratic Republic of Congo (DRC) Ministry of Health, the USAID-funded Integrated Health Project Plus (IHPplus) works to promote sustainable behaviors that are beneficial to the health of individuals and the wider community through grassroots programs, including the Champion Men initiative. In October 2015, 8 women and 17 men from Katana health zone – including Jean Paul – attended Champion Men training sessions, to discuss and change how couples address co-management of household finances, education for girls and boys, fidelity in relationships, family planning, and gender-based violence. From October 2015 to March 2016, an estimated 169 men received the Champion Men training. More than 80% of households with the training have made positive behavior changes. Jean Paul recalled, “I felt ashamed during the Champion Men sessions and decided that I would start to act differently.” Even though the school year had begun a month prior, Jean Paul managed to convince the school to register his two daughters. After three years of working with their mother in the cassava field, Clarisse and Solange returned to school. Jean Paul’s wife, Marthe, said, “My husband has completely changed these last five months. He comes home with his pay, and we plan our finances together. On top of that, my daughters are back in school, and I’ve noticed that they are much happier, which makes me happy.” His daughter Clarisse added, “My sister and I have our dignity again and are proud to be back in school after three years.” Implemented by Management Sciences for Health and Overseas Strategic Consulting, Ltd (OSC) in 83 health zones under a subcontract via Pathfinder/Evidence to Action (E2A), IHPplus is a two-year “bridge” to avoid a gap in services in USAID-supported health zones upon completion of the five-year flagship IHP.
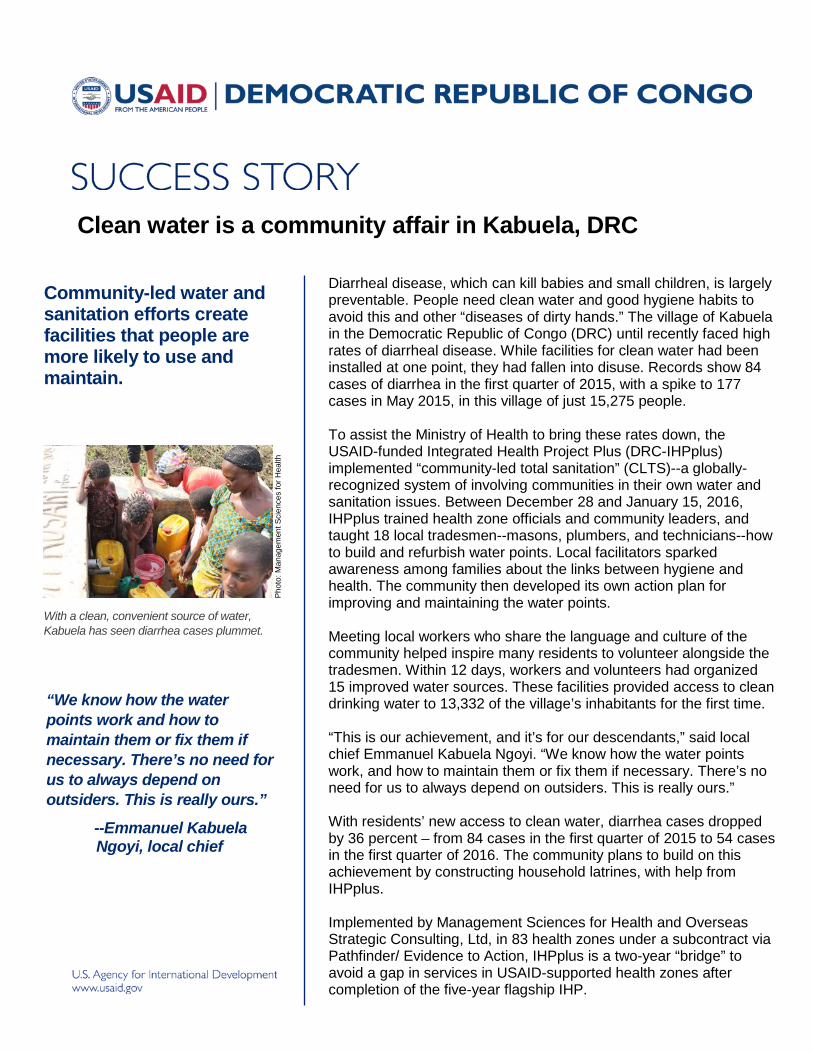
Clean water is a community affair in Kabuela, DRC
Community-led water and sanitation efforts create facilities that people are more likely to use and maintain.
With a clean, convenient source of water, Kabuela has seen diarrhea cases plummet.
“We know how the water points work and how to maintain them or fix them if necessary. There’s no need for us to always depend on outsiders. This is really ours.”
--Emmanuel Kabuela Ngoyi, local chief
Phot
o: M
anag
emen
t Sci
ence
s fo
r Hea
lth
Diarrheal disease, which can kill babies and small children, is largely preventable. People need clean water and good hygiene habits to avoid this and other “diseases of dirty hands.” The village of Kabuela in the Democratic Republic of Congo (DRC) until recently faced high rates of diarrheal disease. While facilities for clean water had been installed at one point, they had fallen into disuse. Records show 84 cases of diarrhea in the first quarter of 2015, with a spike to 177 cases in May 2015, in this village of just 15,275 people. To assist the Ministry of Health to bring these rates down, the USAID-funded Integrated Health Project Plus (DRC-IHPplus) implemented “community-led total sanitation” (CLTS)--a globally- recognized system of involving communities in their own water and sanitation issues. Between December 28 and January 15, 2016, IHPplus trained health zone officials and community leaders, and taught 18 local tradesmen--masons, plumbers, and technicians--how to build and refurbish water points. Local facilitators sparked awareness among families about the links between hygiene and health. The community then developed its own action plan for improving and maintaining the water points. Meeting local workers who share the language and culture of the community helped inspire many residents to volunteer alongside the tradesmen. Within 12 days, workers and volunteers had organized 15 improved water sources. These facilities provided access to clean drinking water to 13,332 of the village’s inhabitants for the first time. “This is our achievement, and it’s for our descendants,” said local chief Emmanuel Kabuela Ngoyi. “We know how the water points work, and how to maintain them or fix them if necessary. There’s no need for us to always depend on outsiders. This is really ours.” With residents’ new access to clean water, diarrhea cases dropped by 36 percent – from 84 cases in the first quarter of 2015 to 54 cases in the first quarter of 2016. The community plans to build on this achievement by constructing household latrines, with help from IHPplus. Implemented by Management Sciences for Health and Overseas Strategic Consulting, Ltd, in 83 health zones under a subcontract via Pathfinder/ Evidence to Action, IHPplus is a two-year “bridge” to avoid a gap in services in USAID-supported health zones after completion of the five-year flagship IHP.
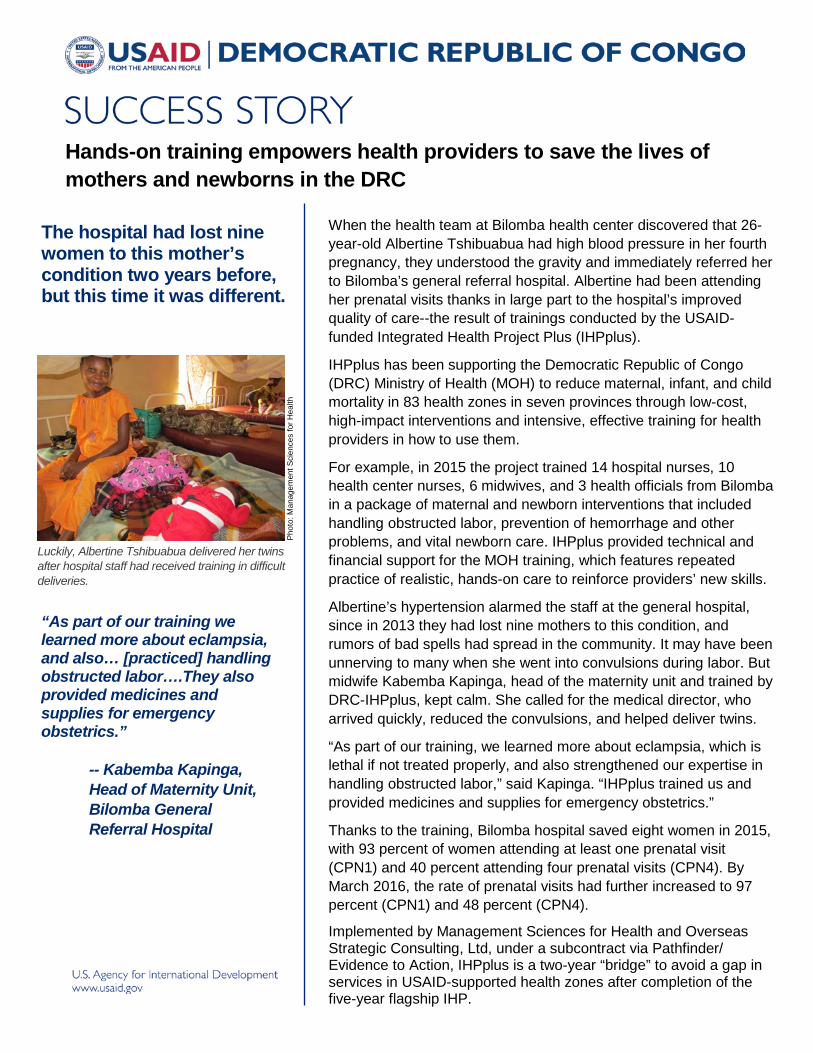
Hands-on training empowers health providers to save the lives of mothers and newborns in the DRC
The hospital had lost nine women to this mother’s condition two years before, but this time it was different.
Luckily, Albertine Tshibuabua delivered her twins after hospital staff had received training in difficult deliveries.
“As part of our training we learned more about eclampsia, and also… [practiced] handling obstructed labor….They also provided medicines and supplies for emergency obstetrics.”
-- Kabemba Kapinga, Head of Maternity Unit, Bilomba General Referral Hospital
Phot
o: M
anag
emen
t Sci
ence
s fo
r Hea
lth
When the health team at Bilomba health center discovered that 26-year-old Albertine Tshibuabua had high blood pressure in her fourth pregnancy, they understood the gravity and immediately referred her to Bilomba’s general referral hospital. Albertine had been attending her prenatal visits thanks in large part to the hospital’s improved quality of care--the result of trainings conducted by the USAID-funded Integrated Health Project Plus (IHPplus).
IHPplus has been supporting the Democratic Republic of Congo (DRC) Ministry of Health (MOH) to reduce maternal, infant, and child mortality in 83 health zones in seven provinces through low-cost, high-impact interventions and intensive, effective training for health providers in how to use them.
For example, in 2015 the project trained 14 hospital nurses, 10 health center nurses, 6 midwives, and 3 health officials from Bilomba in a package of maternal and newborn interventions that included handling obstructed labor, prevention of hemorrhage and other problems, and vital newborn care. IHPplus provided technical and financial support for the MOH training, which features repeated practice of realistic, hands-on care to reinforce providers’ new skills.
Albertine’s hypertension alarmed the staff at the general hospital, since in 2013 they had lost nine mothers to this condition, and rumors of bad spells had spread in the community. It may have been unnerving to many when she went into convulsions during labor. But midwife Kabemba Kapinga, head of the maternity unit and trained by DRC-IHPplus, kept calm. She called for the medical director, who arrived quickly, reduced the convulsions, and helped deliver twins.
“As part of our training, we learned more about eclampsia, which is lethal if not treated properly, and also strengthened our expertise in handling obstructed labor,” said Kapinga. “IHPplus trained us and provided medicines and supplies for emergency obstetrics.”
Thanks to the training, Bilomba hospital saved eight women in 2015, with 93 percent of women attending at least one prenatal visit (CPN1) and 40 percent attending four prenatal visits (CPN4). By March 2016, the rate of prenatal visits had further increased to 97 percent (CPN1) and 48 percent (CPN4).
Implemented by Management Sciences for Health and Overseas Strategic Consulting, Ltd, under a subcontract via Pathfinder/ Evidence to Action, IHPplus is a two-year “bridge” to avoid a gap in services in USAID-supported health zones after completion of the five-year flagship IHP.
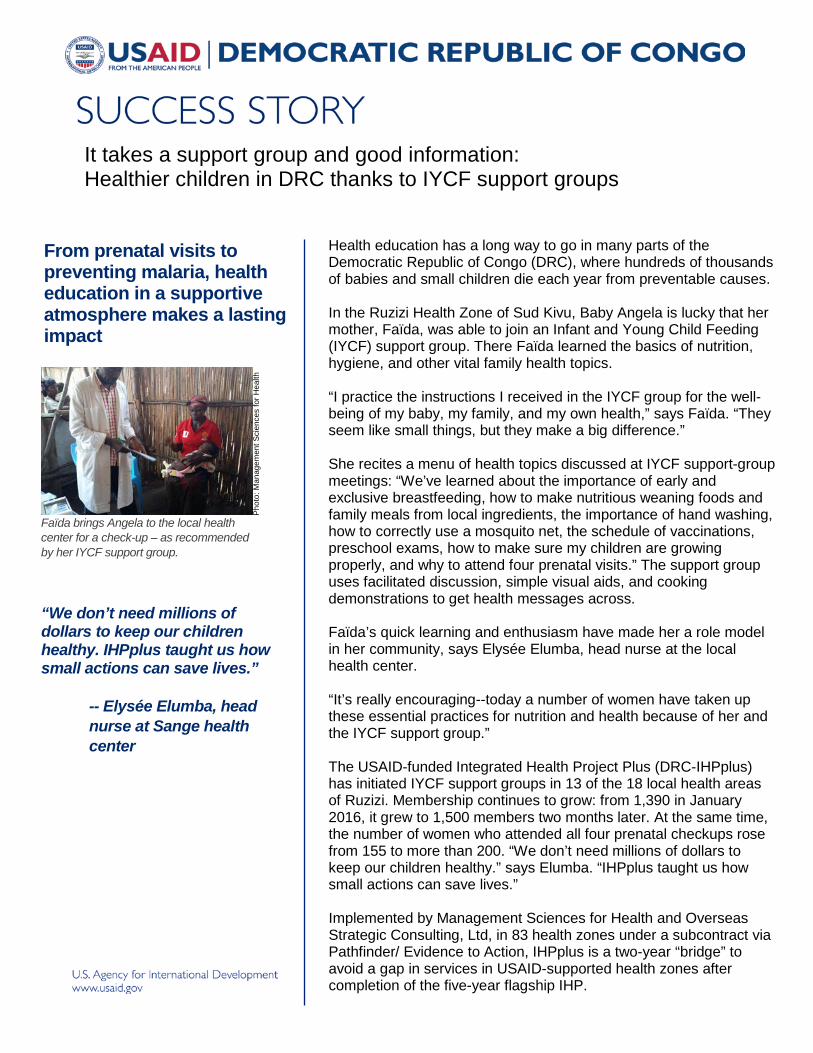
From prenatal visits to preventing malaria, health education in a supportive atmosphere makes a lasting impact
Faïda brings Angela to the local health center for a check-up – as recommended by her IYCF support group.
“We don’t need millions of dollars to keep our children healthy. IHPplus taught us how small actions can save lives.”
-- Elysée Elumba, head nurse at Sange health center
Phot
o: M
anag
emen
t Sci
ence
s fo
r Hea
lth
It takes a support group and good information: Healthier children in DRC thanks to IYCF support groups
Health education has a long way to go in many parts of the Democratic Republic of Congo (DRC), where hundreds of thousands of babies and small children die each year from preventable causes. In the Ruzizi Health Zone of Sud Kivu, Baby Angela is lucky that her mother, Faïda, was able to join an Infant and Young Child Feeding (IYCF) support group. There Faïda learned the basics of nutrition, hygiene, and other vital family health topics. “I practice the instructions I received in the IYCF group for the well-being of my baby, my family, and my own health,” says Faïda. “They seem like small things, but they make a big difference.” She recites a menu of health topics discussed at IYCF support-group meetings: “We’ve learned about the importance of early and exclusive breastfeeding, how to make nutritious weaning foods and family meals from local ingredients, the importance of hand washing, how to correctly use a mosquito net, the schedule of vaccinations, preschool exams, how to make sure my children are growing properly, and why to attend four prenatal visits.” The support group uses facilitated discussion, simple visual aids, and cooking demonstrations to get health messages across. Faïda’s quick learning and enthusiasm have made her a role model in her community, says Elysée Elumba, head nurse at the local health center. “It’s really encouraging--today a number of women have taken up these essential practices for nutrition and health because of her and the IYCF support group.” The USAID-funded Integrated Health Project Plus (DRC-IHPplus) has initiated IYCF support groups in 13 of the 18 local health areas of Ruzizi. Membership continues to grow: from 1,390 in January 2016, it grew to 1,500 members two months later. At the same time, the number of women who attended all four prenatal checkups rose from 155 to more than 200. “We don’t need millions of dollars to keep our children healthy.” says Elumba. “IHPplus taught us how small actions can save lives.” Implemented by Management Sciences for Health and Overseas Strategic Consulting, Ltd, in 83 health zones under a subcontract via Pathfinder/ Evidence to Action, IHPplus is a two-year “bridge” to avoid a gap in services in USAID-supported health zones after completion of the five-year flagship IHP.
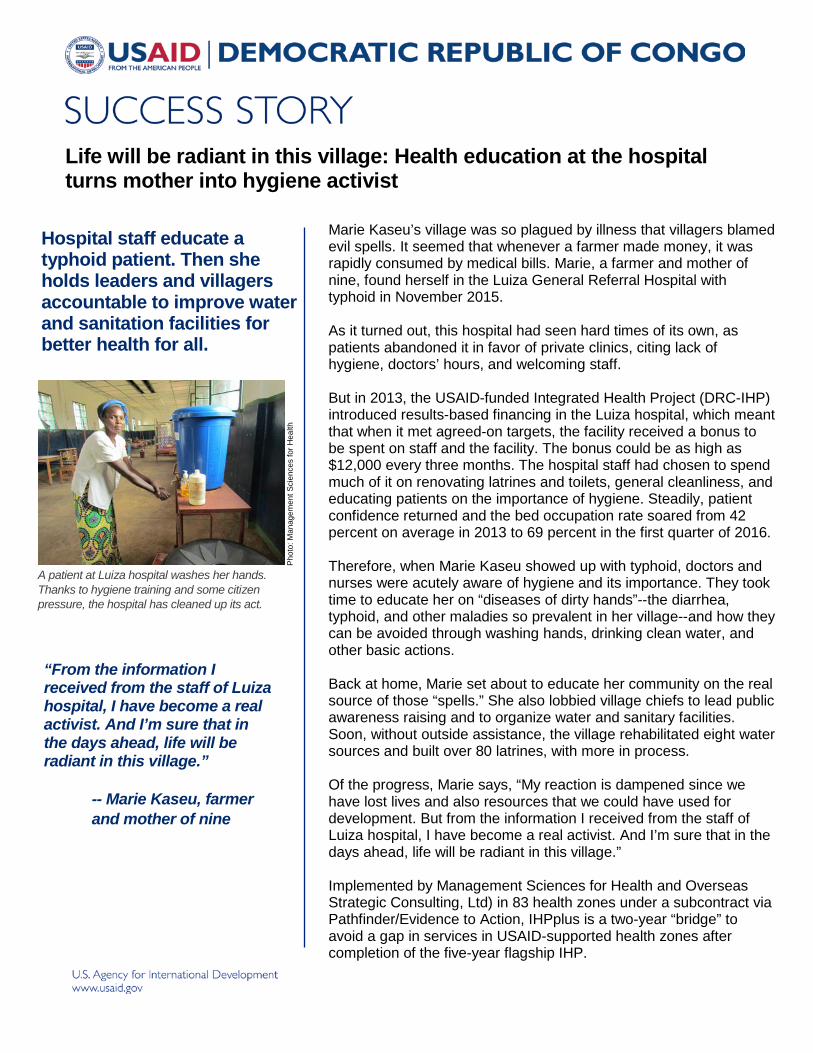
Life will be radiant in this village: Health education at the hospital turns mother into hygiene activist
Hospital staff educate a typhoid patient. Then she holds leaders and villagers accountable to improve water and sanitation facilities for better health for all.
A patient at Luiza hospital washes her hands. Thanks to hygiene training and some citizen pressure, the hospital has cleaned up its act.
“From the information I received from the staff of Luiza hospital, I have become a real activist. And I’m sure that in the days ahead, life will be radiant in this village.”
-- Marie Kaseu, farmer and mother of nine
Phot
o: M
anag
emen
t Sci
ence
s fo
r Hea
lth
Marie Kaseu’s village was so plagued by illness that villagers blamed evil spells. It seemed that whenever a farmer made money, it was rapidly consumed by medical bills. Marie, a farmer and mother of nine, found herself in the Luiza General Referral Hospital with typhoid in November 2015. As it turned out, this hospital had seen hard times of its own, as patients abandoned it in favor of private clinics, citing lack of hygiene, doctors’ hours, and welcoming staff. But in 2013, the USAID-funded Integrated Health Project (DRC-IHP) introduced results-based financing in the Luiza hospital, which meant that when it met agreed-on targets, the facility received a bonus to be spent on staff and the facility. The bonus could be as high as $12,000 every three months. The hospital staff had chosen to spend much of it on renovating latrines and toilets, general cleanliness, and educating patients on the importance of hygiene. Steadily, patient confidence returned and the bed occupation rate soared from 42 percent on average in 2013 to 69 percent in the first quarter of 2016. Therefore, when Marie Kaseu showed up with typhoid, doctors and nurses were acutely aware of hygiene and its importance. They took time to educate her on “diseases of dirty hands”--the diarrhea, typhoid, and other maladies so prevalent in her village--and how they can be avoided through washing hands, drinking clean water, and other basic actions. Back at home, Marie set about to educate her community on the real source of those “spells.” She also lobbied village chiefs to lead public awareness raising and to organize water and sanitary facilities. Soon, without outside assistance, the village rehabilitated eight water sources and built over 80 latrines, with more in process. Of the progress, Marie says, “My reaction is dampened since we have lost lives and also resources that we could have used for development. But from the information I received from the staff of Luiza hospital, I have become a real activist. And I’m sure that in the days ahead, life will be radiant in this village.” Implemented by Management Sciences for Health and Overseas Strategic Consulting, Ltd) in 83 health zones under a subcontract via Pathfinder/Evidence to Action, IHPplus is a two-year “bridge” to avoid a gap in services in USAID-supported health zones after completion of the five-year flagship IHP.
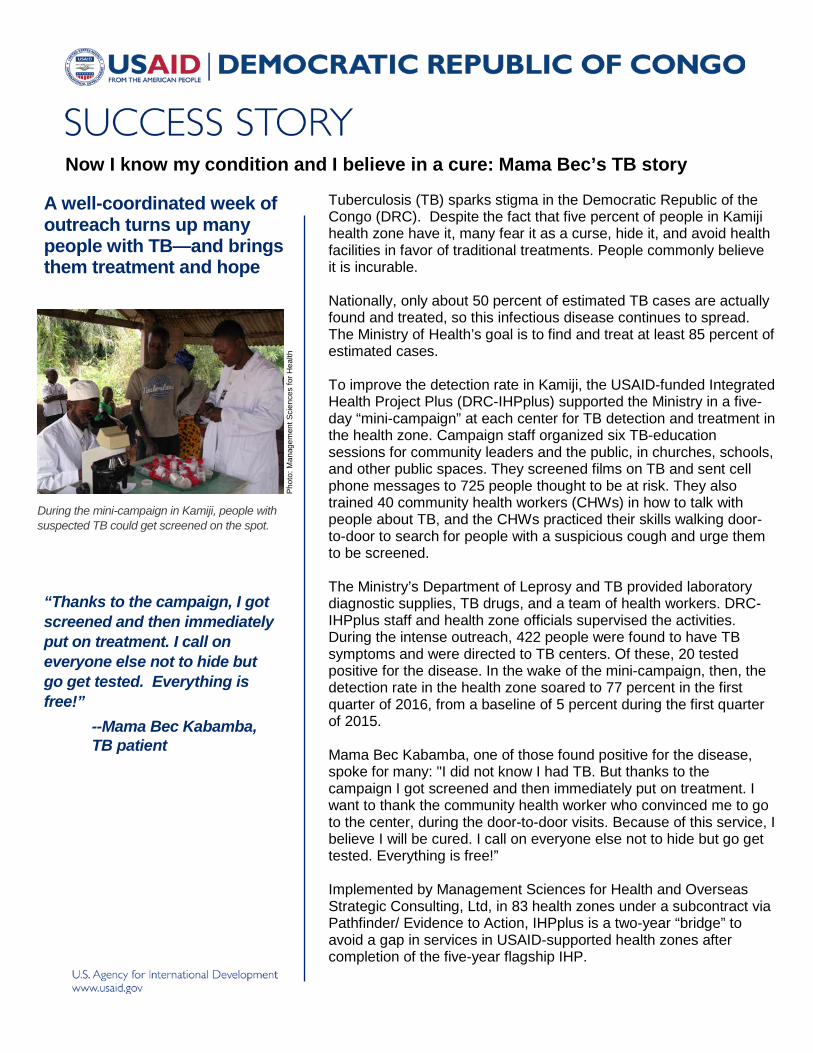
Now I know my condition and I believe in a cure: Mama Bec’s TB story A well-coordinated week of
outreach turns up many people with TB—and brings them treatment and hope
During the mini-campaign in Kamiji, people with suspected TB could get screened on the spot.
“Thanks to the campaign, I got screened and then immediately put on treatment. I call on everyone else not to hide but go get tested. Everything is free!” --Mama Bec Kabamba,
TB patient
Phot
o: M
anag
emen
t Sci
ence
s fo
r Hea
lth
Tuberculosis (TB) sparks stigma in the Democratic Republic of the Congo (DRC). Despite the fact that five percent of people in Kamiji health zone have it, many fear it as a curse, hide it, and avoid health facilities in favor of traditional treatments. People commonly believe it is incurable. Nationally, only about 50 percent of estimated TB cases are actually found and treated, so this infectious disease continues to spread. The Ministry of Health’s goal is to find and treat at least 85 percent of estimated cases. To improve the detection rate in Kamiji, the USAID-funded Integrated Health Project Plus (DRC-IHPplus) supported the Ministry in a five-day “mini-campaign” at each center for TB detection and treatment in the health zone. Campaign staff organized six TB-education sessions for community leaders and the public, in churches, schools, and other public spaces. They screened films on TB and sent cell phone messages to 725 people thought to be at risk. They also trained 40 community health workers (CHWs) in how to talk with people about TB, and the CHWs practiced their skills walking door-to-door to search for people with a suspicious cough and urge them to be screened. The Ministry’s Department of Leprosy and TB provided laboratory diagnostic supplies, TB drugs, and a team of health workers. DRC-IHPplus staff and health zone officials supervised the activities. During the intense outreach, 422 people were found to have TB symptoms and were directed to TB centers. Of these, 20 tested positive for the disease. In the wake of the mini-campaign, then, the detection rate in the health zone soared to 77 percent in the first quarter of 2016, from a baseline of 5 percent during the first quarter of 2015. Mama Bec Kabamba, one of those found positive for the disease, spoke for many: "I did not know I had TB. But thanks to the campaign I got screened and then immediately put on treatment. I want to thank the community health worker who convinced me to go to the center, during the door-to-door visits. Because of this service, I believe I will be cured. I call on everyone else not to hide but go get tested. Everything is free!” Implemented by Management Sciences for Health and Overseas Strategic Consulting, Ltd, in 83 health zones under a subcontract via Pathfinder/ Evidence to Action, IHPplus is a two-year “bridge” to avoid a gap in services in USAID-supported health zones after completion of the five-year flagship IHP.
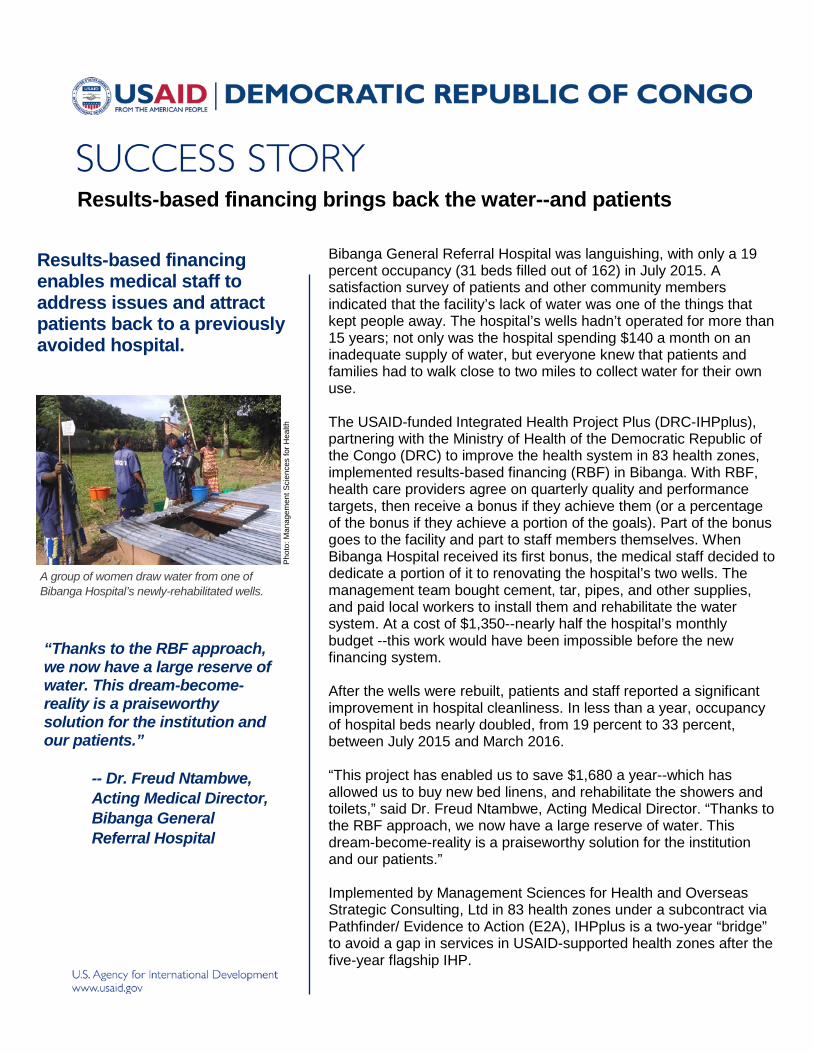
Results-based financing brings back the water--and patients
Results-based financing enables medical staff to address issues and attract patients back to a previously avoided hospital.
A group of women draw water from one of Bibanga Hospital’s newly-rehabilitated wells.
“Thanks to the RBF approach, we now have a large reserve of water. This dream-become-reality is a praiseworthy solution for the institution and our patients.”
-- Dr. Freud Ntambwe, Acting Medical Director, Bibanga General Referral Hospital
Phot
o: M
anag
emen
t Sci
ence
s fo
r Hea
lth
Bibanga General Referral Hospital was languishing, with only a 19 percent occupancy (31 beds filled out of 162) in July 2015. A satisfaction survey of patients and other community members indicated that the facility’s lack of water was one of the things that kept people away. The hospital’s wells hadn’t operated for more than 15 years; not only was the hospital spending $140 a month on an inadequate supply of water, but everyone knew that patients and families had to walk close to two miles to collect water for their own use. The USAID-funded Integrated Health Project Plus (DRC-IHPplus), partnering with the Ministry of Health of the Democratic Republic of the Congo (DRC) to improve the health system in 83 health zones, implemented results-based financing (RBF) in Bibanga. With RBF, health care providers agree on quarterly quality and performance targets, then receive a bonus if they achieve them (or a percentage of the bonus if they achieve a portion of the goals). Part of the bonus goes to the facility and part to staff members themselves. When Bibanga Hospital received its first bonus, the medical staff decided to dedicate a portion of it to renovating the hospital’s two wells. The management team bought cement, tar, pipes, and other supplies, and paid local workers to install them and rehabilitate the water system. At a cost of $1,350--nearly half the hospital’s monthly budget --this work would have been impossible before the new financing system. After the wells were rebuilt, patients and staff reported a significant improvement in hospital cleanliness. In less than a year, occupancy of hospital beds nearly doubled, from 19 percent to 33 percent, between July 2015 and March 2016. “This project has enabled us to save $1,680 a year--which has allowed us to buy new bed linens, and rehabilitate the showers and toilets,” said Dr. Freud Ntambwe, Acting Medical Director. “Thanks to the RBF approach, we now have a large reserve of water. This dream-become-reality is a praiseworthy solution for the institution and our patients.” Implemented by Management Sciences for Health and Overseas Strategic Consulting, Ltd in 83 health zones under a subcontract via Pathfinder/ Evidence to Action (E2A), IHPplus is a two-year “bridge” to avoid a gap in services in USAID-supported health zones after the five-year flagship IHP.
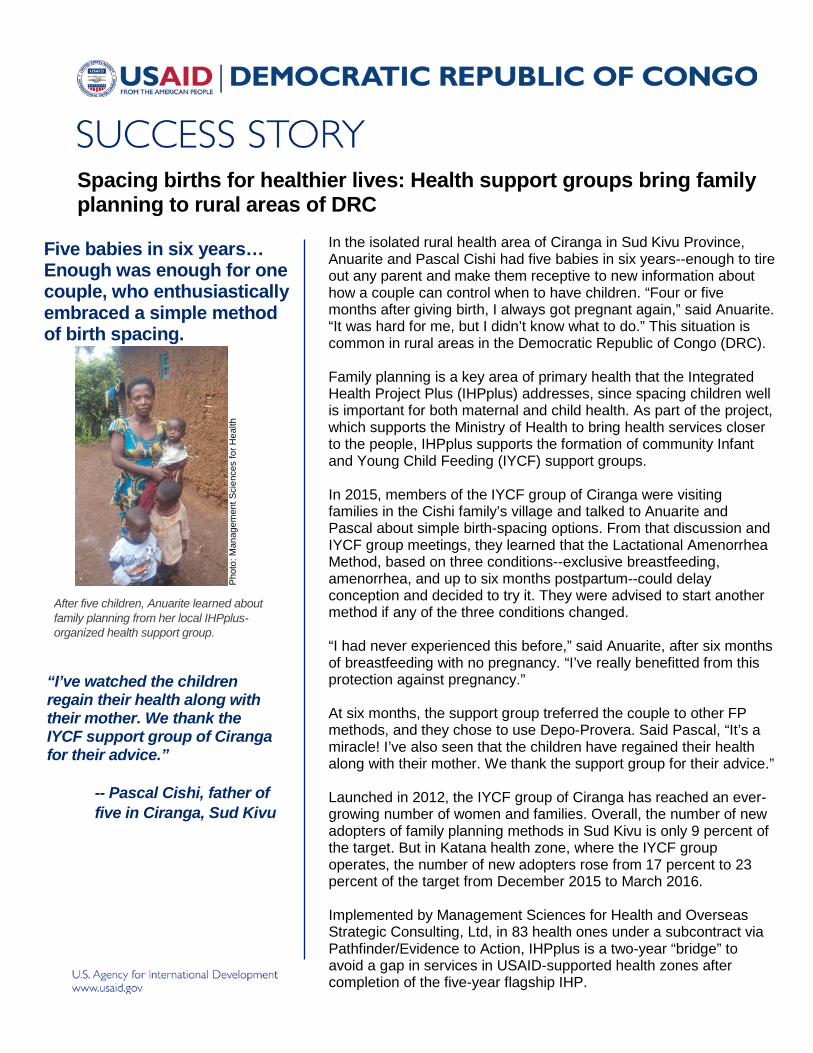
Spacing births for healthier lives: Health support groups bring family planning to rural areas of DRC
Five babies in six years… Enough was enough for one couple, who enthusiastically embraced a simple method of birth spacing.
After five children, Anuarite learned about family planning from her local IHPplus-organized health support group.
“I’ve watched the children regain their health along with their mother. We thank the IYCF support group of Ciranga for their advice.”
-- Pascal Cishi, father of five in Ciranga, Sud Kivu
Pho
to: M
anag
emen
t Sci
ence
s fo
r Hea
lth
In the isolated rural health area of Ciranga in Sud Kivu Province, Anuarite and Pascal Cishi had five babies in six years--enough to tire out any parent and make them receptive to new information about how a couple can control when to have children. “Four or five months after giving birth, I always got pregnant again,” said Anuarite. “It was hard for me, but I didn’t know what to do.” This situation is common in rural areas in the Democratic Republic of Congo (DRC). Family planning is a key area of primary health that the Integrated Health Project Plus (IHPplus) addresses, since spacing children well is important for both maternal and child health. As part of the project, which supports the Ministry of Health to bring health services closer to the people, IHPplus supports the formation of community Infant and Young Child Feeding (IYCF) support groups. In 2015, members of the IYCF group of Ciranga were visiting families in the Cishi family’s village and talked to Anuarite and Pascal about simple birth-spacing options. From that discussion and IYCF group meetings, they learned that the Lactational Amenorrhea Method, based on three conditions--exclusive breastfeeding, amenorrhea, and up to six months postpartum--could delay conception and decided to try it. They were advised to start another method if any of the three conditions changed. “I had never experienced this before,” said Anuarite, after six months of breastfeeding with no pregnancy. “I’ve really benefitted from this protection against pregnancy.” At six months, the support group treferred the couple to other FP methods, and they chose to use Depo-Provera. Said Pascal, “It’s a miracle! I’ve also seen that the children have regained their health along with their mother. We thank the support group for their advice.” Launched in 2012, the IYCF group of Ciranga has reached an ever-growing number of women and families. Overall, the number of new adopters of family planning methods in Sud Kivu is only 9 percent of the target. But in Katana health zone, where the IYCF group operates, the number of new adopters rose from 17 percent to 23 percent of the target from December 2015 to March 2016. Implemented by Management Sciences for Health and Overseas Strategic Consulting, Ltd, in 83 health ones under a subcontract via Pathfinder/Evidence to Action, IHPplus is a two-year “bridge” to avoid a gap in services in USAID-supported health zones after completion of the five-year flagship IHP.
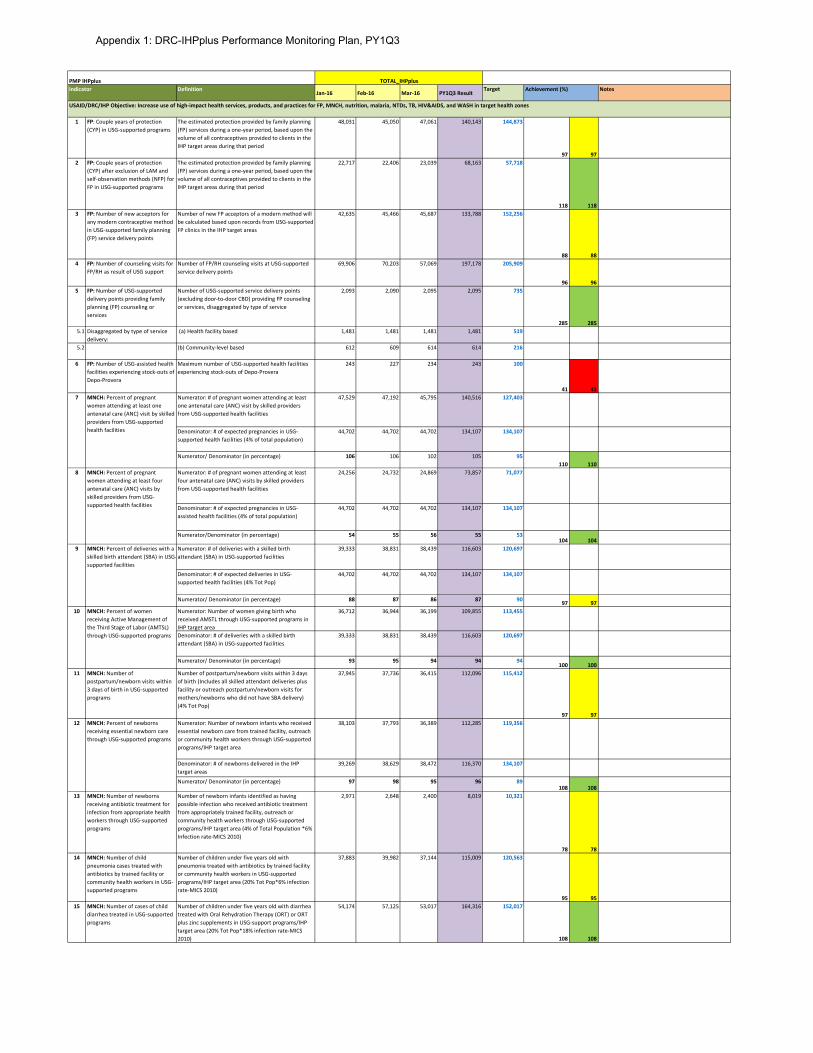
DefinitionJan-16 Feb-16 Mar-16 PY1Q3 Result
Target Notes
1 FP: Couple years of protection (CYP) in USG-supported programs
The estimated protection provided by family planning (FP) services during a one-year period, based upon the volume of all contraceptives provided to clients in the IHP target areas during that period
48,031 45,050 47,061 140,143 144,873
97 972 FP: Couple years of protection
(CYP) after exclusion of LAM and self-observation methods (NFP) for FP in USG-supported programs
The estimated protection provided by family planning (FP) services during a one-year period, based upon the volume of all contraceptives provided to clients in the IHP target areas during that period
22,717 22,406 23,039 68,163 57,718
118 1183 FP: Number of new acceptors for
any modern contraceptive method in USG-supported family planning (FP) service delivery points
Number of new FP acceptors of a modern method will be calculated based upon records from USG-supported FP clinics in the IHP target areas
42,635 45,466 45,687 133,788 152,256
88 884 FP: Number of counseling visits for
FP/RH as result of USG supportNumber of FP/RH counseling visits at USG-supported service delivery points
69,906 70,203 57,069 197,178 205,909
96 965 FP: Number of USG-supported
delivery points providing family planning (FP) counseling or services
Number of USG-supported service delivery points (excluding door-to-door CBD) providing FP counseling or services, disaggregated by type of service
2,093 2,090 2,095 2,095 735
285 2855.1 Disaggregated by type of service
delivery: (a) Health facility based 1,481 1,481 1,481 1,481 519
5.2 (b) Community-level based 612 609 614 614 216
6 FP: Number of USG-assisted health facilities experiencing stock-outs of Depo-Provera
Maximum number of USG-supported health facilities experiencing stock-outs of Depo-Provera
243 227 234 243 100
41 41Numerator: # of pregnant women attending at least one antenatal care (ANC) visit by skilled providers from USG-supported health facilities
47,529 47,192 45,795 140,516 127,403
Denominator: # of expected pregnancies in USG-supported health facilities (4% of total population)
44,702 44,702 44,702 134,107 134,107
Numerator/ Denominator (in percentage) 106 106 102 105 95110 110
Numerator: # of pregnant women attending at least four antenatal care (ANC) visits by skilled providers from USG-supported health facilities
24,256 24,732 24,869 73,857 71,077
Denominator: # of expected pregnancies in USG-assisted health facilities (4% of total population)
44,702 44,702 44,702 134,107 134,107
Numerator/Denominator (in percentage) 54 55 56 55 53104 104
Numerator: # of deliveries with a skilled birth attendant (SBA) in USG-supported facilities
39,333 38,831 38,439 116,603 120,697
Denominator: # of expected deliveries in USG-supported health facilities (4% Tot Pop)
44,702 44,702 44,702 134,107 134,107
Numerator/ Denominator (in percentage) 88 87 86 87 90 97 97Numerator: Number of women giving birth who received AMSTL through USG-supported programs in IHP target area
36,712 36,944 36,199 109,855 113,455
Denominator: # of deliveries with a skilled birth attendant (SBA) in USG-supported facilities
39,333 38,831 38,439 116,603 120,697
Numerator/ Denominator (in percentage) 93 95 94 94 94100 100
11 MNCH: Number of postpartum/newborn visits within 3 days of birth in USG-supported programs
Number of postpartum/newborn visits within 3 days of birth (Includes all skilled attendant deliveries plus facility or outreach postpartum/newborn visits for mothers/newborns who did not have SBA delivery) (4% Tot Pop)
37,945 37,736 36,415 112,096 115,412
97 97Numerator: Number of newborn infants who received essential newborn care from trained facility, outreach or community health workers through USG-supported programs/IHP target area
38,103 37,793 36,389 112,285 119,356
Denominator: # of newborns delivered in the IHP target areas
39,269 38,629 38,472 116,370 134,107
Numerator/ Denominator (in percentage) 97 98 95 96 89108 108
13 MNCH: Number of newborns receiving antibiotic treatment for infection from appropriate health workers through USG-supported programs
Number of newborn infants identified as having possible infection who received antibiotic treatment from appropriately trained facility, outreach or community health workers through USG-supported programs/IHP target area (4% of Total Population *6% Infection rate-MICS 2010)
2,971 2,648 2,400 8,019 10,321
78 7814 MNCH: Number of child
pneumonia cases treated with antibiotics by trained facility or community health workers in USG-supported programs
Number of children under five years old with pneumonia treated with antibiotics by trained facility or community health workers in USG-supported programs/IHP target area (20% Tot Pop*6% infection rate-MICS 2010)
37,883 39,982 37,144 115,009 120,563
95 9515 MNCH: Number of cases of child
diarrhea treated in USG-supported programs
Number of children under five years old with diarrhea treated with Oral Rehydration Therapy (ORT) or ORT plus zinc supplements in USG-support programs/IHP target area (20% Tot Pop*18% infection rate-MICS 2010)
54,174 57,125 53,017 164,316 152,017
108 108
Achievement (%)PMP IHPplus
USAID/DRC/IHP Objective: Increase use of high-impact health services, products, and practices for FP, MNCH, nutrition, malaria, NTDs, TB, HIV&AIDS, and WASH in target health zones
TOTAL_IHPplusIndicator
7 MNCH: Percent of pregnant women attending at least one antenatal care (ANC) visit by skilled providers from USG-supported health facilities
8 MNCH: Percent of pregnant women attending at least four antenatal care (ANC) visits by skilled providers from USG-supported health facilities
9 MNCH: Percent of deliveries with a skilled birth attendant (SBA) in USG-supported facilities
10 MNCH: Percent of women receiving Active Management of the Third Stage of Labor (AMTSL) through USG-supported programs
12 MNCH: Percent of newborns receiving essential newborn care through USG-supported programs
Appendix 1: DRC-IHPplus Performance Monitoring Plan, PY1Q3
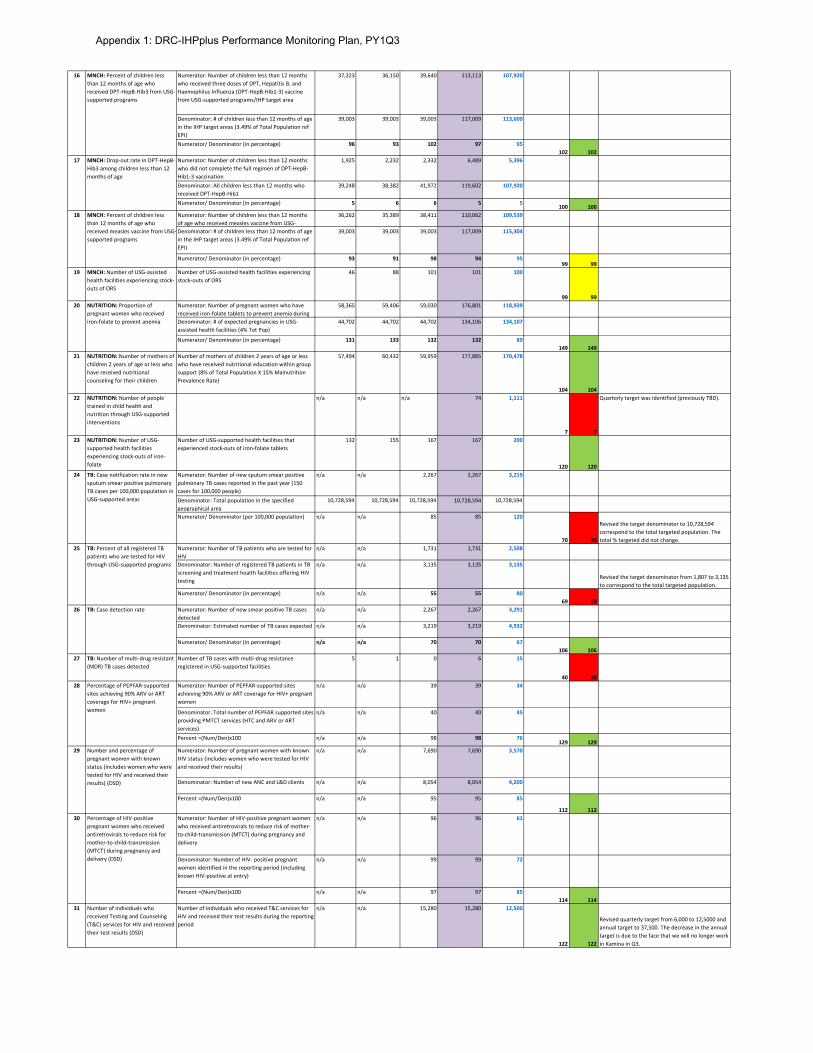
Numerator: Number of children less than 12 months who received three doses of DPT, Hepatitis B, and Haemophilus Influenza (DPT-HepB-Hib1-3) vaccine from USG-supported programs/IHP target area
37,323 36,150 39,640 113,113 107,920
Denominator: # of children less than 12 months of age in the IHP target areas (3.49% of Total Population ref EPI)
39,003 39,003 39,003 117,009 113,600
Numerator/ Denominator (in percentage) 96 93 102 97 95102 102
Numerator: Number of children less than 12 months who did not complete the full regimen of DPT-HepB-Hib1-3 vaccination
1,925 2,232 2,332 6,489 5,396
Denominator: All children less than 12 months who received DPT-HepB-Hib1
39,248 38,382 41,972 119,602 107,920
Numerator/ Denominator (in percentage) 5 6 6 5 5100 100
Numerator: Number of children less than 12 months of age who received measles vaccine from USG-
36,262 35,389 38,411 110,062 109,539
Denominator: # of children less than 12 months of age in the IHP target areas (3.49% of Total Population ref EPI)
39,003 39,003 39,003 117,009 115,304
Numerator/ Denominator (in percentage) 93 91 98 94 9599 99
19 MNCH: Number of USG-assisted health facilities experiencing stock-outs of ORS
Number of USG-assisted health facilities experiencing stock-outs of ORS
46 88 101 101 100
99 99Numerator: Number of pregnant women who have received iron-folate tablets to prevent anemia during
58,365 59,406 59,030 176,801 118,939
Denominator: # of expected pregnancies in USG-assisted health facilities (4% Tot Pop)
44,702 44,702 44,702 134,106 134,107
Numerator/ Denominator (in percentage) 131 133 132 132 89149 149
21 NUTRITION: Number of mothers of children 2 years of age or less who have received nutritional counseling for their children
Number of mothers of children 2 years of age or less who have received nutritional education within group support (8% of Total Population X 15% Malnutrition Prevalence Rate)
57,494 60,432 59,959 177,885 170,478
104 10422 NUTRITION: Number of people
trained in child health and nutrition through USG-supported interventions
n/a n/a n/a 74 1,111
7 7
Quarterly target was identified (previously TBD).
23 NUTRITION: Number of USG-supported health facilities experiencing stock-outs of iron-folate
Number of USG-supported health facilities that experienced stock-outs of iron-folate tablets
132 155 167 167 200
120 120Numerator: Number of new sputum smear positive pulmonary TB cases reported in the past year (150 cases for 100,000 people)
n/a n/a 2,267 2,267 3,219
Denominator: Total population in the specified geographical area
10,728,594 10,728,594 10,728,594 10,728,594 10,728,594
Numerator/ Denominator (per 100,000 population) n/a n/a 85 85 120
70 70
Revised the target denominator to 10,728,594 correspond to the total targeted population. The total % targeted did not change.
Numerator: Number of TB patients who are tested for HIV
n/a n/a 1,731 1,731 2,508
Denominator: Number of registered TB patients in TB screening and treatment health facilities offering HIV testing
n/a n/a 3,135 3,135 3,135
Revised the target denominator from 1,807 to 3,135 to correspond to the total targeted population.
Numerator/ Denominator (in percentage) n/a n/a 55 55 8069 69
Numerator: Number of new smear positive TB cases detected
n/a n/a 2,267 2,267 3,291
Denominator: Estimated number of TB cases expected n/a n/a 3,219 3,219 4,932
Numerator/ Denominator (in percentage) n/a n/a 70 70 67106 106
27 TB: Number of multi-drug resistant (MDR) TB cases detected
Number of TB cases with multi-drug resistance registered in USG-supported facilities
5 1 0 6 15
40 40Numerator: Number of PEPFAR-supported sites achieving 90% ARV or ART coverage for HIV+ pregnant women
n/a n/a 39 39 34
Denominator: Total number of PEPFAR supported sites providing PMTCT services (HTC and ARV or ART services)
n/a n/a 40 40 45
Percent =(Num/Den)x100 n/a n/a 98 98 76129 129
Numerator: Number of pregnant women with known HIV status (includes women who were tested for HIV and received their results)
n/a n/a 7,690 7,690 3,570
Denominator: Number of new ANC and L&D clients n/a n/a 8,054 8,054 4,200
Percent =(Num/Den)x100 n/a n/a 95 95 85
112 112Numerator: Number of HIV-positive pregnant women who received antiretrovirals to reduce risk of mother-to-child-transmission (MTCT) during pregnancy and delivery
n/a n/a 96 96 61
Denominator: Number of HIV- positive pregnant women identified in the reporting period (including known HIV-positive at entry)
n/a n/a 99 99 72
Percent =(Num/Den)x100 n/a n/a 97 97 85114 114
31 Number of individuals who received Testing and Counseling (T&C) services for HIV and received their test results (DSD)
Number of individuals who received T&C services for HIV and received their test results during the reporting period
n/a n/a 15,280 15,280 12,500
122 122
Revised quarterly target from 6,000 to 12,5000 and annual target to 37,500. The decrease in the annual target is due to the face that we will no longer work in Kamina in Q3.
16 MNCH: Percent of children less than 12 months of age who received DPT-HepB-Hib3 from USG-supported programs
17 MNCH: Drop-out rate in DPT-HepB-Hib3 among children less than 12 months of age
18 MNCH: Percent of children less than 12 months of age who received measles vaccine from USG-supported programs
20 NUTRITION: Proportion of pregnant women who received iron-folate to prevent anemia
24 TB: Case notification rate in new sputum smear positive pulmonary TB cases per 100,000 population in USG-supported areas
25 TB: Percent of all registered TB patients who are tested for HIV through USG-supported programs
26 TB: Case detection rate
28 Percentage of PEPFAR-supported sites achieving 90% ARV or ART coverage for HIV+ pregnant women
29 Number and percentage of pregnant women with known status (includes women who were tested for HIV and received their results) (DSD)
30 Percentage of HIV-positive pregnant women who received antiretrovirals to reduce risk for mother-to-child-transmission (MTCT) during pregnancy and delivery (DSD)
Appendix 1: DRC-IHPplus Performance Monitoring Plan, PY1Q3
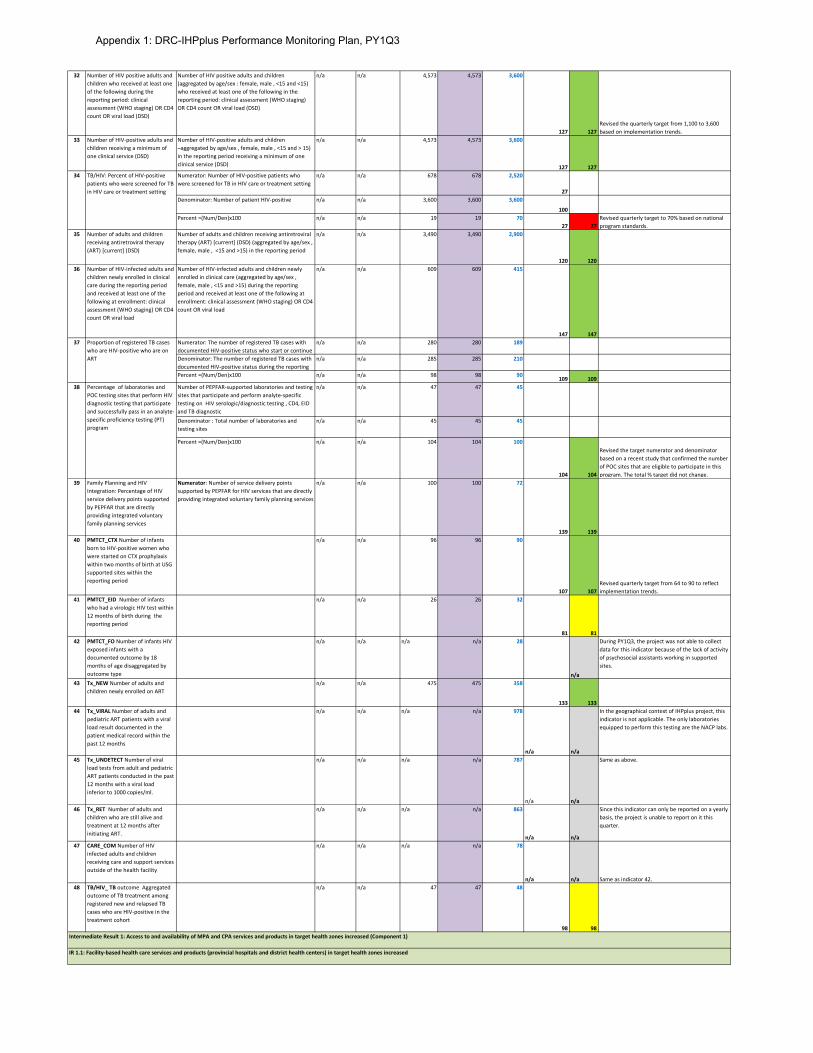
32 Number of HIV positive adults and children who received at least one of the following during the reporting period: clinical assessment (WHO staging) OR CD4 count OR viral load (DSD)
Number of HIV positive adults and children (aggregated by age/sex : female, male , <15 and <15) who received at least one of the following in the reporting period: clinical assessment (WHO staging) OR CD4 count OR viral load (DSD)
n/a n/a 4,573 4,573 3,600
127 127Revised the quarterly target from 1,100 to 3,600 based on implementation trends.
33 Number of HIV-positive adults and children receiving a minimum of one clinical service (DSD)
Number of HIV-positive adults and children –aggregated by age/sex , female, male , <15 and > 15) in the reporting period receiving a minimum of one clinical service (DSD)
n/a n/a 4,573 4,573 3,600
127 127Numerator: Number of HIV-positive patients who were screened for TB in HIV care or treatment setting
n/a n/a 678 678 2,520
27Denominator: Number of patient HIV-positive n/a n/a 3,600 3,600 3,600
100Percent =(Num/Den)x100 n/a n/a 19 19 70
27 27Revised quarterly target to 70% based on national program standards.
35 Number of adults and children receiving antiretroviral therapy (ART) [current] (DSD)
Number of adults and children receiving antiretroviral therapy (ART) [current] (DSD) (aggregated by age/sex , female, male , <15 and >15) in the reporting period
n/a n/a 3,490 3,490 2,900
120 12036 Number of HIV-infected adults and
children newly enrolled in clinical care during the reporting period and received at least one of the following at enrollment: clinical assessment (WHO staging) OR CD4 count OR viral load
Number of HIV-infected adults and children newly enrolled in clinical care (aggregated by age/sex , female, male , <15 and >15) during the reporting period and received at least one of the following at enrollment: clinical assessment (WHO staging) OR CD4 count OR viral load
n/a n/a 609 609 415
147 147Numerator: The number of registered TB cases with documented HIV-positive status who start or continue
n/a n/a 280 280 189
Denominator: The number of registered TB cases with documented HIV-positive status during the reporting
n/a n/a 285 285 210
Percent =(Num/Den)x100 n/a n/a 98 98 90109 109
Number of PEPFAR-supported laboratories and testing sites that participate and perform analyte-specific testing on HIV serologic/diagnostic testing , CD4, EID and TB diagnostic
n/a n/a 47 47 45
Denominator : Total number of laboratories and testing sites
n/a n/a 45 45 45
Percent =(Num/Den)x100 n/a n/a 104 104 100
104 104
Revised the target numerator and denominator based on a recent study that confirmed the number of POC sites that are eligible to participate in this program. The total % target did not change.
39 Family Planning and HIV Integration: Percentage of HIV service delivery points supported by PEPFAR that are directly providing integrated voluntary family planning services
Numerator: Number of service delivery points supported by PEPFAR for HIV services that are directly providing integrated voluntary family planning services
n/a n/a 100 100 72
139 13940 PMTCT_CTX Number of infants
born to HIV-positive women who were started on CTX prophylaxis within two months of birth at USG supported sites within the reporting period
n/a n/a 96 96 90
107 107Revised quarterly target from 64 to 90 to reflect implementation trends.
41 PMTCT_EID Number of infants who had a virologic HIV test within 12 months of birth during the reporting period
n/a n/a 26 26 32
81 8142 PMTCT_FO Number of infants HIV
exposed infants with a documented outcome by 18 months of age disaggregated by outcome type
n/a n/a n/a n/a 28
n/a
During PY1Q3, the project was not able to collect data for this indicator because of the lack of activity of psychosocial assistants working in supported sites.
43 Tx_NEW Number of adults and children newly enrolled on ART
n/a n/a 475 475 358
133 13344 Tx_VIRAL Number of adults and
pediatric ART patients with a viral load result documented in the patient medical record within the past 12 months
n/a n/a n/a n/a 978
n/a n/a
In the geographical context of IHPplus project, this indicator is not applicable. The only laboratories equipped to perform this testing are the NACP labs.
45 Tx_UNDETECT Number of viral load tests from adult and pediatric ART patients conducted in the past 12 months with a viral load inferior to 1000 copies/ml.
n/a n/a n/a n/a 787
n/a n/a
Same as above.
46 Tx_RET Number of adults and children who are still alive and treatment at 12 months after initiating ART.
n/a n/a n/a n/a 863
n/a n/a
Since this indicator can only be reported on a yearly basis, the project is unable to report on it this quarter.
47 CARE_COM Number of HIV infected adults and children receiving care and support services outside of the health facility
n/a n/a n/a n/a 78
n/a n/a Same as indicator 42.48 TB/HIV_ TB outcome Aggregated
outcome of TB treatment among registered new and relapsed TB cases who are HIV-positive in the treatment cohort
n/a n/a 47 47 48
98 98
34 TB/HIV: Percent of HIV-positive patients who were screened for TB in HIV care or treatment setting
37 Proportion of registered TB cases who are HIV-positive who are on ART
38 Percentage of laboratories and POC testing sites that perform HIV diagnostic testing that participate and successfully pass in an analyte-specific proficiency testing (PT) program
Intermediate Result 1: Access to and availability of MPA and CPA services and products in target health zones increased (Component 1)
IR 1.1: Facility-based health care services and products (provincial hospitals and district health centers) in target health zones increased
Appendix 1: DRC-IHPplus Performance Monitoring Plan, PY1Q3
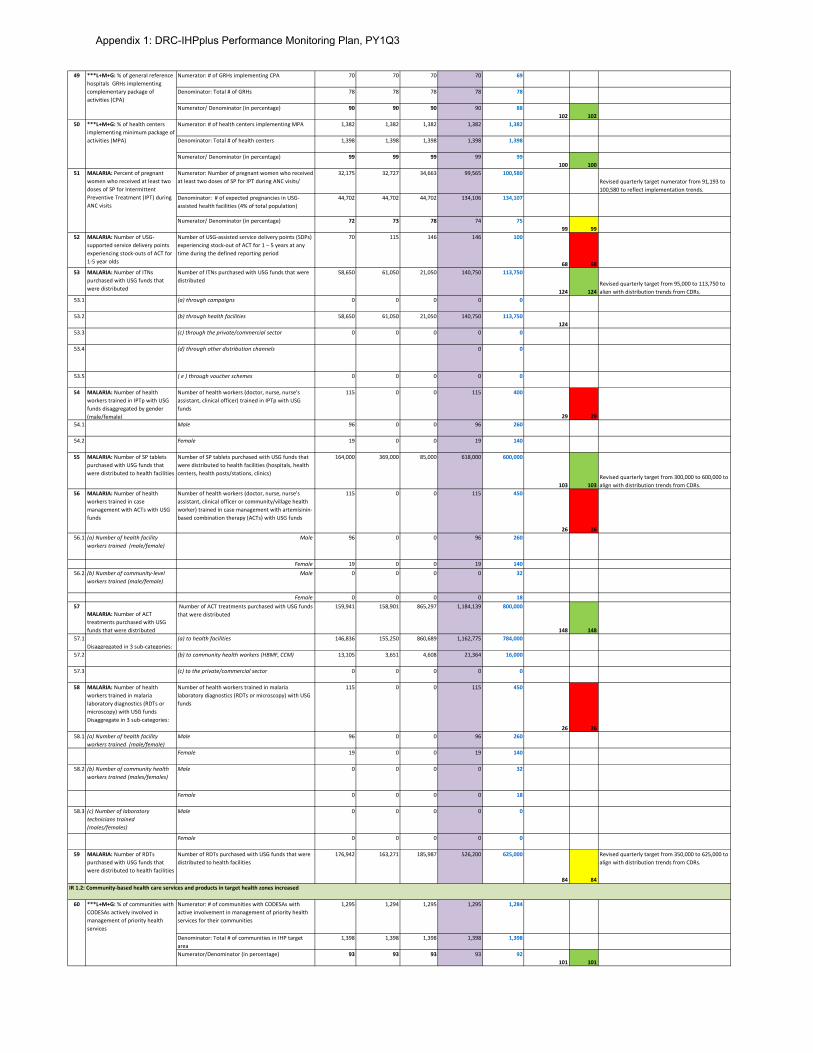
Numerator: # of GRHs implementing CPA 70 70 70 70 69
Denominator: Total # of GRHs 78 78 78 78 78
Numerator/ Denominator (in percentage) 90 90 90 90 88102 102
Numerator: # of health centers implementing MPA 1,382 1,382 1,382 1,382 1,382
Denominator: Total # of health centers 1,398 1,398 1,398 1,398 1,398
Numerator/ Denominator (in percentage) 99 99 99 99 99100 100
Numerator: Number of pregnant women who received at least two doses of SP for IPT during ANC visits/
32,175 32,727 34,663 99,565 100,580Revised quarterly target numerator from 91,193 to 100,580 to reflect implementation trends.
Denominator: # of expected pregnancies in USG-assisted health facilities (4% of total population)
44,702 44,702 44,702 134,106 134,107
Numerator/ Denominator (in percentage) 72 73 78 74 7599 99
52 MALARIA: Number of USG-supported service delivery points experiencing stock-outs of ACT for 1-5 year olds
Number of USG-assisted service delivery points (SDPs) experiencing stock-out of ACT for 1 – 5 years at any time during the defined reporting period
70 115 146 146 100
68 6853 MALARIA: Number of ITNs
purchased with USG funds that were distributed
Number of ITNs purchased with USG funds that were distributed
58,650 61,050 21,050 140,750 113,750
124 124Revised quarterly target from 95,000 to 113,750 to align with distribution trends from CDRs.
53.1 (a) through campaigns 0 0 0 0 0
53.2 (b) through health facilities 58,650 61,050 21,050 140,750 113,750124
53.3 (c) through the private/commercial sector 0 0 0 0 0
53.4 (d) through other distribution channels 0 0
53.5 ( e ) through voucher schemes 0 0 0 0 0
54 MALARIA: Number of health workers trained in IPTp with USG funds disaggregated by gender (male/female)
Number of health workers (doctor, nurse, nurse’s assistant, clinical officer) trained in IPTp with USG funds
115 0 0 115 400
29 2954.1 Male 96 0 0 96 260
54.2 Female 19 0 0 19 140
55 MALARIA: Number of SP tablets purchased with USG funds that were distributed to health facilities
Number of SP tablets purchased with USG funds that were distributed to health facilities (hospitals, health centers, health posts/stations, clinics)
164,000 369,000 85,000 618,000 600,000
103 103Revised quarterly target from 300,000 to 600,000 to align with distribution trends from CDRs.
56 MALARIA: Number of health workers trained in case management with ACTs with USG funds
Number of health workers (doctor, nurse, nurse’s assistant, clinical officer or community/village health worker) trained in case management with artemisinin-based combination therapy (ACTs) with USG funds
115 0 0 115 450
26 2656.1 (a) Number of health facility
workers trained (male/female)Male 96 0 0 96 260
Female 19 0 0 19 14056.2 (b) Number of community-level
workers trained (male/female)Male 0 0 0 0 32
Female 0 0 0 0 1857
MALARIA: Number of ACT treatments purchased with USG funds that were distributed
Number of ACT treatments purchased with USG funds that were distributed
159,941 158,901 865,297 1,184,139 800,000
148 14857.1
Disaggregated in 3 sub-categories:(a) to health facilities 146,836 155,250 860,689 1,162,775 784,000
57.2 (b) to community health workers (HBMF, CCM) 13,105 3,651 4,608 21,364 16,000
57.3 (c) to the private/commercial sector 0 0 0 0 0
58 MALARIA: Number of health workers trained in malaria laboratory diagnostics (RDTs or microscopy) with USG funds Disaggregate in 3 sub-categories:
Number of health workers trained in malaria laboratory diagnostics (RDTs or microscopy) with USG funds
115 0 0 115 450
26 2658.1 (a) Number of health facility
workers trained (male/female)Male 96 0 0 96 260
Female 19 0 0 19 140
58.2 (b) Number of community health workers trained (males/females)
Male 0 0 0 0 32
Female 0 0 0 0 18
58.3 (c) Number of laboratory technicians trained (males/females)
Male 0 0 0 0 0
Female 0 0 0 0 0
59 MALARIA: Number of RDTs purchased with USG funds that were distributed to health facilities
Number of RDTs purchased with USG funds that were distributed to health facilities
176,942 163,271 185,987 526,200 625,000
84 84
Revised quarterly target from 350,000 to 625,000 to align with distribution trends from CDRs.
Numerator: # of communities with CODESAs with active involvement in management of priority health services for their communities
1,295 1,294 1,295 1,295 1,284
Denominator: Total # of communities in IHP target area
1,398 1,398 1,398 1,398 1,398
Numerator/Denominator (in percentage) 93 93 93 93 92101 101
49 ***L+M+G: % of general reference hospitals GRHs implementing complementary package of activities (CPA)
50 ***L+M+G: % of health centers implementing minimum package of activities (MPA)
51 MALARIA: Percent of pregnant women who received at least two doses of SP for Intermittent Preventive Treatment (IPT) during ANC visits
60 ***L+M+G: % of communities with CODESAs actively involved in management of priority health services
IR 1.2: Community-based health care services and products in target health zones increased
Appendix 1: DRC-IHPplus Performance Monitoring Plan, PY1Q3
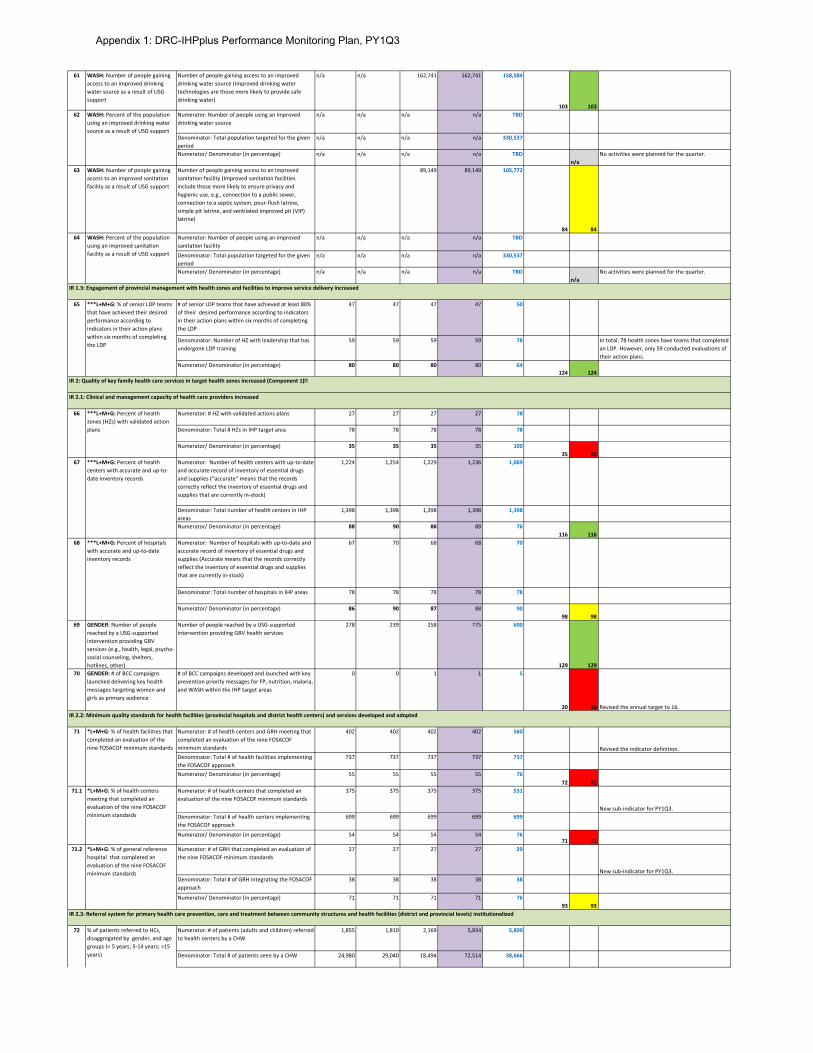
61 WASH: Number of people gaining access to an improved drinking water source as a result of USG support
Number of people gaining access to an improved drinking water source (Improved drinking water technologies are those more likely to provide safe drinking water)
n/a n/a 162,741 162,741 158,584
103 103Numerator: Number of people using an improved drinking water source
n/a n/a n/a n/a TBD
Denominator: Total population targeted for the given period
n/a n/a n/a n/a 330,537
Numerator/ Denominator (in percentage) n/a n/a n/a n/a TBDn/a
No activities were planned for the quarter.
63 WASH: Number of people gaining access to an improved sanitation facility as a result of USG support
Number of people gaining access to an improved sanitation facility (Improved sanitation facilities include those more likely to ensure privacy and hygienic use, e.g., connection to a public sewer, connection to a septic system, pour-flush latrine, simple pit latrine, and ventilated improved pit (VIP) latrine)
89,149 89,149 105,772
84 84Numerator: Number of people using an improved sanitation facility
n/a n/a n/a n/a TBD
Denominator: Total population targeted for the given period
n/a n/a n/a n/a 330,537
Numerator/ Denominator (in percentage) n/a n/a n/a n/a TBDn/a
No activities were planned for the quarter.
# of senior LDP teams that have achieved at least 80% of their desired performance according to indicators in their action plans within six months of completing the LDP
47 47 47 47 50
Denominator: Number of HZ with leadership that has undergone LDP training
59 59 59 59 78 In total, 78 health zones have teams that completed an LDP. However, only 59 conducted evaluations of their action plans.
Numerator/ Denominator (in percentage) 80 80 80 80 64124 124
Numerator: # HZ with validated actions plans 27 27 27 27 78
Denominator: Total # HZs in IHP target area 78 78 78 78 78
Numerator/ Denominator (in percentage) 35 35 35 35 10035 35
Numerator: Number of health centers with up-to-date and accurate record of inventory of essential drugs and supplies (“accurate” means that the records correctly reflect the inventory of essential drugs and supplies that are currently in-stock)
1,224 1,254 1,229 1,236 1,069
Denominator: Total number of health centers in IHP areas
1,398 1,398 1,398 1,398 1,398
Numerator/ Denominator (in percentage) 88 90 88 88 76116 116
Numerator: Number of hospitals with up-to-date and accurate record of inventory of essential drugs and supplies (Accurate means that the records correctly reflect the inventory of essential drugs and supplies that are currently in-stock)
67 70 68 68 70
Denominator: Total number of hospitals in IHP areas 78 78 78 78 78
Numerator/ Denominator (in percentage) 86 90 87 88 9098 98
69 GENDER: Number of people reached by a USG-supported intervention providing GBV services (e.g., health, legal, psycho-social counseling, shelters, hotlines, other)
Number of people reached by a USG-supported intervention providing GBV health services
278 239 258 775 600
129 12970 GENDER: # of BCC campaigns
launched delivering key health messages targeting women and girls as primary audience
# of BCC campaigns developed and launched with key prevention priority messages for FP, nutrition, malaria, and WASH within the IHP target areas
0 0 1 1 5
20 20 Revised the annual target to 16.
Numerator: # of health centers and GRH meeting that completed an evaluation of the nine FOSACOF minimum standards
402 402 402 402 560
Revised the indicator definition.Denominator: Total # of health facilities implementing the FOSACOF approach
737 737 737 737 737
Numerator/ Denominator (in percentage) 55 55 55 55 7672 72
Numerator: # of health centers that completed an evaluation of the nine FOSACOF minimum standards
375 375 375 375 531
New sub-indicator for PY1Q3.Denominator: Total # of health centers implementing the FOSACOF approach
699 699 699 699 699
Numerator/ Denominator (in percentage) 54 54 54 54 7671 71
Numerator: # of GRH that completed an evaluation of the nine FOSACOF minimum standards
27 27 27 27 29
New sub-indicator for PY1Q3.Denominator: Total # of GRH integrating the FOSACOF approach
38 38 38 38 38
Numerator/ Denominator (in percentage) 71 71 71 71 7693 93
Numerator: # of patients (adults and children) referred to health centers by a CHW
1,855 1,810 2,169 5,834 5,800
Denominator: Total # of patients seen by a CHW 24,980 29,040 18,494 72,514 38,666
62 WASH: Percent of the population using an improved drinking water source as a result of USG support
64 WASH: Percent of the population using an improved sanitation facility as a result of USG support
65 ***L+M+G: % of senior LDP teams that have achieved their desired performance according to indicators in their action plans within six months of completing the LDP
66 ***L+M+G: Percent of health zones (HZs) with validated action plans
IR 1.3: Engagement of provincial management with health zones and facilities to improve service delivery increased
IR 2: Quality of key family health care services in target health zones increased (Component 1)
IR 2.1: Clinical and management capacity of health care providers increased
67 ***L+M+G: Percent of health centers with accurate and up-to-date inventory records
68 ***L+M+G: Percent of hospitals with accurate and up-to-date inventory records
71 *L+M+G: % of health facilities that completed an evaluation of the nine FOSACOF minimum standards
IR 2.2: Minimum quality standards for health facilities (provincial hospitals and district health centers) and services developed and adopted
71.1 *L+M+G: % of health centers meeting that completed an evaluation of the nine FOSACOF minimum standards
71.2 *L+M+G: % of general reference hospital that completed an evaluation of the nine FOSACOF minimum standards
72 % of patients referred to HCs, disaggregated by gender, and age groups (< 5 years; 5-14 years; >15 years)
IR 2.3: Referral system for primary health care prevention, care and treatment between community structures and health facilities (district and provincial levels) institutionalized
Appendix 1: DRC-IHPplus Performance Monitoring Plan, PY1Q3
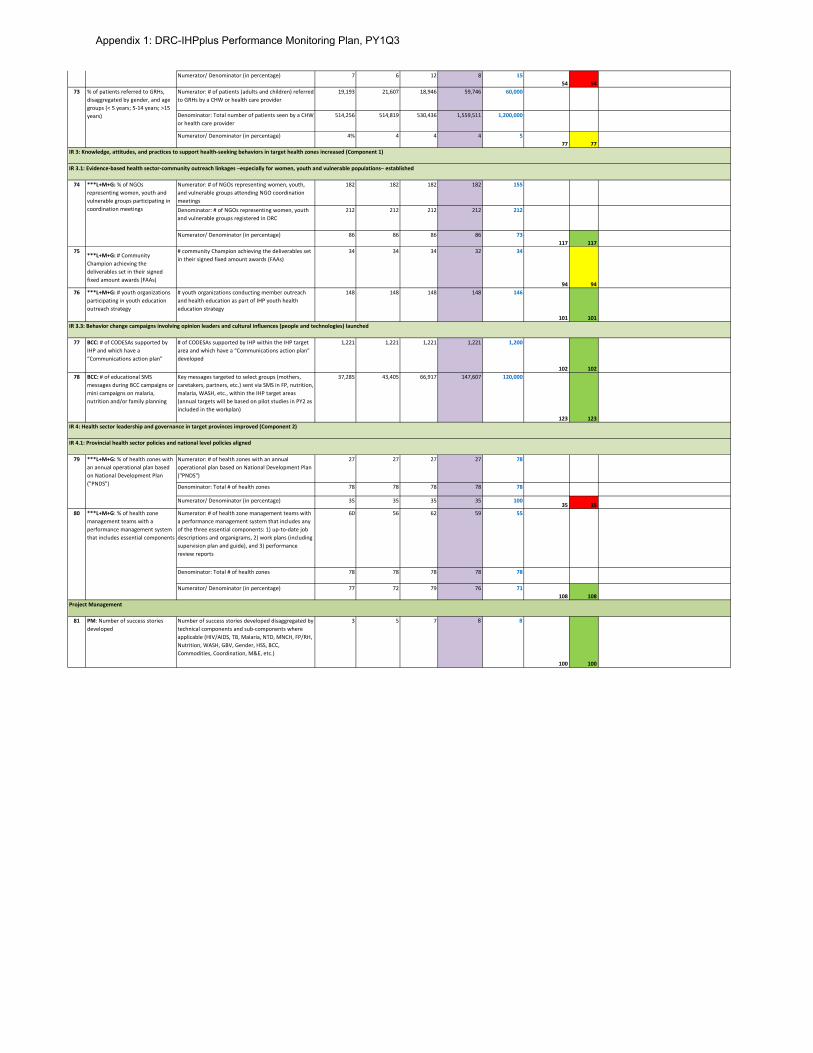
Numerator/ Denominator (in percentage) 7 6 12 8 1554 54
Numerator: # of patients (adults and children) referred to GRHs by a CHW or health care provider
19,193 21,607 18,946 59,746 60,000
Denominator: Total number of patients seen by a CHW or health care provider
514,256 514,819 530,436 1,559,511 1,200,000
Numerator/ Denominator (in percentage) 4% 4 4 4 577 77
Numerator: # of NGOs representing women, youth, and vulnerable groups attending NGO coordination meetings
182 182 182 182 155
Denominator: # of NGOs representing women, youth and vulnerable groups registered in DRC
212 212 212 212 212
Numerator/ Denominator (in percentage) 86 86 86 86 73117 117
75***L+M+G: # Community Champion achieving the deliverables set in their signed fixed amount awards (FAAs)
# community Champion achieving the deliverables set in their signed fixed amount awards (FAAs)
34 34 34 32 34
94 9476 ***L+M+G: # youth organizations
participating in youth education outreach strategy
# youth organizations conducting member outreach and health education as part of IHP youth health education strategy
148 148 148 148 146
101 101
77 BCC: # of CODESAs supported by IHP and which have a “Communications action plan”
# of CODESAs supported by IHP within the IHP target area and which have a “Communications action plan” developed
1,221 1,221 1,221 1,221 1,200
102 10278 BCC: # of educational SMS
messages during BCC campaigns or mini campaigns on malaria, nutrition and/or family planning
Key messages targeted to select groups (mothers, caretakers, partners, etc.) sent via SMS in FP, nutrition, malaria, WASH, etc., within the IHP target areas (annual targets will be based on pilot studies in PY2 as included in the workplan)
37,285 43,405 66,917 147,607 120,000
123 123
Numerator: # of health zones with an annual operational plan based on National Development Plan ("PNDS")
27 27 27 27 78
Denominator: Total # of health zones 78 78 78 78 78
Numerator/ Denominator (in percentage) 35 35 35 35 10035 35
Numerator: # of health zone management teams with a performance management system that includes any of the three essential components: 1) up-to-date job descriptions and organigrams, 2) work plans (including supervision plan and guide), and 3) performance review reports
60 56 62 59 55
Denominator: Total # of health zones 78 78 78 78 78
Numerator/ Denominator (in percentage) 77 72 79 76 71108 108
81 PM: Number of success stories developed
Number of success stories developed disaggregated by technical components and sub-components where applicable (HIV/AIDS, TB, Malaria, NTD, MNCH, FP/RH, Nutrition, WASH, GBV, Gender, HSS, BCC, Commodities, Coordination, M&E, etc.)
3 5 7 8 8
100 100
Project Management
80 ***L+M+G: % of health zone management teams with a performance management system that includes essential components
73 % of patients referred to GRHs, disaggregated by gender, and age groups (< 5 years; 5-14 years; >15 years)
74 ***L+M+G: % of NGOs representing women, youth and vulnerable groups participating in coordination meetings
79 ***L+M+G: % of health zones with an annual operational plan based on National Development Plan ("PNDS")
IR 3: Knowledge, attitudes, and practices to support health-seeking behaviors in target health zones increased (Component 1)
IR 3.1: Evidence-based health sector-community outreach linkages –especially for women, youth and vulnerable populations– established
IR 3.3: Behavior change campaigns involving opinion leaders and cultural influences (people and technologies) launched
IR 4: Health sector leadership and governance in target provinces improved (Component 2)
IR 4.1: Provincial health sector policies and national level policies aligned
Appendix 1: DRC-IHPplus Performance Monitoring Plan, PY1Q3
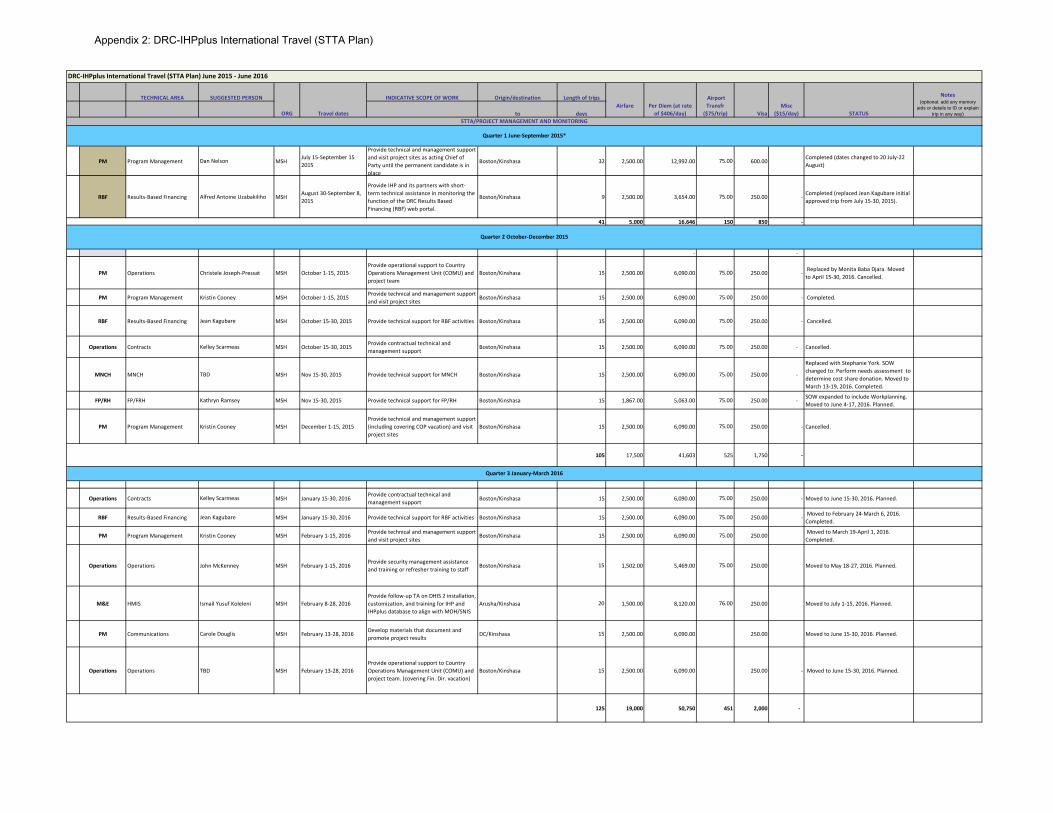
TECHNICAL AREA SUGGESTED PERSON INDICATIVE SCOPE OF WORK Origin/destination Length of trips
to days
PM Program Management Dan Nelson MSHJuly 15-September 15 2015
Provide technical and management support and visit project sites as acting Chief of Party until the permanent candidate is in place
Boston/Kinshasa 32 2,500.00 12,992.00 75.00 600.00 Completed (dates changed to 20 July-22 August)
RBF Results-Based Financing Alfred Antoine Uzabakiliho MSH August 30-September 8, 2015
Provide IHP and its partners with short-term technical assistance in monitoring the function of the DRC Results Based Financing (RBF) web portal.
Boston/Kinshasa 9 2,500.00 3,654.00 75.00 250.00 - Completed (replaced Jean Kagubare initial approved trip from July 15-30, 2015).
41 5,000 16,646 150 850 -
- -
PM Operations Christele Joseph-Pressat MSH October 1-15, 2015Provide operational support to Country Operations Management Unit (COMU) and project team
Boston/Kinshasa 15 2,500.00 6,090.00 75.00 250.00 - Replaced by Monita Baba Djara. Movedto April 15-30, 2016. Cancelled.
PM Program Management Kristin Cooney MSH October 1-15, 2015 Provide technical and management support and visit project sites
Boston/Kinshasa 15 2,500.00 6,090.00 75.00 250.00 - Completed.
RBF Results-Based Financing Jean Kagubare MSH October 15-30, 2015 Provide technical support for RBF activities Boston/Kinshasa 15 2,500.00 6,090.00 75.00 250.00 - Cancelled.
Operations Contracts Kelley Scarmeas MSH October 15-30, 2015 Provide contractual technical and management support
Boston/Kinshasa 15 2,500.00 6,090.00 75.00 250.00 - Cancelled.
MNCH MNCH TBD MSH Nov 15-30, 2015 Provide technical support for MNCH Boston/Kinshasa 15 2,500.00 6,090.00 75.00 250.00 -
Replaced with Stephanie York. SOW changed to: Perform needs assessment to determine cost share donation. Moved to March 13-19, 2016. Completed.
FP/RH FP/FRH Kathryn Ramsey MSH Nov 15-30, 2015 Provide technical support for FP/RH Boston/Kinshasa 15 1,867.00 5,063.00 75.00 250.00 - SOW expanded to include Workplanning. Moved to June 4-17, 2016. Planned.
PM Program Management Kristin Cooney MSH December 1-15, 2015Provide technical and management support (including covering COP vacation) and visit project sites
Boston/Kinshasa 15 2,500.00 6,090.00 75.00 250.00 - Cancelled.
105 17,500 41,603 525 1,750 -
Operations Contracts Kelley Scarmeas MSH January 15-30, 2016Provide contractual technical and management support
Boston/Kinshasa 15 2,500.00 6,090.00 75.00 250.00 - Moved to June 15-30, 2016. Planned.
RBF Results-Based Financing Jean Kagubare MSH January 15-30, 2016 Provide technical support for RBF activities Boston/Kinshasa 15 2,500.00 6,090.00 75.00 250.00 - Moved to February 24-March 6, 2016. Completed.
PM Program Management Kristin Cooney MSH February 1-15, 2016 Provide technical and management support and visit project sites
Boston/Kinshasa 15 2,500.00 6,090.00 75.00 250.00 Moved to March 19-April 1, 2016. Completed.
Operations Operations John McKenney MSH February 1-15, 2016Provide security management assistance and training or refresher training to staff Boston/Kinshasa 15 1,502.00 5,469.00 75.00 250.00 Moved to May 18-27, 2016. Planned.
M&E HMIS Ismail Yusuf Koleleni MSH February 8-28, 2016Provide follow-up TA on DHIS 2 installation, customization, and training for IHP and IHPplus database to align with MOH/SNIS
Arusha/Kinshasa 20 1,500.00 8,120.00 76.00 250.00 Moved to July 1-15, 2016. Planned.
PM Communications Carole Douglis MSH February 13-28, 2016 Develop materials that document and promote project results
DC/Kinshasa 15 2,500.00 6,090.00 250.00 Moved to June 15-30, 2016. Planned.
Operations Operations TBD MSH February 13-28, 2016Provide operational support to Country Operations Management Unit (COMU) and project team. (covering Fin. Dir. vacation)
Boston/Kinshasa 15 2,500.00 6,090.00 250.00 - Moved to June 15-30, 2016. Planned.
125 19,000 50,750 451 2,000 -
DRC-IHPplus International Travel (STTA Plan) June 2015 - June 2016
STTA/PROJECT MANAGEMENT AND MONITORING
Quarter 1 June-September 2015*
Quarter 2 October-December 2015
Misc ($15/day) STATUS
Notes (optional: add any memory
aids or details to ID or explain trip in any way)ORG Travel dates
Airfare Per Diem (at rate of $406/day)
Airport Transfr
($75/trip) Visa
Quarter 3 January-March 2016
Appendix 2: DRC-IHPplus International Travel (STTA Plan)
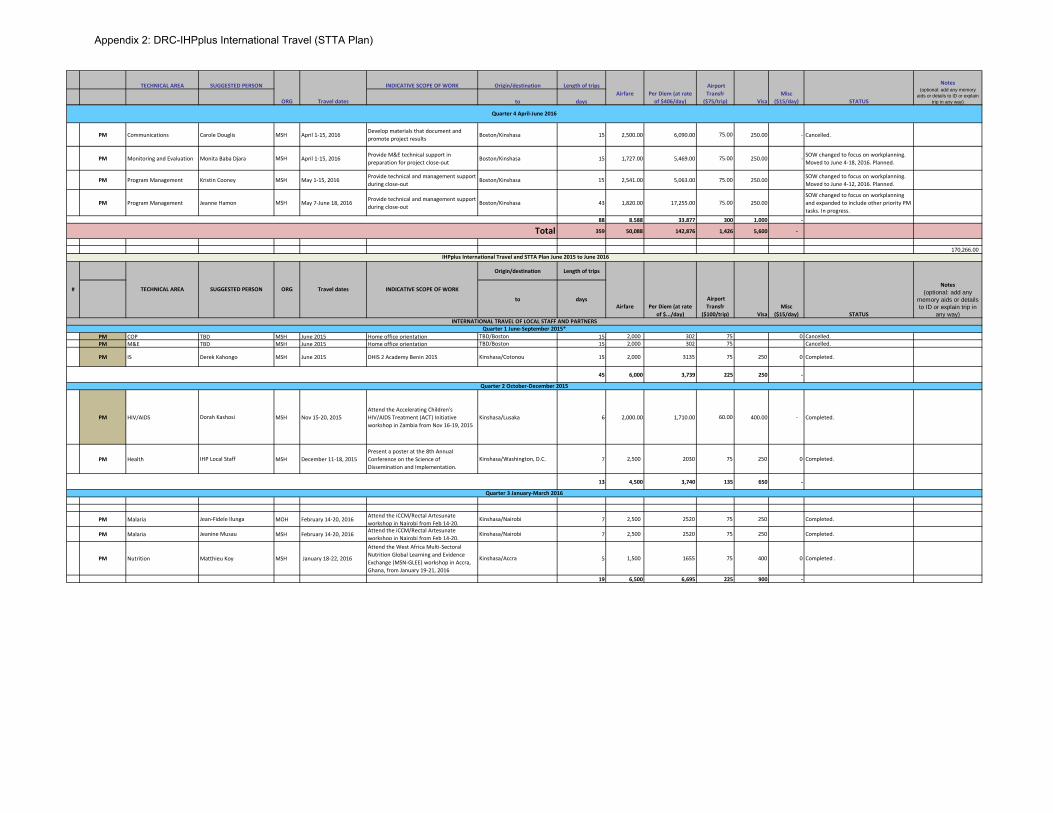
TECHNICAL AREA SUGGESTED PERSON INDICATIVE SCOPE OF WORK Origin/destination Length of trips
to daysMisc
($15/day) STATUS
Notes (optional: add any memory
aids or details to ID or explain trip in any way)ORG Travel dates
Airfare Per Diem (at rate of $406/day)
Airport Transfr
($75/trip) Visa
PM Communications Carole Douglis MSH April 1-15, 2016Develop materials that document and promote project results Boston/Kinshasa 15 2,500.00 6,090.00 75.00 250.00 - Cancelled.
PM Monitoring and Evaluation Monita Baba Djara MSH April 1-15, 2016Provide M&E technical support in preparation for project close-out
Boston/Kinshasa 15 1,727.00 5,469.00 75.00 250.00 - SOW changed to focus on workplanning. Moved to June 4-18, 2016. Planned.
PM Program Management Kristin Cooney MSH May 1-15, 2016 Provide technical and management support during close-out
Boston/Kinshasa 15 2,541.00 5,063.00 75.00 250.00 SOW changed to focus on workplanning. Moved to June 4-12, 2016. Planned.
PM Program Management Jeanne Hamon MSH May 7-June 18, 2016 Provide technical and management support during close-out
Boston/Kinshasa 43 1,820.00 17,255.00 75.00 250.00 SOW changed to focus on workplanning and expanded to include other priority PM tasks. In progress.
88 8,588 33,877 300 1,000 -
359 50,088 142,876 1,426 5,600 -
170,266.00
Origin/destination Length of trips
to days
PM COP TBD MSH June 2015 Home office orientation TBD/Boston 15 2,000 302 75 0 Cancelled.PM M&E TBD MSH June 2015 Home office orientation TBD/Boston 15 2,000 302 75 Cancelled.
PM IS Derek Kahongo MSH June 2015 DHIS 2 Academy Benin 2015 Kinshasa/Cotonou 15 2,000 3135 75 250 0 Completed.
45 6,000 3,739 225 250 -
PM HIV/AIDS Dorah Kashosi MSH Nov 15-20, 2015Attend the Accelerating Children's HIV/AIDS Treatment (ACT) Initiative workshop in Zambia from Nov 16-19, 2015
Kinshasa/Lusaka 6 2,000.00 1,710.00 60.00 400.00 - Completed.
PM Health IHP Local Staff MSH December 11-18, 2015Present a poster at the 8th Annual Conference on the Science of Dissemination and Implementation.
Kinshasa/Washington, D.C. 7 2,500 2030 75 250 0 Completed.
13 4,500 3,740 135 650 -
PM Malaria Jean-Fidele Ilunga MOH February 14-20, 2016 Attend the iCCM/Rectal Artesunate workshop in Nairobi from Feb 14-20.
Kinshasa/Nairobi 7 2,500 2520 75 250 Completed.
PM Malaria Jeanine Musau MSH February 14-20, 2016 Attend the iCCM/Rectal Artesunate workshop in Nairobi from Feb 14-20.
Kinshasa/Nairobi 7 2,500 2520 75 250 Completed.
PM Nutrition Matthieu Koy MSH January 18-22, 2016
Attend the West Africa Multi-Sectoral Nutrition Global Learning and Evidence Exchange (MSN-GLEE) workshop in Accra, Ghana, from January 19-21, 2016
Kinshasa/Accra 5 1,500 1655 75 400 0 Completed .
19 6,500 6,695 225 900 -
Total
INTERNATIONAL TRAVEL OF LOCAL STAFF AND PARTNERSQuarter 1 June-September 2015*
Quarter 2 October-December 2015
Quarter 3 January-March 2016
IHPplus International Travel and STTA Plan June 2015 to June 2016
Misc ($15/day)
Quarter 4 April-June 2016
# TECHNICAL AREA SUGGESTED PERSON ORG Travel dates
Visa STATUS
Notes (optional: add any
memory aids or details to ID or explain trip in
any way)
INDICATIVE SCOPE OF WORK
Airfare Per Diem (at rate of $.../day)
Airport Transfr
($100/trip)
Appendix 2: DRC-IHPplus International Travel (STTA Plan)
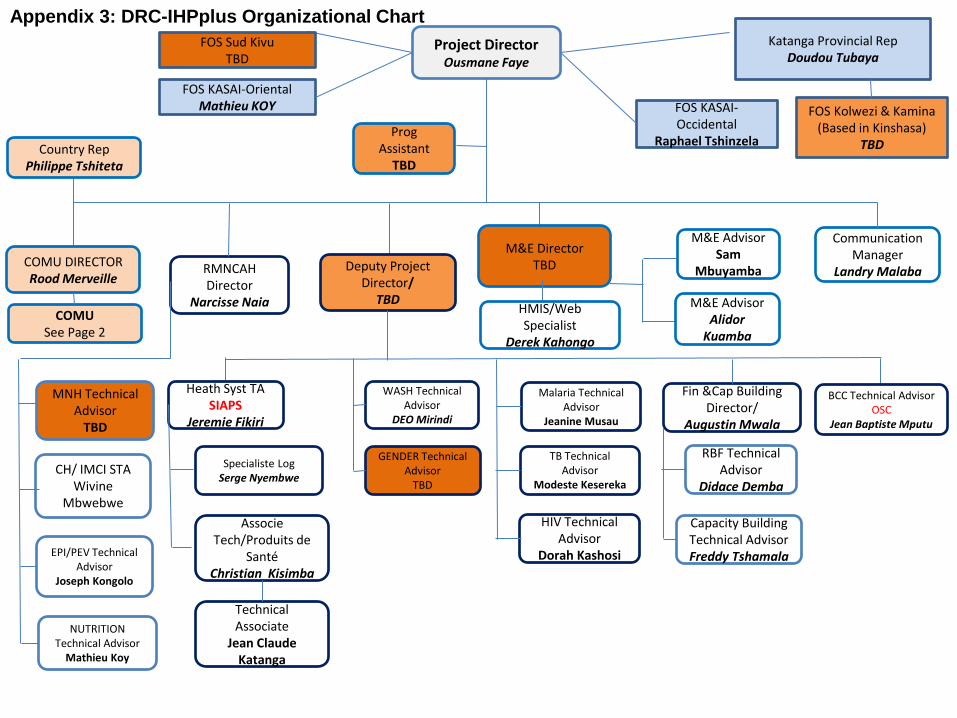
Project Director Ousmane Faye
COMU DIRECTOR Rood Merveille
Deputy Project Director/
TBD
M&E Director TBD
Communication Manager
Landry Malaba
GENDER Technical Advisor
TBD
MNH Technical Advisor
TBD
CH/ IMCI STA Wivine
Mbwebwe
EPI/PEV Technical Advisor
Joseph Kongolo
NUTRITION Technical Advisor
Mathieu Koy
WASH Technical Advisor
DEO Mirindi
RMNCAH Director
Narcisse Naia
Malaria Technical Advisor
Jeanine Musau
TB Technical Advisor
Modeste Kesereka
HIV Technical Advisor
Dorah Kashosi
Fin &Cap Building Director/
Augustin Mwala
M&E Advisor Alidor
Kuamba
M&E Advisor Sam
Mbuyamba
BCC Technical Advisor OSC
Jean Baptiste Mputu
RBF Technical Advisor
Didace Demba
Capacity Building Technical Advisor Freddy Tshamala
HMIS/Web Specialist
Derek Kahongo
Katanga Provincial Rep Doudou Tubaya
FOS Sud Kivu TBD
FOS Kolwezi & Kamina (Based in Kinshasa)
TBD Country Rep Philippe Tshiteta
COMU See Page 2
Heath Syst TA SIAPS
Jeremie Fikiri
Specialiste Log
Serge Nyembwe
Associe Tech/Produits de
Santé Christian Kisimba
Technical Associate
Jean Claude Katanga
FOS KASAI-Oriental Mathieu KOY FOS KASAI-
Occidental Raphael Tshinzela
Prog Assistant
TBD
Appendix 3: DRC-IHPplus Organizational Chart
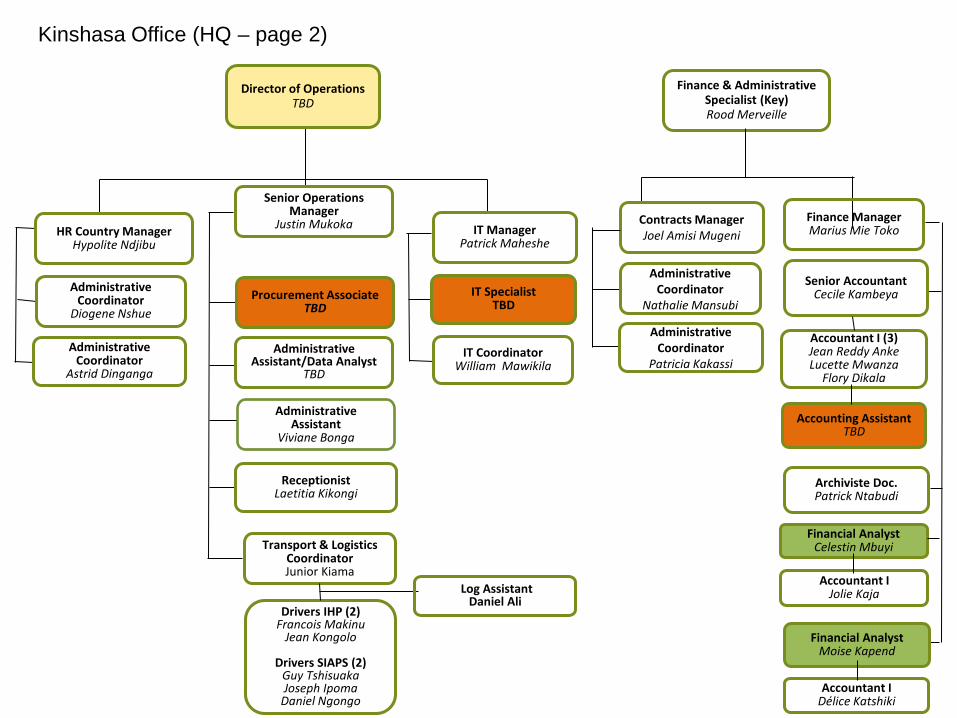
Administrative
Coordinator Nathalie Mansubi
Kinshasa Office (HQ – page 2)
Finance & Administrative Specialist (Key) Rood Merveille
HR Country Manager Hypolite Ndjibu
Administrative
Assistant Viviane Bonga
Administrative Coordinator
Diogene Nshue
Finance Manager Marius Mie Toko
Senior Accountant Cecile Kambeya
Accountant I (3) Jean Reddy Anke Lucette Mwanza
Flory Dikala
Accounting Assistant
TBD
Senior Operations Manager
Justin Mukoka
Drivers IHP (2)
Francois Makinu Jean Kongolo
Drivers SIAPS (2)
Guy Tshisuaka Joseph Ipoma
Daniel Ngongo
Transport & Logistics Coordinator Junior Kiama
Contracts Manager Joel Amisi Mugeni
Administrative Assistant/Data Analyst
TBD
IT Manager Patrick Maheshe
Financial Analyst Moise Kapend
IT Specialist TBD
IT Coordinator William Mawikila
Administrative Coordinator
Astrid Dinganga
Log Assistant
Daniel Ali
Director of Operations
TBD
Administrative
Coordinator Patricia Kakassi
Receptionist
Laetitia Kikongi
Financial Analyst Celestin Mbuyi
Accountant I Jolie Kaja
Accountant I Délice Katshiki
Procurement Associate TBD
Archiviste Doc. Patrick Ntabudi
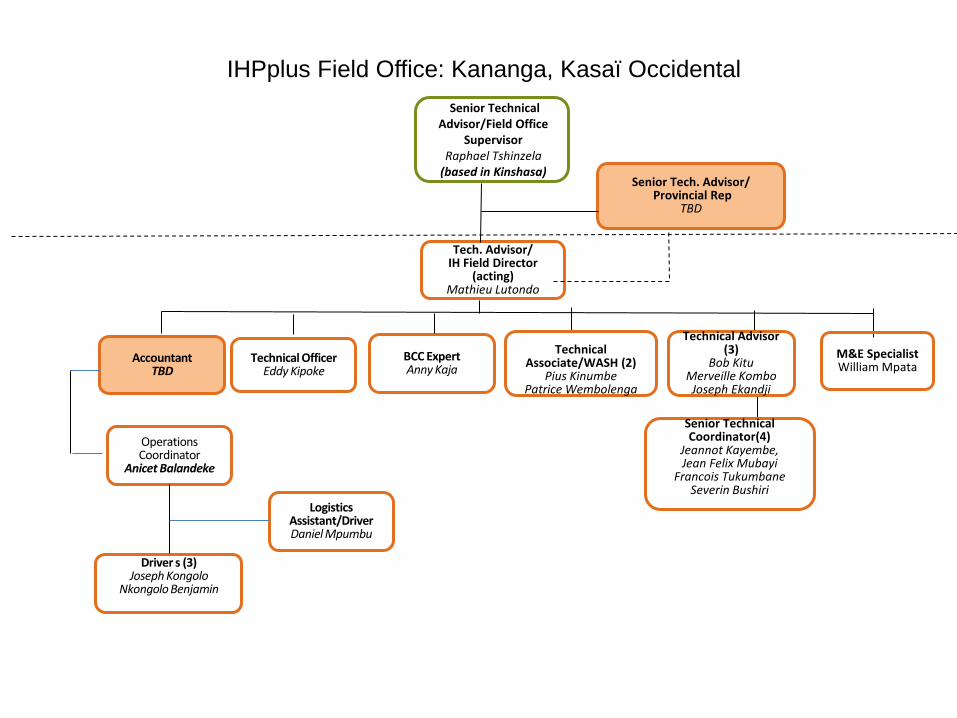
Tech. Advisor/
IH Field Director (acting)
Mathieu Lutondo
Senior Technical Advisor/Field Office
Supervisor Raphael Tshinzela
(based in Kinshasa)
IHPplus Field Office: Kananga, Kasaï Occidental
M&E Specialist William Mpata
Technical Associate/WASH (2)
Pius Kinumbe Patrice Wembolenga
Technical Advisor (3)
Bob Kitu Merveille Kombo Joseph Ekandji
Senior Technical
Coordinator(4) Jeannot Kayembe, Jean Felix Mubayi
Francois Tukumbane Severin Bushiri
Logistics
Assistant/Driver Daniel Mpumbu
Driver s (3) Joseph Kongolo
Nkongolo Benjamin
BCC Expert Anny Kaja
Technical Officer Eddy Kipoke
Senior Tech. Advisor/
Provincial Rep TBD
Accountant TBD
Operations Coordinator
Anicet Balandeke
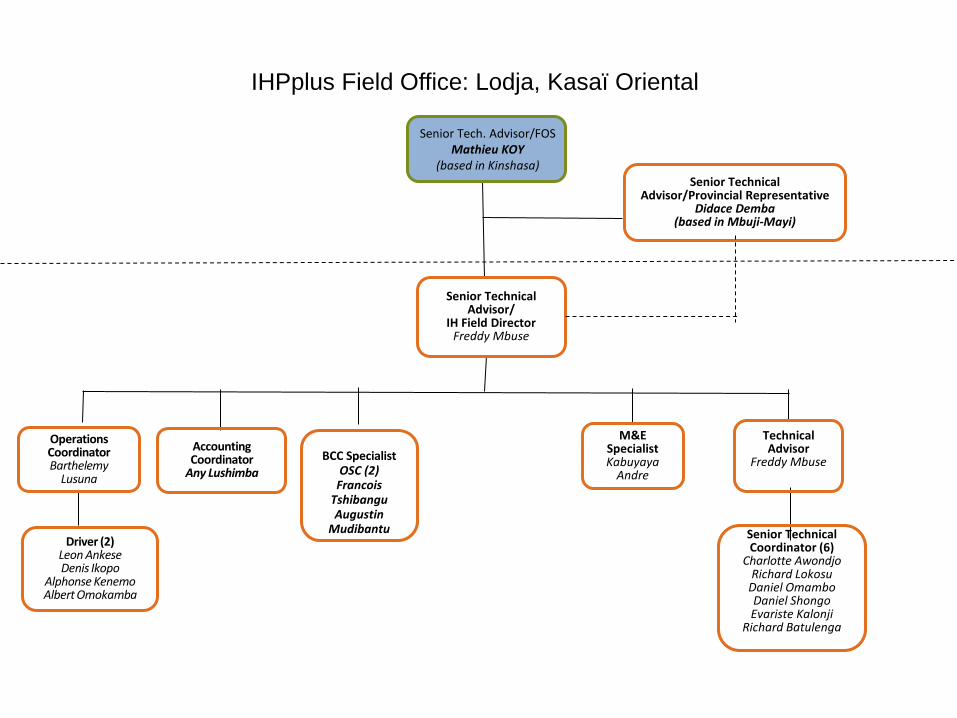
Senior Tech. Advisor/FOS Mathieu KOY
(based in Kinshasa)
IHPplus Field Office: Lodja, Kasaï Oriental
M&E
Specialist Kabuyaya
Andre
Technical Advisor
Freddy Mbuse
Senior Technical Coordinator (6)
Charlotte Awondjo Richard Lokosu
Daniel Omambo Daniel Shongo Evariste Kalonji
Richard Batulenga
Accounting Coordinator
Any Lushimba
Operations Coordinator Barthelemy
Lusuna
Driver (2) Leon Ankese Denis Ikopo
Alphonse Kenemo Albert Omokamba
Senior Technical Advisor/
IH Field Director Freddy Mbuse
BCC Specialist OSC (2)
Francois Tshibangu Augustin
Mudibantu
Senior Technical Advisor/Provincial Representative
Didace Demba (based in Mbuji-Mayi)
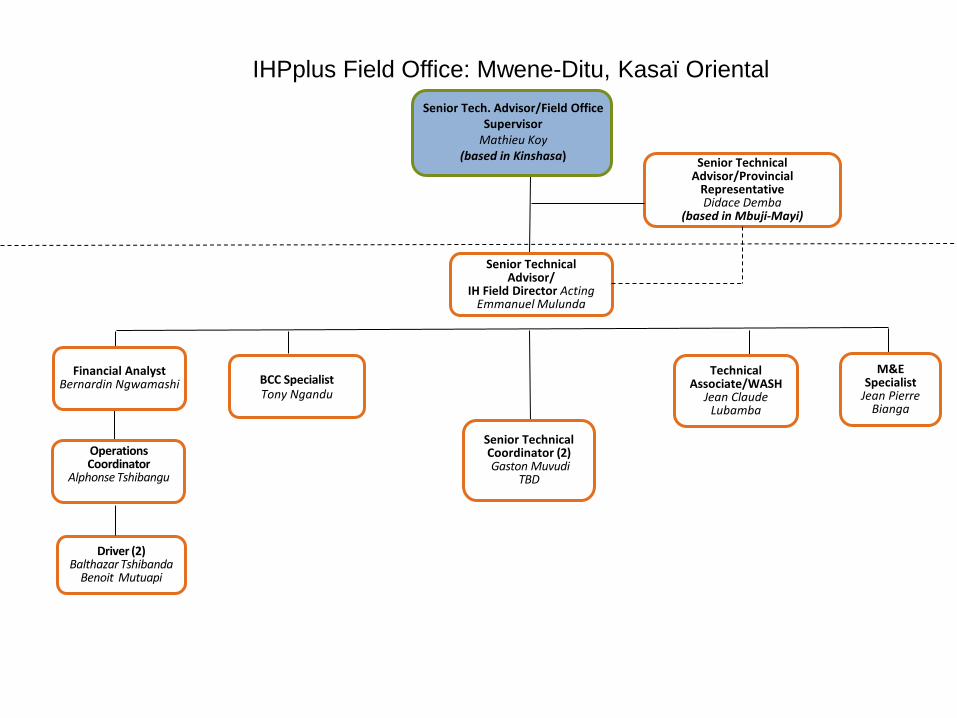
Senior Technical Advisor/
IH Field Director Acting Emmanuel Mulunda
Senior Tech. Advisor/Field Office
Supervisor Mathieu Koy
(based in Kinshasa)
IHPplus Field Office: Mwene-Ditu, Kasaï Oriental
M&E Specialist
Jean Pierre Bianga
Technical Associate/WASH
Jean Claude Lubamba
Financial Analyst Bernardin Ngwamashi
BCC Specialist Tony Ngandu
Senior Technical Coordinator (2) Gaston Muvudi
TBD
Operations Coordinator
Alphonse Tshibangu
Driver (2) Balthazar Tshibanda
Benoit Mutuapi
Senior Technical Advisor/Provincial
Representative Didace Demba
(based in Mbuji-Mayi)
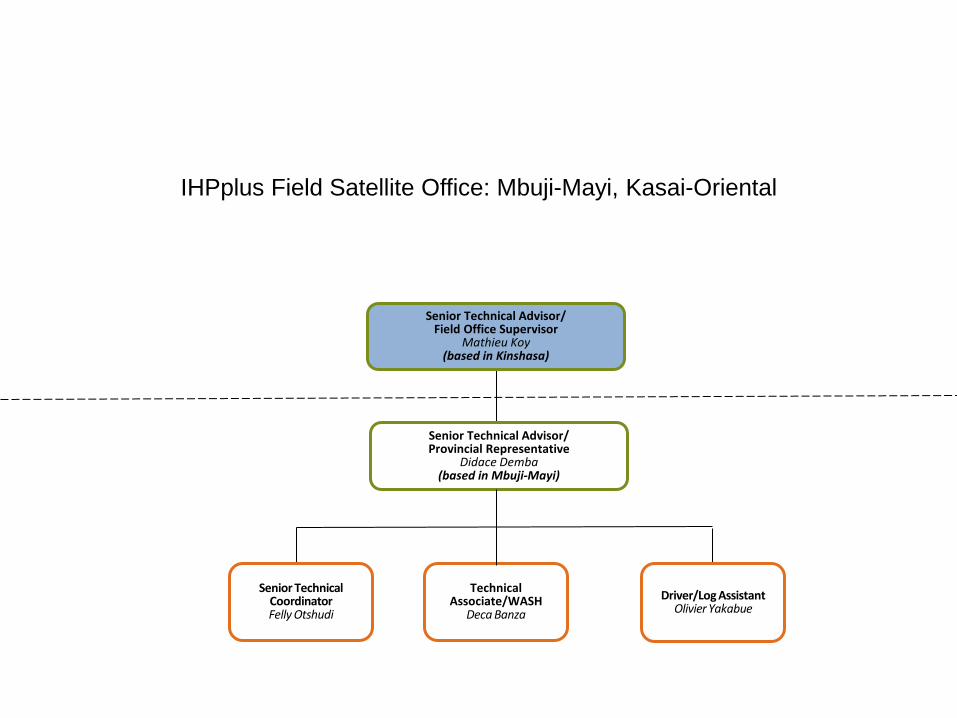
IHPplus Field Satellite Office: Mbuji-Mayi, Kasai-Oriental
Senior Technical Advisor/ Provincial Representative
Didace Demba (based in Mbuji-Mayi)
Driver/Log Assistant Olivier Yakabue
Senior Technical
Coordinator Felly Otshudi
Senior Technical Advisor/ Field Office Supervisor
Mathieu Koy (based in Kinshasa)
Technical
Associate/WASH Deca Banza
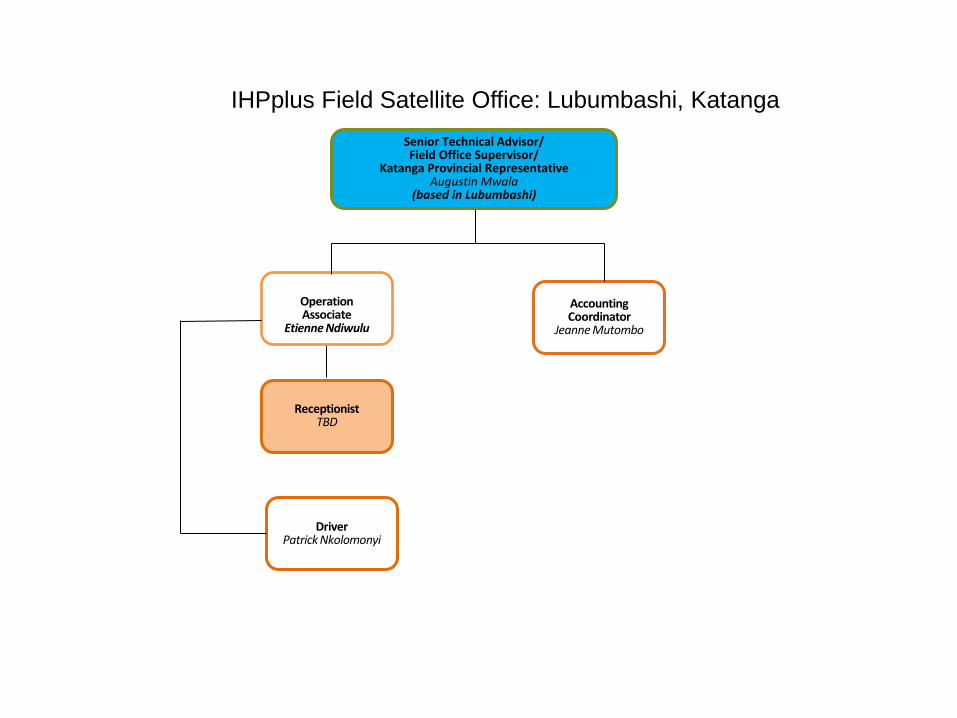
IHPplus Field Satellite Office: Lubumbashi, Katanga Senior Technical Advisor/ Field Office Supervisor/
Katanga Provincial Representative Augustin Mwala
(based in Lubumbashi)
Accounting Coordinator
Jeanne Mutombo
Operation Associate
Etienne Ndiwulu
Receptionist TBD
é
Driver Patrick Nkolomonyi
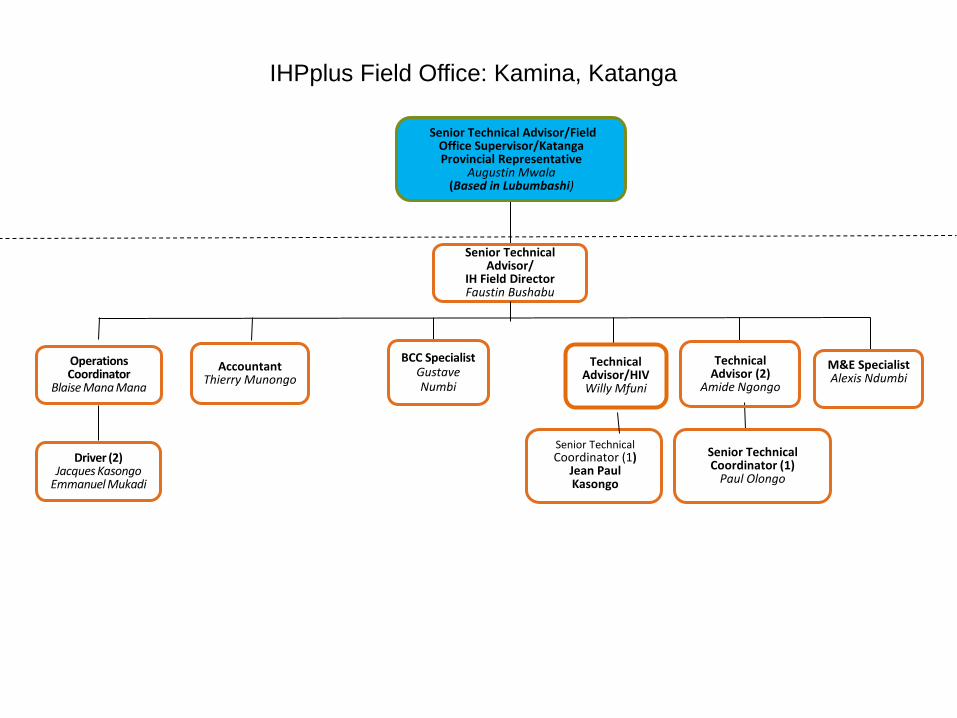
Senior Technical Advisor/
IH Field Director Faustin Bushabu
IHPplus Field Office: Kamina, Katanga
M&E Specialist Alexis Ndumbi
Technical
Advisor/HIV Willy Mfuni
Accountant
Thierry Munongo
BCC Specialist Gustave Numbi
Technical Advisor (2)
Amide Ngongo
Senior Technical Coordinator (1)
Paul Olongo
Operations Coordinator
Blaise Mana Mana
Driver (2) Jacques Kasongo
Emmanuel Mukadi
Senior Technical Advisor/Field Office Supervisor/Katanga Provincial Representative
Augustin Mwala (Based in Lubumbashi)
Senior Technical Coordinator (1)
Jean Paul Kasongo
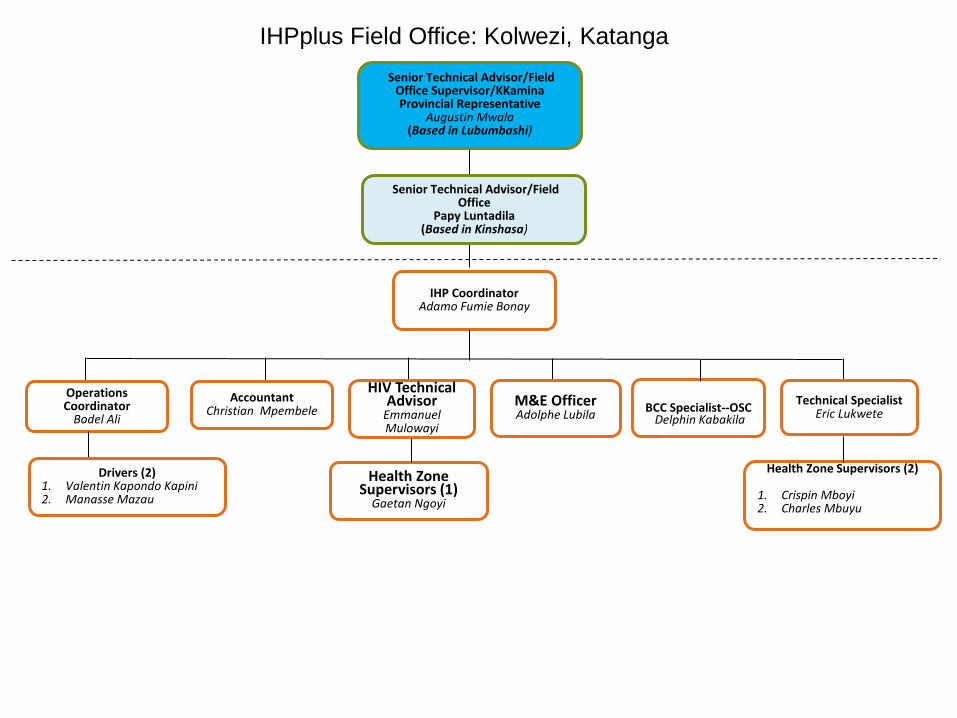
IHP Coordinator
Adamo Fumie Bonay
Senior Technical Advisor/Field Office Supervisor/KKamina Provincial Representative
Augustin Mwala (Based in Lubumbashi)
M&E Officer Adolphe Lubila
Accountant Christian Mpembele
Technical Specialist Eric Lukwete
Health Zone Supervisors (2)
1. Crispin Mboyi 2. Charles Mbuyu
IHPplus Field Office: Kolwezi, Katanga
Operations Coordinator
Bodel Ali
Health Zone Supervisors (1)
Gaetan Ngoyi
Drivers (2)
1. Valentin Kapondo Kapini 2. Manasse Mazau
BCC Specialist--OSC
Delphin Kabakila
HIV Technical Advisor
Emmanuel Mulowayi
Senior Technical Advisor/Field Office
Papy Luntadila (Based in Kinshasa)
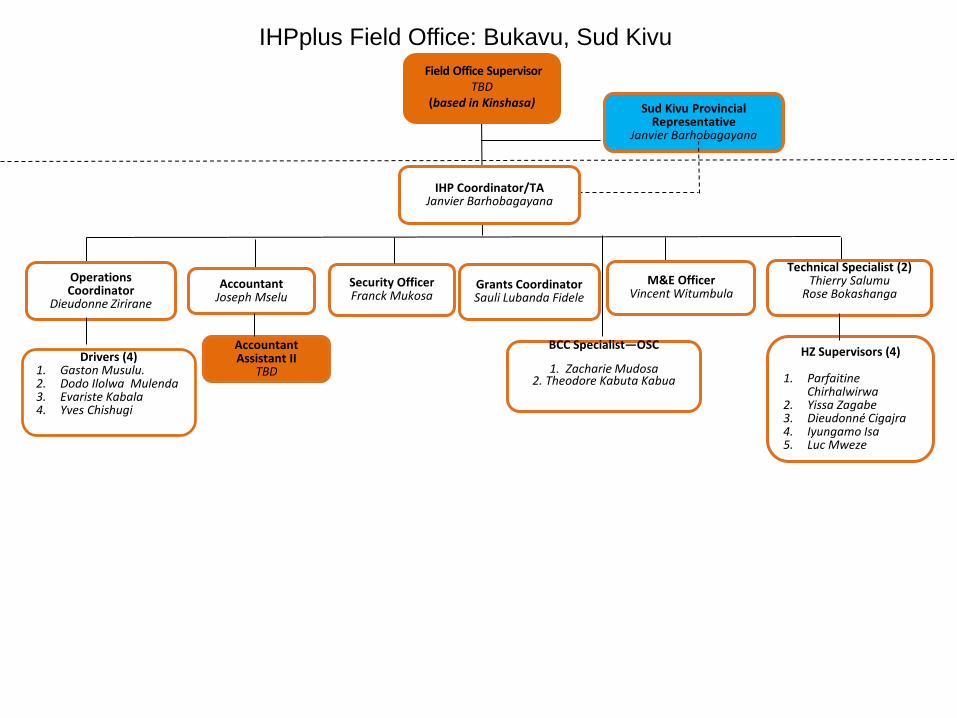
IHP Coordinator/TA Janvier Barhobagayana
M&E Officer Vincent Witumbula
Technical Specialist (2) Thierry Salumu
Rose Bokashanga
HZ Supervisors (4)
1. Parfaitine Chirhalwirwa
2. Yissa Zagabe 3. Dieudonné Cigajra 4. Iyungamo Isa 5. Luc Mweze
IHPplus Field Office: Bukavu, Sud Kivu
Operations Coordinator
Dieudonne Zirirane
Grants Coordinator Sauli Lubanda Fidele
Accountant Joseph Mselu
BCC Specialist—OSC
1. Zacharie Mudosa
2. Theodore Kabuta Kabua
Security Officer Franck Mukosa
Field Office Supervisor TBD
(based in Kinshasa)
Sud Kivu Provincial Representative
Janvier Barhobagayana
Drivers (4)
1. Gaston Musulu. 2. Dodo Ilolwa Mulenda 3. Evariste Kabala 4. Yves Chishugi
Accountant Assistant II
TBD
Rapport de
RAPPO
FOR
Présenté
TUNGUNGAMISI KIZJérémie F
e formation des
Progra
ORT DE
RMATIO
MEDIC
par :
GA MASCOZEGELEE GiFIKIRI, Conse
s cadres provin
Rép
MINIS
amme Natio
MISSIO
ON DES C
CAMEN
Ko
OTY Etienne,ilbert, Respoeiller techni
ciaux de la DPS
publique D
STERE DESECRET
onal D’Appr
N D’APP
CADRES
TS ET A
lwezi, du
Av
, Responsabonsable duique, Projet
JA
S Lualaba en Ge
Démocratiq
E LA SANTARIAT GE
rovisionnenP.N.A.M.
PUI A LA
S PROVI
AUTRES
18 au 21 j
vec l’appui d
ble des estimu service dest SIAPS, MSH
ANVIER 201
estion des Médi
que du Co
NTE PUBLENERAL
nt En Médic
A DPS D
INCIAUX
INTRAN
janvier 20
de :
mations dess statistiqueH/RDC
16
icaments, Janvi
ongo
LIQUE
caments Ess
DE LUAL
X EN GE
NTS DE S
016
s Besoins Paes au PNAM
ier 2016 Pag
sentiels
LABA PO
ESTION
SANTE
ays au PNAM
ge 1 of 31
OUR LA
DES
AM
Appendix 6: Mission Report on drug inventory management training with Lualaba DPS - January 2016
Rapport de formation des cadres provinciaux de la DPS Lualaba en Gestion des Médicaments, Janvier 2016 Page 2 of 31
Ce rapport n’aurait pas été possible sans le soutien de l’USAID à travers les projets SIAPS et PROSANIplus mis en œuvre par MSH. Ces deux projets contribuent au renforcement des capacités de la RDC dans la gestion efficace des médicaments et autres produits de santé. Ils contribuent également à la promotion de l’accès à ces médicaments et de leur usage approprié. Citation recommandée Ce rapport peut être reproduit pourvu que PNAM y soit mentionné. Veuillez utiliser la citation suivante : TUNGUNGA MASCOTY, Responsable des estimations des besoins Pays, AMISI KIZEGELEE Gilbert, Responsable du service des statistiques au PNAM/RDC et Jérémie FIKIRI, Conseiller technique au sein de MSH RDC : Formation des cadres provinciaux sur la gestion des médicaments et autres intrants de santé à Kolwezi dans la province de Lualaba, du 18 au 21 Janvier 2016.
Appendix 6: Mission Report on drug inventory management training with Lualaba DPS - January 2016
Rapport de formation des cadres provinciaux de la DPS Lualaba en Gestion des Médicaments, Janvier 2016 Page 3 of 31
REMERCIEMENTS Nous tenons à remercier la haute hiérarchie du Ministère de la santé publique pour nous avoir mandatés dans la réalisation de cette mission de formation sur la gestion des médicaments en appui à la DPS de LWALABA. Nos remerciements s’adressent également aux partenaires du ministère de la Santé, en l’occurrence l’USAID pour son appui technique et financier à travers les projets SIAPS et PROSANI plus mis en œuvre par MSH. Nous avons apprécié à sa juste valeur la collaboration avec l’équipe de la DPS, la coordination provinciale de MSH (SIAPS et PROSANI plus) et les équipes cadres des ZS de BUNKEYA, DILALA, FUNGURUME, KANZENZE, LWALABA, LUBUDI, MANIKA et MUCHACHA au cours de cette mission. Qu’ils soient tous remerciés.
Appendix 6: Mission Report on drug inventory management training with Lualaba DPS - January 2016
Rapport de formation des cadres provinciaux de la DPS Lualaba en Gestion des Médicaments, Janvier 2016 Page 4 of 31
I. CONTEXTE ET JUSTIFICATION Dans le cadre des activités d’appui que le PNAM apporte aux DPS en rapport avec la gestion des médicaments, il a été noté que la maîtrise des données de consommation demeure un défi majeur dans la plupart des FOSA, entrainant ainsi des cas de ruptures de stocks et/ou des pertes des médicaments par péremption. A côté de ce défi, on note également une faible capacité technique des prestataires doublée par la perdition (instabilité) des personnels formés. Les dernières missions effectuées sur terrain ont rapporté l’existence d’une multiplicité des outils de gestion des données dans les Structures entrainant ainsi une grande difficulté dans la collecte et l’analyse des données, ainsi que le non‐respect du circuit officiel de transmission des rapports de gestion. Cette faible performance a été aussi épinglée par MSH/SIAPS qui a approvisionné 8 ZS dont BUNKEYA, DILALA, FUNGURUME, KANZENZE, LWALABA, LUBUDI,MANIKA et MUCHACHA en médicaments essentiels et autres intrants de santé dans le cadre de la mise en œuvre du projet PROSANI plus. Eu égard de ce qui précède, les deux institutions en l’occurrence la PNAM et MSH ont jugé nécessaire de renforcer les capacités techniques des prestataires commis à la tâche de gestion des MEG dans les structures de prise en charge. C’est pour répondre à ce besoin que la présente mission d’appui à la DPS de LUALABA a été réalisée afin de former les cadres provinciaux qui, à leur tour, procéderont à la formation des prestataires. Cette mission a été effectuée au cours de la période allant du 18 au 21 Janvier 2016.
Appendix 6: Mission Report on drug inventory management training with Lualaba DPS - January 2016
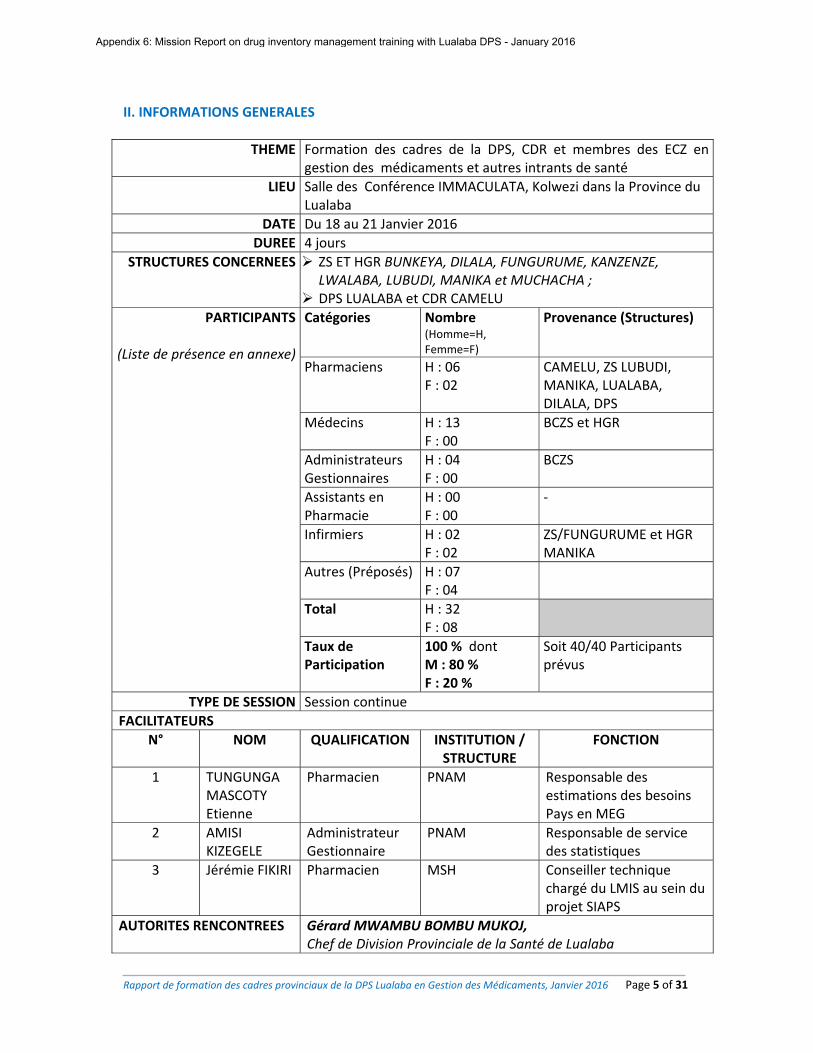
Rapport de formation des cadres provinciaux de la DPS Lualaba en Gestion des Médicaments, Janvier 2016 Page 5 of 31
II. INFORMATIONS GENERALES
THEME Formation des cadres de la DPS, CDR et membres des ECZ engestion des médicaments et autres intrants de santé
LIEU Salle des Conférence IMMACULATA, Kolwezi dans la Province du Lualaba
DATE Du 18 au 21 Janvier 2016
DUREE 4 jours
STRUCTURES CONCERNEES ZS ET HGR BUNKEYA, DILALA, FUNGURUME, KANZENZE,
LWALABA, LUBUDI, MANIKA et MUCHACHA ; DPS LUALABA et CDR CAMELU
PARTICIPANTS
(Liste de présence en annexe)
Catégories Nombre (Homme=H, Femme=F)
Provenance (Structures)
Pharmaciens
H : 06 F : 02
CAMELU, ZS LUBUDI, MANIKA, LUALABA, DILALA, DPS
Médecins H : 13 F : 00
BCZS et HGR
Administrateurs Gestionnaires
H : 04 F : 00
BCZS
Assistants en Pharmacie
H : 00F : 00
‐
Infirmiers H : 02 F : 02
ZS/FUNGURUME et HGR MANIKA
Autres (Préposés) H : 07 F : 04
Total H : 32 F : 08
Taux de Participation
100 % dont M : 80 % F : 20 %
Soit 40/40 Participants prévus
TYPE DE SESSION Session continue
FACILITATEURS
N° NOM QUALIFICATION INSTITUTION / STRUCTURE
FONCTION
1 TUNGUNGA MASCOTY Etienne
Pharmacien PNAM Responsable des estimations des besoins Pays en MEG
2 AMISI KIZEGELE
Administrateur Gestionnaire
PNAM Responsable de service des statistiques
3 Jérémie FIKIRI Pharmacien MSH Conseiller technique chargé du LMIS au sein du projet SIAPS
AUTORITES RENCONTREES Gérard MWAMBU BOMBU MUKOJ, Chef de Division Provinciale de la Santé de Lualaba
Appendix 6: Mission Report on drug inventory management training with Lualaba DPS - January 2016
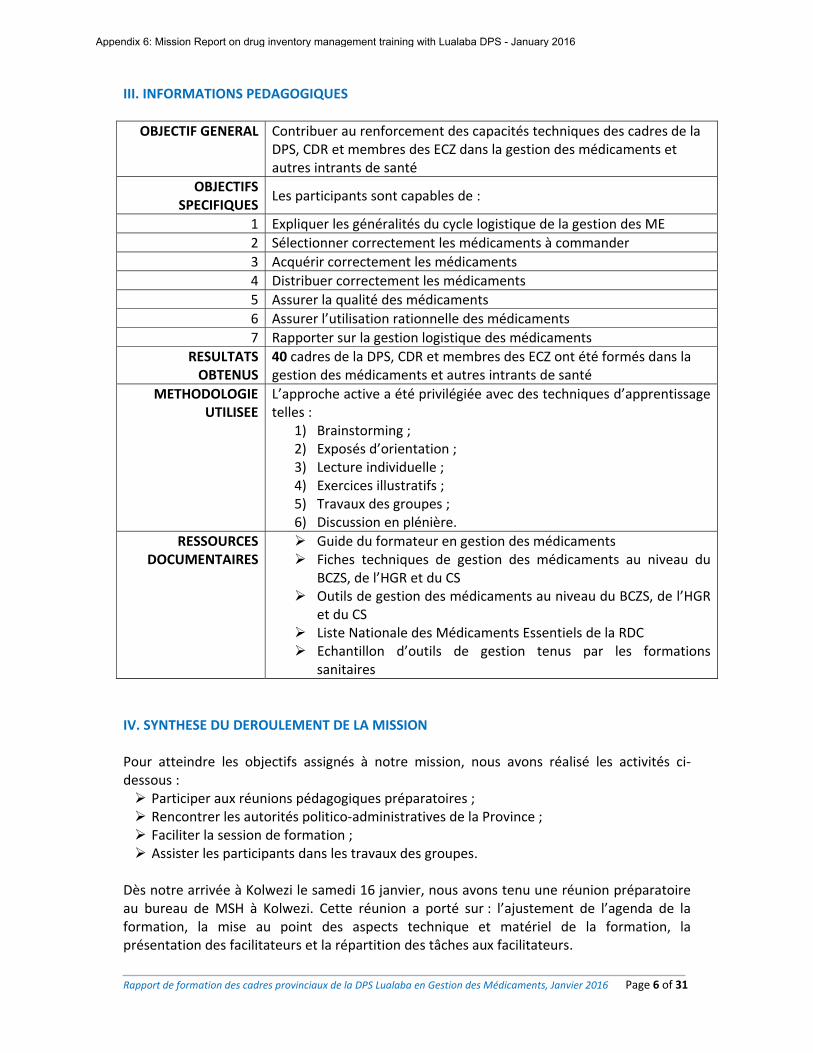
Rapport de formation des cadres provinciaux de la DPS Lualaba en Gestion des Médicaments, Janvier 2016 Page 6 of 31
III. INFORMATIONS PEDAGOGIQUES
OBJECTIF GENERAL Contribuer au renforcement des capacités techniques des cadres de la DPS, CDR et membres des ECZ dans la gestion des médicaments et autres intrants de santé
OBJECTIFS SPECIFIQUES
Les participants sont capables de :
1 Expliquer les généralités du cycle logistique de la gestion des ME
2 Sélectionner correctement les médicaments à commander
3 Acquérir correctement les médicaments
4 Distribuer correctement les médicaments
5 Assurer la qualité des médicaments
6 Assurer l’utilisation rationnelle des médicaments
7 Rapporter sur la gestion logistique des médicaments
RESULTATS OBTENUS
40 cadres de la DPS, CDR et membres des ECZ ont été formés dans la gestion des médicaments et autres intrants de santé
METHODOLOGIE UTILISEE
L’approche active a été privilégiée avec des techniques d’apprentissage telles :
1) Brainstorming ; 2) Exposés d’orientation ; 3) Lecture individuelle ; 4) Exercices illustratifs ; 5) Travaux des groupes ; 6) Discussion en plénière.
RESSOURCES DOCUMENTAIRES
Guide du formateur en gestion des médicaments Fiches techniques de gestion des médicaments au niveau du
BCZS, de l’HGR et du CS Outils de gestion des médicaments au niveau du BCZS, de l’HGR
et du CS Liste Nationale des Médicaments Essentiels de la RDC Echantillon d’outils de gestion tenus par les formations
sanitaires
IV. SYNTHESE DU DEROULEMENT DE LA MISSION Pour atteindre les objectifs assignés à notre mission, nous avons réalisé les activités ci‐dessous : Participer aux réunions pédagogiques préparatoires ; Rencontrer les autorités politico‐administratives de la Province ; Faciliter la session de formation ; Assister les participants dans les travaux des groupes.
Dès notre arrivée à Kolwezi le samedi 16 janvier, nous avons tenu une réunion préparatoire au bureau de MSH à Kolwezi. Cette réunion a porté sur : l’ajustement de l’agenda de la formation, la mise au point des aspects technique et matériel de la formation, la présentation des facilitateurs et la répartition des tâches aux facilitateurs.
Appendix 6: Mission Report on drug inventory management training with Lualaba DPS - January 2016

Rapport de formation des cadres provinciaux de la DPS Lualaba en Gestion des Médicaments, Janvier 2016 Page 7 of 31
Durant les 4 jours, la formation s’est focalisée sur les informations clés ci‐après :
Au premier jour, après la cérémonie d’ouverture par le représentant du Chef de Division, la lecture des Termes de référence de l’atelier et la présentation des participants, il s’en est suivi un pré‐test des connaissances des participants. Sur les 38 participants qui ont pris part à ce pre test, seuls 16 ont obtenu une note supérieure à la moyenne, soit 42% de réussite seulement. Ce résultat s’est sensiblement amélioré à la fin de la formation (Voir tableau à la page 10). En ce premier jour de la formation, les attentes des participants ont été également listées. En résumé, tous les participants ont émis le souhait de bénéficier d’une formation et des exercices pratiques qui leur permettront de mieux surmonter leurs limites et de résoudre les problèmes couramment rencontrés dans l’exercice de leur métier de gestionnaires.
L’agenda de la formation proprement‐dite a porté sur diverses matières dont la synthèse est reprise dans le tableau ci‐après :
Plages Points à retenir
Sélection des Médicaments
La gestion des médicaments passe par un cycle comportant quatre étapes principales à savoir : la sélection, l’acquisition, la distribution et l’utilisation. S’agissant de la « sélection des médicaments », la question fondamentale est de savoir Quels médicaments acheter. Les facilitateurs ont mis un accent sur les documents appropriés pour la sélection des médicaments ainsi que leur importance. Il s’agit notamment de la LNME, les ordinogrammes et les DST. Avant de clore cette plage, le facilitateur a rappelé les « 6 BONS » qui régissent chaîne logistique des médicaments à savoir : bons produits, en bonne quantité, dans les bonnes conditions, au bon endroit, au bon moment, et au bon coût.
Acquisition des Médicaments
Au cours de cette plage, le facilitateur s’est appesanti sur les différents types d’acquisition des médicaments notamment l’allocation et la commande ou la réquisition. Une lumière a été apportée sur le mode calcul de la CMM, du Stock Disponible et Utilisable, du MAD, du Stock Maximum, du Stock Minimum, de la quantité à commander, de la quantité en risque de péremption ainsi que pour l’ajustement des données à tous les niveaux de la chaîne. Pour lier la théorie à la pratique, le facilitateur a procédé à la résolution d’une série d’exercices illustratifs. Ensuite les participants ont été répartis en 5 groupes et 4 Exercices pratiques leurs ont été donnés pour les travaux en groupes dont les résultats ont été par la suite présentés en plénière sous la modération du facilitateur. Retenons qu’un accent particulier a été mis sur les normes Max/Min mises
Appendix 6: Mission Report on drug inventory management training with Lualaba DPS - January 2016
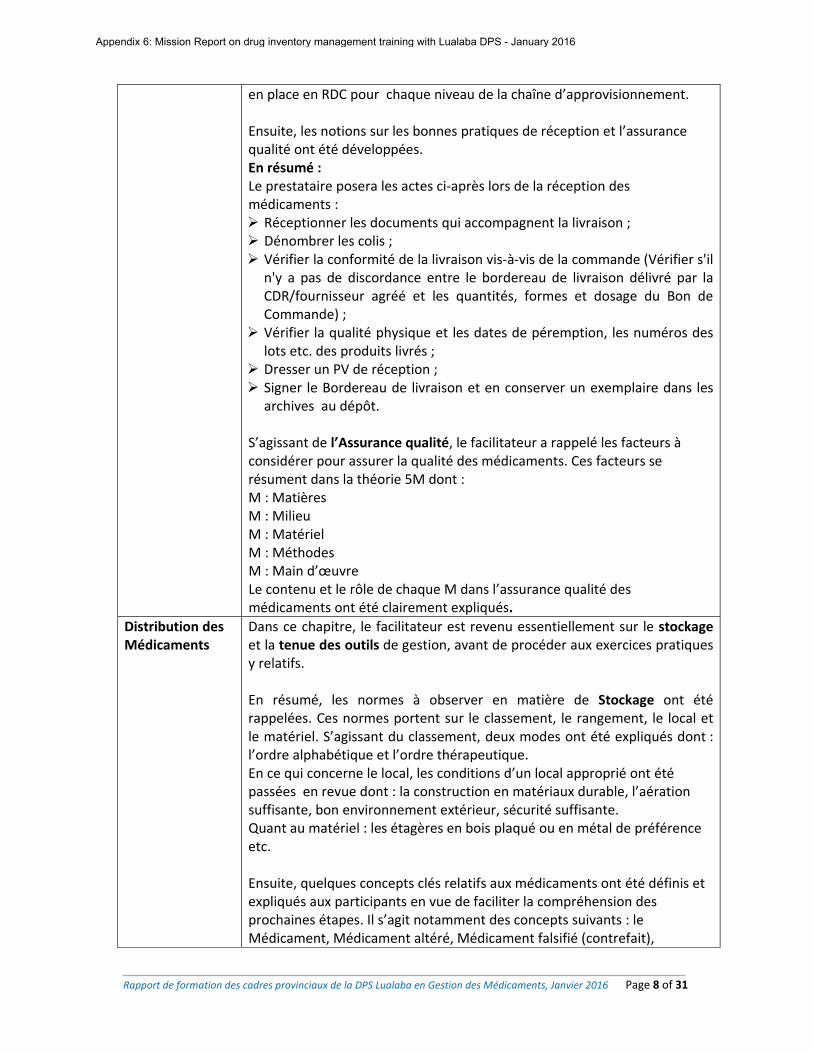
Rapport de formation des cadres provinciaux de la DPS Lualaba en Gestion des Médicaments, Janvier 2016 Page 8 of 31
en place en RDC pour chaque niveau de la chaîne d’approvisionnement. Ensuite, les notions sur les bonnes pratiques de réception et l’assurance qualité ont été développées. En résumé : Le prestataire posera les actes ci‐après lors de la réception des médicaments : Réceptionner les documents qui accompagnent la livraison ; Dénombrer les colis ; Vérifier la conformité de la livraison vis‐à‐vis de la commande (Vérifier s'il
n'y a pas de discordance entre le bordereau de livraison délivré par la CDR/fournisseur agréé et les quantités, formes et dosage du Bon de Commande) ;
Vérifier la qualité physique et les dates de péremption, les numéros des lots etc. des produits livrés ;
Dresser un PV de réception ; Signer le Bordereau de livraison et en conserver un exemplaire dans les
archives au dépôt. S’agissant de l’Assurance qualité, le facilitateur a rappelé les facteurs à considérer pour assurer la qualité des médicaments. Ces facteurs se résument dans la théorie 5M dont : M : Matières M : Milieu M : Matériel M : Méthodes M : Main d’œuvre Le contenu et le rôle de chaque M dans l’assurance qualité des médicaments ont été clairement expliqués.
Distribution des Médicaments
Dans ce chapitre, le facilitateur est revenu essentiellement sur le stockageet la tenue des outils de gestion, avant de procéder aux exercices pratiques y relatifs. En résumé, les normes à observer en matière de Stockage ont été rappelées. Ces normes portent sur le classement, le rangement, le local et le matériel. S’agissant du classement, deux modes ont été expliqués dont : l’ordre alphabétique et l’ordre thérapeutique. En ce qui concerne le local, les conditions d’un local approprié ont été passées en revue dont : la construction en matériaux durable, l’aération suffisante, bon environnement extérieur, sécurité suffisante. Quant au matériel : les étagères en bois plaqué ou en métal de préférence etc. Ensuite, quelques concepts clés relatifs aux médicaments ont été définis et expliqués aux participants en vue de faciliter la compréhension des prochaines étapes. Il s’agit notamment des concepts suivants : le Médicament, Médicament altéré, Médicament falsifié (contrefait),
Appendix 6: Mission Report on drug inventory management training with Lualaba DPS - January 2016
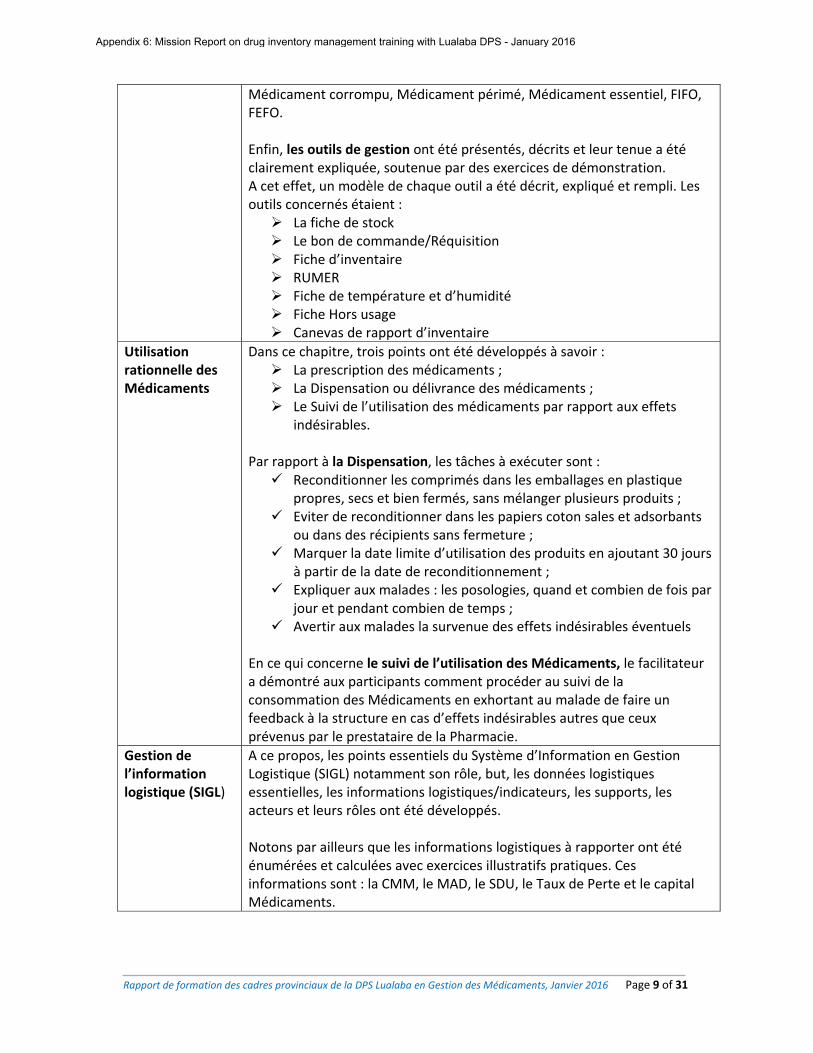
Rapport de formation des cadres provinciaux de la DPS Lualaba en Gestion des Médicaments, Janvier 2016 Page 9 of 31
Médicament corrompu, Médicament périmé, Médicament essentiel, FIFO, FEFO. Enfin, les outils de gestion ont été présentés, décrits et leur tenue a été clairement expliquée, soutenue par des exercices de démonstration. A cet effet, un modèle de chaque outil a été décrit, expliqué et rempli. Les outils concernés étaient : La fiche de stock Le bon de commande/Réquisition Fiche d’inventaire RUMER Fiche de température et d’humidité Fiche Hors usage Canevas de rapport d’inventaire
Utilisation rationnelle des Médicaments
Dans ce chapitre, trois points ont été développés à savoir : La prescription des médicaments ; La Dispensation ou délivrance des médicaments ; Le Suivi de l’utilisation des médicaments par rapport aux effets
indésirables.
Par rapport à la Dispensation, les tâches à exécuter sont : Reconditionner les comprimés dans les emballages en plastique
propres, secs et bien fermés, sans mélanger plusieurs produits ; Eviter de reconditionner dans les papiers coton sales et adsorbants
ou dans des récipients sans fermeture ; Marquer la date limite d’utilisation des produits en ajoutant 30 jours
à partir de la date de reconditionnement ; Expliquer aux malades : les posologies, quand et combien de fois par
jour et pendant combien de temps ; Avertir aux malades la survenue des effets indésirables éventuels
En ce qui concerne le suivi de l’utilisation des Médicaments, le facilitateur a démontré aux participants comment procéder au suivi de la consommation des Médicaments en exhortant au malade de faire un feedback à la structure en cas d’effets indésirables autres que ceux prévenus par le prestataire de la Pharmacie.
Gestion de l’information logistique (SIGL)
A ce propos, les points essentiels du Système d’Information en Gestion Logistique (SIGL) notamment son rôle, but, les données logistiques essentielles, les informations logistiques/indicateurs, les supports, les acteurs et leurs rôles ont été développés. Notons par ailleurs que les informations logistiques à rapporter ont été énumérées et calculées avec exercices illustratifs pratiques. Ces informations sont : la CMM, le MAD, le SDU, le Taux de Perte et le capital Médicaments.
Appendix 6: Mission Report on drug inventory management training with Lualaba DPS - January 2016
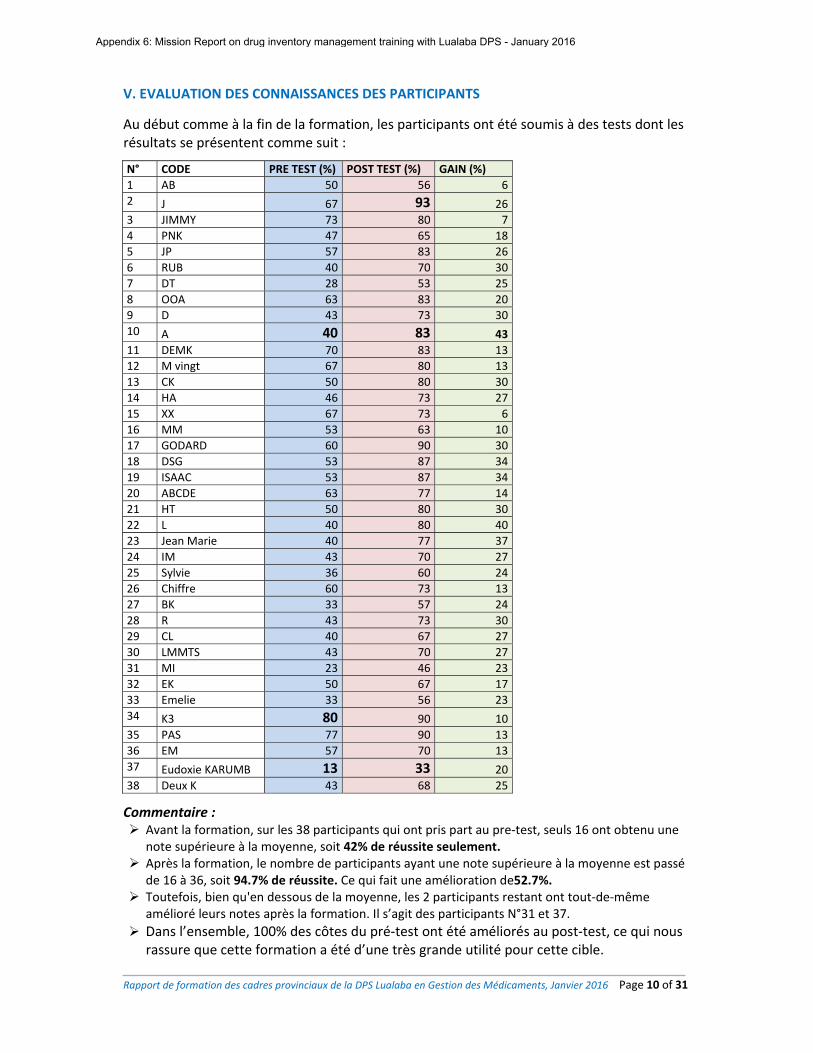
Rapport de formation des cadres provinciaux de la DPS Lualaba en Gestion des Médicaments, Janvier 2016 Page 10 of 31
V. EVALUATION DES CONNAISSANCES DES PARTICIPANTS
Au début comme à la fin de la formation, les participants ont été soumis à des tests dont les résultats se présentent comme suit :
N° CODE PRE TEST (%) POST TEST (%) GAIN (%)
1 AB 50 56 6
2 J 67 93 26
3 JIMMY 73 80 7
4 PNK 47 65 18
5 JP 57 83 26
6 RUB 40 70 30
7 DT 28 53 25
8 OOA 63 83 20
9 D 43 73 30
10 A 40 83 43
11 DEMK 70 83 13
12 M vingt 67 80 13
13 CK 50 80 30
14 HA 46 73 27
15 XX 67 73 6
16 MM 53 63 10
17 GODARD 60 90 30
18 DSG 53 87 34
19 ISAAC 53 87 34
20 ABCDE 63 77 14
21 HT 50 80 30
22 L 40 80 40
23 Jean Marie 40 77 37
24 IM 43 70 27
25 Sylvie 36 60 24
26 Chiffre 60 73 13
27 BK 33 57 24
28 R 43 73 30
29 CL 40 67 27
30 LMMTS 43 70 27
31 MI 23 46 23
32 EK 50 67 17
33 Emelie 33 56 23
34 K3 80 90 10
35 PAS 77 90 13
36 EM 57 70 13
37 Eudoxie KARUMB 13 33 20
38 Deux K 43 68 25
Commentaire : Avant la formation, sur les 38 participants qui ont pris part au pre‐test, seuls 16 ont obtenu une
note supérieure à la moyenne, soit 42% de réussite seulement. Après la formation, le nombre de participants ayant une note supérieure à la moyenne est passé
de 16 à 36, soit 94.7% de réussite. Ce qui fait une amélioration de52.7%. Toutefois, bien qu'en dessous de la moyenne, les 2 participants restant ont tout‐de‐même
amélioré leurs notes après la formation. Il s’agit des participants N°31 et 37.
Dans l’ensemble, 100% des côtes du pré‐test ont été améliorés au post‐test, ce qui nous rassure que cette formation a été d’une très grande utilité pour cette cible.
Appendix 6: Mission Report on drug inventory management training with Lualaba DPS - January 2016
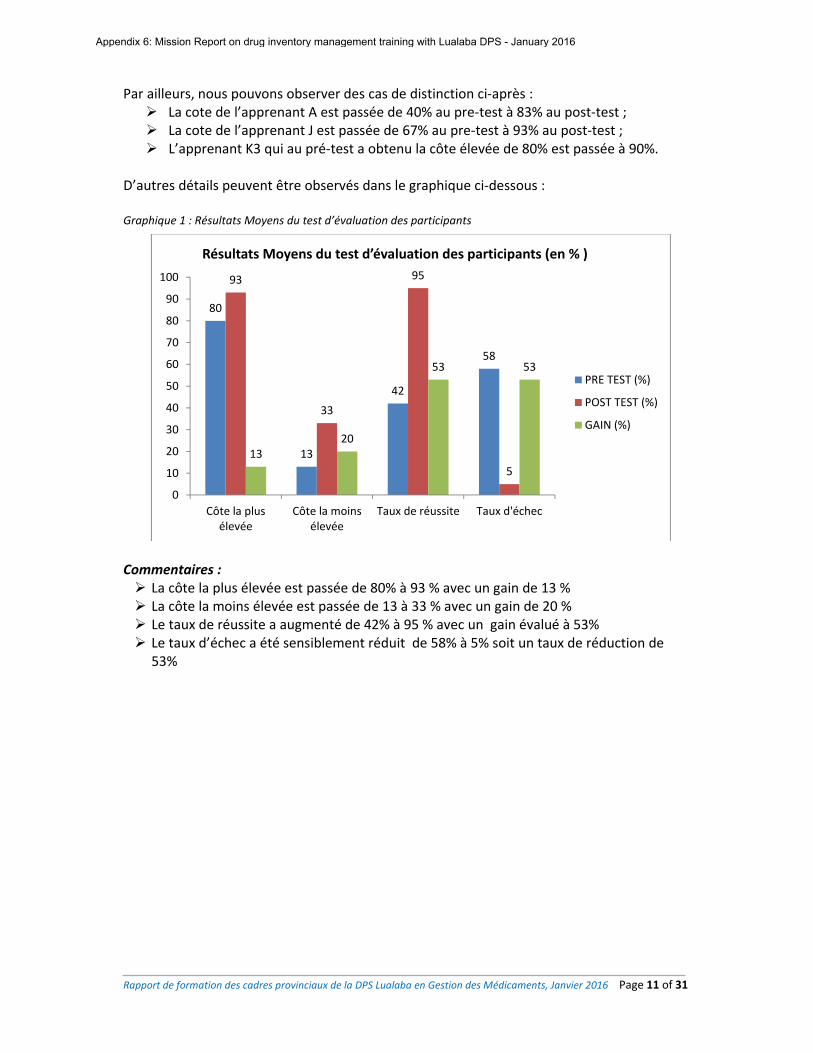
Rapport de formation des cadres provinciaux de la DPS Lualaba en Gestion des Médicaments, Janvier 2016 Page 11 of 31
Par ailleurs, nous pouvons observer des cas de distinction ci‐après : La cote de l’apprenant A est passée de 40% au pre‐test à 83% au post‐test ; La cote de l’apprenant J est passée de 67% au pre‐test à 93% au post‐test ; L’apprenant K3 qui au pré‐test a obtenu la côte élevée de 80% est passée à 90%.
D’autres détails peuvent être observés dans le graphique ci‐dessous : Graphique 1 : Résultats Moyens du test d’évaluation des participants
Commentaires : La côte la plus élevée est passée de 80% à 93 % avec un gain de 13 % La côte la moins élevée est passée de 13 à 33 % avec un gain de 20 % Le taux de réussite a augmenté de 42% à 95 % avec un gain évalué à 53% Le taux d’échec a été sensiblement réduit de 58% à 5% soit un taux de réduction de
53%
80
13
42
58
93
33
95
5
1320
53 53
0
10
20
30
40
50
60
70
80
90
100
Côte la plusélevée
Côte la moinsélevée
Taux de réussite Taux d'échec
Résultats Moyens du test d’évaluation des participants (en % )
PRE TEST (%)
POST TEST (%)
GAIN (%)
Appendix 6: Mission Report on drug inventory management training with Lualaba DPS - January 2016
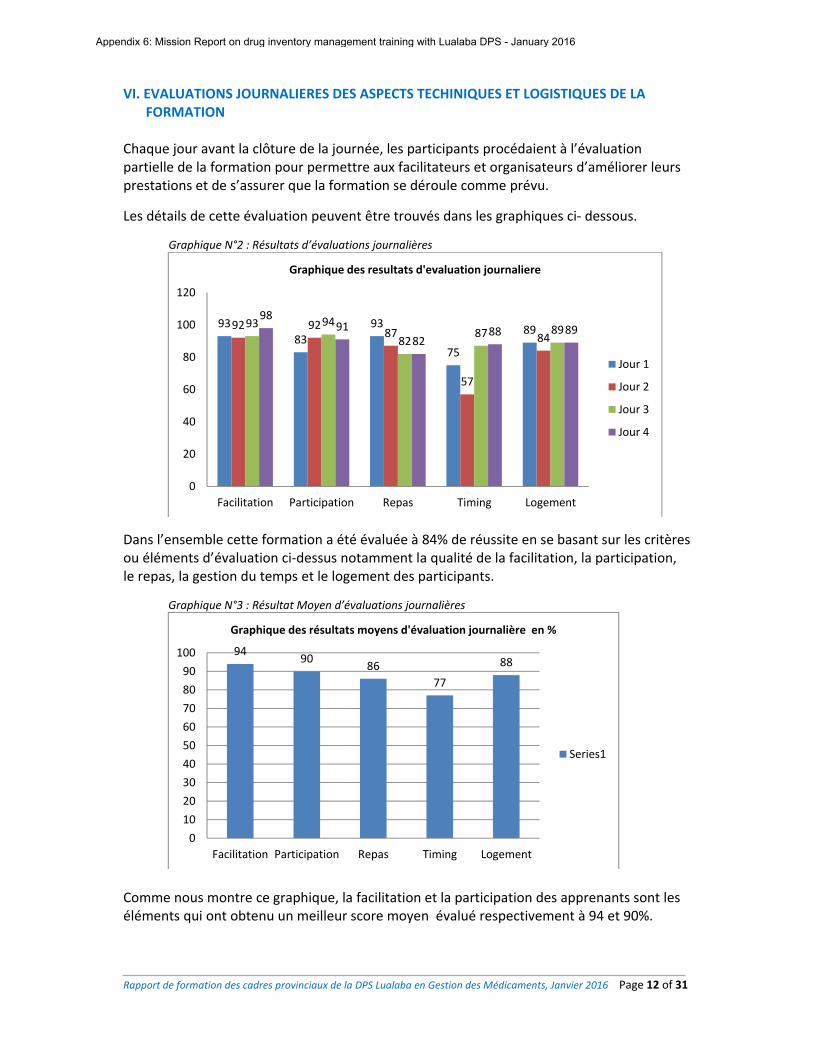
Rapport de formation des cadres provinciaux de la DPS Lualaba en Gestion des Médicaments, Janvier 2016 Page 12 of 31
VI. EVALUATIONS JOURNALIERES DES ASPECTS TECHINIQUES ET LOGISTIQUES DE LA FORMATION
Chaque jour avant la clôture de la journée, les participants procédaient à l’évaluation partielle de la formation pour permettre aux facilitateurs et organisateurs d’améliorer leurs prestations et de s’assurer que la formation se déroule comme prévu.
Les détails de cette évaluation peuvent être trouvés dans les graphiques ci‐ dessous.
Graphique N°2 : Résultats d’évaluations journalières
Dans l’ensemble cette formation a été évaluée à 84% de réussite en se basant sur les critères ou éléments d’évaluation ci‐dessus notamment la qualité de la facilitation, la participation, le repas, la gestion du temps et le logement des participants.
Graphique N°3 : Résultat Moyen d’évaluations journalières
Comme nous montre ce graphique, la facilitation et la participation des apprenants sont les éléments qui ont obtenu un meilleur score moyen évalué respectivement à 94 et 90%.
93
83
93
75
8992 9287
57
8493 94
8287 89
9891
8288 89
0
20
40
60
80
100
120
Facilitation Participation Repas Timing Logement
Graphique des resultats d'evaluation journaliere
Jour 1
Jour 2
Jour 3
Jour 4
9490
86
77
88
0
10
20
30
40
50
60
70
80
90
100
Facilitation Participation Repas Timing Logement
Graphique des résultats moyens d'évaluation journalière en %
Series1
Appendix 6: Mission Report on drug inventory management training with Lualaba DPS - January 2016
Rapport de formation des cadres provinciaux de la DPS Lualaba en Gestion des Médicaments, Janvier 2016 Page 13 of 31
VII. CONCLUSION En se basant sur les résultats d’évaluation générale, nous affirmons que cette formation a apporté un bagage consistant de connaissances additionnelles à tous les participants. Ce fut un succès et pour les facilitateurs et pour les participants en dépit de quelques défis d’ordre logistiques. La participation a été de 40/40 soit 100 % de participants attendus. En terme de connaissances additionnelles, le gain de cette formation est estimée à 53% au regard du nombre d’échecs au test de début et de la fin de la formation. Nous espérons que dans un futur proche, les pratiques de gestion des médicaments dans les formations sanitaires de la DPS Lualaba connaitront une amélioration considérable. Une des conditions à cette amélioration est de restituer correctement cette formation aux prestataires des centres de santé le plus tôt possible. Cette restitution sera faite aux CS par 10 formateurs provinciaux de Lualaba qui seront désignés en se référant aux 10 premières côtes réalisées par les Participants au post‐test.
Appendix 6: Mission Report on drug inventory management training with Lualaba DPS - January 2016
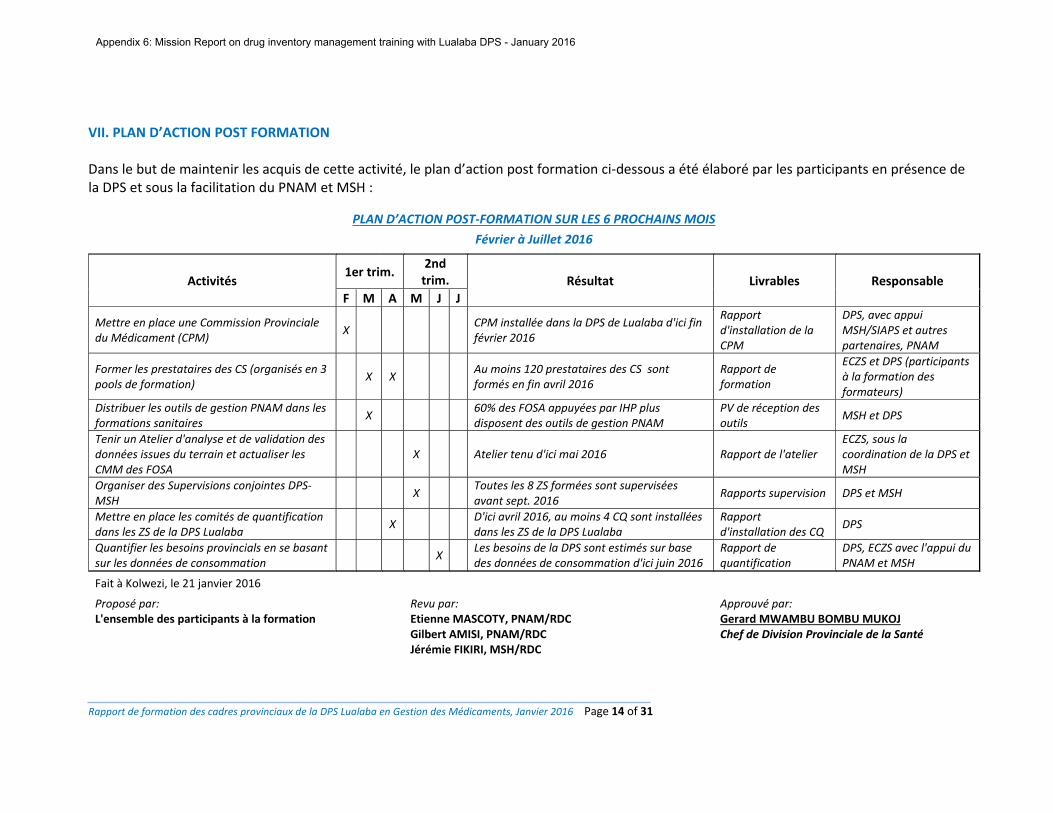
Rapport de formation des cadres provinciaux de la DPS Lualaba en Gestion des Médicaments, Janvier 2016 Page 14 of 31
VII. PLAN D’ACTION POST FORMATION Dans le but de maintenir les acquis de cette activité, le plan d’action post formation ci‐dessous a été élaboré par les participants en présence de la DPS et sous la facilitation du PNAM et MSH :
PLAN D’ACTION POST‐FORMATION SUR LES 6 PROCHAINS MOIS
Février à Juillet 2016
Activités 1er trim.
2nd trim. Résultat Livrables Responsable
F M A M J J
Mettre en place une Commission Provinciale du Médicament (CPM)
X CPM installée dans la DPS de Lualaba d'ici fin février 2016
Rapport d'installation de la CPM
DPS, avec appui MSH/SIAPS et autres partenaires, PNAM
Former les prestataires des CS (organisés en 3 pools de formation)
X X Au moins 120 prestataires des CS sont formés en fin avril 2016
Rapport de formation
ECZS et DPS (participants à la formation des formateurs)
Distribuer les outils de gestion PNAM dans les formations sanitaires
X 60% des FOSA appuyées par IHP plus disposent des outils de gestion PNAM
PV de réception des outils
MSH et DPS
Tenir un Atelier d'analyse et de validation des données issues du terrain et actualiser les CMM des FOSA
X Atelier tenu d'ici mai 2016 Rapport de l'atelier ECZS, sous la coordination de la DPS et MSH
Organiser des Supervisions conjointes DPS‐MSH
X Toutes les 8 ZS formées sont supervisées avant sept. 2016
Rapports supervision DPS et MSH
Mettre en place les comités de quantification dans les ZS de la DPS Lualaba
X D'ici avril 2016, au moins 4 CQ sont installées dans les ZS de la DPS Lualaba
Rapport d'installation des CQ
DPS
Quantifier les besoins provincials en se basant sur les données de consommation
X Les besoins de la DPS sont estimés sur base des données de consommation d'ici juin 2016
Rapport de quantification
DPS, ECZS avec l'appui du PNAM et MSH
Fait à Kolwezi, le 21 janvier 2016
Proposé par: Revu par: Approuvé par:L'ensemble des participants à la formation Etienne MASCOTY, PNAM/RDC
Gilbert AMISI, PNAM/RDC Jérémie FIKIRI, MSH/RDC
Gerard MWAMBU BOMBU MUKOJChef de Division Provinciale de la Santé
Appendix 6: Mission Report on drug inventory management training with Lualaba DPS - January 2016
Rapport de formation des cadres provinciaux de la DPS Lualaba en Gestion des Médicaments, Janvier 2016 Page 15 of 31
ANNEXES
Appendix 6: Mission Report on drug inventory management training with Lualaba DPS - January 2016
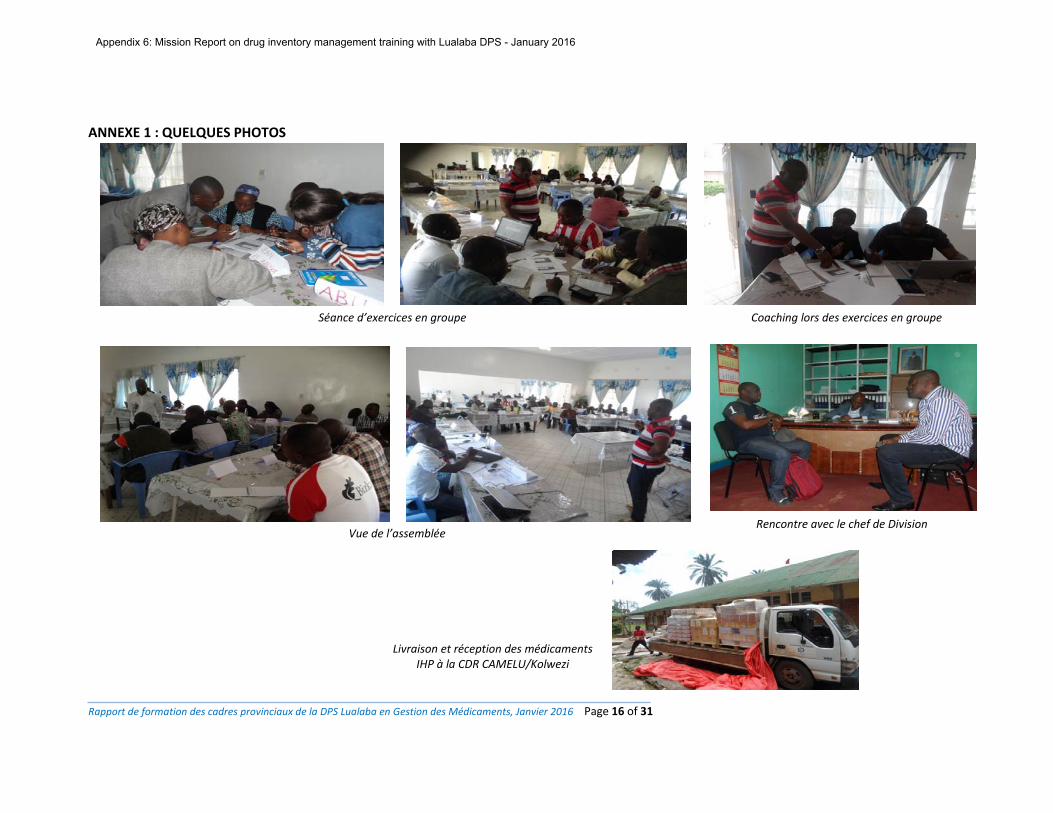
Rapport de formation des cadres provinciaux de la DPS Lualaba en Gestion des Médicaments, Janvier 2016 Page 16 of 31
ANNEXE 1 : QUELQUES PHOTOS
Vue de l’assemblée
Séance d’exercices en groupe Coaching lors des exercices en groupe
Rencontre avec le chef de Division
Livraison et réception des médicaments IHP à la CDR CAMELU/Kolwezi
Appendix 6: Mission Report on drug inventory management training with Lualaba DPS - January 2016
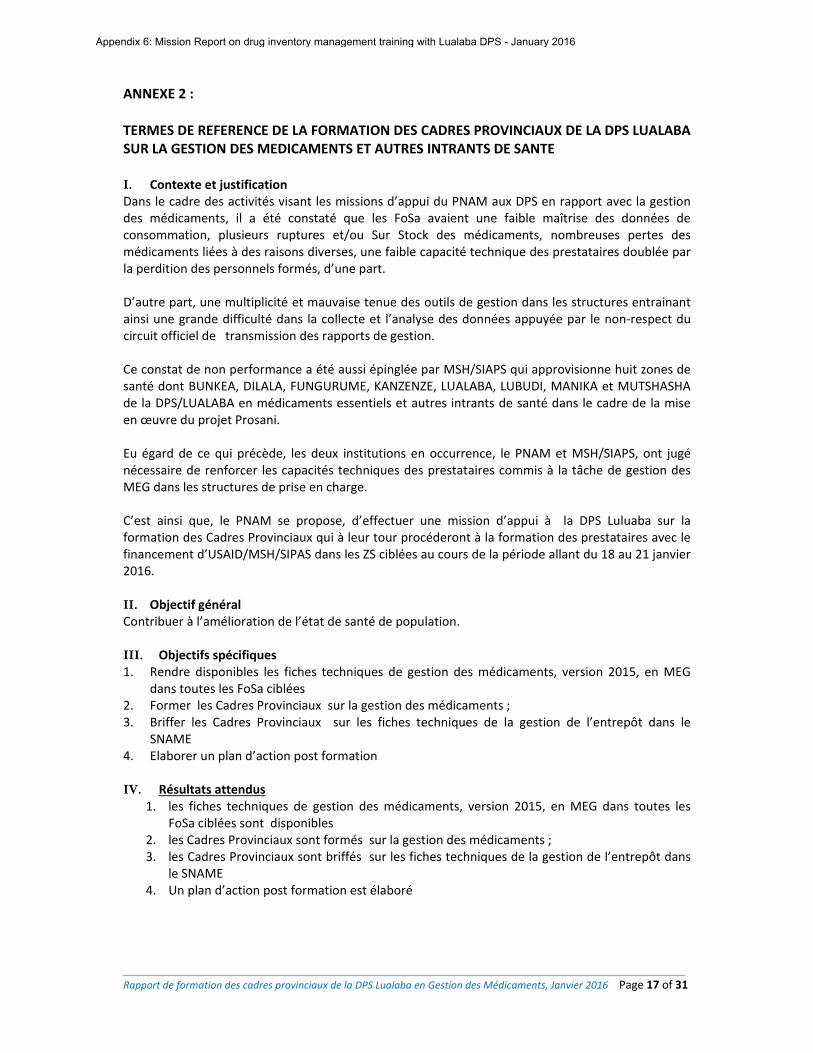
Rapport de formation des cadres provinciaux de la DPS Lualaba en Gestion des Médicaments, Janvier 2016 Page 17 of 31
ANNEXE 2 : TERMES DE REFERENCE DE LA FORMATION DES CADRES PROVINCIAUX DE LA DPS LUALABA SUR LA GESTION DES MEDICAMENTS ET AUTRES INTRANTS DE SANTE I. Contexte et justification Dans le cadre des activités visant les missions d’appui du PNAM aux DPS en rapport avec la gestion des médicaments, il a été constaté que les FoSa avaient une faible maîtrise des données de consommation, plusieurs ruptures et/ou Sur Stock des médicaments, nombreuses pertes des médicaments liées à des raisons diverses, une faible capacité technique des prestataires doublée par la perdition des personnels formés, d’une part. D’autre part, une multiplicité et mauvaise tenue des outils de gestion dans les structures entrainant ainsi une grande difficulté dans la collecte et l’analyse des données appuyée par le non‐respect du circuit officiel de transmission des rapports de gestion. Ce constat de non performance a été aussi épinglée par MSH/SIAPS qui approvisionne huit zones de santé dont BUNKEA, DILALA, FUNGURUME, KANZENZE, LUALABA, LUBUDI, MANIKA et MUTSHASHA de la DPS/LUALABA en médicaments essentiels et autres intrants de santé dans le cadre de la mise en œuvre du projet Prosani. Eu égard de ce qui précède, les deux institutions en occurrence, le PNAM et MSH/SIAPS, ont jugé nécessaire de renforcer les capacités techniques des prestataires commis à la tâche de gestion des MEG dans les structures de prise en charge. C’est ainsi que, le PNAM se propose, d’effectuer une mission d’appui à la DPS Luluaba sur la formation des Cadres Provinciaux qui à leur tour procéderont à la formation des prestataires avec le financement d’USAID/MSH/SIPAS dans les ZS ciblées au cours de la période allant du 18 au 21 janvier 2016. II. Objectif général Contribuer à l’amélioration de l’état de santé de population. III. Objectifs spécifiques 1. Rendre disponibles les fiches techniques de gestion des médicaments, version 2015, en MEG
dans toutes les FoSa ciblées 2. Former les Cadres Provinciaux sur la gestion des médicaments ; 3. Briffer les Cadres Provinciaux sur les fiches techniques de la gestion de l’entrepôt dans le
SNAME 4. Elaborer un plan d’action post formation
IV. Résultats attendus
1. les fiches techniques de gestion des médicaments, version 2015, en MEG dans toutes les FoSa ciblées sont disponibles
2. les Cadres Provinciaux sont formés sur la gestion des médicaments ; 3. les Cadres Provinciaux sont briffés sur les fiches techniques de la gestion de l’entrepôt dans
le SNAME 4. Un plan d’action post formation est élaboré
Appendix 6: Mission Report on drug inventory management training with Lualaba DPS - January 2016
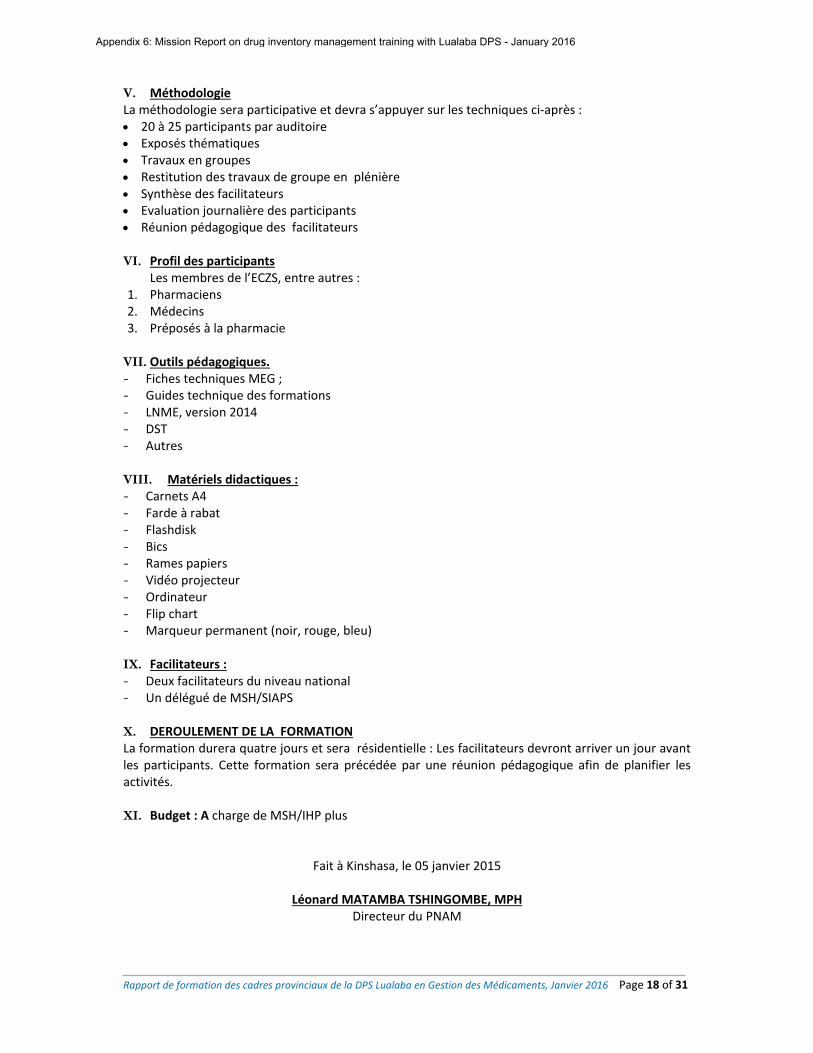
Rapport de formation des cadres provinciaux de la DPS Lualaba en Gestion des Médicaments, Janvier 2016 Page 18 of 31
V. Méthodologie La méthodologie sera participative et devra s’appuyer sur les techniques ci‐après : 20 à 25 participants par auditoire Exposés thématiques Travaux en groupes Restitution des travaux de groupe en plénière Synthèse des facilitateurs Evaluation journalière des participants Réunion pédagogique des facilitateurs
VI. Profil des participants
Les membres de l’ECZS, entre autres : 1. Pharmaciens 2. Médecins 3. Préposés à la pharmacie
VII. Outils pédagogiques. - Fiches techniques MEG ; - Guides technique des formations - LNME, version 2014 - DST - Autres
VIII. Matériels didactiques : - Carnets A4 - Farde à rabat - Flashdisk - Bics - Rames papiers - Vidéo projecteur - Ordinateur - Flip chart - Marqueur permanent (noir, rouge, bleu)
IX. Facilitateurs : - Deux facilitateurs du niveau national - Un délégué de MSH/SIAPS
X. DEROULEMENT DE LA FORMATION La formation durera quatre jours et sera résidentielle : Les facilitateurs devront arriver un jour avant les participants. Cette formation sera précédée par une réunion pédagogique afin de planifier les activités. XI. Budget : A charge de MSH/IHP plus
Fait à Kinshasa, le 05 janvier 2015
Léonard MATAMBA TSHINGOMBE, MPH Directeur du PNAM
Appendix 6: Mission Report on drug inventory management training with Lualaba DPS - January 2016
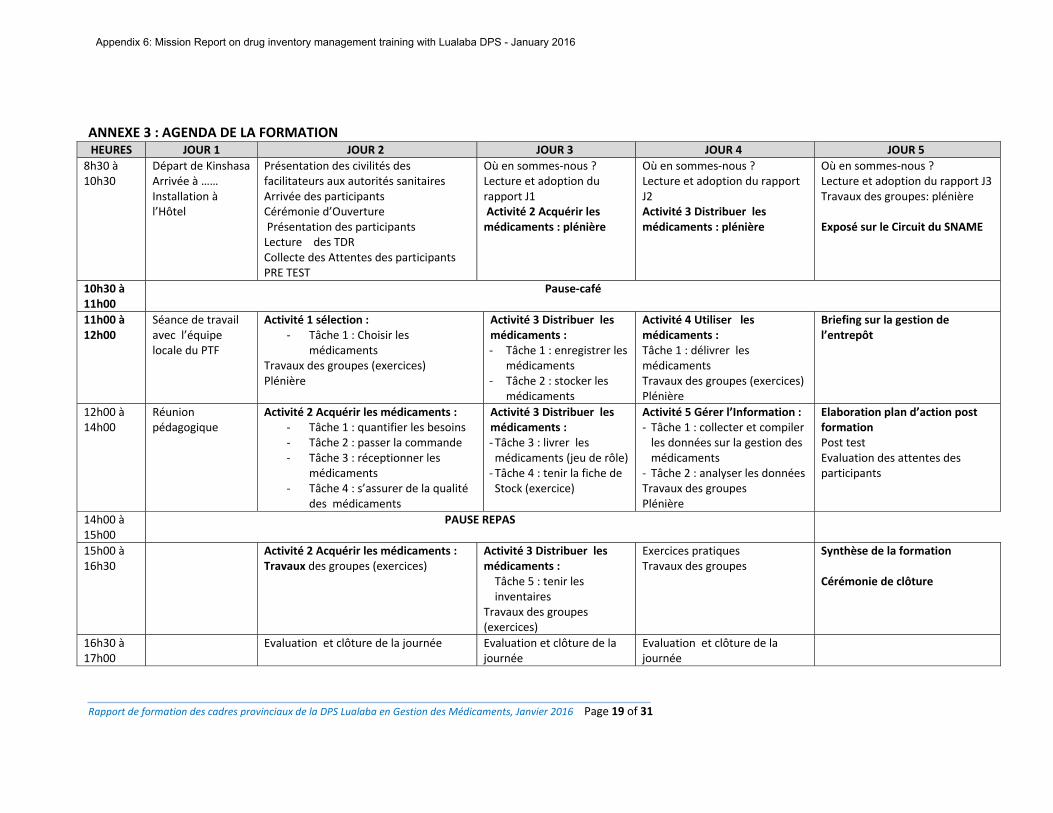
Rapport de formation des cadres provinciaux de la DPS Lualaba en Gestion des Médicaments, Janvier 2016 Page 19 of 31
ANNEXE 3 : AGENDA DE LA FORMATION
HEURES JOUR 1 JOUR 2 JOUR 3 JOUR 4 JOUR 5
8h30 à 10h30
Départ de Kinshasa Arrivée à …… Installation à l’Hôtel
Présentation des civilités des facilitateurs aux autorités sanitaires Arrivée des participants Cérémonie d’Ouverture Présentation des participants Lecture des TDR Collecte des Attentes des participants PRE TEST
Où en sommes‐nous ?Lecture et adoption du rapport J1 Activité 2 Acquérir les médicaments : plénière
Où en sommes‐nous ?Lecture et adoption du rapport J2 Activité 3 Distribuer les médicaments : plénière
Où en sommes‐nous ?Lecture et adoption du rapport J3 Travaux des groupes: plénière Exposé sur le Circuit du SNAME
10h30 à 11h00
Pause‐café
11h00 à 12h00
Séance de travail avec l’équipe locale du PTF
Activité 1 sélection : ‐ Tâche 1 : Choisir les
médicaments Travaux des groupes (exercices) Plénière
Activité 3 Distribuer les médicaments : ‐ Tâche 1 : enregistrer les
médicaments ‐ Tâche 2 : stocker les
médicaments
Activité 4 Utiliser les médicaments : Tâche 1 : délivrer les médicaments Travaux des groupes (exercices) Plénière
Briefing sur la gestion de l’entrepôt
12h00 à 14h00
Réunion pédagogique
Activité 2 Acquérir les médicaments : ‐ Tâche 1 : quantifier les besoins ‐ Tâche 2 : passer la commande ‐ Tâche 3 : réceptionner les
médicaments ‐ Tâche 4 : s’assurer de la qualité
des médicaments
Activité 3 Distribuer les médicaments : ‐ Tâche 3 : livrer les médicaments (jeu de rôle) ‐ Tâche 4 : tenir la fiche de Stock (exercice)
Activité 5 Gérer l’Information : ‐ Tâche 1 : collecter et compiler les données sur la gestion des médicaments
‐ Tâche 2 : analyser les données Travaux des groupes Plénière
Elaboration plan d’action post formation Post test Evaluation des attentes des participants
14h00 à 15h00
PAUSE REPAS
15h00 à 16h30
Activité 2 Acquérir les médicaments : Travaux des groupes (exercices)
Activité 3 Distribuer les médicaments : Tâche 5 : tenir les inventaires
Travaux des groupes (exercices)
Exercices pratiques Travaux des groupes
Synthèse de la formation Cérémonie de clôture
16h30 à 17h00
Evaluation et clôture de la journée Evaluation et clôture de la journée
Evaluation et clôture de la journée
Appendix 6: Mission Report on drug inventory management training with Lualaba DPS - January 2016
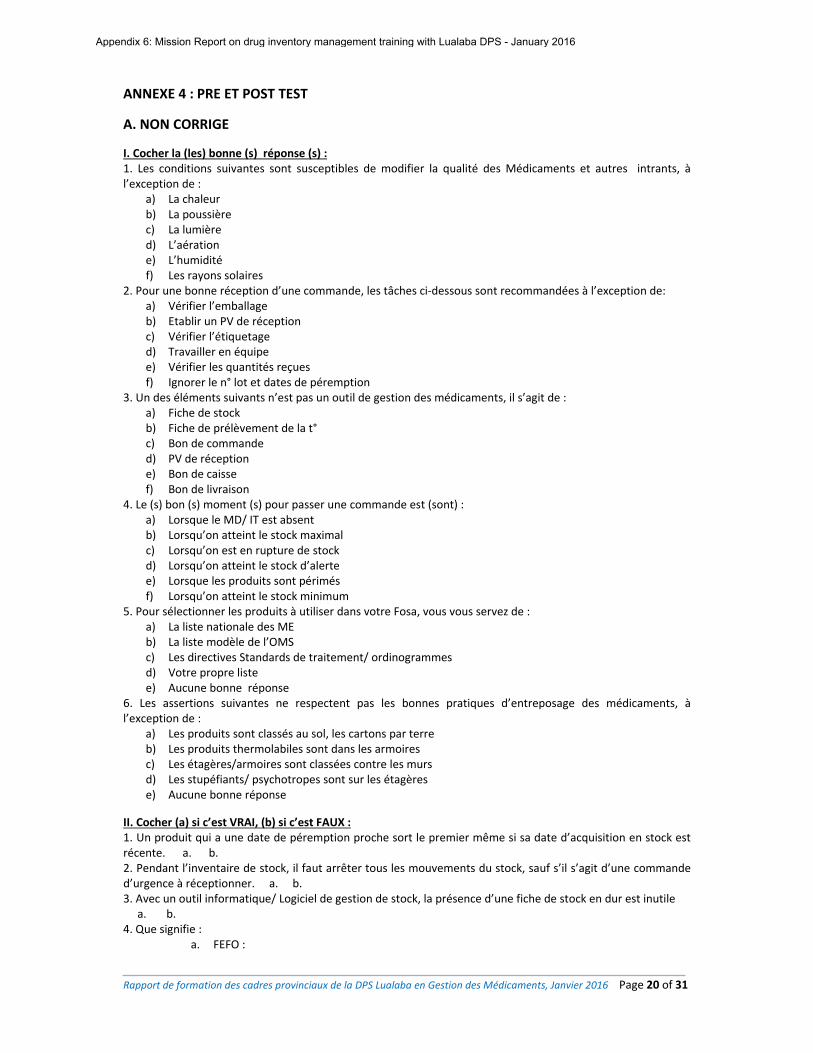
Rapport de formation des cadres provinciaux de la DPS Lualaba en Gestion des Médicaments, Janvier 2016 Page 20 of 31
ANNEXE 4 : PRE ET POST TEST
A. NON CORRIGE
I. Cocher la (les) bonne (s) réponse (s) : 1. Les conditions suivantes sont susceptibles de modifier la qualité des Médicaments et autres intrants, à l’exception de :
a) La chaleur b) La poussière c) La lumière d) L’aération e) L’humidité f) Les rayons solaires
2. Pour une bonne réception d’une commande, les tâches ci‐dessous sont recommandées à l’exception de: a) Vérifier l’emballage b) Etablir un PV de réception c) Vérifier l’étiquetage d) Travailler en équipe e) Vérifier les quantités reçues f) Ignorer le n° lot et dates de péremption
3. Un des éléments suivants n’est pas un outil de gestion des médicaments, il s’agit de : a) Fiche de stock b) Fiche de prélèvement de la t° c) Bon de commande d) PV de réception e) Bon de caisse f) Bon de livraison
4. Le (s) bon (s) moment (s) pour passer une commande est (sont) : a) Lorsque le MD/ IT est absent b) Lorsqu’on atteint le stock maximal c) Lorsqu’on est en rupture de stock d) Lorsqu’on atteint le stock d’alerte e) Lorsque les produits sont périmés f) Lorsqu’on atteint le stock minimum
5. Pour sélectionner les produits à utiliser dans votre Fosa, vous vous servez de : a) La liste nationale des ME b) La liste modèle de l’OMS c) Les directives Standards de traitement/ ordinogrammes d) Votre propre liste e) Aucune bonne réponse
6. Les assertions suivantes ne respectent pas les bonnes pratiques d’entreposage des médicaments, à l’exception de :
a) Les produits sont classés au sol, les cartons par terre b) Les produits thermolabiles sont dans les armoires c) Les étagères/armoires sont classées contre les murs d) Les stupéfiants/ psychotropes sont sur les étagères e) Aucune bonne réponse
II. Cocher (a) si c’est VRAI, (b) si c’est FAUX : 1. Un produit qui a une date de péremption proche sort le premier même si sa date d’acquisition en stock est récente. a. b. 2. Pendant l’inventaire de stock, il faut arrêter tous les mouvements du stock, sauf s’il s’agit d’une commande d’urgence à réceptionner. a. b. 3. Avec un outil informatique/ Logiciel de gestion de stock, la présence d’une fiche de stock en dur est inutile a. b. 4. Que signifie :
a. FEFO :
Appendix 6: Mission Report on drug inventory management training with Lualaba DPS - January 2016
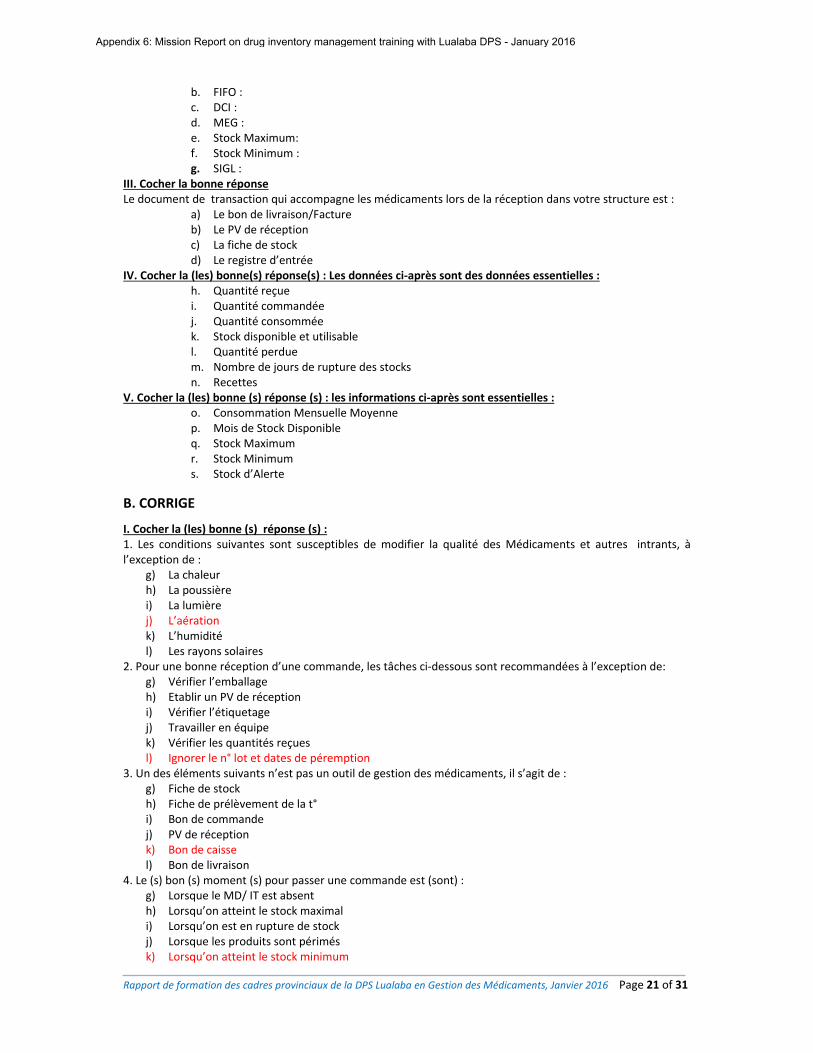
Rapport de formation des cadres provinciaux de la DPS Lualaba en Gestion des Médicaments, Janvier 2016 Page 21 of 31
b. FIFO : c. DCI : d. MEG : e. Stock Maximum: f. Stock Minimum : g. SIGL :
III. Cocher la bonne réponse Le document de transaction qui accompagne les médicaments lors de la réception dans votre structure est :
a) Le bon de livraison/Facture b) Le PV de réception c) La fiche de stock d) Le registre d’entrée
IV. Cocher la (les) bonne(s) réponse(s) : Les données ci‐après sont des données essentielles : h. Quantité reçue i. Quantité commandée j. Quantité consommée k. Stock disponible et utilisable l. Quantité perdue m. Nombre de jours de rupture des stocks n. Recettes
V. Cocher la (les) bonne (s) réponse (s) : les informations ci‐après sont essentielles : o. Consommation Mensuelle Moyenne p. Mois de Stock Disponible q. Stock Maximum r. Stock Minimum s. Stock d’Alerte
B. CORRIGE
I. Cocher la (les) bonne (s) réponse (s) : 1. Les conditions suivantes sont susceptibles de modifier la qualité des Médicaments et autres intrants, à l’exception de :
g) La chaleur h) La poussière i) La lumière j) L’aération k) L’humidité l) Les rayons solaires
2. Pour une bonne réception d’une commande, les tâches ci‐dessous sont recommandées à l’exception de: g) Vérifier l’emballage h) Etablir un PV de réception i) Vérifier l’étiquetage j) Travailler en équipe k) Vérifier les quantités reçues l) Ignorer le n° lot et dates de péremption
3. Un des éléments suivants n’est pas un outil de gestion des médicaments, il s’agit de : g) Fiche de stock h) Fiche de prélèvement de la t° i) Bon de commande j) PV de réception k) Bon de caisse l) Bon de livraison
4. Le (s) bon (s) moment (s) pour passer une commande est (sont) : g) Lorsque le MD/ IT est absent h) Lorsqu’on atteint le stock maximal i) Lorsqu’on est en rupture de stock j) Lorsque les produits sont périmés k) Lorsqu’on atteint le stock minimum
Appendix 6: Mission Report on drug inventory management training with Lualaba DPS - January 2016
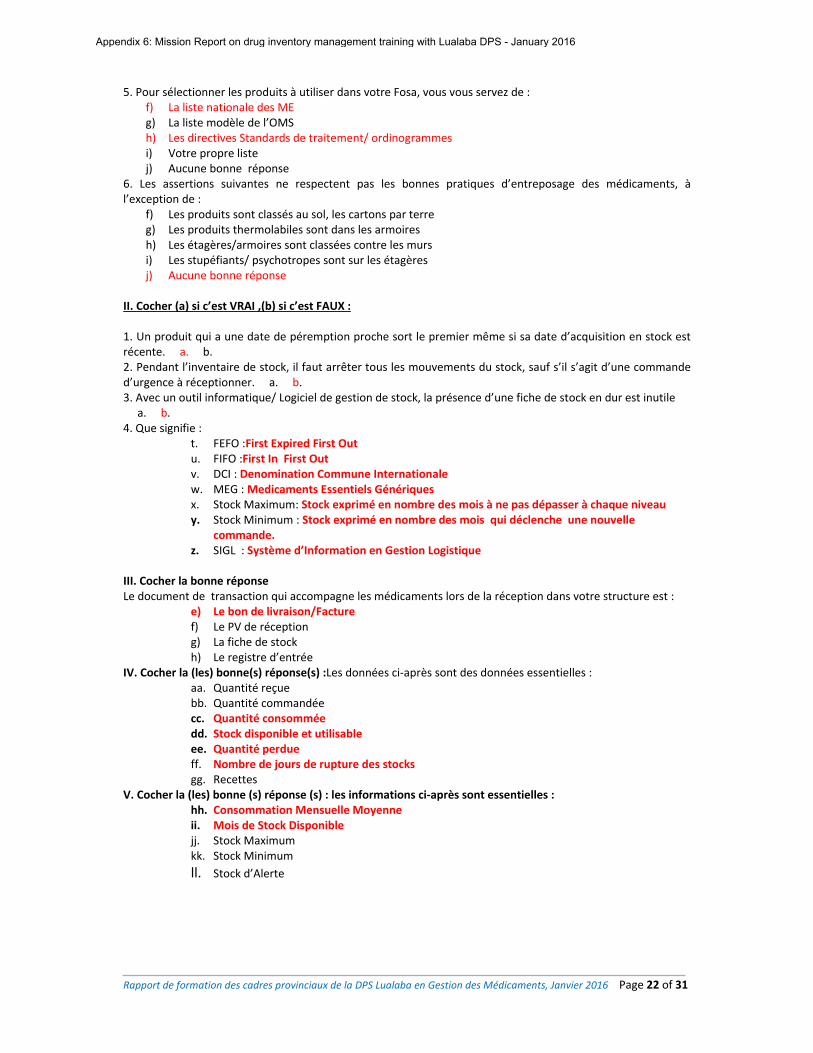
Rapport de formation des cadres provinciaux de la DPS Lualaba en Gestion des Médicaments, Janvier 2016 Page 22 of 31
5. Pour sélectionner les produits à utiliser dans votre Fosa, vous vous servez de : f) La liste nationale des ME g) La liste modèle de l’OMS h) Les directives Standards de traitement/ ordinogrammes i) Votre propre liste j) Aucune bonne réponse
6. Les assertions suivantes ne respectent pas les bonnes pratiques d’entreposage des médicaments, à l’exception de :
f) Les produits sont classés au sol, les cartons par terre g) Les produits thermolabiles sont dans les armoires h) Les étagères/armoires sont classées contre les murs i) Les stupéfiants/ psychotropes sont sur les étagères j) Aucune bonne réponse
II. Cocher (a) si c’est VRAI ,(b) si c’est FAUX :
1. Un produit qui a une date de péremption proche sort le premier même si sa date d’acquisition en stock est récente. a. b. 2. Pendant l’inventaire de stock, il faut arrêter tous les mouvements du stock, sauf s’il s’agit d’une commande d’urgence à réceptionner. a. b. 3. Avec un outil informatique/ Logiciel de gestion de stock, la présence d’une fiche de stock en dur est inutile a. b. 4. Que signifie :
t. FEFO :First Expired First Out u. FIFO :First In First Out v. DCI : Denomination Commune Internationale w. MEG : Medicaments Essentiels Génériques x. Stock Maximum: Stock exprimé en nombre des mois à ne pas dépasser à chaque niveau y. Stock Minimum : Stock exprimé en nombre des mois qui déclenche une nouvelle
commande. z. SIGL : Système d’Information en Gestion Logistique
III. Cocher la bonne réponse Le document de transaction qui accompagne les médicaments lors de la réception dans votre structure est :
e) Le bon de livraison/Facture f) Le PV de réception g) La fiche de stock h) Le registre d’entrée
IV. Cocher la (les) bonne(s) réponse(s) :Les données ci‐après sont des données essentielles : aa. Quantité reçue bb. Quantité commandée cc. Quantité consommée dd. Stock disponible et utilisable ee. Quantité perdue ff. Nombre de jours de rupture des stocks gg. Recettes
V. Cocher la (les) bonne (s) réponse (s) : les informations ci‐après sont essentielles : hh. Consommation Mensuelle Moyenne ii. Mois de Stock Disponible jj. Stock Maximum kk. Stock Minimum
ll. Stock d’Alerte
Appendix 6: Mission Report on drug inventory management training with Lualaba DPS - January 2016
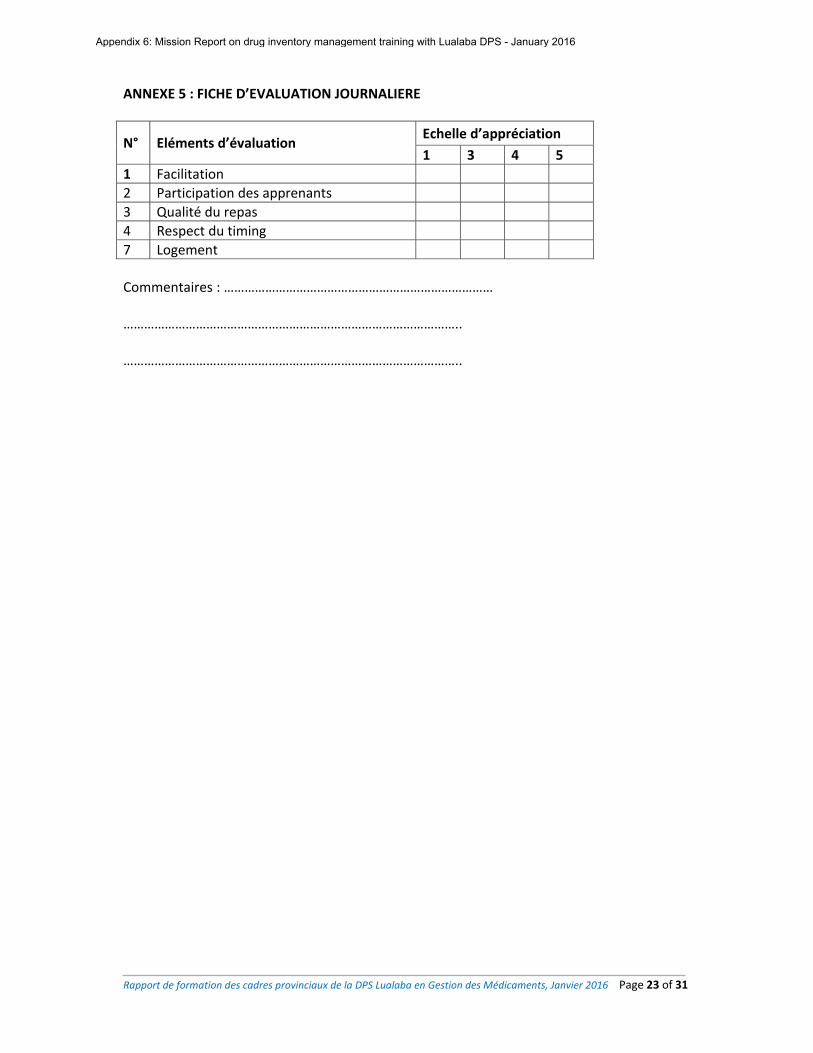
Rapport de formation des cadres provinciaux de la DPS Lualaba en Gestion des Médicaments, Janvier 2016 Page 23 of 31
ANNEXE 5 : FICHE D’EVALUATION JOURNALIERE
N° Eléments d’évaluation Echelle d’appréciation
1 3 4 5
1 Facilitation
2 Participation des apprenants
3 Qualité du repas
4 Respect du timing
7 Logement
Commentaires : …………………………………………………………………… ……………………………………………………………………………………..
……………………………………………………………………………………..
Appendix 6: Mission Report on drug inventory management training with Lualaba DPS - January 2016
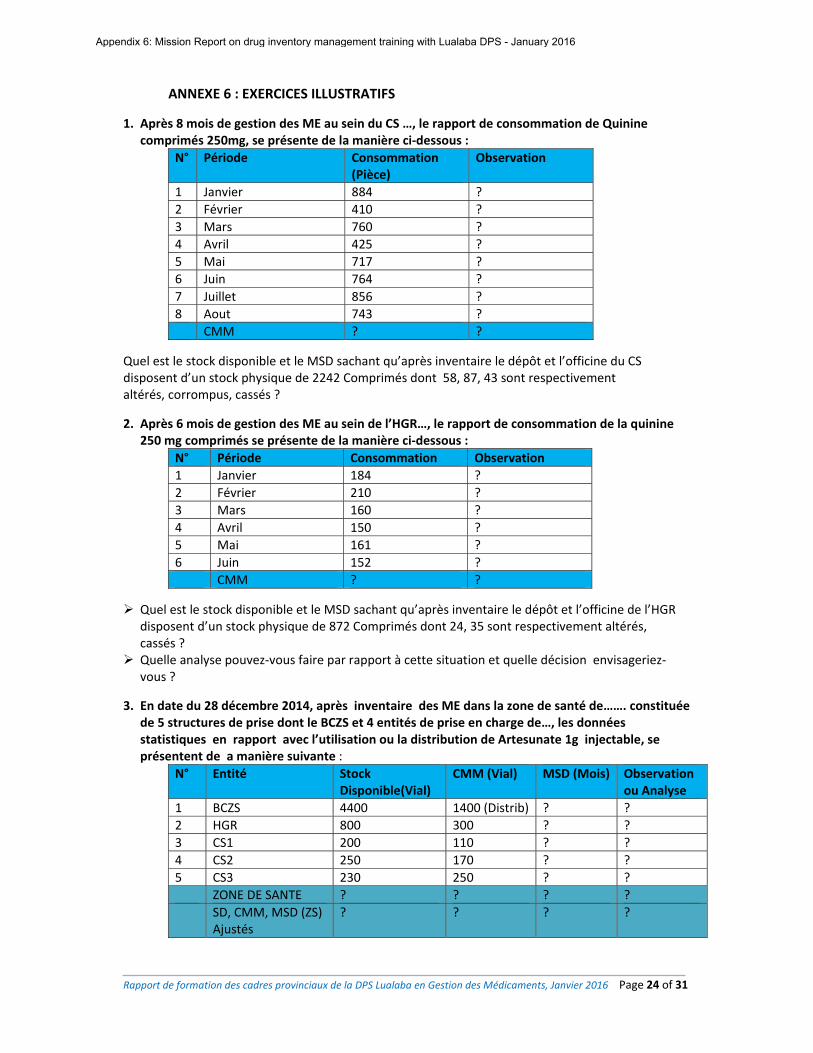
Rapport de formation des cadres provinciaux de la DPS Lualaba en Gestion des Médicaments, Janvier 2016 Page 24 of 31
ANNEXE 6 : EXERCICES ILLUSTRATIFS
1. Après 8 mois de gestion des ME au sein du CS …, le rapport de consommation de Quinine comprimés 250mg, se présente de la manière ci‐dessous :
N° Période Consommation (Pièce)
Observation
1 Janvier 884 ?
2 Février 410 ?
3 Mars 760 ?
4 Avril 425 ?
5 Mai 717 ?
6 Juin 764 ?
7 Juillet 856 ?
8 Aout 743 ?
CMM ? ?
Quel est le stock disponible et le MSD sachant qu’après inventaire le dépôt et l’officine du CS disposent d’un stock physique de 2242 Comprimés dont 58, 87, 43 sont respectivement altérés, corrompus, cassés ?
2. Après 6 mois de gestion des ME au sein de l’HGR…, le rapport de consommation de la quinine 250 mg comprimés se présente de la manière ci‐dessous :
N° Période Consommation Observation
1 Janvier 184 ?
2 Février 210 ?
3 Mars 160 ?
4 Avril 150 ?
5 Mai 161 ?
6 Juin 152 ?
CMM ? ?
Quel est le stock disponible et le MSD sachant qu’après inventaire le dépôt et l’officine de l’HGR disposent d’un stock physique de 872 Comprimés dont 24, 35 sont respectivement altérés, cassés ?
Quelle analyse pouvez‐vous faire par rapport à cette situation et quelle décision envisageriez‐vous ?
3. En date du 28 décembre 2014, après inventaire des ME dans la zone de santé de……. constituée de 5 structures de prise dont le BCZS et 4 entités de prise en charge de…, les données statistiques en rapport avec l’utilisation ou la distribution de Artesunate 1g injectable, se présentent de a manière suivante :
N° Entité Stock Disponible(Vial)
CMM (Vial) MSD (Mois) Observation ou Analyse
1 BCZS 4400 1400 (Distrib) ? ?
2 HGR 800 300 ? ?
3 CS1 200 110 ? ?
4 CS2 250 170 ? ?
5 CS3 230 250 ? ?
ZONE DE SANTE ? ? ? ?
SD, CMM, MSD (ZS) Ajustés
? ? ? ?
Appendix 6: Mission Report on drug inventory management training with Lualaba DPS - January 2016
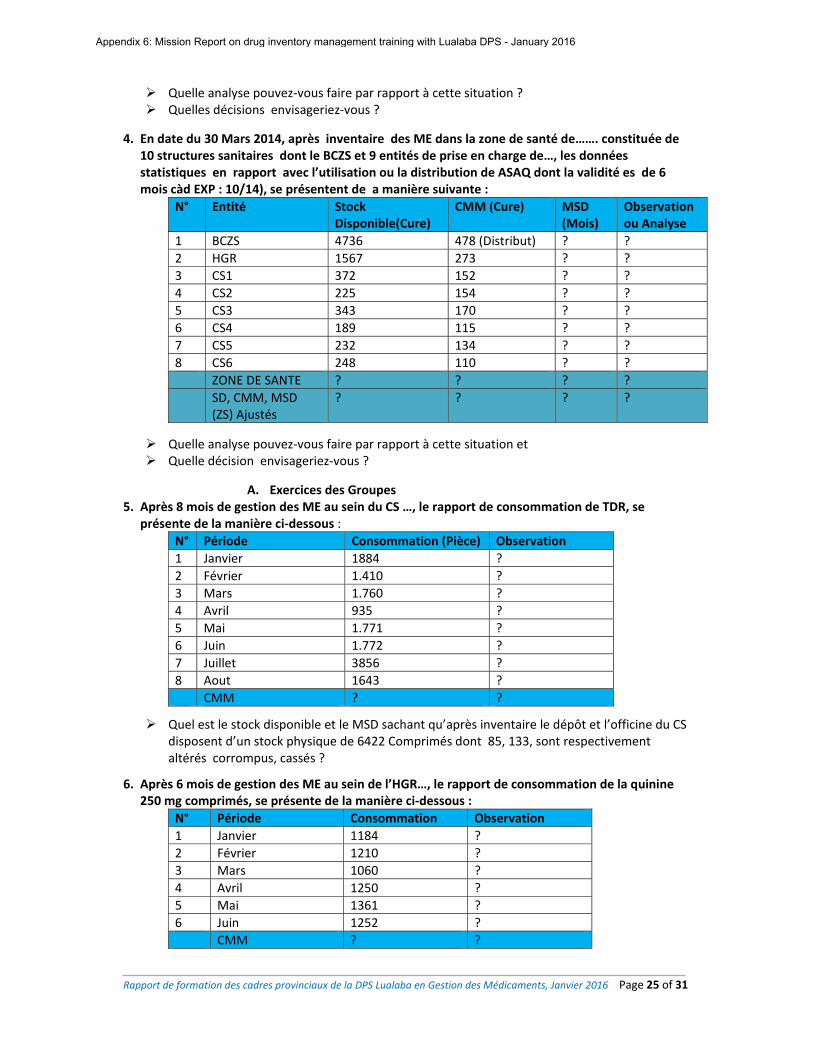
Rapport de formation des cadres provinciaux de la DPS Lualaba en Gestion des Médicaments, Janvier 2016 Page 25 of 31
Quelle analyse pouvez‐vous faire par rapport à cette situation ? Quelles décisions envisageriez‐vous ?
4. En date du 30 Mars 2014, après inventaire des ME dans la zone de santé de……. constituée de 10 structures sanitaires dont le BCZS et 9 entités de prise en charge de…, les données statistiques en rapport avec l’utilisation ou la distribution de ASAQ dont la validité es de 6 mois càd EXP : 10/14), se présentent de a manière suivante :
N° Entité Stock Disponible(Cure)
CMM (Cure) MSD (Mois)
Observation ou Analyse
1 BCZS 4736 478 (Distribut) ? ?
2 HGR 1567 273 ? ?
3 CS1 372 152 ? ?
4 CS2 225 154 ? ?
5 CS3 343 170 ? ?
6 CS4 189 115 ? ?
7 CS5 232 134 ? ?
8 CS6 248 110 ? ?
ZONE DE SANTE ? ? ? ?
SD, CMM, MSD (ZS) Ajustés
? ? ? ?
Quelle analyse pouvez‐vous faire par rapport à cette situation et Quelle décision envisageriez‐vous ?
A. Exercices des Groupes 5. Après 8 mois de gestion des ME au sein du CS …, le rapport de consommation de TDR, se
présente de la manière ci‐dessous :
N° Période Consommation (Pièce) Observation
1 Janvier 1884 ?
2 Février 1.410 ?
3 Mars 1.760 ?
4 Avril 935 ?
5 Mai 1.771 ?
6 Juin 1.772 ?
7 Juillet 3856 ?
8 Aout 1643 ?
CMM ? ?
Quel est le stock disponible et le MSD sachant qu’après inventaire le dépôt et l’officine du CS disposent d’un stock physique de 6422 Comprimés dont 85, 133, sont respectivement altérés corrompus, cassés ?
6. Après 6 mois de gestion des ME au sein de l’HGR…, le rapport de consommation de la quinine 250 mg comprimés, se présente de la manière ci‐dessous :
N° Période Consommation Observation
1 Janvier 1184 ?
2 Février 1210 ?
3 Mars 1060 ?
4 Avril 1250 ?
5 Mai 1361 ?
6 Juin 1252 ?
CMM ? ?
Appendix 6: Mission Report on drug inventory management training with Lualaba DPS - January 2016
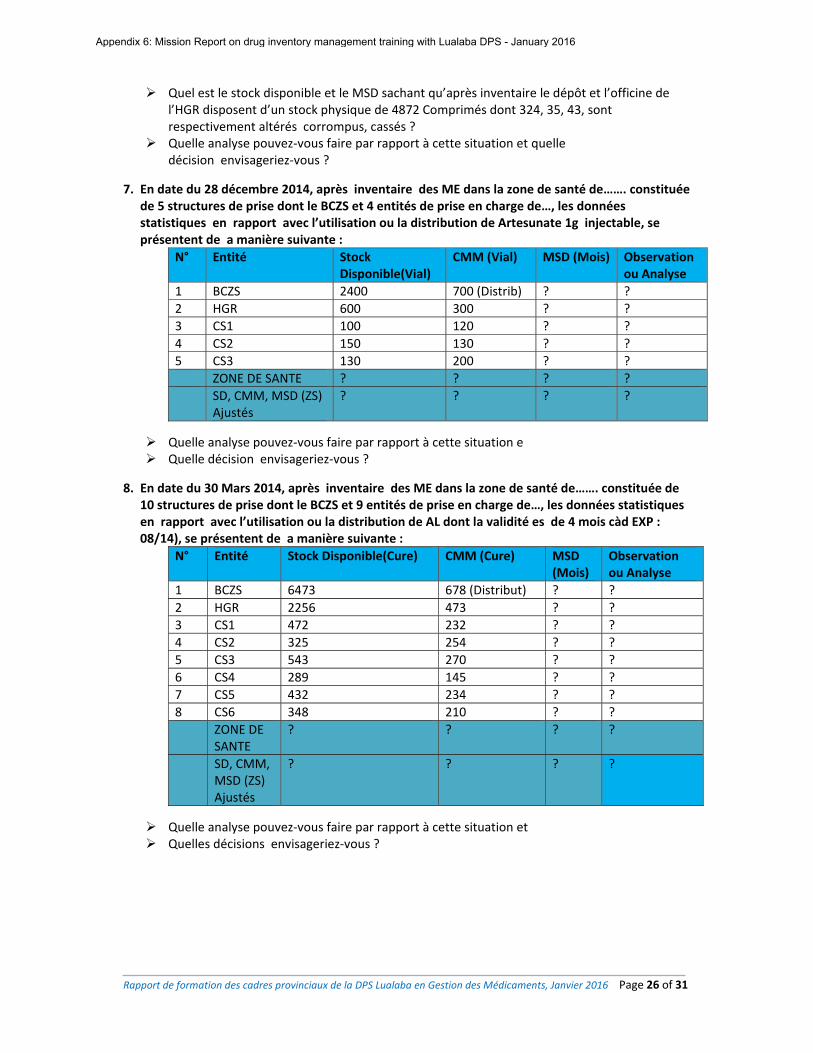
Rapport de formation des cadres provinciaux de la DPS Lualaba en Gestion des Médicaments, Janvier 2016 Page 26 of 31
Quel est le stock disponible et le MSD sachant qu’après inventaire le dépôt et l’officine de l’HGR disposent d’un stock physique de 4872 Comprimés dont 324, 35, 43, sont respectivement altérés corrompus, cassés ?
Quelle analyse pouvez‐vous faire par rapport à cette situation et quelle décision envisageriez‐vous ?
7. En date du 28 décembre 2014, après inventaire des ME dans la zone de santé de……. constituée de 5 structures de prise dont le BCZS et 4 entités de prise en charge de…, les données statistiques en rapport avec l’utilisation ou la distribution de Artesunate 1g injectable, se présentent de a manière suivante :
N° Entité Stock Disponible(Vial)
CMM (Vial) MSD (Mois) Observation ou Analyse
1 BCZS 2400 700 (Distrib) ? ?
2 HGR 600 300 ? ?
3 CS1 100 120 ? ?
4 CS2 150 130 ? ?
5 CS3 130 200 ? ?
ZONE DE SANTE ? ? ? ?
SD, CMM, MSD (ZS) Ajustés
? ? ? ?
Quelle analyse pouvez‐vous faire par rapport à cette situation e Quelle décision envisageriez‐vous ?
8. En date du 30 Mars 2014, après inventaire des ME dans la zone de santé de……. constituée de
10 structures de prise dont le BCZS et 9 entités de prise en charge de…, les données statistiques en rapport avec l’utilisation ou la distribution de AL dont la validité es de 4 mois càd EXP : 08/14), se présentent de a manière suivante :
N° Entité Stock Disponible(Cure) CMM (Cure) MSD (Mois)
Observation ou Analyse
1 BCZS 6473 678 (Distribut) ? ?
2 HGR 2256 473 ? ?
3 CS1 472 232 ? ?
4 CS2 325 254 ? ?
5 CS3 543 270 ? ?
6 CS4 289 145 ? ?
7 CS5 432 234 ? ?
8 CS6 348 210 ? ?
ZONE DE SANTE
? ? ? ?
SD, CMM, MSD (ZS) Ajustés
? ? ? ?
Quelle analyse pouvez‐vous faire par rapport à cette situation et Quelles décisions envisageriez‐vous ?
Appendix 6: Mission Report on drug inventory management training with Lualaba DPS - January 2016
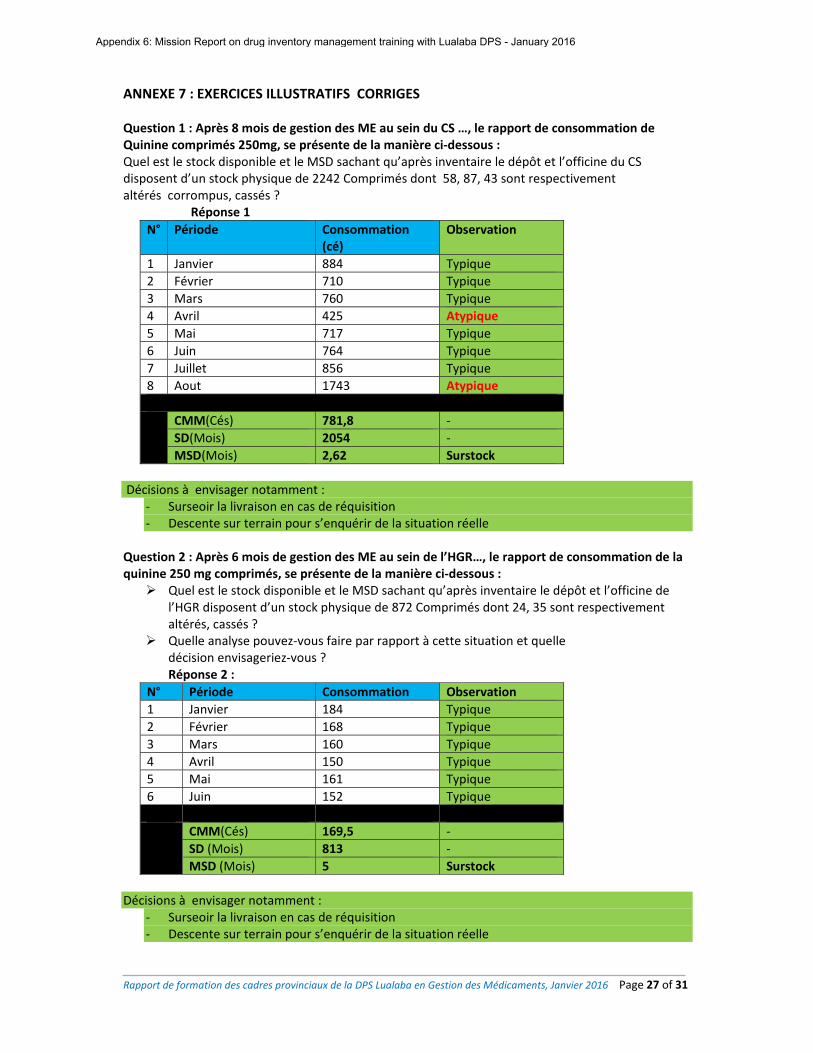
Rapport de formation des cadres provinciaux de la DPS Lualaba en Gestion des Médicaments, Janvier 2016 Page 27 of 31
ANNEXE 7 : EXERCICES ILLUSTRATIFS CORRIGES
Question 1 : Après 8 mois de gestion des ME au sein du CS …, le rapport de consommation de Quinine comprimés 250mg, se présente de la manière ci‐dessous : Quel est le stock disponible et le MSD sachant qu’après inventaire le dépôt et l’officine du CS disposent d’un stock physique de 2242 Comprimés dont 58, 87, 43 sont respectivement altérés corrompus, cassés ?
Réponse 1
N° Période Consommation (cé)
Observation
1 Janvier 884 Typique
2 Février 710 Typique
3 Mars 760 Typique
4 Avril 425 Atypique
5 Mai 717 Typique
6 Juin 764 Typique
7 Juillet 856 Typique
8 Aout 1743 Atypique
CMM(Cés) 781,8 ‐
SD(Mois) 2054 ‐
MSD(Mois) 2,62 Surstock
Décisions à envisager notamment :
‐ Surseoir la livraison en cas de réquisition ‐ Descente sur terrain pour s’enquérir de la situation réelle
Question 2 : Après 6 mois de gestion des ME au sein de l’HGR…, le rapport de consommation de la quinine 250 mg comprimés, se présente de la manière ci‐dessous : Quel est le stock disponible et le MSD sachant qu’après inventaire le dépôt et l’officine de
l’HGR disposent d’un stock physique de 872 Comprimés dont 24, 35 sont respectivement altérés, cassés ?
Quelle analyse pouvez‐vous faire par rapport à cette situation et quelle décision envisageriez‐vous ? Réponse 2 :
N° Période Consommation Observation
1 Janvier 184 Typique
2 Février 168 Typique
3 Mars 160 Typique
4 Avril 150 Typique
5 Mai 161 Typique
6 Juin 152 Typique
CMM(Cés) 169,5 ‐
SD (Mois) 813 ‐
MSD (Mois) 5 Surstock
Décisions à envisager notamment :
‐ Surseoir la livraison en cas de réquisition ‐ Descente sur terrain pour s’enquérir de la situation réelle
Appendix 6: Mission Report on drug inventory management training with Lualaba DPS - January 2016
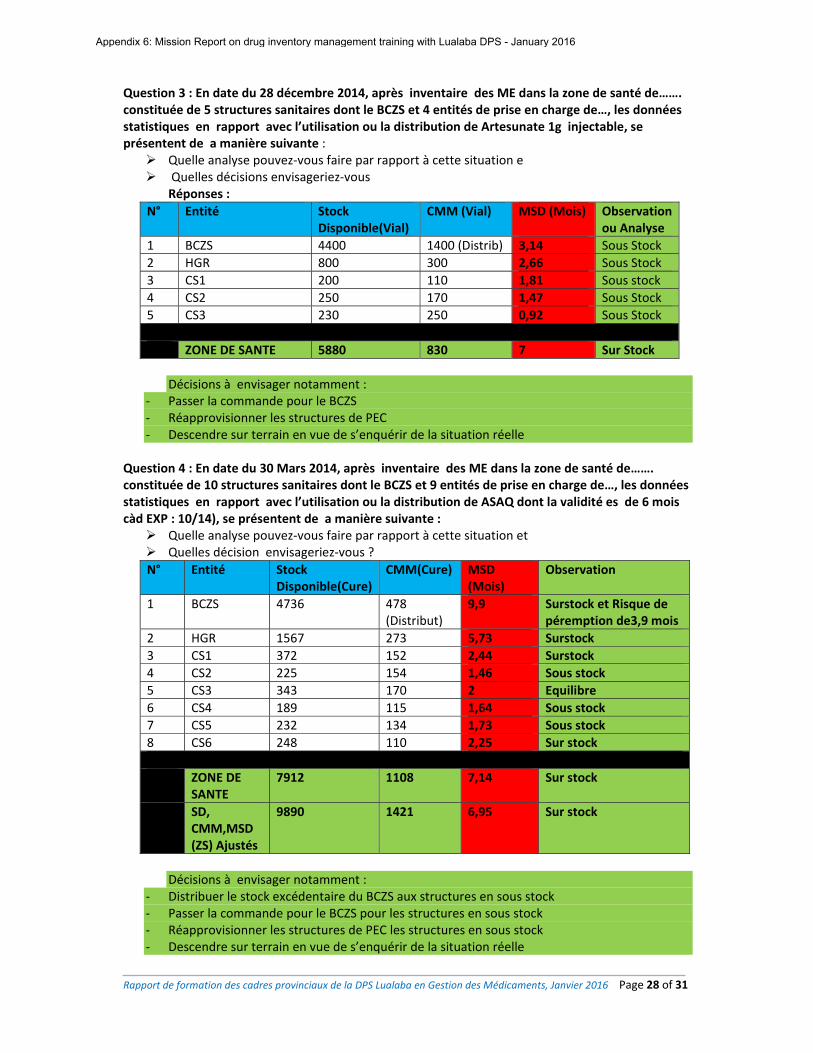
Rapport de formation des cadres provinciaux de la DPS Lualaba en Gestion des Médicaments, Janvier 2016 Page 28 of 31
Question 3 : En date du 28 décembre 2014, après inventaire des ME dans la zone de santé de……. constituée de 5 structures sanitaires dont le BCZS et 4 entités de prise en charge de…, les données statistiques en rapport avec l’utilisation ou la distribution de Artesunate 1g injectable, se présentent de a manière suivante : Quelle analyse pouvez‐vous faire par rapport à cette situation e Quelles décisions envisageriez‐vous
Réponses :
N° Entité Stock Disponible(Vial)
CMM (Vial) MSD (Mois) Observation ou Analyse
1 BCZS 4400 1400 (Distrib) 3,14 Sous Stock
2 HGR 800 300 2,66 Sous Stock
3 CS1 200 110 1,81 Sous stock
4 CS2 250 170 1,47 Sous Stock
5 CS3 230 250 0,92 Sous Stock
ZONE DE SANTE 5880 830 7 Sur Stock
Décisions à envisager notamment :
‐ Passer la commande pour le BCZS ‐ Réapprovisionner les structures de PEC ‐ Descendre sur terrain en vue de s’enquérir de la situation réelle
Question 4 : En date du 30 Mars 2014, après inventaire des ME dans la zone de santé de……. constituée de 10 structures sanitaires dont le BCZS et 9 entités de prise en charge de…, les données statistiques en rapport avec l’utilisation ou la distribution de ASAQ dont la validité es de 6 mois càd EXP : 10/14), se présentent de a manière suivante : Quelle analyse pouvez‐vous faire par rapport à cette situation et Quelles décision envisageriez‐vous ?
N° Entité Stock Disponible(Cure)
CMM(Cure) MSD(Mois)
Observation
1 BCZS 4736 478 (Distribut)
9,9 Surstock et Risque de péremption de3,9 mois
2 HGR 1567 273 5,73 Surstock
3 CS1 372 152 2,44 Surstock
4 CS2 225 154 1,46 Sous stock
5 CS3 343 170 2 Equilibre
6 CS4 189 115 1,64 Sous stock
7 CS5 232 134 1,73 Sous stock
8 CS6 248 110 2,25 Sur stock
ZONE DE SANTE
7912 1108 7,14 Sur stock
SD, CMM,MSD (ZS) Ajustés
9890 1421 6,95 Sur stock
Décisions à envisager notamment :
‐ Distribuer le stock excédentaire du BCZS aux structures en sous stock ‐ Passer la commande pour le BCZS pour les structures en sous stock ‐ Réapprovisionner les structures de PEC les structures en sous stock ‐ Descendre sur terrain en vue de s’enquérir de la situation réelle
Appendix 6: Mission Report on drug inventory management training with Lualaba DPS - January 2016
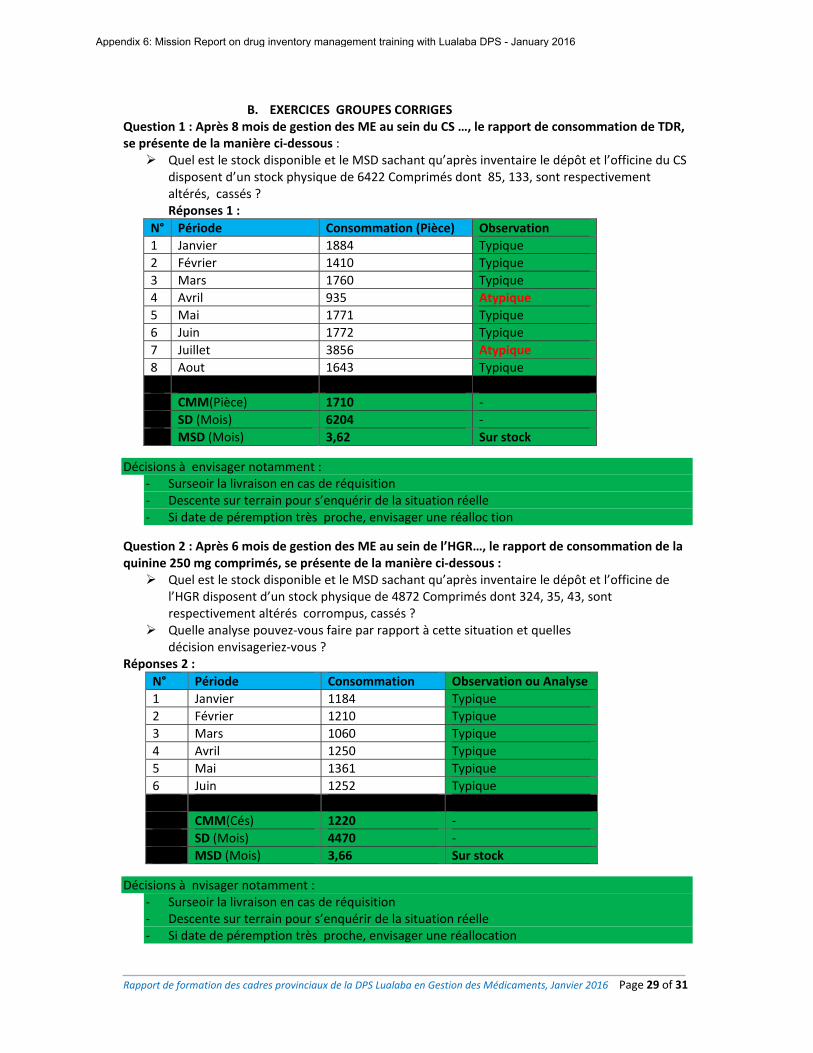
Rapport de formation des cadres provinciaux de la DPS Lualaba en Gestion des Médicaments, Janvier 2016 Page 29 of 31
B. EXERCICES GROUPES CORRIGES
Question 1 : Après 8 mois de gestion des ME au sein du CS …, le rapport de consommation de TDR, se présente de la manière ci‐dessous : Quel est le stock disponible et le MSD sachant qu’après inventaire le dépôt et l’officine du CS
disposent d’un stock physique de 6422 Comprimés dont 85, 133, sont respectivement altérés, cassés ? Réponses 1 :
N° Période Consommation (Pièce) Observation
1 Janvier 1884 Typique
2 Février 1410 Typique
3 Mars 1760 Typique
4 Avril 935 Atypique
5 Mai 1771 Typique
6 Juin 1772 Typique
7 Juillet 3856 Atypique
8 Aout 1643 Typique
CMM(Pièce) 1710 ‐
SD (Mois) 6204 ‐
MSD (Mois) 3,62 Sur stock
Décisions à envisager notamment : ‐ Surseoir la livraison en cas de réquisition ‐ Descente sur terrain pour s’enquérir de la situation réelle ‐ Si date de péremption très proche, envisager une réalloc tion
Question 2 : Après 6 mois de gestion des ME au sein de l’HGR…, le rapport de consommation de la quinine 250 mg comprimés, se présente de la manière ci‐dessous : Quel est le stock disponible et le MSD sachant qu’après inventaire le dépôt et l’officine de
l’HGR disposent d’un stock physique de 4872 Comprimés dont 324, 35, 43, sont respectivement altérés corrompus, cassés ?
Quelle analyse pouvez‐vous faire par rapport à cette situation et quelles décision envisageriez‐vous ?
Réponses 2 :
N° Période Consommation Observation ou Analyse
1 Janvier 1184 Typique
2 Février 1210 Typique
3 Mars 1060 Typique
4 Avril 1250 Typique
5 Mai 1361 Typique
6 Juin 1252 Typique
CMM(Cés) 1220 ‐
SD (Mois) 4470 ‐
MSD (Mois) 3,66 Sur stock
Décisions à nvisager notamment : ‐ Surseoir la livraison en cas de réquisition ‐ Descente sur terrain pour s’enquérir de la situation réelle ‐ Si date de péremption très proche, envisager une réallocation
Appendix 6: Mission Report on drug inventory management training with Lualaba DPS - January 2016
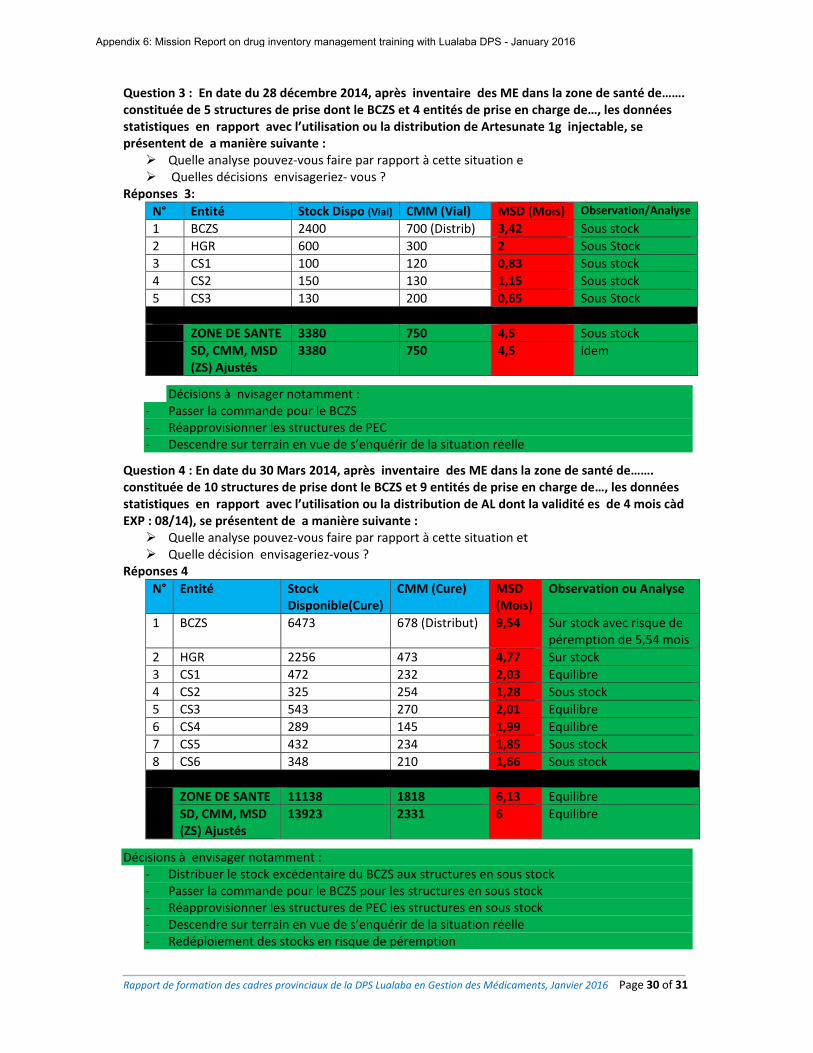
Rapport de formation des cadres provinciaux de la DPS Lualaba en Gestion des Médicaments, Janvier 2016 Page 30 of 31
Question 3 : En date du 28 décembre 2014, après inventaire des ME dans la zone de santé de……. constituée de 5 structures de prise dont le BCZS et 4 entités de prise en charge de…, les données statistiques en rapport avec l’utilisation ou la distribution de Artesunate 1g injectable, se présentent de a manière suivante : Quelle analyse pouvez‐vous faire par rapport à cette situation e Quelles décisions envisageriez‐ vous ?
Réponses 3:
N° Entité Stock Dispo (Vial) CMM (Vial) MSD (Mois) Observation/Analyse
1 BCZS 2400 700 (Distrib) 3,42 Sous stock
2 HGR 600 300 2 Sous Stock
3 CS1 100 120 0,83 Sous stock
4 CS2 150 130 1,15 Sous stock
5 CS3 130 200 0,65 Sous Stock
ZONE DE SANTE 3380 750 4,5 Sous stock
SD, CMM, MSD (ZS) Ajustés
3380 750 4,5 idem
Décisions à nvisager notamment : ‐ Passer la commande pour le BCZS ‐ Réapprovisionner les structures de PEC ‐ Descendre sur terrain en vue de s’enquérir de la situation réelle
Question 4 : En date du 30 Mars 2014, après inventaire des ME dans la zone de santé de……. constituée de 10 structures de prise dont le BCZS et 9 entités de prise en charge de…, les données statistiques en rapport avec l’utilisation ou la distribution de AL dont la validité es de 4 mois càd EXP : 08/14), se présentent de a manière suivante : Quelle analyse pouvez‐vous faire par rapport à cette situation et Quelle décision envisageriez‐vous ?
Réponses 4
N° Entité Stock Disponible(Cure)
CMM (Cure) MSD (Mois)
Observation ou Analyse
1 BCZS 6473 678 (Distribut) 9,54 Sur stock avec risque de péremption de 5,54 mois
2 HGR 2256 473 4,77 Sur stock
3 CS1 472 232 2,03 Equilibre
4 CS2 325 254 1,28 Sous stock
5 CS3 543 270 2,01 Equilibre
6 CS4 289 145 1,99 Equilibre
7 CS5 432 234 1,85 Sous stock
8 CS6 348 210 1,66 Sous stock
ZONE DE SANTE 11138 1818 6,13 Equilibre
SD, CMM, MSD (ZS) Ajustés
13923 2331 6 Equilibre
Décisions à envisager notamment : ‐ Distribuer le stock excédentaire du BCZS aux structures en sous stock ‐ Passer la commande pour le BCZS pour les structures en sous stock ‐ Réapprovisionner les structures de PEC les structures en sous stock ‐ Descendre sur terrain en vue de s’enquérir de la situation réelle ‐ Redéploiement des stocks en risque de péremption
Appendix 6: Mission Report on drug inventory management training with Lualaba DPS - January 2016
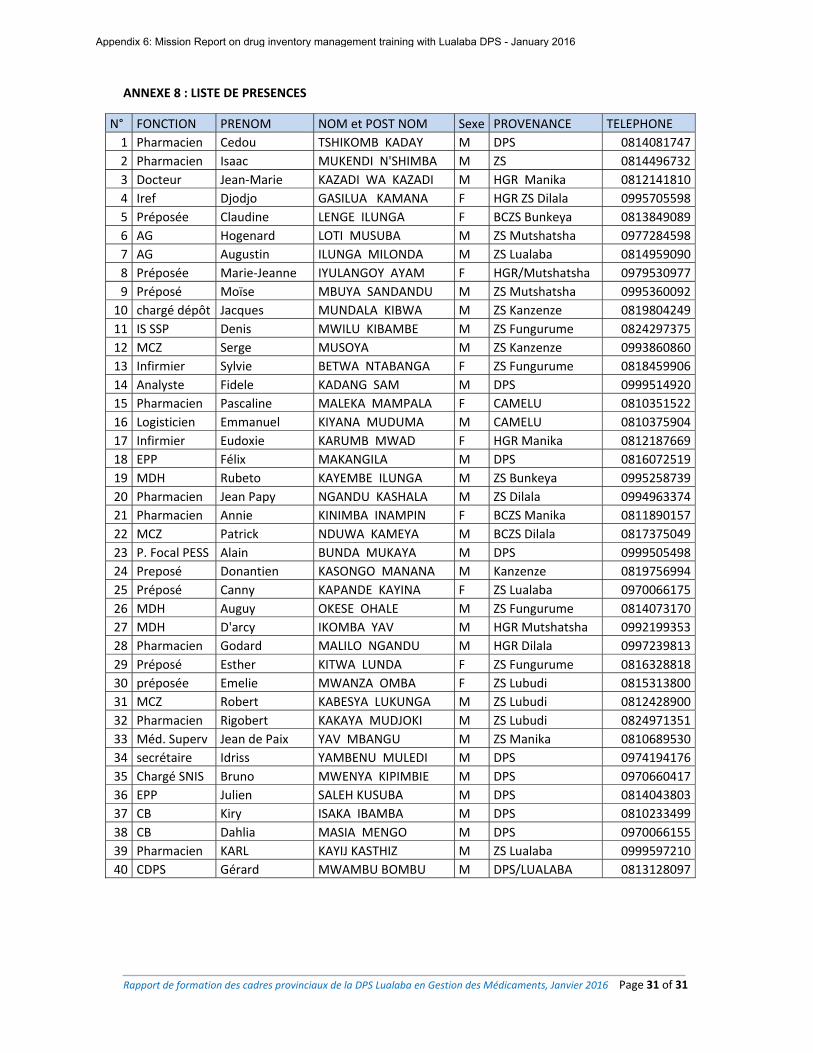
Rapport de formation des cadres provinciaux de la DPS Lualaba en Gestion des Médicaments, Janvier 2016 Page 31 of 31
ANNEXE 8 : LISTE DE PRESENCES
N° FONCTION PRENOM NOM et POST NOM Sexe PROVENANCE TELEPHONE
1 Pharmacien Cedou TSHIKOMB KADAY M DPS 0814081747
2 Pharmacien Isaac MUKENDI N'SHIMBA M ZS 0814496732
3 Docteur Jean‐Marie KAZADI WA KAZADI M HGR Manika 0812141810
4 Iref Djodjo GASILUA KAMANA F HGR ZS Dilala 0995705598
5 Préposée Claudine LENGE ILUNGA F BCZS Bunkeya 0813849089
6 AG Hogenard LOTI MUSUBA M ZS Mutshatsha 0977284598
7 AG Augustin ILUNGA MILONDA M ZS Lualaba 0814959090
8 Préposée Marie‐Jeanne IYULANGOY AYAM F HGR/Mutshatsha 0979530977
9 Préposé Moïse MBUYA SANDANDU M ZS Mutshatsha 0995360092
10 chargé dépôt Jacques MUNDALA KIBWA M ZS Kanzenze 0819804249
11 IS SSP Denis MWILU KIBAMBE M ZS Fungurume 0824297375
12 MCZ Serge MUSOYA M ZS Kanzenze 0993860860
13 Infirmier Sylvie BETWA NTABANGA F ZS Fungurume 0818459906
14 Analyste Fidele KADANG SAM M DPS 0999514920
15 Pharmacien Pascaline MALEKA MAMPALA F CAMELU 0810351522
16 Logisticien Emmanuel KIYANA MUDUMA M CAMELU 0810375904
17 Infirmier Eudoxie KARUMB MWAD F HGR Manika 0812187669
18 EPP Félix MAKANGILA M DPS 0816072519
19 MDH Rubeto KAYEMBE ILUNGA M ZS Bunkeya 0995258739
20 Pharmacien Jean Papy NGANDU KASHALA M ZS Dilala 0994963374
21 Pharmacien Annie KINIMBA INAMPIN F BCZS Manika 0811890157
22 MCZ Patrick NDUWA KAMEYA M BCZS Dilala 0817375049
23 P. Focal PESS Alain BUNDA MUKAYA M DPS 0999505498
24 Preposé Donantien KASONGO MANANA M Kanzenze 0819756994
25 Préposé Canny KAPANDE KAYINA F ZS Lualaba 0970066175
26 MDH Auguy OKESE OHALE M ZS Fungurume 0814073170
27 MDH D'arcy IKOMBA YAV M HGR Mutshatsha 0992199353
28 Pharmacien Godard MALILO NGANDU M HGR Dilala 0997239813
29 Préposé Esther KITWA LUNDA F ZS Fungurume 0816328818
30 préposée Emelie MWANZA OMBA F ZS Lubudi 0815313800
31 MCZ Robert KABESYA LUKUNGA M ZS Lubudi 0812428900
32 Pharmacien Rigobert KAKAYA MUDJOKI M ZS Lubudi 0824971351
33 Méd. Superv Jean de Paix YAV MBANGU M ZS Manika 0810689530
34 secrétaire Idriss YAMBENU MULEDI M DPS 0974194176
35 Chargé SNIS Bruno MWENYA KIPIMBIE M DPS 0970660417
36 EPP Julien SALEH KUSUBA M DPS 0814043803
37 CB Kiry ISAKA IBAMBA M DPS 0810233499
38 CB Dahlia MASIA MENGO M DPS 0970066155
39 Pharmacien KARL KAYIJ KASTHIZ M ZS Lualaba 0999597210
40 CDPS Gérard MWAMBU BOMBU M DPS/LUALABA 0813128097
Appendix 6: Mission Report on drug inventory management training with Lualaba DPS - January 2016
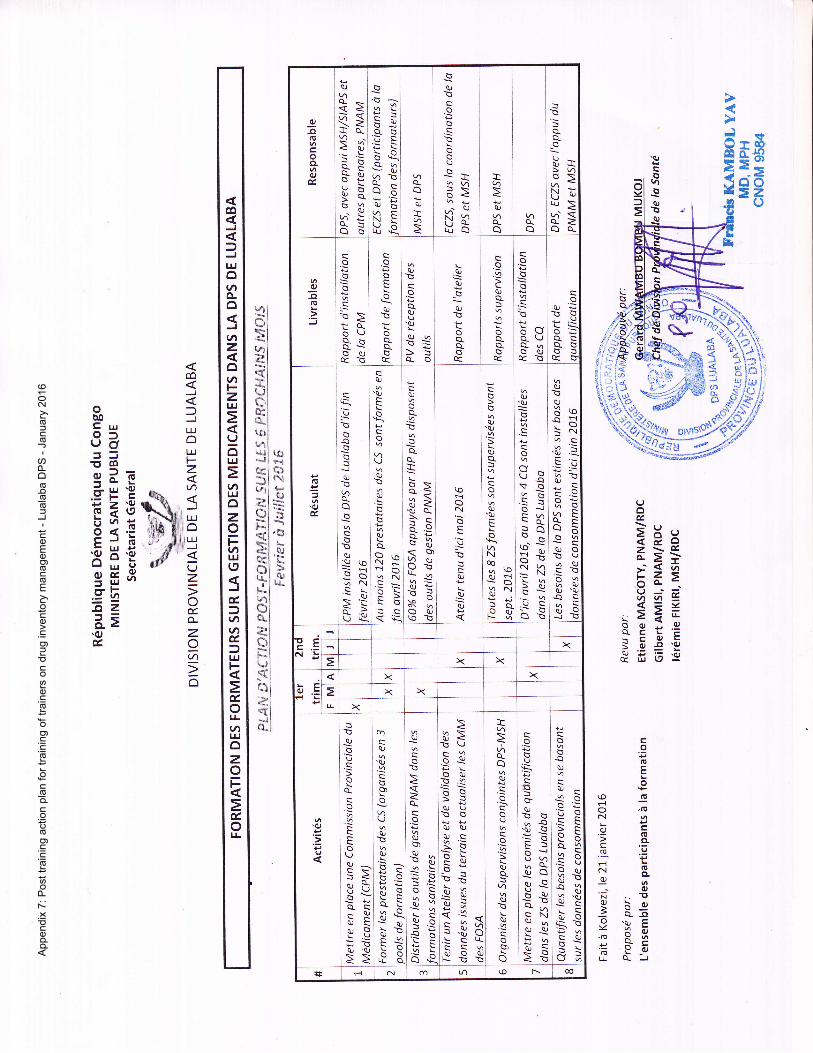
qEoo2zo
F]
:Ev
tn
EHxr>S--<a-b=>-(J-'=ttt ti
=<=Y
iEiE\cOtri aJll'9J&E6E
u)i0le3l€i:Ji
l': i
LLtI(0ti
tJ'i I
uli r*di n-rklE)*{l tu*^J!
=El *
\.)l ;".*! \6i 'd)ss.l *-e*l tu
nl >trlU
Jl*,-tu1l\JI*-l<;l
L:!iJiqi:-;ei<s'!.:it:l
co(!Eo
ro(oO,(Ea-l oL 14..ek=.e(o.9NBqJ6
-o'F .. Tt9 b,9'pExo,GY6,qF
'=YoJuQ-J
[B'ffits,#qs H -.$n o -$rr^oV*
o,.nsroffi
*u"':{*T-1" @ *o
dl\)
d$r,
oEl!
oCL
!,t
!laJlv\o-s;<>=q>3'a-x3EaiX
-qir!OG
c,B-
6iQ-O
beQ-q.-qJ(^Bo.-aOUB(4cNTHE
a-a0)>
a.i-B
oG
!
(J
:+
da6. QJ
Ni u)
iao
>q)
q)
!1o o_
a
s-G(J-U{>14B\ <
UaJtu>ei<o_zQo-
oEGL
.:)
o
G
\s\-o\Jdr:trAJqr3
G
io
B
oq
AJ!
oa.(J
'aJ
qrq
>5o_o
qJ
o_o
AJ!
oa_a-t
o
AJa_
oa-oq
o6B
:\'cbcvAUo-6oaiq-G
fu!B6
a-sG:q6
o!.0J&
:\\5a
!al
(4qoo
o.RAJ
Pto=qqN
=>u*.
elarl'AJ
\ocoq
UAJBal
G
AJ\a.or^N;qOqN
=>=c<s:
AJ
a-
=
a-
I6\c<:<ii='o a-x^:o=hu0J
<B)ciiLL .g
*f,.:oNqOq)(oE
\oHNcS(J:\B
AJ
AJ
al
G
oA,)'o
q)a-
o
qJ
'qJtr
eNoo,^(odiq3Naj]a.
.a QJ
qJ'AJ
G
P"$G!oo{trh
=a-G
ci 'BN !r)-N>AJ
QB
AJ!AJ3osts.nS.:s3:;trIEabseaJO!l)qqJ.EBo90J 'qJAEXl oJB
tcNts x
x x< x x
E Et' x xir x
.6J
.E
.zI
AJ
(J
o
o
S
oUqJ^c\5<^.oP\qc^qarl
qJ 'q
m
a)
.aJ
sl
LjqJ'ao
p.9\tso-tqi\s'b
oeIe
AJ
o.E
zo-
o
AJ
0r
ociiu\cUF\.:
{F
aJ<'b \J:OJ'ErOqJ_s ^ss:qJUB6qJ q)qrcs. 'EB!=!E€.!nE;q'3oc:1 v!.ul.\sLtecaarOa.F-'RT
I14
ha_
a)
o
o()
o
o
\4q)E
a.)
oO)
o
oG
33
AJ!Gua.o.i BIEF56!-o_qiA^,trhU^<BqNQJhOJ AJ
'l- q
>'r
B
aOJ
qJ-
o-!qO.\uoor
ail:l .ar
\q0JO
c 0.J
cv;tt e{ N (n (o l-- @
co
3lr|othCLo
ltlzot)
zUJ
(J6UJ
=qtUJozothLU(,
d,
ttlttl&,fUJ
d.orrlt!ozo
&ol.L
co
J
=JIJJoLIJF.ztJ'l
JLrJotL!J
UzotLzItJl
o
oo0l- LtlofL)or5=Eq_O=(!3u'o.=FcP >'o)Fa(,iviv6<.StrJ6.d H.5
sE3.sEi2a=.ot
App
end
ix 7
: P
ost tr
ain
ing a
ction p
lan f
or
train
ing o
f tr
ain
ers
on d
rug invento
ry m
anagem
ent
- Luala
ba D
PS
- J
anuary
2016
Page 1 sur 19 Guide opérationnel du Dépôt Pharmaceutique de MSH Kinshasa, Version de Février 2014
République Démocratique du Congo
GUIDE
OPERATIONNEL POUR LA GESTION DU DEPOT MSH KAMINA
- Révision Mars 2016 -
Page 2 sur 19 Guide opérationnel du Dépôt Pharmaceutique de MSH Kinshasa, Version de Février 2014
TABLE DES MATIERES PREAMBULE 3
I. ORGANISATION GENERALE DU CIRCUIT D’APPROVISIONNEMENT 4
II. PROCEDURE DE RECEPTION 5
III. PROCEDURE DE STOCKAGE, CONSERVATION ET RANGEMENT DES
PRODUITS PHARMACEUTIQUES 6
IV. PROCEDURE DE GESTION DE STOCK 8
V. PROCEDURES DE DISTRIBUTION DES MEDICAMENTS 9
VI. PROCEDURE DE GESTION DES PRODUITS PRESUMES
CONTREFAITS 11
VII. PROCEDURE DE GESTION DES PRODUITS HORS D’USAGE 11
VIII. DIRECTIVES SECURITAIRES (Sorties et accès au dépôt) 13
IX. PROCEDURE DE NETTOYAGE DU DEPOT 15
X. PROCEDURE DE LUTTE CONTRE LES PESTES ET RONGEURS 15
XI. PROCEDURE DE LUTTE ANTI-INCENDIE 16
XII. PROCEDURE DE GESTION DE LA POLICE D’ASSURANCE 17 XIII. PROCEDURE DE GESTION DES PRODUITS A RISQUE DE PEREMPTION 18
XIV. AUTRES DISPOSITIONS UTILES 20
Page 3 sur 19 Guide opérationnel du Dépôt Pharmaceutique de MSH Kinshasa, Version de Février 2014
PREAMBULE Pour approvisionner les provinces appuyées par l’USAID en médicaments et autres équipements médicaux, MSH utilise 3 portes d’entrée en RDC dans le but de faciliter l’acquisition des médicaments et rationaliser les coûts de transport. Ces portes sont notamment Kinshasa, Lubumbashi et Bukavu. Les médicaments et autres équipements médicaux destinés à couvrir les besoins des zones de santé appuyées par l’USAID dans la province du Haut Lomami entrent en RDC par Lubumbashi, et dans certains cas par Kinshasa. Ces médicaments sont entreposés et distribués par l’entrepôt MSH situé dans la ville de Kamina. Cet entrepôt a pour mission d’assurer la gestion des médicaments dans le strict respect des normes pharmaceutiques et logistiques. Le présent guide opérationnel décrit de manière détaillée et précise la nature et les tâches à exécuter pour les opérations spécifiques de gestion des produits stockés au dépôt de MSH à Kamina afin de répondre à cette mission. Ce guide est également un instrument d’organisation de travail qui formalise les modes opératoires à suivre dans chaque cas de figure, pour permettre aux agents d’agir de façon sûre et rapide devant chaque situation. Ces procédures formalisées aideront à traiter de la même façon les opérations de même nature, et d’éviter des traitements différents selon les agents ou même pour un même agent selon les circonstances. Elles ne se substituent pas aux fiches techniques de gestion des médicaments édictées par le Programme National d’Approvisionnement en Médicaments et disponibles. Ces dernières restent le document officiel de référence pour la gestion quotidienne des médicaments. Objectifs Les présentes procédures opérationnelles visent à donner des orientations et instructions simples, claires, précises et obligatoires permettant d’assurer une gestion saine et transparente des médicaments à l’entrepôt de MSH à Kamina. De manière spécifique, elles visent à : Garantir la régularité des opérations de réception, distribution et
rapportage sur les médicaments reçus et distribués ; Améliorer la qualité de services fournis par l’entrepôt; Faciliter les opérations de contrôle et de suivi ; Clarifier les rôles et responsabilités, et Renforcer la confiance entre les
parties.
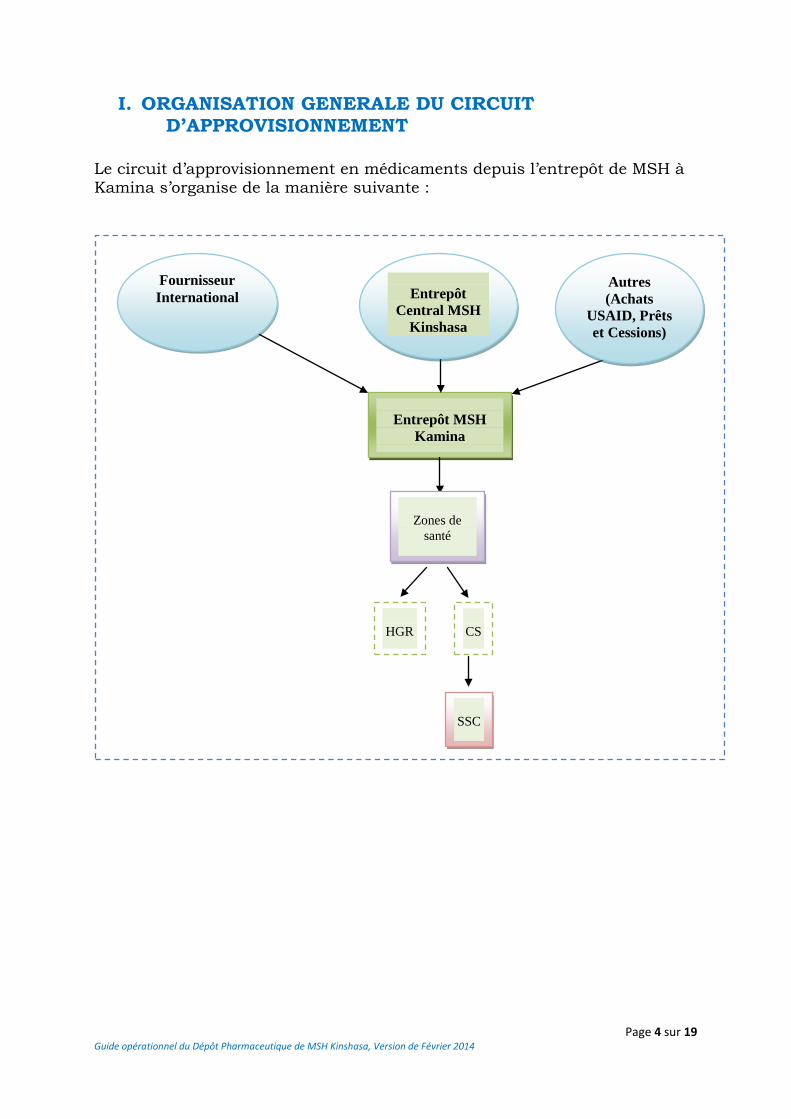
Page 4 sur 19 Guide opérationnel du Dépôt Pharmaceutique de MSH Kinshasa, Version de Février 2014
I. ORGANISATION GENERALE DU CIRCUIT D’APPROVISIONNEMENT
Le circuit d’approvisionnement en médicaments depuis l’entrepôt de MSH à Kamina s’organise de la manière suivante :
Entrepôt MSH
Kamina
Fournisseur International
Entrepôt
Central MSH Kinshasa
Autres (Achats
USAID, Prêts et Cessions)
Zones de
santé
HGR
CS
SSC
Page 5 sur 19 Guide opérationnel du Dépôt Pharmaceutique de MSH Kinshasa, Version de Février 2014
II. PROCEDURE DE RECEPTION Cette procédure est conçue dans le but de s’assurer que les produits sont reçus de manière conformes en quantité, en qualité et en valeur au regard des documents qui les accompagnent. Elle s’applique à tout produit passant par l’entrepôt MSH à Kamina et comporte deux phases : la phase préparatoire de la réception et la réception définitive. 1. Préparation de la réception des médicaments et intrants Avant toute expédition des médicaments à l’entrepôt de Kamina, le Conseiller technique SIAPS Kinshasa devra envoyer une pré-alerte au Conseiller technique provincial et au Gestionnaire de l’entrepôt au moins une semaine avant, accompagnée des documents suivants : les factures, les listes de colisage, la lettre de transport (LTA ou BL) si disponible afin de prendre les dispositions nécessaires liées à l’aménagement de l’emplacement de réception et la manutention. 2. Réception des médicaments au dépôt de MSH Il est recommandé que la réception de colis se fasse de préférence au niveau du dépôt MSH. Les personnes suivantes devront participer à cette réception :
1. le représentant du transitaire, 2. le gestionnaire du dépôt, 3. le conseiller technique SIAPS à Kamina.
Toutes ces personnes contresigneront les documents de remise et reprise relatifs à cette livraison. La réception des médicaments se fait en deux étapes :
a) Comptage et vérification des colis (Réception provisoire) Conformément à la liste de colisage, les colis sont comptés selon leurs numéros d’identification. Le nombre total des colis doit être conforme à la liste de colisage. La vérification consistera à s’assurer que les colis gardent leur intégrité (états d’emballage, vérifier s’ils sont originaux avec leurs scotchs, les étiquettes, repérer les produits endommagés et périmés…). Elaborer un rapport de déchargement avec le transitaire en rapport avec la conformité de comptage des colis de la réception et les observations faites. Après vérification de la conformité entre le Bon de livraison, Bon de commande et la facture, le bon de livraison et le rapport de déchargement doivent être signés par celui qui a assuré la réception (le gestionnaire de l’entrepôt) et le transporteur. Ensuite confirmer la réception à la hiérarchie.
Page 6 sur 19 Guide opérationnel du Dépôt Pharmaceutique de MSH Kinshasa, Version de Février 2014
Le rapport de réception provisoire doit être élaboré endéans un jour.
b) Ouverture et vérification du contenu des colis (Réception définitive)
La deuxième étape (déballage) consistera à ouvrir tous les colis un par un et leur contenu vérifié en présence ou pas du représentant du fournisseur. Vérification de la conformité de la packing list : identifier les produits et leur quantité par rapport au contenu du document, relever les écarts constatés, élaborer un PV de Réception qui doit être imprimé, signé par le gestionnaire de dépôt, le conseiller technique provincial et le transitaire si possible. Ensuite, enregistrer les produits et quantité dans la base de données ou logiciel. Enfin clôturer la réception, s’il y a des écarts négatifs ou des substitutions des produits constatés suivre la procédure pour la réclamation auprès des fournisseurs en transmettant en premier l’information au conseiller technique, au gestionnaire à Kinshasa puis aux Chefs des projets IHP/IHPplus et SIAPS. Le Rapport de réception sera rédigé par le gestionnaire de l’entrepôt endéans deux jours après la vérification de tous les colis et transmis d’abord pour vérification au Conseiller technique provincial, qui a son tour après endossement, transmettra au gestionnaire à Kin, au Conseiller technaux Chefs des projets IHP/IHPplus et SIAPS. S’il y a des réclamations à adresser au fournisseur, le Conseiller Technique provincial initiera la correspondance sur base du constat et la partagera au Conseiller technique SIAPS à Kinshasa et au Responsable de gestion des dépôts à Kinshasa. Ces derniers la feront signer par le chef de Projet IHP/IHPplus ou SIAPS (selon les cas). La lettre de réclamation doit être adressée au fournisseur au plutard deux jours après le rapport de réception.
III. PROCEDURE DE STOCKAGE, CONSERVATION ET RANGEMENT DES PRODUITS PHARMACEUTIQUES
Cette procédure a 3 objectifs principaux :
1. présenter le système de stockage des produits pharmaceutiques dans la zone destinée à l’entreposage ;
2. décrire le système de rangement des produits pharmaceutiques dans la zone de stockage ;
3. décrire les étapes mises en place pour conserver les produits pharmaceutiques dans les conditions qui garantissent la qualité.
Cette procédure s’applique à l’ensemble des produits pharmaceutiques distribués par l’entrepôt MSH à Kamina. La mise en œuvre de cette procédure est sous la responsabilité du gestionnaire de l’entrepôt.
Page 7 sur 19 Guide opérationnel du Dépôt Pharmaceutique de MSH Kinshasa, Version de Février 2014
Procédures :
1. Le stockage des produits pharmaceutiques Les produits pharmaceutiques sont stockés uniquement sur des étagères (de préférence métalliques) et des palettes en bois. Lorsque les produits sont stockés sur des palettes, les cartons sont empilés à 10 cm au moins du sol, à 30 cm au moins des murs et des autres piles et sur une hauteur ne dépassant pas 2,5 m. Pour l'ensemble du stockage il faut respecter les instructions suivantes: Stocker les produits d'une manière qui facilite l'application du principe
de gestion de stock First expired, First out (FEFO) soit « premier périmé, premier sorti. » ;
Disposer les cartons de manière à ce que les flèches pointent vers le haut et à ce que les étiquettes d'identification, les dates de péremption et les dates de fabrication soient visibles. En cas d'impossibilité, écrire le nom du produit et sa date de péremption clairement sur la partie visible ;
Placer les produits liquides sur les étagères les plus bas ou en dessous des autres produits ;
Retirer dès constat les produits endommagés ou périmés du stock et faire rapport à la hiérarchie ;
Entreposer les produits qui nécessitent d'être conservés au froid dans le(s) réfrigérateur(s) ;
Entreposer les produits stupéfiants et psychotropes dans l’armoire à stupéfiants dont la clé doit être gardée par le conseiller technique provincial ou son délégué.
Entreposer les produits inflammables dans la zone réservée à cette catégorie de produits;
Les entrées et les sorties dans le dépôt de MSH doivent être réglementées et autorisées par le gestionnaire de l’entrepôt. Un cahier d’enregistrement des mouvements est rempli à chaque entrée et sortie ;
Il est interdit de manger et de fumer dans le dépôt ; Les personnes qui travaillent dans le dépôt doivent être identifiées et
fouillées à chaque sortie du dépôt, surtout les manutentionnaires ; La présence de sacs et autres objets similaires est interdite dans
l’entrepôt (exception faite des objets privés devant se retrouver dans les bureaux des personnes commis à l’entrepôt);
Le port des chaussures de talons longs est interdit dans l’entrepôt; Le(s) réfrigérateur(s) ne peuvent contenir des produits autres que les
produits pharmaceutiques ; Il est interdit de brancher ou charger les appareils autres que ceux
utilisés pour de fin de service dans l’entrepôt;
Page 8 sur 19 Guide opérationnel du Dépôt Pharmaceutique de MSH Kinshasa, Version de Février 2014
2. La conservation des produits pharmaceutiques Respecter les instructions du fabricant ou du fournisseur sur la
procédure de stockage, ainsi que les conditions de conservation figurant sur les étiquettes ;
Dans la zone de stockage, il faut prélever et enregistrer la température dans le registre le matin entre 8h00 et 9h00, la journée entre 12h00 et 13h00 et le soir entre 16h00 et 17h00 ; Lorsque la température dépasse +30°C et lorsqu’elle baisse en dessous de +15°C, le gestionnaire initiera l’intervention d’une équipe technique de froid pour la résolution du disfonctionnement ; Le gestionnaire fera un rapport trimestriel sur l’évolution de la courbe de température. MSH s’engage à pourvoir l’entrepôt d’un système d’enregistrement automatique de température et d’humidité ambiante qui sera installé dans tous les entrepôts gérés par MSH.
Dans le(s) réfrigérateur(s), il faut prélever et enregistrer la température le matin entre 8h00 et 9h00, la journée entre 12h00 et 13h00 et le soir entre 16h00 et 17h00 ;
Prélever et enregistrer l’humidité relative de l’air dans la zone de stockage, le matin entre 8h00 et 9h00 et le soir entre 16h00 et 17h00.
3. Le rangement des produits pharmaceutiques
Les médicaments sont classés par ordre alphabétique et par voie d’administration. Etant donné que MSH est géré par portefeuille, la classification tiendra compte également de l’appartenance à l’un ou l’autre portefeuille. Ce rangement doit respecter le principe règlementaire FEFO.
4. Etiquetage des produits pharmaceutiques
Le Gestionnaire édite pour chaque groupe d’articles une étiquette d’identification reprenant la DCI, le dosage et la forme au besoin l’appartenance au portefeuille. Le gestionnaire de l’entrepôt est chargé de placer l’étiquette sur la face visible du produit. En cas d’épuisement du stock du produit, l’étiquette est conservée à son emplacement.
IV. PROCEDURE DE CONTROLE DE STOCK
1. Inventaires Les inventaires complets du stock sont réalisés trimestriellement. La commission d’inventaire est instituée par le Directeur de coordination IHP/IHPplus à Kamina. Elle sera composée du Conseiller technique SIAPS, du Gestionnaire de l’entrepôt et d’un technicien IHP/IHPplus désigné par le Directeur de coordination. Le conseiller technique SIAPS à Kamina partage un draft de rapport d’inventaire au Responsable de gestion des entrepôts à Kinshasa pour vérification et analyse. Ensuite le rapport sera transmis en
Page 9 sur 19 Guide opérationnel du Dépôt Pharmaceutique de MSH Kinshasa, Version de Février 2014
ligne à toutes les parties prenantes, notamment les conseillers techniques et les CoP IHP/IHPplus et SIAPS. Les copies « papier » des inventaires doivent être archivées à l’entrepôt et la version électronique conservée également dans les fichiers archives. Des inventaires ponctuels sont réalisés sur quelques items choisis au hasard (de préférence des items de valeur ou ayant un important turnover, tels que les antibiotiques, anti-malariens, etc.) doivent être réalisés indépendamment par le gestionnaire ou une personne de sa hiérarchie. Chaque inventaire doit être comparé avec les valeurs du stock calculé, et tout écart entre le stock « théorique » et le stock « physique » doit être investigué. Etablir un rapport d’inventaire retraçant les mouvements de la période ciblée, le stock de départ, le stock théorique, le stock inventorié et les écarts constatés.
2. Suivi de la base de données La base de données doit être mise à jour par le Conseiller technique SIAPS à chaque mouvement de stock (entrée et sortie). Tout écart entre le stock « théorique » et le stock « physique » devra être justifié par le Gestionnaire de l’entrepôt. En cas d’écart négatif non justifié, la responsabilité doit être établie et, au besoin, après balance générale du stock, la valeur des médicaments perdus sera remboursée par la (les) personne(s) responsable(s).
3. Justificatifs imprimés (sur papier) Toutes les saisies dans l’ordinateur relatives à des mouvements de stock doivent pouvoir se justifier par une trace imprimée et signée : fiche de stock, factures et bons de livraison pour les entrées, bordereau d’expédition, packing-list ou procès-verbal de destruction pour les sorties.
V. PROCEDURES DE DISTRIBUTION DES MEDICAMENTS
La distribution des médicaments entre l’entrepôt à Kamina et les 13 zones de santé appuyées par le Projet IHP/IHPplus est régie par un contrat de service entre IHP/IHPplus et chaque BCZS à Kamina. Ce contrat définit toutes les modalités de collaboration entre les parties. Le représentant Provincial de SIAPS, conjointement avec la DPS à Kamina, calcule les lignes de crédits à attribuer aux ZS sur base du prix d’achat des médicaments et les fait approuver par la DPS.
Page 10 sur 19 Guide opérationnel du Dépôt Pharmaceutique de MSH Kinshasa, Version de Février 2014
Sauf instruction exceptionnelle, les médicaments consignés à l’entrepôt de MSH à Kamina ne peuvent être distribués qu’aux zones de santé appuyées par l’USAID. Les zones de santé (BCZS et HGR) présenteront leurs besoins sur le canevas de bon de commande standard conforme aux fiches techniques du PNAM, qu’elles exprimeront à l’entrepôt MSH à Kamina en passant par la DPS pour analyse et validation. Le Gestionnaire du dépôt distribuera les médicaments aux zones de santé, dans les limites de la valeur de ligne de crédit attribuée à chacune d’elles. Les tâches de l’entrepôt par rapport à la fonction « distribution » sont les suivantes : 1. La réception des réquisitions : le gestionnaire de l’entrepôt analyse ces
réquisitions pour : a. s’assurer que les médicaments commandés sont disponibles en stock ; b. s’assurer que le stock disponible peut bien couvrir la commande pour
chaque médicament commandé ; c. s’assurer que la réquisition présentée à l’entrepôt est conforme au
modèle du PNAM et qu’elle porte la signature du demandeur. 2. Le gestionnaire de l’entrepôt prépare les colis sur base d’une fiche de
commande éditée par conseiller technique selon les commandes analysées en distinguant les différentes destinations. Ensuite le conseiller technique procède à la vérification avant la livraison des colis ;
3. Le conseiller technique établit les bons de livraison, les factures et les listes de colisage au nom du destinataire. Ces documents doivent indiquer tous les médicaments effectivement livrés et sont contresignés par le Conseiller technique SIAPS et le gestionnaire;
4. Le gestionnaire de l’entrepôt informe le Logisticien / service des opérations MSH tout en mettant en copie le conseiller technique de la disponibilité de colis en vue de planifier le transport vers les différentes destinations;
5. Le gestionnaire de l’entrepôt enregistre les sorties sur les fiches de stock et le conseiller technique met à jour la Base des données ou le logiciel ;
6. Les copies des documents envoyés dans les zones de santé doivent être renvoyés à Kamina au gestionnaire après vérification et signature du destinataire ;
7. Toute anomalie relative au contenu de l’expédition, devra faire l’objet d’une recherche et d’une communication entre le destinataire et le gestionnaire, afin de trouver à quel niveau se situe l’erreur et de corriger les données si nécessaire ;
8. Après vérification de la conformité entre les quantités expédiées et les quantités reçues en province, le gestionnaire fait la réconciliation du stock et les preuves sont archivées dans le classeur des sorties à l’entrepôt.
9. La responsabilité première des médicaments expédiés incombe au logisticien, qui est chargé de faire le tracking des expéditions.
NB : Aucune rature n’est admissible sur un bordereau, qui devra être refait
si besoin en était.
Page 11 sur 19 Guide opérationnel du Dépôt Pharmaceutique de MSH Kinshasa, Version de Février 2014
VI. PROCEDURE DE GESTION DES PRODUITS PRESUMES CONTREFAITS
Cette procédure a pour but de dégager tout produit contrefait et d’empêcher l’utilisation des produits de mauvaise qualité dans le circuit de distribution de MSH. Elle s’applique à tous les produits se trouvant dans le stock et ceux déjà distribués.
Procédure :
1. Produits présumés contrefaits La présomption de contrefaçon est faite soit par le Gestionnaire, soit par le Conseiller technique à la suite d’un constat organoleptique ou d’une plainte émanant de terrain (Zones de santé ou autres destinataires). Dans ce cas, il dresse un procès-verbal de constat qu’il transmet directement au(x) Directeur(s) de(s) projet(s). Ce dernier saisit à son tour la 3e Direction (D3) du Ministère de la Santé en vue de la transmission des échantillons au laboratoire d’analyse approprié. Dans l’entretemps les produits sont mis en quarantaine. Au cas où les résultats sont conformes, la quarantaine sera levée. Mais, s’ils sont non-conformes, le produit en quarantaine est déclaré hors usage et un rappel de lot sera effectué conformément à la réglementation en vigueur.
2. Rappel de lot
Les situations suivantes doivent entrainer un rappel de lot : Changement brusque des caractères organoleptiques ; Réclamation des clients jugée fondée ; Confirmation de la toxicité ou l’inefficacité d’un lot par le service
compétent ; Sur demande du fabricant/fournisseur.
Dans tous ces cas, le Gestionnaire /le Conseiller technique SIAPS saisit immédiatement toutes les zones de santé bénéficiaires du lot mis en cause leur demandant de retourner les quantités disponibles en stock vers la CDR. Ces produits sont déclarés hors d’usage.
VII. PROCEDURE DE GESTION DES PRODUITS HORS D’USAGE
Cette procédure a pour but d’écarter les produits non conformes et d’empêcher la circulation des produits non utilisables (périmés, corrompus, altérés, falsifiés, cassés, etc.).
Page 12 sur 19 Guide opérationnel du Dépôt Pharmaceutique de MSH Kinshasa, Version de Février 2014
1. Sortie de stock
a) Pour les produits périmés :
Le gestionnaire dresse à la fin de chaque mois une liste de produits dont la durée de vie restante est inférieure ou égale à un mois qu’il transmet à au Conseiller technique avec copie au pharmacien gestionnaire à Kinshasa et aux Directeurs des Projets. Pour les produits périmés, le Conseiller technique en ordonne le
retrait du stock (Sortie physique, sortie dans la Base des données et sur les fiches de stock par le gestionnaire de stock).
Un procès-verbal pour expiration ou endommagement d’items doit être signé conjointement par le gestionnaire et le Conseiller technique SIAPS.
b) Pour les produits hors d’usage autres que les périmés :
Dès le premier constat, le gestionnaire retire du stock tout produit cassé, falsifié, corrompu, altéré, etc. et invite le Conseiller technique à venir constater physiquement son état. Le gestionnaire déclare ce produit hors usage et en dresse la liste
contresignée par le conseiller technique SIAPS qu’il remet au gestionnaire pour disposition.
Le conseiller technique procède à la sortie informatique en produisant un document en deux exemplaires. Un exemplaire sera transmis au service des Opérations et l’autre remis à l’entrepôt pour la sortie sur la fiche de stock et le transfert du produit vers le local des produits hors usage.
Ces produits sont consignés au fur et à mesure de leur retrait dans le local des produits hors usage dont la clé est gardée par le Gestionnaire.
2. Destruction des produits hors d’usage
Avant la fin du mois de janvier de l’année, le gestionnaire élabore la liste valorisée au prix FOB (Ex-work) de chaque lot de ces items sur base de laquelle le Conseiller technique SIAPS adresse une lettre au Pharmacien Inspecteur provincial de Kamina pour l’inviter à venir retirer les médicaments hors usage en vue de leur destruction.
Le pharmacien inspecteur, par délégation du procureur de la république dresse un procès-verbal valorisé qui atteste la destruction. La destruction de ces médicaments doit se faire en présence du Gestionnaire ou du Conseiller technique. Une copie du PV de destruction sera transmise au Pharmacien gestionnaire à Kinshasa et aux Directeurs des Projets MSH.
Page 13 sur 19 Guide opérationnel du Dépôt Pharmaceutique de MSH Kinshasa, Version de Février 2014
VIII. DIRECTIVES SECURITAIRES (Sorties et accès au dépôt)
Afin de préserver l’intégrité des médicaments entreposés dans le dépôt de Kamina, il est demandé à tout le personnel d’appliquer scrupuleusement les règles suivantes : 1. Accès au dépôt
L’accès au dépôt ne peut être autorisé qu’au personnel MSH et ceux du Ministère de la Santé possédant un ordre de mission pour raison de service.
Toute personne étrangère à MSH non accompagnée par un personnel responsable de l’entrepôt ou de la Direction de MSH ne doit pas être autorisée à pénétrer dans le dépôt.
Sa visite sera cependant consignée dans le registre des mouvements.
Les gardiens disposent d’un registre dit « de mouvements » sur lequel doivent être reportés tous les éléments suivants :
Tout mouvement de véhicule – MSH ou non MSH – doit être noté : • Heure d’arrivée • Heure de départ • Type du véhicule (4x4, camion, moto, autre…) • Appartenance du véhicule (ONG) • Immatriculation du ou des véhicules
En cas de véhicule MSH
• Nom du chauffeur • Noms des passagers
Tout mouvement de personnel, sans véhicule, entrant ou sortant du dépôt, doit également être enregistré dans le registre. (Heure d’entrée et de sortie, nom et raison de la visite)
Toute relève de gardiens (horaire, noms) doit être consignée sur le registre
Toute arrivée ou départ de médicaments (nombre de colis) doit être également consigné dans le registre.
Pendant le déchargement ou le chargement d’un véhicule, le gardien n’est pas chargé de compter les colis, il doit continuer sa surveillance.
Son rôle consiste à noter le nombre de colis, déchargés ou chargés, que lui aura communiqué l’agent de responsable de la surveillance.
Les périodes d’accès normales à l’entrepôt se font pendant les heures ouvrables, c’est à dire du lundi au vendredi, entre 08H30 et 17H30. Aucun accès ne doit être autorisé en dehors de ces horaires sans autorisation.
Ces mouvements sont également à noter dans le registre des gardiens.
Page 14 sur 19 Guide opérationnel du Dépôt Pharmaceutique de MSH Kinshasa, Version de Février 2014
2. Ouverture / Fermeture du dépôt (stock)
a) Clés
Actuellement, il existe six clés pour deux cadenas qui ferment la grande porte de l’entrepôt MSH à Kamina situé dans l’enceinte de BRASIMBA. En plus de la grande porte, il existe une petite porte fermée moyennant un cadenas ayant trois clés. La clé de l’armoire pour les narcotiques et produits dangereux se trouve sur le même trousseau que les clés de l’entrepôt.
Le trousseau de clé complet est remis tous les matins au gestionnaire du dépôt, et est restitué chaque soir au Conseiller technique provincial, ou au Directeur de coordination IHP/IHPplus si ce dernier est absent.
Seuls le Conseiller technique provincial et le Gestionnaire du dépôt ont accès au dépôt; les autres personnes pouvant avoir à y faire (logisticien, ménagères, manutentionnaires) y ont un accès contrôlé uniquement en présence des détenteurs des clés.
Seul le Conseiller technique provincial du dépôt possède le trousseau de clé complet : une clé par cadenas pour l’accès à l’entrepôt et une pour l’armoire à stupéfiants.
Les autres exemplaires de clés de réserve seront gardés par le logisticien de la coordination.
b) Accès limité au stock
Seules les personnes suivantes sont autorisées à pénétrer dans l’entrepôt, en présence du Gestionnaire ou du Conseiller technique provincial :
- Le Directeur de coordination IHP/IHPplus ou son délégué, - Le personnel de nettoyage/entretien, afin de vider les poubelles,
balayer les allées et les étagères : sur demande du gestionnaire du dépôt,
- Les manutentionnaires : lors du chargement et du déchargement de colis. Limiter si possible le nombre de personnes à l’intérieur en organisant un système de travail en chaîne, et les surveiller étroitement pendant le travail,
- Le représentant du fournisseur lors de la réception des commandes et check des quantités,
- Les Agents du Ministère de santé pour raison de service, - Le conseiller technique SIAPS ou le conseiller IHP/IHPplus en
provenance du niveau national, chacun suivant son domaine d’appui, pour une supervision de routine ou autre tâche en rapport avec la gestion des médicaments et conditions de stockage.
3. Autres dispositions
Le registre des gardiens devra être vérifié au moins une fois par mois par le logisticien de la coordination. La signature et la date de vérification attestant du contrôle effectué.
Page 15 sur 19 Guide opérationnel du Dépôt Pharmaceutique de MSH Kinshasa, Version de Février 2014
En quittant l’entrepôt, tout personnel MSH devra émarger sur le registre des gardiens, en précisant la raison de sa visite.
IX. PROCEDURE DE NETTOYAGE DU DEPOT Cette procédure est conçue dans le but d’assurer la propreté du dépôt. Elle s’applique sur tous les locaux abritant les médicaments et les consommables médicaux de MSH dans l’enceinte du dépôt de Kamina.
Procédure : Le gestionnaire de stock élabore un calendrier de nettoyage et l’affiche dans l’entrepôt. Il s’assure que la propreté est faite de façon permanente en vue d’éviter les conditions non hygiéniques dans les installations pharmaceutiques. Cette tâche sera accomplie une fois par semaine par des agents journaliers désignés par le gestionnaire.
Le nettoyage du pavement, mur, vitre, étagère, etc. se fait à l’aide d’un tissu approprié plongé dans l’eau au savon ou autre désinfectant approprié.
Pour le dépoussiérage des produits, l’utilisation du balai et de la brosse est strictement interdite. Ce dépoussiérage se fait avec un tissu sec ou humide suivant le cas.
X. PROCEDURE DE LUTTE CONTRE LES PESTES ET RONGEURS
Cette procédure a pour but de protéger le stock des dommages causés par les pestes et les rongeurs.
Procédure : Est considéré comme peste, tout insecte susceptible de compromettre la qualité des produits stockés (les termites, les cafards, les mouches, les larves, les fourmis, etc). Est considéré comme rongeur, tout vertébré présent dans l’entrepôt qui constitue un vecteur menaçant le maintien de la qualité des médicaments dans le dépôt (les rats, les lézards, etc.).
Pour la première catégorie, le magasinier identifie les zones de pénétration de ces insectes dans les entrepôts et en informe le conseiller technique provincial qui prendra des mesures adéquates.
Quant aux rongeurs, le dépôt opte pour le système de pièges métalliques localisés dans les différentes zones de stockage.
Le dépôt utilisera les appâts secs (fretins ou tout autre aliment) et les recycle chaque 72 heures afin de rendre efficace le processus.
Le personnel du dépôt est tenu de : • Inspecter les pièges chaque jour dans la matinée et avant la fermeture
afin de se rendre compte de l’état de leur fonctionnement et éventuellement les débarrasser des cadavres des rongeurs attrapés et réinstaller l’appât.
Page 16 sur 19 Guide opérationnel du Dépôt Pharmaceutique de MSH Kinshasa, Version de Février 2014
• Nettoyer le piège qui a pris le rongeur et réajuster son emplacement. • Formuler les demandes auprès du Service d’achat pour l’acquisition de
matériels et aliments au début de chaque trimestre ou en cas de besoin ; • Tenir un registre de rapportage indiquant la date, le nombre de rongeurs
pris dans les pièges ainsi que les zones de stockage concernées. NB : Pour sa protection, la personne chargée de manipuler les appâts, d’éliminer les rongeurs et de nettoyer les pièges devra se munir des gants et d’un cache-nez.
XI. PROCEDURE DE LUTTE ANTI-INCENDIE Cette procédure a pour but d’empêcher l’incendie et/ou minimiser les dégâts liés à sa survenue. Elle porte sur la prévention et sur tout cas d’incendie déclaré dans l’entrepôt.
1. Prévention
Le Gestionnaire de l’entrepôt doit en permanence : se rassurer de la présence du matériel anti-incendie (extincteur, bac à
sable, bêche, sceau métallique) aux endroits définis dans la cartographie anti-incendie (à concevoir) ;
se rassurer que la personne se trouvant à proximité du matériel anti-incendie sait s’en servir en cas de besoin ;
afficher la notice sur l’utilisation des extincteurs ; Veiller au bon état de l’installation électrique.
Les usagers des installations électriques à l’entrepôt doivent : Eviter d’utiliser une installation ou matériel électrique endommagés ou
défectueux ; Utiliser au besoin des ampoules non chauffantes pour l’éclairage de
l’entrepôt; Informer immédiatement le Conseiller technique de toute anomalie
constatée sur les installations ou matériel électriques, qui informera à son tour le logisticien de coordination.
2. Lutte contre l’incendie
Toute personne, devant un feu naissant, doit dans la mesure du possible prendre certaines dispositions visant à la fois sa sécurité, celle des personnes se trouvant à l’entrepôt et celle des installations. Pour ce faire : Elle alerte par tous les moyens possibles, les autres personnes
présentes sur le site ; Elle déconnecte tous les matériels électriques de son secteur ; Elle se sert des matériels anti-incendie à sa portée pour lutter contre le
feu.
Le gestionnaire, le conseiller technique, le logisticien ou tout autre cadre de l’entrepôt qui reçoit l’alerte saisit la brigade anti-incendie. Le gestionnaire de l’entrepôt ou tout autre membre de l’équipe logistique présent sur le site doit couper la source d’énergie électrique.
Page 17 sur 19 Guide opérationnel du Dépôt Pharmaceutique de MSH Kinshasa, Version de Février 2014
Après avoir maitrisé l’incendie, le gestionnaire de l’entrepôt dresse un état de lieu comprenant : Le point de départ du feu et sa cause si possible ; La description des dégâts matériels et humains ; La description de l’intervention.
Cet état de lieu est adressé au Conseiller technique provincial et au Directeur de coordination IHP/IHPplus qui se chargeront d’informer le niveau national pour dispositions utiles.
XII. PROCEDURE DE GESTION DE LA POLICE D’ASSURANCE
Par définition, la police d'assurance est un document contractuel qui régit les relations entre la compagnie d'assurance et l'assuré. Ce contrat fixe en particulier :
• la liste des évènements garantis, avec les exclusions éventuelles ; • la garantie, c'est-à-dire l'assistance apportée à l'assuré en cas de
sinistre ; • les obligations de l'assuré ; • les obligations de la compagnie d'assurances.
Cette procédure est conçue dans le but de permettre au gestionnaire de l’entrepôt de prendre connaissance, de suivre et de signaler la survenue de tout événement assuré (listé au contrat) afin de permettre à MSH de demander l'assistance (indemnisation) de son assureur (SONAS). Procédure : Lors de la survenue d’un événement assuré, le gestionnaire du dépôt
est tenu d’informer immédiatement le Conseiller technique qui à son tour informera le service des opérations pour des dispositions utiles ;
La durée de validité de la police d’assurance entre le dépôt MSH et son assureur est d’une année renouvelable. A ce jour, l’assureur des entrepôts MSH est la Société Nationale d’Assurance (SONAS). Le service chargé des Opérations est tenu de partager la police d’assurance disponible afin de permettre à l’entrepôt d’en faire le suivi.
Deux mois avant l’expiration du contrat d’assurance, le gestionnaire est tenu d’informer le Conseiller technique qui devra adresser un rappel au service des opérations pour dispositions utiles.
XIII. GESTION DES PRODUITS A RISQUE DE PEREMPTION
Qu’est-ce qu’un stock à risque de péremption ? Un stock à risque de péremption correspond à tous les items présents dans le stock du dépôt et qui, selon les prévisions de consommation, ne seront pas consommés avant la péremption.
Page 18 sur 19 Guide opérationnel du Dépôt Pharmaceutique de MSH Kinshasa, Version de Février 2014
Cette procédure est élaborée dans le but de minimiser le risque de perte des produits par péremption et éviter ainsi le gaspillage des ressources. Procédure : A la fin de chaque mois, le Gestionnaire du dépôt est tenu de : Identifier, en parcourant les fiches de stock, tous les produits dont la
durée de vie avant péremption est inférieure ou égale à 6 mois; Elaborer la liste valorisée de ces produits et la transmettre au
Conseiller technique provincial SIAPS. Une fois informé, le Conseiller technique provincial SIAPS procèdera aux actions ci-après : Informer les ZS sous appui USAID dans la province du Haut Lomami
de la présence de ces produits à risque de péremption au dépôt de Kamina et leur demander d’en exprimer les besoins. L’information sera également partagée avec d’autres coordinations MSH pour un éventuel besoin de redéploiement ;
Une fois exprimée, ces besoins sont consolidés et présentés aux Directeurs des projets respectifs sous forme d’un plan de distribution pour approbation ;
Si ces produits à risque de péremption ne peuvent pas être complètement absorbés par les ZS appuyées par l’USAID, le Conseiller technique provincial SIAPS demande l’approbation des Directeurs des projets pour que les quantités non consommées soient officiellement mises à la disposition de la DPS Haut Lomami;
Moyennant un plan de distribution élaboré par la DPS Haut Lomami, ces quantités seront attribuées gratuitement aux autres ZS non appuyées par l’USAID;
Les dispositions se rapportant à la prise en charge des frais de transport seront étudiées au cas par cas. Toutefois, un effort sera consenti pour éviter à MSH des charges supplémentaires, si la DPS concerné peut s’occuper du transport avec l’appui éventuel d’autres partenaires.
Page 19 sur 19 Guide opérationnel du Dépôt Pharmaceutique de MSH Kinshasa, Version de Février 2014
XIV. AUTRES DISPOSITIONS UTILES
Pour toute autre disposition de gestion non reprise dans cette procédure, la gestion se fera conformément aux fiches techniques PNAM éditées avec l’appui SIAPS et adoptées par le Ministère de la Santé Publique comme référence pour la gestion pharmaceutique en République Démocratique du Congo.
Révisé à Kamina, le 01 Avril 2016
Proposé par
Approuvé par
Jérémie FIKIRI Conseiller Technique SIAPS
Ruphin MULONGO CoP SIAPS RDC
Christian KISIMBA Gestionnaire responsable du dépôt MSH Kinshasa
Ousmane FAYE CoP IHPplus RDC
Rapport de mission de suivi des recommandations d’état des lieux de la CDR CEDIMEK, avril 2016 Page 1 of 19
République Démocratique du Congo
MINISTERE DE LA SANTE PUBLIQUE SECRETARIAT GENERAL
SECRETARIAT GENERAL A LA SANTE
Programme National d’Approvisionnement en Médicaments essentiels, PNAM
Kinshasa
RAPPORT DE LA MISSION D’APPUI A LA DPS HAUT LOMAMI DANS LE SUIVI RAPPROCHE DE LA CDR CEDIMEK
Du 30 mars au 05 avril 2016
Avec l’appui de :
Présenté par : Fidèle NGOMA BAZIKANGE, Directeur Adjoint du PNAM RDC Gilbert AMISI KIZEGELE, Chef des Services Statistiques du PNAM RDC
Jérémie FIKIRI, Conseiller technique, Projet SIAPS, MSH RDC Christian KISIMBA KAYEMBA, Gestionnaires des dépôts MSH RDC
Avril 2016
Appendix 9: DRC-IHPplus CEDIMEK CDR situational analysis report from April 2016
Rapport de mission de suivi des recommandations d’état des lieux de la CDR CEDIMEK, avril 2016 Page 2 of 19
REMERCIEMENTS
La direction du Programme National d’Approvisionnement en Médicaments essentiels,
PNAM, remercie de tout cœur ceux qui, de loin ou de près, ont contribué à la réalisation de
la présente mission, particulièrement l’USAID pour son appui technique et financier à travers
ses projets SIAPS et IPHplus mis en œuvre par MSH.
Elle exprime aussi sa gratitude aux représentants locaux de ces projets dans la province du
Haut Lomami pour leurs appuis et facilitation durant tout le séjour de la mission.
Les remerciements sont également adressés aux Autorités Provinciales du Ministère de la
Santé, particulièrement à Monsieur le Chef de Division de la DPS Haut Lomami et ses
collaborateurs pour leur assistance à la mission afin que les objectifs fixés soient atteints.
Les remerciements sont enfin adressés à la CEDIMEK, particulièrement à son Directeur pour
sa franche collaboration et disponibilité sans lesquelles la mission n’aurait pas atteint les
objectifs qu’elle s’était fixés.
Les missionnaires.
Appendix 9: DRC-IHPplus CEDIMEK CDR situational analysis report from April 2016
Rapport de mission de suivi des recommandations d’état des lieux de la CDR CEDIMEK, avril 2016 Page 3 of 19
SIGLES ET ABRÉVIATIONS
AG Administrateur Gestionnaire
AT Assistance Technique
BCAF Bureau de Coordination des Achats de la FEDECAME
BCZS Bureau Central de Zone de Santé
CA Conseil d’Administration
CB Chef de Bureau
CD Chef de Division
CDR Centrale de Distribution Régionale des Médicaments Essentiels
CAO Cadre d’Accélération des Objectifs du Millénaire
CPM Comité Provinciale du Médicament
DPS Division Provinciale de la Santé
ECZS Equipe Cadre de Zone de Santé
FEDECAME Fédération des Centrales d’Achat et de distribution régionale des
Médicaments Essentiels
FdR Fonds de Roulement
MEG Médicaments Essentiels Génériques
SIAPS System for Improved Access to Pharmaceuticals and Services
IHP plus Integrated Health Project Plus
MSH Management Sciences for Health
MSP Ministère de la Santé
PCA Président du Conseil d’Administration
PNAM Programme National d'Approvisionnement en Médicaments essentiels
PTF Partenaire Technique et Financier
RDC République Démocratique du Congo
SG Secrétaire Général
SNAME Système National d'Approvisionnement en Médicaments Essentiels
TDR Termes De Référence
USAID United States Agency for International Developpement
ZS Zone de Santé
Appendix 9: DRC-IHPplus CEDIMEK CDR situational analysis report from April 2016
Rapport de mission de suivi des recommandations d’état des lieux de la CDR CEDIMEK, avril 2016 Page 4 of 19
I. RÉSUMÉ
Conformément à l’ordre de service collectif N° MS.1251/SG/404/MK/2018 du 21 mars 2016
de Monsieur le Secrétaire Général à la Santé, une mission composée du directeur Adjoint du
PNAM et du Chef des Services Statistiques du PNAM et Data manager du SNAME a été
réalisée à Kamina pour appuyer la DPS/Haut Lomami dans le suivi rapproché de la CDR
CEDIMEK.
Cette mission qui s’est déroulée du 30 mars au 05 avril 2016 a poursuivi les objectifs
spécifiques suivants :
Évaluer le niveau de mise en œuvre des recommandations de la mission d’état des
lieux effectuée par le PNAM en septembre 2015.
Renforcer les capacités gestionnaires et techniques des Cadres de la CEDIMEK sur
l’utilisation des tableaux de bord de gestion, d’évaluation et financier.
Renforcer les capacités gestionnaires et techniques des Cadres de la CEDIMEK sur les
Bonnes Pratiques de Distribution.
Tenir des séances de travail avec la DPS, le Conseil d’Administration et MSH en vue
de décider sur le devenir de cette CDR.
Participer à la réunion du Groupe de Travail Médicament du CPP-SS de la province du
Haut-Lomami organisée en date du 1er avril en vue de proposer une feuille de route
sur l’amélioration des services selon les défis identifiés à la CEDIMEK.
La méthodologie utilisée a été la suivante :
Descente sur terrain ;
Revue documentaire ;
Interview ;
Entretien
Observation.
Appendix 9: DRC-IHPplus CEDIMEK CDR situational analysis report from April 2016
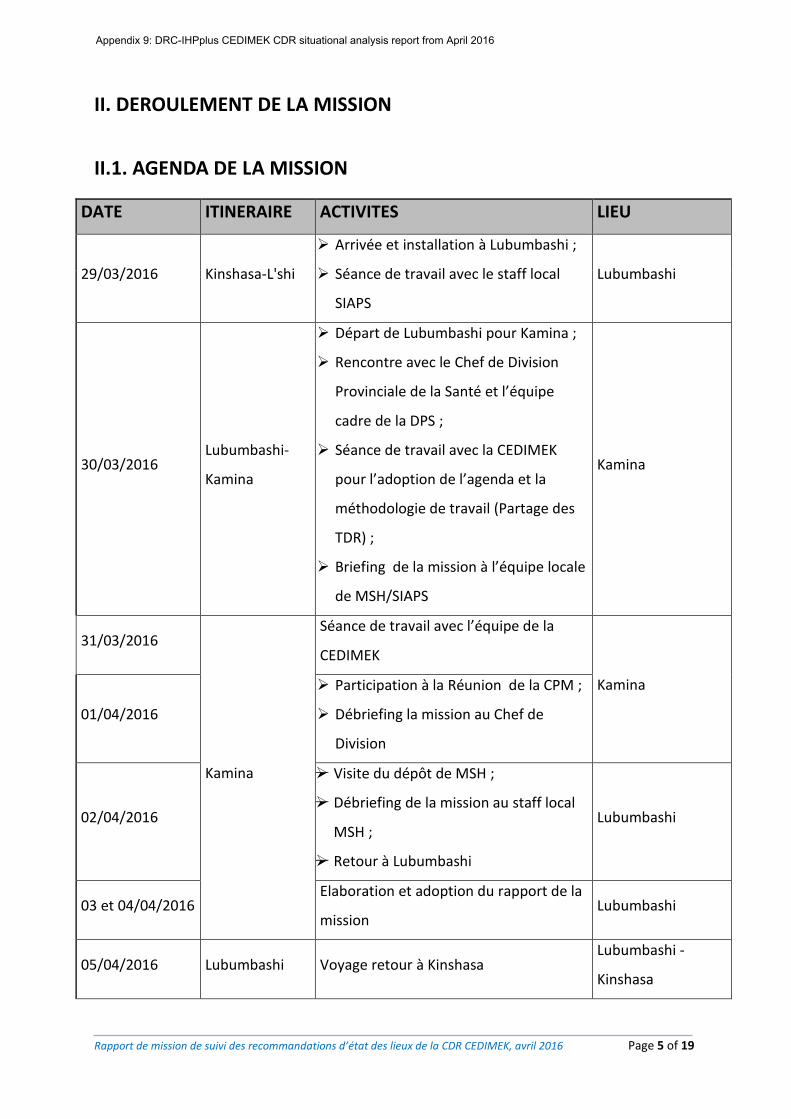
Rapport de mission de suivi des recommandations d’état des lieux de la CDR CEDIMEK, avril 2016 Page 5 of 19
II. DEROULEMENT DE LA MISSION
II.1. AGENDA DE LA MISSION
DATE ITINERAIRE ACTIVITES LIEU
29/03/2016 Kinshasa-L'shi
Arrivée et installation à Lubumbashi ;
Séance de travail avec le staff local
SIAPS
Lubumbashi
30/03/2016 Lubumbashi-
Kamina
Départ de Lubumbashi pour Kamina ;
Rencontre avec le Chef de Division
Provinciale de la Santé et l’équipe
cadre de la DPS ;
Séance de travail avec la CEDIMEK
pour l’adoption de l’agenda et la
méthodologie de travail (Partage des
TDR) ;
Briefing de la mission à l’équipe locale
de MSH/SIAPS
Kamina
31/03/2016
Kamina
Séance de travail avec l’équipe de la
CEDIMEK
Kamina
01/04/2016
Participation à la Réunion de la CPM ;
Débriefing la mission au Chef de
Division
02/04/2016
Visite du dépôt de MSH ;
Débriefing de la mission au staff local
MSH ;
Retour à Lubumbashi
Lubumbashi
03 et 04/04/2016 Elaboration et adoption du rapport de la
mission Lubumbashi
05/04/2016 Lubumbashi Voyage retour à Kinshasa Lubumbashi -
Kinshasa
Appendix 9: DRC-IHPplus CEDIMEK CDR situational analysis report from April 2016
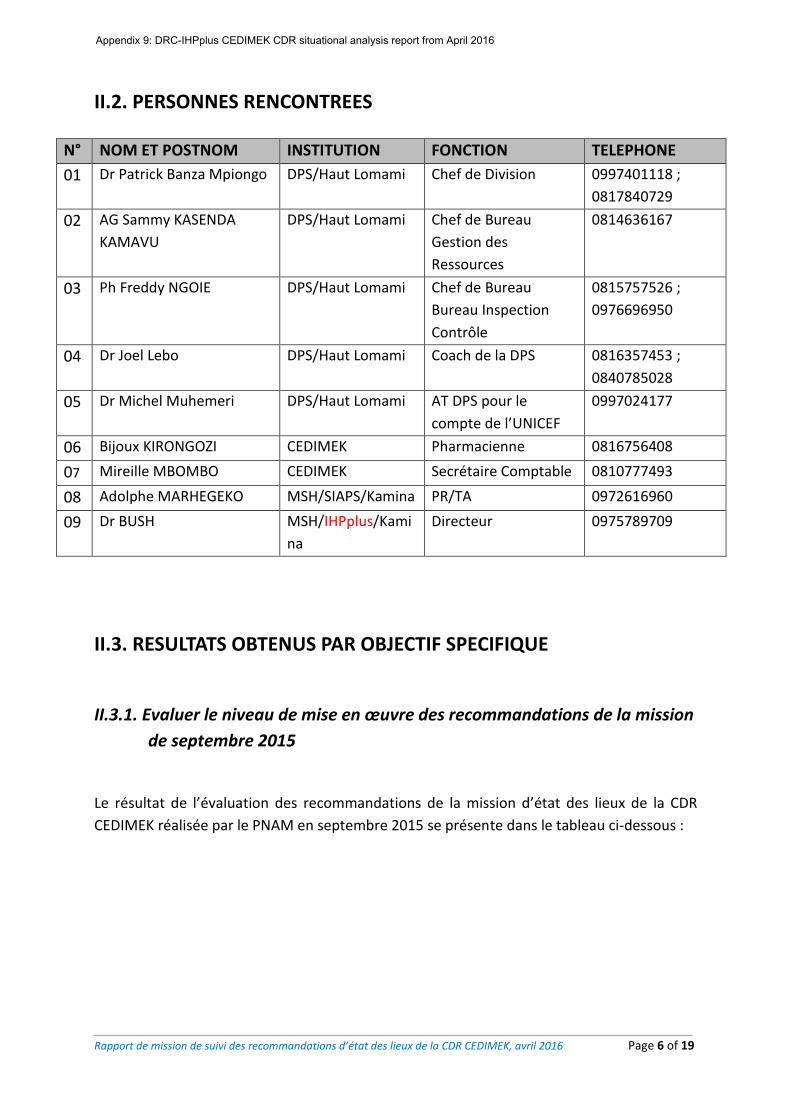
Rapport de mission de suivi des recommandations d’état des lieux de la CDR CEDIMEK, avril 2016 Page 6 of 19
II.2. PERSONNES RENCONTREES
N° NOM ET POSTNOM INSTITUTION FONCTION TELEPHONE
01 Dr Patrick Banza Mpiongo DPS/Haut Lomami Chef de Division 0997401118 ;
0817840729
02 AG Sammy KASENDA
KAMAVU
DPS/Haut Lomami Chef de Bureau
Gestion des
Ressources
0814636167
03 Ph Freddy NGOIE DPS/Haut Lomami Chef de Bureau
Bureau Inspection
Contrôle
0815757526 ;
0976696950
04 Dr Joel Lebo DPS/Haut Lomami Coach de la DPS 0816357453 ;
0840785028
05 Dr Michel Muhemeri DPS/Haut Lomami AT DPS pour le
compte de l’UNICEF
0997024177
06 Bijoux KIRONGOZI CEDIMEK Pharmacienne 0816756408
07 Mireille MBOMBO CEDIMEK Secrétaire Comptable 0810777493
08 Adolphe MARHEGEKO MSH/SIAPS/Kamina PR/TA 0972616960
09 Dr BUSH MSH/IHPplus/Kami
na
Directeur 0975789709
II.3. RESULTATS OBTENUS PAR OBJECTIF SPECIFIQUE
II.3.1. Evaluer le niveau de mise en œuvre des recommandations de la mission
de septembre 2015
Le résultat de l’évaluation des recommandations de la mission d’état des lieux de la CDR
CEDIMEK réalisée par le PNAM en septembre 2015 se présente dans le tableau ci-dessous :
Appendix 9: DRC-IHPplus CEDIMEK CDR situational analysis report from April 2016
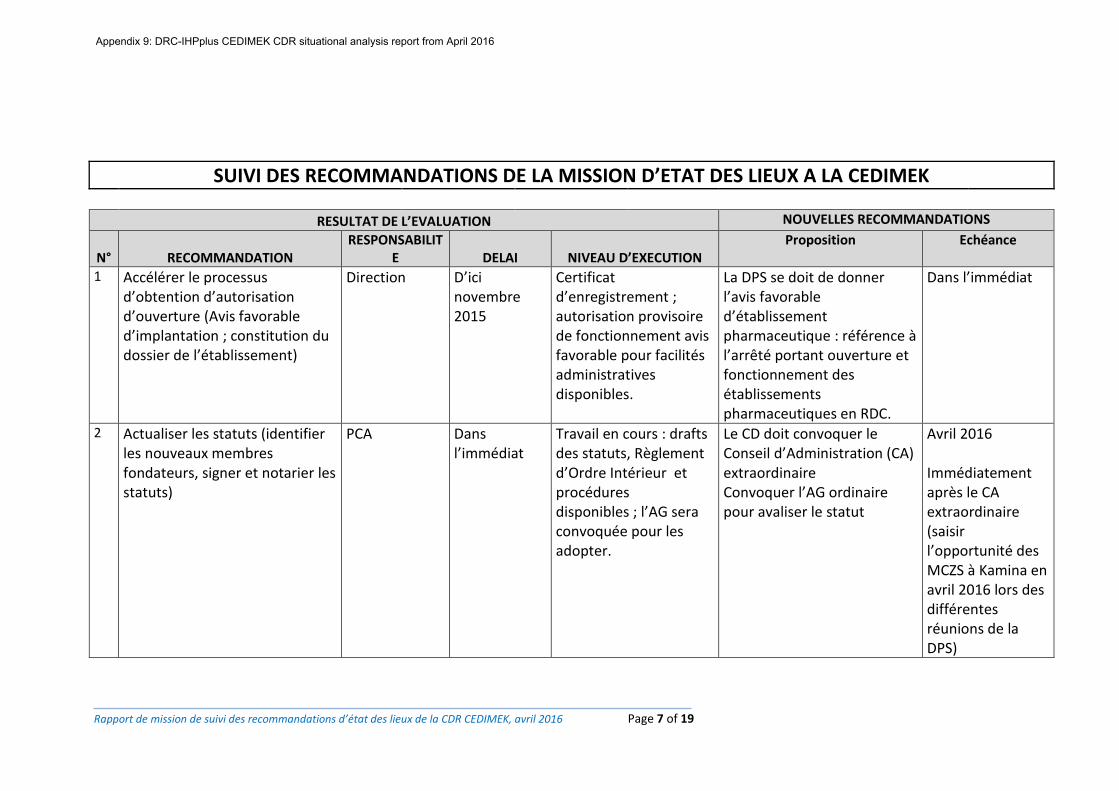
Rapport de mission de suivi des recommandations d’état des lieux de la CDR CEDIMEK, avril 2016 Page 7 of 19
SUIVI DES RECOMMANDATIONS DE LA MISSION D’ETAT DES LIEUX A LA CEDIMEK
RESULTAT DE L’EVALUATION NOUVELLES RECOMMANDATIONS
N° RECOMMANDATION RESPONSABILIT
E DELAI NIVEAU D’EXECUTION Proposition Echéance
1 Accélérer le processus d’obtention d’autorisation d’ouverture (Avis favorable d’implantation ; constitution du dossier de l’établissement)
Direction D’ici novembre 2015
Certificat d’enregistrement ; autorisation provisoire de fonctionnement avis favorable pour facilités administratives disponibles.
La DPS se doit de donner l’avis favorable d’établissement pharmaceutique : référence à l’arrêté portant ouverture et fonctionnement des établissements pharmaceutiques en RDC.
Dans l’immédiat
2 Actualiser les statuts (identifier les nouveaux membres fondateurs, signer et notarier les statuts)
PCA Dans l’immédiat
Travail en cours : drafts des statuts, Règlement d’Ordre Intérieur et procédures disponibles ; l’AG sera convoquée pour les adopter.
Le CD doit convoquer le Conseil d’Administration (CA) extraordinaire Convoquer l’AG ordinaire pour avaliser le statut
Avril 2016 Immédiatement après le CA extraordinaire (saisir l’opportunité des MCZS à Kamina en avril 2016 lors des différentes réunions de la DPS)
Appendix 9: DRC-IHPplus CEDIMEK CDR situational analysis report from April 2016
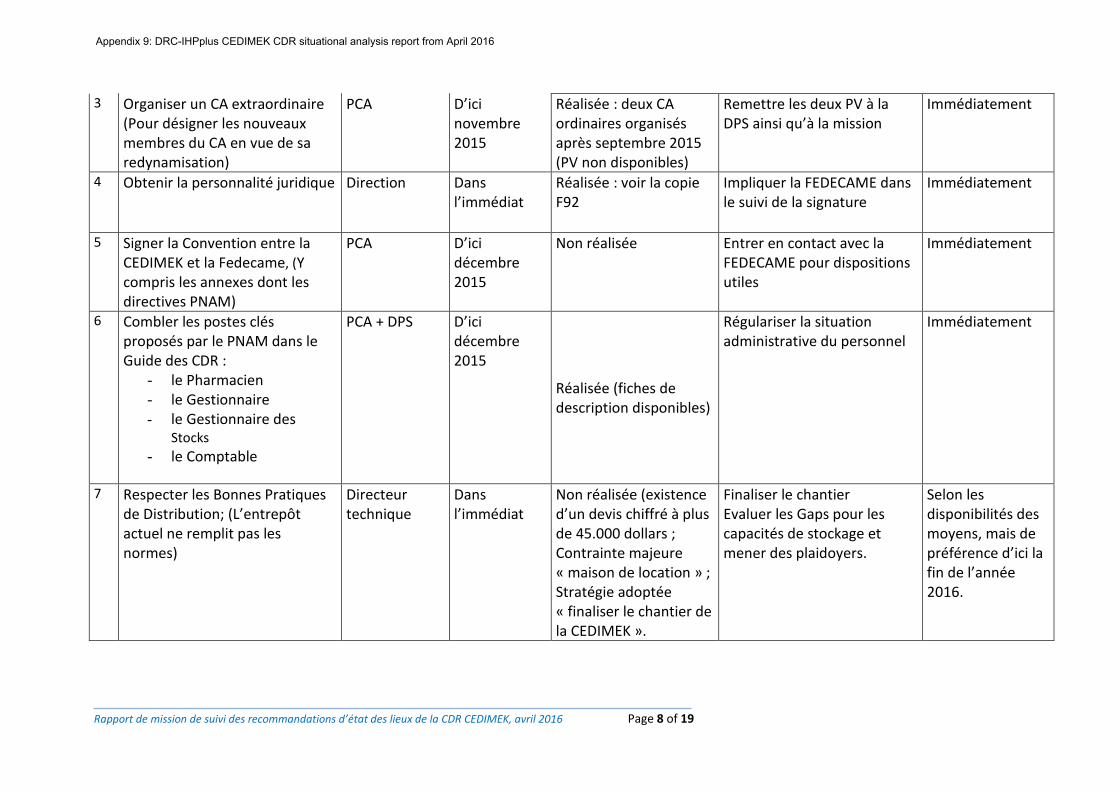
Rapport de mission de suivi des recommandations d’état des lieux de la CDR CEDIMEK, avril 2016 Page 8 of 19
3 Organiser un CA extraordinaire (Pour désigner les nouveaux membres du CA en vue de sa redynamisation)
PCA D’ici novembre 2015
Réalisée : deux CA ordinaires organisés après septembre 2015 (PV non disponibles)
Remettre les deux PV à la DPS ainsi qu’à la mission
Immédiatement
4 Obtenir la personnalité juridique Direction Dans l’immédiat
Réalisée : voir la copie F92
Impliquer la FEDECAME dans le suivi de la signature
Immédiatement
5 Signer la Convention entre la CEDIMEK et la Fedecame, (Y compris les annexes dont les directives PNAM)
PCA D’ici décembre 2015
Non réalisée Entrer en contact avec la FEDECAME pour dispositions utiles
Immédiatement
6 Combler les postes clés proposés par le PNAM dans le Guide des CDR :
- le Pharmacien - le Gestionnaire - le Gestionnaire des
Stocks
- le Comptable
PCA + DPS D’ici décembre 2015
Réalisée (fiches de description disponibles)
Régulariser la situation administrative du personnel
Immédiatement
7 Respecter les Bonnes Pratiques de Distribution; (L’entrepôt actuel ne remplit pas les normes)
Directeur technique
Dans l’immédiat
Non réalisée (existence d’un devis chiffré à plus de 45.000 dollars ; Contrainte majeure « maison de location » ; Stratégie adoptée « finaliser le chantier de la CEDIMEK ».
Finaliser le chantier Evaluer les Gaps pour les capacités de stockage et mener des plaidoyers.
Selon les disponibilités des moyens, mais de préférence d’ici la fin de l’année 2016.
Appendix 9: DRC-IHPplus CEDIMEK CDR situational analysis report from April 2016
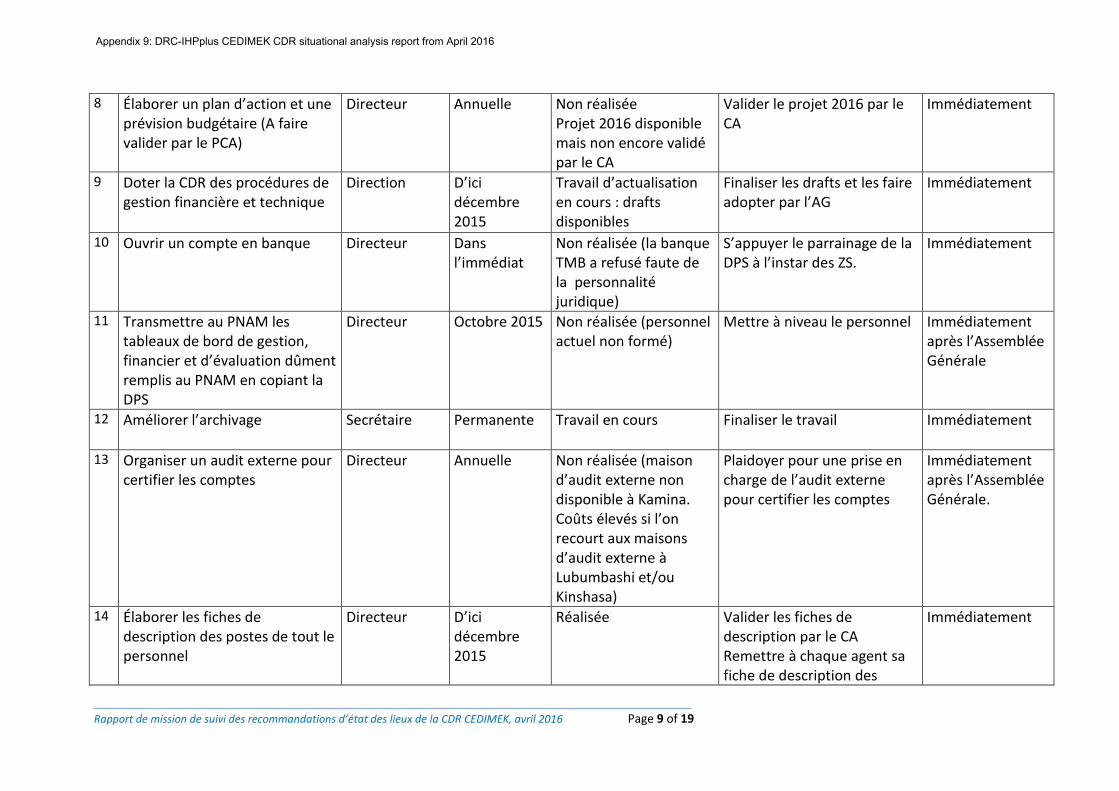
Rapport de mission de suivi des recommandations d’état des lieux de la CDR CEDIMEK, avril 2016 Page 9 of 19
8 Élaborer un plan d’action et une prévision budgétaire (A faire valider par le PCA)
Directeur Annuelle Non réalisée Projet 2016 disponible mais non encore validé par le CA
Valider le projet 2016 par le CA
Immédiatement
9 Doter la CDR des procédures de gestion financière et technique
Direction D’ici décembre 2015
Travail d’actualisation en cours : drafts disponibles
Finaliser les drafts et les faire adopter par l’AG
Immédiatement
10 Ouvrir un compte en banque Directeur Dans l’immédiat
Non réalisée (la banque TMB a refusé faute de la personnalité juridique)
S’appuyer le parrainage de la DPS à l’instar des ZS.
Immédiatement
11 Transmettre au PNAM les tableaux de bord de gestion, financier et d’évaluation dûment remplis au PNAM en copiant la DPS
Directeur Octobre 2015 Non réalisée (personnel actuel non formé)
Mettre à niveau le personnel Immédiatement après l’Assemblée Générale
12 Améliorer l’archivage Secrétaire Permanente Travail en cours Finaliser le travail Immédiatement
13 Organiser un audit externe pour certifier les comptes
Directeur Annuelle Non réalisée (maison d’audit externe non disponible à Kamina. Coûts élevés si l’on recourt aux maisons d’audit externe à Lubumbashi et/ou Kinshasa)
Plaidoyer pour une prise en charge de l’audit externe pour certifier les comptes
Immédiatement après l’Assemblée Générale.
14 Élaborer les fiches de description des postes de tout le personnel
Directeur D’ici décembre 2015
Réalisée Valider les fiches de description par le CA Remettre à chaque agent sa fiche de description des
Immédiatement
Appendix 9: DRC-IHPplus CEDIMEK CDR situational analysis report from April 2016
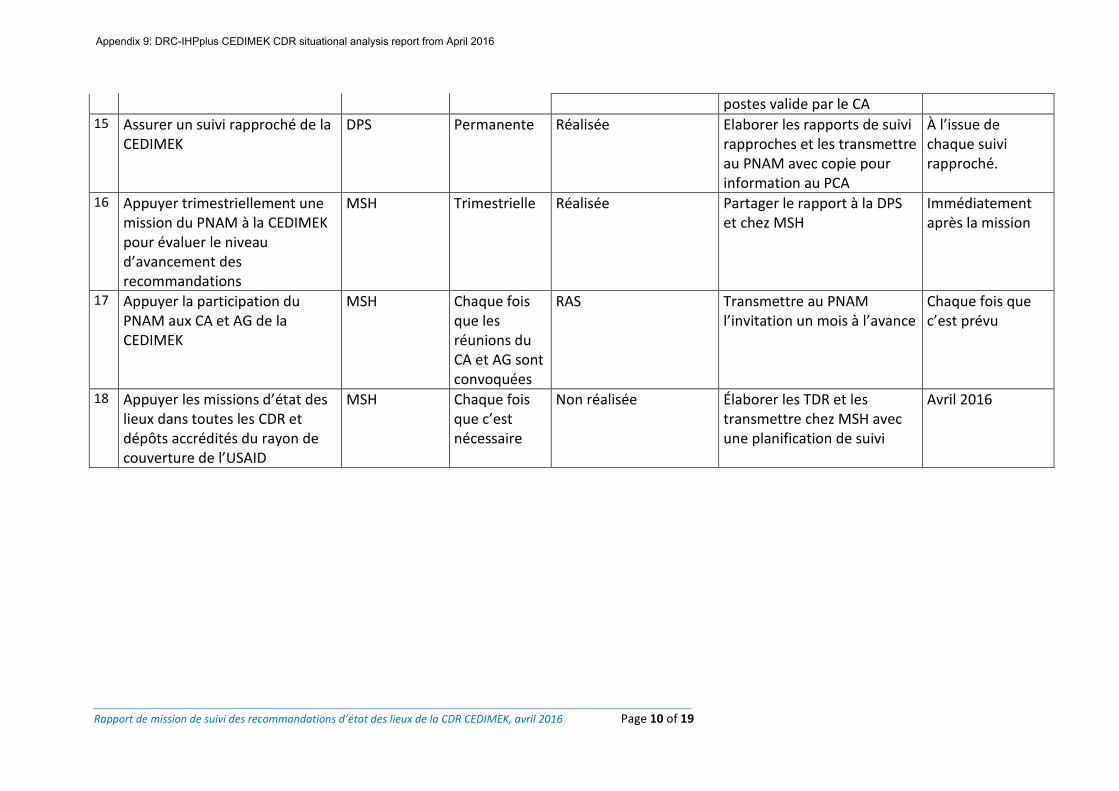
Rapport de mission de suivi des recommandations d’état des lieux de la CDR CEDIMEK, avril 2016 Page 10 of 19
postes valide par le CA 15 Assurer un suivi rapproché de la
CEDIMEK DPS Permanente Réalisée Elaborer les rapports de suivi
rapproches et les transmettre au PNAM avec copie pour information au PCA
À l’issue de chaque suivi rapproché.
16 Appuyer trimestriellement une mission du PNAM à la CEDIMEK pour évaluer le niveau d’avancement des recommandations
MSH Trimestrielle Réalisée Partager le rapport à la DPS et chez MSH
Immédiatement après la mission
17 Appuyer la participation du PNAM aux CA et AG de la CEDIMEK
MSH Chaque fois que les réunions du CA et AG sont convoquées
RAS Transmettre au PNAM l’invitation un mois à l’avance
Chaque fois que c’est prévu
18 Appuyer les missions d’état des lieux dans toutes les CDR et dépôts accrédités du rayon de couverture de l’USAID
MSH Chaque fois que c’est nécessaire
Non réalisée Élaborer les TDR et les transmettre chez MSH avec une planification de suivi
Avril 2016
Appendix 9: DRC-IHPplus CEDIMEK CDR situational analysis report from April 2016
Rapport de mission de suivi des recommandations d’état des lieux de la CDR CEDIMEK, avril 2016 Page 11 of 19
COMMENTAIRES
Il ressort de l’évaluation de niveau d’avancement de mise en œuvre des recommandations
faites par le PNAM à l’issue de la mission d’état des lieux à la CEDIMEK ce qui suit :
Sur les 14 recommandations adressées à la CEDIMEK, 4 ont été réalisées (soit 28,6%) ;
4 ont été partiellement réalisées (soit 28,6%) et 6 n’ont pas été réalisées (soit
42,8%) ;
En rapport avec la principale recommandation càd celle relative à l’amélioration de
Bonnes Pratiques de Distribution, aucune avancée n’a été enregistrée. La raison sur
laquelle s’appuie la direction de la CEDIMEK se situe à trois niveaux :
a. La CEDIMEK loue un entrepôt. Selon le bailleur toute initiative d’amélioration
par le locataire n’engage que ce dernier et n’aura aucun effet bénéfique sur le
prix du loyer ;
b. Le devis élaboré dans le souci du respect de BPD s’élèverait à plus de 45.000
dollars, budget dont la CEDIMEK ne dispose pas ;
c. La CEDIMEK préfère consacrer tous ses efforts à la finalisation de son chantier
pour supprimer les charges liées à la location de l’entrepôt et qui ne répond
pas aux normes.
Au regard de ce qui précède la mission a encouragé la CEDIMEK à mener un plaidoyer
actif pour finaliser la construction de son dépôt d’ici la fin de cette année.
Pour les autres recommandations, la DPS a été chargée de convoquer une réunion
extraordinaire du Conseil d’Administration afin d’adopter toutes les procédures, le
Statut et autres documents en souffrance à la CEDIMEK.
Appendix 9: DRC-IHPplus CEDIMEK CDR situational analysis report from April 2016
Rapport de mission de suivi des recommandations d’état des lieux de la CDR CEDIMEK, avril 2016 Page 12 of 19
II.3.2. Tenir des séances de travail avec la DPS, le Conseil d’Administration de la CDR CEDIMEK, MSH (SIAPS et PROSANIplus) en vue de décider sur le devenir de cette CDR
La mission a tenu des séances de travail avec les structures suivantes :
1. Au niveau de la DPS
Trois séances de travail ont été successivement tenues avec le Chef de Division de la DPS, le Coach de la DPS et l’AT Unicef pour les activités liées au Cadre d’Accélération des Objectifs du millénaire (CAO).
Avec le Chef de Division la mission est revenue sur les objectifs spécifiques de la mission. C’est fut aussi une opportunité de la mission pour obtenir le point de vue de la DPS sur les recommandations formulées par le PNAM en tant que membre du CA de la CEDIMEK et œil de l’Etat Congolais auprès de cette structure d’utilité publique. A l’issue de cette séance de travail, le CD a mis à la disposition de la mission le pharmacien responsable du bureau contrôle et inspection pour l’accompagner dans la suite de sa mission.
Avec le Coach de la DPS, les échanges ont plus tourné sur les attributions du groupe de travail médicaments de la DPS et l’installation du Comité Provincial de Pilotage.
Avec l’AT DPS pour le compte de l’UNICEF DANS les activités du CAO 4 et 5, la mission a focalisé ses échanges sur les stratégies des approvisionnements dans l’axe fluvial de la DPS Haut Lomami.
2. Au niveau de la CEDIMEK
Deux séances de travail ont eu lieu avec le Directeur de la CEDIMEK. Elles avaient pour objectif principal l’évaluation du niveau d’avancement des recommandations de la mission de septembre 2015 dont les résultats sont présentés au point 3.1.
3. Au niveau de MSH
Deux séances de travail ont eu lieu avec le Directeur de Coordination IHPplus. La première pour le briefing de la mission et la seconde pour le débriefing de la mission.
II.3.3. Renforcer les capacités gestionnaires et techniques des cadres de la CEDIMEK sur l’utilisation des tableaux de bord de gestion, d’évaluation et financier
Faute de temps, la mission n’a pas abordé ce point. La recommandation a été faite au Directeur de la CEDIMEK d’inscrire ce point a la prochaine réunion du CA pour relancer ce dossier.
II.3.4. Renforcer les capacités gestionnaires et techniques des Cadres de la CEDIMEK sur les Bonnes Pratiques de Distribution
Voir point 3.3
Appendix 9: DRC-IHPplus CEDIMEK CDR situational analysis report from April 2016
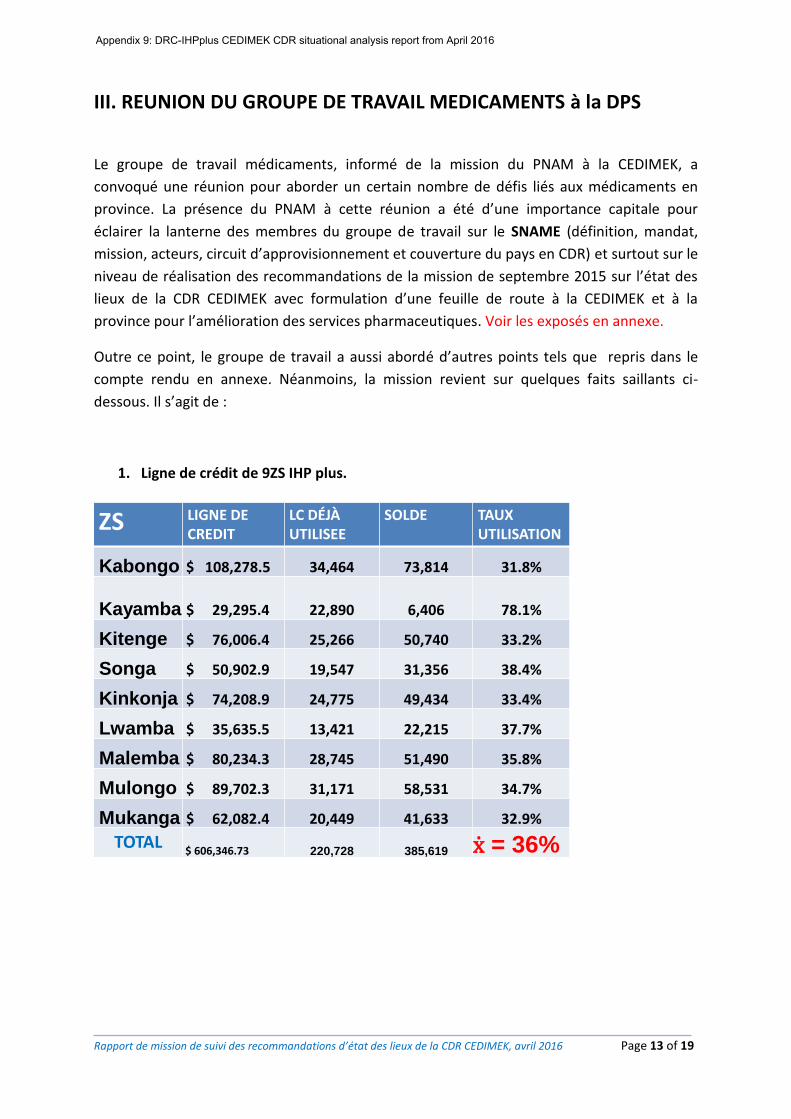
Rapport de mission de suivi des recommandations d’état des lieux de la CDR CEDIMEK, avril 2016 Page 13 of 19
III. REUNION DU GROUPE DE TRAVAIL MEDICAMENTS à la DPS
Le groupe de travail médicaments, informé de la mission du PNAM à la CEDIMEK, a
convoqué une réunion pour aborder un certain nombre de défis liés aux médicaments en
province. La présence du PNAM à cette réunion a été d’une importance capitale pour
éclairer la lanterne des membres du groupe de travail sur le SNAME (définition, mandat,
mission, acteurs, circuit d’approvisionnement et couverture du pays en CDR) et surtout sur le
niveau de réalisation des recommandations de la mission de septembre 2015 sur l’état des
lieux de la CDR CEDIMEK avec formulation d’une feuille de route à la CEDIMEK et à la
province pour l’amélioration des services pharmaceutiques. Voir les exposés en annexe.
Outre ce point, le groupe de travail a aussi abordé d’autres points tels que repris dans le
compte rendu en annexe. Néanmoins, la mission revient sur quelques faits saillants ci-
dessous. Il s’agit de :
1. Ligne de crédit de 9ZS IHP plus.
ZS LIGNE DE CREDIT
LC DÉJÀ UTILISEE
SOLDE TAUX UTILISATION
Kabongo $ 108,278.5 34,464 73,814 31.8%
Kayamba $ 29,295.4 22,890 6,406 78.1%
Kitenge $ 76,006.4 25,266 50,740 33.2%
Songa $ 50,902.9 19,547 31,356 38.4%
Kinkonja $ 74,208.9 24,775 49,434 33.4%
Lwamba $ 35,635.5 13,421 22,215 37.7%
Malemba $ 80,234.3 28,745 51,490 35.8%
Mulongo $ 89,702.3 31,171 58,531 34.7%
Mukanga $ 62,082.4 20,449 41,633 32.9%
TOTAL$ 606,346.73 220,728 385,619 ẋ = 36%
Appendix 9: DRC-IHPplus CEDIMEK CDR situational analysis report from April 2016
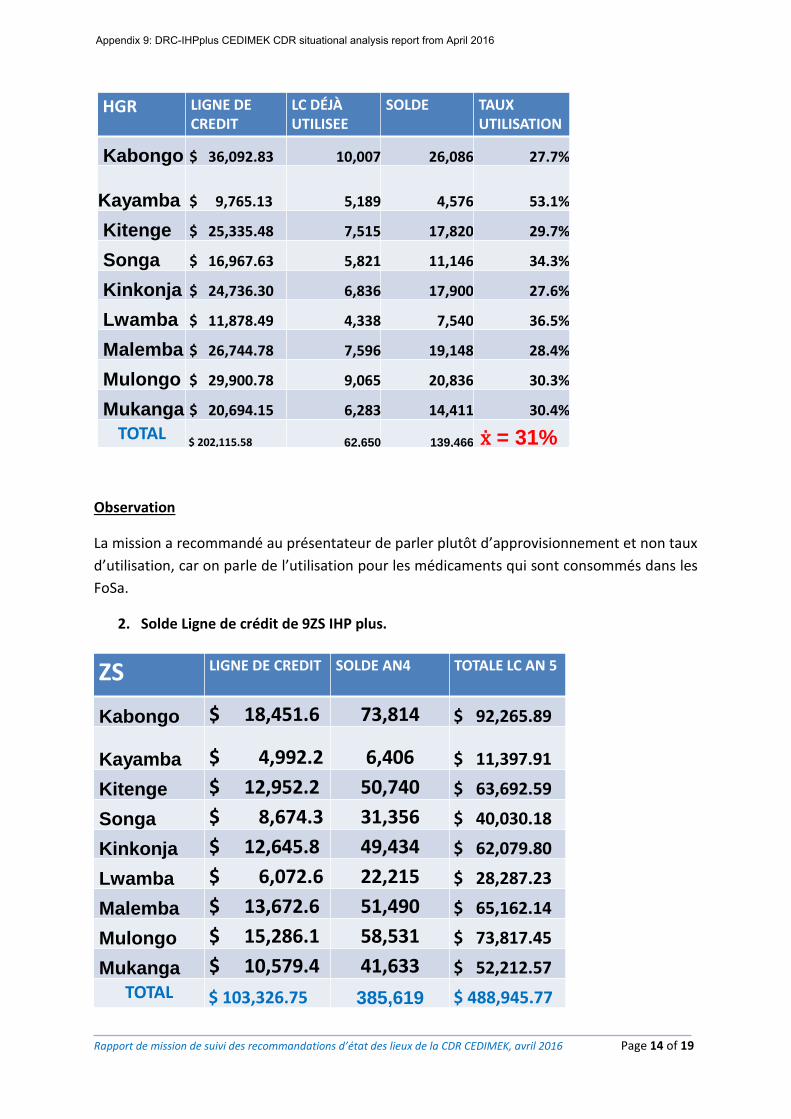
Rapport de mission de suivi des recommandations d’état des lieux de la CDR CEDIMEK, avril 2016 Page 14 of 19
HGR LIGNE DE CREDIT
LC DÉJÀ UTILISEE
SOLDE TAUX UTILISATION
Kabongo $ 36,092.83 10,007 26,086 27.7%
Kayamba $ 9,765.13 5,189 4,576 53.1%
Kitenge $ 25,335.48 7,515 17,820 29.7%
Songa $ 16,967.63 5,821 11,146 34.3%
Kinkonja $ 24,736.30 6,836 17,900 27.6%
Lwamba $ 11,878.49 4,338 7,540 36.5%
Malemba $ 26,744.78 7,596 19,148 28.4%
Mulongo $ 29,900.78 9,065 20,836 30.3%
Mukanga $ 20,694.15 6,283 14,411 30.4%
TOTAL$ 202,115.58 62,650 139,466 ẋ = 31%
Observation
La mission a recommandé au présentateur de parler plutôt d’approvisionnement et non taux
d’utilisation, car on parle de l’utilisation pour les médicaments qui sont consommés dans les
FoSa.
2. Solde Ligne de crédit de 9ZS IHP plus.
ZS LIGNE DE CREDIT SOLDE AN4 TOTALE LC AN 5
Kabongo $ 18,451.6 73,814 $ 92,265.89
Kayamba $ 4,992.2 6,406 $ 11,397.91
Kitenge $ 12,952.2 50,740 $ 63,692.59
Songa $ 8,674.3 31,356 $ 40,030.18
Kinkonja $ 12,645.8 49,434 $ 62,079.80
Lwamba $ 6,072.6 22,215 $ 28,287.23
Malemba $ 13,672.6 51,490 $ 65,162.14
Mulongo $ 15,286.1 58,531 $ 73,817.45
Mukanga $ 10,579.4 41,633 $ 52,212.57
TOTAL $ 103,326.75 385,619 $ 488,945.77
Appendix 9: DRC-IHPplus CEDIMEK CDR situational analysis report from April 2016
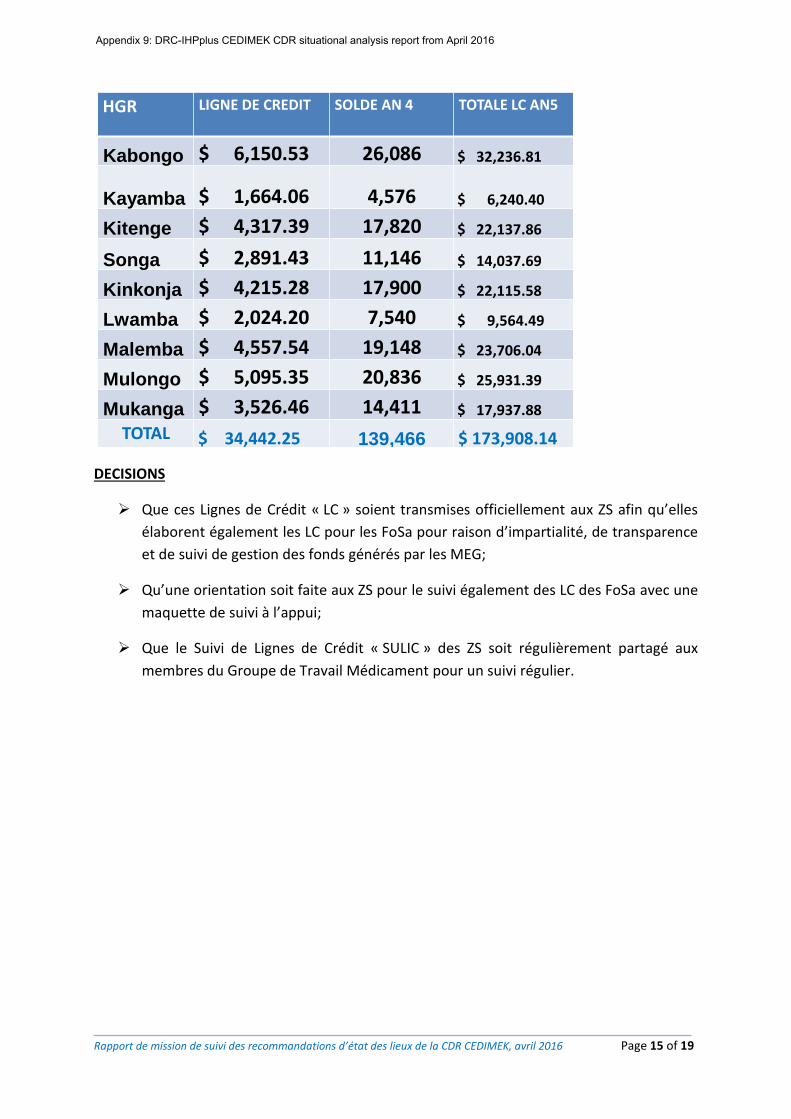
Rapport de mission de suivi des recommandations d’état des lieux de la CDR CEDIMEK, avril 2016 Page 15 of 19
HGR LIGNE DE CREDIT SOLDE AN 4 TOTALE LC AN5
Kabongo $ 6,150.53 26,086 $ 32,236.81
Kayamba $ 1,664.06 4,576 $ 6,240.40
Kitenge $ 4,317.39 17,820 $ 22,137.86
Songa $ 2,891.43 11,146 $ 14,037.69
Kinkonja $ 4,215.28 17,900 $ 22,115.58
Lwamba $ 2,024.20 7,540 $ 9,564.49
Malemba $ 4,557.54 19,148 $ 23,706.04
Mulongo $ 5,095.35 20,836 $ 25,931.39
Mukanga $ 3,526.46 14,411 $ 17,937.88
TOTAL $ 34,442.25 139,466 $ 173,908.14
DECISIONS
Que ces Lignes de Crédit « LC » soient transmises officiellement aux ZS afin qu’elles
élaborent également les LC pour les FoSa pour raison d’impartialité, de transparence
et de suivi de gestion des fonds générés par les MEG;
Qu’une orientation soit faite aux ZS pour le suivi également des LC des FoSa avec une
maquette de suivi à l’appui;
Que le Suivi de Lignes de Crédit « SULIC » des ZS soit régulièrement partagé aux
membres du Groupe de Travail Médicament pour un suivi régulier.
Appendix 9: DRC-IHPplus CEDIMEK CDR situational analysis report from April 2016
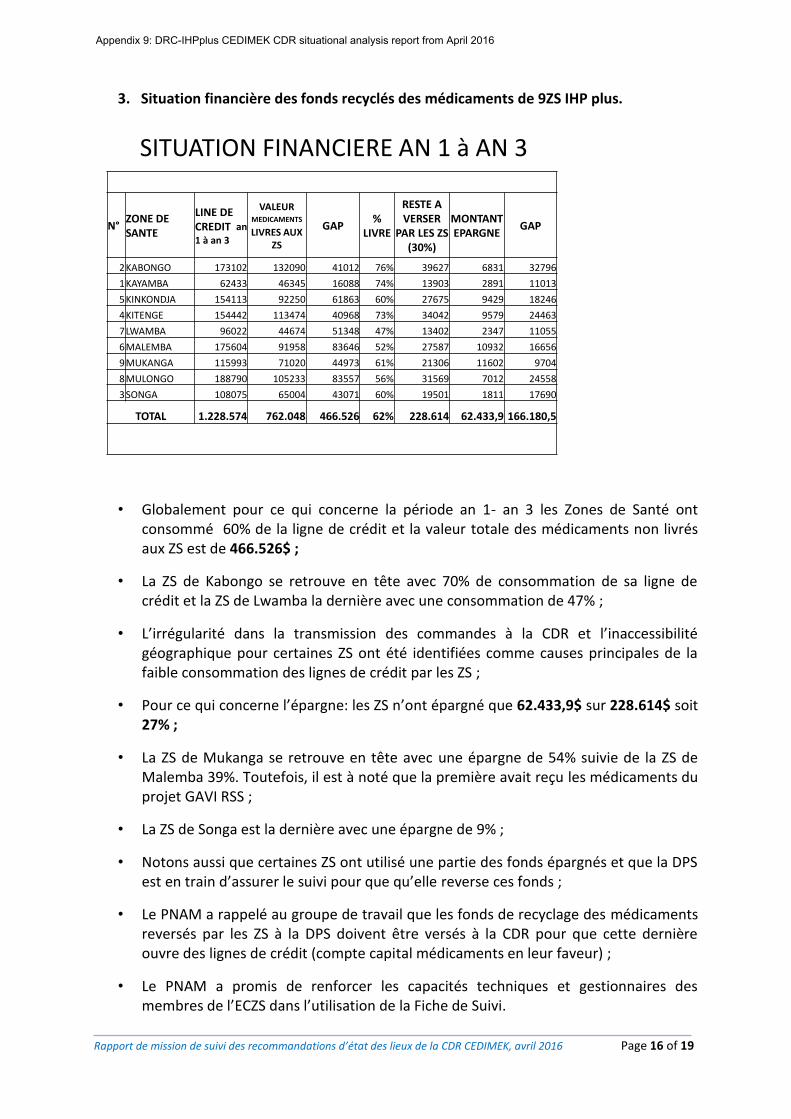
Rapport de mission de suivi des recommandations d’état des lieux de la CDR CEDIMEK, avril 2016 Page 16 of 19
3. Situation financière des fonds recyclés des médicaments de 9ZS IHP plus.
SITUATION FINANCIERE AN 1 à AN 3
N°ZONE DE SANTE
LINE DE CREDIT an
1 à an 3
VALEUR MEDICAMENTS
LIVRES AUX ZS
GAP%
LIVRE
RESTE A VERSER
PAR LES ZS (30%)
MONTANT EPARGNE
GAP
2KABONGO 173102 132090 41012 76% 39627 6831 32796
1KAYAMBA 62433 46345 16088 74% 13903 2891 11013
5KINKONDJA 154113 92250 61863 60% 27675 9429 18246
4KITENGE 154442 113474 40968 73% 34042 9579 24463
7LWAMBA 96022 44674 51348 47% 13402 2347 11055
6MALEMBA 175604 91958 83646 52% 27587 10932 16656
9MUKANGA 115993 71020 44973 61% 21306 11602 9704
8MULONGO 188790 105233 83557 56% 31569 7012 24558
3SONGA 108075 65004 43071 60% 19501 1811 17690
TOTAL 1.228.574 762.048 466.526 62% 228.614 62.433,9 166.180,5
• Globalement pour ce qui concerne la période an 1- an 3 les Zones de Santé ont consommé 60% de la ligne de crédit et la valeur totale des médicaments non livrés aux ZS est de 466.526$ ;
• La ZS de Kabongo se retrouve en tête avec 70% de consommation de sa ligne de crédit et la ZS de Lwamba la dernière avec une consommation de 47% ;
• L’irrégularité dans la transmission des commandes à la CDR et l’inaccessibilité géographique pour certaines ZS ont été identifiées comme causes principales de la faible consommation des lignes de crédit par les ZS ;
• Pour ce qui concerne l’épargne: les ZS n’ont épargné que 62.433,9$ sur 228.614$ soit 27% ;
• La ZS de Mukanga se retrouve en tête avec une épargne de 54% suivie de la ZS de Malemba 39%. Toutefois, il est à noté que la première avait reçu les médicaments du projet GAVI RSS ;
• La ZS de Songa est la dernière avec une épargne de 9% ;
• Notons aussi que certaines ZS ont utilisé une partie des fonds épargnés et que la DPS est en train d’assurer le suivi pour que qu’elle reverse ces fonds ;
• Le PNAM a rappelé au groupe de travail que les fonds de recyclage des médicaments reversés par les ZS à la DPS doivent être versés à la CDR pour que cette dernière ouvre des lignes de crédit (compte capital médicaments en leur faveur) ;
• Le PNAM a promis de renforcer les capacités techniques et gestionnaires des membres de l’ECZS dans l’utilisation de la Fiche de Suivi.
Appendix 9: DRC-IHPplus CEDIMEK CDR situational analysis report from April 2016
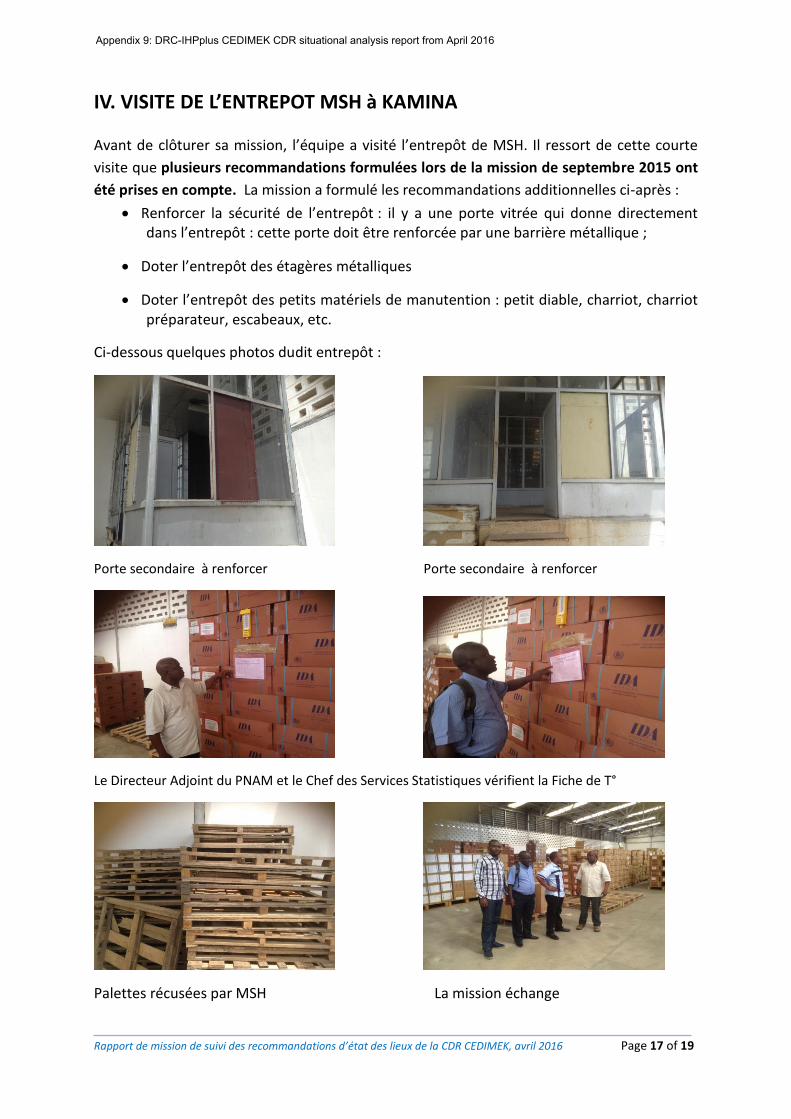
Rapport de mission de suivi des recommandations d’état des lieux de la CDR CEDIMEK, avril 2016 Page 17 of 19
IV. VISITE DE L’ENTREPOT MSH à KAMINA
Avant de clôturer sa mission, l’équipe a visité l’entrepôt de MSH. Il ressort de cette courte
visite que plusieurs recommandations formulées lors de la mission de septembre 2015 ont
été prises en compte. La mission a formulé les recommandations additionnelles ci-après :
Renforcer la sécurité de l’entrepôt : il y a une porte vitrée qui donne directement dans l’entrepôt : cette porte doit être renforcée par une barrière métallique ;
Doter l’entrepôt des étagères métalliques
Doter l’entrepôt des petits matériels de manutention : petit diable, charriot, charriot préparateur, escabeaux, etc.
Ci-dessous quelques photos dudit entrepôt :
Porte secondaire à renforcer Porte secondaire à renforcer
Le Directeur Adjoint du PNAM et le Chef des Services Statistiques vérifient la Fiche de T°
Palettes récusées par MSH La mission échange
Appendix 9: DRC-IHPplus CEDIMEK CDR situational analysis report from April 2016
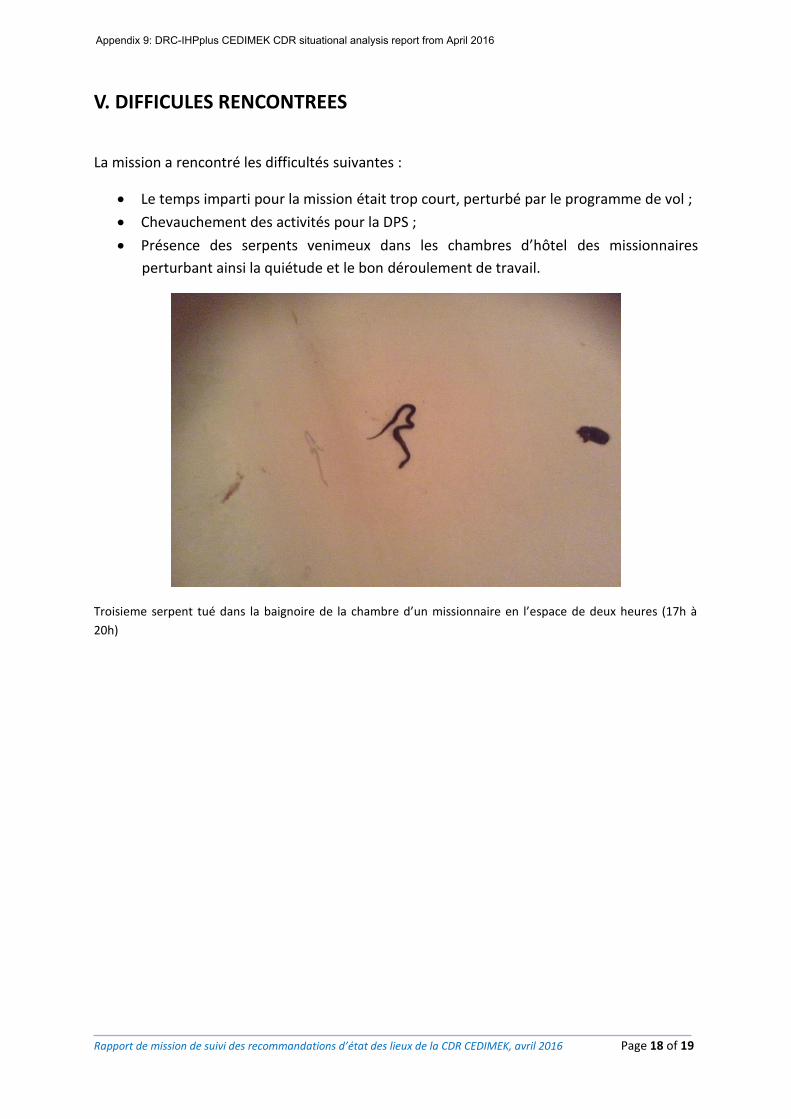
Rapport de mission de suivi des recommandations d’état des lieux de la CDR CEDIMEK, avril 2016 Page 18 of 19
V. DIFFICULES RENCONTREES
La mission a rencontré les difficultés suivantes :
Le temps imparti pour la mission était trop court, perturbé par le programme de vol ;
Chevauchement des activités pour la DPS ;
Présence des serpents venimeux dans les chambres d’hôtel des missionnaires
perturbant ainsi la quiétude et le bon déroulement de travail.
Troisieme serpent tué dans la baignoire de la chambre d’un missionnaire en l’espace de deux heures (17h à
20h)
Appendix 9: DRC-IHPplus CEDIMEK CDR situational analysis report from April 2016
Rapport de mission de suivi des recommandations d’état des lieux de la CDR CEDIMEK, avril 2016 Page 19 of 19
VI. CONCLUSION ET PROCHAINES ETAPES
Cette mission de suivi du niveau d’avancement des recommandations formulées par le PNAM à l’issue de la mission d’état des lieux qui a eu lieu en septembre 2015 à la CDR CEDIMEK a permis à la DPS de se rendre compte qu’elle a intérêt d’effectuer des missions de suivi rapproché à la CEDIMEK pour éviter que cette dernière ne disparaisse.
Donc la DPS se doit de s’approprier cette centrale.
Le résultat de l’évaluation des recommandations prouve à suffisance que le Conseil d’Administration doit ouvrir l’œil et le bon afin que toutes les recommandations non réalisées le soient dans l’échéance proposée.
A l’issue de la présente mission, le PNAM procédera à un plaidoyer auprès des partenaires afin que la CEDIMEK obtienne des appuis pour réaliser les audits externes et finaliser son chantier dans un bref délai.
PROCHAINES ETAPES : Accompagner la DPS dans le suivi du maintien du capital médicament à travers la
« Fiche de Suivi de Gestion des Médicaments » en 45 étapes développé par le PNAM ;
Appuyer la DPS et les ZS dans le maintien de la qualité des médicaments ;
Accompagner la Cedimek dans la finalisation et l’organisation de son bâtiment en
construction ;
S’assurer que les Bonnes Pratiques de Distribution continuent d’être observées dans
le dépôt MSH.
Fait à Kinshasa, le 06 avril 2016
Appendix 9: DRC-IHPplus CEDIMEK CDR situational analysis report from April 2016
This presentation was made possible by the American people through the U.S. Agency for
International Development (USAID) under Cooperative Agreement No. AID-OAA-A-11-00031,
the Strengthening Partnerships, Results, and Innovations in Nutrition Globally (SPRING) project.
Adolescent Girls and
Women’s Nutrition:
Moving the Agenda Forward Sascha Lamstein, PhD
Technical Advisor and Systems Thinking
for Nutrition Team Lead, SPRING
Appendix 10: Adolescent girls and woman's nutrition, moving the agenda forward by USAID and SPRING
By the end of this session,
participants will:
• Know the landscape of nutrition issues that
adolescent girls and women of reproductive
age (WRA) face
• Understand the importance of increasing
nutrition programming for adolescent girls
and WRA
• Be able to identify at least two strategies
for improving nutritional status of adolescent
girls and WRA
Appendix 10: Adolescent girls and woman's nutrition, moving the agenda forward by USAID and SPRING
Nutrition of adolescents
girls and WRA: current context
Appendix 10: Adolescent girls and woman's nutrition, moving the agenda forward by USAID and SPRING
Adolescent girls and WRA
represent ~30% of the population
in the MSN-GLEE countries
Appendix 10: Adolescent girls and woman's nutrition, moving the agenda forward by USAID and SPRING
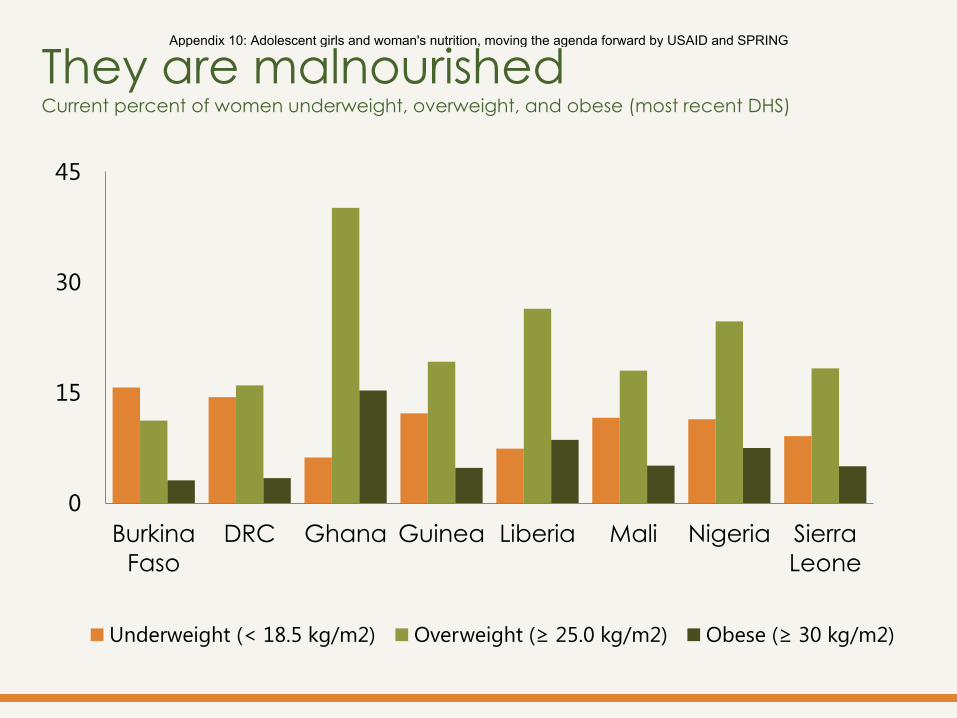
They are malnourished Current percent of women underweight, overweight, and obese (most recent DHS)
0
15
30
45
Burkina
Faso
DRC Ghana Guinea Liberia Mali Nigeria Sierra
Leone
Underweight (< 18.5 kg/m2) Overweight (≥ 25.0 kg/m2) Obese (≥ 30 kg/m2)
Appendix 10: Adolescent girls and woman's nutrition, moving the agenda forward by USAID and SPRING
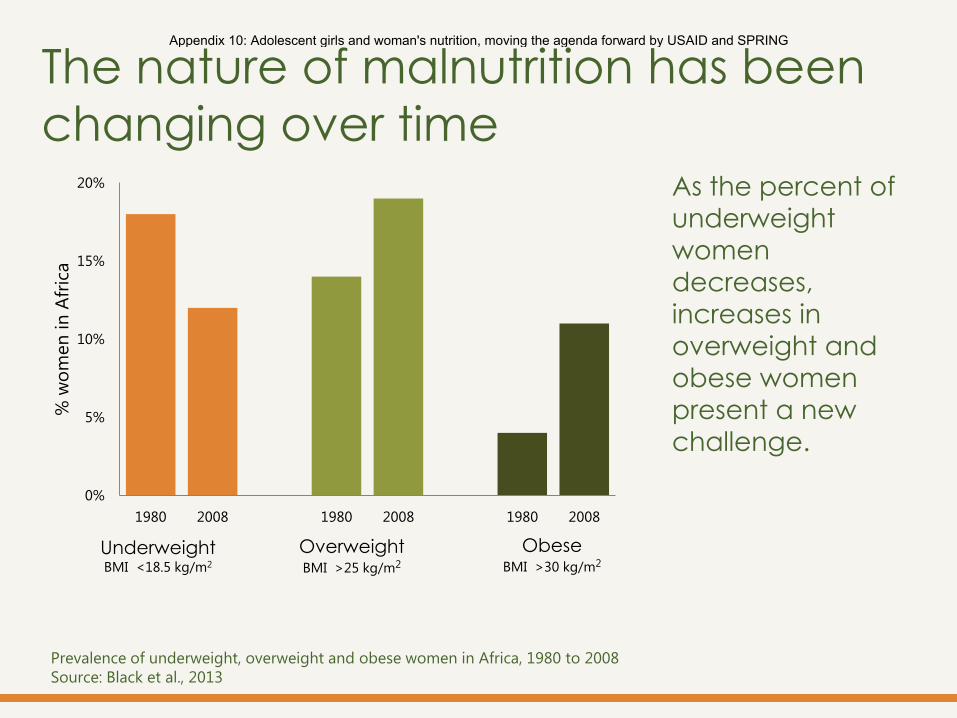
As the percent of
underweight
women
decreases,
increases in
overweight and
obese women
present a new
challenge.
The nature of malnutrition has been
changing over time
Prevalence of underweight, overweight and obese women in Africa, 1980 to 2008
Source: Black et al., 2013
0%
5%
10%
15%
20%
1980 2008 1980 2008 1980 2008
% w
om
en
in
Afr
ica
Underweight BMI <18.5 kg/m2
Overweight BMI >25 kg/m2
Obese BMI >30 kg/m2
Appendix 10: Adolescent girls and woman's nutrition, moving the agenda forward by USAID and SPRING
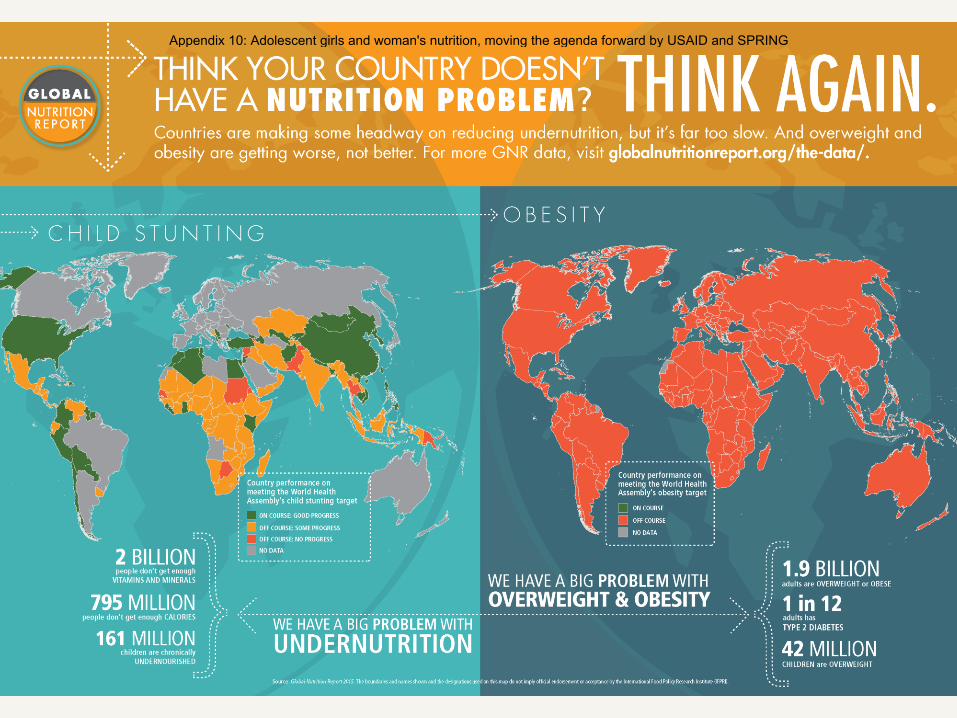
Appendix 10: Adolescent girls and woman's nutrition, moving the agenda forward by USAID and SPRING
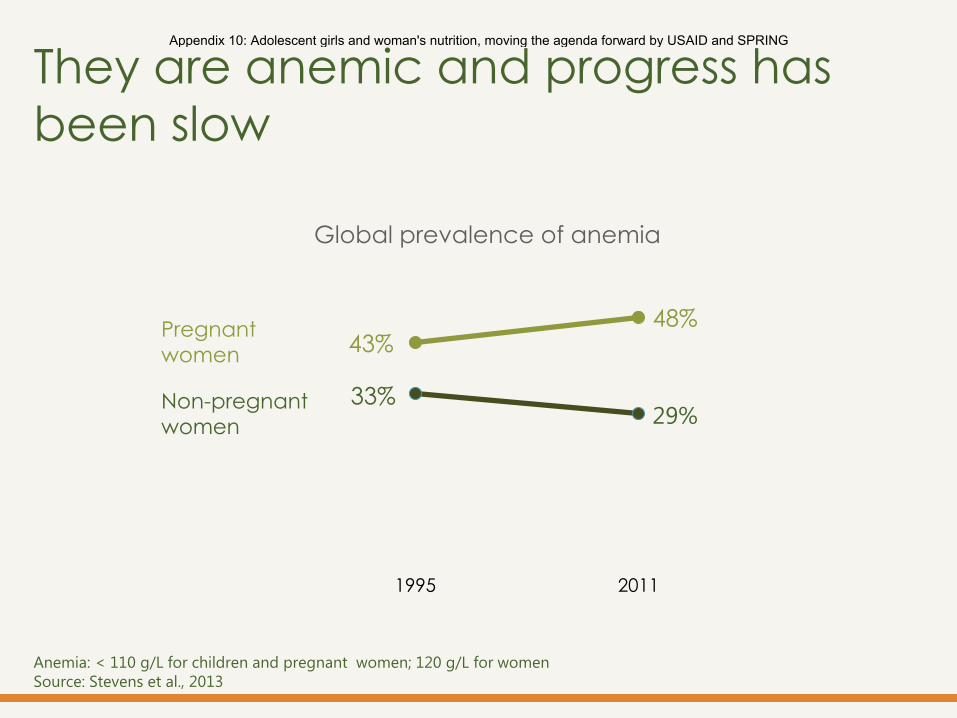
They are anemic and progress has
been slow
43% 48%
33% 29%
1995 2011
Global prevalence of anemia
Pregnant
women
Non-pregnant
women
Anemia: < 110 g/L for children and pregnant women; 120 g/L for women
Source: Stevens et al., 2013
Appendix 10: Adolescent girls and woman's nutrition, moving the agenda forward by USAID and SPRING
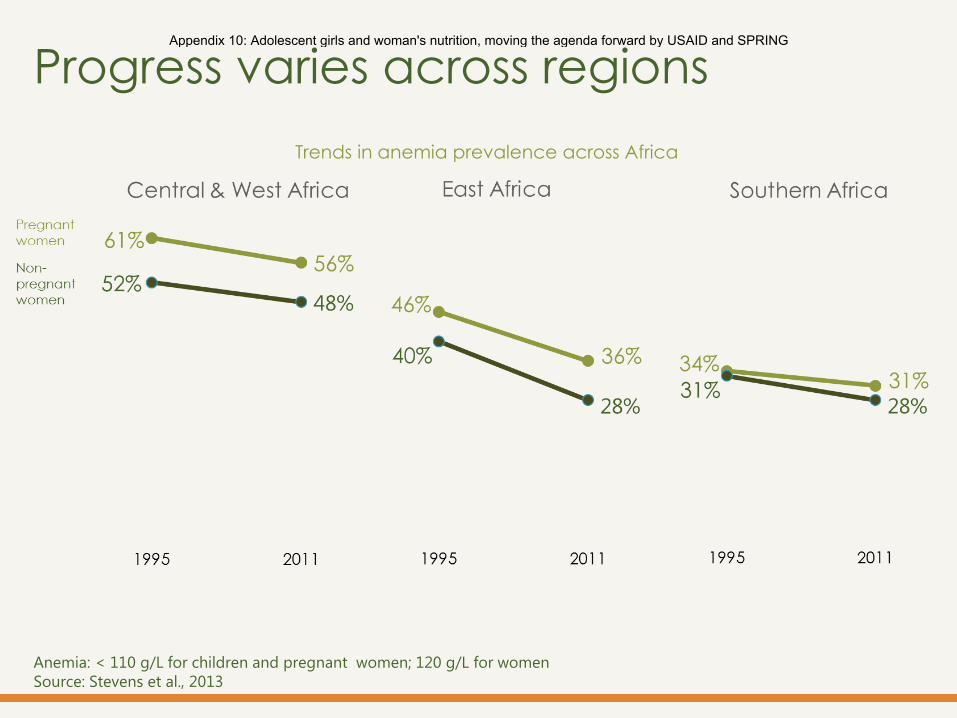
Progress varies across regions
Trends in anemia prevalence across Africa
Anemia: < 110 g/L for children and pregnant women; 120 g/L for women
Source: Stevens et al., 2013
Appendix 10: Adolescent girls and woman's nutrition, moving the agenda forward by USAID and SPRING
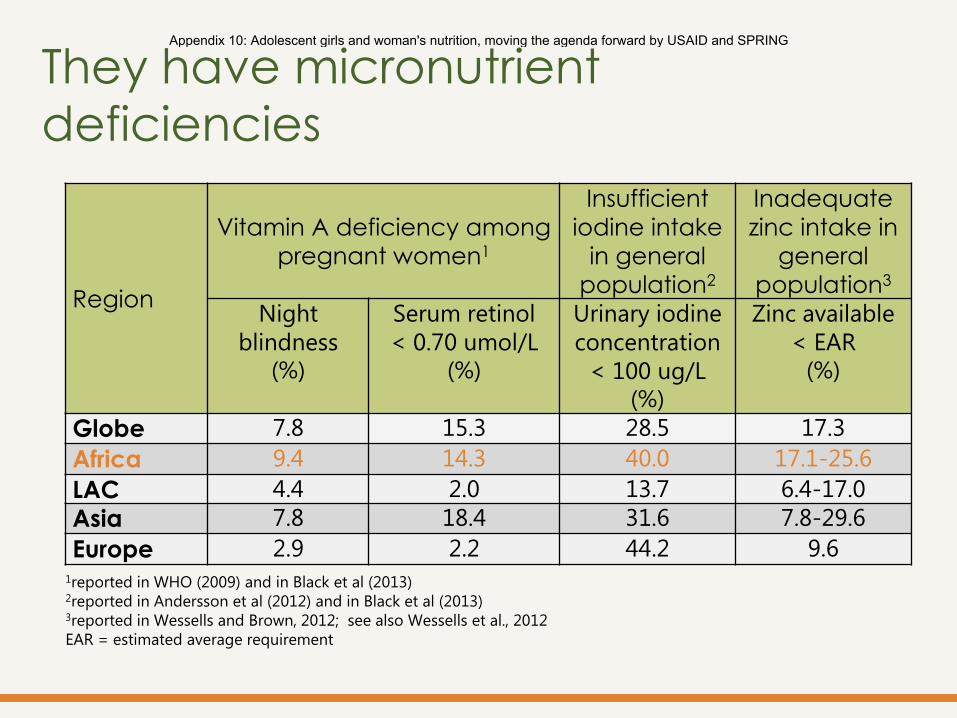
Region
Vitamin A deficiency among
pregnant women1
Insufficient
iodine intake
in general
population2
Inadequate
zinc intake in
general
population3 Night
blindness (%)
Serum retinol
< 0.70 umol/L (%)
Urinary iodine
concentration
< 100 ug/L (%)
Zinc available
< EAR (%)
Globe 7.8 15.3 28.5 17.3
Africa 9.4 14.3 40.0 17.1-25.6
LAC 4.4 2.0 13.7 6.4-17.0 Asia 7.8 18.4 31.6 7.8-29.6
Europe 2.9 2.2 44.2 9.6 1reported in WHO (2009) and in Black et al (2013) 2reported in Andersson et al (2012) and in Black et al (2013) 3reported in Wessells and Brown, 2012; see also Wessells et al., 2012
EAR = estimated average requirement
They have micronutrient
deficiencies
Appendix 10: Adolescent girls and woman's nutrition, moving the agenda forward by USAID and SPRING

Estimated intakes of selected “healthy” and “unhealthy” foods by region among women 20-29 years. See SSA for
data on Sub-Saharan Africa.
Horizontal lines represent the mean of the theoretical minimal risk exposure distribution.
Source: Imamura et al., 2015
They don’t eat well Healthy food intake is below
recommended levels
While unhealthy food
intake exceeds
recommended
thresholds.
Appendix 10: Adolescent girls and woman's nutrition, moving the agenda forward by USAID and SPRING
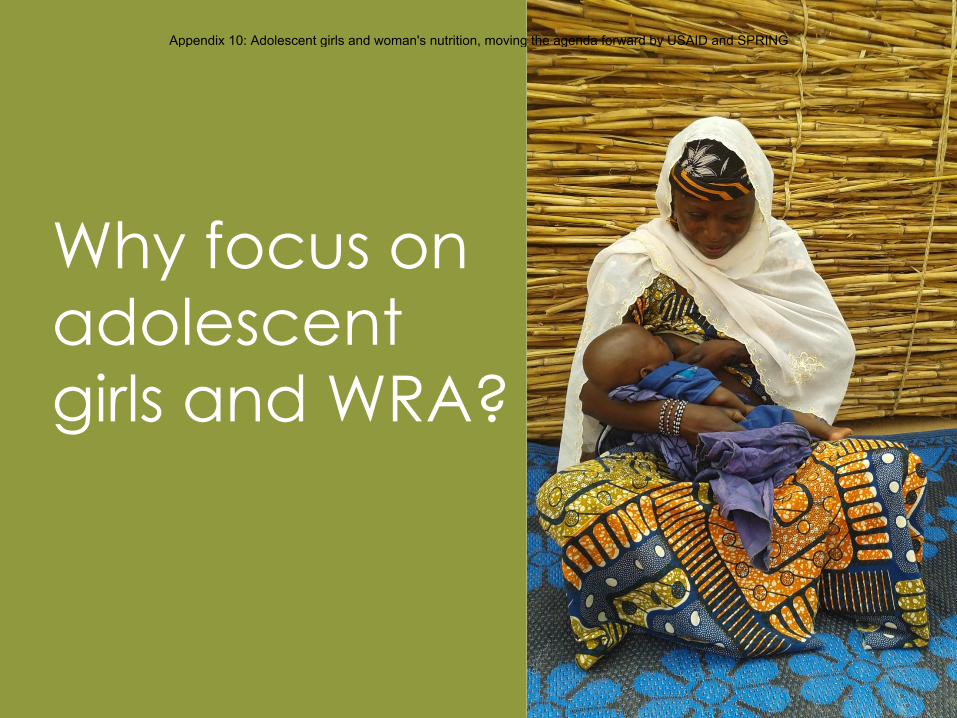
Why focus on
adolescent
girls and WRA?
Appendix 10: Adolescent girls and woman's nutrition, moving the agenda forward by USAID and SPRING
Their nutritional status
affects others.
Appendix 10: Adolescent girls and woman's nutrition, moving the agenda forward by USAID and SPRING
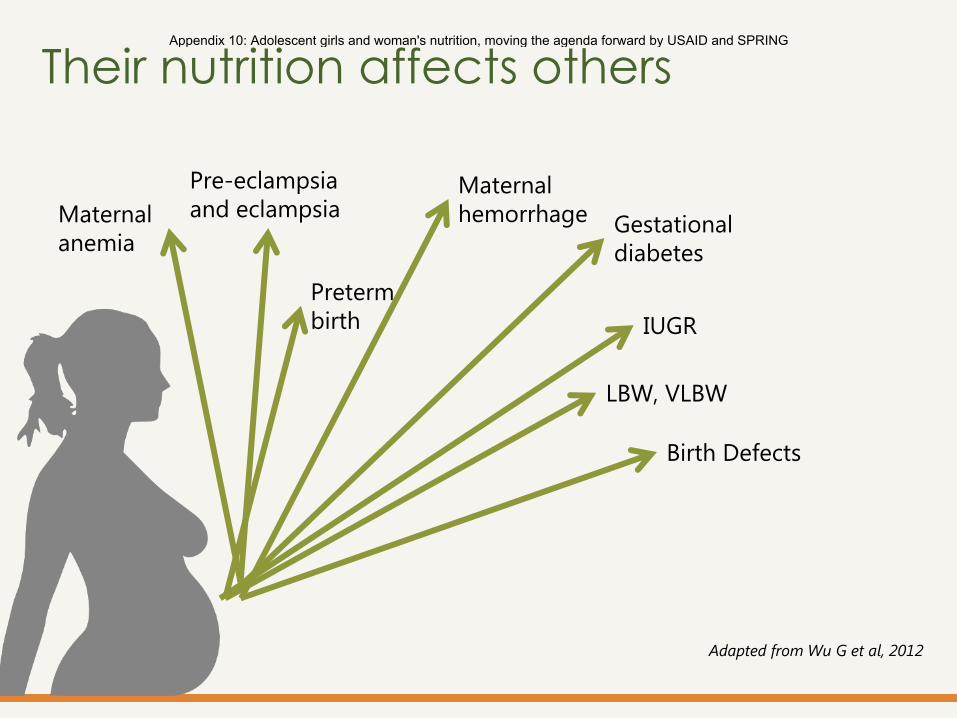
Their nutrition affects others
Maternal
anemia
Adapted from Wu G et al, 2012
Preterm
birth
Maternal
hemorrhage
Pre-eclampsia
and eclampsia
IUGR
LBW, VLBW
Birth Defects
Gestational
diabetes
Appendix 10: Adolescent girls and woman's nutrition, moving the agenda forward by USAID and SPRING
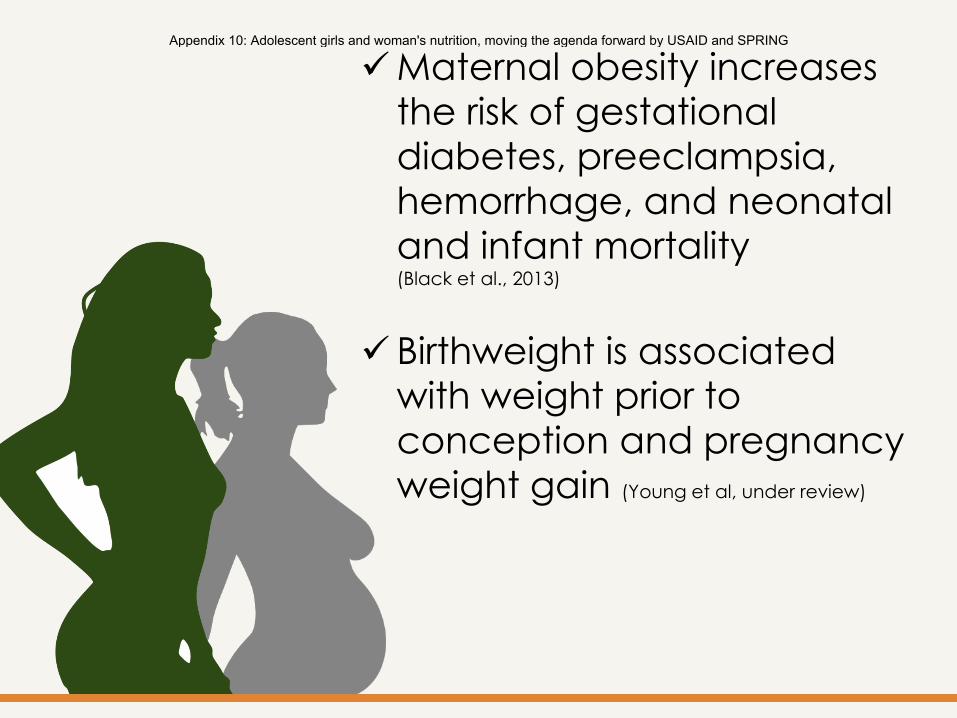
Maternal obesity increases
the risk of gestational
diabetes, preeclampsia,
hemorrhage, and neonatal
and infant mortality (Black et al., 2013)
Birthweight is associated
with weight prior to
conception and pregnancy
weight gain (Young et al, under review)
Appendix 10: Adolescent girls and woman's nutrition, moving the agenda forward by USAID and SPRING
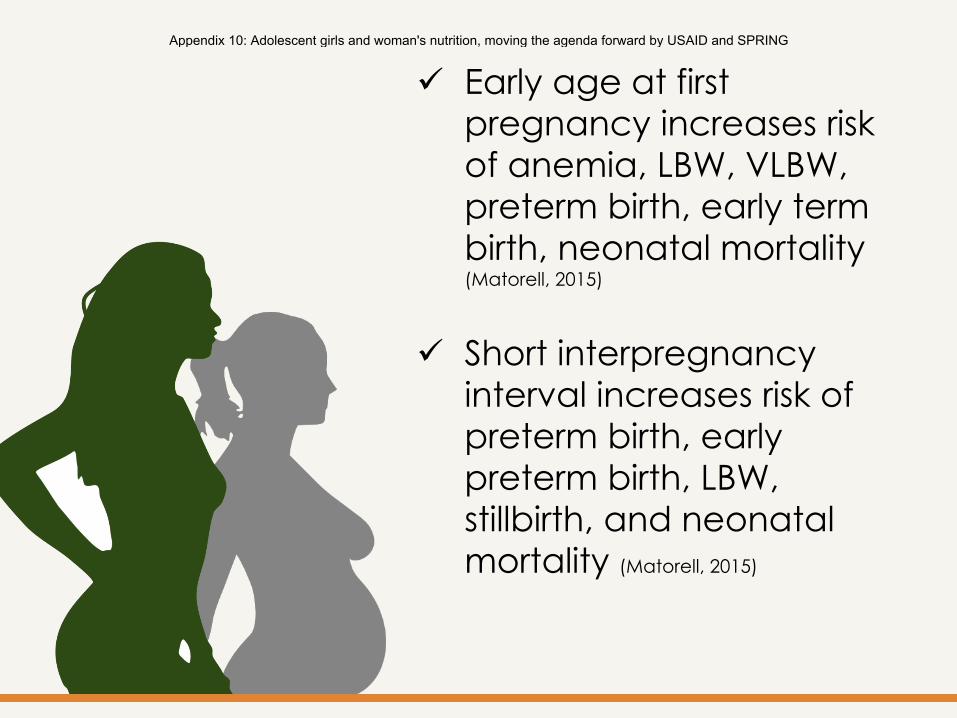
Early age at first
pregnancy increases risk
of anemia, LBW, VLBW,
preterm birth, early term
birth, neonatal mortality (Matorell, 2015)
Short interpregnancy
interval increases risk of
preterm birth, early
preterm birth, LBW,
stillbirth, and neonatal
mortality (Matorell, 2015)
Appendix 10: Adolescent girls and woman's nutrition, moving the agenda forward by USAID and SPRING
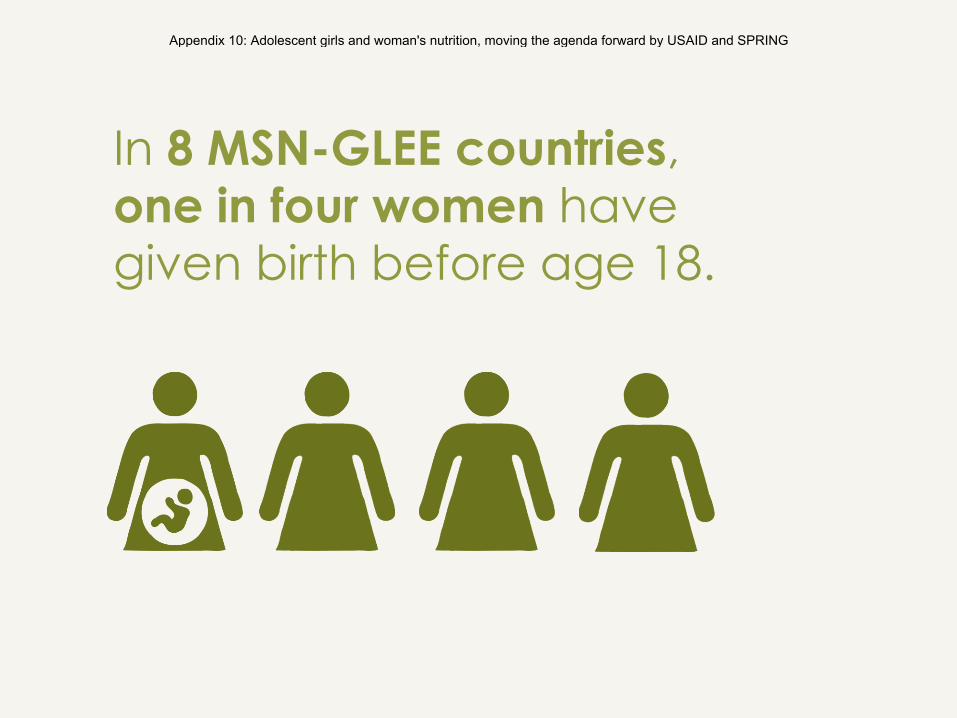
In 8 MSN-GLEE countries,
one in four women have
given birth before age 18.
Appendix 10: Adolescent girls and woman's nutrition, moving the agenda forward by USAID and SPRING
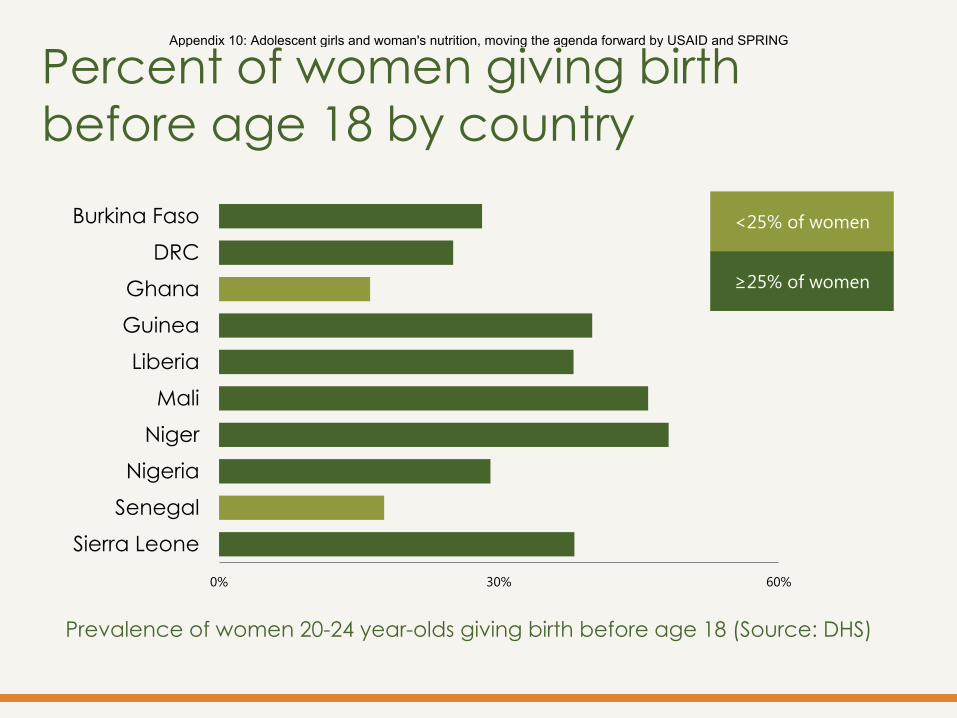
Prevalence of women 20-24 year-olds giving birth before age 18 (Source: DHS)
0% 30% 60%
Burkina Faso
DRC
Ghana
Guinea
Liberia
Mali
Niger
Nigeria
Senegal
Sierra Leone
Percent of women giving birth
before age 18 by country
<25% of women
≥25% of women
Appendix 10: Adolescent girls and woman's nutrition, moving the agenda forward by USAID and SPRING
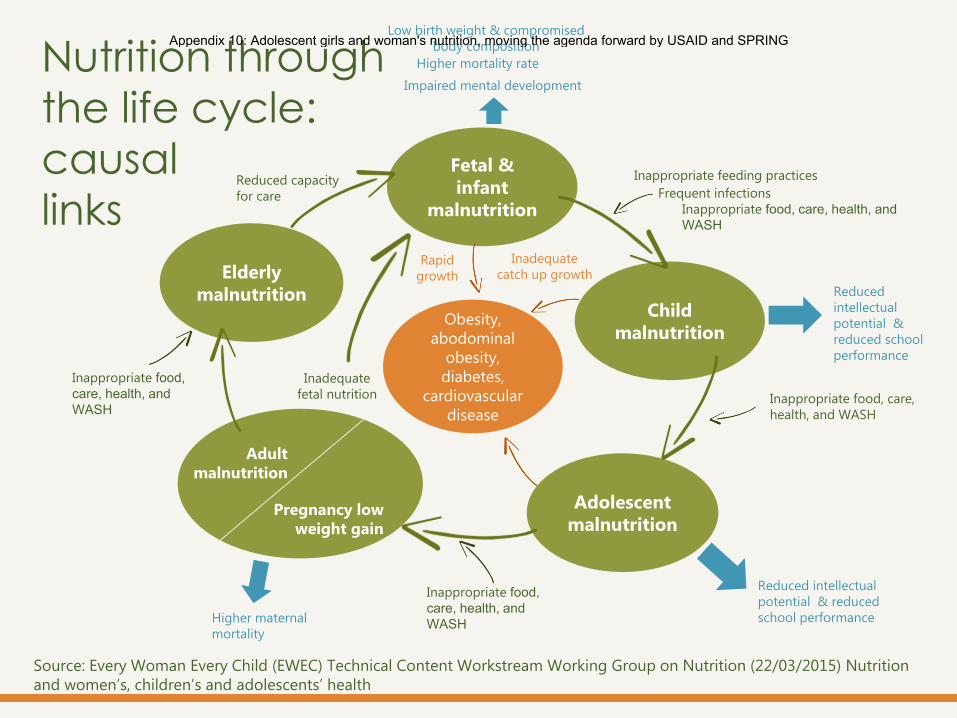
Source: Every Woman Every Child (EWEC) Technical Content Workstream Working Group on Nutrition (22/03/2015) Nutrition
and women’s, children’s and adolescents’ health
Child
malnutrition
Adolescent
malnutrition
Elderly
malnutrition
Fetal &
infant
malnutrition
Pregnancy low
weight gain
Adult
malnutrition
Inadequate
fetal nutrition
Obesity,
abodominal
obesity,
diabetes,
cardiovascular
disease
Low birth weight & compromised
body composition
Reduced
intellectual
potential &
reduced school
performance
Inappropriate feeding practices
Frequent infections
Inappropriate food, care, health, and
WASH
Impaired mental development
Inappropriate food, care,
health, and WASH
Reduced intellectual
potential & reduced
school performance
Inappropriate food,
care, health, and
WASH Higher maternal
mortality
Inappropriate food,
care, health, and
WASH
Reduced capacity
for care
Higher mortality rate
Inadequate
catch up growth Rapid
growth
Nutrition through
the life cycle:
causal
links
Appendix 10: Adolescent girls and woman's nutrition, moving the agenda forward by USAID and SPRING
Targeting girls and women
only when they are
pregnant is too late to
break the intergenerational
cycle of malnutrition.
Appendix 10: Adolescent girls and woman's nutrition, moving the agenda forward by USAID and SPRING
The nutrition of
adolescent girls and
women is important for
the quality of their own
lives and wellbeing.
Appendix 10: Adolescent girls and woman's nutrition, moving the agenda forward by USAID and SPRING
What has
been done?
Appendix 10: Adolescent girls and woman's nutrition, moving the agenda forward by USAID and SPRING
Interest in adolescent girls and women’s
nutrition is gaining momentum
Appendix 10: Adolescent girls and woman's nutrition, moving the agenda forward by USAID and SPRING
Interest in adolescent girls and women’s
nutrition is gaining momentum
Appendix 10: Adolescent girls and woman's nutrition, moving the agenda forward by USAID and SPRING
Interest in adolescent girls and women’s
nutrition is gaining momentum
Appendix 10: Adolescent girls and woman's nutrition, moving the agenda forward by USAID and SPRING
Interest in adolescent girls and women’s
nutrition is gaining momentum
March, 2015
USAID, SPRING, FANTA, PAHO/WHO
Appendix 10: Adolescent girls and woman's nutrition, moving the agenda forward by USAID and SPRING
Interest in adolescent girls and women’s
nutrition is gaining momentum
Appendix 10: Adolescent girls and woman's nutrition, moving the agenda forward by USAID and SPRING
Interest in adolescent girls and women’s
nutrition is gaining momentum
Appendix 10: Adolescent girls and woman's nutrition, moving the agenda forward by USAID and SPRING
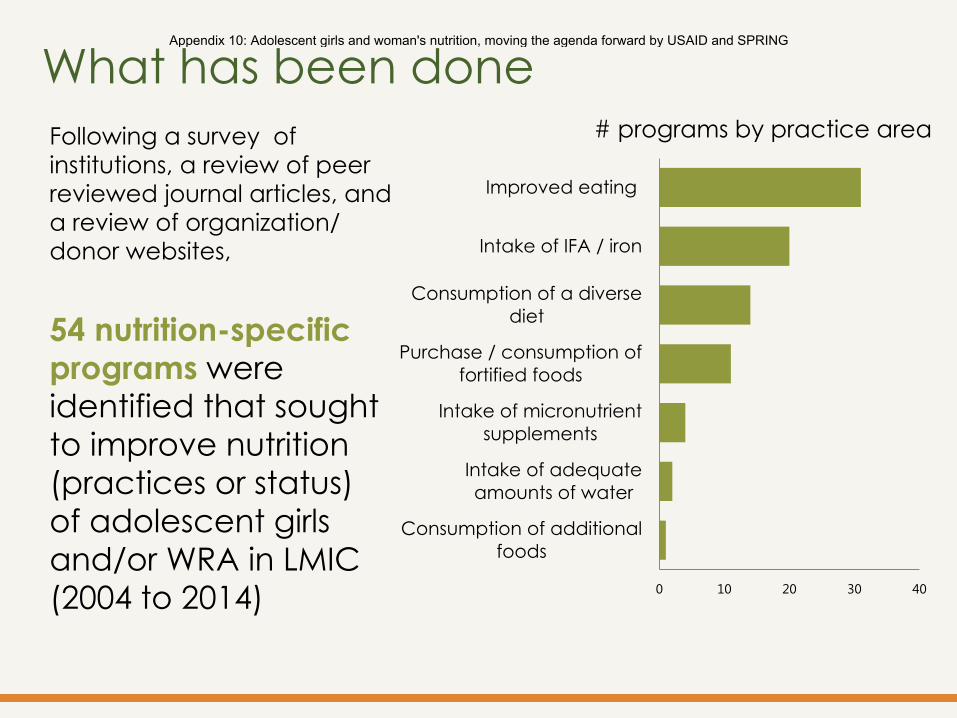
Following a survey of
institutions, a review of peer
reviewed journal articles, and
a review of organization/
donor websites,
54 nutrition-specific programs were identified that sought
to improve nutrition
(practices or status)
of adolescent girls
and/or WRA in LMIC
(2004 to 2014) 0 10 20 30 40
Consumption of additional
foods
Intake of adequate
amounts of water
Intake of micronutrient
supplements
Purchase / consumption of
fortified foods
Consumption of a diverse
diet
Intake of IFA / iron
Improved eating
What has been done # programs by practice area
Appendix 10: Adolescent girls and woman's nutrition, moving the agenda forward by USAID and SPRING
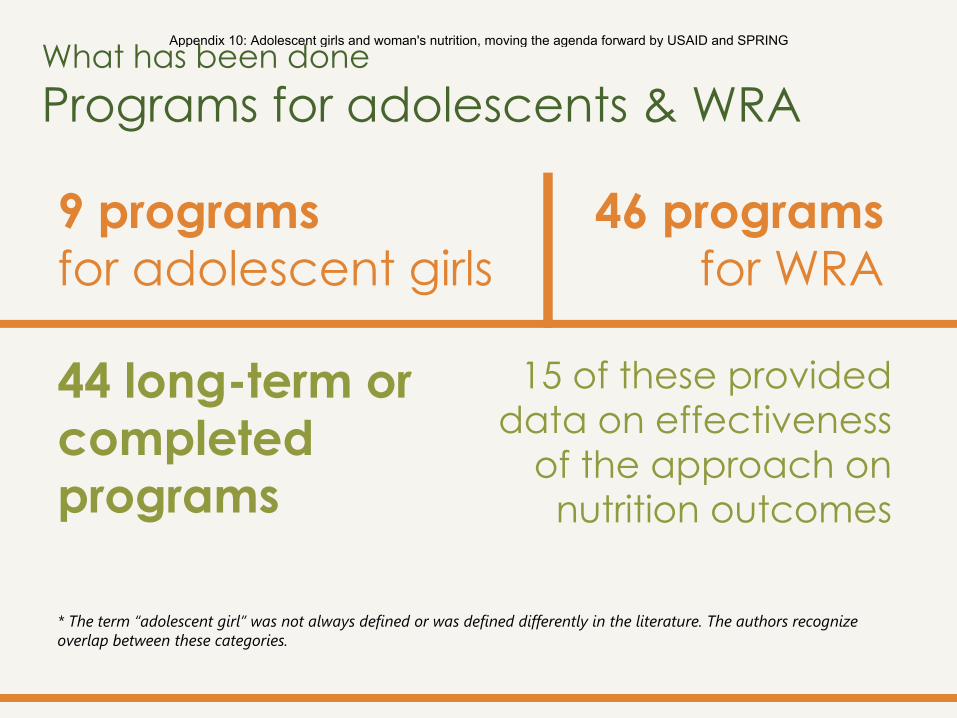
* The term “adolescent girl” was not always defined or was defined differently in the literature. The authors recognize
overlap between these categories.
9 programs for adolescent girls
46 programs for WRA
44 long-term or
completed
programs
15 of these provided
data on effectiveness
of the approach on
nutrition outcomes
What has been done
Programs for adolescents & WRA
Appendix 10: Adolescent girls and woman's nutrition, moving the agenda forward by USAID and SPRING
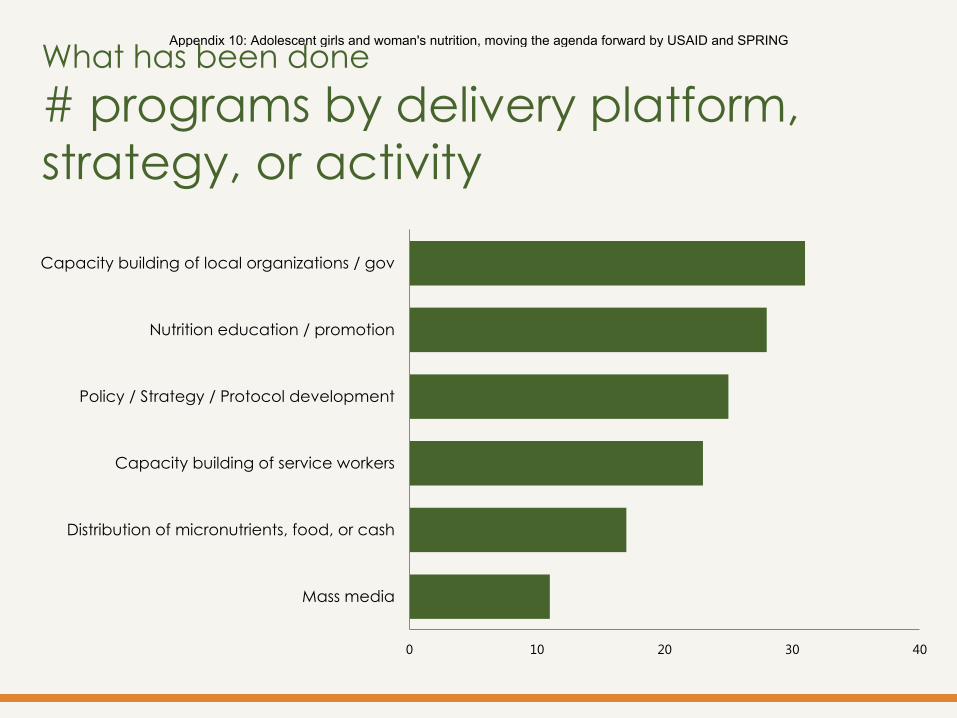
0 10 20 30 40
Mass media
Distribution of micronutrients, food, or cash
Capacity building of service workers
Policy / Strategy / Protocol development
Nutrition education / promotion
Capacity building of local organizations / gov
What has been done
# programs by delivery platform,
strategy, or activity
Appendix 10: Adolescent girls and woman's nutrition, moving the agenda forward by USAID and SPRING
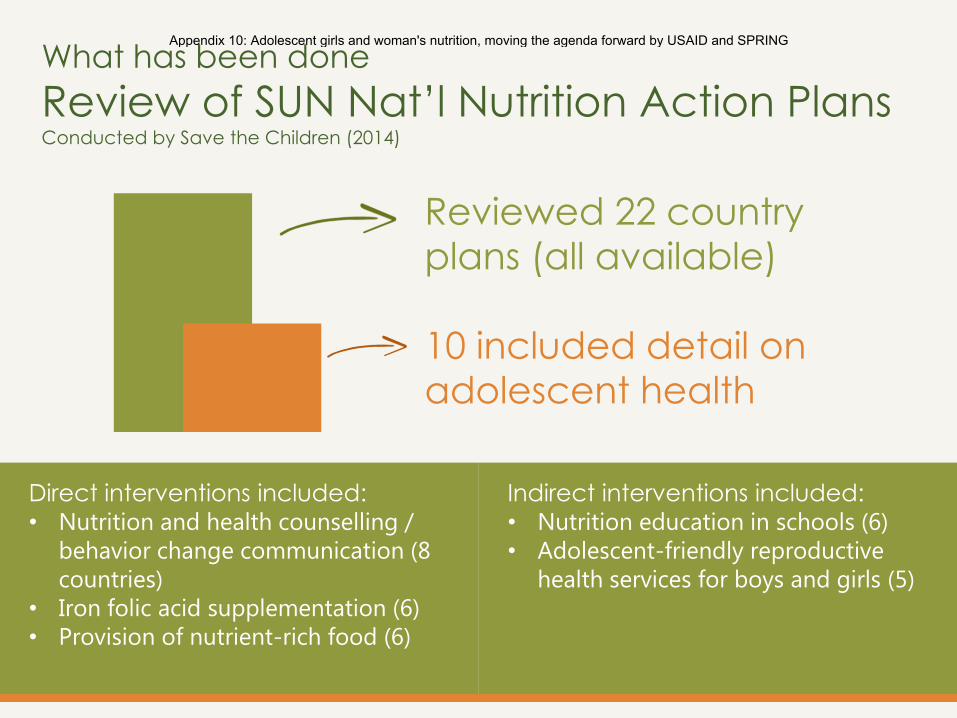
Direct interventions included: • Nutrition and health counselling /
behavior change communication (8
countries)
• Iron folic acid supplementation (6)
• Provision of nutrient-rich food (6)
Indirect interventions included: • Nutrition education in schools (6)
• Adolescent-friendly reproductive
health services for boys and girls (5)
What has been done
Review of SUN Nat’l Nutrition Action Plans Conducted by Save the Children (2014)
Reviewed 22 country
plans (all available)
10 included detail on
adolescent health
Appendix 10: Adolescent girls and woman's nutrition, moving the agenda forward by USAID and SPRING
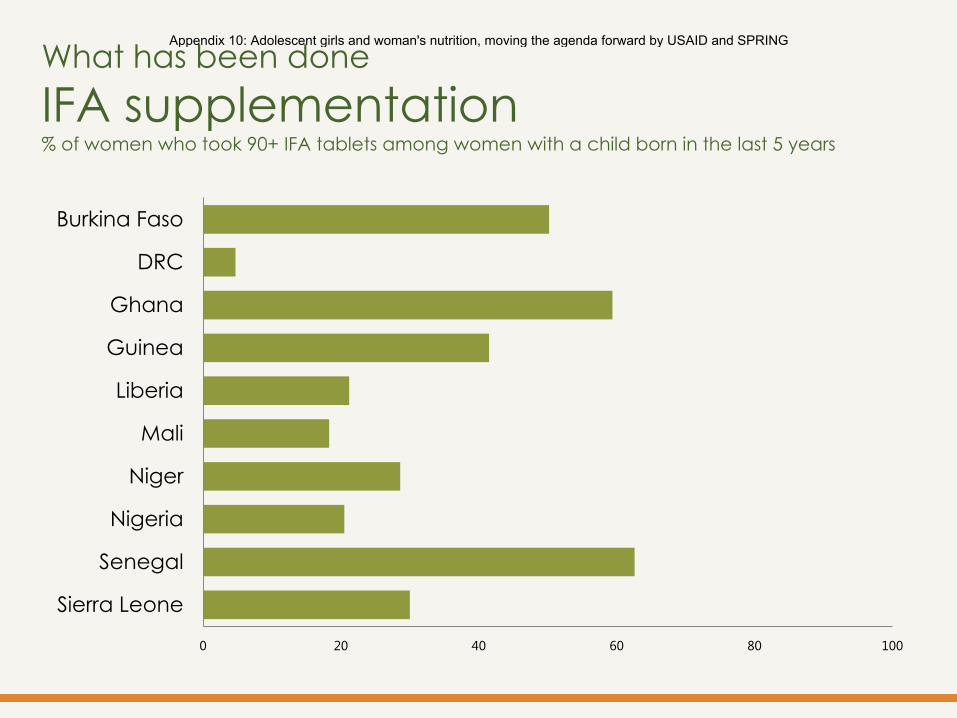
What has been done
IFA supplementation % of women who took 90+ IFA tablets among women with a child born in the last 5 years
0 20 40 60 80 100
Burkina Faso
DRC
Ghana
Guinea
Liberia
Mali
Niger
Nigeria
Senegal
Sierra Leone
Appendix 10: Adolescent girls and woman's nutrition, moving the agenda forward by USAID and SPRING
What can be done?
Appendix 10: Adolescent girls and woman's nutrition, moving the agenda forward by USAID and SPRING
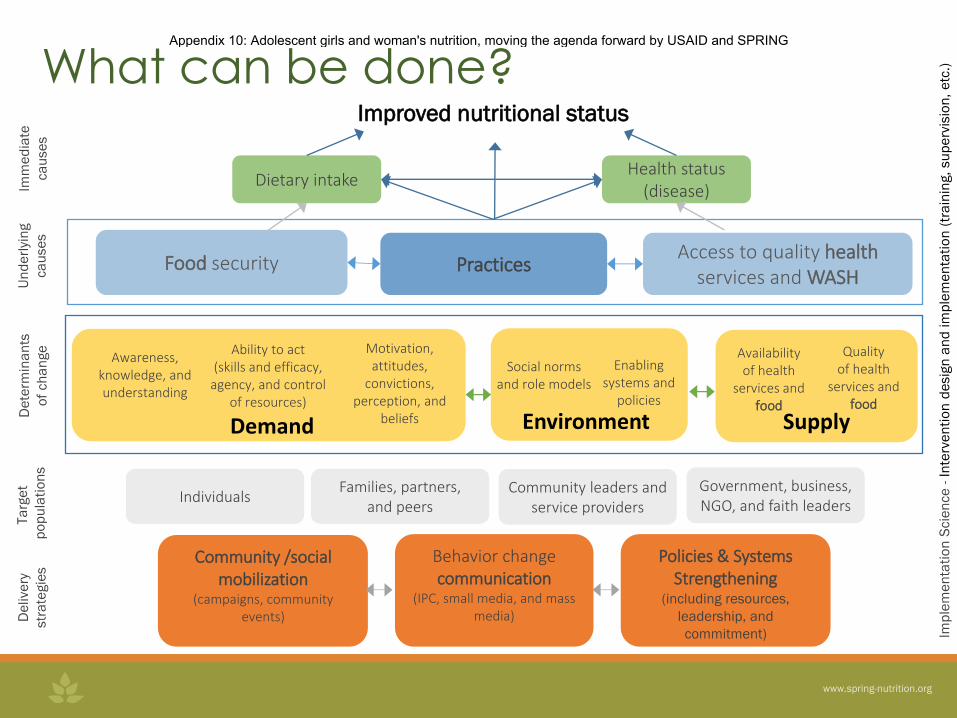
Improved nutritional status
Government, business, NGO, and faith leaders
Community leaders and service providers
Families, partners, and peers
Individuals
Community /social mobilization
(campaigns, community events)
Behavior change communication
(IPC, small media, and mass media)
Policies & Systems Strengthening
(including resources,
leadership, and
commitment)
De
live
ry
str
ate
gie
s
Ta
rge
t
po
pu
lati
on
s
De
term
ina
nts
of
ch
an
ge
Imm
ed
iate
ca
use
s
Un
de
rlyi
ng
ca
use
s
Access to quality health services and WASH
Practices Food security
Dietary intake Health status
(disease)
Ability to act (skills and efficacy,
agency, and control of resources)
Enabling systems and
policies
Awareness, knowledge, and understanding
Availability of health
services and food
Quality of health
services and food
Social norms and role models
Motivation, attitudes,
convictions, perception, and
beliefs Demand Environment Supply
Imp
lem
en
tati
on
Scie
nce
- I
nte
rve
nti
on
de
sig
n a
nd
im
ple
me
nta
tio
n (
tra
inin
g,
su
pe
rvis
ion
, e
tc.)
What can be done? Appendix 10: Adolescent girls and woman's nutrition, moving the agenda forward by USAID and SPRING
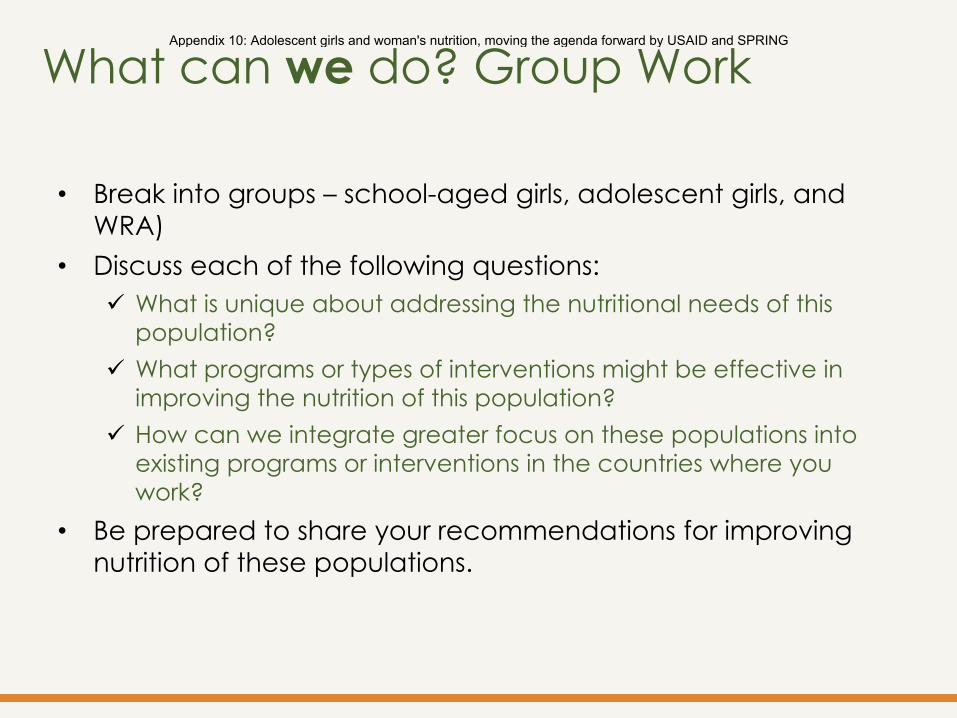
What can we do? Group Work
• Break into groups – school-aged girls, adolescent girls, and
WRA)
• Discuss each of the following questions:
What is unique about addressing the nutritional needs of this
population?
What programs or types of interventions might be effective in
improving the nutrition of this population?
How can we integrate greater focus on these populations into
existing programs or interventions in the countries where you
work?
• Be prepared to share your recommendations for improving
nutrition of these populations.
Appendix 10: Adolescent girls and woman's nutrition, moving the agenda forward by USAID and SPRING
For more information, please visit:
spring-nutrition.org/adolescent-and-womens-nutrition
Appendix 10: Adolescent girls and woman's nutrition, moving the agenda forward by USAID and SPRING
Mise à jour hebdomadaire sur l’Initiative d’Eradication de la Polio
en Afrique Centrale
Mise à jour du 14 mars 2016 IST Afrique Centrale, Libreville-GABON
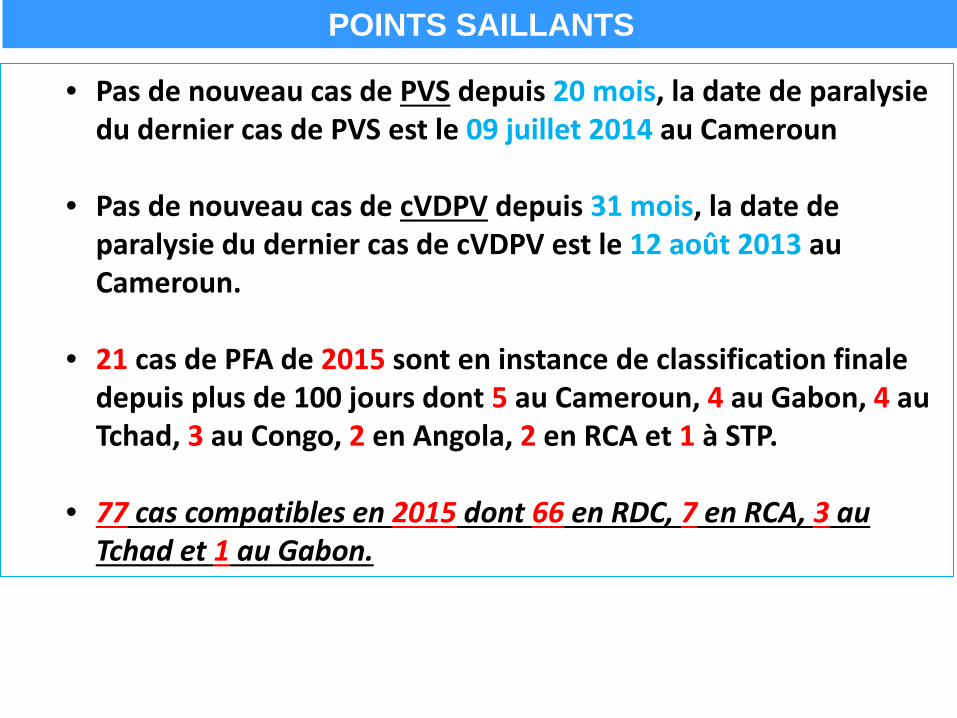
• Pas de nouveau cas de PVS depuis 20 mois, la date de paralysie du dernier cas de PVS est le 09 juillet 2014 au Cameroun
• Pas de nouveau cas de cVDPV depuis 31 mois, la date de
paralysie du dernier cas de cVDPV est le 12 août 2013 au Cameroun.
• 21 cas de PFA de 2015 sont en instance de classification finale depuis plus de 100 jours dont 5 au Cameroun, 4 au Gabon, 4 au Tchad, 3 au Congo, 2 en Angola, 2 en RCA et 1 à STP.
• 77 cas compatibles en 2015 dont 66 en RDC, 7 en RCA, 3 au Tchad et 1 au Gabon.
POINTS SAILLANTS
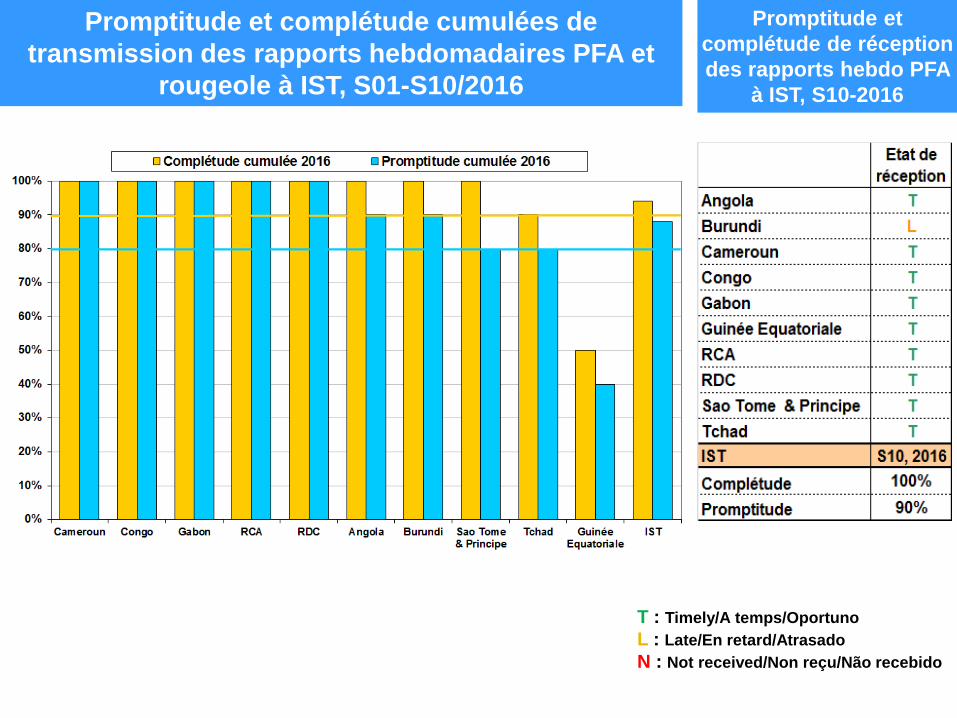
Promptitude et complétude cumulées de transmission des rapports hebdomadaires PFA et
rougeole à IST, S01-S10/2016
Promptitude et complétude de réception des rapports hebdo PFA
à IST, S10-2016
T : Timely/A temps/Oportuno L : Late/En retard/Atrasado N : Not received/Non reçu/Não recebido
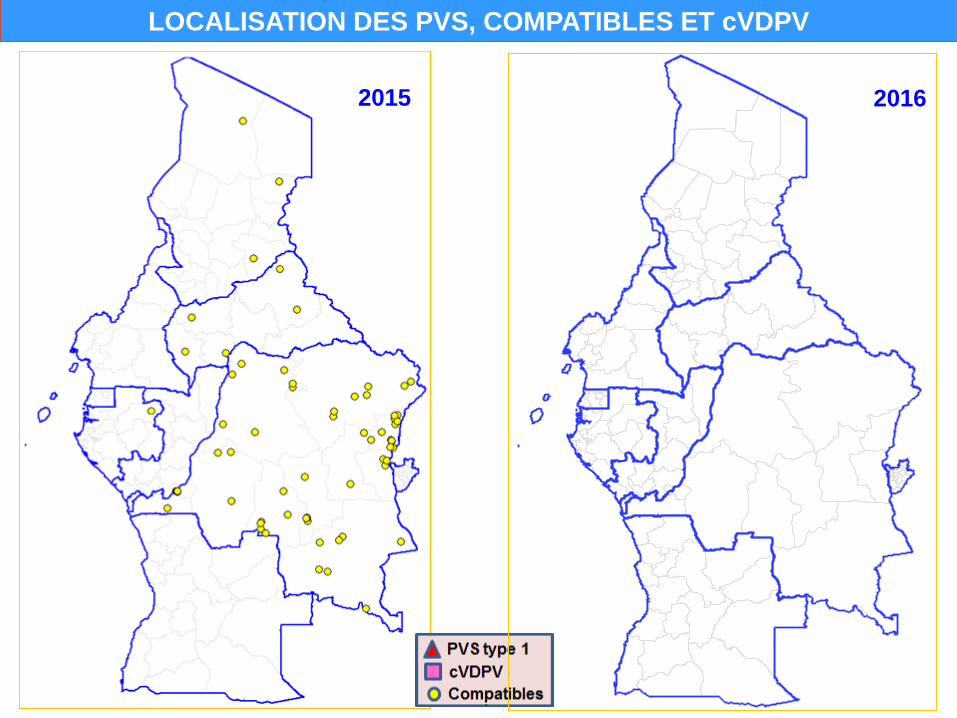
LOCALISATION DES PVS, COMPATIBLES ET cVDPV
2015 2016
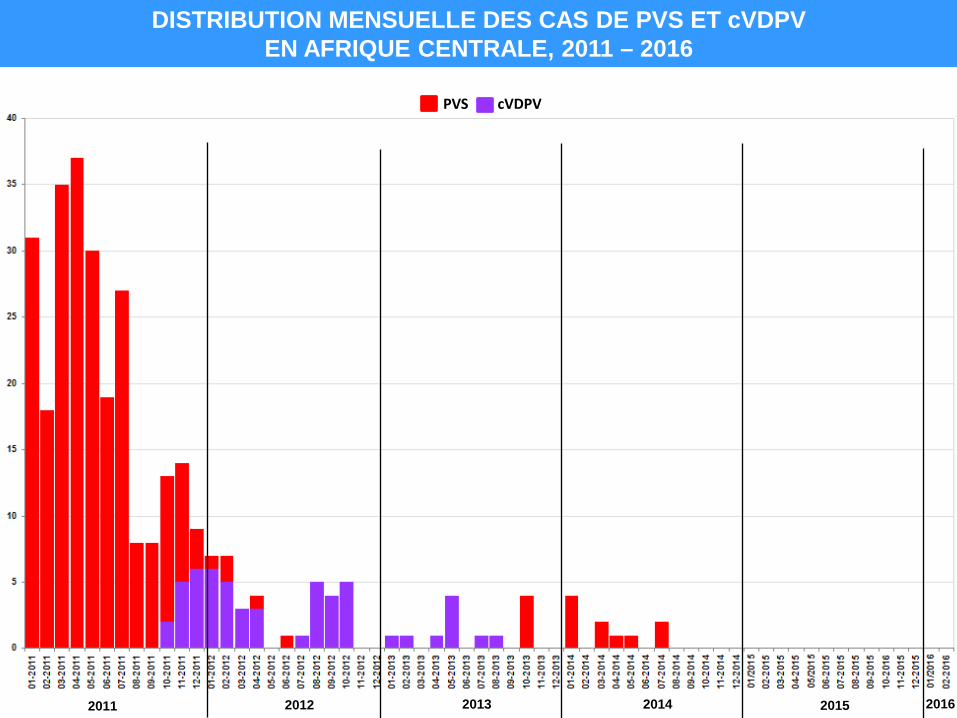
DISTRIBUTION MENSUELLE DES CAS DE PVS ET cVDPV EN AFRIQUE CENTRALE, 2011 – 2016
PVS cVDPV
2011 2012 2013 2014 2015 2016
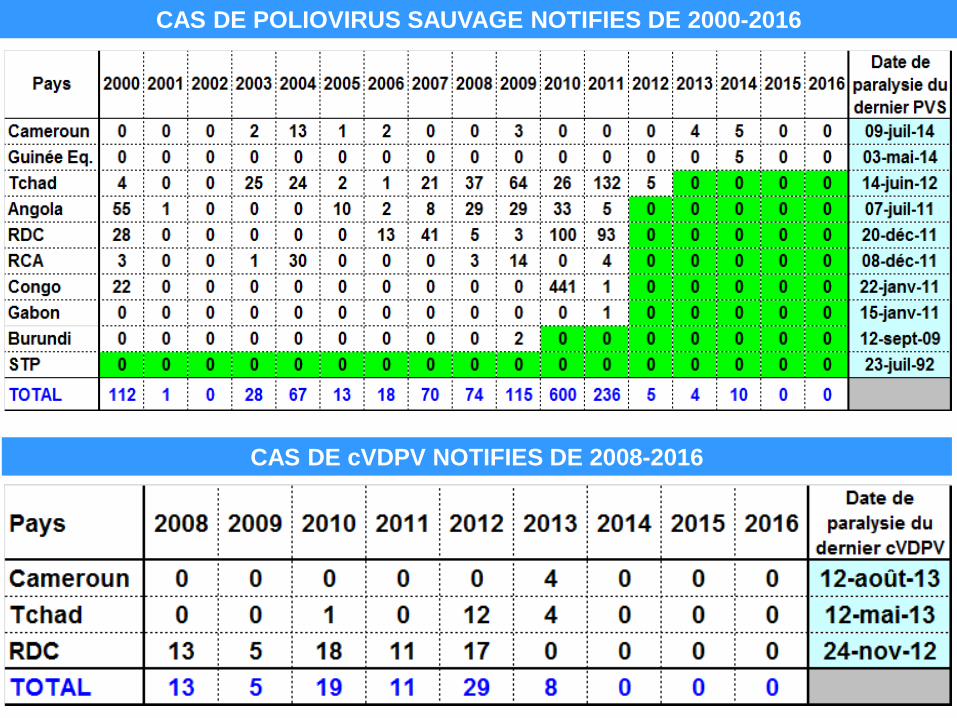
CAS DE POLIOVIRUS SAUVAGE NOTIFIES DE 2000-2016
CAS DE cVDPV NOTIFIES DE 2008-2016
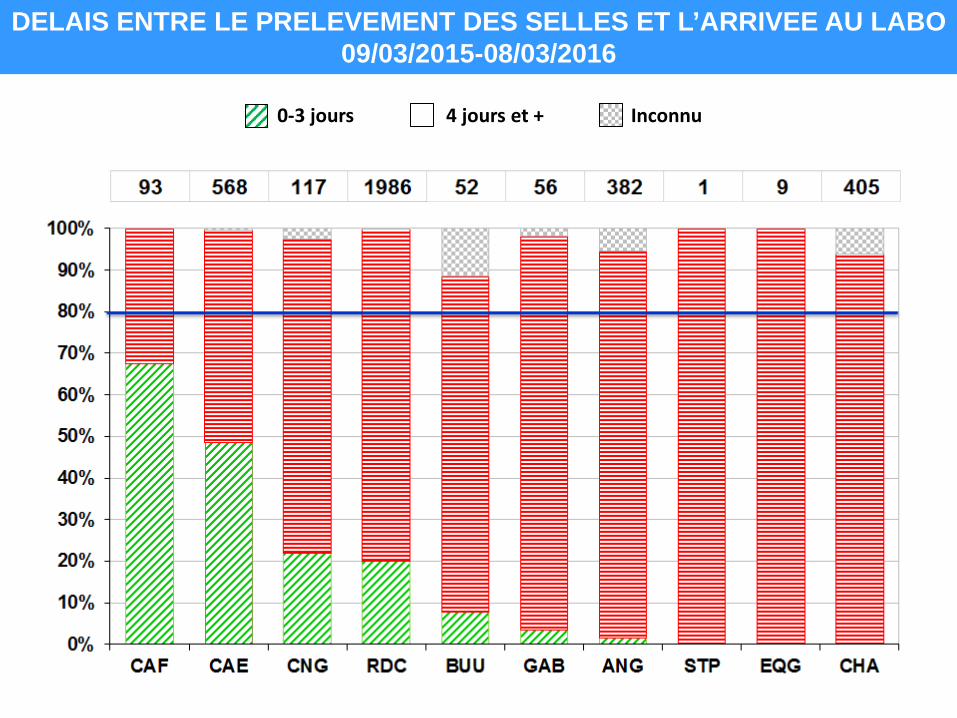
0-3 jours 4 jours et + Inconnu
DELAIS ENTRE LE PRELEVEMENT DES SELLES ET L’ARRIVEE AU LABO 09/03/2015-08/03/2016
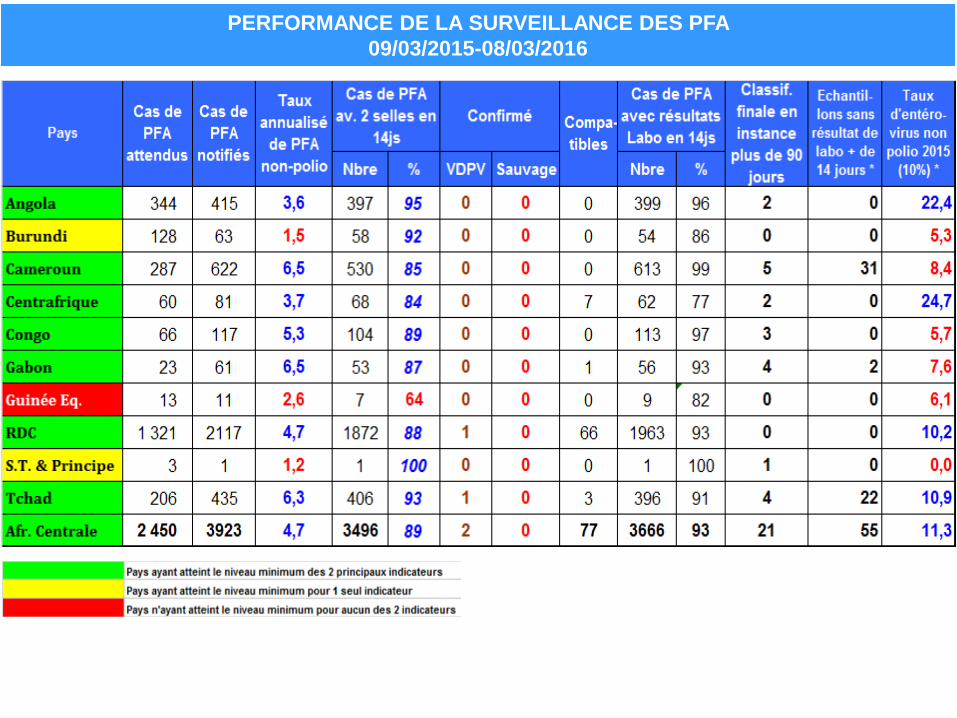
PERFORMANCE DE LA SURVEILLANCE DES PFA 09/03/2015-08/03/2016
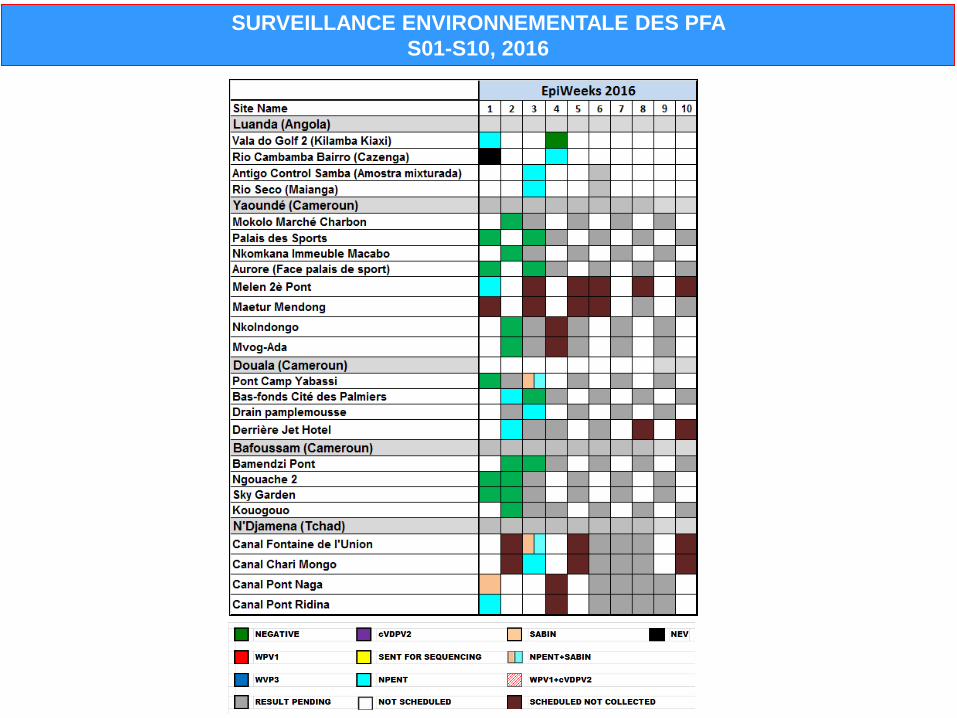
SURVEILLANCE ENVIRONNEMENTALE DES PFA S01-S10, 2016
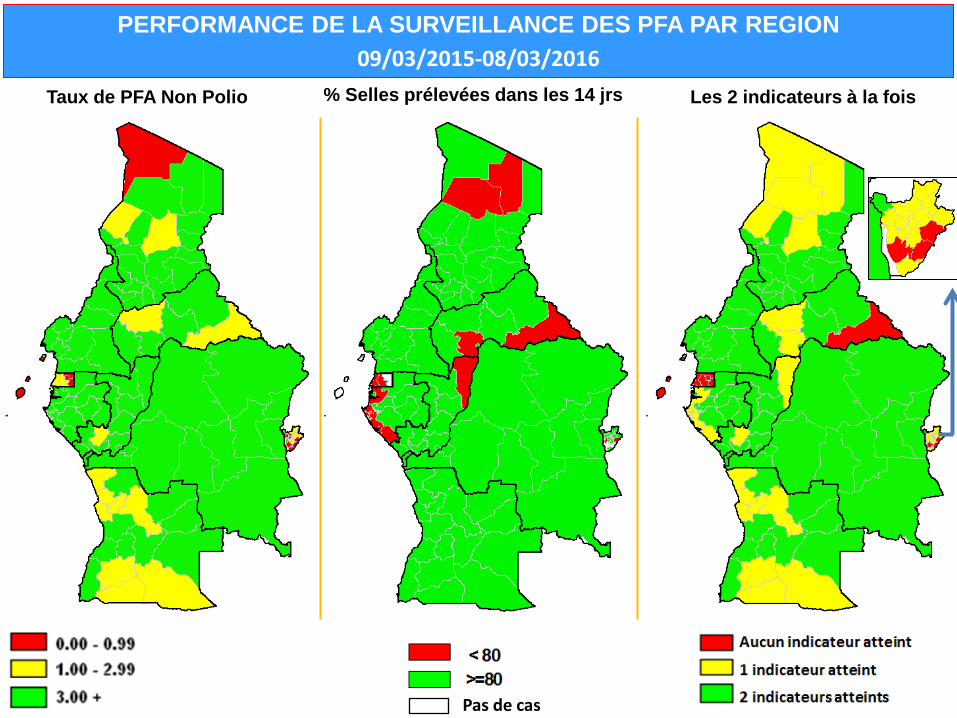
PERFORMANCE DE LA SURVEILLANCE DES PFA PAR REGION 09/03/2015-08/03/2016
Taux de PFA Non Polio % Selles prélevées dans les 14 jrs Les 2 indicateurs à la fois
Pas de cas
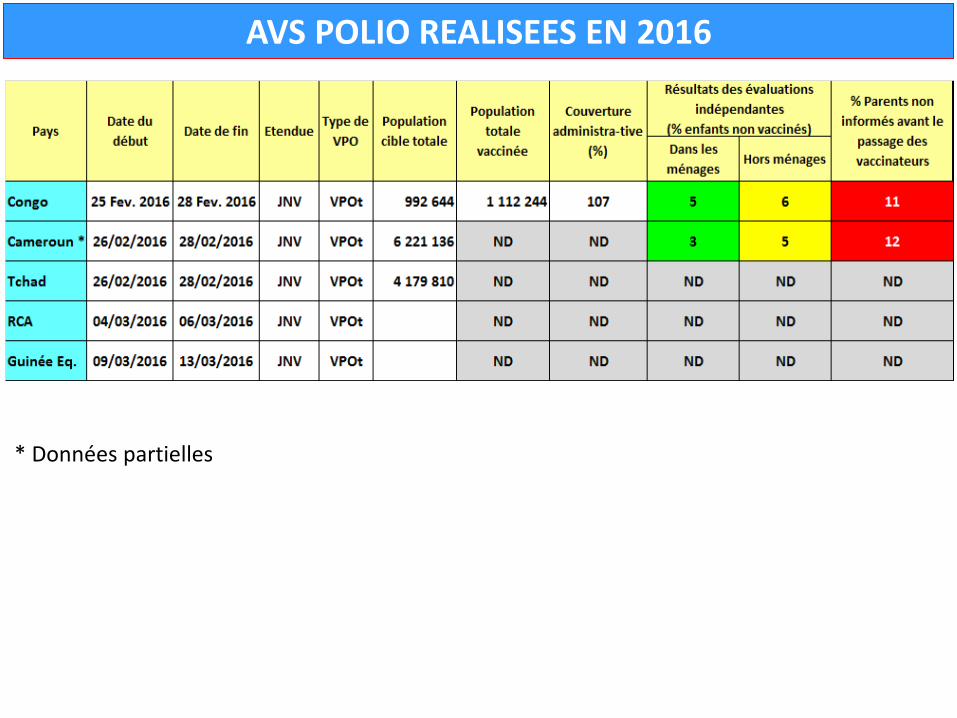
AVS POLIO REALISEES EN 2016
* Données partielles
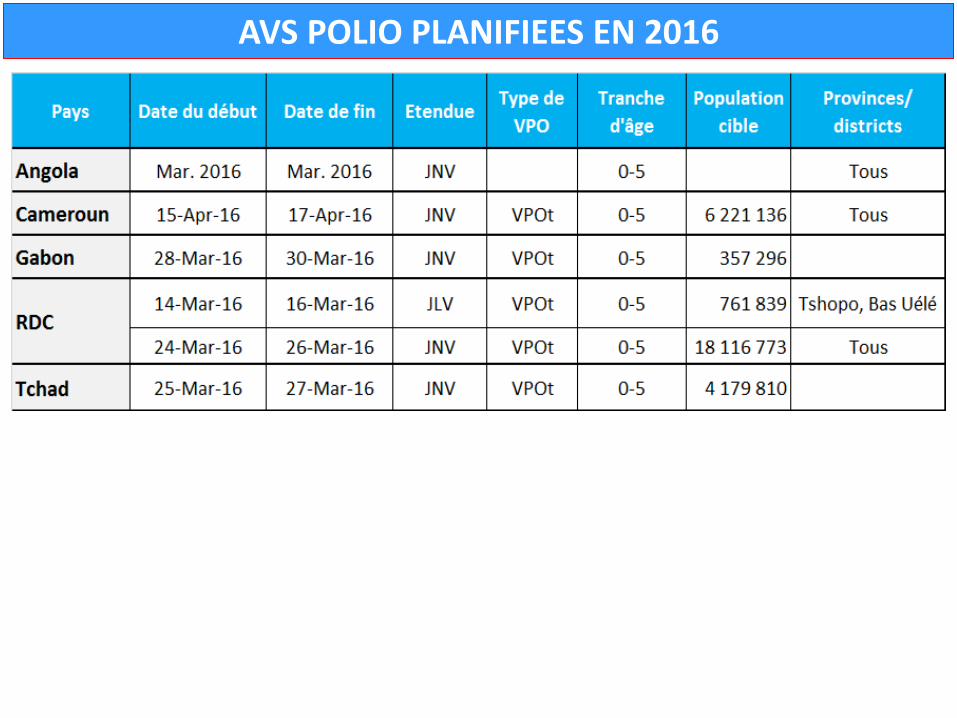
AVS POLIO PLANIFIEES EN 2016
SURVEILLANCE CAS PAR CAS DE LA ROUGEOLE
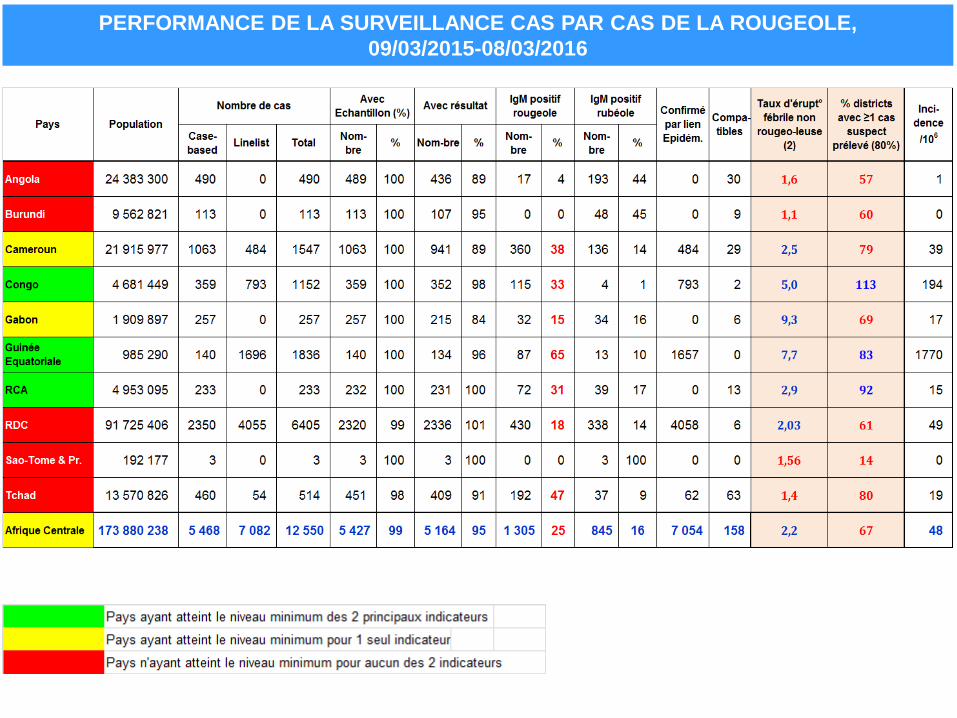
PERFORMANCE DE LA SURVEILLANCE CAS PAR CAS DE LA ROUGEOLE, 09/03/2015-08/03/2016
DISTRICTS AYANT FRANCHI LE SEUIL* DE L’EPIDEMIE DE ROUGEOLE AU COURS DES 3
DERNIERS MOIS, 09/12/2015-08/03/2016
District ayant eu 1 épidémie
* 3 cas confirmés IgM+ dans un intervalle de 30jrs
CAS CONFIRMES DE ROUGEOLE AU COURS DES 3 DERNIERS MOIS, 09/12/2015-08/03/2016
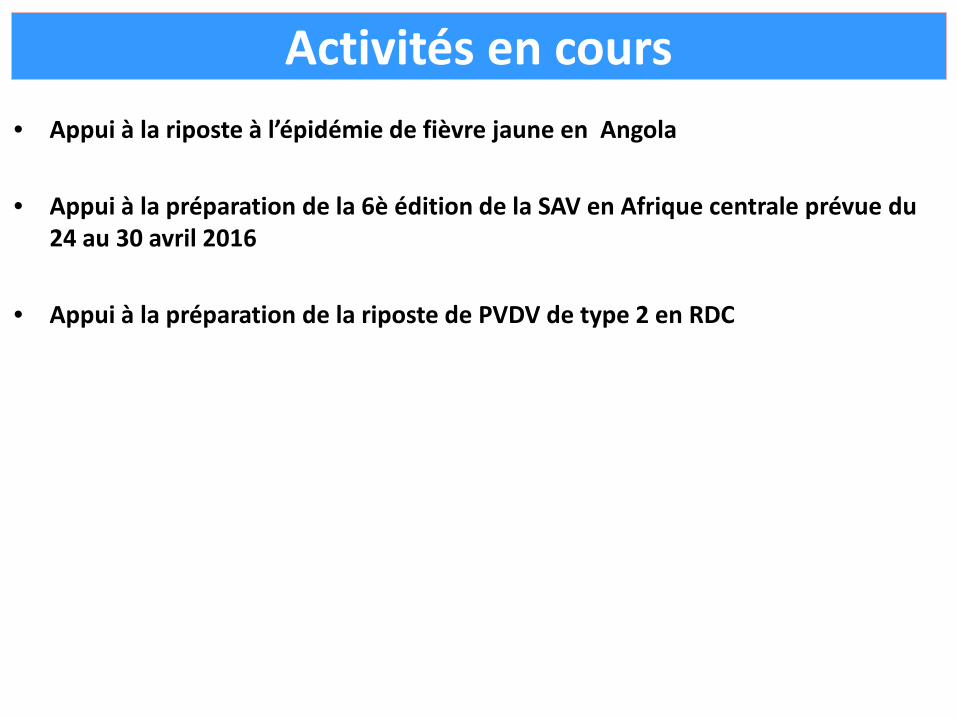
Activités en cours
• Appui à la riposte à l’épidémie de fièvre jaune en Angola • Appui à la préparation de la 6è édition de la SAV en Afrique centrale prévue du
24 au 30 avril 2016
• Appui à la préparation de la riposte de PVDV de type 2 en RDC
Activités d’éradication de la poliomyélite
(IEP) République Démocratique du Congo
Mise à jour du 15 avril 2016
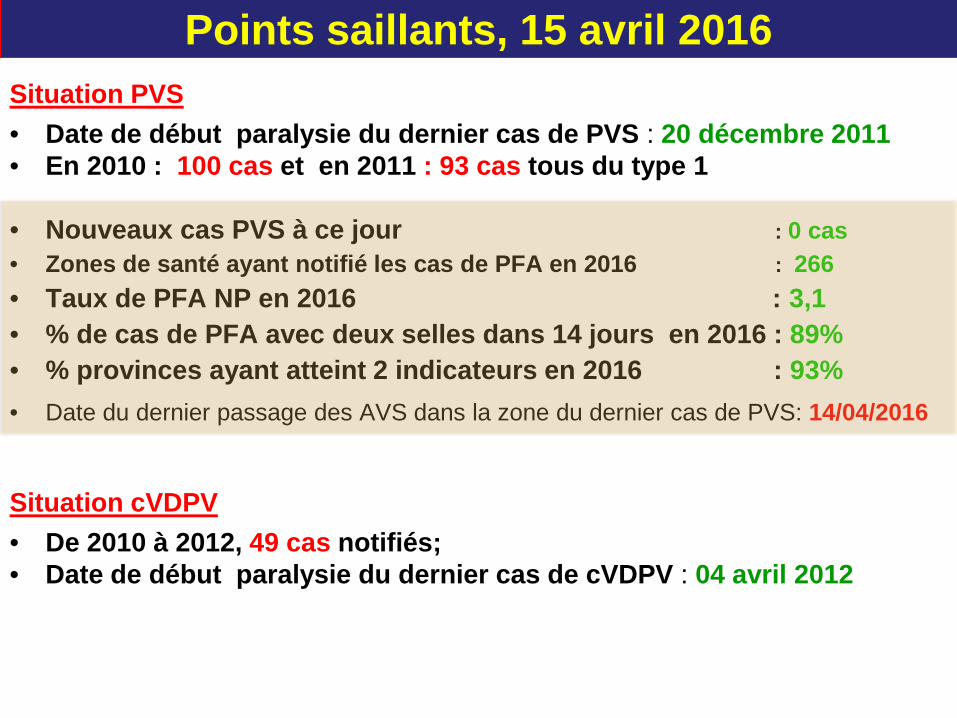
Points saillants, 15 avril 2016 Situation PVS • Date de début paralysie du dernier cas de PVS : 20 décembre 2011 • En 2010 : 100 cas et en 2011 : 93 cas tous du type 1
• Nouveaux cas PVS à ce jour : 0 cas • Zones de santé ayant notifié les cas de PFA en 2016 : 266 • Taux de PFA NP en 2016 : 3,1 • % de cas de PFA avec deux selles dans 14 jours en 2016 : 89% • % provinces ayant atteint 2 indicateurs en 2016 : 93% • Date du dernier passage des AVS dans la zone du dernier cas de PVS: 14/04/2016
Situation cVDPV • De 2010 à 2012, 49 cas notifiés; • Date de début paralysie du dernier cas de cVDPV : 04 avril 2012
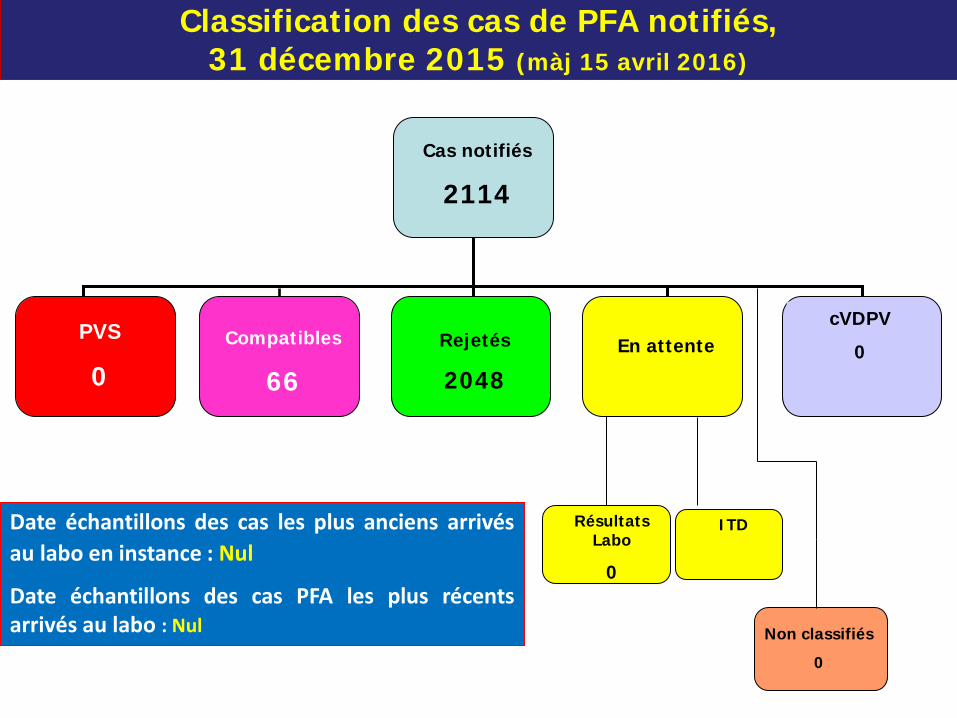
Classification des cas de PFA notifiés, 31 décembre 2015 (màj 15 avril 2016)
Compatibles
66
PVS
0 Rejetés
2048 En attente
cVDPV
0
Cas notifiés
2114
Non classifiés
0
Résultats Labo
0
Date échantillons des cas les plus anciens arrivés au labo en instance : Nul
Date échantillons des cas PFA les plus récents arrivés au labo : Nul
ITD
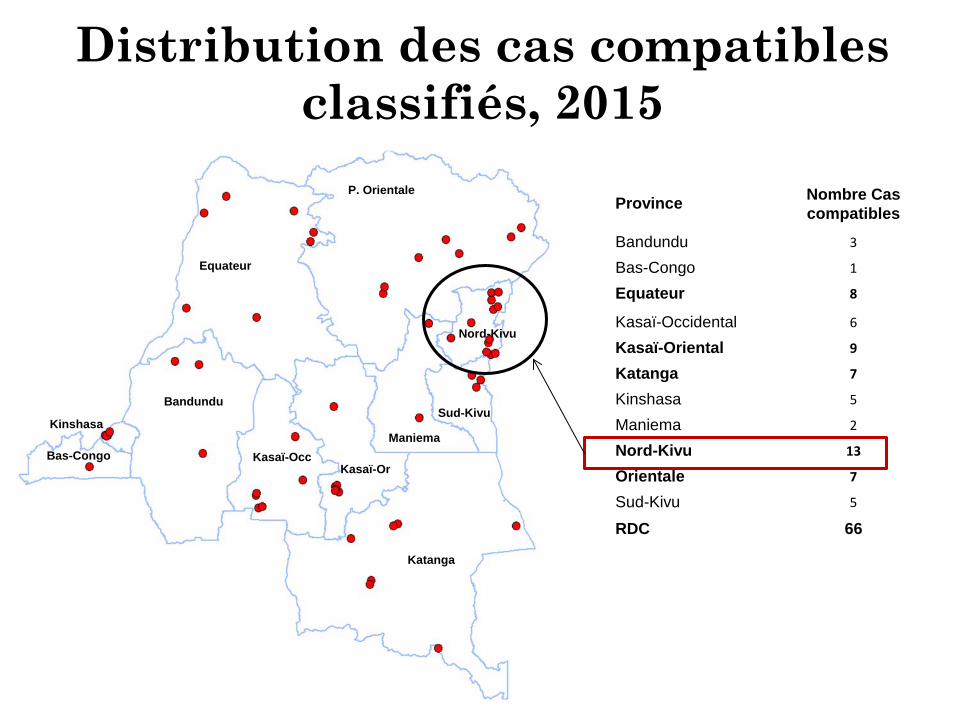
Distribution des cas compatibles classifiés, 2015
Province Nombre Cas compatibles
Bandundu 3
Bas-Congo 1
Equateur 8
Kasaï-Occidental 6
Kasaï-Oriental 9
Katanga 7
Kinshasa 5
Maniema 2
Nord-Kivu 13
Orientale 7
Sud-Kivu 5
RDC 66
P. Orientale
Equateur
Bandundu
Bas-Congo
Kinshasa
Katanga
Maniema
Sud-Kivu
Nord-Kivu
Kasaï-Occ Kasaï-Or
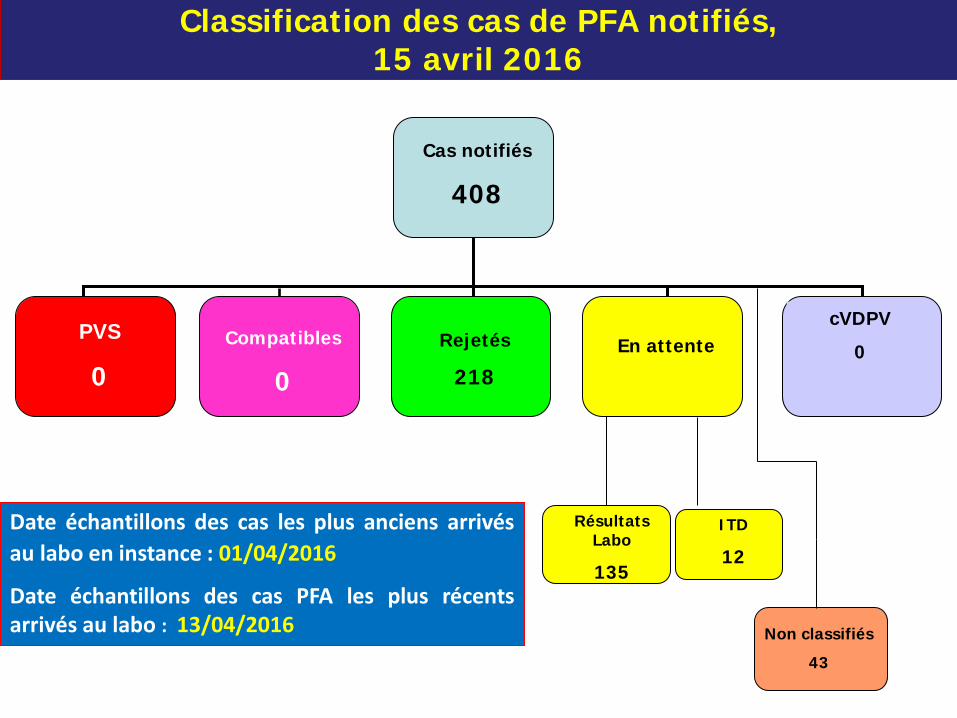
Classification des cas de PFA notifiés, 15 avril 2016
Compatibles
0
PVS
0 Rejetés
218 En attente
cVDPV
0
Cas notifiés
408
Non classifiés
43
Résultats Labo
135
Date échantillons des cas les plus anciens arrivés au labo en instance : 01/04/2016
Date échantillons des cas PFA les plus récents arrivés au labo : 13/04/2016
ITD
12
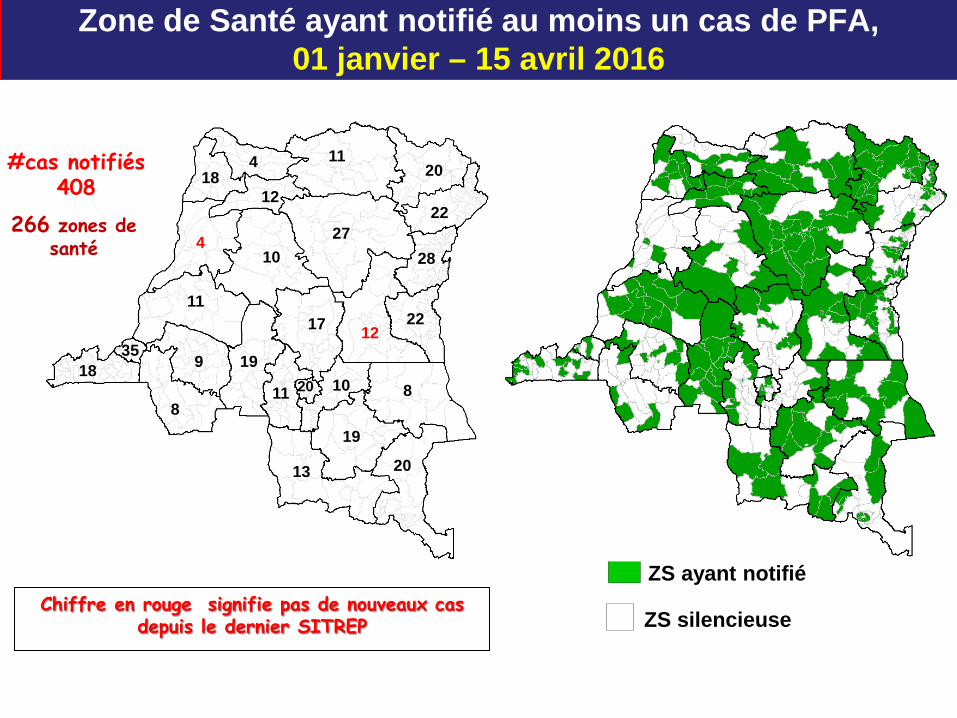
11
4
20
19
20
22
19
11 20
35 18
8
9 10
17
13
8
11
12
12
28
4 18
10 27
22
Zone de Santé ayant notifié au moins un cas de PFA, 01 janvier – 15 avril 2016
ZS silencieuse
ZS ayant notifié
266 zones de santé
#cas notifiés 408
Chiffre en rouge signifie pas de nouveaux cas depuis le dernier SITREP
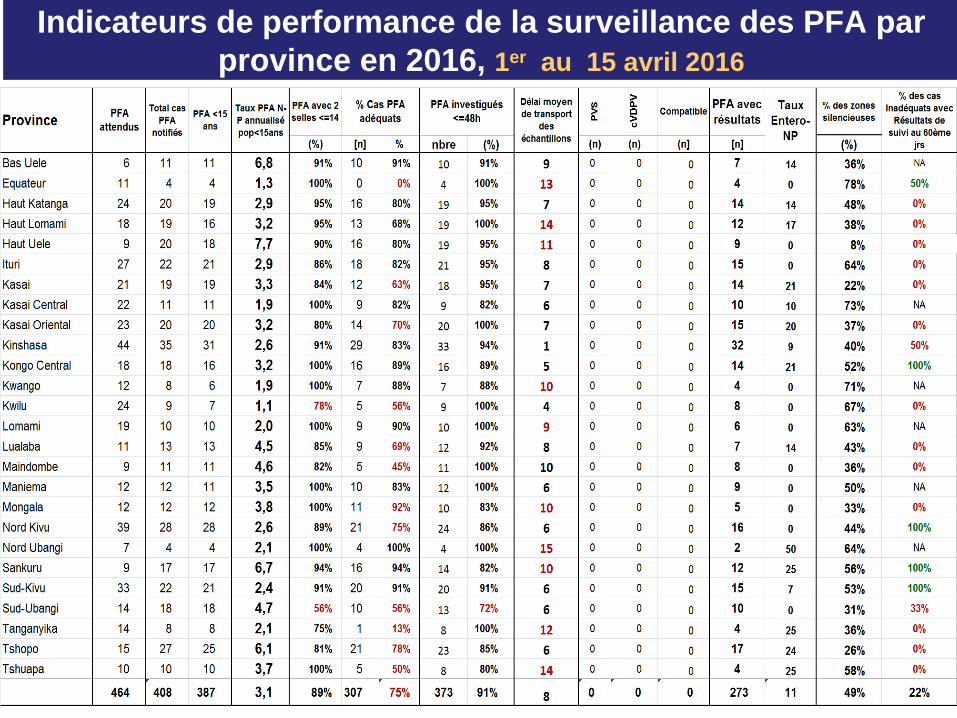
Indicateurs de performance de la surveillance des PFA par province en 2016, 1er au 15 avril 2016
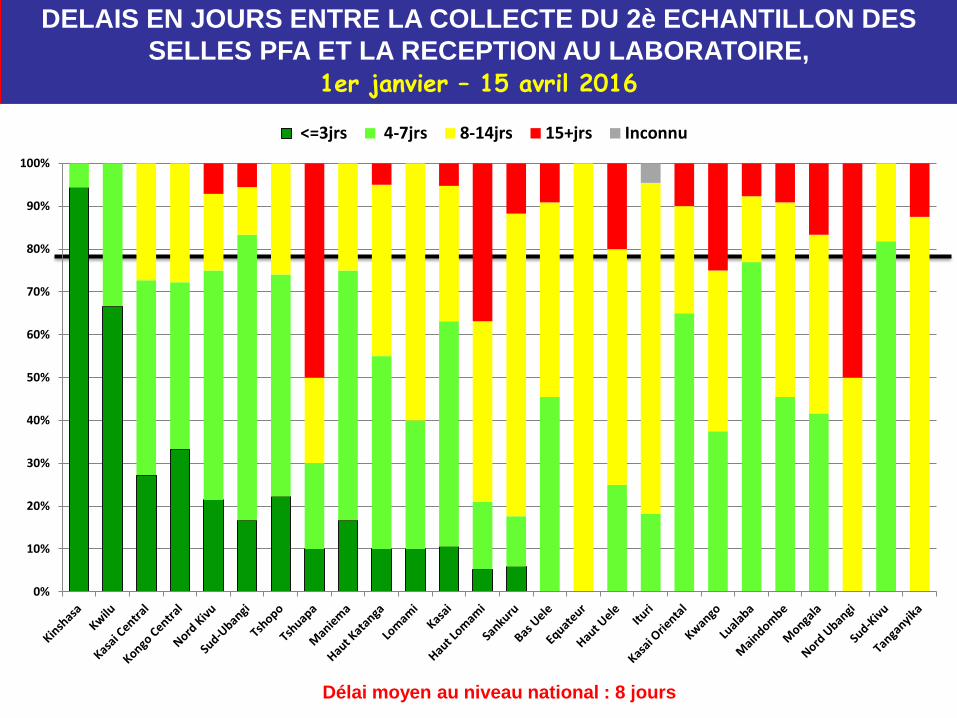
DELAIS EN JOURS ENTRE LA COLLECTE DU 2è ECHANTILLON DES SELLES PFA ET LA RECEPTION AU LABORATOIRE,
1er janvier – 15 avril 2016
Délai moyen au niveau national : 8 jours
0%
10%
20%
30%
40%
50%
60%
70%
80%
90%
100%
<=3jrs 4-7jrs 8-14jrs 15+jrs Inconnu
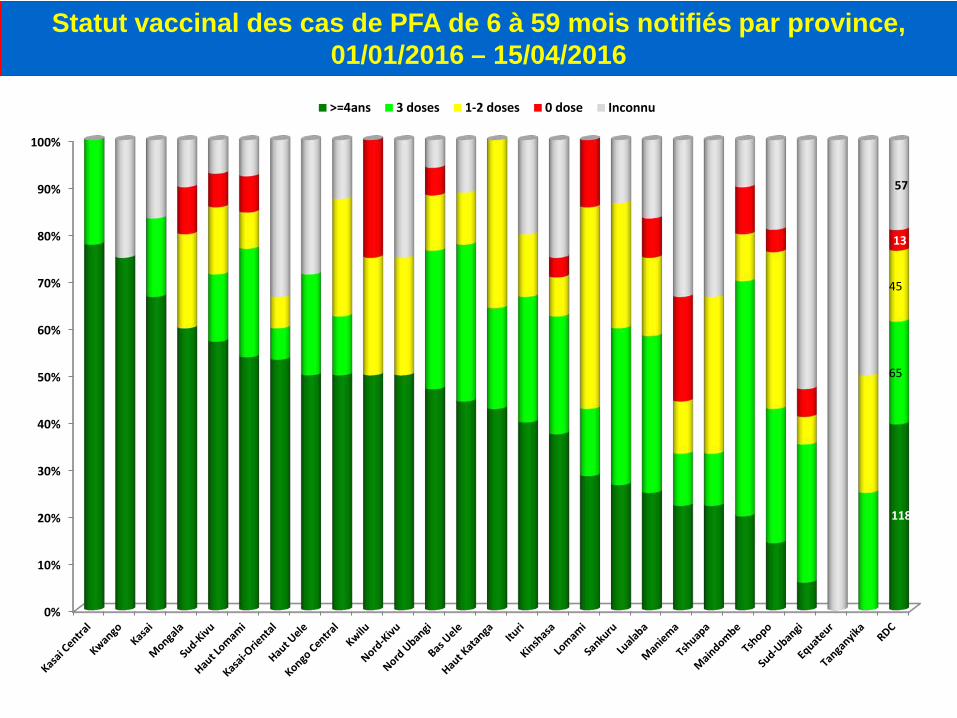
Statut vaccinal des cas de PFA de 6 à 59 mois notifiés par province, 01/01/2016 – 15/04/2016
0%
10%
20%
30%
40%
50%
60%
70%
80%
90%
100%
118
65
45
13
57
>=4ans 3 doses 1-2 doses 0 dose Inconnu
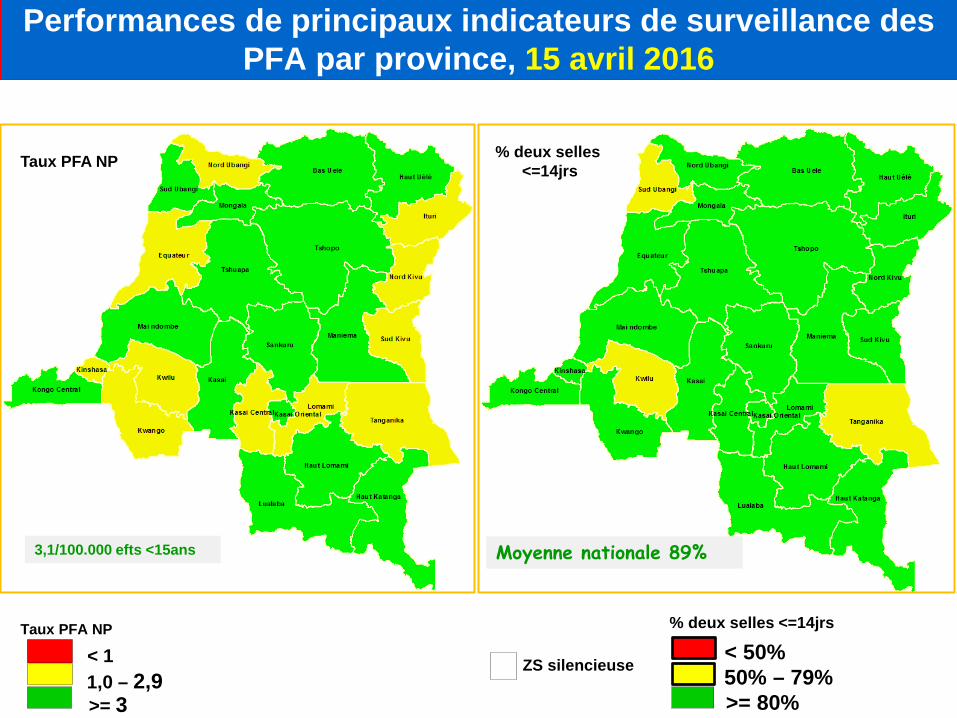
Performances de principaux indicateurs de surveillance des PFA par province, 15 avril 2016
Taux PFA NP
< 1 1,0 – 2,9 >= 3
Taux PFA NP
% deux selles <=14jrs
< 50% 50% – 79% >= 80%
% deux selles <=14jrs
ZS silencieuse
3,1/100.000 efts <15ans Moyenne nationale 89%
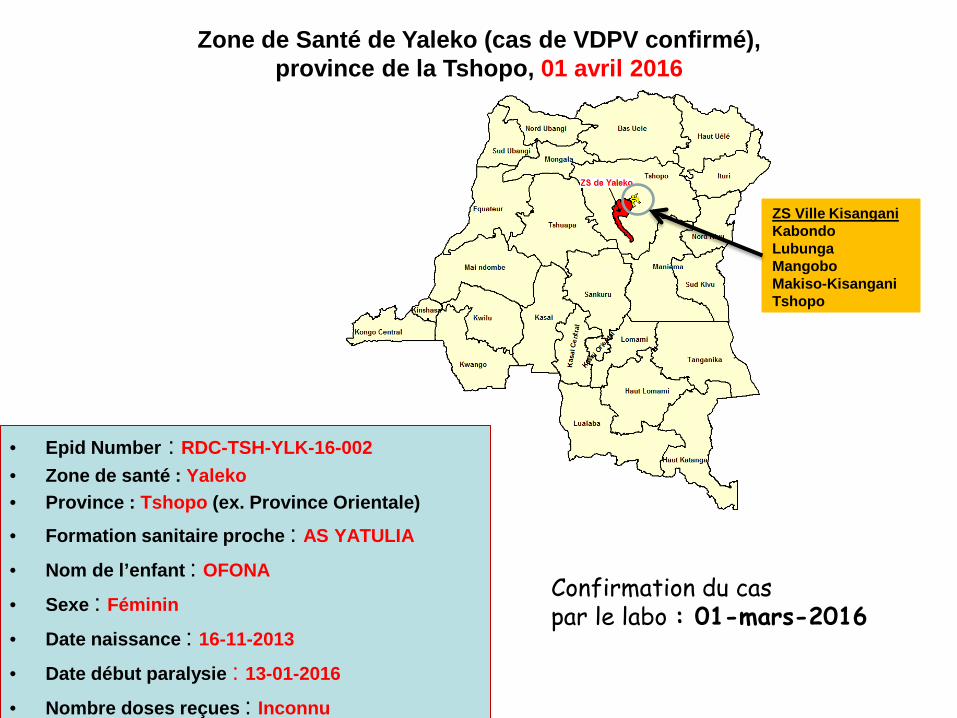
Zone de Santé de Yaleko (cas de VDPV confirmé), province de la Tshopo, 01 avril 2016
ZS Ville Kisangani Kabondo Lubunga Mangobo Makiso-Kisangani Tshopo
• Epid Number : RDC-TSH-YLK-16-002 • Zone de santé : Yaleko • Province : Tshopo (ex. Province Orientale)
• Formation sanitaire proche : AS YATULIA
• Nom de l’enfant : OFONA
• Sexe : Féminin
• Date naissance : 16-11-2013
• Date début paralysie : 13-01-2016
• Nombre doses reçues : Inconnu
Confirmation du cas par le labo : 01-mars-2016
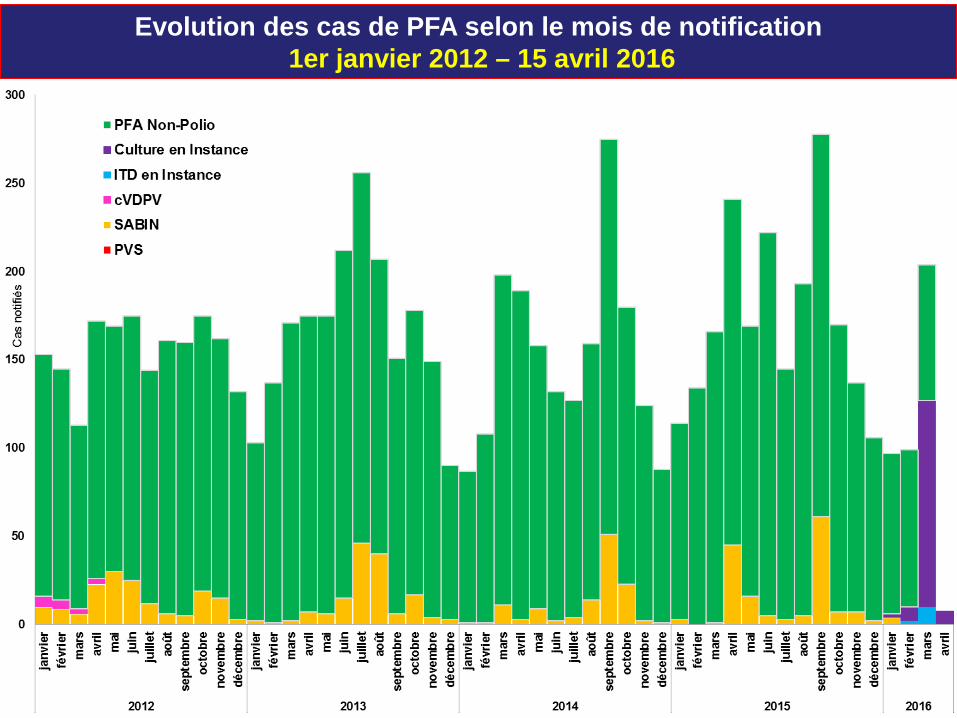
Evolution des cas de PFA selon le mois de notification 1er janvier 2012 – 15 avril 2016
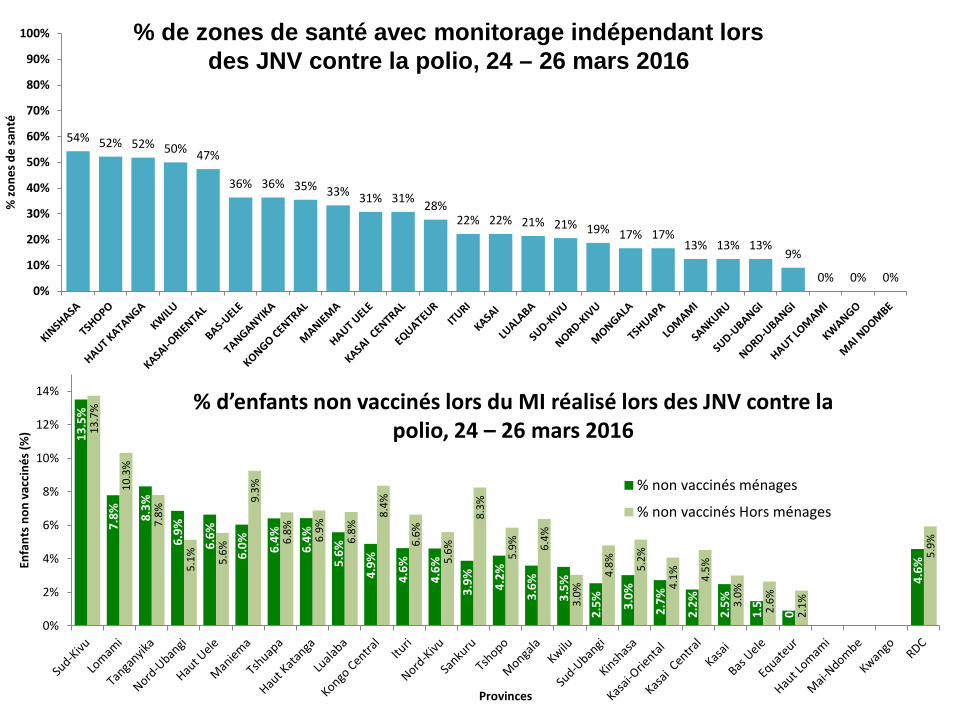
54% 52% 52% 50% 47%
36% 36% 35% 33% 31% 31% 28% 22% 22% 21% 21% 19% 17% 17%
13% 13% 13% 9%
0% 0% 0% 0%
10%
20%
30%
40%
50%
60%
70%
80%
90%
100%
% zo
nes d
e sa
nté
% de zones de santé avec monitorage indépendant lors des JNV contre la polio, 24 – 26 mars 2016
% d’enfants non vaccinés lors du MI réalisé lors des JNV contre la polio, 24 – 26 mars 2016 13
.5%
7.8%
8.3%
6.9%
6.6%
6.0%
6.4%
6.4%
5.6%
4.9%
4.6%
4.6%
3.9%
4.2%
3.6%
3.5%
2.5%
3.0%
2.7%
2.2%
2.5%
1.5%
0.9%
4.6%
13.7
%
10.3
%
7.8%
5.1%
5.6%
9.3%
6.8%
6.9%
6.8%
8.4%
6.6%
5.6%
8.3%
5.9%
6.4%
3.0%
4.8%
5.2%
4.1%
4.5%
3.0%
2.6%
2.1%
5.9%
0%
2%
4%
6%
8%
10%
12%
14%
Enfa
nts
non
vacc
inés
(%)
Provinces
% non vaccinés ménages
% non vaccinés Hors ménages
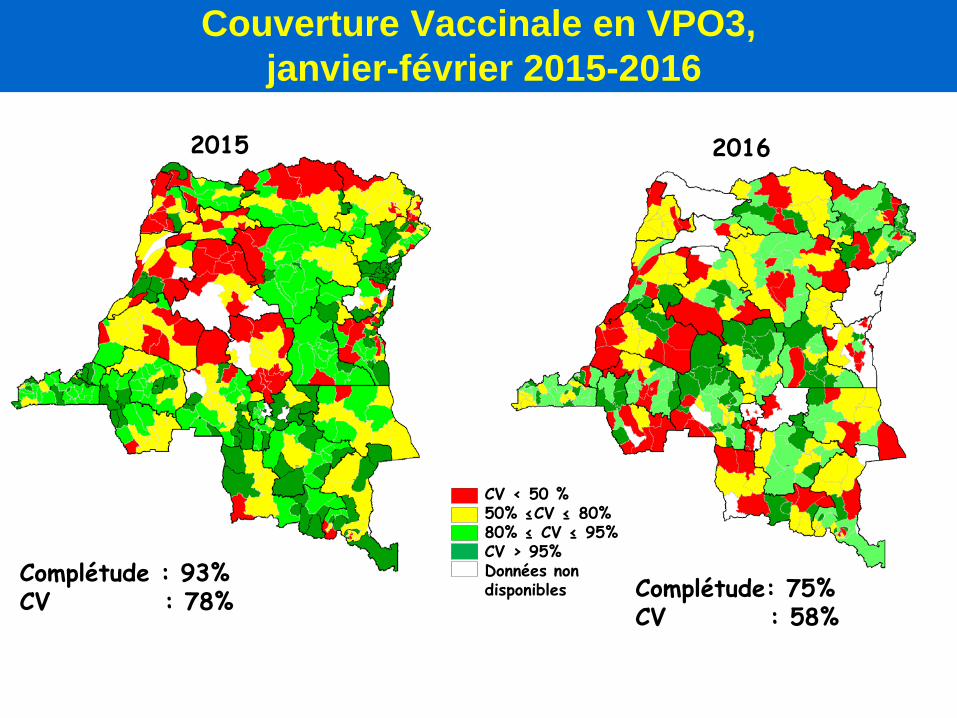
Couverture Vaccinale en VPO3, janvier-février 2015-2016
2015 2016
CV < 50 % 50% ≤CV ≤ 80% 80% ≤ CV ≤ 95% CV > 95% Données non disponibles Complétude: 75%
CV : 58%
Complétude : 93% CV : 78%
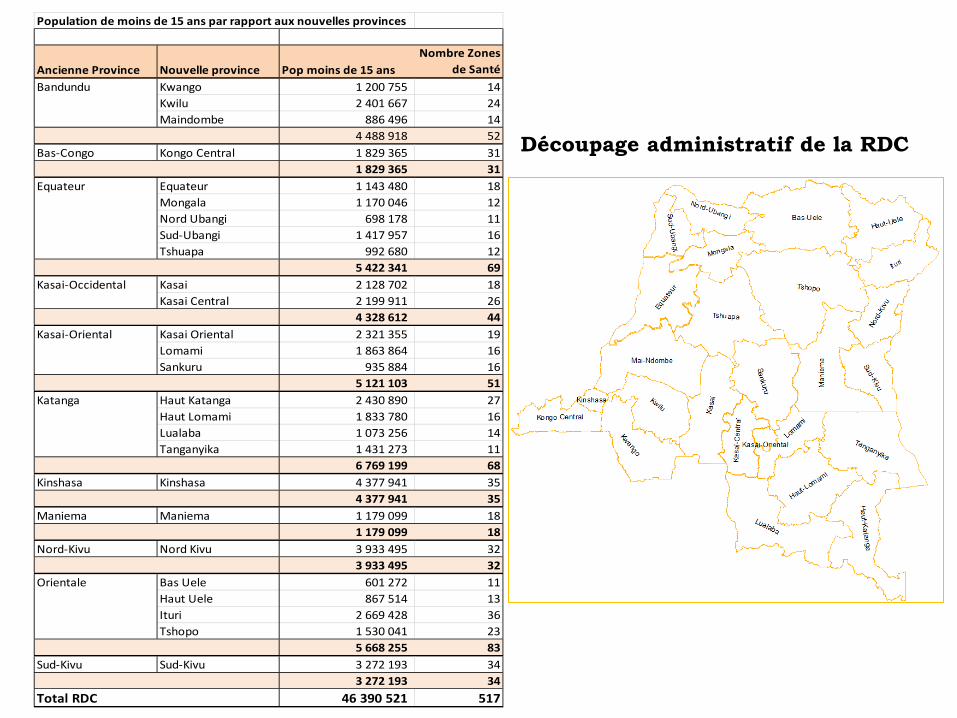
Population de moins de 15 ans par rapport aux nouvelles provinces
Ancienne Province Nouvelle province Pop moins de 15 ansNombre Zones
de SantéBandundu Kwango 1 200 755 14
Kwilu 2 401 667 24Maindombe 886 496 14
4 488 918 52Bas-Congo Kongo Central 1 829 365 31
1 829 365 31Equateur Equateur 1 143 480 18
Mongala 1 170 046 12Nord Ubangi 698 178 11Sud-Ubangi 1 417 957 16Tshuapa 992 680 12
5 422 341 69Kasai-Occidental Kasai 2 128 702 18
Kasai Central 2 199 911 264 328 612 44
Kasai-Oriental Kasai Oriental 2 321 355 19Lomami 1 863 864 16Sankuru 935 884 16
5 121 103 51Katanga Haut Katanga 2 430 890 27
Haut Lomami 1 833 780 16Lualaba 1 073 256 14Tanganyika 1 431 273 11
6 769 199 68Kinshasa Kinshasa 4 377 941 35
4 377 941 35Maniema Maniema 1 179 099 18
1 179 099 18Nord-Kivu Nord Kivu 3 933 495 32
3 933 495 32Orientale Bas Uele 601 272 11
Haut Uele 867 514 13Ituri 2 669 428 36Tshopo 1 530 041 23
5 668 255 83Sud-Kivu Sud-Kivu 3 272 193 34
3 272 193 34Total RDC 46 390 521 517
Découpage administratif de la RDC
Activités planifiées / en cours
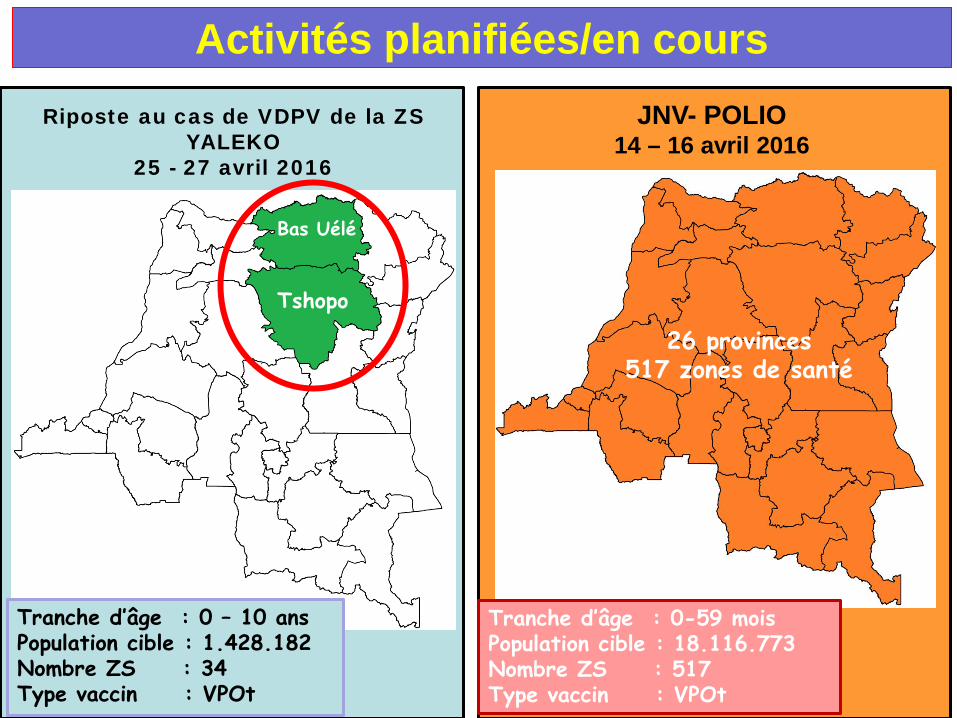
Activités planifiées/en cours JNV- POLIO
14 – 16 avril 2016
Tranche d’âge : 0-59 mois Population cible : 18.116.773 Nombre ZS : 517 Type vaccin : VPOt
26 provinces 517 zones de santé
Riposte au cas de VDPV de la ZS YALEKO
25 - 27 avril 2016
Tshopo
Bas Uélé
Tranche d’âge : 0 – 10 ans Population cible : 1.428.182 Nombre ZS : 34 Type vaccin : VPOt
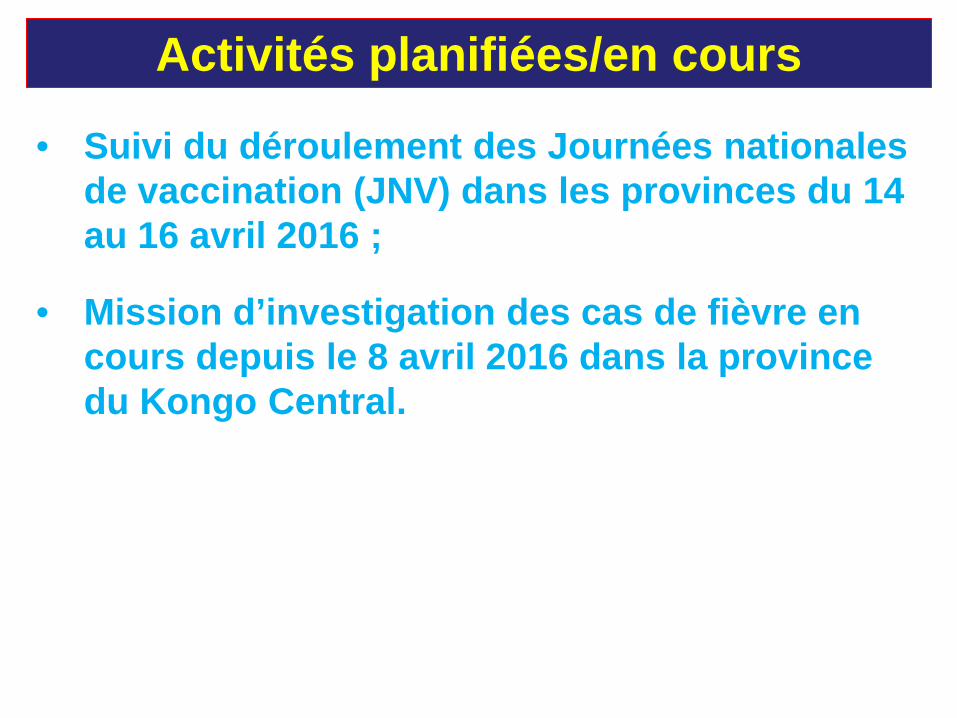
Activités planifiées/en cours
• Suivi du déroulement des Journées nationales de vaccination (JNV) dans les provinces du 14 au 16 avril 2016 ;
• Mission d’investigation des cas de fièvre en cours depuis le 8 avril 2016 dans la province du Kongo Central.
Performances de la surveillance des maladies évitables par la vaccination
Revue à mi parcours du PEV, 2016
Plan PFA Fièvre jaune Rougeole TNN Surveillance des MAPI Sites en sites sentinelles: Gastroentérites infantiles à
Rotavirus Problèmes prioritaires Perspectives Second semestre 2016
SURVEILLANCE DES PFA
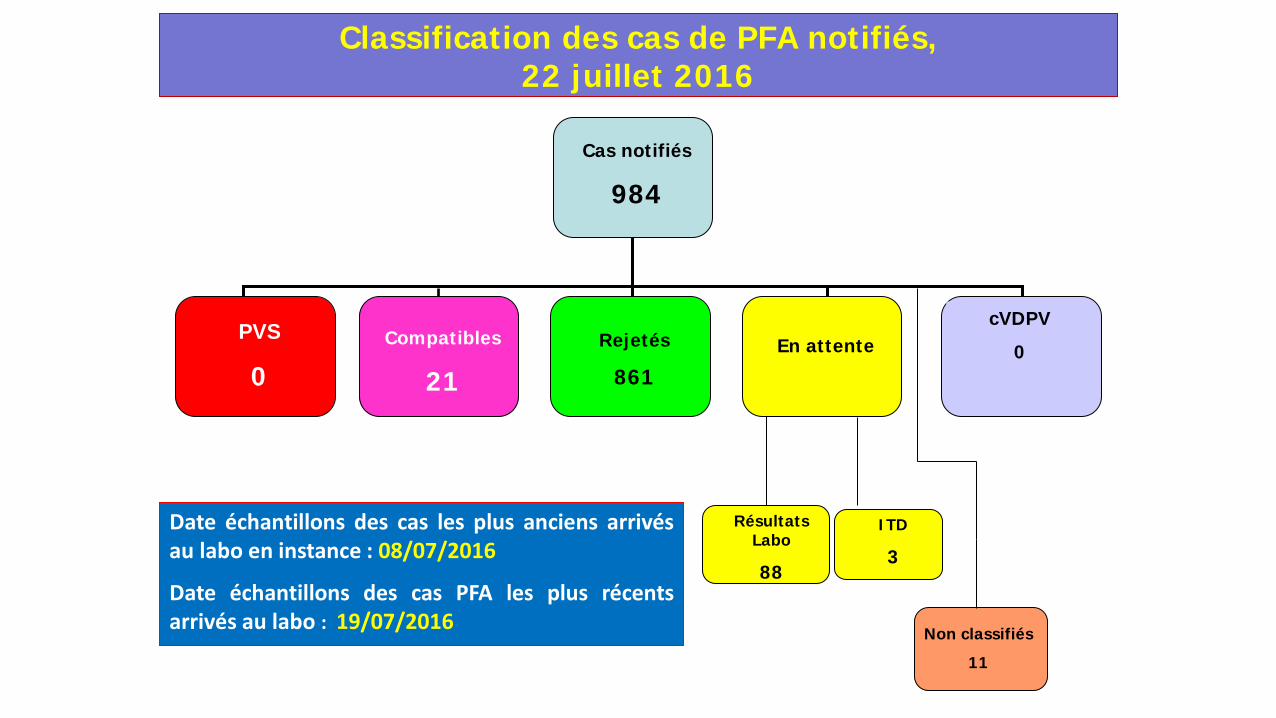
Classification des cas de PFA notifiés, 22 juillet 2016
Compatibles
21
PVS
0 Rejetés
861 En attente
cVDPV
0
Cas notifiés
984
Non classifiés
11
Résultats Labo
88
Date échantillons des cas les plus anciens arrivés au labo en instance : 08/07/2016
Date échantillons des cas PFA les plus récents arrivés au labo : 19/07/2016
ITD
3
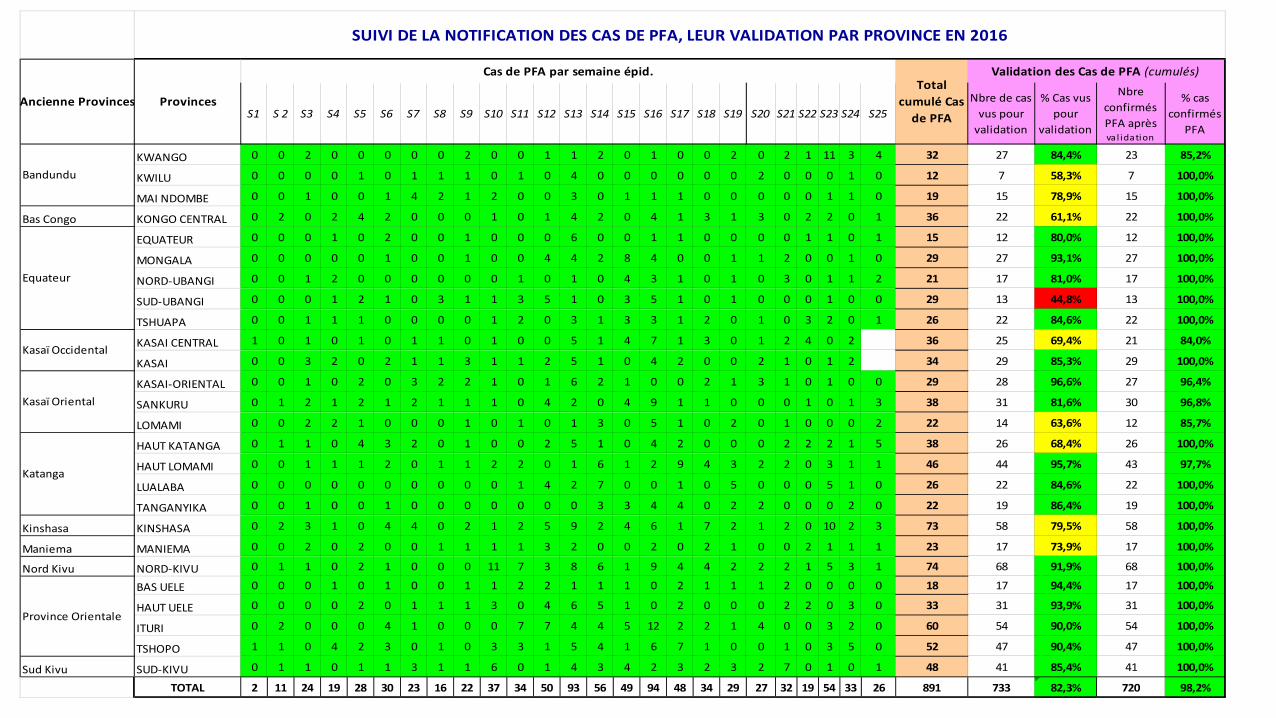
S1 S 2 S3 S4 S5 S6 S7 S8 S9 S10 S11 S12 S13 S14 S15 S16 S17 S18 S19 S20 S21 S22 S23 S24 S25Nbre de cas
vus pour validation
% Cas vus pour
validation
Nbre confirmés PFA après va l idation
% cas confirmés
PFA
KWANGO 0 0 2 0 0 0 0 0 2 0 0 1 1 2 0 1 0 0 2 0 2 1 11 3 4 32 27 84,4% 23 85,2%
KWILU 0 0 0 0 1 0 1 1 1 0 1 0 4 0 0 0 0 0 0 2 0 0 0 1 0 12 7 58,3% 7 100,0%
MAI NDOMBE 0 0 1 0 0 1 4 2 1 2 0 0 3 0 1 1 1 0 0 0 0 0 1 1 0 19 15 78,9% 15 100,0%
Bas Congo KONGO CENTRAL 0 2 0 2 4 2 0 0 0 1 0 1 4 2 0 4 1 3 1 3 0 2 2 0 1 36 22 61,1% 22 100,0%
EQUATEUR 0 0 0 1 0 2 0 0 1 0 0 0 6 0 0 1 1 0 0 0 0 1 1 0 1 15 12 80,0% 12 100,0%
MONGALA 0 0 0 0 0 1 0 0 1 0 0 4 4 2 8 4 0 0 1 1 2 0 0 1 0 29 27 93,1% 27 100,0%
NORD-UBANGI 0 0 1 2 0 0 0 0 0 0 1 0 1 0 4 3 1 0 1 0 3 0 1 1 2 21 17 81,0% 17 100,0%
SUD-UBANGI 0 0 0 1 2 1 0 3 1 1 3 5 1 0 3 5 1 0 1 0 0 0 1 0 0 29 13 44,8% 13 100,0%
TSHUAPA 0 0 1 1 1 0 0 0 0 1 2 0 3 1 3 3 1 2 0 1 0 3 2 0 1 26 22 84,6% 22 100,0%
KASAI CENTRAL 1 0 1 0 1 0 1 1 0 1 0 0 5 1 4 7 1 3 0 1 2 4 0 2 36 25 69,4% 21 84,0%
KASAI 0 0 3 2 0 2 1 1 3 1 1 2 5 1 0 4 2 0 0 2 1 0 1 2 34 29 85,3% 29 100,0%
KASAI-ORIENTAL 0 0 1 0 2 0 3 2 2 1 0 1 6 2 1 0 0 2 1 3 1 0 1 0 0 29 28 96,6% 27 96,4%
SANKURU 0 1 2 1 2 1 2 1 1 1 0 4 2 0 4 9 1 1 0 0 0 1 0 1 3 38 31 81,6% 30 96,8%
LOMAMI 0 0 2 2 1 0 0 0 1 0 1 0 1 3 0 5 1 0 2 0 1 0 0 0 2 22 14 63,6% 12 85,7%
HAUT KATANGA 0 1 1 0 4 3 2 0 1 0 0 2 5 1 0 4 2 0 0 0 2 2 2 1 5 38 26 68,4% 26 100,0%
HAUT LOMAMI 0 0 1 1 1 2 0 1 1 2 2 0 1 6 1 2 9 4 3 2 2 0 3 1 1 46 44 95,7% 43 97,7%
LUALABA 0 0 0 0 0 0 0 0 0 0 1 4 2 7 0 0 1 0 5 0 0 0 5 1 0 26 22 84,6% 22 100,0%
TANGANYIKA 0 0 1 0 0 1 0 0 0 0 0 0 0 3 3 4 4 0 2 2 0 0 0 2 0 22 19 86,4% 19 100,0%
Kinshasa KINSHASA 0 2 3 1 0 4 4 0 2 1 2 5 9 2 4 6 1 7 2 1 2 0 10 2 3 73 58 79,5% 58 100,0%
Maniema MANIEMA 0 0 2 0 2 0 0 1 1 1 1 3 2 0 0 2 0 2 1 0 0 2 1 1 1 23 17 73,9% 17 100,0%
Nord Kivu NORD-KIVU 0 1 1 0 2 1 0 0 0 11 7 3 8 6 1 9 4 4 2 2 2 1 5 3 1 74 68 91,9% 68 100,0%
BAS UELE 0 0 0 1 0 1 0 0 1 1 2 2 1 1 1 0 2 1 1 1 2 0 0 0 0 18 17 94,4% 17 100,0%
HAUT UELE 0 0 0 0 2 0 1 1 1 3 0 4 6 5 1 0 2 0 0 0 2 2 0 3 0 33 31 93,9% 31 100,0%
ITURI 0 2 0 0 0 4 1 0 0 0 7 7 4 4 5 12 2 2 1 4 0 0 3 2 0 60 54 90,0% 54 100,0%
TSHOPO 1 1 0 4 2 3 0 1 0 3 3 1 5 4 1 6 7 1 0 0 1 0 3 5 0 52 47 90,4% 47 100,0%
Sud Kivu SUD-KIVU 0 1 1 0 1 1 3 1 1 6 0 1 4 3 4 2 3 2 3 2 7 0 1 0 1 48 41 85,4% 41 100,0%
TOTAL 2 11 24 19 28 30 23 16 22 37 34 50 93 56 49 94 48 34 29 27 32 19 54 33 26 891 733 82,3% 720 98,2%
Province Orientale
SUIVI DE LA NOTIFICATION DES CAS DE PFA, LEUR VALIDATION PAR PROVINCE EN 2016
Provinces
Cas de PFA par semaine épid.Total
cumulé Cas de PFA
Validation des Cas de PFA (cumulés)
Ancienne Provinces
Bandundu
Equateur
Kasaï Occidental
Kasaï Oriental
Katanga
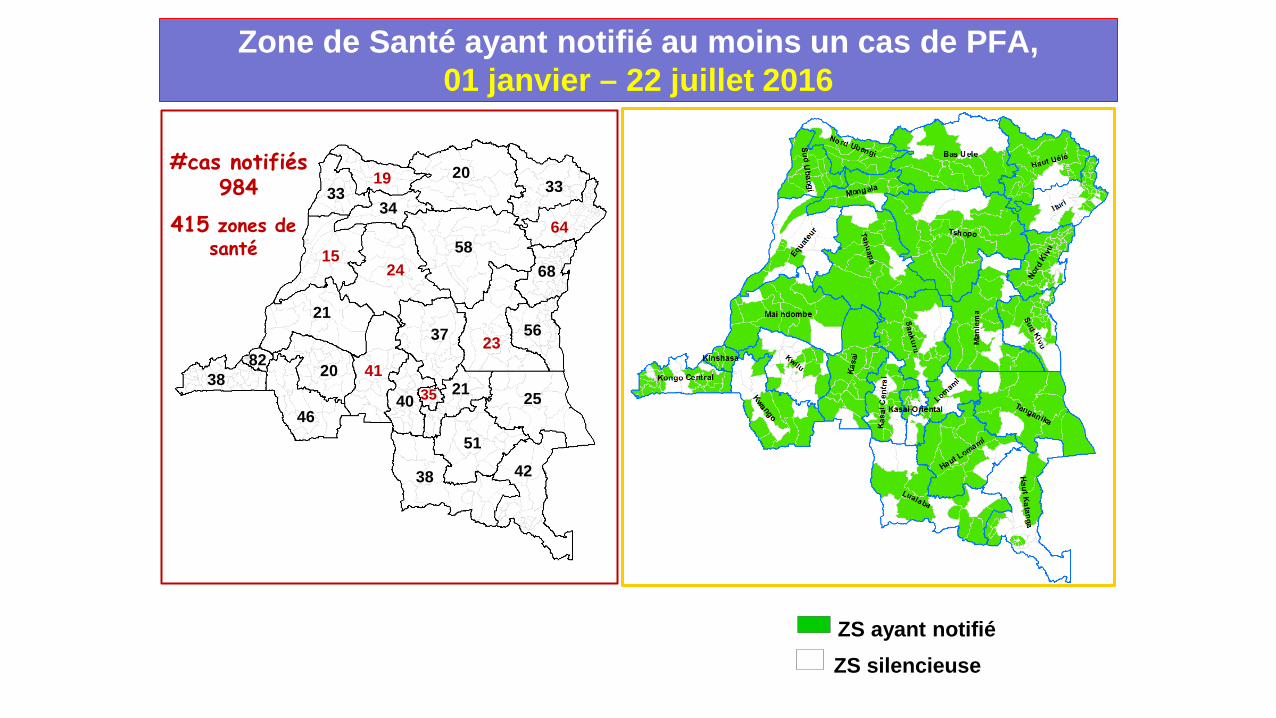
20
15
42
51
33
64
41
40 35
82 38
46
20 21
37
38
25
21
23
34
68
19 33
24 58
56
Zone de Santé ayant notifié au moins un cas de PFA, 01 janvier – 22 juillet 2016
ZS silencieuse ZS ayant notifié
415 zones de santé
#cas notifiés 984
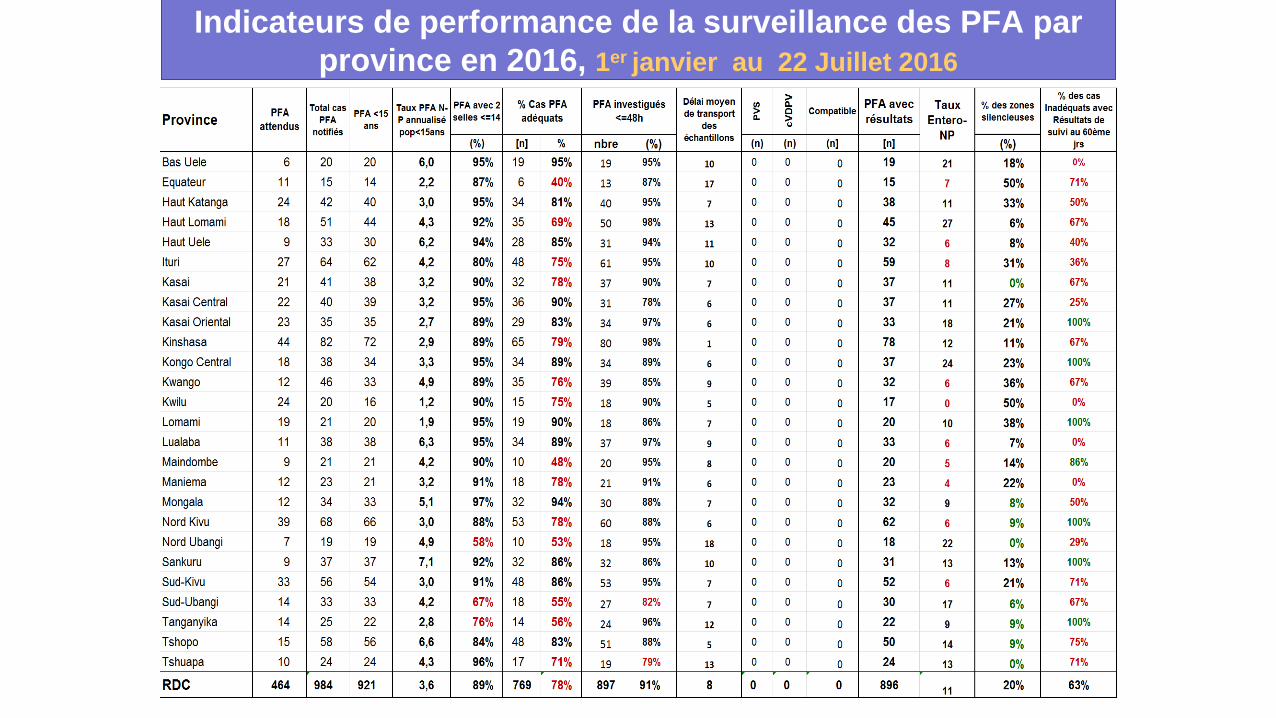
Indicateurs de performance de la surveillance des PFA par province en 2016, 1er janvier au 22 Juillet 2016
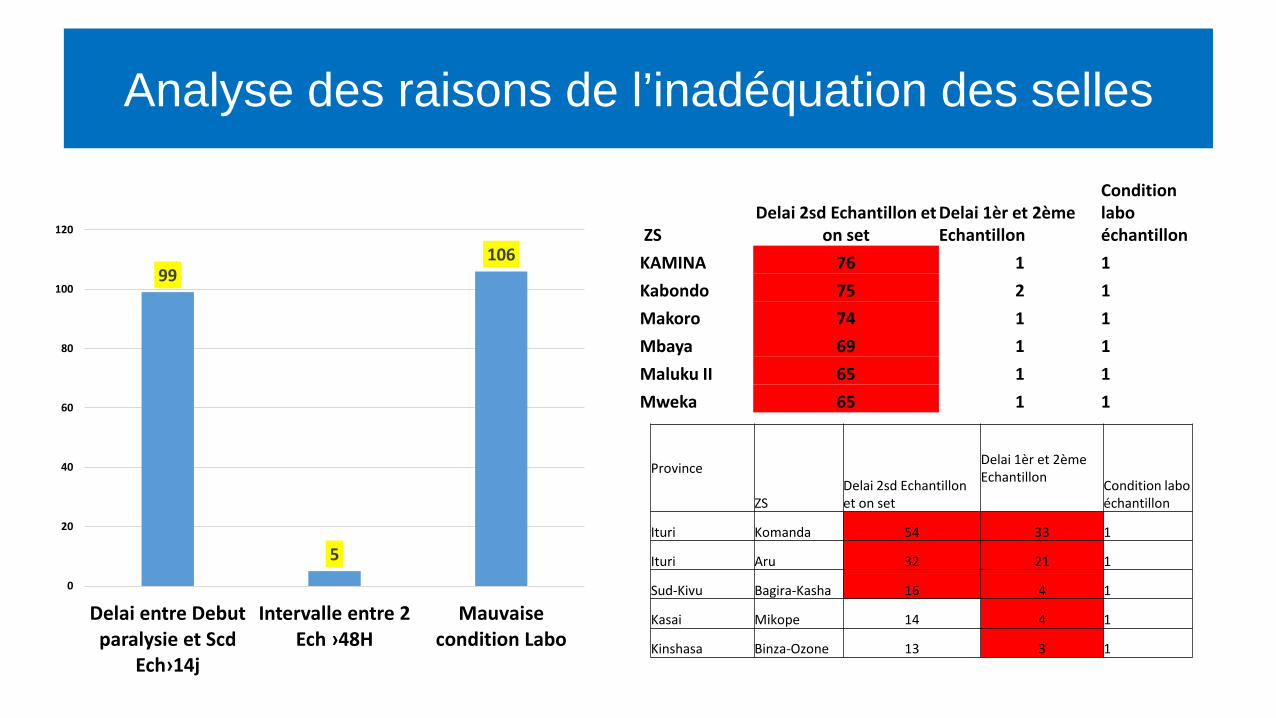
ZS Delai 2sd Echantillon et
on set Delai 1èr et 2ème Echantillon
Condition labo échantillon
KAMINA 76 1 1 Kabondo 75 2 1 Makoro 74 1 1 Mbaya 69 1 1 Maluku II 65 1 1 Mweka 65 1 1
Province
ZS Delai 2sd Echantillon et on set
Delai 1èr et 2ème Echantillon Condition labo
échantillon
Ituri Komanda 54 33 1
Ituri Aru 32 21 1
Sud-Kivu Bagira-Kasha 16 4 1
Kasai Mikope 14 4 1
Kinshasa Binza-Ozone 13 3 1
99
5
106
0
20
40
60
80
100
120
Delai entre Debut paralysie et Scd
Ech›14j
Intervalle entre 2 Ech ›48H
Mauvaisecondition Labo
Analyse des raisons de l’inadéquation des selles
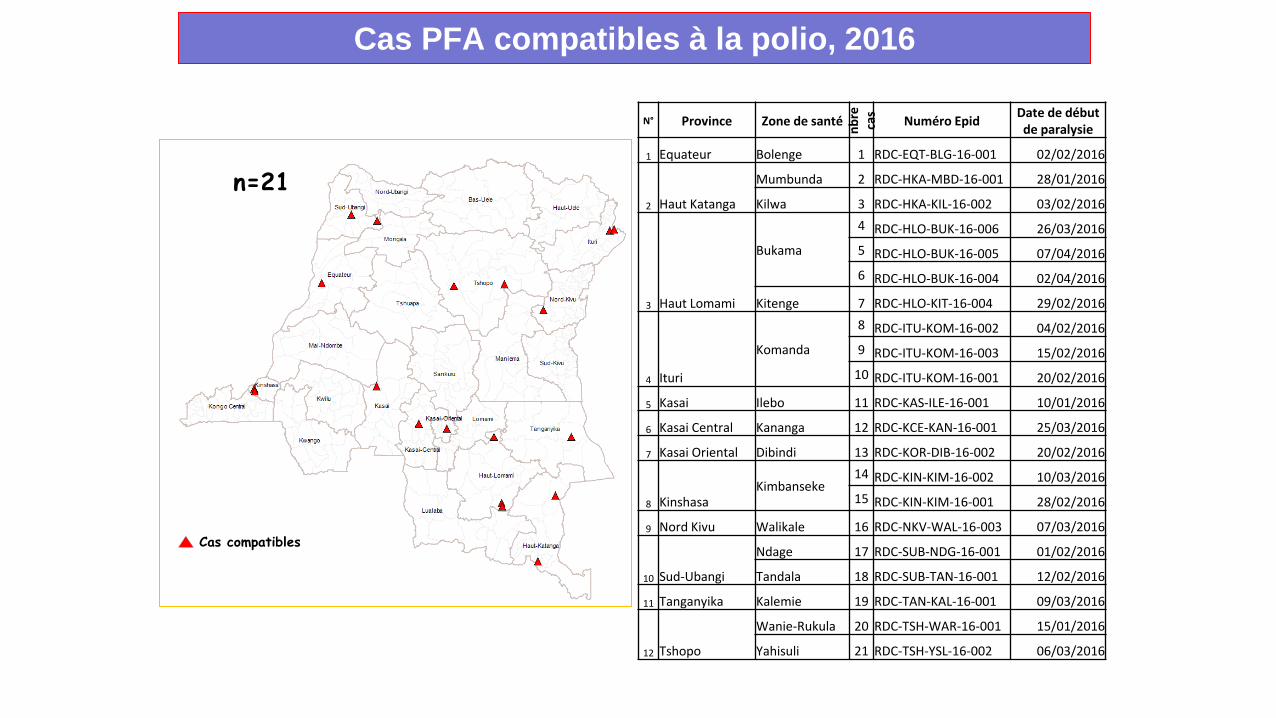
Cas PFA compatibles à la polio, 2016
n=21
N° Province Zone de santé nbre
ca
s Numéro Epid Date de début de paralysie
1 Equateur Bolenge 1 RDC-EQT-BLG-16-001 02/02/2016
2 Haut Katanga
Mumbunda 2 RDC-HKA-MBD-16-001 28/01/2016
Kilwa 3 RDC-HKA-KIL-16-002 03/02/2016
3 Haut Lomami
Bukama
4 RDC-HLO-BUK-16-006 26/03/2016 5 RDC-HLO-BUK-16-005 07/04/2016 6 RDC-HLO-BUK-16-004 02/04/2016
Kitenge 7 RDC-HLO-KIT-16-004 29/02/2016
4 Ituri
Komanda
8 RDC-ITU-KOM-16-002 04/02/2016 9 RDC-ITU-KOM-16-003 15/02/2016
10 RDC-ITU-KOM-16-001 20/02/2016
5 Kasai Ilebo 11 RDC-KAS-ILE-16-001 10/01/2016
6 Kasai Central Kananga 12 RDC-KCE-KAN-16-001 25/03/2016
7 Kasai Oriental Dibindi 13 RDC-KOR-DIB-16-002 20/02/2016
8 Kinshasa Kimbanseke
14 RDC-KIN-KIM-16-002 10/03/2016 15 RDC-KIN-KIM-16-001 28/02/2016
9 Nord Kivu Walikale 16 RDC-NKV-WAL-16-003 07/03/2016
10 Sud-Ubangi
Ndage 17 RDC-SUB-NDG-16-001 01/02/2016
Tandala 18 RDC-SUB-TAN-16-001 12/02/2016
11 Tanganyika Kalemie 19 RDC-TAN-KAL-16-001 09/03/2016
12 Tshopo
Wanie-Rukula 20 RDC-TSH-WAR-16-001 15/01/2016
Yahisuli 21 RDC-TSH-YSL-16-002 06/03/2016
Cas compatibles
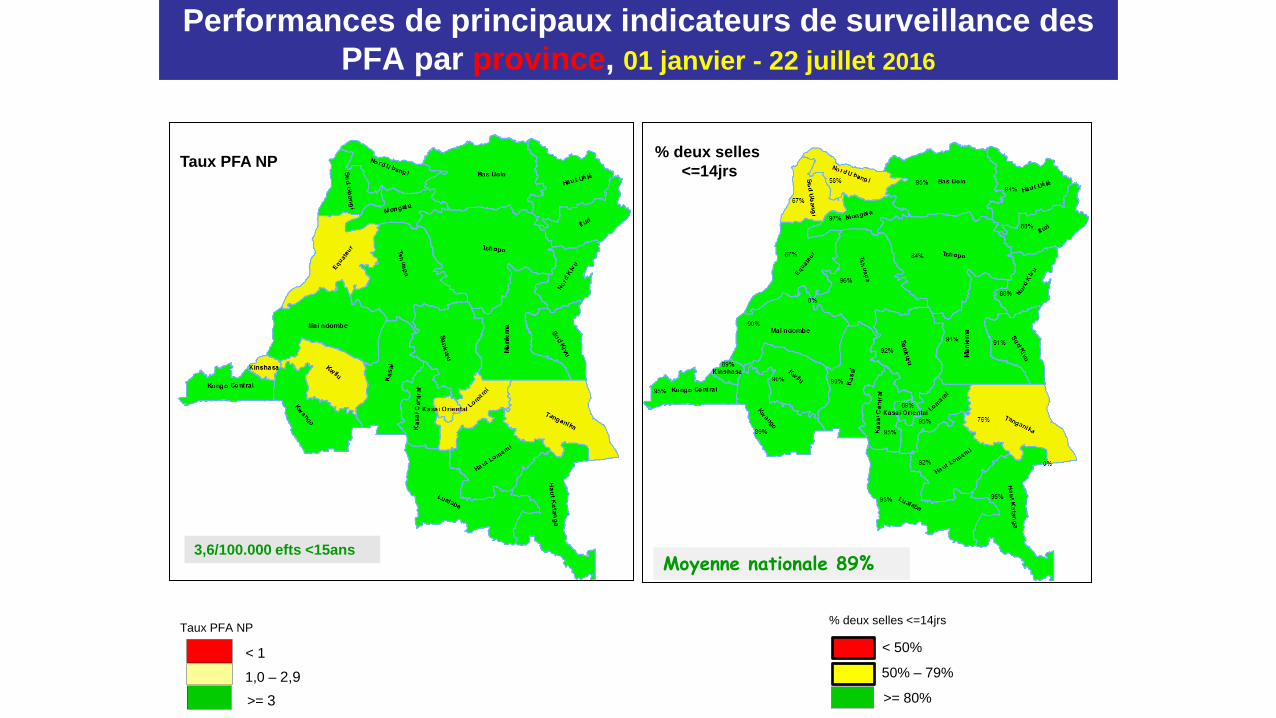
Performances de principaux indicateurs de surveillance des PFA par province, 01 janvier - 22 juillet 2016
Taux PFA NP
< 1
1,0 – 2,9 >= 3
Taux PFA NP
% deux selles <=14jrs
< 50%
50% – 79%
>= 80%
% deux selles <=14jrs
3,6/100.000 efts <15ans Moyenne nationale 89%
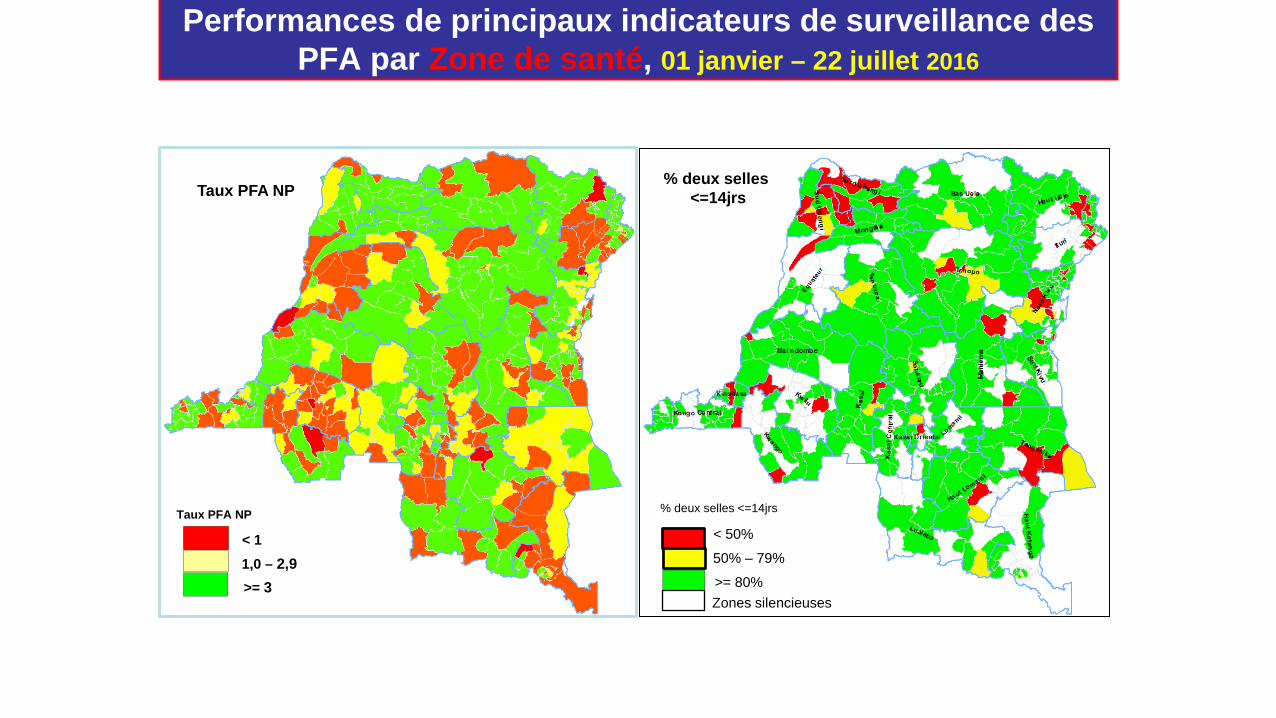
Performances de principaux indicateurs de surveillance des PFA par Zone de santé, 01 janvier – 22 juillet 2016
Taux PFA NP
< 1 1,0 – 2,9 >= 3
Taux PFA NP
% deux selles <=14jrs
< 50%
50% – 79%
>= 80%
% deux selles <=14jrs
Zones silencieuses
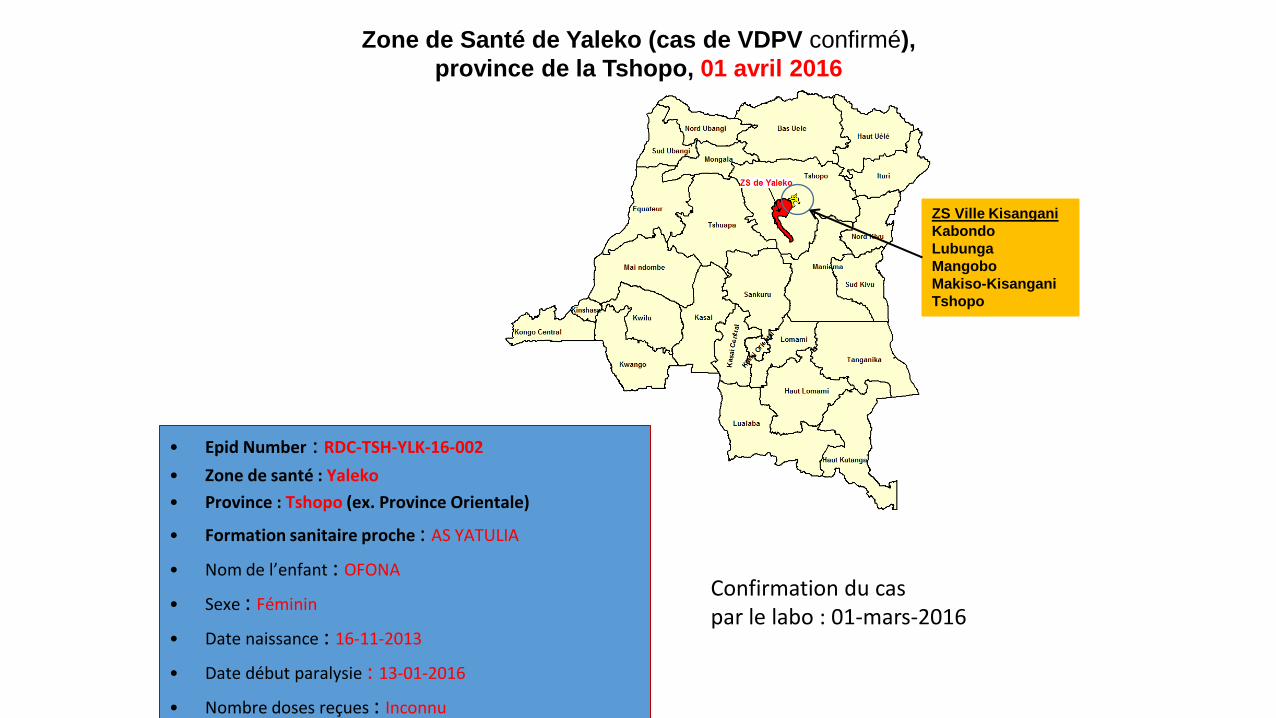
Zone de Santé de Yaleko (cas de VDPV confirmé), province de la Tshopo, 01 avril 2016
ZS Ville Kisangani Kabondo Lubunga Mangobo Makiso-Kisangani Tshopo
• Epid Number : RDC-TSH-YLK-16-002 • Zone de santé : Yaleko • Province : Tshopo (ex. Province Orientale)
• Formation sanitaire proche : AS YATULIA
• Nom de l’enfant : OFONA
• Sexe : Féminin
• Date naissance : 16-11-2013
• Date début paralysie : 13-01-2016
• Nombre doses reçues : Inconnu
Confirmation du cas par le labo : 01-mars-2016
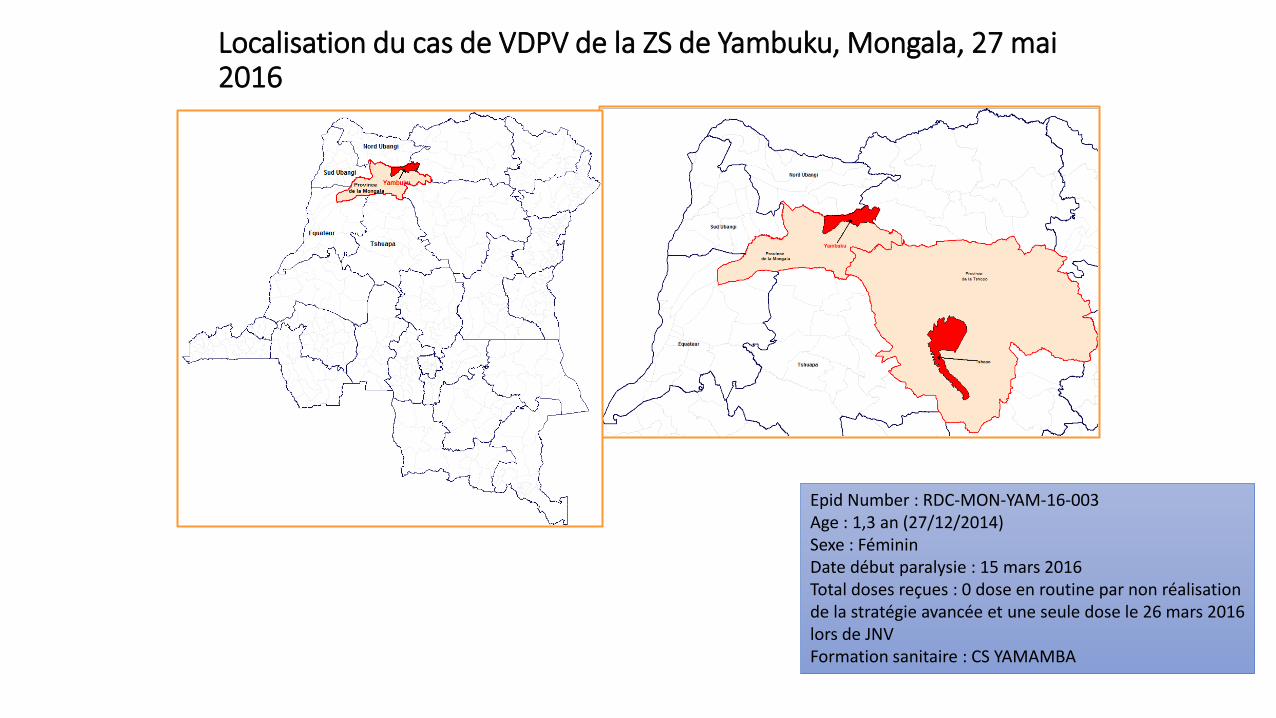
Localisation du cas de VDPV de la ZS de Yambuku, Mongala, 27 mai 2016
Epid Number : RDC-MON-YAM-16-003 Age : 1,3 an (27/12/2014) Sexe : Féminin Date début paralysie : 15 mars 2016 Total doses reçues : 0 dose en routine par non réalisation de la stratégie avancée et une seule dose le 26 mars 2016 lors de JNV Formation sanitaire : CS YAMAMBA
Surveillance de la Fièvre jaune
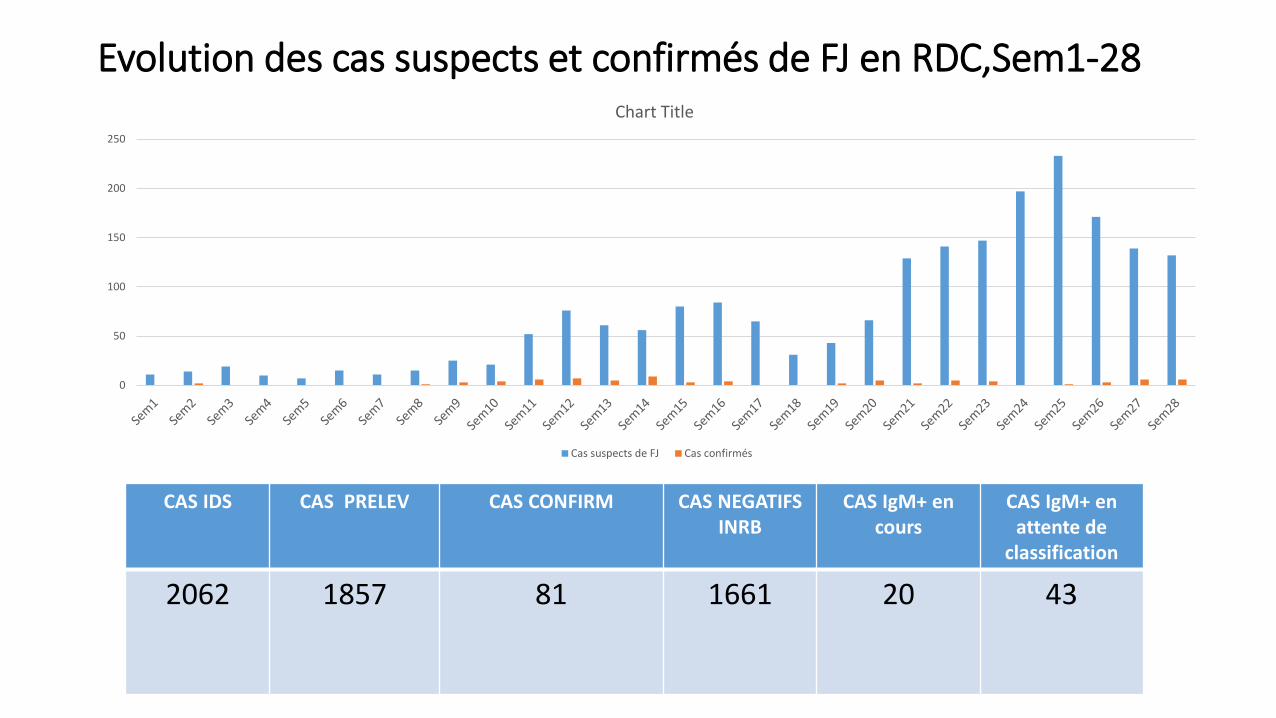
Evolution des cas suspects et confirmés de FJ en RDC,Sem1-28
0
50
100
150
200
250
Chart Title
Cas suspects de FJ Cas confirmés
CAS IDS CAS PRELEV CAS CONFIRM CAS NEGATIFS INRB
CAS IgM+ en cours
CAS IgM+ en attente de
classification
2062 1857
81
1661
20 43
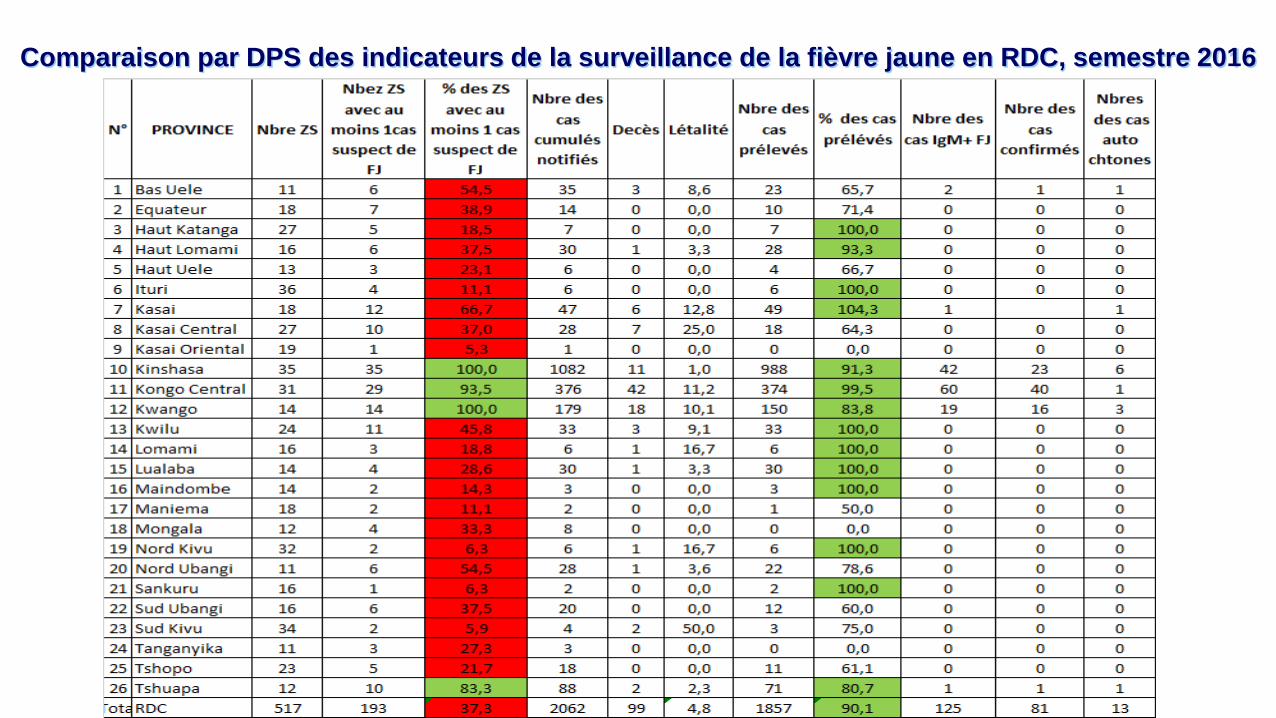
Comparaison par DPS des indicateurs de la surveillance de la fièvre jaune en RDC, semestre 2016
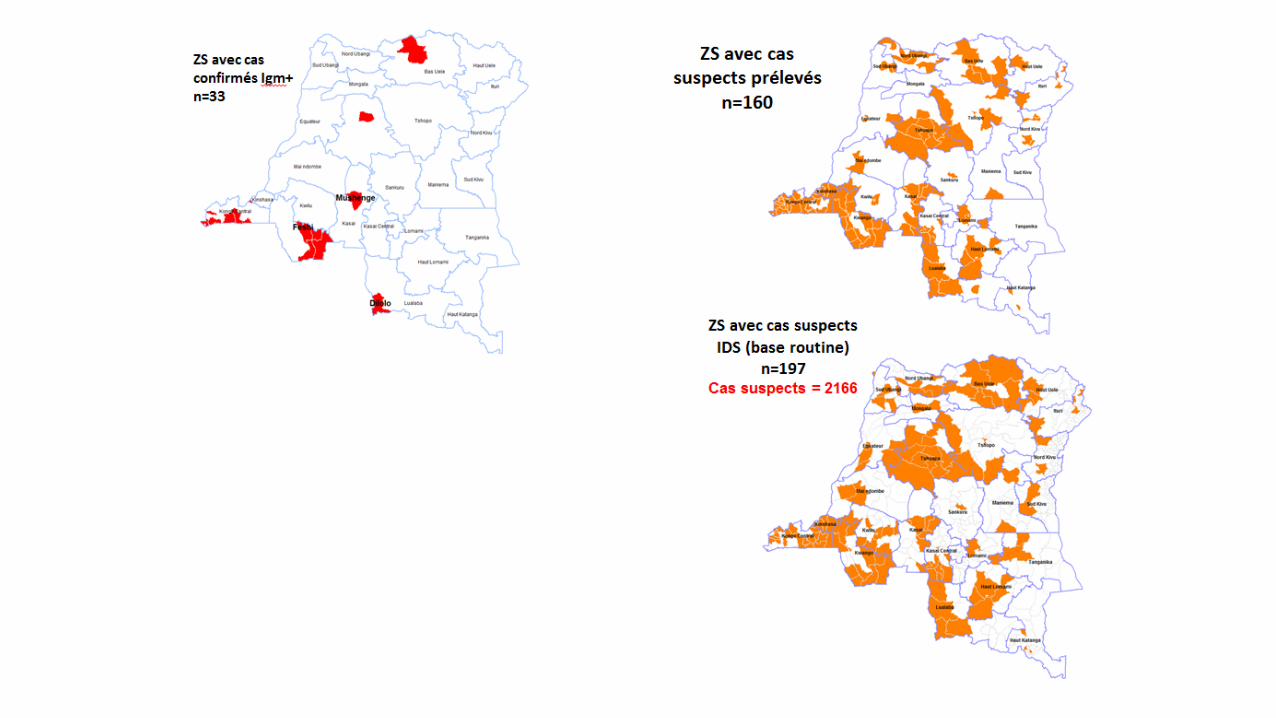
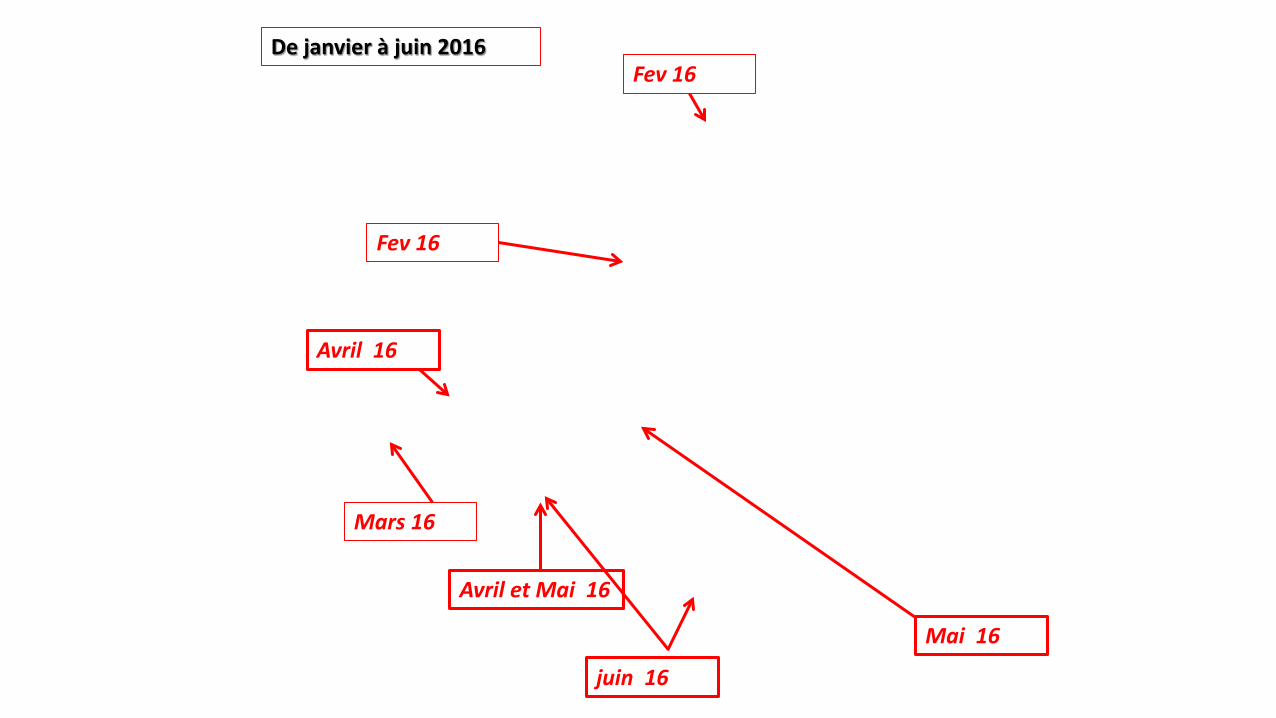
Fev 16
Fev 16
Mars 16
Avril 16
Avril et Mai 16
De janvier à juin 2016
Mai 16
juin 16
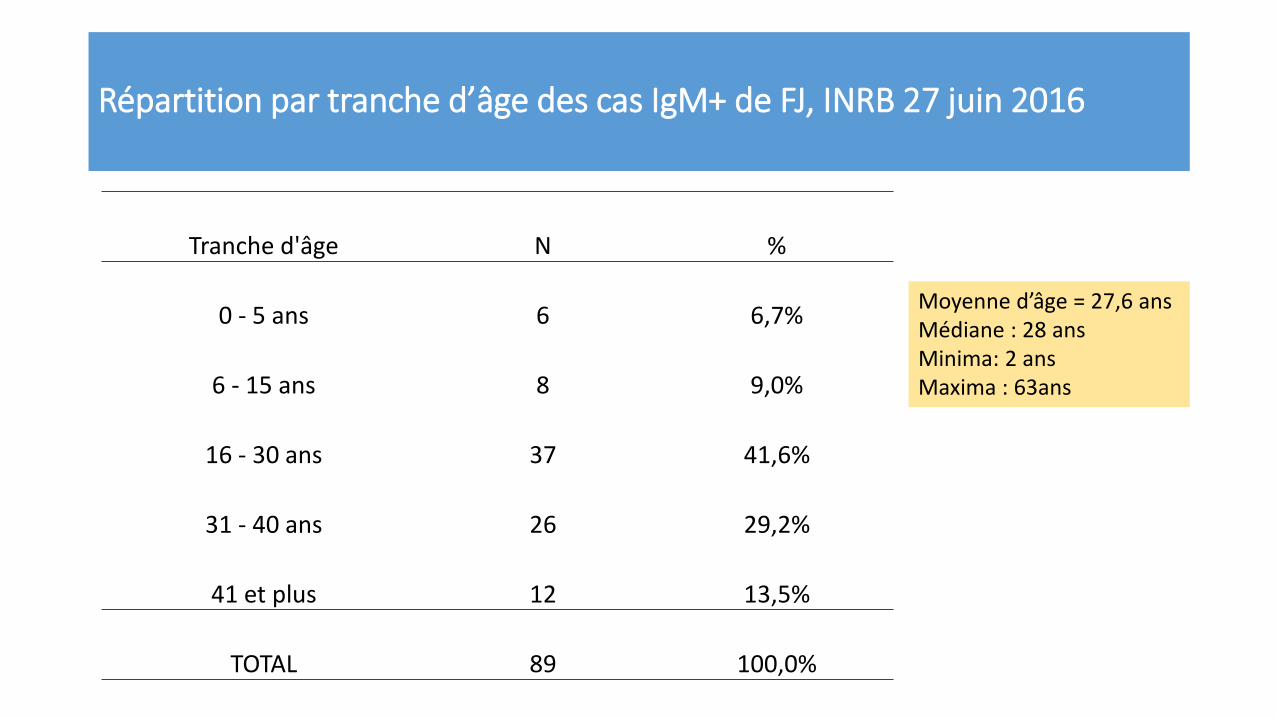
Répartition par tranche d’âge des cas IgM+ de FJ, INRB 27 juin 2016
Tranche d'âge N %
0 - 5 ans 6 6,7%
6 - 15 ans 8 9,0%
16 - 30 ans 37 41,6%
31 - 40 ans 26 29,2%
41 et plus 12 13,5%
TOTAL 89 100,0%
Moyenne d’âge = 27,6 ans Médiane : 28 ans Minima: 2 ans Maxima : 63ans
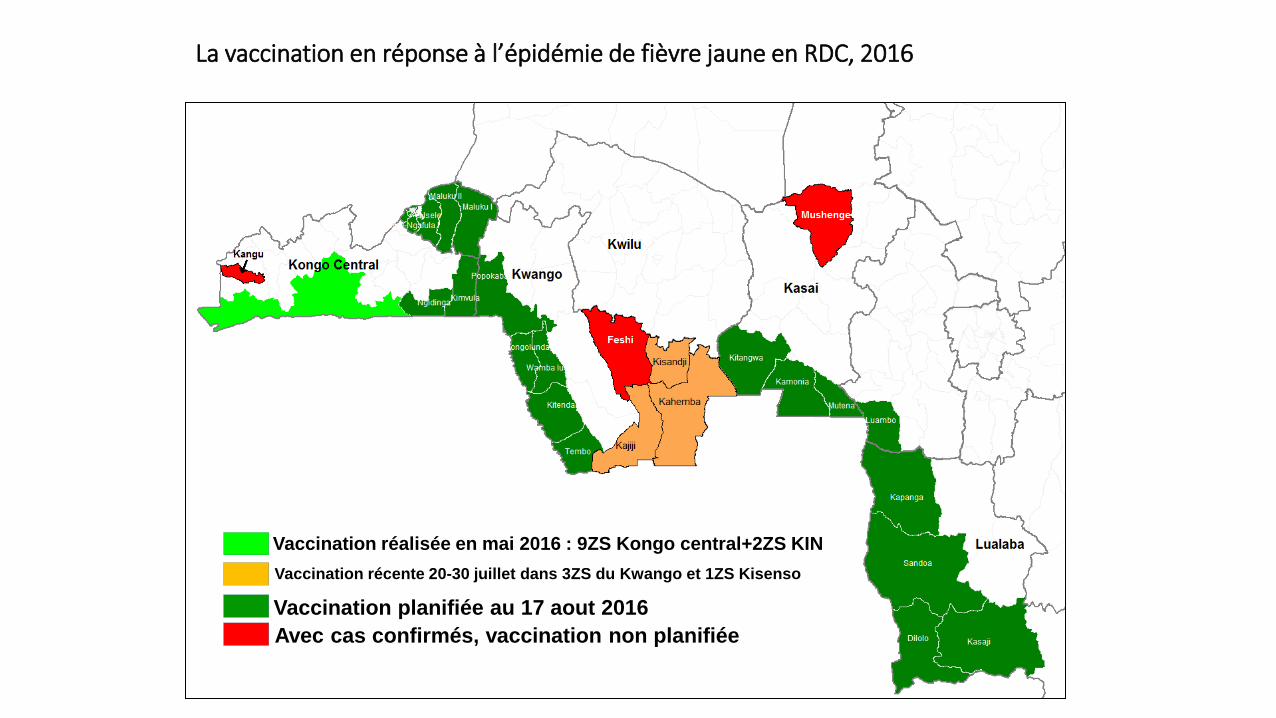
La vaccination en réponse à l’épidémie de fièvre jaune en RDC, 2016
Vaccination planifiée au 17 aout 2016 Vaccination récente 20-30 juillet dans 3ZS du Kwango et 1ZS Kisenso
Avec cas confirmés, vaccination non planifiée
Vaccination réalisée en mai 2016 : 9ZS Kongo central+2ZS KIN
SURVEILLANCE DE LA ROUGEOLE
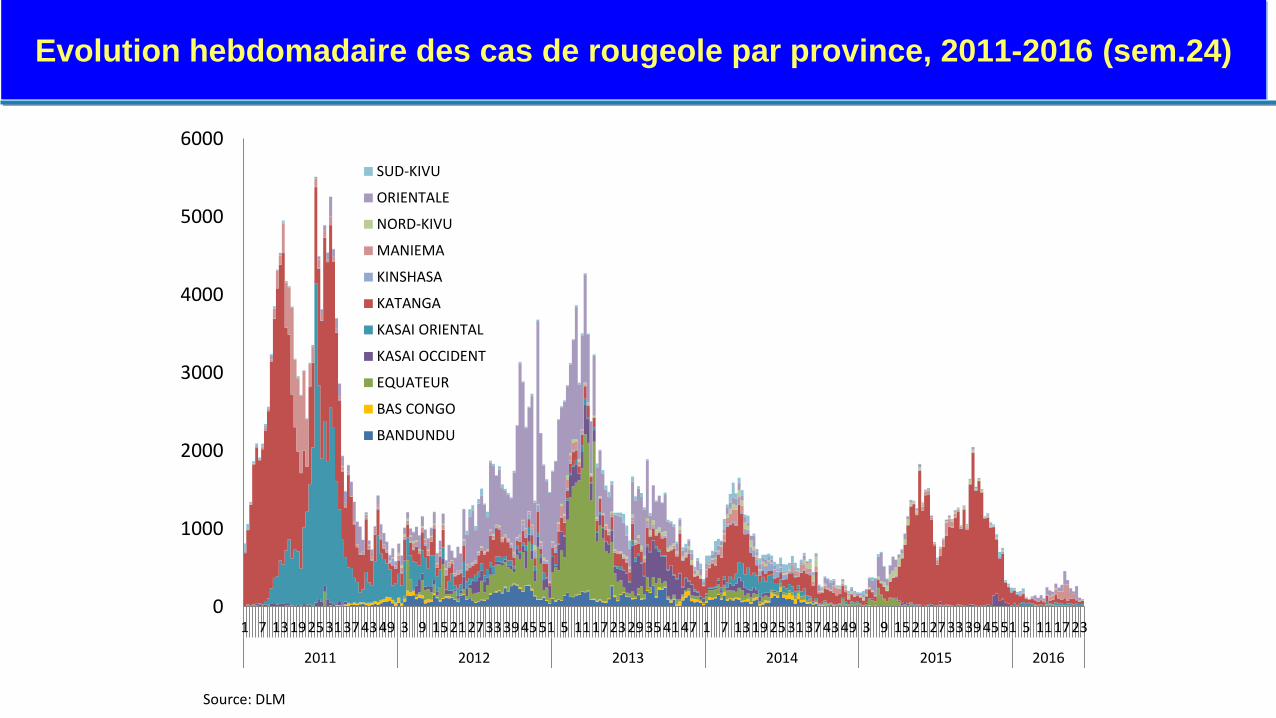
Evolution hebdomadaire des cas de rougeole par province, 2011-2016 (sem.24)
Source: DLM
0
1000
2000
3000
4000
5000
6000
1 7 13192531374349 3 9 15212733394551 5 11172329354147 1 7 13192531374349 3 9 15212733394551 5 111723
2011 2012 2013 2014 2015 2016
SUD-KIVU
ORIENTALE
NORD-KIVU
MANIEMA
KINSHASA
KATANGA
KASAI ORIENTAL
KASAI OCCIDENT
EQUATEUR
BAS CONGO
BANDUNDU
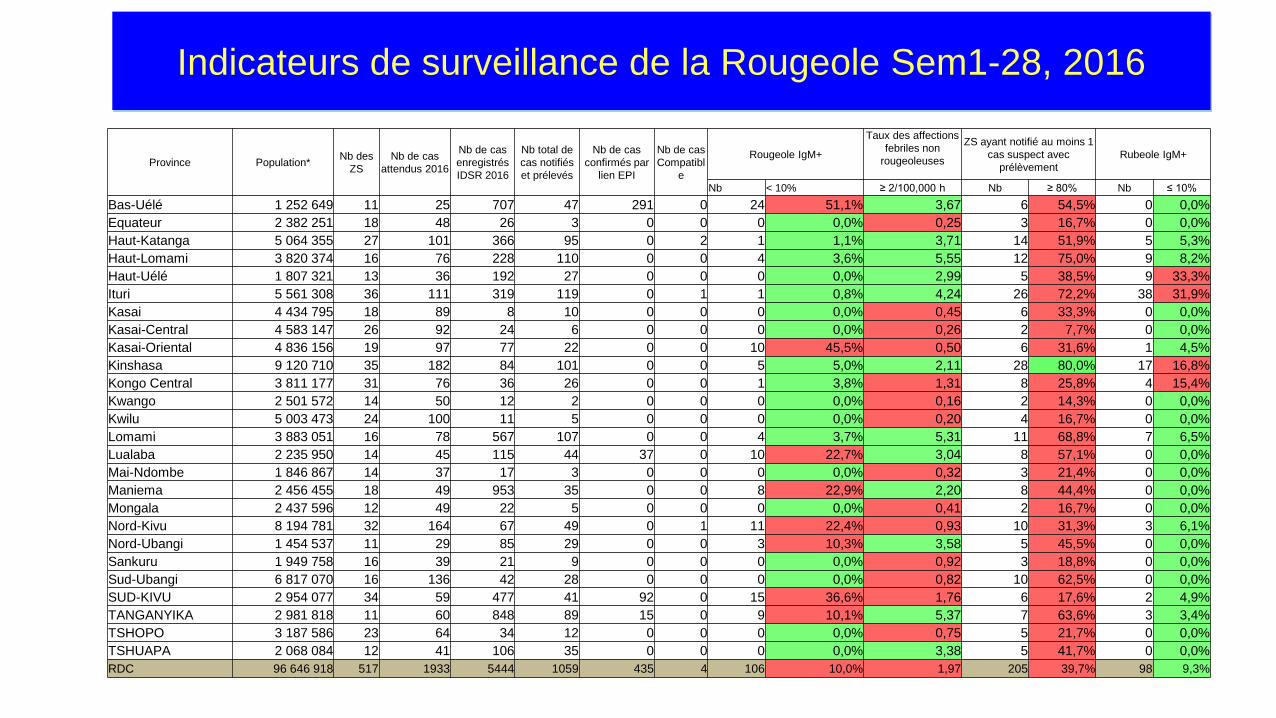
Indicateurs de surveillance de la Rougeole Sem1-28, 2016
Province Population* Nb des ZS
Nb de cas attendus 2016
Nb de cas enregistrés IDSR 2016
Nb total de cas notifiés et prélevés
Nb de cas confirmés par
lien EPI
Nb de cas Compatibl
e
Rougeole IgM+
Taux des affections febriles non
rougeoleuses
ZS ayant notifié au moins 1 cas suspect avec
prélèvement Rubeole IgM+
Nb < 10% ≥ 2/100,000 h Nb ≥ 80% Nb ≤ 10% Bas-Uélé 1 252 649 11 25 707 47 291 0 24 51,1% 3,67 6 54,5% 0 0,0% Equateur 2 382 251 18 48 26 3 0 0 0 0,0% 0,25 3 16,7% 0 0,0% Haut-Katanga 5 064 355 27 101 366 95 0 2 1 1,1% 3,71 14 51,9% 5 5,3% Haut-Lomami 3 820 374 16 76 228 110 0 0 4 3,6% 5,55 12 75,0% 9 8,2% Haut-Uélé 1 807 321 13 36 192 27 0 0 0 0,0% 2,99 5 38,5% 9 33,3% Ituri 5 561 308 36 111 319 119 0 1 1 0,8% 4,24 26 72,2% 38 31,9% Kasai 4 434 795 18 89 8 10 0 0 0 0,0% 0,45 6 33,3% 0 0,0% Kasai-Central 4 583 147 26 92 24 6 0 0 0 0,0% 0,26 2 7,7% 0 0,0% Kasai-Oriental 4 836 156 19 97 77 22 0 0 10 45,5% 0,50 6 31,6% 1 4,5% Kinshasa 9 120 710 35 182 84 101 0 0 5 5,0% 2,11 28 80,0% 17 16,8% Kongo Central 3 811 177 31 76 36 26 0 0 1 3,8% 1,31 8 25,8% 4 15,4% Kwango 2 501 572 14 50 12 2 0 0 0 0,0% 0,16 2 14,3% 0 0,0% Kwilu 5 003 473 24 100 11 5 0 0 0 0,0% 0,20 4 16,7% 0 0,0% Lomami 3 883 051 16 78 567 107 0 0 4 3,7% 5,31 11 68,8% 7 6,5% Lualaba 2 235 950 14 45 115 44 37 0 10 22,7% 3,04 8 57,1% 0 0,0% Mai-Ndombe 1 846 867 14 37 17 3 0 0 0 0,0% 0,32 3 21,4% 0 0,0% Maniema 2 456 455 18 49 953 35 0 0 8 22,9% 2,20 8 44,4% 0 0,0% Mongala 2 437 596 12 49 22 5 0 0 0 0,0% 0,41 2 16,7% 0 0,0% Nord-Kivu 8 194 781 32 164 67 49 0 1 11 22,4% 0,93 10 31,3% 3 6,1% Nord-Ubangi 1 454 537 11 29 85 29 0 0 3 10,3% 3,58 5 45,5% 0 0,0% Sankuru 1 949 758 16 39 21 9 0 0 0 0,0% 0,92 3 18,8% 0 0,0% Sud-Ubangi 6 817 070 16 136 42 28 0 0 0 0,0% 0,82 10 62,5% 0 0,0% SUD-KIVU 2 954 077 34 59 477 41 92 0 15 36,6% 1,76 6 17,6% 2 4,9% TANGANYIKA 2 981 818 11 60 848 89 15 0 9 10,1% 5,37 7 63,6% 3 3,4% TSHOPO 3 187 586 23 64 34 12 0 0 0 0,0% 0,75 5 21,7% 0 0,0% TSHUAPA 2 068 084 12 41 106 35 0 0 0 0,0% 3,38 5 41,7% 0 0,0% RDC 96 646 918 517 1933 5444 1059 435 4 106 10,0% 1,97 205 39,7% 98 9,3%
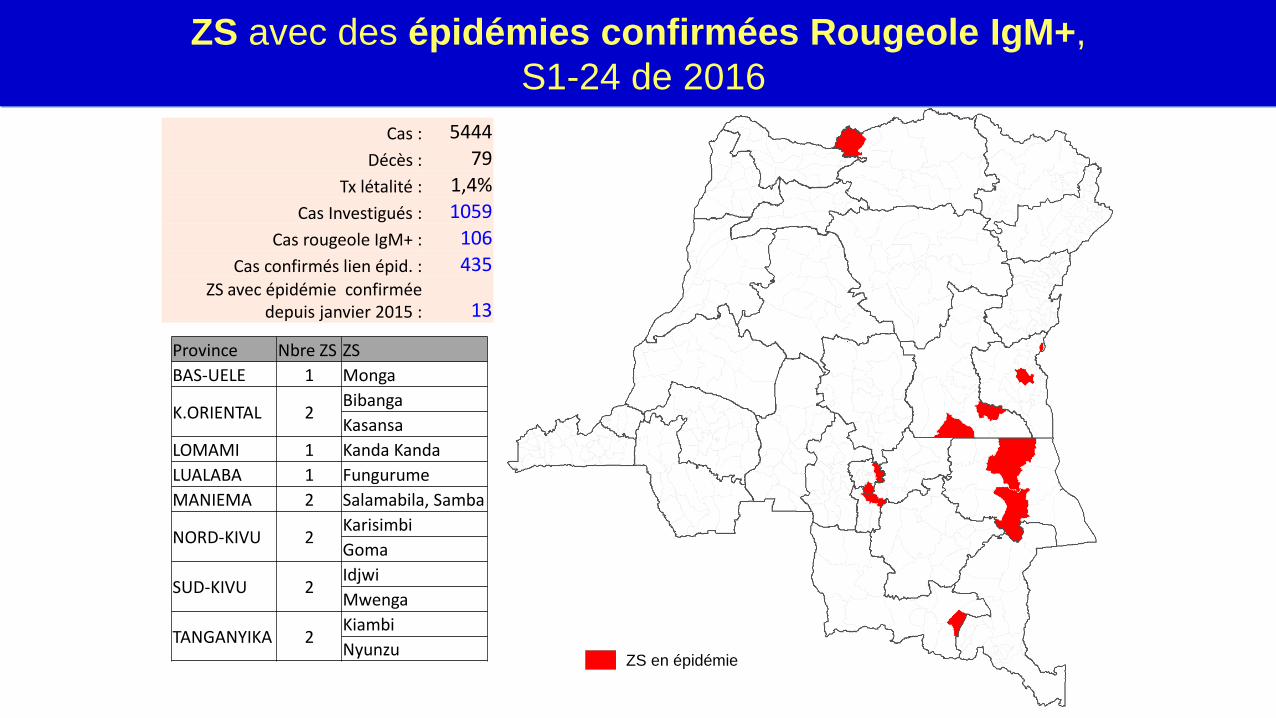
ZS avec des épidémies confirmées Rougeole IgM+, S1-24 de 2016
Cas : 5444 Décès : 79
Tx létalité : 1,4% Cas Investigués : 1059
Cas rougeole IgM+ : 106 Cas confirmés lien épid. : 435
ZS avec épidémie confirmée depuis janvier 2015 : 13
ZS en épidémie
Province Nbre ZS ZS BAS-UELE 1 Monga
K.ORIENTAL 2 Bibanga Kasansa
LOMAMI 1 Kanda Kanda LUALABA 1 Fungurume MANIEMA 2 Salamabila, Samba
NORD-KIVU 2 Karisimbi Goma
SUD-KIVU 2 Idjwi Mwenga
TANGANYIKA 2 Kiambi Nyunzu
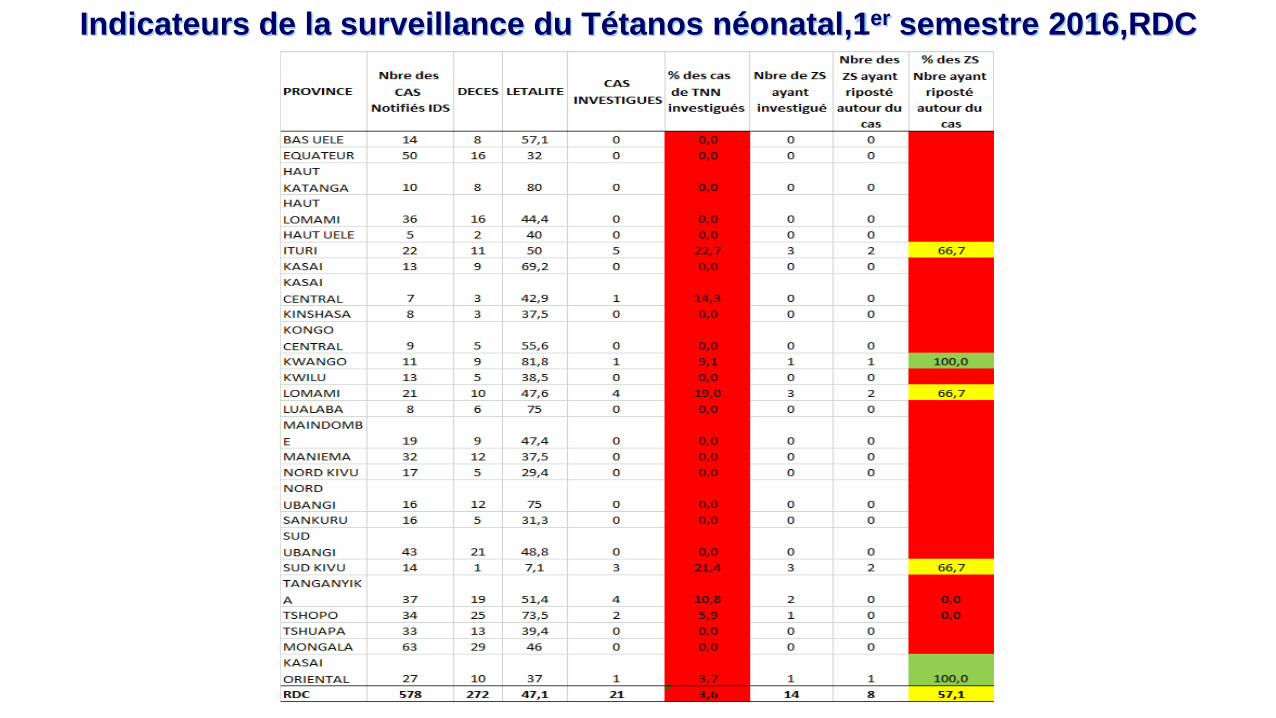
Indicateurs de la surveillance du Tétanos néonatal,1er semestre 2016,RDC
SURVEILLANCE EN SITE SENTINELLE DES GASTRO ENTERITES À ROTAVIRUS
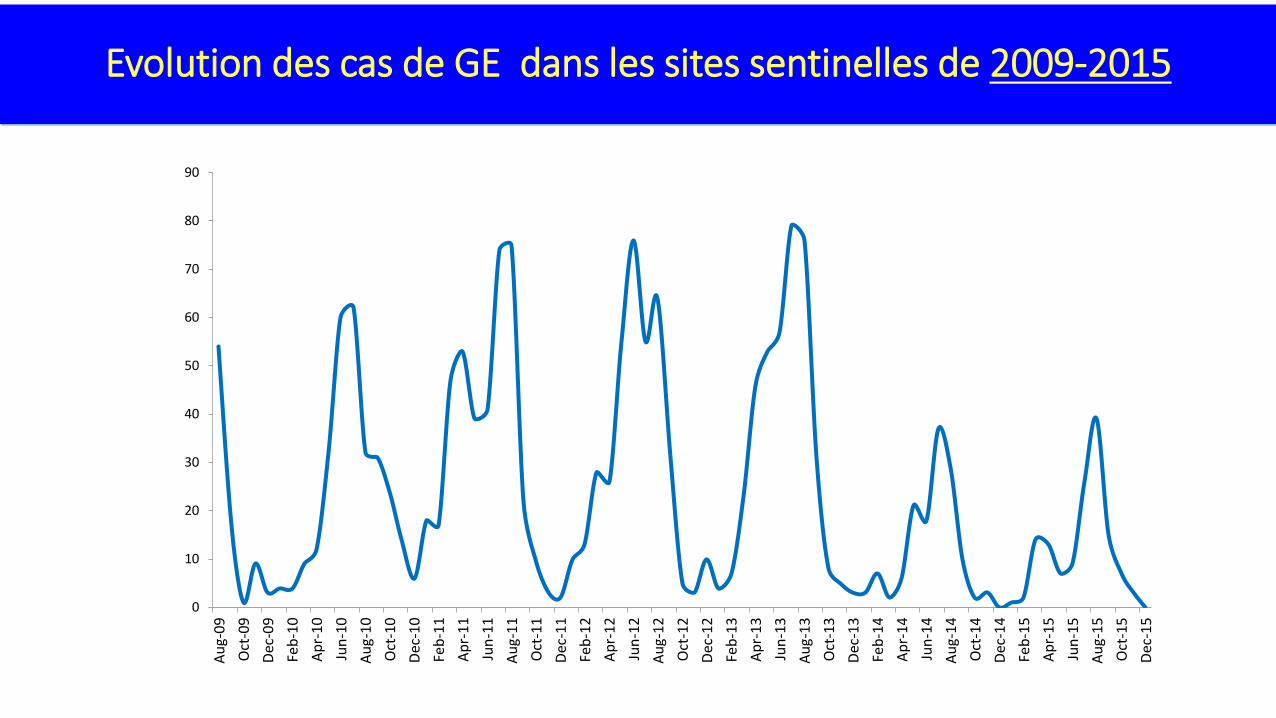
Evolution des cas de GE dans les sites sentinelles de 2009-2015
63%
54%
64% 64%
0
10
20
30
40
50
60
70
80
90
Aug-
09O
ct-0
9De
c-09
Feb-
10Ap
r-10
Jun-
10Au
g-10
Oct
-10
Dec-
10Fe
b-11
Apr-
11Ju
n-11
Aug-
11O
ct-1
1De
c-11
Feb-
12Ap
r-12
Jun-
12Au
g-12
Oct
-12
Dec-
12Fe
b-13
Apr-
13Ju
n-13
Aug-
13O
ct-1
3De
c-13
Feb-
14Ap
r-14
Jun-
14Au
g-14
Oct
-14
Dec-
14Fe
b-15
Apr-
15Ju
n-15
Aug-
15O
ct-1
5De
c-15
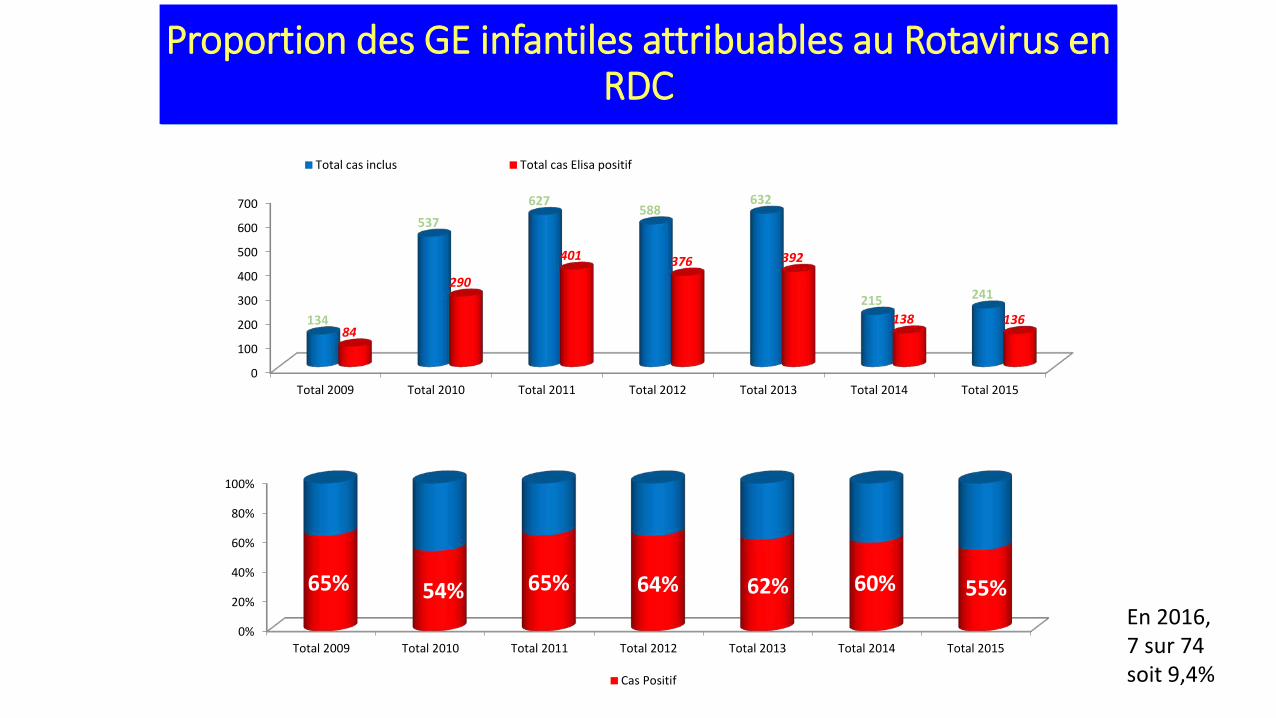
Proportion des GE infantiles attribuables au Rotavirus en RDC
0%
20%
40%
60%
80%
100%
Total 2009 Total 2010 Total 2011 Total 2012 Total 2013 Total 2014 Total 2015
65% 54% 65% 64% 62% 60% 55%
Cas Positif
0
100
200
300
400
500
600
700
Total 2009 Total 2010 Total 2011 Total 2012 Total 2013 Total 2014 Total 2015
134
537 627
588 632
215 241
84
290
401 376 392
138 136
Total cas inclus Total cas Elisa positif
En 2016, 7 sur 74 soit 9,4%
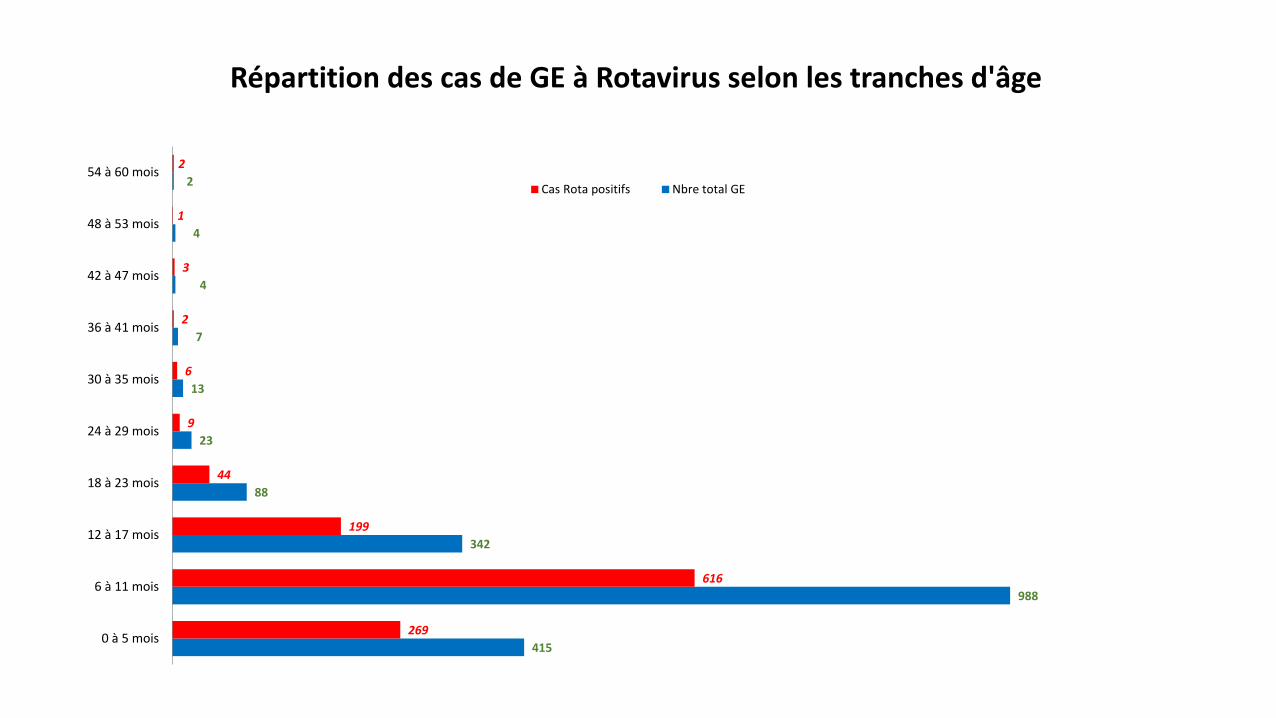
63%
415
988
342
88
23
13
7
4
4
2
269
616
199
44
9
6
2
3
1
2
0 à 5 mois
6 à 11 mois
12 à 17 mois
18 à 23 mois
24 à 29 mois
30 à 35 mois
36 à 41 mois
42 à 47 mois
48 à 53 mois
54 à 60 mois
Répartition des cas de GE à Rotavirus selon les tranches d'âge
Cas Rota positifs Nbre total GE
Manifestations post vaccinales indésirables
Quasi Absence de notification des MAPI en Routine Elaboration du Manuel national de surveillance et
gestion des MAPI Projet de mise en place du Comité National de
Pharmacovigilance Vaccinale ( DPM,CNPV,PEV et Partenaires) MAPI notifiées lors des AVS MenAfrivac, Fièvre jaune
PROBLEMES PRIORITAIRES
• Persistance de l’inadéquation des selles dans 14 DPS sur 26. • Faible notification des cas suspects de fièvre jaune et rougeole en
routine • Ruptures périodiques en réactifs pour la fièvre jaune et la rougeole • Retard dans le démarrage du comité national de pharmacovigilance
vaccinale et de la surveillance des MAPI en routine • Faible proportion des cas de TNN investigués et ayant bénéficié de la
riposte autour du cas • Financement peu sécurisé pour la surveillance en sites sentinelles
MBP-ROTA Rubéole, HPV
PERSPECTIVES • Maintenir et atteindre les indicateurs de la surveillance des
cas des PFA, rougeole, FJ et TNN • Assurer la formation en Surveillance sur les maladies
prioritaires du PEV, • Saisir les opportunités d’appui en ressources humaines
d’appui au système de surveillance Stop team, BMGF • Rendre fonctionnel le Comité de pharmacovigilance
vaccinale • Poursuivre la formation sur les MAPI

MERCI
Expérience de renforcement de la recherche active des PFA par la SBC dans le cadre du projet BMGF =» SANRU,IMC,CROIX ROUGE
• SANRU : Kinshasa Maluku I, Lingwala Haut Katanga : Kowe, Kashobwe, Mubunda Lualaba: Manika Haut Lomami: Baka • IMC: Walikale- Itebero-Kibua • Croix rouge: Nord Kivu: Pinga, Lubero, Rwanguba Equateur: Ntondo , Irebu