studying the effectiveness of penetration enhancers to deliver retinol through the stratum cornum by...
TRANSCRIPT

This article appeared in a journal published by Elsevier. The attachedcopy is furnished to the author for internal non-commercial researchand education use, including for instruction at the authors institution
and sharing with colleagues.
Other uses, including reproduction and distribution, or selling orlicensing copies, or posting to personal, institutional or third party
websites are prohibited.
In most cases authors are permitted to post their version of thearticle (e.g. in Word or Tex form) to their personal website orinstitutional repository. Authors requiring further information
regarding Elsevier’s archiving and manuscript policies areencouraged to visit:
http://www.elsevier.com/copyright

Author's personal copy
Studying the effectiveness of penetration enhancers to deliver retinol through thestratum cornum by in vivo confocal Raman spectroscopy
Mickaël Mélot a, Paul D.A. Pudney a,⁎, Ann-Marie Williamson a, Peter J. Caspers b,Andre Van Der Pol b, Gerwin J. Puppels b
a Measurement Science Unit and Corporate Research, Unilever R&D, Colworth Science Park, Sharnbrook, Bedford, MK44 1LQ, United Kingdomb River Diagnostics B.V., Rotterdam, The Netherlands
a b s t r a c ta r t i c l e i n f o
Article history:Received 30 January 2009Accepted 18 April 2009Available online 3 May 2009
Keywords:SkinVibrational spectroscopyBioavailabilityTransdermal deliveryIn vivo confocal Raman
The purpose of this study is to monitor in vivo the effect of chemical penetration enhancers on the delivery oftrans-retinol into human skin. Chemical penetration enhancers reversibly alter barrier properties of the SC bydisruption of the membrane structures or maximising drug solubility with the skin. So far, most ofpermeation or penetration experiments are performed in vitro. Raman spectroscopy is uniquely placed to beable to measure biological processes in vivo and this paper shows for the first time that the effect ofpenetration enhancer on the delivery of trans-retinol can successfully be measured in vivo using thistechnique. Here, the volar forearm of volunteers was treated with four formulations. One formulation is ahighly effective model delivery system identified from ex vivo experiments: trans-retinol in Propylene Glycol(PG)/ethanol, with PG being a well-known and efficient penetration enhancer. The other three formulationsare based on 0.3% trans-retinol in Caprylic/Capric Acid Triglyceride (MYRITOL®318), an oil commonly used inskin creams but in two of them a specific penetration enhancer is added. One contains a lipid extractor, TritonX 100, whereas another formulation contains a lipid fluidiser, Oleic Acid. Solutions were applied once andmeasurements were performed up to 6 h after treatment. Remarkable differences in the delivery of trans-retinol between formulation with or without penetration enhancer can clearly be seen. Moreover, the type ofpenetration enhancer is also shown to influence the delivery. While using the Oleic Acid, which is a lipidfluidiser, a better delivery of trans-retinol in the skin can be detected. For the first time, the effect ofpenetration enhancer on the delivery of trans-retinol has been monitored, non invasively in vivo, with time.
© 2009 Elsevier B.V. All rights reserved.
1. Introduction
Retinoids play an important role in the control of proliferation anddifferentiation of tissues including the skin [1–3] and are reported toexert beneficial effects on naturally aged and photo-aged skin [3]. Aschange in the external appearance and health of skin is one of thebiggest motivational factors on the consumer, retinoids are widelyused in healthcare and cosmetic industries. Retinoic acid is thebiologically active retinoid that is involved in producing beneficialeffects on skin [4–6]. However as trans-retinol is less irritating butcauses similar qualitative molecular changes [7], this pro-hormone ofretinoic acid is more often used for cosmetic purposes [8]. In the skin,trans-retinol can be metabolised in keratinocytes in the upper layersof the viable epidermis [9]. The trans-retinol is stored as retinyl esteror is converted to retinoic acid to function as a hormone and thus exertbeneficial effects [9–13]. In 1994, it was found that trans-retinol isconvertedmainly to retinyl esters, with a small but detectable amountmetabolised to retinoic acid [10]. Although the role of trans-retinol in
maintaining the physiology and function of skin has been intensivelyinvestigated, its physiological effect has been limited by its inefficientpenetration through natural skin barrier [14]. Moreover, despiteincreasing use of trans-retinol in cosmetic products, there is limitedinformation on its penetration and distribution within the stratifiedskin layers [15,16].
The skin is our major protection against transepidermal water lossand micro-organisms and it is well established that the stratumcorneum (SC) is the least permeable layer of mammalian skin [17–20].This thin outermost layer is a formidable barrier against the delivery ofactive molecules and the efficiency of topically applied actives is limitedby their penetration through that layer [17–20]. Therefore, in order toimprove significantly the dermal absorption of actives, enhancementstrategies have been investigated. Although hydrated skin is generallymore permeable, water as an enhancer is not applicable to all permeatesand particularly to lipophilic molecule such as trans-retinol. Subse-quently, there is considerable interest in the identification of skinpenetration ‘enhancers’. These are now generally added to mosttransdermal, dermatological and cosmetic products.
Purdon et al. [21] defined chemical penetration enhancers asmaterials which reversibly alter barrier properties of the SC by
Journal of Controlled Release 138 (2009) 32–39
⁎ Corresponding author.E-mail address: [email protected] (P.D.A. Pudney).
0168-3659/$ – see front matter © 2009 Elsevier B.V. All rights reserved.doi:10.1016/j.jconrel.2009.04.023
Contents lists available at ScienceDirect
Journal of Controlled Release
j ourna l homepage: www.e lsev ie r.com/ locate / jconre l

Author's personal copy
disruption of the membrane structures or by maximising drugsolubility with the skin. According to them, two conceptual routesto cross the SC can be described: the intercellular lipid route andtranscellular route. Mechanisms of action have been investigated butit has been very difficult to correlate enhancer effects throughstructure–activity relationships. Many publications on enhancermechanisms suggest that they enter the skin lipids and createdisorder. A diffusing penetrant therefore experiences a more fluidenvironment and permeates more rapidly. Karande et al. [22]concluded that there are two mechanisms of penetration enhance-ment through SC lipids: lipid fluidisation and lipid extraction.According to them, membrane partitioning is of prime importancein the case of lipid fluidizers, whereas intermolecular ionic forces(especially hydrogen bonding) are important for lipid extractors. Anumber of other mechanisms have been postulated and the readershould refer to a recent review of the area by Williams and Barry for acomprehensive description and discussion [23].
So far, most of permeation or penetration experiments wereperformed in vitro by mounting excised skin samples on Franz diffusioncells. Only a few studies have been performed in vivo but for all of themthe analysis was carried out ex vivo on skin biopsied or tape strippedfrom mainly animal models and only rarely humans. In this paper,confocal Raman spectroscopy is presented as a non-invasive opticalmethod for in vivomonitoring of the effects of penetration enhancers onthe delivery of trans-retinol in human skin. Here, a formulation istopically applied on the volar forearm of a volunteer andmeasurementsare performed directly without further preparations. The Ramaninstrument allows for depth profiling through the SC into the viableepidermis (VE) this allows depth profiles of the added active as well asthe inherent skin components such as the NMF (Natural MoisturizationFactor) and the level of hydration [24,25]. There have been some studiesex vivo of drug penetration in skin using Raman spectroscopy (e.g.[26,27]) However previously we have shown trans-retinol can besuccessfully measured in vivo by this method [28]. In this paper, wepresent a comparison of four formulations on the delivery of trans-retinol. Three formulations were based on an oil commonly used in skincreams, Caprylic/Capric Acid Triglyceride (MYRITOL®318). Myritol waschosen, apart from it being in skin creams, because it is a non skinpenetrating oil inwhich retinol is highly soluble and therefore the trans-retinolwill have little driving force for partitioning into the skin,makingthe effect of any PE the major factor in penetration. To this baseformulation of myritol and trans-retinol penetration enhancers wereadded to see if it was possible tomeasure any differences in the effect oftwo penetration enhancers which are thought to work by differentmechanisms by in vivo Raman. As described above two of the majormechanisms are generally accepted as lipid fluidiser and lipid extractor.Other criteria that considered in the selection of penetration enhancerswere: similar molecular weights, ensuring minimal effect of retinolsolubility in oil (as Ko/w which is one of the major factors thought toinfluence permeability [29]) and skin and low irritation potential [22].So one of the oil based formulations consists of just oil and trans-retinolwhereas in the other two, a penetration enhancer is added. In oneformulation the penetration enhancer is a lipid fluidiser, Oleic Acid,which is probably one of the most commonly used and one of the mosteffective in its class [22] and in the other formulation is a lipid extractor,Triton X 100. These three formulations containing MYRITOL will becompared to a highly effectivemodel delivery system identified from exvivo experiments: trans-retinol in Propylene Glycol (PG)/ethanol, withPG being a well-known and efficient penetration enhancer [30].
2. Experimental
2.1. Sample preparation
Three MYRITOL®318 and trans-retinol-based solutions were pre-pared and in two of them a penetration enhancer was added: i.e.
Triton X 100 or Oleic Acid. The solutions were mixed so that thefollowing mass ratios were obtained.
Solution 1: 99.7% MYRITOL®318 and 0.3% trans-retinolSolution 2: 98.7%MYRITOL®318, 0.3% trans-retinol and 1% Triton X 100Solution 3: 98.7% MYRITOL®318, 0.3% trans-retinol and 1% Oleic AcidSolution 4: 70% ethanol, 30% PG and 0.3% trans-retinol
MYRITOL®318, PG, Ethanol, trans-retinol, Triton X 100 and OleicAcid were obtained from Sigma Aldrich. For stability reasons, trans-retinol is received in individual sealed vials. For each formulation, oneindividual trans-retinol vial was opened a few seconds prior to mixing.Solutions were prepared freshly before each experiment and weremade homogeneous by using a magnetic stirrer. Note that the molarconcentrations of Triton X 100 and Oleic Acid are virtually the same inboth solutions 2 and 3.
2.2. Raman spectrometer
Raman measurements were performed using the model 3510 SkinComposition Analyzer (model 3510 SCA, River Diagnostics, Rotterdam,The Netherlands). The instrument is CE marked and classified as a 2Mlaserdevice. The instrument is optimized for rapid invivomeasurementson the human skin and offers an axial spatial resolution of 5 μm. Itcomprises a high-performance dispersive spectrometer with 671 nmand 785 nm laser excitation and a confocal measurement stage. Thespectrometer allows for measurements in the so-called highwavenum-ber region (2400–4000 cm−1) and the finger print region (400–2400 cm−1) of the Raman spectrum. The spectral resolution is 4 cm−1
throughout the entire spectral range. The Raman spectrometer wascalibrated on the relativewavenumber axis using the spectral lines of anargon–neon lamp in combinationwith an internal Raman shift standard(PMMA). That is, the spectral lines of argon–neon were used for atransformation frompixels to absolutewavenumbers. Subsequently, theshift to relative wavenumbers was determined by matching thespectrum of an internal Raman standard to a reference spectrum. Thewavelength dependent instrument response was calculated from agreen-glass measurement using the NIST SRM2242 relative intensitycorrection standard. Instrument offset, dark current and backgroundsignals were measured separately and subtracted from the raw dataprior to intensity correction and wavenumber calibration. For Ramanmeasurements the arm of the volunteer is placed on a fused silicawindowmounted in the measurement stage. Laser light is focused intothe skin with a microscope objective located under the window. Aninternal video camera allows for inspection of the skin surface andselection of themeasurement spot. The skin is in good optical contact tothe measurement window and the space between the measurementwindow and the microscope objective was filled with immersion oil.This way, refractive index mismatch (resulting in degraded spatialresolution and poor definition of the position of the laser focus) isminimised [31]. The location of the laser focus relative to the skin surfacecan be accurately varied by changing the focusing depth automatically.Raman spectra are recorded from the skin surface down to the viableepidermis (typically in 2 μm steps). In this way detailed Raman depthprofiles can be acquired in this study across the stratum corneum andinto the viable epidermis. In order to overcome biological lateralvariation in skin composition, several profiles permeasurement area aretypically averaged. All Raman spectra are calibrated and corrected forinstrument response using built-in instrument control software of themodel 3510 SCA (River Diagnostics).
2.3. Protocol
Experiments were performed twice on the volar forearms of 2male volunteers with age ranging from 30 to 45 years. Prior totreatments untreated part of the forearm were measured on each
33M. Mélot et al. / Journal of Controlled Release 138 (2009) 32–39
Author's personal copy
volunteer with 5 or 6 depth profiles for each subject obtained, to takeinto account any biodiversity in different spatial positions on the arm.Then 4 cm×4 cm test areas were marked and treated with 70 μl of thesolution being investigated. Solutions applied on the skinwere spreadgently using the tip of the micropipette, without rubbing. Measure-ments were started 10 min after the application of the solution on theskin. Note that no washing and no dabbing of the remaining solutionsoccurred prior to measurements and that no particular dietaryrestrictions were followed.
For the measurements, the subject places his volar forearm on afused silica window of the measurement stage of the Raman spectro-meter. For both treated and untreated areas, spectrawere collected fromthe surface to 30 or 40 μmbelowwith a step size of 2 μm. Depth profileswere then collected over an hour period from different locations withinthe treated (or untreated) area. For each spectrum, the exposure timewas either 5 or 10 s (fingerprint spectra using the 785 nm laser) with 3accumulations and 1 s with accumulations (high wavenumber spectrausing the 671 nm laser). The Raman spectra were of excellent signal tonoise ratio. No post acquisition treatment (e.g. spectral smoothing) wascarried out on the spectra. Five or six depth profiles were collectedwithin eachhour timeperiod (aswas done for the untreated skin). Thensimilar numbers of spectrawere then collected everyhourup to 6h aftertreatment. Also in order to prevent an occlusion effect (i.e. an increase inhydration of the skin), the armwas lifted after 3 or 4 measurements for10 min and repositioned back onto the device to complete the series.
2.4. Data analysis
2.4.1. Data fittingIn the confocal Raman experiment, the collected signal gets
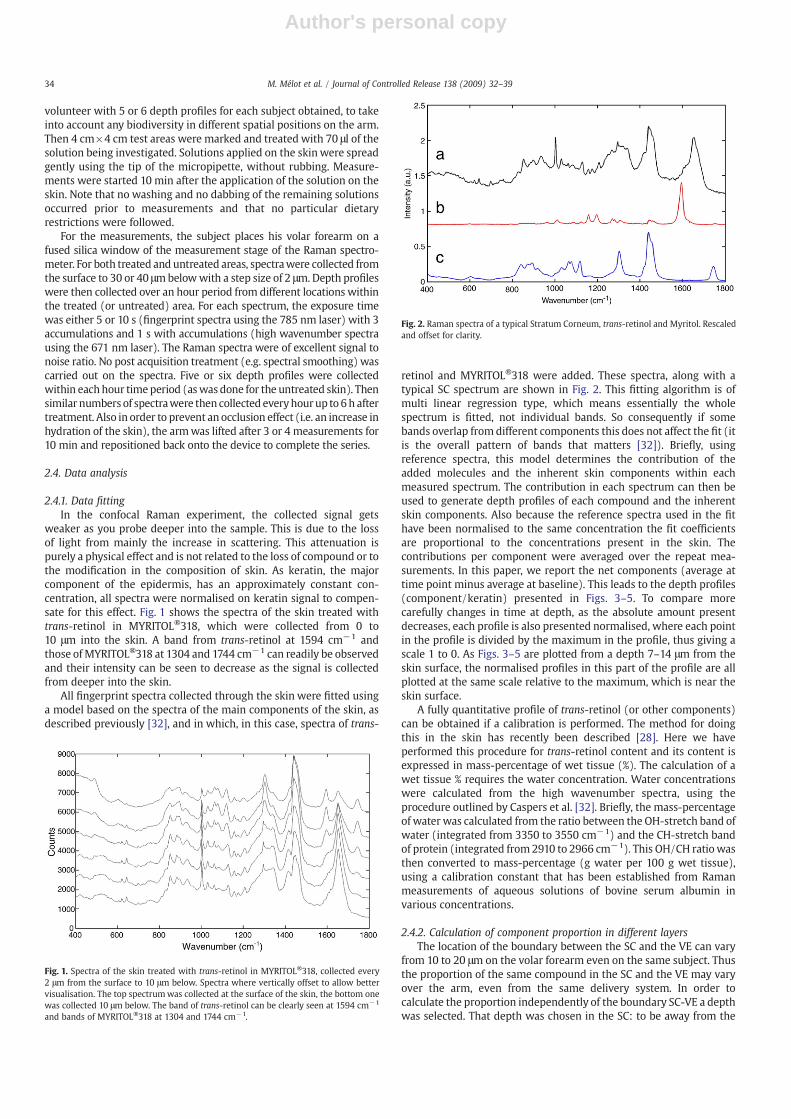
weaker as you probe deeper into the sample. This is due to the lossof light from mainly the increase in scattering. This attenuation ispurely a physical effect and is not related to the loss of compound or tothe modification in the composition of skin. As keratin, the majorcomponent of the epidermis, has an approximately constant con-centration, all spectra were normalised on keratin signal to compen-sate for this effect. Fig. 1 shows the spectra of the skin treated withtrans-retinol in MYRITOL®318, which were collected from 0 to10 μm into the skin. A band from trans-retinol at 1594 cm−1 andthose of MYRITOL®318 at 1304 and 1744 cm−1 can readily be observedand their intensity can be seen to decrease as the signal is collectedfrom deeper into the skin.
All fingerprint spectra collected through the skin were fitted usinga model based on the spectra of the main components of the skin, asdescribed previously [32], and in which, in this case, spectra of trans-
retinol and MYRITOL®318 were added. These spectra, along with atypical SC spectrum are shown in Fig. 2. This fitting algorithm is ofmulti linear regression type, which means essentially the wholespectrum is fitted, not individual bands. So consequently if somebands overlap from different components this does not affect the fit (itis the overall pattern of bands that matters [32]). Briefly, usingreference spectra, this model determines the contribution of theadded molecules and the inherent skin components within eachmeasured spectrum. The contribution in each spectrum can then beused to generate depth profiles of each compound and the inherentskin components. Also because the reference spectra used in the fithave been normalised to the same concentration the fit coefficientsare proportional to the concentrations present in the skin. Thecontributions per component were averaged over the repeat mea-surements. In this paper, we report the net components (average attime point minus average at baseline). This leads to the depth profiles(component/keratin) presented in Figs. 3–5. To compare morecarefully changes in time at depth, as the absolute amount presentdecreases, each profile is also presented normalised, where each pointin the profile is divided by the maximum in the profile, thus giving ascale 1 to 0. As Figs. 3–5 are plotted from a depth 7–14 μm from theskin surface, the normalised profiles in this part of the profile are allplotted at the same scale relative to the maximum, which is near theskin surface.
A fully quantitative profile of trans-retinol (or other components)can be obtained if a calibration is performed. The method for doingthis in the skin has recently been described [28]. Here we haveperformed this procedure for trans-retinol content and its content isexpressed in mass-percentage of wet tissue (%). The calculation of awet tissue % requires the water concentration. Water concentrationswere calculated from the high wavenumber spectra, using theprocedure outlined by Caspers et al. [32]. Briefly, the mass-percentageof water was calculated from the ratio between the OH-stretch band ofwater (integrated from 3350 to 3550 cm−1) and the CH-stretch bandof protein (integrated from2910 to 2966 cm−1). This OH/CH ratiowasthen converted to mass-percentage (g water per 100 g wet tissue),using a calibration constant that has been established from Ramanmeasurements of aqueous solutions of bovine serum albumin invarious concentrations.
2.4.2. Calculation of component proportion in different layersThe location of the boundary between the SC and the VE can vary
from 10 to 20 μm on the volar forearm even on the same subject. Thusthe proportion of the same compound in the SC and the VE may varyover the arm, even from the same delivery system. In order tocalculate the proportion independently of the boundary SC-VE a depthwas selected. That depth was chosen in the SC: to be away from the
Fig. 1. Spectra of the skin treated with trans-retinol in MYRITOL®318, collected every2 μm from the surface to 10 μm below. Spectra where vertically offset to allow bettervisualisation. The top spectrumwas collected at the surface of the skin, the bottom onewas collected 10 μm below. The band of trans-retinol can be clearly seen at 1594 cm−1
and bands of MYRITOL®318 at 1304 and 1744 cm−1.
Fig. 2. Raman spectra of a typical Stratum Corneum, trans-retinol and Myritol. Rescaledand offset for clarity.
34 M. Mélot et al. / Journal of Controlled Release 138 (2009) 32–39

Author's personal copy
Fig. 3. Depth profiles from 7–14 μm below the skin surface of MYRITOL®318 between 0 and 6 h after treatment with 3 different solutions. The absolute and normalised profiles ofMYRITOL®318 (see Experimental section for details) obtained after the treatment with 0.3% trans-retinol in MYRITOL®318 are plotted in (a) and (b), respectively. The absolute andnormalised profiles of MYRITOL®318 obtained after the treatment with 0.3% trans-retinol in MYRITOL®318 with 1% Triton X 100 are shown in (c) and (d), respectively. The absoluteand normalised profiles of MYRITOL®318 obtained after the treatment with 0.3% trans-RETINOL in MYRITOL®318 with 1% Oleic Acid are shown in (e) and (f), respectively.
Fig. 4. Depth profiles from 7–14 μmbelow the skin surface of trans-retinol between 0 and 6 h after treatment with 3 different solutions. The absolute and normalised profiles of trans-retinol (see Experimental section for details) obtained after the treatment with 0.3% trans-retinol in MYRITOL®318 are plotted in (a) and (b), respectively. The absolute andnormalised profiles of trans-retinol obtained after the treatment with 0.3% trans-retinol in MYRITOL®318 with 1% Triton X 100 are shown in (c) and (d), respectively. The absoluteand normalised profiles of trans-retinol obtained after the treatment with 0.3% trans-retinol in MYRITOL®318 with 1% Oleic Acid are reported on the (e) and (f), respectively.
35M. Mélot et al. / Journal of Controlled Release 138 (2009) 32–39

Author's personal copy
surface, where the amount of product is important, but not too close tothe boundary SC-VE, where a compound may not be detected whileusing certain delivery systems. From our analysis and experiences,8 μm depth appears to be a good compromise for obtaining a goodindication on the penetration of compounds from different deliverysystems through the SC. Therefore, the areas of profile in the top andbelow 8 μm was calculated and normalised on the total area of theprofile to give the proportion of compound up to and below theselected depth. One hour time slots are shown, themeanproportion ofcompound was obtained by averaging all the profiles taken withinthat time slot, therefore taking into account the spatial variations onthe skin. These are then plotted as percentages in a bar graph, withtotal area i.e. total amount of retinol present in the skin, being 100%.
3. Results and discussion
Fig. 3 shows the profiles of MYRITOL®318 versus the depth in theskin and time, obtained after treatment with 0.3% trans-retinol eitherin MYRITOL®318, or in MYRITOL®318 with Triton X 100, or inMYRITOL®318 with Oleic Acid.
It can be seen that while treating the skin without an addedpenetration enhancer, the MYRITOL®318 hardly penetrates into theskin (Fig. 3a and b). Most of MYRITOL®318 remains in the top 5 μm,only traces can be seen below 5 μmand nothing can be detected below10 μm. When Triton X 100 is added in the formulation (Fig. 3c and d),whilst the majority of the MYRITOL®318 remains close to the surface,some of it does penetrate deeper than previously and some traces caneven be detected below 10 μm. When Oleic Acid is added in theformulation, more penetration can be seen in the first 2 h compared tothe case with Triton X 100: traces of MYRITOL®318 can even bedetected as deep as 15 μm. Nevertheless after 2 h treatment,MYRITOL®318 does not seem to penetrate deeper than in the case ofTriton X 100. Therefore although the use of a penetration enhancerimproves significantly the delivery of MYRITOL®318 into the skin, the
use of a lipid fluidiser (Oleic Acid) and lipid extractor (Triton X 100)shows largely similar penetration.
3.1. Profiles of trans-retinol
Fig. 4 shows the profiles of trans-retinol versus the depth in theskin and time, obtained after treatment with 0.3% trans-retinol inMYRITOL®318 and with the added penetration enhancers.
When the treatment is performed without any penetrationenhancer (Fig. 4a and b) the trans-retinol does not penetrate much,it penetrates approximately as deep as that observed for MYRI-TOL®318. When Triton X 100 (Fig. 4c and d) or Oleic Acid (Fig. 4eand f) is added to the oil, the maximum of signal remains close to thesurface of the skin but trans-retinol penetrates deeper. Whereas thesignal of trans-retinol is tightly located in the first 5 μm when nopenetration enhancer is used, a wider distribution of trans-retinol isobserved into the SC when Triton X 100 or Oleic Acid is added in theformulation. It can be seen that trans-retinol penetrates deeper anddeeper as we go from MYRITOL®318 alone to added Triton to addedOleic Acid. This indicates that a penetration enhancer improvessignificantly the delivery of retinol into the skin from this oil and theuse of a lipid fluidiser (Oleic Acid) in this case appears more efficienton the delivery of trans-retinol than a lipid extractor (Triton X 100).
In Fig. 5, trans-retinol profiles obtained with the two differentpenetration enhancers are compared to those obtained using a highlyeffective delivery system: trans-retinol in Propylene Glycol (PG)/ethanol. It can be seen that trans-retinol penetrates deeper as we gofrom Triton X 100 (Fig. 5a and b) to Oleic Acid (Fig. 5c and d) to PG(Fig. 5e and f). The lipid fluidiser (Oleic Acid) ensures that trans-retinol gets closer to the depth observed with the PG/ethanol system(23 μm). However, in the case of the PG/ethanol system, the trans-retinol concentration is ten times higher than for the case of thevarious formulations using MYRITOL®318 (despite the same retinolconcentrations in the formulations). It should be noted however the
Fig. 5. Depth profiles of trans-retinol between 0 and 6 h after treatment with 3 different solutions. The absolute and normalised profiles of trans-retinol (see Experimental section fordetails) obtained after the treatment with 0.3% trans-retinol in MYRITOL®318 with 1% Triton X 100 are plotted in (a) and (b), respectively. The absolute and normalised profiles oftrans-retinol obtained after the treatment with 0.3% trans-retinol in MYRITOL®318 with 1%Oleic Acid are shown in (c) and (d), respectively. The absolute and normalised profiles oftrans-retinol obtained after the treatment with 0.3% trans-retinol in PG and ethanol are shown in (e) and (f), respectively, note the scale in (e) is ten times that in (a) and (c).
36 M. Mélot et al. / Journal of Controlled Release 138 (2009) 32–39

Author's personal copy
actual concentration of retinol at the surface from the PG/ethanol is0.7%, i.e. higher than in the original formulation. This is undoubtedlydue to the ethanol evaporating leaving the local concentration at thesurface of the skin in the remaining PG higher. This accounts for afactor of approximately three in the difference, although even if thiseffect is accounted for the concentrations are still approximately threetimes higher.
3.2. Proportion of MYRITOL and trans-retinol in the top 8 μm and below
In order to more clearly show the penetration and delivery ofMYRITOL®318 and trans-retinol the relative proportionswere calculatedabove 8 μm and below, see Figs. 6 and 7. Fig. 6 shows that without apenetrationenhancer (Fig. 6a), all theMYRITOL®318 remainsvirtually inthe top 8 μmaspreviously reported [28].When the TritonX100 is addedin the formulation (Fig. 6b), more MYRITOL®318 can be detected below8 μm. Using Oleic Acid (Fig. 6c) also increases the penetration ofMYRITOL®318.
Fig. 7 reveals that the delivery of trans-retinol is also improved bythe use of penetration enhancers. However, depending on the type ofpenetration enhancer, different behaviour was observed. Compared toMYRITOL®318 alone (Fig. 7a), the penetration of trans-retinol issignificantly increased when using Triton X 100 (Fig. 7b). The additionof Oleic Acid in the formulation further increases the penetration oftrans-retinol inside the skin (Fig. 7c). Again, this indicates that alipid fluidiser (Oleic Acid) in this case is more effective in increasingthe penetration of trans-retinol through the SC.
Also added to Fig. 7 are the results from the model efficientdelivery system (PG/ethanol: Fig. 7d). It shows that when using a lipidfluidiser (Oleic Acid) the penetration depth gets close to that obtainedwith PG/ethanol, although the concentrations detected are signifi-cantly lower.
Oleic acid and other long chain fatty acids are usually described orlabelled as lipid fluidisers. The hypothesis behind this is that thealiphatic chainswill insert themselves within the aliphatic chains of theinherent SC lipids and disrupt them and thus ‘fluidising’ them and
Fig. 6. Proportions ofMYRITOL®318 above and below 8 μmbetween 0 and 6 h after treatment with 3 different solutions. The proportions obtained after the treatmentwith 0.3% trans-retinol in MYRITOL®318 are plotted in (a). The proportions obtained after the treatment with 0.3% trans-retinol in MYRITOL®318 with 1% Triton X 100 are shown in (b). Theproportions obtained after the treatment with 0.3% trans-retinol in MYRITOL®318 with 1% Oleic Acid are shown in (c).
Fig. 7. Proportions of trans-retinol above and below 8 μm between 0 and 6 h after treatment with 3 different solutions. The proportions obtained after the treatment with 0.3% trans-retinol in MYRITOL®318 are plotted in (a). The proportions obtained after the treatment with 0.3% trans-retinol in MYRITOL®318 with 1% Triton X 100 are shown in (b). Theproportions obtained after the treatment with 0.3% trans-retinol in MYRITOL®318 with 1% Oleic Acid are shown in (c). The proportions obtained after the treatment with 0.3% trans-retinol in PG and ethanol are shown in (d).
37M. Mélot et al. / Journal of Controlled Release 138 (2009) 32–39

Author's personal copy
therebyallowing faster transport through theseSC. Lipidmoleculeswithbent cis conformations are expected to be more effective as they woulddisturb the lipid packing more. However evidence is gathering that thisis not the mode of action of oleic acid. Spectroscopic studies both in thestratum corneum [33,34] and in separated lipids [35] show that oleicacid and SC lipids appear largely immiscible and phase separate. Thisphase separation has also been visualised using two-photon fluores-cence microscopy with quite large liquid like regions being observedwithin the SC [36,37]. Therefore current evidence suggests that for oleicacid phase separation facilitates the penetration of topically appliedcomponents and is the dominant driving mechanism.
Triton X 100 is a surfactant and no detailed mechanistic work hasbeen carried out on its impact on the stratum corneum as far as we canascertain, however a substantial amount of work has been carried outon liposome's and lipid bilayers [38–42]. Overall the evidencesuggests that Triton breaks down the lipid lamellar structure toproduce lipid-surfactant mixed micelles. This surfactant lipid interac-tion has been postulated to be a three step process [43]. Firstly,surfactant is incorporated into the lipid membrane. When themembrane becomes saturated, it breaks down and mixed micellesform. This process has been observed by AFM on lipid bilayers and isconcentration dependent (the CMC being the critical concentration)[43]. It is observed that Triton is incorporated into the fluid part of themembrane rather than the gel phase. The lipid bilayer does not breakup until the CMC is reached. The CMC for Triton is 0.24 mM [42],whereas the concentration used in this study is approx 16 mM. Sosome solubilisation of the lipids would be expected (or ‘extraction’ asit is classified in the penetration enhancer literature).
Thus the effect of these two penetration enhancers on the stratumcornum lipids is distinctly different. As oleic acid shows a greaterpenetration for trans-retinol than Triton X 100 it appears that thetransport route provided by this mechanism is more efficient thanthat affected by Triton. So Raman spectroscopy can clearly observedifferences between different PE's but more subjects would need to beexamined to prove the statistical significance.
Details of the different rates of penetration are presently beingexamined within a model developed by Lian et al [44,45].
4. Conclusion
In vivo confocal Raman microspectroscopy is a technique that cannon invasively spatially resolve molecular concentration profiles inskin and is suitable for studying the penetration and delivery ofchemical or drugs after topical application. In this paper we haveshown that this technique can be used for monitoring the effect ofpenetration enhancers on the ingress of trans-retinol into the skin.This is the first study to show the effect of penetration enhancers inthis manner.
After treatment with 0.3% trans-retinol in MYRITOL®318 without apenetration enhancer, it was found that MYRITOL®318 and trans-retinol hardly penetrate into the skin. Most of MYRITOL®318 andtrans-retinol remains in the top 5 μm,with only trace quantities can beseen below this level. Therefore this formulation is not expected toprovide for a very effective enhancement of delivery of molecules tothe skin. When a penetration enhancer is added to the formulation,MYRITOL®318 and trans-retinol penetrate much more efficientlywithin the skin. Nevertheless, whereas the penetration of MYR-ITOL®318 is the samewhatever the type of penetration enhancer used,the delivery of trans-retinol seems to be dependent on the penetrationenhancer selected. Our results show that while using a lipid fluidiser(Oleic Acid), the penetration of trans-retinol is deeper than thatobtained while using a lipid extractor (Triton X 100). Oleic acidappears to cause a phase separation within the SC lipids, thus givingretinol an alternative route into the skin, this appears to be a moreefficient way of increasing the penetration of retinol than the lipid‘extraction’ produced by Triton.
This paper shows clearly in vivo that the presence of penetrationenhancer in the formulation increases remarkably the delivery oftrans-retinol in the skin. In addition, the effect of different penetrationenhancers on the delivery of trans-retinol has been investigated.However more data is required for the statistical significance of theseresults to be properly assessed. The Raman technique is now proven tobe able to reveal in vivo the efficacy of formulations designed todeliver molecules inside the skin and to investigate the effect ofdifferent penetration enhancers on this delivery. It also clearly showsthe dynamics of this ingress.
Acknowledgements
The authors would like to thank the following for usefuldiscussions and input, Brendan O'Malley, Guoping Lian and ScottSingleton.
References
[1] G.J. Fisher, J.J. Voorhees, Molecular mechanisms of retinoid actions in skin, FASEBJournal 10 (1996) 1002–1013.
[2] T. Shigematsu, T. Shingo, Modulation of collagen-synthesis and cell-proliferationby retinoids in human skin fibroblasts, Journal of Dermatological Science 9 (1995)142–145.
[3] J. Varani, J.R.L. Warner, M. Gharaee-Kermani, S.H. Phan, S. Kang, J. Chung, Z. Wang,S.C. Datta, G.J. Fisher, J.J. Voorhees, Vitamin A antagonizes decreased cell growthand elevated collagen-degrading matrix metalloproteinases and stimulatescollagen accumulation in naturally aged human skin, Journal of InvestigativeDermatology 114 (2000) 480–486.
[4] G. Siegenthaler, J.H. Saurat, M. Ponec, Retinol and retinal metabolism. Relationshipto the state of differentiation of cultured human keratinocytes, BiochemicalJournal 268 (1990) 371–378.
[5] T.C. Roos, F.K. Jugert, H.F. Merk, D.R. Bickers, Retinoid metabolism in the skin,Pharmacological Reviews 50 (1998) 315–333.
[6] G.J. Fisher, S.C. Datta, H.S. Talwar, Z.Q. Wang, J. Varani, S. Kang, J.J. Voorhees,Molecular basis of sun-induced premature skin ageing and retinoid antagonism,Nature 379 (1996) 335–339.
[7] S. Kang, E.A. Duell, G.J. Fisher, S.C. Datta, Z.Q. Wang, A.P. Reddy, A. Tavakkol, J.Y. Yi,C.E.M. Griffiths, J.T. Elder, J.J. Voorhees, Application of retinol to human skin in vivoinduces hyperplasia and cellular retinoid binding proteins characteristic of retinoicacid but without measurable retinoic acid levels or irritation, Journal ofInvestigative Dermatology 105 (1995) 549–556.
[8] C.C. Zouboulis, Retinoids: is there a new approach? IFSCC 3 (2000) 9–19.[9] S.B. Kurlandsky, E.A. Duell, S. Kang, J.J. Voorhees, G.J. Fisher, Autoregulation of
retinoic acid biosynthesis through regulation of retinol esterification in humankertinocytes, Journal of Biological Chemistry 271 (1996) 15346–15352.
[10] S.B. Kurlandsky, J.H. Xiao, E.A. Duell, J.J. Voorhees, G.J. Fisher, Biological activity ofall-trans retinol requires metabolic conversion to all-trans retinoic acid and ismediated through activation of nuclear retinoid receptors in human keratinocytes,Journal of Biological Chemistry 269 (1994) 32821–32827.
[11] E.A. Duell, S. Kang, J.J. Voorhees, Unoccluded retinol penetrates human skin in vivomore effectively than unoccluded retinyl palmitate or retinoic acid, Journal ofInvestigative Dermatology 109 (1997) 301–305.
[12] H. Torma, L. Brunnberg, A. Vahlquist, Age-related variations in acyl-CoA:retinolacyltransferase activity and vitamin A concentration in the liver and epidermis ofhairless mice, Biochemica et Biophysica Acta 921 (1987) 254–258.
[13] O. Sorg, C. Tran, P. Carraux, L. Diderjean, J.H. Saurat, Retinol and retinyl esterepidermal pools are not identically sensitive to UVB irradiation and antioxidantprotective effect, Dermatology 199 (1999) 302–307.
[14] K. Abdulmajed, C.M. Heard, C. McGuigan, W.J. Pugh, Topical delivery of retinylascorbate co-drug. 2. Comparative skin tissue and keratin binding studies, SkinPharmacology Physiology 17 (2004) 274–282.
[15] J. Yan, Q. Xia, P. Webb, A.R. Warbritton, W.G. Wamer, P.C. Howard, M. Boudreau, P.P.Fu, Levels of retinyl palmitate and retinol in stratum corneum, epidermis, anddermis of female SKH-1mice, Toxicology and Industrial Health 22 (2006) 103–112.
[16] J. Yan, W.G. Wamer, P.C. Howard, M.D. Boudreau, P.P. Fu, Levels of retinyl palmitateand retinol in the stratum corneum, epidermis and dermis of female SKH-1 micetopically treated with retinyl palmitate, Toxicology and Industrial Health 22(2006) 181–191.
[17] P.M. Elias, Epidermal lipids, barrier function and desquamation, Journal ofInvestigative Dermatology 80 (1983) 44s–49s.
[18] I.H. Blank, R.J. Scheuplein, Transport into and within the skin, British Journal ofDermatology 81 (1969) 4–10.
[19] R.J. Scheuplein, Percutaneous absorption after twenty-five years: or “old wine innew wineskins”, Journal of Investigative Dermatology 76 (1976) 31–38.
[20] C.R. Behl, M. Barett, G.L. Flynn, T. Kurihara, K. Walters, O. Gatmaitan, N. Harper, W.Higuchi, N.F. Ho, C. Pierson, Hydration and percutaneous absorption III: influencesof stripping and scalding on hydration alteration of the permeability of hairlessmouse skin to water and n-alcohols, Journal of Pharmaceutical Sciences 71 (1982)229–234.
38 M. Mélot et al. / Journal of Controlled Release 138 (2009) 32–39

Author's personal copy
[21] C.H. Purdon, C.G. Azzi, J. Zhang, E.W. Smith, H.I. Maibach, Penetration enhance-ment of transdermal delivery—current permutations and limitations, CriticalReviews in Therapeutic Drug Carrier Systems 21 (2004) 97–132.
[22] P. Karande, A. Jain, K. Ergun, V. Kispersky, S. Mitragotri, Design principles ofchemical penetration enhancers for transdermal drug delivery, PNAS 102 (2005)4688–4693.
[23] A.C. Williams, B.W. Barry, Penetration enhancers, Advanced Drug delivery reviews56 (2004) 603–618.
[24] P.J. Caspers, G.W. Lucassen, R. Wolthuis, H.A. Bruining, G.J. Puppels, In vitro and invivo Raman spectroscopy of human skin, Biospectroscopy 4 (1998) S31–S39.
[25] P.J. Caspers, G.W. Lucassen, H.A. Bruining, G.J. Puppels, Automated depth-scanningconfocal Raman microspectrometer for rapid in vivo determination of waterconcentration profiles in human skin, Journal of Raman spectroscopy 31 (2000)813–818.
[26] G. Zhang, D.J. Moore, K.B. Sloan, C.R. Flach, R. Mendelsohn, Imaging the prodrug-to-drug transformation of a 5-fluorouracil derivative in skin by confocal Ramanmicroscopy, Journal of Investigative Dermatology 127 (2007) 1205–1209.
[27] G. Zhang, C.R. Flach, R. Mendelsohn, Tracking the dephosphorylation of resveratroltriphosphate in skin by confocal Raman microscopy, Journal of Controlled Release123 (2007) 141–147.
[28] P.D.A. Pudney, M.E. Mélot, P.J. Caspers, A. Van Der Pol, G.J. Puppels, In-vivo confocalRaman study of the delivery of the skin active retinol to the skin, AppliedSpectroscopy 61 (2007) 804–811.
[29] P.O. Potts, R.H. Guy, Predicting skin permeability, Pharmaceutical Research 9(1992) 663–669.
[30] B.W. Barry, Lipid-protein-partitioning theory of skin penetration enhancement,Journal of Controlled Release 15 (1991) 237–248.
[31] P.D.A. Pudney, T.M. Hancewicz, D.G. Cunningham, M.C. Brown, Quantifying themicrostructures of soft solid materials by confocal Raman spectroscopy, Vibra-tional Spectroscopy 34 (2004) 123–135.
[32] P.J. Caspers, G.W. Lucassen, E.A. Carter, H.A. Bruining, G.J. Puppels, In vivo confocalRaman microspectroscopy of the skin: non-invasive determination of molecularconcentration profiles, Journal of Investigstive Dermatology 116 (3) (2001) 434–442.
[33] A. Naik, L.A.R.M. Pechtold, R.O. Potts, R.H. Guy, Mechanism of oleic acid-induced skinpenetration in vivo in humans, Journal of Controlled Release 37 (1995) 299–306.
[34] B. Ongpipattanakul, R.R. Burnette, R.O. Potts, M.L. Francoeur, Evidence that oleicacid exists in a separate phase within stratum corneum lipids, PharmaceuticalResearch 8 (1991) 350–354.
[35] S. Wartewig, R. Neubert, W. Rettig, K. Hesse, Structure of stratum corneum lipidscharacterised by FT-Raman spectroscopy and DSC IV, mixtures of cerimides andoleic acid, Chemistry and Physics of Lipids 91 (1998) 145–152.
[36] B. Yu, C.Y. Dong, P.T.C. So, D. Blankschtein, R. Langer, In vitro visualization andquantification of oleic acid induced changes in transdermal transport using two-photon fluorescence microscopy, Journal of Investigative Dermatology 117 (2001)16–25.
[37] B. Yu, K.H. Kim, P.T.C. So, D. Blankschtein, R. Langer, Visualization of oleic acidinduced transdermal diffusion pathways using two photon fluorescence micro-scopy, Journal of Investigative Dermatology 120 (2003) 448–455.
[38] M. Cocera, O. Lopez, L. Coderch, J.L. Parra, A. de la Maza, Solubilization of stratumcorneum lipid liposomes by Triton X-100. Influence of the level of cholesterylsulfate in the process, Colloids and Surfaces A—Physiochemical and EngineeringAspects 182 (2001) 15–23.
[39] N. Kamenka, M. Elamrani, J. Appell, M. Lindheimer, Mixed micelle-to-vesicletransition in aqueous non-ionic phospholipids systems, Journal of Colloid andInterface Science 143 (1991) 463–471.
[40] M.A. Partearroyo, A. Alonso, F.M. Goni, M. Tribout, S. Paredes, Solubilization ofphospholipid bilayers by surfactants belonging to the Triton X series: effect ofpolar group size, Journal of Colloid and Interface Science 178 (1996) 156–159.
[41] O. Lopez, M. Cocera, R. Pons, N. Azemar, C. Lopez-Iglesias, E. Wehrli, J.L. Parra, A. dela Maza, Use of a dynamic light scattering technique to study the kinetics ofliposome solubilization by Triton X-100, Langmuir 15 (1999) 4678–4681.
[42] D. Lichtenberg, Characterization of the solubilization of lipid bilayers bysurfactants, Biochimica et Biophysica Acta 821 (1985) 470–478.
[43] S. Morandat, K. El Kiret, Membrane resistance to Triton-X-100 explored by realtime atomic force microscopy, Langmuir 22 (2006) 5786–5791.
[44] G.P. Lian, L. Chen, L. Han, An evaluation of mathematical models for predicting skinpermeability, Journal of Pharmaceutical Sciences 97 (2008) 584–598.
[45] L.J. Chen, G.P. Lian, L.J. Han, Use of “bricks and mortar” model to predicttransdermal permeation: model development and initial validation, Industrial &Engineering Chemistry Research 47 (2008) 6465–6472.
39M. Mélot et al. / Journal of Controlled Release 138 (2009) 32–39