study on physicochemical characterization of konhaye stream district dir lower, khyber pakhtunkhwa...
TRANSCRIPT
World Journal of Fish and Marine Sciences 6 (5): 461-470, 2014ISSN 2078-4589© IDOSI Publications, 2014DOI: 10.5829/idosi.wjfms.2014.06.05.85228
Corresponding Author: Tauseef Ahmad, Department of Microbiology, Hazara University Mansehra, Khyber Pakhtunkhwa, Pakistan.Cell: +92-346-9403966.
461
Study on Physicochemical Characterization ofKonhaye Stream District Dir Lower, Khyber Pakhtunkhwa Pakistan
Sana Ullah, Naseer Ullah, Khaista Rahman, Tariq Mehmood Khan,1 1 2 3
Muhammad Ayub Jadoon and Tauseef Ahmad4 4
Department of Animal Sciences, Quaid-i-Azam University Islamabad, Islamic Republic of Pakistan1
Department of Biotechnology, Quaid-i-Azam University Islamabad, Islamic Republic of Pakistan2
Morgah Biodiversity Project, Attock Refinery Limited Morgah, Rawalpindi, Islamic Republic of Pakistan3
Department of Microbiology, Hazara University Mansehra, 4
Khyber Pakhtunkhwa, Islamic Republic of Pakistan
Abstract: The present study was aimed to assess water quality of Konhaye stream District Dir Lower KhyberPakhtunkhwa, Pakistan. For this purpose sampling was carried out from the stream and was analyzed for twentytwo physical and chemical parameters. The results of the factors were compared with world health organization(WHO) standard and were correlated in between with Pearson correlation coefficient. Agricultural indices likeSodium Absorption Ratio (SAR), Sodium Percentage (Na %), Residual Sodium Carbonate (RSC), Kelley’s Ratio(KR) and Soluble Sodium Percent (SSP) were also find out. The parameters studied were in varying rangessuch as temperature: 19.9-27.9 , pH: 7.1-7.5, dissolved oxygen: 8.5-9.91 mg/L, electrical conductivity: 190.2-217.2 µs/cm, total dissolved solids: 111.1-135.12 ppm, total suspended solids: 120.9-134.4 ppm, free carbondioxide: 110-131 ppm, turbidity: 67-81 NTU, salinity: 35-48 ppt, total hardness: 4.9-5.7 mg/L, calcium hardness:2.3-3.8 mg/L, magnesium hardness: 93-117 mg/L, sodium: 11-19.7 mg/L, potassium: 0.001-0.041 mg/L, totalalkalinity: 4.1-4.5 mg/L, chloride: 1.11-2.67 mg/L, nitrate: 0.001-0.11 mg/L, sulphates: 90-170 mg/L, CO : 10-403
mg/L, HCO : 25-100 mg/L and BOD: 0.2-12 mg/L. The obtained results showed that water quality of the stream3
lie within permissible limits suggested by WHO. It is also suitable for harboring a diversified fish fauna as it alsolie in permissible ranges acquired for aquatic life as suggested by United State Public Health Standards(USPHS). The chemical indices SAR, Na%, RSC, KR and SSP classify the water quality as excellent foragricultural practices. To protect water quality, it should be assessed regularly. Agricultural run offs anddomestic wastes should be treated properly before disposing off and waste materials should be dumped tosuitable sites.
Key words: Konhaye Stream Tributary River Panjkora Dir Lower Dir Upper
INTRODUCTION They cannot survive if their water is loaded with toxic
No one can under estimate the need and necessity of all life forms [6, 7].water for human life [1]. Water quality, as always, is of key Water is must for men’s existence as well as all otherinterest of human beings as their welfare is directly related living things [8]. The riverine system is one of the mostto it [2]. Most of the developmental activities are important resources of water supply in different regionsdepending upon rivers, which make them most important of the world as it provides water for drinking as well as forfreshwater resources [3]. Humans, animals especially agricultural, industrial and other purposes [9, 10]. Theaquatic and plants require water, which is moderately pure water is relatively pure, at the source but changes tookand free of chemicals and microbial contaminants [4]. place in its use, land use and hydrological conditions
chemicals [5]. Even severe load of these contaminants kill
World J. Fish & Marine Sci., 6 (5): 461-470, 2014
462
because of the abstractive water use, urban population MATERIALS AND METHODSgrowth, industrialization, agricultural activities such aschemicals use and household increase of chemicals [11].Throughout the globe, water pollution is on increasewhich makes it one of the most debatable issues of the era[12]. Among the major goals of millennium developmentregarding healthy living of masses, is to provide themwith safe and convenient water [13].
Pollution is the major issue echoing on horizon ofenvironmental research. It is affecting every niche ofbiosphere. The aquatic ecosystem is also one of theseaffected environments [14]. It consists of severalcomponents that are directly as well as indirectly affectedby pollution [15]. This pollution ultimately affects aquaticorganisms, fish being standing first [16, 17]. On accountof anthropogenic activities such as domestic wastes,untreated sewages and industrial and agriculturaleffluents, the main aquatic bodies are continuouslydeteriorating in Pakistan as well as all over the world [18].The nutrient inputs are highest from towns andagricultural fields [19]. This problem increaseddramatically since last few decades with advancement inindustrialization and urbanization [20, 21]. This conditionis even more deteriorated if these water supply sourcespass on through cities or populated areas [22]. Thecontaminants get passed to water bodies from theeveryday life activities of these masses and making waterbodies as focal point of the pollution [23].
Water quality is assessed by evaluating its physicaland chemical contents [24]. Changes take place in waterquality even with seasons and geographic areas’ changewithout any pollution being involved. Water qualityguidelines deliver scientific information about waterquality factors. It also provides ecologically relevanttoxicological threshold values to protect specific wateruses [25]. There are many vital physical and chemicalfactors that affect aquatic bodies [26]. These aretemperature, pH, hardness, carbon dioxide, total solidsand alkalinity etc. Water quality deterioration iscontributed by pollutants and effluents from differentsources such as agricultural runoffs, waste productsdumping, detergents and household wastes etc. [27].
The present study was conducted in order to assessthe water quality of Konhaye stream District Dir KhyberPakhtunkhwa. Its water was assessed by studying itsdifferent physical and chemical parameters. The studiedfactors are temperature, pH, dissolved oxygen, electricalconductivity, total dissolved solids, total suspendedsolids, free carbon dioxide, turbidity, salinity, totalhardness, calcium hardness, magnesium hardness,sodium, potassium, total alkalinity, chloride and nitrate.
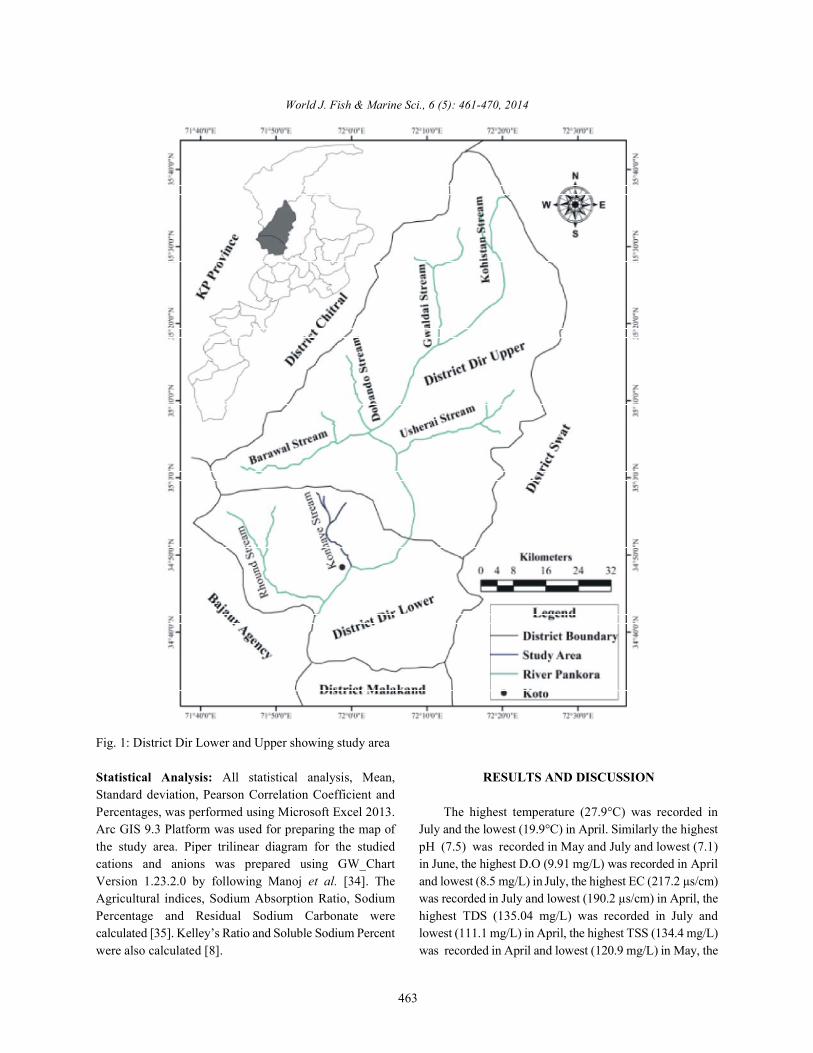
Sampling Area: District Dir Lower is situated withLongitudes and Latitudes of 34°, 37' to 35°, 07' North and71°, 31' to 72°, 14' East respectively with approximate2700 feet (820 meter) above mean sea level experiencing anannual rain fall of 1468.8mm and 253.7mm duringDecember and March respectively [28]. District Dir isbounded by District Chitral to the Northern Side, byBajaur and Afghanistan to the Western side, by DistrictMalakand to the Southern side and by District Swat toEastern side [29]. River Panjkora originates from Kohistan,District Dir (Upper) and flow southward dividing DistrictDir Upper and Lower into two halves. River Panjkora joinsRiver Swat at Bosaq pull, Sharbatti (behind Totakan,District Malakand) [30]. The name Panjkora is because ofthe main five tributaries that fall in the River at fourdifferent places at District Dir Upper (Gwaldi Stream atSheringal, Barawal Stream at Chukiatan, Usherai DaraStream and Nurhund Stream at Darora and DobandoStream at Akhagram) while two tributaries fall in theRiver at two different places in District Dir Lower(Konhaye Stream at Koto and Round Stream behind Thraiby pass near Timergara) [31]. Figure 1 is showing thestudy area.
Sampling and Data Analysis: Water samples werecollected using sterilized polythene bottles, twice a monthon every 15 and 30 , for four months by followingth th
Hassan et al. [32]. These bottles were first washed withtape water and were then rinsed using double deionizedwater. Water sampling was carried out from April throughJuly 2013. The conductivity and pH were determined onthe site, whereas the samples were transported tolaboratory for further analysis.
Portable pH meter was used for measuring the pH ofthe water samples (Natner, UK). The conventionalmethods referred by American Public Health Association[33] were followed for determining total alkalinity, totalsuspended solids (TSS), total dissolved solids (TDS),total hardness, magnesium hardness, calcium hardness,chlorides and sulphate contents. Portable conductivitymeter (Jenway, England) was used for findingconductivity. Sulphonilic method using UVSpectrophotometer (Hitachi-U-2000) was used formeasuring Nitrite contents. For measuring Sodium andPotassium contents Flame Photometer (Jenway-FPF-7)was used. The colour, odour and taste of the watersamples were detected organolaptically.
World J. Fish & Marine Sci., 6 (5): 461-470, 2014
463
Fig. 1: District Dir Lower and Upper showing study area
Statistical Analysis: All statistical analysis, Mean, RESULTS AND DISCUSSIONStandard deviation, Pearson Correlation Coefficient andPercentages, was performed using Microsoft Excel 2013. The highest temperature (27.9°C) was recorded inArc GIS 9.3 Platform was used for preparing the map of July and the lowest (19.9°C) in April. Similarly the highestthe study area. Piper trilinear diagram for the studied pH (7.5) was recorded in May and July and lowest (7.1)cations and anions was prepared using GW_Chart in June, the highest D.O (9.91 mg/L) was recorded in AprilVersion 1.23.2.0 by following Manoj et al. [34]. The and lowest (8.5 mg/L) in July, the highest EC (217.2 µs/cm)Agricultural indices, Sodium Absorption Ratio, Sodium was recorded in July and lowest (190.2 µs/cm) in April, thePercentage and Residual Sodium Carbonate were highest TDS (135.04 mg/L) was recorded in July andcalculated [35]. Kelley’s Ratio and Soluble Sodium Percent lowest (111.1 mg/L) in April, the highest TSS (134.4 mg/L)were also calculated [8]. was recorded in April and lowest (120.9 mg/L) in May, the
World J. Fish & Marine Sci., 6 (5): 461-470, 2014
464
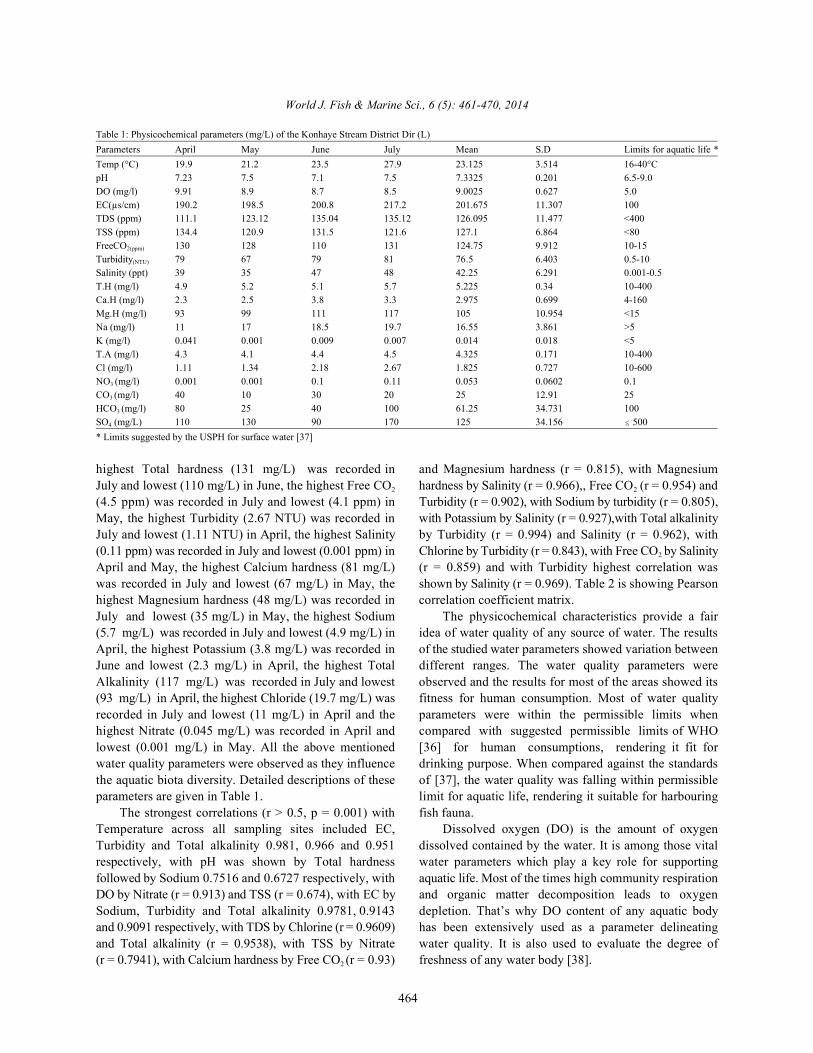
Table 1: Physicochemical parameters (mg/L) of the Konhaye Stream District Dir (L)Parameters April May June July Mean S.D Limits for aquatic life *Temp (°C) 19.9 21.2 23.5 27.9 23.125 3.514 16-40°CpH 7.23 7.5 7.1 7.5 7.3325 0.201 6.5-9.0DO (mg/l) 9.91 8.9 8.7 8.5 9.0025 0.627 5.0EC(µs/cm) 190.2 198.5 200.8 217.2 201.675 11.307 100TDS (ppm) 111.1 123.12 135.04 135.12 126.095 11.477 <400TSS (ppm) 134.4 120.9 131.5 121.6 127.1 6.864 <80FreeCO 130 128 110 131 124.75 9.912 10-152(ppm)
Turbidity 79 67 79 81 76.5 6.403 0.5-10(NTU)
Salinity (ppt) 39 35 47 48 42.25 6.291 0.001-0.5T.H (mg/l) 4.9 5.2 5.1 5.7 5.225 0.34 10-400Ca.H (mg/l) 2.3 2.5 3.8 3.3 2.975 0.699 4-160Mg.H (mg/l) 93 99 111 117 105 10.954 <15Na (mg/l) 11 17 18.5 19.7 16.55 3.861 >5K (mg/l) 0.041 0.001 0.009 0.007 0.014 0.018 <5T.A (mg/l) 4.3 4.1 4.4 4.5 4.325 0.171 10-400Cl (mg/l) 1.11 1.34 2.18 2.67 1.825 0.727 10-600NO (mg/l) 0.001 0.001 0.1 0.11 0.053 0.0602 0.13
CO (mg/l) 40 10 30 20 25 12.91 253
HCO (mg/l) 80 25 40 100 61.25 34.731 1003
SO (mg/L) 110 130 90 170 125 34.156 500 4
* Limits suggested by the USPH for surface water [37]
highest Total hardness (131 mg/L) was recorded in and Magnesium hardness (r = 0.815), with MagnesiumJuly and lowest (110 mg/L) in June, the highest Free CO hardness by Salinity (r = 0.966),, Free CO (r = 0.954) and2
(4.5 ppm) was recorded in July and lowest (4.1 ppm) in Turbidity (r = 0.902), with Sodium by turbidity (r = 0.805),May, the highest Turbidity (2.67 NTU) was recorded in with Potassium by Salinity (r = 0.927),with Total alkalinityJuly and lowest (1.11 NTU) in April, the highest Salinity by Turbidity (r = 0.994) and Salinity (r = 0.962), with(0.11 ppm) was recorded in July and lowest (0.001 ppm) in Chlorine by Turbidity (r = 0.843), with Free CO by SalinityApril and May, the highest Calcium hardness (81 mg/L) (r = 0.859) and with Turbidity highest correlation waswas recorded in July and lowest (67 mg/L) in May, the shown by Salinity (r = 0.969). Table 2 is showing Pearsonhighest Magnesium hardness (48 mg/L) was recorded in correlation coefficient matrix.July and lowest (35 mg/L) in May, the highest Sodium The physicochemical characteristics provide a fair(5.7 mg/L) was recorded in July and lowest (4.9 mg/L) in idea of water quality of any source of water. The resultsApril, the highest Potassium (3.8 mg/L) was recorded in of the studied water parameters showed variation betweenJune and lowest (2.3 mg/L) in April, the highest Total different ranges. The water quality parameters wereAlkalinity (117 mg/L) was recorded in July and lowest observed and the results for most of the areas showed its(93 mg/L) in April, the highest Chloride (19.7 mg/L) was fitness for human consumption. Most of water qualityrecorded in July and lowest (11 mg/L) in April and the parameters were within the permissible limits whenhighest Nitrate (0.045 mg/L) was recorded in April and compared with suggested permissible limits of WHOlowest (0.001 mg/L) in May. All the above mentioned [36] for human consumptions, rendering it fit forwater quality parameters were observed as they influence drinking purpose. When compared against the standardsthe aquatic biota diversity. Detailed descriptions of these of [37], the water quality was falling within permissibleparameters are given in Table 1. limit for aquatic life, rendering it suitable for harbouring
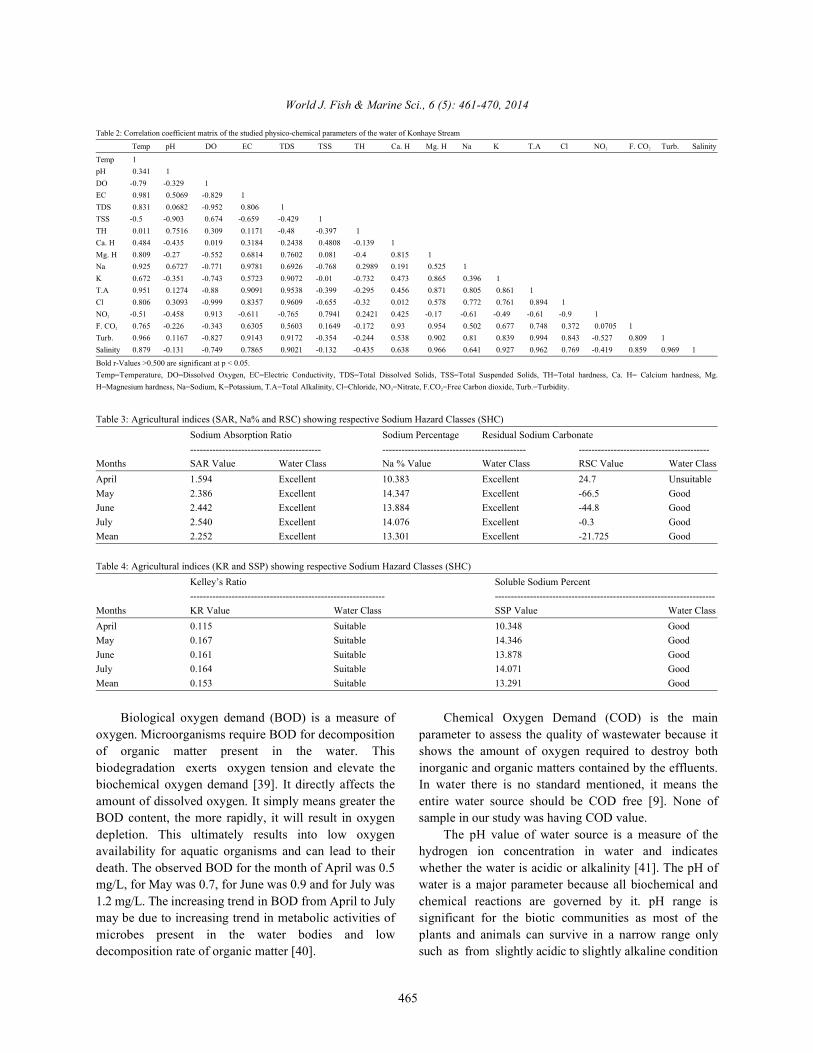
The strongest correlations (r > 0.5, p = 0.001) with fish fauna.Temperature across all sampling sites included EC, Dissolved oxygen (DO) is the amount of oxygenTurbidity and Total alkalinity 0.981, 0.966 and 0.951 dissolved contained by the water. It is among those vitalrespectively, with pH was shown by Total hardness water parameters which play a key role for supportingfollowed by Sodium 0.7516 and 0.6727 respectively, with aquatic life. Most of the times high community respirationDO by Nitrate (r = 0.913) and TSS (r = 0.674), with EC by and organic matter decomposition leads to oxygenSodium, Turbidity and Total alkalinity 0.9781, 0.9143 depletion. That’s why DO content of any aquatic bodyand 0.9091 respectively, with TDS by Chlorine (r = 0.9609) has been extensively used as a parameter delineatingand Total alkalinity (r = 0.9538), with TSS by Nitrate water quality. It is also used to evaluate the degree of(r = 0.7941), with Calcium hardness by Free CO (r = 0.93) freshness of any water body [38].2
2
2
World J. Fish & Marine Sci., 6 (5): 461-470, 2014
465
Table 2: Correlation coefficient matrix of the studied physico-chemical parameters of the water of Konhaye Stream
Temp pH DO EC TDS TSS TH Ca. H Mg. H Na K T.A Cl NO F. CO Turb. Salinity3 2
Temp 1pH 0.341 1DO -0.79 -0.329 1EC 0.981 0.5069 -0.829 1TDS 0.831 0.0682 -0.952 0.806 1TSS -0.5 -0.903 0.674 -0.659 -0.429 1TH 0.011 0.7516 0.309 0.1171 -0.48 -0.397 1Ca. H 0.484 -0.435 0.019 0.3184 0.2438 0.4808 -0.139 1Mg. H 0.809 -0.27 -0.552 0.6814 0.7602 0.081 -0.4 0.815 1Na 0.925 0.6727 -0.771 0.9781 0.6926 -0.768 0.2989 0.191 0.525 1K 0.672 -0.351 -0.743 0.5723 0.9072 -0.01 -0.732 0.473 0.865 0.396 1T.A 0.951 0.1274 -0.88 0.9091 0.9538 -0.399 -0.295 0.456 0.871 0.805 0.861 1Cl 0.806 0.3093 -0.999 0.8357 0.9609 -0.655 -0.32 0.012 0.578 0.772 0.761 0.894 1NO -0.51 -0.458 0.913 -0.611 -0.765 0.7941 0.2421 0.425 -0.17 -0.61 -0.49 -0.61 -0.9 13
F. CO 0.765 -0.226 -0.343 0.6305 0.5603 0.1649 -0.172 0.93 0.954 0.502 0.677 0.748 0.372 0.0705 12
Turb. 0.966 0.1167 -0.827 0.9143 0.9172 -0.354 -0.244 0.538 0.902 0.81 0.839 0.994 0.843 -0.527 0.809 1Salinity 0.879 -0.131 -0.749 0.7865 0.9021 -0.132 -0.435 0.638 0.966 0.641 0.927 0.962 0.769 -0.419 0.859 0.969 1
Bold r-Values >0.500 are significant at p < 0.05.Temp=Temperature, DO=Dissolved Oxygen, EC=Electric Conductivity, TDS=Total Dissolved Solids, TSS=Total Suspended Solids, TH=Total hardness, Ca. H= Calcium hardness, Mg.H=Magnesium hardness, Na=Sodium, K=Potassium, T.A=Total Alkalinity, Cl=Chloride, NO =Nitrate, F.CO =Free Carbon dioxide, Turb.=Turbidity.3 2
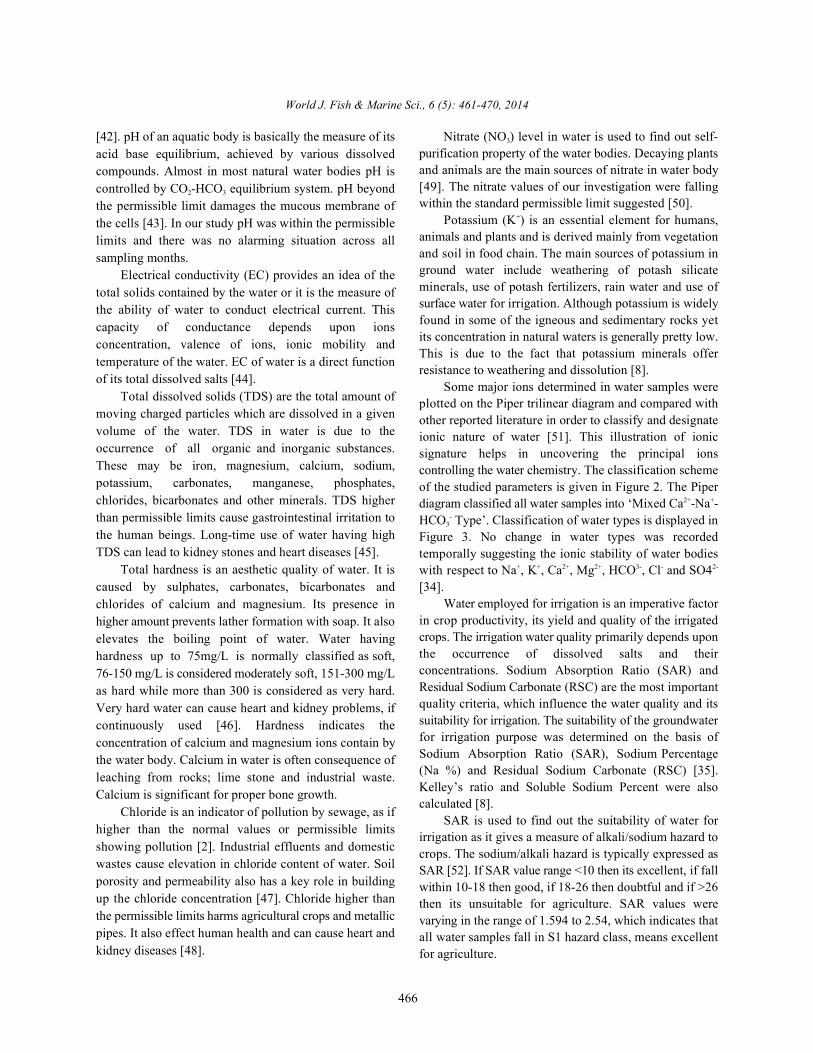
Table 3: Agricultural indices (SAR, Na% and RSC) showing respective Sodium Hazard Classes (SHC)Sodium Absorption Ratio Sodium Percentage Residual Sodium Carbonate----------------------------------------- --------------------------------------------- -----------------------------------------
Months SAR Value Water Class Na % Value Water Class RSC Value Water ClassApril 1.594 Excellent 10.383 Excellent 24.7 UnsuitableMay 2.386 Excellent 14.347 Excellent -66.5 GoodJune 2.442 Excellent 13.884 Excellent -44.8 GoodJuly 2.540 Excellent 14.076 Excellent -0.3 GoodMean 2.252 Excellent 13.301 Excellent -21.725 Good
Table 4: Agricultural indices (KR and SSP) showing respective Sodium Hazard Classes (SHC)Kelley’s Ratio Soluble Sodium Percent------------------------------------------------------------- ---------------------------------------------------------------------
Months KR Value Water Class SSP Value Water ClassApril 0.115 Suitable 10.348 GoodMay 0.167 Suitable 14.346 GoodJune 0.161 Suitable 13.878 GoodJuly 0.164 Suitable 14.071 GoodMean 0.153 Suitable 13.291 Good
Biological oxygen demand (BOD) is a measure of Chemical Oxygen Demand (COD) is the mainoxygen. Microorganisms require BOD for decomposition parameter to assess the quality of wastewater because itof organic matter present in the water. This shows the amount of oxygen required to destroy bothbiodegradation exerts oxygen tension and elevate the inorganic and organic matters contained by the effluents.biochemical oxygen demand [39]. It directly affects the In water there is no standard mentioned, it means theamount of dissolved oxygen. It simply means greater the entire water source should be COD free [9]. None ofBOD content, the more rapidly, it will result in oxygen sample in our study was having COD value. depletion. This ultimately results into low oxygen The pH value of water source is a measure of theavailability for aquatic organisms and can lead to their hydrogen ion concentration in water and indicatesdeath. The observed BOD for the month of April was 0.5 whether the water is acidic or alkalinity [41]. The pH ofmg/L, for May was 0.7, for June was 0.9 and for July was water is a major parameter because all biochemical and1.2 mg/L. The increasing trend in BOD from April to July chemical reactions are governed by it. pH range ismay be due to increasing trend in metabolic activities of significant for the biotic communities as most of themicrobes present in the water bodies and low plants and animals can survive in a narrow range onlydecomposition rate of organic matter [40]. such as from slightly acidic to slightly alkaline condition
World J. Fish & Marine Sci., 6 (5): 461-470, 2014
466
[42]. pH of an aquatic body is basically the measure of its Nitrate (NO ) level in water is used to find out self-acid base equilibrium, achieved by various dissolvedcompounds. Almost in most natural water bodies pH iscontrolled by CO -HCO equilibrium system. pH beyond2 3
the permissible limit damages the mucous membrane ofthe cells [43]. In our study pH was within the permissiblelimits and there was no alarming situation across allsampling months.
Electrical conductivity (EC) provides an idea of thetotal solids contained by the water or it is the measure ofthe ability of water to conduct electrical current. Thiscapacity of conductance depends upon ionsconcentration, valence of ions, ionic mobility andtemperature of the water. EC of water is a direct functionof its total dissolved salts [44].
Total dissolved solids (TDS) are the total amount ofmoving charged particles which are dissolved in a givenvolume of the water. TDS in water is due to theoccurrence of all organic and inorganic substances.These may be iron, magnesium, calcium, sodium,potassium, carbonates, manganese, phosphates,chlorides, bicarbonates and other minerals. TDS higherthan permissible limits cause gastrointestinal irritation tothe human beings. Long-time use of water having highTDS can lead to kidney stones and heart diseases [45].
Total hardness is an aesthetic quality of water. It iscaused by sulphates, carbonates, bicarbonates andchlorides of calcium and magnesium. Its presence inhigher amount prevents lather formation with soap. It alsoelevates the boiling point of water. Water havinghardness up to 75mg/L is normally classified as soft,76-150 mg/L is considered moderately soft, 151-300 mg/Las hard while more than 300 is considered as very hard.Very hard water can cause heart and kidney problems, ifcontinuously used [46]. Hardness indicates theconcentration of calcium and magnesium ions contain bythe water body. Calcium in water is often consequence ofleaching from rocks; lime stone and industrial waste.Calcium is significant for proper bone growth.
Chloride is an indicator of pollution by sewage, as ifhigher than the normal values or permissible limitsshowing pollution [2]. Industrial effluents and domesticwastes cause elevation in chloride content of water. Soilporosity and permeability also has a key role in buildingup the chloride concentration [47]. Chloride higher thanthe permissible limits harms agricultural crops and metallicpipes. It also effect human health and can cause heart andkidney diseases [48].
3
purification property of the water bodies. Decaying plantsand animals are the main sources of nitrate in water body[49]. The nitrate values of our investigation were fallingwithin the standard permissible limit suggested [50].
Potassium (K ) is an essential element for humans,+
animals and plants and is derived mainly from vegetationand soil in food chain. The main sources of potassium inground water include weathering of potash silicateminerals, use of potash fertilizers, rain water and use ofsurface water for irrigation. Although potassium is widelyfound in some of the igneous and sedimentary rocks yetits concentration in natural waters is generally pretty low.This is due to the fact that potassium minerals offerresistance to weathering and dissolution [8].
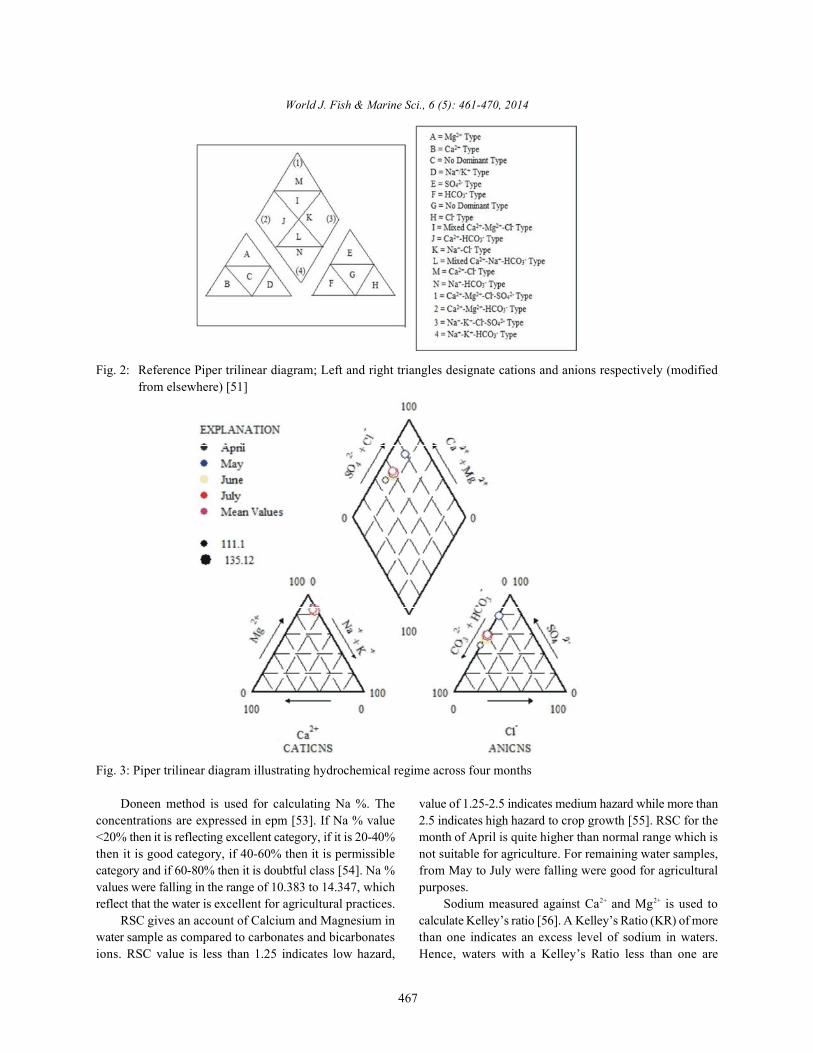
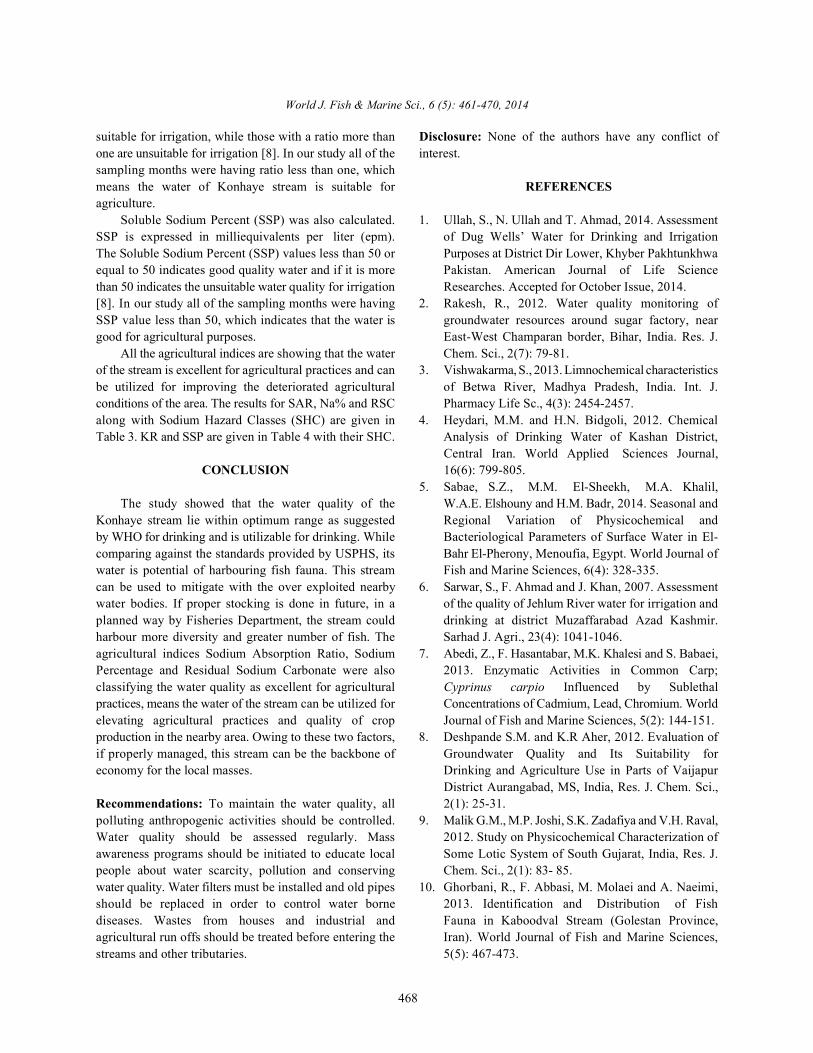
Some major ions determined in water samples wereplotted on the Piper trilinear diagram and compared withother reported literature in order to classify and designateionic nature of water [51]. This illustration of ionicsignature helps in uncovering the principal ionscontrolling the water chemistry. The classification schemeof the studied parameters is given in Figure 2. The Piperdiagram classified all water samples into ‘Mixed Ca -Na -2+ +
HCO Type’. Classification of water types is displayed in3-
Figure 3. No change in water types was recordedtemporally suggesting the ionic stability of water bodieswith respect to Na , K , Ca , Mg , HCO , Cl and SO4+ + 2+ 2+ 3- - 2-
[34].Water employed for irrigation is an imperative factor
in crop productivity, its yield and quality of the irrigatedcrops. The irrigation water quality primarily depends uponthe occurrence of dissolved salts and theirconcentrations. Sodium Absorption Ratio (SAR) andResidual Sodium Carbonate (RSC) are the most importantquality criteria, which influence the water quality and itssuitability for irrigation. The suitability of the groundwaterfor irrigation purpose was determined on the basis ofSodium Absorption Ratio (SAR), Sodium Percentage(Na %) and Residual Sodium Carbonate (RSC) [35].Kelley’s ratio and Soluble Sodium Percent were alsocalculated [8].
SAR is used to find out the suitability of water forirrigation as it gives a measure of alkali/sodium hazard tocrops. The sodium/alkali hazard is typically expressed asSAR [52]. If SAR value range <10 then its excellent, if fallwithin 10-18 then good, if 18-26 then doubtful and if >26then its unsuitable for agriculture. SAR values werevarying in the range of 1.594 to 2.54, which indicates thatall water samples fall in S1 hazard class, means excellentfor agriculture.
World J. Fish & Marine Sci., 6 (5): 461-470, 2014
467
Fig. 2: Reference Piper trilinear diagram; Left and right triangles designate cations and anions respectively (modifiedfrom elsewhere) [51]
Fig. 3: Piper trilinear diagram illustrating hydrochemical regime across four months
Doneen method is used for calculating Na %. The value of 1.25-2.5 indicates medium hazard while more thanconcentrations are expressed in epm [53]. If Na % value 2.5 indicates high hazard to crop growth [55]. RSC for the<20% then it is reflecting excellent category, if it is 20-40% month of April is quite higher than normal range which isthen it is good category, if 40-60% then it is permissible not suitable for agriculture. For remaining water samples,category and if 60-80% then it is doubtful class [54]. Na % from May to July were falling were good for agriculturalvalues were falling in the range of 10.383 to 14.347, which purposes.reflect that the water is excellent for agricultural practices. Sodium measured against Ca and Mg is used to
RSC gives an account of Calcium and Magnesium in calculate Kelley’s ratio [56]. A Kelley’s Ratio (KR) of morewater sample as compared to carbonates and bicarbonates than one indicates an excess level of sodium in waters.ions. RSC value is less than 1.25 indicates low hazard, Hence, waters with a Kelley’s Ratio less than one are
2+ 2+
World J. Fish & Marine Sci., 6 (5): 461-470, 2014
468
suitable for irrigation, while those with a ratio more than Disclosure: None of the authors have any conflict ofone are unsuitable for irrigation [8]. In our study all of the interest.sampling months were having ratio less than one, whichmeans the water of Konhaye stream is suitable for REFERENCESagriculture.
Soluble Sodium Percent (SSP) was also calculated. 1. Ullah, S., N. Ullah and T. Ahmad, 2014. AssessmentSSP is expressed in milliequivalents per liter (epm). of Dug Wells’ Water for Drinking and IrrigationThe Soluble Sodium Percent (SSP) values less than 50 or Purposes at District Dir Lower, Khyber Pakhtunkhwaequal to 50 indicates good quality water and if it is more Pakistan. American Journal of Life Sciencethan 50 indicates the unsuitable water quality for irrigation Researches. Accepted for October Issue, 2014.[8]. In our study all of the sampling months were having 2. Rakesh, R., 2012. Water quality monitoring ofSSP value less than 50, which indicates that the water is groundwater resources around sugar factory, neargood for agricultural purposes. East-West Champaran border, Bihar, India. Res. J.
All the agricultural indices are showing that the water Chem. Sci., 2(7): 79-81.of the stream is excellent for agricultural practices and can 3. Vishwakarma, S., 2013. Limnochemical characteristicsbe utilized for improving the deteriorated agricultural of Betwa River, Madhya Pradesh, India. Int. J.conditions of the area. The results for SAR, Na% and RSC Pharmacy Life Sc., 4(3): 2454-2457.along with Sodium Hazard Classes (SHC) are given in 4. Heydari, M.M. and H.N. Bidgoli, 2012. ChemicalTable 3. KR and SSP are given in Table 4 with their SHC. Analysis of Drinking Water of Kashan District,
CONCLUSION 16(6): 799-805.
The study showed that the water quality of the W.A.E. Elshouny and H.M. Badr, 2014. Seasonal andKonhaye stream lie within optimum range as suggested Regional Variation of Physicochemical andby WHO for drinking and is utilizable for drinking. While Bacteriological Parameters of Surface Water in El-comparing against the standards provided by USPHS, its Bahr El-Pherony, Menoufia, Egypt. World Journal ofwater is potential of harbouring fish fauna. This stream Fish and Marine Sciences, 6(4): 328-335.can be used to mitigate with the over exploited nearby 6. Sarwar, S., F. Ahmad and J. Khan, 2007. Assessmentwater bodies. If proper stocking is done in future, in a of the quality of Jehlum River water for irrigation andplanned way by Fisheries Department, the stream could drinking at district Muzaffarabad Azad Kashmir.harbour more diversity and greater number of fish. The Sarhad J. Agri., 23(4): 1041-1046.agricultural indices Sodium Absorption Ratio, Sodium 7. Abedi, Z., F. Hasantabar, M.K. Khalesi and S. Babaei,Percentage and Residual Sodium Carbonate were also 2013. Enzymatic Activities in Common Carp;classifying the water quality as excellent for agricultural Cyprinus carpio Influenced by Sublethalpractices, means the water of the stream can be utilized for Concentrations of Cadmium, Lead, Chromium. Worldelevating agricultural practices and quality of crop Journal of Fish and Marine Sciences, 5(2): 144-151.production in the nearby area. Owing to these two factors, 8. Deshpande S.M. and K.R Aher, 2012. Evaluation ofif properly managed, this stream can be the backbone of Groundwater Quality and Its Suitability foreconomy for the local masses. Drinking and Agriculture Use in Parts of Vaijapur
Recommendations: To maintain the water quality, all 2(1): 25-31.polluting anthropogenic activities should be controlled. 9. Malik G.M., M.P. Joshi, S.K. Zadafiya and V.H. Raval,Water quality should be assessed regularly. Mass 2012. Study on Physicochemical Characterization ofawareness programs should be initiated to educate local Some Lotic System of South Gujarat, India, Res. J.people about water scarcity, pollution and conserving Chem. Sci., 2(1): 83- 85.water quality. Water filters must be installed and old pipes 10. Ghorbani, R., F. Abbasi, M. Molaei and A. Naeimi,should be replaced in order to control water borne 2013. Identification and Distribution of Fishdiseases. Wastes from houses and industrial and Fauna in Kaboodval Stream (Golestan Province,agricultural run offs should be treated before entering the Iran). World Journal of Fish and Marine Sciences,streams and other tributaries. 5(5): 467-473.
Central Iran. World Applied Sciences Journal,
5. Sabae, S.Z., M.M. El-Sheekh, M.A. Khalil,
District Aurangabad, MS, India, Res. J. Chem. Sci.,
World J. Fish & Marine Sci., 6 (5): 461-470, 2014
469
11. Mahmood, K., M. Suleman, S. Hassan and 22. Ishaq, F. and A. Khan, 2013b. Aquatic BiodiversityS.K. Badshah, 2013. Assessment the Leaching as Ecological Indicators for Water Quality Criteria ofPotential of Pendimenthalin and its Transormation River Yamuna in Doon Valley, Uttarakhand, India.Products in Soil. World Applied Sciences Journal, World Journal of Fish and Marine Sci., 5(3):322-334.26(5): 583-587. 23. Leopold, E.N., P. Baussand and E.G. Emmanuel, 2012.
12. Thorvat, A.R., N.P. Sonaje, M.M. Mujumdar and Heavy Metals Accumulation in Sediment Cores ofV.A. Swami, 2012. A study on the physicochemical the Municipal Lake of Yaounde, Cameroon. Globalcharacteristics of Panchaganga River in Kolhapur Journal of Environmental Research, 6(3): 100-110.city, MS, India. Res. J. Chem. Sci., 2(8): 76-79. 24. Noroozrajabi, A., R. Ghorbani, O. Abdi and E.Nabavi,
13. Adesoji, A.T., A.A. Ogunjobi and I.O. Olatoye, 2014. 2013. The Impact of Rainbow Trout Farm Effluents onDrinking Water Distribution Systems of Dams in Water Physicochemical Properties of DaryasarOndo State, Nigeria as Reservoir of Multi-Drug Stream. World Journal of Fish and Marine Sciences,Resistant Bacteria. World Applied Sciences Journal, 5(3): 342-346.32(3): 403-414. 25. Lawson, E.O., 2011. Physicochemical parameters and
14. Verma, S., 2009. Seasonal Variation of Water Quality Heavy metal contents of water from the mangrovein Betwa River at Bundelkhand Region, India. Global swamps of Lagos Lagoon, Lagos, Nigeria. AdvancesJournal of Environmental Research, 3(3): 164-168. in Biological Research, 5(1): 8-21.
15. Kosygin, L., H. Dhamendra and R. Gyaneshwari, 26. Daniel, E.O., A.U Ugweze and H.E. Igbegu, 2013.2007. Pollution status and conservation strategies of Microbiological Quality and Some Heavy MetalsMoirang River, Manipur with a note on its aquatic Analysis of Smoked Fish Sold in Benin City, Edobio-resources. J. Env. Biol., 28(3): 669-673. State, Nigeria. World Journal of Fish and Marine
16. Ahnagar, I.A., M.F. Mir, D.N. Saksena and Sciences, 5(3): 239-243.M.A. Ahangar, 2012. Zooplankton Diversity of 27. Akan, J.C., Z. Mohammed, L.Jafiya and S.I. Audu,Anchar Lake with Relation to Trophic Status, 2013. Organophosphorus Pesticide Residues inSrinagara, Kashmir. Global Journal of Environmental Different Tissue of Fish Samples from Alau Dam,Research, 6(1): 17-21. Borno State, Nigeria. World Journal of Fish and
17. Sivanatarajan, P. and T. Sivaramakrishnan, 2013. Marine Sciences, 5(5): 519-526.Studies on Some Hematologic Values of 28. Ullah, S., M.W. Javed, S.B. Rasheed, Q. Jamal, F. AzizOreochromis mossambicus (Peters) following its and S. Ullah, 2014b. Assessment of groundwaterSudden Transfer to Various Concentrations of quality of district Dir Lower Pakistan. Int. J. Biosci.,Potassium Chlorate and Potassium Dichromate. 4(8): 248-255.European Journal of Applied Sciences, 5(1): 19-24. 29. Ullah, S., M. Akmal, F. Aziz, S. Ullah and K.J. Khan,
18. Ali, J., N. Ullah, F.A. Khan, Z. Rahman, I. Ahmad, 2014c. Hand Pumps’ Water Quality Analysis forS. Hassan and I. Ahmad, 2013. Bacteriological Drinking and Irrigation Purposes at District DirQuality Analysis of Drinking Water of Rural Areas of Lower, Khyber Pakhtunkhwa Pakistan. Eur. Acad.Peshawar, Pakistan. American-Eurasian Journal of Res., 2(1): 1560-1572.Agriculture and Environmental Sci., 13(9): 1202-1206. 30. Ullah, S., Z. Hasan, S. Ahmad, M. Rauf and B. Khan,
19. Sand-Jensen, K., 2001. Freshwater ecossystems, 2014d. Ichthyofaunal diversity of rhound stream athuman impact on. In: Encyclopaedia of biodiversity. district Lower Dir, Khyber Pakhtunkhwa Pakistan.Vol 3 (Ed.: S. A. Levin). Academic Press, New York. Int. J. Biosci., 4(8): 241-247.pp: 89-108. 31. Ullah, S., 2014. GIS Integrated Approach for
20. Ishaq, F. and A. Khan, 2013. Heavy Metal Analysis Assessing Drinking Water Quality. VDM Publishingof River Yamuna and Their Relation with Some Heinrich-Böcking-Str. 6-8 D - 66121 SaarbrückenPhysicochemical Parameters. Global Journal of Germany, pp: 24-25.Environmental Research, 7(2): 34-39. 32. Hassan, A.A., A, Jenyo-Oni and A.B. Dauda, 2014.
21. Das, N.C., 2013. Physicochemical Characteristics of Assessment of Water Quality, Ichthyofauna andSelected Ground Water Samples of Ballarpur City of Macro flora Diversity of Lower Ogon RiverChandrapur District, Maharashtra, India. Int. Res. J. Wetlands. World Journal of Fish and MarineEnviron. Sci., 2(11): 96-100. Sciences, 6(1): 101-108.
World J. Fish & Marine Sci., 6 (5): 461-470, 2014
470
33. APHA/AWWA, 1998. Standard Methods for the 45. Jain C.K., C. P. Kumar and M. K. Sharma, 2003.examination of water and waste water, 20 edition. Ground water qualities of Ghataprabha command areath
American Public Health Association, Washington Karnataka. Ind. J. Environ. Ecoplan., 7(2): 251-262.DC, USA. 46. Bhattacharya, T., S. Chakraborty and T. Neha, 2012.
34. Manoj, K., S. Ghosh and P.K. Padhy, 2013. Physicochemical characterization of ground water ofCharacterization and Classification of Anand district, Gujrat, India, Int. Res. J. Environ, Sci.,Hydrochemistry using Multivariate Graphical and 1(1): 28-33.Hydrostatistical Techniques. Res. J. Che. Sci., 47. Jain C.K., K. K. Bhatio and S. R. Kumar, 2005. Ground3(5): 32-42. Water quality in Malaprabha sub-basin Karnataka.
35. Kaur, R. and Singh, R.V. 2011. Assessment for Int. J. Environ. Prot., 23(3): 321-329.different groundwater quality parameters for 48. Chapolikar, A.D. and M.B. Ubale, 2010. A correlationirrigation purposes in Bikarner city, Rajastan. Journal study on physicochemical characteristics of groundof Applied Sciences and Environmental Sanitation, water in Thane- Belapur industrial area, Mumbai. Cur.6(3): 385-392. World Environ., 5(1): 67-71.
36. WHO, 2011.World Health Organization, Standard 49. Deepak, S. and N.U. Singh, 2013. Water Quality Indexwater quality parameters for aquatic life. Geneva, for Ground Water (GWQI) of Dhar town, M.P, India.Switzerland. Int. Res. J. Environ. Sci., 2(11): 72-77.
37. USPHS, 1962. Public Health Service Drinking Water 50. WHO, 2000. Wastes from Healthcare Activities,Standards. U.S Department of Health, Education and WHO information, act Sheet No. 253.Welfare Washington 25, DC. 51. Ravikumar, P. and R.K. Somashekar, 2010.
38. Fakayode, S.O., 2005. Impact assessment of industrial Multivariate Analysis to Evaluate Geochemistry ofeffluent on water quality of the receiving Alaro River Ground Water in Varahi River Basin of Udupi inin Ibandan, Nigeria. Ajeam-Ragee, 10: 1-13. Karnataka, India. Ecoscan., 4(2&3): 153-162.
39. Abida, B., 2008. Study on the quality of water in 52. Raghunath, H.M., 1987. Groundwater (2 Edition).some streams of Cauvery River. e-J Chem., 5: 377-384. Wiley Eastern Ltd, Delhi India, pp: 563.
40. Lalparmawii, S. and B.P. Mishra, 2012. Seasonal 53. Pathan, S.S., K.K. Upadhyaya and S.K. Joshi, 2002.variation in water quality of Tuirial River in vicinity Some Physicochemical parameters and primaryof the hydel project in Mizoram, India. Sci. Vis., productivity of river Ramganga (Uttranchal). Him. J.12(4): 159-164. Env. Zool., 16(2): 151-158.
41. Hanipha, M.M. and Z.A. Hussain, 2013. Study of 54. Wilcox, L.V., 1995. Classification and Use ofground water quality at Dindigul town, Tamilnadu, Irrigation Water, US Department of AgriculturalIndia. Int. Res. J. Environ. Sci., 2(1): 68-73. Circular, Washington, DC. US Department of
42. George, J.P., 1997. Aquatic ecosystem: Stucture Agriculture. p. 969.degrada-tion strategies for management. In: 55. Domenico, P.A. and F.W. Schwartz, 1990. PhysicalAdvances in Ecobiological Research. A.P.H. and Chemical hydrology, John Wiley and sons,Publication House, New Delhi, pp: 603. New York, pp: 410.
43. Nishtha, K., R.S. Lokhande and J.K. Dhar, 2012. 56. Kelley, W.P., S.M. Brown and G.F. Jr Liebig, 1940.Physicochemical, bacteriological and pesticide Chemical effects of saline irrigation waters on soils.analysis of tap water in Millennium city Gurgoan, Soil Sci., 49: 95-107.Haryana, India, Int. Res. J. Environ. Sci., 1(2): 1-7.
44. Pradeep J.K., 1998. Hydrology and quality ofground water Hirapur district, Sagar (M.P.). Pol. Res.,17(1): 91-94.
nd